fuel cell emulator based on interleaved synchronous buck converter
TRANSCRIPT
Abstract— This paper shows the design and implementation of
a Fuel Cell (FC) system emulator through the Hardware-in-loop (HIL) technique. The proposed FC emulator is tested on a detailed nonlinear simulator taken from the open literature. The goal of this research is the setup of a test bench that allows developing and testing control strategies in a FC system as well as to dispose with a platform for developing new power conditioning converters for this kind of systems. The Proton Exchange Membrane Fuel Cell (PEMFC) is the class of FC addressed in this research. The emulator is based on an interleaved buck converter in order to get a test bench with an output voltage of good quality.
Index Terms— Fuel cell system, emulator, hardware in the loop, emulator, interleaved buck converter.
I. INTRODUCTION
uel Cells are electrochemical devices which convert chemical energy into electrical and thermal energy.
PEMFCs are one of the most FC’s technology researched due to its high power density, solid electrolyte and low corrosion. Moreover, these FCs operate at low temperatures (50 ºC - 100 ºC) which allow fast start-up. However, even with the advantages of the PEMFCs as portable power sources, their use and research is limited due to their high costs, the complex control task required and the lack of proper electronic converter for the power conditioning produced by the FCs. Besides, special infrastructure is required to operate a FC system.
In the context of this issue, this work shows the design and implementation of a dynamic FC system simulation tool by a HIL technique as a low-cost solution for to accelerate the development of fuel cell systems. Hardware-in-loop is widely used in the automotive industry for the development and validation of control algorithms for drive systems by simulating the vehicle plus the vehicle environment in combination with specific control hardware as the HIL component.
This work was developed under the project “Emulador en tiempo real de un sistema de celda de combustible tipo PEM mediante la técnica de hardware-in-loop”, supported by PROMEP under Grant UQROO-EXB-072.
V. Sanchez, F. Chan, are with the Quintana Roo University, Quintana Roo State, Mexico (e-mail: [email protected]).
Juan Manuel Ramirez-Arredondo is with the Guadalajara Campus of CINVESTAV, Mexico.
Julio C. Rosas-Caro is with the Madero City Technological Institute, Tamaulipas State, Mexico.
There are several references to FC emulators [1-7]. However, the FC system emulator proposed in this work uses a nonlinear dynamic model of a FC system that includes its main auxiliary systems. Also, PEMFC system emulator is tested with linear and nonlinear load. A Matlab/Simulink® environment is used to assemble the FC model, the auxiliary systems, and the controller, then they are programmed in a dSPACE® platform. The corresponding output will determine the emulator’s reference. Power stage of the emulator is based on an interleaved synchronous buck converter. This test bench will allow to develop and to test new power conditioning converters
This paper is organized as follows. Section II presents the fuel cell system model. The PEMFC system emulator prototype is discussed in section III. Section IV discusses experimental results obtained by a hardware-in-the-loop emulation. Finally, section V summarizes some conclusions.
II. FUEL CELL SYSTEM MODEL
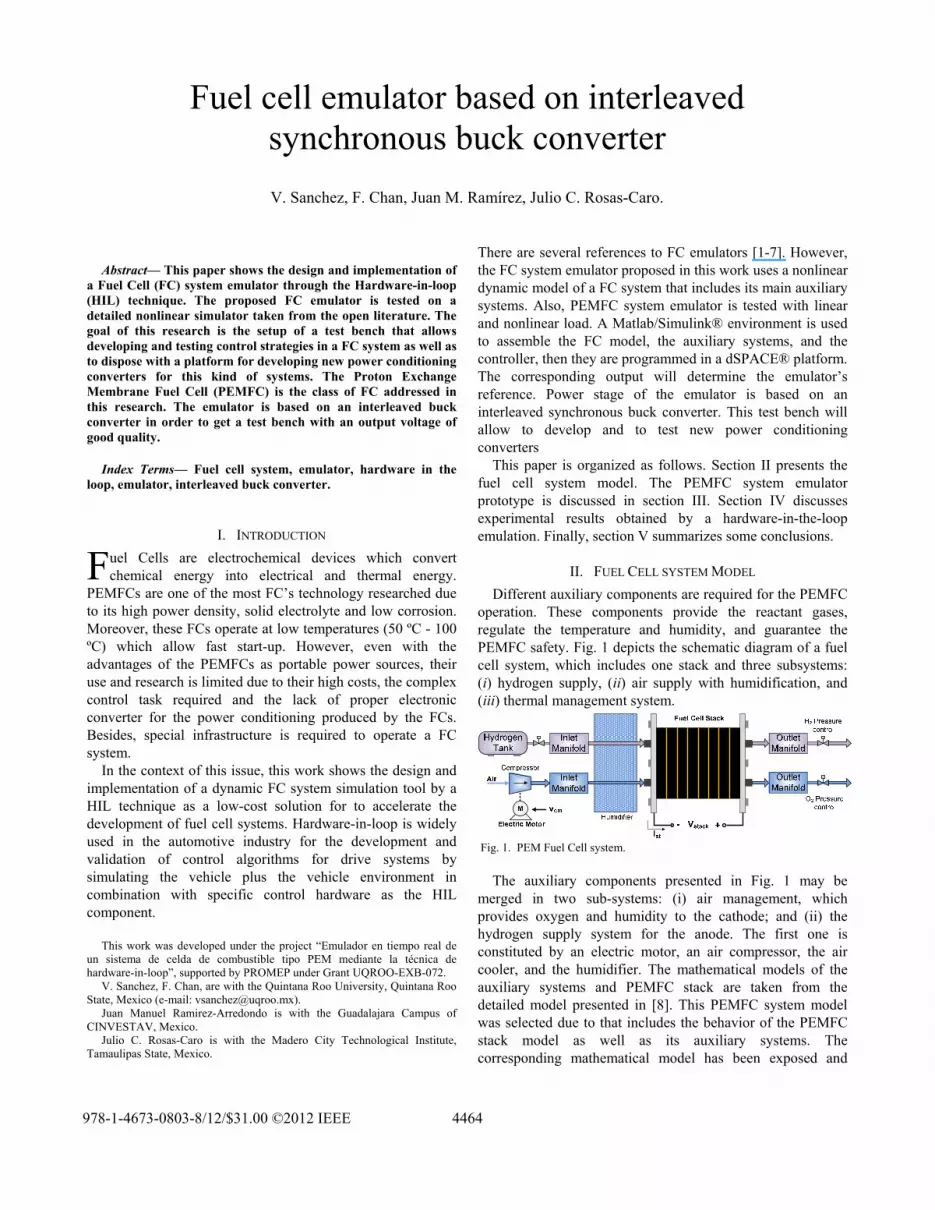
Different auxiliary components are required for the PEMFC operation. These components provide the reactant gases, regulate the temperature and humidity, and guarantee the PEMFC safety. Fig. 1 depicts the schematic diagram of a fuel cell system, which includes one stack and three subsystems: (i) hydrogen supply, (ii) air supply with humidification, and (iii) thermal management system.
Fig. 1. PEM Fuel Cell system.
The auxiliary components presented in Fig. 1 may be
merged in two sub-systems: (i) air management, which provides oxygen and humidity to the cathode; and (ii) the hydrogen supply system for the anode. The first one is constituted by an electric motor, an air compressor, the air cooler, and the humidifier. The mathematical models of the auxiliary systems and PEMFC stack are taken from the detailed model presented in [8]. This PEMFC system model was selected due to that includes the behavior of the PEMFC stack model as well as its auxiliary systems. The corresponding mathematical model has been exposed and
Fuel cell emulator based on interleaved synchronous buck converter
V. Sanchez, F. Chan, Juan M. Ramírez, Julio C. Rosas-Caro.
F
978-1-4673-0803-8/12/$31.00 ©2012 IEEE 4464

validated in [9-12]. The assumptions for the stack’s modeling are: (i) gases
obey the ideal gas law; (ii) the temperature of the flow inside the cathode flow channel is equal to the stack temperature (80ºC); (iii) there is a constancy in the gases’ volume (input-through-output).
The proper performance of the auxiliary systems contributes to the FC’s efficient operation. Among these systems, the air management system is used to control the power generated by the FC system.
A. PEMFC stack model The mathematical model of the PEMFC stack used in this
work is based on physical mass conservation along with electrochemical, thermodynamic, and fluid flow principles. The dynamics of the cathode, anode and membrane hydration are included in the PEMFC stack model.
Stack PEMFC is a series connection of individual cells, so the stack voltage is the sum of the voltage generated by each single cell and is given by (1). The PEMFC cell voltage is calculated by the ideal open circuit voltage minus the losses attributed to the activation, ohmic and concentration losses.
= − − − (1) where E is the ideal open voltage cell known as the Nernst
voltage, vact is the activation losses, vohm is the ohmic losses and vconc is the concentration losses. Assuming that all cells are identical, the stack voltage is calculated by
= ∗ (2) Mass rate of the oxygen, nitrogen and water inside the
cathode can be expressed as: = , − , − , (3) = , − , (4) = , − , + , + , (5)
where m, W denote mass and mass flow rate, respectively.
Subscript w, v, gen, represent water, vapor, cathode, and generated, respectively. The amount of oxygen reacted depends on the stack current and is given by:
= (6)
where MO2 is the molar mass of oxygen, n is the stack´s
number of cells, F is the Faraday´s number and Ifc is the stack current.
Similarly, the mass rate of the hydrogen and water inside the anode are calculated using:
= , − , − , (7)
, = , − , + , (8)
The rate of hydrogen consumed in the reaction is a function
of the stack current, = (9)
The total stack mass flow rate of water across the
membrane can be calculated from: , = , ∙ ∙ ∙ (10) where Nv,membr is the water flow across a single membrane,
Mv is the water vapor molar mass and Afc is the FC active area.
B. Air management system The air supply sub-system consists of a compressor driven
by an electrical motor, so that the compressor’s output can be controlled by the voltage fed to the motor.
The air mass flow rate produced by the compressor, Wcr, is a function of the ratio between the atmospheric pressure, the inlet manifold pressure, and the compressor’s speed. Thus, the corresponding nonlinear flow’s characteristic is approximated by a map data, where a linear function is obtained through curve fitting techniques proposed by Jensen-Kristensen [13]. The method consists in determining the normalized compressor flow rate through a least square fit on experimental data, by the following relationship:
= (11)
where φ is the normalized compressor flow rate, k1, k2, k3
are coefficients determined through least square fit and Ψ is the dimensionless head parameter. Based on (11) the air mass flow of the compressor (Wcr) is calculated using:
= (12)
where dc is the compressor diameter, pa is the air density
and Uc is the compressor blade tip speed. Likewise, the electro-mechanical equation is taken into
account, = − (13)
where Jcp is the compressor inertia, ωcp is the compressor angular speed, τcm and τcp are the compressor motor torque and compressor load torque, respectively.
The air flow of the compressor is controlled by the motor voltage, which is a function of the current drawn from the stack. The compressor motor torque is calculated as a function of the motor’s voltage vcm (14).
4465

= − (14)
where kt, Rcm and kv are motor’s constants and ηcm is its mechanical efficiency.
The control objective in the cathode is to control the oxygen supply through the motor voltage control. Oxygen excess ratio, λO2, is a FC performance parameter to evaluate the oxygen supply and it is described by (15).
= ,, (15)
where WO2,in is the oxygen mass flow rate entering to the cathode, and WO2,react is the rate of reacted oxygen.
PEMFC model system and the air management control are implemented on a dSPACE® platform. A dSPACE1104 board is utilized. Due to the complexity of the whole system a sampling frequency of 500 Hz is used to the hardware-in-the-loop evaluation. Sampling frequency is less than the constant time of the auxiliary subsystems so that it does not affect the behavior of the PEMFC system. Fig. 2 displays the comparison between simulation obtained by Simulink and the results of the dSPACE® platform for the stack voltage.
Fig. 2.Comparison between Simulink and the dSPACE® platform for the stack voltage.
The comparison in Fig. 2 shows a close tracking of the
PEMFC system model through the dSPACE® platform. The dSPACE® platform converts the stack voltage simulated in Matlab-Simulink in a voltage within the range [0 10] V.
III. THE PEMFC SYSTEM EMULATOR PROTOTYPE
The emulator’s power interface aims to boost the power level of the signal generated by the real-time simulation accomplished in the dSPACE® platform. In this research, a multiphase buck converter is proposed as power interface of the PEMFC system emulator. Fig. 3 shows the topology of the interleaved synchronous buck converter comprised by four phases.
Fig. 3. Interleaved synchronous buck converter.
A. Emulator power stage. Interleaved synchronous buck converter is used because of
it exhibits a DC output voltage with minimum ripple as well as a fast dynamic response. So, by means of n stages of interleaved phases, the total current of the whole power stage is divided and each single power stage drives a proportion of the total current. This fact helps to reduce the current stresses on semiconductor devices as well as the voltage switching noise. Interleaved technique allows the following advantages
• Semiconductor devices used in the power converter can be surface mounted technology components (SMT).
• Heatsinks are not necessary. • Magnetic components may be planar or SMT. • Small output filter. A simplified equivalent circuit can be obtained for the
interleaved synchronous buck converter, as shown in Fig. 4.
Fig. 4. Equivalent single-phase synchronous buck converter.
The interleaved buck converter’s equivalent circuit results
in a single-phase buck converter, with an inductance (Leq) and switching frequency (fsweq) equivalents defined by (16) and (17), respectively.
= (16) = ∗ (17)
where L is the inductance in each phase, n is the number of phases of the interleaved converter, and fsw is the switching frequency of each phase. The equivalent circuit in Fig. 4 includes the equivalent inductor’s and capacitor’s parasitic
4466

series resistances in order to include its effects in the power converter’s small signal analysis.
The inductor value can is stated by (18) = ∆ (18)
Then, based on (18) and assuming that the duty cycle of the
power converter can change within the interval 0.1 ≤ D ≤ 0.9, as well as assuming a current ripple (ΔI) of 3 A, the output inductor value variation against D is plotted in Fig. 5.
Fig. 5. Output inductor value vs the duty cycle.
As can be noticed in Fig. 5, the highest inductance value occurs at a duty cycle of 50 %, which corresponds to 33.3 μH. For this inductance, surface mounting inductors can be used. In this way, with the purpose of employing commercial SMD inductors, which are adequate for high switching frequencies, an inductance value in each phase of 15.4 μH is chosen.
The capacitor ripple voltage is given by ∆ = (19)
In order to filter the high frequency current ripple, the
output capacitor value is calculated from (19), and assuming a voltage ripple (Δvc) equal to 0.5 V, the calculated capacitance becomes 10.8 μF. However, this capacitance is not enough to absorb a load transient. During a load current step, an output voltage transient arises. Therefore, the output capacitor must provide the energy demanded immediately after the disturbance. To greater load current step, larger the voltage drop. Thus, the output capacitor value for the interleaved synchronous buck converter is calculated by simulating the power converter and assuming a ripple voltage minor to 1 V for a load current step of 10 A. In this way, the output capacitor becomes 1900 μF, which is assembled by four 470 μF electrolytic capacitors and two 10 μF ceramic capacitors in parallel. The capacitors’ parallel connection helps to decrease the parasitic resistance of the output capacitors (Rc).
In order to take advantage of the interleaved synchronous buck converter topology and with the purpose of obtaining a fast dynamic response of the power stage emulator, the switching frequency has been fixed in 150 kHz per phase. As a consequence, the equivalent inductance and frequency of the multiphase converter, defined in (16) and (17), become Leq = 3.85 μH and fsweq = 600 kHz.
B. Control stage design. The PWM switching model is used to estimate the control-
to-output transfer function of the equivalent single-phase synchronous converter [14]. The resulting circuit of the equivalent single-phase synchronous buck with the PWM switching model is presented in Fig. 6.
+-
D1
c
p
a
Ic d̂
D d̂VapLeq
Co
RL
RC
R+
-Vo^
Fig. 6. PWM switching model of the multiphase Buck converter to estimate the control-to-output transfer function.
The control-to-output transfer function obtained of the multiphase buck converter is given by,
= (20)
The open loop frequency response of the control-to-output
transfer function is plotted in the bode diagram of Fig. 7, where the open-loop gain is 35.5 dB.
Fig. 7. Open loop frequency response of the multiphase buck converter.
In order to obtain an appropriate power converter’s dynamic
response and to suppress the high frequency noise, the power converter’s bandwidth is proposed to be the tenth part of the switching frequency, that is, 60 kHz. Furthermore, in order to assure control loop stability, a margin phase of 60º is proposed.
C. Multiphase buck converter implementation. The control stage of the interleaved buck converter has been
developed on the DSP TMS320F28335 of Texas Instrument. This DSP has PWM modulators, which have been configured in order to generate the PWM signals for each phase of the interleaved synchronous buck converter. Fig. 8 shows the block diagram of the multi-phase synchronous buck converter operating in closed loop. As is seen in Fig. 8, control stage has a master PWM modulator to synchronize the slaves PWM modulators in order to generate the phase-shifting of the remaining PWM signals. The power converter’s control loop acts only on the master PWM modulator and the slaves’
4467

modulators will follow the duty cycle imposed by the master modulator, which minimizes the error of the output voltage with respect to the reference value.
Fig. 8. Control stage’s block diagram.
The power converter’s aim to track the reference signal
generated in the PEMFC system model programmed on the dSPACE® platform. For the tracking task, the power converter’s control stage is comprised by a feed-forward controller as well as a feedback controller. In this proposed control, the reference change stemming from the dSPACE® platform is seen as a disturbance, so the feed-forward control helps to eliminate the effect of the measured disturbance on the power converter [15].
Fig. 9 depicts the block diagram of the whole PEMFC system emulator which is comprised by a PC, dSPACE® Hardware-in-the-Loop simulator and the power stage of the simulator.
Fig. 9. Block diagram of the PEMFC system emulator.
The PEMFC stack voltage (Vst) generated by the HIL simulator is boosted by the power stage and then applied to the load connected to the PEMFC emulator. The controller of the power converter calculates the duty cycles comparing the reference signal and the interleaved buck converter’s output voltage. So, the Vst signal from the dSPACE® platform acts as reference signal for the multiphase buck converter.
Also, the load current is sensed and used by the HIL simulator in order to generate the stack output voltage (Vst) due to that it represents the stack current of the PEMFC system. With the purpose of emulating a PEMFC stack with up fifty cells, the PEMFC system emulator’s output voltage is within the interval 0 – 60 V.
In this way, Fig. 10 shows the physical prototype of the PEMFC system emulator. This prototype is built on a two-sided printed circuit board. As it is noticed in Fig. 10, on the
PCB’s upper face are the opto-couplers and MOSFET drivers of the multiphase synchronous buck converter.
Fig. 10. PEMFC system emulator prototype.
Similarly, Fig. 11 shows the PCB’s bottom face, on which
the phases of the multiphase synchronous buck converter can be identified. It is important to remark that the physical arrangement of the power MOSFETs and power inductors have a symmetrical distribution in order to minimize the noise switching on the emulator output voltage. The power components are SMD technology.
Fig. 11. Multiphase synchronous buck converter.
IV. EXPERIMENTAL RESULTS
In order to illustrate the performance of the PEMFC system emulator, it is tested both with linear as well as with nonlinear load.
The linear load consists in an arrangement of resistances which are controlled by manual switches. The aim of this linear load bank is to produce load-current steps. Load current-steps demand a fast response of the air management system controller in order to maintain an adequate supply of the oxygen towards the PEMFC stack cathode and to avoid a fatal starvation condition, so the PEMFC system controller under test could be evaluated to face this kind of events.
Experimental tests with linear load are carried out to evaluate the tracking of the emulator’s output voltage (vem)
4468

with respect to the reference voltage generated by the HIL simulator (vref). All the images presented in this section were captured using a Tektronix® TPS2024 oscilloscope. Thereby, the Fig. 12(a) shows the response of the emulator’s output voltage during load-current steps-down. On the other hand, the emulator’s output voltage is displayed in Fig. 12(b), during a load-current steps-up. The load-current steps range from 2.8 to 5.6 A.
(a)
(b)
Fig. 12. Response of the emulator’s output voltage under load-current steps. Load-current steps-down. (b) Load-current steps-up. iload (1 A/div), vref (2 V/div), vem (10 V/div), TIME/DIV: (1 s/DIV).
It is noticed that the output voltage of the emulator’s power stage tracks the reference voltage imposed by the HIL simulator.
On the other hand, the nonlinear load consists on one electronic power converter. Multilevel boost converter is used as nonlinear load in order to evaluate the behavior and performance of the PEMFC system emulator with a power conditioning converter. Fig. 13 depicts the topology of the multilevel boost converter.
Fig. 13. Multilevel boost converter.
The DC gain of the multilevel boost converter is determined by,
= (21)
where N is the number of levels of the power converter and
D is the duty cycle. In this study N = 4 and D = 0.2. Thereby, the multilevel boost converter boosting five times the output voltage of the PEMFC system emulator. Besides of the output voltage amplification, another concern consists in the evaluation of the PEMFC system emulator and the multilevel boost converter interaction. This evaluation will determine the feasibility of the emulator for designing new power conditioning converters.
In order to verify the usefulness of the PEMFC system emulator for the design of power conditioning converters, the multilevel boost converter is used as load. Fig. 14 shows the block diagram of the test bench for testing the behavior of the PEMFC system model with the power conditioning converter. The load connected to the multilevel boost converter is constituted by a variable resistive load.
Fig. 14. Block diagram of the nonlinear load connected to the PEMFC system emulator.
In this way, Fig. 15 shows the emulator performance with the multilevel boost converter as load- Results show that the output voltage of the emulator tracking the reference voltage imposed by the nonlinear PEMFC system model with a minimum ripple voltage.
4469

(a)
(b)
Fig. 15. Output profiles of the PEMFC system model and emulator under a nonlinear load. (a) iload (0.5 A/div). (b) iload (1 A/div). vboost_converter (50 V/div), vref (2 V/div), vem (10 V/div), TIME/DIV: (5 s/DIV).
The power conditioning converter boosts the PEMFC
system emulator’s output voltage by a factor of 5, so that the output voltage of the multilevel boost converter is around 150 V. The oscilloscope’s graphs demonstrate a low ripple in both output current and voltage of the PEMFC system emulator even when it must drive a nonlinear load (the multilevel boost converter).
V. CONCLUSIONS
A PEMFC system emulator has been proposed as a low-cost solution for the fast developing of this kind of power generating systems. The power stage’s response in the PEMFC system emulator boosts the power levels of the PEMFC system model. In addition, a low output-ripple is achieved in both the output current and the output voltage of the PEMFC system emulator, which will allow an adequate evaluation and developing of power conditioning converters.
The experimental results validate that the proposed fuel cell emulator well replicates the dynamic performance of the PEMFC system. The output parameters of the PEMFC system emulator match with the results of the model into the HIL simulator. Besides, the experimental results verify the adequate performance of the PEMFC system model respect to reach a satisfactory output power.
REFERENCES [1] P. Acharya, P. Enjeti, I. J. Pitel. “An Advanced Fuel Cell Simulator”.
IEEE Applied Power Electronics Conference and Exposition, APEC '04. Vol. 3. pp. 1554 – 1558.
[2] L. Tae-Won, L. Byoung-Kuk, J Su-Jin, K. Sung-Ho and W. Chung-Yuen.“Development of A 3kW Fuel Cell Generation System with an Active Fuel Cell Simulator: Topology, Control and Design”. IEEE Power Electronics Specialists Conference, 2004. PESC '04.
[3] L. Jeong-Gyu, K. Seok-Hwam, S. Eun-Kyung, L. Hyun-Woo. “Implementation of Fuel Cell Dynamic Simulator”. IEEE Power Electronics Specialists Conference, 2006. PESC '06.
[4] A. Gebregergis and P. Pillay. ”Implementation of Fuel Cell Emulation on DSP and dSPACE Controllers in the Design of Power Electronic Converters”. IEEE Transactions on Industry Applications, Vol. 46, No. 1, January/February 2010. pp. 285 – 294.
[5] G. Marsala, M. Pucci, M. Cirrinciones. “A prototype of a fuel cell emulator based on a buck converter”. Journal of Applied Energy. Vol. 86 No. 2009. pp. 2192 – 2203.
[6] F.R.P Pinto, A.P. Vega Leal. “A Test of HIL COTS Technology for Fuel Cell Systems Emulation”. IEEE Transactions on Industry Applications, Vol. 57, No. 4, 2010. pp. 1237 – 1244.
[7] F. Gao, D. Chrenko, B. Blunier, D. Bouquain, A. Miraoui. “Multi-rates Fuel Cell System Emulation with spatial reduced Real-Time Fuel Cell Modeling”. IEEE Industry Applications Society Annual Meeting (IAS), 2011, pp. 1 – 8.
[8] Pukrushpan J., Stefanopoulou A. and Peng H., “Control of Fuel Cell Power Systems,” Springer Verlag London, 2005.
[9] Pukrushpan J., Stefanopoulou A. and Peng H., “Modelling and control for PEM fuel cell stack system,” Proc. of the 2002 American Control Conference, vol. 4, pp. 3117-3122.
[10] Pukrushpan J., Stefanopoulou A. and Varigonda S., “Control oriented model of fuel processor for hydrogen generation in fuel cell applications,”IFAC Symposium in Advances in Automotive Systems 2004.
[11] Pukrushpan J., Stefanopoulou A. and Peng H., “Control of Fuel Cell Power Systems,” Springer Verlag London, 2005.
[12] Gelfi S, Stefanopoulou A. Pukrushpan J and Peng H, “Dynamics of low pressure and high pressure fuel cell air supply systems,” Proc. of the 2003 American Control Conference, vol. 3 pp. 2049-2053.
[13] Moraal P. and Kolmanovsky I,, “Turbocharger modeling for automotive control applications,” SAE paper 1990-01-0908.
[14] Vatché Vorpérian. “Simplified Analysis of PWM Converters Using Model of PWM Switch Part I: Continuous Conduction Mode”, IEEE Transactions on Aerospace and Electronic Systems, vol. 26, No.3 May 1990. Pages: 490-496.
[15] Astrom J. “Control System Design”. Lectures notes for ME-155A. Department of Mechanical & Environmental Engineering. University of California. 2002.
4470