the effect of within-stand variation in swiss needle cast intensity on douglas-fir stand dynamics
TRANSCRIPT

Forest Ecology and Management 347 (2015) 75–82
Contents lists available at ScienceDirect
Forest Ecology and Management
journal homepage: www.elsevier .com/locate / foreco
The effect of within-stand variation in Swiss needle cast intensityon Douglas-fir stand dynamics
http://dx.doi.org/10.1016/j.foreco.2015.03.0100378-1127/� 2015 Published by Elsevier B.V.
⇑ Corresponding author at: FERM, College of Forestry, Oregon State University,Corvallis, OR 97331, USA. Tel.: +1 541 737 4215.
E-mail address: [email protected] (D.A. Maguire).
Junhui Zhao a, Douglas A. Maguire b,⇑, Douglas B. Mainwaring b, Alan Kanaskie c
a Arbor Research Collaborative for Health, Ann Arbor, MI, USAb Department of Forest Engineering, Resources and Management, College of Forestry, Oregon State University, USAc Oregon Department of Forestry, Salem, OR, USA
a r t i c l e i n f o a b s t r a c t
Article history:Received 12 December 2014Received in revised form 3 March 2015Accepted 5 March 2015
Keywords:Swiss needle castFoliage retentionDiameter incrementGrowth differentiationThinning guidelines
Swiss needle cast (SNC) is a foliar disease of Douglas-fir (Pseudotsuga menziesii (Mirb.) Franco) caused bythe ascomycete Phaeocryptopus gaeumannii (Rohde) Petrak. The number of annual needle cohortsretained by a tree indicates SNC severity and associated growth losses. In previous studies growth losseshave been predicted on the basis of plot-level foliage retention, and plot-level growth multipliers havebeen uniformly applied to all trees within a stand to simulate tree growth. In this analysis, the effectsof within-stand variation in foliage retention on individual-tree growth impact and implied standdynamics were analyzed. Models describing diameter increment of Douglas-fir were developed basedon three different foliage retention ratings: (1) plot-level foliage retention; (2) tree-level foliage reten-tion; and (3) a combination of plot-level foliage retention and the deviation of tree-level from plot-levelfoliage retention. Foliage retention at both the plot-level and tree-level was positively correlated withdiameter increment, and a significant amount of additional variation in diameter growth was explainedby the deviation of individual-tree foliage retention from the plot-level average. The SNC ‘‘effect’’ wasassessed by comparing growth of trees with varying degrees of Swiss needle cast to growth of those thatretained maximal amounts of foliage. Across all plots in the sampled population, the most severelyaffected dominant or co-dominant trees exhibited 30% diameter growth loss relative to trees of similarcrown position with minimal SNC symptoms. Within a plot, diameter growth averaged about 12% higheron trees with the highest foliage retention relative to trees with the lowest foliage retention, implyingthat SNC intensifies stand differentiation. Rather than responding to SNC with proportionally uniformgrowth losses within a plot, these results suggest that individual trees tolerate or resist the disease dif-ferentially. Foliage retention should therefore be used as a criterion for selecting trees for removal duringthinning operations in Douglas-fir stands with moderate to severe SNC.
� 2015 Published by Elsevier B.V.
1. Introduction
Swiss needle cast (SNC) is a foliar disease of Douglas-fir(Pseudotsuga menziesii) caused by the ascomycete Phaeocryptopusgaeumannii (Hansen et al., 2000). This pathogen causes prematureloss of older foliage, resulting in needle longevity of only one yearin the most severe cases, relative to a maximum of approximatelyfour years in unaffected plantations of similar age and geographiclocation (Hansen et al., 2000; Maguire et al., 2002). Over the past20 years, the Swiss needle cast epidemic in the Oregon CoastRange has significantly lowered productivity in affected Douglas-fir forests (Hansen et al., 2000; Maguire et al., 2002; Black et al.,
2010). Aerial surveys conducted by the Oregon Department ofForestry annually since 1996 have detected fluctuating butgradually increasing areas in coastal Oregon with detectable SNCsymptoms, amounting to 212,265 ha in 2013 (Kanaskie andMcWilliams, 2013). Fruiting bodies of the fungal pathogen inter-fere with foliage gas exchange by physically blocking Douglas-firstomata, thereby reducing or halting photosynthesis and leadingto premature needle abscission (Manter et al., 2005). The mecha-nisms leading to growth decline of Douglas-fir include loss ofphotosynthetic surface area (Weiskittel et al., 2006) and physio-logical disruption of surviving foliage (Manter et al., 2005).
In plantations with severe symptoms of SNC, growth losses andreduced tree vigor have been evident (Maguire et al., 2002).Maguire et al. (2011) found that maximum periodic annual growthlosses in cubic volume ranged between 36% and 59% in northcoastal Oregon among four separate growth periods between

76 J. Zhao et al. / Forest Ecology and Management 347 (2015) 75–82
1998 and 2008. In New Zealand, Douglas-fir enjoyed a disease-freeperiod for a number of years after its introduction, providing abasis for estimating growth reductions after the appearance ofSNC in 1959. Kimberley et al. (2011) estimated that averagegrowth loss reached 25% for mean top height increment, 27% forbasal area increment, and 32% for stem volume increment since1959. Black et al. (2010) assessed the impacts of SNC by tree-ringanalysis of mature Douglas-fir and western hemlock trees in thewestern Oregon Coast Ranges, concluding that radial growth wasreduced by as much as 85% since 1984.
The negative effects of SNC-imposed reductions in foliage reten-tion on Douglas-fir growth is well established, but most studies todate have quantified this relationship at the plot-level. To ourknowledge the effects of tree-to-tree variation in foliage retentionon stand dynamics and relative tree growth rates have not beenquantified. Johnson (2002) observed variation in family toleranceto SNC in 11-year-old Douglas-fir progeny, but foliage retentionwas not a significant predictor of diameter or height growth.However, foliage retention was measured as the percentage of 2-yr-old or 3-yr-old needles rather than the number of retainedannual needle cohorts (Johnson, 2002).
The question of whether within-stand variation in foliage reten-tion induced by SNC has altered stand dynamics by differentialeffects on diameter increment has not been addressed directly.However, a tree-level analysis of diameter growth within commer-cially-thinned stands infected with SNC found marginally signifi-cant evidence of an interaction between foliage retention and treediameter, suggesting that larger diameter trees maintain a higherpercentage of their full growth potential than smaller trees as foli-age retention decreased (Mainwaring et al., 2005). Whether smallertrees had lower levels of foliage retention than the larger trees in thesame stand is unknown, leaving open the question of whether varia-tion in foliage retention within a stand influences stand dynamics.
The goal of this study was to gain a better understanding ofstand dynamics within SNC-infected stands, particularly byquantifying the effects of SNC on any departures from normalgrowth differentiation patterns among individual trees. The rateand intensity of these departures would have implications for thetiming of thinnings and the selection of trees for removal.Similarly, shifts in the intensity of differentiation would have impli-cations for growth and yield projections, harvest schedules, andharvested tree and log dimensions. The specific objective of thisstudy therefore was to test the hypothesis that tree-to-tree varia-tion in foliage retention (SNC severity) has intensified differentia-tion of Douglas-fir growth rates. If this hypothesis proves correct,then tree-level foliage retention should account for significantlymore of the variation in tree growth than plot-average foliageretention, and the dynamics of SNC-impacted stands are character-ized by more extreme differentiation in growth rate and size dis-tribution than unimpacted stands. Three steps were followed inpursuit of this objective: (1) separate diameter increment modelswere developed for Douglas-fir based on plot-level versus individ-ual tree-level foliage retention; (2) diameter increment modelswere developed for Douglas-fir that included both plot-level foliageretention and the deviation of individual-tree retention from thisplot-level retention; and (3) the relative proportion of variation inDouglas-fir diameter increment explained by plot-level foliageretention, tree-level foliage retention, and the combination ofplot-level foliage retention and tree-level deviations from the plotaverage were quantified and assessed graphically.
2. Methods
The target population for the Swiss Needle Cast Cooperative(SNCC) Growth Impact Study was 10- to 30-yr-old Douglas-fir
plantations in north coastal Oregon (Maguire et al., 2002, 2011).A list of all 10- to 30-yr-old Douglas-fir stands was first compiledin 1996, with geographic bounds defined by Astoria to the north(N46�110, W123�500), Newport to the south (N44�380, W124�040),the Pacific Ocean to the west (W124�050), and the crest of theOregon Coast Ranges to the east (W123�300). Over the last 40 yearsin this region, the mean January minimum temperature was 0 �Cand the mean July maximum temperature was 25 �C. Total annualprecipitation averaged 150–300 cm, with approximately 70% of thetotal falling between October and March.
A set of 76 stands was randomly selected from this list withprobability proportional to area. The selected sample stands repre-sented a range of SNC severity indicated by a minimum plot-levelfoliage retention of 1.01 years and a maximum of 3.85 years. Theassumption made in this analysis was that SNC was the primaryinfluence on foliage retention. Other factors known to influencefoliage retention (Maguire et al., 2011) were controlled to somedegree by specifying the target population, as well as by includingthe covariates described below.
A single, permanent plot was established in each sampled standin the late winter/early spring of 1998. Plots were square, 0.08 hain area (31.7 � 31.7 m), and centered on the fifth point of an ODF(Oregon Department of Forestry) transect established in spring1997 (retrospective plots reported by Maguire et al. (2002) werecentered on the third point). On each measurement plot, all treeswith diameter at breast height (dbh) greater than 4 cm weretagged and measured (nearest 0.1 cm) at a height of 1.37 m. Inaddition, at least 40 Douglas-fir (largest 10 and smallest 4 bydbh, and the remaining 26 evenly distributed across the dbh dis-tribution) were measured for total height (nearest 0.01 m) andheight to crown base (nearest 0.01 m) at time of plot establish-ment. After two, four, and six growing seasons, all trees wereremeasured for dbh, and all undamaged trees from the originalheight subsample were remeasured for total height and height tocrown base. Some plots contained a significant amount of westernhemlock (Tsuga heterophylla (Raf.) Sarg.), as well as various broad-leaved species, most commonly cascara (Rhamnus purshiana D.C.),red alder (Alnus rubra Bong.), and red elderberry (Sambucus race-mosa L.). Other conifers that occurred less frequently includedSitka spruce (Picea sitchensis (Bong.) Carr.), western redcedar(Thuja plicata Donn.), noble fir (Abies procera Rehder), and grandfir (Abies grandis (Dougl.) Forbes). Other hardwood speciesincluded bitter cherry (Prunus emarginata (Dougl.) Walp.) andbigleaf maple (Acer macrophyllum Pursh).
Ten dominant or codominant trees on each plot were alsoscored for SNC at time of plot establishment in 1998, and just priorto bud break in years 1999–2004. Needle retention of individualtrees was visually estimated by first dividing the live crown intothirds, with the base of the live crown defined as the lowest livebranch. Secondary or lateral branches on a primary or main branchwere then examined in the center of each third, and the averagenumber of needle age classes present at time of sampling was esti-mated to the nearest 0.5 yr (Maguire et al., 2002). The needleretention of the tree was then estimated by averaging these valuesacross crown thirds. Plot-level foliage retention was the average ofthe ten SNC-scored trees.
2.1. Variables in the model
Diameter increment models were developed from the tenindividual Douglas-fir trees that had been scored for foliage reten-tion within each plot and for each growth period that the tree sur-vived without any top damage, resulting in 2469 separatemeasurements (Tables 1 and 2).
Separate diameter increment models for Douglas-fir weredeveloped using each of three different estimates of foliage

Table 2Means and ranges of plot-level attributes from the Swiss needle cast growth impactstudy. See text in Section 2 for variable definitions.
Variable Unit N Mean StdDev
Minimum Maximum
SI m 282 43.69 7.12 13.80 63.10PlotFR years 282 2.38 0.45 1.01 3.85Age years 282 22.67 5.93 11.00 38.00D100 cm 282 29.44 8.08 5.58 49.00H100 m/ha 282 17.25 4.76 4.01 34.14BA m2 282 27.65 10.72 1.71 65.37CCF % 282 184.44 63.25 38.33 539.64TPH trees/ha 282 1121.57 548.90 345.80 4705.35QMD cm 282 18.71 5.76 4.12 35.76SDI 25-cm trees/ha 282 611.98 213.07 69.20 1298.65Douglas-fir BA m2/ha 282 21.77 9.50 0.62 48.35Other conifer BA m2/ha 282 4.19 6.99 0.00 46.98Hardwood BA m2/ha 282 1.70 2.66 0.00 17.29% Douglas-fir BA % 282 80 23 12 100Douglas-fir TPH trees/ha 282 118.59 14.33 37.05 135.85
Fig. 1. Frequency of sample trees in each class of DiffFR, or deviation of tree-levelfoliage retention (TreeFR) from plot-average foliage retention (PlotFR) in the Swissneedle cast growth impact study.
J. Zhao et al. / Forest Ecology and Management 347 (2015) 75–82 77
retention: (1) Model 1: plot-level foliage retention (PlotFR); (2)Model 2: tree-level foliage retention (TreeFR); and (3) Model 3:combination of plot-level foliage retention and the differencebetween tree-level and plot-level foliage retention(DiffFR = TreeFR–PlotFR, Fig. 1). Variables from the following fourclasses of additional explanatory variables were also tested:
1. Tree size: diameter at breast height, DBH (cm); total height, HT(m); height to crown base defined as the lowest live branch,HCB (m); crown ratio, CR.
2. Stand density: trees per ha, TPH (trees/ha); average diameterand average height of the 100 largest (by diameter) trees perha, D100 (cm) and H100 (m), respectively; stand density index,SDI; quadratic mean diameter, QMD (cm); basal area, BA (m2/ha); crown competition factor (Krajicek et al., 1961) using themaximum crown width equations described by Paine andHann (1982), CCF (%).
3. Tree social position: basal area in trees with DBH greater thanthe subject tree, BAL (m2/ha); crown competition factor in treeswith DBH greater than the subject tree, CCFL (%).
4. Site quality: Bruce’s (1981) site index, SI (m at 50 years).
In addition to the untransformed variables, the natural loga-rithm, square, and inverse of each were also tested.
2.2. Model development
The biological processes that influence tree growth are inher-ently non-linear. However, linear regression is a suitable tool formodeling growth curves if a linearizing relationship can be foundbetween the key variables (Curtis, 1967) and biologically reason-able shapes are determined (Trasobares et al., 2004). Various linearand nonlinear regression models were fitted to the data to developa series of equations describing diameter increment. Preliminaryanalysis revealed that nonlinear models tended to have more rea-sonable residual distribution as well as higher accuracy. Therefore,nonlinear regressions were adopted in this analysis.
Repeatedly measured growth and yield data are typically corre-lated, and they usually exhibit heteroskedasticity in model residu-als as well (Gregoire, 1987). Preliminary analysis revealed thatmodel residuals were not homogeneous and that the residual vari-ance increased monotonically with increasing tree diameter.Although the logarithmic transformation was examined to correctfor heteroskedasticity (Calama and Montero, 2005; Yang et al.,2009), the models continued to show a trend of increasing residualvariance with tree diameter. Therefore, weighted nonlinear regres-sion was used to homogenize the variance in residuals. A weight ofDBH�m was tested, with m = 0, 1, 2, 3, and 4.
To account for correlations among trees within a plot, a non-lin-ear model with a random plot effect was estimated with PROCNLMIXED in SAS version 9.2 (SAS Institute 2008). A set of promis-ing model forms was selected by a combination of all-subsetsexploratory analyses on linearized models and numerous existing
Table 1Means and ranges of tree-level attributes from the Swiss needle cast growth impactstudy. See text in Section 2 for variable definitions.
Variable Unit N Mean Std Dev Minimum Maximum
dbh cm 2469 26.77 8.23 3.90 57.30ht m 2469 16.78 4.88 3.32 35.40hcb m 2469 4.20 3.13 0.00 19.69BAL m2/ha 2469 8.90 8.85 0.00 49.31CCFL % 2469 46.04 45.26 0.00 289.88CR – 2469 0.77 0.14 0.26 1.00TreeFR years 2469 2.39 0.58 0.67 4.77DiffFR years 2469 �0.01 0.40 �1.59 1.71
nonlinear diameter growth models. The final model for each ofthe three representations of foliage retention were nonlinear andchosen on the basis of residual analysis, minimization of AIC, andbiological interpretability. Alternative variance–covariance matri-ces, including unstructured, compound symmetry, Toeplitz, andAR(1) structures, were tested on the linearized form of the finalnon-linear model. All parameter estimates were required to be sig-nificantly different from zero at a = 0.05.
2.3. Model evaluation
The models were evaluated by examining the magnitude anddistribution of residuals plotted against the response variableand each of the separate predictor variables. The aim was to detectany obvious dependencies or patterns that indicated systematicbiases. To determine the accuracy of model predictions, bias andprecision of the models were computed directly. Mean difference(MD), mean squared difference (MSD), mean absolute difference(MAD), and R2 were calculated on the original (unweighted) scale

Table 3Statistics for evaluation of diameter growth models for Douglas-fir trees from theSwiss needle cast growth impact study. See equations in Section 2 for exact definitionof statistics.
Variable Definition Model [1] Model [2] Model [3]
MD Mean difference �0.000007 �0.000115 �0.000143MSD Mean squared difference 0.073561 0.072404 0.072667MAD Mean absolute difference 0.208572 0.206675 0.207118R2
pseudo Pseudo-R2 0.687629 0.692551 0.691441
78 J. Zhao et al. / Forest Ecology and Management 347 (2015) 75–82
(including any corrections for log bias from log-transformed mod-els) as follows (Palahí et al., 2003):
MD ¼Xn
i¼1
Ddbhi � dDdbh� �,
n
MSD ¼Xn
i¼1
Ddbhi � dDdbh� �2
,n
MAD ¼Xn
i¼1
jDdbhi � dDdbhj,
n
R2pseudo ¼ 1�
Pni¼1 Ddbhi � dDdbh� �2
Pni¼1 Ddbhi � Ddbh� �2
where Ddbh was the observed periodic annual diameter increment,dDdbh was the predicted periodic annual diameter increment, Ddbhwas the average value of observed periodic annual diameter incre-ment, and i referred to the ith tree with i = 1, 2, . . ., n.
2.4. Model application: growth multiplier
The greatest tree-level foliage retention (4.77 years) and plot-level foliage retention (3.85 years) were assumed to representthe most ‘‘healthy’’ condition of Douglas-fir trees and plots, respec-tively. The diameter growth impact and basal area growth impactfor individual plots with foliage retention between 1.0 and3.85 years, or for trees with average foliage retention between1.0 and 4.77 years, were calculated using the model based onplot-level foliage retention (Model 1) or tree-level foliage retention(Model 2), respectively. Within a plot, the difference betweenTreeFR and PlotFR typically ranged between�0.75 and +0.75 years.Therefore, the SNC multiplier from the model based on both plot-level foliage retention and the deviation of tree-level from plot-level foliage retention (Model 3) was plotted across the range ofPlotFR from 1 to 3.85 years under three different conditions ofTreeFR: (1) TreeFR – PlotFR = �0.75 years; (2) TreeFR –PlotFR = 0 years; and (3) TreeFR – PlotFR = +0.75 years.
2.5. Within-stand variability in foliage retention
Little analysis has been done to date to test the hypothesis thatfoliage retention declines with lower or greater social status withina stand. Foliage retention values on more than 700 trees from morethan 70 plots and four different measurement periods were avail-able to test this hypothesis. Individual-tree foliage retention wasregressed on the ratio of individual-tree dbh (D) to plot-level quad-ratic mean diameter of the Douglas-fir component (Q), treatingplot as a random effect. This analysis was intended to facilitateinterpretation of the final growth models relative to initial tree sizeversus initial foliage retention. As a means of illustrating thewithin-plot variation of foliage retention, the standard deviationin estimated foliage retention for the ten trees within each plotwas calculated for each year of SNC rating, and an average valuefor each plot was determined as the average of all years duringwhich SNC severity was rated for that plot.
3. Results
3.1. The model
The diameter increment models based on plot-level and tree-level foliage retention were as follows:
Ddbh ¼ exp b10 þ b11 � logðdbhÞ þ b12logCR þ 0:2
1:2
� �þ b13 � CCFL
�þb14 � ageþ b15 � SDIþ b16
PlotFR
�þ d1 þ e1 ð1Þ
Ddbh ¼ exp b20 þ b21 � logðdbhÞ þ b22 � logCR þ 0:2
1:2
� ��þb23 � CCFLþ b24 � ageþ b25 � SDIþ b26
TreeFR
�þ d2 þ e2 ð2Þ
Ddbh¼ exp b30þb31 � logðdbhÞþb32 � logCRþ0:2
1:2
� �þb33 �CCFL
�þb34 �ageþb35 �SDIþ b36
PlotFRþb37 � log DiffFRþ2ð Þ
�þd3þe3
ð3Þ
where dbh was diameter at breast height (cm); CR was crown ratio(live crown length/total tree height); CCFL was crown competitionfactor in larger trees (%); age was total stand age (years); SDI wasstand density index (Reineke, 1933); PlotFR was plot-level foliageretention (years); TreeFR was tree-level foliage retention (years);DiffFR was the difference between tree-level foliage retention andaverage plot-level foliage retention (TreeFR – PlotFR); b10–b16,b20–b26, and b30–b37 were parameters to be estimated from thedata; d1, d2, and d3 were random plot effects assumingdi � N(0,rdi
2), with i = 1, 2, or 3; and ei are random errors assumingei � N(0,rei
2) with i = 1, 2, or 3. A weight of DBH�2 was used in allthree of the above models. Variance covariance structures AR(1)and compound symmetry were significant in the linear form ofthese models, however, they had a slightly higher AIC. Therefore,the final model did not specify a variance covariance structure.
The above three models were evaluated with R2pseudo, MD, MSD,
and MAD (Table 3). The model using tree-level foliage retention [2]had a greater R2
pseudo than the model with plot-level foliage retention[1], as well as a lower MD, MSD, and MAD, indicating that tree-levelfoliage retention predicted Douglas-fir diameter increment moreaccurately. Model [3], incorporating both plot-level foliage retentionand the deviation of tree-level retention from plot-level retention,performed almost as well as model [2], but with slightly less preci-sion. However, all three models had similar accuracy, e.g., R2
pseudo ofModel [2] was only 0.0049 higher than that of Model [1] and only0.0011 higher than Model [3]. Similarly, MAD of Model [2] was only0.00190 lower than that of Model [1] and only 0.00044 lower thanthat of Model [3].
Parameter estimates in the final models were all significantlydifferent from zero at a = 0.05 (Table 4). In all models, diametergrowth was positively correlated with dbh and crown ratio, andnegatively correlated with SDI, CCFL, age, and the reciprocal of foli-age retention. In general, diameter growth increased with increas-ing tree size, crown size and foliage retention, and decreased withhigher stand density, lower social position, and greater age.Weighted residuals showed no serious departures from constantvariance or biases across predictor variables (not shown). The ran-dom plot effect and alternative variance–covariance structures in

J. Zhao et al. / Forest Ecology and Management 347 (2015) 75–82 79
the linearized mixed-effects version of this model provided no sig-nificant improvement over the model without these potentialrefinements, and residuals indicated better conformity of the non-linear model to the assumptions of least squares estimation.
3.2. Growth multiplier
Given the model forms and parameter estimates, the trends inimplied diameter growth multipliers (DMOD) over initial foliageretention were as follows:
DMODmodel1 ¼exp �0:4772
plotFR
� �exp �0:4772
3:85
� �¼ exp �0:4772
1plotFR
� 13:85
� �� ð4Þ
DMODmodel2 ¼exp �0:4529
treeFR
� �exp �0:4529
4:77
� � ¼ exp �0:45291
treeFR� 1
4:77
� �� ð5Þ
DMODmodel3;0 ¼0þ 2
2
� �0:1597 exp �0:5069plotFR
� �exp �0:5069
3:85
� �24 35
¼ 0þ 22
� �0:1597
exp �0:50691
plotFR� 1
3:85
� �� ¼ exp �0:5069
1plotFR
� 13:85
� �� ð6Þ
DMODmodel3;�0:75¼�0:75þ2
2
� �0:1597 exp �0:5069plotFR
� �exp �0:5069
3:85
� �24 35
¼ �0:75þ22
� �0:1597
exp �0:50691
plotFR� 1
3:85
� �� ð7Þ
DMODmodel3;þ0:75¼þ0:75þ2
2
� �0:1597 exp �0:5069plotFR
� �exp �0:5069
3:85
� �24 35
¼ þ0:75þ22
� �0:1597
exp �0:50691
plotFR� 1
3:85
� �� ð8Þ
where PlotFR ranged from 1 to 3.85 years, and TreeFR ranged from 1to 4.77 years.
The tree-level foliage retention multiplier exhibited a greaterrange for a given initial foliage retention than did the plot-levelmultiplier (Fig. 2). Where SNC was most severe, (PlotFR =TreeFR = 1 year), the value of the diameter growth multiplier was
Table 4Parameter estimates from the model for predicting diameter increment from plot-average foliage retention (Model 1; PlotFR), individual-tree foliage retention (Model2: TreeFR), and the combination of individual-tree and plot-average foliage retention(Model 3: TreeFR + PlotFR). All parameters are significantly different from zero ata = 0.05.
Model [1] Model [2] Model [3]
Estimate S.E. Estimate S.E. Estimate S.E.
bi0 0.6723 0.1227 0.6524 0.09537 0.5797 0.1243bi1 0.3301 0.03811 0.3306 0.03601 0.3233 0.03802bi2 1.4187 0.09225 1.3888 0.09103 1.3848 0.09154bi3 �0.00246 0.00028 �0.00228 0.000265 �0.00235 0.000277bi4 �0.0399 0.004106 �0.03989 0.004029 �0.03978 0.004041bi5 �0.00056 0.000087 �0.00055 0.000086 �0.00054 0.000086bi6 �0.4772 0.113 �0.4529 0.06101 �0.5069 0.1142bi7 0.1597 0.02624li 0.03336 0.0062 0.03326 0.00616 0.03338 0.0062
0.70 for both plot-averages and individual-trees. As SNC becameless severe, the multipliers for models [1] and [2] approached avalue of 1 at foliage retention levels indicative of little to no SNCimpact. A tree with a foliage retention that was 0.75 years greaterthan the plot average foliage retention (model [3],TreeFR = PlotFR + 0.75) was implied to have a diameter increment5% larger than a tree with the plot-average foliage retention. Incontrast, a tree with a foliage retention that was 0.75 years lessthan that of the plot average foliage retention (model [3],TreeFR = PlotFR-0.75) was implied to have a diameter increment7% less than a tree with the plot-average foliage retention.
3.3. Within-stand variability in foliage retention
The trees selected for SNC severity rating within this datasetwere limited to dominant and co-dominant trees, so the averageD/Q was 1.4 with a standard deviation of 0.37. Regardless, themixed-effects model indicated that foliage retention increased sig-nificantly with increasing D/Q even over this limited diameterrange. On average, foliage retention would increase by 0.19 yearsper unit increase in D/Q (Fig 3).
In the 76 plots analyzed, the average standard deviation in tree-level foliage retention for a given year and a given plot of scoringvaried from 0.04 to 0.90 years, with an average of 0.39 years. Thestandard deviation in tree level foliage retention for each plotand year increased with increasing average tree height (Fig 4), indi-cating that as the stands matured and differentiated, the variationin foliage retention was increasing
4. Discussion
The diameter growth models (Eqs. (1–3)) were consistent withpreviously constructed diameter and basal area increment models(Wykoff, 1990; Monserud and Sterba, 1996; Hann and Hanus,2002; Uzoh and Oliver, 2008); i.e., dbh and crown ratio (CR) werepositively correlated with diameter increment, but stand age,crown competition factor in larger trees (CCFL), and stand densityindex (SDI) were negatively correlated with diameter increment.As expected, foliage retention was positively correlated withdiameter increment at both the plot-level and tree-level. To date,all SNC-related growth impacts have been assessed using plot-average foliage retention. Although there is significant variationin tree-level foliage retention within a stand, plot-level averageshave nonetheless provided a useful means of determining regional
Fig. 2. Inferred diameter growth multipliers from the diameter increment modelusing plot-average foliage retention (Model 1; PlotFR), individual-tree foliageretention (Model 2: TreeFR), and the combination of individual-tree and plot-average foliage retention (Model 3: TreeFR + PlotFR).
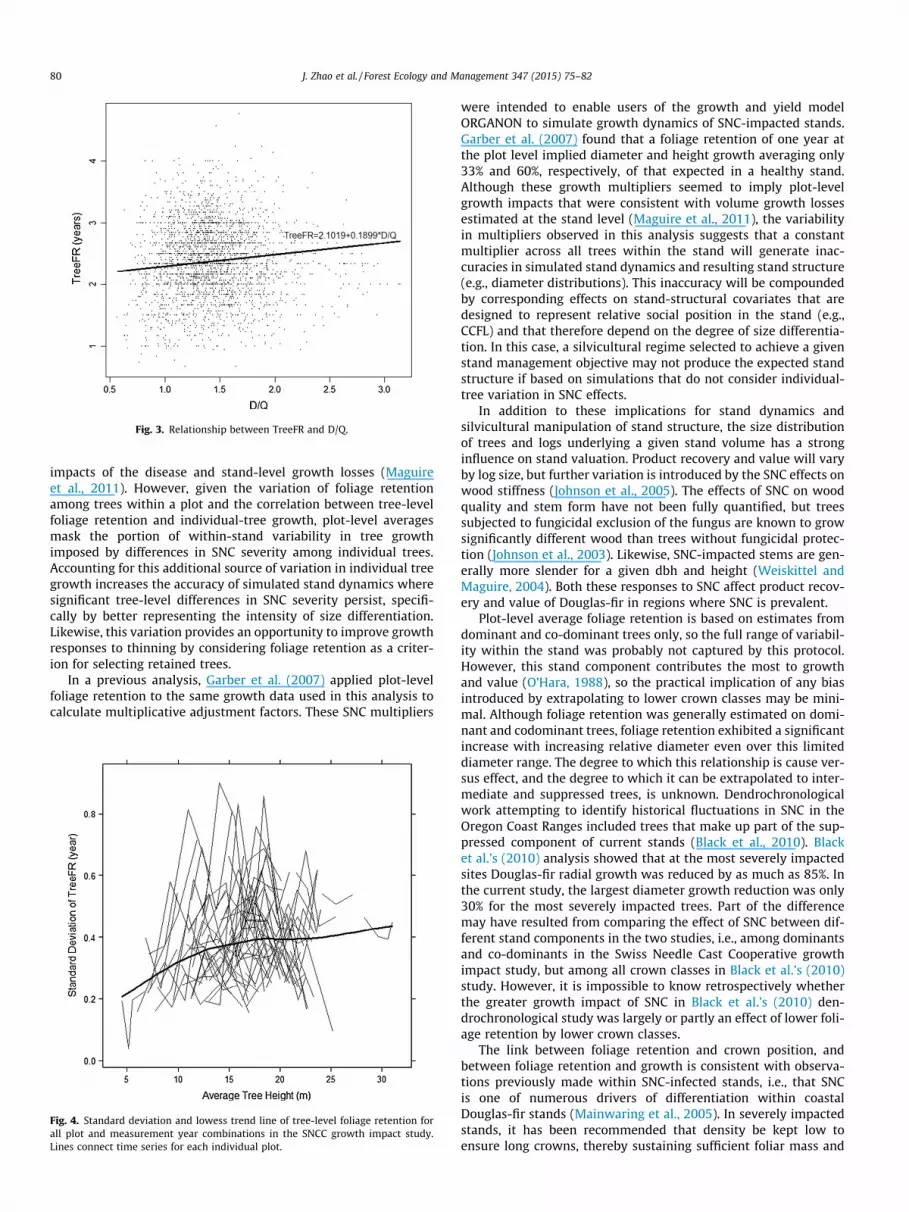
Fig. 3. Relationship between TreeFR and D/Q.
80 J. Zhao et al. / Forest Ecology and Management 347 (2015) 75–82
impacts of the disease and stand-level growth losses (Maguireet al., 2011). However, given the variation of foliage retentionamong trees within a plot and the correlation between tree-levelfoliage retention and individual-tree growth, plot-level averagesmask the portion of within-stand variability in tree growthimposed by differences in SNC severity among individual trees.Accounting for this additional source of variation in individual treegrowth increases the accuracy of simulated stand dynamics wheresignificant tree-level differences in SNC severity persist, specifi-cally by better representing the intensity of size differentiation.Likewise, this variation provides an opportunity to improve growthresponses to thinning by considering foliage retention as a criter-ion for selecting retained trees.
In a previous analysis, Garber et al. (2007) applied plot-levelfoliage retention to the same growth data used in this analysis tocalculate multiplicative adjustment factors. These SNC multipliers
Fig. 4. Standard deviation and lowess trend line of tree-level foliage retention forall plot and measurement year combinations in the SNCC growth impact study.Lines connect time series for each individual plot.
were intended to enable users of the growth and yield modelORGANON to simulate growth dynamics of SNC-impacted stands.Garber et al. (2007) found that a foliage retention of one year atthe plot level implied diameter and height growth averaging only33% and 60%, respectively, of that expected in a healthy stand.Although these growth multipliers seemed to imply plot-levelgrowth impacts that were consistent with volume growth lossesestimated at the stand level (Maguire et al., 2011), the variabilityin multipliers observed in this analysis suggests that a constantmultiplier across all trees within the stand will generate inac-curacies in simulated stand dynamics and resulting stand structure(e.g., diameter distributions). This inaccuracy will be compoundedby corresponding effects on stand-structural covariates that aredesigned to represent relative social position in the stand (e.g.,CCFL) and that therefore depend on the degree of size differentia-tion. In this case, a silvicultural regime selected to achieve a givenstand management objective may not produce the expected standstructure if based on simulations that do not consider individual-tree variation in SNC effects.
In addition to these implications for stand dynamics andsilvicultural manipulation of stand structure, the size distributionof trees and logs underlying a given stand volume has a stronginfluence on stand valuation. Product recovery and value will varyby log size, but further variation is introduced by the SNC effects onwood stiffness (Johnson et al., 2005). The effects of SNC on woodquality and stem form have not been fully quantified, but treessubjected to fungicidal exclusion of the fungus are known to growsignificantly different wood than trees without fungicidal protec-tion (Johnson et al., 2003). Likewise, SNC-impacted stems are gen-erally more slender for a given dbh and height (Weiskittel andMaguire, 2004). Both these responses to SNC affect product recov-ery and value of Douglas-fir in regions where SNC is prevalent.
Plot-level average foliage retention is based on estimates fromdominant and co-dominant trees only, so the full range of variabil-ity within the stand was probably not captured by this protocol.However, this stand component contributes the most to growthand value (O’Hara, 1988), so the practical implication of any biasintroduced by extrapolating to lower crown classes may be mini-mal. Although foliage retention was generally estimated on domi-nant and codominant trees, foliage retention exhibited a significantincrease with increasing relative diameter even over this limiteddiameter range. The degree to which this relationship is cause ver-sus effect, and the degree to which it can be extrapolated to inter-mediate and suppressed trees, is unknown. Dendrochronologicalwork attempting to identify historical fluctuations in SNC in theOregon Coast Ranges included trees that make up part of the sup-pressed component of current stands (Black et al., 2010). Blacket al.’s (2010) analysis showed that at the most severely impactedsites Douglas-fir radial growth was reduced by as much as 85%. Inthe current study, the largest diameter growth reduction was only30% for the most severely impacted trees. Part of the differencemay have resulted from comparing the effect of SNC between dif-ferent stand components in the two studies, i.e., among dominantsand co-dominants in the Swiss Needle Cast Cooperative growthimpact study, but among all crown classes in Black et al.’s (2010)study. However, it is impossible to know retrospectively whetherthe greater growth impact of SNC in Black et al.’s (2010) den-drochronological study was largely or partly an effect of lower foli-age retention by lower crown classes.
The link between foliage retention and crown position, andbetween foliage retention and growth is consistent with observa-tions previously made within SNC-infected stands, i.e., that SNCis one of numerous drivers of differentiation within coastalDouglas-fir stands (Mainwaring et al., 2005). In severely impactedstands, it has been recommended that density be kept low toensure long crowns, thereby sustaining sufficient foliar mass and

J. Zhao et al. / Forest Ecology and Management 347 (2015) 75–82 81
diameter growth. Arguments have also been made that a higherdensity of trees should be planted in these stands to ensure thatenough crop trees produce sufficient volume to maintain net posi-tive revenues from Douglas-fir stand management in SNC-im-pacted coastal regions. Meeting both of these objectives with apre-commercial thinning will alter current management guide-lines in coastal zones, affecting stand structure by providing moregrowing space and opportunity for recruitment and persistence ofother under- and overstory species.
This growth analysis of plots from the Swiss Needle CastCooperative relied on our ability to accurately assess tree-level foli-age retention. Measurement error in estimating foliage retentionfor a given crown third and the average for a given tree may reducethe appeal of accounting for within-stand variation in foliageretention. As the trees on these permanent plots become tallerand foliage visibility declines, maintenance of estimation accuracynecessitated that the method for estimating tree-level foliageretention shift to estimating foliage retention on the southernmostbranch pruned off the fifth whorl from the tip of the tree. Initialcomparisons to the more conventional ground based visual esti-mates when needle cohorts were still visible from the ground indi-cated close agreement between the two approaches. Especially inolder stands, visual estimates are easiest to get for dominant trees,because they tend to have some open space around them, and theirbranches can be more readily seen against the sky. However, inter-mediate and suppressed trees are more difficult to assess from theground, due primarily to the low contrast in color between needleson a specific branch and those on neighboring branches.Incorporation of tree-level foliage retention values for predictivepurposes on a large scale and on taller trees would probably neces-sitate further analysis of sampling strategies to ensure the requiredestimation accuracy.
Finally, it is widely recognized that other factors related to sitequality, stand structure, and silvicultural history influence foliageretention, complicating efforts to quantify pure SNC impacts(Maguire et al., 2011). Both earlier and current work on P. gaeu-mannii indicate that this endemic fungus has been virtually ubiqui-tous on Douglas-fir foliage (Boyce, 1940; Hood, 1982; Stone et al.,2008). In fact, pseudothecia counts on foliage samples indicatedthe presence of the fungus at all the plots included in this study(unpublished data). Slower growth associated with lower fertilityin unmanaged stands has been considered a cause of greater foli-age retention rather than an effect (Reich et al., 1995; Shoettle,1990), and foliage retention has been observed to decline as aresult of positive growth responses to fertilization (Balster andMarshall, 2000). Because these trends are opposite to growth pat-terns observed over the range in SNC intensity characterizing thegrowth impact study, growth reductions quantified in this analysisare attributed predominantly to direct effects of P. gaeumannii ongas exchange and foliage retention (Manter et al., 2003).
5. Conclusion
Within-stand variation in individual-tree foliage retention hasinfluenced individual-tree growth rates and stand dynamics. Themost severely impacted plots exhibited 30% diameter growth lossfor dominant and co-dominant trees. Within a plot, diametergrowth averaged about 12% higher on dominant and co-dominanttrees with the greatest foliage retention relative to trees with theleast foliage retention. Results from this analysis indicated thatuse of a plot-average foliage retention will introduce bias intoindividual-tree growth predictions. Bias would result both fromthe projected growth of individual trees, and from the compound-ing effects over multiple growth periods on covariates that repre-sent the relative size and social position of the tree in the stand.
Furthermore, lack of knowledge about differential SNC growtheffects on individual trees forfeits the opportunity to include foli-age retention as a criterion for selecting trees for removal duringthinnings.
Acknowledgements
This project was funded by the Swiss Needle Cast Cooperative(SNCC) hosted at Oregon State University. We gratefully acknowl-edge field work performed by many different field crews workingfor the SNCC and the Oregon Department of Forestry.
References
Balster, N.J., Marshall, J.D., 2000. Decreased needle longevity of fertilized Douglas-firand grand fir in the northern Rockies. Tree Physiol. 20, 1191–1197.
Black, B.A., Shaw, D.C., Stone, J.K., 2010. Impacts of Swiss needle cast on overstoryDouglas-fir forests of the western Oregon coast range. For. Ecol. Manage. 259,1673–1680.
Boyce, J.S., 1940. A needle cast of Douglas-fir associated with Adelopus gaeumannii.Phytopathology 30, 649–659.
Bruce, D., 1981. Consistent height-growth and growth-rate estimates forremeasured plots. For. Sci. 27, 711–725.
Calama, R., Montero, G., 2005. Multilevel linear mixed model for tree diameterincrement in stone pine (Pinus pinea): a calibration approach. Silva Fenn. 39,37–54.
Curtis, R.O., 1967. Height diameter and height-diameter-age equations for second-growth Douglas-fir. For. Sci. 13, 356–375.
Garber, S., Maguire, D., Mainwaring, D., Hann, D., 2007. Swiss Needle CastORGANON module update. In: Shaw, D., (Ed.). 2007 Swiss Needle CastCooperative Annual Report. College of Forestry, Oregon State University,Corvallis, OR, pp. 63–66.
Gregoire, T.G., 1987. Generalized error structure for forestry yield models. For. Sci.33, 423–444.
Hann, D.W., Hanus M.L., 2002. Enhanced diameter-growth-rate equations forundamaged and damaged trees in southwest Oregon. Forest Research Lab.,Oregon State University, Corvallis, Oregon. Research Contribution 39, 54p.
Hansen, E.M., Stone, J.K., Capitano, B.R., Rosso, P., Sutton, W., Winton, L., Kanaskie,A., McWilliams, M., 2000. Incidence and impact of Swiss needle cast in forestplantations of Douglas-fir in coastal Oregon. Plant Dis. 84, 773–778.
Hood, I.A., 1982. Phaeocryptopus gaeumannii on Pseudotsuga menziesii in southernBritish Columbia. New Zealand J. For. Sci. 12, 415–424.
Johnson, G.R., 2002. Genetic variation of Douglas-fir to Swiss needle cast as assessedby symptom expression. Silvae Genetica 51, 80–86.
Johnson, G.R., Gartner, B.L., Maguire, D., Kanaskie, A., 2003. Influence of Bravofungicide applications on wood density and moisture content of Swiss needlecast affected Douglas-fir trees. For. Ecol. Manage. 186, 339–348.
Johnson, G.R., Grotta, A.T., Gartner, B.L., Downes, G., 2005. Impact of the foliarpathogen Swiss needle cast on wood quality of Douglas-fir. Can. J. For. Res. 35,331–339.
Kanaskie, A., McWilliams, M., 2013. Swiss Needle Cast aerial survey, 2013. In: Shaw,D., (Ed.). 2013 Swiss Needle Cast Cooperative Annual Report. College of Forestry,Oregon State University, Corvallis, OR, pp. 5–8.
Kimberley, M.O., Hood, I.A., Knowles, R.L., 2011. Impact of Swiss needle-cast ongrowth of Douglas-fir. Phytopathology 101, 583–593.
Krajicek, J.E., Brinkman, K.E., Gingrich, S.F., 1961. Crown competition: a measure ofdensity. For. Sci. 7, 35–42.
Maguire, D.A., Kanaskie, A., Voelker, W., Johnson, R., Johnson, G., 2002. Growth ofyoung Douglas-fir plantations across a gradient in Swiss needle cast severity.West. J. Appl. For. 17, 86–95.
Maguire, D.A., Mainwaring, D.B., Kanaskie, A., 2011. Ten-year growth and mortalityin young Douglas-fir stands experiencing a range in Swiss needle cast severity.Can. J. For. Res. 41, 2064–2076.
Mainwaring, D.B., Maguire, D.A., Kanaskie, A., 2005. Interactive effects of Swissneedle cast and commercial thinning on Douglas-fir growth and developmentin north coastal Oregon: two year response from 30 permanent monitoringplots. In: Mainwaring, D., Shaw, D., (Eds.). Swiss Needle Cast Cooperative 2005Annual Report. College of Forestry, Oregon State University, Corvallis, OR, pp.23–33.
Manter, D.K., Bond, B.J., Kavanagh, K.L., Stone, J.K., Filip, G.M., 2003. Modelling theimpacts of the foliar pathogen, Phaeocryptopus gaeumannii, on Douglas-firphysiology: net canopy carbon assimilation, needle abscission and growth. Ecol.Model. 164, 211–226.
Manter, D.K., Reeser, P.D., Stone, J.K., 2005. A climate-based model for predictinggeographic variation in swiss needle cast severity in the oregon coast range.Phytopathology 95, 1256–1265.
Monserud, R.A., Sterba, H., 1996. A basal area increment model for individual treesgrowing in even- and uneven-aged forest stands in Austria. For. Ecol. Manage.80, 57–80.
O’Hara, K.L., 1988. Stand structure and growing space efficiency following thinningin an even-aged Douglas-fir stand. Can. J. For. Res. 18, 859–866.

82 J. Zhao et al. / Forest Ecology and Management 347 (2015) 75–82
Paine, D.P., Hann, D.W., 1982. Maximum crown-width equations for southwesternOregon tree species. Oregon State University, Forest Research Laboratory,Corvallis, OR, Research Pap. 46, 20p.
Palahí, M., Pukkala, T., Miina, J., Montero, G., 2003. Individual-tree growth andmortality models for Scots pine (Pinus sylvestris L.) in north-east Spain. Ann. For.Sci. 60, 1–10.
Reich, P.B., Koike, T., Gower, S.T., Schoettle, A.W., 1995. Causes and consequences ofvariation in conifer leaf life-span. In: Smith, W.K., Hinckley, T.M. (Eds.),Ecophysiology of Coniferous Forests. Academic Press, New York, USA, pp.225–254.
Reineke, L.H., 1933. Perfecting a stand-density index for even-aged forests. J. Agric.Res. 46, 627–638.
SAS Institute Inc., 2008. SAS/STAT� 9.2 User’s Guide. SAS Institute Inc., Cary, NC.Schoettle, A.W., 1990. The interaction between leaf longevity and shoot growth and
foliar biomass per shoot in Pinus contorta at two elevations. Tree Physiol. 7,209–214.
Stone, J.K., Capitano, B.R., Kerrigan, J.L., 2008. The histopathology of Phaeocryptopusgaeumannii on Douglas-fir needles. Mycologia 100, 431–444.
Trasobares, A., Tomé, M., Miina, J., 2004. Growth and yield model for Pinushalepensis Mill. in Catalonia, north-east Spain. For. Ecol. Manage. 203, 49–62.
Uzoh, F.C.C., Oliver, W.W., 2008. Individual tree diameter increment model formanaged even-aged stands of ponderosa pine throughout the western UnitedStates using multilevel linear mixed effects models. For. Ecol. Manage. 256,438–445.
Weiskittel, A.R., Maguire, D.A. 2004. Influence of Swiss needle cast on Douglas-firstem properties. In: Mainwaring, D., (Ed.). Swiss Needle Cast Cooperative 2004Annual Report. College of Forestry, Oregon State University, Corvallis, OR, pp.91–97.
Weiskittel, A.R., Maguire, D.A., Garber, S.M., Kanaskie, A., 2006. Influence of Swissneedle cast on foliage age class structure and vertical distribution in Douglas-firplantations of north coastal Oregon. Can. J. For. Res. 36, 1497–1508.
Wykoff, R.W., 1990. A basal area increment model for individual conifers in thenorthern Rocky Mountains. For. Sci. 36, 1077–1104.
Yang, Y., Huang, S., Meng, S.X., Trincado, G., VanderSchaaf, C.L., 2009. A multilevelindividual tree basal area increment model for aspen in boreal mixedwoodstands. Can. J. For. Res. 39, 2203–2214.