effects of pelletization conditions on breaking strength and dimensional stability of douglas fir...
TRANSCRIPT
Fuel 117 (2014) 1085–1092
Contents lists available at ScienceDirect
Fuel
journal homepage: www.elsevier .com/locate / fuel
Effects of pelletization conditions on breaking strength and dimensionalstability of Douglas fir pellet
0016-2361/$ - see front matter � 2013 Elsevier Ltd. All rights reserved.http://dx.doi.org/10.1016/j.fuel.2013.10.033
⇑ Corresponding author. Tel.: +1 6043558811.E-mail addresses: [email protected], [email protected] (P.S.
Lam).
Pak Yiu Lam a, Pak Sui Lam a,⇑, Shahab Sokhansanj a,b, Xiaotao T. Bi a, C. Jim Lim a, Staffan Melin a
a Department of Chemical and Biological Engineering, University of British Columbia, 2360 East Mall, Vancouver, BC V6T 1Z3, Canadab Environmental Science Division, Oak Ridge National Laboratory, P.O. Box 2008, Oak Ridge, TN 37831-6422, United States
h i g h l i g h t s
� The compression behaviour of Douglas fir particles was investigated.� Temperature, pressure and stress relaxation were significant to the pellet’s mechanical properties.� Walker, Jones, Kawakita and Ludde were the best compaction models for Douglas fir.� The best pelletizing conditions for Douglas fir with a particle size of 1.19 mm was 100 �C, 126 MPa and 30 s relaxation time.
a r t i c l e i n f o
Article history:Received 18 July 2013Received in revised form 28 September2013Accepted 14 October 2013Available online 26 October 2013
Keywords:Wood pelletsElastic modulusStress relaxationHardnessPelletization
a b s t r a c t
The compression behavior of Douglas fir ground particles using a heated piston–cylinder unit was inves-tigated. A complete randomized design (CRD) of experiment with three factors (die temperature, appliedpressure and relaxation time), three levels and five replicates were studied. From the analysis of variance(ANOVA) with a = 0.05, all of the three pelletization factors were significant parameters to the maximumbreaking strength and the relaxed pellet density. The significant factors to the initial pellet density of pel-lets were the die temperature and the applied pressure. Three out of five compaction models of Walker,Jones, Kawakita and Ludde were well described to the compression behavior of Douglas fir ground par-ticles with R2 values between 0.90 and 0.99. The optimum processing condition to produce the best qual-ity of Douglas fir pellets was 100 �C die temperature, 126 MPa applied pressure and 30 s relaxation time.
� 2013 Elsevier Ltd. All rights reserved.
1. Introduction Douglas fir pellets are required to be handled and stored safely
Douglas fir (Pseudotsuga menziesii, L.) is one of the many abun-dant species of coniferous softwood in the western coast of NorthAmerica. It is widely used for structural timber, lumber, and furni-ture; meanwhile, the wood processing generates substantialamounts of residual by-products such as sawdust and shavings.The recovered Douglas fir sawdust and shavings are good candi-dates for producing fuel pellets for energy production, in replace-ment of coal. Douglas fir ground particles with a mean particlesize of 1–2 mm can be pelletized into Douglas fir pellets with a6–8 mm diameter and 12–25 mm length [1,2]. It was found thatthe wood pellets longer than 13 mm decreased the average burn-ing temperature of a pellet stove by 31% and the flue gas temper-ature by 25% [3]. Because of this, Douglas fir pellets with a shorterlength are preferred for efficient combustion.
in order to minimize risks for health and safety. The biodegrada-tion of the wood pellets diminishes the mechanical propertiesand will contribute to mass loss during storage and transportation[4]. Consequently, the major limitation of using Douglas fir pelletsas fuel is low durability. Durability is defined as the weight per-centage of the remaining unbroken wood pellets to the total sam-ple size of the wood pellets after tumbling, according to theEuropean standard EN 15210-1 [5]. The durability of wood pelletsis well correlated with the hardness values measured from thematerial properties testers [6]. In essence, the durability of Douglasfir pellets is highly dependent on the compression behavior of theground particles.
Extensive research has evaluated the pelletization mechanismsof Douglas fir ground particles with or without pre-treatments [7–9]. The compression behavior of biomass ground particles werestudied in different models [8,10–13]. Jones [14], Heckel [15], Coo-per and Eaton [16], Kawakita and Ludde [17] and Panelli and Filho[18] models were studied to determine the pressure–volume andthe pressure–density relationship of barley, canola, oat and wheat
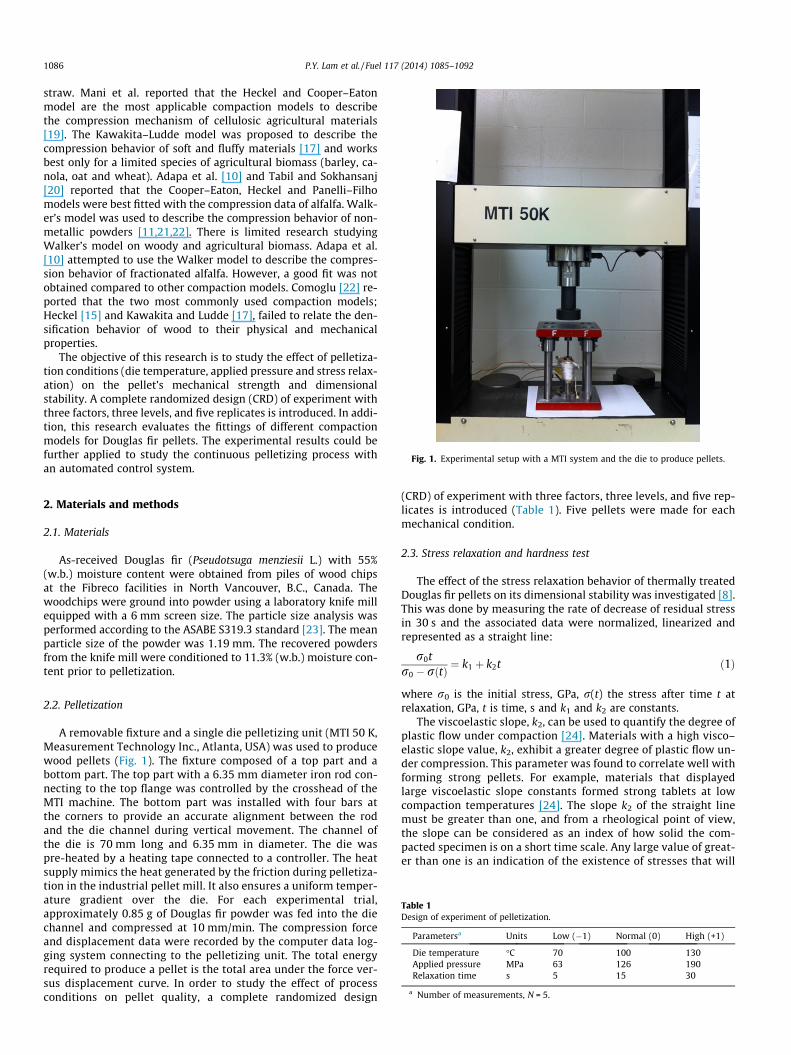
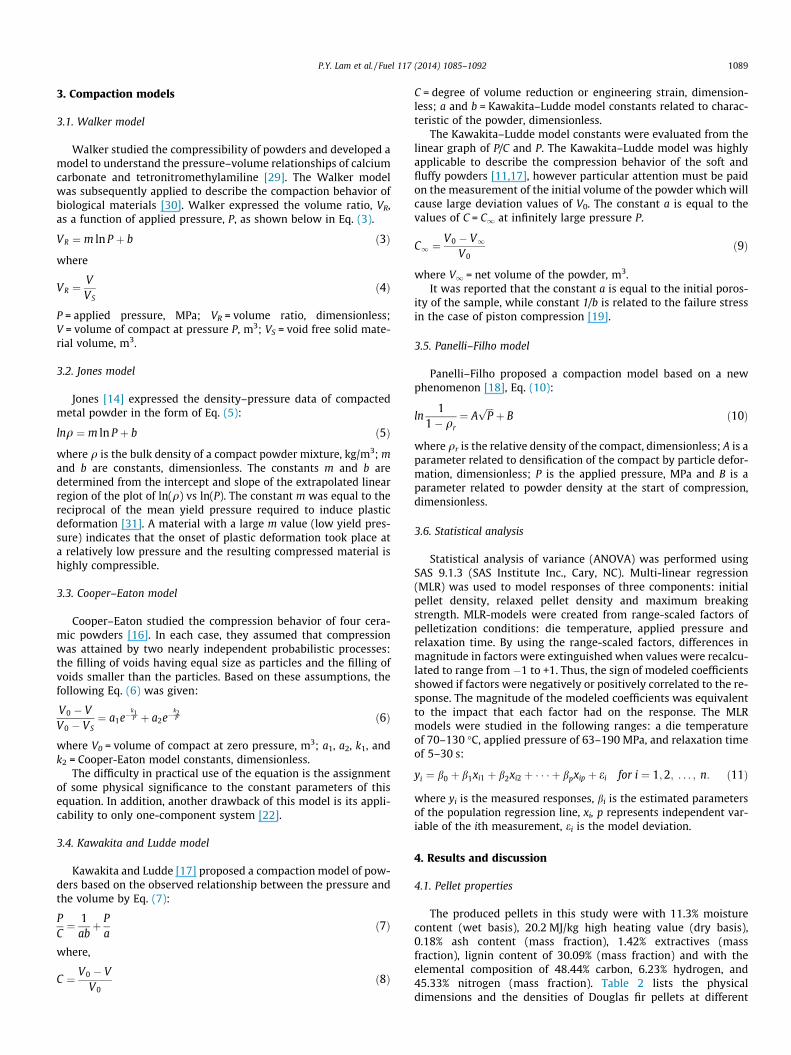
Fig. 1. Experimental setup with a MTI system and the die to produce pellets.
1086 P.Y. Lam et al. / Fuel 117 (2014) 1085–1092
straw. Mani et al. reported that the Heckel and Cooper–Eatonmodel are the most applicable compaction models to describethe compression mechanism of cellulosic agricultural materials[19]. The Kawakita–Ludde model was proposed to describe thecompression behavior of soft and fluffy materials [17] and worksbest only for a limited species of agricultural biomass (barley, ca-nola, oat and wheat). Adapa et al. [10] and Tabil and Sokhansanj[20] reported that the Cooper–Eaton, Heckel and Panelli–Filhomodels were best fitted with the compression data of alfalfa. Walk-er’s model was used to describe the compression behavior of non-metallic powders [11,21,22]. There is limited research studyingWalker’s model on woody and agricultural biomass. Adapa et al.[10] attempted to use the Walker model to describe the compres-sion behavior of fractionated alfalfa. However, a good fit was notobtained compared to other compaction models. Comoglu [22] re-ported that the two most commonly used compaction models;Heckel [15] and Kawakita and Ludde [17], failed to relate the den-sification behavior of wood to their physical and mechanicalproperties.
The objective of this research is to study the effect of pelletiza-tion conditions (die temperature, applied pressure and stress relax-ation) on the pellet’s mechanical strength and dimensionalstability. A complete randomized design (CRD) of experiment withthree factors, three levels, and five replicates is introduced. In addi-tion, this research evaluates the fittings of different compactionmodels for Douglas fir pellets. The experimental results could befurther applied to study the continuous pelletizing process withan automated control system.
2. Materials and methods
2.1. Materials
As-received Douglas fir (Pseudotsuga menziesii L.) with 55%(w.b.) moisture content were obtained from piles of wood chipsat the Fibreco facilities in North Vancouver, B.C., Canada. Thewoodchips were ground into powder using a laboratory knife millequipped with a 6 mm screen size. The particle size analysis wasperformed according to the ASABE S319.3 standard [23]. The meanparticle size of the powder was 1.19 mm. The recovered powdersfrom the knife mill were conditioned to 11.3% (w.b.) moisture con-tent prior to pelletization.
Table 1Design of experiment of pelletization.
Parametersa Units Low (�1) Normal (0) High (+1)
Die temperature �C 70 100 130Applied pressure MPa 63 126 190Relaxation time s 5 15 30
a Number of measurements, N = 5.
2.2. Pelletization
A removable fixture and a single die pelletizing unit (MTI 50 K,Measurement Technology Inc., Atlanta, USA) was used to producewood pellets (Fig. 1). The fixture composed of a top part and abottom part. The top part with a 6.35 mm diameter iron rod con-necting to the top flange was controlled by the crosshead of theMTI machine. The bottom part was installed with four bars atthe corners to provide an accurate alignment between the rodand the die channel during vertical movement. The channel ofthe die is 70 mm long and 6.35 mm in diameter. The die waspre-heated by a heating tape connected to a controller. The heatsupply mimics the heat generated by the friction during pelletiza-tion in the industrial pellet mill. It also ensures a uniform temper-ature gradient over the die. For each experimental trial,approximately 0.85 g of Douglas fir powder was fed into the diechannel and compressed at 10 mm/min. The compression forceand displacement data were recorded by the computer data log-ging system connecting to the pelletizing unit. The total energyrequired to produce a pellet is the total area under the force ver-sus displacement curve. In order to study the effect of processconditions on pellet quality, a complete randomized design
(CRD) of experiment with three factors, three levels, and five rep-licates is introduced (Table 1). Five pellets were made for eachmechanical condition.
2.3. Stress relaxation and hardness test
The effect of the stress relaxation behavior of thermally treatedDouglas fir pellets on its dimensional stability was investigated [8].This was done by measuring the rate of decrease of residual stressin 30 s and the associated data were normalized, linearized andrepresented as a straight line:
r0tr0 � rðtÞ ¼ k1 þ k2t ð1Þ
where r0 is the initial stress, GPa, r(t) the stress after time t atrelaxation, GPa, t is time, s and k1 and k2 are constants.
The viscoelastic slope, k2, can be used to quantify the degree ofplastic flow under compaction [24]. Materials with a high visco–elastic slope value, k2, exhibit a greater degree of plastic flow un-der compression. This parameter was found to correlate well withforming strong pellets. For example, materials that displayedlarge viscoelastic slope constants formed strong tablets at lowcompaction temperatures [24]. The slope k2 of the straight linemust be greater than one, and from a rheological point of view,the slope can be considered as an index of how solid the com-pacted specimen is on a short time scale. Any large value of great-er than one is an indication of the existence of stresses that will
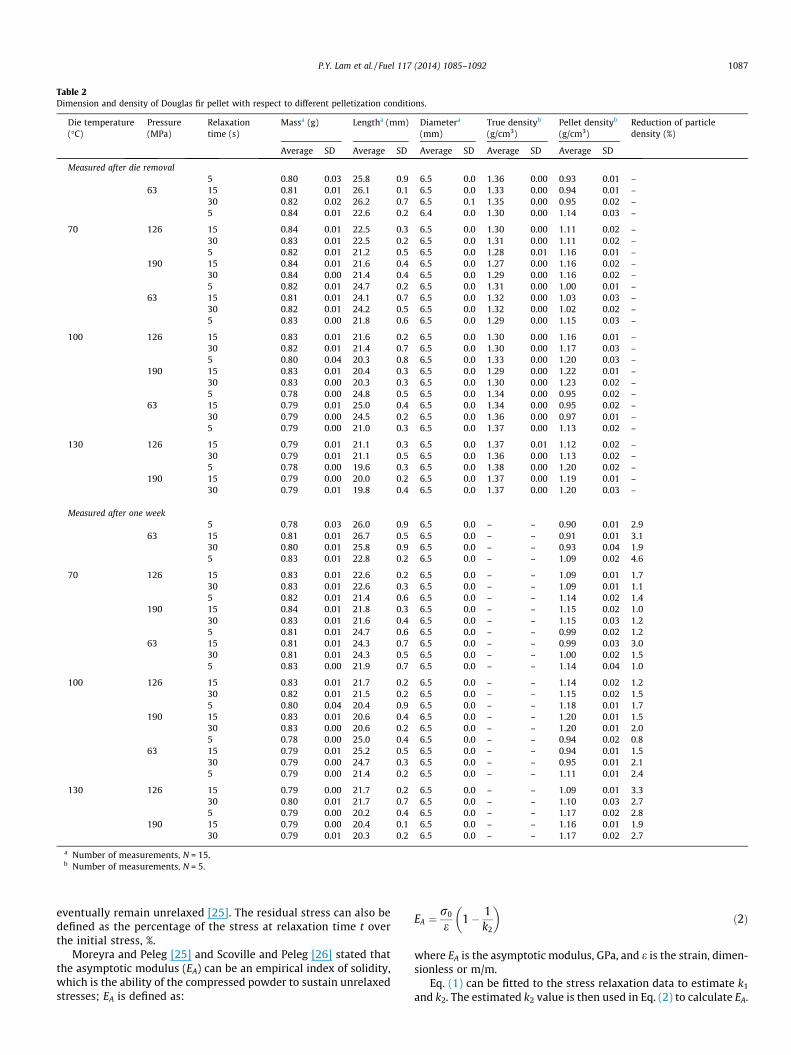
Table 2Dimension and density of Douglas fir pellet with respect to different pelletization conditions.
Die temperature(�C)
Pressure(MPa)
Relaxationtime (s)
Massa (g) Lengtha (mm) Diametera
(mm)True densityb
(g/cm3)Pellet densityb
(g/cm3)Reduction of particledensity (%)
Average SD Average SD Average SD Average SD Average SD
Measured after die removal5 0.80 0.03 25.8 0.9 6.5 0.0 1.36 0.00 0.93 0.01 –
63 15 0.81 0.01 26.1 0.1 6.5 0.0 1.33 0.00 0.94 0.01 –30 0.82 0.02 26.2 0.7 6.5 0.1 1.35 0.00 0.95 0.02 –5 0.84 0.01 22.6 0.2 6.4 0.0 1.30 0.00 1.14 0.03 –
70 126 15 0.84 0.01 22.5 0.3 6.5 0.0 1.30 0.00 1.11 0.02 –30 0.83 0.01 22.5 0.2 6.5 0.0 1.31 0.00 1.11 0.02 –5 0.82 0.01 21.2 0.5 6.5 0.0 1.28 0.01 1.16 0.01 –
190 15 0.84 0.01 21.6 0.4 6.5 0.0 1.27 0.00 1.16 0.02 –30 0.84 0.00 21.4 0.4 6.5 0.0 1.29 0.00 1.16 0.02 –5 0.82 0.01 24.7 0.2 6.5 0.0 1.31 0.00 1.00 0.01 –
63 15 0.81 0.01 24.1 0.7 6.5 0.0 1.32 0.00 1.03 0.03 –30 0.82 0.01 24.2 0.5 6.5 0.0 1.32 0.00 1.02 0.02 –5 0.83 0.00 21.8 0.6 6.5 0.0 1.29 0.00 1.15 0.03 –
100 126 15 0.83 0.01 21.6 0.2 6.5 0.0 1.30 0.00 1.16 0.01 –30 0.82 0.01 21.4 0.7 6.5 0.0 1.30 0.00 1.17 0.03 –5 0.80 0.04 20.3 0.8 6.5 0.0 1.33 0.00 1.20 0.03 –
190 15 0.83 0.01 20.4 0.3 6.5 0.0 1.29 0.00 1.22 0.01 –30 0.83 0.00 20.3 0.3 6.5 0.0 1.30 0.00 1.23 0.02 –5 0.78 0.00 24.8 0.5 6.5 0.0 1.34 0.00 0.95 0.02 –
63 15 0.79 0.01 25.0 0.4 6.5 0.0 1.34 0.00 0.95 0.02 –30 0.79 0.00 24.5 0.2 6.5 0.0 1.36 0.00 0.97 0.01 –5 0.79 0.00 21.0 0.3 6.5 0.0 1.37 0.00 1.13 0.02 –
130 126 15 0.79 0.01 21.1 0.3 6.5 0.0 1.37 0.01 1.12 0.02 –30 0.79 0.01 21.1 0.5 6.5 0.0 1.36 0.00 1.13 0.02 –5 0.78 0.00 19.6 0.3 6.5 0.0 1.38 0.00 1.20 0.02 –
190 15 0.79 0.00 20.0 0.2 6.5 0.0 1.37 0.00 1.19 0.01 –30 0.79 0.01 19.8 0.4 6.5 0.0 1.37 0.00 1.20 0.03 –
Measured after one week5 0.78 0.03 26.0 0.9 6.5 0.0 – – 0.90 0.01 2.9
63 15 0.81 0.01 26.7 0.5 6.5 0.0 – – 0.91 0.01 3.130 0.80 0.01 25.8 0.9 6.5 0.0 – – 0.93 0.04 1.95 0.83 0.01 22.8 0.2 6.5 0.0 – – 1.09 0.02 4.6
70 126 15 0.83 0.01 22.6 0.2 6.5 0.0 – – 1.09 0.01 1.730 0.83 0.01 22.6 0.3 6.5 0.0 – – 1.09 0.01 1.15 0.82 0.01 21.4 0.6 6.5 0.0 – – 1.14 0.02 1.4
190 15 0.84 0.01 21.8 0.3 6.5 0.0 – – 1.15 0.02 1.030 0.83 0.01 21.6 0.4 6.5 0.0 – – 1.15 0.03 1.25 0.81 0.01 24.7 0.6 6.5 0.0 – – 0.99 0.02 1.2
63 15 0.81 0.01 24.3 0.7 6.5 0.0 – – 0.99 0.03 3.030 0.81 0.01 24.3 0.5 6.5 0.0 – – 1.00 0.02 1.55 0.83 0.00 21.9 0.7 6.5 0.0 – – 1.14 0.04 1.0
100 126 15 0.83 0.01 21.7 0.2 6.5 0.0 – – 1.14 0.02 1.230 0.82 0.01 21.5 0.2 6.5 0.0 – – 1.15 0.02 1.55 0.80 0.04 20.4 0.9 6.5 0.0 – – 1.18 0.01 1.7
190 15 0.83 0.01 20.6 0.4 6.5 0.0 – – 1.20 0.01 1.530 0.83 0.00 20.6 0.2 6.5 0.0 – – 1.20 0.01 2.05 0.78 0.00 25.0 0.4 6.5 0.0 – – 0.94 0.02 0.8
63 15 0.79 0.01 25.2 0.5 6.5 0.0 – – 0.94 0.01 1.530 0.79 0.00 24.7 0.3 6.5 0.0 – – 0.95 0.01 2.15 0.79 0.00 21.4 0.2 6.5 0.0 – – 1.11 0.01 2.4
130 126 15 0.79 0.00 21.7 0.2 6.5 0.0 – – 1.09 0.01 3.330 0.80 0.01 21.7 0.7 6.5 0.0 – – 1.10 0.03 2.75 0.79 0.00 20.2 0.4 6.5 0.0 – – 1.17 0.02 2.8
190 15 0.79 0.00 20.4 0.1 6.5 0.0 – – 1.16 0.01 1.930 0.79 0.01 20.3 0.2 6.5 0.0 – – 1.17 0.02 2.7
a Number of measurements, N = 15.b Number of measurements, N = 5.
P.Y. Lam et al. / Fuel 117 (2014) 1085–1092 1087
eventually remain unrelaxed [25]. The residual stress can also bedefined as the percentage of the stress at relaxation time t overthe initial stress, %.
Moreyra and Peleg [25] and Scoville and Peleg [26] stated thatthe asymptotic modulus (EA) can be an empirical index of solidity,which is the ability of the compressed powder to sustain unrelaxedstresses; EA is defined as:
EA ¼r0
e1� 1
k2
� �ð2Þ
where EA is the asymptotic modulus, GPa, and e is the strain, dimen-sionless or m/m.
Eq. (1) can be fitted to the stress relaxation data to estimate k1
and k2. The estimated k2 value is then used in Eq. (2) to calculate EA.
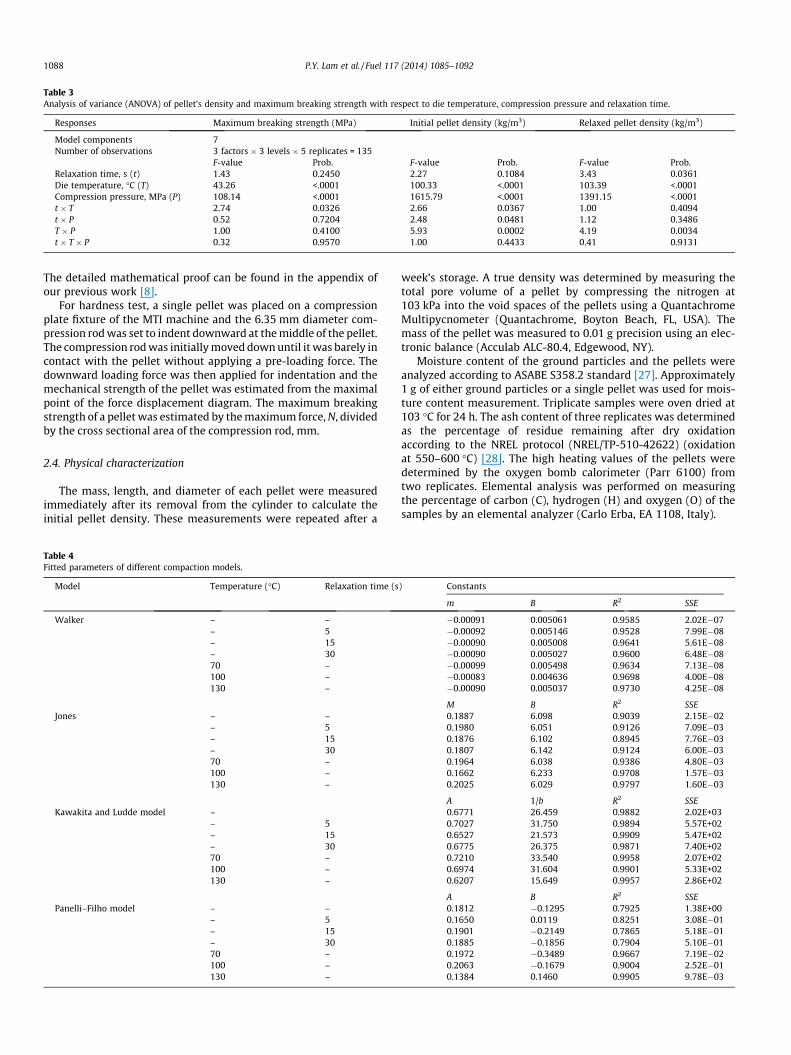
Table 3Analysis of variance (ANOVA) of pellet’s density and maximum breaking strength with respect to die temperature, compression pressure and relaxation time.
Responses Maximum breaking strength (MPa) Initial pellet density (kg/m3) Relaxed pellet density (kg/m3)
Model components 7Number of observations 3 factors � 3 levels � 5 replicates = 135
F-value Prob. F-value Prob. F-value Prob.Relaxation time, s (t) 1.43 0.2450 2.27 0.1084 3.43 0.0361Die temperature, �C (T) 43.26 <.0001 100.33 <.0001 103.39 <.0001Compression pressure, MPa (P) 108.14 <.0001 1615.79 <.0001 1391.15 <.0001t � T 2.74 0.0326 2.66 0.0367 1.00 0.4094t � P 0.52 0.7204 2.48 0.0481 1.12 0.3486T � P 1.00 0.4100 5.93 0.0002 4.19 0.0034t � T � P 0.32 0.9570 1.00 0.4433 0.41 0.9131
1088 P.Y. Lam et al. / Fuel 117 (2014) 1085–1092
The detailed mathematical proof can be found in the appendix ofour previous work [8].
For hardness test, a single pellet was placed on a compressionplate fixture of the MTI machine and the 6.35 mm diameter com-pression rod was set to indent downward at the middle of the pellet.The compression rod was initially moved down until it was barely incontact with the pellet without applying a pre-loading force. Thedownward loading force was then applied for indentation and themechanical strength of the pellet was estimated from the maximalpoint of the force displacement diagram. The maximum breakingstrength of a pellet was estimated by the maximum force, N, dividedby the cross sectional area of the compression rod, mm.
2.4. Physical characterization
The mass, length, and diameter of each pellet were measuredimmediately after its removal from the cylinder to calculate theinitial pellet density. These measurements were repeated after a
Table 4Fitted parameters of different compaction models.
Model Temperature (�C) Relaxation time (s
Walker – –– 5– 15– 3070 –100 –130 –
Jones – –– 5– 15– 3070 –100 –130 –
Kawakita and Ludde model –– 5– 15– 3070 –100 –130 –
Panelli–Filho model – –– 5– 15– 3070 –100 –130 –
week’s storage. A true density was determined by measuring thetotal pore volume of a pellet by compressing the nitrogen at103 kPa into the void spaces of the pellets using a QuantachromeMultipycnometer (Quantachrome, Boyton Beach, FL, USA). Themass of the pellet was measured to 0.01 g precision using an elec-tronic balance (Acculab ALC-80.4, Edgewood, NY).
Moisture content of the ground particles and the pellets wereanalyzed according to ASABE S358.2 standard [27]. Approximately1 g of either ground particles or a single pellet was used for mois-ture content measurement. Triplicate samples were oven dried at103 �C for 24 h. The ash content of three replicates was determinedas the percentage of residue remaining after dry oxidationaccording to the NREL protocol (NREL/TP-510-42622) (oxidationat 550–600 �C) [28]. The high heating values of the pellets weredetermined by the oxygen bomb calorimeter (Parr 6100) fromtwo replicates. Elemental analysis was performed on measuringthe percentage of carbon (C), hydrogen (H) and oxygen (O) of thesamples by an elemental analyzer (Carlo Erba, EA 1108, Italy).
) Constants
m B R2 SSE
�0.00091 0.005061 0.9585 2.02E�07�0.00092 0.005146 0.9528 7.99E�08�0.00090 0.005008 0.9641 5.61E�08�0.00090 0.005027 0.9600 6.48E�08�0.00099 0.005498 0.9634 7.13E�08�0.00083 0.004636 0.9698 4.00E�08�0.00090 0.005037 0.9730 4.25E�08
M B R2 SSE0.1887 6.098 0.9039 2.15E�020.1980 6.051 0.9126 7.09E�030.1876 6.102 0.8945 7.76E�030.1807 6.142 0.9124 6.00E�030.1964 6.038 0.9386 4.80E�030.1662 6.233 0.9708 1.57E�030.2025 6.029 0.9797 1.60E�03
A 1/b R2 SSE0.6771 26.459 0.9882 2.02E+030.7027 31.750 0.9894 5.57E+020.6527 21.573 0.9909 5.47E+020.6775 26.375 0.9871 7.40E+020.7210 33.540 0.9958 2.07E+020.6974 31.604 0.9901 5.33E+020.6207 15.649 0.9957 2.86E+02
A B R2 SSE0.1812 �0.1295 0.7925 1.38E+000.1650 0.0119 0.8251 3.08E�010.1901 �0.2149 0.7865 5.18E�010.1885 �0.1856 0.7904 5.10E�010.1972 �0.3489 0.9667 7.19E�020.2063 �0.1679 0.9004 2.52E�010.1384 0.1460 0.9905 9.78E�03
P.Y. Lam et al. / Fuel 117 (2014) 1085–1092 1089
3. Compaction models
3.1. Walker model
Walker studied the compressibility of powders and developed amodel to understand the pressure–volume relationships of calciumcarbonate and tetronitromethylamiline [29]. The Walker modelwas subsequently applied to describe the compaction behavior ofbiological materials [30]. Walker expressed the volume ratio, VR,as a function of applied pressure, P, as shown below in Eq. (3).
VR ¼ m ln P þ b ð3Þ
where
VR ¼VVS
ð4Þ
P = applied pressure, MPa; VR = volume ratio, dimensionless;V = volume of compact at pressure P, m3; VS = void free solid mate-rial volume, m3.
3.2. Jones model
Jones [14] expressed the density–pressure data of compactedmetal powder in the form of Eq. (5):
lnq ¼ m ln P þ b ð5Þ
where q is the bulk density of a compact powder mixture, kg/m3; mand b are constants, dimensionless. The constants m and b aredetermined from the intercept and slope of the extrapolated linearregion of the plot of ln(q) vs ln(P). The constant m was equal to thereciprocal of the mean yield pressure required to induce plasticdeformation [31]. A material with a large m value (low yield pres-sure) indicates that the onset of plastic deformation took place ata relatively low pressure and the resulting compressed material ishighly compressible.
3.3. Cooper–Eaton model
Cooper–Eaton studied the compression behavior of four cera-mic powders [16]. In each case, they assumed that compressionwas attained by two nearly independent probabilistic processes:the filling of voids having equal size as particles and the filling ofvoids smaller than the particles. Based on these assumptions, thefollowing Eq. (6) was given:
V0 � VV0 � VS
¼ a1e�k1P þ a2e�
k2P ð6Þ
where V0 = volume of compact at zero pressure, m3; a1, a2, k1, andk2 = Cooper-Eaton model constants, dimensionless.
The difficulty in practical use of the equation is the assignmentof some physical significance to the constant parameters of thisequation. In addition, another drawback of this model is its appli-cability to only one-component system [22].
3.4. Kawakita and Ludde model
Kawakita and Ludde [17] proposed a compaction model of pow-ders based on the observed relationship between the pressure andthe volume by Eq. (7):
PC¼ 1
abþ P
að7Þ
where,
C ¼ V0 � VV0
ð8Þ
C = degree of volume reduction or engineering strain, dimension-less; a and b = Kawakita–Ludde model constants related to charac-teristic of the powder, dimensionless.
The Kawakita–Ludde model constants were evaluated from thelinear graph of P/C and P. The Kawakita–Ludde model was highlyapplicable to describe the compression behavior of the soft andfluffy powders [11,17], however particular attention must be paidon the measurement of the initial volume of the powder which willcause large deviation values of V0. The constant a is equal to thevalues of C = C1 at infinitely large pressure P.
C1 ¼V0 � V1
V0ð9Þ
where V1 = net volume of the powder, m3.It was reported that the constant a is equal to the initial poros-
ity of the sample, while constant 1/b is related to the failure stressin the case of piston compression [19].
3.5. Panelli–Filho model
Panelli–Filho proposed a compaction model based on a newphenomenon [18], Eq. (10):
ln1
1� qr¼ A
ffiffiffiPpþ B ð10Þ
where qr is the relative density of the compact, dimensionless; A is aparameter related to densification of the compact by particle defor-mation, dimensionless; P is the applied pressure, MPa and B is aparameter related to powder density at the start of compression,dimensionless.
3.6. Statistical analysis
Statistical analysis of variance (ANOVA) was performed usingSAS 9.1.3 (SAS Institute Inc., Cary, NC). Multi-linear regression(MLR) was used to model responses of three components: initialpellet density, relaxed pellet density and maximum breakingstrength. MLR-models were created from range-scaled factors ofpelletization conditions: die temperature, applied pressure andrelaxation time. By using the range-scaled factors, differences inmagnitude in factors were extinguished when values were recalcu-lated to range from �1 to +1. Thus, the sign of modeled coefficientsshowed if factors were negatively or positively correlated to the re-sponse. The magnitude of the modeled coefficients was equivalentto the impact that each factor had on the response. The MLRmodels were studied in the following ranges: a die temperatureof 70–130 �C, applied pressure of 63–190 MPa, and relaxation timeof 5–30 s:
yi ¼ b0 þ b1xi1 þ b2xi2 þ � � � þ bpxip þ ei for i ¼ 1;2; . . . ; n: ð11Þ
where yi is the measured responses, bi is the estimated parametersof the population regression line, xi, p represents independent var-iable of the ith measurement, ei is the model deviation.
4. Results and discussion
4.1. Pellet properties
The produced pellets in this study were with 11.3% moisturecontent (wet basis), 20.2 MJ/kg high heating value (dry basis),0.18% ash content (mass fraction), 1.42% extractives (massfraction), lignin content of 30.09% (mass fraction) and with theelemental composition of 48.44% carbon, 6.23% hydrogen, and45.33% nitrogen (mass fraction). Table 2 lists the physicaldimensions and the densities of Douglas fir pellets at different
Table 5Mechanical properties of Douglas fir pellets made at different pelletization conditions.
Dietemperature(�C)
Pressure(MPa)
Relaxationtime (s)
Asymptoticmodulus (GPa)
Maximumbreakingstrength (MPa)
Average SD Average SD
5 0.45 0.00 1.50 0.3563 15 0.43 0.01 1.39 0.36
30 0.43 0.01 1.84 0.515 0.89 0.01 2.75 0.94
70 126 15 0.88 0.01 3.44 0.9730 0.85 0.02 2.60 0.265 1.22 0.04 3.00 1.29
190 15 1.19 0.01 3.16 0.6730 1.15 0.06 3.49 0.775 0.45 0.03 3.14 0.71
63 15 0.46 0.03 3.53 1.5830 0.44 0.01 4.08 0.275 0.91 0.04 5.37 1.32
100 126 15 0.90 0.01 5.30 0.9530 0.86 0.02 4.75 1.285 1.23 0.03 5.33 1.34
190 15 1.17 0.00 5.38 1.9530 1.13 0.02 6.43 0.655 0.47 0.01 1.47 0.28
63 15 0.45 0.01 1.47 0.2630 0.43 0.01 1.28 0.175 0.94 0.03 2.08 0.36
130 126 15 0.92 0.01 2.69 0.6830 0.89 0.03 1.96 0.465 1.26 0.03 2.42 0.51
190 15 1.20 0.04 2.98 0.5830 1.18 0.07 3.71 1.08
1090 P.Y. Lam et al. / Fuel 117 (2014) 1085–1092
pelletization conditions. At die temperatures 70 and 100 �C, themass of the pellets ranged between 0.80 and 0.84 g. At die temper-ature 130 �C, only a slight discrepancy of mass was observed be-tween 0.78 and 0.79 g and this was due to the evaporation ofmoisture. The pellet length decreased from 26.2 to 19.6 mm withincreasing applied pressure, regardless of the other associated fac-tors: die temperature and relaxation time. The true density of pel-lets decreased from 1.36 to 1.27 g/cm3 with increasing the appliedpressure at a die temperature of 70 �C while the true density of pel-lets increased from 1.29 to 1.37 g/cm3 with increasing the appliedpressure at a die temperature of 100 and 130 �C. It is observed thatthe evaporation of moisture caused the shrinkage of the micro-pores of the micro-fibrils at die temperature 100 and 130 �C, there-by achieving higher true densities. The pellet densities increasedfrom 0.93 to 1.23 g/cm3 with increasing applied pressure from 63to 190 MPa. At a die temperature of 100 �C, the pellet densitieswere higher than that of pellets made with the other die tempera-tures and corresponding pressure. This was due to the free water ofthe Douglas fir (i.e. moisture) being vaporized at 100 �C and easilydiffused into the middle lamella to activate the lignin as a naturalbinder for increasing the binding ability of the pellet [32]. It wasobserved that there was an expansion in pellet length after oneweek of production. There was no expansion in radial dimension.As a result, the pellet density decreased from 4.6% to 0.8% (Table 2).This information would be an important finding for an industrialdesign of a silo for pellet storage.
From the results of analysis of variance (ANOVA) of the initialand relaxed pellet density of the pellets (Table 3), it was found thatthe two factors, die temperature (T), and compression pressure (P),and its interaction (T � P) were the most significant to the initialdensity of the pellets with a = 0.05. The effect of relaxation time(t) was not significant to the initial pellet density but was highlycorrelated to the relaxed pellet density. This indicated that therelaxation time (t) was an important factor for producing pelletswith good dimensional stability. Two multi-linear model equationswith their significant production parameters for Douglas fir pelletsdescribed the initial pellet density (q1) and the relaxed density (q2)as the following:
q1 ¼ 873:187þ 0:0865T þ 1:4617P þ 0:0021T � P ð12Þ
with RMSEP = 40.7082 F-value = 220.03, R2 = 0.8344
q2 ¼ 806:773þ 0:4243t þ 0:4860T þ 1:7862P � 0:0013T
� P ð13Þ
with RMSEP = 40.7082 F-value = 220.03, R2 = 0.8327where t is the relaxation time, s, T is the die temperature, �C and
P is the die pressure, MPa.
4.2. Compaction models
Table 4 lists the Walker, Jones, Kawawkita and Ludde and Pan-elli–Filho model at different temperature and relaxation time. Theparameters in the first row of different models were fitted by usingall of the experimental data points. The parameters from the sec-ond to the fourth rows of different models were fitted only withthe relaxation time. The parameters from the fifth to the seventhrows of different models were fitted only with the die temperature.Note that the applied pressure was the only independent input ofthese models in the previous studies [10,19]. The temperature andrelaxation time were not included. The Walker model was able topredict the pellet densities at different applied pressure, tempera-ture and relaxation time with R2 values ranging from 0.95 to 0.97.Thus, the Walker model is independent of temperature and relax-ation time. The Jones model showed a higher tendency in predict-ing the pellet densities in temperature with R2 values ranging from
0.94 to 0.98, compared to lower R2 values of relaxation time rang-ing from 0.90 to 0.91. The Kawakita and Luddel model is highlycapable of predicting the initial porosity (a) and the failure stress(1/b) with R2 values ranging from 0.98 to 0.99 regardless of temper-ature and relaxation time. Since the high die temperature causedthe evaporation of material inside the die channel, the initialporosity and the failure stress decreased with increasing die tem-peratures from 100 to 130 �C. The relaxation time had no correla-tion with the initial porosity because the relaxation time onlyaffected the pellet quality at the end of the pellet production. Asa result, the model could not predict a trend with respect to therelaxation time, but only with respect to the die temperature.The Panelli–Filhho model demonstrated a good fit with R2 valuesranging from 0.90 to 0.97. However, poor fits were observed whenfitted with the relaxation time with R2 values ranging from 0.78 to0.79. Thus, the Panelli–Filhho model was only applicable to deter-mine the relative density of compact at different temperatures.Generally speaking, the outcomes of the model fittings suggestedthat all the models, except Panelli–Filho Model, are capable of pre-dicting pressure–volume relationship, yield strength, and plasticdeformation behavior of Douglas fir pellets.
4.3. Mechanical test and energy usage
Table 5 lists the mechanical properties of Douglas fir pellets atdifferent pelletization conditions. Asymptotic modulus is an indi-cator of the degree of stress relaxation of the pellets under a con-stant strain [8]. The lower the asymptotic modulus of the pellet,the higher the dimensional stability of the pellet. It was found thatthe asymptotic modulus was independent of the die temperature,but was highly affected by the applied pressure from 63 to190 MPa. This concurred with the reduction of pellet density aftera week’s storage decreased to a minimum with increasing appliedpressure from 63 to 126 MPa (Table 2). However, the reduction of
P.Y. Lam et al. / Fuel 117 (2014) 1085–1092 1091
pellet density after a week’s storage increased again when furthercompressed at a higher pressure of 190 MPa. This indicated that anexcess applied pressure introduced an uneven stress distributionwithin the Douglas fir pellet and the residual stress built withinthe pellet became more difficult to relax. As a result, the resultantpellet was not dimensionally stable. This suggests that it is crucialto optimize the applied pressure of the pelletization to produce themost durable Douglas fir pellets.
From the hardness test, the maximum breaking strength of theDouglas fir pellets increased by four fold when the die temperatureincreased from 70 to 100 �C. During this temperature range, thewater moisture (i.e. free water) vaporized and diffused into themiddle lamella of the fibers to activate the lignin to undergo plas-ticization. Note that the glass transition temperature of the ligninis lowered with increasing moisture content from 8% to 10% ofwood [33]. This facilitated the deformation of fibers to achieveoptimum packing under compression. Therefore, the pellets madeat 100 �C die temperature were found with the highest range of themaximum breaking strength between 3.53 and 6.43 MPa. How-ever, the moisture was evaporated from the Douglas fir particlesand lost to the atmosphere at a die temperature of 130 �C. Thiscould not facilitate the plasticization of the lignin and the resultantpellet was found to have a decrease of maximum breakingstrength. The resultant wood pellets were more likely to form dustupon external impact and subsequently causing dust explosionduring transportation [34,35]. Therefore, Douglas fir pellets shouldnot be produced at die temperatures higher than 100 �C. Since theterm ‘‘durability’’ refers to describing how much fines will be pro-duced from the pellets upon impact at the maximum fracturepoint, the maximum breaking strength obtained from the hardnesstest can be a good indicator to deduce the durability of Douglas firpellets. Generally speaking, the die temperature is the most signif-icant factor of determining the durability of the Douglas fir pelletfollowed by the effect of applied pressure.
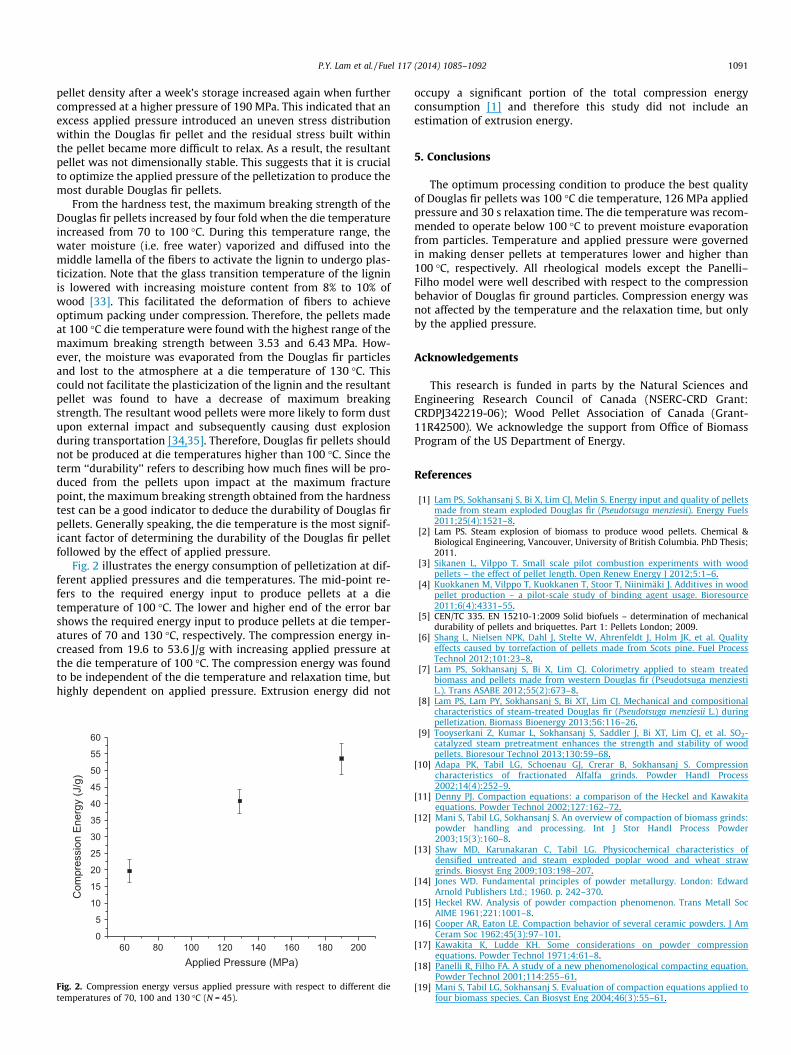
Fig. 2 illustrates the energy consumption of pelletization at dif-ferent applied pressures and die temperatures. The mid-point re-fers to the required energy input to produce pellets at a dietemperature of 100 �C. The lower and higher end of the error barshows the required energy input to produce pellets at die temper-atures of 70 and 130 �C, respectively. The compression energy in-creased from 19.6 to 53.6 J/g with increasing applied pressure atthe die temperature of 100 �C. The compression energy was foundto be independent of the die temperature and relaxation time, buthighly dependent on applied pressure. Extrusion energy did not
60 80 100 120 140 160 180 200
0
5
10
15
20
25
30
35
40
45
50
55
60
Com
pre
ssio
nE
nerg
y(J
/g)
Applied Pressure (MPa)
Fig. 2. Compression energy versus applied pressure with respect to different dietemperatures of 70, 100 and 130 �C (N = 45).
occupy a significant portion of the total compression energyconsumption [1] and therefore this study did not include anestimation of extrusion energy.
5. Conclusions
The optimum processing condition to produce the best qualityof Douglas fir pellets was 100 �C die temperature, 126 MPa appliedpressure and 30 s relaxation time. The die temperature was recom-mended to operate below 100 �C to prevent moisture evaporationfrom particles. Temperature and applied pressure were governedin making denser pellets at temperatures lower and higher than100 �C, respectively. All rheological models except the Panelli–Filho model were well described with respect to the compressionbehavior of Douglas fir ground particles. Compression energy wasnot affected by the temperature and the relaxation time, but onlyby the applied pressure.
Acknowledgements
This research is funded in parts by the Natural Sciences andEngineering Research Council of Canada (NSERC-CRD Grant:CRDPJ342219-06); Wood Pellet Association of Canada (Grant-11R42500). We acknowledge the support from Office of BiomassProgram of the US Department of Energy.
References
[1] Lam PS, Sokhansanj S, Bi X, Lim CJ, Melin S. Energy input and quality of pelletsmade from steam exploded Douglas fir (Pseudotsuga menziesii). Energy Fuels2011;25(4):1521–8.
[2] Lam PS. Steam explosion of biomass to produce wood pellets. Chemical &Biological Engineering, Vancouver, University of British Columbia. PhD Thesis;2011.
[3] Sikanen L, Vilppo T. Small scale pilot combustion experiments with woodpellets – the effect of pellet length. Open Renew Energy J 2012;5:1–6.
[4] Kuokkanen M, Vilppo T, Kuokkanen T, Stoor T, Niinimäki J. Additives in woodpellet production – a pilot-scale study of binding agent usage. Bioresource2011;6(4):4331–55.
[5] CEN/TC 335. EN 15210-1:2009 Solid biofuels – determination of mechanicaldurability of pellets and briquettes. Part 1: Pellets London; 2009.
[6] Shang L, Nielsen NPK, Dahl J, Stelte W, Ahrenfeldt J, Holm JK, et al. Qualityeffects caused by torrefaction of pellets made from Scots pine. Fuel ProcessTechnol 2012;101:23–8.
[7] Lam PS, Sokhansanj S, Bi X, Lim CJ. Colorimetry applied to steam treatedbiomass and pellets made from western Douglas fir (Pseudotsuga menziestiL.). Trans ASABE 2012;55(2):673–8.
[8] Lam PS, Lam PY, Sokhansanj S, Bi XT, Lim CJ. Mechanical and compositionalcharacteristics of steam-treated Douglas fir (Pseudotsuga menziesii L.) duringpelletization. Biomass Bioenergy 2013;56:116–26.
[9] Tooyserkani Z, Kumar L, Sokhansanj S, Saddler J, Bi XT, Lim CJ, et al. SO2-catalyzed steam pretreatment enhances the strength and stability of woodpellets. Bioresour Technol 2013;130:59–68.
[10] Adapa PK, Tabil LG, Schoenau GJ, Crerar B, Sokhansanj S. Compressioncharacteristics of fractionated Alfalfa grinds. Powder Handl Process2002;14(4):252–9.
[11] Denny PJ. Compaction equations: a comparison of the Heckel and Kawakitaequations. Powder Technol 2002;127:162–72.
[12] Mani S, Tabil LG, Sokhansanj S. An overview of compaction of biomass grinds:powder handling and processing. Int J Stor Handl Process Powder2003;15(3):160–8.
[13] Shaw MD, Karunakaran C, Tabil LG. Physicochemical characteristics ofdensified untreated and steam exploded poplar wood and wheat strawgrinds. Biosyst Eng 2009;103:198–207.
[14] Jones WD. Fundamental principles of powder metallurgy. London: EdwardArnold Publishers Ltd.; 1960. p. 242–370.
[15] Heckel RW. Analysis of powder compaction phenomenon. Trans Metall SocAIME 1961;221:1001–8.
[16] Cooper AR, Eaton LE. Compaction behavior of several ceramic powders. J AmCeram Soc 1962;45(3):97–101.
[17] Kawakita K, Ludde KH. Some considerations on powder compressionequations. Powder Technol 1971;4:61–8.
[18] Panelli R, Filho FA. A study of a new phenomenological compacting equation.Powder Technol 2001;114:255–61.
[19] Mani S, Tabil LG, Sokhansanj S. Evaluation of compaction equations applied tofour biomass species. Can Biosyst Eng 2004;46(3):55–61.

1092 P.Y. Lam et al. / Fuel 117 (2014) 1085–1092
[20] Tabil LG, Sokhansanj S. Process conditions affecting the physical quality ofalfalfa pellets. Appl Eng Agric 1996;12(3):345–50.
[21] Stewart A. Pelleting of granular materials. Engineering1938;169(4386):175–6. 203–204.
[22] Comoglu T. An overview of compaction equations. J Fac Pharm Ankara Uni2007;36(2):123–33.
[23] ASABE Standards. S319.3: Method of determining and expressing fineness offeed materials by sieving, St. Joseph, Mich: ASABE; 2003.
[24] Krycer I, Pope DG, Hersey JA. The interpretation of powder compaction data – acritical review. Drug Dev Ind Pharm 1982;8(3):307–42.
[25] Moreyra R, Peleg M. Compressive deformation patterns of selected foodpowders. J Food Sci 1980;45:864–8.
[26] Scoville E, Peleg M. Evaluation of the effects of liquid bridges on the bulkproperties of model powders. J Food Sci 1981;46(1):174–7.
[27] ASABE Standards. S358.2: Moisture measurement-forages. St. Joseph, Mich:ASABE; 2010.
[28] Sluiter A, Hames B, Ruiz R, Scarlata C, Sluiter J, Templeton D, et al.Determination of ash in biomass. NREL/TP-510-42622; NREL; 2008.
[29] Walker EE. The properties of powders-Part VI: the compressibility of powders.Trans Faraday Soc 1923;19:73–82.
[30] Chevanan N, Womac AR, Bitra VSP, Igathinathane C, Yang YT, Miu PI, et al. Bulkdensity and compaction behavior of knife mill chopped switchgrass, wheatstraw, and corn stover. Bioresour Technol 2010;101:207–14.
[31] York P, Pilpel N. The tensile strength and compression behavior of lactose, fourfatty acids and their mixture in relation to tableting. J Pharm Pharmacol1973;25:1–11.
[32] Stelte W, Holm JK, Sanadi AR, Barsberg S, Ahrenfeldt J, Henriksen UB. A studyof bonding and failure mechanisms in fuel pellets from different biomassresources. Biomass Bioenergy 2011;35:910–8.
[33] Goring DAI. Thermal softening of lignin, hemicellulose and cellulose. Pulp PapMag Can 1963;64:517–27.
[34] Calle S, Klaba L, Thomas D, Perrin L, Dufaud O. Influence of the size distributionand concentration on wood dust explosion: experiments and reactionmodelling. Powder Technol 2005;157:144–8.
[35] Melin S. Testing of explosibility and flammability of airborne dust from woodpellets. Wood Pellet Association of Canada; 2008.