within-stand spatial distribution of tree mortality caused by the douglas-fir beetle (coleoptera:...
TRANSCRIPT

COMMUNITY AND ECOSYSTEM ECOLOGY
Within-Stand Spatial Distribution of Tree Mortality Caused by theDouglas-Fir Beetle (Coleoptera: Scolytidae)
JOSE F. NEGRON,1 JOHN A. ANHOLD,2 AND A. STEVE MUNSON2
Environ. Entomol. 30(2): 215Ð224 (2001)
ABSTRACT The Douglas-Þr beetle, Dendroctonus pseudotsugae Hopkins, causes considerablemortality in Douglas-Þr, Pseudotsuga menziesii (Mirb.) Franco, forests. Within-stand distribution ofmortality was examined in affected stands using geostatistical techniques. A 10 3 10 m grid wasestablished in two 4-ha study sites. Live and beetle-killed host basal area was measured at each node.In a 16-ha stand, a variable-resolution grid was established and the same information collected. Therelationship between Douglas-Þr basal area and Douglas-Þr basal area killed was examined usingnon-spatially explicit and spatially explicit linear regressionmodels.Apositive linear relationshipwasobserved between the variables. SigniÞcant spatially explicit models suggest that the relationship isalso true at Þne scales. Relative variograms were constructed for Douglas-Þr basal area before andafter the Douglas-Þr beetle outbreaks. For the 4-ha sites, increased spatial dependency in thedistribution of Douglas-Þr basal area was observed as a result of the Douglas-Þr beetle outbreak. Forthe 16-ha site, kriging was used to estimate live Douglas-Þr basal area before and after the outbreakto a 10-m resolution and the stand rated for potential mortality illustrating the potential applicabilityof geostatistical techniques to rating a stand for potential mortality. Cross-validation analysis indi-cated that although the potential exists for large estimation errors, themajority of the estimateswerewithin acceptable ranges. The study suggests that geostatistical approachesmaybe suitable to extendour understanding bark beetle ecology and improving the application of extent of mortality models.
KEY WORDS Douglas-Þr beetle, Dendroctonus pseudotsugae, bark beetles, disturbance, risk clas-siÞcation model, hazard rating model
THE DOUGLAS-FIR BEETLE, Dendroctonus pseudotsugaeHopkins, is a bark beetle that uses Douglas-Þr,Pseudotsuga menziesii (Mirb.) Franco, as its primaryhost. Adult beetles disperse in the spring and attacknew hosts by burrowing into the bark and laying eggsin galleries constructed by the adults. Large diametertrees are preferred. Eggs hatch in 1Ð3 wk, the larvaedevelop in the bark feeding on the phloem. Pupationand transformation into the adult stage is usually com-pleteby the fall and thebroodadults overwinterunderthe bark and emerge the following spring (Schmitzand Gibson 1996).
In the western United States, endemic populationsof the Douglas-Þr beetle are commonly encounteredon injuredor felledDouglas-Þr (McMullen andAtkins1962, Furniss 1965, Rudinsky 1966, Wright et al. 1984).Biotic and abiotic agents such as root disease (Wrightand Lauterbach 1958), defoliation (Berryman andWright 1978, Wright et al. 1984), windthrow (Rudin-sky 1966), snow breakage (McGregor et al. 1974), Þre(Furniss 1965), and logging (Lejeune et al. 1961,McGregor et al. 1974) can trigger increases in popu-lation size that can cause widespread mortality. Out-
breaks of this insect most commonly last from 2 to 4 yr(Schmitz and Gibson 1996).
Furniss et al. (1979, 1981) proposed that host typeproportion, tree density, and age were key factors inDouglas-Þr stand susceptibility to Douglas-Þr beetle.Weatherby and Thier (1993) presented a system forrating stands for susceptibility to losses to Douglas-Þrbeetle. The systemuses stand basal area, proportion ofstand basal area in Douglas-Þr, average stand age, andaverage diameter at breast height (dbh) of all Dou-glas-Þrs larger than 22.9 cm. Shore et al. (1999) indi-cated that diameter at breast height, tree height,phloem thickness, aspect, and a standardized variablecalculatedbydividingdiameter at breast height by thelast 10 yr growth rate are associated with Douglas-Þrbeetle infestations. Negron et al. (1999) indicated thatwhen a stand is susceptible to a Douglas-Þr beetleoutbreak as indicated by the presence of large diam-eter trees, high stocking levels, and a high proportionof Douglas-Þr, Douglas-Þr basal area can be used toestimate potential mortality.
Many risk and hazard rating models have been de-veloped to determine the degree of susceptibility offorest stands to infestation, or the amount of expectedmortality, or both, caused by different bark beetlespecies. Bentz et al. (1993) indicated that risk classi-Þcation systems developed for mountain pine beetle,Dendroctonus ponderosae Hopkins, in lodgepole pine,Pinus contortaDougl. exLoud., often fail toprovide the
1 Rocky Mountain Research Station, USDA Forest Service, 240 W.Prospect, Ft. Collins, CO 80526.
2 Forest Health Protection, USDA Forest Service, 4746 S. 1900 E.,Ogden, UT 84403.

desired levels of accuracy. Some reasons identiÞed assources of error included the following: not consid-ering beetle population phase during model develop-ment, lack of inclusion of beetle population dynamicsinformation, and theneed to include the spatial natureof beetle populations and stand conditions.
Another potential difÞculty with current models isthat they were developed using stand averages or areapplied to a management unit regardless of the scaleat which they were developed. Stand averages fail tocapture the within-stand variability in stand condi-tions. These variations affect the spatial distribution oftree mortality caused by insects. Olsen et al. (1996)indicated that mountain pine beetle infestations inponderosa pine, Pinus ponderosae Dougl. ex Laws, inthe Black Hills, SD, were associated with microcosmstands, i.e., smaller standswith increased treedensitieswithin larger stands. In a similar manner, mountainpinebeetlepreferentially attacks largerdiameter treesin lodgepole pine forests (Cole and Amman 1969,Safranyik et al. 1974, Amman et al. 1977, Klein et al.1978, Cole and Amman 1980) with colonizing popu-lations clustering around larger diameter trees in astand (Mitchell and Preisler 1991).
Douglas-Þr beetle-caused mortality in affectedstands is patchy. Although some epidemics may beextensive at the landscape level, individual stands ex-hibit different degrees of mortality and do not alwayssuffer catastrophic mortality levels. To better under-stand the ecological role of bark beetles in forestecosystems, it is imperative to extend our knowledgeof the spatial distribution of tree mortality as inßu-enced by the spatial distribution of forest conditionsthat affect bark beetle-caused mortality. The applica-tionof spatial analysis to barkbeetle ecologymayoffermethodologies for this purpose. Geostatistics are sta-tistical methods that focus in describing spatial pat-terns of processes. These techniques originated in thegeological sciences but have become common in ecol-ogy.
For detaileddiscussions ongeostatistical theory andmethodology, see Isaaks and Srivastava (1989), Hohn(1988), and Cressie (1991). Schotzko and OÕkeeffe(1989)andKempet al. (1989)usedgeostatistical tech-niques in entomology; Chellemi et al. (1988) usedthem in plant pathology; and Robertson et al. (1988)and Jackson and Caldwell (1993) used them to eval-uate the interaction between soil properties and plantcommunities. Few studies have applied these tech-niques to forestry problems (see Kohl and Gertner(1997) for some citations). Biondi et al. (1994) usedthis approach to model stem size and increment in aponderosa pine forest and concluded that the under-standing of spatial dependence can lead to improvedperformance of simulation and estimation models.Kohl and Gertner (1997) used geostatistical methodsto present the spatial distribution of needle/leaf lossdata from survey information. Raty et al. (1997) con-ducted a geostatistical analysis of pheromone trapcatches of Ips typographus L. using spatial and tem-poral data in Romania. A number of studies have usedthe techniques to examine various ecological aspects
of the gypsymoth,Lymantria dispar (L.) (Liebhold etal. 1991, 1995; Hohn et al. 1993). Biondi et al. (1994)and Kohl and Gertner (1997) also provide brief de-scriptionsofgeostatisticalmethods, andLiebholdet al.(1993) discuss aspects of their application to insectecology.
In this study, we examined the spatial pattern ofDouglas-Þr basal area in Douglas-Þr stands, deter-mined if the spatial patternofbasal area inßuenced thespatial pattern of mortality caused by the beetle, char-acterized how Douglas-Þr beetle changed the distri-bution of basal area in the stand, and pondered thepotential for using geostatistical techniques to incor-porate within-stand variability of basal area or otherforest conditions into models to estimate potentialmortality in an affected stand.
Materials and Methods
Study Sites. Wasatch–Cache National Forest. Twostudy sites were established in the WasatchÐCacheNational Forest, UT, in June of 1997 in stands wherea Douglas-Þr beetle outbreak had collapsed and nonew mortality was present. Each study site compriseda 4-ha area and was located in the Beaver Creek andthe Middle Sink areas of the Logan Ranger District. Ateach study site, a 10 3 10 m grid was established overthe 4-ha area. At each grid node a variable radius plotwas established using a 20 BAF gauge in a relascope.For all sample trees in each variable radius plot, thefollowing informationwas recorded: species, diameterat breast height, and whether the tree was alive, killedby Douglas-Þr beetle, or dead from other causes. Thisinformation allowed examination of pre- and postout-break forest conditions with the same data set. Largerdiameter trees are more likely to be included in vari-able radius plots. These larger trees contribute themost to stand basal area and are also the preferredhosts by the Douglas-Þr beetle. Because plots werelocated in close proximity to one another, very largetrees could be included in multiple adjacent plots.With this information, spatially referenced data weregenerated on Douglas-Þr basal area, Douglas-Þr basalarea killed by Douglas-Þr beetle, and residual Dou-glas-Þr basal area (live Douglas-Þr basal area after theDouglas-Þr beetle outbreak had collapsed).
AshleyNational Forest.Basedon the results obtainedin 1997, a 16-ha study site was established in August of1998 at the Clements Hollow area of the DuchesneRanger District, Ashley National Forest, UT. A sam-pling grid was established throughout the study site.Grid size was variable with the majority of the studysite sampled using a 40 3 40 m grid. To capture small-scale variability inbasal area across the study site, partsof the site were sampled in a 20 3 20 m or a 10 3 10 mgrid. Areas with different sampling distances weredistributed across the study site (Fig. 1). At eachsample point, data were collected using the same pro-tocol as in 1997. The objective was to examine theapplication of geostatistical methods over a largerarea, by using ordinary kriging (Isaaks and Srivastava1989) to estimate Douglas-Þr basal area and residual
216 ENVIRONMENTAL ENTOMOLOGY Vol. 30, no. 2

Douglas-Þr basal area in unsampled locations, and ratethe study site for potential mortality using the krigedoutput. Incontrast to theBeaverCreekand theMiddleSink study sites, the outbreak at the Clements Hollowsite had not completely collapsed. Aerial surveys ofthe area revealed active Douglas-Þr beetle popula-tions in the study area in 1998 and in the vicinity in1999.
Data Analysis. Regression Analyses. The data pre-sented here for each study site were obtained fromvariable radius plots in very closeproximity; therefore,the presence of spatial autocorrelation was examined.The within-stand relationship between Douglas-Þrbasal area and basal area killed by Douglas-Þr beetlewasexaminedusing linear regressionwithandwithoutadjustments for spatial location. Linear regressionanalyses were conducted using the PROC MIXEDroutines in SAS (Littell et al. 1996),which incorporatespatial correlation among observations directly intothe estimation process using a mixed model formula-tion. Instead of assuming that observations are uncor-related, PROC MIXED estimates a covariance matrixamong observations based on a spatial model. Forexample, consider the model y 5 a 1 bx 1 e, wherey is the basal area killed by Douglas-Þr beetle at nobservationpoints,x is the initialDouglas-Þrbasal areaat the comparable points, a and b are regression pa-rameters, and e is the vector of model errors. If theobservations are assumed to be uncorrelated, then thecovariance matrix of the model errors is Cov (e) 5s2In, where In denotes the n 3 n with one on thediagonal and zero elsewhere. If instead the observa-tions are assumed to be spatially correlated, then thecovariance between ei and ej is estimated based on thedistance (dij) between the two observations, cov(ei,ej) 5 s2f(dij).
This approach reduces or removes the effects ofspatial correlation among observations and producesmore accurate estimates of model parameters and as-
sociated tests of hypothesis. For the regression anal-ysis without spatial location adjustment, Douglas-Þrbasal area was the independent variable with basalarea killed as dependent variable. For the regressionanalysis with spatial location adjustment, a Þt-by-eyeapproach was used to model a variogram of the re-siduals from the nonspatially adjusted regression. TheÞt-by-eye provided starting parameters of the sill,range, and nugget describing the spatial structure ofthe residuals. These parameters were then incorpo-rated into the spatially explicit model with Douglas-Þrbasal area as independent variable and basal areakilled as the dependent variable. The spatially explicitmodelswere comparedwith the nonspatialmodels foreach study area to determine if the inclusion of spatiallocation information improved model Þt. The 22 re-sidual log likelihood statistic and r2 values were usedto evaluate changes in model Þt. Because PROCMIXED does not calculate r2, the statistic was calcu-lated from the likelihood ratios of unrestricted (noparameters applied) and restricted (with interceptand slope) models as described by Magee (1990).
Geostatistical Analyses. Relative variograms werecalculated forDouglas-Þr basal area and residualDou-glas-Þr basal area for theBeaverCreek and theMiddleSink sites to examine the spatial distribution ofDouglas-Þr basal area across the study sites before andafter the Douglas-Þr beetle outbreak. Variogramswere calculatedusingGS1 (GammaDesign Software,Plainwell, MI). Maximum lag distance for all vario-grams was half of the maximum distance between twopoints (Hohn 1988, Isaaks and Srivastava 1989). Atboth sites, directional relative variograms were con-structed for 0, 45, 90, and 135 angle classes with atolerance of 22.5. No evidence of directionality wasdetected, therefore isotropy was assumed and omni-directional variograms used. Sphericalmodelswere Þtto the variograms using a combination of Þt-by-eyeand least squares approaches and values for the sill,nugget, range, degree of spatial dependency, and r2 ofthe Þt model obtained. The spatial statistics modulesinS-Plus (Mathsoft, Seattle,WA)werealsoused in theÞt-by-eye process of the variograms. The sphericalvariogram model is deÞned as:
y~h! 5 C0 1 C @1.5~h/A0! 2 0.5~h/A0!3# when h # A0
and
y~h! 5 C0 1 C when h . A0
where h 5 lag interval, C0 5 nugget, C 5 sill, andA0 5range.
Variogramcharacteristics before and after theDou-glas-Þr beetle outbreaks for the Beaver Creek and theMiddle Sink sites were compared.
Average Douglas-Þr basal area, and average diam-eter at breast height of live Douglas-Þr across the sitesbefore and after theDouglas-Þr beetle outbreakswerecalculated and the means compared with a pairedt-test. To adjust the paired t-tests for spatial autocor-relation, variograms of the paired differences in basalarea and average Douglas-Þr diameter at breast heightbefore and after the Douglas-Þr beetle outbreak were
Fig. 1. Clements Hollow study area. Crosses indicatesample points. Note systematic variation in sampling dis-tances across study site, Ashley National Forest, UT, 1998.
April 2001 NEGRON ET AL.: WITHIN-STAND MORTALITY BY DOUGLAS-FIR BEETLE 217

constructed. An intercept only model, that is, with themean paired differences only, was formulated inPROC MIXED. The residual variance of this modeland the associated test of whether the intercept wasdifferent from zero was adjusted by incorporating anexponential spatial model as described earlier for thespatial regression models. However, the sampling gridwas stratiÞed into 50msquareblockswithinwhich thespatial parameters were estimated since PROCMIXED lacks a framework for estimating an overallspatial model in a paired design scenario. All studystandswere essentially pureDouglas-Þr. Percent basalarea (6SEM) in Douglas-Þr was 95.0 (1.0) for BeaverCreek, 89.6 (1.1) for Middle Sink, and 92.8 (1.1) forClements Hollow. The distribution of Douglas-Þrbasal area before and after the Douglas-Þr beetle out-breakwasmappedusingpotentialmortality classes forUtah from a Douglas-Þr beetle outbreak. Low, me-dium, andhighmortality classes correspondwithDou-glas-Þr basal area #26.4 m2/ha, Douglas-Þr basal areabetween 26.5m2/ha and 39.0m2/ha, and .39.0m2/ha,respectively (Negron et al. 1999)
For the Clements Hollow site in the Ashley NF,directional relative variograms were constructed asindicated above. After no evidence of directionalitywas observed, omnidirectional relative variogramswere calculated for Douglas-Þr basal area and Dou-glas-Þr residual basal area and the variogram charac-teristics compared. Ordinary kriging (Isaaks andSrivastava 1989) was then used to estimate Douglas-Þrbasal area and Douglas-Þr residual basal area in un-sampled locations to a 10 m resolution. The distribu-tion of Douglas-Þr basal area before and after theDouglas-Þr beetle outbreak was then mapped usingthekrigeddata andpotentialmortality classes forUtahas described above. Haining (1990) indicated thatcross-validation and the examination of prediction er-rors can be used to asses the Þt of semivariogrammodels. Toexamineestimationerrors obtained, a jack-knife cross validationanalysiswasconducted.Thiswasdone by sequentially deleting each experimentallymeasured location from the data set and obtaining akriged value for that location. The kriged estimateswere then compared with the actual values obtainedfrom sampled locations (Isaaks and Srivastava 1989).The mean, minimum, maximum, median, and inter-quartile range of differences between kriged and ac-tual values forDouglas-Þr basal area and residualDou-glas-Þr basal area were calculated. The kriging andcross validation analysis were conducted with GS1(Gamma Design Software, Plainwell, MI).
Results and Discussion
Regression Analyses. A signiÞcant positive linearrelationship was observed between Douglas-Þr basalarea and basal area killed at all study sites using non-spatial models (Table 1). The models indicate thatincreasedmortality correlateswith increased stockinglevels. The relationship between high stocking levelsand increased susceptibility tovariousbarkbeetleshasbeen documented in other studies (Safranyik et al.1974; Sartwell and Stevens 1975; McCambridge et al.1982; Reynolds and Holsten 1994, 1996; Negron 1997,1998; Negron et al. 1999). In contrast to the currentstudy, the previously mentioned studies examined therelationship using data from different stands and au-tocorrelation was not a factor. Spatial adjustment ofour linear models resulted in a considerable increasein model Þt as indicated by the increase in r2 and thedecrease in the Ð2 residual log likelihood statistics.
The signiÞcance of the spatially adjusted modelssuggests that the relationship between Douglas-Þrbasal area and basal area killed by the Douglas-Þrbeetle holds true at Þne scales within the stand. Thisagrees with the concept of microcosm stands pro-posed by Olsen et al. (1996), where there are smallstandswithin larger standswhere forest conditions aremore suitable for the development of bark beetleinfestations. This stresses the importance of consid-ering the within stand variability of forest conditionswhen evaluating the potential impacts of a Douglas-Þrbeetle outbreak in a stand. The clumped nature ofDouglas-Þr beetle-caused mortality may be explainedby the presence of clumps of high basal area in thestand. Furniss et al. (1979, 1981) and Weatherby andThier (1993) indicated increased susceptibility toDouglas-Þr beetle in stands with high stocking levels.Negron (1998) indicated that Douglas-Þr beetle ex-hibited preference for slow growing trees growingunder high stocking conditions and Lessard andSchmid (1990) also indicated preference for slowgrowing trees by Douglas-Þr beetle.
Geostatistical Analyses. Wasatch–Cache NationalForest. CoefÞcients of determination for the sphericalmodels Þt to the relative variograms of Douglas-Þrbasal area and Douglas-Þr residual basal area for theBeaver Creek and the Middle Sink study sites rangedfrom 0.94 to 0.99. After Douglas-Þr beetle populationscollapsed, the nugget was reduced at both the BeaverCreek and the Middle Sink sites, with a correspondingincrease in spatial dependency (Table 2; Fig. 2). Thisindicates that basal area at speciÞc points is more
Table 1. Relationship between Douglas-fir basal area (dfba) and basal area killed by Douglas-fir beetle (bak) as described with linearand spatially explicit linear regression models, Wasatch–Cache and Ashley National Forests, UT, 1997–1998
Site Model P R2 MSE22 residual log
likelihood
Beaver CreekÐlinear regression Bak 5 0.11 1 0.45 (dfba) 0.0001 0.38 7.9 3077Beaver CreekÐspatial linear regression Bak 5 1.31 1 0.28 (dfba) 0.0001 0.75 10.2 2674Middle SinkÐlinear regression Bak 5 20.53 1 0.15 (dfba) 0.0001 0.13 5.2 2712Middle SinkÐspatial linear regression Bak 5 0.53 1 0.07 (dfba) 0.0001 0.78 5.7 2114Clements HollowÐlinear regression Bak 5 0.17 1 0.23 (dfba) 0.0001 0.19 7.1 3115Clements HollowÐspatial linear regression Bak 5 0.47 1 0.21 (dfba) 0.0001 0.46 6.3 2929
218 ENVIRONMENTAL ENTOMOLOGY Vol. 30, no. 2

dependent on adjacent points after the Douglas-Þrbeetle outbreak than before the outbreak. Douglas-Þrbeetle reduced the within-stand variability of hosttype basal area. To phrase it differently, the standsbecame more continuous in terms of the distributionof Douglas-Þr basal area.
The range is an indication of the scale of spatialpattern or patch size at short lag distances. The rangedecreased at BeaverCreek and to a lesser extent at theMiddle Sink study site after the Douglas-Þr beetleoutbreak. This suggests that in the process of makingbasal area more continuous at short lag distances, theDouglas-Þr beetle creates smaller basal area patchesthat are more similar to one another. Biondi et al.(1994) indicated that deÞning homogenous areas inforest ecosystems could lead to optimal sampling pro-cedures and the effective application of silviculturaltools. In this study, preoutbreak basal area patcheswere 93 m at the Beaver Creek site and 49 m at theMiddle Sink site (Table 2). The scale at which Dou-glas-Þr beetle activity occurs within a stand may ap-proximate these distances. This may be the appropri-ate scale for rating and managing stands withsilvicultural approaches when the objective is to re-duce potential mortality from Douglas-Þr beetle out-breaks.
Mapping thedistributionofDouglas-Þrbasal areaofthe two study areas before and after the Douglas-Þrbeetle outbreaks illustrates the changes in basal areacontinuity. It also demonstrates the correlation ofDouglas-Þr beetle caused mortality with higher stock-ing levels. In the Beaver Creek study site, the majorityof the stand where Douglas-Þr basal area was .39m2/ha and to a lesser extent where Douglas-Þr basalarea was .26.4 m2/ha was impacted by Douglas-Þrbeetle (Fig. 3A). These values correspond to high andmedium potential mortality categories for Utah as de-
scribed by Negron et al. (1999). The residual basalarea in the stand was more uniform following thebeetle outbreak (Fig. 3B). Although the outbreak atthe Middle Sink study site was less extensive than atthe Beaver Creek site (Table 2), the area affected wasin the southeastern corner of the stand which had apotentialmortality ratingofhighormedium(Fig. 3C).The change was enough to increase the degree ofcontinuity in basal area patches in the stand (Figure3D).
Maps of residual basal area in stands after Douglas-Þr beetle outbreaks demonstrate the patchy nature ofDouglas-Þr beetle outbreaks and how the beetle doesnot seem to remove all high-density pockets within astand. This is important information for resourceman-agers. Managing stands to reduce susceptibility toDouglas-Þr beetle may or may not be compatible withother resource management objectives that requirethe preservation of clumps with high basal area in astand. These clumps are the most likely to exhibit treemortality by theDouglas-Þr beetle.However, becausenot all high-density clumps are always attacked, man-agement strategies can be developed that mimic thenatural disturbance caused by Douglas-Þr beetle.
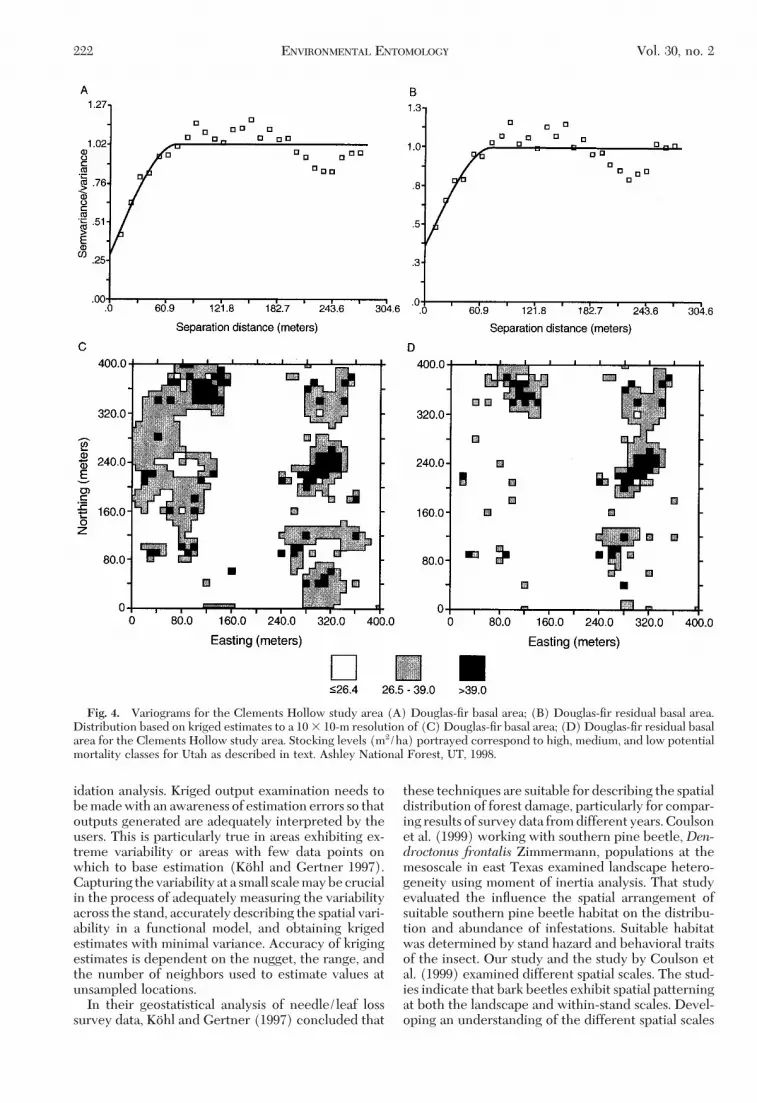
Ashley National Forest. In contrast to the BeaverCreek and the Middle Sink sites, we did not observedchanges in the nugget, range, or spatial dependencyobtained for the Clements Hollow site as a result ofDouglas-Þr beetle activity (Table 2; Fig. 4A and B).The Clements Hollow site comprised 16 ha comparedwith the Beaver Creek and Middle Sink sites, whichcomprised four hectares each. Douglas-Þr beetle out-breaks tend to be patchy and affected landscapes in-clude unaffected areas. This is reßected in the smallchange in basal area observed in the Clements Hollowstudy site. Although part of the site was sampled at 10-and 20-m resolutions the majority of the site was sam-
Table 2. Characteristics for Douglas-fir basal area and residual Douglas-fir basal area variograms, average Douglas-fir basal area(6SEM), average Douglas-fir dbh (6SEM), and sample variance for Douglas-fir basal area before and after the Douglas-fir beetle outbreakat the Beaver Creek, and Middle Sink sites, Wasatch–Cache National Forest, UT, June 1997 and at the Clements Hollow site, AshleyNational Forest, UT, August 1988
Beaver Creek Middle Sink Clements Hollow
Douglas-ÞrBasal area
Residual Douglas-ÞrBasal area
Douglas-ÞrBasal area
Residual Douglas-ÞrBasal area
Douglas-ÞrBasal area
Residual Douglas-ÞrBasal area
Nugget 0.35 0.15 0.22 0.17 0.30 0.36Sill 1.13 0.97 1.00 1.06 1.02 1.03Range (m) 93.3 37.3 49.1 43.9 73.3 74.4R2 0.96 0.99 0.94 0.95 0.71 0.65Spatial dependencya 76.5 86.8 82.1 86.0 77.6 74.0Douglas-Þr basal area
(m2/ha)22.0 (0.7)ab 12.0 (0.5)b 16.9 (0.7)ac 14.8 (0.6)a 18.5 (0.7)ad 14.1 (0.7)b
Douglas-Þr dbh, cm 62.3 (0.7)ae 53.6 (0.8)b 57.9 (0.8)af 56.3 (0.8)b 32.8 (0.6)ag 26.8 (0.7)bDouglas-Þr basal area
variance193.6 121.3 190.5 163.2 247.5 197.8
Means in rows for each study site followed by the same letter are not signiÞcantly different (t-test as described by footnotes).a Spatial dependency 5 (sill/(nugget 1 sill)) 3 100.b t 5 5.25; p , 0.0001; df 5 15.c t 5 1.93; p 5 0.0723; df 5 15.d t 5 11.0; p , 0.0001; df 5 15.e t 5 5.50; p , 0.0001; df 5 15.f t 5 2.15; p , 0.0484; df 5 15.g t 5 6.43; p , 0.0001; df 5 15.
April 2001 NEGRON ET AL.: WITHIN-STAND MORTALITY BY DOUGLAS-FIR BEETLE 219

pled at a 40-m resolution. It is likely that increase insampling distance coupled with sampling a standwhere the outbreak had not completely collapsedmade it difÞcult to capture changes in spatial pattern-ing caused by the Douglas-Þr beetle outbreak. Thesample area was much larger, but with the compro-mise of reducing the number of pairs of observationsavailable to calculate the variogram at each lag dis-tance. This reduction in the number of pairs is prob-ably reßected in the accuracy of the variogram char-acteristics. Ultimately, evaluation of these techniquesat multiple scales, outbreak intensities, and differentforest conditions will add to our understanding of theinterplay of these factors.
Kriging output was used to map the distribution oflive basal area before and after the Douglas-Þr beetleoutbreak using potential mortality classes to a 10-mresolution by estimating the basal area at the un-sampled locations (Fig. 4C and Fig. 4D). From themaps, it can be seen, that reductions in live basal areacaused by Douglas-Þr beetle activity were more prev-alent in the high and medium potential mortalityclasses located in the west side and the southeasterncorner of the stand. This is in agreement with theresults from the spatially referenced regression anal-ysis.
The results illustrate how kriging can be used toincorporate within-stand variability of Douglas-Þrbasal area into the process of rating a stand for po-tential mortality. Maps of the distribution of Douglas-Þr basal area in a stand can be produced using krigingtechniques. Rating models can then be applied to themaps to depict areas with different potential mortalityclasses. Again, not all high-density clumps were re-moved by the beetle, which suggests that parts of thestand may still be susceptible to additional Douglas-Þrbeetle mortality should another outbreak develop.
Results from the cross validation analysis indicatethat for estimation of Douglas-Þr basal area the meandifference between kriged and actual values was20.08m2/hawith amedianof20.5. Theminimumandmaximum differences were 242.1 m2/ha and 52.9 m2/ha, respectively. The 25th and 75th percentiles were26.9 and 5.3, respectively, for an interquartile rangeof12.2. Based on an average Douglas-Þr stand basal areaof 18.5 m2/ha (Table 2), half of the kriged estimateswere within 29% and 37% of the observed basal area.For Douglas-Þr residual basal area the mean differ-ence between kriged and actual valueswas 0.05m2/hawith a median of 21.0. The minimum and maximumdifferenceswere 241.6m2/ha and 45.9m2/ha, respec-tively. The 25th and 75th percentiles were 26.5 and
Fig. 2. Variograms for the Beaver Creek study area (A) Douglas-Þr basal area; (B) Douglas-Þr residual basal area; andthe Middle Sink study area (C) Douglas-Þr basal area; (D) Douglas-Þr residual basal area. WasatchÐCache National Forest,UT, 1997.
220 ENVIRONMENTAL ENTOMOLOGY Vol. 30, no. 2

4.8, respectively, with an interquartile range of 11.3.Based on an average residual Douglas-Þr stand basalarea of 14.1 m2/ha (Table 2), half of the kriged esti-mateswerewithin 34 and 46%of the observed residualDouglas-Þr basal area. Isaaks and Srivastava (1989)indicated that examination of the spatial arrangementof the residuals can help in the process of improvingthe estimation process by suggesting changes in di-rection anddistanceofneighbors tobeused inkriging.In addition, cross-validation estimates can be affectedby clustering in the data set. Clustering was not ofconcern in our study because our sampling points
were regularly distributed across the study site. In ourstudy, cross-validation estimates for Douglas-Þr basalarea before and after the Douglas-Þr beetle outbreakwere generally overestimated for areas of lower basalarea andunderestimated for areas of higher basal area.This is likely to be caused by the smoothing nature ofestimation through kriging. Liebhold et al. (1991) in-dicates that although the kriged estimates minimizeresidual variance, substantial error can be present inthe estimates. The majority of our estimates werewithin acceptable ranges but we also observed thepotential for large estimation errors in our cross val-
Fig. 3. Distribution of (A) Douglas-Þr basal area; (B) Douglas-Þr residual basal area for the Beaver Creek study area; (C)Douglas-Þr basal area; (D) Douglas-Þr residual basal area for the Middle Sink study area. Stocking levels (m2/ha) portrayedcorrespond tohigh,medium, and lowpotentialmortality classes forUtah as described in text.WasatchÐCacheNationalForest,UT, 1997.
April 2001 NEGRON ET AL.: WITHIN-STAND MORTALITY BY DOUGLAS-FIR BEETLE 221
idation analysis. Kriged output examination needs tobemadewith an awareness of estimation errors so thatoutputs generated are adequately interpreted by theusers. This is particularly true in areas exhibiting ex-treme variability or areas with few data points onwhich to base estimation (Kohl and Gertner 1997).Capturing thevariability at a small scalemaybecrucialin the process of adequately measuring the variabilityacross the stand, accurately describing the spatial vari-ability in a functional model, and obtaining krigedestimates with minimal variance. Accuracy of krigingestimates is dependent on the nugget, the range, andthe number of neighbors used to estimate values atunsampled locations.
In their geostatistical analysis of needle/leaf losssurvey data, Kohl and Gertner (1997) concluded that
these techniques are suitable for describing the spatialdistribution of forest damage, particularly for compar-ing results of surveydata fromdifferent years.Coulsonet al. (1999) working with southern pine beetle, Den-droctonus frontalis Zimmermann, populations at themesoscale in east Texas examined landscape hetero-geneity using moment of inertia analysis. That studyevaluated the inßuence the spatial arrangement ofsuitable southern pine beetle habitat on the distribu-tion and abundance of infestations. Suitable habitatwas determined by stand hazard and behavioral traitsof the insect. Our study and the study by Coulson etal. (1999) examined different spatial scales. The stud-ies indicate that bark beetles exhibit spatial patterningat both the landscape and within-stand scales. Devel-oping an understanding of the different spatial scales
Fig. 4. Variograms for the Clements Hollow study area (A) Douglas-Þr basal area; (B) Douglas-Þr residual basal area.Distribution based on kriged estimates to a 10 3 10-m resolution of (C) Douglas-Þr basal area; (D) Douglas-Þr residual basalarea for the Clements Hollow study area. Stocking levels (m2/ha) portrayed correspond to high, medium, and low potentialmortality classes for Utah as described in text. Ashley National Forest, UT, 1998.
222 ENVIRONMENTAL ENTOMOLOGY Vol. 30, no. 2

at which bark beetles operate can help in reÞningmanagement approaches and explaining their role asdisturbance agents.
Our results suggest that geostatistical approacheshave potential for use inmeasuring and characterizingchanges in forest conditions resulting frombarkbeetleoutbreaks. Douglas-Þr beetle-caused mortality re-sulted in a more continuous stand in terms of basalarea by removing high-density clumps. In addition,geostatistical approaches may offer adequate meth-odologies that incorporate the inßuence of variabilityin stand conditions into models to estimate potentialmortality. Based on this study, an approach may be tosample the distribution of basal area or other impor-tant metric at a small-scale where spatial autocorre-lation is present using sample points in a grid system.Variogram models can be constructed and krigingtechniques used to develop a small-scale map of po-tential mortality classes based on the selected metric.
The geostatistical analysis conducted in this studyhas allowed us to begin exploring how within-standbasal area distribution inßuences the activity of Dou-glas-Þr beetle within a stand; how the Douglas-Þrbeetle changes the distribution of basal area in thestand; and the potential application of these tech-niques to bark beetle management. We acknowledgethat more replication and additional research are re-quired in this arena. Nevertheless, we conclude thatgeostatistical approaches offer valuable tools for ex-tending our knowledge of bark beetle ecology anddeveloping improved management strategies.
Acknowledgments
We thank the following individuals: Carl Chapman, Vale-rie DeBlander, Al Dymerski, Dawn Hansen, Patrice Janiga,Jesus Maldonado, Kristen Miller, John Popp, and DarrenMcAlvoy for Þeld assistance and data collection; Mike Ryanand Mike Williams for their reviews of an earlier version ofthe manuscript; Rudy King and Jill Williams for their statis-tical support; Joyce VanDeWater for preparing the Þgures;and twoanonymous reviewerswhose comments signiÞcantlyenhanced themanuscript.This studywas a cooperativeeffortbetween the USDA Forest Service, Rocky Mountain Re-search Station and USDA Forest Service, Forest Health Pro-tection, Ogden, UT.
References Cited
Amman, G. D., M. D. McGregor, D. B. Cahill, and W. H.Klein. 1977. Guidelines for reducing losses of lodgepolepine to the mountain pine beetle in unmanaged stands inthe Rocky Mountains. General Technical Report, INT-GTR-36. USDAForest Service, Intermountain Forest andRange Experiment Station, Ogden, UT.
Bentz, B. J., G. D. Amman, and J. A. Logan. 1993. A criticalassessment of risk classiÞcation systems for the mountainpine beetle. For. Ecol. Manage. 61: 349Ð366.
Berryman, A. A., and L. C. Wright. 1978. Defoliation, treecondition, andbarkbeetles. InM.H.Brookes,R.W. Stark,andR.W.Campbell [eds.],TheDouglas-Þr tussockmoth:a synthesis. USDA For. Serv. Tech. Bull. 1583: 81Ð87.
Biondi, F., D. E. Myers, and C. C. Avery. 1994. Geostatisti-cally modeling stem size and increment in an old-growthforest. Can. J. For. Res. 24: 1354Ð1368.
Chellemi,D.O.,K.G.Rohrbach,R. S.Yost, andR.M.Sonoda.1988. Analysis of the spatial pattern of plant pathogensand diseased plants using geostatistics. Phytopathology78: 221Ð226.
Cole, W. E., and G. D. Amman. 1969. Mountain pine beetleinfestations in relation to lodgepole pine diameters. Re-search Note, RN-INT-95. USDA Forest Service, Inter-mountain Forest and Range Experiment Station, Ogden,UT.
Cole, W. E., and G. D. Amman. 1980. Mountain pine beetledynamics in lodgepole pine forests. Part 1: course of aninfestation. General Technical Report, INT-GTR-89.USDA Forest Service, Intermountain Forest and RangeExperiment Station, Ogden, UT.
Coulson, R. N., McFadden, B. A., Pulley, P. E., Lovelady,C. N., Fitzgerald, J. W., and S. B. Jack. 1999. Heteroge-neity of forest landscapes and the distribution and abun-danceof the southernpinebeetle.For.Ecol.Manage. 114:471Ð485.
Cressie, N.A.C. 1991. Statistics for spatial data. Wiley, NewYork.
Furniss, M. M. 1965. Susceptibility of Þre-injured Douglas-Þr to barkbeetle attack in southern Idaho. J. For. 63: 8Ð11.
Furniss M.M., R. L. Livingston, and M. D. McGregor. 1981.Development of a stand susceptibility classiÞcation forDouglas-Þr beetle, pp. 115Ð128. In R. L. Hedden, S. J.Barras, and J. E. Coster [technical coordinators.], Haz-ard-Rating Systems in Forest Insect Pest Management:Symposium Proceedings. 31 JulyÐ1 August 1980, Athens,GA. Society ofAmericanForesters, EntomologyWorkingGroup, and USDA Forest Service, and The University ofGeorgia, Department of Entomology. General TechnicalReport WO-27. USDA Forest Service, Washington, DC.
Furniss, M. M., M. D. McGregor, M. W. Foiles, and A. D.Partridge. 1979. Chronology and characteristics of aDouglas-Þr beetle outbreak in northern Idaho. GeneralTechnical Report, INT-GTR-59. USDA Forest ServiceIntermountainForest andRangeExperimentStation,Og-den, UT.
Haining, R. 1990. Spatial data analysis in the social and en-vironmental sciences. Cambridge University Press, Cam-bridge.
Hohn,M.E. 1988. Geostatistics andpetroleumgeology.VanNostrand Reinhold, New York.
Hohn, M. E., A. M. Liebhold, and L. Gribko. 1993.Geostatistical model for forecasting the spatial dynamicsofdefoliationcausedby thegypsymoth,Lymantriadispar(Lepidoptera: Lymantriidae). Environ. Entomol. 22:1066Ð1075.
Isaaks, E. H., and R. M. Srivastava. 1989. An introduction toapplied geostatistics. Oxford University Press, New York.
Jackson, R. B., and M. M. Caldwell. 1993. Geostatistical pat-terns of soil heterogeneity around individual perennialplants. J. Ecol. 81: 683Ð692.
Kemp,W.P., T.M.Kalaris, andW.F.Quimby. 1989. Range-land grasshopper (Orthoptera: Acrididae) spatial vari-ability: macroscale population assessment. J. Econ. En-tomol. 82: 1270Ð1276.
Klein, W. H., D. L. Parker, and C. E. Jensen. 1978. Attack,emergence, and stand depletion trends of the mountainpine beetle in a lodgepole pine stand during an outbreak.Environ. Entomol. 7: 732Ð737.
Kohl, M., and G. Gertner. 1997. Geostatistics in evaluatingforest damage surveys: considerations on methods for
April 2001 NEGRON ET AL.: WITHIN-STAND MORTALITY BY DOUGLAS-FIR BEETLE 223

describing spatial distributions. For. Ecol. Manage. 95:131Ð140.
Lejeune,R.R.,L.H.Mcmullen, andM.D.Atkins. 1961. Theinßuence of logging on Douglas-Þr beetle populations.For. Chron. 37: 308Ð314.
Lessard, E. D., and J. M. Schmid. 1990. Emergence, attackdensities, and host relationships for the Douglas-Þr bee-tle, (Dendroctonus pseudotsugae Hopkins) in northernColorado. Great Basin Nat. 50: 333Ð338.
Liebhold, A. M., J. S. Elkington, G. Zhou, M. E. Hohn, R. E.Rossi, G. H. Boettner, C. W. Boettner, C. Burnham, andM. L. McManus. 1995. Regional correlation of gypsymoth (Lepidoptera: Lymantriidae) defoliation withcounts of egg masses, pupae, and male moths. Environ.Entomol. 24: 193Ð203.
Liebhold, A. M., R. E. Rossi, and W. P. Kemp. 1993. Geosta-tistics and geographic information systems in applied in-sect ecology. Annu. Rev. Entomol. 38: 303Ð327.
Liebhold, A. M., X. Zhang, M. E. Hohn, J. S. Elkington, M.Ticehurst, G. L. Benzon, and R. W. Campbell. 1991.Geostatistical analysis of gypsy moth (Lepidoptera: Ly-mantriidae) egg mass populations. Environ. Entomol. 20:1407Ð1417.
Littell, R. C., G. A. Milliken, W. W. Stroup, and R. D.Wolfinger. 1996. SAS system for mixed models. SAS In-stitute, Cary, NC.
Magee, L. 1990. R2 measures based on Wald and likelihoodratio joint signiÞcance tests. Am. Stat. 44: 250Ð253.
McCambridge,F.F.,F.G.Hawksworth,C.B.Edminster, andJ.G.Laut. 1982. Ponderosapinemortality resulting froma mountain pine beetle outbreak. Research Paper RM-RP-235, USDA Forest Service, Rocky Mountain Forestand Range Experiment Station, Ft. Collins, CO.
McGregor, M. D., M. M. Furniss, W. E. Bousefield, D. P.Almas, P. J. Gravelle, and R. D. Oakes. 1974. Evaluationof the Douglas-Þr beetle infestation North Fork Clear-water River Drainage, Northern Idaho, 1970Ð73. ForestPest Management Report 74-7. USDA Forest Service,Northern Region, Missoula, MT.
McMullen, L. H., and M. D. Atkins. 1962. On the ßight andhost selection of the Douglas-Þr beetle, Dendroctonuspseudotsugae Hopk. (Coleoptera: Scolytidae). Can. En-tomol. 94: 1309Ð1325.
Mitchell, R. G., and H. K. Preisler. 1991. Analysis of spatialpatterns of lodgepole pine attacked by outbreak popula-tions of themountain pine beetle. For. Sci. 37: 1390Ð1408.
Negron, J. 1997. Estimating probabilities of infestation andextent of damage by the roundheaded pine beetle inponderosa pine in the Sacramento Mountains, New Mex-ico. Can. J. For. Res. 27: 1936Ð1945.
Negron, J. F. 1998. Probability of infestation and extent ofmortality associated with the Douglas-Þr beetle in theColorado Front Range. For. Ecol. Manage. 107: 71Ð85.
Negron, J. F., W. C. Schaupp, Jr., K. E. Gibson, J. Anhold, D.Hansen, R. Thier, and P. Mocettini. 1999. Estimatingextent of mortality associated with the Douglas-Þr beetlein the Central and Northern Rockies. West. J. Appl. For.14(3): 1Ð7.
Olsen, W. K., J. M. Schmid, and S. A. Mata. 1996. Standcharacteristics associated with mountain pine beetle in-festations in ponderosa pine. For. Sci. 42: 310Ð327.
Raty, L., C. Ciornei, and V. Mihalciuc. 1997. Spatio-tempo-ral analysis for Ips typographus monitoring catches in twoRomanian forest districts, pp. 191Ð203. In J. C. Gregoire,A.M. Liebhold, F.M. Stephen, K. R.Day, and S.M. Salom[eds.], Integrating Cultural Tactics into the Managementof Bark Beetle and Reforestation Pests: Proceedings. 1Ð3September 1996, Vallombrosa, Italy. Sponsored by theInternational Union of Forest Res. Organizations, Work-ing Parties S7.03.03 and S7.03.05. USDA For. Serv. North-east. For. Exp. Stn. Gen. Tech. Rep. NE-236.
Reynolds, K. M., and E. H. Holsten. 1994. ClassiÞcation ofspruce beetle hazard in Lutz spruce (Picea X lutzii)stands on theKenai Peninsula,Alaska.Can. J. For.Res. 24:1015Ð1021.
Reynolds, K. M., and E. H. Holsten. 1996. ClassiÞcation ofspruce beetle hazard in Lutz and Sitka spruce stands onthe Kenai Peninsula, Alaska. For. Ecol. Manage. 84: 251Ð262.
Robertson, G. P., M. A. Huston, F. C. Evans, and J. M. Tiedje.1988. Spatial variability in a successional plant commu-nity: patterns of nitrogen availability. Ecology 69: 1517Ð1524.
Rudinsky, J. A. 1966. Host selection and invasion by theDouglas-Þr beetle, Dendroctonus pseudotsugae Hopkins,in coastal Douglas-Þr forests. Can. Entomol. 98: 98Ð111.
Safranyik, L., D. M. Shrimpton, and H. S. Whitney. 1974.Management of lodgepole pine to reduce losses from themountain pine beetle. Environ. Can. For. Serv. For. Tech.Rep. 1.
Sartwell, C., and R. E. Stevens. 1975. Mountain pine beetlein ponderosa pine, prospects for silvicultural control insecond-growth stands. J. For. 73: 136Ð140.
Schmitz, R. F., and K. E. Gibson. 1996. Douglas-Þr beetle.Forest Insect andDiseaseLeaßet 5.USDAForest Service,Washington, DC.
Schotzko, D. J., and L. E. O’keeffe. 1989. Geostatistical de-scription of the spatial distribution of Lygus hesperus(Heteroptera: Miridae) in lentils. J. Econ. Entomol. 82:1277Ð1288.
Shore, T. L., L. Safranyik, W. G. Riel, M. Ferguson, and J.Castonguay. 1999. Evaluation of factors affecting treeand stand susceptibility to the Douglas-Þr beetle (Co-leoptera: Scolytidae). Can. Entomol. 131: 831Ð839.
Weatherby, J. C., and R. W. Thier. 1993. A preliminaryvalidation of a Douglas-Þr beetle hazard rating system,Mountain Home Ranger District, Boise National Forest,1992. Forest Pest Management Report No. R4-93-05.USDAForest Service, IntermountainRegion,Ogden,UT.
Wright, K. H., and P. G. Lauterbach. 1958. Ten year studyofmortality in aDouglas-Þr saw-timber stand inCoos andDouglas Counties, Oregon. Research Paper PNW-RP-27.USDA Forest Service, PaciÞc Northwest and Range Ex-periment Station, Portland, OR.
Wright, L. C., A. A. Berryman, and B. E. Wickman. 1984.Abundance of the Þr engraver, Scolytus ventralis, and theDouglas-Þr beetle, Dendroctonus pseudotsugae, followingtree defoliation by the Douglas-Þr tussock moth, Orgyiapseudotsugata. Can. Entomol. 116: 293Ð305.
Received for publication 10 February 2000; accepted 16October 2000.
224 ENVIRONMENTAL ENTOMOLOGY Vol. 30, no. 2