the coverage rate of social benefits - research note 9/2013 by manos matsaganis, erhan ozdemir and...
TRANSCRIPT
Research note 9/2013
The coverage rate of social benefits
Employment, Social Affairs and Inclusion The coverage rate of social benefits
February 2014 I 2
SOCIAL SITUATION OBSERVATORY
INCOME DISTRIBUTION AND LIVING CONDITIONS
APPLICA (BE), EUROPEAN CENTRE FOR THE EUROPEAN CENTRE FOR
SOCIAL WELFARE POLICY AND RESEARCH (AT), ISER – UNIVERSITY OF
ESSEX (UK) AND TÁRKI (HU)
THE COVERAGE RATE OF SOCIAL BENEFITS
Manos Matsaganis*, Erhan Ozdemir+ and Terry Ward+
* Athens University of Economics and Business, +Applica
February 2014
This Research note was financed by and prepared for the use of the European
Commission, Directorate- General for Employment, Social Affairs and Inclusion. It
does not necessarily reflect the opinion or position of the European Commission,
Directorate-General for Employment, Social Affairs and Inclusion. Neither the
Commission nor any person acting on its behalf is responsible for the use that might
be made of the information contained in this publication.
Employment, Social Affairs and Inclusion The coverage rate of social benefits
February 2014 I 3
Table of Contents
Abstract ........................................................................................................... 4 The coverage rate of social benefits ..................................................................... 5
Introduction ................................................................................................... 5 Scale of the problem of low income ................................................................... 6 Broad income characteristics of those with low income ........................................ 8 Receipt of social benefits ................................................................................12 The circumstances of those with low income not in receipt of benefits ..................14 Distribution of social benefits by income decile ..................................................17
Access of the unemployed to income support .......................................................20 Access of the unemployed to income support ....................................................20 Non-take-up of social benefits .........................................................................28
References.......................................................................................................33 Annex 1 Jobless households among those with low income ....................................35 Annex 2 Eligibility conditions for unemployment benefits .......................................38
Employment, Social Affairs and Inclusion The coverage rate of social benefits
February 2014 I 4
Abstract
There are a significant number of people on very low incomes in the EU despite a
social security system which is intended in most countries to prevent the income of
families from falling below an acceptable level. This Research Note first examines the
number of people involved across the EU, focusing on those with income below 60% of
the median, which is conventionally taken as the at-risk-of-poverty threshold in the
Union and trying to identify among this group those likely to be in need of income
support. It then explores the extent to which the people concerned are covered by
social benefits of the different types and how this varies according, in particular,
whether they are employed or not. A second part focuses specifically on
unemployment benefits, how far the unemployed are in receipt of payments according
to their previous employment characteristics and how far these might explain non-
coverage given the conditions applying to entitlement to benefits in the different
countries. Evidence on the extent of non-take-up of benefits is also examined.
Employment, Social Affairs and Inclusion The coverage rate of social benefits
February 2014 I 5
The coverage rate of social benefits
Introduction
This Research Note sets out to explore the extent to which those in need of income
support, the unemployed and others not in work in particular, are both entitled to
social benefits and in receipt of them as well as the adequacy of the benefits
concerned in the sense of providing an acceptable level of income. The economic and
financial crisis which has now affected most parts of Europe for the past 5 years or so
and which has seen unemployment rise to high levels in many countries and attempts
by governments to contain the upward pressure on social welfare expenditure has
given added importance to this issue.
The analysis focuses in particular on those of working age with income below 60% of
the median, which is the conventional indicator of those at risk of poverty. These are
not necessarily the people to whom social support is directed in EU Member States.
Even though minimum income schemes intended to prevent the income of households
from falling below a particular level operate to varying degrees in all countries, the
level in question is not typically the same as defined for the indicator and will tend to
take account of other resources available to the household in addition to their annual
income. While such resources, in the form especially of accumulated savings, are
difficult to identify from the data available, it is possible from the EU-SILC to
distinguish those households which appear to be materially deprived and which,
accordingly, can be assumed to have limited access to other sources of purchasing
power to supplement their income.
The central concern, therefore, is with those aged 18-59 with (equivalised household)
income below the at-risk-of-poverty threshold and who live in households identified as
being materially deprived according to the indicator of this1. It should be noted that
the age group is defined to exclude those below 18, most of whom are children or if
not in full-time education or initial vocational training, and those over 59, many of
whom are retired and in receipt of pensions. It should also be noted that although not
identified explicitly almost all children at risk of poverty are implicitly covered too
insofar as they have parents in the 20-59 age group. These are divided further to
distinguish those with income below 40% of the median and who with income closer to
the threshold at 40-60% of the median. The key issue examined is the relative
number of the two groups who are not in receipt of social benefits intended to provide
support to those with low income – or more precisely those who report not being in
receipt of such benefits – and who, accordingly, appear not to be assisted by the
social welfare system. The characteristics of the people in question are then
investigated, along with those who are in receipt of benefits but for whom the amount
received is not enough to raise their income above the two thresholds defined, the aim
being to try to identify why this is the case. There are four potential reasons:
a lack of coverage by design (i.e. individuals and households are excluded from
benefits because they fail to meet the eligibility conditions, even though they
may be in need of support),
the support provided fails to ensure that income is above 60% of the median or
even 40% of the median;
a failure on the part of households to claim the benefits they are entitled to;
1 The indicator is based on being ‘deprived’ in the sense of not being able to afford any three of 9 items, the items including three relating to financial strain and not being able to afford being defined to include those under financial strain as indicated by one or more of the items concerned.
Employment, Social Affairs and Inclusion The coverage rate of social benefits
February 2014 I 6
problems with the income data in the sense that they fail to reflect the true
amount of resources that households have available to spend
The last is a particular possibility in respect of the self-employed, whose income in the
EU-SILC is taken to be equivalent to their net trading income, which in many cases,
especially in respect of small businesses, is likely to understate the resources they
have access to. This is not only because of a tendency to under-report income,
especially if what is reported is based on tax returns but also because the trading
costs reported may well include some personal expenditure which for the non-self-
employed would be met from their net income.
While the data in the EU-SILC in themselves do not indicate directly which of the other
three possible reasons for the income falling below the thresholds identified are at
work, they at least enable the characteristics of the households concerned to be
distinguished which can then be checked against the regulations governing
entitlement to benefits and the level of these. Examining these data is, therefore, a
necessary first step to assessing the relative importance of these various reasons and,
accordingly, the nature and extent limitations of the social welfare system in place.
The Labour Force Survey (LFS) provides a further insight into the possible reasons for
income falling below the thresholds in respect of the unemployed. While it does not
include data on household income, it does include data on the unemployed in receipt
of benefits together with details of their previous employment. This, accordingly,
enables them to be distinguished in terms of the reasons why they left their job and
their professional status at the time, both of which can potentially affect their eligibility
for benefit.
The analysis begins with an examination of the scale of the problem, by identifying the
relative number of people of working age in each country with income below 60% of
the median and below 40% and the proportion of the total population with income
below these levels that they account for.
Scale of the problem of low income
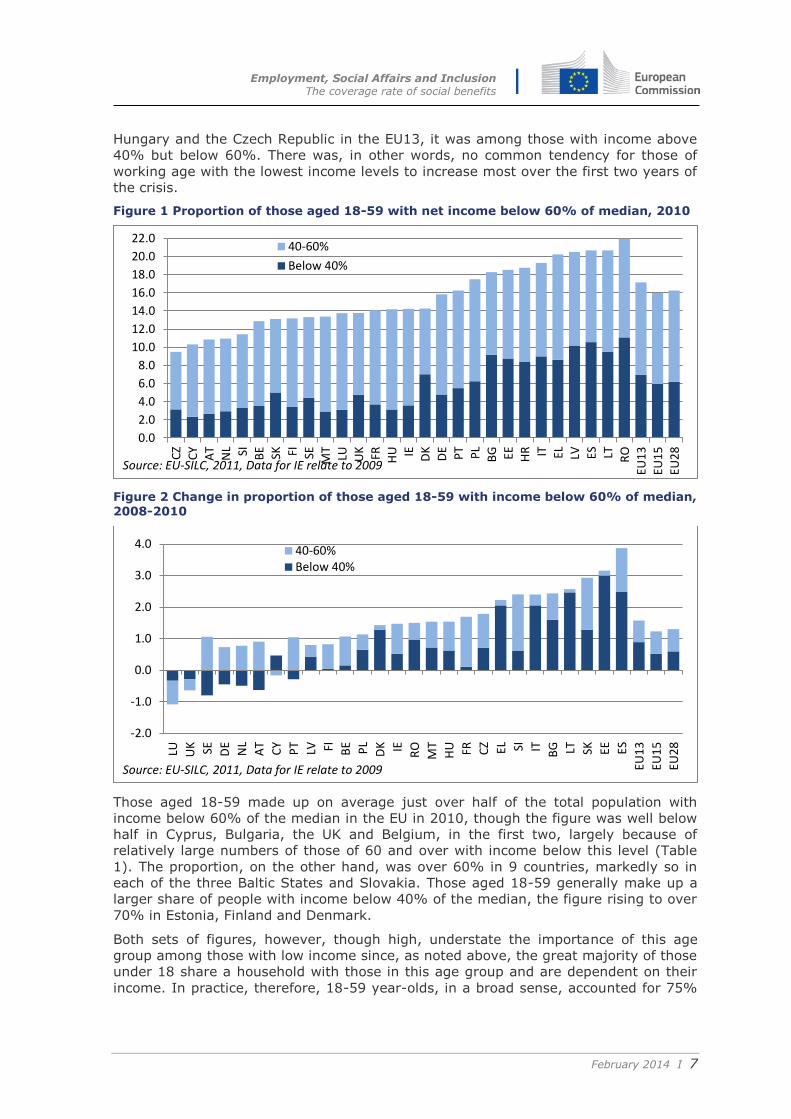
In 2010, just over 16% of people aged 18-59 had disposable income below 60% of
the median in the EU – slightly over 17% in the EU13 and 16% in the EU15 (Figure 1).
Of these, a little more than half had income below 40% of the median, the relative
split being much the same in the EU13 as the EU15.
The relative number of people in this age group with income below 60% of the
median, however, varied from 22% in Romania and over 20-21% in Greece, Spain,
Latvia and Lithuania to 10-11% in Cyprus, Austria and the Netherlands and less than
10% in the Czech Republic. The proportion with income below 40% of the median
varied even more widely, with most of those with income below 60% of the median
having income below 40% in most of the countries where the former was largest and
a minority in countries where it was lowest.
The proportion with income below 60% of the median increased between 2008 and
2010 - a period of economic recession - in all but two Member States, Luxembourg
and the UK, the size of the increase ranging from almost 4 percentage points in Spain
and around 3 percentage points in Slovakia and Estonia to under 0.5 of a percentage
point in Sweden, Germany, Austria and the Netherlands (Figure 2).
Whereas in the EU as a whole, the increase was fairly evenly divided between those
with income below 40% of the median and those with income between 40% and 60%
of the median, there were big differences across countries. In Spain, Italy, Greece and
Denmark in the EU15 and Estonia, Lithuania, Bulgaria and Romania in the EU13, the
increase was predominantly among those with income below 40%. In Sweden,
Germany, the Netherland, Finland and Belgium in the EU15 and Slovakia, Slovenia,
Employment, Social Affairs and Inclusion The coverage rate of social benefits
February 2014 I 7
Hungary and the Czech Republic in the EU13, it was among those with income above
40% but below 60%. There was, in other words, no common tendency for those of
working age with the lowest income levels to increase most over the first two years of
the crisis.
Figure 1 Proportion of those aged 18-59 with net income below 60% of median, 2010
Figure 2 Change in proportion of those aged 18-59 with income below 60% of median, 2008-2010
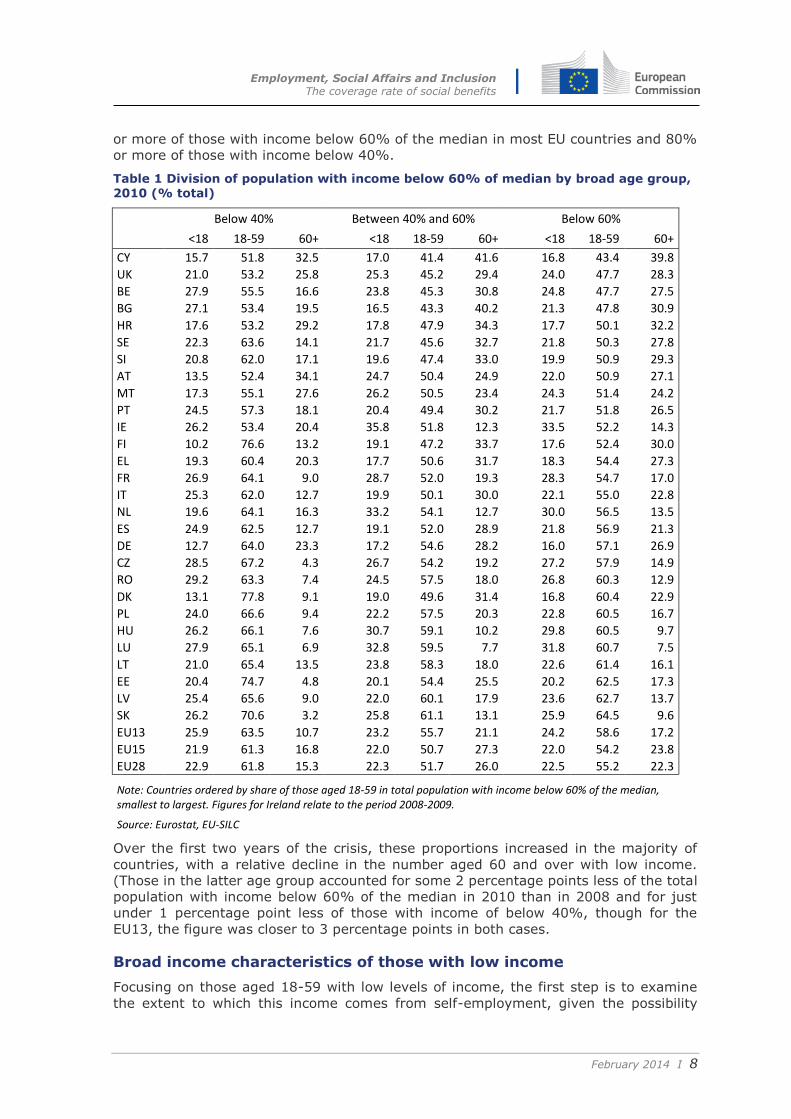
Those aged 18-59 made up on average just over half of the total population with
income below 60% of the median in the EU in 2010, though the figure was well below
half in Cyprus, Bulgaria, the UK and Belgium, in the first two, largely because of
relatively large numbers of those of 60 and over with income below this level (Table
1). The proportion, on the other hand, was over 60% in 9 countries, markedly so in
each of the three Baltic States and Slovakia. Those aged 18-59 generally make up a
larger share of people with income below 40% of the median, the figure rising to over
70% in Estonia, Finland and Denmark.
Both sets of figures, however, though high, understate the importance of this age
group among those with low income since, as noted above, the great majority of those
under 18 share a household with those in this age group and are dependent on their
income. In practice, therefore, 18-59 year-olds, in a broad sense, accounted for 75%
0.0
2.0
4.0
6.0
8.0
10.0
12.0
14.0
16.0
18.0
20.0
22.0
CZ
CY
AT
NL SI BE SK FI SE MT
LU UK FR HU IE DK
DE
PT PL
BG EE HR IT EL LV ES LT RO
EU1
3
EU1
5
EU2
8
40-60%
Below 40%
Source: EU-SILC, 2011, Data for IE relate to 2009
-2.0
-1.0
0.0
1.0
2.0
3.0
4.0
LU UK SE DE
NL
AT
CY
PT
LV FI BE PL
DK IE RO
MT
HU FR CZ EL SI IT BG LT SK EE ES
EU1
3
EU1
5
EU2
8
40-60%Below 40%
Source: EU-SILC, 2011, Data for IE relate to 2009
Employment, Social Affairs and Inclusion The coverage rate of social benefits
February 2014 I 8
or more of those with income below 60% of the median in most EU countries and 80%
or more of those with income below 40%.
Table 1 Division of population with income below 60% of median by broad age group, 2010 (% total)
Below 40% Between 40% and 60% Below 60%
<18 18-59 60+ <18 18-59 60+ <18 18-59 60+
CY 15.7 51.8 32.5 17.0 41.4 41.6 16.8 43.4 39.8
UK 21.0 53.2 25.8 25.3 45.2 29.4 24.0 47.7 28.3
BE 27.9 55.5 16.6 23.8 45.3 30.8 24.8 47.7 27.5
BG 27.1 53.4 19.5 16.5 43.3 40.2 21.3 47.8 30.9
HR 17.6 53.2 29.2 17.8 47.9 34.3 17.7 50.1 32.2
SE 22.3 63.6 14.1 21.7 45.6 32.7 21.8 50.3 27.8
SI 20.8 62.0 17.1 19.6 47.4 33.0 19.9 50.9 29.3
AT 13.5 52.4 34.1 24.7 50.4 24.9 22.0 50.9 27.1
MT 17.3 55.1 27.6 26.2 50.5 23.4 24.3 51.4 24.2
PT 24.5 57.3 18.1 20.4 49.4 30.2 21.7 51.8 26.5
IE 26.2 53.4 20.4 35.8 51.8 12.3 33.5 52.2 14.3
FI 10.2 76.6 13.2 19.1 47.2 33.7 17.6 52.4 30.0
EL 19.3 60.4 20.3 17.7 50.6 31.7 18.3 54.4 27.3
FR 26.9 64.1 9.0 28.7 52.0 19.3 28.3 54.7 17.0
IT 25.3 62.0 12.7 19.9 50.1 30.0 22.1 55.0 22.8
NL 19.6 64.1 16.3 33.2 54.1 12.7 30.0 56.5 13.5
ES 24.9 62.5 12.7 19.1 52.0 28.9 21.8 56.9 21.3
DE 12.7 64.0 23.3 17.2 54.6 28.2 16.0 57.1 26.9
CZ 28.5 67.2 4.3 26.7 54.2 19.2 27.2 57.9 14.9
RO 29.2 63.3 7.4 24.5 57.5 18.0 26.8 60.3 12.9
DK 13.1 77.8 9.1 19.0 49.6 31.4 16.8 60.4 22.9
PL 24.0 66.6 9.4 22.2 57.5 20.3 22.8 60.5 16.7
HU 26.2 66.1 7.6 30.7 59.1 10.2 29.8 60.5 9.7
LU 27.9 65.1 6.9 32.8 59.5 7.7 31.8 60.7 7.5
LT 21.0 65.4 13.5 23.8 58.3 18.0 22.6 61.4 16.1
EE 20.4 74.7 4.8 20.1 54.4 25.5 20.2 62.5 17.3
LV 25.4 65.6 9.0 22.0 60.1 17.9 23.6 62.7 13.7
SK 26.2 70.6 3.2 25.8 61.1 13.1 25.9 64.5 9.6
EU13 25.9 63.5 10.7 23.2 55.7 21.1 24.2 58.6 17.2
EU15 21.9 61.3 16.8 22.0 50.7 27.3 22.0 54.2 23.8
EU28 22.9 61.8 15.3 22.3 51.7 26.0 22.5 55.2 22.3
Note: Countries ordered by share of those aged 18-59 in total population with income below 60% of the median, smallest to largest. Figures for Ireland relate to the period 2008-2009.
Source: Eurostat, EU-SILC
Over the first two years of the crisis, these proportions increased in the majority of
countries, with a relative decline in the number aged 60 and over with low income.
(Those in the latter age group accounted for some 2 percentage points less of the total
population with income below 60% of the median in 2010 than in 2008 and for just
under 1 percentage point less of those with income of below 40%, though for the
EU13, the figure was closer to 3 percentage points in both cases.
Broad income characteristics of those with low income
Focusing on those aged 18-59 with low levels of income, the first step is to examine
the extent to which this income comes from self-employment, given the possibility
Employment, Social Affairs and Inclusion The coverage rate of social benefits
February 2014 I 9
that this understates their true income in terms of purchasing power and the standard
of living it can support. It is also relevant to consider the relative number of people
reporting negative levels of income, which can be the case either because they are
self-employed and make trading losses or because the taxes they pay exceed the
income for the year in question. Either way, the income reported is clearly not a
measure of their purchasing power. In the first case, trading costs may include a large
amount of personal expenditure and/or may follow many years of trading profits, in
the second case because high tax levels could denote a high level of income in the
preceding year, or years. Accordingly, the fact that household disposable income in
any year can be negative highlights the fact that annual income is not necessarily a
good measure of long-term income and the command over resources that households
enjoy.
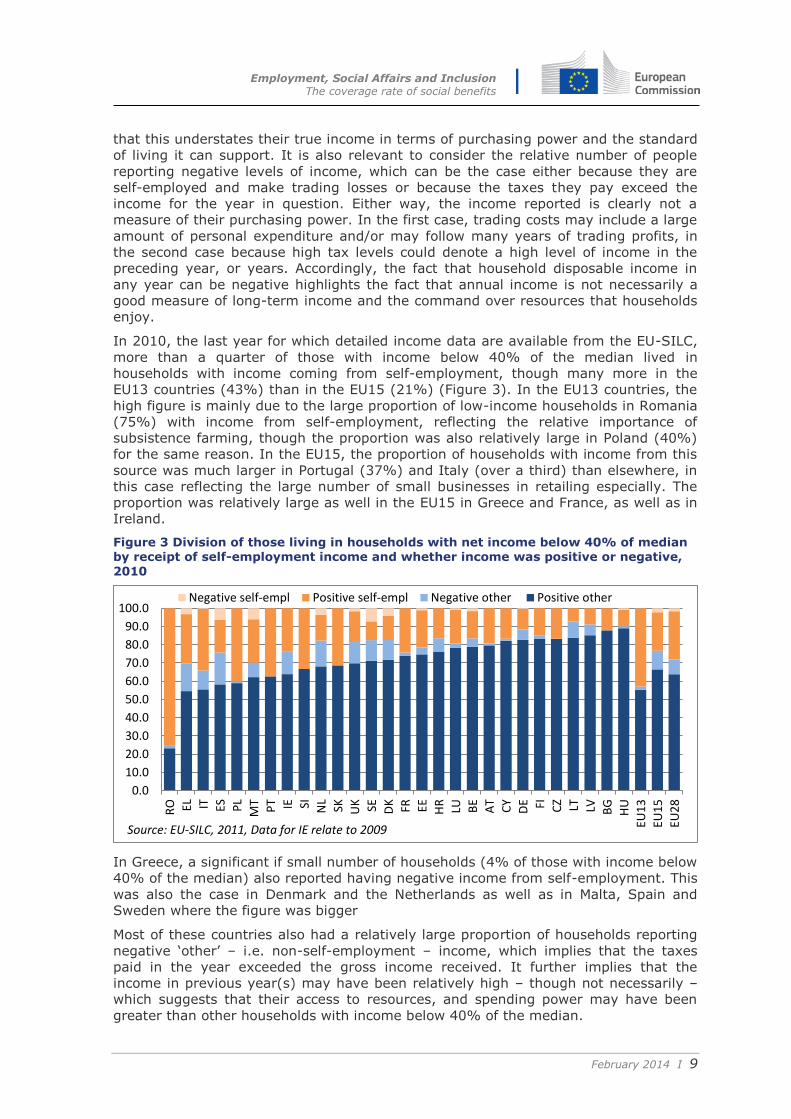
In 2010, the last year for which detailed income data are available from the EU-SILC,
more than a quarter of those with income below 40% of the median lived in
households with income coming from self-employment, though many more in the
EU13 countries (43%) than in the EU15 (21%) (Figure 3). In the EU13 countries, the
high figure is mainly due to the large proportion of low-income households in Romania
(75%) with income from self-employment, reflecting the relative importance of
subsistence farming, though the proportion was also relatively large in Poland (40%)
for the same reason. In the EU15, the proportion of households with income from this
source was much larger in Portugal (37%) and Italy (over a third) than elsewhere, in
this case reflecting the large number of small businesses in retailing especially. The
proportion was relatively large as well in the EU15 in Greece and France, as well as in
Ireland.
Figure 3 Division of those living in households with net income below 40% of median by receipt of self-employment income and whether income was positive or negative, 2010
In Greece, a significant if small number of households (4% of those with income below
40% of the median) also reported having negative income from self-employment. This
was also the case in Denmark and the Netherlands as well as in Malta, Spain and
Sweden where the figure was bigger
Most of these countries also had a relatively large proportion of households reporting
negative ‘other’ – i.e. non-self-employment – income, which implies that the taxes
paid in the year exceeded the gross income received. It further implies that the
income in previous year(s) may have been relatively high – though not necessarily –
which suggests that their access to resources, and spending power may have been
greater than other households with income below 40% of the median.
0.0
10.0
20.0
30.0
40.0
50.0
60.0
70.0
80.0
90.0
100.0
RO EL IT ES PL
MT
PT IE SI NL
SK UK SE DK FR EE HR
LU BE
AT
CY
DE FI CZ LT LV BG
HU
EU1
3
EU1
5
EU2
8
Negative self-empl Positive self-empl Negative other Positive other
Source: EU-SILC, 2011, Data for IE relate to 2009
Employment, Social Affairs and Inclusion The coverage rate of social benefits
February 2014 I 10
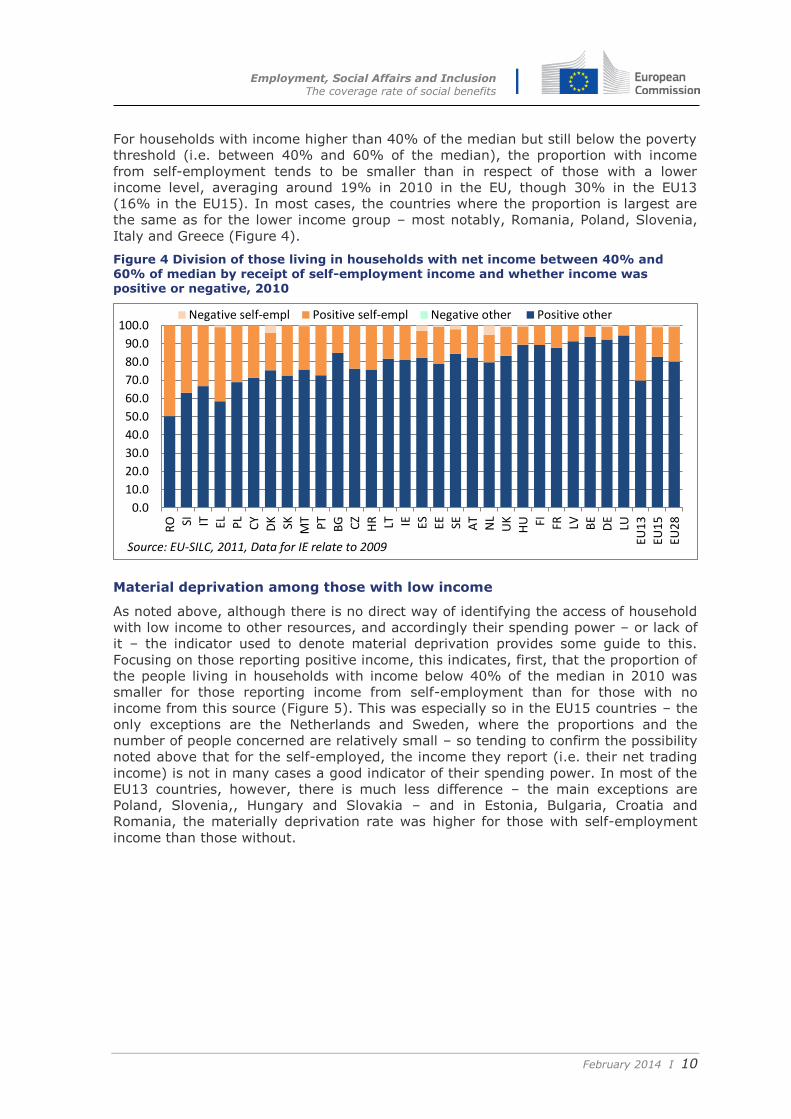
For households with income higher than 40% of the median but still below the poverty
threshold (i.e. between 40% and 60% of the median), the proportion with income
from self-employment tends to be smaller than in respect of those with a lower
income level, averaging around 19% in 2010 in the EU, though 30% in the EU13
(16% in the EU15). In most cases, the countries where the proportion is largest are
the same as for the lower income group – most notably, Romania, Poland, Slovenia,
Italy and Greece (Figure 4).
Figure 4 Division of those living in households with net income between 40% and 60% of median by receipt of self-employment income and whether income was positive or negative, 2010
Material deprivation among those with low income
As noted above, although there is no direct way of identifying the access of household
with low income to other resources, and accordingly their spending power – or lack of
it – the indicator used to denote material deprivation provides some guide to this.
Focusing on those reporting positive income, this indicates, first, that the proportion of
the people living in households with income below 40% of the median in 2010 was
smaller for those reporting income from self-employment than for those with no
income from this source (Figure 5). This was especially so in the EU15 countries – the
only exceptions are the Netherlands and Sweden, where the proportions and the
number of people concerned are relatively small – so tending to confirm the possibility
noted above that for the self-employed, the income they report (i.e. their net trading
income) is not in many cases a good indicator of their spending power. In most of the
EU13 countries, however, there is much less difference – the main exceptions are
Poland, Slovenia,, Hungary and Slovakia – and in Estonia, Bulgaria, Croatia and
Romania, the materially deprivation rate was higher for those with self-employment
income than those without.
0.0
10.0
20.0
30.0
40.0
50.0
60.0
70.0
80.0
90.0
100.0
RO SI IT EL PL
CY
DK SK MT
PT
BG CZ
HR LT IE ES EE SE AT
NL
UK
HU FI FR LV BE
DE
LU
EU1
3
EU1
5
EU2
8
Negative self-empl Positive self-empl Negative other Positive other
Source: EU-SILC, 2011, Data for IE relate to 2009
Employment, Social Affairs and Inclusion The coverage rate of social benefits
February 2014 I 11
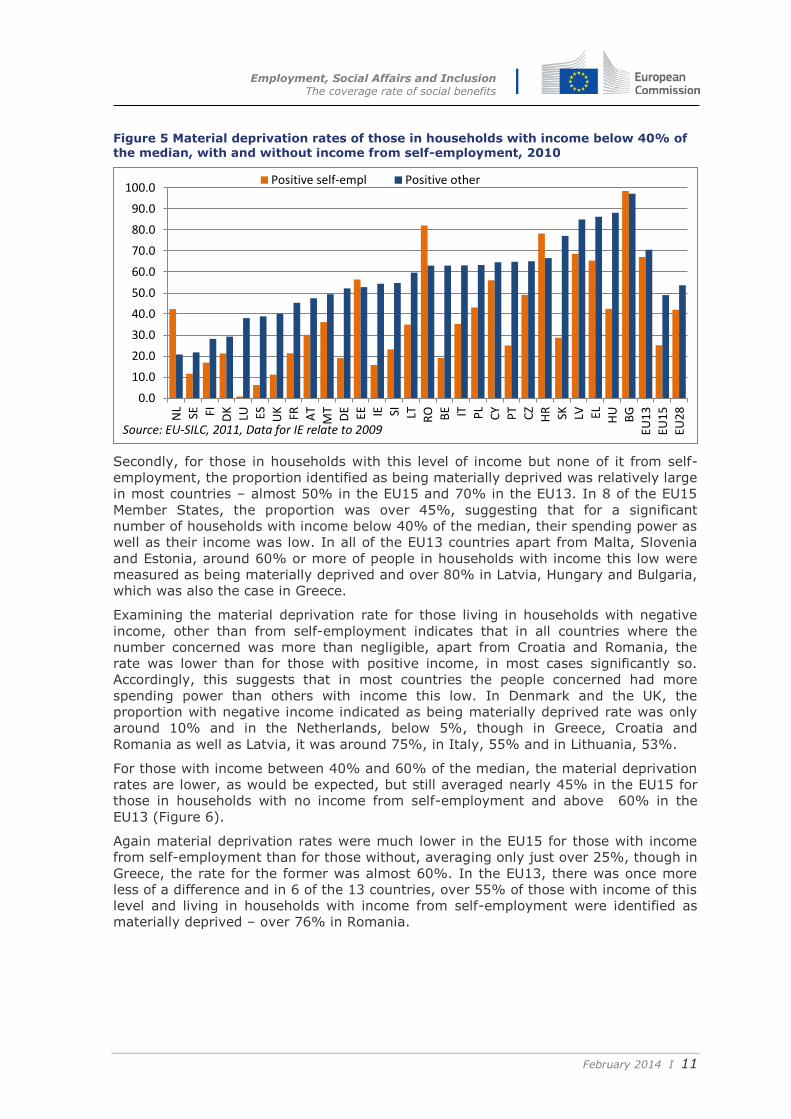
Figure 5 Material deprivation rates of those in households with income below 40% of the median, with and without income from self-employment, 2010
Secondly, for those in households with this level of income but none of it from self-
employment, the proportion identified as being materially deprived was relatively large
in most countries – almost 50% in the EU15 and 70% in the EU13. In 8 of the EU15
Member States, the proportion was over 45%, suggesting that for a significant
number of households with income below 40% of the median, their spending power as
well as their income was low. In all of the EU13 countries apart from Malta, Slovenia
and Estonia, around 60% or more of people in households with income this low were
measured as being materially deprived and over 80% in Latvia, Hungary and Bulgaria,
which was also the case in Greece.
Examining the material deprivation rate for those living in households with negative
income, other than from self-employment indicates that in all countries where the
number concerned was more than negligible, apart from Croatia and Romania, the
rate was lower than for those with positive income, in most cases significantly so.
Accordingly, this suggests that in most countries the people concerned had more
spending power than others with income this low. In Denmark and the UK, the
proportion with negative income indicated as being materially deprived rate was only
around 10% and in the Netherlands, below 5%, though in Greece, Croatia and
Romania as well as Latvia, it was around 75%, in Italy, 55% and in Lithuania, 53%.
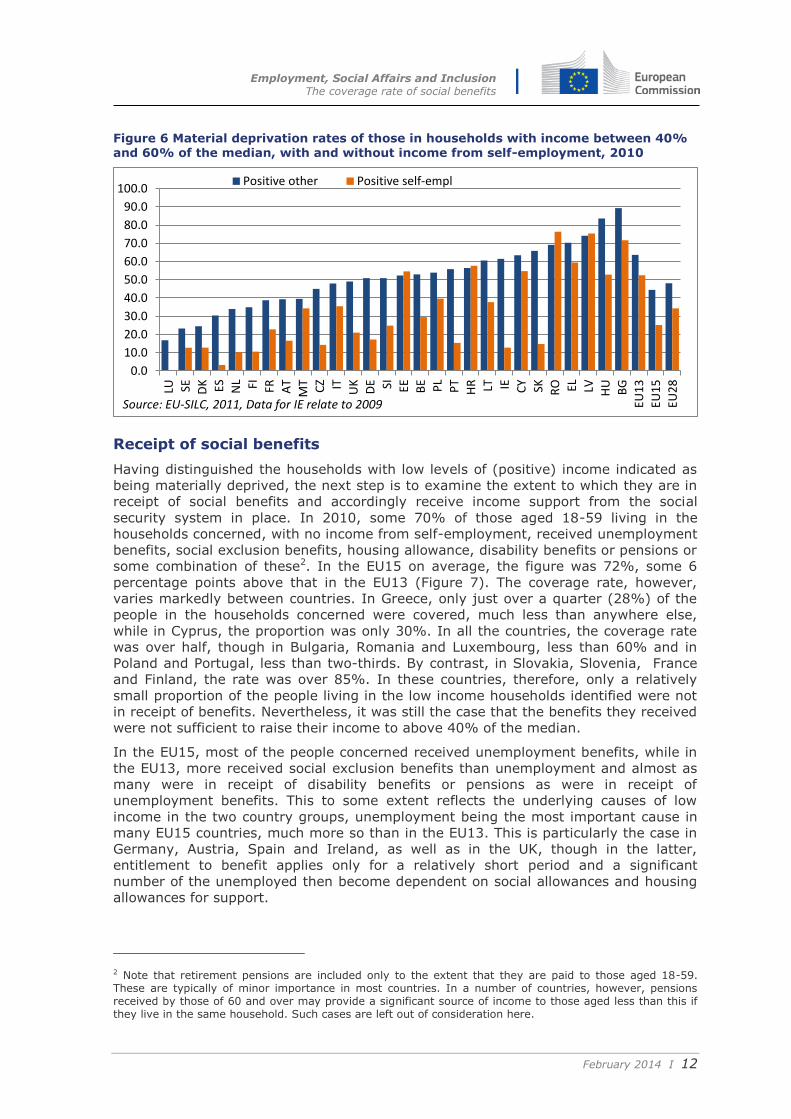
For those with income between 40% and 60% of the median, the material deprivation
rates are lower, as would be expected, but still averaged nearly 45% in the EU15 for
those in households with no income from self-employment and above 60% in the
EU13 (Figure 6).
Again material deprivation rates were much lower in the EU15 for those with income
from self-employment than for those without, averaging only just over 25%, though in
Greece, the rate for the former was almost 60%. In the EU13, there was once more
less of a difference and in 6 of the 13 countries, over 55% of those with income of this
level and living in households with income from self-employment were identified as
materially deprived – over 76% in Romania.
0.0
10.0
20.0
30.0
40.0
50.0
60.0
70.0
80.0
90.0
100.0N
L
SE FI DK
LU ES UK FR AT
MT
DE EE IE SI LT RO BE IT PL
CY
PT
CZ
HR SK LV EL HU
BG
EU1
3
EU1
5
EU2
8
Positive self-empl Positive other
Source: EU-SILC, 2011, Data for IE relate to 2009
Employment, Social Affairs and Inclusion The coverage rate of social benefits
February 2014 I 12
Figure 6 Material deprivation rates of those in households with income between 40% and 60% of the median, with and without income from self-employment, 2010
Receipt of social benefits
Having distinguished the households with low levels of (positive) income indicated as
being materially deprived, the next step is to examine the extent to which they are in
receipt of social benefits and accordingly receive income support from the social
security system in place. In 2010, some 70% of those aged 18-59 living in the
households concerned, with no income from self-employment, received unemployment
benefits, social exclusion benefits, housing allowance, disability benefits or pensions or
some combination of these2. In the EU15 on average, the figure was 72%, some 6
percentage points above that in the EU13 (Figure 7). The coverage rate, however,
varies markedly between countries. In Greece, only just over a quarter (28%) of the
people in the households concerned were covered, much less than anywhere else,
while in Cyprus, the proportion was only 30%. In all the countries, the coverage rate
was over half, though in Bulgaria, Romania and Luxembourg, less than 60% and in
Poland and Portugal, less than two-thirds. By contrast, in Slovakia, Slovenia, France
and Finland, the rate was over 85%. In these countries, therefore, only a relatively
small proportion of the people living in the low income households identified were not
in receipt of benefits. Nevertheless, it was still the case that the benefits they received
were not sufficient to raise their income to above 40% of the median.
In the EU15, most of the people concerned received unemployment benefits, while in
the EU13, more received social exclusion benefits than unemployment and almost as
many were in receipt of disability benefits or pensions as were in receipt of
unemployment benefits. This to some extent reflects the underlying causes of low
income in the two country groups, unemployment being the most important cause in
many EU15 countries, much more so than in the EU13. This is particularly the case in
Germany, Austria, Spain and Ireland, as well as in the UK, though in the latter,
entitlement to benefit applies only for a relatively short period and a significant
number of the unemployed then become dependent on social allowances and housing
allowances for support.
2 Note that retirement pensions are included only to the extent that they are paid to those aged 18-59. These are typically of minor importance in most countries. In a number of countries, however, pensions received by those of 60 and over may provide a significant source of income to those aged less than this if they live in the same household. Such cases are left out of consideration here.
0.0
10.0
20.0
30.0
40.0
50.0
60.0
70.0
80.0
90.0
100.0
LU SE DK ES NL FI FR AT
MT
CZ IT UK
DE SI EE BE PL
PT
HR LT IE CY SK RO EL LV HU
BG
EU1
3
EU1
5
EU2
8
Positive other Positive self-empl
Source: EU-SILC, 2011, Data for IE relate to 2009
Employment, Social Affairs and Inclusion The coverage rate of social benefits
February 2014 I 13
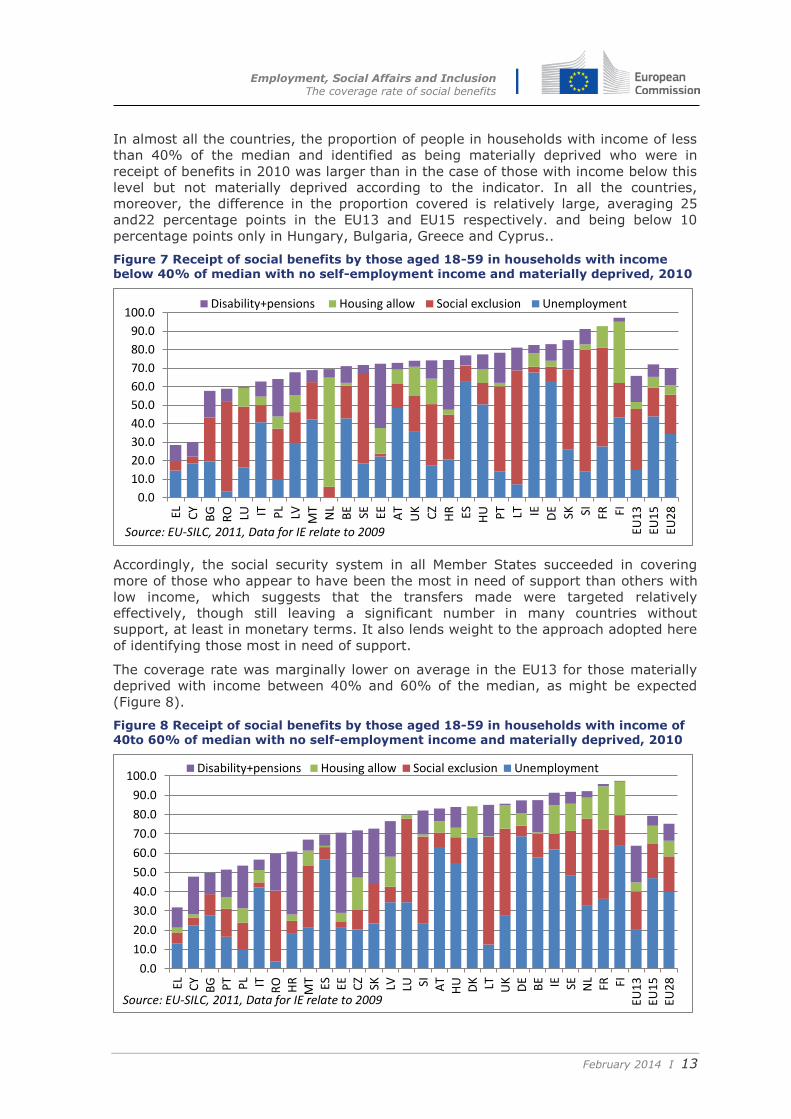
In almost all the countries, the proportion of people in households with income of less
than 40% of the median and identified as being materially deprived who were in
receipt of benefits in 2010 was larger than in the case of those with income below this
level but not materially deprived according to the indicator. In all the countries,
moreover, the difference in the proportion covered is relatively large, averaging 25
and22 percentage points in the EU13 and EU15 respectively. and being below 10
percentage points only in Hungary, Bulgaria, Greece and Cyprus..
Figure 7 Receipt of social benefits by those aged 18-59 in households with income below 40% of median with no self-employment income and materially deprived, 2010
Accordingly, the social security system in all Member States succeeded in covering
more of those who appear to have been the most in need of support than others with
low income, which suggests that the transfers made were targeted relatively
effectively, though still leaving a significant number in many countries without
support, at least in monetary terms. It also lends weight to the approach adopted here
of identifying those most in need of support.
The coverage rate was marginally lower on average in the EU13 for those materially
deprived with income between 40% and 60% of the median, as might be expected
(Figure 8).
Figure 8 Receipt of social benefits by those aged 18-59 in households with income of 40to 60% of median with no self-employment income and materially deprived, 2010
0.0
10.0
20.0
30.0
40.0
50.0
60.0
70.0
80.0
90.0
100.0
EL CY
BG
RO LU IT PL
LV MT
NL
BE SE EE AT
UK CZ
HR ES HU PT LT IE DE SK SI FR FI
EU1
3
EU1
5
EU2
8
Disability+pensions Housing allow Social exclusion Unemployment
Source: EU-SILC, 2011, Data for IE relate to 2009
0.0
10.0
20.0
30.0
40.0
50.0
60.0
70.0
80.0
90.0
100.0
EL CY
BG PT PL IT R
OH
RM
T ES EE CZ
SK LV LU SI AT
HU DK LT UK
DE
BE IE SE NL
FR FIEU
13
EU1
5EU
28
Disability+pensions Housing allow Social exclusion Unemployment
Source: EU-SILC, 2011, Data for IE relate to 2009
Employment, Social Affairs and Inclusion The coverage rate of social benefits
February 2014 I 14
In the EU15, however, the rate was slightly higher and this was the case in 11 of the
15 countries, including the UK, the Netherlands, Austria, Sweden and Greece.
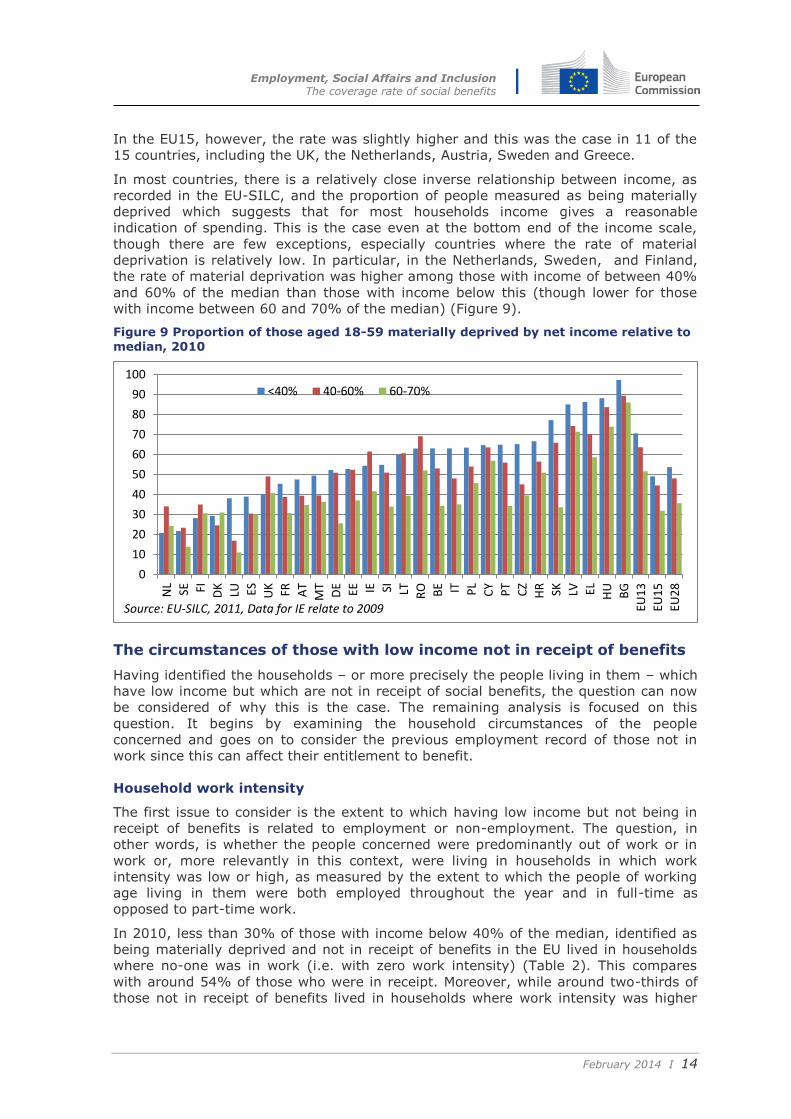
In most countries, there is a relatively close inverse relationship between income, as
recorded in the EU-SILC, and the proportion of people measured as being materially
deprived which suggests that for most households income gives a reasonable
indication of spending. This is the case even at the bottom end of the income scale,
though there are few exceptions, especially countries where the rate of material
deprivation is relatively low. In particular, in the Netherlands, Sweden, and Finland,
the rate of material deprivation was higher among those with income of between 40%
and 60% of the median than those with income below this (though lower for those
with income between 60 and 70% of the median) (Figure 9).
Figure 9 Proportion of those aged 18-59 materially deprived by net income relative to median, 2010
The circumstances of those with low income not in receipt of benefits
Having identified the households – or more precisely the people living in them – which
have low income but which are not in receipt of social benefits, the question can now
be considered of why this is the case. The remaining analysis is focused on this
question. It begins by examining the household circumstances of the people
concerned and goes on to consider the previous employment record of those not in
work since this can affect their entitlement to benefit.
Household work intensity
The first issue to consider is the extent to which having low income but not being in
receipt of benefits is related to employment or non-employment. The question, in
other words, is whether the people concerned were predominantly out of work or in
work or, more relevantly in this context, were living in households in which work
intensity was low or high, as measured by the extent to which the people of working
age living in them were both employed throughout the year and in full-time as
opposed to part-time work.
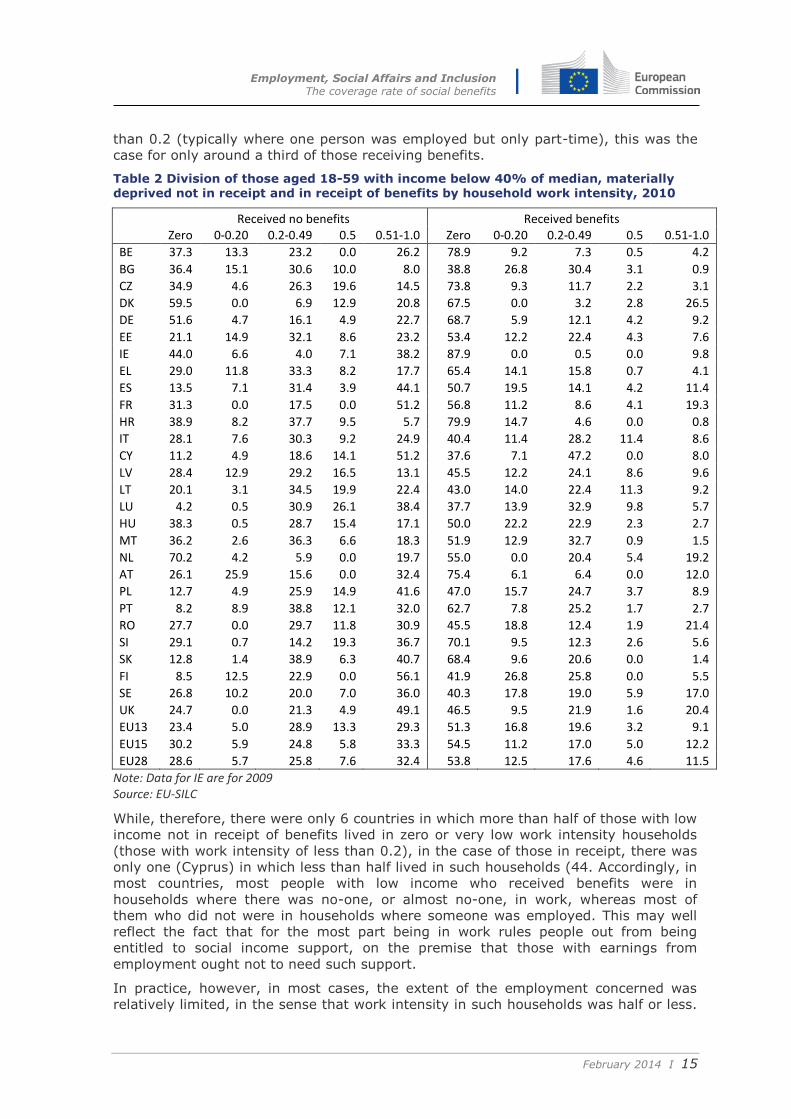
In 2010, less than 30% of those with income below 40% of the median, identified as
being materially deprived and not in receipt of benefits in the EU lived in households
where no-one was in work (i.e. with zero work intensity) (Table 2). This compares
with around 54% of those who were in receipt. Moreover, while around two-thirds of
those not in receipt of benefits lived in households where work intensity was higher
0
10
20
30
40
50
60
70
80
90
100
NL
SE FI DK
LU ES UK FR AT
MT
DE EE IE SI LT RO BE IT PL
CY
PT
CZ
HR SK LV EL HU
BG
EU1
3
EU1
5
EU2
8
<40% 40-60% 60-70%
Source: EU-SILC, 2011, Data for IE relate to 2009
Employment, Social Affairs and Inclusion The coverage rate of social benefits
February 2014 I 15
than 0.2 (typically where one person was employed but only part-time), this was the
case for only around a third of those receiving benefits.
Table 2 Division of those aged 18-59 with income below 40% of median, materially deprived not in receipt and in receipt of benefits by household work intensity, 2010
Received no benefits Received benefits Zero 0-0.20 0.2-0.49 0.5 0.51-1.0 Zero 0-0.20 0.2-0.49 0.5 0.51-1.0
BE 37.3 13.3 23.2 0.0 26.2 78.9 9.2 7.3 0.5 4.2
BG 36.4 15.1 30.6 10.0 8.0 38.8 26.8 30.4 3.1 0.9
CZ 34.9 4.6 26.3 19.6 14.5 73.8 9.3 11.7 2.2 3.1
DK 59.5 0.0 6.9 12.9 20.8 67.5 0.0 3.2 2.8 26.5
DE 51.6 4.7 16.1 4.9 22.7 68.7 5.9 12.1 4.2 9.2
EE 21.1 14.9 32.1 8.6 23.2 53.4 12.2 22.4 4.3 7.6
IE 44.0 6.6 4.0 7.1 38.2 87.9 0.0 0.5 0.0 9.8
EL 29.0 11.8 33.3 8.2 17.7 65.4 14.1 15.8 0.7 4.1
ES 13.5 7.1 31.4 3.9 44.1 50.7 19.5 14.1 4.2 11.4
FR 31.3 0.0 17.5 0.0 51.2 56.8 11.2 8.6 4.1 19.3
HR 38.9 8.2 37.7 9.5 5.7 79.9 14.7 4.6 0.0 0.8
IT 28.1 7.6 30.3 9.2 24.9 40.4 11.4 28.2 11.4 8.6
CY 11.2 4.9 18.6 14.1 51.2 37.6 7.1 47.2 0.0 8.0
LV 28.4 12.9 29.2 16.5 13.1 45.5 12.2 24.1 8.6 9.6
LT 20.1 3.1 34.5 19.9 22.4 43.0 14.0 22.4 11.3 9.2
LU 4.2 0.5 30.9 26.1 38.4 37.7 13.9 32.9 9.8 5.7
HU 38.3 0.5 28.7 15.4 17.1 50.0 22.2 22.9 2.3 2.7
MT 36.2 2.6 36.3 6.6 18.3 51.9 12.9 32.7 0.9 1.5
NL 70.2 4.2 5.9 0.0 19.7 55.0 0.0 20.4 5.4 19.2
AT 26.1 25.9 15.6 0.0 32.4 75.4 6.1 6.4 0.0 12.0
PL 12.7 4.9 25.9 14.9 41.6 47.0 15.7 24.7 3.7 8.9
PT 8.2 8.9 38.8 12.1 32.0 62.7 7.8 25.2 1.7 2.7
RO 27.7 0.0 29.7 11.8 30.9 45.5 18.8 12.4 1.9 21.4
SI 29.1 0.7 14.2 19.3 36.7 70.1 9.5 12.3 2.6 5.6
SK 12.8 1.4 38.9 6.3 40.7 68.4 9.6 20.6 0.0 1.4
FI 8.5 12.5 22.9 0.0 56.1 41.9 26.8 25.8 0.0 5.5
SE 26.8 10.2 20.0 7.0 36.0 40.3 17.8 19.0 5.9 17.0
UK 24.7 0.0 21.3 4.9 49.1 46.5 9.5 21.9 1.6 20.4
EU13 23.4 5.0 28.9 13.3 29.3 51.3 16.8 19.6 3.2 9.1
EU15 30.2 5.9 24.8 5.8 33.3 54.5 11.2 17.0 5.0 12.2
EU28 28.6 5.7 25.8 7.6 32.4 53.8 12.5 17.6 4.6 11.5
Note: Data for IE are for 2009 Source: EU-SILC
While, therefore, there were only 6 countries in which more than half of those with low
income not in receipt of benefits lived in zero or very low work intensity households
(those with work intensity of less than 0.2), in the case of those in receipt, there was
only one (Cyprus) in which less than half lived in such households (44. Accordingly, in
most countries, most people with low income who received benefits were in
households where there was no-one, or almost no-one, in work, whereas most of
them who did not were in households where someone was employed. This may well
reflect the fact that for the most part being in work rules people out from being
entitled to social income support, on the premise that those with earnings from
employment ought not to need such support.
In practice, however, in most cases, the extent of the employment concerned was
relatively limited, in the sense that work intensity in such households was half or less.
Employment, Social Affairs and Inclusion The coverage rate of social benefits
February 2014 I 16
Less than a third of those with income of less than 40% of the median not receiving
benefits in the EU were, therefore, in households where work intensity was more than
a half and only three (Denmark, Cyprus and Finland) where it was more than 50%
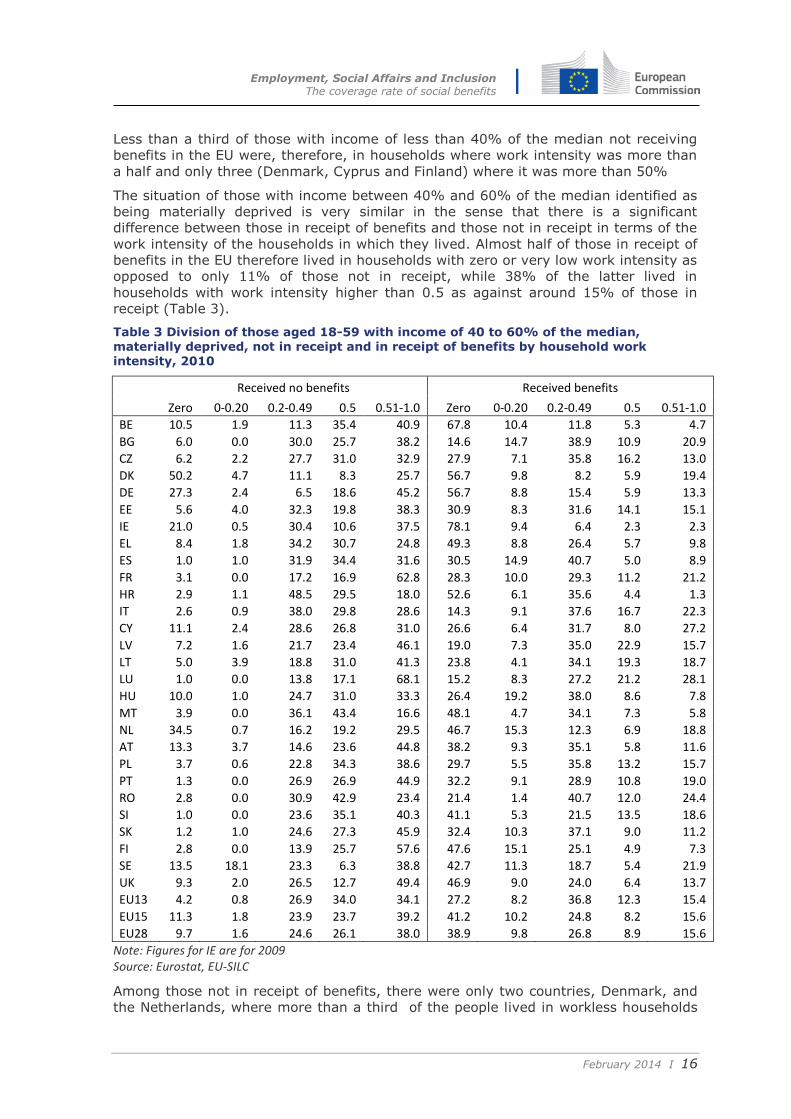
The situation of those with income between 40% and 60% of the median identified as
being materially deprived is very similar in the sense that there is a significant
difference between those in receipt of benefits and those not in receipt in terms of the
work intensity of the households in which they lived. Almost half of those in receipt of
benefits in the EU therefore lived in households with zero or very low work intensity as
opposed to only 11% of those not in receipt, while 38% of the latter lived in
households with work intensity higher than 0.5 as against around 15% of those in
receipt (Table 3).
Table 3 Division of those aged 18-59 with income of 40 to 60% of the median, materially deprived, not in receipt and in receipt of benefits by household work intensity, 2010
Received no benefits Received benefits
Zero 0-0.20 0.2-0.49 0.5 0.51-1.0 Zero 0-0.20 0.2-0.49 0.5 0.51-1.0
BE 10.5 1.9 11.3 35.4 40.9 67.8 10.4 11.8 5.3 4.7
BG 6.0 0.0 30.0 25.7 38.2 14.6 14.7 38.9 10.9 20.9
CZ 6.2 2.2 27.7 31.0 32.9 27.9 7.1 35.8 16.2 13.0
DK 50.2 4.7 11.1 8.3 25.7 56.7 9.8 8.2 5.9 19.4
DE 27.3 2.4 6.5 18.6 45.2 56.7 8.8 15.4 5.9 13.3
EE 5.6 4.0 32.3 19.8 38.3 30.9 8.3 31.6 14.1 15.1
IE 21.0 0.5 30.4 10.6 37.5 78.1 9.4 6.4 2.3 2.3
EL 8.4 1.8 34.2 30.7 24.8 49.3 8.8 26.4 5.7 9.8
ES 1.0 1.0 31.9 34.4 31.6 30.5 14.9 40.7 5.0 8.9
FR 3.1 0.0 17.2 16.9 62.8 28.3 10.0 29.3 11.2 21.2
HR 2.9 1.1 48.5 29.5 18.0 52.6 6.1 35.6 4.4 1.3
IT 2.6 0.9 38.0 29.8 28.6 14.3 9.1 37.6 16.7 22.3
CY 11.1 2.4 28.6 26.8 31.0 26.6 6.4 31.7 8.0 27.2
LV 7.2 1.6 21.7 23.4 46.1 19.0 7.3 35.0 22.9 15.7
LT 5.0 3.9 18.8 31.0 41.3 23.8 4.1 34.1 19.3 18.7
LU 1.0 0.0 13.8 17.1 68.1 15.2 8.3 27.2 21.2 28.1
HU 10.0 1.0 24.7 31.0 33.3 26.4 19.2 38.0 8.6 7.8
MT 3.9 0.0 36.1 43.4 16.6 48.1 4.7 34.1 7.3 5.8
NL 34.5 0.7 16.2 19.2 29.5 46.7 15.3 12.3 6.9 18.8
AT 13.3 3.7 14.6 23.6 44.8 38.2 9.3 35.1 5.8 11.6
PL 3.7 0.6 22.8 34.3 38.6 29.7 5.5 35.8 13.2 15.7
PT 1.3 0.0 26.9 26.9 44.9 32.2 9.1 28.9 10.8 19.0
RO 2.8 0.0 30.9 42.9 23.4 21.4 1.4 40.7 12.0 24.4
SI 1.0 0.0 23.6 35.1 40.3 41.1 5.3 21.5 13.5 18.6
SK 1.2 1.0 24.6 27.3 45.9 32.4 10.3 37.1 9.0 11.2
FI 2.8 0.0 13.9 25.7 57.6 47.6 15.1 25.1 4.9 7.3
SE 13.5 18.1 23.3 6.3 38.8 42.7 11.3 18.7 5.4 21.9
UK 9.3 2.0 26.5 12.7 49.4 46.9 9.0 24.0 6.4 13.7
EU13 4.2 0.8 26.9 34.0 34.1 27.2 8.2 36.8 12.3 15.4
EU15 11.3 1.8 23.9 23.7 39.2 41.2 10.2 24.8 8.2 15.6
EU28 9.7 1.6 24.6 26.1 38.0 38.9 9.8 26.8 8.9 15.6
Note: Figures for IE are for 2009 Source: Eurostat, EU-SILC
Among those not in receipt of benefits, there were only two countries, Denmark, and
the Netherlands, where more than a third of the people lived in workless households
Employment, Social Affairs and Inclusion The coverage rate of social benefits
February 2014 I 17
or those where work intensity was very low (i.e. 0.2 or less), and only another three
(Germany, Ireland and Sweden) where the proportion was over 20%.
Moreover, there were only two EU15 countries, France and Italy, where less than 40%
of those receiving benefits lived in households with zero or low work intensity and in
most, it was well over half. In the EU13, although there were more countries in which
most of those receiving benefits lived in households with work intensity this low, in all
cases, the proportion was less than in the case of those not in receipt of benefits..
The general conclusion that households with low income are more likely to receive
benefits if there is no-one in the household in employment is confirmed by a separate
analysis of the situation of jobless households among those with the lowest income
levels (see Annex 1). This shows that in most countries a large majority of people
living in households of this type were in receipt of benefits in 2010.
There is little sign of any systematic tendency for households in receipt of benefit and
those not in receipt to differ in terms of their composition, i.e. the extent to which
they are single person households as opposed to couple households or households
with children as opposed to those without.
Distribution of social benefits by income decile
The fact that social welfare systems fail to cover all those who seem to be in need of
support and to leave many of those that are covered with very low levels of income
might be a consequence of either an inadequate amount of funding allocated to social
security or the available funds being inadequately targeted on those who seem to be
most in need. In considering this issue, there is a need to distinguish social insurance
benefits which are largely funded by social contributions and which are intended to
enable individuals to build up entitlement to income support in the event of them not
being able to work from those which are specially aimed at providing support to those
in need, irrespective of their contributions’ or employment record. Receipt of the
former type of benefit would not necessarily be expected to vary inversely with
income, except in the sense that people not working are likely to have a relatively low
level of income, whereas the latter type would be expected to be concentrated on
those with low levels of income. To investigate how far this is the case in practice it
not so easy from the EU-SILC data in that benefits are not divided in this way but by
function, as examined above. Nor is the information available to identify the specific
benefits which are included in unemployment benefits or social exclusion benefits. It is
assumed here that the former are predominantly social insurance-type benefits and
the latter are social welfare-type, consisting in particular of various minimum income
schemes or social assistance measures, but there is no certainty about this.
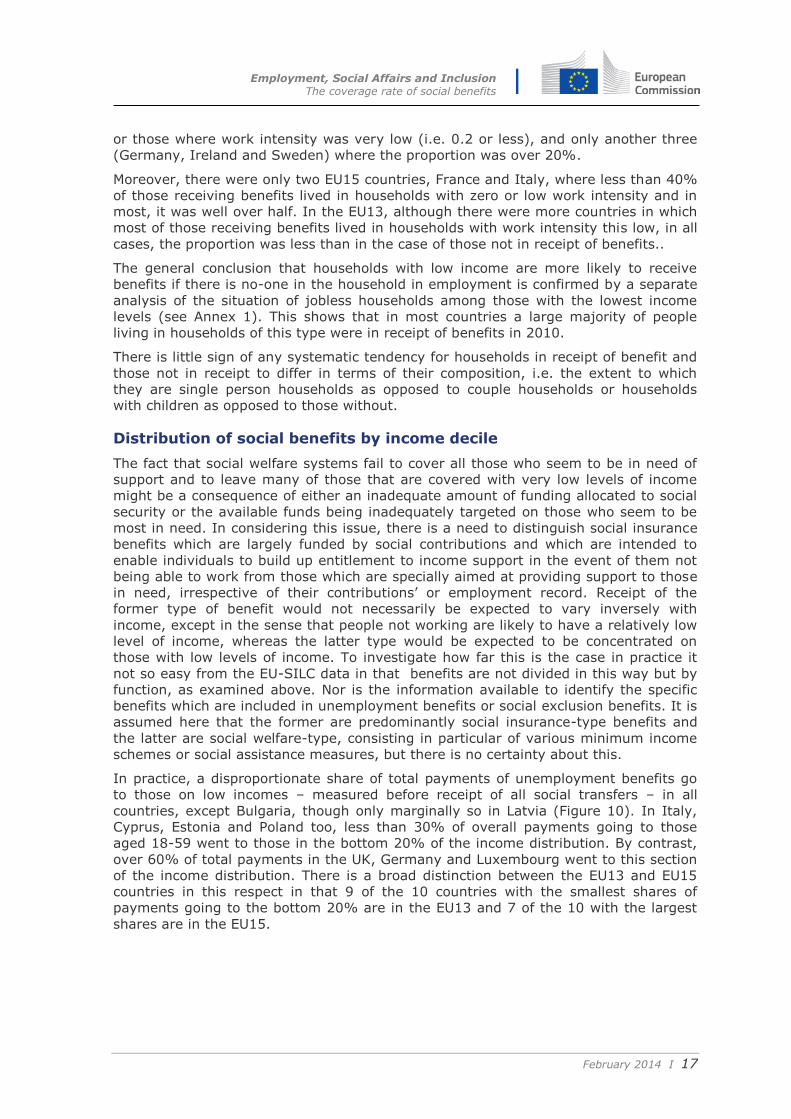
In practice, a disproportionate share of total payments of unemployment benefits go
to those on low incomes – measured before receipt of all social transfers – in all
countries, except Bulgaria, though only marginally so in Latvia (Figure 10). In Italy,
Cyprus, Estonia and Poland too, less than 30% of overall payments going to those
aged 18-59 went to those in the bottom 20% of the income distribution. By contrast,
over 60% of total payments in the UK, Germany and Luxembourg went to this section
of the income distribution. There is a broad distinction between the EU13 and EU15
countries in this respect in that 9 of the 10 countries with the smallest shares of
payments going to the bottom 20% are in the EU13 and 7 of the 10 with the largest
shares are in the EU15.
Employment, Social Affairs and Inclusion The coverage rate of social benefits
February 2014 I 18
Figure 10 Proportion (%) of unemployment benefits going to bottom 20% of the distribution of income among those aged 18-59, 2010
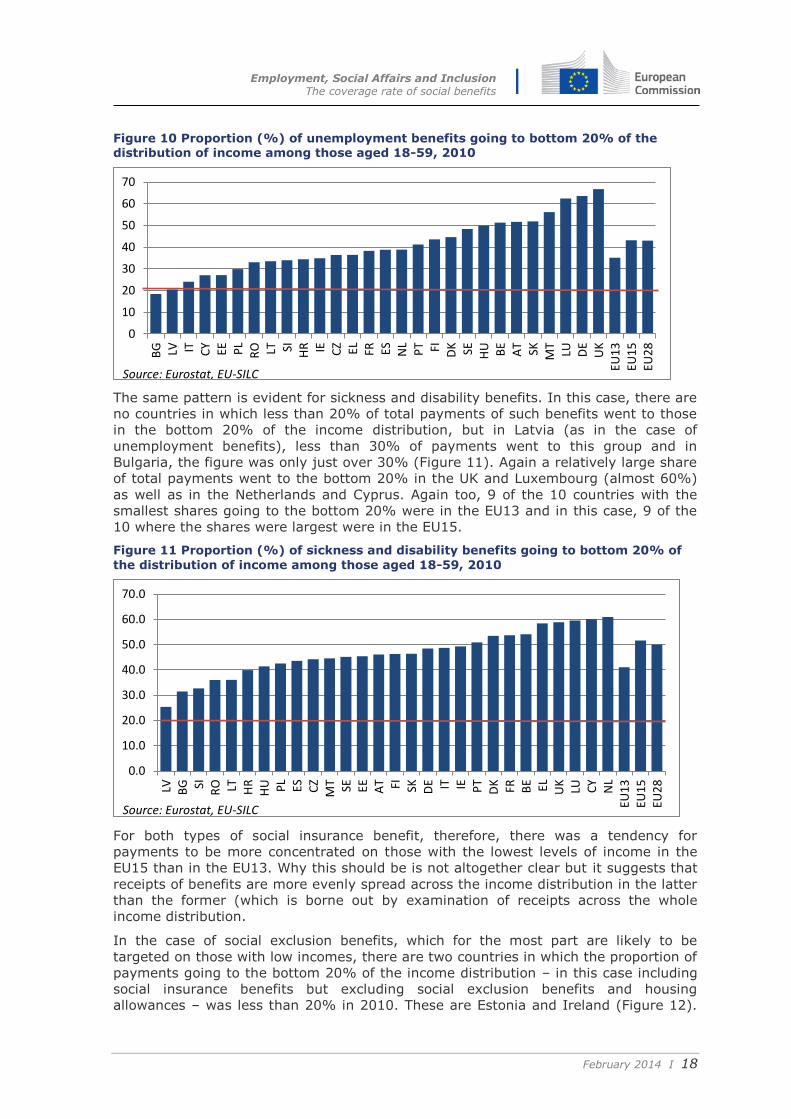
The same pattern is evident for sickness and disability benefits. In this case, there are
no countries in which less than 20% of total payments of such benefits went to those
in the bottom 20% of the income distribution, but in Latvia (as in the case of
unemployment benefits), less than 30% of payments went to this group and in
Bulgaria, the figure was only just over 30% (Figure 11). Again a relatively large share
of total payments went to the bottom 20% in the UK and Luxembourg (almost 60%)
as well as in the Netherlands and Cyprus. Again too, 9 of the 10 countries with the
smallest shares going to the bottom 20% were in the EU13 and in this case, 9 of the
10 where the shares were largest were in the EU15.
Figure 11 Proportion (%) of sickness and disability benefits going to bottom 20% of
the distribution of income among those aged 18-59, 2010
For both types of social insurance benefit, therefore, there was a tendency for
payments to be more concentrated on those with the lowest levels of income in the
EU15 than in the EU13. Why this should be is not altogether clear but it suggests that
receipts of benefits are more evenly spread across the income distribution in the latter
than the former (which is borne out by examination of receipts across the whole
income distribution.
In the case of social exclusion benefits, which for the most part are likely to be
targeted on those with low incomes, there are two countries in which the proportion of
payments going to the bottom 20% of the income distribution – in this case including
social insurance benefits but excluding social exclusion benefits and housing
allowances – was less than 20% in 2010. These are Estonia and Ireland (Figure 12).
0
10
20
30
40
50
60
70
BG LV IT CY EE PL
RO LT SI HR IE CZ EL FR ES NL
PT FI DK SE HU BE
AT SK MT
LU DE
UK
EU1
3EU
15
EU2
8
Source: Eurostat, EU-SILC
0.0
10.0
20.0
30.0
40.0
50.0
60.0
70.0
LV BG SI RO LT HR
HU PL
ES CZ
MT SE EE AT FI SK DE IT IE PT
DK FR BE EL UK
LU CY
NL
EU1
3EU
15
EU2
8
Source: Eurostat, EU-SILC
Employment, Social Affairs and Inclusion The coverage rate of social benefits
February 2014 I 19
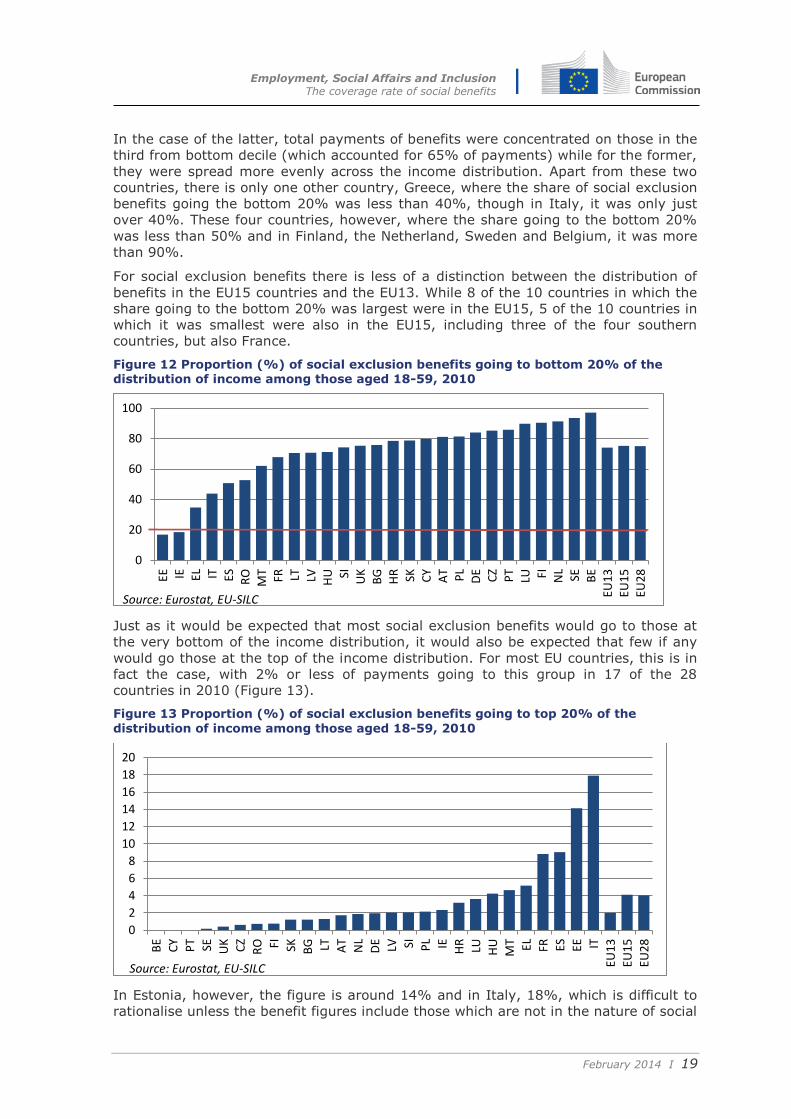
In the case of the latter, total payments of benefits were concentrated on those in the
third from bottom decile (which accounted for 65% of payments) while for the former,
they were spread more evenly across the income distribution. Apart from these two
countries, there is only one other country, Greece, where the share of social exclusion
benefits going the bottom 20% was less than 40%, though in Italy, it was only just
over 40%. These four countries, however, where the share going to the bottom 20%
was less than 50% and in Finland, the Netherland, Sweden and Belgium, it was more
than 90%.
For social exclusion benefits there is less of a distinction between the distribution of
benefits in the EU15 countries and the EU13. While 8 of the 10 countries in which the
share going to the bottom 20% was largest were in the EU15, 5 of the 10 countries in
which it was smallest were also in the EU15, including three of the four southern
countries, but also France.
Figure 12 Proportion (%) of social exclusion benefits going to bottom 20% of the distribution of income among those aged 18-59, 2010
Just as it would be expected that most social exclusion benefits would go to those at
the very bottom of the income distribution, it would also be expected that few if any
would go those at the top of the income distribution. For most EU countries, this is in
fact the case, with 2% or less of payments going to this group in 17 of the 28
countries in 2010 (Figure 13).
Figure 13 Proportion (%) of social exclusion benefits going to top 20% of the
distribution of income among those aged 18-59, 2010
In Estonia, however, the figure is around 14% and in Italy, 18%, which is difficult to
rationalise unless the benefit figures include those which are not in the nature of social
0
20
40
60
80
100
EE IE EL IT ES RO
MT
FR LT LV HU SI UK
BG
HR SK CY
AT PL
DE
CZ
PT
LU FI NL
SE BE
EU1
3EU
15
EU2
8
Source: Eurostat, EU-SILC
0
2
4
6
8
10
12
14
16
18
20
BE
CY
PT SE UK CZ
RO FI SK BG LT AT
NL
DE LV SI PL IE HR
LU HU
MT EL FR ES EE IT
EU1
3
EU1
5
EU2
8
Source: Eurostat, EU-SILC
Employment, Social Affairs and Inclusion The coverage rate of social benefits
February 2014 I 20
assistance or minimum income guarantee schemes. In France and Spain too, the
figure is around 9%, which is also unexpectedly high, though apart from Greece (just
over 5%), these are the only countries in which the share was over 5%.
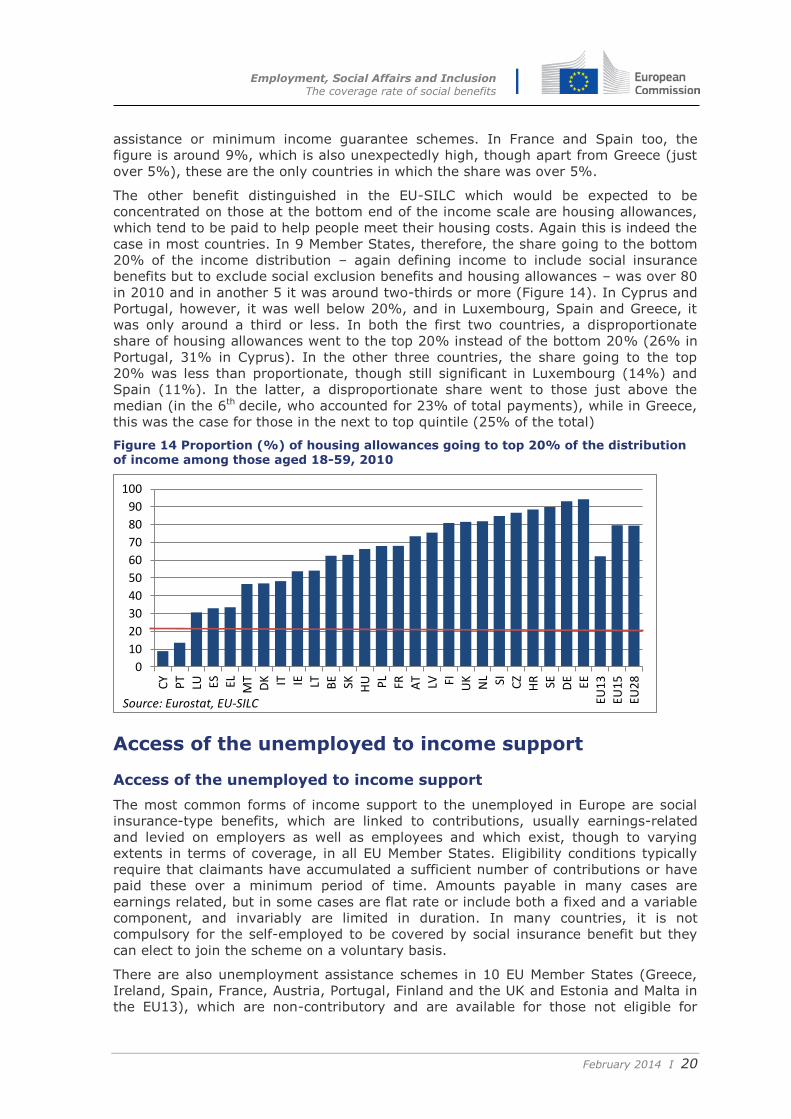
The other benefit distinguished in the EU-SILC which would be expected to be
concentrated on those at the bottom end of the income scale are housing allowances,
which tend to be paid to help people meet their housing costs. Again this is indeed the
case in most countries. In 9 Member States, therefore, the share going to the bottom
20% of the income distribution – again defining income to include social insurance
benefits but to exclude social exclusion benefits and housing allowances – was over 80
in 2010 and in another 5 it was around two-thirds or more (Figure 14). In Cyprus and
Portugal, however, it was well below 20%, and in Luxembourg, Spain and Greece, it
was only around a third or less. In both the first two countries, a disproportionate
share of housing allowances went to the top 20% instead of the bottom 20% (26% in
Portugal, 31% in Cyprus). In the other three countries, the share going to the top
20% was less than proportionate, though still significant in Luxembourg (14%) and
Spain (11%). In the latter, a disproportionate share went to those just above the
median (in the 6th decile, who accounted for 23% of total payments), while in Greece,
this was the case for those in the next to top quintile (25% of the total)
Figure 14 Proportion (%) of housing allowances going to top 20% of the distribution of income among those aged 18-59, 2010
Access of the unemployed to income support
Access of the unemployed to income support
The most common forms of income support to the unemployed in Europe are social
insurance-type benefits, which are linked to contributions, usually earnings-related
and levied on employers as well as employees and which exist, though to varying
extents in terms of coverage, in all EU Member States. Eligibility conditions typically
require that claimants have accumulated a sufficient number of contributions or have
paid these over a minimum period of time. Amounts payable in many cases are
earnings related, but in some cases are flat rate or include both a fixed and a variable
component, and invariably are limited in duration. In many countries, it is not
compulsory for the self-employed to be covered by social insurance benefit but they
can elect to join the scheme on a voluntary basis.
There are also unemployment assistance schemes in 10 EU Member States (Greece,
Ireland, Spain, France, Austria, Portugal, Finland and the UK and Estonia and Malta in
the EU13), which are non-contributory and are available for those not eligible for
0
10
20
30
40
50
60
70
80
90
100
CY
PT
LU ES EL MT
DK IT IE LT BE SK HU PL
FR AT LV FI UK
NL SI CZ
HR SE DE EE
EU1
3
EU1
5
EU2
8
Source: Eurostat, EU-SILC
Employment, Social Affairs and Inclusion The coverage rate of social benefits
February 2014 I 21
insurance benefits or who have exhausted their entitlement. Benefits are means
tested and dependent on the income of the household rather than the individual,
meaning that the unemployed may receive nothing if their household income is
deemed to be above a certain amount. In the other countries, any social transfers to
the unemployed are usually part of general social assistance, or minimum income
guarantee, schemes and so are equally dependent on household income in terms of
both whether they are payable or not and the amount payable.
While the analysis presented in previous sections indicates that many of the people on
low income not receiving benefits are in work, especially in the EU15 countries, it is
still the case that a significant number of the unemployed in many countries seem to
fall through the safety net which social security systems are supposed to provide. The
focus here, therefore, is on the unemployed who are not in receipt of benefits and the
possible reasons for this.
The following sections review the evidence on the situation of the unemployed not
receiving benefits from the European Labour Force Survey (LFS), which unlike the EU-
SILC enables their employment circumstances before they became unemployed to be
examined, which is relevant in many cases for their entitlement to benefit. The evidence
is considered in the light of eligibility rules that affect entitlement, drawing mostly on
information available in the MISSOC database (Mutual Information System on Social
Protection). The focus is on those unemployed for at least three months, since in many
countries, receipt of benefit is delayed for a period, often in particular circumstances,
partly as a disincentive for people to leave their jobs without good reason.
The LFS data on receipt of benefits – methodological issues
There are a number of difficulties of using the LFS data to identify the unemployed in receipt and not in receipt of benefits. The first concerns the definition of the unemployed. The LFS reports data on both an ILO basis (the out of work who are both available for work and actively seeking work), which is the international standard definition and how the unemployed are invariably measured, and according to the self-reporting of respondents (i.e.
those who regard themselves as unemployed). The second measure tends in most cases to be larger than the first, as would be expected, since some of those who consider themselves as unemployed are not actively seeking work, in some cases because they do not believe there are jobs available. This measure also conforms with the EU-SILC data which are on a self-defined basis as well. Use of this measure, however, is made difficult by the fact that the details of the duration of unemployment or the previous situation of the people concerned are not always reported. Accordingly, there are a significant number of people for whom this
information is not available which might mean that the results are distorted if this measure is used. The analysis here, therefore, is carried out for those recorded in the LFS as being unemployed according to the ILO definition for whom relevant details are available to a
greater extent. The fact that this is not in line with the EU-SILC measure of the unemployed should be kept in mind when interpreting the results, though it should not make a significant difference to the results since for most countries the two measures give reasonably similar
totals for the unemployed. (It should be noted that there are anyway no data on a self-defined basis for Germany and the UK
The second difficulty is that the benefit which the unemployed report as receiving or not receiving is not defined but left to individual respondents to interpret. Consequently, it may be the case that some people who receive benefit do not report it because it is not labelled as unemployment benefit.
Thirdly, there a few countries for which data are not available or at least not in a suitable
form. These are Ireland, the Netherlands and the UK (in the last of which, no distinction is made in respect of those registered at a public employment office between those receiving benefits and those not).
Employment, Social Affairs and Inclusion The coverage rate of social benefits
February 2014 I 22
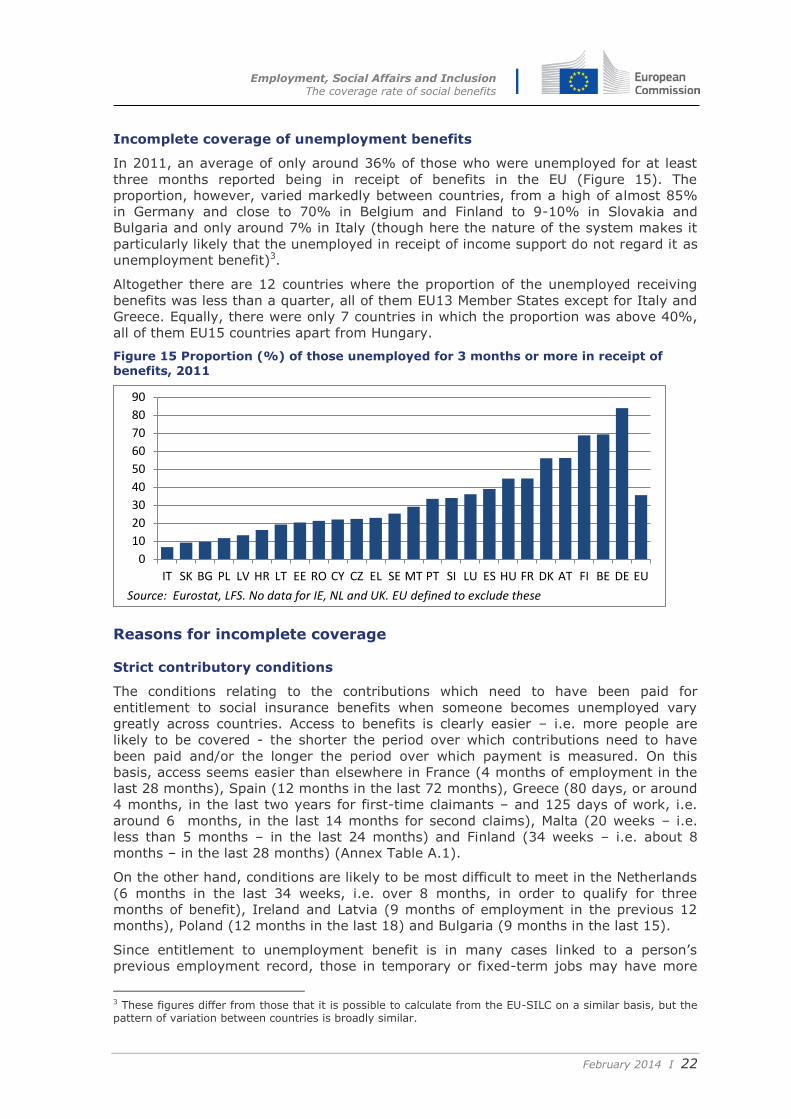
Incomplete coverage of unemployment benefits
In 2011, an average of only around 36% of those who were unemployed for at least
three months reported being in receipt of benefits in the EU (Figure 15). The
proportion, however, varied markedly between countries, from a high of almost 85%
in Germany and close to 70% in Belgium and Finland to 9-10% in Slovakia and
Bulgaria and only around 7% in Italy (though here the nature of the system makes it
particularly likely that the unemployed in receipt of income support do not regard it as
unemployment benefit)3.
Altogether there are 12 countries where the proportion of the unemployed receiving
benefits was less than a quarter, all of them EU13 Member States except for Italy and
Greece. Equally, there were only 7 countries in which the proportion was above 40%,
all of them EU15 countries apart from Hungary.
Figure 15 Proportion (%) of those unemployed for 3 months or more in receipt of
benefits, 2011
Reasons for incomplete coverage
Strict contributory conditions
The conditions relating to the contributions which need to have been paid for
entitlement to social insurance benefits when someone becomes unemployed vary
greatly across countries. Access to benefits is clearly easier – i.e. more people are
likely to be covered - the shorter the period over which contributions need to have
been paid and/or the longer the period over which payment is measured. On this
basis, access seems easier than elsewhere in France (4 months of employment in the
last 28 months), Spain (12 months in the last 72 months), Greece (80 days, or around
4 months, in the last two years for first-time claimants – and 125 days of work, i.e.
around 6 months, in the last 14 months for second claims), Malta (20 weeks – i.e.
less than 5 months – in the last 24 months) and Finland (34 weeks – i.e. about 8
months – in the last 28 months) (Annex Table A.1).
On the other hand, conditions are likely to be most difficult to meet in the Netherlands
(6 months in the last 34 weeks, i.e. over 8 months, in order to qualify for three
months of benefit), Ireland and Latvia (9 months of employment in the previous 12
months), Poland (12 months in the last 18) and Bulgaria (9 months in the last 15).
Since entitlement to unemployment benefit is in many cases linked to a person’s
previous employment record, those in temporary or fixed-term jobs may have more
3 These figures differ from those that it is possible to calculate from the EU-SILC on a similar basis, but the pattern of variation between countries is broadly similar.
0
10
20
30
40
50
60
70
80
90
IT SK BG PL LV HR LT EE RO CY CZ EL SE MT PT SI LU ES HU FR DK AT FI BE DE EU
Source: Eurostat, LFS. No data for IE, NL and UK. EU defined to exclude these
Employment, Social Affairs and Inclusion The coverage rate of social benefits
February 2014 I 23
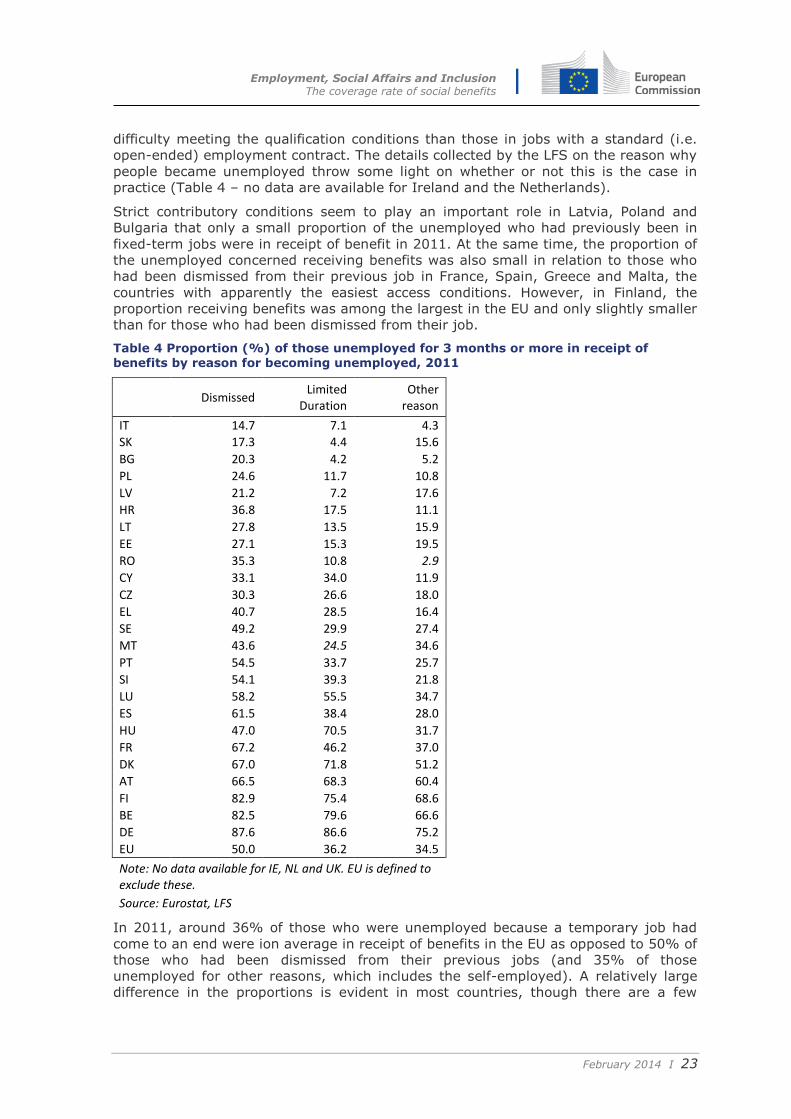
difficulty meeting the qualification conditions than those in jobs with a standard (i.e.
open-ended) employment contract. The details collected by the LFS on the reason why
people became unemployed throw some light on whether or not this is the case in
practice (Table 4 – no data are available for Ireland and the Netherlands).
Strict contributory conditions seem to play an important role in Latvia, Poland and
Bulgaria that only a small proportion of the unemployed who had previously been in
fixed-term jobs were in receipt of benefit in 2011. At the same time, the proportion of
the unemployed concerned receiving benefits was also small in relation to those who
had been dismissed from their previous job in France, Spain, Greece and Malta, the
countries with apparently the easiest access conditions. However, in Finland, the
proportion receiving benefits was among the largest in the EU and only slightly smaller
than for those who had been dismissed from their job.
Table 4 Proportion (%) of those unemployed for 3 months or more in receipt of
benefits by reason for becoming unemployed, 2011
Dismissed Limited
Duration Other
reason
IT 14.7 7.1 4.3
SK 17.3 4.4 15.6
BG 20.3 4.2 5.2
PL 24.6 11.7 10.8
LV 21.2 7.2 17.6
HR 36.8 17.5 11.1
LT 27.8 13.5 15.9
EE 27.1 15.3 19.5
RO 35.3 10.8 2.9
CY 33.1 34.0 11.9
CZ 30.3 26.6 18.0
EL 40.7 28.5 16.4
SE 49.2 29.9 27.4
MT 43.6 24.5 34.6
PT 54.5 33.7 25.7
SI 54.1 39.3 21.8
LU 58.2 55.5 34.7
ES 61.5 38.4 28.0
HU 47.0 70.5 31.7
FR 67.2 46.2 37.0
DK 67.0 71.8 51.2
AT 66.5 68.3 60.4
FI 82.9 75.4 68.6
BE 82.5 79.6 66.6
DE 87.6 86.6 75.2
EU 50.0 36.2 34.5
Note: No data available for IE, NL and UK. EU is defined to exclude these.
Source: Eurostat, LFS
In 2011, around 36% of those who were unemployed because a temporary job had
come to an end were ion average in receipt of benefits in the EU as opposed to 50% of
those who had been dismissed from their previous jobs (and 35% of those
unemployed for other reasons, which includes the self-employed). A relatively large
difference in the proportions is evident in most countries, though there are a few
Employment, Social Affairs and Inclusion The coverage rate of social benefits
February 2014 I 24
where more of those previously in fixed-term jobs received benefits than those who
had been dismissed (Denmark, Austria and, most notably, Hungary, in particular).
The self-employed
The self-employed tend to pay lower social contributions than employees or be
exempted altogether from having to pay these. The corollary, however, is that they
may have more limited access to unemployment and other social benefits when out of
work.
In a few countries (the Czech Republic, Hungary, Slovenia and Luxembourg) the self-
employed have access to unemployment insurance benefits in the same way as
employees if their business fails and they need to look for a job. In a number of others
(Denmark, Germany, Spain, France, the Netherlands, Austria, Poland and Romania),
the self-employed can become entitled to unemployment benefits by voluntarily
paying contributions (which is also the case in Greece but only since April 2013). In
Finland and Sweden, the self-employed are eligible for basic unemployment benefit
and for earnings-related benefit if they voluntarily join a social insurance scheme. In
Portugal, they are entitled to unemployment benefits only if 80% or more of their
activities consist of working for a single contractor and in Slovakia, only if they do not
have employees. In the UK, they are entitled to means-tested unemployment
assistance only. In all the other countries, the self-employed are not eligible for
unemployment benefits.
Examining the evidence on the receipt of benefits in the light of the above indicates
that the countries in which the proportion of the self-employed receiving benefits is
similar to that of employees - Denmark, Finland, Sweden, Slovenia and Slovakia – are
also ones where the self-employed have much the same access to unemployment
benefits as employees (though in Slovakia, only if they do not employees themselves).
On the other hand, in Malta, where the self-employed are not entitled to
unemployment benefits, the proportion receiving benefits was much larger than for
employees in 2011. Moreover, in the Czech Republic and Hungary, where the self-
employed have the same entitlement to benefit as employees, the proportion
receiving benefit was much smaller than for the latter.
Variations in the treatment of self-employed workers by social protection systems are
reflected in the LFS data, which indicate that those who were self-employed before
becoming unemployed were in most cases much less likely to receive benefits than
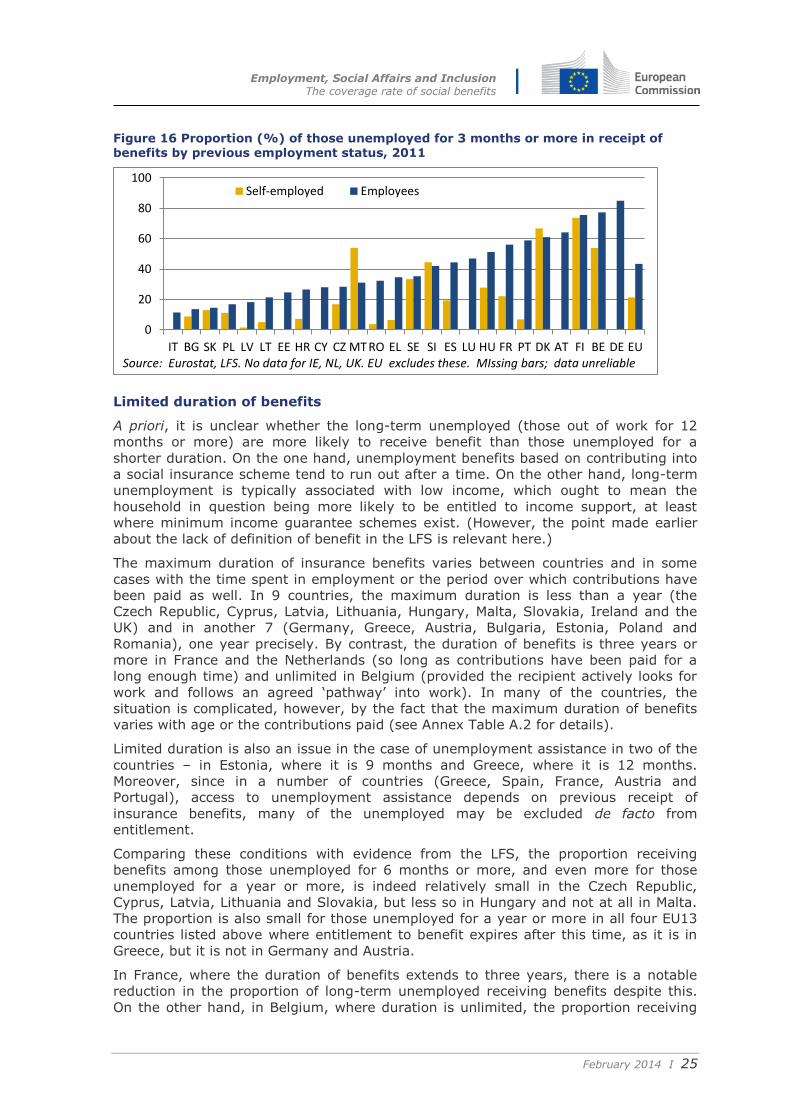
those who had been employees. On average, only 21% of the unemployed who had
previously been self-employed were in receipt of benefits in 2011 as opposed to 43%
of those who had been employees (Figure 16).
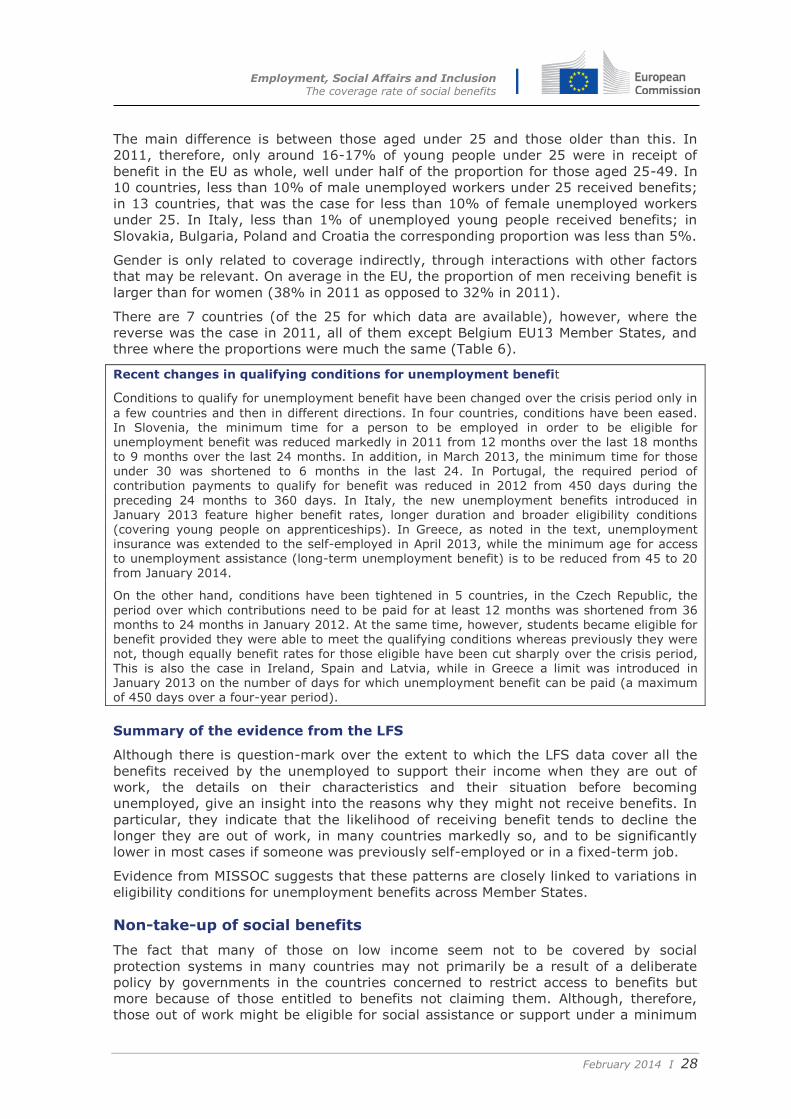
The difference was especially marked in Romania, Greece and Portugal, while in Italy,
less than 1% of those had been self-employed received benefits as against over 11%
of employees. There are, however, three countries where more of the self-employed
received benefits than employees – Malta, Slovenia and Denmark (though in each
case, the number of self-employed among the respondents is small so that the figures
involve a relatively margin of error) – and Finland, where the proportions are much
the same (though where the same qualification applies).
Employment, Social Affairs and Inclusion The coverage rate of social benefits
February 2014 I 25
Figure 16 Proportion (%) of those unemployed for 3 months or more in receipt of benefits by previous employment status, 2011
Limited duration of benefits
A priori, it is unclear whether the long-term unemployed (those out of work for 12
months or more) are more likely to receive benefit than those unemployed for a
shorter duration. On the one hand, unemployment benefits based on contributing into
a social insurance scheme tend to run out after a time. On the other hand, long-term
unemployment is typically associated with low income, which ought to mean the
household in question being more likely to be entitled to income support, at least
where minimum income guarantee schemes exist. (However, the point made earlier
about the lack of definition of benefit in the LFS is relevant here.)
The maximum duration of insurance benefits varies between countries and in some
cases with the time spent in employment or the period over which contributions have
been paid as well. In 9 countries, the maximum duration is less than a year (the
Czech Republic, Cyprus, Latvia, Lithuania, Hungary, Malta, Slovakia, Ireland and the
UK) and in another 7 (Germany, Greece, Austria, Bulgaria, Estonia, Poland and
Romania), one year precisely. By contrast, the duration of benefits is three years or
more in France and the Netherlands (so long as contributions have been paid for a
long enough time) and unlimited in Belgium (provided the recipient actively looks for
work and follows an agreed ‘pathway’ into work). In many of the countries, the
situation is complicated, however, by the fact that the maximum duration of benefits
varies with age or the contributions paid (see Annex Table A.2 for details).
Limited duration is also an issue in the case of unemployment assistance in two of the
countries – in Estonia, where it is 9 months and Greece, where it is 12 months.
Moreover, since in a number of countries (Greece, Spain, France, Austria and
Portugal), access to unemployment assistance depends on previous receipt of
insurance benefits, many of the unemployed may be excluded de facto from
entitlement.
Comparing these conditions with evidence from the LFS, the proportion receiving
benefits among those unemployed for 6 months or more, and even more for those
unemployed for a year or more, is indeed relatively small in the Czech Republic,
Cyprus, Latvia, Lithuania and Slovakia, but less so in Hungary and not at all in Malta.
The proportion is also small for those unemployed for a year or more in all four EU13
countries listed above where entitlement to benefit expires after this time, as it is in
Greece, but it is not in Germany and Austria.
In France, where the duration of benefits extends to three years, there is a notable
reduction in the proportion of long-term unemployed receiving benefits despite this.
On the other hand, in Belgium, where duration is unlimited, the proportion receiving
0
20
40
60
80
100
IT BG SK PL LV LT EE HR CY CZ MT RO EL SE SI ES LU HU FR PT DK AT FI BE DE EU
Self-employed Employees
Source: Eurostat, LFS. No data for IE, NL, UK. EU excludes these. MIssing bars; data unreliable
Employment, Social Affairs and Inclusion The coverage rate of social benefits
February 2014 I 26
benefits is actually larger for those unemployed for a year or more than those
unemployed for a shorter period. This is also the case in Germany, where those
exhausting entitlement to insurance benefits have unemployment assistance to fall
back on for an unlimited period.
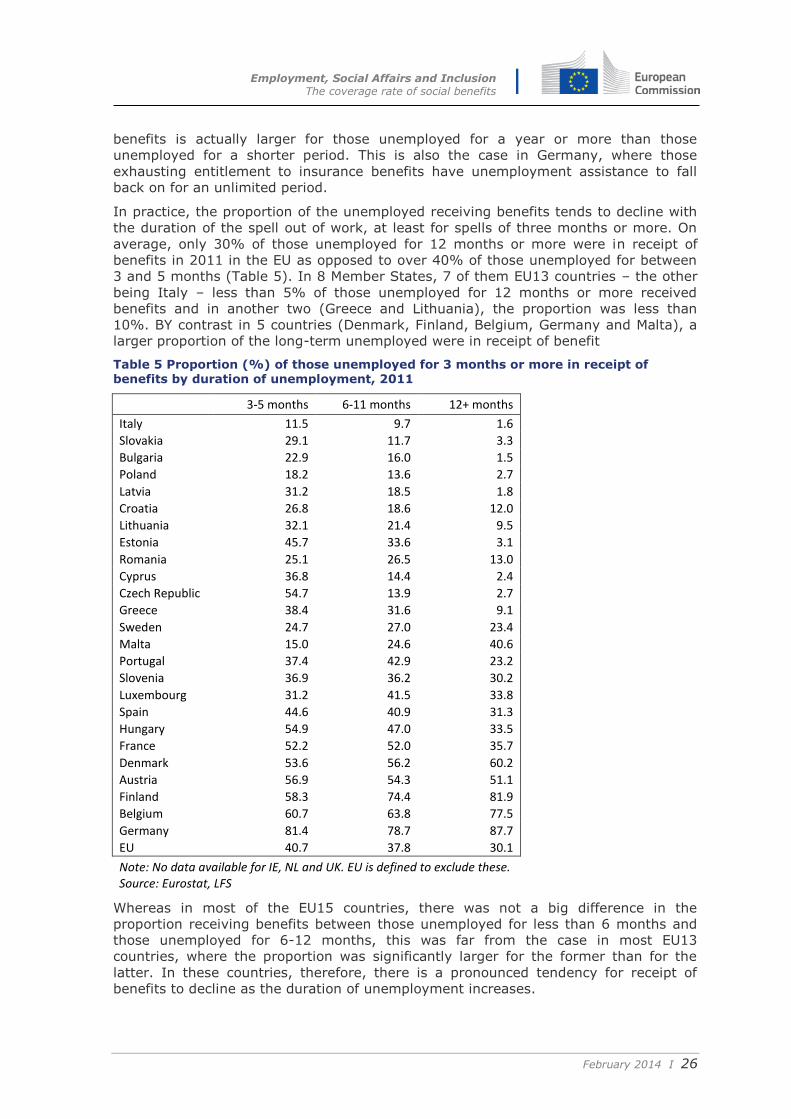
In practice, the proportion of the unemployed receiving benefits tends to decline with
the duration of the spell out of work, at least for spells of three months or more. On
average, only 30% of those unemployed for 12 months or more were in receipt of
benefits in 2011 in the EU as opposed to over 40% of those unemployed for between
3 and 5 months (Table 5). In 8 Member States, 7 of them EU13 countries – the other
being Italy – less than 5% of those unemployed for 12 months or more received
benefits and in another two (Greece and Lithuania), the proportion was less than
10%. BY contrast in 5 countries (Denmark, Finland, Belgium, Germany and Malta), a
larger proportion of the long-term unemployed were in receipt of benefit
Table 5 Proportion (%) of those unemployed for 3 months or more in receipt of benefits by duration of unemployment, 2011
3-5 months 6-11 months 12+ months
Italy 11.5 9.7 1.6
Slovakia 29.1 11.7 3.3
Bulgaria 22.9 16.0 1.5
Poland 18.2 13.6 2.7
Latvia 31.2 18.5 1.8
Croatia 26.8 18.6 12.0
Lithuania 32.1 21.4 9.5
Estonia 45.7 33.6 3.1
Romania 25.1 26.5 13.0
Cyprus 36.8 14.4 2.4
Czech Republic 54.7 13.9 2.7
Greece 38.4 31.6 9.1
Sweden 24.7 27.0 23.4
Malta 15.0 24.6 40.6
Portugal 37.4 42.9 23.2
Slovenia 36.9 36.2 30.2
Luxembourg 31.2 41.5 33.8
Spain 44.6 40.9 31.3
Hungary 54.9 47.0 33.5
France 52.2 52.0 35.7
Denmark 53.6 56.2 60.2
Austria 56.9 54.3 51.1
Finland 58.3 74.4 81.9
Belgium 60.7 63.8 77.5
Germany 81.4 78.7 87.7
EU 40.7 37.8 30.1
Note: No data available for IE, NL and UK. EU is defined to exclude these. Source: Eurostat, LFS
Whereas in most of the EU15 countries, there was not a big difference in the
proportion receiving benefits between those unemployed for less than 6 months and
those unemployed for 6-12 months, this was far from the case in most EU13
countries, where the proportion was significantly larger for the former than for the
latter. In these countries, therefore, there is a pronounced tendency for receipt of
benefits to decline as the duration of unemployment increases.
Employment, Social Affairs and Inclusion The coverage rate of social benefits
February 2014 I 27
In all but a few countries, the proportion of those unemployed for less than three
months in receipt of benefits was smaller than for those out of work for a longer
period, in many countries significantly so, suggesting that the unemployed may have
to wait for a time before receiving income support.
Age
Age is also a condition for entitlement to benefit in some countries. In the UK, people
have to be 18 or over to qualify, in Slovenia, students in work are not eligible and in
Sweden, new graduates and school leavers, while in Greece, entitlement to social
assistance is confined to those of 45 and over. In both Slovenia and Sweden, the
evidence indicates that only a small proportion of the unemployed aged 15-24 were in
receipt of benefit in 2011 and in Greece a larger proportion of those aged 50-59 than
of younger age groups, though this was also the case in most other countries.
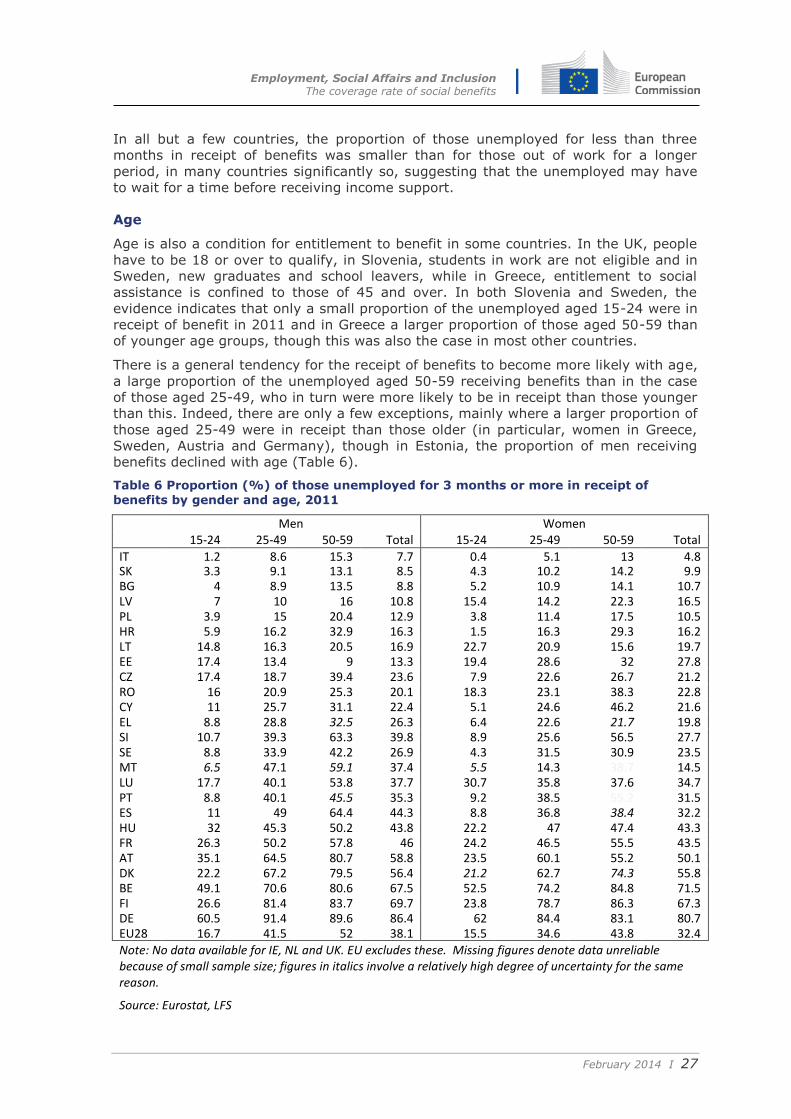
There is a general tendency for the receipt of benefits to become more likely with age,
a large proportion of the unemployed aged 50-59 receiving benefits than in the case
of those aged 25-49, who in turn were more likely to be in receipt than those younger
than this. Indeed, there are only a few exceptions, mainly where a larger proportion of
those aged 25-49 were in receipt than those older (in particular, women in Greece,
Sweden, Austria and Germany), though in Estonia, the proportion of men receiving
benefits declined with age (Table 6).
Table 6 Proportion (%) of those unemployed for 3 months or more in receipt of
benefits by gender and age, 2011
Men Women 15-24 25-49 50-59 Total 15-24 25-49 50-59 Total
IT 1.2 8.6 15.3 7.7 0.4 5.1 13 4.8 SK 3.3 9.1 13.1 8.5 4.3 10.2 14.2 9.9 BG 4 8.9 13.5 8.8 5.2 10.9 14.1 10.7 LV 7 10 16 10.8 15.4 14.2 22.3 16.5 PL 3.9 15 20.4 12.9 3.8 11.4 17.5 10.5 HR 5.9 16.2 32.9 16.3 1.5 16.3 29.3 16.2 LT 14.8 16.3 20.5 16.9 22.7 20.9 15.6 19.7 EE 17.4 13.4 9 13.3 19.4 28.6 32 27.8 CZ 17.4 18.7 39.4 23.6 7.9 22.6 26.7 21.2 RO 16 20.9 25.3 20.1 18.3 23.1 38.3 22.8 CY 11 25.7 31.1 22.4 5.1 24.6 46.2 21.6 EL 8.8 28.8 32.5 26.3 6.4 22.6 21.7 19.8 SI 10.7 39.3 63.3 39.8 8.9 25.6 56.5 27.7 SE 8.8 33.9 42.2 26.9 4.3 31.5 30.9 23.5 MT 6.5 47.1 59.1 37.4 5.5 14.3 38.7 14.5 LU 17.7 40.1 53.8 37.7 30.7 35.8 37.6 34.7 PT 8.8 40.1 45.5 35.3 9.2 38.5 55.2 31.5 ES 11 49 64.4 44.3 8.8 36.8 38.4 32.2 HU 32 45.3 50.2 43.8 22.2 47 47.4 43.3 FR 26.3 50.2 57.8 46 24.2 46.5 55.5 43.5 AT 35.1 64.5 80.7 58.8 23.5 60.1 55.2 50.1 DK 22.2 67.2 79.5 56.4 21.2 62.7 74.3 55.8 BE 49.1 70.6 80.6 67.5 52.5 74.2 84.8 71.5 FI 26.6 81.4 83.7 69.7 23.8 78.7 86.3 67.3 DE 60.5 91.4 89.6 86.4 62 84.4 83.1 80.7 EU28 16.7 41.5 52 38.1 15.5 34.6 43.8 32.4
Note: No data available for IE, NL and UK. EU excludes these. Missing figures denote data unreliable because of small sample size; figures in italics involve a relatively high degree of uncertainty for the same reason.
Source: Eurostat, LFS
Employment, Social Affairs and Inclusion The coverage rate of social benefits
February 2014 I 28
The main difference is between those aged under 25 and those older than this. In
2011, therefore, only around 16-17% of young people under 25 were in receipt of
benefit in the EU as whole, well under half of the proportion for those aged 25-49. In
10 countries, less than 10% of male unemployed workers under 25 received benefits;
in 13 countries, that was the case for less than 10% of female unemployed workers
under 25. In Italy, less than 1% of unemployed young people received benefits; in
Slovakia, Bulgaria, Poland and Croatia the corresponding proportion was less than 5%.
Gender is only related to coverage indirectly, through interactions with other factors
that may be relevant. On average in the EU, the proportion of men receiving benefit is
larger than for women (38% in 2011 as opposed to 32% in 2011).
There are 7 countries (of the 25 for which data are available), however, where the
reverse was the case in 2011, all of them except Belgium EU13 Member States, and
three where the proportions were much the same (Table 6).
Recent changes in qualifying conditions for unemployment benefit
Conditions to qualify for unemployment benefit have been changed over the crisis period only in
a few countries and then in different directions. In four countries, conditions have been eased. In Slovenia, the minimum time for a person to be employed in order to be eligible for unemployment benefit was reduced markedly in 2011 from 12 months over the last 18 months to 9 months over the last 24 months. In addition, in March 2013, the minimum time for those under 30 was shortened to 6 months in the last 24. In Portugal, the required period of contribution payments to qualify for benefit was reduced in 2012 from 450 days during the
preceding 24 months to 360 days. In Italy, the new unemployment benefits introduced in January 2013 feature higher benefit rates, longer duration and broader eligibility conditions (covering young people on apprenticeships). In Greece, as noted in the text, unemployment
insurance was extended to the self-employed in April 2013, while the minimum age for access to unemployment assistance (long-term unemployment benefit) is to be reduced from 45 to 20 from January 2014.
On the other hand, conditions have been tightened in 5 countries, in the Czech Republic, the
period over which contributions need to be paid for at least 12 months was shortened from 36 months to 24 months in January 2012. At the same time, however, students became eligible for benefit provided they were able to meet the qualifying conditions whereas previously they were not, though equally benefit rates for those eligible have been cut sharply over the crisis period, This is also the case in Ireland, Spain and Latvia, while in Greece a limit was introduced in January 2013 on the number of days for which unemployment benefit can be paid (a maximum of 450 days over a four-year period).
Summary of the evidence from the LFS
Although there is question-mark over the extent to which the LFS data cover all the
benefits received by the unemployed to support their income when they are out of
work, the details on their characteristics and their situation before becoming
unemployed, give an insight into the reasons why they might not receive benefits. In
particular, they indicate that the likelihood of receiving benefit tends to decline the
longer they are out of work, in many countries markedly so, and to be significantly
lower in most cases if someone was previously self-employed or in a fixed-term job.
Evidence from MISSOC suggests that these patterns are closely linked to variations in
eligibility conditions for unemployment benefits across Member States.
Non-take-up of social benefits
The fact that many of those on low income seem not to be covered by social
protection systems in many countries may not primarily be a result of a deliberate
policy by governments in the countries concerned to restrict access to benefits but
more because of those entitled to benefits not claiming them. Although, therefore,
those out of work might be eligible for social assistance or support under a minimum
Employment, Social Affairs and Inclusion The coverage rate of social benefits
February 2014 I 29
income-guarantee or social assistance scheme, since payments are means-tested and
so need to be claimed, there may be many people who do not take them up. Non-
take-up may be due to a various reasons, such as the high cost or difficulty of
claiming, the stigma attached to doing so, a lack of information about entitlement or
simply administrative error. Whatever the reason, it is important for policy-makers to
take this factor into account when designing measures of income support or assessing
the effectiveness of those already in place.
The extent of non-take up is difficult to assess, but an OECD survey found that in
many European countries it typically ranged between 20% and 60% (Hernanz et al.
2004). The latest evidence for 17 Member States, some of which dates back a long
way4, is summarised below (and in Table 7).
In Austria, Fuchs (2007) estimated that non take up of social assistance (Hilfe zur
Sicherung des Lebensunterhalts) in 2003 was 56% in terms of claimants (i.e. 56% of
those entitled to claim did not do so) and 48% in terms of the amount of benefit
involved (i.e. 48% of the amount payable was not paid because it was not claimed).
In Belgium, Bouckaert, N. and Schokakert (2010) estimated the rate of non-take-up
of minimum guaranteed income (Leefloon) for those aged 18-65 at 62% in terms of
claimants and 45% in terms of payments in 2005.
In the Czech Republic, Sirovátka (2000), cited in Mareš (2001), found that in 1996
the estimated rate of non-take-up of child benefit (Přídavek na Dítě) was 8%, of social
allowances (Sociální Doplatek) 37% and of housing allowance (Příspěvek na Bydlení)
60%.
In Denmark, Hansen and Hultin (1997) found that 33% of those eligible for the
general housing benefit scheme (Boligsikring) in 1992 failed to claim, as did 15% of
those eligible for the special scheme for pensioners (Boligydelse).
In Finland, Bargain et al. (2007) estimated the non-take-up of social assistance
(Toimeentulotuki) by families of working age in 1996-2003 (i.e. over the period
following the recession of the early 1990s) to have risen to 51% by 2003 and the non-
take-up by the long-term unemployed to 42%.
In France, Terracol (2002) estimated the non-take up of minimum guaranteed
income (Revenu Minimum d’Insertion) at 35%.
In Germany, Frick and Groh-Samberg (2007) estimated the non-take-up of social
assistance (Sozialhilfe) in 2002 at 67% in terms of the number claiming and 57% in
terms of the amount of benefit involved, which was in line with earlier estimates. More
recently, Bruckmeier and Wiemers (2012) estimated that the persistent non take up of
restructured social assistance under the 2005 Hartz IV reform had fallen from 49% in
2005 (the first post-reform year) to 41% in 2007, while temporary non-take-up had
declined from 58% to 46%.
In Greece, Matsaganis et al. (2010) estimated that the non-take-up of social pension
(Σύνταξη ανασφαλίστων υπερηλίκων) was 38% in 2004. More recently, Leventi and
Matsaganis (2013) estimated that, in the case of long-term unemployment benefits
(Επίδομα μακροχρόνιας ανεργίας), it was as much as 89% in 2012 (down from 98% in
2009).
In Ireland, Callan and Keane (2008) estimated that non-take-up of Family Income
Supplement in 2005 was 70% in terms of claimants and 64% in terms of the amount
claimed.
4 Some of this evidence was described in a previous Research Note (Matsaganis et al. 2008).
Employment, Social Affairs and Inclusion The coverage rate of social benefits
February 2014 I 30
In Italy, Bobbio (2011) estimated that non take up of ordinary unemployment benefit
(Indennità di disoccupazione con requisiti pieni) was 89% in 2002 and in the case of
its reduced version (Indennità di disoccupazione con requisiti ridotti), with easier
eligibility conditions and lower benefits, it was 78%.
In Lithuania, Salanauskaite (2013), by using EUROMOD to simulate eligibility for
social assistance (Socialinė Pašalpa), estimated a non-take-up rate of 68% for
claimants and 43% for payments, though she noted that measurement error and
other factors might also be a factor underlying the difference between actual and
estimated payments.
In the Netherlands, where research on non-take-up stretches back to the 1970s (see
van Oorschot 1991), a recent study (Tempelman et al. 2011) estimated the non-take-
up of means-tested benefits in 2011 at 18% in the case of rent allowance
(Huurtoeslag).
In Poland, a comparison between actual participation in the general social assistance
scheme (Pomoc Społeczna) and theoretical eligibility as simulated by EUROMOD,
reported in Matsaganis et al. (2008), implied a rate of non-take-up of 24% for
permanent social assistance and to 57% for temporary social assistance in 2005. ‘Soft
rules’ applied by benefit agencies, however, make the estimation difficult.
In Portugal, Rodrigues (2008) estimated non take up of minimum guaranteed income
(Rendimento Mínimo Garantido) in 2001 at 28%.
In Spain, Matsaganis et al. (2010) estimated the non-take-up of social pensions
(Pensión no contributiva) in 2004 at 44% for claimants and 41% for payments.
In Sweden, a comparison of the number of recipients of general social assistance
(Ekonomiskt Bistånd/Socialbidrag) as recorded by administrative sources with that
simulated by EUROMOD (reported in Matsaganis et al., 2008) suggested a non-take-
up rate of 31% in 2001, which was broadly in line with expert opinion (Eklind, 2008).
In the UK, where there has been extensive research into the scale and causes of non-
take-up of social benefits, official estimates are now released on an annual basis.
According to the latest of these (DWP 2013), for 2009 to 2010, non-take-up of Income
Support (and income-related Employment and Support Allowance) was around 17% in
terms of the number claiming and around 13% in terms of the amounts claimed. In
the case of Housing Benefit (including Local Housing Allowance), the central estimate
of non-take-up was 19% for claimants and 13% for payments. Non take-up of other
benefits was higher: in the case of Pension Credit and Council Tax Benefit, it was
around 35% for claimants and for Jobseeker’s Allowance (the main unemployment
benefit), 37%.
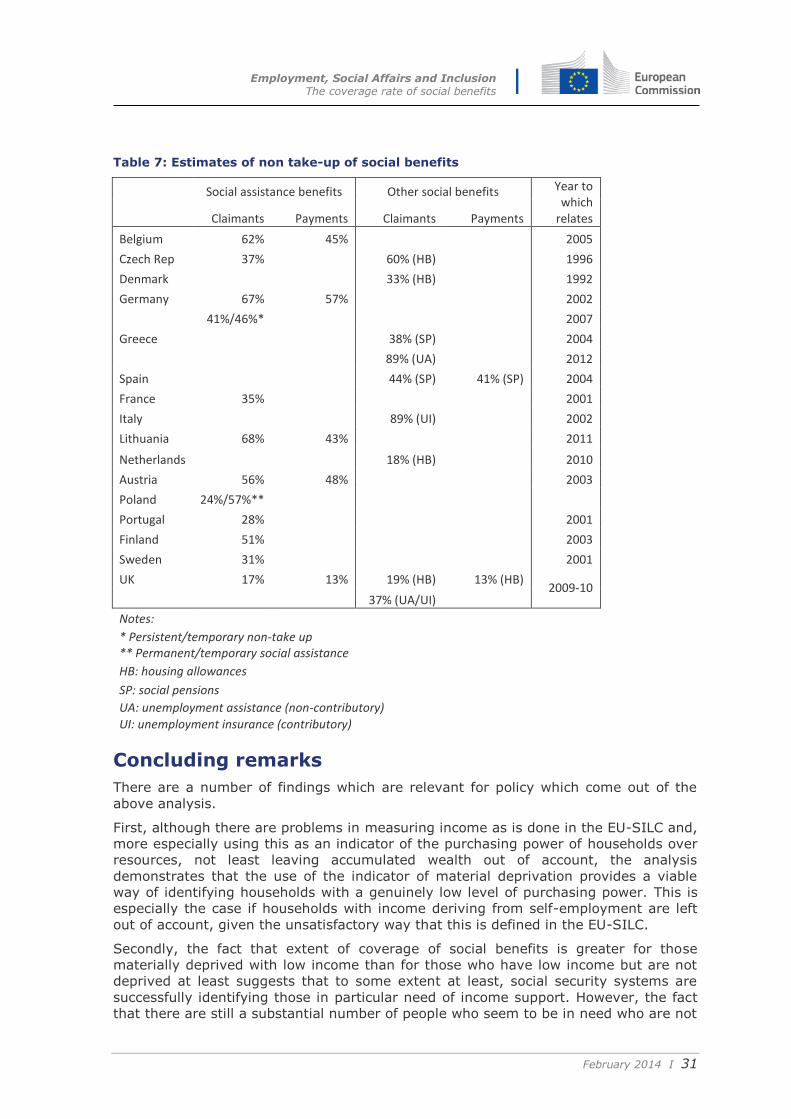
Employment, Social Affairs and Inclusion The coverage rate of social benefits
February 2014 I 31
Table 7: Estimates of non take-up of social benefits
Social assistance benefits Other social benefits Year to which
relates Claimants Payments Claimants Payments
Belgium 62% 45% 2005
Czech Rep 37% 60% (HB) 1996
Denmark
33% (HB) 1992
Germany 67% 57% 2002
41%/46%* 2007
Greece
38% (SP) 2004
89% (UA) 2012
Spain
44% (SP) 41% (SP) 2004
France 35% 2001
Italy
89% (UI) 2002
Lithuania 68% 43% 2011
Netherlands
18% (HB) 2010
Austria 56% 48% 2003
Poland 24%/57%**
Portugal 28% 2001
Finland 51% 2003
Sweden 31% 2001
UK 17% 13% 19% (HB) 13% (HB) 2009-10
37% (UA/UI)
Notes:
* Persistent/temporary non-take up
** Permanent/temporary social assistance
HB: housing allowances
SP: social pensions
UA: unemployment assistance (non-contributory)
UI: unemployment insurance (contributory)
Concluding remarks
There are a number of findings which are relevant for policy which come out of the
above analysis.
First, although there are problems in measuring income as is done in the EU-SILC and,
more especially using this as an indicator of the purchasing power of households over
resources, not least leaving accumulated wealth out of account, the analysis
demonstrates that the use of the indicator of material deprivation provides a viable
way of identifying households with a genuinely low level of purchasing power. This is
especially the case if households with income deriving from self-employment are left
out of account, given the unsatisfactory way that this is defined in the EU-SILC.
Secondly, the fact that extent of coverage of social benefits is greater for those
materially deprived with low income than for those who have low income but are not
deprived at least suggests that to some extent at least, social security systems are
successfully identifying those in particular need of income support. However, the fact
that there are still a substantial number of people who seem to be in need who are not
Employment, Social Affairs and Inclusion The coverage rate of social benefits
February 2014 I 32
covered, or who are not covered satisfactorily, in many countries suggests that there
is some way to go for systems in these countries to provide an effective safety net for
those unable to work.
Thirdly, the fact that low-income households with income from employment are less
likely to be in receipt of benefits than households in a similar situation but with no
income from employment suggests that there is gap in the safety net in this respect.
In many countries, therefore, the social security system is set up primarily to provide
income support for those not in work and there is the implicit assumption that those in
work do not need support.
Fourthly, there appear to be evident gaps in the coverage of unemployment benefits
which result from the conditions attached to eligibility for benefit. In particular, those
in fixed-term jobs and the self-employed are less likely to receive benefits in most
countries if they become unemployed than employees in jobs with standard contract
of employment.
Fifthly, the design of social security systems has to take explicit account of the
potential problem of non-take-up of benefits. Although mean-tested benefits,
therefore, can be an effective means in principle of targeting income support on those
most in need, in practice, they rely on the people concerned to claim the support to
which they are entitled, which for many reasons does not happen in a significant
number of cases. Moreover, the suspicion is that many of those not in receipt are
those who need support the most who may be the most reluctant or the least able to
claim.
Employment, Social Affairs and Inclusion The coverage rate of social benefits
February 2014 I 33
References
Bargain O., Immervoll H. and Viitamäki H. (2007) ‘How tight are safety nets in
Nordic countries? Evidence from Finnish register data’. IZA Discussion Paper 3004.
Bonn: Institute for the Study of Labor (IZA).
Bobbio E. (2011) ‘Some considerations on the optimality and coverage of the Italian
unemployment insurance system’. XXIII Conferenza della Società Italiana di Economia
Pubblica (Pavia 19-20 September).
Bouckaert N. and Schokakert E. (2010) ‘A first compuation of non take-up-
behaviour in the ‘Leefloon’’. Centrum voor Economische Studiën, Katholieke
Universiteit Leuven.
Bruckmeier K. and Wiemers J. (2012) ‘A new targeting: a new take-up? Non-take-
up of social assistance in Germany after social policy reforms’. Empirical Economics 43
(2).
Callan T. and Keane C. (2008) Non-take-up of means-tested benefits. Dublin:
Economic and Social Research Institute.
de Voos K. (2013) Personal communication.
DWP (2013) Income-related benefits: estimates of take-up (update published 18
June 2013). London: Department for Work and Pensions.
Eklind B. (2008) Personal communication.
Frick J.R. and Groh-Samberg O. (2007) Estimating the size and determinants of
benefit non-take-up in Germany. Berlin: Deutsches Institut für Wirtschaftsforschung.
Fuchs M. (2007) ‘Social assistance – no, thanks? Empirical analysis of non-take-up
in Austria 2003’. EUROMOD Working Paper EM4/07.
Hansen H. and Hultin M.L. (1997) Actual and potential recipients of welfare benefit
with a focus on housing benefits, 1987-1992. Copenhagen: Danish Central Bureau of
Statistics.
Hernanz V., Malherbet F. and Pellizzari M. (2004) ‘Take-up of welfare benefits in
OECD countries: a review of the evidence’. Social, Employment and Migration Working
Paper 17. Paris: Organisation of Economic Co-operation and Development.
Leventi C. and Matsaganis M. (2013) ‘Distributional implications of the crisis in
Greece in 2009-2012’. Working Paper EM 14/13, Microsimulation Unit, University of
Essex.
Mareš P. (2001) Problém nečerpání sociálních dávek. VÚPSV Praha: výzkumné
centrum Brno.
Matsaganis M., Levy H. and Flevotomou M. (2010) ‘Non take up of social benefits in
Greece and Spain’. Social Policy and Administration 44 (7) 827–844.
Matsaganis M., Paulus A. and Sutherland H. (2008) ‘The take up of social benefits’.
Research Note 5/2008, Social Situation Observatory, European Commission.
Myck M. (2013) Personal communication.
OECD (2010) Jobs for Youth. Paris: OECD.
Rodrigues C.F. (2008) Distribuição do rendimento, desigualdade pobreza: Portugal
nos anos 90. Coimbra: Edições Almedina.
Salanauskaite L. (2013) Personal communication.
Employment, Social Affairs and Inclusion The coverage rate of social benefits
February 2014 I 34
Sirovátka T. (2000) Odhad nevyužívání některých příjmově testovaných dávek
státní sociální podpory. Interní nepublikovaný materiál. Brno: Fakulta sociálních studií
MU.
Tempelman C., Houkes A. and Prins J. (2011) ‘Niet-gebruik
inkomensondersteunende maatregelen’. SEO Economisch Onderzoek, Universiteit van
Amsterdam.
Terracol A. (2002) ‘Analysing the take-up of means-tested benefits in France’.
Presented at the 57th European Meeting of the Econometric Society (Venice 22-28
August).
Van Oorschot W. (1991) ‘Non-take up of social security benefits in Europe’. Journal
of European Social Policy 1 (1) 15-30.
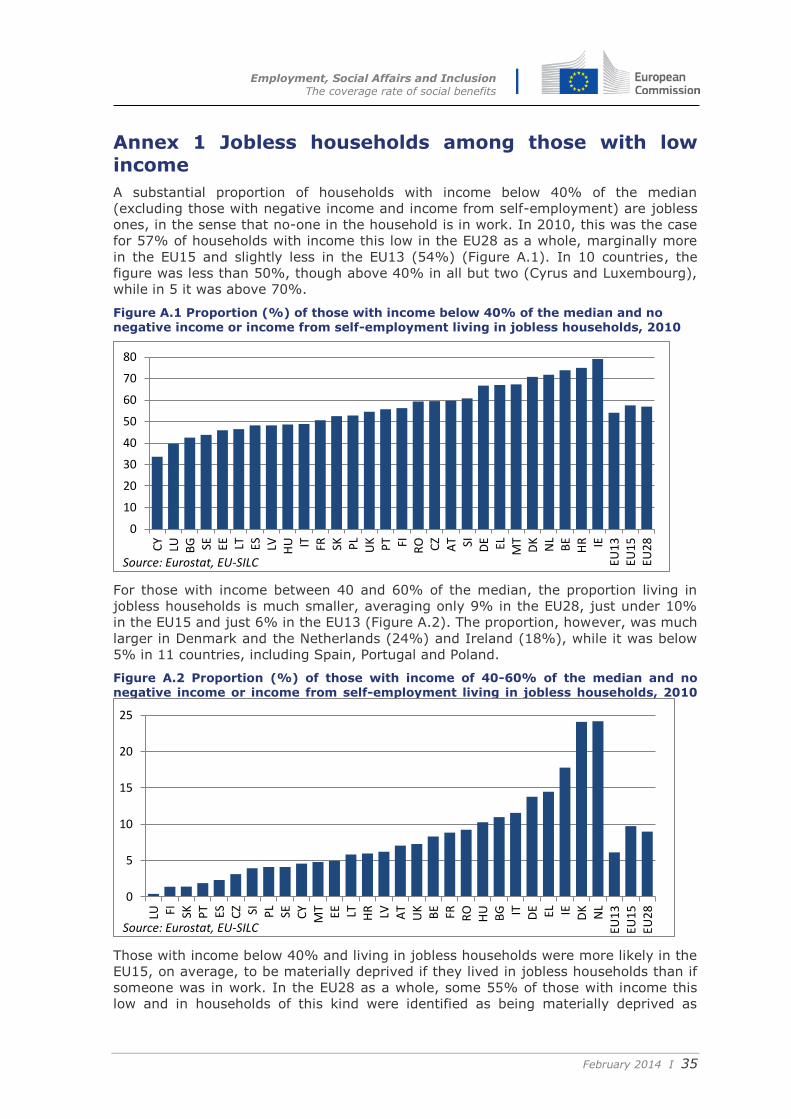
Employment, Social Affairs and Inclusion The coverage rate of social benefits
February 2014 I 35
Annex 1 Jobless households among those with low income
A substantial proportion of households with income below 40% of the median
(excluding those with negative income and income from self-employment) are jobless
ones, in the sense that no-one in the household is in work. In 2010, this was the case
for 57% of households with income this low in the EU28 as a whole, marginally more
in the EU15 and slightly less in the EU13 (54%) (Figure A.1). In 10 countries, the
figure was less than 50%, though above 40% in all but two (Cyrus and Luxembourg),
while in 5 it was above 70%.
Figure A.1 Proportion (%) of those with income below 40% of the median and no
negative income or income from self-employment living in jobless households, 2010
For those with income between 40 and 60% of the median, the proportion living in
jobless households is much smaller, averaging only 9% in the EU28, just under 10%
in the EU15 and just 6% in the EU13 (Figure A.2). The proportion, however, was much
larger in Denmark and the Netherlands (24%) and Ireland (18%), while it was below
5% in 11 countries, including Spain, Portugal and Poland.
Figure A.2 Proportion (%) of those with income of 40-60% of the median and no negative income or income from self-employment living in jobless households, 2010
Those with income below 40% and living in jobless households were more likely in the
EU15, on average, to be materially deprived if they lived in jobless households than if
someone was in work. In the EU28 as a whole, some 55% of those with income this
low and in households of this kind were identified as being materially deprived as
0
10
20
30
40
50
60
70
80
CY
LU BG SE EE LT ES LV HU IT FR SK PL
UK PT FI RO CZ
AT SI DE EL MT
DK
NL
BE
HR IE
EU1
3EU
15
EU2
8
Source: Eurostat, EU-SILC
0
5
10
15
20
25
LU FI SK PT ES CZ SI PL
SE CY
MT EE LT HR LV AT
UK
BE
FR RO
HU
BG IT DE EL IE DK
NL
EU1
3EU
15
EU2
8
Source: Eurostat, EU-SILC
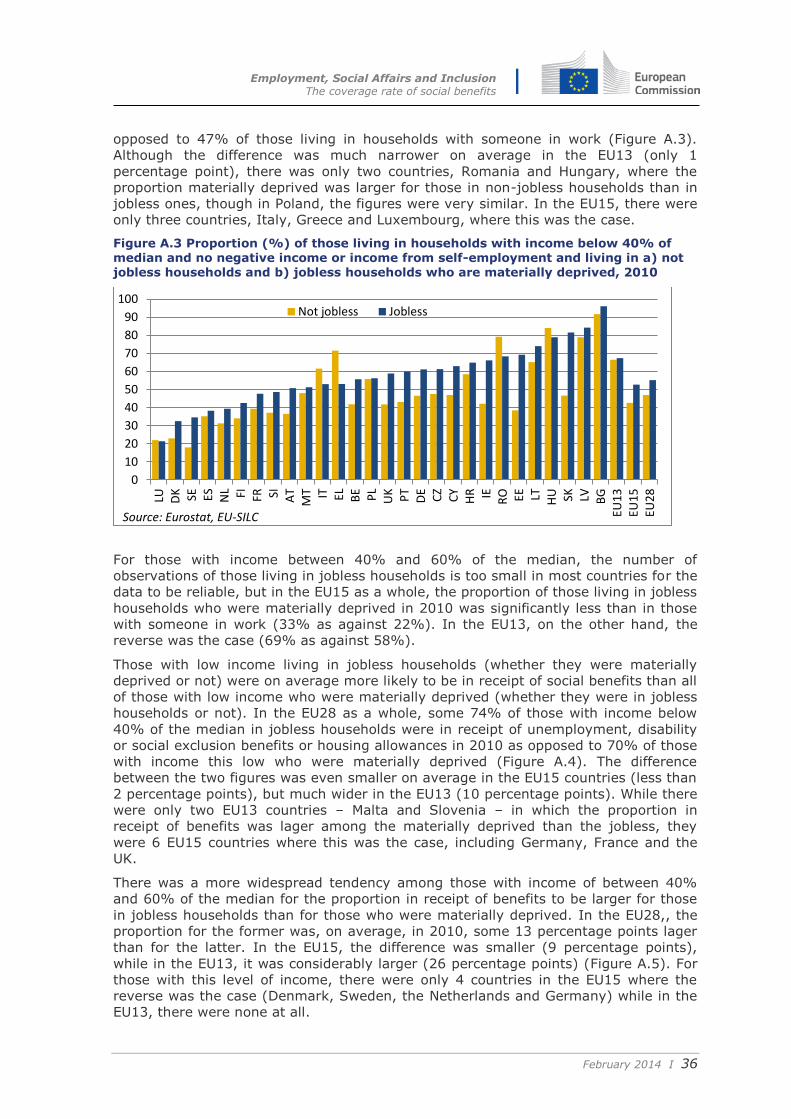
Employment, Social Affairs and Inclusion The coverage rate of social benefits
February 2014 I 36
opposed to 47% of those living in households with someone in work (Figure A.3).
Although the difference was much narrower on average in the EU13 (only 1
percentage point), there was only two countries, Romania and Hungary, where the
proportion materially deprived was larger for those in non-jobless households than in
jobless ones, though in Poland, the figures were very similar. In the EU15, there were
only three countries, Italy, Greece and Luxembourg, where this was the case.
Figure A.3 Proportion (%) of those living in households with income below 40% of median and no negative income or income from self-employment and living in a) not jobless households and b) jobless households who are materially deprived, 2010
For those with income between 40% and 60% of the median, the number of
observations of those living in jobless households is too small in most countries for the
data to be reliable, but in the EU15 as a whole, the proportion of those living in jobless
households who were materially deprived in 2010 was significantly less than in those
with someone in work (33% as against 22%). In the EU13, on the other hand, the
reverse was the case (69% as against 58%).
Those with low income living in jobless households (whether they were materially
deprived or not) were on average more likely to be in receipt of social benefits than all
of those with low income who were materially deprived (whether they were in jobless
households or not). In the EU28 as a whole, some 74% of those with income below
40% of the median in jobless households were in receipt of unemployment, disability
or social exclusion benefits or housing allowances in 2010 as opposed to 70% of those
with income this low who were materially deprived (Figure A.4). The difference
between the two figures was even smaller on average in the EU15 countries (less than
2 percentage points), but much wider in the EU13 (10 percentage points). While there
were only two EU13 countries – Malta and Slovenia – in which the proportion in
receipt of benefits was lager among the materially deprived than the jobless, they
were 6 EU15 countries where this was the case, including Germany, France and the
UK.
There was a more widespread tendency among those with income of between 40%
and 60% of the median for the proportion in receipt of benefits to be larger for those
in jobless households than for those who were materially deprived. In the EU28,, the
proportion for the former was, on average, in 2010, some 13 percentage points lager
than for the latter. In the EU15, the difference was smaller (9 percentage points),
while in the EU13, it was considerably larger (26 percentage points) (Figure A.5). For
those with this level of income, there were only 4 countries in the EU15 where the
reverse was the case (Denmark, Sweden, the Netherlands and Germany) while in the
EU13, there were none at all.
0
10
20
30
40
50
60
70
80
90
100
LU DK SE ES NL FI FR SI AT
MT IT EL BE PL
UK PT
DE
CZ
CY
HR IE RO EE LT HU SK LV BG
EU1
3EU
15
EU2
8
Not jobless Jobless
Source: Eurostat, EU-SILC
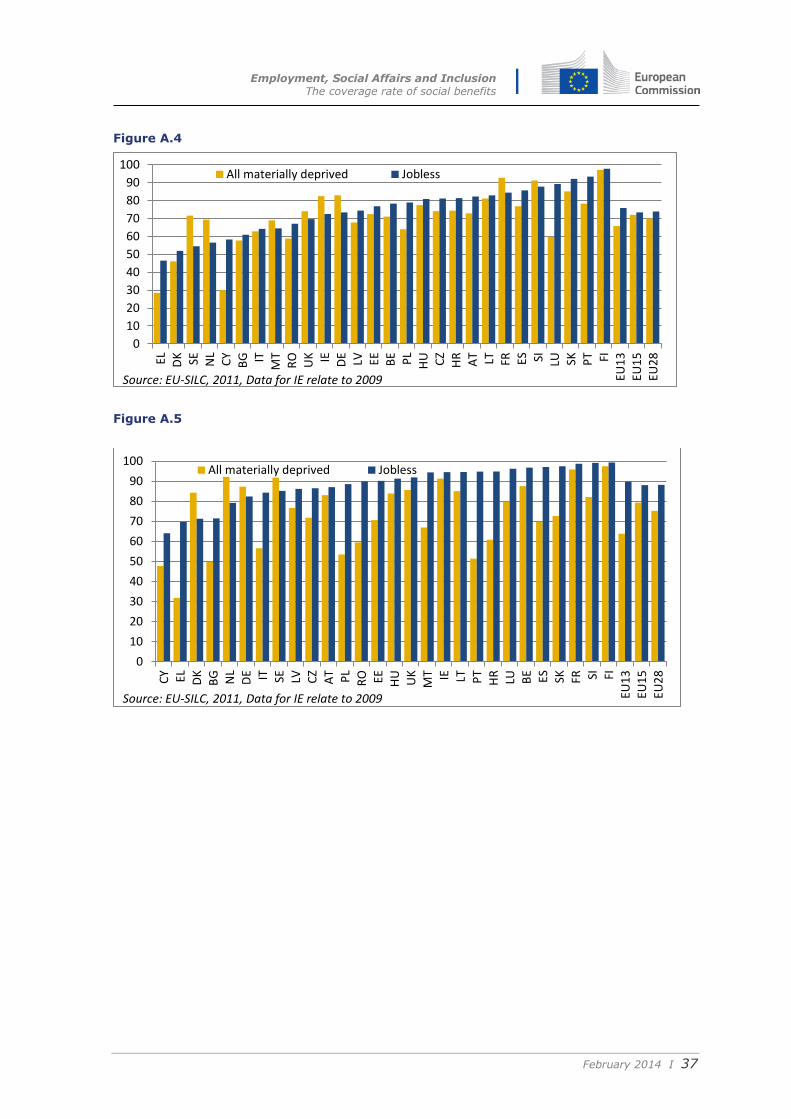
Employment, Social Affairs and Inclusion The coverage rate of social benefits
February 2014 I 37
Figure A.4
Figure A.5
0
10
20
30
40
50
60
70
80
90
100EL DK SE NL
CY
BG IT
MT
RO UK IE DE LV EE BE PL
HU CZ
HR
AT LT FR ES SI LU SK PT FI
EU1
3EU
15
EU2
8
All materially deprived Jobless
Source: EU-SILC, 2011, Data for IE relate to 2009
0
10
20
30
40
50
60
70
80
90
100
CY EL DK
BG NL
DE IT SE LV CZ
AT PL
RO EE HU
UK
MT IE LT PT
HR
LU BE ES SK FR SI FI
EU1
3EU
15
EU2
8
All materially deprived Jobless
Source: EU-SILC, 2011, Data for IE relate to 2009
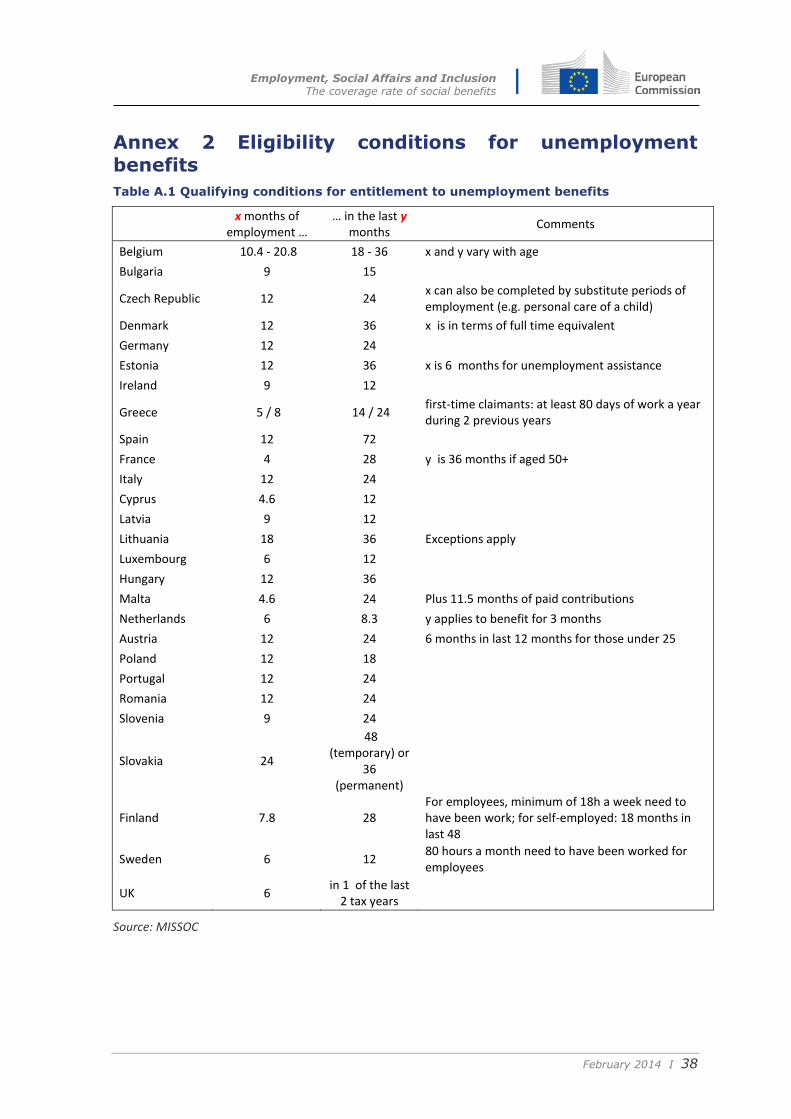
Employment, Social Affairs and Inclusion The coverage rate of social benefits
February 2014 I 38
Annex 2 Eligibility conditions for unemployment benefits
Table A.1 Qualifying conditions for entitlement to unemployment benefits
x months of
employment … … in the last y
months Comments
Belgium 10.4 - 20.8 18 - 36 x and y vary with age
Bulgaria 9 15
Czech Republic 12 24 x can also be completed by substitute periods of employment (e.g. personal care of a child)
Denmark 12 36 x is in terms of full time equivalent
Germany 12 24
Estonia 12 36 x is 6 months for unemployment assistance
Ireland 9 12
Greece 5 / 8 14 / 24 first-time claimants: at least 80 days of work a year during 2 previous years
Spain 12 72
France 4 28 y is 36 months if aged 50+
Italy 12 24
Cyprus 4.6 12
Latvia 9 12
Lithuania 18 36 Exceptions apply
Luxembourg 6 12
Hungary 12 36
Malta 4.6 24 Plus 11.5 months of paid contributions
Netherlands 6 8.3 y applies to benefit for 3 months
Austria 12 24 6 months in last 12 months for those under 25
Poland 12 18
Portugal 12 24
Romania 12 24
Slovenia 9 24
Slovakia 24
48 (temporary) or
36 (permanent)
Finland 7.8 28 For employees, minimum of 18h a week need to have been work; for self-employed: 18 months in last 48
Sweden 6 12 80 hours a month need to have been worked for employees
UK 6 in 1 of the last
2 tax years
Source: MISSOC
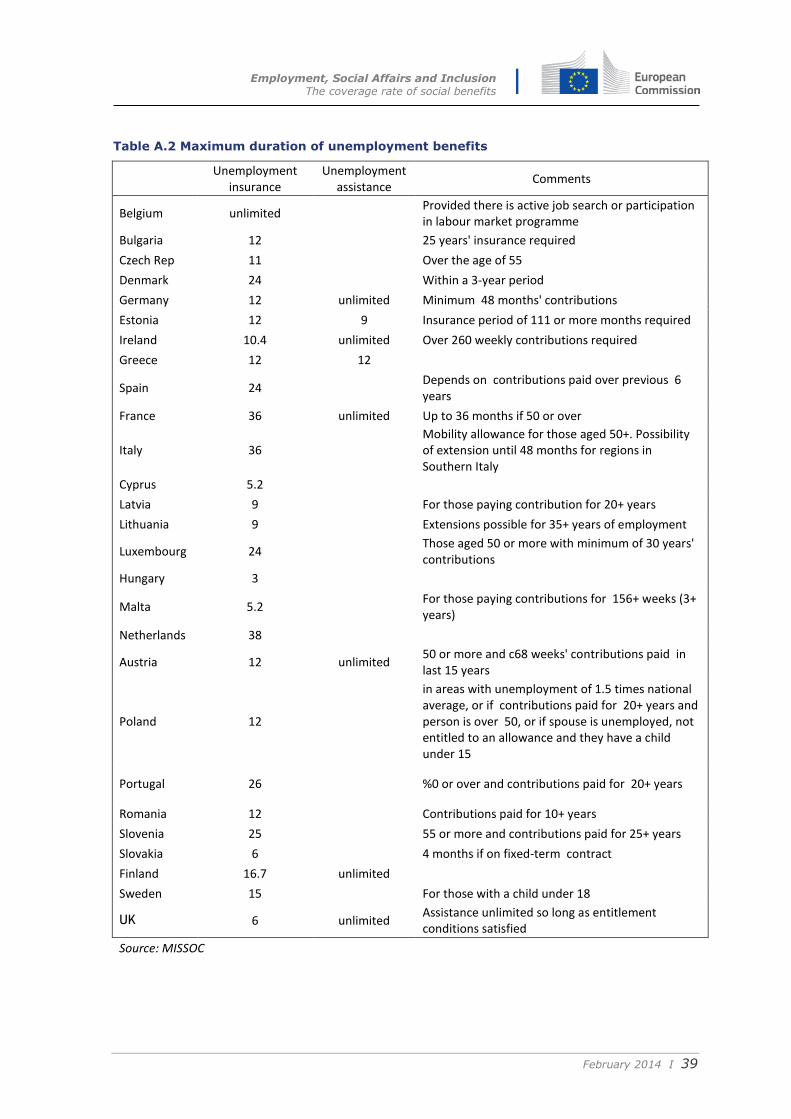
Employment, Social Affairs and Inclusion The coverage rate of social benefits
February 2014 I 39
Table A.2 Maximum duration of unemployment benefits
Unemployment
insurance Unemployment
assistance Comments
Belgium unlimited Provided there is active job search or participation in labour market programme
Bulgaria 12
25 years' insurance required
Czech Rep 11
Over the age of 55
Denmark 24
Within a 3-year period
Germany 12 unlimited Minimum 48 months' contributions
Estonia 12 9 Insurance period of 111 or more months required
Ireland 10.4 unlimited Over 260 weekly contributions required
Greece 12 12
Spain 24
Depends on contributions paid over previous 6 years
France 36 unlimited Up to 36 months if 50 or over
Italy 36
Mobility allowance for those aged 50+. Possibility of extension until 48 months for regions in Southern Italy
Cyprus 5.2
Latvia 9
For those paying contribution for 20+ years
Lithuania 9
Extensions possible for 35+ years of employment
Luxembourg 24
Those aged 50 or more with minimum of 30 years' contributions
Hungary 3
Malta 5.2
For those paying contributions for 156+ weeks (3+ years)
Netherlands 38
Austria 12 unlimited 50 or more and c68 weeks' contributions paid in last 15 years
Poland 12
in areas with unemployment of 1.5 times national average, or if contributions paid for 20+ years and person is over 50, or if spouse is unemployed, not entitled to an allowance and they have a child under 15
Portugal 26
%0 or over and contributions paid for 20+ years
Romania 12
Contributions paid for 10+ years
Slovenia 25
55 or more and contributions paid for 25+ years
Slovakia 6
4 months if on fixed-term contract
Finland 16.7 unlimited
Sweden 15
For those with a child under 18
UK 6 unlimited Assistance unlimited so long as entitlement conditions satisfied
Source: MISSOC