the commercial success of innovations: an econometric analysis at the firm lebel in french...
TRANSCRIPT

ANNALES D’ECONOMIE ET DE STATISTIQUE. – N� 49/50 — 1998
The CommercialSuccess of Innovations:an Econometric Analysis
at the Firm Levelin French Manufacturing
Corinne BARLET, Emmanuel DUGUET,David ENCAOUA, Jacqueline PRADEL*
ABSTRACT. – This paper offers some empirical evidence on how do product and processinnovations affect manufacturing sales and exports. Accounting for differences in technologicalopportunities between industries, and the ”market pull” or “technology push” nature of firms’innovations, we explain the share of new products in total sales and exports by the innovationtypes firms have implemented. The data come from the French Ministry of Industry’s Innovationsurvey 1986-1990. The left-hand variables are the sales revenues and the export revenues of thefirms that are attributable to products introduced within the last 5 years. Given that the surveyreports only interval data, our estimates were obtained by maximum likelihood on the orderedprobit model. The following results are obtained: (i) The contribution of products less than 5years old is lower to overall exports than to total sales but the innovative content is stronger inexports than in domestic sales; (ii) The greater the underlying technological opportunities, theless successful are product imitations; (iii) Both domestic sales and exports are mostly made ofproduct improvements; (iv) Firm size has a positive effect on innovation output only when thetechnological opportunity is strong.
De quoi d epend le succ es commercial des innovations?Une analyse econom etrique sur donn ees d’entreprises
RESUME. – Cet article se propose de repondre sur le plan empirique a la question suivante :Comment les innovations de produits et de procedes affectent-elles les ventes et les exportations del’industrie manufacturiere ? En tenant compte des differences sectorielles en termes d’opportunitestechnologiques et des differences entre entreprises selon que leurs innovations sont induites parle marche ou par la technologie, nous expliquons la part des ventes et des exportations enproduits innovants par les differents types d’innovations que les entreprises ont mis en œuvre.Les donnees proviennent de l’Enquete Innovation realisee par le Ministere de l’Industrie sur laperiode 1986-1990. Les variables expliquees, la part des ventes et des exportations en produits demoins de cinq ans sont disponibles dans cette enquete sous forme qualitative. L’utilisation de cetype de variable expliquee necessite la mise en oeuvre de methodes econometriques specifiques.Les estimations, par le maximum de vraisemblance, d’un modele probit polytomique ordonne nouspermettent de parvenir aux conclusions suivantes : (i) La part des produits de moins de cinq ansest plus faible dans les ventes a l’exportations que dans les ventes totales mais le contenu deces produits est plus novateur ; (ii) plus les opportunites d’innovation technologique d’un secteursont elevees, moins les entreprises ont la possibilite de recourir a l’imitation ; (iii) l’amelioration deproduit, innovation intermediaire entre l’imitation et la mise sur le marche d’un produit nouveau,joue de maniere generale un role dominant dans les ventes et les exportations ; (iv) la taille desentreprises n’affecte positivement l’innovation que dans les activites de haute technologie.
* C. BARLET : CEME-Universite de Paris 1, CRESE-Universite de Besancon ;E. DUGUET : CEME-Universite de Paris 1, INSEE-DMSE. D. ENCAOUA et J. PRADEL :CEME-Universite de Paris 1.We thank W. J. ADAMS, B. H. HALL, N. IUNG, F. LAISNEY, F. MELESE and two anonymousreferees for helpful suggestions and comments as well as the participants at the XthADRES Conference on the Economics and Econometrics of Innovation (Strasbourg,June 1996) and at the XIVth Journees de Microeconomie Appliquee (Marrakech,May 1997). The usual disclaimer applies.

1 Introduction
Economic effects of innovation are often appraised in the context of laboror total factor productivity (GRILICHES, [1986]; HALL and MAIRESSE, [1995]).This permits the evaluation of the impact of innovation on productiveefficiency, but it ignores the degree to which an innovation is receivedfavorably in the marketplace. Yet, commercial success is a crucial aspectof product innovations. Potential innovators often face considerable productmarket risk as they make their R&D decisions. In fact, it is preciselythe existence of product market risk that distinguishes product innovationfrom product invention. Such risk explains why product innovators seeklinkages with potential customers well before their innovations are readyfor market. The success of an innovator’s R&D project depends heavily onacceptance in the marketplace. In the case of a firm that produces a largenumber of products, introduced at various points in time, the commercialsuccess of these innovations can be measured in terms of the sales revenueof the firm that is attributable to products introduced relatively recently –say, within the last five years. We shall refer to this measure, defined asa fraction of total revenue, as the new product ratio (NPR) of the firm.Although business enterprises attach a great deal of importance to NPR, ithas received little attention in the applied econometric literature given therelative scarcity of data.
The purpose of this paper is to study the determinants of commercialsuccess of various product innovation strategies using NPR as the measureof commercial success. It is important to know why firms differ in thecommercial success they derive from their innovations. On the one hand,such an understanding reveals the compatibility of research incentives andmarket performance. It reveals how the ex ante market risk of productinnovation gets resolved after innovation occurs. On the other hand, NPRis a unique feature of business enterprises. At any given moment, each firmoffers a variety of products for sale, each one conceived and introduced ina different period. NPR can be interpreted as a measure of the firm’s abilityto replenish its stock of products. The larger NPR, the greater the degreeto which the firm has replenished its stock of products, and the lower theaverage age of its products.
The first question of interest is whether different types of innovation enjoydifferent degrees of commercial success. Innovations can be distinguishedon the basis of their degree of novelty. Novelty is a concept difficultto define precisely, but the intuition behind it is quickly understood byexploring some of its properties. To begin with, the degree of novelty is anordinal concept, implying a value judgment on the degree of novelty of theinnovation. Second, this judgment might differ depending on whether one’spoint of view is that of the innovator or that of the marketplace. Let usexamine three types of product innovations, ranked in order of increasingnovelty from the consumer’s point of view.
First, a firm can launch a product that is new for the firm but not forthe market. In other words the firm can launch a product that has close
458

substitutes already offered by other firms. For example, a pharmaceuticalfirm might introduce a new antihistamine. The firm is seeking to broadenits product line to include antihistamines, but very similar antihistaminesare already offered by other pharmaceutical companies.
Second, a firm can launch a product that represents considerably higherquality than other versions of the product that already exist in themarketplace. The other versions of the product might be those of thefirm itself. Returning to the example presented in the previous paragraph, apharmaceutical company might introduce a new antihistamine that representsconsiderable therapeutic improvement over the other antihistamines alreadyoffered by the firm. From the firm’s perspective, such an innovation mightbe considered a product improvement; from the market’s perspective, itmight be considered a real novelty.
Third, a firm can launch a product that is new both for the firm and forthe market. This is the most novel of all new products.
This categorization of new products can also be used in the context ofnew methods of production. Some new methods represent improvements onexisting methods. Others embody greater novelty such as a technologicalbreakthrough in production methods.
With these categories in mind, the first goal of the paper is to explore theeffects of product novelty on the degree of commercial success. A priori,one can imagine two distinct and opposite effects. The first, which onemight call theinertia effect, suggests that the greater the novelty the greaterthe risk. The market’s acceptance of novel products will occur only verygradually over time. The second effect, which one might call theefficiencyeffect, suggests that novelty is valued, at least to the extent to which itresponds to market demand. Knowledge of how these two effects balanceout in practice will improve our understanding of innovative strategy.
One can also evaluate the effects of innovations on commercial successusing other schemes of categorization. These include whether the innovationis product or process in nature, and whether the innovation is market- orknowledge- driven (demand- pull or technology push in nature, SCHMOOKLER
[1966]).
The effect of different types of innovation on commercial performancelikely depends on the specific economic environment facing the firm. Forexample, underlying technological opportunities differ among industries.Technological opportunity is another concept that is difficult to defineprecisely but easy to describe intuitively. Technological opportunity of anindustry relates to its innovative potential. The innovative potential of anindustry depends on the stock of, and rate of change of the correspondingscientific base. It also depends on the level and rate of change of the demandfor differentiated products embodied in the demand function.
Here we study the effect of novelty on commercial performance whilecontrolling for technological opportunity. If the inertia effect prevails whenthere are little technological opportunities, while the efficiency effect prevailswhen there are abundant technological opportunities, then novelty is likelyto reduce commercial performance in the former case and increase it inthe latter.
THE COMMERCIAL SUCCESS OF INNOVATIONS 459
Until now, commercial success has been defined in terms of NPR – thevalue of new products as a fraction of total sales. But total sales includeboth domestic and foreign sales. It may well be that the determinants ofcommercial success differ between the two markets. Foreign markets caneither be more or less receptive to novelty than their domestic counterpart.If the domestic market is the more receptive to novelty, one would expectthe firm to concentrate sales of its newest products at home. If this is thecase, then the existence of a domestic market ready to absorb new productscould be a crucial prerequisite to high levels of export performance.
To study these questions we use the Innovation Survey in Frenchmanufacturing firms that covers the period 1986-1990. Most of the data inthe survey are available only in ordinal form. For example, NPR is notmeasured continuously in the interval [0,1]; rather, the interval is dividedarbitrarily into several sub- intervals, and each firm is then assigned to answerin one of those sub- intervals. As a result, it is necessary to use orderedprobit methods, applied to transforms of the primitive ordinal variables.
The article is organized as follows: section 2 describes the datasetand the economic specification of the model. Section 3 describes theestimation procedure. Section 4 presents the empirical results regarding thedeterminants of NPR. Section 5 presents the empirical results regarding thedeterminants of export NPR. Conclusions appear in section 6.
2 Types of Innovation, TechnologicalOpportunities and the New ProductRatio
2.1. Sources, Data and Variables Definitions
The main variables used in this paper come from the Innovation Survey,gathered by the French Ministry of Industry in 1991. The survey consists ofa qualitative questionnaire on the different types of innovation implementedby manufacturing firms in France over the period 1986- 90. Unfortunately,no yearly information was collected for the period.
The first question focused on the different types of product and processinnovations introduced by firms over the five-year period from January1986 to December 1990. Product and process innovations are distinguishedaccording to their degree of novelty. Each firm was asked to answer thefollowing three questions with a “yes” or a “no”:
During the last five years, has the firm:
– substantially improved, from a technological viewpoint, on existing products?
(“yes” or “no”)
460
– launched new products embodying technological innovations (excluding packaging)that were :
– new for the firm but not for the market? (“yes” or “no”)– new for the firm and for the market? (“yes” or “no”)
Two additional questions are related to the process innovation types whichoccurred during the same five-year period:
– has the firm implemented a technological breakthrough? (“yes” or “no”)– has the firm substantially improved, from a technological viewpoint, on existingproduction methods? (“yes” or “no”)
Thus, five innovation types are introduced in the analysis. From themarket point of view, the degree of novelty allows a ranking of productinnovations from products new for the firm and for the market, followed byproducts substantially improved and products which are new for the firmbut not for the market.
The other questions are related to “market pull”, “technology push” andthe innovative potential of the firm’s activity. At the firm level, marketpull and technology push variables are provided through the answers to thefollowing questions:
Does your firm estimate that innovation is determined by:– market impetus (relationships with customers, competitors) (“no”, “weakly”,“moderately” or “strongly”)– the own dynamics of technology (“no”, “weakly”, “moderately” or “strongly”)
The question regarding the innovative potential of the firm’s activity,which Dasgupta (1986) calls “technological opportunity” of the industry is:
Do you consider that your activity is technologically:– not innovative– weakly innovative– moderately innovative– strongly innovative
The technological opportunities for undertaking innovations are clearlylinked to advances in basic scientific knowledge. ROSENBERG [1974] hasemphasized the importance of progress in the underlying scientific base forfacilitating innovative possibilities. We have grouped the first two levelsof responses (" no " and " weakly ") so that we classify firms into threecategories1.
Our dependent variable is the New Product Ratio (NPR). In the Innovationsurvey, it is a categorical variable, given into four classes: 0-10%, 10-30%,30-70% and 70-100%. NPR is defined as the share of sales revenuesattributable to product innovations introduced within the last five years.
1. This question is an assessment of the technological opportunities of theactivity of the firm,not of the firm itself. Indeed, the questionnaire includes two questions about technologicalopportunities: one on the activity of the firm and one on the firm itself. Since our innovationvariables already assess the innovation level of the firm, we have kept the environment variableonly.
THE COMMERCIAL SUCCESS OF INNOVATIONS 461

2.2. Description of the Sample and Preliminary Evi-dence
In order to assess the importance of NPR we have selected the responses offirms which were product innovators. Moreover, as the whole questionnaireis related to the 5-year period 1986-1990, we have kept the firms that werepresent in the same period. After these two selections, our sample includes5402 manufacturing firms.
The median firm in the sample is relatively small with sales ofFRF 43 millions2 in 1989 (table 1). However, since the mean is muchhigher than the median (293 millions of FRF), the distribution of firm sizein the sample is skewed. Moreover, the median and average firm sizesvary according to innovation types. The largest firms have implemented themost innovative products and processes. For instance, firms that claim tohave implemented a technological breakthrough have median sales of 60FRF millions and average sales of 600 FRF millions. A difference of thesame order of magnitude exists between firms that launched new productsin the market and those that didn’t. As a result, we have to control fordifferences in firm size when we estimate the model. Since similar dataexists for industries, along with our measure of firm size, we include 18industry dummies in each of our regressions.
The first table shows the distribution of the New Product Ratio for totalsales. Firms that have implemented process breakthroughs or launched newproducts appear to have a higher NPR. But since they also have a differentsize and operate in different industries, only a regression that controls forthese two effects can tell us if these innovation types explain the successof innovation in the marketplace.
The second part of table 1 shows the marginal and conditional frequenciesfor each innovation type. These frequencies are similar to the correlationanalysis for qualitative data (although the frequencies are not symmetric).More common innovations tend to be less innovative, which is not surprising.More interesting is the finding that the introduction of the most novelinnovations – either product or process – are strongly correlated. But therelation is not symmetric: while 43% of the firms that launched a newproduct on the market also implemented a process breakthrough, 75% ofprocess breakthrough firms also launched a new product on the market.
These results suggest that it is harder to change a process without changingthe product than to change the product while improving on the productionprocess. Globally, the data exhibit imperfect correlations between productand process innovations. This explains why we introduce both product andprocess innovations in our model when explaining the commercial successof product innovations. A more innovative process may contribute to thesuccess of a new product by, say, lowering its price or allowing for strongerscale economies. It may also be the only way to produce the new good.
2. About 8.6 USD millions (1 USD 5 FRF).
462
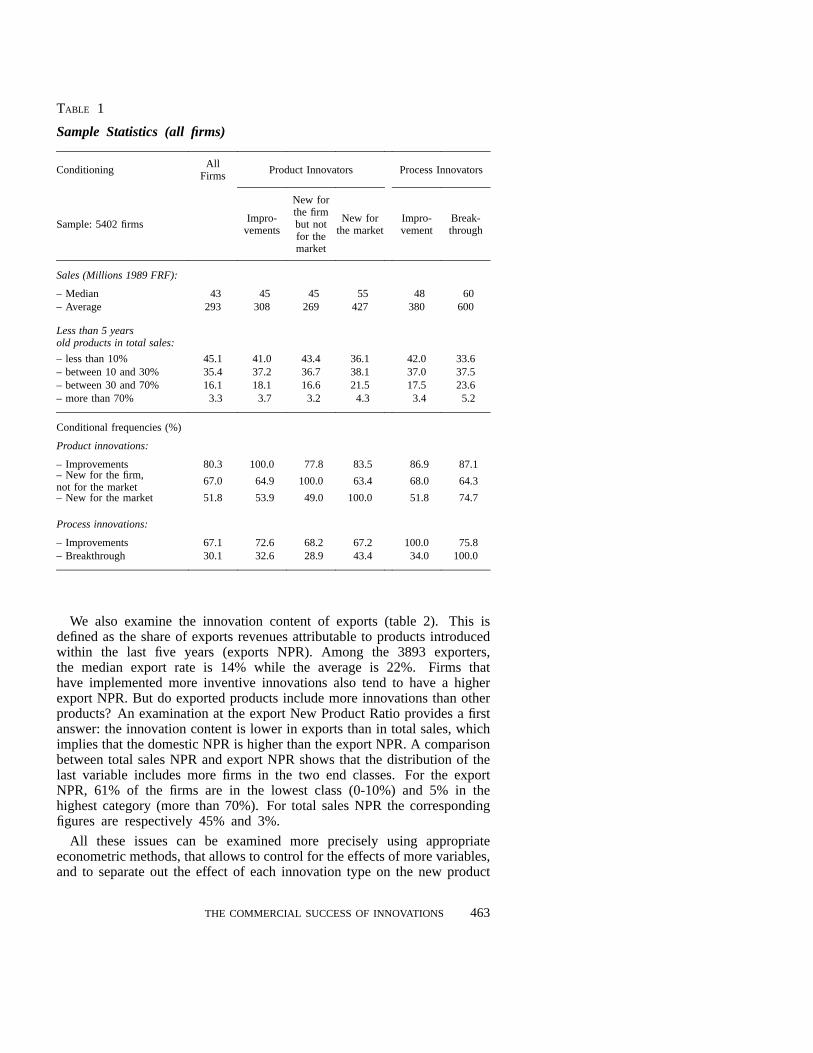
TABLE 1
Sample Statistics (all firms)
ConditioningAll
FirmsProduct Innovators Process Innovators
Sample: 5402 firmsImpro-
vements
New forthe firmbut notfor themarket
New forthe market
Impro-vement
Break-through
Sales (Millions 1989 FRF):
– Median 43 45 45 55 48 60– Average 293 308 269 427 380 600
Less than 5 yearsold products in total sales:
– less than 10% 45.1 41.0 43.4 36.1 42.0 33.6– between 10 and 30% 35.4 37.2 36.7 38.1 37.0 37.5– between 30 and 70% 16.1 18.1 16.6 21.5 17.5 23.6– more than 70% 3.3 3.7 3.2 4.3 3.4 5.2
Conditional frequencies (%)
Product innovations:
– Improvements 80.3 100.0 77.8 83.5 86.9 87.1– New for the firm,not for the market
67.0 64.9 100.0 63.4 68.0 64.3
– New for the market 51.8 53.9 49.0 100.0 51.8 74.7
Process innovations:
– Improvements 67.1 72.6 68.2 67.2 100.0 75.8– Breakthrough 30.1 32.6 28.9 43.4 34.0 100.0
We also examine the innovation content of exports (table 2). This isdefined as the share of exports revenues attributable to products introducedwithin the last five years (exports NPR). Among the 3893 exporters,the median export rate is 14% while the average is 22%. Firms thathave implemented more inventive innovations also tend to have a higherexport NPR. But do exported products include more innovations than otherproducts? An examination at the export New Product Ratio provides a firstanswer: the innovation content is lower in exports than in total sales, whichimplies that the domestic NPR is higher than the export NPR. A comparisonbetween total sales NPR and export NPR shows that the distribution of thelast variable includes more firms in the two end classes. For the exportNPR, 61% of the firms are in the lowest class (0-10%) and 5% in thehighest category (more than 70%). For total sales NPR the correspondingfigures are respectively 45% and 3%.
All these issues can be examined more precisely using appropriateeconometric methods, that allows to control for the effects of more variables,and to separate out the effect of each innovation type on the new product
THE COMMERCIAL SUCCESS OF INNOVATIONS 463
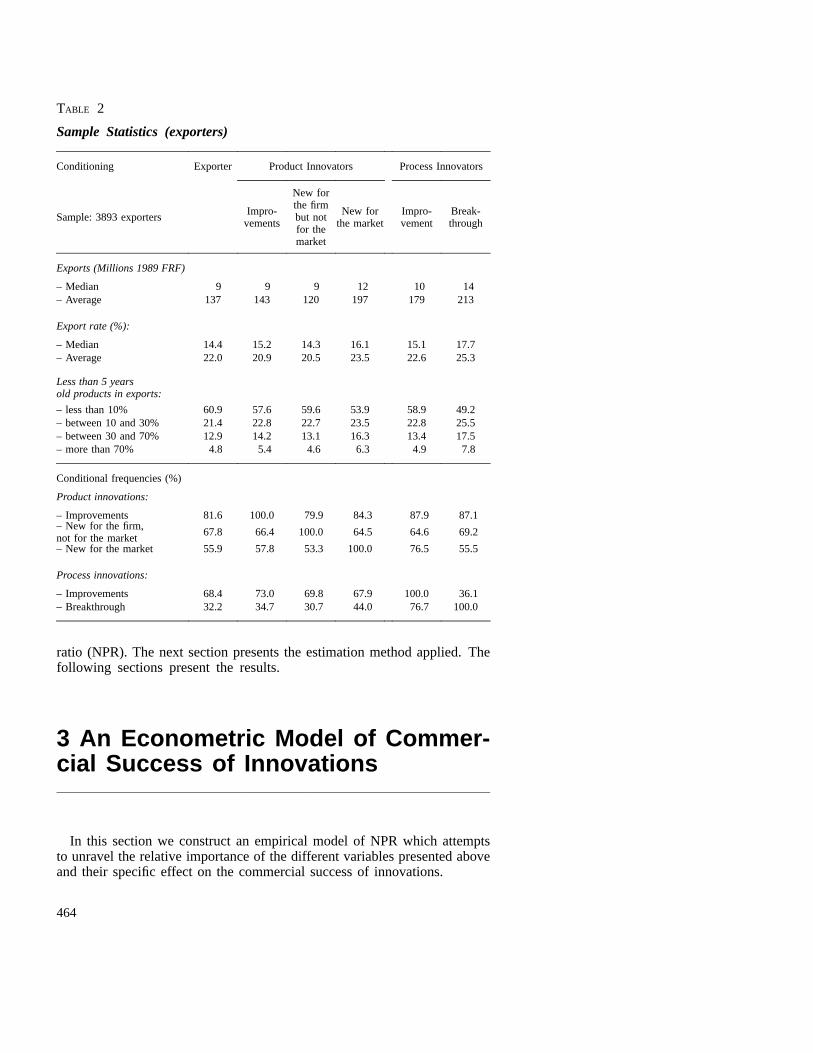
TABLE 2
Sample Statistics (exporters)
Conditioning Exporter Product Innovators Process Innovators
Sample: 3893 exportersImpro-
vements
New forthe firmbut notfor themarket
New forthe market
Impro-vement
Break-through
Exports (Millions 1989 FRF)
– Median 9 9 9 12 10 14– Average 137 143 120 197 179 213
Export rate (%):
– Median 14.4 15.2 14.3 16.1 15.1 17.7– Average 22.0 20.9 20.5 23.5 22.6 25.3
Less than 5 yearsold products in exports:
– less than 10% 60.9 57.6 59.6 53.9 58.9 49.2– between 10 and 30% 21.4 22.8 22.7 23.5 22.8 25.5– between 30 and 70% 12.9 14.2 13.1 16.3 13.4 17.5– more than 70% 4.8 5.4 4.6 6.3 4.9 7.8
Conditional frequencies (%)
Product innovations:
– Improvements 81.6 100.0 79.9 84.3 87.9 87.1– New for the firm,not for the market
67.8 66.4 100.0 64.5 64.6 69.2
– New for the market 55.9 57.8 53.3 100.0 76.5 55.5
Process innovations:
– Improvements 68.4 73.0 69.8 67.9 100.0 36.1– Breakthrough 32.2 34.7 30.7 44.0 76.7 100.0
ratio (NPR). The next section presents the estimation method applied. Thefollowing sections present the results.
3 An Econometric Model of Commer-cial Success of Innovations
In this section we construct an empirical model of NPR which attemptsto unravel the relative importance of the different variables presented aboveand their specific effect on the commercial success of innovations.
464
3.1. The Model
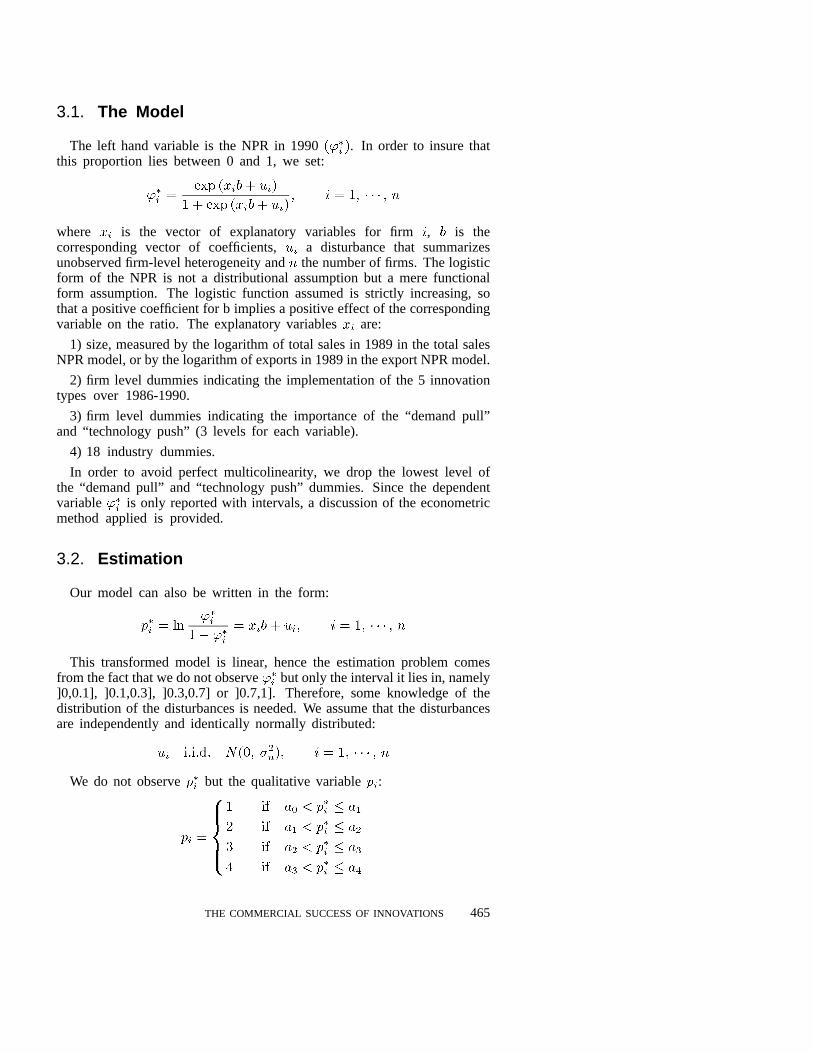
The left hand variable is the NPR in 1990 . In order to insure thatthis proportion lies between 0 and 1, we set:
where is the vector of explanatory variables for firm, is thecorresponding vector of coefficients, a disturbance that summarizesunobserved firm-level heterogeneity andthe number of firms. The logisticform of the NPR is not a distributional assumption but a mere functionalform assumption. The logistic function assumed is strictly increasing, sothat a positive coefficient for b implies a positive effect of the correspondingvariable on the ratio. The explanatory variablesare:
1) size, measured by the logarithm of total sales in 1989 in the total salesNPR model, or by the logarithm of exports in 1989 in the export NPR model.
2) firm level dummies indicating the implementation of the 5 innovationtypes over 1986-1990.
3) firm level dummies indicating the importance of the “demand pull”and “technology push” (3 levels for each variable).
4) 18 industry dummies.
In order to avoid perfect multicolinearity, we drop the lowest level ofthe “demand pull” and “technology push” dummies. Since the dependentvariable is only reported with intervals, a discussion of the econometricmethod applied is provided.
3.2. Estimation
Our model can also be written in the form:
This transformed model is linear, hence the estimation problem comesfrom the fact that we do not observe but only the interval it lies in, namely]0,0.1], ]0.1,0.3], ]0.3,0.7] or ]0.7,1]. Therefore, some knowledge of thedistribution of the disturbances is needed. We assume that the disturbancesare independently and identically normally distributed:
We do not observe but the qualitative variable :
THE COMMERCIAL SUCCESS OF INNOVATIONS 465

with , , , and. The log-likelihood of the sample comes directly from the
underlying model and is given by:
with
where is the cdf of the standard normal3 distribution. Notice that,when the thresholds are known, the standard error of the disturbancesis identified. We estimate this model by maximum likelihood under SAS-IML 4. Two goodness-of-fit measures are provided: the Mc Faddenandthe of the underlying linear model (denoted ), defined here as:
where is the maximum likelihood estimate of , and denotes theempirical variance5.
3.3. Direct Impact of Each Innovation Type
The relationship between the innovation ratio and the explanatoryvariables is not linear (because of the logistic transformation) so thatwe need to evaluate the impact of each innovation type, firm by firm. Weproceed as follows: let be a dummy equal to 1 if firm implemented
3. Taking the limits, we obtain the specific cases:
i 1 i u i 3 i u
4. We make the parameter change u and u so that the log-likelihood is concave inand (MADDALA , 1992). We use a Newton-Raphson algorithm with the analytical Hessian,
which is used to estimate the covariance matrix of the parameters. The original parametersand their covariance are calculated from Slutsky’s theorem once the maximum is reached. Theestimation program we use is a slight extension of %PROBITO, a SAS-IML macro commandpresented in a previous working paper (CREPON and DUGUET, 1995).
5. For a discussion of these measures and other goodness-of -fit measures, see the survey byWINDMEIJER [1995].
466
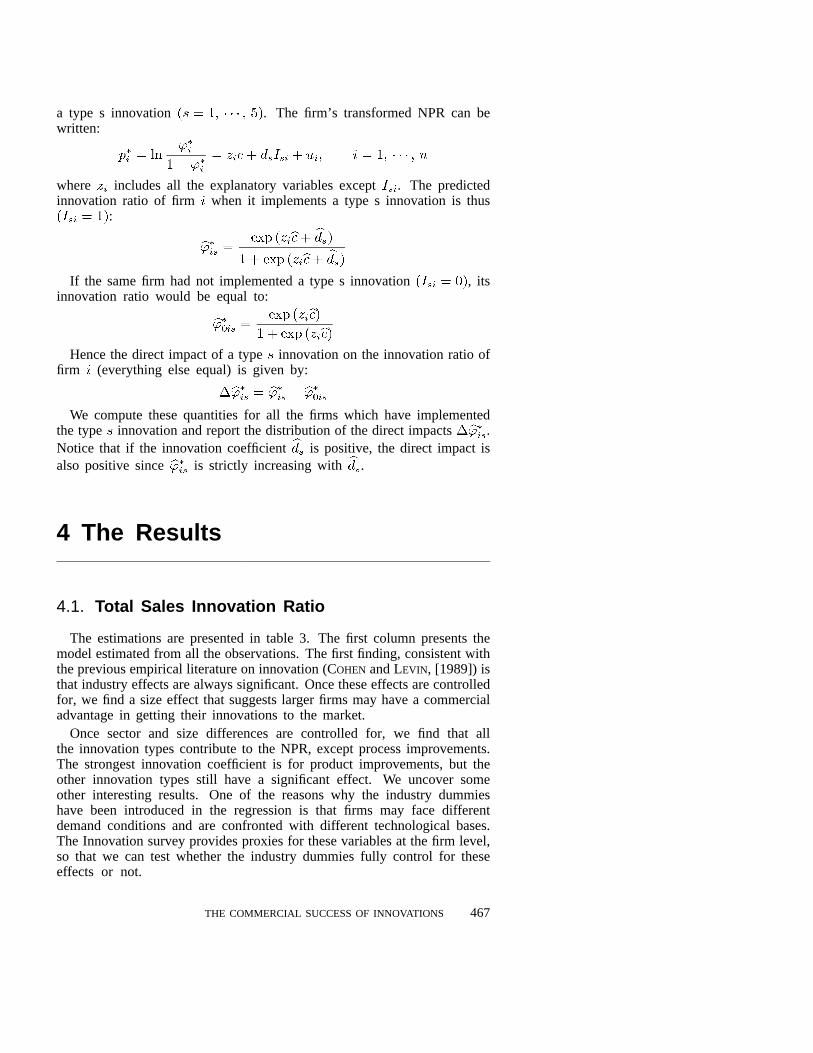
a type s innovation . The firm’s transformed NPR can bewritten:
where includes all the explanatory variables except. The predictedinnovation ratio of firm when it implements a type s innovation is thus
:
If the same firm had not implemented a type s innovation , itsinnovation ratio would be equal to:
Hence the direct impact of a typeinnovation on the innovation ratio offirm (everything else equal) is given by:
We compute these quantities for all the firms which have implementedthe type innovation and report the distribution of the direct impacts .Notice that if the innovation coefficient is positive, the direct impact isalso positive since is strictly increasing with .
4 The Results
4.1. Total Sales Innovation Ratio
The estimations are presented in table 3. The first column presents themodel estimated from all the observations. The first finding, consistent withthe previous empirical literature on innovation (COHEN and LEVIN, [1989]) isthat industry effects are always significant. Once these effects are controlledfor, we find a size effect that suggests larger firms may have a commercialadvantage in getting their innovations to the market.
Once sector and size differences are controlled for, we find that allthe innovation types contribute to the NPR, except process improvements.The strongest innovation coefficient is for product improvements, but theother innovation types still have a significant effect. We uncover someother interesting results. One of the reasons why the industry dummieshave been introduced in the regression is that firms may face differentdemand conditions and are confronted with different technological bases.The Innovation survey provides proxies for these variables at the firm level,so that we can test whether the industry dummies fully control for theseeffects or not.
THE COMMERCIAL SUCCESS OF INNOVATIONS 467

More precisely we use three new indicators. The first one, “marketpull”, indicates whether the innovation arose from a demand impetus and/orfrom rivalry. The second indicator, “technology push”, is related to theimportance of the dynamics of technology as a determinant of innovation.The last indicator, “technological opportunities”, reveals whether the firmconsiders itself to belong to a weakly, a moderately or a strongly innovativeactivity. The first two indicators are often used at the industry level inprevious empirical studies (COHEN and LEVIN, [1989]). However, until nowno such measures were available at the firm level. The third indicator isdifferent. Although the market pull and technology push indicators referto the nature of the determinants of a firm’s innovations, the technologicalopportunities variable is not a characteristic of the firm but rather of itslevel of activity. This activity is not identical to the industry. Since thefirm answers directly to the question, the activity is closer to the relevantmarket definition than the industry to which the firm belongs. Then, wecan examine whether the decomposition in 18 industries6 is enough tosummarize the sectoral variations in innovation commercial successes ornot. We find that they are not: there remains a significant heterogeneityamong firms inside the same industry.
TABLE 3
Sales from Innovations.
Left-hand variable: percentage of less than 5 years old products in total sales 1990Transformation:18 industry dummies are included in all the regressionsMaximum likelihood estimates on the ordered probit model(asymptotic statistic between parentheses)
Firm level innovation Opportunities:Estimates:
All(1)
All(2)
Weak(3)
Moderate(4)
Strong(5)
Sales logarithm 1989 0.056* 0.066* 0.004 0.046* 0.123*(12.1) (4.0) (0.11) (2.15) (3.57)
Product innovation (dummies):
– Improvement of an existing 0.379* 0.500* 0.518* 0.388* 0.003product (6.67) (9.03) (5.38) (4.94) (0.02)– New for the firm but not 0.133* 0.148* 0.200 0.193* – 0.119for the market (3.00) (3.27) (2.21) (3.36) (1.11)– New for the market 0.283* 0.410* 0.259* 0.311* 0.263*
(6.33) (9.03) (2.92) (5.47) (2.18)
Process innovation (dummies):
– Improvement of an existing 0.038 0.077 – 0.041 0.120* 0.013process (0.82) (1.62) (0.47) (1.96) (0.11)– Technological breakthrough 0.178* 0.303* 0.212 0.120* 0.256*
(3.71) (6.25) (1.93) (1.97) (2.47)
6. This industry classification is the French NAP 40.
468

TABLE 3 (continued)
Firm level innovation Opportunities:Estimates
All(1)
All(2)
Weak(3)
Moderate(4)
Strong(5)
Firm-level market pull (dummies):
– Moderate 0.217* 0.241* 0.284* 0.225* 0.038(3.04) (3.29) (2.19) (2.32) (0.20)
– Strong 0.349* 0.452* 0.501* 0.381* – 0.004(5.43) (6.88) (4.26) (4.37) (0.03)
Firm-level Technology push (dummies):
– Moderate 0.169* 0.268* 0.139 0.163* 0.273(3.45) (5.23) (1.48) (2.63) (1.85)
– Strong 0.212* 0.469* 0.084 0.235* 0.207(3.78) (8.43) (0.66) (3.24) (1.49)
Firm-level innovation opportunities (dummies):
– Moderate 0.559* – – – –(10.88)
– Strong 1.146* – – – –(16.52)
u 1.314* 1.358* 1.372* 1.231* 1.393*(62.93) (63.06) (27.05) (47.01) (31.60)
Number of firms 5 402 5 402 1 720 2 715 967
Log-likelihood – 5 628.98 – 5 767.74 – 1 436.13 – 2 940.08 – 1 201.79Test: sectoral dummiesa 649.2 669.0 130.6 280.0 123.5Mc Fadden 2 0.084 0.062 0.036 0.038 0.047Latent model 2 0.212 0.161 0.092 0.101 0.133
Estimated (%):
– 1st quartile 7.3 7.9 4.4 10.1 18.2– Median 11.5 11.5 5.9 13.2 24.0– 3rd quartile 17.2 16.6 7.8 16.6 31.6
* Significant at the 5% level.a. The null hypothesis is that the sectoral dummies can be replaced by a constant term. Underthe null the statistic is chi-square distributed with 17 degrees of freedom. The critical value atthe 5% level is 27.6.
The first column clearly shows that there are significant differencesbetween firms in the same industry: in terms of market pull, technologypush, but mostly in terms of technological opportunities. The coefficientsof the latter indicator are 5 to 6 times higher than the ones of market pulland technology push. This suggests that it is appropriate to run separateregressions on each of the classes defined by the levels of technologicalopportunity. In fact, the entire relationship depends on firms’ technologicalopportunities7. This implies that the different innovation types have returnsthat depend on the technological environment facing the firms.
7. An interesting comparison could be made between this “technological opportunities” variableand more disaggregated industry classifications, using data analysis.
THE COMMERCIAL SUCCESS OF INNOVATIONS 469
Columns 3 to 5 present the separate regressions8. Since, the size effect9
increases with technological opportunities (with no significant effect in thelowest class), the largest firms enjoy an advantage when innovations arecommercialized in activities characterized by a high level of technologicalopportunity. We also find remaining (positive) differences stemming frommore favorable demand and technology conditions, except in the highesttechnological opportunity class. The meaning of this last result may besimply that in this class, both market pull and technology push achievestrong levels for a majority of firms. The performance differences aretherefore to be found elsewhere, namely in the type of innovations that thefirms have implemented.
The effect of innovation types on the NPR vary according to the levelof technological opportunities. First, innovation profiles differ betweenregressions. When we restrict our attention to comparisons betweensignificant coefficients10, the remaining coefficients are significantlydifferent at the 5% level11.
Second, our results clearly illustrate the effect of what has been classifiedas “weak”, “moderate” and “strong” technological opportunities. We findsignificant differences in median predicted12 NPR between these threeclasses: 6%, 13% and 24%. The median nearly doubles each time one getsin the upper class.
Under weak technological opportunities, the product innovations soldby the firms are mostly improvements on an existing product, followedby the more innovative products. Process innovations are not significantat the 5% level. As technological opportunities increase, improvementsand new products for the market have an equal contribution to innovativesales, followed by product imitation (that are new for the firm but not
8. We have kept the sectoral dummies in the model since their coefficients always significantlydiffer at the 5% level.
9. Size is measured by total sales, since it is the denominator of the innovation ratio.
10. The specification tests are presented in tables 5 (total sales) and 8 (for exports). We firsttest the equality of coefficients among different technological opportunity classes. We alwaysreject the equality of all coefficients at the 5% level. Sometimes, we find that some innovationcoefficients are equal among regressions, but it is often because one of the coefficients isnot significant (with a large standard error). Following a suggestion by a referee, we havealso performed a second test. We examine if our “known threshold” model is compatiblewith the standard ordered probit model (with unknown threshold). We find that the separateregressions nearly always accept this model: the only exception is for the regression oftotal sales NPR under moderate technological opportunities. In this last case, however, theinnovation coefficients are not very different from the ones presented here.
11. When a coefficient is not significant, it has a relatively large standard error, so that the equalitytest between this coefficient and the other coefficients are often accepted. It is a misleadingresult since one of the coefficient is significant while the other is not. This is why we commenton the statistics dealing with significant coefficients only.
12. The ratios cannot be observed, but a prediction can be computed for each firm. This comesfrom the fact that the variance parameteru is identified when the truncation thresholds areknown.
470

for the market). Moreover, process innovations have a modest althoughsignificant contribution to innovation sales. Finally, when technologicalopportunities are strong, only new products for the market and technologicalbreakthrough contribute significantly to the NPR. Moreover, these twoinnovation types have equal effects. To sum up, an innovation of agiven type will not necessarily achieve the same commercial success indifferent activities. The impact of an innovation type will differ accordingto the level of technological opportunity. In strongly innovative activitiesproduct imitations or improvements have no significant effect on the NPR.Conversely, in the same activities, real product innovation and processbreakthrough have a significant impact on NPR.
Since these regressions do not allow for a direct measurement of thereturn on each innovation type, we have performed additional computationsto assess the gains from innovation. They are computed for innovationperformers only (defined by type) and presented in table 4.
Table 4 reveals the NPR variations that can be attributed to each innovationtype 13; controlling for size, sector, market pull, technology push, and theimplementation of all the other innovations types. Since these computationsmust be done for each firm, we report the quartiles of the gains distributions.The main question to be examined in this table is: when does an innovationreach its maximum return (i.e., its maximum direct impact)?
Product improvements achieve a strong commercial return under moderatetechnological opportunities only, with a median gain of 4%. Products thatare new for the firm but not for the market never achieve a strong gain.This suggests that, overall, “imitation” is a small contributor to NPR. Itsmaximum value lies in moderate technological opportunities, but it is only2%.
The strongest contribution to the NPR comes from products that are newfor the market: 1.6% under low technological opportunities, 3.7% undermoderate technological opportunities and 4.7% when they are strong. Thisdemonstrates that commercial returns on real innovations increase with thetechnological opportunity basis of a firm’s activity.
A comparable result holds for process innovations: improvements make asmall contribution to NPR, and only in activities with moderate technologicalopportunities. Conversely, process breakthrough have greater returns: from1.5% under moderate technological opportunities activities to 4.7% in strongones.
These results demonstrate that not all innovation types are efficientfor a given market environment. In particular, product imitations andprocess improvements never contribute much to the commercial success ofinnovations. Moreover, the commercial impact of real innovations increaseswith the level of technological opportunities.
Since innovation is often considered as favoring exports, we undertakea similar analysis for the export NPR, the share of exports attributable toproducts introduced within the last five years.
13. The variation is expressed in percentage points, so that it can be added directly to the medianNPR without the corresponding innovation type (also given in the table).
THE COMMERCIAL SUCCESS OF INNOVATIONS 471

TABLE 4
Direct Effect of Each Innovation Type on the % of less than 5 years oldproducts in total sales 1990(firms with innovations, computed from the estimates in table 3ceterisparibus)
Product Innovations Process Innovations
All figures are %Impro-
vements
New forthe firmbut notfor themarket
New forthe market
Impro-vement
Break-through
Low Innovation Opportunities:
Innovators (1 720 firms) 68.0 66.6 35.2 57.5 17.3Median without the direct effect 4.4 5.1 5.7 6.5 6.4
direct effect:– 1st quartile 0.2 0.8 1.2 – 0.3 1.0– Median 0.3 1.1 1.6 – 0.2 1.4– 3rd quartile 0.3 1.4 2.0 – 0.2 1.8
Moderate Innovation Opportunities:
Innovators (2 715 firms) 84.6 67.0 54.5 70.3 29.3Median without the direct effect 10.0 11.8 11.9 12.4 14.0
direct effect:– 1st quartile 3.3 1.7 3.3 1.1 1.3– Median 4.1 2.2 3.7 1.4 1.5– 3rd quartile 4.9 2.6 4.3 1.6 1.8
Strong Innovation Opportunities:
Innovators (967 firms) 90.2 67.7 73.4 79.0 55.1Median without the direct effect 24.3 23.2 21.4 23.8 22.2
direct effect:– 1st quartile 0.4 – 2.6 4.0 0.2 4.1– Median 0.5 – 2.1 4.7 0.2 4.7– 3rd quartile 0.6 – 1.8 5.6 0.3 5.6
4.2. Export Innovation Ratio
Examining the innovation intensity of exports, we retain only firmsthat export14. Exporters represent 72% of firms in the sample. Similarregressions are run. Once again we find significant differences in theregressions, although the first two innovation opportunity classes exhibitedsimilar patterns15 (tables 6 and 8).The median export NPR is lower thanthe one obtained on total sales. Ranked from weak to strong technologicalopportunities we get increases in export NPR of 2%, 7% and 14%respectively. A comparison with figures in table 3 shows that every quartile
14. We keep the firms with an export rate of at least 1%.15. The rejection of the test comes mostly from the coefficients of the industry dummies.
472
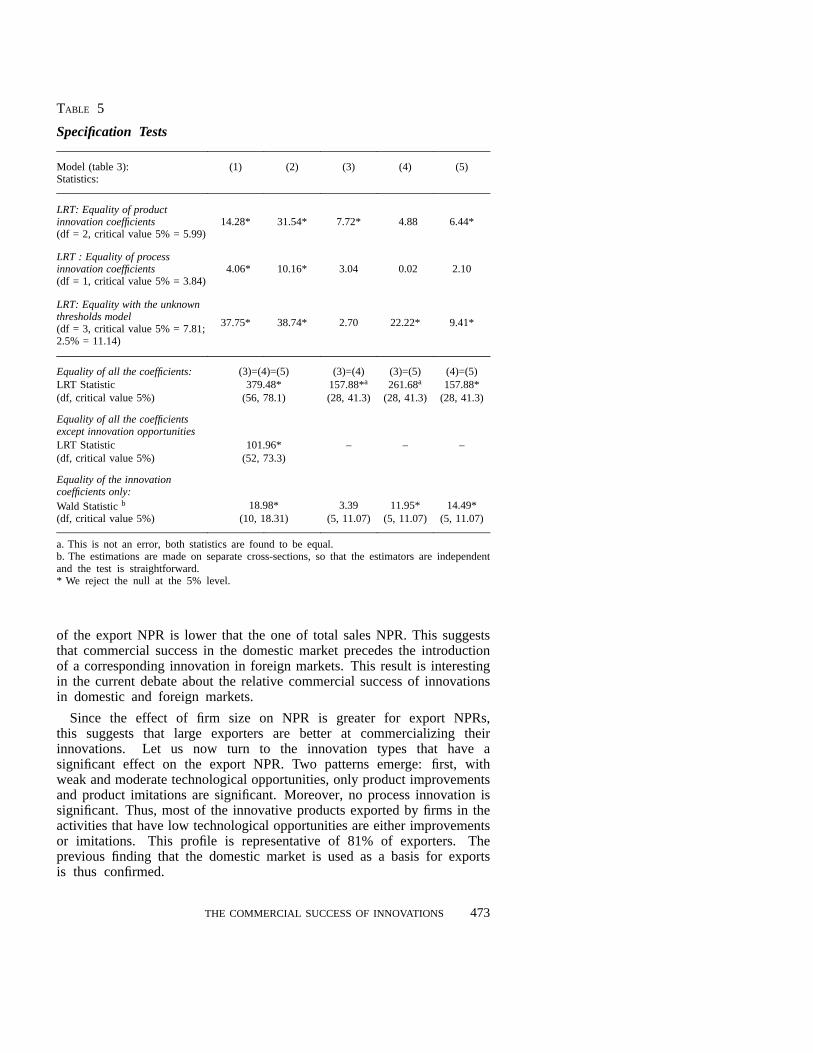
TABLE 5
Specification Tests
Model (table 3):Statistics:
(1) (2) (3) (4) (5)
LRT: Equality of productinnovation coefficients(df = 2, critical value 5% = 5.99)
14.28* 31.54* 7.72* 4.88 6.44*
LRT : Equality of processinnovation coefficients(df = 1, critical value 5% = 3.84)
4.06* 10.16* 3.04 0.02 2.10
LRT: Equality with the unknownthresholds model(df = 3, critical value 5% = 7.81;2.5% = 11.14)
37.75* 38.74* 2.70 22.22* 9.41*
Equality of all the coefficients: (3)=(4)=(5) (3)=(4) (3)=(5) (4)=(5)LRT Statistic 379.48* 157.88*a 261.68a 157.88*(df, critical value 5%) (56, 78.1) (28, 41.3) (28, 41.3) (28, 41.3)
Equality of all the coefficientsexcept innovation opportunitiesLRT Statistic 101.96* – – –(df, critical value 5%) (52, 73.3)
Equality of the innovationcoefficients only:Wald Statisticb 18.98* 3.39 11.95* 14.49*(df, critical value 5%) (10, 18.31) (5, 11.07) (5, 11.07) (5, 11.07)
a. This is not an error, both statistics are found to be equal.b. The estimations are made on separate cross-sections, so that the estimators are independentand the test is straightforward.* We reject the null at the 5% level.
of the export NPR is lower that the one of total sales NPR. This suggeststhat commercial success in the domestic market precedes the introductionof a corresponding innovation in foreign markets. This result is interestingin the current debate about the relative commercial success of innovationsin domestic and foreign markets.
Since the effect of firm size on NPR is greater for export NPRs,this suggests that large exporters are better at commercializing theirinnovations. Let us now turn to the innovation types that have asignificant effect on the export NPR. Two patterns emerge: first, withweak and moderate technological opportunities, only product improvementsand product imitations are significant. Moreover, no process innovation issignificant. Thus, most of the innovative products exported by firms in theactivities that have low technological opportunities are either improvementsor imitations. This profile is representative of 81% of exporters. Theprevious finding that the domestic market is used as a basis for exportsis thus confirmed.
THE COMMERCIAL SUCCESS OF INNOVATIONS 473

TABLE 6
Exports from Innovations.
Left-hand variable: percentage of less than 5 years old products in total exports 1990Transformation:18 industry dummies are included in all the regressionsMaximum likelihood estimates on the ordered probit model(asymptotic statistic between parentheses)
Firm level innovationOpportunities:Estimates
All(1)
All(2)
Weak(3)
Moderate(4)
Strong(5)
Exports logarithm 1989 0.272* 0.288* 0.215* 0.257* 0.358*(13.4) (14.0) (4.75) (9.91) (8.06)
Product innovation (dummies):
– Improvement of an existing 0.429* 0.591* 0.517* 0.420* 0.297product (3.98) (5.46) (2.82) (2.85) (0.92)– New for the firm but not 0.127 0.128 0.463* 0.258* – 0.112for the market (1.58) (1.57) (2.60) (2.54) (0.60)– New for the market 0.284* 0.428* 0.147 0.096 0.563*
(3.48) (5.22) (0.88) (0.93) (2.55)
Process innovation (dummies):
– Improvement of an existing – 0.096 – 0.082 – 0.100 – 0.017 – 0.222process (1.14) (0.96) (0.58) (0.15) (1.08)– Technological breakthrough 0.276* 0.411* 0.306 0.183 0.404*
(3.30) (4.90) (1.49) (1.75) (2.24)
Firm-level market pull (dummies):
– Moderate 0.136 0.179 0.035 0.237 – 0.004(0.99) (1.29) (0.14) (1.28) (0.01)
– Strong 0.358* 0.483* 0.403 0.485* – 0.029(2.89) (3.84) (1.76) (2.88) (0.10)
Firm-level Technology push (dummies):
– Moderate 0.345* 0.455* 0.242 0.398* 0.256(3.87) (5.07) (1.34) (3.61) (1.01)
– Strong 0.339* 0.614* 0.292 0.488* – 0.007(3.33) (6.14) (1.21) (3.75) (0.03)
Firm-level innovation opportunities (dummies):
– Moderate 0.638* – – – –(6.60)
– Strong 1.243* – – – –(9.95)
u 1.880* 1.920* 1.967* 1.747* 1.991*(43.0) (43.0) (17.8) (32.4) (21.9)
Number of firms 3 893 3 893 1 166 1 991 736Log-likelihood – 3 681.82 – 3 732.40 – 807.43 – 1 959.98 – 874.29Test: sectoral dummiesa 1 040.4 1 051.0 224.7 483.6 178.4Mc Fadden 2 0.093 0.080 0.044 0.064 0.088Latent model 2 0.236 0.210 0.156 0.172 0.246
474

TABLE 6 (continued)
Firm level innovationOpportunities:Estimates
All(1)
All(2)
Weak(3)
Moderate(4)
Strong(5)
Estimated (%):
– 1st quartile 2.8 2.9 1.5 4.0 7.5– Median 5.6 5.6 2.3 6.9 14.4– 3rd quartile 10.9 10.5 3.7 11.1 25.6
* Significant at the 5% level.a. The null hypothesis is that the sectoral dummies can be replaced by a constant term. Underthe null the statistic is chi-square distributed with 17 degrees of freedom. The critical value atthe 5% level is 27.6.
The remaining 19% of exporters, from activities with strong technologicalopportunities, exhibit entirely different results. For these firms, products thatare new to the market are the only significant contributors to the export NPR.Process breakthroughs are also significant with a comparable coefficient. Inthose activities, firms do tend to export ‘high-tech’ goods, thus contributingto the diffusion of up-to-date products in the other countries.
The commercial gains associated to innovation are low for improvementsand imitations (table 7): from 1% to 2%. In contrast, firms that bring stronginnovations to the market make strong gains under strong technologicalopportunities: the median is 6.6% for new products and 5.4% for processbreakthroughs. Clearly, nearly all gains accrue to the strongest innovatorslocated in activities with strong technological opportunities.
These results undermine the usual view that imitations of innovationsare always successful. ROSENBERG and STEINMUELLER [1986] also argueagainst this view. In fact, our results clearly demonstrate that there are twotypes of activities in an economy: ones with strong underlying technologicalopportunities, and ones with weak or moderate underlying technologicalopportunities. In the first category, only product innovations that appear asnew products to the market are successful. In the second category, onlyimitations and improvements have a significant effect on the NPR. Thedynamics of manufacturing in France thus results from a combination ofthese two types of activities. The figures obtained for the French industryshow that 19% of the exporters fall in the first category while 81% belong thesecond category. Further research efforts that would provide a comparisonwith other countries would be very valuable.
Finally, if one assumes that firms in the different technologicalopportunities classes do not export their production to the same countries, theresults of this paper support the view that exporters of product improvementscontribute to the diffusion of innovations by exporting to countries witha lower innovation level. By contrast, firms with strong technologicalopportunities would tend to be more involved in intra-industry trade betweendeveloped countries where the diffusion of innovations involves moreinnovative products.
THE COMMERCIAL SUCCESS OF INNOVATIONS 475

TABLE 7
Direct Effect of Each Innovation Type on the % of less than 5 years oldproducts in total exports 1990(firms with innovations, computed from the estimates in table 6ceterisparibus)
Product Innovators Process Innovators
All figures are %Impro-
vements
New forthe firmbut notfor themarket
New forthe market
Impro-vement
Break-through
Low Innovation Opportunities:
Innovators (1 166 firms) 68.0 67.8 37.9 61.0 18.4Median without the direct effect 1.7 1.7 2.4 2.7 2.6
direct effect:– 1st quartile 0.7 0.6 0.2 – 0.4 0.5– Median 1.1 1.0 0.4 – 0.3 0.9– 3rd quartile 1.7 1.4 0.6 – 0.2 1.3
Moderate Innovation Opportunities:
Innovators (1 991 firms) 86.0 67.6 58.3 70.6 31.0Median without the direct effect 5.0 6.6 6.4 7.3 7.8
direct effect:– 1st quartile 1.5 0.4 1.1 – 0.1 0.9– Median 2.4 0.6 1.7 – 0.1 1.4– 3rd quartile 3.7 0.9 2.7 – 0.1 2.1
Strong Innovation Opportunities:
Innovators (736 firms) 91.0 68.2 78.1 73.9 57.1Median without the direct effect 12.1 15.1 10.7 17.0 13.8
direct effect:– 1st quartile 1.9 – 0.2 3.9 – 4.3 3.1– Median 3.5 – 0.1 6.6 – 2.9 5.4– 3rd quartile 5.2 – 0.1 9.8 – 1.6 7.7
5 Conclusion
The French Ministry of Industry’s innovation survey provides much ofnew information on the outputs of innovation. Besides the usual measuresof innovation, such as patents and R&D expenditures, this survey offersthe possibility of examining the commercial success of different typesof innovations. Although the Innovation survey provides only qualitativevariables, based on subjective answers to objective questions, the carefuluse of these variables yields sensible results.
476
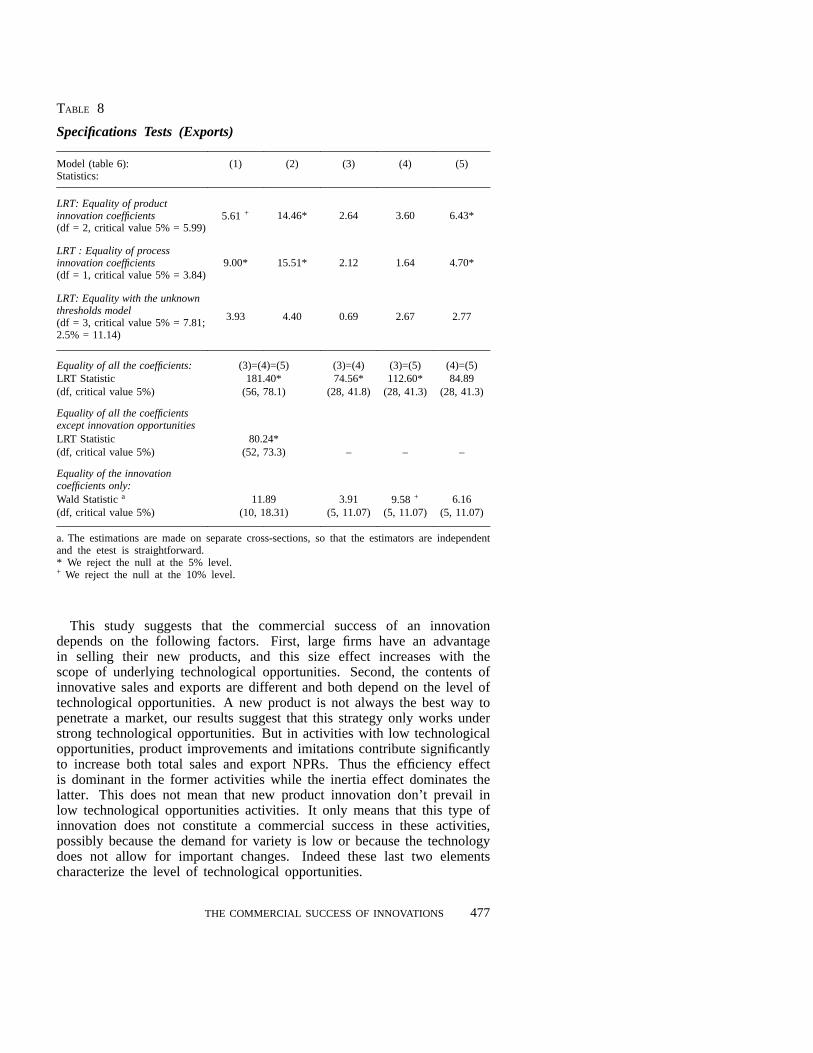
TABLE 8
Specifications Tests (Exports)
Model (table 6):Statistics:
(1) (2) (3) (4) (5)
LRT: Equality of productinnovation coefficients(df = 2, critical value 5% = 5.99)
5.61 + 14.46* 2.64 3.60 6.43*
LRT : Equality of processinnovation coefficients(df = 1, critical value 5% = 3.84)
9.00* 15.51* 2.12 1.64 4.70*
LRT: Equality with the unknownthresholds model(df = 3, critical value 5% = 7.81;2.5% = 11.14)
3.93 4.40 0.69 2.67 2.77
Equality of all the coefficients: (3)=(4)=(5) (3)=(4) (3)=(5) (4)=(5)LRT Statistic 181.40* 74.56* 112.60* 84.89(df, critical value 5%) (56, 78.1) (28, 41.8) (28, 41.3) (28, 41.3)
Equality of all the coefficientsexcept innovation opportunitiesLRT Statistic 80.24*(df, critical value 5%) (52, 73.3) – – –
Equality of the innovationcoefficients only:Wald Statistica 11.89 3.91 9.58 + 6.16(df, critical value 5%) (10, 18.31) (5, 11.07) (5, 11.07) (5, 11.07)
a. The estimations are made on separate cross-sections, so that the estimators are independentand the etest is straightforward.* We reject the null at the 5% level.+ We reject the null at the 10% level.
This study suggests that the commercial success of an innovationdepends on the following factors. First, large firms have an advantagein selling their new products, and this size effect increases with thescope of underlying technological opportunities. Second, the contents ofinnovative sales and exports are different and both depend on the level oftechnological opportunities. A new product is not always the best way topenetrate a market, our results suggest that this strategy only works understrong technological opportunities. But in activities with low technologicalopportunities, product improvements and imitations contribute significantlyto increase both total sales and export NPRs. Thus the efficiency effectis dominant in the former activities while the inertia effect dominates thelatter. This does not mean that new product innovation don’t prevail inlow technological opportunities activities. It only means that this type ofinnovation does not constitute a commercial success in these activities,possibly because the demand for variety is low or because the technologydoes not allow for important changes. Indeed these last two elementscharacterize the level of technological opportunities.
THE COMMERCIAL SUCCESS OF INNOVATIONS 477

Finally, our results tend to support the view that commercial success in thedomestic market precedes the introduction of a corresponding innovation inforeign markets. However, this interpretation points the need for additionaltheoretical and empirical research.
v References
COHEN, W., LEVIN, R. (1989). – “Innovation and Market Structure”. In R. Schmalenseeand R. Willing eds., Handbook of Industrial Organization, vol. 2, ch. 18,pp. 1060-1107.
CREPON, B., DUGUET, E. (1995). – “Une bibliotheque de macro commandes pourl’ econometrie des donnees de comptage et des variables qualitatives”.CRESTworking paper 9525.
DASGUPTA, P. (1986). – “The Theory of Technological Competition”. In J. Stiglitzand F. Mathewson eds.,New Developments in the Analysis of Market Structure.The MIT Press
FRANCOIS, J.-P. (1991). – “Une enquete sur l’innovation”. Courrier des Statistiques,n� 57.
GRILICHES, Z. (1986). – “Productivity, R&D and Basic Research at the Firm Level inthe 1970’s”,American Economic Review,vol. 76, n�1, pp. 141-154.
HALL , B. H., MAIRESSE, J. (1995). – “Exploring the Relationship between R&D andProductivity in French Manufacturing Firms”.Journal of Econometrics,vol. 65,pp. 263-293.
MADDALA , G. (1992). –Limited Dependent and Qualitative Variables in Econometrics,Econometric Society Monograph, n�3, Cambridge University Press.
ROSENBERG, N. (1974). – “Science, Innovation and Economic Growth”.EconomicJournal, 84, pp. 90-108.
ROSENBERG, N., STEINMUELLER E. (1988). – “Why are Americans such poor imitators?”,American Economic Review, Papers and Proceedings, vol. 78, pp. 229-234.
SCHMOOKLER, J. (1966). – “Invention and Economic Growth”. Harvard University Press.WINDMEIJER, F. (1995). – “Goodness-of-Fit Measures in Binary Choice Models”.
Econometric Reviews, Vol. 14, n� 1, pp. 101-116.
478