the bulgeless seyfert/liner galaxy ngc 3367: disk, bar, lopsidedness, and environment
TRANSCRIPT
arX
iv:1
104.
3622
v4 [
astr
o-ph
.CO
] 2
6 A
pr 2
011
The Bulgeless Seyfert/LINER Galaxy NGC 3367: Disk, Bar,
Lopsidedness and Environment1
H. M. Hernandez-Toledo2,a, M. Cano-Dıaza,b, O. Valenzuelaa, I. Pueraric, J. A.
Garcıa-Barretoa, E. Moreno-Dıaza, H. Bravo-AlfarodaInstituto de Astronomıa, Universidad Nacional Autonoma de Mexico, Apartado Postal 70-264, Mexico
D.F., 04510, MexicobINAF-Osservatorio Astronomico di Roma, via di Frascati 33, 00040, Monte Porzio Catone, Italy
cInstituto Nacional de Astrofısica, Optica y Electronica, Calle Luis Enrique Erro 1, 72840, Sta. Marıa
Tonantzintla, Puebla, MexicodDepartamento de Astronomıa, Universidad de Guanajuato, Apdo. Postal 144, Guanajuato 36000, Mexico
ABSTRACT
NGC 3367 is a nearby isolated active galaxy that shows a radio jet, a strong bar and evidenceof lopsidedness. We present a quantitative analysis of the stellar and gaseous structure of thegalaxy disk and a search for evidence of recent interaction based on new UBV RI Hα and JHKimages and on archival Hα Fabry-Perot and HI VLA data. From a coupled 1D/2D GALFITbulge/bar/disk decomposition an (B/D ∼ 0.07-0.1) exponential pseudobulge is inferred in all theobserved bands. A NIR estimate of the bar strength < Qmax
T (R) > = 0.44 places NGC 3367 baramong the strongest ones. The asymmetry properties were studied using (1) optical and NIRCAS indexes (2) the stellar (NIR) and gaseous (Hα, HI) A1 Fourier mode amplitudes and (3) theHI integrated profile and HI mean intensity distribution. While the average stellar componentshows asymmetry values close to the average found in the Local Universe for isolated galaxies,the young stellar component and gas values are largely decoupled showing significantly larger A1
mode amplitudes suggesting that the gas has been recently perturbed. NGC 3367 is devoidedof HI gas in the central regions where a significant amount of molecular CO gas exists instead.Our search for (1) faint stellar structures in the outer regions (up to µR ∼ 26 mag arcsec−2),(2) (Hα) star-forming satellite galaxies and (3) regions with different colors (stellar populations)along the disk all failed. Such an absence is interpreted using recent numerical simulations toconstrain a tidal event with an LMC like galaxy to some dynamical times in the past or to acurrent very low mass, gas rich accretion. We conclude that a cold accretion mode (gas andsmall/dark galaxies) may be responsible of the nuclear activity and peculiar (young stars andgas) morphology regardless of the highly isolated environment. Black hole growth in bulgelessgalaxies may be triggered by cosmic smooth mass accretion.
Subject headings: Galaxies: individual – Galaxies: structure – Galaxies: bars – Galaxies: photometry –
Galaxies: interactions – Galaxies: morphology – Galaxies: general
1Based on data obtained at the 0.84m, 1.5m and 2.1m
telescopes of the Observatorio Astronomico Nacional, San
Pedro Martir operated by the Instituto de Astronomıa,
Universidad Nacional Autonoma de Mexico.
1. Introduction
NGC 3367 is a nearby barred galaxy that isclassified as SB(rs)c in the Third Reference Cata-log of Bright Galaxies (de Vaucouleurs et al. 1991,hereafter RC3) and as Sy 2-like, HII in Veron-Cetty & Veron (1986). MIR Spitzer observations
1
of NGC 3367 reveal the presence of [Ne v] lines at14.3µm and 24.3µm with X-ray luminosity domi-nated by a power law with 2-10 keV luminositiesof 2.0 ×1040erg s−1 (McAlpine et al. 2011). NGC3367 is located in the field of the Leo Group butit belongs to the background based on its opti-cal velocity of vo = 2998 km s−1 and the meanvelocity of the Leo I Group = 900 km s−1 (Fergu-son and Sandage 1990; Stocke et al. 1991; Tonryet al. 2001). The closest candidate for a galaxycompanion is NGC 3391 at a projected distance of∼ 563 kpc or 18 optical diameters away (Garcıa-Barreto et al. 2003) and a recent search for iso-lated galaxies in the local Universe based on theSDSS has also confirmed that NGC 3367 is an iso-lated galaxy (Hernandez-Toledo et al. 2010). Theoptical appearance of NGC 3367 is dominated by abright bar and an apparent large-scale asymmetryor lopsidedness to the southwest side.
Radio observations in NGC 3367 reveal a bipo-lar synchrotron outflow from the nucleus and twolarge lobes with a total projected extent on thesky (from NE-to-SW) of 12 kpc, resembling a ra-dio galaxy. The axis of the ejected outflow ishighly inclined with respect to the axis of rotationof the disk (Garcıa-Barreto et al. 1998; Garcıa-Barreto, Franco & Rudnick 2002). Single-dish HIcontent of MHI ∼ 7 × 10⁹M⊙ has been reportedfor this galaxy (Huchtmeier & Richter 1989) anda high fraction of molecular gas has been foundmostly concentrated in the central 27′′ (r=5.7 kpc)M(H2) = 2.7 × 10⁹M⊙ (Garcıa-Barreto et al.2005). NGC 3367 also shows weak thermal radiocontinuum emission (at 4.5” angular resolution)extended throughout the disk (Garcıa-Barreto etal. 1998) and Hα Fabry-Perot observations in-dicate that its rotation axis lies projected on thedisk at a P.A. of 141, the N side of that projectedline being closer to the observer (Garcıa-Barreto& Rosado 2001).
Despite that several properties of NGC 3367somehow resemble a gravitational interacting sys-tem with another galaxy, there is yet no support-ing evidence. This is the first paper of a serieswhere we present our multi-wavelength data anddiscuss some alternatives to the origin of the ob-served morphology and asymmetries. Our paper issplit into two general parts; one describing the ob-servations and the estimate of the galaxy parame-ters and the second discussing the interpretation of
measurements as constraints to the recent dynam-ical history in NGC 3367. Specifically, a descrip-tion of observations and the techniques used in thedata reduction are briefly described in Section 2.In Section 3 we present a brief summary of themain morphological features found in the opticaland NIR images. A surface photometry analysisis carried out in Section 4, including (i) an analy-sis of the surface brightness and color profiles, (ii)a coupled 1D-2D bulge/disk and bulge/bar/diskdecomposition into Sersic, Exponential and Fer-rer components. Section 5 presents different barproperties like ISM shocks based on the dust lanegeometry revealed by a B − I color map, a quan-tification of the bar strength and length, and abrief discussion of the bar nature in terms of theAthanassoula & Misiriotis (2002) models. In Sec-tion 6 Lopsidedness is reviewed from various es-timators, namely, the Concentration-Asymmetry-Clumpiness (hereafter CAS) parameters in the op-tical and NIR bands, the m = 0 − 2 Fourier NIRand Hα amplitudes and the VLA HI asymmetryfrom the moment 0 distribution and the corre-sponding HI line profile. In Section 7 we lookfor (i) evidence of low surface brightness featureslikely related to a tidal origin and (ii) the presenceof recent galaxy accretion events or satellite com-panions in the observed colors. Section 8 presentsa general discussion on the origin of the disk Lop-sidedness. We use Fabry-Perot Hα and HI VLAdata to discuss possible evidence of anisotropic gasaccretion and its possible connection to the AGNactivity in NGC 3367. Finally, our summary andconcluding remarks are presented in Section 9. Adistance of 43.6 Mpc (Ho = 75 km s−1Mpc−1) isadopted for NGC 3367 (Tully 1988), resulting ina linear scale of 210 pc arcsec−1.
2. Observations and Data Reduction
The optical UBV RI observations were carriedout at the 0.84m telescope of the Observatorio As-tronomico Nacional at San Pedro Martir (OAN-SPM), Baja California, Mexico, with a Site1 CCDdetector yielding a total field of view of 7.2 x 7.2arcmin and typical seeing FWHM values of 1.8arcsec. A detailed description of the optical ob-servations and the standard data reduction within
2
the IRAF platform 3 can be found in Garcıa-Barreto et al. (2007). The routines under SpaceTelescope Science Data Analysis System (STS-DAS) were used in the reduction and analysis ofboth the optical and near-IR data. In this pa-per a further processing of the images in 2 × 2binning mode was applied to have a pixel scaleof 0.85 arcsec/pix, similar to that in the Near-IRobservations.
The Near-IR observations were carried out us-ing the CAMILA instrument (Cruz-Gonzalez etal. 1994) at the OAN-SPM 2.1m telescope. TheCAMILA instrument uses a NICMOS 3 detectorof 256 x 256 pixel format. The instrument wasused in the imaging mode with the focal reducerconfiguration f/4.5 in all our observations, result-ing in a spatial scale of 0.85 arcsec/pix and a totalfield of view of 3.6 x 3.6 arcmin. The imaging ob-servations were carried out using the broadbandJ , H and K ′ filters. Each observation consisted ofa sequence of object and sky exposures, with theintegration time of an individual exposure limitedby the sky counts, which was kept well below thenonlinear regime of the detector. The final expo-sure times on NGC 3367 were 23, 11 and 21 min-utes for the J , H and K ′ bands respectively. Thephotometric calibration of the JHK system wasperformed using the U.K. Infrared System (Huntet al. 1998). The sky conditions were almost pho-tometric with a typical seeing FWHM of 2 arcsec.
We also dispose of VLA HI data coming fromthe NRAO VLA-archive, originally obtained in2001 with the C-configuration. We produced afull Natural Weighting data-cube in order to im-prove the sensitivity. Our final data-cube has 63channels and a beam size of 18.7× 15.6 arcsec. Wefully describe the HI data reduction in a forthcom-ing paper (Bravo-Alfaro et al. 2011, in prep).
3. General Morphology
The morphology of the galaxy in the optical andNIR bands is shown in Figure 1. Filter-enhancedversions in each band are also presented (right-hand side), where the sky has been subtractedand the images have been Gaussian-filtered and
3IRAF is distributed by the National Optical Astronomy
Observatories, which are operated by the Association of
Universities for Research in Astronomy, Inc., under coop-
erative agreement with the National Science Foundation
then subtracted from the original image to en-hance both internal and external structures in theform of star forming regions, structures embeddedinto dusty regions or faint outer details of partic-ular interest for our discussion.
The bluer bands highlight a sharp semi-circularoutline at the N-W-S direction. This structurepresents a complex pattern of arms at a radiusof about 50 arcsec (10 kpc) from the center. Thearms in the inner region almost coalesce to form aninternal ring. Some bright HII regions are strungalong the inner parts of two major arms that beginat the ends of the bar, these arms experiencingvarious levels of winding and branching.
The contrast produced by the filter-enhancedimages enable us to visualize (i) fainter structurebeyond 50 arcsec (10 kpc) in the form of fragmen-tary structures at the north and along the externalborder of the outline (U-to-R band images) butalso offers hints on the more circular nature of theexternal disk (R and I bands) and (ii) emphasize afalloff of the surface brightness at about 50 arcsec(U , B and V bands) that is observed to occur notwith the same abruptness in the western than inthe northeastern side.
The NIR band images show the prominence ofthe bar as it is clearly enhanced by a dominance ofan old population of stars in that region. There arealso some localized high surface brightness knotsin the eastern end of the bar, perhaps evidenc-ing the presence, depending on their age, of eithera non-negligible population of asymptotic giantbranch stars or red giant and supergiant branchstars there. Notice, as shown in Figure 2 be-low, that the typical depth of the NIR images is∼ 21 mag arcsec−2 while that of the optical im-ages is ∼ 23− 24 mag arcsec−2 at 60 arcsec fromthe center, respectively. This is a relevant issue,specially when discussing properties of the exter-nal disk.
4. Surface Photometry Analysis
4.1. Surface Brightness and Color Profiles
Azimuthally averaged radial surface brightness(SB) profiles have been obtained from our opticalUBV RI images (see Garcıa-Barreto et al. (2007))and from our NIR images as an initial charac-terization of NGC 3367 structure. Ellipse fittingto the isophotes was used to estimate radial pro-
3
files of intensity, ellipticity (ǫ), and position angle(P.A.). The ellipses were calculated using the rou-tines under the STSDAS package. Prior to profileextraction, the FWHM of stars in all the imageswere matched to the one having the poorest seeing(2.3 arcsec). The SB profiles were extracted usingellipse fitting with a fixed center. In order to as-sure a homogeneous computation of structural pa-rameters and color gradients, we use the R bandexternal isophotes as input parameters to deter-mine the SB profiles in UBV IJHK bands. Wetrace SB profiles up to ∼ 23− 25mag arcsec−2 inoptical bands and ∼ 21− 22 mag arcsec−2 in theNIR bands. These levels correspond to conserva-tive SB errors of ∼ 0.12 mag arcsec−2.
The results of the surface photometric analy-sis are plotted in Figure 2. To avoid crowding,the surface brightness and color profiles for a fewwavelengths are plotted. Two dashed vertical linesin each panel indicate, from left to right, the endof the bar and the position of the NE surfacebrightness fall-off respectively. The middle pan-els show the corresponding ellipticity and P.A. ra-dial profiles aimed to illustrate the difficulties be-hind a correct identification of the bar propertiesas a function of wavelength also in the presenceof prominent knots at both ends of the bar (seeFigure 1). The lower panel shows the externalellipticity and P.A.radial profiles of NGC 3367 es-timated from an additional deep R band image(see Figure 11 below) that was built from the sumof our various R band exposures adding up to atotal of 1.4 hours exposure, useful to estimate arepresentative geometry for the external disk.
The upper left panel of Figure 2 shows a sys-tematic flattening of the surface brightness profilesas we go from K to U bands. This behavior couldbe interpreted as a signature of an optically thickdisk at the central regions becoming mildly trans-parent at large radii (Evans 1994). The flatteningin the SB profile is correlated with a color gradi-ent showing that the disk becomes gradually bluerat outer radii. A red bump in the color profilesreaches as red as 4.5 mag in (B −K) in the firstfew arcsec and decreases to about 4 mag at about17 arcsec which corresponds to the end of the stel-lar bar (first vertical dashed line). The peak of thered bump is consistent with the maximum con-centration of CO emission (Garcıa-Barreto et al.2005). In the external region of the surface bright-
ness profile we notice a turnover or possible disktruncation at ∼ 55 arcsec (second vertical dashedline), this truncation being more evident in the op-tical than in the NIR bands. van der Kruit (1988)proposed that many stellar disks may posses ra-dial cutoffs at approximately the same location asseen in the star formation regions. Figure 1 showsthat this turnover is visible at approximately thesame position corresponding to a radius where theabrupt falloff in star formation is appreciated.
The bar ellipticity was measured as the maxi-mum of the ellipticity within the bar region whilethe bar length was measured at the transition re-gion between the bar and the disk where both theellipticity and P.A. change significantly. A set ofhigh surface brightness knots precisely at the NEand SW ends of the bar were identified as thedominant sources influencing a correct estimate ofthe bar ellipticity and P.A. Similarly in the exter-nal regions, another set of high surface brightnessknots along the N-W-S outline were identified asthe dominant features influencing a correct esti-mate of the geometry of the disk. Instead of lettingthe ellipse-fitting routines run blindly, we carefullymasked all the prominent knots and implementedan interactive routine to superpose each isophoteonto the corresponding images, allowing us for avisual checking of the masking performance andthe correct estimate of the bar parameters.
The bar length in the K band converged tor ∼ 17 arcsec, corresponding to a diameter of ∼ 7kpc at the distance of NGC 3367. Similarly, theobserved P.A. of the bar is 66±4, both quantitiesin agreement with other estimates (Garcıa-Barretoet al. 1996;1998). A representative ellipticity ofthe bar (corrected for inclination) in the J andK bands is ǫmax = 0.58 ±0.05. Finally, from thelower panel in Figure 2, we adopt a nominal ra-dius of 80 arcsec (∼ 3.2 R band disk scale-lengths)to estimate an inclination of 25 ± 5 for NGC3367. This value is within the reported range ofvalues coming from different methods, as discussedin Garcıa-Barreto & Rosado (2001) and more re-cently, from a kinematic analysis using various gastracers (Cano-Dıaz et al. in preparation).
4.2. 1D-2D Bulge/Bar/Disk Decomposi-tion
Although NGC 3367 has a prominent stellarbar, a common approximation is to perform a
4
bulge/disk decomposition to an azimuthally aver-aged one-dimensional profile (in fixed P.A. and ǫmode) that smooths out the bar as well as the spi-ral arms in the profile extraction. In a first-orderapproach, we fit the radial intensity profiles with acomposite profile containing a Sersic bulge and anexponential disk. Our algorithm splits 1D galaxyluminosity profiles into bulge and disk componentssimultaneously by using a nonlinear Levenberg-Marquardt least-squares fit (Press et al. 1992)to the logarithmic intensities. Seeing effects areaccounted for by convolving the theoretical bulge-disk SB profiles with a radially symmetric Gaus-sian PSF.
In the upper-left panel of Figure 2, notice thatthe shape of the U band SB profile resemble atruncated Freeman type II profile. However, thatshape practically disappears at longer wavelengthsin the NIR bands, this fact combined with the highcentral CO emission reported by (Garcıa-Barretoet al. 2005) suggest that extinction may play asignificant role in the gradual change of surfacebrightness profile across wavelengths. We did nottake into account that apparent truncation in theU and B bands. Instead, we homogenized the 1Dfits by using the same radial zones (up to 55 arc-sec) in all the U to K band profiles and then thefitting was carried out. At this stage, our resultsindicate that the bulge is exponential in all theobserved bands (Sersic n = 0.9-1.1).
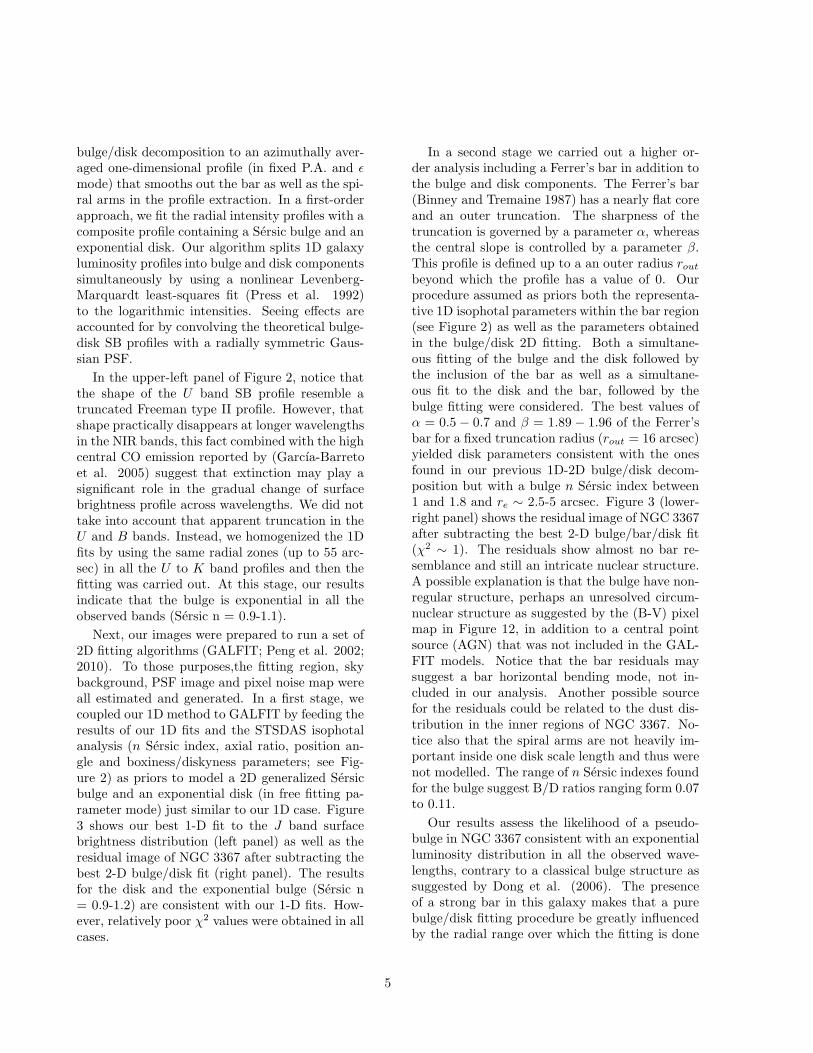
Next, our images were prepared to run a set of2D fitting algorithms (GALFIT; Peng et al. 2002;2010). To those purposes,the fitting region, skybackground, PSF image and pixel noise map wereall estimated and generated. In a first stage, wecoupled our 1D method to GALFIT by feeding theresults of our 1D fits and the STSDAS isophotalanalysis (n Sersic index, axial ratio, position an-gle and boxiness/diskyness parameters; see Fig-ure 2) as priors to model a 2D generalized Sersicbulge and an exponential disk (in free fitting pa-rameter mode) just similar to our 1D case. Figure3 shows our best 1-D fit to the J band surfacebrightness distribution (left panel) as well as theresidual image of NGC 3367 after subtracting thebest 2-D bulge/disk fit (right panel). The resultsfor the disk and the exponential bulge (Sersic n= 0.9-1.2) are consistent with our 1-D fits. How-ever, relatively poor χ2 values were obtained in allcases.
In a second stage we carried out a higher or-der analysis including a Ferrer’s bar in addition tothe bulge and disk components. The Ferrer’s bar(Binney and Tremaine 1987) has a nearly flat coreand an outer truncation. The sharpness of thetruncation is governed by a parameter α, whereasthe central slope is controlled by a parameter β.This profile is defined up to a an outer radius routbeyond which the profile has a value of 0. Ourprocedure assumed as priors both the representa-tive 1D isophotal parameters within the bar region(see Figure 2) as well as the parameters obtainedin the bulge/disk 2D fitting. Both a simultane-ous fitting of the bulge and the disk followed bythe inclusion of the bar as well as a simultane-ous fit to the disk and the bar, followed by thebulge fitting were considered. The best values ofα = 0.5 − 0.7 and β = 1.89 − 1.96 of the Ferrer’sbar for a fixed truncation radius (rout = 16 arcsec)yielded disk parameters consistent with the onesfound in our previous 1D-2D bulge/disk decom-position but with a bulge n Sersic index between1 and 1.8 and re ∼ 2.5-5 arcsec. Figure 3 (lower-right panel) shows the residual image of NGC 3367after subtracting the best 2-D bulge/bar/disk fit(χ2 ∼ 1). The residuals show almost no bar re-semblance and still an intricate nuclear structure.A possible explanation is that the bulge have non-regular structure, perhaps an unresolved circum-nuclear structure as suggested by the (B-V) pixelmap in Figure 12, in addition to a central pointsource (AGN) that was not included in the GAL-FIT models. Notice that the bar residuals maysuggest a bar horizontal bending mode, not in-cluded in our analysis. Another possible sourcefor the residuals could be related to the dust dis-tribution in the inner regions of NGC 3367. No-tice also that the spiral arms are not heavily im-portant inside one disk scale length and thus werenot modelled. The range of n Sersic indexes foundfor the bulge suggest B/D ratios ranging form 0.07to 0.11.
Our results assess the likelihood of a pseudo-bulge in NGC 3367 consistent with an exponentialluminosity distribution in all the observed wave-lengths, contrary to a classical bulge structure assuggested by Dong et al. (2006). The presenceof a strong bar in this galaxy makes that a purebulge/disk fitting procedure be greatly influencedby the radial range over which the fitting is done
5
causing, depending on the adopted parameters,possible overestimates of the bulge. It is thusimportant to consider the bar to characterize thebulge of NGC 3367.
5. Bar Dissection
The evolution of galaxies in later stages of theUniverse may be governed by slow secular pro-cesses, related to collective dynamical phenom-ena, such as bars, spiral arms or the dark mat-ter halo response to baryons (Kormendy & Ken-nicutt 2004). Do bars contain information aboutthe strength of secular evolution? Bars may drivespiral density waves (Kormendy & Norman 1979),generate resonance rings of stars and gas (Buta &Combes 1996), change abundance gradients (Mar-tin & Roy 1994), or induce gas inflow that maylead to bar weakening and bulge growth (Normanet al. 1996).
5.1. Dustlanes
The structural differences between B and Iband images can be used to map the star for-mation and dust distributions. Figure 4 shows aclose-up of the inner region of NGC 3367 as seenthrough a B−I color map. Dark regions representredder colors. A dust lane, conspicuous in thiscolor map, can be appreciated as a dark curvedfeature running from east to west of the nucleus.The nucleus and part of the bar/arms can also beappreciated as gross bluer features. The dust laneappear slightly offset from the bar major axis to-ward its leading edge. Dust lanes are caused bybuilding up of gas at shocks (Prendergast 1966;van Albada & Sanders 1982; Prendergast 1983;Athanassoula 1992). Dust lanes are closely linkedto the bar mass, potential ellipticity and patternspeed. Athanassoula (1992) has modeled system-atically the ISM response in disks to stellar barsscanning different masses, structure and angularspeed, concluding that shocks strength and loca-tion are useful to infer the bar physical proper-ties (Weiner et al. 2001). The dust lane curva-ture observed in Figure 4 when compared withthe results of Athanassoula (1992), suggests thatthe bar in NGC 3367 might be either weak or notas fast as the ones found in early type galaxieswhich are lines parallel to the bar major axis. Asa reference, Salo et al. (1999) presented one of
the largest collection of Ωp estimates for 38 OS-UBSGS spiral galaxies (Rautiainen, Salo & Lau-rikainen 2008), concluding that the pattern speedof the bar depends roughly on the morphologicaltype. The average value of corotation resonanceradius to bar radius increases from 1.15 ± 0.25in types SB0/aSBab to 1.44 ± 0.29 in SBb and1.82 ± 0.63 in SBbcSBc types, similar in type toNGC 3367. While the curved dust lane morphol-ogy in Figure 4 might be consistent with NGC3367 having a relatively slow bar, it is knownthat this diagnostic is degenerated and a weak barcan trigger curved dustlanes (Athanassoula 1992).On the other hand, Gabbasov et al. (2009) re-cently applied the Tremaine & Weinberg method(Tremaine & Weinberg 1984) to a set of Fabry-Perot Hα gas observations in NGC 3367 findinga value of Ωp = 43± 6 km s−1kpc−1, consistentwith a fast bar (R ≤ 1.4). Although currently wedo not have enough data to sort out this apparentcontradiction, a forthcoming paper (Cano-Dıaz etal. in preparation) will treat this issue.
5.2. Bar Shape and Nature
Figure 5 shows intensity profiles along the ma-jor and minor axis of the bar. Athanassoula& Misiriotis (2002) have suggested that the barstructure is sensitive to which is the dominantgalaxy component exchanging angular momentumwith the bar itself. They introduce the followingnomenclature for profiles along the bar major axis:Halo (MH)/Disk (MD)/Disk-Bulge (MDB) intheir figure 5. The characters in parenthesis in-dicate the dominant structure in the bar region,namely a centrally concentrated halo (MH), a lesscentrally concentrated halo or disk (MD) or abulge and a non-centrally concentrated halo orbulged disk (MDB). For instance, that indicatesthe structural component dominating the angu-lar momentum extraction out from the bar. SinceNGC 3367 is a low inclination galaxy (∼ 25, seeSection 4.1), projection effects are not consideredas an important systematic to assign a morpholog-ical bar type from the intensity profiles. However,it is important to mention that a direct compar-ison of theoretical predictions with NGC 3367 issubject to knowing stellar M/L gradients and alsoany dust effect. We minimize the latest by usingK-band images and adopting a ratio of M/L ∼
1, consistent with the values reported by Faber &
6
Gallagher (1979) for late-type spiral galaxies (seealso Bershady et al. 2010) .
In particular MH models show a flat surfacebrightness profile along the bar major axis. Eval-uating that situation for NGC 3367 is more com-plex because of the multiple spiral arms. In Figure5, we can see that there is a lack of a flat featurein the profile making the MH model unlikely. Inorder to decide between MD and MDB models,we must also compare figure 3 in Athanassoula &Misiriotis (2002) with images in our Figure 1. Al-though the bar in NGC 3367 is strong (see sectionbelow), it is by no means similar to the one inMH models, however, it is also not as round asthe bar in a MD model. We tentatively concludethat NGC 3367 bar is closer to MDB models, butbecause of the the negligible bulge inferred fromour B/D analysis, Figure 5 could be evidencingfor a subdominant dark matter mass inside an ex-ponential length. Notice that in this interpreta-tion the halo contribution is not negligible to theone from the disk, this is not un-reasonable be-cause Halo Adiabatic Contraction models predicta similar structure (Klypin et al. 2002; Gnedinet al. 2004; Colin et al. 2006). Although it ispossible to argue that dust extinction is mask-ing a light profile truly closer to an MD or MHmodel, notice however that not only the K bandbut even the 3.6µ images from Spitzer (Scoville etal. 2008) support our conclusion that MDB/MHmodel represents better the surface density profile.A stronger assessment of the result requires re-examination including stellar population and dustradiative transfer analysis and also considering barproperties in an accreting galaxy.
5.3. Bar Strength
The evolution caused by bars in disk galax-ies is due to gravity torques. Any disk asymme-try like a bar or spiral mode give rise to tangen-tial forces in addition to radial forces, and thento a gravity torques. The computation of thegravitational torques provides important informa-tion about the average strength of the perturbingpotential. Combes & Sanders (1981) suggestedthat these torques could provide a useful wayto quantify nonaxi-symmetric features strength ifthe potential could be estimated. The potentialcan be estimated from de-projected NIR imagesby solving Poisson equations, for example using
Fourier transform techniques, along with assump-tions concerning mass-to-light ratios and verticaldensity distributions (Quillen et al. 1994). Fromthis potential, the radial and tangential compo-nents of the forces in the plane of the galaxy canbe estimated. Following this ideas we estimate thebar strength in NGC 3367 by using the followingequation (Combes & Sanders 1981, Buta & Block2001):
QT (R) =FmaxT (R)
< FR(R) >(1)
where FmaxT (R) = 1/R[∂Φ(R, θ)/∂θ]max repre-
sents the maximum amplitude of the tangentialforce at radius R and < FR(R) >= (dΦ0/dR) isthe mean axi-symmetric radial force at the sameradius, derived from the m = 0 component of thegravitational potential. The potential Φ is esti-mated by using the NIR images, assuming a con-stant (M/L) ratio across the disk. Then the po-tential in two dimensions can be derived as theconvolution of the mass density with the func-tion 1/R using fast Fourier transform techniques(Binney & Tremaine 1987, p. 90). The gravita-tional torque is a function of R, but the maximumvalue of QT (R) can provide a single measure of barstrength for a whole galaxy, if the gravitationalpotential is known. Table 1 shows the estimatesof QT (R) for NGC 3367 from the J , H and Kband images. In our analysis we adopt hz = 325pc, which is the exponential scale height of ourGalaxy (Gilmore & Reid 1983). The study by deGrijs (1998) indicates that late-type galaxies onaverage have a thinner disk than earlier type sys-tems. To account for possible variations in scaleheight and for the possibility that some bars arethicker than their disks, we have made separatepotential runs for hz = 225 and 425 pc. Figure6 shows the ratio map for NGC 3367 (hz = 325pc) with the contours from an R band image over-ploted.
Figure 6 shows the characteristic pattern of abar with four well-defined regions where the ra-tio, depending on quadrant relative to the bar,can be negative or positive due to the change ofsign of the tangential force. The color coding isuseful to visualize the differences that exist in Qby quadrant. These differences may be explainedeither by the presence of the inner spiral arms en-
7
closing the bar (see Figure 1) or by some intrinsicasymmetry in the bar itself that could make theseregions unequal. Table 1 in Buta & Block (2001)defines the bar strength classes that we adopt inour study. NGC 3367 approximately retains itsbar strength class independently of scale heightvariations from 225 to 425 pc. We find that anuncertainty of ± 100 pc in hz produces an aver-age uncertainty of ∼ 5− 10% in bar strength. Wereport that the maximum tangential force reaches44% of the mean radial force with a mean valueof < Qmax
T (R) > = 0.44 for hz = 325 pc. Thisvalue places NGC 3367 in the borderline betweenclasses 4 and 5 of Buta & Block bar-strength clas-sification scheme. In that study, classes 1, 2 and3 indicate a weak bar, while only a small frac-tion of the galaxies have a bar class = 4 or largersuggesting that NGC 3367 can be considered asa galaxy with a strong bar. This strong gravita-tional torque could be the source of secular evolu-tive processes. The significant increase in molec-ular gas mass toward the central regions of NGC3367 as reported by Garcıa-Barreto et al. (2005)could be related to such processes. Secular scenar-ios invoking bar formation or dissolution and bulgeformation (possibly related to the presence of nu-clear activity) might be viable mechanisms for theevolution of isolated galaxies along the Hubble se-quence (Bournaud & Combes 2002).
Alternatively, bars can be characterized asstrong when they have large ellipticities or thetangential forces are large. As the orbital familiesof bars strongly depend on the underlying gravi-tational potential, a correlation between the ellip-ticity and the tangential force is expected (Lau-rikainen et al. 2002; Buta et al. 2004). We havecompared our de-projected bar ellipticity in NGC3367 with that predicted from the < Qmax
T (R) >- ǫ relation in Laurikainen et al. (2002). A consis-tent bar strength estimate could be obtained. Thefact that we can directly measure the bar strengthand also the pattern speed opens the possibilityof accurately estimating the central stellar M/L.We are exploring that possibility in a forthcomingpaper (Cano-Dıaz et al. in preparation).
6. Lopsidedness
Next we present a quantitative analysis of theasymmetry properties of NGC 3367 in various
wavelengths. We start with the analysis of the op-tical and NIR light by means of the Concentration-Asymmetry-Clumpiness parameters. These threestructural and morphological indexes constitutethe so-called CAS system, which has been pro-posed for distinguishing galaxies at different stagesof evolution (Conselice 2003, hereafter C03 andreferences therein). Briefly, the concentration in-dex C is defined as the ratio of the 80% to 20%curve of growth radii (r80, r20) within 1.5 timesthe Petrosian inverted radius at r(η = 0.2) r nor-malized by a logarithm: C = 5log(r80/r20). Theconcentration of light is related to the galaxy light(or stellar mass) distribution.
The asymmetry index is the number computedwhen a galaxy is rotated 180 from its center andthen subtracted from its prerotated image. Thesummation of the intensities of the absolute-valueresiduals of this subtraction are compared with theoriginal galaxy flux. This parameter is also mea-sured within r. The A-index is sensitive to anyfeature that produces asymmetric light distribu-tions. This includes galaxy interactions and merg-ers, large star-forming regions, and dust lanes.
Galaxies undergoing SF are very patchy andcontain large amounts of light at high spatial fre-quency. To quantify this, the clumpiness indexS is defined as the ratio of the amount of lightcontained in high-frequency structures to the to-tal amount of light in the galaxy within r. TheS-parameter, because of its morphological nature,is sensitive to dust lanes and inclination.
6.1. CAS Structural Parameters
Figure 7 shows the wavelength-dependent po-sition of NGC 3367 in the CAS parameter space(UBV RIJK symbols). The loci (average and itsstandard deviation) for a sample of isolated Sa-Sb and Sbc-Sm galaxies (Hernandez-Toledo et al.2007, 2008) in the R− band CAS planes are in-dicated as crosses and continuous error bars. Thesolid boxes indicate the maximum amplitude ofvariation (lower and upper limits) of the CAS pa-rameters from B to K bands for the isolated disksample. For comparison, the R−band CAS aver-ages and standard deviations of galaxies in inter-acting S+S pairs (open circles; Hernandez-Toledoet al. 2005), Starburst (long-dash) and Ultra Lu-minous Infrared (ULIR) galaxies (short-dash;C03)are also plotted.
8
NGC 3367 experiences a strong migration inthe CAS diagram. While the UBV R band CASvalues place it as a typical Starburst, the R bandasymmetry (A(R) = 0.35) is also consistent withthat of weakly interacting galaxies (Hernandez-Toledo et al. 2005) and at the end its locus in theJK bands place it within the boundaries of nearlyisolated galaxies. The Population I disk of youngstars (and dust) yield a significant contributionto the optical U,B, V CAS distributions, makingtheir average values largely decoupled from thecorresponding to older J,K stars. The clumpi-ness parameter S, compares the amount of light instar-forming clusters and young associations to thelight in a more diffuse older disk population. Thismeasure correlates with Hydrogen recombinationlines (Hα) and gives an indication of recent star-formation activity. We estimate the star formationrate (SFR) in NGC 3367 through LFIR (see Table2). SFRFIR(M⊙yr
−1) = 1.40 × 10⁻¹⁰LFIR(L⊙)(Devereux & Young 1991) holds for the high-massend (M ≥ 10M⊙) and was corrected by the factorgiven in Devereux & Young (1990) to take into ac-count the fact that LFIR is used instead of LIR. ASFR ∼ 3.1M⊙yr
−1 in NGC 3367 (compared with5 M⊙yr
−1 reported by Garcıa-Barreto et a. 2005)is an order of magnitude higher than the medianvalue SFR ∼ 0.27M⊙yr
−1 obtained for a sampleof isolated galaxies of similar (Sc) morphologicaltypes (Hernandez-Toledo et al. 2001), consistentwith NGC 3367 being in the Starburst region ofthe CAS diagrams.
6.2. NIR Lopsidedness (Fourier Analysis)
The light distribution in many galaxy disks isnon-axisymmetric or lopsided with a spatial ex-tent much larger along one half of a galaxy thanthe other. Nearly 30 % of galaxies have significantlopsidedness in stellar disks with an amplitude of> 10% measured as the Fourier amplitude of them = 1 component normalized to the average value(Rix & Zaritsky 1995, Zaritsky & Rix 1997, Bour-naud et al. 2005).
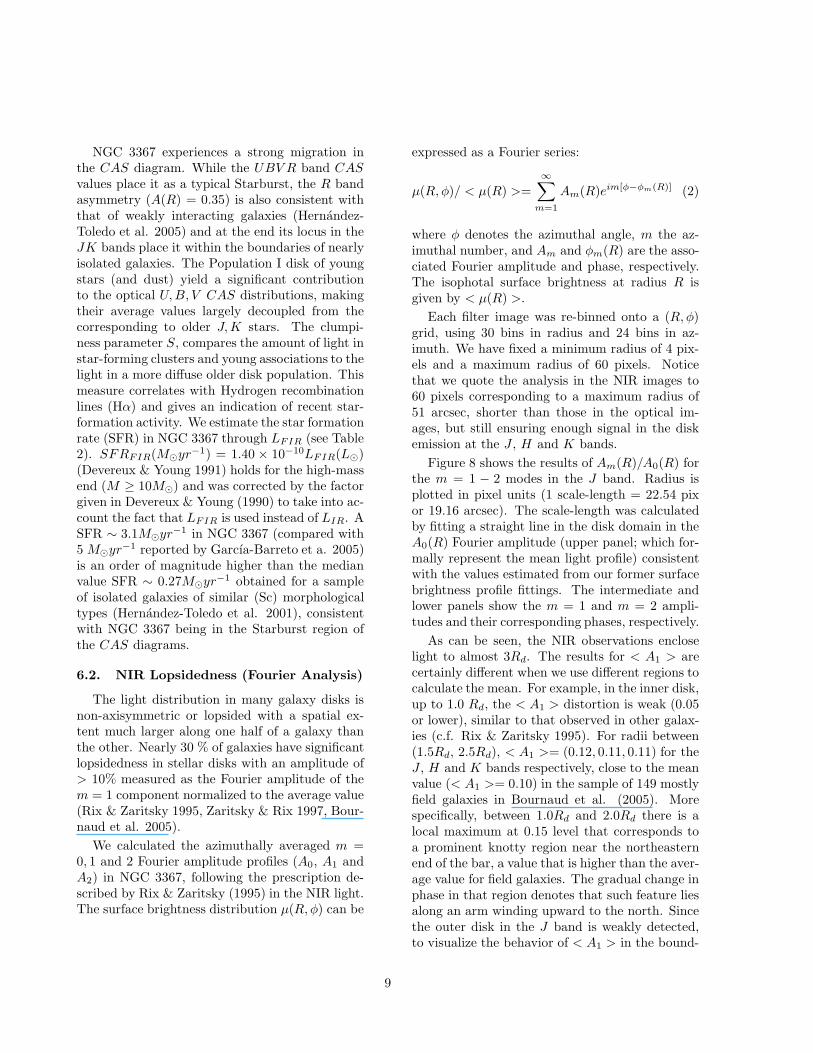
We calculated the azimuthally averaged m =0, 1 and 2 Fourier amplitude profiles (A0, A1 andA2) in NGC 3367, following the prescription de-scribed by Rix & Zaritsky (1995) in the NIR light.The surface brightness distribution µ(R, φ) can be
expressed as a Fourier series:
µ(R, φ)/ < µ(R) >=
∞∑
m=1
Am(R)eim[φ−φm(R)] (2)
where φ denotes the azimuthal angle, m the az-imuthal number, and Am and φm(R) are the asso-ciated Fourier amplitude and phase, respectively.The isophotal surface brightness at radius R isgiven by < µ(R) >.
Each filter image was re-binned onto a (R, φ)grid, using 30 bins in radius and 24 bins in az-imuth. We have fixed a minimum radius of 4 pix-els and a maximum radius of 60 pixels. Noticethat we quote the analysis in the NIR images to60 pixels corresponding to a maximum radius of51 arcsec, shorter than those in the optical im-ages, but still ensuring enough signal in the diskemission at the J , H and K bands.
Figure 8 shows the results of Am(R)/A0(R) forthe m = 1 − 2 modes in the J band. Radius isplotted in pixel units (1 scale-length = 22.54 pixor 19.16 arcsec). The scale-length was calculatedby fitting a straight line in the disk domain in theA0(R) Fourier amplitude (upper panel; which for-mally represent the mean light profile) consistentwith the values estimated from our former surfacebrightness profile fittings. The intermediate andlower panels show the m = 1 and m = 2 ampli-tudes and their corresponding phases, respectively.
As can be seen, the NIR observations encloselight to almost 3Rd. The results for < A1 > arecertainly different when we use different regions tocalculate the mean. For example, in the inner disk,up to 1.0 Rd, the < A1 > distortion is weak (0.05or lower), similar to that observed in other galax-ies (c.f. Rix & Zaritsky 1995). For radii between(1.5Rd, 2.5Rd), < A1 >= (0.12, 0.11, 0.11) for theJ , H and K bands respectively, close to the meanvalue (< A1 >= 0.10) in the sample of 149 mostlyfield galaxies in Bournaud et al. (2005). Morespecifically, between 1.0Rd and 2.0Rd there is alocal maximum at 0.15 level that corresponds toa prominent knotty region near the northeasternend of the bar, a value that is higher than the aver-age value for field galaxies. The gradual change inphase in that region denotes that such feature liesalong an arm winding upward to the north. Sincethe outer disk in the J band is weakly detected,to visualize the behavior of < A1 > in the bound-
9
ary of 60 pix and beyond, we use a deep R bandimage instead, obtaining that < A1 > appears todecrease below 0.05 level, with a roughly constantphase. By comparison, the phase is nearly con-stant with radius in the data of Rix & Zaritsky(1995). NGC 3367 could be regarded as slightlynon-symmetric, at the nominal intermediate radii.In the lower panel of Figure 8, the m = 2 ampli-tude and phase confirms the existence of the barwithin 1.0Rd. Between 1.0Rd and 2.0Rd there isanother local maximum of similar amplitude, thataccording to the associated phase, corresponds tothe inner arms enclosing the bar.
6.3. Hα Lopsidedness
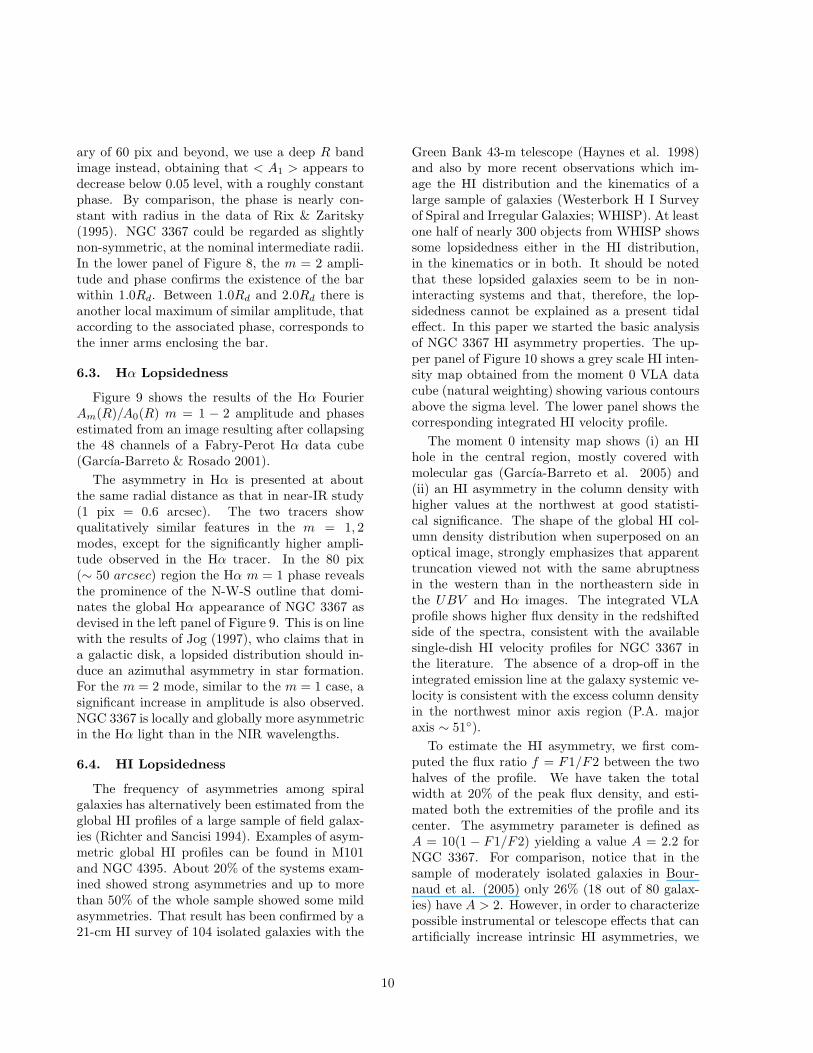
Figure 9 shows the results of the Hα FourierAm(R)/A0(R) m = 1 − 2 amplitude and phasesestimated from an image resulting after collapsingthe 48 channels of a Fabry-Perot Hα data cube(Garcıa-Barreto & Rosado 2001).
The asymmetry in Hα is presented at aboutthe same radial distance as that in near-IR study(1 pix = 0.6 arcsec). The two tracers showqualitatively similar features in the m = 1, 2modes, except for the significantly higher ampli-tude observed in the Hα tracer. In the 80 pix(∼ 50 arcsec) region the Hα m = 1 phase revealsthe prominence of the N-W-S outline that domi-nates the global Hα appearance of NGC 3367 asdevised in the left panel of Figure 9. This is on linewith the results of Jog (1997), who claims that ina galactic disk, a lopsided distribution should in-duce an azimuthal asymmetry in star formation.For the m = 2 mode, similar to the m = 1 case, asignificant increase in amplitude is also observed.NGC 3367 is locally and globally more asymmetricin the Hα light than in the NIR wavelengths.
6.4. HI Lopsidedness
The frequency of asymmetries among spiralgalaxies has alternatively been estimated from theglobal HI profiles of a large sample of field galax-ies (Richter and Sancisi 1994). Examples of asym-metric global HI profiles can be found in M101and NGC 4395. About 20% of the systems exam-ined showed strong asymmetries and up to morethan 50% of the whole sample showed some mildasymmetries. That result has been confirmed by a21-cm HI survey of 104 isolated galaxies with the
Green Bank 43-m telescope (Haynes et al. 1998)and also by more recent observations which im-age the HI distribution and the kinematics of alarge sample of galaxies (Westerbork H I Surveyof Spiral and Irregular Galaxies; WHISP). At leastone half of nearly 300 objects from WHISP showssome lopsidedness either in the HI distribution,in the kinematics or in both. It should be notedthat these lopsided galaxies seem to be in non-interacting systems and that, therefore, the lop-sidedness cannot be explained as a present tidaleffect. In this paper we started the basic analysisof NGC 3367 HI asymmetry properties. The up-per panel of Figure 10 shows a grey scale HI inten-sity map obtained from the moment 0 VLA datacube (natural weighting) showing various contoursabove the sigma level. The lower panel shows thecorresponding integrated HI velocity profile.
The moment 0 intensity map shows (i) an HIhole in the central region, mostly covered withmolecular gas (Garcıa-Barreto et al. 2005) and(ii) an HI asymmetry in the column density withhigher values at the northwest at good statisti-cal significance. The shape of the global HI col-umn density distribution when superposed on anoptical image, strongly emphasizes that apparenttruncation viewed not with the same abruptnessin the western than in the northeastern side inthe UBV and Hα images. The integrated VLAprofile shows higher flux density in the redshiftedside of the spectra, consistent with the availablesingle-dish HI velocity profiles for NGC 3367 inthe literature. The absence of a drop-off in theintegrated emission line at the galaxy systemic ve-locity is consistent with the excess column densityin the northwest minor axis region (P.A. majoraxis ∼ 51).
To estimate the HI asymmetry, we first com-puted the flux ratio f = F1/F2 between the twohalves of the profile. We have taken the totalwidth at 20% of the peak flux density, and esti-mated both the extremities of the profile and itscenter. The asymmetry parameter is defined asA = 10(1 − F1/F2) yielding a value A = 2.2 forNGC 3367. For comparison, notice that in thesample of moderately isolated galaxies in Bour-naud et al. (2005) only 26% (18 out of 80 galax-ies) have A > 2. However, in order to characterizepossible instrumental or telescope effects that canartificially increase intrinsic HI asymmetries, we
10
estimated the HI lopsidedness in NGC 3367 fromintegrated spectra retrieved from other single-dishtelescopes (Huchtmeier & Seiradakis 1985 [Effels-berg]; Mirabel & Sanders 1988 [Arecibo]; Staveley-Smith & Davies 1988 [Jodrell-Bank]; Springob etal. 2005 [Arecibo]), obtaining a mean value ofA = 1.8 with a scatter of 0.7. Notice that eventhe lowest estimated value is similar to the aver-age asymmetry (stellar component) reported byBournaud et al. (2005) for galaxies in the localuniverse, indicating that in NGC 3367 HI asymme-try is detected with good statistical significance,regardless of the instrumentation.
We also explored the VLA HI velocity chan-nels. However at the current signal level we donot find convincing evidence of neutral gas fall orejection. The fact that we find a significant lopsid-edness in the HI gas component in NGC 3367 sug-gest that the triggering event must have happenedsome time in the past. In section 8 we use gas re-laxation time arguments in order to constrain thetime of a perturbation event.
7. Low Surface Brightness Structures andCompanions
The most natural explanation for NGC 3367perturbed morphology and asymmetries is a re-cent encounter with a low-mass galaxy. A deep 7.2× 7.2 arcmin R band image of NGC 3367 has beenproduced in order to look for low surface bright-ness features reminiscent of possible tidal interac-tions. The final image in Figure 11 is the sum ofone 1800 seconds exposure, two 1200 seconds ex-posures, and one 900 seconds exposure and it ispresented in logarithmic scale. The circular con-tour illustrates the position of regions with S/N =3.
This image highlights the more circular natureof the disk and some possible diffuse light struc-tures at the outskirts. To quote the depth of theimage we built a pixel representation of two im-ages dubbed as the variance and the average bycombining all the images intervening in Figure 11.Since the calibration of this deep image is not cur-rently available, we relied in our calibrated shortexposure images (typically 15 min) at the sameband, as shown in Figure 2. We estimate a S/Nratio ∼ 3 at a maximum radius of the order of 80arcsec (see circular contour), with a detection limit
at that position µR ∼ 26.0 mag arcsec−2. Thatlevel is of the order of that in recent studies lookingfor similar features in isolated galaxies (Smirnovaet al. 2010). We also applied histogram equaliza-tion and unsharp masking transformations to theimage similar to recent studies (Martınez-Delgadoet al. 2010), however because of the low S/N be-yond 80 arcsec, we find no reliable evidence for theexistence of external low surface brightness fea-tures at the current depth of this image. A care-ful control of the background fluctuations due toflat-field residuals, internal reflections, ghosts andscattered light that were not considered in detailin the present image, deserves special attention.Deeper and careful observations are still neces-sary to provide unambiguous evidence of any tidalstructure at the outskirts of NGC 3367 (Martınez-Delgado et al. 2010).
A procedure, coined as blinking colors, was im-plemented to search for small companions withinthe disk and/or in the close neighborhood of NGC3367. A fact is used that under some circum-stances, a small galaxy laying in front of a big-ger one could still be recognized if its own colors(stellar population, however dust effects should beaccounted) are different enough from those in thebackground galaxy. To that purpose, we have pro-duced various combinations of color index maps,namely U−B, B−V , U−K, B−K, from our U -to-K band observations blinking the parent imagesalong with their corresponding color maps withthe hope of visually identify any feature not shar-ing the observed colors of the ground host galaxy.We also produced a pixel representation of eachcolor map to have a more quantitative visualiza-tion of the color properties. Unfortunately theseprocedures produced no positive detections. Fig-ure 12 (left panel) shows a (B−V ) color-index mapand the corresponding distribution of pixels (rightpanel) within a radius of 60 pixels, well within thedisk and assuring a pixel S/N ratio of 3. Pixelswere binned to the order of the seeing and thencorrected for galactic extinction. Blue color repre-sents values (0 < (B − V ) < 0.5), pixels in green(0.5 < (B − V ) < 0.75), pixels in yellow (0.75 <(B − V ) < 1.0) and pixels in red (B − V ) > 1.0.
The color pixel representation suggests the exis-tence of structure adjacent to the compact nucleusin the (0.75 < (B − V ) < 1.0) color range (cen-tral green-yellow-red transition region in the up-
11
per right panel) resembling a circumnuclear com-ponent. Whether there is a circumnuclear ringor disc is currently being assessed using archiveSpitzer images and CO kinematics and will be pre-sented elsewhere (see also the residual image afterour 2D bulge/bar/disk decomposition in Figure 3).
Finally, we mention our search for Hα emissionsatellite galaxies in the close neighborhood of NGC3367. A series of narrow-band (∆λ ∼ 80A) Hα im-ages with a field of view of 4.5 × 4.5 arcmin wereobtained at the OAN-SPM 1.5m telescope with aset of extragalactic Hα filters tuned at differentred-shifts (covering a radial velocity range from1000 km s−1 up to 6000 km s−1) and sharing adegree of velocity overlap among adjacent filters.A blinking of the images at different recession ve-locities with respect to that in the Gunn r broad-band yielded no positive identifications. RecentlyIvory & James (2011) showed that this kind ofsearches reveal star forming satellite galaxies.
In the mean time, and with the above evidence,NGC 3367 is tentatively added to the list of can-didate spirals showing various signs of perturba-tion, but no large nearby companions, these sys-tems may have undergone some kind of smoothlikemass accretion during the past Gyrs.
8. Discussion
8.1. Evidence for Recent NGC 3367 inter-action with a small galaxy?
An intuitive explanation for NGC 3367 opti-cal asymmetric morphology and large bipolar syn-chrotron emission might be a recent merger witha small galaxy since NGC 3367 has no large op-tical companion closer than 500 kpc (Garcıa -Barreto, Carrillo and Vera-Villamizar 2003). Agas rich galaxy may be a suited candidate be-cause the asymmetric star formation distribution.NGC 5548 is an example of another Seyfert galaxythat is not suffering a major encounter, but thatpresents faint stellar structures remnant of pastinteractions. Other important differences in thiscomparison are the galaxy morphological typeand the high density environment in NGC 5548.Hence, finding evidence for a past possible mergerevent in NGC 3367 is important in order to definea plausible scenario that explains its properties. Amultiwavelength search was performed in order tolook for a possible remnant signature or a dwarf
perturber, within the disk and in its close neigh-borhood. Initially we used our data at variousoptical Hα and infrared wavelengths and differentenhancing procedures, as presented in section7. Sofar no convincing evidence was found, thus plac-ing constraints to the time of any possible galaxyaccretion event.
Different studies have analyzed galaxy disk re-sponse to minor mergers. For example, Kazantzidiset al. (2008) have recently studied the signa-ture of galaxy merger histories in the context ofΛCDM scenarios mostly focusing in gravitationalinteractions between existing thin galactic disksand small galaxies with masses comparable tothe LMC. They conclude that if a merging eventoccurs, it could at least, be responsible for theformation of thick disks, central bars, low surfacebrightness ring-like configurations and faint fila-mentary structures around a main galaxy, like inNGC 3367 making this scenario compelling. Un-fortunately Kazantzidis et al. (2008) did not showthe perturber remnant distribution. In the fol-lowing sections we compare instead with similarexperiments by Villalobos & Helmi (2008) becausethey present both the perturber satellite and thehost disk distributions across different times. Atthe current state of our photometric search we cannot support the idea of a recent minor merger withan LMC-like galaxy; at most we can constraint theevent to the distant past. Alternatively, if we con-sider a recent interaction with a dwarf galaxy, itsmass should be considerably lighter than NGC3367 disk, otherwise narrow stellar streams maystill be detectable.
8.2. Possible Origin of Disk Lopsidedness
NGC 3367 asymmetry properties were char-acterized using different techniques and differentwavelengths. The high redshift motivated asym-metry parameter in the CAS diagram goes froma strongly perturbed galaxy values and a strongStarburst one in U and B bands (young stellarcomponent and dust) to the ones correspondingto a nearly isolated spiral galaxy in the J and Kbands (average stellar population).
The azimuthally averaged m = 0,1 and 2Fourier amplitude and phases, (A0,A1,A2 and φ1,φ2 and φ3 ) in the K band (also the ones from ourdeep R band image for the external regions) wereestimated finding that:
12
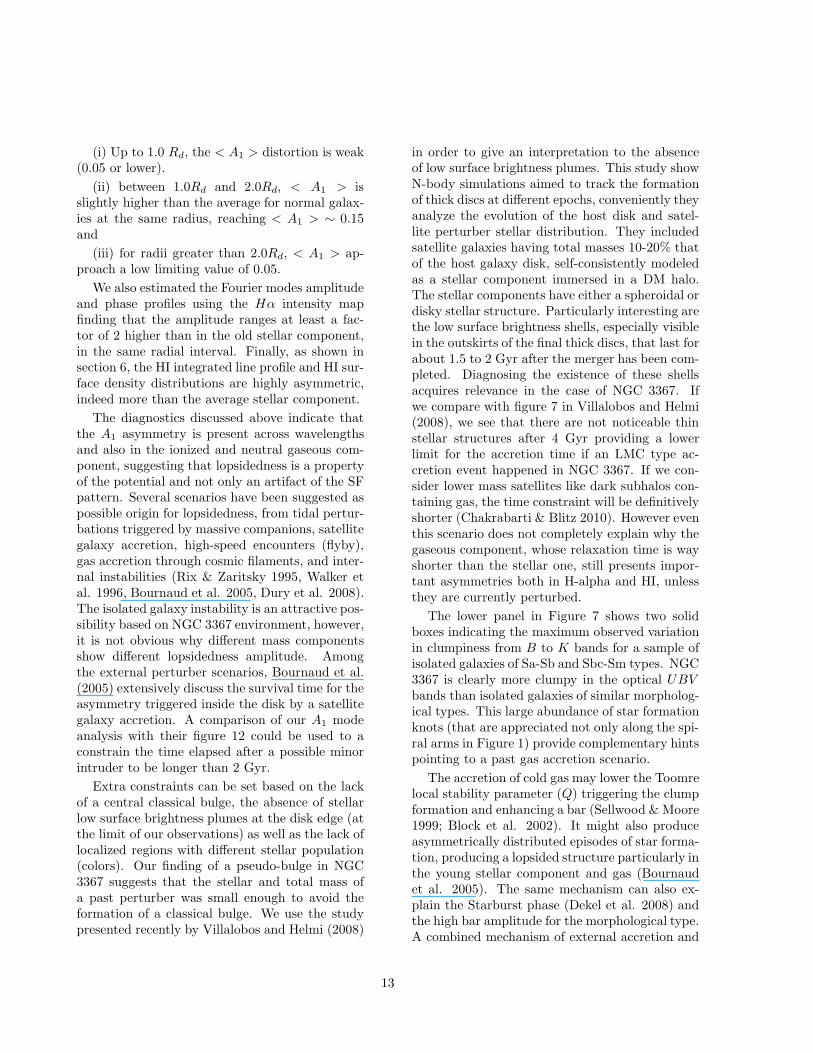
(i) Up to 1.0 Rd, the < A1 > distortion is weak(0.05 or lower).
(ii) between 1.0Rd and 2.0Rd, < A1 > isslightly higher than the average for normal galax-ies at the same radius, reaching < A1 > ∼ 0.15and
(iii) for radii greater than 2.0Rd, < A1 > ap-proach a low limiting value of 0.05.
We also estimated the Fourier modes amplitudeand phase profiles using the Hα intensity mapfinding that the amplitude ranges at least a fac-tor of 2 higher than in the old stellar component,in the same radial interval. Finally, as shown insection 6, the HI integrated line profile and HI sur-face density distributions are highly asymmetric,indeed more than the average stellar component.
The diagnostics discussed above indicate thatthe A1 asymmetry is present across wavelengthsand also in the ionized and neutral gaseous com-ponent, suggesting that lopsidedness is a propertyof the potential and not only an artifact of the SFpattern. Several scenarios have been suggested aspossible origin for lopsidedness, from tidal pertur-bations triggered by massive companions, satellitegalaxy accretion, high-speed encounters (flyby),gas accretion through cosmic filaments, and inter-nal instabilities (Rix & Zaritsky 1995, Walker etal. 1996, Bournaud et al. 2005, Dury et al. 2008).The isolated galaxy instability is an attractive pos-sibility based on NGC 3367 environment, however,it is not obvious why different mass componentsshow different lopsidedness amplitude. Amongthe external perturber scenarios, Bournaud et al.(2005) extensively discuss the survival time for theasymmetry triggered inside the disk by a satellitegalaxy accretion. A comparison of our A1 modeanalysis with their figure 12 could be used to aconstrain the time elapsed after a possible minorintruder to be longer than 2 Gyr.
Extra constraints can be set based on the lackof a central classical bulge, the absence of stellarlow surface brightness plumes at the disk edge (atthe limit of our observations) as well as the lack oflocalized regions with different stellar population(colors). Our finding of a pseudo-bulge in NGC3367 suggests that the stellar and total mass ofa past perturber was small enough to avoid theformation of a classical bulge. We use the studypresented recently by Villalobos and Helmi (2008)
in order to give an interpretation to the absenceof low surface brightness plumes. This study showN-body simulations aimed to track the formationof thick discs at different epochs, conveniently theyanalyze the evolution of the host disk and satel-lite perturber stellar distribution. They includedsatellite galaxies having total masses 10-20% thatof the host galaxy disk, self-consistently modeledas a stellar component immersed in a DM halo.The stellar components have either a spheroidal ordisky stellar structure. Particularly interesting arethe low surface brightness shells, especially visiblein the outskirts of the final thick discs, that last forabout 1.5 to 2 Gyr after the merger has been com-pleted. Diagnosing the existence of these shellsacquires relevance in the case of NGC 3367. Ifwe compare with figure 7 in Villalobos and Helmi(2008), we see that there are not noticeable thinstellar structures after 4 Gyr providing a lowerlimit for the accretion time if an LMC type ac-cretion event happened in NGC 3367. If we con-sider lower mass satellites like dark subhalos con-taining gas, the time constraint will be definitivelyshorter (Chakrabarti & Blitz 2010). However eventhis scenario does not completely explain why thegaseous component, whose relaxation time is wayshorter than the stellar one, still presents impor-tant asymmetries both in H-alpha and HI, unlessthey are currently perturbed.
The lower panel in Figure 7 shows two solidboxes indicating the maximum observed variationin clumpiness from B to K bands for a sample ofisolated galaxies of Sa-Sb and Sbc-Sm types. NGC3367 is clearly more clumpy in the optical UBVbands than isolated galaxies of similar morpholog-ical types. This large abundance of star formationknots (that are appreciated not only along the spi-ral arms in Figure 1) provide complementary hintspointing to a past gas accretion scenario.
The accretion of cold gas may lower the Toomrelocal stability parameter (Q) triggering the clumpformation and enhancing a bar (Sellwood &Moore1999; Block et al. 2002). It might also produceasymmetrically distributed episodes of star forma-tion, producing a lopsided structure particularly inthe young stellar component and gas (Bournaudet al. 2005). The same mechanism can also ex-plain the Starburst phase (Dekel et al. 2008) andthe high bar amplitude for the morphological type.A combined mechanism of external accretion and
13
bar radial transport of gas and stars might be re-sponsible of the color profiles presented in section4.1, and also of the large A1 amplitude in bluecolors (Mapelli et al. 2008). Although gas ac-cretion seems an attractive scenario, from the HIVLA observations we find no convincing evidencefor extraplanar gas in the gas kinematics, conclud-ing that the gas asymmetry may be the result ofa past event. The gas relaxation time constraintsthe time of the event to be a few million years. Asa coincidence, if we assume that the radio jet speedis one-tenth the speed of light with a projected ra-dius of 6.5 kpc, the ejection time is constrainedto a similar short time scale suggesting that thesame accretion event may be responsible of bothmorphology and nuclear activity.
8.3. Evidence of Secular Evolution inNGC 3367
Bar structural and kinematic properties are cor-related with its dynamical history. We determinedthe bar strength using two complementary meth-ods, showing that NGC 3367 has a strong bar. TheB − I color map revealed conspicuous dust laneswhose shape is sensitive to the bar pattern speed.Specifically, the dust lane orientation non-parallelto the bar major axis may suggest a relatively slowbar, which is not unexpected in late-type galaxies(Salo et al. 1999). However a definitive answermust wait to direct estimation. The bar elliptic-ity and overall structure suggest a spheroid pres-ence absorbing angular momentum from the bartriggering its growth. Because the 2-D photom-etry does not indicate an important bulge, thebar structure may indicate the presence of a darkmatter component. However, the lopsided struc-ture and the possible gas accretion introduce anuncertainty that can not be sorted out withoutmore investigation of the angular momentum his-tory if m=2 and m=1 modes coexist in gas ac-creting disk galaxies. Comparison of images in Kand U and B bands, suggest that secular evolu-tion has triggered gas inflow and star formationalong the bar. In particular the U and B mor-phology suggest a very thin and curved bar andalso a blue compact nucleus, suggesting star for-mation along the bar. The NIR torque strengthparameter indicates that NGC 3367 has an out-standing strong bar, this probably relates to thenuclear activity and is consistent with the molec-
ular gas abundance in the bar region.
The bulge of NGC 3367 is exponential, simi-lar to the so-called ”pseudobulges”. Bulges of thistype are thought to be generated via internal sec-ular evolution processes (see, e.g., Kormendy &Kennicutt 2004). Given that NGC 3367 is iso-lated, secular evolution is likely the dominant evo-lutionary mechanism. Pseudobulges typically re-semble small discs embedded in larger ones or flat-tened spheroids. The strong bar presence and thelarge abundance of young stellar clumps in thedisk (Garcıa-Barreto et al. 2007; Elmegreen et al.2008), support this scenario as a possible one forNGC 3367 bulge formation. Foyle et al. (2009) ob-servationally estimated the effect of gravitationaltorques due to the present day global disk stel-lar distribution. They discussed whether thesetorques are efficient at transporting angular mo-mentum within a Hubble Time. They found thattorques due to the stellar disk lead on average tooutward angular momentum transport over muchof the disk (r ≤ 3 rexp). Gravitational torquesinduce angular momentum change on time scalesshorter than a Hubble Time inside one scalelength,where they act on a time scales of 4 Gyr. If wecompare with Foyle et al. (2009) results, secularevolution is thus expected to be effective in theinner parts of NGC 3367 and perhaps is also con-nected with the nuclear activity, however, the de-tails for this process and its relationship to the fu-eling of the central active galactic nucleus (AGN)in NGC 3367 need to be worked out.
8.4. Nuclear Activity and NGC 3367Structure
NGC 3367 is a Seyfert2/Liner galaxy present-ing a radio continuum jet, however it is still con-sidered a radio quiet galaxy. A natural questionis what is the connection, if any, between the nu-clear activity and the asymmetric galaxy morphol-ogy. As we concluded above, the most compellingcandidate scenario for being responsible for NGC3367 morphology is a past gas rich accretion event.Currently cosmological galaxy formation scenar-ios provide an explanation of both possibilities;galaxies smaller than 1012M⊙ receive significantaccretion (small galaxies and gas) through cosmicfilaments (Dekel et al. 2009). The main argu-ment favoring this scenario is the lack of dynam-ically young stellar signatures associated to a re-
14
cent tidal event. Specifically the absence of thintidal tails constrains any interaction event to somedynamical times in the past (3-5 Gyr) (c.f. Vil-lalobos & Helmi 2008), however the gas compo-nent that has a shorter relaxation time shows botha global (A1 mode) and localized overdensities.That short gas relaxation time compared with thestellar component, suggest a perturbing event inthe last hundreds of million years. The images inshort (U and B) wavelengths reveal young stellarpopulation all the way along the bar up to the nu-cleus suggesting that a continuous gas supply hasbeen channeled by the bar towards the nuclei.
Cosmological simulations of galaxy formationshow that accreted gas (either from satellites orcold flows) frequently has a different angular mo-mentum orientation compared with the existingdisks originating warps or polar disks (Maccio etal. 2007, Roskar et al. 2010). The highly inclinedjet in NGC 3367 (Garcıa-Barreto et al. 2001)might well be the result of a nuclear inclined disktriggered by misaligned gas accretion. The factthat statistical studies show an unexpectedly highfraction (22 %) of active isolated galaxies (Sabateret al. 2010) as well as asymmetric isolated diskgalaxies (30%) (Hernandez-Toledo et al. in prepa-ration), and also that roughly half (44%) of theSeyfert/LINER galaxies in a distance limited sam-ple show radio jet-like structures at kpc-scale (Gal-limore et al. 2006), suggest that asymmetric gasaccretion, isolated lopsided, barred galaxies andnuclear activity may be correlated. If this is con-firmed by the future corresponding statistical mul-tiwavelength studies, large scale gas accretion mayraise as an important source of nuclear galaxy ac-tivity. Furthermore, we can expect that at highredshift, when filament accretion rate was morevigorous and common (gas and satellites), theAGN feedback triggered only by the cold accre-tion mode and enhanced by disk asymmetries maybe considerably more important than typically as-sumed.
NGC 3367 can be added to the list of local late-type galaxies that lack a classical bulge but thathost an obscured AGN (McAlpine et al. 2011;Ghosh et al. 2008; Desroches & Ho 2009). Thistype of galaxies may reveal kpc-scale jet-like struc-tures in deep enough radio imaging of local sur-veys. The black hole mass in this pseudo-bulgegalaxy has been recently estimated using various
methods, ranging between 105−107M⊙ (McAlpineet al. 2011).
8.5. Constraining Formation Scenarios
The discussion presented above favors the fol-lowing facts:
(i) NGC 3367 is a galaxy likely localized in a lowdensity environment, the nearest dense structureis the Leo Group, however the difference in line ofsight velocity is near to 2000 km s−1, consider-ably larger than Leo escape velocity, therefore wethink they are unlikely bounded.
(ii) The importance of major mergers in NGC3367 assembling and even of minor mergers withmassive satellites is severely constrained becauseof the lack of a classical bulge as well as the ab-sence of bright and thin stellar streams. In fact theB/D ratio 0.07-0.11 marginally favors a pseudob-ulge, perhaps caught in the act of formation. Thisgalaxy is an example of the late type active onesdiscussed by Schawinski et al. (2011), the pos-sibility of a gas rich minor merger although notdiscarded, is constrained to current very low masssatellites or toward the past 3-4 Gyr. For com-parison, typical fractional lopsidedness amplitudeA1 within the central 5 kpc from 2MASS imagesof advanced mergers of galaxies (Jog & Maybhate2006) go from ∼ 0.12 to 0.2, higher than the val-ues found in the inner regions of NGC 3367. No-tice that those advanced mergers were selected ashaving merged into single nucleus but still showindications of interactions, including visible tidaltails, contrary to what is observed in NGC 3367.
(iii) The stronger asymmetry found in theyoung stellar component and gas constrains a pos-sible perturbation to the gas relaxation time scaleswhich are shorter than the stellar relaxation times(Gyr scale), therefore the gas perturbation musthas happened a few million years in the past.
(iv) The high clumpiness parameter value andthe global Starburst phase (see Figure 7) may beexplained if the gas richness is high. Based onthe integrated HI line profile and CO observations,NGC 3367 has a gaseous mass of a few 1010M⊙
(Huchtmeier and Richter 1989; Garcıa -Barreto etal. 2005). A naive estimation of the stellar massis severely affected by the AGN light and by dustextinction. For example, if we use published Kband photometry, a maximum rotation velocity
15
close to 300 km s−1 or larger is inferred fromthe Tully-Fischer relation. In contrast, Garcıa-Barreto & Rosado (2001) present estimates of thegalaxy maximum rotation velocity in the rangeof (195-225) km s−1, not far from the reportedvalues for the Milky Way. As a comparison, theMilky Way has a stellar mass around 6 ×10¹⁰M⊙
and a gas to baryon fraction of 13%. Avoiding adetailed modelling of the disk and nuclear emis-sion required to estimate the stellar mass, and us-ing recent theoretical studies (Baldry et a 2008,Rodrıguez-Puebla et al. 2011) that suggest a re-lationship between the total galaxy mass and thestellar mass, we can assume a Vmax = 225 kms−1 for NGC 3367 and infer a stellar mass of theorder of 6 ×10¹⁰M⊙. Since the gas mass can bedirectly estimated from the observations, the in-ferred gas to baryon fraction attains 16%. Onthe other hand, if we assume the lower limit ofVmax, we can infer a gas fraction of about (25-30)%. The estimated gas richness in NGC 3367(16-30%) when compared versus galaxies of simi-lar Vmax like the Milky Way (13%), suggest thatthe gaseous disk has been experiencing fragmenta-tion and localized stellar bursts (see Figure 7 andGarcıa-Barreto et al. 2007).
(v) The scenario resembles truly rich gas galax-ies at z > 1, where disk fragmentation is believedto contribute to bulge formation (e.g. Ceverino etal. 2010). However, notice that NGC 3367 is lessgaseous and less violently unstable. If this anal-ogy is correct, disk clumps infall due to dynam-ical friction may be forming now a pseudobulge(Elmegreen et al. 2008) and may be feeding thecentral blackhole growth and activity. Recent ob-servational evidence (Kormendy et al. 2011) foundno correlation between pseudobulge and blackholemasses, setting a question mark on the importanceof clump migration as a blackhole feeding mecha-nism.
9. Conclusions
From a set of optical, NIR and Hα Fabry-Perotobservations carried out at San Pedro Martir, Na-tional Optical Observatory in Mexico and fromarchive HI VLA data we studied some structuralproperties in NGC 3367 and tried to constrain pos-sible origins for its asymmetric structure.
Our surface photometry analysis and coupled
1D-2D bulge/bar/disk decomposition proceduresindicate that both the bulge and disk of NGC 3367are consistent with a double exponential luminos-ity distribution in all the observed wavelengthswith a rather small B/D luminosity ratio suggest-ing a R’SBcd(r) morphological type with a pseu-dobulge, constraining the mass of possible pastperturber to rather low values. From the positionof the galaxy in the CAS structural diagrams, itis inferred that NGC 3367 is in a global Starburstphase, with a SFR ∼ 3− 4M⊙yr
−1.
A qualitative comparison of the observed dust-lane morphology from (B − I) color index mapswith the results from bar numerical simulationssuggest that NGC 3367 may host a relatively slowbar. Bar torques, estimated from the NIR images(Buta & Block 2001) yielded a bar strength Qb =0.44, placing NGC 3367 as a galaxy with a verystrong bar. The presence of such a bar may be be-hind the complete absence of HI gas in the centralregions of NGC 3367, mostly covered with a highamount of CO gas instead. The absence of suchbars may explain why other similarly asymmetricgalaxies like M101 do not currently present strongnuclear activity.
Global and local asymmetry in NGC 3367 hasbeen analyzed from three alternative indicators:1) through the CAS structural parameters in theoptical and NIR light, 2) from an estimate of theFourier amplitude of the m-components of thedensity distributions in the NIR and Hα light andfinally, 3) from a new analysis of the HI VLA in-tegrated profile and the moment 0 HI intensitydistribution.
NGC 3367 shows a moderately high value of A1
in its intermediate stellar disk (0.15) but it is neg-ligible in the inner and outer regions. An asymme-try a factor of 2 higher is revealed in the Hα lightand integrated HI profile instead. This strong de-coupling in asymmetry with respect to the meanstellar component challenge an internal disk insta-bility origin for lopsidedness which seems naturalbased on NGC 3367 environment. However the-oretical models have not considered gas and starformation yet (Dury et al. 2008), therefore furtherresearch is needed in order to assess such scenariothat is relevant in our case.
Table 2 presents a summary of results inferredfrom the study presented here.
16
We performed a detailed search for dynami-cally young stellar signatures of a recent minormerger like stellar plumes or tidal tails, up to µR =26 mag arcsec−2, similar to recent studies re-porting companions in Seyfert and normal galax-ies previously considered as isolated (Smirnova etal. 2010, Martınez-Delgado et al. 2010). We alsosearched for localized regions with different colordistribution (stellar population). Both searcheswere unsuccessful but are useful to constrain eitherpossible events like the incidence of minor mergerstowards the past in such a way that any remnant iswell mixed (3-5 Gyr) or to recent encounters withvery small mass, even with dark matter satellitescontaining gas (Chakrabarti & Blitz 2010).
The strong decoupling in asymmetry of the HIintegrated profile an the zero moment (intensitydistribution) suggest that the gas which has ashort relaxation time, has been recently perturbedmostly at the southeast and northwest, where wefind some possibly related features but at low sta-tistical significance. This picture and the highlyinclined jet is consistent with the scenario of mis-aligned gas/satellite accretion by cosmic filamentsas a trigger for lopsidedness. We suggest that thenuclear activity in this almost bulgeless late-typegalaxy is also probably stimulated by the verystrong bar. We speculate that at high red-shiftswhen gas/satellite accretion by filaments is morevigorous, the AGN feedback that is not triggeredby major mergers and is enhanced by disk insta-bilities is likely more important than it has beentypically considered. Statistical multiwavelengthstudies may verify this statement for local AGNsand future surveys will extend the analysis for highredshift.
HMHT, IP and JAGB thank the staff of theObservatorio Astronomico Nacional for the helpin the observations. HMHT acknowledges supportfrom grant CONACyT-42810. JAGB acknowl-edges partial support from PAPIIT (UNAM)grants IN-107806 and IN-112408. OV acknowl-edges support from the PAPIIT (UNAM) grantIN-118108. IP acknowledges support from CONA-CyT. HBA thanks E. Brinks for assistance to cal-ibrate VLA HI-data.
REFERENCES
Athanassoula, E. 1992, MNRAS, 259, 328.
Athanassoula, E., & Misiriotis, A. 2002, MNRAS,330, 35
Baldry, I. K., Glazebrook, K., & Driver, S. P. 2008,MNRAS, 388, 945
Binney J., Tremaine S. 1987, Galactic Dynamics,Princeton NJ, Princeton University Press.
Block D.L., Bournaud F., Combes F., Puerari I.,Buta R. 2002, A&A, 394, L35
Bournaud F., Combes F. 2002, A&A, 392, 83
Bournaud F., Combes F., Jog C.J., Puerari I.2005, A&A, 438, 507
Buta, R. & Combes, F. 1996, Fundam. Cosm.Phys., 17, 95
Buta R., Block D.L. 2001, ApJ, 550, 243
Buta, R., Laurikainen, E., Salo, H. 2004, AJ, 127,279.
Chakrabarti, S., & Blitz, L. 2011, ApJ, 731, 40
Colın, P., Valenzuela, O., & Klypin, A. 2006, ApJ,644, 687
Combes F., Sanders R.H. 1981, A&A, 96, 164
Conselice, C. J. 2003, ApJS, 147, 1 (C2003)
Cruz-Gonzalez, I., et al. 1994, Rev. Mexicana As-tron. Astrofis., 29, 197
de Grijs, R. 1998, MNRAS, 299, 595
Desroches, L., & Ho, L. C. 2009, ApJ, 690, 267
Dekel, A., Sari, R., & Ceverino, D. 2009, ApJ, 703,785
de Vaucouleurs, G., Vaucouleurs, A., Corwin, H.,Buta, R., Fouque, R., Paturel, G. 1991, ThirdReference Catalogue of Bright Galaxies (NewYork: Springer) (RC3).
Devereux, N. A., & Young, J. S. 1990, ApJ, 359,42
Devereux, N. A., & Young, J. S. 1991, ApJ, 371,515
Dong, X. Y., De Robertis, M. M. 2006, AJ, 131,1236
17
Dury, V., de Rijcke, S., Debattista, V. P., & De-jonghe, H. 2008, MNRAS, 387, 2
Elmegreen, B. G., Bournaud, F., & Elmegreen,D. M. 2008, ApJ, 688, 67
Evans, R. 1994 MNRAS, 266, 511
Faber, S. M., & Gallagher, J. S. 1979, ARA&A,17, 135
Ferguson, H. C., Sandage, A. 1990, AJ, 100, 1.
Foyle, K., Rix, H.-W., & Zibetti, S. 2010, MN-RAS, 407, 163
Gabbasov, R. F., Repetto, P., & Rosado, M. 2009,ApJ, 702, 392
Gallimore, J. F., Axon, D. J., O’Dea, C. P., Baum,S. A., & Pedlar, A. 2006, AJ, 132, 546
Garcıa-Barreto, J. A., Carrillo, R., Vera-Villamizar, N. 2003, AJ, 126, 1707
Garcıa-Barreto, J. A., Franco, J., Carrillo, R.1996, ApJ, 469, 138.
Garcıa-Barreto, J. A., Rudnick, L., Franco, J.,Martos, M. 1998, AJ, 116, 111
Garcıa-Barreto, J. A., Franco, J., Rudnick, L.2002, AJ, 123, 1913
Garcıa-Barreto, J. A., Scoville, N. Z., Koda, J.,Sheth, K. 2005, AJ, 129, 125
Garcıa-Barreto, J. A., Rosado, M. 2001, AJ, 121,2540
Garcıa-Barreto, J. A., Hernandez-Toledo, H. M.,Moreno-Dıaz, E., Villareal-Castillo, A. L.,Bernal-Marın T. 2007, AJ, 134, 142
Ghosh, H., Mathur, S., Fiore, F., & Ferrarese, L.2008, ApJ, 687, 216
Gilmore, G., & Reid, N. 1983, MNRAS, 202, 1025
Gnedin, O. Y., Kravtsov, A. V., Klypin, A. A., &Nagai, D. 2004, ApJ, 616, 16
Haynes, M. P., van Zee, L., Hogg, D. E., Roberts,M. S., & Maddalena, R. J. 1998, AJ, 115, 62
Hernandez-Toledo, H. M., Dultzin-Hacyan, D., &Sulentic, J. W. 2001, AJ, 121, 1319
Hernandez-Toledo, H. M., Avila-Reese, V., Con-selice, C. J., & Puerari, I. 2005, AJ, 129, 682
Hernandez-Toledo, H. M., Avila-Reese, V.,Salazar-Contreras, J. R., & Conselice, C. J.2006, AJ, 132, 71
Hernandez-Toledo, H. M., Zendejas-DomınguezJ., Avila-Reese, V. 2007, AJ, 134, 2286
Hernandez-Toledo, H. M., Vazquez-Mata, J. A.,Martınez-Vazquez, L. A., Choi, Y.-Y., & Park,C. 2010, AJ, 139, 2525
Huchtmeier, W. K., Seiradakis, J. H. 1985, A&A,143, 216.
Huchtmeier, W. K., & Richter, O.-G. 1989, AGeneral Catalog of HI Observations of Galaxies(New York: Springer)
Hunt L.K., Mannucci F., Testi L., Migliorini S.,Stanga R.M., Baffa C., Lisi F., Vanzi L. 1998,AJ, 115, 2594
James, P. A., & Ivory, C. F. 2011, MNRAS, 411,495
Jog, C. J. 1997, ApJ, 488, 642
Jog, C. J., & Maybhate, A. 2006, MNRAS, 370,891
Kazantzidis, S., Bullock, J. S., Zentner, A. R.,Kravtsov, A. V., & Moustakas, L. A. 2008, ApJ,688, 254
Klypin, A.; Zhao, H.; Somerville, R.S. 2002, ApJ,573, 597
Kormendy, J., Norman, C. A. 1979, ApJ, 233, 539
Kormendy, J., & Kennicutt, R. C., Jr. 2004,ARA&A, 42, 603
Kormendy, J., Bender, R., & Cornell, M. E. 2011,Nature, 469, 374
Laurikainen, E., Salo, H., & Rautiainen, P. 2002,MNRAS, 331, 880
Maccio, A. V., Dutton, A. A., van den Bosch,F. C., Moore, B., Potter, D., & Stadel, J. 2007,MNRAS, 378, 55
Mapelli, M., Moore, B., & Bland-Hawthorn, J.2008, MNRAS, 388, 697
18
Martin, P., Roy, J-R. 1994, ApJ, 424 599.
Martınez-Delgado, D., et al. 2010, AJ, 140, 962
McAlpine, W., Satyapal, S., Gliozzi, M., Cheung,C. C., Sambruna, R. M., & Eracleous, M. 2011,ApJ, 728, 25
Mirabel, I. F., Sanders, D. B. 1988, ApJ, 335, 104
Norman, C. A., Sellwood, J. A., Hasan, H. 1996,ApJ, 462, 114
Peng, C. Y., Ho, L. C., Impey, C. D., Rix, H. W.2002, AJ, 124, 266
Peng, C. Y., Ho, L. C., Impey, C. D., & Rix, H.-W.2010, AJ, 139, 2097
Prendergast, K. H. 1966 IAU Symposium 25, 60
Prendergast, K. H. 1983 IAU Symposium 100, 215
Press, W. H., Teukolsky, S. A., Vetterling, W. T.,& Flannery, B. P. 1992, Cambridge: UniversityPress, 1992, 2nd ed.
Quillen, A. C., Frogel, J. A., & Gonzalez, R. A.1994, ApJ, 437, 162
Rautiainen, P., Salo, H., & Laurikainen, E. 2008,MNRAS, 388, 1803
Richter, O., & Sancisi, R. 1994, A&A, 290, L9
Rix, H. W., & Zaritsky, D. 1995, ApJ, 447 82
Rodrıguez-Puebla A. et al. 2011 submitted.
Roskar, R., Debattista, V. P., Brooks, A. M.,Quinn, T. R., Brook, C. B., Governato, F., Dal-canton, J. J., &Wadsley, J. 2010, MNRAS, 408,783
Sabater, J., Leon, S., Verdes-Montenegro, L.,Lisenfeld, U., Sulentic, J., & Verley, S. 2010,Astronomical Society of the Pacific ConferenceSeries, 421, 57
Salo, H., Rautiainen, P., Buta, R., Purcell, GuyB., Cobb, Melinda Lewis, Crocker, D. A., Lau-rikainen, E. 1999, AJ, 117, 792
Schawinski, K., Treister, E., Urry, C. M., Carda-mone, C. N., Simmons, B., & Yi, S. K. 2011,ApJ, 727, L31
Scoville, N. Z. 2008, private communication.
Sellwood, J. A., & Moore, E. M. 1999, ApJ, 510,125
Smirnova, A. A., Moiseev, A. V., & Afanasiev,V. L. 2010, MNRAS, 408, 400
Springob, C, M., Haynes, M. P., Giovanelli, R.,Kent, B. R. 2005, ApJS, 160, 149.
Staveley-Smith, L., & Davies, R. D 1988, MNRAS,231, 833
Stocke, J. T., Morris, S. L., Gioia, I. M., Maccac-aro, T., Schild, R., Wolter, A., Fleming, T. A.,& Henry, J. P. 1991, ApJS, 76, 813
Tonry, J. L., Dressler, A., Blakeslee, J. P., Ajhar,E. A., Fletcher, A. B., Luppino, G. A., Metzger,M. R., & Moore, C. B. 2001, ApJ, 546, 681
Tremaine, S., & Weinberg, M. D. 1984, ApJ, 282,L5
Tully, R. B. 1988, Nearby Galaxies Catalog (Cam-bridge: Cambridge Univ. Press)
van Albada, T. S., & Sanders, R. H. 1982MNRAS,201, 303
van der Kruit, P. C. 1988, A&A, 192, 117
Veron-Cetty, M.-P., & Veron, P. 1986, A&AS, 66,335
Walker, I. R., Mihos, J. C., Hernquist, L. 1996,ApJ, 460, 121
Weiner, B. J., Williams, T. B., van Gorkom, J. H.,Sellwood, J. A. 2001, ApJ, 546, 916
Zaritsky D., Rix H.-W. 1997, ApJ, 477, 118
This 2-column preprint was prepared with the AAS LATEX
macros v5.0.
19
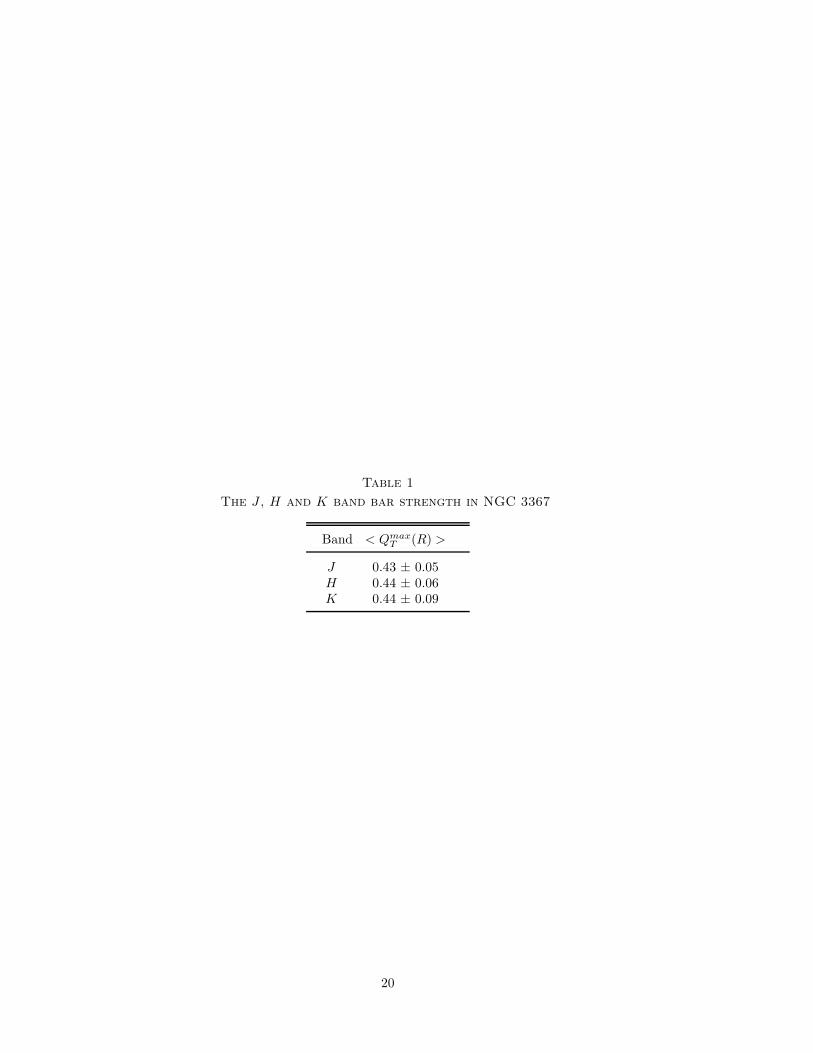
Table 1
The J , H and K band bar strength in NGC 3367
Band < QmaxT (R) >
J 0.43 ± 0.05H 0.44 ± 0.06K 0.44 ± 0.09
20
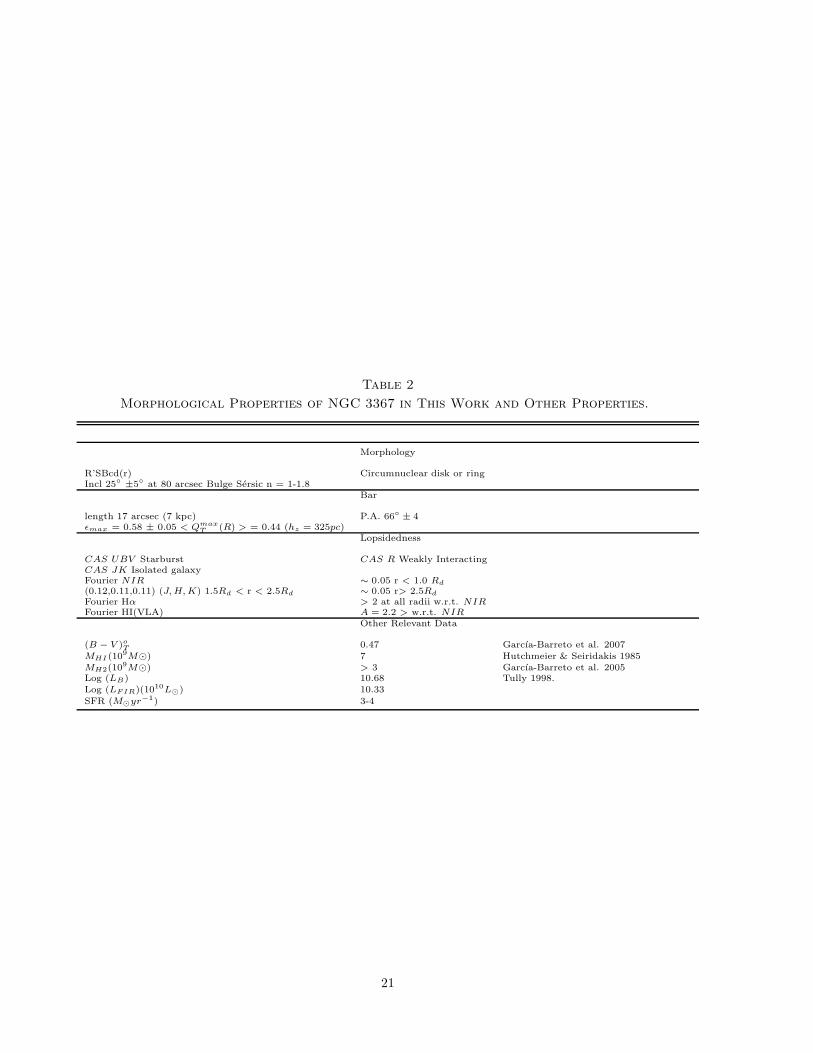
Table 2
Morphological Properties of NGC 3367 in This Work and Other Properties.
Morphology
R’SBcd(r) Circumnuclear disk or ringIncl 25 ±5 at 80 arcsec Bulge Sersic n = 1-1.8
Bar
length 17 arcsec (7 kpc) P.A. 66 ± 4ǫmax = 0.58 ± 0.05 < Qmax
T(R) > = 0.44 (hz = 325pc)
Lopsidedness
CAS UBV Starburst CAS R Weakly InteractingCAS JK Isolated galaxyFourier NIR ∼ 0.05 r < 1.0 Rd
(0.12,0.11,0.11) (J,H,K) 1.5Rd < r < 2.5Rd ∼ 0.05 r> 2.5Rd
Fourier Hα > 2 at all radii w.r.t. NIRFourier HI(VLA) A = 2.2 > w.r.t. NIR
Other Relevant Data
(B − V )oT
0.47 Garcıa-Barreto et al. 2007MHI (10
9M⊙) 7 Hutchmeier & Seiridakis 1985MH2(10
9M⊙) > 3 Garcıa-Barreto et al. 2005Log (LB) 10.68 Tully 1998.Log (LFIR)(1010L⊙) 10.33
SFR (M⊙yr−1) 3-4
21
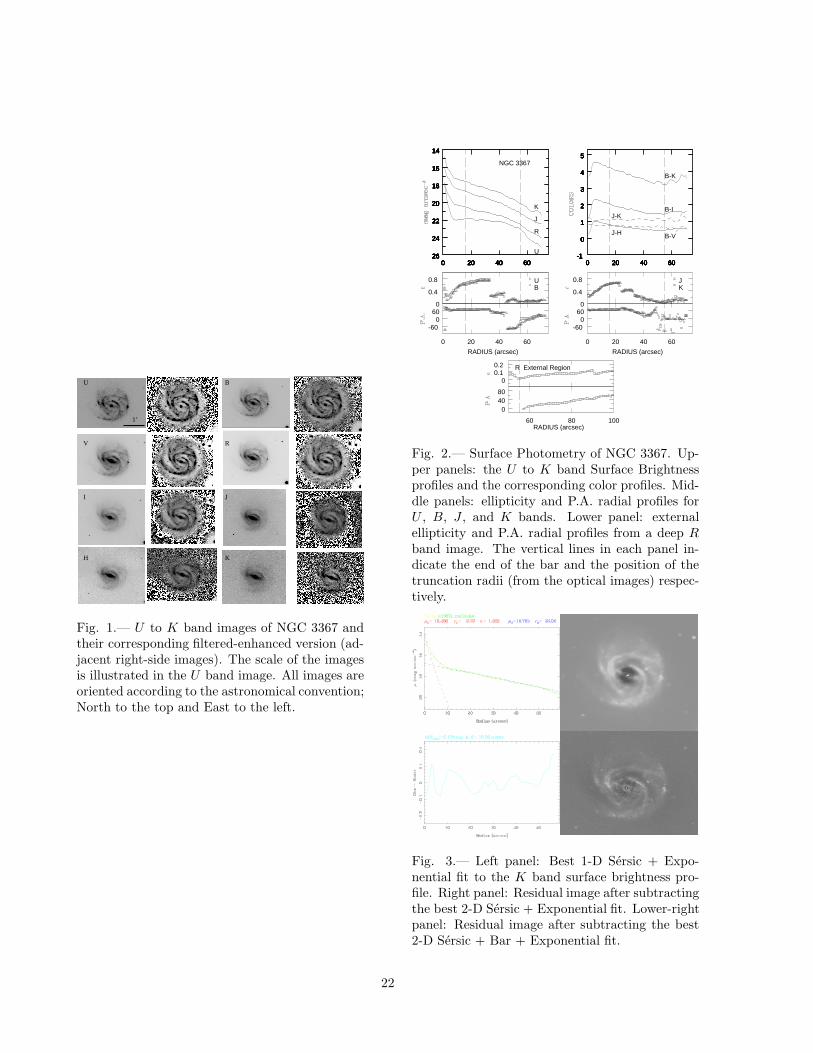
U B
V R
I J
H K
1’
Fig. 1.— U to K band images of NGC 3367 andtheir corresponding filtered-enhanced version (ad-jacent right-side images). The scale of the imagesis illustrated in the U band image. All images areoriented according to the astronomical convention;North to the top and East to the left.
0 20 40 6026
24
22
20
18
16
14
0 20 40 6026
24
22
20
18
16
14
0 20 40 6026
24
22
20
18
16
14
0 20 40 6026
24
22
20
18
16
14
0 20 40 6026
24
22
20
18
16
14
0 20 40 6026
24
22
20
18
16
14
0 20 40 6026
24
22
20
18
16
14
0 20 40 6026
24
22
20
18
16
14
NGC 3367
U
R
J
K
0 20 40 60-1
0
1
2
3
4
5
0 20 40 60-1
0
1
2
3
4
5
0 20 40 60-1
0
1
2
3
4
5
0 20 40 60-1
0
1
2
3
4
5
0 20 40 60-1
0
1
2
3
4
5
0 20 40 60-1
0
1
2
3
4
5
0 20 40 60-1
0
1
2
3
4
5
0 20 40 60-1
0
1
2
3
4
5
B-K
B-I
B-V
J-K
J-H
0
0.4
0.8 UB
0 20 40 60
-600
60
RADIUS (arcsec)
0
0.4
0.8 JK
0 20 40 60
-600
60
RADIUS (arcsec)
R
00.10.2 External Region
RADIUS (arcsec)60 80 100
04080
Fig. 2.— Surface Photometry of NGC 3367. Up-per panels: the U to K band Surface Brightnessprofiles and the corresponding color profiles. Mid-dle panels: ellipticity and P.A. radial profiles forU , B, J , and K bands. Lower panel: externalellipticity and P.A. radial profiles from a deep Rband image. The vertical lines in each panel in-dicate the end of the bar and the position of thetruncation radii (from the optical images) respec-tively.
Fig. 3.— Left panel: Best 1-D Sersic + Expo-nential fit to the K band surface brightness pro-file. Right panel: Residual image after subtractingthe best 2-D Sersic + Exponential fit. Lower-rightpanel: Residual image after subtracting the best2-D Sersic + Bar + Exponential fit.
22
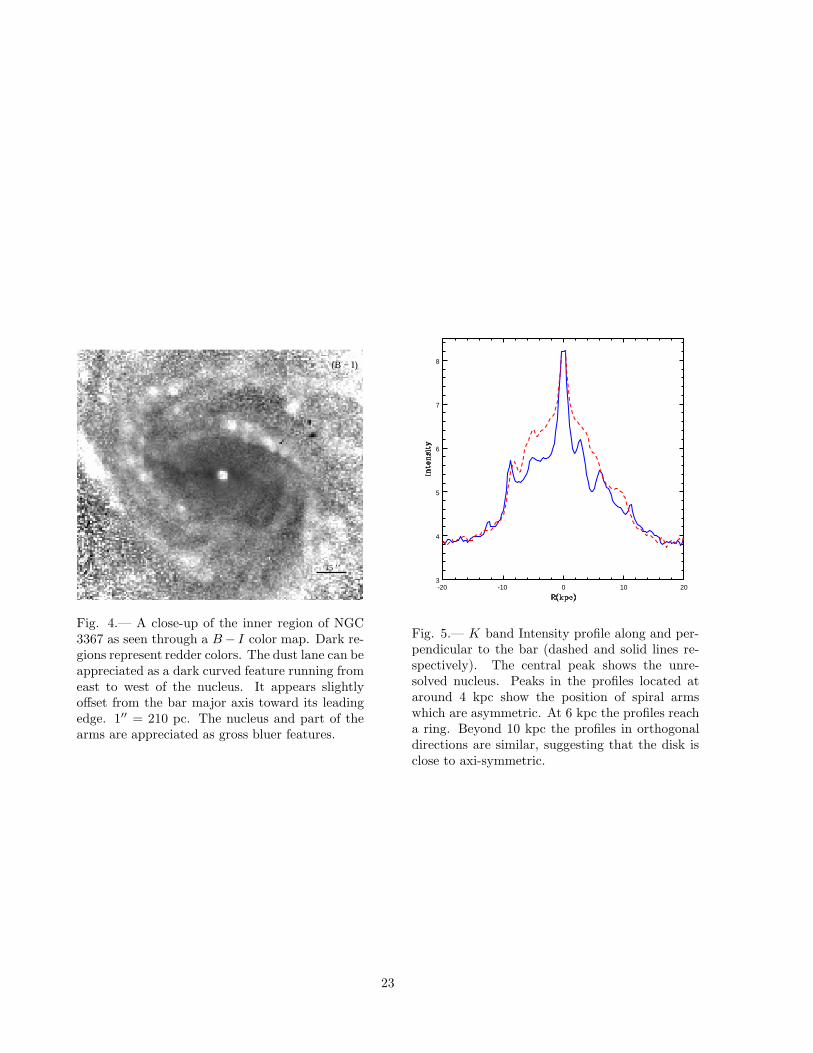
15 ’’
(B − I)
Fig. 4.— A close-up of the inner region of NGC3367 as seen through a B− I color map. Dark re-gions represent redder colors. The dust lane can beappreciated as a dark curved feature running fromeast to west of the nucleus. It appears slightlyoffset from the bar major axis toward its leadingedge. 1′′ = 210 pc. The nucleus and part of thearms are appreciated as gross bluer features.
-20 -10 0 10 203
4
5
6
7
8
Fig. 5.— K band Intensity profile along and per-pendicular to the bar (dashed and solid lines re-spectively). The central peak shows the unre-solved nucleus. Peaks in the profiles located ataround 4 kpc show the position of spiral armswhich are asymmetric. At 6 kpc the profiles reacha ring. Beyond 10 kpc the profiles in orthogonaldirections are similar, suggesting that the disk isclose to axi-symmetric.
23
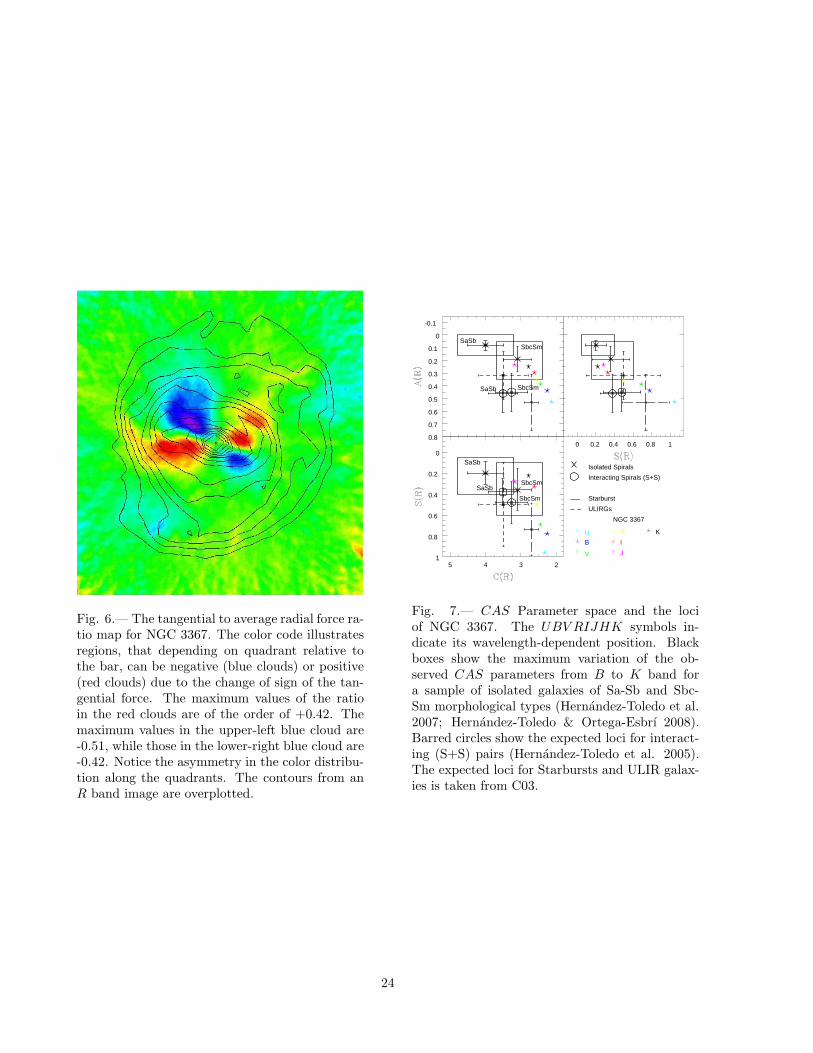
Fig. 6.— The tangential to average radial force ra-tio map for NGC 3367. The color code illustratesregions, that depending on quadrant relative tothe bar, can be negative (blue clouds) or positive(red clouds) due to the change of sign of the tan-gential force. The maximum values of the ratioin the red clouds are of the order of +0.42. Themaximum values in the upper-left blue cloud are-0.51, while those in the lower-right blue cloud are-0.42. Notice the asymmetry in the color distribu-tion along the quadrants. The contours from anR band image are overplotted.
0.8
0.7
0.6
0.5
0.4
0.3
0.2
0.1
0
-0.1
SaSbSbcSm
SaSb SbcSm
0 0.2 0.4 0.6 0.8 1
5 4 3 21
0.8
0.6
0.4
0.2
0SaSb
SbcSmSaSb
SbcSm
Isolated Spirals
Interacting Spirals (S+S)
Starburst
ULIRGs
NGC 3367
UB
V
R
I
J
K
Fig. 7.— CAS Parameter space and the lociof NGC 3367. The UBV RIJHK symbols in-dicate its wavelength-dependent position. Blackboxes show the maximum variation of the ob-served CAS parameters from B to K band fora sample of isolated galaxies of Sa-Sb and Sbc-Sm morphological types (Hernandez-Toledo et al.2007; Hernandez-Toledo & Ortega-Esbrı 2008).Barred circles show the expected loci for interact-ing (S+S) pairs (Hernandez-Toledo et al. 2005).The expected loci for Starbursts and ULIR galax-ies is taken from C03.
24
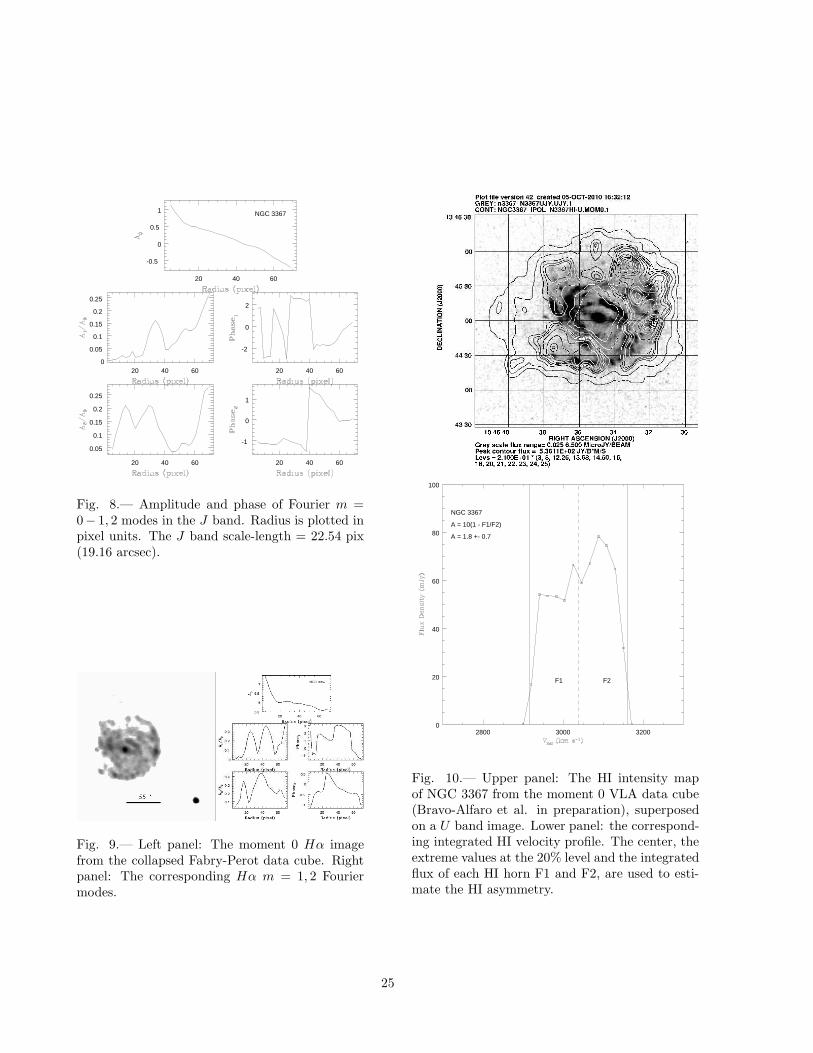
20 40 60
-0.5
0
0.5
1 NGC 3367
20 40 600
0.05
0.1
0.15
0.2
0.25
20 40 60
-2
0
2
20 40 60
0.05
0.1
0.15
0.2
0.25
20 40 60
-1
0
1
Fig. 8.— Amplitude and phase of Fourier m =0− 1, 2 modes in the J band. Radius is plotted inpixel units. The J band scale-length = 22.54 pix(19.16 arcsec).
Fig. 9.— Left panel: The moment 0 Hα imagefrom the collapsed Fabry-Perot data cube. Rightpanel: The corresponding Hα m = 1, 2 Fouriermodes.
2800 3000 32000
20
40
60
80
100
F2F1
NGC 3367
A = 10(1 - F1/F2)
A = 1.8 +- 0.7
Fig. 10.— Upper panel: The HI intensity mapof NGC 3367 from the moment 0 VLA data cube(Bravo-Alfaro et al. in preparation), superposedon a U band image. Lower panel: the correspond-ing integrated HI velocity profile. The center, theextreme values at the 20% level and the integratedflux of each HI horn F1 and F2, are used to esti-mate the HI asymmetry.
25
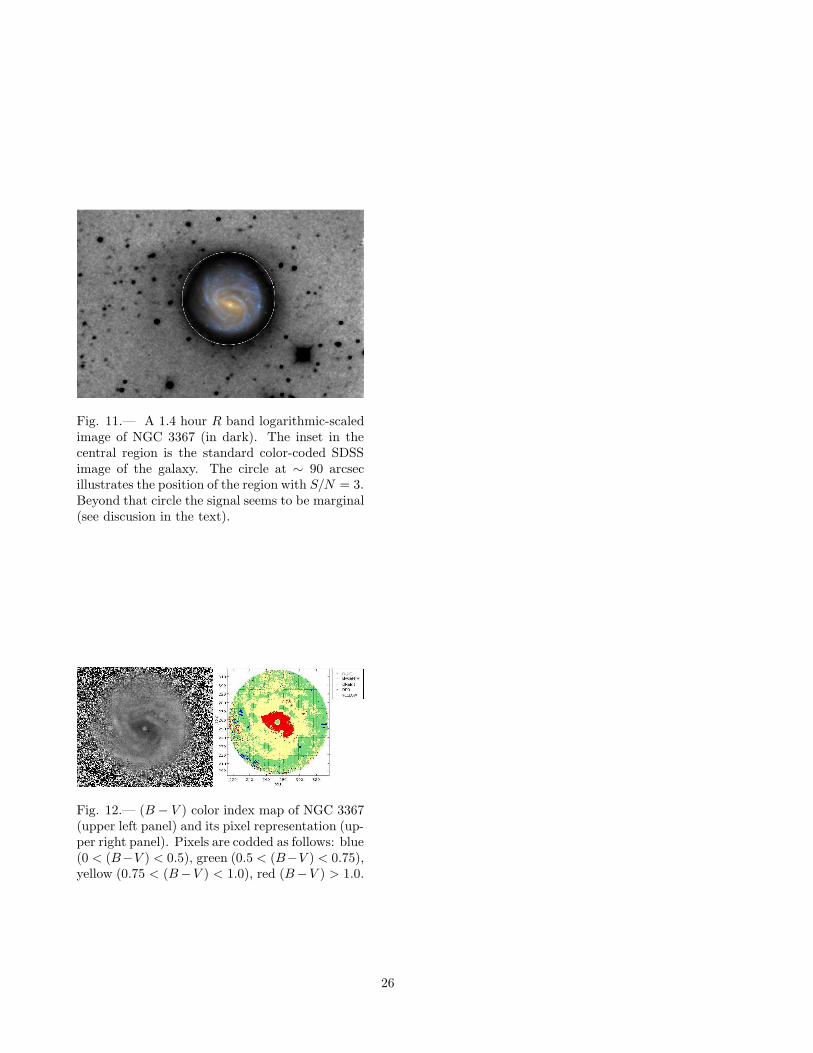
Fig. 11.— A 1.4 hour R band logarithmic-scaledimage of NGC 3367 (in dark). The inset in thecentral region is the standard color-coded SDSSimage of the galaxy. The circle at ∼ 90 arcsecillustrates the position of the region with S/N = 3.Beyond that circle the signal seems to be marginal(see discusion in the text).
Fig. 12.— (B − V ) color index map of NGC 3367(upper left panel) and its pixel representation (up-per right panel). Pixels are codded as follows: blue(0 < (B−V ) < 0.5), green (0.5 < (B−V ) < 0.75),yellow (0.75 < (B−V ) < 1.0), red (B−V ) > 1.0.
26