far ultraviolet spectroscopic explorer observations of the seyfert 1.5 galaxy ngc 5548 in a low...
TRANSCRIPT
FAR ULTRAVIOLET SPECTROSCOPIC EXPLORER SPECTROSCOPYOF THE NOVA-LIKE CATACLYSMIC VARIABLE BB DORADUS1
Patrick Godon2and Edward M. Sion
Department of Astronomy and Astrophysics, Villanova University, Villanova, PA 19085; [email protected],
Paul E. Barrett
United States Naval Observatory, Washington, DC 20392; [email protected]
Paula Szkody
Department of Astronomy, University of Washington, Seattle, WA 98195; [email protected]
and
Eric M. Schlegel
Department of Physics and Astronomy, University of Texas, San Antonio, TX 78249; [email protected]
Received 2008 May 2; accepted 2008 June 27
ABSTRACT
We present an analysis of the Far Ultraviolet Spectroscopic Explorer (FUSE ) spectra of the little-known southernnova-like cataclysmic variable, BBDoradus. The spectrumwas obtained as part of our Cycle 8 FUSE survey of high-declination nova-like stars. The FUSE spectrum of BB Dor, observed in a high state, is modeled with an accretiondisk with a very low inclination (possibly lower than 10�). Assuming an average white dwarf (WD) mass of 0.8M�leads to a mass accretion rate of 10�9 M� yr�1 and a distance on the order of �650 pc, consistent with the extremelylow Galactic reddening in the direction of BB Dor. The spectrum presents some broad and deep silicon and sulfur ab-sorption lines, indicating that these elements are overabundant by 3 and 20 times solar, respectively.
Subject headinggs: accretion, accretion disks — novae, cataclysmic variables — stars: abundances —stars: individual (BB Doradus) — white dwarfs
Online material: color figures
1. INTRODUCTION
1.1. Nova-like Cataclysmic Variables
Cataclysmic variables (CVs) are close binaries in which theprimary, a white dwarf (WD), accretes matter and angular mo-mentum from the secondary, amain-sequence star, filling its Rochelobe. The matter is transferred by means of either an accretiondisk around the WD or an accretion column, formed when theWD has a strong (�10 MG) magnetic field. Ongoing accretionat a low rate (quiescence) is interrupted every fewweeks tomonthsby intense accretion (outburst) of days to weeks (a dwarf novaaccretion event), and every few thousand years by a thermonuclearexplosion (TNR; the classical nova event). CV systems are dividedinto subclasses according to the duration, occurrence, and ampli-tude of their outbursts: dwarf novae (DNs) are foundmostly in thelow state, while nova-like CVs (NLs) exhibit the spectroscopicand photometric characteristics of novae between or after out-bursts, but have never had a recorded outburst. NLs form a lesshomogeneous class and are divided into subtypes depending oncertain properties, such as eclipsing systems, magnetic systems,or systems that go into unexpected low states (Warner 1995).Nonmagnetic NLs can be divided into UX UMa systems, whichremain in a state of high optical brightness or a ‘‘permanent out-
burst state,’’ and VY Scl systems (antiYdwarf novae), whichexperience unexpected low states when the optical brightnessplummets.CVs are believed to evolve from long period (�2 days) to-
ward short period (�1 hr) as the mass ratio q decreases, crossingthe 2Y3 hr ‘‘period gap,’’ where few systems are found. Theorypredicts that the period of those systems with a sufficiently low qwill increase as q continues to decrease, producing the so-called‘‘period bouncers’’ (Patterson et al. 2005a). The driving mech-anism behind the mass transfer (M ) and hence, the evolution ofCVs, is believed to be angular momentum loss, dominated bymagnetic stellar wind braking at periods above 3 hr and by grav-itational wave emission below this period. The secondaries arestripped to <0.08 M� on a timescale of only 1Y4 Gyr after theyform as close binaries above the gap. Consequently, in the life-time of the Galaxy, the vast majority of CVs should have evolvedto a period minimum near 80 minutes, and should now have de-generate brown dwarflike secondaries (Howell et al. 2001). How-ever, recent models (Andronov et al. 2003) suggest (1) muchlower angular momentum loss rates, such that it takes 10Y12 Gyrto even reach a 3 hr period, and (2) multiple evolutionary tracksyielding different populations of CVs above and below the 3 hrorbital period.The accretion disks and underlying accretingWDs in CVs can
provide crucial clues and constraints on these evolutionary sce-narios. It is important to derive M from observations, as the masstransfer rate is tied to the angular momentum loss. As to theWDs,they are the central engines of the observed outbursts, either as po-tential wells for the release of accretional energy or as the sites of
A
1 Based on observations made with the NASA-CNES-CSA Far UltravioletSpectroscopic Explorer, which is operated for NASA by the Johns HopkinsUniversity under NASA contract NAS5-32985.
2 Visiting at the Space Telescope Science Institute, Baltimore, MD 21218;[email protected].
532
The Astrophysical Journal, 687:532Y541, 2008 November 1
# 2008. The American Astronomical Society. All rights reserved. Printed in U.S.A.
Report Documentation Page Form ApprovedOMB No. 0704-0188
Public reporting burden for the collection of information is estimated to average 1 hour per response, including the time for reviewing instructions, searching existing data sources, gathering andmaintaining the data needed, and completing and reviewing the collection of information. Send comments regarding this burden estimate or any other aspect of this collection of information,including suggestions for reducing this burden, to Washington Headquarters Services, Directorate for Information Operations and Reports, 1215 Jefferson Davis Highway, Suite 1204, ArlingtonVA 22202-4302. Respondents should be aware that notwithstanding any other provision of law, no person shall be subject to a penalty for failing to comply with a collection of information if itdoes not display a currently valid OMB control number.
1. REPORT DATE 01 NOV 2008 2. REPORT TYPE
3. DATES COVERED 00-00-2008 to 00-00-2008
4. TITLE AND SUBTITLE Far Ultraviolet Spectroscopic Explorer Spectroscopy of the Nova-LikeCataclysmic Variable BB Doradus
5a. CONTRACT NUMBER
5b. GRANT NUMBER
5c. PROGRAM ELEMENT NUMBER
6. AUTHOR(S) 5d. PROJECT NUMBER
5e. TASK NUMBER
5f. WORK UNIT NUMBER
7. PERFORMING ORGANIZATION NAME(S) AND ADDRESS(ES) Department of Astronomy and Astrophysics,Villanova University,Villanova,PA,19085
8. PERFORMING ORGANIZATIONREPORT NUMBER
9. SPONSORING/MONITORING AGENCY NAME(S) AND ADDRESS(ES) 10. SPONSOR/MONITOR’S ACRONYM(S)
11. SPONSOR/MONITOR’S REPORT NUMBER(S)
12. DISTRIBUTION/AVAILABILITY STATEMENT Approved for public release; distribution unlimited
13. SUPPLEMENTARY NOTES
14. ABSTRACT
15. SUBJECT TERMS
16. SECURITY CLASSIFICATION OF: 17. LIMITATION OF ABSTRACT Same as
Report (SAR)
18. NUMBEROF PAGES
10
19a. NAME OFRESPONSIBLE PERSON
a. REPORT unclassified
b. ABSTRACT unclassified
c. THIS PAGE unclassified
Standard Form 298 (Rev. 8-98) Prescribed by ANSI Std Z39-18

explosive TNR shell burning. In addition, the differences be-tween the temperatures, rotation, and chemical abundances ofCV WDs and single isolated WDs provide clues as to the ef-fects of accretion, diffusion, and long-term heating and evolu-tion (Sion 1995).
With a wavelength range of 905Y1187 8, the Far UltravioletSpectroscopicExplorer (FUSE ) covers that part of the far-ultraviolet(FUV) spectrum where the hotter CV component is dominant.For NLs, the dominant component in the FUSE range is usuallythe accretion disk. Additional possible components are the hotwhite dwarf, the boundary layer or accretion belt, and other hotregions on or close to the WD. Many CV FUV spectra are mod-eled with two components, usually a WD plus a disk. For eachsystem, one usually derives from the FUSE spectrum the temper-ature of theWD (TeA), the gravity, the rotational velocity (Vrot sin i),the chemical abundances, the mass accretion rate, the inclination,and the distance to the system.
It has therefore been very important to try to obtain FUSEdata for more CV systems, in order to populate the TeA-periodand the M -period parameter spaces. There is a need to enlargethe sample to obtain an accurate global picture of the systemsabove and below the period gap. For that reason, we proposedto observe with FUSE a set of 16 high-declination dwarf novae(our Cycle 7 survey of DNs) and 16 high-declination NLs (ourCycle 8 survey of NLs, all chosen from the online CV catalog ofDownes et al.). Unfortunately, our FUSE NL survey was cutshort due to the fatal failure of the reaction wheel of the tele-scope. Of the 16 targets, only two were observed: BB Dor andP831-57. The analysis of the FUSE spectrum of P831-57 is pre-sented elsewhere (P. Barrett et al. 2008, in preparation). In thiswork, we present the result of the FUSE spectroscopic analysisof BB Dor.
1.2. The Nova-like CV BB Doradus
BB Dor (also known as EC 05287�5847, an object from theEdinburgh-Cape Survey [Chen et al. 2001]) was spectroscop-ically identified as a CV in 1987 December, and was seen fainterthan V � 16:5 until 1992 November (Chen et al. 2001). Sincethat time, it seems to be in bright state (V � 14:6Y13:6). A first(extremely uncertain) estimate of its period by Chen et al. (2001)put it right in the middle of the period gap, with a period of0.107 days, or 2.57 hr. However, a 45 day observation (Patterson2002; Patterson et al. 2005b) corrected this value to 0.14923 days,or 3.58 hr, as expected for VY Scl stars, which usually have pe-riods between�3 and�4 hr. BB Dor exhibits superhumps, witha period excess of " ¼ 9:4% (Patterson 2002); it has the largestknown fractional superhump of all systems, and therefore pro-vides a calibrating point at large " (Patterson et al. 2005b).BB Dor is a VY Scl NL, and so far no magnetic activity has beenfound. The system also exhibits quasi-periodic oscillations (Chenet al. 2001). Chen et al. (2001) also noted that due to its verynarrow Balmer lines (with wings extending �650 km s�1 fromthe line center), BB Dor is most likely a low-inclination system.From the Austral Variable Star Observer Network (AVSON), itappears that BB Dor has been around V � 13:6Y14:6 mag (withan error <0.1 mag) for the last couple of years and can vary asmuch as 0.4 mag within 1 hr. The reddening value E(B� V )toward BBDor is not known. However, the Galactic reddeningvalue in the direction of BB Dor as inferred from the 100 �m dustemission map (Schlegel et al. 1998) is very small: E(B� V ) ¼� 0:03. Since the dust map gives the maximum dust extinc-tion, we deduce that BB Dor must have a negligible reddening[E(B� V ) � 0:01 at most], which should not affect the results;consequently we do not deredden its FUSE spectrum.
2. OBSERVATIONS
2.1. The FUSE Spectrum of BB Dor
BB Doradus was observed with FUSE on 2007 July 9 at02:51:09 (UT), and three exposures were obtained (H9030301;exposures 001, 002, 003). The FUSE spectrum was obtainedthrough the low-resolution (LWRS; 3000 ; 3000) aperture in TIMETAG mode. The data were processed with the last and final ver-sion of CalFUSE, version 3.2.0 (Dixon et al. 2007).
A look at the count rate graph (generated by CalFUSE) in-dicates that the data for each exposure were collected mainlyduring the first 1000 s, followed by a jitter lasting about 1500 s.Toward the end of each exposure, the count rate dropped to zero.Therefore, while the coadded exposures for the 8 individual seg-ments after processing by CalFUSE give a good exposure time(after screening) of between about 8750 s for segments SiC1a,SiC1b, LiF1a, and LiF1b (segments 1) and 9750 s for segmentsSiC2a, SiC2b, LiF2a, and LiF2b (segments 2), the count rate plotindicates that the total good collection time ranges between 3350 s(segments 1) and 3650 s (segments 2).We thereforeweighted thesesegments accordingly, multiplying the flux (on the order of 1 ;10�13 erg s�1cm �2 8�1 in the online preview) by a factor of2.61 (segments 1) and 2.67 (segments 2). After that, we pro-cessed the data as usual (see below).
The spectral regions covered by the spectral channels overlap,and these overlap regions are then used to scale the spectra in theSiC1, SiC2, and LiF2 channels to the flux in the LiF1 channel.The low-sensitivity portions (usually the edges) of each channelare discarded. In the present case, the SiC2b spectral segmentwas very noisy, and we discarded it too. We also carried out avisual inspection of the FUSE channels to locate ‘‘the worm’’(a wire flaw in the FUSE spectrograph that occults the saggitalfocus), and we manually discarded those portions of the spec-trum affected by the worm. We combined the individual expo-sures and channels to create a time-averaged spectrumweightingthe flux in each output datum by the exposure time and sensitiv-ity of the input exposure and channel of origin. The final productis a spectrum that covers the full FUSE wavelength range of905Y1187 8. Because we disregarded the right edge of both theSiC1a and SiC2b segments, there is a gap between the LiF1a andLiF2b segments (�1082Y�1087 8).
TheFUSE spectrum of BBDor is shown in Figure 1. Note thatthe FUSE exposures of BB Dor consist entirely of observationscarried out during the day. The short night exposure was ignoredbecause of jitters and other problems. We suspect that most ofthe emission lines are due to helio- and geocoronal emissions.
2.2. The FUSE Lines
The FUSE spectra of CVs exhibit mainly broad absorptionlines from the accretion disk andWD, as well as sharp absorptionlines from circumstellar (or circumbinary) material and the inter-stellar medium (ISM). Emission lines from the hotter regionsare usually broadened, depending on the inclination angle i, dueto the large Keplerian velocity in the inner disk. Sharp emissionlines from air glow (geo- and heliocoronal in origin) are alsopresent, due mainly to the reverberation of sunlight inside theFUSE telescope during daytime observations. The presentFUSEspectrum of BBDor presents such a complexity, and all the linesare listed in Table 1.
Absorption lines.— The main characteristic of the FUSEspectrum of BB Dor is the broad Ly� absorption feature due toeither the exposed WD, the disk at low inclination angle i, orpossibly both (see x 4). Absorption features from the higherorders of the Lyman series are also clearly visible, indicating a
FUSE SPECTROSCOPY OF BB DOR 533

temperature T � 35; 000 K. The other main absorption featuresexpected at this temperature are C iii (1175 8), Si iii (�1108Y1114 8 and �1140Y1144 8), Si iv (�1120Y1130 8), and C ii
(1010 8). The spectrum is, however, also marked by some high-order ionization absorption lines, such as S iv (1063 and 10738),Si iv (1066.6 8), and the O vi doublet. The S iv (1006 8), C ii
(1010 8), and S iv (1099 8) absorption multiplets are all unre-solved and shallow. However, we have indicated them on thefigures, as they appear deeper in the modeling. On the other hand,the S iv (1063 and 1073 8) and Si iii (�1010 8) absorption linesappear deeper in the observed spectrum than in themodeling. Thepresence of high-order ionization species (such as the oxygendoublet) indicates the presence of a hotter absorbing componentabove the main FUV-emitting region. The P ii line (�9618) hasbeen marked in the spectrum, although the feature is most prob-ably due to noise. All the lines are listed in Table 1 with theirwavelengths. Most of the broad absorption lines and featuresassociated with the source are redshifted by about 0.6Y0.9 8,corresponding to a receding velocity of 200 � 40 kms�1. It seemsvery likely that this redshift is due to the orbital motion of theWD; however, we do not have enough time tag data to verify thisassumption.
Emission lines.— The spectrum of BB Dor exhibits sharpemission lines, including all the orders of the Lyman series, N iv
(�9238), S vi (933.5 and 944.58), C iii (9778), He ii (9928),andHe i (10688). Someof these lines, in particular theH i lines, theHe i and He ii lines, the C iii (977 8) line, and the O vi doublet,seem to be due to heliocoronal emission (sunlight reflected in-side the telescope), which contaminates the SiC channels. Thesegments of the spectrum from the LiF channels overlapping
the SiC Channels down to about 10008 do not show any oxygenlines, and we therefore did not include these spectral regions ofthe SiC channels. However, other emission lines may be solelyfrom the source. In many NLs, the emission lines from the diskare broadened by the Keplerian velocity and are consequentlyeasily identified. However, Chen et al. (2001) have detected verynarrow Balmer lines and concluded that BB Dor is most likely alow-inclination system. Because of this, the identification of theemission lines from the source is not trivial. This issue is furthercomplicated by the lack of night exposure and the very low signal-to-noise ratio, which makes it difficult to analyze the two-dimensional image of the spectrum for the effect of scatteredsunlight on the emission lines.Since the system is a NL in a high state, we first expect the N iv
(�923 8), S vi (933.5 and 944.5 8), and C iii (977 8) emissionlines to be from the source, with some possible heliocoronal con-tamination mostly affecting the carbon emission lines. The N iv
(923.068) emission line is contaminated with the H i (923.158)line, while the N iv (922.52 and 924.28 8) lines are not. How-ever, the complete absence of narrow emission lines from the oxy-gen doublet and C iii (1175 8) seems to indicate otherwise; i.e.,all the sharp emission lines might be heliocoronal in origin. Tofurther check this possibility, wemeasured the relative intensitiesof the narrow emission lines below 1000 8 and compared themwith those of the solar spectrum (Curdt et al. 2001). We foundgood agreement with the solar diskYaverage quiet-Sun data, ex-cept for S vi (944.58), which has a higher relative intensity in thespectrum of BBDor. This could be due to sunspot activity duringthe FUSE observation of BB Dor, as this line intensity increasesby a factor of 30 inside sunspots, while the other lines increase
Fig. 1.—Solar abundance, single-WD model. The best-fit WD model assuming solar abundances (solid black line) is shown together with the FUSE spectrum ofBB Dor (red line). Blue lines show the segments of the spectrum that were masked before the fitting. The WD has a temperature T ¼ 37;000 K, a projected rotationalvelocity Vrot sin i ¼ 400 km s�1, and log g ¼ 8:3. The distance obtained is d ¼ 217 pc, and �2
� ¼ 0:3348.
GODON ET AL.534 Vol. 687

by at most a factor of 3. We therefore conclude that all the sharpemission lines in the FUSE spectrum of BB Dor are due to sun-light reflected inside the telescope.
3. SPECTRAL MODELING
We created a grid of models of synthetic spectra of WDs andaccretion disks for different values of the WD temperature TeA,gravity log g, projected rotational velocity Vrot sin i, inclination i,mass accretion rate M , and abundances. We then ran a �2 fit-ting program to find the best fit for (1) a singleWD component,(2) a single accretion disk component, and (3) a combinedWD+accretion disk. We describe below howwe generate thesesynthetic spectra and how we perform the fitting.
We create the synthetic model spectra for high-gravity stellaratmospheres using the TLUSTYand SYNSPEC3 codes (Hubeny1988; Hubeny & Lanz 1995). Atmospheric structure is com-puted (using TLUSTY) assuming a H-He LTE atmosphere; theother species are then added in the spectrum synthesis stageusing SYNSPEC. We generate photospheric models with effec-tive temperatures ranging from�20,000Y50,000K in incrementsof 1000K.We chose values of log g ranging between 7.5 and 9.0.We also varied the stellar rotational velocity Vrot sin i from 100to 1000 km s�1 in steps of 100 km s�1 (or smaller if needed).The WD rotation (Vrot sin i) rate is determined by fitting theWD model to the spectrum while paying careful attention to theline profiles in the FUSE spectrum. We do not carry out separatefits to individual lines, but rather try to fit the lines and continuumsimultaneously, while paying careful attention to the absorptionlines. It is important to note that the depth of the absorption fea-tures depends not only on the abundances, but also on the ro-tational velocity. Increasing the rotational velocity reduces thecentral depths of the absorption features, thus reducing the abun-dance. However, the widths of the absorption features also in-crease with increasing rotational velocity. As a consequence,abundances and rotational velocity effects are intertwined, andcannot always be easily separated without additional informa-tion about one of the parameters. For any WD mass, there is acorresponding radius, or equivalently one single value of log g(e.g., see the mass radius relation from Hamada & Salpeter[1961], or see Wood [1990] or Panei et al. [2000] for WDs ofdifferent compositions and nonzero temperature). Therefore, byscaling the theoretical spectrum to the observed one, we obtainthe distance to the system.
We model accretion disk spectra by first assuming that thedisk is made of a collection of annuli, where each annulus has atemperature T (r) and gravity log g(r), as given by the standarddisk model (Shakura & Sunyaev 1973; Pringle 1981), for agiven central massMWD and accretion rate M . A variant of theTLUSTY code, called TLDISK, is then used, which generatesan atmosphere model for each annulus that is then used as inputfor SYNSPEC. The contribution of all the annuli are then com-bined using DISKSYN, and a final spectrum is obtained for anygiven inclination angle. A detailed explanation of the procedureis given in Wade & Hubeny (1998). In the present work, we donot use the grid of synthetic accretion disk spectra tabulated byWade & Hubeny (1998); instead, we generate them. This allowsus to compute disk spectra assuming nonsolar abundances andfor any inclination angle (the disk spectra of Wade & Hubeny[1998] have solar abundances and have been generated for aspecific value of the inclination i).
Before carrying out a synthetic spectral fit of the spectra, wemasked portions of the spectra with strong emission lines, strong
TABLE 1
FUSE Line Identification
Ion
krest(8)
kobs(8) Origin /Nature of Linea
H i .............................. 918.13 918.0 c/e
919.35 919.3 c/e
920.96 920.9 c/e
N iv ............................ 922.52 922.3 s/e
923.06 923.0 s, c/e
H i .............................. 923.15 923.2 c/e
N iv ............................ 923.22 923.2 c/e
924.28 924.2 c/e
H i .............................. 926.23 926.2 c/e
930.75 930.7 c/e
S vi ............................. 933.50 933.4 c/e
H i .............................. 937.80 937.8 c/e
S vi ............................. 944.50 944.4 c/e
H i .............................. 949.74 949.7 c/e
N i .............................. 952.40 925.5 ism/a
953.42 . . . . . .
953.66 . . . . . .953.97 . . . . . .
954.10 954.2 ism/a
P ii .............................. 961.04 961.2 ism/a?
H i .............................. 972.54 972.5 c/e
C iii............................. 977.02 977.0 c/e
Si iii ............................ 993.52 993.2 s?/a
994.19 994.9 s?/a
997.39 997.1 s?/a
S iv ............................. 1006.07 . . . s/a - unresolved
1006.39 . . . s/a - unresolved
C ii.............................. 1009.85 . . . s/a - unresolved
1010.08 . . . s/a - unresolved
1010.37 . . . s/a - unresolved
H i .............................. 1025.77 1025.7 c/e
O vi ............................ 1031.91 1032.9 s/a
C ii.............................. 1036.34 1036.4 ism/a
O vi ............................ 1037.61 1038.3 s/a
O i .............................. 1039.10 1039.3 ism/a
Ar i ............................. 1048.20 1048.3 ism/a
S iv ............................. 1062.65 1063.4 s/a
Si iv ............................ 1066.60 1067.1 s/a
Ar i ............................. 1066.66 1066.8 ism/a
S iv ............................. 1072.97 1073.9 s/a
1073.52 1073.9 s/a
S iv ............................. 1098.36 . . . s/a - unresolved
1098.93 . . . s/a - unresolved
1099.48 . . . s/a - unresolved
1100.53 . . . s/a - unresolved
Si iii ............................ 1108.36 1108.8 s/a
1109.94 1110.6 s/a
�1113.20 1113.8 s/a
Si iv ............................ 1122.49 1123.0 s/a
�1128.33 1128.9 s/a
N i .............................. 1134.16 1134.3 c/a
1134.42 1134.3 c/a
1134.98 1135.2 c/a
S i ............................... 1145.10 1145.0 ism/a
He ii............................ 1168.61 1168.6 c/e
C iii............................. 1174.90 1176.4 s/a - unresolved
1175.26 1176.4 s/a - unresolved
1175.60 1176.4 s/a - unresolved
1175.71 1176.4 s/a - unresolved
1176.00 1176.4 s/a - unresolved
1176.40 1176.4 s/a - unresolved
a (a): absorption; (e): emission; (c): contamination (e.g., air glow; heliocoronalemission); (s): source; ‘‘ism’’indicates interstellar medium. 3 TLUSTY, ver. 200 and SYNSPEC, ver. 48; see http://nova.astro.umd.edu.
FUSE SPECTROSCOPY OF BB DOR 535No. 1, 2008

ISM absorption lines, detector noise, and air glow. The regionsexcluded from the fit appear in blue in Figure 1.
After generating grids of models for the FUSE spectrum ofBB Dor, we use FIT (Press et al. 1992), a �2 minimization rou-tine, to compute the reduced �2
� (i.e., �2 per number of degrees
of freedom) and scale factor (which gives the distance) for eachmodel fit. While we use a �2 minimization technique, we do notblindly select the least-�2 models, but we also examine the mod-els that best fit some of the features such as absorption lines and,when possible, the slope of thewings of the broad Lyman absorp-tion features.
Initially, we generate solar abundance models, and when agood fit is found, we start varying the chemical abundances ofC, N, S, and Si to fit the absorption features of the spectrum. Inparticular, the carbon abundance was set using the C ii (10108)and C iii (11758) multiplets, the sulfur abundance was set usingthe S iv (1063 and 10738) lines, and the silicon abundance wasset using the Si iv (1067 , 1023 , and 1028 8) and Si iii (�1110and �1138Y1146 8) lines.
4. RESULTS
The data obtained by AVSON imply that BB Dor has been ina high state around V � 13:6Y14:6 for the last couple of years.We therefore expect the FUSE spectrum to be dominated byflux from the accretion disk with a relatively high M . However,in our modeling we follow a systematic approach that consistsof fitting (1) a single WD, (2) a single accretion disk, and (3) aWD+accretion disk composite.
4.1. White Dwarf
Since we do not have any information about the mass of theWD, we look for all the best-fit models in the log g-TeA plane.Namely, for each assumed value of log g, we vary the tempera-ture to find the best-fit model. As expected, we find that the tem-perature is somewhere between 34,000 K (for log g ¼ 7:5) and40,000 K (for log g ¼ 9:0), with a distance between 377 and135 pc, respectively (see Table 1). The least �2
� is obtained forlog g ¼ 8:0Y8:65. We chose the intermediate-value log g ¼ 8:3model, with T ¼ 37;000 K, d ¼ 247 pc, and solar abundancesto illustrate our results in Figure 1. We then further improve thefit by varying the abundances. We find that in order to better fitthe sulfur and silicon lines, we have to set the sulfur to 20 timesits solar abundance, and the silicon to 3 times, while all the otherspecies are kept at solar abundances. The �2
� value decreasesfrom 0.3348 to 0.3129 (by about 7%). While some of the linesare better fitted (such as S iv 1063 and 1073 8, Si iii �1010 8,and Si iv�10258), the S iv (1006 and 11008) are far too deep(see Fig. 2).
4.2. Accretion Disk
Next, we fit the solar abundance disk models. We find that alow inclination is needed in order to match the absorption lines,and in our models we initially set i ¼ 5�, 8�, 12�, and 18�. Again,because we have no information about the mass of the WD, foreach value of log g (ranging between 7.5 and 9.0) we vary themass accretion rate between 10�10:5 and 10�8:0 M� yr�1 to findthe best-fit models. Again, we find that the best-fit models are
Fig. 2.—Nonsolar abundance, single-WDmodel. The best-fitWDmodel (solid black line) to theFUSE spectrum of BBDor (solid gray line) is shown, where the abun-dances of sulfur and silicon have been set to ½S� ¼ 20 solar and ½Si� ¼ 3 solar. The abundances of all the other elements have been set to solar. Dashed gray line segmentsshow the segments of the spectrum that were masked before the fitting. The WD has a temperature T ¼ 37;000 K, a projected rotational velocity Vrot sin i ¼ 400 km s�1,and log g ¼ 8:3. The distance obtained is d ¼ 211 pc, and �2
� ¼ 0:3129. [See the electronic edition of the Journal for a color version of this figure.]
GODON ET AL.536 Vol. 687

around log g ¼ 8:3, but the difference between the �2� values is
not significant, and the improvement over the single-WDmod-els is also only marginal (on the order of �1% in the �2
� value).All these models are presented in Table 2. Next, we improvethe disk model by varying the abundances, although we do not
expect the fit to improve much because of the Keplerian ve-locity broadening of the disk. However, we find that setting thesilicon and sulfur abundances to 3 and 20 times solar, respec-tively, actually reduces the �2
� value by 10%, which is more thanfor the single-WD model. This is because the S iv (1006 and
TABLE 2
Synthetic Spectra
log g
(cgs)
TWD
(103 K)
Vrot sin i
( km s�1)
[Si]
(solar)
[S]
(solar)
[Z]
(solar)
i
(deg)
logM
(M� yr�1)
WD/Disk
(%)
d
(pc) �2� Figure
7.50........... 34.0 400 1.0 1.0 1.0 . . . . . . 100/0 377 0.3427
8.00........... 36.0 400 1.0 1.0 1.0 . . . . . . 100/0 266 0.3361
8.30........... 37.0 400 1.0 1.0 1.0 . . . . . . 100/0 247 0.3348 1
8.30........... 37.0 400 3.0 20. 1.0 . . . . . . 100/0 211 0.3129 2
8.50........... 38.0 400 1.0 1.0 1.0 . . . . . . 100/0 193 0.3345
8.50........... 38.0 400 3.0 20. 1.0 . . . . . . 100/0 184 0.3100
8.65........... 38.0 400 1.0 1.0 1.0 . . . . . . 100/0 172 0.3360
9.00........... 40.0 400 1.0 1.0 1.0 . . . . . . 100/0 135 0.3390
7.50........... . . . . . . 1.0 1.0 1.0 12 �8.0 0/100 878 0.3346
7.88........... . . . . . . 1.0 1.0 1.0 12 �8.5 0/100 878 0.3346
8.30........... . . . . . . 1.0 1.0 1.0 8 �9.0 0/100 693 0.3297
8.30........... . . . . . . 3.0 20. 1.0 8 �9.0 0/100 665 0.3000 3
8.65........... . . . . . . 1.0 1.0 1.0 5 �9.5 0/100 496 0.3332
9.00........... . . . . . . 1.0 1.0 1.0 5 �10.0 0/100 361 0.3376
8.30........... 32.0 400 3.0 20. 1.0 08 �9.0 10/90 700 0.2989 4
8.30........... 37.0 400 3.0 20. 1.0 80 �9.0 74/26 246 0.2873 5
8.65........... 38.0 400 3.0 20. 1.0 80 �9.5 75/25 184 0.2880
Fig. 3.—Nonsolar abundance, single-disk model. The FUSE spectrum of BB Dor is shown together with one of the best-fit synthetic disk models (solid black line).The model hasM ¼ 0:80M�, M ¼ 10�9 M� yr�1, i ¼ 8�, a distance d ¼ 665 pc, and �2
� ¼ 0:3000. Abundances and solid gray/dashed gray spectral segments are asin Fig. 2. The low inclination is needed in order to fit the silicon, sulfur, and carbon absorption lines. [See the electronic edition of the Journal for a color version of thisfigure.]
FUSE SPECTROSCOPY OF BB DOR 537No. 1, 2008

1100 8) lines have better fits (Fig. 3). This best-fit single-diskmodel has i ¼ 8
�, M ¼ 10�9 M� yr�1, a distance of 665 pc,
and �2� ¼ 0:3000.
4.3. Composite Model: WD+Accretion Disk
Last, we fit composite WD+Disk models. Since the numberof models increases exponentially when we change log g, TeA,and M , we restrict our search using our best fit for log g, namely8.3. We also set the sulfur to 20 times solar and silicon 3 timessolar. This procedure reduces the number of free parameters to3 (M , TeA, i).
Low inclination.— Since the system is believed to have a lowinclination angle (Chen et al. 2001), we generate low-inclinationmodels (i ¼ 5�, 8�, 12�, and 18�). Not surprisingly, the best fitmodel has i ¼ 8
�and M ¼ 10�9 M� yr�1, but this time the WD
has a temperature of 32,000 K and provides only 10% of theflux, while the disk provides the remaining 90%. Such a modelagain brings an insignificant improvement in the value of �2
� , andit is clear (Fig. 4) that it is barely distinguishable from the best-fitsingle-disk model. From the point of view of the physics, thismodel is preferred because, if the system has a low inclinationangle, then the emission from theWDmust contribute to the flux.Models with a WD temperature T < 30;000 K have a WD con-tribution of only a few percent of the total FUV flux, and cannotbe distinguished from the single-disk models. If the WD has atemperature TeA < 30;000 K, it will not be detected while thesystem is in a high state (with M ¼ 10�9 M� yr�1). These resultsimply that the contribution from the WD is not very large andthat the temperature of the WD must be �32,000 K.
High inclination.— From the sharp Balmer emission lines,Chen et al. (2001) suggest that the system has a low inclination.However, we cannot confirm the inclination directly from theemission lines of the FUSE spectrum, as all the sharp emis-sion lines in the FUSE spectrum are of heliocoronal origin. Ourlow-inclination, single-disk models provide a slightly better fitthan the single-WD models (and a much better fit than the high-inclination, single-disk models); however, for completeness weinclude here the results from the composite WD+disk model fitswhen the assumption about the inclination angle is relaxed.We search for the best-fitWD+disk models (assuming log g ¼
8:3) in the TeA-M parameter space using all inclination angles,and find that the models with an intermediate inclination (i ¼18�, 41�, 60�, and 75�) do not provide the best fit. The best-fitmodel has i ¼ 80
�and reflects a situation in which the WD is
dominant with T ¼ 37; 000 K and contributes 3/4 of the totalflux, while the disk has M ¼ 10�9M� yr�1 and contributes only1/4 of the flux. The distance obtained from this model is 246 pcand �2
� ¼ 0:2873. This is the least �2 value we obtained from allour models. This model is presented in Figure 5. Similar resultswere obtained assuming log g ¼ 8:65, but with a slightly lowermass accretion rate (Table 2).
5. DISCUSSION AND CONCLUSION
BBDor is a little-known southern NL, and consequently boththe distance and the mass of the WD are unknown, which im-plies a larger uncertainty in the results. In addition, the FUSEspectrum is definitely of poor quality. In theory, a fine-tuning ofthe temperature (say to an accuracy of about �50 K) and mass
Fig. 4.—Low-inclination, nonsolar abundance, WD+disk model. The FUSE spectrum of BB Dor is shown together with one of the best-fit WD+disk models (solidblack line), assuming a low inclination angle. The model hasM ¼ 0:80M�, M ¼ 10�9 M� yr�1, i ¼ 8�, a distance d ¼ 700 pc, and �2
� ¼ 0:2889. Abundances and solidgray/dashed gray spectral segments are as in Fig. 2. The WD (dotted line) contributes 10% of the flux, while the high-inclination disk (dashed black line) contributes theremaining 90%. [See the electronic edition of the Journal for a color version of this figure.]
GODON ET AL.538 Vol. 687

accretion rate can be carried out by fitting the flux levels, suchthat the distance to the system (when known) is obtained accu-rately. However, the fitting to the distance depends strongly onthe radius (and therefore the mass) of theWD.We discuss belowsome additional restrictions that we use to constrain the proper-ties of the system.
On the basis of the least�2� , the bestmodel is the high-inclination,
WD+disk composite. However (see Fig. 5), because of the highinclination, the disk contributes a rather flat component all theway into the shorter wavelengths. At such a high inclination, onewould not expect the WD to dominate the flux, but rather theWD would be almost completely masked by the swollen disk;actually, the systemwould likely be observed to undergo eclipses,but none have been observed. Also, since BB Dor can vary asmuch 0.4 mag in 1 hr, this means that the light cannot be dom-inated by the WD, and that the disk must be contributing at least40% of the light. In other words, while the least �2 indicatesthat the best fit is a WD with a rather flat disk component, thereare other indications that this cannot be correct. Actually, theWD+disk, high-inclination model strikingly resembles the sec-ond component observed in the FUSE spectra of some dwarfnovae during quiescence (e.g., VWHyi; Godon et al. 2004). Thisis likely a caveat in state-of-the-art spectral modeling rather thanan indication of a physical link between the spectrum of BB Dorand that of a DN in quiescence. The need for improved modelingalso stems from the difficulty in producing a model that fits low-and high-order ionization lines at the same time. For BBDor, it is
possible that the S iv 1063 and 1073 8 absorption lines form inthe same hotter region/ layer where the O vi doublet forms, whilethe C iii and Si iii lines form in a cooler region / layer where theLyman series (and continuum) form. This is similar to theHubbleSpace Telescope STIS spectrum of TT Crt (Sion et al. 2008),which exhibits a rich variety of absorption lines from differentionization stages, suggesting line formation in (at least) two dif-ferent temperature regions.
In order to reduce the size of the domain for which we havebest-fit models in the parameter space, we use the infraredmagnitudes J, H, and K from the Two Micron All Sky Survey(2MASS) to assess the distance to BBDor as prescribed byKnigge(2006) for systems with P < 6 hr. The IR data were collected on1999 November 9, at a time when BB Dor was in a high statewith a visual red magnitude R ¼ 14:60 and a blue magnitudeB ¼ 13:90 (whereas B � 16:5 in the low state). The 2MASS IRapparent magnitudes are J ¼ 14:322, H ¼ 14:089, and K ¼14:053. For a primary star withMWD ¼ 0:75M� and period of3.559 hr (corresponding to BBDor), the donor star mass isM2 ¼0:25 M� (Patterson et al. 2005b suggest M2 ¼ 0:256 M�), andthe IR absolute magnitude estimates areMJ ¼ 7:47,MH ¼ 6:90,and MK ¼ 6:63. Inserting these into equation (15) of Knigge(2006) gives distances of 235, 274, and 305 pc, respectively.These distances are typically underestimated by factors of 2.05,1.86, and 1.75 for the J, H and and K bands, giving distances of482, 510, and 534 pc, respectively, assuming that the donor starcontributes only �1/4Y1/3 of the total IR flux (Knigge 2006).
Fig. 5.—High-inclination, nonsolar abundance, WD+disk model. The FUSE spectrum of BB Dor is shown together with one of the best-fit WD+disk models (solidblack line). The model hasM ¼ 0:80M�, M ¼ 10�9 M� yr�1, a distance of d ¼ 246 pc, and �2
� ¼ 0:2873. The inclination angle of the system is kept as a free parameter,and the best-fit model gives i ¼ 80�. Abundances and solid gray/dashed gray spectral segments are as in Fig. 2. The fits of the silicon, sulfur, and carbon absorption lines areobtained by letting theWD component dominate the spectrum. TheWD (dotted line) contributes 74% of the flux, while the high-inclination disk (dashed black line) con-tributes the remaining 26%. [See the electronic edition of the Journal for a color version of this figure.]
FUSE SPECTROSCOPY OF BB DOR 539No. 1, 2008
The distance to BB Dor is therefore certainly larger than 300 pc,and most likely in the range of �500 pc. Since BB Dor wasobserved in a high state (with 2MASS), it is likely that the in-frared flux of the donor star is on the lower side, namely evenless than 1/4, in which case the 500 pc itself is only a lower limit.Using this restriction on the distance, we can safely reject thesingle-WDmodels (with d < 400 pc), the high-inclination mod-els (with d < 250 pc), and the large-mass log g ¼ 9:0 models(with d ¼ 361 pc or less).
On the basis of the distance alone, the low-inclination diskand WD+disk models are the best fits. These are also the bestfits on the basis of the optical spectrum ( low inclination) andvisual magnitude (high state/disk).
We are now able to summarize the basic characteristics of thesystem and itsWD.We are confident that the systemmust have aWDwith log g ¼ 8:3 � 0:3, TeA ¼ 32;000 K or lower (disk+WDcomposite models), a mass accretion rate on the order of M ¼10�9 M� yr�1 (disk and disk+WD models), and a distancesomewhere between 500 and 700 pc (choosing the least �2 mod-els agreeing with the distance). From the best-fit single-diskmodels alone, we find that the inclination angle must be verysmall (�8�) to fit the absorption lines. There is an indication thatthe sulfur and silicon are overabundant, and it is also possiblethat some of the high-order ionization lines form in a layer infront of the disk and the WD.
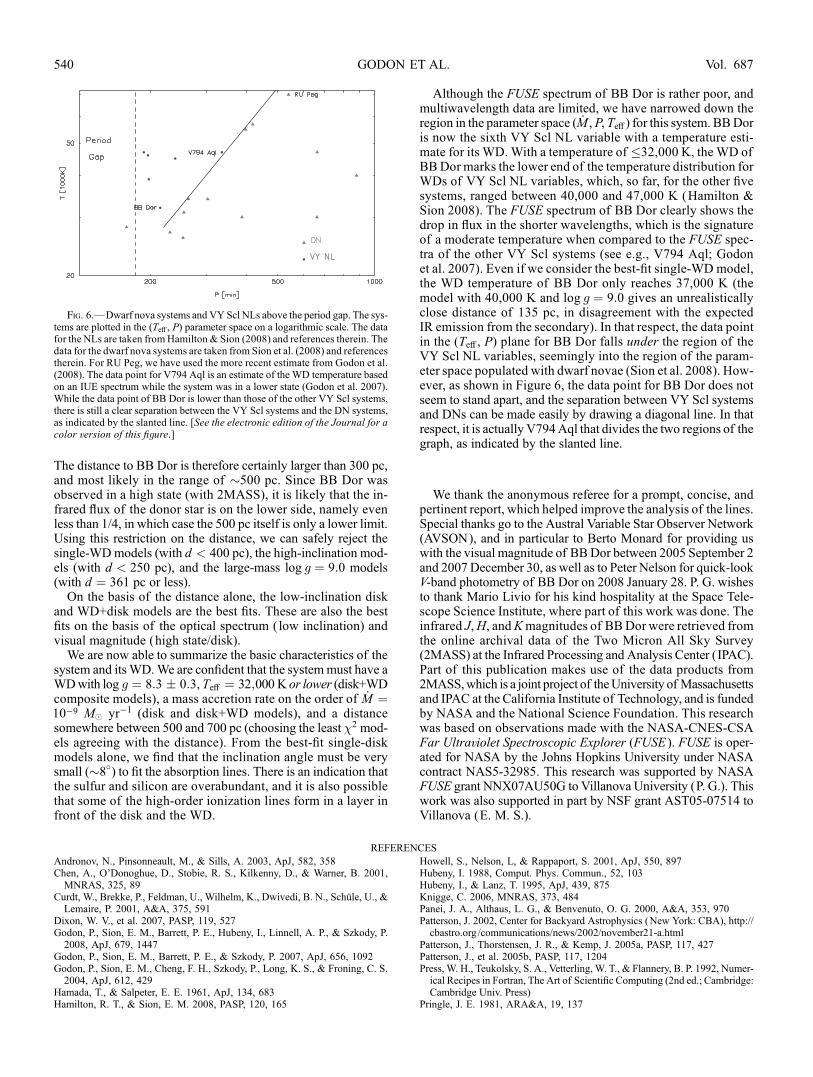
Although the FUSE spectrum of BB Dor is rather poor, andmultiwavelength data are limited, we have narrowed down theregion in the parameter space (M , P, TeA) for this system. BBDoris now the sixth VY Scl NL variable with a temperature esti-mate for its WD. With a temperature of �32,000 K, the WD ofBBDor marks the lower end of the temperature distribution forWDs of VY Scl NL variables, which, so far, for the other fivesystems, ranged between 40,000 and 47,000 K (Hamilton &Sion 2008). The FUSE spectrum of BB Dor clearly shows thedrop in flux in the shorter wavelengths, which is the signatureof a moderate temperature when compared to the FUSE spec-tra of the other VY Scl systems (see e.g., V794 Aql; Godonet al. 2007). Even if we consider the best-fit single-WD model,the WD temperature of BB Dor only reaches 37,000 K (themodel with 40,000 K and log g ¼ 9:0 gives an unrealisticallyclose distance of 135 pc, in disagreement with the expectedIR emission from the secondary). In that respect, the data pointin the (TeA, P) plane for BB Dor falls under the region of theVY Scl NL variables, seemingly into the region of the param-eter space populated with dwarf novae (Sion et al. 2008). How-ever, as shown in Figure 6, the data point for BB Dor does notseem to stand apart, and the separation between VY Scl systemsand DNs can be made easily by drawing a diagonal line. In thatrespect, it is actually V794Aql that divides the two regions of thegraph, as indicated by the slanted line.
We thank the anonymous referee for a prompt, concise, andpertinent report, which helped improve the analysis of the lines.Special thanks go to the Austral Variable Star Observer Network(AVSON), and in particular to Berto Monard for providing uswith the visual magnitude of BBDor between 2005 September 2and 2007 December 30, as well as to Peter Nelson for quick-lookV-band photometry of BB Dor on 2008 January 28. P. G. wishesto thank Mario Livio for his kind hospitality at the Space Tele-scope Science Institute, where part of this work was done. Theinfrared J,H, andKmagnitudes of BBDor were retrieved fromthe online archival data of the Two Micron All Sky Survey(2MASS) at the Infrared Processing and Analysis Center (IPAC).Part of this publication makes use of the data products from2MASS,which is a joint project of theUniversity of Massachusettsand IPAC at the California Institute of Technology, and is fundedby NASA and the National Science Foundation. This researchwas based on observations made with the NASA-CNES-CSAFar Ultraviolet Spectroscopic Explorer (FUSE ). FUSE is oper-ated for NASA by the Johns Hopkins University under NASAcontract NAS5-32985. This research was supported by NASAFUSE grant NNX07AU50G to Villanova University (P. G.). Thiswork was also supported in part by NSF grant AST05-07514 toVillanova (E. M. S.).
REFERENCES
Andronov, N., Pinsonneault, M., & Sills, A. 2003, ApJ, 582, 358Chen, A., O’Donoghue, D., Stobie, R. S., Kilkenny, D., & Warner, B. 2001,MNRAS, 325, 89
Curdt, W., Brekke, P., Feldman, U., Wilhelm, K., Dwivedi, B. N., Schule, U., &Lemaire, P. 2001, A&A, 375, 591
Dixon, W. V., et al. 2007, PASP, 119, 527Godon, P., Sion, E. M., Barrett, P. E., Hubeny, I., Linnell, A. P., & Szkody, P.2008, ApJ, 679, 1447
Godon, P., Sion, E. M., Barrett, P. E., & Szkody, P. 2007, ApJ, 656, 1092Godon, P., Sion, E. M., Cheng, F. H., Szkody, P., Long, K. S., & Froning, C. S.2004, ApJ, 612, 429
Hamada, T., & Salpeter, E. E. 1961, ApJ, 134, 683Hamilton, R. T., & Sion, E. M. 2008, PASP, 120, 165
Howell, S., Nelson, L, & Rappaport, S. 2001, ApJ, 550, 897Hubeny, I. 1988, Comput. Phys. Commun., 52, 103Hubeny, I., & Lanz, T. 1995, ApJ, 439, 875Knigge, C. 2006, MNRAS, 373, 484Panei, J. A., Althaus, L. G., & Benvenuto, O. G. 2000, A&A, 353, 970Patterson, J. 2002, Center for Backyard Astrophysics (New York: CBA), http://cbastro.org /communications/news/2002/november21-a.html
Patterson, J., Thorstensen, J. R., & Kemp, J. 2005a, PASP, 117, 427Patterson, J., et al. 2005b, PASP, 117, 1204Press, W. H., Teukolsky, S. A., Vetterling, W. T., & Flannery, B. P. 1992, Numer-ical Recipes in Fortran, The Art of Scientific Computing (2nd ed.; Cambridge:Cambridge Univ. Press)
Pringle, J. E. 1981, ARA&A, 19, 137
Fig. 6.—Dwarf nova systems and VY Scl NLs above the period gap. The sys-tems are plotted in the (TeA, P) parameter space on a logarithmic scale. The datafor the NLs are taken fromHamilton & Sion (2008) and references therein. Thedata for the dwarf nova systems are taken from Sion et al. (2008) and referencestherein. For RU Peg, we have used the more recent estimate from Godon et al.(2008). The data point for V794 Aql is an estimate of the WD temperature basedon an IUE spectrum while the system was in a lower state (Godon et al. 2007).While the data point of BB Dor is lower than those of the other VY Scl systems,there is still a clear separation between the VY Scl systems and the DN systems,as indicated by the slanted line. [See the electronic edition of the Journal for acolor version of this figure.]
GODON ET AL.540 Vol. 687

Schlegel, D. J., Finkbeiner, D. P., & Davis, M. 1998, ApJ, 500, 525Shakura, N. I., & Sunyaev, R. A. 1973, A&A, 24, 337Sion, E. M. 1995, ApJ, 438, 876Sion, E. M., Bansicke, B. T., Long, K. S., Szkody, P., Knigge, C., Hubeny, I.,deMartino, D., & Godon, P. 2008, ApJ, 681, 543
Wade, R. A., & Hubeny, I. 1998, ApJ, 509, 350Warner, B. 1995, Cataclysmic Variable Stars (Cambridge: Cambridge Univ.Press)
Wood, M. A. 1990, Ph.D. thesis, Univ. Texas at Austin
FUSE SPECTROSCOPY OF BB DOR 541No. 1, 2008