the application of variable chlorophyll fluorescence to microphytobenthic biofilms
TRANSCRIPT
237
1 Introduction to Benthic Biofilms
Community assemblages of diatoms, green algae and cyanobacteria comprise the microphytobenthos (MPB), which inhabit benthic sediment ecosystems (Admiraal 1984; Underwood and Kromkamp 1999; Consalvey
et al. 2004). Particular attention has been paid to the analysis of intertidal soft sediment systems, e.g. cohesive mudflat and sandy substrata typical of estuarine habitats. Variable chlorophyll fluorescence has been applied to these systems since the 1990s, in an attempt to investi-gate the primary productivity and photophysiology of the integrated biofilms, when viewed as a “black box system”, and also at the species level (Sections 5, 6 and 7). These transient (i.e. temporary) biofilms are not con-fined to such soft sediment habitats however, and more recently application of fluorescence methodologies has been applied to biofilms inhabiting rocky shores and stromatolite systems (Kromkamp et al. 2007; Perkins et al. 2007). However the large majority of published work has centred upon benthic soft-sediment biofilms, due to their important ecosystem functions of carbon flow and sediment stability (Underwood and Kromkamp 1999). In the former their high magnitude of productivity fuels carbon flow through invertebrate and bacterial food webs to support important trophic levels of anthropo-genically exploited taxa, including coastal fish and shell fisheries and coastal avifauna. In the case of sediment stability, biogenic exopolymers, usually referred to as extracellular polymeric substances (EPS), produced by the MPB in part to facilitate mobility, may contribute significantly to sediment stability, hence increasing the sediment resistance to hydrodynamic stresses and thus resistance to coastal erosion (e.g. Underwood and Kromkamp 1999 and citations there-in). Finally, the photosynthetic production of oxygen can be regarded as an important ecosystem function.
One attribute of MPB ecology has in particular contributed to confounding the application of fluore-scence methodology to benthic biofilms. This is the behavioural adaptation of the MPB to migrate verti-cally in their sediment matrix habitat in response to
Chapter 12The Application of Variable Chlorophyll Fluorescence to Microphytobenthic Biofilms
R.G. Perkins, J.C. Kromkamp, J. Serôdio, J. Lavaud, B. Jesus, J.L. Mouget, S. Lefebvre, and R.M. Forster
R.G. Perkins (*) School of Earth and Ocean Sciences, Cardiff University, Main Building, Park Place, Cardiff, CF10 3YE, UK e-mail: [email protected]
J.C. Kromkamp NIOO-KNAW Centre for Estuarine and Marine Ecology, P.O. Box 140, 4400 AC Yerseke, The Netherlands
J. Serôdio Departamento de Biologia and CESAM – Centro de Estudos do Ambiente e do Mar, Universidade de Aveiro, Campus de Santiago, 3810-193, Aveiro, Portugal
J. Lavaud CNRS UMR6250 ‘LIENSs’, Institute for Coastal and Environmental Research (ILE), University of La Rochelle, 2 rue Olympe de Gouges, 17042 La Rochelle cedex, France
B. Jesus Centro de Oceanografia, Faculdade de Ciências da Universidade de Lisboa, Campo Grande, 1749-016 Lisboa, Portugal
J.L. Mouget Laboratoire de Physiologie et de Biochimie végétales, MMS EA 2160, Université du Maine, Av. O. Messiaen, 72085 Le Mans Cedex 9, France
S. Lefebvre Laboratoire de Biologie et Biotechnologies Marine, Université de Caen, Esplanade de la Paix, 14032 Caen cedex, France
R.M. Forster Ecosystem Interactions, Centre for Environment, Fisheries and Aquaculture Science (CEFAS), Pakefield Road, Lowestoft, Suffolk NR33 0HT, UK
D.J. Suggett et al. (eds.), Chlorophyll a Fluorescence in Aquatic Sciences: Methods and Applications, Developments in Applied Phycology 4, DOI 10.1007/978-90-481-9268-7_12, © Springer Science+Business Media B.V. 2010
238 R.G. Perkins et al.
environmental stimuli, as well as part of endogenous tidal and diel rhythms (Sections 2, 3, 4, 5 and 6). Consalvey et al. (2004) reviewed this migration in MPB biofilms and Consalvey et al. (2005) discussed the effect of this as part of a review of fluorescence methodology applied to MPB biofilms. Vertical migra-tion appears to follow tidal and diel rhythms such that cells migrate to the surface of the sediment to coincide with daylight emersion periods, whilst migrating back in to the sediment for immersion periods (Consalvey et al. 2004 and citations there-in). In some instances this appears to be modulated by light environment such that low turbidity in the overlaying water column enables the MPB to remain at the sediment surface after the onset of immersion, and during bright moonlit emersion periods, MPB will migrate to the surface (Perkins, Kromkamp, Serôdio and Jesus, personal observations).
Light is undoubtedly a major stimulus in MPB ver-tical migration. Several studies have shown that cells within MPB biofilms show negative or positive photo-taxis. For example, cells will migrate down to avoid potentially harmful high light environments and migrate up to optimise the light environment when ambient light levels are low (Sections 2, 3 and 6). Cells also show “microcycling” such that there can be a con-stant turnover of taxa at the sediment surface, resulting in a reduction in photodose integrated over time (Section 2, 5, 6 and 7). As well as affecting productiv-ity, such “behavioural” down regulation of photosyn-thesis may act to make interpretation of fluorescence measurements difficult. For example, cells will migrate to different positions within the sediment matrix mak-ing the distance between the cells and the fluorometer probe variable and unknown. This leads to a variable attenuation of applied actinic light, as well as the fluo-rescence yields used to study aspects of photoacclima-tion. Furthermore, cells may migrate in response to darkness applied for measurement of dark adapted fluorescence parameters, again altering fluorescence yields (Sections 2, 3 and 6). These effects, and others discussed in this chapter, lead to potential errors in the application of variable chlorophyll fluorescence to migratory MPB biofilms. As a result great care is needed in the interpretation of fluorescence data obtained. Benthic diatom taxa, which can comprise the majority of MPB biomass, also show differences in photophysiology from higher plants, making conven-tional interpretation of fluorescence data incorrect. For example, diatoms exhibit high levels of down regulation
through diadinoxanthin/diatoxanthin xanthophyll cycling, non-photochemical quenching (NPQ), induced as a result of the trans-thylakoid proton gradient result-ing from light induced electron transport (Section 3). Thus MPB cells can show behavioural and physiologi-cal down regulation. However chlororespiration dur-ing dark periods leads to retention of this proton gradient, retaining NPQ in the dark (Section 3). This can suppress maximum fluorescence yield in the dark (F
m) such that it is lower than operational maximum
yield in low light (Fm¢), making conventional calcula-
tion of NPQ from the difference in these yields prob-lematic (Sections 3 and 5).
In this review, the authors have summarised the main areas of fluorescence research as applied to ben-thic biofilms, principally concentrating on those of intertidal soft sediment ecosystems. Fluorescence is now widely applied in the field of benthic biofilm research, being relatively non-invasive, although obvi-ously the application of the measurement, e.g. actinic light during a light curve, is inherently intrusive to some extent. Fluorescence also has the distinct advan-tage of being non-destructive when compared to other measurements of, for example, productivity using slurries or intact biofilms with radioactive labels added. The methodology is summarised, along with potential problems, as well as ways to minimise error and achieve correct interpretation of data obtained. The review covers subsurface signal as a result of vertical integration of fluorescence measurements (Section 2), non-photochemical quenching and the xanthophyll cycle (Section 3), measurement and calculation of flu-orescence derived electron transport rate (Section 5), methodology used to obtain light curve parameters of photophysiology, e.g. photoacclimation (Section 6) and concludes with a section comparing fluorescence to other methods including radio-labelled carbon uptake and oxymetry (Section 7).
2 The Effects of Subsurface Signal
2.1 Microphytobenthic Biofilms on Soft Sediments
Sediments colonised by microphytobenthos are opti-cally dense, causing both downwelling light (including light generated by a fluorometer) as well as upwelling
23912 The Application of Variable Chlorophyll Fluorescence to Microphytobenthic Biofilms
fluorescence to be attenuated within the microalgal bio-film/sediment matrix. As a result, the fluorescence levels F
s and F
m¢ measured from just above the surface repre-
sent the integration of the fluorescence signals emitted at various depths, distorting the relationship between F
o
and chl a as this relationship will thus not only depend upon the total biomass, but also on the shape of the ver-tical biomass profile. Of more importance, this effect causes the measurement of the effective quantum yield, DF/F
m¢, at the surface to differ significantly from the
true, inherent value of the microalgae composing the biofilm, because the relationship between F
s and F
m¢
varies with irradiance within the depth range over which the fluorometer signal is integrated (Forster and Kromkamp 2004; Serôdio 2004).
The depth-integration effect was first predicted from observations of changes in DF/F
m¢ in undisturbed
biofilms under constant irradiance (Underwood and Kromkamp, 1999; Perkins et al. 2001, 2002), and was studied in detail using numerical simulation models
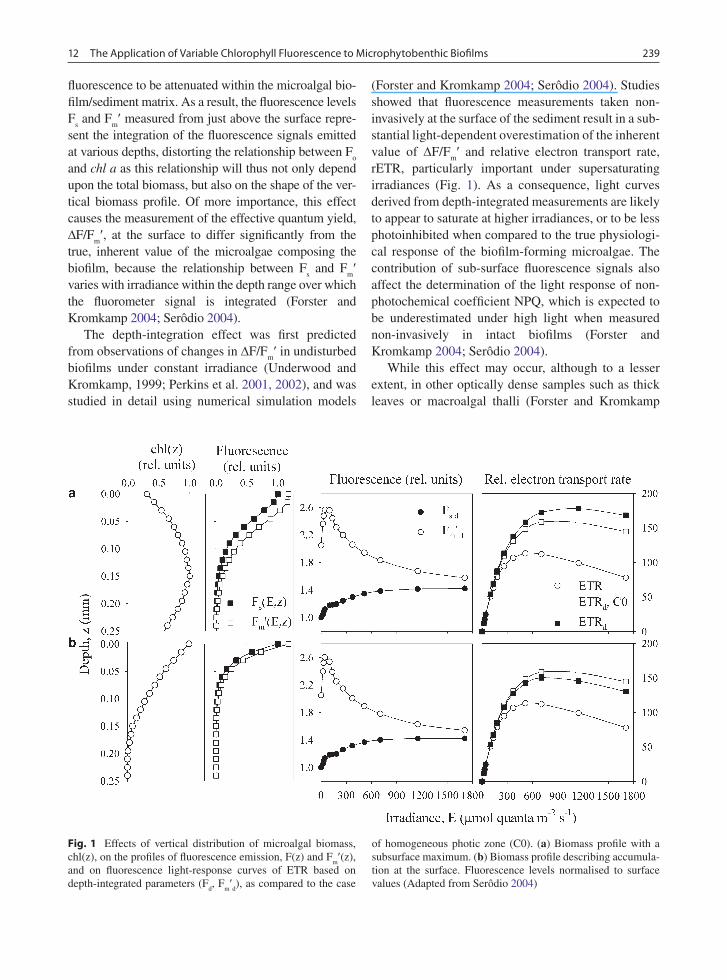
(Forster and Kromkamp 2004; Serôdio 2004). Studies showed that fluorescence measurements taken non-invasively at the surface of the sediment result in a sub-stantial light-dependent overestimation of the inherent value of DF/F
m¢ and relative electron transport rate,
rETR, particularly important under supersaturating irradiances (Fig. 1). As a consequence, light curves derived from depth-integrated measurements are likely to appear to saturate at higher irradiances, or to be less photoinhibited when compared to the true physiologi-cal response of the biofilm-forming microalgae. The contribution of sub-surface fluorescence signals also affect the determination of the light response of non-photochemical coefficient NPQ, which is expected to be underestimated under high light when measured non-invasively in intact biofilms (Forster and Kromkamp 2004; Serôdio 2004).
While this effect may occur, although to a lesser extent, in other optically dense samples such as thick leaves or macroalgal thalli (Forster and Kromkamp
Fig. 1 Effects of vertical distribution of microalgal biomass, chl(z), on the profiles of fluorescence emission, F(z) and F
m¢(z),
and on fluorescence light-response curves of ETR based on depth-integrated parameters (F
d, F
m¢d), as compared to the case
of homogeneous photic zone (C0). (a) Biomass profile with a subsurface maximum. (b) Biomass profile describing accumula-tion at the surface. Fluorescence levels normalised to surface values (Adapted from Serôdio 2004)
240 R.G. Perkins et al.
2004; Serôdio 2004; Sušila et al. 2004), in the case of microphytobenthos the problem is further complicated by the occurrence of comparatively large scale vertical migration by motile diatoms. In this case, it becomes highly difficult to interpret fluorescence yields from biofilms where the cells move vertically within the sediment matrix, since the subsurface signal emanates not only from cells at unknown depth, but at a variable depth in the sediment. Additionally, signal strength is proportional to the distance between the fluorometer probe and the cells themselves, thus vertical migration may increase or decrease measured yields, so making interpretation of changes in yield or calculation of photophysiological parameters difficult. For example, a decrease in both F
m¢ and F can be due to induction of
NPQ down regulation on exposure to increasing PAR or to downward migration (negative phototaxis). It is often not possible to differentiate between the two pro-cesses using fluorescence methods. For this reason it can be prudent to use subsurface spectral reflectance for measurements such as biomass, see below, (Kromkamp et al. 2006; Morris et al. 2008) as the reflectance spectra are not influenced by NPQ.
It is hard to avoid artefacts of tidally induced verti-cal migration and positive or negative phototaxis, but the effects can be minimized by not taking measure-ments during the first and last hour of the emersion period when vertical migration is maximal. In addition it is better to minimize the effects of phototaxis by keeping the duration of measurements as short as pos-sible (e.g. minimise the duration of light steps during rapid light curves, RLCs, see later). PSII quantum effi-ciency often stabilizes before true steady state fluores-cence is reached (Perkins, Kromkamp, Serôdio and Jesus, personal observations).
The issue of the subsurface signal from the cells within the subsurface sediment has been investigated in considerable depth (Kromkamp et al. 1998; Perkins et al. 2002; Forster and Kromkamp 2004; Serôdio 2004; Jesus et al. 2006a, b). Kromkamp et al. (1998) dis-cussed the issue of microcycling of cells such that the fluorescence yield was obtained from a varied surface community over time and that this could explain the persistent high ∆F/F
m¢ at high incident irradiance.
Perkins et al. (2002) reported over estimation of ETR in sediments due to subsurface signal from cells exposed to a lower light level than that applied at the surface and showed that the community composition could change during a light curve. In addition it appeared that the
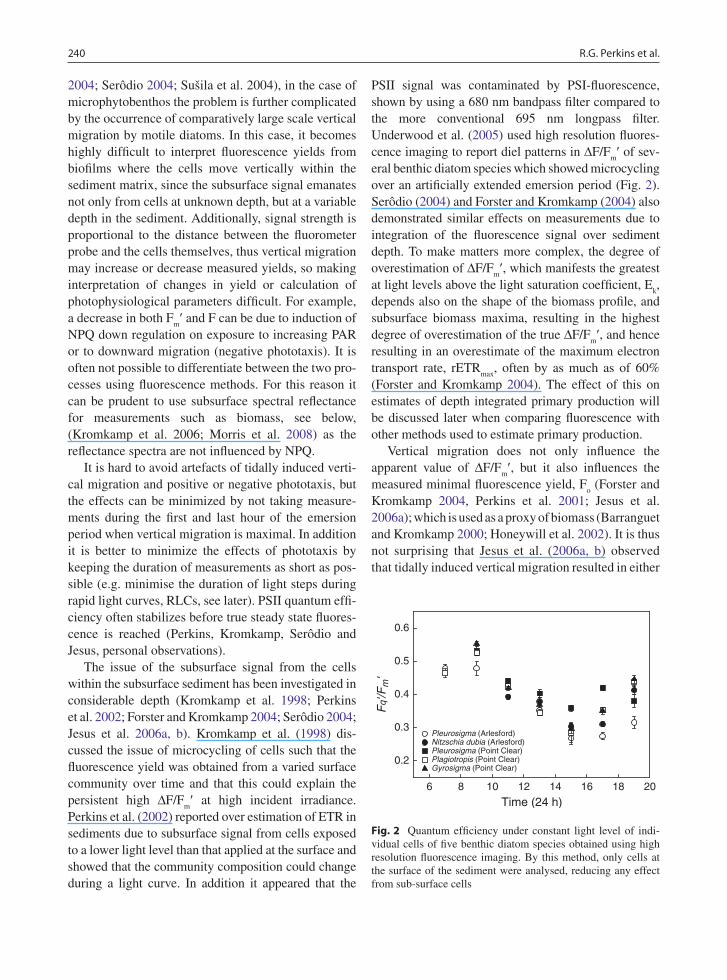
PSII signal was contaminated by PSI-fluorescence, shown by using a 680 nm bandpass filter compared to the more conventional 695 nm longpass filter. Underwood et al. (2005) used high resolution fluores-cence imaging to report diel patterns in DF/F
m¢ of sev-
eral benthic diatom species which showed microcycling over an artificially extended emersion period (Fig. 2). Serôdio (2004) and Forster and Kromkamp (2004) also demonstrated similar effects on measurements due to integration of the fluorescence signal over sediment depth. To make matters more complex, the degree of overestimation of ∆F/F
m¢, which manifests the greatest
at light levels above the light saturation coefficient, Ek,
depends also on the shape of the biomass profile, and subsurface biomass maxima, resulting in the highest degree of overestimation of the true ∆F/F
m¢, and hence
resulting in an overestimate of the maximum electron transport rate, rETR
max, often by as much as of 60%
(Forster and Kromkamp 2004). The effect of this on estimates of depth integrated primary production will be discussed later when comparing fluorescence with other methods used to estimate primary production.
Vertical migration does not only influence the apparent value of ∆F/F
m¢, but it also influences the
measured minimal fluorescence yield, Fo (Forster and
Kromkamp 2004, Perkins et al. 2001; Jesus et al. 2006a); which is used as a proxy of biomass (Barranguet and Kromkamp 2000; Honeywill et al. 2002). It is thus not surprising that Jesus et al. (2006a, b) observed that tidally induced vertical migration resulted in either
Time (24 h)6 8 10 12 14 16 18 20
Fq'
/Fm
'
0.2
0.3
0.4
0.5
0.6
Pleurosigma (Arlesford)Nitzschia dubia (Arlesford)Pleurosigma (Point Clear)Plagiotropis (Point Clear)Gyrosigma (Point Clear)
Fig. 2 Quantum efficiency under constant light level of indi-vidual cells of five benthic diatom species obtained using high resolution fluorescence imaging. By this method, only cells at the surface of the sediment were analysed, reducing any effect from sub-surface cells
24112 The Application of Variable Chlorophyll Fluorescence to Microphytobenthic Biofilms
an over estimation or under estimation of biomass dependent upon the time the measurements were made within the emersion period. Cells either migrated up or away from the sediment surface, thereby enriching or depleting the biomass at the sediment surface contrib-uting to the F
o signal measured.
Recent work using migration inhibitors (Cartaxana et al. 2008; Perkins et al. in preparation) and engi-neered non-migratory biofilms (Jesus et al. 2006a, b; Mouget et al. 2008) have investigated these issues further and confirm that vertical migration and the concomitant “deep layer fluorescence” lead to erroneous estimates of quenching coefficients and overestimation of ∆F/F
m¢.
2.2 Stromatolites – the effect of “layered” biofilms
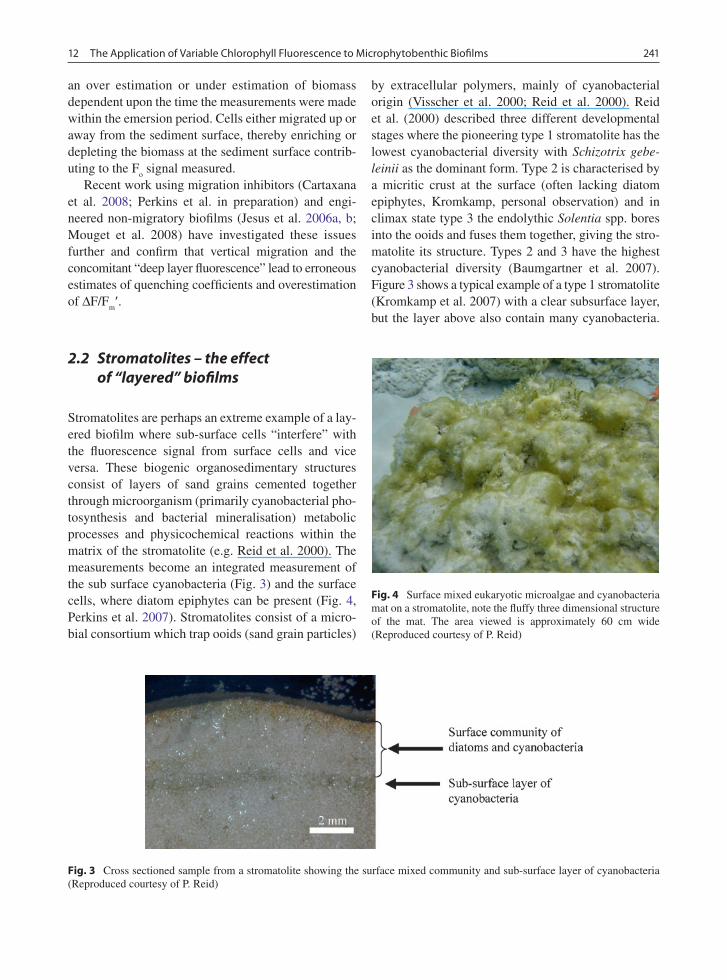
Stromatolites are perhaps an extreme example of a lay-ered biofilm where sub-surface cells “interfere” with the fluorescence signal from surface cells and vice versa. These biogenic organosedimentary structures consist of layers of sand grains cemented together through microorganism (primarily cyanobacterial pho-tosynthesis and bacterial mineralisation) metabolic processes and physicochemical reactions within the matrix of the stromatolite (e.g. Reid et al. 2000). The measurements become an integrated measurement of the sub surface cyanobacteria (Fig. 3) and the surface cells, where diatom epiphytes can be present (Fig. 4, Perkins et al. 2007). Stromatolites consist of a micro-bial consortium which trap ooids (sand grain particles)
by extracellular polymers, mainly of cyanobacterial origin (Visscher et al. 2000; Reid et al. 2000). Reid et al. (2000) described three different developmental stages where the pioneering type 1 stromatolite has the lowest cyanobacterial diversity with Schizotrix gebe-leinii as the dominant form. Type 2 is characterised by a micritic crust at the surface (often lacking diatom epiphytes, Kromkamp, personal observation) and in climax state type 3 the endolythic Solentia spp. bores into the ooids and fuses them together, giving the stro-matolite its structure. Types 2 and 3 have the highest cyanobacterial diversity (Baumgartner et al. 2007). Figure 3 shows a typical example of a type 1 stromatolite (Kromkamp et al. 2007) with a clear subsurface layer, but the layer above also contain many cyanobacteria.
Fig. 3 Cross sectioned sample from a stromatolite showing the surface mixed community and sub-surface layer of cyanobacteria (Reproduced courtesy of P. Reid)
Fig. 4 Surface mixed eukaryotic microalgae and cyanobacteria mat on a stromatolite, note the fluffy three dimensional structure of the mat. The area viewed is approximately 60 cm wide (Reproduced courtesy of P. Reid)
242 R.G. Perkins et al.
This clearly highlights the difficulty when applying surface measurements using PAM fluorometry: the depth and thickness of the subsurface layer varies as well as the distance of the cells from the stromatolite surface. This means that quantitative analyses of both cyanobacterial biomass as well as effective quantum efficiency is very difficult as the apparent ∆F/F
m¢ and
Fo is integrated over an unknown depth interval with
varying biomass distribution. This problem can be partly circumvented by measuring on a sample cross section, by putting the PAM fiberoptics parallel to the mat surface (Perkins et al. 2007). However, this will disrupt chemical and light gradients, especially of oxy-gen and light, and hence greatly influence photosyn-thetic activity (Kromkamp et al. 2007).
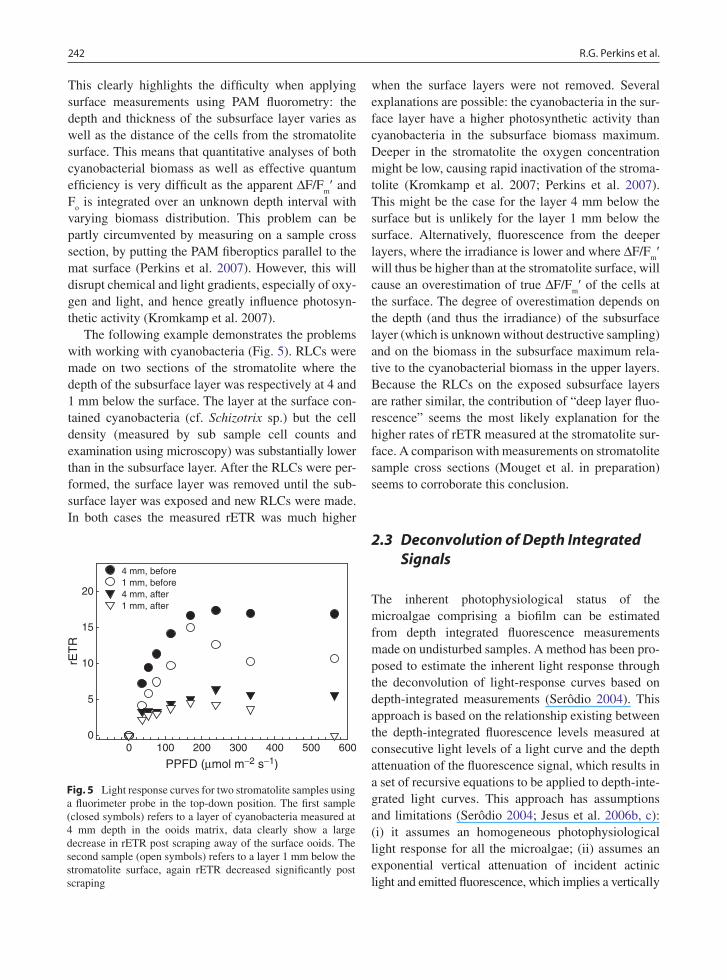
The following example demonstrates the problems with working with cyanobacteria (Fig. 5). RLCs were made on two sections of the stromatolite where the depth of the subsurface layer was respectively at 4 and 1 mm below the surface. The layer at the surface con-tained cyanobacteria (cf. Schizotrix sp.) but the cell density (measured by sub sample cell counts and examination using microscopy) was substantially lower than in the subsurface layer. After the RLCs were per-formed, the surface layer was removed until the sub-surface layer was exposed and new RLCs were made. In both cases the measured rETR was much higher
when the surface layers were not removed. Several explanations are possible: the cyanobacteria in the sur-face layer have a higher photosynthetic activity than cyanobacteria in the subsurface biomass maximum. Deeper in the stromatolite the oxygen concentration might be low, causing rapid inactivation of the stroma-tolite (Kromkamp et al. 2007; Perkins et al. 2007). This might be the case for the layer 4 mm below the surface but is unlikely for the layer 1 mm below the surface. Alternatively, fluorescence from the deeper layers, where the irradiance is lower and where ∆F/F
m¢
will thus be higher than at the stromatolite surface, will cause an overestimation of true ∆F/F
m¢ of the cells at
the surface. The degree of overestimation depends on the depth (and thus the irradiance) of the subsurface layer (which is unknown without destructive sampling) and on the biomass in the subsurface maximum rela-tive to the cyanobacterial biomass in the upper layers. Because the RLCs on the exposed subsurface layers are rather similar, the contribution of “deep layer fluo-rescence” seems the most likely explanation for the higher rates of rETR measured at the stromatolite sur-face. A comparison with measurements on stromatolite sample cross sections (Mouget et al. in preparation) seems to corroborate this conclusion.
2.3 Deconvolution of Depth Integrated Signals
The inherent photophysiological status of the microalgae comprising a biofilm can be estimated from depth integrated fluorescence measurements made on undisturbed samples. A method has been pro-posed to estimate the inherent light response through the decon volution of light-response curves based on depth-integrated measurements (Serôdio 2004). This approach is based on the relationship existing between the depth-integrated fluorescence levels measured at consecutive light levels of a light curve and the depth attenuation of the fluorescence signal, which results in a set of recursive equations to be applied to depth-inte-grated light curves. This approach has assumptions and limitations (Serôdio 2004; Jesus et al. 2006b, c): (i) it assumes an homogeneous photophysiological light response for all the microalgae; (ii) assumes an exponential vertical attenuation of incident actinic light and emitted fluorescence, which implies a vertically
PPFD (µmol m−2 s−1)0 100 200 300 400 500 600
rET
R
0
5
10
15
20
4 mm, before1 mm, before4 mm, after1 mm, after
Fig. 5 Light response curves for two stromatolite samples using a fluorimeter probe in the top-down position. The first sample (closed symbols) refers to a layer of cyanobacteria measured at 4 mm depth in the ooids matrix, data clearly show a large decrease in rETR post scraping away of the surface ooids. The second sample (open symbols) refers to a layer 1 mm below the stromatolite surface, again rETR decreased significantly post scraping
24312 The Application of Variable Chlorophyll Fluorescence to Microphytobenthic Biofilms
homogeneous photic zone; (iii) it requires the attenuation coefficients for downwelling actinic light and upwell-ing fluorescence to be known; (iv) it does not account for changes in surface biomass during the construction of the light curve on intact biofilms. Nevertheless, numerical simulations using published values for actinic light and fluorescence have shown a significant reduction in the differences between depth-independent light curves and those deconvoluted from depth-integrated curves (Serôdio 2004).
3 Down Regulation Through Non-photochemical Quenching
3.1 NPQ and the Xanthophyll Cycle in Diatoms
Diatoms of MPB biofilms are submitted to an extreme light environment which includes exposure to both high visible and UV irradiances, and fast and unpredictable light fluctuations. Additionally, other environmental pressures (nutrient limitation, extremes in temperature and salinity, etc.) can slow down the photosynthetic machinery and create a situation where the photosyn-thetically converted light energy cannot be entirely used for metabolic purposes. In order to maintain their photo-synthetic productivity at an optimal level by preventing photoinhibition (i.e. decrease in quantum efficiencies F
v/F
m and DF/F
m¢), diatoms need to acclimate to envi-
ronmental changes through fast regulation of their pho-tosynthetic activity (Lavaud 2007). Together with the PS II electron cycle (Lavaud et al. 2002c), the non-photochemical quenching of chlorophyll fluorescence (NPQ) is believed to be one of the most important of these ‘photoprotective’ (or ‘photoacclimative’) mecha-nisms in diatoms (Lavaud 2007). Most of the diatoms of the MPB are capable of vertical migration into the sedi-ment as a behavioral photoprotective strategy in order to avoid excess light exposure at the surface. However, vertical migration and NPQ appear to be complemen-tary, NPQ induction may occur before the onset of the migratory response (Serôdio et al. 2008; Underwood et al. 2005), although recent work using chemical inhibitors of migration and NPQ suggests that migra-tion may occur instead of NPQ induction (Perkins et al. in preparation).
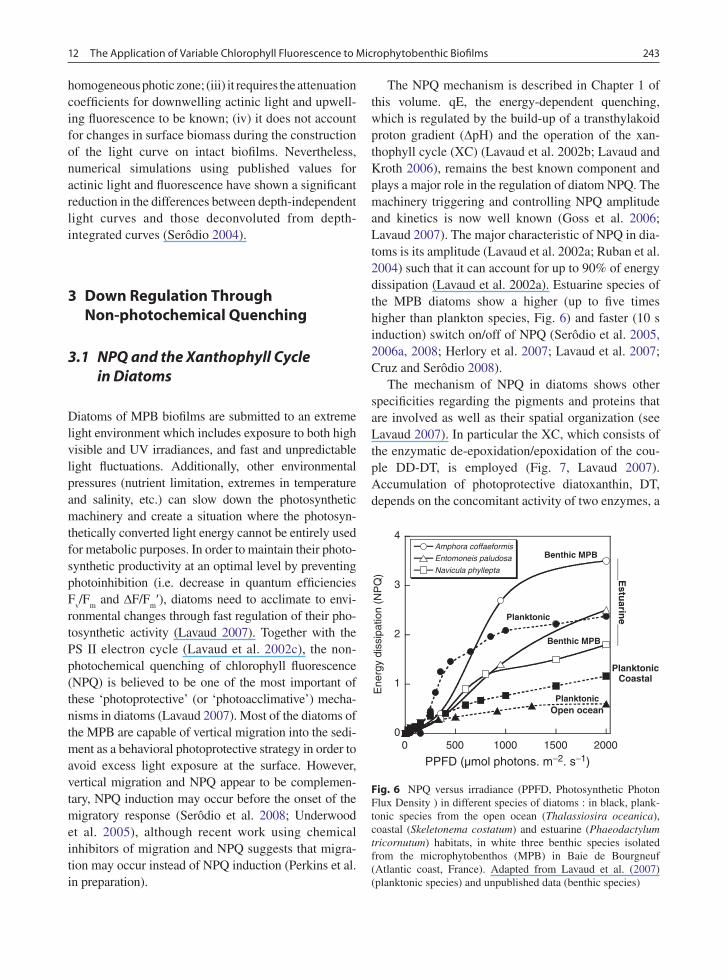
The NPQ mechanism is described in Chapter 1 of this volume. qE, the energy-dependent quenching, which is regulated by the build-up of a transthylakoid proton gradient (DpH) and the operation of the xan-thophyll cycle (XC) (Lavaud et al. 2002b; Lavaud and Kroth 2006), remains the best known component and plays a major role in the regulation of diatom NPQ. The machinery triggering and controlling NPQ amplitude and kinetics is now well known (Goss et al. 2006; Lavaud 2007). The major characteristic of NPQ in dia-toms is its amplitude (Lavaud et al. 2002a; Ruban et al. 2004) such that it can account for up to 90% of energy dissipation (Lavaud et al. 2002a). Estuarine species of the MPB diatoms show a higher (up to five times higher than plankton species, Fig. 6) and faster (10 s induction) switch on/off of NPQ (Serôdio et al. 2005, 2006a, 2008; Herlory et al. 2007; Lavaud et al. 2007; Cruz and Serôdio 2008).
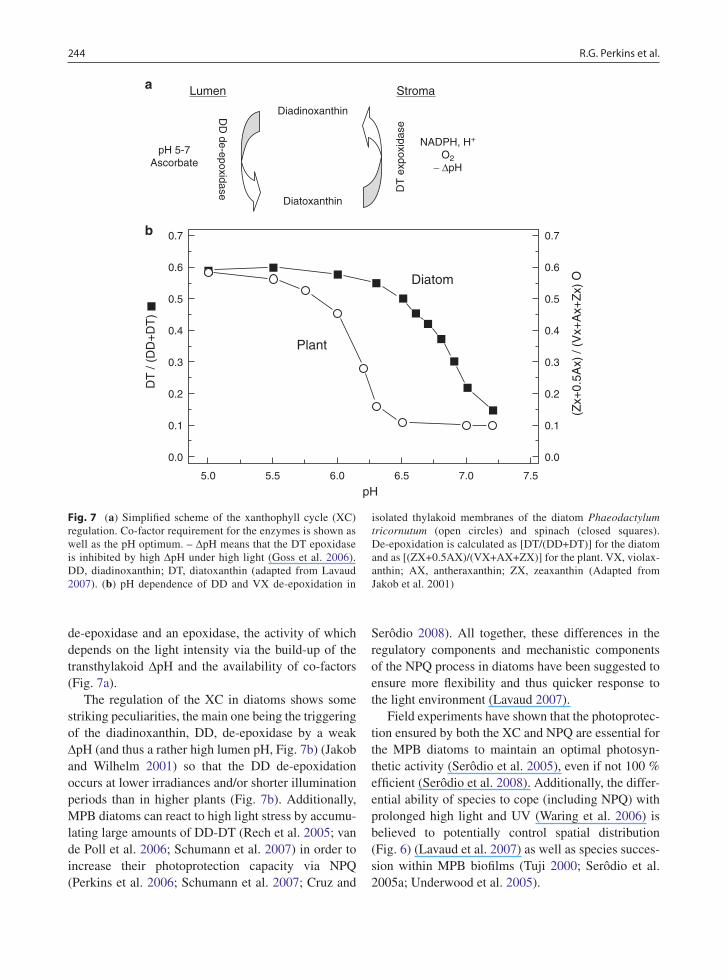
The mechanism of NPQ in diatoms shows other specificities regarding the pigments and proteins that are involved as well as their spatial organization (see Lavaud 2007). In particular the XC, which consists of the enzymatic de-epoxidation/epoxidation of the cou-ple DD-DT, is employed (Fig. 7, Lavaud 2007). Accumulation of photoprotective diatoxanthin, DT, depends on the concomitant activity of two enzymes, a
0
1
2
3
4
0 500 1000 1500 2000
Entomoneis paludosa
Amphora coffaeformis
Navicula phyllepta
Ene
rgy
diss
ipat
ion
(NP
Q)
PPFD (µmol photons. m−2. s−1)
Planktonic
PlanktonicCoastal
____Estu
arine____
Benthic MPB
Benthic MPB
PlanktonicOpen ocean
Fig. 6 NPQ versus irradiance (PPFD, Photosynthetic Photon Flux Density ) in different species of diatoms : in black, plank-tonic species from the open ocean (Thalassiosira oceanica), coastal (Skeletonema costatum) and estuarine (Phaeodactylum tricornutum) habitats, in white three benthic species isolated from the microphytobenthos (MPB) in Baie de Bourgneuf (Atlantic coast, France). Adapted from Lavaud et al. (2007) (planktonic species) and unpublished data (benthic species)
244 R.G. Perkins et al.
de-epoxidase and an epoxidase, the activity of which depends on the light intensity via the build-up of the transthylakoid DpH and the availability of co-factors (Fig. 7a).
The regulation of the XC in diatoms shows some striking peculiarities, the main one being the triggering of the diadinoxanthin, DD, de-epoxidase by a weak DpH (and thus a rather high lumen pH, Fig. 7b) (Jakob and Wilhelm 2001) so that the DD de-epoxidation occurs at lower irradiances and/or shorter illumination periods than in higher plants (Fig. 7b). Additionally, MPB diatoms can react to high light stress by accumu-lating large amounts of DD-DT (Rech et al. 2005; van de Poll et al. 2006; Schumann et al. 2007) in order to increase their photoprotection capacity via NPQ (Perkins et al. 2006; Schumann et al. 2007; Cruz and
Serôdio 2008). All together, these differences in the regulatory components and mechanistic components of the NPQ process in diatoms have been suggested to ensure more flexibility and thus quicker response to the light environment (Lavaud 2007).
Field experiments have shown that the photoprotec-tion ensured by both the XC and NPQ are essential for the MPB diatoms to maintain an optimal photosyn-thetic activity (Serôdio et al. 2005), even if not 100 % efficient (Serôdio et al. 2008). Additionally, the differ-ential ability of species to cope (including NPQ) with prolonged high light and UV (Waring et al. 2006) is believed to potentially control spatial distribution (Fig. 6) (Lavaud et al. 2007) as well as species succes-sion within MPB biofilms (Tuji 2000; Serôdio et al. 2005a; Underwood et al. 2005).
Fig. 7 (a) Simplified scheme of the xanthophyll cycle (XC) regulation. Co-factor requirement for the enzymes is shown as well as the pH optimum. – DpH means that the DT epoxidase is inhibited by high DpH under high light (Goss et al. 2006). DD, diadinoxanthin; DT, diatoxanthin (adapted from Lavaud 2007). (b) pH dependence of DD and VX de-epoxidation in
isolated thylakoid membranes of the diatom Phaeodactylum tricornutum (open circles) and spinach (closed squares). De-epoxidation is calculated as [DT/(DD+DT)] for the diatom and as [(ZX+0.5AX)/(VX+AX+ZX)] for the plant. VX, violax-anthin; AX, antheraxanthin; ZX, zeaxanthin (Adapted from Jakob et al. 2001)
0.7
0.6
0.5
Plant
Diatom
(Zx+
0.5A
x) /
(Vx+
Ax+
Zx)
O
0.4
0.3
0.2
0.1
0.0
0.7
0.6
0.5
0.4
0.3
0.2
0.1
0.0
5.0 5.5 6.0 6.5
pH
DT
/ (D
D+
DT
)
7.0 7.5
Lumen
pH 5-7Ascorbate
Diadinoxanthin
NADPH, H+
O2− ∆pH
DD
de-epoxidase DT
exp
oxid
ase
Diatoxanthin
Stromaa
b
24512 The Application of Variable Chlorophyll Fluorescence to Microphytobenthic Biofilms
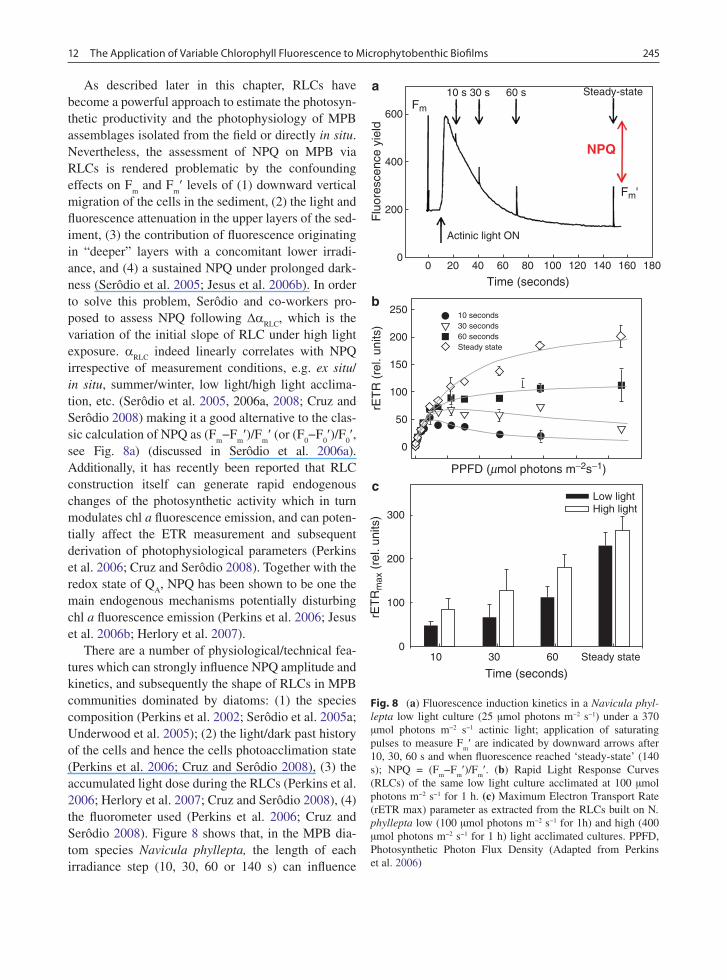
As described later in this chapter, RLCs have become a powerful approach to estimate the photosyn-thetic productivity and the photophysiology of MPB assemblages isolated from the field or directly in situ. Nevertheless, the assessment of NPQ on MPB via RLCs is rendered problematic by the confounding effects on F
m and F
m¢ levels of (1) downward vertical
migration of the cells in the sediment, (2) the light and fluorescence attenuation in the upper layers of the sed-iment, (3) the contribution of fluorescence originating in “deeper” layers with a concomitant lower irradi-ance, and (4) a sustained NPQ under prolonged dark-ness (Serôdio et al. 2005; Jesus et al. 2006b). In order to solve this problem, Serôdio and co-workers pro-posed to assess NPQ following Da
RLC, which is the
variation of the initial slope of RLC under high light exposure. a
RLC indeed linearly correlates with NPQ
irrespective of measurement conditions, e.g. ex situ/ in situ, summer/winter, low light/high light acclima-tion, etc. (Serôdio et al. 2005, 2006a, 2008; Cruz and Serôdio 2008) making it a good alternative to the clas-sic calculation of NPQ as (F
m−F
m¢)/F
m¢ (or (F
0−F
0¢)/F
0¢,
see Fig. 8a) (discussed in Serôdio et al. 2006a). Additionally, it has recently been reported that RLC construction itself can generate rapid endogenous changes of the photosynthetic activity which in turn modulates chl a fluorescence emission, and can poten-tially affect the ETR measurement and subsequent derivation of photophysiological parameters (Perkins et al. 2006; Cruz and Serôdio 2008). Together with the redox state of Q
A, NPQ has been shown to be one the
main endogenous mechanisms potentially disturbing chl a fluorescence emission (Perkins et al. 2006; Jesus et al. 2006b; Herlory et al. 2007).
There are a number of physiological/technical fea-tures which can strongly influence NPQ amplitude and kinetics, and subsequently the shape of RLCs in MPB communities dominated by diatoms: (1) the species composition (Perkins et al. 2002; Serôdio et al. 2005a; Underwood et al. 2005); (2) the light/dark past history of the cells and hence the cells photoacclimation state (Perkins et al. 2006; Cruz and Serôdio 2008), (3) the accumulated light dose during the RLCs (Perkins et al. 2006; Herlory et al. 2007; Cruz and Serôdio 2008), (4) the fluorometer used (Perkins et al. 2006; Cruz and Serôdio 2008). Figure 8 shows that, in the MPB dia-tom species Navicula phyllepta, the length of each irradiance step (10, 30, 60 or 140 s) can influence
Fig. 8 (a) Fluorescence induction kinetics in a Navicula phyl-lepta low light culture (25 µmol photons m−2 s−1) under a 370 µmol photons m−2 s−1 actinic light; application of saturating pulses to measure F
m¢ are indicated by downward arrows after
10, 30, 60 s and when fluorescence reached ‘steady-state’ (140 s); NPQ = (F
m−F
m¢)/F
m¢. (b) Rapid Light Response Curves
(RLCs) of the same low light culture acclimated at 100 µmol photons m−2 s−1 for 1 h. (c) Maximum Electron Transport Rate (rETR max) parameter as extracted from the RLCs built on N. phyllepta low (100 µmol photons m−2 s−1 for 1h) and high (400 µmol photons m−2 s−1 for 1 h) light acclimated cultures. PPFD, Photosynthetic Photon Flux Density (Adapted from Perkins et al. 2006)
0 20
Actinic light ON
Time (seconds)
Flu
ores
cenc
e yi
eld
Fm'
Fm
10 s 30 s Steady-state60 s
40 60 80 100 120 140 160 180
NPQ
0
200
400
600
25010 seconds30 seconds60 secondsSteady state
200
rET
R (
rel.
units
)rE
TR
max
(re
l. un
its)
150
100
50
0
PPFD (mmol photons m−2s−1)
100
100
200
300
30
Time (seconds)60
Low lightHigh light
Steady state
a
b
c
246 R.G. Perkins et al.
partly the level of NPQ induction (Fig. 8a), the profile of RLCs (Fig. 8b) and the subsequent determination of ETR
max as a function of the light history of the cells
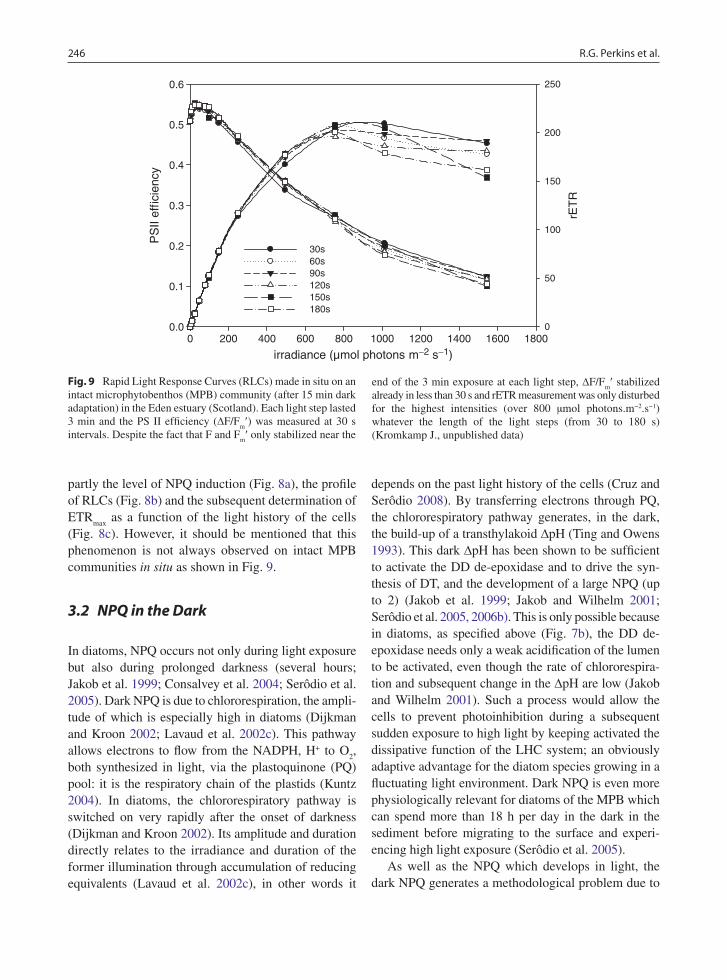
(Fig. 8c). However, it should be mentioned that this phenomenon is not always observed on intact MPB communities in situ as shown in Fig. 9.
3.2 NPQ in the Dark
In diatoms, NPQ occurs not only during light exposure but also during prolonged darkness (several hours; Jakob et al. 1999; Consalvey et al. 2004; Serôdio et al. 2005). Dark NPQ is due to chlororespiration, the ampli-tude of which is especially high in diatoms (Dijkman and Kroon 2002; Lavaud et al. 2002c). This pathway allows electrons to flow from the NADPH, H+ to O
2,
both synthesized in light, via the plastoquinone (PQ) pool: it is the respiratory chain of the plastids (Kuntz 2004). In diatoms, the chlororespiratory pathway is switched on very rapidly after the onset of darkness (Dijkman and Kroon 2002). Its amplitude and duration directly relates to the irradiance and duration of the former illumination through accumulation of reducing equivalents (Lavaud et al. 2002c), in other words it
depends on the past light history of the cells (Cruz and Serôdio 2008). By transferring electrons through PQ, the chlororespiratory pathway generates, in the dark, the build-up of a transthylakoid DpH (Ting and Owens 1993). This dark DpH has been shown to be sufficient to activate the DD de-epoxidase and to drive the syn-thesis of DT, and the development of a large NPQ (up to 2) (Jakob et al. 1999; Jakob and Wilhelm 2001; Serôdio et al. 2005, 2006b). This is only possible because in diatoms, as specified above (Fig. 7b), the DD de-epoxidase needs only a weak acidification of the lumen to be activated, even though the rate of chlororespira-tion and subsequent change in the DpH are low (Jakob and Wilhelm 2001). Such a process would allow the cells to prevent photoinhibition during a subsequent sudden exposure to high light by keeping activated the dissipative function of the LHC system; an obviously adaptive advantage for the diatom species growing in a fluctuating light environment. Dark NPQ is even more physiologically relevant for diatoms of the MPB which can spend more than 18 h per day in the dark in the sediment before migrating to the surface and experi-encing high light exposure (Serôdio et al. 2005).
As well as the NPQ which develops in light, the dark NPQ generates a methodological problem due to
irradiance (µmol photons m−2 s−1)0 200 400 600 800 1000 1200 1400 1600 1800
PS
II ef
ficie
ncy
0.0
0.1
0.2
0.3
0.4
0.5
0.6
rET
R
0
50
100
150
200
250
30s60s90s120s150s180s
Fig. 9 Rapid Light Response Curves (RLCs) made in situ on an intact microphytobenthos (MPB) community (after 15 min dark adaptation) in the Eden estuary (Scotland). Each light step lasted 3 min and the PS II efficiency (DF/F
m¢) was measured at 30 s
intervals. Despite the fact that F and Fm¢ only stabilized near the
end of the 3 min exposure at each light step, DF/Fm¢ stabilized
already in less than 30 s and rETR measurement was only disturbed for the highest intensities (over 800 µmol photons.m−2.s−1) whatever the length of the light steps (from 30 to 180 s) (Kromkamp J., unpublished data)
24712 The Application of Variable Chlorophyll Fluorescence to Microphytobenthic Biofilms
our inability to instantaneously measure the ‘true’ Fm
(and F0) level during dark-adaption of the cells in situ
where their past light/dark history is usually unknown. Indeed, to achieve correct measurement of fluorescence parameters, complete Q
A oxidation and NPQ relaxation
are required, which is usually reached after a short (15 min) dark-adaptation in controlled laboratory con-ditions but which might not be enough in situ (Perkins et al. 2001; Consalvey et al. 2004; Jesus et al. 2006a). Dark NPQ can easily quench F
m by at least 10–15%
depending on the diatom species (Jakob and Wilhelm 2001). When the cells are further exposed to a low irra-diance (below 150 µmol photons m−2 s−1, Mouget and Tremblin 2002) during the measurement following dark-adaptation (typically at the beginning of RLCs acquisition), the whole photosynthetic machinery is fully activated which (1) reoxidizes Q
A and the PS II,
(2) dissipate the DpH and subsequently change the equilibrium of the XC, hence relaxing the fluorescence quenching (Consalvey et al. 2004; Serôdio et al. 2005, 2006a). Hence, it is rather common to observe F
m¢ level
transiently higher than the dark Fm level (Mouget and
Tremblin 2002; Consalvey et al. 2004; Serôdio et al. 2005, 2006a). As a consequence it significantly affects the measurement and calculation of many fluorescence parameters. It can also significantly perturb the use of F
o and its changes as a proxy for the dynamics of MPB
diatom biomass at the surface and within the sediment (Consalvey et al. 2004; Jesus et al. 2006a). Solutions have been proposed to rule this problem out: (1) mea-surement of the ‘true’ F
m level in the presence of DCMU
which is only applicable in controlled laboratory condi-tions (see Chapter 12, paragraph 12.4), (2) short expo-sure to low dose of far-red or low light instead of dark-adaptation in order to reoxidize PS II and dissi-pate the DpH and NPQ (Consalvey et al. 2004; Jesus et al. 2006a), (3) use F
m¢m, the maximum F
m¢ value mea-
sured as the ‘true’ Fm, instead of the dark F
m level
(Serôdio et al. 2006a, 2008; Cruz and Serôdio 2008).
4 The Quantification of the Microalgal Biomass Using Fluorescence
The quantification of the microalgal biomass of micro-phytobenthic biofilms is a methodological challenge, due to the thinness of the sediment photic zone, the large horizontal and vertical heterogeneity, and the
rapid changes in microalgae near the surface due to vertical migratory movements. Serôdio et al. (1997) was the first study to investigate the possibility of using in vivo chlorophyll fluorescence to non-destructively quantify the microalgal biomass of microphytobenthic biofilms. They experimentally established a linear relationship between sediment chl a content and mini-mum fluorescence yield F
o, showing that large F
o vari-
ations in the dark represented changes in the amount of microalgae at the sediment surface, as the result of cell vertical migratory movements. The use of F
o as a bio-
mass proxy was shown to be preferable to other fluo-rescence parameters such as F
m or F
m¢ because it varied
the least with previous light history, temperature and microalgal group. F
o was shown to allow the estima-
tion of the miroalgal biomass present in the photic zone of the sediment (defined as ‘photosynthetically active biomass’; Guarini et al. 2000; Honeywill et al. 2002) but also of the microalgal biomass in the photic zone weighted by its contribution to depth-integrated photosynthesis (defines as ‘productive biomass’; Serôdio et al. 2001). This method overcomes the oper-ational difficulties with previously used methods, based on destructive and time-consuming procedures, and intro-duced considerable operational advantages, including the possibility to obtain repeated measurements in the same sample over time, without any physical distur-bance of the sediment-air or sediment-water interface, and allowing the concurrent measurement of other variables in the same sample (Serôdio et al. 1997).
However, the determination of Fo in MPB biofilms is
not without problems and has been the source of signifi-cant discussion (e.g. Consalvey et al. 2004; Jesus et al. 2006b, c). These problems are related to MPB vertical movements during the dark adaptation (DA) period and to problems concerning the presence of NPQ in the dark (exhibited by diatom dominated biofilms). The determi-nation of fluorescence parameters requiring DA (F
o, as
well other parameters and indices such as Fm or F
v/F
m)
requires that PSII reaction centres and QA be in their
fully oxidised form (Schreiber et al. 1986). To achieve this state it is conventional to place samples in full dark-ness until a DA steady state is reached. However, dark adapting microphytobenthic biofilms presents a number of specific problems unique to this type of community.
Microphytobenthic biofilms are know to exhibit a behavioural photo-regulation mechanism where microal-gae migrate vertically within the sediment matrix as a response to changes in ambient light in order to maintain
248 R.G. Perkins et al.
an optimum light environment and avoid photo-inhibition (e.g. Perkins et al. 2002; Jesus et al. 2006b, c). This response to changes in ambient light can hinder the determination of F
o if vertical migration occurs during
the DA period necessary for QA and PSII re-oxidation.
This has been recognized as a potential problem since the first studies using fluorescence (e.g. Serôdio et al. 1997) and short adaptation periods have been suggested as alternatives. Several forms of determining the mini-mum fluorescence yield have been tested, depending on the length of DA used (F¢, F
o¢, F
o2, F
o5, F
o10, F
o15; the
superscript number denoting the duration of the dark period in minutes). By far, the most commonly used parameter is F
o15 (Kromkamp et al. 1998; Underwood
et al. 1999; Barranguet and Kromkamp 2000; Perkins et al. 2001; Hagerthey et al. 2002; Honeywill et al. 2002; Perkins et al. 2002; Consalvey et al. 2004; Defew et al. 2004; Jesus et al. 2006b, c), followed by 5 min (Serôdio et al. 1997, 2001, Serôdio 2003; Serôdio and Catarino 2000; Jesus et al. 2006b, c) and 2 min (Serôdio et al. 2006b, 2007, 2008). However, the 15 min of DA can be excessive in some biofilms inducing significant down-ward migration during that period (e.g. Jesus et al. 2006a, b, c), suggesting that shorter time periods might be pref-erable. In fact, Jesus et al. (2006c) compared the relation-ship between chl a with F
o¢, F
o5 and F
o15 and found no
significant differences from Fo¢ to F
o15 in muddy sedi-
ment assemblages, suggesting that light history had little or no effect in the epipelic assemblages and that no DA was necessary for a good relationship between chl a and fluorescence. However, in sandy sediments there was evidence of a light history effect and a 5 min DA period was necessary to remove this effect. Other authors (e.g. Serôdio et al. 2007) have found that shorter DA times (2 min) might be even better than 5 min for the determina-tion of photosynthesis fluorescence indices that require the input of a minimum fluorescence yield parameter.
Intertidal biofilms exhibit the additional problem of not showing an homogeneous behavioural response to light stimulus throughout the tidal cycle, i.e. biofilms close to the beginning of the emersion period will tend to increase F
o values during the DA period as a result
of cells migrating to the sediment surface, and mea-surements close to the end of the emersion period will be very sensitive to darkness and cells will migrate downwards quickly over the DA period. Although, this does not seem to be the case in all estuaries (e.g. Kromkamp et al. 1998; Barranguet and Kromkamp 2000; Hagerthey et al. 2002; Honeywill et al. 2002).
To reduce this problem it was proposed that measure-ments are taken closer to the middle of the emersion period and that a low light or far-red treatment is used instead to the dark treatment (Jesus et al. 2006b). It is not clear why low light and far-red light work similarly but both treatments have to be applied at a reduced photon flux quantity to work properly. Thus, it is pos-sible that this reduced photon flux promotes the dissi-pation of the chlororespiration trans-thylakoid proton gradient (DpH) exhibited by diatoms in the dark (Ting and Owens 1993; Dijkman and Kroon 2002c; Lavaud et al. 2002c). The reduction in the DpH promotes the epoxidation of diatoxanthin into diadinoxanthin, there-fore, decreasing the NPQ caused by diatoxanthin pres-ence in the dark (Jakob et al. 1999; Jakob and Wilhelm 2001). Another advantage of low light is that it seems to promote the presence of cells at the surface, thus reducing the problem of migration downwards that occurs during the DA period (Jesus et al. 2006b).
5 Calculation of Electron Transport Rate: ETR v rETR
5.1 Multiple and Single Turnover Methods
The rate of electron transport by PSII depends on the amount of light absorbed by the antenna of PSII and the efficiency at which the absorbed light by PSII is used by the reaction centers (RCII) to drive charge separation. Basically two methods are used which are both based on the light doubling method originally proposed by Bradbury and Baker (1981) which we will call the multiple turnover (MT) method and the single turnover (ST) method and which relate to the descrip-tion of the pulse-amplitude modulation principle by Schreiber et al. (1986) and the pump and probe method (Falkowski et al. 1986b) respectively. The differences between these two approaches have recently been reviewed by Kromkamp and Forster (2003).
5.2 The MT-method
The MT-method is usually used by scientists using the PAM family of fluorometers which uses a multiple
24912 The Application of Variable Chlorophyll Fluorescence to Microphytobenthic Biofilms
turnover flash to measure the quantum efficiency of PSII. Because the flash duration used to measure the maximum fluorescence (F
m) is relatively long (50 ms
– 1 s) it allows for multiple charge separations during the flash and will thus lead to fully reduced Q
A, Q
B and
PQ-pool. When the PSII effective quantum efficiency (DF/F
m¢) is measured the absolute rate of electron
transport per unit area (ETRA) can be calculated as follows:
AII RC mETR E• A • • F / F ′= Φ ∆ (1)
AII is the fraction of the incident light (E) which is
absorbed by PSII. FRC
is yield (in electrons) of reduced Q
A per trapped photon, i.e. the maximum quantum yield
of photochemistry within PSII, and it is usually assumed to be equal to 1 (Kolber and Falkowski 1993). Note that ETRA is expressed in µmol electrons s−1 m−2 of surface area. When working with higher plants it is assumed that leaves absorb approx. 85% of incident light, and about half of this is partitioned to PSII. Assuming that
RCΦ is close to 1, Eq. 1 can be rewritten as:
AmETR 0.43• E• F / F ′≈ ∆ (2)
Often the fraction of absorbed light is determined by measuring the transmittance of light through a piece of macroalgal thallus using a light sensor (Beer et al. 1998; Longstaff et al. 2002). Implicit in this assump-tion is that the measured signal is equivalent to the integrated fluorescence yield over the entire path length, an assumption which might not be met, cer-tainly when several cell layers are involved. The arte-facts associated with this assumption were discussed above where the effects of “deep layer” fluorescence are described.
When working with optically thin suspensions of phytoplankton or unicellular algal cultures a slightly different approach is taken: in this case the ETR is usu-ally calculated per mg chl a (µmol e− (mg chl a)−1s−1):
PSII m RCETR E•a * • F / F •′= ∆ Φ′ (3a)
Where a¢*PSII
is the optical absorption cross section of PSII (here expressed in m2 (mg chl a)−1, which is the product of the cross section of a single PSII unit and the number of PSII per mg chl (a¢*
PSII = a*
PSII • n
PSII)).
As it is rather difficult to measure the absorption cross section of PSII it is normally assumed that a¢*
PSII is half
the optical cross section of the cells (a* m2 (mg chl a)−1, i.e. it is assumed that 50% of the absorbed light is funneled to PSII and the other half to PSI). Below we will discuss this assumption. Thus, assuming Ф
RC equals
1 we can rewrite Eq. 3a as:
mETR E•a*•0.5• F / F ′= ∆ (3b)
The optical cross section can be easily determined using a spectrophotometer equipped with an integrat-ing sphere, i.e. by using the filterpad method for natu-ral phytoplankton which requires concentration on a filter before the absorption measurements can be made (Tassan and Ferrari 1998; Simis et al. 2005).
5.3 The ST-method
Researchers using a saturating single turnover flash to measure F
m¢ usually take the approach developed by
Falkowski et al. (1986b) and Kolber and Falkowski (1993), based on the development of the pump and probe fluorometer, which was followed up by the Fast Repetition Rate Fluorometer (FRRF) (Kolber et al. 1998). Here the rate of photosynthetic electron trans-port is described as follows:
*PSII PSII p tm RCETR E•a • n •q • • • f= Φ Φ (4)
Here a*PSII
is the optical cross section of a single PSII unit (m2/mol PSII) and n
PSII is the number of PSII
units per mg chl a, usually assumed equal to 0.002 (thus assuming 500 chl a molecules per PSII (Falkowski 1981; Kolber and Falkowski 1993). The photochemi-cal quenching coefficient q
P (moles electrons trans-
ferred per mole photons absorbed by PSII) reflects the proportion of oxidized PSII centers and is often used as a proxy of the number of open reaction centers. This is, however, only true when the PSII centers are not connected (Kramer et al. 2004). The trapping effi-ciency F
tm is the efficiency at which trapped photons
in the pigment bed are transferred to an open RCII and f is the fraction of functional PSII centers. The product of the optical PSII cross section and the trapping effi-ciency equals the effective PSII cross section (s
PSII,
units m−2 (mol PSII)−1):
PSII PSII tma * •σ = Φ (5)
250 R.G. Perkins et al.
As the FRRF can measure the functional cross section s
PSII from the rise of F to F
m during the induction flash-
let sequence, Eq. 4 can be rewritten as
PSII PSII p tmETR E• • n •q • • f= σ Φ (6)
Equation 6 is the one that is proposed by Kolber and Falkowski (1993) and Kolber et al. (1998) for use with the pump and probe and FRR fluorometer. The fraction of inactive centers (f) was measured as F
sat/0.65, where
Fsat
is the maximum PSII efficiency measured and 0.65 the assumed maximum PSII efficiency of healthy cells without non-functional PSII centers. Kromkamp and Forster (2003) argued that this factor should be omitted because non-functional PSII centers will affect the level of F
o¢, and this is already incorporated in the value of q
P.
5.4 Assumptions and Uncertainties
Fraction of light absorbed by PSII. Both the MT as well as the ST method usually use a number of a-priori assumptions. When using the MT method to calculate ETR it is necessary to know which fraction of the absorbed light is funneled to PSII. Using a combina-tion of optical and biophysical techniques Suggett et al. (2004) tested the hypothesis that about 50% of the light is absorbed by PSII. For a large range of taxa (diatoms, green alga, haptophytes and a cryptophyte) the fraction of light absorbed by PSII varied between 0.48 and 0.58, justifying this assumption. However, in the pelagophytin diatom Aureococcus anophagefferens
the PSII-antenna absorbed about 36% of the light and in two cyanobacterial Synechoccocus species PSII absorbed 25–32% of the total light. The fraction of light absorbed by PSII was independent of the growth irradiance. A similar approach was taken by Johnsen and Sakshaug (2007), but they used a slightly different scaling procedure to match the fluorescence excitation spectra to the absorption spectra in order to arrive at the fraction of light absorbed by PSII: their results show that 48–88% of the light absorbed by the photo-synthetic pigments was absorbed by PSII, which is generally higher than the estimates obtained by Suggett et al. (2004). Whether this difference is entirely due to methodological question or to growth conditions and different algal species remains an open question, but clearly this topic requires further research.
Estimates of the number of PSII. When using the ST protocol the absorption is quantified by multiplying the measured functional cross section s
PSII with the n
PSII.
This latter factor is also rather difficult to measure, cer-tainly using field material, and for this reason it is assumed that n
PSII equals 0.002, i.e. a PSII contains 500
mol chl a (mol PSII)−1 (Kolber and Falkowski 1993), a value based on the determinations by the photosyn-thetic unit (PSU) size by Mauzerall and Greenbaum (1989). Assuming that a PSU contains 4 RCII it can be calculated from the data presented by the references in Table 1 that generally n
PSII varies between 500–725
mol chl a per mol PSII, although lower values have been reported for Isochrysis galbana.
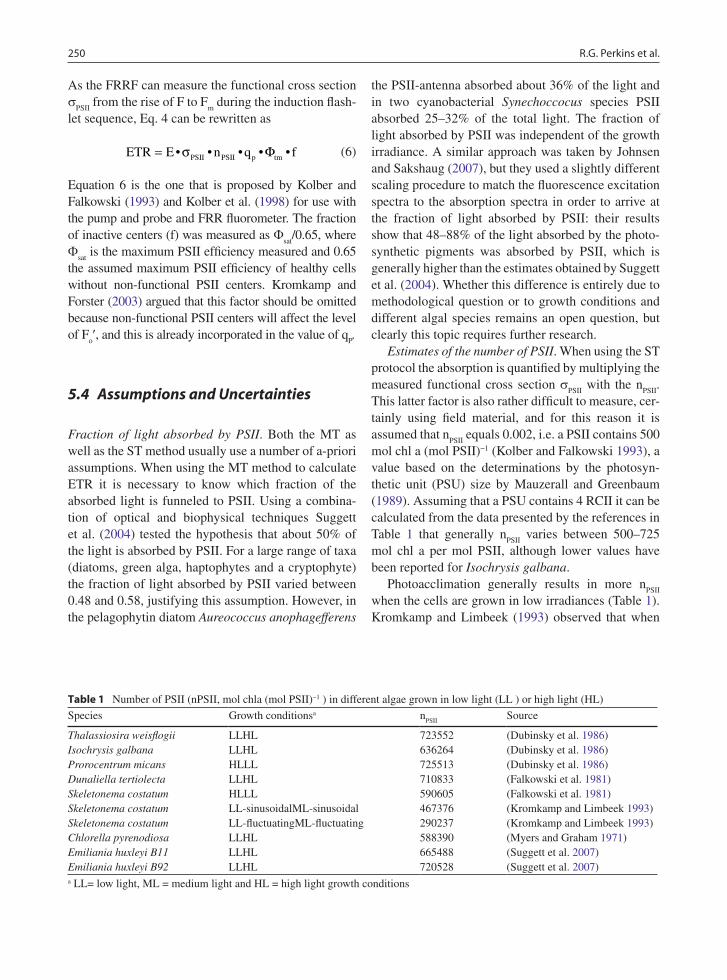
Photoacclimation generally results in more nPSII
when the cells are grown in low irradiances (Table 1). Kromkamp and Limbeek (1993) observed that when
Table 1 Number of PSII (nPSII, mol chla (mol PSII)−1 ) in different algae grown in low light (LL ) or high light (HL)
Species Growth conditionsa nPSII
Source
Thalassiosira weisflogii LLHL 723552 (Dubinsky et al. 1986)Isochrysis galbana LLHL 636264 (Dubinsky et al. 1986)Prorocentrum micans HLLL 725513 (Dubinsky et al. 1986)Dunaliella tertiolecta LLHL 710833 (Falkowski et al. 1981)Skeletonema costatum HLLL 590605 (Falkowski et al. 1981)Skeletonema costatum LL-sinusoidalML-sinusoidal 467376 (Kromkamp and Limbeek 1993)Skeletonema costatum LL-fluctuatingML-fluctuating 290237 (Kromkamp and Limbeek 1993)Chlorella pyrenodiosa LLHL 588390 (Myers and Graham 1971)Emiliania huxleyi B11 LLHL 665488 (Suggett et al. 2007)Emiliania huxleyi B92 LLHL 720528 (Suggett et al. 2007)a LL= low light, ML = medium light and HL = high light growth conditions
25112 The Application of Variable Chlorophyll Fluorescence to Microphytobenthic Biofilms
the marine diatom Skeletonema costatum was grown in fluctuating light simulating vertical mixing, this resulted in smaller but more n
PSII. This makes sense as
it allows the cells to both harvest the same amount of light as with large PSU, but it will result in a higher rate of maximal photosynthesis. Recently Suggett et al. (2004) compared estimates of n
PSII obtained using
the ST turnover oxygen measurements with those obtained from a biooptical: n
PSII = s
PSII/a*
PSII: they
observed a linear 1:1 relationship between both methods and for most eukaryotic algae n
PSII varied
between 500–600 mol chl a per mol PSII. The pel-agophyte A. anophagefferens had a larger n
PSII and
cyanobacteria seem to contain smaller nPSII
(240–280 mol chl a per mol PSII).
Uncertainties in sPSII
. Although the FRRF technique allows estimation of the measurement of the functional PSII cross section, it is necessary to stress that LED’s (mainly blue) are used to induce the fluorescence induc-tion curve from which s
PSII is estimated. Without spec-
tral correction of the effective absorption of the FRRF in relation to the underwater light field, this may lead to an overestimation of s
PSII (Suggett et al. 2001).
5.5 Calculation of ETR in Microphytobenthos Studies
Most research measuring ETR on MPB or macroalgae have used a PAM-type fluorometer because a commer-cially available FRR-type fluorometer (such as Chelsea’s FastTracka or Satlantic’s FIRe) that are able to measure s
PSII , have not been available (RandD versions of both
instruments have been used for coral reef research). As is clear from the above section on the MT-protocol, cal-culation of absolute rates of PSII electron transport requires knowledge of incident irradiance and the opti-cal absorption cross section, and this is exceedingly dif-ficult when working on benthic biofilms. For this reason the relative rate of ETR (rETR) is often calculated as DF/F
m¢ • E as opposed to the absolute ETR calculated as
DF/Fm¢ • E • a*. Because the value of a* (the proportion
of light absorbed) will change as a result of photoaccli-mation (time scales of change are hours-days because they relate to de-novo synthesis or break-down of pig-ments) it is not always possible to compare rates of rETR between publications.
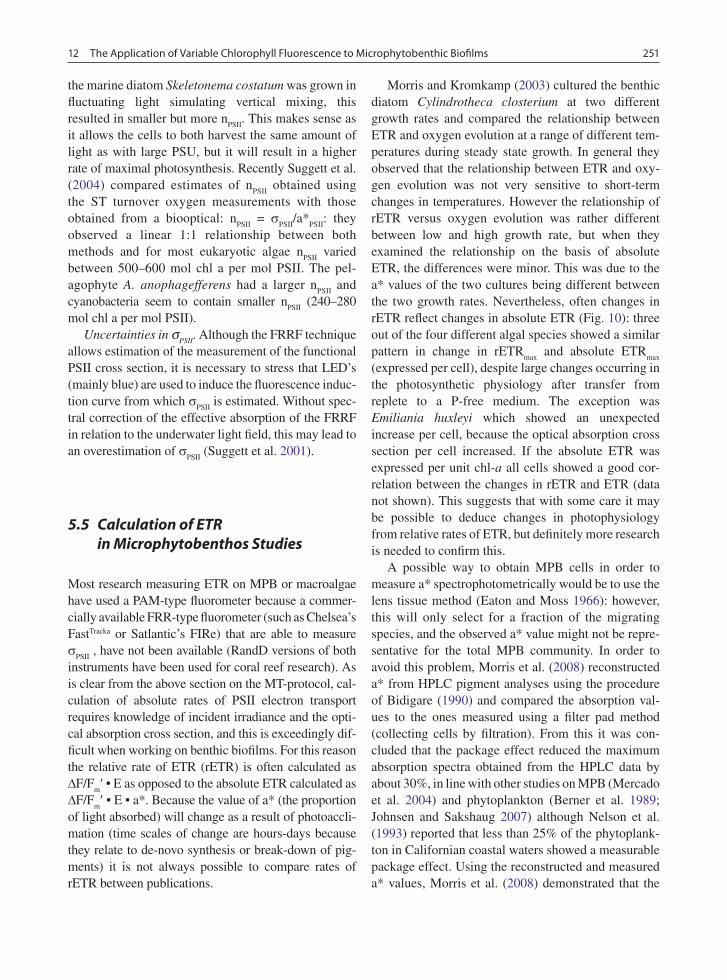
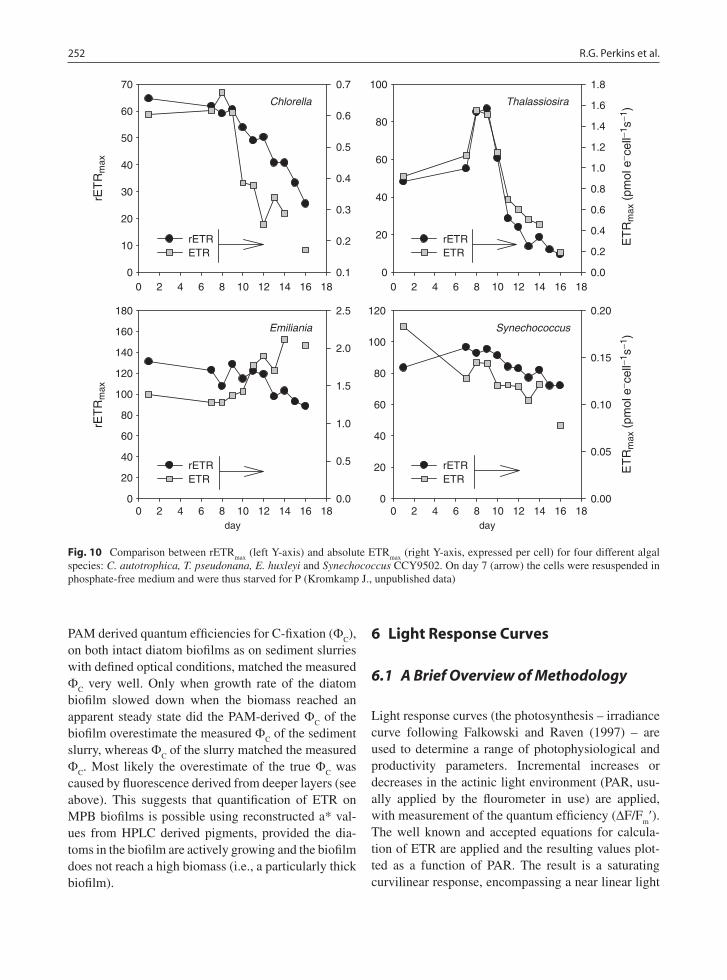
Morris and Kromkamp (2003) cultured the benthic diatom Cylindrotheca closterium at two different growth rates and compared the relationship between ETR and oxygen evolution at a range of different tem-peratures during steady state growth. In general they observed that the relationship between ETR and oxy-gen evolution was not very sensitive to short-term changes in temperatures. However the relationship of rETR versus oxygen evolution was rather different between low and high growth rate, but when they examined the relationship on the basis of absolute ETR, the differences were minor. This was due to the a* values of the two cultures being different between the two growth rates. Nevertheless, often changes in rETR reflect changes in absolute ETR (Fig. 10): three out of the four different algal species showed a similar pattern in change in rETR
max and absolute ETR
max
(expressed per cell), despite large changes occurring in the photosynthetic physiology after transfer from replete to a P-free medium. The exception was Emiliania huxleyi which showed an unexpected increase per cell, because the optical absorption cross section per cell increased. If the absolute ETR was expressed per unit chl-a all cells showed a good cor-relation between the changes in rETR and ETR (data not shown). This suggests that with some care it may be possible to deduce changes in photophysiology from relative rates of ETR, but definitely more research is needed to confirm this.
A possible way to obtain MPB cells in order to measure a* spectrophotometrically would be to use the lens tissue method (Eaton and Moss 1966): however, this will only select for a fraction of the migrating species, and the observed a* value might not be repre-sentative for the total MPB community. In order to avoid this problem, Morris et al. (2008) reconstructed a* from HPLC pigment analyses using the procedure of Bidigare (1990) and compared the absorption val-ues to the ones measured using a filter pad method (collecting cells by filtration). From this it was con-cluded that the package effect reduced the maximum absorption spectra obtained from the HPLC data by about 30%, in line with other studies on MPB (Mercado et al. 2004) and phytoplankton (Berner et al. 1989; Johnsen and Sakshaug 2007) although Nelson et al. (1993) reported that less than 25% of the phytoplank-ton in Californian coastal waters showed a measurable package effect. Using the reconstructed and measured a* values, Morris et al. (2008) demonstrated that the
252 R.G. Perkins et al.
PAM derived quantum efficiencies for C-fixation (FC),
on both intact diatom biofilms as on sediment slurries with defined optical conditions, matched the measured F
C very well. Only when growth rate of the diatom
biofilm slowed down when the biomass reached an apparent steady state did the PAM-derived F
C of the
biofilm overestimate the measured FC of the sediment
slurry, whereas FC of the slurry matched the measured
FC. Most likely the overestimate of the true F
C was
caused by fluorescence derived from deeper layers (see above). This suggests that quantification of ETR on MPB biofilms is possible using reconstructed a* val-ues from HPLC derived pigments, provided the dia-toms in the biofilm are actively growing and the biofilm does not reach a high biomass (i.e., a particularly thick biofilm).
6 Light Response Curves
6.1 A Brief Overview of Methodology
Light response curves (the photosynthesis – irradiance curve following Falkowski and Raven (1997) – are used to determine a range of photophysiological and productivity parameters. Incremental increases or decreases in the actinic light environment (PAR, usu-ally applied by the flourometer in use) are applied, with measurement of the quantum efficiency (DF/F
m¢).
The well known and accepted equations for calcula-tion of ETR are applied and the resulting values plot-ted as a function of PAR. The result is a saturating curvilinear response, encompassing a near linear light
Chlorella
0 2 4 6 8 10 12 14 16 18 0 2 4 6 8 10 12 14 16 18
0 2 4 6 8 10 12 14 16 18 0 2 4 6 8 10 12 14 16 18
rET
Rm
axrE
TR
max
0
10
20
30
40
50
60
70
0.1
0.2
0.3
0.4
0.5
0.6
0.7
rETRETR
Thalassiosira
0
20
40
60
80
100
ET
Rm
ax (
pmol
e− c
ell−1
s−1)
ET
Rm
ax (
pmol
e− c
ell−1
s−1)
0.0
0.2
0.4
0.6
0.8
1.0
1.2
1.4
1.6
1.8
rETRETR
Emiliania
day
0
20
40
60
80
100
120
140
160
180
0.0
0.5
1.0
1.5
2.0
2.5
rETRETR
Synechococcus
day
0
20
40
60
80
100
120
0.00
0.05
0.10
0.15
0.20
rETRETR
Fig. 10 Comparison between rETRmax
(left Y-axis) and absolute ETRmax
(right Y-axis, expressed per cell) for four different algal species: C. autotrophica, T. pseudonana, E. huxleyi and Synechococcus CCY9502. On day 7 (arrow) the cells were resuspended in phosphate-free medium and were thus starved for P (Kromkamp J., unpublished data)
25312 The Application of Variable Chlorophyll Fluorescence to Microphytobenthic Biofilms
limited phase, a light saturated phase and then, in some instances, a third phase which is not always present and often attributed to down regulation/photoinhibi-tion. Various methods of curve fitting have been applied to this curve, from which physiological parameters can be derived, including the method of Eilers and Peeters (1988) followed by curve fitting such as that following the Nelder-Mead model (Press et al. 2003). Parameters derived are usually:-
1. rETRmax
– the maximum relative electron transport rate when light becomes saturating
2. a – the maximum light use coefficient 3. E
k – the light saturation coefficient, calculated as
rETRmax
/ a 4. b – the coefficient of down regulation / photoinhibition
These parameters, except b, along with the PAR at which saturation occurs (E
s) can be calculated using
the parameters derived from various models such Eilers and Peeters (1988).
The application of the methodology to benthic bio-films has been reviewed in Consalvey et al. (2005), but here it will be discussed principally to compare the three main types of light response curves: steady state light curves (SS), rapid light curves (RLC) and non-sequen-tial light curves (NSLC). Light curve parameters (rETR
max, a etc.) are mostly interpreted in similar ways
for all light curves, except for the coefficient b. In SS light curves the decline in ETR indicated by the value of b is attributed to photoinhibition, whereas in RLCs b is a measurement of down regulation as the short duration of the light curve is not thought sufficient to induce pho-toinhibition (White and Critchley 1999). The other parameter worth mentioning here is rETR
max, where the
letter (r) preceding ETR denotes whether the measure-ment is of “relative” electron transport rate, i.e. in the absence of any measurement of the light absorption coefficient a* (Sakshaug et al. 1997; Beer et al. 2000; Forster and Kromkamp 2004; Perkins et al. 2006). In most instances, measurement of a functional value of a* is highly problematic for benthic biofilms, due to inter-ference from the sediment matrix and the time required for measurement. As a result the majority of work has used rETR and hence determined rETR
max. Data are
often considered to be comparative as a result of this relative measurement, as opposed to absolute values for comparison to other measurements of productivity (e.g. 14C, O
2 described later in this chapter).
6.2 Steady State Light Curves
Steady state (SS) light curves are those where the oper-ational fluorescence yield (F or F¢) is allowed to reach a stable value after each incremental increase / decrease in PAR (Falkowski and Raven 1997). Thus the effects of Q
A reduction/oxidation and NPQ induction/reversal
are allowed to reach completion for the light environ-ment applied. Once this has been achieved the saturat-ing pulse is applied to determine the rise in fluorescence yield to F
m¢ and hence calculation of DF/F
m¢. SS light
curves are often considered to be a measurement of the potential photophysiology of the cells at the time of measurement, as opposed to their actual operational photophysiology at that time. Hence, they reflect the capacity for photosynthesis and for this reason allow comparison between SS light curves of different spe-cies and under different environmental conditions. SS light curves can thus be used for examination of phe-notypic (light history exposure) and genotypic (species specific variation) adaptation. For example, the effects of light dose history prior to the light curve (pheno-typic adaptation) are greatly changed, or possibly negated, due to the photoacclimation during each step of the light curve. Obviously some aspects of prior photoacclimation will remain, such as changes in pig-ment bed which take longer to be modified by the cells. In fact the time to reach steady state is a function of light history; e.g. the rate and magnitude of NPQ induction / reversal is a function of previous light dose history. This time period is therefore highly variable, and can be in the order of several minutes or longer. This has several drawbacks when applied to benthic biofilms:
1. The long duration of the light curves (up to 40 min for an 8 step light curve1) often makes replication of measurements impossible.
2. Investigation of temporal or spatial variation is pro-hibited by the long time period spent obtaining a single set of measurements.
3. Changes in biofilm surface community may occur over this period of time due to microcycling (e.g. Kromkamp et al. 1998) and positive or negative
1 Walz fluorometers such as the Diving-PAM and Water-PAM are programmed to have 8 step light curves. However other man-ufacturer’s fluorometers differ and can allow the number of steps to be dictated by the user.
254 R.G. Perkins et al.
phototaxis (e.g. Serôdio et al. 2006a) induced by the applied PAR, as well as possible diel and tidal patterns in vertical migration (see elsewhere in this chapter), hence measurements at incremental light steps may be made on different cells.
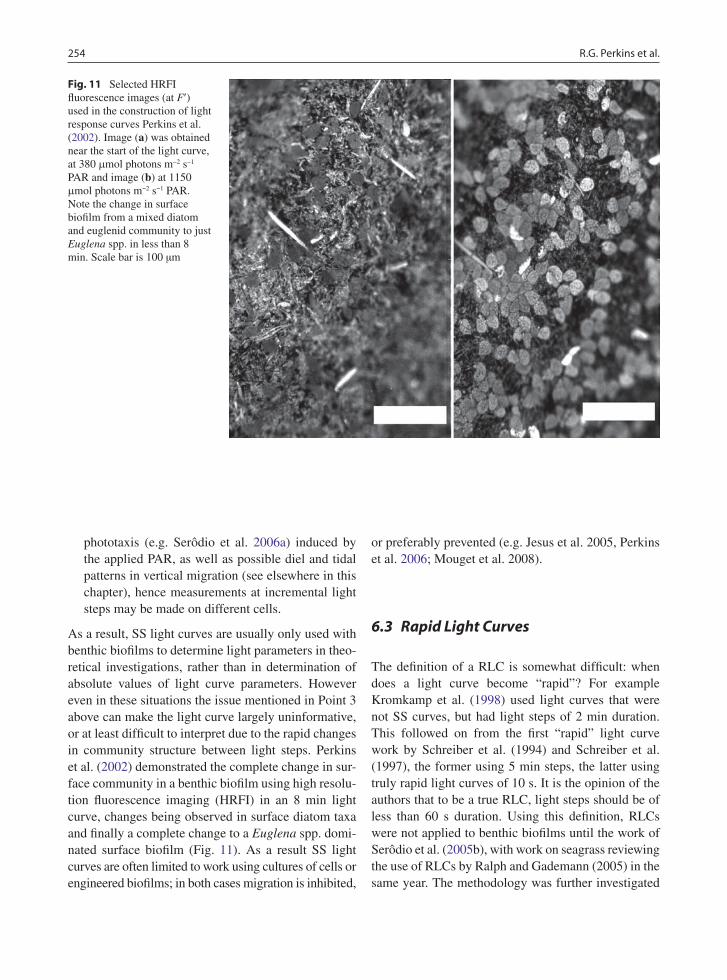
As a result, SS light curves are usually only used with benthic biofilms to determine light parameters in theo-retical investigations, rather than in determination of absolute values of light curve parameters. However even in these situations the issue mentioned in Point 3 above can make the light curve largely uninformative, or at least difficult to interpret due to the rapid changes in community structure between light steps. Perkins et al. (2002) demonstrated the complete change in sur-face community in a benthic biofilm using high resolu-tion fluorescence imaging (HRFI) in an 8 min light curve, changes being observed in surface diatom taxa and finally a complete change to a Euglena spp. domi-nated surface biofilm (Fig. 11). As a result SS light curves are often limited to work using cultures of cells or engineered biofilms; in both cases migration is inhibited,
or preferably prevented (e.g. Jesus et al. 2005, Perkins et al. 2006; Mouget et al. 2008).
6.3 Rapid Light Curves
The definition of a RLC is somewhat difficult: when does a light curve become “rapid”? For example Kromkamp et al. (1998) used light curves that were not SS curves, but had light steps of 2 min duration. This followed on from the first “rapid” light curve work by Schreiber et al. (1994) and Schreiber et al. (1997), the former using 5 min steps, the latter using truly rapid light curves of 10 s. It is the opinion of the authors that to be a true RLC, light steps should be of less than 60 s duration. Using this definition, RLCs were not applied to benthic biofilms until the work of Serôdio et al. (2005b), with work on seagrass reviewing the use of RLCs by Ralph and Gademann (2005) in the same year. The methodology was further investigated
Fig. 11 Selected HRFI fluorescence images (at F¢) used in the construction of light response curves Perkins et al. (2002). Image (a) was obtained near the start of the light curve, at 380 mmol photons m−2 s−1 PAR and image (b) at 1150 mmol photons m−2 s−1 PAR. Note the change in surface biofilm from a mixed diatom and euglenid community to just Euglena spp. in less than 8 min. Scale bar is 100 µm
25512 The Application of Variable Chlorophyll Fluorescence to Microphytobenthic Biofilms
using benthic diatom cultures and microphytobenthos suspensions (Perkins et al. 2006; Serôdio et al. 2006a; Herlory et al. 2007; Cruz and Serôdio 2008) and is now an accepted method for field and laboratory mea-surements of operational photophysiological state.
In some cases RLCs can be considered to be a com-promise between SS light curves and practical limita-tions of data acquisition and replication. This however is an error as RLCs measure an entirely different photo-physiological state, namely the operational photophysi-ology at that time. The duration of light steps used is often a compromise between practical time limitations and obtaining the required measurements. The longer the duration of each light step, obviously the longer the cells exposed to this new PAR will have to photoaccli-mate and the measurement becomes an intermediate between a RLC and a SS light curve. Indeed many workers now prefer RLCs between 10 and 30 s at each light step, with 60 s considered too long due to effects of photoacclimation during the light curve. Also an important consideration, as discussed above, is that the longer each light step, the longer the cells will have to migrate in response to the applied PAR or as part of diel and tidal patterns of vertical migration, hence altering the community structure being investigated during the light response curve itself.
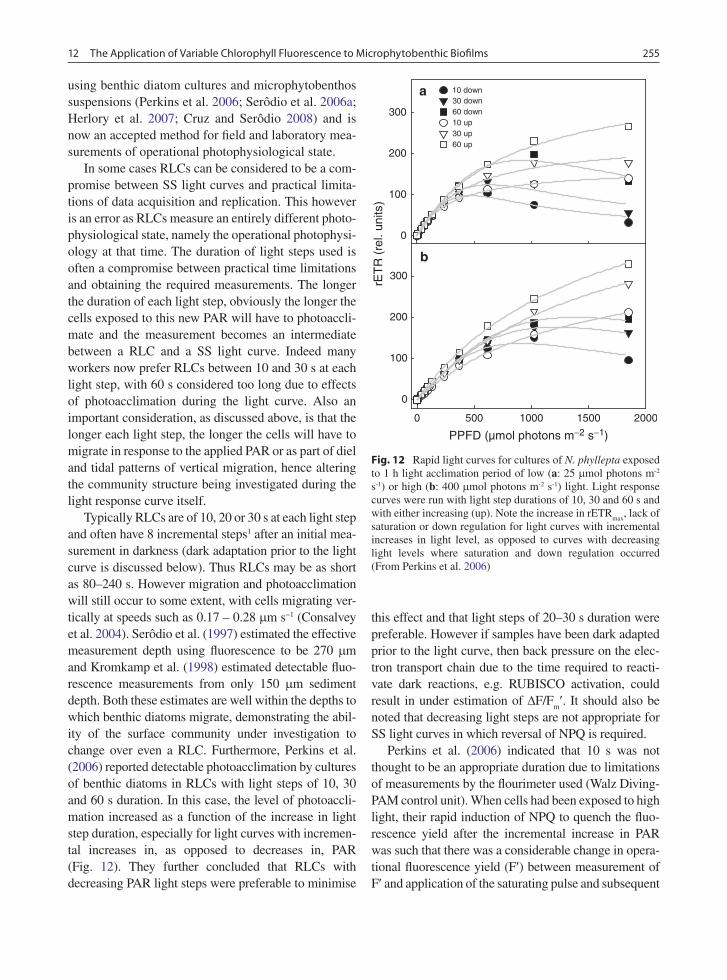
Typically RLCs are of 10, 20 or 30 s at each light step and often have 8 incremental steps1 after an initial mea-surement in darkness (dark adaptation prior to the light curve is discussed below). Thus RLCs may be as short as 80–240 s. However migration and photoacclimation will still occur to some extent, with cells migrating ver-tically at speeds such as 0.17 – 0.28 mm s−1 (Consalvey et al. 2004). Serôdio et al. (1997) estimated the effective measurement depth using fluorescence to be 270 mm and Kromkamp et al. (1998) estimated detectable fluo-rescence measurements from only 150 mm sediment depth. Both these estimates are well within the depths to which benthic diatoms migrate, demonstrating the abil-ity of the surface community under investigation to change over even a RLC. Furthermore, Perkins et al. (2006) reported detectable photoacclimation by cultures of benthic diatoms in RLCs with light steps of 10, 30 and 60 s duration. In this case, the level of photoaccli-mation increased as a function of the increase in light step duration, especially for light curves with incremen-tal increases in, as opposed to decreases in, PAR (Fig. 12). They further concluded that RLCs with decreasing PAR light steps were preferable to minimise
this effect and that light steps of 20–30 s duration were preferable. However if samples have been dark adapted prior to the light curve, then back pressure on the elec-tron transport chain due to the time required to reacti-vate dark reactions, e.g. RUBISCO activation, could result in under estimation of DF/F
m¢. It should also be
noted that decreasing light steps are not appropriate for SS light curves in which reversal of NPQ is required.
Perkins et al. (2006) indicated that 10 s was not thought to be an appropriate duration due to limitations of measurements by the flourimeter used (Walz Diving-PAM control unit). When cells had been exposed to high light, their rapid induction of NPQ to quench the fluo-rescence yield after the incremental increase in PAR was such that there was a considerable change in opera-tional fluorescence yield (F¢) between measurement of F¢ and application of the saturating pulse and subsequent
PPFD (µmol photons m−2 s−1)
0 500 1000 1500 2000
rET
R (
rel.
units
)
0
100
200
300
10 down30 down60 down10 up30 up60 up
0
100
200
300
a
b
Fig. 12 Rapid light curves for cultures of N. phyllepta exposed to 1 h light acclimation period of low (a: 25 mmol photons m-2 s-1) or high (b: 400 mmol photons m-2 s-1) light. Light response curves were run with light step durations of 10, 30 and 60 s and with either increasing (up). Note the increase in rETR
max, lack of
saturation or down regulation for light curves with incremental increases in light level, as opposed to curves with decreasing light levels where saturation and down regulation occurred (From Perkins et al. 2006)
256 R.G. Perkins et al.
measurement of Fm¢. Where this happened, F
m¢ was
under estimated relative to F ¢ causing under estimation of DF/F
m¢ and hence the calculated value of ETR.
While this question demands further research, it is clear that the most appropriate light step to be used in each case will depend on the relative benefit of avoid-ing the mentioned artefact when applying 10 s, and of the confounding errors introduced by increasing the light step to 20s, namely short-term photoacclimation and migratory responses during the construction of the light curve. For example, the detection of diel rhythms in the photoacclimation status of microphytobenthos using RLCs has been shown to be possible when apply-ing short light steps of 10 or 20 s, whilst becoming almost undetectable when using light steps of 40 s due to the rapid light-activation of dark-acclimated com-munity (Serôdio et al. 2005).
Despite the mentioned potential problems, incre-mental RLCs using 10 s light steps were shown to allow characterization of the steady-state photoaccli-mation status of samples acclimated to a wide range of ambient irradiances, through the estimation of the light-saturation parameter E
k from RLC parameters
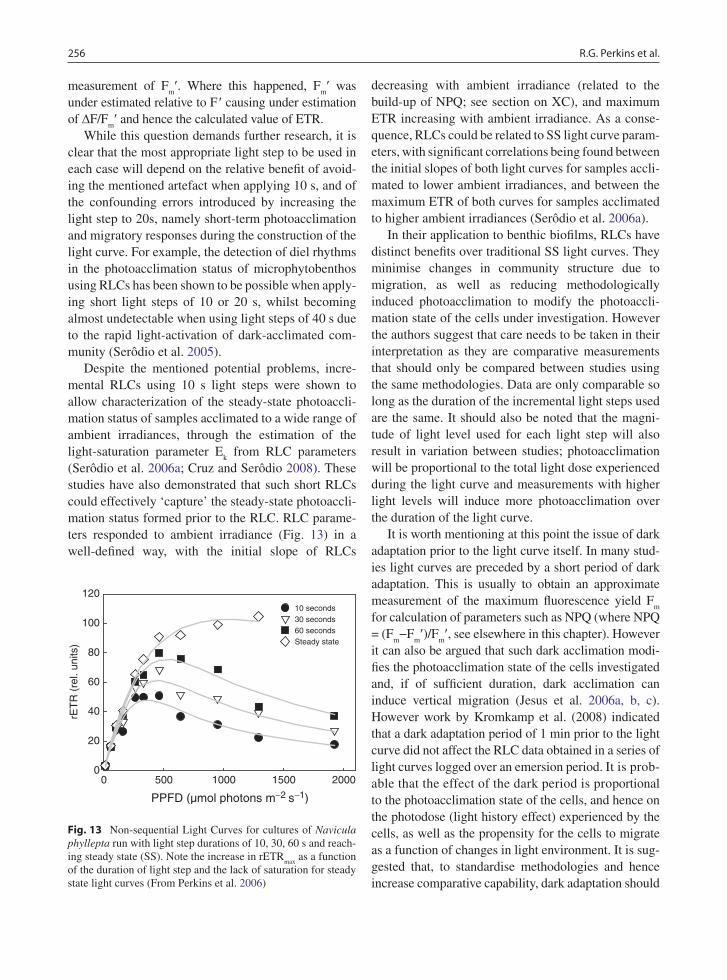
(Serôdio et al. 2006a; Cruz and Serôdio 2008). These studies have also demonstrated that such short RLCs could effectively ‘capture’ the steady-state photoaccli-mation status formed prior to the RLC. RLC parame-ters responded to ambient irradiance (Fig. 13) in a well-defined way, with the initial slope of RLCs
decreasing with ambient irradiance (related to the build-up of NPQ; see section on XC), and maximum ETR increasing with ambient irradiance. As a conse-quence, RLCs could be related to SS light curve param-eters, with significant correlations being found between the initial slopes of both light curves for samples accli-mated to lower ambient irradiances, and between the maximum ETR of both curves for samples acclimated to higher ambient irradiances (Serôdio et al. 2006a).
In their application to benthic biofilms, RLCs have distinct benefits over traditional SS light curves. They minimise changes in community structure due to migration, as well as reducing methodologically induced photoacclimation to modify the photoaccli-mation state of the cells under investigation. However the authors suggest that care needs to be taken in their interpretation as they are comparative measurements that should only be compared between studies using the same methodologies. Data are only comparable so long as the duration of the incremental light steps used are the same. It should also be noted that the magni-tude of light level used for each light step will also result in variation between studies; photoacclimation will be proportional to the total light dose experienced during the light curve and measurements with higher light levels will induce more photoacclimation over the duration of the light curve.
It is worth mentioning at this point the issue of dark adaptation prior to the light curve itself. In many stud-ies light curves are preceded by a short period of dark adaptation. This is usually to obtain an approximate measurement of the maximum fluorescence yield F
m
for calculation of parameters such as NPQ (where NPQ = (F
m−F
m¢)/F
m¢, see elsewhere in this chapter). However
it can also be argued that such dark acclimation modi-fies the photoacclimation state of the cells investigated and, if of sufficient duration, dark acclimation can induce vertical migration (Jesus et al. 2006a, b, c). However work by Kromkamp et al. (2008) indicated that a dark adaptation period of 1 min prior to the light curve did not affect the RLC data obtained in a series of light curves logged over an emersion period. It is prob-able that the effect of the dark period is proportional to the photoacclimation state of the cells, and hence on the photodose (light history effect) experienced by the cells, as well as the propensity for the cells to migrate as a function of changes in light environment. It is sug-gested that, to standardise methodologies and hence increase comparative capability, dark adaptation should
PPFD (µmol photons m−2 s−1)
0 500 1000 1500 2000
rET
R (
rel.
units
)
0
20
40
60
80
100
12010 seconds30 seconds60 secondsSteady state
Fig. 13 Non-sequential Light Curves for cultures of Navicula phyllepta run with light step durations of 10, 30, 60 s and reach-ing steady state (SS). Note the increase in rETR
max as a function
of the duration of light step and the lack of saturation for steady state light curves (From Perkins et al. 2006)
25712 The Application of Variable Chlorophyll Fluorescence to Microphytobenthic Biofilms
be avoided prior to light curves. Comparative values of F
m and hence calculation of parameters such as NPQ
may still be achieved as in most cases fluorometer pro-gramming results in the first light curve steps being in darkness and at low light. The former replaces the dark adapted measurement, and Jesus et al. (2006a) indi-cated that, for benthic diatoms which retain NPQ in the dark, low light reverses NPQ more efficiently than darkness, hence giving a value of F
m¢ which exceeds F
m
in some instances (see elsewhere in this chapter). However, as with most methodologies, the use of dark adaptation will depend on what is being investigated, and in some studies reversal of NPQ prior to the light curve may be required.
6.4 Non-sequential Light Curves
The last form of light curve to be discussed here are NSLCs, in which each light step is applied to a sepa-rate culture sample or biofilm sample/area that has not been used for any previous measurements as part of the light curve (Perkins et al. 2006; Herlory et al. 2007). For example, the fluorometer probe is placed over one (sub)sample for the selected light step dura-tion, at the end of which DF/F
m¢ is obtained. The probe
is then moved to the next (sub)sample for the next light step of the light curve. There is no requirement here for the measurements to be sequential, but for this meth-odology dark adaptation prior to the light curve is not possible. In most cases this is a theoretical light curve as it requires an extensive set of replicate samples (e.g. cultures) or, in the case of field measurements, a sub-stantially large area of biofilm which is considered to be homogeneous enough to allow a large number of replicate measurements. This method should therefore almost totally remove the photoacclimation induced by the light curve and, with enough replication, can be considered to be measuring the true operational photo-acclimation state of the cells. The disadvantage is the number of replicates required.
Perkins et al. (2006) applied this method to cultures of benthic diatom cells, principally the species Navicula phyllepta. Despite using different culture sub samples for each light step, photoacclimation still occurred, with rETR
max proportional to the increasing length of
each light step. Notable however was that down regu-lation was observed at irradiances above the point
where the curve saturated when light steps were of short duration (e.g. 10 and 30 s), and also that SS light curves did not saturate at all and showed the highest rETR
max values. This demonstrates the rapid rate of
induction of photoacclimation processes during the light curve steps themselves. Also reported by Perkins et al. (2006) was the effect of light history, when cul-tures incubated at high light level (400 mmol photons m−2 s−1 PAR) prior to the light curve measurements did not saturate or show down regulation, but cultures incubated at low light (25 mmol photons m−2 s−1 PAR) showed both saturation and down regulation for 10 and 30 s light curves, saturation for 60 s curves, but no saturation for steady state curves. The rate and level of photoacclimation processes was therefore proportional to light history and the length of the light curve steps used. An important point that should be mentioned at this point is that the light curves referred to in Perkins et al. (2006) used rETR. It would be expected that as photoacclimation increased, a higher level of NPQ induction would result in a lower effective ETR. Thus if the cross section of PSII had been measured to deter-mine the “true” ETR as opposed to rETR, the ETR
max
may decrease as a function of increasing light step duration. This clearly needs further investigation, although the measurement of PSII cross section is dif-ficult for benthic biofilms during light curves.
6.5 Light Curves Summary
The use of steady state light curves has been a power-ful tool in the use of fluorescence to investigate photo-physiology of photoautotrophs, but due to the long duration required for measurement to be achieved, is not practical for use with benthic biofilms, especially those exhibiting rapid migratory activity in response to changes in light environment or as part of diel and tidal rhythms. It is suggested here that RLCs of 10–30 s duration with no prior dark adaptation step should be utilised, the particular light step to be applied being dependent on the previous evaluation of the relative magnitude of the errors introduced by (i) photoaccli-mation and (ii) migration during the RLC, and (iii) fluorometer software, factors varying with sample composition and light history, light levels applied dur-ing the RLC, and instrument characteristics. Furthermore, RLCs starting at high light and proceeding to lower
258 R.G. Perkins et al.
irradiance may represent an advantageous alternative to minimize the effect of cumulative light dose on the PSII quantum efficiency, although systematic compar-ative studies are still missing. Having said this, this would require a change in the setup of the automated LC used to be made with Walz-PAM fluorometers, as currently the models mostly used in the field (mini-PAM, Diving-PAM etc.) can only make LC from low to high light. Obviously this does not rule out further work in which different durations of light step are used to investigate photoacclimation etc., indeed this is highly recommended by the authors, especially with regard to the use of RLCs in situ.
7 Comparison of Fluorescence with Other Methodologies
In Section 5 we described how absolute rates of elec-tron transport can be calculated. However, ETR is not the common currency in primary production studies. Photosynthetic rate measurements in aquatic organ-isms usually imply recording of either O
2 emission
(e.g., oxymetry, mass spectrometry) or CO2/HCO
3−
uptake (e.g., 14C labelling, infra-red gas analysis) and in the marine environment as well as in ecosystem models C is the most often used. A comparison between ETR and the rate of oxygen evolution or C-fixation (PB) can be obtained from a comparison of both meth-ods: when PB is plotted as a function of ETR the regres-sion coefficient (providing a linear relationship is obtained) is the conversion factor needed to convert ETR into PB and thus equals the efficiency electron yield (F
e) for O
2 evolution or C-fixation (mol O
2 pro-
duced or CO2 fixed per mol electron produced. Thus:
BeP • ETR= Φ (7a)
Theoretically the optimal value for Fe is 0.25, which
means that in the case of O2-evolution four absorbed
photons give rise to four charge separations and thus the production of four electrons. In the case of C-fixation we need to know the photosynthetic quo-tient (PQ) if we want to convert rates of O
2-evolution to
rates of C-fixation. Thus:
B 1 12 eP ( mol O (mgchl ) s ) • ETRa − −µ = Φ (7b)
B 1 1 1eP ( mol C(mgchl ) s ) • ETR • PQa − − −µ = Φ (7c)
As explained above, two different methods of active fluorescence have been developed: the Pulse Amplitude Modulated (PAM) principle which uses a MT-flash to measure F
m and the Fast Repetition rate Fluorometry
(FRRF).2 It should be noted that when the MT method is used (Eq. 1, 3) with a fluorometer giving a ST-flash, the F
m (F
m−ST) measured is lower than that measured
with a MT-flash (Fm−MT
). As a consequence a lower PSII efficiency is obtained and thus a lower rate of ETR, because a ST flash leads to a single reduction of all Q
A, whereas an MT flash also reduces the Q
B and
PQ-pool, leading to a higher Fm (Schreiber et al. 1995;
Koblizek et al. 2001; Suggett et al. 2003; Kromkamp and Forster 2003). ETR measured using a PAM fluo-rometer can be up to ca. 35% higher than ETR mea-sured using a FRRF (Suggett et al. 2003; Kromkamp and Forster 2003).
At room temperature, most of the fluorescence emis-sion originates from PSII and because charge separation and the splitting of water in the oxygen evolving com-plex both take place in RCII it might be expected that ETR and the rate of gross O
2-evolution show a tight cou-
pling. As carbon fixation (the “dark reactions”) takes place ‘later’ and is a ‘more distant’ step of the photosyn-thetic process, a more loose relationship might be obtained. Some diatoms seem also be able to use a C4-like C-fixation process using phosphoenolpyruvate carboxykinase (PEPCKase) or phosphoenolpyruvate carboxylase (PEPCase) (Cabello-Pasini et al. 2001; McGinn and Morel 2008) but whether MPB diatoms also possess this capacity has not been investigated yet.
Table 2 presents a compilation of studies where rates of ETR are compared to rates of photosynthesis obtained using more classical methods. Only a small number (12%) of these studies deal with biofilms. Most of these studies (85%) concern marine organ-isms, and ca. 70% relate to field studies or use natural samples photoacclimated in the laboratory for differ-ent periods of time. Natural phytoplankton studies mainly used the ST-approach; five studies used the
2 Several manufacturers make PAM-like fluorometers (e.g. Walz, PSI, Hansatech, Moldaenke). Fluorometers using the ST-protocol are made by Chelsea Instruments, Satlantic, PSI (and some Walz models). The former 2 use the FRRF protocol and can apply MT and ST flashes.
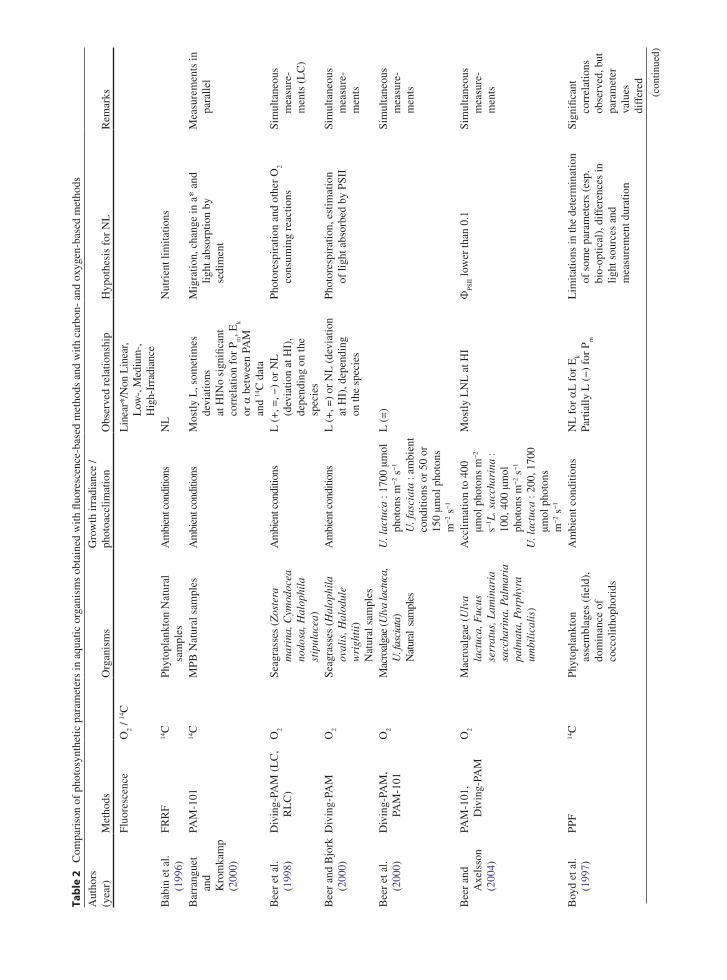
Tab
le 2
C
ompa
riso
n of
pho
tosy
nthe
tic p
aram
eter
s in
aqu
atic
org
anis
ms
obta
ined
with
fluo
resc
ence
-bas
ed m
etho
ds a
nd w
ith c
arbo
n- a
nd o
xyge
n-ba
sed
met
hods
Aut
hors
(y
ear)
Met
hods
Org
anis
ms
Gro
wth
irra
dian
ce /
phot
oacc
limat
ion
Obs
erve
d re
latio
nshi
pH
ypot
hesi
s fo
r N
LR
emar
ks
Fluo
resc
ence
O2 /
14C
Lin
ear*
/Non
Lin
ear,
L
ow-,
Med
ium
-,
Hig
h-Ir
radi
ance
Bab
in e
t al.
(199
6)FR
RF
14C
Phyt
opla
nkto
n N
atur
al
sam
ples
Am
bien
t con
ditio
nsN
LN
utri
ent l
imita
tions
Bar
rang
uet
and
Kro
mka
mp
(200
0)
PAM
-101
14C
MPB
Nat
ural
sam
ples
Am
bien
t con
ditio
nsM
ostly
L, s
omet
imes
de
viat
ions
at
HIN
o si
gnifi
cant
co
rrel
atio
n fo
r P m
, Ek
or a
bet
wee
n PA
M
and
14C
dat
a
Mig
ratio
n, c
hang
e in
a*
and
lig
ht a
bsor
ptio
n by
se
dim
ent
Mea
sure
men
ts in
pa
ralle
l
Bee
r et
al.
(199
8)D
ivin
g-PA
M (
LC
, R
LC
)O
2Se
agra
sses
(Z
oste
ra
mar
ina,
Cym
odoc
ea
nodo
sa, H
alop
hila
st
ipul
acea
)
Am
bien
t con
ditio
nsL
(+
, =, −
) or
NL
(d
evia
tion
at H
I),
depe
ndin
g on
the
sp
ecie
s
Phot
ores
pira
tion
and
othe
r O
2 co
nsum
ing
reac
tions
Sim
ulta
neou
s m
easu
re-
men
ts (
LC
)
Bee
r an
d B
jork
(2
000)
Div
ing-
PAM
O2
Seag
rass
es (
Hal
ophi
la
oval
is, H
alod
ule
wri
ghti
i)
Nat
ural
sam
ples
Am
bien
t con
ditio
nsL
(+
, =)
or N
L (
devi
atio
n
at H
I), d
epen
ding
on
the
spec
ies
Phot
ores
pira
tion,
est
imat
ion
of
ligh
t abs
orbe
d by
PSI
ISi
mul
tane
ous
mea
sure
-m
ents
Bee
r et
al.
(200
0)D
ivin
g-PA
M,
PAM
-101
O2
Mac
roal
gae
(Ulv
a la
ctuc
a,
U. f
asci
ata)
N
atur
al s
ampl
es
U. l
actu
ca :
1700
µm
ol
phot
ons
m−
2 s−
1 U
. fas
ciat
a : a
mbi
ent
cond
ition
s or
50
or
150
µmol
pho
tons
m
−2 s
−1
L (
=)
Sim
ulta
neou
s m
easu
re-
men
ts
Bee
r an
d A
xels
son
(200
4)
PAM
-101
, D
ivin
g-PA
MO
2M
acro
alga
e (U
lva
la
ctuc
a, F
ucus
se
rrat
us, L
amin
aria
sa
ccha
rina
, Pal
mar
ia
palm
ata,
Por
phyr
a um
bili
cali
s)
Acc
limat
ion
to 4
00
µmol
pho
tons
m−
2 s−
1 L. s
acch
arin
a :
100,
400
µm
ol
phot
ons
m−
2 s−
1
U. l
actu
ca :
200,
170
0 µm
ol p
hoto
ns
m−
2 s−
1
Mos
tly L
NL
at H
IF
PSII lo
wer
than
0.1
Sim
ulta
neou
s m
easu
re-
men
ts
Boy
d et
al.
(199
7)PP
F14
CPh
ytop
lank
ton
as
sem
blag
es (
field
),
dom
inan
ce o
f co
ccol
ithop
hori
ds
Am
bien
t con
ditio
nsN
L f
or a
L f
or E
k
Part
ially
L (
−)
for
P m
Lim
itatio
ns in
the
dete
rmin
atio
n
of s
ome
para
met
ers
(esp
. bi
o-op
tical
), d
iffe
renc
es in
lig
ht s
ourc
es a
nd
mea
sure
men
t dur
atio
n
Sign
ifica
nt
corr
elat
ions
ob
serv
ed, b
ut
para
met
er
valu
es
diff
ered
(con
tinue
d)
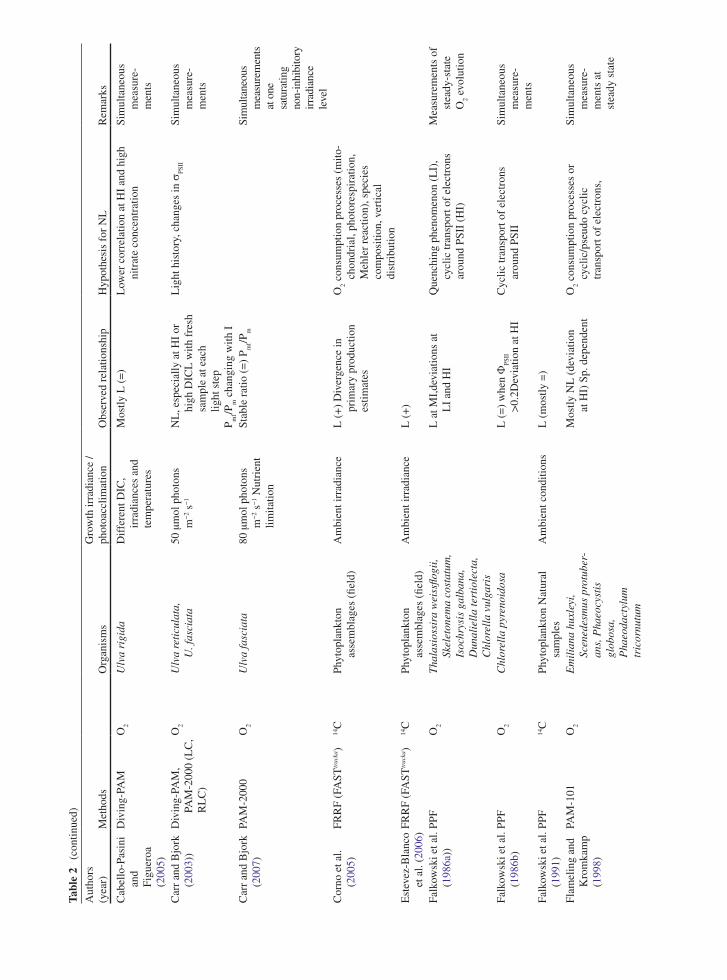
Aut
hors
(y
ear)
Met
hods
Org
anis
ms
Gro
wth
irra
dian
ce /
phot
oacc
limat
ion
Obs
erve
d re
latio
nshi
pH
ypot
hesi
s fo
r N
LR
emar
ks
Cab
ello
-Pas
ini
and
Figu
eroa
(2
005)
Div
ing-
PAM
O2
Ulv
a ri
gida
Dif
fere
nt D
IC,
irra
dian
ces
and
tem
pera
ture
s
Mos
tly L
(=
)L
ower
cor
rela
tion
at H
I an
d hi
gh
nitr
ate
conc
entr
atio
nSi
mul
tane
ous
mea
sure
-m
ents
Car
r an
d B
jork
(2
003)
)D
ivin
g-PA
M,
PAM
-200
0 (L
C,
RL
C)
O2
Ulv
a re
ticu
lata
, U
. fas
ciat
a50
µm
ol p
hoto
ns
m−
2 s−
1
NL
, esp
ecia
lly a
t HI
or
high
DIC
L w
ith f
resh
sa
mpl
e at
eac
h
light
ste
pP m
f/Pm c
hang
ing
with
I
Lig
ht h
isto
ry, c
hang
es in
sPS
IISi
mul
tane
ous
mea
sure
-m
ents
Car
r an
d B
jork
(2
007)
PAM
-200
0O
2U
lva
fasc
iata
80 µ
mol
pho
tons
m
−2 s
−1 N
utri
ent
limita
tion
Stab
le r
atio
(=
) P m
f/Pm
Sim
ulta
neou
s m
easu
rem
ents
at
one
sa
tura
ting
non-
inhi
bito
ry
irra
dian
ce
leve
lC
orno
et a
l. (2
005)
FRR
F (F
AST
trac
ka)
14C
Phyt
opla
nkto
n
asse
mbl
ages
(fie
ld)
Am
bien
t irr
adia
nce
L (
+)
Div
erge
nce
in
prim
ary
prod
uctio
n es
timat
es
O2 c
onsu
mpt
ion
proc
esse
s (m
ito-
chon
dria
l, ph
otor
espi
ratio
n,
Meh
ler
reac
tion)
, spe
cies
co
mpo
sitio
n, v
ertic
al
dist
ribu
tion
Est
evez
-Bla
nco
et a
l. (2
006)
FRR
F (F
AST
trac
ka)
14C
Phyt
opla
nkto
n
asse
mbl
ages
(fie
ld)
Am
bien
t irr
adia
nce
L (
+)
Falk
owsk
i et a
l. (1
986a
))PP
FO
2T
hala
sios
sira
wei
ssflo
gii,
Skel
eton
ema
cost
atum
, Is
ochr
ysis
gal
bana
, D
unal
iell
a te
rtio
lect
a,
Chl
orel
la v
ulga
ris
L a
t MI,
devi
atio
ns a
t L
I an
d H
IQ
uenc
hing
phe
nom
enon
(L
I),
cycl
ic tr
ansp
ort o
f el
ectr
ons
arou
nd P
SII
(HI)
Mea
sure
men
ts o
f st
eady
-sta
te
O2 e
volu
tion
Falk
owsk
i et a
l. (1
986b
)PP
FO
2C
hlor
ella
pyr
enoi
dosa
L (
=)
whe
n F
PSII
>0.
2Dev
iatio
n at
HI
Cyc
lic tr
ansp
ort o
f el
ectr
ons
ar
ound
PSI
ISi
mul
tane
ous
mea
sure
-m
ents
Falk
owsk
i et a
l. (1
991)
PPF
14C
Phyt
opla
nkto
n N
atur
al
sam
ples
Am
bien
t con
ditio
nsL
(m
ostly
=)
Flam
elin
g an
d K
rom
kam
p (1
998)
PAM
-101
O2
Em
ilia
na h
uxle
yi,
Scen
edes
mus
pro
tube
r-an
s, P
haeo
cyst
is
glob
osa,
P
haeo
dact
ylum
tr
icor
nutu
m
Mos
tly N
L (
devi
atio
n
at H
I) S
p. d
epen
dent
O2 c
onsu
mpt
ion
proc
esse
s or
cy
clic
/pse
udo
cycl
ic
tran
spor
t of
elec
tron
s,
Sim
ulta
neou
s m
easu
re-
men
ts a
t st
eady
sta
te
Tabl
e 2
(con
tinue
d)
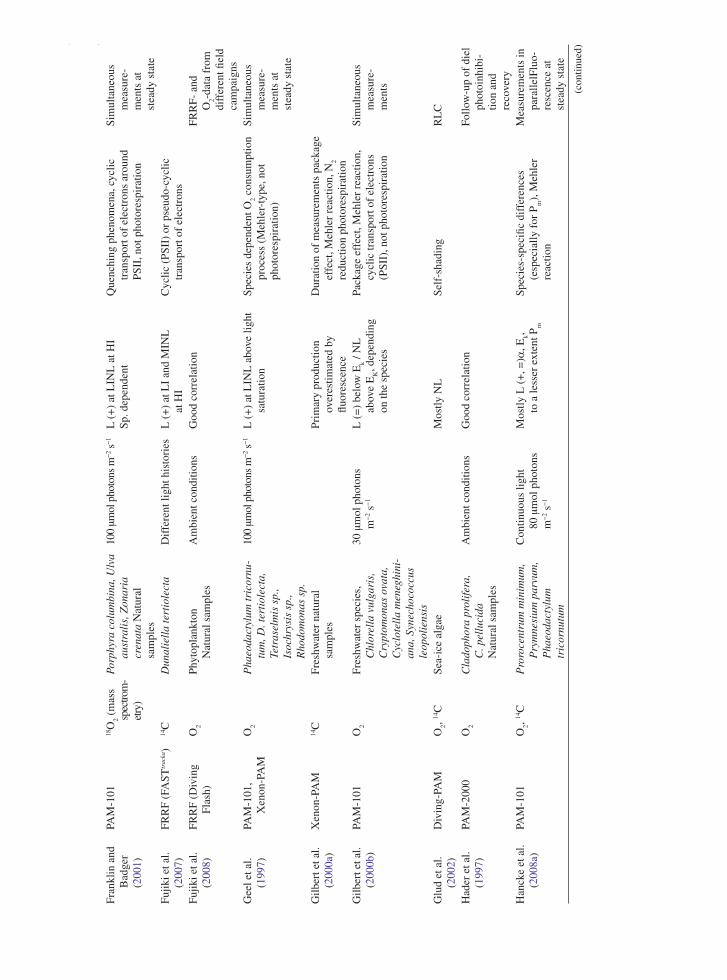
(con
tinue
d)
Aut
hors
(y
ear)
Met
hods
Org
anis
ms
Gro
wth
irra
dian
ce /
phot
oacc
limat
ion
Obs
erve
d re
latio
nshi
pH
ypot
hesi
s fo
r N
LR
emar
ks
Fran
klin
and
B
adge
r (2
001)
PAM
-101
18O
2 (m
ass
spec
trom
-et
ry)
Porp
hyra
col
umbi
na, U
lva
aust
rali
s, Z
onar
ia
cren
ata
Nat
ural
sa
mpl
es
100
µmol
pho
tons
m−2
s−1
L (
+)
at L
INL
at H
ISp
. dep
ende
ntQ
uenc
hing
phe
nom
ena,
cyc
lic
tran
spor
t of
elec
tron
s ar
ound
PS
II, n
ot p
hoto
resp
irat
ion
Sim
ulta
neou
s m
easu
re-
men
ts a
t st
eady
sta
teFu
jiki e
t al.
(200
7)FR
RF
(FA
STtr
acka
)14
CD
unal
iell
a te
rtio
lect
aD
iffe
rent
ligh
t his
tori
esL
(+
) at
LI
and
MIN
L
at H
IC
yclic
(PS
II)
or p
seud
o-cy
clic
tr
ansp
ort o
f el
ectr
ons
Fujik
i et a
l. (2
008)
FRR
F (D
ivin
g Fl
ash)
O2
Phyt
opla
nkto
n
Nat
ural
sam
ples
Am
bien
t con
ditio
nsG
ood
corr
elat
ion
FRR
F- a
nd
O2-
data
fro
m
diff
eren
t fiel
d ca
mpa
igns
Gee
l et a
l. (1
997)
PAM
-101
, X
enon
-PA
MO
2P
haeo
dact
ylum
tric
ornu
-tu
m, D
. ter
tiol
ecta
, Te
tras
elm
is s
p.,
Isoc
hrys
is s
p.,
Rho
dom
onas
sp.
100
µmol
pho
tons
m−2
s−1
L (
+)
at L
INL
abo
ve li
ght
satu
ratio
nSp
ecie
s de
pend
ent O
2 con
sum
ptio
n pr
oces
s (M
ehle
r-ty
pe, n
ot
phot
ores
pira
tion)
Sim
ulta
neou
s m
easu
re-
men
ts a
t st
eady
sta
te
Gilb
ert e
t al.
(200
0a)
Xen
on-P
AM
14C
Fres
hwat
er n
atur
al
sam
ples
Prim
ary
prod
uctio
n ov
eres
timat
ed b
y flu
ores
cenc
e
Dur
atio
n of
mea
sure
men
ts p
acka
ge
effe
ct, M
ehle
r re
actio
n, N
2 re
duct
ion
phot
ores
pira
tion
Gilb
ert e
t al.
(200
0b)
PAM
-101
O2
Fres
hwat
er s
peci
es,
Chl
orel
la v
ulga
ris,
C
rypt
omon
as o
vata
, C
yclo
tell
a m
eneg
hini
-an
a, S
ynec
hoco
ccus
le
opol
iens
is
30 µ
mol
pho
tons
m
−2 s
−1
L (
=)
belo
w E
k / N
L
abov
e E
K, d
epen
ding
on
the
spec
ies
Pack
age
effe
ct, M
ehle
r re
actio
n,
cycl
ic tr
ansp
ort o
f el
ectr
ons
(PSI
I), n
ot p
hoto
resp
irat
ion
Sim
ulta
neou
s m
easu
re-
men
ts
Glu
d et
al.
(200
2)D
ivin
g-PA
MO
2, 14
CSe
a-ic
e al
gae
Mos
tly N
LSe
lf-s
hadi
ngR
LC
Had
er e
t al.
(199
7)PA
M-2
000
O2
Cla
doph
ora
prol
ifer
a,
C. p
ellu
cida
N
atur
al s
ampl
es
Am
bien
t con
ditio
nsG
ood
corr
elat
ion
Follo
w-u
p of
die
l ph
otoi
nhib
i-tio
n an
d re
cove
ryH
anck
e et
al.
(200
8a)
PAM
-101
O2,
14C
Pro
roce
ntru
m m
inim
um,
Pry
mne
sium
par
vum
, P
haeo
dact
ylum
tr
icor
nutu
m
Con
tinuo
us li
ght
80 µ
mol
pho
tons
m
−2 s
−1
Mos
tly L
(+
, =)a
, Ek,
to
a le
sser
ext
ent P
m
Spec
ies-
spec
ific
diff
eren
ces
(esp
ecia
lly f
or P
m),
Meh
ler
reac
tion
Mea
sure
men
ts in
pa
ralle
lFlu
o-re
scen
ce a
t st
eady
sta
te
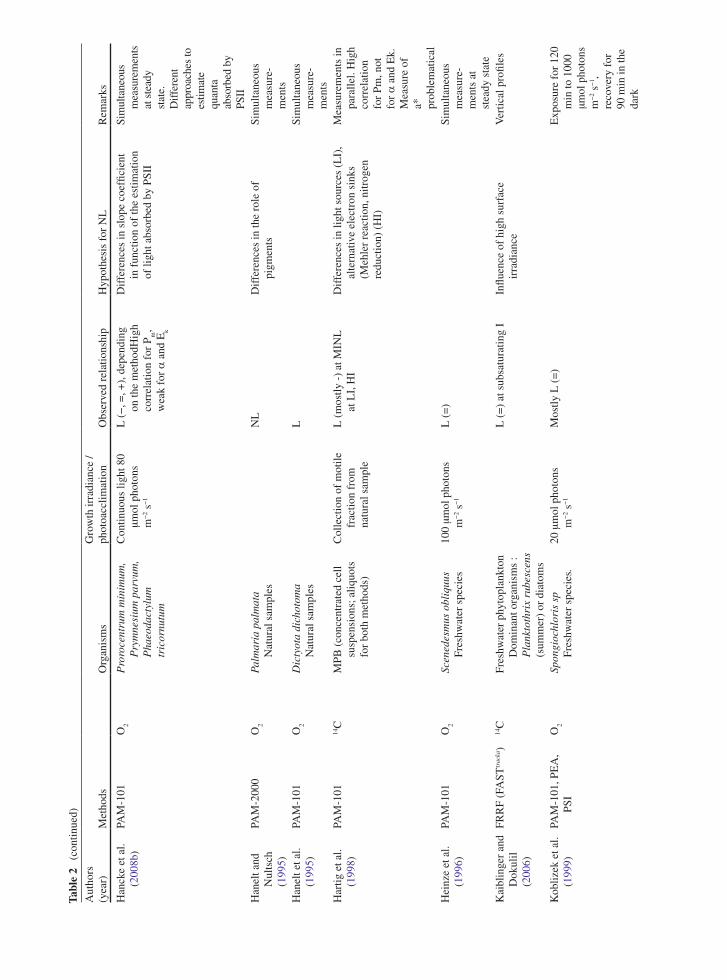
Tabl
e 2
(con
tinue
d)
Aut
hors
(y
ear)
Met
hods
Org
anis
ms
Gro
wth
irra
dian
ce /
phot
oacc
limat
ion
Obs
erve
d re
latio
nshi
pH
ypot
hesi
s fo
r N
LR
emar
ks
Han
cke
et a
l. (2
008b
)PA
M-1
01O
2P
roro
cent
rum
min
imum
, P
rym
nesi
um p
arvu
m,
Pha
eoda
ctyl
um
tric
ornu
tum
Con
tinuo
us li
ght 8
0 µm
ol p
hoto
ns
m−
2 s−
1
L (
−, =
, +),
dep
endi
ng
on th
e m
etho
dHig
h co
rrel
atio
n fo
r P m
, w
eak
for a
and
Ek
Dif
fere
nces
in s
lope
coe
ffici
ent
in f
unct
ion
of th
e es
timat
ion
of
ligh
t abs
orbe
d by
PSI
I
Sim
ulta
neou
s m
easu
rem
ents
at
ste
ady
stat
e.
Dif
fere
nt
appr
oach
es to
es
timat
e qu
anta
ab
sorb
ed b
y PS
IIH
anel
t and
N
ults
ch
(199
5)
PAM
-200
0O
2Pa
lmar
ia p
alm
ata
Nat
ural
sam
ples
NL
Dif
fere
nces
in th
e ro
le o
f
pigm
ents
Sim
ulta
neou
s m
easu
re-
men
tsH
anel
t et a
l. (1
995)
PAM
-101
O2
Dic
tyot
a di
chot
oma
Nat
ural
sam
ples
LSi
mul
tane
ous
mea
sure
-m
ents
Har
tig e
t al.
(199
8)PA
M-1
0114
CM
PB (
conc
entr
ated
cel
l su
spen
sion
s; a
liquo
ts
for
both
met
hods
)
Col
lect
ion
of m
otile
fr
actio
n fr
om
natu
ral s
ampl
e
L (
mos
tly -
) at
MIN
L
at L
I, H
ID
iffe
renc
es in
ligh
t sou
rces
(L
I),
alte
rnat
ive
elec
tron
sin
ks
(Meh
ler
reac
tion,
nitr
ogen
re
duct
ion)
(H
I)
Mea
sure
men
ts in
pa
ralle
l. H
igh
corr
elat
ion
for
Pm, n
ot
for a
and
Ek.
M
easu
re o
f a*
pr
oble
mat
ical
Hei
nze
et a
l. (1
996)
PAM
-101
O2
Scen
edes
mus
obl
iquu
s Fr
eshw
ater
spe
cies
100
µmol
pho
tons
m
−2 s
−1
L (
=)
Sim
ulta
neou
s m
easu
re-
men
ts a
t st
eady
sta
teK
aibl
inge
r an
d D
okul
il (2
006)
FRR
F (F
AST
trac
ka)
14C
Fres
hwat
er p
hyto
plan
kton
D
omin
ant o
rgan
ism
s :
Pla
nkto
thri
x ru
besc
ens
(sum
mer
) or
dia
tom
s
L (
=)
at s
ubsa
tura
ting
IIn
fluen
ce o
f hi
gh s
urfa
ce
irra
dian
ceV
ertic
al p
rofil
es
Kob
lizek
et a
l. (1
999)
PAM
-101
, PE
A,
PSI
O2
Spon
gioc
hlor
is s
p Fr
eshw
ater
spe
cies
.20
µm
ol p
hoto
ns
m−
2 s−
1
Mos
tly L
(=
)E
xpos
ure
for
120
min
to 1
000
µmol
pho
tons
m
−2 s
−1 ,
reco
very
for
90
min
in th
e da
rk
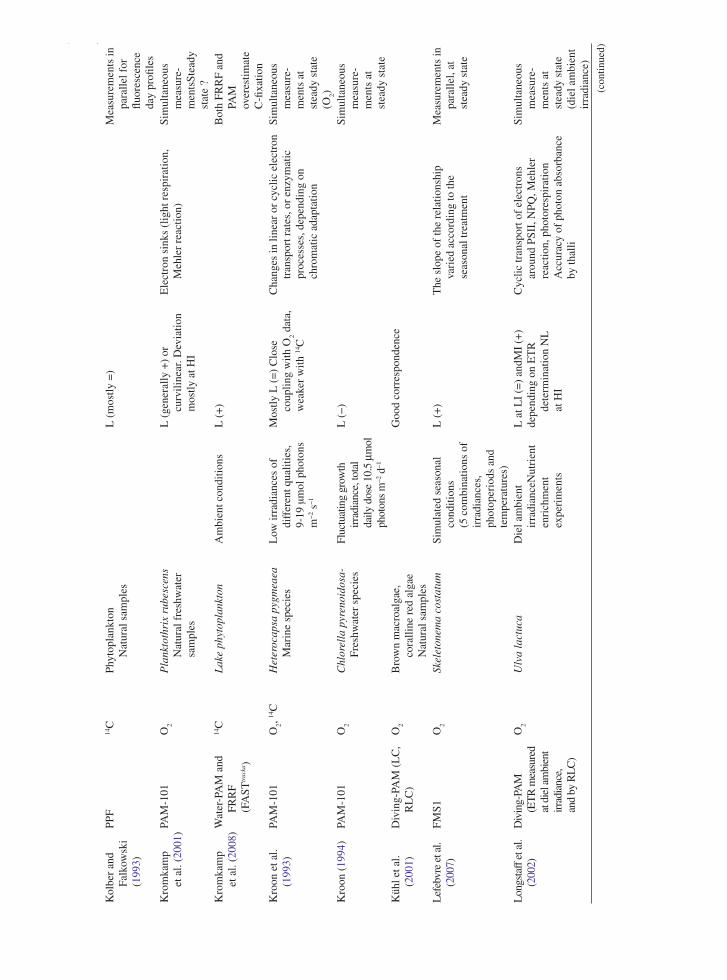
Aut
hors
(y
ear)
Met
hods
Org
anis
ms
Gro
wth
irra
dian
ce /
phot
oacc
limat
ion
Obs
erve
d re
latio
nshi
pH
ypot
hesi
s fo
r N
LR
emar
ks
Kol
ber
and
Falk
owsk
i (1
993)
PPF
14C
Phyt
opla
nkto
n
Nat
ural
sam
ples
L (
mos
tly =
)M
easu
rem
ents
in
para
llel f
or
fluor
esce
nce
day
profi
les
Kro
mka
mp
et a
l. (2
001)
PAM
-101
O2
Pla
nkto
thri
x ru
besc
ens
Nat
ural
fre
shw
ater
sa
mpl
es
L (
gene
rally
+)
or
curv
iline
ar. D
evia
tion
mos
tly a
t HI
Ele
ctro
n si
nks
(lig
ht r
espi
ratio
n,
Meh
ler
reac
tion)
Sim
ulta
neou
s m
easu
re-
men
tsSt
eady
st
ate
?K
rom
kam
p et
al.
(200
8)W
ater
-PA
M a
nd
FRR
F (F
AST
trac
ka)
14C
Lak
e ph
ytop
lank
ton
Am
bien
t con
ditio
nsL
(+
)B
oth
FRR
F an
d PA
M
over
estim
ate
C-fi
xatio
nK
roon
et a
l. (1
993)
PAM
-101
O2,
14C
Het
eroc
apsa
pyg
mea
ea
Mar
ine
spec
ies
Low
irra
dian
ces
of
diff
eren
t qua
litie
s,
9-19
µm
ol p
hoto
ns
m−
2 s−
1
Mos
tly L
(=
) C
lose
co
uplin
g w
ith O
2 dat
a,
wea
ker
with
14C
Cha
nges
in li
near
or
cycl
ic e
lect
ron
tran
spor
t rat
es, o
r en
zym
atic
pr
oces
ses,
dep
endi
ng o
n ch
rom
atic
ada
ptat
ion
Sim
ulta
neou
s m
easu
re-
men
ts a
t st
eady
sta
te
(O2)
Kro
on (
1994
)PA
M-1
01O
2C
hlor
ella
pyr
enoi
dosa
-Fr
eshw
ater
spe
cies
Fluc
tuat
ing
grow
th
irra
dian
ce, t
otal
da
ily d
ose
10.5
mm
ol
phot
ons
m−2
d−1
L (
−)
Sim
ulta
neou
s m
easu
re-
men
ts a
t st
eady
sta
teK
ühl e
t al.
(200
1)D
ivin
g-PA
M (
LC
, R
LC
)O
2B
row
n m
acro
alga
e,
cora
lline
red
alg
ae
Nat
ural
sam
ples
Goo
d co
rres
pond
ence
Lef
ebvr
e et
al.
(200
7)FM
S1O
2Sk
elet
onem
a co
stat
umSi
mul
ated
sea
sona
l co
nditi
ons
(5
com
bina
tions
of
irra
dian
ces,
ph
otop
erio
ds a
nd
tem
pera
ture
s)
L (
+)
The
slo
pe o
f th
e re
latio
nshi
p
vari
ed a
ccor
ding
to th
e
seas
onal
trea
tmen
t
Mea
sure
men
ts in
pa
ralle
l, at
st
eady
sta
te
Lon
gsta
ff e
t al.
(200
2)D
ivin
g-PA
M
(ET
R m
easu
red
at d
iel a
mbi
ent
irrad
ianc
e,
and
by R
LC
)
O2
Ulv
a la
ctuc
aD
iel a
mbi
ent
irra
dian
ceN
utri
ent
enri
chm
ent
expe
rim
ents
L a
t LI
(=)
andM
I (+
)de
pend
ing
on E
TR
de
term
inat
ion
NL
at
HI
Cyc
lic tr
ansp
ort o
f el
ectr
ons
ar
ound
PSI
I, N
PQ, M
ehle
r re
actio
n, p
hoto
resp
irat
ion
Acc
urac
y of
pho
ton
abso
rban
ce
by th
alli
Sim
ulta
neou
s m
easu
re-
men
ts a
t st
eady
sta
te
(die
l am
bien
t ir
radi
ance
)
(con
tinue
d)
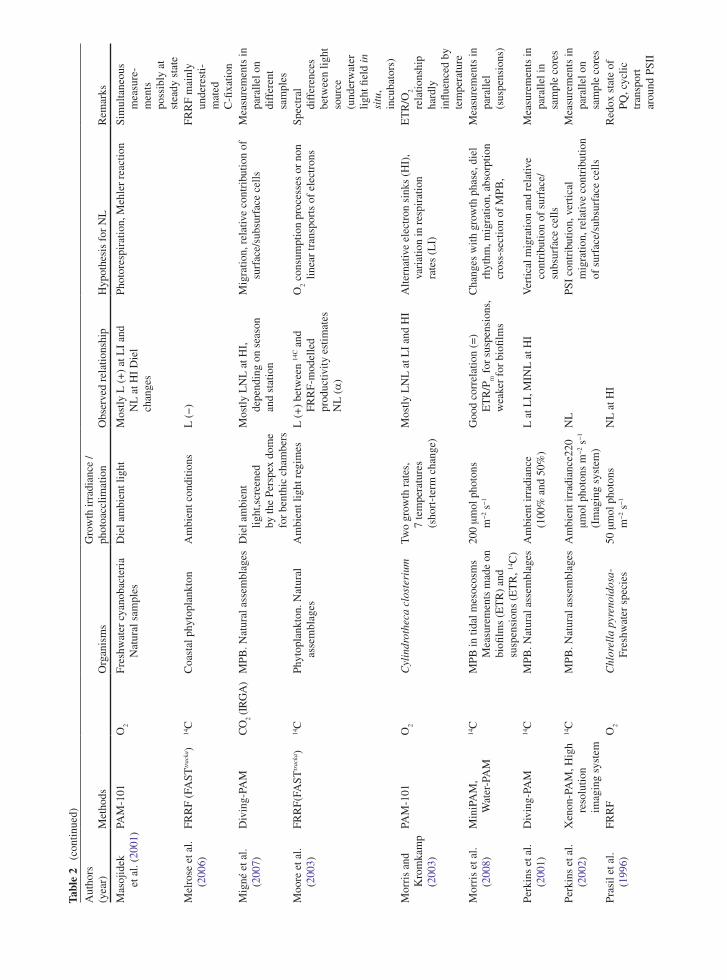
Tabl
e 2
(con
tinue
d)
Aut
hors
(y
ear)
Met
hods
Org
anis
ms
Gro
wth
irra
dian
ce /
phot
oacc
limat
ion
Obs
erve
d re
latio
nshi
pH
ypot
hesi
s fo
r N
LR
emar
ks
Mas
ojid
ek
et a
l. (2
001)
PAM
-101
O2
Fres
hwat
er c
yano
bact
eria
N
atur
al s
ampl
esD
iel a
mbi
ent l
ight
Mos
tly L
(+
) at
LI
and
N
L a
t HI
Die
l ch
ange
s
Phot
ores
pira
tion,
Meh
ler
reac
tion
Sim
ulta
neou
s m
easu
re-
men
ts
poss
ibly
at
stea
dy s
tate
Mel
rose
et a
l. (2
006)
FRR
F (F
AST
trac
ka)
14C
Coa
stal
phy
topl
ankt
onA
mbi
ent c
ondi
tions
L (
−)
FRR
F m
ainl
y un
dere
sti-
mat
ed
C-fi
xatio
nM
igné
et a
l. (2
007)
Div
ing-
PAM
CO
2 (IR
GA
)M
PB. N
atur
al a
ssem
blag
esD
iel a
mbi
ent
light
,scr
eene
d
by th
e Pe
rspe
x do
me
for
bent
hic
cham
bers
Mos
tly L
NL
at H
I,
depe
ndin
g on
sea
son
an
d st
atio
n
Mig
ratio
n, r
elat
ive
cont
ribu
tion
of
surf
ace/
subs
urfa
ce c
ells
Mea
sure
men
ts in
pa
ralle
l on
diff
eren
t sa
mpl
esM
oore
et a
l. (2
003)
FRR
F(FA
STtr
acka
)14
CPh
ytop
lank
ton.
Nat
ural
as
sem
blag
esA
mbi
ent l
ight
reg
imes
L (
+)
betw
een
14C a
nd
FRR
F-m
odel
led
prod
uctiv
ity e
stim
ates
N
L (a
)
O2 c
onsu
mpt
ion
proc
esse
s or
non
lin
ear
tran
spor
ts o
f el
ectr
ons
Spec
tral
di
ffer
ence
s be
twee
n lig
ht
sour
ce
(und
erw
ater
lig
ht fi
eld
in
situ
, in
cuba
tors
)M
orri
s an
d K
rom
kam
p (2
003)
PAM
-101
O2
Cyl
indr
othe
ca c
lost
eriu
mTw
o gr
owth
rat
es,
7 te
mpe
ratu
res
(sho
rt-t
erm
cha
nge)
Mos
tly L
NL
at L
I an
d H
IA
ltern
ativ
e el
ectr
on s
inks
(H
I),
vari
atio
n in
res
pira
tion
ra
tes
(LI)
ET
R/O
2 re
latio
nshi
p ha
rdly
in
fluen
ced
by
tem
pera
ture
Mor
ris
et a
l. (2
008)
Min
iPA
M,
Wat
er-P
AM
14C
MPB
in ti
dal m
esoc
osm
s M
easu
rem
ents
mad
e on
bi
ofilm
s (E
TR
) an
d su
spen
sion
s (E
TR
, 14C
)
200
µmol
pho
tons
m
−2 s
−1
Goo
d co
rrel
atio
n (=
)
ET
R/P
m f
or s
uspe
nsio
ns,
wea
ker
for
biofi
lms
Cha
nges
with
gro
wth
pha
se, d
iel
rhyt
hm, m
igra
tion,
abs
orpt
ion
cros
s-se
ctio
n of
MPB
,
Mea
sure
men
ts in
pa
ralle
l (s
uspe
nsio
ns)
Perk
ins
et a
l. (2
001)
Div
ing-
PAM
14C
MPB
. Nat
ural
ass
embl
ages
Am
bien
t irr
adia
nce
(100
% a
nd 5
0%)
L a
t LI,
MIN
L a
t HI
Ver
tical
mig
ratio
n an
d re
lativ
e co
ntri
butio
n of
sur
face
/ su
bsur
face
cel
ls
Mea
sure
men
ts in
pa
ralle
l in
sam
ple
core
sPe
rkin
s et
al.
(200
2)X
enon
-PA
M, H
igh
reso
lutio
n im
agin
g sy
stem
14C
MPB
. Nat
ural
ass
embl
ages
Am
bien
t irr
adia
nce2
20
µmol
pho
tons
m−
2 s−
1 (I
mag
ing
syst
em)
NL
PSI
cont
ribu
tion,
ver
tical
m
igra
tion,
rel
ativ
e co
ntri
butio
n
of s
urfa
ce/s
ubsu
rfac
e ce
lls
Mea
sure
men
ts in
pa
ralle
l on
sam
ple
core
sPr
asil
et a
l. (1
996)
FRR
FO
2C
hlor
ella
pyr
enoi
dosa
-Fr
eshw
ater
spe
cies
50 µ
mol
pho
tons
m
−2 s
−1
NL
at H
IR
edox
sta
te o
f PQ
, cyc
lic
tran
spor
t ar
ound
PSI
I
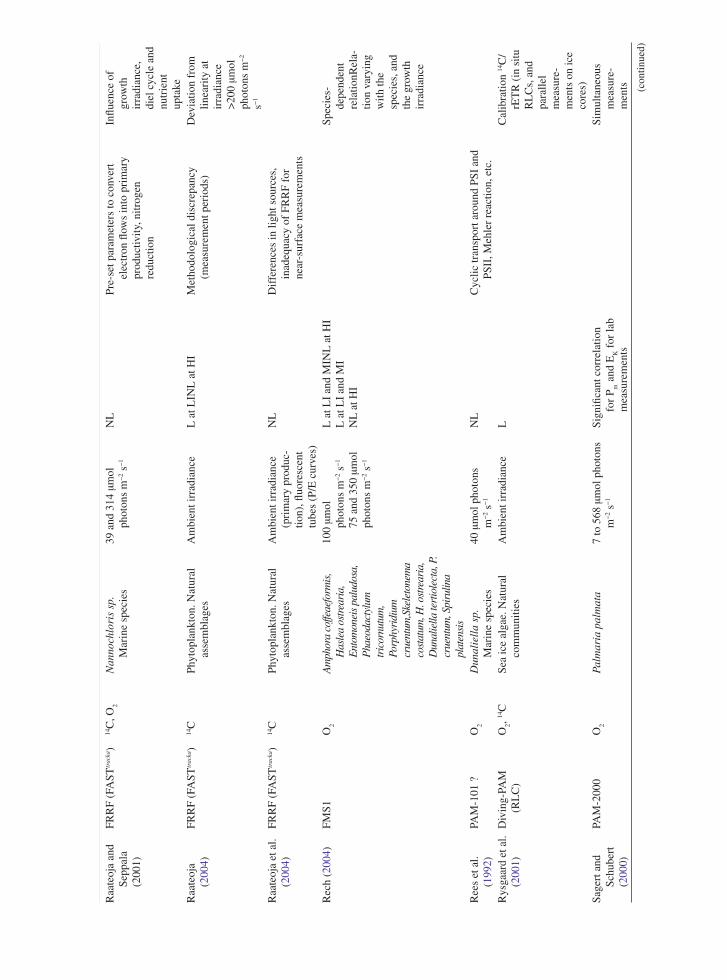
Aut
hors
(y
ear)
Met
hods
Org
anis
ms
Gro
wth
irra
dian
ce /
phot
oacc
limat
ion
Obs
erve
d re
latio
nshi
pH
ypot
hesi
s fo
r N
LR
emar
ks
Raa
teoj
a an
d Se
ppal
a (2
001)
FRR
F (F
AST
trac
ka)
14C
, O2
Nan
noch
lori
s sp
. M
arin
e sp
ecie
s39
and
314
µm
ol
phot
ons
m−
2 s−
1
NL
Pre-
set p
aram
eter
s to
con
vert
el
ectr
on fl
ows
into
pri
mar
y pr
oduc
tivity
, nitr
ogen
re
duct
ion
Influ
ence
of
grow
th
irra
dian
ce,
diel
cyc
le a
nd
nutr
ient
up
take
Raa
teoj
a
(200
4)FR
RF
(FA
STtr
acka
)14
CPh
ytop
lank
ton.
Nat
ural
as
sem
blag
esA
mbi
ent i
rrad
ianc
eL
at L
INL
at H
IM
etho
dolo
gica
l dis
crep
ancy
(m
easu
rem
ent p
erio
ds)
Dev
iatio
n fr
om
linea
rity
at
irra
dian
ce
>20
0 µm
ol
phot
ons
m−
2 s−
1
Raa
teoj
a et
al.
(200
4)FR
RF
(FA
STtr
acka
)14
CPh
ytop
lank
ton.
Nat
ural
as
sem
blag
esA
mbi
ent i
rrad
ianc
e (p
rim
ary
prod
uc-
tion)
, fluo
resc
ent
tube
s (P
/E c
urve
s)
NL
Dif
fere
nces
in li
ght s
ourc
es,
inad
equa
cy o
f FR
RF
for
near
-sur
face
mea
sure
men
ts
Rec
h (2
004)
FMS1
O2
Am
phor
a co
ffeae
form
is,
Has
lea
ostr
eari
a,
Ent
omon
eis
palu
dosa
, P
haeo
dact
ylum
tr
icor
nutu
m,
Porp
hyri
dium
cr
uent
um,S
kele
tone
ma
cost
atum
, H. o
stre
aria
, D
unal
iella
tert
iole
cta,
P.
crue
ntum
, Spi
rulin
a pl
aten
sis
100
µmol
ph
oton
s m
−2 s
−1
75 a
nd 3
50 µ
mol
ph
oton
s m
−2 s
−1
L a
t LI
and
MIN
L a
t HI
L a
t LI
and
MI
NL
at H
I
Spec
ies-
depe
nden
t re
latio
nRel
a-tio
n va
ryin
g w
ith th
e sp
ecie
s, a
nd
the
grow
th
irra
dian
ce
Ree
s et
al.
(199
2)PA
M-1
01 ?
O2
Dun
alie
lla
sp.
Mar
ine
spec
ies
40 µ
mol
pho
tons
m
−2 s
−1
NL
Cyc
lic tr
ansp
ort a
roun
d PS
I an
d PS
II, M
ehle
r re
actio
n, e
tc.
Rys
gaar
d et
al.
(200
1)D
ivin
g-PA
M
(RL
C)
O2,
14C
Sea
ice
alga
e. N
atur
al
com
mun
ities
Am
bien
t irr
adia
nce
LC
alib
ratio
n 14
C/
rET
R (
in s
itu
RL
Cs,
and
pa
ralle
l m
easu
re-
men
ts o
n ic
e co
res)
Sage
rt a
nd
Schu
bert
(2
000)
PAM
-200
0O
2Pa
lmar
ia p
alm
ata
7 to
568
µm
ol p
hoto
ns
m−
2 s−
1
Sign
ifica
nt c
orre
latio
n
for
P m a
nd E
K f
or la
b m
easu
rem
ents
Sim
ulta
neou
s m
easu
re-
men
ts (con
tinue
d)
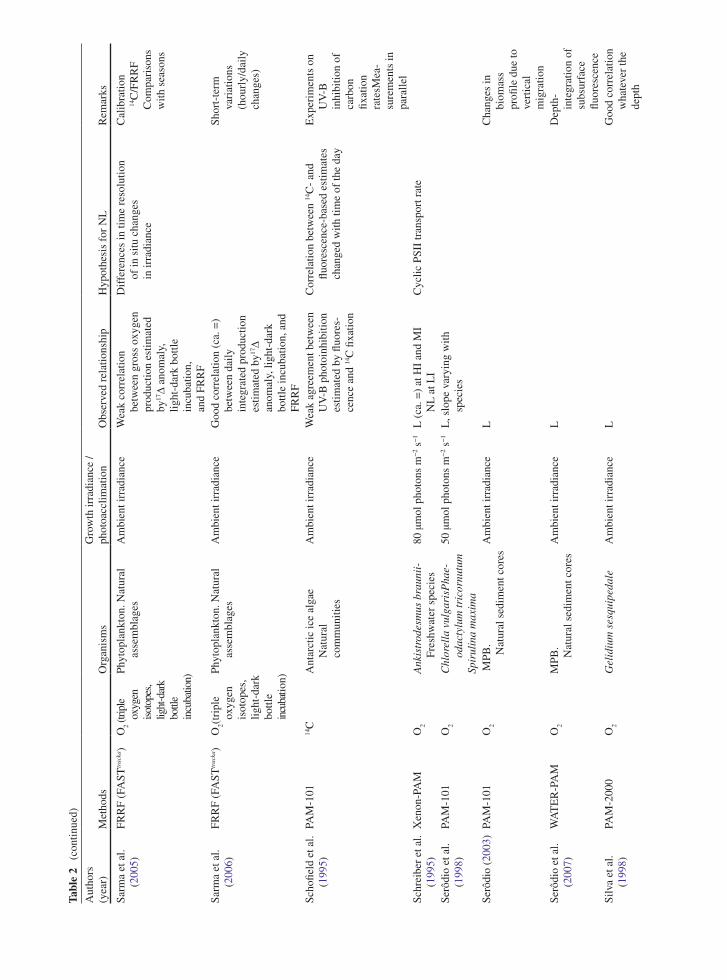
Tabl
e 2
(con
tinue
d)
Aut
hors
(y
ear)
Met
hods
Org
anis
ms
Gro
wth
irra
dian
ce /
phot
oacc
limat
ion
Obs
erve
d re
latio
nshi
pH
ypot
hesi
s fo
r N
LR
emar
ks
Sarm
a et
al.
(200
5)FR
RF
(FA
STtr
acka
)O
2 (tri
ple
oxyg
en
isot
opes
, lig
ht-d
ark
bottl
e in
cuba
tion)
Phyt
opla
nkto
n. N
atur
al
asse
mbl
ages
Am
bien
t irr
adia
nce
Wea
k co
rrel
atio
n
betw
een
gros
s ox
ygen
pr
oduc
tion
estim
ated
by
17D
anom
aly,
lig
ht-d
ark
bottl
e in
cuba
tion,
an
d FR
RF
Dif
fere
nces
in ti
me
reso
lutio
n
of in
situ
cha
nges
in
irra
dian
ce
Cal
ibra
tion
14C
/FR
RF
Com
pari
sons
w
ith s
easo
ns
Sarm
a et
al.
(200
6)FR
RF
(FA
STtr
acka
)O
2(tr
iple
ox
ygen
is
otop
es,
light
-dar
k bo
ttle
incu
batio
n)
Phyt
opla
nkto
n. N
atur
al
asse
mbl
ages
Am
bien
t irr
adia
nce
Goo
d co
rrel
atio
n (c
a. =
) be
twee
n da
ily
inte
grat
ed p
rodu
ctio
n es
timat
ed b
y17D
an
omal
y, li
ght-
dark
bo
ttle
incu
batio
n, a
nd
FRR
F
Shor
t-te
rm
vari
atio
ns
(hou
rly/
daily
ch
ange
s)
Scho
field
et a
l. (1
995)
PAM
-101
14C
Ant
arct
ic ic
e al
gae
Nat
ural
co
mm
uniti
es
Am
bien
t irr
adia
nce
Wea
k ag
reem
ent b
etw
een
UV
-B p
hoto
inhi
bitio
n es
timat
ed b
y flu
ores
-ce
nce
and
14C
fixa
tion
Cor
rela
tion
betw
een
14C
- an
d flu
ores
cenc
e-ba
sed
estim
ates
ch
ange
d w
ith ti
me
of th
e da
y
Exp
erim
ents
on
UV
-B
inhi
bitio
n of
ca
rbon
fix
atio
n ra
tesM
ea-
sure
men
ts in
pa
ralle
lSc
hrei
ber
et a
l. (1
995)
Xen
on-P
AM
O2
Ank
istr
odes
mus
bra
unii
-Fr
eshw
ater
spe
cies
80 µ
mol
pho
tons
m−
2 s−
1L
(ca
. =)
at H
I an
d M
I
NL
at L
IC
yclic
PSI
I tr
ansp
ort r
ate
Serô
dio
et a
l. (1
998)
PAM
-101
O2
Chl
orel
la v
ulga
risP
hae-
odac
tylu
m tr
icor
nutu
mSp
irul
ina
max
ima
50 µ
mol
pho
tons
m−
2 s−
1L
, slo
pe v
aryi
ng w
ith
spec
ies
Serô
dio
(200
3)PA
M-1
01O
2 M
PB.
Nat
ural
sed
imen
t cor
esA
mbi
ent i
rrad
ianc
eL
Cha
nges
in
biom
ass
profi
le d
ue to
ve
rtic
al
mig
ratio
nSe
rôdi
o et
al.
(200
7)W
AT
ER
-PA
MO
2M
PB.
Nat
ural
sed
imen
t cor
esA
mbi
ent i
rrad
ianc
eL
Dep
th-
inte
grat
ion
of
subs
urfa
ce
fluor
esce
nce
Silv
a et
al.
(199
8)PA
M-2
000
O2
Gel
idiu
m s
esqu
iped
ale
Am
bien
t irr
adia
nce
LG
ood
corr
elat
ion
wha
teve
r th
e de
pth
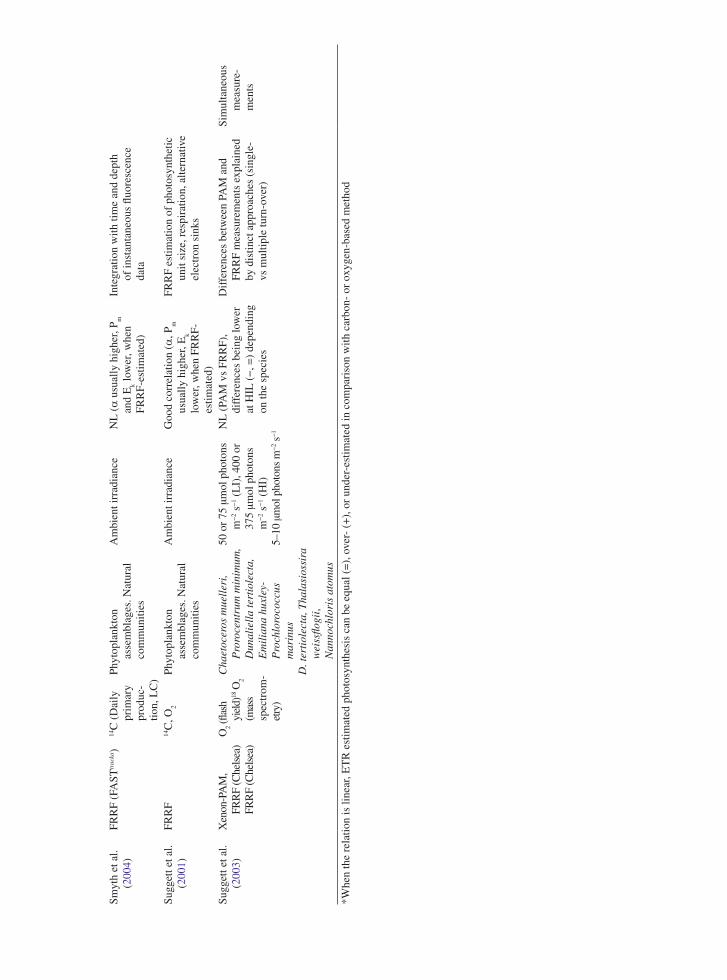
Aut
hors
(y
ear)
Met
hods
Org
anis
ms
Gro
wth
irra
dian
ce /
phot
oacc
limat
ion
Obs
erve
d re
latio
nshi
pH
ypot
hesi
s fo
r N
LR
emar
ks
Smyt
h et
al.
(200
4)FR
RF
(FA
STtr
acka
)14
C (
Dai
ly
prim
ary
prod
uc-
tion,
LC
)
Phyt
opla
nkto
n
asse
mbl
ages
. Nat
ural
co
mm
uniti
es
Am
bien
t irr
adia
nce
NL
(a
usu
ally
hig
her,
P m
and
Ek l
ower
, whe
n FR
RF-
estim
ated
)
Inte
grat
ion
with
tim
e an
d de
pth
of
inst
anta
neou
s flu
ores
cenc
e
data
Sugg
ett e
t al.
(200
1)FR
RF
14C
, O2
Phyt
opla
nkto
n
asse
mbl
ages
. Nat
ural
co
mm
uniti
es
Am
bien
t irr
adia
nce
Goo
d co
rrel
atio
n (a
, Pm
usua
lly h
ighe
r, E
k lo
wer
, whe
n FR
RF-
estim
ated
)
FRR
F es
timat
ion
of p
hoto
synt
hetic
un
it si
ze, r
espi
ratio
n, a
ltern
ativ
e el
ectr
on s
inks
Sugg
ett e
t al.
(200
3)X
enon
-PA
M,
FRR
F (C
hels
ea)
FRR
F (C
hels
ea)
O2 (
flash
yi
eld)
18 O
2 (m
ass
spec
trom
-et
ry)
Cha
etoc
eros
mue
ller
i, P
roro
cent
rum
min
imum
, D
unal
iell
a te
rtio
lect
a,
Em
ilia
na h
uxle
y-P
roch
loro
cocc
us
mar
inus
D. t
erti
olec
ta, T
hala
sios
sira
w
eiss
flogi
i, N
anno
chlo
ris
atom
us
50 o
r 75
µm
ol p
hoto
ns
m−
2 s−
1 (L
I), 4
00 o
r
375
µmol
pho
tons
m
−2 s
−1 (
HI)
5–10
µm
ol p
hoto
ns m
−2 s
−1
NL
(PA
M v
s FR
RF)
, di
ffer
ence
s be
ing
low
er
at H
IL (
−, =
) de
pend
ing
on th
e sp
ecie
s
Dif
fere
nces
bet
wee
n PA
M a
nd
FRR
F m
easu
rem
ents
exp
lain
ed
by d
istin
ct a
ppro
ache
s (s
ingl
e-
vs m
ultip
le tu
rn-o
ver)
Sim
ulta
neou
s m
easu
re-
men
ts
*Whe
n th
e re
latio
n is
line
ar, E
TR
est
imat
ed p
hoto
synt
hesi
s ca
n be
equ
al (
=),
ove
r- (
+),
or
unde
r-es
timat
ed in
com
pari
son
with
car
bon-
or
oxyg
en-b
ased
met
hod
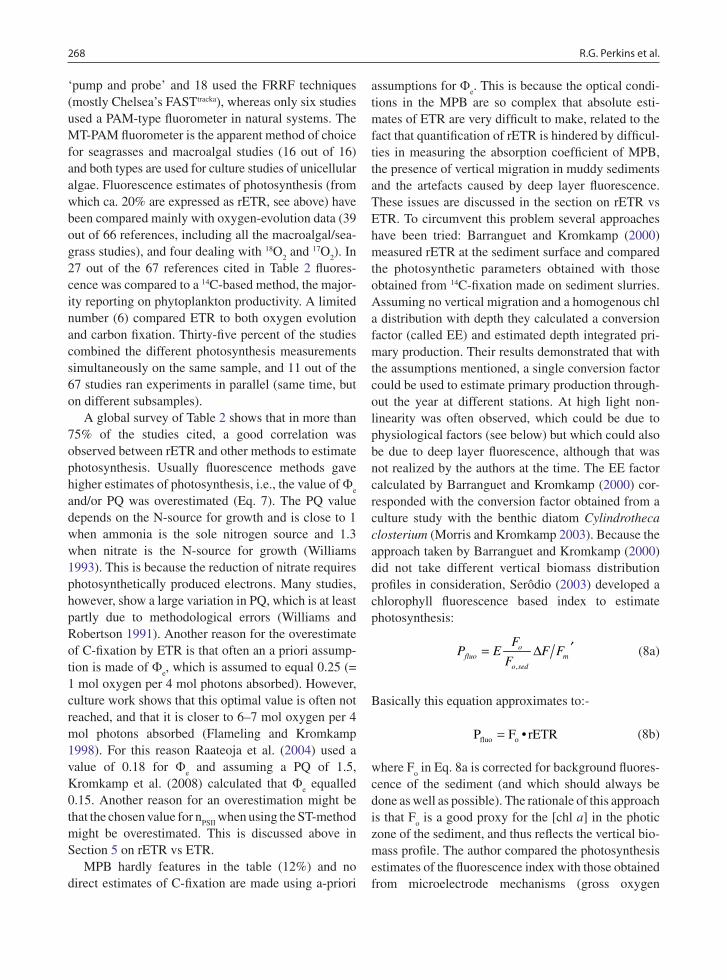
268 R.G. Perkins et al.
‘pump and probe’ and 18 used the FRRF techniques (mostly Chelsea’s FASTtracka), whereas only six studies used a PAM-type fluorometer in natural systems. The MT-PAM fluorometer is the apparent method of choice for seagrasses and macroalgal studies (16 out of 16) and both types are used for culture studies of unicellular algae. Fluorescence estimates of photosynthesis (from which ca. 20% are expressed as rETR, see above) have been compared mainly with oxygen-evolution data (39 out of 66 references, including all the macroalgal/sea-grass studies), and four dealing with 18O
2 and 17O
2). In
27 out of the 67 references cited in Table 2 fluores-cence was compared to a 14C-based method, the major-ity reporting on phytoplankton productivity. A limited number (6) compared ETR to both oxygen evolution and carbon fixation. Thirty-five percent of the studies combined the different photosynthesis measurements simultaneously on the same sample, and 11 out of the 67 studies ran experiments in parallel (same time, but on different subsamples).
A global survey of Table 2 shows that in more than 75% of the studies cited, a good correlation was observed between rETR and other methods to estimate photosynthesis. Usually fluorescence methods gave higher estimates of photosynthesis, i.e., the value of F
e
and/or PQ was overestimated (Eq. 7). The PQ value depends on the N-source for growth and is close to 1 when ammonia is the sole nitrogen source and 1.3 when nitrate is the N-source for growth (Williams 1993). This is because the reduction of nitrate requires photosynthetically produced electrons. Many studies, however, show a large variation in PQ, which is at least partly due to methodological errors (Williams and Robertson 1991). Another reason for the overestimate of C-fixation by ETR is that often an a priori assump-tion is made of F
e, which is assumed to equal 0.25 (=
1 mol oxygen per 4 mol photons absorbed). However, culture work shows that this optimal value is often not reached, and that it is closer to 6–7 mol oxygen per 4 mol photons absorbed (Flameling and Kromkamp 1998). For this reason Raateoja et al. (2004) used a value of 0.18 for F
e and assuming a PQ of 1.5,
Kromkamp et al. (2008) calculated that Fe equalled
0.15. Another reason for an overestimation might be that the chosen value for n
PSII when using the ST-method
might be overestimated. This is discussed above in Section 5 on rETR vs ETR.
MPB hardly features in the table (12%) and no direct estimates of C-fixation are made using a-priori
assumptions for Fe. This is because the optical condi-
tions in the MPB are so complex that absolute esti-mates of ETR are very difficult to make, related to the fact that quantification of rETR is hindered by difficul-ties in measuring the absorption coefficient of MPB, the presence of vertical migration in muddy sediments and the artefacts caused by deep layer fluorescence. These issues are discussed in the section on rETR vs ETR. To circumvent this problem several approaches have been tried: Barranguet and Kromkamp (2000) measured rETR at the sediment surface and compared the photosynthetic parameters obtained with those obtained from 14C-fixation made on sediment slurries. Assuming no vertical migration and a homogenous chl a distribution with depth they calculated a conversion factor (called EE) and estimated depth integrated pri-mary production. Their results demonstrated that with the assumptions mentioned, a single conversion factor could be used to estimate primary production through-out the year at different stations. At high light non-linearity was often observed, which could be due to physiological factors (see below) but which could also be due to deep layer fluorescence, although that was not realized by the authors at the time. The EE factor calculated by Barranguet and Kromkamp (2000) cor-responded with the conversion factor obtained from a culture study with the benthic diatom Cylindrotheca closterium (Morris and Kromkamp 2003). Because the approach taken by Barranguet and Kromkamp (2000) did not take different vertical biomass distribution profiles in consideration, Serôdio (2003) developed a chlorophyll fluorescence based index to estimate photosynthesis:
,
ofluo m
o sed
FP E F F
F′= ∆ (8a)
Basically this equation approximates to:-
fluo oP F • rETR= (8b)
where Fo in Eq. 8a is corrected for background fluores-
cence of the sediment (and which should always be done as well as possible). The rationale of this approach is that F
o is a good proxy for the [chl a] in the photic
zone of the sediment, and thus reflects the vertical bio-mass profile. The author compared the photosynthesis estimates of the fluorescence index with those obtained from microelectrode mechanisms (gross oxygen
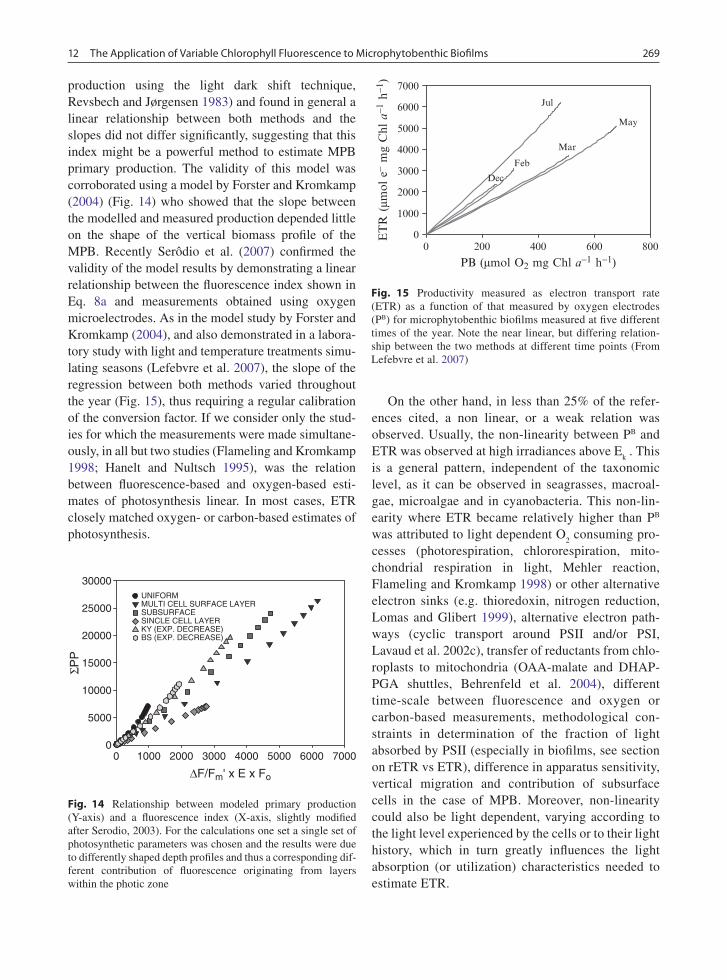
26912 The Application of Variable Chlorophyll Fluorescence to Microphytobenthic Biofilms
production using the light dark shift technique, Revsbech and Jørgensen 1983) and found in general a linear relationship between both methods and the slopes did not differ significantly, suggesting that this index might be a powerful method to estimate MPB primary production. The validity of this model was corroborated using a model by Forster and Kromkamp (2004) (Fig. 14) who showed that the slope between the modelled and measured production depended little on the shape of the vertical biomass profile of the MPB. Recently Serôdio et al. (2007) confirmed the validity of the model results by demonstrating a linear relationship between the fluorescence index shown in Eq. 8a and measurements obtained using oxygen microelectrodes. As in the model study by Forster and Kromkamp (2004), and also demonstrated in a labora-tory study with light and temperature treatments simu-lating seasons (Lefebvre et al. 2007), the slope of the regression between both methods varied throughout the year (Fig. 15), thus requiring a regular calibration of the conversion factor. If we consider only the stud-ies for which the measurements were made simultane-ously, in all but two studies (Flameling and Kromkamp 1998; Hanelt and Nultsch 1995), was the relation between fluorescence-based and oxygen-based esti-mates of photosynthesis linear. In most cases, ETR closely matched oxygen- or carbon-based estimates of photosynthesis.
On the other hand, in less than 25% of the refer-ences cited, a non linear, or a weak relation was observed. Usually, the non-linearity between PB and ETR was observed at high irradiances above E
k . This
is a general pattern, independent of the taxonomic level, as it can be observed in seagrasses, macroal-gae, microalgae and in cyanobacteria. This non-lin-earity where ETR became relatively higher than PB was attributed to light dependent O
2 consuming pro-
cesses (photorespiration, chlororespiration, mito-chondrial respiration in light, Mehler reaction, Flameling and Kromkamp 1998) or other alternative electron sinks (e.g. thioredoxin, nitrogen reduction, Lomas and Glibert 1999), alternative electron path-ways (cyclic transport around PSII and/or PSI, Lavaud et al. 2002c), transfer of reductants from chlo-roplasts to mitochondria (OAA-malate and DHAP-PGA shuttles, Behrenfeld et al. 2004), different time-scale between fluorescence and oxygen or carbon-based measurements, methodological con-straints in determination of the fraction of light absorbed by PSII (especially in biofilms, see section on rETR vs ETR), difference in apparatus sensitivity, vertical migration and contribution of subsurface cells in the case of MPB. Moreover, non-linearity could also be light dependent, varying according to the light level experienced by the cells or to their light history, which in turn greatly influences the light absorption (or utilization) characteristics needed to estimate ETR.
∆F/Fm' x E x Fo
0 1000 2000 3000 4000 5000 6000 7000
ΣPP
0
5000
10000
15000
20000
25000
30000UNIFORMMULTI CELL SURFACE LAYERSUBSURFACESINCLE CELL LAYERKY (EXP. DECREASE)BS (EXP. DECREASE)
Fig. 14 Relationship between modeled primary production (Y-axis) and a fluorescence index (X-axis, slightly modified after Serodio, 2003). For the calculations one set a single set of photosynthetic parameters was chosen and the results were due to differently shaped depth profiles and thus a corresponding dif-ferent contribution of fluorescence originating from layers within the photic zone
0
1000
2000
3000
4000
5000
6000
7000
0 200 400 600 800
PB (µmol O2 mg Chl a-1 h-1)
ET
R (
µmol
e-
mg
Chl
a-1
h-1
)
Dec
Feb
Mar
May
Jul
Fig. 15 Productivity measured as electron transport rate (ETR) as a function of that measured by oxygen electrodes (PB) for microphytobenthic biofilms measured at five different times of the year. Note the near linear, but differing relation-ship between the two methods at different time points (From Lefebvre et al. 2007)
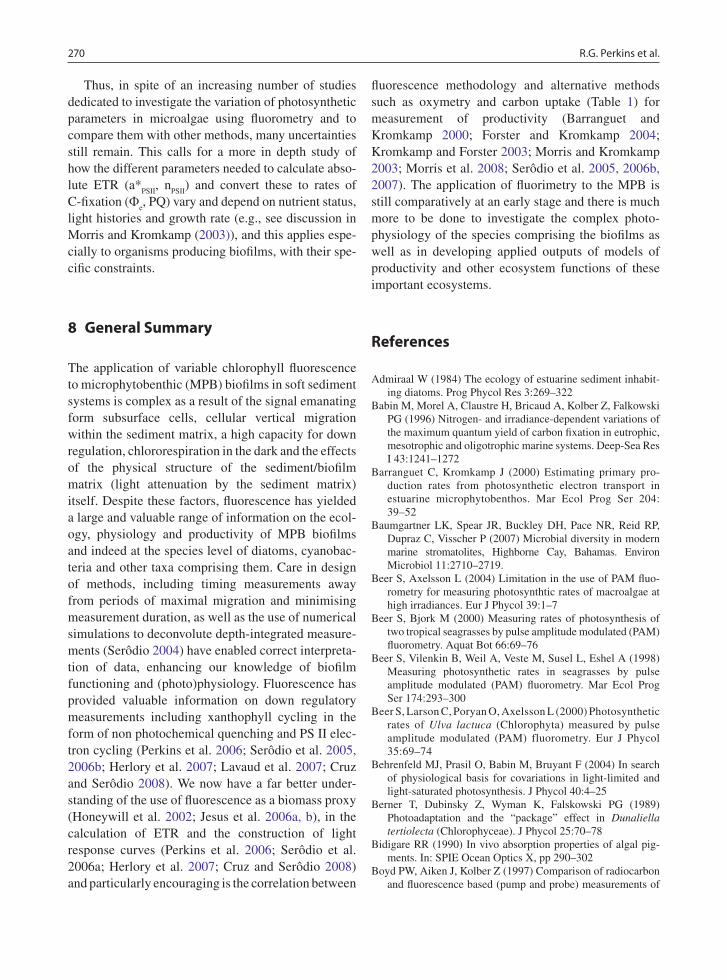
270 R.G. Perkins et al.
Thus, in spite of an increasing number of studies dedicated to investigate the variation of photosynthetic parameters in microalgae using fluorometry and to compare them with other methods, many uncertainties still remain. This calls for a more in depth study of how the different parameters needed to calculate abso-lute ETR (a*
PSII, n
PSII) and convert these to rates of
C-fixation (Fe, PQ) vary and depend on nutrient status,
light histories and growth rate (e.g., see discussion in Morris and Kromkamp (2003)), and this applies espe-cially to organisms producing biofilms, with their spe-cific constraints.
8 General Summary
The application of variable chlorophyll fluorescence to microphytobenthic (MPB) biofilms in soft sediment systems is complex as a result of the signal emanating form subsurface cells, cellular vertical migration within the sediment matrix, a high capacity for down regulation, chlororespiration in the dark and the effects of the physical structure of the sediment/biofilm matrix (light attenuation by the sediment matrix) itself. Despite these factors, fluorescence has yielded a large and valuable range of information on the ecol-ogy, physiology and productivity of MPB biofilms and indeed at the species level of diatoms, cyanobac-teria and other taxa comprising them. Care in design of methods, including timing measurements away from periods of maximal migration and minimising measurement duration, as well as the use of numerical simulations to deconvolute depth-integrated measure-ments (Serôdio 2004) have enabled correct interpreta-tion of data, enhancing our knowledge of biofilm functioning and (photo)physiology. Fluorescence has provided valuable information on down regulatory measurements including xanthophyll cycling in the form of non photochemical quenching and PS II elec-tron cycling (Perkins et al. 2006; Serôdio et al. 2005, 2006b; Herlory et al. 2007; Lavaud et al. 2007; Cruz and Serôdio 2008). We now have a far better under-standing of the use of fluorescence as a biomass proxy (Honeywill et al. 2002; Jesus et al. 2006a, b), in the calculation of ETR and the construction of light response curves (Perkins et al. 2006; Serôdio et al. 2006a; Herlory et al. 2007; Cruz and Serôdio 2008) and particularly encouraging is the correlation between
fluorescence methodology and alternative methods such as oxymetry and carbon uptake (Table 1) for measurement of productivity (Barranguet and Kromkamp 2000; Forster and Kromkamp 2004; Kromkamp and Forster 2003; Morris and Kromkamp 2003; Morris et al. 2008; Serôdio et al. 2005, 2006b, 2007). The application of fluorimetry to the MPB is still comparatively at an early stage and there is much more to be done to investigate the complex photo-physiology of the species comprising the biofilms as well as in developing applied outputs of models of productivity and other ecosystem functions of these important ecosystems.
References
Admiraal W (1984) The ecology of estuarine sediment inhabit-ing diatoms. Prog Phycol Res 3:269–322
Babin M, Morel A, Claustre H, Bricaud A, Kolber Z, Falkowski PG (1996) Nitrogen- and irradiance-dependent variations of the maximum quantum yield of carbon fixation in eutrophic, mesotrophic and oligotrophic marine systems. Deep-Sea Res I 43:1241–1272
Barranguet C, Kromkamp J (2000) Estimating primary pro-duction rates from photosynthetic electron transport in estuarine microphytobenthos. Mar Ecol Prog Ser 204: 39–52
Baumgartner LK, Spear JR, Buckley DH, Pace NR, Reid RP, Dupraz C, Visscher P (2007) Microbial diversity in modern marine stromatolites, Highborne Cay, Bahamas. Environ Microbiol 11:2710–2719.
Beer S, Axelsson L (2004) Limitation in the use of PAM fluo-rometry for measuring photosynthtic rates of macroalgae at high irradiances. Eur J Phycol 39:1–7
Beer S, Bjork M (2000) Measuring rates of photosynthesis of two tropical seagrasses by pulse amplitude modulated (PAM) fluorometry. Aquat Bot 66:69–76
Beer S, Vilenkin B, Weil A, Veste M, Susel L, Eshel A (1998) Measuring photosynthetic rates in seagrasses by pulse amplitude modulated (PAM) fluorometry. Mar Ecol Prog Ser 174:293–300
Beer S, Larson C, Poryan O, Axelsson L (2000) Photosynthetic rates of Ulva lactuca (Chlorophyta) measured by pulse amplitude modulated (PAM) fluorometry. Eur J Phycol 35:69–74
Behrenfeld MJ, Prasil O, Babin M, Bruyant F (2004) In search of physiological basis for covariations in light-limited and light-saturated photosynthesis. J Phycol 40:4–25
Berner T, Dubinsky Z, Wyman K, Falskowski PG (1989) Photoadaptation and the “package” effect in Dunaliella tertiolecta (Chlorophyceae). J Phycol 25:70–78
Bidigare RR (1990) In vivo absorption properties of algal pig-ments. In: SPIE Ocean Optics X, pp 290–302
Boyd PW, Aiken J, Kolber Z (1997) Comparison of radiocarbon and fluorescence based (pump and probe) measurements of
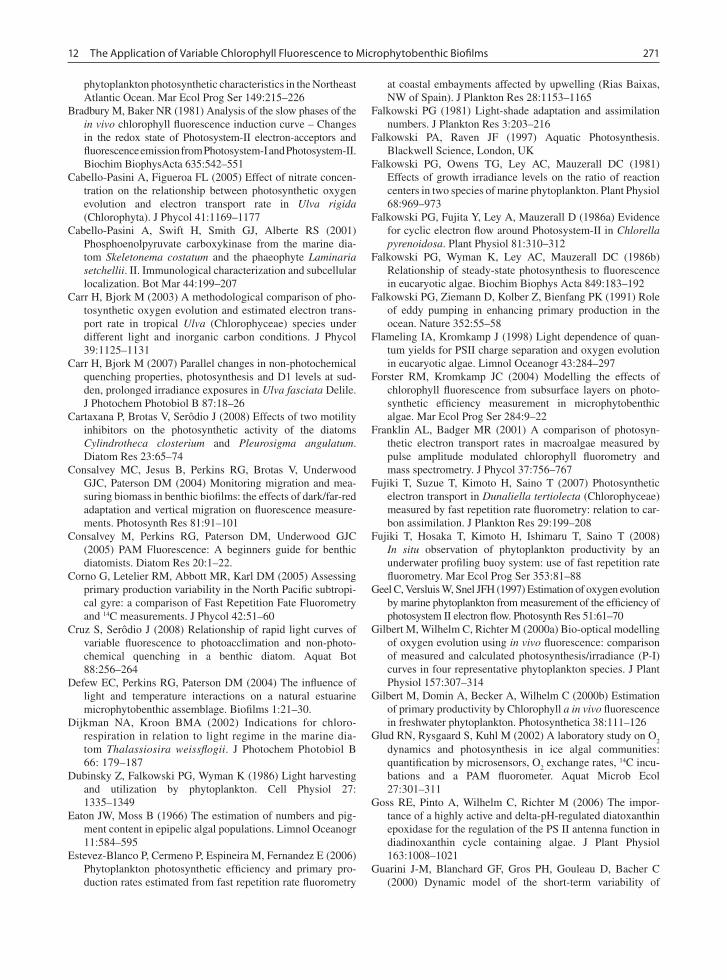
27112 The Application of Variable Chlorophyll Fluorescence to Microphytobenthic Biofilms
phytoplankton photosynthetic characteristics in the Northeast Atlantic Ocean. Mar Ecol Prog Ser 149:215–226
Bradbury M, Baker NR (1981) Analysis of the slow phases of the in vivo chlorophyll fluorescence induction curve – Changes in the redox state of Photosystem-II electron-acceptors and fluorescence emission from Photosystem-I and Photosystem-II. Biochim BiophysActa 635:542–551
Cabello-Pasini A, Figueroa FL (2005) Effect of nitrate concen-tration on the relationship between photosynthetic oxygen evolution and electron transport rate in Ulva rigida (Chlorophyta). J Phycol 41:1169–1177
Cabello-Pasini A, Swift H, Smith GJ, Alberte RS (2001) Phosphoenolpyruvate carboxykinase from the marine dia-tom Skeletonema costatum and the phaeophyte Laminaria setchellii. II. Immunological characterization and subcellular localization. Bot Mar 44:199–207
Carr H, Bjork M (2003) A methodological comparison of pho-tosynthetic oxygen evolution and estimated electron trans-port rate in tropical Ulva (Chlorophyceae) species under different light and inorganic carbon conditions. J Phycol 39:1125–1131
Carr H, Bjork M (2007) Parallel changes in non-photochemical quenching properties, photosynthesis and D1 levels at sud-den, prolonged irradiance exposures in Ulva fasciata Delile. J Photochem Photobiol B 87:18–26
Cartaxana P, Brotas V, Serôdio J (2008) Effects of two motility inhibitors on the photosynthetic activity of the diatoms Cylindrotheca closterium and Pleurosigma angulatum. Diatom Res 23:65–74
Consalvey MC, Jesus B, Perkins RG, Brotas V, Underwood GJC, Paterson DM (2004) Monitoring migration and mea-suring biomass in benthic biofilms: the effects of dark/far-red adaptation and vertical migration on fluorescence measure-ments. Photosynth Res 81:91–101
Consalvey M, Perkins RG, Paterson DM, Underwood GJC (2005) PAM Fluorescence: A beginners guide for benthic diatomists. Diatom Res 20:1–22.
Corno G, Letelier RM, Abbott MR, Karl DM (2005) Assessing primary production variability in the North Pacific subtropi-cal gyre: a comparison of Fast Repetition Fate Fluorometry and 14C measurements. J Phycol 42:51–60
Cruz S, Serôdio J (2008) Relationship of rapid light curves of variable fluorescence to photoacclimation and non-photo-chemical quenching in a benthic diatom. Aquat Bot 88:256–264
Defew EC, Perkins RG, Paterson DM (2004) The influence of light and temperature interactions on a natural estuarine microphytobenthic assemblage. Biofilms 1:21–30.
Dijkman NA, Kroon BMA (2002) Indications for chloro-respiration in relation to light regime in the marine dia-tom Thalassiosira weissflogii. J Photochem Photobiol B 66: 179–187
Dubinsky Z, Falkowski PG, Wyman K (1986) Light harvesting and utilization by phytoplankton. Cell Physiol 27: 1335–1349
Eaton JW, Moss B (1966) The estimation of numbers and pig-ment content in epipelic algal populations. Limnol Oceanogr 11:584–595
Estevez-Blanco P, Cermeno P, Espineira M, Fernandez E (2006) Phytoplankton photosynthetic efficiency and primary pro-duction rates estimated from fast repetition rate fluorometry
at coastal embayments affected by upwelling (Rias Baixas, NW of Spain). J Plankton Res 28:1153–1165
Falkowski PG (1981) Light-shade adaptation and assimilation numbers. J Plankton Res 3:203–216
Falkowski PA, Raven JF (1997) Aquatic Photosynthesis. Blackwell Science, London, UK
Falkowski PG, Owens TG, Ley AC, Mauzerall DC (1981) Effects of growth irradiance levels on the ratio of reaction centers in two species of marine phytoplankton. Plant Physiol 68:969–973
Falkowski PG, Fujita Y, Ley A, Mauzerall D (1986a) Evidence for cyclic electron flow around Photosystem-II in Chlorella pyrenoidosa. Plant Physiol 81:310–312
Falkowski PG, Wyman K, Ley AC, Mauzerall DC (1986b) Relationship of steady-state photosynthesis to fluorescence in eucaryotic algae. Biochim Biophys Acta 849:183–192
Falkowski PG, Ziemann D, Kolber Z, Bienfang PK (1991) Role of eddy pumping in enhancing primary production in the ocean. Nature 352:55–58
Flameling IA, Kromkamp J (1998) Light dependence of quan-tum yields for PSII charge separation and oxygen evolution in eucaryotic algae. Limnol Oceanogr 43:284–297
Forster RM, Kromkamp JC (2004) Modelling the effects of chlorophyll fluorescence from subsurface layers on photo-synthetic efficiency measurement in microphytobenthic algae. Mar Ecol Prog Ser 284:9–22
Franklin AL, Badger MR (2001) A comparison of photosyn-thetic electron transport rates in macroalgae measured by pulse amplitude modulated chlorophyll fluorometry and mass spectrometry. J Phycol 37:756–767
Fujiki T, Suzue T, Kimoto H, Saino T (2007) Photosynthetic electron transport in Dunaliella tertiolecta (Chlorophyceae) measured by fast repetition rate fluorometry: relation to car-bon assimilation. J Plankton Res 29:199–208
Fujiki T, Hosaka T, Kimoto H, Ishimaru T, Saino T (2008) In situ observation of phytoplankton productivity by an underwater profiling buoy system: use of fast repetition rate fluorometry. Mar Ecol Prog Ser 353:81–88
Geel C, Versluis W, Snel JFH (1997) Estimation of oxygen evolution by marine phytoplankton from measurement of the efficiency of photosystem II electron flow. Photosynth Res 51:61–70
Gilbert M, Wilhelm C, Richter M (2000a) Bio-optical modelling of oxygen evolution using in vivo fluorescence: comparison of measured and calculated photosynthesis/irradiance (P-I) curves in four representative phytoplankton species. J Plant Physiol 157:307–314
Gilbert M, Domin A, Becker A, Wilhelm C (2000b) Estimation of primary productivity by Chlorophyll a in vivo fluorescence in freshwater phytoplankton. Photosynthetica 38:111–126
Glud RN, Rysgaard S, Kuhl M (2002) A laboratory study on O2
dynamics and photosynthesis in ice algal communities: quantification by microsensors, O
2 exchange rates, 14C incu-
bations and a PAM fluorometer. Aquat Microb Ecol 27:301–311
Goss RE, Pinto A, Wilhelm C, Richter M (2006) The impor-tance of a highly active and delta-pH-regulated diatoxanthin epoxidase for the regulation of the PS II antenna function in diadinoxanthin cycle containing algae. J Plant Physiol 163:1008–1021
Guarini J-M, Blanchard GF, Gros PH, Gouleau D, Bacher C (2000) Dynamic model of the short-term variability of
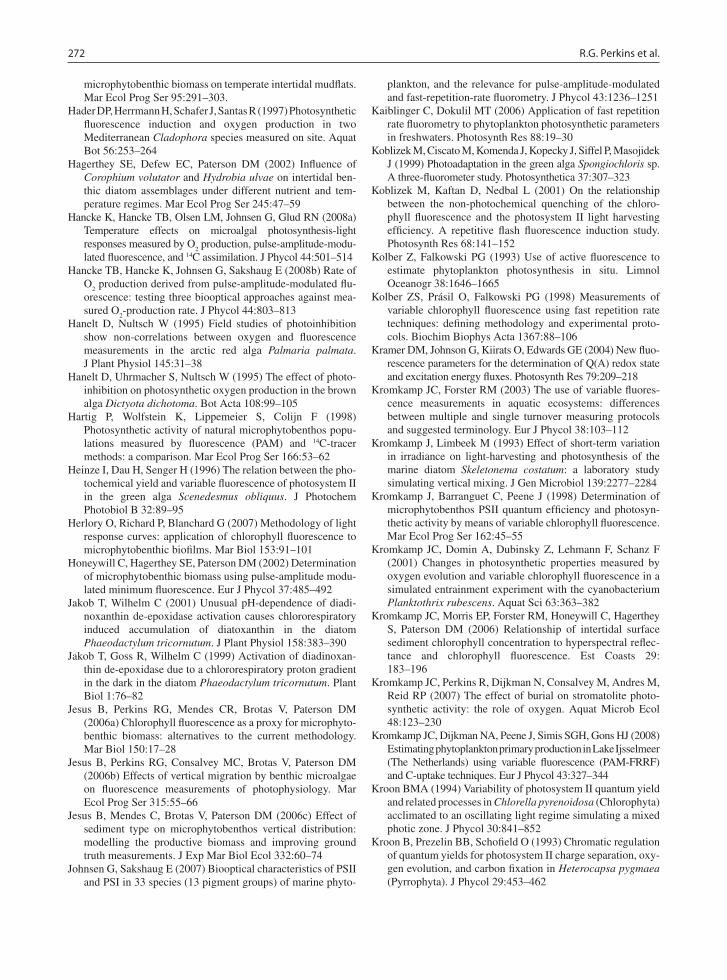
272 R.G. Perkins et al.
microphytobenthic biomass on temperate intertidal mudflats. Mar Ecol Prog Ser 95:291–303.
Hader DP, Herrmann H, Schafer J, Santas R (1997) Photosynthetic fluorescence induction and oxygen production in two Mediterranean Cladophora species measured on site. Aquat Bot 56:253–264
Hagerthey SE, Defew EC, Paterson DM (2002) Influence of Corophium volutator and Hydrobia ulvae on intertidal ben-thic diatom assemblages under different nutrient and tem-perature regimes. Mar Ecol Prog Ser 245:47–59
Hancke K, Hancke TB, Olsen LM, Johnsen G, Glud RN (2008a) Temperature effects on microalgal photosynthesis-light responses measured by O
2 production, pulse-amplitude-modu-
lated fluorescence, and 14C assimilation. J Phycol 44:501–514Hancke TB, Hancke K, Johnsen G, Sakshaug E (2008b) Rate of
O2 production derived from pulse-amplitude-modulated flu-
orescence: testing three biooptical approaches against mea-sured O
2-production rate. J Phycol 44:803–813
Hanelt D, Nultsch W (1995) Field studies of photoinhibition show non-correlations between oxygen and fluorescence measurements in the arctic red alga Palmaria palmata. J Plant Physiol 145:31–38
Hanelt D, Uhrmacher S, Nultsch W (1995) The effect of photo-inhibition on photosynthetic oxygen production in the brown alga Dictyota dichotoma. Bot Acta 108:99–105
Hartig P, Wolfstein K, Lippemeier S, Colijn F (1998) Photosynthetic activity of natural microphytobenthos popu-lations measured by fluorescence (PAM) and 14C-tracer methods: a comparison. Mar Ecol Prog Ser 166:53–62
Heinze I, Dau H, Senger H (1996) The relation between the pho-tochemical yield and variable fluorescence of photosystem II in the green alga Scenedesmus obliquus. J Photochem Photobiol B 32:89–95
Herlory O, Richard P, Blanchard G (2007) Methodology of light response curves: application of chlorophyll fluorescence to microphytobenthic biofilms. Mar Biol 153:91–101
Honeywill C, Hagerthey SE, Paterson DM (2002) Determination of microphytobenthic biomass using pulse-amplitude modu-lated minimum fluorescence. Eur J Phycol 37:485–492
Jakob T, Wilhelm C (2001) Unusual pH-dependence of diadi-noxanthin de-epoxidase activation causes chlororespiratory induced accumulation of diatoxanthin in the diatom Phaeodactylum tricornutum. J Plant Physiol 158:383–390
Jakob T, Goss R, Wilhelm C (1999) Activation of diadinoxan-thin de-epoxidase due to a chlororespiratory proton gradient in the dark in the diatom Phaeodactylum tricornutum. Plant Biol 1:76–82
Jesus B, Perkins RG, Mendes CR, Brotas V, Paterson DM (2006a) Chlorophyll fluorescence as a proxy for microphyto-benthic biomass: alternatives to the current methodology. Mar Biol 150:17–28
Jesus B, Perkins RG, Consalvey MC, Brotas V, Paterson DM (2006b) Effects of vertical migration by benthic microalgae on fluorescence measurements of photophysiology. Mar Ecol Prog Ser 315:55–66
Jesus B, Mendes C, Brotas V, Paterson DM (2006c) Effect of sediment type on microphytobenthos vertical distribution: modelling the productive biomass and improving ground truth measurements. J Exp Mar Biol Ecol 332:60–74
Johnsen G, Sakshaug E (2007) Biooptical characteristics of PSII and PSI in 33 species (13 pigment groups) of marine phyto-
plankton, and the relevance for pulse-amplitude-modulated and fast-repetition-rate fluorometry. J Phycol 43:1236–1251
Kaiblinger C, Dokulil MT (2006) Application of fast repetition rate fluorometry to phytoplankton photosynthetic parameters in freshwaters. Photosynth Res 88:19–30
Koblizek M, Ciscato M, Komenda J, Kopecky J, Siffel P, Masojidek J (1999) Photoadaptation in the green alga Spongiochloris sp. A three-fluorometer study. Photosynthetica 37:307–323
Koblizek M, Kaftan D, Nedbal L (2001) On the relationship between the non-photochemical quenching of the chloro-phyll fluorescence and the photosystem II light harvesting efficiency. A repetitive flash fluorescence induction study. Photosynth Res 68:141–152
Kolber Z, Falkowski PG (1993) Use of active fluorescence to estimate phytoplankton photosynthesis in situ. Limnol Oceanogr 38:1646–1665
Kolber ZS, Prásil O, Falkowski PG (1998) Measurements of variable chlorophyll fluorescence using fast repetition rate techniques: defining methodology and experimental proto-cols. Biochim Biophys Acta 1367:88–106
Kramer DM, Johnson G, Kiirats O, Edwards GE (2004) New fluo-rescence parameters for the determination of Q(A) redox state and excitation energy fluxes. Photosynth Res 79:209–218
Kromkamp JC, Forster RM (2003) The use of variable fluores-cence measurements in aquatic ecosystems: differences between multiple and single turnover measuring protocols and suggested terminology. Eur J Phycol 38:103–112
Kromkamp J, Limbeek M (1993) Effect of short-term variation in irradiance on light-harvesting and photosynthesis of the marine diatom Skeletonema costatum: a laboratory study simulating vertical mixing. J Gen Microbiol 139:2277–2284
Kromkamp J, Barranguet C, Peene J (1998) Determination of microphytobenthos PSII quantum efficiency and photosyn-thetic activity by means of variable chlorophyll fluorescence. Mar Ecol Prog Ser 162:45–55
Kromkamp JC, Domin A, Dubinsky Z, Lehmann F, Schanz F (2001) Changes in photosynthetic properties measured by oxygen evolution and variable chlorophyll fluorescence in a simulated entrainment experiment with the cyanobacterium Planktothrix rubescens. Aquat Sci 63:363–382
Kromkamp JC, Morris EP, Forster RM, Honeywill C, Hagerthey S, Paterson DM (2006) Relationship of intertidal surface sediment chlorophyll concentration to hyperspectral reflec-tance and chlorophyll fluorescence. Est Coasts 29: 183–196
Kromkamp JC, Perkins R, Dijkman N, Consalvey M, Andres M, Reid RP (2007) The effect of burial on stromatolite photo-synthetic activity: the role of oxygen. Aquat Microb Ecol 48:123–230
Kromkamp JC, Dijkman NA, Peene J, Simis SGH, Gons HJ (2008) Estimating phytoplankton primary production in Lake Ijsselmeer (The Netherlands) using variable fluorescence (PAM-FRRF) and C-uptake techniques. Eur J Phycol 43:327–344
Kroon BMA (1994) Variability of photosystem II quantum yield and related processes in Chlorella pyrenoidosa (Chlorophyta) acclimated to an oscillating light regime simulating a mixed photic zone. J Phycol 30:841–852
Kroon B, Prezelin BB, Schofield O (1993) Chromatic regulation of quantum yields for photosystem II charge separation, oxy-gen evolution, and carbon fixation in Heterocapsa pygmaea (Pyrrophyta). J Phycol 29:453–462
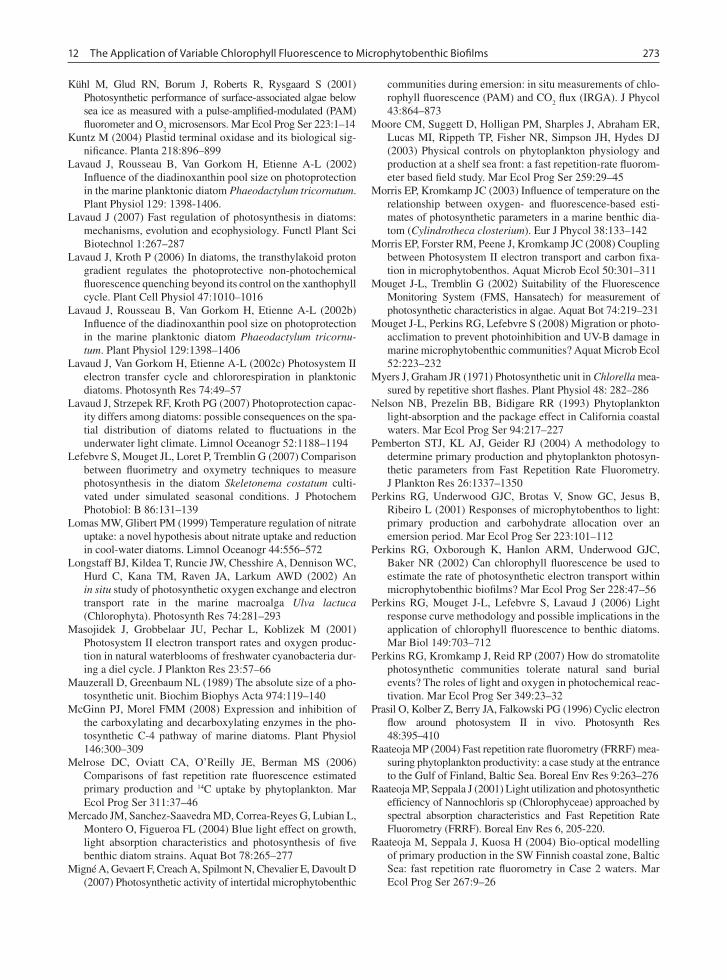
27312 The Application of Variable Chlorophyll Fluorescence to Microphytobenthic Biofilms
Kühl M, Glud RN, Borum J, Roberts R, Rysgaard S (2001) Photosynthetic performance of surface-associated algae below sea ice as measured with a pulse-amplified-modulated (PAM) fluorometer and O
2 microsensors. Mar Ecol Prog Ser 223:1–14
Kuntz M (2004) Plastid terminal oxidase and its biological sig-nificance. Planta 218:896–899
Lavaud J, Rousseau B, Van Gorkom H, Etienne A-L (2002) Influence of the diadinoxanthin pool size on photoprotection in the marine planktonic diatom Phaeodactylum tricornutum. Plant Physiol 129: 1398-1406.
Lavaud J (2007) Fast regulation of photosynthesis in diatoms: mechanisms, evolution and ecophysiology. Functl Plant Sci Biotechnol 1:267–287
Lavaud J, Kroth P (2006) In diatoms, the transthylakoid proton gradient regulates the photoprotective non-photochemical fluorescence quenching beyond its control on the xanthophyll cycle. Plant Cell Physiol 47:1010–1016
Lavaud J, Rousseau B, Van Gorkom H, Etienne A-L (2002b) Influence of the diadinoxanthin pool size on photoprotection in the marine planktonic diatom Phaeodactylum tricornu-tum. Plant Physiol 129:1398–1406
Lavaud J, Van Gorkom H, Etienne A-L (2002c) Photosystem II electron transfer cycle and chlororespiration in planktonic diatoms. Photosynth Res 74:49–57
Lavaud J, Strzepek RF, Kroth PG (2007) Photoprotection capac-ity differs among diatoms: possible consequences on the spa-tial distribution of diatoms related to fluctuations in the underwater light climate. Limnol Oceanogr 52:1188–1194
Lefebvre S, Mouget JL, Loret P, Tremblin G (2007) Comparison between fluorimetry and oxymetry techniques to measure photosynthesis in the diatom Skeletonema costatum culti-vated under simulated seasonal conditions. J Photochem Photobiol: B 86:131–139
Lomas MW, Glibert PM (1999) Temperature regulation of nitrate uptake: a novel hypothesis about nitrate uptake and reduction in cool-water diatoms. Limnol Oceanogr 44:556–572
Longstaff BJ, Kildea T, Runcie JW, Chesshire A, Dennison WC, Hurd C, Kana TM, Raven JA, Larkum AWD (2002) An in situ study of photosynthetic oxygen exchange and electron transport rate in the marine macroalga Ulva lactuca (Chlorophyta). Photosynth Res 74:281–293
Masojidek J, Grobbelaar JU, Pechar L, Koblizek M (2001) Photosystem II electron transport rates and oxygen produc-tion in natural waterblooms of freshwater cyanobacteria dur-ing a diel cycle. J Plankton Res 23:57–66
Mauzerall D, Greenbaum NL (1989) The absolute size of a pho-tosynthetic unit. Biochim Biophys Acta 974:119–140
McGinn PJ, Morel FMM (2008) Expression and inhibition of the carboxylating and decarboxylating enzymes in the pho-tosynthetic C-4 pathway of marine diatoms. Plant Physiol 146:300–309
Melrose DC, Oviatt CA, O’Reilly JE, Berman MS (2006) Comparisons of fast repetition rate fluorescence estimated primary production and 14C uptake by phytoplankton. Mar Ecol Prog Ser 311:37–46
Mercado JM, Sanchez-Saavedra MD, Correa-Reyes G, Lubian L, Montero O, Figueroa FL (2004) Blue light effect on growth, light absorption characteristics and photosynthesis of five benthic diatom strains. Aquat Bot 78:265–277
Migné A, Gevaert F, Creach A, Spilmont N, Chevalier E, Davoult D (2007) Photosynthetic activity of intertidal microphytobenthic
communities during emersion: in situ measurements of chlo-rophyll fluorescence (PAM) and CO
2 flux (IRGA). J Phycol
43:864–873Moore CM, Suggett D, Holligan PM, Sharples J, Abraham ER,
Lucas MI, Rippeth TP, Fisher NR, Simpson JH, Hydes DJ (2003) Physical controls on phytoplankton physiology and production at a shelf sea front: a fast repetition-rate fluorom-eter based field study. Mar Ecol Prog Ser 259:29–45
Morris EP, Kromkamp JC (2003) Influence of temperature on the relationship between oxygen- and fluorescence-based esti-mates of photosynthetic parameters in a marine benthic dia-tom (Cylindrotheca closterium). Eur J Phycol 38:133–142
Morris EP, Forster RM, Peene J, Kromkamp JC (2008) Coupling between Photosystem II electron transport and carbon fixa-tion in microphytobenthos. Aquat Microb Ecol 50:301–311
Mouget J-L, Tremblin G (2002) Suitability of the Fluorescence Monitoring System (FMS, Hansatech) for measurement of photosynthetic characteristics in algae. Aquat Bot 74:219–231
Mouget J-L, Perkins RG, Lefebvre S (2008) Migration or photo-acclimation to prevent photoinhibition and UV-B damage in marine microphytobenthic communities? Aquat Microb Ecol 52:223–232
Myers J, Graham JR (1971) Photosynthetic unit in Chlorella mea-sured by repetitive short flashes. Plant Physiol 48: 282–286
Nelson NB, Prezelin BB, Bidigare RR (1993) Phytoplankton light-absorption and the package effect in California coastal waters. Mar Ecol Prog Ser 94:217–227
Pemberton STJ, KL AJ, Geider RJ (2004) A methodology to determine primary production and phytoplankton photosyn-thetic parameters from Fast Repetition Rate Fluorometry. J Plankton Res 26:1337–1350
Perkins RG, Underwood GJC, Brotas V, Snow GC, Jesus B, Ribeiro L (2001) Responses of microphytobenthos to light: primary production and carbohydrate allocation over an emersion period. Mar Ecol Prog Ser 223:101–112
Perkins RG, Oxborough K, Hanlon ARM, Underwood GJC, Baker NR (2002) Can chlorophyll fluorescence be used to estimate the rate of photosynthetic electron transport within microphytobenthic biofilms? Mar Ecol Prog Ser 228:47–56
Perkins RG, Mouget J-L, Lefebvre S, Lavaud J (2006) Light response curve methodology and possible implications in the application of chlorophyll fluorescence to benthic diatoms. Mar Biol 149:703–712
Perkins RG, Kromkamp J, Reid RP (2007) How do stromatolite photosynthetic communities tolerate natural sand burial events? The roles of light and oxygen in photochemical reac-tivation. Mar Ecol Prog Ser 349:23–32
Prasil O, Kolber Z, Berry JA, Falkowski PG (1996) Cyclic electron flow around photosystem II in vivo. Photosynth Res 48:395–410
Raateoja MP (2004) Fast repetition rate fluorometry (FRRF) mea-suring phytoplankton productivity: a case study at the entrance to the Gulf of Finland, Baltic Sea. Boreal Env Res 9:263–276
Raateoja MP, Seppala J (2001) Light utilization and photosynthetic efficiency of Nannochloris sp (Chlorophyceae) approached by spectral absorption characteristics and Fast Repetition Rate Fluorometry (FRRF). Boreal Env Res 6, 205-220.
Raateoja M, Seppala J, Kuosa H (2004) Bio-optical modelling of primary production in the SW Finnish coastal zone, Baltic Sea: fast repetition rate fluorometry in Case 2 waters. Mar Ecol Prog Ser 267:9–26
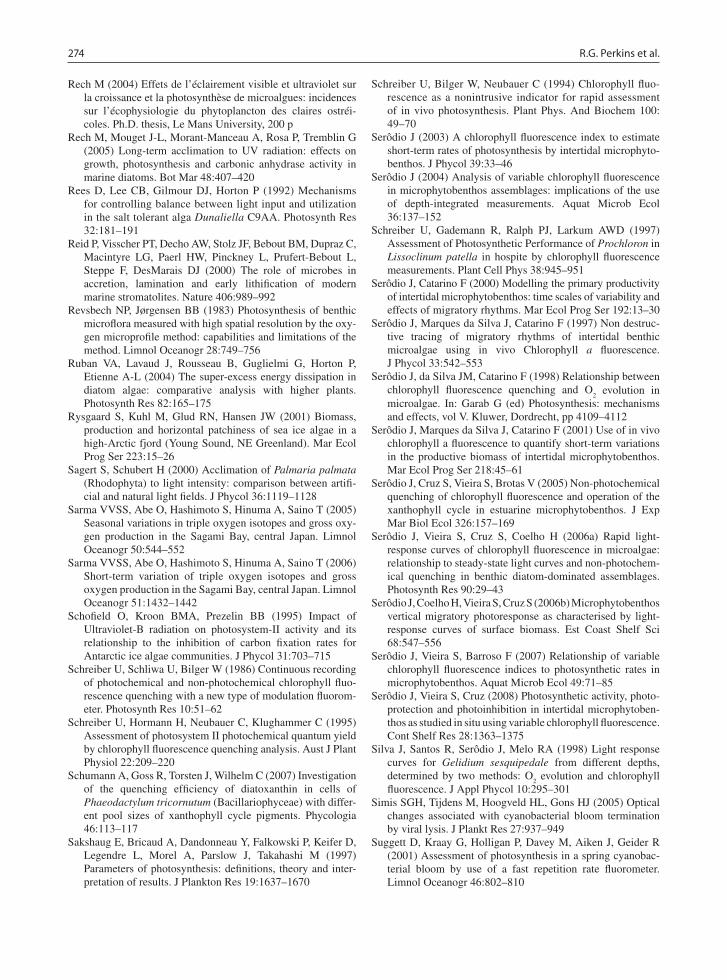
274 R.G. Perkins et al.
Rech M (2004) Effets de l’éclairement visible et ultraviolet sur la croissance et la photosynthèse de microalgues: incidences sur l’écophysiologie du phytoplancton des claires ostréi-coles. Ph.D. thesis, Le Mans University, 200 p
Rech M, Mouget J-L, Morant-Manceau A, Rosa P, Tremblin G (2005) Long-term acclimation to UV radiation: effects on growth, photosynthesis and carbonic anhydrase activity in marine diatoms. Bot Mar 48:407–420
Rees D, Lee CB, Gilmour DJ, Horton P (1992) Mechanisms for controlling balance between light input and utilization in the salt tolerant alga Dunaliella C9AA. Photosynth Res 32:181–191
Reid P, Visscher PT, Decho AW, Stolz JF, Bebout BM, Dupraz C, Macintyre LG, Paerl HW, Pinckney L, Prufert-Bebout L, Steppe F, DesMarais DJ (2000) The role of microbes in accretion, lamination and early lithification of modern marine stromatolites. Nature 406:989–992
Revsbech NP, Jørgensen BB (1983) Photosynthesis of benthic microflora measured with high spatial resolution by the oxy-gen microprofile method: capabilities and limitations of the method. Limnol Oceanogr 28:749–756
Ruban VA, Lavaud J, Rousseau B, Guglielmi G, Horton P, Etienne A-L (2004) The super-excess energy dissipation in diatom algae: comparative analysis with higher plants. Photosynth Res 82:165–175
Rysgaard S, Kuhl M, Glud RN, Hansen JW (2001) Biomass, production and horizontal patchiness of sea ice algae in a high-Arctic fjord (Young Sound, NE Greenland). Mar Ecol Prog Ser 223:15–26
Sagert S, Schubert H (2000) Acclimation of Palmaria palmata (Rhodophyta) to light intensity: comparison between artifi-cial and natural light fields. J Phycol 36:1119–1128
Sarma VVSS, Abe O, Hashimoto S, Hinuma A, Saino T (2005) Seasonal variations in triple oxygen isotopes and gross oxy-gen production in the Sagami Bay, central Japan. Limnol Oceanogr 50:544–552
Sarma VVSS, Abe O, Hashimoto S, Hinuma A, Saino T (2006) Short-term variation of triple oxygen isotopes and gross oxygen production in the Sagami Bay, central Japan. Limnol Oceanogr 51:1432–1442
Schofield O, Kroon BMA, Prezelin BB (1995) Impact of Ultraviolet-B radiation on photosystem-II activity and its relationship to the inhibition of carbon fixation rates for Antarctic ice algae communities. J Phycol 31:703–715
Schreiber U, Schliwa U, Bilger W (1986) Continuous recording of photochemical and non-photochemical chlorophyll fluo-rescence quenching with a new type of modulation fluorom-eter. Photosynth Res 10:51–62
Schreiber U, Hormann H, Neubauer C, Klughammer C (1995) Assessment of photosystem II photochemical quantum yield by chlorophyll fluorescence quenching analysis. Aust J Plant Physiol 22:209–220
Schumann A, Goss R, Torsten J, Wilhelm C (2007) Investigation of the quenching efficiency of diatoxanthin in cells of Phaeodactylum tricornutum (Bacillariophyceae) with differ-ent pool sizes of xanthophyll cycle pigments. Phycologia 46:113–117
Sakshaug E, Bricaud A, Dandonneau Y, Falkowski P, Keifer D, Legendre L, Morel A, Parslow J, Takahashi M (1997) Parameters of photosynthesis: definitions, theory and inter-pretation of results. J Plankton Res 19:1637–1670
Schreiber U, Bilger W, Neubauer C (1994) Chlorophyll fluo-rescence as a nonintrusive indicator for rapid assessment of in vivo photosynthesis. Plant Phys. And Biochem 100: 49–70
Serôdio J (2003) A chlorophyll fluorescence index to estimate short-term rates of photosynthesis by intertidal microphyto-benthos. J Phycol 39:33–46
Serôdio J (2004) Analysis of variable chlorophyll fluorescence in microphytobenthos assemblages: implications of the use of depth-integrated measurements. Aquat Microb Ecol 36:137–152
Schreiber U, Gademann R, Ralph PJ, Larkum AWD (1997) Assessment of Photosynthetic Performance of Prochloron in Lissoclinum patella in hospite by chlorophyll fluorescence measurements. Plant Cell Phys 38:945–951
Serôdio J, Catarino F (2000) Modelling the primary productivity of intertidal microphytobenthos: time scales of variability and effects of migratory rhythms. Mar Ecol Prog Ser 192:13–30
Serôdio J, Marques da Silva J, Catarino F (1997) Non destruc-tive tracing of migratory rhythms of intertidal benthic microalgae using in vivo Chlorophyll a fluorescence. J Phycol 33:542–553
Serôdio J, da Silva JM, Catarino F (1998) Relationship between chlorophyll fluorescence quenching and O
2 evolution in
microalgae. In: Garab G (ed) Photosynthesis: mechanisms and effects, vol V. Kluwer, Dordrecht, pp 4109–4112
Serôdio J, Marques da Silva J, Catarino F (2001) Use of in vivo chlorophyll a fluorescence to quantify short-term variations in the productive biomass of intertidal microphytobenthos. Mar Ecol Prog Ser 218:45–61
Serôdio J, Cruz S, Vieira S, Brotas V (2005) Non-photochemical quenching of chlorophyll fluorescence and operation of the xanthophyll cycle in estuarine microphytobenthos. J Exp Mar Biol Ecol 326:157–169
Serôdio J, Vieira S, Cruz S, Coelho H (2006a) Rapid light-response curves of chlorophyll fluorescence in microalgae: relationship to steady-state light curves and non-photochem-ical quenching in benthic diatom-dominated assemblages. Photosynth Res 90:29–43
Serôdio J, Coelho H, Vieira S, Cruz S (2006b) Microphytobenthos vertical migratory photoresponse as characterised by light-response curves of surface biomass. Est Coast Shelf Sci 68:547–556
Serôdio J, Vieira S, Barroso F (2007) Relationship of variable chlorophyll fluorescence indices to photosynthetic rates in microphytobenthos. Aquat Microb Ecol 49:71–85
Serôdio J, Vieira S, Cruz (2008) Photosynthetic activity, photo-protection and photoinhibition in intertidal microphytoben-thos as studied in situ using variable chlorophyll fluorescence. Cont Shelf Res 28:1363–1375
Silva J, Santos R, Serôdio J, Melo RA (1998) Light response curves for Gelidium sesquipedale from different depths, determined by two methods: O
2 evolution and chlorophyll
fluorescence. J Appl Phycol 10:295–301Simis SGH, Tijdens M, Hoogveld HL, Gons HJ (2005) Optical
changes associated with cyanobacterial bloom termination by viral lysis. J Plankt Res 27:937–949
Suggett D, Kraay G, Holligan P, Davey M, Aiken J, Geider R (2001) Assessment of photosynthesis in a spring cyanobac-terial bloom by use of a fast repetition rate fluorometer. Limnol Oceanogr 46:802–810
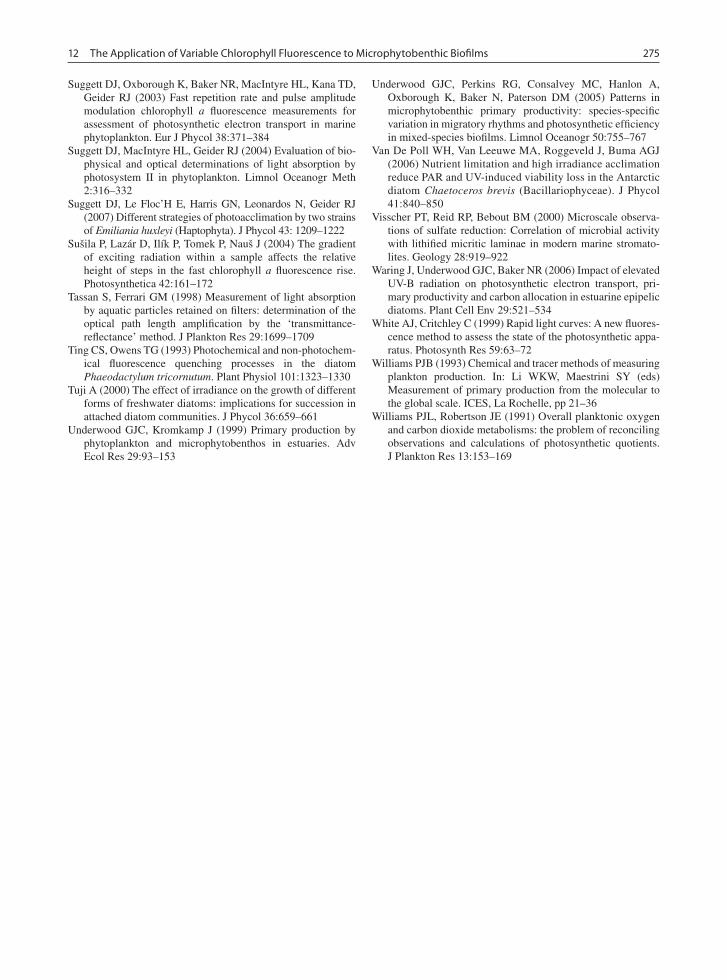
27512 The Application of Variable Chlorophyll Fluorescence to Microphytobenthic Biofilms
Suggett DJ, Oxborough K, Baker NR, MacIntyre HL, Kana TD, Geider RJ (2003) Fast repetition rate and pulse amplitude modulation chlorophyll a fluorescence measurements for assessment of photosynthetic electron transport in marine phytoplankton. Eur J Phycol 38:371–384
Suggett DJ, MacIntyre HL, Geider RJ (2004) Evaluation of bio-physical and optical determinations of light absorption by photosystem II in phytoplankton. Limnol Oceanogr Meth 2:316–332
Suggett DJ, Le Floc’H E, Harris GN, Leonardos N, Geider RJ (2007) Different strategies of photoacclimation by two strains of Emiliania huxleyi (Haptophyta). J Phycol 43: 1209–1222
Sušila P, Lazár D, Ilík P, Tomek P, Nauš J (2004) The gradient of exciting radiation within a sample affects the relative height of steps in the fast chlorophyll a fluorescence rise. Photosynthetica 42:161–172
Tassan S, Ferrari GM (1998) Measurement of light absorption by aquatic particles retained on filters: determination of the optical path length amplification by the ‘transmittance-reflectance’ method. J Plankton Res 29:1699–1709
Ting CS, Owens TG (1993) Photochemical and non-photochem-ical fluorescence quenching processes in the diatom Phaeodactylum tricornutum. Plant Physiol 101:1323–1330
Tuji A (2000) The effect of irradiance on the growth of different forms of freshwater diatoms: implications for succession in attached diatom communities. J Phycol 36:659–661
Underwood GJC, Kromkamp J (1999) Primary production by phytoplankton and microphytobenthos in estuaries. Adv Ecol Res 29:93–153
Underwood GJC, Perkins RG, Consalvey MC, Hanlon A, Oxborough K, Baker N, Paterson DM (2005) Patterns in microphytobenthic primary productivity: species-specific variation in migratory rhythms and photosynthetic efficiency in mixed-species biofilms. Limnol Oceanogr 50:755–767
Van De Poll WH, Van Leeuwe MA, Roggeveld J, Buma AGJ (2006) Nutrient limitation and high irradiance acclimation reduce PAR and UV-induced viability loss in the Antarctic diatom Chaetoceros brevis (Bacillariophyceae). J Phycol 41:840–850
Visscher PT, Reid RP, Bebout BM (2000) Microscale observa-tions of sulfate reduction: Correlation of microbial activity with lithified micritic laminae in modern marine stromato-lites. Geology 28:919–922
Waring J, Underwood GJC, Baker NR (2006) Impact of elevated UV-B radiation on photosynthetic electron transport, pri-mary productivity and carbon allocation in estuarine epipelic diatoms. Plant Cell Env 29:521–534
White AJ, Critchley C (1999) Rapid light curves: A new fluores-cence method to assess the state of the photosynthetic appa-ratus. Photosynth Res 59:63–72
Williams PJB (1993) Chemical and tracer methods of measuring plankton production. In: Li WKW, Maestrini SY (eds) Measurement of primary production from the molecular to the global scale. ICES, La Rochelle, pp 21–36
Williams PJL, Robertson JE (1991) Overall planktonic oxygen and carbon dioxide metabolisms: the problem of reconciling observations and calculations of photosynthetic quotients. J Plankton Res 13:153–169