a voltammetric flavin microelectrode for use in biofilms
TRANSCRIPT
A VOLTAMMETRIC FLAVIN MICROELECTRODE FOR USE INBIOFILMS
Hung Duc Nguyena, Ryan Renslowa, Jerome Babautaa, Bulbul Ahmeda, and HalukBeyenala,*
aThe Gene and Linda Voiland School of Chemical Engineering and Bioengineering, WashingtonState University, Pullman, WA, United States of America
AbstractBiofilms used in bioelectrochemical systems are expected to transfer electrons using electrontransfer mediators. One mediator type, flavins, which includes flavin mononucleotide, riboflavin,and flavin adenine dinucleotide, has been found to be endogenously produced by Shewanellaoneidensis MR-1. However, the presence and concentration of flavins inside a S. oneidensis MR-1biofilm have never been reported. The goal of this study was to develop a flavin microelectrodecapable of measuring flavins inside a living biofilm and apply it to a biofilm which producesflavins. Because flavins are electrochemically active molecules, the flavin microelectrode wasbased on detection via square-wave voltammetry. The microelectrode consisted of a carbonworking electrode with a 10–30 μm tip diameter, a built-in platinum counter electrode, and a Ag/AgCl reference electrode, all enclosed in a glass outer case. The microelectrode was calibratedbetween 0.1 μM and 10 μM flavins and showed a linear correlation between flavin concentrationand peak currents located at −424 mVAg/AgCl on a square-wave voltammogram. We alsodeveloped a model to explain the electrochemical mechanism of flavin detection, and to determinethe effective surface area of the microelectrode, the standard reduction potential, and the transfercoefficient. We found that the effective surface area of the microelectrode was close to 100 timesthe projected surface area. The model predicted a standard reduction potential for RF/RFH2 of−419 mVAg/AgCl at 20 °C and a transfer coefficient of 0.45. Lastly, we measured flavinconcentration inside a S. oneidensis MR-1 biofilm grown on a glass surface using oxygen as theelectron acceptor. The flavin concentration reached 0.7 μM, increasing near the bottom of thebiofilm, where no oxygen was present. This shows the possibility that flavins are produced in theanaerobic zone to act as intermediate electron acceptors in the deeper parts of the biofilm, wherethere is no oxygen.
Keywordsmicroelectrode; flavin; riboflavin; biofilm; electron transfer; mediator
© 2011 Elsevier B.V. All rights reserved.*Corresponding author. Mailing address: The Gene and Linda Voiland School of Chemical Engineering and Bioengineering,Washington State University, 118 Dana Hall Spokane St., P.O. Box 642710, Pullman, WA 99164-2710, Phone: (509) 335-6607, Fax:(509) 335-4806.Publisher's Disclaimer: This is a PDF file of an unedited manuscript that has been accepted for publication. As a service to ourcustomers we are providing this early version of the manuscript. The manuscript will undergo copyediting, typesetting, and review ofthe resulting proof before it is published in its final citable form. Please note that during the production process errors may bediscovered which could affect the content, and all legal disclaimers that apply to the journal pertain.
NIH Public AccessAuthor ManuscriptSens Actuators B Chem. Author manuscript; available in PMC 2013 January 3.
Published in final edited form as:Sens Actuators B Chem. 2012 January 3; 161(1): 929–937. doi:10.1016/j.snb.2011.11.066.
NIH
-PA Author Manuscript
NIH
-PA Author Manuscript
NIH
-PA Author Manuscript
1. IntroductionMicroelectrodes have played a significant role in the expanding field of biofilm research. Todate, microelectrodes have been used to measure numerous chemical species andmicroenvironment properties in biofilms, such as dissolved oxygen and pH. [1–6].Microelectrodes have many advantages in biofilm research: microelectrodes are 1) able tomeasure microscale and high-temporal resolution profiles, 2) able to respond quickly, 3)capable of taking measurements in live biofilms, and 4) minimally invasive—they do notimpact biofilm structure. It is well accepted that understanding biofilm microenvironmentsand microscale phenomena is the key to controlling and manipulating biofilms at themacroscale, as these microenvironments are the primary source of the advantages of biofilmformation over the planktonic mode [4].
Recently, a significant amount of research has focused on microbial fuel cells (MFCs) andbioelectrochemical systems (BESs), which utilize the ability of some bacterial biofilms totransfer and/or accept extracellular electrons [7, 8]. These devices have been studied becauseof their potential role in 1) niche energy applications, such as powering remote sensors andaquatic instruments [9–12], and 2) the production of high-value molecules such as hydrogen,1,3-propanediol, and ethanol [7, 13–15]. These technologies utilize biofilms comprised of aclass of microorganisms termed electrochemically active bacteria (EAB), which have beenfound to possess the ability to use insoluble conducting surfaces, via extracellular electrontransfer (EET), as terminal electron acceptors for respiration or as electron donors for energy[16–19]. EET is one of the microscale phenomena in these biofilms that is still not wellunderstood, and it is an important key for making BES and MFC technologies commericallyviable. This is because research has shown that EET plays an important role in the chemicalmicroenvironments of electrochemically active biofilms, affecting microscaleelectrochemical gradients, pH, chemical concentrations, and metabolic rates [16, 20].Furthermore, EET from electrochemically active biofilms has been proposed to causecertain types of metal corrosion and the solubilization of solid Fe(III) minerals [21, 22].Thus, understanding EET may have an impact on a wide array of research areas.
The mechanisms by which EET occurs are not currently fully known, but one identifiedmechanism is electron mediation. Electron mediation occurs by the following steps: 1)terminal electrons from the electron transport chain are first transported to the cell surfacevia a pathway of redox-active proteins and low molecular weight compounds, 2) theelectrons are then passed to electron mediators, most likely utilizing outer-membranecytochromes as intermediaries, 3) the reduced electron mediators are transported to a solidelectron acceptor such as insoluble oxides or an anode, where 4) they finally are oxidizedand transfer the electrons. Electron mediators have been found to be low molecular weightorganic molecules which are shuttled between the electrochemically active cells and theelectrode by diffusive, advective, and/or electromigrative transport [23]. Scientific studieshave revealed that EABs can utilize both exogenous (added) or endogenous (self-produced)mediators for EET [24]. In some cases endogenous mediators are used to accept electrons indeeper locations in biofilms where there is no oxygen. One mediator type that has beenfound to play a role in EET is flavins [25–29].
Flavins are electrochemically active organic compounds featuring a tricyclic ring dimethylisoalloxazine skeleton with a substituent off the center ring nitrogen (10 position) [30].Three flavins, shown in Figure 1, have been studied for their role in biofilm EET: flavinmononucleotide (FMN), riboflavin (RF), and flavin adenine dinucleotide (FAD). The flavinmoiety can undergo a two-step redox reaction. When fully oxidized, or in the flavoquinoneform, it can undergo a single-electron reduction to the flavosemiquinone form and then a
Nguyen et al. Page 2
Sens Actuators B Chem. Author manuscript; available in PMC 2013 January 3.
NIH
-PA Author Manuscript
NIH
-PA Author Manuscript
NIH
-PA Author Manuscript
second single-electron reduction to the flavohydroquinone form. As an example, this isshown for RF, but the reaction form is identical for all of the flavins:
Equation1
Equation2
It has been found that flavosemiquinones generally only exist in solution in a lowconcentration (around 2% [31], although they were previously believed to be present inmuch higher concentrations [32]), as they are rapidly converted through the fast reaction oftwo flavosemiquinones to one flavoquinone and one flavohydroquinone [33]:
Equation3
Furthermore, the full reduction of flavoquinones to flavohydroquinones is very rapid andcan be considered a single two-electron reduction step as shown:
Equation4
S. oneidensis MR-1 has recently been found to produce actively secreted flavins, particularlyRF and FMN, as endogenous electron shuttles [25, 26, 29, 34–36]. Von Canstein et al. foundthat both FMN and RF were excreted by S. oneidensis MR-1 and were used as an electronmediator during the reduction of Fe(III) oxides[29]. Marsili et al. also detected the secretionof flavins by S. oneidensis cells and confirmed their electron mediator activity [26].Velasquez-Orta et al. found that flavin concentrations increased continuously in the bulkliquid of S. oneidensis MFCs, with FMN as the predominant flavin [36]. In their study,MFCs that were operated with membranes that restricted cell contact with the anode stillproduced current, highlighting the ability of flavins to mediate EET to remote electrodes,without the cells having direct access to the surface. Furthermore, they showed that whenexogenous flavins were added to the MFC both current and power output increased.Covington et al. also confirmed the presence of endogenous flavins in S. oneidensis cultures[25]. They hypothesized that FAD was produced inside the cell and then converted to FMNin the periplasmic space, after which the FMN diffused through outer-membrane porins.Once outside the cell, a fraction of the FMN underwent spontaneous conversion to RF,allowing both FMN and RF to be detected.
Flavins have primarily been detected in biofilm research via high–performance liquidchromatography (HPLC) [25, 29, 36–40], liquid chromatography–mass spectrometry (LC–MS) [26], cyclic voltammetry (CV) [26, 41, 42], or differential voltammetry [43]. Othermethods used to detect flavins include polarography [44, 45], flow injection analysis withfluorescence [46], square–wave voltammetry (SWV) using a mercury drop electrode [47],and spectrofluorimetry [48, 49]. Most of these methods require extracted liquid samples, andthe analyzed data therefore represent the macroscale or bulk concentrations. To date,analysis of flavins inside a biofilm has never been performed in situ. This is critical fordetermining the limitations of EET in MFCs and BESs and understanding the role of flavinsas EET mediators.
Our goal was to develop a microelectrode capable of measuring flavins inside a livingbiofilm. Flavins are electrochemically active molecules and are therefore detectable usingelectroanalytical methods, such as voltammetry. The flavin microelectrode is based on
Nguyen et al. Page 3
Sens Actuators B Chem. Author manuscript; available in PMC 2013 January 3.
NIH
-PA Author Manuscript
NIH
-PA Author Manuscript
NIH
-PA Author Manuscript
detection via square-wave voltammetry, which is one of the most sensitive voltammetrictechniques: it is much more sensitive than CV due to its ability to minimize charging current[50, 51]. SWV utilizes a potential square wave superimposed on a staircase sweep, and theSWV signal is comprised of the difference between the current measured at the end of thepeak potential and that measured at the end of the trough potential. We developed andoptimized a flavin microelectrode for use in biofilms and tested it in a S. oneidensis MR-1biofilm.
2. Materials and methods2.1. Operational principles of the flavin microelectrode
Our flavin microelectrode works by performing SWV on a glass-covered carbon wire usinga Reference 600™ potentiostat (Gamry® Instruments, Warminster, PA, USA). Only the wiretip (10–30 μm diameter) is exposed, acting as the working electrode, as shown in Figure 2.During the experiment, the microelectrode is scanned from +700 mVAg/AgCl to −700mVAg/AgCl. Note that all potentials in this study are given against a saturated Ag/AgClreference electrode. We begin at +700 mVAg/AgCl to insure that all flavins near the surfaceof the electrode are fully oxidized to the flavoquinone form, which is generally the case forthe bulk solution under aerobic conditions. This is because the standard redox potentials offlavins are located around −400 mVAg/AgCl, and any potential more positive than this willbegin to oxidize any flavohydroquinones present near the electrode surface. When SWVbegins, flavins will therefore not produce any current signal. Upon approaching −400mVAg/AgCl, the characteristic peak of flavin species will appear, as flavoquinones undergothe reaction exemplified by RF in Equation 4. The actual standard reduction potentialdepends on the flavin(s) present, and the characteristic peak height center of the SWVvoltammogram will match that potential. However, using SWV to discriminate betweendifferent flavins is not practical as the standard reduction potentials of the various flavinsonly differ by a few millivolts. Furthermore, standard reduction potentials can shift slightlyin biofilms. Determining flavin type using SWV is not possible, as the differential currentpeaks are not distinguishable. Thus, the differential current peak height is proportional to thetotal flavin concentration.
2.2. Flavin microelectrode constructionFigure 2 shows a diagram of the constructed flavin microelectrode. The flavinmicroelectrode is composed of a carbon wire working electrode, a platinum wire counterelectrode, and a Ag/AgCl reference electrode encompassed in a Pasteur pipette.
2.2.1. Making the glass capillary—A glass capillary is used to cover the carbon wire inorder to isolate it from the KCl electrolyte solution surrounding the reference and counterelectrodes. The glass capillary is made from Corning 8161 premium patch clamp glass(Model #: G86165T-4, Warner Instruments, Hamden, CT, USA). Its relatively low softeningtemperature of 600 °C allows for easy pulling and complete embracement of the carbonwire. The glass tube is pulled over a propane torch flame by hand to form a capillary. Thecapillary is cut in the middle to separate the two sides of pulled glass, creating twocapillaries.
2.2.2. Covering the carbon wire with glass—The carbon wire is a 30 μm diameterelectrochemically activated carbon fiber (Catalog #: C3005, World Precision Instruments,Sarasota, FL, USA). A ~5 cm long piece of wire is inserted into one of the glass capillaries,leaving 1 cm of carbon wire exposed at the end to be soldered to a copper wire. A custom-made microelectrode puller with an O-shaped electrical resistance heating element, shown inFigure 4.28 of Lewandowski and Beyenal[4], is used to melt and pull the glass around the
Nguyen et al. Page 4
Sens Actuators B Chem. Author manuscript; available in PMC 2013 January 3.
NIH
-PA Author Manuscript
NIH
-PA Author Manuscript
NIH
-PA Author Manuscript
carbon wire. The heat is applied ~1 cm below the carbon wire tip inside the capillary, whichallows the glass to flow down slowly and uniformly to cover the carbon wire. Because of thehigh temperatures present during the glass pulling, the carbon wire tip is partially burnedand the tip diameter is therefore generally smaller than the starting 30 μm.
A diamond grinding wheel (Narishige, model EG-4) is used to remove glass from the tip ofthe carbon wire in order to expose it. Micromanipulators are used to control the capillary,and a stereomicroscope (Stemi 2000, Carl Zeiss MicroImaging GmbH, Göttingen, Germany)is used to monitor progress. Part of the carbon wire is also ground away, to refresh theburned tip and increase electrochemical activity. The final tip diameter is between 10 μmand 30 μm. The larger the diameter, the lower the detection limit will be. The tip of thecarbon wire is then gently rinsed with nanopure water to remove glass and carbon particlesaccumulated during the grinding.
2.2.3. Making the outer case—The outer case is constructed from a borosilicate glassPasteur pipette (Catalog #: 22-183-632, Fisher Scientific, Pittsburgh, PA, USA). The base ofthe pipette is cut so that the pipette is ~9 cm long, and the cut end is fire-polished with apropane torch, keeping the rough edge in the flame until the edge of the glass is smooth. Tomake the outer diameter of the electrode small enough to be useful in probing biofilms andto allow for enough space for an agar salt bridge, the outer case is tapered down to a 100 μmtip diameter. This is achieved by using the O-shaped heating element of the micropipettepuller. The pipette is lowered by a micromanipulator to the tapered region to start thenecking down process. Heat is applied until the glass begins to melt and the pipette begins todrop; then the heat delivery is quickly stopped. The pipette is then pulled back up to the nextnecked position. This sequence is repeated until the pipette tip is a few hundred microns indiameter. For the final thinning of the tip we use a smaller heating element, made of a 100μm Pt wire, powered by a DC power supply (Model HY3005, RSR Electronics, Rahway,New Jersey, USA). We repeat the procedure for thinning the tip, applying the heat andstopping the current flow through the heating element when the pipette begins to drop.Usually just two applications of this procedure are enough to produce tip diameters less than100 μm. Finally, using a micromanipulator, the tip of the outer case is broken under a 40×microscope by jamming it against a glass ball which has been made on the tip of a Pasteurpipette. Jamming the casing into the glass ball is continued until the tip of the outer case is~100 μm in diameter.
2.2.4. Making the silver/silver chloride reference electrode—An 8 cm length ofsilver wire (0.25 mm diameter, ≥99.99% pure, Product #: 327034, Sigma-Aldrich, St. Louis,MO, USA) is polished using very fine 220 grit silicon carbide sandpaper (Ace Hardware,Pullman, WA, USA) and then rinsed with nanopure water. The silver wire and a 10 cmgraphite rod cathode (Product #: 496545, Sigma-Aldrich, St. Louis, MO, USA) are dippedinto a 0.1 M HCl solution and connected to a DC power supply (Model HY3005, RSRElectronics, Rahway, New Jersey, USA) at 0.5 V DC for 24 hours. The finished silver/silverchloride wire is rinsed with nanopure water.
2.2.5. Final assembly of the flavin microelectrode—The carbon wire microelectrodeand the outer case are assembled under 40× microscope magnification using manipulators.The carbon wire working electrode is inserted into the casing, with the tip positioned ~400μm outside the casing tip. It is then glued to the casing using five-minute epoxy near thefire-polished end. At least two hours are provided so that the drying process is completedand the bond between the two glass walls is strongly formed.
A salt bridge is used to separate the working electrode from the reference and counterelectrodes. In order to form the salt bridge, an agar (R-2A agar, Product #: 17209, Sigma-
Nguyen et al. Page 5
Sens Actuators B Chem. Author manuscript; available in PMC 2013 January 3.
NIH
-PA Author Manuscript
NIH
-PA Author Manuscript
NIH
-PA Author Manuscript
Aldrich, St. Louis, MO, USA) and 0.1 M Na2SO4 (reagent grade, Sigma-Aldrich, St. Louis,MO, USA) solution is first boiled and then allowed to cool to ~50 °C. This insures that theair bubbles inside the agar have disappeared. It is then applied inside the tip of the casing toa thickness of 1–1.5 mm, using a custom-made plastic capillary [4]. The agar salt bridgebecomes solid after 10 minutes. Note that if the agar is applied directly after boiling, airbubbles will form, which will make the salt bridge less conductive and ultimately causeoverflow current during use. If the temperature of the agar is too low during application, theagar will solidify too quickly, making it difficult to apply. The outer case is then filled withthe electrolyte filling solution: saturated KCl saturated with AgCl (Fisher Scientific,Pittsburgh, PA, USA). Finally, the silver/silver chloride reference electrode and counterelectrode (two twisted 100 μm platinum wires, 99.9999% pure, catalog #21884, CaliforniaFine Wire Company, Grover Beach, CA, USA) are inserted and glued using five-minuteepoxy.
2.3. Microelectrode preconditioningIn order to enhance the signal, the microelectrode is preconditioned. We usechronoamperometry and CV to pretreat the flavin microelectrode, following these steps: 1)the clean microelectrode is polarized at a potential of +1800 mVAg/AgCl for 300 s in a 10mM phosphate buffer (0.5075 g/L NaH2PO4 and 0.8195 g/L Na2HPO4). Then CV isperformed at 100 mV/s from −800 mVAg/AgCl to +1000 mVAg/AgCl in the same solution for30 cycles. The purpose of the preconditioning step is to create hydroxyl functional groups onthe carbon surface [52–54]:
Equation5
Hydroxyl functional groups increase the number of active sites for flavin oxidation/reduction at the electrode surface and enhance the electron transfer capacity [54].Additionally, previous studies have shown that the electrode surface structure becomes moreporous after such treatment and the effective electrode surface area increases [54, 55]. Theflavin microelectrode can be regenerated by repeating the preconditioning. We obtainedreproducible calibration curves after each use. A similar procedure was used by Brendel andLuther (1995) [2].
2.4. Calibration and optimizationSquare-wave parameters, including equilibrium time, pulse potential, and scan frequency,are optimized in a 5 μM riboflavin solution to hone the microelectrode sensitivityspecifically for flavins, similar to the approach used by Çakir et al. [47]. The flavinmicroelectrode is calibrated in riboflavin solutions with concentrations ranging from 10−7 Mto 10−5 M. Riboflavin powder (Catalog #: R4500, Sigma-Aldrich, St. Louis, MO, USA) isdiluted in the biofilm growth medium and used for both the optimization and the calibration[56].
2.5. Dissolved oxygen microelectrodeWe followed the procedures described by Lewandowski and Beyenal to construct andcalibrate a dissolved oxygen microelectrode [4]. The microelectrode had a tip diameter of 15μm and was calibrated in sodium sulfite (Catalog #: 31454, Sigma-Aldrich, St. Louis, MO,USA) for the zero oxygen concentration and in air-bubbled nanopure water for the saturatedoxygen concentration.
Nguyen et al. Page 6
Sens Actuators B Chem. Author manuscript; available in PMC 2013 January 3.
NIH
-PA Author Manuscript
NIH
-PA Author Manuscript
NIH
-PA Author Manuscript
2.6. Biofilm growthS. oneidensis MR-1 biofilms were grown on glass coverslips using a constant depth filmfermenter (CDFF) as described by Renslow et al. [56].
2.7. Microelectrode measurements and data analysisThe biofilms were harvested from the CDFF and placed in a sterile Petri plate filled withgrowth medium at 20 °C. A flavin microelectrode and a dissolved oxygen microelectrodewere used to measure concentration profiles near the center of a large cell cluster in thebiofilm. The movement of the microelectrode was managed using a precision linear actuator(PI M-230.10S, Physik Instrumente, Auburn, MA, USA) controlled using custom-madeLabVIEW software (National Instruments, Austin, TX, USA). The microelectrodemeasurements started in the bulk liquid, penetrated into the biofilm and stopped at thebottom of the biofilm. The setup is shown in Figure 3. For the oxygen profile measurement,the microelectrode was moved downwards from the bulk phase to the MR-1 biofilm by astep size of 10 μm. For each flavin profile measurement, the microelectrode was moveddownwards from the bulk phase to the MR-1 biofilm by a step size of 20 μm. After eachstep, the flavin microelectrode was scanned in SWV mode and the data were recorded in thecomputer with Gamry software.
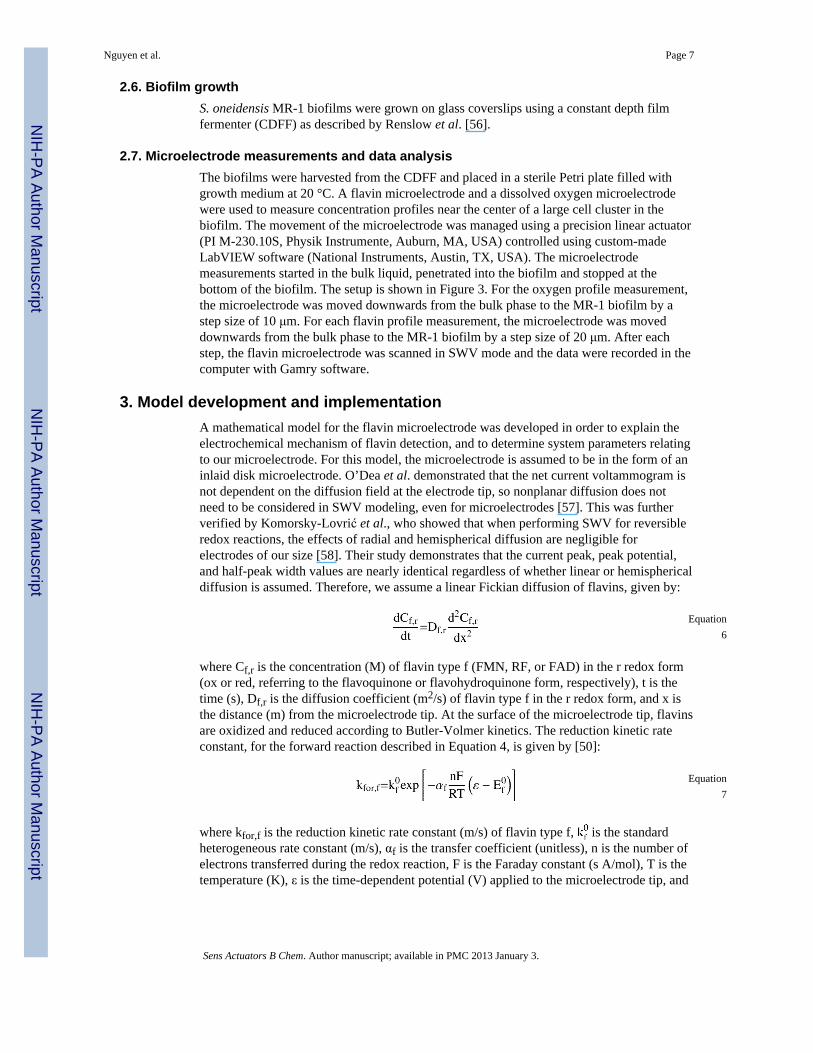
3. Model development and implementationA mathematical model for the flavin microelectrode was developed in order to explain theelectrochemical mechanism of flavin detection, and to determine system parameters relatingto our microelectrode. For this model, the microelectrode is assumed to be in the form of aninlaid disk microelectrode. O’Dea et al. demonstrated that the net current voltammogram isnot dependent on the diffusion field at the electrode tip, so nonplanar diffusion does notneed to be considered in SWV modeling, even for microelectrodes [57]. This was furtherverified by Komorsky-Lovrić et al., who showed that when performing SWV for reversibleredox reactions, the effects of radial and hemispherical diffusion are negligible forelectrodes of our size [58]. Their study demonstrates that the current peak, peak potential,and half-peak width values are nearly identical regardless of whether linear or hemisphericaldiffusion is assumed. Therefore, we assume a linear Fickian diffusion of flavins, given by:
Equation6
where Cf,r is the concentration (M) of flavin type f (FMN, RF, or FAD) in the r redox form(ox or red, referring to the flavoquinone or flavohydroquinone form, respectively), t is thetime (s), Df,r is the diffusion coefficient (m2/s) of flavin type f in the r redox form, and x isthe distance (m) from the microelectrode tip. At the surface of the microelectrode tip, flavinsare oxidized and reduced according to Butler-Volmer kinetics. The reduction kinetic rateconstant, for the forward reaction described in Equation 4, is given by [50]:
Equation7
where kfor,f is the reduction kinetic rate constant (m/s) of flavin type f, is the standardheterogeneous rate constant (m/s), αf is the transfer coefficient (unitless), n is the number ofelectrons transferred during the redox reaction, F is the Faraday constant (s A/mol), T is thetemperature (K), ε is the time-dependent potential (V) applied to the microelectrode tip, and
Nguyen et al. Page 7
Sens Actuators B Chem. Author manuscript; available in PMC 2013 January 3.
NIH
-PA Author Manuscript
NIH
-PA Author Manuscript
NIH
-PA Author Manuscript
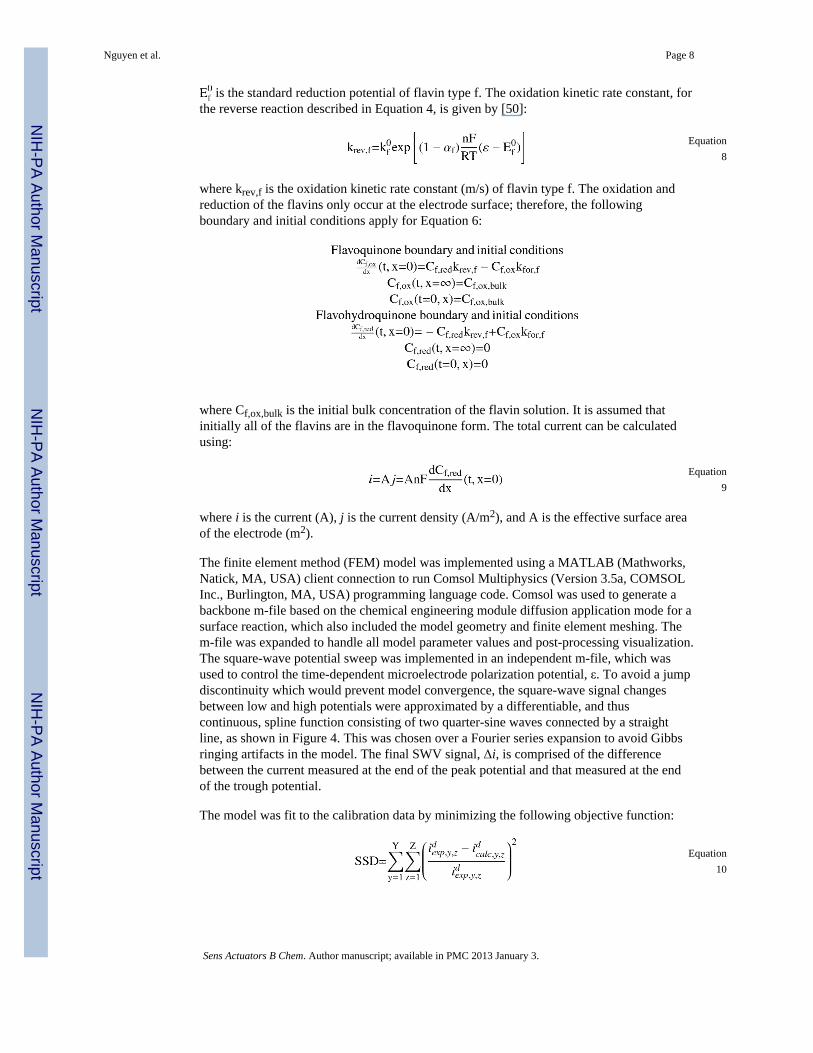
is the standard reduction potential of flavin type f. The oxidation kinetic rate constant, forthe reverse reaction described in Equation 4, is given by [50]:
Equation8
where krev,f is the oxidation kinetic rate constant (m/s) of flavin type f. The oxidation andreduction of the flavins only occur at the electrode surface; therefore, the followingboundary and initial conditions apply for Equation 6:
where Cf,ox,bulk is the initial bulk concentration of the flavin solution. It is assumed thatinitially all of the flavins are in the flavoquinone form. The total current can be calculatedusing:
Equation9
where i is the current (A), j is the current density (A/m2), and A is the effective surface areaof the electrode (m2).
The finite element method (FEM) model was implemented using a MATLAB (Mathworks,Natick, MA, USA) client connection to run Comsol Multiphysics (Version 3.5a, COMSOLInc., Burlington, MA, USA) programming language code. Comsol was used to generate abackbone m-file based on the chemical engineering module diffusion application mode for asurface reaction, which also included the model geometry and finite element meshing. Them-file was expanded to handle all model parameter values and post-processing visualization.The square-wave potential sweep was implemented in an independent m-file, which wasused to control the time-dependent microelectrode polarization potential, ε. To avoid a jumpdiscontinuity which would prevent model convergence, the square-wave signal changesbetween low and high potentials were approximated by a differentiable, and thuscontinuous, spline function consisting of two quarter-sine waves connected by a straightline, as shown in Figure 4. This was chosen over a Fourier series expansion to avoid Gibbsringing artifacts in the model. The final SWV signal, Δi, is comprised of the differencebetween the current measured at the end of the peak potential and that measured at the endof the trough potential.
The model was fit to the calibration data by minimizing the following objective function:
Equation10
Nguyen et al. Page 8
Sens Actuators B Chem. Author manuscript; available in PMC 2013 January 3.
NIH
-PA Author Manuscript
NIH
-PA Author Manuscript
NIH
-PA Author Manuscript
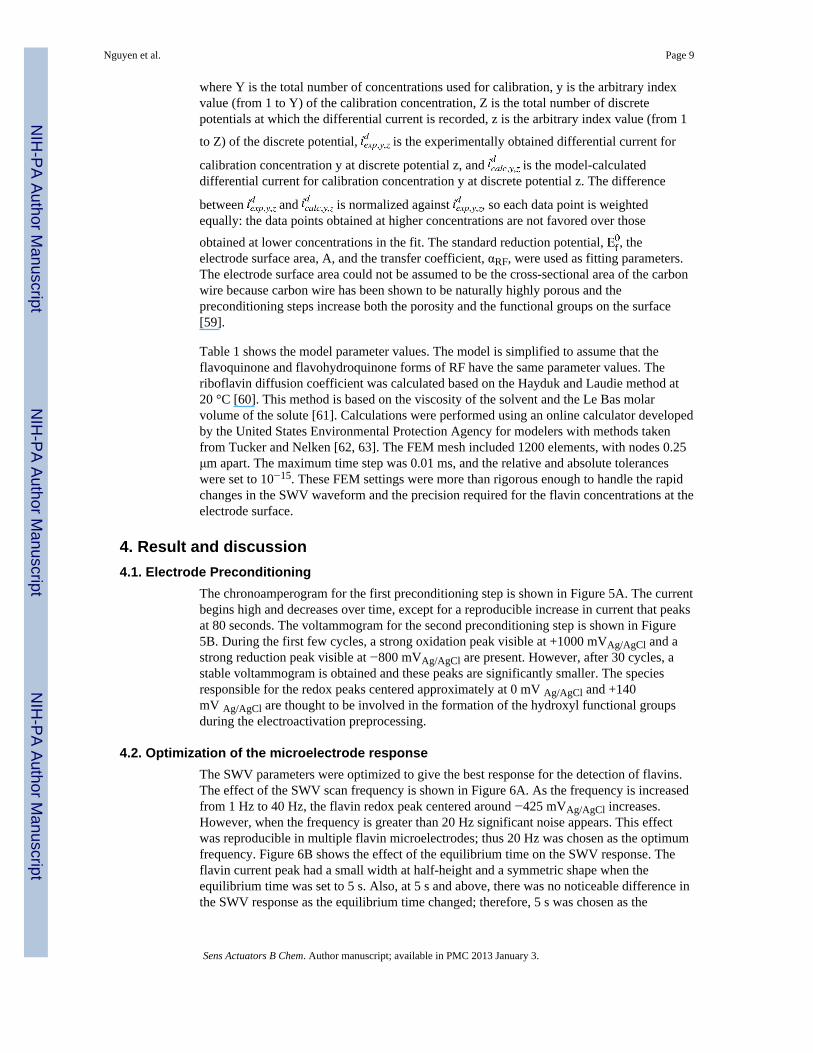
where Y is the total number of concentrations used for calibration, y is the arbitrary indexvalue (from 1 to Y) of the calibration concentration, Z is the total number of discretepotentials at which the differential current is recorded, z is the arbitrary index value (from 1
to Z) of the discrete potential, is the experimentally obtained differential current for
calibration concentration y at discrete potential z, and is the model-calculateddifferential current for calibration concentration y at discrete potential z. The difference
between and is normalized against , so each data point is weightedequally: the data points obtained at higher concentrations are not favored over thoseobtained at lower concentrations in the fit. The standard reduction potential, , theelectrode surface area, A, and the transfer coefficient, αRF, were used as fitting parameters.The electrode surface area could not be assumed to be the cross-sectional area of the carbonwire because carbon wire has been shown to be naturally highly porous and thepreconditioning steps increase both the porosity and the functional groups on the surface[59].
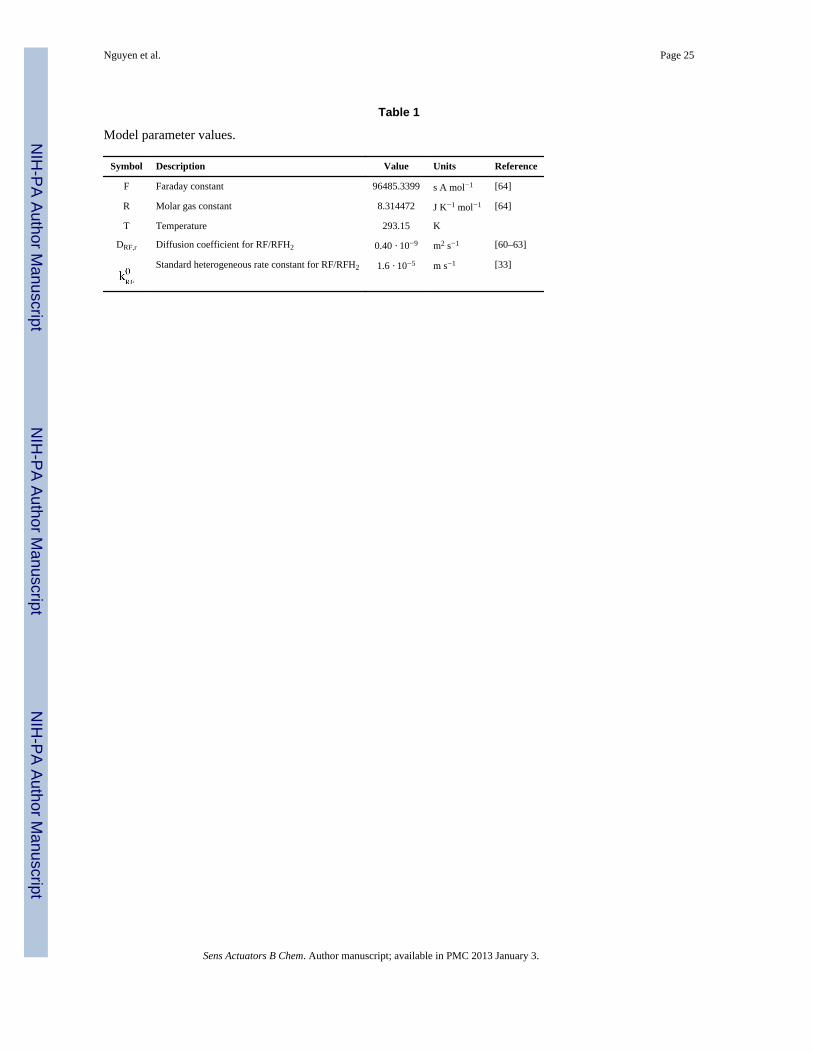
Table 1 shows the model parameter values. The model is simplified to assume that theflavoquinone and flavohydroquinone forms of RF have the same parameter values. Theriboflavin diffusion coefficient was calculated based on the Hayduk and Laudie method at20 °C [60]. This method is based on the viscosity of the solvent and the Le Bas molarvolume of the solute [61]. Calculations were performed using an online calculator developedby the United States Environmental Protection Agency for modelers with methods takenfrom Tucker and Nelken [62, 63]. The FEM mesh included 1200 elements, with nodes 0.25μm apart. The maximum time step was 0.01 ms, and the relative and absolute toleranceswere set to 10−15. These FEM settings were more than rigorous enough to handle the rapidchanges in the SWV waveform and the precision required for the flavin concentrations at theelectrode surface.
4. Result and discussion4.1. Electrode Preconditioning
The chronoamperogram for the first preconditioning step is shown in Figure 5A. The currentbegins high and decreases over time, except for a reproducible increase in current that peaksat 80 seconds. The voltammogram for the second preconditioning step is shown in Figure5B. During the first few cycles, a strong oxidation peak visible at +1000 mVAg/AgCl and astrong reduction peak visible at −800 mVAg/AgCl are present. However, after 30 cycles, astable voltammogram is obtained and these peaks are significantly smaller. The speciesresponsible for the redox peaks centered approximately at 0 mV Ag/AgCl and +140mV Ag/AgCl are thought to be involved in the formation of the hydroxyl functional groupsduring the electroactivation preprocessing.
4.2. Optimization of the microelectrode responseThe SWV parameters were optimized to give the best response for the detection of flavins.The effect of the SWV scan frequency is shown in Figure 6A. As the frequency is increasedfrom 1 Hz to 40 Hz, the flavin redox peak centered around −425 mVAg/AgCl increases.However, when the frequency is greater than 20 Hz significant noise appears. This effectwas reproducible in multiple flavin microelectrodes; thus 20 Hz was chosen as the optimumfrequency. Figure 6B shows the effect of the equilibrium time on the SWV response. Theflavin current peak had a small width at half-height and a symmetric shape when theequilibrium time was set to 5 s. Also, at 5 s and above, there was no noticeable difference inthe SWV response as the equilibrium time changed; therefore, 5 s was chosen as the
Nguyen et al. Page 9
Sens Actuators B Chem. Author manuscript; available in PMC 2013 January 3.
NIH
-PA Author Manuscript
NIH
-PA Author Manuscript
NIH
-PA Author Manuscript
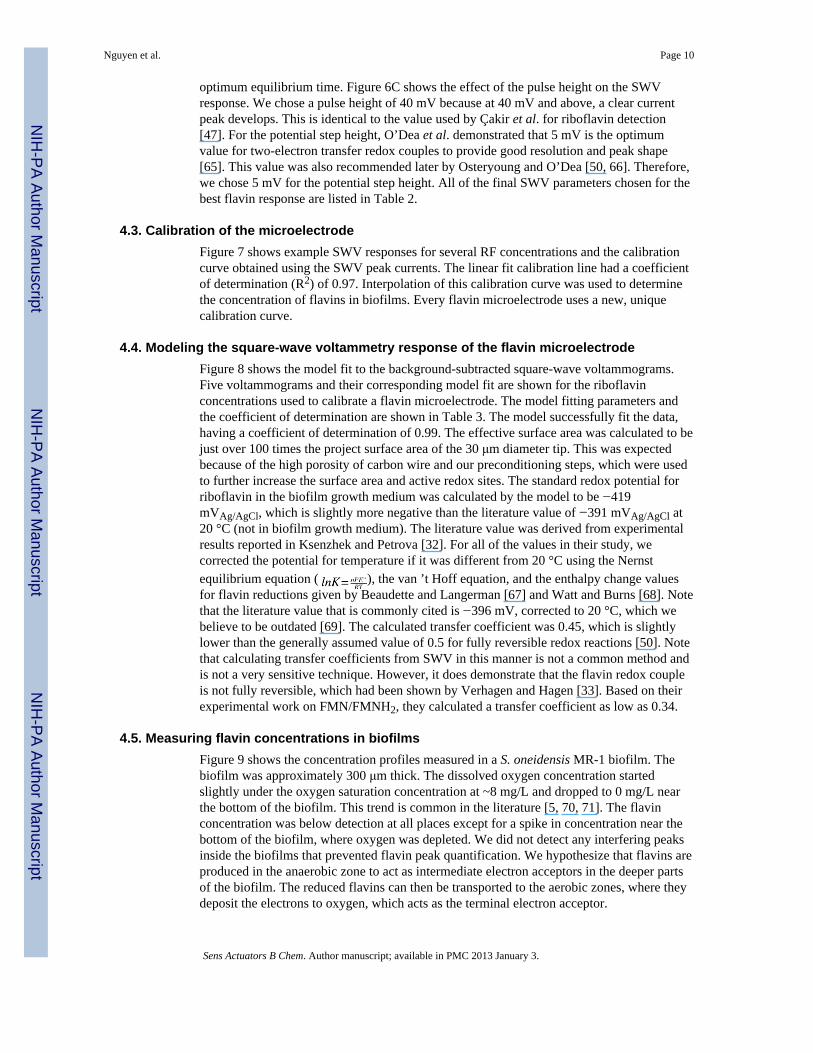
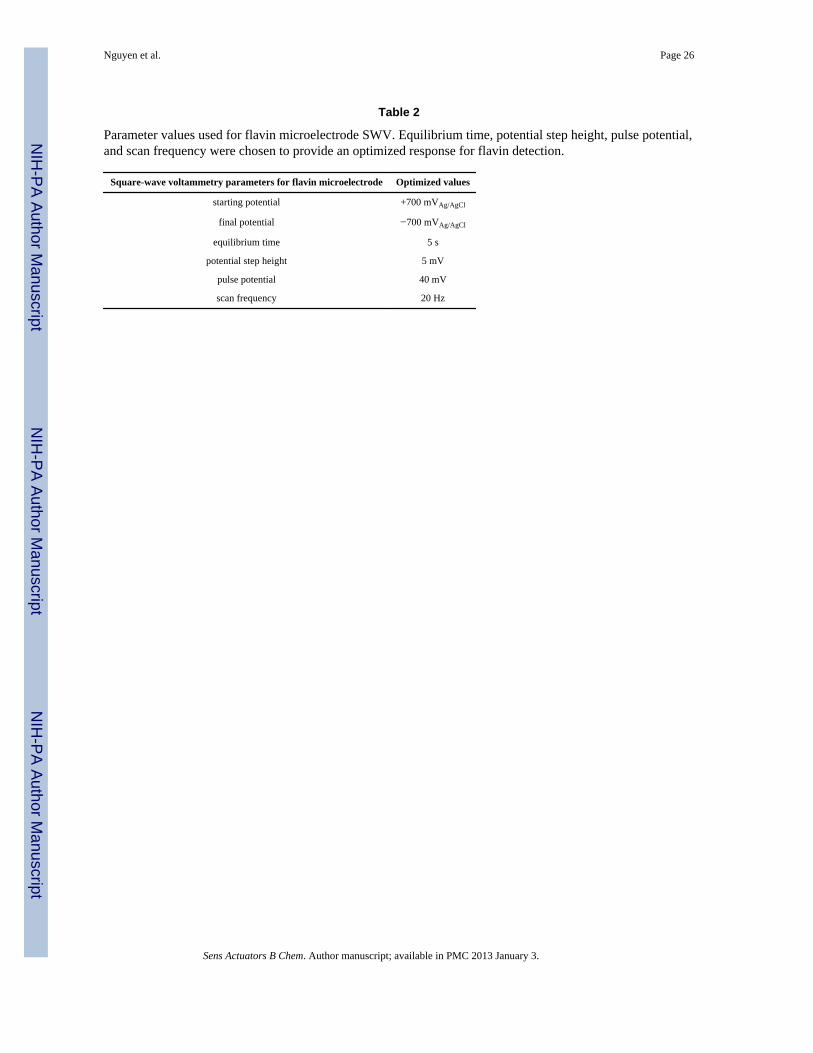
optimum equilibrium time. Figure 6C shows the effect of the pulse height on the SWVresponse. We chose a pulse height of 40 mV because at 40 mV and above, a clear currentpeak develops. This is identical to the value used by Çakir et al. for riboflavin detection[47]. For the potential step height, O’Dea et al. demonstrated that 5 mV is the optimumvalue for two-electron transfer redox couples to provide good resolution and peak shape[65]. This value was also recommended later by Osteryoung and O’Dea [50, 66]. Therefore,we chose 5 mV for the potential step height. All of the final SWV parameters chosen for thebest flavin response are listed in Table 2.
4.3. Calibration of the microelectrodeFigure 7 shows example SWV responses for several RF concentrations and the calibrationcurve obtained using the SWV peak currents. The linear fit calibration line had a coefficientof determination (R2) of 0.97. Interpolation of this calibration curve was used to determinethe concentration of flavins in biofilms. Every flavin microelectrode uses a new, uniquecalibration curve.
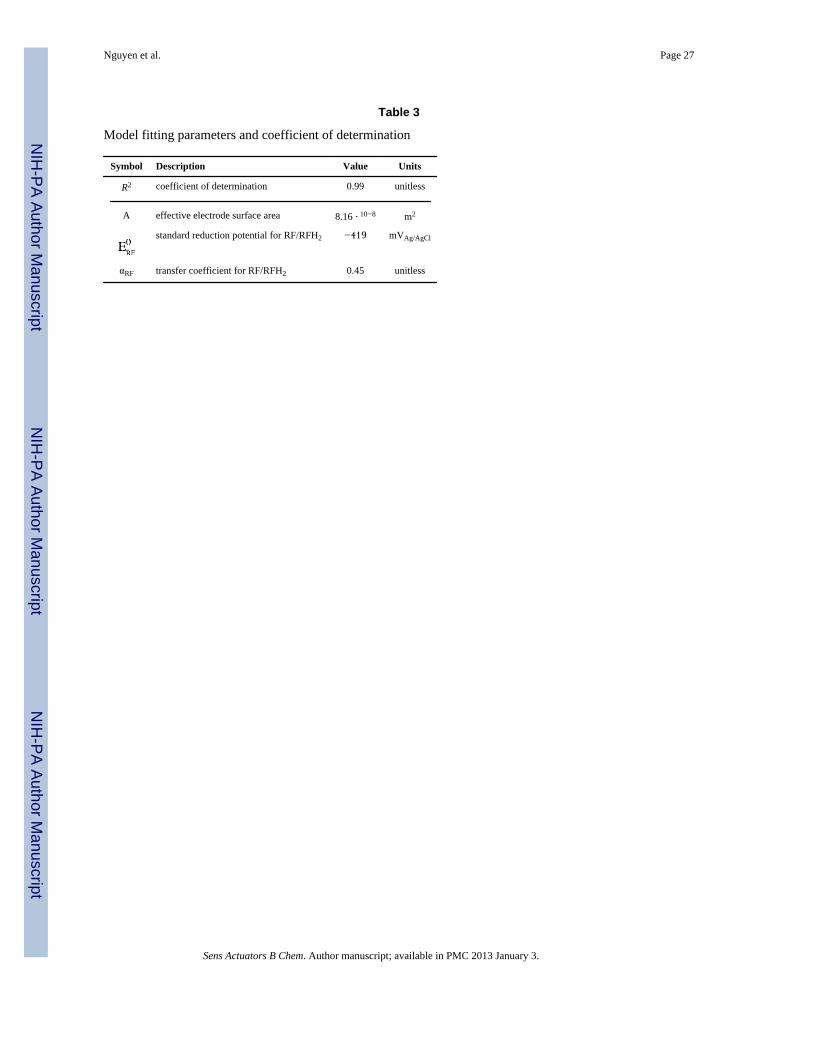
4.4. Modeling the square-wave voltammetry response of the flavin microelectrodeFigure 8 shows the model fit to the background-subtracted square-wave voltammograms.Five voltammograms and their corresponding model fit are shown for the riboflavinconcentrations used to calibrate a flavin microelectrode. The model fitting parameters andthe coefficient of determination are shown in Table 3. The model successfully fit the data,having a coefficient of determination of 0.99. The effective surface area was calculated to bejust over 100 times the project surface area of the 30 μm diameter tip. This was expectedbecause of the high porosity of carbon wire and our preconditioning steps, which were usedto further increase the surface area and active redox sites. The standard redox potential forriboflavin in the biofilm growth medium was calculated by the model to be −419mVAg/AgCl, which is slightly more negative than the literature value of −391 mVAg/AgCl at20 °C (not in biofilm growth medium). The literature value was derived from experimentalresults reported in Ksenzhek and Petrova [32]. For all of the values in their study, wecorrected the potential for temperature if it was different from 20 °C using the Nernstequilibrium equation ( ), the van ’t Hoff equation, and the enthalpy change valuesfor flavin reductions given by Beaudette and Langerman [67] and Watt and Burns [68]. Notethat the literature value that is commonly cited is −396 mV, corrected to 20 °C, which webelieve to be outdated [69]. The calculated transfer coefficient was 0.45, which is slightlylower than the generally assumed value of 0.5 for fully reversible redox reactions [50]. Notethat calculating transfer coefficients from SWV in this manner is not a common method andis not a very sensitive technique. However, it does demonstrate that the flavin redox coupleis not fully reversible, which had been shown by Verhagen and Hagen [33]. Based on theirexperimental work on FMN/FMNH2, they calculated a transfer coefficient as low as 0.34.
4.5. Measuring flavin concentrations in biofilmsFigure 9 shows the concentration profiles measured in a S. oneidensis MR-1 biofilm. Thebiofilm was approximately 300 μm thick. The dissolved oxygen concentration startedslightly under the oxygen saturation concentration at ~8 mg/L and dropped to 0 mg/L nearthe bottom of the biofilm. This trend is common in the literature [5, 70, 71]. The flavinconcentration was below detection at all places except for a spike in concentration near thebottom of the biofilm, where oxygen was depleted. We did not detect any interfering peaksinside the biofilms that prevented flavin peak quantification. We hypothesize that flavins areproduced in the anaerobic zone to act as intermediate electron acceptors in the deeper partsof the biofilm. The reduced flavins can then be transported to the aerobic zones, where theydeposit the electrons to oxygen, which acts as the terminal electron acceptor.
Nguyen et al. Page 10
Sens Actuators B Chem. Author manuscript; available in PMC 2013 January 3.
NIH
-PA Author Manuscript
NIH
-PA Author Manuscript
NIH
-PA Author Manuscript
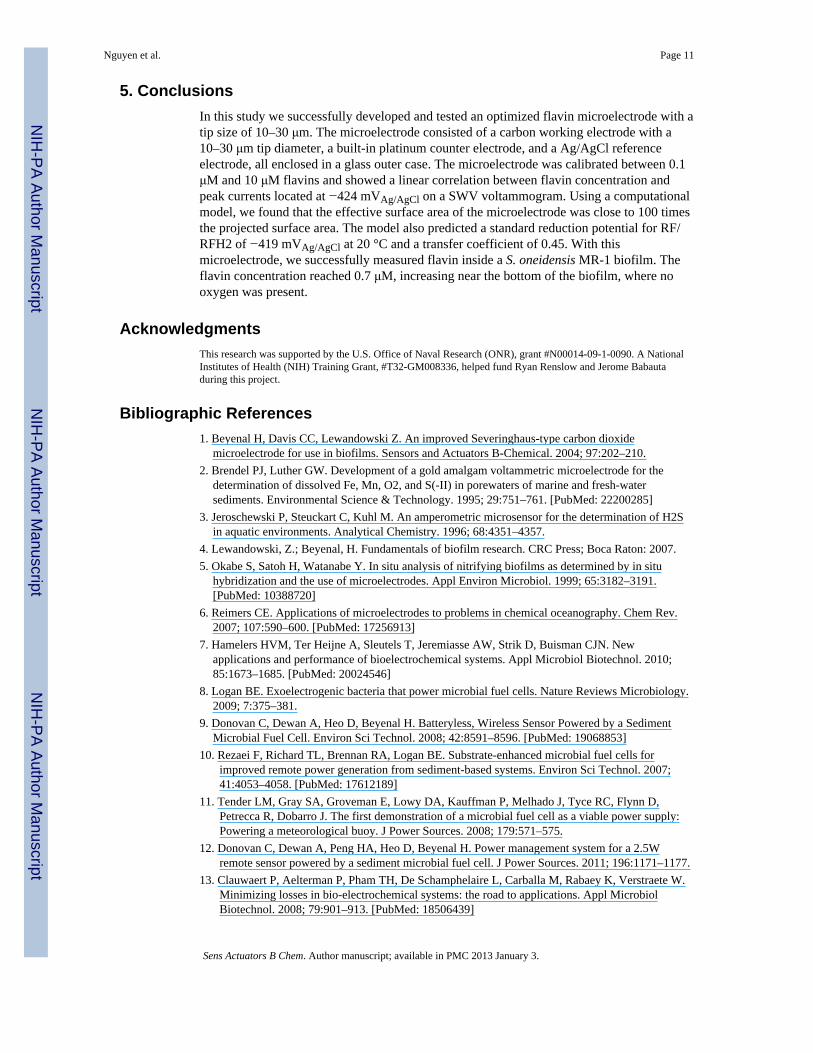
5. ConclusionsIn this study we successfully developed and tested an optimized flavin microelectrode with atip size of 10–30 μm. The microelectrode consisted of a carbon working electrode with a10–30 μm tip diameter, a built-in platinum counter electrode, and a Ag/AgCl referenceelectrode, all enclosed in a glass outer case. The microelectrode was calibrated between 0.1μM and 10 μM flavins and showed a linear correlation between flavin concentration andpeak currents located at −424 mVAg/AgCl on a SWV voltammogram. Using a computationalmodel, we found that the effective surface area of the microelectrode was close to 100 timesthe projected surface area. The model also predicted a standard reduction potential for RF/RFH2 of −419 mVAg/AgCl at 20 °C and a transfer coefficient of 0.45. With thismicroelectrode, we successfully measured flavin inside a S. oneidensis MR-1 biofilm. Theflavin concentration reached 0.7 μM, increasing near the bottom of the biofilm, where nooxygen was present.
AcknowledgmentsThis research was supported by the U.S. Office of Naval Research (ONR), grant #N00014-09-1-0090. A NationalInstitutes of Health (NIH) Training Grant, #T32-GM008336, helped fund Ryan Renslow and Jerome Babautaduring this project.
Bibliographic References1. Beyenal H, Davis CC, Lewandowski Z. An improved Severinghaus-type carbon dioxide
microelectrode for use in biofilms. Sensors and Actuators B-Chemical. 2004; 97:202–210.2. Brendel PJ, Luther GW. Development of a gold amalgam voltammetric microelectrode for the
determination of dissolved Fe, Mn, O2, and S(-II) in porewaters of marine and fresh-watersediments. Environmental Science & Technology. 1995; 29:751–761. [PubMed: 22200285]
3. Jeroschewski P, Steuckart C, Kuhl M. An amperometric microsensor for the determination of H2Sin aquatic environments. Analytical Chemistry. 1996; 68:4351–4357.
4. Lewandowski, Z.; Beyenal, H. Fundamentals of biofilm research. CRC Press; Boca Raton: 2007.5. Okabe S, Satoh H, Watanabe Y. In situ analysis of nitrifying biofilms as determined by in situ
hybridization and the use of microelectrodes. Appl Environ Microbiol. 1999; 65:3182–3191.[PubMed: 10388720]
6. Reimers CE. Applications of microelectrodes to problems in chemical oceanography. Chem Rev.2007; 107:590–600. [PubMed: 17256913]
7. Hamelers HVM, Ter Heijne A, Sleutels T, Jeremiasse AW, Strik D, Buisman CJN. Newapplications and performance of bioelectrochemical systems. Appl Microbiol Biotechnol. 2010;85:1673–1685. [PubMed: 20024546]
8. Logan BE. Exoelectrogenic bacteria that power microbial fuel cells. Nature Reviews Microbiology.2009; 7:375–381.
9. Donovan C, Dewan A, Heo D, Beyenal H. Batteryless, Wireless Sensor Powered by a SedimentMicrobial Fuel Cell. Environ Sci Technol. 2008; 42:8591–8596. [PubMed: 19068853]
10. Rezaei F, Richard TL, Brennan RA, Logan BE. Substrate-enhanced microbial fuel cells forimproved remote power generation from sediment-based systems. Environ Sci Technol. 2007;41:4053–4058. [PubMed: 17612189]
11. Tender LM, Gray SA, Groveman E, Lowy DA, Kauffman P, Melhado J, Tyce RC, Flynn D,Petrecca R, Dobarro J. The first demonstration of a microbial fuel cell as a viable power supply:Powering a meteorological buoy. J Power Sources. 2008; 179:571–575.
12. Donovan C, Dewan A, Peng HA, Heo D, Beyenal H. Power management system for a 2.5Wremote sensor powered by a sediment microbial fuel cell. J Power Sources. 2011; 196:1171–1177.
13. Clauwaert P, Aelterman P, Pham TH, De Schamphelaire L, Carballa M, Rabaey K, Verstraete W.Minimizing losses in bio-electrochemical systems: the road to applications. Appl MicrobiolBiotechnol. 2008; 79:901–913. [PubMed: 18506439]
Nguyen et al. Page 11
Sens Actuators B Chem. Author manuscript; available in PMC 2013 January 3.
NIH
-PA Author Manuscript
NIH
-PA Author Manuscript
NIH
-PA Author Manuscript
14. Harnisch F, Schroder U. From MFC to MXC: chemical and biological cathodes and their potentialfor microbial bioelectrochemical systems. Chem Soc Rev. 2010; 39:4433–4448. [PubMed:20830322]
15. Rozendal RA, Hamelers HVM, Rabaey K, Keller J, Buisman CJN. Towards practicalimplementation of bioelectrochemical wastewater treatment. Trends in biotechnology. 2008;26:450–459. [PubMed: 18585807]
16. Babauta JT, Nguyen HD, Beyenal H. Redox and pH microenvironments within Shewanellaoneidensis MR-1 biofilms reveal electron transfer mechanism. Environmental Science &Technology. 2011 In press.
17. Du ZW, Li HR, Gu TY. A state of the art review on microbial fuel cells: A promising technologyfor wastewater treatment and bioenergy. Biotechnol Adv. 2007; 25:464–482. [PubMed: 17582720]
18. Logan BE, Hamelers B, Rozendal RA, Schrorder U, Keller J, Freguia S, Aelterman P, VerstraeteW, Rabaey K. Microbial fuel cells: Methodology and technology. Environmental Science &Technology. 2006; 40:5181–5192. [PubMed: 16999087]
19. Lovley DR. Microbial fuel cells: novel microbial physiologies and engineering approaches.Current Opinion in Biotechnology. 2006; 17:327–332. [PubMed: 16679010]
20. Picioreanu C, van Loosdrecht MCM, Curtis TP, Scott K. Model based evaluation of the effect ofpH and electrode geometry on microbial fuel cell performance. Bioelectrochemistry. 2010; 78:8–24. [PubMed: 19523880]
21. Beech WB, Sunner J. Biocorrosion: towards understanding interactions between biofilms andmetals. Current Opinion in Biotechnology. 2004; 15:181–186. [PubMed: 15193324]
22. Lee AK, Newman DK. Microbial iron respiration: impacts on corrosion processes. Appl MicrobiolBiotechnol. 2003; 62:134–139. [PubMed: 12734693]
23. Torres CI, Marcus AK, Lee HS, Parameswaran P, Krajmalnik-Brown R, Rittmann BE. A kineticperspective on extracellular electron transfer by anode-respiring bacteria. Fems Microbiol Rev.2010; 34:3–17. [PubMed: 19895647]
24. Chang IS, Moon H, Bretschger O, Jang JK, Park HI, Nealson KH, Kim BH. Electrochemicallyactive bacteria (EAB) and mediator-less microbial fuel cells. Journal of Microbiology andBiotechnology. 2006; 16:163–177.
25. Covington ED, Gelbmann CB, Kotloski NJ, Gralnick JA. An essential role for UshA in processingof extracellular flavin electron shuttles by Shewanella oneidensis. Mol Microbiol. 2010; 78:519–532. [PubMed: 20807196]
26. Marsili E, Baron DB, Shikhare ID, Coursolle D, Gralnick JA, Bond DR. Shewanella Secretesflavins that mediate extracellular electron transfer. Proc Natl Acad Sci U S A. 2008; 105:3968–3973. [PubMed: 18316736]
27. Masuda M, Freguia S, Wang YF, Tsujimura S, Kano K. Flavins contained in yeast extract areexploited for anodic electron transfer by Lactococcus lactis. Bioelectrochemistry. 2010; 78:173–175. [PubMed: 19717350]
28. Suzuki Y, Kitatsuji Y, Ohnuki T, Tsujimura S. Flavin mononucleotide mediated electron pathwayfor microbial U(VI) reduction. Physical Chemistry Chemical Physics. 2010; 12:10081–10087.[PubMed: 20623083]
29. von Canstein H, Ogawa J, Shimizu S, Lloyd JR. Secretion of flavins by Shewanella species andtheir role in extracellular electron transfer. Appl Environ Microbiol. 2008; 74:615–623. [PubMed:18065612]
30. IUPAC. the “Gold Book”. 2. Blackwell Scientific Publications; Oxford: 1997. Compendium ofChemical Terminology.
31. Müller F. Flavin radicals: chemistry and biochemistry. Free Radical Biology and Medicine. 1987;3:215–230. [PubMed: 3311900]
32. Ksenzhek OS, Petrova SA. Electrochemical properties of flavins in aqueous solutions.Bioelectrochemistry and Bioenergetics. 1983; 11:105–127.
33. Verhagen MF, Hagen WR. Electron transfer mechanisms of flavine adenine dinucleotide at theglassy carbon electrode; a model study for protein electrochemistry. Journal of ElectroanalyticalChemistry. 1992; 334:339–350.
Nguyen et al. Page 12
Sens Actuators B Chem. Author manuscript; available in PMC 2013 January 3.
NIH
-PA Author Manuscript
NIH
-PA Author Manuscript
NIH
-PA Author Manuscript

34. Wang H, Hollywood K, Jarvis RM, Lloyd JR, Goodacre R. Phenotypic Characterization ofShewanella oneidensis MR-1 under Aerobic and Anaerobic Growth Conditions by Using FourierTransform Infrared Spectroscopy and High-Performance Liquid Chromatography Analyses. ApplEnviron Microbiol. 2010; 76:6266–6276. [PubMed: 20675447]
35. Coursolle D, Baron DB, Bond DR, Gralnick JA. The Mtr Respiratory Pathway Is Essential forReducing Flavins and Electrodes in Shewanella oneidensis. J Bacteriol. 2010; 192:467–474.[PubMed: 19897659]
36. Velasquez-Orta SB, Head IM, Curtis TP, Scott K, Lloyd JR, von Canstein H. The effect of flavinelectron shuttles in microbial fuel cells current production. Appl Microbiol Biotechnol. 2010;85:1373–1381. [PubMed: 19697021]
37. Mondragon-Portocarrero AD, Vazquez-Oderiz L, Romero-Rodriguez MA. Development andValidation of an HPLC Method for the Determination of Thiamine and Riboflavin in Green LeafyVegetables Using Clara-Diastase. Journal of Food Science. 2011; 76:C639–C642.
38. Petteys BJ, Frank EL. Rapid determination of vitamin B2 (riboflavin) in plasma by HPLC. ClinicaChimica Acta. 2011; 412:38–43.
39. Petteys BJ, Frank EL. Determination of Vitamin B-2 (Riboflavin) by HPLC. Clinical Chemistry.2009; 55:A233–A233.
40. Russell LF, Brooks L, McRae KB. Development of a robotic-HPLC determination of riboflavinvitamers in food. Food Chemistry. 1998; 63:125–131.
41. Mielech K. Simultaneous voltammetric determination of riboflavin and L-ascorbic acid inmultivitamin pharmaceutical preparations. Journal of Trace and Microprobe Techniques. 2003;21:111–121.
42. Shiu KK, Shi K. Selective determination of vitamin B-2 at electrochemically activated glassycarbon electrode. Electroanalysis. 2000; 12:134–139.
43. Mikheeva EV, Martynyuk OA, Slepchenko GB, Anisimova LS. Study of the voltammetricbehavior of vitamin B-2 and the development of a procedure for its determination in breast milk.Journal of Analytical Chemistry. 2009; 64:731–734.
44. Siddiqui I, Pitre KS. Voltammetric determination of vitamins in a pharmaceutical formulation.Journal of Pharmaceutical and Biomedical Analysis. 2001; 26:1009–1015. [PubMed: 11600314]
45. Zhu L, Luo DB. Determination of Riboflavin Using the Polarographic Reduction Wave of ItsPhotochemical Reaction Products. Analytical Letters. 2008; 41:3138–3146.
46. Wang LH, Hung HC. Simultaneous determination of water-soluble vitamins in human urine byfluorescence in a flow-injection analysis. Journal of Liquid Chromatography & RelatedTechnologies. 2006; 29:329–338.
47. Çakir S, Atayman I, Çakir O. Simultaneous square-wave voltammetric determination of riboflavinand folic acid in pharmaceutical preparations. Mikrochim Acta. 1997; 126:237–240.
48. Garcia FP, Diaz C, Hardisson A. Spectrofuorometric determination of thiamin and riboflavin invegetable foods. Analytical Letters. 1993; 26:1977–1996.
49. Li X-Y, Wang R-y, Cai R-x, Liu Z-H. Highly sensitive spectrofluorimetric determination ofriboflavin based on the generation of active oxygen coupled with enzymatic reaction. WuhanUniversity Journal of Natural Sciences. 2002; 7:361–364.
50. Bard, AJ.; Faulkner, LR. Electrochemical Methods: Fundamentals and Applications. Wiley; NewYork: 2001.
51. Osteryoung JG, Osteryoung RA. Square-wave voltammetry. Analytical Chemistry. 1985; 57:A101.52. Bowers ML, Yenser BA. Electrochemical-behavior of glass-carbon electrodes modified by
electrochemical oxidation. Analytica Chimica Acta. 1991; 243:43–53.53. Cabaniss GE, Diamantis AA, Murphy WR, Linton RW, Meyer TJ. Electrocatalysis of proton-
coupled electron-transfer reactions at glassy-carbon electrodes. Journal of the American ChemicalSociety. 1985; 107:1845–1853.
54. Gu HY, Yu AM, Chen HY. Electrochemical behavior and simultaneous determination of vitaminB-2, B-6, and C at electrochemically pretreated glassy carbon electrode. Analytical Letters. 2001;34:2361–2374.
55. Engstrom RC. Electrochemical pretreatment of glassy-carbon electrodes. Analytical Chemistry.1982; 54:2310–2314.
Nguyen et al. Page 13
Sens Actuators B Chem. Author manuscript; available in PMC 2013 January 3.
NIH
-PA Author Manuscript
NIH
-PA Author Manuscript
NIH
-PA Author Manuscript
56. Renslow RS, Majors PD, McLean JS, Fredrickson JK, Ahmed B, Beyenal H. In Situ EffectiveDiffusion Coefficient Profiles in Live Biofilms Using Pulsed-Field Gradient Nuclear MagneticResonance. Biotechnology and Bioengineering. 2010; 106:928–937. [PubMed: 20589671]
57. O’Dea J, Wojciechowski M, Osteryoung J, Aoki K. Square-wave voltammetry at electrodes havinga small dimension. Analytical Chemistry. 1985; 57:954–955.
58. Komorsky-Lovrić Š, Lovrić M, Bond AM. Square-wave voltammetry at spherical and diskmicroelectrodes as a function of electrode radius and frequency. Electroanalysis. 1993; 5:29–40.
59. Liu Y, Harnisch F, Fricke K, Schroder U, Climent V, Feliu JM. The study of electrochemicallyactive microbial biofilms on different carbon-based anode materials in microbial fuel cells.Biosens Bioelectron. 2010; 25:2167–2171. [PubMed: 20189793]
60. Hayduk W, Laudie H. Prediction of diffusion coefficients for nonelectrolytes in dilute aqueoussolutions. Aiche Journal. 1974; 20:611–615.
61. Bas, GL. The Molecular Volumes of Liquid Chemical Compounds from the point of view of Kopp.Longmans, Green & Co; London: 1915.
62. EPA. EPA On-line Tools for Site Assessment Calculation: Estimated Diffusion Coefficients -Extended Chemical Range. United States Environmental Protection Agency: Ecosystems ResearchDivision; 2010.
63. Tucker, WA.; Nelken, LH. Chapter 17: Diffusion Coefficients in Air and Water. In: Lyman, WJ.;Rosenblatt, DH.; Reehl, WF., editors. Handbook of chemical property estimation methods:environmental behavior of organic compounds. American Chemical Society; Washington, DC:1982.
64. Mohr PJ, Taylor BN, Newell DB. CODATA recommended values of the fundamental physicalconstants: 2006. Rev Mod Phys. 2008; 80:633–730.
65. O’Dea JJ, Osteryoung J, Osteryoung RA. Square wave voltammetry and other pulse techniques forthe determination of kinetic parameters. The reduction of zinc(II) at mercury electrodes. J PhysChem. 1983; 87:3911–3918.
66. Osteryoung, J.; Odea, J. Square-wave voltammetry. In: Bard, AJ., editor. Electroanalyticalchemistry. Marcel Dekker; New York: 1986. p. 209
67. Beaudette NV, Langerman N. The enthalpy of oxidation of flavin mononucleotide. Archives ofBiochemistry and Biophysics. 1974; 161:125–133.
68. Watt GD, Burns A. The thermochemical characterization of sodium dithionite, flavinmononucleotide, flavin-adenine dinucleotide and methyl and benzyl viologens as low-potentialreductants for biological system. Biochemical Journal. 1975; 152:33–37. [PubMed: 1212225]
69. Michaelis L, Schubert MP, Smythe CV. Potentiometric study of the flavins. J Biol Chem. 1936;116:587–607.
70. Nielsen LP, Christensen PB, Revsbech NP, Sorensen J. Denitrification and oxygen respiration inbiofilms studied with a microsensor for nitrous-oxide and oxygen. Microbial Ecology. 1990;19:63–72.
71. Yurt N, Beyenal H, Sears J, Lewandowski Z. Quantifying selected growth parameters ofLeptothrix discophora SP-6 in biofilms from oxygen concentration profiles. Chemical EngineeringScience. 2003; 58:4557–4566.
BiographiesHung Duc Nguyen received his BSc in Oil Refining and Petrochemical Engineering in 2005from Hanoi University of Mining and Geology, Vietnam, and his MSc in ChemicalEngineering in 2008 from Washington State University. He is currently a PhD candidate atWashington State University. His current research focuses on the development andapplication of microelectrodes and on quantifying local chemistry in biofilm systems.
Ryan Renslow received his BSc and MSc in Chemical Engineering in 2008 and 2009,respectively, from Washington State University. He is currently a PhD candidate and anNIH Protein Biotechnology Training fellow at Washington State University, researchingelectron transfer mechanisms in biofilms. His work also focuses on the uses of NMR in
Nguyen et al. Page 14
Sens Actuators B Chem. Author manuscript; available in PMC 2013 January 3.
NIH
-PA Author Manuscript
NIH
-PA Author Manuscript
NIH
-PA Author Manuscript
biofilm research, biofilm mathematical modeling, and cathodic biofilms in microbial fuelcells.
Jerome Babauta received his BSc in Chemical Engineering in 2008 from Washington StateUniversity. He is currently a PhD candidate and an NIH Protein Biotechnology TrainingFellow at Washington State University. His current research is on discerning electrontransfer mechanisms in both anodic and cathodic biofilms using microsensors and advancedelectrochemical techniques.
Bulbul Ahmed received his BSc and MSc in Chemical Engineering in 2005 and 2008,respectively, from Bangladesh University of Engineering & Technology and NationalUniversity of Singapore. He is currently a PhD candidate at Washington State University,researching groundwater bioremediation using biofilms.
Haluk Beyenal received his BSc, MSc, and PhD in Chemical Engineering in 1990, 1993 and1997, respectively, from Hacettepe University, Turkey. He is coauthor of the bookFundamentals of Biofilm Research. He has coauthored more than 75 research papers in thefield. His current research interests include electron transfer processes in biofilms,subsurface biofilms, microsensors, microscale chemistry, electrochemistry in biologicalsystems, and biofilm processes.
Nguyen et al. Page 15
Sens Actuators B Chem. Author manuscript; available in PMC 2013 January 3.
NIH
-PA Author Manuscript
NIH
-PA Author Manuscript
NIH
-PA Author Manuscript
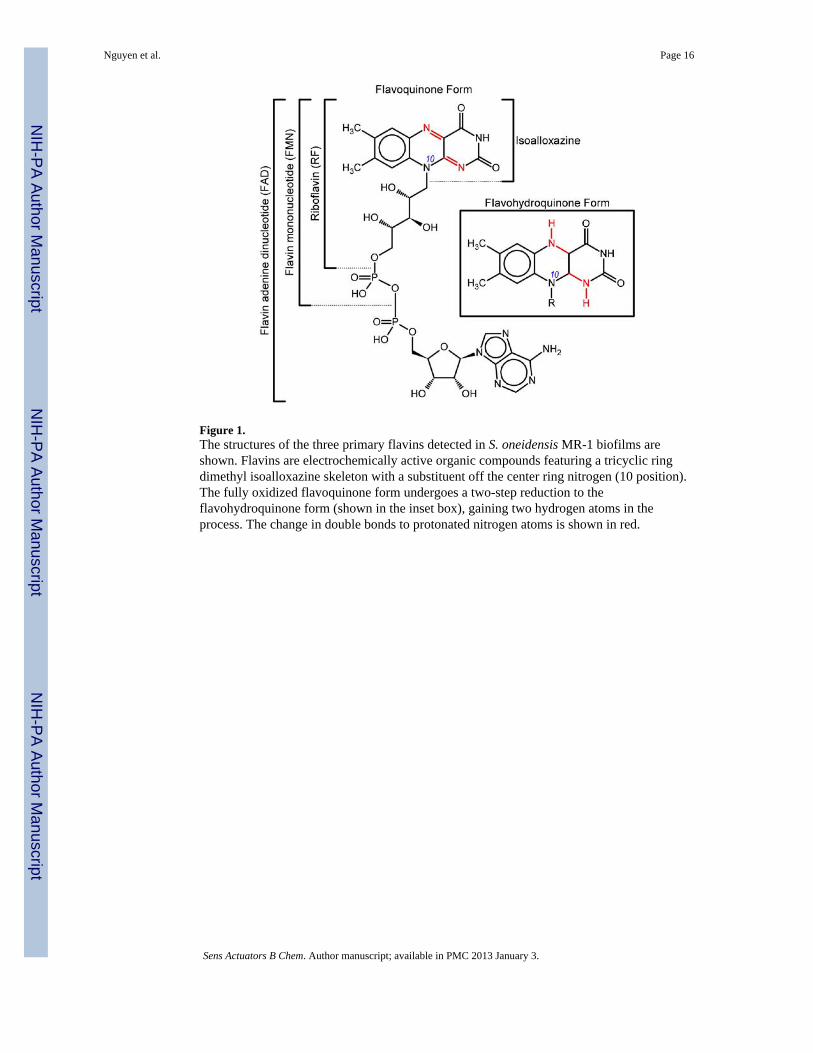
Figure 1.The structures of the three primary flavins detected in S. oneidensis MR-1 biofilms areshown. Flavins are electrochemically active organic compounds featuring a tricyclic ringdimethyl isoalloxazine skeleton with a substituent off the center ring nitrogen (10 position).The fully oxidized flavoquinone form undergoes a two-step reduction to theflavohydroquinone form (shown in the inset box), gaining two hydrogen atoms in theprocess. The change in double bonds to protonated nitrogen atoms is shown in red.
Nguyen et al. Page 16
Sens Actuators B Chem. Author manuscript; available in PMC 2013 January 3.
NIH
-PA Author Manuscript
NIH
-PA Author Manuscript
NIH
-PA Author Manuscript
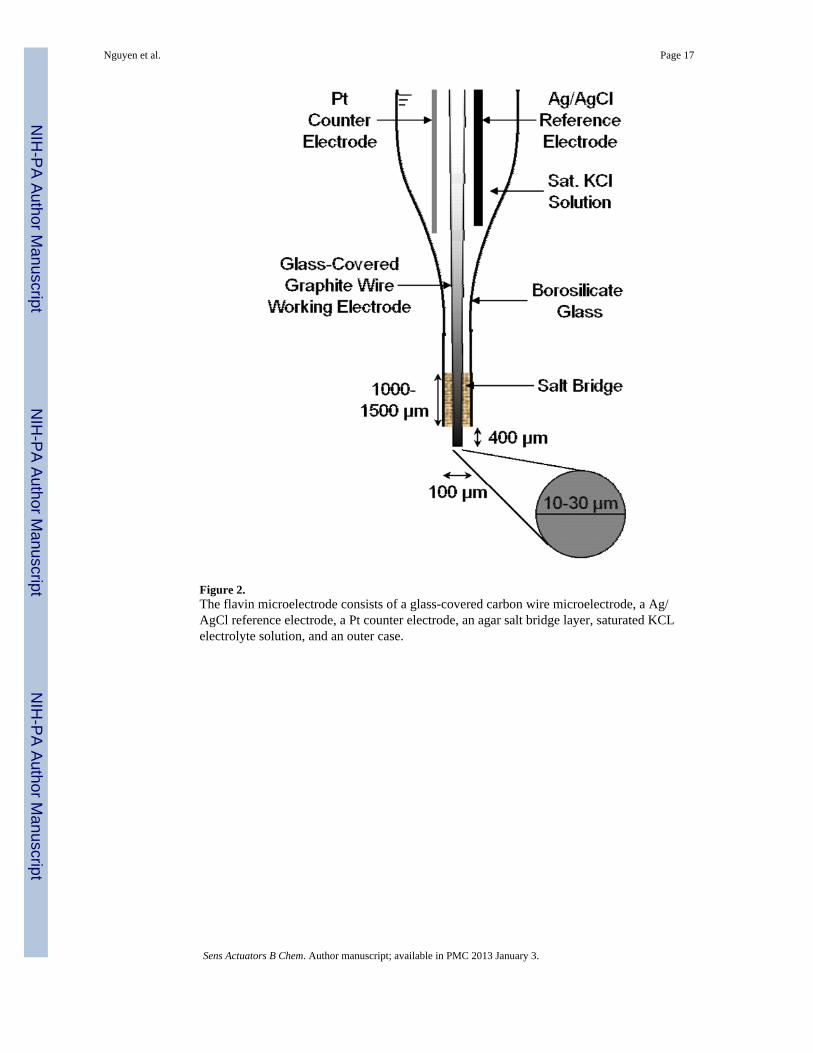
Figure 2.The flavin microelectrode consists of a glass-covered carbon wire microelectrode, a Ag/AgCl reference electrode, a Pt counter electrode, an agar salt bridge layer, saturated KCLelectrolyte solution, and an outer case.
Nguyen et al. Page 17
Sens Actuators B Chem. Author manuscript; available in PMC 2013 January 3.
NIH
-PA Author Manuscript
NIH
-PA Author Manuscript
NIH
-PA Author Manuscript
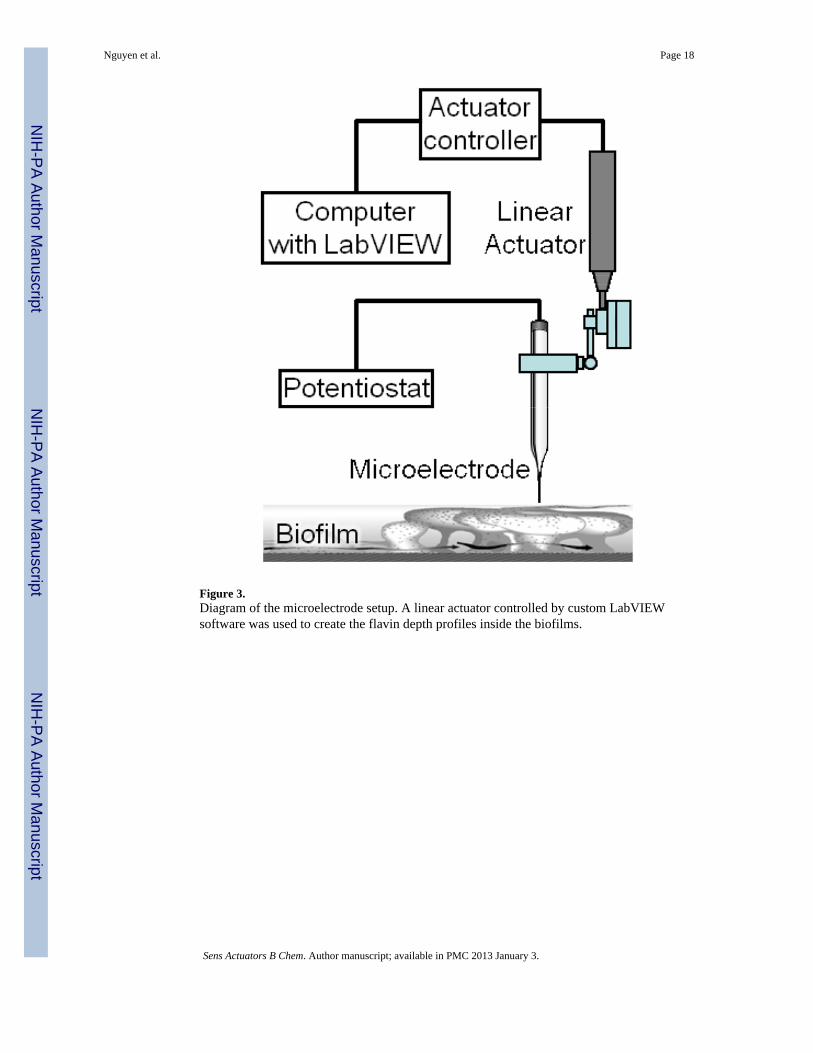
Figure 3.Diagram of the microelectrode setup. A linear actuator controlled by custom LabVIEWsoftware was used to create the flavin depth profiles inside the biofilms.
Nguyen et al. Page 18
Sens Actuators B Chem. Author manuscript; available in PMC 2013 January 3.
NIH
-PA Author Manuscript
NIH
-PA Author Manuscript
NIH
-PA Author Manuscript
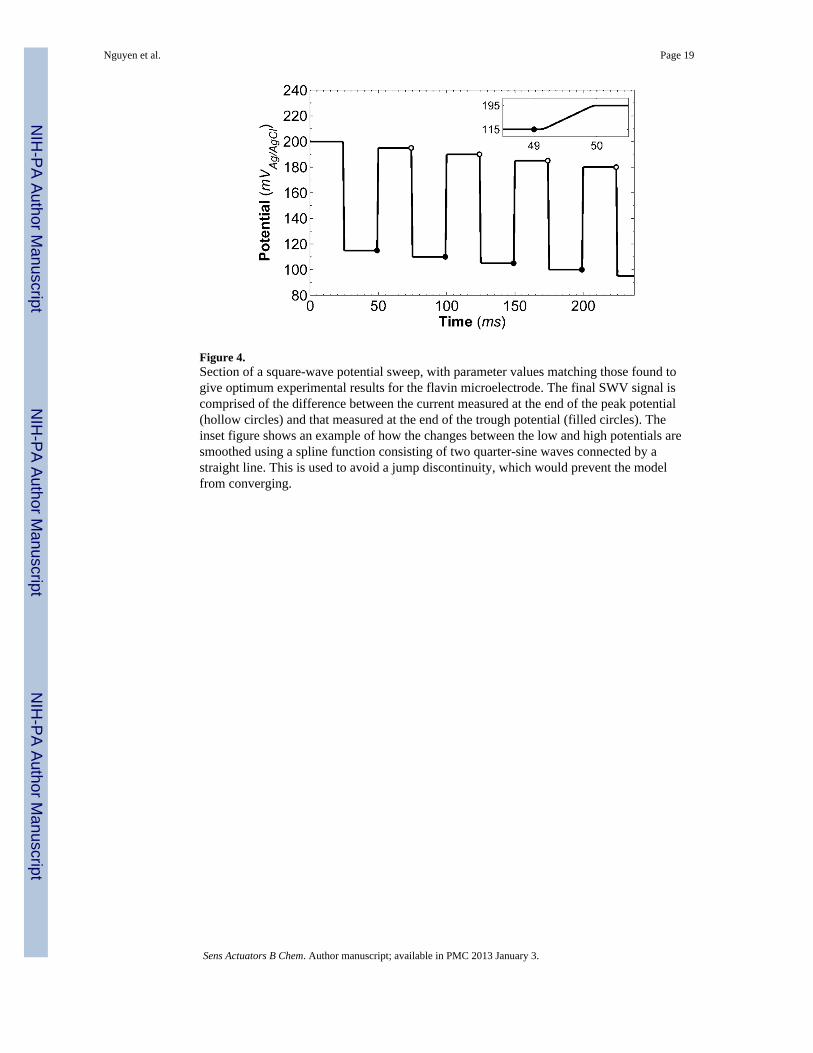
Figure 4.Section of a square-wave potential sweep, with parameter values matching those found togive optimum experimental results for the flavin microelectrode. The final SWV signal iscomprised of the difference between the current measured at the end of the peak potential(hollow circles) and that measured at the end of the trough potential (filled circles). Theinset figure shows an example of how the changes between the low and high potentials aresmoothed using a spline function consisting of two quarter-sine waves connected by astraight line. This is used to avoid a jump discontinuity, which would prevent the modelfrom converging.
Nguyen et al. Page 19
Sens Actuators B Chem. Author manuscript; available in PMC 2013 January 3.
NIH
-PA Author Manuscript
NIH
-PA Author Manuscript
NIH
-PA Author Manuscript
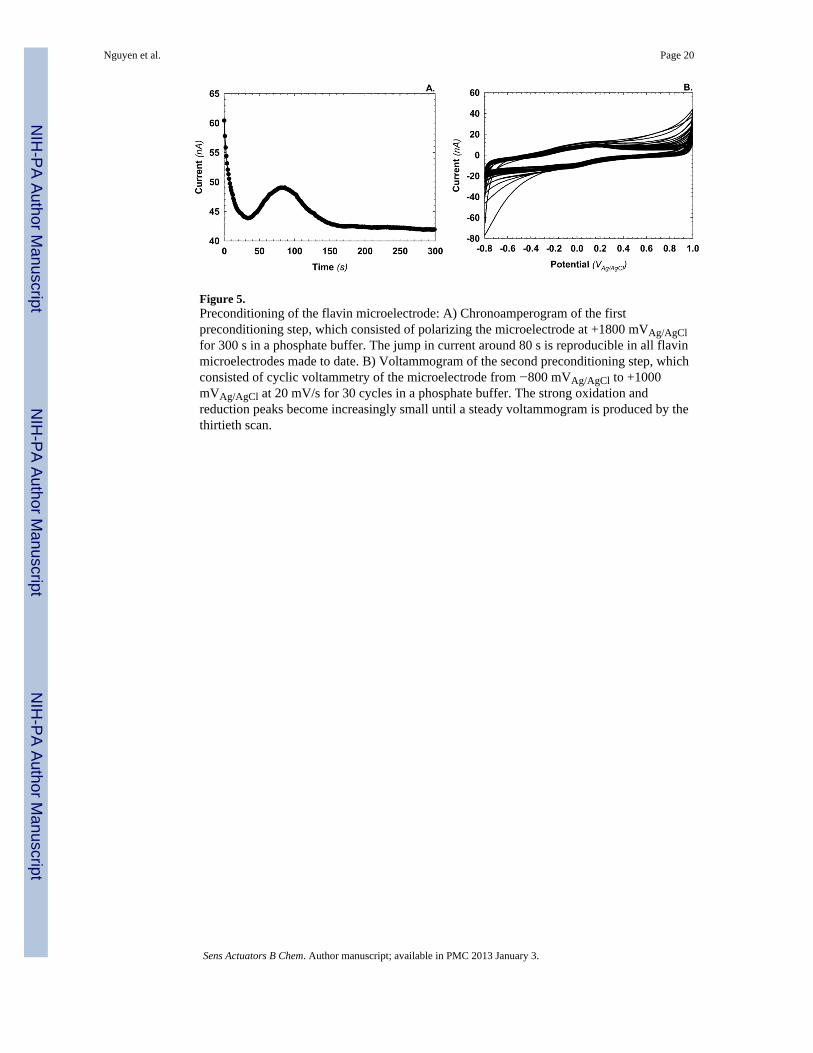
Figure 5.Preconditioning of the flavin microelectrode: A) Chronoamperogram of the firstpreconditioning step, which consisted of polarizing the microelectrode at +1800 mVAg/AgClfor 300 s in a phosphate buffer. The jump in current around 80 s is reproducible in all flavinmicroelectrodes made to date. B) Voltammogram of the second preconditioning step, whichconsisted of cyclic voltammetry of the microelectrode from −800 mVAg/AgCl to +1000mVAg/AgCl at 20 mV/s for 30 cycles in a phosphate buffer. The strong oxidation andreduction peaks become increasingly small until a steady voltammogram is produced by thethirtieth scan.
Nguyen et al. Page 20
Sens Actuators B Chem. Author manuscript; available in PMC 2013 January 3.
NIH
-PA Author Manuscript
NIH
-PA Author Manuscript
NIH
-PA Author Manuscript
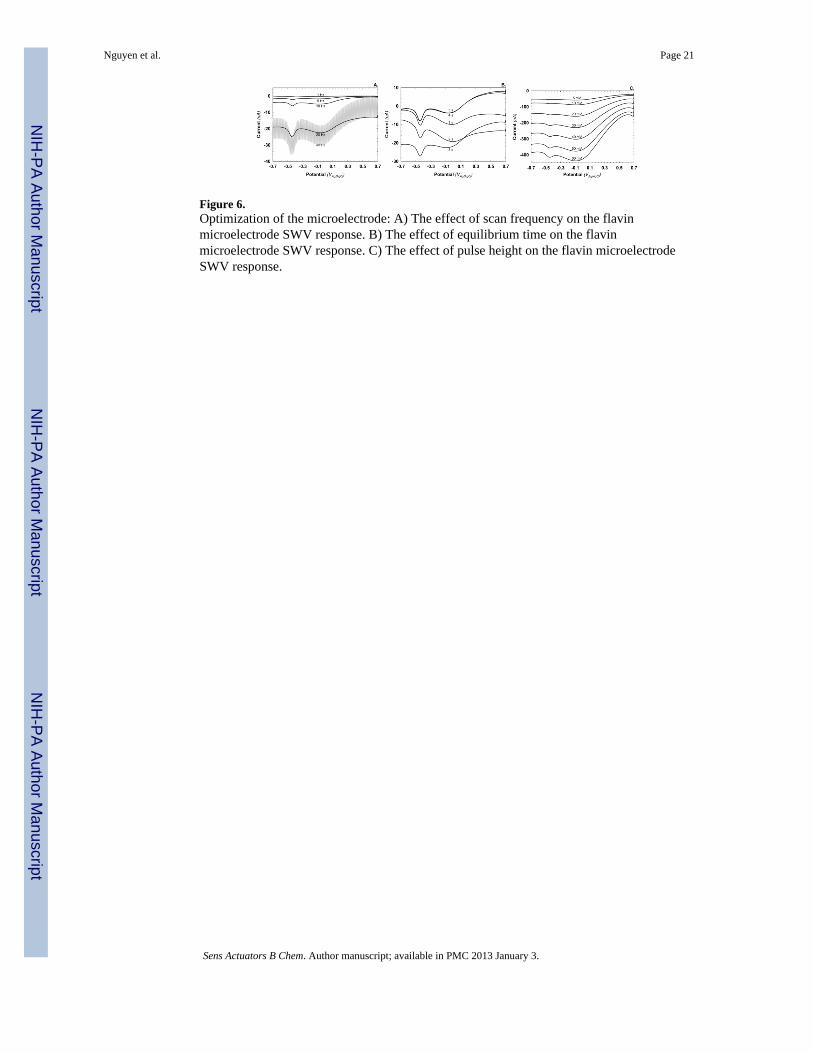
Figure 6.Optimization of the microelectrode: A) The effect of scan frequency on the flavinmicroelectrode SWV response. B) The effect of equilibrium time on the flavinmicroelectrode SWV response. C) The effect of pulse height on the flavin microelectrodeSWV response.
Nguyen et al. Page 21
Sens Actuators B Chem. Author manuscript; available in PMC 2013 January 3.
NIH
-PA Author Manuscript
NIH
-PA Author Manuscript
NIH
-PA Author Manuscript
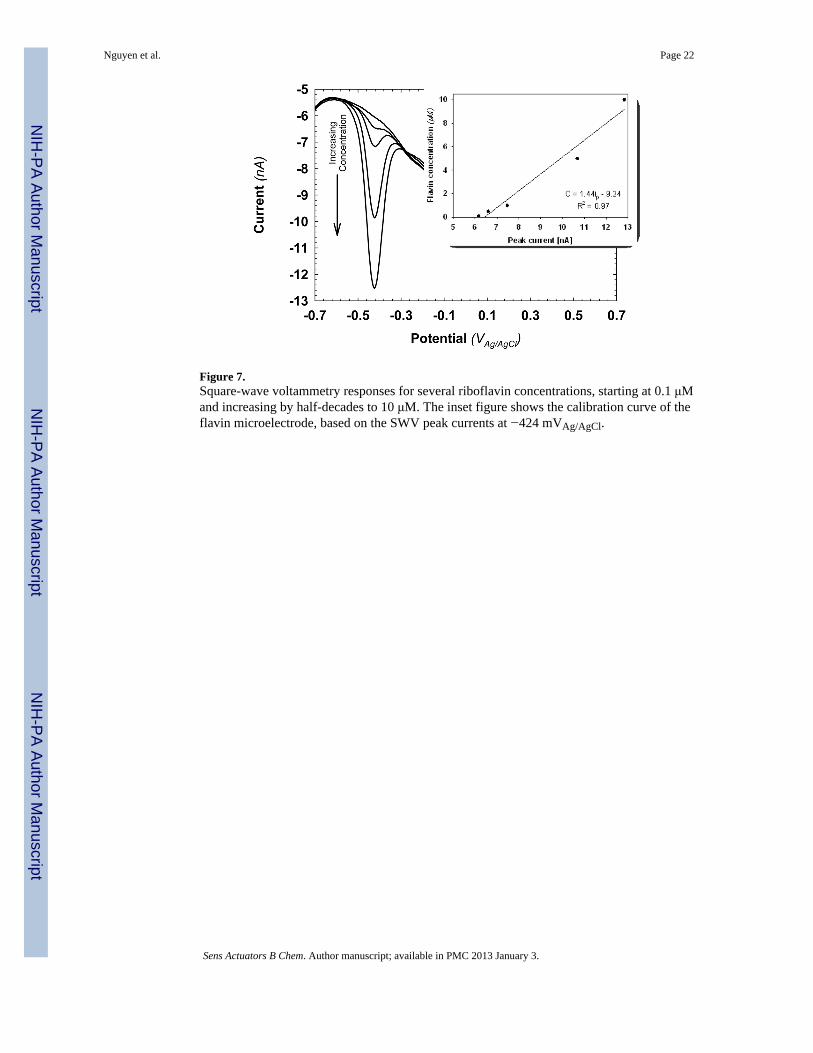
Figure 7.Square-wave voltammetry responses for several riboflavin concentrations, starting at 0.1 μMand increasing by half-decades to 10 μM. The inset figure shows the calibration curve of theflavin microelectrode, based on the SWV peak currents at −424 mVAg/AgCl.
Nguyen et al. Page 22
Sens Actuators B Chem. Author manuscript; available in PMC 2013 January 3.
NIH
-PA Author Manuscript
NIH
-PA Author Manuscript
NIH
-PA Author Manuscript
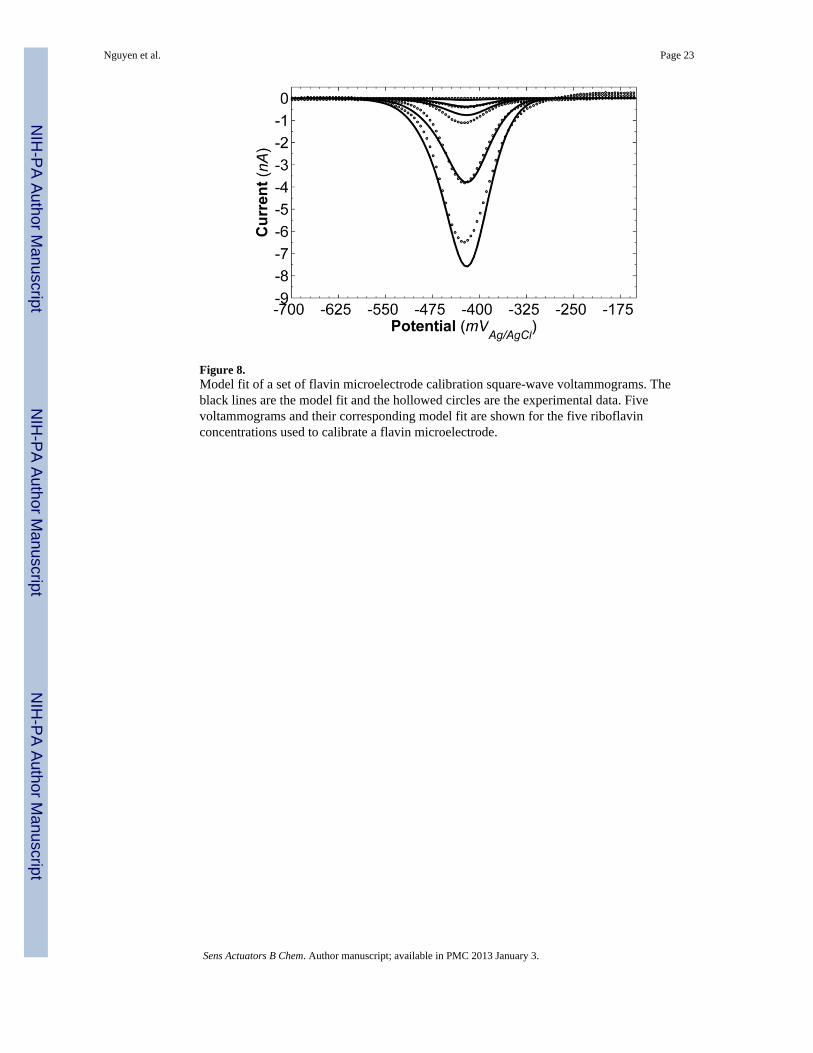
Figure 8.Model fit of a set of flavin microelectrode calibration square-wave voltammograms. Theblack lines are the model fit and the hollowed circles are the experimental data. Fivevoltammograms and their corresponding model fit are shown for the five riboflavinconcentrations used to calibrate a flavin microelectrode.
Nguyen et al. Page 23
Sens Actuators B Chem. Author manuscript; available in PMC 2013 January 3.
NIH
-PA Author Manuscript
NIH
-PA Author Manuscript
NIH
-PA Author Manuscript
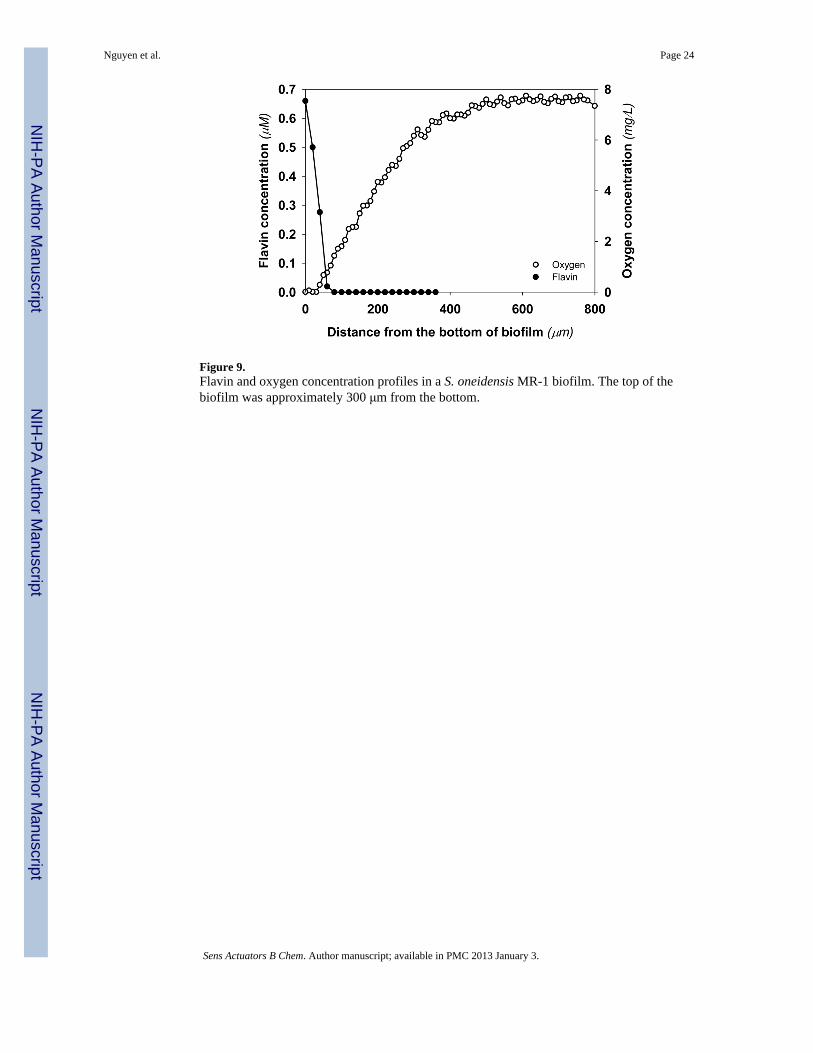
Figure 9.Flavin and oxygen concentration profiles in a S. oneidensis MR-1 biofilm. The top of thebiofilm was approximately 300 μm from the bottom.
Nguyen et al. Page 24
Sens Actuators B Chem. Author manuscript; available in PMC 2013 January 3.
NIH
-PA Author Manuscript
NIH
-PA Author Manuscript
NIH
-PA Author Manuscript
NIH
-PA Author Manuscript
NIH
-PA Author Manuscript
NIH
-PA Author Manuscript
Nguyen et al. Page 25
Table 1
Model parameter values.
Symbol Description Value Units Reference
F Faraday constant 96485.3399 s A mol−1 [64]
R Molar gas constant 8.314472 J K−1 mol−1 [64]
T Temperature 293.15 K
DRF,r Diffusion coefficient for RF/RFH2 0.40 · 10−9 m2 s−1 [60–63]
Standard heterogeneous rate constant for RF/RFH2 1.6 · 10−5 m s−1 [33]
Sens Actuators B Chem. Author manuscript; available in PMC 2013 January 3.
NIH
-PA Author Manuscript
NIH
-PA Author Manuscript
NIH
-PA Author Manuscript
Nguyen et al. Page 26
Table 2
Parameter values used for flavin microelectrode SWV. Equilibrium time, potential step height, pulse potential,and scan frequency were chosen to provide an optimized response for flavin detection.
Square-wave voltammetry parameters for flavin microelectrode Optimized values
starting potential +700 mVAg/AgCl
final potential −700 mVAg/AgCl
equilibrium time 5 s
potential step height 5 mV
pulse potential 40 mV
scan frequency 20 Hz
Sens Actuators B Chem. Author manuscript; available in PMC 2013 January 3.
NIH
-PA Author Manuscript
NIH
-PA Author Manuscript
NIH
-PA Author Manuscript
Nguyen et al. Page 27
Table 3
Model fitting parameters and coefficient of determination
Symbol Description Value Units
R2 coefficient of determination 0.99 unitless
A effective electrode surface area 8.16 · 10−8 m2
standard reduction potential for RF/RFH2 −419 mVAg/AgCl
αRF transfer coefficient for RF/RFH2 0.45 unitless
Sens Actuators B Chem. Author manuscript; available in PMC 2013 January 3.