direct voltammetric determination of gold nanoparticles using graphite-epoxy composite electrode
TRANSCRIPT
Electrochimica Acta 50 (2005) 3702–3707
Direct voltammetric determination of gold nanoparticles usinggraphite-epoxy composite electrode
Martin Pumeraa, Marta Aldaverta, Chris Millsb, Arben Merkoci a, ∗, Salvador Alegreta
a Grup de Sensors i Biosensors, Departament de Qu´ımica, Universitat Aut`onoma de Barcelona, E-08193 Bellaterra, Barcelona, Catalonia, Spainb Laboratori de Recerca en Nanobioenginyeria, Parc Cient´ıfic de Barcelona, C/ Josep Samitier 1-5, 08028 Barcelona, Catalonia, Spain
Received 12 November 2004; received in revised form 10 January 2005; accepted 16 January 2005Available online 13 February 2005
Abstract
A new voltammetric method for a direct determination of gold nanoparticles, based on adsorption and electrochemical detection of colloidalgold, is described. In this protocol, the absorption of gold nanoparticles onto the rough surface of graphite-epoxy composite electrode isfollowed by their electrochemical oxidation in 0.1 M HCl medium at a potential of +1.25 V. The resulting tetrachloroaurate ions generatednear the electrode surface are detected by differential pulse voltammetry (DPV). The DPV response is linear in the range from 4.7× 10⁸
t sitee mized.©
K
1
caeptsvbAcaamg
o
eth-s inu-
dsarti-ent,
eitherthe
andnew-
oure-
e ofifiedThead-
0d
o 4.7× 10¹¹ nanoparticles cm−3 with a limit of detection of 1.8× 10⁸ gold nanoparticles cm−3. The surface characteristics of the compolectrode are investigated and the parameters that affect the complete analytical detection process of gold nanoparticles are opti2005 Elsevier Ltd. All rights reserved.
eywords:Gold nanoparticles; Graphite-epoxy composite; Stripping voltammetry; Differential pulse voltammetry
. Introduction
Metal nanoparticles are of wide interest for analyticalhemists as they display unique optical, electronic, magneticnd catalytic properties[1]. These properties are very differ-nt from those of the corresponding bulk materials and de-end strongly on the particle size, the interparticle distance,
he nature of protecting organic shell and the nanoparticlehape[2–4]. Gold nanoparticles (AuNPs) stand out from theariety of nanoparticles and quantum dots because of theiriocompatibility[1]. Due to these distinctive properties, theuNPs are extensively used in immunocytochemistry andell biology[5]. They have also been used in a variety of an-lytical [6,7] and sensing applications, including DNA[8,9]nd immuno-sensing[10]. The majority of sensing systemsentioned in the literature rely on the optical properties ofold nanoparticles.
In recent years, there has been an explosive growthf AuNP-based immuno and DNA electrochemical assays
∗ Corresponding author. Tel.: +34 93581 1976; fax: +34 93581 2379.
[11–17]. The vast majority of these electrochemical mods have been based on chemical dissolution of AuNPa hydrobromic acid/bromine mixture followed by accumlation and stripping analysis of the resulting AuIII+ solution.The HBr/Br2 solution is highly toxic and therefore methobased on direct electrochemical detection of gold nanopcle tags, which would replace the chemical oxidation agare urgently needed. Costa-Garcıa and coworkers[18,19]em-ployed a carbon paste electrode and detected AuNPsby silver enhancement or directly after accumulation ontoelectrode surface.
The aim of the present work is to develop a robustdirect method for determination of AuNPs based on a reable graphite-epoxy composite electrode (GECE)[20]. TheGECE (without surface modification) has been used inlaboratory for differential pulse anodic stripping voltammtry (DPASV) [21] and stripping potentiometry[22] of leadand other heavy metals of interest. The use of this typelectrode was a simpler alternative to the use of modelectrodes for analysis of trace levels of heavy metals.use of GECE for direct detection of AuNPs utilises the
E-mail address:[email protected] (A. Merkoc¸i). vantages inherent in the electrode surface topography along
013-4686/$ – see front matter © 2005 Elsevier Ltd. All rights reserved.oi:10.1016/j.electacta.2005.01.035
M. Pumera et al. / Electrochimica Acta 50 (2005) 3702–3707 3703
with the interesting electrochemical properties of compositeelectrodes.
2. Experimental
2.1. Apparatus
All voltammetric experiments were performed using anelectrochemical analyzer Autolab 20 (Eco Chemie, TheNetherlands) connected to a personal computer. Electro-chemical experiments were carried out in a 10 ml voltammet-ric cell, at room temperature (23◦C), using a three electrodeconfiguration. GECEs were fabricated in our laboratory ac-cording to the procedure described in Section2.3. A platinumelectrode served as an auxiliary electrode and an Ag/AgCl asa reference electrode. A glassy carbon electrode (GCE, i.d.3 mm; model MF 2012) was purchased from BioanalyticalSystems, IN, USA. Electrode surface topography was mea-sured using white light interferometry (Wyko NT110; VeccoMetrology, USA) at 50× magnification.
2.2. Reagents
All solutions were prepared in doubly distilled wa-ter. Tris(hydroxymethyl)methylamine (Tris), potassiumf dihy-d rich,h eac( di-a d-iS re-p t ofm
2.3. Preparation of graphite-epoxy composite electrodes(GECE)
GECE were prepared as described in previously[23,24].Briefly, epoxy resin (Epotek H77A, Epoxy Technology,USA) and hardener (Epotek H77B) were mixed manuallyin the ratio 20:3 (w/w) using a spatula. When the resin andhardener were well-mixed, the graphite powder (particle size50�m, BDH, UK) was added in the optimal ratio 20:80 (w/w)and mixed for 30 min[23,24]. The resulting paste was placedinto a cylindrical PVC sleeve (6 mm i.d.). Electrical contactwas completed using copper wire. The conducting compos-ite was cured at 40◦C for one week. Prior to use, the sur-face of the electrode was polished with abrasive paper andthen with alumina paper (polishing strips 301044-001, Orion,Spain).
2.4. Electrochemical procedures
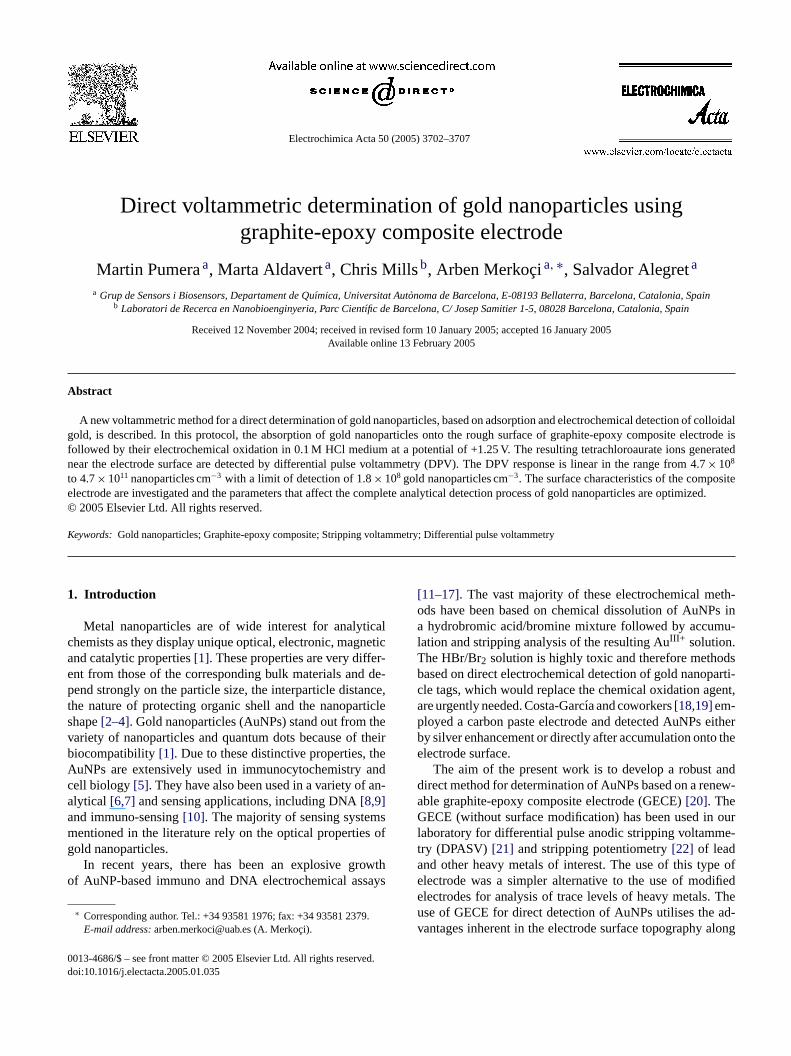
2.4.1. Electrochemical detection of AuNPsThe proposed AuNP detection protocol (seeFig. 1) in-
volves absorption of AuNPs on the surface of the GECE(Fig. 1A). During this step the GECE in an open circuit wasimmersed in a solution containing an appropriate concentra-tion of AuNPs for 10 min. After the accumulation step, thee foreb 1 MH toA for1 tion( ions ed.D m+ de
tocol fo
erricyanide, potassium phosphate and potassiumrogen phosphate were purchased from Sigma–Aldydrochloric acid (37%) was purchased from PanRBarcelona, Spain). Colloidal gold nanoparticles (10 nmmeter, 2.54× 10⁻⁴ mol l−1 gold concentration, correspon
ng to 4.7× 10¹² nanoparticles cm−3) were obtained fromigma–Aldrich. Dilutions from this stock solution were pared in 20 mM Tris/HCl buffer (pH 7.0) prior of each seeasurements.
Fig. 1. Schematic diagram of the electroanalytical pro
lectrode was carefully washed with distilled water beeing immersed into the voltammetric cell containing 0.Cl. The electrochemical oxidation of colloidal AuNPsuCl4− was performed at +1.25 V (versus Ag/AgCl)20 s (if not stated otherwise) in the non-stirred soluFig. 1B). Immediately after the electrochemical oxidattep, differential pulse voltammetry (DPV) was performuring this step (Fig. 1C) the potential was scanned fro1.25 to 0 V (step potential 10 mV, modulation amplitu
r direct voltammetric determination of AuNPs using a GECE.
3704 M. Pumera et al. / Electrochimica Acta 50 (2005) 3702–3707
50 mV, non-stirred solution), resulting in an analytical signaldue to the reduction of AuCl4
−. After the DPV measurementa cleaning step was performed (Fig. 1D), consisting of theapplication of a potential of +1.25 V (versus Ag/AgCl) for5 min whilst stirring. A DPV scan was carried out after thecleaning step to confirm the removal of the gold residues.The final measurements employed a background substrac-tion protocol involving storing the response for the blanksolution and substracting it from the analytical signal. Nospecial activation of electrode surface was used for DPVexperiments.
2.4.2. Cyclic voltammetry (CV)CV experiments on AuNPs were performed in place of
the DPV measurement (step C,Fig. 1) in hydrochloric acid(0.1 M) using a GECE. A 10 min accumulation time, 120 selectrochemical oxidation time, and a +1.25 V electrochem-ical oxidation potential were used; the potential was scannedfrom +1.4 to 0 V (versus Ag/AgCl) and reversed thereafterto +1.4 V. The scan speed was varied as indicated in the fol-lowing section.
Determination of electrochemical surface are using CVwas carried out in 0.05 M phosphate buffer (pH 7.4) using1 mM potassium ferricyanide.
3
n ofAt no
F ion( ).C ula-t 5 V;s
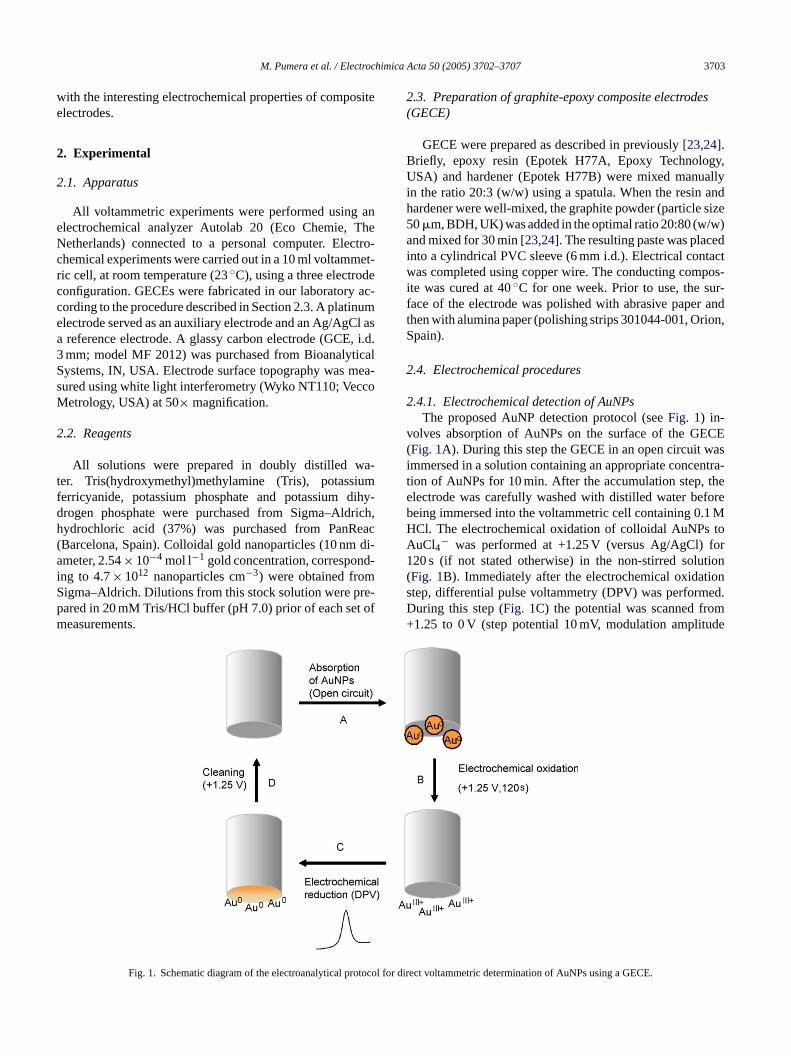
displays a well-defined response at +0.43 V (versus Ag/AgCl)to an AuNPs solution of 4.7× 10¹¹ nanoparticles cm−3. Thedetection peak corresponds to the reduction of the AuIII+
to Au0 on the surface of GECE. On the other hand,no AuNP redox activity is observed at the GCE, evenin the presence of a 10× increase in AuNP concentra-tion (4.7× 10¹² particles cm−3). Consequently,Fig. 2clearlydemonstrates the advantage of electrochemical detection ofAuNPs using a GECE over a GCE with respect the ability ofdirect AuNP detection.
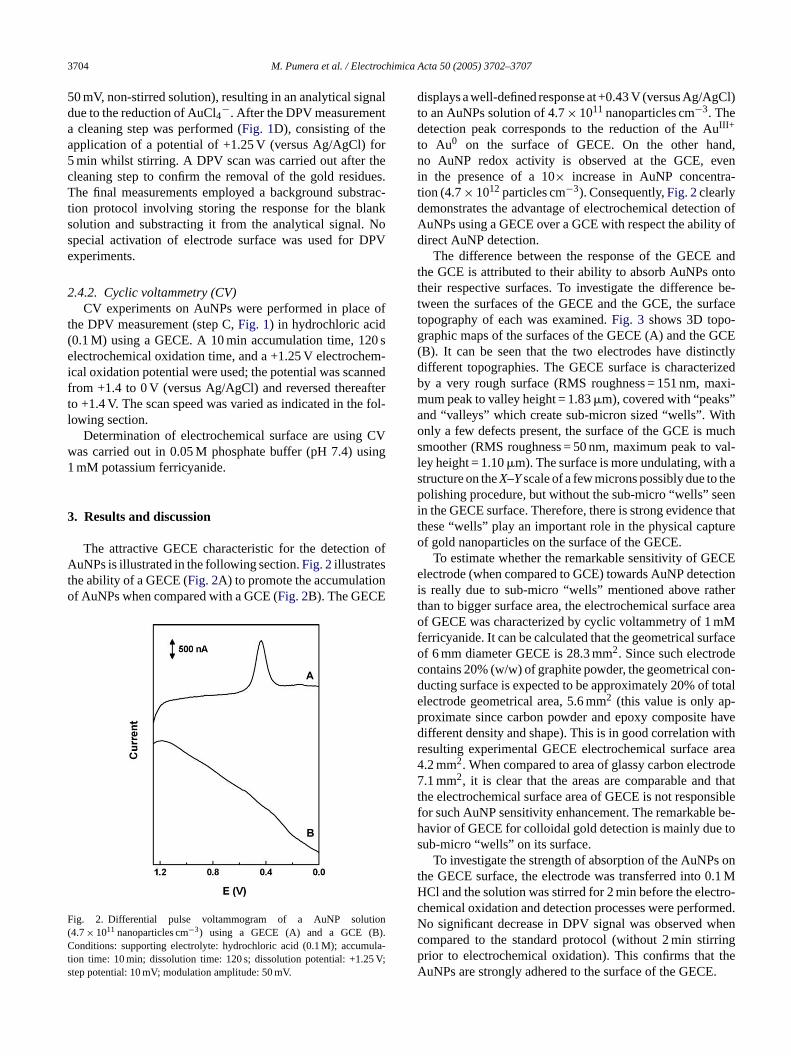
The difference between the response of the GECE andthe GCE is attributed to their ability to absorb AuNPs ontotheir respective surfaces. To investigate the difference be-tween the surfaces of the GECE and the GCE, the surfacetopography of each was examined.Fig. 3 shows 3D topo-graphic maps of the surfaces of the GECE (A) and the GCE(B). It can be seen that the two electrodes have distinctlydifferent topographies. The GECE surface is characterizedby a very rough surface (RMS roughness = 151 nm, maxi-mum peak to valley height = 1.83�m), covered with “peaks”and “valleys” which create sub-micron sized “wells”. Withonly a few defects present, the surface of the GCE is muchsmoother (RMS roughness = 50 nm, maximum peak to val-ley height = 1.10�m). The surface is more undulating, with astructure on theX–Yscale of a few microns possibly due to thepolishing procedure, but without the sub-micro “wells” seeni e thatt tureo
CEe ctioni thert areao Mf rfaceo ec con-d totale -p haved withr area4 rode7 thatt siblef e be-h tos
s ont .1 MH tro-c med.N henc ringp theA .
. Results and discussion
The attractive GECE characteristic for the detectiouNPs is illustrated in the following section.Fig. 2illustrates
he ability of a GECE (Fig. 2A) to promote the accumulatiof AuNPs when compared with a GCE (Fig. 2B). The GECE
ig. 2. Differential pulse voltammogram of a AuNP solut4.7× 1011 nanoparticles cm−3) using a GECE (A) and a GCE (Bonditions: supporting electrolyte: hydrochloric acid (0.1 M); accum
ion time: 10 min; dissolution time: 120 s; dissolution potential: +1.2tep potential: 10 mV; modulation amplitude: 50 mV.
n the GECE surface. Therefore, there is strong evidenchese “wells” play an important role in the physical capf gold nanoparticles on the surface of the GECE.
To estimate whether the remarkable sensitivity of GElectrode (when compared to GCE) towards AuNP dete
s really due to sub-micro “wells” mentioned above rahan to bigger surface area, the electrochemical surfacef GECE was characterized by cyclic voltammetry of 1 m
erricyanide. It can be calculated that the geometrical suf 6 mm diameter GECE is 28.3 mm2. Since such electrodontains 20% (w/w) of graphite powder, the geometricalucting surface is expected to be approximately 20% oflectrode geometrical area, 5.6 mm2 (this value is only aproximate since carbon powder and epoxy compositeifferent density and shape). This is in good correlationesulting experimental GECE electrochemical surface.2 mm2. When compared to area of glassy carbon elect.1 mm2, it is clear that the areas are comparable and
he electrochemical surface area of GECE is not responor such AuNP sensitivity enhancement. The remarkablavior of GECE for colloidal gold detection is mainly dueub-micro “wells” on its surface.
To investigate the strength of absorption of the AuNPhe GECE surface, the electrode was transferred into 0Cl and the solution was stirred for 2 min before the elechemical oxidation and detection processes were perforo significant decrease in DPV signal was observed wompared to the standard protocol (without 2 min stirrior to electrochemical oxidation). This confirms thatuNPs are strongly adhered to the surface of the GECE
M. Pumera et al. / Electrochimica Acta 50 (2005) 3702–3707 3705
Fig. 3. White light interferometric profilometry of the surfaces of a GECE (A) and a GCE (B) (at 50× magnification in each case).
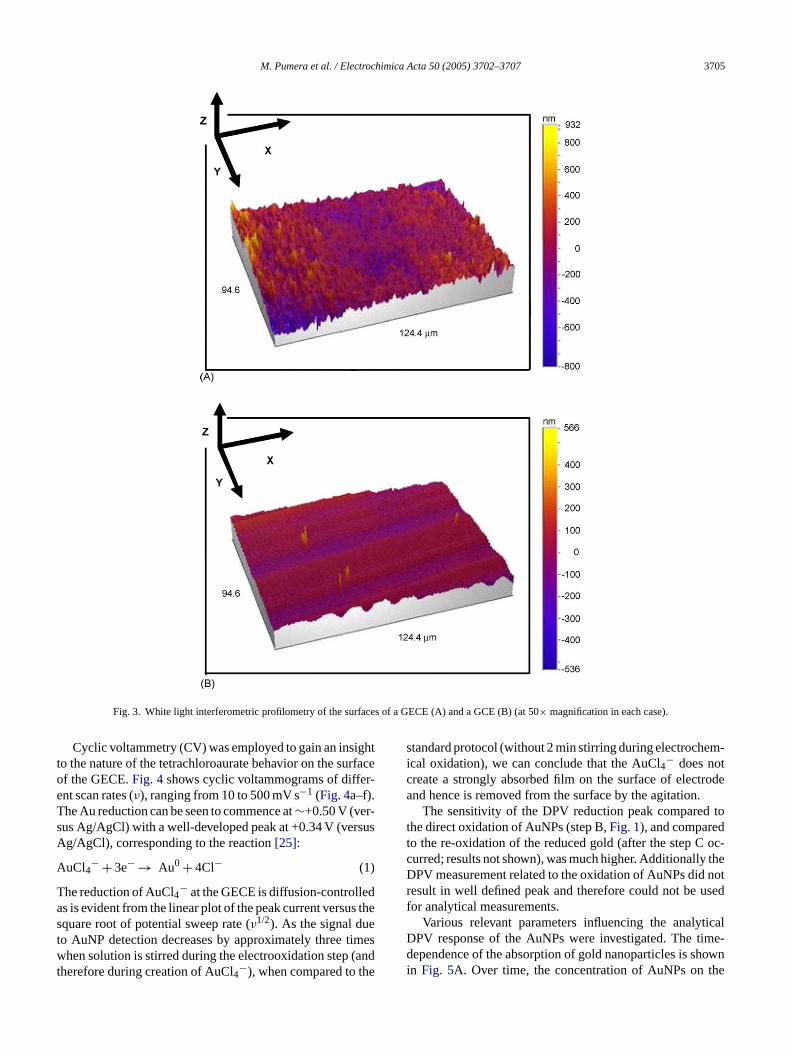
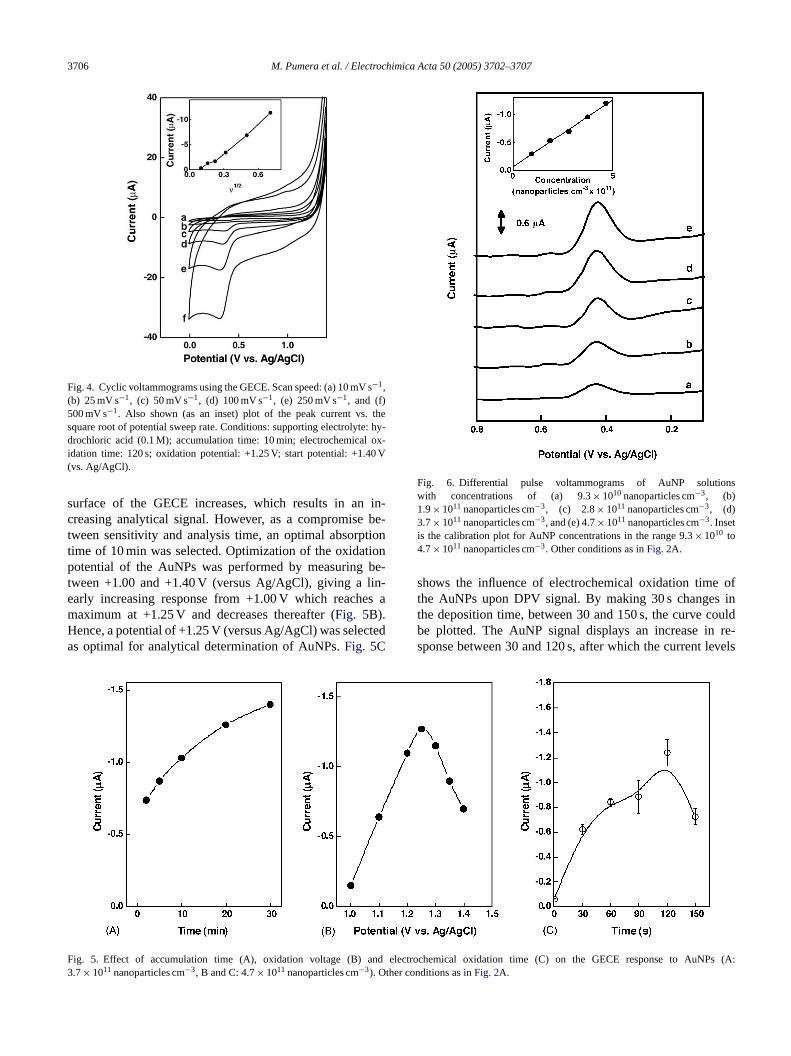
Cyclic voltammetry (CV) was employed to gain an insightto the nature of the tetrachloroaurate behavior on the surfaceof the GECE.Fig. 4shows cyclic voltammograms of differ-ent scan rates (ν), ranging from 10 to 500 mV s−1 (Fig. 4a–f).The Au reduction can be seen to commence at∼+0.50 V (ver-sus Ag/AgCl) with a well-developed peak at +0.34 V (versusAg/AgCl), corresponding to the reaction[25]:
AuCl4− + 3e− → Au0 + 4Cl− (1)
The reduction of AuCl4− at the GECE is diffusion-controlledas is evident from the linear plot of the peak current versus thesquare root of potential sweep rate (ν1/2). As the signal dueto AuNP detection decreases by approximately three timeswhen solution is stirred during the electrooxidation step (andtherefore during creation of AuCl4
−), when compared to the
standard protocol (without 2 min stirring during electrochem-ical oxidation), we can conclude that the AuCl4
− does notcreate a strongly absorbed film on the surface of electrodeand hence is removed from the surface by the agitation.
The sensitivity of the DPV reduction peak compared tothe direct oxidation of AuNPs (step B,Fig. 1), and comparedto the re-oxidation of the reduced gold (after the step C oc-curred; results not shown), was much higher. Additionally theDPV measurement related to the oxidation of AuNPs did notresult in well defined peak and therefore could not be usedfor analytical measurements.
Various relevant parameters influencing the analyticalDPV response of the AuNPs were investigated. The time-dependence of the absorption of gold nanoparticles is shownin Fig. 5A. Over time, the concentration of AuNPs on the
3706 M. Pumera et al. / Electrochimica Acta 50 (2005) 3702–3707
Fig. 4. Cyclic voltammograms using the GECE. Scan speed: (a) 10 mV s−1,(b) 25 mV s−1, (c) 50 mV s−1, (d) 100 mV s−1, (e) 250 mV s−1, and (f)500 mV s−1. Also shown (as an inset) plot of the peak current vs. thesquare root of potential sweep rate. Conditions: supporting electrolyte: hy-drochloric acid (0.1 M); accumulation time: 10 min; electrochemical ox-idation time: 120 s; oxidation potential: +1.25 V; start potential: +1.40 V(vs. Ag/AgCl).
surface of the GECE increases, which results in an in-creasing analytical signal. However, as a compromise be-tween sensitivity and analysis time, an optimal absorptiontime of 10 min was selected. Optimization of the oxidationpotential of the AuNPs was performed by measuring be-tween +1.00 and +1.40 V (versus Ag/AgCl), giving a lin-early increasing response from +1.00 V which reaches amaximum at +1.25 V and decreases thereafter (Fig. 5B).Hence, a potential of +1.25 V (versus Ag/AgCl) was selectedas optimal for analytical determination of AuNPs.Fig. 5C
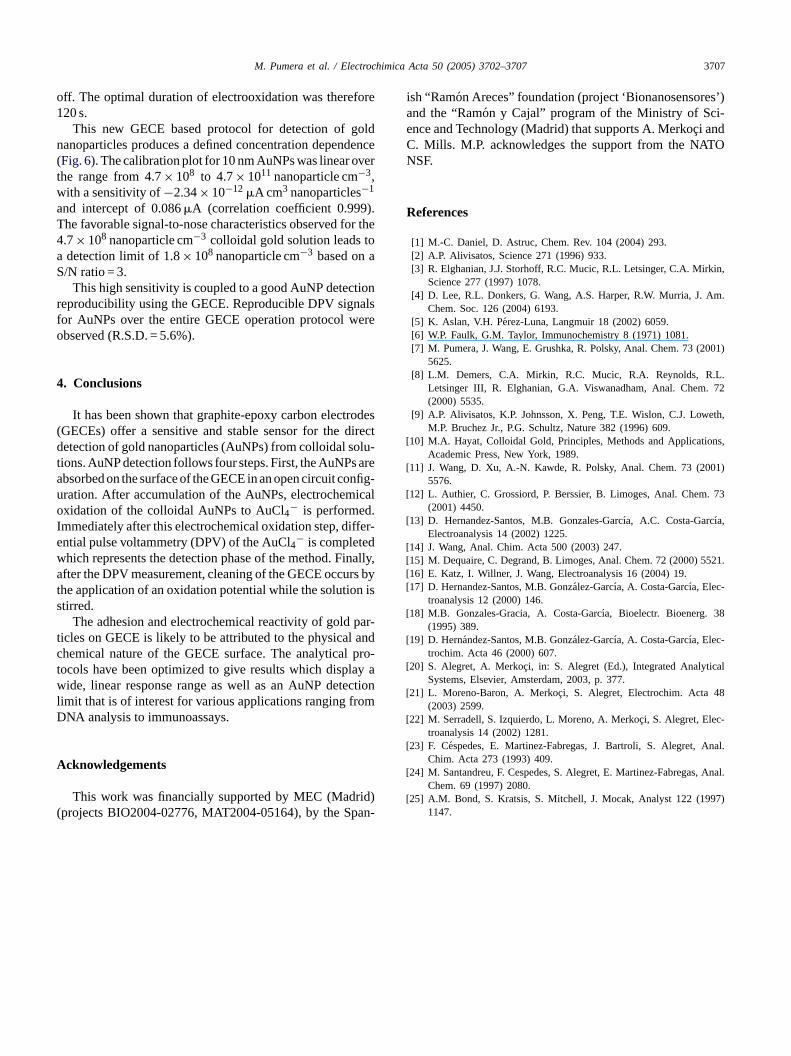
Fig. 6. Differential pulse voltammograms of AuNP solutionswith concentrations of (a) 9.3× 10¹⁰ nanoparticles cm−3, (b)1.9× 10¹¹ nanoparticles cm−3, (c) 2.8× 10¹¹ nanoparticles cm−3, (d)3.7× 10¹¹ nanoparticles cm−3, and (e) 4.7× 10¹¹ nanoparticles cm−3. Insetis the calibration plot for AuNP concentrations in the range 9.3× 10¹⁰ to4.7× 1011 nanoparticles cm−3. Other conditions as inFig. 2A.
shows the influence of electrochemical oxidation time ofthe AuNPs upon DPV signal. By making 30 s changes inthe deposition time, between 30 and 150 s, the curve couldbe plotted. The AuNP signal displays an increase in re-sponse between 30 and 120 s, after which the current levels
F nd electrochemical oxidation time (C) on the GECE response to AuNPs (A:3 ther conditions as inFig. 2A.
ig. 5. Effect of accumulation time (A), oxidation voltage (B) a.7× 1011 nanoparticles cm−3, B and C: 4.7× 10¹¹ nanoparticles cm−3). O
M. Pumera et al. / Electrochimica Acta 50 (2005) 3702–3707 3707
off. The optimal duration of electrooxidation was therefore120 s.
This new GECE based protocol for detection of goldnanoparticles produces a defined concentration dependence(Fig. 6). The calibration plot for 10 nm AuNPs was linear overthe range from 4.7× 10⁸ to 4.7× 10¹¹ nanoparticle cm−3,with a sensitivity of−2.34× 10⁻¹² �A cm3 nanoparticles−1
and intercept of 0.086�A (correlation coefficient 0.999).The favorable signal-to-nose characteristics observed for the4.7× 108 nanoparticle cm−3 colloidal gold solution leads toa detection limit of 1.8× 10⁸ nanoparticle cm−3 based on aS/N ratio = 3.
This high sensitivity is coupled to a good AuNP detectionreproducibility using the GECE. Reproducible DPV signalsfor AuNPs over the entire GECE operation protocol wereobserved (R.S.D. = 5.6%).
4. Conclusions
It has been shown that graphite-epoxy carbon electrodes(GECEs) offer a sensitive and stable sensor for the directdetection of gold nanoparticles (AuNPs) from colloidal solu-tions. AuNP detection follows four steps. First, the AuNPs areabsorbed on the surface of the GECE in an open circuit config-uration. After accumulation of the AuNPs, electrochemicalo .I ffer-ew nally,a rs byt n iss
par-t andc pro-t ay aw ctionl omD
A
id)( an-
ish “Ramon Areces” foundation (project ‘Bionanosensores’)and the “Ramon y Cajal” program of the Ministry of Sci-ence and Technology (Madrid) that supports A. Merkoc¸i andC. Mills. M.P. acknowledges the support from the NATONSF.
References
[1] M.-C. Daniel, D. Astruc, Chem. Rev. 104 (2004) 293.[2] A.P. Alivisatos, Science 271 (1996) 933.[3] R. Elghanian, J.J. Storhoff, R.C. Mucic, R.L. Letsinger, C.A. Mirkin,
Science 277 (1997) 1078.[4] D. Lee, R.L. Donkers, G. Wang, A.S. Harper, R.W. Murria, J. Am.
Chem. Soc. 126 (2004) 6193.[5] K. Aslan, V.H. Perez-Luna, Langmuir 18 (2002) 6059.[6] W.P. Faulk, G.M. Taylor, Immunochemistry 8 (1971) 1081.[7] M. Pumera, J. Wang, E. Grushka, R. Polsky, Anal. Chem. 73 (2001)
5625.[8] L.M. Demers, C.A. Mirkin, R.C. Mucic, R.A. Reynolds, R.L.
Letsinger III, R. Elghanian, G.A. Viswanadham, Anal. Chem. 72(2000) 5535.
[9] A.P. Alivisatos, K.P. Johnsson, X. Peng, T.E. Wislon, C.J. Loweth,M.P. Bruchez Jr., P.G. Schultz, Nature 382 (1996) 609.
[10] M.A. Hayat, Colloidal Gold, Principles, Methods and Applications,Academic Press, New York, 1989.
[11] J. Wang, D. Xu, A.-N. Kawde, R. Polsky, Anal. Chem. 73 (2001)5576.
[12] L. Authier, C. Grossiord, P. Berssier, B. Limoges, Anal. Chem. 73
[
[[ 521.[[
[ 8
[
[ al
[ 8
[ -
[ nal.
[ Anal.
[ 97)
xidation of the colloidal AuNPs to AuCl4− is performed
mmediately after this electrochemical oxidation step, dintial pulse voltammetry (DPV) of the AuCl4
− is completedhich represents the detection phase of the method. Fifter the DPV measurement, cleaning of the GECE occu
he application of an oxidation potential while the solutiotirred.
The adhesion and electrochemical reactivity of goldicles on GECE is likely to be attributed to the physicalhemical nature of the GECE surface. The analyticalocols have been optimized to give results which displide, linear response range as well as an AuNP dete
imit that is of interest for various applications ranging frNA analysis to immunoassays.
cknowledgements
This work was financially supported by MEC (Madrprojects BIO2004-02776, MAT2004-05164), by the Sp
(2001) 4450.13] D. Hernandez-Santos, M.B. Gonzales-Garcıa, A.C. Costa-Garcıa,
Electroanalysis 14 (2002) 1225.14] J. Wang, Anal. Chim. Acta 500 (2003) 247.15] M. Dequaire, C. Degrand, B. Limoges, Anal. Chem. 72 (2000) 516] E. Katz, I. Willner, J. Wang, Electroanalysis 16 (2004) 19.17] D. Hernandez-Santos, M.B. Gonzalez-Garcıa, A. Costa-Garcıa, Elec-
troanalysis 12 (2000) 146.18] M.B. Gonzales-Gracia, A. Costa-Garcıa, Bioelectr. Bioenerg. 3
(1995) 389.19] D. Hernandez-Santos, M.B. Gonzalez-Garcıa, A. Costa-Garcıa, Elec-
trochim. Acta 46 (2000) 607.20] S. Alegret, A. Merkoc¸i, in: S. Alegret (Ed.), Integrated Analytic
Systems, Elsevier, Amsterdam, 2003, p. 377.21] L. Moreno-Baron, A. Merkoc¸i, S. Alegret, Electrochim. Acta 4
(2003) 2599.22] M. Serradell, S. Izquierdo, L. Moreno, A. Merkoc¸i, S. Alegret, Elec
troanalysis 14 (2002) 1281.23] F. Cespedes, E. Martinez-Fabregas, J. Bartroli, S. Alegret, A
Chim. Acta 273 (1993) 409.24] M. Santandreu, F. Cespedes, S. Alegret, E. Martinez-Fabregas,
Chem. 69 (1997) 2080.25] A.M. Bond, S. Kratsis, S. Mitchell, J. Mocak, Analyst 122 (19
1147.