stripping voltammetric methods for the determination of
TRANSCRIPT

STRIPPING VOLTAMMETRIC METHODS FOR
THE DETERMINATION OF AFLATOXIN COMPOUNDS
MOHAMAD HADZRI BIN YAACOB
UNIVERSITI TEKNOLOGI MALAYSIA


BAHAGIAN A – Pengesahan Kerjasama * Adalah disahkan bahawa projek penyelidikan tesis ini telah dilaksanakan melalui kerjasama antara _____________________ dengan _________________________ Disahkan oleh: Tandatangan : .......................................................... Tarikh : .......................... Nama : .......................................................... Jawatan :........................................................... (Cop rasmi) * Jika penyediaan tesis/projek melibatkan kerjasama.
BAHAGIAN B – Untuk Kegunaan Pejabat Sekolah Pengajian Siswazah Tesis ini telah diperiksa dan diakui oleh: Nama dan Alamat Pemeriksa Luar : Prof. Dr. Noor Azhar Bin Mohd Shazili
Pengarah Institut Oseanografi, Kolej Universiti Sains dan Teknologi Malaysia, Mengabang Telipot 21030 Kuala Terengganu
Nama dan Alamat Pemeriksa Dalam I : Prof. Madya Dr. Razali Bin Ismail
Fakulti Sains, UTM, Skudai Pemeriksa Dalam II : Nama Penyelia Lain (jika ada) : Disahkan oleh Penolong Pendaftar di Sekolah Pengajian Siswazah: Tandatangan : .......................................................... Tarikh : .......................... Nama : .GANESAN A/L ANDIMUTHU

STRIPPING VOLTAMMETRIC METHODS FOR
THE DETERMINATION OF AFLATOXIN COMPOUNDS
MOHAMAD HADZRI BIN YAACOB
A thesis submitted in fulfilment of the
requirements for the award of the degree of
Doctor of Philosophy
Faculty of Science
Universiti Teknologi Malaysia
APRIL 2006

ii

iii
Specially dedicated to:
My mother, wife, sons, daughters and all families for
all the love, support and continuous prayer
for my success in completing this work.

iv
ACKNOWLEDGEMENT
All praise be to ALLAH SWT and blessing be upon His Prophet SAW whose
ultimate guidance creates a more meaningful purpose to this work.
I wish to express my sincere gratitude and appreciation to the people who have both
directly and indirectly contributed to this thesis. The following are those to whom I
am particularly indebted:
My supervisors A.P. Dr. Abdull Rahim bin Hj. Mohd. Yusoff and Prof. Dr.
Rahmalan Ahamad for their invaluable guidance, freedom of work and
constant encouragement throughout the course of this work.
School Of Health Sciences, USM, Health Campus, Kubang Krian Kelantan
for awarding study leave together with scholarship in completing the work.
Prof Baharuddin Saad from USM Penang, AP Dr. Razali Ismail from
Chemistry Department, Faculty of Science, UTM and Prof Barek from
Charles University, Prague, Czeck Republic for their useful discussion and
suggestion. Also to Mr Radwan Ismail from Department of Chemistry,
Penang Branch, Mrs Marpongahtun Misni and Mr Wan Kamaruzaman Wan
Ahmad for their friendship, ideas and continuous support in carrying out this
work. Also to Mr Mat Yasin bin Sirin, Mrs Ramlah binti Husin and Mr Azmi
Mahmud for their assistance throughout the work.
UTM for awarding Short Term Grant No: 75152 / 2004
My mother, wife and all families for their encouragements, supports, patience,
tolerance and understanding.
v
ABSTRACT
Aflatoxin, which is produced by Aspergillus flavus and Aspergillus parasiticus fungi is one of the compounds in the mycotoxin group. The main types of aflatoxins are AFB1, AFB2, AFG1 and AFG2 which have carcinogenic properties and are dangerous to human health. Various techniques have been used for their measurements such as the high performance liquid chromatography (HPLC), enzyme linked immunosorbant assay (ELISA) and radioimmunoassay (RIA) but all these methods have disadvantages such as long analysis time, consume a lot of reagents and expensive. To overcome these problems, the voltammetric technique was proposed in this study using controlled growth mercury drop (CGME) as the working electrode and Britton Robinson buffer (BRB) as the supporting electrolyte. The voltammetric methods were used for investigating the electrochemical properties and the quantitative analysis of aflatoxins at the mercury electrode. The experimental conditions were optimised to obtain the best characterised peak in terms of peak height with analytical validation of the methods for each aflatoxin. The proposed methods were applied for the analysis of aflatoxins in groundnut samples and the results were compared with those obtained by the HPLC technique. All aflatoxins were found to adsorb and undergo irreversible reduction reaction at the working mercury electrode. The optimum experimental parameters for the differential pulse cathodic stripping voltammetry (DPCSV) method were the BRB at pH 9.0 as the supporting electrolyte, initial potential (Ei): -0.1 V, final potential (Ef): -1.4 V, accumulation potential (Eacc): -0.6 V, accumulation time (tacc): 80 s, scan rate: 50 mV/s and pulse amplitude: 80 mV. The optimum parameters for the square wave stripping voltammetry (SWSV) method were Ei = -0.1 V, Ef = -1.4 V, Eacc: -0.8 V, tacc: 100 s, scan rate: 3750 mV/s, frequency: 125 Hz and voltage step: 30 V. At the concentration of 0.10 µM, using DPCSV method with the optimum parameters, AFB1, AFB2, AFG1 and AFG2 produced a single peak at -1.21 V, -1.23 V, -1.17 V and -1.15 V (versus Ag/AgCl) respectively. Using the SWSV method, a single peak appeared at -1.30 V for AFB1 and AFB2 while -1.22 V for AFG1 and AFG2. The calibration curves for all aflatoxins were linear with the limit of detection (LOD) of approximately 2.0 ppb and 0.50 ppb obtained by the DPCSV and SWSV methods respectively. The results of aflatoxins content in individual groundnut samples do not vary significantly when compared with those obtained by the HPLC technique. Finally, it can be concluded that both proposed methods which are accurate, precise, robust, rugged, fast and low cost were successfully developed and are potential alternative methods for routine analysis of aflatoxins in groundnut samples.
vi
ABSTRAK
Aflatoksin adalah sejenis sebatian yang dihasilkan oleh kulat Aspergillus flavus dan Aspergillus parasiticus yang digolongkan di dalam kumpulan mikotoksin. Jenis utama aflatoksin adalah AFB1, AFB2, AFG1 dan AFG2 yang bersifat karsinogen serta merbahaya kepada kesihatan manusia. Pelbagai teknik telah digunakan untuk menentukan aflatoksin seperti kromatografi cecair prestasi tinggi (HPLC), asai serapan imuno berikatan enzim (ELISA) dan radioamunoasai (RIA) tetapi teknik-teknik ini mempunyai kelemahan seperti masa analisis yang panjang, melibatkan reagen yang banyak dan kos yang mahal. Untuk mengatasi masalah ini, teknik voltammetri telah dicadangkan untuk kajian aflatoksin menggunakan titisan raksa pembesaran terkawal (CGME) sebagai elektrod bekerja dan larutan penimbal Britton-Robinson (BRB) sebagai elektrolit penyokong. Pelbagai kaedah voltammetri telah digunakan untuk mengkaji sifat elektrokimia aflatoksin pada elektrod raksa dan analisis kuantitatifnya. Parameter kajian telah dioptimumkan untuk memperolehi puncak yang elok berdasarkan ketinggian puncak serta pengesahan analisis untuk kaedah yang dibangunkan bagi setiap aflatoksin. Kaedah ini telah digunakan untuk menentukan kandungan aflatoksin di dalam sampel kacang tanah di mana keputusan yang diperolehi telah dibandingkan dengan keputusan HPLC. Semua aflatoksin yang dikaji didapati terjerap dan menjalani proses tindakbalas penurunan tidak berbalik pada elektrod raksa. Parameter optimum untuk kaedah voltammetri perlucutan kathodik denyut pembeza (DPCSV) adalah larutan BRB pada pH 9.0 sebagai larutan elektrolit, keupayaan awal (Ei): -1.0 V, keupayaan akhir (Ef): -1.4 V, keupayaan pengumpulan (Eacc): -0.6 V, masa pengumpulan (tacc): 80 s, kadar imbasan: 50 mV/s dan amplitud denyut: 80 mV. Untuk kaedah voltammetri perlucutan gelombang bersegi (SWSV), parameter optimum adalah Ei : -1.0 V, Ef : -1.4 V, Eacc: -0.8 V, tacc: 100 s, kadar imbasan: 3750 mV/s, frekuensi: 125 Hz dan beza keupayaan: 30 mV. Menggunakan parameter optimum untuk DPCSV, 0.10 µM AFB1, AFB2, AFG1 dan AFG2 menghasilkan puncak tunggal pada keupayaan -1.21 V, -1.23 V, -1.17 V dan -1.15 V (melawan Ag/AgCl) masing-masingnya. Menggunakan kaedah SWSV, puncak terhasil pada -1.30 V untuk AFB1 dan AFB2, -1.22 V untuk AFG1 dan AFG2. Keluk kalibrasi adalah linear untuk semua aflatoksin dengan had pengesanan (LOD) pada 2.0 dan 0.5 ppb diperolehi dari kaedah DPCSV dan SWSV masing-masingnya. Keputusan analisis kandungan aflatoksin di dalam sampel kacang tanah tidak memberi perbezaan ketara berbanding dengan yang diperolehi menggunakan teknik HPLC. Kesimpulannya, kedua-dua kaedah yang dikaji yang merupakan kaedah yang tepat, jitu, cepat, sesuai digunakan dengan pelbagai model voltammetri dan kos yang murah telah berjaya dibangunkan dan berpotensi besar menjadi kaedah alternatif untuk analisis kandungan aflatoksin di dalam kacang tanah secara berkala.

vii
TABLE OF CONTENTS
CHAPTER TITLE PAGE
TITLE i
DECLARATION ii
DEDICATION iii
ACKNOWLEDGEMENT iv
ABSTRACT v
ABSTRAK vi
TABLE OF CONTENTS vii
LIST OF TABLES xiii
LIST OF FIGURES xvi
ABBREVATIONS xxix
LIST OF APPENDICES xxxiii
1 LITERATURE REVIEW 1
1.1 Overview 1
1.2 Aflatoxins 3
1.2.1 Aflatoxins in general 3
1.2.2 Chemistry of aflatoxins 5
1.2.3 Health aspects of aflatoxins 12
1.2.4 Analytical methods for the determination of 16
aflatoxins
1.2.5 Electrochemical properties of aflatoxins 28
1.3. Voltammetric technique 30
1.3.1 Voltammetric techniques in general 30
viii
1.3.2 Voltammetric measurement 31
1.3.2.1 Instrumentation 31
1.3.2.2 Solvent and supporting electrolyte 44
1.3.2.3 Current in voltammetry 46
1.3.2.4 Quantitative and quantitative aspects of 48
voltammetry
1.3.3 Type of voltammetric techniques 49
1.3.3.1 Polarography 49
1.3.3.2 Cyclic voltammetry 51
1.3.3.3 Stripping voltammetry 54
1.3.3.3a Anodic stripping voltammetry 56
1.3.3.3b Cathodic stripping voltammetry 57
1.3.3.3c Adsorptive stripping voltammetry 58
1.3.3.4 Pulse voltammetry 59
1.3.3.4a Differential pulse voltammetry 60
1.3.3.4b Square wave voltammetry 61
1.4 Objective and scope of study 64
1.4.1 Objective of study 64
1.4.2 Scope of study 67
2 RESEARCH METHODOLOGY 70
2.1 Apparatus, material and reagents 70
2.1.1 Apparatus 70
2.1.2 Materials 72
2.1.2.1 Aflatoxin stock and standard solutions 72
2.1.2.2 Real samples 73
2.1.3 Reagents 73
2.1.3.1 Britton Robinson buffer, 0.04 M 73
2.1.3.2 Carbonate buffer, 0.04 M 74
2.1.3.3 Phosphate buffer, 0.04 M 74
ix
2.1.3.4 Ascorbic acid 74
2.1.3.5 β-cyclodextrin solution, 1.0 mM 75
2.1.3.6 L-Cysteine, 1.0 x 10⁻⁵ M 75
2.1.3.7 2,4-dihydrofuran, 0.15 M 75
2.1.3.8 Coumarin, 3.0 x 10⁻² M 75
2.1.3.9 Poly-L-lysine, 10 ppm 75
2.1.3.10 Standard aluminium (II) solution, 1.0 mM 75
2.1.3.11 Standard plumbum(II) solution, 1.0 mM 76
2.1.3.12 Standard zinc (II) solution, 1.0 mM 76
2.1.3.13 Standard copper (II) solution, 1.0 mM 76
2.1.3.14 Standard nickel (II) solution, 1.0 mM 76
2.1.3.15 Methanol: 0.1 N HCl solution, 95% 76
2.1.3.16 Zinc sulphate solution, 15% 76
2.2 Analytical Technique 77
2.2.1 General procedure for voltammetric analysis 77
2.2.2 Cyclic voltammetry (Anodic and cathodic 77
directions)
2.2.2.1 Standard addition of sample 77
2.2.2.2 Repetitive cyclic voltammetry 78
2.2.2.3 Effect of scan rate 78
2.2.3 Differential pulse cathodic stripping 78
voltammetric determination of AFB2
2.2.3.1 Effect of pH 79
2.2.3.2 Method optimisation for the determination 79
of AFB2
2.2.3.2a Effect of scan rate 79
2.2.3.2b Effect of accumulation potential 80
2.2.3.2c Effect of accumulation time 80
2.2.3.2d Effect of initial potential 80
2.2.3.2e Effect of pulse amplitude 80

x
2.2.3.3 Method validation 80
2.2.3.4 Interference studies 81
2.2.3.4a Effect of Cu(II), Ni (II), Al(III), 81
Pb(II) and Zn(II)
2.2.3.4b Effect of ascorbic acid, 82
β-cyclodextrin and L-cysteine
2.2.3.5 Modified mercury electrode with PLL 82
2.2.4 Square wave cathodic stripping voltammetry 82
(SWSV)
2.2.4.1 SWSV parameters optimisation 82
2.2.4.2 SWSV determination of all aflatoxins 82
2.2.5 Stability studies of aflatoxins 83
2.2.5.1 Stability of 10 ppm aflatoxins 83
2.2.5.2 Stability of 1 ppm aflatoxins 83
2.2.5.3 Stability of 0.1 µM aflatoxins exposed 83
to ambient temperature
2.2.5.4 Stability of 0.1 µM aflatoxins in different 84
pH of BRB
2.2.6 Application to food samples 84
2.2.6.1 Technique 1 84
2.2.6.2 Technique 2 84
2.2.6.3 Technique 3 85
2.2.6.4 Blank measurement 85
2.2.6.5 Recovery studies 85
2.2.6.6 Voltammetric analysis 86
3 RESULTS AND DISCUSSION 88
3.1 Cyclic voltammetric studies of aflatoxins 88
3.1.1 Cathodic and anodic cyclic voltammetric 89
of aflatoxins
xi
3.2 Differential pulse cathodic stripping voltammetry 102
of AFB2
3.2.1 Optimisation of conditions for the stripping 104
analysis
3.2.1.1 Effect of pH and type of supporting 104
electrolyte
3.2.1.2 Optmisation of instrumental conditions 117
3.2.1.2a Effect of scan rate 118
3.2.1.2b Effect of accumulation time 119
3.2.1.2c Effect of accumulation 120
potential
3.2.1.2d Effect of initial potential 121
3.2.1.2e Effect of pulse amplitude 122
3.2.2 Analysis of aflatoxins 127
3.2.2.1 Calibration curves of aflatoxins and 129
validation of the proposed method
3.2.2.1a Calibration curve of AFB2 129
3.2.2.1b Calibration curve of AFB1 134
3.2.2.1c Calibration curve of AFG1 137
3.2.2.1d Calibration curve of AFG2 140
3.2.2.2 Determination of limit of detection 143
3.2.2.3 Determination of limit of quantification 147
3.2.2.4 Inteference studies 150
3.3 Square-wave stripping voltammetry (SWSV) of 157
aflatoxins
3.3.1 SWSV determination of AFB2 158
3.3.1.1 Optimisation of experimental and 159
instrumental SWSV parameters
3.3.3.1a Influence of pH of BRB 159
3.3.3.1b Effect of instrumental 160
variables
xii
3.3.2 SWSV determination of other aflatoxins 166
3.3.3 Calibration curves and method validation 168
3.4 Stability studies of aflatoxins 175
3.4.1 10 ppm aflatoxin stock solutions 175
3.4.2 1 ppm aflatoxins in BRB at pH 9.0 179
3.4.2.1 Month to month stability studies 179
3.4.2.2 Hour to hour stability studies 181
3.4.2.3 Stability studies in different pH 186
of BRB
3.4.2.4 Stability studies in 1.0 M HCl and 191
1.0 M NaOH
3.5 Voltammetric analysis of aflatoxins in real samples 192
3.5.1 Study on the extraction techniques 193
3.5.2 Analysis of blank 194
3.5.3 Recovery studies of aflatoxins in real samples 196
3.5.4 Analysis of aflatoxins in real samples 199
4 CONCLUSIONS AND RECOMMENDATIONS 204
4.1 Conclusions 204
4.2 Recommendations 206
REFERENCES 208
Appendices A – AM 255 - 317

xiii
LIST OF TABLES
TABLE NO. TITLE PAGE 1.0 Scientific name for aflatoxin compounds 7 1.1 Chemical and physical properties of aflatoxin 10 compounds 1.2 Summary of analysis methods used for 19 determination of aflatoxins in various samples 1.3 Working electrode and limit of detection for 32 modern polarographic and voltammetric techniques. 1.4 The application range of various analytical 33
techniques and their concentration limits when compared with the requirements in different fields of chemical analysis
1.5 List of different type of working electrodes and 36 its potential windows 1.6 Electroreducible and electrooxidisable organic 50 functional groups 1.7 The characteristics of different type of 53 electrochemical reaction. 1.8 Application of Square Wave Voltammetry 62 technique 2.0 List of aflatoxins and their batch numbers 72 used in this experiment 2.1 Injected volume of aflatoxins into eluate of 86 groundnut and the final concentrations obtained in voltammetric cell 3.0 The dependence of current peaks of aflatoxins to 97 their concentrations obtained by cathodic cyclic
measurements in BRB at 9.0.

xiv
3.1 Effect of buffer constituents on the peak height 109 of 2.0 µM AFB2 at pH 9.0. Experimental conditions are the same as Figure 3.21
3.2 Compounds reduced at the mercury electrode 116 3.3 Optimum parameters for 0.06 µM and 2.0 µM 126 AFB2 in BRB at pH 9.0. 3.4 The peak height and peak potential of aflatoxins 127 obtained by optimised parameters in BRB at pH 9.0 using DPCSV technique. 3.5 Peak height (in nA) obtained for intra-day and 131 inter-day precision studies of 0.10 µM and 0.20 µM by the proposed voltammetric procedure (n=8). 3.6 Mean values for recovery of AFB2 standard 132 solution (n=3). 3.7 Influence of small variation in some of the 133 assay condition of the proposed procedure on its suitability and sensitivity using 0.10 µM AFB2. 3.8 Results of ruggedness test for proposed method 134 using 0.10 µM AFB2. 3.9 Peak height (in nA) obtained for intra-day and 136 inter-day precision studies of 0.10 µM and 0.20 µM AFB1 by proposed voltammetric procedure
(n=5). 3.10 Mean values for recovery of AFB1 standard 137 solution (n=3). 3.11 Peak height (in nA) obtained for intra-day and 139 inter-day precision studies of 0.10 µM and 0.20 µM AFG1 by proposed voltammetric procedure (n=5). 3.12 Mean values for recovery of AFG1 standard 139 solution (n=3). 3.13 Peak height (in nA) obtained for intra-day and 141 inter-day precision studies of 0.10 µM and 0.20 µM AFG2 by proposed voltammetric procedure.
xv
3.14 Mean values for recovery of AFG2 standard 142 solution (n=5). 3.15 Peak height and peak potential of 0.10 µM 143 aflatoxins obtained by BAS and Metrohm voltammetry analysers under optimised operational parameters for DPCSV method. 3.16 Analytical parameters for calibration curves 145 for AFB1,AFB2, AFG1 and AFG2 obtained by DPCSV technique using BRB at pH 9.0 as the supporting electrolyte. 3.17 LOD values for determination of aflatoxins 148 obtained by various methods. 3.18 LOQ values for determination of aflatoxins 149 obtained by various methods. 3.19 Peak current and peak potential for all aflatoxins 167 obtained by SWSV in BRB at pH 9.0 (n=5). 3.20 Analytical parameters for calibration curves for 172 AFB1, AFB2, AFG1 and AFG2 obtained by SWSV technique in BRB pH 9.0 as the supporting electrolyte. 3.21 Result of reproducibility study (intra-day and inter- 173 day measurements) for 0.1 µM aflatoxins in BRB at pH 9.0 obtained by SWSV method. 3.22 Application of the proposed method in evaluation 174 of the SWSV method by spiking the aflatoxin standard solutions. 3.23 Average concentration of all aflatoxins within a 175 year stability studies. 3.24 The peak current and peak potential of 10 ppb 196 AFB2 in presence and absence of a blank sample. 3.25 Total aflatoxin contents in real samples which 203 were obtained by DPCSV and HPLC techniques (average of duplicate analysis)

xvi
LIST OF FIGURES
FIGURE NO. TITLE PAGE 1.0 Aspergillus flavus seen under an electron 4 microscope. 1.1 Chemical structure of coumarin 6 1.2 Chemical structures of (a) AFB1, (b) AFB2, 8
(c) AFG1, (d) AFG2, (e) AFM1 and (f) AFM2 1.3 Hydration of (a) AFB1 and (b) AFG1 by TFA 9 produces (c) AFB2a and (d) AFG2a 1.4 Transformation of toxic (a) AFB1 to non-toxic 11 (b) aflatoxicol A. 1.5 Major DNA adducts of AFB1; (a) 8,9-Dihydro-8- 13 (N7-guanyl)-9-hydroxy-aflatoxin B1 (AFB1-Gua) and (b) 8,9-Dihydro-8-(N5-Formyl-2’.5’.6’- triamino-4’-oxo-N5-pyrimidyl)-9-hydroxy-Aflatoxin B1 (AFB1-triamino-Py) 1.6 Metabolic pathways of AFB1 by cytochrom P-450 14 enzymes; B1-epoxide = AFB1 epoxide, M1= aflatoxin M1, P1= aflatoxin P1 and Q1 = aflatoxin Q1. 1.7 A typical arrangement for a voltammetric 34
electrochemical cell (RE: reference electrode, WE: working electrode. AE: auxiliary electrode)
1.8 A diagram of the Hanging Mercury Drop Electrode 37
(HMDE) 1.9 A diagram of the Controlled Growth Mercury 38 Electrode (CGME) 1.10 Cyclic voltammograms of (a) reversible, 52 (b) irriversible and (c) quasireversible reaction at mercury electrode (O = oxidised form and R = reduced
form)

xvii
1.11 The potential-time sequence in stripping analysis 55 1.12 Schematic drawing showing the Faradaic current 59 and charging current versus pulse time course 1.13 Schematic drawing of steps in DPV by 60 superimposing a periodic pulse on a linear scan 1.14 Waveform for square-wave voltammetry 61 2.0 BAS CGME stand (a) which is connected to 71 CV-50W voltammetric analyser and interface with computer (b) for data processing 2.1 VA757 Computrace Metrohm voltammetric 71 analyser with 663 VA stand (consists of Multi Mode (MME)) 3.0 Cathodic peak current of 0.6 µM AFB1 in various 89 pH of BRB obtained in cathodic cyclic voltammetry. Ei = 0, Elow = -1.5 V, Ehigh = 0 and scan rate = 200
mV/s) 3.1 Shifting of peak potential of AFB1 with increasing 90 pH of BRB. Parameter conditions are the same as in Figure 3.0. 3.2 Mechanism of reduction of AFB1 in BRB at pH 6.0 90 to 8.0. 3.3 Mechanism of reduction of AFB1 in BRB at pH 9.0 91 to 11.0. 3.4 Cathodic cyclic voltammogram for 1.3 µM AFB1 92 obtained at scan rate of 200 mV/s, Ei = 0, Elow =
-1.5 V and Ehigh = 0 in BRB solution at pH 9.0. 3.5 Cathodic cyclic voltammogram for 1.3 µM AFB2 92 in BRB solution at pH 9.0. All parameter conditions are the same as in Figure 3.4. 3.6 Cathodic cyclic voltammogram for 1.3 µM AFG1 93 in BRB solution at pH 9.0. All parameter conditions are the same as in Figure 3.4.

xviii
3.7 Cathodic cyclic voltammogram for 1.3 µM AFG2 93 in BRB solution at pH 9.0. All parameter conditions are the same as in Figure 3.4. 3.8 Effect of Ei to the Ip of 0.6 µM AFB1 in BRB at pH 94
9.0 obtained by cathodic cyclic voltammetry. All parameter conditions are the same as in Figure 3.4.
3.9 Effect of Ei to the Ip of 0.1 µM Zn2+ in BRB at pH 94 9.0 obtained by cathodic cyclic voltammetry. All parameter conditions are the same as in Figure 3.4.
3.10 Anodic cyclic voltammogram of 1.3 µM AFB2 95 obtained at scan rate of 200 mV/s, Ei = -1.5 V, Elow = -1.5 V and Ehigh = 0 in BRB at pH 9.0. 3.11 Effect of increasing AFB2 concentration on the 96 peak height of cathodic cyclic voltammetrc curve in BRB at pH = 9.0. (1.30 µM, 2.0 µM, 2.70 µM and 3.40 µM). All parameter conditions are the same as in Figure 3.4. 3.12 Peak height of reduction peak of AFB2 with 96 increasing concentration of AFB2. All parameter
conditions are the same as in Figure 3.4. 3.13 Repetitive cathodic cyclic voltammograms of 1.3 98 µM AFB2 in BRB solution at pH 9.0. All
experimental conditions are the same as in Figure 3.4. 3.14 Increasing Ip of 1.3 µM AFB2 cathodic peak 98 obtained from repetitive cyclic voltammetry. All
experimental conditions are the same as in Figure 3.4. 3.15 Peak potential of 1.3 µM AFB2 with increasing 99 number of cycle obtained by repetitive cyclic
voltammetry.
xix
3.16 Plot of log Ip versus log υ for 1.3 µM AFB2 in 100 BRB solution at pH 9.0. All experimental conditions
are the same as in Figure 3.4. 3.17 Plot of Ep versus log υ for 1.3 µM AFB2 in BRB 101
solution at pH 9.0. 3.18 Plot of Ip versus υ for 1.3 µM AFB2 in BRB 102 solution at pH 9.0. All parameter conditions
are the same as in Figure 3.4. 3.19 DPCS voltammograms of 1.0 µM AFB2 (Peak I) 103 in BRB at pH 9.0 (a) at tacc = 0 and 30 s. Other parameter conditions; Ei = 0, Ef = -1.50 V,
Eacc = 0, υ =50 mV/s and pulse amplitude = 100 mV. Peak II is the Zn peak.
3.20 DPCS voltammograms of 2.0 µM AFB2 in BRB 104 in BRB (Peak I) at different pH values; 6.0, 7.0,
8.0, 9.0, 11.0and 13.0. Other parameter conditions; Ei = 0, Ef =-1.50 V, Eacc = 0, υ = 50 mV/s and pulse amplitude =100 mV. Peak II is the Zn peak.
3.21 Dependence of the Ip for AFB2 on the pH of 105 0.04 M BRB solution. AFB2 concentration: 2.0 µM, Ei =0, Ef = -1.5 V, Eacc = 0, tacc = 30 sec, υ = 50 mV/s and pulse amplitude = 100 mV. 3.22 Ip of 2.0 µM AFB2 obtained in BRB (a) at pH 106 from 9.0 decreases to 4.0 and re-increase to 9.0 and
(b) at pH from 9.0 increase to 13.0 and re-decrease to 9.0.
3.23 UV-VIS spectrums of 1 ppm AFB2 in BRB at 107 pH (a) 6.0, (b) 9.0 and (c) 13.0.
3.24 Opening of lactone ring by strong alkali caused no 108 peak to be observed for AFB2 in BRB at pH 13.0. 3.25 Ip of 2.0 µM AFB2 in different concentration of 109 BRB at pH 9.0. Experimental conditions are the same as in Figure 3.20. 3.26 Ip of 2.0 µM AFB2 in different pH and concentrations 110 of BRB.

xx
3.27 DPCS voltammograms of 2.0 AFB2 (Peak I) 110 in (a) 0.04 M, (b) 0.08 M and (c) 0.08 M BRB
at pH 9.0 as the blank. Ei = 0 V, Ef = -1.5 V, Eacc = 0 V, tacc = 30 sec, υ = 50mV/s and pulse amplitude = 100 mV. Peak II is the Zn peak.
3.28 Chemical structures of (a) 2,3-dihydrofuran, 111
(b) tetrahydrofuran and (c) coumarin.
3.29 Voltammograms of 2,3-dihydrifuran (peak I) for 112 concentrations from (b) 0.02 to 0.2 µM in (a) BRB at pH 9.0. 3.30 Dependence of Ip of coumarin to its concentrations 112 3.31 Voltammograms of coumarin at concentration of 113 (b) 34 µM, (c) 68 µM, (d) 102 µM, (e) 136 µM
and (f) 170 µM in (a) BRB at pH 9.0. 3.32 Chemical structures of (a) cortisone and (b) 114
testosterone. 3.33 Chemical structures of (a) digoxin and (b) digitoxin 115 3.34 Effect of pH of BRB solution on the Ep for AFB2. 117 AFB2 concentration: 2.0 µM. Ei = 0, Ef = -1.5 V, Eacc = 0, tacc = 30 s and υ = 50 mV/s. 3.35 Effect of various υ to the (a) Ip and (b) Ep of 2.0 µM 118
AFB2 peak in BRB at pH 9.0. Ei = 0, Ef = 1.50 V, Eacc = 0, tacc = 15 s and pulse amplitude = 100 mV.
3.36 Effect of tacc on (a) Ip and (b) Ep of 2.0 µM AFB2 119 peak in BRB at pH 9.0. Ei = 0, Ef = 1.50 V, Eacc = 0,
υ = 40 mV/s and pulse amplitude = 100 mV. 3.37 The relationship between (a) Ip and (b) Ep with 120 Eacc for 2.0 µM AFB2 in BRB at pH 9.0. Ei = 0, Ef = -1.5 V, tacc = 15 s, υ = 40 mV/s and
pulse amplitude = 100 mV.
3.38 Effect of Ei on (a) Ip and (b) Ep of 2.0 µM AFB2 121 in BRB at pH 9.0. Ef = 1.50 V, Eacc = -0.80 V,
tacc = 40 s,υ = 40 mV/s and pulse amplitude = 100 mV.

xxi
3.39 Effect of pulse amplitude on (a) Ip and (b) Ep 122 of 2.0 µM AFB2 in BRB at pH 9.0. Ei = -1.0 V, Ef = 1.50 V, Eacc = -0.80 V, tacc = 40 s and υ = 40 mV/s.
3.40 Effect of Eacc on Ip of 0.06 µM AFB2. Ei = -1.0 V, 123 Ef = -1.50 V, tacc = 40 s, υ = 40 mV/s and pulse amplitude = 100 mV.
3.41 Effect of tacc on (a) Ip and (b) Ep of 0.06 µM AFB2 124 in BRB at pH 9.0. Ei = -1.0 V, Ef = -1.50 V, Eacc = -0.6 V, υ = 40 mV/s and pulse amplitude = 100 mV.
3.42 The effect υ on (a) Ip and (b) Ep of 0.06 µM AFB2 125 In BRB at pH 9.0. Ei = -1.0 V, Ef = -1.50 V, Eacc = -0.6 V, tacc = 80 s and pulse amplitude = 100 mV.
3.43 Voltammograms of 0.06 µM AFB2 obtained under 126 (a) optimised and (b) unoptimised parameters in BRB
at pH 9.0.
3.44 Voltammograms of 0.1 µM (a) AFB1, (b) AFG1, 128 (c) AFB2 and (d) AFG2 in BRB at pH 9.0. Ei = 1.0 (except for AFG1 = -0.95 V), Ef = -1.4 V, Eacc = -0.6 V, tacc = 80 s, υ = 50 mV/s and pulse amplitude = 80 mV.
3.45 Voltammograms of (b) mixed aflatoxins in (a) BRB at 129
pH 9.0 as the blank. Parameters condition: Ei = -0.95 V, Ef = -1.4 V, Eacc = -0.6 V, tacc = 80 s, υ = 50 mV/s and Pulse amplitude = 80 mV.
3.46 Increasing concentration of AFB2 in BRB at pH 9.0. 130 The parameter conditions: Ei = -1.0 V, Ef = -1.4 V, Eacc =-0.6 V, tacc = 80 s, υ = 50 mV/s and pulse amplitude = 80 mV. 3.47 Linear plot of Ip versus concentration of AFB2 130 in BRB at pH 9.0. The parameter conditions are
the same as in Figure 3.46. 3.48 Standard addition of AFB1 in BRB at pH 9.0. 135 The parameter conditions: Ei = -1.0 V, Ef = -1.4 V, Eacc =-0.8 V, tacc = 80 s, υ = 50 mV/s and pulse amplitude = 80 mV.

xxii
3.49 Linear plot of Ip versus concentration of AFB1 135 in BRB at pH 9.0. The parameter conditions are
the same as in Figure 3.48. 3.50 Effect of concentration to Ip of AFG1 in BRB at 138 pH 9.0. Ei = -0.95 V, Ef = -1.40 V, Eacc =-0.8 V,
tacc = 80 s, υ = 50 mV/s and pulse amplitude = 80 mV.
3.51 Linear plot of Ip versus concentration of AFG1 138 in BRB at pH 9.0. The parameter conditions are the same as in Figure 3.50.
3.52 Effect of concentration to Ip of AFG2 in BRB at 140 pH 9.0. Ei = -1.0 V, Ef = -1.40 V, Eacc =-0.8 V,
tacc = 80 s, υ = 50 mV/s and pulse amplitude = 80 mV. 3.53 Linear plot of Ip versus concentration of AFG2 141 in BRB at pH 9.0. The parameter conditions are
the same as in Figure 3.52.
3.54 Voltammograms of 0.1 µM (a) AFB1, (b) AFB2, 144 (c) AFG1 and (d) AFG2 in BRB at pH 9.0 (d) obtained by 747 VA Metrohm. Ei = -1.0 V (except for AFG1 = -0.95 V), Ef = -1.4 V, Eacc = -0.6 V, tacc = 80 s, υ = 50 mV/s and pulse amplitude = 80 mV.
3.55 Ip of all aflatoxins with increasing concentration of 150 Zn2+ up to 1.0 µM. 3.56 Voltammograms of (i) 0.1µM AFB2 and (ii) AFB2-Zn 151
complex with increasing concentration of Zn2+ (a = 0, b = 0.75 µM, c = 1.50 µM, d = 2.25 µM and e = 3.0 µM). Blank = BRB at pH 9.0. Experimental conditions; Ei = -1.0 V, Ef = -1.40 V, Eacc = -0.6 V, tacc = 80 s, υ = 50 mV/s and pulse amplitude = 80 mV.
3.57 Ip of all aflatoxins after reacting with increasing 151 concentration of Zn2+ in BRB at pH 3.0. Measurements were made in BRB at pH 9.0 within 15 minutes of reaction time. Ei = -1.0 V (except
for AFG1 = -0.95 V), Ef = -1.40 V, Eacc = -0.6 V, tacc = 80 s, υ = 50 mV/s and pulse amplitude = 80 mV.

xxiii
3.58 Absorbance of all aflatoxins with increasing 152 concentration of Zn2+ in BRB at pH 3.0 within 15 minutes of reaction time
3.59 Voltammograms of 0.1µM AFB2 with increasing 153 concentration of Zn2+ (from 0.10 to 0.50 µM) in
BRB at pH 9.0. Ei = -0.25 V, Ef = -1.4 V, Eacc = -0.6 V, tacc = 80 s, υ = 50 mV/s and pulse amplirude = 80 mV. .
3.60 Chemical structure of ascorbic acid. 153 3.61 Ip of all aflatoxins with increasing concentration 154 of ascorbic acid up to 1.0 µM. Concentrations of all aflatoxins are 0.1µM. 3.62 Voltammograms of 0.1µM AFB2 with increasing 154 concentration of ascorbic acid. 3.63 Ip of all aflatoxins with increasing concentration 155 of β-cyclodextrin up to 1.0 µM. 3.64 Voltammograms of 0.1µM AFB2 with increasing 156 concentration of β-cyclodextrin. 3.65 Chemical structure of L-cysteine. 156 3.66 Ip of all aflatoxins with increasing concentration 157 of cysteine up to 1.0 µM. 3.67 Voltammograms of 0.1 µM AFB2 obtained by 158 (a) DPCSV and (b) SWSV techniques in BRB at pH 9.0. Parameters for DPCSV: Ei = -1.0 V, Ef =
-1.40V, Eacc = -0.6 V, tacc = 80 s, υ = 50 mV/s and pulse amplitude = 80 mV and for SWSV: Ei = -1.0 V, Ef = -1.40V, Eacc = -0.6 V, tacc = 80 s, frequency = 50 Hz, voltage step = 0.02 V, amplitude = 80 mV and υ = 1000 mV/s.
3.68 Influence of pH of BRB on the Ip of 0.10 µM 159 AFB2 using SWSV technique. The instrumental
Parameters are the same as in Figure 3.67. 3.69 Voltammograms of 0.1 µM AFB2 in different pH 160 of BRB. Parameter conditions: Ei = -1.0 V, Ef = -1.40 V, Eacc = -0.6 V, tacc = 80 s, voltage step =

xxiv
0.02 V, amplitude = 50 mV, frequency = 50 Hz and υ = 1000 mV/s. 3.70 Effect of Ei to the Ip of 0.10 µM AFB2 in BRB at 160 pH 9.0. 3.71 Effect of Eaccto the Ip of 0.10 µM AFB2 in BRB at 161 pH 9.0. 3.72 Relationship between Ip of 0.10 µM AFB2 while 162 increasing tacc.
3.73 Effect of frequency to the Ip of 0.10 µM AFB2 in 162 BRB at pH 9.0.
3.74 Linear relatioship between Ip of AFB2 and square 163 root of frequency. 3.75 Influence of square-wave voltage step to Ip of 163 0.10 µM AFB2. 3.76 Influence of square-wave amplitude to Ip of 0.10 µM 164 AFB2. 3.77 Relationship of SWSV Ep of AFB2 with increasing 164 amplitude.
3.78 Ip of 0.10 µM AFB2 obtained under (a) non-optimised 165 and (b) optimised SWSV parameters compared with that obtained under (c) optimised DPCSV parameters.
3.79 Voltammograms of 0.10 µM AFB2 obtained under 166 (a) non-optimised and (b) optimised SWSV
parameters compared with that obtained under (c) optimised DPCSV parameters.
3.80 Ip of 0.10 µM aflatoxins obtained using two 167 different stripping voltammetric techniques under their optimum paramter conditions in BRB at pH 9.0. 3.81 Voltammograms of (i) AFB1, (ii) AFB2, (iii) AFG1 168 and (iV) AFG2 obtained by (b) DPCSV compared with that obtained by (c) SWSV in (a) BRB at pH 9.0. 3.82 SWSV voltammograms for different concentrations 169 of AFB1 in BRB at pH 9.0. The broken line

xxv
represents the blank: (a) 0.01 µM, (b) 0.025 µM, (c) 0.05 µM, (d) 0.075 µM, (e) 0.10 µM, (f) 0.125 µM and (g) 0.150 µM. Parameter conditions:
Ei = -1.0 V, Ef = -1.4 V, Eacc = -0.8 V, tacc = 100 s, frequency = 125 Hz, voltage step = 0.03 V, pulse amplitude = 75 mV and scan rate = 3750 mV/s.
3.83 Calibration curve for AFB1 obtained by SWSV 170 method. 3.84 Calibration curve for AFB2 obtained by SWSV 170 method. 3.85 Calibration curve for AFG1 obtained by SWSV 170 method. 3.86 Calibration curve for AFG2 obtained by SWSV 171 method. 3.87 LOD for determination of aflatoxins obtained by 171 two different stripping methods. 3.88 UV-VIS spectrums of 10 ppm of all aflatoxins in 176 benzene: acetonitrile (98%) at preparation date. 3.89 UV-VIS spectrums of 10 ppm of all aflatoxins in 176 benzene: acetonitrile (98%) after 6 months of storage time. 3.90 UV-VIS spectrums of 10 ppm of all aflatoxins in 177 benzene: acetonitrile (98%) after 12 months of storage time. 3.91 UV-VIS spectrums of 10 ppm AFB1 (a) kept in 178 the cool and dark conditions and (b) exposed to ambient conditions for 3 days. 3.92 UV-VIS spectrums of 1 ppm AFB1 in BRB 178 solution prepared from (a) good and (b) damaged 10 ppm AFB1 stock solution. 3.93 UV-VIS spectrums of 1 ppm AFB1 in BRB 179 solution prepared from (a) good and (b) damaged 10 ppm AFB1 stock solution after 2 week stored in the cool and dark conditions.
xxvi
3.94 Percentage of Ip of 0.10 µM aflatoxins in BRB at pH 180 9.0 at different storage time in the cool and dark
conditions.
3.95 Percentage of Ip of all aflatoxins in BRB at pH 9.0 181 exposed to ambient conditions up to 8 hours of exposure time.
3.96 Reaction of 8,9 double bond furan rings in AFB1 182 with TFA, iodine and bromine under special conditions (Kok, et al., 1986). 3.97 Voltammograms of 0.10 µM AFB1 obtained in (a) 183 BRB at pH 9.0 which were prepared from (b) damaged and (c) fresh stock solutions. 3.98 Ip of 0.10 µM AFB1 obtained in BRB at pH 9.0 184 from 0 to 8 hours in (a) light exposed and (b)
light protected. 3.99 Ip of 0.10 µM AFB2 obtained in BRB at pH 9.0 184 from 0 to 8 hours in (a) light exposed and (b)
light protected. 3.100 Ip of 0.10 µM AFG1 obtained in BRB at pH 9.0 185 from 0 to 8 hours in (a) light exposed and (b)
light protected. 3.101 Ip of 0.10 µM AFG2 obtained in BRB at pH 9.0 185 from 0 to 8 hours in (a) light exposed and (b)
light protected. 3.102 Peak heights of 0.10 µM aflatoxins in BRB at pH 187 (a) 6.0, (b) 7.0, (c) 9.0 and (d) 11.0 exposed to ambient conditions up to 3 hours of exposure time. 3.103 Resonance forms of the phenolate ion 187 (Heathcote, 1984).
3.104 Voltammograms of 0.10 µM AFB2 in BRB at pH 188 6.0 from 0 to 3 hrs exposure time.
3.105 Voltammograms of 0.10 µM AFB2 in BRB at pH 188
11.0 from 0 to 3 hrs of exposure time.

xxvii
3.106 Voltammograms of 0.10 µM AFG2 in BRB at pH 189 6.0 from 0 to 3 hrs of exposure time.
3.107 Voltammograms of 0.10 µM AFG2 in BRB at pH 189 11.0 from 0 to 3 hrs of exposure time.
3.108 Absorbance of 1.0 ppm aflatoxins in BRB at pH 190 (a) 6.0, (b) 7.0, (c) 9.0 and (d) 11.0 from 0 to 3
hours of exposure time. 3.109 The peak heights of aflatoxins in 1.0 M HCl from 191 0 to 6 hours of reaction time. 3.110 The peak heights of aflatoxins in 1.0 M NaOH from 192 0 to 6 hours of reaction time. 3.111 Voltammograms of real samples after extraction by 193 Technique (a) 1, (b) 2 and (c) 3 with addition of AFB1 standard solution in BRB at pH 9.0 as a blank. 3.112 Voltammograms of blank in BRB at pH 9.0 obtained 194 by (a) DPCSV and (b) SWSV methods. 3.113 DPCSV (a) and SWSV (b) voltammograms of 10 195 ppb AFB2 (i) in present of blank sample (ii) obtained in BRB at pH 9.0 (iii) as the supporting electrolyte. 3.114 DPCSV voltammograms of real samples (b) added 197 with 3 ppb (i), 9 ppb (ii) and 15 ppb (iii) AFB1 obtained in BRB at pH 9.0 (a) as the blank on the first day measurement. 3.115 Percentage of recoveries of (a) 3 ppb, (b) 9 ppb, 198 (c) 15 ppb of all aflatoxins in real samples obtained by DPCSV methods for one to three days of measurements. 3.116 DPCSV voltammograms of real sample, S11 (b) 199 with the addition of 10 ppb AFB1 (c) in BRB at pH 9.0 (a) as the blank. Parameter conditions: Eacc = -0.6 V, tacc = 80 s, scan rate = 50 mV/s and pulse amplitude = 80 mV.

xxviii
3.117 SWSV voltammograms of real sample, S11 (b) 200 with the addition of 10 ppb AFB1 (c) in BRB at pH 9.0 (a) as the blank. Parameter conditions: Eacc = -0.8 V, tacc = 100 s, scan rate = 3750 mV/s,
frequency = 125 Hz, voltage step = 0.03 V and pulse amplitude = 75 mV.
3.118 DPCSV voltammograms of real sample, S07 (b) 200 with the addition of 10 ppb AFB1 (c) in BRB at pH 9.0 (a) as the blank. Parameter conditions: Eacc = -0.6 V, tacc = 80 s, scan rate = 50 mV/s and pulse amplitude = 80 mV. 3.119 SWSV voltammograms of real sample, S07 (b) 201 with the addition of 10 ppb AFB1 (c) in BRB at pH 9.0 (a) as the blank. Parameter conditions: Eacc = -0.8 V, tacc = 100 s, scan rate = 3750 mV/s,
frequency = 125 Hz, voltage step = 0.03 V and pulse amplitude = 75 mV.
3.120 DPCSV voltammograms of real sample, S10 (b) 201 with the addition of 10 ppb AFB1 (c) in BRB at pH 9.0 (a) as the blank. Parameter conditions: Eacc = -0.6 V, tacc = 80 s, scan rate = 50 mV/s and pulse amplitude = 80 mV. 3.121 SWSV voltammograms of real sample, S10 (b) 202 with the addition of 10 ppb AFB1 (c) in BRB at pH 9.0 (a) as the blank. Parameter conditions: Eacc = -0.8 V, tacc = 100 s, scan rate = 3750 mV/s,
frequency = 125 Hz, voltage step = 0.03 V and pulse amplitude = 80 mV.

xxix
ABBREVIATIONS
AAS Atomic absorption spectrometry
Abs Absorbance
ACP Alternate current polarography
ACV Alternate current voltammetry
AD Amperometric detector
AdCSV Adsorptive cathodic stripping voltammetry
AE Auxiliary electrode
AFB1 Aflatoxin B1
AFB2 Aflatoxin B2
AFG1 Aflatoxin G1
AFG2 Aflatoxin G2
AFM1 Aflatoxin M1
AFM2 Aflatoxin M2
AFP1 Aflatoxin P1
AFQ1 Aflatoxin Q1
Ag/AgCl Silver/silver chloride
ASV Anodic stripping voltammetry
β-CD β-cyclodextrin
BFE Bismuth film electrode
BLMs Bilayer lipid membranes
BRB Britton Robinson Buffer
CA Concentration of analyte
CE Capillary electrophoresis
CGME Controlled growth mercury electrode
CME Chemically modified electrode
CPE Carbon paste electrode
CSV Cathodic stripping voltammetry
CV Cyclic voltammetry
xxx
DC Direct current
DCP Direct current polarography
DME Dropping mercury electrode
DMSO Dimethyl sulphonic acid
DNA Deoxyribonucliec acid
DPCSV Differential pulse cathodic stripping voltammetry
DPP Differential pulse polarography
DPV Differential pulse voltammetry
Eacc Accumulation potential
Ei Initial potential
Ef Final potential
Ehigh High potential
Elow Low potential
Ep Peak potential
ECS Electrochemical sensing
Et4NH4 OH Tetraethyl ammonium hydroxide
ELISA Enzyme linked immunosorbant assay
FD Fluorescence detector
FDA Food and Drug Administration
GCE Glassy carbon electrode
GC-FID Gas chromatography with flame ionisation detector
HMDE Hanging mercury drop electrode
HPLC High performance liquid chromatography
HPTLC High pressure thin liquid chromatography
IAC Immunoaffinity chromatography
IACLC Immunoaffinity column liquid chromatography
IAFB Immunoaffinity fluorometer biosensor
IARC International Agency for Research Cancer
Ic Charging current
Id Diffusion current
If Faradaic current

xxxi
Ip Peak height
ICP-MS Induced coupled plasma-mass spectrometer
IR Infra red
IUPAC International Union of Pure and Applied Chemistry
KGy Kilogray
LD50 Lethal dose 50
LOD Limit of detection
LOQ Limit of quantification
LSV Linear sweep voltammetry
MFE Mercury film electrode
MS Mass spectrometer
MECC Micellar electrokinetic capillary chromatography
MOPS 3-(N-morpholino)propanesulphonic
MOSTI Ministry of Science, Technology and Innovation
NP Normal polarography
NPP Normal pulse polarography
NPV Normal pulse voltammetry
OPLC Over pressured liquid chromatography
PAH Polycyclic aromatic hydrocarbon
PLL Poly-L-lysine
ppb part per billion
ppm part per million
PSA Potentiometric stripping analysis
RDX Hexahydro-1,3,5-trinitro-1,3,5-triazine
RE Reference electrode
RIA Radioimmunoassay
RNA Ribonucleic acid
RSD Relative standard deviation
S/N Signal to noise ratio
SCE Standard calomel electrode
SCV Stair case voltammetry
xxxii
SDS Sodium dodecyl sulphate
SHE Standard hydrogen electrode
SIIA Sequential injection immunoassay
SMDE Static mercury drop electrode
SPE Solid phase extraction
SPCE Screen printed carbon electrode
SWP Square-wave polarography
SWV Square-wave voltammetry
SWSV Square-wave stripping voltammetry
SV Stripping voltammetry
tacc Accumulation time
TBS Tris buffered saline
TEA Triethylammonium
TLC Thin layer chromatography
TFA Trifluoroacetic acid
UME Ultra microelectrode
ν Scan rate
v/v Volume per volume
UVD Ultraviolet-Visible detector
UV-VIS Ultraviolet-Visible
WE Working electrode
WHO World Health Organisation
λmax Maximum wavelenght
εmax Maximum molar absorptivity

xxxiii
LIST OF APPENDICES
APPENDIX TITLE PAGE A Relative fluorescence of aflatoxins in different 255 solvent s
B UV spectra of the principal aflatoxins (in methanol) 256 C Relative intensities of principal bands in the IR 257 spectra of the aflatoxins D Calculation of concentration of aflatoxin stock 258 solution E Extraction procedure for aflatoxins in real samples 259 F Calculation of individual aflatoxin in groundnut 260 samples. G Cyclic voltammograms of AFB1, AFB2 and AFG2 262 with increasing of their concentrations. H Dependence if the peak heights of AFB1, AFG1 264 and AFG2 on their concentrations. I Repetitive cyclic voltammograms and their peak 266
heights of AFB1, AFG1 and AFG2 in BRB at pH 9.0 J Plot Ep – log scan rate for the reduction of AFB1, 270
AFG1 and AFG2 in BRB at pH 9.0 K Plot of peak height versus scan rate for 1.3 µM of 272 AFB1, AFG1 and AFG2 in BRB at pH 9.0 L Voltammograms of AFB2 with increasing 274 concentration. M Voltammograms of 0.1 µM and 0.2 µM AFB2 275 obtained on the same day measurements N Voltammograms of AFB2 at inter-day 276 measurements

xxxiv
O F test for robustness and ruggedness tests 278 P Voltammograms of AFB1 with increasing 280 concentration Q Voltammograms of AFG1 with increasing 281 concentration R Voltammograms of AFG2 with increasing 282 concentration S LOD determination according to Barek et al. (2001a) 283 T LOD determination according to Barek et al. (1999) 286 U LOD determination according to Zhang et al. (1996) 287 V LOD determination according to Miller and 288
Miller (1993) W ANOVA test 290 X Peak height of aflatoxins in presence and absence of PLL 292 Y SWSV voltammograms of AFB1, AFB2, AFG1 293 and AFG2 in BRB at pH 9.0 Z SWSV voltammograms of 0.10 µM AFB1, AFB2, 295 AFG1 and AFG2 in BRB at pH 9.0 AA UV-VIS spectrums of 10 ppm AFB1, AFB2, AFG1 297 and AFG2 stock solutions AB Voltammograms of AFB1, AFB2, AFG1 and AFG2 299 obtained from 0 to 6 months of storage time in the
cool and dark conditions.
AC Voltammograms of AFB1, AFB2, AFG1 and 302 AFG2 in BRB at pH 9.0 from 0 to 8 hours of
exposure time. AD UV-VIS spectrums of AFB2 in BRB at pH 6.0 305 and 11.0.
xxxv
AE Voltammograms of AFB1 and AFG1 in 1.0 M HCl 307 and 1.0 M NaOH
AF DPCSV voltammograms of real samples added with 309
various concentrations of AFG1 AG SWSV voltammograms of real samples added with 310
various concentrations of AFB1.
AH Percentage of recoveries of various concentrations 311 of all aflatoxins (3.0 and 9.0 ppb) in real samples obtained by SWSV method.
AI Calculation of percentage of recovery for 3.0 ppb 312 AFG1 added into real samples. AJ HPLC chromatograms of real samples: S10 and S07 313 AK Calculation of aflatoxin in real sample, S13 314 AL List of papers presented or published to date 315 resulting from this study. AM ICP-MS results for analysis of BRB at pH 9.0 317
CHAPTER I
LITERATURE REVIEW
1.1 Overview
Humans are continuously exposed to varying amounts of chemicals that have
been shown to have carcinogenic or mutagenic properties in environmental systems.
Exposure can occur exogenously when these agents are present in food, air or water, and
also endogenously when they are products of metabolism or pathophysiologic states such
as inflammation. Great attention is focused on environmental health in the past two
decades as a consequence of the increasing awareness over the quality of life due to
major environment pollutants that affect it. Studies have shown that exposure to
environmental chemical carcinogens have contributed significantly to cause human
cancers, when exposures are related to life style factors such as diet (Wogan et al., 2004).
The contamination of food is part of the global problem of environmental
pollution. Foodstuffs have been found contaminated with substances having
carcinogenic, mutagenic, teratogenic and allergenic properties. As these substances can
be supplied with food throughout the entire life-time of a person, it is necessary to deal
with the chronic action of trace amounts of such substances. Hence the systematic
determination of the foreign substances in nutritional products and feedstock plays an
important role. The determination of trace impurities presents considerable difficulties
owing to the fact that food is a complex system containing thousands of major and minor
compounds (Nilufer and Boyacio, 2002). Increasing environment pollution by toxic
substances such as toxic metals, organometallic and organic pollutants in air,
2
water, soil and food, calls for reliable analytical procedures for their control in
environmental samples which needs reliable and sensitive methods (Fifield and Haines,
2000). The choice of the method of analysis depends on the sample, the analyte to be
assayed, accuracy, limit of detection, cost and time to complete the analysis (Aboul-
Eneim et a., 2000). For development of this method, emphasis should be on
development of simplified, cost-effective and efficient method that complies with the
legislative requirements (Stroka and Anklam, 2002; Enker, 2003).
The widespread occurrence of aflatoxins producing fungi in our environment and
the reported naturally occurring of toxin in a number of agricultural commodities has led
the investigator to develop a new method for aflatoxin analysis (Creepy, 2002). An
accurate and sensitive method of analysis is therefore required for the determination of
these compounds in foodstuffs that have sustained mould growth.
Numerous articles concerning methods for determination of aflatoxins have been
published. However, with regard to electroanalytical technique, only one method of
determination was reported using the differential pulse pulse polarographic (DPP)
technique which was developed by Smyth et al. (1979). In this experiment, the obtained
limit of detection of aflatoxin B1 was 25 ppb which was higher as compared to the
common amount of aflatoxin in contaminated food samples which is 10 ppb as reported
by Pare (1997) or even less. In Malaysia, the regulatory limit for total aflatoxins in
groundnut is 15 ppb. The regulatory for other foods and milk is 10 ppb and 0.05 ppb
respectively (Malaysian Food Act, 1983).
1.2 AFLATOXINS
1.2.1 Aflatoxins in General
Aflatoxins are a group of heterocyclic, oxygen-containing mycotoxins that
possess the bisdifuran ring system. It was discovered some 43 years ago in England
3
following a poisoning outbreak causing 100,000 turkeys death (Miller, 1987 and
Cespedez and Diaz, 1997). The aflatoxins are the most widely distributed fungal toxins
in food. The occurrence of the aflatoxins in food products demonstrated that the high
levels of aflatoxins are significant concern both for food traders and food consumers
(Tozzi et al. 2003; Herrman, 2004; Haberneh, 2004). Aflatoxin is a by-product of mold
growth in a wide range of agriculture commodities such as peanuts (Urano et al., 1993),
maize and maize based food (Papp et al., 2002; Mendez-Albores et al., 2004),
cottonseeds (Pons and Franz, 1977), cocoa (Jefferey et al., 1982), coffee beans (Batista et
al., 2003), medical herbs ( Reif and Metzger, 1998; Rizzo et al., 2004), spices
(Erdogen, 2004; Garner et al., 1993; Akiyama et al., 2001; Aziz et al., 1998), melon
seeds (Bankole et al., 2004) and also in human food such as rice (Shotwell et al., 1966;
Begum and Samajpati, 2000), groundnut (Bankole et al., 2005), peanut products ( Patey
et al., 1990), corn ( Shotwell and Goulden, 1977; Urano et al., 1993 ), vegetable oil
(Miller et al., 1985), beer (Scott and Lawrence, 1997), dried fruits ( Abdul Kadar et al.,
2004, Arrus et al. (2004), milk and dairy products (Kamkar, 2004; Aycicek et al. 2005;
Sarimehmetoglu et al., 2004; Martin and Martin, 2004 ). Meat and meat products are
also contaminated with alfatoxins when farm animals are fed with aflatoxin contaminated
feed (Miller, 1987 and Chiavaro et al., 2001).
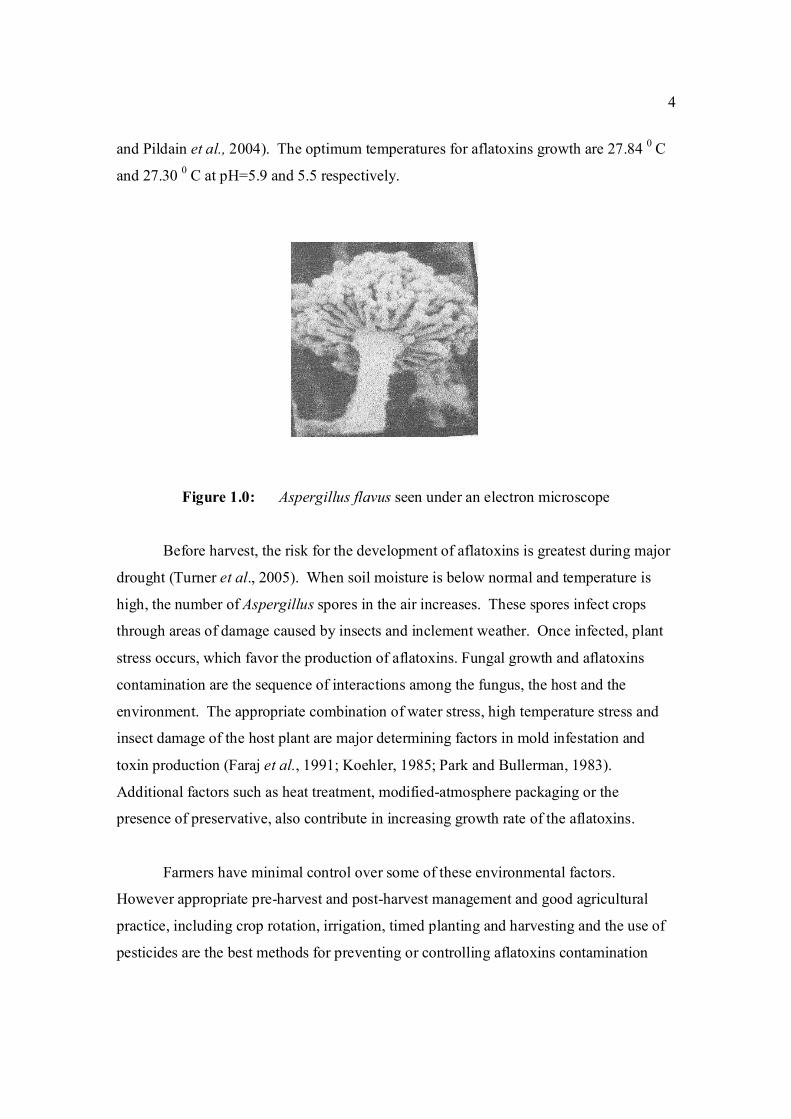
The molds that are major producers of aflatoxin are Aspergillus flavus
(Bankole et al. 2004) and Aspergillus parasiticus (Begum and Samajpati, 2000;
Setamou et al., 1997; Erdogen, 2004; Gourama and Bullerman, 1995). Aspergillus
flavus, which is ubiquitous, produces B aflatoxins (Samajphati, 1979) while Aspergillus
parasiticus, which produces both B and G aflatoxins, has more limited distribution
(Garcia-Villanova et al., 2004). A picture of Aspergillus flavus seen under an electron
microscope is shown in Figure 1.0.
Black olive is one of the substrate for Aspergillus parasiticus growth and
aflatoxin B1 production as reported by Leontopoulos et al., (2003). Biosynthesis of
aflatoxins by this fungi depends on the environmental condition such as temperature and
humidity during crop growth and storage (Leszczynska et al., 2000; Tarin et al., 2004
4
and Pildain et al., 2004). The optimum temperatures for aflatoxins growth are 27.84 0 C
and 27.30 0 C at pH=5.9 and 5.5 respectively.
Figure 1.0: Aspergillus flavus seen under an electron microscope
Before harvest, the risk for the development of aflatoxins is greatest during major
drought (Turner et al., 2005). When soil moisture is below normal and temperature is
high, the number of Aspergillus spores in the air increases. These spores infect crops
through areas of damage caused by insects and inclement weather. Once infected, plant
stress occurs, which favor the production of aflatoxins. Fungal growth and aflatoxins
contamination are the sequence of interactions among the fungus, the host and the
environment. The appropriate combination of water stress, high temperature stress and
insect damage of the host plant are major determining factors in mold infestation and
toxin production (Faraj et al., 1991; Koehler, 1985; Park and Bullerman, 1983).
Additional factors such as heat treatment, modified-atmosphere packaging or the
presence of preservative, also contribute in increasing growth rate of the aflatoxins.
Farmers have minimal control over some of these environmental factors.
However appropriate pre-harvest and post-harvest management and good agricultural
practice, including crop rotation, irrigation, timed planting and harvesting and the use of
pesticides are the best methods for preventing or controlling aflatoxins contamination
5
(Turner et al., 2005). Timely harvesting could reduce crop moisture to a point where the
formation of the mould would not occur. For example harvesting corn early when
moisture is above 20 percent and then quickly drying it to a moisture level of at least 15
percent will keep the Aspergillus flavus from completing its life cycle, resulting in lower
aflatoxin concentration. Aflatoxins are to be found in agricultural products as a
consequence of unprosperous storage conditions where humidity of 70 -90 % and a
minimum temperature of about 10° C. Commodities that have been dried to about 12 to
0.5 % moisture are generally considered stable, and immune to any risk of additional
aflatoxins development. Moreover, the minimum damage of shells during mechanized
harvesting of crop reduces significantly the mould contamination. Biocontrol of
aflatoxin contamination is another way to reduce this contamination. The natural ability
of many microorganisms including bacteria, actinomycetes, yeasts, moulds and algae has
been a source for bacteriological breakdown of mycotoxins. The most active organism
such as Flavobacterium aurantiacum which in aqueous solution can take up and
metabolise aflatoxins B1, G1 and M1 (Smith and Moss, 1985).
Production of aflatoxins is greatly inhibited by propionic acid as revealed by
Molina and Gianuzzi (2002) when they studied the production of aflatoxins in solid
medium at different temperature, pH and concentration of propionic acid. It also can be
inhibited by essential oil extracted from thyme as found by Rasooli and Abnayeh (2004).
Other chemicals that can inhibit the growth of this fungus are ammonia, copper sulphate
and acid benzoic (Gowda et al., 2004).
1.2.2 Chemistry of Aflatoxins
Aflatoxins can be classified into two broad groups according to chemical
structure which are difurocoumarocyclopentenone series and ifurocoumarolactone
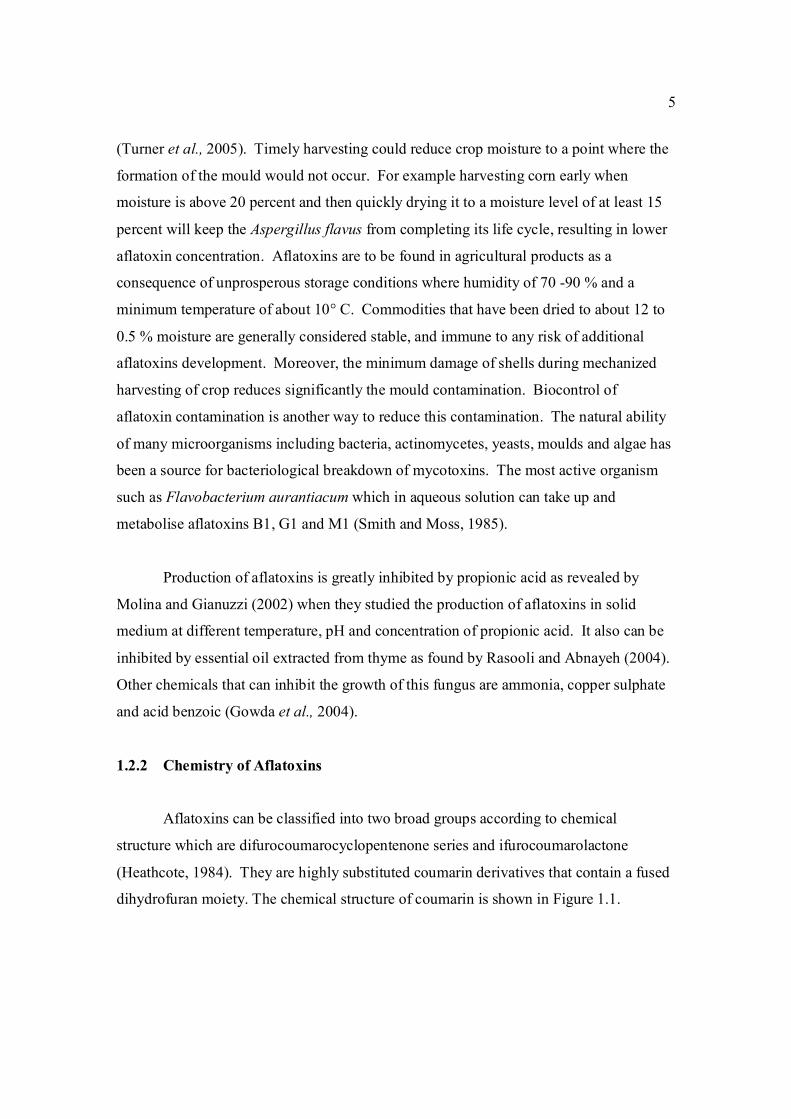
(Heathcote, 1984). They are highly substituted coumarin derivatives that contain a fused
dihydrofuran moiety. The chemical structure of coumarin is shown in Figure 1.1.
6
O O
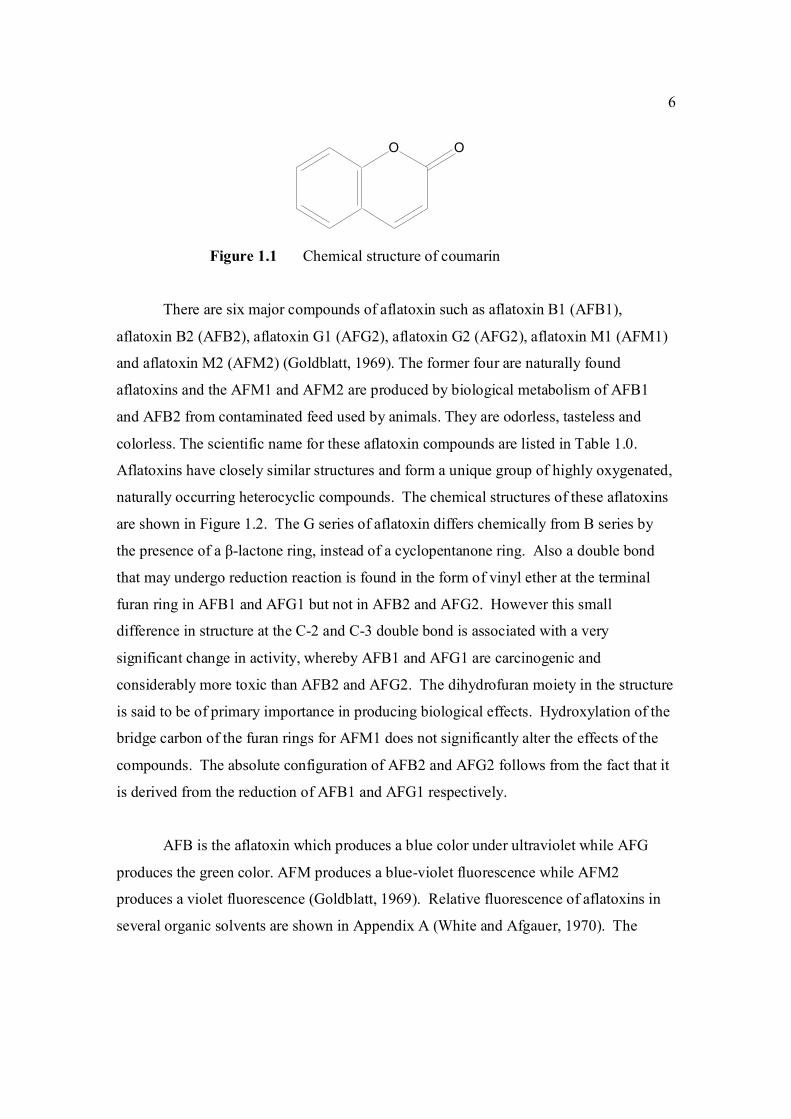
Figure 1.1 Chemical structure of coumarin
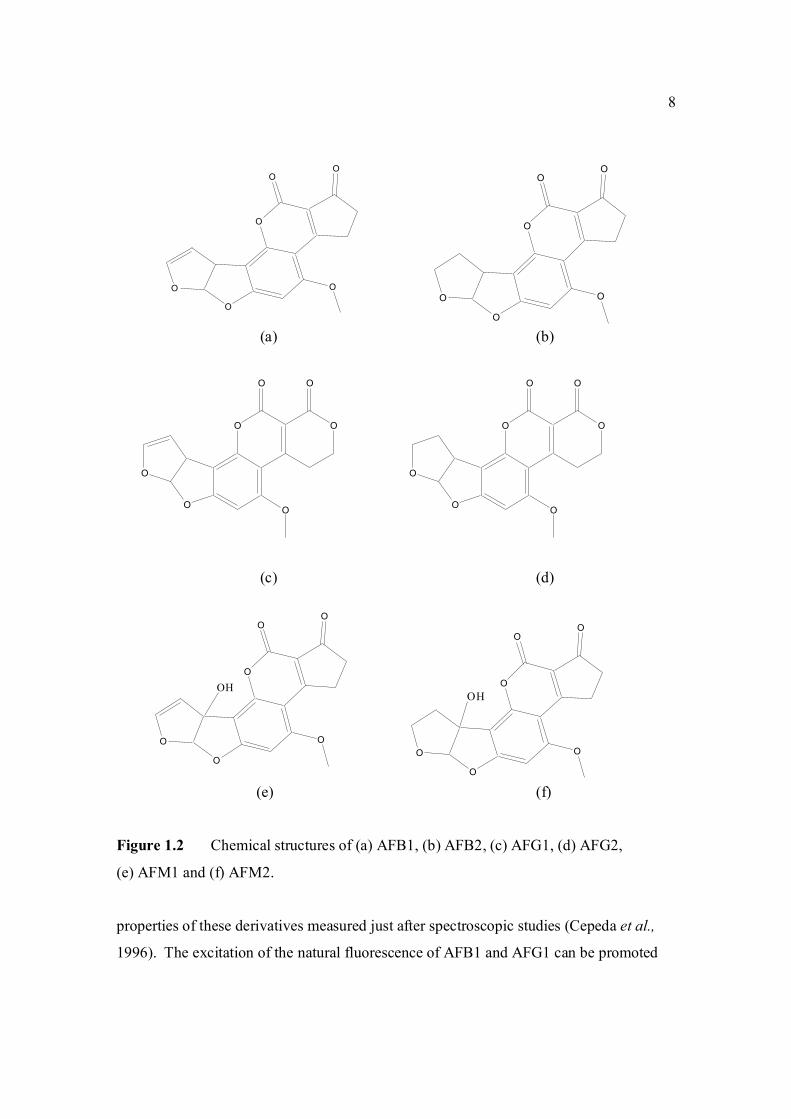
There are six major compounds of aflatoxin such as aflatoxin B1 (AFB1),
aflatoxin B2 (AFB2), aflatoxin G1 (AFG2), aflatoxin G2 (AFG2), aflatoxin M1 (AFM1)
and aflatoxin M2 (AFM2) (Goldblatt, 1969). The former four are naturally found
aflatoxins and the AFM1 and AFM2 are produced by biological metabolism of AFB1
and AFB2 from contaminated feed used by animals. They are odorless, tasteless and
colorless. The scientific name for these aflatoxin compounds are listed in Table 1.0.
Aflatoxins have closely similar structures and form a unique group of highly oxygenated,
naturally occurring heterocyclic compounds. The chemical structures of these aflatoxins
are shown in Figure 1.2. The G series of aflatoxin differs chemically from B series by
the presence of a β-lactone ring, instead of a cyclopentanone ring. Also a double bond
that may undergo reduction reaction is found in the form of vinyl ether at the terminal
furan ring in AFB1 and AFG1 but not in AFB2 and AFG2. However this small
difference in structure at the C-2 and C-3 double bond is associated with a very
significant change in activity, whereby AFB1 and AFG1 are carcinogenic and
considerably more toxic than AFB2 and AFG2. The dihydrofuran moiety in the structure
is said to be of primary importance in producing biological effects. Hydroxylation of the
bridge carbon of the furan rings for AFM1 does not significantly alter the effects of the
compounds. The absolute configuration of AFB2 and AFG2 follows from the fact that it
is derived from the reduction of AFB1 and AFG1 respectively.
AFB is the aflatoxin which produces a blue color under ultraviolet while AFG
produces the green color. AFM produces a blue-violet fluorescence while AFM2
produces a violet fluorescence (Goldblatt, 1969). Relative fluorescence of aflatoxins in
several organic solvents are shown in Appendix A (White and Afgauer, 1970). The
7
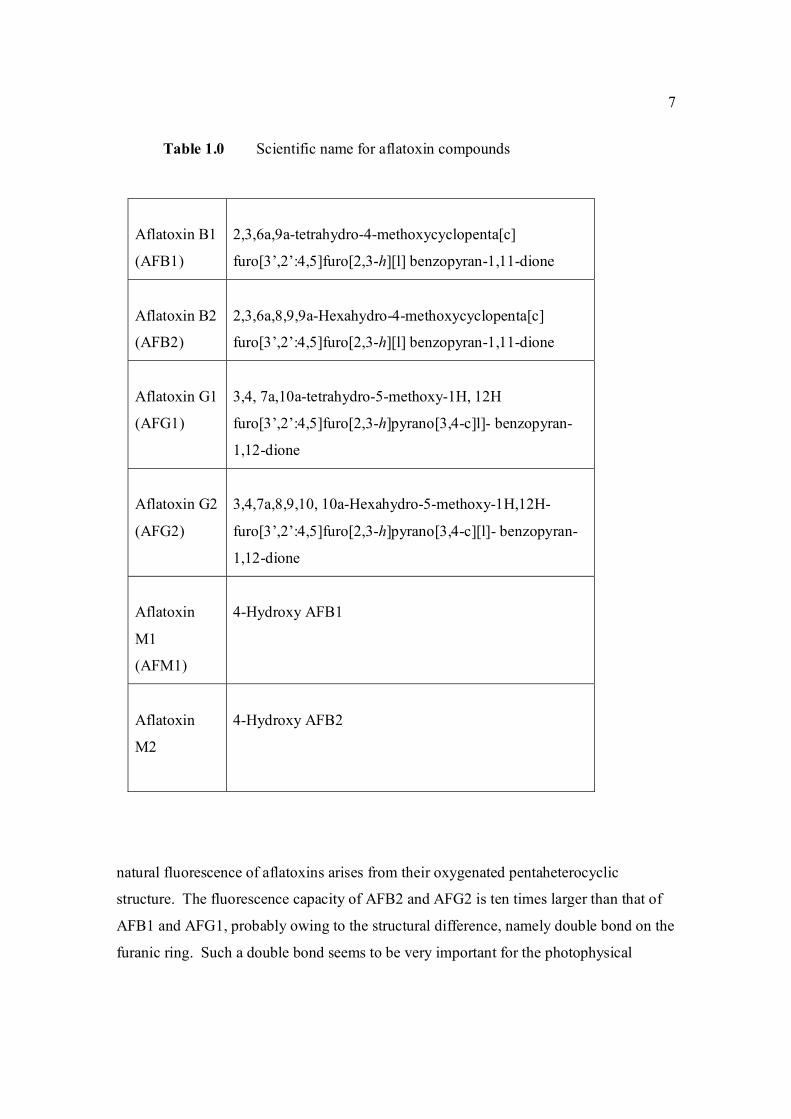
Table 1.0 Scientific name for aflatoxin compounds
natural fluorescence of aflatoxins arises from their oxygenated pentaheterocyclic
structure. The fluorescence capacity of AFB2 and AFG2 is ten times larger than that of
AFB1 and AFG1, probably owing to the structural difference, namely double bond on the
furanic ring. Such a double bond seems to be very important for the photophysical
Aflatoxin B1
(AFB1)
2,3,6a,9a-tetrahydro-4-methoxycyclopenta[c]
furo[3’,2’:4,5]furo[2,3-h][l] benzopyran-1,11-dione
Aflatoxin B2
(AFB2)
2,3,6a,8,9,9a-Hexahydro-4-methoxycyclopenta[c]
furo[3’,2’:4,5]furo[2,3-h][l] benzopyran-1,11-dione
Aflatoxin G1
(AFG1)
3,4, 7a,10a-tetrahydro-5-methoxy-1H, 12H
furo[3’,2’:4,5]furo[2,3-h]pyrano[3,4-c]l]- benzopyran-
1,12-dione
Aflatoxin G2
(AFG2)
3,4,7a,8,9,10, 10a-Hexahydro-5-methoxy-1H,12H-
furo[3’,2’:4,5]furo[2,3-h]pyrano[3,4-c][l]- benzopyran-
1,12-dione
Aflatoxin
M1
(AFM1)
4-Hydroxy AFB1
Aflatoxin
M2
4-Hydroxy AFB2
8
O
O
O
OO
O
O
O
O
OO
O
O O
O
O
OO
O
O
O
O
OO
O
OH O
O
O
OO
O
OH
O O
O
O
OO
O
(a) (b)
(c) (d)
(e) (f)
Figure 1.2 Chemical structures of (a) AFB1, (b) AFB2, (c) AFG1, (d) AFG2,
(e) AFM1 and (f) AFM2.
properties of these derivatives measured just after spectroscopic studies (Cepeda et al.,
1996). The excitation of the natural fluorescence of AFB1 and AFG1 can be promoted
9
O O
O
O
OO
O
O O
O
O
OO
O
HOTFA
O
OO
OO
O
HO
O
OO
OO
O
TFA
in many different ways such as post-column iodination (Tuinstra and Haasnoot, 1983;
Davis and Diener, 1980), post-column bromination (Kok et al.,1986; Kok, 1994 ;
Versantroort et al., 2005 ), use of cyclodextrin compound (Cepeda et al., 1996; Chiavaro
et al., 2001; Franco et al., 1998) and trifluoroacetic acid, TFA (Stack and Pohland,
1975; Takahashi, 1977a; Haghighi et al., 1981; Nieduetzki et al., 1994 ).
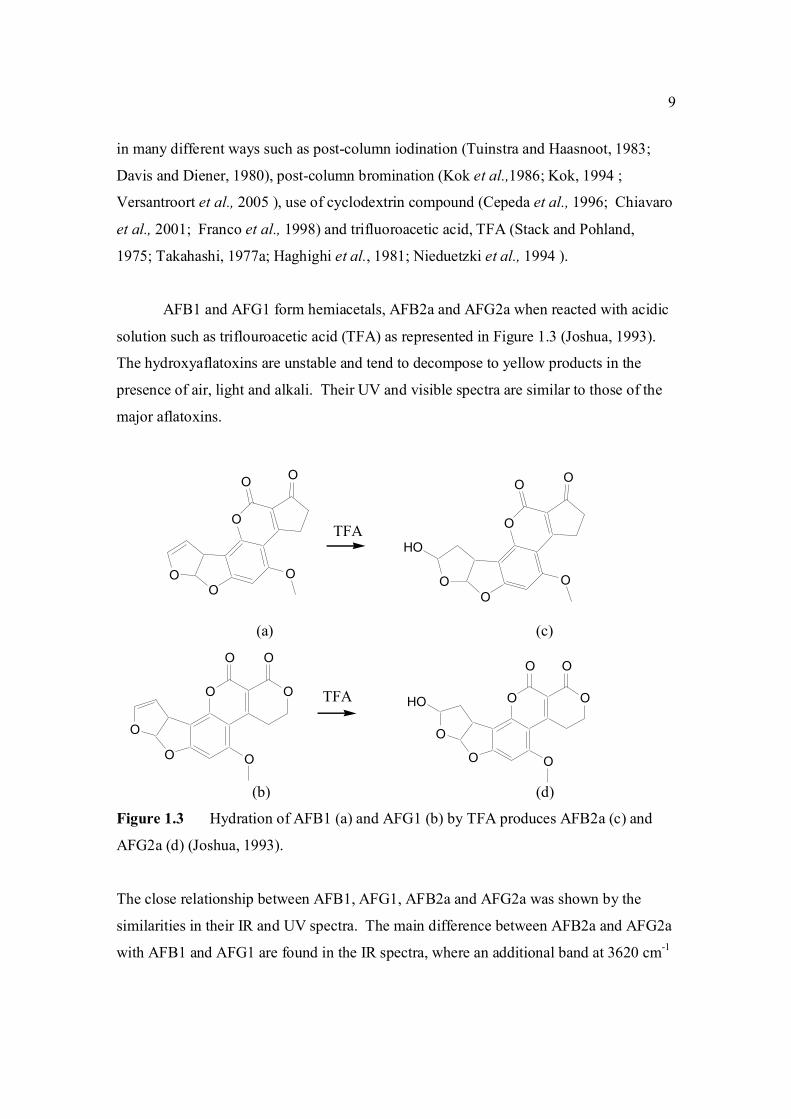
AFB1 and AFG1 form hemiacetals, AFB2a and AFG2a when reacted with acidic
solution such as triflouroacetic acid (TFA) as represented in Figure 1.3 (Joshua, 1993).
The hydroxyaflatoxins are unstable and tend to decompose to yellow products in the
presence of air, light and alkali. Their UV and visible spectra are similar to those of the
major aflatoxins.
(a) (c)
(b) (d)
Figure 1.3 Hydration of AFB1 (a) and AFG1 (b) by TFA produces AFB2a (c) and
AFG2a (d) (Joshua, 1993).
The close relationship between AFB1, AFG1, AFB2a and AFG2a was shown by the
similarities in their IR and UV spectra. The main difference between AFB2a and AFG2a
with AFB1 and AFG1 are found in the IR spectra, where an additional band at 3620 cm-1
10
indicates the presence of a hydroxyl group in AFB2a and AFG2a. The absence of bands
at 3100, 1067 and 722 cm-1 (which arise in AFB1 and AFG1 from the vinyl ether group)
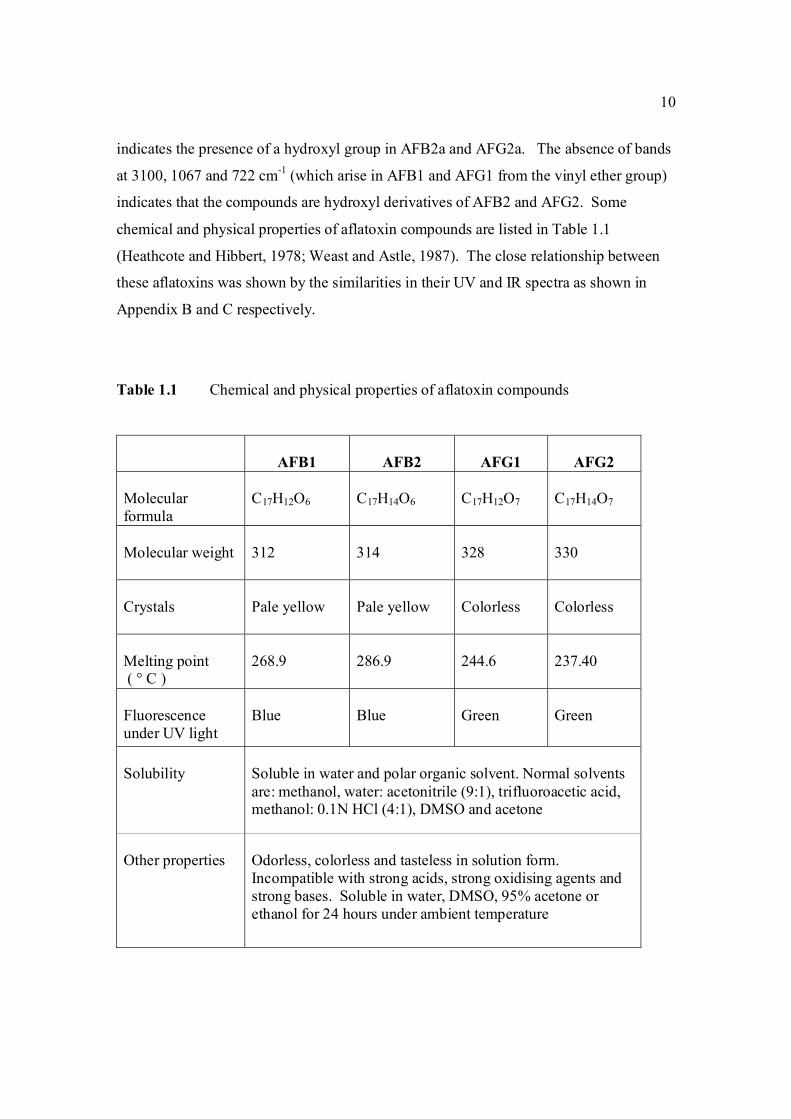
indicates that the compounds are hydroxyl derivatives of AFB2 and AFG2. Some
chemical and physical properties of aflatoxin compounds are listed in Table 1.1
(Heathcote and Hibbert, 1978; Weast and Astle, 1987). The close relationship between
these aflatoxins was shown by the similarities in their UV and IR spectra as shown in
Appendix B and C respectively.
Table 1.1 Chemical and physical properties of aflatoxin compounds
AFB1
AFB2
AFG1
AFG2
Molecular formula
C17H12O6
C17H14O6
C17H12O7
C17H14O7
Molecular weight
312
314
328
330
Crystals
Pale yellow
Pale yellow
Colorless
Colorless
Melting point ( ° C )
268.9
286.9
244.6
237.40
Fluorescence under UV light
Blue
Blue
Green Green
Solubility
Soluble in water and polar organic solvent. Normal solvents are: methanol, water: acetonitrile (9:1), trifluoroacetic acid, methanol: 0.1N HCl (4:1), DMSO and acetone
Other properties
Odorless, colorless and tasteless in solution form. Incompatible with strong acids, strong oxidising agents and strong bases. Soluble in water, DMSO, 95% acetone or ethanol for 24 hours under ambient temperature

STRIPPING VOLTAMMETRIC METHODS FOR
THE DETERMINATION OF AFLATOXIN COMPOUNDS
MOHAMAD HADZRI BIN YAACOB
UNIVERSITI TEKNOLOGI MALAYSIA


BAHAGIAN A – Pengesahan Kerjasama * Adalah disahkan bahawa projek penyelidikan tesis ini telah dilaksanakan melalui kerjasama antara _____________________ dengan _________________________ Disahkan oleh: Tandatangan : .......................................................... Tarikh : .......................... Nama : .......................................................... Jawatan :........................................................... (Cop rasmi) * Jika penyediaan tesis/projek melibatkan kerjasama.
BAHAGIAN B – Untuk Kegunaan Pejabat Sekolah Pengajian Siswazah Tesis ini telah diperiksa dan diakui oleh: Nama dan Alamat Pemeriksa Luar : Prof. Dr. Noor Azhar Bin Mohd Shazili
Pengarah Institut Oseanografi, Kolej Universiti Sains dan Teknologi Malaysia, Mengabang Telipot 21030 Kuala Terengganu
Nama dan Alamat Pemeriksa Dalam I : Prof. Madya Dr. Razali Bin Ismail
Fakulti Sains, UTM, Skudai Pemeriksa Dalam II : Nama Penyelia Lain (jika ada) : Disahkan oleh Penolong Pendaftar di Sekolah Pengajian Siswazah: Tandatangan : .......................................................... Tarikh : .......................... Nama : .GANESAN A/L ANDIMUTHU

STRIPPING VOLTAMMETRIC METHODS FOR
THE DETERMINATION OF AFLATOXIN COMPOUNDS
MOHAMAD HADZRI BIN YAACOB
A thesis submitted in fulfilment of the
requirements for the award of the degree of
Doctor of Philosophy
Faculty of Science
Universiti Teknologi Malaysia
APRIL 2006
ii

iii
Specially dedicated to:
My mother, wife, sons, daughters and all families for
all the love, support and continuous prayer
for my success in completing this work.

iv
ACKNOWLEDGEMENT
All praise be to ALLAH SWT and blessing be upon His Prophet SAW whose
ultimate guidance creates a more meaningful purpose to this work.
I wish to express my sincere gratitude and appreciation to the people who have both
directly and indirectly contributed to this thesis. The following are those to whom I
am particularly indebted:
My supervisors A.P. Dr. Abdull Rahim bin Hj. Mohd. Yusoff and Prof. Dr.
Rahmalan Ahamad for their invaluable guidance, freedom of work and
constant encouragement throughout the course of this work.
School Of Health Sciences, USM, Health Campus, Kubang Krian Kelantan
for awarding study leave together with scholarship in completing the work.
Prof Baharuddin Saad from USM Penang, AP Dr. Razali Ismail from
Chemistry Department, Faculty of Science, UTM and Prof Barek from
Charles University, Prague, Czeck Republic for their useful discussion and
suggestion. Also to Mr Radwan Ismail from Department of Chemistry,
Penang Branch, Mrs Marpongahtun Misni and Mr Wan Kamaruzaman Wan
Ahmad for their friendship, ideas and continuous support in carrying out this
work. Also to Mr Mat Yasin bin Sirin, Mrs Ramlah binti Husin and Mr Azmi
Mahmud for their assistance throughout the work.
UTM for awarding Short Term Grant No: 75152 / 2004
My mother, wife and all families for their encouragements, supports, patience,
tolerance and understanding.

v
ABSTRACT
Aflatoxin, which is produced by Aspergillus flavus and Aspergillus parasiticus fungi is one of the compounds in the mycotoxin group. The main types of aflatoxins are AFB1, AFB2, AFG1 and AFG2 which have carcinogenic properties and are dangerous to human health. Various techniques have been used for their measurements such as the high performance liquid chromatography (HPLC), enzyme linked immunosorbant assay (ELISA) and radioimmunoassay (RIA) but all these methods have disadvantages such as long analysis time, consume a lot of reagents and expensive. To overcome these problems, the voltammetric technique was proposed in this study using controlled growth mercury drop (CGME) as the working electrode and Britton Robinson buffer (BRB) as the supporting electrolyte. The voltammetric methods were used for investigating the electrochemical properties and the quantitative analysis of aflatoxins at the mercury electrode. The experimental conditions were optimised to obtain the best characterised peak in terms of peak height with analytical validation of the methods for each aflatoxin. The proposed methods were applied for the analysis of aflatoxins in groundnut samples and the results were compared with those obtained by the HPLC technique. All aflatoxins were found to adsorb and undergo irreversible reduction reaction at the working mercury electrode. The optimum experimental parameters for the differential pulse cathodic stripping voltammetry (DPCSV) method were the BRB at pH 9.0 as the supporting electrolyte, initial potential (Ei): -0.1 V, final potential (Ef): -1.4 V, accumulation potential (Eacc): -0.6 V, accumulation time (tacc): 80 s, scan rate: 50 mV/s and pulse amplitude: 80 mV. The optimum parameters for the square wave stripping voltammetry (SWSV) method were Ei = -0.1 V, Ef = -1.4 V, Eacc: -0.8 V, tacc: 100 s, scan rate: 3750 mV/s, frequency: 125 Hz and voltage step: 30 V. At the concentration of 0.10 µM, using DPCSV method with the optimum parameters, AFB1, AFB2, AFG1 and AFG2 produced a single peak at -1.21 V, -1.23 V, -1.17 V and -1.15 V (versus Ag/AgCl) respectively. Using the SWSV method, a single peak appeared at -1.30 V for AFB1 and AFB2 while -1.22 V for AFG1 and AFG2. The calibration curves for all aflatoxins were linear with the limit of detection (LOD) of approximately 2.0 ppb and 0.50 ppb obtained by the DPCSV and SWSV methods respectively. The results of aflatoxins content in individual groundnut samples do not vary significantly when compared with those obtained by the HPLC technique. Finally, it can be concluded that both proposed methods which are accurate, precise, robust, rugged, fast and low cost were successfully developed and are potential alternative methods for routine analysis of aflatoxins in groundnut samples.

vi
ABSTRAK
Aflatoksin adalah sejenis sebatian yang dihasilkan oleh kulat Aspergillus flavus dan Aspergillus parasiticus yang digolongkan di dalam kumpulan mikotoksin. Jenis utama aflatoksin adalah AFB1, AFB2, AFG1 dan AFG2 yang bersifat karsinogen serta merbahaya kepada kesihatan manusia. Pelbagai teknik telah digunakan untuk menentukan aflatoksin seperti kromatografi cecair prestasi tinggi (HPLC), asai serapan imuno berikatan enzim (ELISA) dan radioamunoasai (RIA) tetapi teknik-teknik ini mempunyai kelemahan seperti masa analisis yang panjang, melibatkan reagen yang banyak dan kos yang mahal. Untuk mengatasi masalah ini, teknik voltammetri telah dicadangkan untuk kajian aflatoksin menggunakan titisan raksa pembesaran terkawal (CGME) sebagai elektrod bekerja dan larutan penimbal Britton-Robinson (BRB) sebagai elektrolit penyokong. Pelbagai kaedah voltammetri telah digunakan untuk mengkaji sifat elektrokimia aflatoksin pada elektrod raksa dan analisis kuantitatifnya. Parameter kajian telah dioptimumkan untuk memperolehi puncak yang elok berdasarkan ketinggian puncak serta pengesahan analisis untuk kaedah yang dibangunkan bagi setiap aflatoksin. Kaedah ini telah digunakan untuk menentukan kandungan aflatoksin di dalam sampel kacang tanah di mana keputusan yang diperolehi telah dibandingkan dengan keputusan HPLC. Semua aflatoksin yang dikaji didapati terjerap dan menjalani proses tindakbalas penurunan tidak berbalik pada elektrod raksa. Parameter optimum untuk kaedah voltammetri perlucutan kathodik denyut pembeza (DPCSV) adalah larutan BRB pada pH 9.0 sebagai larutan elektrolit, keupayaan awal (Ei): -1.0 V, keupayaan akhir (Ef): -1.4 V, keupayaan pengumpulan (Eacc): -0.6 V, masa pengumpulan (tacc): 80 s, kadar imbasan: 50 mV/s dan amplitud denyut: 80 mV. Untuk kaedah voltammetri perlucutan gelombang bersegi (SWSV), parameter optimum adalah Ei : -1.0 V, Ef : -1.4 V, Eacc: -0.8 V, tacc: 100 s, kadar imbasan: 3750 mV/s, frekuensi: 125 Hz dan beza keupayaan: 30 mV. Menggunakan parameter optimum untuk DPCSV, 0.10 µM AFB1, AFB2, AFG1 dan AFG2 menghasilkan puncak tunggal pada keupayaan -1.21 V, -1.23 V, -1.17 V dan -1.15 V (melawan Ag/AgCl) masing-masingnya. Menggunakan kaedah SWSV, puncak terhasil pada -1.30 V untuk AFB1 dan AFB2, -1.22 V untuk AFG1 dan AFG2. Keluk kalibrasi adalah linear untuk semua aflatoksin dengan had pengesanan (LOD) pada 2.0 dan 0.5 ppb diperolehi dari kaedah DPCSV dan SWSV masing-masingnya. Keputusan analisis kandungan aflatoksin di dalam sampel kacang tanah tidak memberi perbezaan ketara berbanding dengan yang diperolehi menggunakan teknik HPLC. Kesimpulannya, kedua-dua kaedah yang dikaji yang merupakan kaedah yang tepat, jitu, cepat, sesuai digunakan dengan pelbagai model voltammetri dan kos yang murah telah berjaya dibangunkan dan berpotensi besar menjadi kaedah alternatif untuk analisis kandungan aflatoksin di dalam kacang tanah secara berkala.

vii
TABLE OF CONTENTS
CHAPTER TITLE PAGE
TITLE i
DECLARATION ii
DEDICATION iii
ACKNOWLEDGEMENT iv
ABSTRACT v
ABSTRAK vi
TABLE OF CONTENTS vii
LIST OF TABLES xiii
LIST OF FIGURES xvi
ABBREVATIONS xxix
LIST OF APPENDICES xxxiii
1 LITERATURE REVIEW 1
1.1 Overview 1
1.2 Aflatoxins 3
1.2.1 Aflatoxins in general 3
1.2.2 Chemistry of aflatoxins 5
1.2.3 Health aspects of aflatoxins 12
1.2.4 Analytical methods for the determination of 16
aflatoxins
1.2.5 Electrochemical properties of aflatoxins 28
1.3. Voltammetric technique 30
1.3.1 Voltammetric techniques in general 30

viii
1.3.2 Voltammetric measurement 31
1.3.2.1 Instrumentation 31
1.3.2.2 Solvent and supporting electrolyte 44
1.3.2.3 Current in voltammetry 46
1.3.2.4 Quantitative and quantitative aspects of 48
voltammetry
1.3.3 Type of voltammetric techniques 49
1.3.3.1 Polarography 49
1.3.3.2 Cyclic voltammetry 51
1.3.3.3 Stripping voltammetry 54
1.3.3.3a Anodic stripping voltammetry 56
1.3.3.3b Cathodic stripping voltammetry 57
1.3.3.3c Adsorptive stripping voltammetry 58
1.3.3.4 Pulse voltammetry 59
1.3.3.4a Differential pulse voltammetry 60
1.3.3.4b Square wave voltammetry 61
1.4 Objective and scope of study 64
1.4.1 Objective of study 64
1.4.2 Scope of study 67
2 RESEARCH METHODOLOGY 70
2.1 Apparatus, material and reagents 70
2.1.1 Apparatus 70
2.1.2 Materials 72
2.1.2.1 Aflatoxin stock and standard solutions 72
2.1.2.2 Real samples 73
2.1.3 Reagents 73
2.1.3.1 Britton Robinson buffer, 0.04 M 73
2.1.3.2 Carbonate buffer, 0.04 M 74
2.1.3.3 Phosphate buffer, 0.04 M 74

ix
2.1.3.4 Ascorbic acid 74
2.1.3.5 β-cyclodextrin solution, 1.0 mM 75
2.1.3.6 L-Cysteine, 1.0 x 10⁻⁵ M 75
2.1.3.7 2,4-dihydrofuran, 0.15 M 75
2.1.3.8 Coumarin, 3.0 x 10⁻² M 75
2.1.3.9 Poly-L-lysine, 10 ppm 75
2.1.3.10 Standard aluminium (II) solution, 1.0 mM 75
2.1.3.11 Standard plumbum(II) solution, 1.0 mM 76
2.1.3.12 Standard zinc (II) solution, 1.0 mM 76
2.1.3.13 Standard copper (II) solution, 1.0 mM 76
2.1.3.14 Standard nickel (II) solution, 1.0 mM 76
2.1.3.15 Methanol: 0.1 N HCl solution, 95% 76
2.1.3.16 Zinc sulphate solution, 15% 76
2.2 Analytical Technique 77
2.2.1 General procedure for voltammetric analysis 77
2.2.2 Cyclic voltammetry (Anodic and cathodic 77
directions)
2.2.2.1 Standard addition of sample 77
2.2.2.2 Repetitive cyclic voltammetry 78
2.2.2.3 Effect of scan rate 78
2.2.3 Differential pulse cathodic stripping 78
voltammetric determination of AFB2
2.2.3.1 Effect of pH 79
2.2.3.2 Method optimisation for the determination 79
of AFB2
2.2.3.2a Effect of scan rate 79
2.2.3.2b Effect of accumulation potential 80
2.2.3.2c Effect of accumulation time 80
2.2.3.2d Effect of initial potential 80
2.2.3.2e Effect of pulse amplitude 80
x
2.2.3.3 Method validation 80
2.2.3.4 Interference studies 81
2.2.3.4a Effect of Cu(II), Ni (II), Al(III), 81
Pb(II) and Zn(II)
2.2.3.4b Effect of ascorbic acid, 82
β-cyclodextrin and L-cysteine
2.2.3.5 Modified mercury electrode with PLL 82
2.2.4 Square wave cathodic stripping voltammetry 82
(SWSV)
2.2.4.1 SWSV parameters optimisation 82
2.2.4.2 SWSV determination of all aflatoxins 82
2.2.5 Stability studies of aflatoxins 83
2.2.5.1 Stability of 10 ppm aflatoxins 83
2.2.5.2 Stability of 1 ppm aflatoxins 83
2.2.5.3 Stability of 0.1 µM aflatoxins exposed 83
to ambient temperature
2.2.5.4 Stability of 0.1 µM aflatoxins in different 84
pH of BRB
2.2.6 Application to food samples 84
2.2.6.1 Technique 1 84
2.2.6.2 Technique 2 84
2.2.6.3 Technique 3 85
2.2.6.4 Blank measurement 85
2.2.6.5 Recovery studies 85
2.2.6.6 Voltammetric analysis 86
3 RESULTS AND DISCUSSION 88
3.1 Cyclic voltammetric studies of aflatoxins 88
3.1.1 Cathodic and anodic cyclic voltammetric 89
of aflatoxins

xi
3.2 Differential pulse cathodic stripping voltammetry 102
of AFB2
3.2.1 Optimisation of conditions for the stripping 104
analysis
3.2.1.1 Effect of pH and type of supporting 104
electrolyte
3.2.1.2 Optmisation of instrumental conditions 117
3.2.1.2a Effect of scan rate 118
3.2.1.2b Effect of accumulation time 119
3.2.1.2c Effect of accumulation 120
potential
3.2.1.2d Effect of initial potential 121
3.2.1.2e Effect of pulse amplitude 122
3.2.2 Analysis of aflatoxins 127
3.2.2.1 Calibration curves of aflatoxins and 129
validation of the proposed method
3.2.2.1a Calibration curve of AFB2 129
3.2.2.1b Calibration curve of AFB1 134
3.2.2.1c Calibration curve of AFG1 137
3.2.2.1d Calibration curve of AFG2 140
3.2.2.2 Determination of limit of detection 143
3.2.2.3 Determination of limit of quantification 147
3.2.2.4 Inteference studies 150
3.3 Square-wave stripping voltammetry (SWSV) of 157
aflatoxins
3.3.1 SWSV determination of AFB2 158
3.3.1.1 Optimisation of experimental and 159
instrumental SWSV parameters
3.3.3.1a Influence of pH of BRB 159
3.3.3.1b Effect of instrumental 160
variables

xii
3.3.2 SWSV determination of other aflatoxins 166
3.3.3 Calibration curves and method validation 168
3.4 Stability studies of aflatoxins 175
3.4.1 10 ppm aflatoxin stock solutions 175
3.4.2 1 ppm aflatoxins in BRB at pH 9.0 179
3.4.2.1 Month to month stability studies 179
3.4.2.2 Hour to hour stability studies 181
3.4.2.3 Stability studies in different pH 186
of BRB
3.4.2.4 Stability studies in 1.0 M HCl and 191
1.0 M NaOH
3.5 Voltammetric analysis of aflatoxins in real samples 192
3.5.1 Study on the extraction techniques 193
3.5.2 Analysis of blank 194
3.5.3 Recovery studies of aflatoxins in real samples 196
3.5.4 Analysis of aflatoxins in real samples 199
4 CONCLUSIONS AND RECOMMENDATIONS 204
4.1 Conclusions 204
4.2 Recommendations 206
REFERENCES 208
Appendices A – AM 255 - 317
xiii
LIST OF TABLES
TABLE NO. TITLE PAGE 1.0 Scientific name for aflatoxin compounds 7 1.1 Chemical and physical properties of aflatoxin 10 compounds 1.2 Summary of analysis methods used for 19 determination of aflatoxins in various samples 1.3 Working electrode and limit of detection for 32 modern polarographic and voltammetric techniques. 1.4 The application range of various analytical 33
techniques and their concentration limits when compared with the requirements in different fields of chemical analysis
1.5 List of different type of working electrodes and 36 its potential windows 1.6 Electroreducible and electrooxidisable organic 50 functional groups 1.7 The characteristics of different type of 53 electrochemical reaction. 1.8 Application of Square Wave Voltammetry 62 technique 2.0 List of aflatoxins and their batch numbers 72 used in this experiment 2.1 Injected volume of aflatoxins into eluate of 86 groundnut and the final concentrations obtained in voltammetric cell 3.0 The dependence of current peaks of aflatoxins to 97 their concentrations obtained by cathodic cyclic
measurements in BRB at 9.0.
xiv
3.1 Effect of buffer constituents on the peak height 109 of 2.0 µM AFB2 at pH 9.0. Experimental conditions are the same as Figure 3.21
3.2 Compounds reduced at the mercury electrode 116 3.3 Optimum parameters for 0.06 µM and 2.0 µM 126 AFB2 in BRB at pH 9.0. 3.4 The peak height and peak potential of aflatoxins 127 obtained by optimised parameters in BRB at pH 9.0 using DPCSV technique. 3.5 Peak height (in nA) obtained for intra-day and 131 inter-day precision studies of 0.10 µM and 0.20 µM by the proposed voltammetric procedure (n=8). 3.6 Mean values for recovery of AFB2 standard 132 solution (n=3). 3.7 Influence of small variation in some of the 133 assay condition of the proposed procedure on its suitability and sensitivity using 0.10 µM AFB2. 3.8 Results of ruggedness test for proposed method 134 using 0.10 µM AFB2. 3.9 Peak height (in nA) obtained for intra-day and 136 inter-day precision studies of 0.10 µM and 0.20 µM AFB1 by proposed voltammetric procedure
(n=5). 3.10 Mean values for recovery of AFB1 standard 137 solution (n=3). 3.11 Peak height (in nA) obtained for intra-day and 139 inter-day precision studies of 0.10 µM and 0.20 µM AFG1 by proposed voltammetric procedure (n=5). 3.12 Mean values for recovery of AFG1 standard 139 solution (n=3). 3.13 Peak height (in nA) obtained for intra-day and 141 inter-day precision studies of 0.10 µM and 0.20 µM AFG2 by proposed voltammetric procedure.

xv
3.14 Mean values for recovery of AFG2 standard 142 solution (n=5). 3.15 Peak height and peak potential of 0.10 µM 143 aflatoxins obtained by BAS and Metrohm voltammetry analysers under optimised operational parameters for DPCSV method. 3.16 Analytical parameters for calibration curves 145 for AFB1,AFB2, AFG1 and AFG2 obtained by DPCSV technique using BRB at pH 9.0 as the supporting electrolyte. 3.17 LOD values for determination of aflatoxins 148 obtained by various methods. 3.18 LOQ values for determination of aflatoxins 149 obtained by various methods. 3.19 Peak current and peak potential for all aflatoxins 167 obtained by SWSV in BRB at pH 9.0 (n=5). 3.20 Analytical parameters for calibration curves for 172 AFB1, AFB2, AFG1 and AFG2 obtained by SWSV technique in BRB pH 9.0 as the supporting electrolyte. 3.21 Result of reproducibility study (intra-day and inter- 173 day measurements) for 0.1 µM aflatoxins in BRB at pH 9.0 obtained by SWSV method. 3.22 Application of the proposed method in evaluation 174 of the SWSV method by spiking the aflatoxin standard solutions. 3.23 Average concentration of all aflatoxins within a 175 year stability studies. 3.24 The peak current and peak potential of 10 ppb 196 AFB2 in presence and absence of a blank sample. 3.25 Total aflatoxin contents in real samples which 203 were obtained by DPCSV and HPLC techniques (average of duplicate analysis)
xvi
LIST OF FIGURES
FIGURE NO. TITLE PAGE 1.0 Aspergillus flavus seen under an electron 4 microscope. 1.1 Chemical structure of coumarin 6 1.2 Chemical structures of (a) AFB1, (b) AFB2, 8
(c) AFG1, (d) AFG2, (e) AFM1 and (f) AFM2 1.3 Hydration of (a) AFB1 and (b) AFG1 by TFA 9 produces (c) AFB2a and (d) AFG2a 1.4 Transformation of toxic (a) AFB1 to non-toxic 11 (b) aflatoxicol A. 1.5 Major DNA adducts of AFB1; (a) 8,9-Dihydro-8- 13 (N7-guanyl)-9-hydroxy-aflatoxin B1 (AFB1-Gua) and (b) 8,9-Dihydro-8-(N5-Formyl-2’.5’.6’- triamino-4’-oxo-N5-pyrimidyl)-9-hydroxy-Aflatoxin B1 (AFB1-triamino-Py) 1.6 Metabolic pathways of AFB1 by cytochrom P-450 14 enzymes; B1-epoxide = AFB1 epoxide, M1= aflatoxin M1, P1= aflatoxin P1 and Q1 = aflatoxin Q1. 1.7 A typical arrangement for a voltammetric 34
electrochemical cell (RE: reference electrode, WE: working electrode. AE: auxiliary electrode)
1.8 A diagram of the Hanging Mercury Drop Electrode 37
(HMDE) 1.9 A diagram of the Controlled Growth Mercury 38 Electrode (CGME) 1.10 Cyclic voltammograms of (a) reversible, 52 (b) irriversible and (c) quasireversible reaction at mercury electrode (O = oxidised form and R = reduced
form)
xvii
1.11 The potential-time sequence in stripping analysis 55 1.12 Schematic drawing showing the Faradaic current 59 and charging current versus pulse time course 1.13 Schematic drawing of steps in DPV by 60 superimposing a periodic pulse on a linear scan 1.14 Waveform for square-wave voltammetry 61 2.0 BAS CGME stand (a) which is connected to 71 CV-50W voltammetric analyser and interface with computer (b) for data processing 2.1 VA757 Computrace Metrohm voltammetric 71 analyser with 663 VA stand (consists of Multi Mode (MME)) 3.0 Cathodic peak current of 0.6 µM AFB1 in various 89 pH of BRB obtained in cathodic cyclic voltammetry. Ei = 0, Elow = -1.5 V, Ehigh = 0 and scan rate = 200
mV/s) 3.1 Shifting of peak potential of AFB1 with increasing 90 pH of BRB. Parameter conditions are the same as in Figure 3.0. 3.2 Mechanism of reduction of AFB1 in BRB at pH 6.0 90 to 8.0. 3.3 Mechanism of reduction of AFB1 in BRB at pH 9.0 91 to 11.0. 3.4 Cathodic cyclic voltammogram for 1.3 µM AFB1 92 obtained at scan rate of 200 mV/s, Ei = 0, Elow =
-1.5 V and Ehigh = 0 in BRB solution at pH 9.0. 3.5 Cathodic cyclic voltammogram for 1.3 µM AFB2 92 in BRB solution at pH 9.0. All parameter conditions are the same as in Figure 3.4. 3.6 Cathodic cyclic voltammogram for 1.3 µM AFG1 93 in BRB solution at pH 9.0. All parameter conditions are the same as in Figure 3.4.
xviii
3.7 Cathodic cyclic voltammogram for 1.3 µM AFG2 93 in BRB solution at pH 9.0. All parameter conditions are the same as in Figure 3.4. 3.8 Effect of Ei to the Ip of 0.6 µM AFB1 in BRB at pH 94
9.0 obtained by cathodic cyclic voltammetry. All parameter conditions are the same as in Figure 3.4.
3.9 Effect of Ei to the Ip of 0.1 µM Zn2+ in BRB at pH 94 9.0 obtained by cathodic cyclic voltammetry. All parameter conditions are the same as in Figure 3.4.
3.10 Anodic cyclic voltammogram of 1.3 µM AFB2 95 obtained at scan rate of 200 mV/s, Ei = -1.5 V, Elow = -1.5 V and Ehigh = 0 in BRB at pH 9.0. 3.11 Effect of increasing AFB2 concentration on the 96 peak height of cathodic cyclic voltammetrc curve in BRB at pH = 9.0. (1.30 µM, 2.0 µM, 2.70 µM and 3.40 µM). All parameter conditions are the same as in Figure 3.4. 3.12 Peak height of reduction peak of AFB2 with 96 increasing concentration of AFB2. All parameter
conditions are the same as in Figure 3.4. 3.13 Repetitive cathodic cyclic voltammograms of 1.3 98 µM AFB2 in BRB solution at pH 9.0. All
experimental conditions are the same as in Figure 3.4. 3.14 Increasing Ip of 1.3 µM AFB2 cathodic peak 98 obtained from repetitive cyclic voltammetry. All
experimental conditions are the same as in Figure 3.4. 3.15 Peak potential of 1.3 µM AFB2 with increasing 99 number of cycle obtained by repetitive cyclic
voltammetry.

xix
3.16 Plot of log Ip versus log υ for 1.3 µM AFB2 in 100 BRB solution at pH 9.0. All experimental conditions
are the same as in Figure 3.4. 3.17 Plot of Ep versus log υ for 1.3 µM AFB2 in BRB 101
solution at pH 9.0. 3.18 Plot of Ip versus υ for 1.3 µM AFB2 in BRB 102 solution at pH 9.0. All parameter conditions
are the same as in Figure 3.4. 3.19 DPCS voltammograms of 1.0 µM AFB2 (Peak I) 103 in BRB at pH 9.0 (a) at tacc = 0 and 30 s. Other parameter conditions; Ei = 0, Ef = -1.50 V,
Eacc = 0, υ =50 mV/s and pulse amplitude = 100 mV. Peak II is the Zn peak.
3.20 DPCS voltammograms of 2.0 µM AFB2 in BRB 104 in BRB (Peak I) at different pH values; 6.0, 7.0,
8.0, 9.0, 11.0and 13.0. Other parameter conditions; Ei = 0, Ef =-1.50 V, Eacc = 0, υ = 50 mV/s and pulse amplitude =100 mV. Peak II is the Zn peak.
3.21 Dependence of the Ip for AFB2 on the pH of 105 0.04 M BRB solution. AFB2 concentration: 2.0 µM, Ei =0, Ef = -1.5 V, Eacc = 0, tacc = 30 sec, υ = 50 mV/s and pulse amplitude = 100 mV. 3.22 Ip of 2.0 µM AFB2 obtained in BRB (a) at pH 106 from 9.0 decreases to 4.0 and re-increase to 9.0 and
(b) at pH from 9.0 increase to 13.0 and re-decrease to 9.0.
3.23 UV-VIS spectrums of 1 ppm AFB2 in BRB at 107 pH (a) 6.0, (b) 9.0 and (c) 13.0.
3.24 Opening of lactone ring by strong alkali caused no 108 peak to be observed for AFB2 in BRB at pH 13.0. 3.25 Ip of 2.0 µM AFB2 in different concentration of 109 BRB at pH 9.0. Experimental conditions are the same as in Figure 3.20. 3.26 Ip of 2.0 µM AFB2 in different pH and concentrations 110 of BRB.
xx
3.27 DPCS voltammograms of 2.0 AFB2 (Peak I) 110 in (a) 0.04 M, (b) 0.08 M and (c) 0.08 M BRB
at pH 9.0 as the blank. Ei = 0 V, Ef = -1.5 V, Eacc = 0 V, tacc = 30 sec, υ = 50mV/s and pulse amplitude = 100 mV. Peak II is the Zn peak.
3.28 Chemical structures of (a) 2,3-dihydrofuran, 111
(b) tetrahydrofuran and (c) coumarin.
3.29 Voltammograms of 2,3-dihydrifuran (peak I) for 112 concentrations from (b) 0.02 to 0.2 µM in (a) BRB at pH 9.0. 3.30 Dependence of Ip of coumarin to its concentrations 112 3.31 Voltammograms of coumarin at concentration of 113 (b) 34 µM, (c) 68 µM, (d) 102 µM, (e) 136 µM
and (f) 170 µM in (a) BRB at pH 9.0. 3.32 Chemical structures of (a) cortisone and (b) 114
testosterone. 3.33 Chemical structures of (a) digoxin and (b) digitoxin 115 3.34 Effect of pH of BRB solution on the Ep for AFB2. 117 AFB2 concentration: 2.0 µM. Ei = 0, Ef = -1.5 V, Eacc = 0, tacc = 30 s and υ = 50 mV/s. 3.35 Effect of various υ to the (a) Ip and (b) Ep of 2.0 µM 118
AFB2 peak in BRB at pH 9.0. Ei = 0, Ef = 1.50 V, Eacc = 0, tacc = 15 s and pulse amplitude = 100 mV.
3.36 Effect of tacc on (a) Ip and (b) Ep of 2.0 µM AFB2 119 peak in BRB at pH 9.0. Ei = 0, Ef = 1.50 V, Eacc = 0,
υ = 40 mV/s and pulse amplitude = 100 mV. 3.37 The relationship between (a) Ip and (b) Ep with 120 Eacc for 2.0 µM AFB2 in BRB at pH 9.0. Ei = 0, Ef = -1.5 V, tacc = 15 s, υ = 40 mV/s and
pulse amplitude = 100 mV.
3.38 Effect of Ei on (a) Ip and (b) Ep of 2.0 µM AFB2 121 in BRB at pH 9.0. Ef = 1.50 V, Eacc = -0.80 V,
tacc = 40 s,υ = 40 mV/s and pulse amplitude = 100 mV.
xxi
3.39 Effect of pulse amplitude on (a) Ip and (b) Ep 122 of 2.0 µM AFB2 in BRB at pH 9.0. Ei = -1.0 V, Ef = 1.50 V, Eacc = -0.80 V, tacc = 40 s and υ = 40 mV/s.
3.40 Effect of Eacc on Ip of 0.06 µM AFB2. Ei = -1.0 V, 123 Ef = -1.50 V, tacc = 40 s, υ = 40 mV/s and pulse amplitude = 100 mV.
3.41 Effect of tacc on (a) Ip and (b) Ep of 0.06 µM AFB2 124 in BRB at pH 9.0. Ei = -1.0 V, Ef = -1.50 V, Eacc = -0.6 V, υ = 40 mV/s and pulse amplitude = 100 mV.
3.42 The effect υ on (a) Ip and (b) Ep of 0.06 µM AFB2 125 In BRB at pH 9.0. Ei = -1.0 V, Ef = -1.50 V, Eacc = -0.6 V, tacc = 80 s and pulse amplitude = 100 mV.
3.43 Voltammograms of 0.06 µM AFB2 obtained under 126 (a) optimised and (b) unoptimised parameters in BRB
at pH 9.0.
3.44 Voltammograms of 0.1 µM (a) AFB1, (b) AFG1, 128 (c) AFB2 and (d) AFG2 in BRB at pH 9.0. Ei = 1.0 (except for AFG1 = -0.95 V), Ef = -1.4 V, Eacc = -0.6 V, tacc = 80 s, υ = 50 mV/s and pulse amplitude = 80 mV.
3.45 Voltammograms of (b) mixed aflatoxins in (a) BRB at 129
pH 9.0 as the blank. Parameters condition: Ei = -0.95 V, Ef = -1.4 V, Eacc = -0.6 V, tacc = 80 s, υ = 50 mV/s and Pulse amplitude = 80 mV.
3.46 Increasing concentration of AFB2 in BRB at pH 9.0. 130 The parameter conditions: Ei = -1.0 V, Ef = -1.4 V, Eacc =-0.6 V, tacc = 80 s, υ = 50 mV/s and pulse amplitude = 80 mV. 3.47 Linear plot of Ip versus concentration of AFB2 130 in BRB at pH 9.0. The parameter conditions are
the same as in Figure 3.46. 3.48 Standard addition of AFB1 in BRB at pH 9.0. 135 The parameter conditions: Ei = -1.0 V, Ef = -1.4 V, Eacc =-0.8 V, tacc = 80 s, υ = 50 mV/s and pulse amplitude = 80 mV.
xxii
3.49 Linear plot of Ip versus concentration of AFB1 135 in BRB at pH 9.0. The parameter conditions are
the same as in Figure 3.48. 3.50 Effect of concentration to Ip of AFG1 in BRB at 138 pH 9.0. Ei = -0.95 V, Ef = -1.40 V, Eacc =-0.8 V,
tacc = 80 s, υ = 50 mV/s and pulse amplitude = 80 mV.
3.51 Linear plot of Ip versus concentration of AFG1 138 in BRB at pH 9.0. The parameter conditions are the same as in Figure 3.50.
3.52 Effect of concentration to Ip of AFG2 in BRB at 140 pH 9.0. Ei = -1.0 V, Ef = -1.40 V, Eacc =-0.8 V,
tacc = 80 s, υ = 50 mV/s and pulse amplitude = 80 mV. 3.53 Linear plot of Ip versus concentration of AFG2 141 in BRB at pH 9.0. The parameter conditions are
the same as in Figure 3.52.
3.54 Voltammograms of 0.1 µM (a) AFB1, (b) AFB2, 144 (c) AFG1 and (d) AFG2 in BRB at pH 9.0 (d) obtained by 747 VA Metrohm. Ei = -1.0 V (except for AFG1 = -0.95 V), Ef = -1.4 V, Eacc = -0.6 V, tacc = 80 s, υ = 50 mV/s and pulse amplitude = 80 mV.
3.55 Ip of all aflatoxins with increasing concentration of 150 Zn2+ up to 1.0 µM. 3.56 Voltammograms of (i) 0.1µM AFB2 and (ii) AFB2-Zn 151
complex with increasing concentration of Zn2+ (a = 0, b = 0.75 µM, c = 1.50 µM, d = 2.25 µM and e = 3.0 µM). Blank = BRB at pH 9.0. Experimental conditions; Ei = -1.0 V, Ef = -1.40 V, Eacc = -0.6 V, tacc = 80 s, υ = 50 mV/s and pulse amplitude = 80 mV.
3.57 Ip of all aflatoxins after reacting with increasing 151 concentration of Zn2+ in BRB at pH 3.0. Measurements were made in BRB at pH 9.0 within 15 minutes of reaction time. Ei = -1.0 V (except
for AFG1 = -0.95 V), Ef = -1.40 V, Eacc = -0.6 V, tacc = 80 s, υ = 50 mV/s and pulse amplitude = 80 mV.
xxiii
3.58 Absorbance of all aflatoxins with increasing 152 concentration of Zn2+ in BRB at pH 3.0 within 15 minutes of reaction time
3.59 Voltammograms of 0.1µM AFB2 with increasing 153 concentration of Zn2+ (from 0.10 to 0.50 µM) in
BRB at pH 9.0. Ei = -0.25 V, Ef = -1.4 V, Eacc = -0.6 V, tacc = 80 s, υ = 50 mV/s and pulse amplirude = 80 mV. .
3.60 Chemical structure of ascorbic acid. 153 3.61 Ip of all aflatoxins with increasing concentration 154 of ascorbic acid up to 1.0 µM. Concentrations of all aflatoxins are 0.1µM. 3.62 Voltammograms of 0.1µM AFB2 with increasing 154 concentration of ascorbic acid. 3.63 Ip of all aflatoxins with increasing concentration 155 of β-cyclodextrin up to 1.0 µM. 3.64 Voltammograms of 0.1µM AFB2 with increasing 156 concentration of β-cyclodextrin. 3.65 Chemical structure of L-cysteine. 156 3.66 Ip of all aflatoxins with increasing concentration 157 of cysteine up to 1.0 µM. 3.67 Voltammograms of 0.1 µM AFB2 obtained by 158 (a) DPCSV and (b) SWSV techniques in BRB at pH 9.0. Parameters for DPCSV: Ei = -1.0 V, Ef =
-1.40V, Eacc = -0.6 V, tacc = 80 s, υ = 50 mV/s and pulse amplitude = 80 mV and for SWSV: Ei = -1.0 V, Ef = -1.40V, Eacc = -0.6 V, tacc = 80 s, frequency = 50 Hz, voltage step = 0.02 V, amplitude = 80 mV and υ = 1000 mV/s.
3.68 Influence of pH of BRB on the Ip of 0.10 µM 159 AFB2 using SWSV technique. The instrumental
Parameters are the same as in Figure 3.67. 3.69 Voltammograms of 0.1 µM AFB2 in different pH 160 of BRB. Parameter conditions: Ei = -1.0 V, Ef = -1.40 V, Eacc = -0.6 V, tacc = 80 s, voltage step =
xxiv
0.02 V, amplitude = 50 mV, frequency = 50 Hz and υ = 1000 mV/s. 3.70 Effect of Ei to the Ip of 0.10 µM AFB2 in BRB at 160 pH 9.0. 3.71 Effect of Eaccto the Ip of 0.10 µM AFB2 in BRB at 161 pH 9.0. 3.72 Relationship between Ip of 0.10 µM AFB2 while 162 increasing tacc.
3.73 Effect of frequency to the Ip of 0.10 µM AFB2 in 162 BRB at pH 9.0.
3.74 Linear relatioship between Ip of AFB2 and square 163 root of frequency. 3.75 Influence of square-wave voltage step to Ip of 163 0.10 µM AFB2. 3.76 Influence of square-wave amplitude to Ip of 0.10 µM 164 AFB2. 3.77 Relationship of SWSV Ep of AFB2 with increasing 164 amplitude.
3.78 Ip of 0.10 µM AFB2 obtained under (a) non-optimised 165 and (b) optimised SWSV parameters compared with that obtained under (c) optimised DPCSV parameters.
3.79 Voltammograms of 0.10 µM AFB2 obtained under 166 (a) non-optimised and (b) optimised SWSV
parameters compared with that obtained under (c) optimised DPCSV parameters.
3.80 Ip of 0.10 µM aflatoxins obtained using two 167 different stripping voltammetric techniques under their optimum paramter conditions in BRB at pH 9.0. 3.81 Voltammograms of (i) AFB1, (ii) AFB2, (iii) AFG1 168 and (iV) AFG2 obtained by (b) DPCSV compared with that obtained by (c) SWSV in (a) BRB at pH 9.0. 3.82 SWSV voltammograms for different concentrations 169 of AFB1 in BRB at pH 9.0. The broken line
xxv
represents the blank: (a) 0.01 µM, (b) 0.025 µM, (c) 0.05 µM, (d) 0.075 µM, (e) 0.10 µM, (f) 0.125 µM and (g) 0.150 µM. Parameter conditions:
Ei = -1.0 V, Ef = -1.4 V, Eacc = -0.8 V, tacc = 100 s, frequency = 125 Hz, voltage step = 0.03 V, pulse amplitude = 75 mV and scan rate = 3750 mV/s.
3.83 Calibration curve for AFB1 obtained by SWSV 170 method. 3.84 Calibration curve for AFB2 obtained by SWSV 170 method. 3.85 Calibration curve for AFG1 obtained by SWSV 170 method. 3.86 Calibration curve for AFG2 obtained by SWSV 171 method. 3.87 LOD for determination of aflatoxins obtained by 171 two different stripping methods. 3.88 UV-VIS spectrums of 10 ppm of all aflatoxins in 176 benzene: acetonitrile (98%) at preparation date. 3.89 UV-VIS spectrums of 10 ppm of all aflatoxins in 176 benzene: acetonitrile (98%) after 6 months of storage time. 3.90 UV-VIS spectrums of 10 ppm of all aflatoxins in 177 benzene: acetonitrile (98%) after 12 months of storage time. 3.91 UV-VIS spectrums of 10 ppm AFB1 (a) kept in 178 the cool and dark conditions and (b) exposed to ambient conditions for 3 days. 3.92 UV-VIS spectrums of 1 ppm AFB1 in BRB 178 solution prepared from (a) good and (b) damaged 10 ppm AFB1 stock solution. 3.93 UV-VIS spectrums of 1 ppm AFB1 in BRB 179 solution prepared from (a) good and (b) damaged 10 ppm AFB1 stock solution after 2 week stored in the cool and dark conditions.

xxvi
3.94 Percentage of Ip of 0.10 µM aflatoxins in BRB at pH 180 9.0 at different storage time in the cool and dark
conditions.
3.95 Percentage of Ip of all aflatoxins in BRB at pH 9.0 181 exposed to ambient conditions up to 8 hours of exposure time.
3.96 Reaction of 8,9 double bond furan rings in AFB1 182 with TFA, iodine and bromine under special conditions (Kok, et al., 1986). 3.97 Voltammograms of 0.10 µM AFB1 obtained in (a) 183 BRB at pH 9.0 which were prepared from (b) damaged and (c) fresh stock solutions. 3.98 Ip of 0.10 µM AFB1 obtained in BRB at pH 9.0 184 from 0 to 8 hours in (a) light exposed and (b)
light protected. 3.99 Ip of 0.10 µM AFB2 obtained in BRB at pH 9.0 184 from 0 to 8 hours in (a) light exposed and (b)
light protected. 3.100 Ip of 0.10 µM AFG1 obtained in BRB at pH 9.0 185 from 0 to 8 hours in (a) light exposed and (b)
light protected. 3.101 Ip of 0.10 µM AFG2 obtained in BRB at pH 9.0 185 from 0 to 8 hours in (a) light exposed and (b)
light protected. 3.102 Peak heights of 0.10 µM aflatoxins in BRB at pH 187 (a) 6.0, (b) 7.0, (c) 9.0 and (d) 11.0 exposed to ambient conditions up to 3 hours of exposure time. 3.103 Resonance forms of the phenolate ion 187 (Heathcote, 1984).
3.104 Voltammograms of 0.10 µM AFB2 in BRB at pH 188 6.0 from 0 to 3 hrs exposure time.
3.105 Voltammograms of 0.10 µM AFB2 in BRB at pH 188
11.0 from 0 to 3 hrs of exposure time.
xxvii
3.106 Voltammograms of 0.10 µM AFG2 in BRB at pH 189 6.0 from 0 to 3 hrs of exposure time.
3.107 Voltammograms of 0.10 µM AFG2 in BRB at pH 189 11.0 from 0 to 3 hrs of exposure time.
3.108 Absorbance of 1.0 ppm aflatoxins in BRB at pH 190 (a) 6.0, (b) 7.0, (c) 9.0 and (d) 11.0 from 0 to 3
hours of exposure time. 3.109 The peak heights of aflatoxins in 1.0 M HCl from 191 0 to 6 hours of reaction time. 3.110 The peak heights of aflatoxins in 1.0 M NaOH from 192 0 to 6 hours of reaction time. 3.111 Voltammograms of real samples after extraction by 193 Technique (a) 1, (b) 2 and (c) 3 with addition of AFB1 standard solution in BRB at pH 9.0 as a blank. 3.112 Voltammograms of blank in BRB at pH 9.0 obtained 194 by (a) DPCSV and (b) SWSV methods. 3.113 DPCSV (a) and SWSV (b) voltammograms of 10 195 ppb AFB2 (i) in present of blank sample (ii) obtained in BRB at pH 9.0 (iii) as the supporting electrolyte. 3.114 DPCSV voltammograms of real samples (b) added 197 with 3 ppb (i), 9 ppb (ii) and 15 ppb (iii) AFB1 obtained in BRB at pH 9.0 (a) as the blank on the first day measurement. 3.115 Percentage of recoveries of (a) 3 ppb, (b) 9 ppb, 198 (c) 15 ppb of all aflatoxins in real samples obtained by DPCSV methods for one to three days of measurements. 3.116 DPCSV voltammograms of real sample, S11 (b) 199 with the addition of 10 ppb AFB1 (c) in BRB at pH 9.0 (a) as the blank. Parameter conditions: Eacc = -0.6 V, tacc = 80 s, scan rate = 50 mV/s and pulse amplitude = 80 mV.
xxviii
3.117 SWSV voltammograms of real sample, S11 (b) 200 with the addition of 10 ppb AFB1 (c) in BRB at pH 9.0 (a) as the blank. Parameter conditions: Eacc = -0.8 V, tacc = 100 s, scan rate = 3750 mV/s,
frequency = 125 Hz, voltage step = 0.03 V and pulse amplitude = 75 mV.
3.118 DPCSV voltammograms of real sample, S07 (b) 200 with the addition of 10 ppb AFB1 (c) in BRB at pH 9.0 (a) as the blank. Parameter conditions: Eacc = -0.6 V, tacc = 80 s, scan rate = 50 mV/s and pulse amplitude = 80 mV. 3.119 SWSV voltammograms of real sample, S07 (b) 201 with the addition of 10 ppb AFB1 (c) in BRB at pH 9.0 (a) as the blank. Parameter conditions: Eacc = -0.8 V, tacc = 100 s, scan rate = 3750 mV/s,
frequency = 125 Hz, voltage step = 0.03 V and pulse amplitude = 75 mV.
3.120 DPCSV voltammograms of real sample, S10 (b) 201 with the addition of 10 ppb AFB1 (c) in BRB at pH 9.0 (a) as the blank. Parameter conditions: Eacc = -0.6 V, tacc = 80 s, scan rate = 50 mV/s and pulse amplitude = 80 mV. 3.121 SWSV voltammograms of real sample, S10 (b) 202 with the addition of 10 ppb AFB1 (c) in BRB at pH 9.0 (a) as the blank. Parameter conditions: Eacc = -0.8 V, tacc = 100 s, scan rate = 3750 mV/s,
frequency = 125 Hz, voltage step = 0.03 V and pulse amplitude = 80 mV.
xxix
ABBREVIATIONS
AAS Atomic absorption spectrometry
Abs Absorbance
ACP Alternate current polarography
ACV Alternate current voltammetry
AD Amperometric detector
AdCSV Adsorptive cathodic stripping voltammetry
AE Auxiliary electrode
AFB1 Aflatoxin B1
AFB2 Aflatoxin B2
AFG1 Aflatoxin G1
AFG2 Aflatoxin G2
AFM1 Aflatoxin M1
AFM2 Aflatoxin M2
AFP1 Aflatoxin P1
AFQ1 Aflatoxin Q1
Ag/AgCl Silver/silver chloride
ASV Anodic stripping voltammetry
β-CD β-cyclodextrin
BFE Bismuth film electrode
BLMs Bilayer lipid membranes
BRB Britton Robinson Buffer
CA Concentration of analyte
CE Capillary electrophoresis
CGME Controlled growth mercury electrode
CME Chemically modified electrode
CPE Carbon paste electrode
CSV Cathodic stripping voltammetry
CV Cyclic voltammetry

xxx
DC Direct current
DCP Direct current polarography
DME Dropping mercury electrode
DMSO Dimethyl sulphonic acid
DNA Deoxyribonucliec acid
DPCSV Differential pulse cathodic stripping voltammetry
DPP Differential pulse polarography
DPV Differential pulse voltammetry
Eacc Accumulation potential
Ei Initial potential
Ef Final potential
Ehigh High potential
Elow Low potential
Ep Peak potential
ECS Electrochemical sensing
Et4NH4 OH Tetraethyl ammonium hydroxide
ELISA Enzyme linked immunosorbant assay
FD Fluorescence detector
FDA Food and Drug Administration
GCE Glassy carbon electrode
GC-FID Gas chromatography with flame ionisation detector
HMDE Hanging mercury drop electrode
HPLC High performance liquid chromatography
HPTLC High pressure thin liquid chromatography
IAC Immunoaffinity chromatography
IACLC Immunoaffinity column liquid chromatography
IAFB Immunoaffinity fluorometer biosensor
IARC International Agency for Research Cancer
Ic Charging current
Id Diffusion current
If Faradaic current
xxxi
Ip Peak height
ICP-MS Induced coupled plasma-mass spectrometer
IR Infra red
IUPAC International Union of Pure and Applied Chemistry
KGy Kilogray
LD50 Lethal dose 50
LOD Limit of detection
LOQ Limit of quantification
LSV Linear sweep voltammetry
MFE Mercury film electrode
MS Mass spectrometer
MECC Micellar electrokinetic capillary chromatography
MOPS 3-(N-morpholino)propanesulphonic
MOSTI Ministry of Science, Technology and Innovation
NP Normal polarography
NPP Normal pulse polarography
NPV Normal pulse voltammetry
OPLC Over pressured liquid chromatography
PAH Polycyclic aromatic hydrocarbon
PLL Poly-L-lysine
ppb part per billion
ppm part per million
PSA Potentiometric stripping analysis
RDX Hexahydro-1,3,5-trinitro-1,3,5-triazine
RE Reference electrode
RIA Radioimmunoassay
RNA Ribonucleic acid
RSD Relative standard deviation
S/N Signal to noise ratio
SCE Standard calomel electrode
SCV Stair case voltammetry

xxxii
SDS Sodium dodecyl sulphate
SHE Standard hydrogen electrode
SIIA Sequential injection immunoassay
SMDE Static mercury drop electrode
SPE Solid phase extraction
SPCE Screen printed carbon electrode
SWP Square-wave polarography
SWV Square-wave voltammetry
SWSV Square-wave stripping voltammetry
SV Stripping voltammetry
tacc Accumulation time
TBS Tris buffered saline
TEA Triethylammonium
TLC Thin layer chromatography
TFA Trifluoroacetic acid
UME Ultra microelectrode
ν Scan rate
v/v Volume per volume
UVD Ultraviolet-Visible detector
UV-VIS Ultraviolet-Visible
WE Working electrode
WHO World Health Organisation
λmax Maximum wavelenght
εmax Maximum molar absorptivity
xxxiii
LIST OF APPENDICES
APPENDIX TITLE PAGE A Relative fluorescence of aflatoxins in different 255 solvent s
B UV spectra of the principal aflatoxins (in methanol) 256 C Relative intensities of principal bands in the IR 257 spectra of the aflatoxins D Calculation of concentration of aflatoxin stock 258 solution E Extraction procedure for aflatoxins in real samples 259 F Calculation of individual aflatoxin in groundnut 260 samples. G Cyclic voltammograms of AFB1, AFB2 and AFG2 262 with increasing of their concentrations. H Dependence if the peak heights of AFB1, AFG1 264 and AFG2 on their concentrations. I Repetitive cyclic voltammograms and their peak 266
heights of AFB1, AFG1 and AFG2 in BRB at pH 9.0 J Plot Ep – log scan rate for the reduction of AFB1, 270
AFG1 and AFG2 in BRB at pH 9.0 K Plot of peak height versus scan rate for 1.3 µM of 272 AFB1, AFG1 and AFG2 in BRB at pH 9.0 L Voltammograms of AFB2 with increasing 274 concentration. M Voltammograms of 0.1 µM and 0.2 µM AFB2 275 obtained on the same day measurements N Voltammograms of AFB2 at inter-day 276 measurements
xxxiv
O F test for robustness and ruggedness tests 278 P Voltammograms of AFB1 with increasing 280 concentration Q Voltammograms of AFG1 with increasing 281 concentration R Voltammograms of AFG2 with increasing 282 concentration S LOD determination according to Barek et al. (2001a) 283 T LOD determination according to Barek et al. (1999) 286 U LOD determination according to Zhang et al. (1996) 287 V LOD determination according to Miller and 288
Miller (1993) W ANOVA test 290 X Peak height of aflatoxins in presence and absence of PLL 292 Y SWSV voltammograms of AFB1, AFB2, AFG1 293 and AFG2 in BRB at pH 9.0 Z SWSV voltammograms of 0.10 µM AFB1, AFB2, 295 AFG1 and AFG2 in BRB at pH 9.0 AA UV-VIS spectrums of 10 ppm AFB1, AFB2, AFG1 297 and AFG2 stock solutions AB Voltammograms of AFB1, AFB2, AFG1 and AFG2 299 obtained from 0 to 6 months of storage time in the
cool and dark conditions.
AC Voltammograms of AFB1, AFB2, AFG1 and 302 AFG2 in BRB at pH 9.0 from 0 to 8 hours of
exposure time. AD UV-VIS spectrums of AFB2 in BRB at pH 6.0 305 and 11.0.

xxxv
AE Voltammograms of AFB1 and AFG1 in 1.0 M HCl 307 and 1.0 M NaOH
AF DPCSV voltammograms of real samples added with 309
various concentrations of AFG1 AG SWSV voltammograms of real samples added with 310
various concentrations of AFB1.
AH Percentage of recoveries of various concentrations 311 of all aflatoxins (3.0 and 9.0 ppb) in real samples obtained by SWSV method.
AI Calculation of percentage of recovery for 3.0 ppb 312 AFG1 added into real samples. AJ HPLC chromatograms of real samples: S10 and S07 313 AK Calculation of aflatoxin in real sample, S13 314 AL List of papers presented or published to date 315 resulting from this study. AM ICP-MS results for analysis of BRB at pH 9.0 317
CHAPTER I
LITERATURE REVIEW
1.1 Overview
Humans are continuously exposed to varying amounts of chemicals that have
been shown to have carcinogenic or mutagenic properties in environmental systems.
Exposure can occur exogenously when these agents are present in food, air or water,
and also endogenously when they are products of metabolism or pathophysiologic
states such as inflammation. Great attention is focused on environmental health in the
past two decades as a consequence of the increasing awareness over the quality of life
due to major environment pollutants that affect it. Studies have shown that exposure to
environmental chemical carcinogens have contributed significantly to cause human
cancers, when exposures are related to life style factors such as diet (Wogan et al.,
2004).
The contamination of food is part of the global problem of environmental
pollution. Foodstuffs have been found contaminated with substances having
carcinogenic, mutagenic, teratogenic and allergenic properties. As these substances can
be supplied with food throughout the entire life-time of a person, it is necessary to deal
with the chronic action of trace amounts of such substances. Hence the systematic
determination of the foreign substances in nutritional products and feedstock plays an
important role. The determination of trace impurities presents considerable difficulties
owing to the fact that food is a complex system containing thousands of major and
minor compounds (Nilufer and Boyacio, 2002). Increasing environment pollution by
toxic substances such as toxic metals, organometallic and organic pollutants in air,
2
water, soil and food, calls for reliable analytical procedures for their control in
environmental samples which needs reliable and sensitive methods (Fifield and Haines,
2000). The choice of the method of analysis depends on the sample, the analyte to be
assayed, accuracy, limit of detection, cost and time to complete the analysis (Aboul-
Eneim et a., 2000). For development of this method, emphasis should be on
development of simplified, cost-effective and efficient method that complies with the
legislative requirements (Stroka and Anklam, 2002; Enker, 2003).
The widespread occurrence of aflatoxins producing fungi in our environment
and the reported naturally occurring of toxin in a number of agricultural commodities
has led the investigator to develop a new method for aflatoxin analysis (Creepy, 2002).
An accurate and sensitive method of analysis is therefore required for the determination
of these compounds in foodstuffs that have sustained mould growth.
Numerous articles concerning methods for determination of aflatoxins have
been published. However, with regard to electroanalytical technique, only one method
of determination was reported using the differential pulse pulse polarographic (DPP)
technique which was developed by Smyth et al. (1979). In this experiment, the
obtained limit of detection of aflatoxin B1 was 25 ppb which was higher as compared
to the common amount of aflatoxin in contaminated food samples which is 10 ppb as
reported by Pare (1997) or even less. In Malaysia, the regulatory limit for total
aflatoxins in groundnut is 15 ppb. The regulatory for other foods and milk is 10 ppb
and 0.05 ppb respectively (Malaysian Food Act, 1983).
1.2 AFLATOXINS
1.2.1 Aflatoxins in General
Aflatoxins are a group of heterocyclic, oxygen-containing mycotoxins that
possess the bisdifuran ring system. It was discovered some 43 years ago in England
3
following a poisoning outbreak causing 100,000 turkeys death (Miller, 1987 and
Cespedez and Diaz, 1997). The aflatoxins are the most widely distributed fungal toxins
in food. The occurrence of the aflatoxins in food products demonstrated that the high
levels of aflatoxins are significant concern both for food traders and food consumers
(Tozzi et al. 2003; Herrman, 2004; Haberneh, 2004). Aflatoxin is a by-product of mold
growth in a wide range of agriculture commodities such as peanuts (Urano et al., 1993),
maize and maize based food (Papp et al., 2002; Mendez-Albores et al., 2004),
cottonseeds (Pons and Franz, 1977), cocoa (Jefferey et al., 1982), coffee beans (Batista
et al., 2003), medical herbs ( Reif and Metzger, 1998; Rizzo et al., 2004), spices
(Erdogen, 2004; Garner et al., 1993; Akiyama et al., 2001; Aziz et al., 1998), melon
seeds (Bankole et al., 2004) and also in human food such as rice (Shotwell et al., 1966;
Begum and Samajpati, 2000), groundnut (Bankole et al., 2005), peanut products (
Patey et al., 1990), corn ( Shotwell and Goulden, 1977; Urano et al., 1993 ), vegetable
oil (Miller et al., 1985), beer (Scott and Lawrence, 1997), dried fruits ( Abdul Kadar et
al., 2004, Arrus et al. (2004), milk and dairy products (Kamkar, 2004; Aycicek et al.
2005; Sarimehmetoglu et al., 2004; Martin and Martin, 2004 ). Meat and meat
products are also contaminated with alfatoxins when farm animals are fed with
aflatoxin contaminated feed (Miller, 1987 and Chiavaro et al., 2001).
The molds that are major producers of aflatoxin are Aspergillus flavus
(Bankole et al. 2004) and Aspergillus parasiticus (Begum and Samajpati, 2000;
Setamou et al., 1997; Erdogen, 2004; Gourama and Bullerman, 1995). Aspergillus
flavus, which is ubiquitous, produces B aflatoxins (Samajphati, 1979) while Aspergillus
parasiticus, which produces both B and G aflatoxins, has more limited distribution
(Garcia-Villanova et al., 2004). A picture of Aspergillus flavus seen under an electron
microscope is shown in Figure 1.0.
Black olive is one of the substrate for Aspergillus parasiticus growth and
aflatoxin B1 production as reported by Leontopoulos et al., (2003). Biosynthesis of
aflatoxins by this fungi depends on the environmental condition such as temperature
and humidity during crop growth and storage (Leszczynska et al., 2000; Tarin et al.,
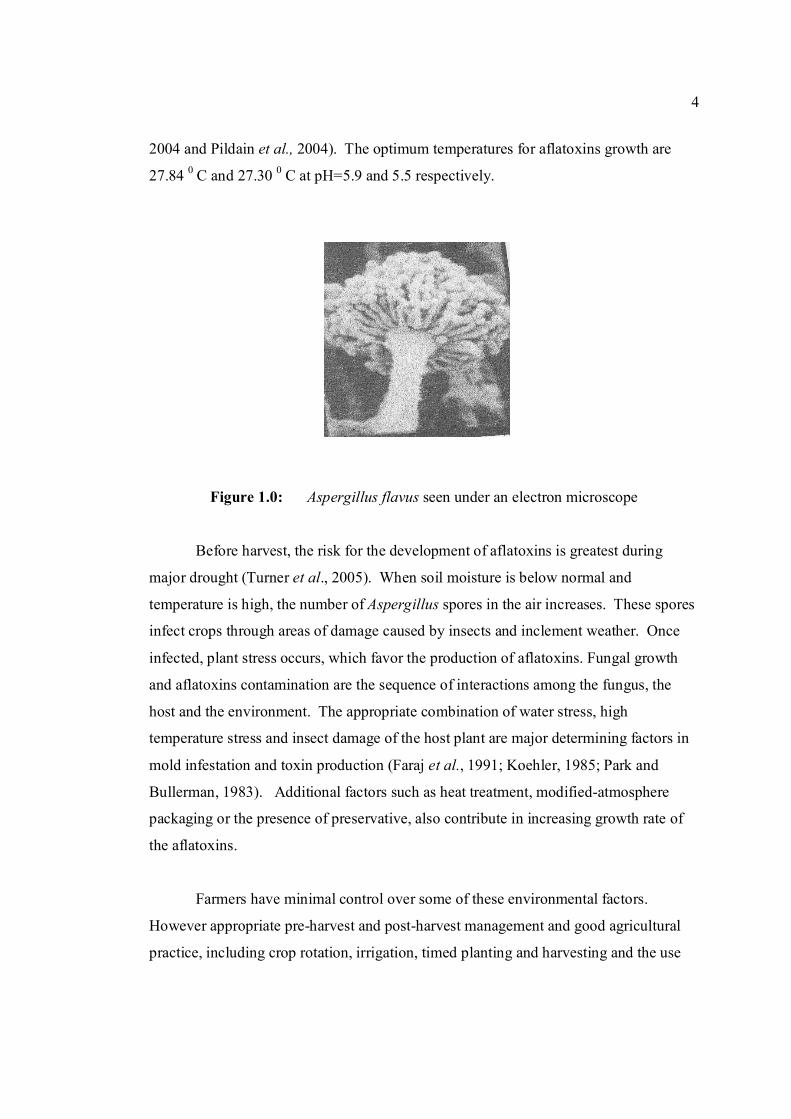
4
2004 and Pildain et al., 2004). The optimum temperatures for aflatoxins growth are
27.84 0 C and 27.30 0 C at pH=5.9 and 5.5 respectively.
Figure 1.0: Aspergillus flavus seen under an electron microscope
Before harvest, the risk for the development of aflatoxins is greatest during
major drought (Turner et al., 2005). When soil moisture is below normal and
temperature is high, the number of Aspergillus spores in the air increases. These spores
infect crops through areas of damage caused by insects and inclement weather. Once
infected, plant stress occurs, which favor the production of aflatoxins. Fungal growth
and aflatoxins contamination are the sequence of interactions among the fungus, the
host and the environment. The appropriate combination of water stress, high
temperature stress and insect damage of the host plant are major determining factors in
mold infestation and toxin production (Faraj et al., 1991; Koehler, 1985; Park and
Bullerman, 1983). Additional factors such as heat treatment, modified-atmosphere
packaging or the presence of preservative, also contribute in increasing growth rate of
the aflatoxins.
Farmers have minimal control over some of these environmental factors.
However appropriate pre-harvest and post-harvest management and good agricultural
practice, including crop rotation, irrigation, timed planting and harvesting and the use
5
of pesticides are the best methods for preventing or controlling aflatoxins
contamination (Turner et al., 2005). Timely harvesting could reduce crop moisture to a
point where the formation of the mould would not occur. For example harvesting corn
early when moisture is above 20 percent and then quickly drying it to a moisture level
of at least 15 percent will keep the Aspergillus flavus from completing its life cycle,
resulting in lower aflatoxin concentration. Aflatoxins are to be found in agricultural
products as a consequence of unprosperous storage conditions where humidity of 70 -
90 % and a minimum temperature of about 10° C. Commodities that have been dried
to about 12 to 0.5 % moisture are generally considered stable, and immune to any risk
of additional aflatoxins development. Moreover, the minimum damage of shells during
mechanized harvesting of crop reduces significantly the mould contamination.
Biocontrol of aflatoxin contamination is another way to reduce this contamination. The
natural ability of many microorganisms including bacteria, actinomycetes, yeasts,
moulds and algae has been a source for bacteriological breakdown of mycotoxins. The
most active organism such as Flavobacterium aurantiacum which in aqueous solution
can take up and metabolise aflatoxins B1, G1 and M1 (Smith and Moss, 1985).
Production of aflatoxins is greatly inhibited by propionic acid as revealed by
Molina and Gianuzzi (2002) when they studied the production of aflatoxins in solid
medium at different temperature, pH and concentration of propionic acid. It also can be
inhibited by essential oil extracted from thyme as found by Rasooli and Abnayeh
(2004). Other chemicals that can inhibit the growth of this fungus are ammonia, copper
sulphate and acid benzoic (Gowda et al., 2004).
1.2.2 Chemistry of Aflatoxins
Aflatoxins can be classified into two broad groups according to chemical
structure which are difurocoumarocyclopentenone series and ifurocoumarolactone
(Heathcote, 1984). They are highly substituted coumarin derivatives that contain a
fused dihydrofuran moiety. The chemical structure of coumarin is shown in Figure 1.1.
6
O O
Figure 1.1 Chemical structure of coumarin
There are six major compounds of aflatoxin such as aflatoxin B1 (AFB1),
aflatoxin B2 (AFB2), aflatoxin G1 (AFG2), aflatoxin G2 (AFG2), aflatoxin M1
(AFM1) and aflatoxin M2 (AFM2) (Goldblatt, 1969). The former four are naturally
found aflatoxins and the AFM1 and AFM2 are produced by biological metabolism of
AFB1 and AFB2 from contaminated feed used by animals. They are odorless, tasteless
and colorless. The scientific name for these aflatoxin compounds are listed in Table 1.0.
Aflatoxins have closely similar structures and form a unique group of highly
oxygenated, naturally occurring heterocyclic compounds. The chemical structures of
these aflatoxins are shown in Figure 1.2. The G series of aflatoxin differs chemically
from B series by the presence of a β-lactone ring, instead of a cyclopentanone ring.
Also a double bond that may undergo reduction reaction is found in the form of vinyl
ether at the terminal furan ring in AFB1 and AFG1 but not in AFB2 and AFG2.
However this small difference in structure at the C-2 and C-3 double bond is associated
with a very significant change in activity, whereby AFB1 and AFG1 are carcinogenic
and considerably more toxic than AFB2 and AFG2. The dihydrofuran moiety in the
structure is said to be of primary importance in producing biological effects.
Hydroxylation of the bridge carbon of the furan rings for AFM1 does not significantly
alter the effects of the compounds. The absolute configuration of AFB2 and AFG2
follows from the fact that it is derived from the reduction of AFB1 and AFG1
respectively.
AFB is the aflatoxin which produces a blue color under ultraviolet while AFG
produces the green color. AFM produces a blue-violet fluorescence while AFM2
produces a violet fluorescence (Goldblatt, 1969). Relative fluorescence of aflatoxins in
several organic solvents are shown in Appendix A (White and Afgauer, 1970). The
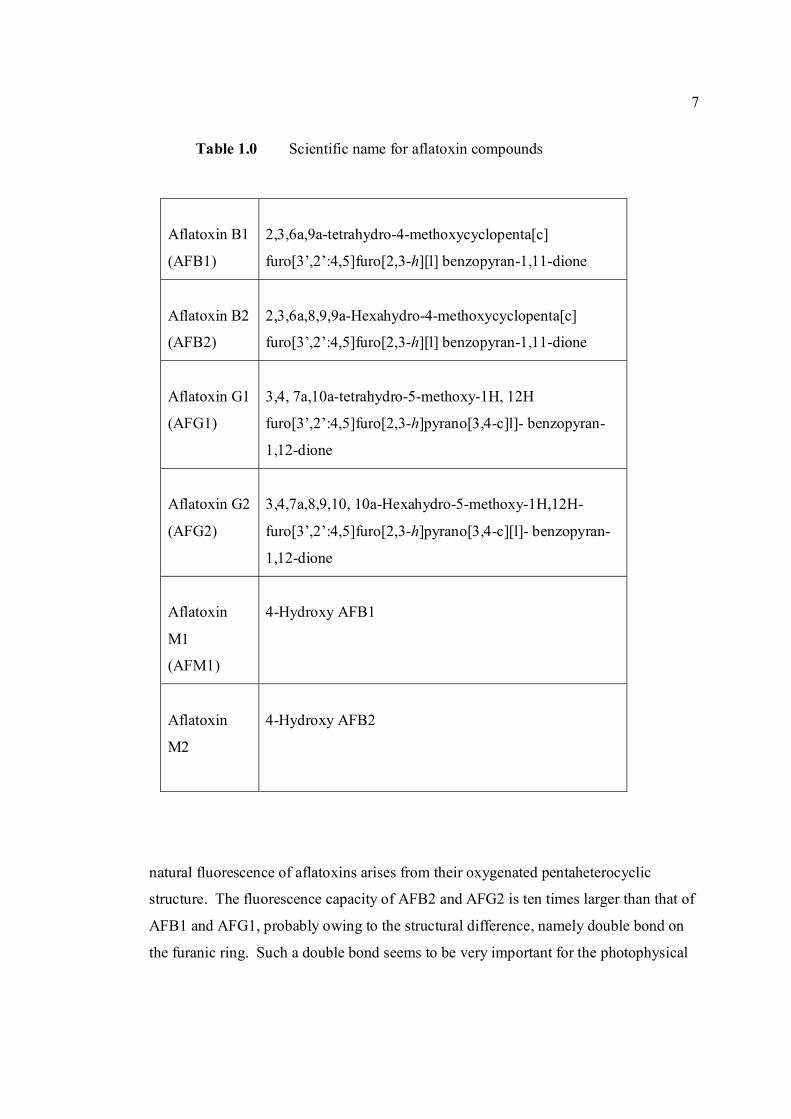
7
Table 1.0 Scientific name for aflatoxin compounds
natural fluorescence of aflatoxins arises from their oxygenated pentaheterocyclic
structure. The fluorescence capacity of AFB2 and AFG2 is ten times larger than that of
AFB1 and AFG1, probably owing to the structural difference, namely double bond on
the furanic ring. Such a double bond seems to be very important for the photophysical
Aflatoxin B1
(AFB1)
2,3,6a,9a-tetrahydro-4-methoxycyclopenta[c]
furo[3’,2’:4,5]furo[2,3-h][l] benzopyran-1,11-dione
Aflatoxin B2
(AFB2)
2,3,6a,8,9,9a-Hexahydro-4-methoxycyclopenta[c]
furo[3’,2’:4,5]furo[2,3-h][l] benzopyran-1,11-dione
Aflatoxin G1
(AFG1)
3,4, 7a,10a-tetrahydro-5-methoxy-1H, 12H
furo[3’,2’:4,5]furo[2,3-h]pyrano[3,4-c]l]- benzopyran-
1,12-dione
Aflatoxin G2
(AFG2)
3,4,7a,8,9,10, 10a-Hexahydro-5-methoxy-1H,12H-
furo[3’,2’:4,5]furo[2,3-h]pyrano[3,4-c][l]- benzopyran-
1,12-dione
Aflatoxin
M1
(AFM1)
4-Hydroxy AFB1
Aflatoxin
M2
4-Hydroxy AFB2
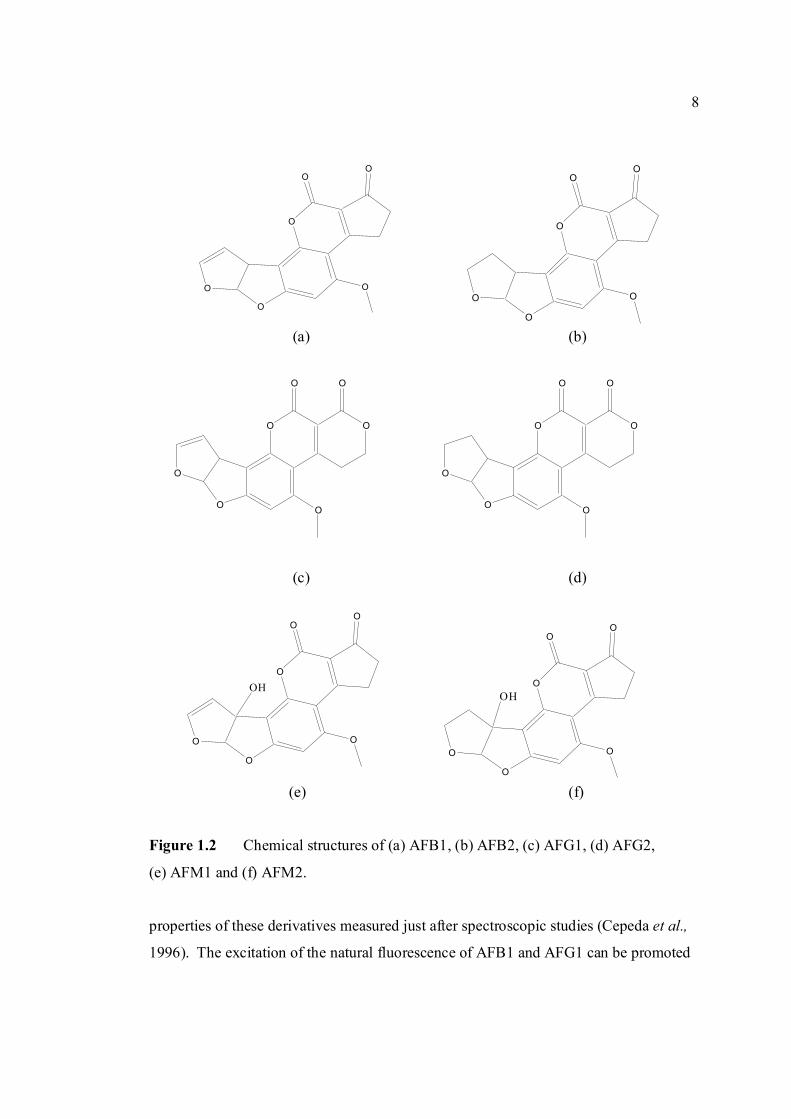
8
O
O
O
OO
O
O
O
O
OO
O
O O
O
O
OO
O
O
O
O
OO
O
OH O
O
O
OO
O
OH
O O
O
O
OO
O
(a) (b)
(c) (d)
(e) (f)
Figure 1.2 Chemical structures of (a) AFB1, (b) AFB2, (c) AFG1, (d) AFG2,
(e) AFM1 and (f) AFM2.
properties of these derivatives measured just after spectroscopic studies (Cepeda et al.,
1996). The excitation of the natural fluorescence of AFB1 and AFG1 can be promoted
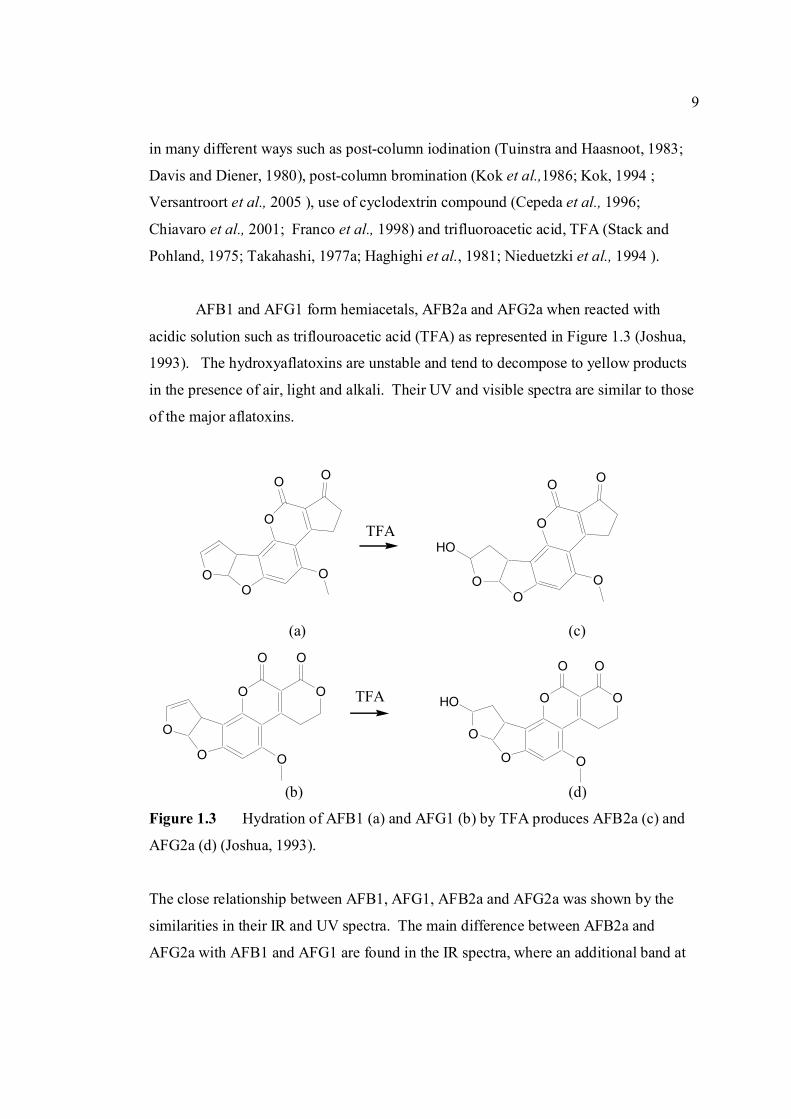
9
O O
O
O
OO
O
O O
O
O
OO
O
HOTFA
O
OO
OO
O
HO
O
OO
OO
O
TFA
in many different ways such as post-column iodination (Tuinstra and Haasnoot, 1983;
Davis and Diener, 1980), post-column bromination (Kok et al.,1986; Kok, 1994 ;
Versantroort et al., 2005 ), use of cyclodextrin compound (Cepeda et al., 1996;
Chiavaro et al., 2001; Franco et al., 1998) and trifluoroacetic acid, TFA (Stack and
Pohland, 1975; Takahashi, 1977a; Haghighi et al., 1981; Nieduetzki et al., 1994 ).
AFB1 and AFG1 form hemiacetals, AFB2a and AFG2a when reacted with
acidic solution such as triflouroacetic acid (TFA) as represented in Figure 1.3 (Joshua,
1993). The hydroxyaflatoxins are unstable and tend to decompose to yellow products
in the presence of air, light and alkali. Their UV and visible spectra are similar to those
of the major aflatoxins.
(a) (c)
(b) (d)
Figure 1.3 Hydration of AFB1 (a) and AFG1 (b) by TFA produces AFB2a (c) and
AFG2a (d) (Joshua, 1993).
The close relationship between AFB1, AFG1, AFB2a and AFG2a was shown by the
similarities in their IR and UV spectra. The main difference between AFB2a and
AFG2a with AFB1 and AFG1 are found in the IR spectra, where an additional band at
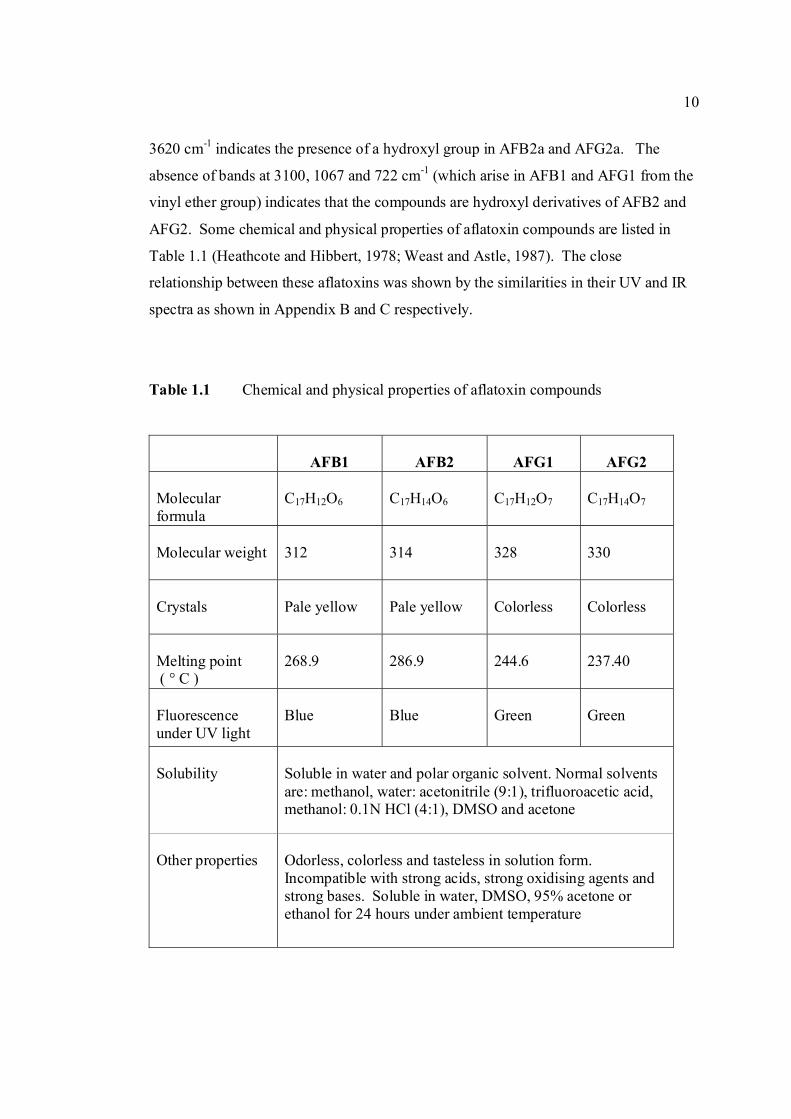
10
3620 cm-1 indicates the presence of a hydroxyl group in AFB2a and AFG2a. The
absence of bands at 3100, 1067 and 722 cm-1 (which arise in AFB1 and AFG1 from the
vinyl ether group) indicates that the compounds are hydroxyl derivatives of AFB2 and
AFG2. Some chemical and physical properties of aflatoxin compounds are listed in
Table 1.1 (Heathcote and Hibbert, 1978; Weast and Astle, 1987). The close
relationship between these aflatoxins was shown by the similarities in their UV and IR
spectra as shown in Appendix B and C respectively.
Table 1.1 Chemical and physical properties of aflatoxin compounds
AFB1
AFB2
AFG1
AFG2
Molecular formula
C17H12O6
C17H14O6
C17H12O7
C17H14O7
Molecular weight
312
314
328
330
Crystals
Pale yellow
Pale yellow
Colorless
Colorless
Melting point ( ° C )
268.9
286.9
244.6
237.40
Fluorescence under UV light
Blue
Blue
Green Green
Solubility
Soluble in water and polar organic solvent. Normal solvents are: methanol, water: acetonitrile (9:1), trifluoroacetic acid, methanol: 0.1N HCl (4:1), DMSO and acetone
Other properties
Odorless, colorless and tasteless in solution form. Incompatible with strong acids, strong oxidising agents and strong bases. Soluble in water, DMSO, 95% acetone or ethanol for 24 hours under ambient temperature
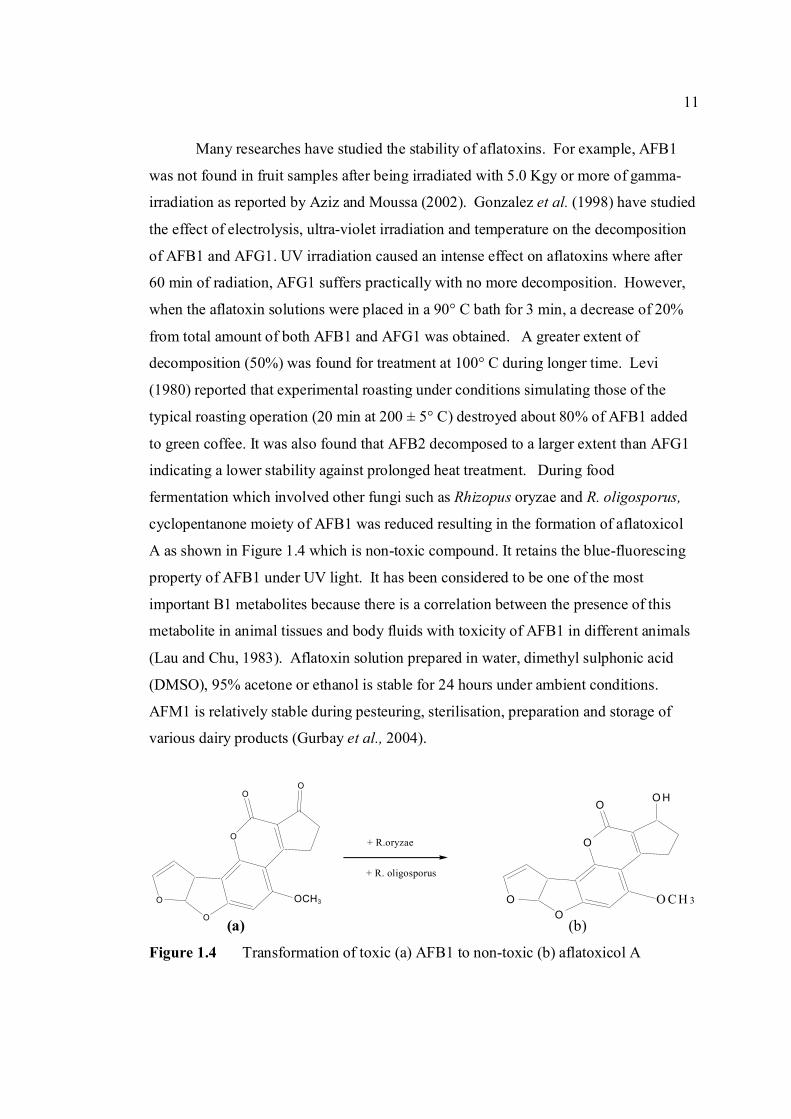
11
O
O
O
OO
OCH3
+ R.oryzae
+ R. oligosporus
O
OO
OO H
O C H 3
Many researches have studied the stability of aflatoxins. For example, AFB1
was not found in fruit samples after being irradiated with 5.0 Kgy or more of gamma-
irradiation as reported by Aziz and Moussa (2002). Gonzalez et al. (1998) have studied
the effect of electrolysis, ultra-violet irradiation and temperature on the decomposition
of AFB1 and AFG1. UV irradiation caused an intense effect on aflatoxins where after
60 min of radiation, AFG1 suffers practically with no more decomposition. However,
when the aflatoxin solutions were placed in a 90° C bath for 3 min, a decrease of 20%
from total amount of both AFB1 and AFG1 was obtained. A greater extent of
decomposition (50%) was found for treatment at 100° C during longer time. Levi
(1980) reported that experimental roasting under conditions simulating those of the
typical roasting operation (20 min at 200 ± 5° C) destroyed about 80% of AFB1 added
to green coffee. It was also found that AFB2 decomposed to a larger extent than AFG1
indicating a lower stability against prolonged heat treatment. During food
fermentation which involved other fungi such as Rhizopus oryzae and R. oligosporus,
cyclopentanone moiety of AFB1 was reduced resulting in the formation of aflatoxicol
A as shown in Figure 1.4 which is non-toxic compound. It retains the blue-fluorescing
property of AFB1 under UV light. It has been considered to be one of the most
important B1 metabolites because there is a correlation between the presence of this
metabolite in animal tissues and body fluids with toxicity of AFB1 in different animals
(Lau and Chu, 1983). Aflatoxin solution prepared in water, dimethyl sulphonic acid
(DMSO), 95% acetone or ethanol is stable for 24 hours under ambient conditions.
AFM1 is relatively stable during pesteuring, sterilisation, preparation and storage of
various dairy products (Gurbay et al., 2004).
(a) (b)
Figure 1.4 Transformation of toxic (a) AFB1 to non-toxic (b) aflatoxicol A
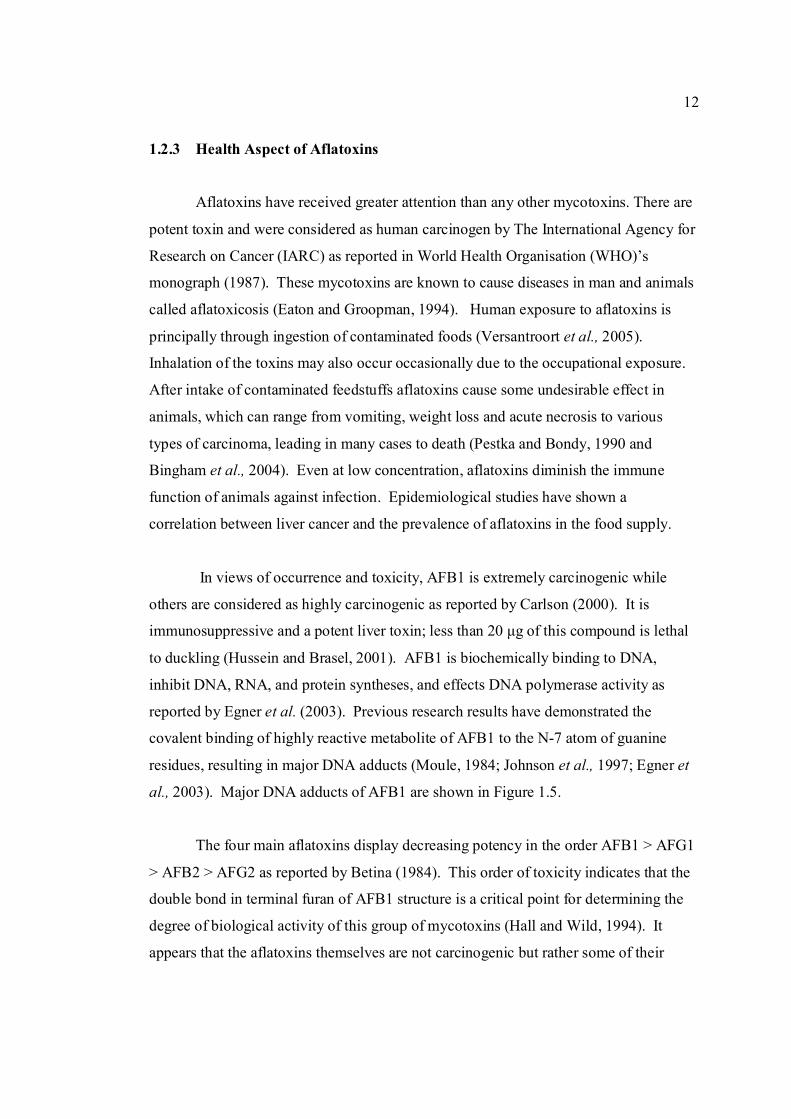
12
1.2.3 Health Aspect of Aflatoxins
Aflatoxins have received greater attention than any other mycotoxins. There are
potent toxin and were considered as human carcinogen by The International Agency for
Research on Cancer (IARC) as reported in World Health Organisation (WHO)’s
monograph (1987). These mycotoxins are known to cause diseases in man and animals
called aflatoxicosis (Eaton and Groopman, 1994). Human exposure to aflatoxins is
principally through ingestion of contaminated foods (Versantroort et al., 2005).
Inhalation of the toxins may also occur occasionally due to the occupational exposure.
After intake of contaminated feedstuffs aflatoxins cause some undesirable effect in
animals, which can range from vomiting, weight loss and acute necrosis to various
types of carcinoma, leading in many cases to death (Pestka and Bondy, 1990 and
Bingham et al., 2004). Even at low concentration, aflatoxins diminish the immune
function of animals against infection. Epidemiological studies have shown a
correlation between liver cancer and the prevalence of aflatoxins in the food supply.
In views of occurrence and toxicity, AFB1 is extremely carcinogenic while
others are considered as highly carcinogenic as reported by Carlson (2000). It is
immunosuppressive and a potent liver toxin; less than 20 µg of this compound is lethal
to duckling (Hussein and Brasel, 2001). AFB1 is biochemically binding to DNA,
inhibit DNA, RNA, and protein syntheses, and effects DNA polymerase activity as
reported by Egner et al. (2003). Previous research results have demonstrated the
covalent binding of highly reactive metabolite of AFB1 to the N-7 atom of guanine
residues, resulting in major DNA adducts (Moule, 1984; Johnson et al., 1997; Egner et
al., 2003). Major DNA adducts of AFB1 are shown in Figure 1.5.
The four main aflatoxins display decreasing potency in the order AFB1 > AFG1
> AFB2 > AFG2 as reported by Betina (1984). This order of toxicity indicates that the
double bond in terminal furan of AFB1 structure is a critical point for determining the
degree of biological activity of this group of mycotoxins (Hall and Wild, 1994). It
appears that the aflatoxins themselves are not carcinogenic but rather some of their
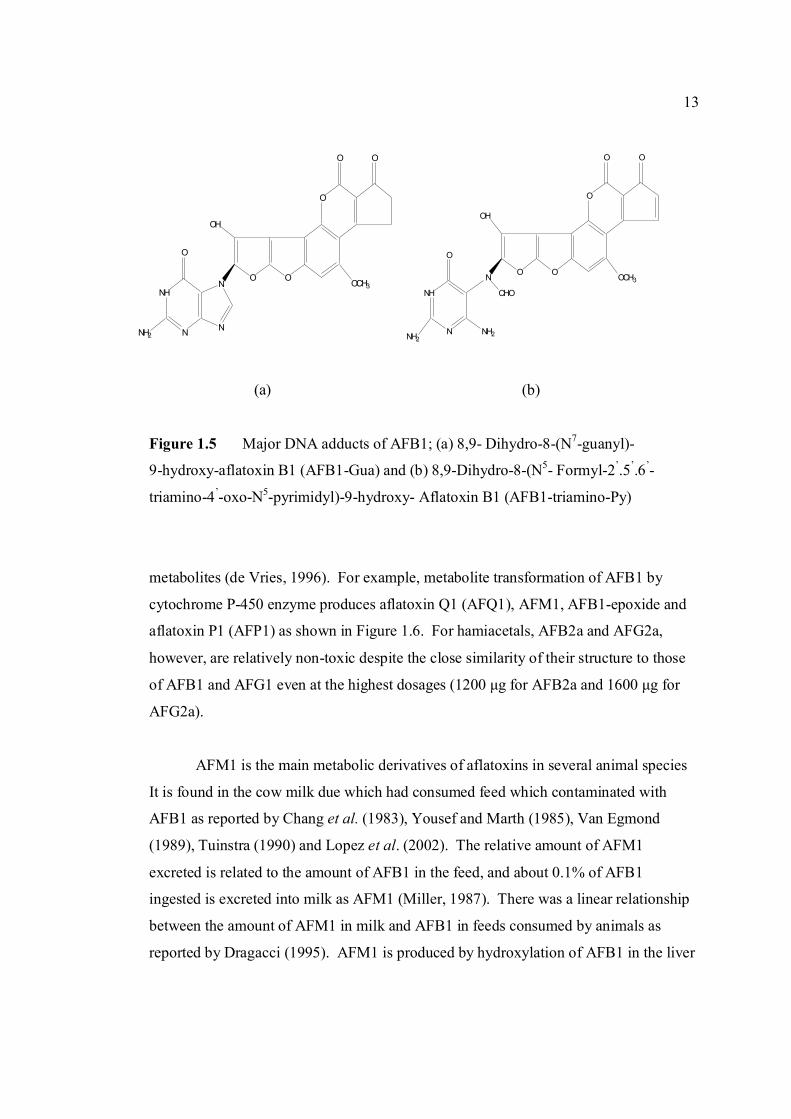
13
O
CHO
N O
O
OH
O O
OCH3
NH
N NH2NH2
O
NH
N
O
N
NO O
O
OH
OCH3
NH2
O O
(a) (b)
Figure 1.5 Major DNA adducts of AFB1; (a) 8,9- Dihydro-8-(N7-guanyl)-
9-hydroxy-aflatoxin B1 (AFB1-Gua) and (b) 8,9-Dihydro-8-(N5- Formyl-2’.5’.6’-
triamino-4’-oxo-N5-pyrimidyl)-9-hydroxy- Aflatoxin B1 (AFB1-triamino-Py)
metabolites (de Vries, 1996). For example, metabolite transformation of AFB1 by
cytochrome P-450 enzyme produces aflatoxin Q1 (AFQ1), AFM1, AFB1-epoxide and
aflatoxin P1 (AFP1) as shown in Figure 1.6. For hamiacetals, AFB2a and AFG2a,
however, are relatively non-toxic despite the close similarity of their structure to those
of AFB1 and AFG1 even at the highest dosages (1200 µg for AFB2a and 1600 µg for
AFG2a).
AFM1 is the main metabolic derivatives of aflatoxins in several animal species
It is found in the cow milk due which had consumed feed which contaminated with
AFB1 as reported by Chang et al. (1983), Yousef and Marth (1985), Van Egmond
(1989), Tuinstra (1990) and Lopez et al. (2002). The relative amount of AFM1
excreted is related to the amount of AFB1 in the feed, and about 0.1% of AFB1
ingested is excreted into milk as AFM1 (Miller, 1987). There was a linear relationship
between the amount of AFM1 in milk and AFB1 in feeds consumed by animals as
reported by Dragacci (1995). AFM1 is produced by hydroxylation of AFB1 in the liver
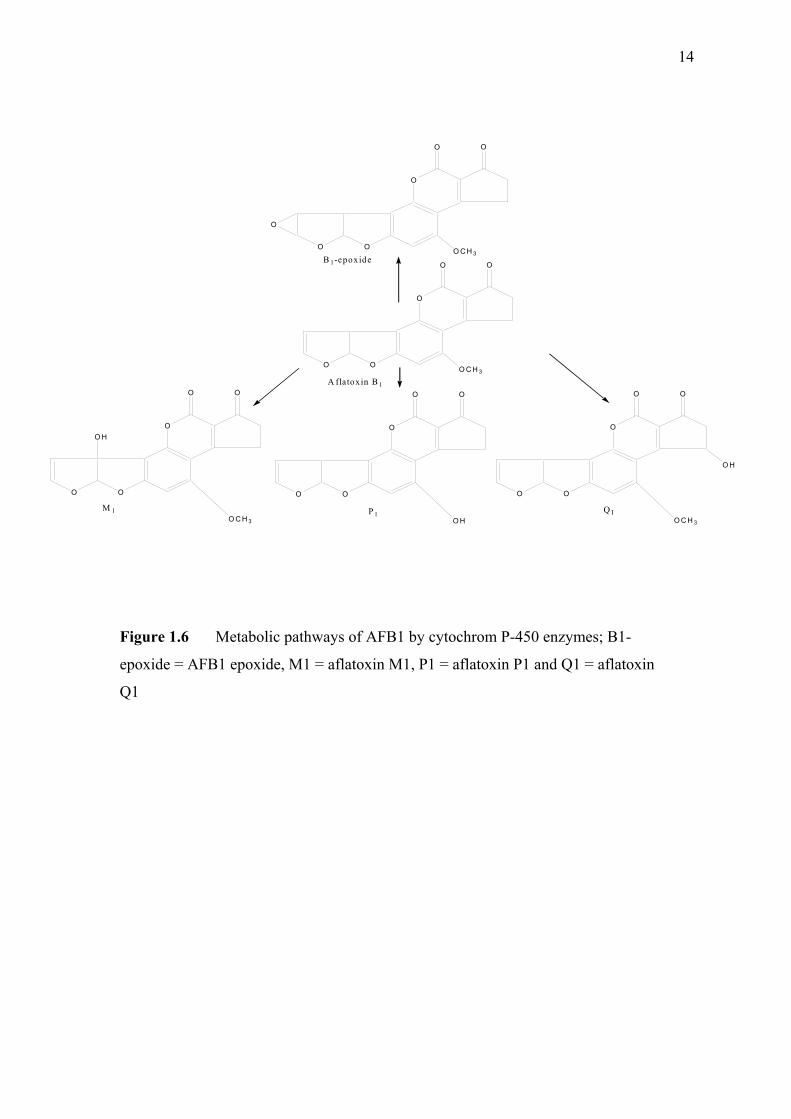
14
OCH3
O
O
OO
O
O
OCH3
O
O
OO
O
OH
OCH3
O
O
OO
O
OH
O
O
OO
O
M 1 P 1OCH3
O
O
OO
O
OH
Q I
B 1-epoxide
A flatox in B 1
Figure 1.6 Metabolic pathways of AFB1 by cytochrom P-450 enzymes; B1-
epoxide = AFB1 epoxide, M1 = aflatoxin M1, P1 = aflatoxin P1 and Q1 = aflatoxin
Q1
15
of lactating animals, including humans. It is also known as milk toxin which is much
less carcinogenic and mutagenic than AFB1. It has been classified by the International
Agency For Research Cancer (IARC) as a Group 2 carcinogen (IARC, 1993). It can
generally be found in milk and milk products such as dry milk, whey, butter, cheese,
yogurt and ice cream. AFM2 is the analogous metabolic derivatives of AFB2.
Aflatoxins have been considered as one of the most dangerous contaminant in
food and feed. The contaminated food will pose a potential health risk to human such as
aflatoxicosis and cancer (Jeffrey and Williams, 2005). Aflatoxins consumption by
livestock and poultry results in a disease called aflatoxicosis which clinical sign for
animals include gastro intestinal dysfunction, reduced reproductivity, reduced feed
utilisation, anemia and jaundice. Humans are exposed to aflatoxins by ingestion,
inhalation and dermal exposure as reported by Etzel (2002). LD50 which is the amount
of a materials, given all at once, causes the death of 50% (one half) of a group of test
animal (www.aacohs.ca/oshanswers) for most animal and human for AFB1 is between
0.5 to 10.0 mg kg-1 body weight (Smith and Moss, 1985; Salleh, 1998). Clinical
features were characterised by jaundice, vomiting, and anorexia and followed by
ascites, which appeared rapidly within a period of 2-3 weeks.
Besides causing health problems to humans, aflatoxin also can cause adverse
economic effect in which it lowers yield of food production and fiber crops and
becoming a major constraint of profitability for food crop producer countries, an
example of which is given in Rachaputi et al. (2001). It has been estimated that
mycotoxin contamination may affect as much as 25% of the world’s food crop each
year (Lopez, 1999) resulting in significant economic loss for these countries.
Aflatoxins also inflict losses to livestock and poultry producers from aflatoxin-
contaminated feeds including death and the more subtle effects of immune system
suppression, reduced growth rates, and losses in feed efficiency.
Due to the above reason, aflatoxin levels in animal feed and various human food
products is now monitored and tightly regulated by the most countries. In Malaysia,
16
the action level for total aflatoxins is 15ppb (Malaysian Food Act, 1983). The
European Commission has set limits for the maximum levels of total aflatoxins and
AFB1 allowed in groundnuts, nuts, dried fruit and their products. For foods ready for
retail sale, these limits are 4 ppb for total aflatoxins and 2 ppb for AFB1, and for foods
that are to be processed further the limits stand at 15 ppb for total aflatoxins and 8 ppb
of AFB1 (European Commission Regulation, 2001). The Food and Drug
Administration (FDA) in USA has established an action level of 0.5 ppb of mycotoxin,
AFM1 in milk for humans and 20 ppb for other aflatoxins in food other than milk
(www.ansci.cornel.edu/toxiagents).
In Brazil, the limits allowed for food destined for human consumption are 20
µg/kg of total aflatoxin for corn in grain, flours, peanut and by-products, and 0.5 µg/l of
AFM1 in fluid milk (Sassahara et al., 2005). Australia has established a minimum level
of 15 ppb for aflatoxin in raw peanut and peanut product (Mackson et al., 1999). In
Germany, regulatory levels of total aflatoxins are 4 ppb and 2 ppb for AFB1. For
human dietary products, such as infant nutriment, there are stronger legal limits, 0.05
ppb for AFB1 and the total aflatoxins (Reif and Metzger, 1995). The Dutch Food Act
regulates that food and beverages may contain no more than 5 µg of AFB1 per kg
(Scholten and Spanjer, 1996).
Regulatory level set by Hong Kong government is 20 ppb for peanuts and
peanut products and 15 ppb for all other foods (Risk Assessment Studies report, 2001).
Because of all these reasons, systematic approaches to sampling, sample preparation
and selecting appropriate and accurate method of analysis of aflatoxin are absolutely
necessary to determine aflatoxins at the part-of-billion (ppb) level as reported by Park
and Rua (1991).
1.2.4 Analytical Methods for the Determination of Aflatoxins
Monitoring the presence of aflatoxin in various samples especially in food is
not only important for consumer protection, but also for producers of raw products
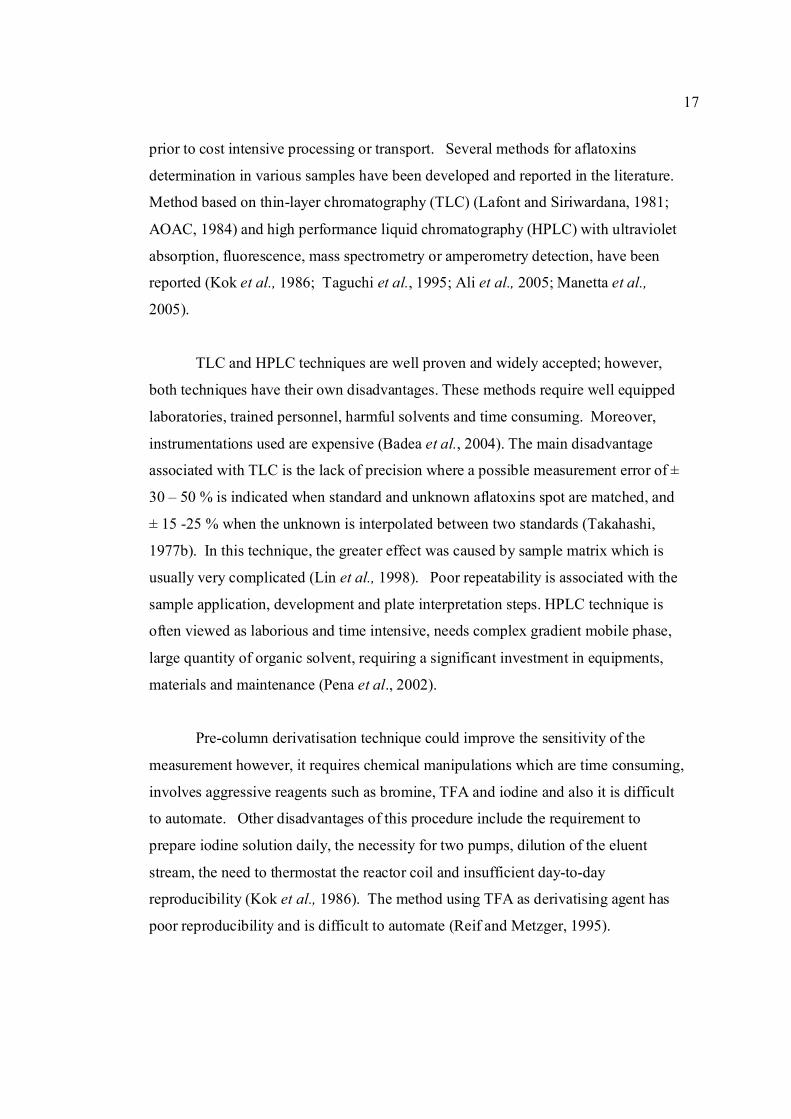
17
prior to cost intensive processing or transport. Several methods for aflatoxins
determination in various samples have been developed and reported in the literature.
Method based on thin-layer chromatography (TLC) (Lafont and Siriwardana, 1981;
AOAC, 1984) and high performance liquid chromatography (HPLC) with ultraviolet
absorption, fluorescence, mass spectrometry or amperometry detection, have been
reported (Kok et al., 1986; Taguchi et al., 1995; Ali et al., 2005; Manetta et al.,
2005).
TLC and HPLC techniques are well proven and widely accepted; however,
both techniques have their own disadvantages. These methods require well equipped
laboratories, trained personnel, harmful solvents and time consuming. Moreover,
instrumentations used are expensive (Badea et al., 2004). The main disadvantage
associated with TLC is the lack of precision where a possible measurement error of ±
30 – 50 % is indicated when standard and unknown aflatoxins spot are matched, and
± 15 -25 % when the unknown is interpolated between two standards (Takahashi,
1977b). In this technique, the greater effect was caused by sample matrix which is
usually very complicated (Lin et al., 1998). Poor repeatability is associated with the
sample application, development and plate interpretation steps. HPLC technique is
often viewed as laborious and time intensive, needs complex gradient mobile phase,
large quantity of organic solvent, requiring a significant investment in equipments,
materials and maintenance (Pena et al., 2002).
Pre-column derivatisation technique could improve the sensitivity of the
measurement however, it requires chemical manipulations which are time consuming,
involves aggressive reagents such as bromine, TFA and iodine and also it is difficult
to automate. Other disadvantages of this procedure include the requirement to
prepare iodine solution daily, the necessity for two pumps, dilution of the eluent
stream, the need to thermostat the reactor coil and insufficient day-to-day
reproducibility (Kok et al., 1986). The method using TFA as derivatising agent has
poor reproducibility and is difficult to automate (Reif and Metzger, 1995).
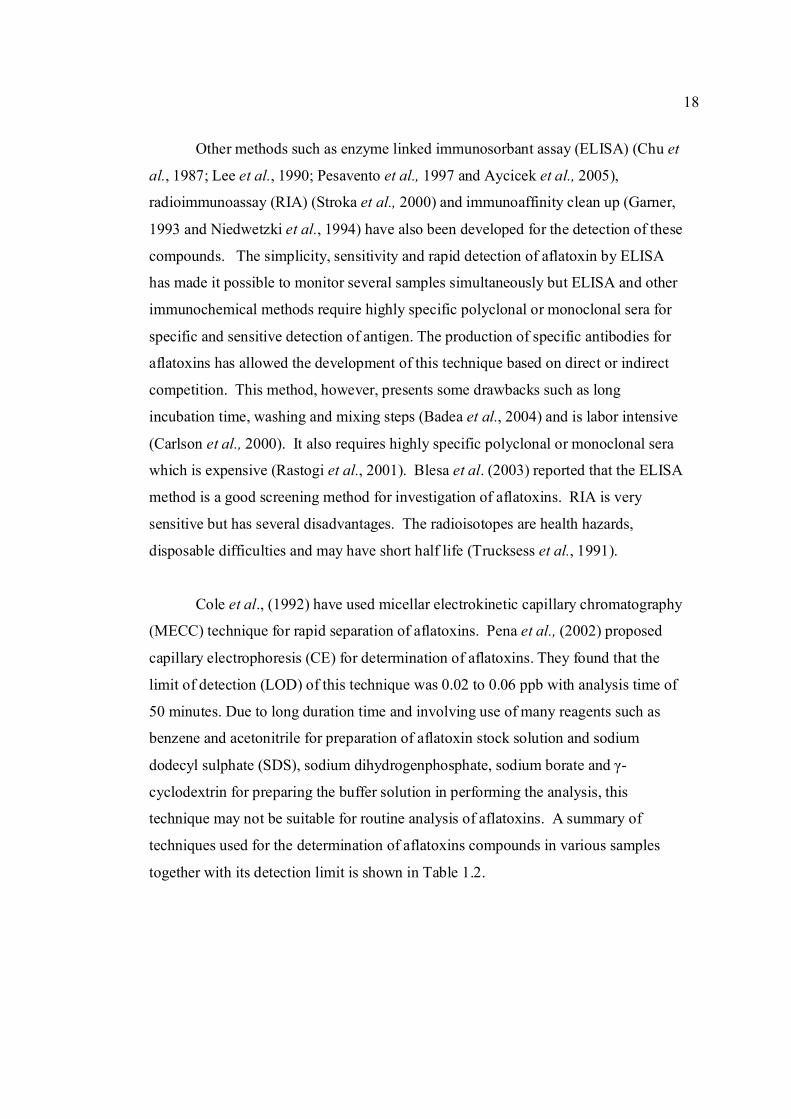
18
Other methods such as enzyme linked immunosorbant assay (ELISA) (Chu et
al., 1987; Lee et al., 1990; Pesavento et al., 1997 and Aycicek et al., 2005),
radioimmunoassay (RIA) (Stroka et al., 2000) and immunoaffinity clean up (Garner,
1993 and Niedwetzki et al., 1994) have also been developed for the detection of these
compounds. The simplicity, sensitivity and rapid detection of aflatoxin by ELISA
has made it possible to monitor several samples simultaneously but ELISA and other
immunochemical methods require highly specific polyclonal or monoclonal sera for
specific and sensitive detection of antigen. The production of specific antibodies for
aflatoxins has allowed the development of this technique based on direct or indirect
competition. This method, however, presents some drawbacks such as long
incubation time, washing and mixing steps (Badea et al., 2004) and is labor intensive
(Carlson et al., 2000). It also requires highly specific polyclonal or monoclonal sera
which is expensive (Rastogi et al., 2001). Blesa et al. (2003) reported that the ELISA
method is a good screening method for investigation of aflatoxins. RIA is very
sensitive but has several disadvantages. The radioisotopes are health hazards,
disposable difficulties and may have short half life (Trucksess et al., 1991).
Cole et al., (1992) have used micellar electrokinetic capillary chromatography
(MECC) technique for rapid separation of aflatoxins. Pena et al., (2002) proposed
capillary electrophoresis (CE) for determination of aflatoxins. They found that the
limit of detection (LOD) of this technique was 0.02 to 0.06 ppb with analysis time of
50 minutes. Due to long duration time and involving use of many reagents such as
benzene and acetonitrile for preparation of aflatoxin stock solution and sodium
dodecyl sulphate (SDS), sodium dihydrogenphosphate, sodium borate and γ-
cyclodextrin for preparing the buffer solution in performing the analysis, this
technique may not be suitable for routine analysis of aflatoxins. A summary of
techniques used for the determination of aflatoxins compounds in various samples
together with its detection limit is shown in Table 1.2.
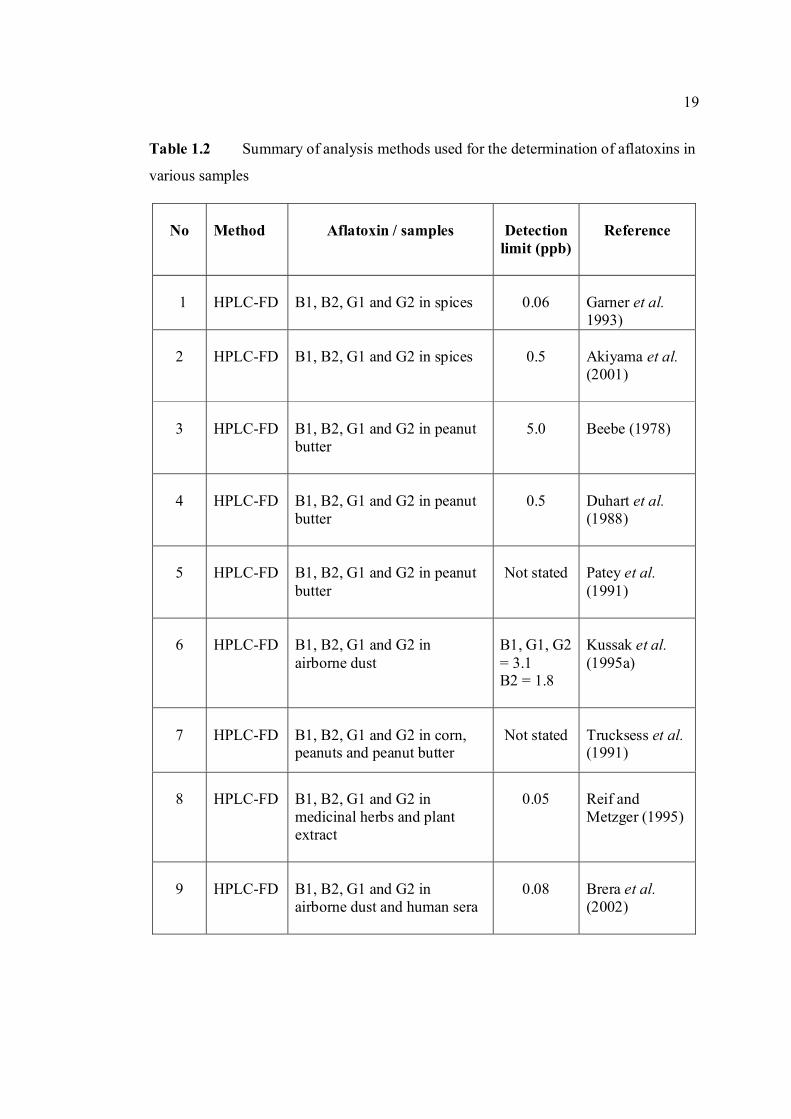
19
Table 1.2 Summary of analysis methods used for the determination of aflatoxins in
various samples
No
Method
Aflatoxin / samples
Detection
limit (ppb)
Reference
1
HPLC-FD
B1, B2, G1 and G2 in spices
0.06
Garner et al. 1993)
2
HPLC-FD
B1, B2, G1 and G2 in spices
0.5
Akiyama et al. (2001)
3
HPLC-FD
B1, B2, G1 and G2 in peanut butter
5.0
Beebe (1978)
4
HPLC-FD
B1, B2, G1 and G2 in peanut butter
0.5
Duhart et al. (1988)
5
HPLC-FD
B1, B2, G1 and G2 in peanut butter
Not stated
Patey et al. (1991)
6
HPLC-FD
B1, B2, G1 and G2 in airborne dust
B1, G1, G2 = 3.1 B2 = 1.8
Kussak et al. (1995a)
7
HPLC-FD
B1, B2, G1 and G2 in corn, peanuts and peanut butter
Not stated
Trucksess et al. (1991)
8
HPLC-FD
B1, B2, G1 and G2 in medicinal herbs and plant extract
0.05
Reif and Metzger (1995)
9
HPLC-FD
B1, B2, G1 and G2 in airborne dust and human sera
0.08
Brera et al. (2002)
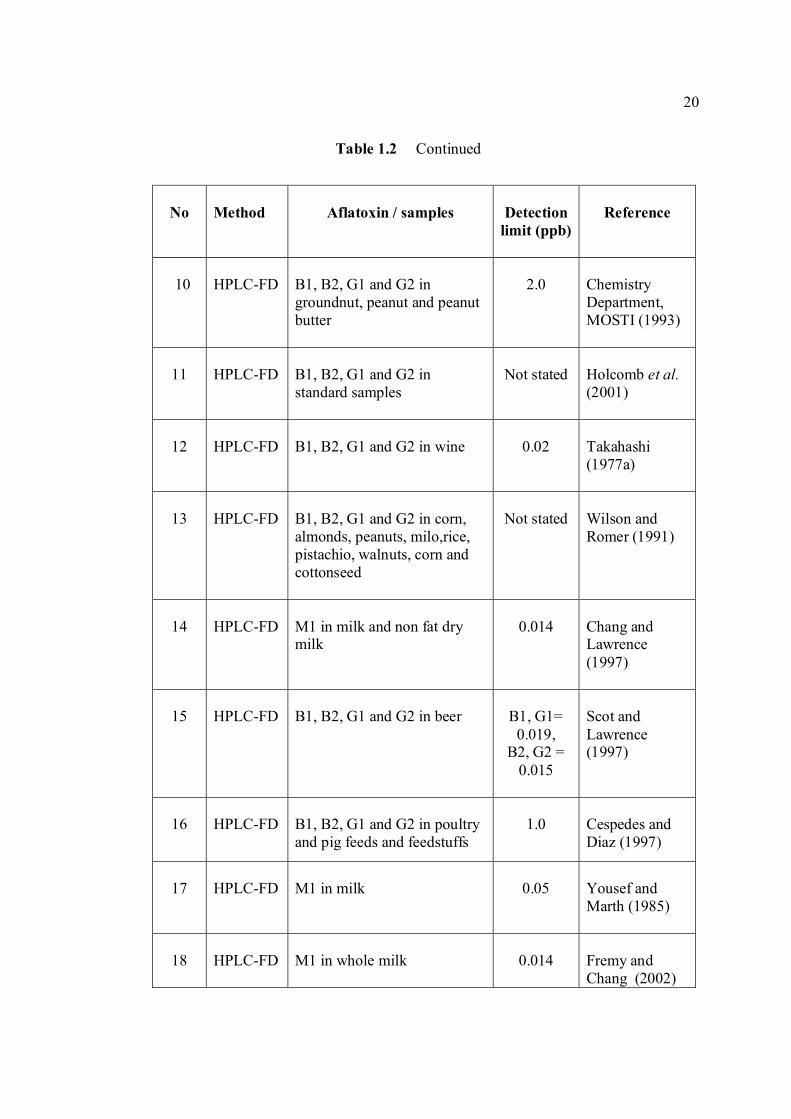
20
Table 1.2 Continued
No
Method
Aflatoxin / samples
Detection
limit (ppb)
Reference
10
HPLC-FD
B1, B2, G1 and G2 in groundnut, peanut and peanut butter
2.0
Chemistry Department, MOSTI (1993)
11
HPLC-FD
B1, B2, G1 and G2 in standard samples
Not stated
Holcomb et al. (2001)
12
HPLC-FD
B1, B2, G1 and G2 in wine
0.02
Takahashi (1977a)
13
HPLC-FD
B1, B2, G1 and G2 in corn, almonds, peanuts, milo,rice, pistachio, walnuts, corn and cottonseed
Not stated
Wilson and Romer (1991)
14
HPLC-FD
M1 in milk and non fat dry milk
0.014
Chang and Lawrence (1997)
15
HPLC-FD
B1, B2, G1 and G2 in beer
B1, G1=
0.019, B2, G2 =
0.015
Scot and Lawrence (1997)
16
HPLC-FD
B1, B2, G1 and G2 in poultry and pig feeds and feedstuffs
1.0
Cespedes and Diaz (1997)
17
HPLC-FD
M1 in milk
0.05
Yousef and Marth (1985)
18
HPLC-FD
M1 in whole milk
0.014
Fremy and Chang (2002)
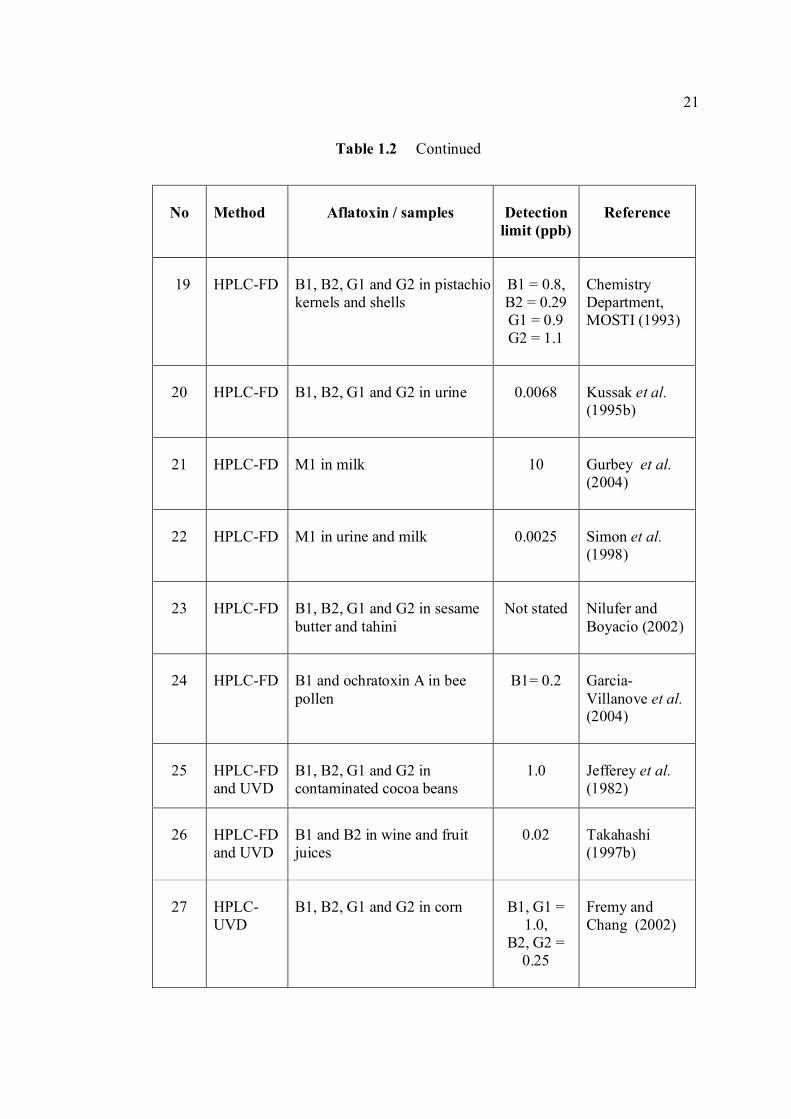
21
Table 1.2 Continued
No
Method
Aflatoxin / samples
Detection
limit (ppb)
Reference
19
HPLC-FD
B1, B2, G1 and G2 in pistachio kernels and shells
B1 = 0.8, B2 = 0.29 G1 = 0.9 G2 = 1.1
Chemistry Department, MOSTI (1993)
20
HPLC-FD
B1, B2, G1 and G2 in urine
0.0068
Kussak et al. (1995b)
21
HPLC-FD
M1 in milk
10
Gurbey et al. (2004)
22
HPLC-FD
M1 in urine and milk
0.0025
Simon et al. (1998)
23
HPLC-FD
B1, B2, G1 and G2 in sesame butter and tahini
Not stated
Nilufer and Boyacio (2002)
24
HPLC-FD
B1 and ochratoxin A in bee pollen
B1= 0.2
Garcia-Villanove et al. (2004)
25
HPLC-FD and UVD
B1, B2, G1 and G2 in contaminated cocoa beans
1.0
Jefferey et al. (1982)
26
HPLC-FD and UVD
B1 and B2 in wine and fruit juices
0.02
Takahashi (1997b)
27
HPLC-UVD
B1, B2, G1 and G2 in corn
B1, G1 =
1.0, B2, G2 =
0.25
Fremy and Chang (2002)
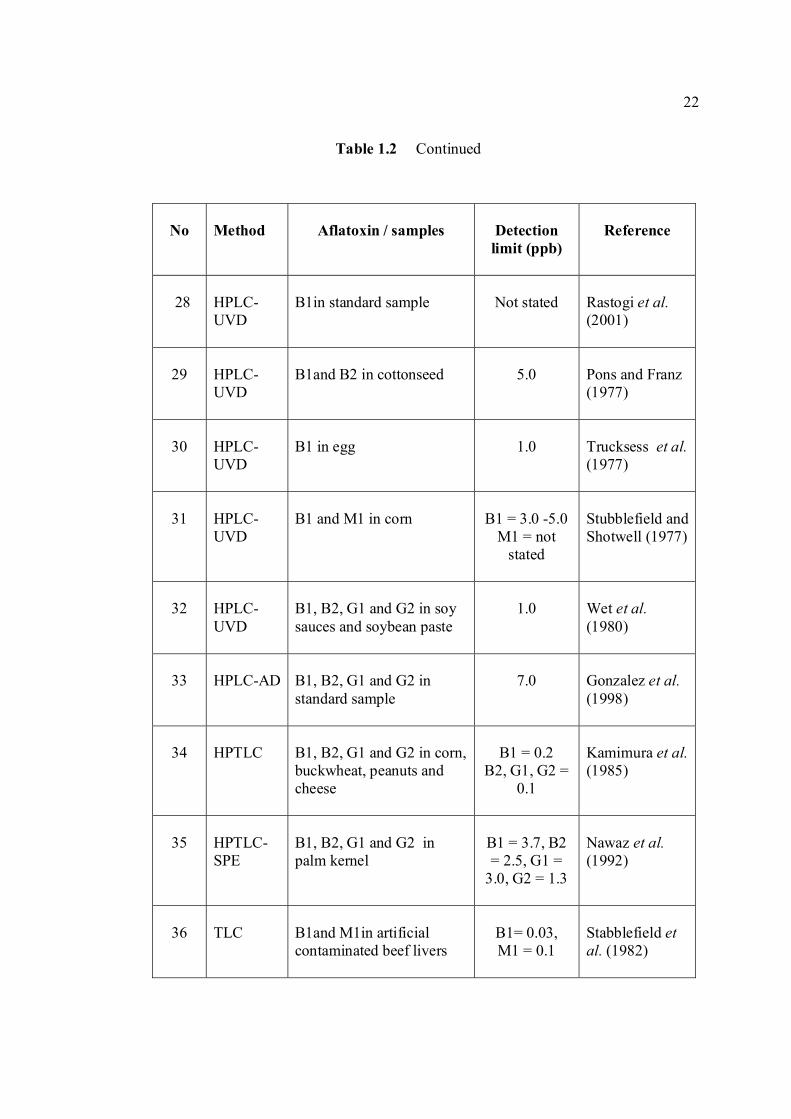
22
Table 1.2 Continued
No
Method
Aflatoxin / samples
Detection limit (ppb)
Reference
28
HPLC-UVD
B1in standard sample
Not stated
Rastogi et al. (2001)
29
HPLC-UVD
B1and B2 in cottonseed
5.0
Pons and Franz (1977)
30
HPLC-UVD
B1 in egg
1.0
Trucksess et al. (1977)
31
HPLC-UVD
B1 and M1 in corn
B1 = 3.0 -5.0
M1 = not stated
Stubblefield and Shotwell (1977)
32
HPLC-UVD
B1, B2, G1 and G2 in soy sauces and soybean paste
1.0
Wet et al. (1980)
33
HPLC-AD
B1, B2, G1 and G2 in standard sample
7.0
Gonzalez et al. (1998)
34
HPTLC
B1, B2, G1 and G2 in corn, buckwheat, peanuts and cheese
B1 = 0.2
B2, G1, G2 = 0.1
Kamimura et al. (1985)
35
HPTLC-SPE
B1, B2, G1 and G2 in palm kernel
B1 = 3.7, B2 = 2.5, G1 =
3.0, G2 = 1.3
Nawaz et al. (1992)
36
TLC
B1and M1in artificial contaminated beef livers
B1= 0.03, M1 = 0.1
Stabblefield et al. (1982)
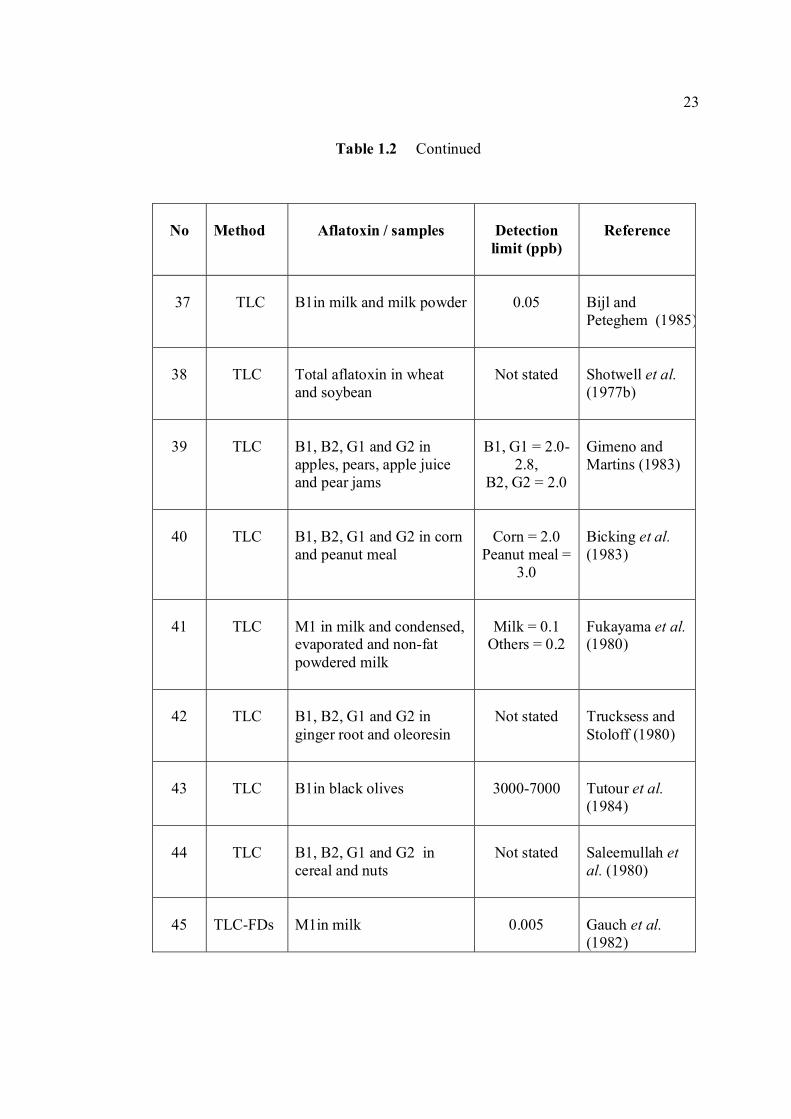
23
Table 1.2 Continued
No
Method
Aflatoxin / samples
Detection limit (ppb)
Reference
37
TLC
B1in milk and milk powder
0.05
Bijl and Peteghem (1985)
38
TLC
Total aflatoxin in wheat and soybean
Not stated
Shotwell et al. (1977b)
39
TLC
B1, B2, G1 and G2 in apples, pears, apple juice and pear jams
B1, G1 = 2.0-
2.8, B2, G2 = 2.0
Gimeno and Martins (1983)
40
TLC
B1, B2, G1 and G2 in corn and peanut meal
Corn = 2.0
Peanut meal = 3.0
Bicking et al. (1983)
41
TLC
M1 in milk and condensed, evaporated and non-fat powdered milk
Milk = 0.1
Others = 0.2
Fukayama et al. (1980)
42
TLC
B1, B2, G1 and G2 in ginger root and oleoresin
Not stated
Trucksess and Stoloff (1980)
43
TLC
B1in black olives
3000-7000
Tutour et al. (1984)
44
TLC
B1, B2, G1 and G2 in cereal and nuts
Not stated
Saleemullah et al. (1980)
45
TLC-FDs
M1in milk
0.005
Gauch et al. (1982)
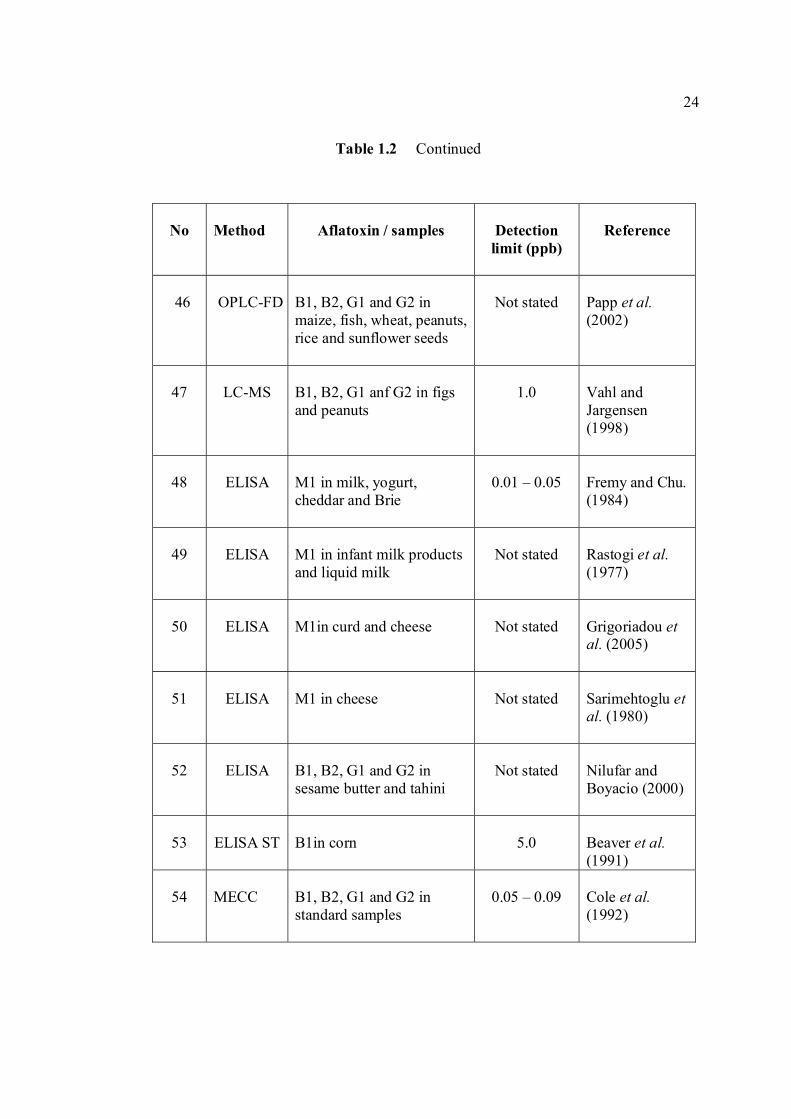
24
Table 1.2 Continued
No
Method
Aflatoxin / samples
Detection limit (ppb)
Reference
46
OPLC-FD
B1, B2, G1 and G2 in maize, fish, wheat, peanuts, rice and sunflower seeds
Not stated
Papp et al. (2002)
47
LC-MS
B1, B2, G1 anf G2 in figs and peanuts
1.0
Vahl and Jargensen (1998)
48
ELISA
M1 in milk, yogurt, cheddar and Brie
0.01 – 0.05
Fremy and Chu. (1984)
49
ELISA
M1 in infant milk products and liquid milk
Not stated
Rastogi et al. (1977)
50
ELISA
M1in curd and cheese
Not stated
Grigoriadou et al. (2005)
51
ELISA
M1 in cheese
Not stated
Sarimehtoglu et al. (1980)
52
ELISA
B1, B2, G1 and G2 in sesame butter and tahini
Not stated
Nilufar and Boyacio (2000)
53
ELISA ST
B1in corn
5.0
Beaver et al. (1991)
54
MECC
B1, B2, G1 and G2 in standard samples
0.05 – 0.09
Cole et al. (1992)
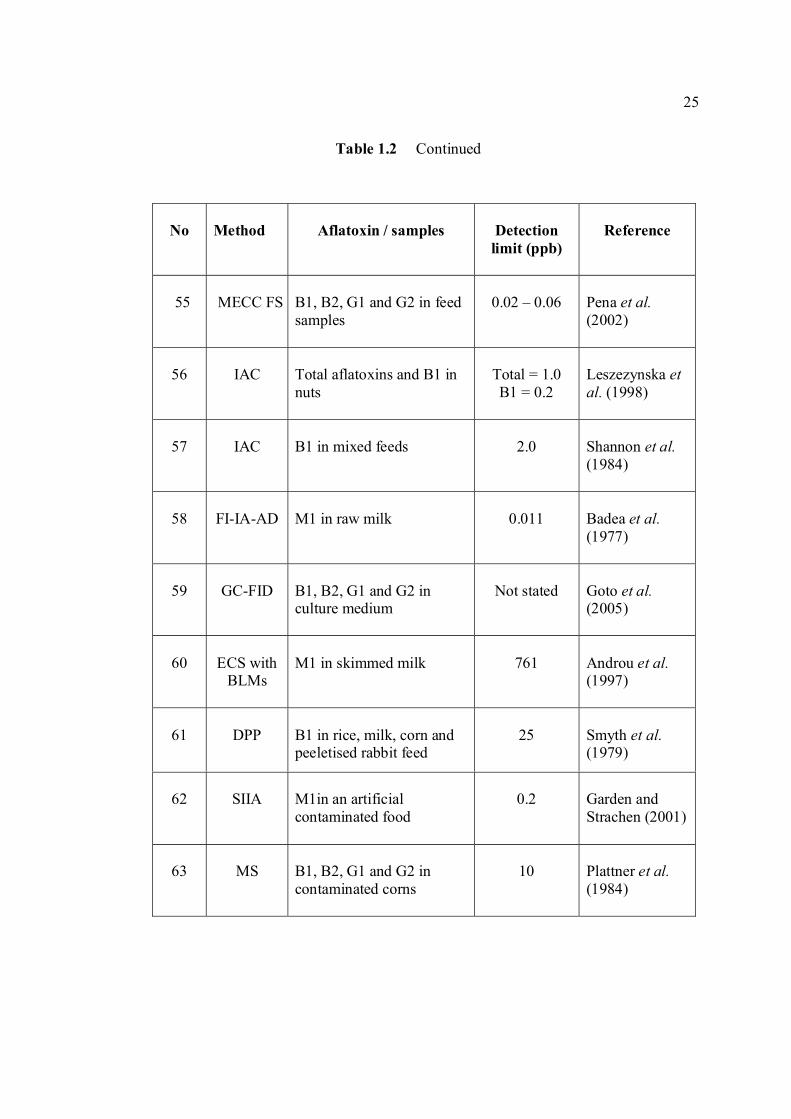
25
Table 1.2 Continued
No
Method
Aflatoxin / samples
Detection limit (ppb)
Reference
55
MECC FS
B1, B2, G1 and G2 in feed samples
0.02 – 0.06
Pena et al. (2002)
56
IAC
Total aflatoxins and B1 in nuts
Total = 1.0 B1 = 0.2
Leszezynska et al. (1998)
57
IAC
B1 in mixed feeds
2.0
Shannon et al. (1984)
58
FI-IA-AD
M1 in raw milk
0.011
Badea et al. (1977)
59
GC-FID
B1, B2, G1 and G2 in culture medium
Not stated
Goto et al. (2005)
60
ECS with
BLMs
M1 in skimmed milk
761
Androu et al. (1997)
61
DPP
B1 in rice, milk, corn and peeletised rabbit feed
25
Smyth et al. (1979)
62
SIIA
M1in an artificial contaminated food
0.2
Garden and Strachen (2001)
63
MS
B1, B2, G1 and G2 in contaminated corns
10
Plattner et al. (1984)
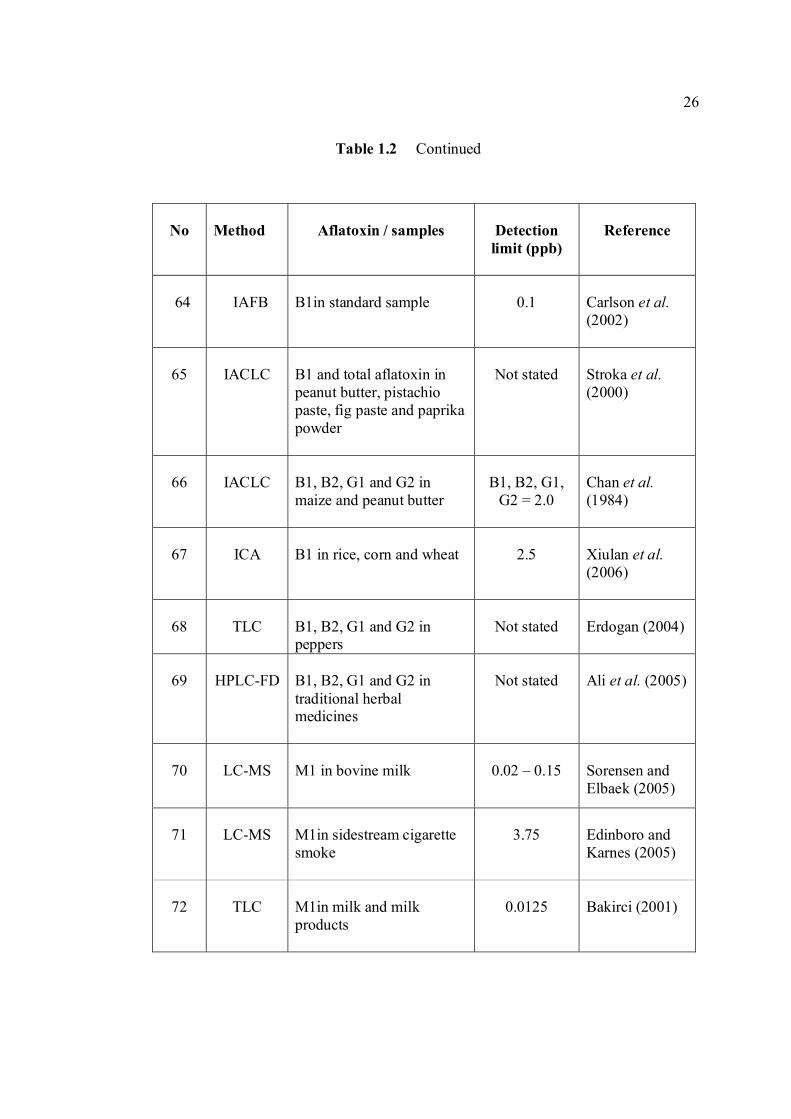
26
Table 1.2 Continued
No
Method
Aflatoxin / samples
Detection limit (ppb)
Reference
64
IAFB
B1in standard sample
0.1
Carlson et al. (2002)
65
IACLC
B1 and total aflatoxin in peanut butter, pistachio paste, fig paste and paprika powder
Not stated
Stroka et al. (2000)
66
IACLC
B1, B2, G1 and G2 in maize and peanut butter
B1, B2, G1,
G2 = 2.0
Chan et al. (1984)
67
ICA
B1 in rice, corn and wheat
2.5
Xiulan et al. (2006)
68
TLC
B1, B2, G1 and G2 in peppers
Not stated
Erdogan (2004)
69
HPLC-FD
B1, B2, G1 and G2 in traditional herbal medicines
Not stated
Ali et al. (2005)
70
LC-MS
M1 in bovine milk
0.02 – 0.15
Sorensen and Elbaek (2005)
71
LC-MS
M1in sidestream cigarette smoke
3.75
Edinboro and Karnes (2005)
72
TLC
M1in milk and milk products
0.0125
Bakirci (2001)
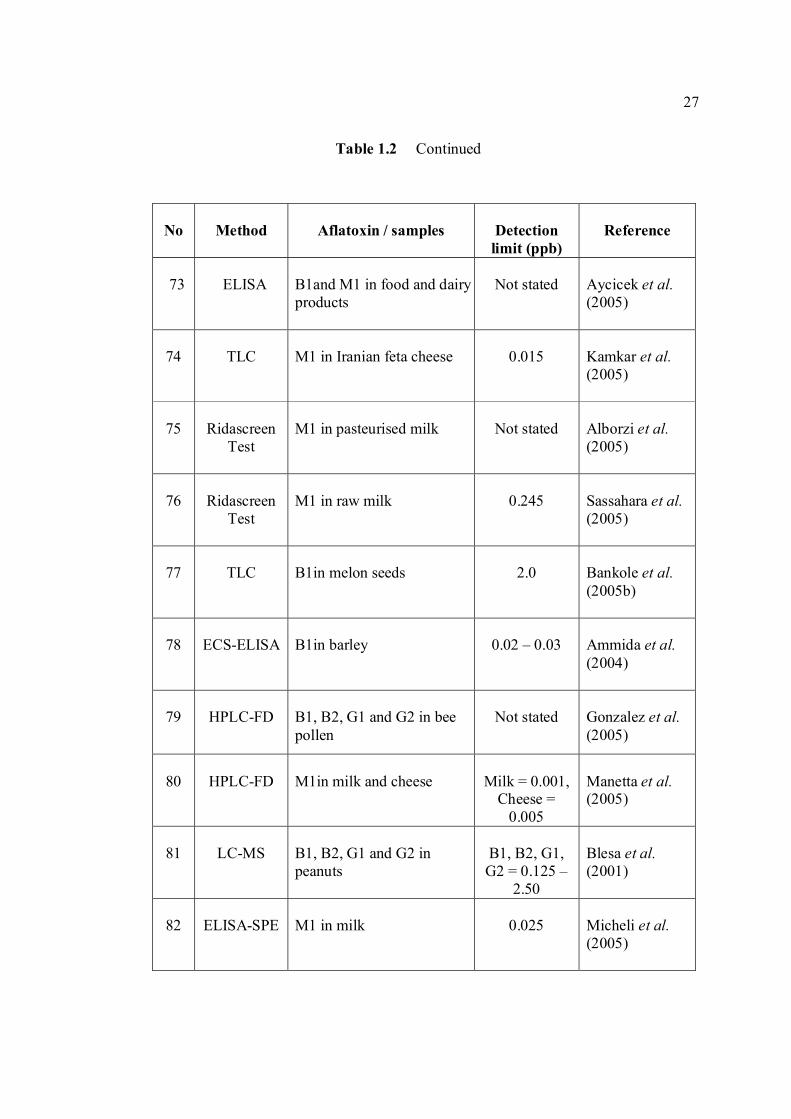
27
Table 1.2 Continued
No
Method
Aflatoxin / samples
Detection limit (ppb)
Reference
73
ELISA
B1and M1 in food and dairy products
Not stated
Aycicek et al. (2005)
74
TLC
M1 in Iranian feta cheese
0.015
Kamkar et al. (2005)
75
Ridascreen
Test
M1 in pasteurised milk
Not stated
Alborzi et al. (2005)
76
Ridascreen
Test
M1 in raw milk
0.245
Sassahara et al. (2005)
77
TLC
B1in melon seeds
2.0
Bankole et al. (2005b)
78
ECS-ELISA
B1in barley
0.02 – 0.03
Ammida et al. (2004)
79
HPLC-FD
B1, B2, G1 and G2 in bee pollen
Not stated
Gonzalez et al. (2005)
80
HPLC-FD
M1in milk and cheese
Milk = 0.001,
Cheese = 0.005
Manetta et al. (2005)
81
LC-MS
B1, B2, G1 and G2 in peanuts
B1, B2, G1, G2 = 0.125 –
2.50
Blesa et al. (2001)
82
ELISA-SPE
M1 in milk
0.025
Micheli et al. (2005)
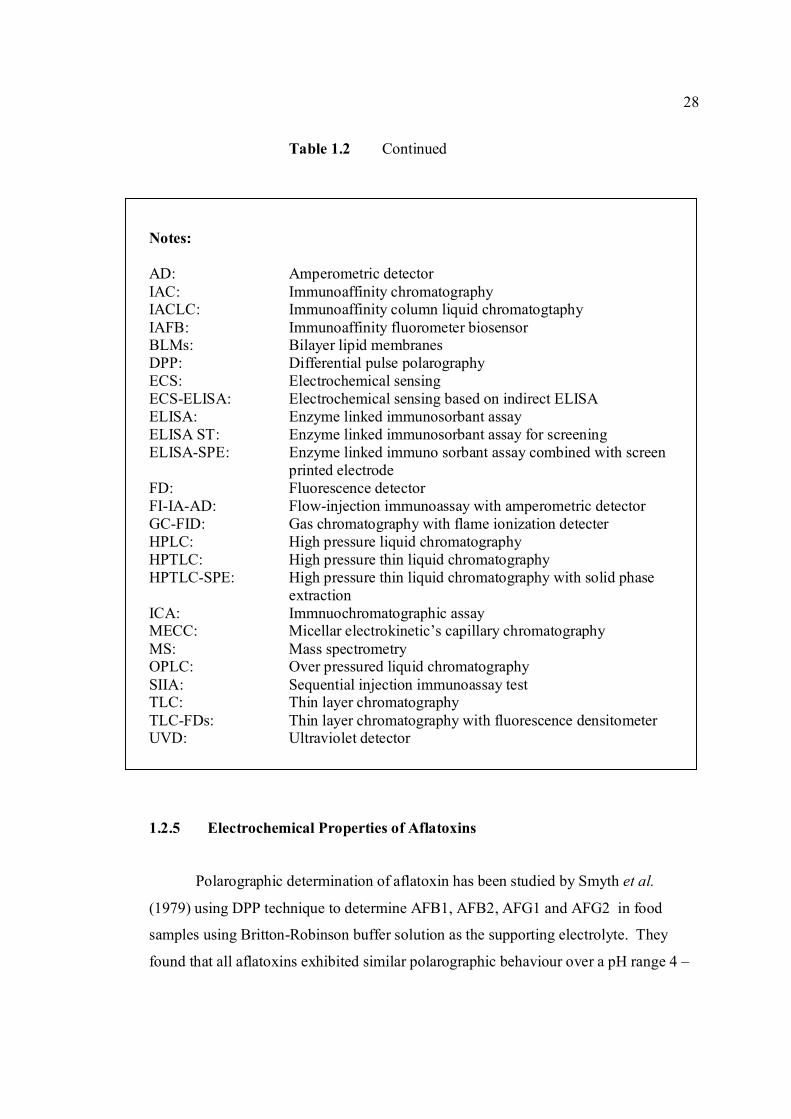
28
Table 1.2 Continued Notes: AD: Amperometric detector IAC: Immunoaffinity chromatography IACLC: Immunoaffinity column liquid chromatogtaphy IAFB: Immunoaffinity fluorometer biosensor BLMs: Bilayer lipid membranes DPP: Differential pulse polarography ECS: Electrochemical sensing ECS-ELISA: Electrochemical sensing based on indirect ELISA ELISA: Enzyme linked immunosorbant assay ELISA ST: Enzyme linked immunosorbant assay for screening ELISA-SPE: Enzyme linked immuno sorbant assay combined with screen
printed electrode FD: Fluorescence detector FI-IA-AD: Flow-injection immunoassay with amperometric detector GC-FID: Gas chromatography with flame ionization detecter HPLC: High pressure liquid chromatography HPTLC: High pressure thin liquid chromatography HPTLC-SPE: High pressure thin liquid chromatography with solid phase
extraction ICA: Immnuochromatographic assay MECC: Micellar electrokinetic’s capillary chromatography MS: Mass spectrometry OPLC: Over pressured liquid chromatography SIIA: Sequential injection immunoassay test TLC: Thin layer chromatography TLC-FDs: Thin layer chromatography with fluorescence densitometer UVD: Ultraviolet detector
1.2.5 Electrochemical Properties of Aflatoxins
Polarographic determination of aflatoxin has been studied by Smyth et al.
(1979) using DPP technique to determine AFB1, AFB2, AFG1 and AFG2 in food
samples using Britton-Robinson buffer solution as the supporting electrolyte. They
found that all aflatoxins exhibited similar polarographic behaviour over a pH range 4 –
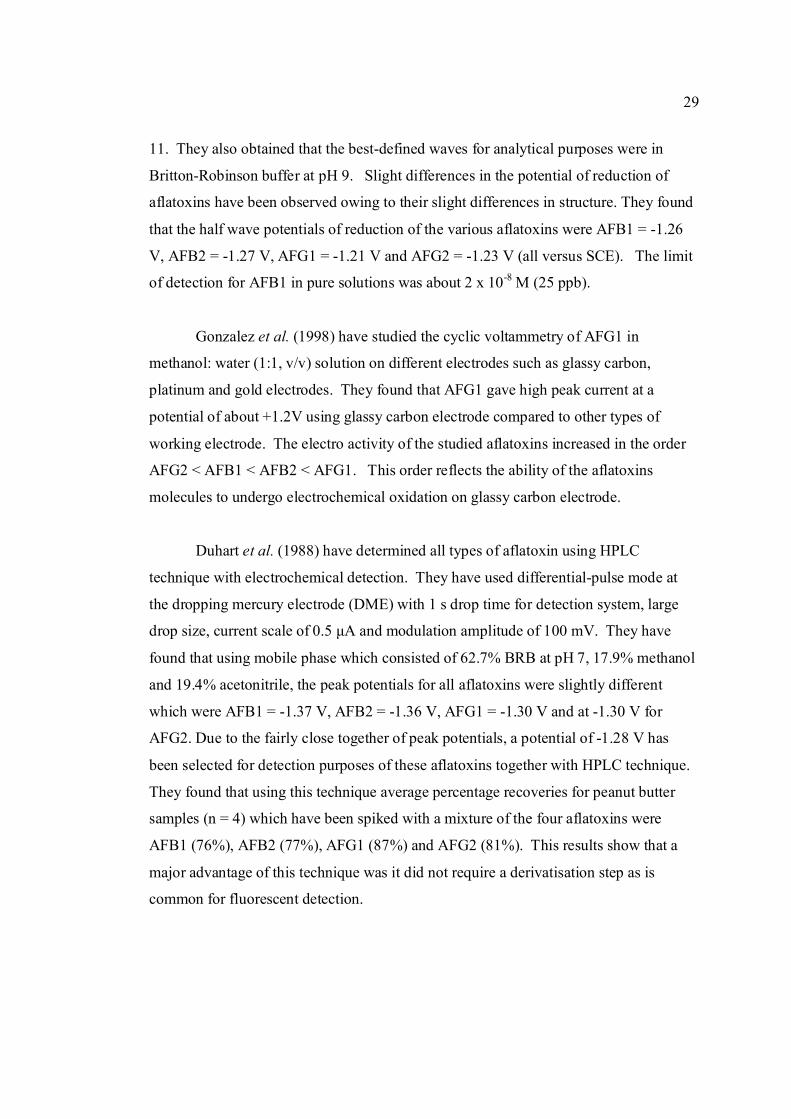
29
11. They also obtained that the best-defined waves for analytical purposes were in
Britton-Robinson buffer at pH 9. Slight differences in the potential of reduction of
aflatoxins have been observed owing to their slight differences in structure. They found
that the half wave potentials of reduction of the various aflatoxins were AFB1 = -1.26
V, AFB2 = -1.27 V, AFG1 = -1.21 V and AFG2 = -1.23 V (all versus SCE). The limit
of detection for AFB1 in pure solutions was about 2 x 10⁻⁸ M (25 ppb).
Gonzalez et al. (1998) have studied the cyclic voltammetry of AFG1 in
methanol: water (1:1, v/v) solution on different electrodes such as glassy carbon,
platinum and gold electrodes. They found that AFG1 gave high peak current at a
potential of about +1.2V using glassy carbon electrode compared to other types of
working electrode. The electro activity of the studied aflatoxins increased in the order
AFG2 < AFB1 < AFB2 < AFG1. This order reflects the ability of the aflatoxins
molecules to undergo electrochemical oxidation on glassy carbon electrode.
Duhart et al. (1988) have determined all types of aflatoxin using HPLC
technique with electrochemical detection. They have used differential-pulse mode at
the dropping mercury electrode (DME) with 1 s drop time for detection system, large
drop size, current scale of 0.5 µA and modulation amplitude of 100 mV. They have
found that using mobile phase which consisted of 62.7% BRB at pH 7, 17.9% methanol
and 19.4% acetonitrile, the peak potentials for all aflatoxins were slightly different
which were AFB1 = -1.37 V, AFB2 = -1.36 V, AFG1 = -1.30 V and at -1.30 V for
AFG2. Due to the fairly close together of peak potentials, a potential of -1.28 V has
been selected for detection purposes of these aflatoxins together with HPLC technique.
They found that using this technique average percentage recoveries for peanut butter
samples (n = 4) which have been spiked with a mixture of the four aflatoxins were
AFB1 (76%), AFB2 (77%), AFG1 (87%) and AFG2 (81%). This results show that a
major advantage of this technique was it did not require a derivatisation step as is
common for fluorescent detection.
30
1.3 Voltammetric Techniques
1.3.1 Voltammetric Techniques in General
Voltammetry is an electrochemical method in which current is measured as a
function of the applied potential. It is a branch of electrochemistry in which the
electrode potential, or the faradaic current or both are changed with time. Normally,
there is an interrelationship between all three of these variables (Bond et al., 1989).
The principle of this technique is a measurement of the diffusion controlled current
flowing in an electrolysis cell in which one electrode is polarisable (Fifield and Kealey,
2000). In this technique a time dependent potential is applied to an electrochemical
cell, and the current flowing through the cell is measured as a function of that potential.
A plot of current which is directly proportional to the concentration of an electroactive
species as a function of applied potential is called a voltammogram. The
voltammogram provides quantitative and qualitative information about the species
involved in the oxidation or reduction reaction or both at the working electrode.
Polarography is the earliest voltammetric technique which was developed by
Jaroslav Heyrovsky (1890-1967) in the early 1920s, for which he was awarded the
Nobel Prize in Chemistry in 1959. It was the first major electro analytical technique
(Barek et al., 2001a). Since then many different forms of voltammetry have been
developed such as direct current polarography (DCP), normal polarography (NP),
differential pulse polarography (DPP), square-wave polarography (SWP), alternate
current polarography (ACP), cyclic voltammetry (CV), stripping voltammetry (SV),
adsorptive stripping voltammetry (AdSV) and adsorptive catalytic stripping
voltammetry (AdCSV) techniques. Working electrodes and limit of detection (LOD)
for these modern voltammetric techniques are shown in Table 1.3 (Barek et al., 2001a).
The advantage of this technique include high sensitivity where quantitative and
qualitative determination of metals, inorganic and organic compounds at trace levels,
10-4 – 10-8 M (Fifield and Kealey, 2000), selectivity towards electro active species
31
(Barek et al., 2001b), a wide linear range, portable and low-cost instrumentation,
speciation capability and a wide range of electrode that allow assays of many types of
samples such as environmental samples (Zhang et al., 2002; Ghoneim et al., 2000;
Buffle et al., 2005), pharmaceutical samples (Yaacob, 1993; Yardimer et al., 2001;
Abdine et al., 2002; Hilali et al., 2003 and Carapuca et al., 2005 ), food samples
(Ximenes et al., 2000; Volkoiv et al., 2001); Karadjova et al., 2000; Sabry and Wahbi,
1999 and Sanna et al., 2000), dye samples (Mohd Yusoff et al., 1998 and Gooding et
al., 1997) and forensic samples (Liu et al., 1980; Wasiak et al., 1996; Pourhaghi-Azar
and Dastangoo, 2000; Woolever et al., 2001).
Various advances during the past few years have pushed the detectability of
voltammetric techniques from the submicromolar level for pulse voltammetric
techniques to the subpicomolar level by using an adsorptive catalytic stripping
voltammetry (Czae and Wang, 1999). The comparison of using polarographic and other
analytical techniques in different application fields is depicted in Table 1.4 (Barek et al.,
2001a).
1.3.2 Voltammetric Measurement
1.3.2.1 Instrumentation
Voltammetry technique makes use of a three-electrode system such as working
electrode (WE), reference electrode (RE) and auxiliary electrode (AE). The whole
system consist of a voltammetric cell with a various volume capacity, magnetic stirrer
and gas line for purging and blanketing the electrolyte solution.
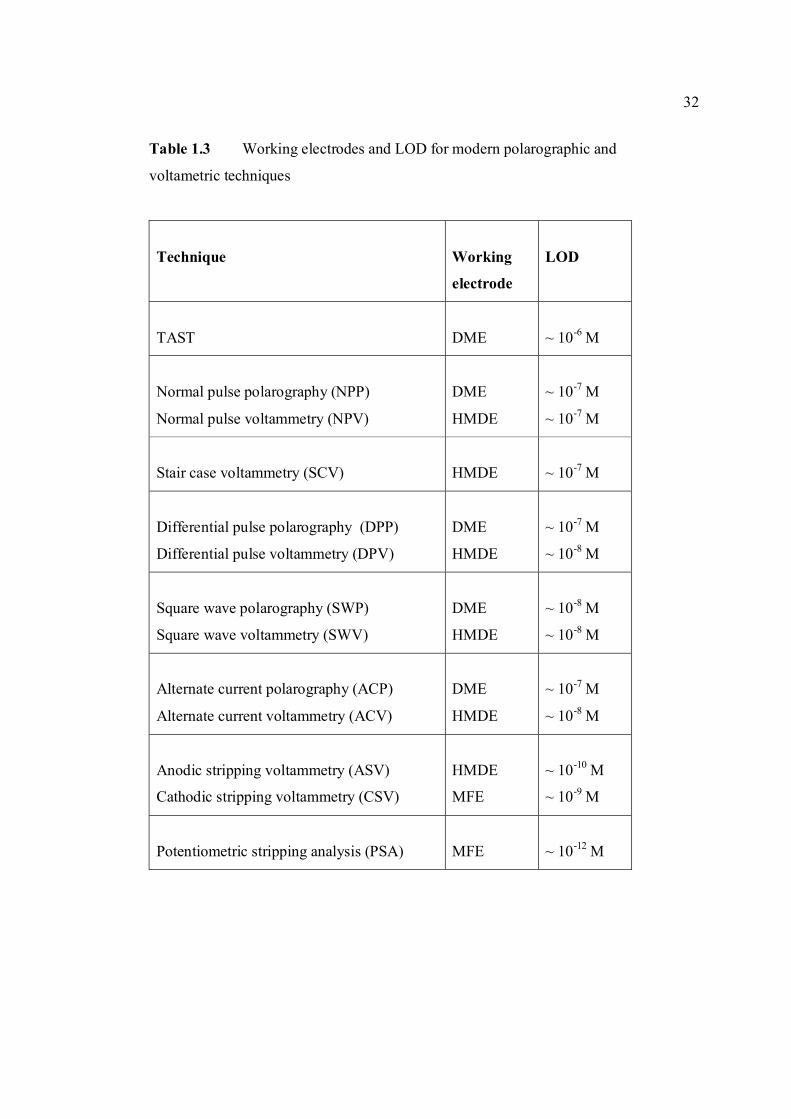
32
Table 1.3 Working electrodes and LOD for modern polarographic and
voltametric techniques
Technique
Working
electrode
LOD
TAST
DME
~ 10-6 M
Normal pulse polarography (NPP)
Normal pulse voltammetry (NPV)
DME
HMDE
~ 10-7 M
~ 10-7 M
Stair case voltammetry (SCV)
HMDE
~ 10-7 M
Differential pulse polarography (DPP)
Differential pulse voltammetry (DPV)
DME
HMDE
~ 10-7 M
~ 10-8 M
Square wave polarography (SWP)
Square wave voltammetry (SWV)
DME
HMDE
~ 10-8 M
~ 10-8 M
Alternate current polarography (ACP)
Alternate current voltammetry (ACV)
DME
HMDE
~ 10-7 M
~ 10-8 M
Anodic stripping voltammetry (ASV)
Cathodic stripping voltammetry (CSV)
HMDE
MFE
~ 10-10 M
~ 10-9 M
Potentiometric stripping analysis (PSA)
MFE
~ 10-12 M
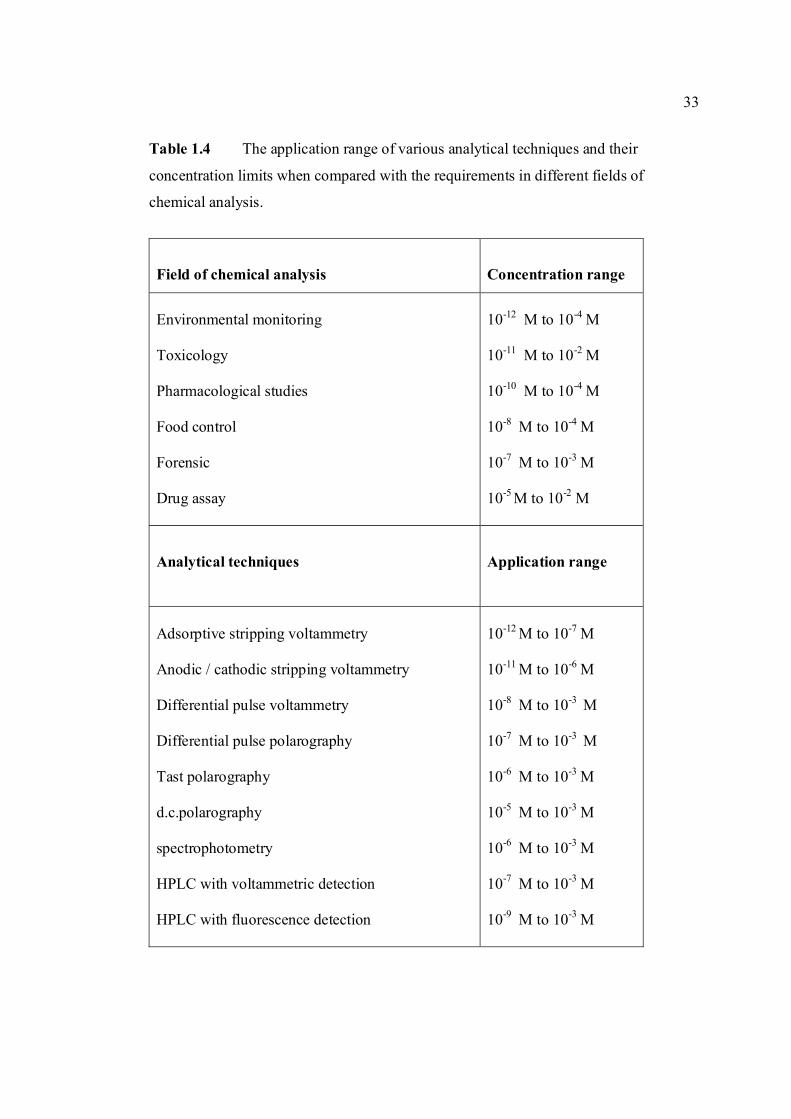
33
Table 1.4 The application range of various analytical techniques and their
concentration limits when compared with the requirements in different fields of
chemical analysis.
Field of chemical analysis
Concentration range
Environmental monitoring Toxicology Pharmacological studies Food control Forensic Drug assay
10-12 M to 10-4 M 10-11 M to 10-2 M 10-10 M to 10-4 M 10-8 M to 10-4 M 10-7 M to 10-3 M 10-5 M to 10-2 M
Analytical techniques
Application range
Adsorptive stripping voltammetry Anodic / cathodic stripping voltammetry Differential pulse voltammetry Differential pulse polarography Tast polarography d.c.polarography spectrophotometry HPLC with voltammetric detection HPLC with fluorescence detection
10-12 M to 10-7 M 10-11 M to 10-6 M 10-8 M to 10-3 M 10-7 M to 10-3 M 10-6 M to 10-3 M 10-5 M to 10-3 M 10-6 M to 10-3 M 10-7 M to 10-3 M 10-9 M to 10-3 M
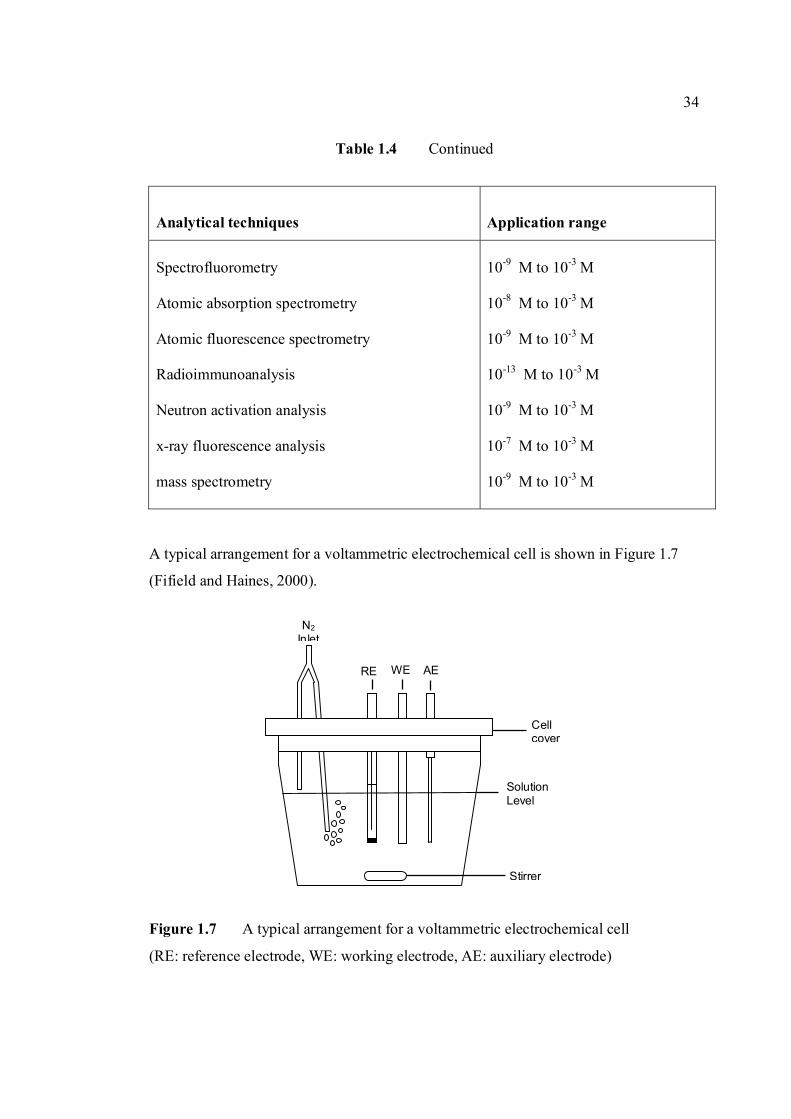
34
Table 1.4 Continued
A typical arrangement for a voltammetric electrochemical cell is shown in Figure 1.7
(Fifield and Haines, 2000).
Figure 1.7 A typical arrangement for a voltammetric electrochemical cell
(RE: reference electrode, WE: working electrode, AE: auxiliary electrode)
Analytical techniques
Application range
Spectrofluorometry Atomic absorption spectrometry Atomic fluorescence spectrometry Radioimmunoanalysis Neutron activation analysis x-ray fluorescence analysis mass spectrometry
10-9 M to 10-3 M 10-8 M to 10-3 M 10-9 M to 10-3 M 10-13 M to 10-3 M 10-9 M to 10-3 M 10-7 M to 10-3 M 10-9 M to 10-3 M
N2 Inlet
AERE WE
Cell cover
Stirrer
Solution Level
35
The arrangement of the electrodes within the cell is important. The RE is
placed close to the WE and the WE is located between the RE and the AE. Using the
three-electrode-cell concept, a potentiostat monitors the voltage over the WE and AE
which is automatically adjusted to give the correct applied potential. This is obtained
by continuously measuring the potential between the WE and the RE, by comparing it
to the set voltage and by adjusting the applied voltage accordingly if necessary. The
cell material depends on application that it is usually a small glass beaker with a close
fitting lid, which includes ports for electrodes and a nitrogen gas purge line for
removing dissolved oxygen and an optional stir bar.
The WE is the electrode where the redox reaction of electroactive species takes
place and where the charge transfer occurs. It is potentiostatically controlled and can
minimise errors from cell resistance. It is made of several different materials including
mercury, platinum, gold, silver, carbon, chemically modified and screen printed
electrode. The performance of voltammetry is strongly influenced by the WE. The
ideal characteristics of this electrode are a wide potential range, low resistance,
reproducible surface and be able to provide a high signal-to-noise response. The WE
must be made of a material that will not react with the solvent or any component of the
solution over as wide a potential range as possible. The potential window of such
electrodes depends on the electrode material and the composition of the electrolyte as
summarised in Table 1.5 below (Wang, 2000). Majority of electrochemical methods
use HMDE and MFE (Economou and Fielden, 1995) for use in the cathodic potential
area, whereas solid electrode such as gold, platinum, glassy carbon, carbon paste are
used for examining anodic processes.
Mercury has been used for the WE in earlier voltammetry techniques,
including polarography. Since mercury is a liquid, the WE often consists of a drop
suspended from the end of a capillary tube. It has several advantages including its high
over potential for the reduction of hydronium ion to hydrogen gas. This allows for the
application of potential as negative as -1.0 V versus SCE in acidic solution, and -2.0V
versus SCE in basic solution.
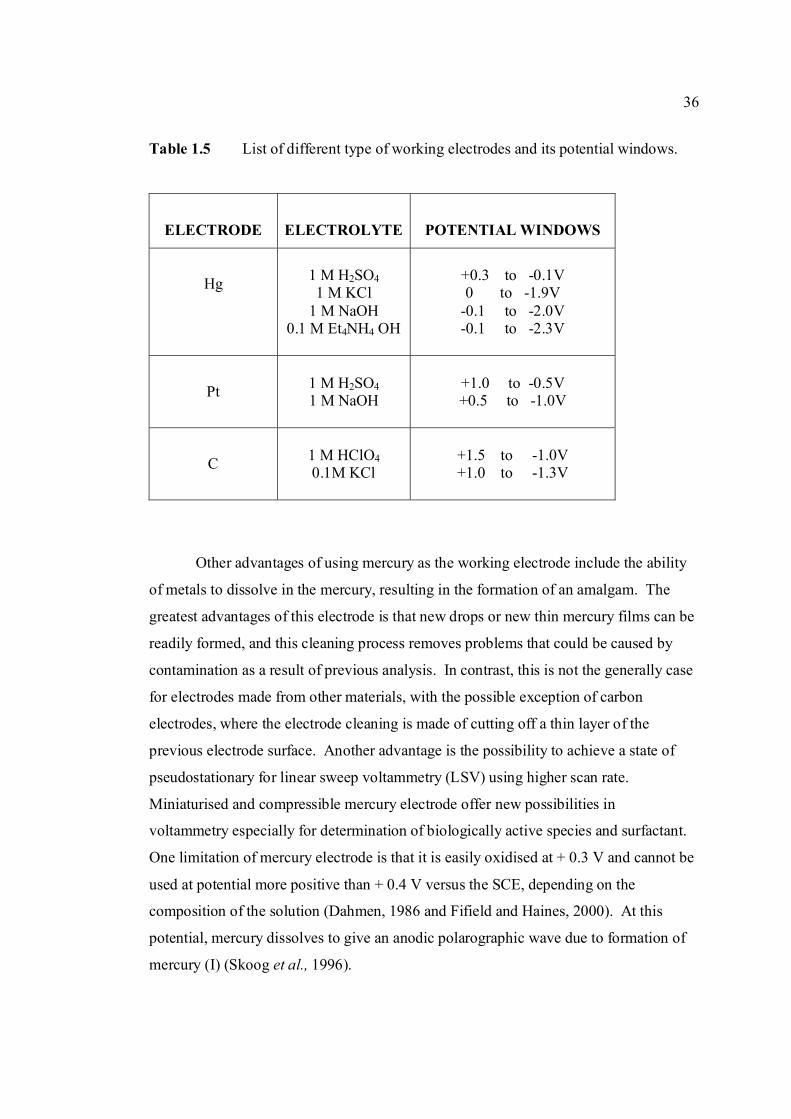
36
Table 1.5 List of different type of working electrodes and its potential windows.
ELECTRODE
ELECTROLYTE
POTENTIAL WINDOWS
Hg
1 M H2SO4 1 M KCl
1 M NaOH 0.1 M Et4NH4 OH
+0.3 to -0.1V 0 to -1.9V
-0.1 to -2.0V -0.1 to -2.3V
Pt
1 M H2SO4 1 M NaOH
+1.0 to -0.5V +0.5 to -1.0V
C
1 M HClO4 0.1M KCl
+1.5 to -1.0V +1.0 to -1.3V
Other advantages of using mercury as the working electrode include the ability
of metals to dissolve in the mercury, resulting in the formation of an amalgam. The
greatest advantages of this electrode is that new drops or new thin mercury films can be
readily formed, and this cleaning process removes problems that could be caused by
contamination as a result of previous analysis. In contrast, this is not the generally case
for electrodes made from other materials, with the possible exception of carbon
electrodes, where the electrode cleaning is made of cutting off a thin layer of the
previous electrode surface. Another advantage is the possibility to achieve a state of
pseudostationary for linear sweep voltammetry (LSV) using higher scan rate.
Miniaturised and compressible mercury electrode offer new possibilities in
voltammetry especially for determination of biologically active species and surfactant.
One limitation of mercury electrode is that it is easily oxidised at + 0.3 V and cannot be
used at potential more positive than + 0.4 V versus the SCE, depending on the
composition of the solution (Dahmen, 1986 and Fifield and Haines, 2000). At this
potential, mercury dissolves to give an anodic polarographic wave due to formation of
mercury (I) (Skoog et al., 1996).
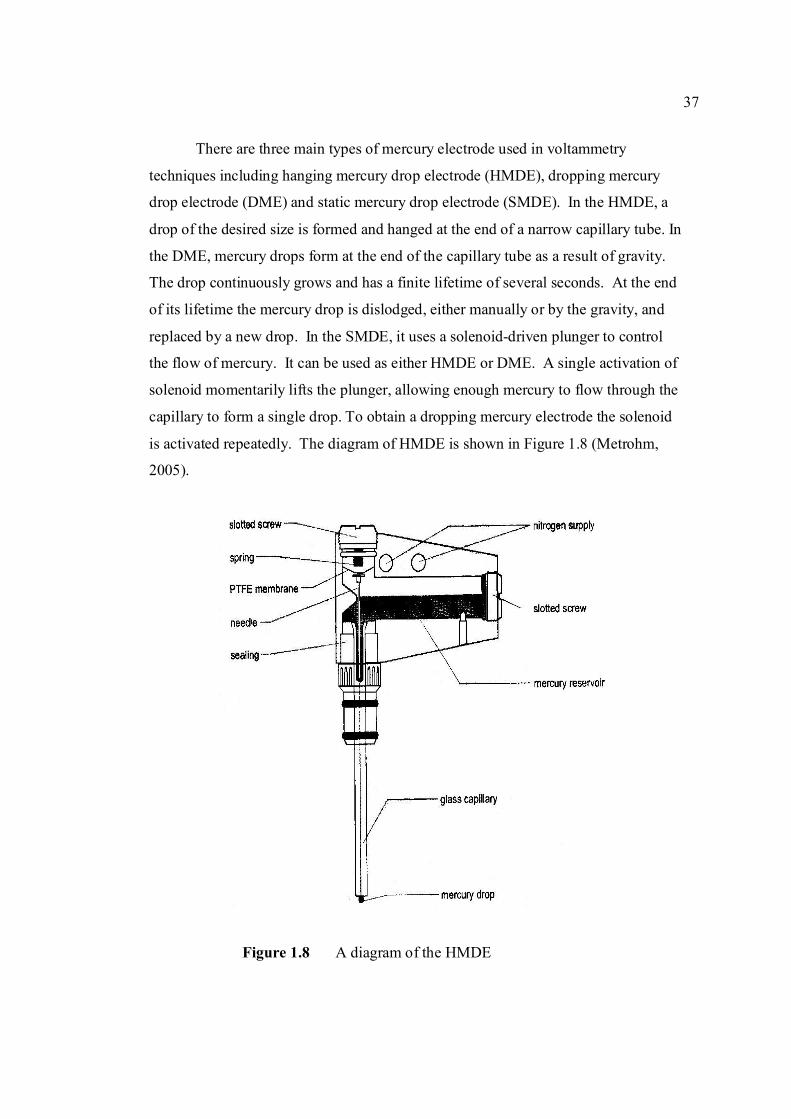
37
There are three main types of mercury electrode used in voltammetry
techniques including hanging mercury drop electrode (HMDE), dropping mercury
drop electrode (DME) and static mercury drop electrode (SMDE). In the HMDE, a
drop of the desired size is formed and hanged at the end of a narrow capillary tube. In
the DME, mercury drops form at the end of the capillary tube as a result of gravity.
The drop continuously grows and has a finite lifetime of several seconds. At the end
of its lifetime the mercury drop is dislodged, either manually or by the gravity, and
replaced by a new drop. In the SMDE, it uses a solenoid-driven plunger to control
the flow of mercury. It can be used as either HMDE or DME. A single activation of
solenoid momentarily lifts the plunger, allowing enough mercury to flow through the
capillary to form a single drop. To obtain a dropping mercury electrode the solenoid
is activated repeatedly. The diagram of HMDE is shown in Figure 1.8 (Metrohm,
2005).
Figure 1.8 A diagram of the HMDE
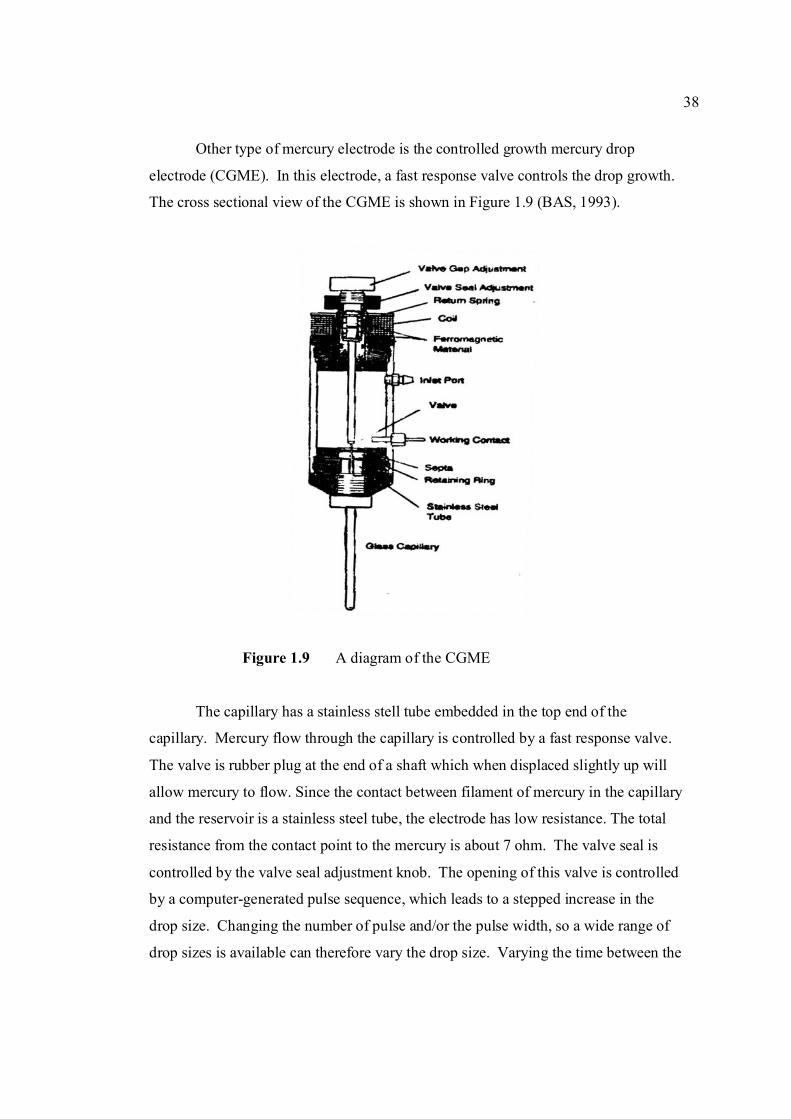
38
Other type of mercury electrode is the controlled growth mercury drop
electrode (CGME). In this electrode, a fast response valve controls the drop growth.
The cross sectional view of the CGME is shown in Figure 1.9 (BAS, 1993).
Figure 1.9 A diagram of the CGME
The capillary has a stainless stell tube embedded in the top end of the
capillary. Mercury flow through the capillary is controlled by a fast response valve.
The valve is rubber plug at the end of a shaft which when displaced slightly up will
allow mercury to flow. Since the contact between filament of mercury in the capillary
and the reservoir is a stainless steel tube, the electrode has low resistance. The total
resistance from the contact point to the mercury is about 7 ohm. The valve seal is
controlled by the valve seal adjustment knob. The opening of this valve is controlled
by a computer-generated pulse sequence, which leads to a stepped increase in the
drop size. Changing the number of pulse and/or the pulse width, so a wide range of
drop sizes is available can therefore vary the drop size. Varying the time between the
39
pulses can control the rate of growth of the mercury drop. Therefore, a slowly
growing mercury drop suitable for stripping experiments can be generated. An
important advantage of the CGME compared to HMDE is no contamination of the
capillary due to back diffusion (Dean, 1995).
In addition to the mercury drop electrode, mercury may be deposited onto the
surface of a solid electrode to produce mercury film electrode (MFE). The MFE is
based on an electrochemically deposited mercury film on conventional substrate
electrode such as a solid carbon, platinum, or gold electrode. The solid electrode is
placed in solution of mercury ion (Hg2+) and held at a potential at which the reduction
of Hg2+ to Hg is favorable, forming a thin mercury film. It displays the properties of a
mercury electrode, having various electro analytical advantageous such as a high
hydrogen evolution over potential and simple electrochemistry of many metals and
other species of analytical interest. For example, Castro et al. (2004) have used thin-
film coated on a glassy carbon electrode (GCE) for quantitative determination of
polycyclic aromatic hydrogen (PAH). In this experiment, they plated the mercury over
5 min at a cell voltage of -0.9 V. Economou and Fielden (1995) have developed a
square wave adsorptive stripping voltammetric technique on the MFE for study of
riboflavin. In this work, riboflavin was absorbed on the MFE at a potential of 0.0 V
(vs. Ag/AgCl) in pH 12.0 of electrolyte solution.
However, the increased risks associated with the use, manipulation and disposal
of metallic mercury or mercury salt, have led to general trend for more environmental-
friendly analytical methods such as using bismuth film electrode (BFE) instead of
mercury (Kefala et al., 2003; Economou, 2005; Lin et al., 2005a and Lin et al., 2005b ).
The BFE consists of a thin bismuth film deposited on a carbon paste substrate that has
shown to offer comparable performance to the MFE. Morfobos et al. (2004) have
studied square wave adsorptive stripping voltammetry (SWAdSV) on a rotating-disc
BFE for simultaneous determination of nickel (II) and cobalt (II). Hocevar et al. (2005)
have developed a novel bismuth-modified carbon paste (Bi-CPE) for a convenient and
40
reliable electrochemical sensor for trace heavy metals detection in conjunction with
stripping electroanalysis.
In another study, using pencil-lead BFE as the working electrode, Demetriades
et al. (2004) have determined trace metals by anodic stripping voltammetry (ASV).
They revealed that pencil-lead BFE were successfully applied to the determination of
plumbum and zinc in tap water with results in satisfactory agreement with atomic
absorption spectrometry (AAS). Zahir and Abd Ghani (1997) have developed a pencil
2B graphite paste electrode which was fabricated with polymerized 4-vinylpyridine for
glucose monitoring.
Other solid or metal electrode commonly used as WE are carbon, platinum
(Salavagione et al., 2004; Santos and Machado, 2004; Aslanoglu and Ayne, 2004 ),
gold (Hamilton and Ellis,1980; Parham and Zargar, 2001; Parlim and Zarger, 2003;
Moressi et al., 2004; Munoz et al., 2005;), graphite (Orinakova et al., 2004; Pezzatini et
al., 2004; Jin and Lin, 2005), diamond (Sonthalia et al., 2004) and silver (Iwamoto et
al., 1984). Solid electrodes based on carbon are currently in widespread use in
voltammetric technique, primarily because of their broad potential window, low
background current, rich surface chemistry, low cost, chemical inertness, and suitability
for various sensing and detection application (Wang, 2000). It includes glassy carbon
electrode (GCE), carbon paste electrode (CPE), chemically modified electrode (CME)
and screen-printed electrode (SPE).
For the GCE, the usual electrode construction is a rod of glassy carbon, sealed
into an inert electrode body, a disc of electrode material is exposed to the solution. It is
the most commonly used carbon electrode in electro analytical application (Ozkan and
Uslu, 2002; Ibrahim et al., 2003; Erk, 2004). The cleaning of this electrode is
important, to maintain a reactive and reproducible surface. Pre-treated
electrochemically GCE have increased oxygen functionalities that contribute to more
rapid electron transfer. Wang et al. (1997) have used in adsorptive potentiometric
stripping analysis of tamoxifen, a nonsteriodal anti-estrogen used widely for the
41
treatment of hormone-dependent breast cancer. The electrode was anodised at + 1.7 V
for 1 min in the electrolyte containing tomixifen. Using cyclic voltammetric technique,
they found that a large definite anodic peak corresponding to the oxidation of the
adsorbed drug at GCE at + 0.985 V. Other workers using GCE as the WE were Wang
et al. (2004), Shi and Shiu (2004) and Ji et al. (2004).
The CPE, a mixture of carbon powder and a pasting medium at certain ratio,
were the result of an attempt to produce electrode similar to the dropping mercury
electrode (Kizek et al., 2005). They are particularly useful for anodic studies, modified
electrode and also for stripping analysis. CMEs are electrodes which have been
deliberately treated with some reagents, having desirable properties, so as to take on the
properties of the reagents (Arrigan, 1994; Kutner et al., 1998). A few examples of
these applications were reported by Abbaspour and Moosavi, (2002), Abbas and
Mostafa (2003); Ciucu et al. (2003); Ferancova et al. (2000) and Padano and Rivas
(2000).
SPE are increasingly being used for inexpensive, reproducible and sensitive
disposable electrochemical sensors for determination of trace levels of pollutant and
toxic compounds in environmental and biological fluids sample (Wring et al., 1991).
A disposable sensor has several advantages, such as preventing contamination between
samples, constant sensitivity and high reproducibility of different printed sensors (Kim
et al., 2002). The most useful materials for printing electrochemical sensors could be
carbon-based inks because they have a very low firing temperature (20-120° C) and can
be printed on plastic substrate. Carbon can also be directly mixed with different
compounds, such as mediator and enzymes. A few examples of the experiments which
used SPE as the WE were reported by Kim et al. (2002), for detection of phenols using
α-cyclodextrin modified screen printed graphite electrodes. Ohfuji et al. (2004) have
constructed a glucose sensor based on a SPE and a novel mediator pyocyanin from
Pseudomonas aeruginosa. Carpini et al. (2004) have studied oligonucleotide-modified
screen printed gold electrodes for enzyme-amplified sensing of nucleic acid. Lupu et
al. (2004) have developed SPE for the detection of marker analytes during wine
42
making. In this work they have developed biosensors for malic acid and glucose with a
limit of detection of 10-5 M and 10-6 M for malic acid and glucose respectively. The
sensors were applied in the analysis of different samples of wine.
Besides using macro-electrode, voltammetric technique also utilizes
microelectrode (Lafleur et al. 1990) with the size of electrode radius much smaller than
the diffusion-layer thickness, typically between 7 to 10 µM (Hutton et al., 2005 and
Buffle and Tercier-Waeber, 2005) as the WE. It is constructed from the same materials
as the macro-electrode but with a smaller diameter to enhance mass transport of analyte
to the electrode surface due to smaller electrode than the diffusion layer. Hence,
increasing signal-to noise ratio and measurement can be made in highly resistive media
due to decrease of the ohmic drop that results when the electrode size reduced
(Andrieux et al., 1990). The microelectrode with diameter as small as 2 µm, allow
voltammetric measurements to be made on even smaller sample (Harvey, 2002). Aoki
(1990) reported that ultra microelectrodes influence electrode kinetics more specifically
than conventional electrode because of lateral diffusion promotes mass transport. Since
it minimise uncompensated resistance, they are useful for determination of kinetic
parameters. Almeida et al. (1998) have done voltammetric studies of the oxidation of
the anti-oxidant drug dipyridamole (DIP) in acetonitrile and ethanol using ultra
microelectrode (UME). In this work they studied cyclic voltammetric technique of the
drug with the UME which was 12.7 µm diameters. They found that with that electrode,
the diffusion current of DIP is proportional to the electrode radii for low scan rates in
cyclic voltammetry.
The second electrode used in the voltammetric system is auxiliary electrode
(AE). The AE is made of an inert conducting material typically a platinum electrode
wire (Wang, 2000). It provides a surface for a redox reaction to balance the process that
occured at the surface of the WE. It does not need special care, such as polishing. In
order to support the current generated at the WE, the surface area of the AE must be
equal to or larger than of the WE. The function of the AE is to complete the circuit,
allowing charge flow through the cell (Fifield and Haines, 2000). In an electro
43
analytical experiment, there is no need to place the AE in a separate compartment since
the diffusion of product that was produced by a redox reaction at the surface of the AE
does not significantly interfere the redox reaction at the WE.
The third electrode used in the voltammetric technique is reference electrode
(RE). This RE provides a stable potential so that any change in cell potential is
attributed to the working electrode. The major requirement for the RE is that the
potential does not change during the recording voltammetric curve at different applied
voltage (Heyrovsky and Zuman, 1968). The common RE are standard hydrogen
electrode (SHE), calomel electrode (SCE) and silver/silver electrode (Ag/AgCl). The
SHE is the reference electrode used to establish standard-state potential for other half
reaction. It consists of a platinum electrode immersed in a solution in which the
hydrogen ion activity is 1.00 and in which hydrogen gas is bubbled at a pressure of 1
atm. The standard-state potential for the reaction;
2H+ (aq) + 2e- → H2 (g) (1.0)
is 0.00 V for all temperatures. It is rarely used because it is difficult to prepare and
inconvenient to use.
The second reference electrode is the Standard Calomel Electrode (SCE)
which is based on the redox couple between mercury chloride (Hg2Cl2) and Hg as
below;
Hg2Cl2(s) + 2e 2Hg(l) + 2Cl-(aq) (1.1)
The potential of this electrode is determined by the concentration of chloride ion. It is
constructed using an aqueous solution saturated with potassium chloride (KCl) which
has a potential of + 0.2444 V at 250 C. It consists of an inner tube packed with a paste
of Hg, Hg2Cl2 and saturated KCl. A small hole connects the two tubes, an asbestos fiber
serves as a salt bridge to the solution in which the SCE is immersed.
44
Other type of reference electrode is the Ag/AgCl electrode which is the most
common RE since it can be used at higher temperature. This electrode is based on the
redox couple between silver chloride ( AgCl ) and silver ( Ag ) as illustrated below;
AgCl(s) + 2e Ag(s) + Cl- (1.2)
The potential of this electrode is determined by the concentration of Cl-. For saturated
KCl the potential is + 0.197 V whereas for 3.5 M KCl the potential electrode is + 0.205
V at 25° C (Harvey, 2000).
1.3.2.2 Solvent and Supporting Electrolyte
Electrochemical measurements are commonly carried out in a medium which
consists of solvent containing a supporting electrolyte. Sometimes in most cases,
supporting electrolyte has to be added to the dissolved sample in an attempt to achieve
the following (Heyrovsky and Zuman 1968);
a) To make solution conductive
b) To control the pH value so that organic substances are reduced in a
given potential range and inorganic substances are not hydrolysed
c) To ensure the formation of such complexes that give well
developed and well separated waves
d) To shift the hydrogen evaluation towards more negative potentials
and to eliminate catalytic effects on hydrogen evolution
e) To suppress unwanted maxima by addition of surface-active
substances to the supporting electrolyte.
The choice of the solvent is primarily by the solubility of the analyte, its redox
activity and also by solvent properties such as electrical conductivity, electrochemical
activity and chemical reactivity. The solvent should not react with the analyte and
45
should not undergo electrochemical reaction over a wide potential range. In aqueous
solution the cathodic potential is limited by the reduction of hydrogen ions:
2 H+ (aq) + 2 e- → H2 (g) (1.3)
resulting hydrogen evolution current. The more acidic the solution the more positive
is the potential of this current due to the reaction expressed by;
E = E0H2/H+ - 0.059 pH (1.4)
The composition of the electrolyte may affect the selectivity of voltammetric
measurements. The ideal electrolyte should give well-separated and well-shaped peaks
for all the analytes sought, so that they can be determined simultaneously. For example
Kontoyannis et al. (1999) used tris buffered saline (TBS) at pH 7.4 as the supporting
electrolyte for simultaneous determination of diazepam and liposome using DPP
technique. Inam and Somer (1998) have determined selenium (Se) and lead (Pb)
simultaneously in whole blood sample by the same technique using 0.1 M HCl as the
supporting electrolyte. They observed that there were three peaks at -0.33 V, -0.54 V
and -0.41 V which belonged to an intermetallic compound (PbSe), Se and Pb
respectively. Barbiera et al. (1997) have developed anodic stripping voltammetric
technique for simultaneous determination of trace amounts of zinc, lead and copper in
rum without pre-treatment and in the absence of supporting electrolyte. They observed
that there were three peaks at -0.92 V, -0.42 V and 0.05 V which belong to Zn, Pb and
Cu respectively.
Because of the sensitivity of the voltammetric method, certain impurities in
supporting electrolyte can affect the accuracy of the procedures. It is thus necessary to
prepare the supporting electrolyte from highly purified reagents and should not easily
oxidised and reduced. To obtain acceptable ionic strength of supporting electrolyte,
certain concentration should be prepared which is usually about 0.1 M. This level is a
compromise between high conductivity and minimum contamination (Wang, 2000).
46
The low ionic strength which is 0.01 M of supporting electrolyte (HClO4 – NaClO4)
was very effective for the adsorptive accumulation of analyte on the electrode as found
by Berzas et al. (2000) when they developed adsorptive stripping square wave
technique for determination of sildenafil citrate (Viagra) in pharmaceutical tablet.
Dissolved oxygen must be removed from supporting electrolyte first since the
reduction of dissolved oxygen will cause two cathodic peaks at -0.05 V and -0.9 V
(versus SCE) as reported by Fraga et al. (1998) and Reinke and Simon (2002). With
increasing pH, the waves due to reduction of oxygen are shifted to more negative
potential. The oxygen reduction generates a large background current, greater than that
of the trace analyte, and dissolved oxygen therefore tends to interfere with
voltammetric analysis (Colombo and van den Berg, 1998). The common method for the
removal of dissolved oxygen is by purging with an inert gas such as nitrogen or argon
where longer time may be required for large sample volume or for trace measurements.
To prevent oxygen from reentering, the cell should be blanketed with the gas while the
voltammogram is being recorded. However, this conventional procedure is time
consuming and not suitable for flow analysis. Due to this reason, Colombo and van den
Berg (1998) have introduced in-line deoxygenating for flow analysis with voltammetric
detection. They have used an apparatus which is based on the permeation of oxygen
through semi-permeable silicone tubing into an oxygen free chamber and enables the
determination of trace metals by flow analysis with voltammetric determination.
1.3.2.3 Current in Voltammetry
When an analyte is oxidised at the working electrode, a current passes electrons
through the external electric circuitry to the auxiliary electrode, where reduction of the
solvent or other components of the solution matrix occurs. Reducing an analyte at the
working electrode requires a source of electrons, generating a current that flows from
the auxiliary electrode to the cathode. In either case, a current resulting from redox
reaction at the working electrode and auxiliary electrode is called a faradaic current. A
current due to the analyte’s reduction is called a cathodic current. Anodic currents are
47
due to oxidation reaction. The magnitude of the faradaic current is determined by the
rate ofthe resulting oxidation or reduction reaction at the electrode surface. Two factors
contribute to the rate of the electrochemical reaction which are the rate at which the
reactants and products are transported to and from the electrode, and the rate at which
electron pass between the electrode and the reactants and products in solution.
There are three modes of mass transport that influence the rate at which reactant
and products are transported to and from the electrode surface which are diffusion,
migration and convection. Difussion from a region of high concentration to region of
low concentration occurs whenever the concentration of an ion or molecule at the
surface of electrode is different from that in bulk solution. When the potential applied
to the WE is sufficient to reduce or oxidise the analyte at the electrode surface, a
concentration gradient is established. The volume of solution in which the
concentration gradient exists is called the diffusion layer. Without other modes of mass
transport, the width of the diffusion layer increases with time as the concentration of
reactants near electrode surface decreases. The contribution of diffusion to the rate of
mass transport is time-dependent.
Convection occurs when a mechanical means is used to carry reactants toward
the electrode and to remove products from the electrode. Ther most common means of
convection is to stirr the solution using a stir bar. Other methods include rotating the
electrode and incorporating the electrode into a flow cell.
Migration occurs when charged particles in solution are attracted or repelled
from an electrode that has a positive or negative surface charge. When the electrode is
positively charged, negatively charged particles move toward the electrode, while the
positive charged particles move toward the bulk solution. Unlike diffusion and
convection, migration only affects the mass transport of charged particles.
The rate of mass transport is one factor influencing the current in voltammetry
experiment. When electron transfer kinetics are fast, the redox reaction is equilibrium,
48
and the concentrations of reactants and products at the electrode are those psecified by
Nersnt Equation. Such systems are considered electrochemically reversible. In other
system, when electron transfer kinetics are sufficiently slow, the concentration of
reactants and products at the electrode surface, and thus the current, differ from that
predicted by the Nersnt euqation. In this case the system is electrochemically
irreversible.
Other currents that may exist in an electrochemical cell those are unrelated to
any redox reaction are nonfaradaic and residual currents. The nonfaradaic current must
be accounted for if the faradaic component of the measured current is to be determined.
This current occurs whenever the electrode’s potential is changed. Another type of non-
faradaic current is charging current which occur in electrochemical cell due to the
electrical double layer’s formation. Residual current is a small current that inevitably
flows through electrochemical cell even in the absence of analyte (Harvey, 2000).
1.3.2.4 Quantitative and Qualitative Aspects of Voltammetry
Quantitative information is obtained by relating current to the concentration of
analyte in the bulk solution and qualitative information is obtained from the
voltammogram by extracting the standard-state potential for redox reaction. The
concentration of the electroactive species can be quantitatively determined by the
measurement of limiting current which is linear function of the concentration of electro
active species in bulk solution.
Half- potential serves as a characteristic of a particular species which undergoes
reduction or oxidation process at the electrode surface in a given supporting electrolyte,
and it is independent of the concentration of that species. Its function in the qualitative
determination is the same as retention time in chromatographic technique.
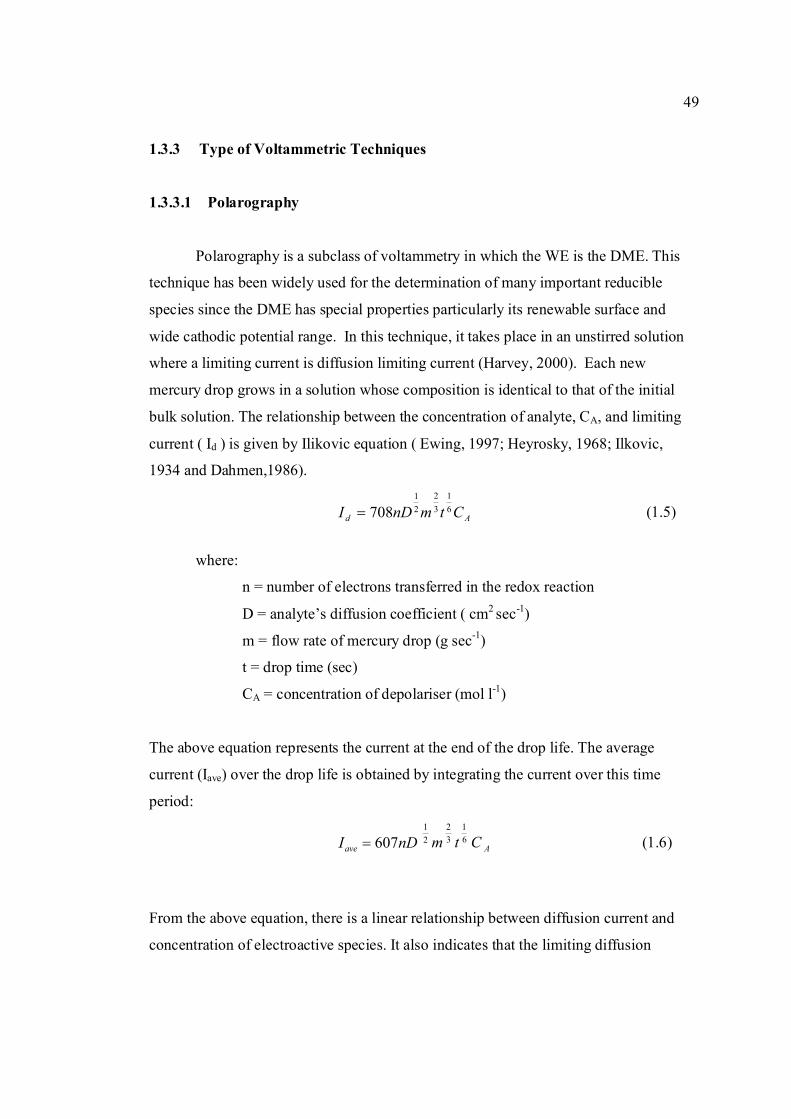
49
1.3.3 Type of Voltammetric Techniques
1.3.3.1 Polarography
Polarography is a subclass of voltammetry in which the WE is the DME. This
technique has been widely used for the determination of many important reducible
species since the DME has special properties particularly its renewable surface and
wide cathodic potential range. In this technique, it takes place in an unstirred solution
where a limiting current is diffusion limiting current (Harvey, 2000). Each new
mercury drop grows in a solution whose composition is identical to that of the initial
bulk solution. The relationship between the concentration of analyte, CA, and limiting
current ( Id ) is given by Ilikovic equation ( Ewing, 1997; Heyrosky, 1968; Ilkovic,
1934 and Dahmen,1986).
Ad CtmnDI 61
32
21
708= (1.5)
where:
n = number of electrons transferred in the redox reaction
D = analyte’s diffusion coefficient ( cm2 sec-1)
m = flow rate of mercury drop (g sec-1)
t = drop time (sec)
CA = concentration of depolariser (mol l-1)
The above equation represents the current at the end of the drop life. The average
current (Iave) over the drop life is obtained by integrating the current over this time
period:
nDIave 607= 21
m 32
t 61
C A (1.6)
From the above equation, there is a linear relationship between diffusion current and
concentration of electroactive species. It also indicates that the limiting diffusion
50
current is a function of the diffusion coefficient which depends on the size and shape
of the diffusion particle. As compared to another technique such as cyclic
voltammetry technique, in this technique, the peak current is directly proportional to
concentration and increases with the square root of the scan rate as given by the
Randles-Sevcik equation (Equation 1.7) for a reversible system (Wang, 2000).
Ip = (2.69 x 10⁵) n3/2 ACD1/2υ1/2 (1.7)
where;
n = number of electron
A = electrode area (cm2)
C = concentration (mol cm-3)
D = diffusion coefficient (cm2 s-1)
υ = scan rate (V s-1)
There are several types of polarographic techniques as was mentioned earlier.
Polarography is used extensively in the analysis of metal ion, inorganic anions and
organic compounds containing easily reducible or oxidisable functional group. A list
of electroreducible and electrooxidisable organic functional groups is shown in Table
1.6 (Dean, 1995).
Table 1.6 Electroreducible and electrooxidisable organic functional groups
Electroreducible organic functional groups
Aromatic carboxylic acid, azomethines, azoxy compounds conjugated alkene, conjugated aromatic, conjugated carboxylic acid conjugated halide, conjugated ketone, diazo compounds, dienes, conjugated double bond, nitroso compounds, organometallics, disulfide, heterocycles, hydroquinones, acetylene, acyl sulfide aldehyde, hydroxylamines, imines, ketones, nitrates, nitriles nitro compounds, oximes, peroxides, quinones, sulfones, sulfonium salts and thiocyanates.
Electrooxidisable organic functional groups
Alcohols, aliphatic halides, amines, aromatic amines, aromatic ides, carboxylic acids, ethers, heterocyclic amines, heterocyclic aromatics, olefins, organometallic and phenols.
51
1.3.3.2 Cyclic Voltammetry
Cyclic voltammetry (CV) is a potential-controlled reversal electrochemical
experiment. A cyclic potential sweep is imposed on an electrode and the current
response is observed (Gosser, 1993). CV is an extension of linear sweep
voltammetry (LSV) in that the direction of the potential scan is reversed at the end of
the first scan (the first switching potential) and the potential range is scanned again in
the reverse direction. The experiment can be stopped at the final potential, or the
potential can be scanned past this potential to the second switching potential, where
the direction of the potential scan is again reversed. The potential can be cycled
between the two switching potentials for several cycles before the experiment is
ended at the final potential. CV is the most widely used technique for acquiring
qualitative information about electrochemical reactions.
Analysis of the current response can give considerable information about the
thermodynamics of redox processes, the kinetics of heterogeneous electron-transfer
reaction and the coupled chemical reactions or adsorption processes. It is often the first
electrochemical experiment performed in an electrochemical study especially for any
new analyte since it offers a rapid location of redox potentials of the electro active
species and convenient evaluation of the effect of media upon the redox process. In the
CV technique, the applied potential sweep backwards and forwards between two limits,
the starting potential and the switching potentials. In this technique, the potential of the
WE is increased linearly in an unstirred solution. The resulting plot of current versus
potential is called a cyclic voltammogram. Figure 1.10a to 1.10c show the cyclic
voltammograms for reversible, irreversible and quasireversible reactions. For a typical
reduction and oxidation process in reversible reaction (as in Figure 1.10a), during the
forward sweep the oxidised form is reduced, while on the reverse sweep the reduced
form near the electrode is reoxidised. Chemical reaction coupled to the electrode
reaction can drastically affect the shape of the CV response. In the case of irreversible
reaction, no reverse peak is observed (Figure 1.10b).
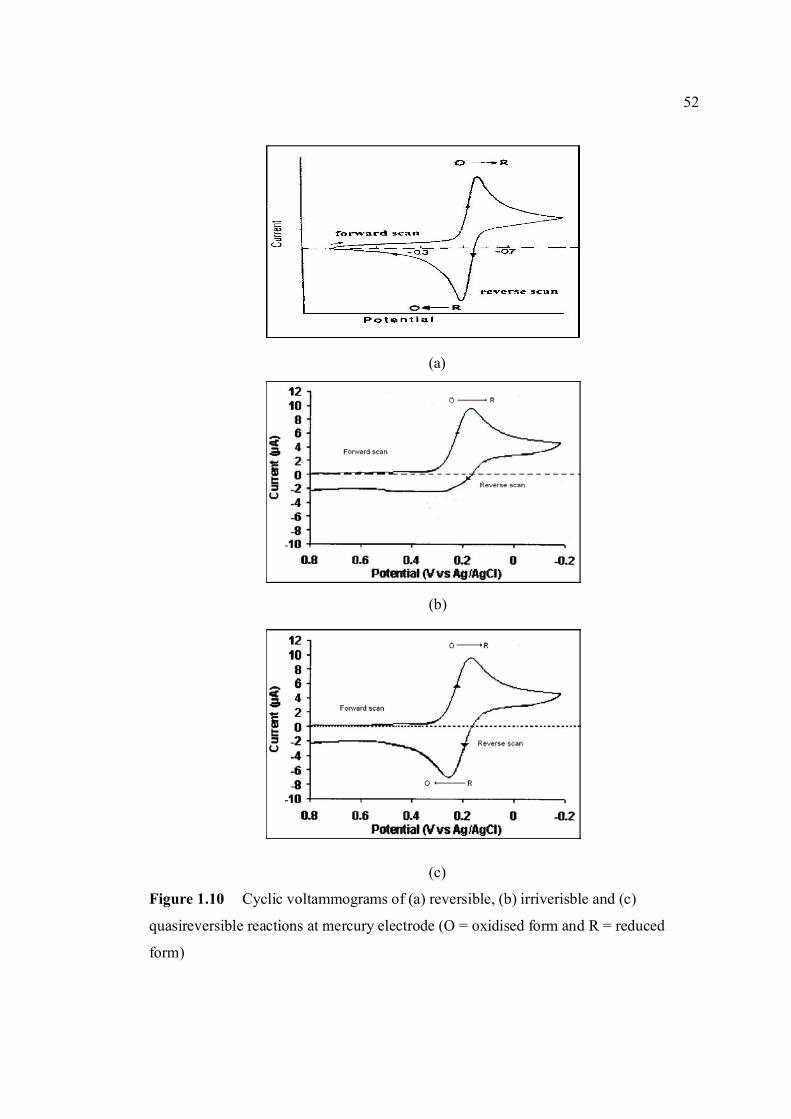
52
(a)
(b)
(c)
Figure 1.10 Cyclic voltammograms of (a) reversible, (b) irriverisble and (c)
quasireversible reactions at mercury electrode (O = oxidised form and R = reduced
form)
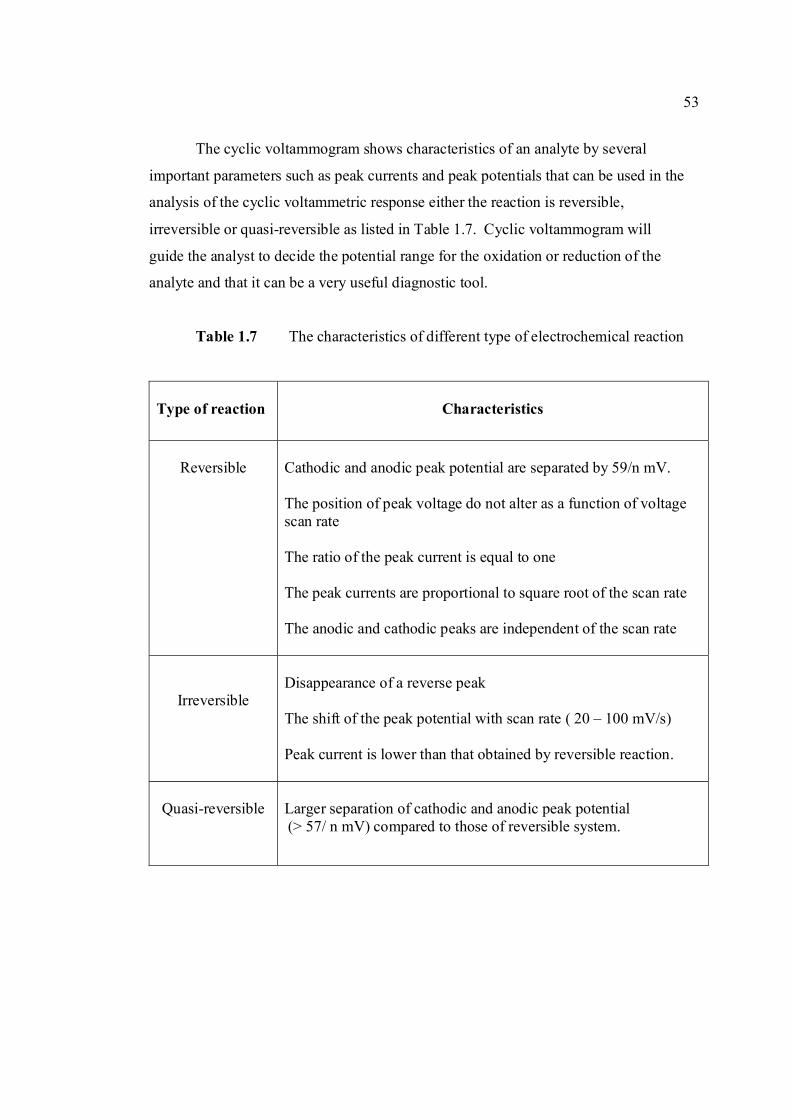
53
The cyclic voltammogram shows characteristics of an analyte by several
important parameters such as peak currents and peak potentials that can be used in the
analysis of the cyclic voltammetric response either the reaction is reversible,
irreversible or quasi-reversible as listed in Table 1.7. Cyclic voltammogram will
guide the analyst to decide the potential range for the oxidation or reduction of the
analyte and that it can be a very useful diagnostic tool.
Table 1.7 The characteristics of different type of electrochemical reaction
Type of reaction
Characteristics
Reversible
Cathodic and anodic peak potential are separated by 59/n mV. The position of peak voltage do not alter as a function of voltage scan rate The ratio of the peak current is equal to one The peak currents are proportional to square root of the scan rate The anodic and cathodic peaks are independent of the scan rate
Irreversible
Disappearance of a reverse peak The shift of the peak potential with scan rate ( 20 – 100 mV/s) Peak current is lower than that obtained by reversible reaction.
Quasi-reversible
Larger separation of cathodic and anodic peak potential (> 57/ n mV) compared to those of reversible system.
54
1.3.3.3 Stripping Voltammetry
Stripping technique is one of the most important and sensitive electrochemical
technique for measuring trace metals and organic samples. The term stripping is
applied to a group of procedures involving preconcentration of the determinant onto
the working electrode, prior to its direct or indirect determination by means of a
potential sweep (Wang, 1985). The preconcentration (or accumulation) step can be
adsorptive, cathodic or anodic. Its remarkable sensitivity is attributed to the addition
of an effective preconcentration step with advanced measurement procedures that
generate an extremely favorable signal-to-noise ratio as reported by Blanc et al.
(2000). Brainina et al. (2000) list advantages of this technique such as high
sensitivity, low detection limit, wide spectrum of test materials and analytes, both of
organic and inorganic origin, insignificant effect of matrix in certain instances,
compatibility with other methods, relative simplicity and low cost of equipment and
finally, it can be automatic on-line and portable options. This technique is able to
measure many analytes simultaneously such as reported by Ghoneim et al. (2000).
They have determined up to eleven metals in water sample simultaneously using this
technique. Stripping voltammetry technique utilises a few steps as follows;
a) Deposition step:
In this step, analyte will be preconcentrated on the WE within a certain time
while solution is stirred. The deposition potential imposed on the WE is chosen
according to the species to be determined and is maintained for a deposition period
depending on their concentration. The choice of deposition potential can provide some
selectivity in the measurement (Sun et al., 2005). Deposition time must be controlled
since the longer the deposition time, the larger the amount of analye available at the
electrode during stripping. During deposition step, the solution is stirred to facilitate
transportation of ions of interest to the surface of WE.
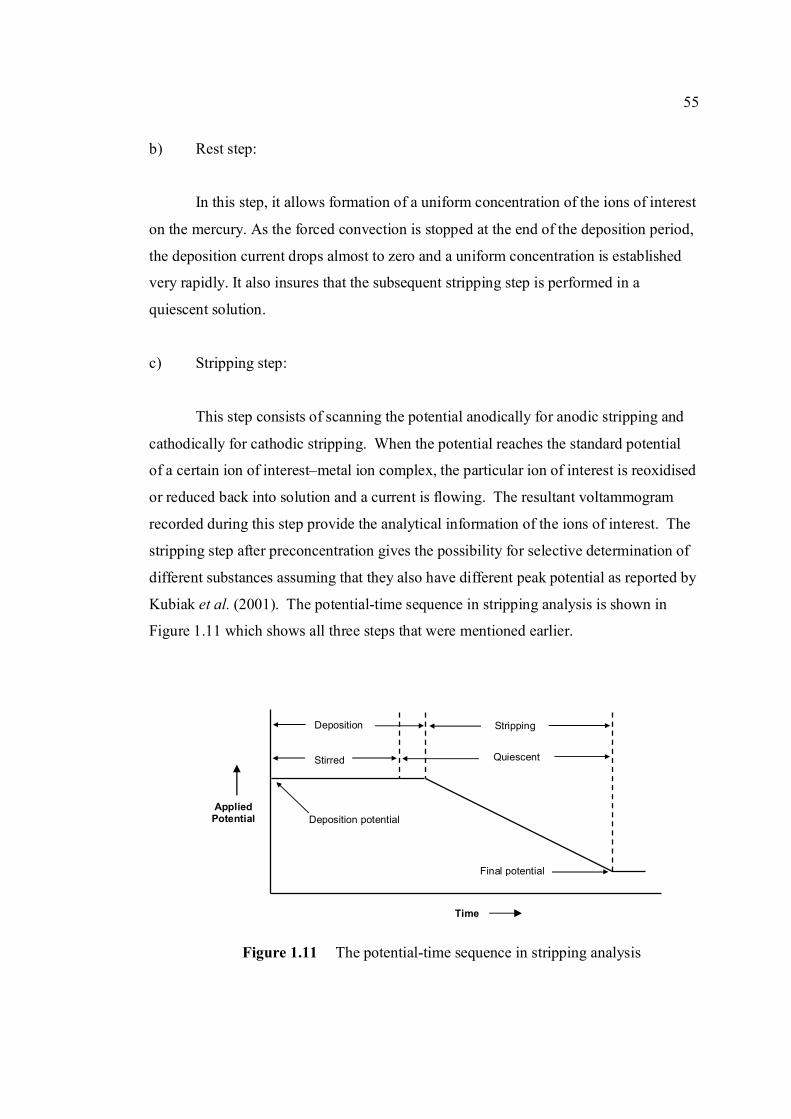
55
b) Rest step:
In this step, it allows formation of a uniform concentration of the ions of interest
on the mercury. As the forced convection is stopped at the end of the deposition period,
the deposition current drops almost to zero and a uniform concentration is established
very rapidly. It also insures that the subsequent stripping step is performed in a
quiescent solution.
c) Stripping step:
This step consists of scanning the potential anodically for anodic stripping and
cathodically for cathodic stripping. When the potential reaches the standard potential
of a certain ion of interest–metal ion complex, the particular ion of interest is reoxidised
or reduced back into solution and a current is flowing. The resultant voltammogram
recorded during this step provide the analytical information of the ions of interest. The
stripping step after preconcentration gives the possibility for selective determination of
different substances assuming that they also have different peak potential as reported by
Kubiak et al. (2001). The potential-time sequence in stripping analysis is shown in
Figure 1.11 which shows all three steps that were mentioned earlier.
Figure 1.11 The potential-time sequence in stripping analysis
Applied Potential
Deposition
Stirred
Stripping
Quiescent
Final potential
Deposition potential
Time
56
Most stripping measurements require the addition of appropriate supporting
electrolyte and removal of dissolved oxygen. The former is needed to decrease the
resistance of the solution and to ensure that the metal ions of interest are transported
toward the electrode by diffusion and not by electrical migration. Contamination of the
sample by impurities in the reagents used for preparing the supporting electrolyte is a
serious problem. Dissolved oxygen severely hampers the quantitation and must be
removed.
The main types of interference in stripping analysis are overlapping stripping
signals, the adsorption of organic surfactants on the electrode surface, the presence of
dissolved oxygen and the formation of intermetallic compounds by metals such as
copper and zinc co-deposited in the mercury electrode. Overlapping signals cause
problems in the simultaneous determination of analytes with similar redox potential
such as lead and tin. Intermetallic-compounds formation and surfactant cause a
depression of the stripping response and also shifting the signal location. Stripping
voltammetry is composed of three related techniques that are anodic, cathodic and
adsorptive stripping voltammetry.
1.3.3.3a Anodic Stripping Voltammetry (ASV)
ASV is mainly used in the determination of metal ions that can be reduced and
then re-oxidised at a mercury electrode. Voltammetric measurements of numerous
metal ions in various types of samples have been reported (Arancibia et al., (2004) and
Shams et al., (2004)). The term ASV is applied to the technique in which metal ions
are accumulated by reduction at an HMDE held at a suitable negative potential. The
deposition potential is usually 0.3 to 0.5 V more negative than a standard potential for
reduced metal ion to be determined. ASV consists of two steps. The first step is a
controlled potential electrolysis in which the working electrode is held at a cathodic
potential sufficient to deposit the metal ion (Mn+) on the electrode to form an amalgam,
M(Hg). This step is called accumulation step which is represented by an equation;
57
Mn+ + ne- + Hg → M(Hg) (1.8)
The solution is stirred during this process to increase the rate of deposition. Near the
end of the deposition time, stirring is stopped to eliminate convection as a mode of
mass transport. The duration of the deposition step is selected according to the
concentration level of the metals ion.
In the second step, the potential is scanned anodically toward more positive
potential. When the potential of the WE is sufficiently positive the analyte is stripped
from the electrode, returning to solution as its oxidised form. This step is called
stripping which is represented by an equation
M(Hg) → Mn+ + ne- (1.9)
The current during the stripping step is monitored as a function of potential giving rise
to a peak-shaped voltammogram. The peak current is proportional to the analyte’s
concentration.
1.3.3.3b Cathodic Stripping Voltammetry (CSV)
CSV is used to determine a wide range of organic compounds, and also
inorganic compounds that form insoluble salts with the electrode material. It has been
found to be widely applicable to many problems of clinical and pharmaceutical interest
(Wang, 1988). Voltammetric measurements of numerous electro active species of
biological significance such as drugs (Ghoneim et al., 2003; Arranz et al., 1999;
Rodriguez et al., 2004; Ghoneim and Beltagi, 2003 and Cabanillas et al., 2003 ) and
toxic substances ( Hourch et al., 2003; Safavi et al., 2004 ) have been reported.
The term CSV was used originally for the indirect trace determination of
organic compounds as mercury salt, involving anodic oxidation of mercury and
subsequently cathodic reduction of mercury. This technique is similar to the previous
58
technique with two exceptions. First, the deposition step involves the oxidation of the
mercury electrode from Hg to Hg2+, which then reacts with the analyte to form an
insoluble salt at the surface of the electrode. For example, when chloride ion (Cl-) is the
analyte, the deposition step is
2Hg(l) + 2Cl- (aq) → Hg2Cl2 (s) + 2e- (1.10)
Secondly, stripping is accomplished by scanning cathodically toward a more negative
potential, reducing Hg2+ back to Hg and returning the analyte to the solution.
Hg2Cl2(s) + 2e- → 2Hg(l) + 2Cl-(aq) (1.11)
1.3.3.3c Adsorptive Stripping Voltammetry (AdSV)
The term AdSV seems to have been first used by Lam et al. in 1983. It is a
powerful analytical technique for the determination of nmol levels of a wide range of
organic compounds (Smyth and Smyth, 1978; Smyth and Vos, 1992). In technical
report for International Union Of Pure And Applied Chemistry under Analytical
Chemistry Division Commission On Electro analytical Chemistry (Fogg and Wang
1999), suggested that AdSV technique is applied to stripping voltammetric technique in
which accumulation is effected by adsorption of mainly organic determinants and that
can be justified less in case of the adsorption of metal complexes in determining metal
ions. The AdSV term should not be applied when there is a change of oxidation state
of the metal ion during the accumulation for example in the accumulation of copper (I)
complexes or salts or in other cases where an organic compounds is being accumulated,
and determined indirectly, as a metal salts or complex such as mercury salts or nickel
complexes.
In this technique the deposition step occurs without electrolysis process.
Instead, the analyte adsorbs on to the electrode’s surface. During deposition, the
electrode is maintained at a potential that enhances adsorption. When deposition is
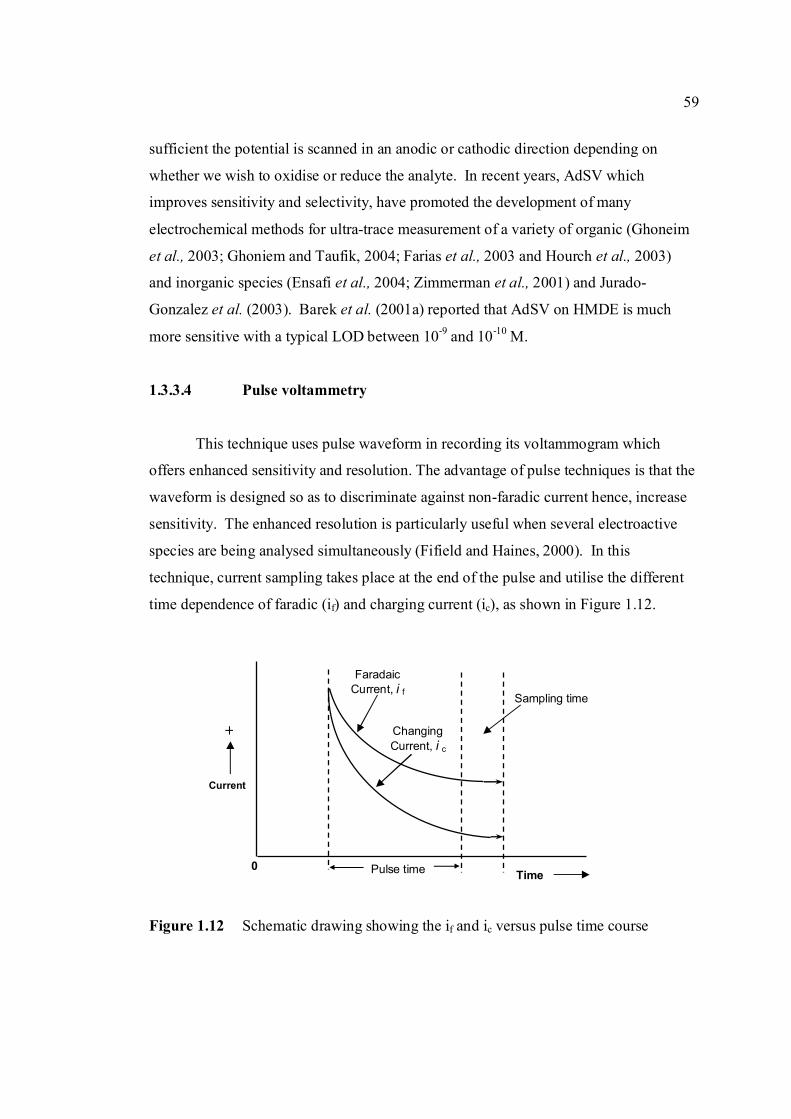
59
sufficient the potential is scanned in an anodic or cathodic direction depending on
whether we wish to oxidise or reduce the analyte. In recent years, AdSV which
improves sensitivity and selectivity, have promoted the development of many
electrochemical methods for ultra-trace measurement of a variety of organic (Ghoneim
et al., 2003; Ghoniem and Taufik, 2004; Farias et al., 2003 and Hourch et al., 2003)
and inorganic species (Ensafi et al., 2004; Zimmerman et al., 2001) and Jurado-
Gonzalez et al. (2003). Barek et al. (2001a) reported that AdSV on HMDE is much
more sensitive with a typical LOD between 10-9 and 10-10 M.
1.3.3.4 Pulse voltammetry
This technique uses pulse waveform in recording its voltammogram which
offers enhanced sensitivity and resolution. The advantage of pulse techniques is that the
waveform is designed so as to discriminate against non-faradic current hence, increase
sensitivity. The enhanced resolution is particularly useful when several electroactive
species are being analysed simultaneously (Fifield and Haines, 2000). In this
technique, current sampling takes place at the end of the pulse and utilise the different
time dependence of faradic (if) and charging current (ic), as shown in Figure 1.12.
Figure 1.12 Schematic drawing showing the if and ic versus pulse time course
Sampling time
0
Changing Current, i c
Current
+
Pulse time Time
Faradaic Current, i f
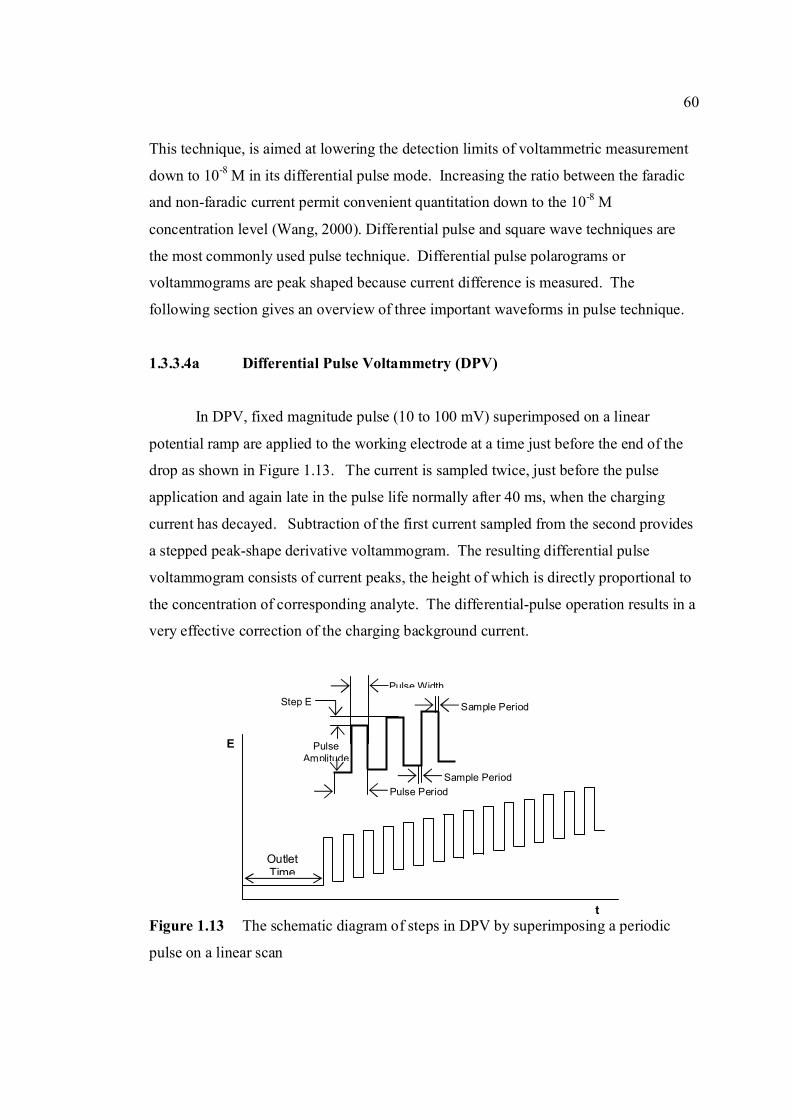
60
This technique, is aimed at lowering the detection limits of voltammetric measurement
down to 10-8 M in its differential pulse mode. Increasing the ratio between the faradic
and non-faradic current permit convenient quantitation down to the 10-8 M
concentration level (Wang, 2000). Differential pulse and square wave techniques are
the most commonly used pulse technique. Differential pulse polarograms or
voltammograms are peak shaped because current difference is measured. The
following section gives an overview of three important waveforms in pulse technique.
1.3.3.4a Differential Pulse Voltammetry (DPV)
In DPV, fixed magnitude pulse (10 to 100 mV) superimposed on a linear
potential ramp are applied to the working electrode at a time just before the end of the
drop as shown in Figure 1.13. The current is sampled twice, just before the pulse
application and again late in the pulse life normally after 40 ms, when the charging
current has decayed. Subtraction of the first current sampled from the second provides
a stepped peak-shape derivative voltammogram. The resulting differential pulse
voltammogram consists of current peaks, the height of which is directly proportional to
the concentration of corresponding analyte. The differential-pulse operation results in a
very effective correction of the charging background current.
Figure 1.13 The schematic diagram of steps in DPV by superimposing a periodic
pulse on a linear scan
t
E
Outlet Time
Pulse Amplitude
Step E
Pulse Period
Pulse Width
Sample Period
Sample Period
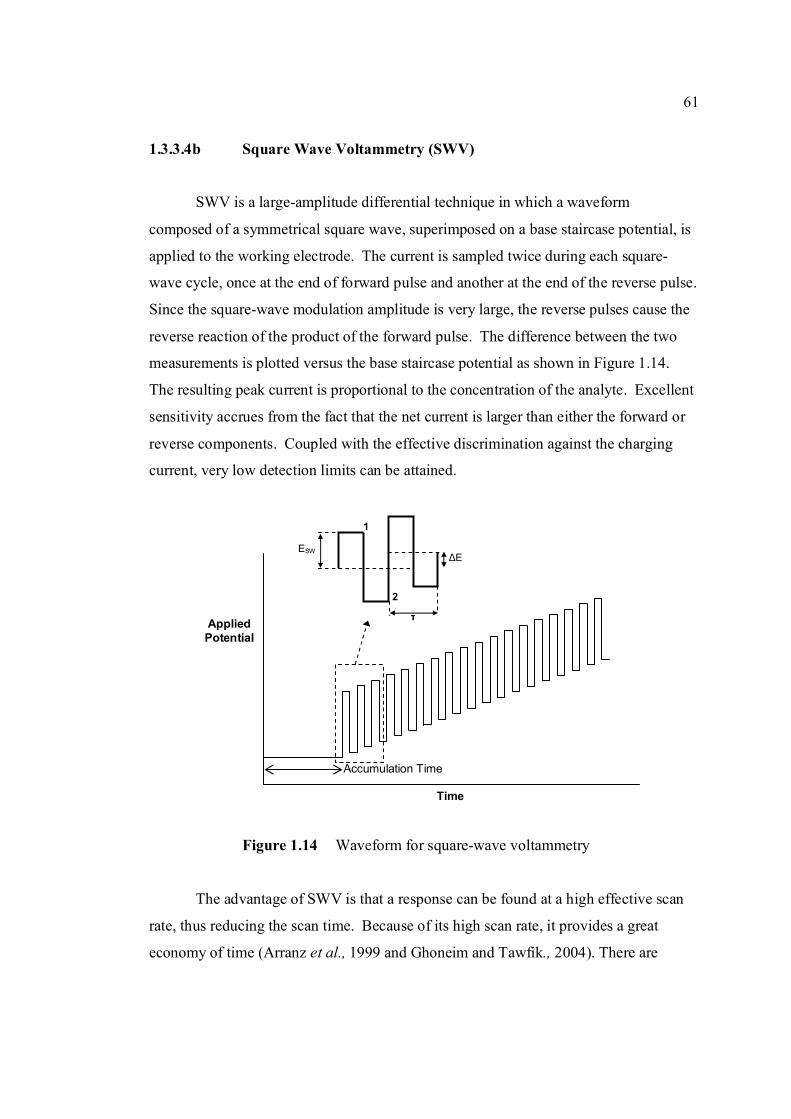
61
1.3.3.4b Square Wave Voltammetry (SWV)
SWV is a large-amplitude differential technique in which a waveform
composed of a symmetrical square wave, superimposed on a base staircase potential, is
applied to the working electrode. The current is sampled twice during each square-
wave cycle, once at the end of forward pulse and another at the end of the reverse pulse.
Since the square-wave modulation amplitude is very large, the reverse pulses cause the
reverse reaction of the product of the forward pulse. The difference between the two
measurements is plotted versus the base staircase potential as shown in Figure 1.14.
The resulting peak current is proportional to the concentration of the analyte. Excellent
sensitivity accrues from the fact that the net current is larger than either the forward or
reverse components. Coupled with the effective discrimination against the charging
current, very low detection limits can be attained.
Figure 1.14 Waveform for square-wave voltammetry
The advantage of SWV is that a response can be found at a high effective scan
rate, thus reducing the scan time. Because of its high scan rate, it provides a great
economy of time (Arranz et al., 1999 and Ghoneim and Tawfik., 2004). There are
Accumulation Time
Applied Potential
Time
τ
ESW ∆E
2
1
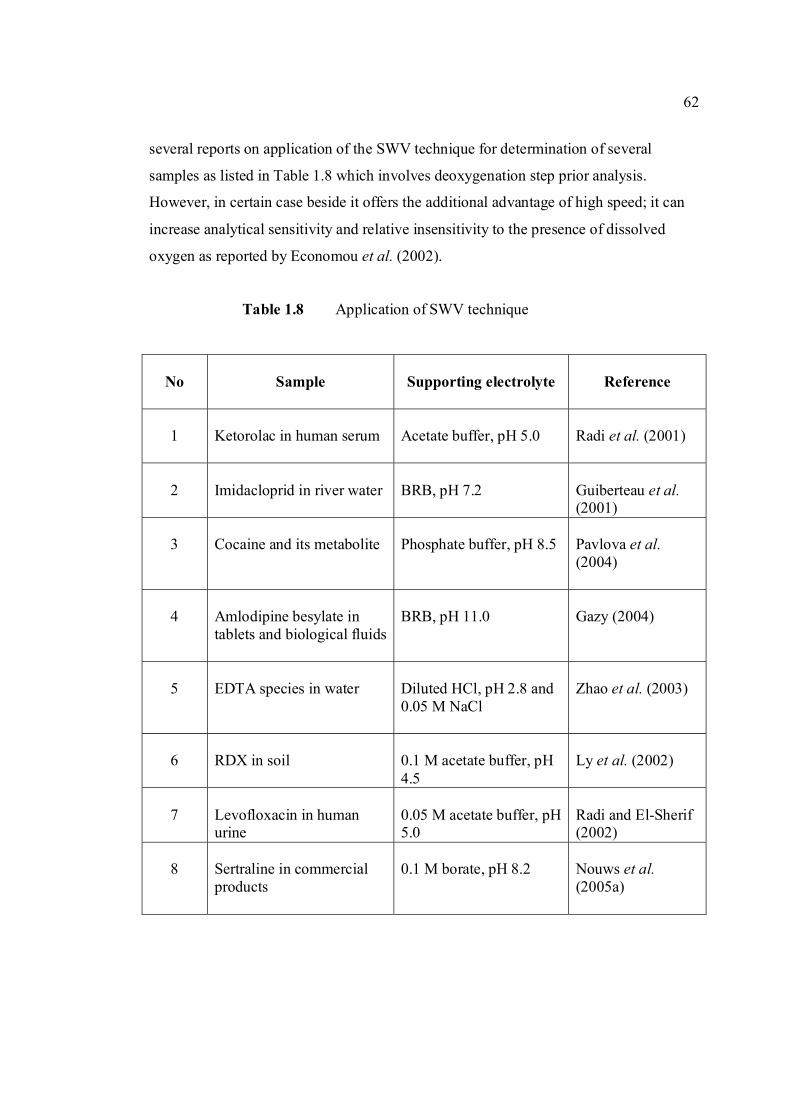
62
several reports on application of the SWV technique for determination of several
samples as listed in Table 1.8 which involves deoxygenation step prior analysis.
However, in certain case beside it offers the additional advantage of high speed; it can
increase analytical sensitivity and relative insensitivity to the presence of dissolved
oxygen as reported by Economou et al. (2002).
Table 1.8 Application of SWV technique
No
Sample
Supporting electrolyte
Reference
1
Ketorolac in human serum
Acetate buffer, pH 5.0
Radi et al. (2001)
2
Imidacloprid in river water
BRB, pH 7.2
Guiberteau et al. (2001)
3
Cocaine and its metabolite
Phosphate buffer, pH 8.5
Pavlova et al. (2004)
4
Amlodipine besylate in tablets and biological fluids
BRB, pH 11.0
Gazy (2004)
5
EDTA species in water
Diluted HCl, pH 2.8 and 0.05 M NaCl
Zhao et al. (2003)
6
RDX in soil
0.1 M acetate buffer, pH 4.5
Ly et al. (2002)
7
Levofloxacin in human urine
0.05 M acetate buffer, pH 5.0
Radi and El-Sherif (2002)
8
Sertraline in commercial products
0.1 M borate, pH 8.2
Nouws et al. (2005a)
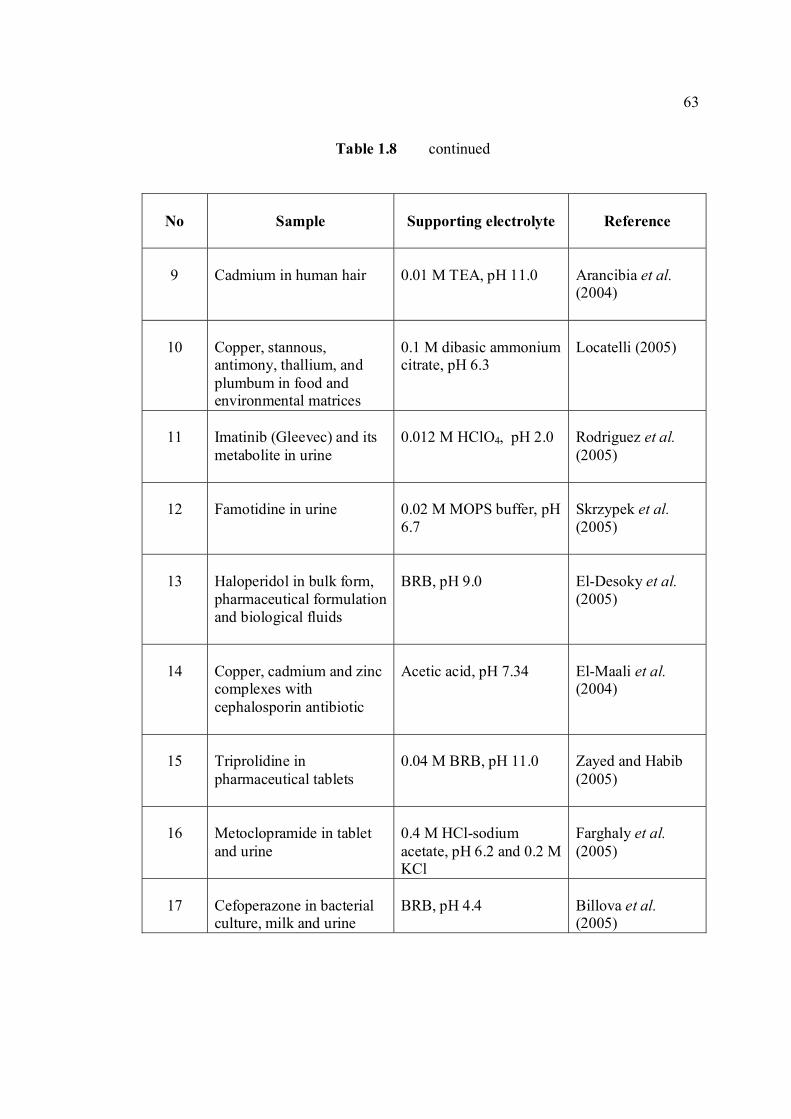
63
Table 1.8 continued
No
Sample
Supporting electrolyte
Reference
9
Cadmium in human hair
0.01 M TEA, pH 11.0
Arancibia et al. (2004)
10
Copper, stannous, antimony, thallium, and plumbum in food and environmental matrices
0.1 M dibasic ammonium citrate, pH 6.3
Locatelli (2005)
11
Imatinib (Gleevec) and its metabolite in urine
0.012 M HClO4, pH 2.0
Rodriguez et al. (2005)
12
Famotidine in urine
0.02 M MOPS buffer, pH 6.7
Skrzypek et al. (2005)
13
Haloperidol in bulk form, pharmaceutical formulation and biological fluids
BRB, pH 9.0
El-Desoky et al. (2005)
14
Copper, cadmium and zinc complexes with cephalosporin antibiotic
Acetic acid, pH 7.34
El-Maali et al. (2004)
15
Triprolidine in pharmaceutical tablets
0.04 M BRB, pH 11.0
Zayed and Habib (2005)
16
Metoclopramide in tablet and urine
0.4 M HCl-sodium acetate, pH 6.2 and 0.2 M KCl
Farghaly et al. (2005)
17
Cefoperazone in bacterial culture, milk and urine
BRB, pH 4.4
Billova et al. (2005)
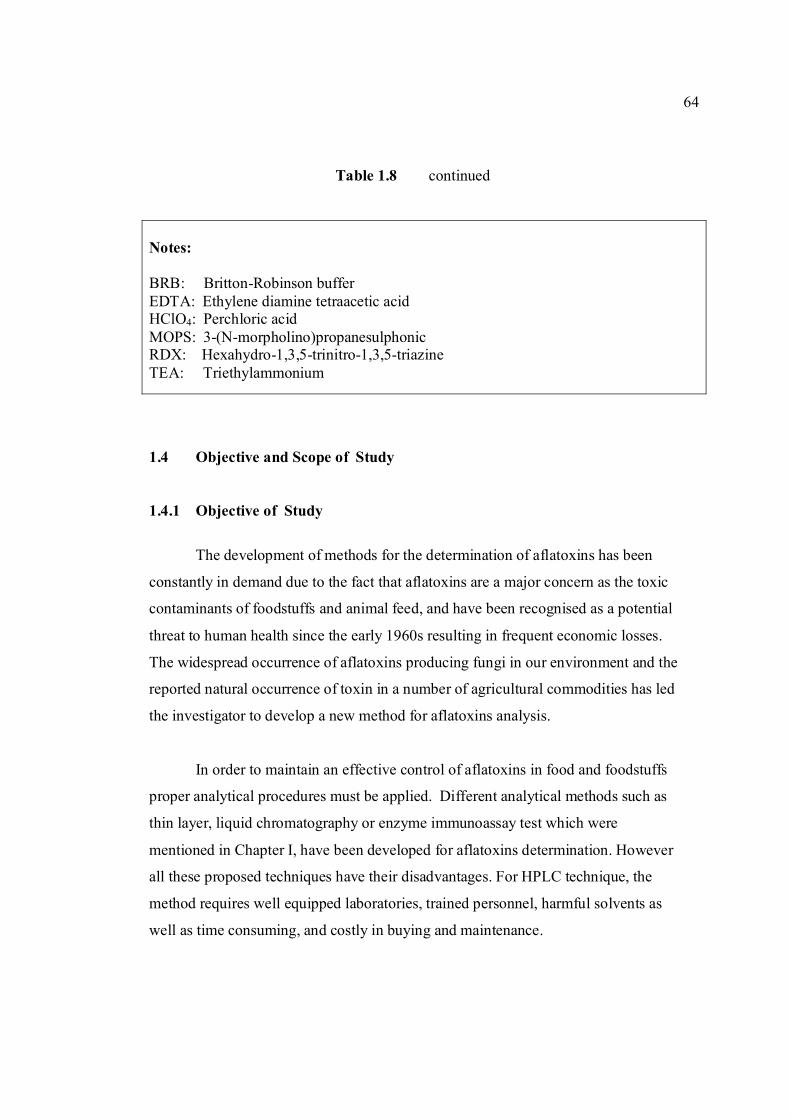
64
Table 1.8 continued
Notes: BRB: Britton-Robinson buffer EDTA: Ethylene diamine tetraacetic acid HClO4: Perchloric acid MOPS: 3-(N-morpholino)propanesulphonic RDX: Hexahydro-1,3,5-trinitro-1,3,5-triazine TEA: Triethylammonium
1.4 Objective and Scope of Study
1.4.1 Objective of Study
The development of methods for the determination of aflatoxins has been
constantly in demand due to the fact that aflatoxins are a major concern as the toxic
contaminants of foodstuffs and animal feed, and have been recognised as a potential
threat to human health since the early 1960s resulting in frequent economic losses.
The widespread occurrence of aflatoxins producing fungi in our environment and the
reported natural occurrence of toxin in a number of agricultural commodities has led
the investigator to develop a new method for aflatoxins analysis.
In order to maintain an effective control of aflatoxins in food and foodstuffs
proper analytical procedures must be applied. Different analytical methods such as
thin layer, liquid chromatography or enzyme immunoassay test which were
mentioned in Chapter I, have been developed for aflatoxins determination. However
all these proposed techniques have their disadvantages. For HPLC technique, the
method requires well equipped laboratories, trained personnel, harmful solvents as
well as time consuming, and costly in buying and maintenance.
65
For immunological methods such as ELISA technique, it has a few
disadvantages such as long incubation time, washing and mixing steps and also labour
intensive. This method requires highly specific polyclonal or monoclonal sera which
is costly. For radioimmunoassay (RIA) technique, it uses radioisotope which raises
concerns in radiation safety in dealing with and also in disposing radioactive waste. For
micellar electrokinetic capillary chromatography (MECC) technique, it needs preparing
a lot of reagents for the buffering system and takes considerable time to complete the
analysis.
With regards to voltammetric analysis, no stripping voltammetric study of
aflatoxins is reported until now. This study has been proposed in order to develop a
new alternative technique for determination of aflatoxins. This technique is the most
promising method for determination of aflatoxins due to its main advantages compared
to competing analytical techniques such as excellent sensitivity, reasonable speed,
minimal sample pre-treatment, satisfactory selectivity, wide applicability, ability to
undertake speciation analysis and low cost of instrumentation and maintenance as
reported by Economou et al. (2002) and Radi (2003). Stripping analysis has been
proven to be a powerful technique for the determination of both organic and inorganic
electroactive species (Bond, 1980). Differential pulse cathodic stripping voltammetry
satisfies the requirement of an efficient and senstitive technique for the determination
of aflatoxin compounds because it has been shown to be a powerful technique in
determination of other organic compounds in various sample origins down to ppb level
as reported by Zima et al. (2001), Sun and Jiao (2002), Yardimer and Ozaltin (2004)
and Nouws et al. (2005b).
In this research, the voltammetric behaviour of these compounds would be
studied in great detail and the stripping voltammetry especially differential pulse
stripping voltammetry (DPSV) and square wave stripping voltammetry (SWSV)
techniques could provide accurate and sensitive methods for aflatoxins determination
especially in food sample such as groundnuts, would be investigated.
66
The groundnut is selected for the sample to be analysed in this study since
among foods and foodstuff, peanut and peanuts products are widely utilized as health
food (www.copdockmill.co.uk/aflatoxin). It seem to be significantly contaminated with
aflatoxins. It contains high content of carbohydrate which provides a substrate that is
particularly suitable for toxin production (Neal, 1987). This will affect the quality and
safety of humans life. Futhermore, Aspergillus moulds which produces aflatoxins grow
easy on groundnut.
AFB1, AFB2, AFG1 and AFG2 were selected as the subjects in this study due
to the regulatory requirement for their determination in imported raw grounnuts as
imposed by the Malaysian government to assure that this commodity is free from any
toxin contamination before being supplied for the domestic market. AFM1 and AFM2
are not involved in this study since currently no such regulation imposed by the
Malaysian government even though a regulatory standard has already been set which is
not more 0.05 ppb AFM1 and AFM2 should be present in milk and milk products. For
the time being, the analysis on AFM1 and AFM2 are not being carried out in Malaysia.
The other reason, globally, AFB1, AFB2, AFG1 and AFG2 are more concerned with
their contamination in many food samples compared to AFM1 and AFM2 which
contaminate milk and milk products only.
The objectives of this study are:
a) To investigate the electrochemical behaviour of aflatoxins B1 (AFB1), AFB2,
AFG1 and AFG2 on the mercury electrode in appropriate supporting electrolyte.
b) To establish optimum conditions for the determination of those aflatoxins by
the method of differential pulse cathodic stripping voltammetry (DPCSV) and
square wave stripping voltammetry (SWV) techniques with a HMDE as the
working electrode using Britton-Robinson buffer (BRB) solution as the
supporting electrolyte.
67
c) To develop an accurate, sensitive, fast and simple method for the determination
of all studied aflatoxins in food samples such as ground nut and comparing the
results with the established method such as HPLC.
1.4.2 Scope of Study
The studies are as follows:
a) Studies on the voltammetric behaviour of aflatoxin compounds using cyclic
voltammetry (CV) technique as an introductory step. Using this technique, the
effect of increasing concentration of aflatoxins, scan rate and repetitive scanning
on the peak height (Ip) and peak potential (Ep) of each aflatoxin will be
investigated.
b) Studies on the differential pulse cathodic and anodic stripping voltammetriy
(DPCSV) of all aflatoxins. Parameters optimisation include pH of supporting
electrolyte, accumulation potential (Eacc), accumulation time (tacc), scan rate (υ),
initial potential (Ei), final potential (Ef) and pulse amplitude.
c) Using optimised analytical parameters and experimental conditions, the effect of
increasing concentration of aflatoxins to the Ip of the compounds will be studied.
Regression equation, R2 value, linearity range, limit of detection (LOD), limit of
quantification (LOQ), accuracy and reliability of the method will be obtained.
Ruggedness and robustness tests also will be studied for the proposed technique.
d) The proposed technique will be further investigated in terms of interference
where each aflatoxin will be reacted with increasing amounts of metals ion such
as zinc, aluminum, nickel, lead and copper, and with organic compounds such as
ascorbic acid, L-cysteine and β-cyclodextrin.
68
e) The optimised parameters for DPCSV technique will be applied for square wave
stripping voltammetry (SWSV) including optimisation steps such as the Eacc,
tacc, pulse amplitude, scan rate, voltage step and frequency. The last 3
parameters are interrelated to each other in the SWSV technique.
f) Both DPCSV and SWSV techniques that were successfully developed will be
applied in the determination of aflatoxins content in real samples such as
groundnut. The recovery studies also will be carried out for the accuracy test of
the developed method. The results will be compared with that obtained by
accepted technique such HPLC. For the HPLC analysis, the final solutions from
the extraction and clean-up procedures of groundnut in chloroform were sent to
the Chemistry Department, Penang Branch, Ministry of Science, Technology
and Innovation (MOSTI).
g) The stability of aflatoxins will be determined for aflatoxin stock and standard
solutions according to the following procedures
i) Aflatoxin stock solutions prepared in benzene: acetonitrile (98:2)
will be studied using ultra-violet-visible spectrophotometer. In
this analysis, each aflatoxin stock solution will be monitored
every month (from 0 to 12 months) and the concentrations of
aflatoxins will be calculated from the measured absorbance.
ii) Aflatoxin standard solutions in BRB which was kept in the
freezer at -4.00 C will be measured using voltammetric technique
monthly up to 6 months
iii) Aflatoxin standard solutions in BRB which have been added into
the voltammetric cell and exposed to ambient temperature will be
onitored every hour (from 0 to 8 hours) by measuring their peak
height and peak potential

69
iv) Aflatoxin standard solution in BRB which was added into the
voltammetric cell containing BRB at different pH (6.0, 7.0, 9.0
and 11.0) and exposed to ambient temperature will be monitored
every hour (from 0 to 3 hours) by measuring their peak height
and peak potential.
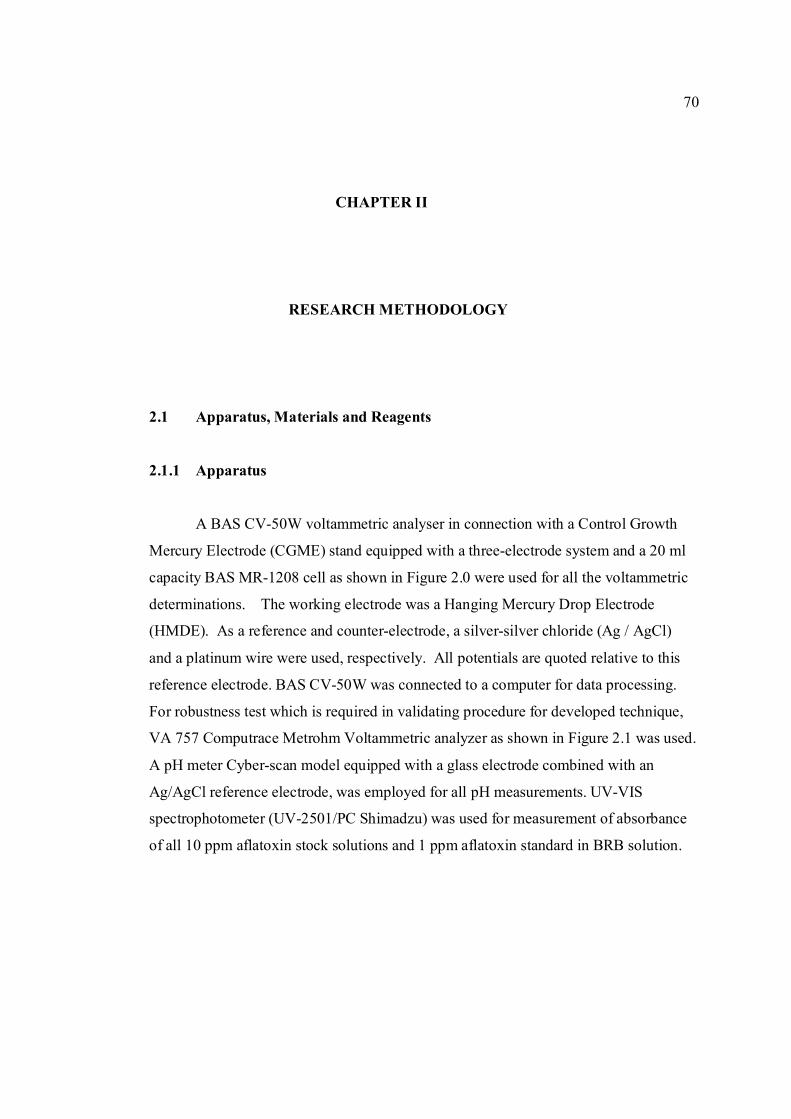
70
CHAPTER II
RESEARCH METHODOLOGY
2.1 Apparatus, Materials and Reagents
2.1.1 Apparatus
A BAS CV-50W voltammetric analyser in connection with a Control Growth
Mercury Electrode (CGME) stand equipped with a three-electrode system and a 20 ml
capacity BAS MR-1208 cell as shown in Figure 2.0 were used for all the voltammetric
determinations. The working electrode was a Hanging Mercury Drop Electrode
(HMDE). As a reference and counter-electrode, a silver-silver chloride (Ag / AgCl)
and a platinum wire were used, respectively. All potentials are quoted relative to this
reference electrode. BAS CV-50W was connected to a computer for data processing.
For robustness test which is required in validating procedure for developed technique,
VA 757 Computrace Metrohm Voltammetric analyzer as shown in Figure 2.1 was used.
A pH meter Cyber-scan model equipped with a glass electrode combined with an
Ag/AgCl reference electrode, was employed for all pH measurements. UV-VIS
spectrophotometer (UV-2501/PC Shimadzu) was used for measurement of absorbance
of all 10 ppm aflatoxin stock solutions and 1 ppm aflatoxin standard in BRB solution.
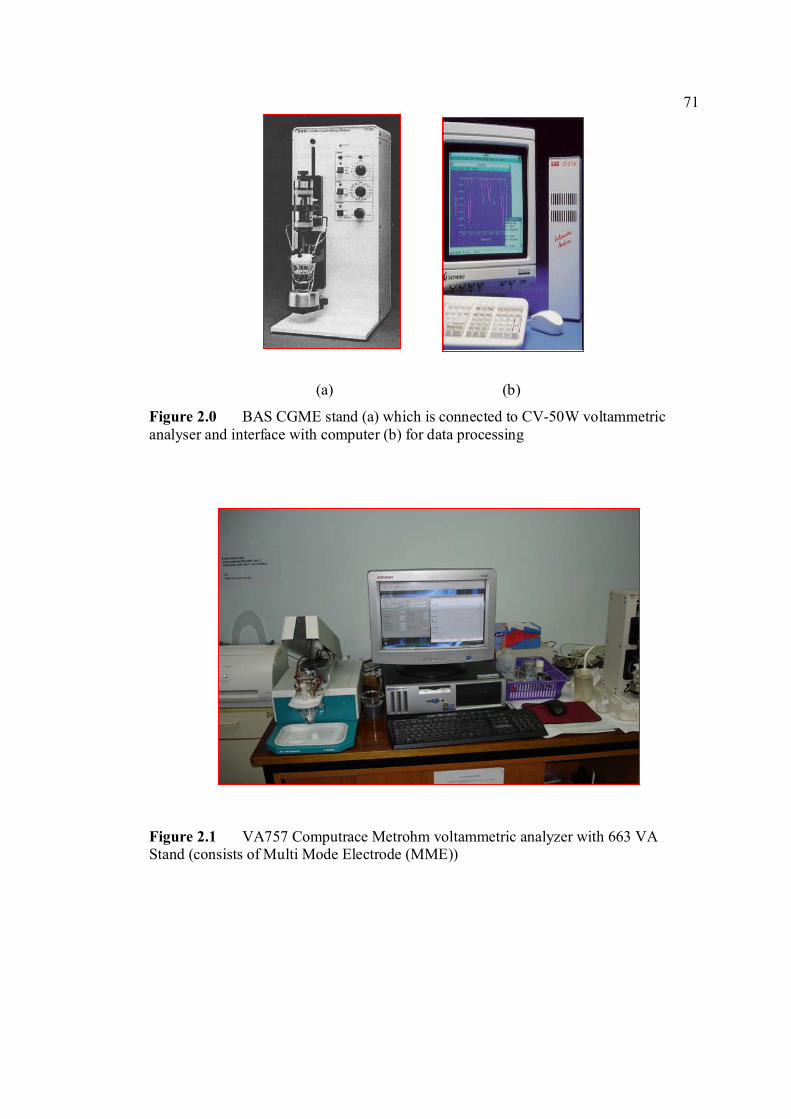
71
(a) (b)
Figure 2.0 BAS CGME stand (a) which is connected to CV-50W voltammetric analyser and interface with computer (b) for data processing
Figure 2.1 VA757 Computrace Metrohm voltammetric analyzer with 663 VA Stand (consists of Multi Mode Electrode (MME))
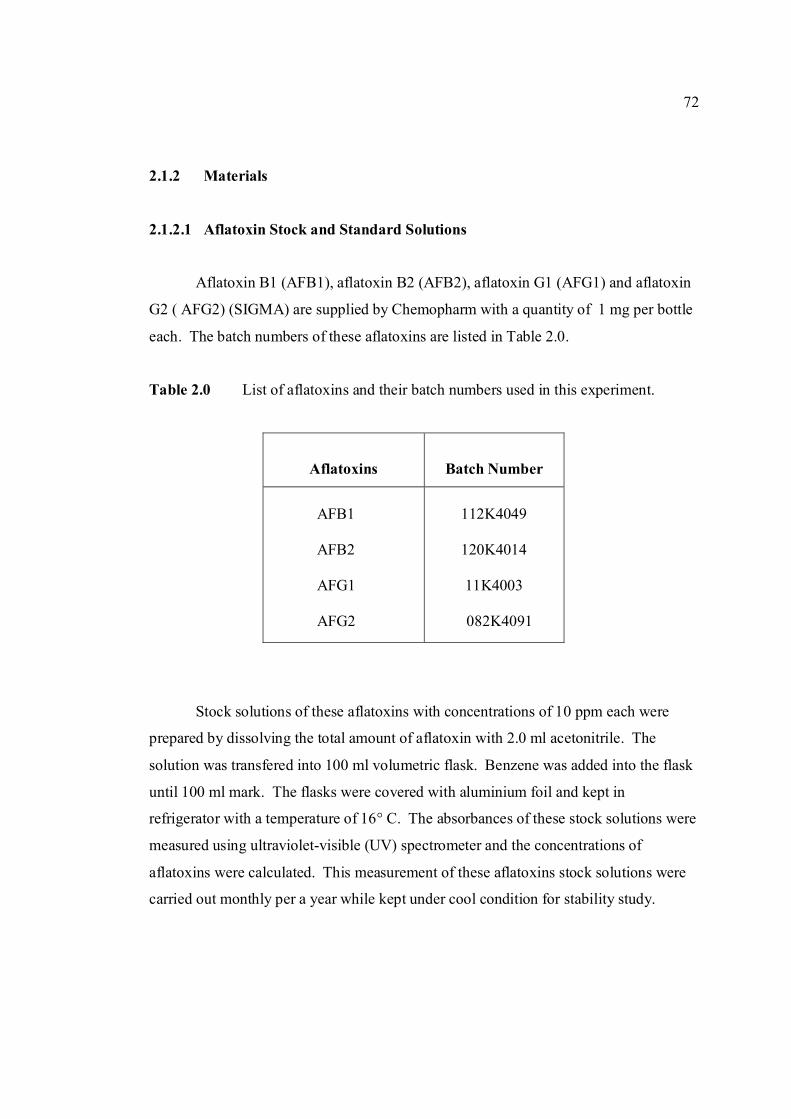
72
2.1.2 Materials
2.1.2.1 Aflatoxin Stock and Standard Solutions
Aflatoxin B1 (AFB1), aflatoxin B2 (AFB2), aflatoxin G1 (AFG1) and aflatoxin
G2 ( AFG2) (SIGMA) are supplied by Chemopharm with a quantity of 1 mg per bottle
each. The batch numbers of these aflatoxins are listed in Table 2.0.
Table 2.0 List of aflatoxins and their batch numbers used in this experiment.
Stock solutions of these aflatoxins with concentrations of 10 ppm each were
prepared by dissolving the total amount of aflatoxin with 2.0 ml acetonitrile. The
solution was transfered into 100 ml volumetric flask. Benzene was added into the flask
until 100 ml mark. The flasks were covered with aluminium foil and kept in
refrigerator with a temperature of 16° C. The absorbances of these stock solutions were
measured using ultraviolet-visible (UV) spectrometer and the concentrations of
aflatoxins were calculated. This measurement of these aflatoxins stock solutions were
carried out monthly per a year while kept under cool condition for stability study.
Aflatoxins
Batch Number
AFB1
AFB2
AFG1
AFG2
112K4049
120K4014
11K4003
082K4091
73
For preparation of aflatoxins standard solution with concentration of 1 ppm, 1
ml of the stock solution was pipetted and placed into an amber bottle. Nitrogen was
bubbled into the solution to remove all the organic solvent until dryness followed with
an addition of 10 ml BRB at pH of 9.0. The solution was well mixed and kept in
freezer at temperature of -4 0 C. This standard solution was analysed by voltammetric
technique very month for 6 months to observe the stability of the aflatoxins in buffered
solution. To obtain the concentration of 0.1 µM of AFB1, AFB2, AFG1 and AFG2
each in 10 ml supporting electrolyte, an amount of 312, 315, 328 and 330 µl was
injected into the cell respectively.
2.1.2.2 Real Samples
Real samples such as groundnut were purchased from a few domestic shops
which are located in Taman Universiti, Skudai, Johor. These samples were labeled as
S01 to S15.
2.1.3 Reagents
The chemicals used were all of analytical reagent quality grade and the
solutions were prepared with de-ionised water obtained from a Barnstead Ultra
Nanopure water system. 1% of sodium hypochlorite was used to clean all glasswares
used.
2.1.3.1 Britton-Robinson Buffer (BRB), 0.04 M
BRB with a buffering range from 2.0 to 12 was prepared by dissolving 2.47 g of
boric acid (Fluka) in a 1liter flask containing 2.3 ml of glacial acetic acid (MERCK)
and 2.70 ml orthophosphoric acid (Ashland Chemical) and then further diluting to the 1
liter mark with deionised water. The pH of the buffer solution was adjusted to the
74
required value by addition of 1.0 M sodium hydroxide (MERCK) or 1.0 M
hydrochloric acid solutions (MERCK).
2.1.3.2 Carbonate Buffer, 0.04 M
Carbonate buffer with a buffering range from pH 9.0 to 12 was prepared by
mixing two different solutions which were firstly prepared. The first solution, 0.04 M
sodium bicarbonate was prepared by dissolving 3.36 g sodium bicarbonate (MERCK) in
a 1 liter of de-ionised water. Similarly, for the second solution, 0.04 M sodium
carbonate was prepared by dissolving 4.24 g sodium carbonate (MERCK) in 1 liter of
deionised water. The pH of the buffer was adjusted to the required value by mixing the
two solutions.
2.1.3.3 Phosphate Buffer, 0.04 M
Phosphate buffer was prepared by mixing two different solutions which were
firstly prepared. The first solution, 0.04 M potassium hydrogen phosphate was prepared
by dissolving 5.44 g potassium hydrogen phosphate (BDH) in a 1 liter of deionised
water. Similarly, for the second solution, 0.04 M sodium hydrogen phosphate was
prepared by dissolving 5.68 g sodium hydrogen phosphate (BDH) in 1 liter of deionised
water. The pH of the buffer was adjusted to the required value by mixing the two
solutions.
2.1.3.4 Ascorbic Acid Solution, 1.0 mM
This solution was prepared by dissolving 0.0176 g of ascorbic acid (GCE) in
100 ml of de-ionised water.
75
2.1.3.5 β-cyclodextrin (β-CD) Solution, 1.0 mM
This solution was prepared by dissolving 0.1135 g of C42H70O35 (Fluka) in 100
ml of de-ionised water.
2.1.3.6 L-cysteine, 1.0 x 10⁻⁵ M
This solution was prepared by dissolving 0.012 g of cysteine (SIGMA) in 100
ml of de-ionised water. 1.0 ml of this solution was diluted to 100 ml with de-ionised
water.
2.1.3.7 2,4-dihydrofuran, 0.15 M
This solution was prepared by diluting 1.105 ml of 13.57 M of 2,4 dihydrofuran
(SIGMA) into 100 ml with de-ionised water.
2.1.3.8 Coumarin, 3.0 x 10⁻² M
This solution was prepared by dissolving 0.21 g of coumarin (SIGMA) in 50 ml
methanol.
2.1.3.9 Poly-L-lysine (PLL), 10 ppm
This solution was prepared by dissolving 0.001 g of poly-l-lysine (SIGMA) in
100 ml de-ionised water.
2.1.3.10 Standard Aluminium (III) Solution, 1.0 mM
The standard aluminium (III) solution was prepared by dissolving 0.5212 g of
Al(NO3)3.9H2O (MERCK) in 100 ml de-ionised water.
76
2.1.3.11 Standard Plumbum (II) Solution, 1.0 mM
The standard plumbum (II) solution was prepared by dissolving 0.0530 g
Pb(NO3)2 (EMORY) in 100 ml deionised water.
2.1.3.12 Standard Zinc (II) Solution, 1.0 mM
The standard zinc (II) solution was prepared by dissolving 0.121g ZnSO4.5H2O
(BDH) in 100 ml de-ionised water.
2.1.3.13 Standard Copper (II) Solution, 1.0 mM
The standard copper (II) solution was prepared by dissolving 0.0980 g.
CuSO4.7H2O (GCE) in 100 ml de-ionised water.
2.1.3.14 Standard Nickel (II) Solution, 1.0 mM
The standard nickel (II) solution was prepared by dissolving 0.0963 g
NiCl2.6H2O (MERCK) in 100 ml deionised water.
2.1.3.15 Methanol: 0.1 N HCl Solution, 98 %
This solution was prepared by mixing 98 ml of methanol and 2 ml 0.1 N HCl.
2.1.3.16 Zinc Sulphate Solution, 15%
This solution was prepared by dissolving 15 g of zinc sulphate (MERCK) in 100
ml de-ionised water.
77
2.2 Analytical Technique
2.2.1 General Procedure for Voltammetry Analysis
The general procedure used to obtain stripping voltammograms was according
to the following procedures. A 10 ml aliquot of buffer solution was placed in a
voltammographic cell and the required aflatoxin standard solution was added using a
micropipette. The stirrer was switched on at 300 rpm and the solution was purged with
nitrogen gas for 10 minute. After forming a new HMDE, accumulation was effected for
the required time at the appropriate potential while stirring the solution. A medium
mercury drop size was used. At the end of the accumulation time the stirring was
switched off and after 10 s had elapsed to allow the solution to become quiescent, the
negative going potential was initiated. When further volume of aflatoxin were added to
the cell, the solution was redeoxygenated with nitrogen gas for another 2 minute before
carrying out further voltammetric determination following the mentioned general
procedures.
2.2.2 Cyclic Voltammetry (Anodic and Cathodic Directions)
Cyclic voltammetry of all aflatoxins were carried out by anodic and cathodic
cyclic techniques. The initial parameters for cathodic cyclic voltammetry are as
follows; initial potential (Ei) = 0 V, high potential, (EH) = 0 V, low potential (EL) = -
1.50 V, scan rate (υ)= 200 mV/s, quiet time = 10 s and sensitivity = 1 µA/V. For anodic
cyclic voltammetry, all previous parameters were maintained except for Ei = -1.50 V.
The concentration of aflatoxins used for these experiments were fixed at 1.3 µM.
2.2.2.1 Standard Addition of Sample
5 ppm (1.59 x 10⁻⁵ M) AFB2 standard solution was prepared by taking 5.0 ml
aflatoxin stock solution, degassed until dryness and redissolved in BRB pH 9.0. For
cyclic voltammetry experiment, general procedure as previouly mentioned was
78
followed. A 818 µl of 1.59 x 10⁻⁵ M AFB2 standard solution was then added into
voltammetric cell containing 10 ml of supporting electrolyte which resulted in
concentration of aflatoxin of 1.3 µM in the cell. The solution was purged with nitrogen
for 120 s before being scanned. Further series of scans were carried out with increasing
concentration of the aflatoxins from 2.0 to 3.4 µM. Subsequently a purge of 120 s was
employed between the cyclic voltammetry. A graph of peak current against aflatoxin
concentration was plotted and linearity of the curve was calculated. This method was
repeated for other aflatoxins.
2.2.2.2 Repetitive Cyclic Voltammetry
Using the aflatoxins with concentration of 1.3 µM, repetitive cyclic voltammetry
for anodic and cathodic direction were run using the same parameters as mentioned
before with the υ of 200 mV/s and 10 cyclic number. Any change in the Ip and Ep
height of all aflatoxins due to the increasing number of the cycle were observed.
2.2.2.3 Effect of Scan Rate (υ)
The whole procedure for cyclic voltammetry was repeated for all aflatoxins with
different υ from 20 mV/s to 500 mV/s while other parameters kept constant. The
applied υ were 20, 40, 60, 80, 100, 200, 300, 400 and 500 mV/s. Any change in the Ip
and Ep of all aflatoxins due to the changing of the υ were observed. Graphs of log Ip
against log υ, Ep versus log υ and Ip versus υ were plotted.
2.2.3 Differential Pulse Cathodic Stripping Voltammetric Determination of
AFB2
A 315 µl of 1 ppm (0.318 x 1-0-5 M) AFB2 sample solution in BRB at pH 9.0
was added by means of micropipette into the cell which contained 10 ml of the BRB
with the same pH. The resulting concentration of sample in the voltammetric cell is 0.1
µM (31.4 ppb). The solution was deoxygenated with nitrogen free oxygen for 120 s
79
before carrying out further voltammetry. Three further series of sample additions were
employed with a purge of 120 s were performed between each cathodic stripping cycle.
2.2.3.1 Effect of pH
The following general procedure was carried out. A 1.26 ml of 5 ppm (1.59 x
10-5 M) AFB2 standard solution was added by means of micropipette into the cell which
contained 8.74 ml of BRB at pH 9.0. The resulting concentration of sample in
voltammetric cell is 2.0 µM (628 ppb). The solution was deoxygenated with nitrogen
for 120 s before carrying out further voltammetry. The whole procedure was repeated
for series of buffer from pH 4.0 to 13.0 and a graph of Ip vs. pH was then plotted.
2.2.3.2 Method Optimisation for the Determination of AFB2
The optimisation steps for determination of AFB2 were carried out using two
different concentrations of AFB2 which were 2.0 uM and 0.02 µM for high and low
concentrations respectively. The initial parameters used for this optimisation steps are;
Ei = 0 mV, Ef = -1500 mV, Eacc = 0 mV, tacc = 0, υ = 20 mV/s, pulse implitude = 100
mV and quite time = 10 s. General procedure for voltammetric analysis was employed.
The Ip and Ep values were observed. The same procedure was repeated with the same
parameters except for tacc was 30 s. For the optimisation steps, the influence of each
parameter on the Ip and Ep of AFB2 was studied. In each experiment, one of the
parameters was varied while others were kept constant.
2.2.3.2a Effect of Scan Rate (υ)
After the best condition of pH was chosen, the effect of υ was carried out. The υ
were varied from 20 to 100 mV/s while maintaining other parameters constant.
Subsequently a purge of nitrogen gas for 120 s was employed between cathodic
stripping cycles. A graph of Ip against υ was then plotted and the best υ was then
selected.
80
2.2.3.2b Effect of Accumulation Potential (Eacc)
The general procedure was followed with the best condition of pH and υ set to
the required value. Effect of Eacc was carried out with other parameters kept unchanged
as previously mentioned. A graph of Ip against Eacc was then plotted.
2.2.3.2c Effect of Accumulation Time (tacc)
Using the best condition for Eacc, tacc and pH of BRB solution, general procedure
was followed where a series of scans with increasing tacc were carried out. A graph of Ip
against tacc was then plotted.
2.2.3.2d Effect of Initial Potential (Ei)
The effect of Ei to the Ip using the chosen previous optimised parameters was
carried out where a series of scans with different Ei while Ef kept constant were
performed. The effect of Ei was carried out with variation of 0 V to -1.10 V and
increasing towards more negative potential until it reached the required maximum Ip. A
graph of Ip against Ei was then plotted.
2.2.3.2e Effect of Pulse Amplitude
The best conditions of other parameter were chosen and the pulse amplitude was
optimised as the final step in this optimisation procedure. The effect of pulse amplitude
was carried out with variation of 30 to 100 mV. A graph of Ip against pulse amplitude
was then plotted.
2.2.3.3 Method Validation
Validation of the method was examined via evaluation of linearity, limit of
detection (LOD), limit of quantification (LOQ), accuracy, repeatability, reproducibility,
81
recovery, robustness and ruggedness. Multiple scanning of blank before addition of
AFB2 standard solution was performed. LOD was calculated by standard addition of
low concentration of aflatoxins until a response was obtained that is significantly
different from the blank sample (Barek et al., 2001a). The intra-assay and inter-assay
precision for AFB2 was calculated from repeated analysis of certain concentration of
AFB2 during one working day and on different days respectively. Recovery study for
the accuracy of the method were performed by adding an amount of AFB2 into the
eluate of real samples and after extraction and clean-up procedures before being
analysed for AFB2 and percentage recovery of AFB2 was calculated. The robustness,
as a measure of procedure’s capability to remain unaffected by small variations of some
important procedure conditions, was examined by analysis of 0.1 µM AFB2 (31.4 ppb)
under the successive variation of pH of the supporting electrolyte (pH 8.5 – 9.5), Eacc
(from - 0.59 to - 0.61 V) and tacc (75 – 85 s). The ruggedness of the measurement was
examined by applying the proposed procedure to assay of aflatoxin using two different
models of voltammetry instruments that were BAS and Metrohm voltammetry
analysers.
For other aflatoxins (AFB1, AFG1 and AFG2) the same procedures were
followed as mentioned for AFB2 including method validation as well. For all cases,
each calibration curve was constructed and the same statistical parameters were
evaluated.
2.2.3.4 Interference Studies
2.2.3.4a Effect of Cu (II), Ni (II), Al (III), Pb (II) and Zn (II)
The effect of all the above metals on the measurement of 0.1 µM of aflatoxin in
BRB pH 9 was carried out by adding a series of concentration of all metal standard
solutions into the aflatoxin solution in the voltammetric cell started from 0.1 to 1.0 µM
concentration. The graphs of Ip of respective aflatoxin against the concentration of all
standard solutions were plotted.
82
2.2.3.4b Effect of Ascorbic Acid, β-CD and L-cysteine
The effect of ascorbic acid, β-CD and L-cysteine on the measurement of 0.1µM
of aflatoxin in BRB pH 9 were carried by adding a series of concentration of ascorbic
acid, β-CD and L-cysteine solutions into the aflatoxin solution in the voltammetric cell
from 0.1 to 1.0 µM concentration of each compound. The graphs of Ip of respective
aflatoxin against the concentration of added acorbic acid, β-CD and L-cysteine were
plotted.
2.2.3.5 Modified Mercury Electrode with Poly-L-Lysine (PLL)
10 ml of BRB solution at pH 9.0 was pipetted into voltammetric cell followed
with 10 µl of PLL and 0.1 µM aflatoxins. The solution was purged for 10 minutes
before general procedure for voltammetric determination was applied. Ip of 0.1µM
AFB2 was measured. The procedure was repeated by using different pH of BRB.
2.2.4 Square Wave Cathodic Stripping Voltammetry (SWSV)
All optimised parameters which were obtained using DPCSV were applied using
SWSV for determination of 0.1 µM of each aflatoxin.
2.2.4.1 SWSV Parameters Optimisation
All SWSV parameters such as pulse amplitude, voltage step and frequency were
optimised to obtain maximum Ip and defined peak for AFB2. For this optimisation
procedure, 0.1 µM AFB2 was used.
2.2.4.2 SWSV Determination of All Aflatoxins
Other aflatoxins with concentration of 0.1 µM have been measured using SWSV
technique with optimised parameters. The results of Ip and Ep of all aflatoxins were
83
compared with those obtained by DPCSV technique. The effect of concentration on Ip
and Ep of aflatoxins has been observed. The plot of Ip versus concentration of
respective aflatoxin was constructed and all statistical parameters were evaluated.
2.2.5 Stability Studies of Aflatoxins
These studies were carried out by a series of experiments according to the
procedures elaborated below;
2.2.5.1 Stability of 10 ppm Aflatoxins
Stability of 10 ppm aflatoxin stock solutions prepared in benzene: acetonitrile
(98%) was monitored using UV-VIS spectrophotometer using 98% of benzene:
acetonitrile as a blank. 1 ml of sample was scanned three times starting from λ of 500
nm to 280 nm. This measurement was done every month from first day of preparation
for 12 months period time. The concentration of each aflatoxin were calculated using
the formula as stated in Appendix D.
2.2.5.2 Stability of 1 ppm Aflatoxins
Stability of 1ppm aflatoxin standard solutions prepared in BRB pH 9.0 was
performed using DPCSV method. In this experiment, 0.1 µM of each aflatoxin was
scanned every month from first to 6th month. The graph of Ip current against months of
keeping period was plotted.
2.2.5.3 Stability of 0.1 µM Aflatoxins Exposed to Ambient Temperature
Stability study of 0.1 µM aflatoxins in BRB pH 9.0 which was exposed to the
ambient temperature in voltammetric cell was performed using DPCSV method. In this
experiment, 0.1 µM of each aflatoxin was scanned every hour from 0 to 8th hour
84
exposure time. The graph of Ip against exposure time was plotted. Nitrogen gas was
purged for 10 min before performing each scan.
2.2.5.4 Stability of 0.1µM Aflatoxins in Different pH of BRB
Stability of 0.1µM aflatoxins in different pH of BRB (6 to 11.0) were observed.
For each pH value, the Ip of aflatoxin was measured for 3 hours. The graph of Ip against
exposure time for each pH of BRB was plotted.
2.2.6 Application to Food Sample
Fifteen batches of real samples (groundnut) were purchased and labeled with
S01 to S15 were used in this study. The samples were subjected to the extraction and
clean-up procedure prior voltammetric analysis using DPCSV and SWSV techniques.
A few techniques which were named as Technique 1, 2 and 3 were studied for
extraction and clean-up of real samples.
2.2.6.1 Technique 1
50 g of groundnut samples were weighed into 250 ml blender, then 100 ml of
acetonitrile-water (9:1) solution were added and shaken for 1 hour. The extraction
solution was filtered through a pre-pleated filter paper to remove solid material and
extract was collected and kept for analysis (Pena et al., 2002).
2.2.6.2 Technique 2
Groundnut samples were first ground in a household blender at high speed for
3 minutes. For extraction, 10 ml of methanol-water (80:20) was added to 5g of sample,
followed by 5 ml hexane. The suspension was hand shaken for 3 minutes and then
passed through Whatman No. 4 filter paper. The aqueous layer was diluted 1 in 10 for
the assays to avoid any interference from methanol, hence the consequence aflatoxin’s
85
concentration in the extracted solution was 1/20th that in groundnut samples. The
extraction took approximately 15 minutes to perform (Garden et al., 2001)
2.2.6.3 Technique 3
This technique is adapted by The Chemistry Department, Penang Branch,
Ministry of Science, Technology and Innovation (MOSTI), Pulau Pinang (2003) as
shown in Appendix E. 1.0 ml of final solution in chloroform was taken and put into an
amber bottle followed with degassing and re-dissolved in 1.0 ml BRB at pH 9.0 before
spiking into voltammetric cell for analysis.
2.2.6.4 Blank Measurement
For blank measurement, the procedure of extraction and clean-up steps were
followed as previously mentioned in Appendix E without addition of real sample. The
blank consisted of methanol, 0.1 N HCl, 15% ZnSO4 and chloroform. 1.0 ml of final
solution was collected from extraction procedure in chloroform, degassed and re-
dissolved in 1.0 ml of BRB at pH 9.0.
2.2.6.5 Recovery Studies
Recovery studies for aflatoxins in groundnut samples were performed using
DPCSV and SWSV techniques. For this study, a certain volume of 1.0 ppm of
aflatoxins as listed in Table 3.3 were injected into 20.0 ml of eluate from blended real
sample (Ammida et al., 2004). The sample with injected aflatoxins was then mixed
with 20.0 ml zinc sulphate, 15%. The total amount of added aflatoxins in the cell
obtained by respective injected volume is shown in Table 2.1. The solution was well
mixed for 30 s and subjected to extraction procedure as previously mentioned. Sample
solution was prepared by degassed of 1 ml of chloroform until dryness followed with
dissolution in BRB at pH 9.0.
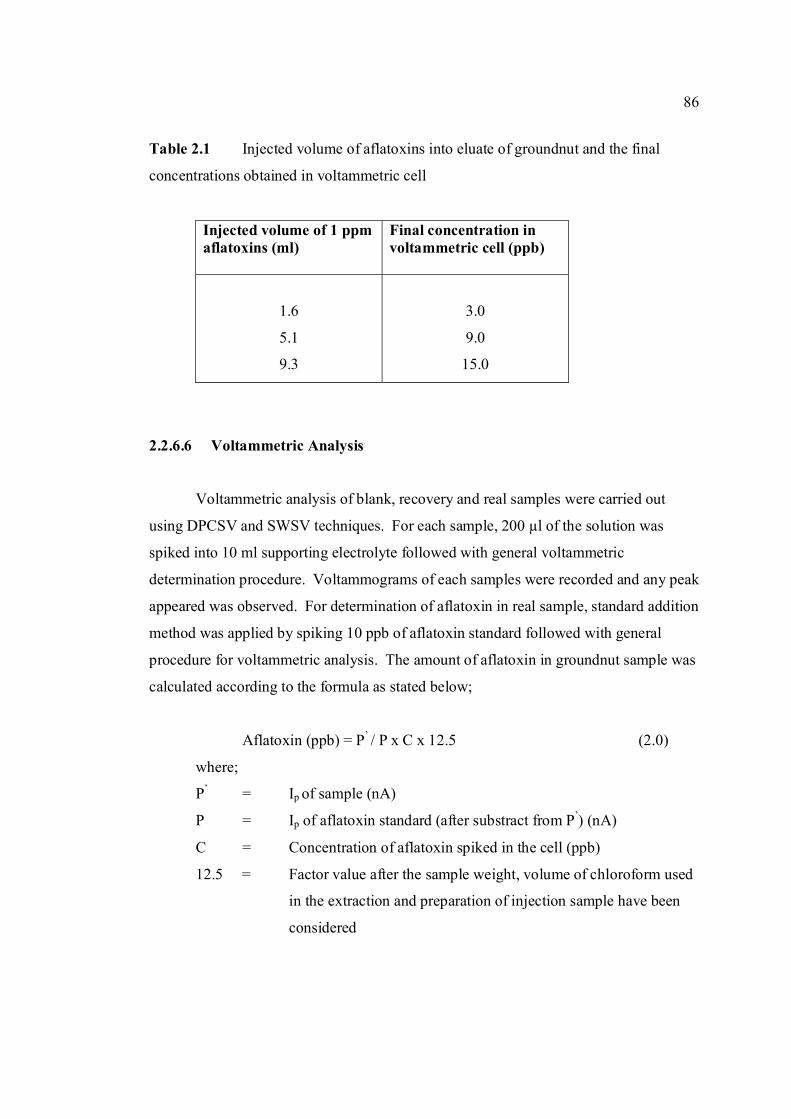
86
Table 2.1 Injected volume of aflatoxins into eluate of groundnut and the final
concentrations obtained in voltammetric cell
Injected volume of 1 ppm aflatoxins (ml)
Final concentration in voltammetric cell (ppb)
1.6
5.1
9.3
3.0
9.0
15.0
2.2.6.6 Voltammetric Analysis
Voltammetric analysis of blank, recovery and real samples were carried out
using DPCSV and SWSV techniques. For each sample, 200 µl of the solution was
spiked into 10 ml supporting electrolyte followed with general voltammetric
determination procedure. Voltammograms of each samples were recorded and any peak
appeared was observed. For determination of aflatoxin in real sample, standard addition
method was applied by spiking 10 ppb of aflatoxin standard followed with general
procedure for voltammetric analysis. The amount of aflatoxin in groundnut sample was
calculated according to the formula as stated below;
Aflatoxin (ppb) = P’ / P x C x 12.5 (2.0)
where;
P’ = Ip of sample (nA)
P = Ip of aflatoxin standard (after substract from P’) (nA)
C = Concentration of aflatoxin spiked in the cell (ppb)
12.5 = Factor value after the sample weight, volume of chloroform used
in the extraction and preparation of injection sample have been
considered
87
The detailed information on how this formula was formulated are shown in Appendix F
The results were compared with that obtained by HPLC technique. The HPLC
system used was a Waters model comprising WATERS 600 controller, WATERS 717
auto sampler, WATERS temperature control module and MILLENIUM
chromatography manager, equipped with a model WATERS 420-AC fluorescence
detector filled with standard optical filters with 338 nm bandpass excitation filter and
425 nm longpass emission filter, gain; 16 and maximum span. For chromatographic
separation, a Nova-Pak C-18 steel column (150 x 3.9 mm, 4um particle size) was
employed. The separation was carried out at room temperature using, as the mobile
phase of 70% water, 20 % methanol and 10 % acetonitrile with a flow rate of 1.6 ml /
min at column temperature of 30° C. The injection volume was 30 µl with 12 min for
running time.
88
CHAPTER III
RESULTS AND DISCUSSION
3.1 Cyclic Voltammetric Studies of Aflatoxins
Cyclic voltammetric (CV) experiment is normally carried out for the initial
electroanalytical studies of any compound to obtain information on electroanalytical
properties of the compounds before being investigated in depth using other
electroanalytical techniques is carried out (Wang, 2000). In this work, all aflatoxins
(AFB1, AFB2, AFG1 and AFG2) have been initially analysed by this technique. The
main objective of this experiment was to obtain the electroanalytical properties of
aflatoxin at different scan rates in various pH of BRB solution. Any current peak that
appeared from the voltammogram was evaluated to confirm the type of reaction of
aflatoxin on the mercury electrode. The repetitive cyclic voltammetry were also
performed at certain CV parameters such as scan rate of 200 mV/s in BRB solution with
pH of 9.0. This experiment was carried out to observe the process of accumulation of
aflatoxins on mercury electrode with longer accumulation time. Various pH medium of
BRB have been used in these experiments to observe any involvement of hydronium
ion in the electrode processs of aflatoxins on the mercury electrode (Kamal et al.,
1996). The peak potentials of these compounds which were measured throughout this
work were against an Ag/AgCl as the reference electrode.
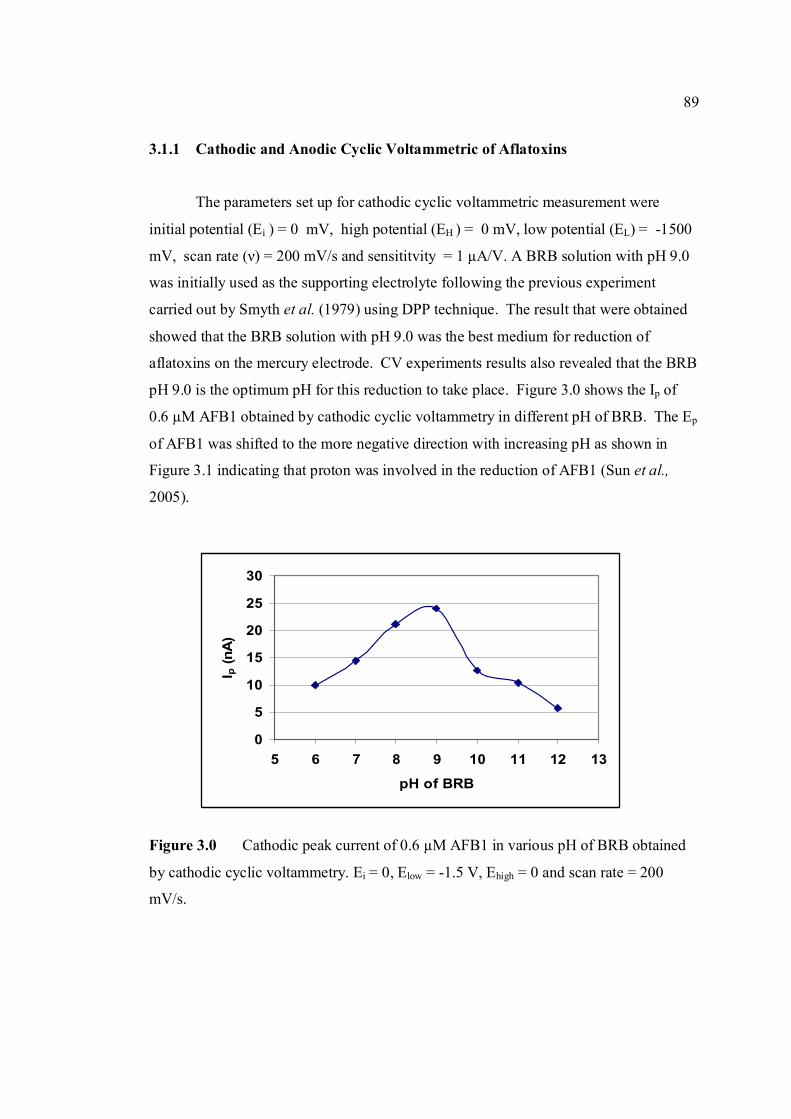
89
0
5
10
15
20
25
30
5 6 7 8 9 10 11 12 13
pH of BRB
I p (n
A)
3.1.1 Cathodic and Anodic Cyclic Voltammetric of Aflatoxins
The parameters set up for cathodic cyclic voltammetric measurement were
initial potential (Ei ) = 0 mV, high potential (EH ) = 0 mV, low potential (EL) = -1500
mV, scan rate (ν) = 200 mV/s and sensititvity = 1 µA/V. A BRB solution with pH 9.0
was initially used as the supporting electrolyte following the previous experiment
carried out by Smyth et al. (1979) using DPP technique. The result that were obtained
showed that the BRB solution with pH 9.0 was the best medium for reduction of
aflatoxins on the mercury electrode. CV experiments results also revealed that the BRB
pH 9.0 is the optimum pH for this reduction to take place. Figure 3.0 shows the Ip of
0.6 µM AFB1 obtained by cathodic cyclic voltammetry in different pH of BRB. The Ep
of AFB1 was shifted to the more negative direction with increasing pH as shown in
Figure 3.1 indicating that proton was involved in the reduction of AFB1 (Sun et al.,
2005).
Figure 3.0 Cathodic peak current of 0.6 µM AFB1 in various pH of BRB obtained
by cathodic cyclic voltammetry. Ei = 0, Elow = -1.5 V, Ehigh = 0 and scan rate = 200
mV/s.
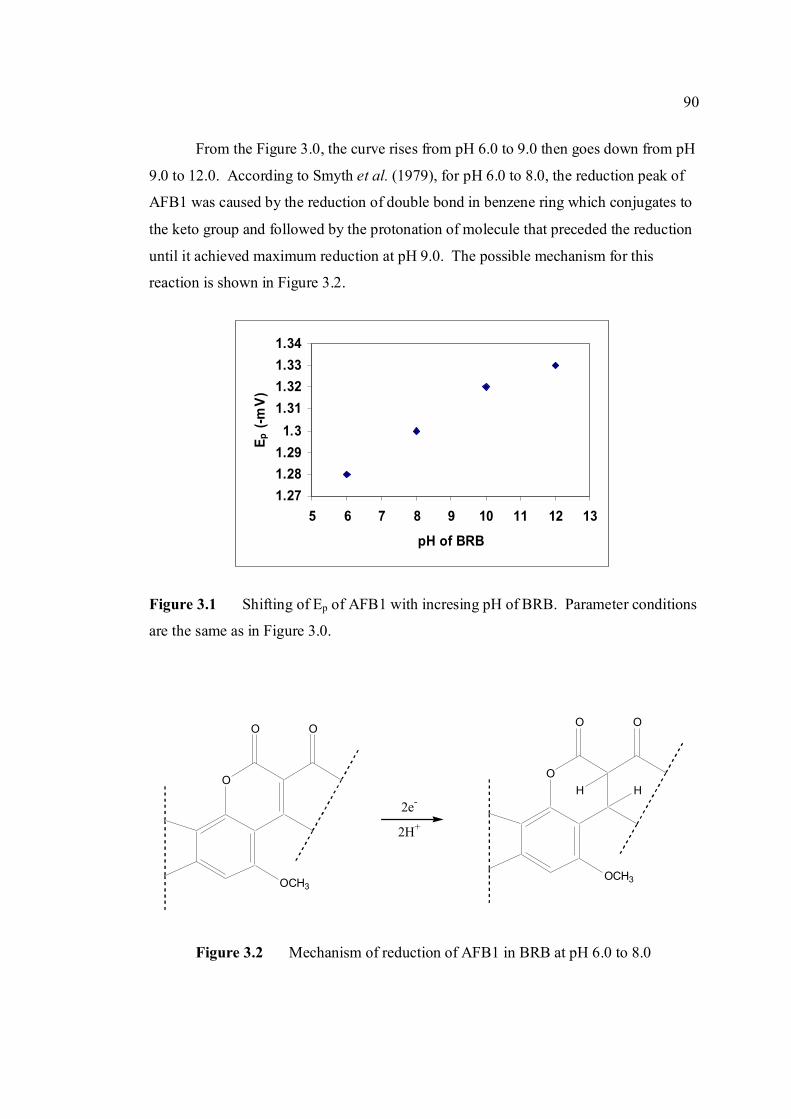
90
O
OO
OCH3
2H+
O
OO
OCH3
H H2e-
1.271.281.29
1.31.311.321.331.34
5 6 7 8 9 10 11 12 13
pH of BRB
E p (-
mV)
From the Figure 3.0, the curve rises from pH 6.0 to 9.0 then goes down from pH
9.0 to 12.0. According to Smyth et al. (1979), for pH 6.0 to 8.0, the reduction peak of
AFB1 was caused by the reduction of double bond in benzene ring which conjugates to
the keto group and followed by the protonation of molecule that preceded the reduction
until it achieved maximum reduction at pH 9.0. The possible mechanism for this
reaction is shown in Figure 3.2.
Figure 3.1 Shifting of Ep of AFB1 with incresing pH of BRB. Parameter conditions
are the same as in Figure 3.0.
Figure 3.2 Mechanism of reduction of AFB1 in BRB at pH 6.0 to 8.0
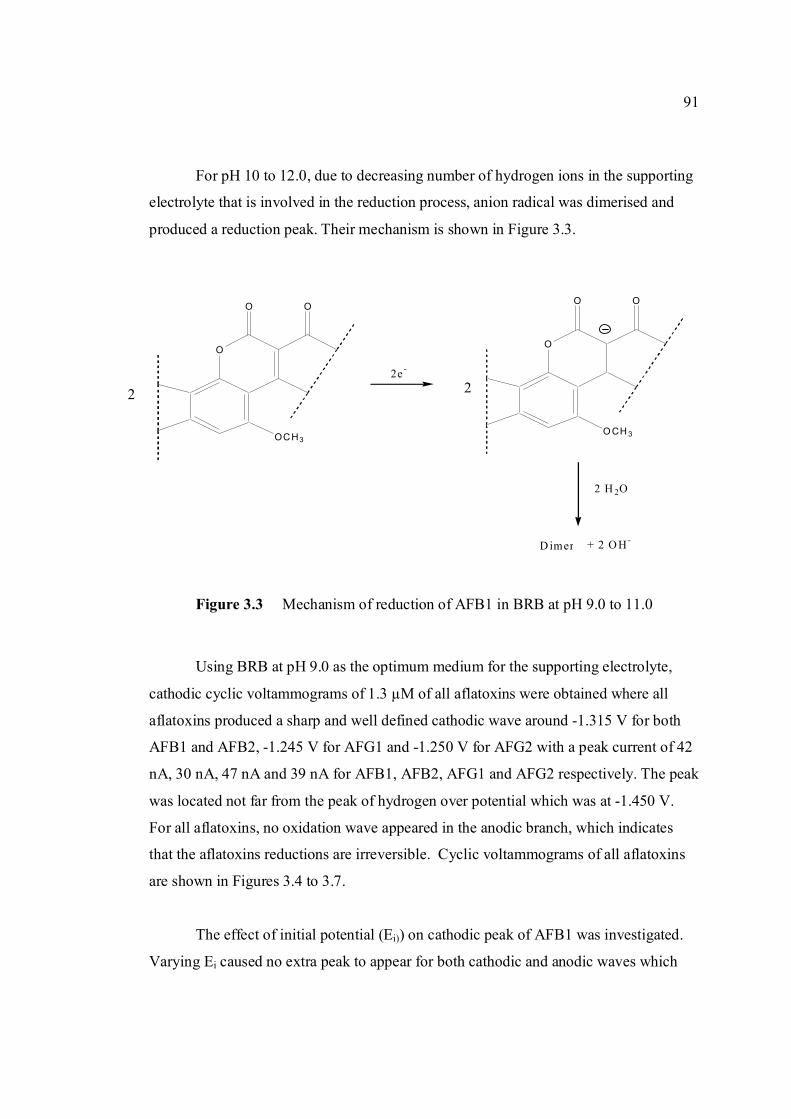
91
O
OO
O CH 3
O
OO
OCH3
2 H 2O
D imer + 2 O H-
2e -
2 2
For pH 10 to 12.0, due to decreasing number of hydrogen ions in the supporting
electrolyte that is involved in the reduction process, anion radical was dimerised and
produced a reduction peak. Their mechanism is shown in Figure 3.3.
Figure 3.3 Mechanism of reduction of AFB1 in BRB at pH 9.0 to 11.0
Using BRB at pH 9.0 as the optimum medium for the supporting electrolyte,
cathodic cyclic voltammograms of 1.3 µM of all aflatoxins were obtained where all
aflatoxins produced a sharp and well defined cathodic wave around -1.315 V for both
AFB1 and AFB2, -1.245 V for AFG1 and -1.250 V for AFG2 with a peak current of 42
nA, 30 nA, 47 nA and 39 nA for AFB1, AFB2, AFG1 and AFG2 respectively. The peak
was located not far from the peak of hydrogen over potential which was at -1.450 V.
For all aflatoxins, no oxidation wave appeared in the anodic branch, which indicates
that the aflatoxins reductions are irreversible. Cyclic voltammograms of all aflatoxins
are shown in Figures 3.4 to 3.7.
The effect of initial potential (Ei)) on cathodic peak of AFB1 was investigated.
Varying Ei caused no extra peak to appear for both cathodic and anodic waves which
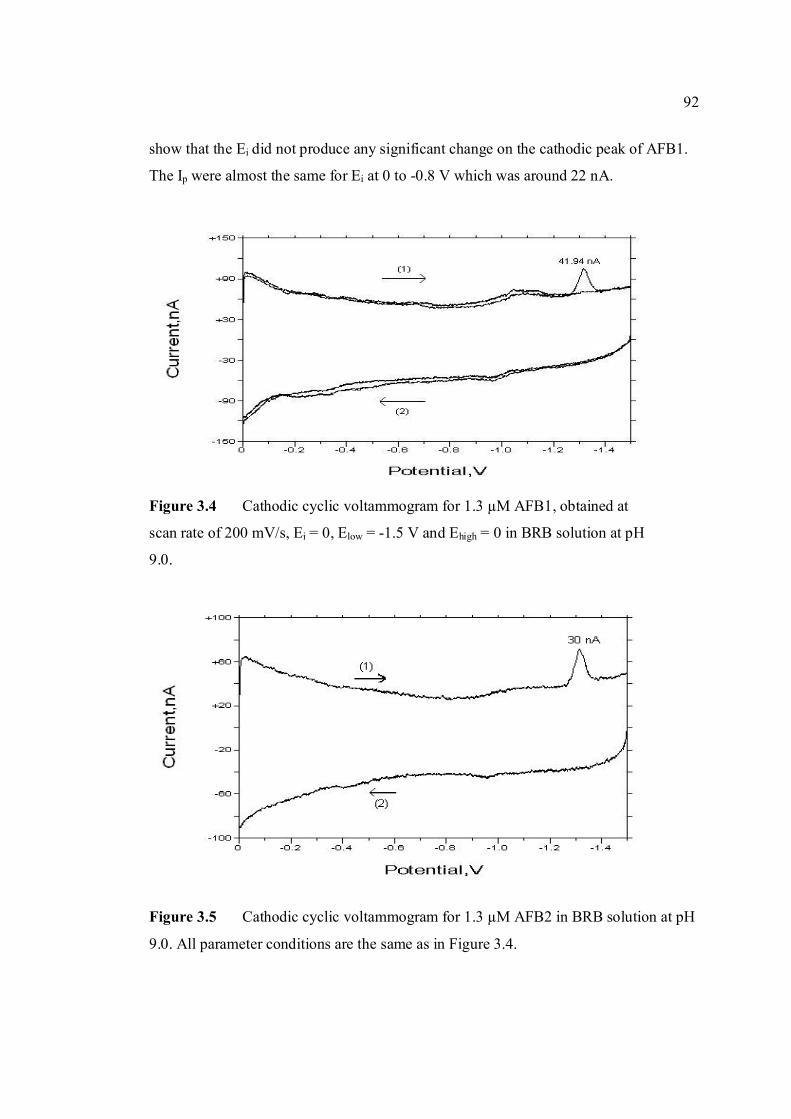
92
show that the Ei did not produce any significant change on the cathodic peak of AFB1.
The Ip were almost the same for Ei at 0 to -0.8 V which was around 22 nA.
Figure 3.4 Cathodic cyclic voltammogram for 1.3 µM AFB1, obtained at
scan rate of 200 mV/s, Ei = 0, Elow = -1.5 V and Ehigh = 0 in BRB solution at pH
9.0.
Figure 3.5 Cathodic cyclic voltammogram for 1.3 µM AFB2 in BRB solution at pH
9.0. All parameter conditions are the same as in Figure 3.4.
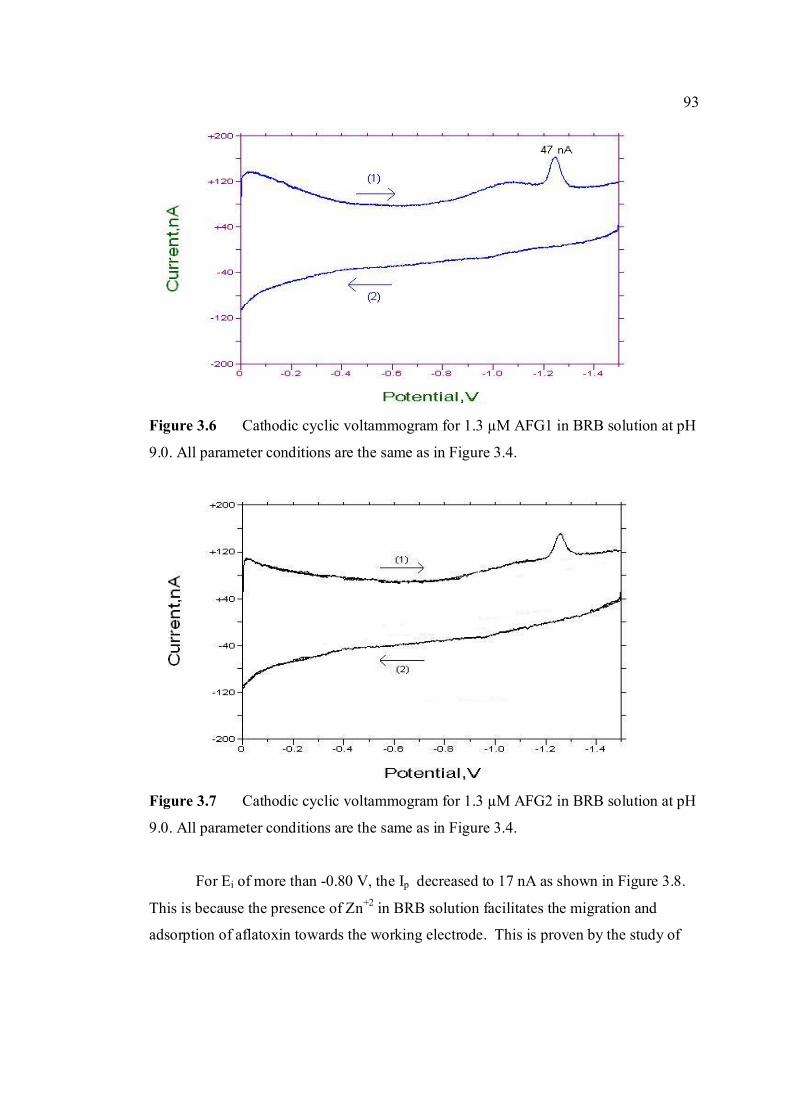
93
Figure 3.6 Cathodic cyclic voltammogram for 1.3 µM AFG1 in BRB solution at pH
9.0. All parameter conditions are the same as in Figure 3.4.
Figure 3.7 Cathodic cyclic voltammogram for 1.3 µM AFG2 in BRB solution at pH
9.0. All parameter conditions are the same as in Figure 3.4.
For Ei of more than -0.80 V, the Ip decreased to 17 nA as shown in Figure 3.8.
This is because the presence of Zn+2 in BRB solution facilitates the migration and
adsorption of aflatoxin towards the working electrode. This is proven by the study of
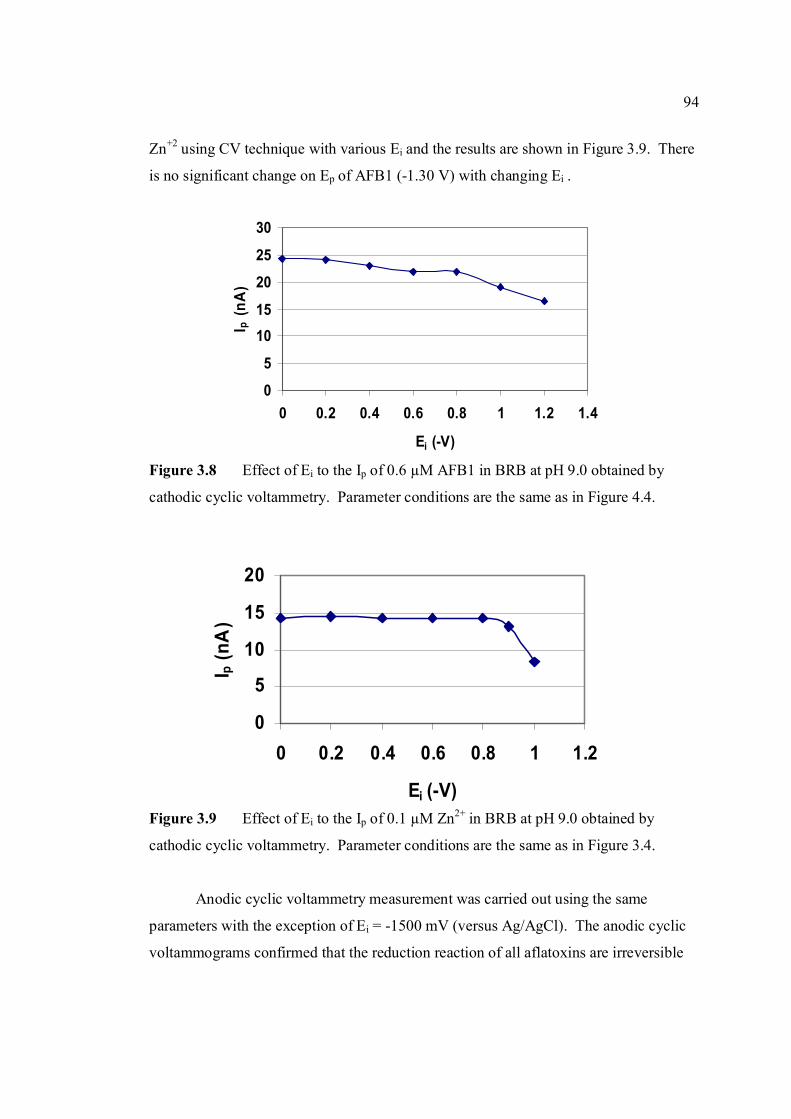
94
0
5
10
15
20
0 0.2 0.4 0.6 0.8 1 1.2
Ei (-V)
I p (n
A)
0
5
1015
20
25
30
0 0.2 0.4 0.6 0.8 1 1.2 1.4
Ei (-V)
I p (n
A)
Zn+2 using CV technique with various Ei and the results are shown in Figure 3.9. There
is no significant change on Ep of AFB1 (-1.30 V) with changing Ei .
Figure 3.8 Effect of Ei to the Ip of 0.6 µM AFB1 in BRB at pH 9.0 obtained by
cathodic cyclic voltammetry. Parameter conditions are the same as in Figure 4.4.
Figure 3.9 Effect of Ei to the Ip of 0.1 µM Zn2+ in BRB at pH 9.0 obtained by
cathodic cyclic voltammetry. Parameter conditions are the same as in Figure 3.4.
Anodic cyclic voltammetry measurement was carried out using the same
parameters with the exception of Ei = -1500 mV (versus Ag/AgCl). The anodic cyclic
voltammograms confirmed that the reduction reaction of all aflatoxins are irreversible
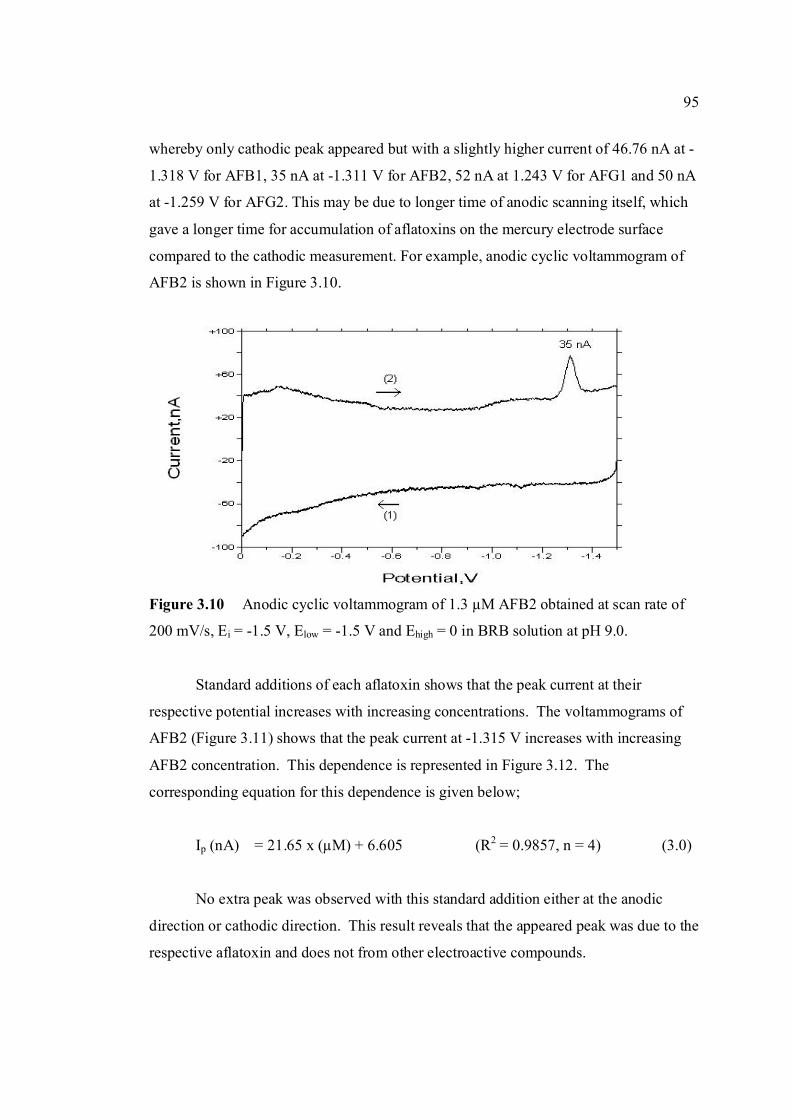
95
whereby only cathodic peak appeared but with a slightly higher current of 46.76 nA at -
1.318 V for AFB1, 35 nA at -1.311 V for AFB2, 52 nA at 1.243 V for AFG1 and 50 nA
at -1.259 V for AFG2. This may be due to longer time of anodic scanning itself, which
gave a longer time for accumulation of aflatoxins on the mercury electrode surface
compared to the cathodic measurement. For example, anodic cyclic voltammogram of
AFB2 is shown in Figure 3.10.
Figure 3.10 Anodic cyclic voltammogram of 1.3 µM AFB2 obtained at scan rate of
200 mV/s, Ei = -1.5 V, Elow = -1.5 V and Ehigh = 0 in BRB solution at pH 9.0.
Standard additions of each aflatoxin shows that the peak current at their
respective potential increases with increasing concentrations. The voltammograms of
AFB2 (Figure 3.11) shows that the peak current at -1.315 V increases with increasing
AFB2 concentration. This dependence is represented in Figure 3.12. The
corresponding equation for this dependence is given below;
Ip (nA) = 21.65 x (µM) + 6.605 (R2 = 0.9857, n = 4) (3.0)
No extra peak was observed with this standard addition either at the anodic
direction or cathodic direction. This result reveals that the appeared peak was due to the
respective aflatoxin and does not from other electroactive compounds.
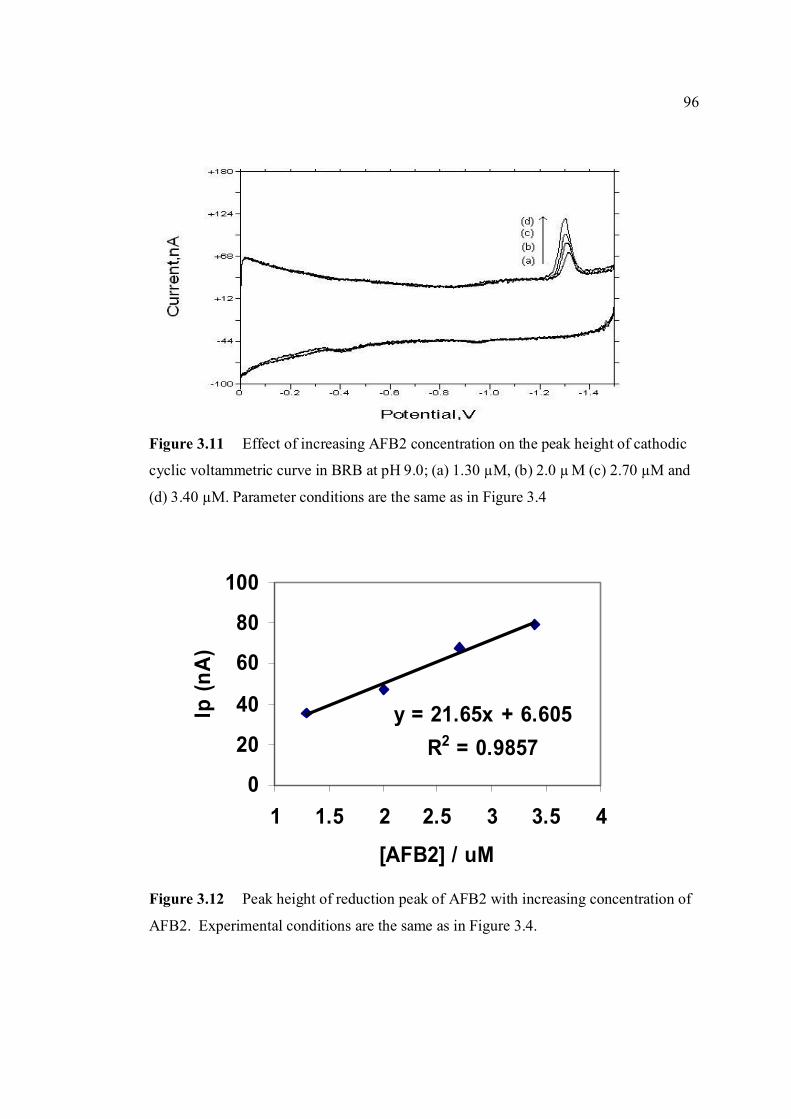
96
y = 21.65x + 6.605R2 = 0.9857
0
20
40
60
80
100
1 1.5 2 2.5 3 3.5 4
[AFB2] / uM
Ip (n
A)
Figure 3.11 Effect of increasing AFB2 concentration on the peak height of cathodic
cyclic voltammetric curve in BRB at pH 9.0; (a) 1.30 µM, (b) 2.0 µ M (c) 2.70 µM and
(d) 3.40 µM. Parameter conditions are the same as in Figure 3.4
Figure 3.12 Peak height of reduction peak of AFB2 with increasing concentration of
AFB2. Experimental conditions are the same as in Figure 3.4.
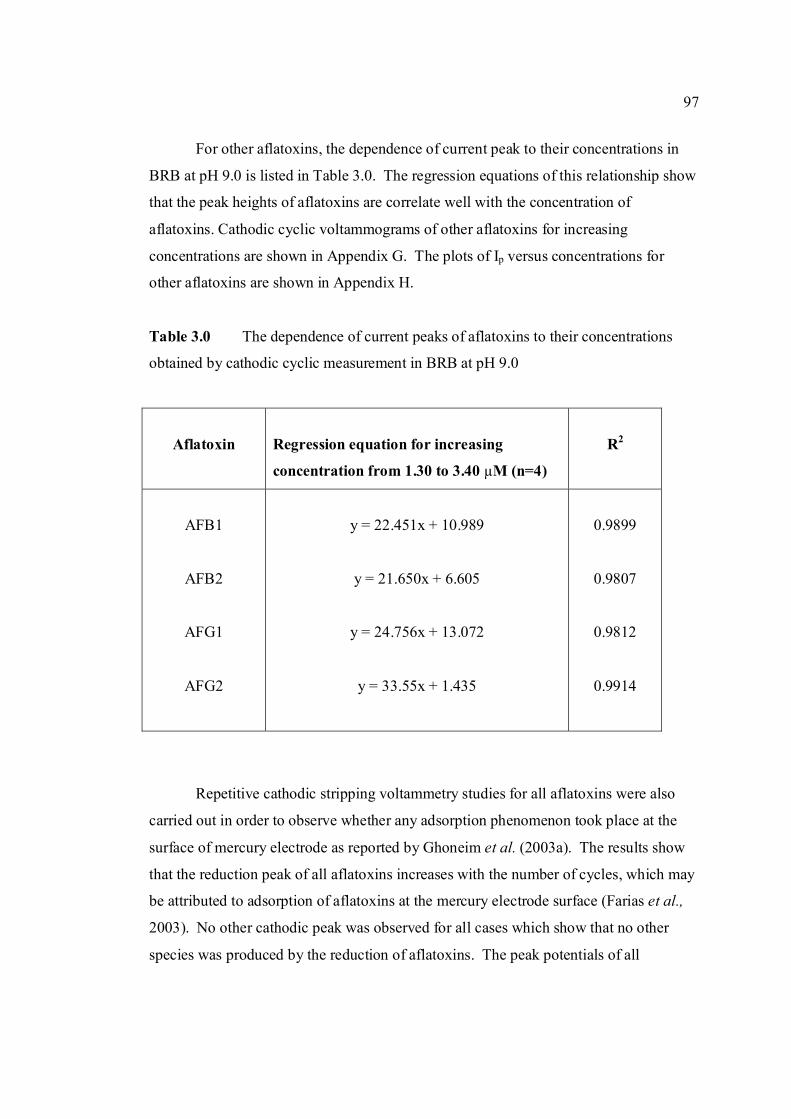
97
For other aflatoxins, the dependence of current peak to their concentrations in
BRB at pH 9.0 is listed in Table 3.0. The regression equations of this relationship show
that the peak heights of aflatoxins are correlate well with the concentration of
aflatoxins. Cathodic cyclic voltammograms of other aflatoxins for increasing
concentrations are shown in Appendix G. The plots of Ip versus concentrations for
other aflatoxins are shown in Appendix H.
Table 3.0 The dependence of current peaks of aflatoxins to their concentrations
obtained by cathodic cyclic measurement in BRB at pH 9.0
Aflatoxin
Regression equation for increasing
concentration from 1.30 to 3.40 µM (n=4)
R2
AFB1
AFB2
AFG1
AFG2
y = 22.451x + 10.989
y = 21.650x + 6.605
y = 24.756x + 13.072
y = 33.55x + 1.435
0.9899
0.9807
0.9812
0.9914
Repetitive cathodic stripping voltammetry studies for all aflatoxins were also
carried out in order to observe whether any adsorption phenomenon took place at the
surface of mercury electrode as reported by Ghoneim et al. (2003a). The results show
that the reduction peak of all aflatoxins increases with the number of cycles, which may
be attributed to adsorption of aflatoxins at the mercury electrode surface (Farias et al.,
2003). No other cathodic peak was observed for all cases which show that no other
species was produced by the reduction of aflatoxins. The peak potentials of all
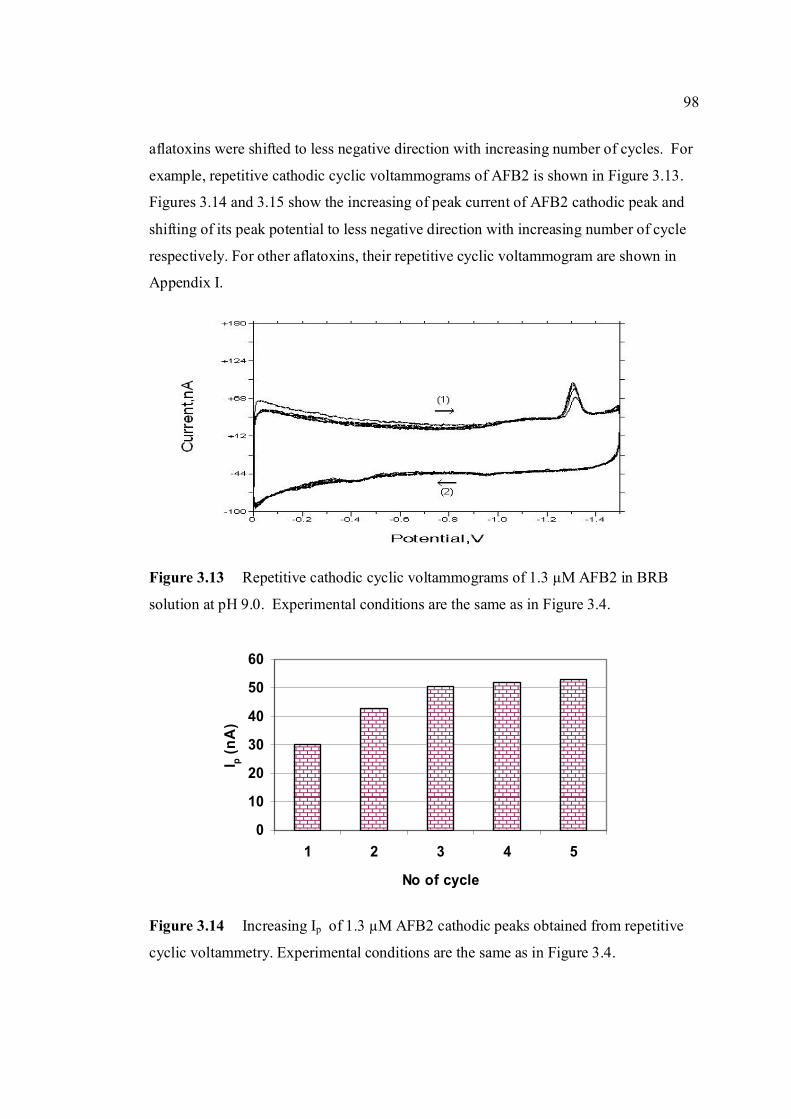
98
0
10
20
30
40
50
60
1 2 3 4 5
No of cycle
I p (nA
)
aflatoxins were shifted to less negative direction with increasing number of cycles. For
example, repetitive cathodic cyclic voltammograms of AFB2 is shown in Figure 3.13.
Figures 3.14 and 3.15 show the increasing of peak current of AFB2 cathodic peak and
shifting of its peak potential to less negative direction with increasing number of cycle
respectively. For other aflatoxins, their repetitive cyclic voltammogram are shown in
Appendix I.
Figure 3.13 Repetitive cathodic cyclic voltammograms of 1.3 µM AFB2 in BRB
solution at pH 9.0. Experimental conditions are the same as in Figure 3.4.
Figure 3.14 Increasing Ip of 1.3 µM AFB2 cathodic peaks obtained from repetitive
cyclic voltammetry. Experimental conditions are the same as in Figure 3.4.
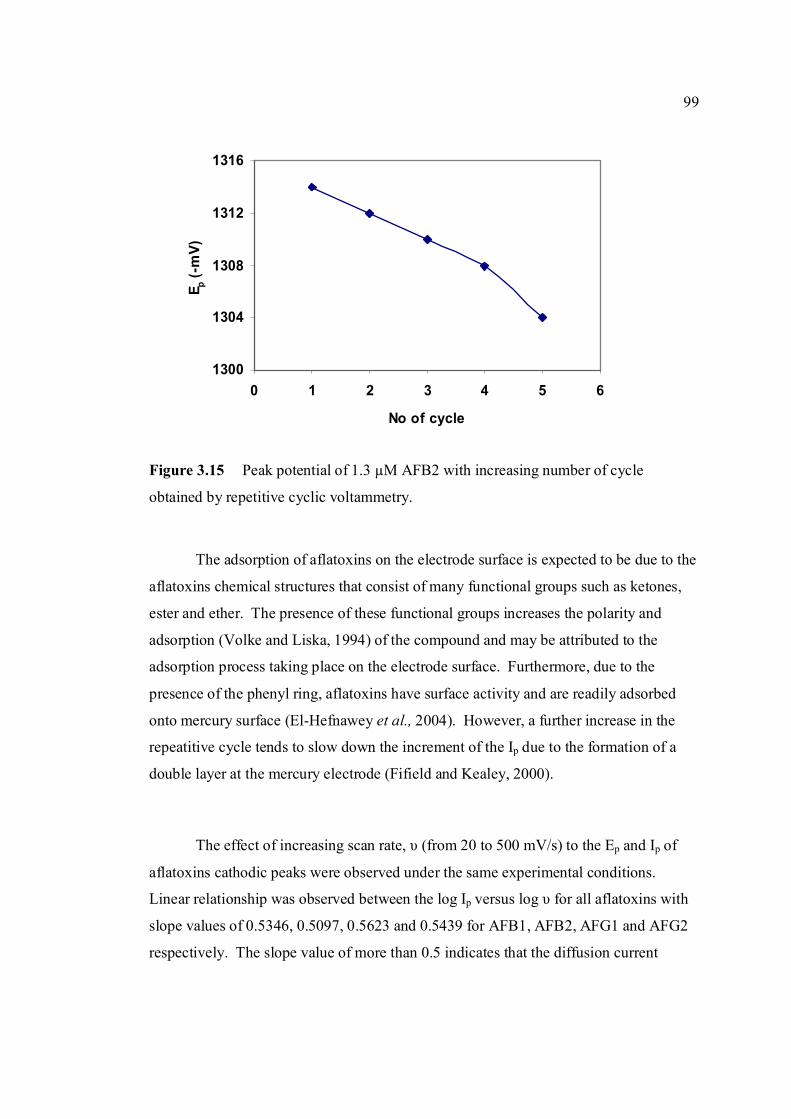
99
1300
1304
1308
1312
1316
0 1 2 3 4 5 6
No of cycle
E p (-m
V)
Figure 3.15 Peak potential of 1.3 µM AFB2 with increasing number of cycle
obtained by repetitive cyclic voltammetry.
The adsorption of aflatoxins on the electrode surface is expected to be due to the
aflatoxins chemical structures that consist of many functional groups such as ketones,
ester and ether. The presence of these functional groups increases the polarity and
adsorption (Volke and Liska, 1994) of the compound and may be attributed to the
adsorption process taking place on the electrode surface. Furthermore, due to the
presence of the phenyl ring, aflatoxins have surface activity and are readily adsorbed
onto mercury surface (El-Hefnawey et al., 2004). However, a further increase in the
repeatitive cycle tends to slow down the increment of the Ip due to the formation of a
double layer at the mercury electrode (Fifield and Kealey, 2000).
The effect of increasing scan rate, υ (from 20 to 500 mV/s) to the Ep and Ip of
aflatoxins cathodic peaks were observed under the same experimental conditions.
Linear relationship was observed between the log Ip versus log υ for all aflatoxins with
slope values of 0.5346, 0.5097, 0.5623 and 0.5439 for AFB1, AFB2, AFG1 and AFG2
respectively. The slope value of more than 0.5 indicates that the diffusion current
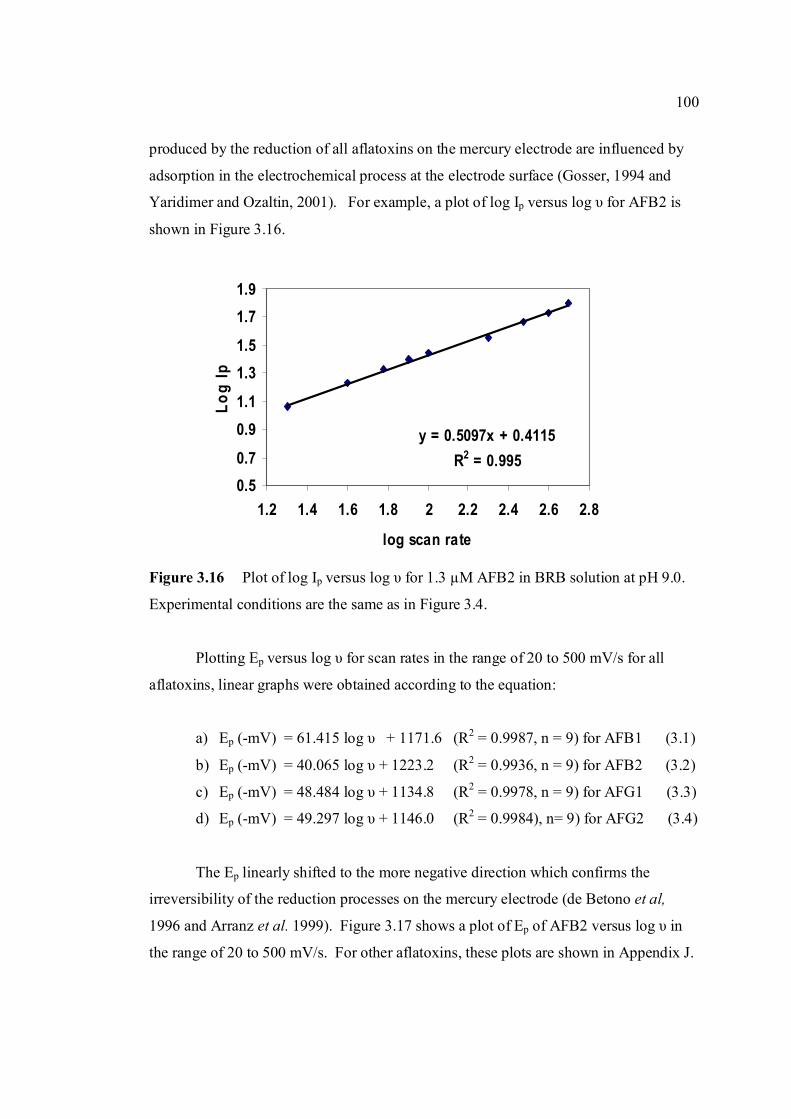
100
y = 0.5097x + 0.4115R2 = 0.995
0.50.7
0.91.1
1.31.5
1.71.9
1.2 1.4 1.6 1.8 2 2.2 2.4 2.6 2.8
log scan rate
Log
Ip
produced by the reduction of all aflatoxins on the mercury electrode are influenced by
adsorption in the electrochemical process at the electrode surface (Gosser, 1994 and
Yaridimer and Ozaltin, 2001). For example, a plot of log Ip versus log υ for AFB2 is
shown in Figure 3.16.
Figure 3.16 Plot of log Ip versus log υ for 1.3 µM AFB2 in BRB solution at pH 9.0.
Experimental conditions are the same as in Figure 3.4.
Plotting Ep versus log υ for scan rates in the range of 20 to 500 mV/s for all
aflatoxins, linear graphs were obtained according to the equation:
a) Ep (-mV) = 61.415 log υ + 1171.6 (R2 = 0.9987, n = 9) for AFB1 (3.1)
b) Ep (-mV) = 40.065 log υ + 1223.2 (R2 = 0.9936, n = 9) for AFB2 (3.2)
c) Ep (-mV) = 48.484 log υ + 1134.8 (R2 = 0.9978, n = 9) for AFG1 (3.3)
d) Ep (-mV) = 49.297 log υ + 1146.0 (R2 = 0.9984), n= 9) for AFG2 (3.4)
The Ep linearly shifted to the more negative direction which confirms the
irreversibility of the reduction processes on the mercury electrode (de Betono et al,
1996 and Arranz et al. 1999). Figure 3.17 shows a plot of Ep of AFB2 versus log υ in
the range of 20 to 500 mV/s. For other aflatoxins, these plots are shown in Appendix J.
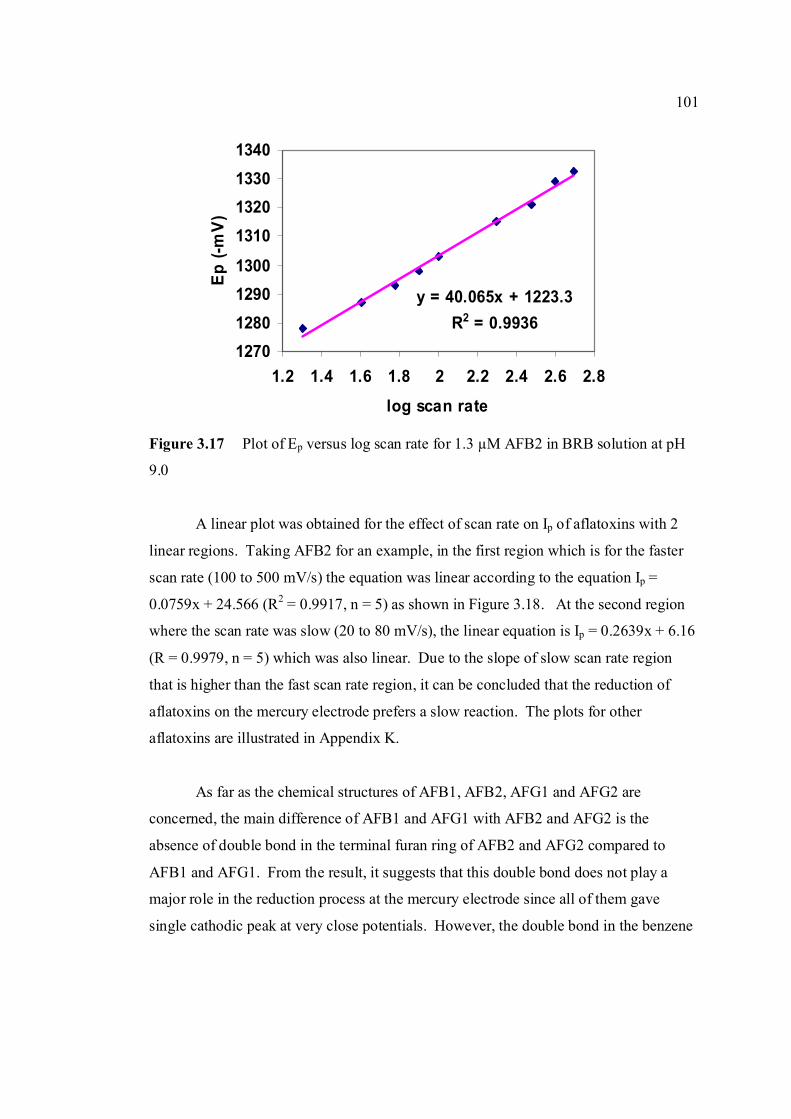
101
y = 40.065x + 1223.3R2 = 0.9936
1270128012901300
1310132013301340
1.2 1.4 1.6 1.8 2 2.2 2.4 2.6 2.8
log scan rate
Ep (-
mV)
Figure 3.17 Plot of Ep versus log scan rate for 1.3 µM AFB2 in BRB solution at pH
9.0
A linear plot was obtained for the effect of scan rate on Ip of aflatoxins with 2
linear regions. Taking AFB2 for an example, in the first region which is for the faster
scan rate (100 to 500 mV/s) the equation was linear according to the equation Ip =
0.0759x + 24.566 (R2 = 0.9917, n = 5) as shown in Figure 3.18. At the second region
where the scan rate was slow (20 to 80 mV/s), the linear equation is Ip = 0.2639x + 6.16
(R = 0.9979, n = 5) which was also linear. Due to the slope of slow scan rate region
that is higher than the fast scan rate region, it can be concluded that the reduction of
aflatoxins on the mercury electrode prefers a slow reaction. The plots for other
aflatoxins are illustrated in Appendix K.
As far as the chemical structures of AFB1, AFB2, AFG1 and AFG2 are
concerned, the main difference of AFB1 and AFG1 with AFB2 and AFG2 is the
absence of double bond in the terminal furan ring of AFB2 and AFG2 compared to
AFB1 and AFG1. From the result, it suggests that this double bond does not play a
major role in the reduction process at the mercury electrode since all of them gave
single cathodic peak at very close potentials. However, the double bond in the benzene
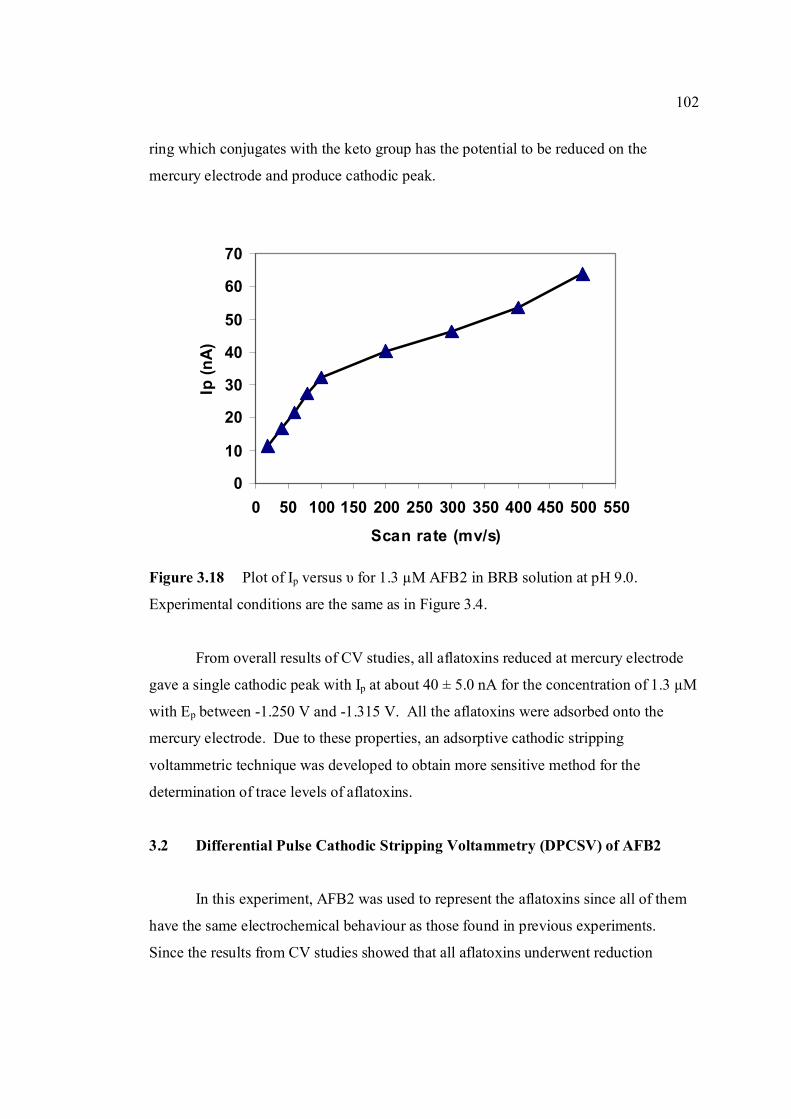
102
0
10
20
30
40
50
60
70
0 50 100 150 200 250 300 350 400 450 500 550
Scan rate (mv/s)
Ip (n
A)
ring which conjugates with the keto group has the potential to be reduced on the
mercury electrode and produce cathodic peak.
Figure 3.18 Plot of Ip versus υ for 1.3 µM AFB2 in BRB solution at pH 9.0.
Experimental conditions are the same as in Figure 3.4.
From overall results of CV studies, all aflatoxins reduced at mercury electrode
gave a single cathodic peak with Ip at about 40 ± 5.0 nA for the concentration of 1.3 µM
with Ep between -1.250 V and -1.315 V. All the aflatoxins were adsorbed onto the
mercury electrode. Due to these properties, an adsorptive cathodic stripping
voltammetric technique was developed to obtain more sensitive method for the
determination of trace levels of aflatoxins.
3.2 Differential Pulse Cathodic Stripping Voltammetry (DPCSV) of AFB2
In this experiment, AFB2 was used to represent the aflatoxins since all of them
have the same electrochemical behaviour as those found in previous experiments.
Since the results from CV studies showed that all aflatoxins underwent reduction
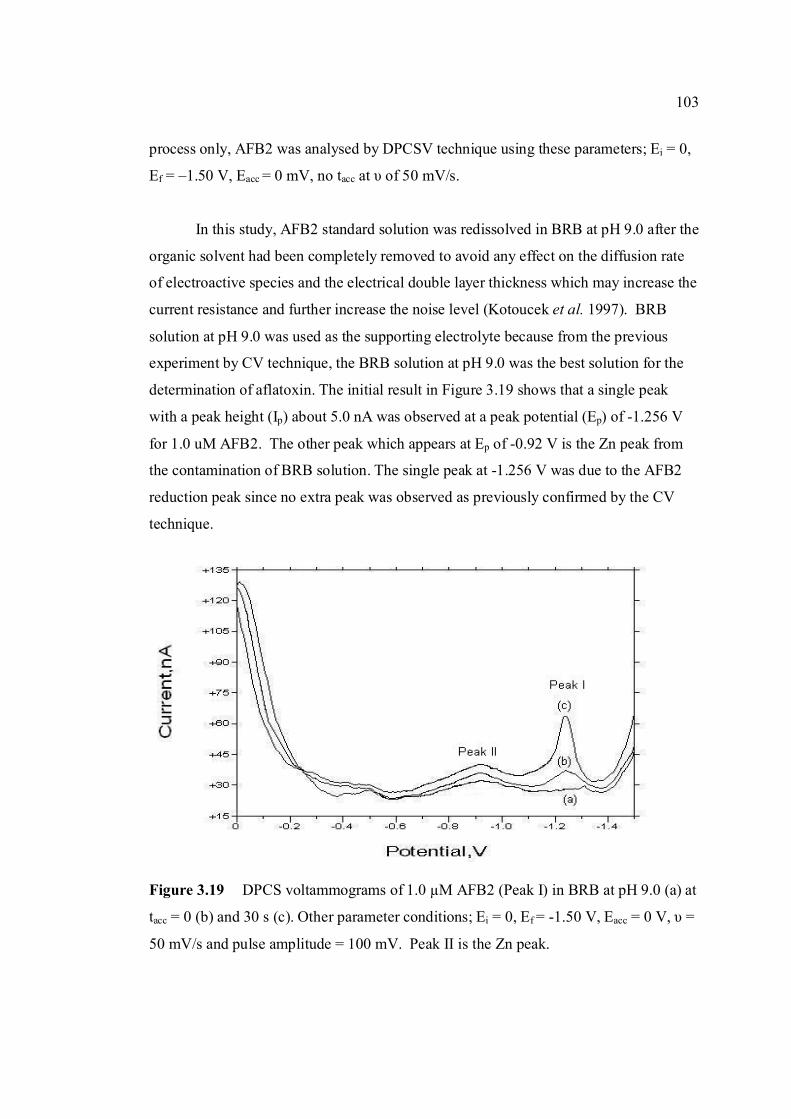
103
process only, AFB2 was analysed by DPCSV technique using these parameters; Ei = 0,
Ef = –1.50 V, Eacc = 0 mV, no tacc at υ of 50 mV/s.
In this study, AFB2 standard solution was redissolved in BRB at pH 9.0 after the
organic solvent had been completely removed to avoid any effect on the diffusion rate
of electroactive species and the electrical double layer thickness which may increase the
current resistance and further increase the noise level (Kotoucek et al. 1997). BRB
solution at pH 9.0 was used as the supporting electrolyte because from the previous
experiment by CV technique, the BRB solution at pH 9.0 was the best solution for the
determination of aflatoxin. The initial result in Figure 3.19 shows that a single peak
with a peak height (Ip) about 5.0 nA was observed at a peak potential (Ep) of -1.256 V
for 1.0 uM AFB2. The other peak which appears at Ep of -0.92 V is the Zn peak from
the contamination of BRB solution. The single peak at -1.256 V was due to the AFB2
reduction peak since no extra peak was observed as previously confirmed by the CV
technique.
Figure 3.19 DPCS voltammograms of 1.0 µM AFB2 (Peak I) in BRB at pH 9.0 (a) at
tacc = 0 (b) and 30 s (c). Other parameter conditions; Ei = 0, Ef = -1.50 V, Eacc = 0 V, υ =
50 mV/s and pulse amplitude = 100 mV. Peak II is the Zn peak.
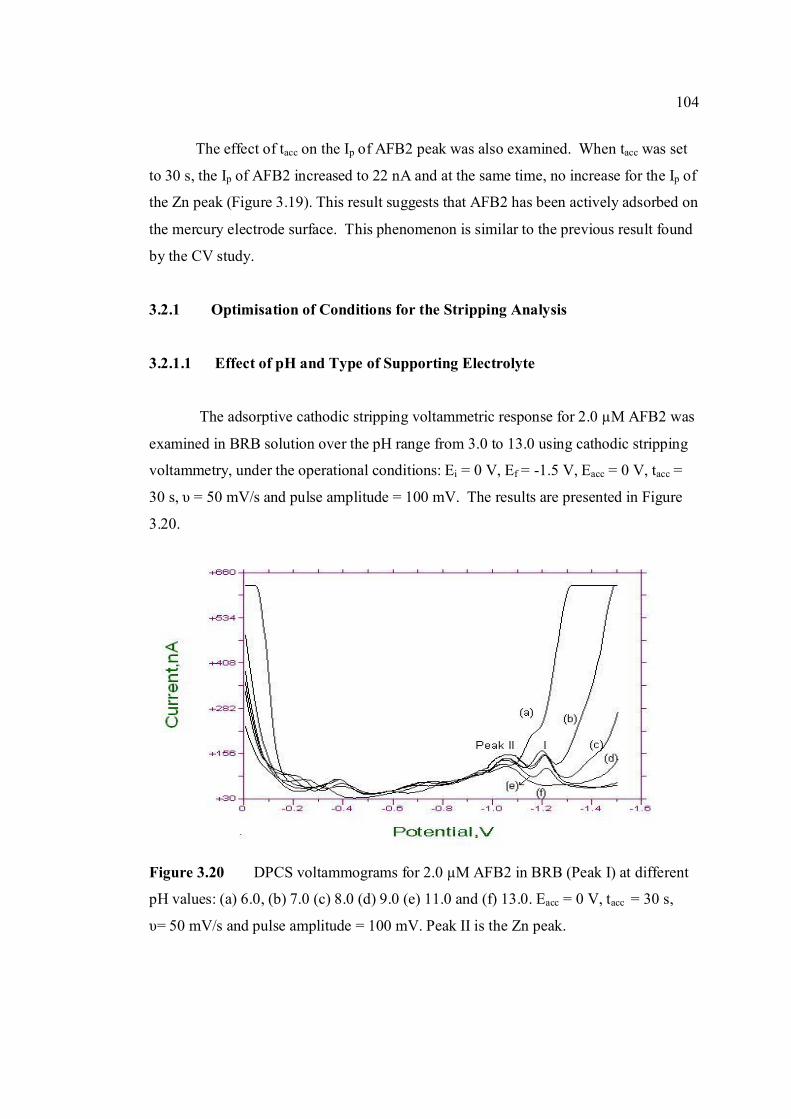
104
The effect of tacc on the Ip of AFB2 peak was also examined. When tacc was set
to 30 s, the Ip of AFB2 increased to 22 nA and at the same time, no increase for the Ip of
the Zn peak (Figure 3.19). This result suggests that AFB2 has been actively adsorbed on
the mercury electrode surface. This phenomenon is similar to the previous result found
by the CV study.
3.2.1 Optimisation of Conditions for the Stripping Analysis
3.2.1.1 Effect of pH and Type of Supporting Electrolyte
The adsorptive cathodic stripping voltammetric response for 2.0 µM AFB2 was
examined in BRB solution over the pH range from 3.0 to 13.0 using cathodic stripping
voltammetry, under the operational conditions: Ei = 0 V, Ef = -1.5 V, Eacc = 0 V, tacc =
30 s, υ = 50 mV/s and pulse amplitude = 100 mV. The results are presented in Figure
3.20.
Figure 3.20 DPCS voltammograms for 2.0 µM AFB2 in BRB (Peak I) at different
pH values: (a) 6.0, (b) 7.0 (c) 8.0 (d) 9.0 (e) 11.0 and (f) 13.0. Eacc = 0 V, tacc = 30 s,
υ= 50 mV/s and pulse amplitude = 100 mV. Peak II is the Zn peak.
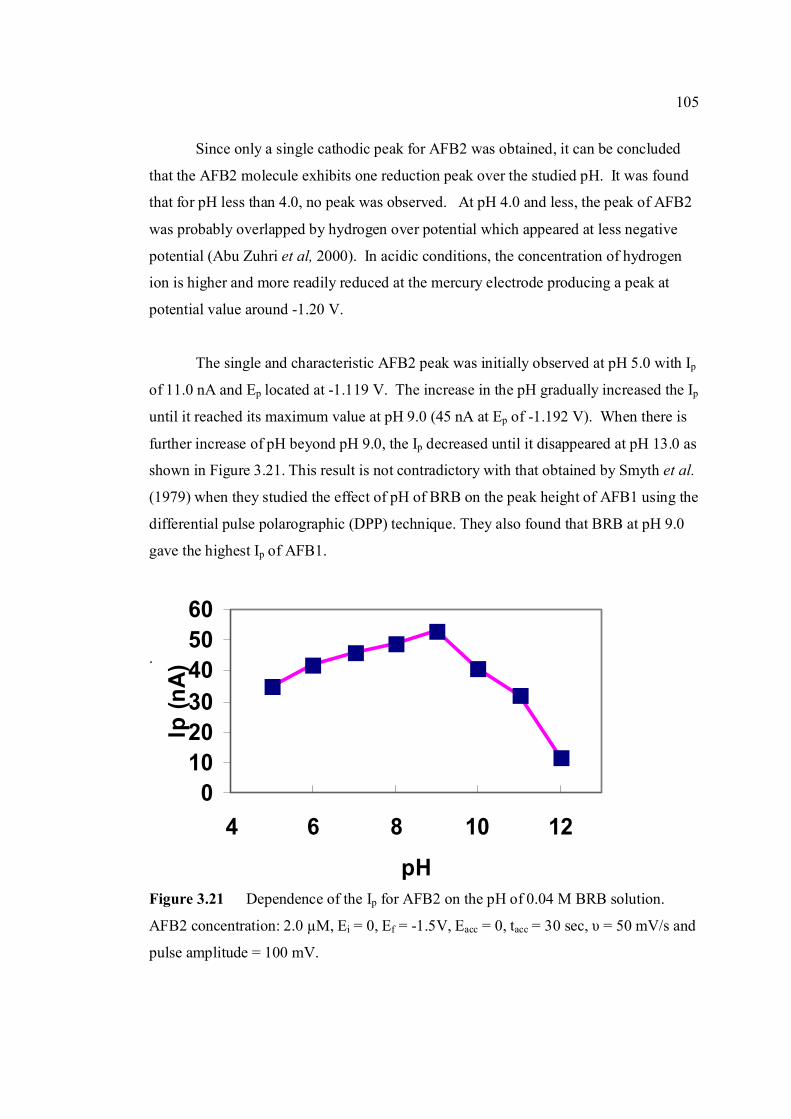
105
0102030405060
4 6 8 10 12
pH
Ip (n
A)Since only a single cathodic peak for AFB2 was obtained, it can be concluded
that the AFB2 molecule exhibits one reduction peak over the studied pH. It was found
that for pH less than 4.0, no peak was observed. At pH 4.0 and less, the peak of AFB2
was probably overlapped by hydrogen over potential which appeared at less negative
potential (Abu Zuhri et al, 2000). In acidic conditions, the concentration of hydrogen
ion is higher and more readily reduced at the mercury electrode producing a peak at
potential value around -1.20 V.
The single and characteristic AFB2 peak was initially observed at pH 5.0 with Ip
of 11.0 nA and Ep located at -1.119 V. The increase in the pH gradually increased the Ip
until it reached its maximum value at pH 9.0 (45 nA at Ep of -1.192 V). When there is
further increase of pH beyond pH 9.0, the Ip decreased until it disappeared at pH 13.0 as
shown in Figure 3.21. This result is not contradictory with that obtained by Smyth et al.
(1979) when they studied the effect of pH of BRB on the peak height of AFB1 using the
differential pulse polarographic (DPP) technique. They also found that BRB at pH 9.0
gave the highest Ip of AFB1.
.
Figure 3.21 Dependence of the Ip for AFB2 on the pH of 0.04 M BRB solution.
AFB2 concentration: 2.0 µM, Ei = 0, Ef = -1.5V, Eacc = 0, tacc = 30 sec, υ = 50 mV/s and
pulse amplitude = 100 mV.
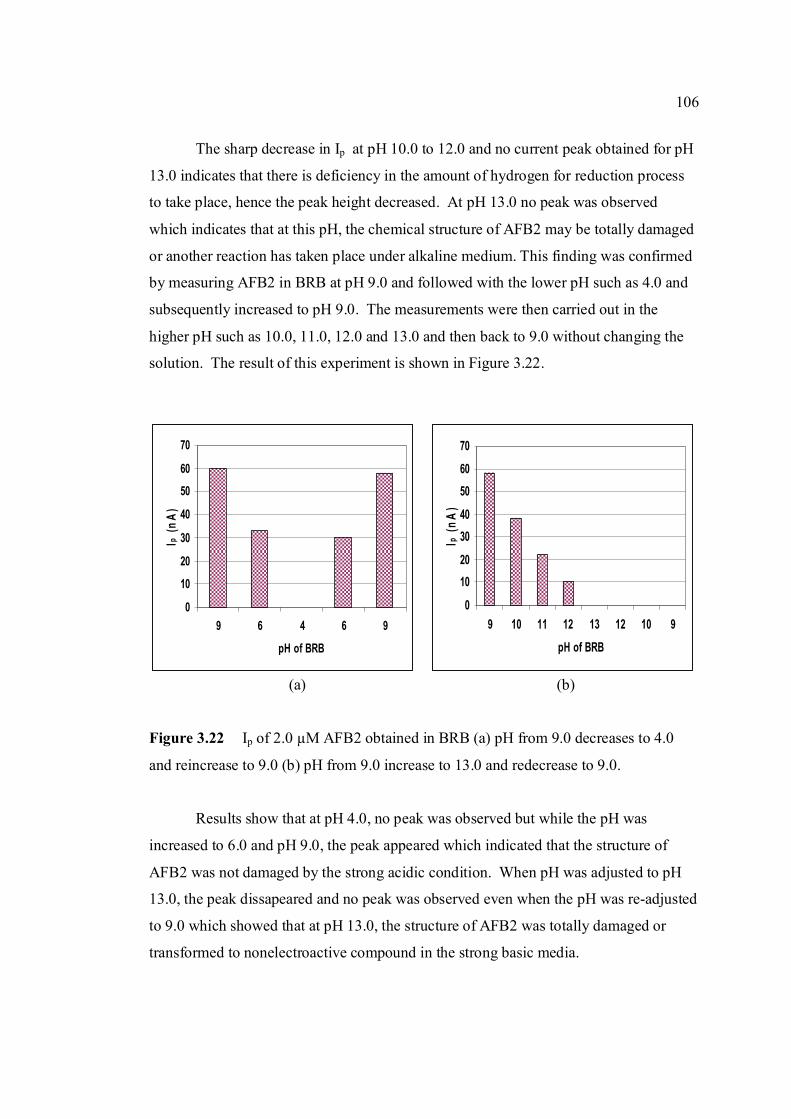
106
0
1020
3040
5060
70
9 10 11 12 13 12 10 9
pH of BRB
Ip (n
A)
0
10
20
30
40
50
60
70
9 6 4 6 9
pH of BRB
Ip (n
A)The sharp decrease in Ip at pH 10.0 to 12.0 and no current peak obtained for pH
13.0 indicates that there is deficiency in the amount of hydrogen for reduction process
to take place, hence the peak height decreased. At pH 13.0 no peak was observed
which indicates that at this pH, the chemical structure of AFB2 may be totally damaged
or another reaction has taken place under alkaline medium. This finding was confirmed
by measuring AFB2 in BRB at pH 9.0 and followed with the lower pH such as 4.0 and
subsequently increased to pH 9.0. The measurements were then carried out in the
higher pH such as 10.0, 11.0, 12.0 and 13.0 and then back to 9.0 without changing the
solution. The result of this experiment is shown in Figure 3.22.
(a) (b)
Figure 3.22 Ip of 2.0 µM AFB2 obtained in BRB (a) pH from 9.0 decreases to 4.0
and reincrease to 9.0 (b) pH from 9.0 increase to 13.0 and redecrease to 9.0.
Results show that at pH 4.0, no peak was observed but while the pH was
increased to 6.0 and pH 9.0, the peak appeared which indicated that the structure of
AFB2 was not damaged by the strong acidic condition. When pH was adjusted to pH
13.0, the peak dissapeared and no peak was observed even when the pH was re-adjusted
to 9.0 which showed that at pH 13.0, the structure of AFB2 was totally damaged or
transformed to nonelectroactive compound in the strong basic media.
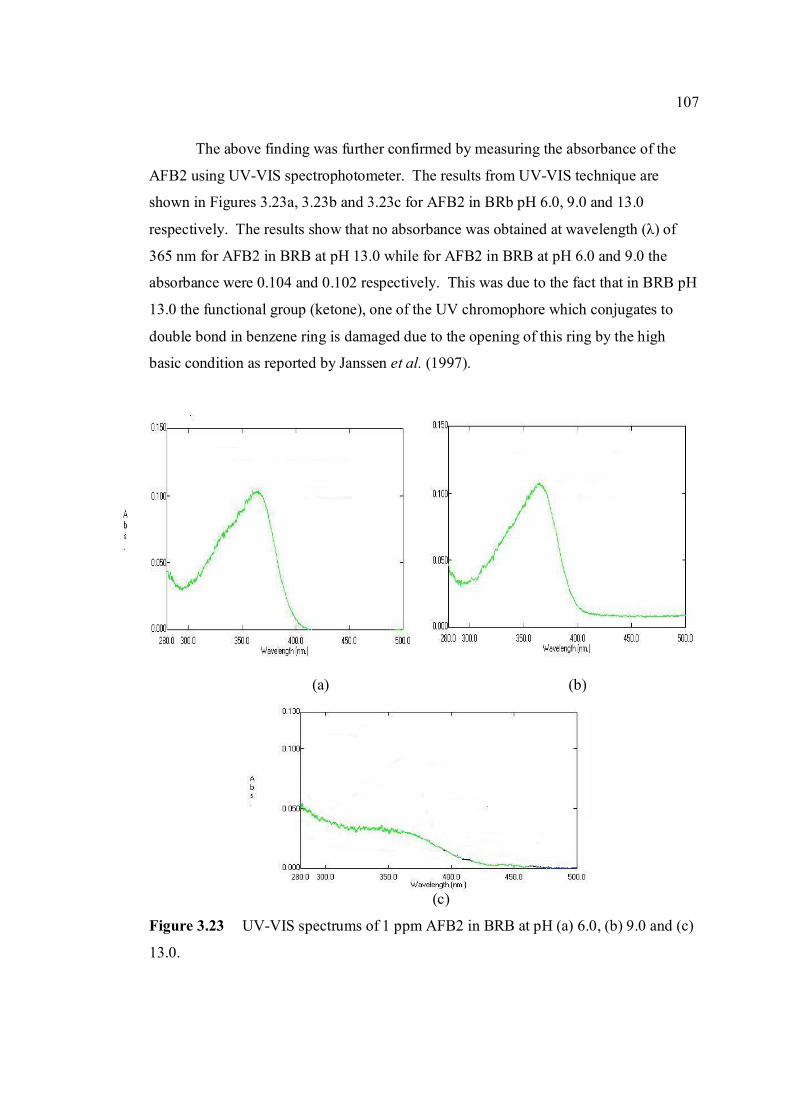
107
The above finding was further confirmed by measuring the absorbance of the
AFB2 using UV-VIS spectrophotometer. The results from UV-VIS technique are
shown in Figures 3.23a, 3.23b and 3.23c for AFB2 in BRb pH 6.0, 9.0 and 13.0
respectively. The results show that no absorbance was obtained at wavelength (λ) of
365 nm for AFB2 in BRB at pH 13.0 while for AFB2 in BRB at pH 6.0 and 9.0 the
absorbance were 0.104 and 0.102 respectively. This was due to the fact that in BRB pH
13.0 the functional group (ketone), one of the UV chromophore which conjugates to
double bond in benzene ring is damaged due to the opening of this ring by the high
basic condition as reported by Janssen et al. (1997).
(a) (b)
(c)
Figure 3.23 UV-VIS spectrums of 1 ppm AFB2 in BRB at pH (a) 6.0, (b) 9.0 and (c)
13.0.
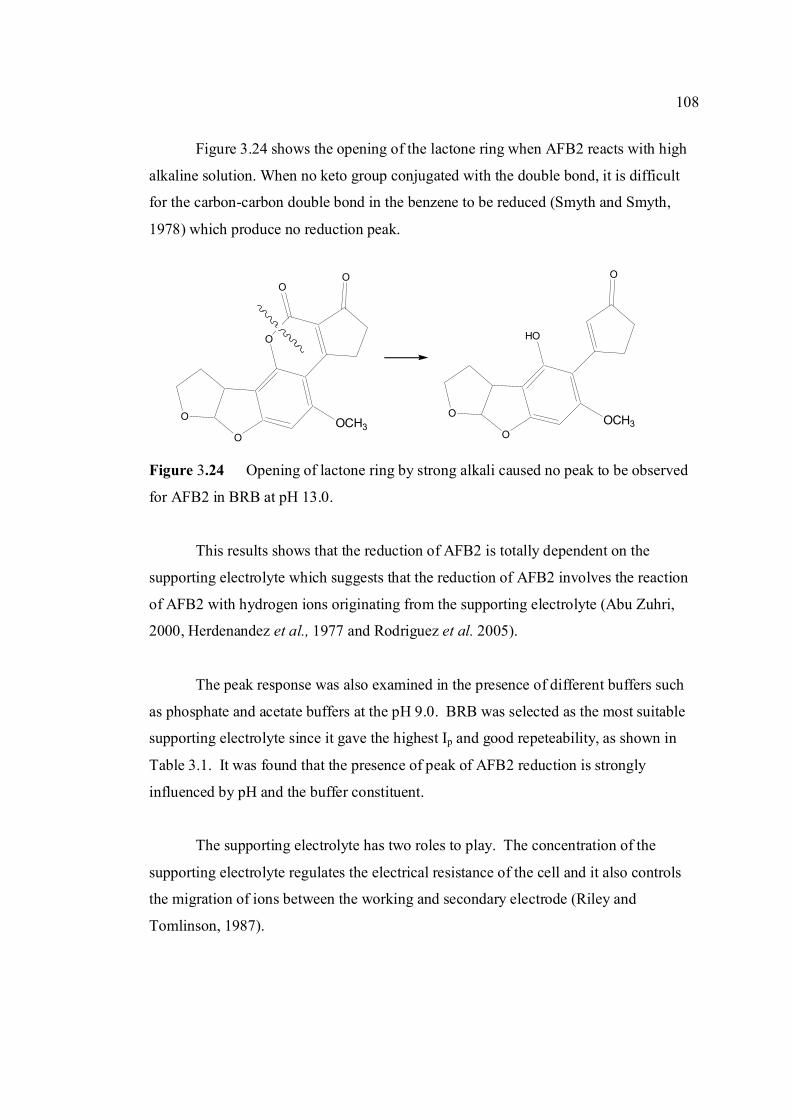
108
O
O
O
OO
OCH3
HO
O
O
O
OCH3
Figure 3.24 shows the opening of the lactone ring when AFB2 reacts with high
alkaline solution. When no keto group conjugated with the double bond, it is difficult
for the carbon-carbon double bond in the benzene to be reduced (Smyth and Smyth,
1978) which produce no reduction peak.
Figure 3.24 Opening of lactone ring by strong alkali caused no peak to be observed
for AFB2 in BRB at pH 13.0.
This results shows that the reduction of AFB2 is totally dependent on the
supporting electrolyte which suggests that the reduction of AFB2 involves the reaction
of AFB2 with hydrogen ions originating from the supporting electrolyte (Abu Zuhri,
2000, Herdenandez et al., 1977 and Rodriguez et al. 2005).
The peak response was also examined in the presence of different buffers such
as phosphate and acetate buffers at the pH 9.0. BRB was selected as the most suitable
supporting electrolyte since it gave the highest Ip and good repeteability, as shown in
Table 3.1. It was found that the presence of peak of AFB2 reduction is strongly
influenced by pH and the buffer constituent.
The supporting electrolyte has two roles to play. The concentration of the
supporting electrolyte regulates the electrical resistance of the cell and it also controls
the migration of ions between the working and secondary electrode (Riley and
Tomlinson, 1987).
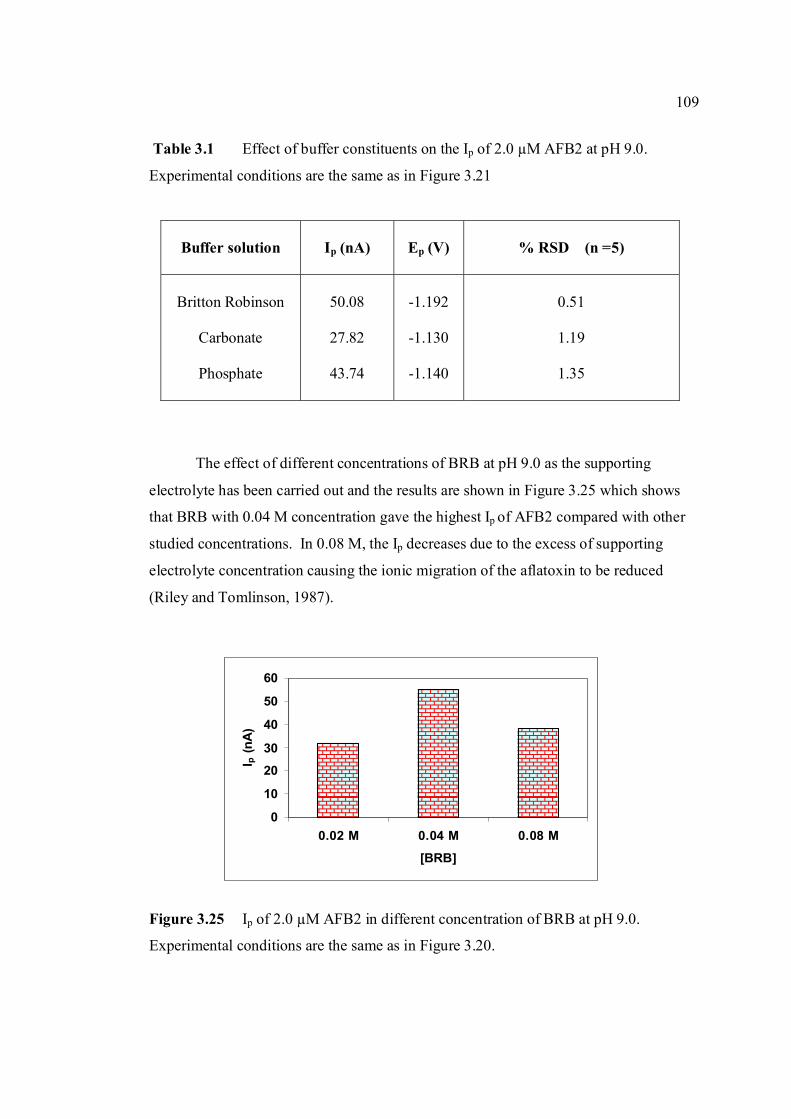
109
0
10
20
30
40
50
60
0.02 M 0.04 M 0.08 M
[BRB]
I p (n
A)
Table 3.1 Effect of buffer constituents on the Ip of 2.0 µM AFB2 at pH 9.0.
Experimental conditions are the same as in Figure 3.21
Buffer solution
Ip (nA)
Ep (V)
% RSD (n =5)
Britton Robinson
Carbonate
Phosphate
50.08
27.82
43.74
-1.192
-1.130
-1.140
0.51
1.19
1.35
The effect of different concentrations of BRB at pH 9.0 as the supporting
electrolyte has been carried out and the results are shown in Figure 3.25 which shows
that BRB with 0.04 M concentration gave the highest Ip of AFB2 compared with other
studied concentrations. In 0.08 M, the Ip decreases due to the excess of supporting
electrolyte concentration causing the ionic migration of the aflatoxin to be reduced
(Riley and Tomlinson, 1987).
Figure 3.25 Ip of 2.0 µM AFB2 in different concentration of BRB at pH 9.0.
Experimental conditions are the same as in Figure 3.20.
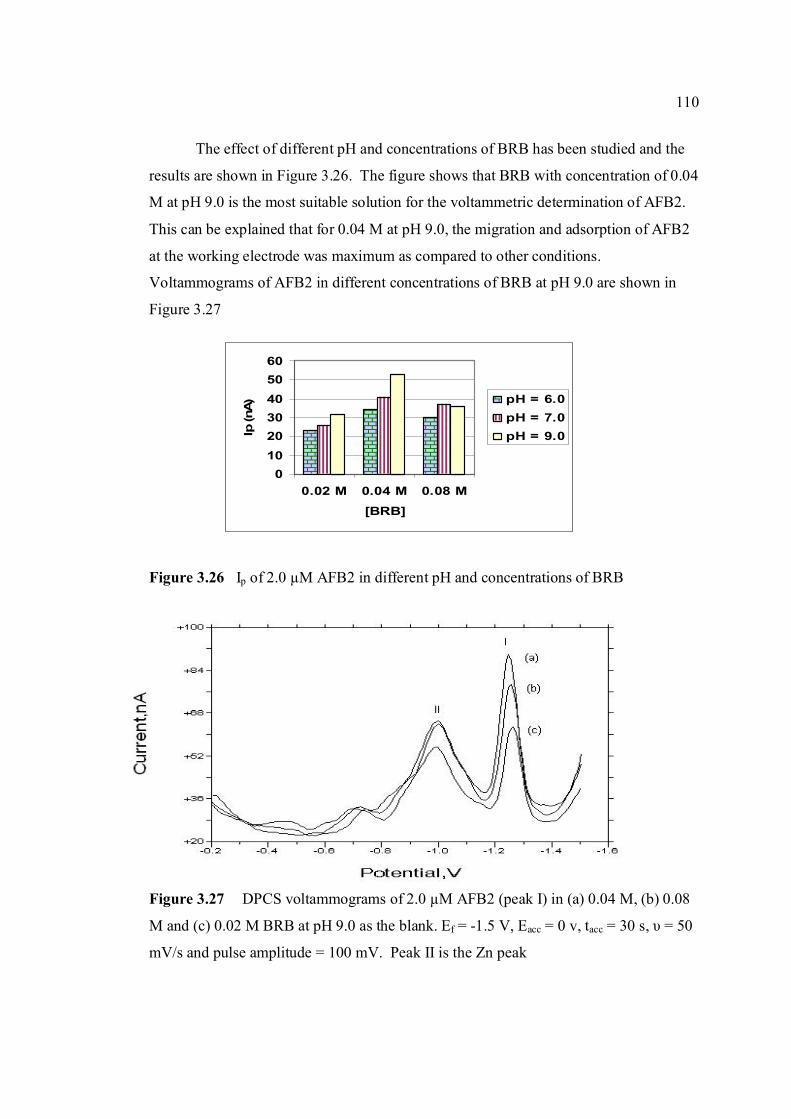
110
0102030405060
0.02 M 0.04 M 0.08 M
[BRB]
Ip (n
A) pH = 6.0
pH = 7.0pH = 9.0
The effect of different pH and concentrations of BRB has been studied and the
results are shown in Figure 3.26. The figure shows that BRB with concentration of 0.04
M at pH 9.0 is the most suitable solution for the voltammetric determination of AFB2.
This can be explained that for 0.04 M at pH 9.0, the migration and adsorption of AFB2
at the working electrode was maximum as compared to other conditions.
Voltammograms of AFB2 in different concentrations of BRB at pH 9.0 are shown in
Figure 3.27
Figure 3.26 Ip of 2.0 µM AFB2 in different pH and concentrations of BRB
Figure 3.27 DPCS voltammograms of 2.0 µM AFB2 (peak I) in (a) 0.04 M, (b) 0.08
M and (c) 0.02 M BRB at pH 9.0 as the blank. Ef = -1.5 V, Eacc = 0 v, tacc = 30 s, υ = 50
mV/s and pulse amplitude = 100 mV. Peak II is the Zn peak
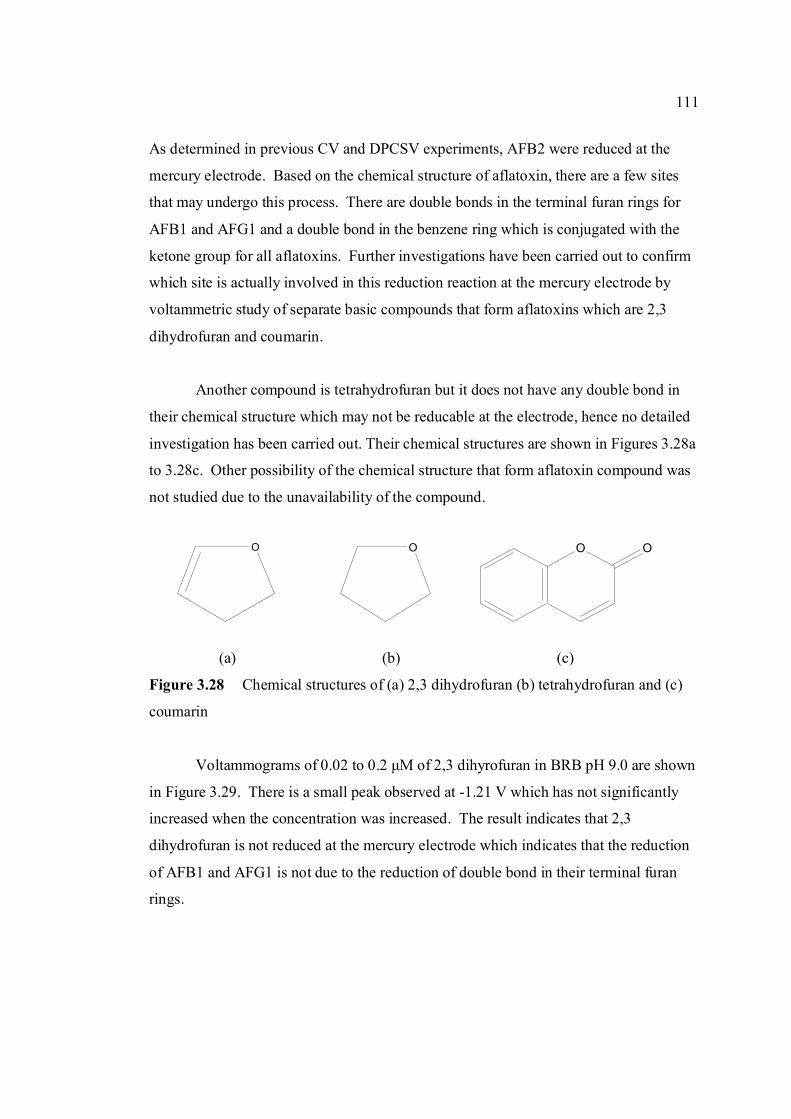
111
O O
O O
As determined in previous CV and DPCSV experiments, AFB2 were reduced at the
mercury electrode. Based on the chemical structure of aflatoxin, there are a few sites
that may undergo this process. There are double bonds in the terminal furan rings for
AFB1 and AFG1 and a double bond in the benzene ring which is conjugated with the
ketone group for all aflatoxins. Further investigations have been carried out to confirm
which site is actually involved in this reduction reaction at the mercury electrode by
voltammetric study of separate basic compounds that form aflatoxins which are 2,3
dihydrofuran and coumarin.
Another compound is tetrahydrofuran but it does not have any double bond in
their chemical structure which may not be reducable at the electrode, hence no detailed
investigation has been carried out. Their chemical structures are shown in Figures 3.28a
to 3.28c. Other possibility of the chemical structure that form aflatoxin compound was
not studied due to the unavailability of the compound.
(a) (b) (c)
Figure 3.28 Chemical structures of (a) 2,3 dihydrofuran (b) tetrahydrofuran and (c)
coumarin
Voltammograms of 0.02 to 0.2 µM of 2,3 dihyrofuran in BRB pH 9.0 are shown
in Figure 3.29. There is a small peak observed at -1.21 V which has not significantly
increased when the concentration was increased. The result indicates that 2,3
dihydrofuran is not reduced at the mercury electrode which indicates that the reduction
of AFB1 and AFG1 is not due to the reduction of double bond in their terminal furan
rings.
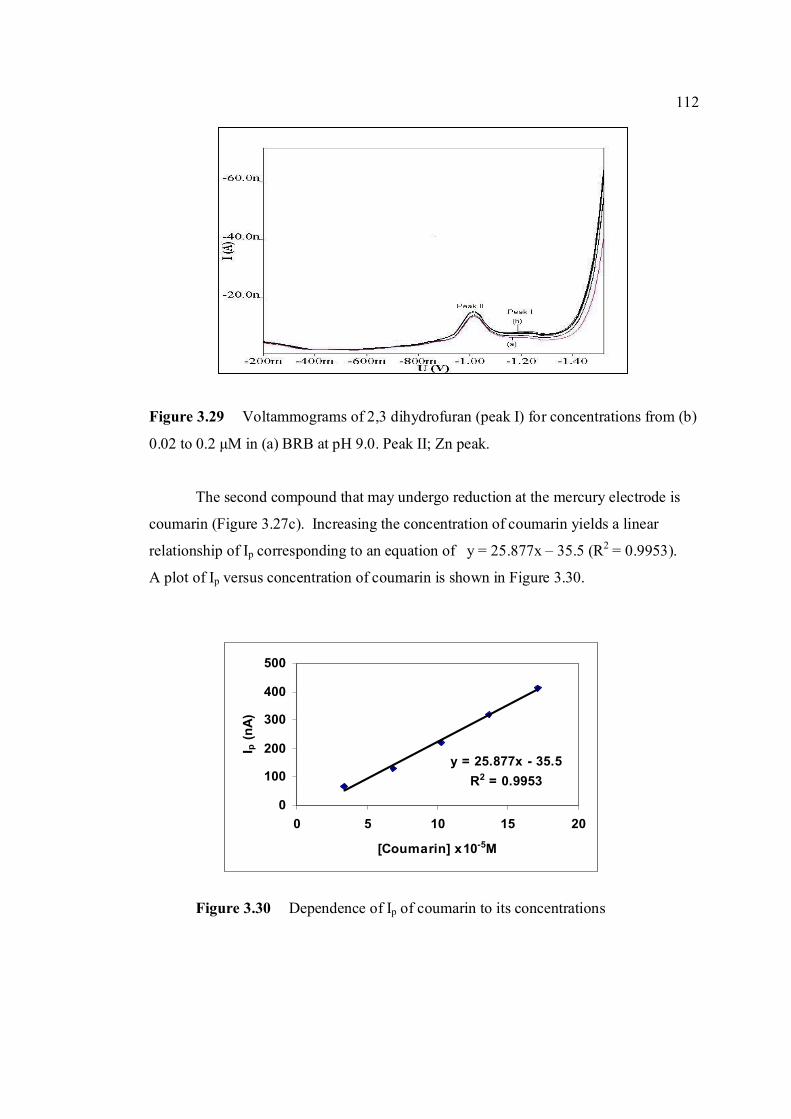
112
y = 25.877x - 35.5R2 = 0.9953
0
100
200
300
400
500
0 5 10 15 20
[Coumarin] x10-5M
I p (n
A)
Figure 3.29 Voltammograms of 2,3 dihydrofuran (peak I) for concentrations from (b)
0.02 to 0.2 µM in (a) BRB at pH 9.0. Peak II; Zn peak.
The second compound that may undergo reduction at the mercury electrode is
coumarin (Figure 3.27c). Increasing the concentration of coumarin yields a linear
relationship of Ip corresponding to an equation of y = 25.877x – 35.5 (R2 = 0.9953).
A plot of Ip versus concentration of coumarin is shown in Figure 3.30.
Figure 3.30 Dependence of Ip of coumarin to its concentrations
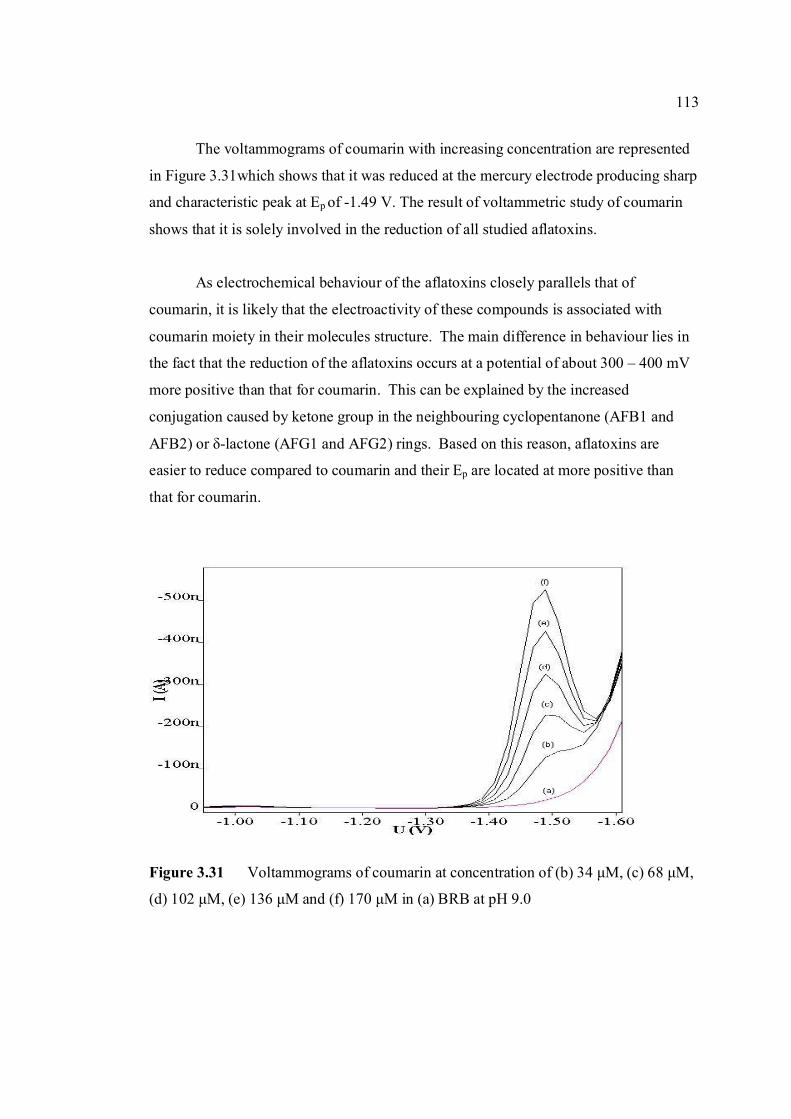
113
The voltammograms of coumarin with increasing concentration are represented
in Figure 3.31which shows that it was reduced at the mercury electrode producing sharp
and characteristic peak at Ep of -1.49 V. The result of voltammetric study of coumarin
shows that it is solely involved in the reduction of all studied aflatoxins.
As electrochemical behaviour of the aflatoxins closely parallels that of
coumarin, it is likely that the electroactivity of these compounds is associated with
coumarin moiety in their molecules structure. The main difference in behaviour lies in
the fact that the reduction of the aflatoxins occurs at a potential of about 300 – 400 mV
more positive than that for coumarin. This can be explained by the increased
conjugation caused by ketone group in the neighbouring cyclopentanone (AFB1 and
AFB2) or δ-lactone (AFG1 and AFG2) rings. Based on this reason, aflatoxins are
easier to reduce compared to coumarin and their Ep are located at more positive than
that for coumarin.
Figure 3.31 Voltammograms of coumarin at concentration of (b) 34 µM, (c) 68 µM,
(d) 102 µM, (e) 136 µM and (f) 170 µM in (a) BRB at pH 9.0
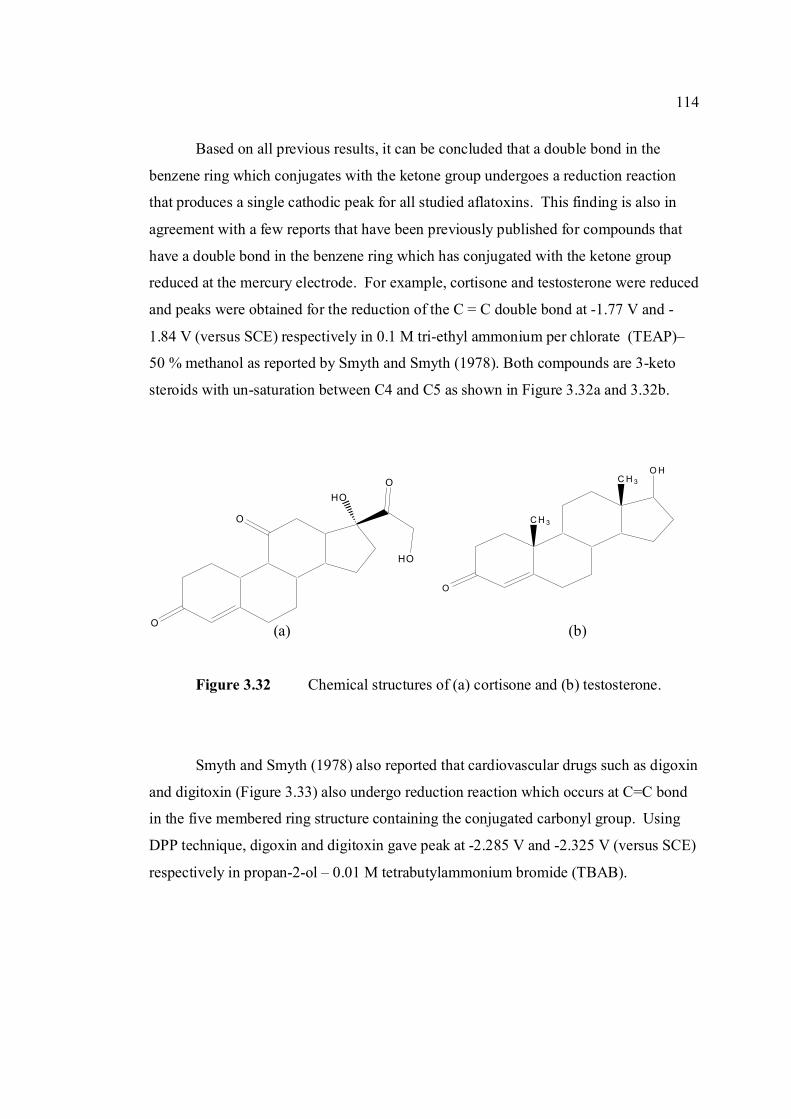
114
O
O
HO
HO
O
C H 3
C H 3
O
O H
Based on all previous results, it can be concluded that a double bond in the
benzene ring which conjugates with the ketone group undergoes a reduction reaction
that produces a single cathodic peak for all studied aflatoxins. This finding is also in
agreement with a few reports that have been previously published for compounds that
have a double bond in the benzene ring which has conjugated with the ketone group
reduced at the mercury electrode. For example, cortisone and testosterone were reduced
and peaks were obtained for the reduction of the C = C double bond at -1.77 V and -
1.84 V (versus SCE) respectively in 0.1 M tri-ethyl ammonium per chlorate (TEAP)–
50 % methanol as reported by Smyth and Smyth (1978). Both compounds are 3-keto
steroids with un-saturation between C4 and C5 as shown in Figure 3.32a and 3.32b.
(a) (b)
Figure 3.32 Chemical structures of (a) cortisone and (b) testosterone.
Smyth and Smyth (1978) also reported that cardiovascular drugs such as digoxin
and digitoxin (Figure 3.33) also undergo reduction reaction which occurs at C=C bond
in the five membered ring structure containing the conjugated carbonyl group. Using
DPP technique, digoxin and digitoxin gave peak at -2.285 V and -2.325 V (versus SCE)
respectively in propan-2-ol – 0.01 M tetrabutylammonium bromide (TBAB).
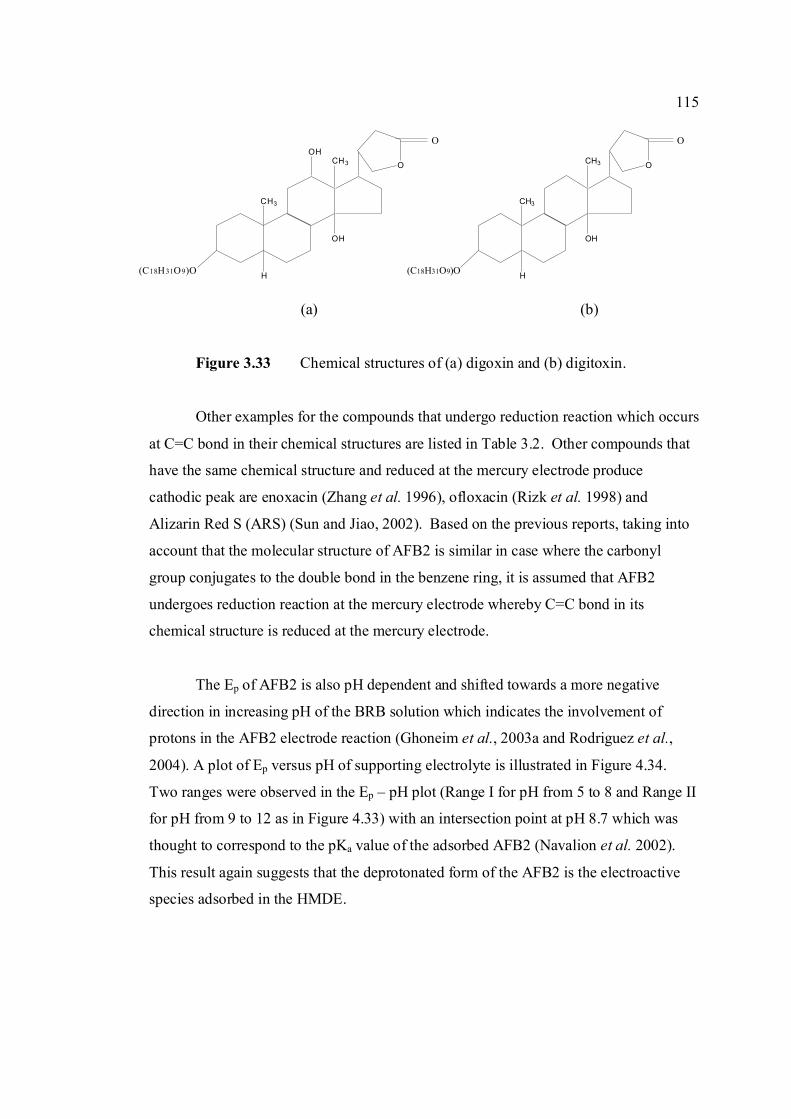
115
CH3
H
CH3
OH
O
(C18H31O9)O
OHO
CH3
H
CH3
OH
O
(C18H31O9)O
O
(a) (b)
Figure 3.33 Chemical structures of (a) digoxin and (b) digitoxin.
Other examples for the compounds that undergo reduction reaction which occurs
at C=C bond in their chemical structures are listed in Table 3.2. Other compounds that
have the same chemical structure and reduced at the mercury electrode produce
cathodic peak are enoxacin (Zhang et al. 1996), ofloxacin (Rizk et al. 1998) and
Alizarin Red S (ARS) (Sun and Jiao, 2002). Based on the previous reports, taking into
account that the molecular structure of AFB2 is similar in case where the carbonyl
group conjugates to the double bond in the benzene ring, it is assumed that AFB2
undergoes reduction reaction at the mercury electrode whereby C=C bond in its
chemical structure is reduced at the mercury electrode.
The Ep of AFB2 is also pH dependent and shifted towards a more negative
direction in increasing pH of the BRB solution which indicates the involvement of
protons in the AFB2 electrode reaction (Ghoneim et al., 2003a and Rodriguez et al.,
2004). A plot of Ep versus pH of supporting electrolyte is illustrated in Figure 4.34.
Two ranges were observed in the Ep – pH plot (Range I for pH from 5 to 8 and Range II
for pH from 9 to 12 as in Figure 4.33) with an intersection point at pH 8.7 which was
thought to correspond to the pKa value of the adsorbed AFB2 (Navalion et al. 2002).
This result again suggests that the deprotonated form of the AFB2 is the electroactive
species adsorbed in the HMDE.
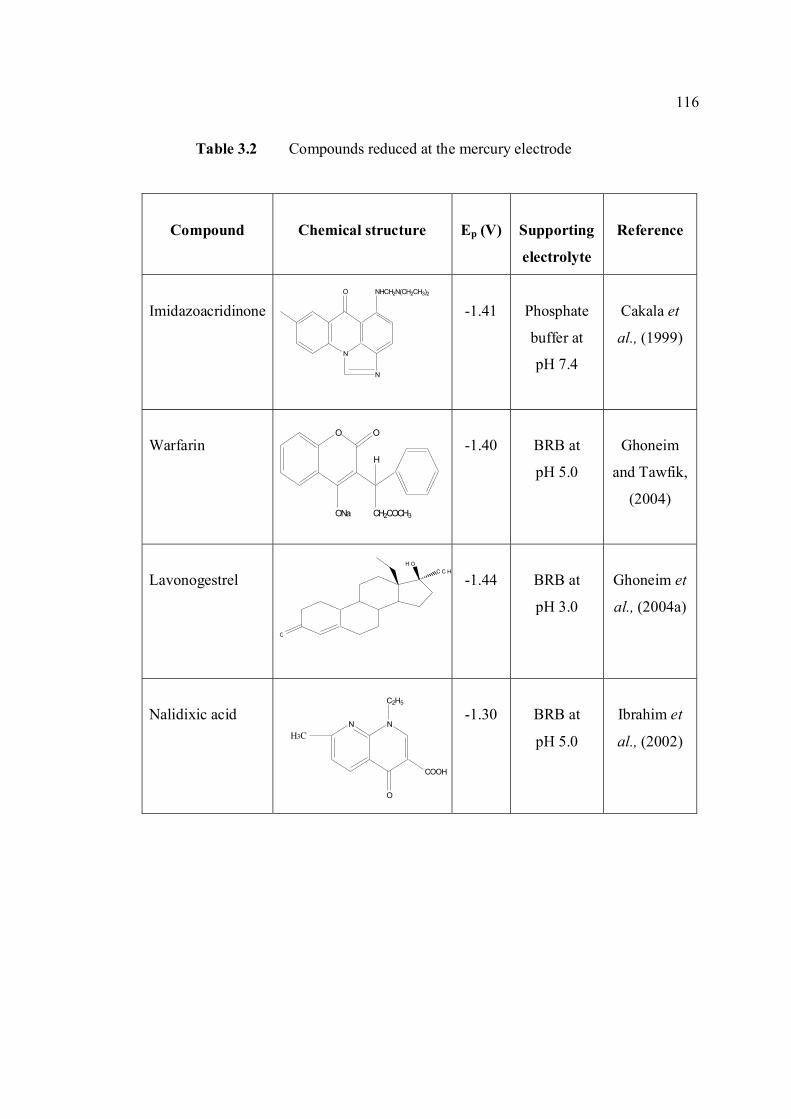
116
N
O
N
NHCH2N(CH2CH3)2
O O
ONa CH2COCH3
H
O
H OC C H
N N
O
C2H5
COOH
H3C
Table 3.2 Compounds reduced at the mercury electrode
Compound
Chemical structure
Ep (V)
Supporting
electrolyte
Reference
Imidazoacridinone
-1.41
Phosphate
buffer at
pH 7.4
Cakala et
al., (1999)
Warfarin
-1.40
BRB at
pH 5.0
Ghoneim
and Tawfik,
(2004)
Lavonogestrel
-1.44
BRB at
pH 3.0
Ghoneim et
al., (2004a)
Nalidixic acid
-1.30
BRB at
pH 5.0
Ibrahim et
al., (2002)
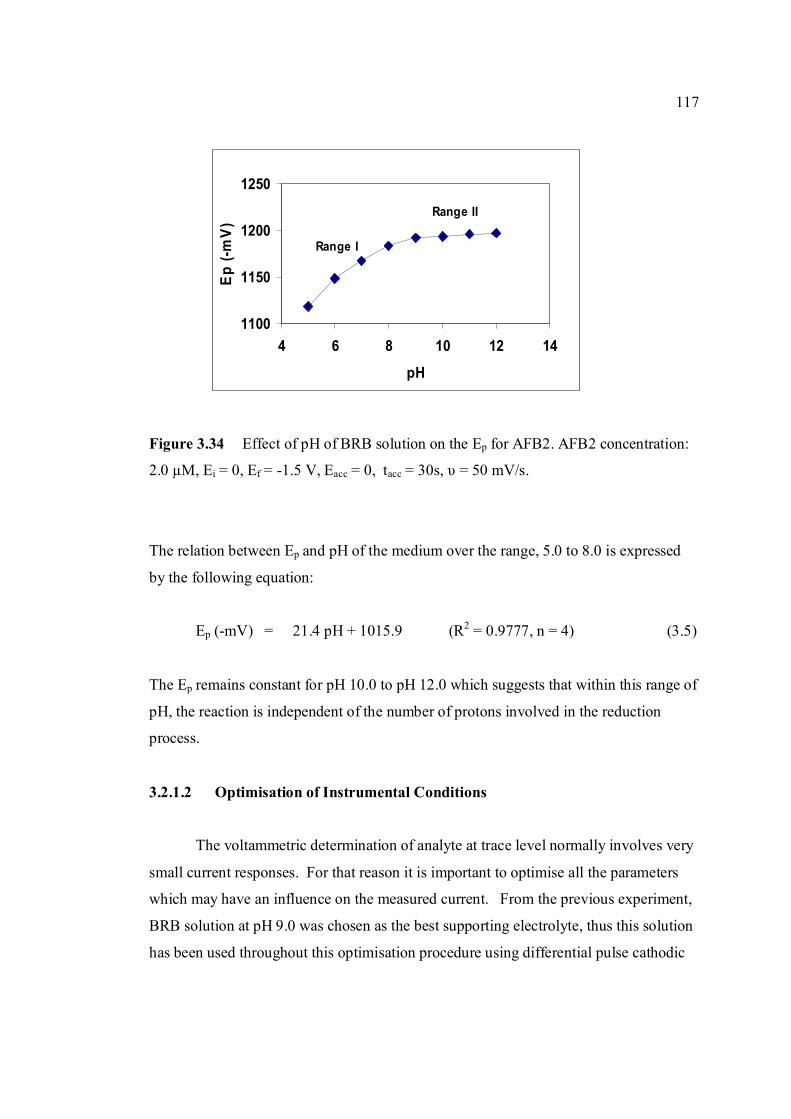
117
1100
1150
1200
1250
4 6 8 10 12 14
pH
Ep
(-mV
)Range I
Range II
Figure 3.34 Effect of pH of BRB solution on the Ep for AFB2. AFB2 concentration:
2.0 µM, Ei = 0, Ef = -1.5 V, Eacc = 0, tacc = 30s, υ = 50 mV/s.
The relation between Ep and pH of the medium over the range, 5.0 to 8.0 is expressed
by the following equation:
Ep (-mV) = 21.4 pH + 1015.9 (R2 = 0.9777, n = 4) (3.5)
The Ep remains constant for pH 10.0 to pH 12.0 which suggests that within this range of
pH, the reaction is independent of the number of protons involved in the reduction
process.
3.2.1.2 Optimisation of Instrumental Conditions
The voltammetric determination of analyte at trace level normally involves very
small current responses. For that reason it is important to optimise all the parameters
which may have an influence on the measured current. From the previous experiment,
BRB solution at pH 9.0 was chosen as the best supporting electrolyte, thus this solution
has been used throughout this optimisation procedure using differential pulse cathodic
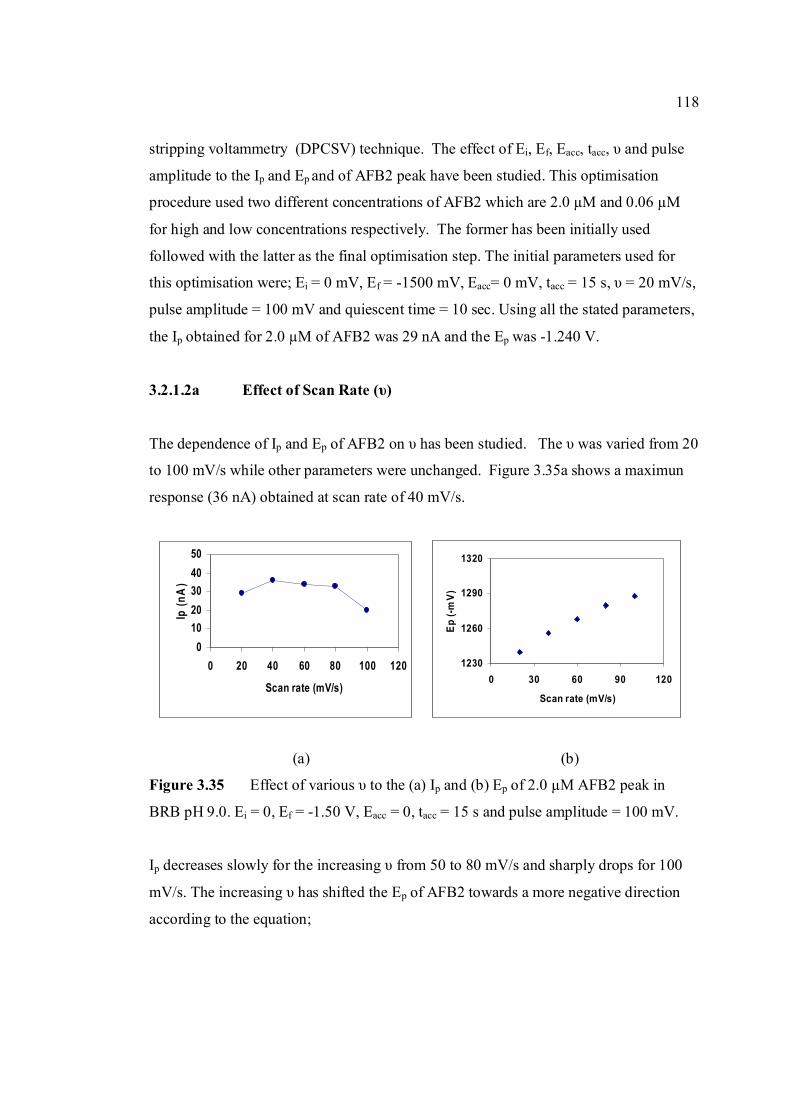
118
01020304050
0 20 40 60 80 100 120
Scan rate (mV/s)
Ip (n
A)
1230
1260
1290
1320
0 30 60 90 120
Scan rate (mV/s)
Ep (-
mV)
stripping voltammetry (DPCSV) technique. The effect of Ei, Ef, Eacc, tacc, υ and pulse
amplitude to the Ip and Ep and of AFB2 peak have been studied. This optimisation
procedure used two different concentrations of AFB2 which are 2.0 µM and 0.06 µM
for high and low concentrations respectively. The former has been initially used
followed with the latter as the final optimisation step. The initial parameters used for
this optimisation were; Ei = 0 mV, Ef = -1500 mV, Eacc= 0 mV, tacc = 15 s, υ = 20 mV/s,
pulse amplitude = 100 mV and quiescent time = 10 sec. Using all the stated parameters,
the Ip obtained for 2.0 µM of AFB2 was 29 nA and the Ep was -1.240 V.
3.2.1.2a Effect of Scan Rate (υ)
The dependence of Ip and Ep of AFB2 on υ has been studied. The υ was varied from 20
to 100 mV/s while other parameters were unchanged. Figure 3.35a shows a maximun
response (36 nA) obtained at scan rate of 40 mV/s.
(a) (b)
Figure 3.35 Effect of various υ to the (a) Ip and (b) Ep of 2.0 µM AFB2 peak in
BRB pH 9.0. Ei = 0, Ef = -1.50 V, Eacc = 0, tacc = 15 s and pulse amplitude = 100 mV.
Ip decreases slowly for the increasing υ from 50 to 80 mV/s and sharply drops for 100
mV/s. The increasing υ has shifted the Ep of AFB2 towards a more negative direction
according to the equation;
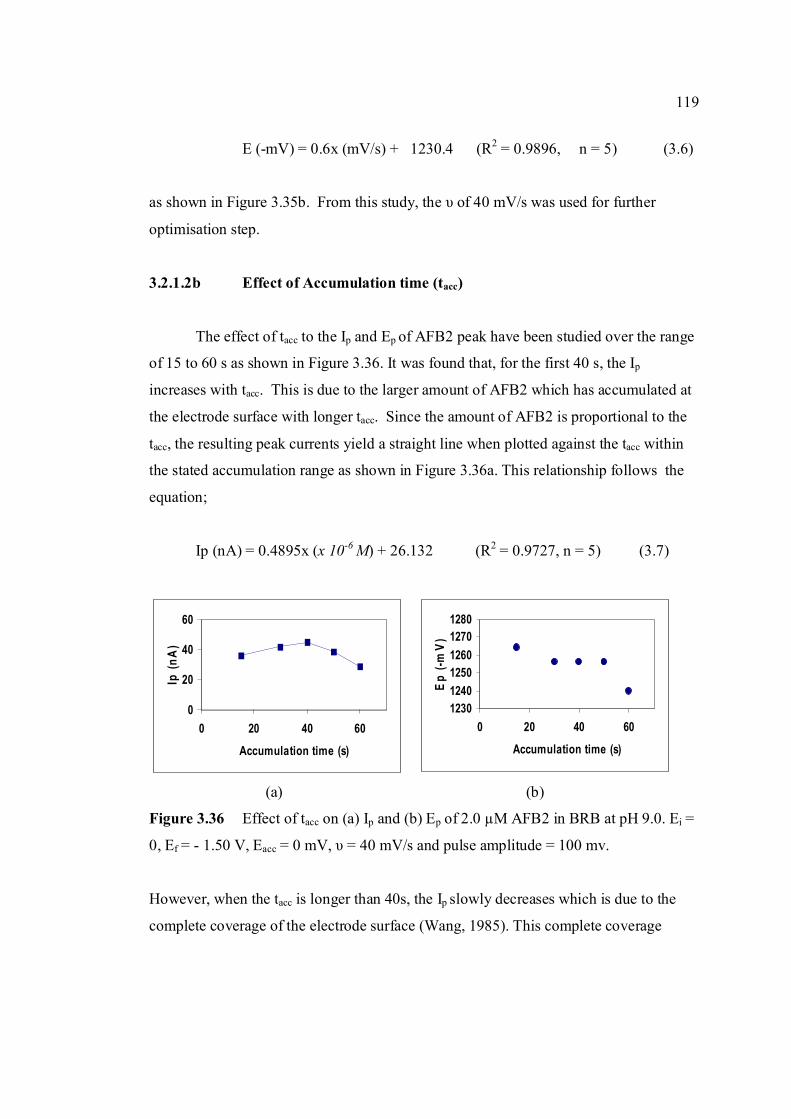
119
0
20
40
60
0 20 40 60
Accumulation time (s)
Ip (n
A)
123012401250126012701280
0 20 40 60
Accumulation time (s)
Ep
(-mV)
E (-mV) = 0.6x (mV/s) + 1230.4 (R2 = 0.9896, n = 5) (3.6)
as shown in Figure 3.35b. From this study, the υ of 40 mV/s was used for further
optimisation step.
3.2.1.2b Effect of Accumulation time (tacc)
The effect of tacc to the Ip and Ep of AFB2 peak have been studied over the range
of 15 to 60 s as shown in Figure 3.36. It was found that, for the first 40 s, the Ip
increases with tacc. This is due to the larger amount of AFB2 which has accumulated at
the electrode surface with longer tacc. Since the amount of AFB2 is proportional to the
tacc, the resulting peak currents yield a straight line when plotted against the tacc within
the stated accumulation range as shown in Figure 3.36a. This relationship follows the
equation;
Ip (nA) = 0.4895x (x 10-6 M) + 26.132 (R2 = 0.9727, n = 5) (3.7)
(a) (b)
Figure 3.36 Effect of tacc on (a) Ip and (b) Ep of 2.0 µM AFB2 in BRB at pH 9.0. Ei =
0, Ef = - 1.50 V, Eacc = 0 mV, υ = 40 mV/s and pulse amplitude = 100 mv.
However, when the tacc is longer than 40s, the Ip slowly decreases which is due to the
complete coverage of the electrode surface (Wang, 1985). This complete coverage
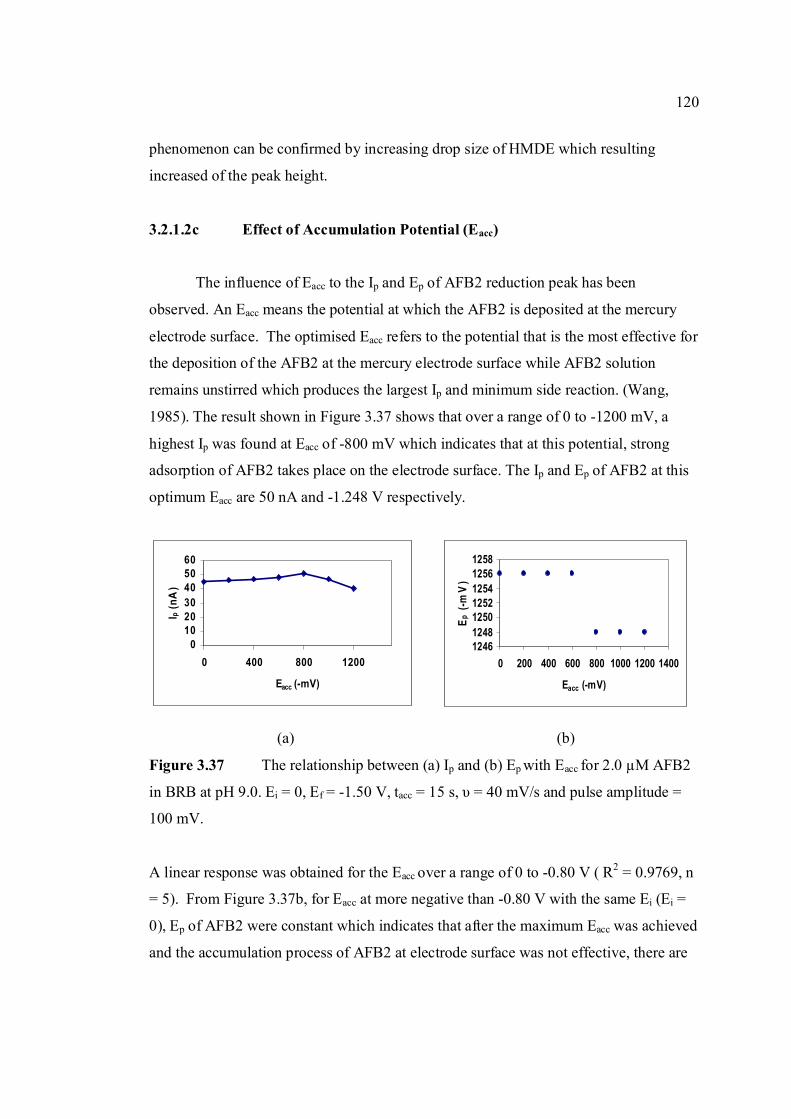
120
0102030405060
0 400 800 1200
Eacc (-mV)
I p (n
A)
1246124812501252125412561258
0 200 400 600 800 1000 1200 1400
Eacc (-mV)
Ep (-
mV
)
phenomenon can be confirmed by increasing drop size of HMDE which resulting
increased of the peak height.
3.2.1.2c Effect of Accumulation Potential (Eacc)
The influence of Eacc to the Ip and Ep of AFB2 reduction peak has been
observed. An Eacc means the potential at which the AFB2 is deposited at the mercury
electrode surface. The optimised Eacc refers to the potential that is the most effective for
the deposition of the AFB2 at the mercury electrode surface while AFB2 solution
remains unstirred which produces the largest Ip and minimum side reaction. (Wang,
1985). The result shown in Figure 3.37 shows that over a range of 0 to -1200 mV, a
highest Ip was found at Eacc of -800 mV which indicates that at this potential, strong
adsorption of AFB2 takes place on the electrode surface. The Ip and Ep of AFB2 at this
optimum Eacc are 50 nA and -1.248 V respectively.
(a) (b)
Figure 3.37 The relationship between (a) Ip and (b) Ep with Eacc for 2.0 µM AFB2
in BRB at pH 9.0. Ei = 0, Ef = -1.50 V, tacc = 15 s, υ = 40 mV/s and pulse amplitude =
100 mV.
A linear response was obtained for the Eacc over a range of 0 to -0.80 V ( R2 = 0.9769, n
= 5). From Figure 3.37b, for Eacc at more negative than -0.80 V with the same Ei (Ei =
0), Ep of AFB2 were constant which indicates that after the maximum Eacc was achieved
and the accumulation process of AFB2 at electrode surface was not effective, there are
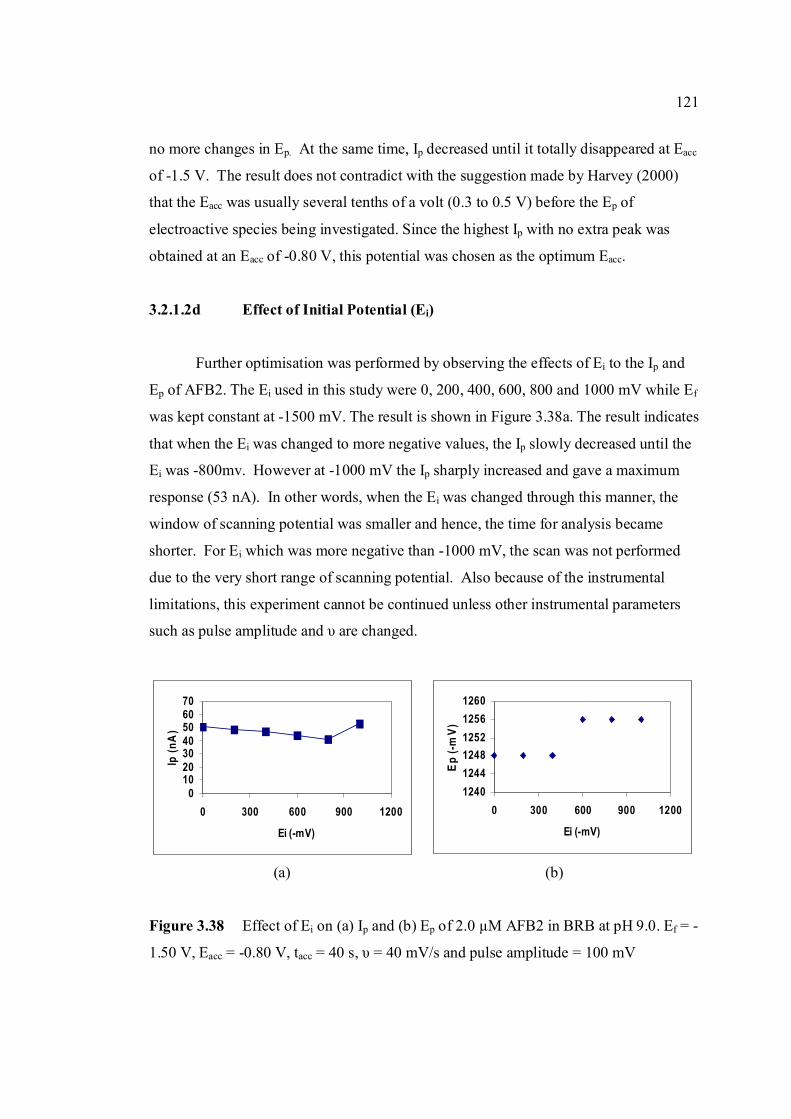
121
010203040506070
0 300 600 900 1200
Ei (-mV)
Ip (n
A)
124012441248125212561260
0 300 600 900 1200
Ei (-mV)
Ep (-
mV)
no more changes in Ep. At the same time, Ip decreased until it totally disappeared at Eacc
of -1.5 V. The result does not contradict with the suggestion made by Harvey (2000)
that the Eacc was usually several tenths of a volt (0.3 to 0.5 V) before the Ep of
electroactive species being investigated. Since the highest Ip with no extra peak was
obtained at an Eacc of -0.80 V, this potential was chosen as the optimum Eacc.
3.2.1.2d Effect of Initial Potential (Ei)
Further optimisation was performed by observing the effects of Ei to the Ip and
Ep of AFB2. The Ei used in this study were 0, 200, 400, 600, 800 and 1000 mV while Ef
was kept constant at -1500 mV. The result is shown in Figure 3.38a. The result indicates
that when the Ei was changed to more negative values, the Ip slowly decreased until the
Ei was -800mv. However at -1000 mV the Ip sharply increased and gave a maximum
response (53 nA). In other words, when the Ei was changed through this manner, the
window of scanning potential was smaller and hence, the time for analysis became
shorter. For Ei which was more negative than -1000 mV, the scan was not performed
due to the very short range of scanning potential. Also because of the instrumental
limitations, this experiment cannot be continued unless other instrumental parameters
such as pulse amplitude and υ are changed.
(a) (b)
Figure 3.38 Effect of Ei on (a) Ip and (b) Ep of 2.0 µM AFB2 in BRB at pH 9.0. Ef = -
1.50 V, Eacc = -0.80 V, tacc = 40 s, υ = 40 mV/s and pulse amplitude = 100 mV
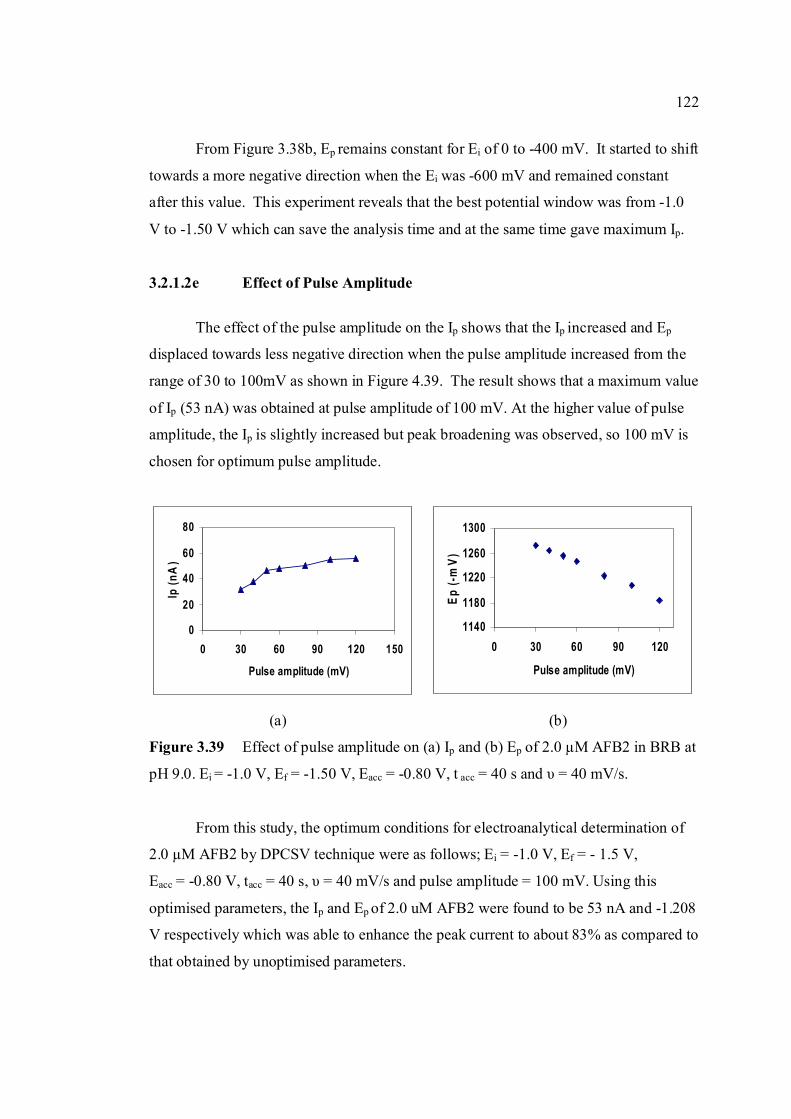
122
0
20
40
60
80
0 30 60 90 120 150
Pulse amplitude (mV)
Ip (n
A)
1140
1180
1220
1260
1300
0 30 60 90 120
Pulse amplitude (mV)
Ep (-
mV)
From Figure 3.38b, Ep remains constant for Ei of 0 to -400 mV. It started to shift
towards a more negative direction when the Ei was -600 mV and remained constant
after this value. This experiment reveals that the best potential window was from -1.0
V to -1.50 V which can save the analysis time and at the same time gave maximum Ip.
3.2.1.2e Effect of Pulse Amplitude
The effect of the pulse amplitude on the Ip shows that the Ip increased and Ep
displaced towards less negative direction when the pulse amplitude increased from the
range of 30 to 100mV as shown in Figure 4.39. The result shows that a maximum value
of Ip (53 nA) was obtained at pulse amplitude of 100 mV. At the higher value of pulse
amplitude, the Ip is slightly increased but peak broadening was observed, so 100 mV is
chosen for optimum pulse amplitude.
(a) (b)
Figure 3.39 Effect of pulse amplitude on (a) Ip and (b) Ep of 2.0 µM AFB2 in BRB at
pH 9.0. Ei = -1.0 V, Ef = -1.50 V, Eacc = -0.80 V, t acc = 40 s and υ = 40 mV/s.
From this study, the optimum conditions for electroanalytical determination of
2.0 µM AFB2 by DPCSV technique were as follows; Ei = -1.0 V, Ef = - 1.5 V,
Eacc = -0.80 V, tacc = 40 s, υ = 40 mV/s and pulse amplitude = 100 mV. Using this
optimised parameters, the Ip and Ep of 2.0 uM AFB2 were found to be 53 nA and -1.208
V respectively which was able to enhance the peak current to about 83% as compared to
that obtained by unoptimised parameters.
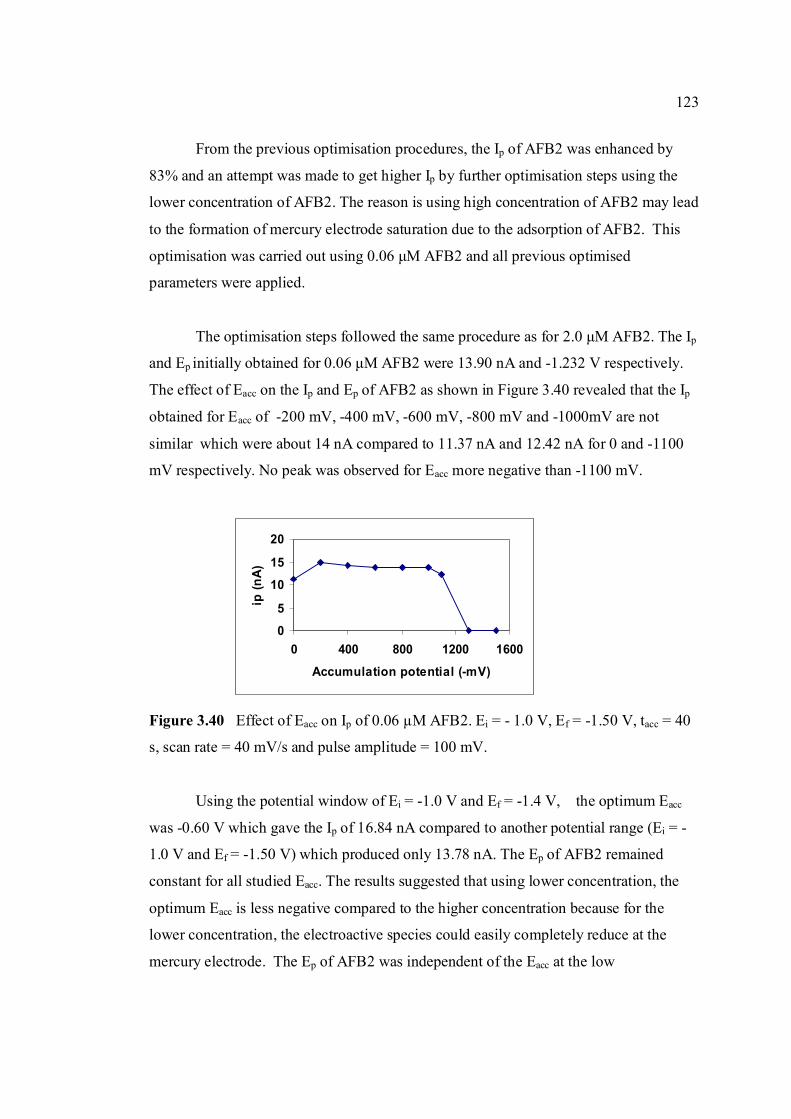
123
0
5
10
15
20
0 400 800 1200 1600
Accumulation potential (-mV)
ip (n
A)
From the previous optimisation procedures, the Ip of AFB2 was enhanced by
83% and an attempt was made to get higher Ip by further optimisation steps using the
lower concentration of AFB2. The reason is using high concentration of AFB2 may lead
to the formation of mercury electrode saturation due to the adsorption of AFB2. This
optimisation was carried out using 0.06 µM AFB2 and all previous optimised
parameters were applied.
The optimisation steps followed the same procedure as for 2.0 µM AFB2. The Ip
and Ep initially obtained for 0.06 µM AFB2 were 13.90 nA and -1.232 V respectively.
The effect of Eacc on the Ip and Ep of AFB2 as shown in Figure 3.40 revealed that the Ip
obtained for Eacc of -200 mV, -400 mV, -600 mV, -800 mV and -1000mV are not
similar which were about 14 nA compared to 11.37 nA and 12.42 nA for 0 and -1100
mV respectively. No peak was observed for Eacc more negative than -1100 mV.
Figure 3.40 Effect of Eacc on Ip of 0.06 µM AFB2. Ei = - 1.0 V, Ef = -1.50 V, tacc = 40
s, scan rate = 40 mV/s and pulse amplitude = 100 mV.
Using the potential window of Ei = -1.0 V and Ef = -1.4 V, the optimum Eacc
was -0.60 V which gave the Ip of 16.84 nA compared to another potential range (Ei = -
1.0 V and Ef = -1.50 V) which produced only 13.78 nA. The Ep of AFB2 remained
constant for all studied Eacc. The results suggested that using lower concentration, the
optimum Eacc is less negative compared to the higher concentration because for the
lower concentration, the electroactive species could easily completely reduce at the
mercury electrode. The Ep of AFB2 was independent of the Eacc at the low
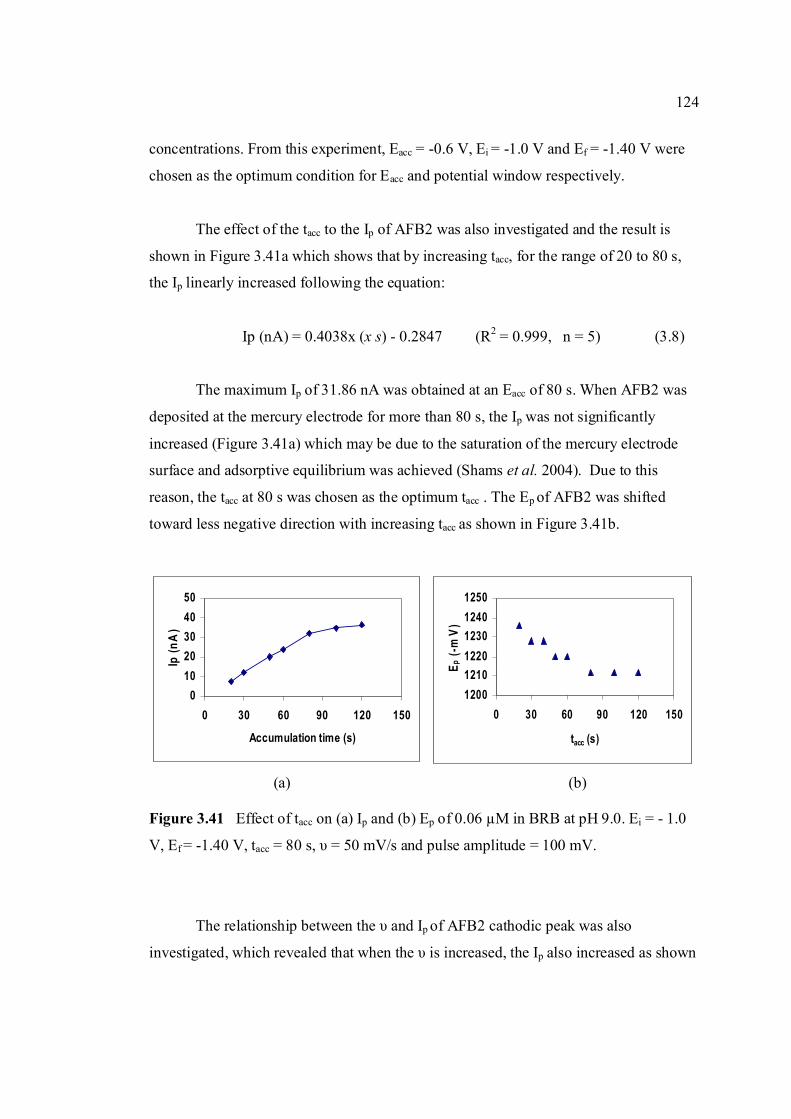
124
01020304050
0 30 60 90 120 150
Accumulation time (s)
Ip (n
A)
120012101220123012401250
0 30 60 90 120 150
tacc (s)
E p (-
mV)
concentrations. From this experiment, Eacc = -0.6 V, Ei = -1.0 V and Ef = -1.40 V were
chosen as the optimum condition for Eacc and potential window respectively.
The effect of the tacc to the Ip of AFB2 was also investigated and the result is
shown in Figure 3.41a which shows that by increasing tacc, for the range of 20 to 80 s,
the Ip linearly increased following the equation:
Ip (nA) = 0.4038x (x s) - 0.2847 (R2 = 0.999, n = 5) (3.8)
The maximum Ip of 31.86 nA was obtained at an Eacc of 80 s. When AFB2 was
deposited at the mercury electrode for more than 80 s, the Ip was not significantly
increased (Figure 3.41a) which may be due to the saturation of the mercury electrode
surface and adsorptive equilibrium was achieved (Shams et al. 2004). Due to this
reason, the tacc at 80 s was chosen as the optimum tacc . The Ep of AFB2 was shifted
toward less negative direction with increasing tacc as shown in Figure 3.41b.
(a) (b) Figure 3.41 Effect of tacc on (a) Ip and (b) Ep of 0.06 µM in BRB at pH 9.0. Ei = - 1.0
V, Ef = -1.40 V, tacc = 80 s, υ = 50 mV/s and pulse amplitude = 100 mV.
The relationship between the υ and Ip of AFB2 cathodic peak was also
investigated, which revealed that when the υ is increased, the Ip also increased as shown
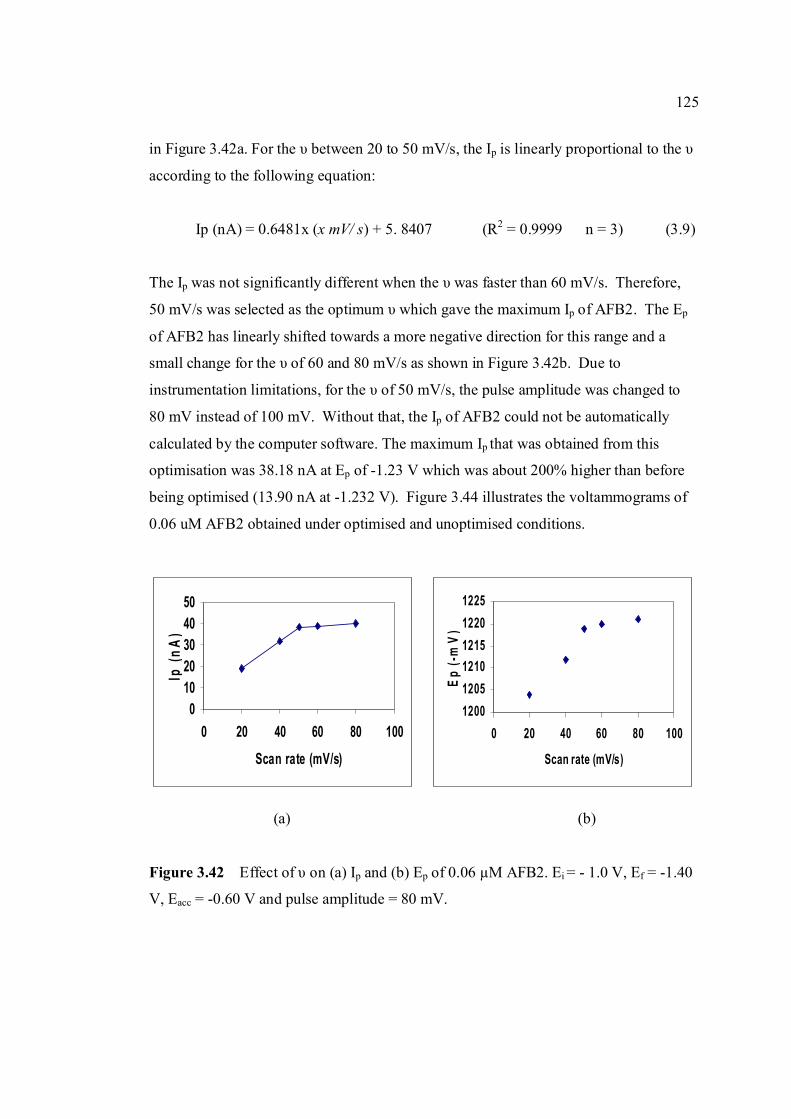
125
01020304050
0 20 40 60 80 100
Scan rate (mV/s)
Ip (n
A)
120012051210121512201225
0 20 40 60 80 100
Scan rate (mV/s)
Ep (-
mV)
in Figure 3.42a. For the υ between 20 to 50 mV/s, the Ip is linearly proportional to the υ
according to the following equation:
Ip (nA) = 0.6481x (x mV/ s) + 5. 8407 (R2 = 0.9999 n = 3) (3.9)
The Ip was not significantly different when the υ was faster than 60 mV/s. Therefore,
50 mV/s was selected as the optimum υ which gave the maximum Ip of AFB2. The Ep
of AFB2 has linearly shifted towards a more negative direction for this range and a
small change for the υ of 60 and 80 mV/s as shown in Figure 3.42b. Due to
instrumentation limitations, for the υ of 50 mV/s, the pulse amplitude was changed to
80 mV instead of 100 mV. Without that, the Ip of AFB2 could not be automatically
calculated by the computer software. The maximum Ip that was obtained from this
optimisation was 38.18 nA at Ep of -1.23 V which was about 200% higher than before
being optimised (13.90 nA at -1.232 V). Figure 3.44 illustrates the voltammograms of
0.06 uM AFB2 obtained under optimised and unoptimised conditions.
(a) (b)
Figure 3.42 Effect of υ on (a) Ip and (b) Ep of 0.06 µM AFB2. Ei = - 1.0 V, Ef = -1.40
V, Eacc = -0.60 V and pulse amplitude = 80 mV.
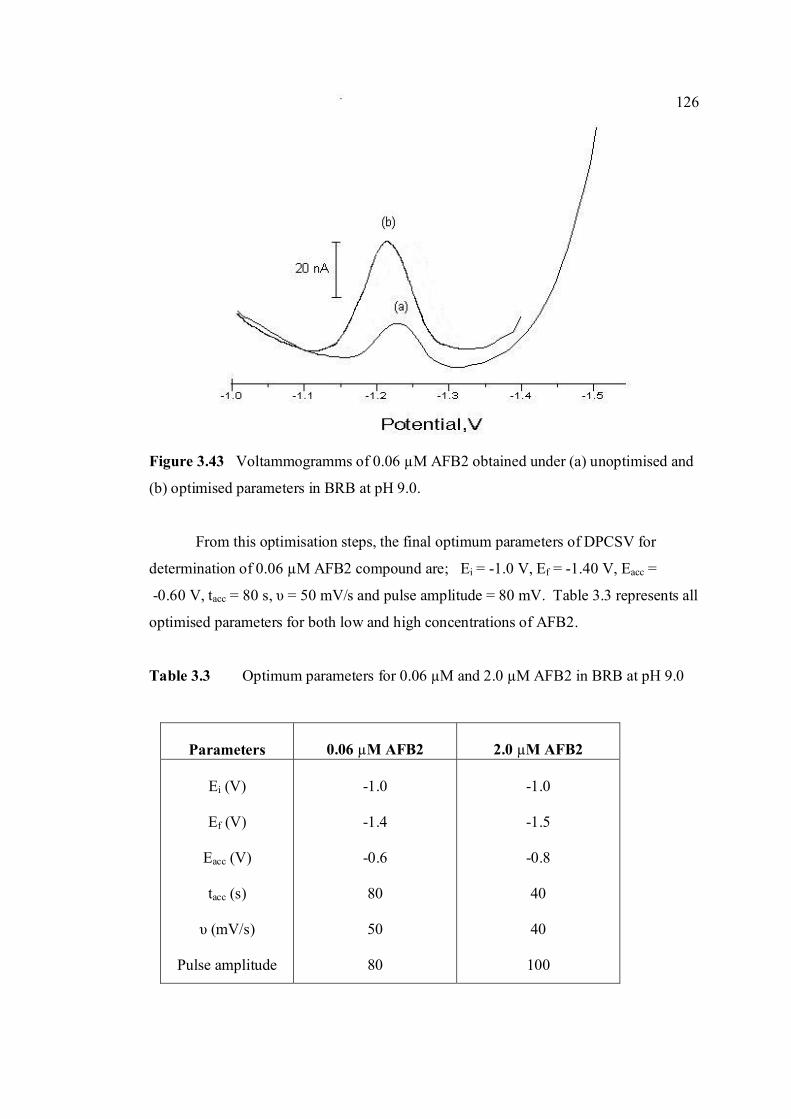
126
Figure 3.43 Voltammogramms of 0.06 µM AFB2 obtained under (a) unoptimised and
(b) optimised parameters in BRB at pH 9.0.
From this optimisation steps, the final optimum parameters of DPCSV for
determination of 0.06 µM AFB2 compound are; Ei = -1.0 V, Ef = -1.40 V, Eacc =
-0.60 V, tacc = 80 s, υ = 50 mV/s and pulse amplitude = 80 mV. Table 3.3 represents all
optimised parameters for both low and high concentrations of AFB2.
Table 3.3 Optimum parameters for 0.06 µM and 2.0 µM AFB2 in BRB at pH 9.0
Parameters
0.06 µM AFB2
2.0 µM AFB2
Ei (V)
Ef (V)
Eacc (V)
tacc (s)
υ (mV/s)
Pulse amplitude
-1.0
-1.4
-0.6
80
50
80
-1.0
-1.5
-0.8
40
40
100
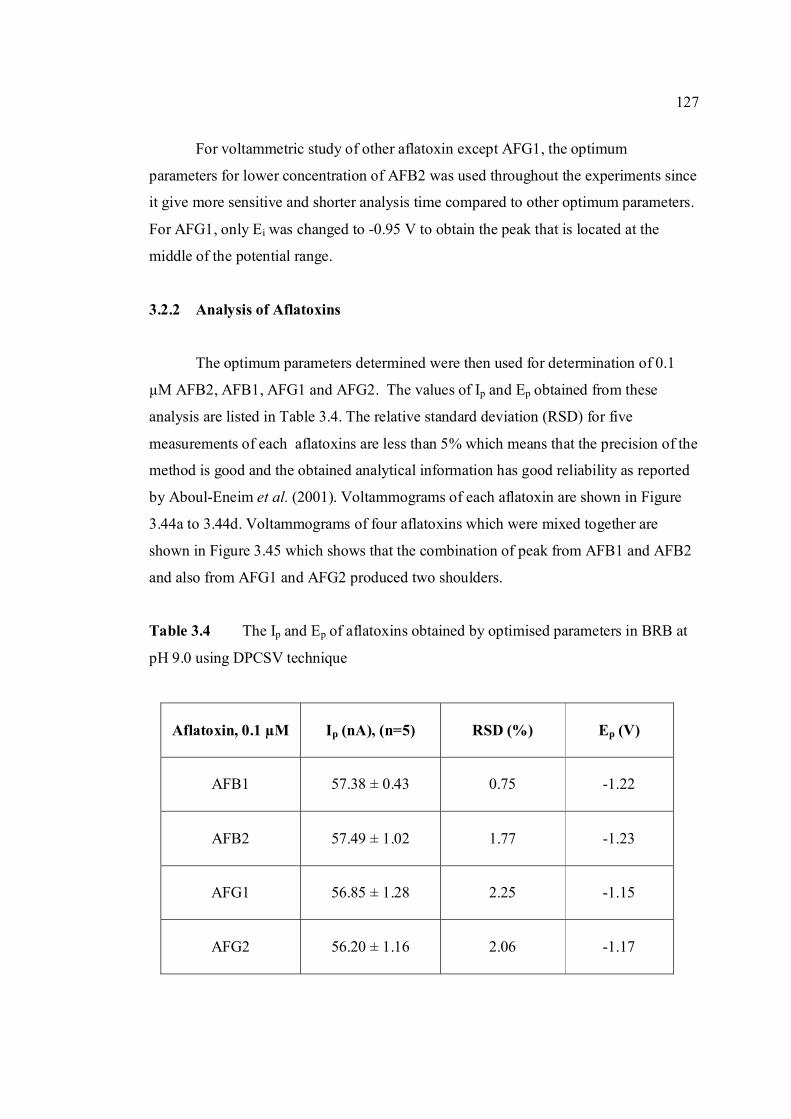
127
For voltammetric study of other aflatoxin except AFG1, the optimum
parameters for lower concentration of AFB2 was used throughout the experiments since
it give more sensitive and shorter analysis time compared to other optimum parameters.
For AFG1, only Ei was changed to -0.95 V to obtain the peak that is located at the
middle of the potential range.
3.2.2 Analysis of Aflatoxins
The optimum parameters determined were then used for determination of 0.1
µM AFB2, AFB1, AFG1 and AFG2. The values of Ip and Ep obtained from these
analysis are listed in Table 3.4. The relative standard deviation (RSD) for five
measurements of each aflatoxins are less than 5% which means that the precision of the
method is good and the obtained analytical information has good reliability as reported
by Aboul-Eneim et al. (2001). Voltammograms of each aflatoxin are shown in Figure
3.44a to 3.44d. Voltammograms of four aflatoxins which were mixed together are
shown in Figure 3.45 which shows that the combination of peak from AFB1 and AFB2
and also from AFG1 and AFG2 produced two shoulders.
Table 3.4 The Ip and Ep of aflatoxins obtained by optimised parameters in BRB at
pH 9.0 using DPCSV technique
Aflatoxin, 0.1 µM
Ip (nA), (n=5)
RSD (%)
Ep (V)
AFB1
57.38 ± 0.43
0.75
-1.22
AFB2
57.49 ± 1.02
1.77
-1.23
AFG1
56.85 ± 1.28
2.25
-1.15
AFG2
56.20 ± 1.16
2.06
-1.17
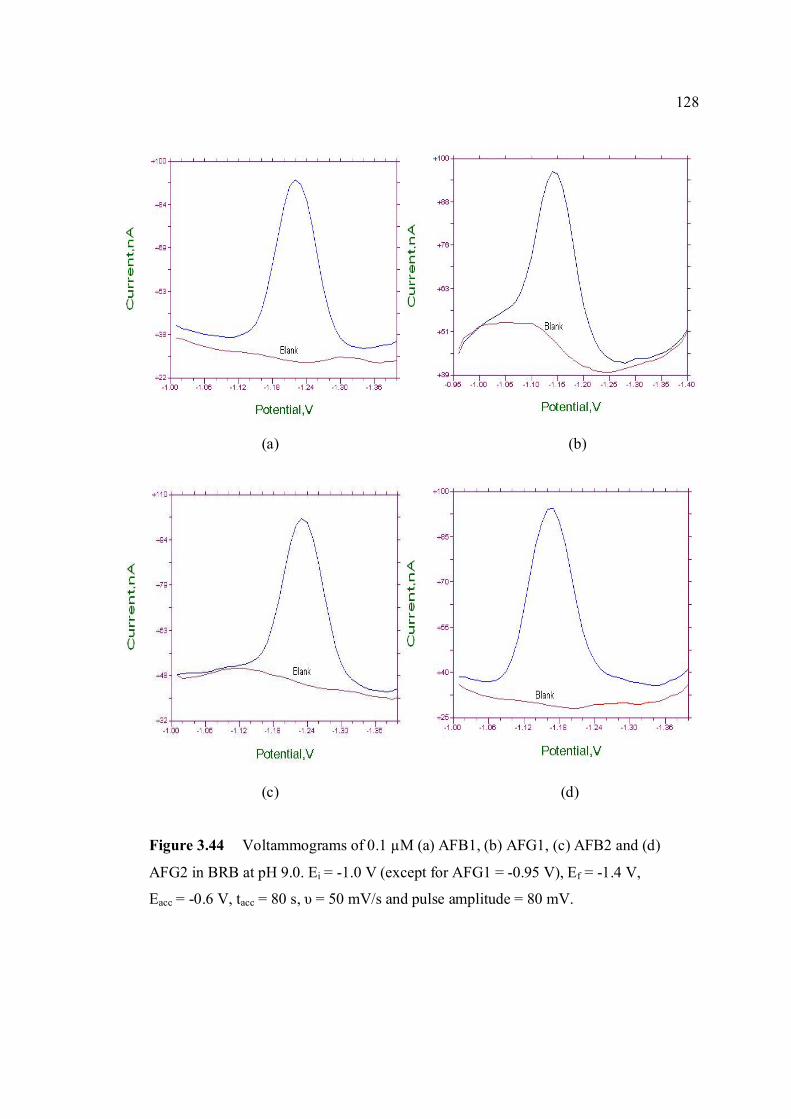
128
(a) (b)
(c) (d)
Figure 3.44 Voltammograms of 0.1 µM (a) AFB1, (b) AFG1, (c) AFB2 and (d)
AFG2 in BRB at pH 9.0. Ei = -1.0 V (except for AFG1 = -0.95 V), Ef = -1.4 V,
Eacc = -0.6 V, tacc = 80 s, υ = 50 mV/s and pulse amplitude = 80 mV.
129
Figure 3.45 Voltammograms of (b) mixed aflatoxins in BRB at pH 9.0 as the blank
(a). Parameters condition; Ei = -0.95 V, Ef = -1.4 V, Eacc = -0.6 V, tacc = 80 s, υ = 50
mV/s and pulse amplitude = 80 mV.
A study was carried out to observe a relationship between Ip and concentration
of aflatoxins. For each aflatoxin, the calibration curve was prepared by a series of
standard addition of aflatoxins. Statistical parameters such as linearity range, R2 value,
limit of detection (LOD), limit of quantification (LOQ), accuracy and precision were
evaluated. For ruggedness and robustness tests of the proposed technique, only AFB2
was used.
3.2.2.1 Calibration Curves of Aflatoxins and Validation of the Proposed Method
3.2.2.1a Calibration curve of AFB2
The calibration curve for AFB2 determination was established by applying the
developed procedure. The Ip of AFB2 with increasing concentration is shown in Figure
3.46 which shows that after Ip achieved its maximum value it tends to level off with
further addition of AFB2 standard solution as expected for a process that was limited by
adsorption of analyte. This phenomenon was similarly observed in the previous study
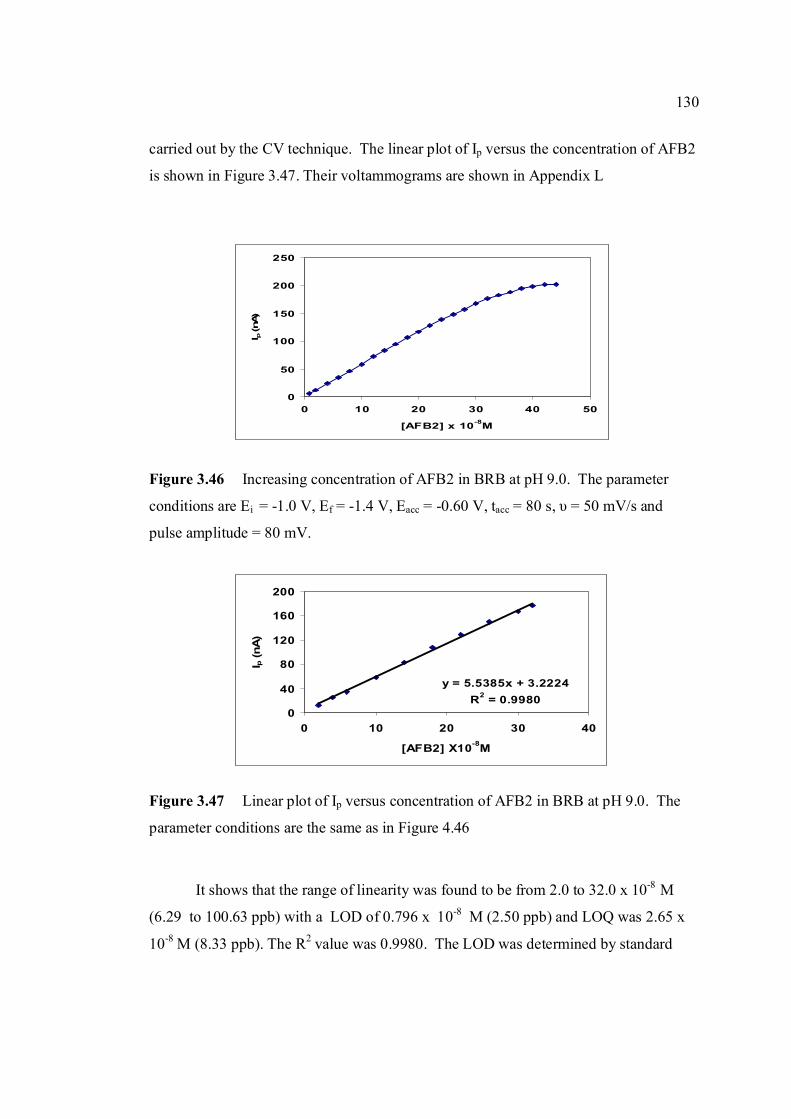
130
0
50
100
150
200
250
0 10 20 30 40 50
[AFB2] x 10-8M
I p (n
A)
y = 5.5385x + 3.2224R2 = 0.9980
0
40
80
120
160
200
0 10 20 30 40
[AFB2] X10-8M
I p (n
A)
carried out by the CV technique. The linear plot of Ip versus the concentration of AFB2
is shown in Figure 3.47. Their voltammograms are shown in Appendix L
Figure 3.46 Increasing concentration of AFB2 in BRB at pH 9.0. The parameter
conditions are Ei = -1.0 V, Ef = -1.4 V, Eacc = -0.60 V, tacc = 80 s, υ = 50 mV/s and
pulse amplitude = 80 mV.
Figure 3.47 Linear plot of Ip versus concentration of AFB2 in BRB at pH 9.0. The
parameter conditions are the same as in Figure 4.46
It shows that the range of linearity was found to be from 2.0 to 32.0 x 10⁻⁸ M
(6.29 to 100.63 ppb) with a LOD of 0.796 x 10⁻⁸ M (2.50 ppb) and LOQ was 2.65 x
10-8 M (8.33 ppb). The R2 value was 0.9980. The LOD was determined by standard
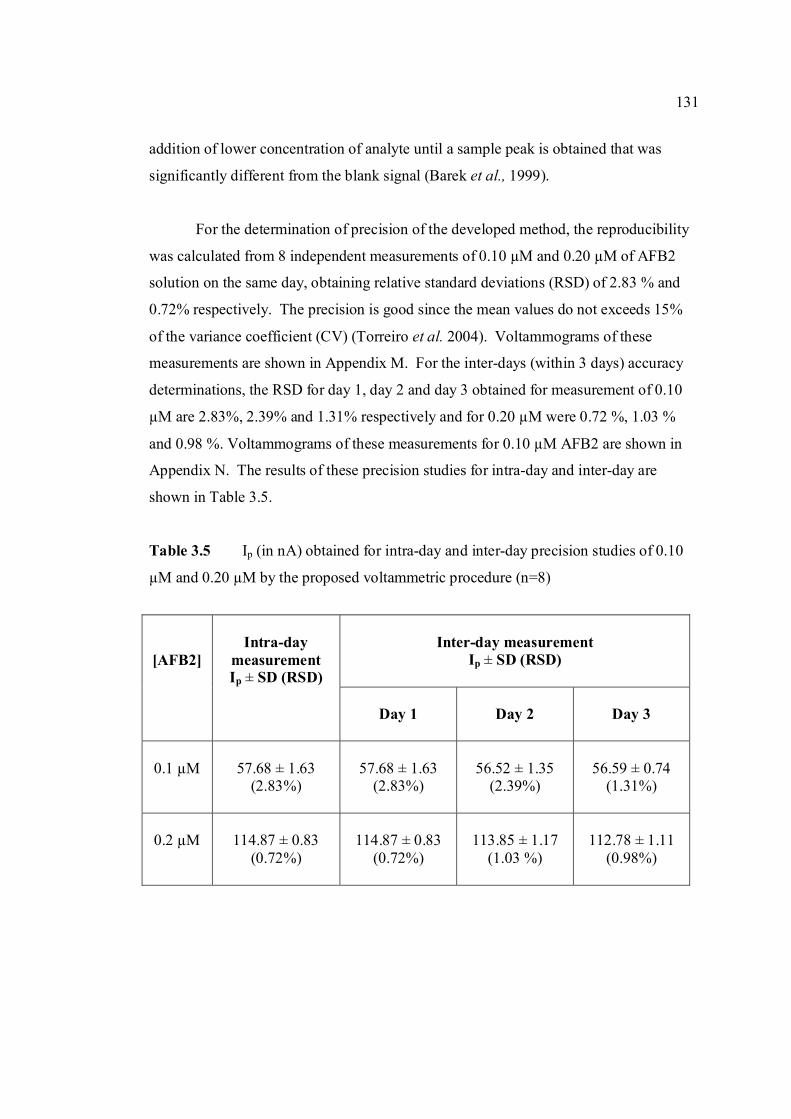
131
addition of lower concentration of analyte until a sample peak is obtained that was
significantly different from the blank signal (Barek et al., 1999).
For the determination of precision of the developed method, the reproducibility
was calculated from 8 independent measurements of 0.10 µM and 0.20 µM of AFB2
solution on the same day, obtaining relative standard deviations (RSD) of 2.83 % and
0.72% respectively. The precision is good since the mean values do not exceeds 15%
of the variance coefficient (CV) (Torreiro et al. 2004). Voltammograms of these
measurements are shown in Appendix M. For the inter-days (within 3 days) accuracy
determinations, the RSD for day 1, day 2 and day 3 obtained for measurement of 0.10
µM are 2.83%, 2.39% and 1.31% respectively and for 0.20 µM were 0.72 %, 1.03 %
and 0.98 %. Voltammograms of these measurements for 0.10 µM AFB2 are shown in
Appendix N. The results of these precision studies for intra-day and inter-day are
shown in Table 3.5.
Table 3.5 Ip (in nA) obtained for intra-day and inter-day precision studies of 0.10
µM and 0.20 µM by the proposed voltammetric procedure (n=8)
Inter-day measurement
Ip ± SD (RSD)
[AFB2]
Intra-day
measurement Ip ± SD (RSD)
Day 1
Day 2
Day 3
0.1 µM
57.68 ± 1.63
(2.83%)
57.68 ± 1.63
(2.83%)
56.52 ± 1.35
(2.39%)
56.59 ± 0.74
(1.31%)
0.2 µM
114.87 ± 0.83
(0.72%)
114.87 ± 0.83
(0.72%)
113.85 ± 1.17
(1.03 %)
112.78 ± 1.11
(0.98%)
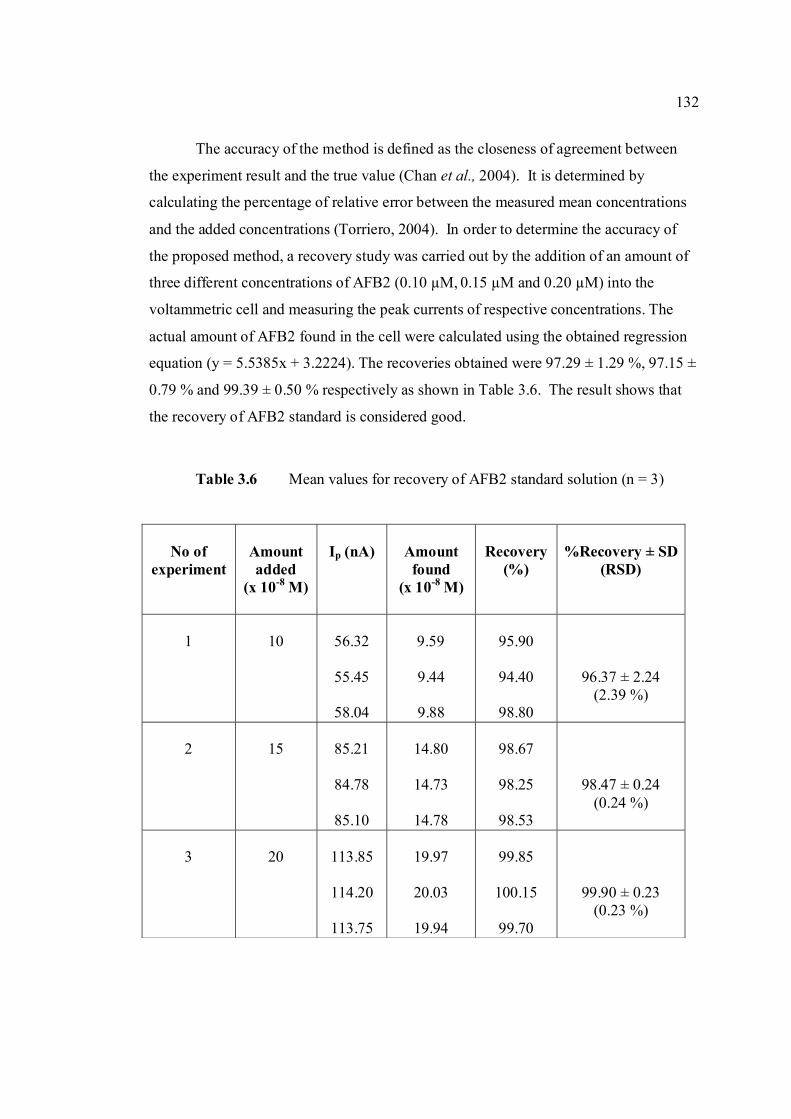
132
The accuracy of the method is defined as the closeness of agreement between
the experiment result and the true value (Chan et al., 2004). It is determined by
calculating the percentage of relative error between the measured mean concentrations
and the added concentrations (Torriero, 2004). In order to determine the accuracy of
the proposed method, a recovery study was carried out by the addition of an amount of
three different concentrations of AFB2 (0.10 µM, 0.15 µM and 0.20 µM) into the
voltammetric cell and measuring the peak currents of respective concentrations. The
actual amount of AFB2 found in the cell were calculated using the obtained regression
equation (y = 5.5385x + 3.2224). The recoveries obtained were 97.29 ± 1.29 %, 97.15 ±
0.79 % and 99.39 ± 0.50 % respectively as shown in Table 3.6. The result shows that
the recovery of AFB2 standard is considered good.
Table 3.6 Mean values for recovery of AFB2 standard solution (n = 3)
No of
experiment
Amount added
(x 10-8 M)
Ip (nA)
Amount
found (x 10-8 M)
Recovery
(%)
%Recovery ± SD
(RSD)
1
10
56.32
55.45
58.04
9.59
9.44
9.88
95.90
94.40
98.80
96.37 ± 2.24 (2.39 %)
2
15
85.21
84.78
85.10
14.80
14.73
14.78
98.67
98.25
98.53
98.47 ± 0.24 (0.24 %)
3
20
113.85
114.20
113.75
19.97
20.03
19.94
99.85
100.15
99.70
99.90 ± 0.23
(0.23 %)
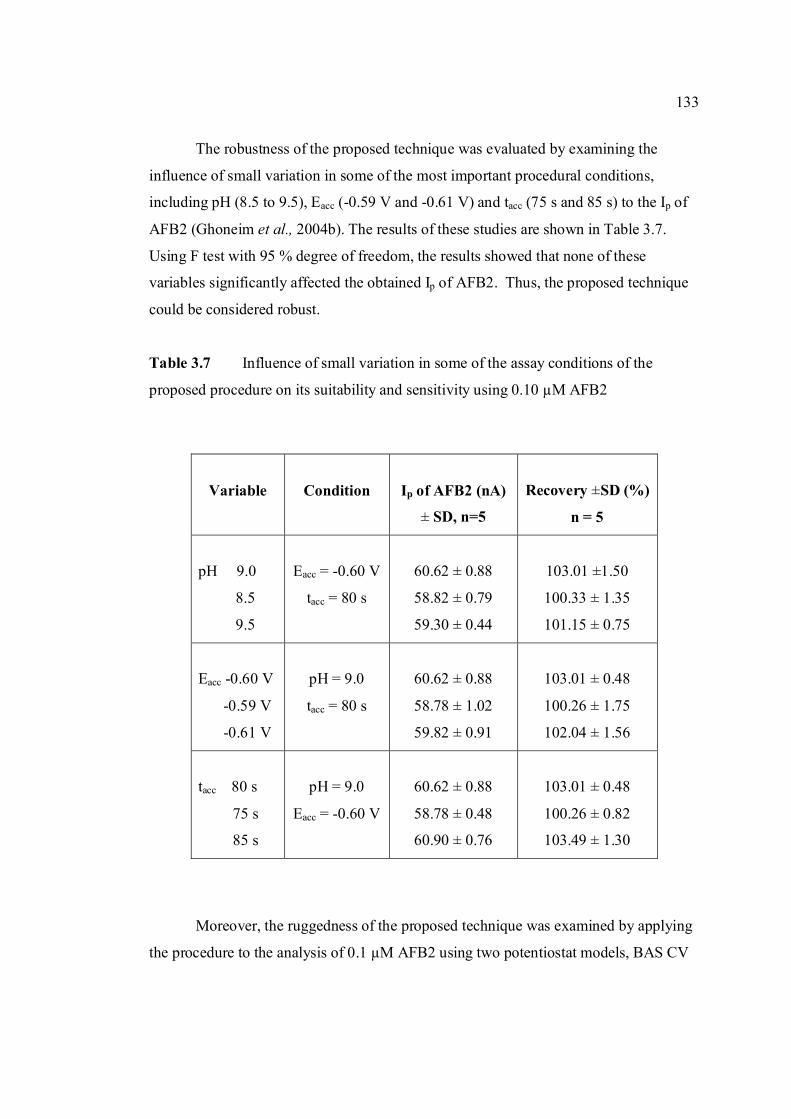
133
The robustness of the proposed technique was evaluated by examining the
influence of small variation in some of the most important procedural conditions,
including pH (8.5 to 9.5), Eacc (-0.59 V and -0.61 V) and tacc (75 s and 85 s) to the Ip of
AFB2 (Ghoneim et al., 2004b). The results of these studies are shown in Table 3.7.
Using F test with 95 % degree of freedom, the results showed that none of these
variables significantly affected the obtained Ip of AFB2. Thus, the proposed technique
could be considered robust.
Table 3.7 Influence of small variation in some of the assay conditions of the
proposed procedure on its suitability and sensitivity using 0.10 µM AFB2
Moreover, the ruggedness of the proposed technique was examined by applying
the procedure to the analysis of 0.1 µM AFB2 using two potentiostat models, BAS CV
Variable
Condition
Ip of AFB2 (nA)
± SD, n=5
Recovery ±SD (%)
n = 5
pH 9.0
8.5
9.5
Eacc = -0.60 V
tacc = 80 s
60.62 ± 0.88
58.82 ± 0.79
59.30 ± 0.44
103.01 ±1.50
100.33 ± 1.35
101.15 ± 0.75
Eacc -0.60 V
-0.59 V
-0.61 V
pH = 9.0
tacc = 80 s
60.62 ± 0.88
58.78 ± 1.02
59.82 ± 0.91
103.01 ± 0.48
100.26 ± 1.75
102.04 ± 1.56
tacc 80 s
75 s
85 s
pH = 9.0
Eacc = -0.60 V
60.62 ± 0.88
58.78 ± 0.48
60.90 ± 0.76
103.01 ± 0.48
100.26 ± 0.82
103.49 ± 1.30
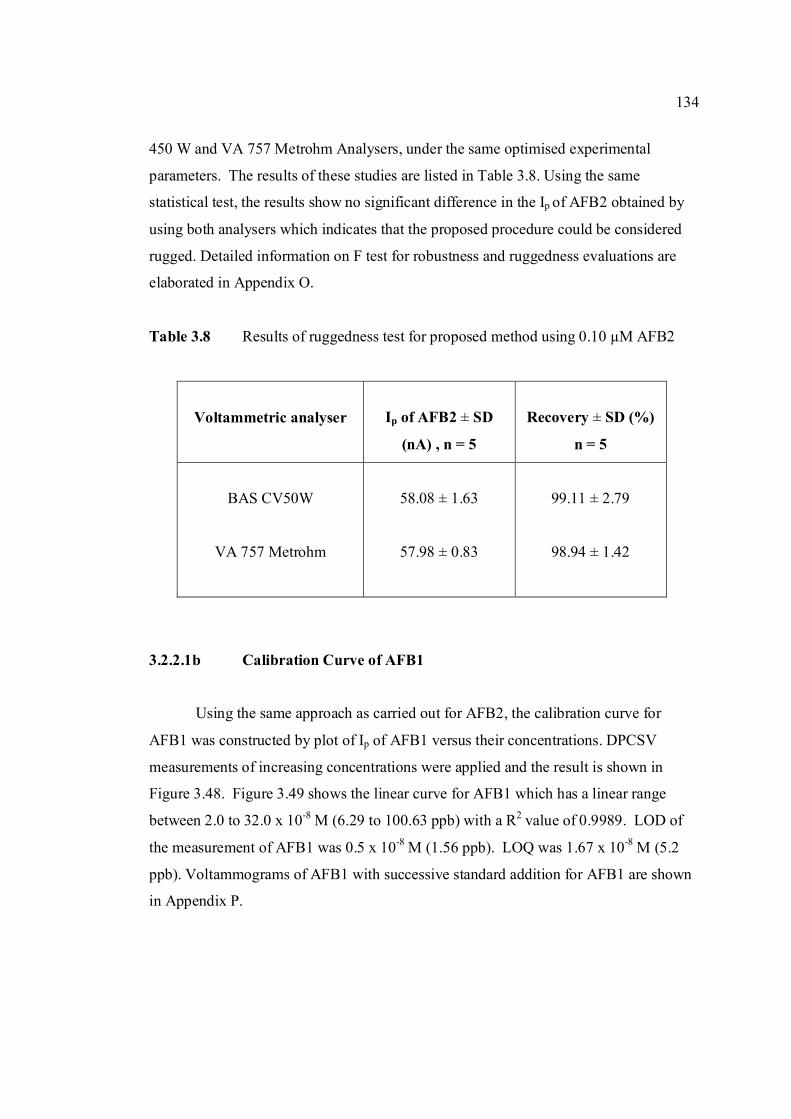
134
450 W and VA 757 Metrohm Analysers, under the same optimised experimental
parameters. The results of these studies are listed in Table 3.8. Using the same
statistical test, the results show no significant difference in the Ip of AFB2 obtained by
using both analysers which indicates that the proposed procedure could be considered
rugged. Detailed information on F test for robustness and ruggedness evaluations are
elaborated in Appendix O.
Table 3.8 Results of ruggedness test for proposed method using 0.10 µM AFB2
Voltammetric analyser
Ip of AFB2 ± SD
(nA) , n = 5
Recovery ± SD (%)
n = 5
BAS CV50W
VA 757 Metrohm
58.08 ± 1.63
57.98 ± 0.83
99.11 ± 2.79
98.94 ± 1.42
3.2.2.1b Calibration Curve of AFB1
Using the same approach as carried out for AFB2, the calibration curve for
AFB1 was constructed by plot of Ip of AFB1 versus their concentrations. DPCSV
measurements of increasing concentrations were applied and the result is shown in
Figure 3.48. Figure 3.49 shows the linear curve for AFB1 which has a linear range
between 2.0 to 32.0 x 10⁻⁸ M (6.29 to 100.63 ppb) with a R2 value of 0.9989. LOD of
the measurement of AFB1 was 0.5 x 10⁻⁸ M (1.56 ppb). LOQ was 1.67 x 10⁻⁸ M (5.2
ppb). Voltammograms of AFB1 with successive standard addition for AFB1 are shown
in Appendix P.
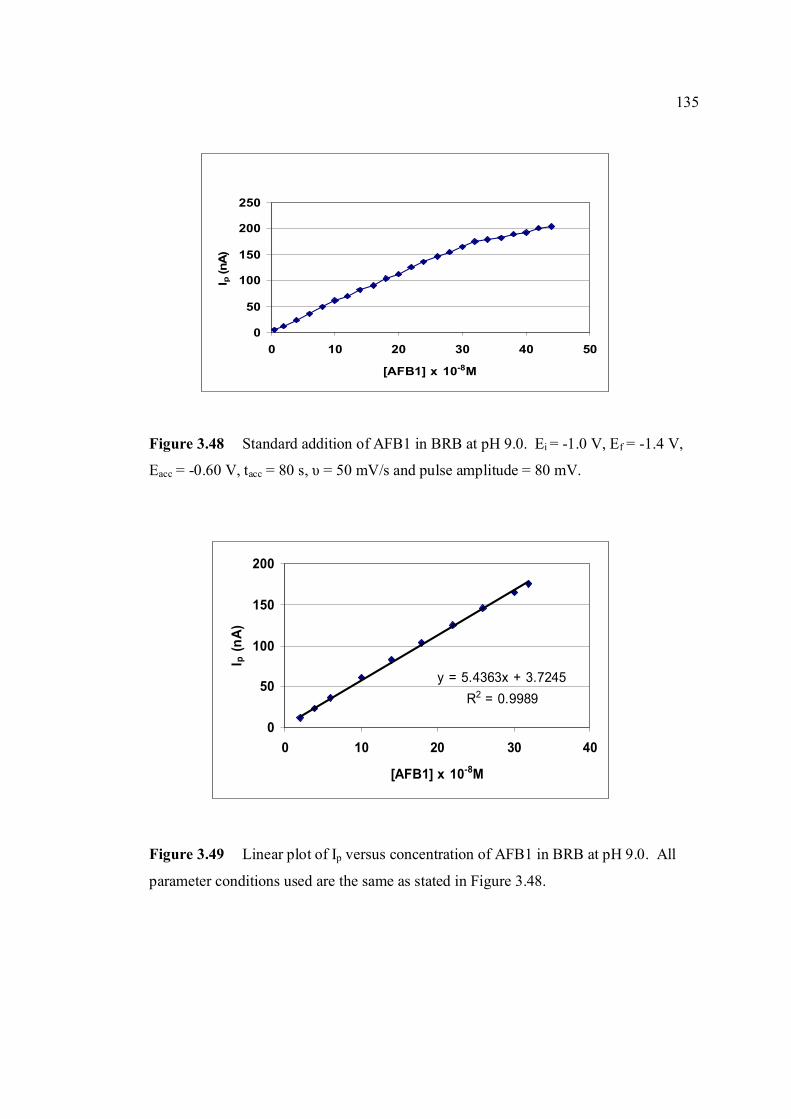
135
0
50
100
150
200
250
0 10 20 30 40 50
[AFB1] x 10-8M
I p (n
A)
y = 5.4363x + 3.7245R2 = 0.9989
0
50
100
150
200
0 10 20 30 40
[AFB1] x 10-8M
I p (n
A)
Figure 3.48 Standard addition of AFB1 in BRB at pH 9.0. Ei = -1.0 V, Ef = -1.4 V,
Eacc = -0.60 V, tacc = 80 s, υ = 50 mV/s and pulse amplitude = 80 mV.
Figure 3.49 Linear plot of Ip versus concentration of AFB1 in BRB at pH 9.0. All
parameter conditions used are the same as stated in Figure 3.48.
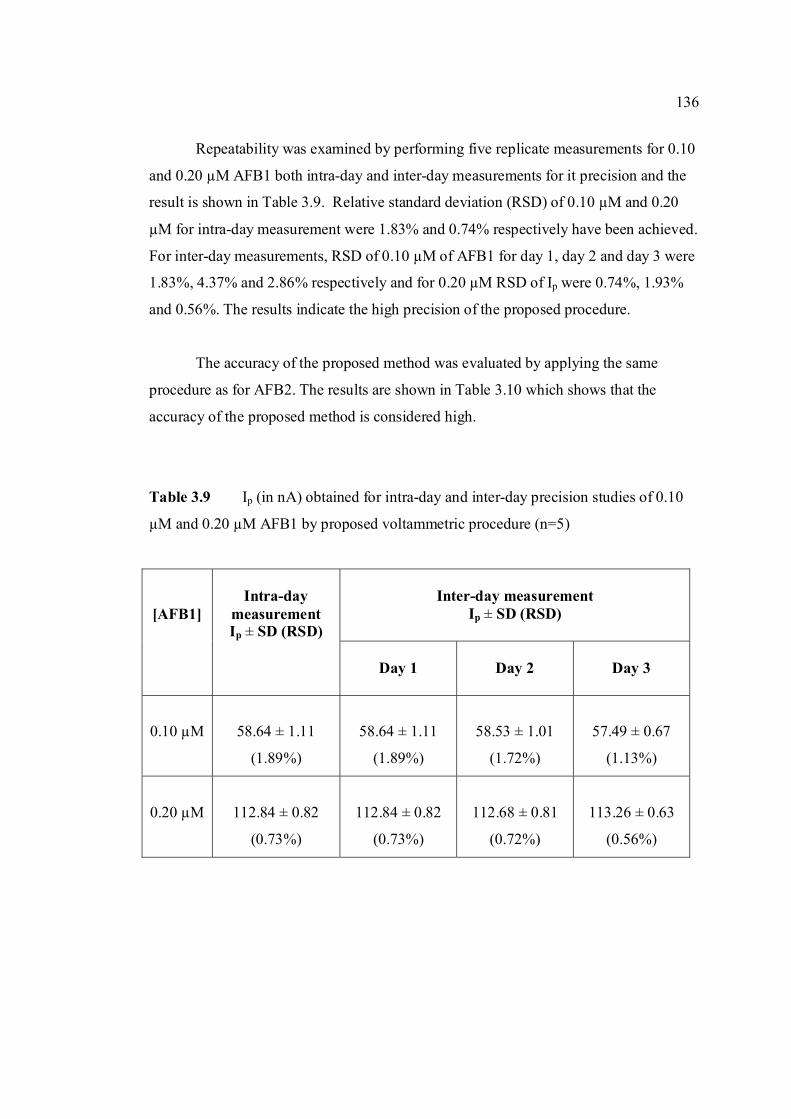
136
Repeatability was examined by performing five replicate measurements for 0.10
and 0.20 µM AFB1 both intra-day and inter-day measurements for it precision and the
result is shown in Table 3.9. Relative standard deviation (RSD) of 0.10 µM and 0.20
µM for intra-day measurement were 1.83% and 0.74% respectively have been achieved.
For inter-day measurements, RSD of 0.10 µM of AFB1 for day 1, day 2 and day 3 were
1.83%, 4.37% and 2.86% respectively and for 0.20 µM RSD of Ip were 0.74%, 1.93%
and 0.56%. The results indicate the high precision of the proposed procedure.
The accuracy of the proposed method was evaluated by applying the same
procedure as for AFB2. The results are shown in Table 3.10 which shows that the
accuracy of the proposed method is considered high.
Table 3.9 Ip (in nA) obtained for intra-day and inter-day precision studies of 0.10
µM and 0.20 µM AFB1 by proposed voltammetric procedure (n=5)
Inter-day measurement
Ip ± SD (RSD)
[AFB1]
Intra-day
measurement Ip ± SD (RSD)
Day 1
Day 2
Day 3
0.10 µM
58.64 ± 1.11
(1.89%)
58.64 ± 1.11
(1.89%)
58.53 ± 1.01
(1.72%)
57.49 ± 0.67
(1.13%)
0.20 µM
112.84 ± 0.82
(0.73%)
112.84 ± 0.82
(0.73%)
112.68 ± 0.81
(0.72%)
113.26 ± 0.63
(0.56%)
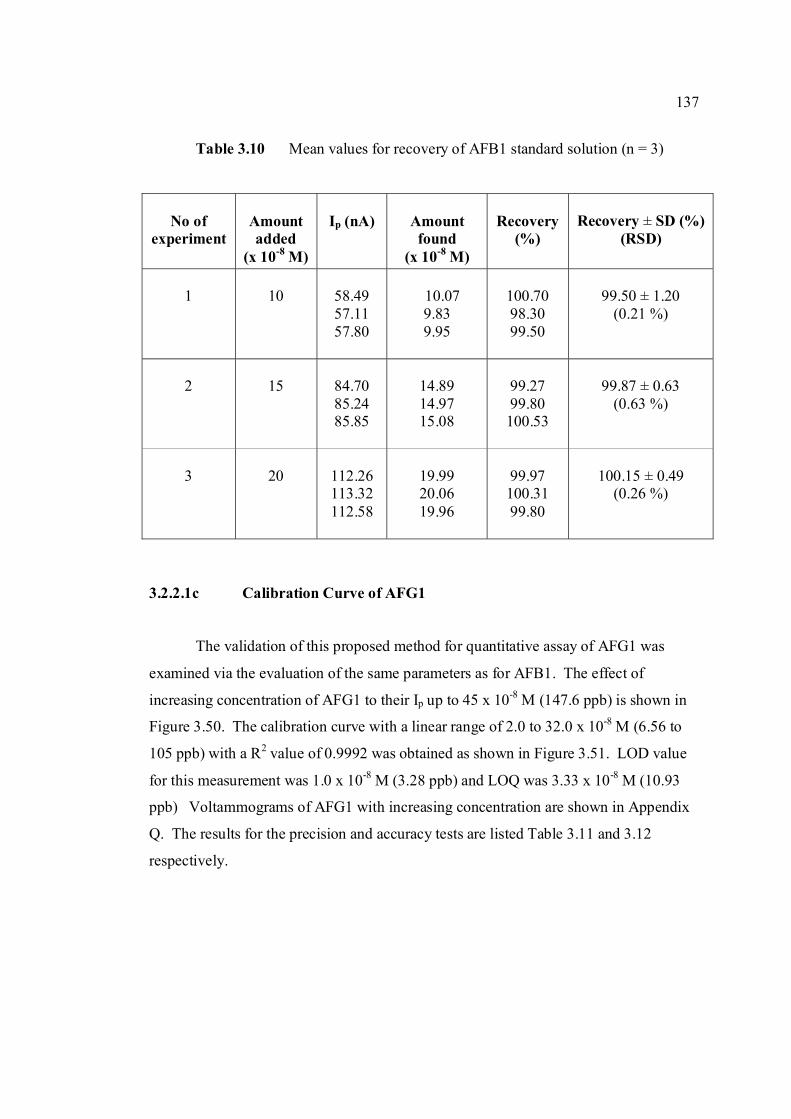
137
Table 3.10 Mean values for recovery of AFB1 standard solution (n = 3)
No of
experiment
Amount added
(x 10-8 M)
Ip (nA)
Amount found
(x 10-8 M)
Recovery
(%)
Recovery ± SD (%)
(RSD)
1
10
58.49 57.11 57.80
10.07
9.83 9.95
100.70 98.30 99.50
99.50 ± 1.20
(0.21 %)
2
15
84.70 85.24 85.85
14.89 14.97 15.08
99.27 99.80 100.53
99.87 ± 0.63
(0.63 %)
3
20
112.26 113.32 112.58
19.99 20.06 19.96
99.97 100.31 99.80
100.15 ± 0.49
(0.26 %)
3.2.2.1c Calibration Curve of AFG1
The validation of this proposed method for quantitative assay of AFG1 was
examined via the evaluation of the same parameters as for AFB1. The effect of
increasing concentration of AFG1 to their Ip up to 45 x 10-8 M (147.6 ppb) is shown in
Figure 3.50. The calibration curve with a linear range of 2.0 to 32.0 x 10⁻⁸ M (6.56 to
105 ppb) with a R2 value of 0.9992 was obtained as shown in Figure 3.51. LOD value
for this measurement was 1.0 x 10⁻⁸ M (3.28 ppb) and LOQ was 3.33 x 10⁻⁸ M (10.93
ppb) Voltammograms of AFG1 with increasing concentration are shown in Appendix
Q. The results for the precision and accuracy tests are listed Table 3.11 and 3.12
respectively.
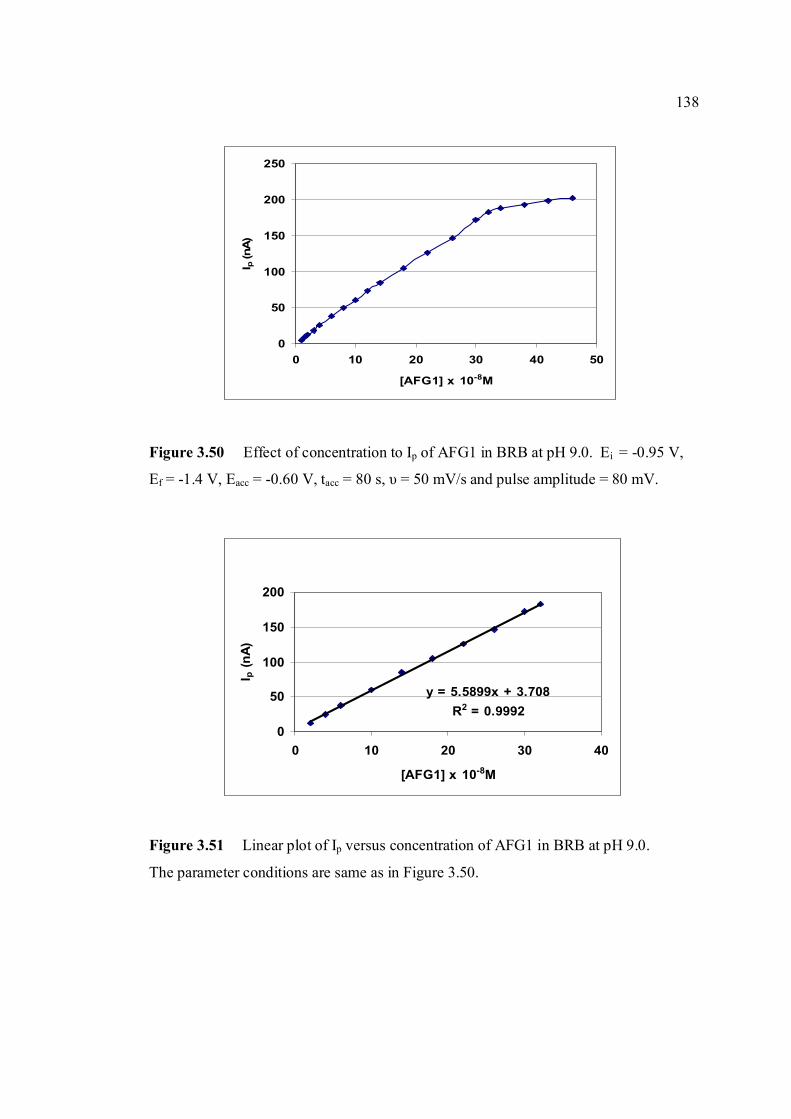
138
y = 5.5899x + 3.708R2 = 0.9992
0
50
100
150
200
0 10 20 30 40
[AFG1] x 10-8M
I p (n
A)
0
50
100
150
200
250
0 10 20 30 40 50
[AFG1] x 10-8M
I p (n
A)
Figure 3.50 Effect of concentration to Ip of AFG1 in BRB at pH 9.0. Ei = -0.95 V,
Ef = -1.4 V, Eacc = -0.60 V, tacc = 80 s, υ = 50 mV/s and pulse amplitude = 80 mV.
Figure 3.51 Linear plot of Ip versus concentration of AFG1 in BRB at pH 9.0.
The parameter conditions are same as in Figure 3.50.
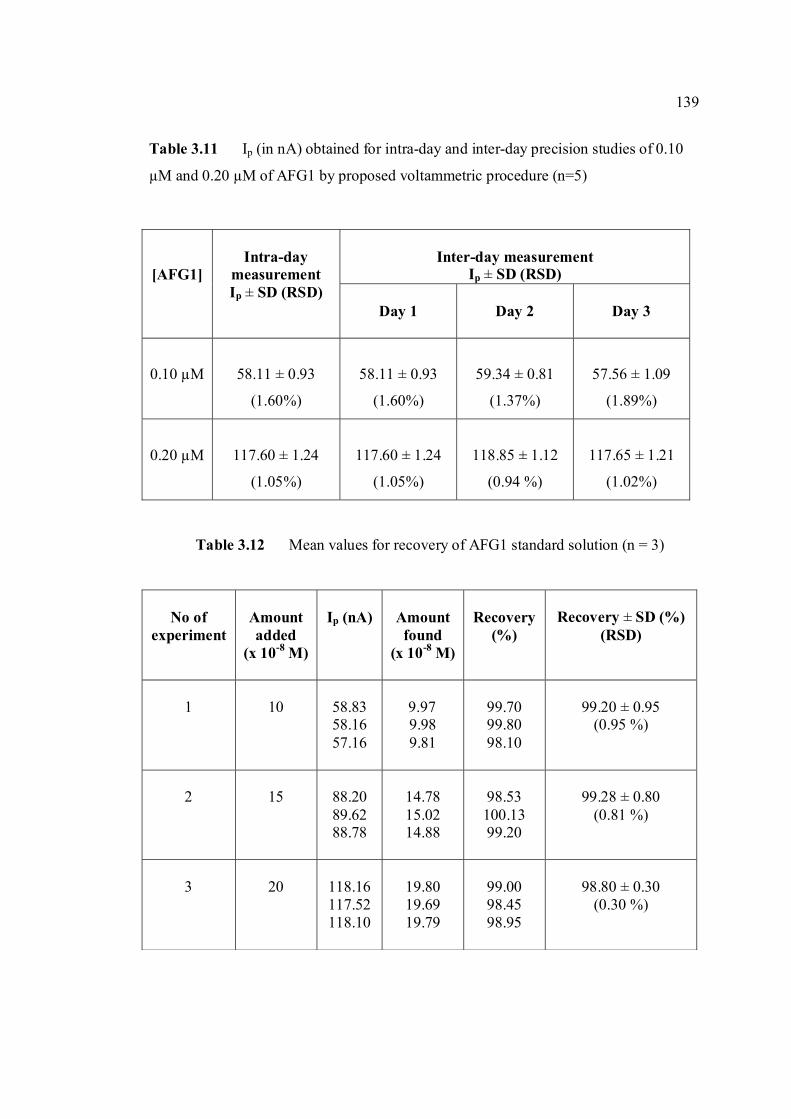
139
Table 3.11 Ip (in nA) obtained for intra-day and inter-day precision studies of 0.10
µM and 0.20 µM of AFG1 by proposed voltammetric procedure (n=5)
Inter-day measurement
Ip ± SD (RSD)
[AFG1]
Intra-day
measurement Ip ± SD (RSD)
Day 1
Day 2
Day 3
0.10 µM
58.11 ± 0.93
(1.60%)
58.11 ± 0.93
(1.60%)
59.34 ± 0.81
(1.37%)
57.56 ± 1.09
(1.89%)
0.20 µM
117.60 ± 1.24
(1.05%)
117.60 ± 1.24
(1.05%)
118.85 ± 1.12
(0.94 %)
117.65 ± 1.21
(1.02%)
Table 3.12 Mean values for recovery of AFG1 standard solution (n = 3)
No of
experiment
Amount added
(x 10-8 M)
Ip (nA)
Amount found
(x 10-8 M)
Recovery
(%)
Recovery ± SD (%)
(RSD)
1
10
58.83 58.16 57.16
9.97
9.98 9.81
99.70 99.80 98.10
99.20 ± 0.95
(0.95 %)
2
15
88.20 89.62 88.78
14.78 15.02 14.88
98.53 100.13 99.20
99.28 ± 0.80
(0.81 %)
3
20
118.16 117.52 118.10
19.80 19.69 19.79
99.00 98.45 98.95
98.80 ± 0.30
(0.30 %)
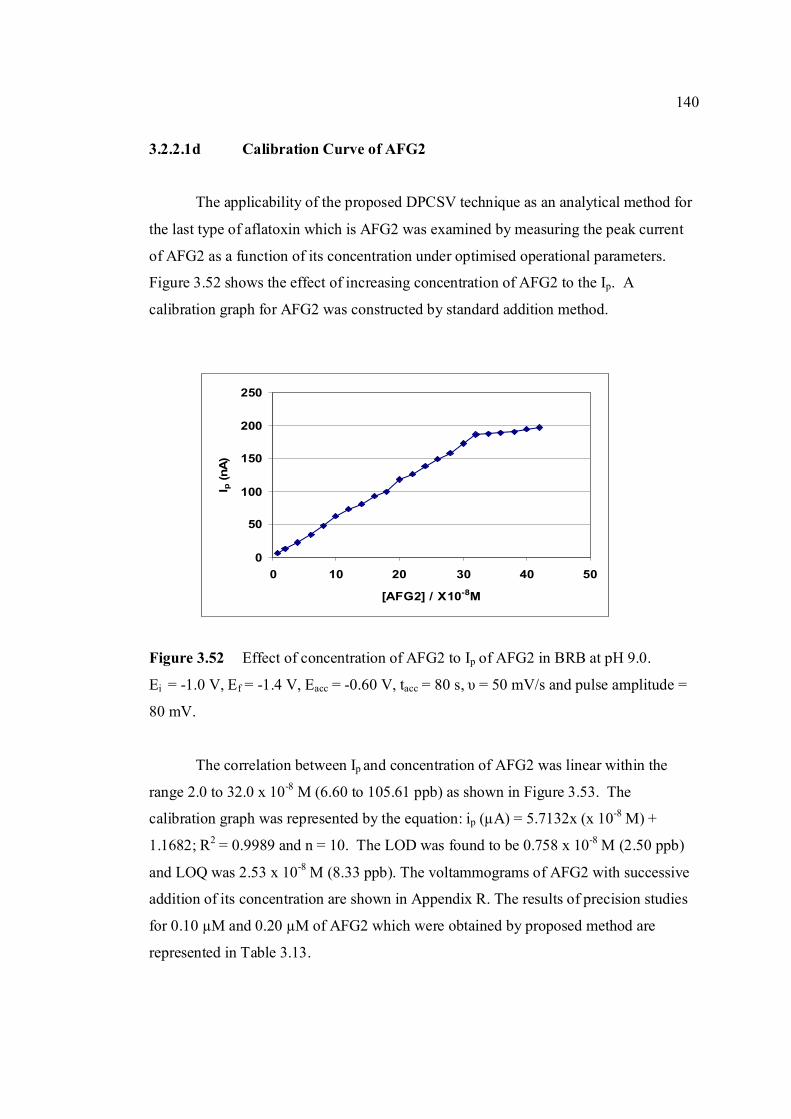
140
0
50
100
150
200
250
0 10 20 30 40 50
[AFG2] / X10-8M
I p (n
A)
3.2.2.1d Calibration Curve of AFG2
The applicability of the proposed DPCSV technique as an analytical method for
the last type of aflatoxin which is AFG2 was examined by measuring the peak current
of AFG2 as a function of its concentration under optimised operational parameters.
Figure 3.52 shows the effect of increasing concentration of AFG2 to the Ip. A
calibration graph for AFG2 was constructed by standard addition method.
Figure 3.52 Effect of concentration of AFG2 to Ip of AFG2 in BRB at pH 9.0.
Ei = -1.0 V, Ef = -1.4 V, Eacc = -0.60 V, tacc = 80 s, υ = 50 mV/s and pulse amplitude =
80 mV.
The correlation between Ip and concentration of AFG2 was linear within the
range 2.0 to 32.0 x 10⁻⁸ M (6.60 to 105.61 ppb) as shown in Figure 3.53. The
calibration graph was represented by the equation: ip (µA) = 5.7132x (x 10-8 M) +
1.1682; R2 = 0.9989 and n = 10. The LOD was found to be 0.758 x 10⁻⁸ M (2.50 ppb)
and LOQ was 2.53 x 10⁻⁸ M (8.33 ppb). The voltammograms of AFG2 with successive
addition of its concentration are shown in Appendix R. The results of precision studies
for 0.10 µM and 0.20 µM of AFG2 which were obtained by proposed method are
represented in Table 3.13.
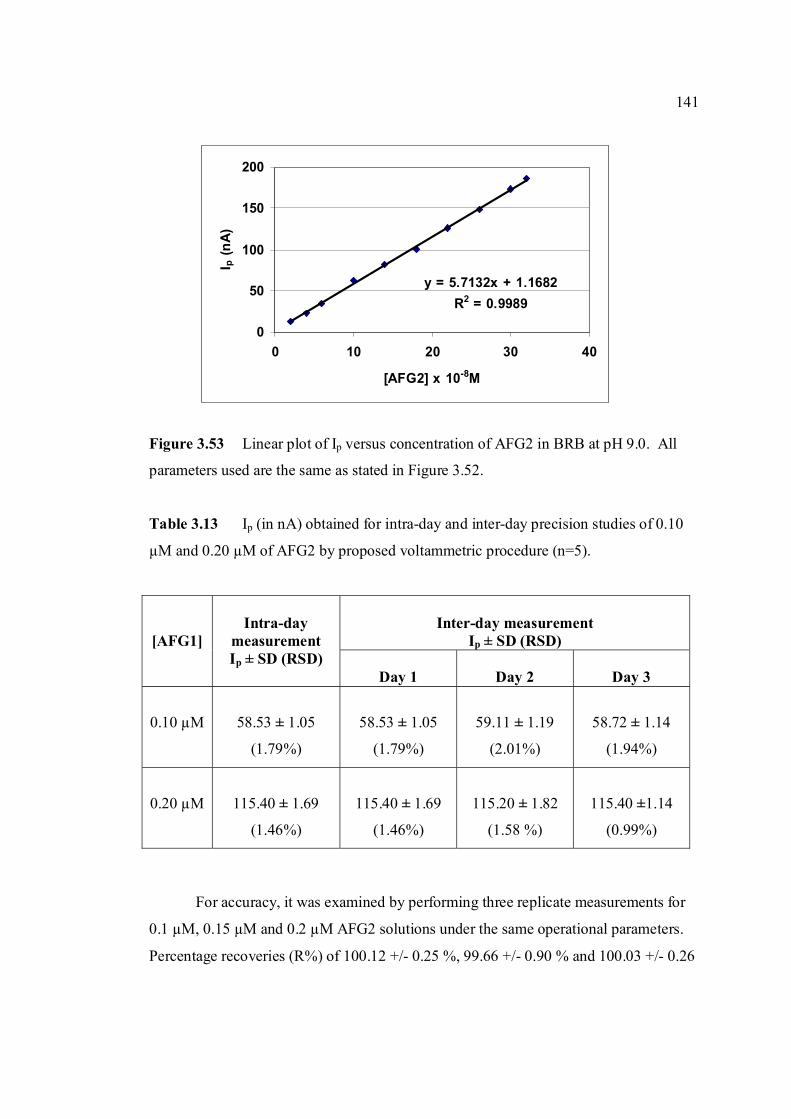
141
y = 5.7132x + 1.1682R2 = 0.9989
0
50
100
150
200
0 10 20 30 40
[AFG2] x 10-8M
I p (n
A)
Figure 3.53 Linear plot of Ip versus concentration of AFG2 in BRB at pH 9.0. All
parameters used are the same as stated in Figure 3.52.
Table 3.13 Ip (in nA) obtained for intra-day and inter-day precision studies of 0.10
µM and 0.20 µM of AFG2 by proposed voltammetric procedure (n=5).
Inter-day measurement
Ip ± SD (RSD)
[AFG1]
Intra-day
measurement Ip ± SD (RSD)
Day 1
Day 2
Day 3
0.10 µM
58.53 ± 1.05
(1.79%)
58.53 ± 1.05
(1.79%)
59.11 ± 1.19
(2.01%)
58.72 ± 1.14
(1.94%)
0.20 µM
115.40 ± 1.69
(1.46%)
115.40 ± 1.69
(1.46%)
115.20 ± 1.82
(1.58 %)
115.40 ±1.14
(0.99%)
For accuracy, it was examined by performing three replicate measurements for
0.1 µM, 0.15 µM and 0.2 µM AFG2 solutions under the same operational parameters.
Percentage recoveries (R%) of 100.12 +/- 0.25 %, 99.66 +/- 0.90 % and 100.03 +/- 0.26
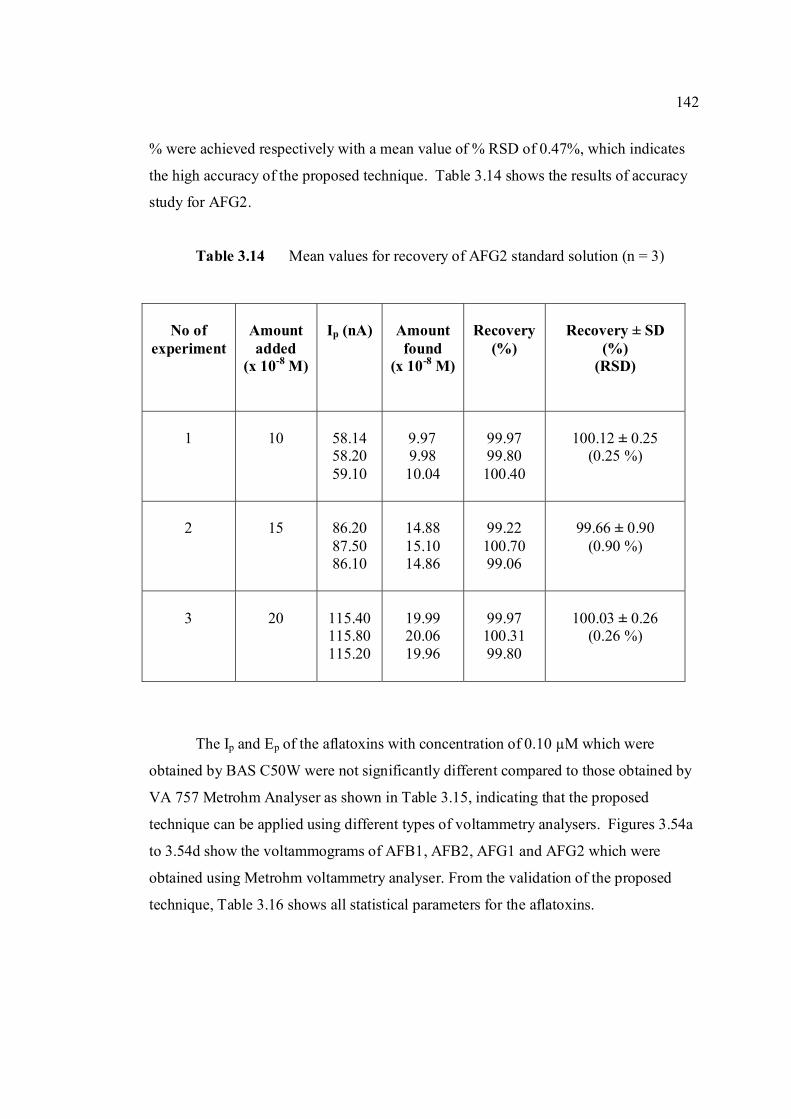
142
% were achieved respectively with a mean value of % RSD of 0.47%, which indicates
the high accuracy of the proposed technique. Table 3.14 shows the results of accuracy
study for AFG2.
Table 3.14 Mean values for recovery of AFG2 standard solution (n = 3)
The Ip and Ep of the aflatoxins with concentration of 0.10 µM which were
obtained by BAS C50W were not significantly different compared to those obtained by
VA 757 Metrohm Analyser as shown in Table 3.15, indicating that the proposed
technique can be applied using different types of voltammetry analysers. Figures 3.54a
to 3.54d show the voltammograms of AFB1, AFB2, AFG1 and AFG2 which were
obtained using Metrohm voltammetry analyser. From the validation of the proposed
technique, Table 3.16 shows all statistical parameters for the aflatoxins.
No of
experiment
Amount added
(x 10-8 M)
Ip (nA)
Amount found
(x 10-8 M)
Recovery
(%)
Recovery ± SD
(%) (RSD)
1
10
58.14 58.20 59.10
9.97
9.98 10.04
99.97 99.80 100.40
100.12 ± 0.25
(0.25 %)
2
15
86.20 87.50 86.10
14.88 15.10 14.86
99.22 100.70 99.06
99.66 ± 0.90
(0.90 %)
3
20
115.40 115.80 115.20
19.99 20.06 19.96
99.97 100.31 99.80
100.03 ± 0.26
(0.26 %)
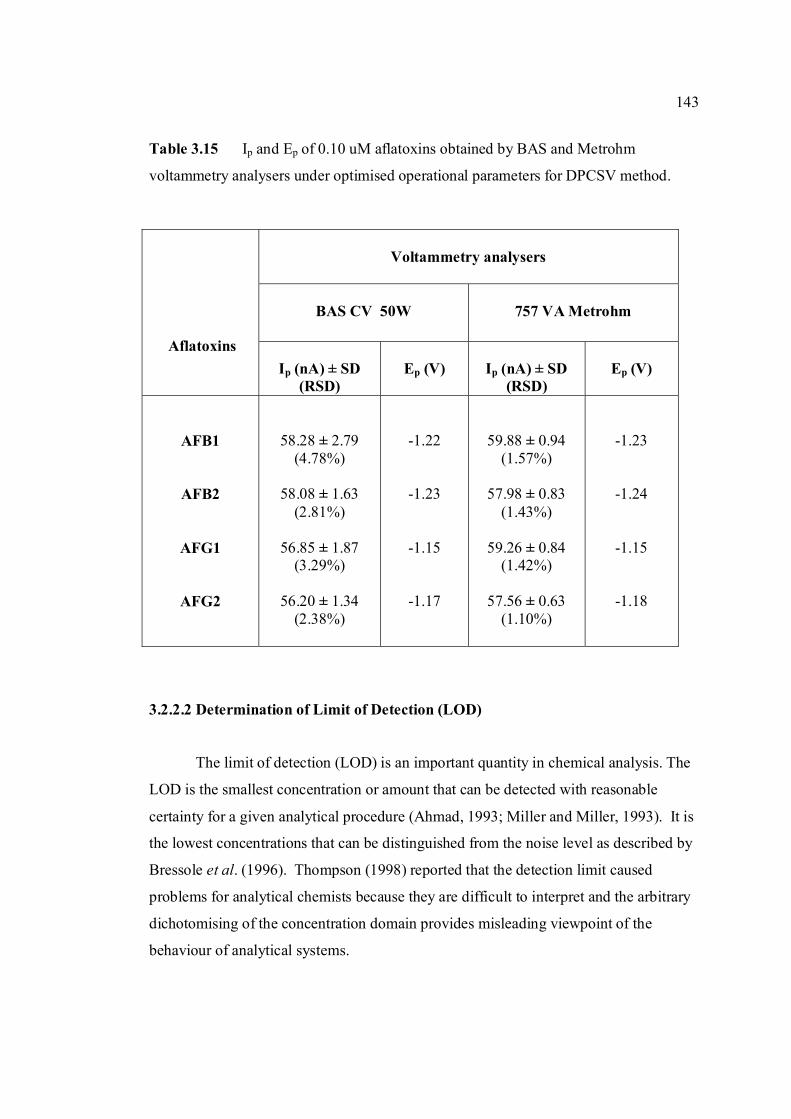
143
Table 3.15 Ip and Ep of 0.10 uM aflatoxins obtained by BAS and Metrohm
voltammetry analysers under optimised operational parameters for DPCSV method.
Voltammetry analysers
BAS CV 50W
757 VA Metrohm
Aflatoxins
Ip (nA) ± SD
(RSD)
Ep (V)
Ip (nA) ± SD
(RSD)
Ep (V)
AFB1
AFB2
AFG1
AFG2
58.28 ± 2.79 (4.78%)
58.08 ± 1.63
(2.81%)
56.85 ± 1.87 (3.29%)
56.20 ± 1.34
(2.38%)
-1.22
-1.23
-1.15
-1.17
59.88 ± 0.94 (1.57%)
57.98 ± 0.83
(1.43%)
59.26 ± 0.84 (1.42%)
57.56 ± 0.63
(1.10%)
-1.23
-1.24
-1.15
-1.18
3.2.2.2 Determination of Limit of Detection (LOD)
The limit of detection (LOD) is an important quantity in chemical analysis. The
LOD is the smallest concentration or amount that can be detected with reasonable
certainty for a given analytical procedure (Ahmad, 1993; Miller and Miller, 1993). It is
the lowest concentrations that can be distinguished from the noise level as described by
Bressole et al. (1996). Thompson (1998) reported that the detection limit caused
problems for analytical chemists because they are difficult to interpret and the arbitrary
dichotomising of the concentration domain provides misleading viewpoint of the
behaviour of analytical systems.
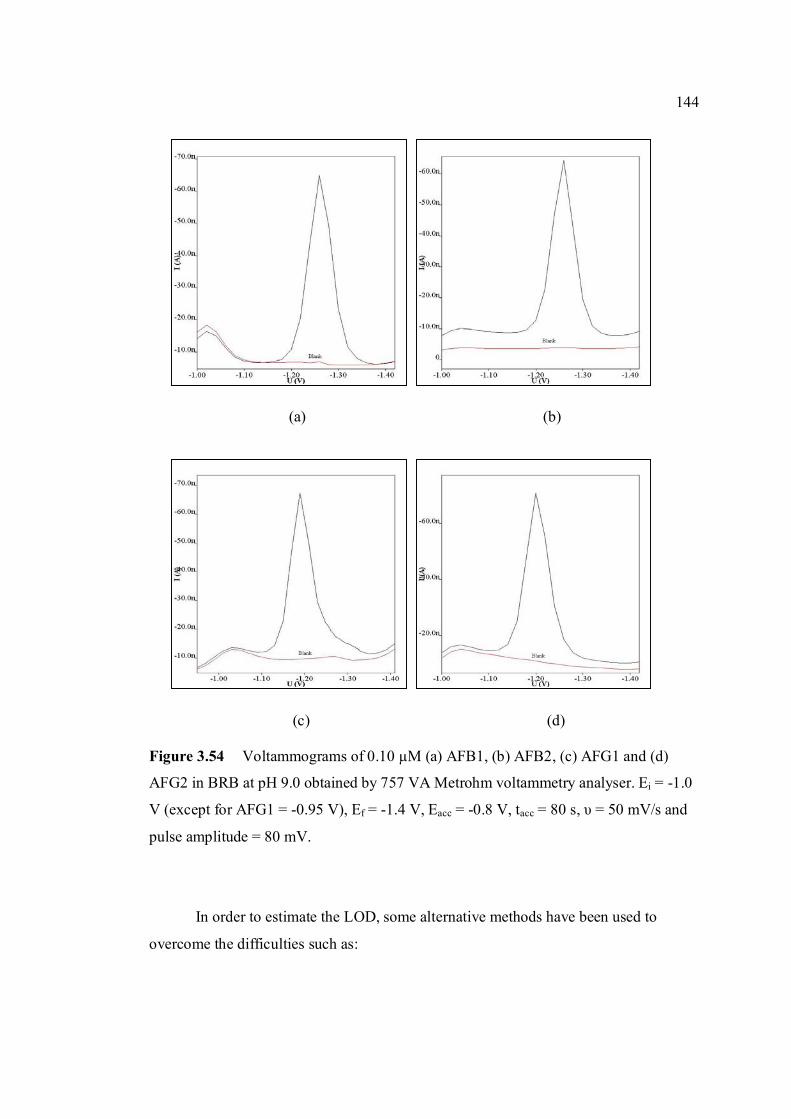
144
(a) (b)
(c) (d)
Figure 3.54 Voltammograms of 0.10 µM (a) AFB1, (b) AFB2, (c) AFG1 and (d)
AFG2 in BRB at pH 9.0 obtained by 757 VA Metrohm voltammetry analyser. Ei = -1.0
V (except for AFG1 = -0.95 V), Ef = -1.4 V, Eacc = -0.8 V, tacc = 80 s, υ = 50 mV/s and
pulse amplitude = 80 mV.
In order to estimate the LOD, some alternative methods have been used to
overcome the difficulties such as:
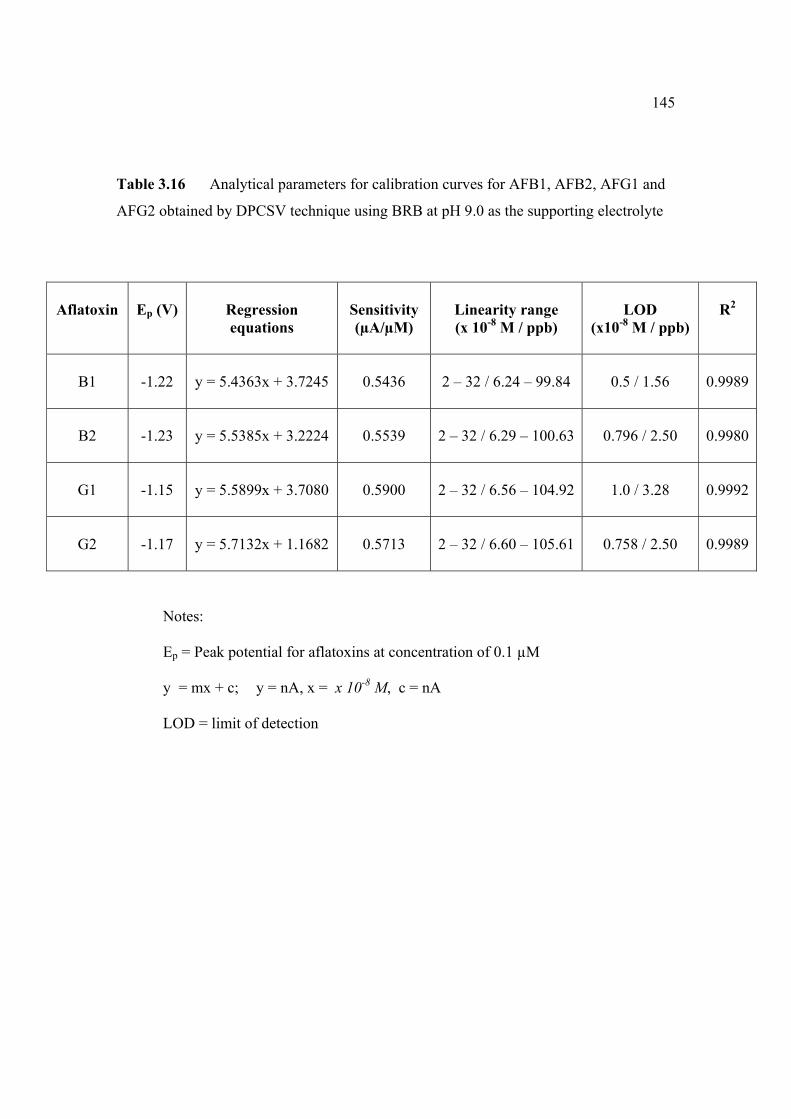
145
Table 3.16 Analytical parameters for calibration curves for AFB1, AFB2, AFG1 and
AFG2 obtained by DPCSV technique using BRB at pH 9.0 as the supporting electrolyte
Aflatoxin
Ep (V)
Regression equations
Sensitivity (µA/µM)
Linearity range (x 10-8 M / ppb)
LOD
(x10-8 M / ppb)
R2
B1
-1.22
y = 5.4363x + 3.7245
0.5436
2 – 32 / 6.24 – 99.84
0.5 / 1.56
0.9989
B2
-1.23
y = 5.5385x + 3.2224
0.5539
2 – 32 / 6.29 – 100.63
0.796 / 2.50
0.9980
G1
-1.15
y = 5.5899x + 3.7080
0.5900
2 – 32 / 6.56 – 104.92
1.0 / 3.28
0.9992
G2
-1.17
y = 5.7132x + 1.1682
0.5713
2 – 32 / 6.60 – 105.61
0.758 / 2.50
0.9989
Notes:
Ep = Peak potential for aflatoxins at concentration of 0.1 µM
y = mx + c; y = nA, x = x 10-8 M, c = nA
LOD = limit of detection
146
a) The concentration giving a signal three times the standard error plus the
y-intercept divided by the slope of calibration curve (Miller and Miller,
1993; Sturm et al., 1997; Yilmaz et al., 2001: Arranz et al., 2003;
Skrzypek et al., 2005 and Nouws et al., 2005). This calculation is used
by International Union of Pure and Applied Chemistry (IUPAC)
(IUPAC, 1978).
b) The analyte concentration giving a signal equal to a blank signal plus
two or three (Conesa et al., 1996) standard deviations of the blank.
c) The concentration giving a signal equal to three times (Zhang et al.,
1996) or 3.3 times (Perez-Ruiz et al., 2004) the standard deviation of the
blank signal divided by the slope from the calibration curve. The latter
used 12 blank determinations to calculate standard deviation of the
blank.
d) The concentration giving a signal to noise ratio of 3:1 (3 S/N) (Yardimer
and Ozaltin, 2001; Khodari et al., 1997; Wang et al., 1997; Liu et al.,
2000; Ibrahim et al., 2002; Al-ghamdie et al., 2004 and Farghaly et al.,
2005).
e) The value of three fold standard deviation from seven determinations of
the analyte at the concentration corresponding to the lowest point on the
appropriate straight line of the calibration curve which was evaluated by
R2 value as reported by Barek et al. (1999).
f) The concentration giving 3 times standard deviation of intercept of the
calibration divided by a slope of the calibration curve as reported by Gao
et al. (2004) and El-Desoky and Ghoneim (2005).
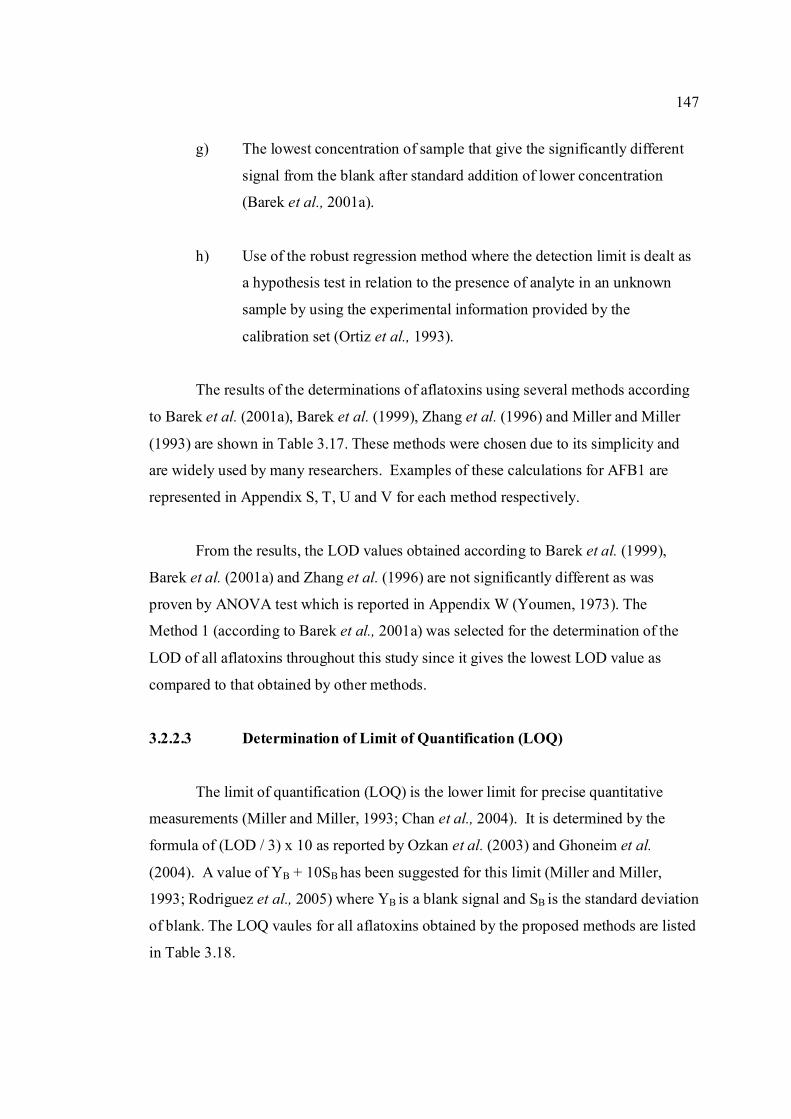
147
g) The lowest concentration of sample that give the significantly different
signal from the blank after standard addition of lower concentration
(Barek et al., 2001a).
h) Use of the robust regression method where the detection limit is dealt as
a hypothesis test in relation to the presence of analyte in an unknown
sample by using the experimental information provided by the
calibration set (Ortiz et al., 1993).
The results of the determinations of aflatoxins using several methods according
to Barek et al. (2001a), Barek et al. (1999), Zhang et al. (1996) and Miller and Miller
(1993) are shown in Table 3.17. These methods were chosen due to its simplicity and
are widely used by many researchers. Examples of these calculations for AFB1 are
represented in Appendix S, T, U and V for each method respectively.
From the results, the LOD values obtained according to Barek et al. (1999),
Barek et al. (2001a) and Zhang et al. (1996) are not significantly different as was
proven by ANOVA test which is reported in Appendix W (Youmen, 1973). The
Method 1 (according to Barek et al., 2001a) was selected for the determination of the
LOD of all aflatoxins throughout this study since it gives the lowest LOD value as
compared to that obtained by other methods.
3.2.2.3 Determination of Limit of Quantification (LOQ)
The limit of quantification (LOQ) is the lower limit for precise quantitative
measurements (Miller and Miller, 1993; Chan et al., 2004). It is determined by the
formula of (LOD / 3) x 10 as reported by Ozkan et al. (2003) and Ghoneim et al.
(2004). A value of YB + 10SB has been suggested for this limit (Miller and Miller,
1993; Rodriguez et al., 2005) where YB is a blank signal and SB is the standard deviation
of blank. The LOQ vaules for all aflatoxins obtained by the proposed methods are listed
in Table 3.18.
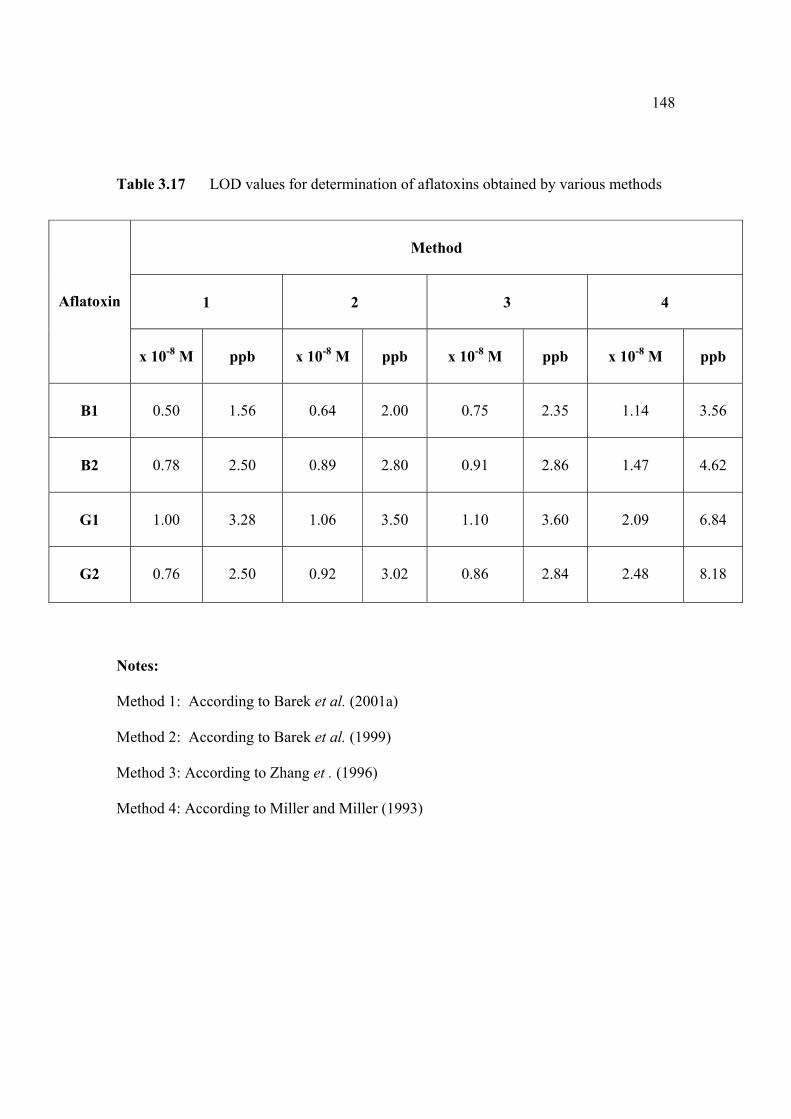
148
Table 3.17 LOD values for determination of aflatoxins obtained by various methods
Notes:
Method 1: According to Barek et al. (2001a) Method 2: According to Barek et al. (1999) Method 3: According to Zhang et . (1996) Method 4: According to Miller and Miller (1993)
Method
1 2
3
4
Aflatoxin
x 10-8 M
ppb
x 10-8 M
ppb
x 10-8 M
ppb
x 10-8 M
ppb
B1
0.50
1.56
0.64
2.00
0.75
2.35
1.14
3.56
B2
0.78
2.50
0.89
2.80
0.91
2.86
1.47
4.62
G1
1.00
3.28
1.06
3.50
1.10
3.60
2.09
6.84
G2
0.76
2.50
0.92
3.02
0.86
2.84
2.48
8.18
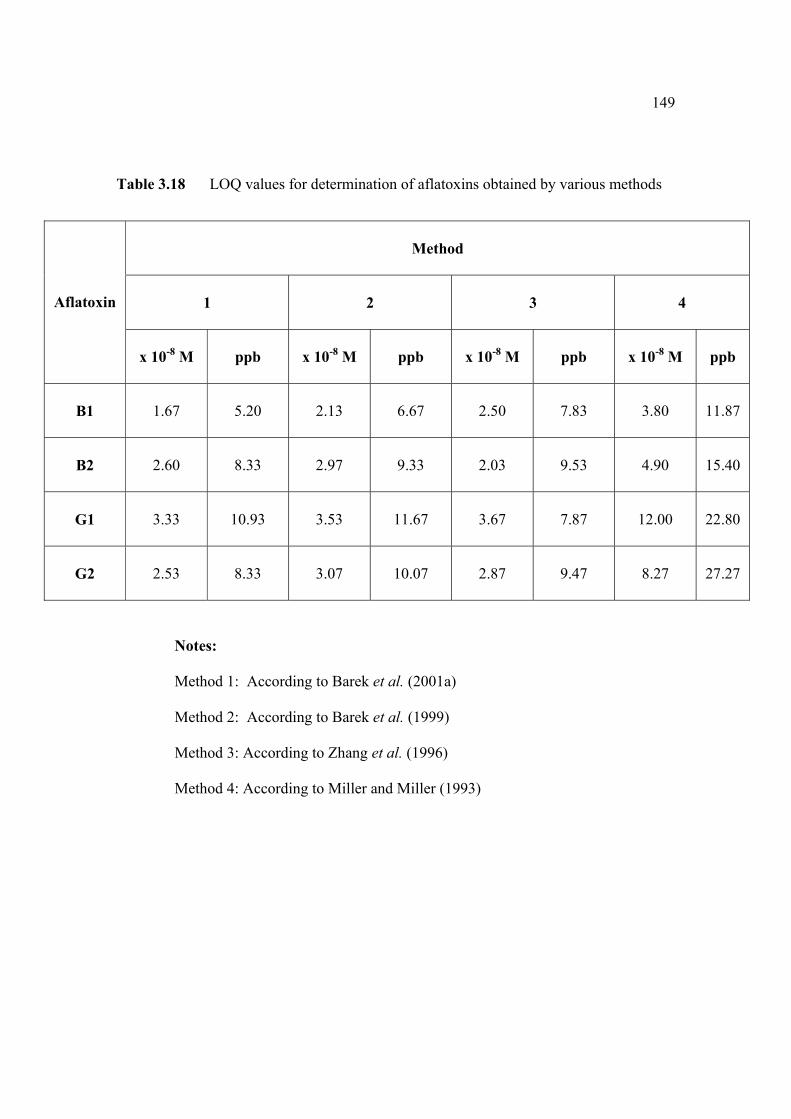
149
Table 3.18 LOQ values for determination of aflatoxins obtained by various methods
Notes: Method 1: According to Barek et al. (2001a) Method 2: According to Barek et al. (1999) Method 3: According to Zhang et al. (1996) Method 4: According to Miller and Miller (1993)
Method
1
2
3
4
Aflatoxin
x 10-8 M
ppb
x 10-8 M
ppb
x 10-8 M
ppb
x 10-8 M
ppb
B1
1.67
5.20
2.13
6.67
2.50
7.83
3.80
11.87
B2
2.60
8.33
2.97
9.33
2.03
9.53
4.90
15.40
G1
3.33
10.93
3.53
11.67
3.67
7.87
12.00
22.80
G2
2.53
8.33
3.07
10.07
2.87
9.47
8.27
27.27
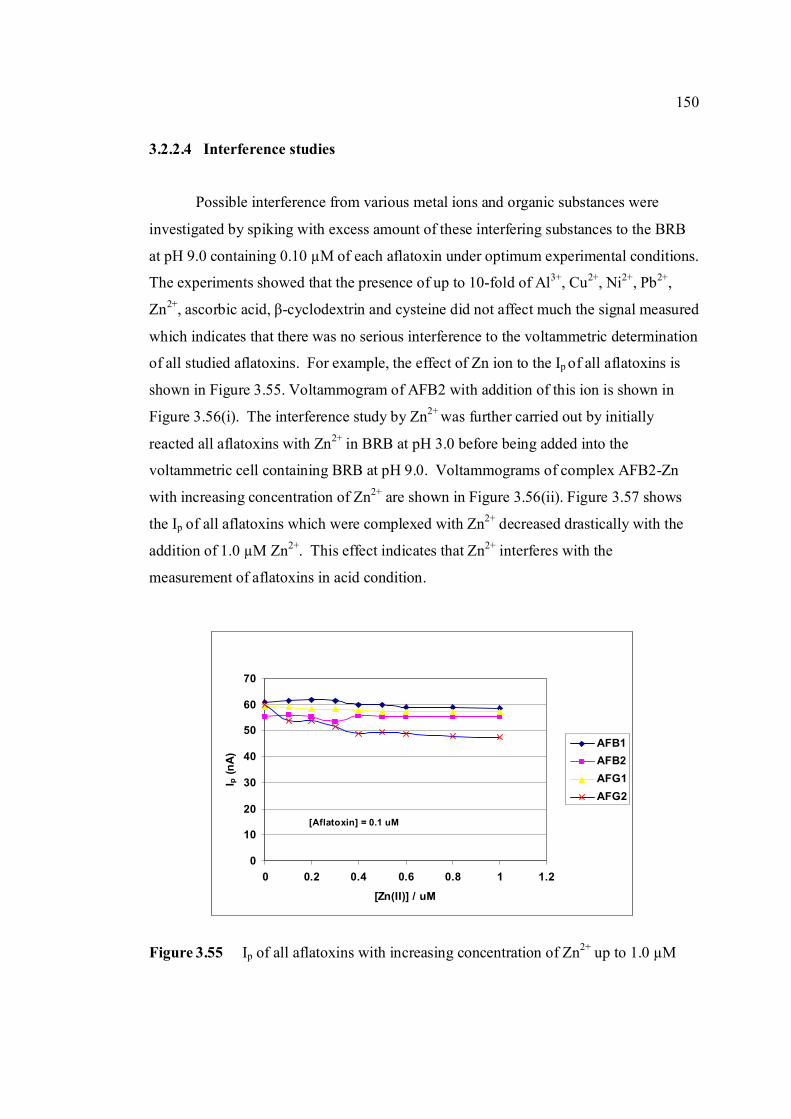
150
0
10
20
30
40
50
60
70
0 0.2 0.4 0.6 0.8 1 1.2
[Zn(II)] / uM
I p (n
A)
AFB1AFB2AFG1AFG2
[Aflatoxin] = 0.1 uM
3.2.2.4 Interference studies
Possible interference from various metal ions and organic substances were
investigated by spiking with excess amount of these interfering substances to the BRB
at pH 9.0 containing 0.10 µM of each aflatoxin under optimum experimental conditions.
The experiments showed that the presence of up to 10-fold of Al3+, Cu2+, Ni2+, Pb2+,
Zn2+, ascorbic acid, β-cyclodextrin and cysteine did not affect much the signal measured
which indicates that there was no serious interference to the voltammetric determination
of all studied aflatoxins. For example, the effect of Zn ion to the Ip of all aflatoxins is
shown in Figure 3.55. Voltammogram of AFB2 with addition of this ion is shown in
Figure 3.56(i). The interference study by Zn2+ was further carried out by initially
reacted all aflatoxins with Zn2+ in BRB at pH 3.0 before being added into the
voltammetric cell containing BRB at pH 9.0. Voltammograms of complex AFB2-Zn
with increasing concentration of Zn2+ are shown in Figure 3.56(ii). Figure 3.57 shows
the Ip of all aflatoxins which were complexed with Zn2+ decreased drastically with the
addition of 1.0 µM Zn2+. This effect indicates that Zn2+ interferes with the
measurement of aflatoxins in acid condition.
Figure 3.55 Ip of all aflatoxins with increasing concentration of Zn2+ up to 1.0 µM
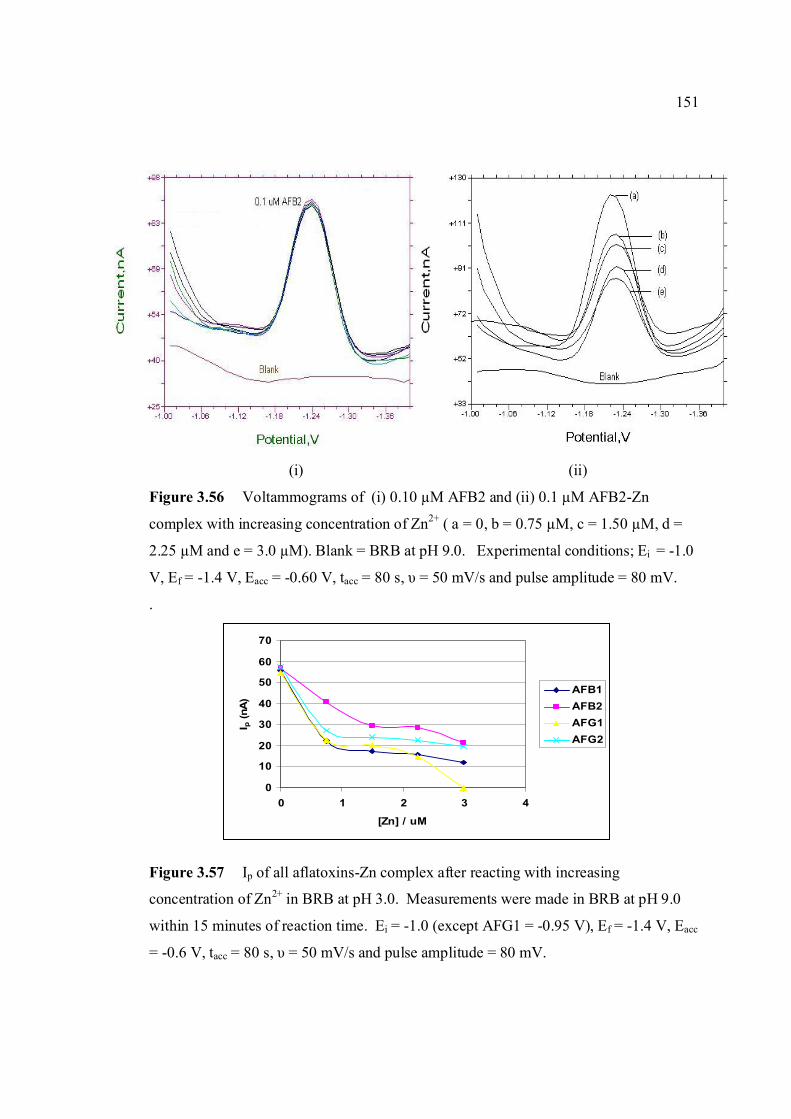
151
0
10
20
30
40
50
60
70
0 1 2 3 4
[Zn] / uM
I p (n
A)
AFB1AFB2AFG1AFG2
(i) (ii)
Figure 3.56 Voltammograms of (i) 0.10 µM AFB2 and (ii) 0.1 µM AFB2-Zn
complex with increasing concentration of Zn2+ ( a = 0, b = 0.75 µM, c = 1.50 µM, d =
2.25 µM and e = 3.0 µM). Blank = BRB at pH 9.0. Experimental conditions; Ei = -1.0
V, Ef = -1.4 V, Eacc = -0.60 V, tacc = 80 s, υ = 50 mV/s and pulse amplitude = 80 mV.
.
Figure 3.57 Ip of all aflatoxins-Zn complex after reacting with increasing
concentration of Zn2+ in BRB at pH 3.0. Measurements were made in BRB at pH 9.0
within 15 minutes of reaction time. Ei = -1.0 (except AFG1 = -0.95 V), Ef = -1.4 V, Eacc
= -0.6 V, tacc = 80 s, υ = 50 mV/s and pulse amplitude = 80 mV.
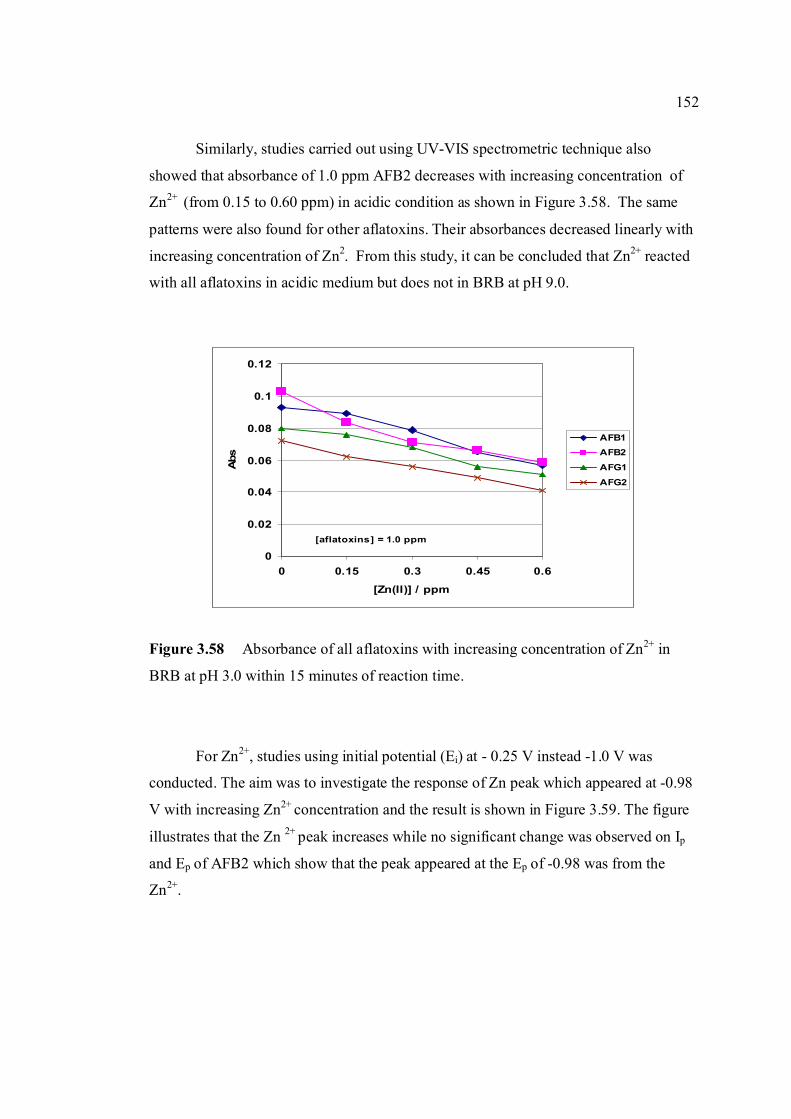
152
0
0.02
0.04
0.06
0.08
0.1
0.12
0 0.15 0.3 0.45 0.6
[Zn(II)] / ppm
Abs
AFB1AFB2
AFG1
AFG2
[aflatoxins] = 1.0 ppm
Similarly, studies carried out using UV-VIS spectrometric technique also
showed that absorbance of 1.0 ppm AFB2 decreases with increasing concentration of
Zn2+ (from 0.15 to 0.60 ppm) in acidic condition as shown in Figure 3.58. The same
patterns were also found for other aflatoxins. Their absorbances decreased linearly with
increasing concentration of Zn2. From this study, it can be concluded that Zn2+ reacted
with all aflatoxins in acidic medium but does not in BRB at pH 9.0.
Figure 3.58 Absorbance of all aflatoxins with increasing concentration of Zn2+ in
BRB at pH 3.0 within 15 minutes of reaction time.
For Zn2+, studies using initial potential (Ei) at - 0.25 V instead -1.0 V was
conducted. The aim was to investigate the response of Zn peak which appeared at -0.98
V with increasing Zn2+ concentration and the result is shown in Figure 3.59. The figure
illustrates that the Zn 2+ peak increases while no significant change was observed on Ip
and Ep of AFB2 which show that the peak appeared at the Ep of -0.98 was from the
Zn2+.
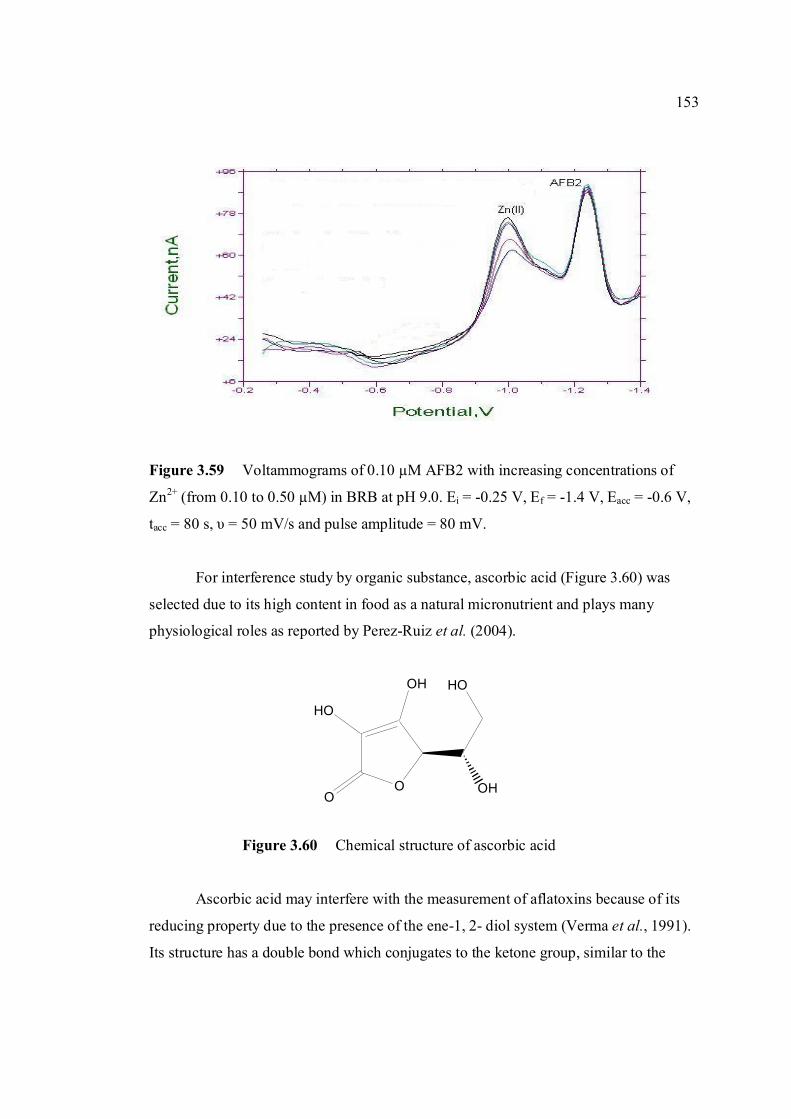
153
OH
OH
HO
OO
HO
Figure 3.59 Voltammograms of 0.10 µM AFB2 with increasing concentrations of
Zn2+ (from 0.10 to 0.50 µM) in BRB at pH 9.0. Ei = -0.25 V, Ef = -1.4 V, Eacc = -0.6 V,
tacc = 80 s, υ = 50 mV/s and pulse amplitude = 80 mV.
For interference study by organic substance, ascorbic acid (Figure 3.60) was
selected due to its high content in food as a natural micronutrient and plays many
physiological roles as reported by Perez-Ruiz et al. (2004).
Figure 3.60 Chemical structure of ascorbic acid
Ascorbic acid may interfere with the measurement of aflatoxins because of its
reducing property due to the presence of the ene-1, 2- diol system (Verma et al., 1991).
Its structure has a double bond which conjugates to the ketone group, similar to the
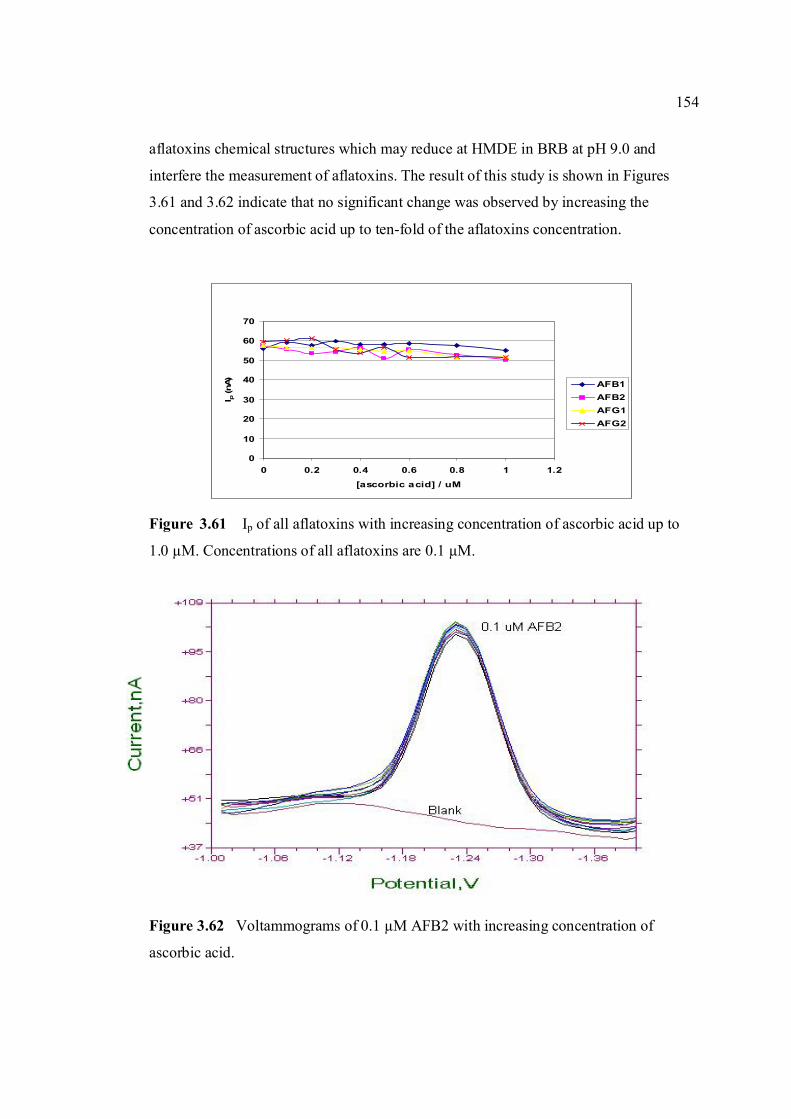
154
0
10
20
30
40
50
60
70
0 0.2 0.4 0.6 0.8 1 1.2
[ascorbic acid] / uM
I p (n
A) AFB1AFB2AFG1AFG2
aflatoxins chemical structures which may reduce at HMDE in BRB at pH 9.0 and
interfere the measurement of aflatoxins. The result of this study is shown in Figures
3.61 and 3.62 indicate that no significant change was observed by increasing the
concentration of ascorbic acid up to ten-fold of the aflatoxins concentration.
Figure 3.61 Ip of all aflatoxins with increasing concentration of ascorbic acid up to
1.0 µM. Concentrations of all aflatoxins are 0.1 µM.
Figure 3.62 Voltammograms of 0.1 µM AFB2 with increasing concentration of
ascorbic acid.
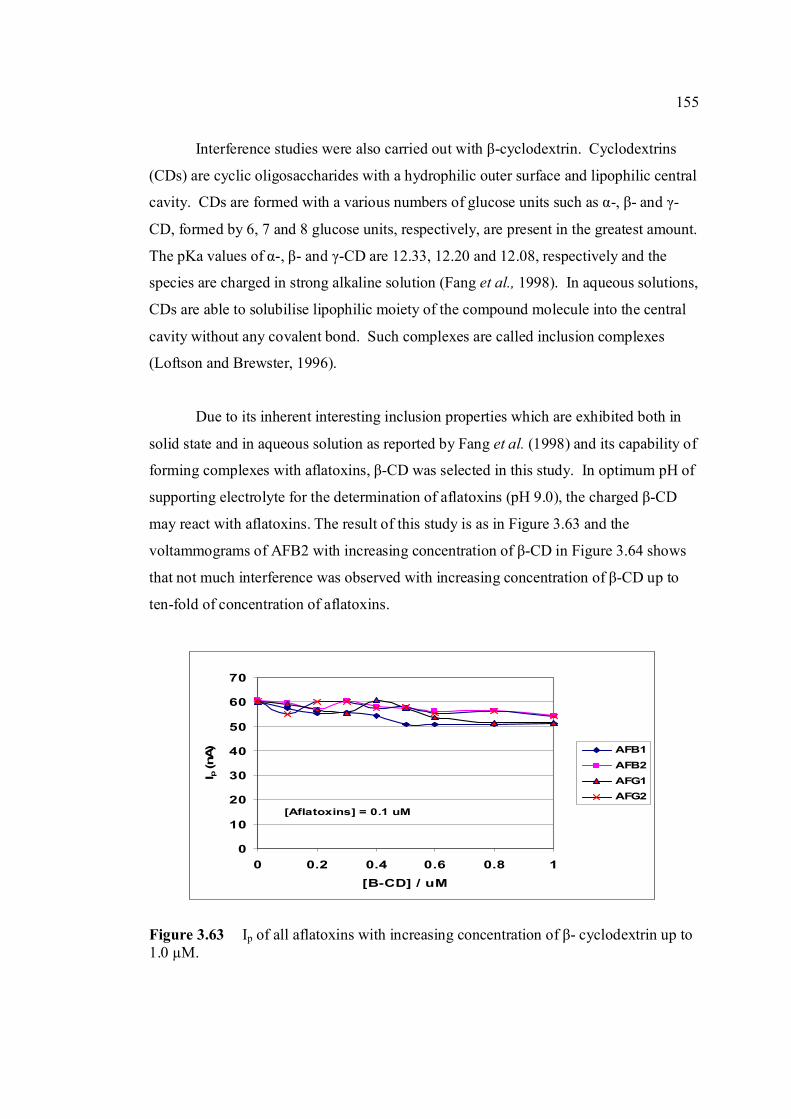
155
0
10
20
30
40
50
60
70
0 0.2 0.4 0.6 0.8 1[B-CD] / uM
I p (n
A) AFB1
AFB2AFG1AFG2
[Aflatoxins] = 0.1 uM
Interference studies were also carried out with β-cyclodextrin. Cyclodextrins
(CDs) are cyclic oligosaccharides with a hydrophilic outer surface and lipophilic central
cavity. CDs are formed with a various numbers of glucose units such as α-, β- and γ-
CD, formed by 6, 7 and 8 glucose units, respectively, are present in the greatest amount.
The pKa values of α-, β- and γ-CD are 12.33, 12.20 and 12.08, respectively and the
species are charged in strong alkaline solution (Fang et al., 1998). In aqueous solutions,
CDs are able to solubilise lipophilic moiety of the compound molecule into the central
cavity without any covalent bond. Such complexes are called inclusion complexes
(Loftson and Brewster, 1996).
Due to its inherent interesting inclusion properties which are exhibited both in
solid state and in aqueous solution as reported by Fang et al. (1998) and its capability of
forming complexes with aflatoxins, β-CD was selected in this study. In optimum pH of
supporting electrolyte for the determination of aflatoxins (pH 9.0), the charged β-CD
may react with aflatoxins. The result of this study is as in Figure 3.63 and the
voltammograms of AFB2 with increasing concentration of β-CD in Figure 3.64 shows
that not much interference was observed with increasing concentration of β-CD up to
ten-fold of concentration of aflatoxins.
Figure 3.63 Ip of all aflatoxins with increasing concentration of β- cyclodextrin up to 1.0 µM.
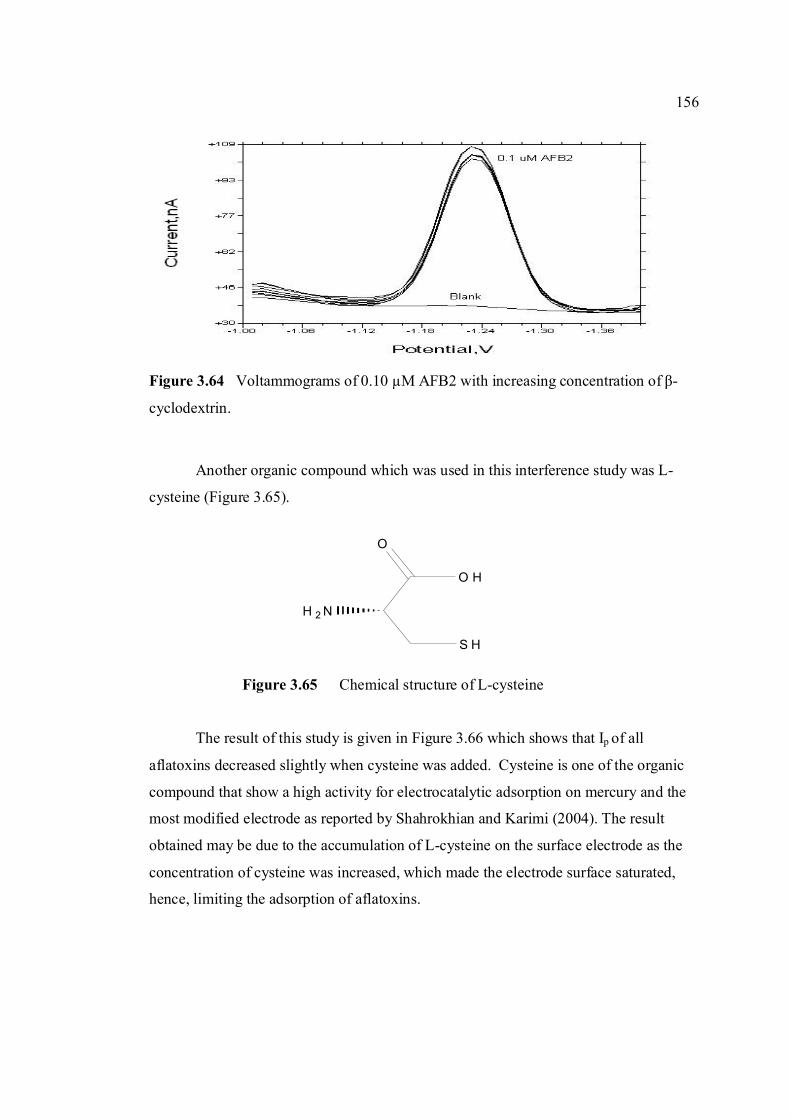
156
H 2 N
S H
O
O H
Figure 3.64 Voltammograms of 0.10 µM AFB2 with increasing concentration of β-
cyclodextrin.
Another organic compound which was used in this interference study was L-
cysteine (Figure 3.65).
Figure 3.65 Chemical structure of L-cysteine
The result of this study is given in Figure 3.66 which shows that Ip of all
aflatoxins decreased slightly when cysteine was added. Cysteine is one of the organic
compound that show a high activity for electrocatalytic adsorption on mercury and the
most modified electrode as reported by Shahrokhian and Karimi (2004). The result
obtained may be due to the accumulation of L-cysteine on the surface electrode as the
concentration of cysteine was increased, which made the electrode surface saturated,
hence, limiting the adsorption of aflatoxins.
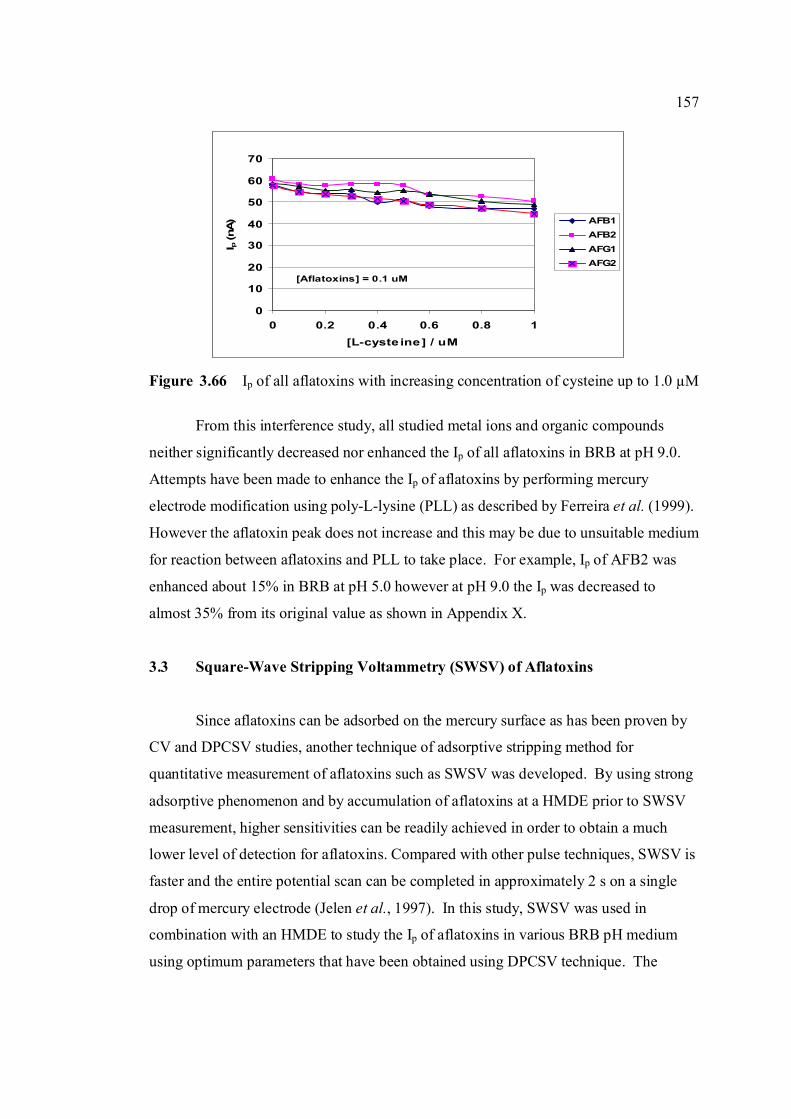
157
0
10
20
30
40
50
60
70
0 0.2 0.4 0.6 0.8 1[L-cyste ine] / uM
I p (n
A) AFB1
AFB2AFG1AFG2
[Aflatoxins] = 0.1 uM
Figure 3.66 Ip of all aflatoxins with increasing concentration of cysteine up to 1.0 µM
From this interference study, all studied metal ions and organic compounds
neither significantly decreased nor enhanced the Ip of all aflatoxins in BRB at pH 9.0.
Attempts have been made to enhance the Ip of aflatoxins by performing mercury
electrode modification using poly-L-lysine (PLL) as described by Ferreira et al. (1999).
However the aflatoxin peak does not increase and this may be due to unsuitable medium
for reaction between aflatoxins and PLL to take place. For example, Ip of AFB2 was
enhanced about 15% in BRB at pH 5.0 however at pH 9.0 the Ip was decreased to
almost 35% from its original value as shown in Appendix X.
3.3 Square-Wave Stripping Voltammetry (SWSV) of Aflatoxins
Since aflatoxins can be adsorbed on the mercury surface as has been proven by
CV and DPCSV studies, another technique of adsorptive stripping method for
quantitative measurement of aflatoxins such as SWSV was developed. By using strong
adsorptive phenomenon and by accumulation of aflatoxins at a HMDE prior to SWSV
measurement, higher sensitivities can be readily achieved in order to obtain a much
lower level of detection for aflatoxins. Compared with other pulse techniques, SWSV is
faster and the entire potential scan can be completed in approximately 2 s on a single
drop of mercury electrode (Jelen et al., 1997). In this study, SWSV was used in
combination with an HMDE to study the Ip of aflatoxins in various BRB pH medium
using optimum parameters that have been obtained using DPCSV technique. The
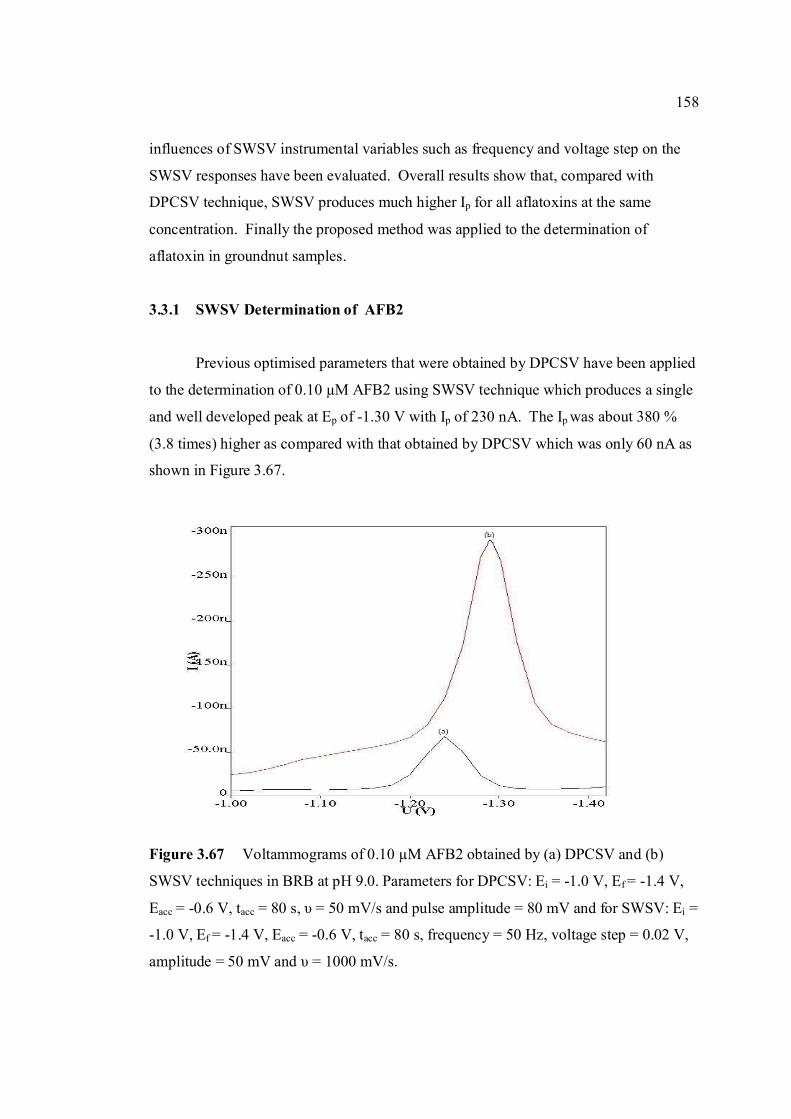
158
influences of SWSV instrumental variables such as frequency and voltage step on the
SWSV responses have been evaluated. Overall results show that, compared with
DPCSV technique, SWSV produces much higher Ip for all aflatoxins at the same
concentration. Finally the proposed method was applied to the determination of
aflatoxin in groundnut samples.
3.3.1 SWSV Determination of AFB2
Previous optimised parameters that were obtained by DPCSV have been applied
to the determination of 0.10 µM AFB2 using SWSV technique which produces a single
and well developed peak at Ep of -1.30 V with Ip of 230 nA. The Ip was about 380 %
(3.8 times) higher as compared with that obtained by DPCSV which was only 60 nA as
shown in Figure 3.67.
Figure 3.67 Voltammograms of 0.10 µM AFB2 obtained by (a) DPCSV and (b)
SWSV techniques in BRB at pH 9.0. Parameters for DPCSV: Ei = -1.0 V, Ef = -1.4 V,
Eacc = -0.6 V, tacc = 80 s, υ = 50 mV/s and pulse amplitude = 80 mV and for SWSV: Ei =
-1.0 V, Ef = -1.4 V, Eacc = -0.6 V, tacc = 80 s, frequency = 50 Hz, voltage step = 0.02 V,
amplitude = 50 mV and υ = 1000 mV/s.
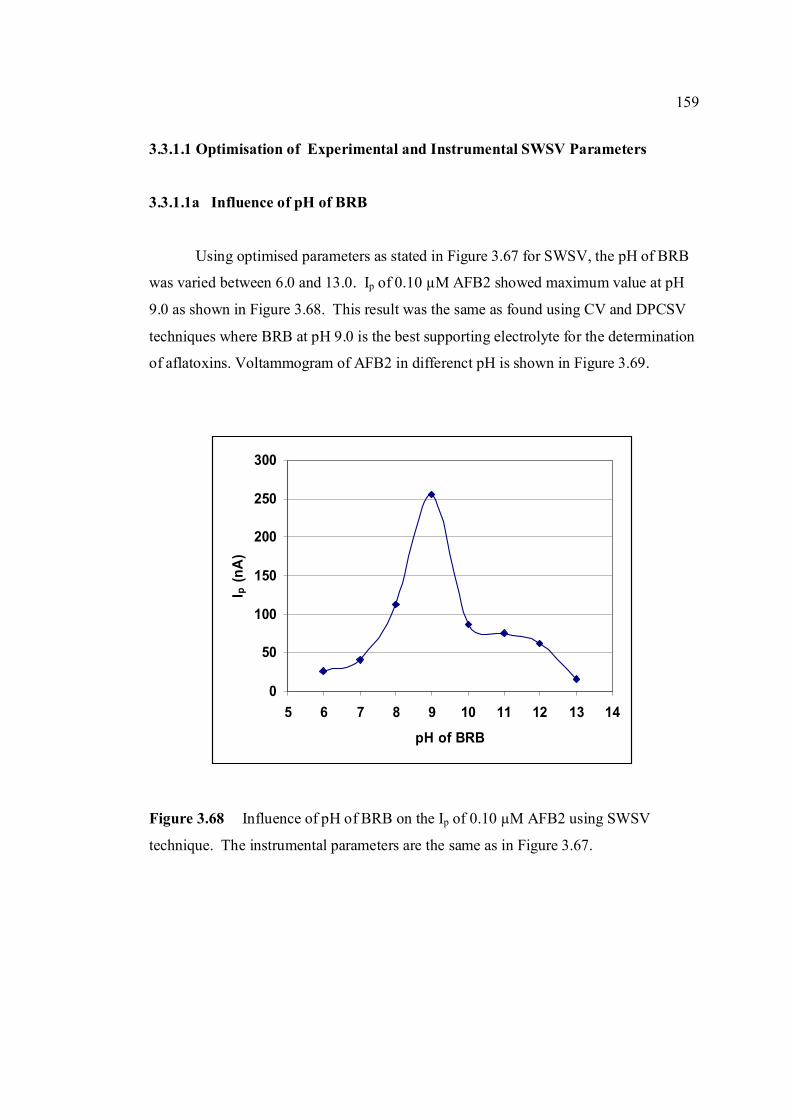
159
0
50
100
150
200
250
300
5 6 7 8 9 10 11 12 13 14
pH of BRB
I p (n
A)
3.3.1.1 Optimisation of Experimental and Instrumental SWSV Parameters
3.3.1.1a Influence of pH of BRB
Using optimised parameters as stated in Figure 3.67 for SWSV, the pH of BRB
was varied between 6.0 and 13.0. Ip of 0.10 µM AFB2 showed maximum value at pH
9.0 as shown in Figure 3.68. This result was the same as found using CV and DPCSV
techniques where BRB at pH 9.0 is the best supporting electrolyte for the determination
of aflatoxins. Voltammogram of AFB2 in differenct pH is shown in Figure 3.69.
Figure 3.68 Influence of pH of BRB on the Ip of 0.10 µM AFB2 using SWSV
technique. The instrumental parameters are the same as in Figure 3.67.
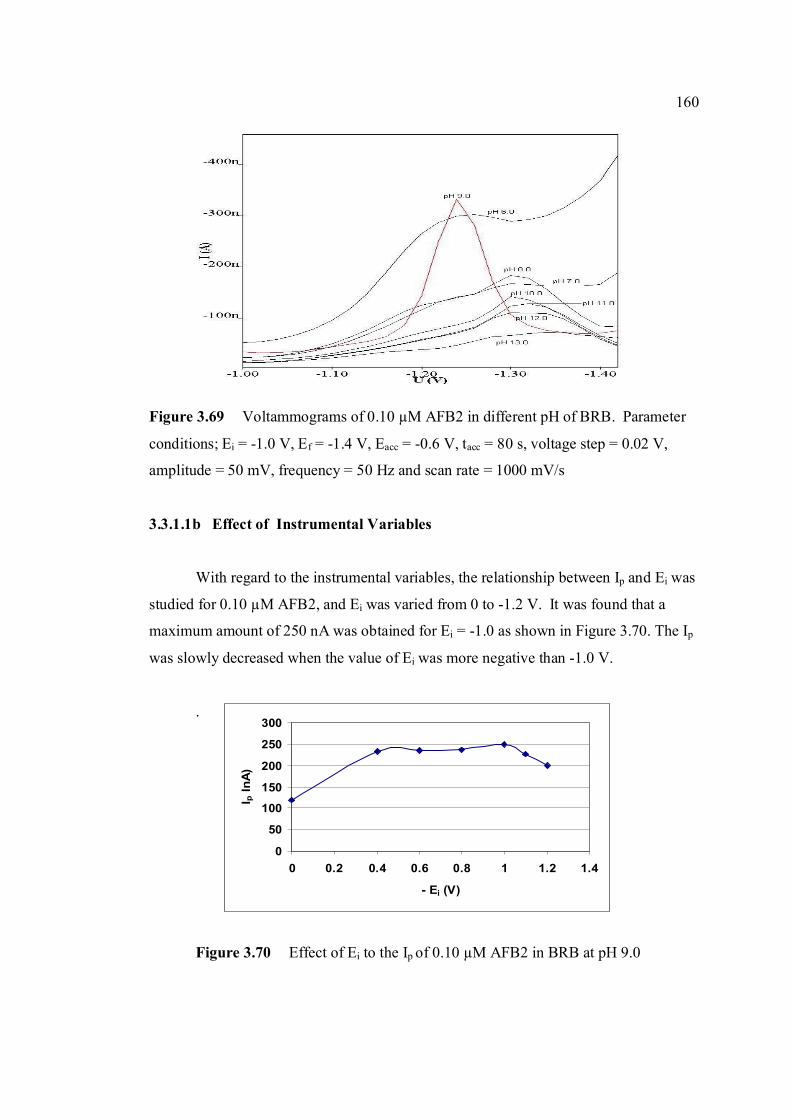
160
0
50
100
150
200
250
300
0 0.2 0.4 0.6 0.8 1 1.2 1.4
- Ei (V)
I p In
A)
Figure 3.69 Voltammograms of 0.10 µM AFB2 in different pH of BRB. Parameter
conditions; Ei = -1.0 V, Ef = -1.4 V, Eacc = -0.6 V, tacc = 80 s, voltage step = 0.02 V,
amplitude = 50 mV, frequency = 50 Hz and scan rate = 1000 mV/s
3.3.1.1b Effect of Instrumental Variables
With regard to the instrumental variables, the relationship between Ip and Ei was
studied for 0.10 µM AFB2, and Ei was varied from 0 to -1.2 V. It was found that a
maximum amount of 250 nA was obtained for Ei = -1.0 as shown in Figure 3.70. The Ip
was slowly decreased when the value of Ei was more negative than -1.0 V.
.
Figure 3.70 Effect of Ei to the Ip of 0.10 µM AFB2 in BRB at pH 9.0
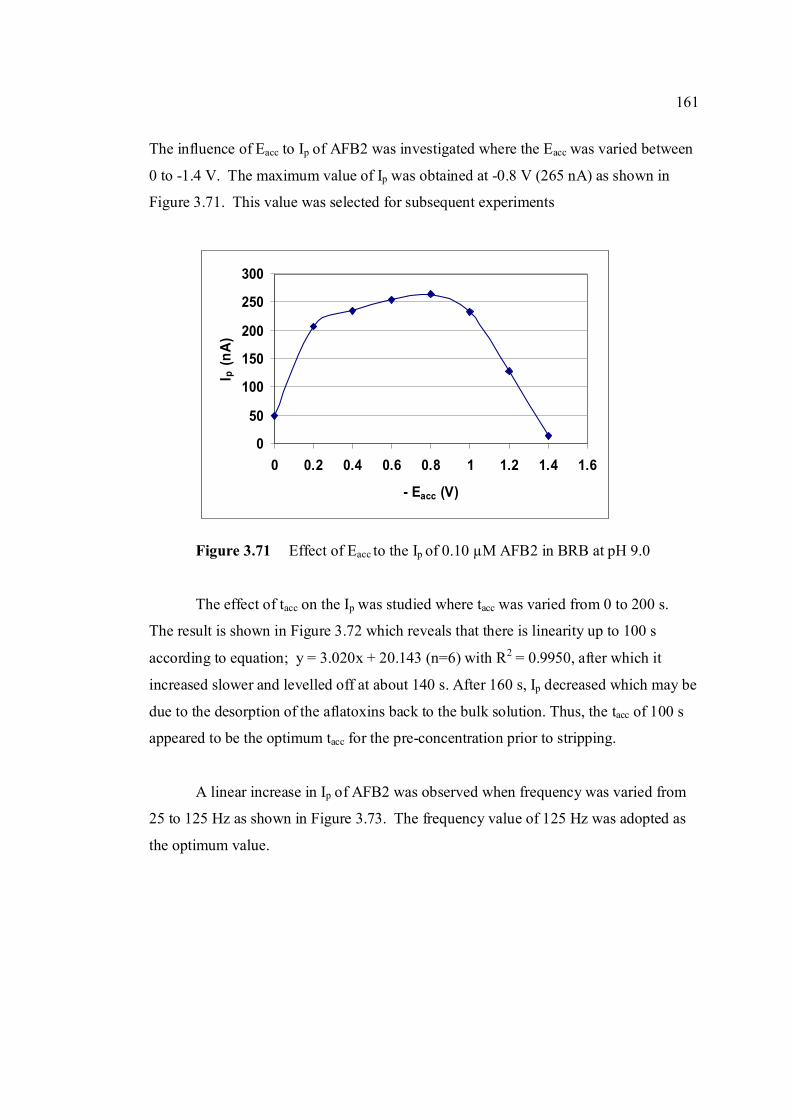
161
0
50
100
150
200
250
300
0 0.2 0.4 0.6 0.8 1 1.2 1.4 1.6
- Eacc (V)
I p (n
A)
The influence of Eacc to Ip of AFB2 was investigated where the Eacc was varied between
0 to -1.4 V. The maximum value of Ip was obtained at -0.8 V (265 nA) as shown in
Figure 3.71. This value was selected for subsequent experiments
Figure 3.71 Effect of Eacc to the Ip of 0.10 µM AFB2 in BRB at pH 9.0
The effect of tacc on the Ip was studied where tacc was varied from 0 to 200 s.
The result is shown in Figure 3.72 which reveals that there is linearity up to 100 s
according to equation; y = 3.020x + 20.143 (n=6) with R2 = 0.9950, after which it
increased slower and levelled off at about 140 s. After 160 s, Ip decreased which may be
due to the desorption of the aflatoxins back to the bulk solution. Thus, the tacc of 100 s
appeared to be the optimum tacc for the pre-concentration prior to stripping.
A linear increase in Ip of AFB2 was observed when frequency was varied from
25 to 125 Hz as shown in Figure 3.73. The frequency value of 125 Hz was adopted as
the optimum value.
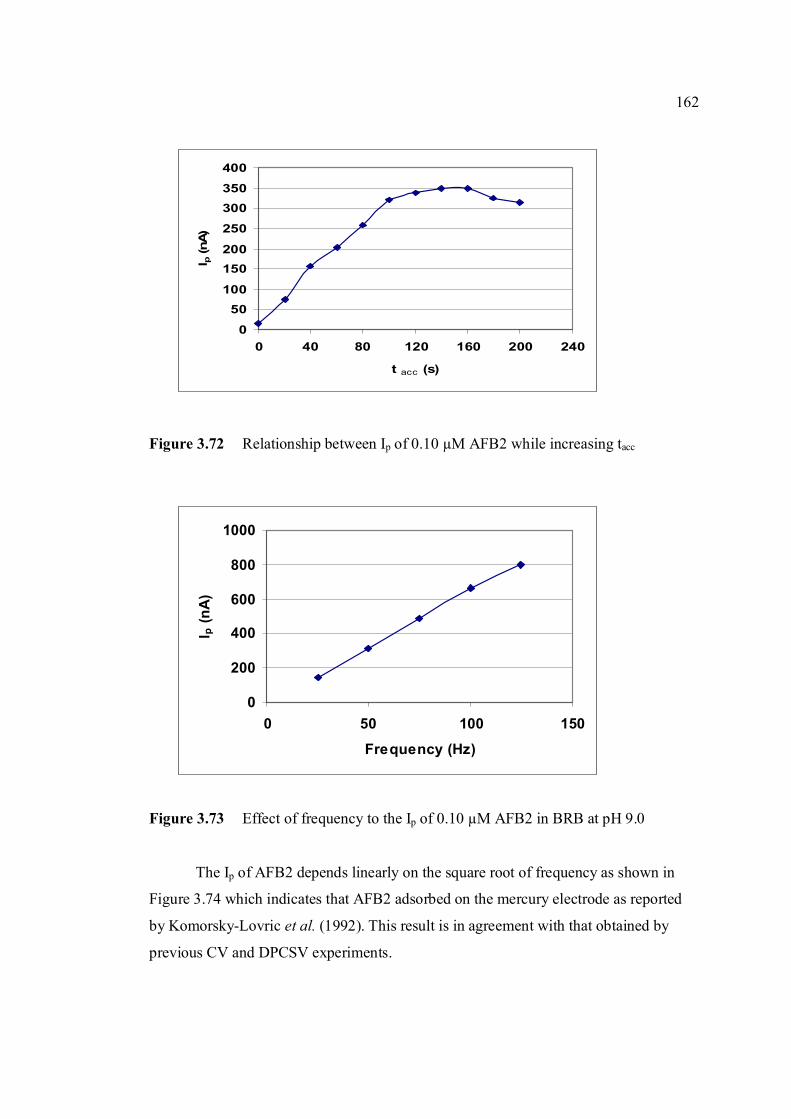
162
0
50100
150200
250
300350
400
0 40 80 120 160 200 240
t acc (s)
I p (n
A)
0
200
400
600
800
1000
0 50 100 150
Frequency (Hz)
I p (n
A)
Figure 3.72 Relationship between Ip of 0.10 µM AFB2 while increasing tacc
Figure 3.73 Effect of frequency to the Ip of 0.10 µM AFB2 in BRB at pH 9.0
The Ip of AFB2 depends linearly on the square root of frequency as shown in
Figure 3.74 which indicates that AFB2 adsorbed on the mercury electrode as reported
by Komorsky-Lovric et al. (1992). This result is in agreement with that obtained by
previous CV and DPCSV experiments.
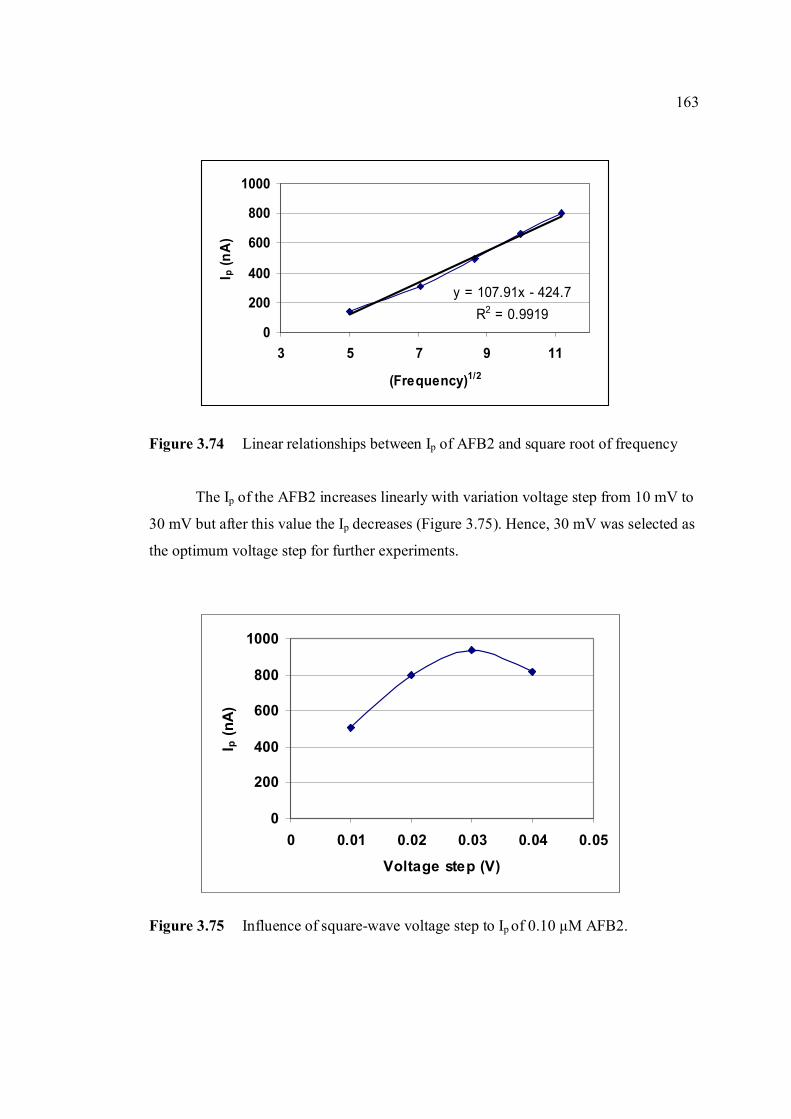
163
y = 107.91x - 424.7R2 = 0.9919
0
200
400
600
800
1000
3 5 7 9 11
(Frequency)1/2
I p (n
A)
0
200
400
600
800
1000
0 0.01 0.02 0.03 0.04 0.05
Voltage step (V)
I p (n
A)
Figure 3.74 Linear relationships between Ip of AFB2 and square root of frequency
The Ip of the AFB2 increases linearly with variation voltage step from 10 mV to
30 mV but after this value the Ip decreases (Figure 3.75). Hence, 30 mV was selected as
the optimum voltage step for further experiments.
Figure 3.75 Influence of square-wave voltage step to Ip of 0.10 µM AFB2.
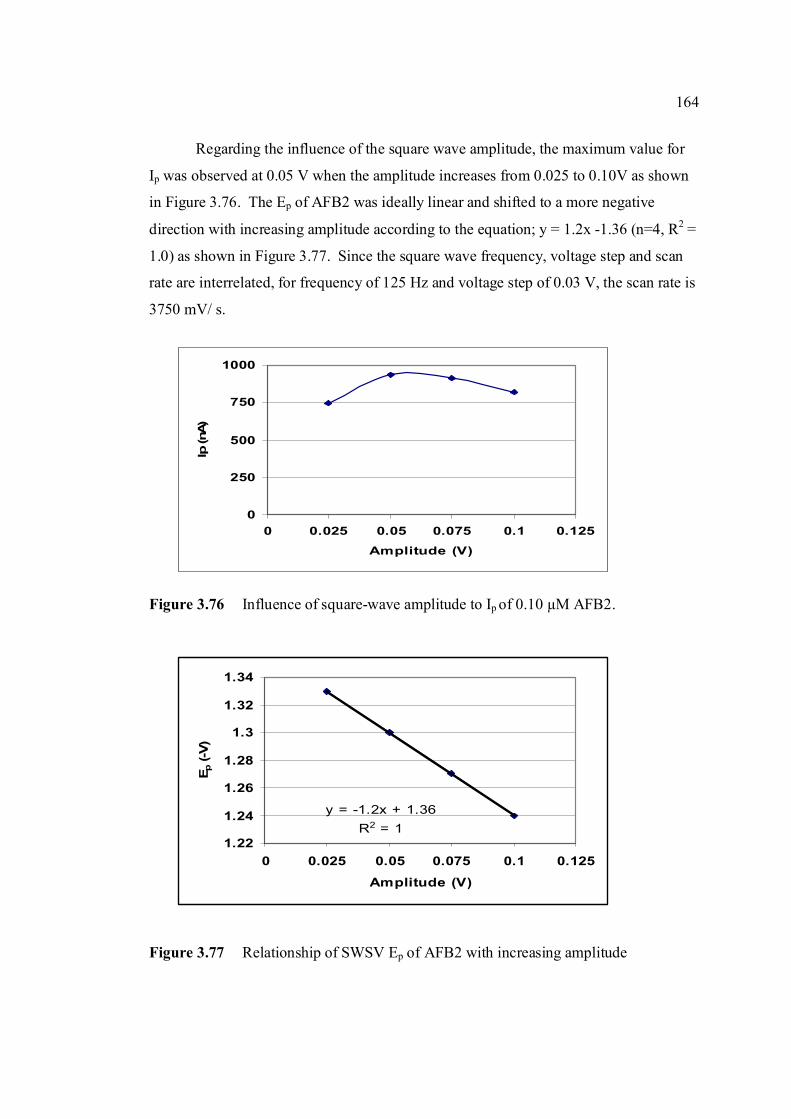
164
0
250
500
750
1000
0 0.025 0.05 0.075 0.1 0.125
Amplitude (V)
Ip (n
A)
y = -1.2x + 1.36R2 = 1
1.22
1.24
1.26
1.28
1.3
1.32
1.34
0 0.025 0.05 0.075 0.1 0.125
Amplitude (V)
E p (-
V)
Regarding the influence of the square wave amplitude, the maximum value for
Ip was observed at 0.05 V when the amplitude increases from 0.025 to 0.10V as shown
in Figure 3.76. The Ep of AFB2 was ideally linear and shifted to a more negative
direction with increasing amplitude according to the equation; y = 1.2x -1.36 (n=4, R2 =
1.0) as shown in Figure 3.77. Since the square wave frequency, voltage step and scan
rate are interrelated, for frequency of 125 Hz and voltage step of 0.03 V, the scan rate is
3750 mV/ s.
Figure 3.76 Influence of square-wave amplitude to Ip of 0.10 µM AFB2.
Figure 3.77 Relationship of SWSV Ep of AFB2 with increasing amplitude
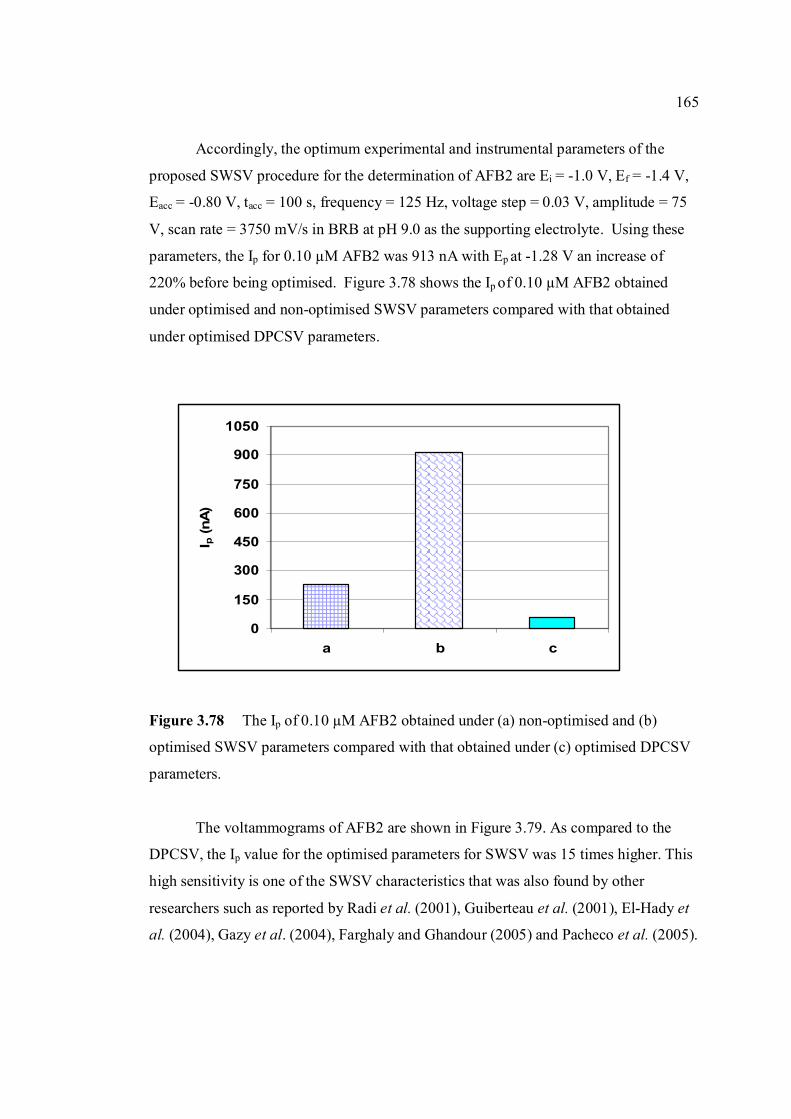
165
0
150
300
450
600
750
900
1050
a b c
I p (n
A)
Accordingly, the optimum experimental and instrumental parameters of the
proposed SWSV procedure for the determination of AFB2 are Ei = -1.0 V, Ef = -1.4 V,
Eacc = -0.80 V, tacc = 100 s, frequency = 125 Hz, voltage step = 0.03 V, amplitude = 75
V, scan rate = 3750 mV/s in BRB at pH 9.0 as the supporting electrolyte. Using these
parameters, the Ip for 0.10 µM AFB2 was 913 nA with Ep at -1.28 V an increase of
220% before being optimised. Figure 3.78 shows the Ip of 0.10 µM AFB2 obtained
under optimised and non-optimised SWSV parameters compared with that obtained
under optimised DPCSV parameters.
Figure 3.78 The Ip of 0.10 µM AFB2 obtained under (a) non-optimised and (b)
optimised SWSV parameters compared with that obtained under (c) optimised DPCSV
parameters.
The voltammograms of AFB2 are shown in Figure 3.79. As compared to the
DPCSV, the Ip value for the optimised parameters for SWSV was 15 times higher. This
high sensitivity is one of the SWSV characteristics that was also found by other
researchers such as reported by Radi et al. (2001), Guiberteau et al. (2001), El-Hady et
al. (2004), Gazy et al. (2004), Farghaly and Ghandour (2005) and Pacheco et al. (2005).
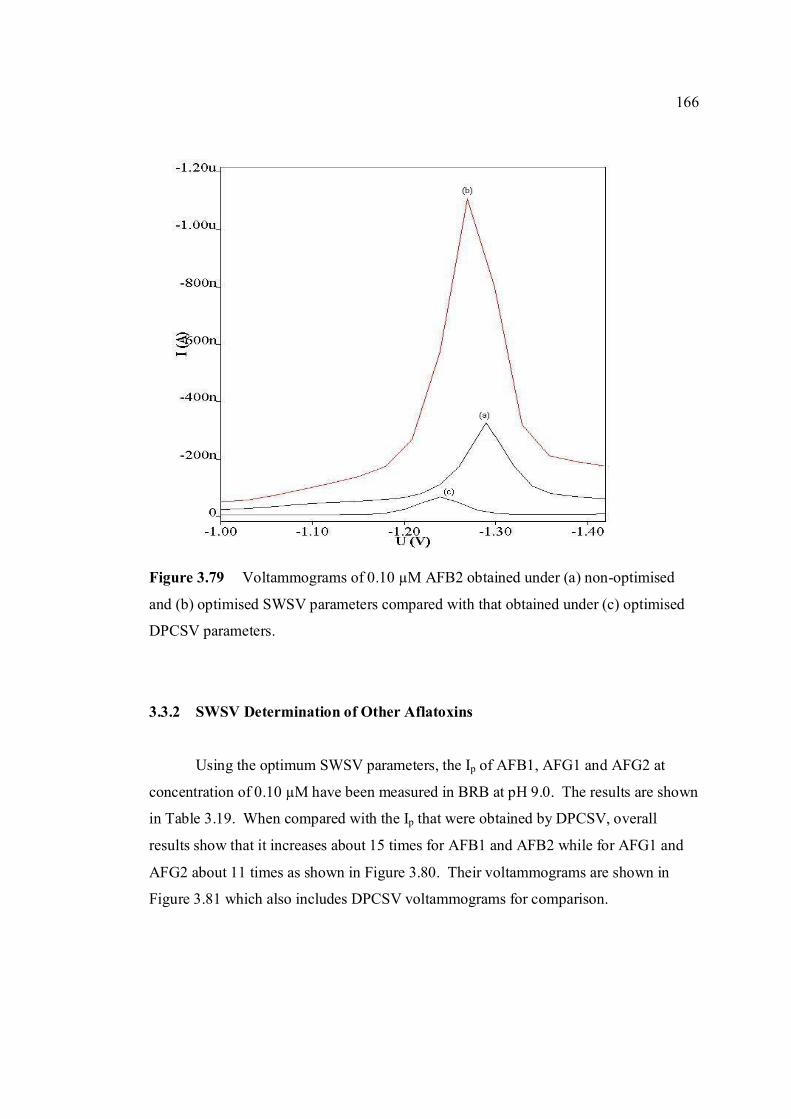
166
Figure 3.79 Voltammograms of 0.10 µM AFB2 obtained under (a) non-optimised
and (b) optimised SWSV parameters compared with that obtained under (c) optimised
DPCSV parameters.
3.3.2 SWSV Determination of Other Aflatoxins
Using the optimum SWSV parameters, the Ip of AFB1, AFG1 and AFG2 at
concentration of 0.10 µM have been measured in BRB at pH 9.0. The results are shown
in Table 3.19. When compared with the Ip that were obtained by DPCSV, overall
results show that it increases about 15 times for AFB1 and AFB2 while for AFG1 and
AFG2 about 11 times as shown in Figure 3.80. Their voltammograms are shown in
Figure 3.81 which also includes DPCSV voltammograms for comparison.
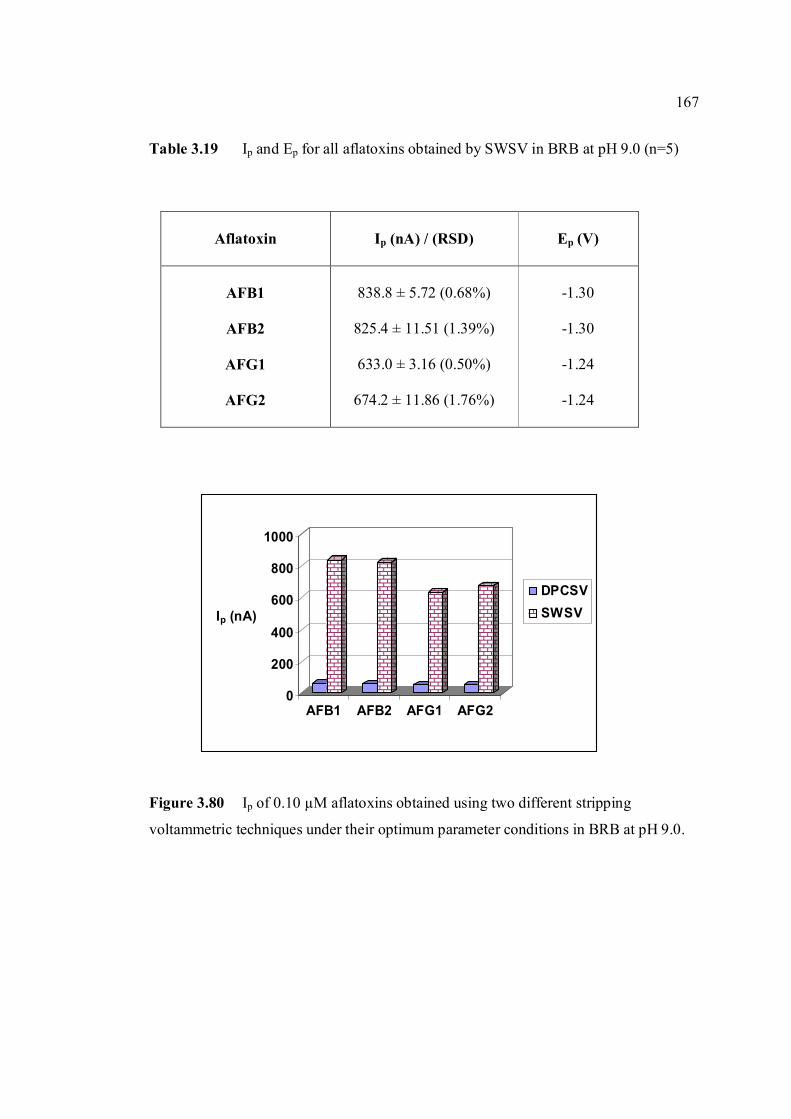
167
0
200
400
600
800
1000
Ip (nA)
AFB1 AFB2 AFG1 AFG2
DPCSVSWSV
Table 3.19 Ip and Ep for all aflatoxins obtained by SWSV in BRB at pH 9.0 (n=5)
Aflatoxin
Ip (nA) / (RSD)
Ep (V)
AFB1
AFB2
AFG1
AFG2
838.8 ± 5.72 (0.68%)
825.4 ± 11.51 (1.39%)
633.0 ± 3.16 (0.50%)
674.2 ± 11.86 (1.76%)
-1.30
-1.30
-1.24
-1.24
Figure 3.80 Ip of 0.10 µM aflatoxins obtained using two different stripping
voltammetric techniques under their optimum parameter conditions in BRB at pH 9.0.
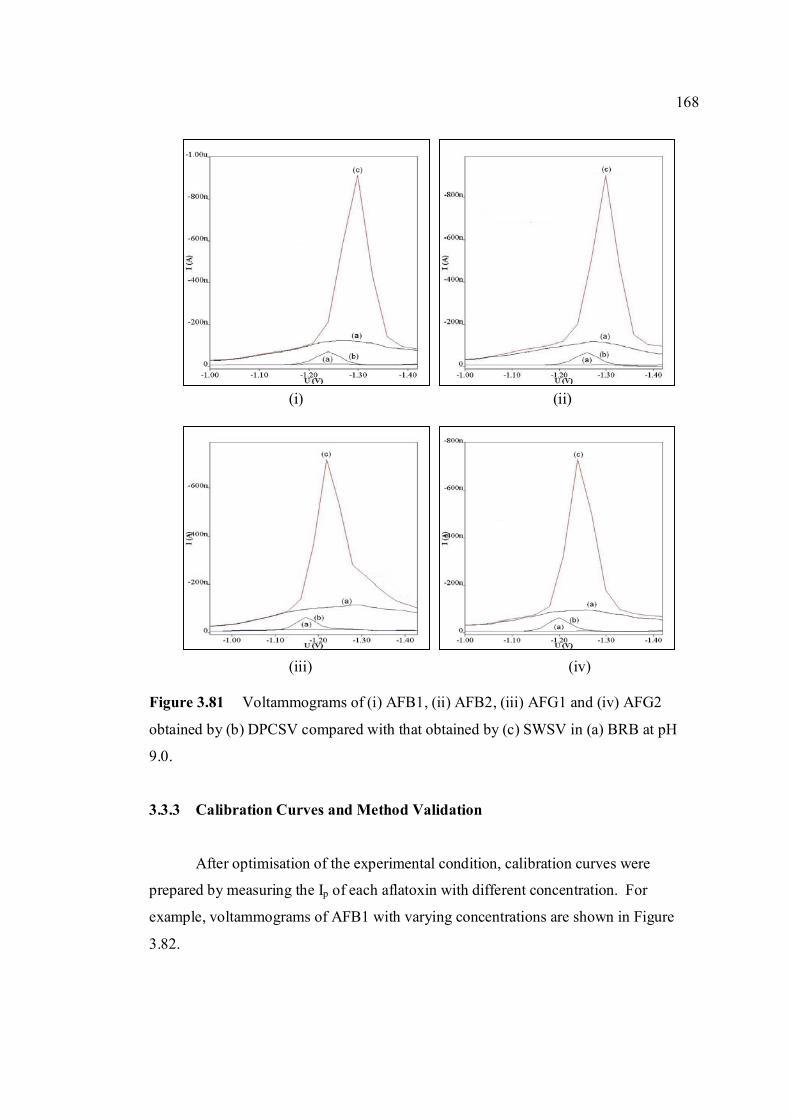
168
(i) (ii)
(iii) (iv)
Figure 3.81 Voltammograms of (i) AFB1, (ii) AFB2, (iii) AFG1 and (iv) AFG2
obtained by (b) DPCSV compared with that obtained by (c) SWSV in (a) BRB at pH
9.0.
3.3.3 Calibration Curves and Method Validation
After optimisation of the experimental condition, calibration curves were
prepared by measuring the Ip of each aflatoxin with different concentration. For
example, voltammograms of AFB1 with varying concentrations are shown in Figure
3.82.
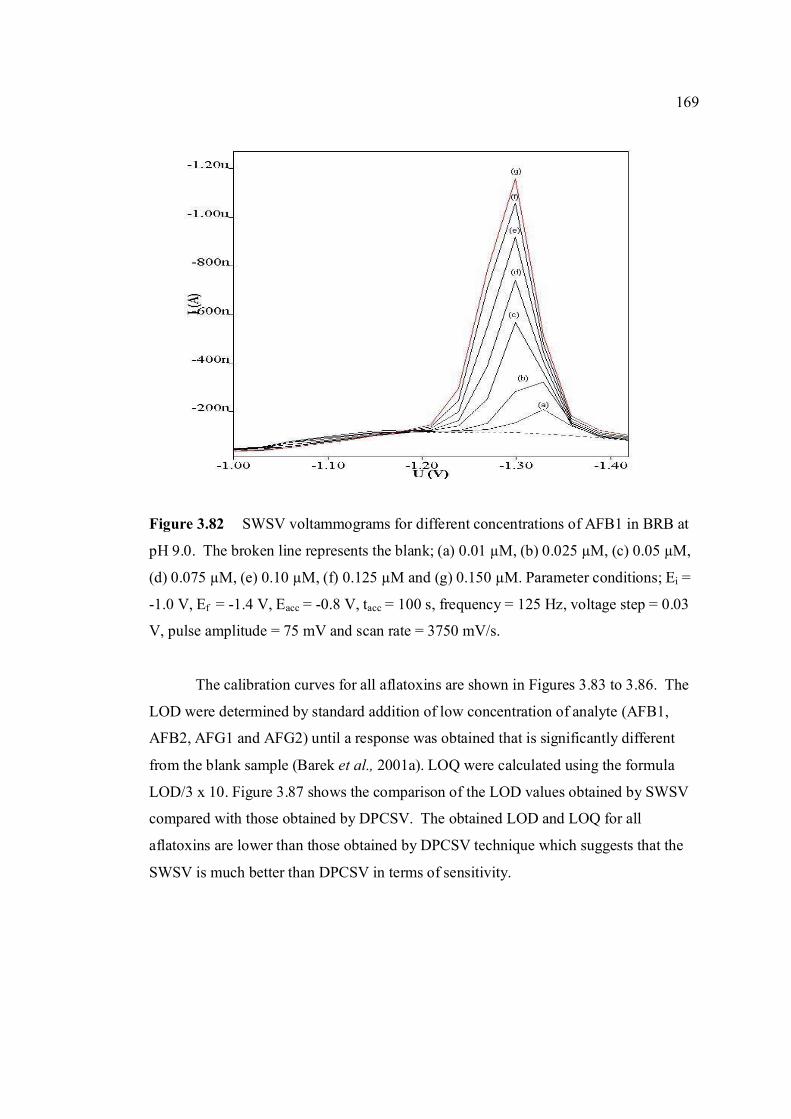
169
Figure 3.82 SWSV voltammograms for different concentrations of AFB1 in BRB at
pH 9.0. The broken line represents the blank; (a) 0.01 µM, (b) 0.025 µM, (c) 0.05 µM,
(d) 0.075 µM, (e) 0.10 µM, (f) 0.125 µM and (g) 0.150 µM. Parameter conditions; Ei =
-1.0 V, Ef = -1.4 V, Eacc = -0.8 V, tacc = 100 s, frequency = 125 Hz, voltage step = 0.03
V, pulse amplitude = 75 mV and scan rate = 3750 mV/s.
The calibration curves for all aflatoxins are shown in Figures 3.83 to 3.86. The
LOD were determined by standard addition of low concentration of analyte (AFB1,
AFB2, AFG1 and AFG2) until a response was obtained that is significantly different
from the blank sample (Barek et al., 2001a). LOQ were calculated using the formula
LOD/3 x 10. Figure 3.87 shows the comparison of the LOD values obtained by SWSV
compared with those obtained by DPCSV. The obtained LOD and LOQ for all
aflatoxins are lower than those obtained by DPCSV technique which suggests that the
SWSV is much better than DPCSV in terms of sensitivity.
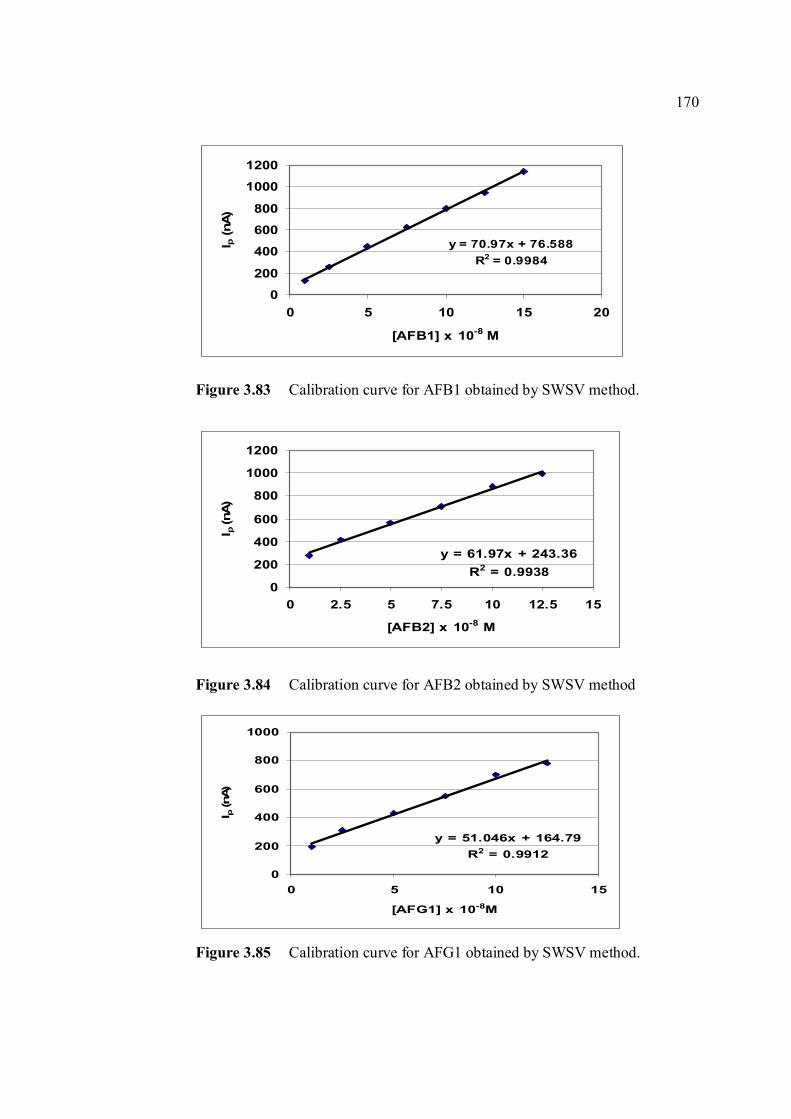
170
y = 70.97x + 76.588R2 = 0.9984
0
200
400
600
800
1000
1200
0 5 10 15 20
[AFB1] x 10-8 M
I p (n
A)
y = 61.97x + 243.36R2 = 0.9938
0
200
400
600
800
1000
1200
0 2.5 5 7.5 10 12.5 15
[AFB2] x 10-8 M
I p (n
A)
y = 51.046x + 164.79R2 = 0.9912
0
200
400
600
800
1000
0 5 10 15
[AFG1] x 10-8M
I p (n
A)
Figure 3.83 Calibration curve for AFB1 obtained by SWSV method.
Figure 3.84 Calibration curve for AFB2 obtained by SWSV method
Figure 3.85 Calibration curve for AFG1 obtained by SWSV method.
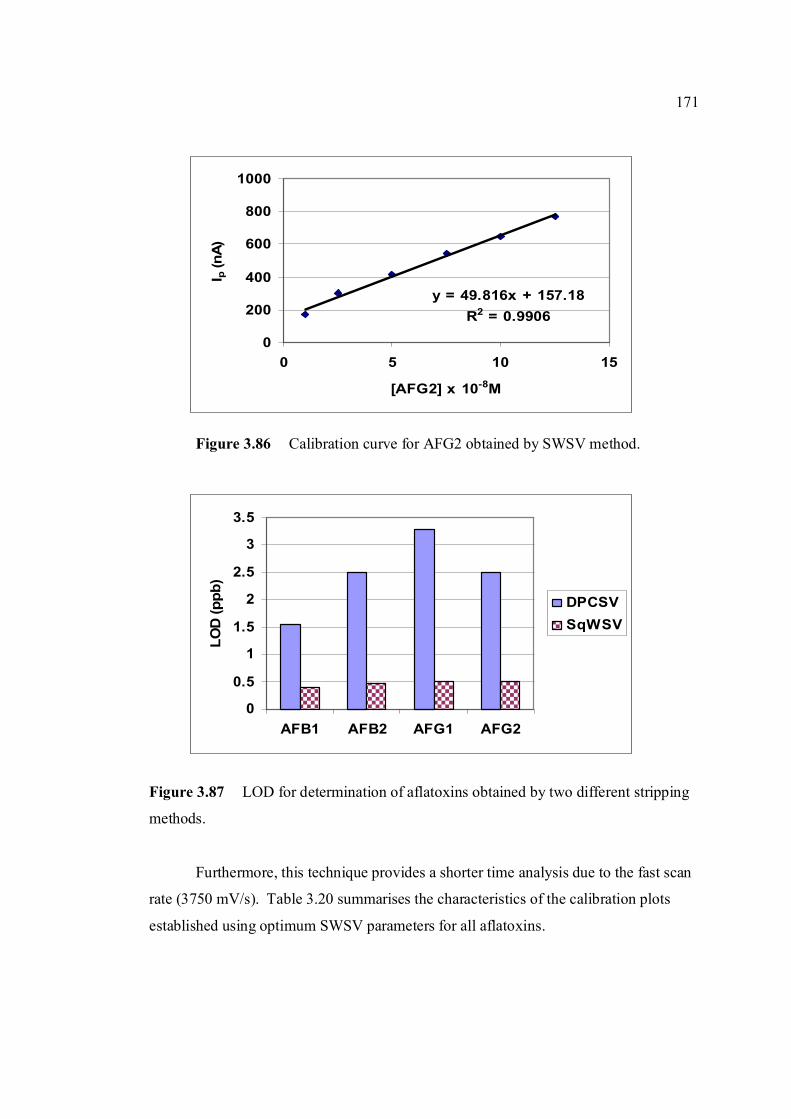
171
y = 49.816x + 157.18R2 = 0.9906
0
200
400
600
800
1000
0 5 10 15
[AFG2] x 10-8M
I p (n
A)
0
0.5
1
1.5
2
2.5
3
3.5
AFB1 AFB2 AFG1 AFG2
LOD
(ppb
)
DPCSVSqWSV
Figure 3.86 Calibration curve for AFG2 obtained by SWSV method.
Figure 3.87 LOD for determination of aflatoxins obtained by two different stripping
methods.
Furthermore, this technique provides a shorter time analysis due to the fast scan
rate (3750 mV/s). Table 3.20 summarises the characteristics of the calibration plots
established using optimum SWSV parameters for all aflatoxins.
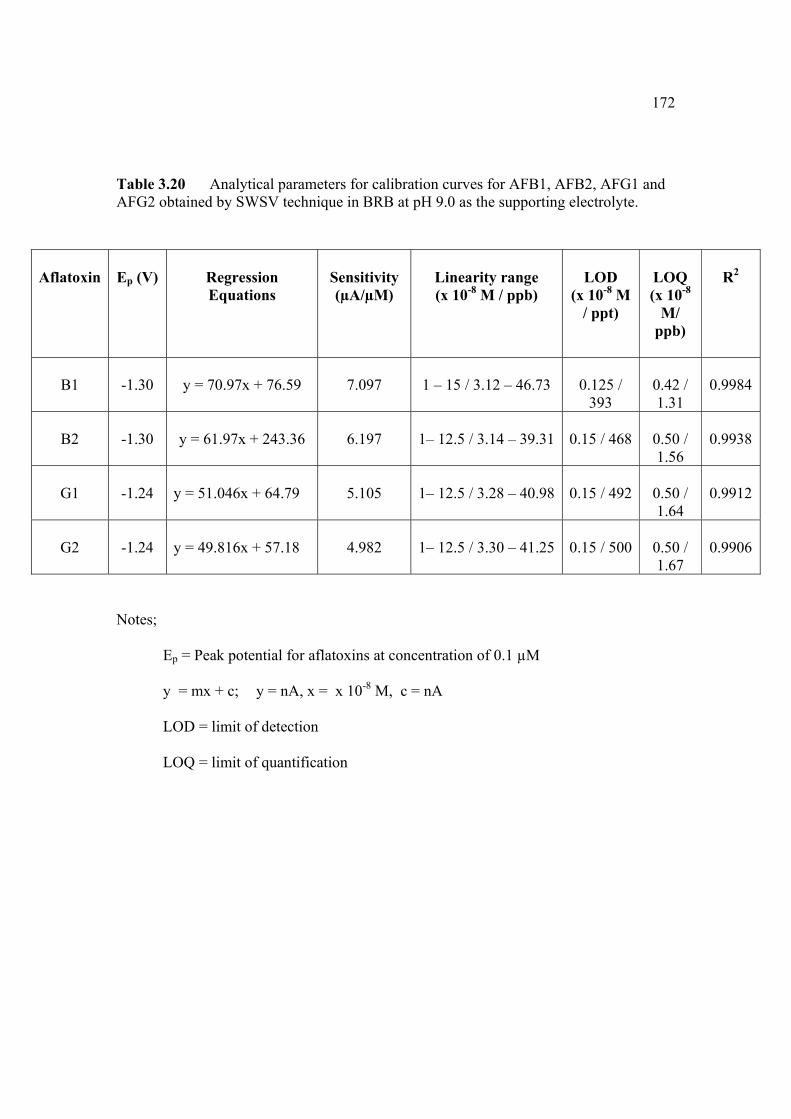
172
Table 3.20 Analytical parameters for calibration curves for AFB1, AFB2, AFG1 and AFG2 obtained by SWSV technique in BRB at pH 9.0 as the supporting electrolyte.
Notes;
Ep = Peak potential for aflatoxins at concentration of 0.1 µM
y = mx + c; y = nA, x = x 10-8 M, c = nA LOD = limit of detection LOQ = limit of quantification
Aflatoxin
Ep (V)
Regression Equations
Sensitivity (µA/µM)
Linearity range (x 10-8 M / ppb)
LOD
(x 10-8 M / ppt)
LOQ (x 10-8
M/ ppb)
R2
B1
-1.30
y = 70.97x + 76.59
7.097
1 – 15 / 3.12 – 46.73
0.125 /
393
0.42 / 1.31
0.9984
B2
-1.30
y = 61.97x + 243.36
6.197
1– 12.5 / 3.14 – 39.31
0.15 / 468
0.50 / 1.56
0.9938
G1
-1.24
y = 51.046x + 64.79
5.105
1– 12.5 / 3.28 – 40.98
0.15 / 492
0.50 / 1.64
0.9912
G2
-1.24
y = 49.816x + 57.18
4.982
1– 12.5 / 3.30 – 41.25
0.15 / 500
0.50 / 1.67
0.9906
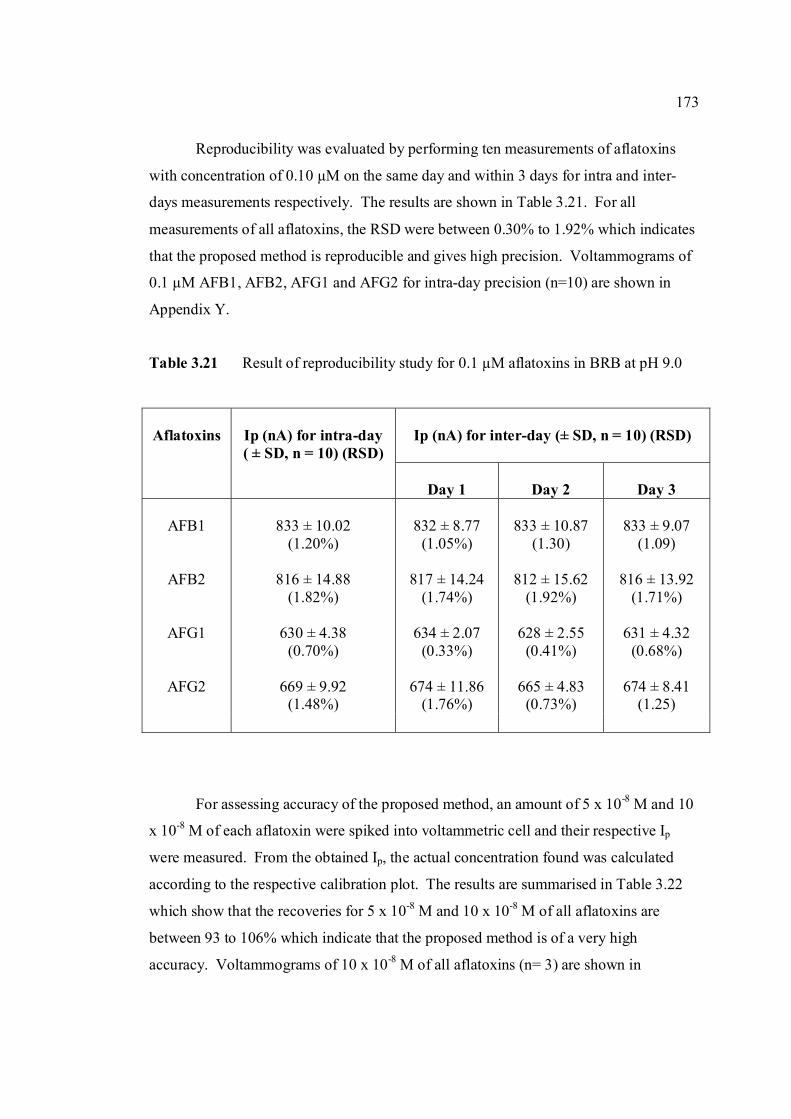
173
Reproducibility was evaluated by performing ten measurements of aflatoxins
with concentration of 0.10 µM on the same day and within 3 days for intra and inter-
days measurements respectively. The results are shown in Table 3.21. For all
measurements of all aflatoxins, the RSD were between 0.30% to 1.92% which indicates
that the proposed method is reproducible and gives high precision. Voltammograms of
0.1 µM AFB1, AFB2, AFG1 and AFG2 for intra-day precision (n=10) are shown in
Appendix Y.
Table 3.21 Result of reproducibility study for 0.1 µM aflatoxins in BRB at pH 9.0
Ip (nA) for inter-day (± SD, n = 10) (RSD)
Aflatoxins
Ip (nA) for intra-day ( ± SD, n = 10) (RSD)
Day 1
Day 2
Day 3
833 ± 10.02
(1.20%)
816 ± 14.88 (1.82%)
630 ± 4.38
(0.70%)
669 ± 9.92 (1.48%)
832 ± 8.77
(1.05%)
817 ± 14.24 (1.74%)
634 ± 2.07
(0.33%)
674 ± 11.86 (1.76%)
833 ± 10.87
(1.30)
812 ± 15.62 (1.92%)
628 ± 2.55
(0.41%)
665 ± 4.83 (0.73%)
833 ± 9.07
(1.09)
816 ± 13.92 (1.71%)
631 ± 4.32
(0.68%)
674 ± 8.41 (1.25)
AFB1
AFB2
AFG1
AFG2
For assessing accuracy of the proposed method, an amount of 5 x 10⁻⁸ M and 10
x 10-8 M of each aflatoxin were spiked into voltammetric cell and their respective Ip
were measured. From the obtained Ip, the actual concentration found was calculated
according to the respective calibration plot. The results are summarised in Table 3.22
which show that the recoveries for 5 x 10⁻⁸ M and 10 x 10-8 M of all aflatoxins are
between 93 to 106% which indicate that the proposed method is of a very high
accuracy. Voltammograms of 10 x 10-8 M of all aflatoxins (n= 3) are shown in
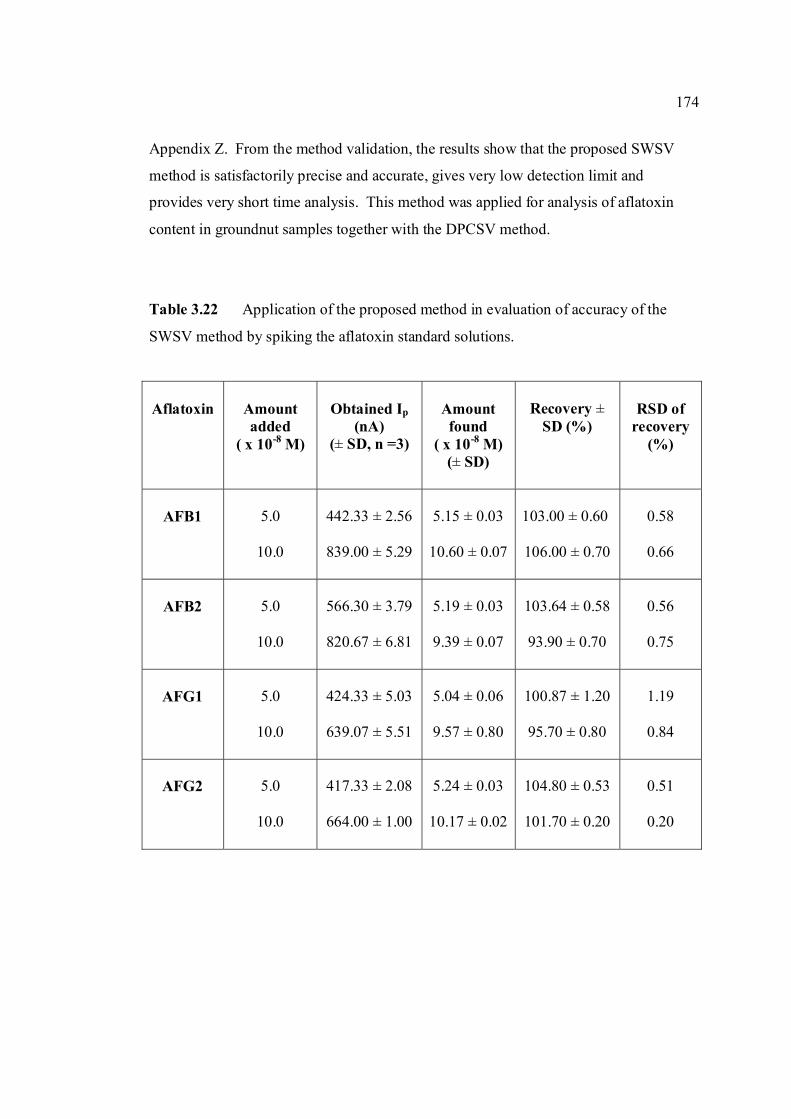
174
Appendix Z. From the method validation, the results show that the proposed SWSV
method is satisfactorily precise and accurate, gives very low detection limit and
provides very short time analysis. This method was applied for analysis of aflatoxin
content in groundnut samples together with the DPCSV method.
Table 3.22 Application of the proposed method in evaluation of accuracy of the
SWSV method by spiking the aflatoxin standard solutions.
Aflatoxin
Amount added
( x 10-8 M)
Obtained Ip
(nA) (± SD, n =3)
Amount found
( x 10-8 M) (± SD)
Recovery ±
SD (%)
RSD of
recovery (%)
AFB1
5.0
10.0
442.33 ± 2.56
839.00 ± 5.29
5.15 ± 0.03
10.60 ± 0.07
103.00 ± 0.60 106.00 ± 0.70
0.58
0.66
AFB2
5.0
10.0
566.30 ± 3.79
820.67 ± 6.81
5.19 ± 0.03
9.39 ± 0.07
103.64 ± 0.58
93.90 ± 0.70
0.56
0.75
AFG1
5.0
10.0
424.33 ± 5.03
639.07 ± 5.51
5.04 ± 0.06
9.57 ± 0.80
100.87 ± 1.20
95.70 ± 0.80
1.19
0.84
AFG2
5.0
10.0
417.33 ± 2.08
664.00 ± 1.00
5.24 ± 0.03
10.17 ± 0.02
104.80 ± 0.53
101.70 ± 0.20
0.51
0.20
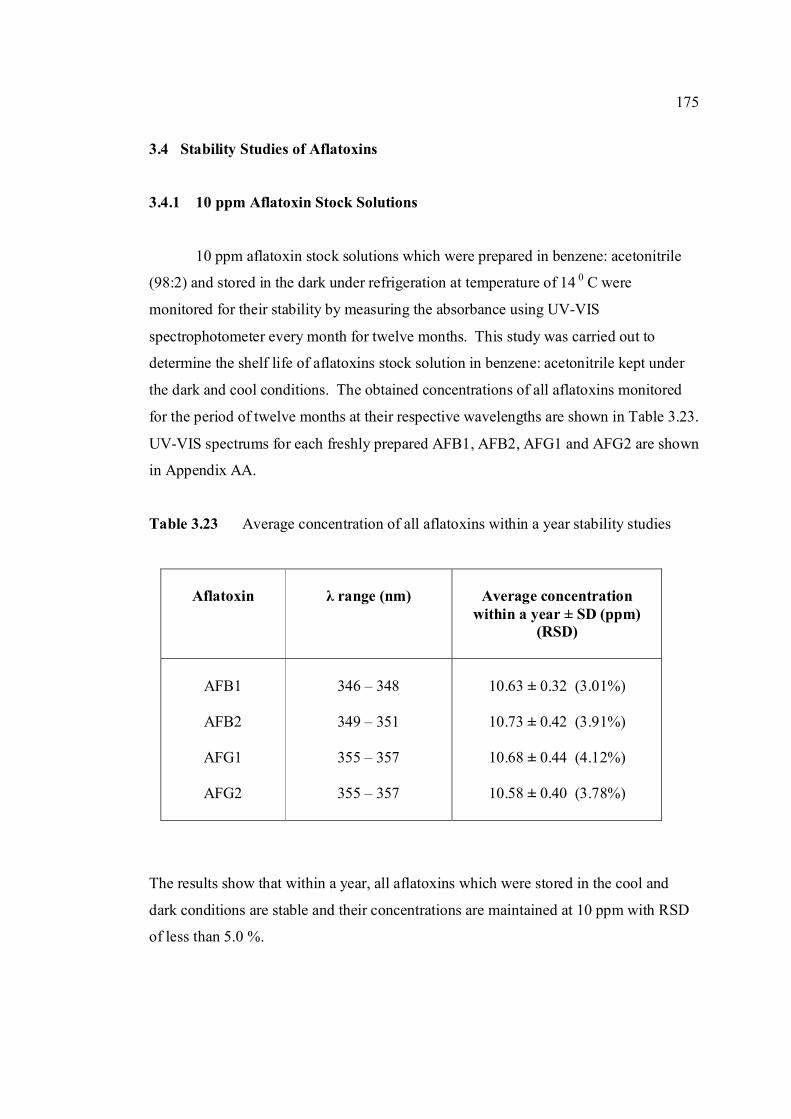
175
3.4 Stability Studies of Aflatoxins
3.4.1 10 ppm Aflatoxin Stock Solutions
10 ppm aflatoxin stock solutions which were prepared in benzene: acetonitrile
(98:2) and stored in the dark under refrigeration at temperature of 14 0 C were
monitored for their stability by measuring the absorbance using UV-VIS
spectrophotometer every month for twelve months. This study was carried out to
determine the shelf life of aflatoxins stock solution in benzene: acetonitrile kept under
the dark and cool conditions. The obtained concentrations of all aflatoxins monitored
for the period of twelve months at their respective wavelengths are shown in Table 3.23.
UV-VIS spectrums for each freshly prepared AFB1, AFB2, AFG1 and AFG2 are shown
in Appendix AA.
Table 3.23 Average concentration of all aflatoxins within a year stability studies
Aflatoxin
λ range (nm)
Average concentration
within a year ± SD (ppm) (RSD)
AFB1
AFB2
AFG1
AFG2
346 – 348
349 – 351
355 – 357
355 – 357
10.63 ± 0.32 (3.01%)
10.73 ± 0.42 (3.91%)
10.68 ± 0.44 (4.12%)
10.58 ± 0.40 (3.78%)
The results show that within a year, all aflatoxins which were stored in the cool and
dark conditions are stable and their concentrations are maintained at 10 ppm with RSD
of less than 5.0 %.
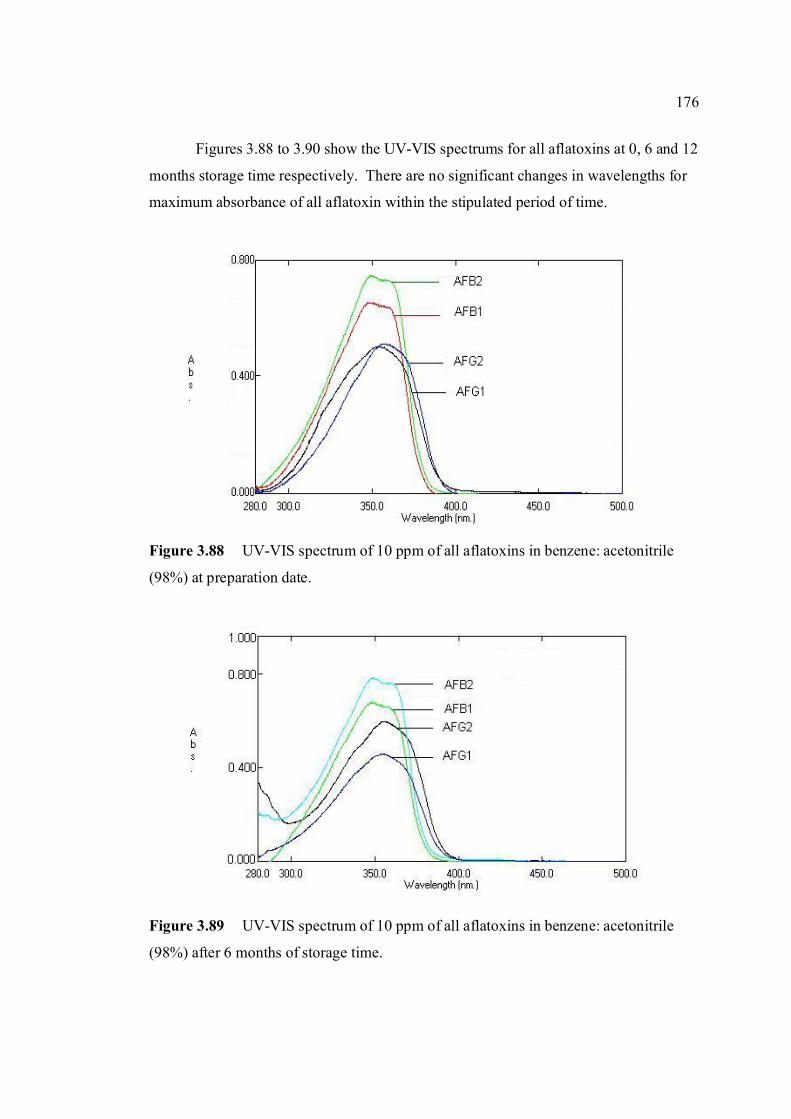
176
Figures 3.88 to 3.90 show the UV-VIS spectrums for all aflatoxins at 0, 6 and 12
months storage time respectively. There are no significant changes in wavelengths for
maximum absorbance of all aflatoxin within the stipulated period of time.
Figure 3.88 UV-VIS spectrum of 10 ppm of all aflatoxins in benzene: acetonitrile
(98%) at preparation date.
Figure 3.89 UV-VIS spectrum of 10 ppm of all aflatoxins in benzene: acetonitrile
(98%) after 6 months of storage time.
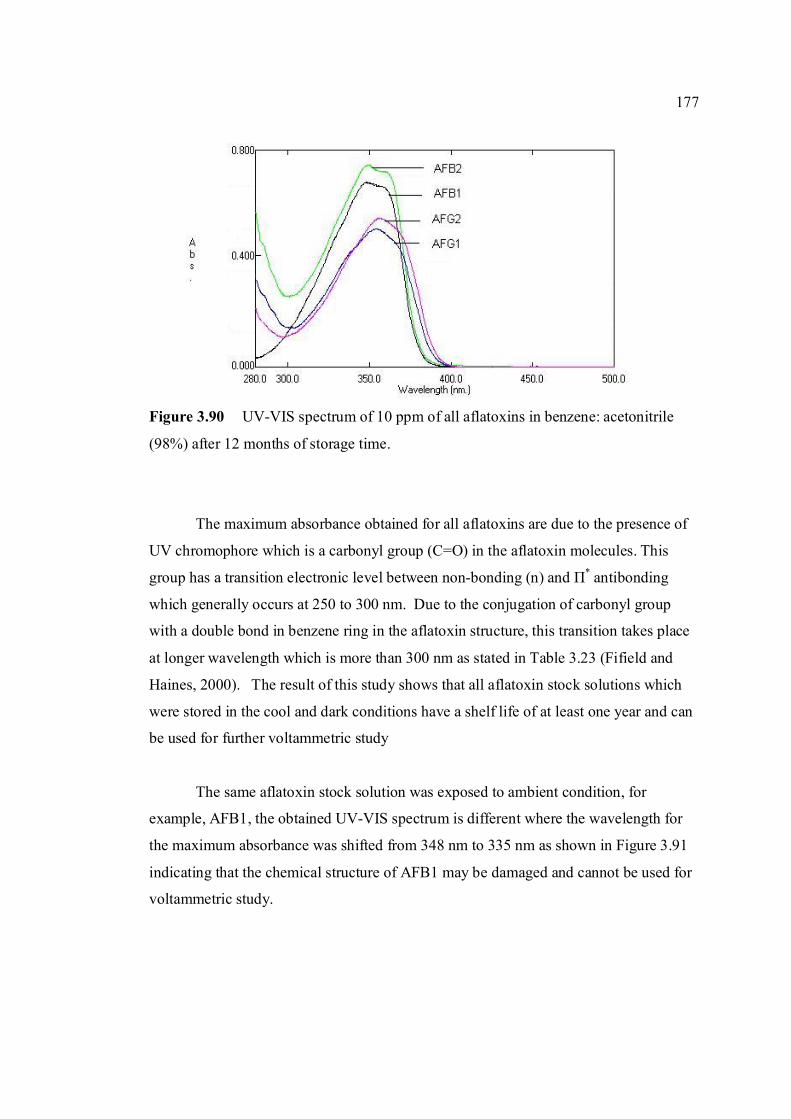
177
Figure 3.90 UV-VIS spectrum of 10 ppm of all aflatoxins in benzene: acetonitrile
(98%) after 12 months of storage time.
The maximum absorbance obtained for all aflatoxins are due to the presence of
UV chromophore which is a carbonyl group (C=O) in the aflatoxin molecules. This
group has a transition electronic level between non-bonding (n) and Π* antibonding
which generally occurs at 250 to 300 nm. Due to the conjugation of carbonyl group
with a double bond in benzene ring in the aflatoxin structure, this transition takes place
at longer wavelength which is more than 300 nm as stated in Table 3.23 (Fifield and
Haines, 2000). The result of this study shows that all aflatoxin stock solutions which
were stored in the cool and dark conditions have a shelf life of at least one year and can
be used for further voltammetric study
The same aflatoxin stock solution was exposed to ambient condition, for
example, AFB1, the obtained UV-VIS spectrum is different where the wavelength for
the maximum absorbance was shifted from 348 nm to 335 nm as shown in Figure 3.91
indicating that the chemical structure of AFB1 may be damaged and cannot be used for
voltammetric study.
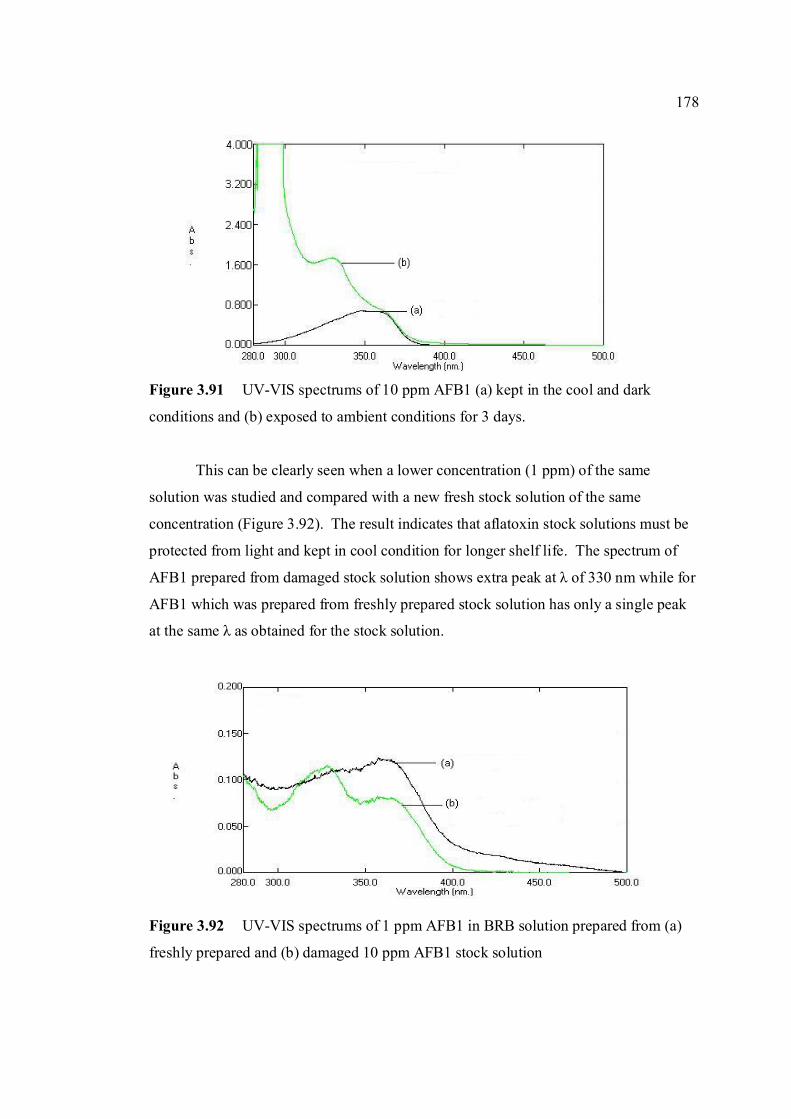
178
Figure 3.91 UV-VIS spectrums of 10 ppm AFB1 (a) kept in the cool and dark
conditions and (b) exposed to ambient conditions for 3 days.
This can be clearly seen when a lower concentration (1 ppm) of the same
solution was studied and compared with a new fresh stock solution of the same
concentration (Figure 3.92). The result indicates that aflatoxin stock solutions must be
protected from light and kept in cool condition for longer shelf life. The spectrum of
AFB1 prepared from damaged stock solution shows extra peak at λ of 330 nm while for
AFB1 which was prepared from freshly prepared stock solution has only a single peak
at the same λ as obtained for the stock solution.
Figure 3.92 UV-VIS spectrums of 1 ppm AFB1 in BRB solution prepared from (a)
freshly prepared and (b) damaged 10 ppm AFB1 stock solution
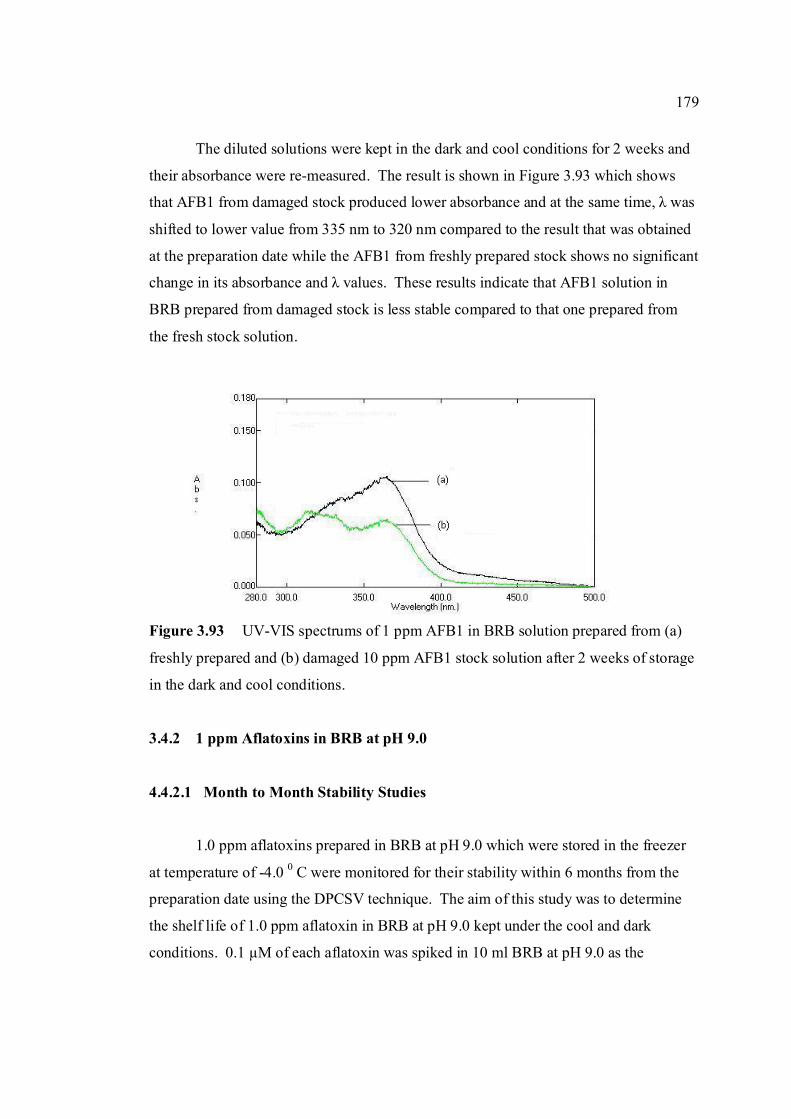
179
The diluted solutions were kept in the dark and cool conditions for 2 weeks and
their absorbance were re-measured. The result is shown in Figure 3.93 which shows
that AFB1 from damaged stock produced lower absorbance and at the same time, λ was
shifted to lower value from 335 nm to 320 nm compared to the result that was obtained
at the preparation date while the AFB1 from freshly prepared stock shows no significant
change in its absorbance and λ values. These results indicate that AFB1 solution in
BRB prepared from damaged stock is less stable compared to that one prepared from
the fresh stock solution.
Figure 3.93 UV-VIS spectrums of 1 ppm AFB1 in BRB solution prepared from (a)
freshly prepared and (b) damaged 10 ppm AFB1 stock solution after 2 weeks of storage
in the dark and cool conditions.
3.4.2 1 ppm Aflatoxins in BRB at pH 9.0
4.4.2.1 Month to Month Stability Studies
1.0 ppm aflatoxins prepared in BRB at pH 9.0 which were stored in the freezer
at temperature of -4.0 0 C were monitored for their stability within 6 months from the
preparation date using the DPCSV technique. The aim of this study was to determine
the shelf life of 1.0 ppm aflatoxin in BRB at pH 9.0 kept under the cool and dark
conditions. 0.1 µM of each aflatoxin was spiked in 10 ml BRB at pH 9.0 as the
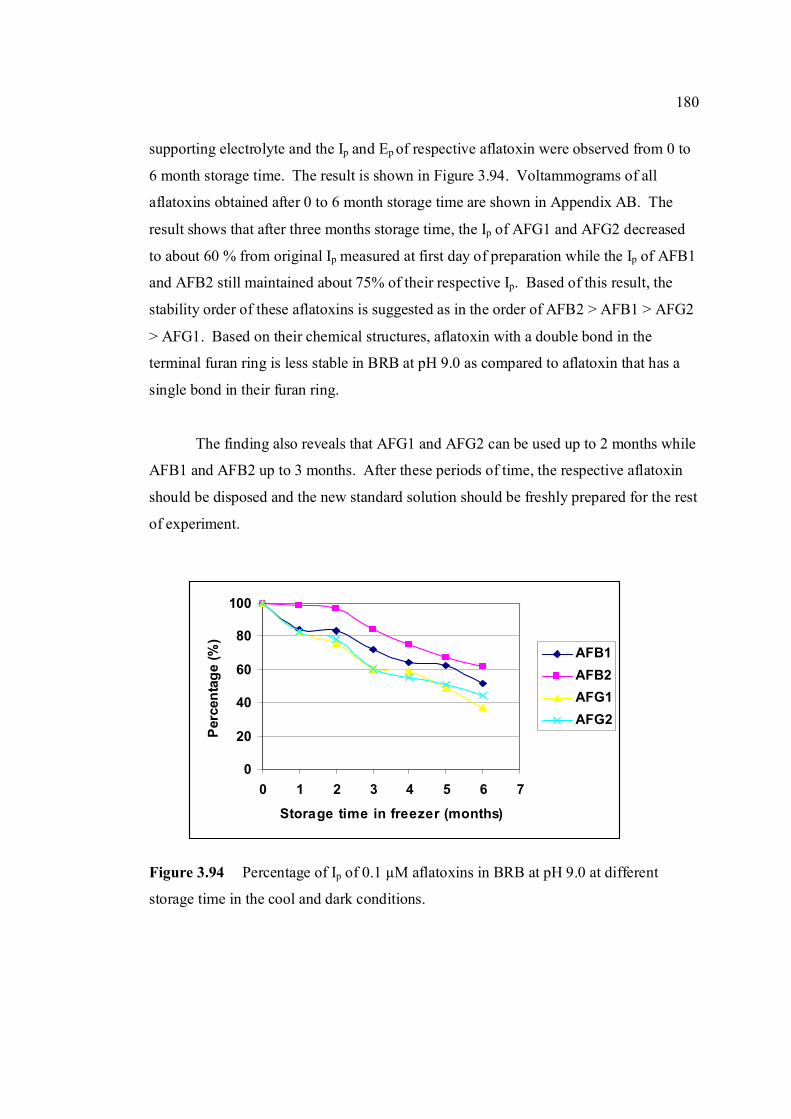
180
0
20
40
60
80
100
0 1 2 3 4 5 6 7
Storage time in freezer (months)
Per
cent
age
(%)
AFB1AFB2AFG1AFG2
supporting electrolyte and the Ip and Ep of respective aflatoxin were observed from 0 to
6 month storage time. The result is shown in Figure 3.94. Voltammograms of all
aflatoxins obtained after 0 to 6 month storage time are shown in Appendix AB. The
result shows that after three months storage time, the Ip of AFG1 and AFG2 decreased
to about 60 % from original Ip measured at first day of preparation while the Ip of AFB1
and AFB2 still maintained about 75% of their respective Ip. Based of this result, the
stability order of these aflatoxins is suggested as in the order of AFB2 > AFB1 > AFG2
> AFG1. Based on their chemical structures, aflatoxin with a double bond in the
terminal furan ring is less stable in BRB at pH 9.0 as compared to aflatoxin that has a
single bond in their furan ring.
The finding also reveals that AFG1 and AFG2 can be used up to 2 months while
AFB1 and AFB2 up to 3 months. After these periods of time, the respective aflatoxin
should be disposed and the new standard solution should be freshly prepared for the rest
of experiment.
Figure 3.94 Percentage of Ip of 0.1 µM aflatoxins in BRB at pH 9.0 at different
storage time in the cool and dark conditions.
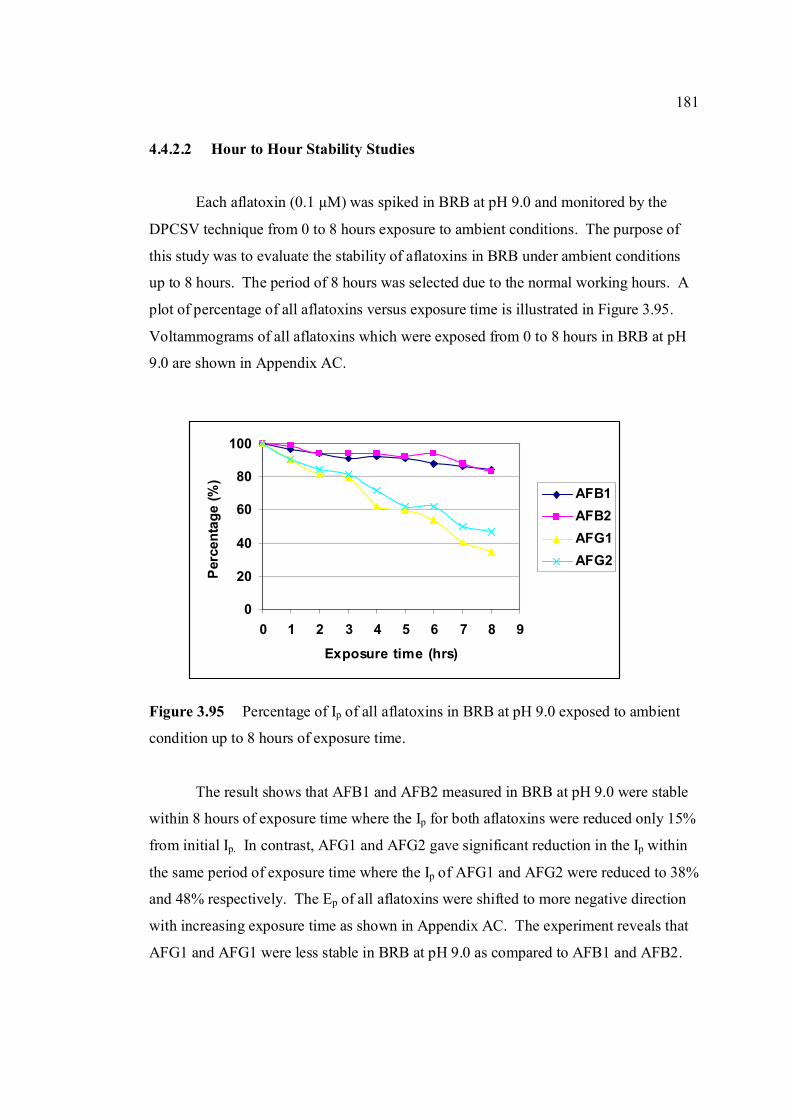
181
0
20
40
60
80
100
0 1 2 3 4 5 6 7 8 9
Exposure time (hrs)
Per
cent
age
(%)
AFB1AFB2AFG1AFG2
4.4.2.2 Hour to Hour Stability Studies
Each aflatoxin (0.1 µM) was spiked in BRB at pH 9.0 and monitored by the
DPCSV technique from 0 to 8 hours exposure to ambient conditions. The purpose of
this study was to evaluate the stability of aflatoxins in BRB under ambient conditions
up to 8 hours. The period of 8 hours was selected due to the normal working hours. A
plot of percentage of all aflatoxins versus exposure time is illustrated in Figure 3.95.
Voltammograms of all aflatoxins which were exposed from 0 to 8 hours in BRB at pH
9.0 are shown in Appendix AC.
Figure 3.95 Percentage of Ip of all aflatoxins in BRB at pH 9.0 exposed to ambient
condition up to 8 hours of exposure time.
The result shows that AFB1 and AFB2 measured in BRB at pH 9.0 were stable
within 8 hours of exposure time where the Ip for both aflatoxins were reduced only 15%
from initial Ip. In contrast, AFG1 and AFG2 gave significant reduction in the Ip within
the same period of exposure time where the Ip of AFG1 and AFG2 were reduced to 38%
and 48% respectively. The Ep of all aflatoxins were shifted to more negative direction
with increasing exposure time as shown in Appendix AC. The experiment reveals that
AFG1 and AFG1 were less stable in BRB at pH 9.0 as compared to AFB1 and AFB2.
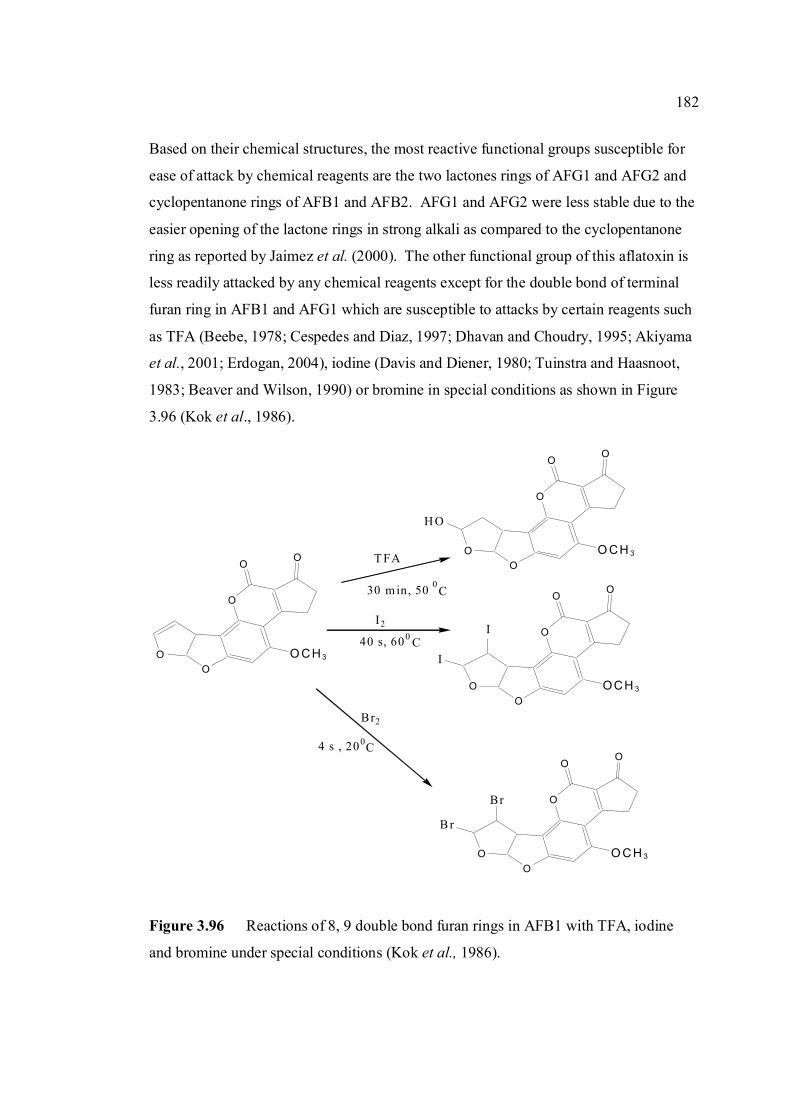
182
O
OO
OO
O CH3
T FA
H O
I2
O
OO
OO
O CH 3
Br2
I
I O
OO
OO
OCH 3
B r
Br O
OO
OO
O CH 3
30 m in, 50 0
40 s, 600
4 s , 200
C
C
C
Based on their chemical structures, the most reactive functional groups susceptible for
ease of attack by chemical reagents are the two lactones rings of AFG1 and AFG2 and
cyclopentanone rings of AFB1 and AFB2. AFG1 and AFG2 were less stable due to the
easier opening of the lactone rings in strong alkali as compared to the cyclopentanone
ring as reported by Jaimez et al. (2000). The other functional group of this aflatoxin is
less readily attacked by any chemical reagents except for the double bond of terminal
furan ring in AFB1 and AFG1 which are susceptible to attacks by certain reagents such
as TFA (Beebe, 1978; Cespedes and Diaz, 1997; Dhavan and Choudry, 1995; Akiyama
et al., 2001; Erdogan, 2004), iodine (Davis and Diener, 1980; Tuinstra and Haasnoot,
1983; Beaver and Wilson, 1990) or bromine in special conditions as shown in Figure
3.96 (Kok et al., 1986).
Figure 3.96 Reactions of 8, 9 double bond furan rings in AFB1 with TFA, iodine
and bromine under special conditions (Kok et al., 1986).
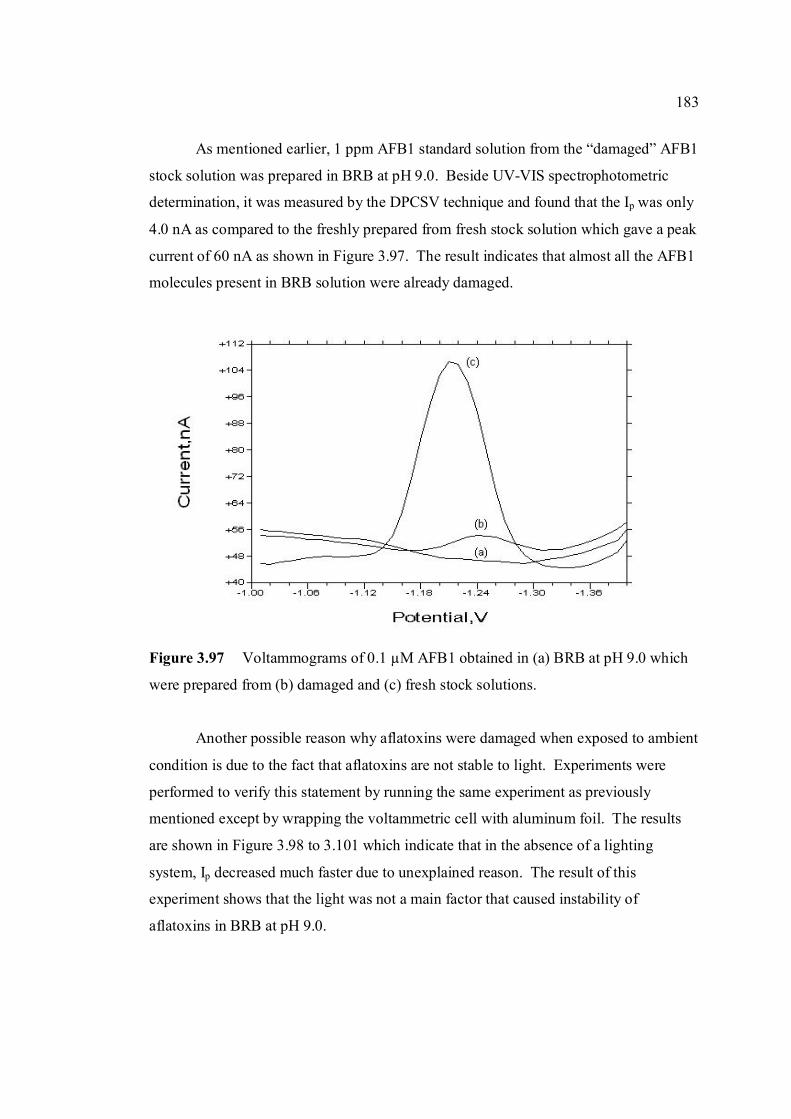
183
As mentioned earlier, 1 ppm AFB1 standard solution from the “damaged” AFB1
stock solution was prepared in BRB at pH 9.0. Beside UV-VIS spectrophotometric
determination, it was measured by the DPCSV technique and found that the Ip was only
4.0 nA as compared to the freshly prepared from fresh stock solution which gave a peak
current of 60 nA as shown in Figure 3.97. The result indicates that almost all the AFB1
molecules present in BRB solution were already damaged.
Figure 3.97 Voltammograms of 0.1 µM AFB1 obtained in (a) BRB at pH 9.0 which
were prepared from (b) damaged and (c) fresh stock solutions.
Another possible reason why aflatoxins were damaged when exposed to ambient
condition is due to the fact that aflatoxins are not stable to light. Experiments were
performed to verify this statement by running the same experiment as previously
mentioned except by wrapping the voltammetric cell with aluminum foil. The results
are shown in Figure 3.98 to 3.101 which indicate that in the absence of a lighting
system, Ip decreased much faster due to unexplained reason. The result of this
experiment shows that the light was not a main factor that caused instability of
aflatoxins in BRB at pH 9.0.
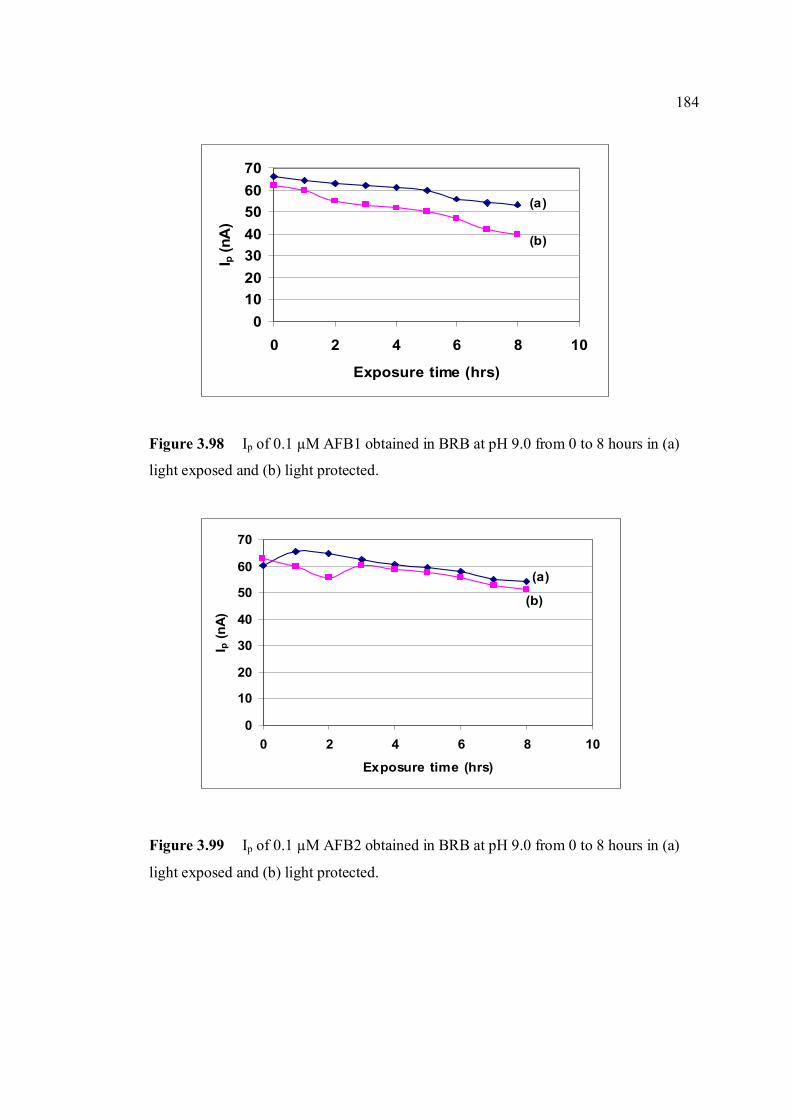
184
010203040506070
0 2 4 6 8 10
Exposure time (hrs)
I p (n
A)
(a)
(b)
0
10
20
30
40
50
60
70
0 2 4 6 8 10
Exposure time (hrs)
I p (n
A)
(a)
(b)
Figure 3.98 Ip of 0.1 µM AFB1 obtained in BRB at pH 9.0 from 0 to 8 hours in (a)
light exposed and (b) light protected.
Figure 3.99 Ip of 0.1 µM AFB2 obtained in BRB at pH 9.0 from 0 to 8 hours in (a)
light exposed and (b) light protected.
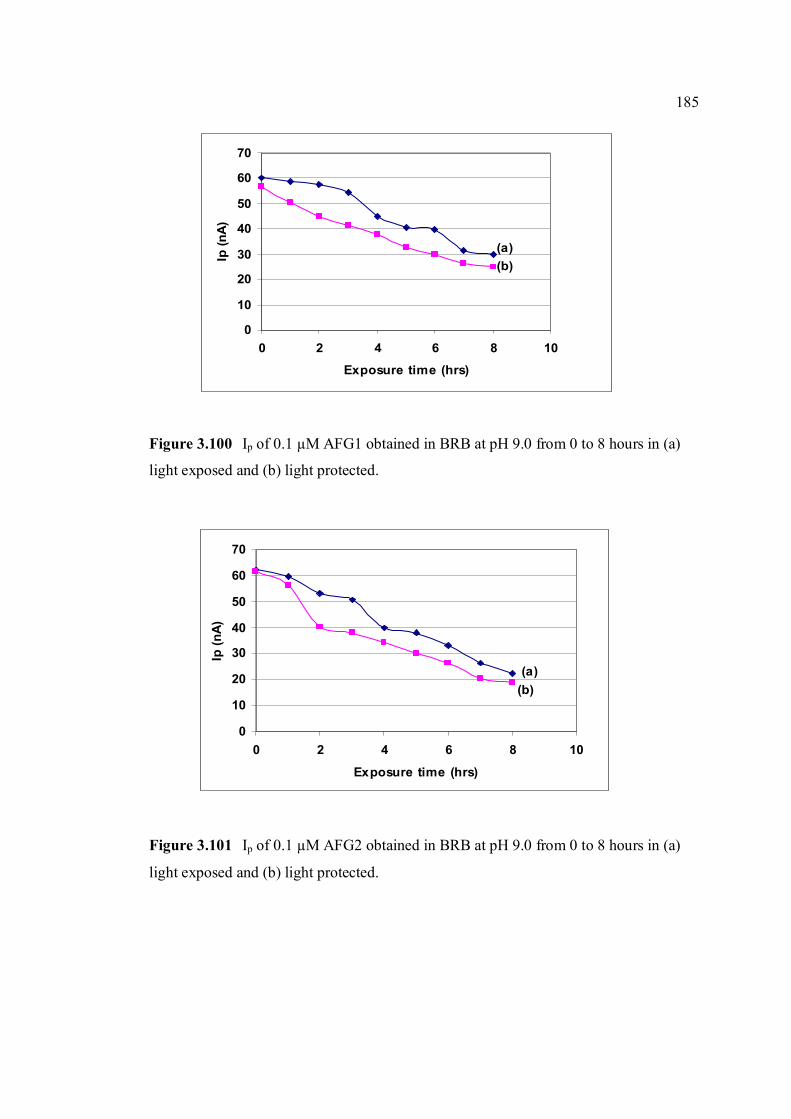
185
0
10
20
30
40
50
60
70
0 2 4 6 8 10
Exposure time (hrs)
Ip (n
A)
(a)(b)
0
10
20
30
40
50
60
70
0 2 4 6 8 10
Exposure time (hrs)
Ip (n
A)
(a)(b)
Figure 3.100 Ip of 0.1 µM AFG1 obtained in BRB at pH 9.0 from 0 to 8 hours in (a)
light exposed and (b) light protected.
Figure 3.101 Ip of 0.1 µM AFG2 obtained in BRB at pH 9.0 from 0 to 8 hours in (a)
light exposed and (b) light protected.
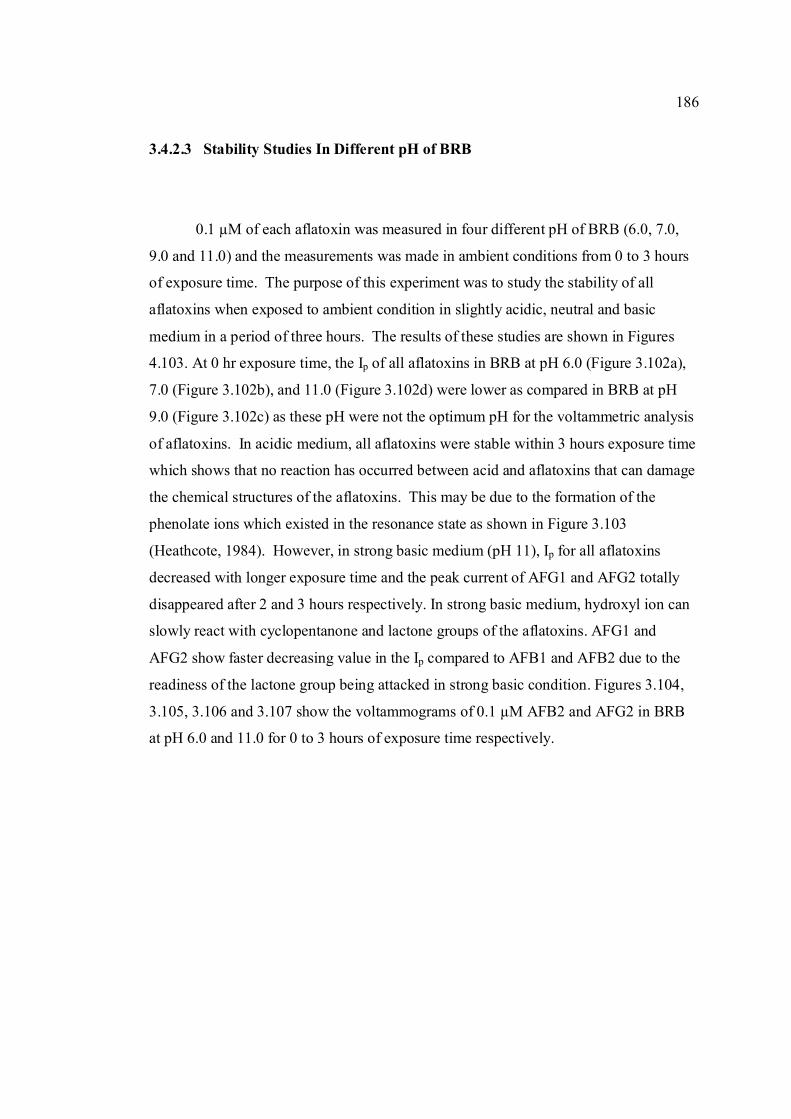
186
3.4.2.3 Stability Studies In Different pH of BRB
0.1 µM of each aflatoxin was measured in four different pH of BRB (6.0, 7.0,
9.0 and 11.0) and the measurements was made in ambient conditions from 0 to 3 hours
of exposure time. The purpose of this experiment was to study the stability of all
aflatoxins when exposed to ambient condition in slightly acidic, neutral and basic
medium in a period of three hours. The results of these studies are shown in Figures
4.103. At 0 hr exposure time, the Ip of all aflatoxins in BRB at pH 6.0 (Figure 3.102a),
7.0 (Figure 3.102b), and 11.0 (Figure 3.102d) were lower as compared in BRB at pH
9.0 (Figure 3.102c) as these pH were not the optimum pH for the voltammetric analysis
of aflatoxins. In acidic medium, all aflatoxins were stable within 3 hours exposure time
which shows that no reaction has occurred between acid and aflatoxins that can damage
the chemical structures of the aflatoxins. This may be due to the formation of the
phenolate ions which existed in the resonance state as shown in Figure 3.103
(Heathcote, 1984). However, in strong basic medium (pH 11), Ip for all aflatoxins
decreased with longer exposure time and the peak current of AFG1 and AFG2 totally
disappeared after 2 and 3 hours respectively. In strong basic medium, hydroxyl ion can
slowly react with cyclopentanone and lactone groups of the aflatoxins. AFG1 and
AFG2 show faster decreasing value in the Ip compared to AFB1 and AFB2 due to the
readiness of the lactone group being attacked in strong basic condition. Figures 3.104,
3.105, 3.106 and 3.107 show the voltammograms of 0.1 µM AFB2 and AFG2 in BRB
at pH 6.0 and 11.0 for 0 to 3 hours of exposure time respectively.
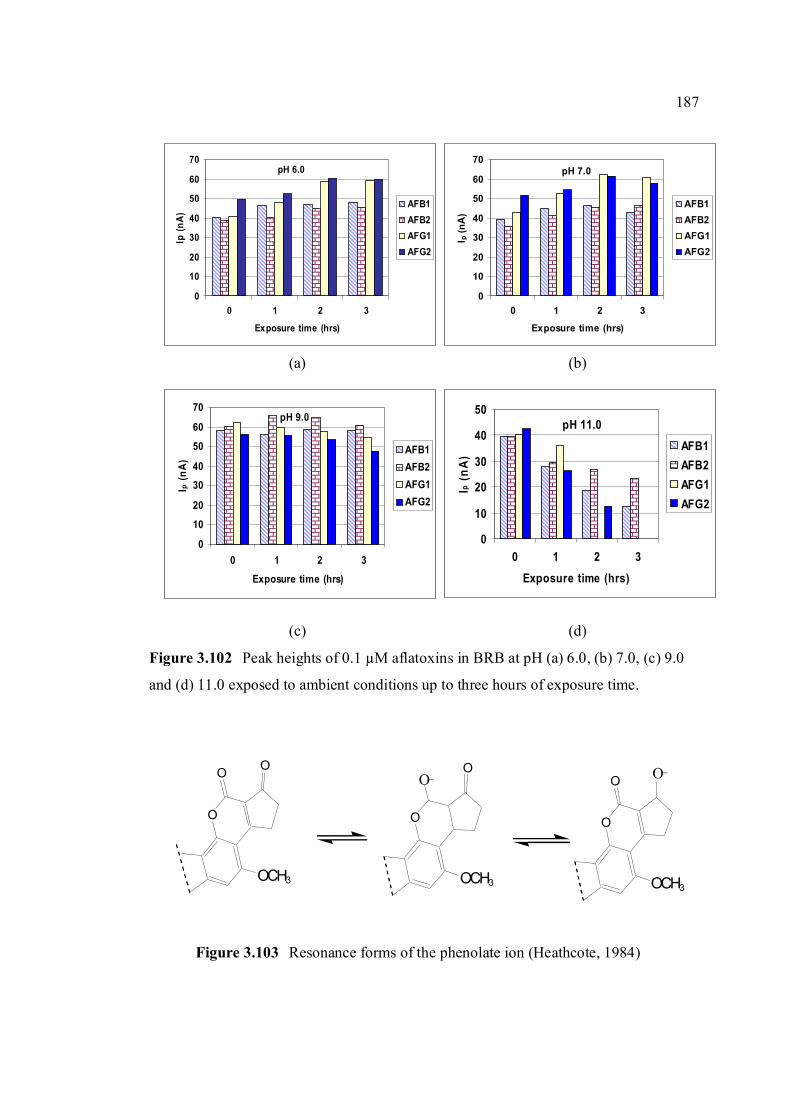
187
0
10
20
30
40
50
60
70
0 1 2 3
Exposure time (hrs)
Ip (n
A)
AFB1AFB2AFG1AFG2
pH 6.0
0
10
20
30
40
50
60
70
0 1 2 3
Exposure time (hrs)
I p (n
A)
AFB1AFB2AFG1AFG2
pH 7.0
0
10
20
30
40
50
60
70
0 1 2 3
Exposure time (hrs)
I p (n
A)
AFB1AFB2AFG1AFG2
pH 9.0
0
10
20
30
40
50
0 1 2 3
Exposure time (hrs)
Ip (n
A)
AFB1AFB2AFG1AFG2
pH 11.0
O
OO
OCH3
O
O
OCH3
O
O
OCH3
O_ O_
(a) (b)
(c) (d)
Figure 3.102 Peak heights of 0.1 µM aflatoxins in BRB at pH (a) 6.0, (b) 7.0, (c) 9.0
and (d) 11.0 exposed to ambient conditions up to three hours of exposure time.
Figure 3.103 Resonance forms of the phenolate ion (Heathcote, 1984)
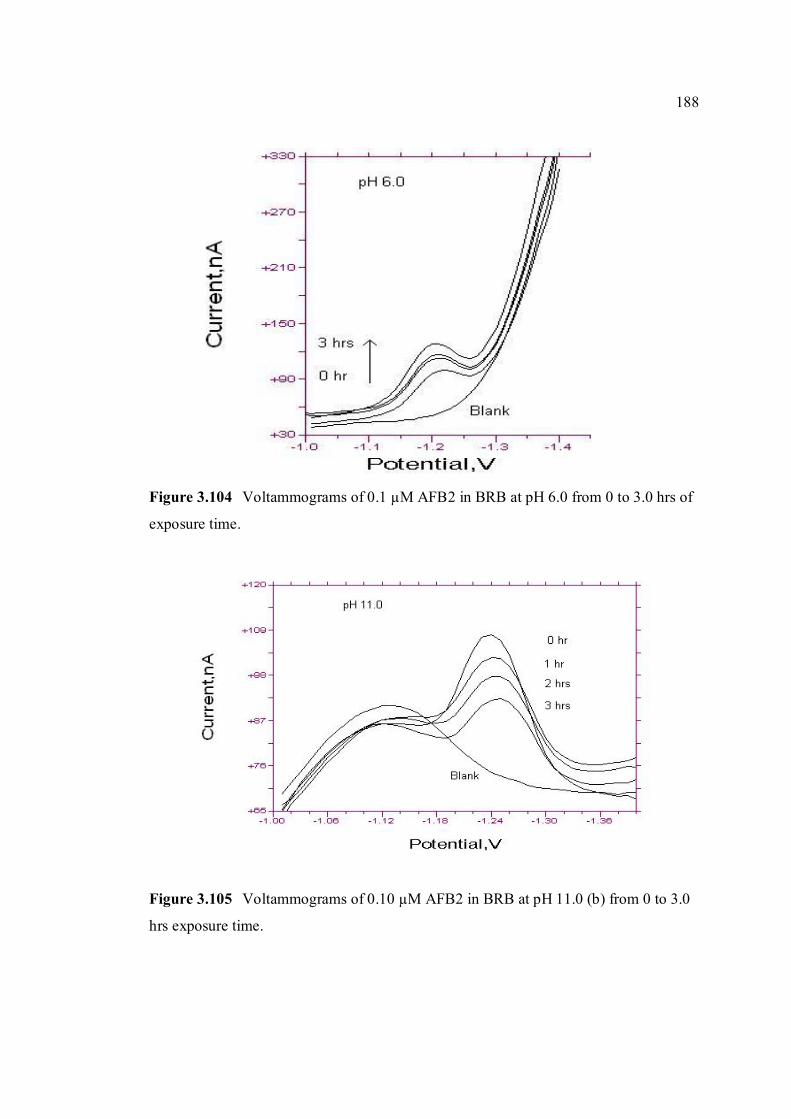
188
Figure 3.104 Voltammograms of 0.1 µM AFB2 in BRB at pH 6.0 from 0 to 3.0 hrs of
exposure time.
Figure 3.105 Voltammograms of 0.10 µM AFB2 in BRB at pH 11.0 (b) from 0 to 3.0
hrs exposure time.
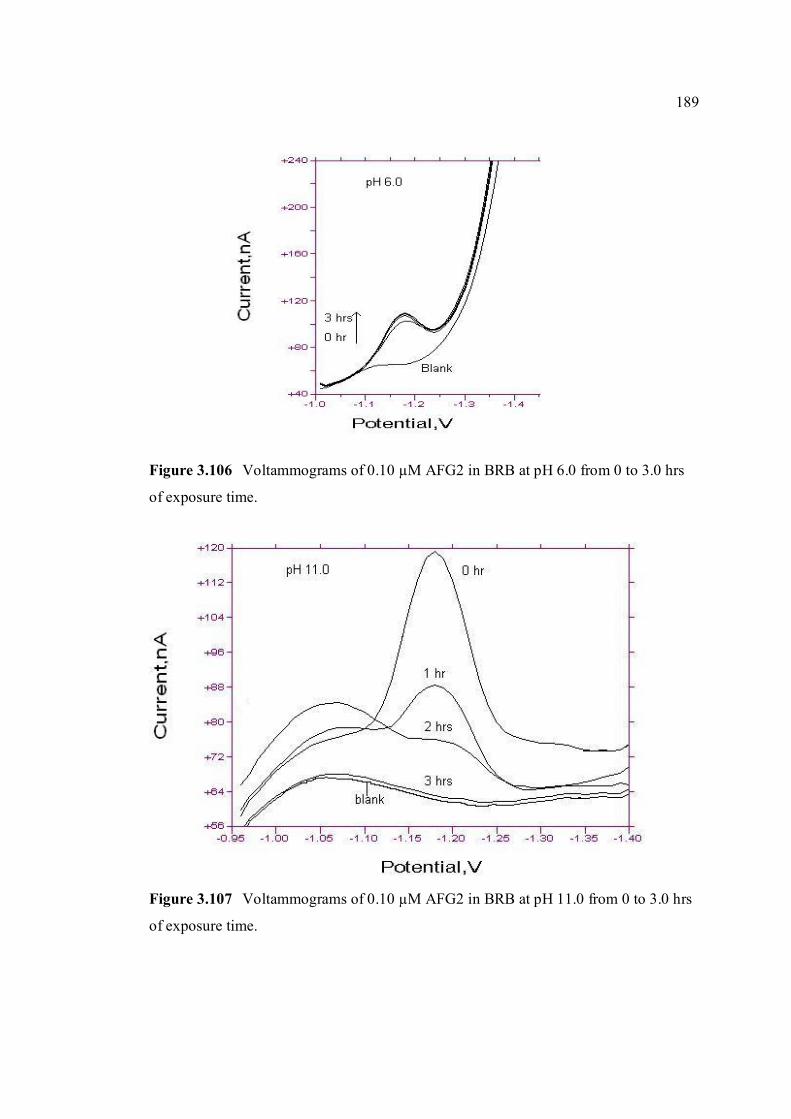
189
Figure 3.106 Voltammograms of 0.10 µM AFG2 in BRB at pH 6.0 from 0 to 3.0 hrs
of exposure time.
Figure 3.107 Voltammograms of 0.10 µM AFG2 in BRB at pH 11.0 from 0 to 3.0 hrs
of exposure time.
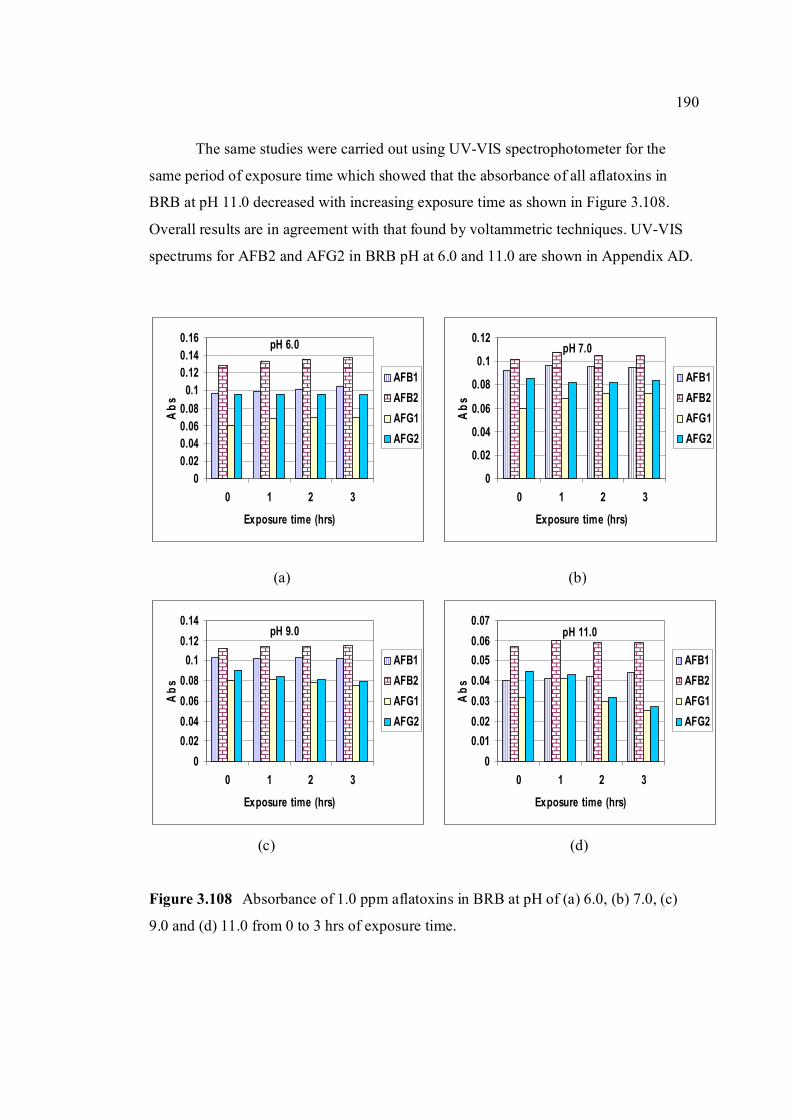
190
00.020.040.060.08
0.10.120.140.16
0 1 2 3
Exposure time (hrs)
Abs
AFB1AFB2AFG1AFG2
pH 6.0
0
0.02
0.04
0.06
0.08
0.1
0.12
0 1 2 3
Exposure time (hrs)
Abs
AFB1AFB2AFG1AFG2
pH 7.0
00.020.040.060.08
0.10.120.14
0 1 2 3
Exposure time (hrs)
Abs
AFB1AFB2AFG1AFG2
pH 9.0
00.010.020.030.040.050.060.07
0 1 2 3
Exposure time (hrs)
Abs
AFB1AFB2AFG1AFG2
pH 11.0
The same studies were carried out using UV-VIS spectrophotometer for the
same period of exposure time which showed that the absorbance of all aflatoxins in
BRB at pH 11.0 decreased with increasing exposure time as shown in Figure 3.108.
Overall results are in agreement with that found by voltammetric techniques. UV-VIS
spectrums for AFB2 and AFG2 in BRB pH at 6.0 and 11.0 are shown in Appendix AD.
(a) (b)
(c) (d)
Figure 3.108 Absorbance of 1.0 ppm aflatoxins in BRB at pH of (a) 6.0, (b) 7.0, (c)
9.0 and (d) 11.0 from 0 to 3 hrs of exposure time.
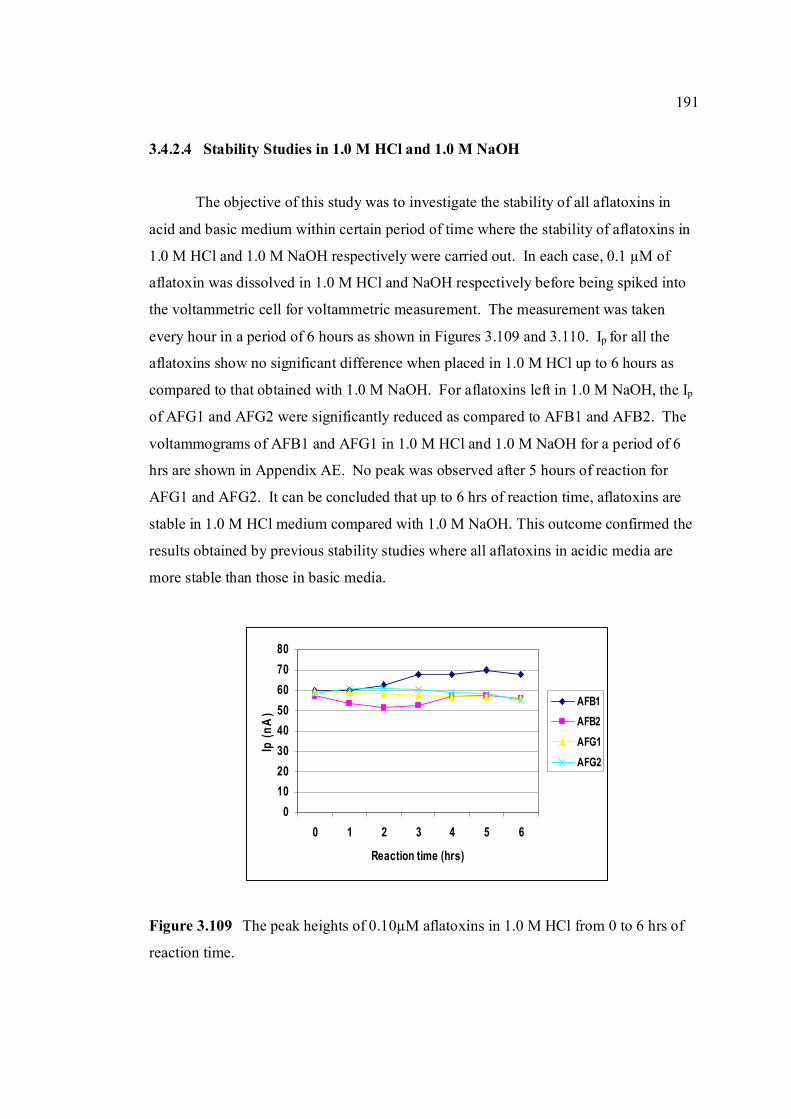
191
01020304050607080
0 1 2 3 4 5 6
Reaction time (hrs)
Ip (n
A)
AFB1AFB2
AFG1
AFG2
3.4.2.4 Stability Studies in 1.0 M HCl and 1.0 M NaOH
The objective of this study was to investigate the stability of all aflatoxins in
acid and basic medium within certain period of time where the stability of aflatoxins in
1.0 M HCl and 1.0 M NaOH respectively were carried out. In each case, 0.1 µM of
aflatoxin was dissolved in 1.0 M HCl and NaOH respectively before being spiked into
the voltammetric cell for voltammetric measurement. The measurement was taken
every hour in a period of 6 hours as shown in Figures 3.109 and 3.110. Ip for all the
aflatoxins show no significant difference when placed in 1.0 M HCl up to 6 hours as
compared to that obtained with 1.0 M NaOH. For aflatoxins left in 1.0 M NaOH, the Ip
of AFG1 and AFG2 were significantly reduced as compared to AFB1 and AFB2. The
voltammograms of AFB1 and AFG1 in 1.0 M HCl and 1.0 M NaOH for a period of 6
hrs are shown in Appendix AE. No peak was observed after 5 hours of reaction for
AFG1 and AFG2. It can be concluded that up to 6 hrs of reaction time, aflatoxins are
stable in 1.0 M HCl medium compared with 1.0 M NaOH. This outcome confirmed the
results obtained by previous stability studies where all aflatoxins in acidic media are
more stable than those in basic media.
Figure 3.109 The peak heights of 0.10µM aflatoxins in 1.0 M HCl from 0 to 6 hrs of
reaction time.
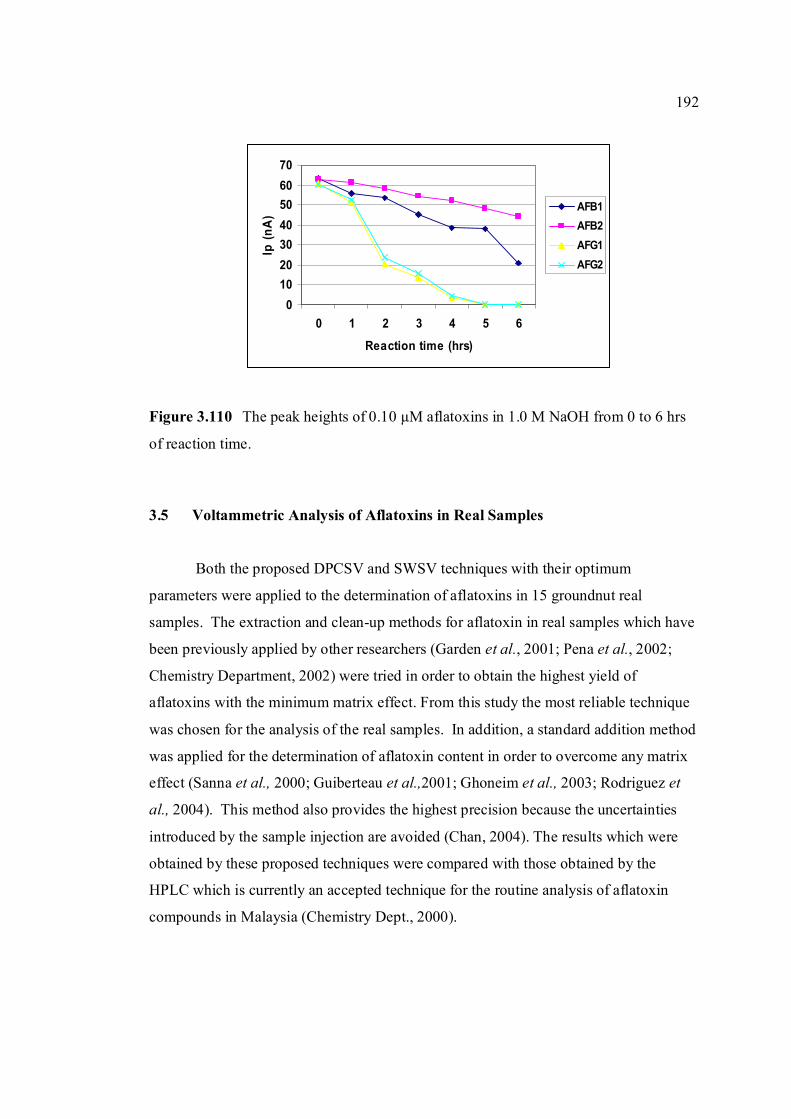
192
010203040506070
0 1 2 3 4 5 6
Reaction time (hrs)
Ip (n
A)
AFB1AFB2AFG1AFG2
Figure 3.110 The peak heights of 0.10 µM aflatoxins in 1.0 M NaOH from 0 to 6 hrs
of reaction time.
3.5 Voltammetric Analysis of Aflatoxins in Real Samples
Both the proposed DPCSV and SWSV techniques with their optimum
parameters were applied to the determination of aflatoxins in 15 groundnut real
samples. The extraction and clean-up methods for aflatoxin in real samples which have
been previously applied by other researchers (Garden et al., 2001; Pena et al., 2002;
Chemistry Department, 2002) were tried in order to obtain the highest yield of
aflatoxins with the minimum matrix effect. From this study the most reliable technique
was chosen for the analysis of the real samples. In addition, a standard addition method
was applied for the determination of aflatoxin content in order to overcome any matrix
effect (Sanna et al., 2000; Guiberteau et al.,2001; Ghoneim et al., 2003; Rodriguez et
al., 2004). This method also provides the highest precision because the uncertainties
introduced by the sample injection are avoided (Chan, 2004). The results which were
obtained by these proposed techniques were compared with those obtained by the
HPLC which is currently an accepted technique for the routine analysis of aflatoxin
compounds in Malaysia (Chemistry Dept., 2000).
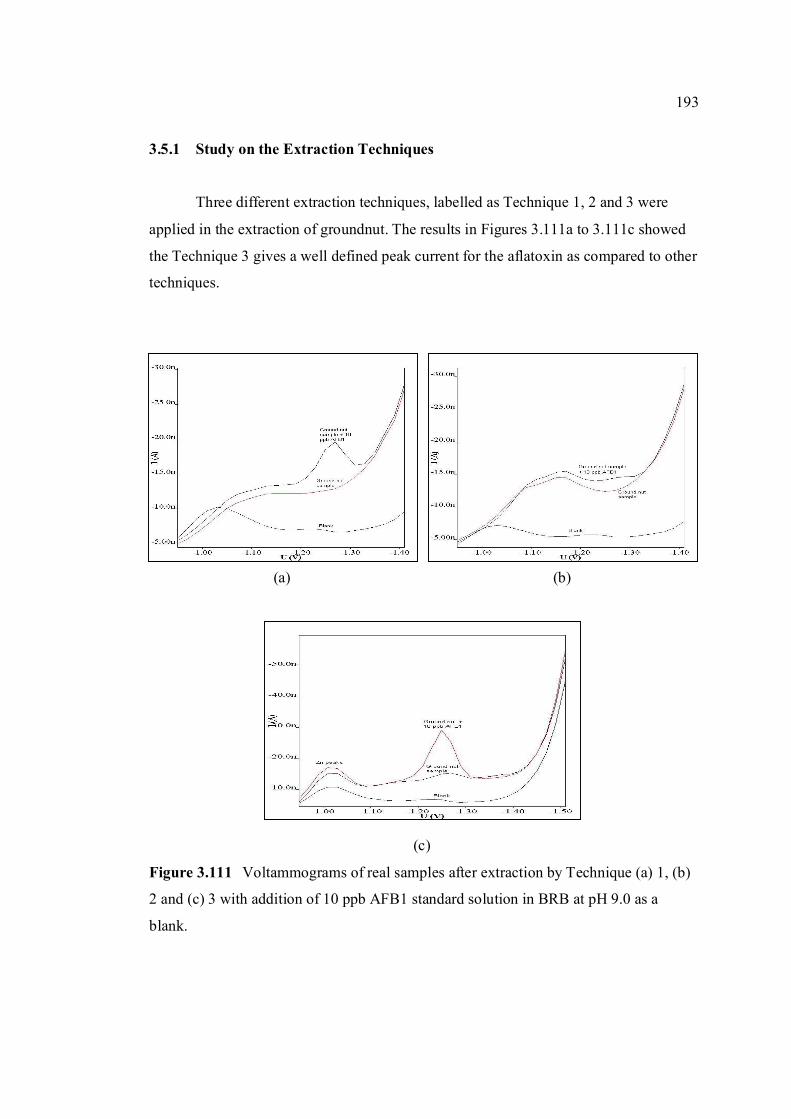
193
3.5.1 Study on the Extraction Techniques
Three different extraction techniques, labelled as Technique 1, 2 and 3 were
applied in the extraction of groundnut. The results in Figures 3.111a to 3.111c showed
the Technique 3 gives a well defined peak current for the aflatoxin as compared to other
techniques.
(a) (b)
(c)
Figure 3.111 Voltammograms of real samples after extraction by Technique (a) 1, (b)
2 and (c) 3 with addition of 10 ppb AFB1 standard solution in BRB at pH 9.0 as a
blank.
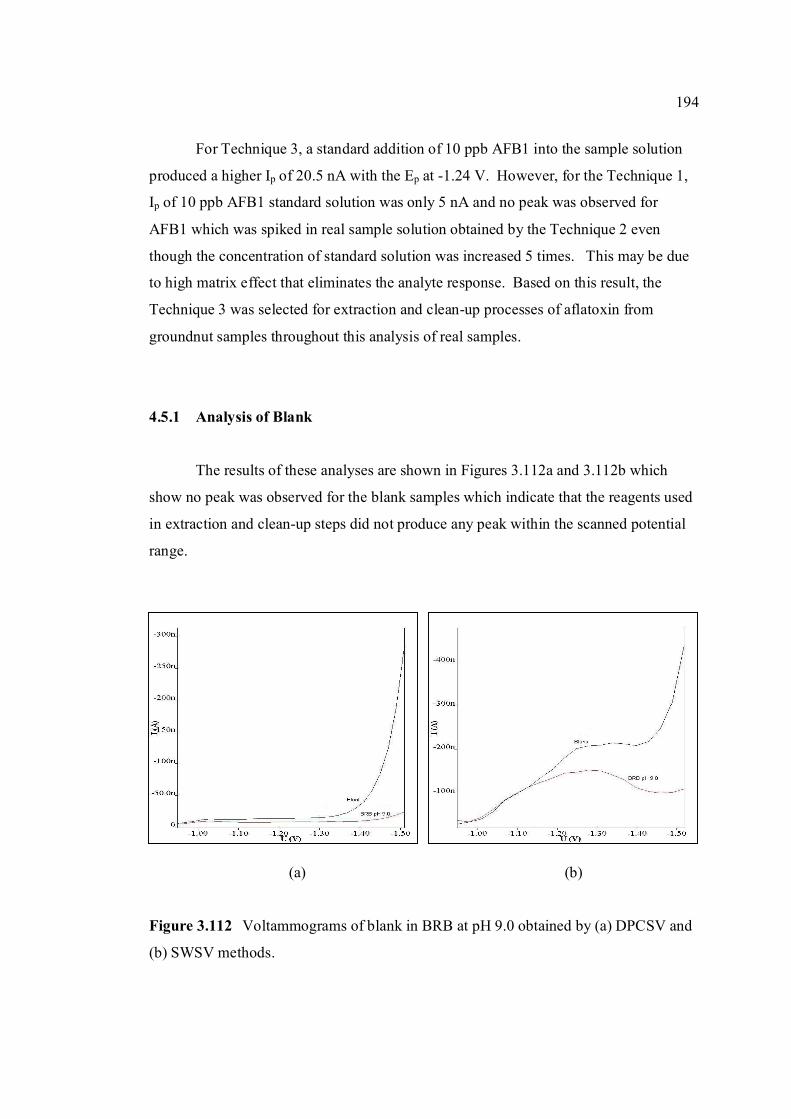
194
For Technique 3, a standard addition of 10 ppb AFB1 into the sample solution
produced a higher Ip of 20.5 nA with the Ep at -1.24 V. However, for the Technique 1,
Ip of 10 ppb AFB1 standard solution was only 5 nA and no peak was observed for
AFB1 which was spiked in real sample solution obtained by the Technique 2 even
though the concentration of standard solution was increased 5 times. This may be due
to high matrix effect that eliminates the analyte response. Based on this result, the
Technique 3 was selected for extraction and clean-up processes of aflatoxin from
groundnut samples throughout this analysis of real samples.
4.5.1 Analysis of Blank
The results of these analyses are shown in Figures 3.112a and 3.112b which
show no peak was observed for the blank samples which indicate that the reagents used
in extraction and clean-up steps did not produce any peak within the scanned potential
range.
(a) (b)
Figure 3.112 Voltammograms of blank in BRB at pH 9.0 obtained by (a) DPCSV and
(b) SWSV methods.
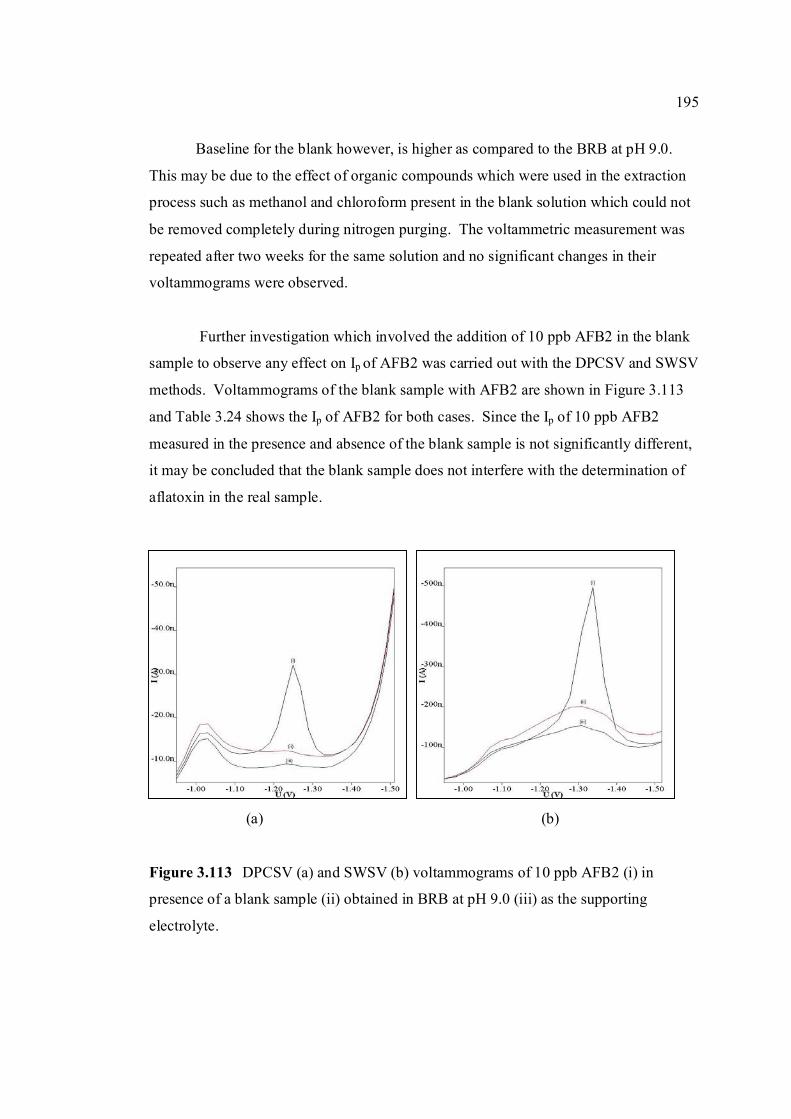
195
Baseline for the blank however, is higher as compared to the BRB at pH 9.0.
This may be due to the effect of organic compounds which were used in the extraction
process such as methanol and chloroform present in the blank solution which could not
be removed completely during nitrogen purging. The voltammetric measurement was
repeated after two weeks for the same solution and no significant changes in their
voltammograms were observed.
Further investigation which involved the addition of 10 ppb AFB2 in the blank
sample to observe any effect on Ip of AFB2 was carried out with the DPCSV and SWSV
methods. Voltammograms of the blank sample with AFB2 are shown in Figure 3.113
and Table 3.24 shows the Ip of AFB2 for both cases. Since the Ip of 10 ppb AFB2
measured in the presence and absence of the blank sample is not significantly different,
it may be concluded that the blank sample does not interfere with the determination of
aflatoxin in the real sample.
(a) (b)
Figure 3.113 DPCSV (a) and SWSV (b) voltammograms of 10 ppb AFB2 (i) in
presence of a blank sample (ii) obtained in BRB at pH 9.0 (iii) as the supporting
electrolyte.
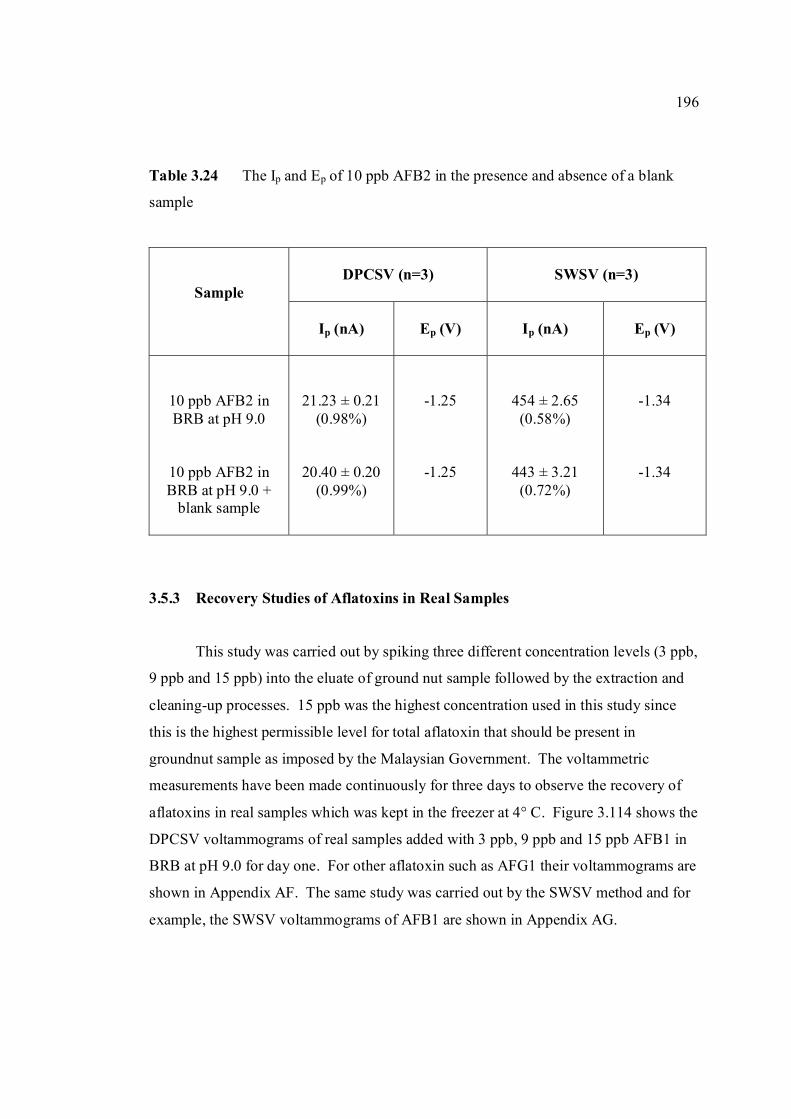
196
Table 3.24 The Ip and Ep of 10 ppb AFB2 in the presence and absence of a blank
sample
DPCSV (n=3)
SWSV (n=3)
Sample
Ip (nA)
Ep (V)
Ip (nA)
Ep (V)
10 ppb AFB2 in BRB at pH 9.0
10 ppb AFB2 in BRB at pH 9.0 +
blank sample
21.23 ± 0.21 (0.98%)
20.40 ± 0.20 (0.99%)
-1.25
-1.25
454 ± 2.65 (0.58%)
443 ± 3.21 (0.72%)
-1.34
-1.34
3.5.3 Recovery Studies of Aflatoxins in Real Samples
This study was carried out by spiking three different concentration levels (3 ppb,
9 ppb and 15 ppb) into the eluate of ground nut sample followed by the extraction and
cleaning-up processes. 15 ppb was the highest concentration used in this study since
this is the highest permissible level for total aflatoxin that should be present in
groundnut sample as imposed by the Malaysian Government. The voltammetric
measurements have been made continuously for three days to observe the recovery of
aflatoxins in real samples which was kept in the freezer at 4° C. Figure 3.114 shows the
DPCSV voltammograms of real samples added with 3 ppb, 9 ppb and 15 ppb AFB1 in
BRB at pH 9.0 for day one. For other aflatoxin such as AFG1 their voltammograms are
shown in Appendix AF. The same study was carried out by the SWSV method and for
example, the SWSV voltammograms of AFB1 are shown in Appendix AG.
197
(i) (ii)
(iii) Figure 3.114 DPCSV voltammograms of real sample (b) added with 3 ppb (i), 9 ppb
(ii) and 15 ppb AFB1 (iii) obtained in BRB at pH 9.0 (a) as the blank on the first day of
measurement.
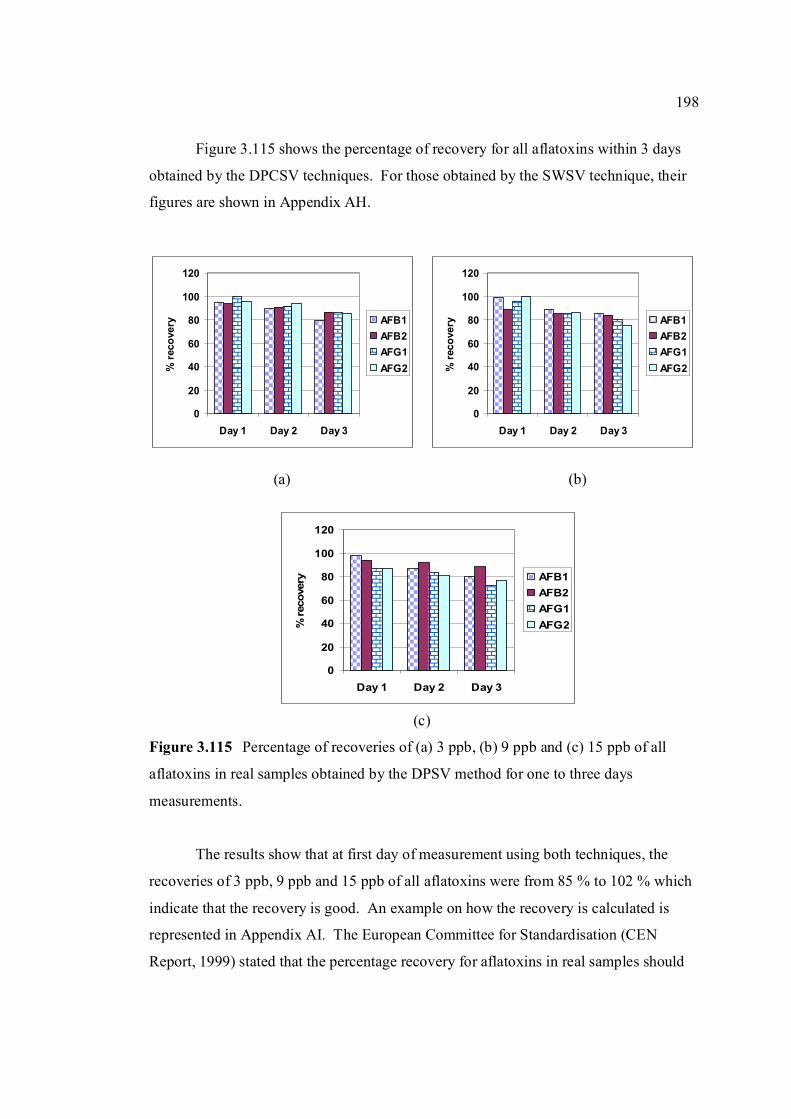
198
0
20
40
60
80
100
120
Day 1 Day 2 Day 3
% re
cove
ry AFB1AFB2AFG1AFG2
0
20
40
60
80
100
120
Day 1 Day 2 Day 3
% re
cove
ry AFB1AFB2AFG1AFG2
0
20
40
60
80
100
120
Day 1 Day 2 Day 3
% re
cove
ry AFB1AFB2AFG1AFG2
Figure 3.115 shows the percentage of recovery for all aflatoxins within 3 days
obtained by the DPCSV techniques. For those obtained by the SWSV technique, their
figures are shown in Appendix AH.
(a) (b)
(c)
Figure 3.115 Percentage of recoveries of (a) 3 ppb, (b) 9 ppb and (c) 15 ppb of all
aflatoxins in real samples obtained by the DPSV method for one to three days
measurements.
The results show that at first day of measurement using both techniques, the
recoveries of 3 ppb, 9 ppb and 15 ppb of all aflatoxins were from 85 % to 102 % which
indicate that the recovery is good. An example on how the recovery is calculated is
represented in Appendix AI. The European Committee for Standardisation (CEN
Report, 1999) stated that the percentage recovery for aflatoxins in real samples should
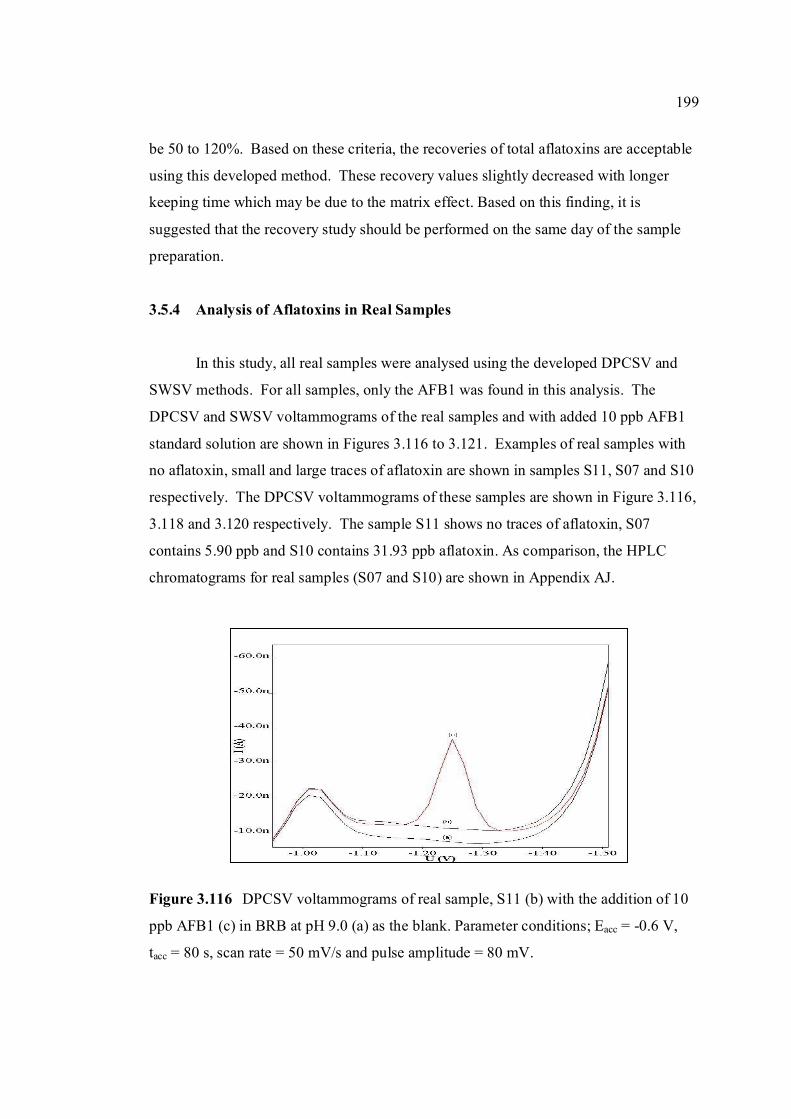
199
be 50 to 120%. Based on these criteria, the recoveries of total aflatoxins are acceptable
using this developed method. These recovery values slightly decreased with longer
keeping time which may be due to the matrix effect. Based on this finding, it is
suggested that the recovery study should be performed on the same day of the sample
preparation.
3.5.4 Analysis of Aflatoxins in Real Samples
In this study, all real samples were analysed using the developed DPCSV and
SWSV methods. For all samples, only the AFB1 was found in this analysis. The
DPCSV and SWSV voltammograms of the real samples and with added 10 ppb AFB1
standard solution are shown in Figures 3.116 to 3.121. Examples of real samples with
no aflatoxin, small and large traces of aflatoxin are shown in samples S11, S07 and S10
respectively. The DPCSV voltammograms of these samples are shown in Figure 3.116,
3.118 and 3.120 respectively. The sample S11 shows no traces of aflatoxin, S07
contains 5.90 ppb and S10 contains 31.93 ppb aflatoxin. As comparison, the HPLC
chromatograms for real samples (S07 and S10) are shown in Appendix AJ.
Figure 3.116 DPCSV voltammograms of real sample, S11 (b) with the addition of 10
ppb AFB1 (c) in BRB at pH 9.0 (a) as the blank. Parameter conditions; Eacc = -0.6 V,
tacc = 80 s, scan rate = 50 mV/s and pulse amplitude = 80 mV.
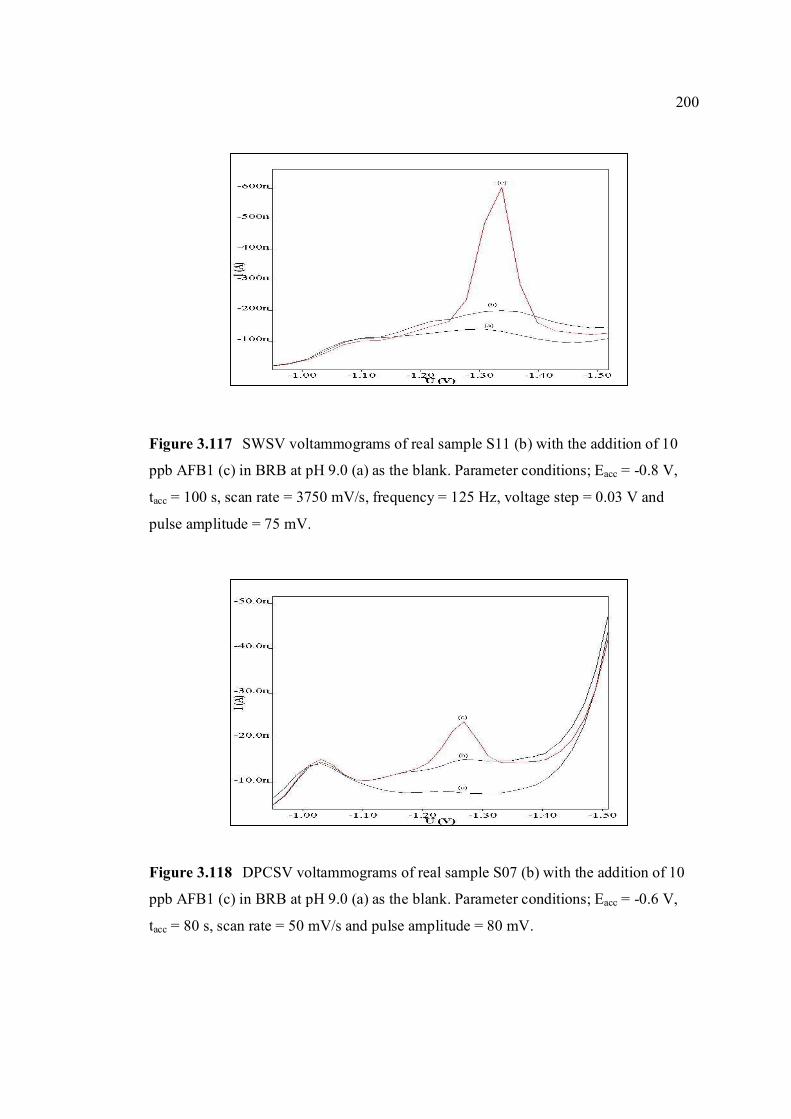
200
Figure 3.117 SWSV voltammograms of real sample S11 (b) with the addition of 10
ppb AFB1 (c) in BRB at pH 9.0 (a) as the blank. Parameter conditions; Eacc = -0.8 V,
tacc = 100 s, scan rate = 3750 mV/s, frequency = 125 Hz, voltage step = 0.03 V and
pulse amplitude = 75 mV.
Figure 3.118 DPCSV voltammograms of real sample S07 (b) with the addition of 10
ppb AFB1 (c) in BRB at pH 9.0 (a) as the blank. Parameter conditions; Eacc = -0.6 V,
tacc = 80 s, scan rate = 50 mV/s and pulse amplitude = 80 mV.
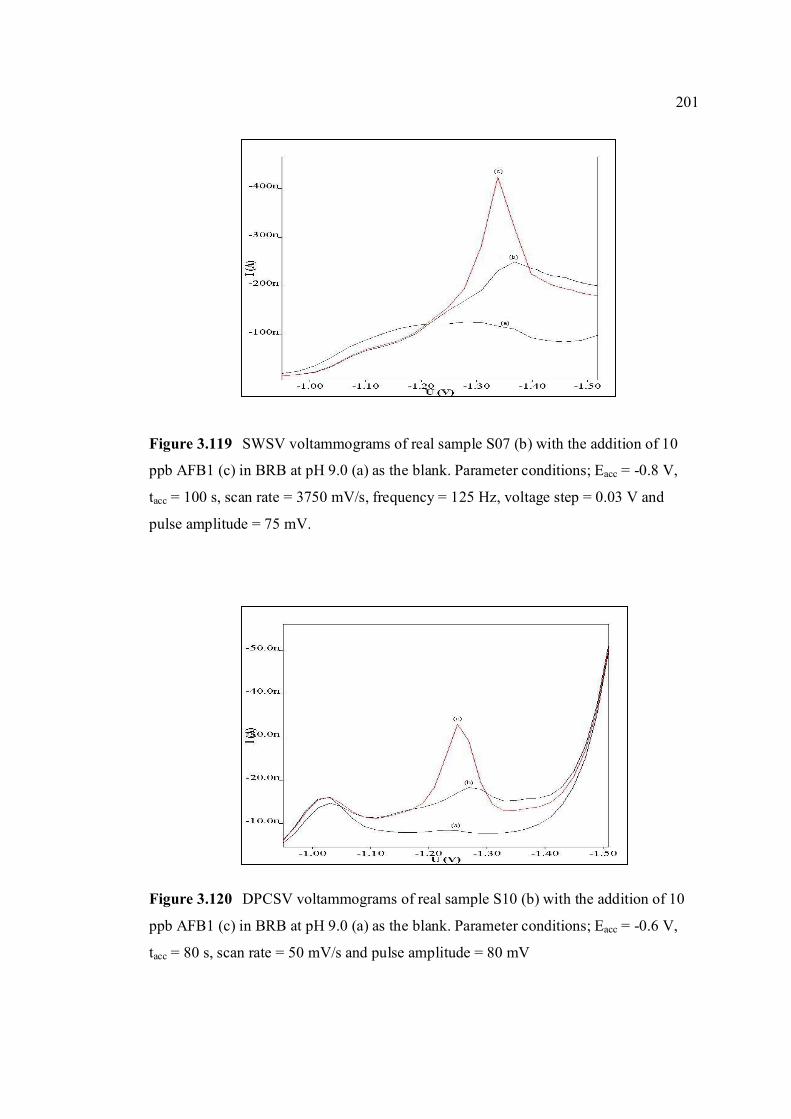
201
Figure 3.119 SWSV voltammograms of real sample S07 (b) with the addition of 10
ppb AFB1 (c) in BRB at pH 9.0 (a) as the blank. Parameter conditions; Eacc = -0.8 V,
tacc = 100 s, scan rate = 3750 mV/s, frequency = 125 Hz, voltage step = 0.03 V and
pulse amplitude = 75 mV.
Figure 3.120 DPCSV voltammograms of real sample S10 (b) with the addition of 10
ppb AFB1 (c) in BRB at pH 9.0 (a) as the blank. Parameter conditions; Eacc = -0.6 V,
tacc = 80 s, scan rate = 50 mV/s and pulse amplitude = 80 mV
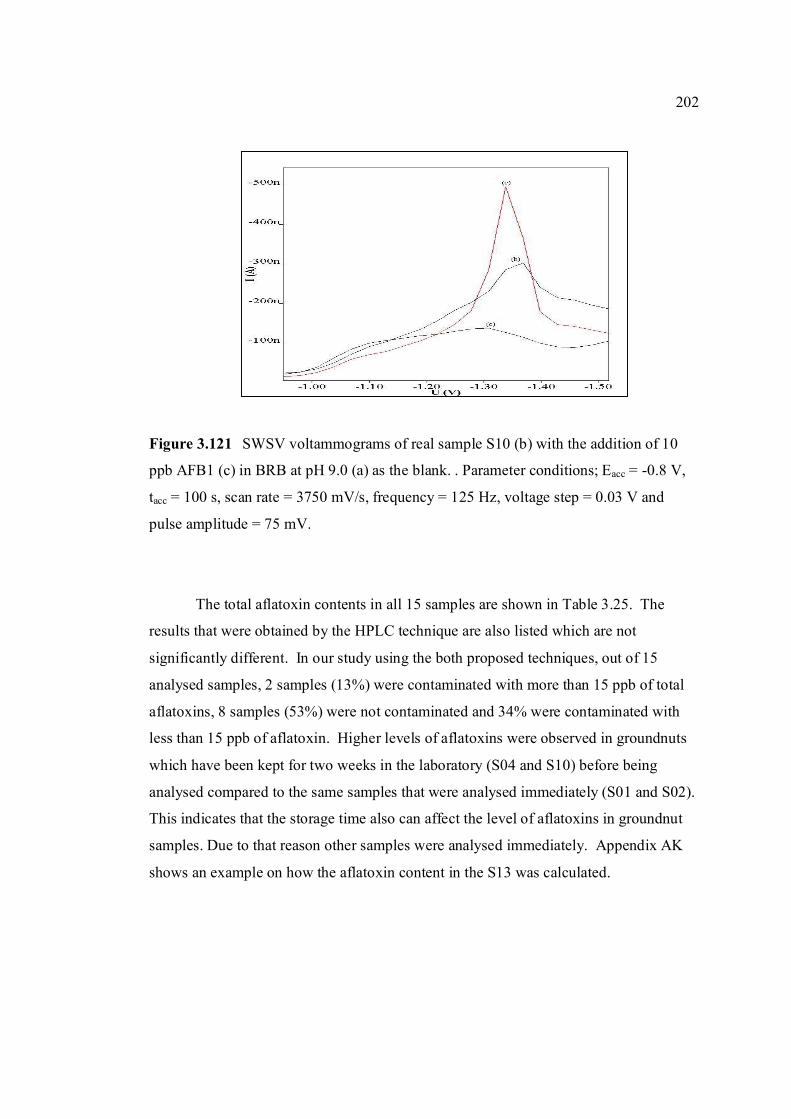
202
Figure 3.121 SWSV voltammograms of real sample S10 (b) with the addition of 10
ppb AFB1 (c) in BRB at pH 9.0 (a) as the blank. . Parameter conditions; Eacc = -0.8 V,
tacc = 100 s, scan rate = 3750 mV/s, frequency = 125 Hz, voltage step = 0.03 V and
pulse amplitude = 75 mV.
The total aflatoxin contents in all 15 samples are shown in Table 3.25. The
results that were obtained by the HPLC technique are also listed which are not
significantly different. In our study using the both proposed techniques, out of 15
analysed samples, 2 samples (13%) were contaminated with more than 15 ppb of total
aflatoxins, 8 samples (53%) were not contaminated and 34% were contaminated with
less than 15 ppb of aflatoxin. Higher levels of aflatoxins were observed in groundnuts
which have been kept for two weeks in the laboratory (S04 and S10) before being
analysed compared to the same samples that were analysed immediately (S01 and S02).
This indicates that the storage time also can affect the level of aflatoxins in groundnut
samples. Due to that reason other samples were analysed immediately. Appendix AK
shows an example on how the aflatoxin content in the S13 was calculated.
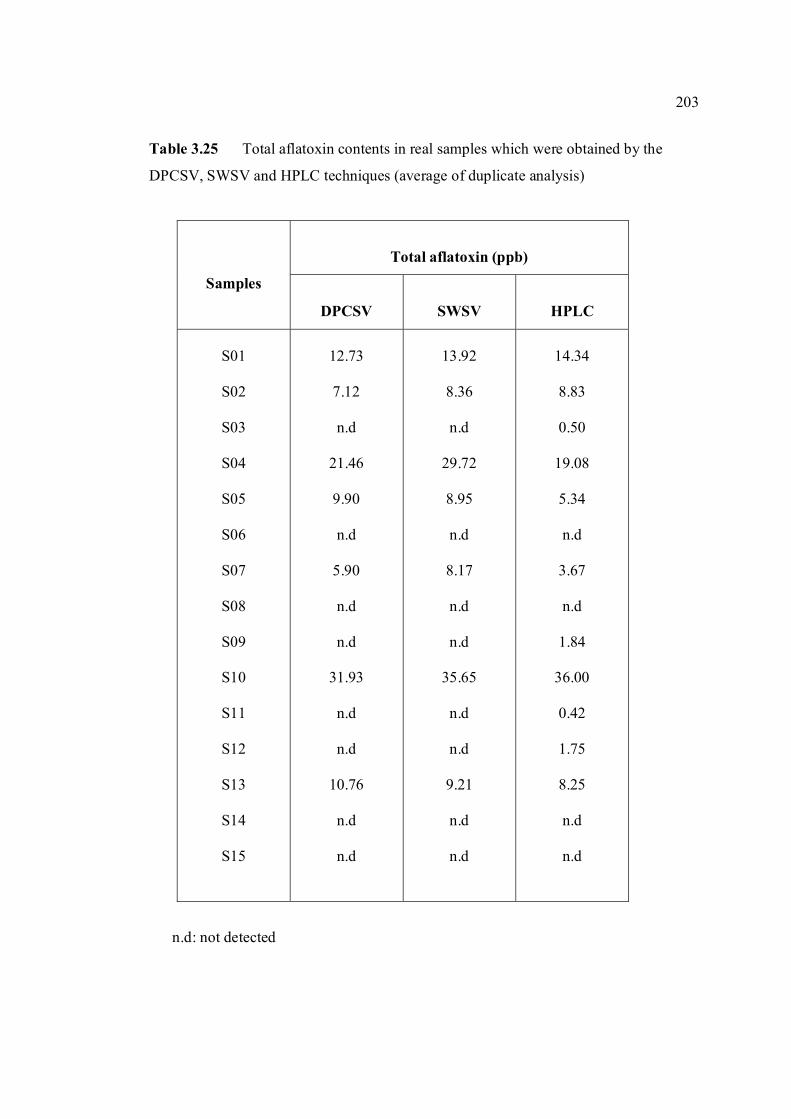
203
Table 3.25 Total aflatoxin contents in real samples which were obtained by the
DPCSV, SWSV and HPLC techniques (average of duplicate analysis)
Total aflatoxin (ppb)
Samples
DPCSV
SWSV
HPLC
S01
S02
S03
S04
S05
S06
S07
S08
S09
S10
S11
S12
S13
S14
S15
12.73
7.12
n.d
21.46
9.90
n.d
5.90
n.d
n.d
31.93
n.d
n.d
10.76
n.d
n.d
13.92
8.36
n.d
29.72
8.95
n.d
8.17
n.d
n.d
35.65
n.d
n.d
9.21
n.d
n.d
14.34
8.83
0.50
19.08
5.34
n.d
3.67
n.d
1.84
36.00
0.42
1.75
8.25
n.d
n.d
n.d: not detected
204
CHAPTER IV
CONCLUSIONS AND RECOMMENDATIONS
4.1 Conclusions
The voltammetry technique which is one of the electrochemical methods was
successfully studied through various methods such as cyclic voltammetry (CV),
differential pulse cathodic stripping voltammetry (DPCSV) and square-wave stripping
voltammetry (SWSV) for determination of aflatoxin compounds. The objectives of this
research were to study the electroanalytical properties of aflatoxins and developing
voltammetric methods for the determination of these compounds in food samples such
as groundnuts. This study met these objectives in terms of the determination of
electroanalytical properties of aflatoxins and has also proven the hypothesis regarding
these properties for the studied compounds such as the compounds that are actively
adsorbed on mercury electrode and undergone totally irreversible reduction reaction.
This study was also successful in developing the DPCSV and SWSV methods for
qualitative and quantitive determinations of aflatoxins in standard solution and real
groundnut samples. The study also proved that aflatoxins which are organic compounds
can be determined by voltammetric techniques with convenient quantitation down to
10-9 M (or ppt) concentration level
The voltammetric studies of aflatoxins reveals that the proposed DPCSV and
SWSV methods are free from inteference effect by studied metal ions and organic
compounds. Both techniques are successful in the determination of aflatoxin as
205
individual rather than in mixed condition. An attempt to analyse them simultaneously
was not possible due to the fact that the location of the peak potentials of all aflatoxins
are very close each other. Harvey (2000) suggested that to get separate peaks for mixed
analytes, the difference of their respective peak potential should be more than 0.08 V.
All studied aflatoxins (AFB1, AFB2, AFG1 and AFG2) undergo reduction
reactions at the mercury electrode with totally irreversible reaction in BRB at pH 9.0.
The respective DPCSV and SWSV peak currents increase linearly with increasing
concentration for all aflatoxins in the range of 0.02 to 0.32 µM and from 0.01 to 0.125
µM. The peak potentials for all aflatoxins in this solution are located within -1.20 V
and they are shifted towards the less negative direction with increasing concentration of
aflatoxins. The aflatoxins that are adsorbed on the mercury electrode produce higher
peak current with longer accumulation time until a limit is reached due to the saturation
of the electrode surface.
The DPCSV technique that was successfully developed for the determination of
aflatoxins was one which gives a detection limit of around 2.0 ppb for all aflatoxins.
This is an acceptable LOD for the determination of aflatoxin in groundnut samples.
The optimum parameter conditions for the DPCSV method of the aflatoxins are Ei = -
1.0 V (except for AFG1 = -0.95 V), Ef = -1.4 V, Eacc = -0.6 V, tacc = 80 s, scan rate = 50
mV/s and pulse amplitude = 80 mV/s. A SWSV technique was also successfully
developed for the analysis of aflatoxins which gives a lower LOD of around 0.5 ppb.
The optimum parameter conditions for the SWSV for all aflatoxins are Ei = -1.0 V
(except for AFG1 = -0.95 V), Ef = -1.4 V, Eacc = -0.8 V, tacc = 100 s, scan rate = 3750
mV/s, frequency = 125 Hz, voltage step = 0.03 V and pulse amplitude = 50 mV/s. From
the statistical analysis of the both proposed techniques, the methods are considered
sensitive, accurate, precise, rugged, robust and provide shorter analysis time.
From the stability studies of aflatoxins, it can be concluded that aflatoxins stock
solution in acetonitrile: benzene (98%) should be kept in the dark and cool conditions
for longer shelf life. For aflatoxin standard solutions prepared in BRB at pH 9.0 and
206
stored in the same conditions as for the stock solutions, AFG1 and AFG2 could be used
up to 2 months while AFB1 and AFB2 up to 3 months. All afaltoxins are stable in 1.0
M HCl within 6 hours compared to that in 1.0 M NaOH.
Both proposed technique are successfully developed and applied in the
determination of aflatoxins in groundnuts. The results that were obtained by both
techniques are not significantly different than those obtained by the HPLC. As
compared to the latter technique, the proposed techniques gave an advantage in terms of
analysis time where the voltammetric analysis need less than 2 minutes or even less
than 30 s for SWSV technique to complete the analysis of one sample while the HPLC
takes approximate 15 min. However, the HPLC is able to separate and analyse all
aflatoxins simultaneously compared to the proposed techniques.
Finally, it can be concluded that the proposed DPCSV and SWSV methods
which are sensitive, accurate, precise, fast, rugged, robust and low cost methods were
successfully developed for the determination of aflatoxins in groundnuts samples. Both
methods have a great potential as an alternative method for this application in the
future.
4.2 Recommendations
In this study, the mercury electrode was applied throughout the experiment. Due
to the oxidation of mercury taking place at the oxidation potential of more than 0 V to
form mercury (I), the study of aflatoxins were restricted in the range of 0 to -1.5 V.
Further study is suggested by using alternative electrodes such as carbon paste, carbon
paste with chemical modified electrode, gold, platinum or glassy carbon electrode
which has a larger potential window compared to the mercury electrode. Another
working electrode such as bismuth film electrode (BFE) can be further investigated for
this analysis due to its performance that has been proven to compare favorably to or
even surpass to that of mercury electrode (Hutton et al., 2005; Economou, 2005).
207
A study on reagents that can complex with aflatoxins is suggested in order to
make the simultaneous determination of aflatoxins in real sample possible. The use of
surface active reagents such as alginic acid, Triton X-100 or alkaline phosphatase that
can be adsorbed on mercury electrode (Wang, 2000) and inhibit one of the aflatoxins
can be studied so as to observe their effect on the peak current of aflatoxins either as in
standard solution or simulation samples.
A study of the effect of storage condition and the storing time duration of
groundnut samples to the level of aflatoxins using the DPCSV and SWSV techniques is
suggested. The results from this study can provide valuable information on good
practice in storing groundnuts at home and for obtaining a data base regarding the
storing time of groundnuts to avoid any contamination by aflatoxins. The stability of
aflatoxins which are treated at various temperatures and exposure time to ultra violet
(UV) light is suggested. The reason for this study is to determine the degree of
temperature and exposure time to UV light that can totally diminish the aflatoxins.
Finally, in this study, the DPCSV and SWSV techniques were applied in
analysed of groundnut samples but for the future works, both techniques can be
explored for analysis of aflatoxins in other types of samples such as rice, cooking oil,
cigarettes tobacco, local and imported meats, bread, fish and vegetables due to higher
consumption by the Malaysian population. Some reports have been published regarding
these analyses (Aycicek et al., 2005; Edinboro and Karnes, 2005; Shenasi and Candlish,
2002; Arrus et al., 2004; AbdulKadar et al., 2004; Erdogan, 2004; Gowda, 2004) but
unfortunately none of them are related to the local environment in Malaysia except a
paper by Ali et al. (2005) which focused on the analysis of aflatoxins in commercial
traditional herbal medicines used in Malaysia and Indonesia.
208
REFERENCES
Abbas, A.N. and Mostafa, G.A.E. (2003). New Triiodomercurate-Modified Carbon
Paste Electrode for the Potentiometric Determination of Mercury. Anal. Chim.
Acta. 478:329-335.
Abbaspour, A. and Moosavi, S.M.M.(2002). Chemically Modified Carbon Paste
Electrode for Determination of Copper (II) by Potentiometric Method. Talanta.
52: 91-96.
Abdine, H. and Belal, F. (2002). Polarographic Behaviour and Determination of
Acrivastine Capsules and Human Urine. Talanta. 56: 97-104
Abdulkadar, A.H.W., Abdulla, A. A. A., Afrah M. A. and Jassim, H.A. (2004).
Mycotoxins in Food Products Available in Qatar. Food Control. 15: 543-548.
Aboul-Eneim, H. Y., Stefan, R-I. and Baiulescu, G-E. (2000). Quality and Realibility in
Analytical Chemistry. New York: CRC Press.
Abu Zuhri, A. Z., Zatar, N. A., Shubeitah, R.M. and Arafat, H.H. (2000). Voltammetric
and Spectrophotometric Determination of Nizatidine in Pharmaceutical
Formulations. Mikrochim. Acta.134:153-160.
Ahmad, M. (1993). Pengenalan Statistik Dalam Kimia Analisis. Kuala Lumpur: Dewan
Bahasa Dan Pustaka.
Akiyama, H., Goda, Y. Tanaka. T, and Toyoda, M. (2001). Determination of Aflatoxins
B1, B2, G1 and G2 in Spices Using a Multifunctional Column Clean-up, J. of
Chromatography A. 932: 153-157.
209
Alborzi, S., Pourabbas, B., Rashidi, M. and Astaneh, B. (2005). Aflatoxin M1
Contaminated in Pasteurised Milk in Shiraz (south of Iran). Food Control. Article
in press.
Al-Ghamdi, A.H., Al-shadokhy, M.A. and Al-watan, A.A. (2004). Electrochemical
Determination of Cephalothin Antibiotic by Adsorptive Stripping Voltammetric
Technique. J.Pharm. Bioanal. Anal. 35(5):1001-1009.
Ali, N., Hashim, N.H., Saad, B., Safan, K., Nakajima, M. and Yoshizawa, T. (2005).
Evaluation of a Method to Determine the Natural Occurence of Aflatoxins in
Commercial Traditional Herbal Medicines From Malaysia and Indonesia. Food
and Chemical Toxicology. 43(12): 1763-1772.
Almeida, l.E., Castilho, M., Maza, L.H. and Tabak, M.(1998). Voltammetric and
Spectroscopic Studies of the Oxidation of the Anti-oxidant Drug Dipyridamole in
Acetonitrile and Ethanol. Anal. Chim. Acta. 375: 223-231.
Ammida, N.H.S., Micheli, L. and Palleschi, G. (2004). Electrochemical Immunosensor
for Determination of Aflatoxin B1 inBarley. Anal. Chim. Acta. 520: 159-164.
Andrieux, C.P., Hapiot, P. and Saveant, J.M.(1990). Ultramicroelectroded for Fast
Electrochemical Kinetics. Electroanalysis. 2:183-193.
Androu, V.G., Nikolelis, D. and Tarus, B. (1997). Electrochemistry Investigation of
Transduction of Interactions of Alfatoixin M1 With Bilayer Lipid Membranes
(BLMs), Anal. Chim. Acta. 350:121-127.
Aoki, K. (1990). Theory of Stationary Current Potential Curves at Interdigitated
Microarray Electrodes for Quasi-reversible and Totally Irreversible Electrode
Reactions. Electroanalysis. 2: 229-233.
210
Arancibia, V., Alarcon, L. and Sefura, R. (2004). Supercritical Fluid Extraction of
Cadmium as Cd-Oxime Complex From Human Hair; Determination of Square-
Wave Anodic or Adsorptive Stripping Voltammetry. Anal. Chim. Acta. 502:
189-194.
Arranz, A., Dolara, I., de Betono, S.F., Moreda, J. M., Cid, A. and Arranz, J.F.
(1999). Electroanalytical Study and Square Wave Voltammetric Techniques for
the Determination of β-blocker Timolol at the Mercury Electrode. Anal. Chim
.Acta. 389: 225-232.
Arranz, P., Arranz, A., Moreda, J. M., Cid, A. and Arranz, J.F. (2003). Stripping
Voltammetric and Polarographic Techniques for Determination of Anti-fungal
Ketoconazole on the Mercury Electrode. J. Pharm. Biomed. Anal. 33: 589-596.
Arrigan, D. W. M. (1994). Voltammetric Determination of Trace Metals and
Organics After Accumulation at Modified Electrodes. Analyst. 119: 1953-1966.
Arrus, K., Blank, G., Abramson, D. Clear, R. and Holley, R. A. (2004). Aflatoxins
Production by Aspergillus flavous in Brazil Nuts. J of Stored Products
Research. 41(5): 513-527.
Aslanoglu, M. and Ayne, G. (2004). Voltammetric Studies of the Interaction of
Quinacrine With DNA. Anal. Bioanal.Chem. 380: 658-663.
Aycicek, H., Aksoy, A. and Saygi, S.(2005). Determination of Aflatoxin Levels in
Some Dairy and Food Products Which Consumed in Ankara, Turkey. Food
Control. 16: 263-266.
Aziz, N.H. and Moussa, L.A., (2002). Influence of Gamma-radiation on Mycotoxin
Producing Moulds and Mycotoxins in Fruits. Food Control. 13: 281-288.
211
Aziz, N.H., Youssef, Y.A., El-Fouly, M.Z. and Moussa, L.A., (1998).
Contamination of Some Common Medicinal plant Samples and Spices by Fungi
and Their Mycotoxins. Bot. Bull. Acad. Sin. 39: 279-285.
Badea, M., Micheli, L., Messia, M. C., Candigliota, T., Marconi, E., Mottram, T.,
Velasco-Garcia, M., Moscone, E. and Palleschi, G. (2004). Aflatoxin M1
Determination in Raw Milk Using a Flow-injection Immunoassay System. Anal
Chim Acta. 520: 141-148.
Bakirci, I. (2001). A Study On the Occurence of Aflatoxin M1 in Milk and Milk
Products Produced in Van Province of Turkey. Food Control. 12: 47-51.
Bankole, S.A., Ogunsanwo, B.M. and Eseigbe, D.A. (2005a). Aflatoxins in Nigerian
Dry-roasted Groundnuts. Food Chemistry. 89: 503-506.
Bankole, S.A., Ogunsanwo, B.M. and Mabekoje, O.O.(2004) Natural Occurrence of
Moulds and Aflatoxin B1 in Melon Seed From Markets in Nigeria. Food and
Chemical Toxicology. 42: 1309-1314.
Bankole, S.A., Ogunsanwo, B.M., Osho, A. and Adewuyi, G.O. (2005b). Fungal
Contamination and Aflatoxin B1 of ‘Egusi’ Melon Seeds in Nigeria. Food
Control. Article in press.
Barbeira, P.J.S. and Stradiotto, W.R., (1997). Simultaneous Determination of Trace
Amounts of Zinc, Lead and Copper in Rum by Anodic Stripping Voltammetry.
Talanta. 44: 185-188.
Barker, G.C. and Jenkins, I.L. (1952). Square-wave Polarography. Analyst. 77: 685-
695.
212
Barek, J., Fogg, A. G., Muck, A. and Zima, J. (2001a). Polarography and
Voltammetry at Mercury Electrodes. Critical Reviews In Analytical Chemistry.
31: 291-309.
Barek, J., Cvacka, J., Muck, A. and Quaiserova, A. (2001b). Electrochemical
Methods for Monitoring of Environmental Carcinogens. Fresenius J Anal Chem.
369: 556-562.
Barek, J., Pumera, M., Muck. A., Kaderabkova, M. and Zima, J. (1999).
Polarographic and Voltammetric Determination of Selected Nitrated Polycyclic
Aromatic Hydrocarbons. Anal Chim Acta. 393: 141-146.
BAS (1993) Controlled Growth Mercury Electrode Instruction Manual,
Bioanalytical System, Inc. Indiana.
Batista, L.B., Chalfoun, S.M., Prado, G., Schwan, R.F. and Wheals, A.E. (2003).
Toxigenic Fungi Associated With Processed (green) Coffee Beans (Coffea
arabica-L). Int J Of Food Microbiolog. 85: 293 – 300.
Beaver, R.W. and Wilson, D.M. (1990). Comparison of Postcolumn Derivatisation-
Liquid Chromatography With Thin-layer Chromatography for Determination of
Aflatoxins in Naturally Contaminated Corn. J. Assoc.Off. Anal. Chem. 73(4):
379 – 381.
Beaver, R.W., James, M.A. and Lin, T.Y. (1991). ELISA-based Screening Test
With Liquid Chromatography for the Determination of Aflatoxin in Corn. J.
Assoc.Off. Anal. Chem. 74: 827 – 829.
Beebe, B.M. (1978). Reverse Phase High Pressure Liquid Chromatographic
Determination of Aflatoxins in Foods. J. Assoc. Off. Anal. Chem. 81: 1347-
1352.
213
Begum, F. and Samajpati, N. (2000). Mycotoxin Production on Rice, Pulses and
Oilseeds. Naturwissenschaften. 87: 275-277.
Berzas, J.J., Rodriguez, J., Castaneda, G. and Villasenor, M.J. (2000).
Voltammetric Behavior of Sildenafil Citrate (Viagra) Using Square-wave and
Adsorptive Stripping Square-wave Techniques. Determination in
Pharmaceutical Products. Anal. Chim. Acta. 417: 143-148.
Betina, V. (1984). Mycotoxin – Production, Isolation, Separation and Purification.
Netherland: Elsevier Science.
Bicking, M.K.L., Kniseley, R.N and Svec, H.J. (1983). Coupled-Column for
Quantitating Low Levels of Aflatoxins. J . Assoc. Off. Anal. Chem. 66: 905-908.
Bijl, J. and Peteghen, C.V.(1985). Rapid Extraction and Sample Clean-up for the
Fluorescence DensitometricDetermination of Aflatoxin M1in Milk and Milk
Powder. Anal. Chim. Act. 170: 149-152.
Billova, S., Kizek, R., Jelen, F. and Novotna, P. (2003). Square-wave Voltammetric
Determination of Cefoperazone in a Bacterial Culture, Pharmaceutical Drug,
Milk and Urine. Anal Bioanal Chem. 377: 362-369.
Bingham, A.K., Huebner, H.J., Phillips, T.D. and Baver, J.E. (2004). Identification
and Reduction of Urinary Aflatoxin Metabolites in Dog. Food and Chemical
Toxicology. 42(11): 1851-1858.
Blanc, R., Gonzalez-Casado, A., Navabu, A. and Vilchez, J.L. (2000). The Estimate
of Blanks in Differential Pulse Voltammetric Technique: Application to
Detection Limits Evaluation as Recommended by IUPAC. Anal. Chim. Acta.
403: 117-123.
214
Blesa, J., Soriano, J.M., Molto, J.C., Marin, R. and Manes, J. (2003). Determination
of Aflatoxins in Peanuts by Matrix Solid-phase Dispersion and Liquid
Chromatography, J of Chromatography A. 1011: 49-54.
Bond, A.M., Oldham, K.B. and Zoski, C.G. (1989). Steady State Voltammetry.
Anal. Chim. Acta. 216: 177-230.
Brainina, Kh. (1974). Stripping Voltammetry in Chemical Analysis. New York:
Wiley and Sons.
Brainina, Kh., Malakhova, N.A. and Stojko, Y. (2000). Stripping Voltammetry in
Environmental and Food Analysis. Fresenius J Anal Chem. 368: 307-325.
Brera, C., Caputi, R., Miraglia, M., Iavicoli, I., Salerno, A. and Carelli, G. (2002).
Exposure Assessment to Mycotoxins in Workplace: Aflatoxins and Ochratoxin
A Occurence in Airborne Dust and Human Sera. Microchemical J. 73(1-2): 167-
173.
Bressolle, F., Bromet-Petit, M. and Audron, M. (1996). Validation of Liquid
Chromatography and Gas Chromatography Methods: Application to
Pharmacokinetic. J. Chromatogr, B. 686: 3-10.
Buffle, J. and Tercier-Waeber, M-L. (2005). Voltammetric Environmental Trace-
Metal Analysis and Speciation: From Laboratory to in situ Measurements. Trend
In Anal. Chem. 24(3): 172-191.
Cakala, M., Mazerska, Z., Donten, M. and Stojek, Z. (1999). Electroanalytical and
Acid-base Properties of Imidazoacridinanone, an Antitumor Drug (C-1311).
Anal. Chim. Acta. 379: 209-215.
215
Canabillas, A.G., Burguillos, J.M.O., Canas, M.A.M, Caceres, M.I.R. and Lopez,
F.S. (2003). Square Wave Adsorptive Stripping Voltammetric Determination of
Piromidic acid. Application in Urine. J Pharm. Biomed. Anal. 33: 553-562.
Carapuca, H.M., Cabral, D.J. and Rocha, L.S. (2005). Adsorptive Stripping
Voltammetry of Trimethoprim: Mechanistic Studies and Application to the Fast
Determination in Pharmaceutical Suspensions. J Pharm. Biomed. Anal. 38: 364-
369.
Carlson, M.A. , Bargeron, C.B. , Benson, R.C., Fraser, A.B., Phillips, T.E., Velky, J.
T., Groopman, J.D., Strickland, P.T. and Ko, H.W. (2000). An Automated,
Handheld Biosensor for Aflatoxin. Biosensors and Bioelectronic. 14: 841-848.
Carpini, G., Lucavelli, F., Marrazza, G. and Mascini, M., (2004). Oligonucleotide-
Modified Screen-printed Gold Electrodes for Enzyme Amplified Sensing of
Nucleic Acids. Biosensors and Bioelectronic. 20: 167-175.
Castro, A.A., Wagener, A.L.R., Farias, P.A.M. and Bastos, M. B. (2004).
Adsorptive Stripping Voltammetry of 1-hydroxypyrene at the Thin-film
Mercury Electrode-basis for Quantitative Determination of PAH Metabolite in
Biological Materials. Anal. Chim. Acta. 521: 201-207.
CEN Report. (1999). Food analysis – Biotoxins – Criteria of Analytical Methods of
Mycotoxins. European Committee for Standardisation CR 13505:99 E. 1-7.
Cepeda, A., Franco, C.M., Fente, C.A., Vazquez, B.I., Rodriguez, J.L., Prognon, P.
and Mahuzier, G. (1996). Post-collumn Excitation of Aflatoxins Using
Cyclodextrins in Lliquid Chromatography for Food Analysis. J of Chromatogr.
A. 721: 69-74.
216
Cespedez, A.E and Diaz, G.J. (1997). Analysis of Aflatoxins in Poultry and Pig
Feeds and Feedstuffs used in Colombia. J. Assoc. Off. Anal. Chem. 80: 1215-
1219.
Chan, C.C. (2004). Potency method validation. In: Chan, C.C., Lam, H., Lee, Y.C.
and Zhang, X-M. Analytical Method Validation and Instrument Performance
Verification. USA: John Wiley and Sons.
Chan, D., MacDonald, S.J., Boughtflower, V. and Brereton, P. (2004). Simultaneous
Determination of Aflatoxins and Ochratoxin A in Food Using a Fully
Automated Immunoaffinity Column Clean-up and Liquid Chromatography-
Fluorescence Detection. J of Chromatoraphy A. 1059: 13-16.
Chang, H.L. and De Vries, J.W. (1983). Rapid High Performance Liquid
Chromatography Determination of AFM1 in Milk and Nonfat Dry Milk. J.
Assoc. Off. Anal. Chem. 66: 913-917.
Chemistry Department, Ministry of Science Technology and Innovation. (2000).
Standard Procedure for Determination of Aflatoxins (unpublished paper),
Malaysia.
Chiavaro, E., Asta, D., Galaverna, G., Biancardi, A., Gambarelli, E., Dossena, A.
and Marchelli, R. (2001). New Reversed-phase Liquid Chromatography Method
to Detect Aflatoxins in Food and Feed with Cyclodextrins as Fluorescence
Enhancers Added to the Eluent. J of Chromatogr. A. 937: 31-40.
Chu, F.S., Fan, T.S.L., Zhang, G.S., Xu, Y.S. Faust, S. and Mac Mohan, P.L.
(1987). Improved Enzyme-linked Immunosorbent Assay for Aflatoxin B1 in
Agricultural Commodities. J. Assoc. Anal. Chem. 70: 854-857.
217
Ciucu, A.A., Neguleseus, C. and Beldwin, R. P. (2003). Detection of Pesticides
Using an Amperometric Biosensor Based on Ferophthalocyanine Chemically
Modified Carbon Paste Electrode and Immobilised Enzymetic System.
Biosensors and Bioelectronic.18: 303-310.
Cole, R.O., Holland, R.D. and Sepaniak, M.J. (1992). Factors Influencing
Performance in the Rapid Separation of Aflatoxins by Micellar Electrokinetics
Capillary Chromatography. Talanta.39: 1139-1147.
Colombo, C. and van den Berg, C.M.G. (1998). In-line Deoxygenated for Flow
Analysis With Voltammetric Detection. Anal. Chim. Acta. 377: 229-240.
Conesa, A. J., Pinilla, J. M. and Hernandez, L. (1996). Determination of
Metbendazole in Urine by Cathodic Stripping Voltammetry. Anal. Chim. Acta.
331: 111-116.
Creepy, E.E. (2002). Update of Survey, Regulation and Toxic Effect of Mycotoxins
in Europe. Toxicology Letter. 127: 19-28.
Czae, M. Z. and Wang, J. (1999). Pushing the Detectibility of Voltammetry: How
Low Can Go ?. Talanta. 50: 921-928.
Dahmen, E.A.M.F. (1986). Electroanalysis: Theory and Application in Aqueous and
Non-aqeuous Media and in Automated Chemical Control. New York: Elsevier.
Davies, N.D. and Diener, U.L. (1980). Confirmatory Test for the High Pressure
Liquid Chromatographic Determination of Aflatoxin B1. J. Assoc. Off. Anal.
Chem. 63 (1): 107- 109.
218
De Botono, S.F., Moreda, J.M., Arranz, A. and Arranz, J.F. (1996). Study of the
Adsorptive Stripping Voltammetric Behaviour of the Antihypertensive Drug
Doxazosin. Anal. Chim. Acta. 329: 25-31.
De Vries, J. (1996). Food Safety and Toxicity. New York: CRC.
Dean, J.A. (1995). Analytical Chemistry Handbook. USA: Mc Graw Hill.
Demetriades, D., Economou, A. and Voulgaropoulos, A. (2004). A Study of Pencil-
Lead Bismuth-film Electrodes for the Determination of Trace Metals by Anodic
Stripping Voltammetry. Anal. Chim. Acta. 519: 167-172.
Dhavan, A.S. and Choudry, M.R. (1995). Incidence of Aflatoxins in Animal
Feedstuffs: A decade’s Scenario in India. J. AOAC Int. 78 (3): 693 – 698.
Dragacci, S., Gleizes, E., Fremy, J.M. and Candlish A.A.G. (1995). Use of
Immunoaffinity Chromatography as a Purification Step for the Determination of
AFM1 in Cheese. Food Additives and Contaminants. 12(1): 59-65.
Duhart, B.T., Shaw, S., Wooley, M., Allen, T. and Grimes, C. ( 1988a).
Determination of Aflatoxins B1, B2, G1 and G2 by High Performance Liquid
Chromatography With Electrochemical Detector. Anal. Chim. Acta. 208: 343-
346.
Eaton, D.L and Groopman, J.D. (1994).The Toxicity of Aflatoxin. United Kingdom:
Academic Press.
Economou, A. (2005). Bismuth-film Electrode: Recent Development and
Potentialities for Electroanalysis. Trends Anal. Chem. 24(4): 334-340.
219
Economou, A. and Fielden, P.R. (1995). A Study of Riboflavin Determination by
Squarw-Wave Adsorptive Stripping Voltammetry on Mercury Film Electrode,
Electroanalysis. 7: 447 – 453.
Economou, A., Bolis, S.D., Efstathiou, C.E. and Volikakis, G.J. (2002). A Virtual
Electroanalytical Instrument for Square-wave Voltammetry. Anal. Chim. Acta.
467: 179-188.
Edinboro, L.E. and Karnes, H.T. (2005). Determination of Aflatoxin B1 in
Sidestream Cigarette Smoke by Immunoaffinity Column Extraction Coupled
With Liquid Chromatography/mass Spectrometry. J of Chrom. A. 1083: 127-
132.
Egner, P.A., Munoz, A and Kensler, T.W. (2003). Chemoprevention With
Chlorophylin in Individuals Exposed to Dietary Aflatoxins. Mutation Research.
523: 209-216.
El-Desoky, H.S. and Ghoneim, M.M. (2005). Assay of the Anti-psychotic Drug
Haloperidol in Bulk Form, Pharmaceutical Formulation and Biological Fluids
Using Square-wave Adsorptive Stripping Voltammetry at a Mercury Electrode.
J Pharm. Biomed. Anal. 38: 543-550.
El-Hady, D.A., Abdel-Hamid, M.I., Seliem, M.M., Andrisano, V. and El-Maali,
N.A. (2004). Osteryoung Square Wave Stripping Voltammetry at Mercury Film
Electrode for Monitoring Ultra Levels of Tarabine PFS and its Interaction With
SsDNA. J Pharm. Biomed. Anal. 34: 879-890.
El-Hafnawey, G.B., El-Hallag, I.S., Ghoneim, E.M. and Ghoniem, M.M. (2004),
Voltammetric Behavior and Quantification of the Sedative-hypnotic Drug
Chlordiazepoxide in Bulk Form, Pharmaceutical Formulation and Human Serum
at a Mercury Electrode. J of Pharm. And Biomed Anal. 34: 75-86.
220
El-Maali, N.A., Osman, A.H., Aly, A.A.A., Al-Hazmi, G.A.A. (2005).
Voltammetric Analysis of Cu(II), Cd(II) and Zn(II) Complexes and Their Cyclic
Voltammetry with Several Cephalosporin Antibiotics. Bioelectrochemistry. 65:
95-104.
Enker, C.G. (2003). The Art and Science of Chemical Analysis. New York: John
Wiley and Sons.
Ensafi, A.A., Khayamian, T. and Khaloo, S.S. (2004). Application of Adsorptive
Cathodic Differential Pulse Stripping Method for Simultaneous Determination
of Copper and Molybdenum Using Pyrogallol Red. Anal. Chim. Acta. 505: 201-
207.
Erdogan, A. (2004). The Aflatoxin Contamination of Some Pepper Types Sold in
Turkey. Chemosphere. 56: 321-325.
Erk, N. (2004). Voltammetric Behaviour and Determination of Moxifloxacin in
Pharmaceutical Products and Human Plasma. Anal. Bioanal.Chem. 378: 1351-
1356.
Etzel, R.A. (2002). Mycotoxin. J of Am.Med.Assoc. 287: 425-427.
EU Commision, Commision Regulation (EC) No 466/2001 of 8 March 2001 Setting
Maximum Levels for Certain Contamination Foodstuffs. (2001). J European
Community. L7.1
Ewing, G.W (Ed). (1997). Analytical Instrumentation Handbook: Revised and
Expanded, 2nd Ed. New York: Marcel Dekker.
221
Fang, Y., Gong, F., Fang, X. and Fu, C. (1998). Separation and Determination of
Cyclodextrins by Capillary Electrophoresis With Aperometric Detection. Anal.
Chim. Acta. 369: 39-45.
Faraj, M.K., Smith, J.E. and Harren, G. (1991). Introduction of Water Activity and
Temperature on Aflatoxin Production by Aspergillus flavus and Aspergillus
parasiticus in Irradiated Maize Seeds. Food Additives Contaminants. 6(6): 731-
736.
Farghaly, O.A. and Ghandour, M.A. (2005). Square Wave Stripping Voltammetry
for Direct Determination of Eight Heavy Metals in Soil and Indoor-airborne
Particulate Matter. Environ. Research. 97: 229-235.
Farghaly, O.A., Taher, M.A., Naggar, A.H. and El-Sayed,A.Y., (2005). Square
Wave Anodic Stripping Voltammetric Determination of Metoclopramide in
Tablets and Urine at Carbon Paste Electrode. J Pharm. Biomed. Anal. 38: 14-20.
Farias, P.A.M., Wargener, A.L.R., Bastos, M.B.R., de Silva, A.T. and Castro,
A.G.(2004). Cathodic Adsorptive Stripping Voltammetric Behavior of Guanine
in the Presence of Copper at the Static Mercury Drop Electrode. Talanta. 61:
829-835.
Feroncova, A., Korgova, E., Miko, R. and Labuda, J., (2001). Determination of
Tricyclic Antidepressent Using a Carbon Paste Electrode Modified with β-
Cyclodextrin. J. of Electroanalytical Chem. 492: 74-77.
Ferreira, V.S., Zanoni, M.V.B. and Fogg, A.G. (1999). Cathodic Stripping
Voltammetric Determination of Ceftazidine With Reactive Accumulation at a
Poly-L-lysine Modified Hanging Mercury Drop Electrode. Anal. Chim. Acta.
384: 159-166.
222
Fifield, F.W. and Kealey, D. (2000). Principle and Practice of Analytical
Chemistry 3rd Edition. UK: Blackwell science.
Fifield, F.W. and Haines, P.J. (2000).Environmental Analytical Chemistry 2nd Ed,
UK: Blackwell Science.
Foog, A.G. and Wang, J. (1999).Terminology and Convention for Electrochemical
Stripping Analysis. Pure Appl. Chemistry. 71: 891-897.
Fraga, J.M.G., Abizanda, A.I.J., Moreno, F.J. and Leon, J.J.A. (1998). Application
of Principal Component Regression to the Determination of Captopril by
Differential Pulse Polarography With no Prior Removal of Dissolved Oxygen.
Talanta. 46: 73-82
Franco, C.M., Fente, C.A., Vazquez, B.T., Cepede, A., Mahuzier, G. and Prognon,
P. (1998). Interaction Between Cyclodextrin and Alatoxins Q1, M1 and P1
Flourescence and Chromatographic Studies. J of Chromatogr. A. 815: 21-29.
Fremy, J.M. and Chang, B. (1983). Rapid Determination of AFM1 in Whole Milk
by Reversed-phase High Performance Liquid Chromatography. J of
Chromatogr. A. 219: 156-161.
Fremy, J.M. and Chu, F.S. (1984). Direct Enzyme-linked Immunosorbent Assay for
Determining Aflatoxin M1 at Picogram Levels in Dairy Products. J. Assoc.
Anal. Chem. 67: 1098 – 1101.
Fukayama, M. Winterli, W. and Hsieh, D.P.H (1980). Rapid Method for Analysis of
Aflatoxin M1 in Dairy Products. J. Assoc. Anal. Chem. 63: 927 – 930.
223
Gao, W., Song, J. and Wu, N. (2004). Voltammetric Behavior and Square-wave
Voltammetric Determination of Trepibutone at a Pencil Graphite Electrode. J.
Electroanalytical Chem. 576(1): 1-7.
Garcia-Villanova, R.J., Cordon, C., Parama,s A.M.G., Aparicio, P. and Rosales,
M.E.G. (2004). Simultaneous Immunoaffinity Column Clean up and HPLC
Analysis of Aflatoxins and Ochratoxin A in Spanish Bee Pollen. J Agric. Food
Chem.52: 7235-7239.
Garden, S.R. and Strachan, N.J.C. (2001). Novel Colorimetric Immunoassay for the
Detection of Aflatoxin B1, Anal. Chim. Acta. 444: 187-191.
Gauch, R., Leuenberger, U. and Baumgartne, E. (1979). Rapid and Simple
Determination of Aflatoxin M1 in Milk in the Low Parts per 1012 range. J of
Chromatogr. A. 178: 543-549.
Garner, R.C., Whattam, M.M. , Taylor, P.J.L. and Stow, M.W. ( 1993). Analysis of
United Kingdom Purchased Spices for Aflatoxins Using Immunoaffinity
Column Clean up Procedure Followed up by High-performance Liquid
Chromatographic Analysis and Post-column Derivatization with Pyridium
Bromide Perbromide. J. Chromatography. 648: 485-490.
Gazy, A.A.K. (2004). Determination of Amlodipine Besylate by Adsorptive Square-
Wave Anodic Stripping Voltammetry on Glassy Carbon Electrode in Tablets
and Biological Fluids. Talanta. 62: 575-582.
Ghoneim, M.M. Hassanein, A.M., Hamman, E. and Beltagi, A.M. (2000).
Simultanoues Determination of Cd, Pb, Cu, Sb, Bi, Se, Zn, Mn, Ni, Cr and Fe in
Water Sample by Differential Pulse Stripping Voltammetry at a Hanging
Mercury Drop Electrode. Fresenius J. Anal. Chem. 367: 378-383.
224
Ghoneim, M. M., Tawfik, A. and Khashaba, P.Y. (2003a). Cathodic Adsorptive
Stripping Square-wave Voltammetric Determination of Nifedipine Drug in
Bulk, Pharmaceutical Formulation and Human Serum. Anal. Bioanal. Chem.
375: 369-375.
Ghoneim, M.M., and Tawfik, H.(2004). Assay of Anti-coagulant Drug Warfarin
Sodium in Pharmaceutical Formulation and Human Biological Fluids by
Square-wave Adsorptive Cathodic Stripping Voltammetry. Anal. Chim. Acta.
511: 63-69.
Ghoneim, M.M., El Reis, M.A., Hamman, E. and Beltagi, A.M. (2004). A Validated
Stripping Voltammetric Procedure for Quantification of the Anti-hypertensive
and Benign Prostatic Hyperplasia Drug Terazosine in Tablets and Human
Serum. Talanta. 64(3): 703-710.
Ghoneim, M.M., El-Baradie, K.Y. and Tawfik, H. (2003b). Electrochemical
Behavior of the Antituberculosis Drug Isonianid and its Square-wave
Adsorptive Stripping Voltammetric Estimation in Bulk Form, Tablets and
Biological Fluids at a Mercury Electrode. J. Pharm. Biomed. Anal. 33: 673-685.
Ghoniem, M.M. and Beltagi, A.M. (2003). Adsorptive Stripping Voltammetric
Determination of the Anti-inflammatory Drug Celecoxib in Pharmaceutical
Formulation and Human Serum. Talanta, 60: 911-921.
Ghoniem, M.M. and Tawfik A. (2004). Assay of Anti-coagulant Drug Warfarin
Sodium in Pharmaceutical Formulation and Human Biological Fluids by
Square-wave Adsorptive Cathodic Stripping Voltammetry. Anal. Chim. Acta.
511: 63-69.
225
Gimeno, A. and Martins, M. L (1983). Rapid Thin Layer Chromatographic
Determination of Patulin, Citrinin and Aflatoxin in Apples and Pears and Their
Juices and Jams. J. Assoc. Anal. Chem., 66: 85-91.
Goldblatt L.A (1969) Aflatoxin. New York: Academic Press.
Gonzalez, M.P.E., Mattusch, J. and Wennrich, R. ( 1998). Stability and
Determination of Aflatoxins by High-performance Liquid Chromatography
With Amperometric Detection. J.Chromatography A. 828: 439-444.
Gonzalez, G., Hinojo, M.J., Mateo, R., Medina, A. and Jimenez, M. (2005).
Occurrence of Mycotoxin Producing Fungi in Bee Pollen. Int. J. Food
Microbiology. Article in press.
Gooding, J.J., Compton, R.G., Brennan, C.M. and Atherton, J.H. (1997). A New
Electrochemical Method for the Investigation of the Aggregation of Dyes in
Solution. Electroanalysis. 9(10): 759-764.
Gosser, D.K (1993). Cyclic Voltammetry. New York: Wiley-VCH.
Goto, T., Matsui, M. and Kitsuwa, T. (1988). Determination of Aflatoxins by
Capillary Column gas Chromatography. J of Chromatography. 447: 410-414.
Gourama, H. and Bullerman, L. (1995). Aspergillus flavus and Aspergillus
parasiticus: Aflatoxigenic Fungi of Concern in Foods and Feeds: a Review. J of
Food Protection. 58: 1395-1404.
Gowda, N.K.S., Malathi, V. and Suganthi, R.U. (2004). Effect of Some Chemical
and Herbal Compounds on Growth of Aspergillus parasiticus and Aflatoxin
Production. Anim. Feed Sci. Technol. 116(3-4): 281- 291.
226
Grigoriadou, I.K., Eleftheriadou, A., Mouratidou, T. and Katikou, P. (2005).
Determination of Aflatoxin M1 in Ewe’s Milk Samples and the Produced Curd
and Feta Cheese. Food Control. 16: 257-261.
Guiberteau, A., Galcano, T., More, N., Parilla, P. and Salinas, F., (2001). Study and
Determination of the Pesticide Imidacloprid by Square-wave Adsorptive
Stripping Voltammetry. Talanta. 53: 943-949.
Gurbay, A., Aydin, S., Girgin, G., Engin, A.B. and Sahin, G. (2004). Assessment of
Aflatoxin M1 Levels in Milk in Ankara, Turkey. Food Control. Article in press.
Haghighi, B., Thorpe, C., Pohland, A.E. and Barnette, R. (1981). Development of a
Sensitive High performance Liquid Chromatographic Method for Detection of
Aflatoxins in Pistachio Nuts. J. of Chromatography. 206: 101-108.
Hall, A.J. and Wild, C.P. (1994). The toxicity of aflatoxin: Human, Health,
Veterinary and Agriculture Significance. New York: Academic.
Hamilton, F.W. and Ellis, J. (1980). Determination of Arsenic and Antimony in
Electrolytic Copper by Anodic Stripping Voltammetry at a Gold Film Electrode.
Anal. Chim. Acta. 119: 225-233.
Harvey, D. (2000). Modern Analytical Chemistry. USA: McGraw Hill.
Heathcote, J.G. (1984). Aflatoxins and Related Toxins. In: Betina, V. (Ed).
Mycotoxins – Production, Isolation, Separation and Purification. Netherland:
Elsevier Science.
Heathcote, J.G. and Hibbert, J.R (1984) Aflatoxin: Chemical and Biological Aspect.
New York: Elsevier.
227
Heberneh, G.G. (2004). Highlight on Plant Toxin in Toxicon. Toxicon. 44: 341-344.
Hernandez, P., Dabrio-Ramos, M., Paton, F., Ballesteros, Y. and Hernandez, L.
(1997). Determination of Abscisic Acid by Cathodic Stripping Square Wave
Voltammetry. Talanta. 44: 1783-1792.
Herrman, T. (2004). Mycotoxin in feed grains and ingredient in www.
oznet.ksu.edu. Quote dated: 18th April 2004
Heyrovsky, J. and Zuman, P. ( 1968). Practical Polarography; An Intoduction for
Chemistry Students. New York: Academic Press.
Hilali, A., Jimenez, J.C., Callejon, M., Bello, M.A. and Guirem, A. (2003).
.Electrochemical Reduction of Cefminox at the Mercury Electrode and its
Voltammetric Determination in Urine. Talanta. 59(1): 137-146.
Hocevar, S.B., Svancara, I., Vytras, K. and Ogorevc, B. (2005). Novel Electrode for
Electrochemical Stripping Analysis Based on Carbon Paste Modified With
Bismuth Powder. Electrochim. Acta. Article in press.
Holcomb, M. , Wilson, D.M., Truckess, M. W. and Thompson, H. C. (1992).
Determination of Aflatoxins in Food Products by Chromatography. J. of
Chromatography A. 624: 341-352.
Hourch, M.E., Dudoit, A. and Amiard, J-C. (2003). Optimization of New
Voltammetric Method for the Determination of Metallothionein.
Electrochim.Acta, 48: 4083-4088.
Hussien, H.S. and Brasel, J.M. (2001). Mycotoxin, Metabolism and Impact on
Humans and Animals. J Toxicology. 167(2): 101-134.
228
Hutton, E.A., Hocevar, S.B. and Ogorevc, B. (2005). Ex situ Preparation of Bismuth
Film Microelectrode for Use in Electrochemical Stripping Microanalysis. Anal.
Chim. Acta. 537: 285-292.
Ibrahim, M.S., Kamal, M.M. and Temerk. Y.M. (2003). Comparison of the
Voltammetric Studies at Mercury Electrode and Glassy Carbon Electrodes for
the Interaction of Lumichrome with DNA and Analytical Application. Anal.
Bioanal.Chem. 375: 1024-1030.
Ibrahim, M.S., Shehatta I.S. and Sultan, M.R. (2002). Cathodic Adsorptive
Stripping Voltammetric Determination of Nalidixic Acid in Pharmaceuticals,
HumanUrine and Serum. Talanta. 56: 471-579.
Illkovic, D. (1934). Polarography Study With the Dropping Mercury Cathode. Part
XLIV- The Dependence of Limiting Currents on the Diffusion Constant, on the
Rate of Dropping on the Size Electrode. Collection of Czechoslovak chemical
communication. 6: 498-513.
Inam, R. and Somer, G. (1998). Simultaneous Determination of Selenium and Lead
in Whole Blood Samples by Differential Pulse Polarography. Talanta. 46: 1347-
1355.
International Agency for Research on Cancer (1993). IARC Monographs on the
Evaluation of Carcinogenic Risk to Humans, vol. 56. World Health
Organisation, Lyon.
IUPAC. (1978). Nomenclature: Symbols, Units and Their Usage in Spectrochemical
Analysis-II. Spectrochim. Acta, Part B. 32: 242.
229
Iwamoto, M., Webber, A. and Osteryoung, A. (1984). Cathodic Reduction of
Thyroxine and Related Compounds on Silver Electrode. Anal. Chem. 56: 1203-
1206.
Jaimez, J., Fente, C.A., Vazquez, B.I., Franco, C.M., Cepeda, A., Mahuzier, G. and
Prognon, P. (2000). Application of the Assay of Aflatoxins by Liquid
Chromatography with Fluorescence Detection in Food Analysis. J.
Chromatography A.. 882: 1-10.
Janssens, M. M. T., Put, H. M. C. and Nout, M. J. R. (1996). In Vries, Food Safety
and Toxicity. New York: CRC Press.
Jeffrey, A.M. and Williams, G.M. (2005). Risk Assessment of DNA-reactive
Carcinogens in Food. Toxicology and Appl. Pharmacology. 207(2): 628-635.
Jeffery, H.W., Lenorich, L.M and Martin, R. Jr. (1982). Liquid Chromatography
Determination of Aflatoxins in Artificially Contaminated Cocoa Beans. J.
Assoc. Off. Anal. Chem. 80: 1215-1219.
Jelen, F., Tomschik, M. and Palecek, E. (1997). Adsorptive Striping Square-wave
Voltammetry of DNA. J. Electroanal. Chem. 423: 141-148.
Ji, Z., Yuan, G., Cai, S., Liu, J. and Liu, G. (2004). Electrochemical Studies of the
Oxidation Mechanism of Polyamide on Glassy Carbon Electrode, J. of
Electroanalytical Chem. 570: 265-273.
Jin, G-P. and Lin, X-Q. (2005). Voltammetric Behavior and Determination of
Estrogens at Carbamylcholine Modified Paraffin-impregnated Graphite
Electrode. Electrochim. Acta. 50: 3556-3562.
230
Johnson, W.W., Harris, T.M. and Guyerich V.P. (1996). Kinetics and Mechanism of
Hydrolysis of AFB1 exo-8-9-epoxide and Rearrangement of the Dihydrodiol. J.
Am. Chem. Soc. 118: 672-676.
Joshua, H. (1993). Determination ofAflatoxin by Reversed-phase High Performance
Liquid Chromatography with Post-column in-line Photochemical Derivatization
and Fluorescence Detection. J. Chromatography A. 654: 247-254.
Jurado-Gonzalez, A. J., Galindo-Riano, M. D. and Garcia-Vargas, M. (2003).
Experimental Designs in the Development of a New Method for the Sensitive
Determination of Cadmium in Sea Water by Adsorptive Cathodic Stripping
Voltammetry. Anal. Chim. Acta. 487: 229-241.
Kamal, M.M., Abu Zuhri, A.Z. and Nasser, A.A. O. (1996). Adsorptive Stripping
Voltammetric Analysis of 2,4,6-tri(2’-pyridyl)-1,3,5-triazine at a Mercury
Electrode. Fresenius J Anal Chem. 356: 500-503.
Kamimura, H., Nishijima, M., Yasuda, K., Ushiyama, H., Tabata, S., Matsumoto, S.
and Nishima, T. (1985). Simple, Rapid Clean-up Method for Analysis of
Aflatoxins and Comparison with Various Methods. J. Assoc. Off. Anal. Chem.
68: 458-461.
Kamkar A. (2004) A Study on the Occurence of Aflatoxin M1 in Raw Milk
Produced in Sarab City of Iran. Food Control. 16(7): 593-599.
Kamkar, A. (2005). A Study of the Occurrence of Aflatoxin M1 in Iranian Feta
Cheese. Food Control. Article in press.
Karadjova, I., Girousi, S. , Illadou, E. and Stratis, I. (2000). Determination of Cd,
Co, Cr, Cu, Fe, Ni and Pb in Milk, Cheese and Chocolate. Mikrochim. Acta.
134: 185-191.
231
Kefala, G., Economou, A., Voulgaropoulos, A. and Sofoniou, M.(2003). A Study of
Bismuth-film Electrode for the Detection of Trace Metals by Anodic Stripping
Voltammetry and Their Application to the Determination of Pb and Zn in
Tapwater and Human Hair. Talanta. 61: 603-610.
Khodari, M., Ghandour, M. and Taha, A.M. (1997). Cathodic Stripping
Voltammetric of the Anticancer Agent 5-fluorouracil and Determination in
Urine. Talanta. 44: 305-310.
Kim, H. J., Chang, S-C. and Shim, Y-B., (2002). α-cyclodextrin Modified Screen
Printed Graphite Electrodes for Detection of Phenols. Bull, Korean Chem. Soc.
23: 427-431.
Kizek, R., Masarik, M., Kramer, K.J., Potesil, D., Bailey, M., Howard, J.A.,
Klejdus, B., Mikelova, R., Adam, V., Trimkova, L. and Jelan, F. (2005). An
Analysis of Avidin, Biotin and Their Interaction at Attomole Levels by
Voltammetric and Chromatographic Techniques. Anal. Bioanal. Chem. 381:
1167-1178.
Koehler, P.E., Benchat, L.R. and Chhinnan, M.S. (1985). Influence of Temparature
and Water Activity on Aflatoxin Production by Aspergillus flavus in Cowpea
(Vigna Ungiculata) Seeds and Meal. J of Food Protection. 48: 1040-1043.
Kok, W. T., Van Neer, T.C.H., Traag, W.A. and Tuinstra, L.G.M.T. (1986).
Determination of Aflatoxins in Cattle Feed by Liquid Chromtography and Post-
column Derivatization with Electrochemically Generated Bromine. J.
Chromatogr. 367: 231 – 236.
Kok, W.Th. (1994). Derivatization Reactions for the Determination of Aflatoxins by
Liquid Chromatography With Fluorescence Detection. J Chromatography B
659: 127 – 137.
232
Komorsky-Lovric, S., Lovric, M. and Branica, M. (1992). Peak Current–frequency
Relationship in Adsorptive Stripping Square-wave Voltammetry. J. Electroanal.
Chem. 335(1-2): 297-308.
Kontoyannis, C. G., Antimisianis, S.G. and Douromis, D. (1999). Simultaneous
Quantitative Determination of Diazepan and Liposomes using Differential Pulse
Polarography. Anal. Chim. Acta. 391: 83-88.
Kotoucek, M. Skopilova, J. and Michalkova, D. (1997). Electroanalytical Study of
Salozosulfapyridine and Biseptol Components at the Mercury Electrode. Anal.
Chim.Acta. 353: 61-69.
Kubiak, W.W., Latonen, R.M., and Ivaska, A. (2001). The Sequential Injection
System With Adsorptive Stripping Voltammetry Detection. Talanta. 53: 1211-
1219.
Kussak, A., Anderson, B. and Anderson, K. (1995a). Determination of Aflatoxins in
Airborne Dust From Feed Factories by Automated Immunoaffinity Column
Clean-up and Liquid Chromatography. J Of Chromatogr. A. 708: 55-60.
Kussak, A., Anderson, B. and Anderson, K. (1995b). Immunity Column Clean-up
for the High Performance Liquid Chromatographic Determination of Aflatoxins
B1, B2, G1, G2, M1 and Q1 in Urine. J Of Chromatogr. B. 672: 253-259
Kutner, W., Wang, J., L’Her, M. and Buck, R. (1998). Analytical Aspects of
Chemically Modified Electrode: Classification, CriticalEvaluation and
Recommendation. (IUPAC Recommendation 1998). Pure and Appl. Chem. 70:
1301-1318.
Lafleur, R.D., Myland, J.C. and Oldham, K.B. (1990). Analytical Microelectrode
Voltammetry with Minimal Instrumentation. Electroanalysis. 2: 223-238.
233
Lafont, P. and Siriwardana, M. C. (1981). Assay Method for Aflatoxin in Milk. J of
Chromatogr. 219: 162-166.
Lam, G.K., Kalvoda, R. and Kaponica, M. (1983). Determination of Uranium by
Adsorption Stripping Voltammetry. Anal. Chim. Acta. 154: 79-83.
Lau, P.H. and Chu, F.S. (1983). Preparation and Characterisation of Acid
Dehydration Product of Aflatoxicol. J. Assoc. Off. Anal Chem. 66(1): 98-101..
Lee, L.S., Wall, J.H., Cotty, P.J. and Bayman, P. (1990). Interpretation of Enzyme-
linked Immunosorbent Assay with Conventional Chromatography Procedures
for Quantitation of Aflatoxin in Individual Cotton Bolls, Seeds and Seeds
Sections. J. Assoc. Anal. Chem. 73(4): 581-584.
Leontopoulos, D., Siafaka, A. and Markaki, P. (2003). Black Olives as Substrate for
Aspergillus parasiticus Growth and Aflatoxin B1 Production. Food
Microbiology. 20: 119-126.
Leszezynska, J. Kucharska, U. and Zegota, H. (2000). Aflatoxin in Nuts Assayed by
Immunological Methods. Eur Food Res Technol. 210: 213-215.
Levi, C. (1980). Mycotoxins in Coffee. J Assoc. Off. Anal. Chem. 63(6): 1282-
1285.
Lin, L., Lawrence, N.S., Thongngamdee, S., Wang, J. and Lin, Y. (2005). Catalytic
Adsorptive Stripping Determination of Trace Chromium (VI) at the Bismuth
Film Electrode. Talanta. 65: 144-148.
Lin, L., Thongngamdee S., Wang, J., Lin, Y., Sadik, O.A. and Ly, S-Y. (2005).
Adsorptive Stripping Voltammetric Measurements of Trace Uranium at the
Bismuth Film Electrode. Anal. Chim. Acta. 535: 9-13.
234
Lin, L., Zhang, J., Wang, P., Wang, Y. and Chen, J. (1998). Thin-layer
Chromatography of Mycotoxins and Comparison with Other Chromatographic
Methods. J of Chromatogr. A. 815: 3-20.
Liu, J.H., Lin, W.F. and Nicol, J.D. (1980). The application of Anodic Stripping
Voltammetry to Forensic Science. II. Anodic Stripping Voltammetric Analysis
of Gunshot Residues. Forensic Sci Int. 16: 53-62.
Liu, Y., Jiang, Y., Song, W., Lu, N., Zou, M., Xu, H. and Yu, Z. (2000).
Voltammetric Determination of 5-hydroxydole-3-acetic Acid in Human Gastric
Juice. Talanta. 50: 1261-1266.
Locatelli, C. (2005). Overlapping Voltammetric Peaks – an Analytical Procedure for
Simultaneous Determination of Trace Metals. Application to Food and
Environmental Matrices. Anal Bioanal Chem. 381: 1073-1081.
Loftsson, T. and Brewster, M.E. (1996) Pharmaceutical Applications of
Cyclodextrins. 1. Drug Solubilisation and Stabilisation. J. Pharm. Sci. 85: 1017-
1025.
Lopez, C.E, Ramos, L.L., Ramadan, S.S. and Bulacio, L.C. (2002). Presence of
Aflatoxin M1 in Milk for Human Consumption in Argentina. Food Control.
14(1): 31-34.
Lupu, A., Compagnone, D. and Palleschi, A. (2004). Screen-printed Enzyme
Electrodes for the Detection of Marker Analytes During Wine Making. Anal.
Chim. Acta. 513: 67-72.
Ly, S-Y, Kim,D-H. and Kim, M-H. (2002). Square-wave Cathodic Stripping
Voltammetry Analysis of RDX Using Mercury-film Plated Glassy Carbon
Electrode. Talanta. 58: 919-926.
235
Malaysian Food Act (1983) Act No 281, Reviewed 2002, Food Quality Control
Dept, Ministry of Health, Malaysia.
Mackson, J., Wright, G., Rachaputi, N.C., Krosch, S. and Tatnell, J. (1999).
Aflatoxin Research Update Workshop Proceeding. Kingaroy, Queensland.
August 1999.
Martins, M.L. and Martin, H.M.,(2004). Aflatoxins M1 in Yoghurts in Portugal. Int.
J of Food Microbiology. 91: 315-317.
Manetta, A.C., Giuseppe, L.D., Giammarco, M.,Fusaro, I., Simonella, A.,
Gramenzi, A. and Formigoni, A. (2005). High-performance Liquid
Chromatography With Post-column Derivatisation and Fluorescence Detection
for Sensitive Determination of Aflatoxin M1 in Milk and Cheese. J Chrom. A.
1083: 219-222.
Mendez-Albores J.A., Arambula-Villa G., Preciado-Ortiz R.E. and Moreno-
Martinez E., (2004). Aflatoxins in Pozol, a Nixtamalized Maize-based Food. Int
J of Food Microbiology. 94: 211-215.
Metrohm (2005). Introduction to Polarography and Voltammetry Monograph,
Metrohm Ltd, Switzerland.
Micheli, L. Grecco, R., Moscone, D. and Palleschi, G. (2005). An Electrochemical
Immunosensor for Aflatoxin M1 Determination in Milk Using Screen-printed
Electrodes. Biosensors and Bioelectronic. 21(4): 588-596.
Miller, N. (1987). Toxicology Aspects of Food. New York: Elsevier Science.
Miller, J.C. and Miller, J.N. (1993). Statistic for Analytical Chemistry. London: Ellis
Horwood.
236
Miller, N., Pretorius,H.E. and Trinder, D.W. (1985). Determination of Aflatoxins in
Vegetable Oils. J. Assoc. Off. Anal. Chem. 68: 136-137.
Mohd. Yusoff, A.R., Ahamad, R. and Azman, S. (1998). Kaedah Voltammetri
Dalam Penentuan Pewarna reaktif dan Hasil Hidrolisisnya. Malays. J. Anal. Sci.
4(1): 139-146.
Molina, M. and Gianuzzi, L. (2002). Modelling of Aflatoxin Production by
Aspergillus parasticus in a Solid Medium at Different Temperature, pH and
Propionic Acid Concentration. Food Res. Int. 35: 585-594.
Moressi, M.B., Andreu, R., Calvente, J.J, Fernandez, H. and Zon, M. A. (2004).
Improvement of Alterneriol Monomethyl Ether Detection at Gold Electrode
Modified With a Dedocanethiol Self-assembled Monolayer. J. of
Electroanalytical Chem. 570: 209-217.
Morfobos, M., Economou, A. and Voulgaropoulos, A. (2004). Simultaneous
Determination of Nickel(II) and cobalt(II) by Square Wave Adsorptive Stripping
Voltammetry on a Rotating-disc Bismuth-film Electrode. Anal Chim Acta. 519:
57-64.
Mouley, Y. (1984). Biochemical Effects of Mycotoxin. In Betina, V (Ed.).
Mycotoxin – Producton, Isolation, Separation and Purification. Netherland:
Elsevier Science.
Nawaz, S., Coker, R.D and Haswell, S.J. (1992). Development and Evaluation of
Analytical Methodology for Determination of Aflatoxins in Palm Kernel.
Analyst. 117: 67 – 71.
237
Navalion, A., Blanc, R., Reyes, L., Navas, N. and Vikches, J.K. (2002).
Determination of the Antibacterial Enrofloxacin by Differential Pulse
Adsorptive Stripping Voltammetry. Anal. Chim. Acta. 454: 83-91.
Neal, G.E. (1987). Influence of Metabolism: AflatoxinMetabolism and its Possible
Relationships With Disease. In: Watson D.H. Natural Toxicants in Foods:
Progress and prospects. London: VCH.
Niedwetzki, G. Lach, G. and Ceschwill, K. (1994). Determination of Aflatoxin in
Food by Use of an Automatic Work Statio. .J.Of Chromatography A. 661: 175-
180.
Nilufer, D. and Boyacio, D. (2002). Comparative Study of Three Different Methods
for the Determination of Aflatoxins in Tahini. J. Agric. Food. Chem. 50: 3375-
3379.
Nouws, H.P.A., Delerue-Matos, C., Barros, A.A. and Rodrigues, J.A., (2005a).
Electroanalytical Study of the Antidepressant Sertraline. J. Pharm. Biomed.
Anal. 39(1-2): 290-293.
Nouws, H.P.A., Delerue-Matos, C., Barros, A.A., Rodrigues, J.A. and Silva, A.S.
(2005b). Electroanalytical Study of Fluvoxamine. Anal and Bioanal. Chem.
382(7): 1662-1668.
Official Methods of Analysis 14th Ed. (1984) AOAC, Washington D.C.
Ohfuji, K., Sato, N., Hamadansoto, N., Kabayashi, T., Imada, N., Okura, H. and
Watanabe, E., (2004). Construction of a Glucose Based on a Screen-printed
Electrode and a Novel Mediator Pyocyanin From Pseudomonos Aeruginosa.
Biosensors and Bioelectronic. 19: 1237-1244.
238
Orinakova, R., Tankova, L., Galova, M. and Supicova, A. (2004). Application of
Elimination Voltammetry in the Study of Electroplating Processes on the
Graphite Electrode. Electrochimica Acta. 49: 3587-3594.
Ortiz, M.Z., Arcos, J., Juarros, J.V., Lopez-Palacios, J. and Sarabia, L.A. (1993).
Robust Procedure for Calibration and Calculation of the Detection Limit of
Trimipramine by Adsorptive Stripping Voltammetry at a Carbon Paste
Electrode. Anal. Chem. 65: 678-682.
Ozkan, S.A. and Uslu, B. (2002). Electrochemical Study of Fluvastatin Sodium –
Analytical Application to Pharmaceutical Dosage Forms, Human Serum and
Simulated Gastric Juice. Anal. Bioanal.Chem. 372: 582-586.
Ozkan, S.A., Uslu, B., Aboul-Enein, H.Y. (2003). Voltammetric Investigation of
Tamsulosin. Talanta. 61: 147-156.
Pacheco, W.F., Farias, P.A.M. and Aucelio, R.Q. (2005). Square-wave Adsorptive
Stripping Voltammetry for the Determination of Cyclofenil After Photochemical
Derivatisation. Anal. Chim. Acta. 549(1-2): 67-73.
Padano, M. L. and Rivas, G. A., (2000). Amperometric Biosensor for the
Quantification of Gentisic Acid using Poliphenol Oxidase Modified Carbon
Paste Electrode. Talanta. 53: 489-495.
Papp E., Otta K.H., Zaray G. and Mincsvics (2002). Liquid Chromatographic
Determination of Aflatoxins. Microchemical J . 73(1-2): 39-46.
Pare, J.R.J and Belanger, J.M.R. (1997). Instrumental Methods in Food Analysis.
N.York : Elsevier.
239
Parham, H and Zargar, B. (2001). Determination of Isosorbic Dinitrate in Arterial
Plasma, Synthetic Serum and Pharmaceutical Formulations by Linear Sweep
Voltammetry on a Gold Electrode. Talanta. 55: 255-262.
Park, K.Y. and Bullerman. L.B. (1983). Effects of Cycling Temperature on
Aflatoxins Production by Aspergillus parasiticus and Aspergillus flavous in Rice
and Cheese. J of Food Science. 48: 889-896.
Park, D.L. and Rua, S.M. (1991). Sample Collection and Preparation Techniques
for Aflatoxin Determination in Whole Cottonseed. J Assoc. Off. Anal. Chem. 74:
73-75.
Parlim, A. and Zerger, S. (2003). Determination of Isosorbide Synthetic Serum and
Pharmaceutical Formulation by Linear Sweep Voltammetry on a Gold
Electrode. Talanta. 55: 255-262.
Patey A.L., Sharman M. and Gilbert J (1990). Determination of Aflatoxin B1 Levels
in Peanut Butter Using an Immunoaffinity Column Cleanup Procedure:
Interlaboratory Study. Food Addit. Contam. 7; 515-520.
Patey, A.L., Sharman, M. and Gilbert, J. (1991). Liquid Chromatographic
Determination of Aflatoxin Levels in Peanut Butters Using an Immunoaffinity
Column Clean up Method: International Collaborative Trial. J. Assoc. Off. Anal.
Chem. 74: 76-81.
Pavlova V., Mirceski V., Lovric S.K, Javanovic S.P. and Mitrevski B. (2004).
Studying Electrode Mechanism and Analytical Determination of Cocaine and its
Metabolites at the Mercury Electrode Using Square-wave Voltammetry. Anal
Chim.Acta. 512: 49-56.
240
Pena, R. Alcaraz, M.C., Arce, L., Rios, A. and Valcarcel, M. (2002). Screening of
Aflatoxins in Feed Samples Using a Flow System Coupled to Capillary
Electrophoresis. J Of Chromatography A. 967: 303-314.
Perez-Ruiz, T., Martinez-Lozano, C., Sanz, A. and Guillen, A. (2004). Successive
Determination of Thiamine and Ascorbic Acid in Pharmaceuticals by Flow
Injection Analysis. J.Pharm. Biomed. Anal. 34: 551-557.
Pesavento, M., Domagala, S., Baldini, E. and Cucca, L. (1997). Characterisation of
Enzyme Linked Immunosorbent Assay for Aflatoxin B1 Based on Commercial
Reagents. Talanta. 45: 91-104.
Pestka, J. and Bundy, G. (1990). Alteration of Immune Function Following Dietary
Mycotoxin Exposures. Canadian J. of Physilogy and Pharmacology. 68: 1009-
1016.
Pezzatini, G., Midili, I., Toti, G., Loglio, F. and Innoceti, M. (2004). Determination
of Chlorite in Drinking Water by Differential Pulse Voltammetry on Graphite.
Anal. Bioanal.Chem. 380: 650 - 657.
Pildain, M.B., Vaamonde, G. and Cabral, D. (2004). Analysis of Population
Structure of Aspergillus flavus From Peanut Based Vegetative Compatibility,
Geographic Origin, Mycotoxin and Sclerotia Production. Int. J. Food Microb.
93: 31- 40.
Plattner, R.D., Bennett, G.A. and Stubblefield, R.D. (1984). Identification of
Aflatoxins by Quadrupole Mass Spectrometry/Mass Spectrometry. J. Assoc.
Anal. Chem. 67(4): 734 -738.
241
Pons, W.A. Jr. and Franz, A.O. Jr. (1977). High Performance Liquid
Chromatography of Aflatoxins in Cottonseed Products. J Assoc off Anal Chem.
60: 89 - 95.
Pournaghi-Azar, M.H. and Dastango, H. (2002). Differential Pulse Anodic Stripping
Voltammetry of Copper in Dichloromethane: Application to the Analysis of
Human Hair. Anal. Chim. Acta. 405:135 - 144.
Rachaputi, N.C., Wright, G.C., Krosch, S. and Tatnell,J. (2001). Management
Practice to Reduce Aflatoxin Contamination in Peanut. Proceedings of the 10th
Australian Agronomy Conference, Hobart. 2001.
Radi, A. (2003). Square-wave Adsorptive Cathodic Stripping Voltammetry of
Pantoprazole. J of Pharmaceutical and biomedical analysis. 33: 687 – 692.
Radi, A. and El-Sherif, Z. (2002). Determination of Levofloxacin in Human Urine
by Adsorptive Square-wave Anodic Stripping Voltammetry on a Glassy Carbon
Electrode. Talanta. 58: 319 - 324.
Radi, A., Beltagi, A.M. and Ghoniem, M.M. (2001). Determination of Ketorolac in
Human Serum by Square-wave Adsorption Stripping Voltammetry. Talanta. 54:
283 - 289.
Rasooli, I. and Abnayeh, M.R.(2004). Inhibitory Effect of Thyme Oils on Growth
and Aflatoxin Production by Aspergillus parasiticus. Food Control. 15: 479 -
483.
Rastogi, S., Das, M. and Khanna, S.K. (2001). Quantitative Determination of
Aflatoxin B1-oxime by Column Liquid Chromatography With Utraviolet
Detection. J Of Chromatography A. 933: 91 - 97.
242
Rastogi, S., Dwivedi, P.D., Khanna, S.K. and Das, M. (2004). Detection of
Aflatoxin M1 Contamination in Milk and Infant milk Products From Indian
Market by ELISA. Food Control. 15: 287 - 290.
Reif, K. and Metzger, W. (1995). Determination of Aflatoxins in Medicinal Herbs
and Plant Extracts. J Of Chromatography A. 692: 131 - 136.
Reinke, R. and Simon, J. (2002). The Online Removal of Dissolved Oxygen From
Aqueous Solutions Used in Voltammetric Technique by Chromatomembrane
Method. Anal. Bioanal. Chem. 374: 1256 - 1260.
Riley, T. and Tomlinson, C. (1984). Principles of Electroanalytical Methods
(Analytical Chemistry by Open Learning). London: John Wiley.
Risk assesment studies report No. 5 (1991). Chemical Hazrad – Evaluation
Aflatoxin in Food. Food and Environmental Hygeine Department, Hong Kong.
Rizk, M., Belal, F., Aly, F.A. and El-Enany, N.M. (1998). Differential Pulse
Polarographic Determination of Ofloxacin Pharmaceuticals and Biological
Fluids. Talanta. 46: 83 - 89.
Rizzo I., Vedoya G., Maurutto S., Haidukowski M. and Varsavsky E., (2004).
Assessment of Toxigenic Fungi on Argentinean Medicinal herbs.
Microbiological Research. 159: 113 - 120.
Rodriguez, J., Berzas, J.J., Castanada, G. and Rodrigues, N., (2005). Voltammetric
Determination of Imanitib (Gleevec) and its Main Metabolite Using Square-
wave and Adsorptive Stripping Square-wave Technique in Urine Samples.
Talanta. 66: 202 - 209.
243
Rodriguez, J., Berzas, J.J., Castanada, G. and Rodrigues, R. (2004). Determination
of Seldenafil Citrate (Viagra) and its Metabolite (UK-103,320) by Square-wave
and Adsorption Stripping Square-wave Voltammetry. Total Determination in
Biological samples. Talanta. 62: 427 - 432.
Sabry, S.M. and Wahbi, A.A.M. (1999). Application of Orthogonal Functions to
Differential Pulse Voltammetric Analysis: Simultanuoes Determination of tin
and Lead on Soft Drinks. Anal. Chim. Acta, 401: 173 - 183.
Safavi, A., Maleki, N. and Shahbaazi, H.R.(2004). Indirect Determination of
Cyanide Ion and Hydrogen Cyanide by Adsorptive Stripping Voltammetry at a
Mercury Electrode. Anal.Chim.Acta. 503: 213 - 221.
Salavagione. H.J., Arias. J., Garces. P., Marallon. E., Barbero. C. and Vazguez. J.L,
(2004). Spectroelectrochemical Study of the Oxidation of Aminophenols on
Platinum Electrode in Acid Medium. J. Of Electroanalytical Chem. 565: 375 -
383.
Saleemullah, Iqbal, A., Khalil, I.A. and Shah H. (2005). Aflatoxin Contents of
Stored andArtificially Inoculated Cereals and Nuts. Food Chemistry. Article in
press.
Salleh, B. (1998). Mikotoksin- Implikasi Terhadap Kesihatan Manusia dan Haiwan.
Pulau Pinang: Universiti Sains Malaysia.
Samajpathi, N. (1979) .Aflatoxin Produced by Five Species of Aspergillus on Rice.
Naturwissenschaften. 66: 365 - 366.
Sandulescu, R., Mirel, S. and Oprean, R. (2000). The Development of
Spectrophotometric and Electroanalytical Methods for Ascorbic Acid and
244
Acetaminophen and Their Application in the Analysis of Effervescent Dosage
Form. J. Pharm. Biomed. Anal. 23: 77 - 87.
Sanna, G., Pilo, M.I., Pin, P.C. Tapparo, A. and Seeber, R. (2000). Determination of
Heavy Metals in Honey by Anodic Stripping Voltammetry at Microelectrode.
Anal. Chim. Acta. 415: 165 - 173.
Santos, M.C. and Machado, S.A.S. (2004). Microgravimetric, Rotating Ring-disc
and Voltammetric Studies of the Underpotential Deposition of Selenium on
Polycrystalline Platinum Electrode. J. of Electroanalytical Chem. 567: 203 -
210.
Sarimehmetoglu, B., Kuplulu, O. and Celik, T.H. (2004). Detection of Aflatoxin M1
in CheeseSamples by ELISA. Food Control. 15: 45 - 49.
Sassahara, M., Netto, D.P. and Yanaka, E.K. (2005). Aflatoxin Occurence in
Foodstuff Supplied to Dairy Cattle and Aflatoxin M1 in Raw Milk in the North
of Parana State. Food and Chemical Technology. 43: 981 - 984.
Scholten, J.M and Spanjer, M.C. (1996). Determination of Aflatoxin B1 in
Pastachio Kernels and Shells. J. Assoc. Off. Anal. Chem. 79: 1360 - 1364.
Scott, P.M. and Lawrence, G.A. (1997). Determination of Aflatoxins in Beer. J.
Assoc. Off. Anal. Chem. 80: 1229 - 1233.
Setamou, M.K., Gardwell, F., Schulthess, S. and Hell, K. (1997). Aspergillus flavus
Infection and Aflatoxin Contaminants of Preharvest Maize in Benin. Plant
Disease. 81: 1327 - 1327.
Shahrokhian, S. and Karimi, M. (2004). Voltammetric Studies of a cobalt(II)-4-
Methylsalophen Modified Carbon-paste Electrode and its Application for the
245
Simultaneous Determination of Cysteine and Ascorbic Acid. Electrochim. Acta.
50: 77 - 84.
Shams, E., Barbei, A. and Soltaninezhad,M. (2004). Simultaneous Determination of
Copper, Zinc and Lead by Adsorptive Stripping Voltammetry in the Presence of
Morin. Anal. Chim. Acta. 501: 119 - 124.
Shannon, G.M., Shotwell, O.L and Kwole, W.F. (1983). Extraction and Thin Layer
Chromatography of Aflatoxin B1 in Mixed Feeds. J. Assoc. Off. Anal. Chem. 66:
582 - 586
Shenasi, M., Aidoo, K.E. and Candlish, A.A.G. (2002). Microflora of Date Fruits
and Production of Aflatoxins at Various Stages of Maturation. Int.J Food
Microbiology. 79(1-2): 113 - 119.
Shi K. and Shiu K.K. (2004). Adsorption of Some Quinone Derivatives at
Chemically Activated Glassy Carbon Electrode. J. of Electroanalytical Chem.
574(1): 63 - 70.
Shotwell, O.L and Goulden, M.L (1977). Aflatoxins: Comparison of Analysis of
Corn by Various Methods. J. Assoc. Off. Anal. Chem. 60: 83 - 88.
Shotwell, O.L, Goulden, M.L., Benntt, G.A., Plattner, R.D. and Hesseltine, C.W
(1977). Survey of 1975 Wheat and Soybeans for Aflatoxins, Zeralenone and
Ochratonin, J. Assoc. Off. Anal. Chem. 60: 778 - 783.
Shotwell, O.L., Hesseltin,e C. and Stubblefield, R.D. (1966). Production of aflatoxin
on rice. Appl. Microbiol. 14: 425 - 428.
246
Simon, P., Delsaut, P., Lafontaine, M. Morele, Y. and Nicol, T. (1998). Automated
Column-switching High-performance liquid chromatography for the
determination of aflatoxin M1. J of Chromatogr. B. (1998). 712: 95 - 104.
Skoog, D.A., West, D.M. and James, F. (1996) Fundamentals of Analytical
Chemistry. 7th Ed. New York; Saunders College Publishing,
Skrzypek S., Ciesielski W., Sokolowski A., Yilmaz S. and Kazmierczak A. (2005).
Square Wave Adsorptive Stripping Voltammetric Determination of Famotidine
in Urine. Talanta. 66:1146 - 1151.
Smith, J.E. and Moss M.O. (1985). Mycotoxins – Formation, Analysis and
Significance. Chichester: John Wiley.
Smyth, M. R., Lawellin, D. W. and Osteryoung, J.G (1979) Polarographic Study of
Aflatoxin B1, B2, G1 and G2: Application of Differential-pulse polarography to
the determination of Aflatoxin B1 in Various Foodstuff. Analyst. 104: 73 - 78.
Smyth, M.R. and Vos, J.G., (1992). In Shevla, G. (Ed). Analytical Voltammetry in
Comprehensive Analytical Chemistry. Amsterdam: Elsevier Science.
Smyth, M.R. and Smyth, W.F. (1978). Voltammetric Methods for the Determination
of Foreign Organic Compounds of Biological Significance. A review. Analyst.
103(1227): 103 - 122.
Sonthalia, P., McGaw, E., Show, Y. and Swain, G.M. (2004). Metal Ion Analysis in
Contaminated Water Samples Using Anodic Stripping Voltammetry and a
Nanocrystalline Diamond Thin-film Electrode. Anal Chim Acta. 522: 35 - 44.
247
Sorensen, L.K. and Elbaek, T. (2005). Determination of Mycotoxins Bovine Milk
by Liquid Chromatography Tandem Mass Spectrometry. J Chrom. B. 820:183-
196.
Stack, M. E. and Pohland, A.E. (1975). Collabration Study of a Method for
Chemical Confirmation of the Identify of Aflatoxin. J. Assoc.Off. Anal.Chem.
58: 110 - 113.
Stroka, J. and Anklem, E (2002). New Strategies for the Screening and
Determination of Aflatoxins and Detection of Aflatoxin-producing Moulds in
Food and Feed. Trend In Anal. Chem. 21: 90 - 95.
Stroka, J., Elke, A., Urban, J., John, G., Anna, B., Carlo, B., Per-Erik, C., Fiona, G.,
John, G., and Loius, S. (2000). Immunoaffinity Column Cleanup With Liquid
Chromatograhpy Using Post-column Bromination for Determination of
Aflatoxins in Peanut Butter, Pistachio Paste, Fig Paste and Paprika Powder.
Collaborative Study. J. of AOAC International. 83: 320 - 340.
Stubblefield, R.D and Showell, O.L (1977). Reverse Phase Analytical and
Preparative High Performance Liquid Chromatography of Aflatoxins. J. Assoc.
Off. Anal. Chem. 60: 784 - 790.
Stubblefield, R.D., Kwolek, W.F. and Stoloff, L (1982). Determination and Thin
Layer Chromatographic Confirmation of Identity of AFB1 and AFM1 in
Artificially Contaminated Beef Livers: Collaborative Study. J. Assoc. Off. Anal.
Chem. 65: 1435 - 14.
Sturm, J.C., Canelo, H., Nunez-Vergara, L.J. and Squella, J.A. (1997).
Voltammetric Study of Ketorolac and its Differential Pulse Polarographic
Determination in Pharmaceuticals. Talanta. 44: 931 - 937.
248
Sun, N., Mo, W-M. Shen, Z-L and Hu, B-X. (2005). Adsorptive Stripping
Voltammetric Technique for the Rapid Determination of Tobramycin on the
Hanging Mercury Electrode. J. Pharm. Biomed. Anal. 38(2): 256 - 262.
Sun, W. and Jiao, K. (2002). Linear Sweep Voltammetric Determination of Protein
Based on its Interaction With Alizarin Red S. Talant. 56: 1073 - 1080.
Taguchi, S., Fukushima, S., Summoto, T., Yoshida, S. and Nishimune, T. (1995).
Aflatoxins in Foods Collected in Osaka, Japan. J AOAC Int. 78: 325 – 327.
Takahashi, D.M. (1977a). Reverse Phase High Pressure Liquid Chromatographic
Analytical System for Aflatoxins in Wine With Fluorescence Detection. J
Chromatograph. 131: 147 - 156.
Takahashi, D.M. (1977b). Reverse Phase High Pressure Liquid Chromatographic
Analytical System for Aflatoxins in Wine and Fruit Juices. J. Assoc. Off. Anal.
Chem. 60: 799 – 804.
Tarin, A, Russell, M.G. and Guardino, X. (2004). Use of High Performance Liquid
Chromatography in Assess Airborne Mycotoxins. J of Chromatogr. A. 1047(2):
235 - 240.
Thompson, M. (1998). Do We Really Need Detection Limit?. Analyst. 123: 405 -
407.
Torriero, A.A.J., Luco, J.M., Sereno, L. and Raba, J. (2004). Voltammetric
Determination of Salicylic Acid in Pharmaceuticals Formulations of
Acetylsalicylic Acid. Talanta. 62: 247- 254.
249
Tozzi, C., Anfossi, L. Baggiani, C., Giavanalli, C. and Girandi, G. (2003). A
Combinatorial Approach to Obtain Affinity Media With Binding Properties
Towards the Aflatoxins. Anal. Bioanal. Chem. 375: 994 - 999.
Trucksess, M. W. and Stollof, L. (1980). Thin Layer Chromatographic
Determination of Alatoxins in Dry Ginger Root and Ginger Oleoresin. J. Assoc.
Off. Anal. Chem.63: 1052 - 1054.
Trucksess, M. W., Stack, M. E., Nesheim, S., Page, S.W. , Albert, R.H., Hansen,
T.J. and Donahue, K.F. (1991). Immunoaffinity Column Coupled with Solution
Fluometry or Liquid Chromatography Postcolumn Derivatization for
Determination of Aflatoxins in Corn, Peanuts and Peanut butter: Collaborative
Study. J. Assoc. Off. Anal. Chem. 74: 81 - 88.
Trucksess, M. W., Stollof, L., Pons, W.A., Cucullu, A.F. Lee, L.S. and Franz, A.O.
(1977). Thin Layer Chromatography of AFB1 in Egg. J. Assoc. Off. Anal. Chem.
60: 795 - 798.
Tuinstra L.G.M. and Hassnott, W. (1983). Rapid Determination of Aflatoxin B1 in
Dutch Feedingstuffs by High Performance Liquid Chromatography and Post-
column Derivatisation. J of Chromatogr. 282: 457 - 462.
Tuinstra, L.G.M., Kienhuis, P.G.M. and Dols, P. (1990). Automated Liquid
Chromatographic Determination of Aflatoxin M1 in Milk Using on-line Dialysis
for Sample Preparation. J. Assoc. Off. Anal. Chem. 73: 969 - 973.
Turner, P.C., Sylla, A., Gong, Y.Y., Diallo, M.S., Surcliffer, A.E., Hall, A. J. and
Wild, C.P. (2005). Reduction in Exposure to Carcinogenic Aflatoxins by
Postharvest Intervention Measures in West Africa: Community Based
Intervention Study. Lancet. 365: 1950 - 1956.
250
Tutour, L.B., Elaraki, A. T. and Aboussalim, A.(1984). Simultaneous Thin Layer
Chromatographic Determination of Aflatoxin B1 and Ochratoxin A in Black
Olives, J Assoc Off Anal Chem. 67: 611 - 620.
Urano, T., Trucksess ,M.W. and Page, S.W., (1993). Automated Affinity Liquid
Chromatography Sstem for On-line Isolation, Separation and Quantitation of
Aflatoxins in Methanol-water Extracts of Corn or Peanuts. J.Agric. Food Chem.
41: 1982 - 1985.
Vahl, M. and Jorgensen, F. (1998). Determination of Aflatoxins in Food Using
LC/MS/MS. Z Lebensm Unters Forsch A.. 206: 243 - 245.
Van Egmond, H.P. (1989). Introduction of Mycotoxins in Dairy Products. London:
Elsevier Applied Science.
Verma, K.K., Jain, A., Verma, a. and Chaurasia, A. (1991). Spectrophotometric
Determination of Ascorbic Acid in Pharmaceuticals by Background Correction
and Flow Injection. Analyst. 116: 641 - 645.
Versantroort, C.H.M., Oomen, A.G., and Sips, A.J.A.M. (2005). Applicability of an
in Vitro Digestion Model in Assessing the Bioaccessibility of Mycotoxins From
Food. Food and Chemical Toxicology. 43: 31- 40.
Volke, J. and Liska, F. (1994). Electrochemistry in Organic Synthesis. New York:
Springer-Verlag.
Volkov, A.G. and Mwesigwa, S. (2001). Electrochemistry of Soyabean: Effect of
Uncouplers, Pollutant and Pesticides. J. Of Electroanalytical Chemistry. 496:
153 - 157.
251
Wang, H. S., Huang, D. H. and Liu, R.M. (2004). Study on the Electrochemical
Behavior of Epinephrine at a Poly(3-methylthiophene) Modified Glassy Carbon
Electrode. J. of Electroanalytical Chem. 570: 83 - 90.
Wang, J. (1985): Stripping analysis: Principles, Instrumentation and Application.
USA: VCH Publishers.
Wang, J., Cai, X., Fernandes, J. R., Ozsoz, M. and Grant, D. H., (1997). Adsorptive
Potentiometric Stripping Analysis of Trace Tomoxifen at a Glassy Carbon
Electrode, Talanta. 45: 273 - 278.
Wang, J. (1988). Electroanalytical Technique in Clinical Chemistry and Laboratory
Medicine. USA: VCH publisher.
Wang, J. (2000). Analytical Electrochemistry. USA: WILEY-VCH.
Weast, R.C and Astle, M.J. (1981). Handbook of Chemistry and Physics. 61th Ed.
Flourida: CRC Press.
Wasiak, W, Cissewska, W. and Ciszewski, A. (1996). Hair Analysis Part I:
Differentrial Pulse Anodic Stripping Voltammetry Determination of Lead,
Cadmium, Zinc and Copper in Human Hair Samples of Persons in Permanent
Contact With a Polluted Workplace Environment. Anal. Chim. Acta. 335: 201 -
207.
Weast, R.C and Astle, M.J. (1987). CRC Handbook of Data On Organic
Compounds, Vol II. Flourida: CRC Press.
Wei, R.D., Chang, S.Ch. and Lee, S.S. (1980). High Pressure Liquid
Chromatography Determination of Aflatoxins in Soy Sauces anf Fermented
Soybean Paste. J. Assoc. Off. Anal. Chem. 63:1269- 1274.

252
White, C.E. and Argauer, R.J. (1970). Fluorescence Analysis- A Practical
Approach. New York: Marcell Dekker.
Wilson, T.J. and Romer, T.R (1991). Use of the Mycosep Multifunctional Clean-up
Column for Liquid Chromatography Determination of Aflatoxins in Agriculture
Products. J. Assoc. Off. Anal. Chem.74 : 951 - 956.
Wogan, G.N., Hecht, S. S., Felton, J. S., Conney, A.H. and Loeb, L.A. (2004).
Environmental and Chemical Carcinogenesis. Seminars In Cancer Biology. 14:
473 - 486.
Woolever, C.A. and Dewald,H.D. (2001). Differential Pulse Anodic Stripping
Voltammetry of Barium and Lead in Gunshot Residues. Forensic Sci Int. 117:
185-190.
World Health Organisation (1987) in: IARC Monograph on the Evaluation of
Carcinogenic Risk to Human, WHO, Lyon, pp 82 Supl. I.
Wring S. A., Hart J.P. and Birck B.J. (1991). Voltammetric Behaviour of Screen-
printed Carbon Electrode, Chemically Modified With Selected Mediatiors and
Their Applications as Sensor for Detection of Reduced Gluthathione. Analyst.
116 : 123-129.
www.ansci.cornell.edu/toxicagents/aflatoxin. Quoted date - 30th. July 2002.
www.ccohs.ca/oshanswers/chemicals. Quoted date – 5th February 2006
www.copdockmill.co.uk/aflatoxin Quoted date – 26th August 2001
Ximenes, M.I.N., Rath, S. and Reyes, F.G.R. (2000). Polarographic Determination
of Nitrate in Vegetable. Talanta. 51: 49 - 56.
253
Xiulan S., Xiaolian, Z., Jian, T., Xiaohong, G., jun, Z. and Chu, F.S. (2006).
Development of an Immunochromatographic Assay for Detection of Aflatoxin
B1 in Foods. Food Control. 17: 256 - 262.
Yardimer, C. and Ozaltin, N. (2001). Electrochemical Studies and Differential Pulse
Polarographic Analysis of Lansoprazole in Pharmaceuticals. Analyst. 126: 361-
366.
Yardimer, C. and Ozaltin, N. (2004). Electrochemical Studies and Square-wave
Voltammetric Determination of Fenofibrate in Pharmacetical Formulations.
Anal. Bioanal. Chem. 378: 495 - 498.
Yaacob, M.H. (1993). Polarographic Determination of Sn(II) in
Radiopharmaceutical Samples. University of Manchester, Institute of Science
and Technology (UMIST), United Kingdom. MSc Thesis.
Yilmaz, S., Uslu, B. and Ozkan, S.A. (2001). Anodic Oxidation of Etodolac and its
Square Wave and Differential Pulse Voltammetric Determination in
Pharmaceuticals and Human Serum. Talanta. 54: 351 - 360.
Youmens, H.L. (1973). Statistics for Chemistry. USA: Bells and Howell Publishers.
Yousef, A.E and Marth, E.H. (1985). Rapid Reverse Phase Liquid Chromatography
Determination of AFM1 in Milk. J. Assoc. Off. Anal. Chem. 68: 462 - 465.
Zahir, M.H. and Abd. Ghani, S. (1997). Fabrication of Directly Polymerized 4-
vinylpyridine onto a Pencil 2B Graphite Paste Electrode for Glucose
Monitoring, Anal Chim Acta, 354: 351 - 358.
254
Zayed, S.I.M. and Habib, I.H.I. (2005). Adsorptive Stripping Voltammetric
Determination of Triprolidine Hydrochloride in Pharmaceutical Tablets. I1
Farmaco. 60(6-7): 621 - 625.
Zhang, Z.Q., Zhang, H. and H,e G. F. (2002). Preconcentration with Membrane Cell
and Adsorptive Polarographic Determination of Formaldehyde in Air. Talanta.
57: 317 - 322.
Zhang, Z.Q, Li, Y.F., He, X.M. and Zhang, H. (1996). Electroanalytical
Characteristics of Enoxican and Their Analytical Application. Talanta.43: 635 -
641.
Zhao, C., Pan, Y., Su, Y., Zhang, Z., Guo, Z. and Sun, L. (2003). Determination of
EDTA Species in Water by Square-wave Voltammetry using a Chitosan-coated
Glassy Carbon Electrode. Water Research. 37: 4270 - 4274.
Zima, J., Barek, J., Moriera, J.C., Mejstrik, V. and Fogg, A.G. (2001).
Electrochemical Determination of Trace Amounts of Environmentally Important
Dyes. Fresenius. J. Anal. Chem. 369: 567 - 570.
Zimmermann, S., Menzel A., Bernaz Z., Eckhardt J-D., Stubens D., Alt F.,
Messerschmidt H., Taraschewski H. and Sures B.(2001). Trace Analysis of
Platinum in Biological Samples: A Comparison Between Sector field ICP-MS
and Adsorptive Cathodic Stripping Voltammetry Following Different Digestion
Procedures. Anal. Chim. Acta. 439: 203 - 209.
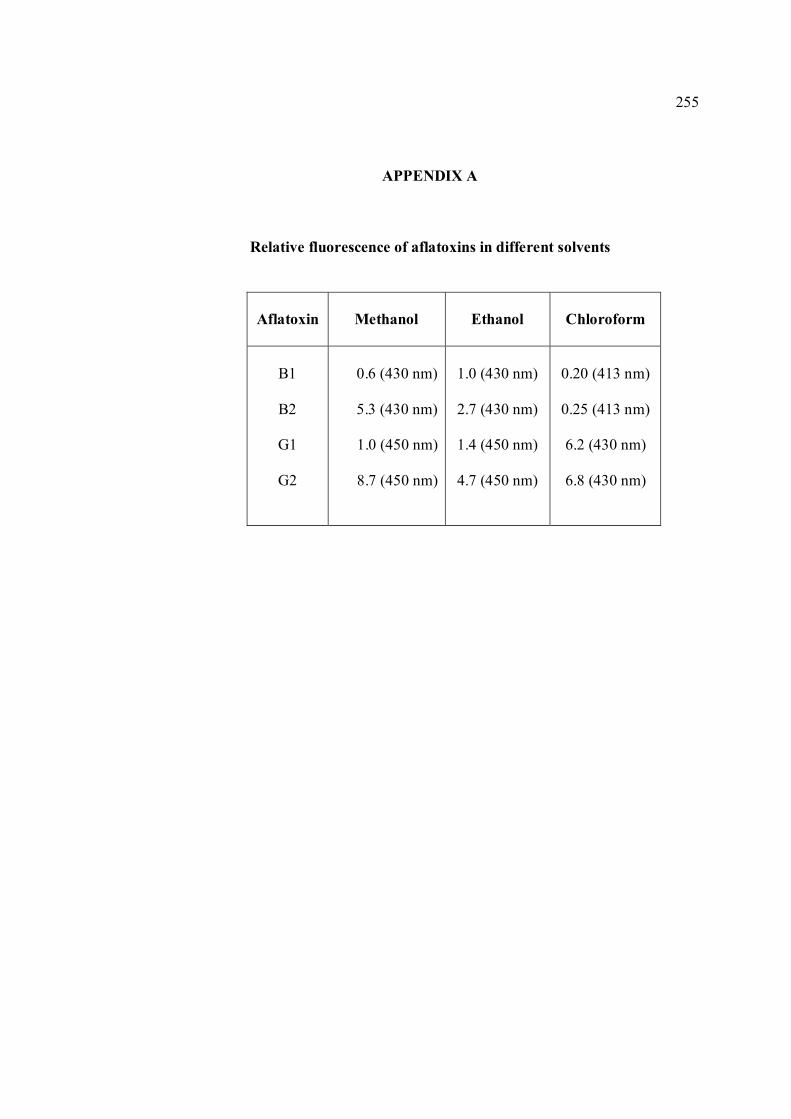
255
APPENDIX A
Relative fluorescence of aflatoxins in different solvents
Aflatoxin
Methanol
Ethanol
Chloroform
B1
B2
G1
G2
0.6 (430 nm)
5.3 (430 nm)
1.0 (450 nm)
8.7 (450 nm)
1.0 (430 nm)
2.7 (430 nm)
1.4 (450 nm)
4.7 (450 nm)
0.20 (413 nm)
0.25 (413 nm)
6.2 (430 nm)
6.8 (430 nm)

256
APPENDIX B

257
APPENDIX C
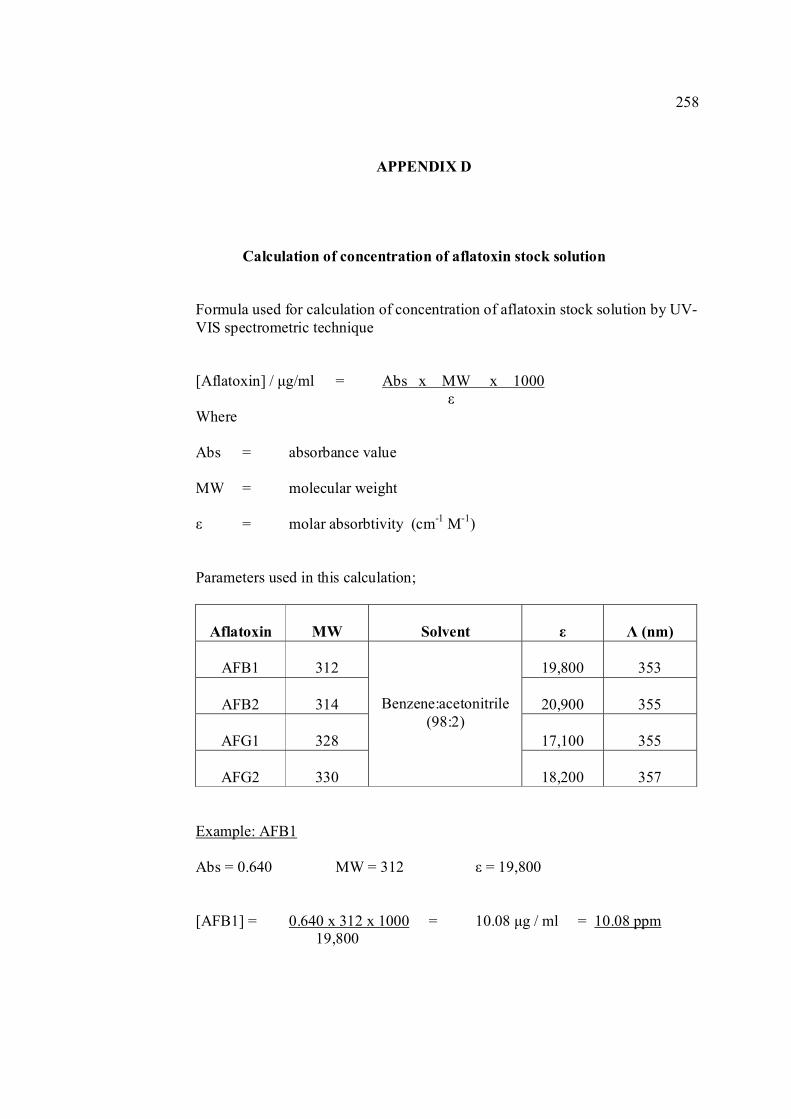
258
APPENDIX D
Calculation of concentration of aflatoxin stock solution
Formula used for calculation of concentration of aflatoxin stock solution by UV-VIS spectrometric technique
[Aflatoxin] / µg/ml = Abs x MW x 1000 ε Where Abs = absorbance value MW = molecular weight ε = molar absorbtivity (cm-1 M-1) Parameters used in this calculation;
Aflatoxin
MW
Solvent
ε
Λ (nm)
AFB1
312
19,800
353
AFB2
314
20,900
355
AFG1
328
17,100
355
AFG2
330
Benzene:acetonitrile (98:2)
18,200
357
Example: AFB1 Abs = 0.640 MW = 312 ε = 19,800 [AFB1] = 0.640 x 312 x 1000 = 10.08 µg / ml = 10.08 ppm 19,800
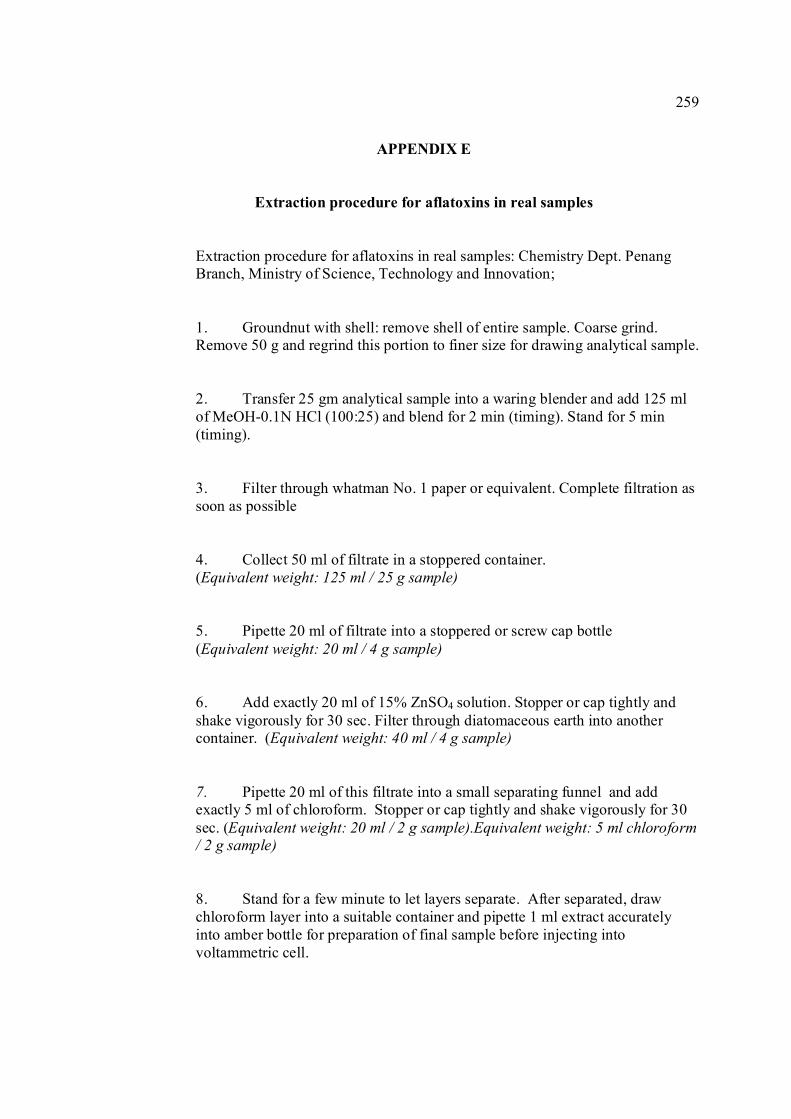
259
APPENDIX E
Extraction procedure for aflatoxins in real samples
Extraction procedure for aflatoxins in real samples: Chemistry Dept. Penang Branch, Ministry of Science, Technology and Innovation;
1. Groundnut with shell: remove shell of entire sample. Coarse grind. Remove 50 g and regrind this portion to finer size for drawing analytical sample.
2. Transfer 25 gm analytical sample into a waring blender and add 125 ml of MeOH-0.1N HCl (100:25) and blend for 2 min (timing). Stand for 5 min (timing).
3. Filter through whatman No. 1 paper or equivalent. Complete filtration as soon as possible
4. Collect 50 ml of filtrate in a stoppered container. (Equivalent weight: 125 ml / 25 g sample)
5. Pipette 20 ml of filtrate into a stoppered or screw cap bottle (Equivalent weight: 20 ml / 4 g sample)
6. Add exactly 20 ml of 15% ZnSO4 solution. Stopper or cap tightly and shake vigorously for 30 sec. Filter through diatomaceous earth into another container. (Equivalent weight: 40 ml / 4 g sample)
7. Pipette 20 ml of this filtrate into a small separating funnel and add exactly 5 ml of chloroform. Stopper or cap tightly and shake vigorously for 30 sec. (Equivalent weight: 20 ml / 2 g sample).Equivalent weight: 5 ml chloroform / 2 g sample)
8. Stand for a few minute to let layers separate. After separated, draw chloroform layer into a suitable container and pipette 1 ml extract accurately into amber bottle for preparation of final sample before injecting into voltammetric cell.

260
APPENDIX F
Calculation of individual aflatoxin in groundnut sample
Aflatoxin, ng/g (ppb) =
P x C x 1000 µl x 125 ml x 1 P’ 100 µl V W
where; P = peak height of sample (nA) P’= peak height of standard (after substract with peak height of sample) (nA) C = amount of aflatoxin injected into voltammetric cell (ng) V = effective volume; = 20 x volume of chloroform used for sample preparation = 20 x 1 = 2 ml 2 total volume of chloroform added 2 5 W = weight of sample (25 g)
===> P x C x 1000 µl x 125 ml x 1 P’ 100 µl 2 ml 25 g ===> P x C x 25 ( for injected volume = 100 µl) P’
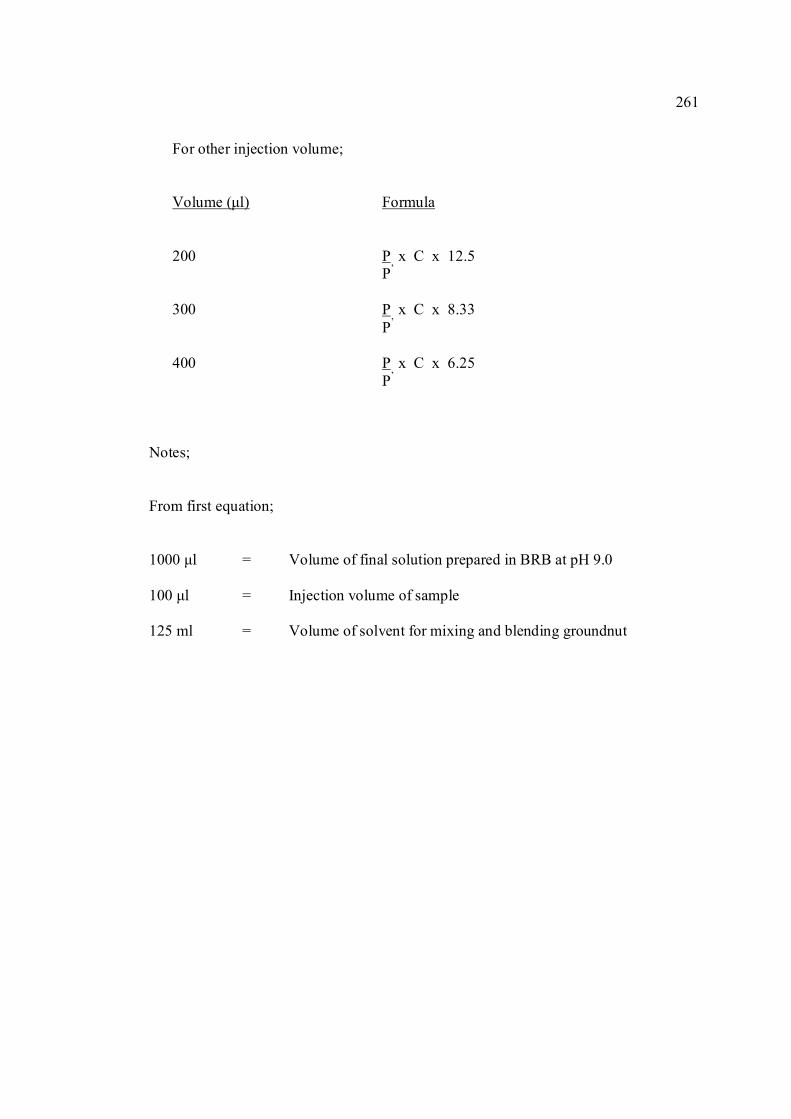
261
For other injection volume; Volume (µl) Formula 200 P x C x 12.5
P’
300 P x C x 8.33 P’
400 P x C x 6.25
P’
Notes; From first equation; 1000 µl = Volume of final solution prepared in BRB at pH 9.0 100 µl = Injection volume of sample 125 ml = Volume of solvent for mixing and blending groundnut
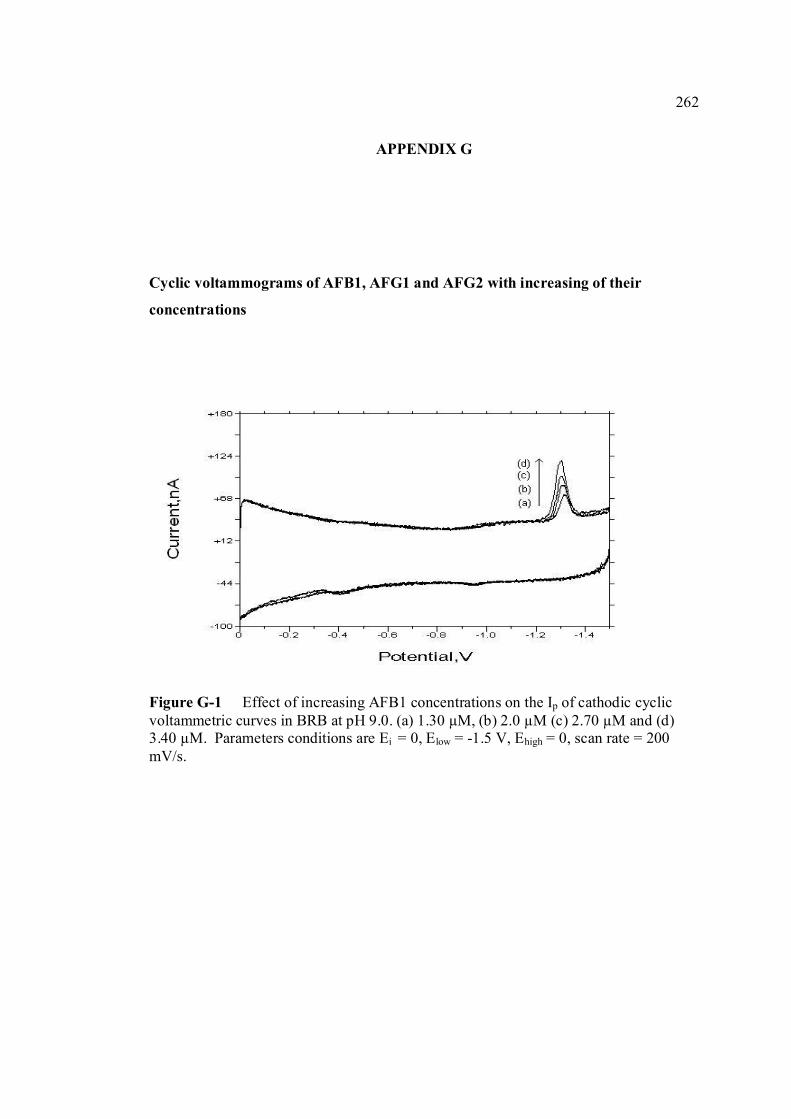
262
APPENDIX G
Cyclic voltammograms of AFB1, AFG1 and AFG2 with increasing of their
concentrations
Figure G-1 Effect of increasing AFB1 concentrations on the Ip of cathodic cyclic voltammetric curves in BRB at pH 9.0. (a) 1.30 µM, (b) 2.0 µM (c) 2.70 µM and (d) 3.40 µM. Parameters conditions are Ei = 0, Elow = -1.5 V, Ehigh = 0, scan rate = 200 mV/s.
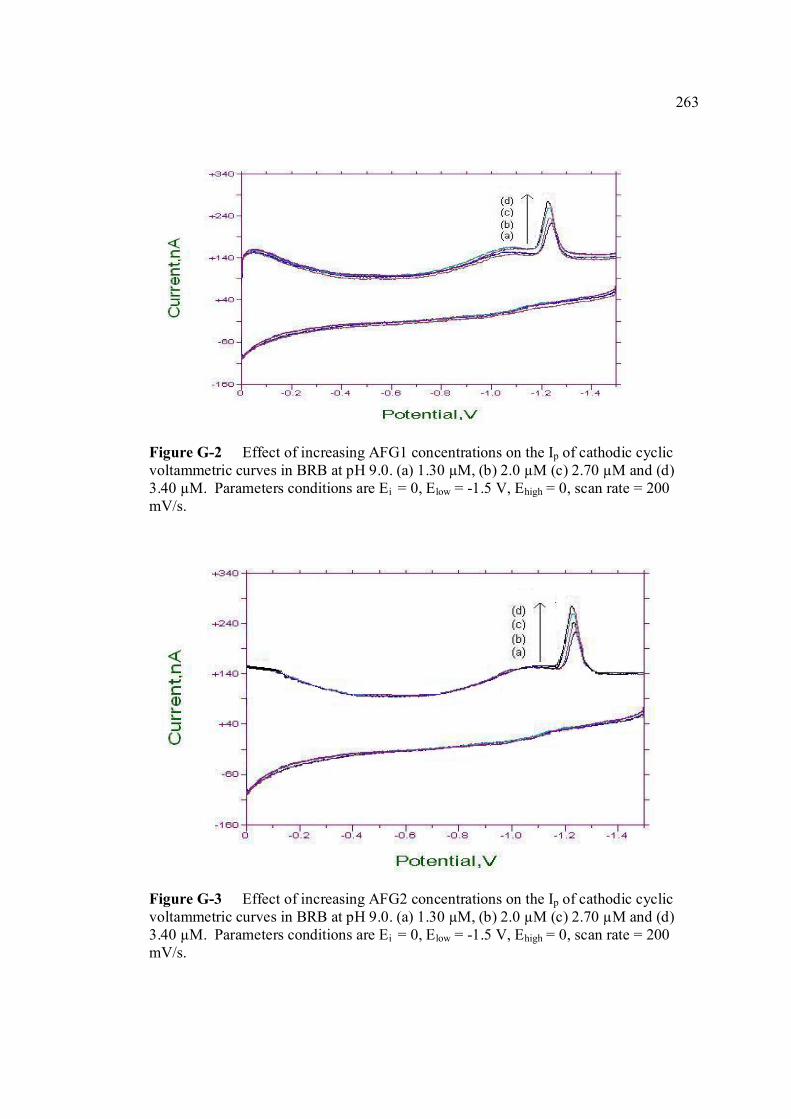
263
Figure G-2 Effect of increasing AFG1 concentrations on the Ip of cathodic cyclic voltammetric curves in BRB at pH 9.0. (a) 1.30 µM, (b) 2.0 µM (c) 2.70 µM and (d) 3.40 µM. Parameters conditions are Ei = 0, Elow = -1.5 V, Ehigh = 0, scan rate = 200 mV/s. Figure G-3 Effect of increasing AFG2 concentrations on the Ip of cathodic cyclic voltammetric curves in BRB at pH 9.0. (a) 1.30 µM, (b) 2.0 µM (c) 2.70 µM and (d) 3.40 µM. Parameters conditions are Ei = 0, Elow = -1.5 V, Ehigh = 0, scan rate = 200 mV/s.
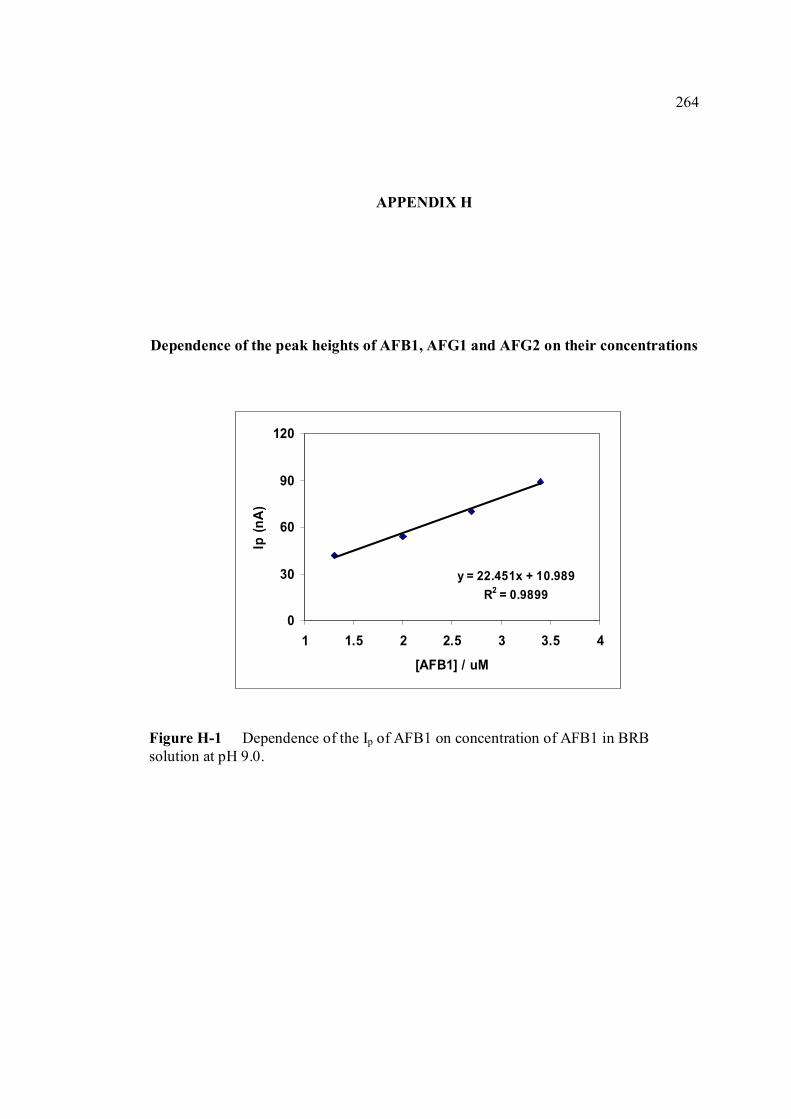
264
y = 22.451x + 10.989R2 = 0.9899
0
30
60
90
120
1 1.5 2 2.5 3 3.5 4
[AFB1] / uM
Ip (n
A)
APPENDIX H
Dependence of the peak heights of AFB1, AFG1 and AFG2 on their concentrations Figure H-1 Dependence of the Ip of AFB1 on concentration of AFB1 in BRB solution at pH 9.0.
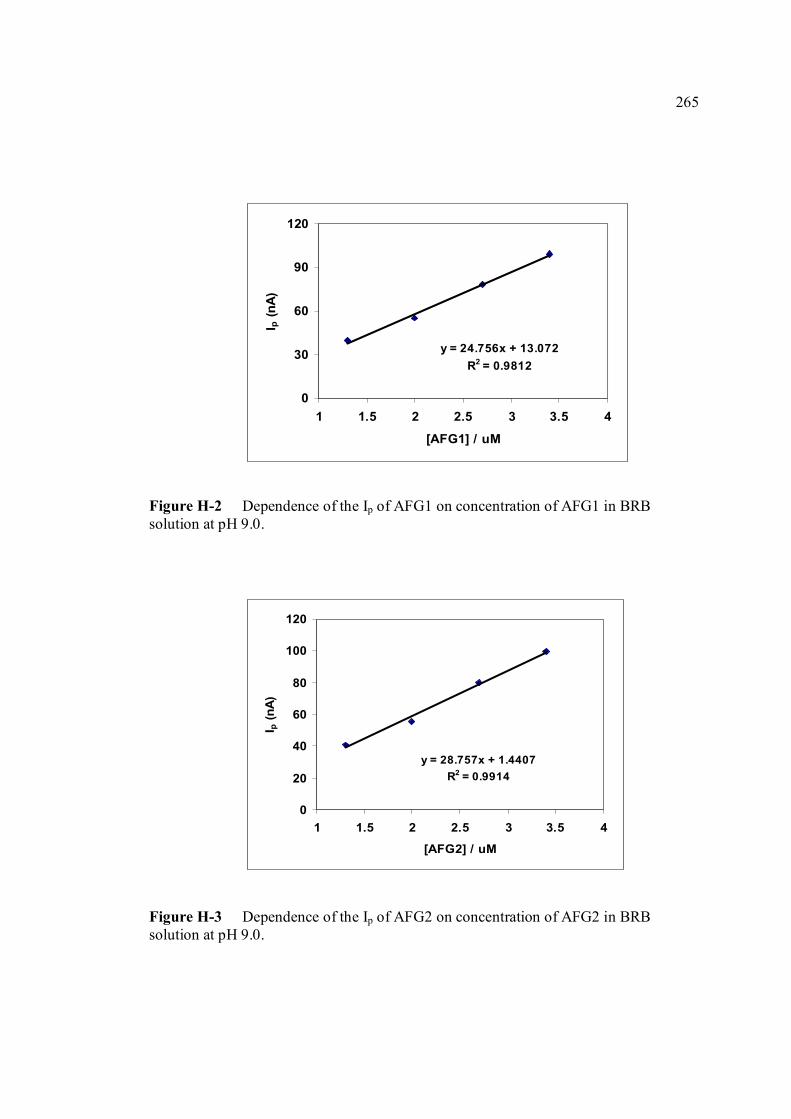
265
y = 28.757x + 1.4407R2 = 0.9914
0
20
40
60
80
100
120
1 1.5 2 2.5 3 3.5 4
[AFG2] / uM
I p (n
A)
y = 24.756x + 13.072R2 = 0.9812
0
30
60
90
120
1 1.5 2 2.5 3 3.5 4
[AFG1] / uM
I p (n
A)
Figure H-2 Dependence of the Ip of AFG1 on concentration of AFG1 in BRB solution at pH 9.0. Figure H-3 Dependence of the Ip of AFG2 on concentration of AFG2 in BRB solution at pH 9.0.
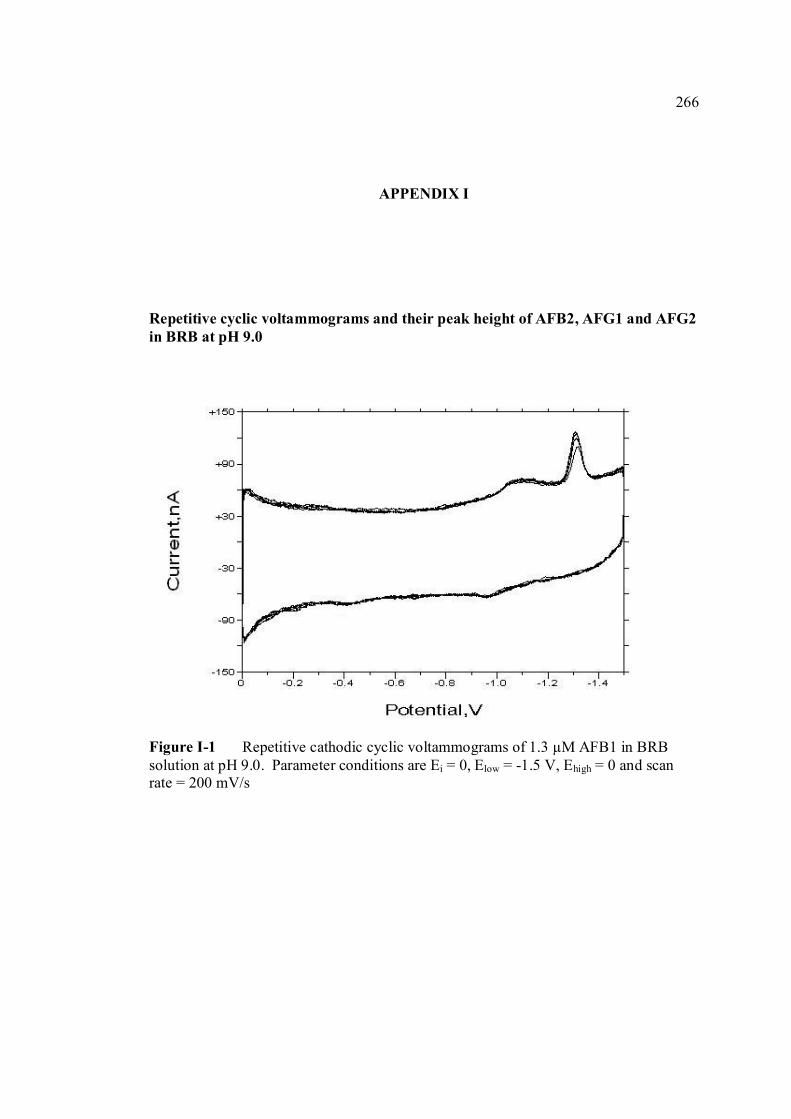
266
APPENDIX I
Repetitive cyclic voltammograms and their peak height of AFB2, AFG1 and AFG2 in BRB at pH 9.0 Figure I-1 Repetitive cathodic cyclic voltammograms of 1.3 µM AFB1 in BRB solution at pH 9.0. Parameter conditions are Ei = 0, Elow = -1.5 V, Ehigh = 0 and scan rate = 200 mV/s
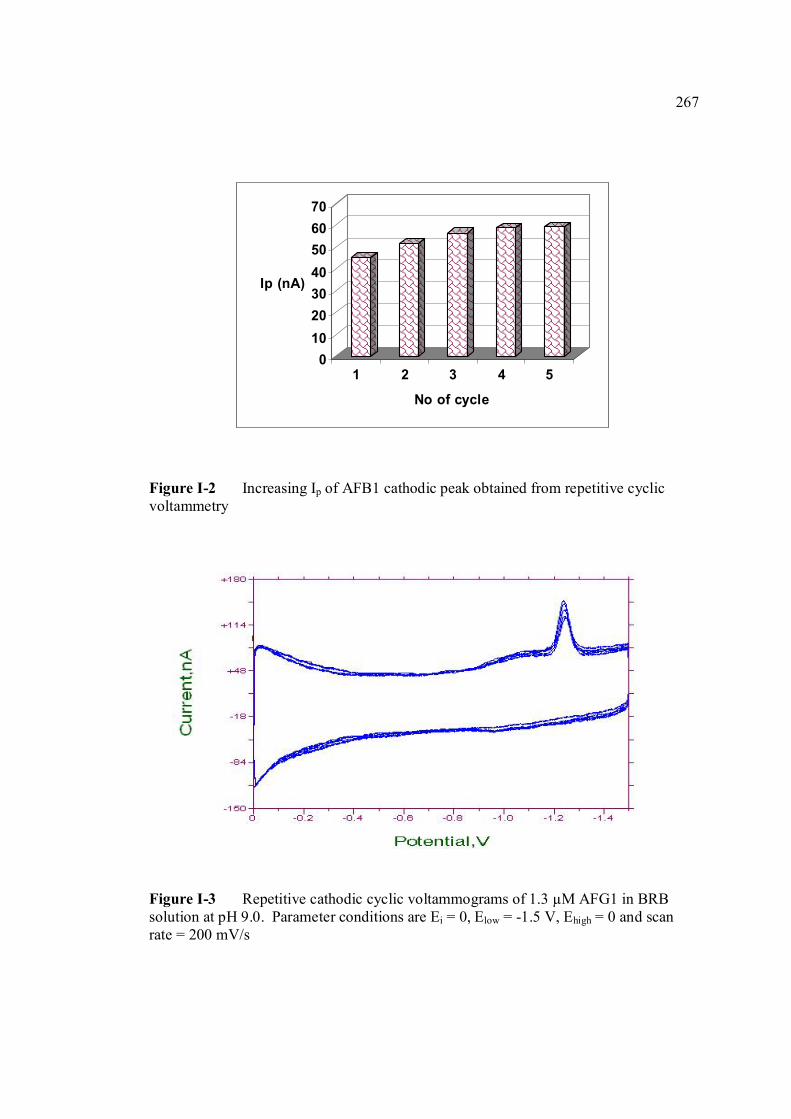
267
010203040506070
Ip (nA)
1 2 3 4 5
No of cycle
Figure I-2 Increasing Ip of AFB1 cathodic peak obtained from repetitive cyclic voltammetry Figure I-3 Repetitive cathodic cyclic voltammograms of 1.3 µM AFG1 in BRB solution at pH 9.0. Parameter conditions are Ei = 0, Elow = -1.5 V, Ehigh = 0 and scan rate = 200 mV/s
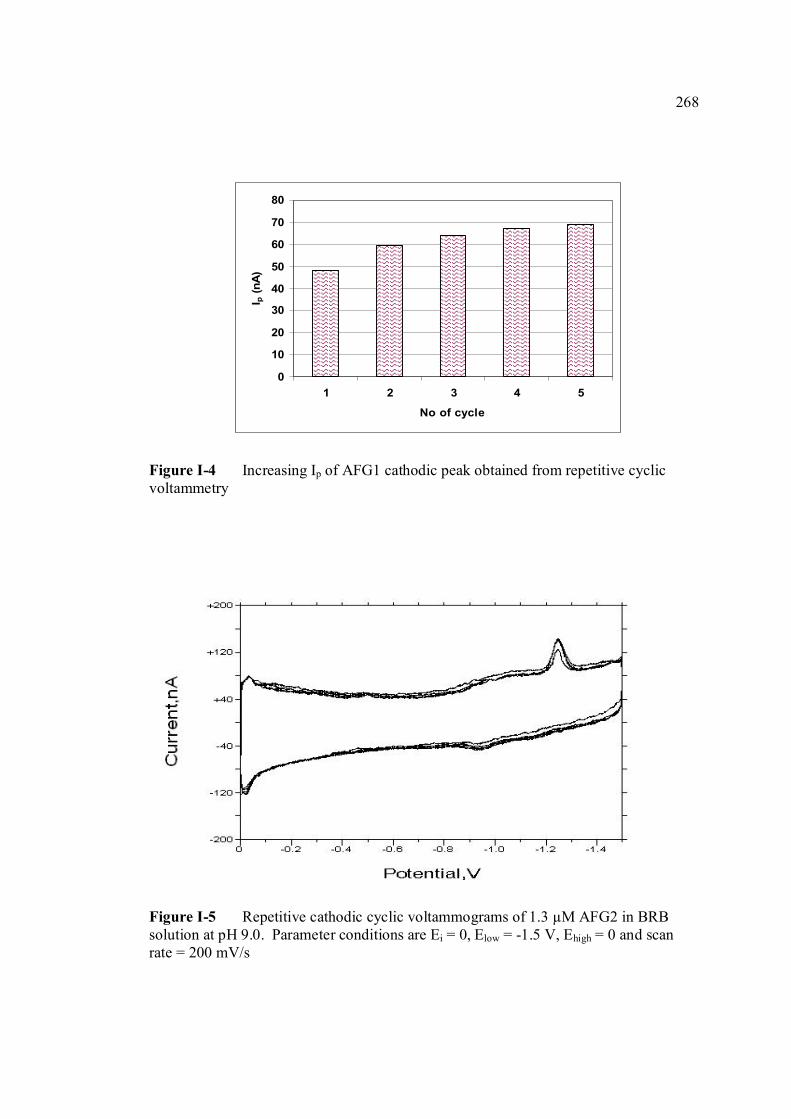
268
0
10
20
30
40
50
60
70
80
1 2 3 4 5
No of cycle
I p (n
A)
Figure I-4 Increasing Ip of AFG1 cathodic peak obtained from repetitive cyclic voltammetry Figure I-5 Repetitive cathodic cyclic voltammograms of 1.3 µM AFG2 in BRB solution at pH 9.0. Parameter conditions are Ei = 0, Elow = -1.5 V, Ehigh = 0 and scan rate = 200 mV/s
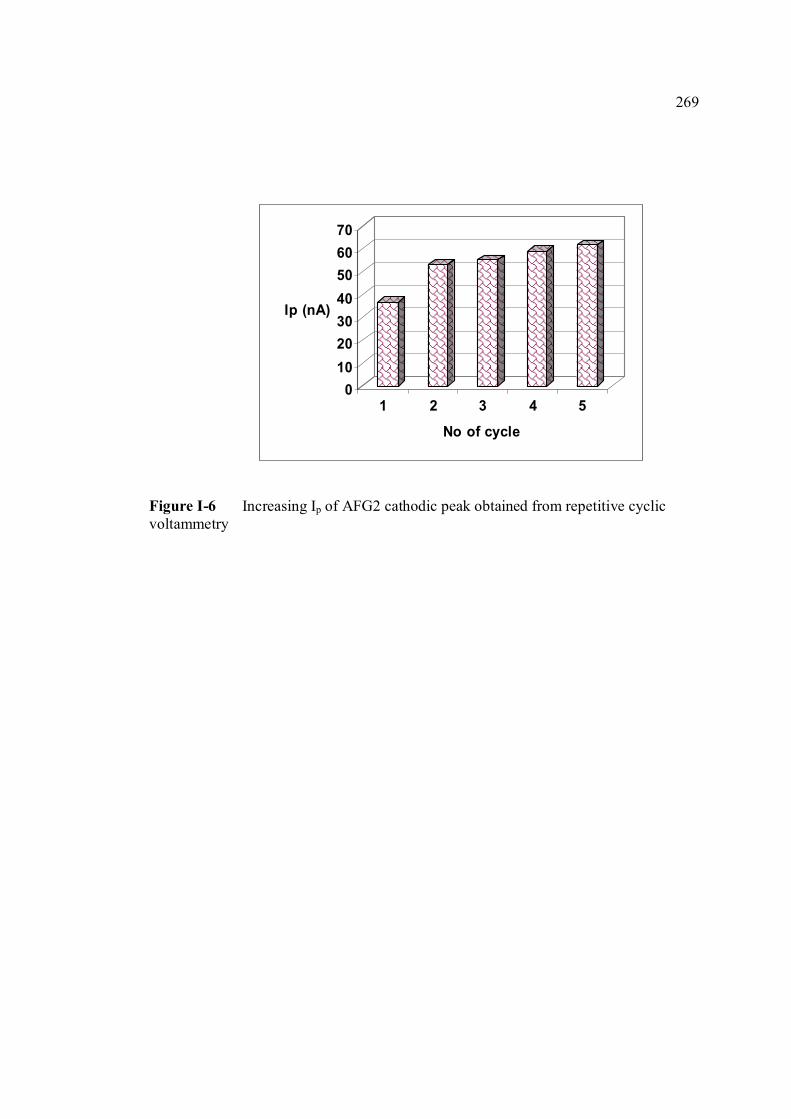
269
010203040506070
Ip (nA)
1 2 3 4 5
No of cycle
Figure I-6 Increasing Ip of AFG2 cathodic peak obtained from repetitive cyclic voltammetry
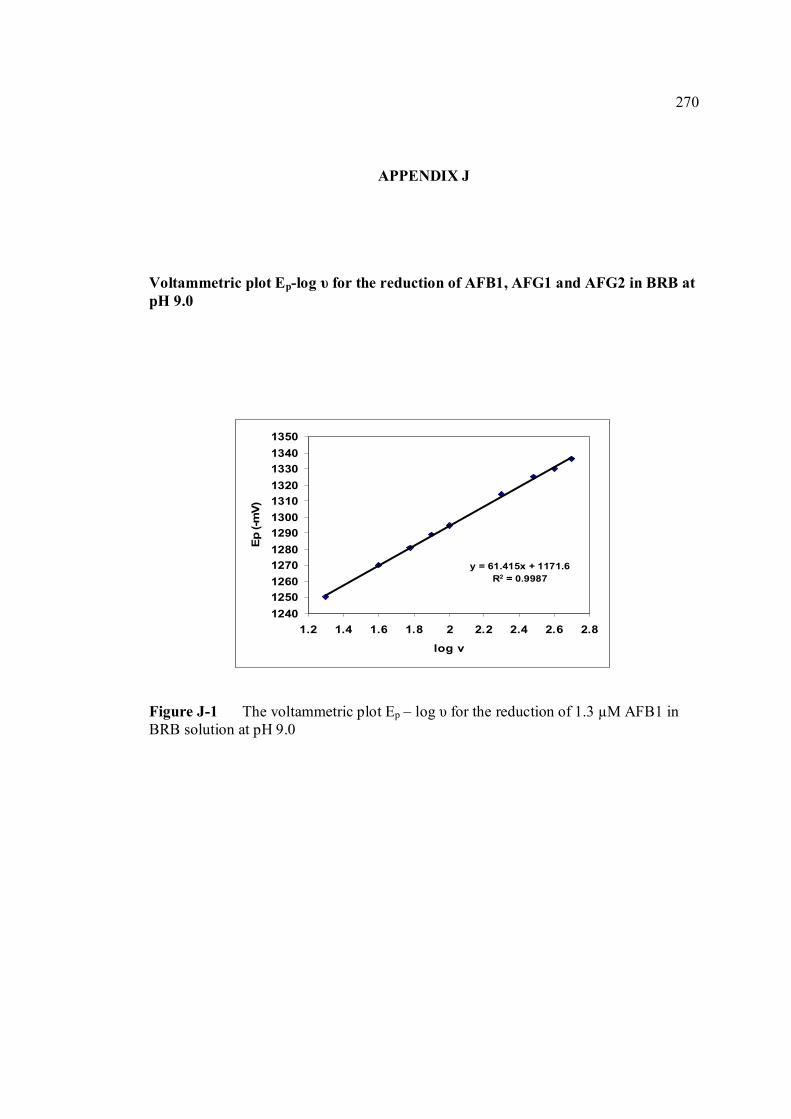
270
y = 61.415x + 1171.6R2 = 0.9987
124012501260127012801290130013101320133013401350
1.2 1.4 1.6 1.8 2 2.2 2.4 2.6 2.8
log v
Ep
(-mV)
APPENDIX J
Voltammetric plot Ep-log υ for the reduction of AFB1, AFG1 and AFG2 in BRB at pH 9.0 Figure J-1 The voltammetric plot Ep – log υ for the reduction of 1.3 µM AFB1 in BRB solution at pH 9.0
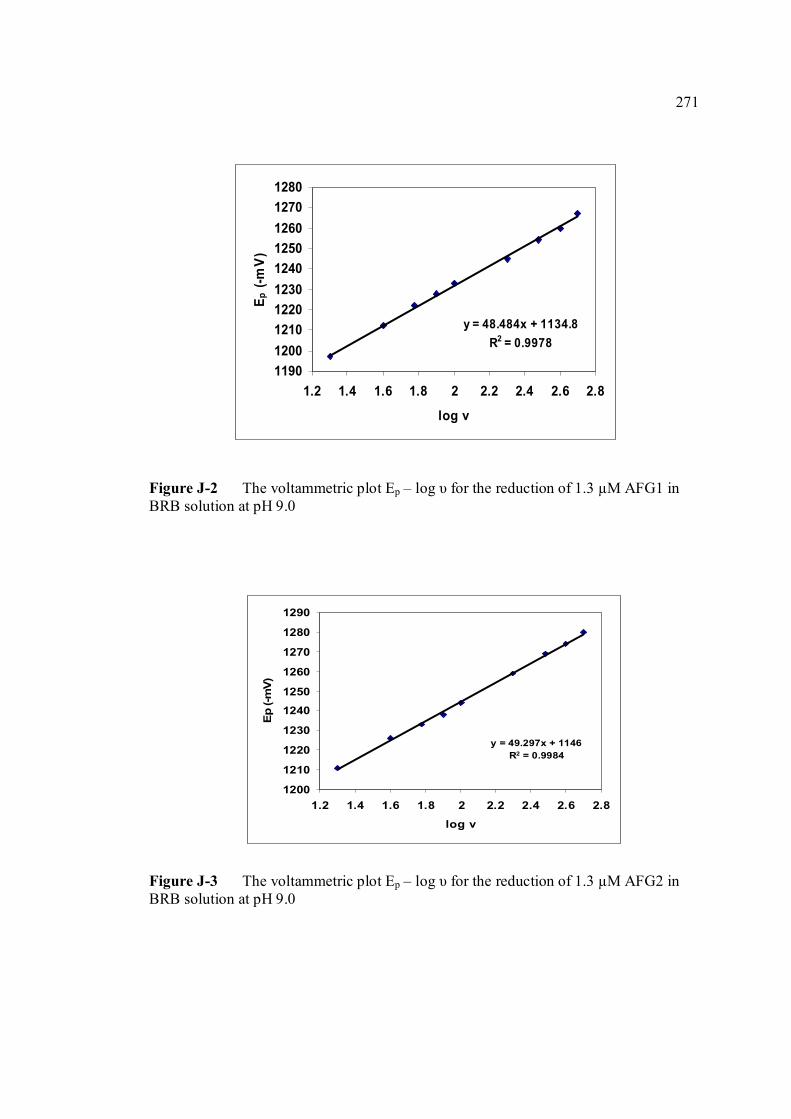
271
y = 49.297x + 1146R2 = 0.9984
1200
1210
1220
1230
1240
1250
1260
1270
1280
1290
1.2 1.4 1.6 1.8 2 2.2 2.4 2.6 2.8
log v
Ep
(-mV)
y = 48.484x + 1134.8R2 = 0.9978
1190120012101220123012401250126012701280
1.2 1.4 1.6 1.8 2 2.2 2.4 2.6 2.8
log v
E p (-
mV
)
Figure J-2 The voltammetric plot Ep – log υ for the reduction of 1.3 µM AFG1 in BRB solution at pH 9.0 Figure J-3 The voltammetric plot Ep – log υ for the reduction of 1.3 µM AFG2 in BRB solution at pH 9.0
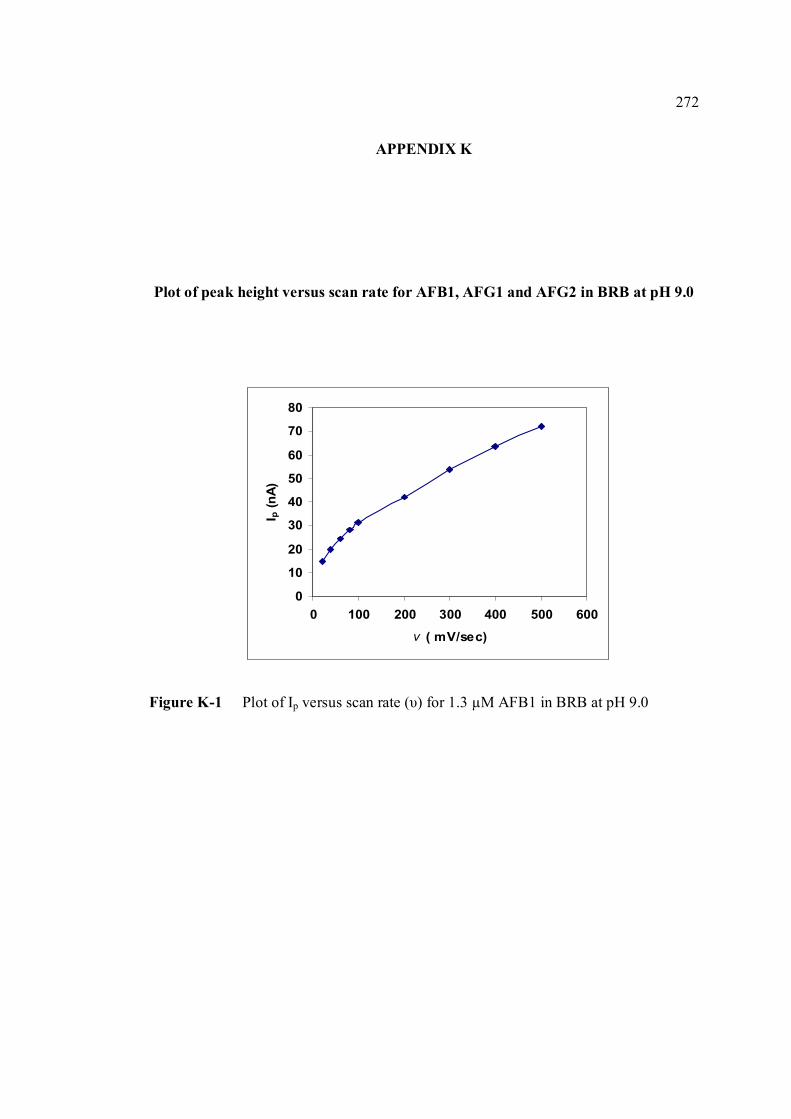
272
0
10
20
30
40
50
60
70
80
0 100 200 300 400 500 600
v ( mV/sec)
I p (n
A)
APPENDIX K
Plot of peak height versus scan rate for AFB1, AFG1 and AFG2 in BRB at pH 9.0 Figure K-1 Plot of Ip versus scan rate (υ) for 1.3 µM AFB1 in BRB at pH 9.0
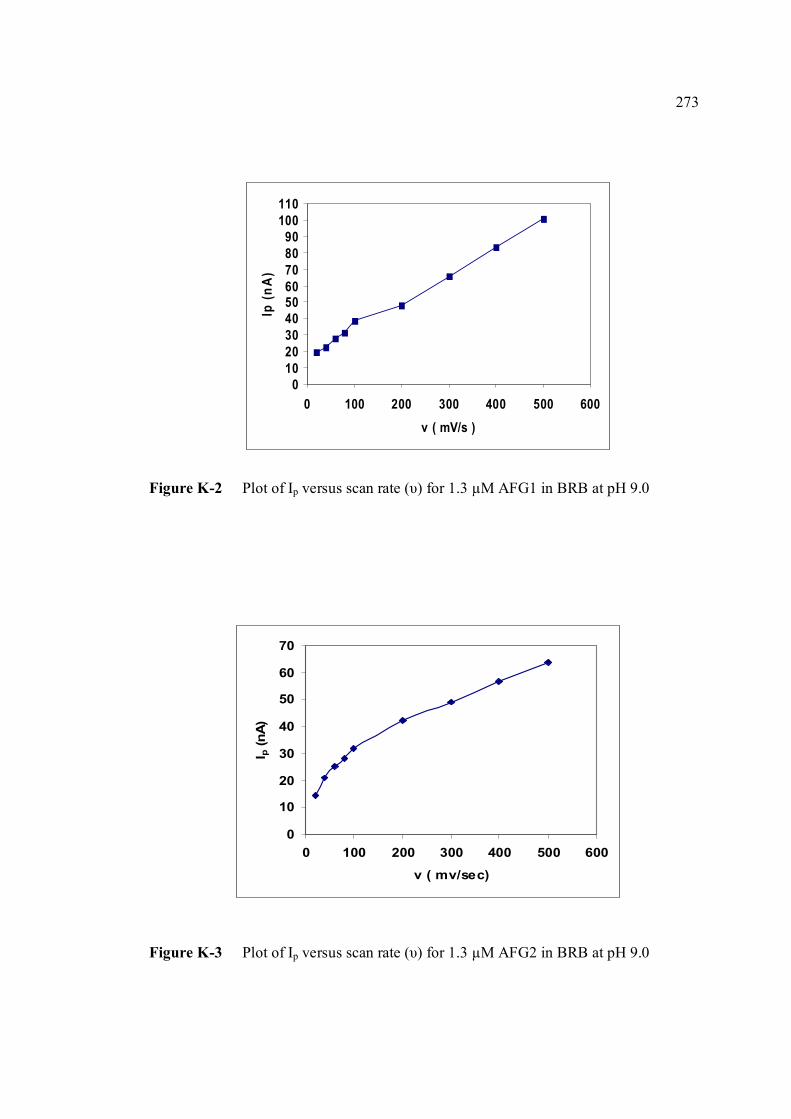
273
0102030405060708090
100110
0 100 200 300 400 500 600v ( mV/s )
Ip (n
A)
0
10
20
30
40
50
60
70
0 100 200 300 400 500 600
v ( mv/sec)
I p (n
A)
Figure K-2 Plot of Ip versus scan rate (υ) for 1.3 µM AFG1 in BRB at pH 9.0 Figure K-3 Plot of Ip versus scan rate (υ) for 1.3 µM AFG2 in BRB at pH 9.0
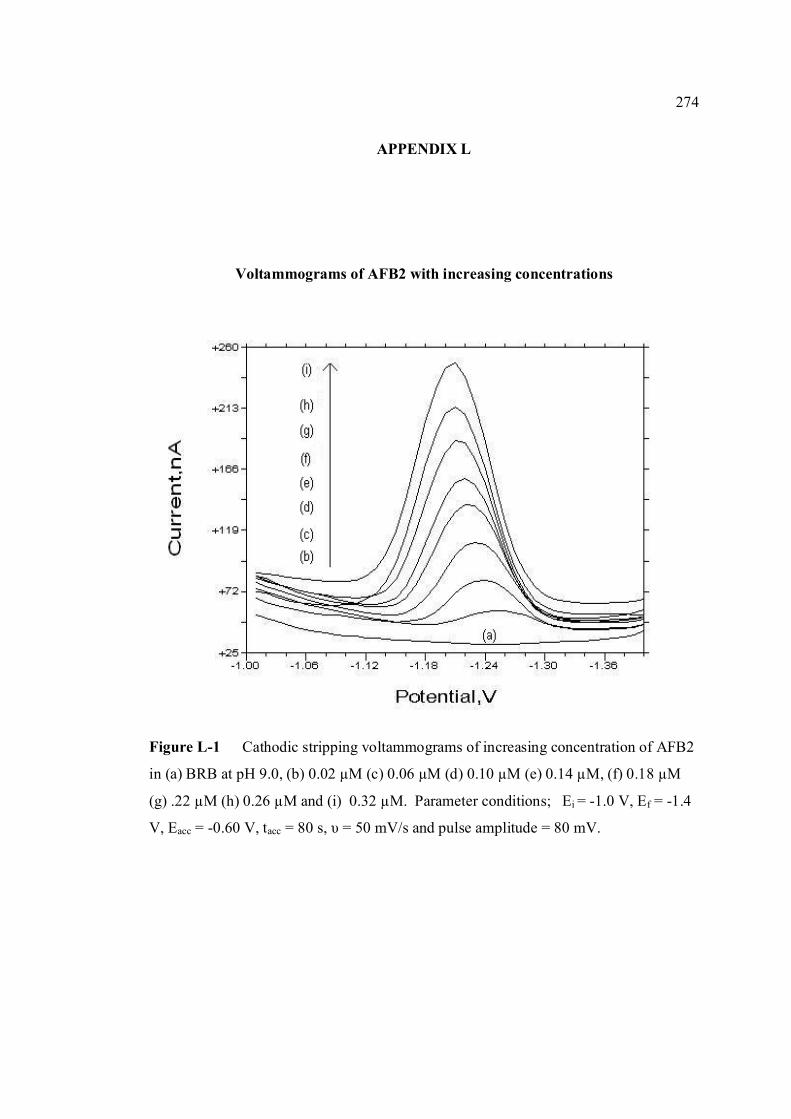
274
APPENDIX L
Voltammograms of AFB2 with increasing concentrations
Figure L-1 Cathodic stripping voltammograms of increasing concentration of AFB2
in (a) BRB at pH 9.0, (b) 0.02 µM (c) 0.06 µM (d) 0.10 µM (e) 0.14 µM, (f) 0.18 µM
(g) .22 µM (h) 0.26 µM and (i) 0.32 µM. Parameter conditions; Ei = -1.0 V, Ef = -1.4
V, Eacc = -0.60 V, tacc = 80 s, υ = 50 mV/s and pulse amplitude = 80 mV.
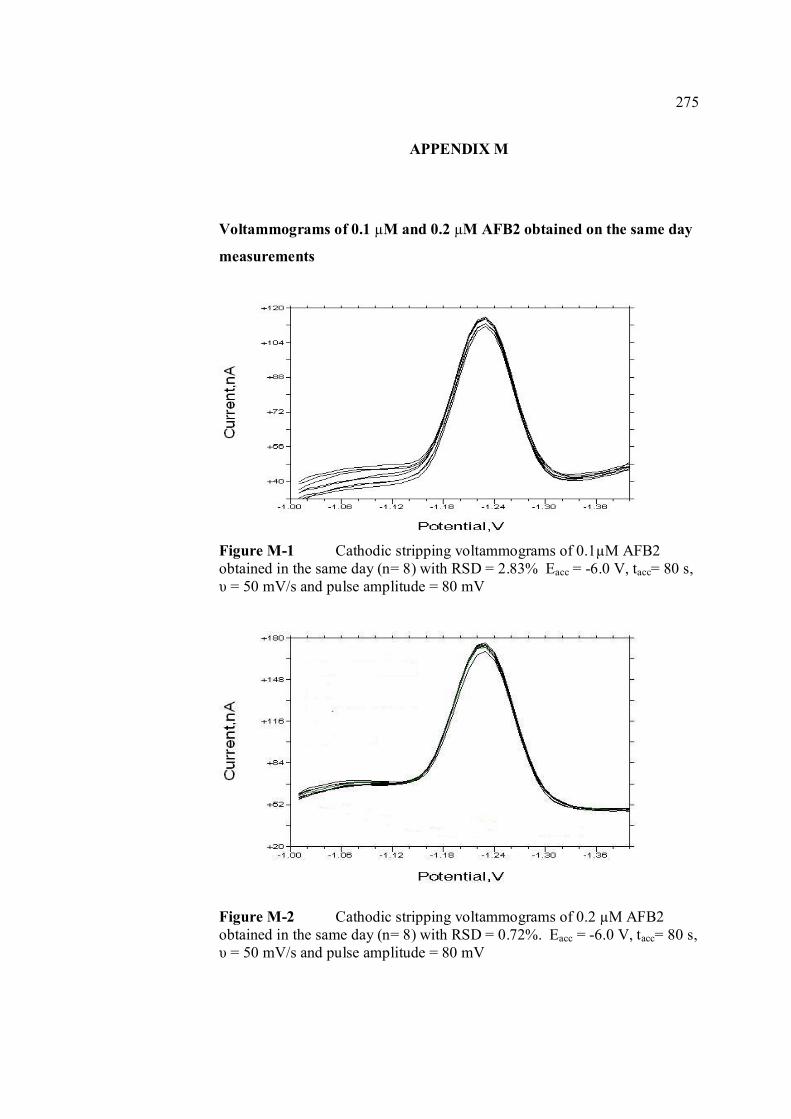
275
APPENDIX M
Voltammograms of 0.1 µM and 0.2 µM AFB2 obtained on the same day
measurements
Figure M-1 Cathodic stripping voltammograms of 0.1µM AFB2 obtained in the same day (n= 8) with RSD = 2.83% Eacc = -6.0 V, tacc= 80 s, υ = 50 mV/s and pulse amplitude = 80 mV
Figure M-2 Cathodic stripping voltammograms of 0.2 µM AFB2 obtained in the same day (n= 8) with RSD = 0.72%. Eacc = -6.0 V, tacc= 80 s, υ = 50 mV/s and pulse amplitude = 80 mV
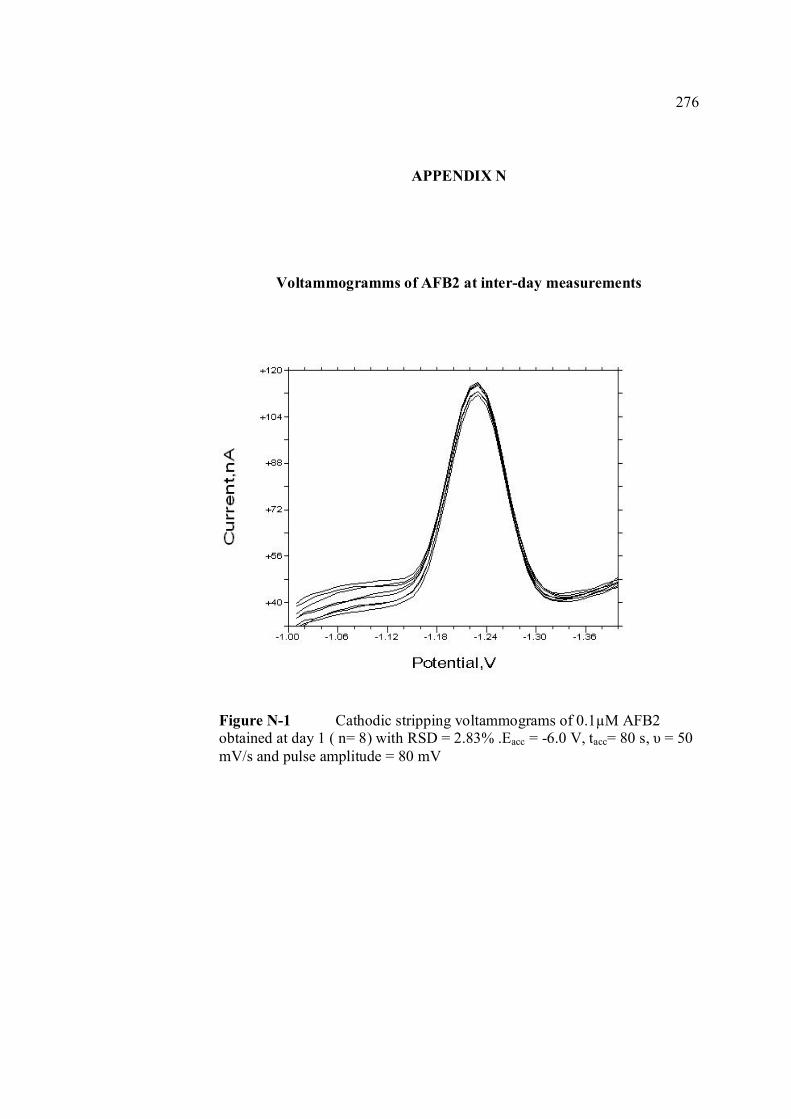
276
APPENDIX N
Voltammogramms of AFB2 at inter-day measurements
Figure N-1 Cathodic stripping voltammograms of 0.1µM AFB2 obtained at day 1 ( n= 8) with RSD = 2.83% .Eacc = -6.0 V, tacc= 80 s, υ = 50 mV/s and pulse amplitude = 80 mV
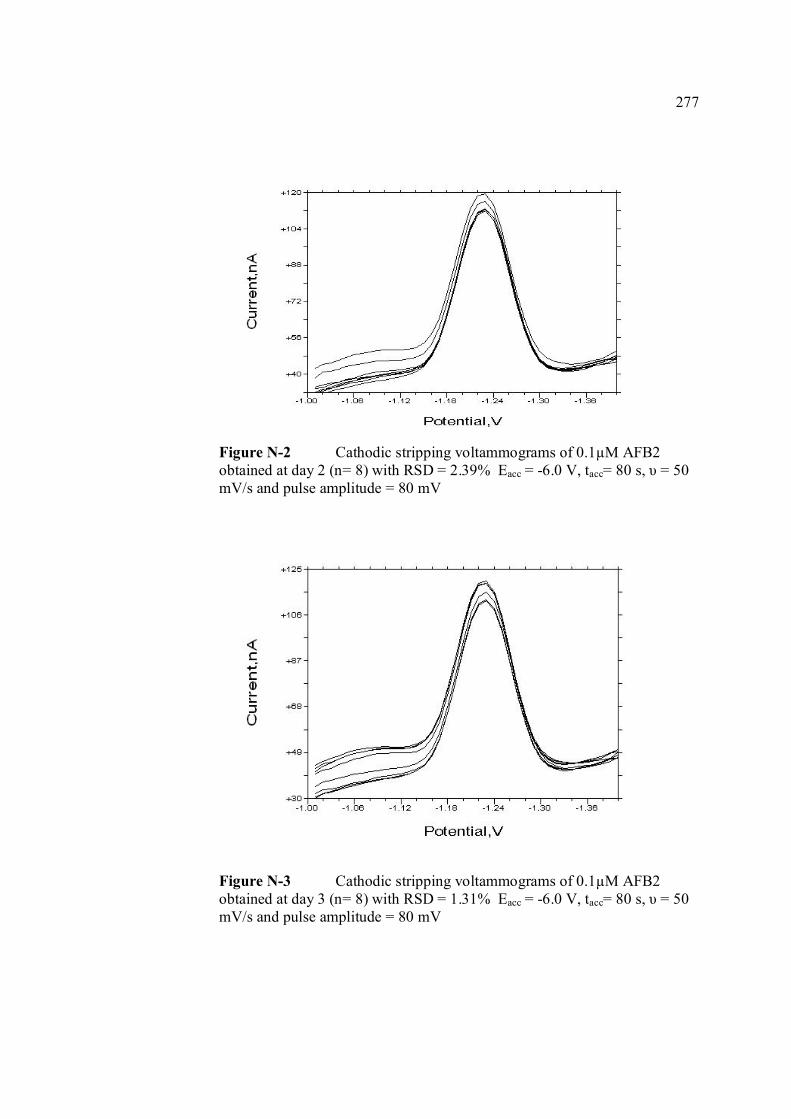
277
Figure N-2 Cathodic stripping voltammograms of 0.1µM AFB2 obtained at day 2 (n= 8) with RSD = 2.39% Eacc = -6.0 V, tacc= 80 s, υ = 50 mV/s and pulse amplitude = 80 mV
Figure N-3 Cathodic stripping voltammograms of 0.1µM AFB2 obtained at day 3 (n= 8) with RSD = 1.31% Eacc = -6.0 V, tacc= 80 s, υ = 50 mV/s and pulse amplitude = 80 mV
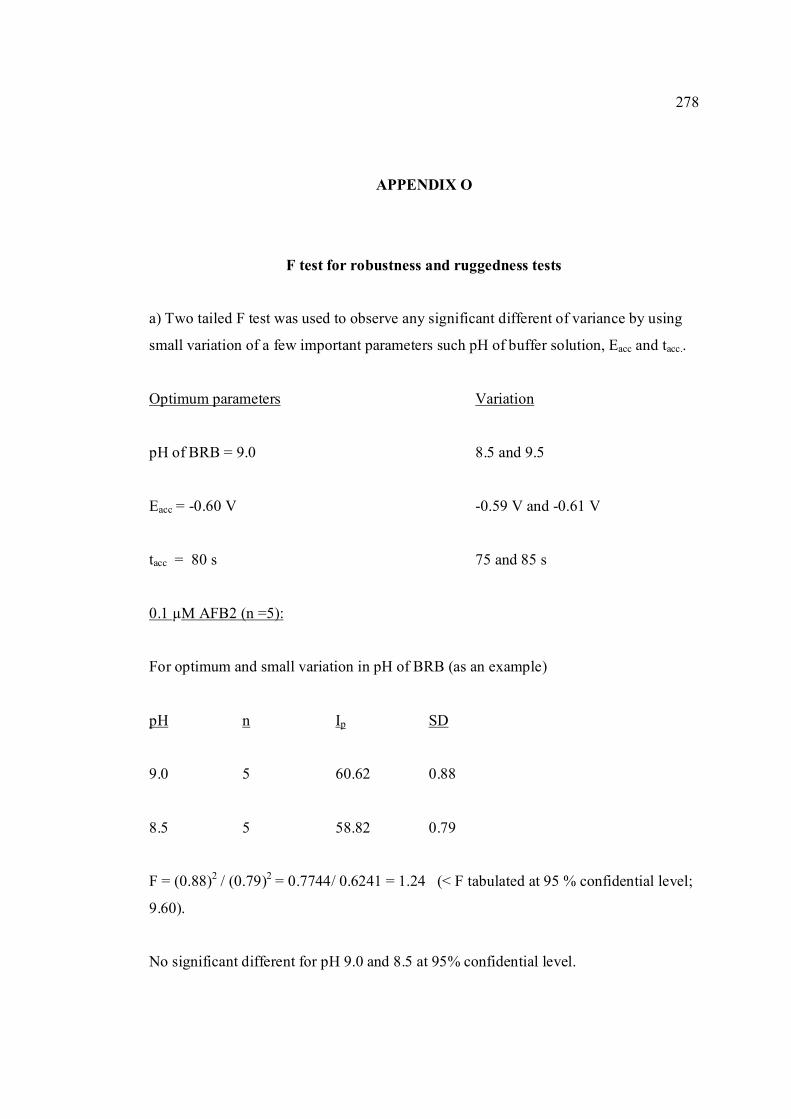
278
APPENDIX O
F test for robustness and ruggedness tests
a) Two tailed F test was used to observe any significant different of variance by using
small variation of a few important parameters such pH of buffer solution, Eacc and tacc..
Optimum parameters Variation
pH of BRB = 9.0 8.5 and 9.5
Eacc = -0.60 V -0.59 V and -0.61 V
tacc = 80 s 75 and 85 s
0.1 µM AFB2 (n =5):
For optimum and small variation in pH of BRB (as an example)
pH n Ip SD
9.0 5 60.62 0.88
8.5 5 58.82 0.79
F = (0.88)2 / (0.79)2 = 0.7744/ 0.6241 = 1.24 (< F tabulated at 95 % confidential level;
9.60).
No significant different for pH 9.0 and 8.5 at 95% confidential level.
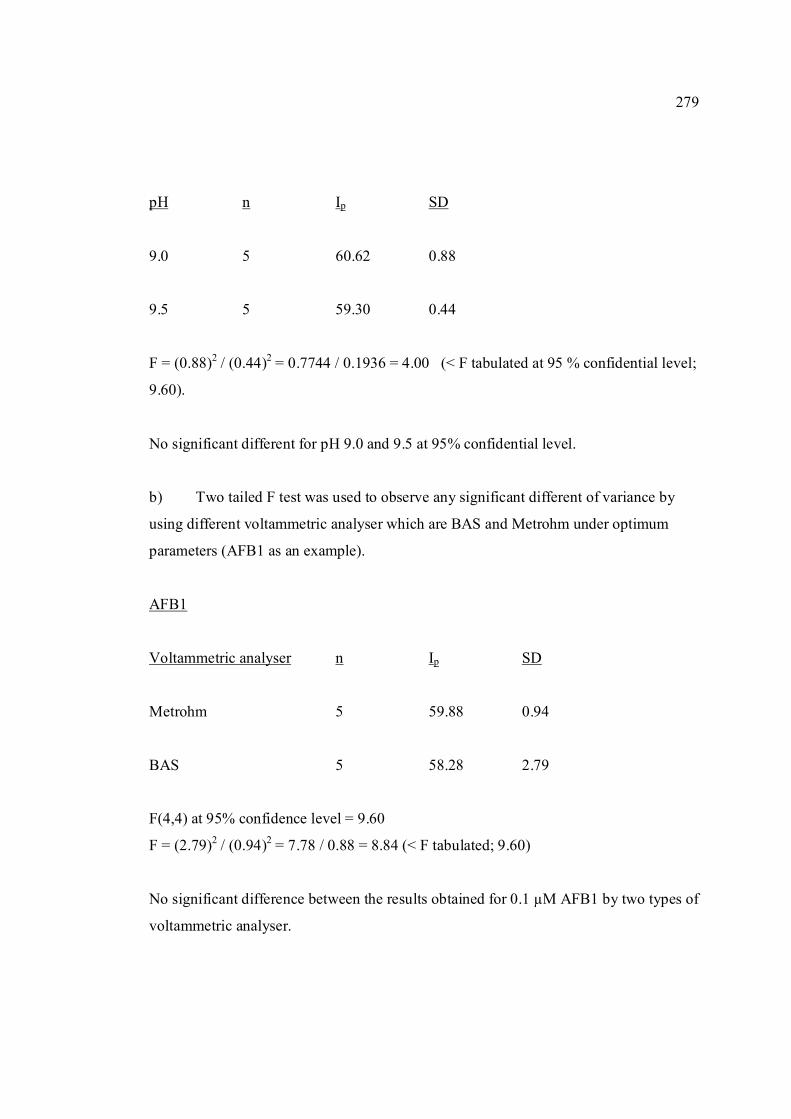
279
pH n Ip SD
9.0 5 60.62 0.88
9.5 5 59.30 0.44
F = (0.88)2 / (0.44)2 = 0.7744 / 0.1936 = 4.00 (< F tabulated at 95 % confidential level;
9.60).
No significant different for pH 9.0 and 9.5 at 95% confidential level.
b) Two tailed F test was used to observe any significant different of variance by
using different voltammetric analyser which are BAS and Metrohm under optimum
parameters (AFB1 as an example).
AFB1
Voltammetric analyser n Ip SD
Metrohm 5 59.88 0.94
BAS 5 58.28 2.79
F(4,4) at 95% confidence level = 9.60
F = (2.79)2 / (0.94)2 = 7.78 / 0.88 = 8.84 (< F tabulated; 9.60)
No significant difference between the results obtained for 0.1 µM AFB1 by two types of
voltammetric analyser.
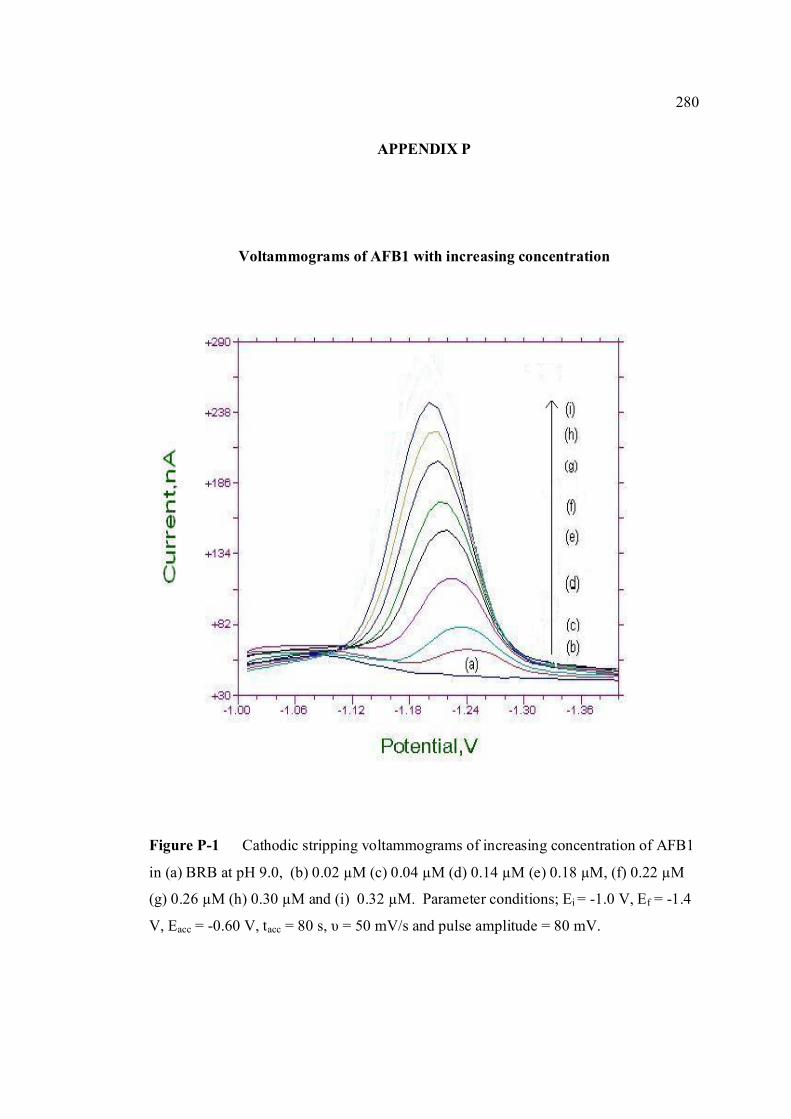
280
APPENDIX P
Voltammograms of AFB1 with increasing concentration Figure P-1 Cathodic stripping voltammograms of increasing concentration of AFB1
in (a) BRB at pH 9.0, (b) 0.02 µM (c) 0.04 µM (d) 0.14 µM (e) 0.18 µM, (f) 0.22 µM
(g) 0.26 µM (h) 0.30 µM and (i) 0.32 µM. Parameter conditions; Ei = -1.0 V, Ef = -1.4
V, Eacc = -0.60 V, tacc = 80 s, υ = 50 mV/s and pulse amplitude = 80 mV.
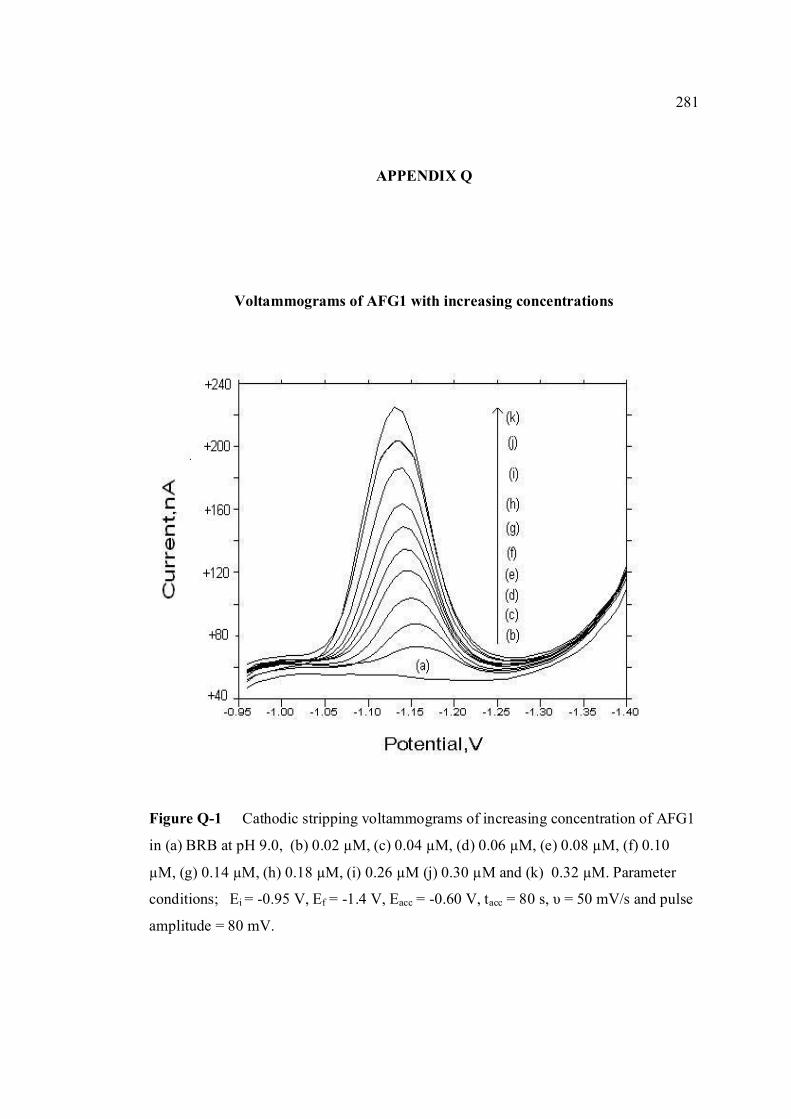
281
APPENDIX Q
Voltammograms of AFG1 with increasing concentrations
Figure Q-1 Cathodic stripping voltammograms of increasing concentration of AFG1
in (a) BRB at pH 9.0, (b) 0.02 µM, (c) 0.04 µM, (d) 0.06 µM, (e) 0.08 µM, (f) 0.10
µM, (g) 0.14 µM, (h) 0.18 µM, (i) 0.26 µM (j) 0.30 µM and (k) 0.32 µM. Parameter
conditions; Ei = -0.95 V, Ef = -1.4 V, Eacc = -0.60 V, tacc = 80 s, υ = 50 mV/s and pulse
amplitude = 80 mV.
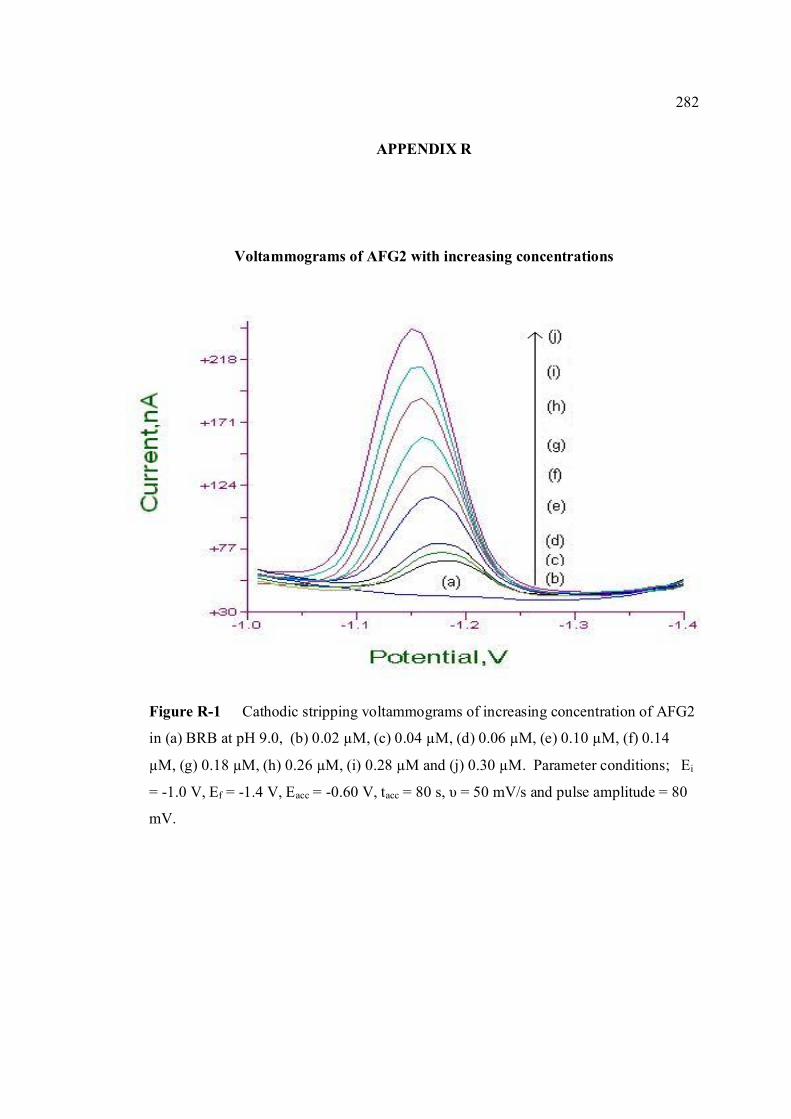
282
APPENDIX R
Voltammograms of AFG2 with increasing concentrations
Figure R-1 Cathodic stripping voltammograms of increasing concentration of AFG2
in (a) BRB at pH 9.0, (b) 0.02 µM, (c) 0.04 µM, (d) 0.06 µM, (e) 0.10 µM, (f) 0.14
µM, (g) 0.18 µM, (h) 0.26 µM, (i) 0.28 µM and (j) 0.30 µM. Parameter conditions; Ei
= -1.0 V, Ef = -1.4 V, Eacc = -0.60 V, tacc = 80 s, υ = 50 mV/s and pulse amplitude = 80
mV.
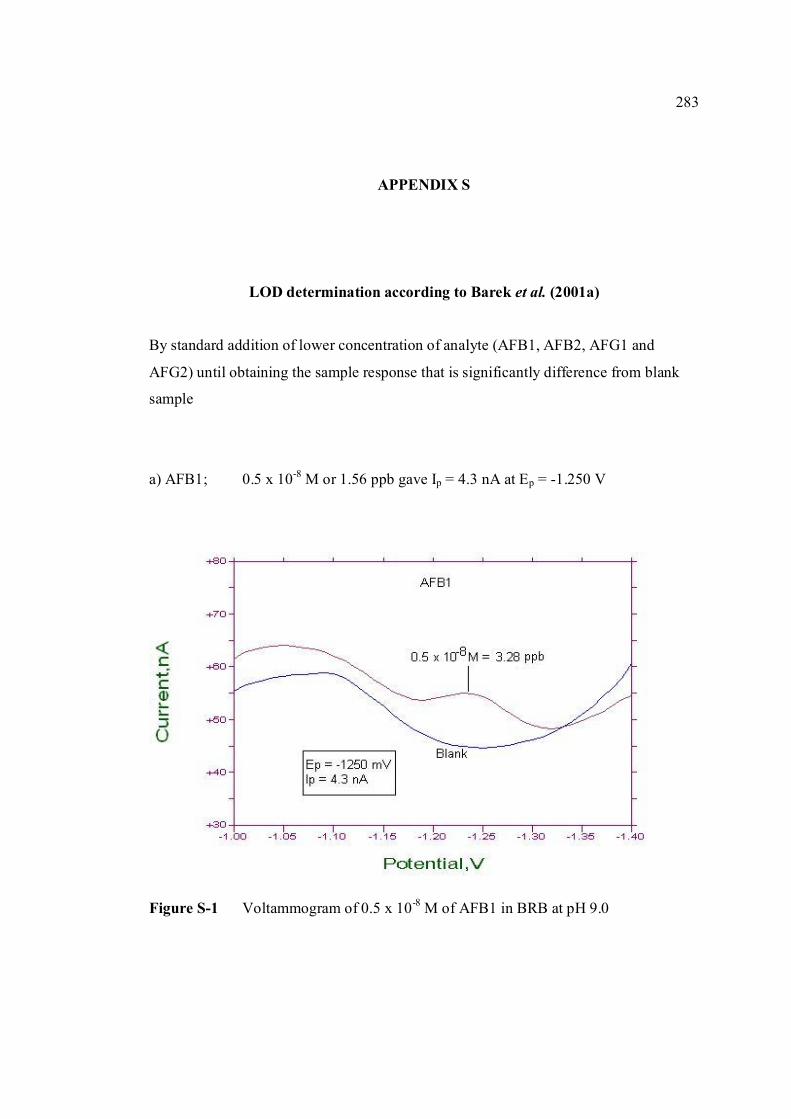
283
APPENDIX S
LOD determination according to Barek et al. (2001a)
By standard addition of lower concentration of analyte (AFB1, AFB2, AFG1 and
AFG2) until obtaining the sample response that is significantly difference from blank
sample
a) AFB1; 0.5 x 10⁻⁸ M or 1.56 ppb gave Ip = 4.3 nA at Ep = -1.250 V
Figure S-1 Voltammogram of 0.5 x 10⁻⁸ M of AFB1 in BRB at pH 9.0
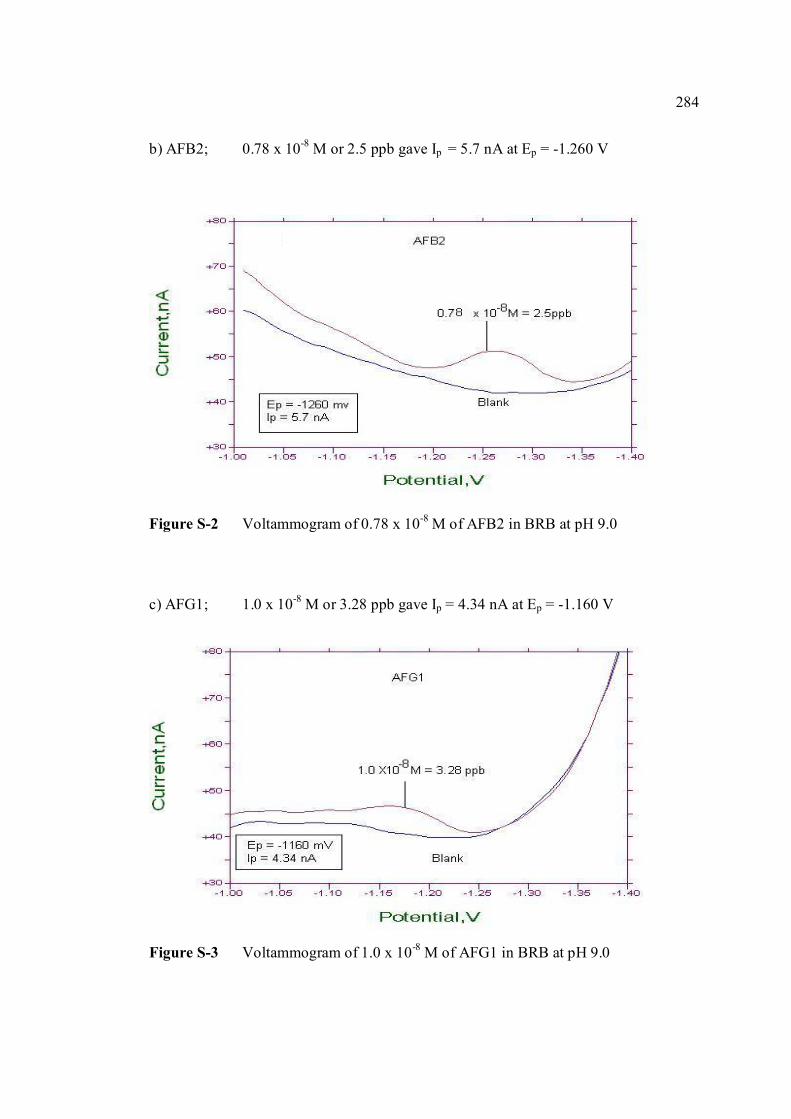
284
b) AFB2; 0.78 x 10⁻⁸ M or 2.5 ppb gave Ip = 5.7 nA at Ep = -1.260 V
Figure S-2 Voltammogram of 0.78 x 10⁻⁸ M of AFB2 in BRB at pH 9.0
c) AFG1; 1.0 x 10⁻⁸ M or 3.28 ppb gave Ip = 4.34 nA at Ep = -1.160 V
Figure S-3 Voltammogram of 1.0 x 10⁻⁸ M of AFG1 in BRB at pH 9.0
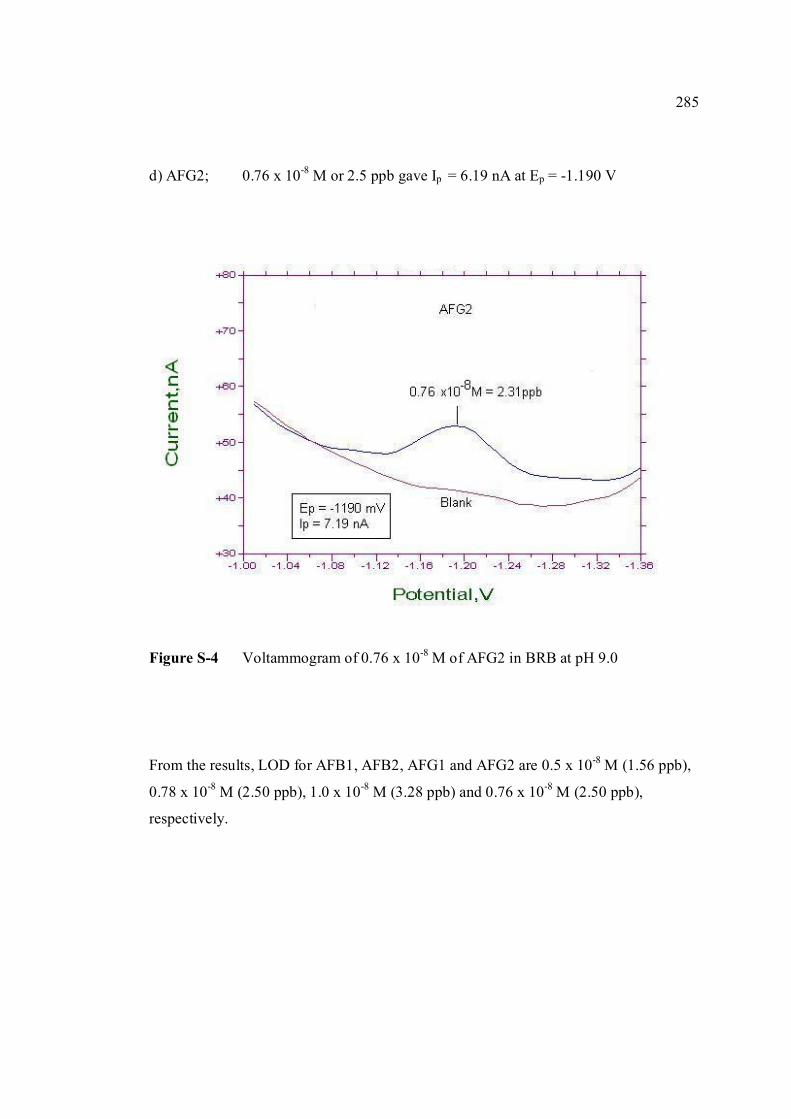
285
d) AFG2; 0.76 x 10⁻⁸ M or 2.5 ppb gave Ip = 6.19 nA at Ep = -1.190 V
Figure S-4 Voltammogram of 0.76 x 10⁻⁸ M of AFG2 in BRB at pH 9.0
From the results, LOD for AFB1, AFB2, AFG1 and AFG2 are 0.5 x 10⁻⁸ M (1.56 ppb),
0.78 x 10⁻⁸ M (2.50 ppb), 1.0 x 10⁻⁸ M (3.28 ppb) and 0.76 x 10⁻⁸ M (2.50 ppb),
respectively.
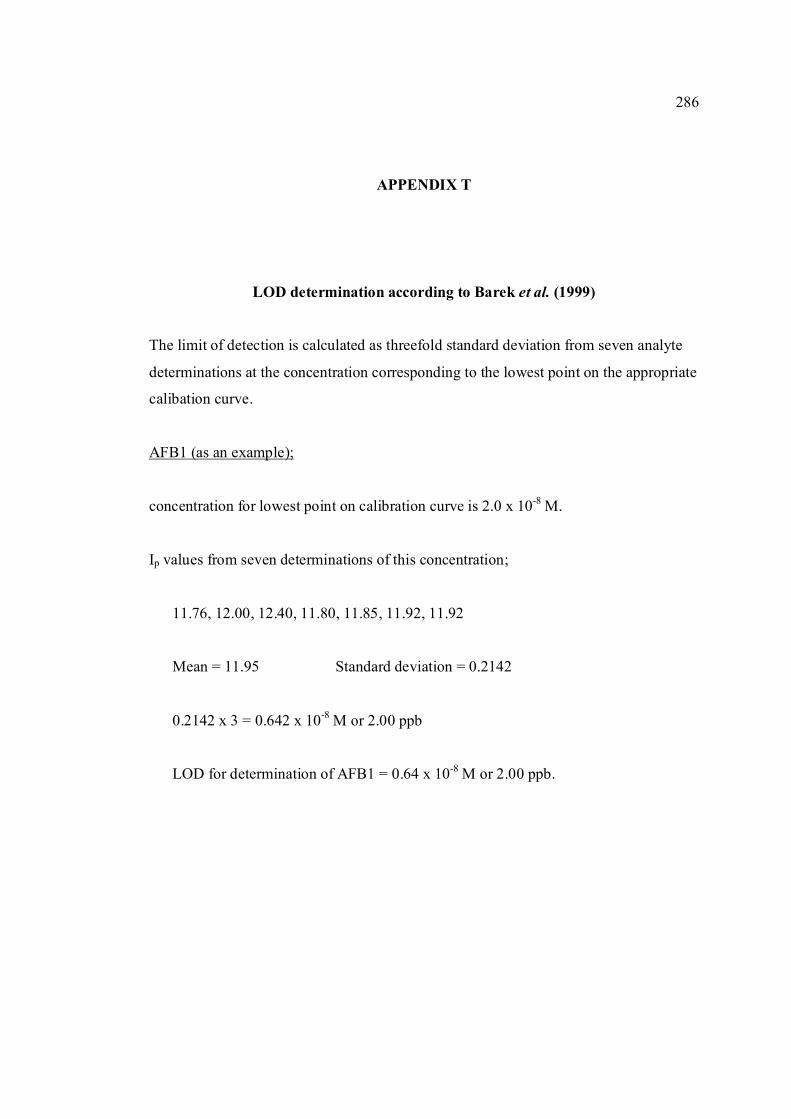
286
APPENDIX T
LOD determination according to Barek et al. (1999)
The limit of detection is calculated as threefold standard deviation from seven analyte
determinations at the concentration corresponding to the lowest point on the appropriate
calibation curve.
AFB1 (as an example);
concentration for lowest point on calibration curve is 2.0 x 10⁻⁸ M.
Ip values from seven determinations of this concentration;
11.76, 12.00, 12.40, 11.80, 11.85, 11.92, 11.92
Mean = 11.95 Standard deviation = 0.2142
0.2142 x 3 = 0.642 x 10⁻⁸ M or 2.00 ppb
LOD for determination of AFB1 = 0.64 x 10⁻⁸ M or 2.00 ppb.
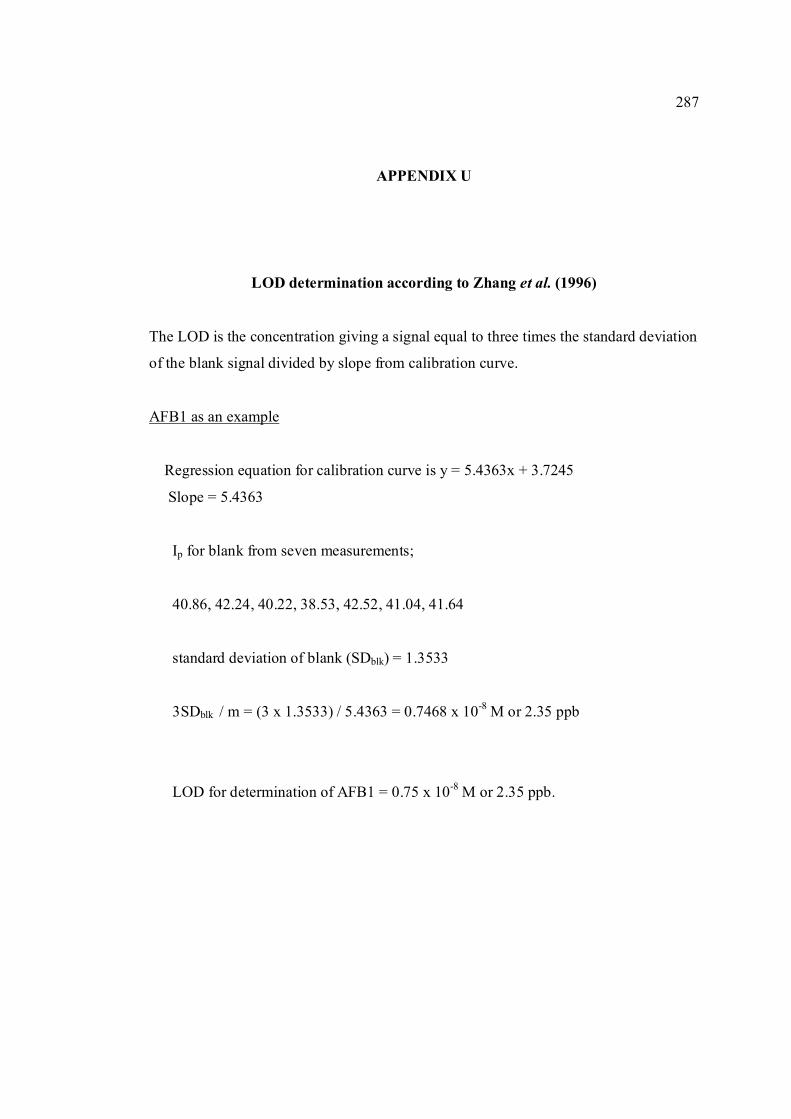
287
APPENDIX U
LOD determination according to Zhang et al. (1996)
The LOD is the concentration giving a signal equal to three times the standard deviation
of the blank signal divided by slope from calibration curve.
AFB1 as an example
Regression equation for calibration curve is y = 5.4363x + 3.7245
Slope = 5.4363
Ip for blank from seven measurements;
40.86, 42.24, 40.22, 38.53, 42.52, 41.04, 41.64
standard deviation of blank (SDblk) = 1.3533
3SDblk / m = (3 x 1.3533) / 5.4363 = 0.7468 x 10⁻⁸ M or 2.35 ppb
LOD for determination of AFB1 = 0.75 x 10⁻⁸ M or 2.35 ppb.
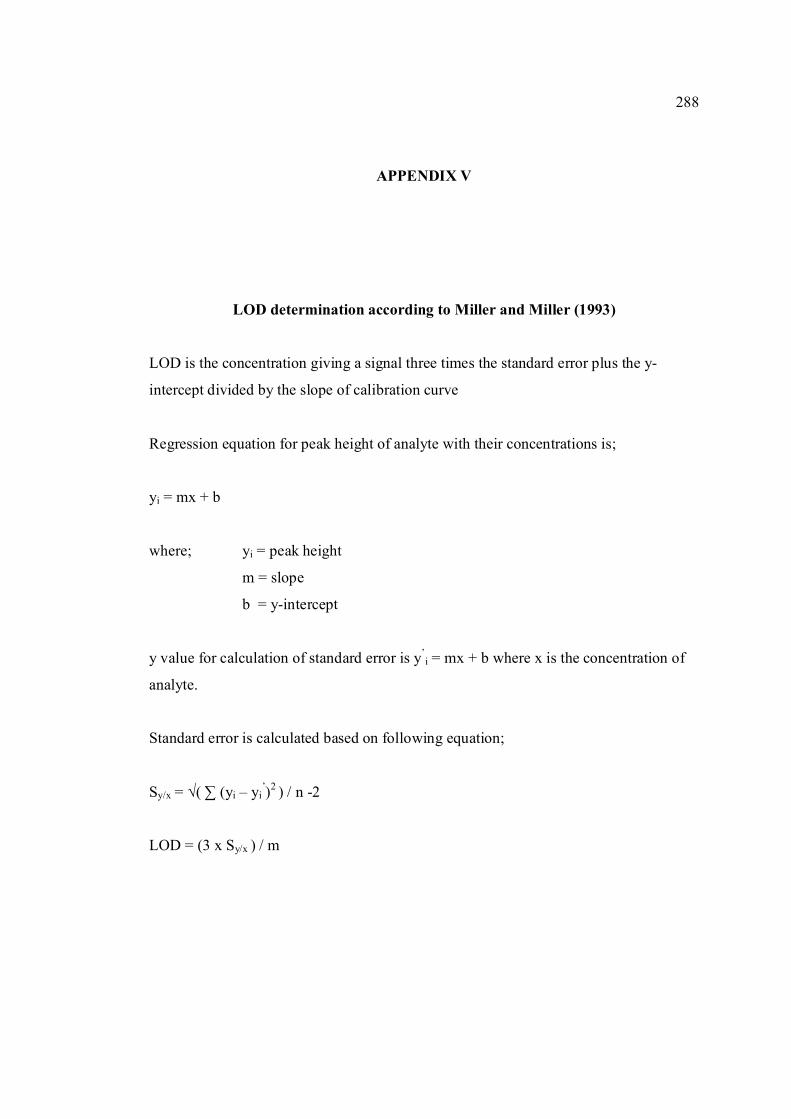
288
APPENDIX V
LOD determination according to Miller and Miller (1993)
LOD is the concentration giving a signal three times the standard error plus the y-
intercept divided by the slope of calibration curve
Regression equation for peak height of analyte with their concentrations is;
yi = mx + b
where; yi = peak height
m = slope
b = y-intercept
y value for calculation of standard error is y’i = mx + b where x is the concentration of
analyte.
Standard error is calculated based on following equation;
Sy/x = √( ∑ (yi – yi’)2 ) / n -2
LOD = (3 x Sy/x ) / m
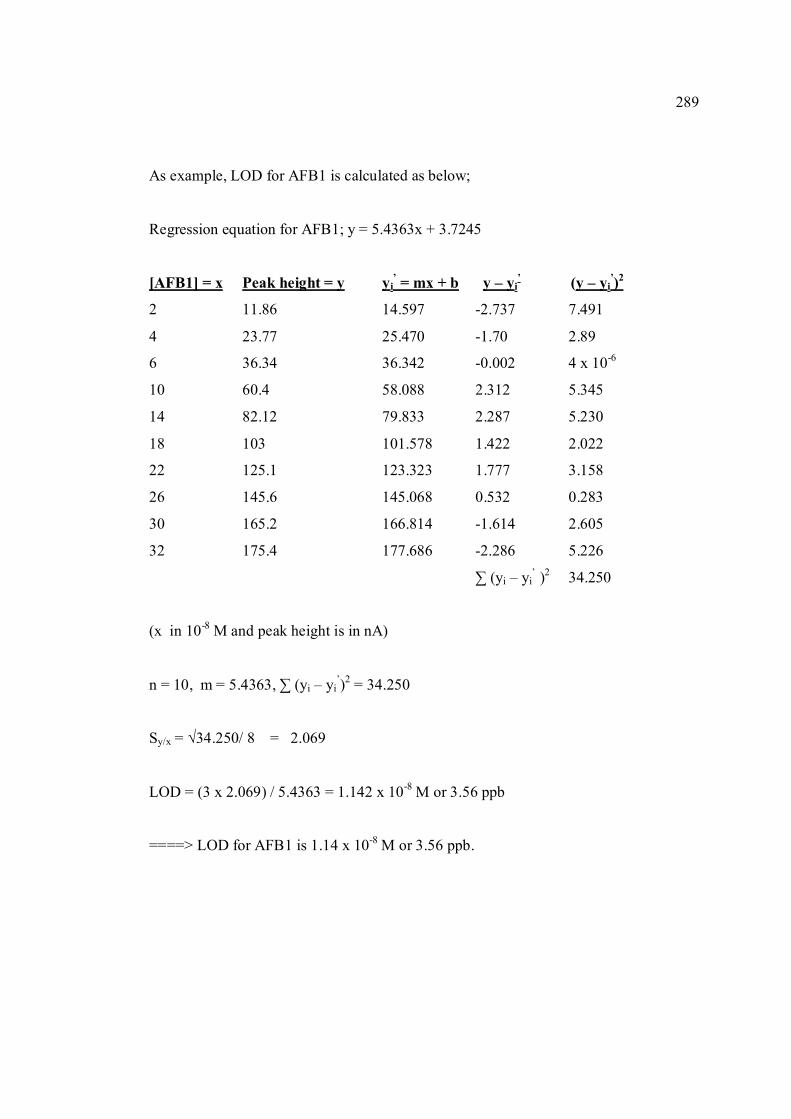
289
As example, LOD for AFB1 is calculated as below;
Regression equation for AFB1; y = 5.4363x + 3.7245
[AFB1] = x Peak height = y yi’ = mx + b y – yi
’ (y – yi’)2
2 11.86 14.597 -2.737 7.491
4 23.77 25.470 -1.70 2.89
6 36.34 36.342 -0.002 4 x 10⁻⁶
10 60.4 58.088 2.312 5.345
14 82.12 79.833 2.287 5.230
18 103 101.578 1.422 2.022
22 125.1 123.323 1.777 3.158
26 145.6 145.068 0.532 0.283
30 165.2 166.814 -1.614 2.605
32 175.4 177.686 -2.286 5.226
∑ (yi – yi’ )2 34.250
(x in 10-8 M and peak height is in nA)
n = 10, m = 5.4363, ∑ (yi – yi’)2 = 34.250
Sy/x = √34.250/ 8 = 2.069
LOD = (3 x 2.069) / 5.4363 = 1.142 x 10⁻⁸ M or 3.56 ppb
====> LOD for AFB1 is 1.14 x 10⁻⁸ M or 3.56 ppb.
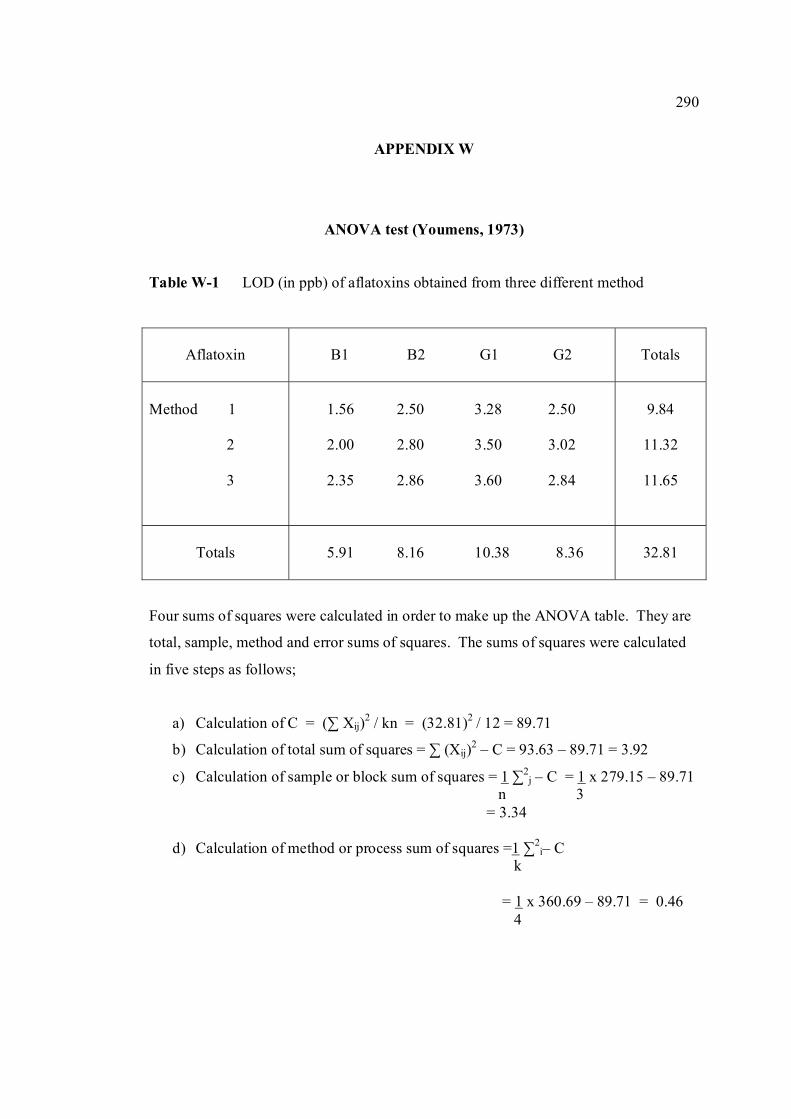
290
APPENDIX W
ANOVA test (Youmens, 1973)
Table W-1 LOD (in ppb) of aflatoxins obtained from three different method
Aflatoxin
B1 B2 G1 G2
Totals
Method 1 2 3
1.56 2.50 3.28 2.50 2.00 2.80 3.50 3.02 2.35 2.86 3.60 2.84
9.84
11.32
11.65
Totals
5.91 8.16 10.38 8.36
32.81
Four sums of squares were calculated in order to make up the ANOVA table. They are
total, sample, method and error sums of squares. The sums of squares were calculated
in five steps as follows;
a) Calculation of C = (∑ Xij)2 / kn = (32.81)2 / 12 = 89.71
b) Calculation of total sum of squares = ∑ (Xij)2 – C = 93.63 – 89.71 = 3.92
c) Calculation of sample or block sum of squares = 1 ∑2j – C = 1 x 279.15 – 89.71
n 3 = 3.34
d) Calculation of method or process sum of squares =1 ∑2i– C
k = 1 x 360.69 – 89.71 = 0.46 4
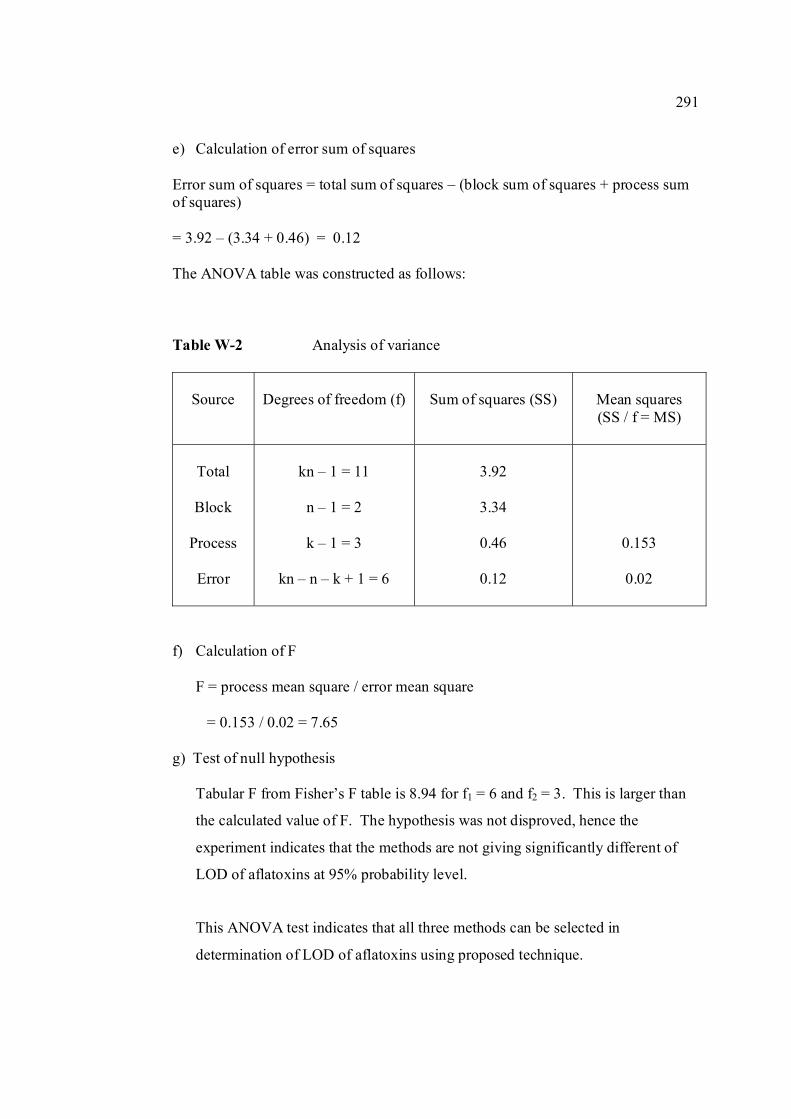
291
e) Calculation of error sum of squares Error sum of squares = total sum of squares – (block sum of squares + process sum of squares) = 3.92 – (3.34 + 0.46) = 0.12 The ANOVA table was constructed as follows: Table W-2 Analysis of variance
Source
Degrees of freedom (f)
Sum of squares (SS)
Mean squares (SS / f = MS)
Total
Block
Process
Error
kn – 1 = 11
n – 1 = 2
k – 1 = 3
kn – n – k + 1 = 6
3.92
3.34
0.46
0.12
0.153
0.02
f) Calculation of F
F = process mean square / error mean square = 0.153 / 0.02 = 7.65
g) Test of null hypothesis Tabular F from Fisher’s F table is 8.94 for f1 = 6 and f2 = 3. This is larger than
the calculated value of F. The hypothesis was not disproved, hence the
experiment indicates that the methods are not giving significantly different of
LOD of aflatoxins at 95% probability level.
This ANOVA test indicates that all three methods can be selected in
determination of LOD of aflatoxins using proposed technique.
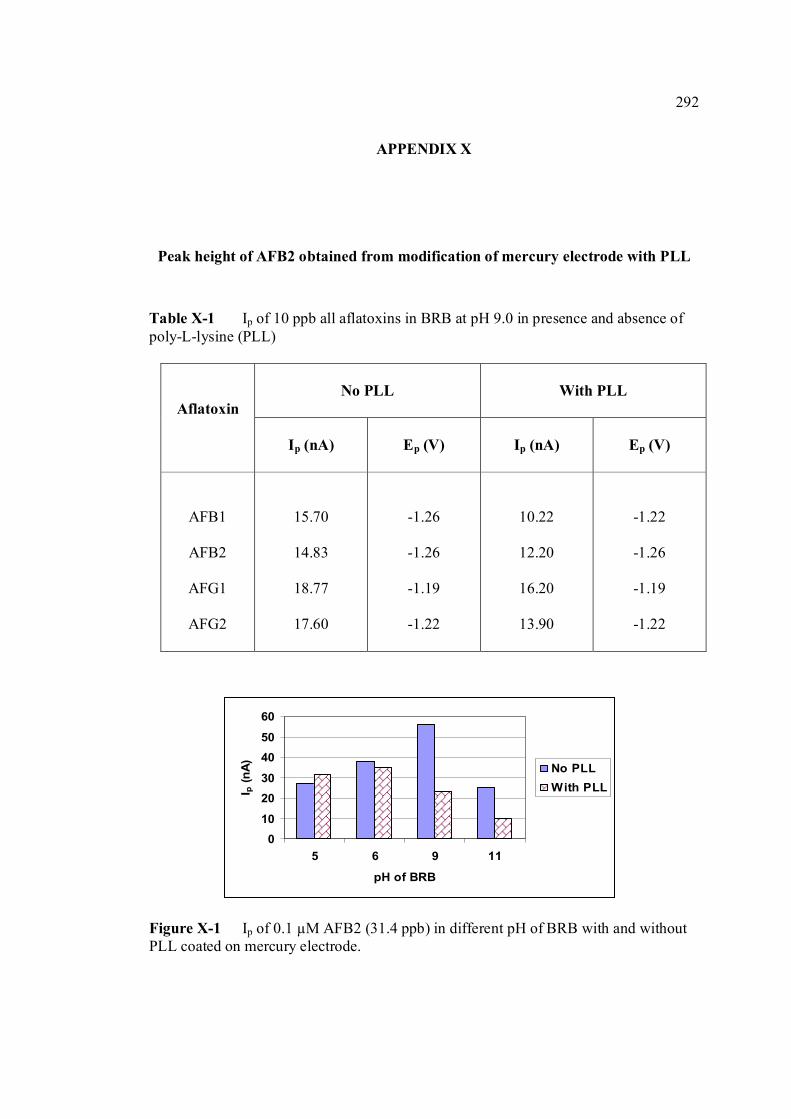
292
010
2030
4050
60
5 6 9 11
pH of BRB
I p (n
A) No PLLWith PLL
APPENDIX X
Peak height of AFB2 obtained from modification of mercury electrode with PLL
Table X-1 Ip of 10 ppb all aflatoxins in BRB at pH 9.0 in presence and absence of poly-L-lysine (PLL)
No PLL
With PLL
Aflatoxin
Ip (nA)
Ep (V)
Ip (nA)
Ep (V)
AFB1
AFB2
AFG1
AFG2
15.70
14.83
18.77
17.60
-1.26
-1.26
-1.19
-1.22
10.22
12.20
16.20
13.90
-1.22
-1.26
-1.19
-1.22
Figure X-1 Ip of 0.1 µM AFB2 (31.4 ppb) in different pH of BRB with and without PLL coated on mercury electrode.
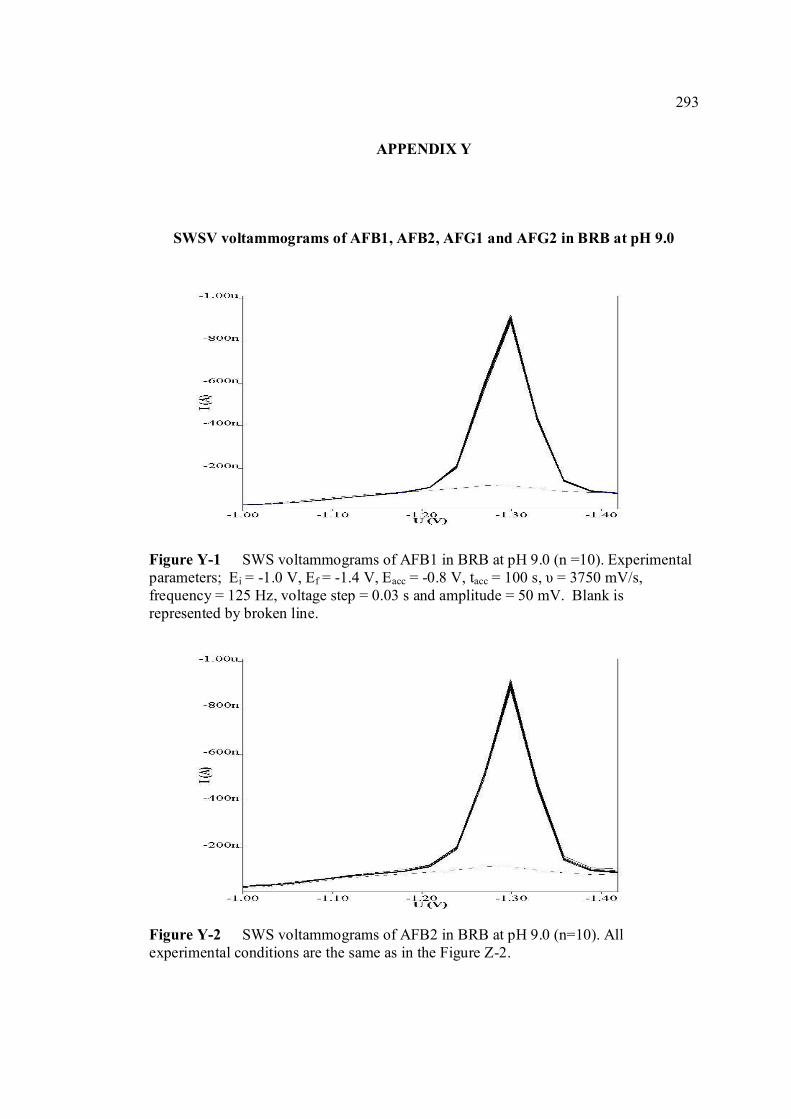
293
APPENDIX Y
SWSV voltammograms of AFB1, AFB2, AFG1 and AFG2 in BRB at pH 9.0
Figure Y-1 SWS voltammograms of AFB1 in BRB at pH 9.0 (n =10). Experimental parameters; Ei = -1.0 V, Ef = -1.4 V, Eacc = -0.8 V, tacc = 100 s, υ = 3750 mV/s, frequency = 125 Hz, voltage step = 0.03 s and amplitude = 50 mV. Blank is represented by broken line.
Figure Y-2 SWS voltammograms of AFB2 in BRB at pH 9.0 (n=10). All experimental conditions are the same as in the Figure Z-2.
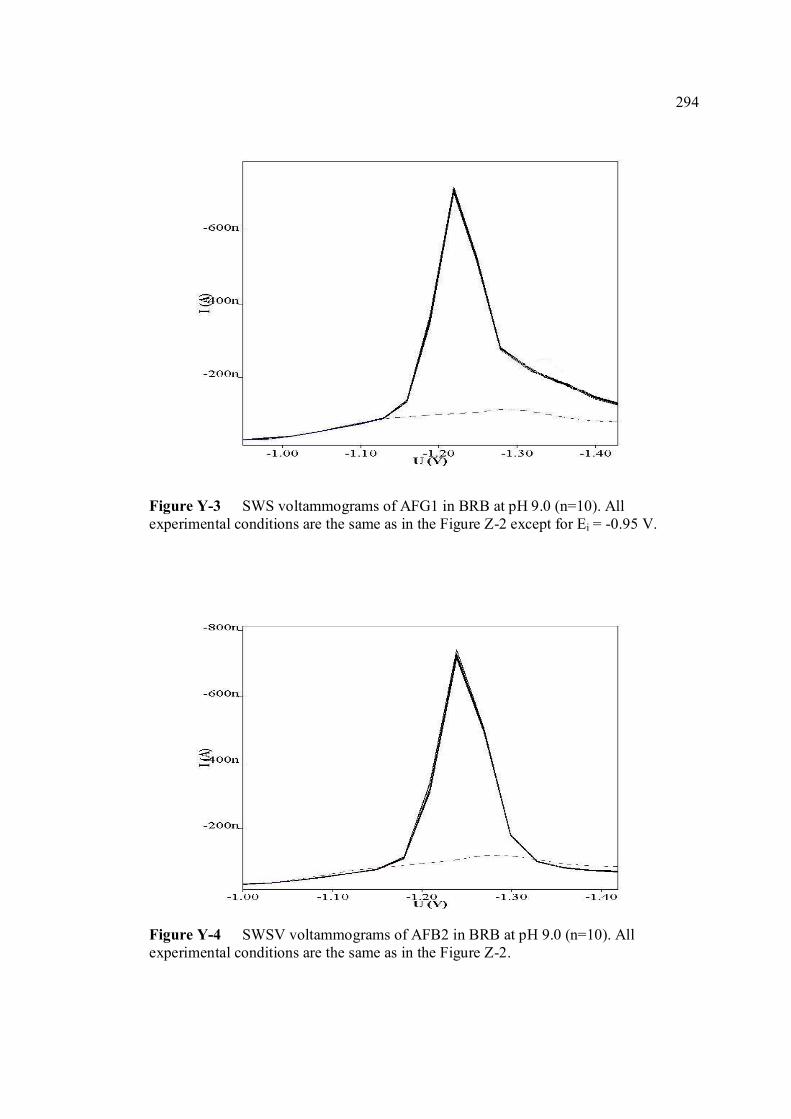
294
Figure Y-3 SWS voltammograms of AFG1 in BRB at pH 9.0 (n=10). All experimental conditions are the same as in the Figure Z-2 except for Ei = -0.95 V. Figure Y-4 SWSV voltammograms of AFB2 in BRB at pH 9.0 (n=10). All experimental conditions are the same as in the Figure Z-2.
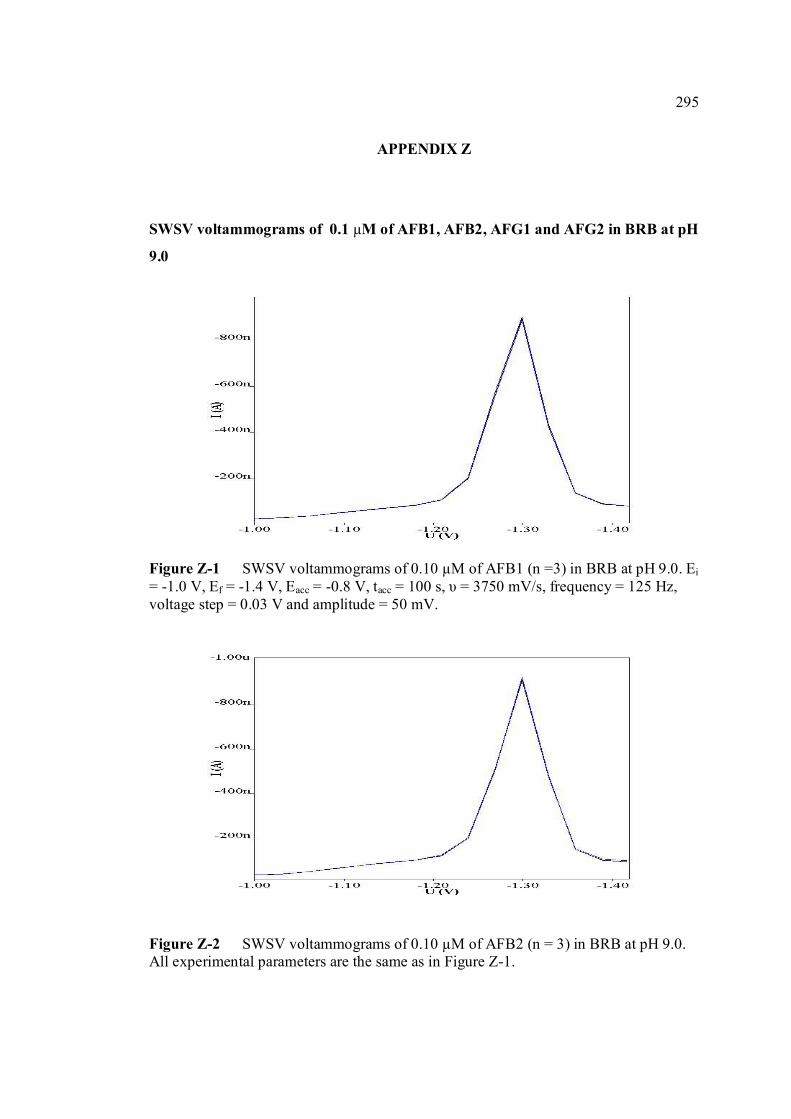
295
APPENDIX Z
SWSV voltammograms of 0.1 µM of AFB1, AFB2, AFG1 and AFG2 in BRB at pH
9.0
Figure Z-1 SWSV voltammograms of 0.10 µM of AFB1 (n =3) in BRB at pH 9.0. Ei = -1.0 V, Ef = -1.4 V, Eacc = -0.8 V, tacc = 100 s, υ = 3750 mV/s, frequency = 125 Hz, voltage step = 0.03 V and amplitude = 50 mV. Figure Z-2 SWSV voltammograms of 0.10 µM of AFB2 (n = 3) in BRB at pH 9.0. All experimental parameters are the same as in Figure Z-1.
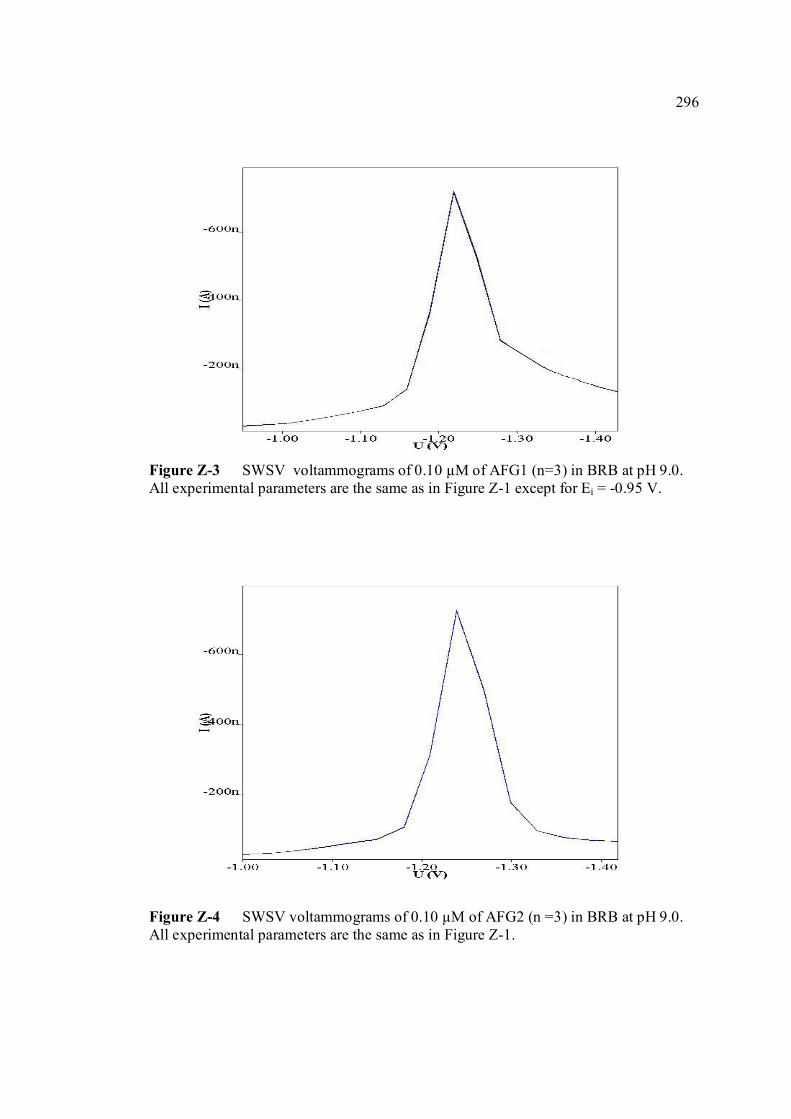
296
Figure Z-3 SWSV voltammograms of 0.10 µM of AFG1 (n=3) in BRB at pH 9.0. All experimental parameters are the same as in Figure Z-1 except for Ei = -0.95 V. Figure Z-4 SWSV voltammograms of 0.10 µM of AFG2 (n =3) in BRB at pH 9.0. All experimental parameters are the same as in Figure Z-1.
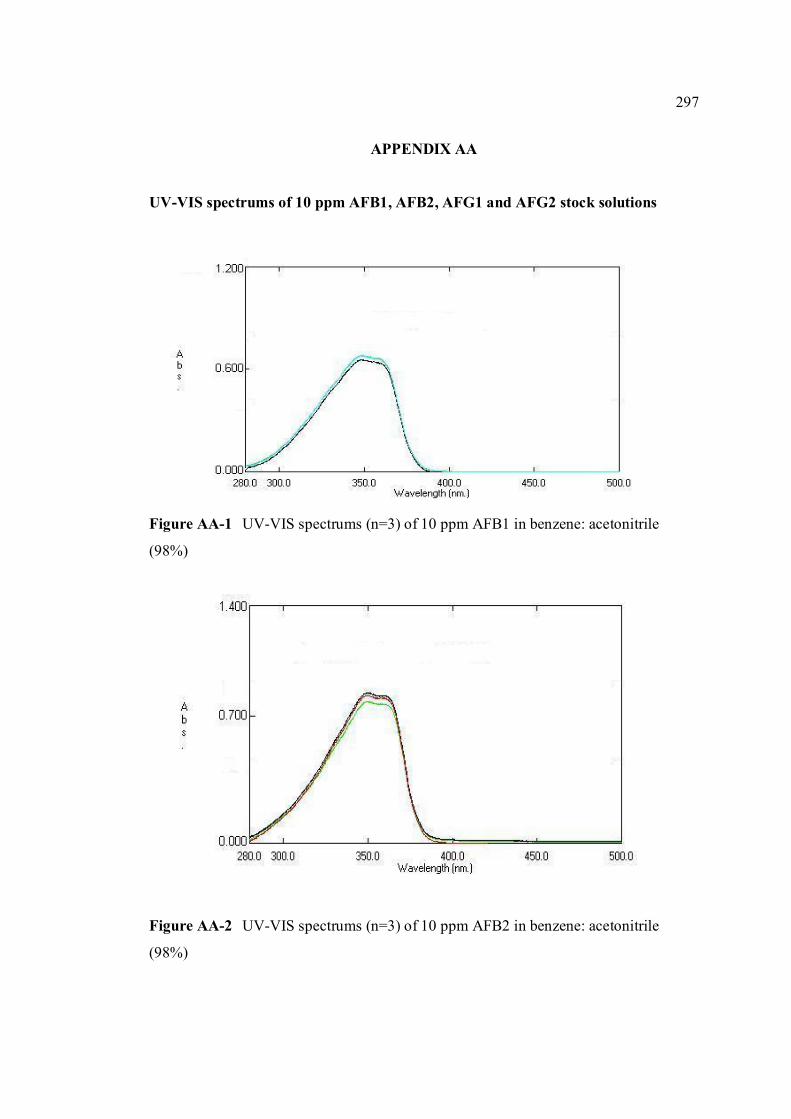
297
APPENDIX AA
UV-VIS spectrums of 10 ppm AFB1, AFB2, AFG1 and AFG2 stock solutions
Figure AA-1 UV-VIS spectrums (n=3) of 10 ppm AFB1 in benzene: acetonitrile
(98%)
Figure AA-2 UV-VIS spectrums (n=3) of 10 ppm AFB2 in benzene: acetonitrile
(98%)
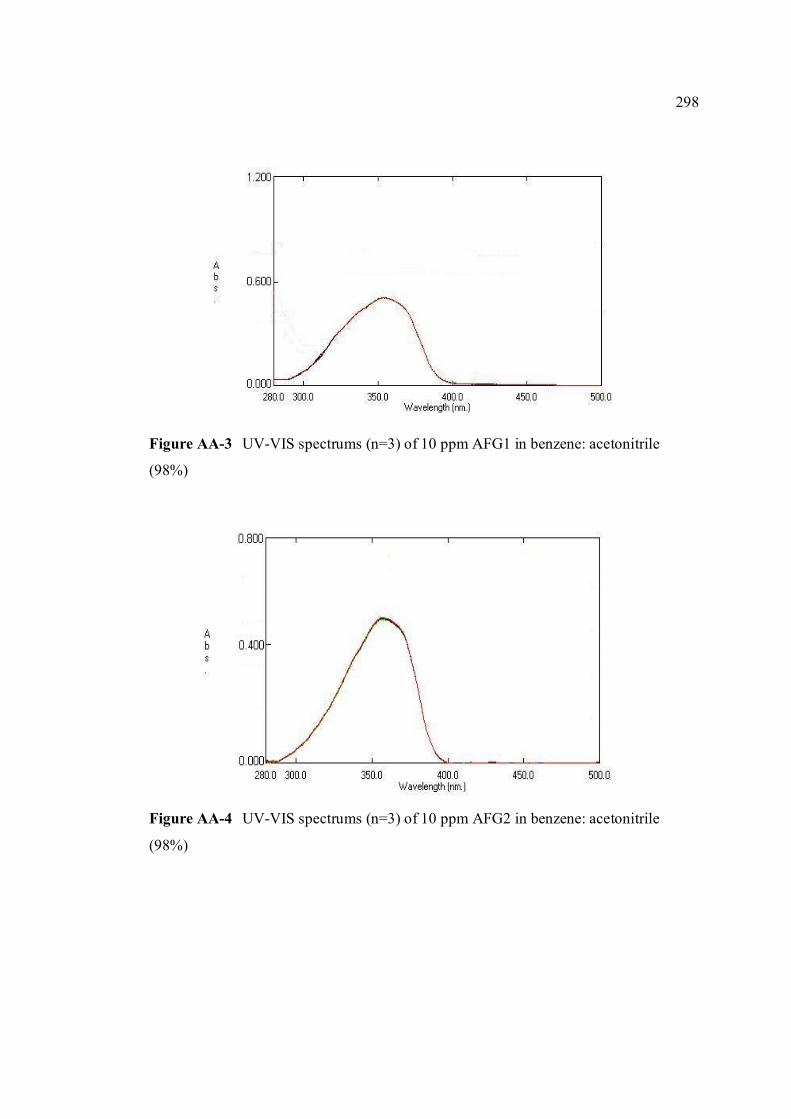
298
Figure AA-3 UV-VIS spectrums (n=3) of 10 ppm AFG1 in benzene: acetonitrile
(98%)
Figure AA-4 UV-VIS spectrums (n=3) of 10 ppm AFG2 in benzene: acetonitrile
(98%)
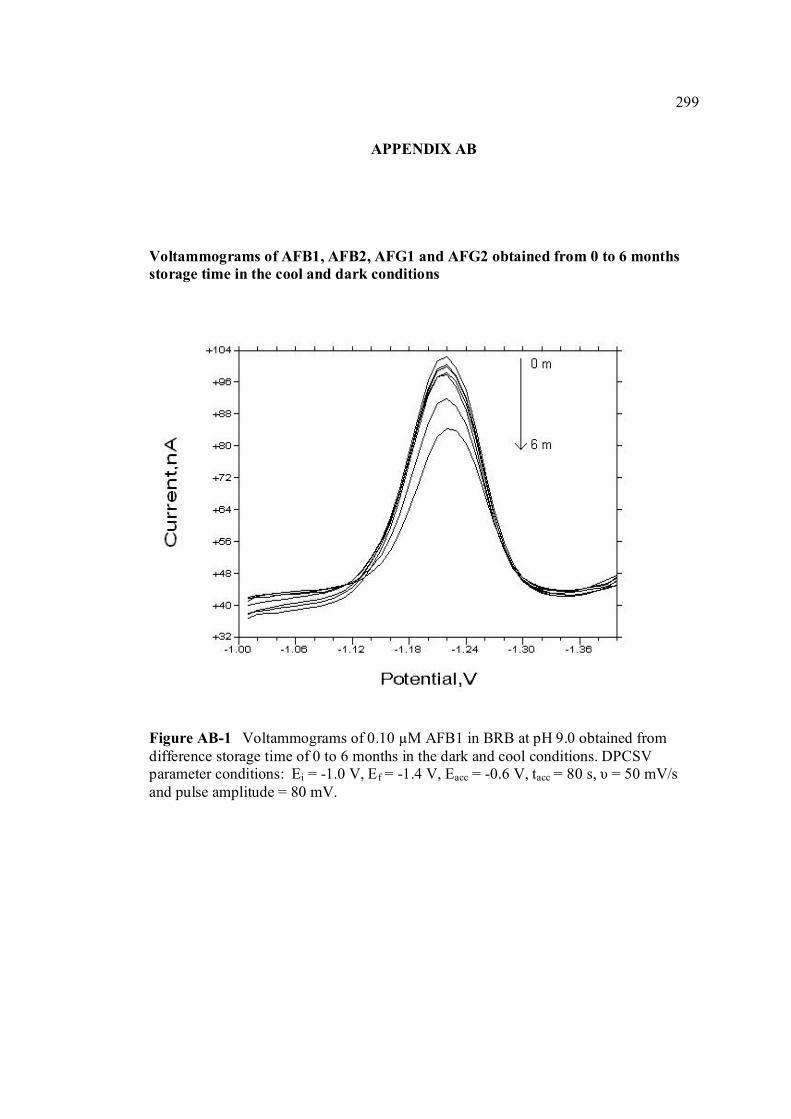
299
APPENDIX AB
Voltammograms of AFB1, AFB2, AFG1 and AFG2 obtained from 0 to 6 months storage time in the cool and dark conditions
Figure AB-1 Voltammograms of 0.10 µM AFB1 in BRB at pH 9.0 obtained from difference storage time of 0 to 6 months in the dark and cool conditions. DPCSV parameter conditions: Ei = -1.0 V, Ef = -1.4 V, Eacc = -0.6 V, tacc = 80 s, υ = 50 mV/s and pulse amplitude = 80 mV.
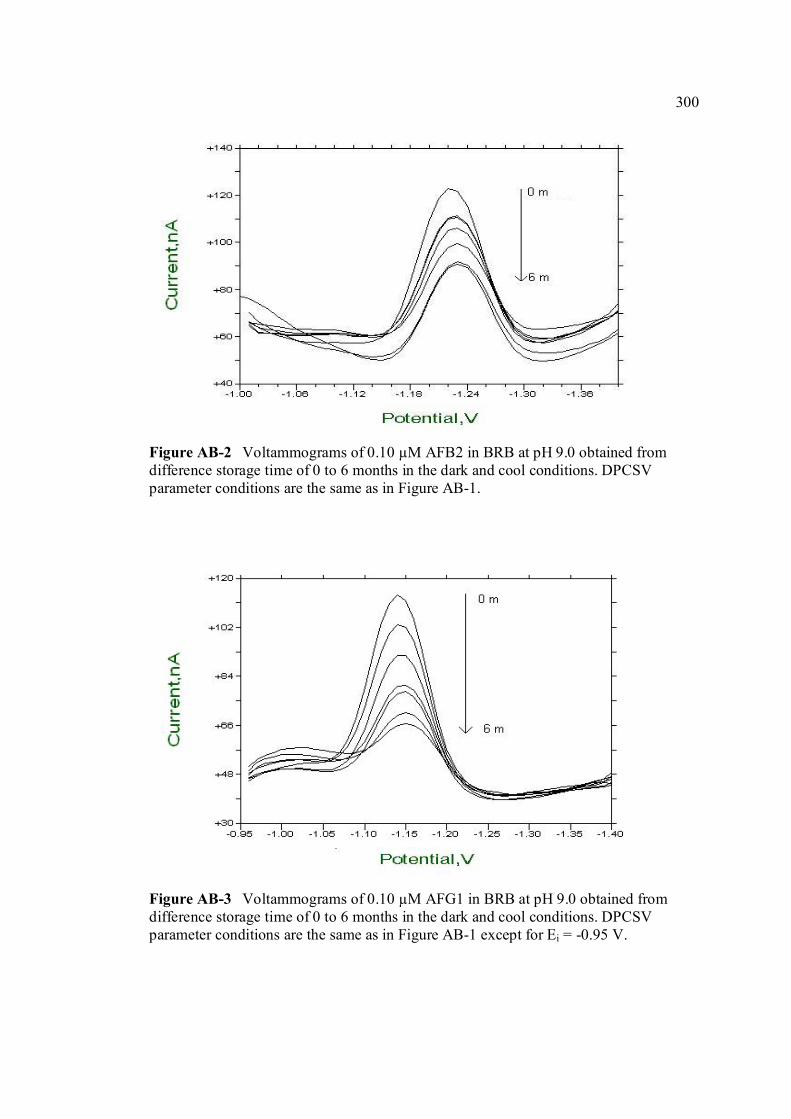
300
Figure AB-2 Voltammograms of 0.10 µM AFB2 in BRB at pH 9.0 obtained from difference storage time of 0 to 6 months in the dark and cool conditions. DPCSV parameter conditions are the same as in Figure AB-1. Figure AB-3 Voltammograms of 0.10 µM AFG1 in BRB at pH 9.0 obtained from difference storage time of 0 to 6 months in the dark and cool conditions. DPCSV parameter conditions are the same as in Figure AB-1 except for Ei = -0.95 V.
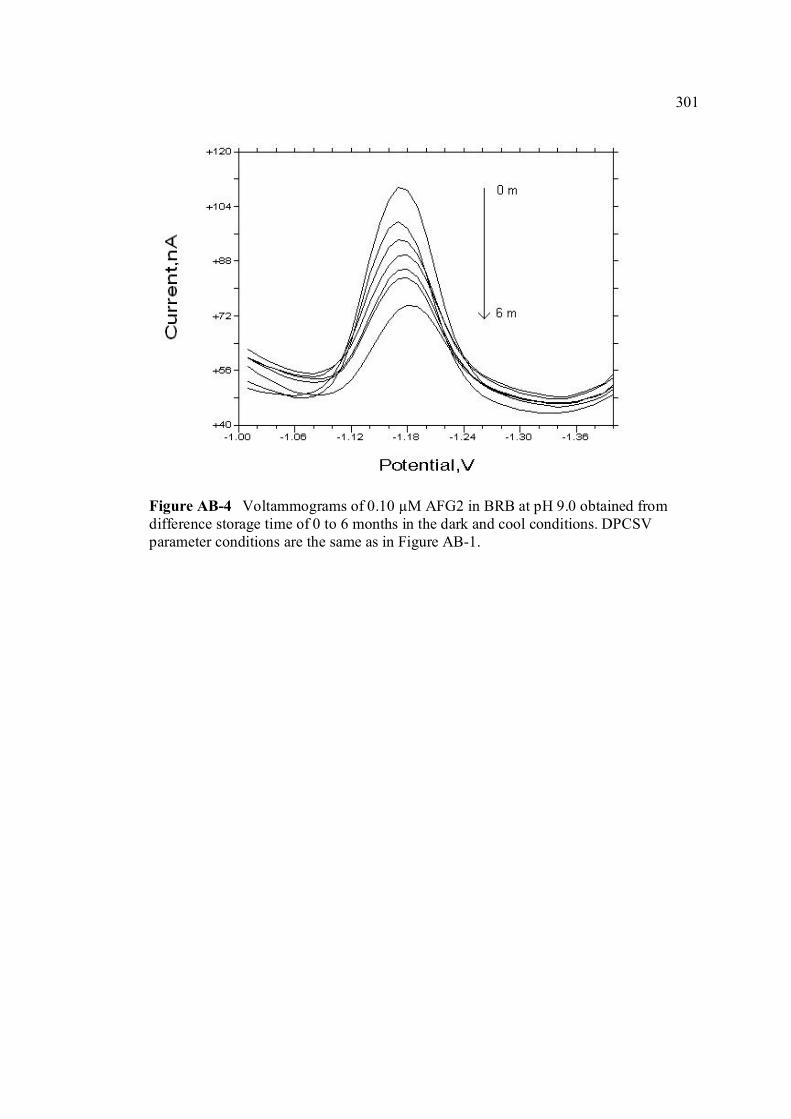
301
Figure AB-4 Voltammograms of 0.10 µM AFG2 in BRB at pH 9.0 obtained from difference storage time of 0 to 6 months in the dark and cool conditions. DPCSV parameter conditions are the same as in Figure AB-1.
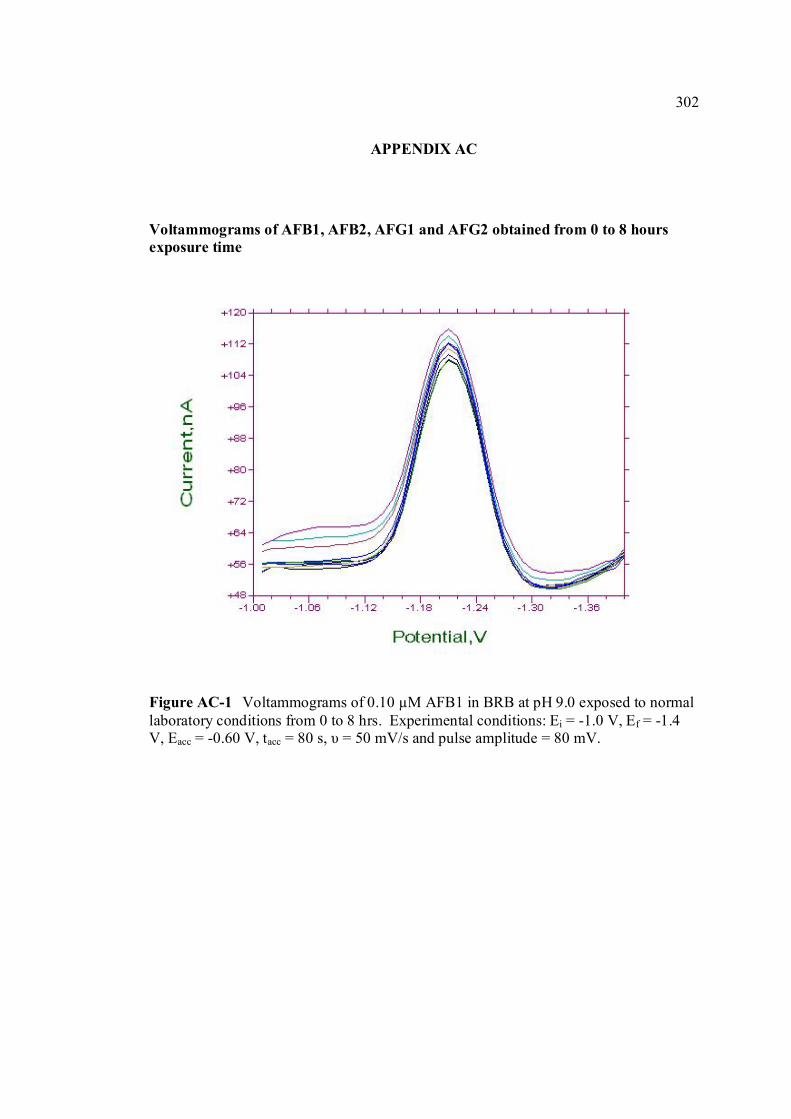
302
APPENDIX AC
Voltammograms of AFB1, AFB2, AFG1 and AFG2 obtained from 0 to 8 hours exposure time
Figure AC-1 Voltammograms of 0.10 µM AFB1 in BRB at pH 9.0 exposed to normal laboratory conditions from 0 to 8 hrs. Experimental conditions: Ei = -1.0 V, Ef = -1.4 V, Eacc = -0.60 V, tacc = 80 s, υ = 50 mV/s and pulse amplitude = 80 mV.
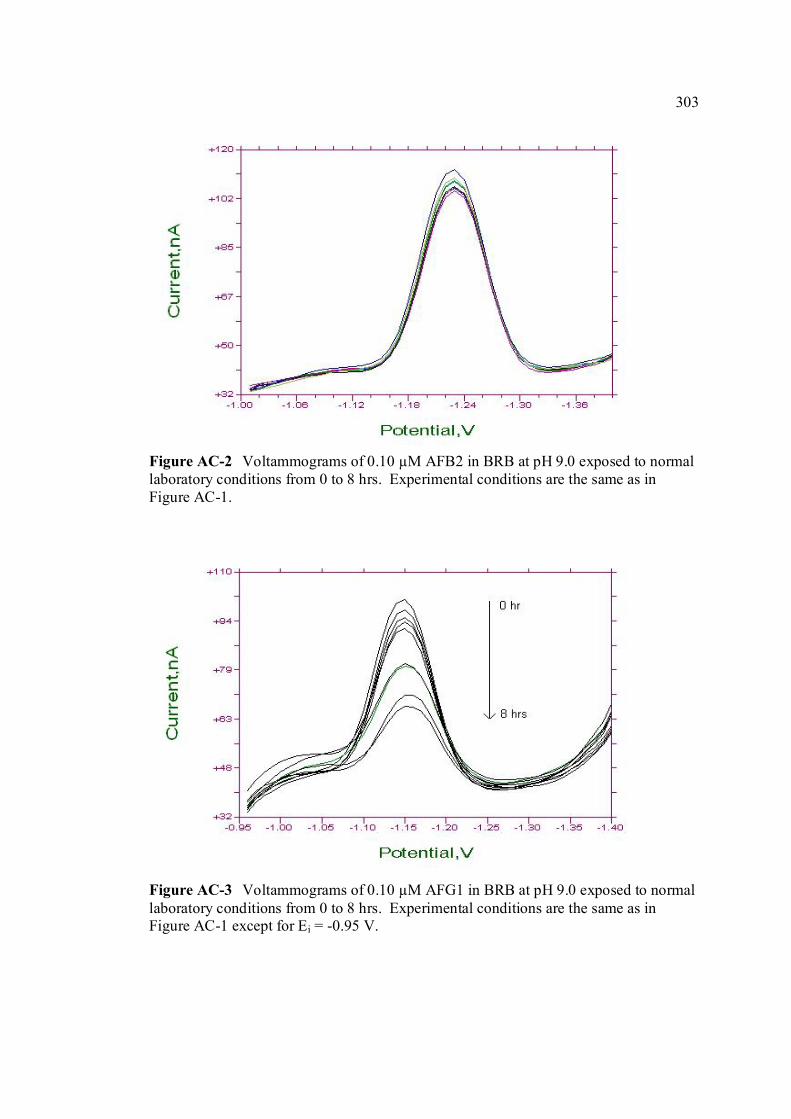
303
Figure AC-2 Voltammograms of 0.10 µM AFB2 in BRB at pH 9.0 exposed to normal laboratory conditions from 0 to 8 hrs. Experimental conditions are the same as in Figure AC-1.
Figure AC-3 Voltammograms of 0.10 µM AFG1 in BRB at pH 9.0 exposed to normal laboratory conditions from 0 to 8 hrs. Experimental conditions are the same as in Figure AC-1 except for Ei = -0.95 V.
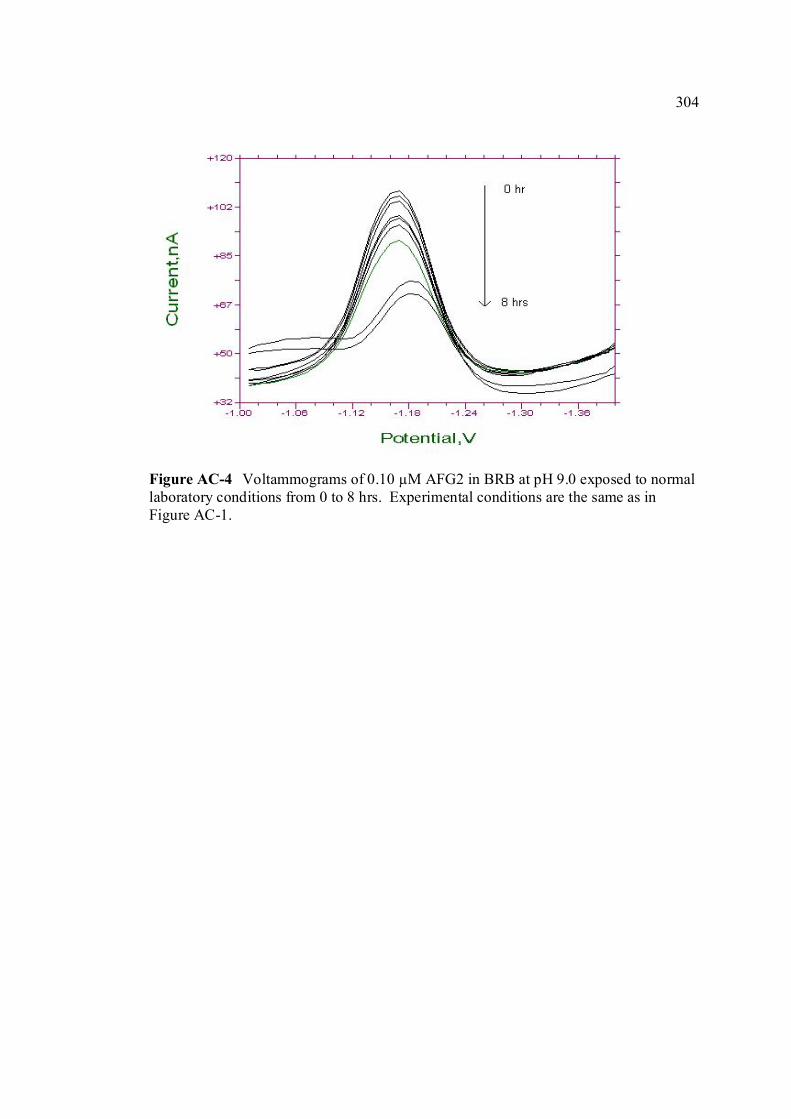
304
Figure AC-4 Voltammograms of 0.10 µM AFG2 in BRB at pH 9.0 exposed to normal laboratory conditions from 0 to 8 hrs. Experimental conditions are the same as in Figure AC-1.
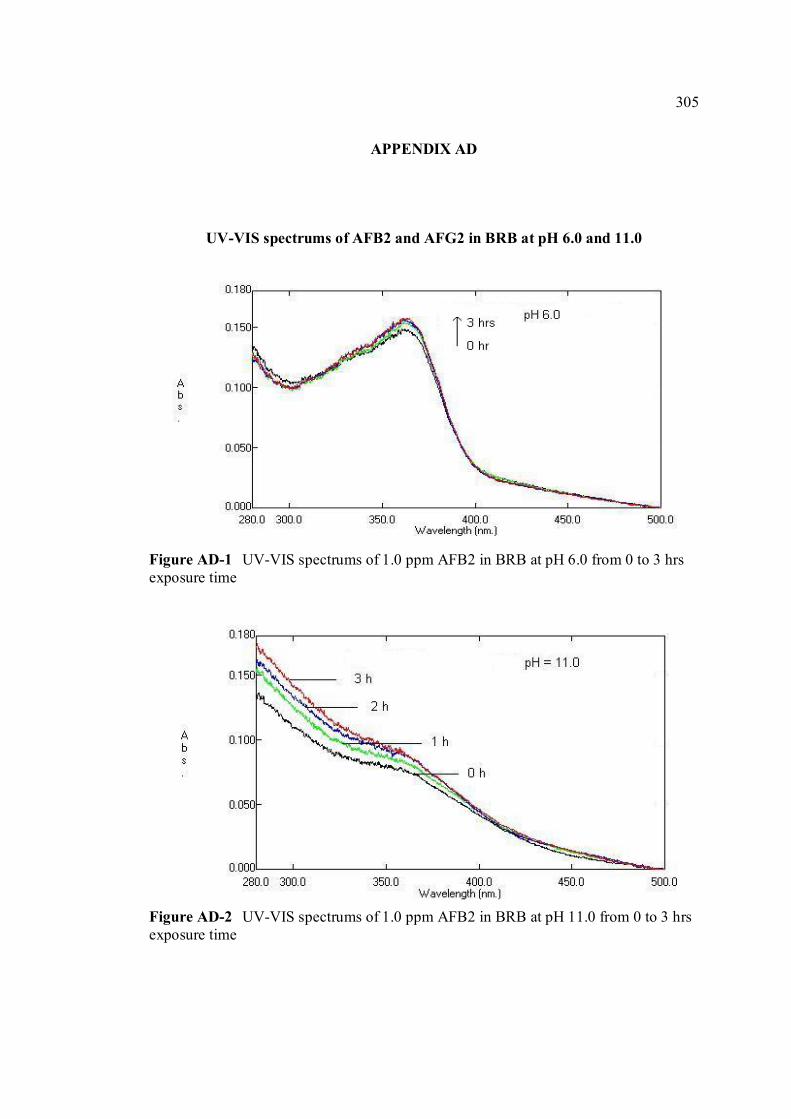
305
APPENDIX AD
UV-VIS spectrums of AFB2 and AFG2 in BRB at pH 6.0 and 11.0 Figure AD-1 UV-VIS spectrums of 1.0 ppm AFB2 in BRB at pH 6.0 from 0 to 3 hrs exposure time Figure AD-2 UV-VIS spectrums of 1.0 ppm AFB2 in BRB at pH 11.0 from 0 to 3 hrs exposure time
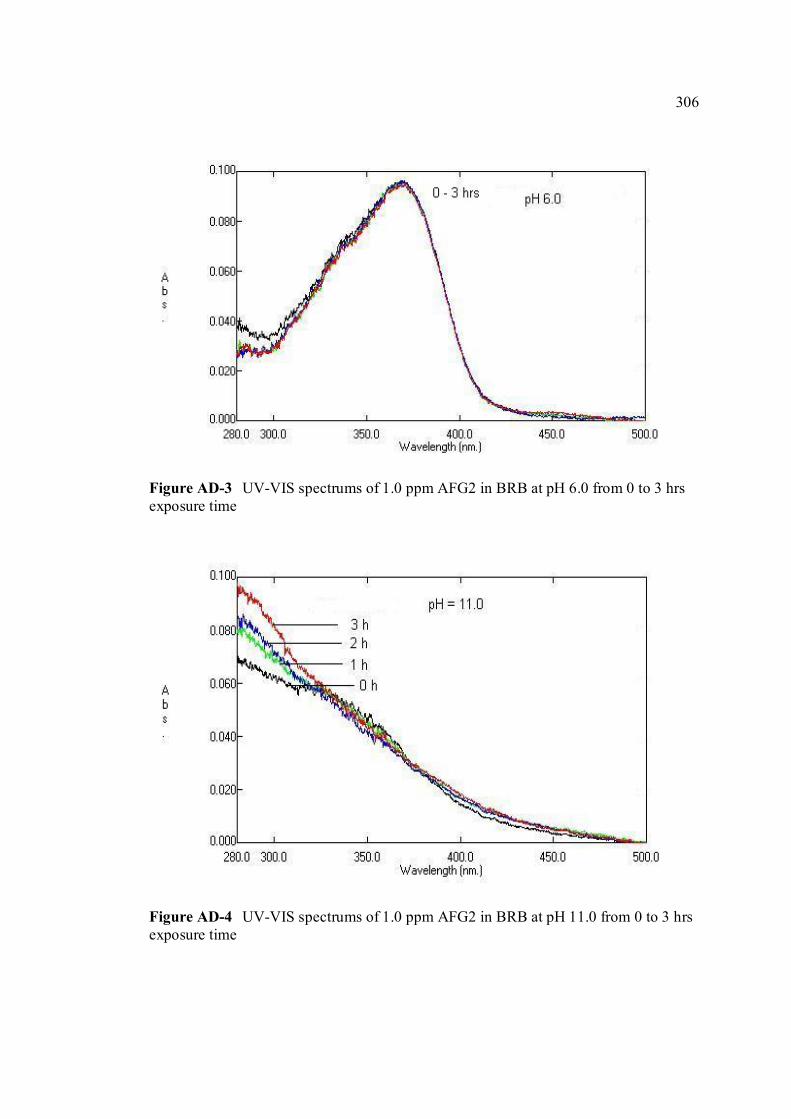
306
Figure AD-3 UV-VIS spectrums of 1.0 ppm AFG2 in BRB at pH 6.0 from 0 to 3 hrs exposure time Figure AD-4 UV-VIS spectrums of 1.0 ppm AFG2 in BRB at pH 11.0 from 0 to 3 hrs exposure time
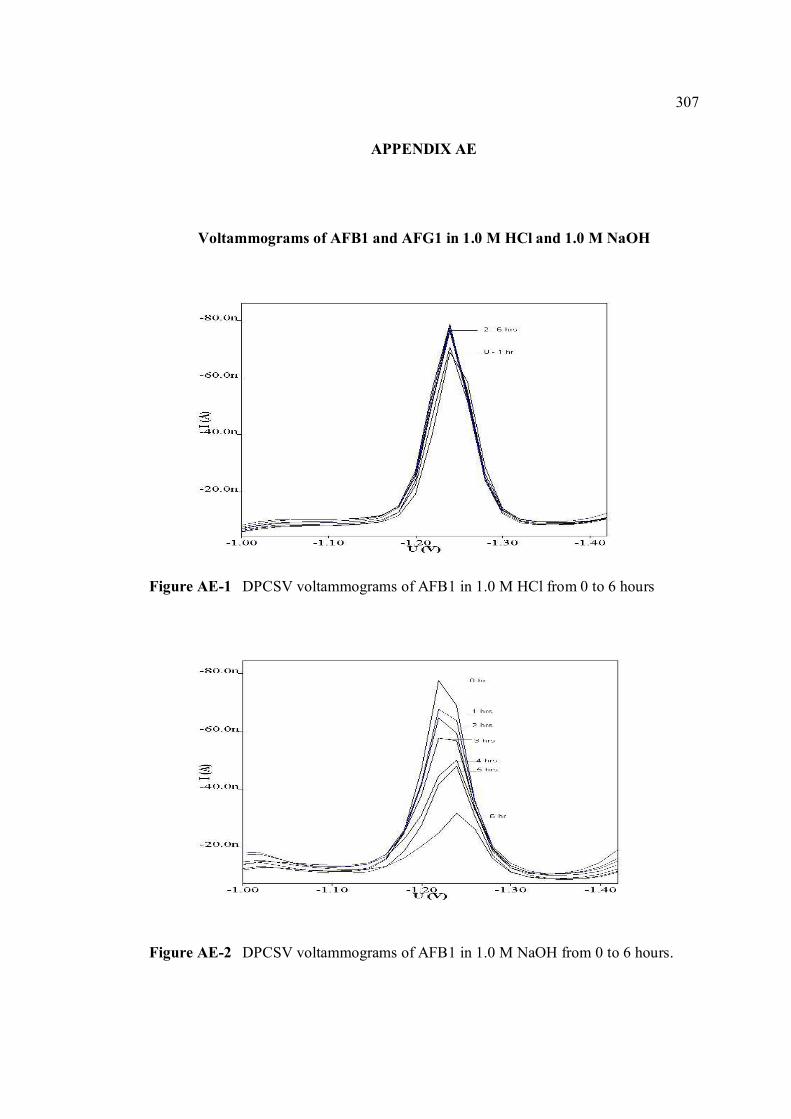
307
APPENDIX AE
Voltammograms of AFB1 and AFG1 in 1.0 M HCl and 1.0 M NaOH
Figure AE-1 DPCSV voltammograms of AFB1 in 1.0 M HCl from 0 to 6 hours
Figure AE-2 DPCSV voltammograms of AFB1 in 1.0 M NaOH from 0 to 6 hours.
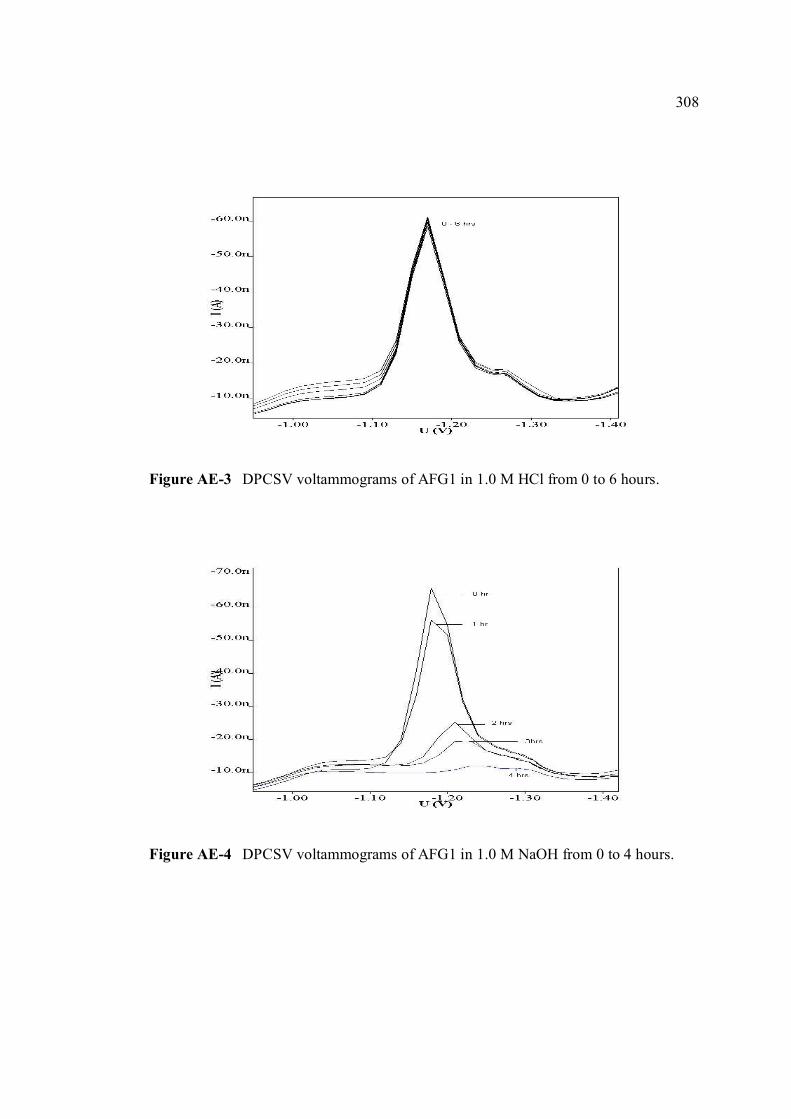
308
Figure AE-3 DPCSV voltammograms of AFG1 in 1.0 M HCl from 0 to 6 hours.
Figure AE-4 DPCSV voltammograms of AFG1 in 1.0 M NaOH from 0 to 4 hours.
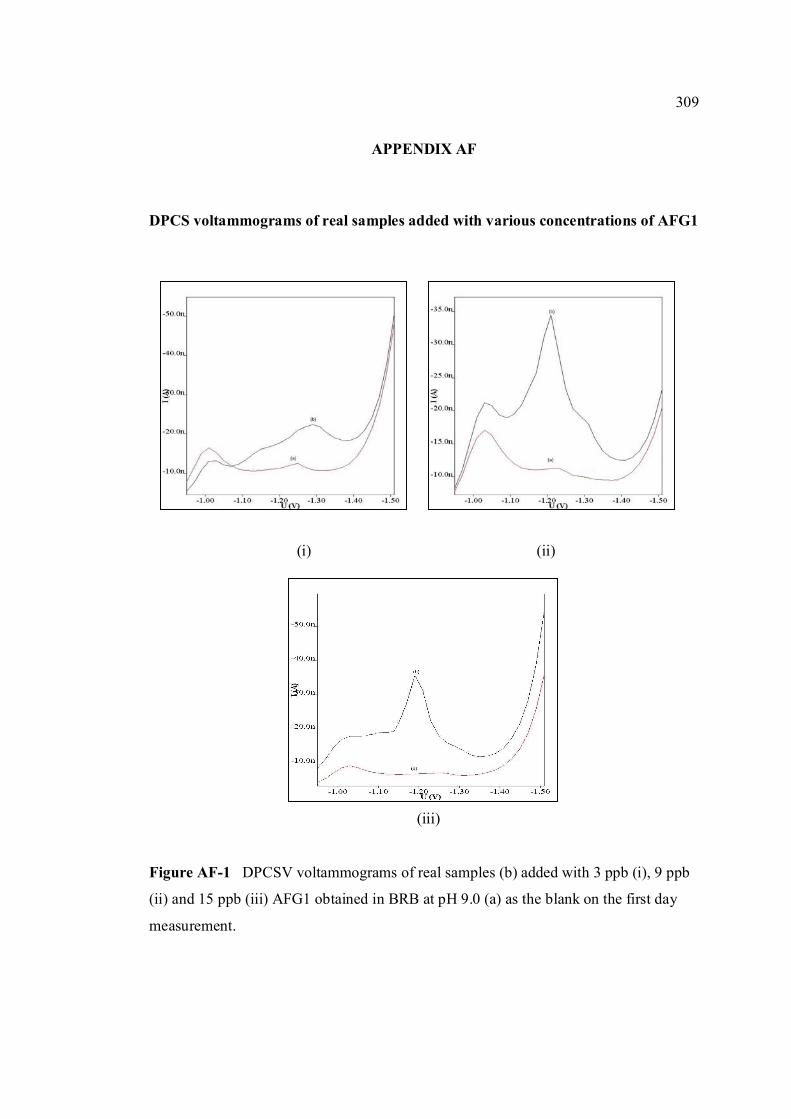
309
APPENDIX AF
DPCS voltammograms of real samples added with various concentrations of AFG1
(i) (ii)
(iii)
Figure AF-1 DPCSV voltammograms of real samples (b) added with 3 ppb (i), 9 ppb
(ii) and 15 ppb (iii) AFG1 obtained in BRB at pH 9.0 (a) as the blank on the first day
measurement.
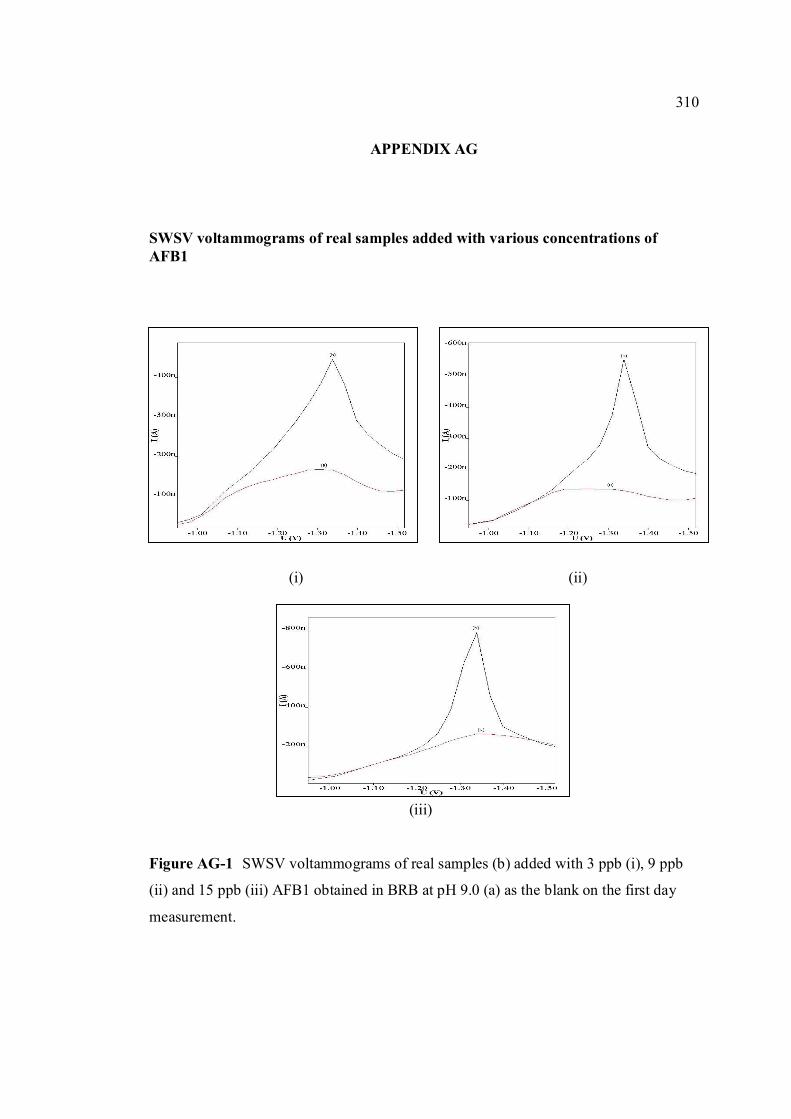
310
APPENDIX AG
SWSV voltammograms of real samples added with various concentrations of AFB1
(i) (ii)
(iii)
Figure AG-1 SWSV voltammograms of real samples (b) added with 3 ppb (i), 9 ppb
(ii) and 15 ppb (iii) AFB1 obtained in BRB at pH 9.0 (a) as the blank on the first day
measurement.
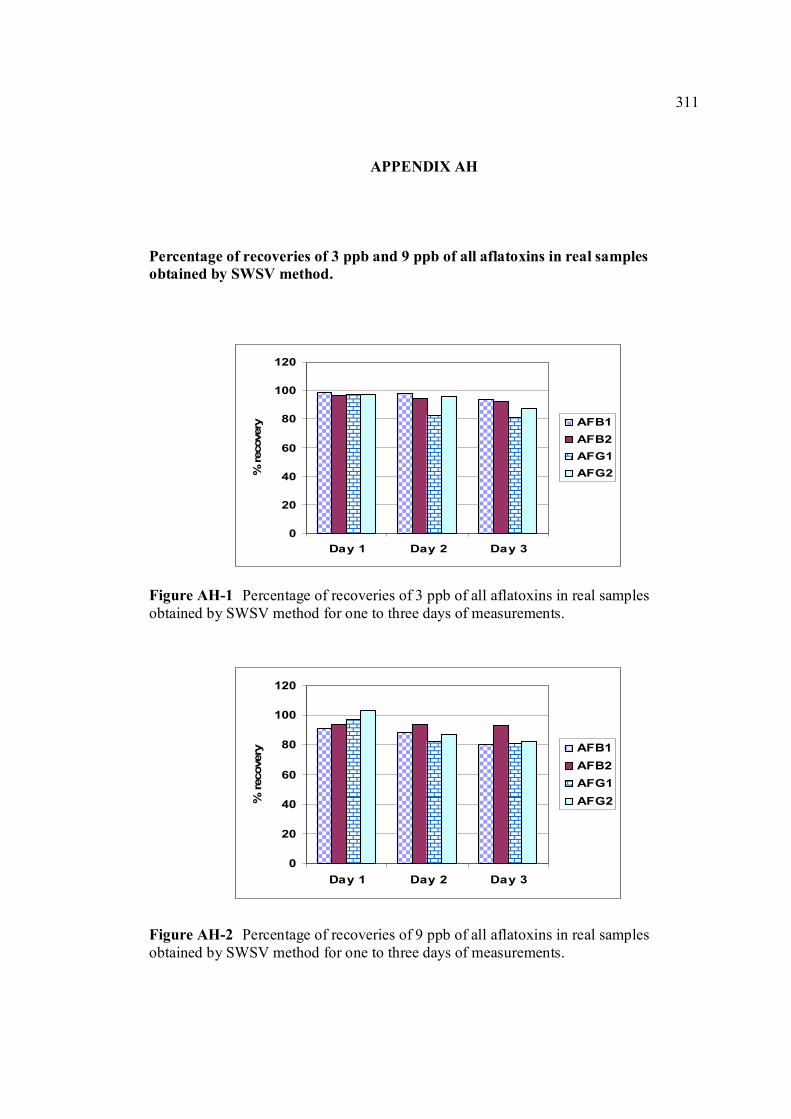
311
0
20
40
60
80
100
120
Day 1 Day 2 Day 3
% rec
over
y AFB1AFB2AFG1AFG2
0
20
40
60
80
100
120
Day 1 Day 2 Day 3
% r
ecov
ery AFB1
AFB2AFG1AFG2
APPENDIX AH
Percentage of recoveries of 3 ppb and 9 ppb of all aflatoxins in real samples obtained by SWSV method.
Figure AH-1 Percentage of recoveries of 3 ppb of all aflatoxins in real samples obtained by SWSV method for one to three days of measurements.
Figure AH-2 Percentage of recoveries of 9 ppb of all aflatoxins in real samples obtained by SWSV method for one to three days of measurements.
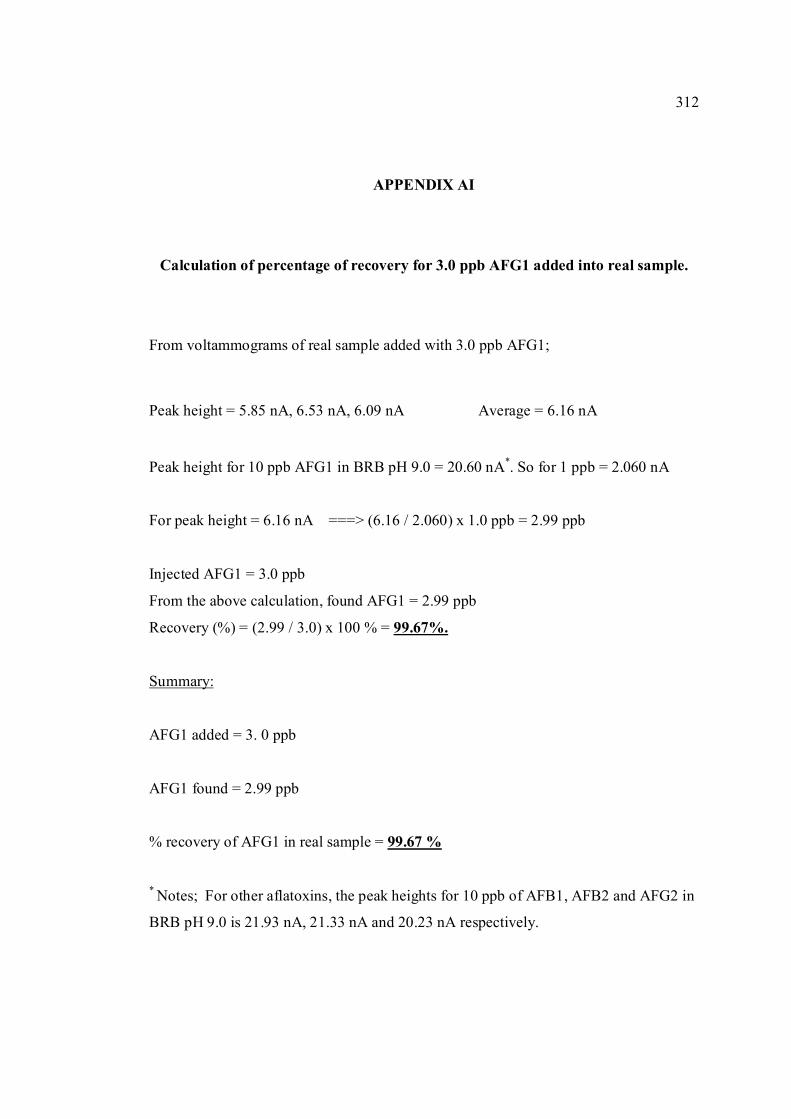
312
APPENDIX AI
Calculation of percentage of recovery for 3.0 ppb AFG1 added into real sample.
From voltammograms of real sample added with 3.0 ppb AFG1;
Peak height = 5.85 nA, 6.53 nA, 6.09 nA Average = 6.16 nA
Peak height for 10 ppb AFG1 in BRB pH 9.0 = 20.60 nA*. So for 1 ppb = 2.060 nA
For peak height = 6.16 nA ===> (6.16 / 2.060) x 1.0 ppb = 2.99 ppb
Injected AFG1 = 3.0 ppb
From the above calculation, found AFG1 = 2.99 ppb
Recovery (%) = (2.99 / 3.0) x 100 % = 99.67%.
Summary:
AFG1 added = 3. 0 ppb
AFG1 found = 2.99 ppb
% recovery of AFG1 in real sample = 99.67 %
* Notes; For other aflatoxins, the peak heights for 10 ppb of AFB1, AFB2 and AFG2 in
BRB pH 9.0 is 21.93 nA, 21.33 nA and 20.23 nA respectively.
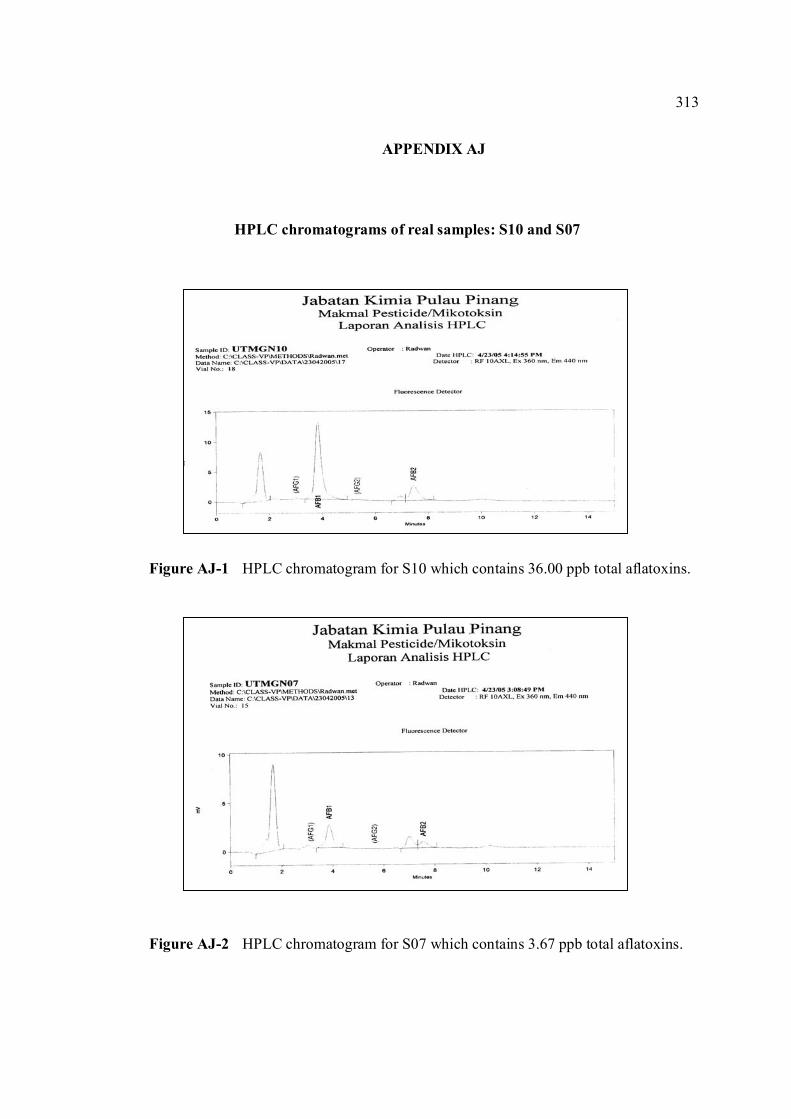
313
APPENDIX AJ
HPLC chromatograms of real samples: S10 and S07 Figure AJ-1 HPLC chromatogram for S10 which contains 36.00 ppb total aflatoxins.
Figure AJ-2 HPLC chromatogram for S07 which contains 3.67 ppb total aflatoxins.
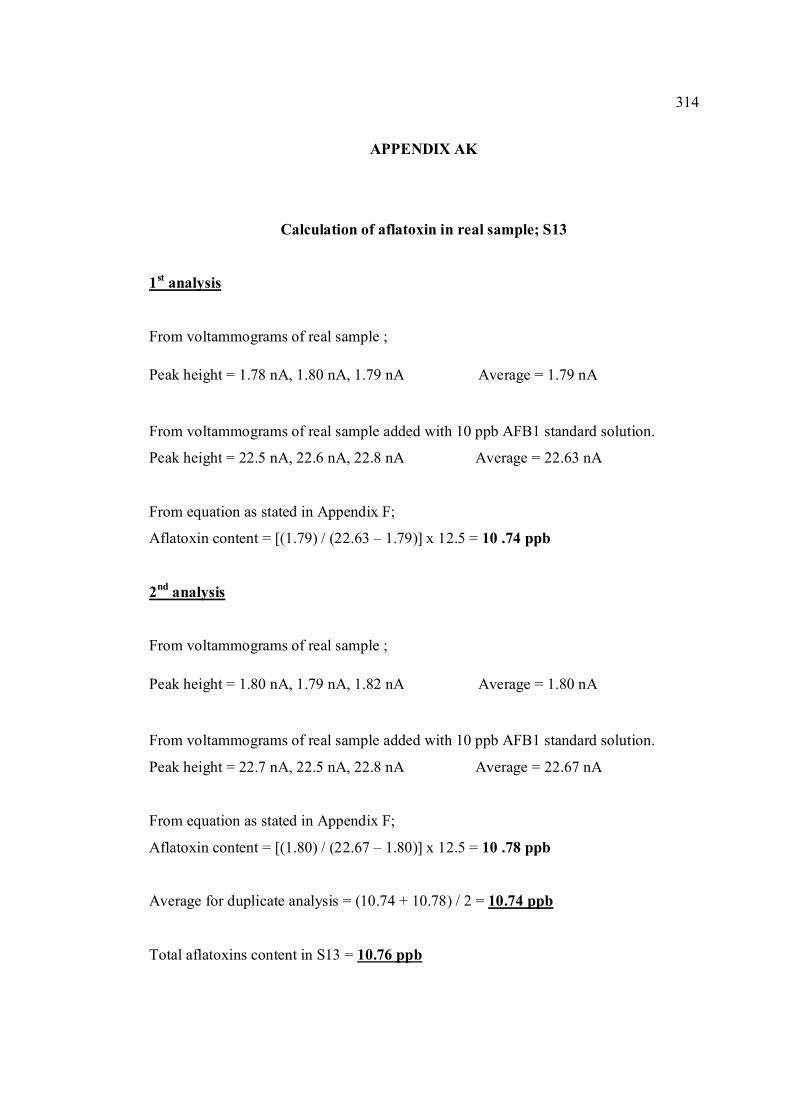
314
APPENDIX AK
Calculation of aflatoxin in real sample; S13
1st analysis
From voltammograms of real sample ;
Peak height = 1.78 nA, 1.80 nA, 1.79 nA Average = 1.79 nA
From voltammograms of real sample added with 10 ppb AFB1 standard solution.
Peak height = 22.5 nA, 22.6 nA, 22.8 nA Average = 22.63 nA
From equation as stated in Appendix F;
Aflatoxin content = [(1.79) / (22.63 – 1.79)] x 12.5 = 10 .74 ppb
2nd analysis
From voltammograms of real sample ;
Peak height = 1.80 nA, 1.79 nA, 1.82 nA Average = 1.80 nA
From voltammograms of real sample added with 10 ppb AFB1 standard solution.
Peak height = 22.7 nA, 22.5 nA, 22.8 nA Average = 22.67 nA
From equation as stated in Appendix F;
Aflatoxin content = [(1.80) / (22.67 – 1.80)] x 12.5 = 10 .78 ppb
Average for duplicate analysis = (10.74 + 10.78) / 2 = 10.74 ppb
Total aflatoxins content in S13 = 10.76 ppb
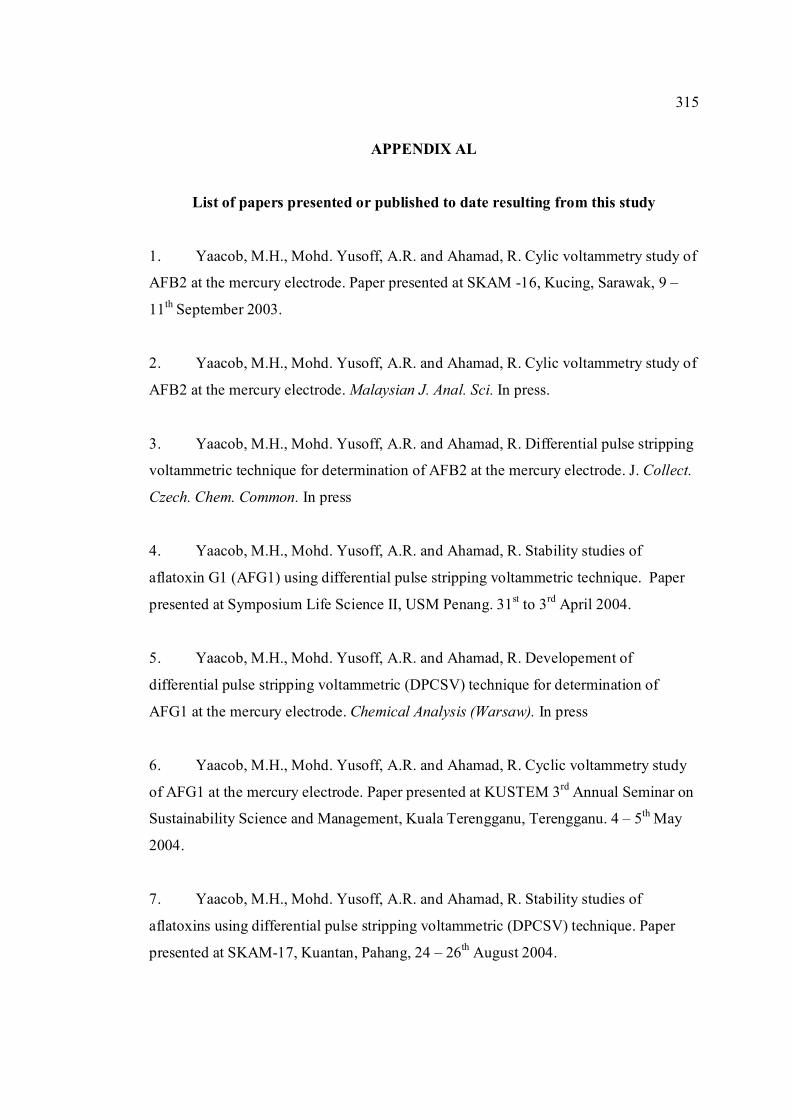
315
APPENDIX AL
List of papers presented or published to date resulting from this study
1. Yaacob, M.H., Mohd. Yusoff, A.R. and Ahamad, R. Cylic voltammetry study of
AFB2 at the mercury electrode. Paper presented at SKAM -16, Kucing, Sarawak, 9 –
11th September 2003.
2. Yaacob, M.H., Mohd. Yusoff, A.R. and Ahamad, R. Cylic voltammetry study of
AFB2 at the mercury electrode. Malaysian J. Anal. Sci. In press.
3. Yaacob, M.H., Mohd. Yusoff, A.R. and Ahamad, R. Differential pulse stripping
voltammetric technique for determination of AFB2 at the mercury electrode. J. Collect.
Czech. Chem. Common. In press
4. Yaacob, M.H., Mohd. Yusoff, A.R. and Ahamad, R. Stability studies of
aflatoxin G1 (AFG1) using differential pulse stripping voltammetric technique. Paper
presented at Symposium Life Science II, USM Penang. 31st to 3rd April 2004.
5. Yaacob, M.H., Mohd. Yusoff, A.R. and Ahamad, R. Developement of
differential pulse stripping voltammetric (DPCSV) technique for determination of
AFG1 at the mercury electrode. Chemical Analysis (Warsaw). In press
6. Yaacob, M.H., Mohd. Yusoff, A.R. and Ahamad, R. Cyclic voltammetry study
of AFG1 at the mercury electrode. Paper presented at KUSTEM 3rd Annual Seminar on
Sustainability Science and Management, Kuala Terengganu, Terengganu. 4 – 5th May
2004.
7. Yaacob, M.H., Mohd. Yusoff, A.R. and Ahamad, R. Stability studies of
aflatoxins using differential pulse stripping voltammetric (DPCSV) technique. Paper
presented at SKAM-17, Kuantan, Pahang, 24 – 26th August 2004.
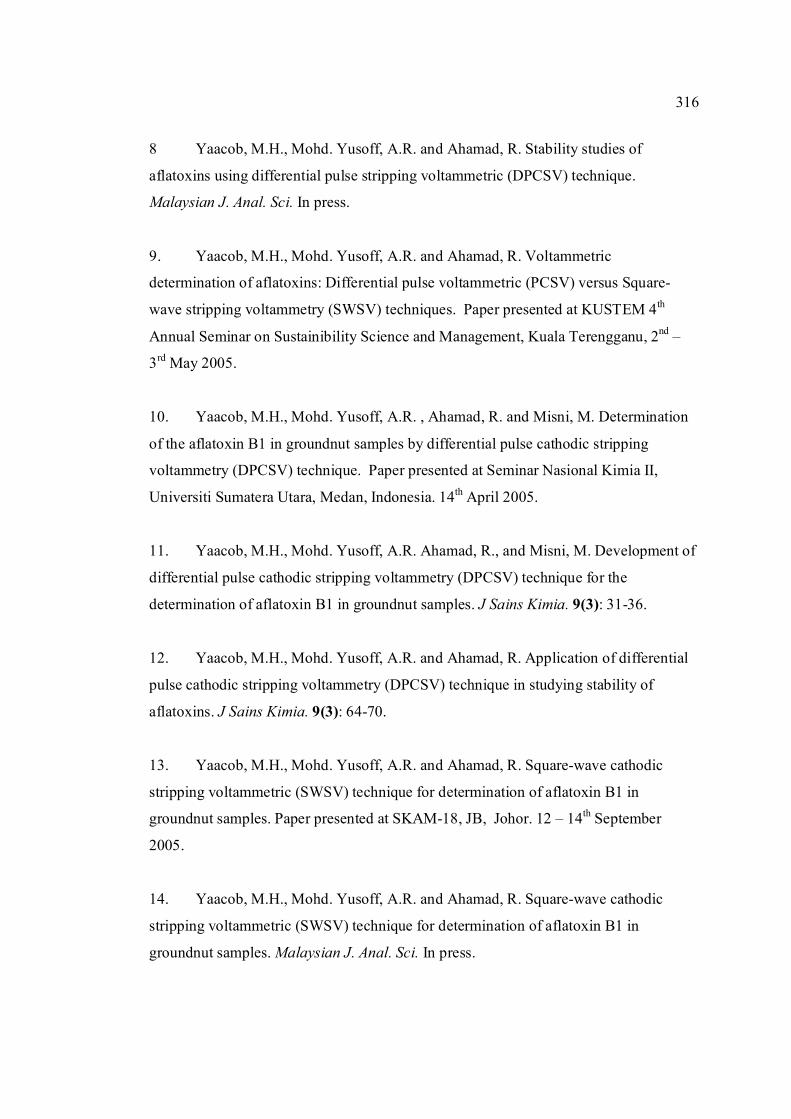
316
8 Yaacob, M.H., Mohd. Yusoff, A.R. and Ahamad, R. Stability studies of
aflatoxins using differential pulse stripping voltammetric (DPCSV) technique.
Malaysian J. Anal. Sci. In press.
9. Yaacob, M.H., Mohd. Yusoff, A.R. and Ahamad, R. Voltammetric
determination of aflatoxins: Differential pulse voltammetric (PCSV) versus Square-
wave stripping voltammetry (SWSV) techniques. Paper presented at KUSTEM 4th
Annual Seminar on Sustainibility Science and Management, Kuala Terengganu, 2nd –
3rd May 2005.
10. Yaacob, M.H., Mohd. Yusoff, A.R. , Ahamad, R. and Misni, M. Determination
of the aflatoxin B1 in groundnut samples by differential pulse cathodic stripping
voltammetry (DPCSV) technique. Paper presented at Seminar Nasional Kimia II,
Universiti Sumatera Utara, Medan, Indonesia. 14th April 2005.
11. Yaacob, M.H., Mohd. Yusoff, A.R. Ahamad, R., and Misni, M. Development of
differential pulse cathodic stripping voltammetry (DPCSV) technique for the
determination of aflatoxin B1 in groundnut samples. J Sains Kimia. 9(3): 31-36.
12. Yaacob, M.H., Mohd. Yusoff, A.R. and Ahamad, R. Application of differential
pulse cathodic stripping voltammetry (DPCSV) technique in studying stability of
aflatoxins. J Sains Kimia. 9(3): 64-70.
13. Yaacob, M.H., Mohd. Yusoff, A.R. and Ahamad, R. Square-wave cathodic
stripping voltammetric (SWSV) technique for determination of aflatoxin B1 in
groundnut samples. Paper presented at SKAM-18, JB, Johor. 12 – 14th September
2005.
14. Yaacob, M.H., Mohd. Yusoff, A.R. and Ahamad, R. Square-wave cathodic
stripping voltammetric (SWSV) technique for determination of aflatoxin B1 in
groundnut samples. Malaysian J. Anal. Sci. In press.
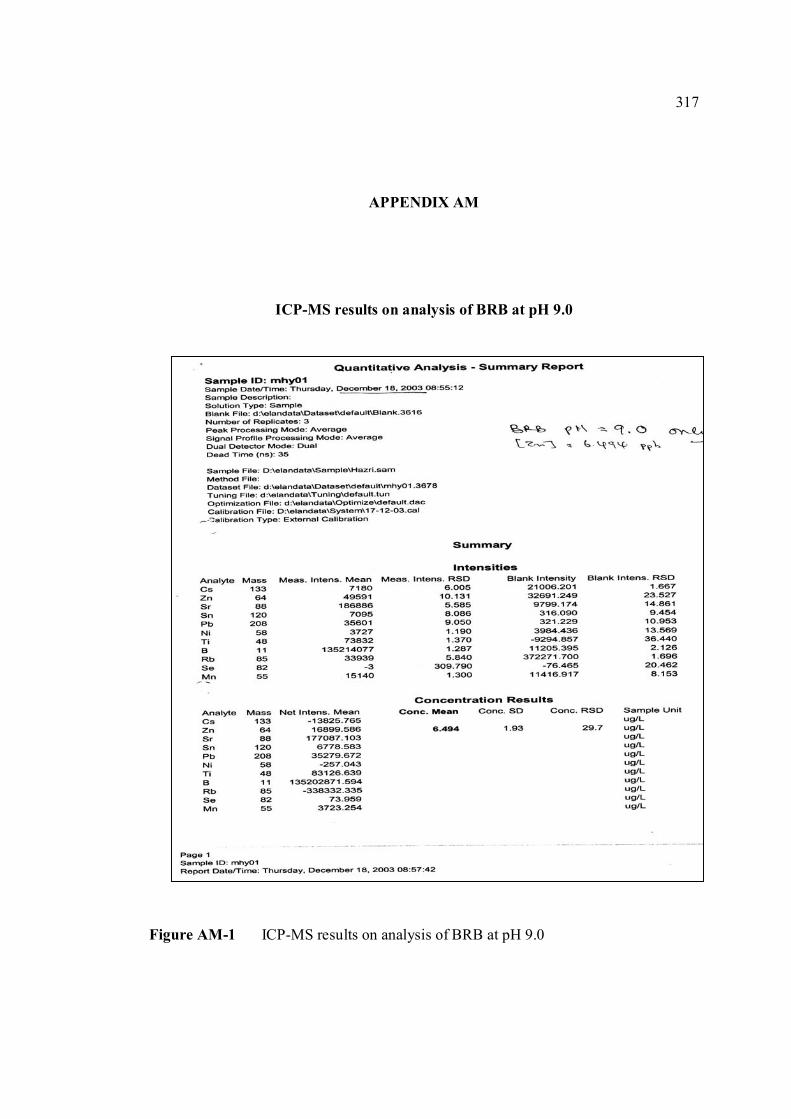
317
APPENDIX AM
ICP-MS results on analysis of BRB at pH 9.0
Figure AM-1 ICP-MS results on analysis of BRB at pH 9.0

3/1/2007 1st ASSESSMENT REPORT 1
Introduction Experimental Results & Discussion Problem Future Works
PRESENTED AT 1st ASSESMENT
SEMINAR.
STRIPPING VOLTAMMETRIC STUDY FOR DETERMINATION OF AFLATOXIN COMPOUNDS
MOHAMAD HADZRI YAACOB (PS023001)
SUPERVISOR:AP DR ABDUL RAHIM HJ MOHD YUSOFF
CO-SUPERVISOR:PROF RAHMALAN AHAMAD
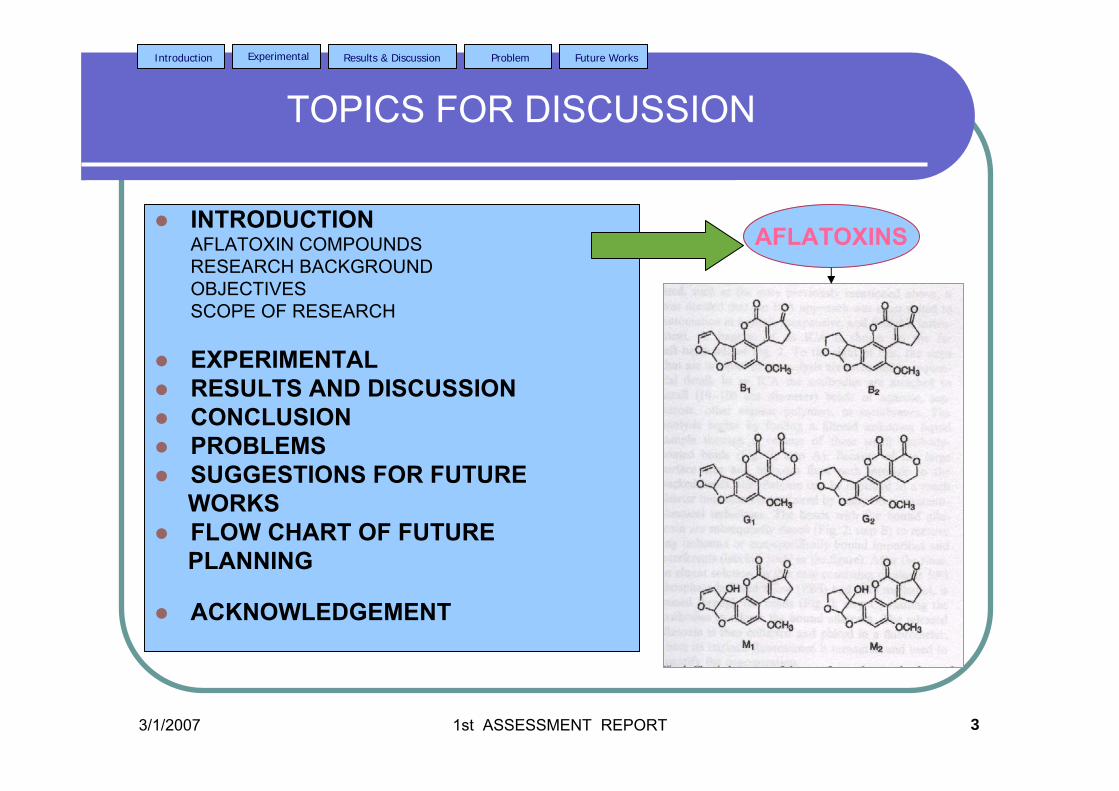
3/1/2007 1st ASSESSMENT REPORT 3
Introduction Experimental Results & Discussion Problem Future Works
TOPICS FOR DISCUSSION
INTRODUCTIONAFLATOXIN COMPOUNDSRESEARCH BACKGROUND OBJECTIVES SCOPE OF RESEARCH
EXPERIMENTALRESULTS AND DISCUSSIONCONCLUSIONPROBLEMSSUGGESTIONS FOR FUTURE WORKSFLOW CHART OF FUTURE PLANNING
ACKNOWLEDGEMENT
AFLATOXINS
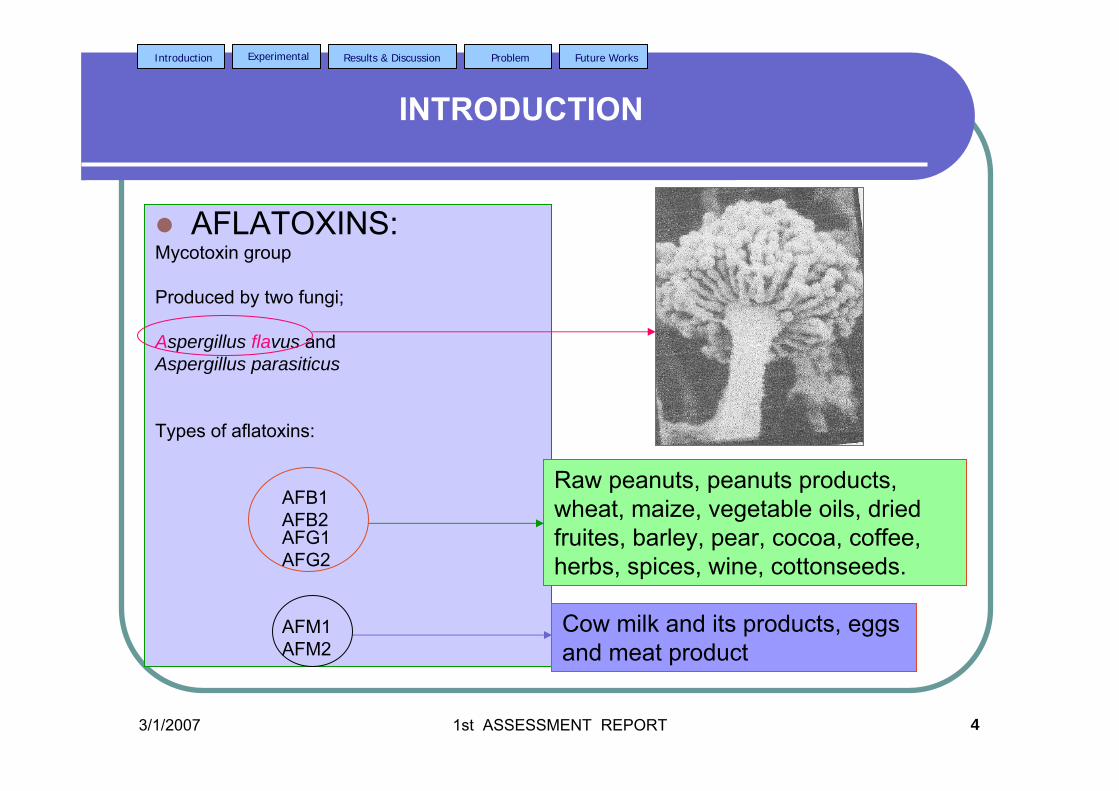
3/1/2007 1st ASSESSMENT REPORT 4
Introduction Experimental Results & Discussion Problem Future Works
INTRODUCTION
AFLATOXINS:Mycotoxin group
Produced by two fungi;
Aspergillus flavus and Aspergillus parasiticus
Types of aflatoxins:
AFB1 AFB2 AFG1AFG2
AFM1AFM2
Raw peanuts, peanuts products, wheat, maize, vegetable oils, dried fruites, barley, pear, cocoa, coffee, herbs, spices, wine, cottonseeds.
Cow milk and its products, eggs and meat product

3/1/2007 1st ASSESSMENT REPORT 5
Introduction Experimental Results & Discussion Problem Future Works
INTRODUCTION …cont
AFLATOXINS:Occurs naturally in commodities used for animal and human
Carcinogenic, teratogenic and mutagenic
IARC (1988): Class I carcinogenic materials
Dangerous to health: will cause aflatoxicosis disease.
Effect the economy of commodities export countries
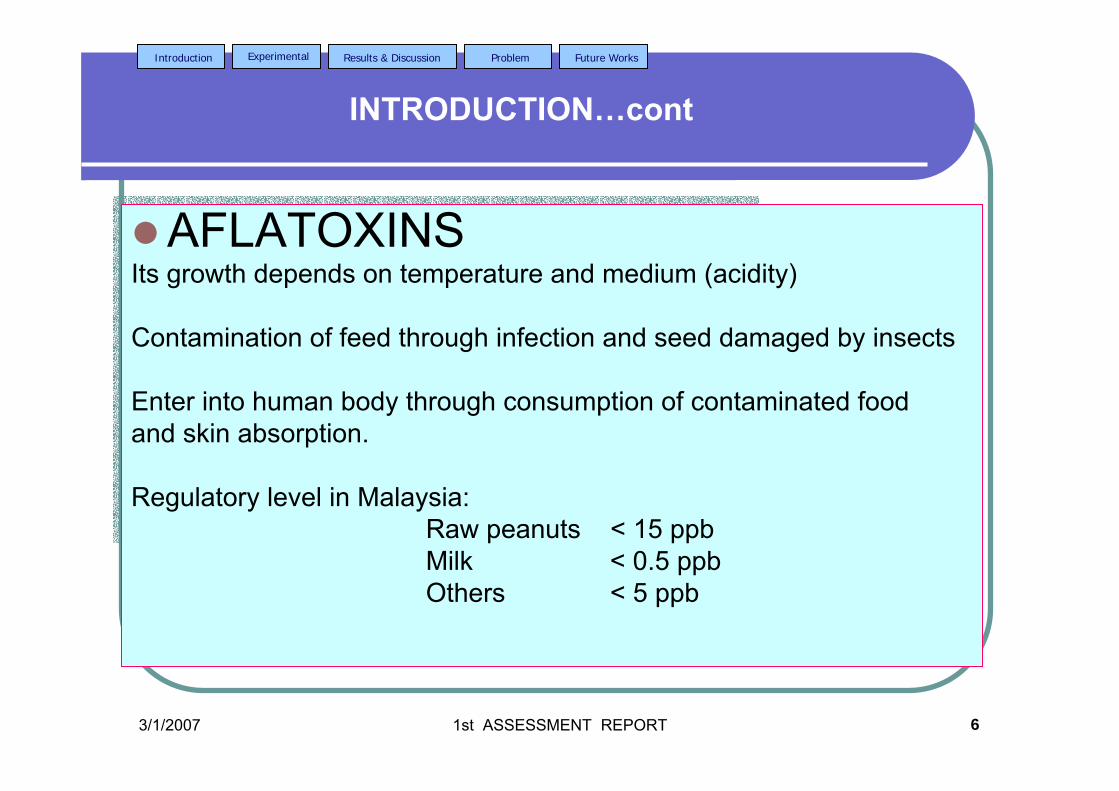
3/1/2007 1st ASSESSMENT REPORT 6
Introduction Experimental Results & Discussion Problem Future Works
INTRODUCTION…cont
AFLATOXINSIts growth depends on temperature and medium (acidity)
Contamination of feed through infection and seed damaged by insects
Enter into human body through consumption of contaminated food and skin absorption.
Regulatory level in Malaysia: Raw peanuts < 15 ppbMilk < 0.5 ppbOthers < 5 ppb
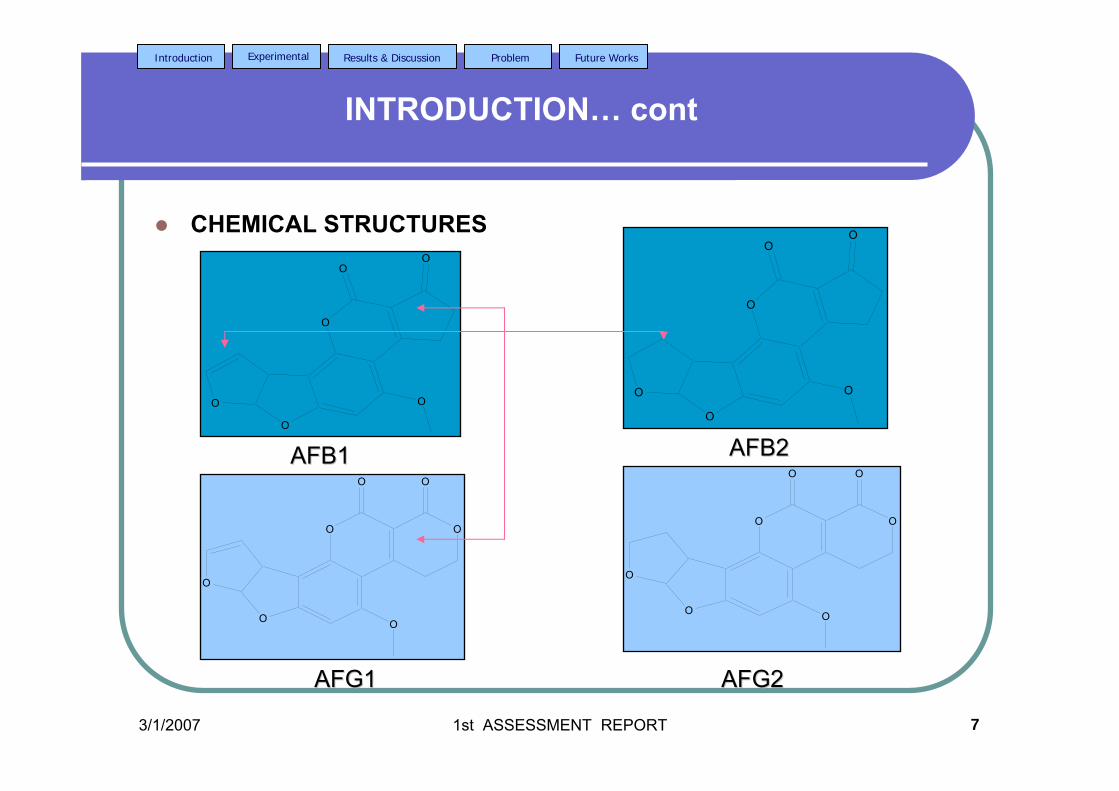
3/1/2007 1st ASSESSMENT REPORT 7
Introduction Experimental Results & Discussion Problem Future Works
INTRODUCTION… cont
CHEMICAL STRUCTURES
O
O
O
OO
O
AFB1AFB1 AFB2AFB2
AFG1AFG1 AFG2AFG2
O
O
O
OO
O
O O
O
O
OO
O
O O
O
O
OO
O
3/1/2007 1st ASSESSMENT REPORT 8
Introduction Experimental Results & Discussion Problem Future Works
RESEARCH BACKGROUND
Very dangerous to human health
Its actual amount must be determined by fast, accurate and relatively low cost technique / method.
Analytical level must be at ppb or ppt ( In Malaysia: HPLC with LOD:2.0 ppb and analysis time: 20 mins)
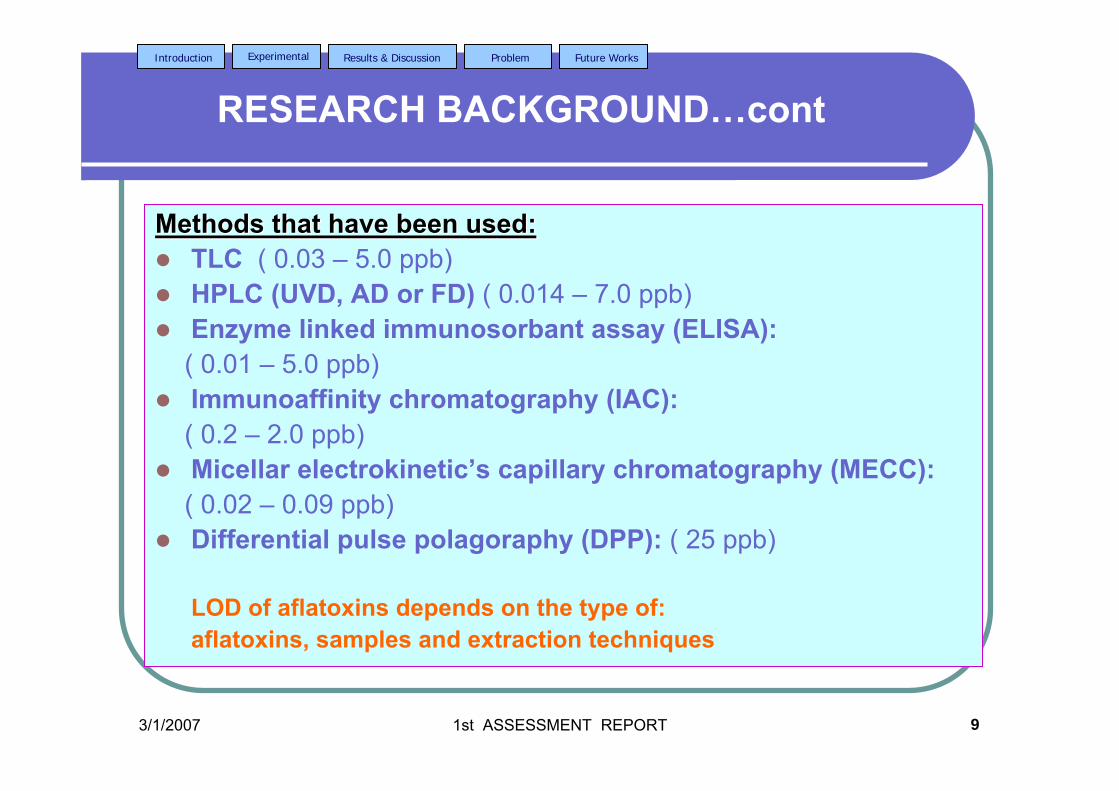
3/1/2007 1st ASSESSMENT REPORT 9
Introduction Experimental Results & Discussion Problem Future Works
RESEARCH BACKGROUND…cont
Methods that have been used:Methods that have been used:TLC ( 0.03 – 5.0 ppb) HPLC (UVD, AD or FD) ( 0.014 – 7.0 ppb) Enzyme linked immunosorbant assay (ELISA):( 0.01 – 5.0 ppb)Immunoaffinity chromatography (IAC):( 0.2 – 2.0 ppb)Micellar electrokinetic’s capillary chromatography (MECC):( 0.02 – 0.09 ppb)Differential pulse polagoraphy (DPP): ( 25 ppb)
LOD of aflatoxins depends on the type of:aflatoxins, samples and extraction techniques

3/1/2007 1st ASSESSMENT REPORT 10
Introduction Experimental Results & Discussion Problem Future Works
RESEARCH BACKGROUND… cont
Problems/disadvantages:
Antibodies are costly, using dangerous radioisotopes, need special precaution for dealing with radioisotopes and its waste. It has certain half life.
RIA
Reagents /kits are costly. Suitable for screen test.
ELISA
Longer analysis time, need a lot of toxic organic solvents, high cost for instruments, and maintenance
HPLC
Longer analysis time, accuracy problem, aflatoxins absorption problem
TLC
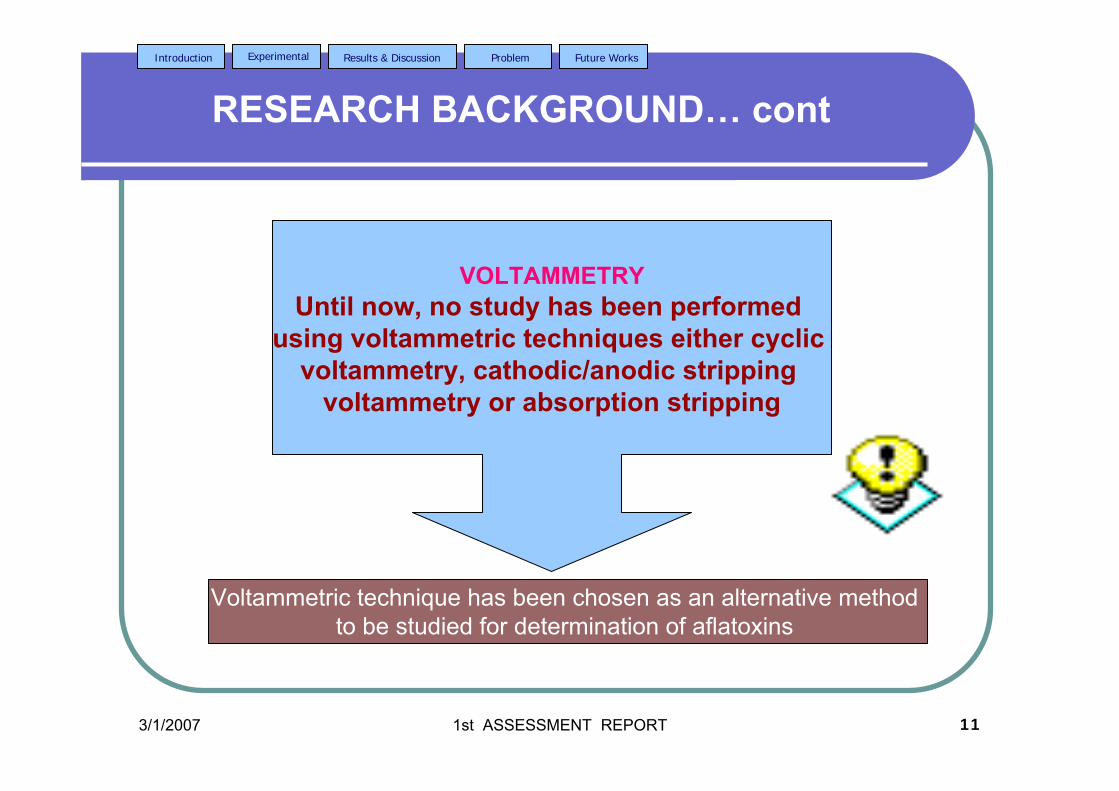
3/1/2007 1st ASSESSMENT REPORT 11
Introduction Experimental Results & Discussion Problem Future Works
RESEARCH BACKGROUND… cont
Voltammetric technique has been chosen as an alternative method to be studied for determination of aflatoxins
VOLTAMMETRYUntil now, no study has been performed
using voltammetric techniques either cyclic voltammetry, cathodic/anodic stripping
voltammetry or absorption stripping
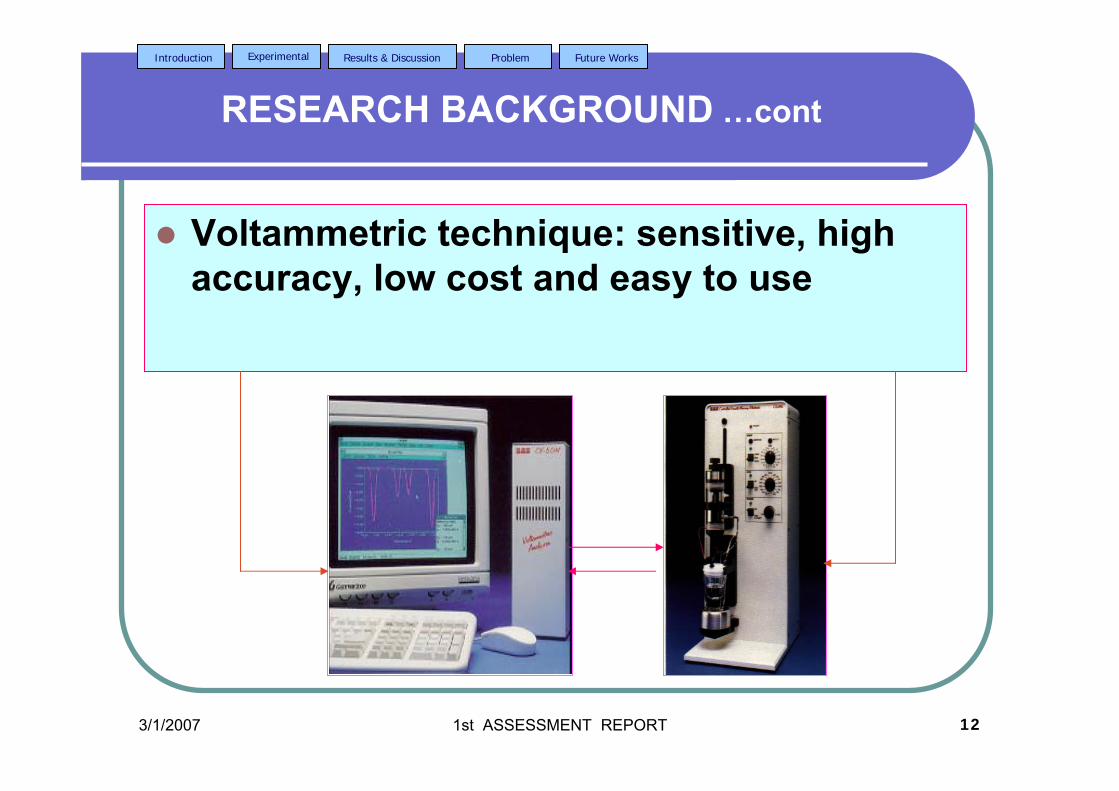
3/1/2007 1st ASSESSMENT REPORT 12
Introduction Experimental Results & Discussion Problem Future Works
RESEARCH BACKGROUND …cont
Voltammetric technique: sensitive, high accuracy, low cost and easy to use
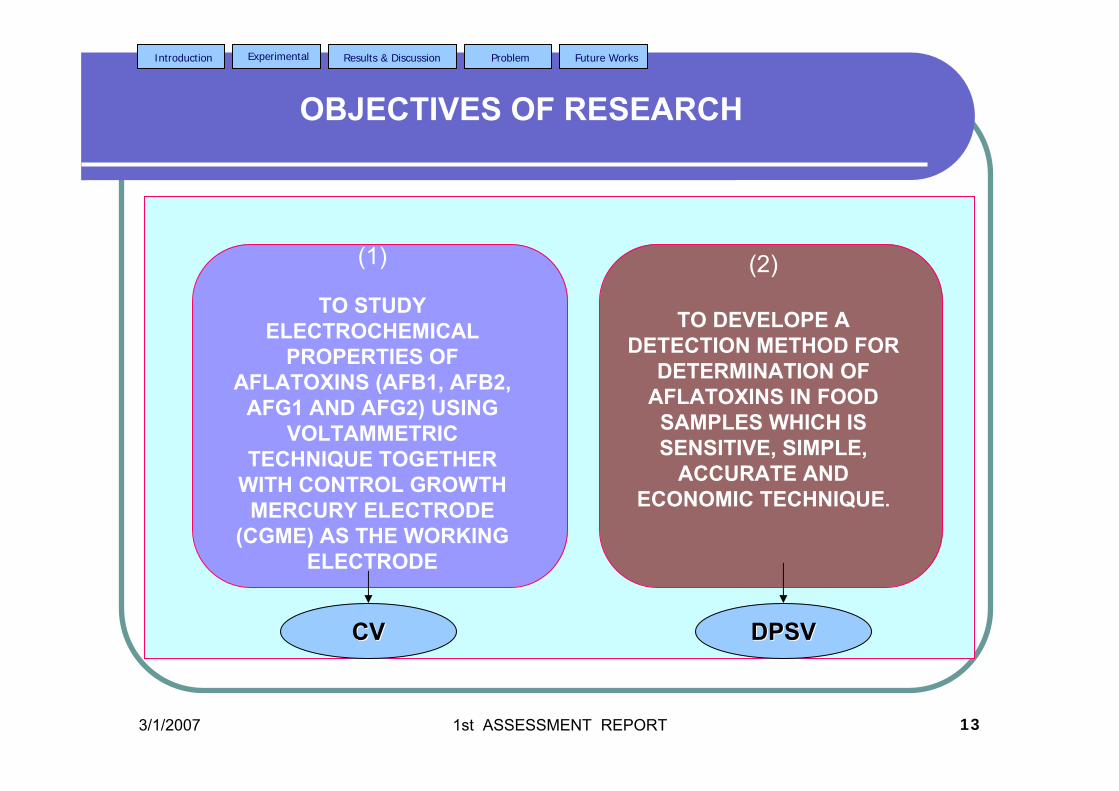
3/1/2007 1st ASSESSMENT REPORT 13
Introduction Experimental Results & Discussion Problem Future Works
OBJECTIVES OF RESEARCH
(1)
TO STUDY ELECTROCHEMICAL
PROPERTIES OF AFLATOXINS (AFB1, AFB2,
AFG1 AND AFG2) USING VOLTAMMETRIC
TECHNIQUE TOGETHER WITH CONTROL GROWTH
MERCURY ELECTRODE (CGME) AS THE WORKING
ELECTRODE
(2)
TO DEVELOPE A DETECTION METHOD FOR
DETERMINATION OF AFLATOXINS IN FOOD
SAMPLES WHICH IS SENSITIVE, SIMPLE,
ACCURATE AND ECONOMIC TECHNIQUE.
CVCV DPSVDPSV
3/1/2007 1st ASSESSMENT REPORT 14
Introduction Experimental Results & Discussion Problem Future Works
SCOPE OF STUDY
Using cyclic voltammetry (CV):-
Determine the type of aflatoxins reaction at mercury electrode when anodic or cathodicscanning is performed.
3/1/2007 1st ASSESSMENT REPORT 15
Introduction Experimental Results & Discussion Problem Future Works
SCOPE OF STUDY…cont
Identify the peak or peaks obtained either oxidation peak or reduction peak or both for developing a technique for analysis of aflatoxins.
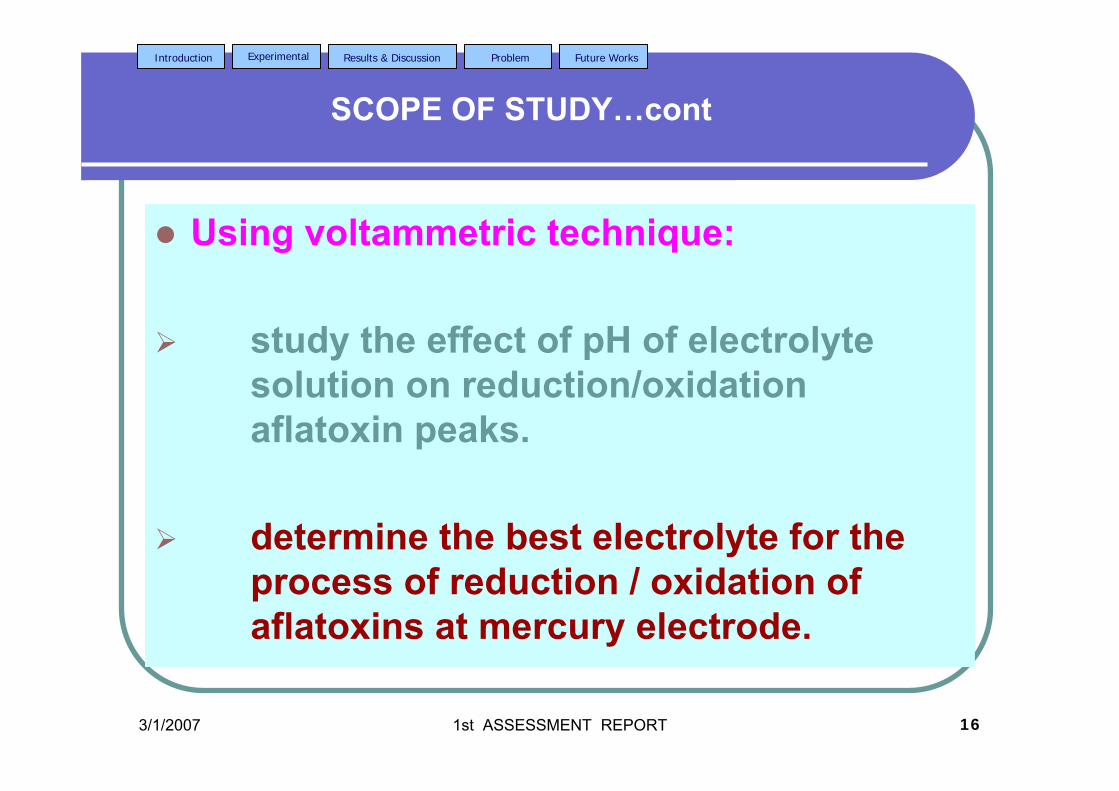
3/1/2007 1st ASSESSMENT REPORT 16
Introduction Experimental Results & Discussion Problem Future Works
SCOPE OF STUDY…cont
Using voltammetric technique:
study the effect of pH of electrolyte solution on reduction/oxidation aflatoxin peaks.
determine the best electrolyte for the process of reduction / oxidation of aflatoxins at mercury electrode.
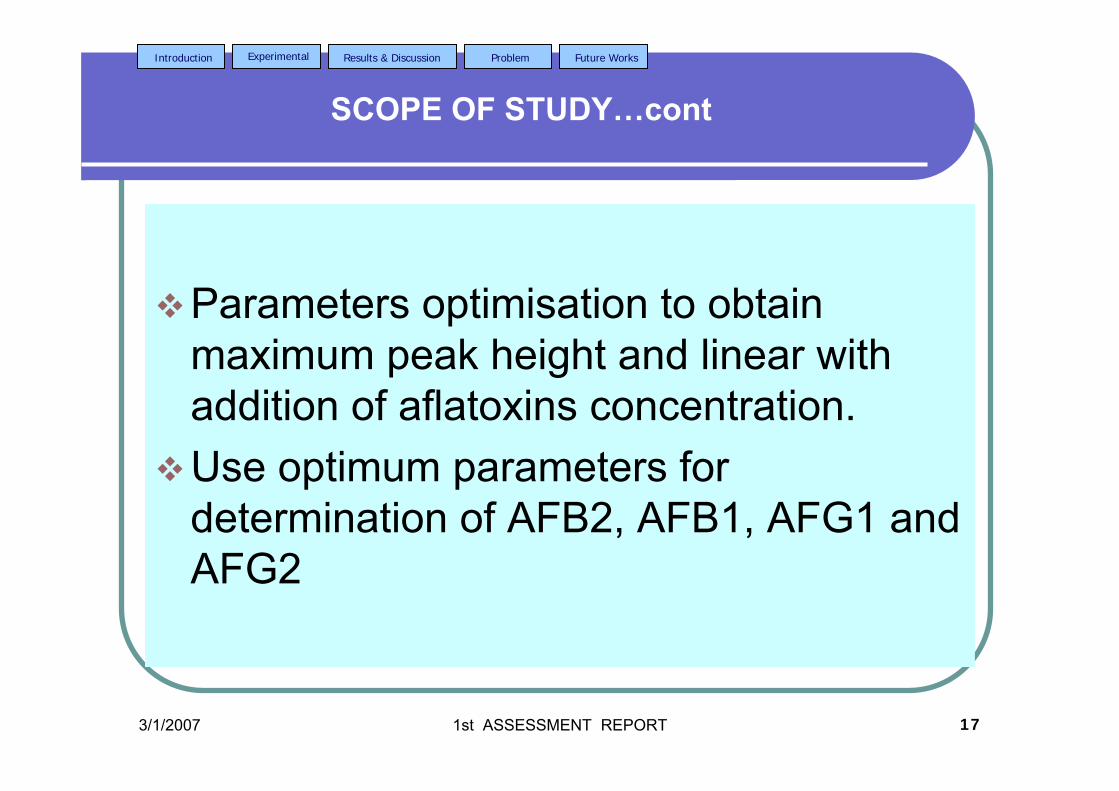
3/1/2007 1st ASSESSMENT REPORT 17
Introduction Experimental Results & Discussion Problem Future Works
SCOPE OF STUDY…cont
Parameters optimisation to obtain maximum peak height and linear with addition of aflatoxins concentration.Use optimum parameters for determination of AFB2, AFB1, AFG1 and AFG2
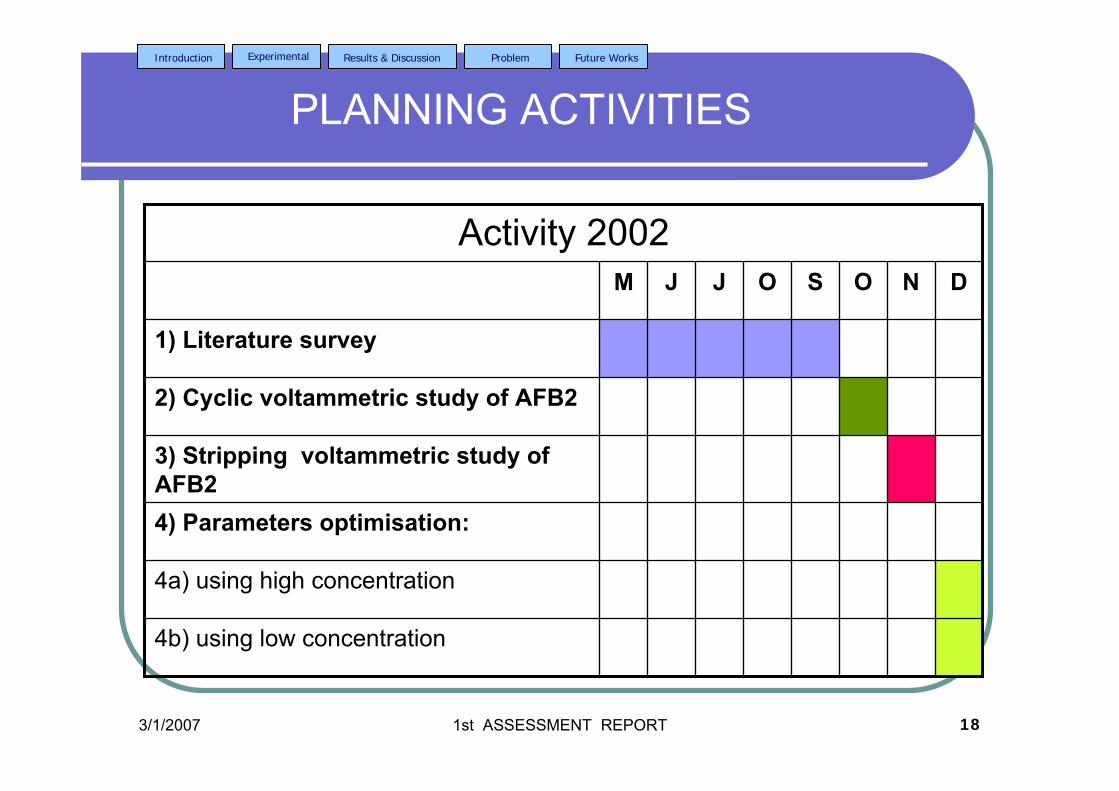
3/1/2007 1st ASSESSMENT REPORT 18
Introduction Experimental Results & Discussion Problem Future Works
PLANNING ACTIVITIES
4b) using low concentration
4a) using high concentration
4) Parameters optimisation:
3) Stripping voltammetric study of AFB2
2) Cyclic voltammetric study of AFB2
1) Literature survey
DNOSOJJM
Activity 2002

3/1/2007 1st ASSESSMENT REPORT 19
Introduction Experimental Results & Discussion Problem Future Works
PLANNING ACTIVITIES…cont
J OAF
3) Complexing of aflatoxins study
2) Interference study
1b) Determine analytical parameters
1a) Prepare calibration curve
1) Determination of AFB1, AFB2, AFG1 and AFG2
DNOSJJMMActivity 2003

3/1/2007 1st ASSESSMENT REPORT 20
Introduction Experimental Results & Discussion Problem Future Works
PLANNING ACTIVITIES…cont
5) Study using different working electrodes
6) Thesis writting up
1) Analysis of contaminated food samples
2) Thesis writting up
Activity 2005
J OAF
5) Comparison study
4)Determination by HPLC
3)Determination of aflatoxinsin real samples
2)Determination of aflatoxinsin artificially contaminated samples
1) Determination of mixing aflatoxins
DNOSJJMM
Activity 2004
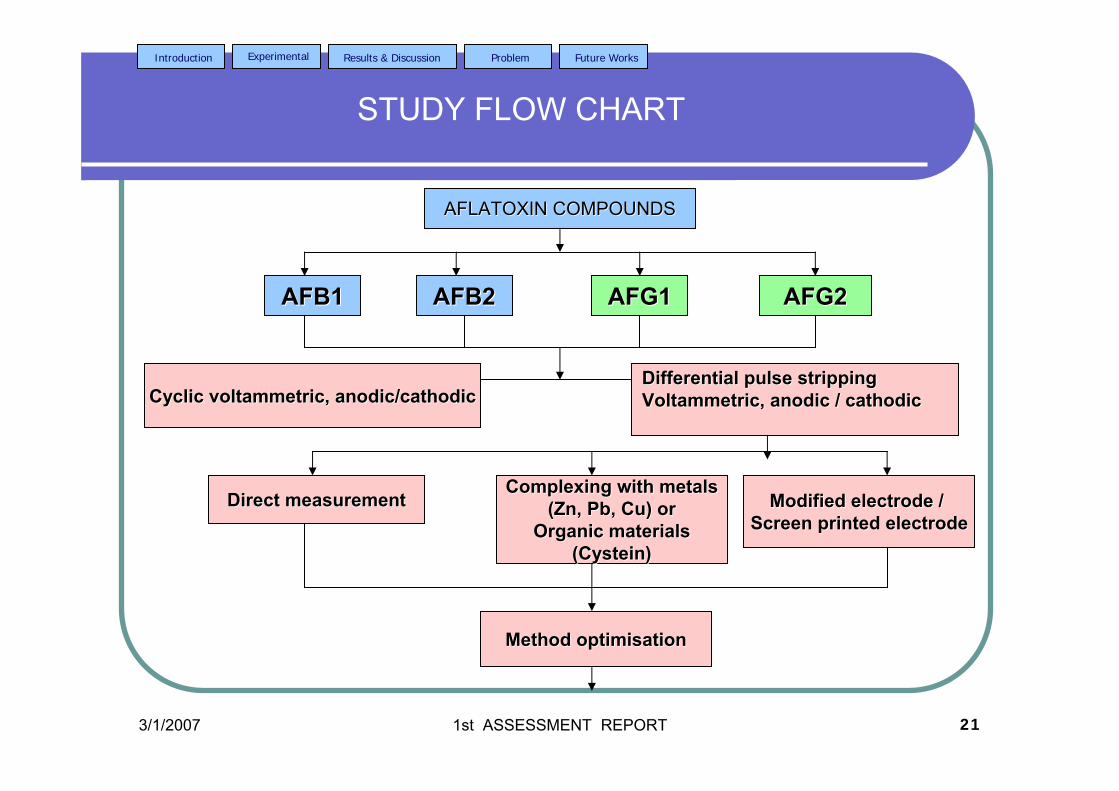
3/1/2007 1st ASSESSMENT REPORT 21
Introduction Experimental Results & Discussion Problem Future Works
STUDY FLOW CHART
AFLATOXIN COMPOUNDSAFLATOXIN COMPOUNDS
AFB1AFB1 AFB2AFB2 AFG1AFG1 AFG2AFG2
Cyclic Cyclic voltammetricvoltammetric, anodic/, anodic/cathodiccathodicDifferential pulse stripping Differential pulse stripping VoltammetricVoltammetric, anodic / , anodic / cathodiccathodic
Direct measurementDirect measurement ComplexingComplexing with metalswith metals(Zn, (Zn, PbPb, Cu) or, Cu) or
Organic materialsOrganic materials((CysteinCystein))
Modified electrode / Modified electrode / Screen printed electrodeScreen printed electrode
Method Method optimisationoptimisation
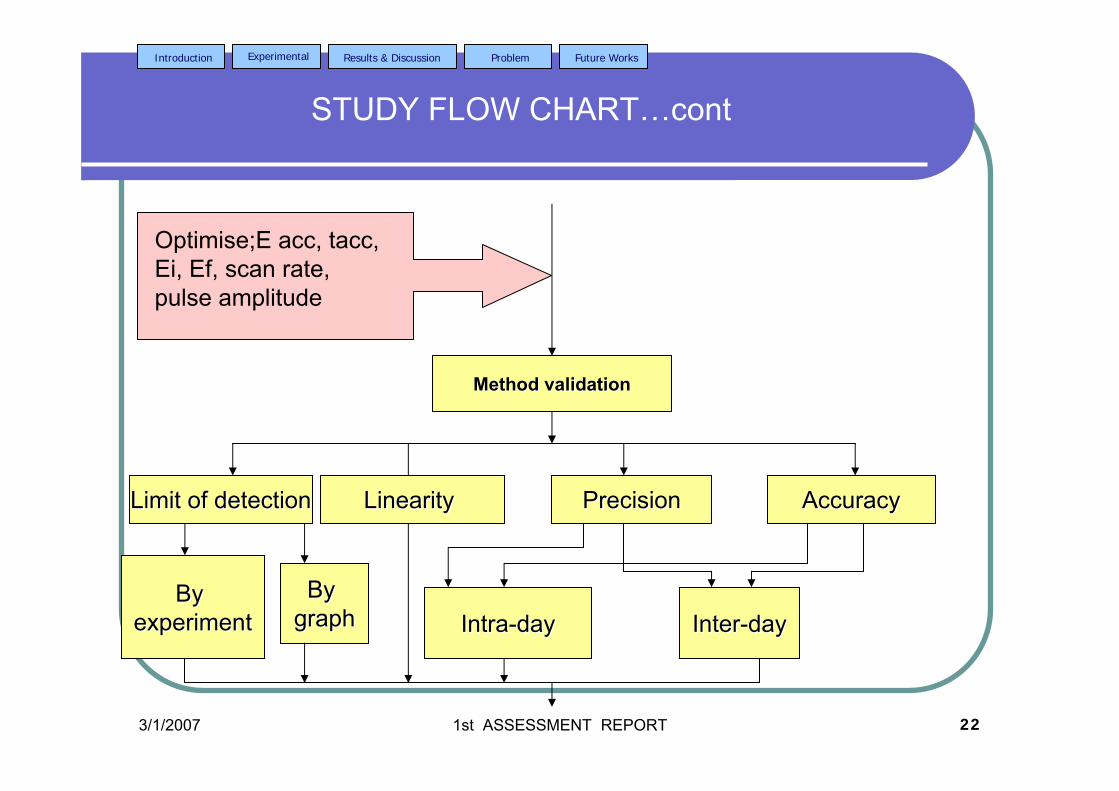
3/1/2007 1st ASSESSMENT REPORT 22
Introduction Experimental Results & Discussion Problem Future Works
STUDY FLOW CHART…cont
Method validationMethod validation
Limit of detectionLimit of detection Linearity Linearity PrecisionPrecision AccuracyAccuracy
By By experimentexperiment
By By graphgraph InterInter--daydayIntraIntra--dayday
Optimise;E acc, tacc, Ei, Ef, scan rate, pulse amplitude
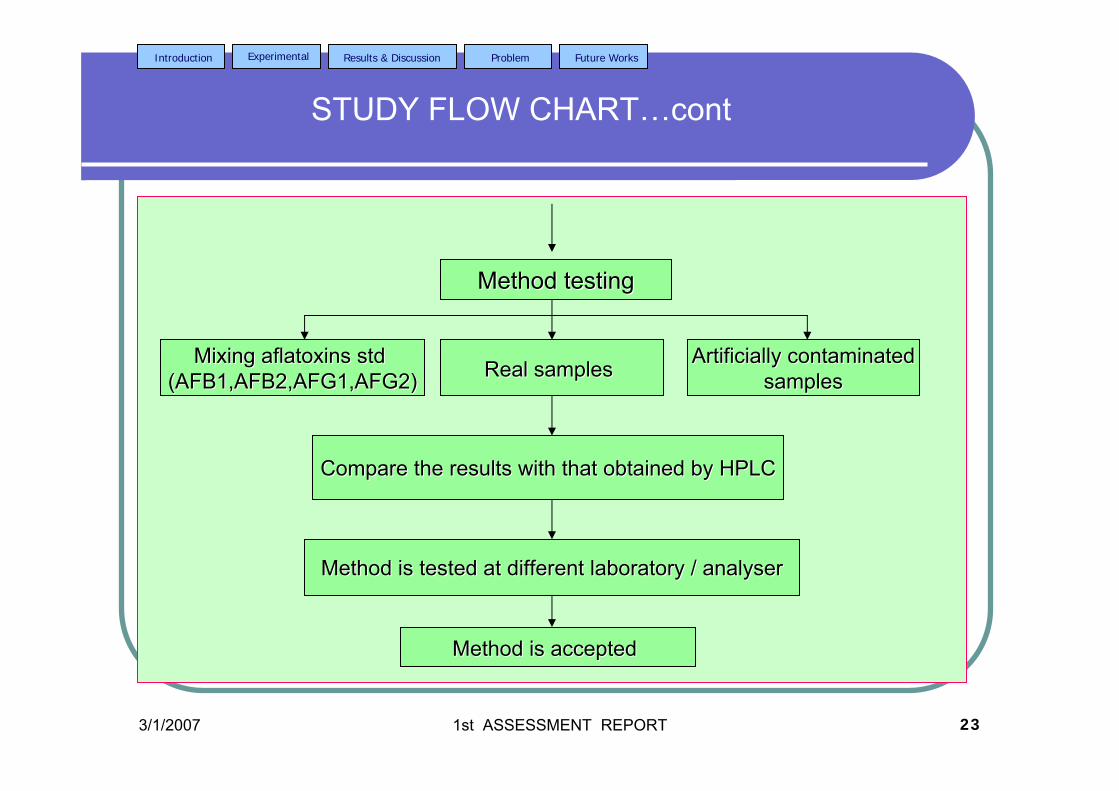
3/1/2007 1st ASSESSMENT REPORT 23
Introduction Experimental Results & Discussion Problem Future Works
STUDY FLOW CHART…cont
Method testingMethod testing
Real samplesReal samples Artificially contaminatedArtificially contaminatedsamplessamples
Compare the results with that obtained by HPLCCompare the results with that obtained by HPLC
Method is tested at different laboratory / Method is tested at different laboratory / analyseranalyser
Method is acceptedMethod is accepted
Mixing Mixing aflatoxinsaflatoxins std std (AFB1,AFB2,AFG1,AFG2)(AFB1,AFB2,AFG1,AFG2)
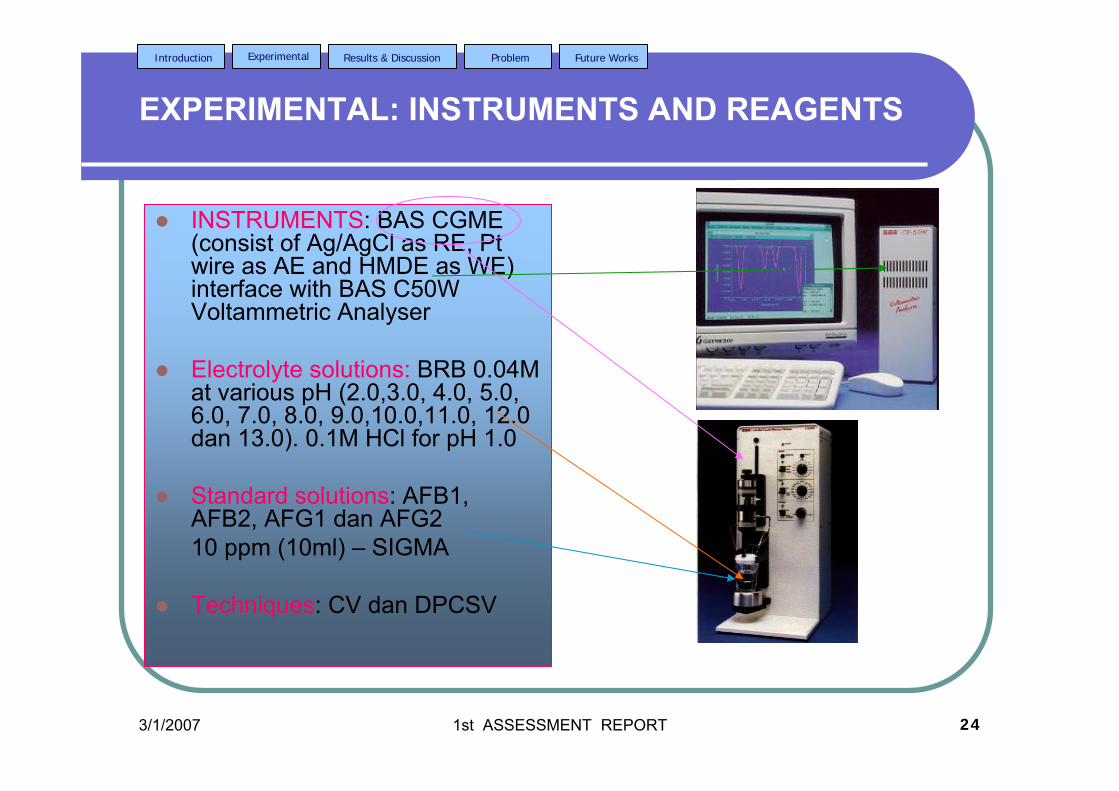
3/1/2007 1st ASSESSMENT REPORT 24
Introduction Experimental Results & Discussion Problem Future Works
EXPERIMENTAL: INSTRUMENTS AND REAGENTS
INSTRUMENTS: BAS CGME (consist of Ag/AgCl as RE, Pt wire as AE and HMDE as WE) interface with BAS C50W Voltammetric Analyser
Electrolyte solutions: BRB 0.04M at various pH (2.0,3.0, 4.0, 5.0, 6.0, 7.0, 8.0, 9.0,10.0,11.0, 12.0 dan 13.0). 0.1M HCl for pH 1.0
Standard solutions: AFB1, AFB2, AFG1 dan AFG210 ppm (10ml) – SIGMA
Techniques: CV dan DPCSV
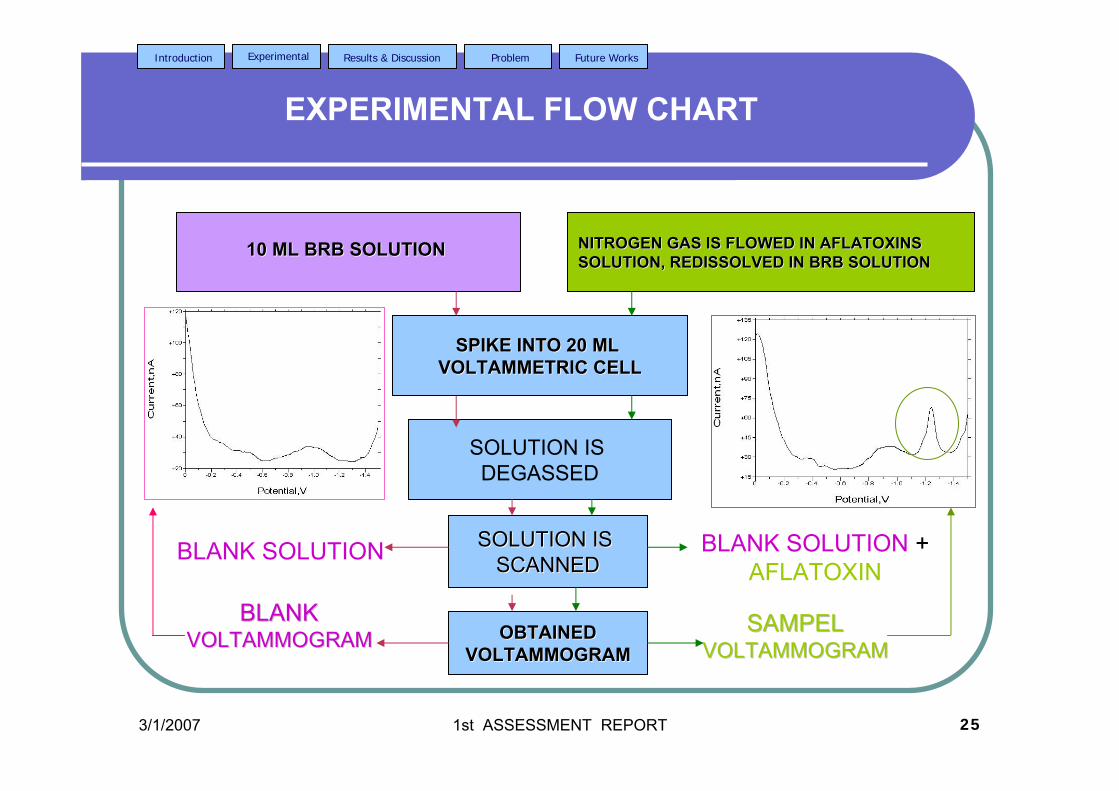
3/1/2007 1st ASSESSMENT REPORT 25
Introduction Experimental Results & Discussion Problem Future Works
EXPERIMENTAL FLOW CHART
NITROGEN GAS IS FLOWED IN AFLATOXINS NITROGEN GAS IS FLOWED IN AFLATOXINS SOLUTION, REDISSOLVED IN BRB SOLUTION SOLUTION, REDISSOLVED IN BRB SOLUTION
10 ML BRB SOLUTION 10 ML BRB SOLUTION
SOLUTION IS DEGASSED
SOLUTION IS SOLUTION IS SCANNEDSCANNED
SPIKE INTO 20 ML SPIKE INTO 20 ML VOLTAMMETRIC CELLVOLTAMMETRIC CELL
OBTAINEDOBTAINEDVOLTAMMOGRAMVOLTAMMOGRAM
BLANK SOLUTION BLANK SOLUTION + AFLATOXIN
BLANKBLANKVOLTAMMOGRAM VOLTAMMOGRAM
SAMPELSAMPELVOLTAMMOGRAM VOLTAMMOGRAM
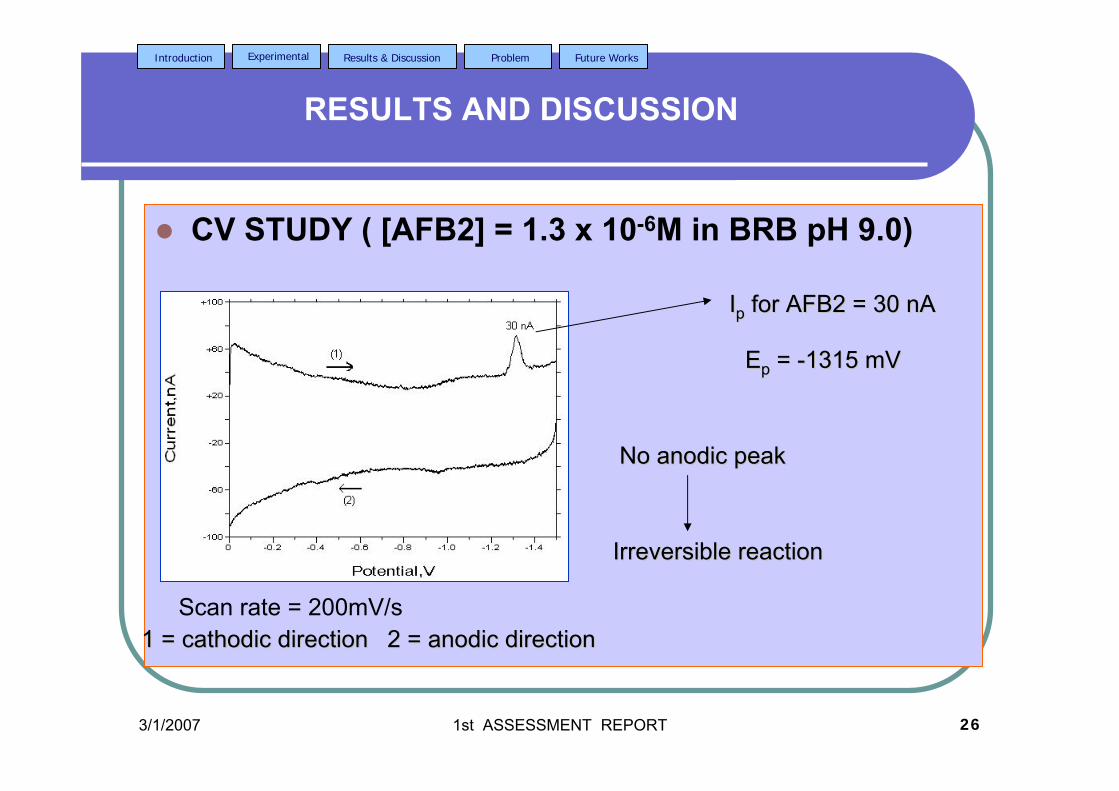
3/1/2007 1st ASSESSMENT REPORT 26
Introduction Experimental Results & Discussion Problem Future Works
RESULTS AND DISCUSSION
CV STUDY ( [AFB2] = 1.3 x 10⁻⁶M in BRB pH 9.0)
IIpp for AFB2 = 30 for AFB2 = 30 nAnA
EEpp = = --1315 mV1315 mV
No anodic peakNo anodic peak
Irreversible reaction Irreversible reaction
1 = 1 = cathodiccathodic directiondirection 2 = anodic direction2 = anodic directionScan rate = 200mV/s
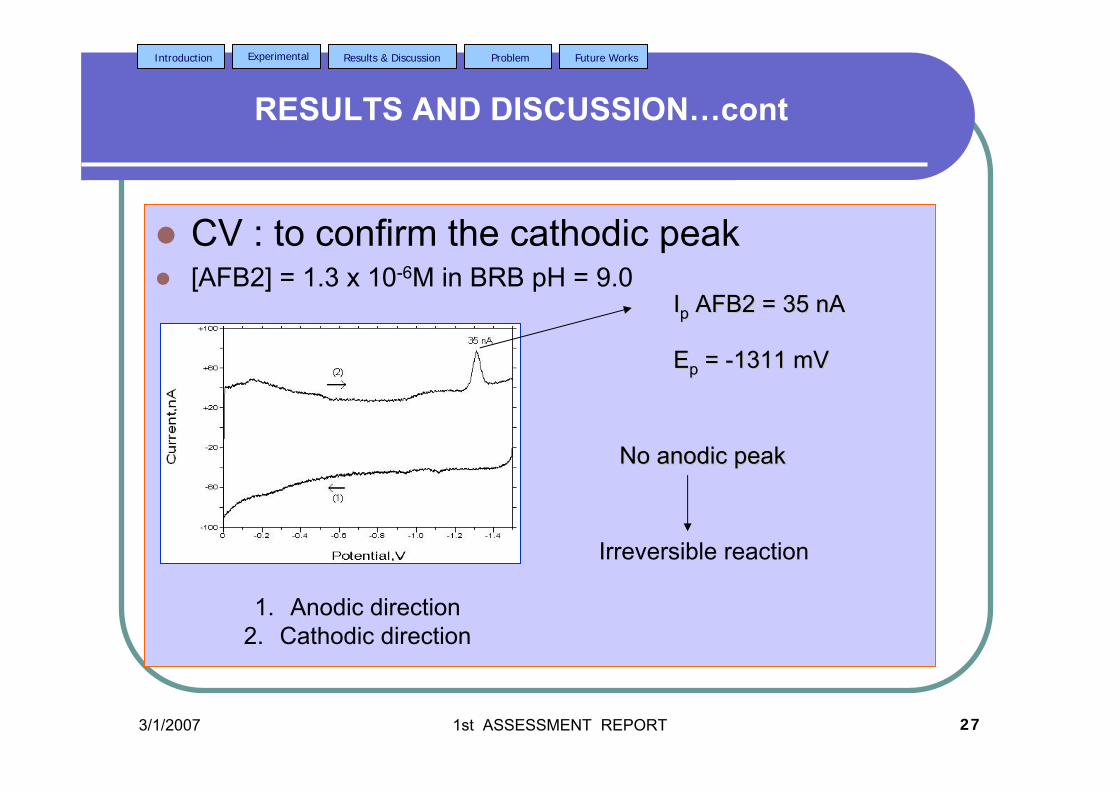
3/1/2007 1st ASSESSMENT REPORT 27
Introduction Experimental Results & Discussion Problem Future Works
RESULTS AND DISCUSSION…cont
CV : to confirm the cathodic peak[AFB2] = 1.3 x 10⁻⁶M in BRB pH = 9.0
IIpp AFB2 = 35 AFB2 = 35 nAnA
EEpp = = --1311 mV1311 mV
No anodic peakNo anodic peak
Irreversible reaction
1. Anodic direction2. Cathodic direction
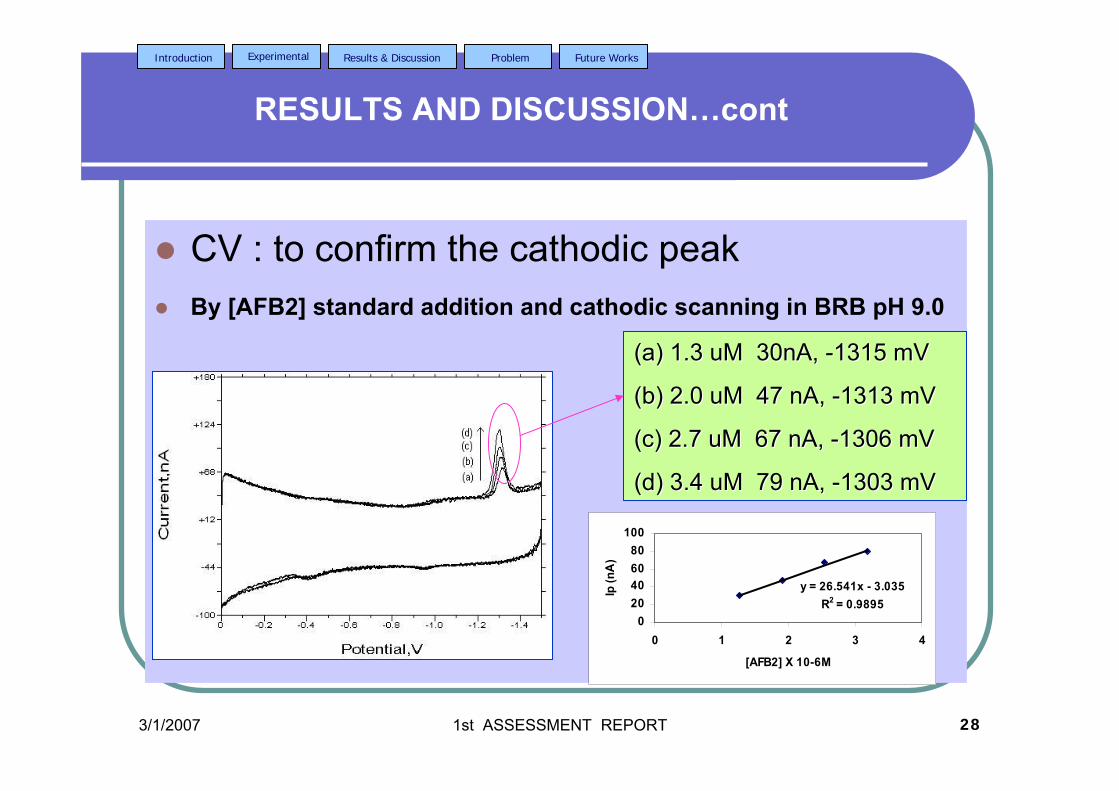
3/1/2007 1st ASSESSMENT REPORT 28
Introduction Experimental Results & Discussion Problem Future Works
RESULTS AND DISCUSSION…cont
CV : to confirm the cathodic peak By [AFB2] standard addition and cathodic scanning in BRB pH 9.0
(a) 1.3 (a) 1.3 uMuM 30nA, 30nA, --1315 mV1315 mV
(b) 2.0 (b) 2.0 uMuM 47 47 nAnA, , --1313 mV1313 mV
(c) 2.7 (c) 2.7 uMuM 67 67 nAnA, , --1306 mV1306 mV
(d) 3.4 (d) 3.4 uMuM 79 79 nAnA, , --1303 mV1303 mV
y = 26.541x - 3.035R2 = 0.9895
020406080
100
0 1 2 3 4
[AFB2] X 10-6M
Ip (n
A)
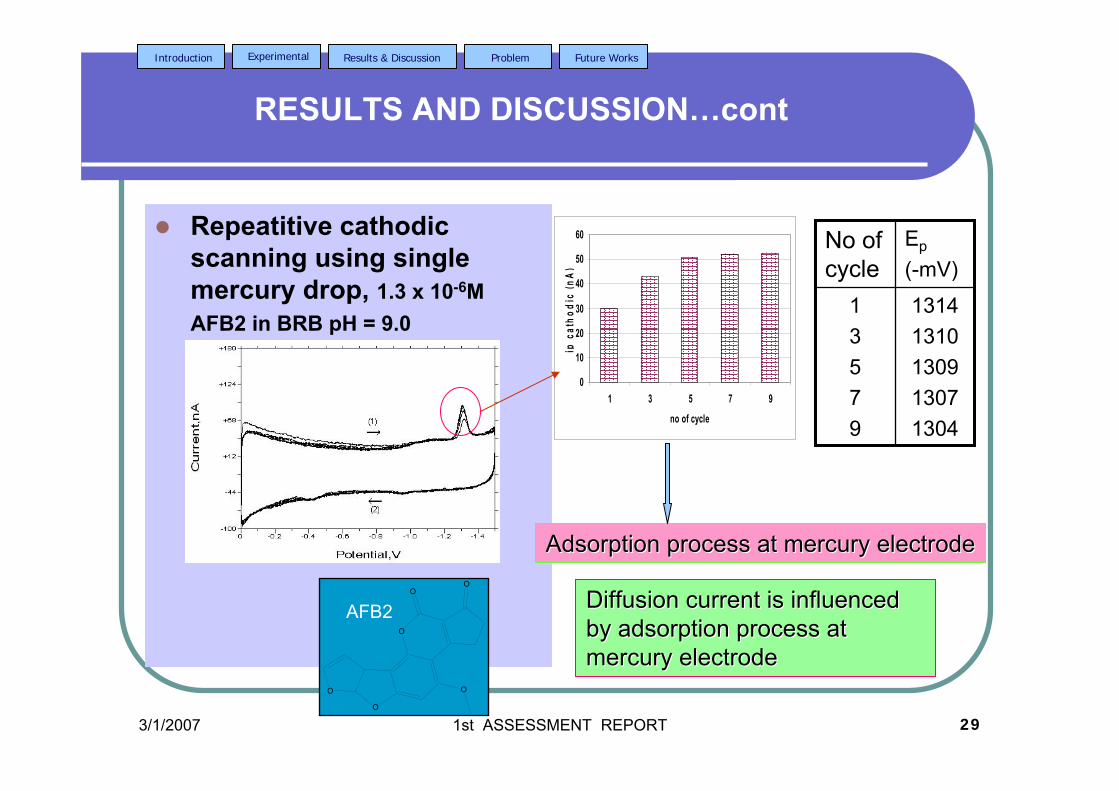
3/1/2007 1st ASSESSMENT REPORT 29
Introduction Experimental Results & Discussion Problem Future Works
RESULTS AND DISCUSSION…cont
Repeatitive cathodicscanning using single mercury drop, 1.3 x 10⁻⁶MAFB2 in BRB pH = 9.0
0
10
20
30
40
50
60
1 3 5 7 9
no of cycle
ip c
atho
dic
(nA)
Adsorption process at mercury electrodeAdsorption process at mercury electrode
Diffusion current is influenced Diffusion current is influenced by adsorption process at by adsorption process at mercury electrodemercury electrode
O
O
O
OO
O
AFB2
13141310130913071304
13579
Ep
(-mV)No of cycle
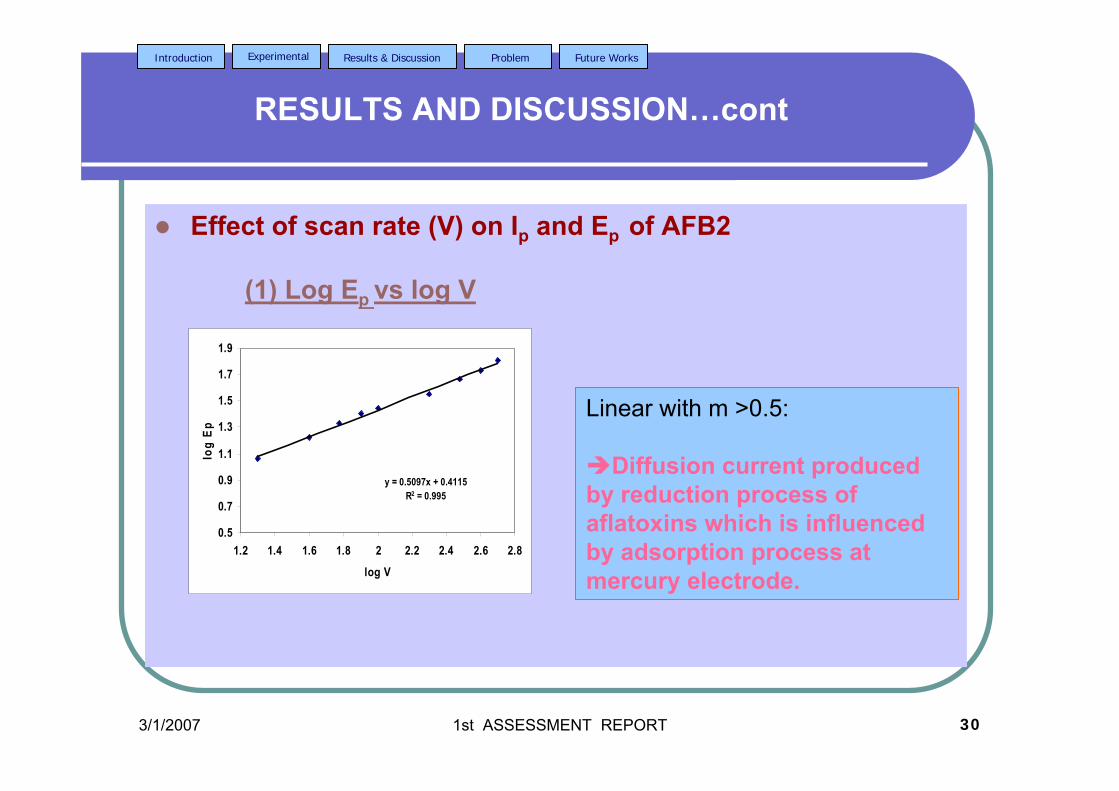
3/1/2007 1st ASSESSMENT REPORT 30
Introduction Experimental Results & Discussion Problem Future Works
RESULTS AND DISCUSSION…cont
Effect of scan rate (V) on Ip and Ep of AFB2
(1) Log Ep vs log V
y = 0.5097x + 0.4115R2 = 0.995
0.5
0.7
0.9
1.1
1.3
1.5
1.7
1.9
1.2 1.4 1.6 1.8 2 2.2 2.4 2.6 2.8
log V
log
Ep
Linear with m >0.5:
Diffusion current produced by reduction process of aflatoxins which is influenced by adsorption process at mercury electrode.
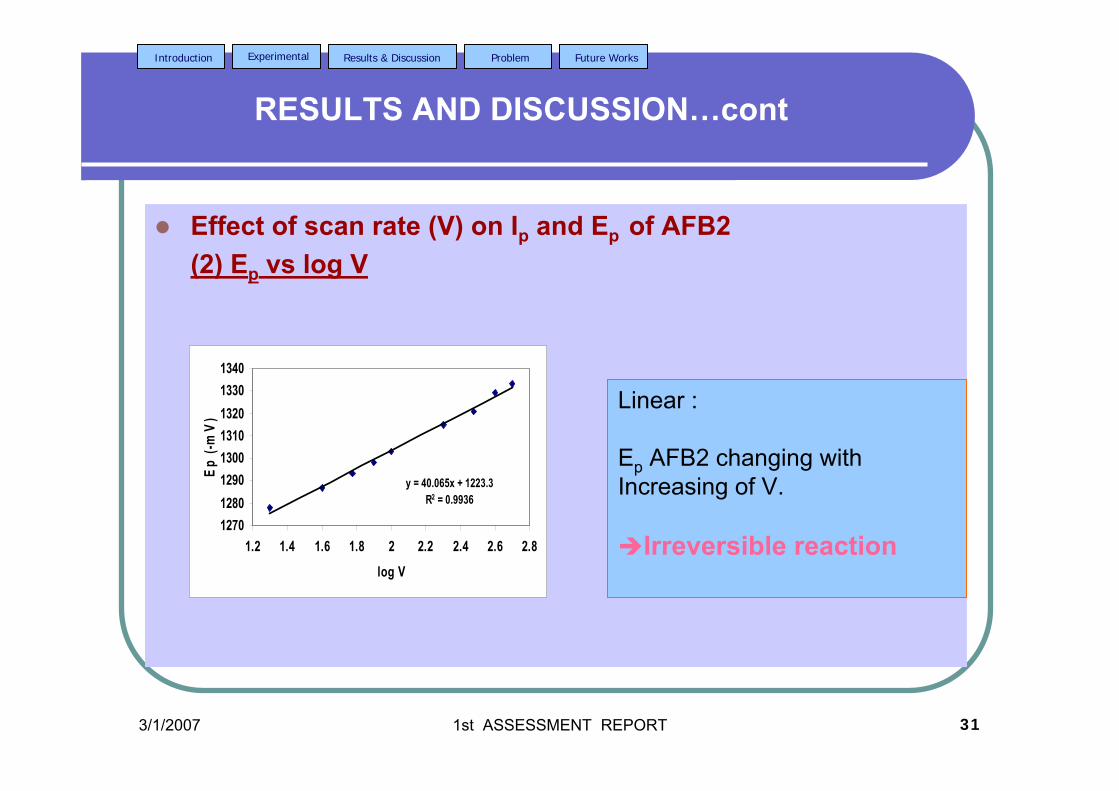
3/1/2007 1st ASSESSMENT REPORT 31
Introduction Experimental Results & Discussion Problem Future Works
RESULTS AND DISCUSSION…cont
Effect of scan rate (V) on Ip and Ep of AFB2(2) Ep vs log V
y = 40.065x + 1223.3R2 = 0.9936
12701280129013001310132013301340
1.2 1.4 1.6 1.8 2 2.2 2.4 2.6 2.8
log V
Ep
(-mV
)
Linear :
Ep AFB2 changing with Increasing of V.
Irreversible reaction
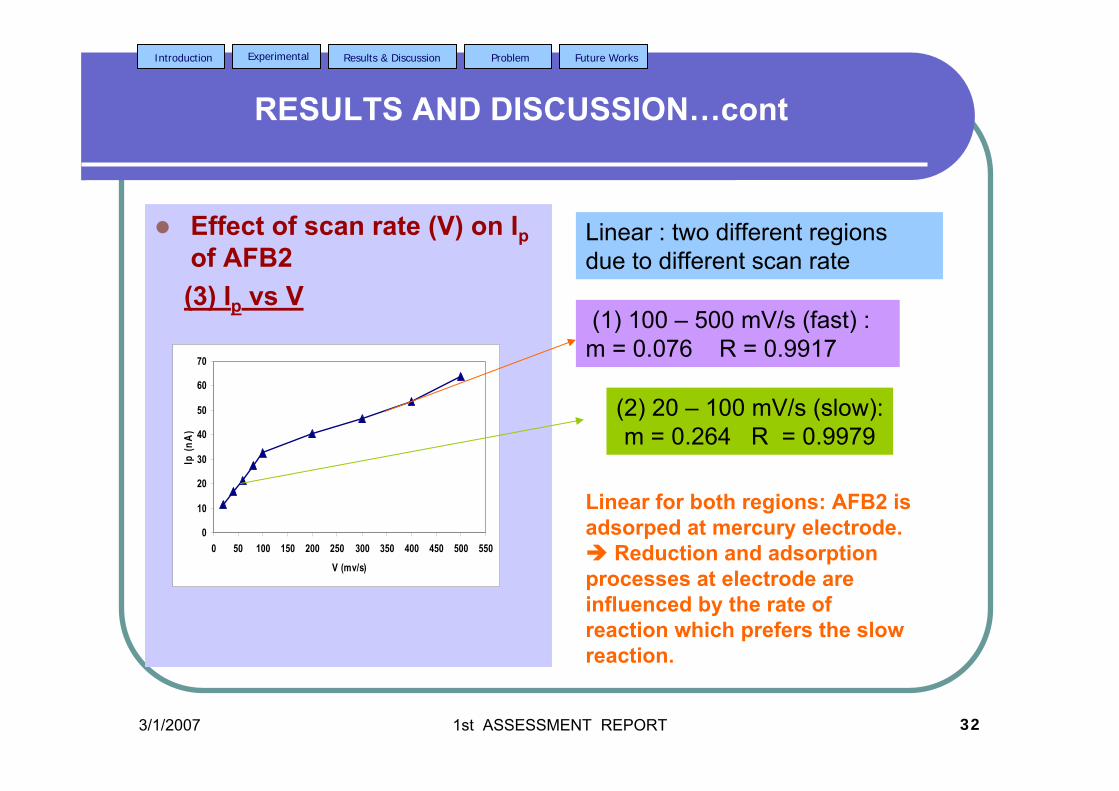
3/1/2007 1st ASSESSMENT REPORT 32
Introduction Experimental Results & Discussion Problem Future Works
RESULTS AND DISCUSSION…cont
Effect of scan rate (V) on Ipof AFB2(3) Ip vs V
0
10
20
30
40
50
60
70
0 50 100 150 200 250 300 350 400 450 500 550
V (mv/s)
Ip (n
A)
Linear : two different regions due to different scan rate
(1) 100 – 500 mV/s (fast) : m = 0.076 R = 0.9917
(2) 20 – 100 mV/s (slow):m = 0.264 R = 0.9979
Linear for both regions: AFB2 is adsorped at mercury electrode.
Reduction and adsorption processes at electrode are influenced by the rate of reaction which prefers the slow reaction.
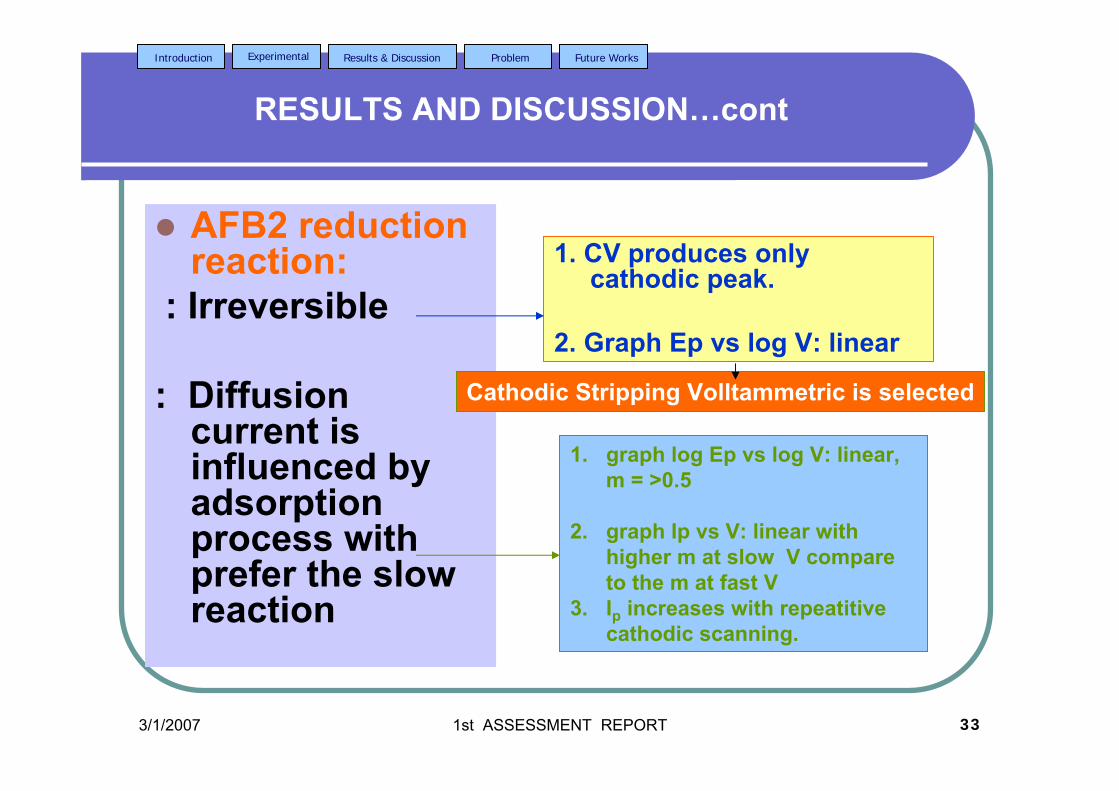
3/1/2007 1st ASSESSMENT REPORT 33
Introduction Experimental Results & Discussion Problem Future Works
RESULTS AND DISCUSSION…cont
AFB2 reduction reaction:
: Irreversible
: Diffusion current is influenced by adsorption process with prefer the slow reaction
1. CV produces only cathodic peak.
2. Graph Ep vs log V: linear
1. graph log Ep vs log V: linear, m = >0.5
2. graph Ip vs V: linear with higher m at slow V compare to the m at fast V
3. Ip increases with repeatitivecathodic scanning.
Cathodic Stripping Volltammetric is selected
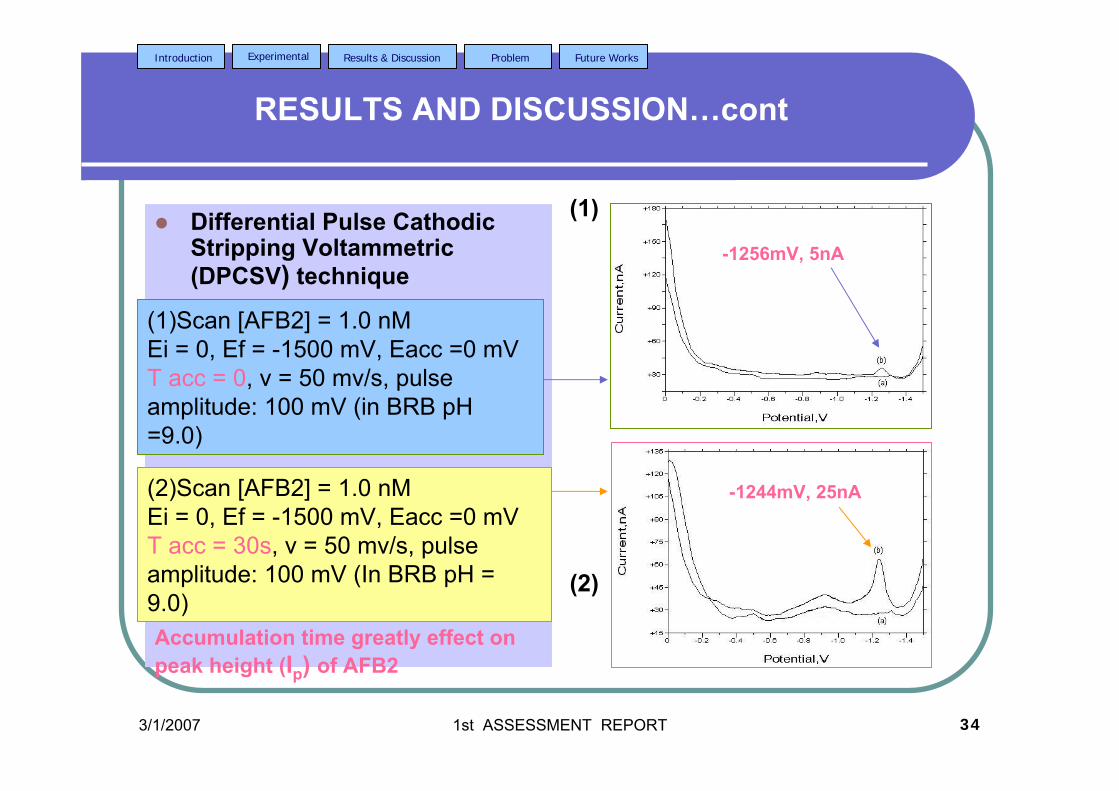
3/1/2007 1st ASSESSMENT REPORT 34
Introduction Experimental Results & Discussion Problem Future Works
RESULTS AND DISCUSSION…cont
Differential Pulse CathodicStripping Voltammetric(DPCSV) technique
(1)Scan [AFB2] = 1.0 nMEi = 0, Ef = -1500 mV, Eacc =0 mVT acc = 0, v = 50 mv/s, pulse amplitude: 100 mV (in BRB pH =9.0)
(2)Scan [AFB2] = 1.0 nMEi = 0, Ef = -1500 mV, Eacc =0 mV T acc = 30s, v = 50 mv/s, pulse amplitude: 100 mV (In BRB pH = 9.0)Accumulation time greatly effect on peak height (Ip) of AFB2
(1)
(2)
-1256mV, 5nA
-1244mV, 25nA
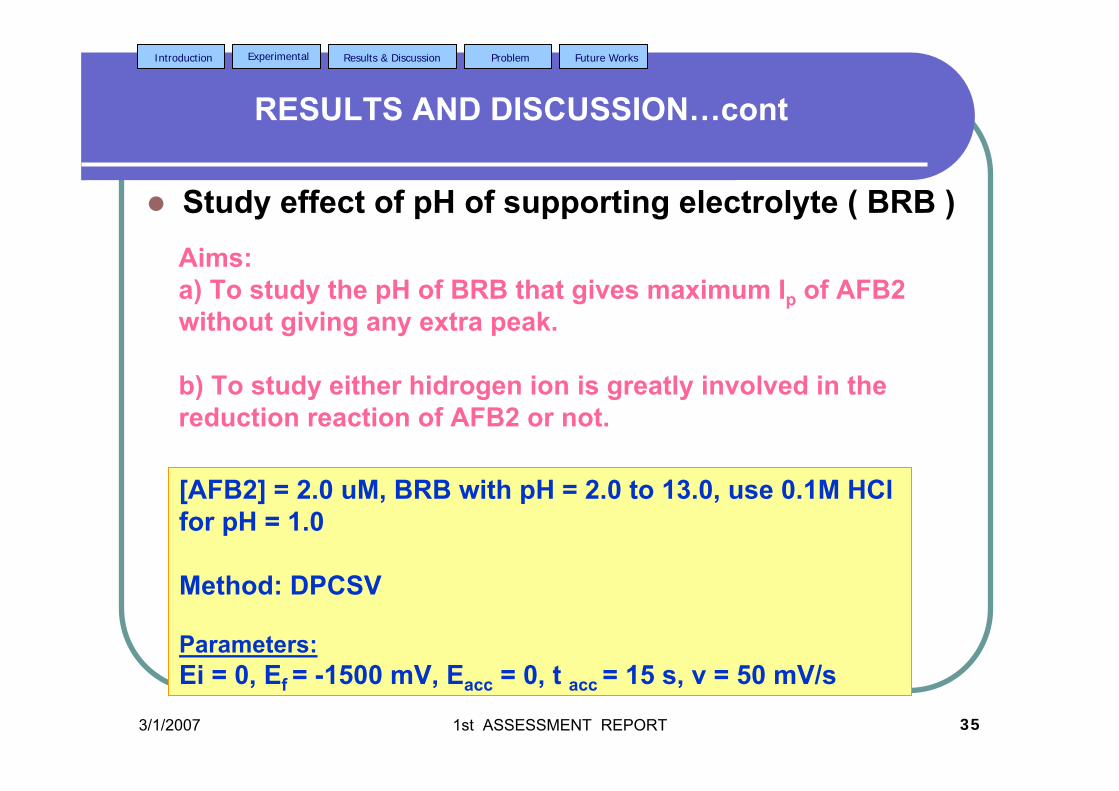
3/1/2007 1st ASSESSMENT REPORT 35
Introduction Experimental Results & Discussion Problem Future Works
RESULTS AND DISCUSSION…cont
Study effect of pH of supporting electrolyte ( BRB )Aims:a) To study the pH of BRB that gives maximum Ip of AFB2 without giving any extra peak.
b) To study either hidrogen ion is greatly involved in the reduction reaction of AFB2 or not.
[AFB2] = 2.0 uM, BRB with pH = 2.0 to 13.0, use 0.1M HClfor pH = 1.0
Method: DPCSV
Parameters:Ei = 0, Ef = -1500 mV, Eacc = 0, t acc = 15 s, v = 50 mV/s
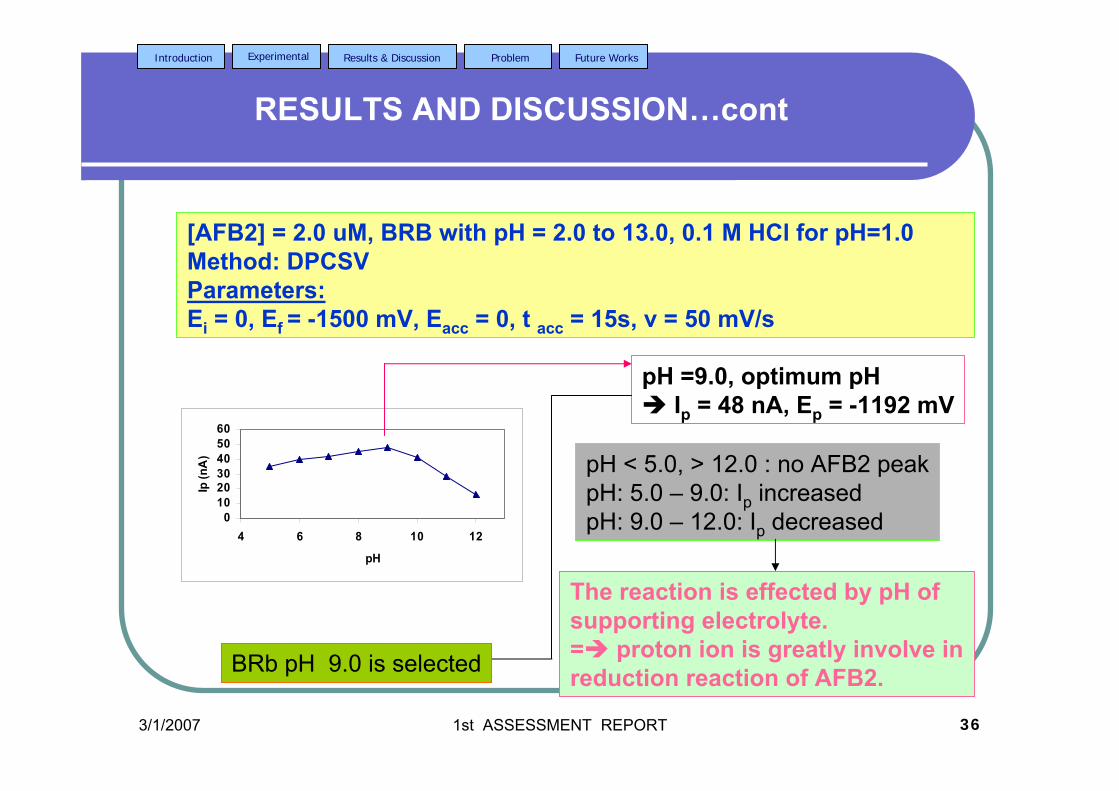
3/1/2007 1st ASSESSMENT REPORT 36
Introduction Experimental Results & Discussion Problem Future Works
RESULTS AND DISCUSSION…cont
[AFB2] = 2.0 uM, BRB with pH = 2.0 to 13.0, 0.1 M HCl for pH=1.0Method: DPCSV Parameters:Ei = 0, Ef = -1500 mV, Eacc = 0, t acc = 15s, v = 50 mV/s
pH =9.0, optimum pH Ip = 48 nA, Ep = -1192 mV
pH < 5.0, > 12.0 : no AFB2 peakpH: 5.0 – 9.0: Ip increasedpH: 9.0 – 12.0: Ip decreased
The reaction is effected by pH of supporting electrolyte.= proton ion is greatly involve in reduction reaction of AFB2. BRb pH 9.0 is selected
0102030405060
4 6 8 10 12
pH
Ip (n
A)
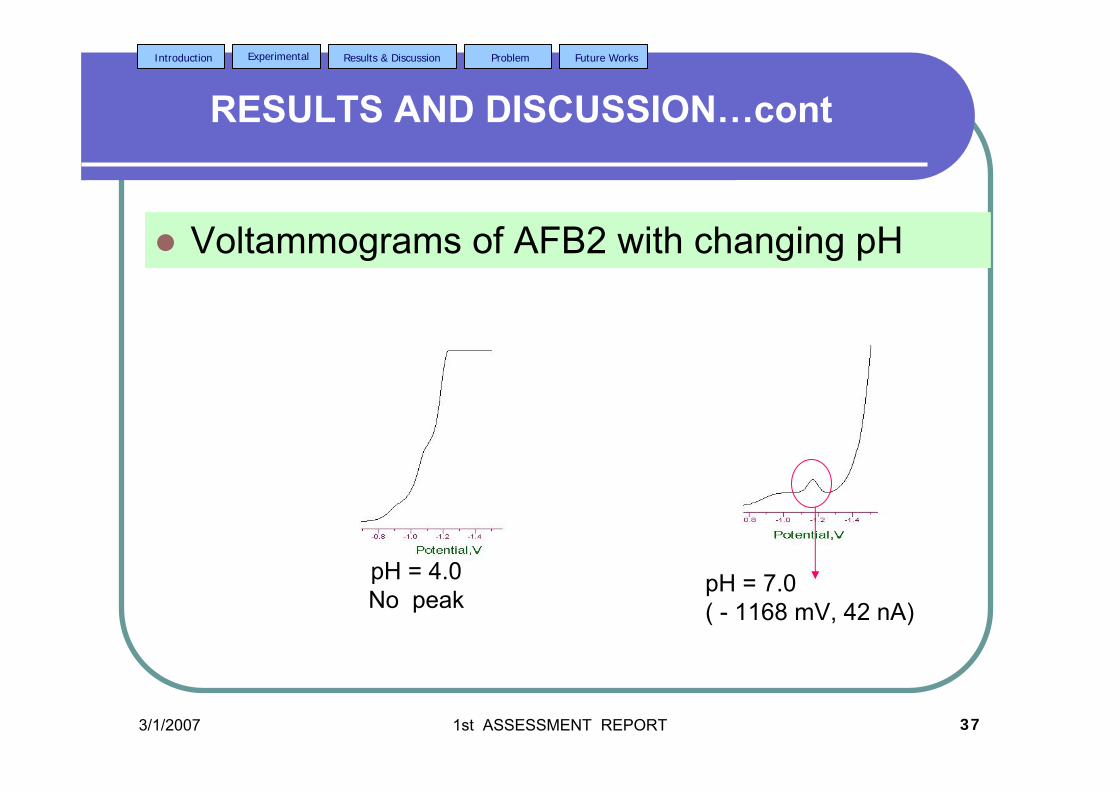
3/1/2007 1st ASSESSMENT REPORT 37
Introduction Experimental Results & Discussion Problem Future Works
RESULTS AND DISCUSSION…cont
Voltammograms of AFB2 with changing pH
pH = 4.0No peak
pH = 7.0( - 1168 mV, 42 nA)
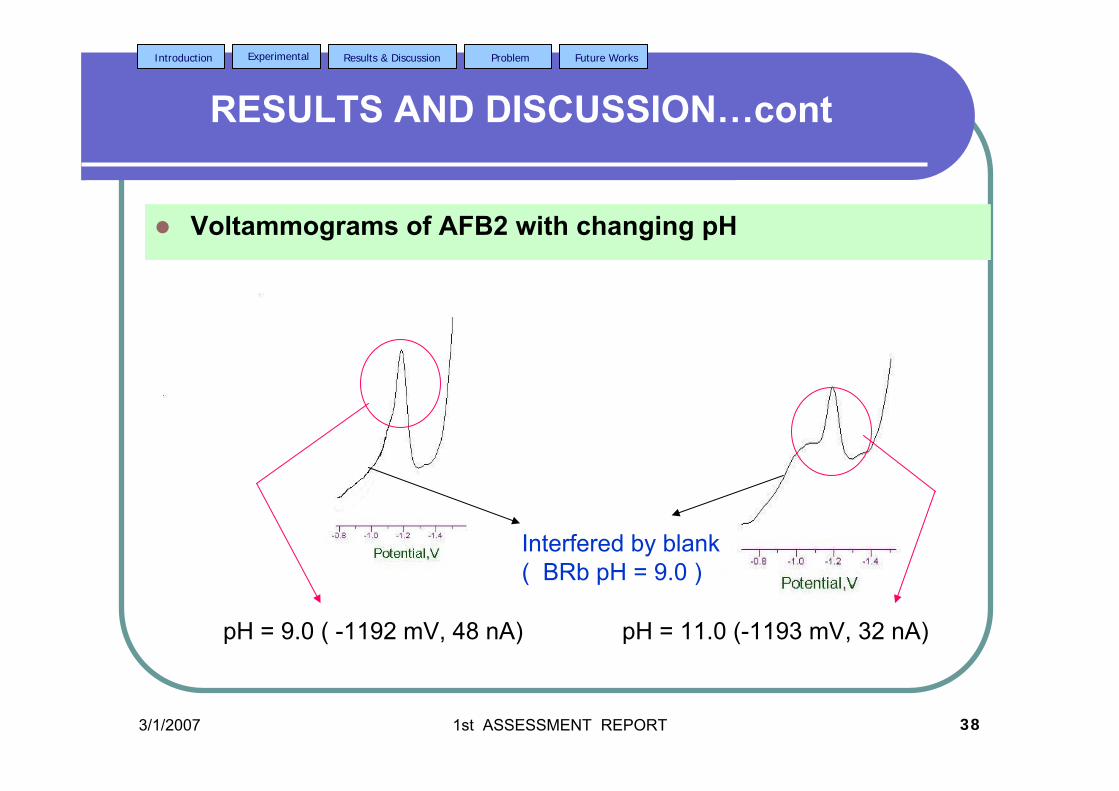
3/1/2007 1st ASSESSMENT REPORT 38
Introduction Experimental Results & Discussion Problem Future Works
RESULTS AND DISCUSSION…cont
Voltammograms of AFB2 with changing pH
pH = 9.0 ( -1192 mV, 48 nA) pH = 11.0 (-1193 mV, 32 nA)
Interfered by blank( BRb pH = 9.0 )
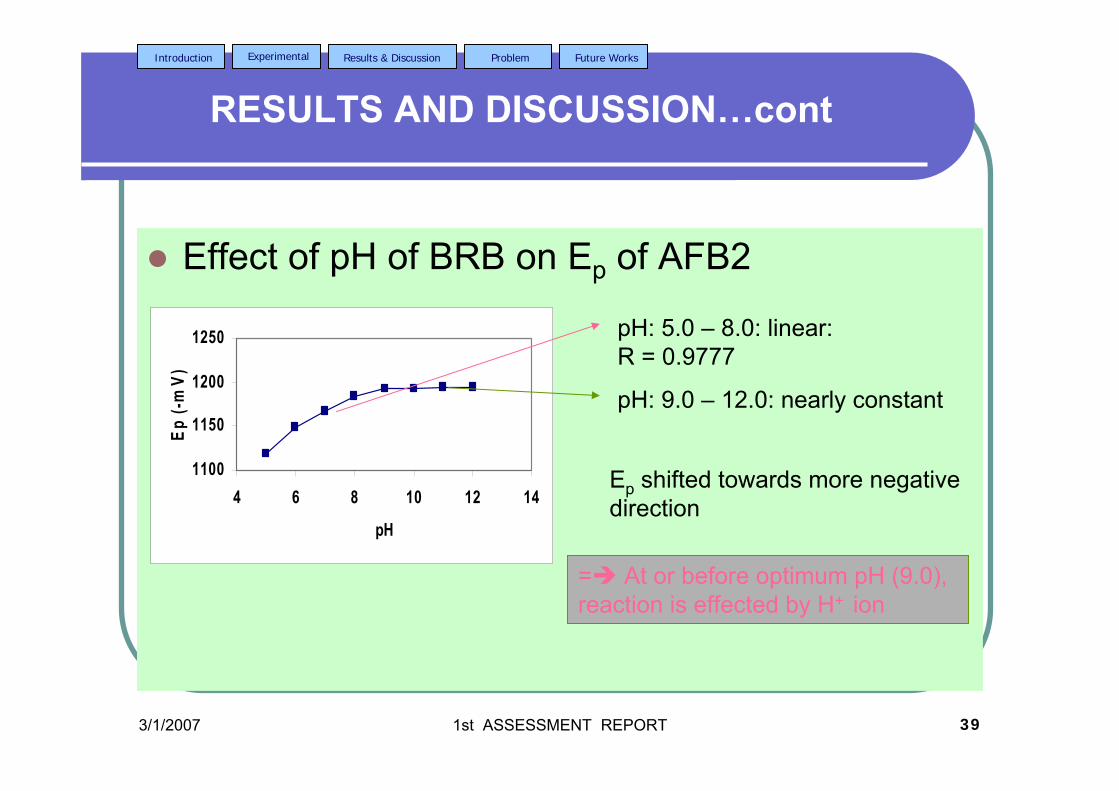
3/1/2007 1st ASSESSMENT REPORT 39
Introduction Experimental Results & Discussion Problem Future Works
RESULTS AND DISCUSSION…cont
Effect of pH of BRB on Ep of AFB2
1100
1150
1200
1250
4 6 8 10 12 14
pH
Ep (-
mV)
pH: 5.0 – 8.0: linear: R = 0.9777
pH: 9.0 – 12.0: nearly constant
Ep shifted towards more negative direction
= At or before optimum pH (9.0), reaction is effected by H+ ion
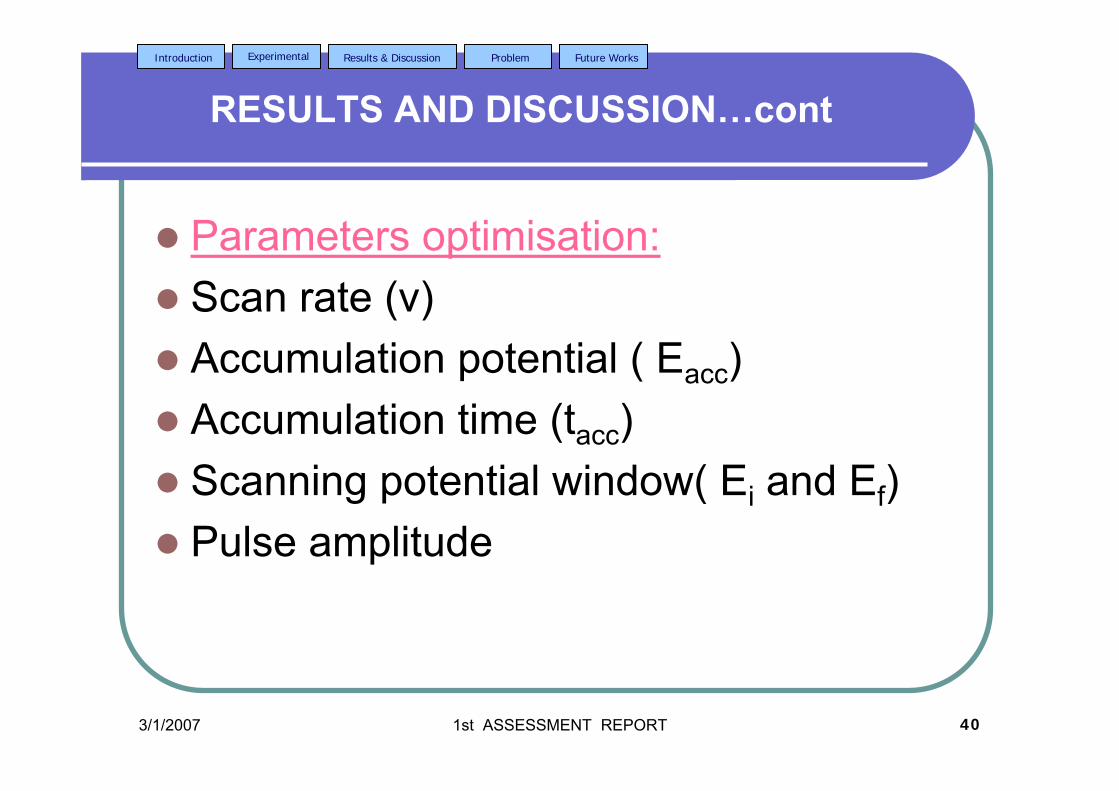
3/1/2007 1st ASSESSMENT REPORT 40
Introduction Experimental Results & Discussion Problem Future Works
RESULTS AND DISCUSSION…cont
Parameters optimisation:Scan rate (v)Accumulation potential ( Eacc)Accumulation time (tacc)Scanning potential window( Ei and Ef)Pulse amplitude
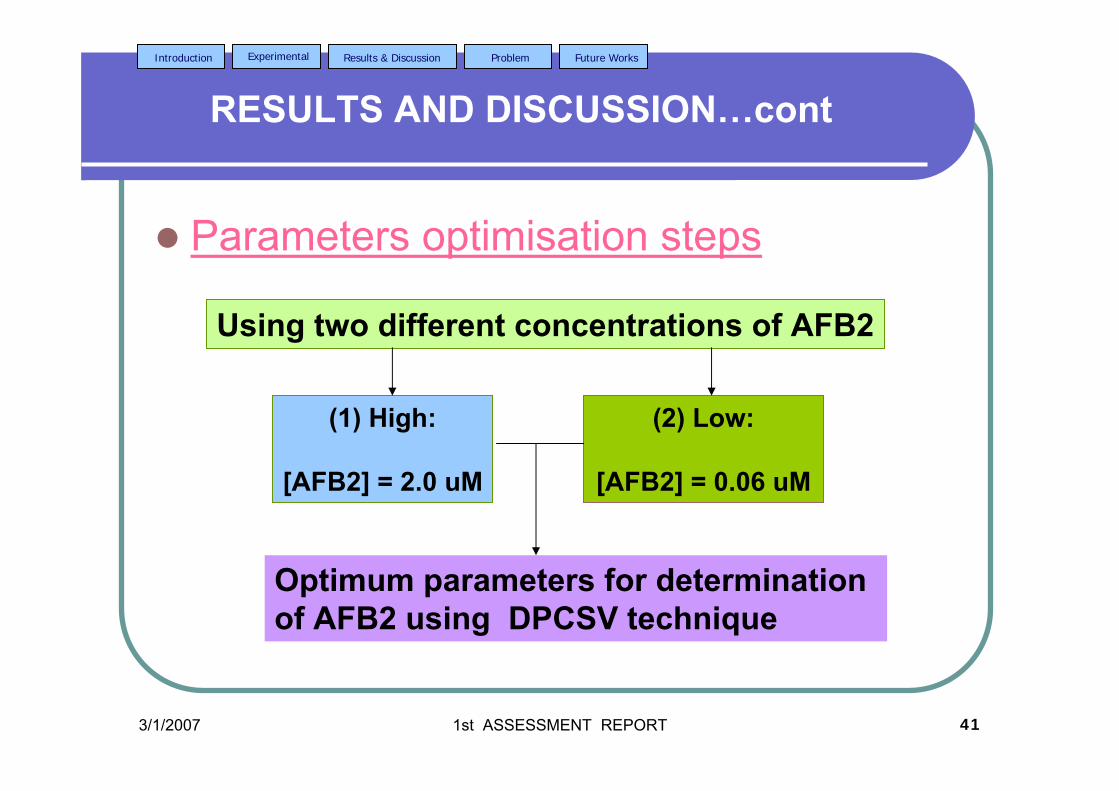
3/1/2007 1st ASSESSMENT REPORT 41
Introduction Experimental Results & Discussion Problem Future Works
RESULTS AND DISCUSSION…cont
Parameters optimisation steps
Using two different concentrations of AFB2
(1) High:
[AFB2] = 2.0 uM
(2) Low:
[AFB2] = 0.06 uM
Optimum parameters for determination of AFB2 using DPCSV technique
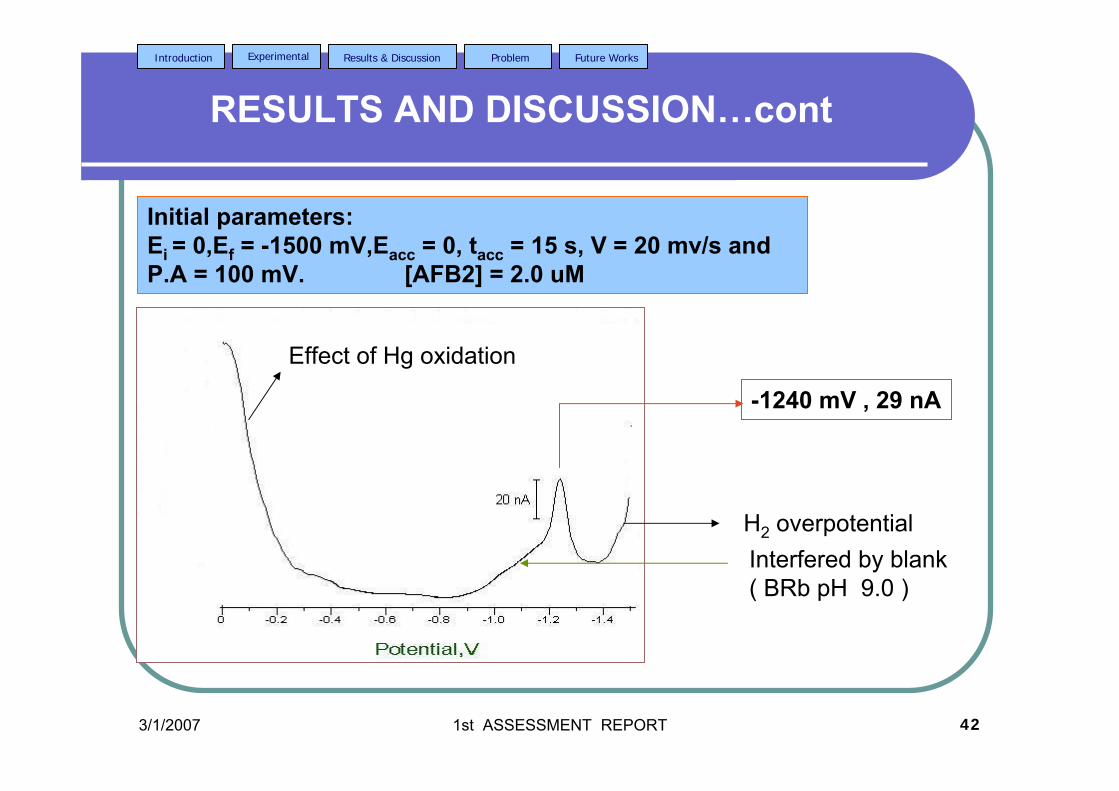
3/1/2007 1st ASSESSMENT REPORT 42
Introduction Experimental Results & Discussion Problem Future Works
RESULTS AND DISCUSSION…cont
Initial parameters:Ei = 0,Ef = -1500 mV,Eacc = 0, tacc = 15 s, V = 20 mv/s and P.A = 100 mV. [AFB2] = 2.0 uM
-1240 mV , 29 nA
Interfered by blank( BRb pH 9.0 )
Effect of Hg oxidation
H2 overpotential
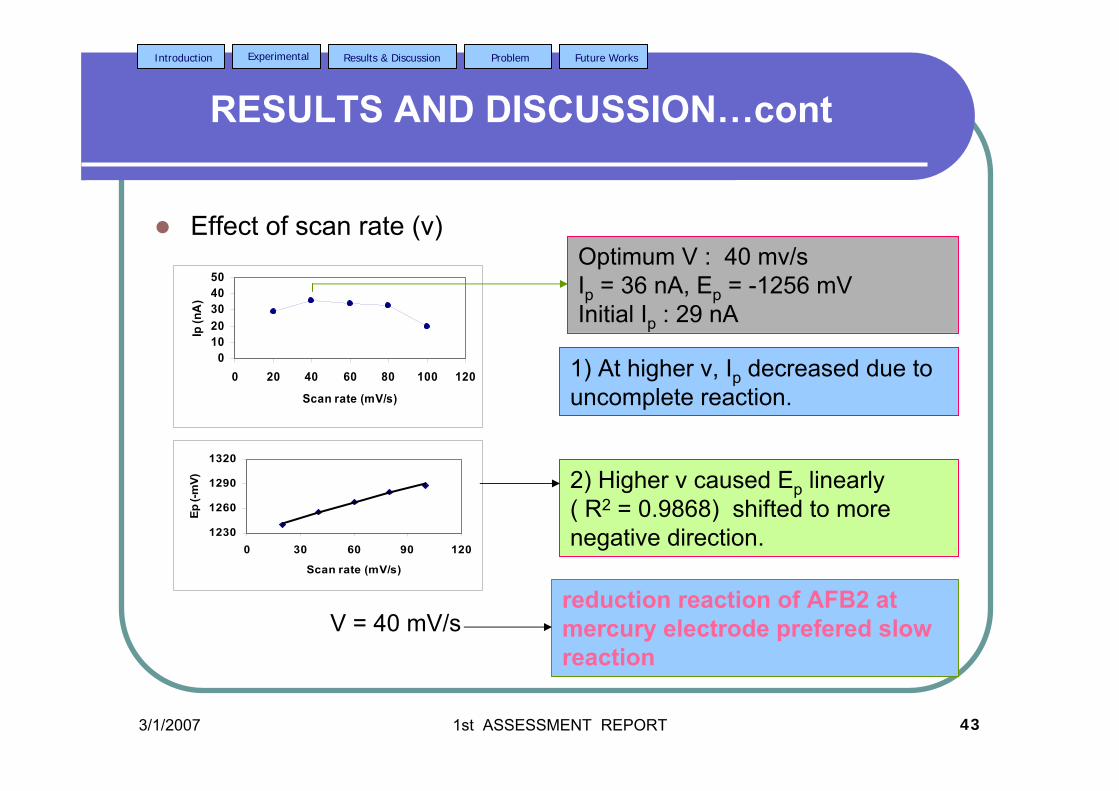
3/1/2007 1st ASSESSMENT REPORT 43
Introduction Experimental Results & Discussion Problem Future Works
RESULTS AND DISCUSSION…cont
Effect of scan rate (v)
01020304050
0 20 40 60 80 100 120
Scan rate (mV/s)
Ip (n
A)
Optimum V : 40 mv/sIp = 36 nA, Ep = -1256 mVInitial Ip : 29 nA
reduction reaction of AFB2 at mercury electrode prefered slow reaction
1) At higher v, Ip decreased due to uncomplete reaction.
2) Higher v caused Ep linearly ( R2 = 0.9868) shifted to more negative direction.
V = 40 mV/s
1230
1260
1290
1320
0 30 60 90 120
Scan rate (mV/s)
Ep (-
mV)
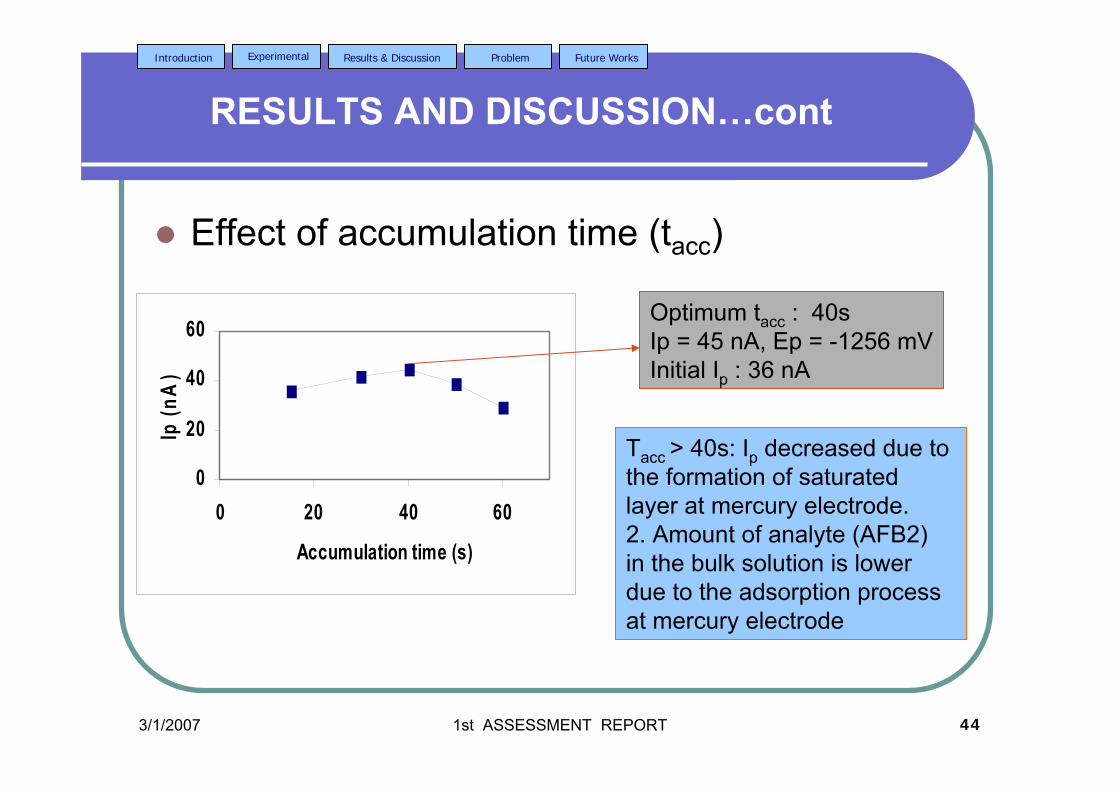
3/1/2007 1st ASSESSMENT REPORT 44
Introduction Experimental Results & Discussion Problem Future Works
RESULTS AND DISCUSSION…cont
Effect of accumulation time (tacc)
0
20
40
60
0 20 40 60
Accumulation time (s)
Ip (n
A)
Optimum tacc : 40s Ip = 45 nA, Ep = -1256 mVInitial Ip : 36 nA
Tacc > 40s: Ip decreased due to the formation of saturated layer at mercury electrode.2. Amount of analyte (AFB2) in the bulk solution is lower due to the adsorption process at mercury electrode
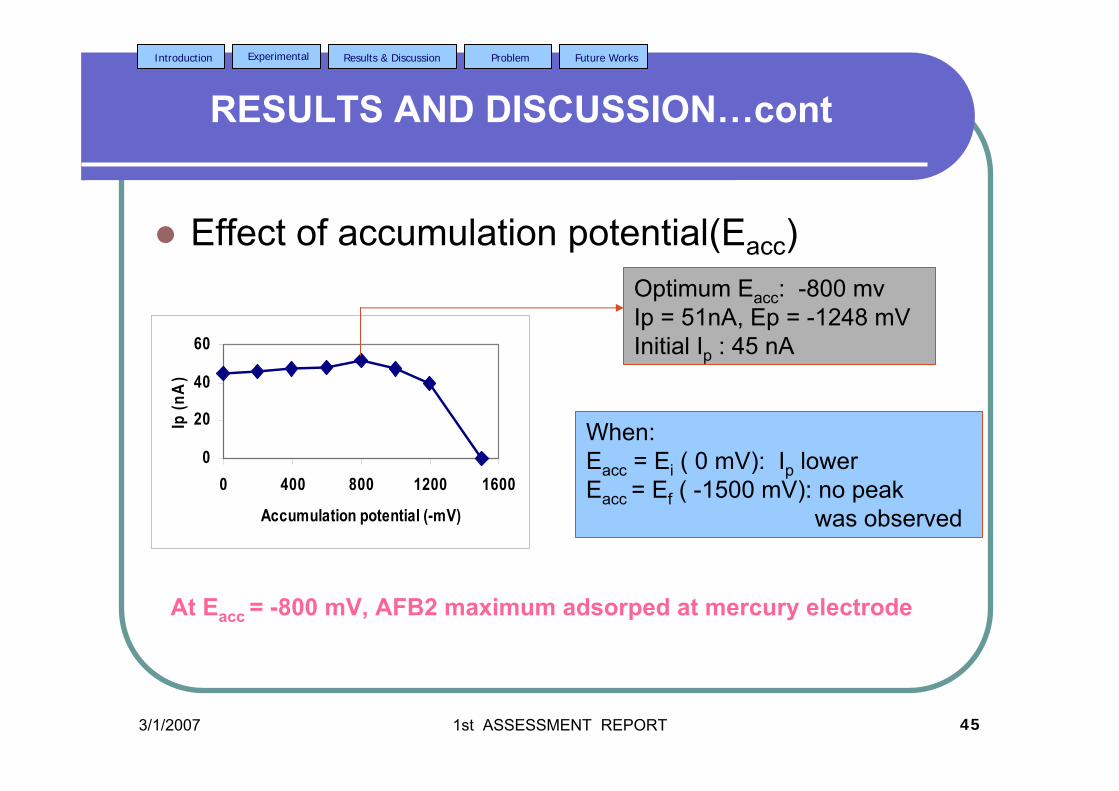
3/1/2007 1st ASSESSMENT REPORT 45
Introduction Experimental Results & Discussion Problem Future Works
RESULTS AND DISCUSSION…cont
Effect of accumulation potential(Eacc)Optimum Eacc: -800 mvIp = 51nA, Ep = -1248 mVInitial Ip : 45 nA
When:Eacc = Ei ( 0 mV): Ip lowerEacc = Ef ( -1500 mV): no peak
was observed
At Eacc = -800 mV, AFB2 maximum adsorped at mercury electrode
0
20
40
60
0 400 800 1200 1600
Accumulation potential (-mV)
Ip (n
A)
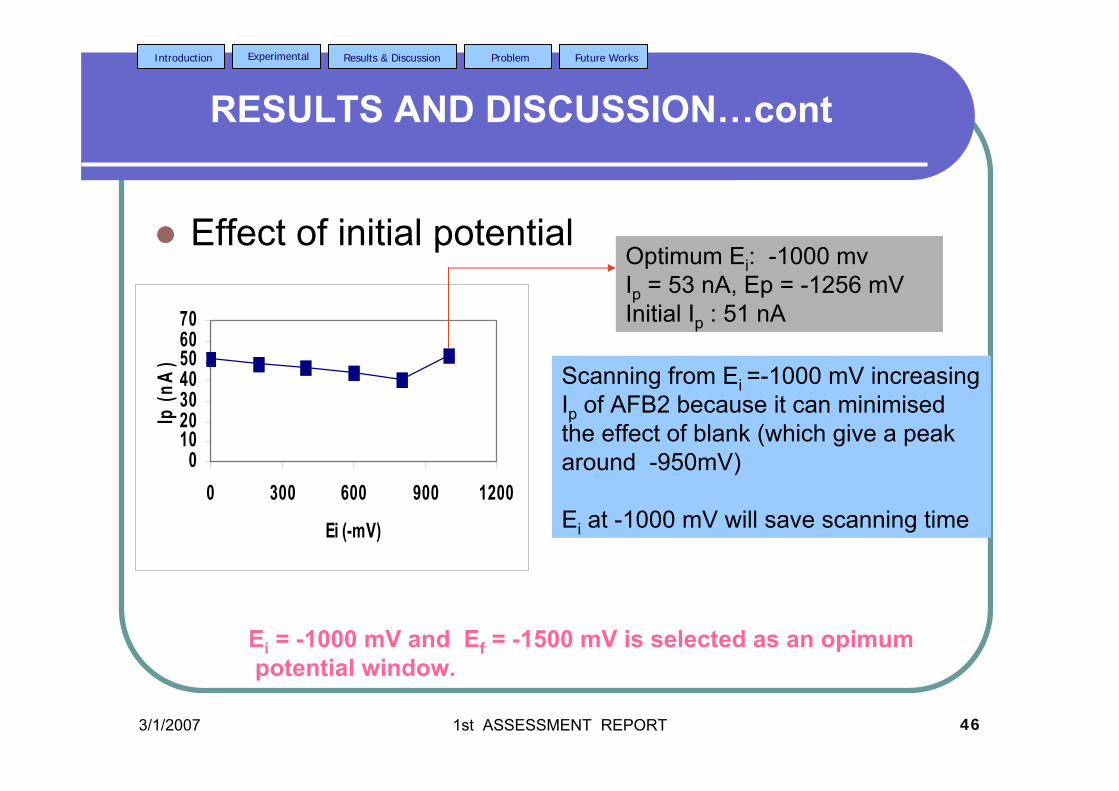
3/1/2007 1st ASSESSMENT REPORT 46
Introduction Experimental Results & Discussion Problem Future Works
RESULTS AND DISCUSSION…cont
Effect of initial potential
010203040506070
0 300 600 900 1200
Ei (-mV)
Ip (n
A)
Optimum Ei: -1000 mvIp = 53 nA, Ep = -1256 mVInitial Ip : 51 nA
Scanning from Ei =-1000 mV increasing Ip of AFB2 because it can minimisedthe effect of blank (which give a peak around -950mV)
Ei at -1000 mV will save scanning time
Ei = -1000 mV and Ef = -1500 mV is selected as an opimumpotential window.
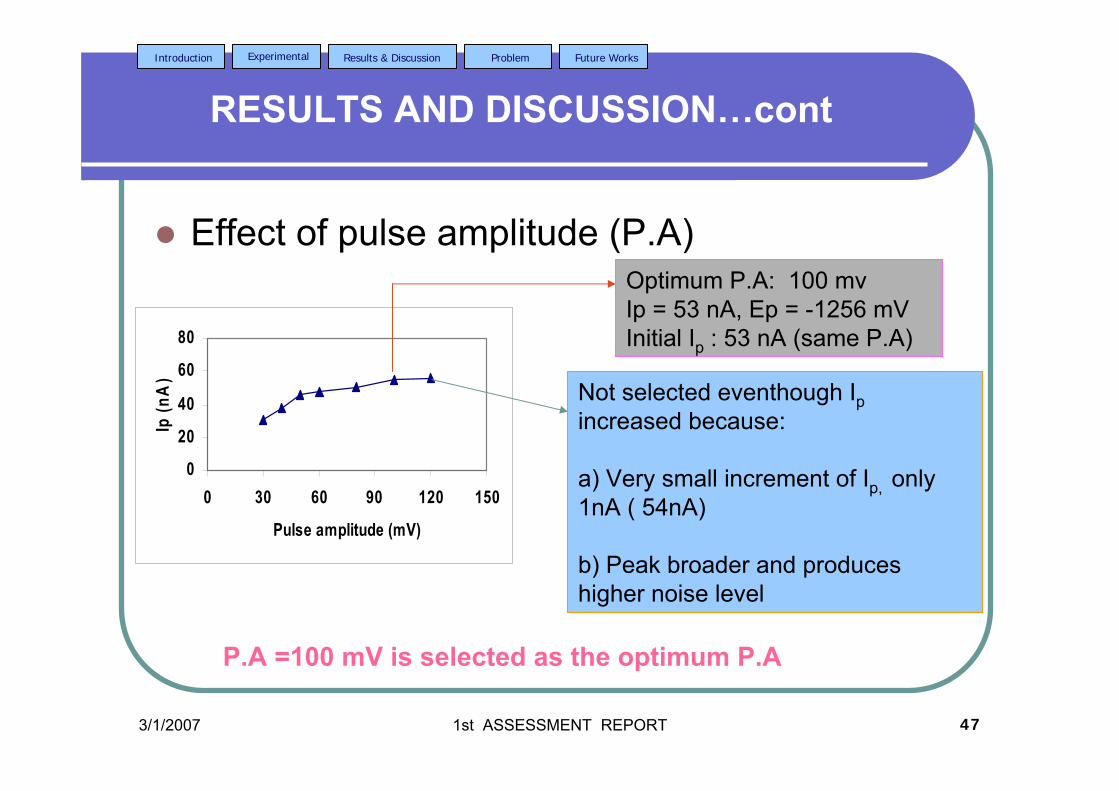
3/1/2007 1st ASSESSMENT REPORT 47
Introduction Experimental Results & Discussion Problem Future Works
RESULTS AND DISCUSSION…cont
Effect of pulse amplitude (P.A)
0
20
40
60
80
0 30 60 90 120 150
Pulse amplitude (mV)
Ip (n
A)
Optimum P.A: 100 mvIp = 53 nA, Ep = -1256 mVInitial Ip : 53 nA (same P.A)
Not selected eventhough Ipincreased because:
a) Very small increment of Ip, only 1nA ( 54nA)
b) Peak broader and produces higher noise level
P.A =100 mV is selected as the optimum P.A
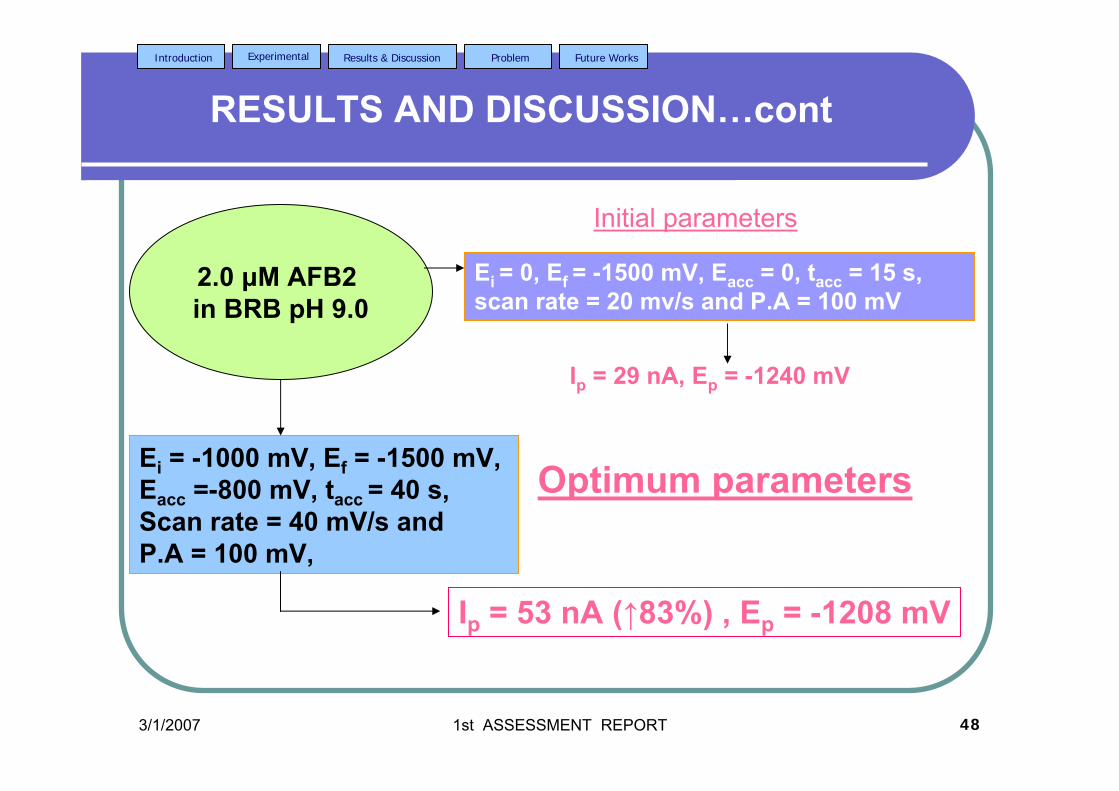
3/1/2007 1st ASSESSMENT REPORT 48
Introduction Experimental Results & Discussion Problem Future Works
RESULTS AND DISCUSSION…cont
Optimum parametersEi = -1000 mV, Ef = -1500 mV, Eacc =-800 mV, tacc = 40 s,Scan rate = 40 mV/s and P.A = 100 mV,
Ip = 53 nA (↑83%) , Ep = -1208 mV
Ei = 0, Ef = -1500 mV, Eacc = 0, tacc = 15 s, scan rate = 20 mv/s and P.A = 100 mV
2.0 µM AFB2 in BRB pH 9.0
Initial parameters
Ip = 29 nA, Ep = -1240 mV
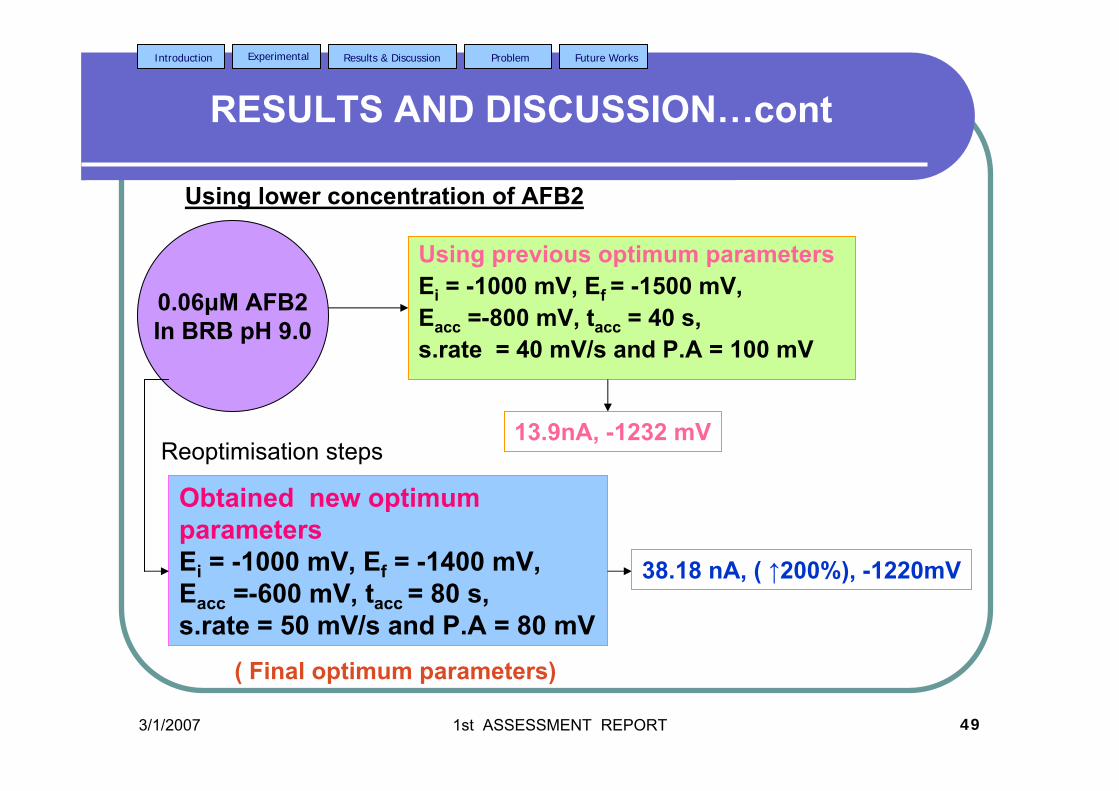
3/1/2007 1st ASSESSMENT REPORT 49
Introduction Experimental Results & Discussion Problem Future Works
RESULTS AND DISCUSSION…cont
Using previous optimum parameters Ei = -1000 mV, Ef = -1500 mV, Eacc =-800 mV, tacc = 40 s,s.rate = 40 mV/s and P.A = 100 mV
Obtained new optimum parametersEi = -1000 mV, Ef = -1400 mV, Eacc =-600 mV, tacc = 80 s,s.rate = 50 mV/s and P.A = 80 mV
13.9nA, -1232 mV
0.06µM AFB2In BRB pH 9.0
38.18 nA, ( ↑200%), -1220mV
Using lower concentration of AFB2
Reoptimisation steps
( Final optimum parameters)
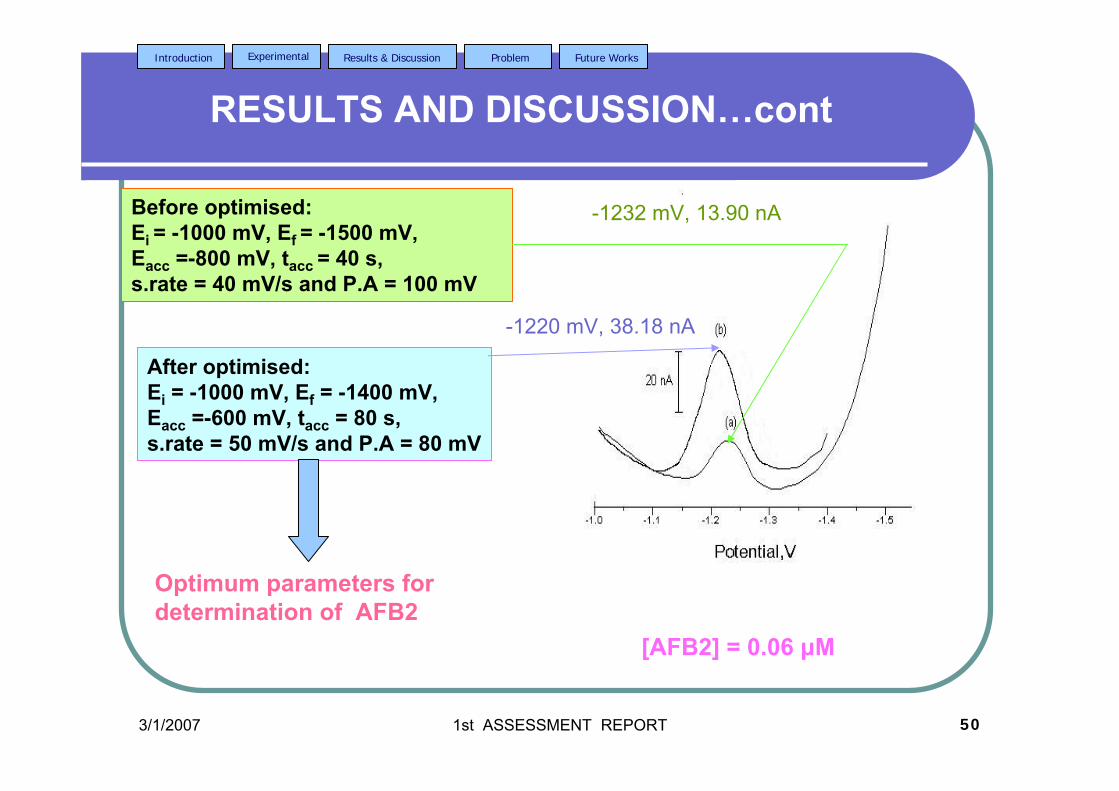
3/1/2007 1st ASSESSMENT REPORT 50
Introduction Experimental Results & Discussion Problem Future Works
RESULTS AND DISCUSSION…cont
Before optimised:Ei = -1000 mV, Ef = -1500 mV, Eacc =-800 mV, tacc = 40 s,s.rate = 40 mV/s and P.A = 100 mV
After optimised:Ei = -1000 mV, Ef = -1400 mV, Eacc =-600 mV, tacc = 80 s,s.rate = 50 mV/s and P.A = 80 mV
Optimum parameters for determination of AFB2
[AFB2] = 0.06 µM
-1232 mV, 13.90 nA
-1220 mV, 38.18 nA
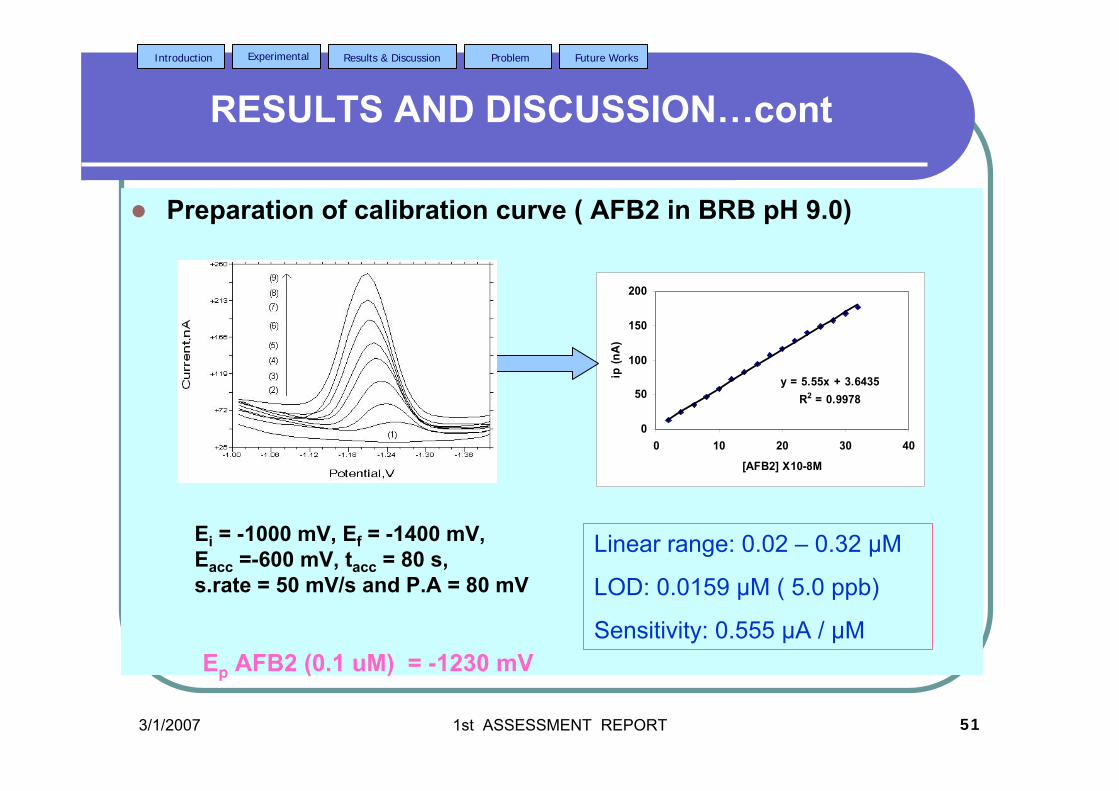
3/1/2007 1st ASSESSMENT REPORT 51
Introduction Experimental Results & Discussion Problem Future Works
RESULTS AND DISCUSSION…cont
Preparation of calibration curve ( AFB2 in BRB pH 9.0)
y = 5.55x + 3.6435R2 = 0.9978
0
50
100
150
200
0 10 20 30 40
[AFB2] X10-8M
ip (n
A)
Ei = -1000 mV, Ef = -1400 mV, Eacc =-600 mV, tacc = 80 s,s.rate = 50 mV/s and P.A = 80 mV
Linear range: 0.02 – 0.32 µM
LOD: 0.0159 µM ( 5.0 ppb)
Sensitivity: 0.555 µA / µMEp AFB2 (0.1 uM) = -1230 mV
3/1/2007 1st ASSESSMENT REPORT 52
Introduction Experimental Results & Discussion Problem Future Works
RESULTS AND DISCUSSION…cont
From calibration curve:1) Precision :
Determine the AFB2 with concentrations of (1) 0.06 µM and (2) 0.10 µM. Calculate relative standard deviation (RSD) for each determination. ( repeatibility ) ( RSD < 5%)
2) Accuracy:
Determine the recovery by scanning a known amount of AFB2 and calculate the actual amount of AFB2 using regression equation which was obtained from the calibration curve. The obtained value is compared with amount of spiked AFB2. (recovery)
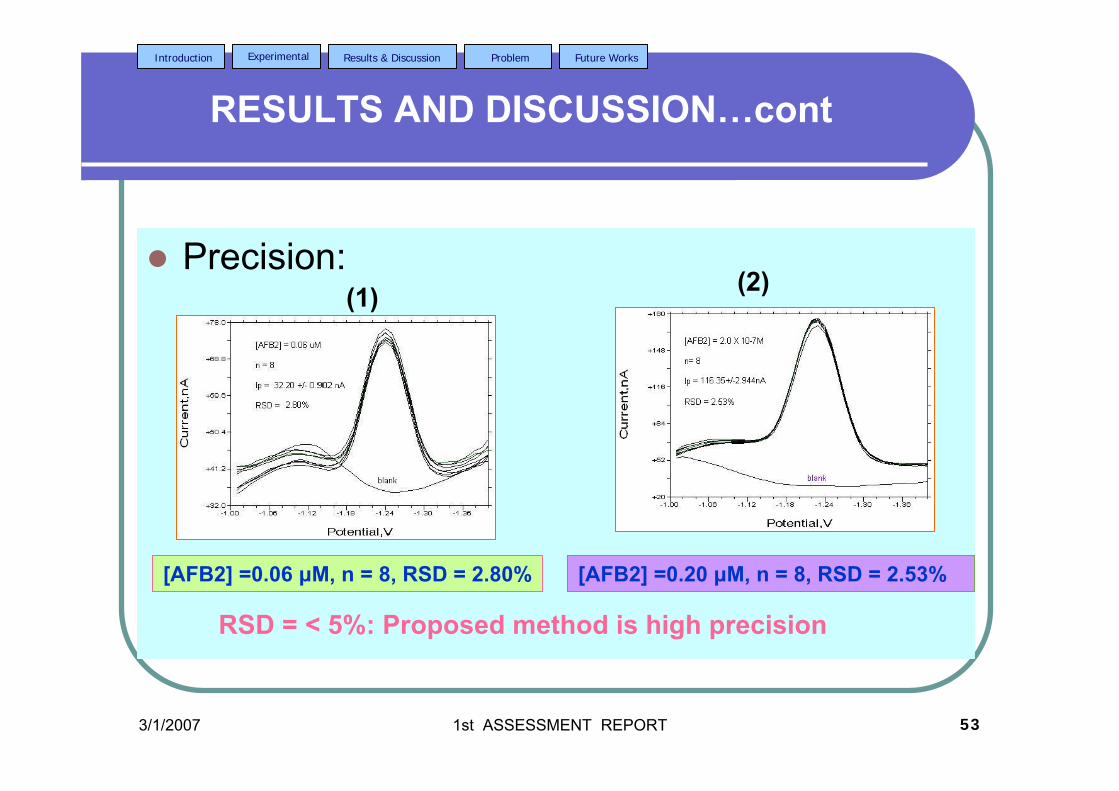
3/1/2007 1st ASSESSMENT REPORT 53
Introduction Experimental Results & Discussion Problem Future Works
RESULTS AND DISCUSSION…cont
Precision:
[AFB2] =0.06 µM, n = 8, RSD = 2.80%
(1) (2)
[AFB2] =0.20 µM, n = 8, RSD = 2.53%
RSD = < 5%: Proposed method is high precision
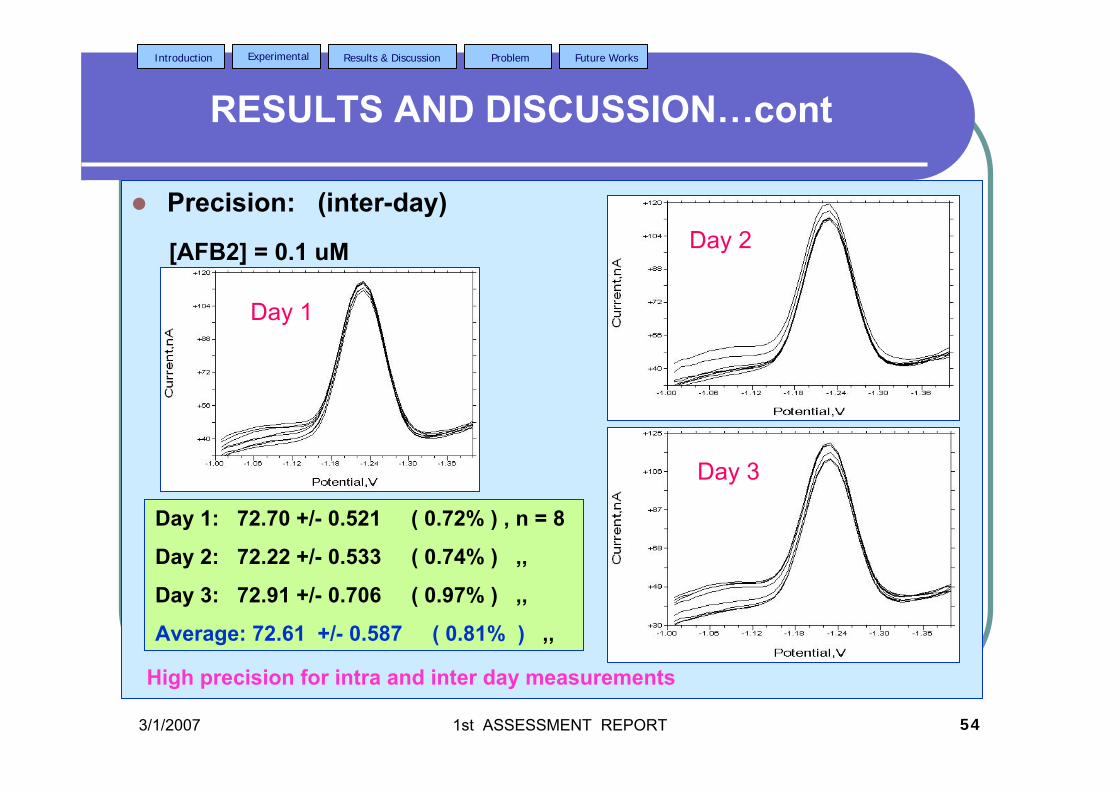
3/1/2007 1st ASSESSMENT REPORT 54
Introduction Experimental Results & Discussion Problem Future Works
RESULTS AND DISCUSSION…cont
Precision: (inter-day)
Day 1
Day 2
Day 3
Day 1: 72.70 +/- 0.521 ( 0.72% ) , n = 8
Day 2: 72.22 +/- 0.533 ( 0.74% ) ,,
Day 3: 72.91 +/- 0.706 ( 0.97% ) ,,
Average: 72.61 +/- 0.587 ( 0.81% ) ,,
[AFB2] = 0.1 uM
High precision for intra and inter day measurements
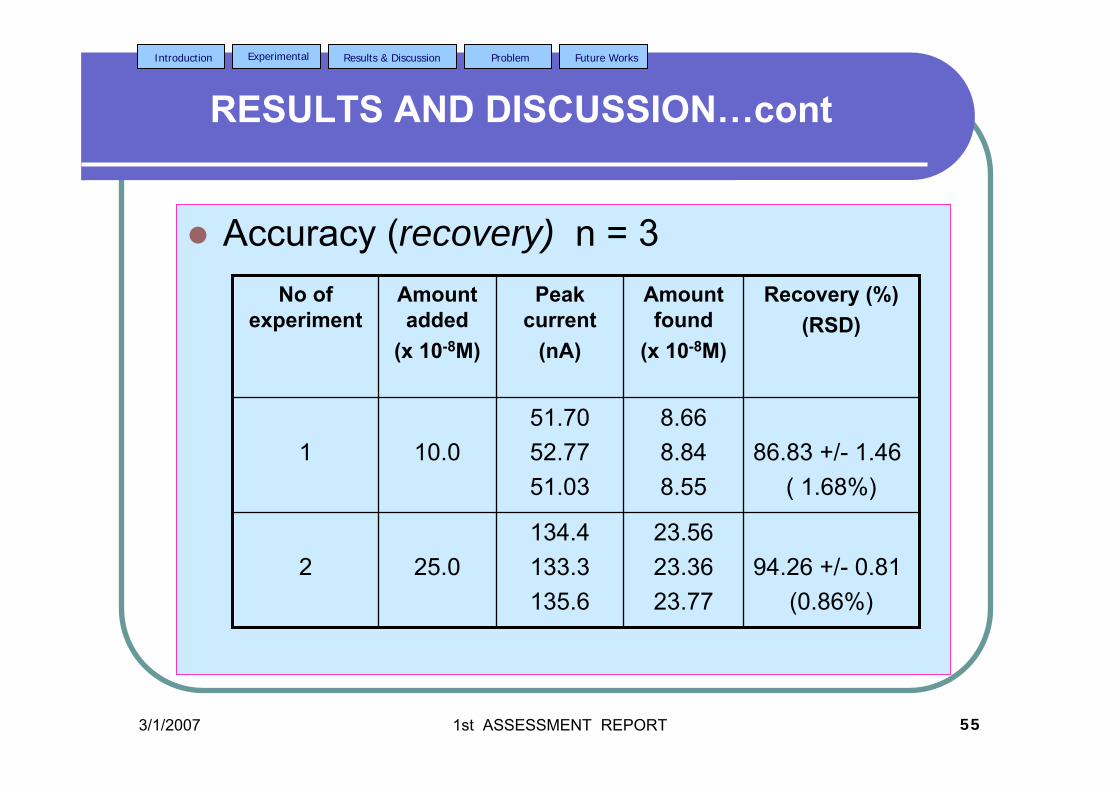
3/1/2007 1st ASSESSMENT REPORT 55
Introduction Experimental Results & Discussion Problem Future Works
RESULTS AND DISCUSSION…cont
Accuracy (recovery) n = 3
94.26 +/- 0.81(0.86%)
23.5623.3623.77
134.4133.3135.6
25.02
86.83 +/- 1.46( 1.68%)
8.668.848.55
51.7052.7751.03
10.01
Recovery (%) (RSD)
Amount found
(x 10-8M)
Peak current
(nA)
Amount added
(x 10-8M)
No of experiment
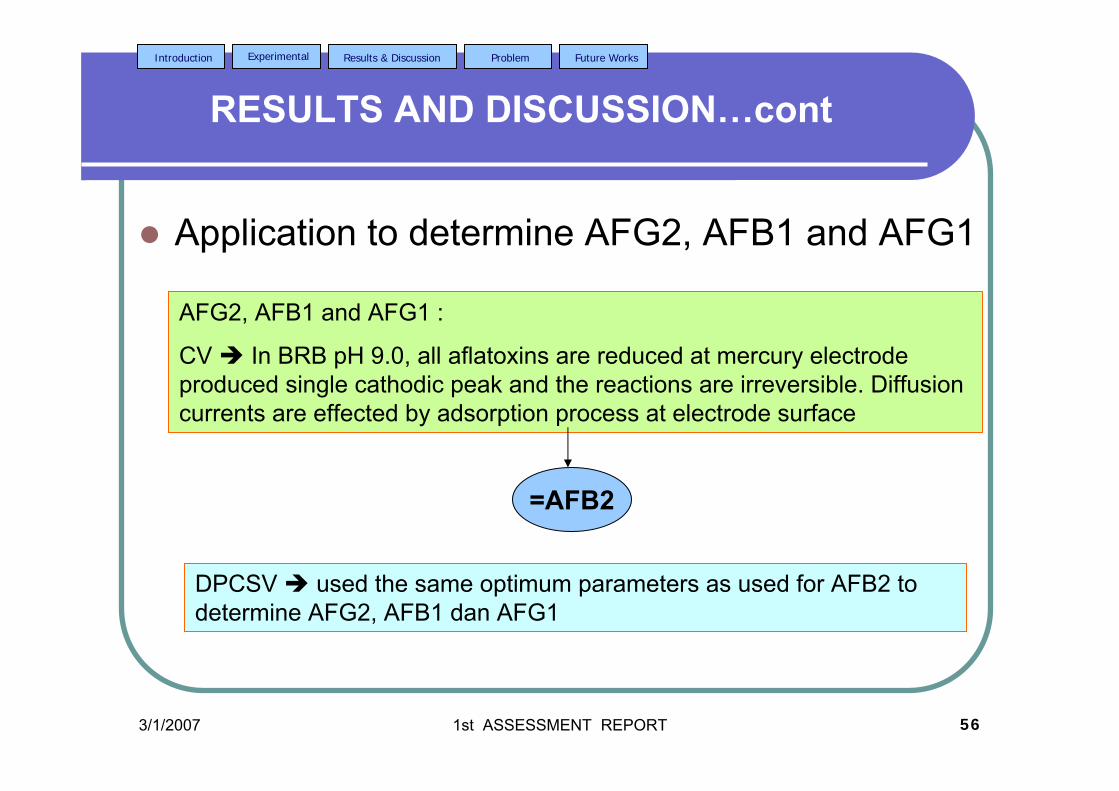
3/1/2007 1st ASSESSMENT REPORT 56
Introduction Experimental Results & Discussion Problem Future Works
RESULTS AND DISCUSSION…cont
Application to determine AFG2, AFB1 and AFG1
AFG2, AFB1 and AFG1 :
CV In BRB pH 9.0, all aflatoxins are reduced at mercury electrode produced single cathodic peak and the reactions are irreversible. Diffusion currents are effected by adsorption process at electrode surface
DPCSV used the same optimum parameters as used for AFB2 to determine AFG2, AFB1 dan AFG1
=AFB2
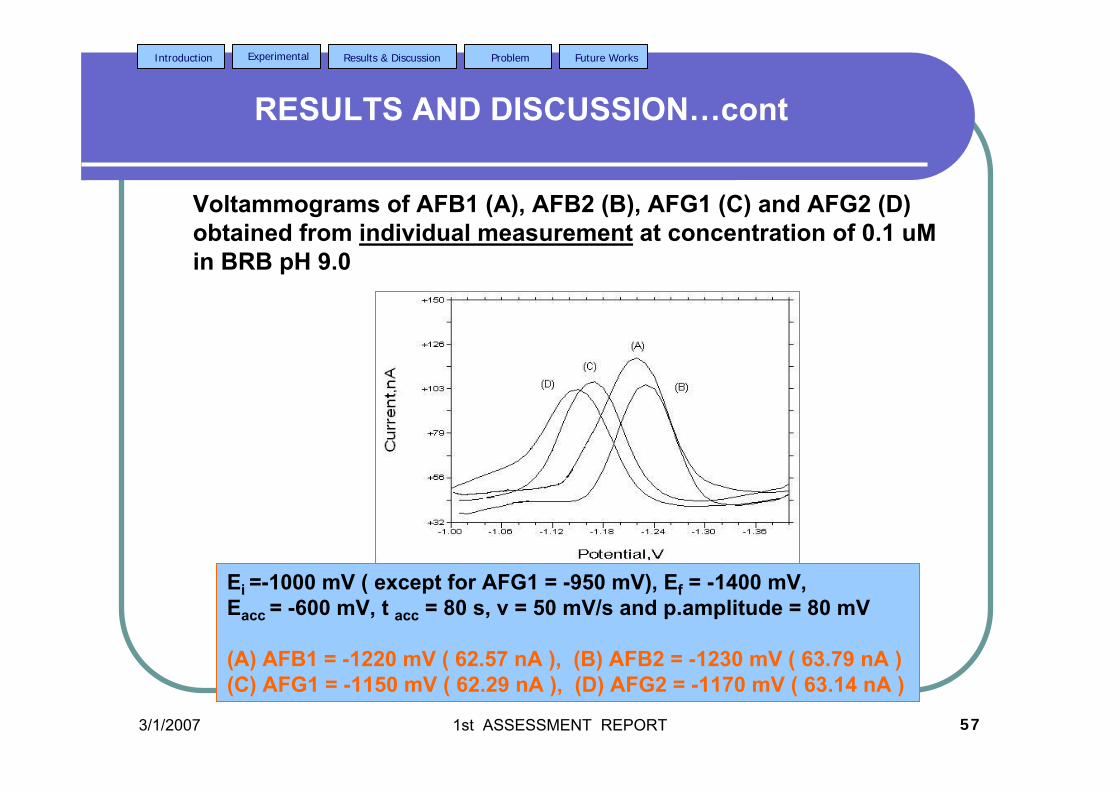
3/1/2007 1st ASSESSMENT REPORT 57
Introduction Experimental Results & Discussion Problem Future Works
RESULTS AND DISCUSSION…cont
Voltammograms of AFB1 (A), AFB2 (B), AFG1 (C) and AFG2 (D) obtained from individual measurement at concentration of 0.1 uMin BRB pH 9.0
Ei =-1000 mV ( except for AFG1 = -950 mV), Ef = -1400 mV, Eacc = -600 mV, t acc = 80 s, v = 50 mV/s and p.amplitude = 80 mV
(A) AFB1 = -1220 mV ( 62.57 nA ), (B) AFB2 = -1230 mV ( 63.79 nA ) (C) AFG1 = -1150 mV ( 62.29 nA ), (D) AFG2 = -1170 mV ( 63.14 nA )
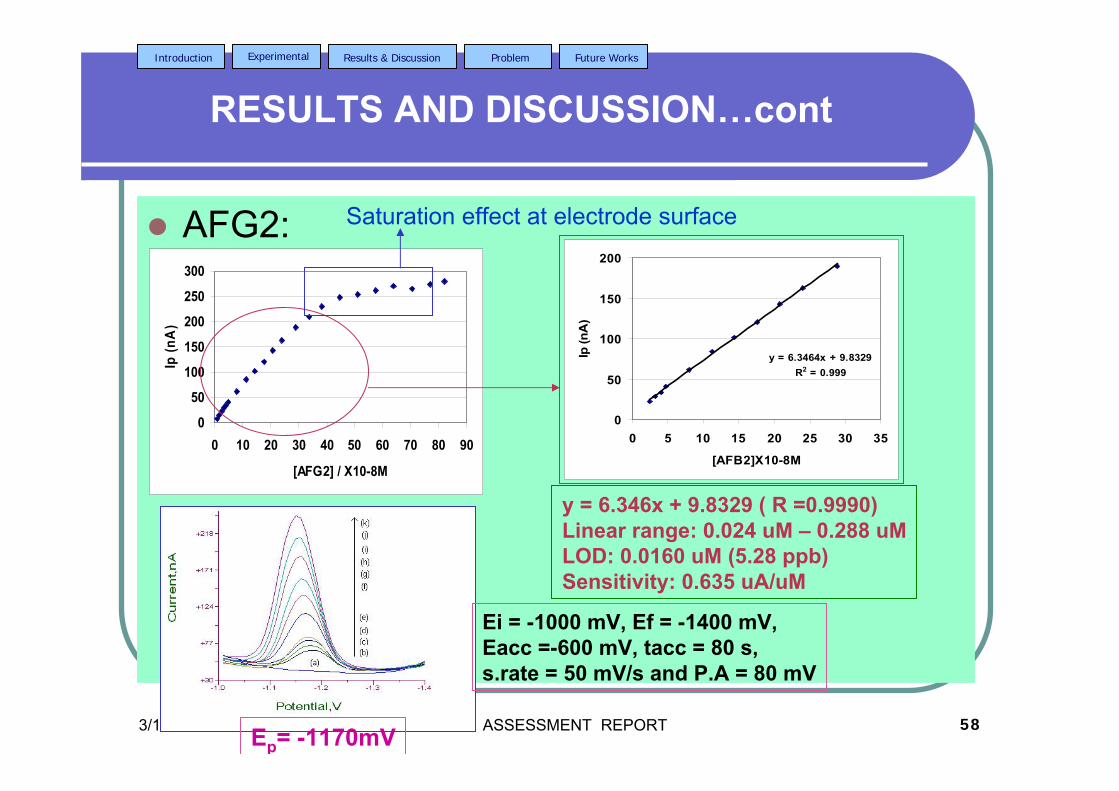
3/1/2007 1st ASSESSMENT REPORT 58
Introduction Experimental Results & Discussion Problem Future Works
RESULTS AND DISCUSSION…cont
AFG2:
0
50
100
150
200
250
300
0 10 20 30 40 50 60 70 80 90
[AFG2] / X10-8M
Ip (n
A)
y = 6.3464x + 9.8329R2 = 0.999
0
50
100
150
200
0 5 10 15 20 25 30 35
[AFB2]X10-8M
Ip (n
A)
Saturation effect at electrode surface
y = 6.346x + 9.8329 ( R =0.9990)Linear range: 0.024 uM – 0.288 uMLOD: 0.0160 uM (5.28 ppb)Sensitivity: 0.635 uA/uM
Ei = -1000 mV, Ef = -1400 mV, Eacc =-600 mV, tacc = 80 s,s.rate = 50 mV/s and P.A = 80 mV
Ep= -1170mV
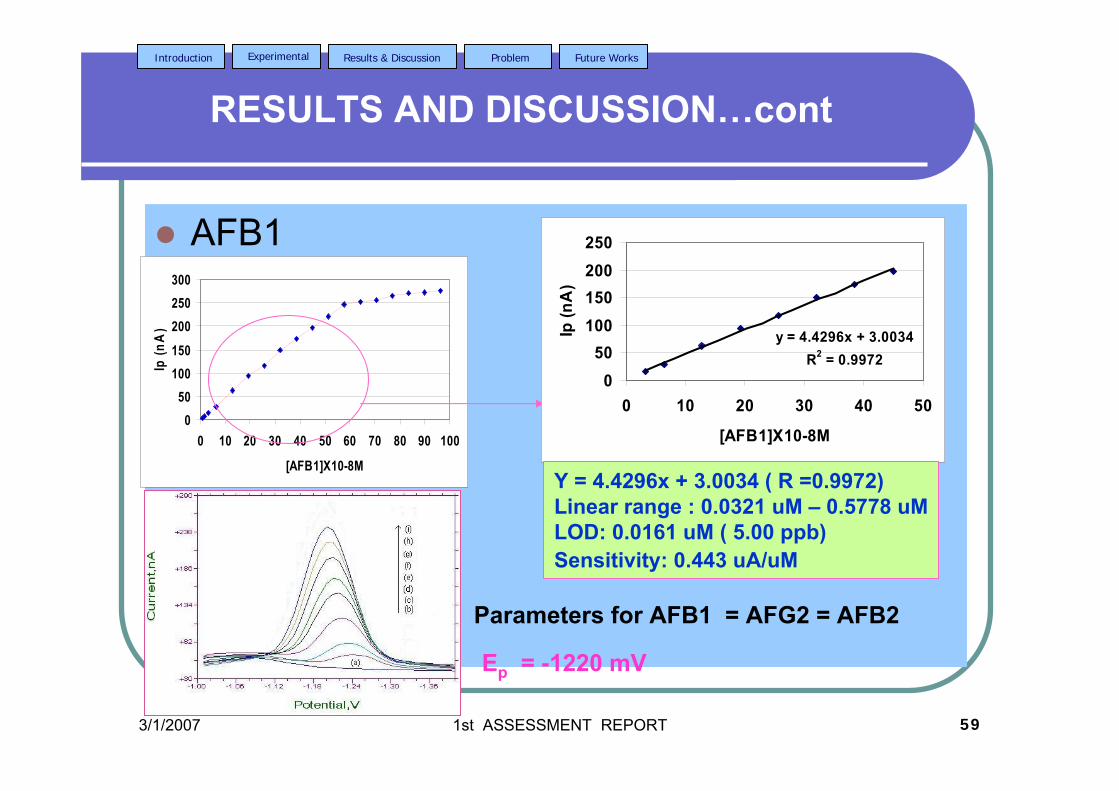
3/1/2007 1st ASSESSMENT REPORT 59
Introduction Experimental Results & Discussion Problem Future Works
RESULTS AND DISCUSSION…cont
AFB1
050
100150
200250300
0 10 20 30 40 50 60 70 80 90 100
[AFB1]X10-8M
Ip (n
A) y = 4.4296x + 3.0034
R2 = 0.99720
50100150200250
0 10 20 30 40 50
[AFB1]X10-8M
Ip (n
A)
Y = 4.4296x + 3.0034 ( R =0.9972)Linear range : 0.0321 uM – 0.5778 uMLOD: 0.0161 uM ( 5.00 ppb)Sensitivity: 0.443 uA/uM
Parameters for AFB1 = AFG2 = AFB2
Ep = -1220 mV
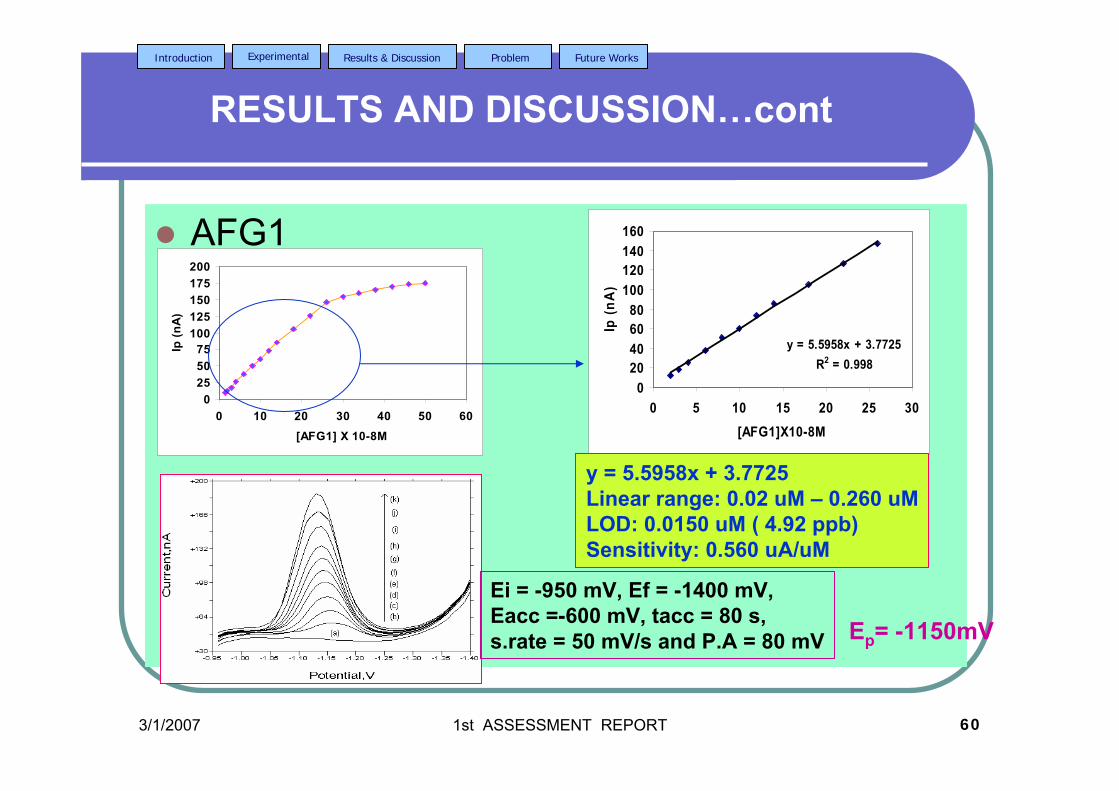
3/1/2007 1st ASSESSMENT REPORT 60
Introduction Experimental Results & Discussion Problem Future Works
RESULTS AND DISCUSSION…cont
AFG1
0255075
100125150175200
0 10 20 30 40 50 60[AFG1] X 10-8M
Ip (n
A)
y = 5.5958x + 3.7725R2 = 0.998
020406080
100120140160
0 5 10 15 20 25 30[AFG1]X10-8M
Ip (n
A)
y = 5.5958x + 3.7725Linear range: 0.02 uM – 0.260 uMLOD: 0.0150 uM ( 4.92 ppb)Sensitivity: 0.560 uA/uM
Ei = -950 mV, Ef = -1400 mV, Eacc =-600 mV, tacc = 80 s,s.rate = 50 mV/s and P.A = 80 mV Ep= -1150mV
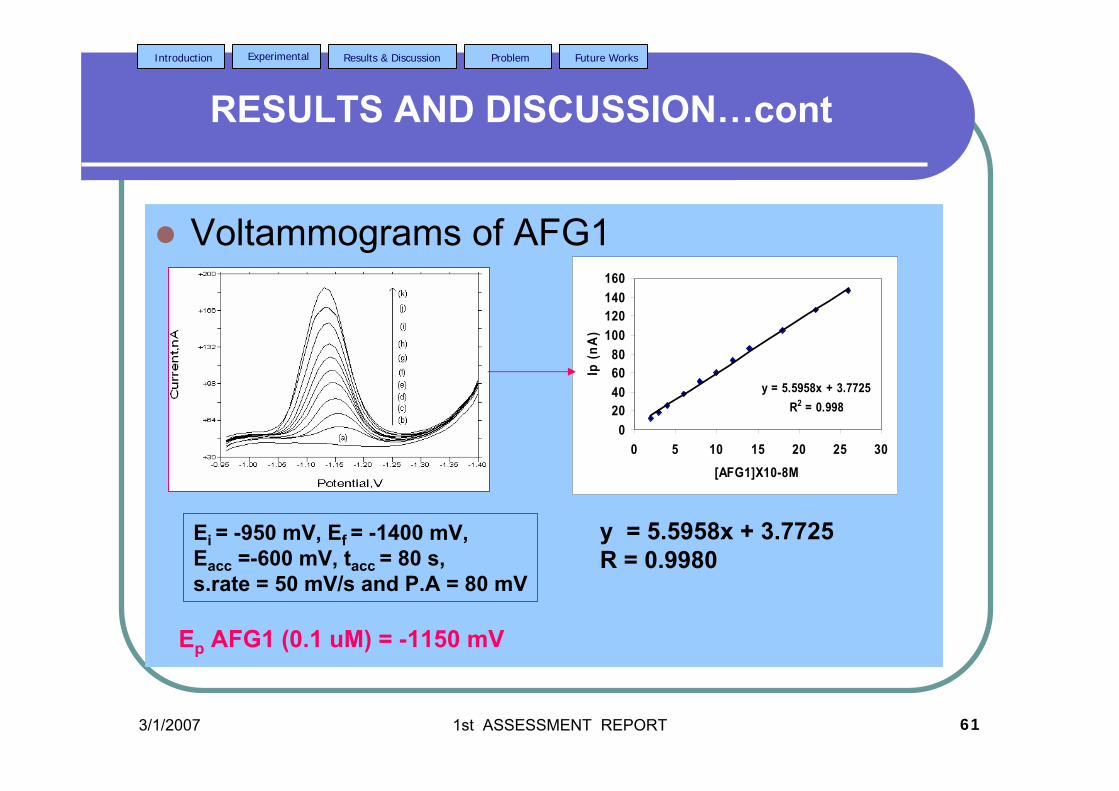
3/1/2007 1st ASSESSMENT REPORT 61
Introduction Experimental Results & Discussion Problem Future Works
RESULTS AND DISCUSSION…cont
Voltammograms of AFG1
y = 5.5958x + 3.7725R2 = 0.998
020406080
100120140160
0 5 10 15 20 25 30[AFG1]X10-8M
Ip (n
A)
y = 5.5958x + 3.7725R = 0.9980
Ei = -950 mV, Ef = -1400 mV, Eacc =-600 mV, tacc = 80 s,s.rate = 50 mV/s and P.A = 80 mV
Ep AFG1 (0.1 uM) = -1150 mV
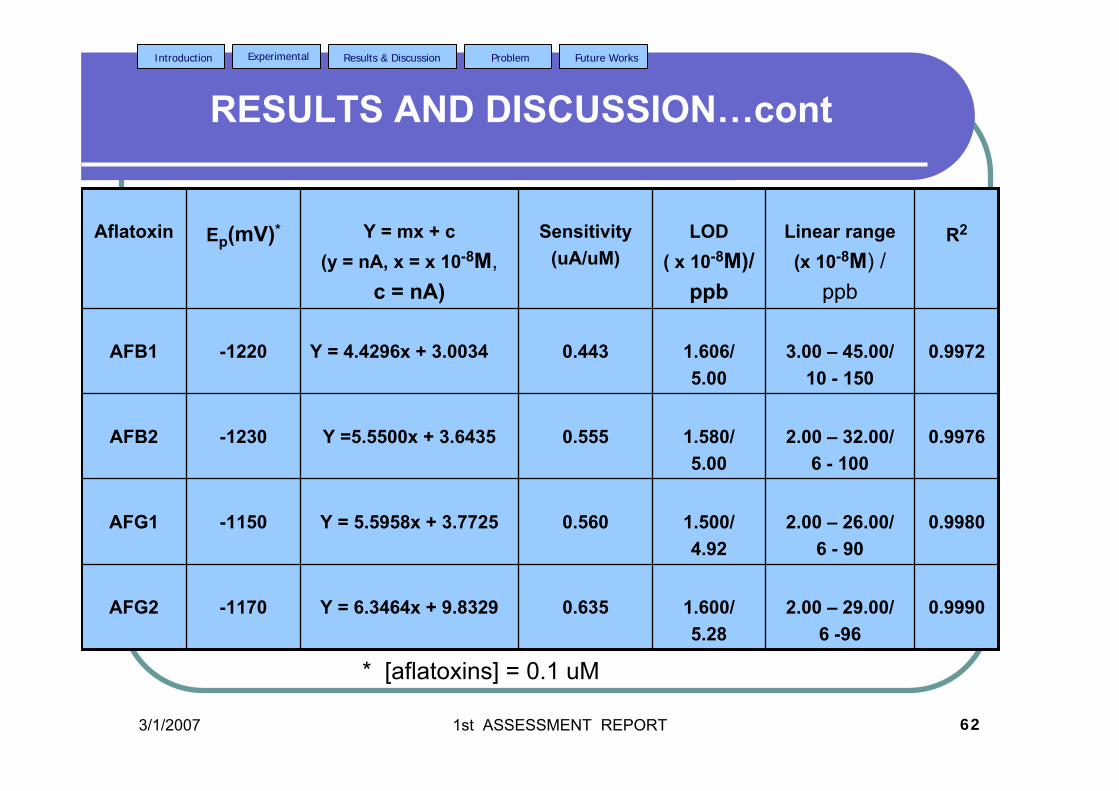
3/1/2007 1st ASSESSMENT REPORT 62
Introduction Experimental Results & Discussion Problem Future Works
RESULTS AND DISCUSSION…cont
AFB1, AFB2, AFG1 dan AFG2:
* [aflatoxins] = 0.1 uM
0.99902.00 – 29.00/6 -96
1.600/5.28
0.635Y = 6.3464x + 9.8329-1170AFG2
0.99802.00 – 26.00/6 - 90
1.500/4.92
0.560Y = 5.5958x + 3.7725-1150AFG1
0.99762.00 – 32.00/6 - 100
1.580/5.00
0.555Y =5.5500x + 3.6435-1230AFB2
0.99723.00 – 45.00/10 - 150
1.606/5.00
0.443Y = 4.4296x + 3.0034-1220AFB1
R2Linear range(x 10-8M) /
ppb
LOD( x 10-8M)/
ppb
Sensitivity(uA/uM)
Y = mx + c(y = nA, x = x 10-8M,
c = nA)
Ep(mV)*Aflatoxin
3/1/2007 1st ASSESSMENT REPORT 63
Introduction Experimental Results & Discussion Problem Future Works
CONCLUSION
From the CV study, AFB1, AFB2, AFG1 and AFG2 have reduced at a mercury electrode which produced diffusion current that controlled by adsorption process at electrode surface. The reduction reaction was totally irreversible and prefered the slow reaction.
3/1/2007 1st ASSESSMENT REPORT 64
Introduction Experimental Results & Discussion Problem Future Works
CONCLUSION…cont
From the DPCSV, in BRB pH 9.0, AFB1, AFB2, AFG1, AFG2 have reduced at peak potentials of -1220 mV, -1230 mV, -1150 mV and -1170 mV ( versus Ag/AgCl) respectively.The proposed method provides high precision and accuracy for determination of AFB2.
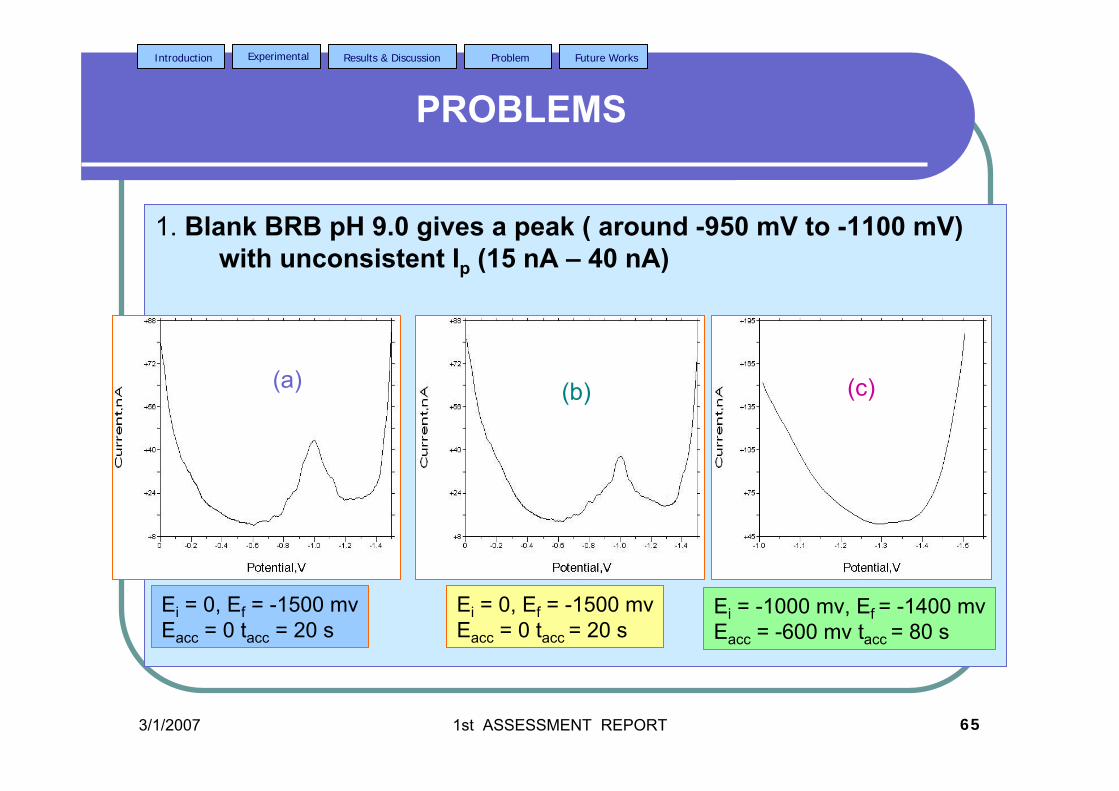
3/1/2007 1st ASSESSMENT REPORT 65
Introduction Experimental Results & Discussion Problem Future Works
PROBLEMS
1. Blank BRB pH 9.0 gives a peak ( around -950 mV to -1100 mV) with unconsistent Ip (15 nA – 40 nA)
Ei = 0, Ef = -1500 mvEacc = 0 tacc = 20 s
Ei = 0, Ef = -1500 mvEacc = 0 tacc = 20 s
Ei = -1000 mv, Ef = -1400 mvEacc = -600 mv tacc = 80 s
(a) (b) (c)
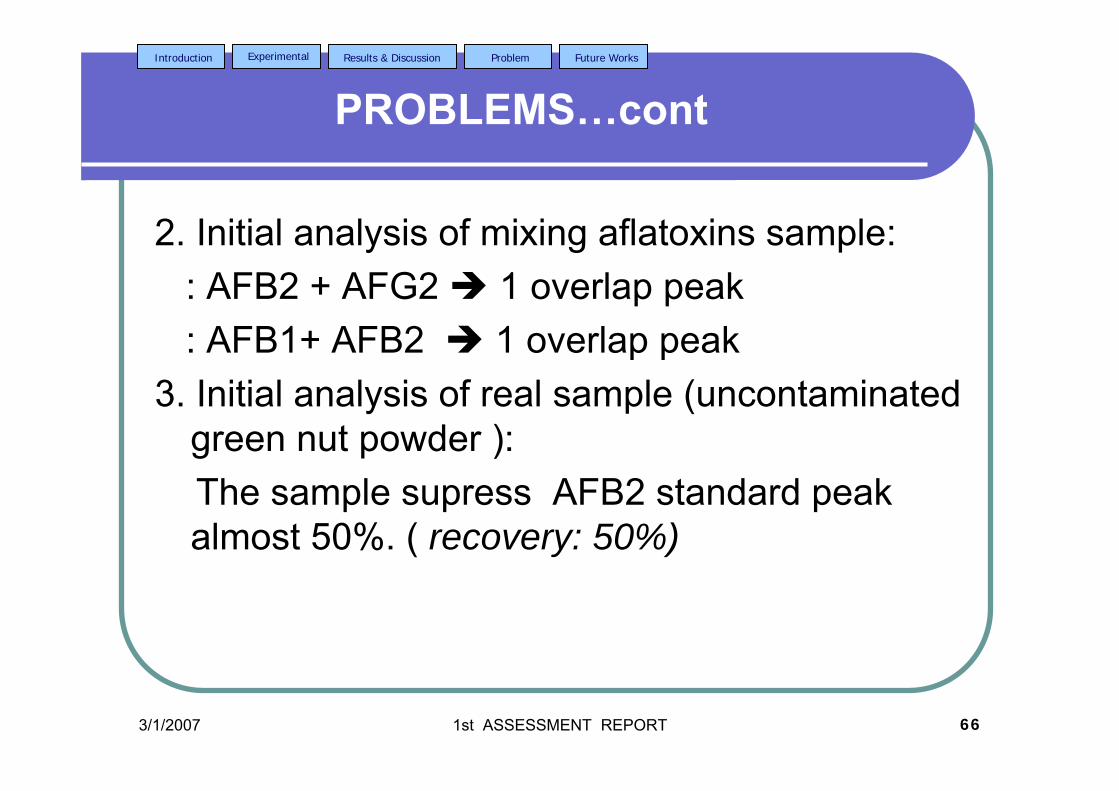
3/1/2007 1st ASSESSMENT REPORT 66
Introduction Experimental Results & Discussion Problem Future Works
PROBLEMS…cont
2. Initial analysis of mixing aflatoxins sample:: AFB2 + AFG2 1 overlap peak : AFB1+ AFB2 1 overlap peak
3. Initial analysis of real sample (uncontaminated green nut powder ):The sample supress AFB2 standard peak almost 50%. ( recovery: 50%)
3/1/2007 1st ASSESSMENT REPORT 67
Introduction Experimental Results & Discussion Problem Future Works
FUTURE WORKS
Further study on suitable technique to reduce LOD / enhance sensitivity.Analysis of accuracy ( recovery) at inter-day for AFB2.Analysis of precision and accuracy at intra-day and inter-day for AFG2, AFB1 dan AFG1
3/1/2007 1st ASSESSMENT REPORT 68
Introduction Experimental Results & Discussion Problem Future Works
FUTURE WORKS…cont
Complexing of aflatoxin for the selectivity of analysis.
Study interference effect;1. Analysis the mixing of aflatoxinssample.
2. Standard aflatoxin solution will be mixed with other ketone compounds.
3/1/2007 1st ASSESSMENT REPORT 69
Introduction Experimental Results & Discussion Problem Future Works
FUTURE WORKS…cont
Study the stability of aflatoxins ( shelf life study) and the effect of exposure time to the aflatoxins peak current ( aflatoxins will be left in voltammetric cell subject to the laboratory conditions for 8 hrs and measurement will be carried out for every hour)
Study other type of working electrodes such as carbon paste and screen printed electrodes.
Robustness test of the proposed method.
3/1/2007 1st ASSESSMENT REPORT 70
Introduction Experimental Results & Discussion Problem Future Works
FUTURE WORKS…cont
Analysis an artificially and real contaminated samples.
Compare the results with that obtained using accepted technique such as HPLC-FD.

3/1/2007 1st ASSESSMENT REPORT 71
Introduction Experimental Results & Discussion Problem Future Works
FUTURE WORKS…cont
J OAF
3) Complexing of aflatoxins study
2) Interference study
1b) Determine analytical parameters
1a) Prepare calibration curve
1) Determination of AFB1, AFB2, AFG1 and AFG2
DNOSJJMMActivity 2003
finished

3/1/2007 1st ASSESSMENT REPORT 72
Introduction Experimental Results & Discussion Problem Future Works
FUTURE WORKS…cont
5) Study using different working electrodes
6) Thesis writting up
1) Analysis of contaminated food samples
2) Thesis writting up
Activity 2005
J OAF
5) Comparison study
4)Determination by HPLC
3)Determination of aflatoxinsin real samples
2)Determination of aflatoxinsin artificially contaminated samples
1) Determination of mixing aflatoxins
DNOSJJMM
Activity 2004
3/1/2007 1st ASSESSMENT REPORT 73
Introduction Experimental Results & Discussion Problem Future Works
WHAT EXPERTS SAID ABOUT VOLTAMMETRY?
Prof Barek (2001):
“Polarographic and voltammetric methods can play a useful role in the analysis as an alternative to chromatographic and
spectrophotometric techniques, however, their relationship to other methods is complimentry rather than competitive”
Prof Wang (1999):“Stripping analysis to the 21th century: faster, smaller,
cheaper, simpler and better”.
Hopefully this will come true!!!
Jaroslav Heyrovsky (1890-1967)
3/1/2007 1st ASSESSMENT REPORT 74
Introduction Experimental Results & Discussion Problem Future Works
ACKNOWLEDGEMENT
SUPERVISOR:AP DR ABDUL RAHIM MOHD YUSOFF
CO-SUPERVISORS:
1. PROF RAHMALAN AHAMAD2. DR ABD. RAHIM YAACOB
STAFF OF CHEMISTRY DEPT, UTMCHEM. DEPT, MOSTE ( EN.RODWAN )ELECTROANALYSIS GROUP, CHEM. DEPT, UTM
USM ( STUDY LEAVE UNDER ASHES)

3/1/2007 1st ASSESSMENT REPORT 75
Introduction Experimental Results & Discussion Problem Future Works
THANK YOU
MohdMohd HadzriHadzri,,PPSainsPPSains KesihatanKesihatan20 20 OgosOgos 2003/2003/22 22 RejabRejab 1424H1424H
Wassalam
3/1/2007 1st ASSESSMENT REPORT 76
Introduction Experimental Results & Discussion Problem Future Works

3/1/2007 1st ASSESSMENT REPORT 77
Introduction Experimental Results & Discussion Problem Future Works
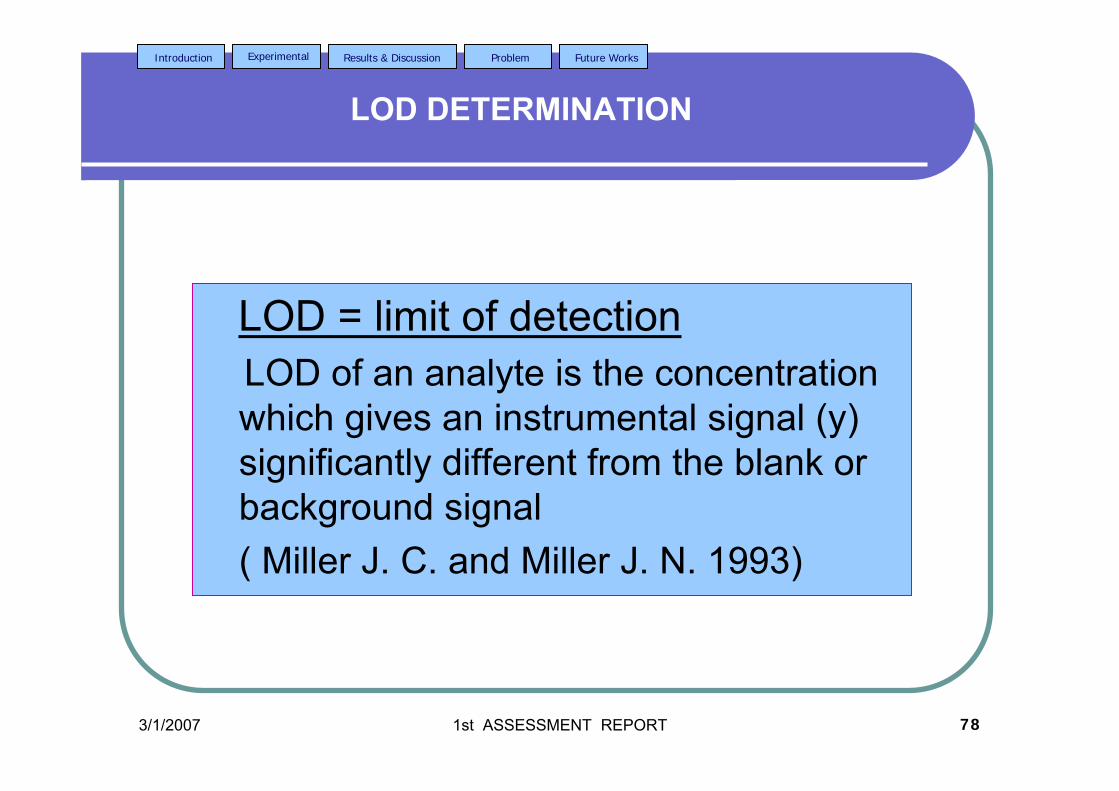
3/1/2007 1st ASSESSMENT REPORT 78
Introduction Experimental Results & Discussion Problem Future Works
LOD DETERMINATION
LOD = limit of detectionLOD of an analyte is the concentration which gives an instrumental signal (y) significantly different from the blank or background signal ( Miller J. C. and Miller J. N. 1993)
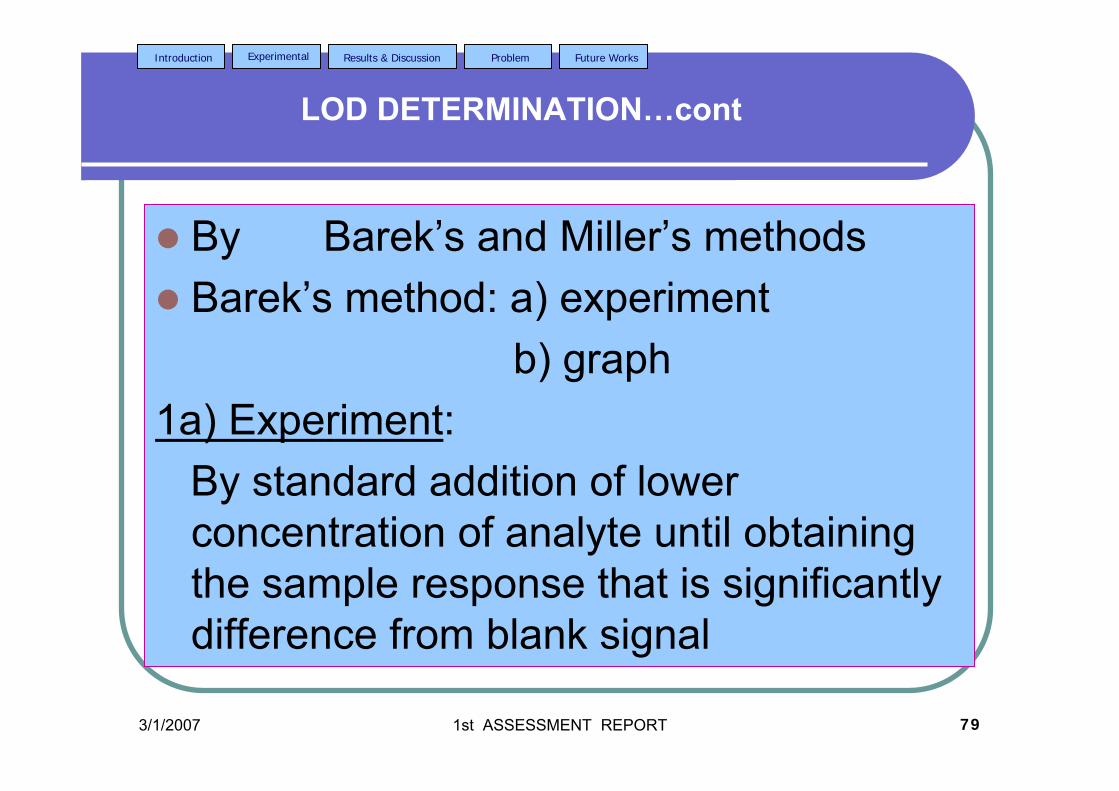
3/1/2007 1st ASSESSMENT REPORT 79
Introduction Experimental Results & Discussion Problem Future Works
LOD DETERMINATION…cont
By Barek’s and Miller’s methodsBarek’s method: a) experiment
b) graph1a) Experiment:
By standard addition of lower concentration of analyte until obtaining the sample response that is significantly difference from blank signal
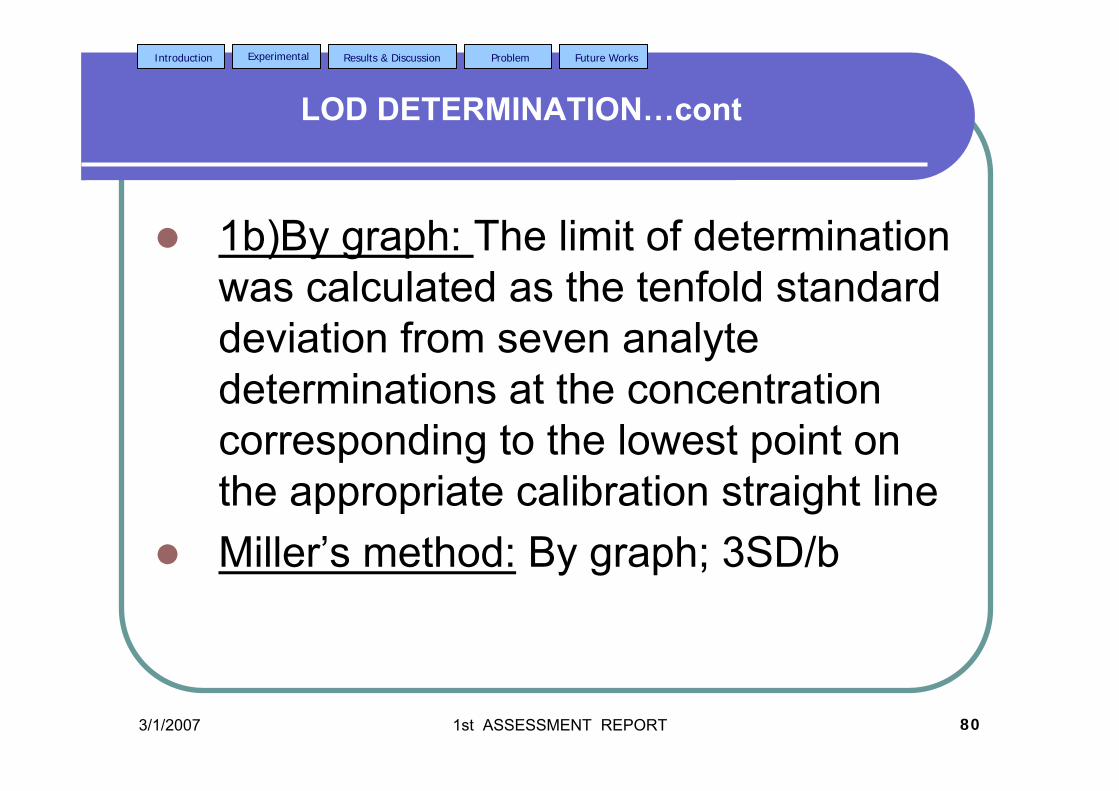
3/1/2007 1st ASSESSMENT REPORT 80
Introduction Experimental Results & Discussion Problem Future Works
LOD DETERMINATION…cont
1b)By graph: The limit of determination was calculated as the tenfold standard deviation from seven analytedeterminations at the concentration corresponding to the lowest point on the appropriate calibration straight lineMiller’s method: By graph; 3SD/b
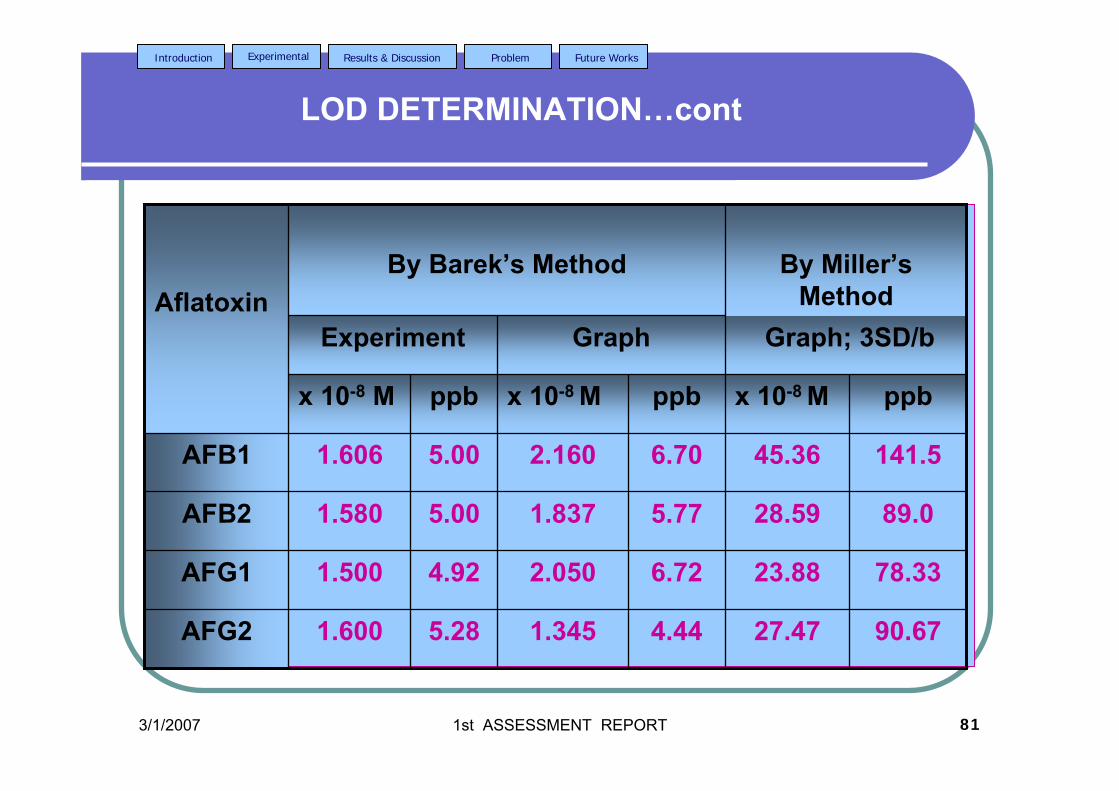
3/1/2007 1st ASSESSMENT REPORT 81
Introduction Experimental Results & Discussion Problem Future Works
LOD DETERMINATION…cont
90.6727.474.441.3455.281.600AFG2
78.3323.886.722.0504.921.500AFG1
89.028.595.771.8375.001.580AFB2
141.545.366.702.1605.001.606AFB1
ppbx 10-8 Mppbx 10-8 Mppbx 10-8 M
Graph; 3SD/bGraphExperiment
By Miller’s Method
By Barek’s MethodAflatoxin
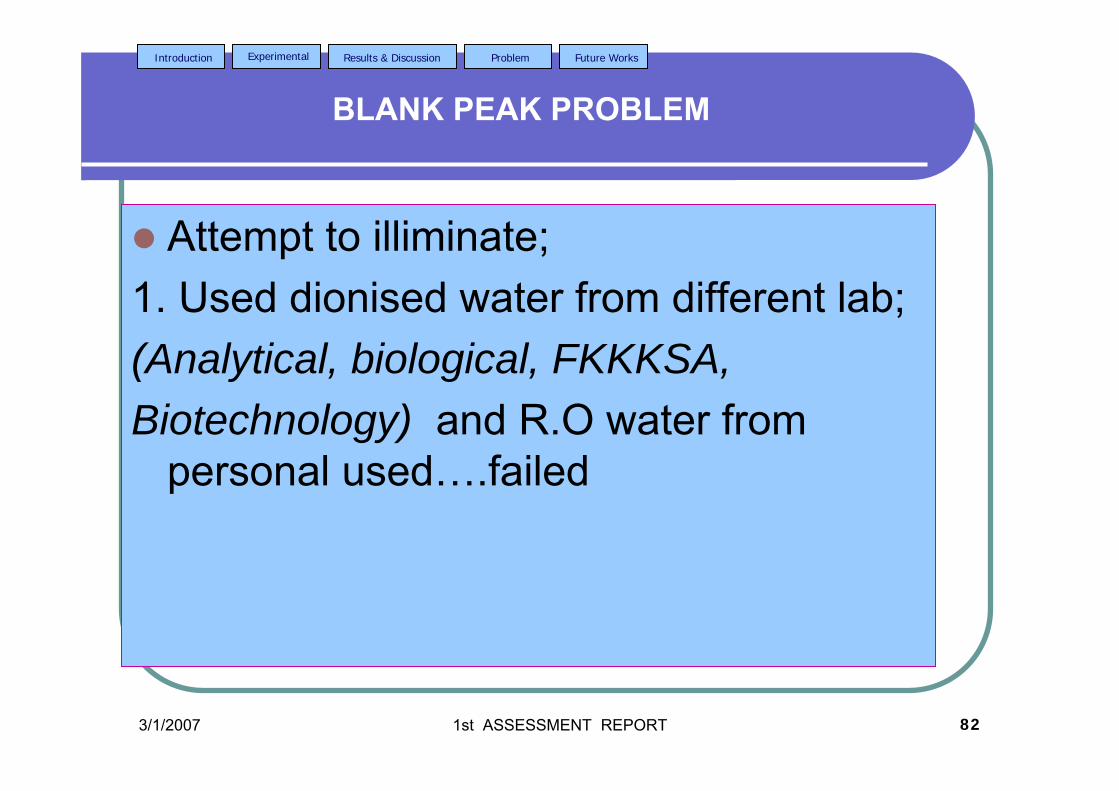
3/1/2007 1st ASSESSMENT REPORT 82
Introduction Experimental Results & Discussion Problem Future Works
BLANK PEAK PROBLEM
Attempt to illiminate;1. Used dionised water from different lab;(Analytical, biological, FKKKSA, Biotechnology) and R.O water from
personal used….failed
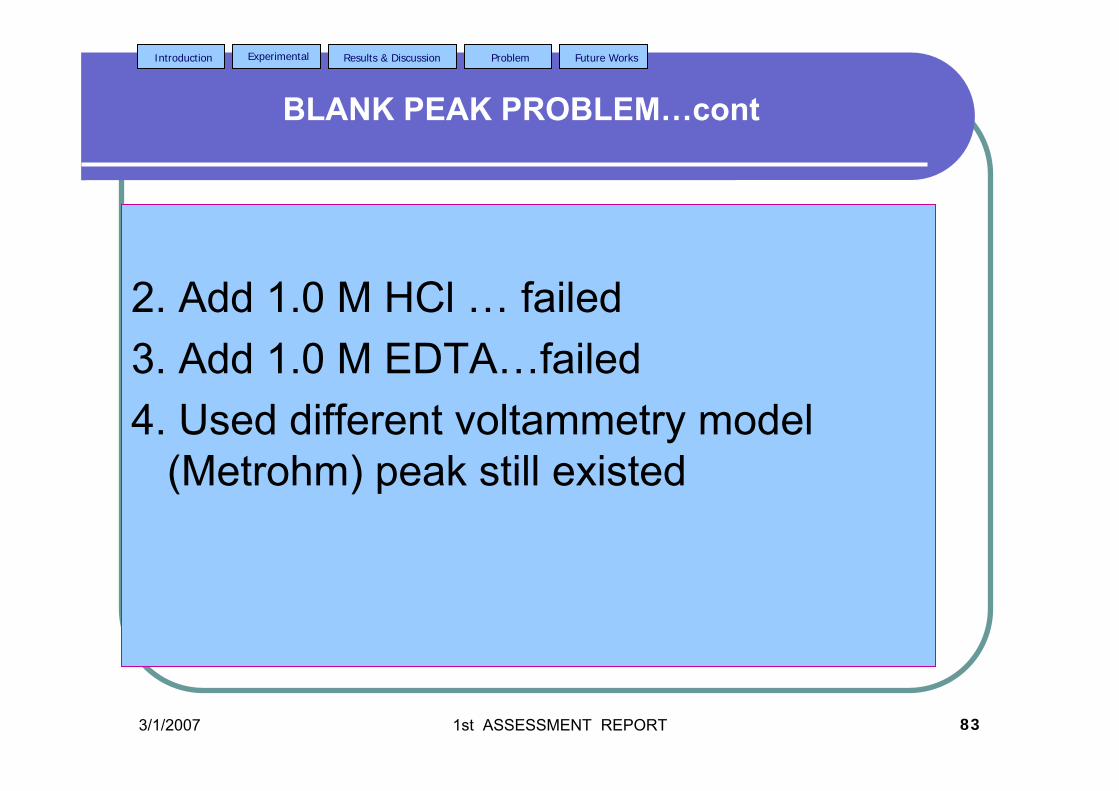
3/1/2007 1st ASSESSMENT REPORT 83
Introduction Experimental Results & Discussion Problem Future Works
BLANK PEAK PROBLEM…cont
2. Add 1.0 M HCl … failed3. Add 1.0 M EDTA…failed4. Used different voltammetry model
(Metrohm) peak still existed
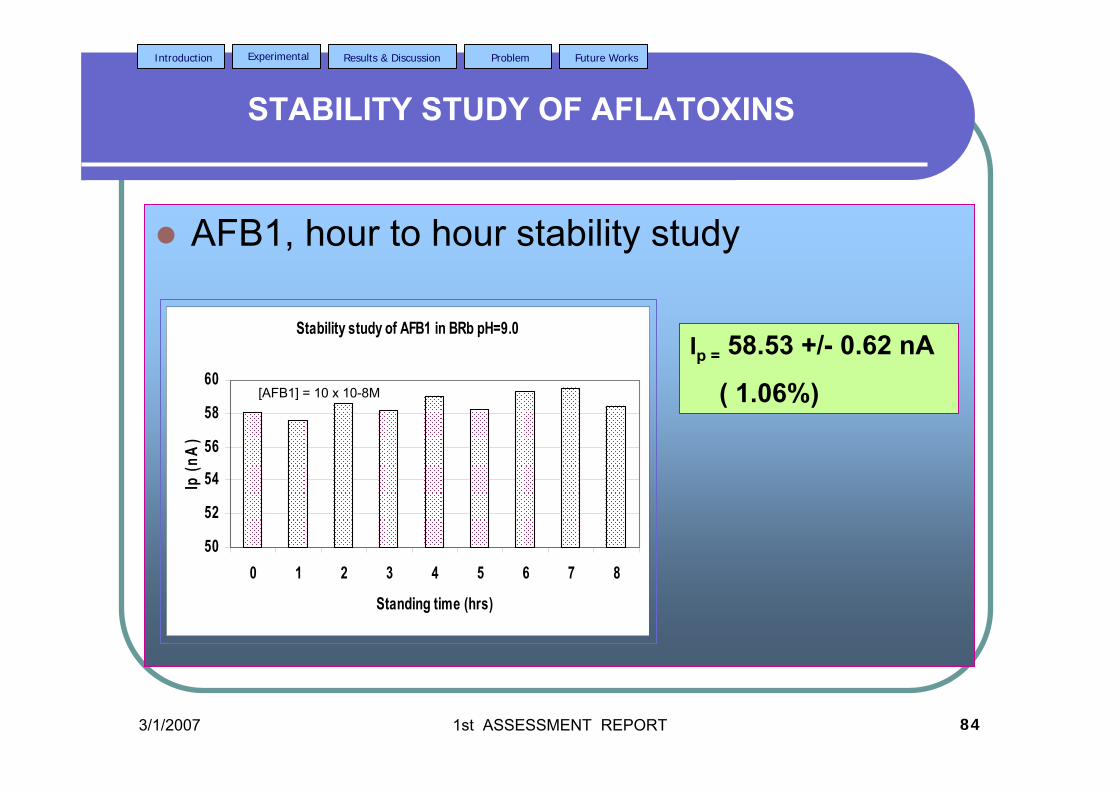
3/1/2007 1st ASSESSMENT REPORT 84
Introduction Experimental Results & Discussion Problem Future Works
STABILITY STUDY OF AFLATOXINS
AFB1, hour to hour stability study
Stability study of AFB1 in BRb pH=9.0
50
52
54
56
58
60
0 1 2 3 4 5 6 7 8
Standing time (hrs)
Ip (n
A)
Ip = 58.53 +/- 0.62 nA
( 1.06%)[AFB1] = 10 x 10-8M
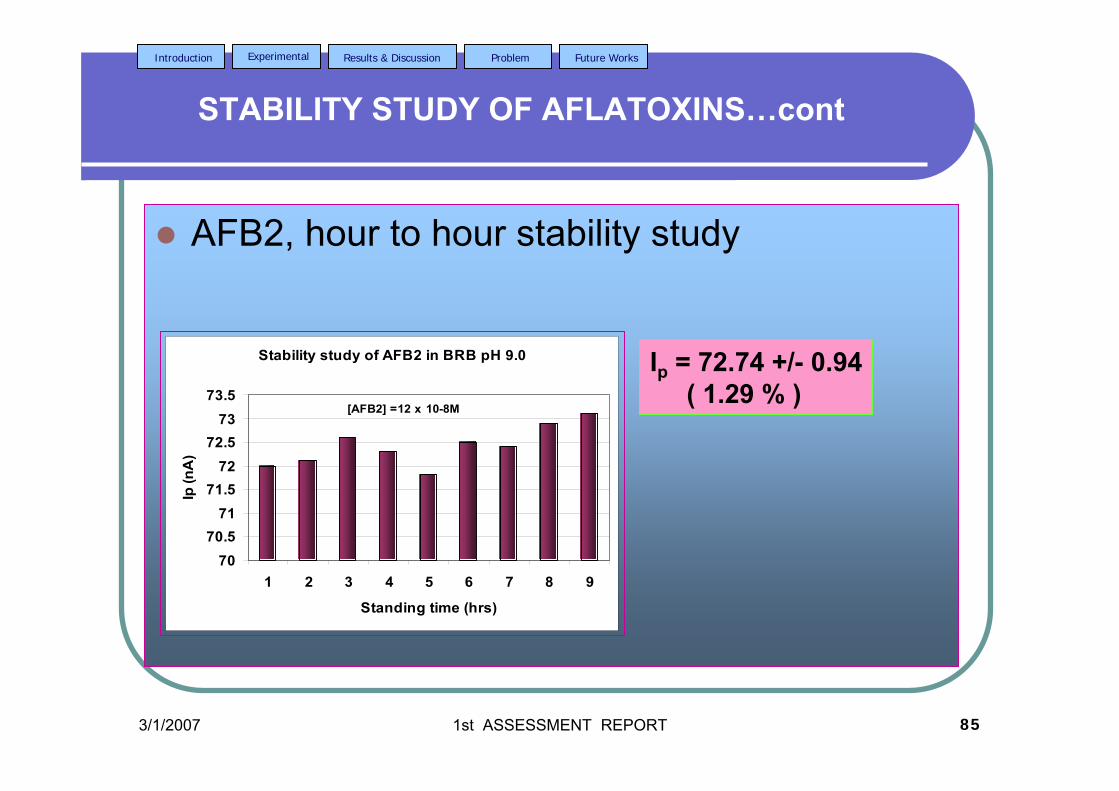
3/1/2007 1st ASSESSMENT REPORT 85
Introduction Experimental Results & Discussion Problem Future Works
STABILITY STUDY OF AFLATOXINS…cont
AFB2, hour to hour stability study
Stability study of AFB2 in BRB pH 9.0
7070.5
7171.5
7272.5
7373.5
1 2 3 4 5 6 7 8 9
Standing time (hrs)
Ip (n
A)
[AFB2] =12 x 10-8M
Ip = 72.74 +/- 0.94( 1.29 % )
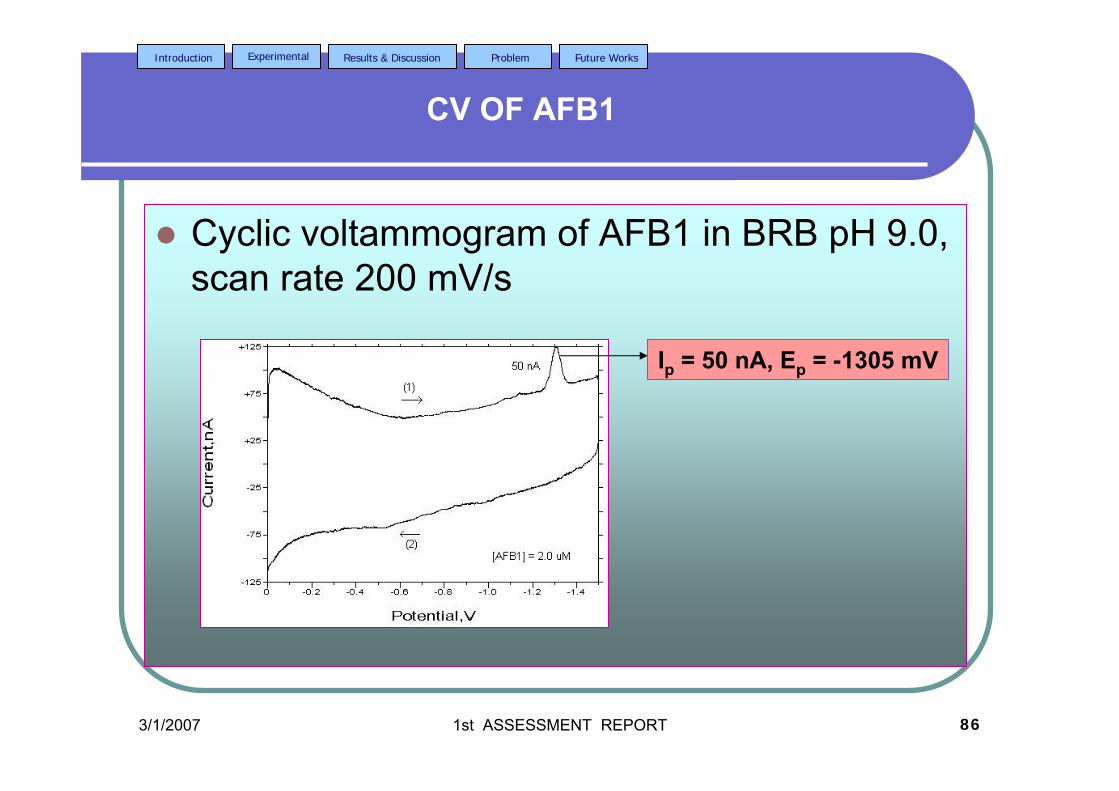
3/1/2007 1st ASSESSMENT REPORT 86
Introduction Experimental Results & Discussion Problem Future Works
CV OF AFB1
Cyclic voltammogram of AFB1 in BRB pH 9.0, scan rate 200 mV/s
Ip = 50 nA, Ep = -1305 mV
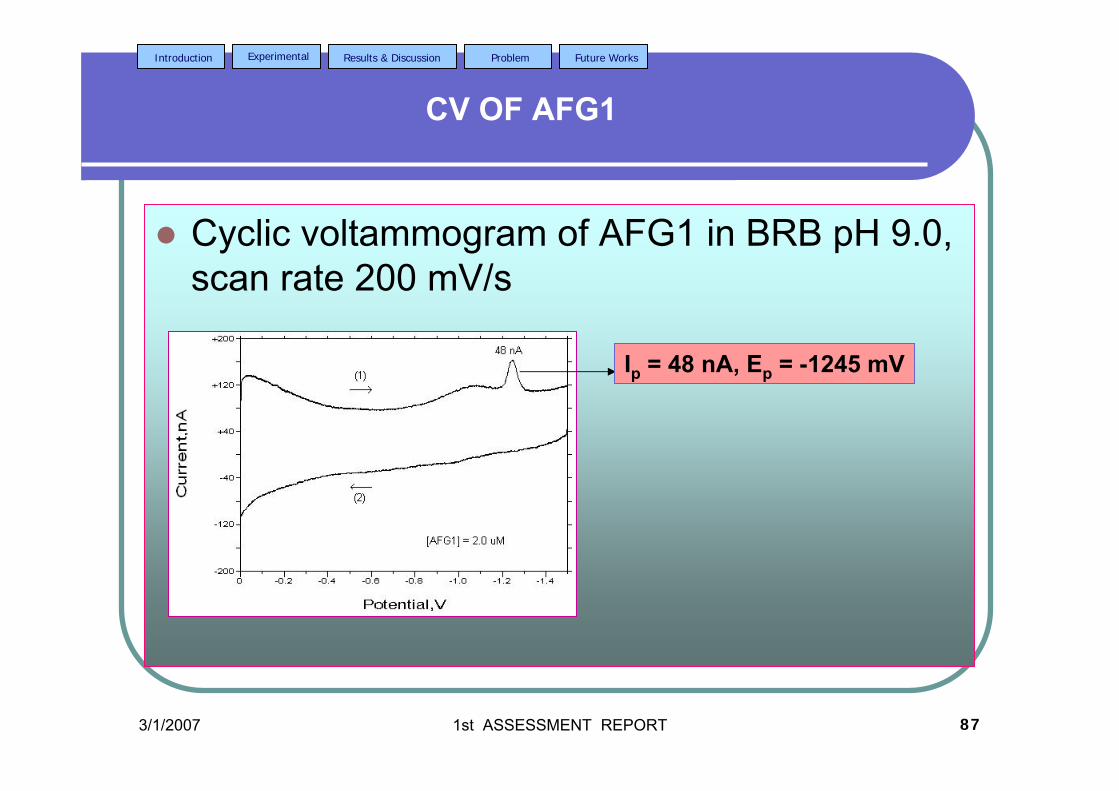
3/1/2007 1st ASSESSMENT REPORT 87
Introduction Experimental Results & Discussion Problem Future Works
CV OF AFG1
Cyclic voltammogram of AFG1 in BRB pH 9.0, scan rate 200 mV/s
Ip = 48 nA, Ep = -1245 mV
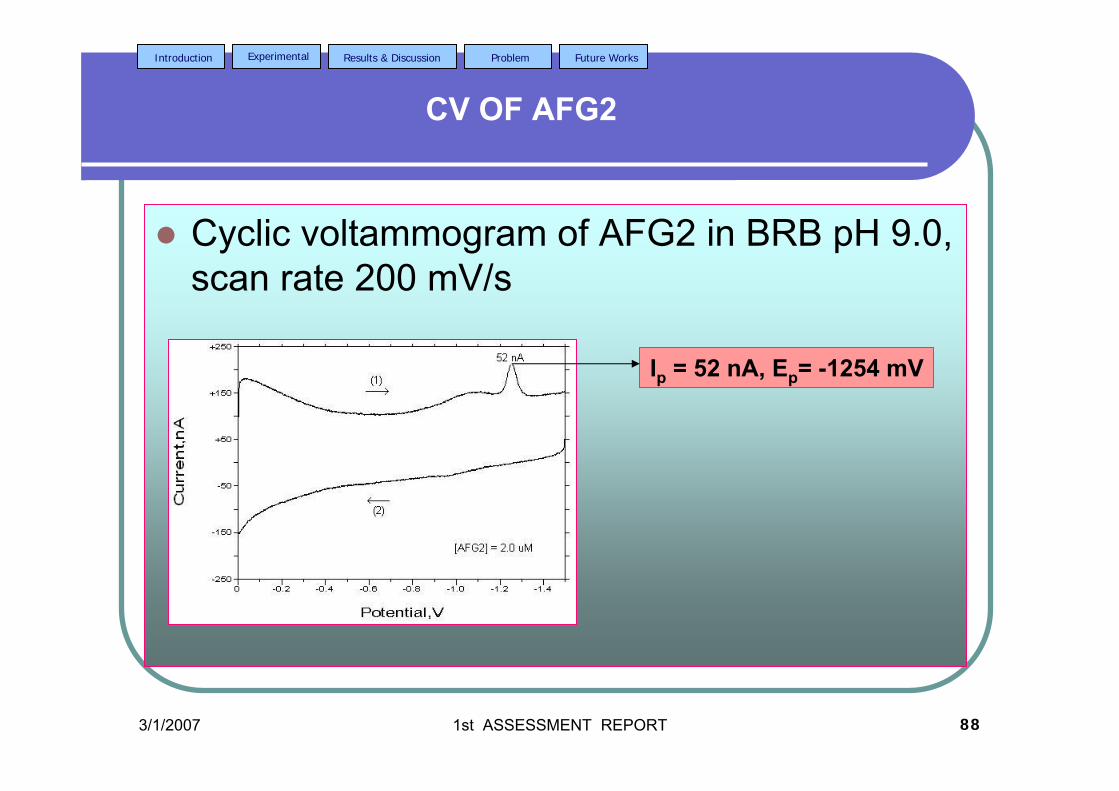
3/1/2007 1st ASSESSMENT REPORT 88
Introduction Experimental Results & Discussion Problem Future Works
CV OF AFG2
Cyclic voltammogram of AFG2 in BRB pH 9.0, scan rate 200 mV/s
Ip = 52 nA, Ep= -1254 mV
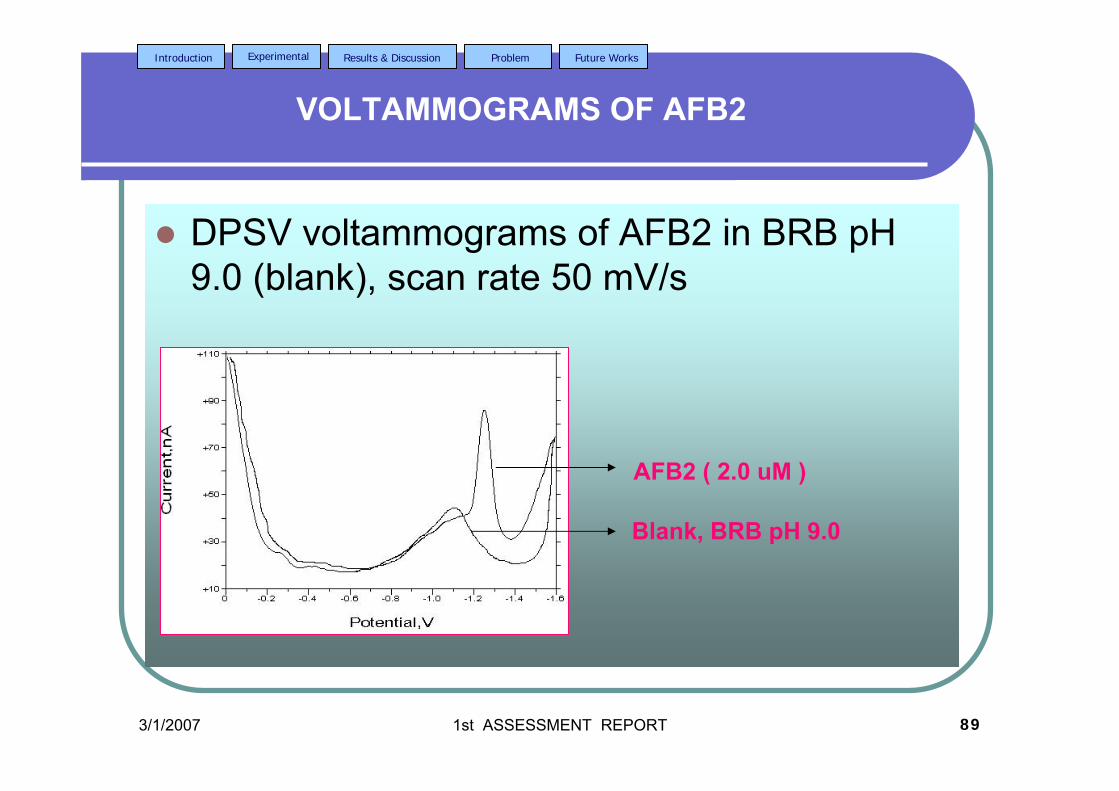
3/1/2007 1st ASSESSMENT REPORT 89
Introduction Experimental Results & Discussion Problem Future Works
VOLTAMMOGRAMS OF AFB2
DPSV voltammograms of AFB2 in BRB pH 9.0 (blank), scan rate 50 mV/s
AFB2 ( 2.0 uM )
Blank, BRB pH 9.0
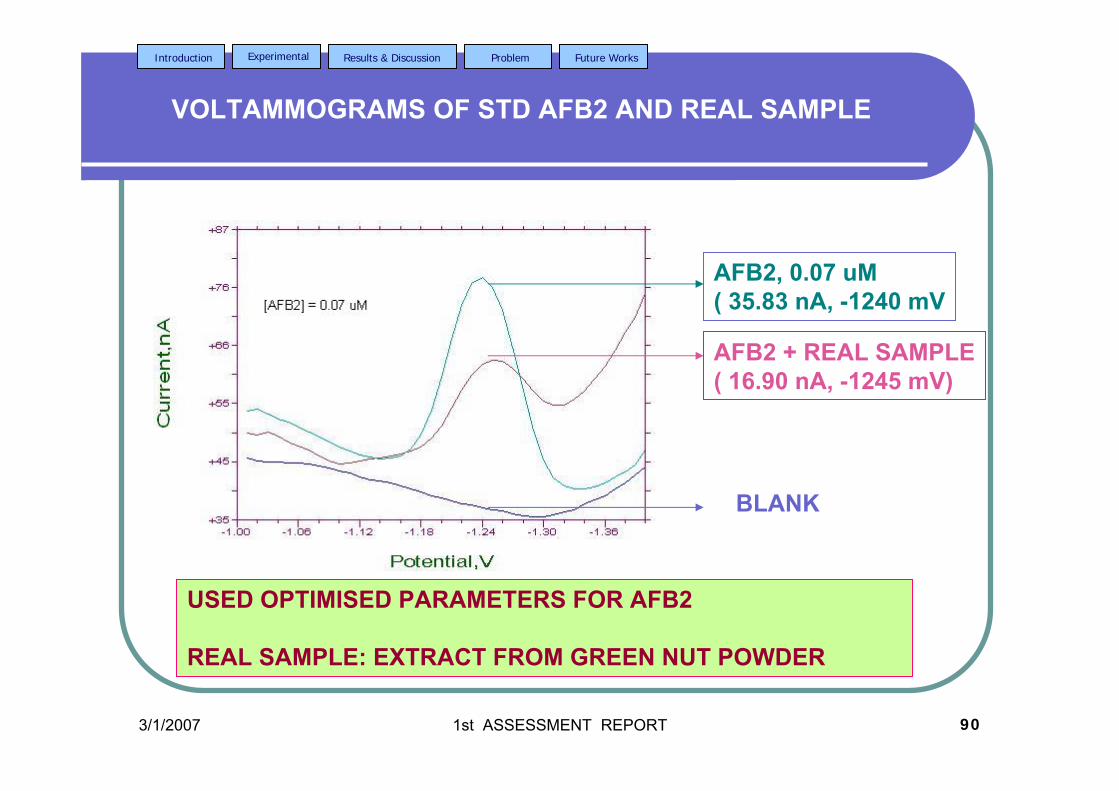
3/1/2007 1st ASSESSMENT REPORT 90
Introduction Experimental Results & Discussion Problem Future Works
VOLTAMMOGRAMS OF STD AFB2 AND REAL SAMPLE
AFB2, 0.07 uM( 35.83 nA, -1240 mV
AFB2 + REAL SAMPLE( 16.90 nA, -1245 mV)
BLANK
USED OPTIMISED PARAMETERS FOR AFB2
REAL SAMPLE: EXTRACT FROM GREEN NUT POWDER
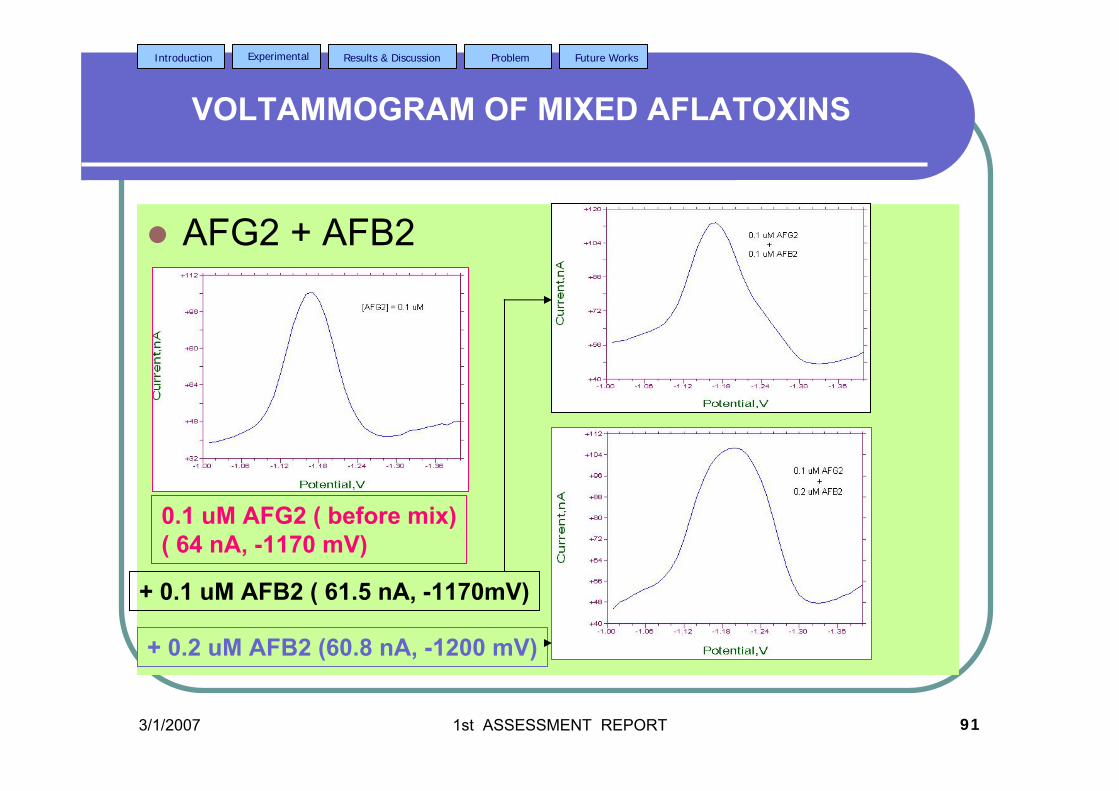
3/1/2007 1st ASSESSMENT REPORT 91
Introduction Experimental Results & Discussion Problem Future Works
VOLTAMMOGRAM OF MIXED AFLATOXINS
AFG2 + AFB2
0.1 uM AFG2 ( before mix)( 64 nA, -1170 mV)
+ 0.1 uM AFB2 ( 61.5 nA, -1170mV)
+ 0.2 uM AFB2 (60.8 nA, -1200 mV)
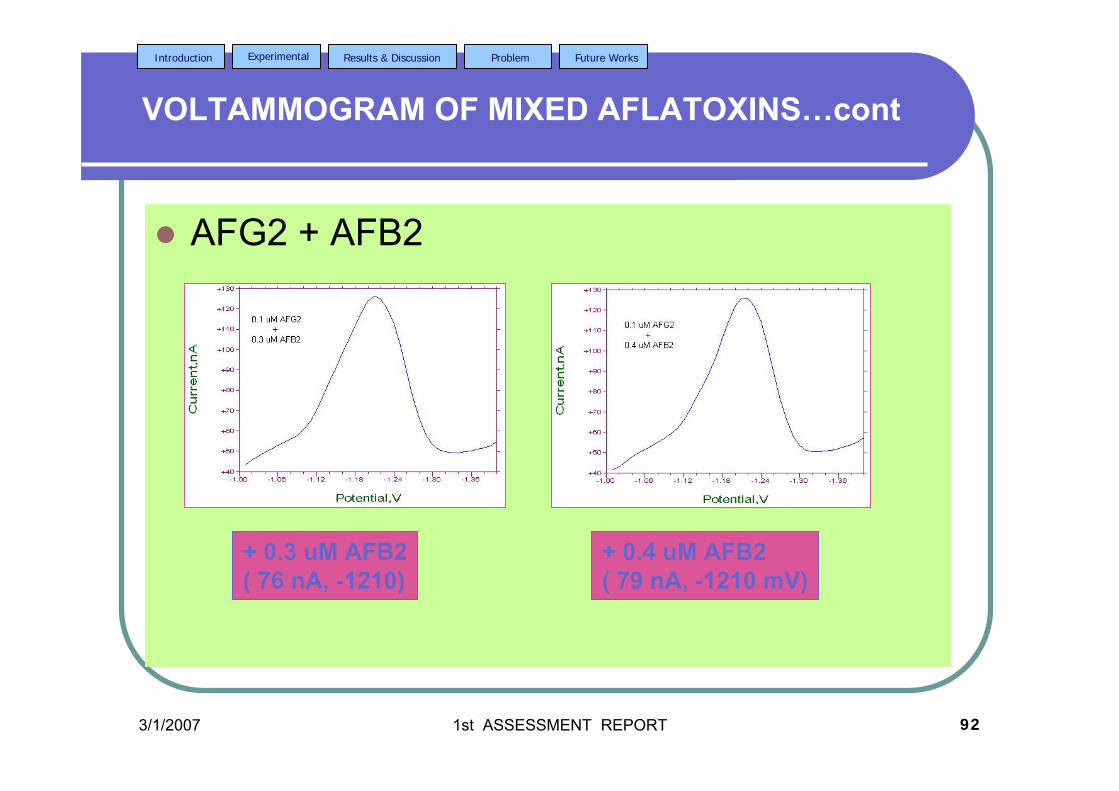
3/1/2007 1st ASSESSMENT REPORT 92
Introduction Experimental Results & Discussion Problem Future Works
VOLTAMMOGRAM OF MIXED AFLATOXINS…cont
AFG2 + AFB2
+ 0.3 uM AFB2( 76 nA, -1210)
+ 0.4 uM AFB2( 79 nA, -1210 mV)
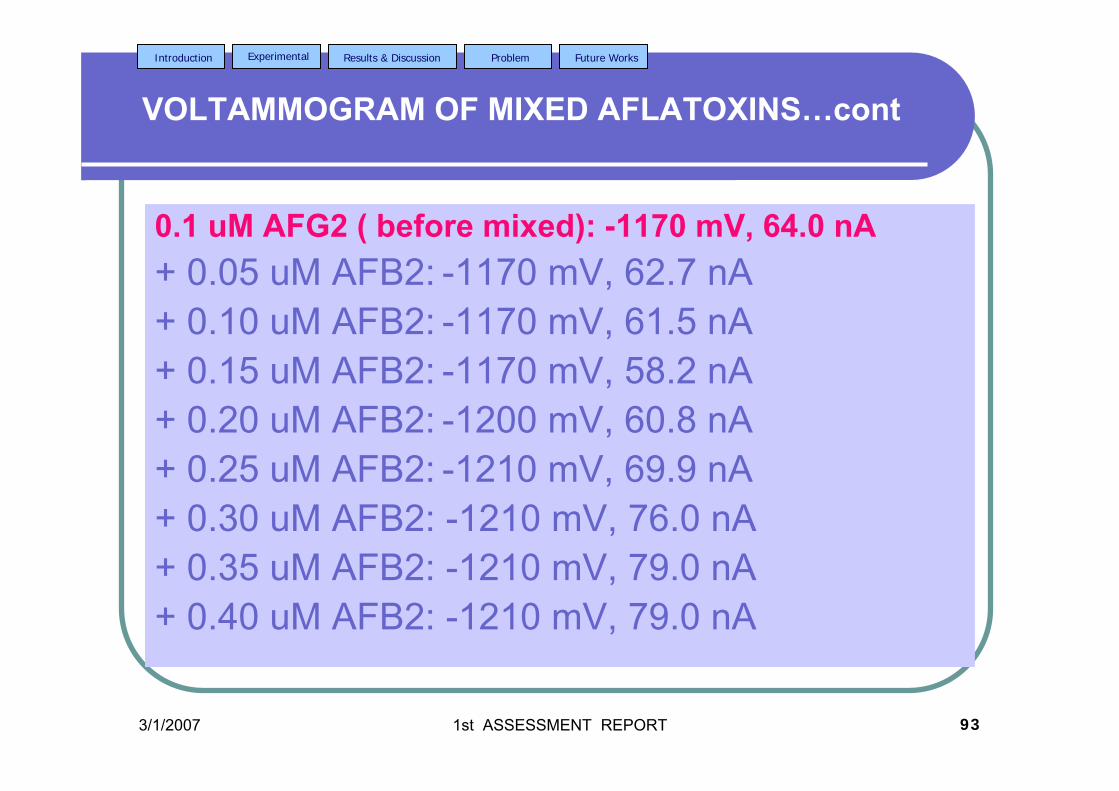
3/1/2007 1st ASSESSMENT REPORT 93
Introduction Experimental Results & Discussion Problem Future Works
VOLTAMMOGRAM OF MIXED AFLATOXINS…cont
0.1 uM AFG2 ( before mixed): -1170 mV, 64.0 nA+ 0.05 uM AFB2: -1170 mV, 62.7 nA+ 0.10 uM AFB2: -1170 mV, 61.5 nA+ 0.15 uM AFB2: -1170 mV, 58.2 nA+ 0.20 uM AFB2: -1200 mV, 60.8 nA+ 0.25 uM AFB2: -1210 mV, 69.9 nA+ 0.30 uM AFB2: -1210 mV, 76.0 nA+ 0.35 uM AFB2: -1210 mV, 79.0 nA+ 0.40 uM AFB2: -1210 mV, 79.0 nA
3/1/2007 1st ASSESSMENT REPORT 94
Introduction Experimental Results & Discussion Problem Future Works

3/1/2007 PhD viva presentation
WILL BE PRESENTED FOR
PhD VIVA PRESENTATION
STRIPPING VOLTAMMETRIC STRIPPING VOLTAMMETRIC METHOD TO DETERMINE METHOD TO DETERMINE AFLATOXIN COMPOUNDSAFLATOXIN COMPOUNDS
BY BY MOHAMAD HADZRI YAACOBMOHAMAD HADZRI YAACOB
PS 023001PS 023001

3/1/2007 PhD viva presentation
INTRODUCTIONINTRODUCTION
MycotoxinMycotoxin groupgroup
Produced by two fungi; Produced by two fungi;
AAspergillusspergillus flaflavusvus and and AspergillusAspergillus parasiticusparasiticus
Types of Types of aflatoxinsaflatoxins::
AFB1, AFB2, AFG1, AFG2AFB1, AFB2, AFG1, AFG2AFM1 and AFM2AFM1 and AFM2
AAspergillusspergillus flaflavusvus
Contaminated corn

3/1/2007 PhD viva presentation
INTRODUCTION…contINTRODUCTION…cont
O
O
O
OO
O
O
O
O
OO
O
O O
O
O
OO
O
Chemical structures;
AFB1
AFG1O O
O
O
OO
O
AFB2
AFG2
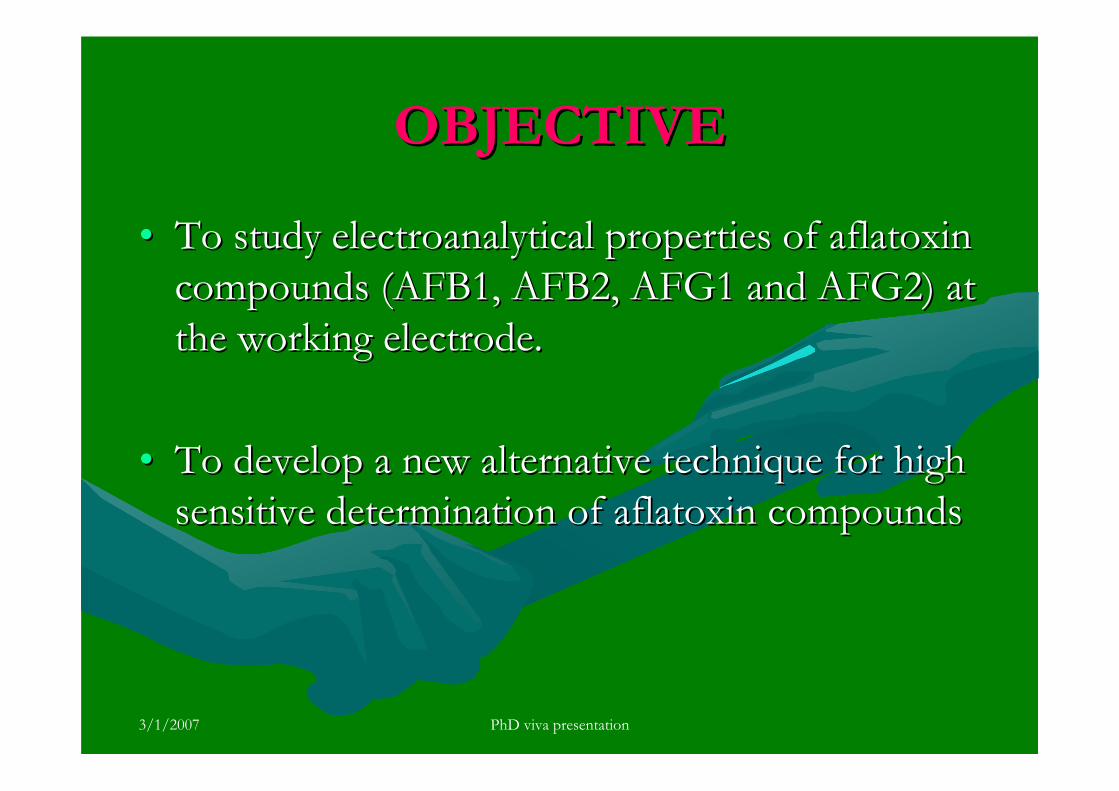
3/1/2007 PhD viva presentation
OBJECTIVEOBJECTIVE
•• To study To study electroanalyticalelectroanalytical properties of properties of aflatoxinaflatoxincompounds (AFB1, AFB2, AFG1 and AFG2) at compounds (AFB1, AFB2, AFG1 and AFG2) at the working electrode.the working electrode.
•• To develop a new alternative technique for high To develop a new alternative technique for high sensitive determination of sensitive determination of aflatoxinaflatoxin compoundscompounds
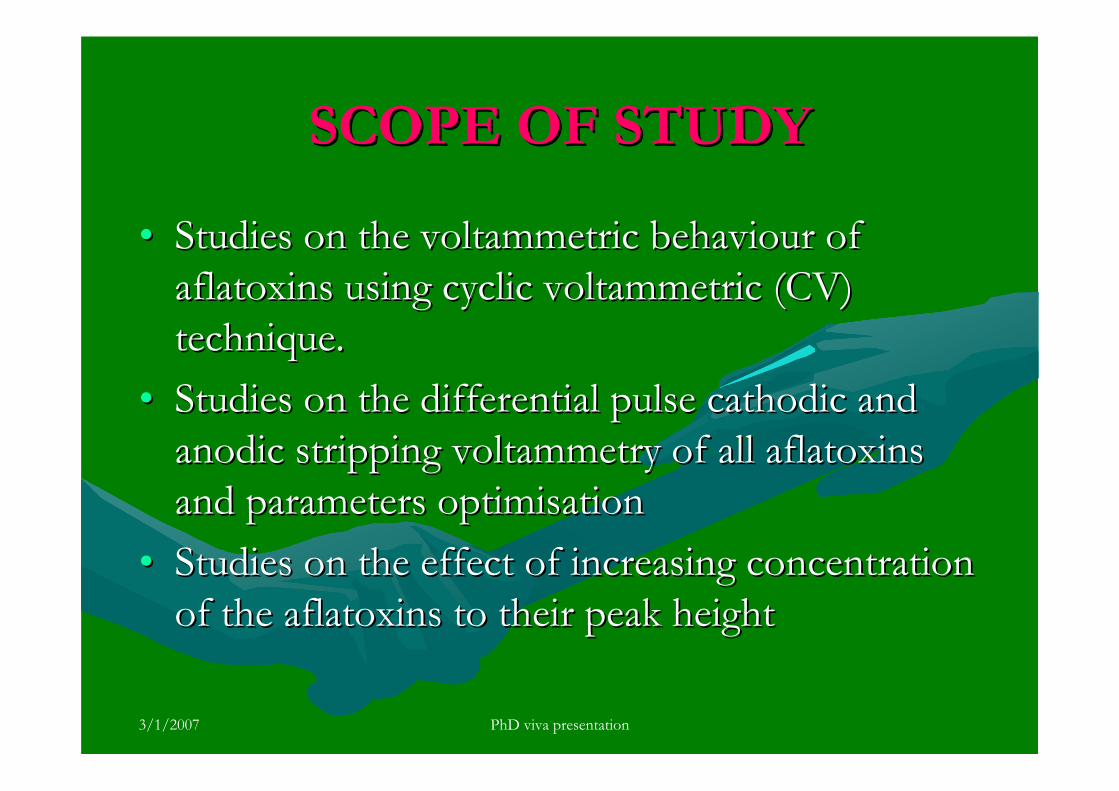
3/1/2007 PhD viva presentation
SCOPE OF STUDYSCOPE OF STUDY
•• Studies on the Studies on the voltammetricvoltammetric behaviourbehaviour of of aflatoxinsaflatoxins using cyclic using cyclic voltammetricvoltammetric (CV) (CV) technique.technique.
•• Studies on the differential pulse Studies on the differential pulse cathodiccathodic and and anodic stripping anodic stripping voltammetryvoltammetry of all of all aflatoxinsaflatoxinsand parameters and parameters optimisationoptimisation
•• Studies on the effect of increasing concentration Studies on the effect of increasing concentration of the of the aflatoxinsaflatoxins to their peak height to their peak height
3/1/2007 PhD viva presentation
SCOPE OF STUDY…contSCOPE OF STUDY…cont
•• Interference studies by metal ions and organic Interference studies by metal ions and organic compoundscompounds
•• Studies on the square wave stripping Studies on the square wave stripping voltammetryvoltammetrytechnique for the determination of technique for the determination of aflatoxinaflatoxincompoundscompounds
•• Application of the proposed methods for the Application of the proposed methods for the determination of determination of aflatoxinaflatoxin compounds in real samples. compounds in real samples. The results were compared with HPLC resultsThe results were compared with HPLC results
•• Stability studies of Stability studies of aflatoxinaflatoxin solutionssolutions
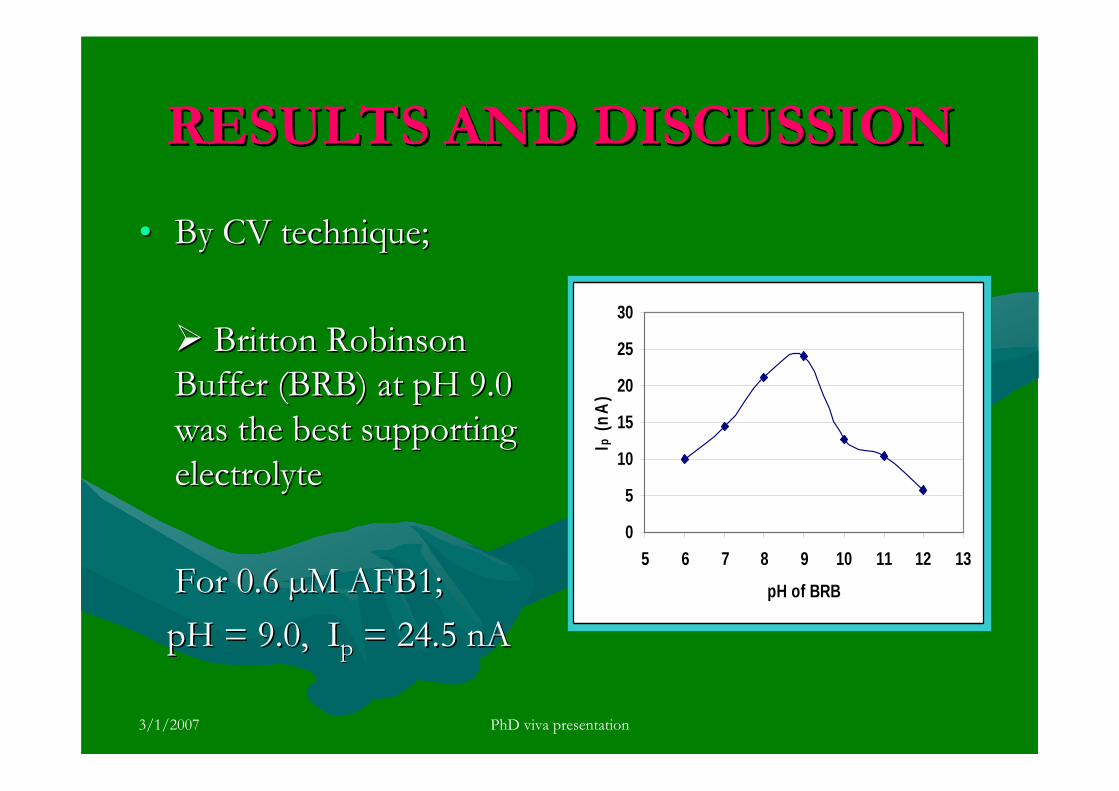
3/1/2007 PhD viva presentation
RESULTS AND DISCUSSIONRESULTS AND DISCUSSION
•• By CV technique;By CV technique;
Britton Robinson Britton Robinson Buffer (BRB) at pH 9.0 Buffer (BRB) at pH 9.0 was the best supporting was the best supporting electrolyte electrolyte
For 0.6 µM AFB1; For 0.6 µM AFB1; pH = 9.0, pH = 9.0, IIpp = 24.5 = 24.5 nAnA
0
5
10
15
20
25
30
5 6 7 8 9 10 11 12 13
pH of BRBIp
(nA)

3/1/2007 PhD viva presentation
RESULTS AND DISCUSSION…contRESULTS AND DISCUSSION…cont
•• Suggested mechanism (Smyth Suggested mechanism (Smyth et al.,et al.,1979)1979)
O
OO
OCH3
O
OO
OCH3
2 H2O
Dimer + 2 OH-
2e-
2 2
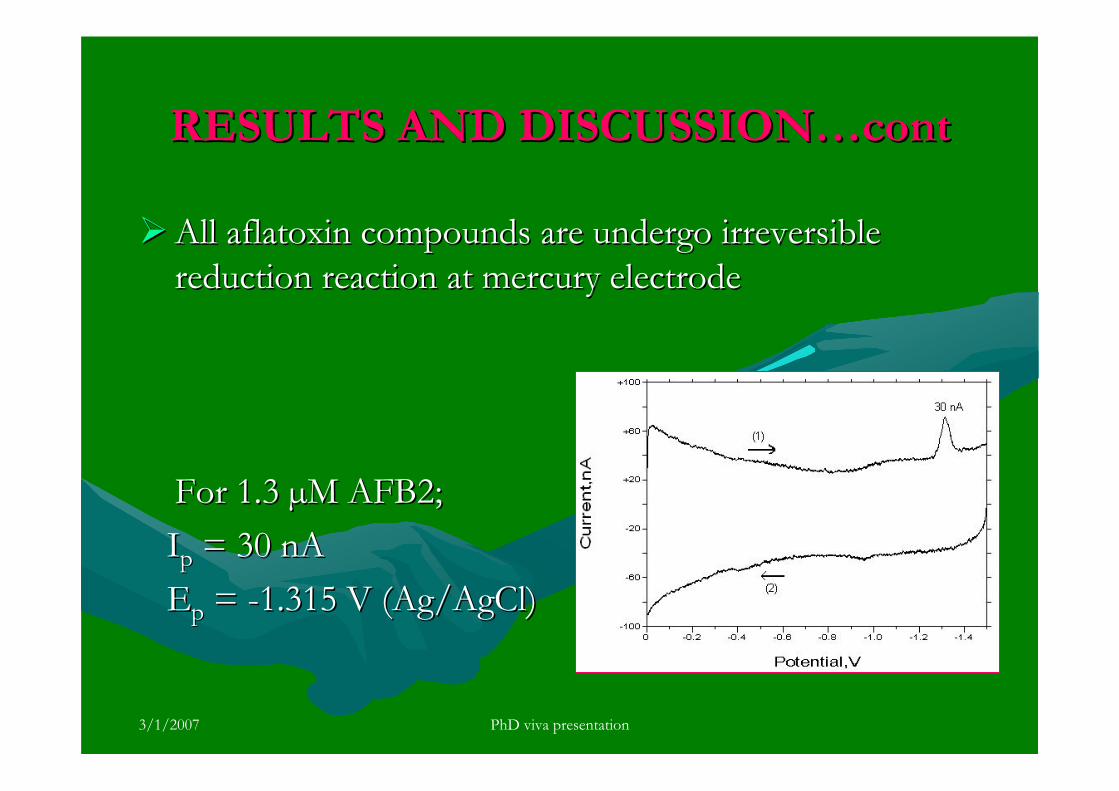
3/1/2007 PhD viva presentation
RESULTS AND DISCUSSION…contRESULTS AND DISCUSSION…cont
All All aflatoxinaflatoxin compounds are undergo irreversible compounds are undergo irreversible reduction reaction at mercury electrode reduction reaction at mercury electrode
For 1.3 For 1.3 µµM AFB2;M AFB2;IIpp = 30 = 30 nAnAEEpp = = --1.315 V (Ag/1.315 V (Ag/AgClAgCl))
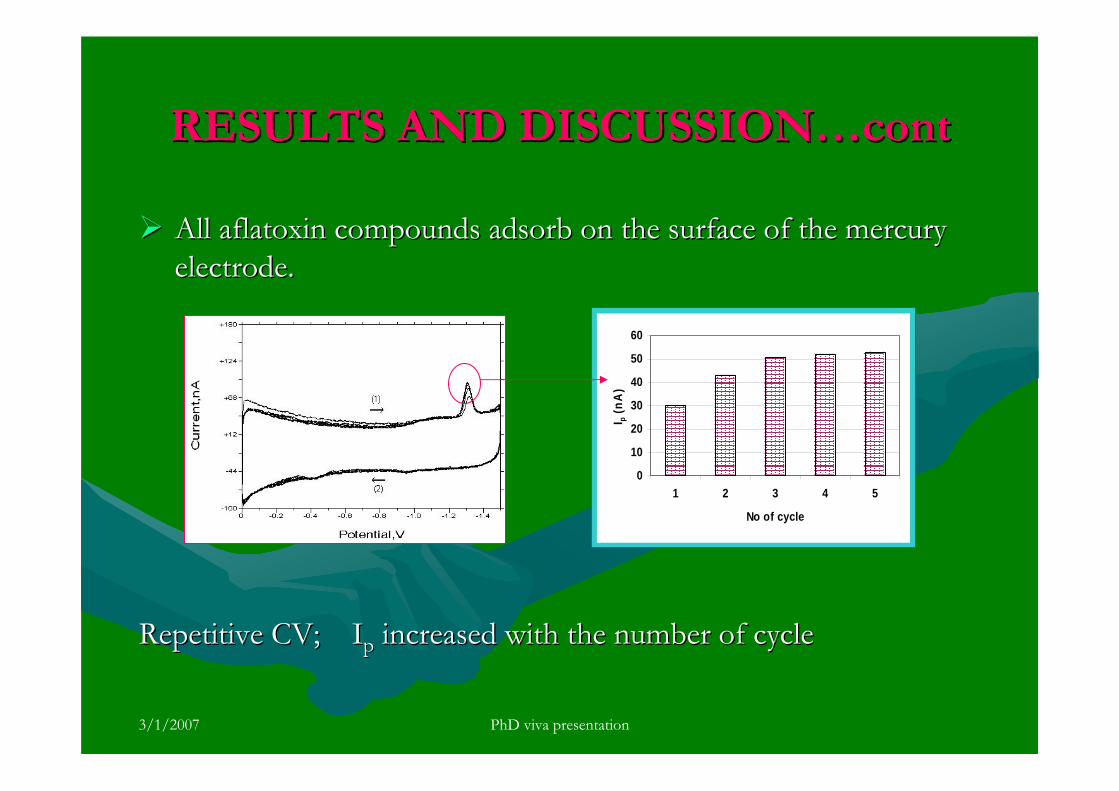
3/1/2007 PhD viva presentation
RESULTS AND DISCUSSION…contRESULTS AND DISCUSSION…cont
All All aflatoxinaflatoxin compounds adsorb on the surface of the mercury compounds adsorb on the surface of the mercury electrode.electrode.
Repetitive CV; Repetitive CV; IIpp increased with the number of cycleincreased with the number of cycle
0
10
20
30
40
50
60
1 2 3 4 5
No of cycle
I p (n
A)
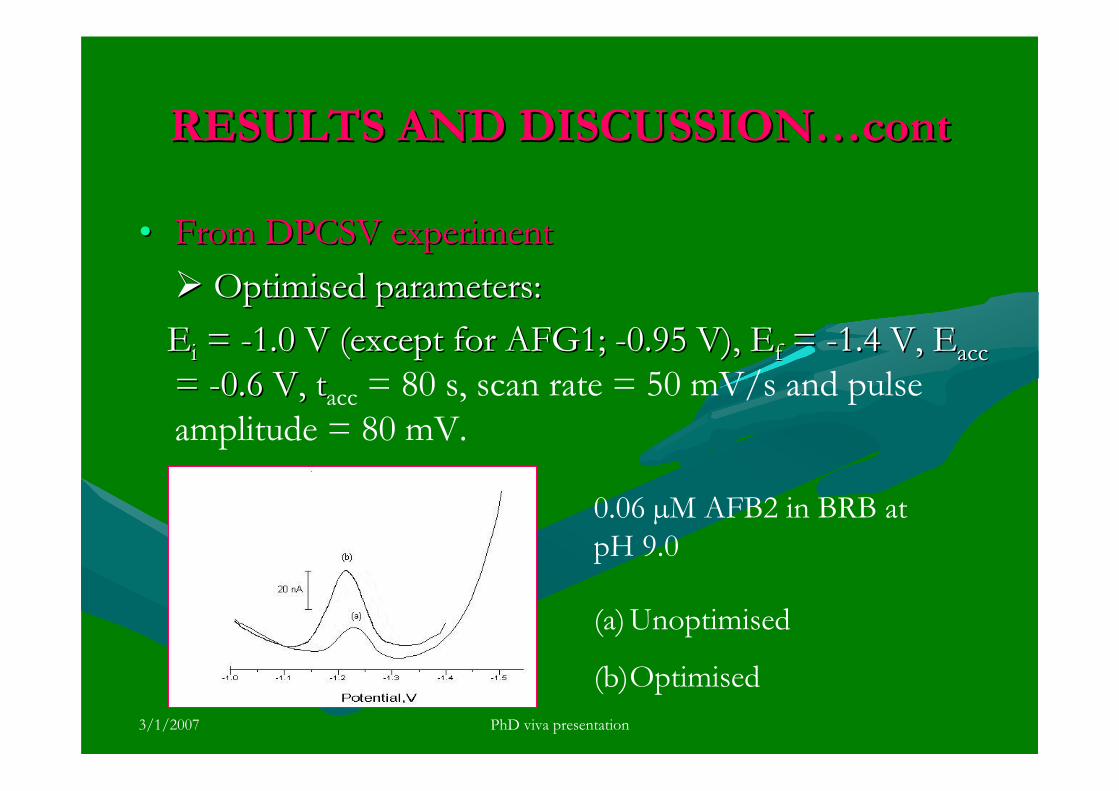
3/1/2007 PhD viva presentation
RESULTS AND DISCUSSION…contRESULTS AND DISCUSSION…cont
•• From DPCSV experimentFrom DPCSV experimentOptimisedOptimised parameters:parameters:
EEii = = --1.0 V (except for AFG1; 1.0 V (except for AFG1; --0.95 V), 0.95 V), EEff = = --1.4 V, 1.4 V, EEaccacc= = --0.6 V, 0.6 V, ttacc = 80 s, scan rate = 50 mV/s and pulse amplitude = 80 mV.
(a) Unoptimised
(b)Optimised
0.06 µM AFB2
0.06 µM AFB2 0.06 µM AFB2 in BRB at pH 9.0
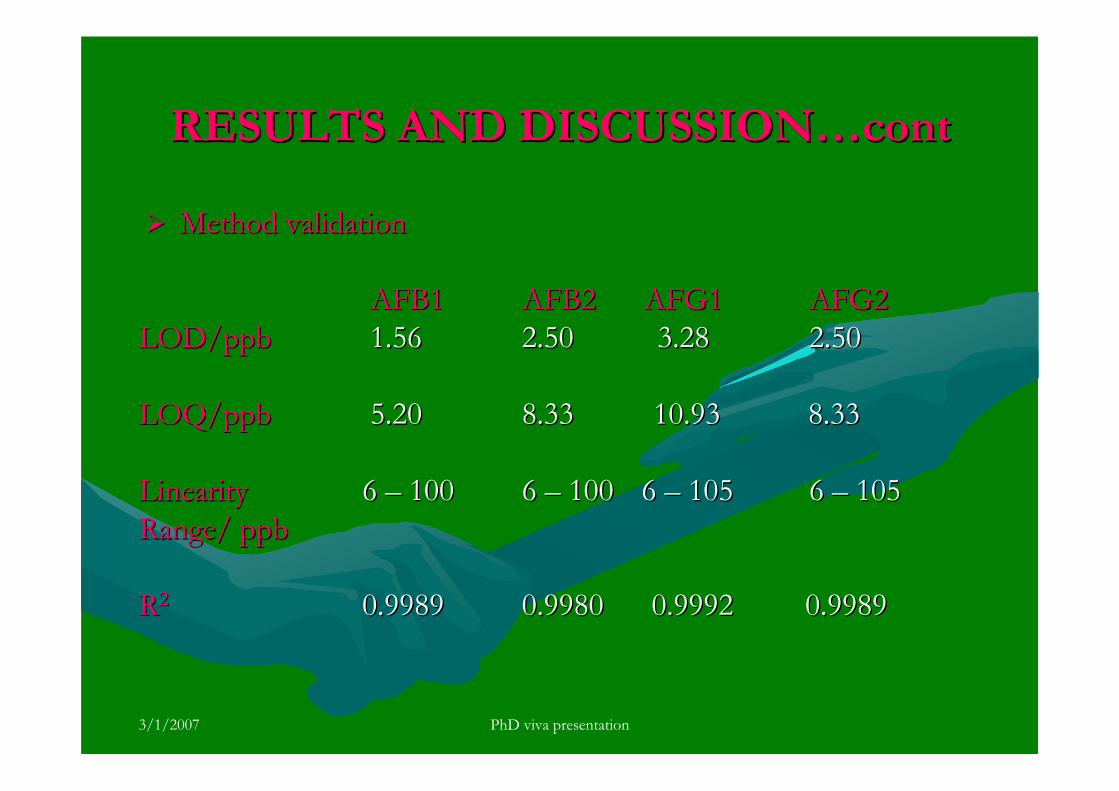
3/1/2007 PhD viva presentation
RESULTS AND DISCUSSION…contRESULTS AND DISCUSSION…cont
Method validationMethod validation
AFB1 AFB1 AFB2 AFG1 AFB2 AFG1 AFG2AFG2LOD/ppb LOD/ppb 1.561.56 2.502.50 3.283.28 2.502.50
LOQ/ppbLOQ/ppb 5.205.20 8.33 10.93 8.338.33 10.93 8.33
Linearity Linearity 6 6 –– 100100 6 6 –– 100100 6 6 –– 105105 6 6 –– 105105Range/ ppbRange/ ppb
RR22 0.99890.9989 0.9980 0.9992 0.99890.9980 0.9992 0.9989
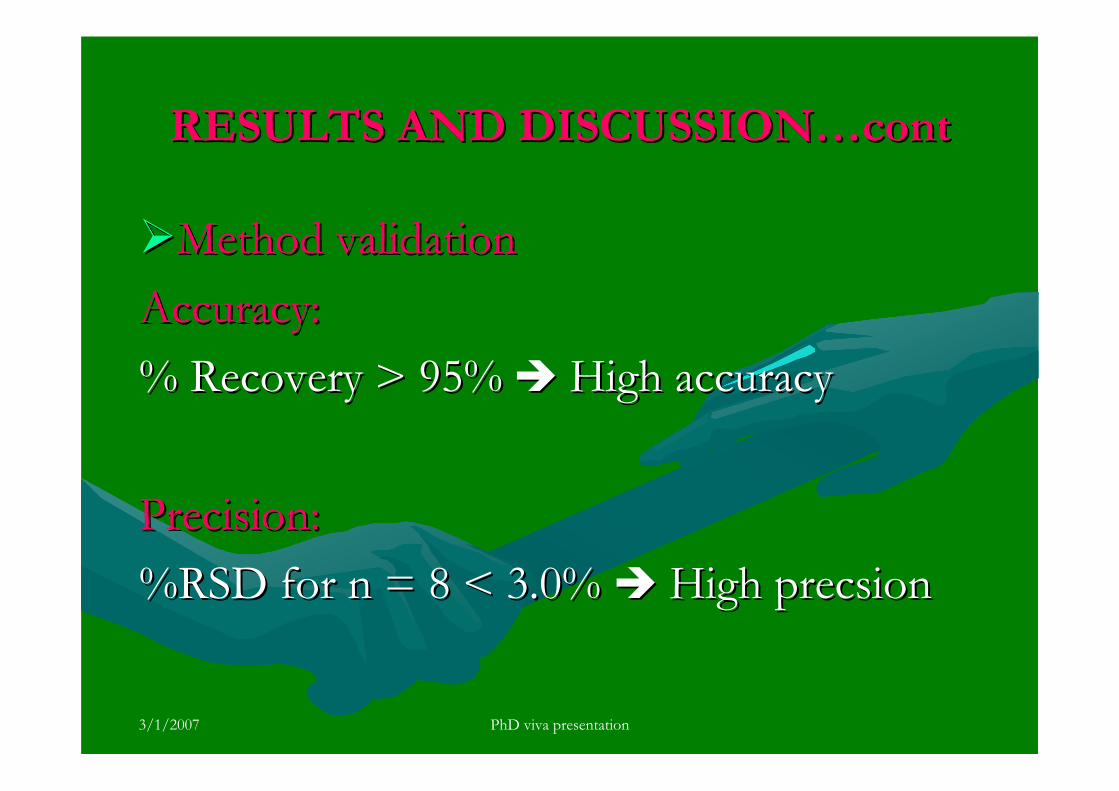
3/1/2007 PhD viva presentation
RESULTS AND DISCUSSION…contRESULTS AND DISCUSSION…cont
Method validationMethod validationAccuracy:Accuracy:% Recovery > 95%% Recovery > 95% High accuracy High accuracy
Precision:Precision:%RSD for n = 8 < 3.0% %RSD for n = 8 < 3.0% High High precsionprecsion

3/1/2007 PhD viva presentation
RESULTS AND DISCUSSION…contRESULTS AND DISCUSSION…cont
Robustness;Robustness;Small influences of important conditions (pH of BRB, Small influences of important conditions (pH of BRB,
EEaccacc and and ttacc ) were not significantly affect the peak height Method is robust
Ruggedess;No significant different in the peak heights obtained by
using two different voltammetric analysers (BAS vsMetrohm) Method is rugged
3/1/2007 PhD viva presentation
RESULTS AND DISCUSSION…contRESULTS AND DISCUSSION…cont
•• Interference studies;Interference studies;Metal ions (Al, Cu, Metal ions (Al, Cu, PbPb, Ni and Zn) and organic , Ni and Zn) and organic compounds (ascorbic acid, compounds (ascorbic acid, ββ--cyclodextrincyclodextrin and Land L--cysteinecysteine) were not interfere up to 10 times ) were not interfere up to 10 times concentration as compared with concentration as compared with aflatoxinaflatoxincompoundscompounds
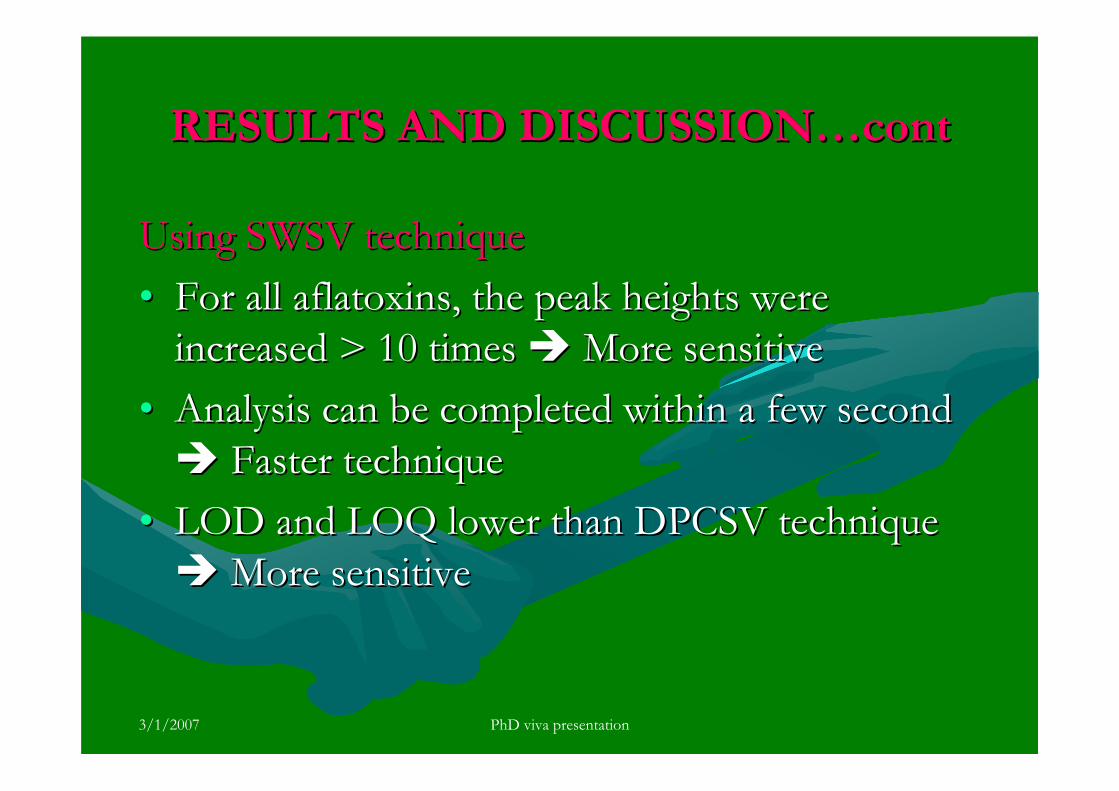
3/1/2007 PhD viva presentation
RESULTS AND DISCUSSION…contRESULTS AND DISCUSSION…cont
Using SWSV techniqueUsing SWSV technique•• For all For all aflatoxinsaflatoxins, the peak heights were , the peak heights were
increased > 10 times increased > 10 times More sensitiveMore sensitive•• Analysis can be completed within a few second Analysis can be completed within a few second
Faster techniqueFaster technique•• LOD and LOQ lower than DPCSV technique LOD and LOQ lower than DPCSV technique
More sensitiveMore sensitive
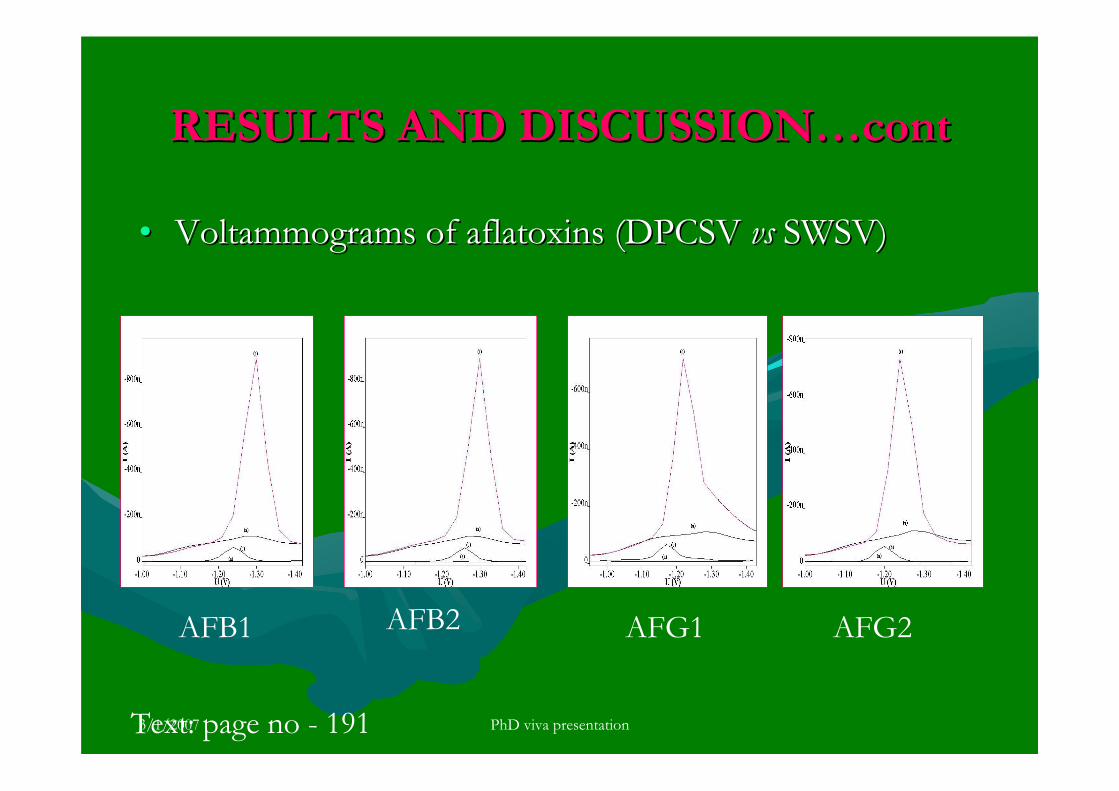
3/1/2007 PhD viva presentation
RESULTS AND DISCUSSION…contRESULTS AND DISCUSSION…cont
•• VoltammogramsVoltammograms of of aflatoxinsaflatoxins (DPCSV (DPCSV vsvs SWSV)SWSV)
AFB1 AFB2 AFG1 AFG2
Text: page no - 191
3/1/2007 PhD viva presentation
RESULTS AND DISCUSSION…contRESULTS AND DISCUSSION…cont
•• From stability studies;From stability studies;
10 10 ppmppm aflatoxinaflatoxin stock solutions (in stock solutions (in benzene:acetonitrilebenzene:acetonitrile, , 98%) stored in the dark and cool condition: stable up to 1 98%) stored in the dark and cool condition: stable up to 1 year.year.
1 1 ppmppm aflatoxinaflatoxin standard solutions (in BRB pH 9.0 ) stored standard solutions (in BRB pH 9.0 ) stored in the dark and cool conditions: stable up to 3 months for in the dark and cool conditions: stable up to 3 months for AFB1 and AFB2 while for AFG1 and AFG2 stable up to 2 AFB1 and AFB2 while for AFG1 and AFG2 stable up to 2 months..months..
3/1/2007 PhD viva presentation
RESULTS AND DISCUSSION…contRESULTS AND DISCUSSION…cont
1 1 ppmppm aflatoxinsaflatoxins in BRB pH 9.0 exposed to in BRB pH 9.0 exposed to normal laboratory condition; AFB1 and AFB2 normal laboratory condition; AFB1 and AFB2 were stable up to 8 hrs but for AFG1 and AFG2 were stable up to 8 hrs but for AFG1 and AFG2 were stable up to 3 hrs. were stable up to 3 hrs.
AflatoxinAflatoxin prepared in basic condition were less prepared in basic condition were less stable as compared to those prepared in acidic stable as compared to those prepared in acidic and neutral media.and neutral media.
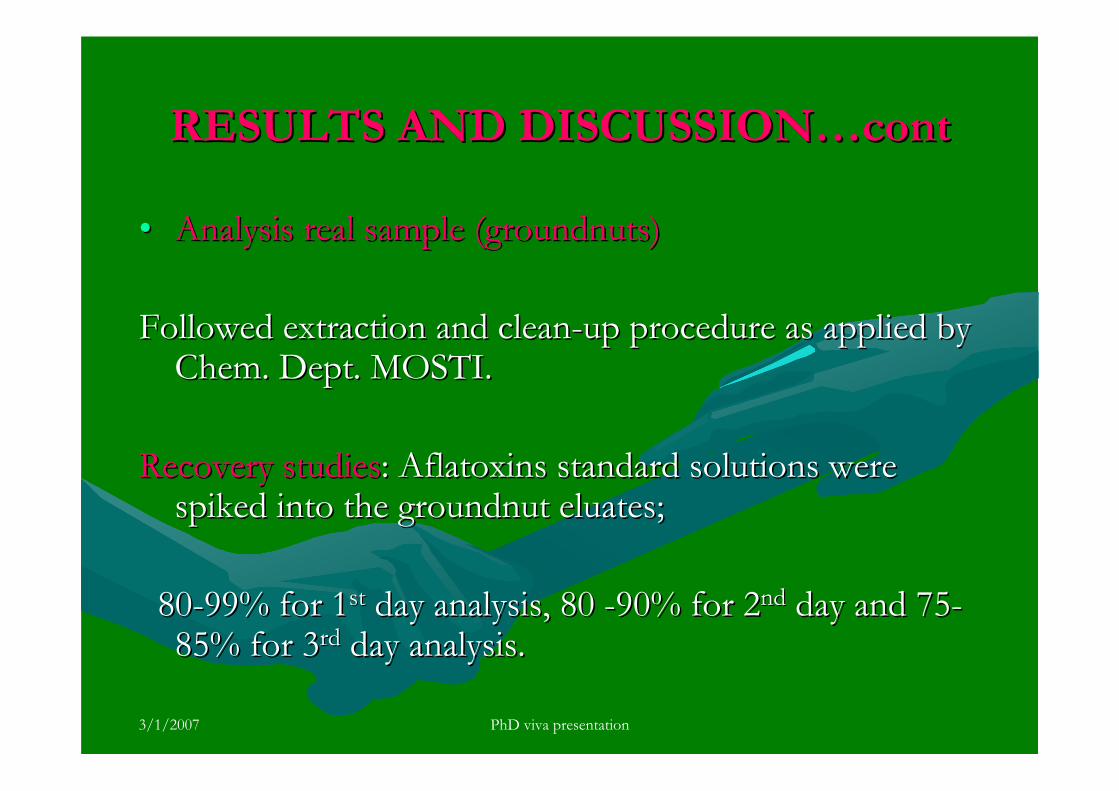
3/1/2007 PhD viva presentation
RESULTS AND DISCUSSION…contRESULTS AND DISCUSSION…cont
•• Analysis real sample (groundnuts) Analysis real sample (groundnuts)
Followed extraction and cleanFollowed extraction and clean--up procedure as applied by up procedure as applied by Chem. Dept. MOSTI.Chem. Dept. MOSTI.
Recovery studiesRecovery studies: : AflatoxinsAflatoxins standard solutions were standard solutions were spiked into the groundnut spiked into the groundnut eluateseluates;;
8080--99% for 199% for 1stst day analysis, 80 day analysis, 80 --90% for 290% for 2ndnd day and 75day and 75--85% for 385% for 3rdrd day analysis. day analysis.
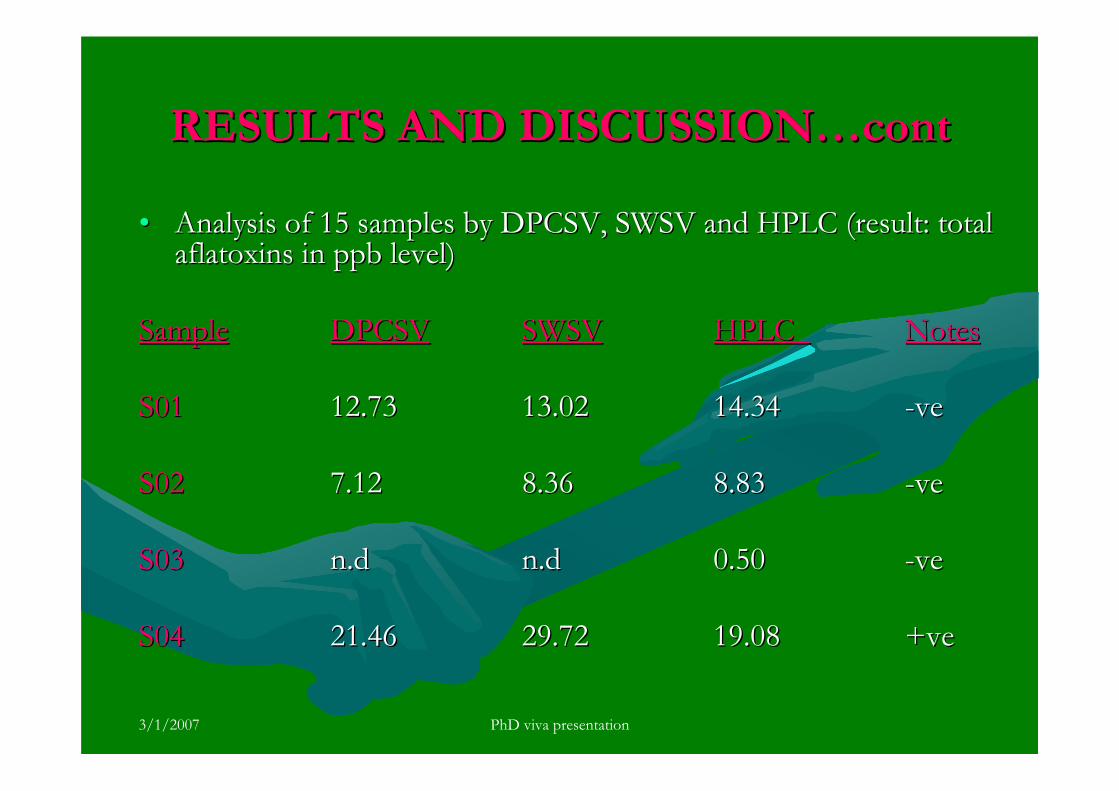
3/1/2007 PhD viva presentation
RESULTS AND DISCUSSION…contRESULTS AND DISCUSSION…cont
•• Analysis of 15 samples by DPCSV, SWSV and HPLC (result: total Analysis of 15 samples by DPCSV, SWSV and HPLC (result: total aflatoxinsaflatoxins in ppb level)in ppb level)
SampleSample DPCSVDPCSV SWSVSWSV HPLC HPLC Notes Notes
S01S01 12.7312.73 13.0213.02 14.3414.34 --veve
S02S02 7.127.12 8.368.36 8.838.83 --veve
S03S03 n.dn.d n.dn.d 0.500.50 --veve
S04S04 21.4621.46 29.7229.72 19.0819.08 ++veve
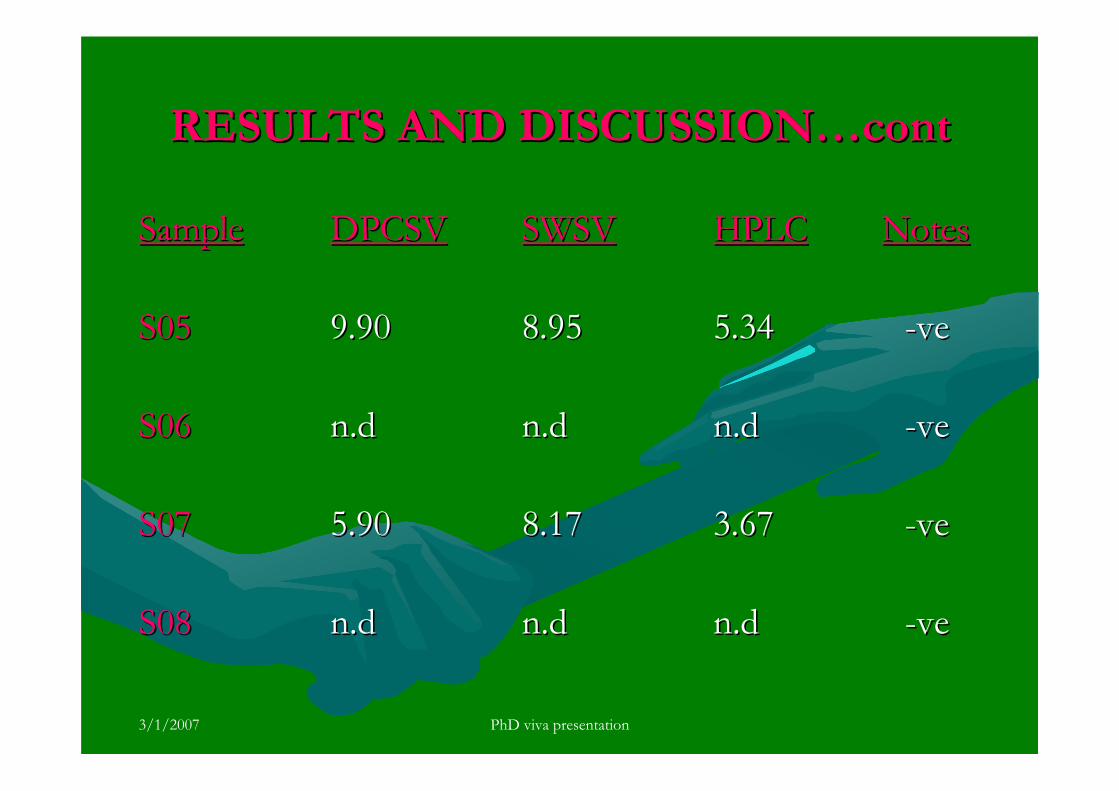
3/1/2007 PhD viva presentation
RESULTS AND DISCUSSION…contRESULTS AND DISCUSSION…cont
SampleSample DPCSVDPCSV SWSVSWSV HPLCHPLC Notes Notes
S05S05 9.909.90 8.958.95 5.345.34 --veve
S06S06 n.dn.d n.dn.d n.dn.d --veve
S07S07 5.905.90 8.178.17 3.673.67 --veve
S08S08 n.dn.d n.dn.d n.dn.d --veve
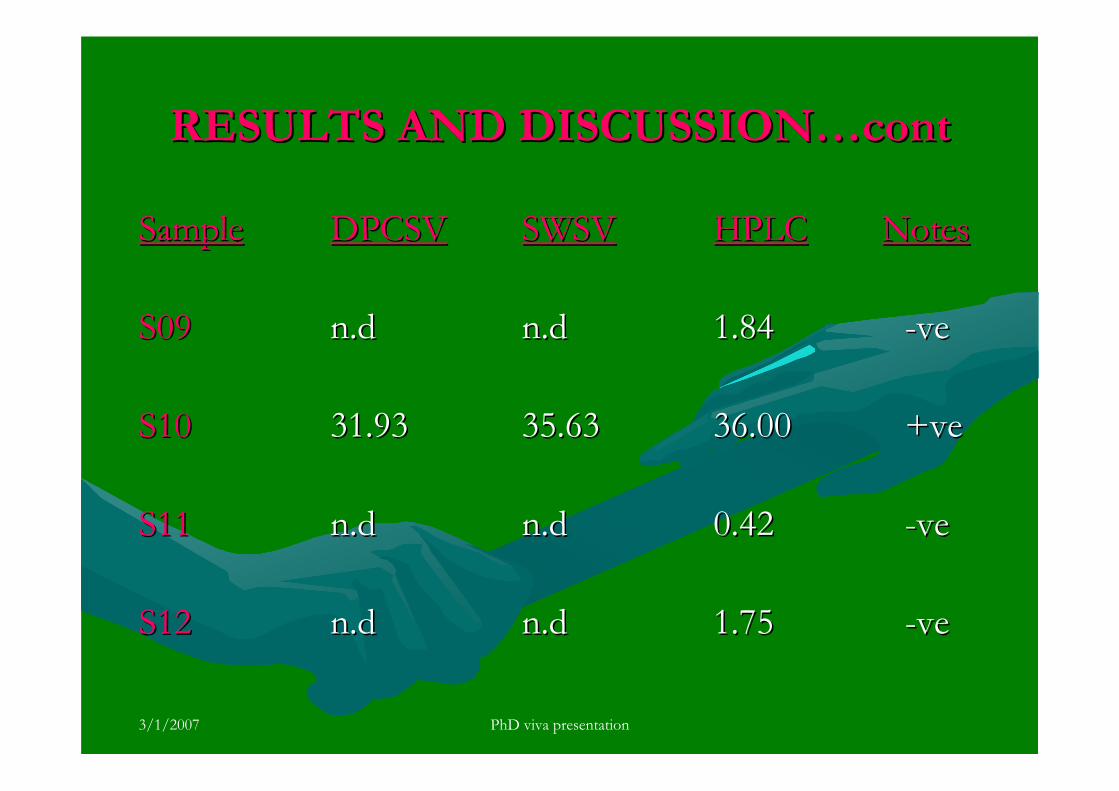
3/1/2007 PhD viva presentation
RESULTS AND DISCUSSION…contRESULTS AND DISCUSSION…cont
SampleSample DPCSVDPCSV SWSVSWSV HPLCHPLC Notes Notes
S09S09 n.dn.d n.dn.d 1.841.84 --veve
S10S10 31.9331.93 35.6335.63 36.0036.00 ++veve
S11S11 n.dn.d n.dn.d 0.420.42 --veve
S12S12 n.dn.d n.dn.d 1.751.75 --veve
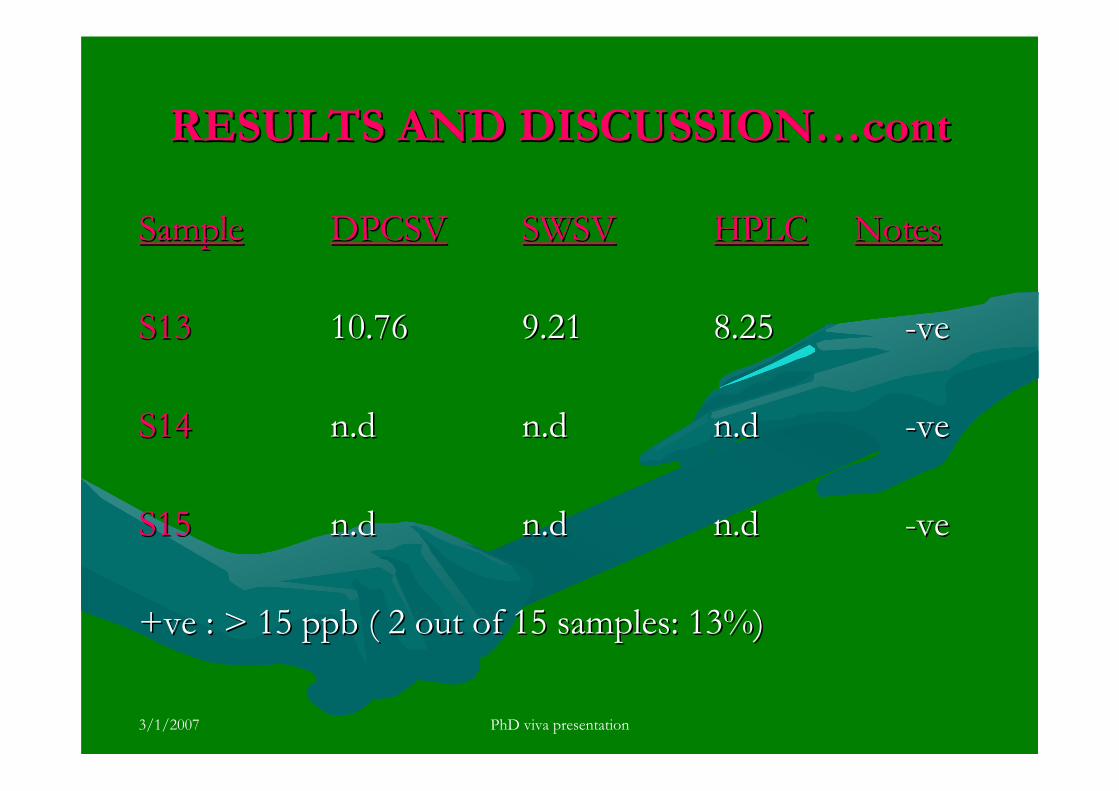
3/1/2007 PhD viva presentation
RESULTS AND DISCUSSION…contRESULTS AND DISCUSSION…cont
SampleSample DPCSVDPCSV SWSVSWSV HPLCHPLC Notes Notes
S13S13 10.7610.76 9.219.21 8.258.25 --veve
S14S14 n.dn.d n.dn.d n.dn.d --veve
S15S15 n.dn.d n.dn.d n.dn.d --veve
++veve : > 15 ppb ( 2 out of 15 samples: 13%): > 15 ppb ( 2 out of 15 samples: 13%)
3/1/2007 PhD viva presentation
CONCLUSIONSCONCLUSIONS
The study has achieved the objective;The study has achieved the objective;
A sensitive, accurate, robust, rugged, fast and A sensitive, accurate, robust, rugged, fast and low cost technique was successfully developed low cost technique was successfully developed and applied for the determination of and applied for the determination of aflatoxinsaflatoxinsin groundnut samplesin groundnut samples
The hypothesis regarding The hypothesis regarding electroanalyticalelectroanalyticalproperties of properties of aflatoxinsaflatoxins was also proven. was also proven.

3/1/2007 PhD viva presentation
SUGGESTIONSSUGGESTIONS
•• Use other types of the working electrode (CPE, Use other types of the working electrode (CPE, GCE or BFE)GCE or BFE)
•• Study the reagents that can be Study the reagents that can be complexedcomplexed with with aflatoxinsaflatoxins
•• Study the effect of storage time and conditions Study the effect of storage time and conditions of groundnuts to the level of of groundnuts to the level of aflatoxinsaflatoxins
•• AnalyseAnalyse aflatoxinsaflatoxins in other type of samples (rice, in other type of samples (rice, bread, fish, vegetables and bread, fish, vegetables and cigarretescigarretes tobacco) tobacco) using the proposed technique.using the proposed technique.

3/1/2007 PhD viva presentation
ACKNOWLEDGEMENTACKNOWLEDGEMENT
•• Supervisors: AP Dr Supervisors: AP Dr AbdullAbdull RahimRahim HjHj. . MohdMohd. . YusoffYusoff and Prof and Prof RahmalanRahmalan AhamadAhamad
•• USM: study leave and fellowship USM: study leave and fellowship
•• UTM: Short term grant (UTM: Short term grant (VotVot No: 75152/2004)No: 75152/2004)
•• Chemistry Dept staffChemistry Dept staff

3/1/2007 PhD viva presentation

ORAL PRESENTED AT KUSTEM 3rd ANNUAL
SEMINAR ON SUSTAINABLE SCIENCE
AND MANAGEMENT (TERENGGANU; 4 - 5th
MAY 2004)
CYCLIC VOLTAMMETRIC STUDY OF AFLATOXIN G1 (AFG1) AT THE MERCURY
ELECTRODE
BY
Mohd Hadzri Yaacob, Abd.Rahim Yusoff and Rahmalan Ahamad
UTM, SKUDAI
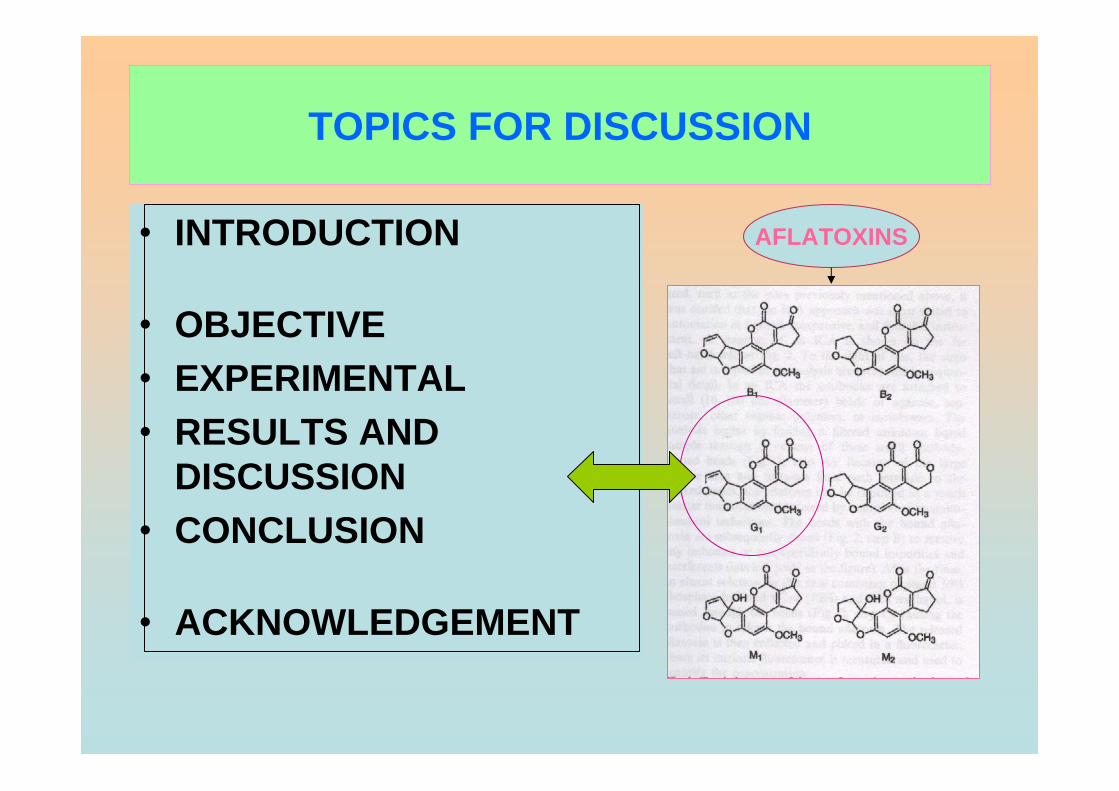
TOPICS FOR DISCUSSION
• INTRODUCTION
• OBJECTIVE• EXPERIMENTAL• RESULTS AND
DISCUSSION• CONCLUSION
• ACKNOWLEDGEMENT
AFLATOXINS
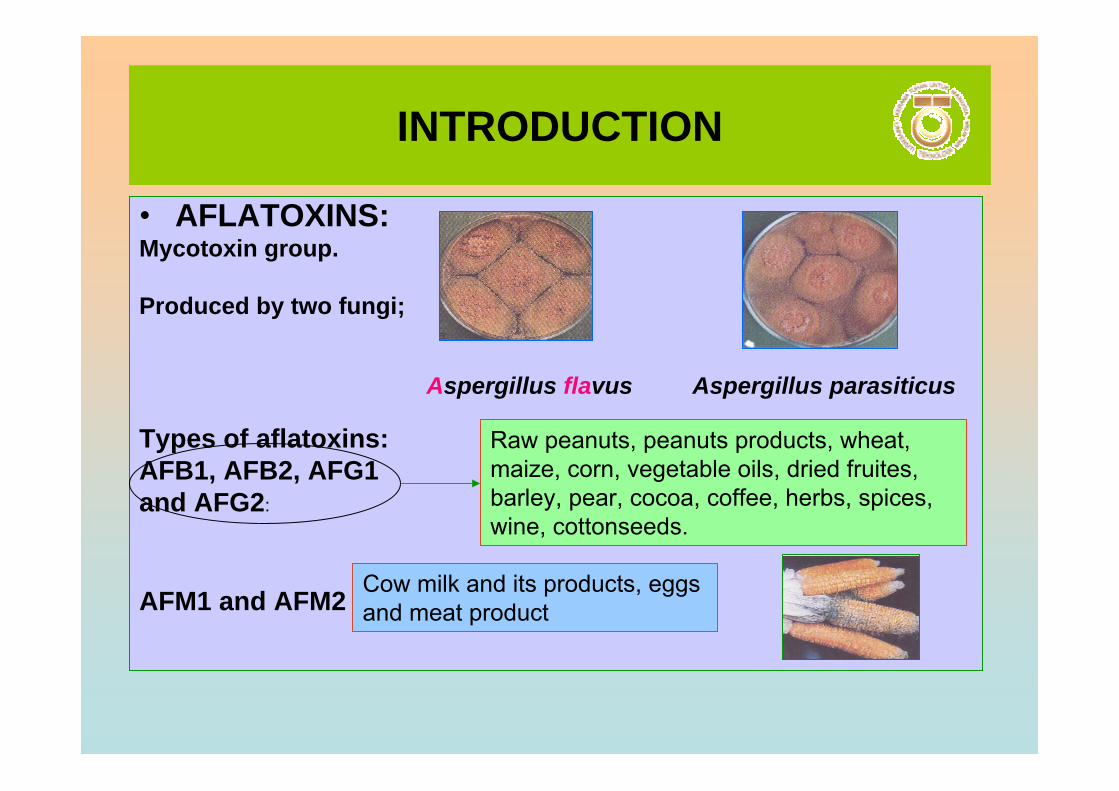
INTRODUCTION
• AFLATOXINS:Mycotoxin group.
Produced by two fungi;
Aspergillus flavus Aspergillus parasiticus
Types of aflatoxins: AFB1, AFB2, AFG1 and AFG2:
AFM1 and AFM2
Raw peanuts, peanuts products, wheat, maize, corn, vegetable oils, dried fruites, barley, pear, cocoa, coffee, herbs, spices, wine, cottonseeds.
Cow milk and its products, eggs and meat product

INTRODUCTION …cont
• AFLATOXINS:Occurs naturally in commodities used for animal and
human
Carcinogenic, teratogenic and mutagenic
IARC (1988): Class I carcinogenic materials
Dangerous to health: causes aflatoxicosis disease.
Effect the economy of commodities export countries
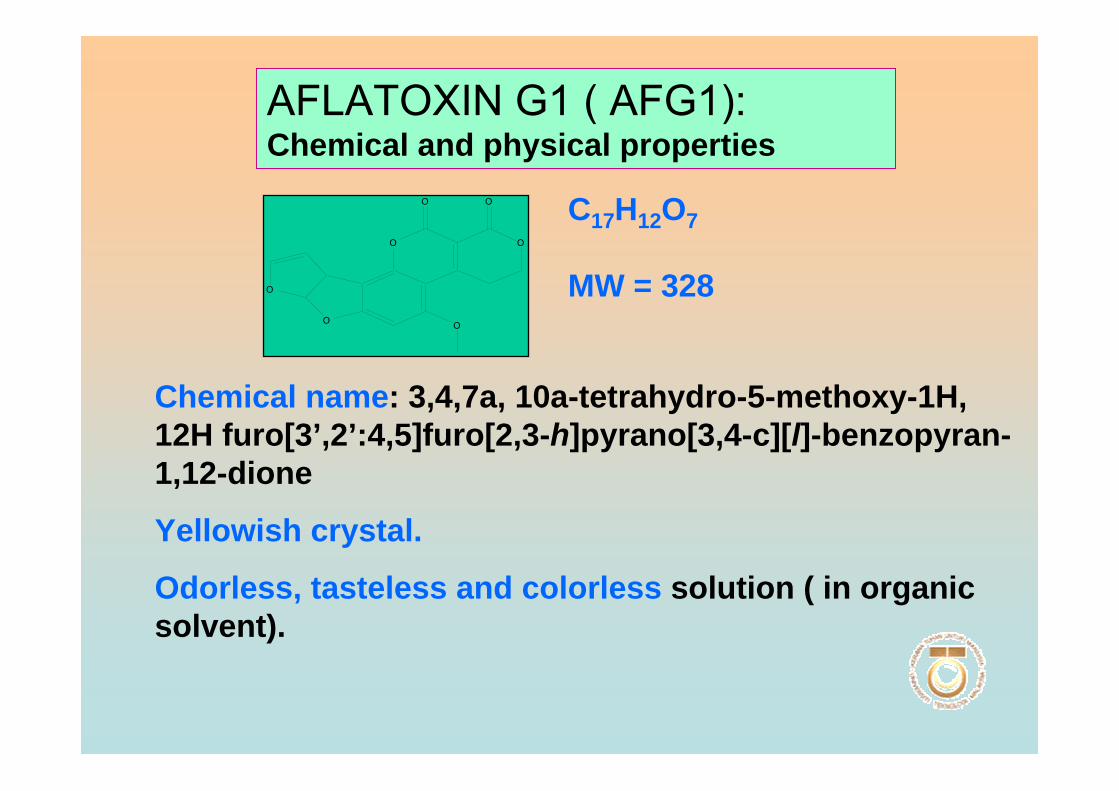
O O
O
O
OO
O
AFLATOXIN G1 ( AFG1): Chemical and physical properties
Chemical name: 3,4,7a, 10a-tetrahydro-5-methoxy-1H, 12H furo[3’,2’:4,5]furo[2,3-h]pyrano[3,4-c][l]-benzopyran-1,12-dione
Yellowish crystal.
Odorless, tasteless and colorless solution ( in organic solvent).
C17H12O7
MW = 328

Solubility: Dissolve in methanol, water:acetonitrile (9:1), trifluoroactic acid, DMSO and acetone. In water: 10-20 mg / liter
m.p; 244 – 246 0 C
Produces green color under UV light
UV abs (max) in methanol: 216, 242, 265 and 362 nm
IR spectrum ( in chloroform): 1760, 1695, 1630 and 1595 cm-1
AFLATOXIN G1 ( AFG1): Chemical and physical properties…cont
Stability of AFG1
In crystal form: extremely stable in the absence of light or UV radiation, even at T = > 1000C
Solution in water, DMSO, 95% acetone or ethanol stable for 24 hrs under normal condition. Stable for years if kept in cool and dark place
Stable in most food process; not destroy by normal cooking process since it heat stable

Based on chemical structure:
Ketone groups in lactone ring can be reduced and produce cathodic wave.
Unsaturated terminal furan ring can be reduced and produce cathodic wave.
O O
O
O
OO
O
ELECTROCHEMICAL PROPERTIES OF AFG1
Can forms anionic radical

WHAT AND WHY CYLIC VOLTAMMETRY (CV)?
CV: Voltammetric technique that consist of scanning linearly the potential of a stationary working electrode ( forward and reverse ) and the current flowing through the cell is measured as a function of that potential.
Three parameters needed to be characteristiced; starting potential of the scan, finishing / switching potential and scan rate ( rate of change of potential with the time)
A plot of current as a function of applied potential is called a voltammogram ( as in figure below)
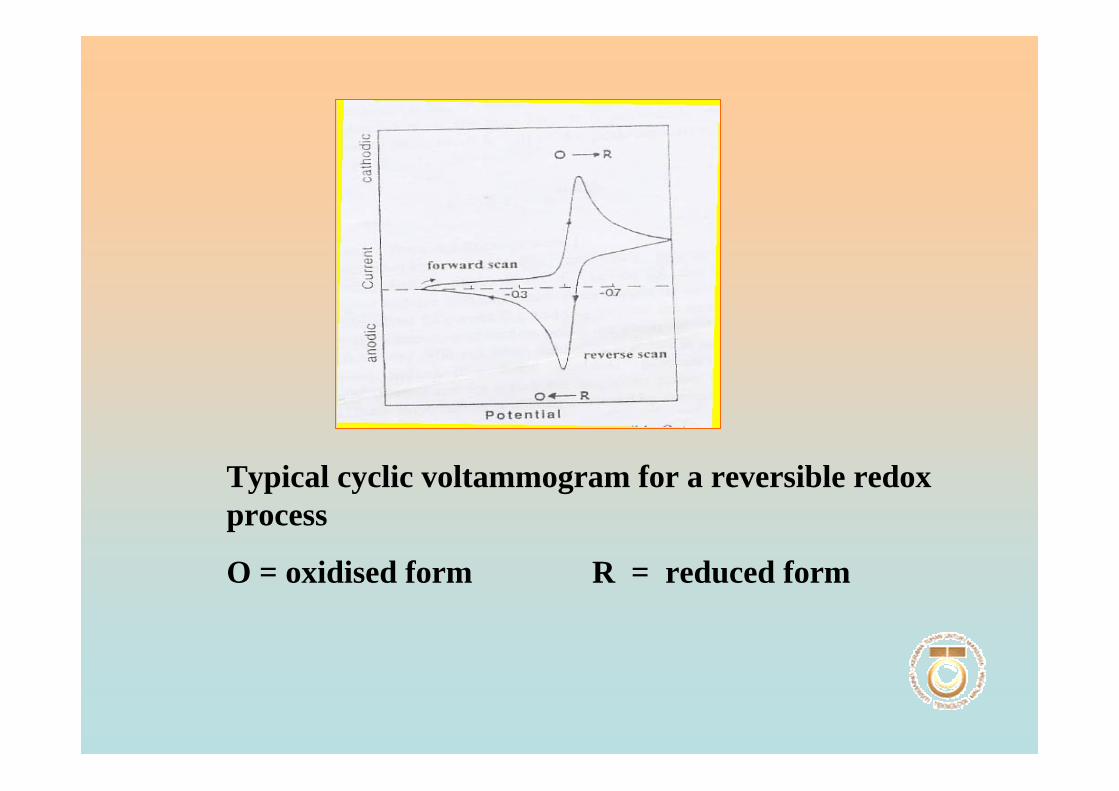
Typical cyclic voltammogram for a reversible redoxprocess
O = oxidised form R = reduced form
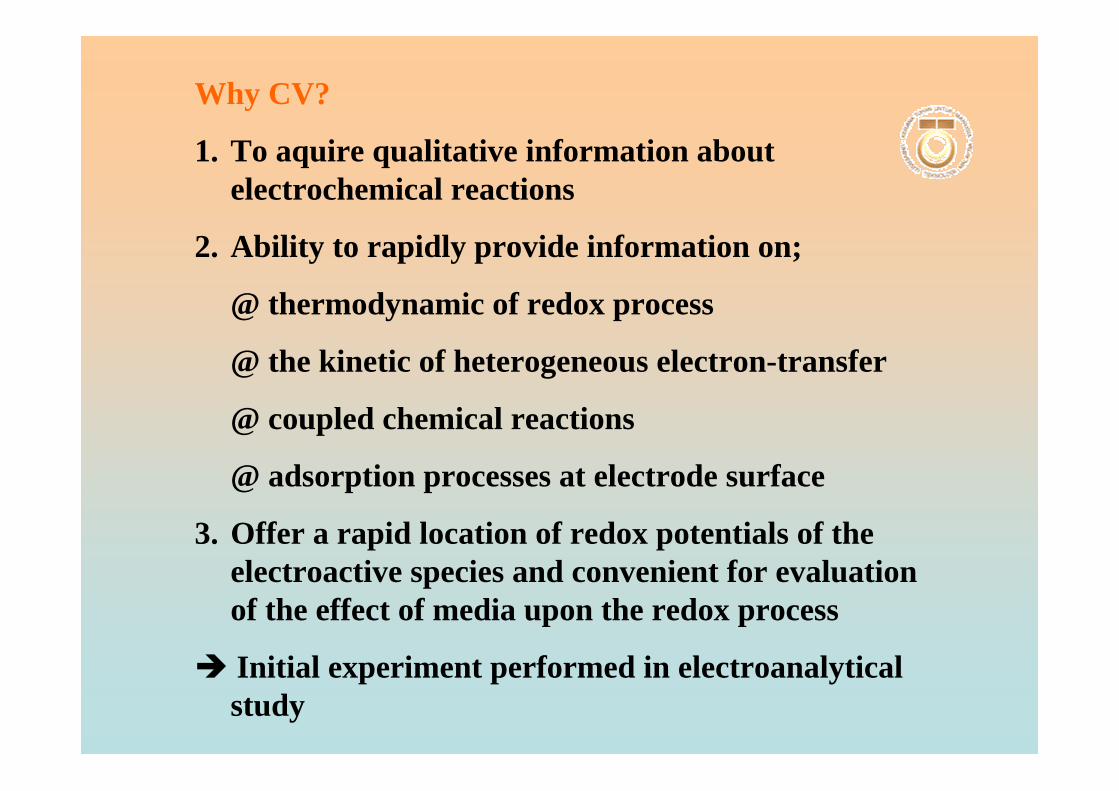
Why CV?
1. To aquire qualitative information about electrochemical reactions
2. Ability to rapidly provide information on;
@ thermodynamic of redox process
@ the kinetic of heterogeneous electron-transfer
@ coupled chemical reactions
@ adsorption processes at electrode surface
3. Offer a rapid location of redox potentials of the electroactive species and convenient for evaluation of the effect of media upon the redox process
Initial experiment performed in electroanalyticalstudy
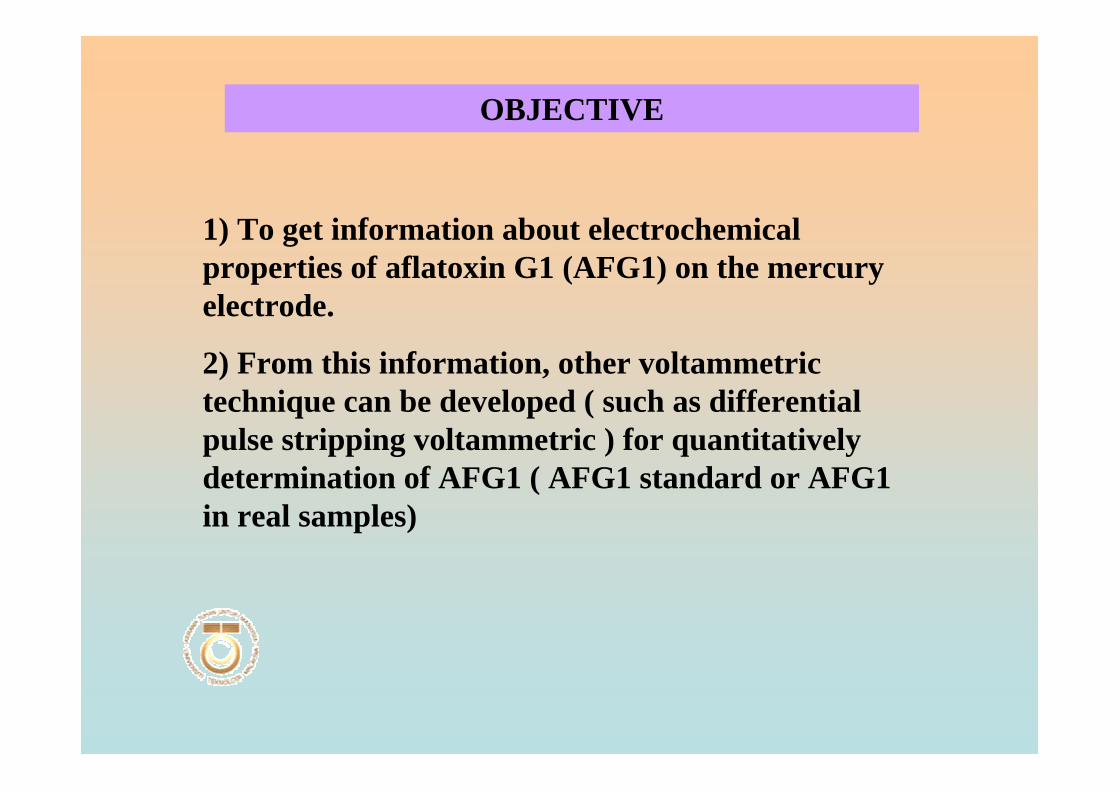
OBJECTIVE
1) To get information about electrochemical properties of aflatoxin G1 (AFG1) on the mercury electrode.
2) From this information, other voltammetrictechnique can be developed ( such as differential pulse stripping voltammetric ) for quantitatively determination of AFG1 ( AFG1 standard or AFG1 in real samples)
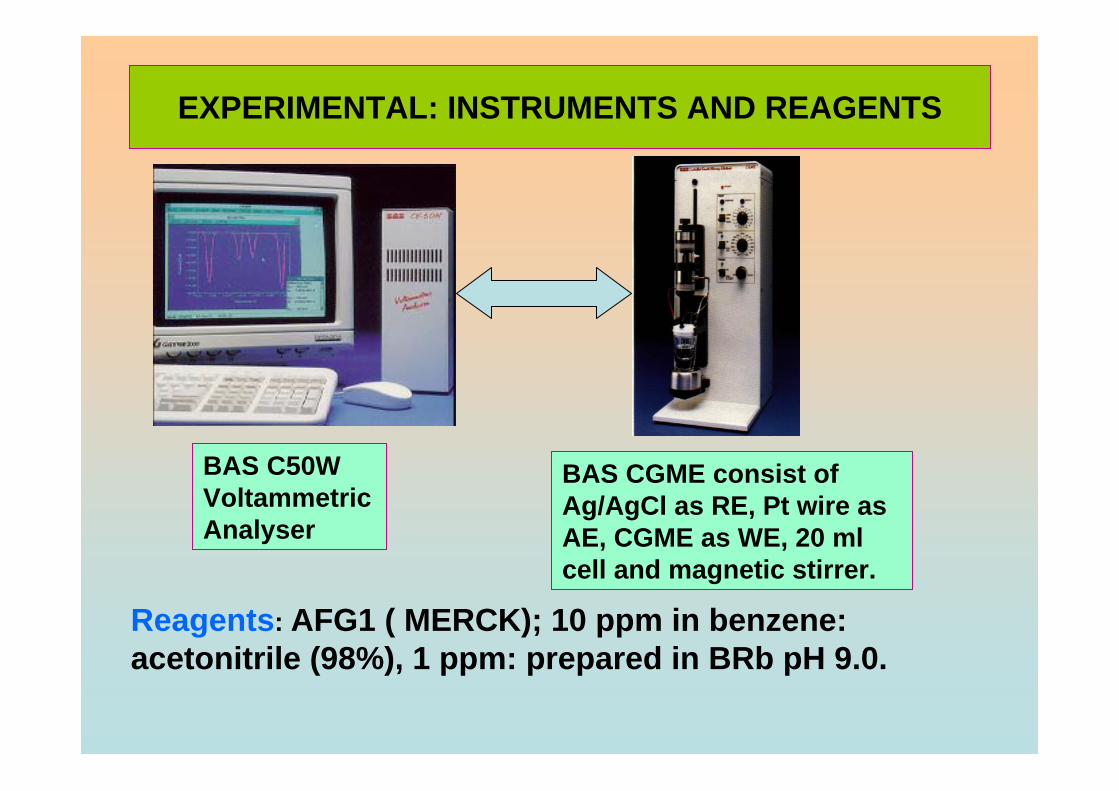
EXPERIMENTAL: INSTRUMENTS AND REAGENTS
BAS CGME consist of Ag/AgCl as RE, Pt wire as AE, CGME as WE, 20 ml cell and magnetic stirrer.
BAS C50W VoltammetricAnalyser
Reagents: AFG1 ( MERCK); 10 ppm in benzene: acetonitrile (98%), 1 ppm: prepared in BRb pH 9.0.
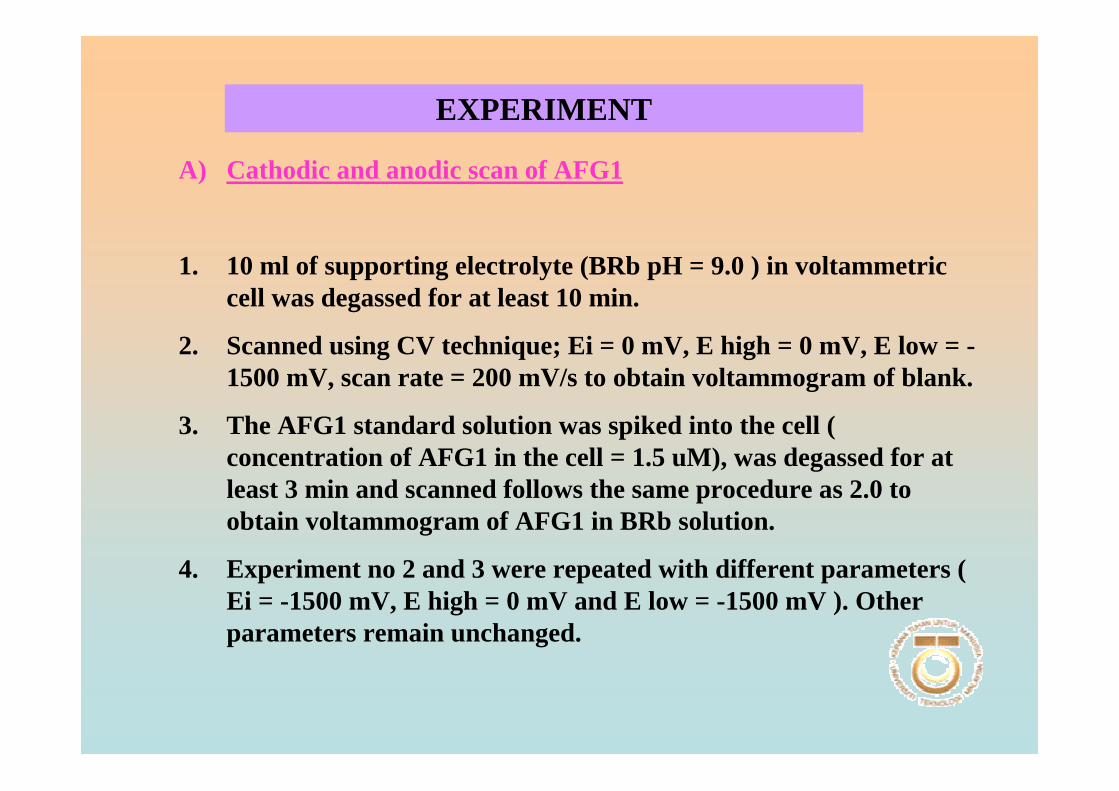
EXPERIMENT
A) Cathodic and anodic scan of AFG1
1. 10 ml of supporting electrolyte (BRb pH = 9.0 ) in voltammetriccell was degassed for at least 10 min.
2. Scanned using CV technique; Ei = 0 mV, E high = 0 mV, E low = -1500 mV, scan rate = 200 mV/s to obtain voltammogram of blank.
3. The AFG1 standard solution was spiked into the cell ( concentration of AFG1 in the cell = 1.5 uM), was degassed for at least 3 min and scanned follows the same procedure as 2.0 to obtain voltammogram of AFG1 in BRb solution.
4. Experiment no 2 and 3 were repeated with different parameters ( Ei = -1500 mV, E high = 0 mV and E low = -1500 mV ). Other parameters remain unchanged.
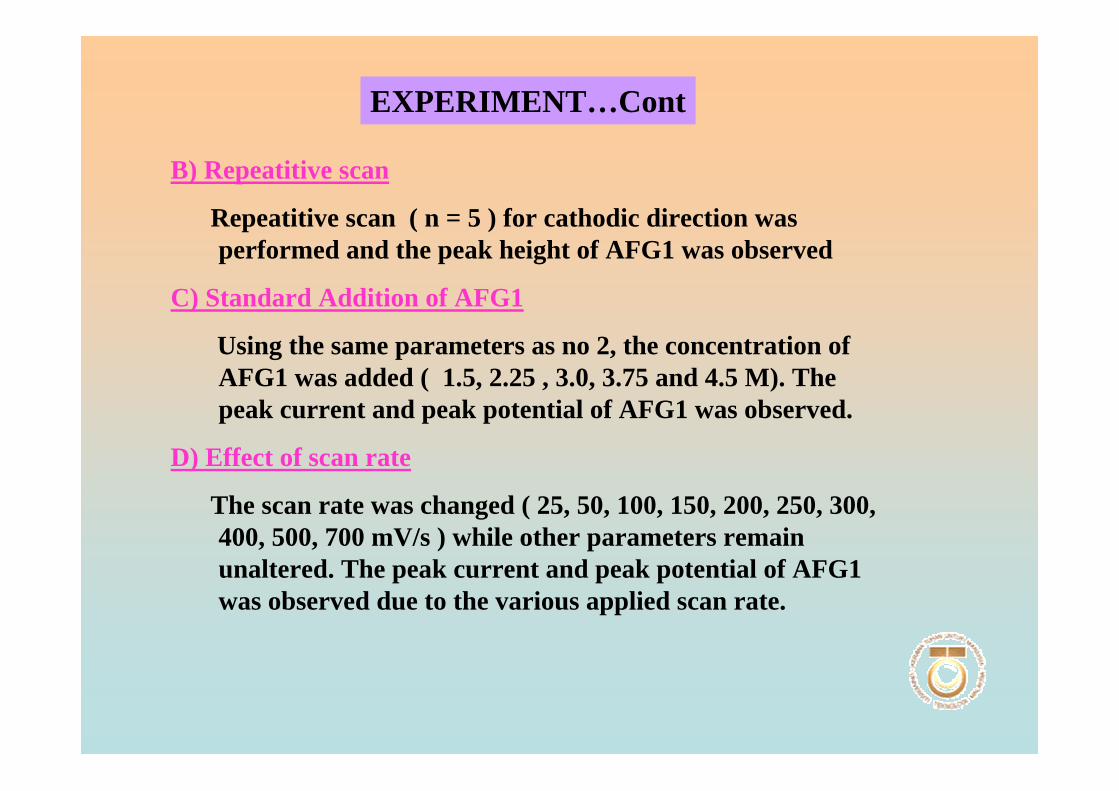
EXPERIMENT…Cont
B) Repeatitive scan
Repeatitive scan ( n = 5 ) for cathodic direction was performed and the peak height of AFG1 was observed
C) Standard Addition of AFG1
Using the same parameters as no 2, the concentration of AFG1 was added ( 1.5, 2.25 , 3.0, 3.75 and 4.5 M). The peak current and peak potential of AFG1 was observed.
D) Effect of scan rate
The scan rate was changed ( 25, 50, 100, 150, 200, 250, 300, 400, 500, 700 mV/s ) while other parameters remain unaltered. The peak current and peak potential of AFG1 was observed due to the various applied scan rate.
E) Effect of pH of BRb solution
The pH of supporting electrolyte (BRb solution ) was adjusted from 3.0 to 13.0 ( using 1.0 M NaOH or 1.0 M HCl ) and the AFG1 standard solution was scanned in various pH of BRB. The peak current and peak potential of AFG1 was observed.
EXPERIMENT…Cont
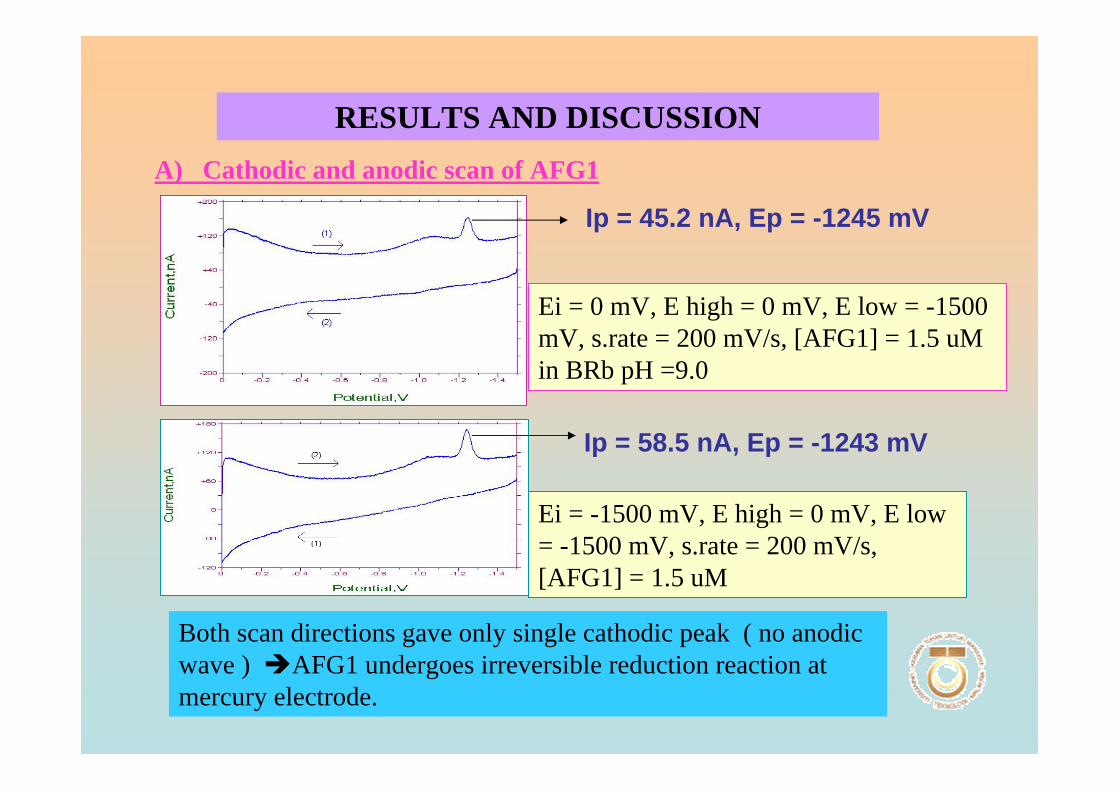
RESULTS AND DISCUSSIONA) Cathodic and anodic scan of AFG1
Ei = 0 mV, E high = 0 mV, E low = -1500 mV, s.rate = 200 mV/s, [AFG1] = 1.5 uMin BRb pH =9.0
Ei = -1500 mV, E high = 0 mV, E low = -1500 mV, s.rate = 200 mV/s, [AFG1] = 1.5 uM
Both scan directions gave only single cathodic peak ( no anodic wave ) AFG1 undergoes irreversible reduction reaction at mercury electrode.
Ip = 45.2 nA, Ep = -1245 mV
Ip = 58.5 nA, Ep = -1243 mV
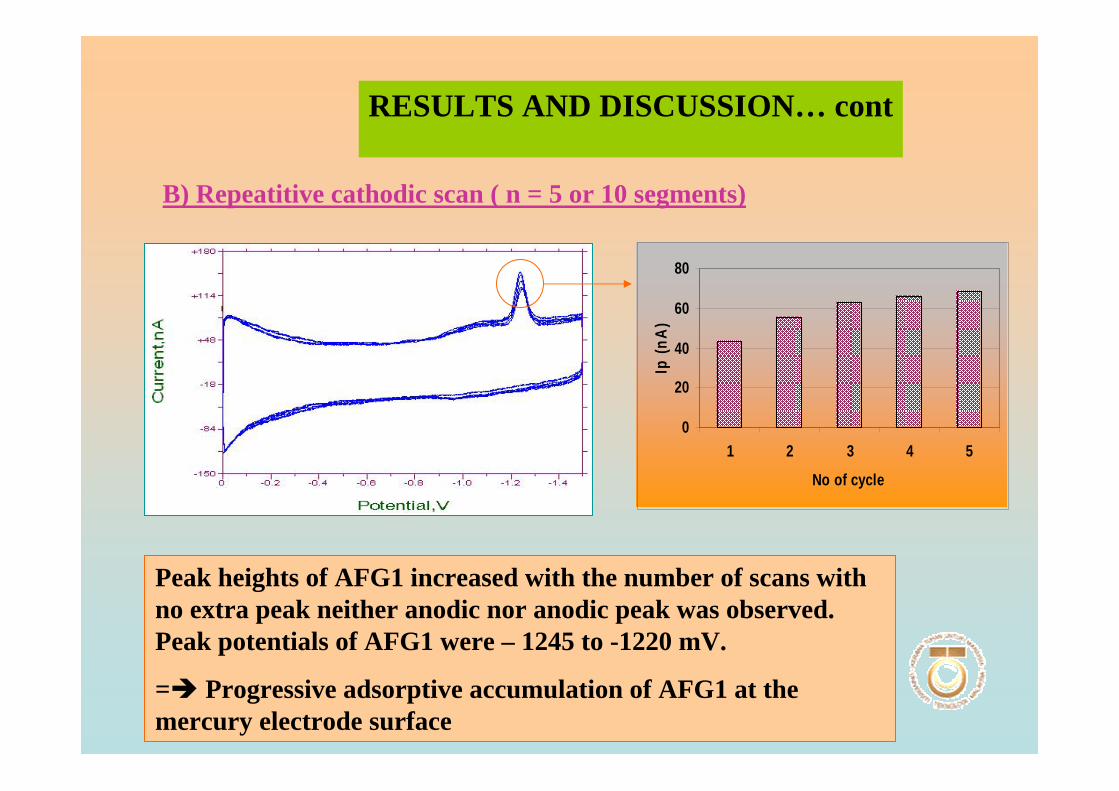
RESULTS AND DISCUSSION… cont
B) Repeatitive cathodic scan ( n = 5 or 10 segments)
Peak heights of AFG1 increased with the number of scans with no extra peak neither anodic nor anodic peak was observed. Peak potentials of AFG1 were – 1245 to -1220 mV.
= Progressive adsorptive accumulation of AFG1 at the mercury electrode surface
0
20
40
60
80
1 2 3 4 5
No of cycle
Ip (n
A)
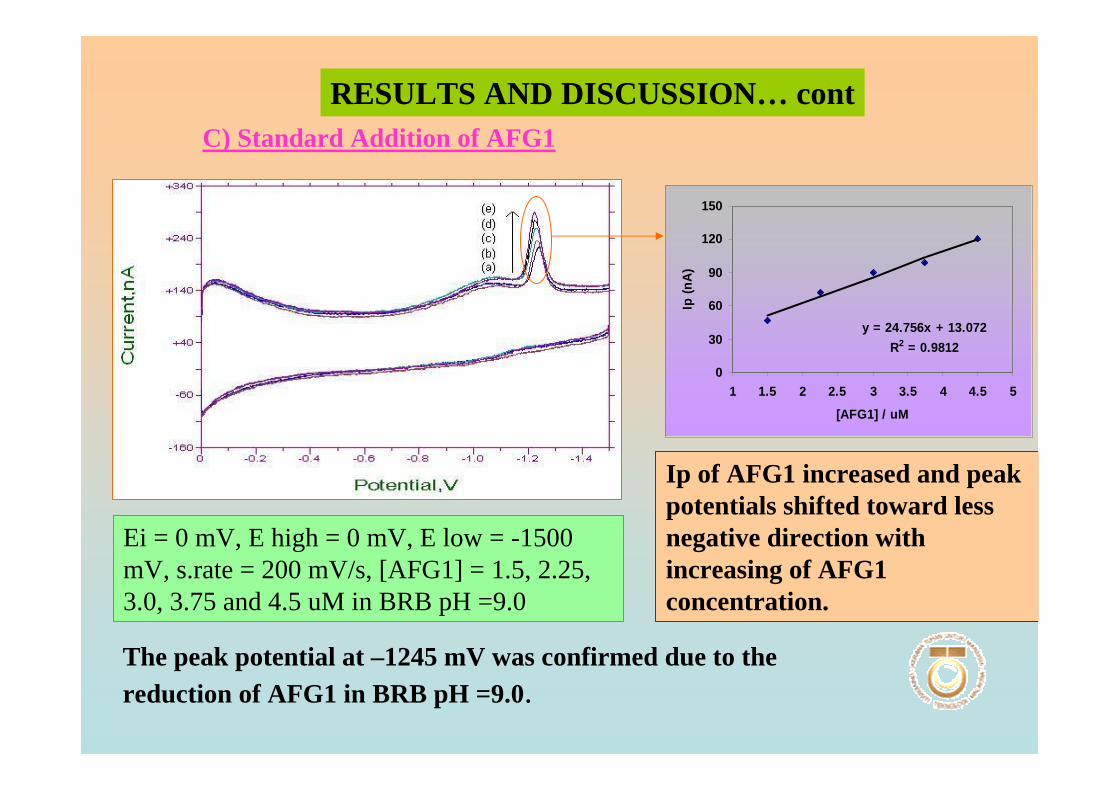
C) Standard Addition of AFG1
Ei = 0 mV, E high = 0 mV, E low = -1500 mV, s.rate = 200 mV/s, [AFG1] = 1.5, 2.25, 3.0, 3.75 and 4.5 uM in BRB pH =9.0
Ip of AFG1 increased and peak potentials shifted toward less negative direction with increasing of AFG1 concentration.
The peak potential at –1245 mV was confirmed due to the reduction of AFG1 in BRB pH =9.0.
RESULTS AND DISCUSSION… cont
y = 24.756x + 13.072R2 = 0.9812
0
30
60
90
120
150
1 1.5 2 2.5 3 3.5 4 4.5 5
[AFG1] / uM
Ip (n
A)
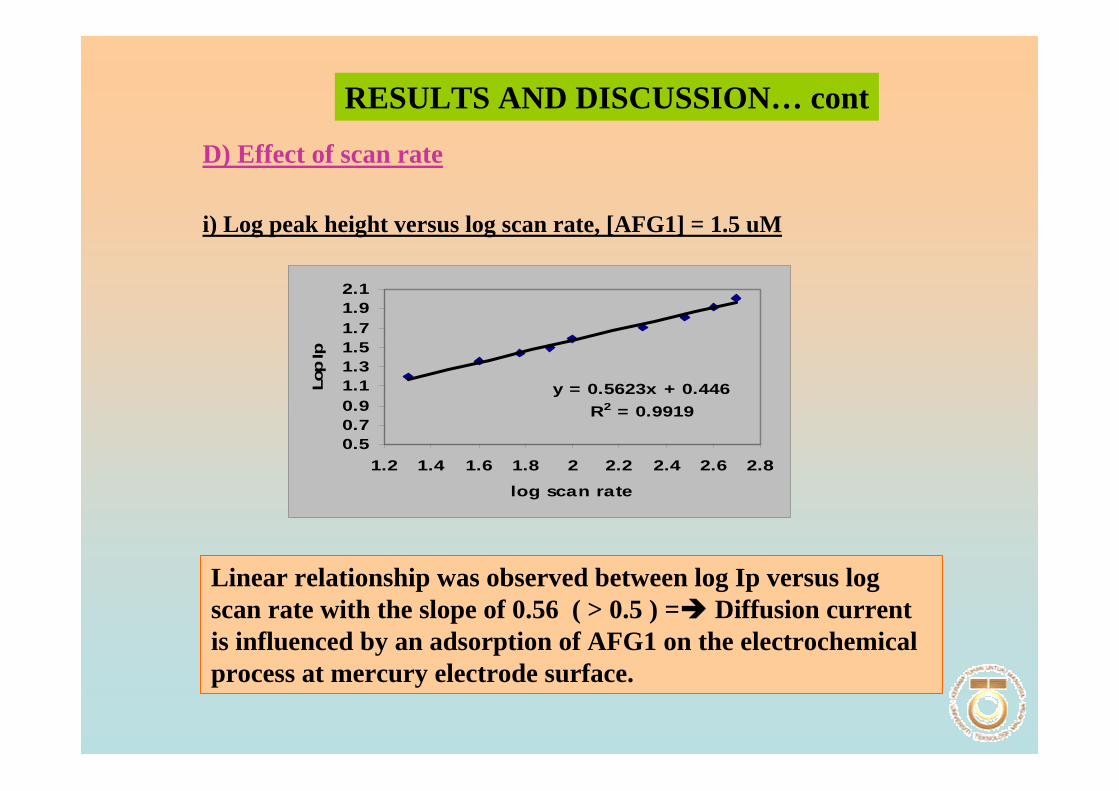
RESULTS AND DISCUSSION… cont
D) Effect of scan rate
i) Log peak height versus log scan rate, [AFG1] = 1.5 uM
y = 0.5623x + 0.446R2 = 0.9919
0.50.70.91.11.31.51.71.92.1
1.2 1.4 1.6 1.8 2 2.2 2.4 2.6 2.8
log scan rate
Lop
Ip
Linear relationship was observed between log Ip versus log scan rate with the slope of 0.56 ( > 0.5 ) = Diffusion current is influenced by an adsorption of AFG1 on the electrochemical process at mercury electrode surface.
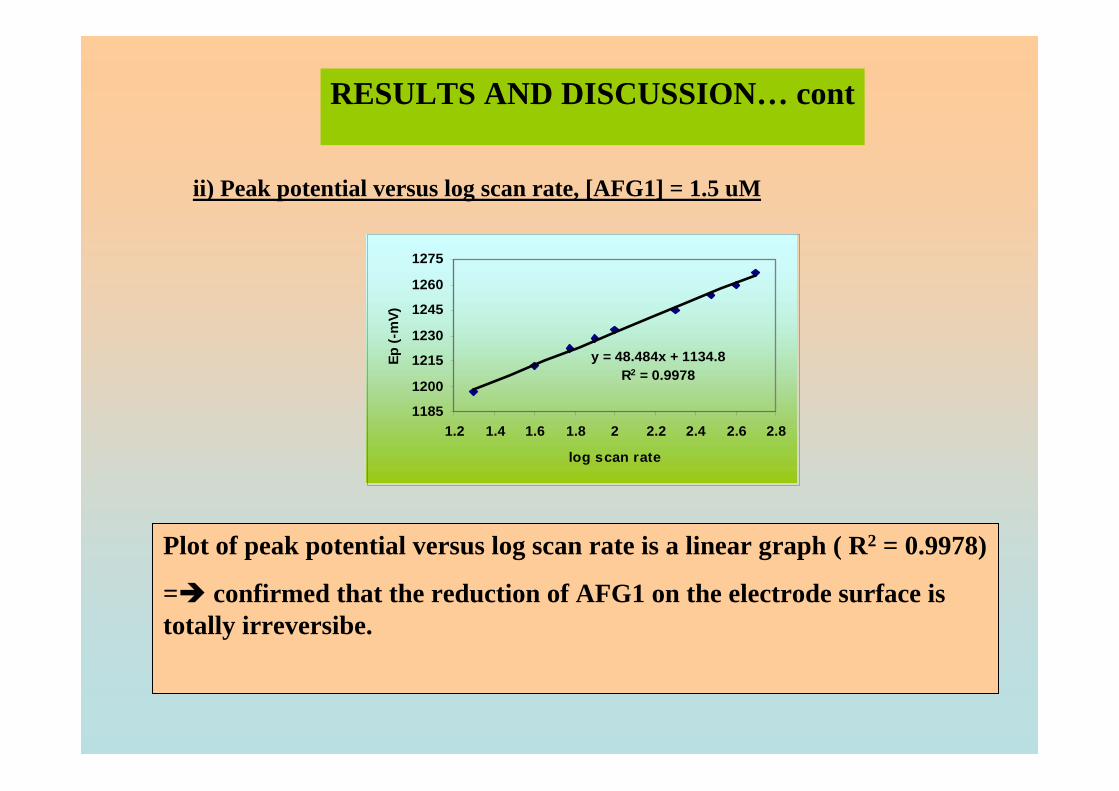
y = 48.484x + 1134.8R2 = 0.9978
1185
1200
1215
1230
1245
1260
1275
1.2 1.4 1.6 1.8 2 2.2 2.4 2.6 2.8
log scan rate
Ep (-
mV)
RESULTS AND DISCUSSION… cont
ii) Peak potential versus log scan rate, [AFG1] = 1.5 uM
Plot of peak potential versus log scan rate is a linear graph ( R2 = 0.9978)
= confirmed that the reduction of AFG1 on the electrode surface is totally irreversibe.
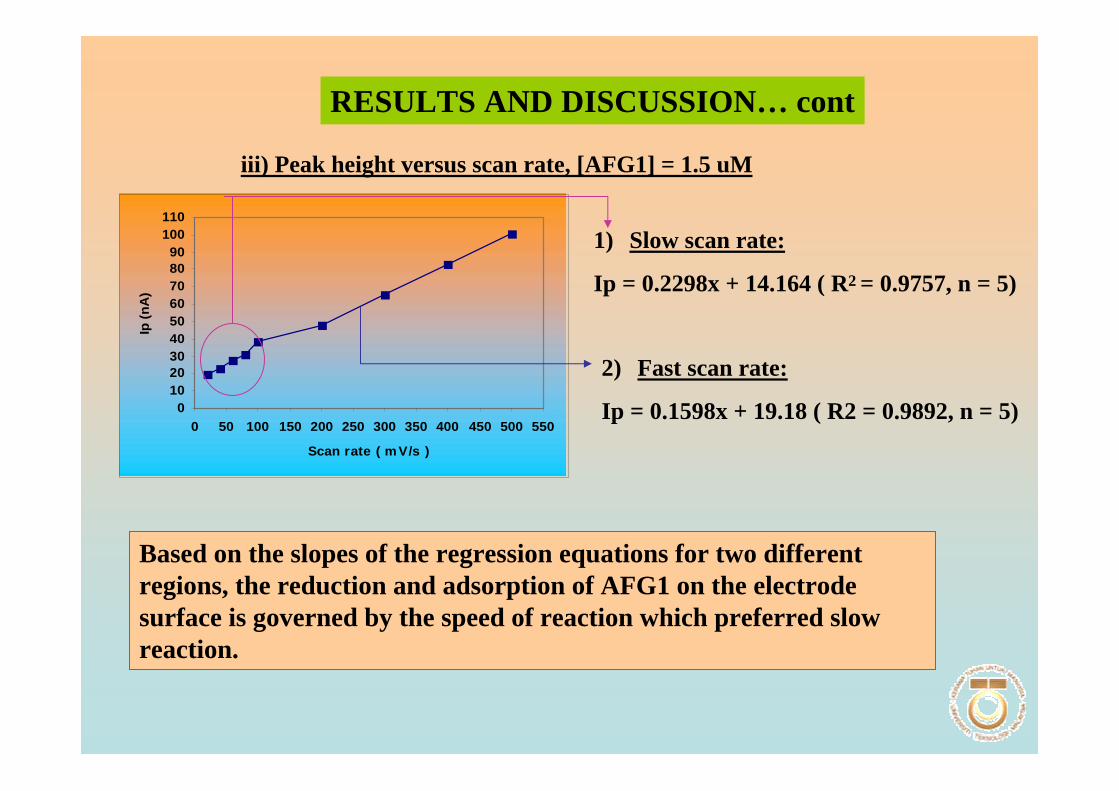
0102030405060708090
100110
0 50 100 150 200 250 300 350 400 450 500 550
Scan rate ( m V/s )
Ip (n
A)
RESULTS AND DISCUSSION… cont
iii) Peak height versus scan rate, [AFG1] = 1.5 uM
1) Slow scan rate:
Ip = 0.2298x + 14.164 ( R2 = 0.9757, n = 5)
2) Fast scan rate:
Ip = 0.1598x + 19.18 ( R2 = 0.9892, n = 5)
Based on the slopes of the regression equations for two different regions, the reduction and adsorption of AFG1 on the electrode surface is governed by the speed of reaction which preferred slow reaction.
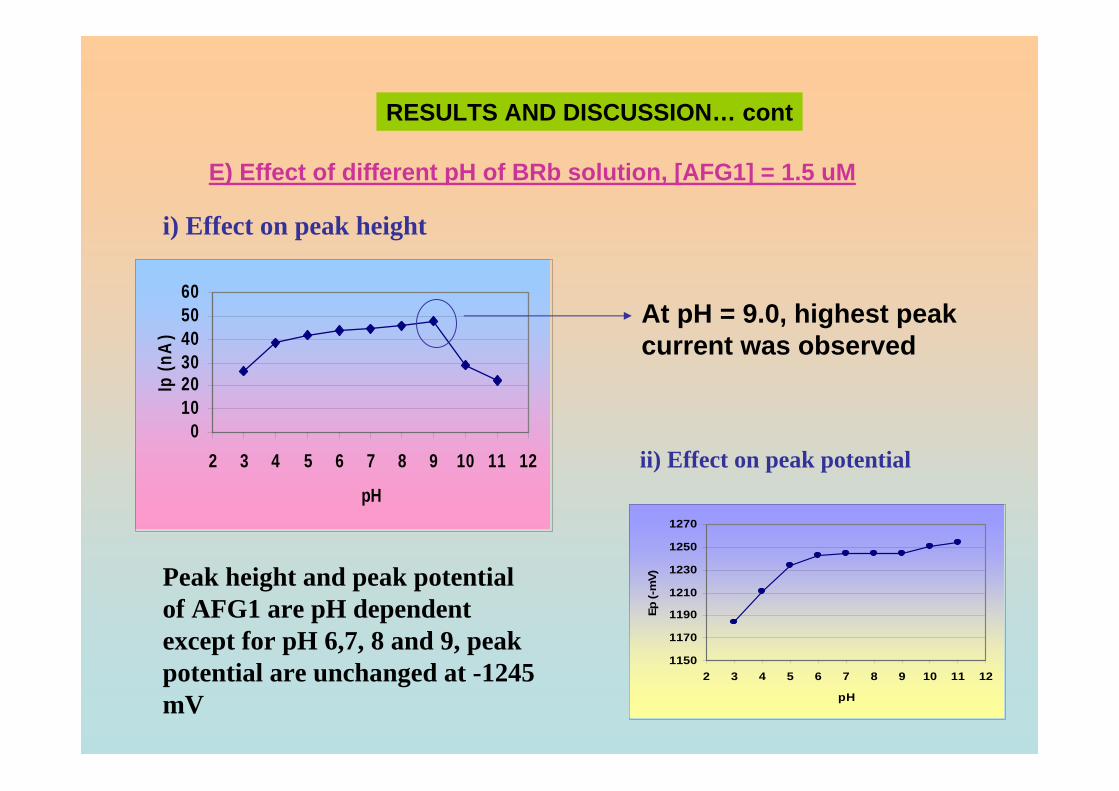
RESULTS AND DISCUSSION… cont
E) Effect of different pH of BRb solution, [AFG1] = 1.5 uM
0102030405060
2 3 4 5 6 7 8 9 10 11 12
pH
Ip (n
A)
At pH = 9.0, highest peak current was observed
1150
1170
1190
1210
1230
1250
1270
2 3 4 5 6 7 8 9 10 11 12
pH
Ep (-
mV)
i) Effect on peak height
ii) Effect on peak potential
Peak height and peak potential of AFG1 are pH dependent except for pH 6,7, 8 and 9, peak potential are unchanged at -1245 mV
CONCLUSION
1. AFG1 is reduced at mercury electrode. The reduction reaction is totally irreversible reaction which gives maximum peak height in BRb at pH of 9.0. The diffusion current produced by this reaction is affected by adsorption process of AFG1 at the mercury electrode surface which prefer a slow reaction.
2. All information on electrochemical properties of AFG1 are useful for development of other voltammetric technique for determination of AFG1 in standard solution and real samples.

ACKNOWLEDGEMENT
SUPERVISOR:AP DR ABDUL RAHIM MOHD YUSOFF
CO-SUPERVISORS:1. PROF RAHMALAN AHAMAD2. AP DR ABD. RAHIM YAACOB
ELECTROANALYSIS GROUP AND STAFF OF CHEMISTRY DEPT
SCHOOL OF HEALTH SCIENCES, USM ,HEALTH CAMPUS, KUBANG KRIAN, KELANTAN

THANK YOU
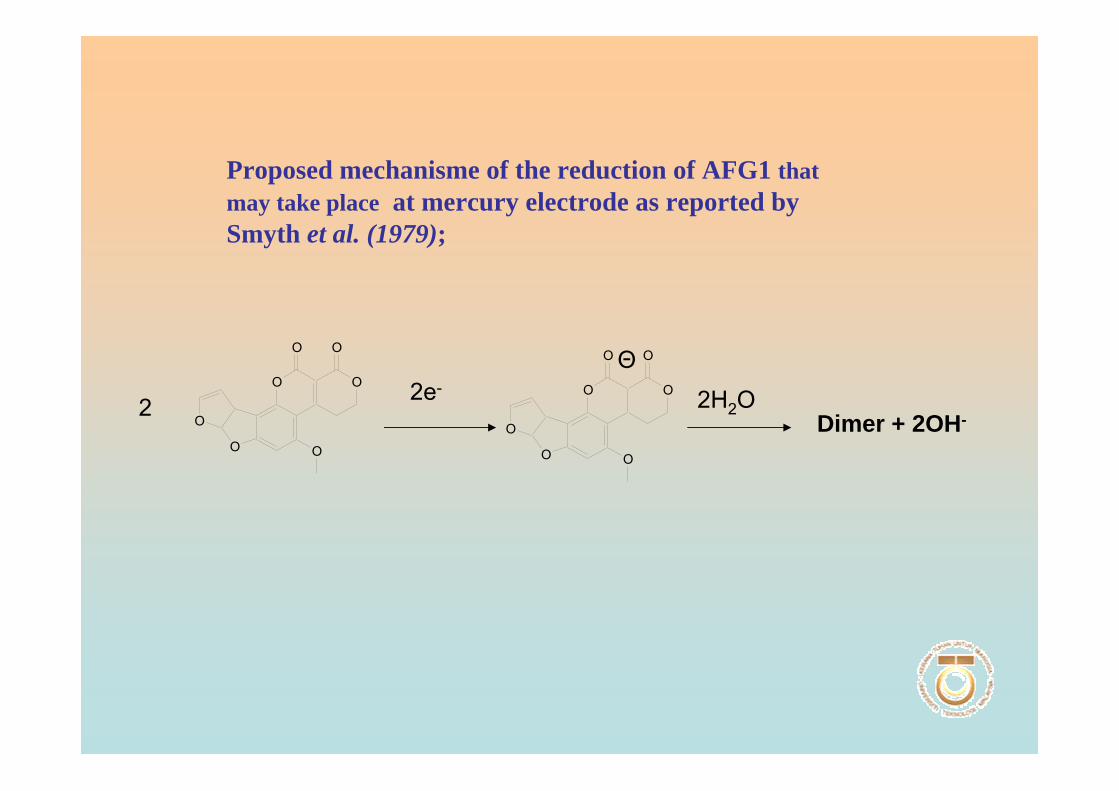
Proposed mechanisme of the reduction of AFG1 that may take place at mercury electrode as reported by Smyth et al. (1979);
O O
O
O
OO
O
O O
O
O
OO
O
22e-
Θ
Dimer + 2OH-2H2O

3/1/2007 2nd Life PostCon USM Penang 1
ORAL PRESENTED AT SYMPOSIUM LIFE SCIENCE II
(USM PENANG; 31st MAC – 3rd
APRIL 2004)
3/1/2007 2nd Life PostCon USM Penang 2
STABILITY STUDY OF AFLATOXIN G1 (AFG1) USING DIFFERENTIAL PULSE
STRIPPING VOLTAMMETRIC TECHNIQUE
BY
Mohd Hadzri Yaacob, Abd.Rahim Yusoff and Rahmalan Ahamad
UTM, SKUDAI
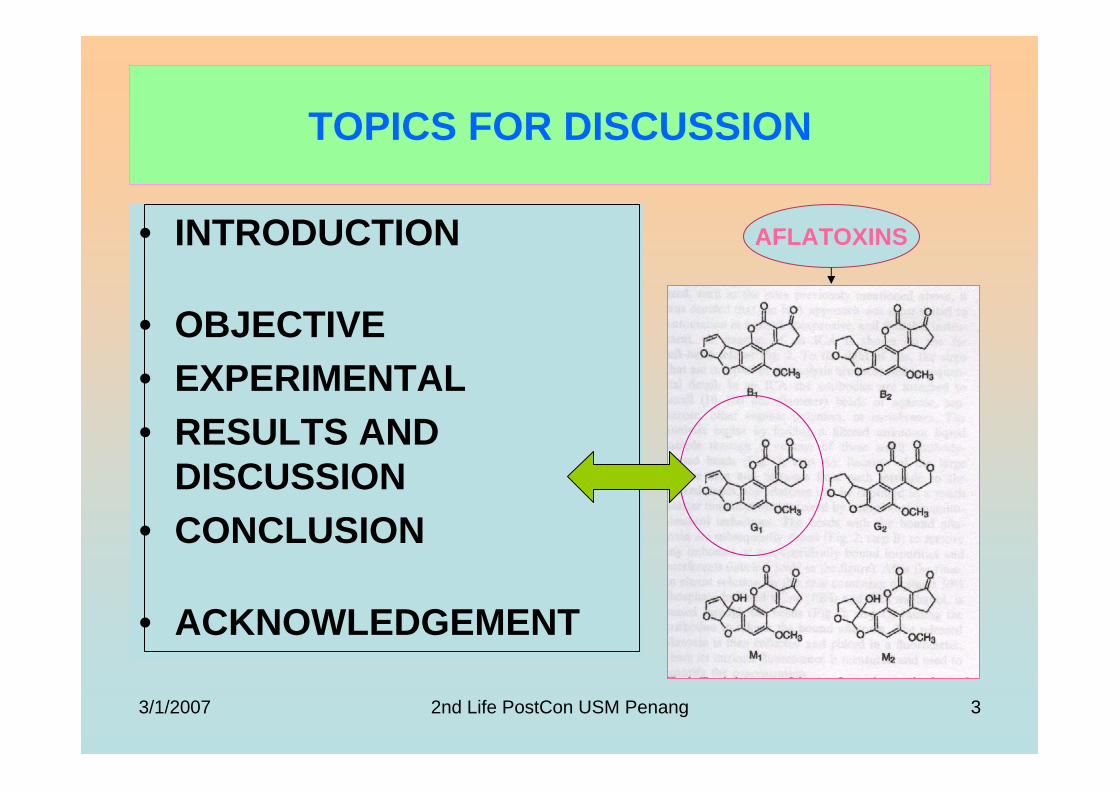
3/1/2007 2nd Life PostCon USM Penang 3
TOPICS FOR DISCUSSION
• INTRODUCTION
• OBJECTIVE• EXPERIMENTAL• RESULTS AND
DISCUSSION• CONCLUSION
• ACKNOWLEDGEMENT
AFLATOXINS
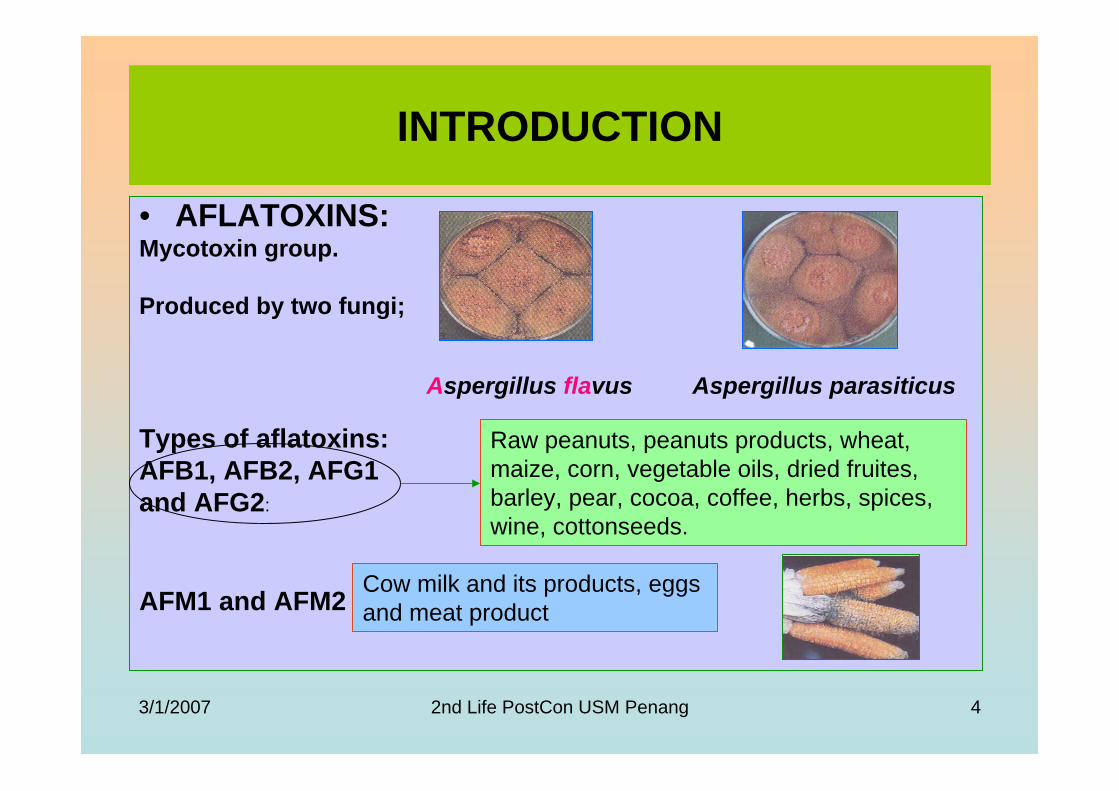
3/1/2007 2nd Life PostCon USM Penang 4
INTRODUCTION
• AFLATOXINS:Mycotoxin group.
Produced by two fungi;
Aspergillus flavus Aspergillus parasiticus
Types of aflatoxins: AFB1, AFB2, AFG1 and AFG2:
AFM1 and AFM2
Raw peanuts, peanuts products, wheat, maize, corn, vegetable oils, dried fruites, barley, pear, cocoa, coffee, herbs, spices, wine, cottonseeds.
Cow milk and its products, eggs and meat product

3/1/2007 2nd Life PostCon USM Penang 5
INTRODUCTION …cont
• AFLATOXINS:Occurs naturally in commodities used for animal and
human
Carcinogenic, teratogenic and mutagenic
IARC (1988): Class I carcinogenic materials
Dangerous to health: causes aflatoxicosis disease.
Effect the economy of commodities export countries
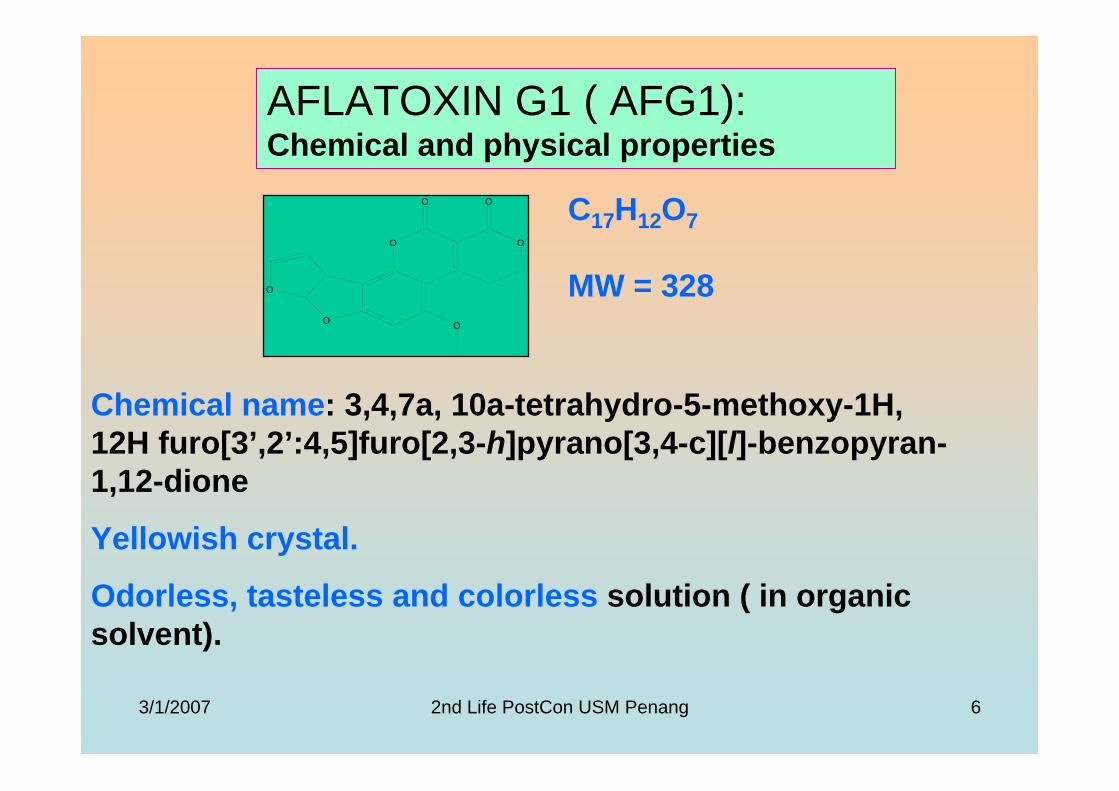
3/1/2007 2nd Life PostCon USM Penang 6
O O
O
O
OO
O
AFLATOXIN G1 ( AFG1): Chemical and physical properties
Chemical name: 3,4,7a, 10a-tetrahydro-5-methoxy-1H, 12H furo[3’,2’:4,5]furo[2,3-h]pyrano[3,4-c][l]-benzopyran-1,12-dione
Yellowish crystal.
Odorless, tasteless and colorless solution ( in organic solvent).
C17H12O7
MW = 328
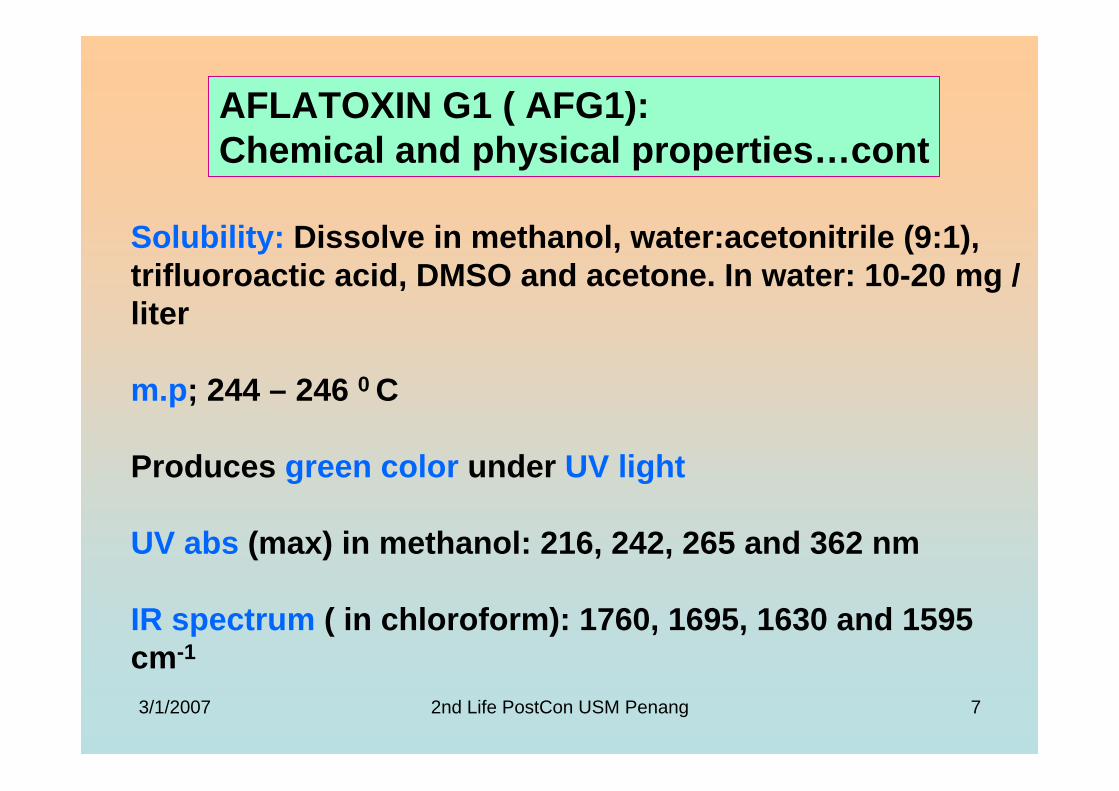
3/1/2007 2nd Life PostCon USM Penang 7
Solubility: Dissolve in methanol, water:acetonitrile (9:1), trifluoroactic acid, DMSO and acetone. In water: 10-20 mg / liter
m.p; 244 – 246 0 C
Produces green color under UV light
UV abs (max) in methanol: 216, 242, 265 and 362 nm
IR spectrum ( in chloroform): 1760, 1695, 1630 and 1595 cm-1
AFLATOXIN G1 ( AFG1): Chemical and physical properties…cont
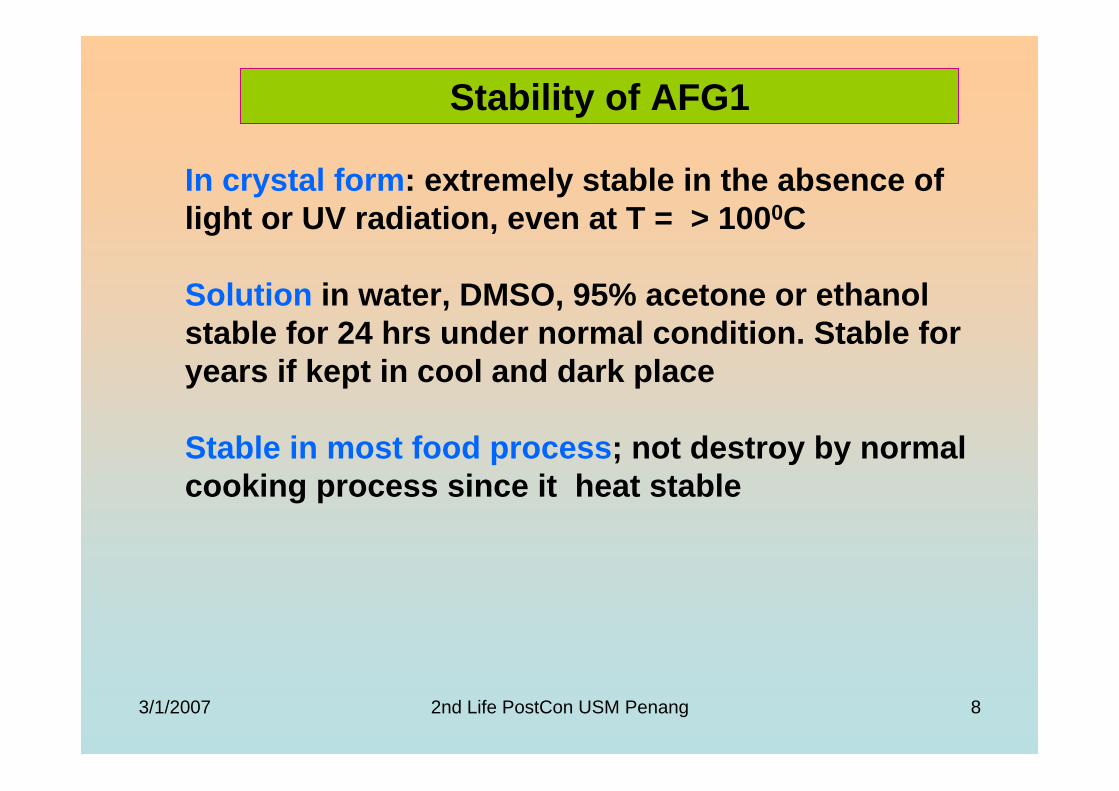
3/1/2007 2nd Life PostCon USM Penang 8
Stability of AFG1
In crystal form: extremely stable in the absence of light or UV radiation, even at T = > 1000C
Solution in water, DMSO, 95% acetone or ethanol stable for 24 hrs under normal condition. Stable for years if kept in cool and dark place
Stable in most food process; not destroy by normal cooking process since it heat stable
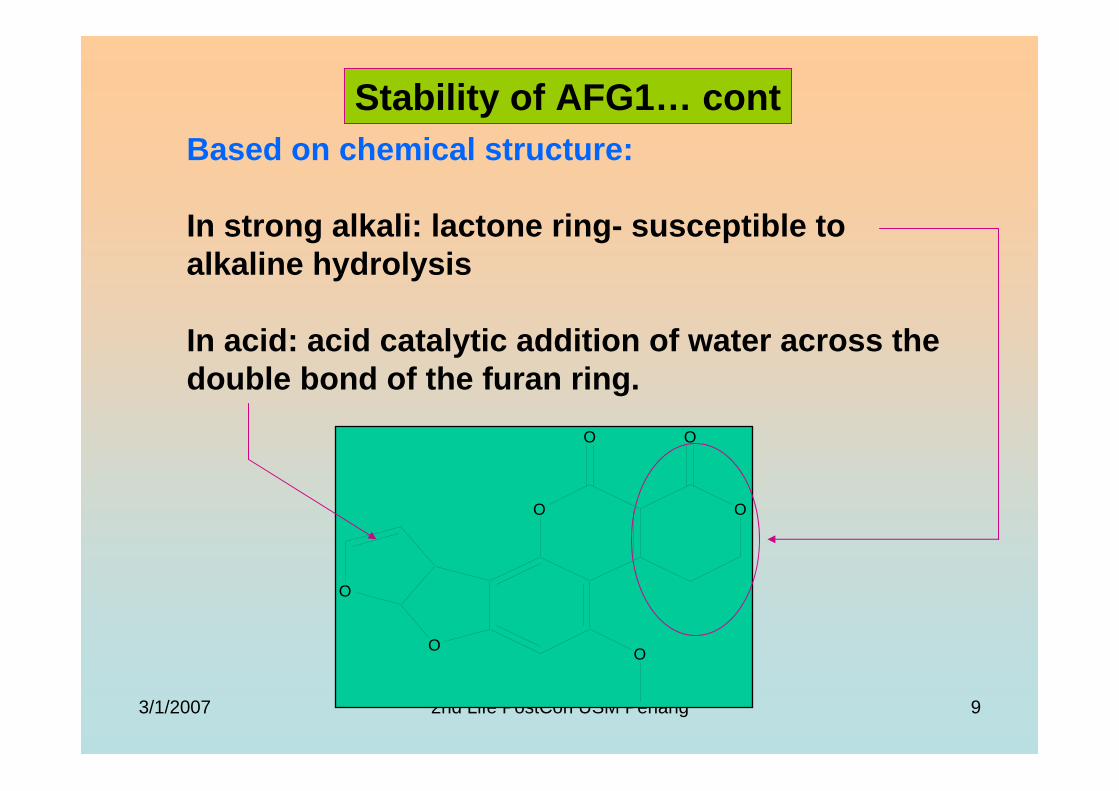
3/1/2007 2nd Life PostCon USM Penang 9
Based on chemical structure:
In strong alkali: lactone ring- susceptible to alkaline hydrolysis
In acid: acid catalytic addition of water across the double bond of the furan ring.
O O
O
O
OO
O
Stability of AFG1… cont
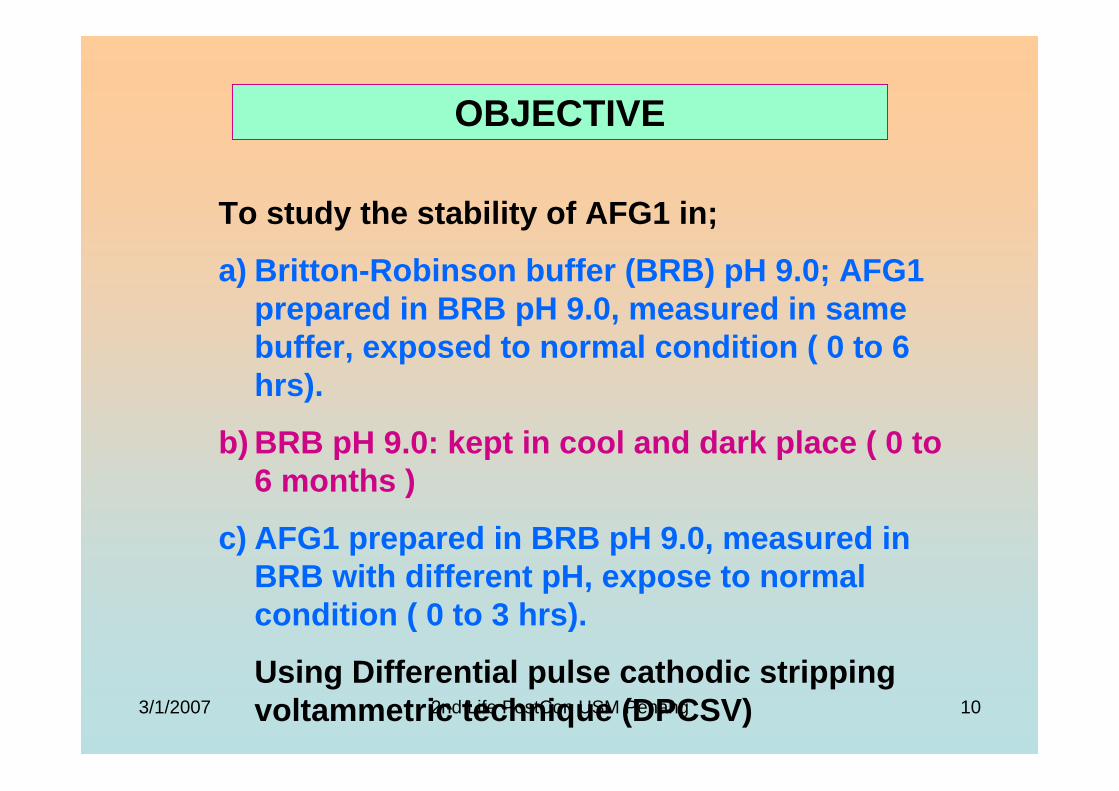
3/1/2007 2nd Life PostCon USM Penang 10
OBJECTIVE
To study the stability of AFG1 in;
a) Britton-Robinson buffer (BRB) pH 9.0; AFG1 prepared in BRB pH 9.0, measured in same buffer, exposed to normal condition ( 0 to 6 hrs).
b) BRB pH 9.0: kept in cool and dark place ( 0 to 6 months )
c) AFG1 prepared in BRB pH 9.0, measured in BRB with different pH, expose to normal condition ( 0 to 3 hrs).
Using Differential pulse cathodic stripping voltammetric technique (DPCSV)
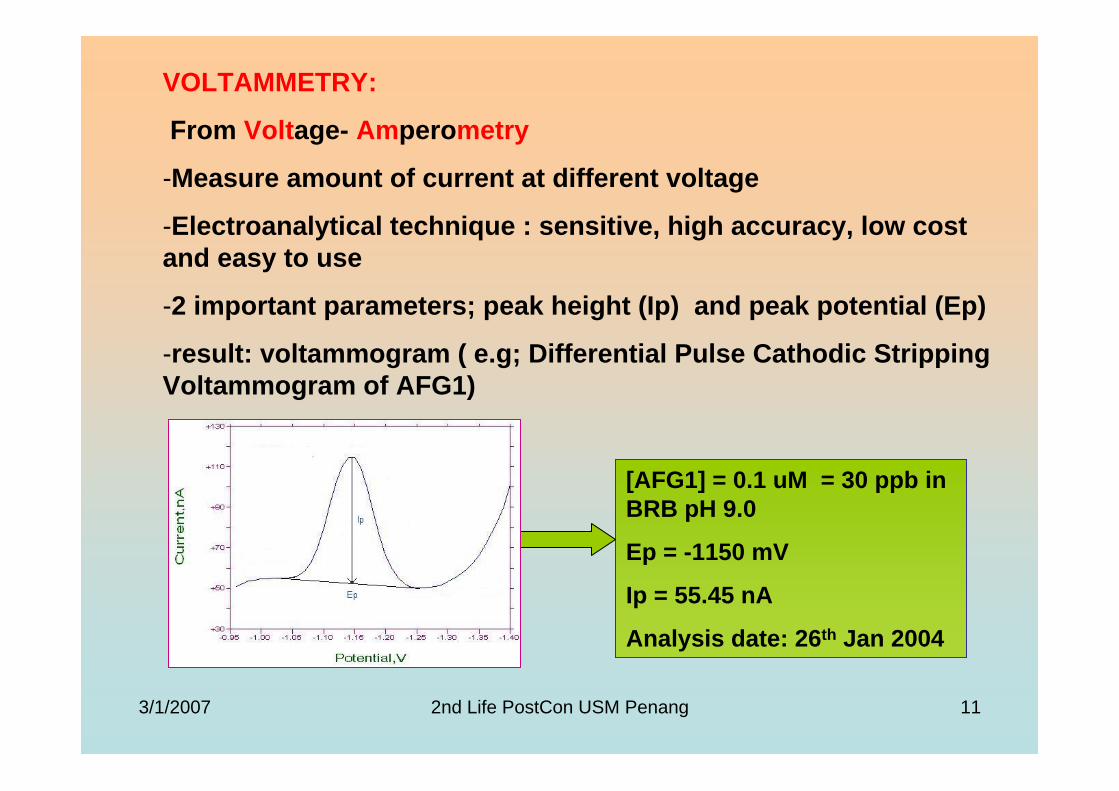
3/1/2007 2nd Life PostCon USM Penang 11
VOLTAMMETRY:
From Voltage- Amperometry
-Measure amount of current at different voltage
-Electroanalytical technique : sensitive, high accuracy, low cost and easy to use
-2 important parameters; peak height (Ip) and peak potential (Ep)
-result: voltammogram ( e.g; Differential Pulse Cathodic Stripping Voltammogram of AFG1)
[AFG1] = 0.1 uM = 30 ppb in BRB pH 9.0
Ep = -1150 mV
Ip = 55.45 nA
Analysis date: 26th Jan 2004
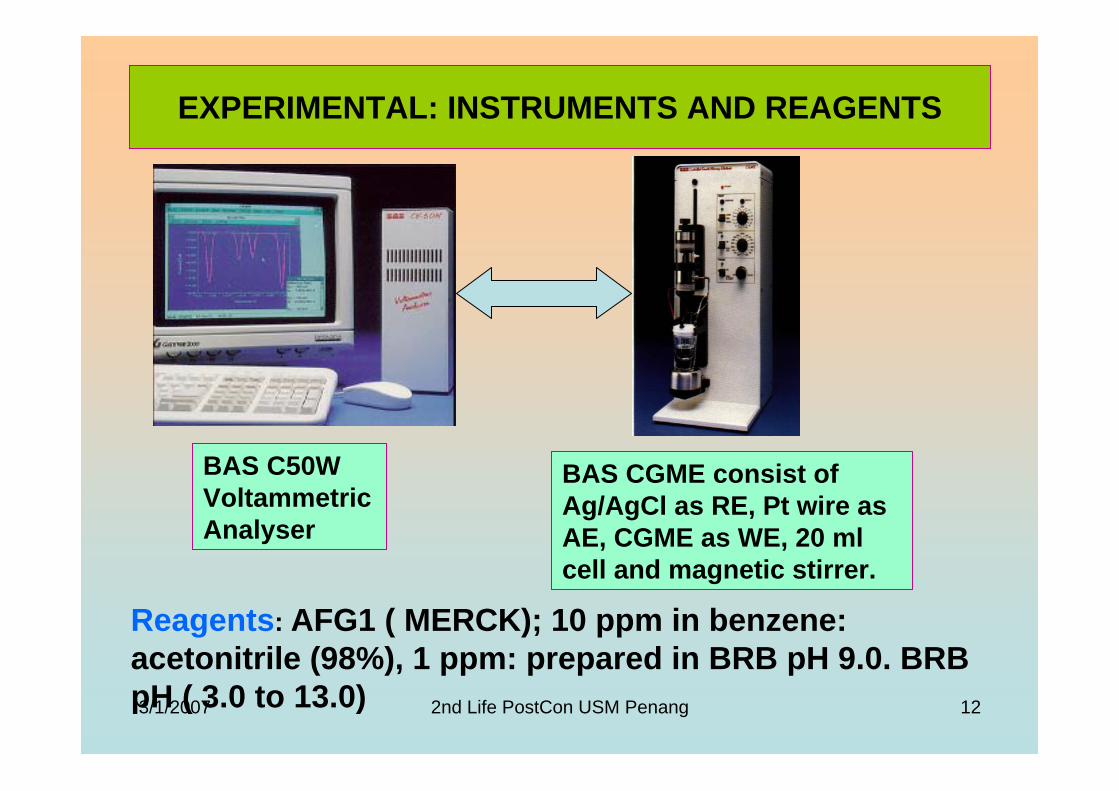
3/1/2007 2nd Life PostCon USM Penang 12
EXPERIMENTAL: INSTRUMENTS AND REAGENTS
BAS CGME consist of Ag/AgCl as RE, Pt wire as AE, CGME as WE, 20 ml cell and magnetic stirrer.
BAS C50W VoltammetricAnalyser
Reagents: AFG1 ( MERCK); 10 ppm in benzene: acetonitrile (98%), 1 ppm: prepared in BRB pH 9.0. BRB pH ( 3.0 to 13.0)
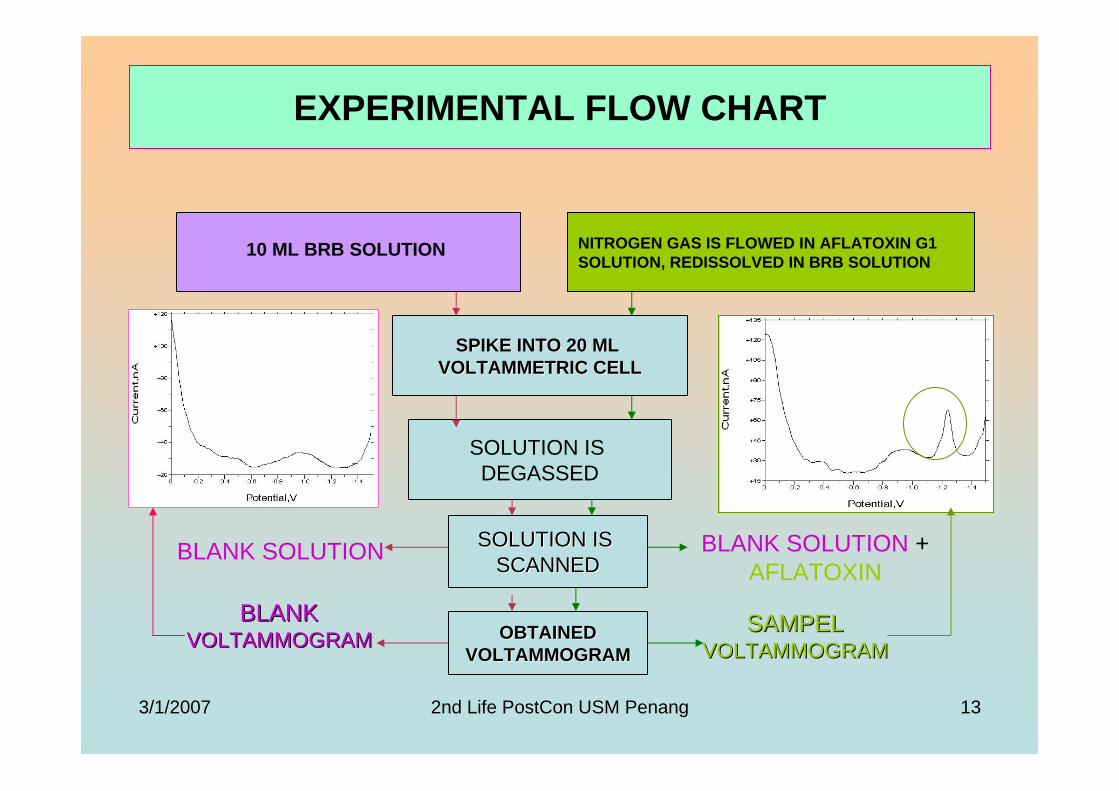
3/1/2007 2nd Life PostCon USM Penang 13
EXPERIMENTAL FLOW CHART
NITROGEN GAS IS FLOWED IN AFLATOXIN G1 SOLUTION, REDISSOLVED IN BRB SOLUTION
10 ML BRB SOLUTION
SOLUTION IS DEGASSED
SOLUTION IS SOLUTION IS SCANNEDSCANNED
SPIKE INTO 20 ML SPIKE INTO 20 ML VOLTAMMETRIC CELLVOLTAMMETRIC CELL
OBTAINEDOBTAINEDVOLTAMMOGRAMVOLTAMMOGRAM
BLANK SOLUTION BLANK SOLUTION + AFLATOXIN
BLANKBLANKVOLTAMMOGRAM VOLTAMMOGRAM
SAMPELSAMPELVOLTAMMOGRAM VOLTAMMOGRAM
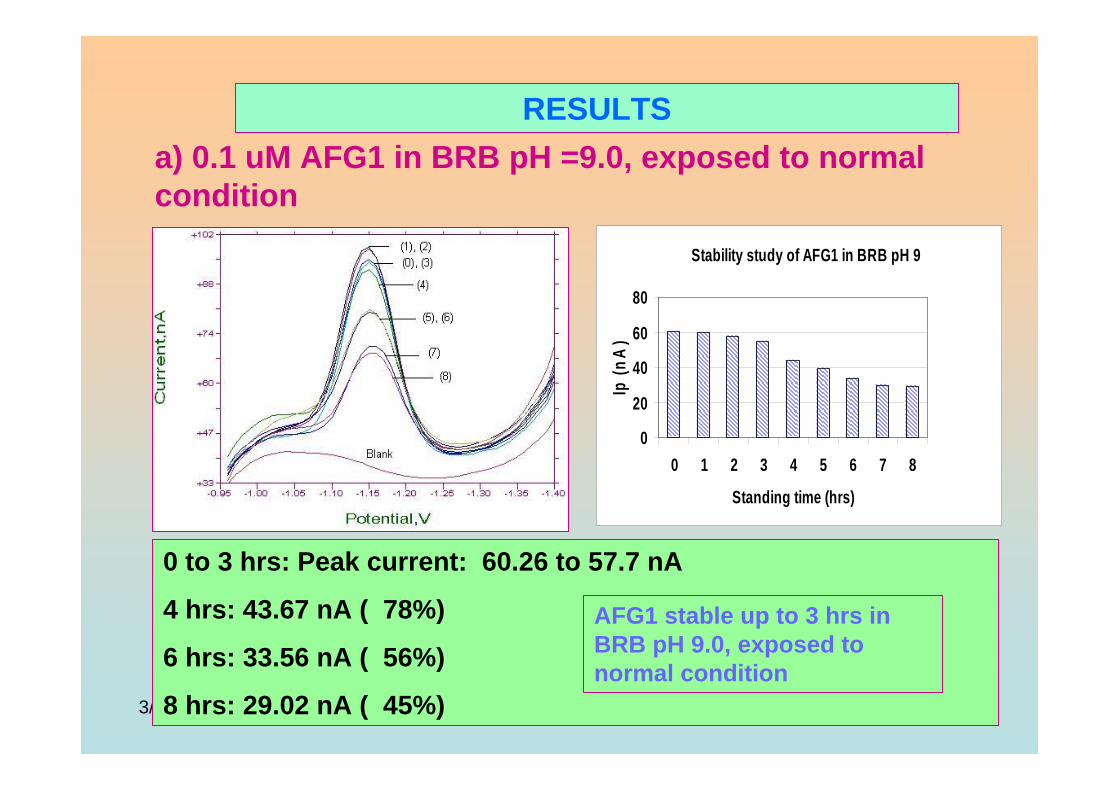
3/1/2007 2nd Life PostCon USM Penang 14
RESULTSa) 0.1 uM AFG1 in BRB pH =9.0, exposed to normal condition
Stability study of AFG1 in BRB pH 9
0
20
40
60
80
0 1 2 3 4 5 6 7 8
Standing time (hrs)
Ip (n
A)
0 to 3 hrs: Peak current: 60.26 to 57.7 nA
4 hrs: 43.67 nA ( 78%)
6 hrs: 33.56 nA ( 56%)
8 hrs: 29.02 nA ( 45%)
AFG1 stable up to 3 hrs in BRB pH 9.0, exposed to normal condition
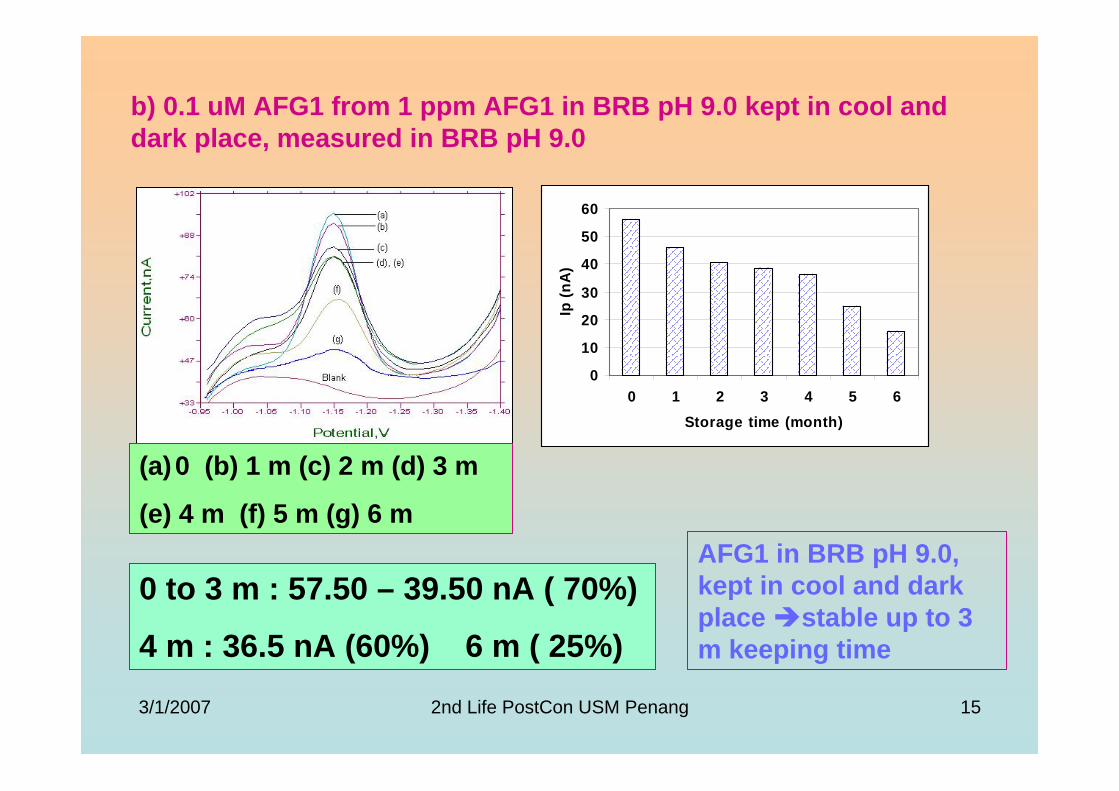
3/1/2007 2nd Life PostCon USM Penang 15
b) 0.1 uM AFG1 from 1 ppm AFG1 in BRB pH 9.0 kept in cool and dark place, measured in BRB pH 9.0
0
10
20
30
40
50
60
0 1 2 3 4 5 6Storage time (month)
Ip (n
A)
(a)0 (b) 1 m (c) 2 m (d) 3 m
(e) 4 m (f) 5 m (g) 6 m
0 to 3 m : 57.50 – 39.50 nA ( 70%)
4 m : 36.5 nA (60%) 6 m ( 25%)
AFG1 in BRB pH 9.0, kept in cool and dark place stable up to 3 m keeping time
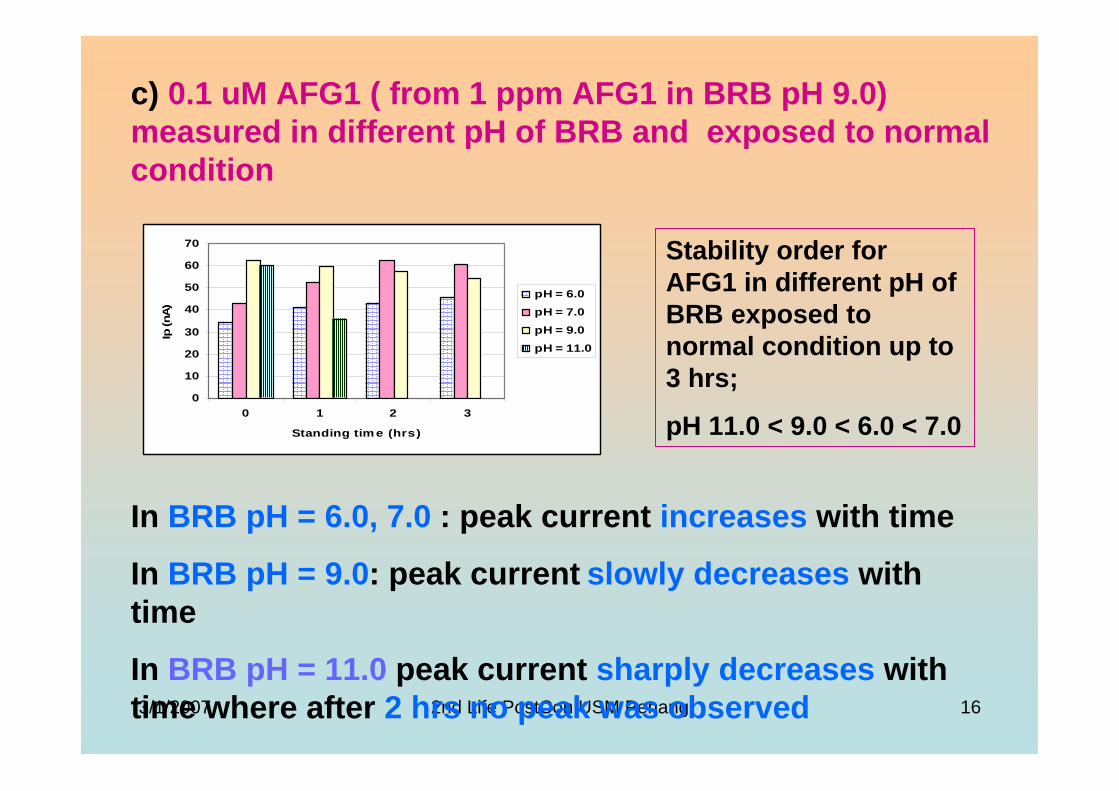
3/1/2007 2nd Life PostCon USM Penang 16
c) 0.1 uM AFG1 ( from 1 ppm AFG1 in BRB pH 9.0) measured in different pH of BRB and exposed to normal condition
0
10
20
30
40
50
60
70
0 1 2 3
Standing tim e (hrs)
Ip (n
A)
pH = 6.0pH = 7.0pH = 9.0pH = 11.0
In BRB pH = 6.0, 7.0 : peak current increases with time
In BRB pH = 9.0: peak current slowly decreases with time
In BRB pH = 11.0 peak current sharply decreases with time where after 2 hrs no peak was observed
Stability order for AFG1 in different pH of BRB exposed to normal condition up to 3 hrs;
pH 11.0 < 9.0 < 6.0 < 7.0
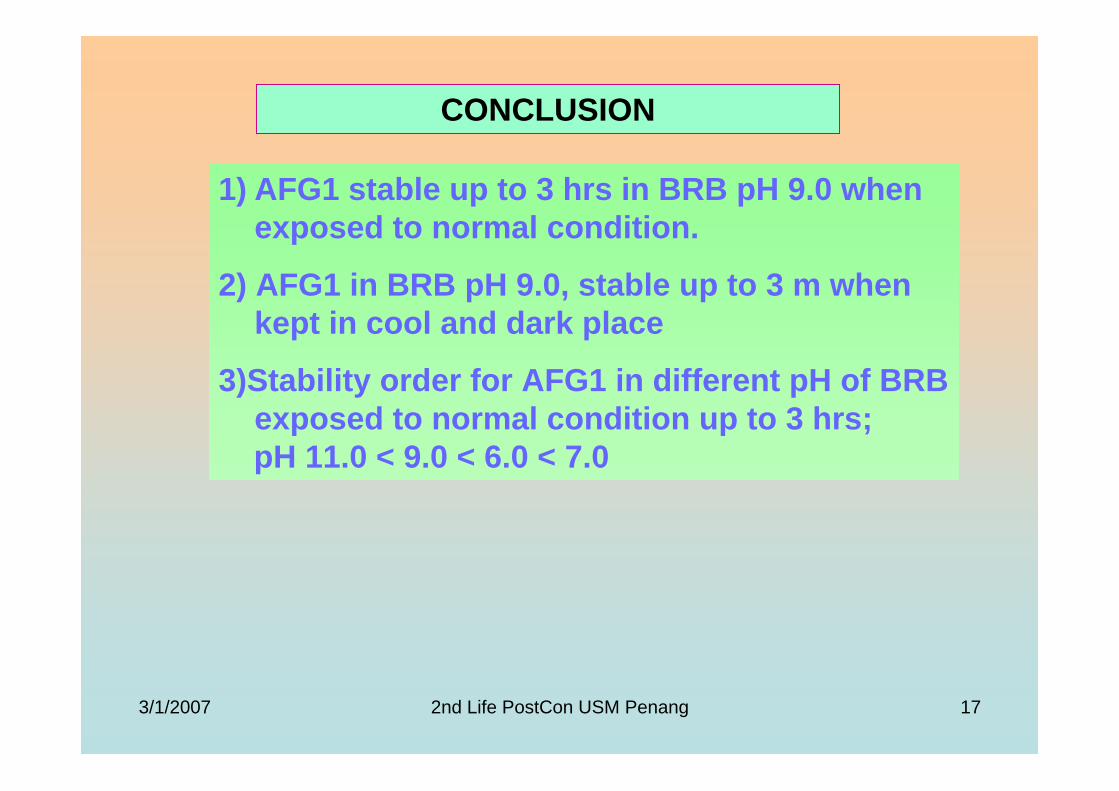
3/1/2007 2nd Life PostCon USM Penang 17
CONCLUSION
1) AFG1 stable up to 3 hrs in BRB pH 9.0 when exposed to normal condition.
2) AFG1 in BRB pH 9.0, stable up to 3 m when kept in cool and dark place
3)Stability order for AFG1 in different pH of BRB exposed to normal condition up to 3 hrs;pH 11.0 < 9.0 < 6.0 < 7.0
3/1/2007 2nd Life PostCon USM Penang 18
FURTHER WORKS
1. Stability study of AFG1 using different concentration of AFG1 ( 0.05 uM and 1.0 uM)
2. Stability study of AFG1, keep in room temperature and expose to light from 0 to 6 months.
3. Stability study of other aflatoxins (AFB1, AFB2 and AFG2)

3/1/2007 2nd Life PostCon USM Penang 19
ACKNOWLEDGEMENT
SCHOOL OF HEALTH SCIENCES, USM ( STUDY LEAVE AND FELLOWSHIP UNDER ASHES: May 2002 – May 2005)
SUPERVISOR:AP DR ABDUL RAHIM MOHD YUSOFF
CO-SUPERVISORS:1. PROF RAHMALAN AHAMAD2. AP DR ABD. RAHIM YAACOB
ELECTROANALYSIS GROUP AND STAFF OF CHEMISTRY DEPT
MR RODWAN MAT AIL, CHEM DEPT, MOSTE, PENANG.

3/1/2007 2nd Life PostCon USM Penang 20
THANK YOU
MohdMohd HadzriHadzri,,SainsSains ForensikForensik, , PPSainsPPSains KesihatanKesihatanUSM KELANTANUSM KELANTAN
Wassalam

ORAL PRESENTED AT SKAM-17
(KUANTAN, 24-26th
AUGUST 2004)
STABILITY STUDIES OF AFLATOXINS USING DIFFERENTIAL PULSE CATHODIC
STRIPPING VOLTAMMETRIC (DPCSV) TECHNIQUE
BY
Mohd Hadzri Yaacob, Abd.Rahim Yusoff and Rahmalan Ahamad
UTM, SKUDAI
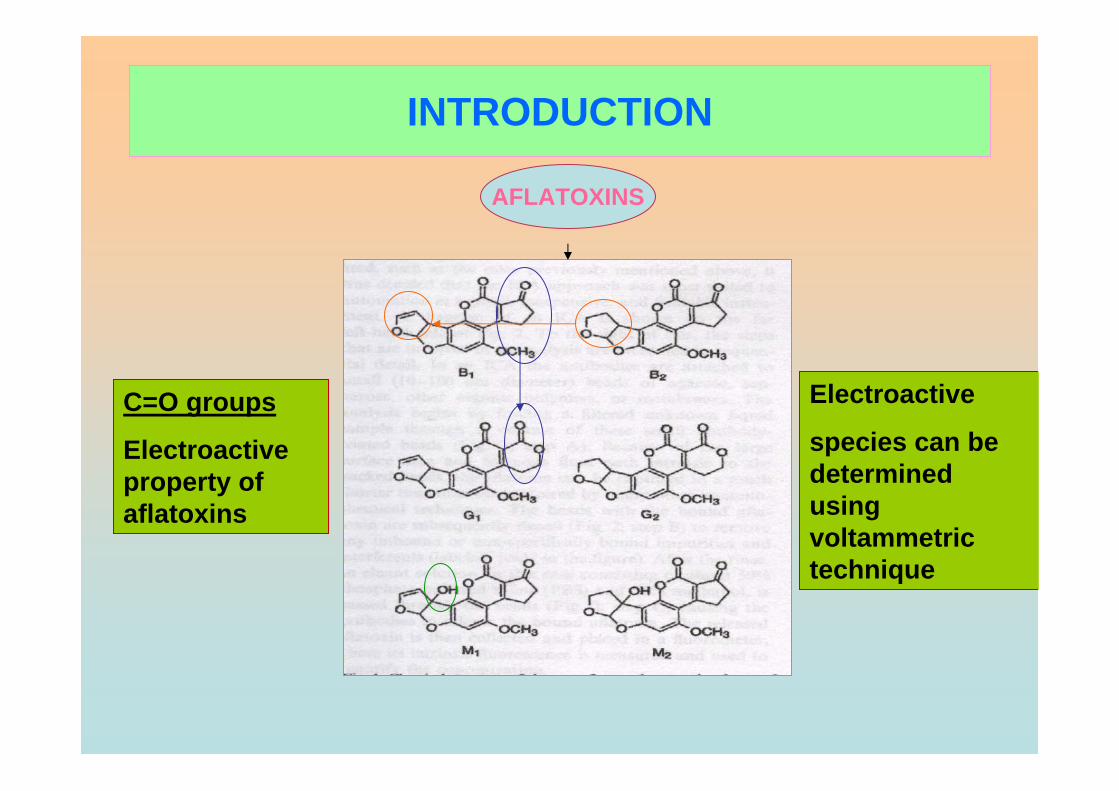
INTRODUCTION
AFLATOXINS
C=O groups
Electroactiveproperty of aflatoxins
Electroactive
species can be determined using voltammetrictechnique
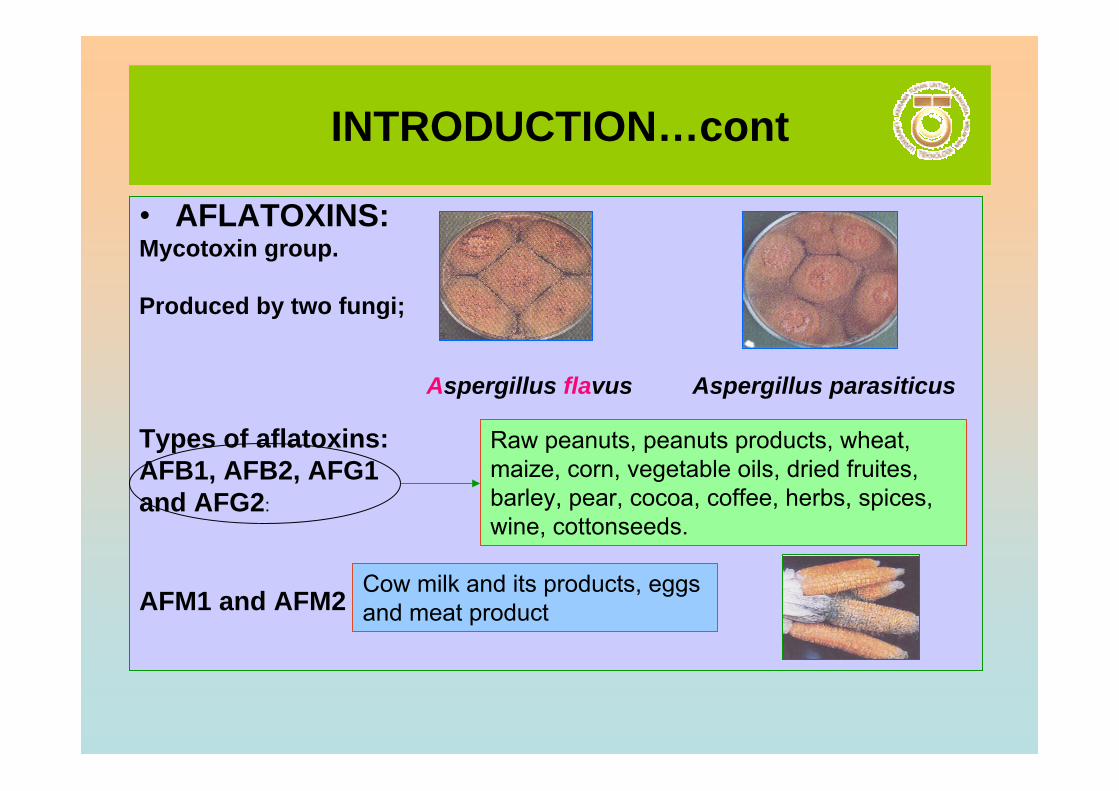
INTRODUCTION…cont
• AFLATOXINS:Mycotoxin group.
Produced by two fungi;
Aspergillus flavus Aspergillus parasiticus
Types of aflatoxins: AFB1, AFB2, AFG1 and AFG2:
AFM1 and AFM2
Raw peanuts, peanuts products, wheat, maize, corn, vegetable oils, dried fruites, barley, pear, cocoa, coffee, herbs, spices, wine, cottonseeds.
Cow milk and its products, eggs and meat product

INTRODUCTION …cont
• AFLATOXINS:Occurs naturally in commodities used for animal and
human
Carcinogenic, teratogenic and mutagenic
IARC (1988): Class I carcinogenic materials
Dangerous to health: causes aflatoxicosis disease.
Effect the economy of commodities export countries
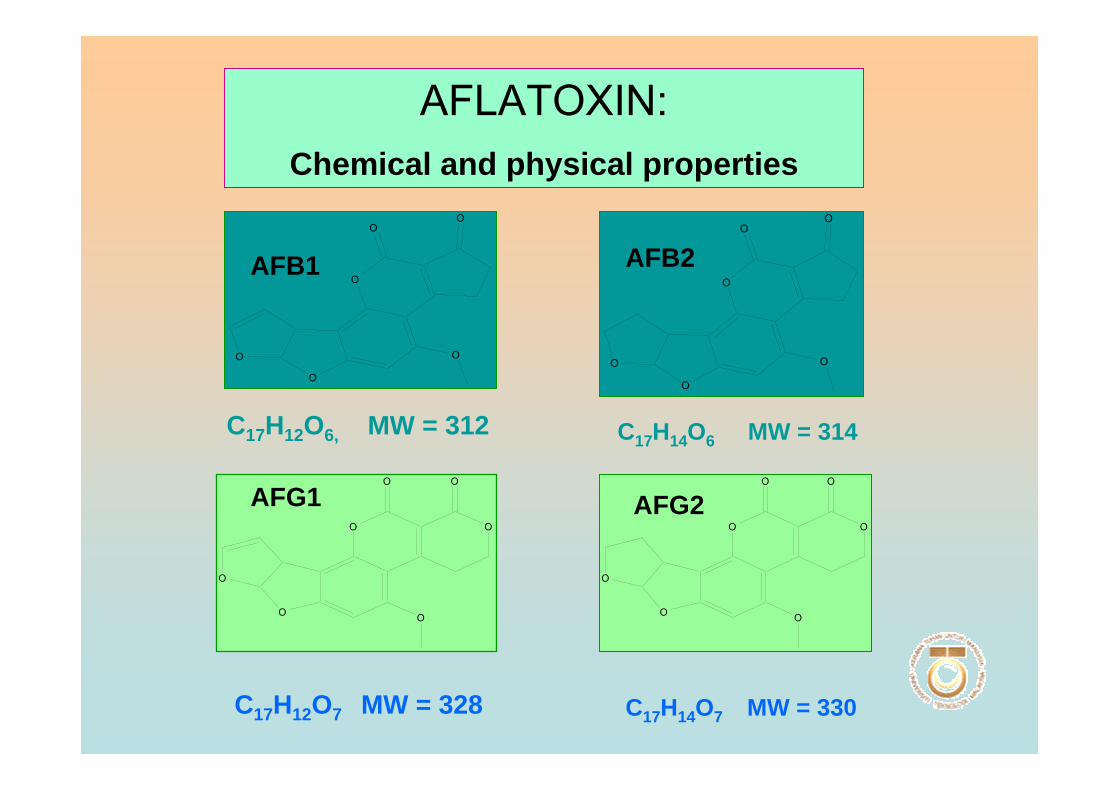
O O
O
O
OO
O
AFLATOXIN: Chemical and physical properties
C17H12O7 MW = 328
O
O
O
OO
O
O
O
O
OO
O
O O
O
O
OO
O
C17H12O6, MW = 312
AFB1 AFB2
AFG1 AFG2
C17H14O6 MW = 314
C17H14O7 MW = 330
Solubility: Dissolve in methanol, water:acetonitrile (9:1), trifluoroactic acid, DMSO and acetone. In water: 10-20 mg / liter
Yellowish crystal
Odorless, tasteless and colorless solution ( in organic solvent).
AFLATOXIN: Chemical and physical properties…cont
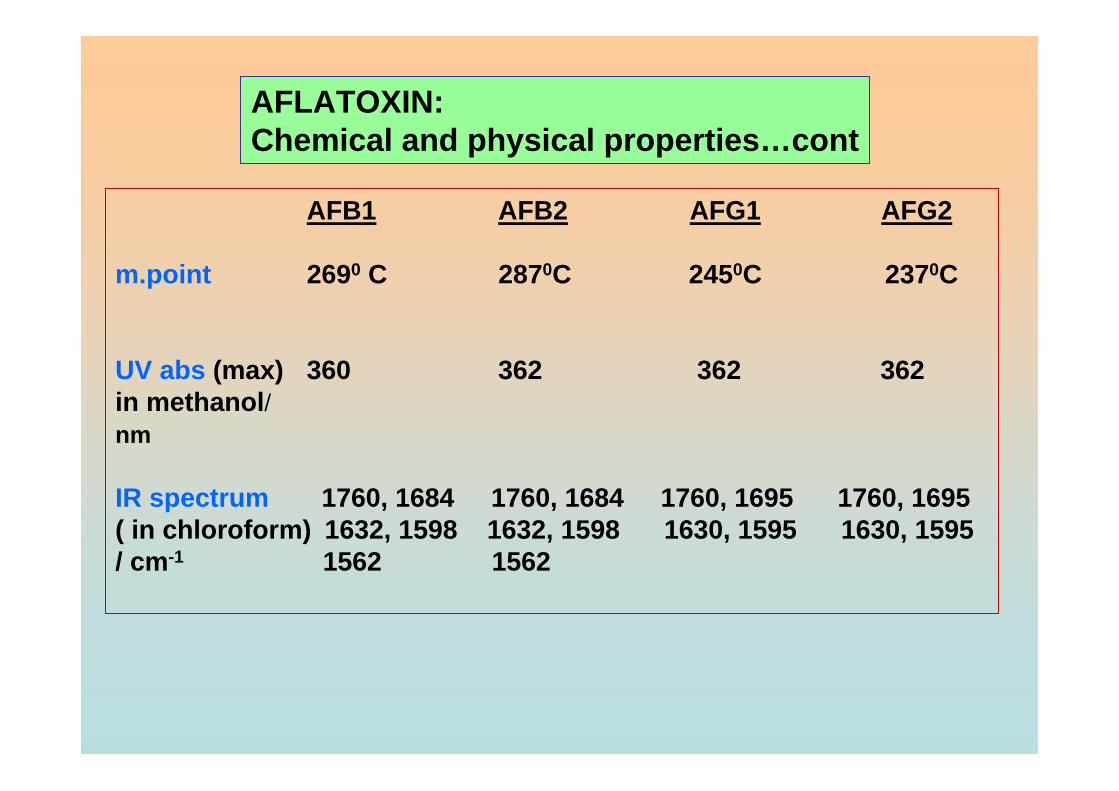
AFB1 AFB2 AFG1 AFG2
m.point 2690 C 2870C 2450C 2370C
UV abs (max) 360 362 362 362in methanol/nm
IR spectrum 1760, 1684 1760, 1684 1760, 1695 1760, 1695( in chloroform) 1632, 1598 1632, 1598 1630, 1595 1630, 1595/ cm-1 1562 1562
AFLATOXIN: Chemical and physical properties…cont
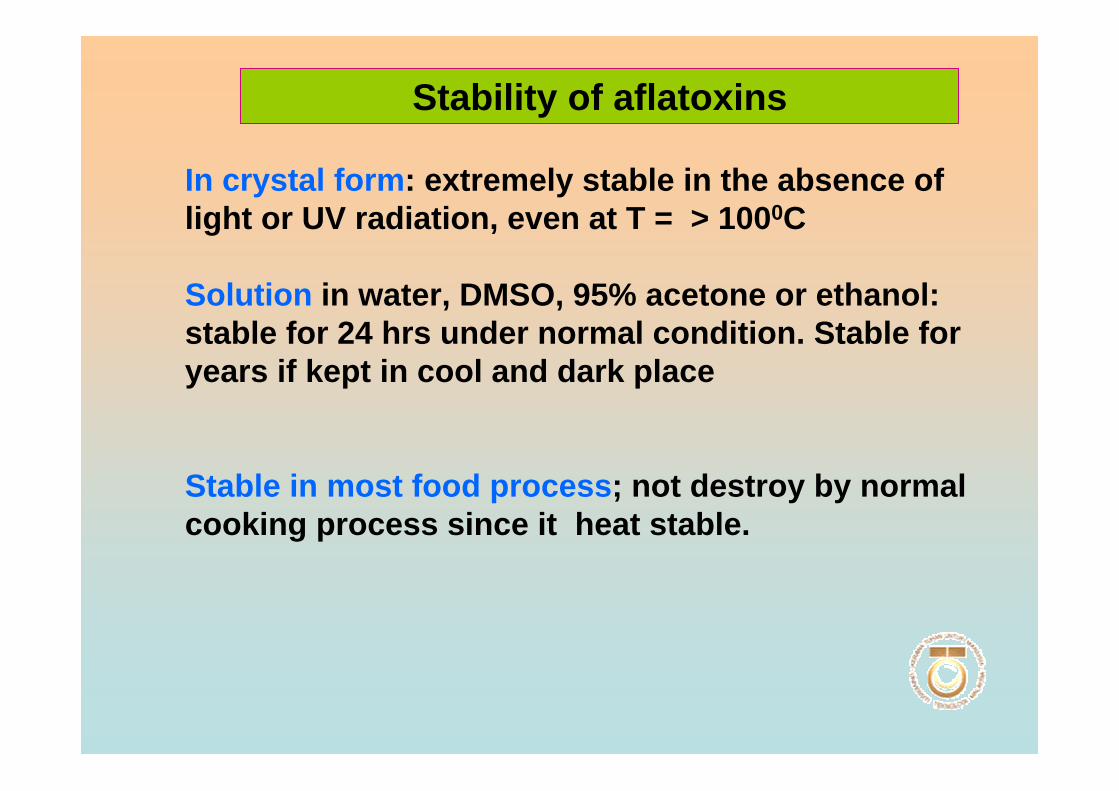
Stability of aflatoxins
In crystal form: extremely stable in the absence of light or UV radiation, even at T = > 1000C
Solution in water, DMSO, 95% acetone or ethanol:stable for 24 hrs under normal condition. Stable for years if kept in cool and dark place
Stable in most food process; not destroy by normal cooking process since it heat stable.
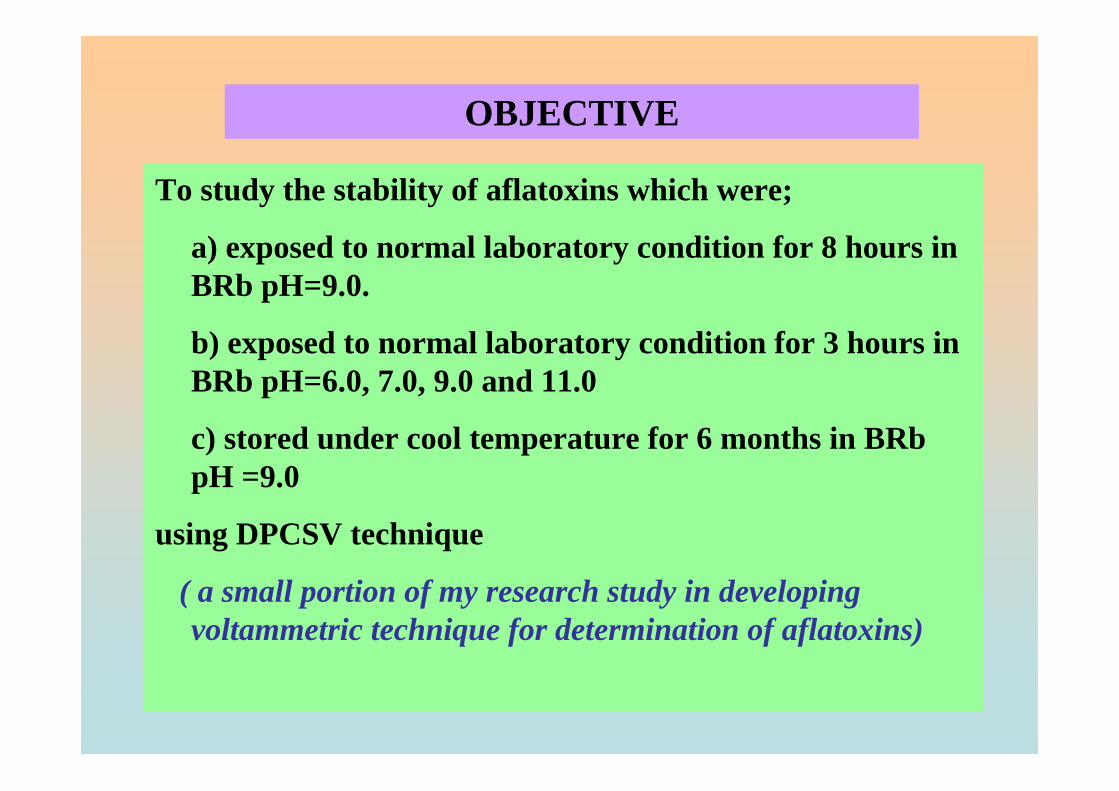
OBJECTIVE
To study the stability of aflatoxins which were;
a) exposed to normal laboratory condition for 8 hours in BRb pH=9.0.
b) exposed to normal laboratory condition for 3 hours in BRb pH=6.0, 7.0, 9.0 and 11.0
c) stored under cool temperature for 6 months in BRbpH =9.0
using DPCSV technique
( a small portion of my research study in developing voltammetric technique for determination of aflatoxins)

EXPERIMENTAL: INSTRUMENTS AND REAGENTS
BAS CGME consist of Ag/AgCl as RE, Pt wire as AE, CGME as WE, 20 ml cell and magnetic stirrer.
BAS C50W VoltammetricAnalyser
Reagents: AFB1, B2, G1, G2 ( MERCK); 10 ppm in benzene: acetonitrile (98%), 1 ppm: prepared in BRb at required pH.
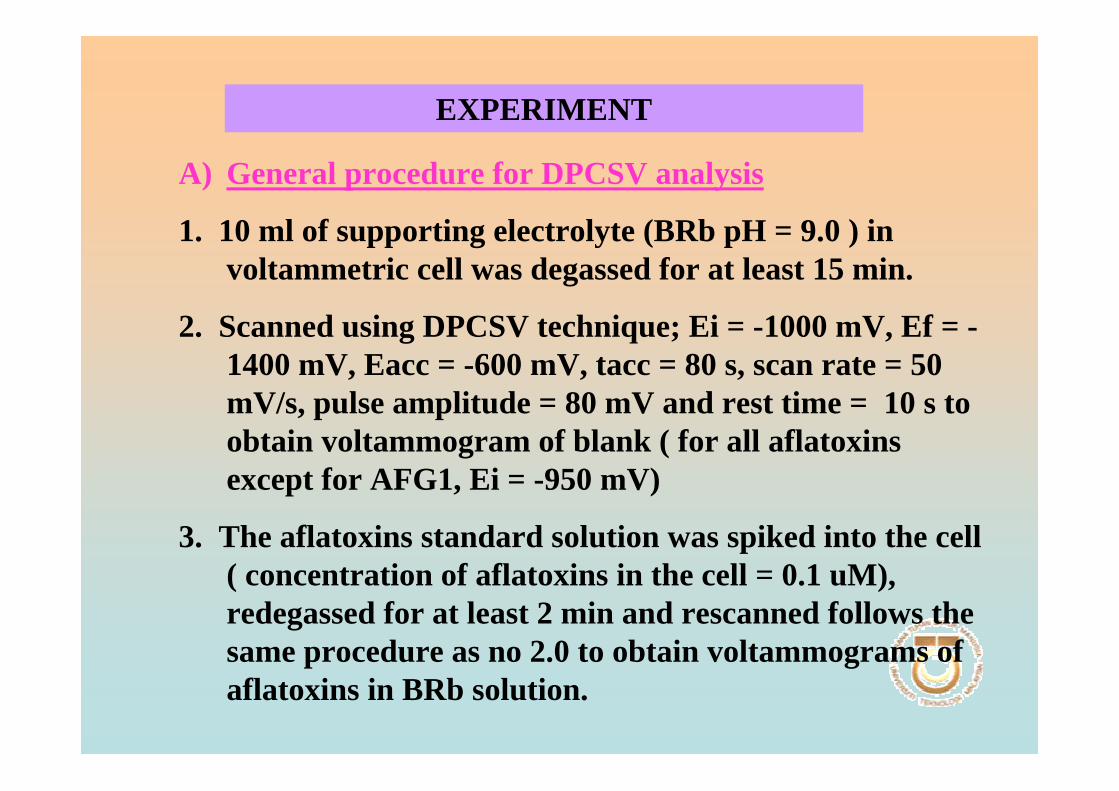
EXPERIMENT
A) General procedure for DPCSV analysis
1. 10 ml of supporting electrolyte (BRb pH = 9.0 ) in voltammetric cell was degassed for at least 15 min.
2. Scanned using DPCSV technique; Ei = -1000 mV, Ef = -1400 mV, Eacc = -600 mV, tacc = 80 s, scan rate = 50 mV/s, pulse amplitude = 80 mV and rest time = 10 s to obtain voltammogram of blank ( for all aflatoxinsexcept for AFG1, Ei = -950 mV)
3. The aflatoxins standard solution was spiked into the cell ( concentration of aflatoxins in the cell = 0.1 uM), redegassed for at least 2 min and rescanned follows the same procedure as no 2.0 to obtain voltammograms of aflatoxins in BRb solution.
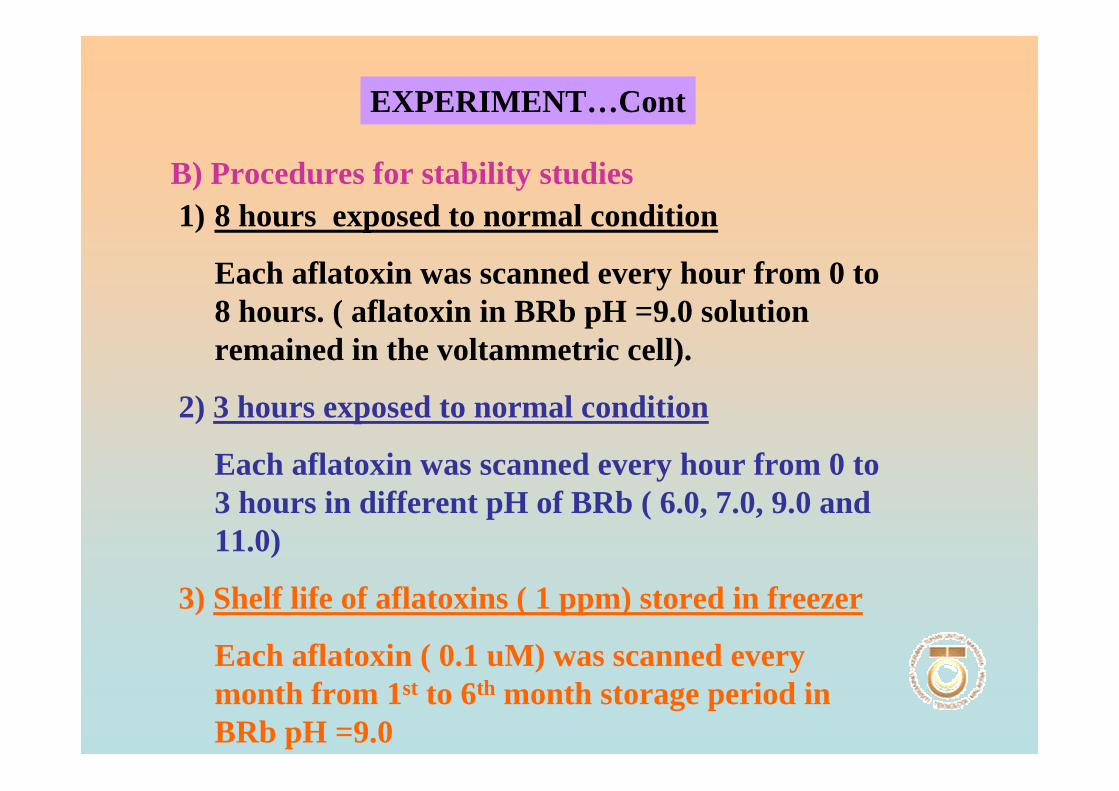
EXPERIMENT…Cont
B) Procedures for stability studies1) 8 hours exposed to normal condition
Each aflatoxin was scanned every hour from 0 to 8 hours. ( aflatoxin in BRb pH =9.0 solution remained in the voltammetric cell).
2) 3 hours exposed to normal condition
Each aflatoxin was scanned every hour from 0 to 3 hours in different pH of BRb ( 6.0, 7.0, 9.0 and 11.0)
3) Shelf life of aflatoxins ( 1 ppm) stored in freezer
Each aflatoxin ( 0.1 uM) was scanned every month from 1st to 6th month storage period in BRb pH =9.0
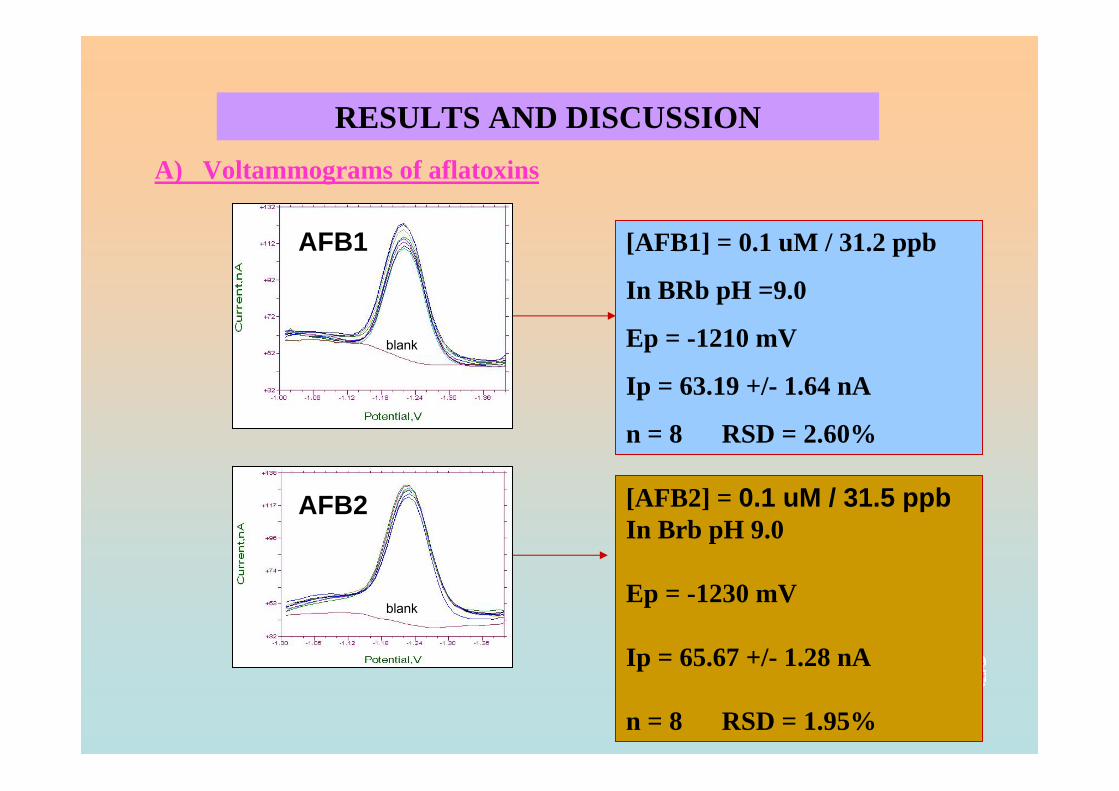
RESULTS AND DISCUSSIONA) Voltammograms of aflatoxins
[AFB1] = 0.1 uM / 31.2 ppb
In BRb pH =9.0
Ep = -1210 mV
Ip = 63.19 +/- 1.64 nA
n = 8 RSD = 2.60%
[AFB2] = 0.1 uM / 31.5 ppbIn Brb pH 9.0
Ep = -1230 mV
Ip = 65.67 +/- 1.28 nA
n = 8 RSD = 1.95%
blank
blank
AFB1
AFB2
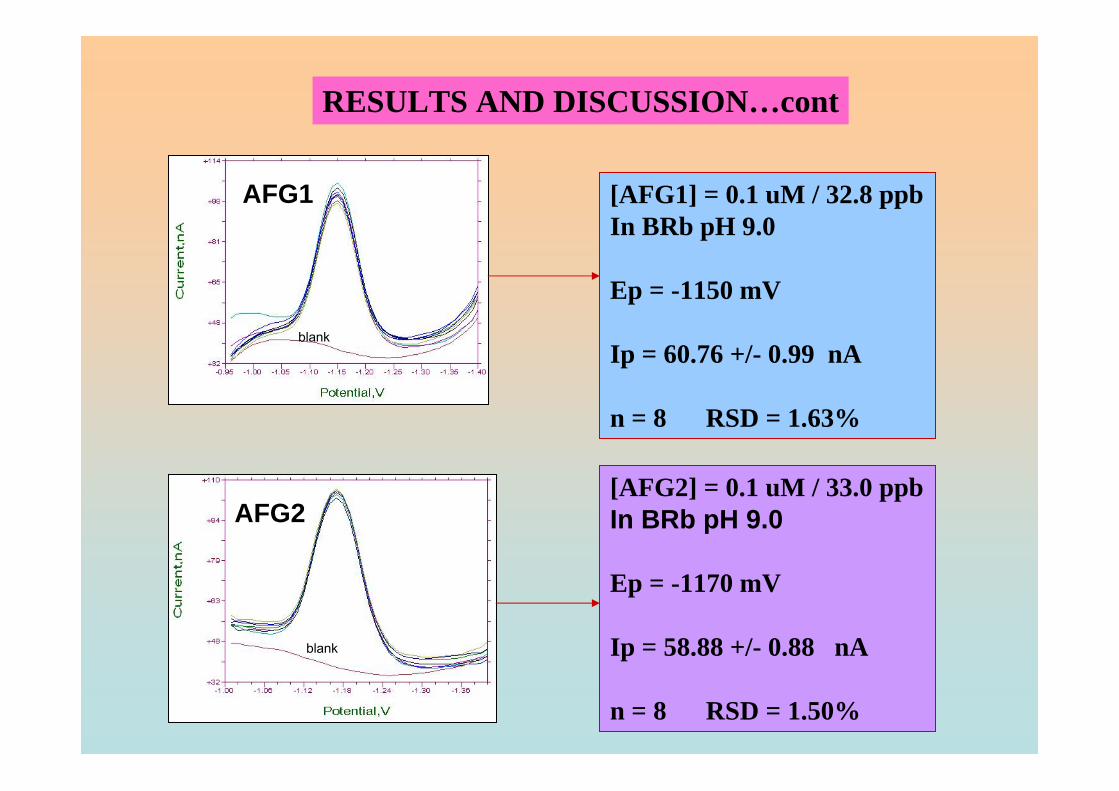
RESULTS AND DISCUSSION…cont
[AFG1] = 0.1 uM / 32.8 ppbIn BRb pH 9.0
Ep = -1150 mV
Ip = 60.76 +/- 0.99 nA
n = 8 RSD = 1.63%
[AFG2] = 0.1 uM / 33.0 ppbIn BRb pH 9.0
Ep = -1170 mV
Ip = 58.88 +/- 0.88 nA
n = 8 RSD = 1.50%
blank
blank
AFG1
AFG2
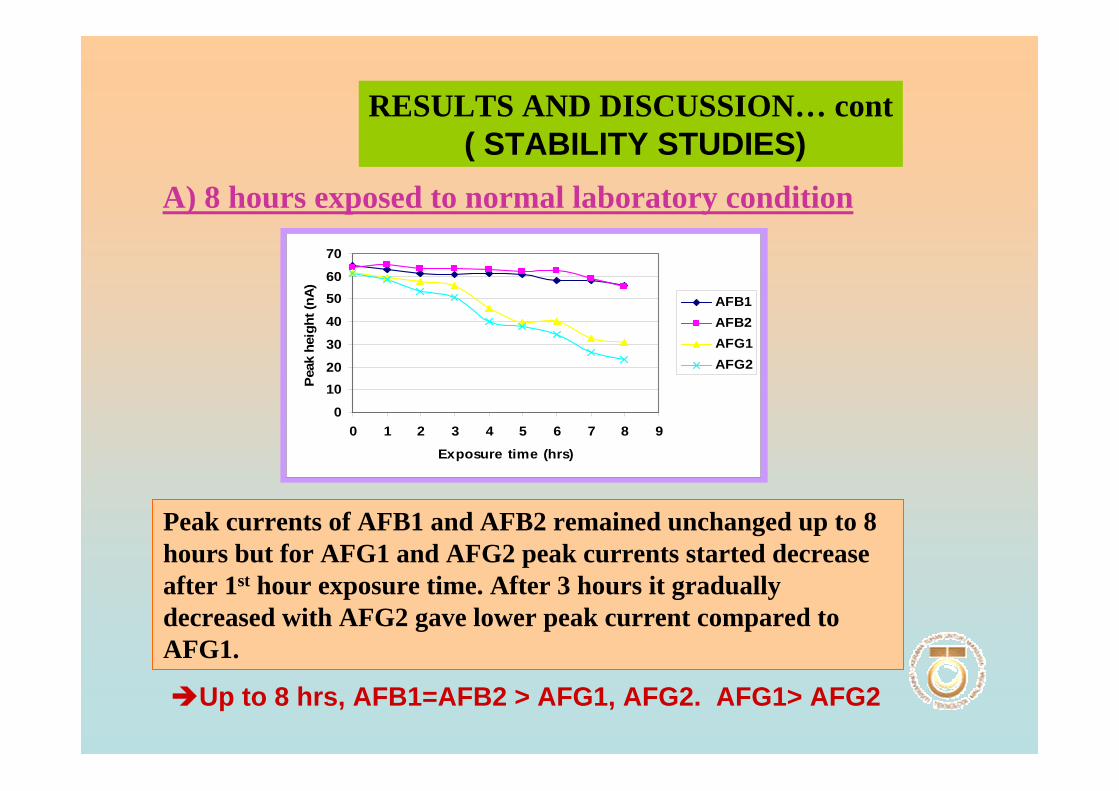
RESULTS AND DISCUSSION… cont( STABILITY STUDIES)
A) 8 hours exposed to normal laboratory condition
Peak currents of AFB1 and AFB2 remained unchanged up to 8 hours but for AFG1 and AFG2 peak currents started decrease after 1st hour exposure time. After 3 hours it gradually decreased with AFG2 gave lower peak current compared to AFG1.
0
1020
30
40
5060
70
0 1 2 3 4 5 6 7 8 9
Exposure time (hrs)
Pea
k he
ight
(nA
)AFB1AFB2AFG1AFG2
Up to 8 hrs, AFB1=AFB2 > AFG1, AFG2. AFG1> AFG2
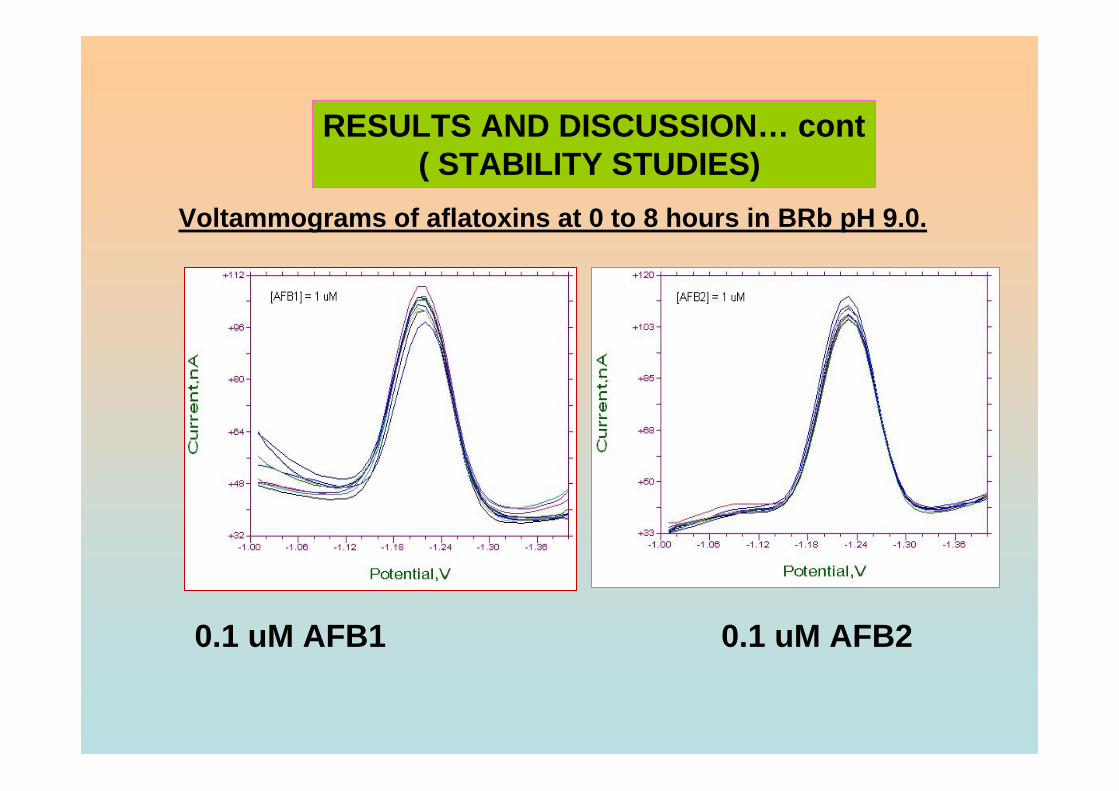
RESULTS AND DISCUSSION… cont( STABILITY STUDIES)
Voltammograms of aflatoxins at 0 to 8 hours in BRb pH 9.0.
0.1 uM AFB1 0.1 uM AFB2
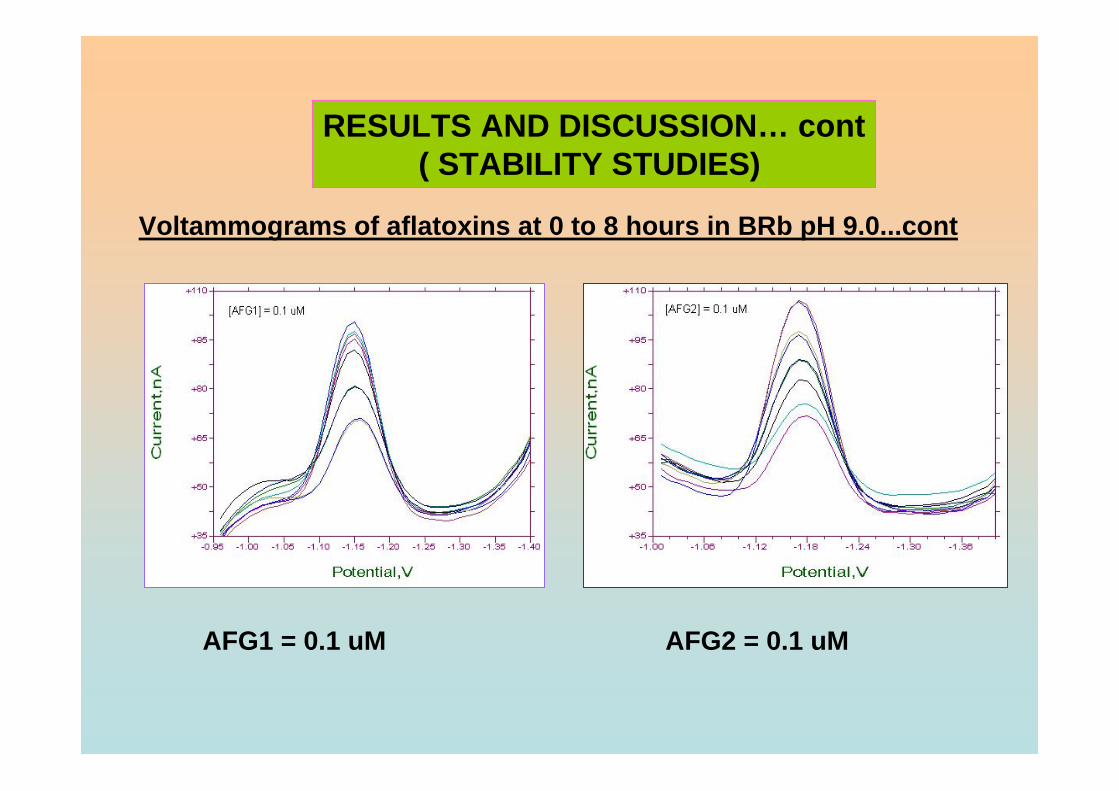
RESULTS AND DISCUSSION… cont( STABILITY STUDIES)
Voltammograms of aflatoxins at 0 to 8 hours in BRb pH 9.0...cont
AFG1 = 0.1 uM AFG2 = 0.1 uM
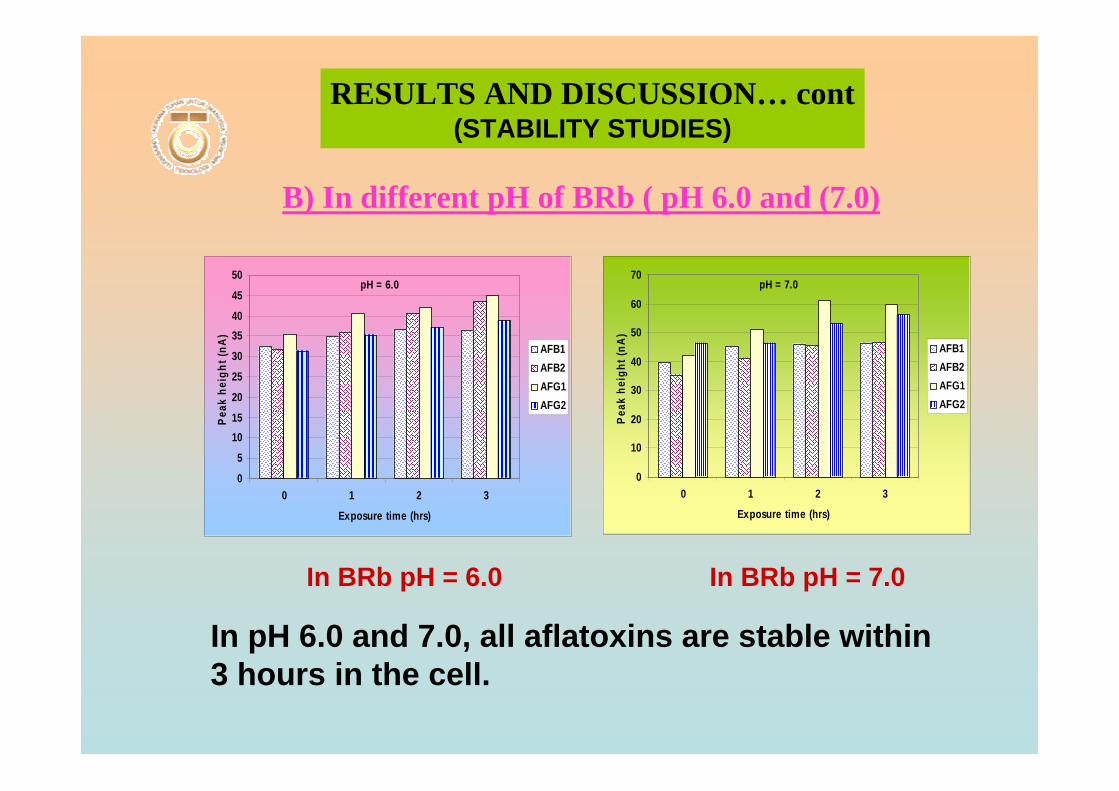
B) In different pH of BRb ( pH 6.0 and (7.0)
RESULTS AND DISCUSSION… cont(STABILITY STUDIES)
In pH 6.0 and 7.0, all aflatoxins are stable within 3 hours in the cell.
0
5
1015
20
25
30
3540
45
50
0 1 2 3
Exposure time (hrs)
Pea
k he
ight
(nA) AFB1
AFB2AFG1AFG2
pH = 6.0
0
10
20
30
40
50
60
70
0 1 2 3
Exposure time (hrs)
Peak
hei
ght (
nA)
AFB1AFB2AFG1AFG2
pH = 7.0
In BRb pH = 6.0 In BRb pH = 7.0
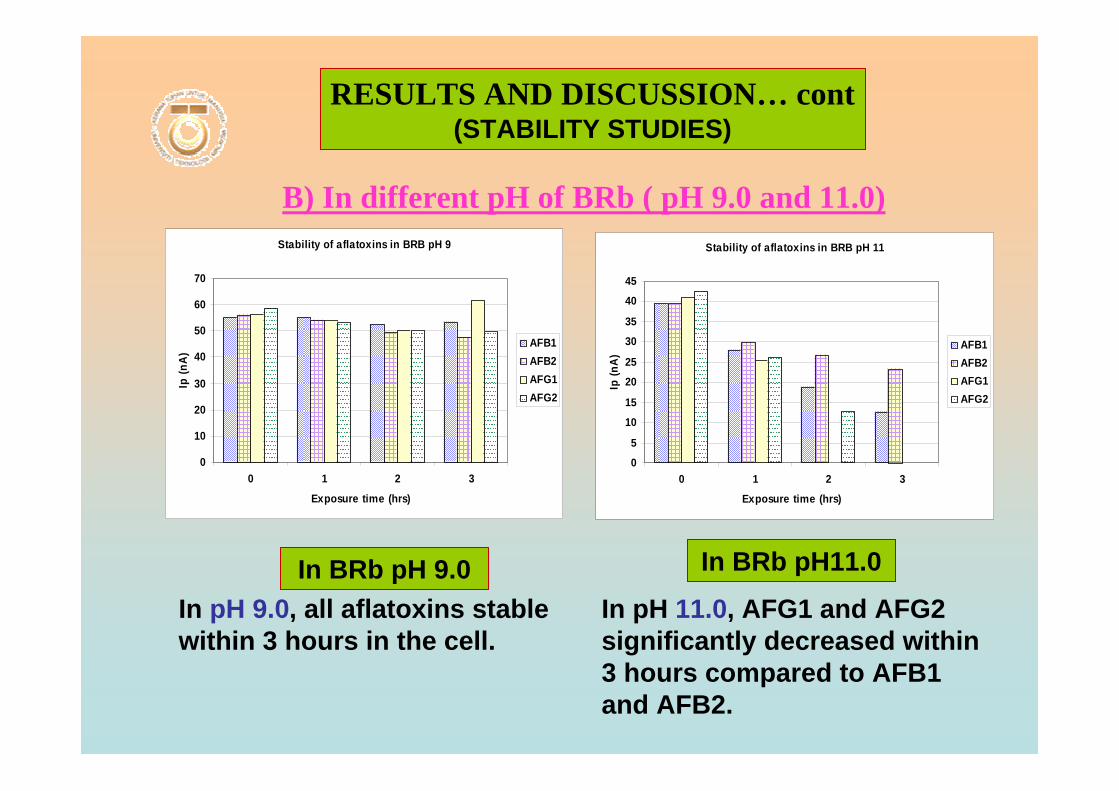
B) In different pH of BRb ( pH 9.0 and 11.0)
RESULTS AND DISCUSSION… cont(STABILITY STUDIES)
Stability of aflatoxins in BRB pH 9
0
10
20
30
40
50
60
70
0 1 2 3
Exposure time (hrs)
Ip (n
A)
AFB1AFB2AFG1AFG2
In pH 9.0, all aflatoxins stable within 3 hours in the cell.
Stability of aflatoxins in BRB pH 11
0
5
10
15
20
25
30
35
40
45
0 1 2 3
Exposure time (hrs)
Ip (n
A)
AFB1AFB2AFG1AFG2
In pH 11.0, AFG1 and AFG2 significantly decreased within 3 hours compared to AFB1 and AFB2.
In BRb pH 9.0 In BRb pH11.0
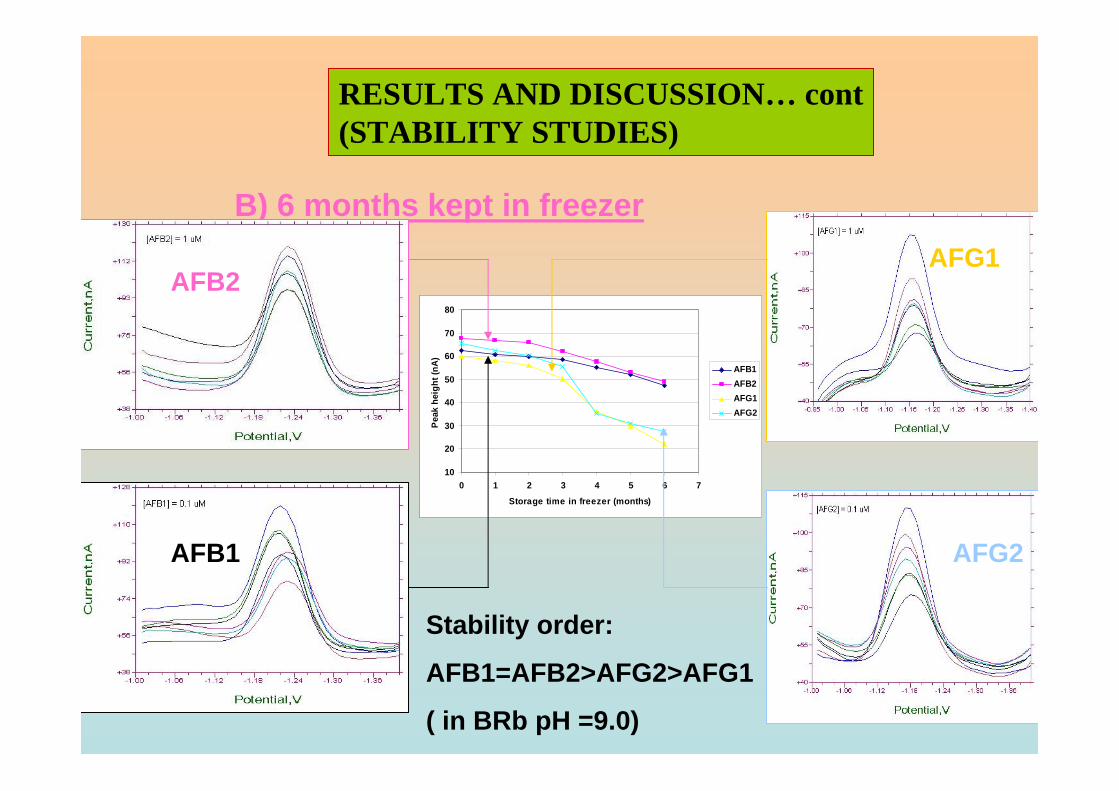
RESULTS AND DISCUSSION… cont(STABILITY STUDIES)
B) 6 months kept in freezer
10
20
30
40
50
60
70
80
0 1 2 3 4 5 6 7
Storage time in freezer (months)
Peak
hei
ght (
nA)
AFB1AFB2AFG1AFG2
Stability order:
AFB1=AFB2>AFG2>AFG1
( in BRb pH =9.0)
AFB2
AFB1
AFG1
AFG2
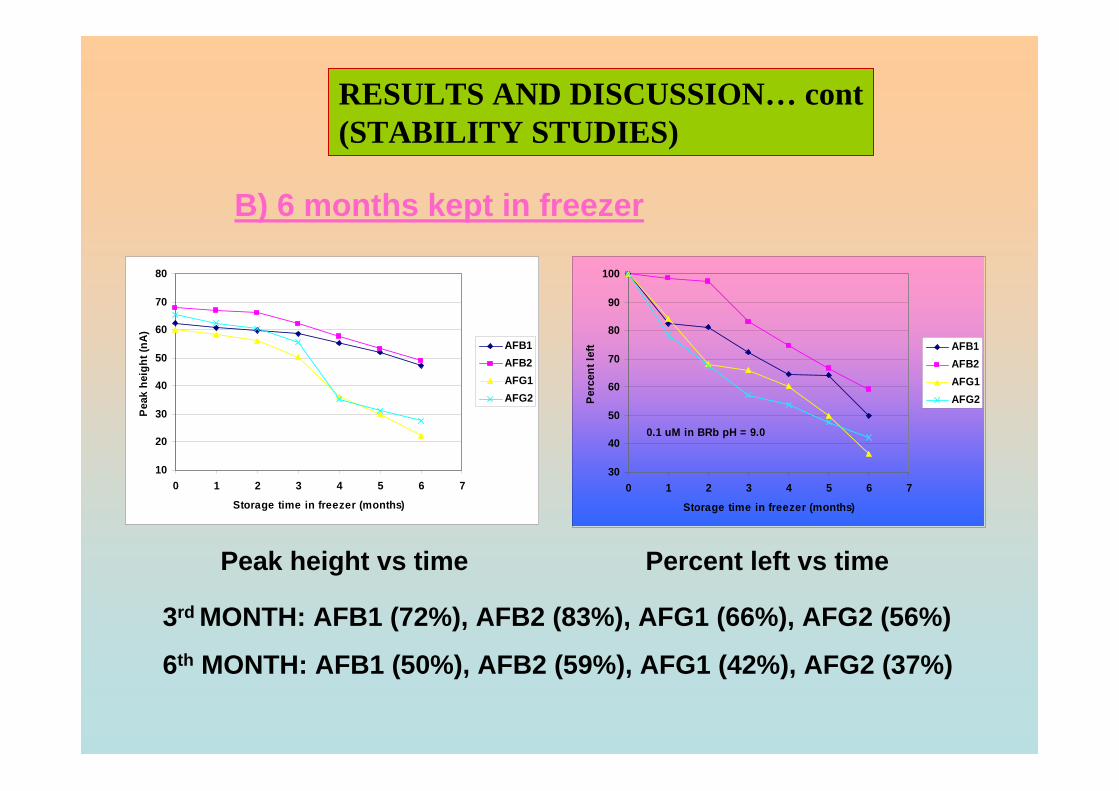
RESULTS AND DISCUSSION… cont(STABILITY STUDIES)
B) 6 months kept in freezer
10
20
30
40
50
60
70
80
0 1 2 3 4 5 6 7
Storage time in freezer (months)
Peak
hei
ght (
nA)
AFB1AFB2AFG1AFG2
Peak height vs time Percent left vs time
3rd MONTH: AFB1 (72%), AFB2 (83%), AFG1 (66%), AFG2 (56%)
6th MONTH: AFB1 (50%), AFB2 (59%), AFG1 (42%), AFG2 (37%)
30
40
50
60
70
80
90
100
0 1 2 3 4 5 6 7
Storage time in freezer (months)
Perc
ent l
eft AFB1
AFB2AFG1AFG2
0.1 uM in BRb pH = 9.0
CONCLUSION
1. In BRb pH 9.0, AFB1 and AFB2 are stable up to 8 hours while AFG1 and AFG2 are stable up to 3 hours when exposed to normal condition in voltammetric cell.
2. Within 3 hours exposed to normal condition, all aflatoxins are stable in BRb pH 6, 7 and 9.0 but in BRb pH 11.0, AFG1 is very unstable compared to other aflatoxins. The proposed stability order for aflatoxins in BRb pH 11.0 is:
AFB2 > AFB1 > AFG2 > AFG1
3. AFB1 and AFB2 solution in BRb pH 9.0 kept in freezer have shelf life of 3 months while AFG1 and AFG2 only 2 months. After this period of time, the new aflatoxins solution should be prepared.
CONCLUSION…. cont

ACKNOWLEDGEMENT
SUPERVISOR:AP DR ABDUL RAHIM MOHD YUSOFF
CO-SUPERVISORS: 1. PROF RAHMALAN AHAMAD2. AP DR ABD. RAHIM YAACOB
ELECTROANALYSIS GROUP AND STAFF OF CHEMISTRY DEPT
SCHOOL OF HEALTH SCIENCES, USM ,HEALTH CAMPUS, KUBANG KRIAN, KELANTAN

THANK YOU

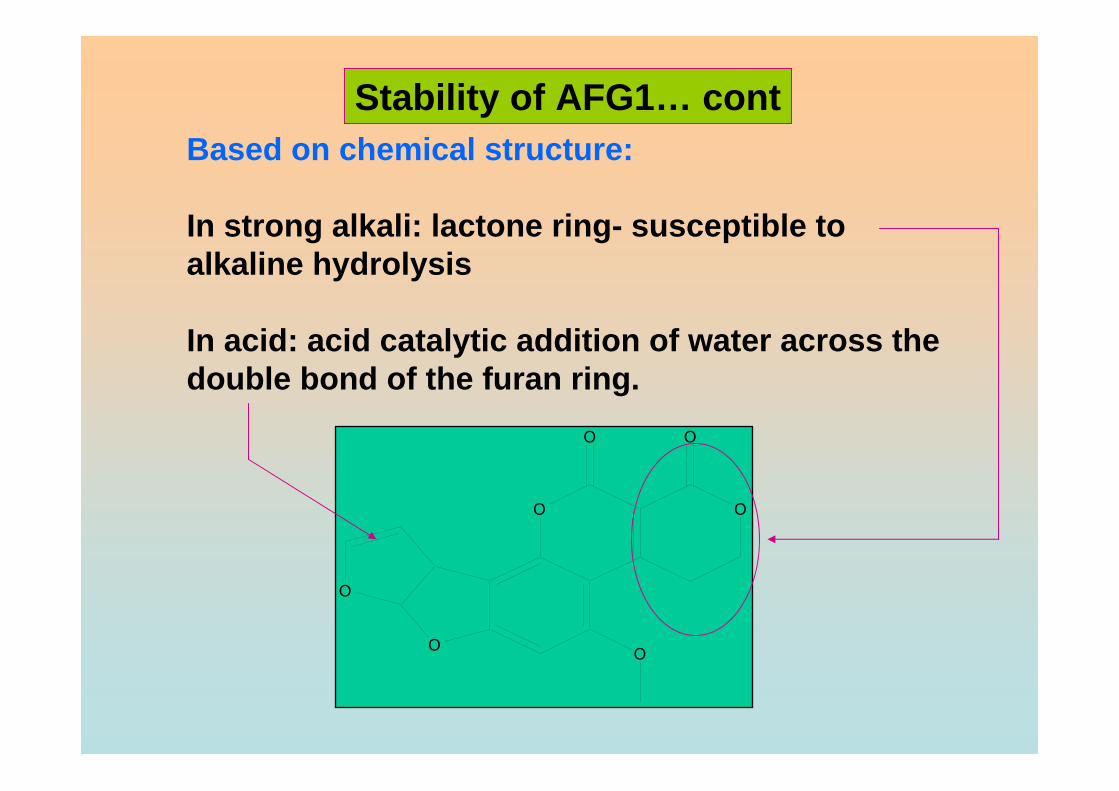
Based on chemical structure:
In strong alkali: lactone ring- susceptible to alkaline hydrolysis
In acid: acid catalytic addition of water across the double bond of the furan ring.
O O
O
O
OO
O
Stability of AFG1… cont
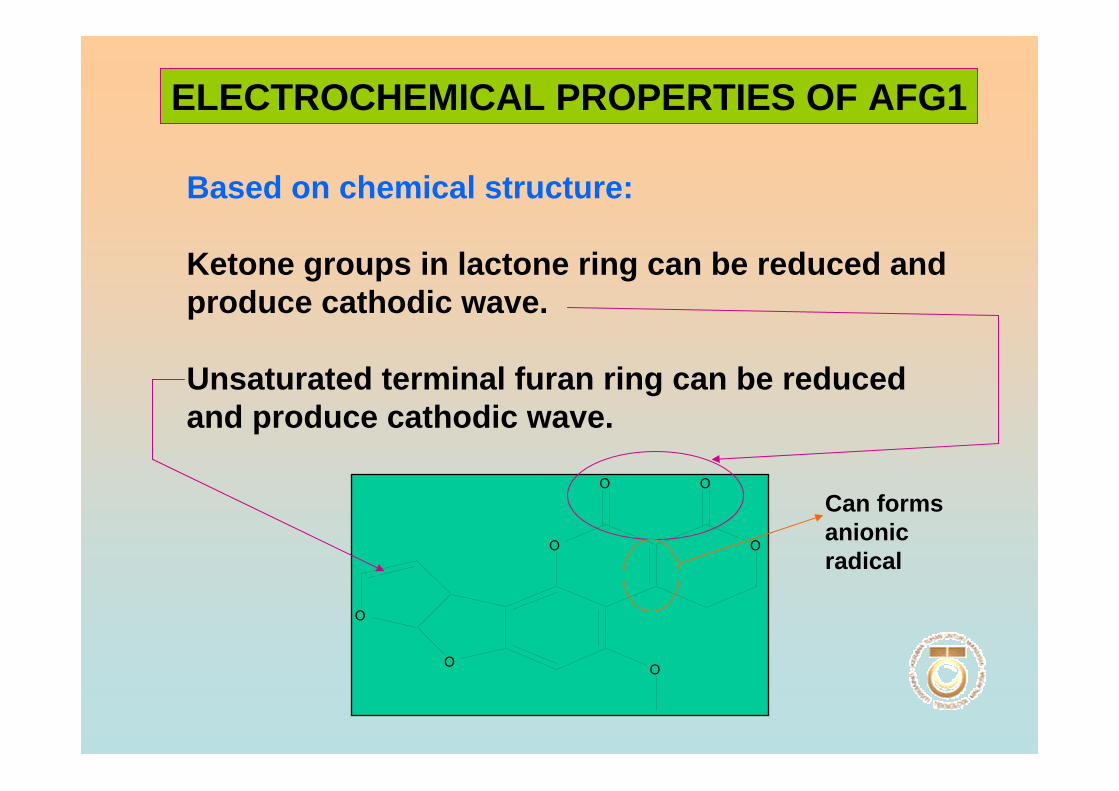
Based on chemical structure:
Ketone groups in lactone ring can be reduced and produce cathodic wave.
Unsaturated terminal furan ring can be reduced and produce cathodic wave.
O O
O
O
OO
O
ELECTROCHEMICAL PROPERTIES OF AFG1
Can forms anionic radical

Proposed mechanisme of the reduction of AFG1 that may take place at mercury electrode as reported by Smyth et al. (1979);
O O
O
O
OO
O
O O
O
O
OO
O
22e-
Θ
Dimer + 2OH-2H2O
2H+
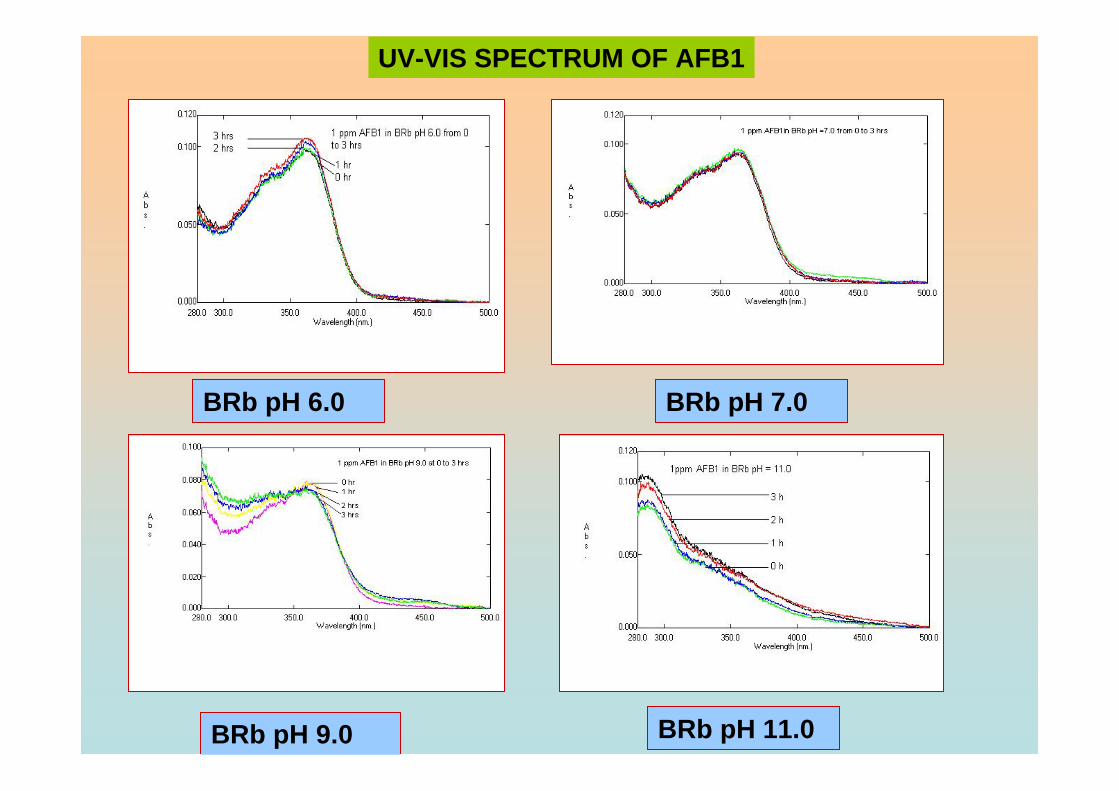
UV-VIS SPECTRUM OF AFB1
BRb pH 6.0 BRb pH 7.0
BRb pH 11.0BRb pH 9.0
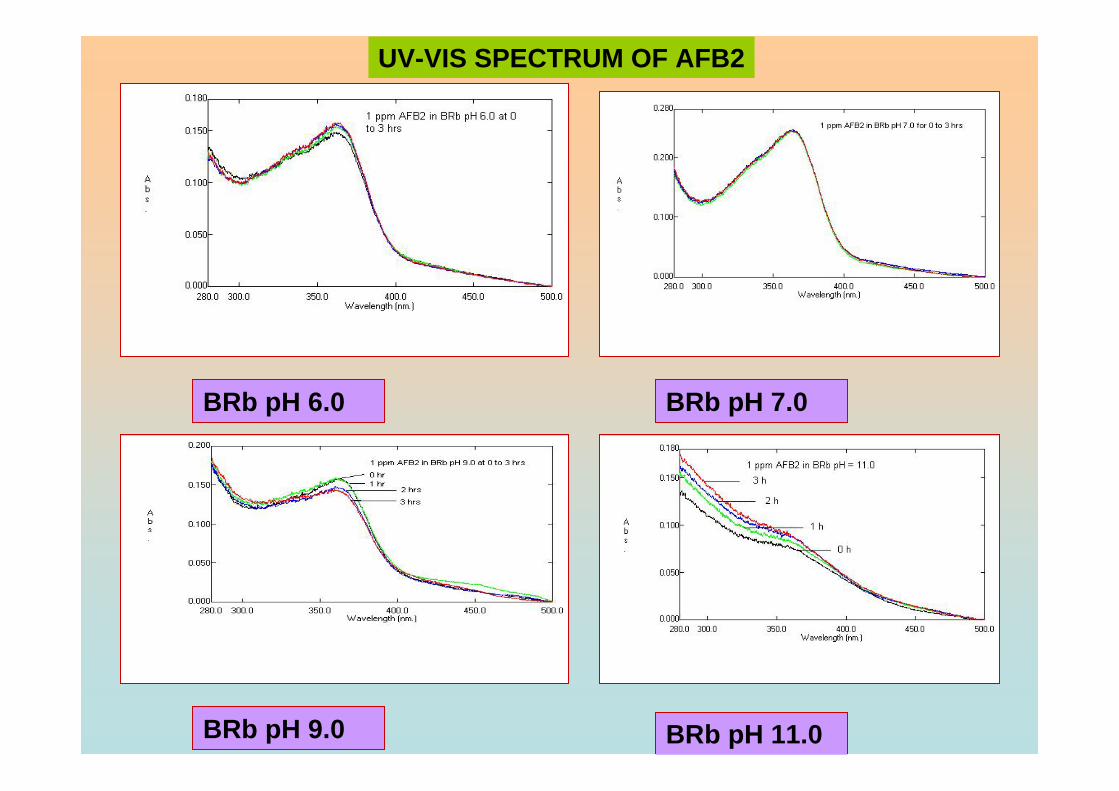
UV-VIS SPECTRUM OF AFB2
BRb pH 6.0 BRb pH 7.0
BRb pH 11.0BRb pH 9.0
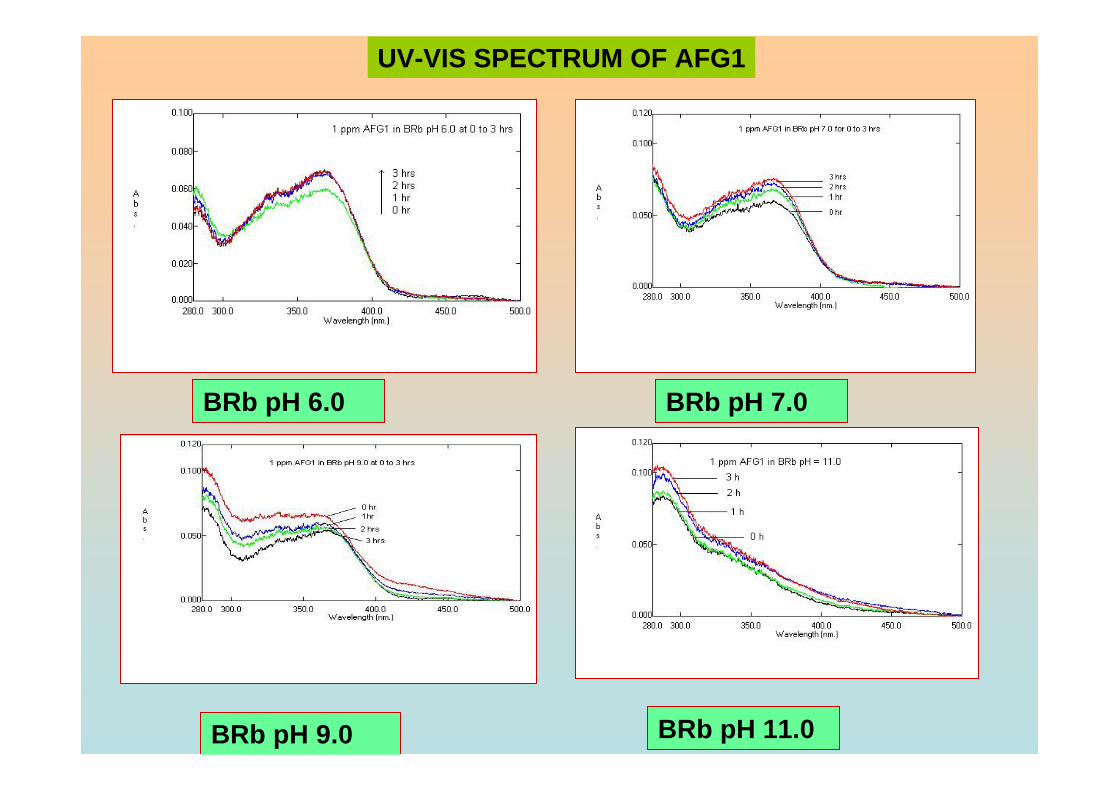
UV-VIS SPECTRUM OF AFG1
BRb pH 6.0 BRb pH 7.0
BRb pH 11.0BRb pH 9.0
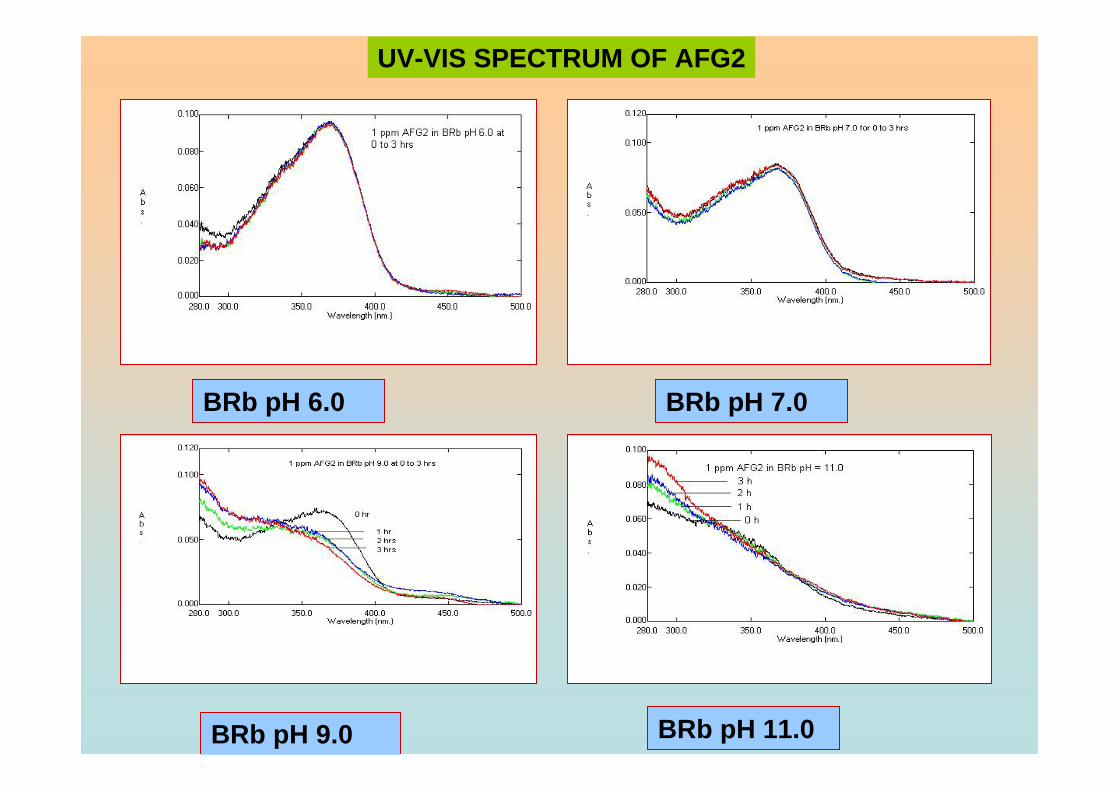
UV-VIS SPECTRUM OF AFG2
BRb pH 6.0 BRb pH 7.0
BRb pH 11.0BRb pH 9.0

ORAL PRESENTED AT SKAM-18
(JOHOR BAHRU, JOHOR ; 12 -14th SEPTEMBER 2005)
SQUARE-WAVE STRIPPING VOLTAMMETRIC TECHNIQUE FOR THE DETERMINATION OF AFLATOXIN B1 IN
GROUNDNUT SAMPLESBY
MOHAMAD HADZRI YAACOB
AP DR ABDULL RAHIM MOHD YUSOFF
PROF RAHMALAN AHAMAD
(UTM)

OBJECTIVE OF THIS STUDY
TO DEVELOP SWSV TECHNIQUE FOR THE DETERMINATION OF AFB1
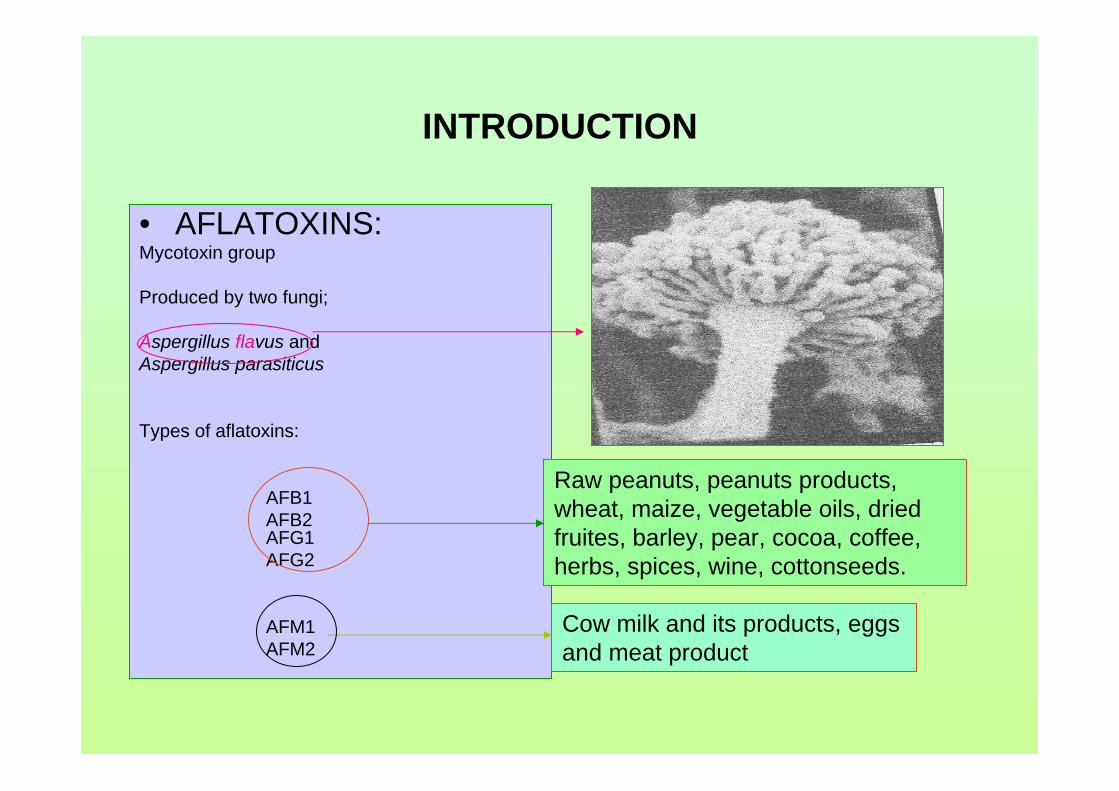
INTRODUCTION
• AFLATOXINS:Mycotoxin group
Produced by two fungi;
Aspergillus flavus and Aspergillus parasiticus
Types of aflatoxins:
AFB1 AFB2 AFG1AFG2
AFM1AFM2
Raw peanuts, peanuts products, wheat, maize, vegetable oils, dried fruites, barley, pear, cocoa, coffee, herbs, spices, wine, cottonseeds.
Cow milk and its products, eggs and meat product
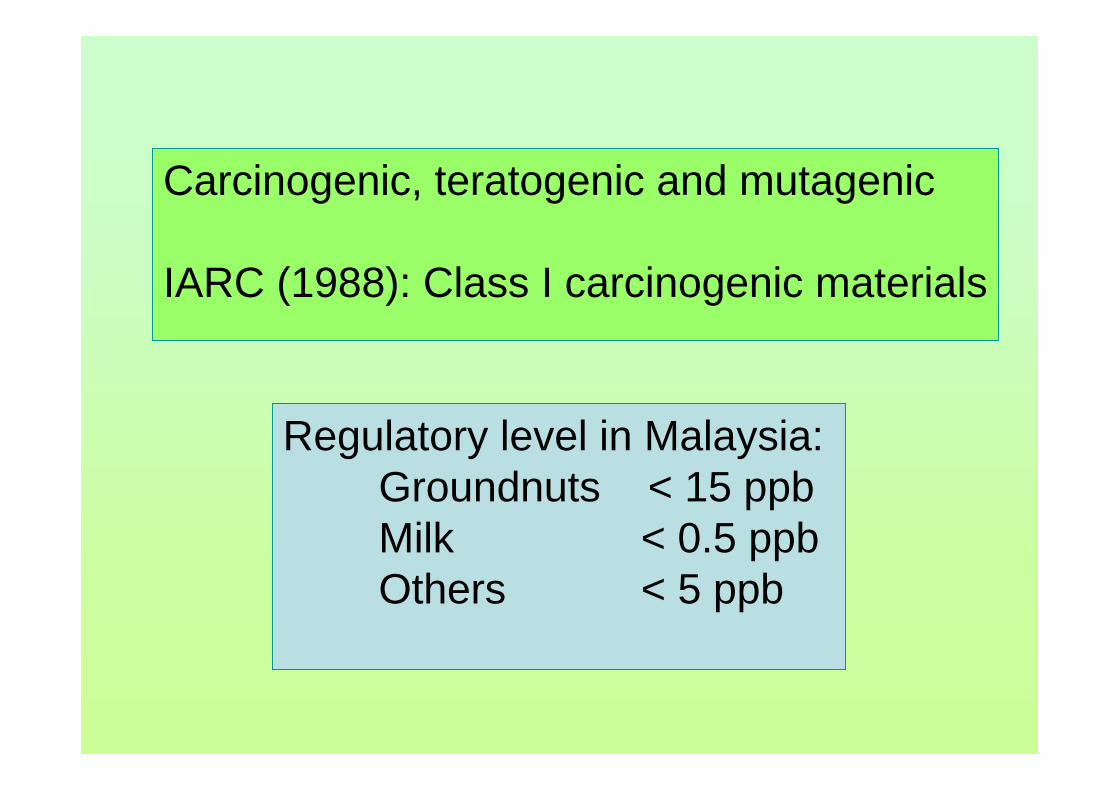
Regulatory level in Malaysia: Groundnuts < 15 ppbMilk < 0.5 ppbOthers < 5 ppb
Carcinogenic, teratogenic and mutagenic
IARC (1988): Class I carcinogenic materials
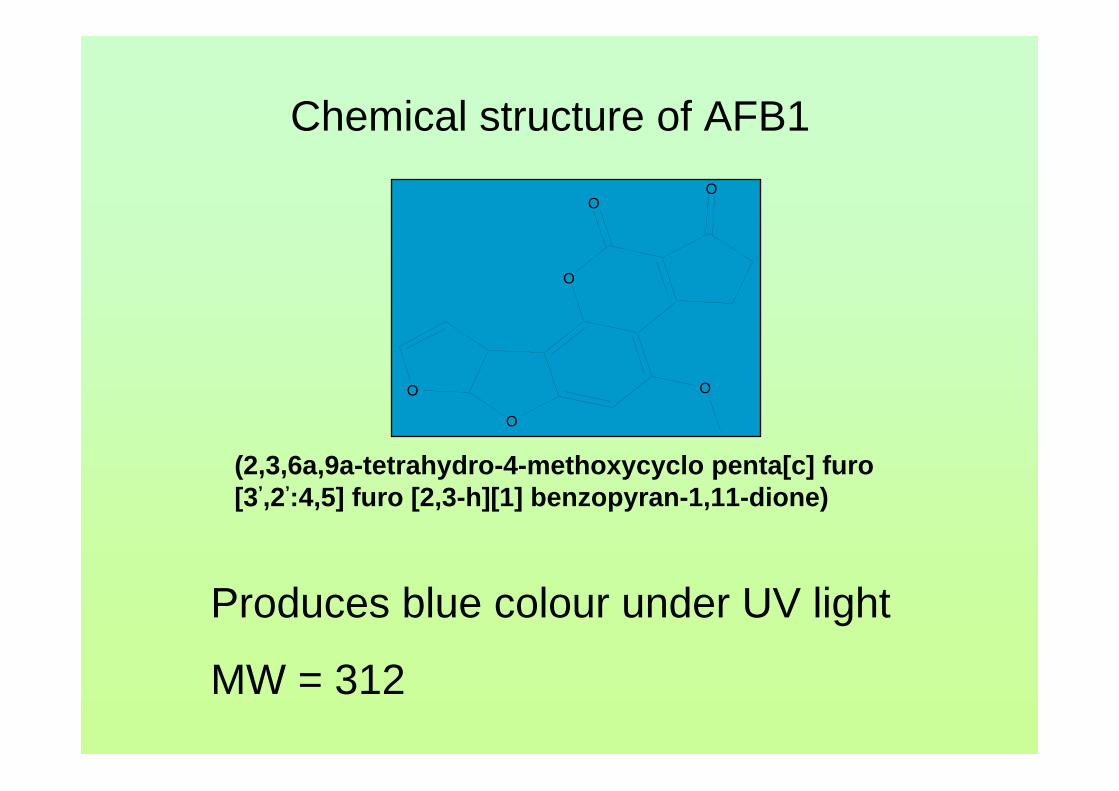
O
O
O
OO
O
Chemical structure of AFB1
Produces blue colour under UV light
MW = 312
(2,3,6a,9a-tetrahydro-4-methoxycyclo penta[c] furo[3’,2’:4,5] furo [2,3-h][1] benzopyran-1,11-dione)
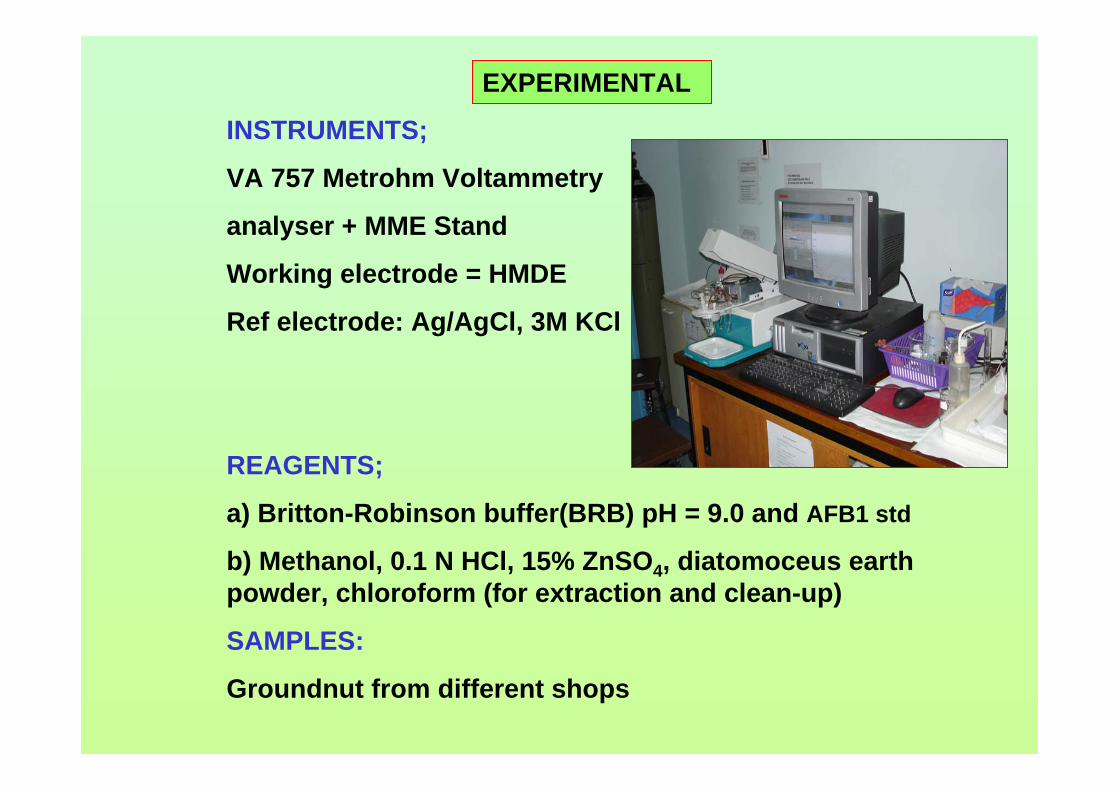
INSTRUMENTS;
VA 757 Metrohm Voltammetry
analyser + MME Stand
Working electrode = HMDE
Ref electrode: Ag/AgCl, 3M KCl
REAGENTS;
a) Britton-Robinson buffer(BRB) pH = 9.0 and AFB1 std
b) Methanol, 0.1 N HCl, 15% ZnSO4, diatomoceus earth powder, chloroform (for extraction and clean-up)
SAMPLES:
Groundnut from different shops
EXPERIMENTAL
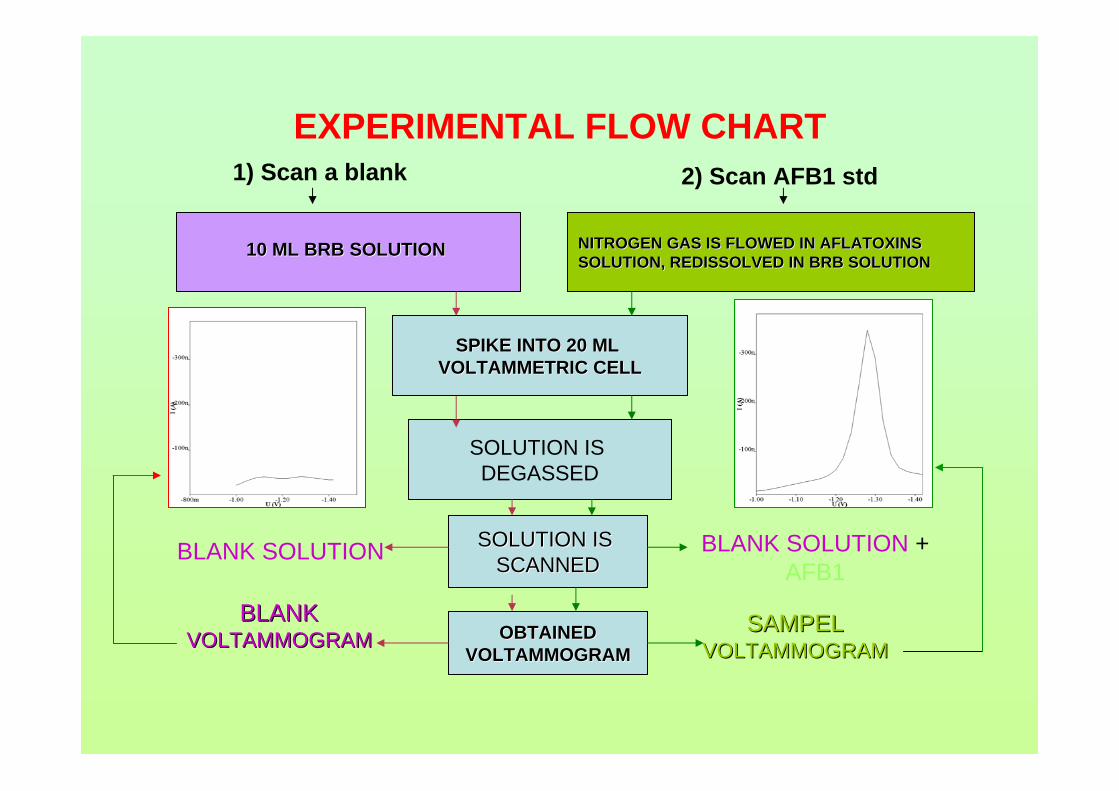
EXPERIMENTAL FLOW CHART
NITROGEN GAS IS FLOWED IN AFLATOXINS NITROGEN GAS IS FLOWED IN AFLATOXINS SOLUTION, REDISSOLVED IN BRB SOLUTION SOLUTION, REDISSOLVED IN BRB SOLUTION
10 ML BRB SOLUTION 10 ML BRB SOLUTION
SOLUTION IS DEGASSED
SOLUTION IS SOLUTION IS SCANNEDSCANNED
SPIKE INTO 20 ML SPIKE INTO 20 ML VOLTAMMETRIC CELLVOLTAMMETRIC CELL
OBTAINEDOBTAINEDVOLTAMMOGRAMVOLTAMMOGRAM
BLANK SOLUTION BLANK SOLUTION + AFB1
BLANKBLANKVOLTAMMOGRAM VOLTAMMOGRAM
SAMPELSAMPELVOLTAMMOGRAM VOLTAMMOGRAM
1) Scan a blank 2) Scan AFB1 std
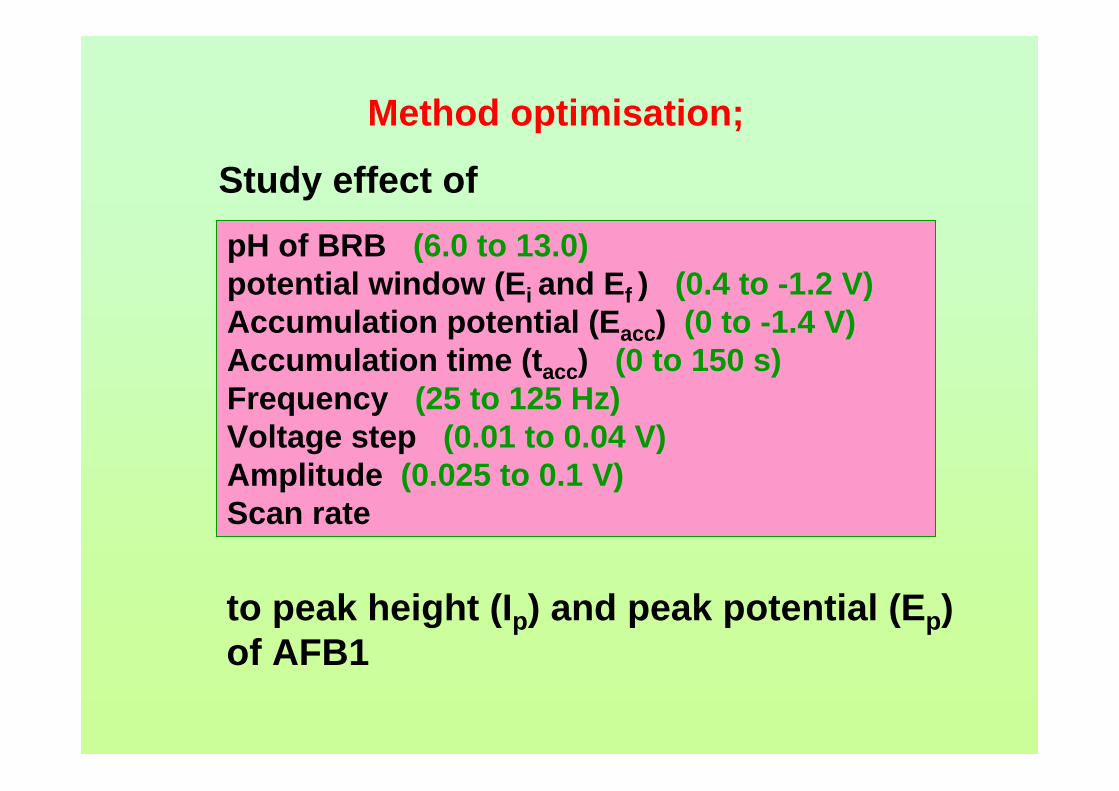
Method optimisation;
Study effect of pH of BRB (6.0 to 13.0)potential window (Ei and Ef ) (0.4 to -1.2 V)Accumulation potential (Eacc) (0 to -1.4 V)Accumulation time (tacc) (0 to 150 s)Frequency (25 to 125 Hz)Voltage step (0.01 to 0.04 V)Amplitude (0.025 to 0.1 V)Scan rate
to peak height (Ip) and peak potential (Ep) of AFB1
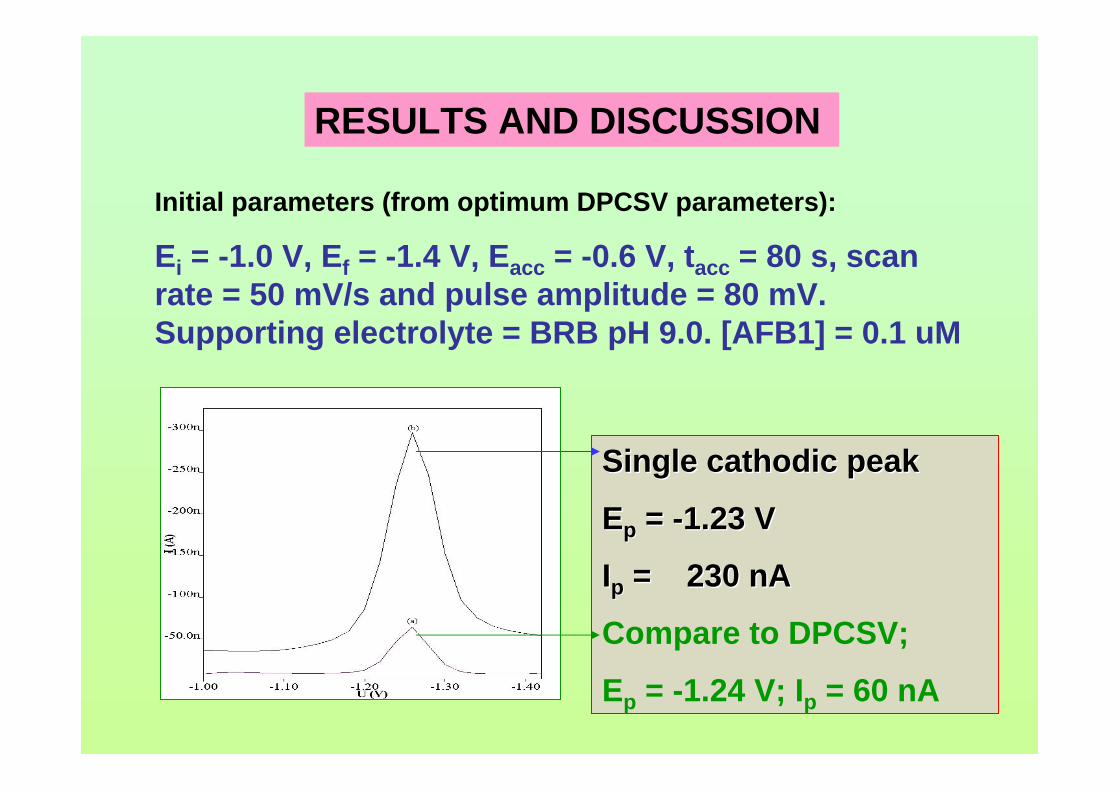
RESULTS AND DISCUSSION
Initial parameters (from optimum DPCSV parameters):
Ei = -1.0 V, Ef = -1.4 V, Eacc = -0.6 V, tacc = 80 s, scan rate = 50 mV/s and pulse amplitude = 80 mV. Supporting electrolyte = BRB pH 9.0. [AFB1] = 0.1 uM
Single Single cathodiccathodic peakpeak
EEpp = = --1.23 V1.23 V
IIpp = 230 = 230 nAnA
Compare to DPCSV;
Ep = -1.24 V; Ip = 60 nA
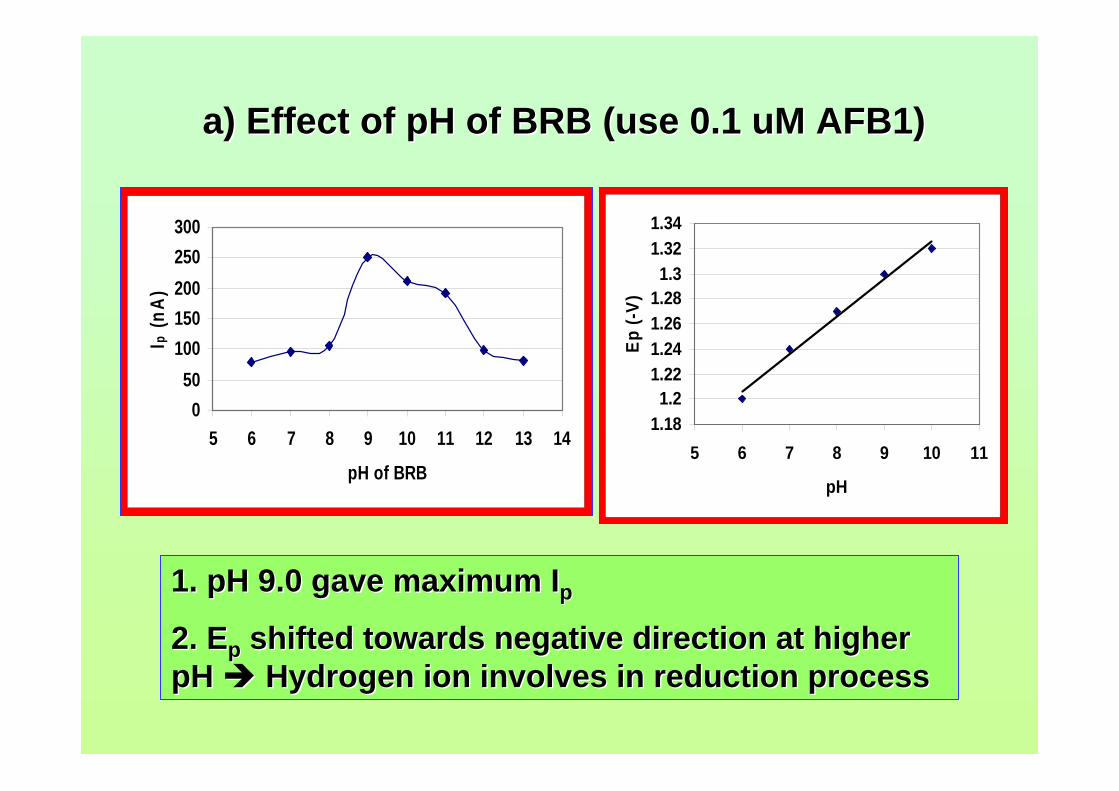
a) Effect of pH of BRB (use 0.1 a) Effect of pH of BRB (use 0.1 uMuM AFB1)AFB1)
1. pH 9.0 gave maximum 1. pH 9.0 gave maximum IIpp
2. 2. EEpp shifted towards negative direction at higher shifted towards negative direction at higher pH pH Hydrogen ion involves in reduction process Hydrogen ion involves in reduction process
050
100150200250300
5 6 7 8 9 10 11 12 13 14
pH of BRB
Ip (n
A)
1.181.2
1.221.241.261.281.3
1.321.34
5 6 7 8 9 10 11
pH
Ep (-
V)
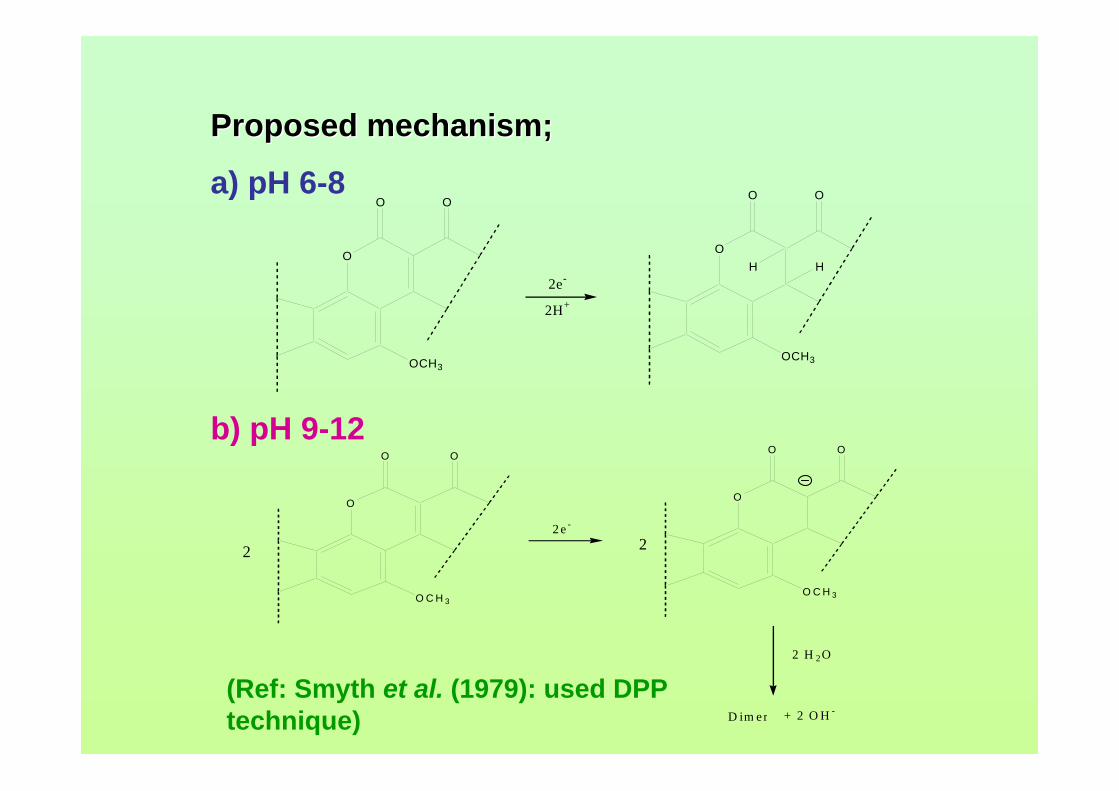
Proposed mechanism;Proposed mechanism;
a) pH 6-8
b) pH 9-12
O
OO
OCH3
2H+
O
OO
OCH3
H H2e-
O
OO
O C H 3
O
OO
O C H 3
2 H 2O
D im er + 2 O H -
2 e -
2 2
(Ref: Smyth et al. (1979): used DPP technique)
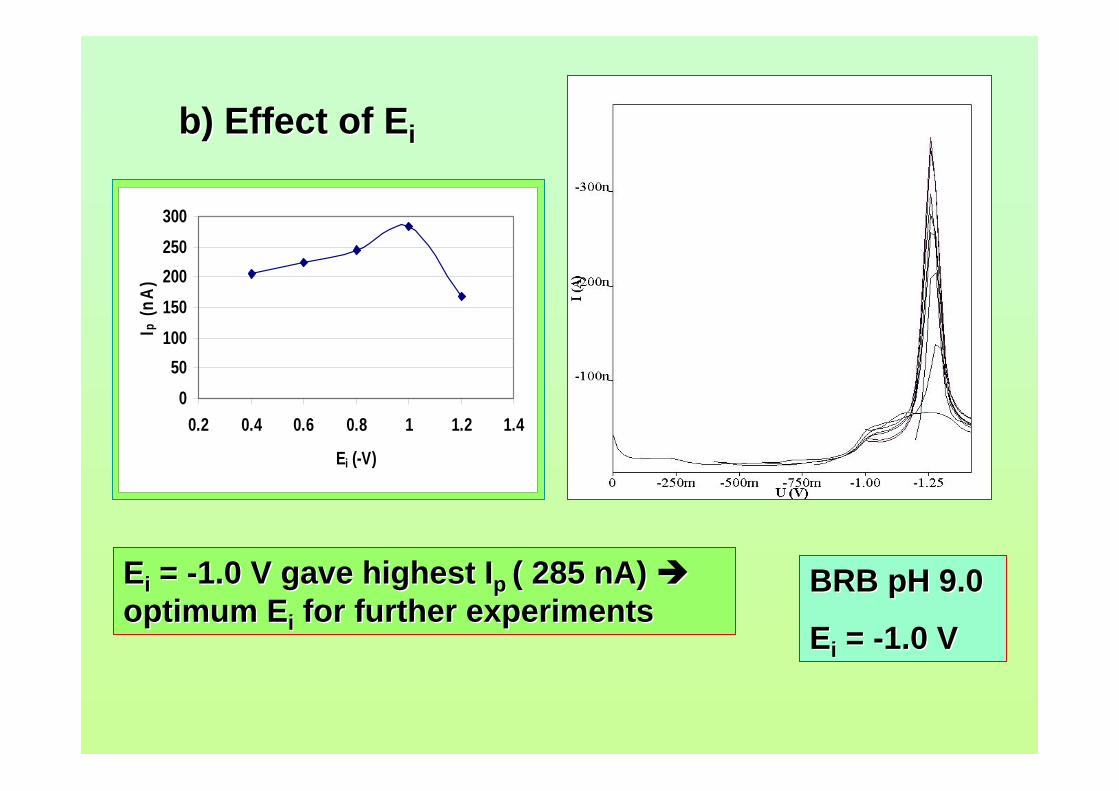
b) Effect of b) Effect of EEii
EEii = = --1.0 V gave highest 1.0 V gave highest IIpp ( 285 ( 285 nAnA) ) optimum optimum EEii for further experimentsfor further experiments
050
100150200250300
0.2 0.4 0.6 0.8 1 1.2 1.4
Ei (-V)
I p (n
A)
BRB pH 9.0BRB pH 9.0
EEii = = --1.0 V1.0 V
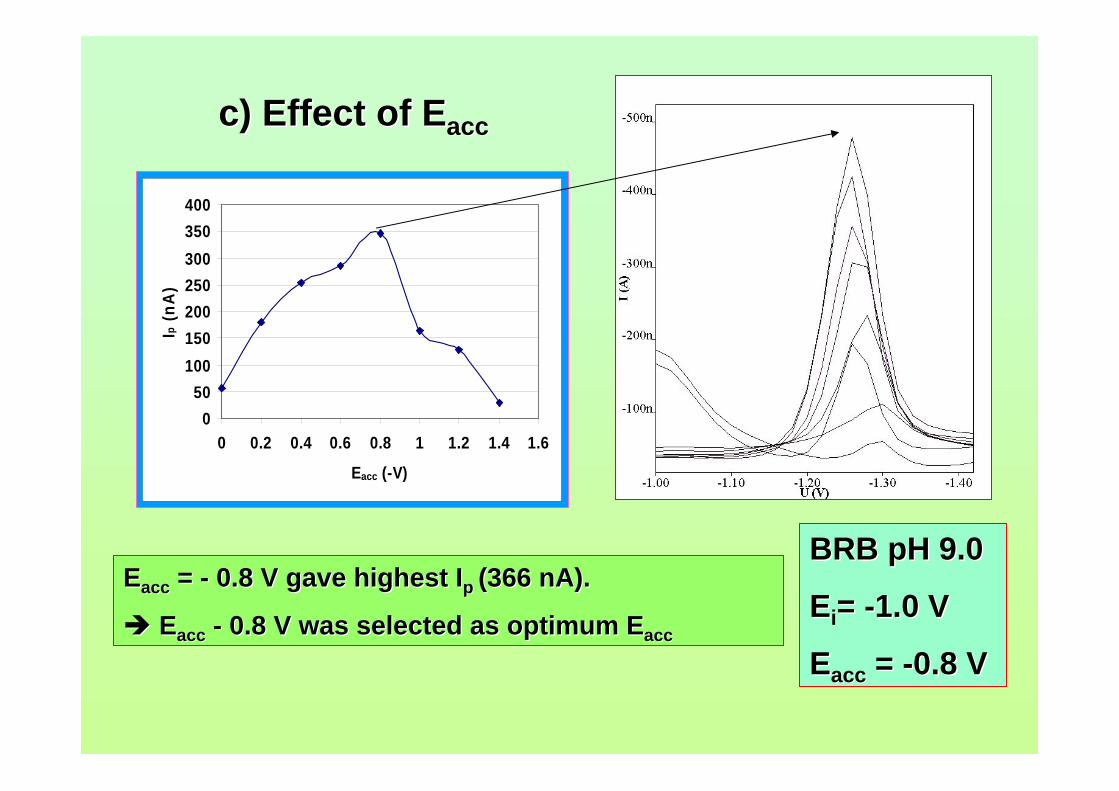
c) Effect of c) Effect of EEaccacc
EEaccacc = = -- 0.8 V gave highest 0.8 V gave highest IIpp (366 (366 nAnA).).
EEaccacc -- 0.8 V was selected as optimum 0.8 V was selected as optimum EEaccacc
050
100150200250300350400
0 0.2 0.4 0.6 0.8 1 1.2 1.4 1.6
Eacc (-V)
Ip (n
A)
BRB pH 9.0BRB pH 9.0
EEii= = --1.0 V1.0 V
EEaccacc = = --0.8 V0.8 V
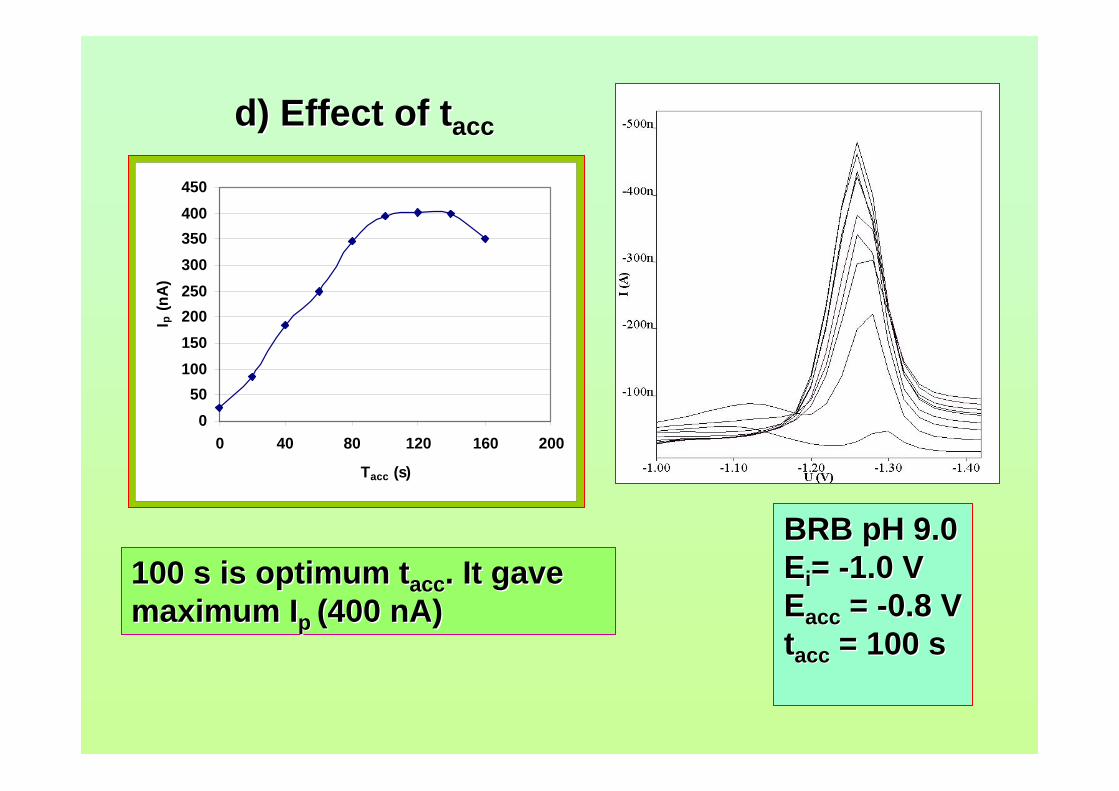
d) Effect of d) Effect of ttaccacc
100 s is optimum 100 s is optimum ttaccacc. It gave . It gave maximum maximum IIpp (400 (400 nAnA))
050
100150200250300350400450
0 40 80 120 160 200
Tacc (s)
I p (n
A)
BRB pH 9.0BRB pH 9.0EEii= = --1.0 V1.0 VEEaccacc = = --0.8 V0.8 Vttaccacc = 100 s= 100 s
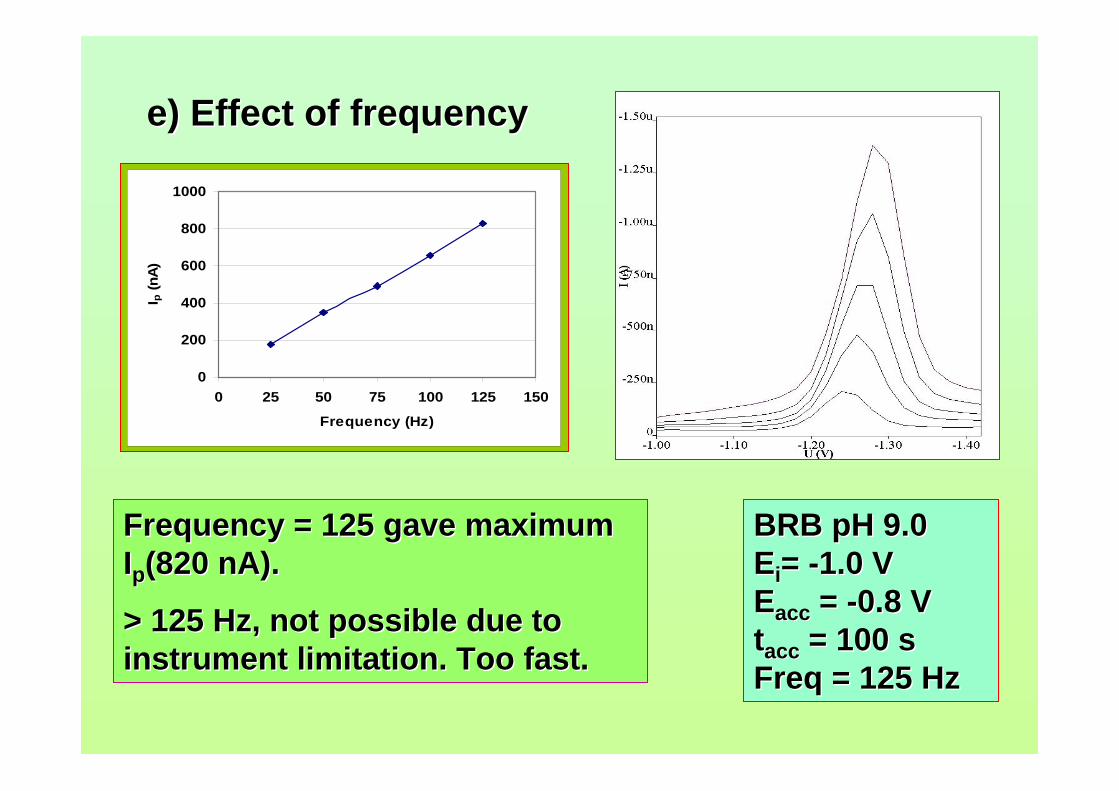
e) Effect of frequencye) Effect of frequency
Frequency = 125 gave maximum Frequency = 125 gave maximum IIpp(820 (820 nAnA). ).
> 125 Hz, not possible due to > 125 Hz, not possible due to instrument limitation. Too fast.instrument limitation. Too fast.
0
200
400
600
800
1000
0 25 50 75 100 125 150
Frequency (Hz)
I p (n
A)
BRB pH 9.0BRB pH 9.0EEii= = --1.0 V1.0 VEEaccacc = = --0.8 V0.8 Vttaccacc = 100 s= 100 sFreq = 125 HzFreq = 125 Hz
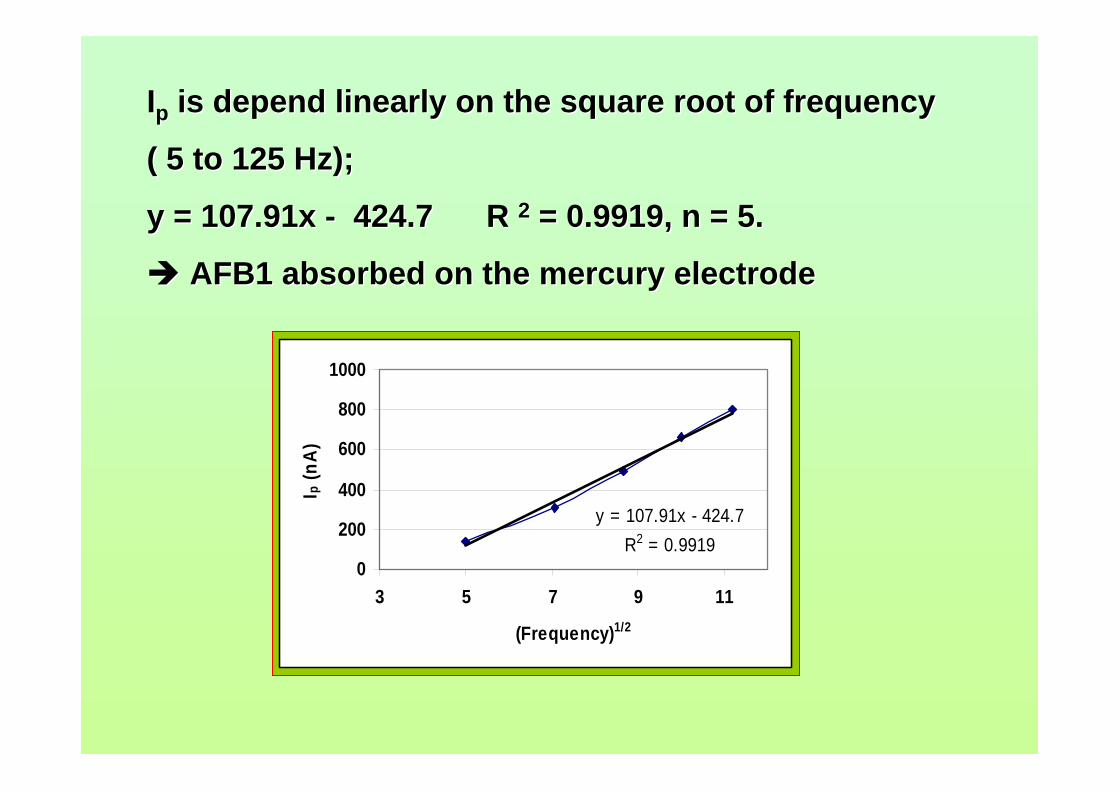
IIpp is depend linearly on the square root of frequency is depend linearly on the square root of frequency
( 5 to 125 Hz); ( 5 to 125 Hz);
y = 107.91x y = 107.91x -- 424.7 R 424.7 R 22 = 0.9919, n = 5.= 0.9919, n = 5.
AFB1 absorbed on the mercury electrode AFB1 absorbed on the mercury electrode
y = 107.91x - 424.7R2 = 0.9919
0
200
400
600
800
1000
3 5 7 9 11
(Frequency)1/2
I p (n
A)
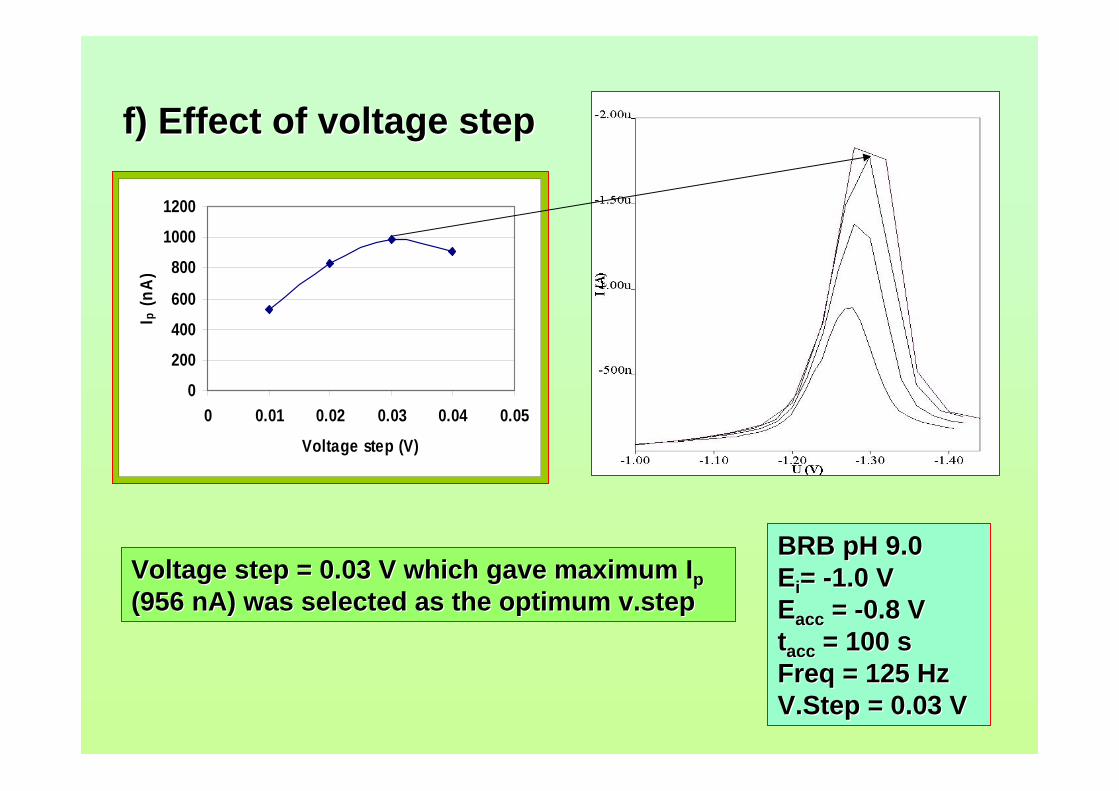
f) Effect of voltage stepf) Effect of voltage step
Voltage step = 0.03 V which gave maximum Voltage step = 0.03 V which gave maximum IIpp(956 (956 nAnA) was selected as the optimum ) was selected as the optimum v.stepv.step
0
200
400
600
800
1000
1200
0 0.01 0.02 0.03 0.04 0.05
Voltage step (V)
I p (n
A)
BRB pH 9.0BRB pH 9.0EEii= = --1.0 V1.0 VEEaccacc = = --0.8 V0.8 Vttaccacc = 100 s= 100 sFreq = 125 HzFreq = 125 HzV.StepV.Step = 0.03 V= 0.03 V
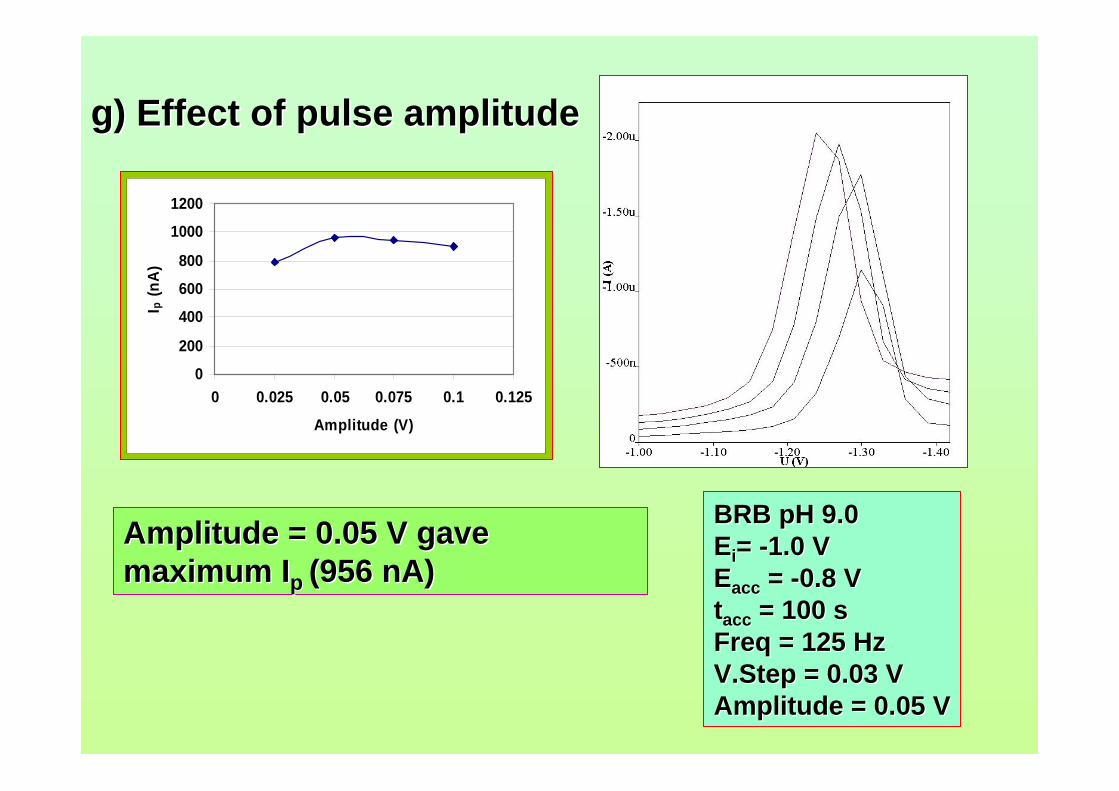
g) Effect of pulse amplitudeg) Effect of pulse amplitude
Amplitude = 0.05 V gave Amplitude = 0.05 V gave maximum maximum IIpp (956 (956 nAnA) )
0
200
400
600
800
1000
1200
0 0.025 0.05 0.075 0.1 0.125
Amplitude (V)
I p (n
A)
BRB pH 9.0BRB pH 9.0EEii= = --1.0 V1.0 VEEaccacc = = --0.8 V0.8 Vttaccacc = 100 s= 100 sFreq = 125 HzFreq = 125 HzV.StepV.Step = 0.03 V= 0.03 VAmplitude = 0.05 VAmplitude = 0.05 V
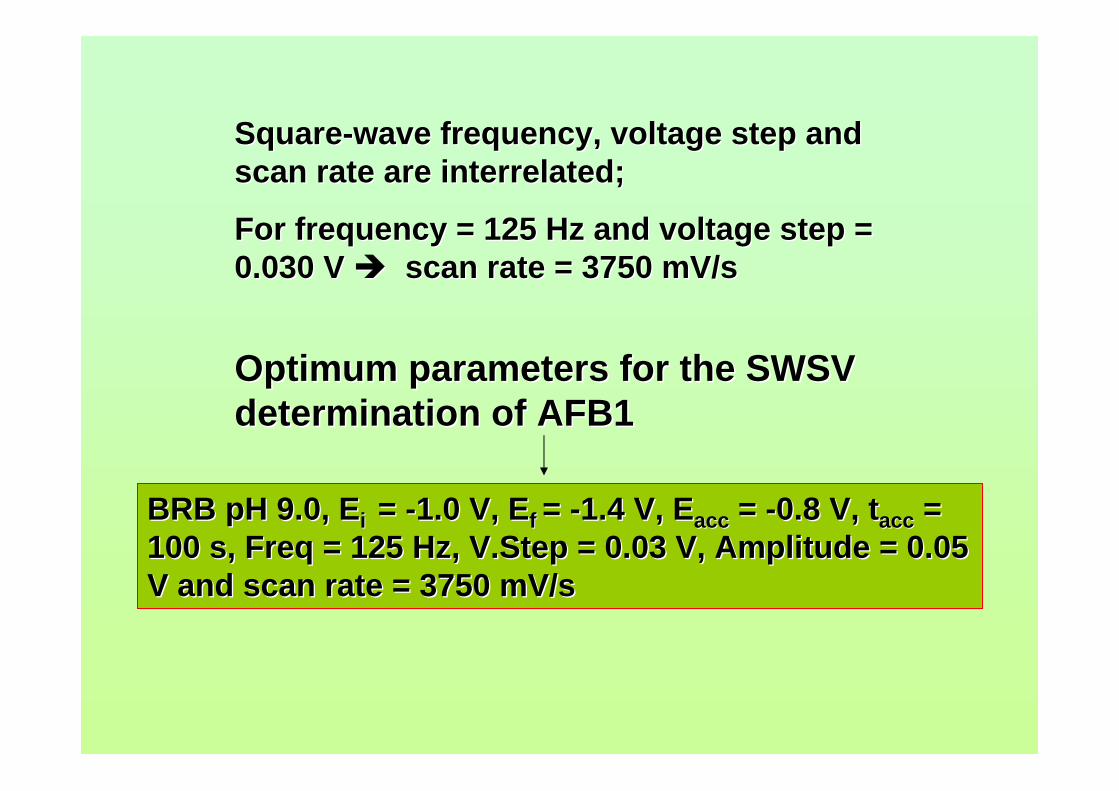
SquareSquare--wave frequency, voltage step and wave frequency, voltage step and scan rate are interrelated;scan rate are interrelated;
For frequency = 125 Hz and voltage step = For frequency = 125 Hz and voltage step = 0.030 V 0.030 V scan rate = 3750 mV/sscan rate = 3750 mV/s
Optimum parameters for the SWSV Optimum parameters for the SWSV determination of AFB1determination of AFB1
BRB pH 9.0, BRB pH 9.0, EEii = = --1.0 V, 1.0 V, EEff = = --1.4 V, 1.4 V, EEaccacc = = --0.8 V, 0.8 V, ttaccacc = = 100 s, Freq = 125 Hz, 100 s, Freq = 125 Hz, V.StepV.Step = 0.03 V, Amplitude = 0.05 = 0.03 V, Amplitude = 0.05 V and scan rate = 3750 mV/sV and scan rate = 3750 mV/s
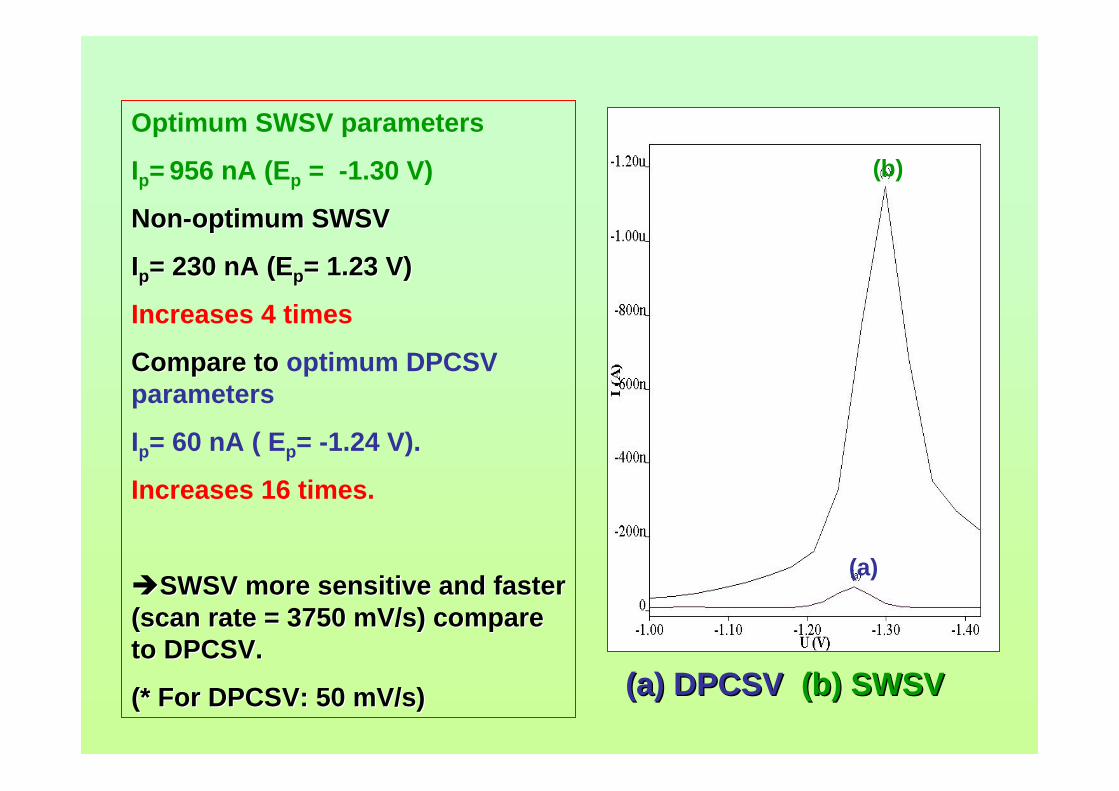
Optimum SWSV parameters
Ip= 956 nA (Ep = -1.30 V)
NonNon--optimum SWSVoptimum SWSV
IIpp= 230 = 230 nAnA ((EEpp= 1.23 V)= 1.23 V)
Increases 4 times
Compare to Compare to optimum DPCSV parameters
Ip= 60 nA ( Ep= -1.24 V).
Increases 16 times.
SWSV more sensitive and faster SWSV more sensitive and faster (scan rate = 3750 mV/s) compare (scan rate = 3750 mV/s) compare to DPCSV.to DPCSV.
(* For DPCSV: 50 mV/s)(* For DPCSV: 50 mV/s) (a) DPCSV(a) DPCSV (b) SWSV(b) SWSV
(b)
(a)
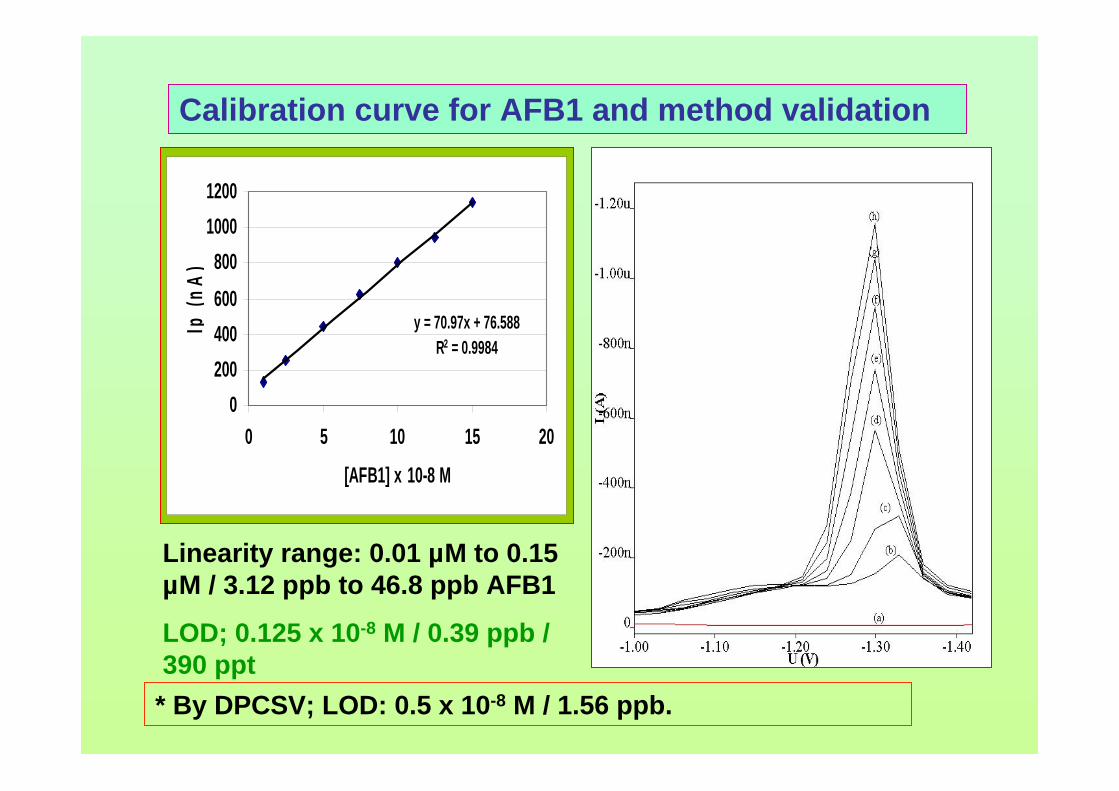
Calibration curve for AFB1 and method validation
y = 70.97x + 76.588R2 = 0.9984
0200400600800
10001200
0 5 10 15 20
[AFB1] x 10-8 M
Ip (n
A)
Linearity range: 0.01 µM to 0.15 µM / 3.12 ppb to 46.8 ppb AFB1
LOD; 0.125 x 10⁻⁸ M / 0.39 ppb / 390 ppt
* By DPCSV; LOD: 0.5 x 10⁻⁸ M / 1.56 ppb.
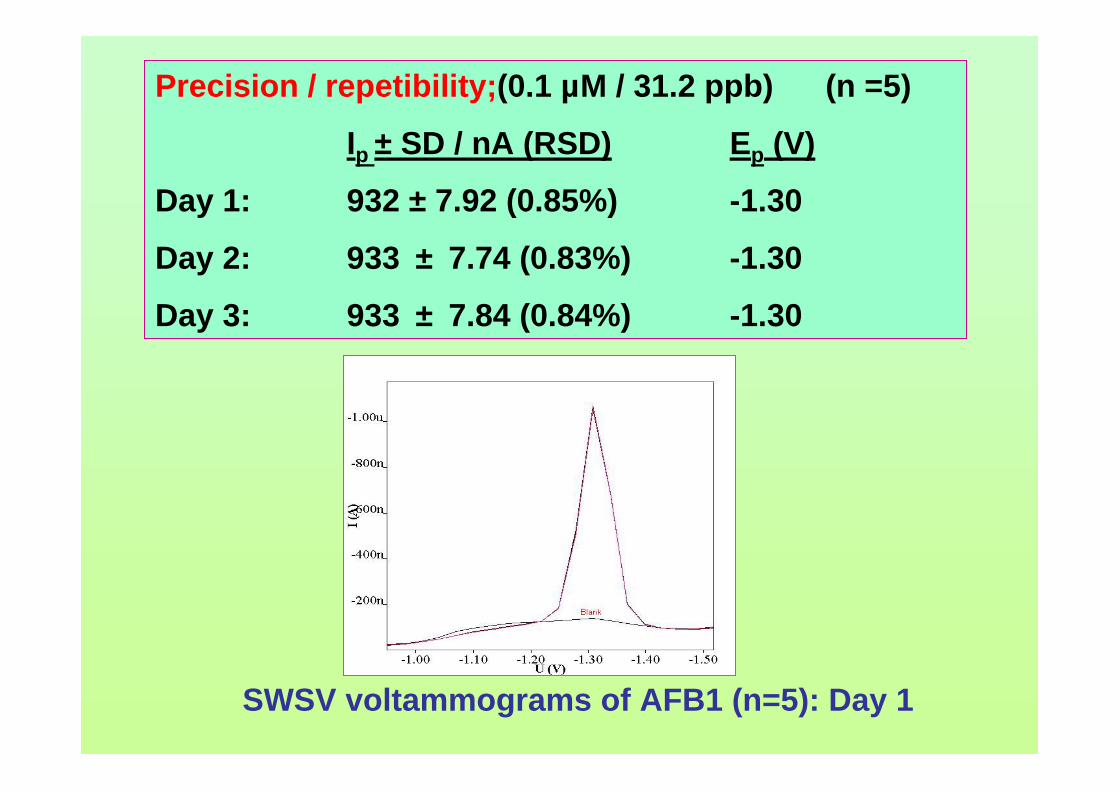
Precision / repetibility;(0.1 µM / 31.2 ppb) (n =5)
Ip ± SD / nA (RSD) Ep (V)
Day 1: 932 ± 7.92 (0.85%) -1.30
Day 2: 933 ± 7.74 (0.83%) -1.30
Day 3: 933 ± 7.84 (0.84%) -1.30
SWSV voltammograms of AFB1 (n=5): Day 1
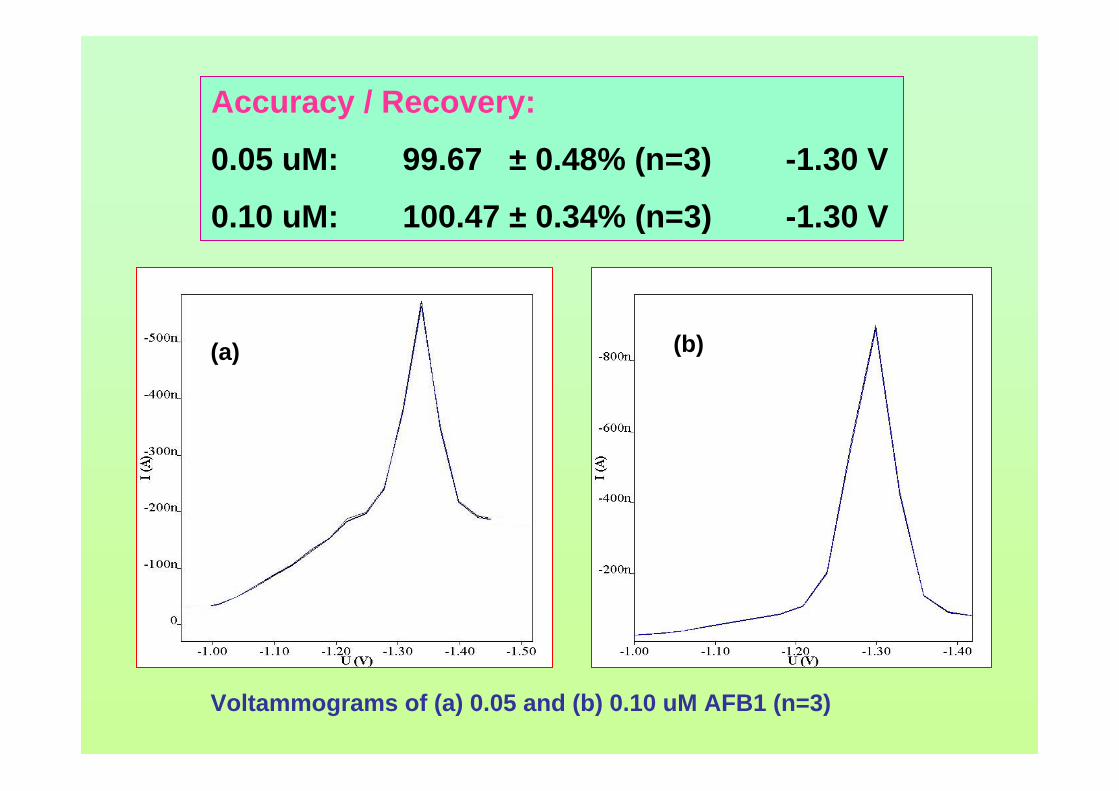
Accuracy / Recovery:
0.05 uM: 99.67 ± 0.48% (n=3) -1.30 V
0.10 uM: 100.47 ± 0.34% (n=3) -1.30 V
Voltammograms of (a) 0.05 and (b) 0.10 uM AFB1 (n=3)
(a) (b)
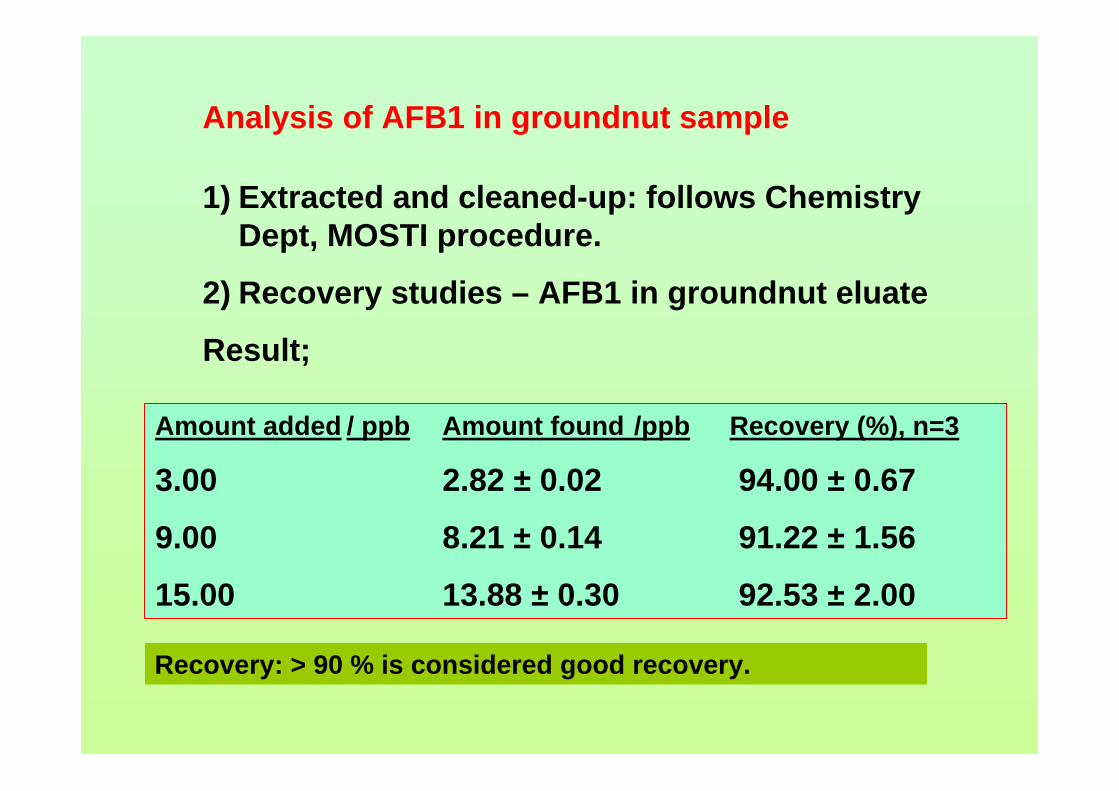
Analysis of AFB1 in groundnut sample
1) Extracted and cleaned-up: follows Chemistry Dept, MOSTI procedure.
2) Recovery studies – AFB1 in groundnut eluate
Result;
Amount added / ppb Amount found /ppb Recovery (%), n=3
3.00 2.82 ± 0.02 94.00 ± 0.67
9.00 8.21 ± 0.14 91.22 ± 1.56
15.00 13.88 ± 0.30 92.53 ± 2.00
Recovery: > 90 % is considered good recovery.
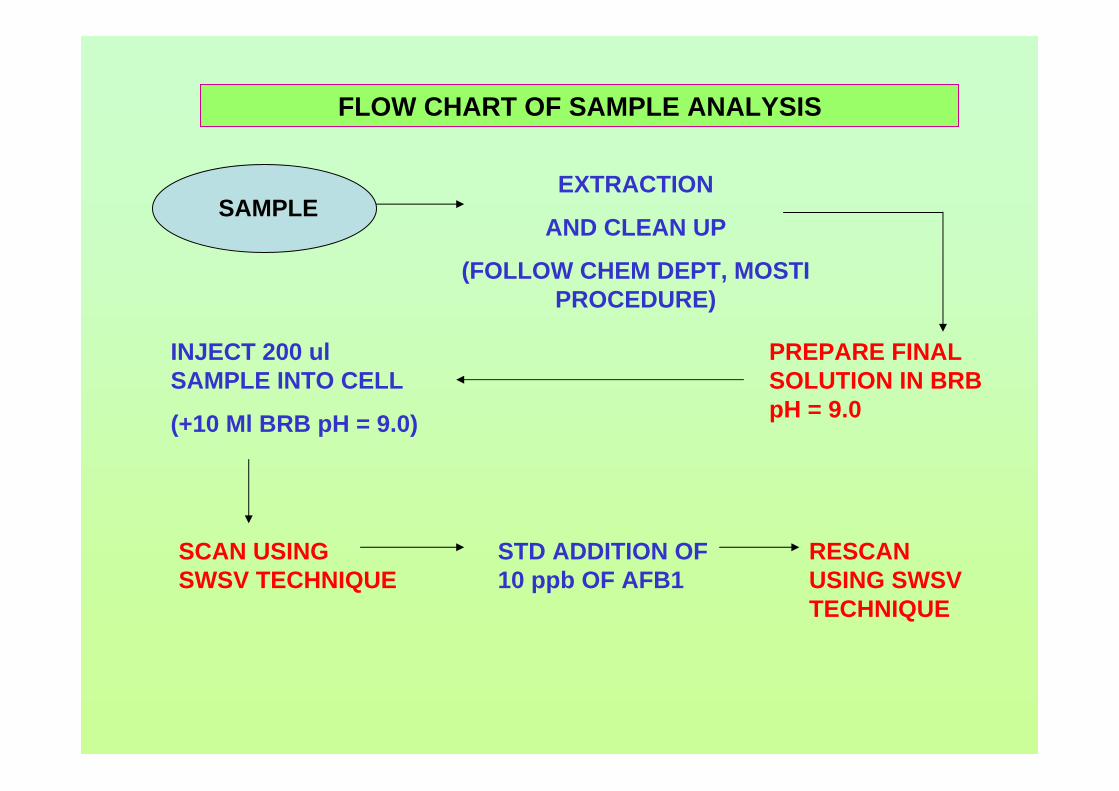
FLOW CHART OF SAMPLE ANALYSIS
SAMPLEEXTRACTION
AND CLEAN UP
(FOLLOW CHEM DEPT, MOSTI PROCEDURE)
PREPARE FINAL SOLUTION IN BRB pH = 9.0
INJECT 200 ulSAMPLE INTO CELL
(+10 Ml BRB pH = 9.0)
SCAN USING SWSV TECHNIQUE
STD ADDITION OF 10 ppb OF AFB1
RESCAN USING SWSV TECHNIQUE
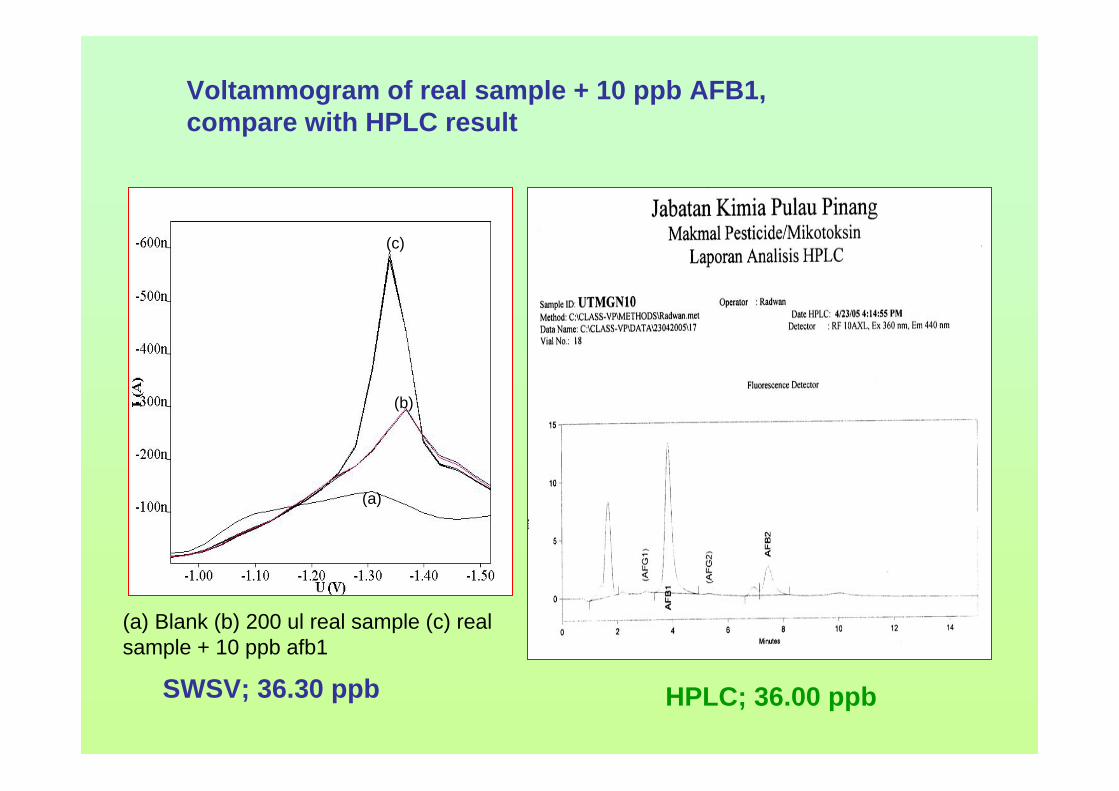
Voltammogram of real sample + 10 ppb AFB1, compare with HPLC result
(a) Blank (b) 200 ul real sample (c) real sample + 10 ppb afb1
(a)
(b)
(c)
SWSV; 36.30 ppb HPLC; 36.00 ppb
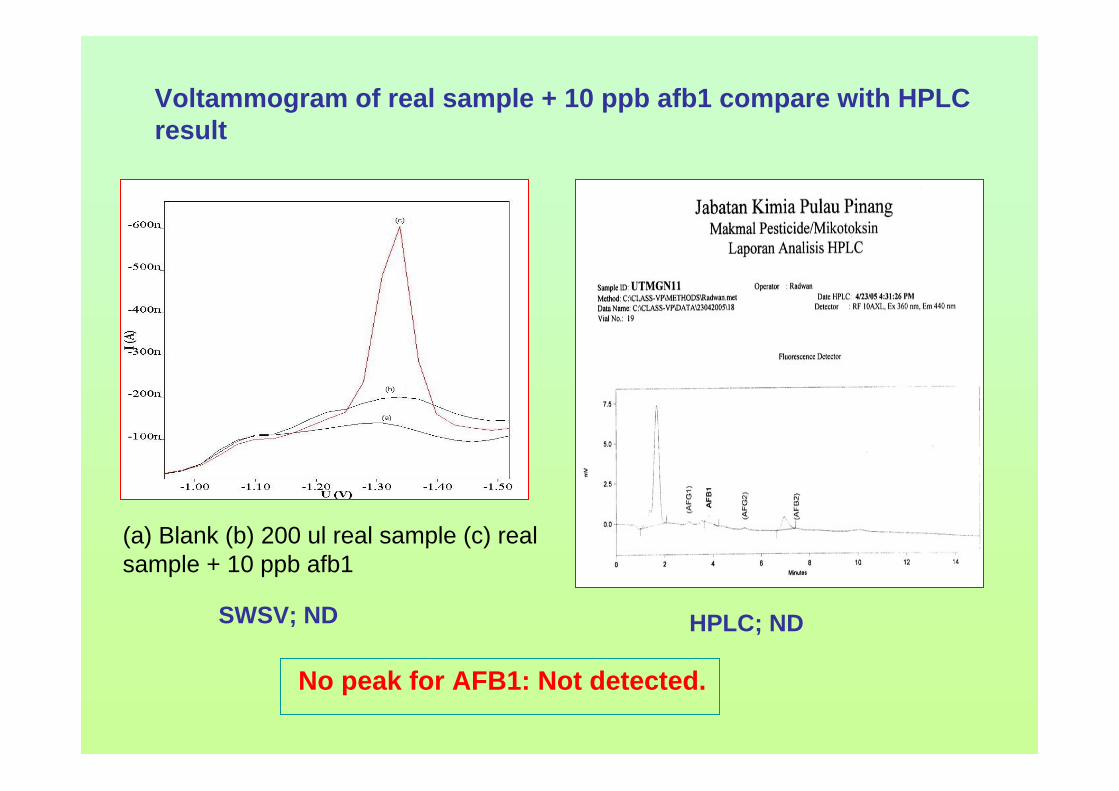
Voltammogram of real sample + 10 ppb afb1 compare with HPLC result
No peak for AFB1: Not detected.
(a) Blank (b) 200 ul real sample (c) real sample + 10 ppb afb1
SWSV; ND HPLC; ND
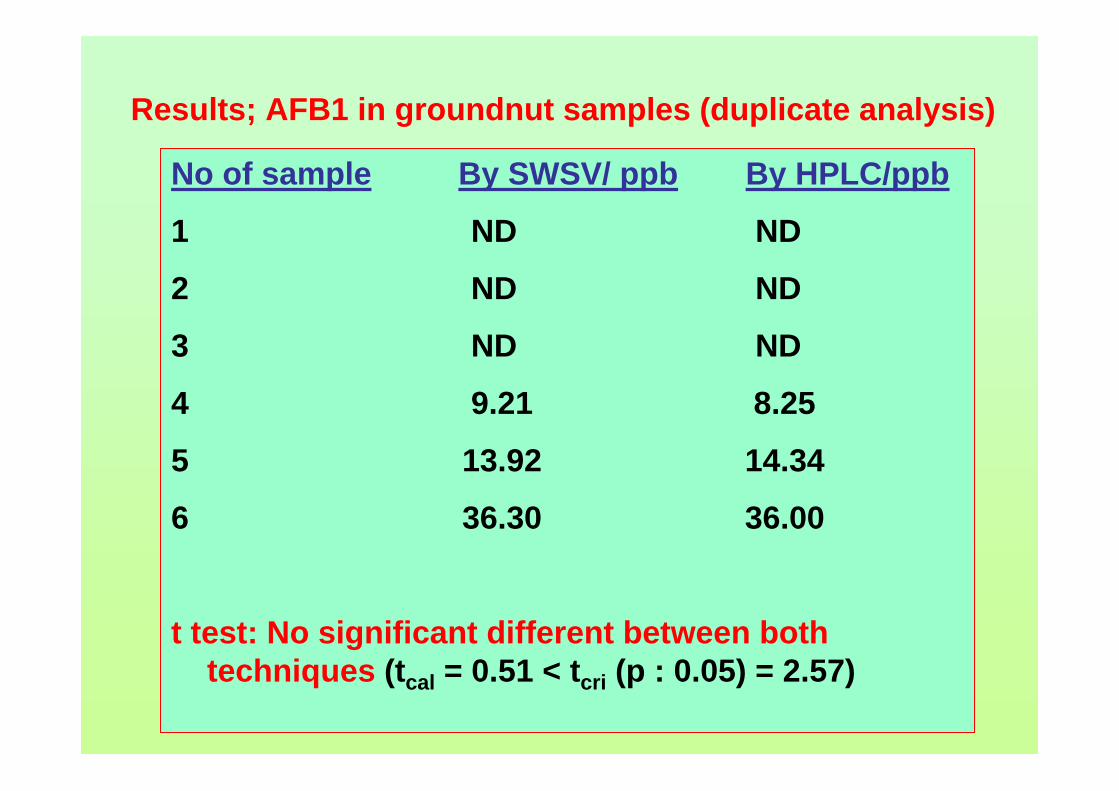
Results; AFB1 in groundnut samples (duplicate analysis)
No of sample By SWSV/ ppb By HPLC/ppb
1 ND ND
2 ND ND
3 ND ND
4 9.21 8.25
5 13.92 14.34
6 36.30 36.00
t test: No significant different between both techniques (tcal = 0.51 < tcri (p : 0.05) = 2.57)
CONCLUSION
SWSV technique for the determination of AFB1 in groundnut sample was successfully developed. The technique is precise, accurate, high sensitive, fast and low cost technique.

ACKNOWLEDGEMENT
SUPERVISORS:
AP DR ABDUL RAHIM MOHD YUSOFFPROF RAHMALAN AHAMAD
SHORT TERM GRANT: 75152/2004
SCHOOL OF HEALTH SCIENCES, USM ,HEALTH CAMPUS, KUBANG KRIAN, KELANTAN
MR RADWAN, CHEM DEPT. MOSTI, PENANG BRANCH.


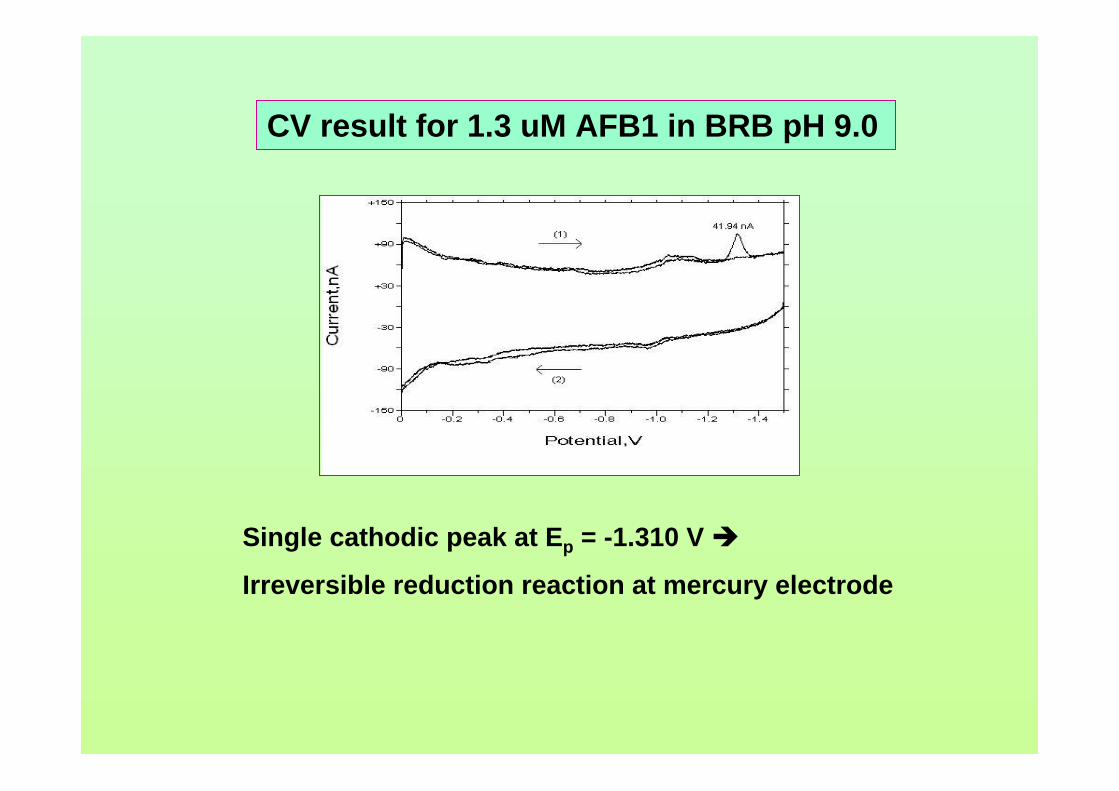
CV result for 1.3 uM AFB1 in BRB pH 9.0
Single cathodic peak at Ep = -1.310 V
Irreversible reduction reaction at mercury electrode
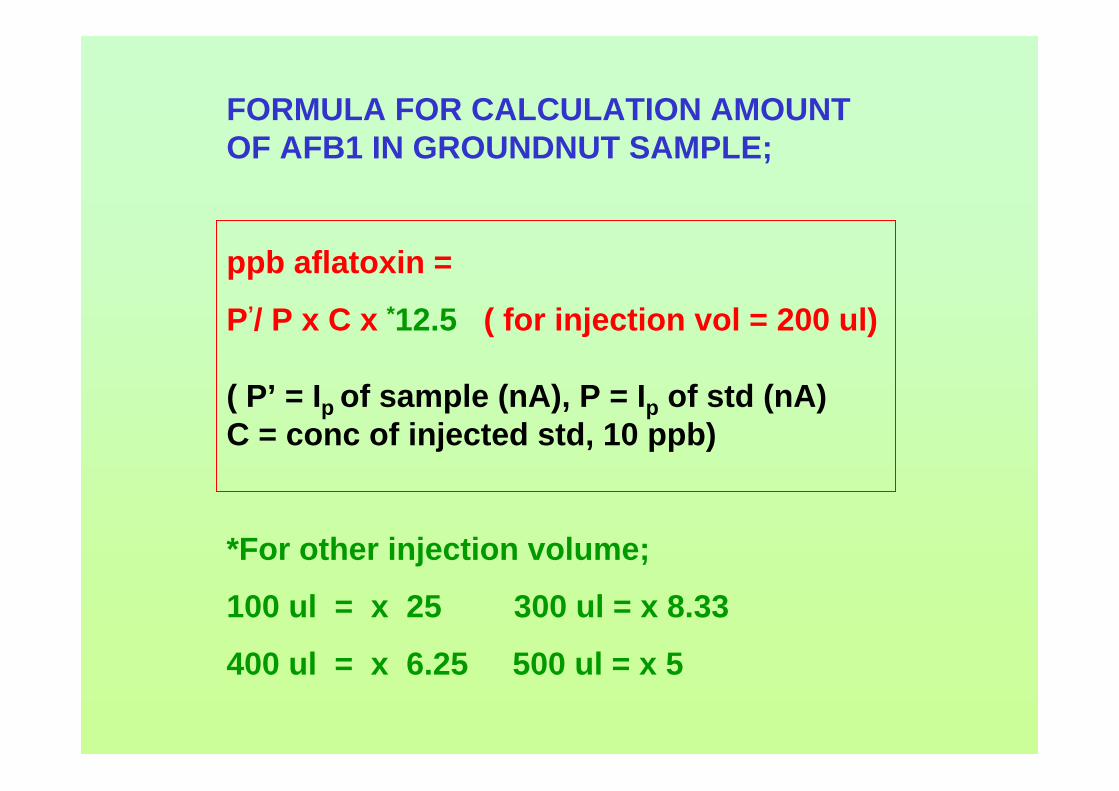
FORMULA FOR CALCULATION AMOUNT OF AFB1 IN GROUNDNUT SAMPLE;
ppb aflatoxin =
P’/ P x C x *12.5 ( for injection vol = 200 ul)
( P’ = Ip of sample (nA), P = Ip of std (nA)C = conc of injected std, 10 ppb)
*For other injection volume;
100 ul = x 25 300 ul = x 8.33
400 ul = x 6.25 500 ul = x 5
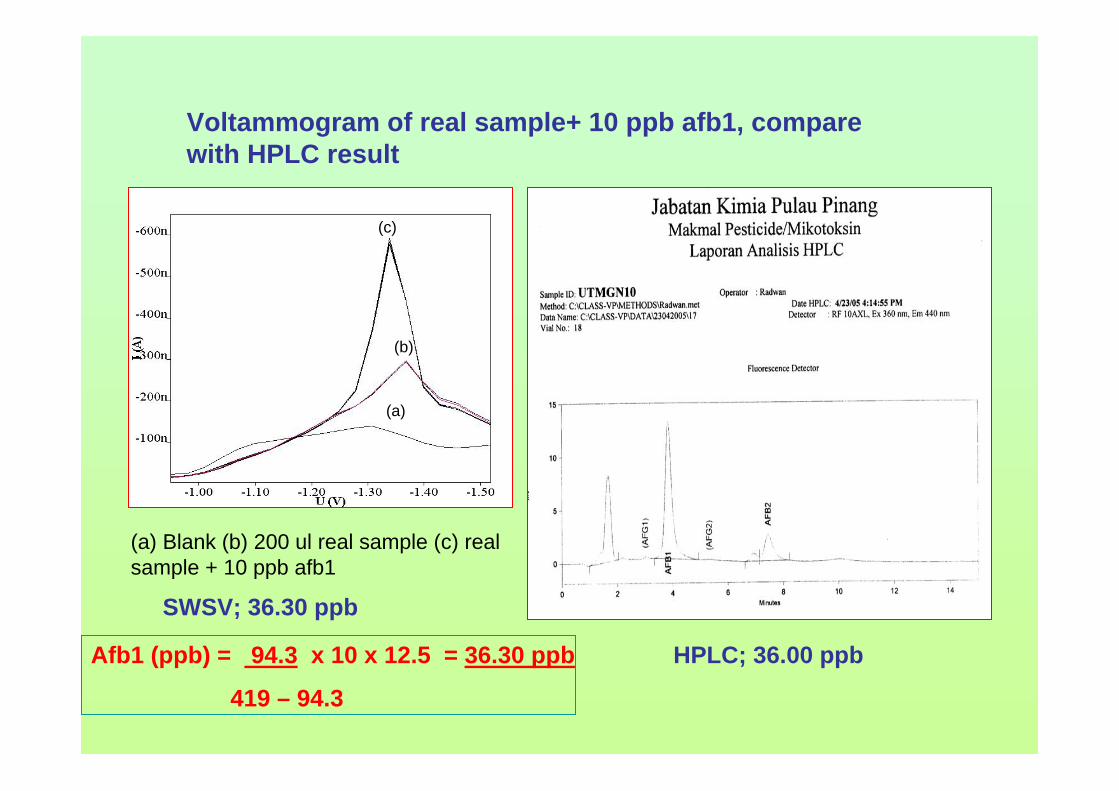
Voltammogram of real sample+ 10 ppb afb1, compare with HPLC result
Afb1 (ppb) = 94.3 x 10 x 12.5 = 36.30 ppb
419 – 94.3
(a) Blank (b) 200 ul real sample (c) real sample + 10 ppb afb1
(a)
(b)
(c)
SWSV; 36.30 ppb
HPLC; 36.00 ppb
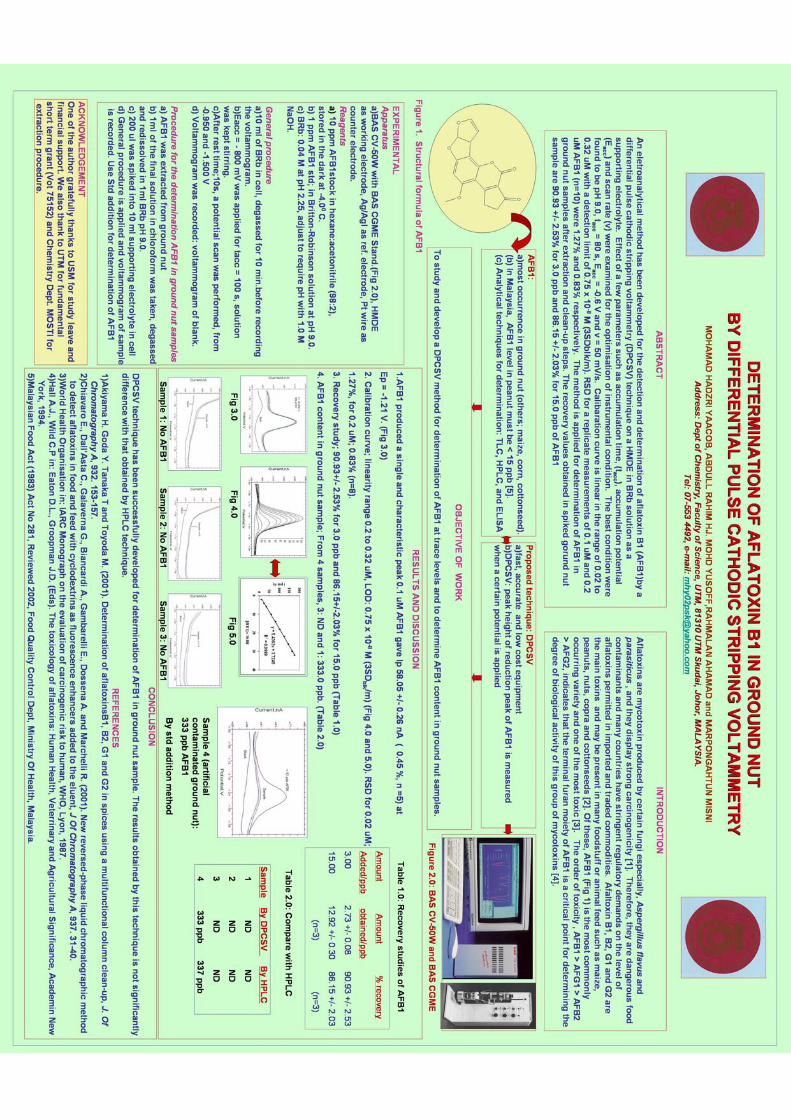
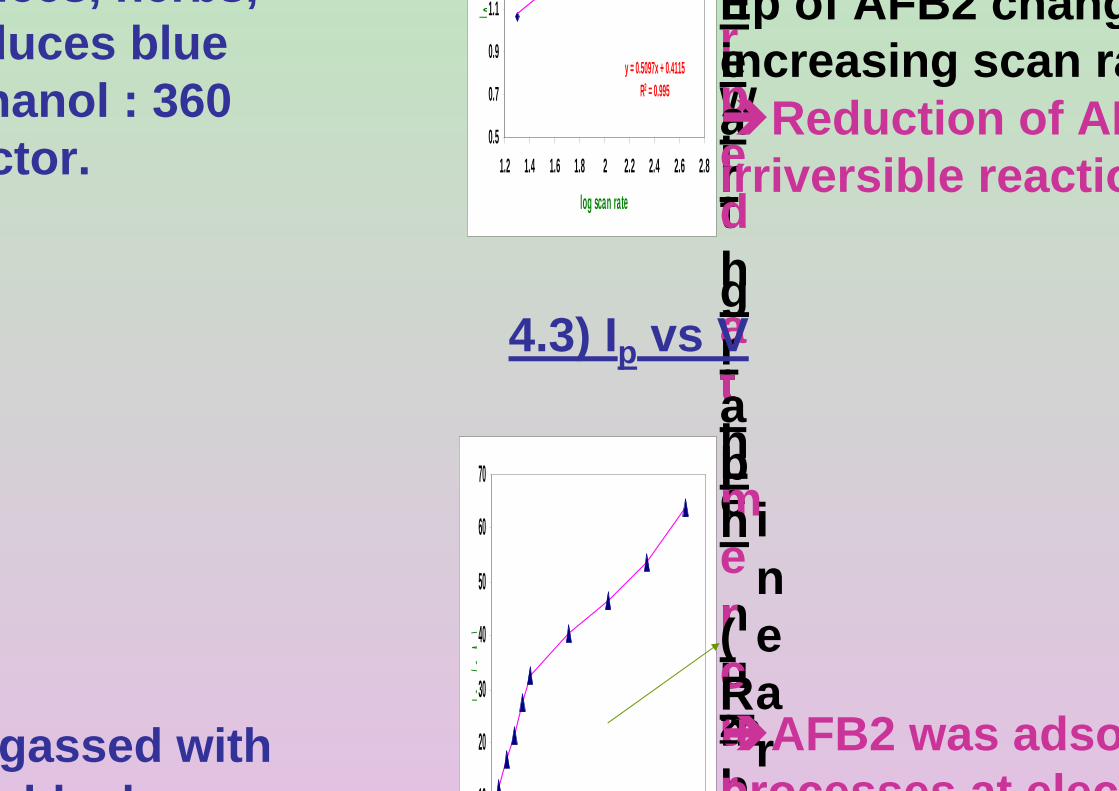
ices, herbs,duces blue hanol : 360 ctor.
gassed with bl k
with
the
numb
rped
at
mercur
near
graph
(R2
Ep of AFB2 changincreasing scan ra
Reduction of AFirriversible reactio
4.3) Ip vs V
LinearAFB2 was adso
processes at elect
y = 0.5097x + 0.4115R2 = 0.995
0.5
0.7
0.9
1.1
1.2 1.4 1.6 1.8 2 2.2 2.4 2.6 2.8
log scan rate
lo
10
20
30
40
50
60
70Ip
(nA
)
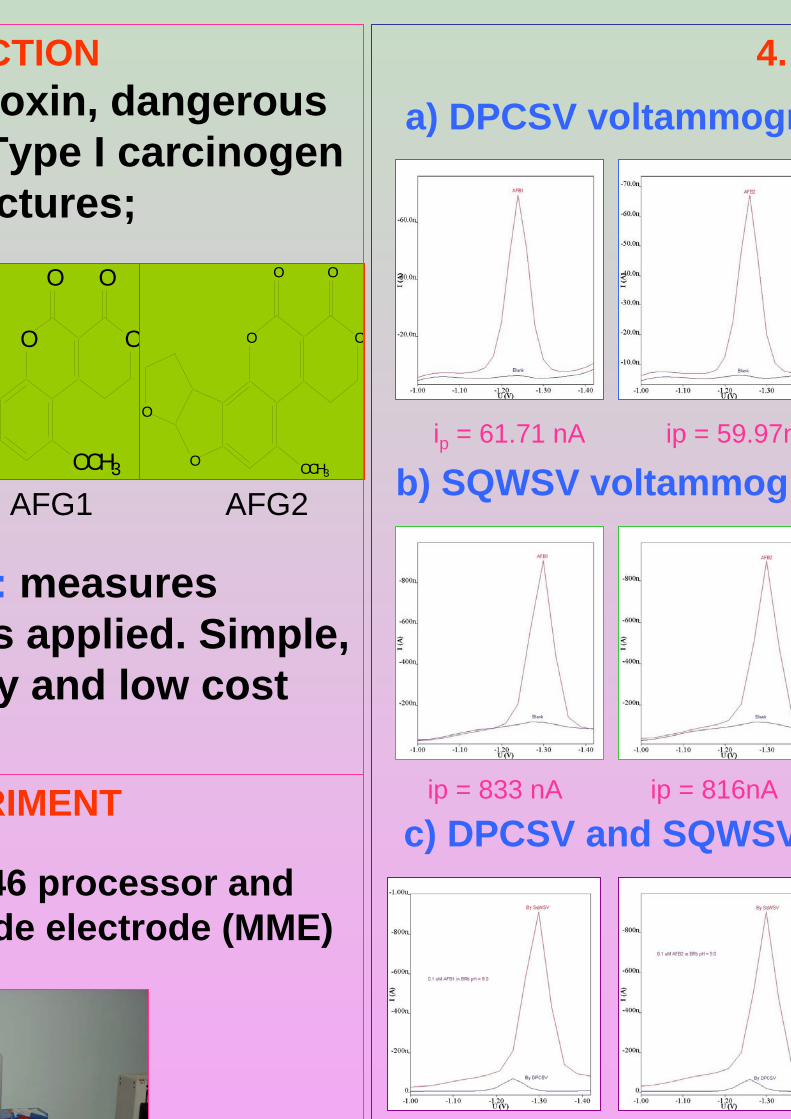
CTIONoxin, dangerous
Type I carcinogen ctures;
: measures s applied. Simple, y and low cost
O O
OO
OCH3
O O
O
O
OO
OCH3
AFG1 AFG2
RIMENT
46 processor and de electrode (MME)
4. a) DPCSV voltammogr
ip = 61.71 nA ip = 59.97n
b) SQWSV voltammogr
ip = 833 nA ip = 816nA
c) DPCSV and SQWSV

1
Paper will be published in
Malaysian Journal of Analytical Science
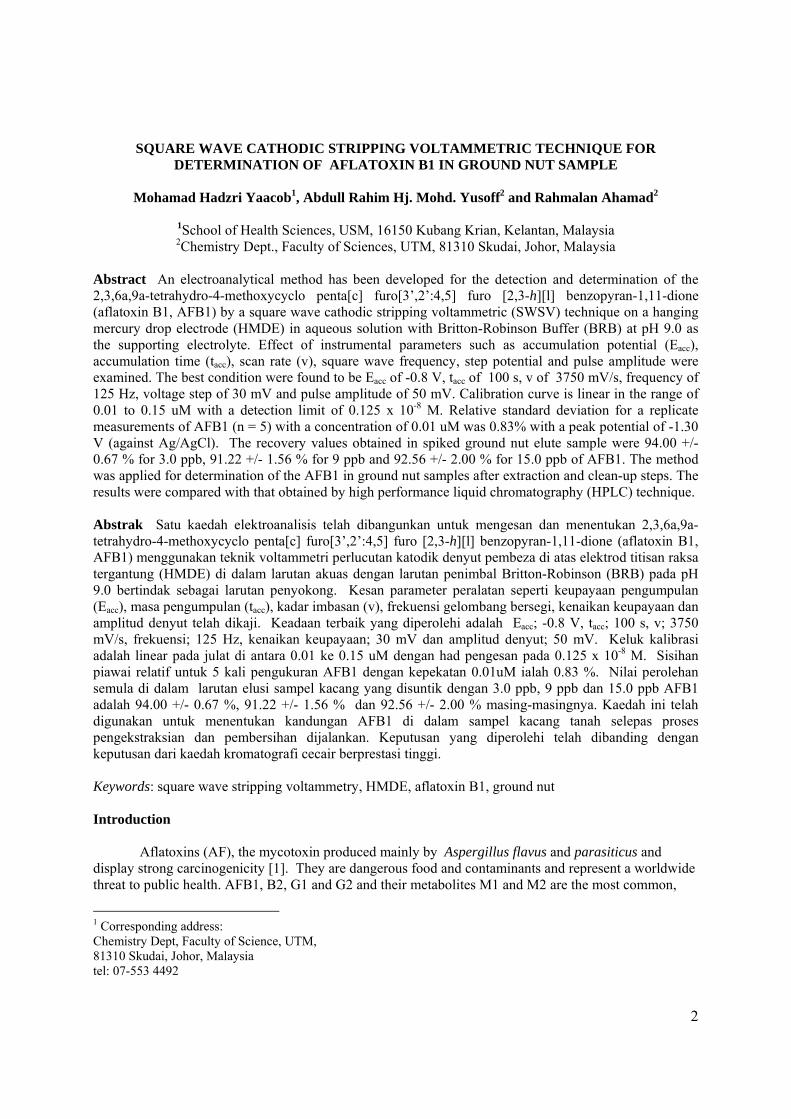
2
SQUARE WAVE CATHODIC STRIPPING VOLTAMMETRIC TECHNIQUE FOR DETERMINATION OF AFLATOXIN B1 IN GROUND NUT SAMPLE
Mohamad Hadzri Yaacob1, Abdull Rahim Hj. Mohd. Yusoff2 and Rahmalan Ahamad2
1School of Health Sciences, USM, 16150 Kubang Krian, Kelantan, Malaysia 2Chemistry Dept., Faculty of Sciences, UTM, 81310 Skudai, Johor, Malaysia
Abstract An electroanalytical method has been developed for the detection and determination of the 2,3,6a,9a-tetrahydro-4-methoxycyclo penta[c] furo[3’,2’:4,5] furo [2,3-h][l] benzopyran-1,11-dione (aflatoxin B1, AFB1) by a square wave cathodic stripping voltammetric (SWSV) technique on a hanging mercury drop electrode (HMDE) in aqueous solution with Britton-Robinson Buffer (BRB) at pH 9.0 as the supporting electrolyte. Effect of instrumental parameters such as accumulation potential (Eacc), accumulation time (tacc), scan rate (v), square wave frequency, step potential and pulse amplitude were examined. The best condition were found to be Eacc of -0.8 V, tacc of 100 s, v of 3750 mV/s, frequency of 125 Hz, voltage step of 30 mV and pulse amplitude of 50 mV. Calibration curve is linear in the range of 0.01 to 0.15 uM with a detection limit of 0.125 x 10⁻⁸ M. Relative standard deviation for a replicate measurements of AFB1 (n = 5) with a concentration of 0.01 uM was 0.83% with a peak potential of -1.30 V (against Ag/AgCl). The recovery values obtained in spiked ground nut elute sample were 94.00 +/- 0.67 % for 3.0 ppb, 91.22 +/- 1.56 % for 9 ppb and 92.56 +/- 2.00 % for 15.0 ppb of AFB1. The method was applied for determination of the AFB1 in ground nut samples after extraction and clean-up steps. The results were compared with that obtained by high performance liquid chromatography (HPLC) technique. Abstrak Satu kaedah elektroanalisis telah dibangunkan untuk mengesan dan menentukan 2,3,6a,9a-tetrahydro-4-methoxycyclo penta[c] furo[3’,2’:4,5] furo [2,3-h][l] benzopyran-1,11-dione (aflatoxin B1, AFB1) menggunakan teknik voltammetri perlucutan katodik denyut pembeza di atas elektrod titisan raksa tergantung (HMDE) di dalam larutan akuas dengan larutan penimbal Britton-Robinson (BRB) pada pH 9.0 bertindak sebagai larutan penyokong. Kesan parameter peralatan seperti keupayaan pengumpulan (Eacc), masa pengumpulan (tacc), kadar imbasan (v), frekuensi gelombang bersegi, kenaikan keupayaan dan amplitud denyut telah dikaji. Keadaan terbaik yang diperolehi adalah Eacc; -0.8 V, tacc; 100 s, v; 3750 mV/s, frekuensi; 125 Hz, kenaikan keupayaan; 30 mV dan amplitud denyut; 50 mV. Keluk kalibrasi adalah linear pada julat di antara 0.01 ke 0.15 uM dengan had pengesan pada 0.125 x 10⁻⁸ M. Sisihan piawai relatif untuk 5 kali pengukuran AFB1 dengan kepekatan 0.01uM ialah 0.83 %. Nilai perolehan semula di dalam larutan elusi sampel kacang yang disuntik dengan 3.0 ppb, 9 ppb dan 15.0 ppb AFB1 adalah 94.00 +/- 0.67 %, 91.22 +/- 1.56 % dan 92.56 +/- 2.00 % masing-masingnya. Kaedah ini telah digunakan untuk menentukan kandungan AFB1 di dalam sampel kacang tanah selepas proses pengekstraksian dan pembersihan dijalankan. Keputusan yang diperolehi telah dibanding dengan keputusan dari kaedah kromatografi cecair berprestasi tinggi. Keywords: square wave stripping voltammetry, HMDE, aflatoxin B1, ground nut Introduction
Aflatoxins (AF), the mycotoxin produced mainly by Aspergillus flavus and parasiticus and display strong carcinogenicity [1]. They are dangerous food and contaminants and represent a worldwide threat to public health. AFB1, B2, G1 and G2 and their metabolites M1 and M2 are the most common,
1 Corresponding address: Chemistry Dept, Faculty of Science, UTM, 81310 Skudai, Johor, Malaysia tel: 07-553 4492
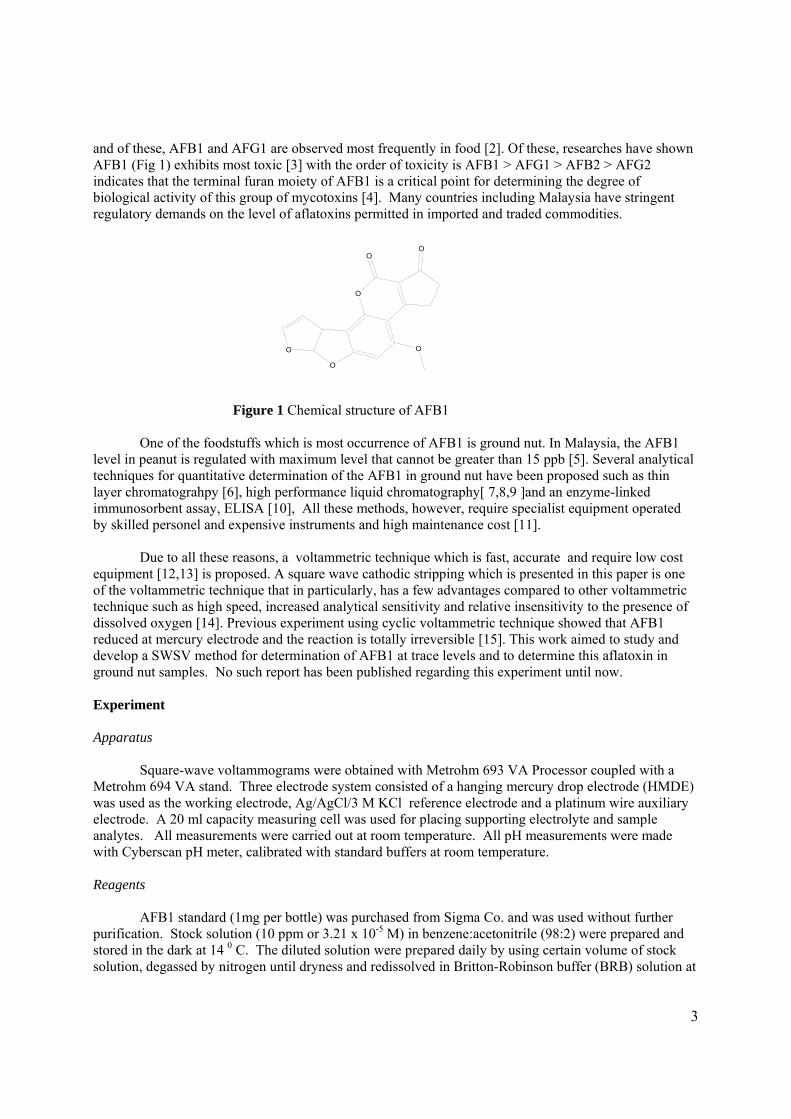
3
O
O
O
OO
O
and of these, AFB1 and AFG1 are observed most frequently in food [2]. Of these, researches have shown AFB1 (Fig 1) exhibits most toxic [3] with the order of toxicity is AFB1 > AFG1 > AFB2 > AFG2 indicates that the terminal furan moiety of AFB1 is a critical point for determining the degree of biological activity of this group of mycotoxins [4]. Many countries including Malaysia have stringent regulatory demands on the level of aflatoxins permitted in imported and traded commodities.
Figure 1 Chemical structure of AFB1
One of the foodstuffs which is most occurrence of AFB1 is ground nut. In Malaysia, the AFB1 level in peanut is regulated with maximum level that cannot be greater than 15 ppb [5]. Several analytical techniques for quantitative determination of the AFB1 in ground nut have been proposed such as thin layer chromatograhpy [6], high performance liquid chromatography[ 7,8,9 ]and an enzyme-linked immunosorbent assay, ELISA [10], All these methods, however, require specialist equipment operated by skilled personel and expensive instruments and high maintenance cost [11].
Due to all these reasons, a voltammetric technique which is fast, accurate and require low cost
equipment [12,13] is proposed. A square wave cathodic stripping which is presented in this paper is one of the voltammetric technique that in particularly, has a few advantages compared to other voltammetric technique such as high speed, increased analytical sensitivity and relative insensitivity to the presence of dissolved oxygen [14]. Previous experiment using cyclic voltammetric technique showed that AFB1 reduced at mercury electrode and the reaction is totally irreversible [15]. This work aimed to study and develop a SWSV method for determination of AFB1 at trace levels and to determine this aflatoxin in ground nut samples. No such report has been published regarding this experiment until now. Experiment Apparatus
Square-wave voltammograms were obtained with Metrohm 693 VA Processor coupled with a Metrohm 694 VA stand. Three electrode system consisted of a hanging mercury drop electrode (HMDE) was used as the working electrode, Ag/AgCl/3 M KCl reference electrode and a platinum wire auxiliary electrode. A 20 ml capacity measuring cell was used for placing supporting electrolyte and sample analytes. All measurements were carried out at room temperature. All pH measurements were made with Cyberscan pH meter, calibrated with standard buffers at room temperature. Reagents
AFB1 standard (1mg per bottle) was purchased from Sigma Co. and was used without further purification. Stock solution (10 ppm or 3.21 x 10⁻⁵ M) in benzene:acetonitrile (98:2) were prepared and stored in the dark at 14 0 C. The diluted solution were prepared daily by using certain volume of stock solution, degassed by nitrogen until dryness and redissolved in Britton-Robinson buffer (BRB) solution at
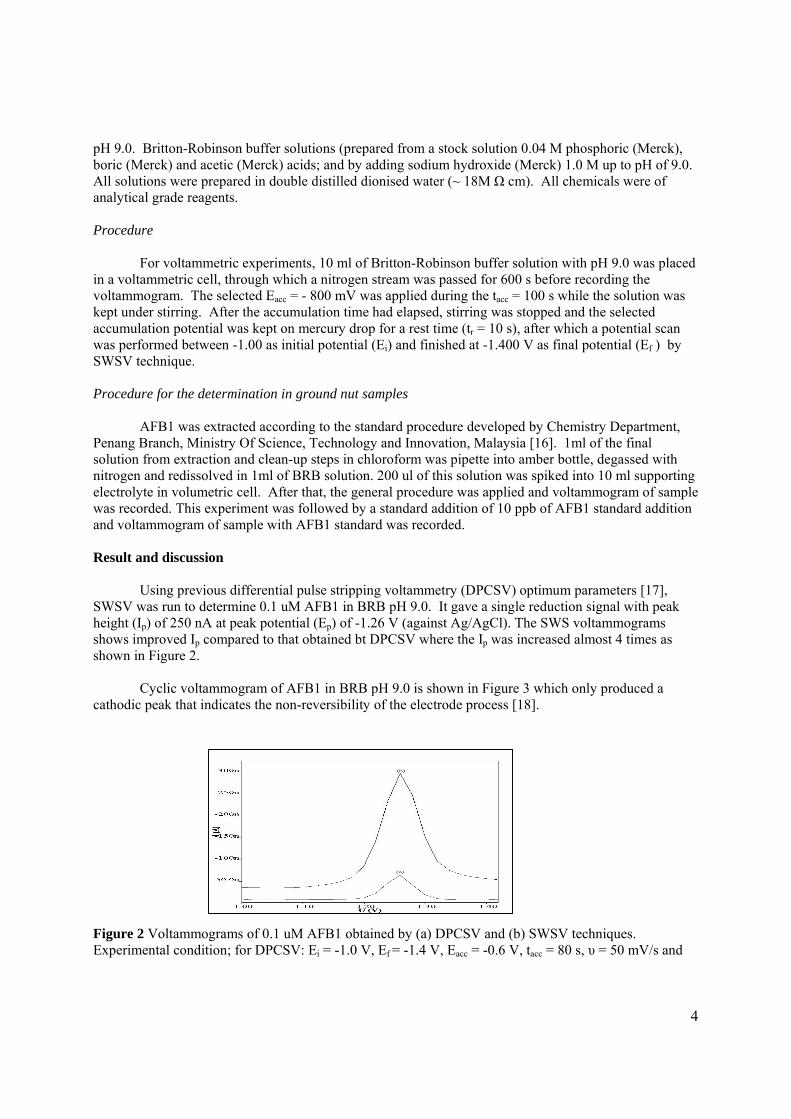
4
pH 9.0. Britton-Robinson buffer solutions (prepared from a stock solution 0.04 M phosphoric (Merck), boric (Merck) and acetic (Merck) acids; and by adding sodium hydroxide (Merck) 1.0 M up to pH of 9.0. All solutions were prepared in double distilled dionised water (~ 18M Ω cm). All chemicals were of analytical grade reagents. Procedure
For voltammetric experiments, 10 ml of Britton-Robinson buffer solution with pH 9.0 was placed in a voltammetric cell, through which a nitrogen stream was passed for 600 s before recording the voltammogram. The selected Eacc = - 800 mV was applied during the tacc = 100 s while the solution was kept under stirring. After the accumulation time had elapsed, stirring was stopped and the selected accumulation potential was kept on mercury drop for a rest time (tr = 10 s), after which a potential scan was performed between -1.00 as initial potential (Ei) and finished at -1.400 V as final potential (Ef ) by SWSV technique. Procedure for the determination in ground nut samples
AFB1 was extracted according to the standard procedure developed by Chemistry Department, Penang Branch, Ministry Of Science, Technology and Innovation, Malaysia [16]. 1ml of the final solution from extraction and clean-up steps in chloroform was pipette into amber bottle, degassed with nitrogen and redissolved in 1ml of BRB solution. 200 ul of this solution was spiked into 10 ml supporting electrolyte in volumetric cell. After that, the general procedure was applied and voltammogram of sample was recorded. This experiment was followed by a standard addition of 10 ppb of AFB1 standard addition and voltammogram of sample with AFB1 standard was recorded. Result and discussion
Using previous differential pulse stripping voltammetry (DPCSV) optimum parameters [17],
SWSV was run to determine 0.1 uM AFB1 in BRB pH 9.0. It gave a single reduction signal with peak height (Ip) of 250 nA at peak potential (Ep) of -1.26 V (against Ag/AgCl). The SWS voltammograms shows improved Ip compared to that obtained bt DPCSV where the Ip was increased almost 4 times as shown in Figure 2.
Cyclic voltammogram of AFB1 in BRB pH 9.0 is shown in Figure 3 which only produced a cathodic peak that indicates the non-reversibility of the electrode process [18]. Figure 2 Voltammograms of 0.1 uM AFB1 obtained by (a) DPCSV and (b) SWSV techniques. Experimental condition; for DPCSV: Ei = -1.0 V, Ef = -1.4 V, Eacc = -0.6 V, tacc = 80 s, υ = 50 mV/s and
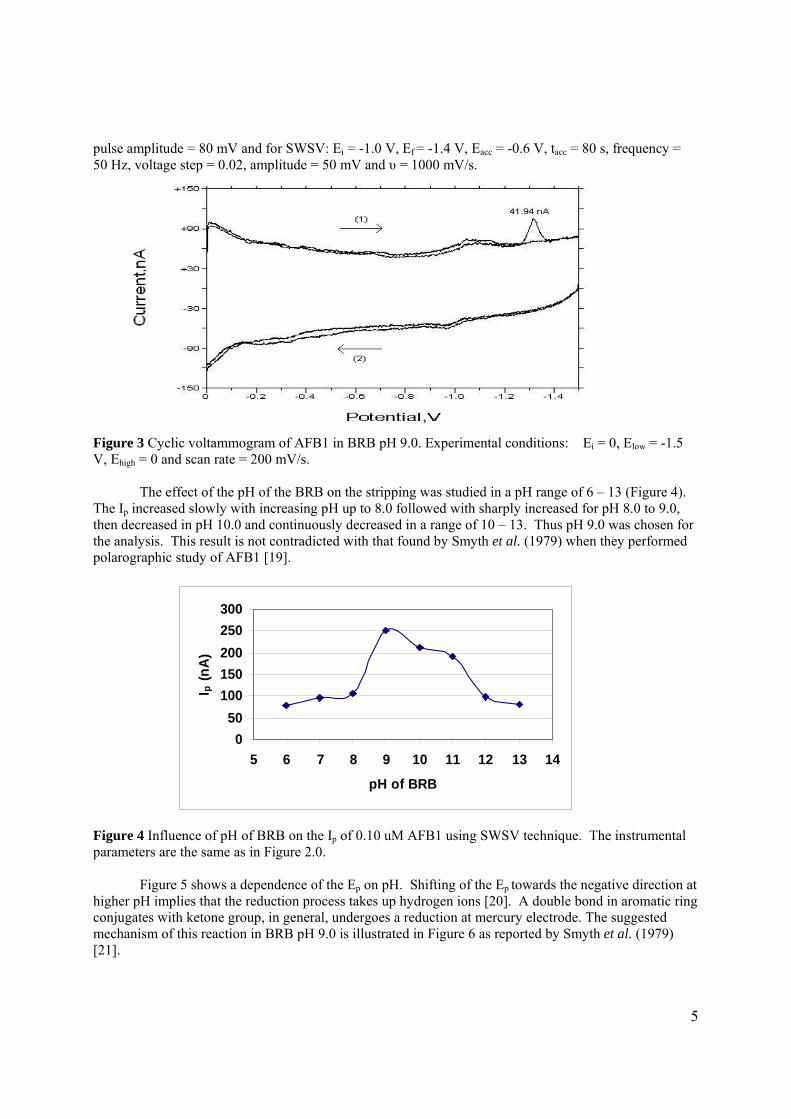
5
050
100150200250300
5 6 7 8 9 10 11 12 13 14
pH of BRB
I p (n
A)
pulse amplitude = 80 mV and for SWSV: Ei = -1.0 V, Ef = -1.4 V, Eacc = -0.6 V, tacc = 80 s, frequency = 50 Hz, voltage step = 0.02, amplitude = 50 mV and υ = 1000 mV/s. Figure 3 Cyclic voltammogram of AFB1 in BRB pH 9.0. Experimental conditions: Ei = 0, Elow = -1.5 V, Ehigh = 0 and scan rate = 200 mV/s.
The effect of the pH of the BRB on the stripping was studied in a pH range of 6 – 13 (Figure 4). The Ip increased slowly with increasing pH up to 8.0 followed with sharply increased for pH 8.0 to 9.0, then decreased in pH 10.0 and continuously decreased in a range of 10 – 13. Thus pH 9.0 was chosen for the analysis. This result is not contradicted with that found by Smyth et al. (1979) when they performed polarographic study of AFB1 [19].
Figure 4 Influence of pH of BRB on the Ip of 0.10 uM AFB1 using SWSV technique. The instrumental parameters are the same as in Figure 2.0.
Figure 5 shows a dependence of the Ep on pH. Shifting of the Ep towards the negative direction at
higher pH implies that the reduction process takes up hydrogen ions [20]. A double bond in aromatic ring conjugates with ketone group, in general, undergoes a reduction at mercury electrode. The suggested mechanism of this reaction in BRB pH 9.0 is illustrated in Figure 6 as reported by Smyth et al. (1979) [21].
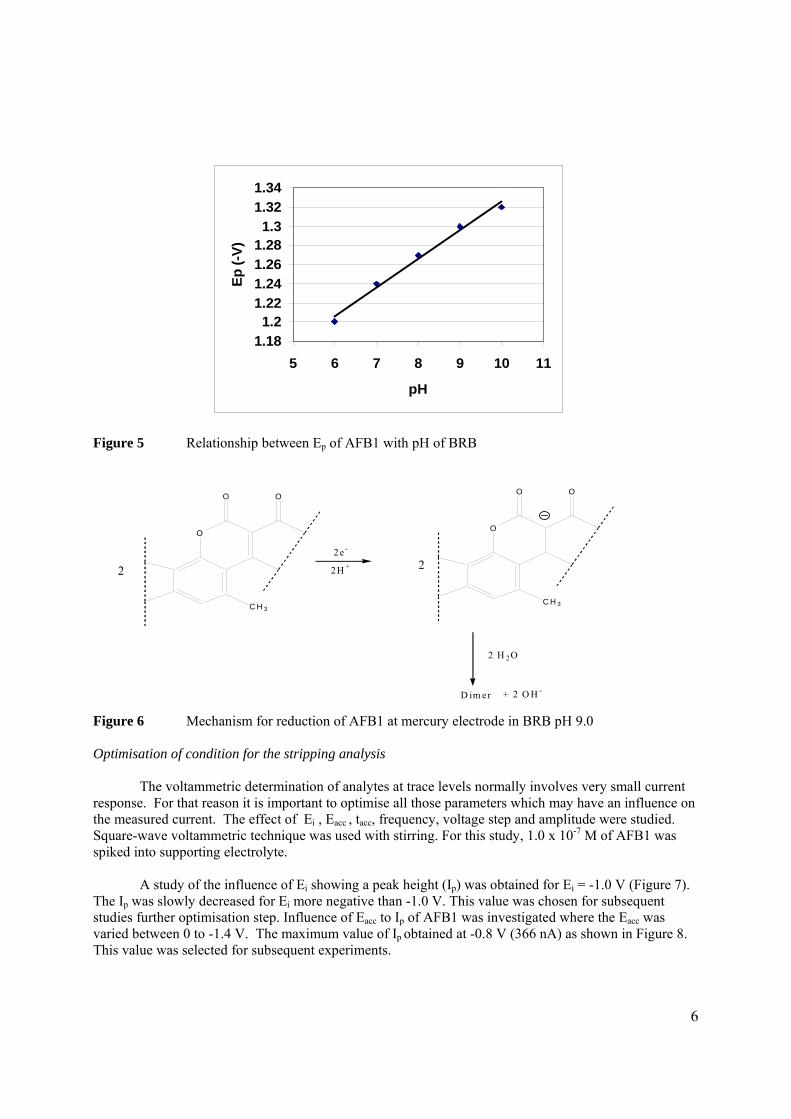
6
1.181.2
1.221.241.261.281.3
1.321.34
5 6 7 8 9 10 11
pH
Ep (-
V)
O
OO
C H 3
O
OO
C H 3
2H +
2 H 2O
D im er + 2 O H -
2e -
2 2
Figure 5 Relationship between Ep of AFB1 with pH of BRB Figure 6 Mechanism for reduction of AFB1 at mercury electrode in BRB pH 9.0 Optimisation of condition for the stripping analysis
The voltammetric determination of analytes at trace levels normally involves very small current response. For that reason it is important to optimise all those parameters which may have an influence on the measured current. The effect of Ei , Eacc , tacc, frequency, voltage step and amplitude were studied. Square-wave voltammetric technique was used with stirring. For this study, 1.0 x 10⁻⁷ M of AFB1 was spiked into supporting electrolyte.
A study of the influence of Ei showing a peak height (Ip) was obtained for Ei = -1.0 V (Figure 7).
The Ip was slowly decreased for Ei more negative than -1.0 V. This value was chosen for subsequent studies further optimisation step. Influence of Eacc to Ip of AFB1 was investigated where the Eacc was varied between 0 to -1.4 V. The maximum value of Ip obtained at -0.8 V (366 nA) as shown in Figure 8. This value was selected for subsequent experiments.
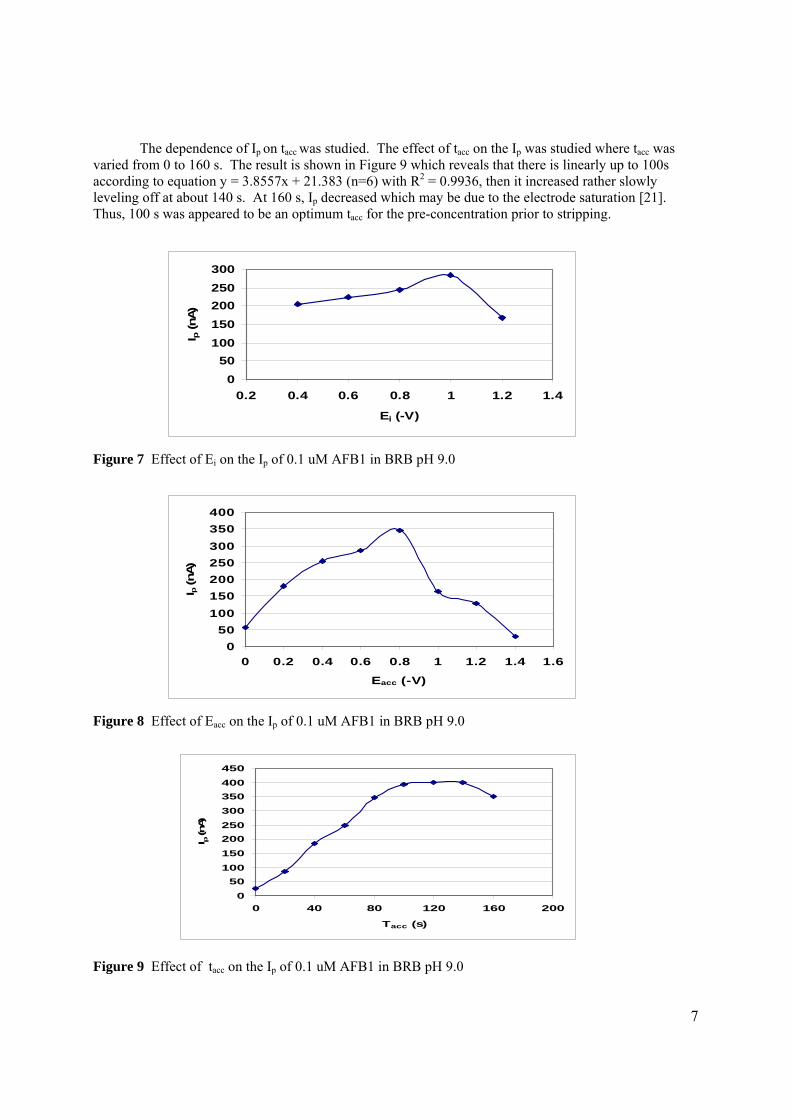
7
050
100150200250300
0.2 0.4 0.6 0.8 1 1.2 1.4
Ei (-V)
I p (n
A)
050
100150200250300350400
0 0.2 0.4 0.6 0.8 1 1.2 1.4 1.6
Eacc (-V)
I p (n
A)
050
100150200250300350400450
0 40 80 120 160 200
Tacc (s)
I p (n
A)
The dependence of Ip on tacc was studied. The effect of tacc on the Ip was studied where tacc was varied from 0 to 160 s. The result is shown in Figure 9 which reveals that there is linearly up to 100s according to equation y = 3.8557x + 21.383 (n=6) with R2 = 0.9936, then it increased rather slowly leveling off at about 140 s. At 160 s, Ip decreased which may be due to the electrode saturation [21]. Thus, 100 s was appeared to be an optimum tacc for the pre-concentration prior to stripping.
Figure 7 Effect of Ei on the Ip of 0.1 uM AFB1 in BRB pH 9.0
Figure 8 Effect of Eacc on the Ip of 0.1 uM AFB1 in BRB pH 9.0
Figure 9 Effect of tacc on the Ip of 0.1 uM AFB1 in BRB pH 9.0
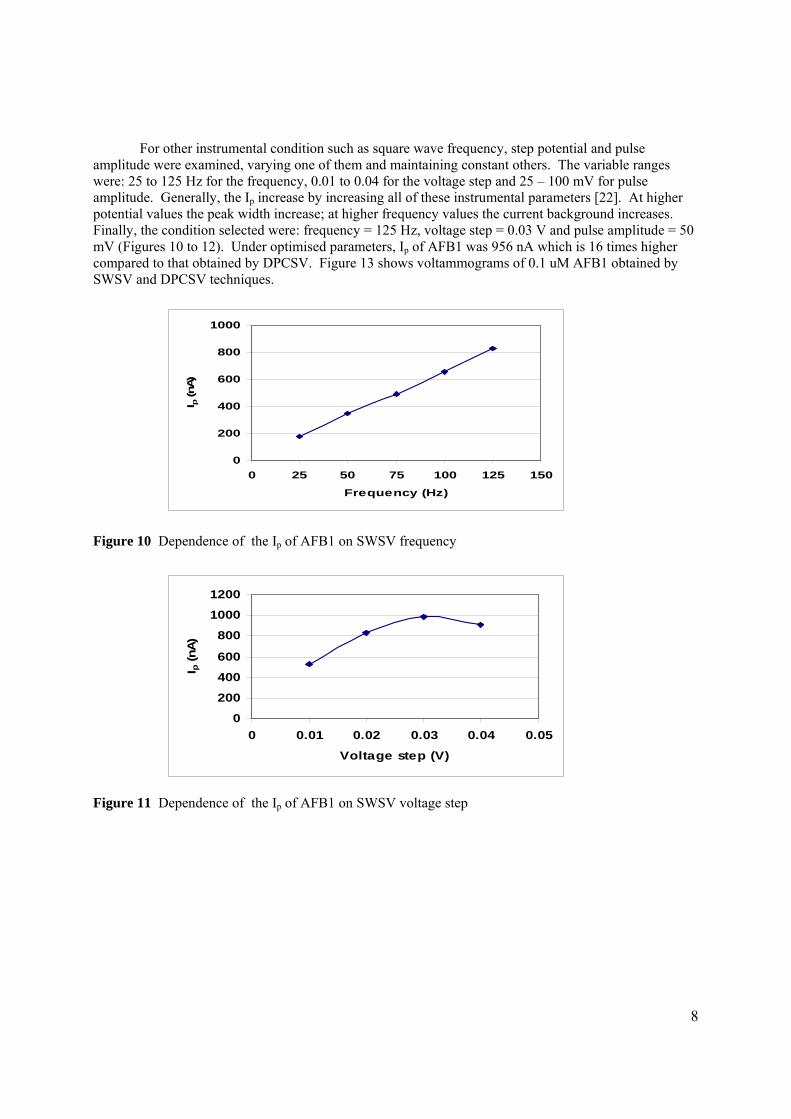
8
0
200
400
600
800
1000
0 25 50 75 100 125 150
Frequency (Hz)
I p (n
A)
0
200
400
600
800
1000
1200
0 0.01 0.02 0.03 0.04 0.05
Voltage step (V)
I p (n
A)
For other instrumental condition such as square wave frequency, step potential and pulse amplitude were examined, varying one of them and maintaining constant others. The variable ranges were: 25 to 125 Hz for the frequency, 0.01 to 0.04 for the voltage step and 25 – 100 mV for pulse amplitude. Generally, the Ip increase by increasing all of these instrumental parameters [22]. At higher potential values the peak width increase; at higher frequency values the current background increases. Finally, the condition selected were: frequency = 125 Hz, voltage step = 0.03 V and pulse amplitude = 50 mV (Figures 10 to 12). Under optimised parameters, Ip of AFB1 was 956 nA which is 16 times higher compared to that obtained by DPCSV. Figure 13 shows voltammograms of 0.1 uM AFB1 obtained by SWSV and DPCSV techniques. Figure 10 Dependence of the Ip of AFB1 on SWSV frequency Figure 11 Dependence of the Ip of AFB1 on SWSV voltage step
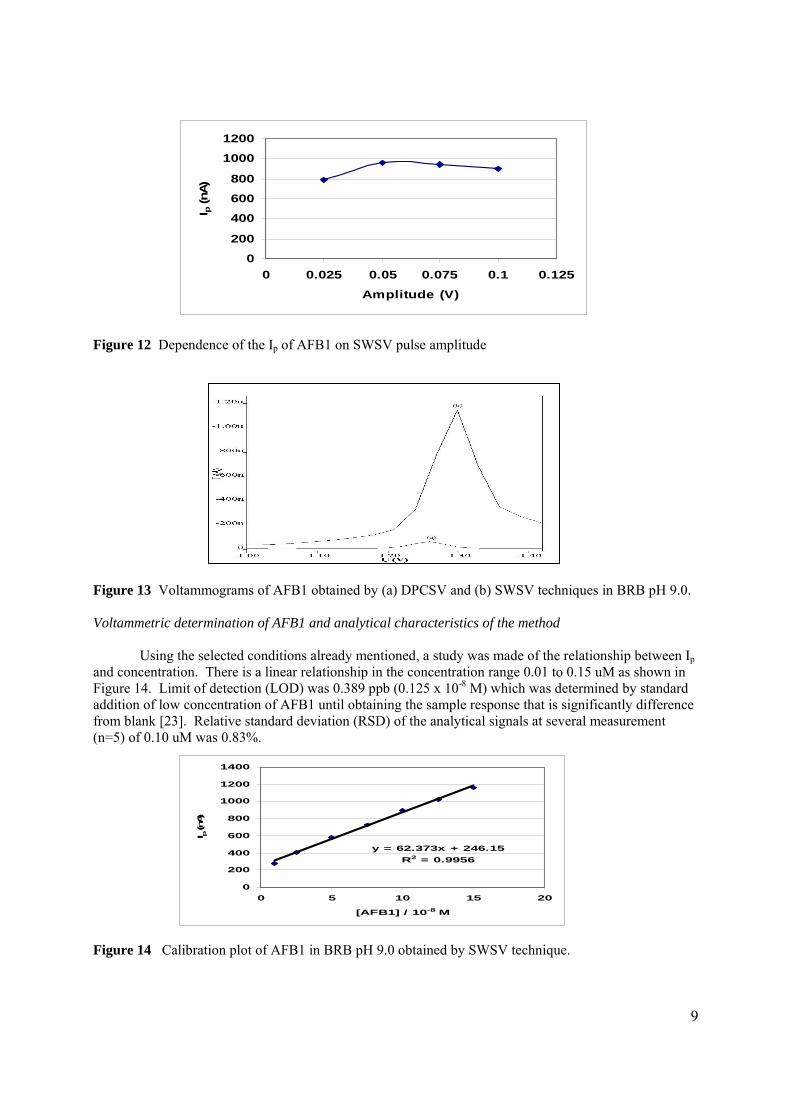
9
0
200
400
600
800
1000
1200
0 0.025 0.05 0.075 0.1 0.125
Amplitude (V)
I p (n
A)
y = 62.373x + 246.15R2 = 0.9956
0
200
400
600
800
1000
1200
1400
0 5 10 15 20
[AFB1] / 10-8 M
I p (n
A)
Figure 12 Dependence of the Ip of AFB1 on SWSV pulse amplitude Figure 13 Voltammograms of AFB1 obtained by (a) DPCSV and (b) SWSV techniques in BRB pH 9.0. Voltammetric determination of AFB1 and analytical characteristics of the method Using the selected conditions already mentioned, a study was made of the relationship between Ip and concentration. There is a linear relationship in the concentration range 0.01 to 0.15 uM as shown in Figure 14. Limit of detection (LOD) was 0.389 ppb (0.125 x 10⁻⁸ M) which was determined by standard addition of low concentration of AFB1 until obtaining the sample response that is significantly difference from blank [23]. Relative standard deviation (RSD) of the analytical signals at several measurement (n=5) of 0.10 uM was 0.83%. Figure 14 Calibration plot of AFB1 in BRB pH 9.0 obtained by SWSV technique.
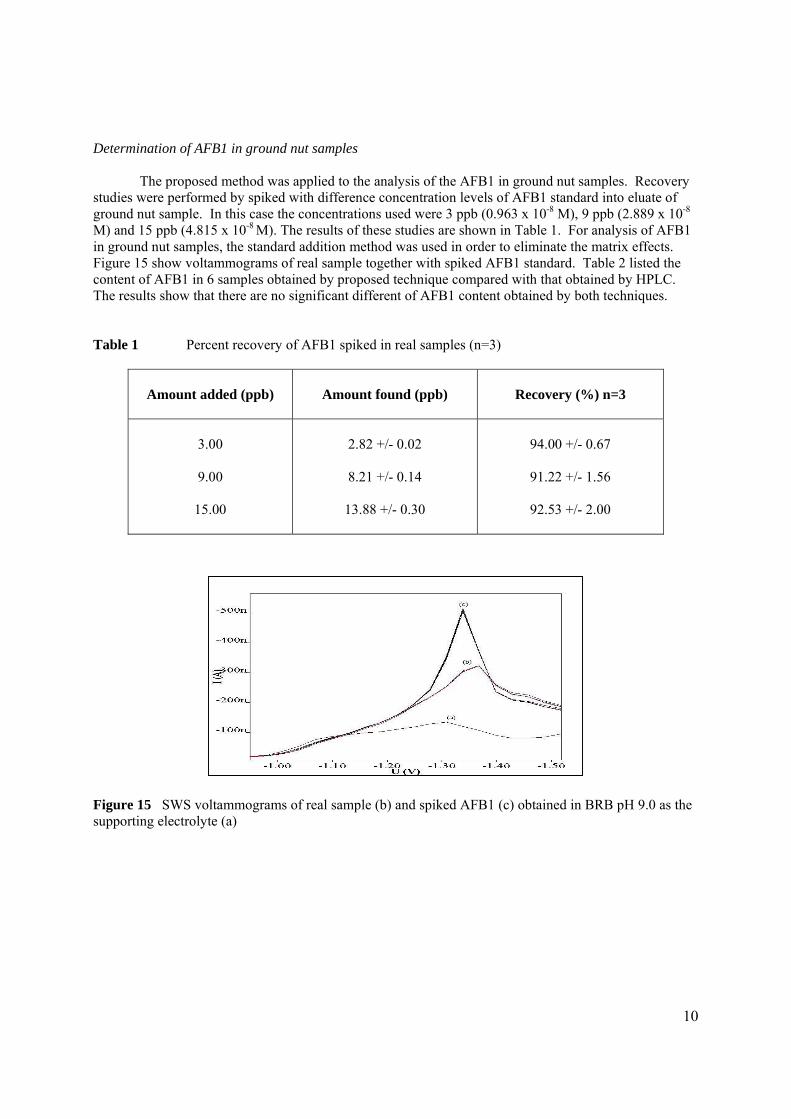
10
Determination of AFB1 in ground nut samples The proposed method was applied to the analysis of the AFB1 in ground nut samples. Recovery studies were performed by spiked with difference concentration levels of AFB1 standard into eluate of ground nut sample. In this case the concentrations used were 3 ppb (0.963 x 10⁻⁸ M), 9 ppb (2.889 x 10⁻⁸ M) and 15 ppb (4.815 x 10⁻⁸ M). The results of these studies are shown in Table 1. For analysis of AFB1 in ground nut samples, the standard addition method was used in order to eliminate the matrix effects. Figure 15 show voltammograms of real sample together with spiked AFB1 standard. Table 2 listed the content of AFB1 in 6 samples obtained by proposed technique compared with that obtained by HPLC. The results show that there are no significant different of AFB1 content obtained by both techniques. Table 1 Percent recovery of AFB1 spiked in real samples (n=3)
Amount added (ppb)
Amount found (ppb)
Recovery (%) n=3
3.00
9.00
15.00
2.82 +/- 0.02
8.21 +/- 0.14
13.88 +/- 0.30
94.00 +/- 0.67
91.22 +/- 1.56
92.53 +/- 2.00
Figure 15 SWS voltammograms of real sample (b) and spiked AFB1 (c) obtained in BRB pH 9.0 as the supporting electrolyte (a)
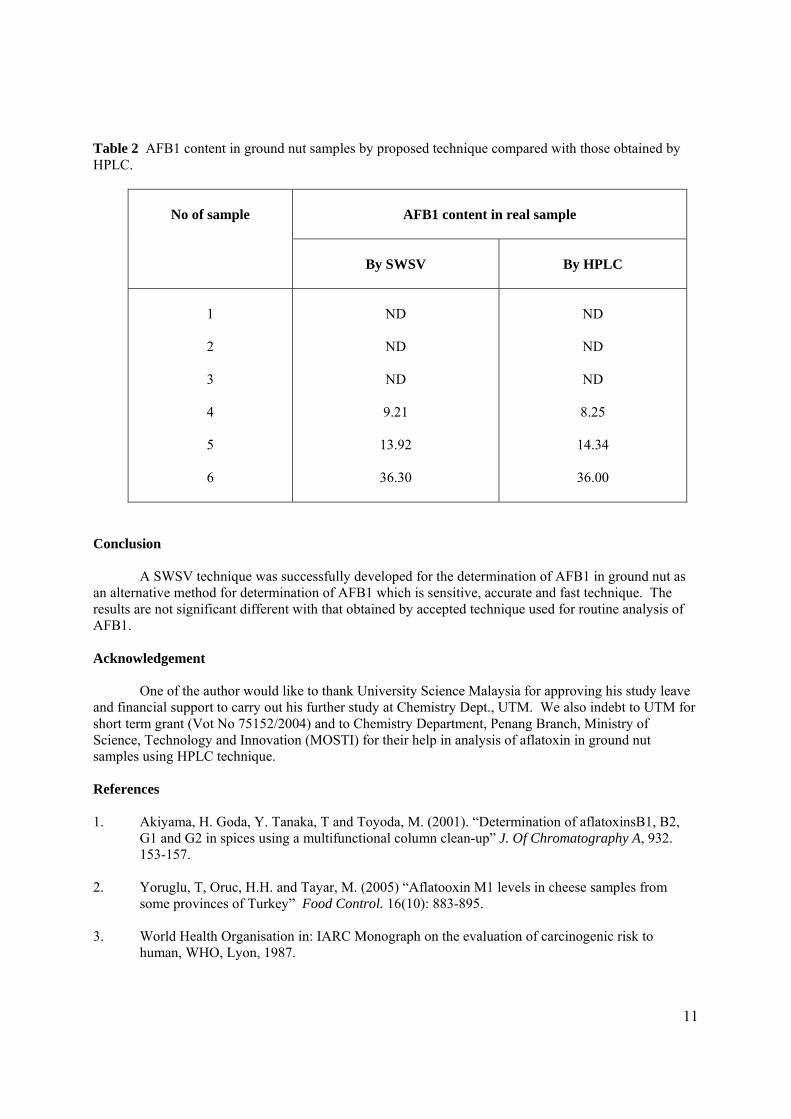
11
Table 2 AFB1 content in ground nut samples by proposed technique compared with those obtained by HPLC.
AFB1 content in real sample
No of sample
By SWSV
By HPLC
1
2
3
4
5
6
ND
ND
ND
9.21
13.92
36.30
ND
ND
ND
8.25
14.34
36.00
Conclusion
A SWSV technique was successfully developed for the determination of AFB1 in ground nut as an alternative method for determination of AFB1 which is sensitive, accurate and fast technique. The results are not significant different with that obtained by accepted technique used for routine analysis of AFB1. Acknowledgement
One of the author would like to thank University Science Malaysia for approving his study leave
and financial support to carry out his further study at Chemistry Dept., UTM. We also indebt to UTM for short term grant (Vot No 75152/2004) and to Chemistry Department, Penang Branch, Ministry of Science, Technology and Innovation (MOSTI) for their help in analysis of aflatoxin in ground nut samples using HPLC technique.
References
1. Akiyama, H. Goda, Y. Tanaka, T and Toyoda, M. (2001). “Determination of aflatoxinsB1, B2,
G1 and G2 in spices using a multifunctional column clean-up” J. Of Chromatography A, 932. 153-157.
2. Yoruglu, T, Oruc, H.H. and Tayar, M. (2005) “Aflatooxin M1 levels in cheese samples from
some provinces of Turkey” Food Control. 16(10): 883-895. 3. World Health Organisation in: IARC Monograph on the evaluation of carcinogenic risk to
human, WHO, Lyon, 1987.
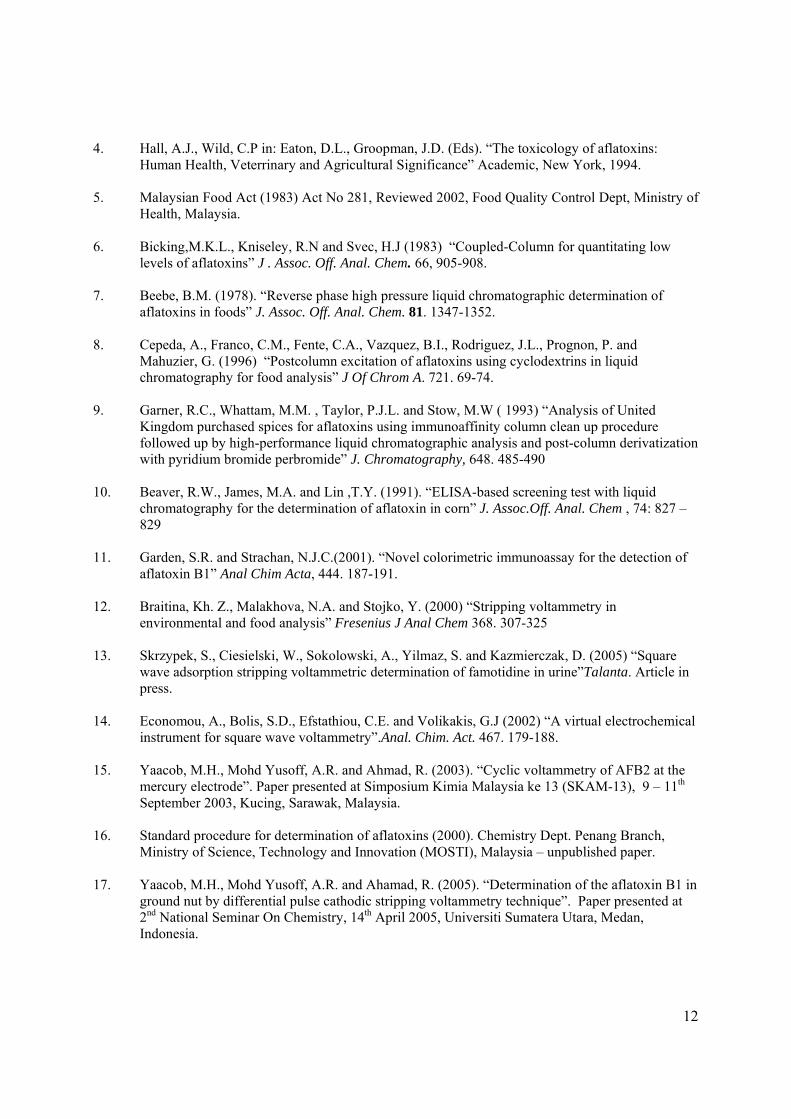
12
4. Hall, A.J., Wild, C.P in: Eaton, D.L., Groopman, J.D. (Eds). “The toxicology of aflatoxins: Human Health, Veterrinary and Agricultural Significance” Academic, New York, 1994.
5. Malaysian Food Act (1983) Act No 281, Reviewed 2002, Food Quality Control Dept, Ministry of
Health, Malaysia. 6. Bicking,M.K.L., Kniseley, R.N and Svec, H.J (1983) “Coupled-Column for quantitating low
levels of aflatoxins” J . Assoc. Off. Anal. Chem. 66, 905-908.
7. Beebe, B.M. (1978). “Reverse phase high pressure liquid chromatographic determination of aflatoxins in foods” J. Assoc. Off. Anal. Chem. 81. 1347-1352.
8. Cepeda, A., Franco, C.M., Fente, C.A., Vazquez, B.I., Rodriguez, J.L., Prognon, P. and
Mahuzier, G. (1996) “Postcolumn excitation of aflatoxins using cyclodextrins in liquid chromatography for food analysis” J Of Chrom A. 721. 69-74.
9. Garner, R.C., Whattam, M.M. , Taylor, P.J.L. and Stow, M.W ( 1993) “Analysis of United
Kingdom purchased spices for aflatoxins using immunoaffinity column clean up procedure followed up by high-performance liquid chromatographic analysis and post-column derivatization with pyridium bromide perbromide” J. Chromatography, 648. 485-490
10. Beaver, R.W., James, M.A. and Lin ,T.Y. (1991). “ELISA-based screening test with liquid
chromatography for the determination of aflatoxin in corn” J. Assoc.Off. Anal. Chem , 74: 827 – 829
11. Garden, S.R. and Strachan, N.J.C.(2001). “Novel colorimetric immunoassay for the detection of
aflatoxin B1” Anal Chim Acta, 444. 187-191. 12. Braitina, Kh. Z., Malakhova, N.A. and Stojko, Y. (2000) “Stripping voltammetry in
environmental and food analysis” Fresenius J Anal Chem 368. 307-325 13. Skrzypek, S., Ciesielski, W., Sokolowski, A., Yilmaz, S. and Kazmierczak, D. (2005) “Square
wave adsorption stripping voltammetric determination of famotidine in urine”Talanta. Article in press.
14. Economou, A., Bolis, S.D., Efstathiou, C.E. and Volikakis, G.J (2002) “A virtual electrochemical
instrument for square wave voltammetry”.Anal. Chim. Act. 467. 179-188.
15. Yaacob, M.H., Mohd Yusoff, A.R. and Ahmad, R. (2003). “Cyclic voltammetry of AFB2 at the mercury electrode”. Paper presented at Simposium Kimia Malaysia ke 13 (SKAM-13), 9 – 11th September 2003, Kucing, Sarawak, Malaysia.
16. Standard procedure for determination of aflatoxins (2000). Chemistry Dept. Penang Branch,
Ministry of Science, Technology and Innovation (MOSTI), Malaysia – unpublished paper.
17. Yaacob, M.H., Mohd Yusoff, A.R. and Ahamad, R. (2005). “Determination of the aflatoxin B1 in ground nut by differential pulse cathodic stripping voltammetry technique”. Paper presented at 2nd National Seminar On Chemistry, 14th April 2005, Universiti Sumatera Utara, Medan, Indonesia.
13
18. Rodriguez, J., Berzas, J.J., Casteneda, G. and Rodriguez, N. (2005). “Voltammetric determination of Imatinib (Gleevec) and its main metabolite using square-wave and adsorptive stripping square-wave techniques in urine samples”. Talanta. 66. 202-209.
19. Smyth, M. R., Lawellin, D. W. and Osteryoung, J.G. (1979). “Polarographic study of Aflatoxin
B1, B2, G1 and G2: Application of differential pulse polarography to the determination of Aflatoxin B1 in various foodstuffs” Analyst. 104. 73-78
20. Sun, N., Mo, W-M., Shen, Z-L. and Hu, B-X. (2005). “Adsorptive stripping voltammetric
technique for the rapid determination of tobramycin on the hanging mercury electrode”. J Pharm. Biomed. Anal. Article in press.
21. Wang J. (1994) “Analytical Electrochemistry” VCH Publisher, USA.
22. Komorsky-Lovric, S., Lovric, M. and Branica, M. (1992). “Peak current-frequency relationship in
adsorptive stripping square-wave voltammetry”. J of Electroanal. Chem. 335(1-2). 297-308. 23. Barek, J. , Fogg, A. G., Muck, A. and Zima, J. (2001). “Polarography and Voltammetry at
Mercury Electrodes”, Critical Reviews In Analytical Chemistry, 31. 291-309

1
PAPER SENT TO PROF BAREK
TO BE PUBLISHED IN
J. COLLECT. CZECH. CHEM. COMMON
( IN PRESS )
2
DEVELOPMENT OF DIFFERENTIAL PULSE STRIPPING VOLTAMMETRIC (DPSV) TECHNIQUE FOR DETERMINATION OF AFLATOXIN G1 AT THE
MERCURY ELECTRODE
Mohamad Hadzri Yaacob1, Abdull Rahim Hj. Mohd. Yusoff2 and Rahmalan Ahamad2 1School of Health Sciences, USM, 16150 Kubang Krian, Kelantan 2Chemistry Dept., Faculty Of Sciences, UTM, 81310 Skudai, Johor
Abstract DPSV technique was developed for determination of aflatoxin G1 (AFG1) in
Britton-Robinson Buffer (BRB). Controlled Growth Mercury Electrode (CGME)
and Ag/AgCl have been used as working and reference electrodes respectively.
In this experiment, the analyte was initially scanned from -200 mV to -1500 mV in
BRB from pH 2.0 to 9.0. The effect of pH of supporting electrolyte, scan rate,
accumulation potential, accumulation time and pulse amplitude on the peak
potential and peak current of the analyte were studied. The results showed that
AFG1 compound undergoes reduction at potential -1175 mV ( versus Ag / AgCl ).
Maximum peak height was observed in BRB pH 9.0 with the optimised
parameters such as scan rate; 50 mV/s, accumulation potential; -600 mV,
accumulation time; 80s and pulse amplitude; 80 mV . Under the optimum
condition, the peak height of AFG1 was proportional to the concentrations of the
AFG1 in the range of 0.02 to 0.26 uM with a limit of detection of 0.015 uM.
Relative standard deviation for a replicate measurements of AFG1 ( n= 8) with
the concentrations of 0.06 and 0.20 uM were 3.52% and 1.54% respectively.
Recoveries of the different AFG1 concentrations in prepared standard solutions
were found to be 85% to 95% with the precision around 0.4% to 1.0%.
1 Correspondence address; Chemistry Dept, Faculty Of Science, UTM 81310 Skudai Johor
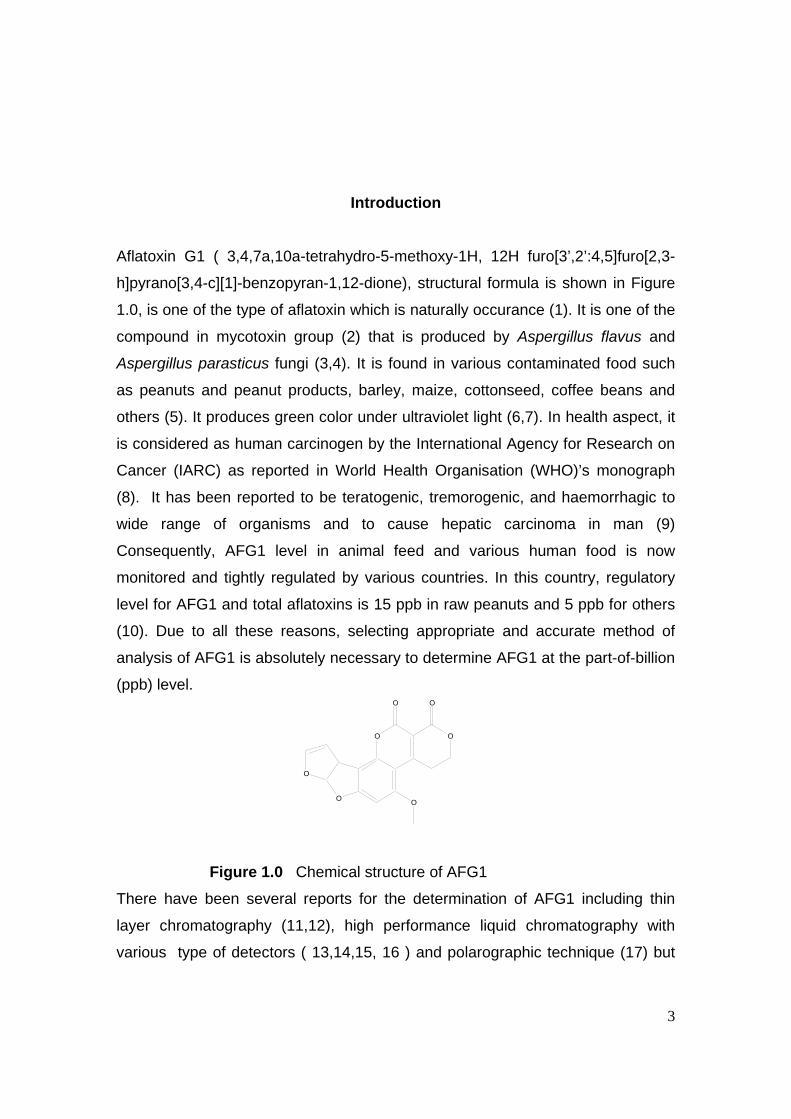
3
O O
O
O
OO
O
Introduction
Aflatoxin G1 ( 3,4,7a,10a-tetrahydro-5-methoxy-1H, 12H furo[3’,2’:4,5]furo[2,3-
h]pyrano[3,4-c][1]-benzopyran-1,12-dione), structural formula is shown in Figure
1.0, is one of the type of aflatoxin which is naturally occurance (1). It is one of the
compound in mycotoxin group (2) that is produced by Aspergillus flavus and
Aspergillus parasticus fungi (3,4). It is found in various contaminated food such
as peanuts and peanut products, barley, maize, cottonseed, coffee beans and
others (5). It produces green color under ultraviolet light (6,7). In health aspect, it
is considered as human carcinogen by the International Agency for Research on
Cancer (IARC) as reported in World Health Organisation (WHO)’s monograph
(8). It has been reported to be teratogenic, tremorogenic, and haemorrhagic to
wide range of organisms and to cause hepatic carcinoma in man (9)
Consequently, AFG1 level in animal feed and various human food is now
monitored and tightly regulated by various countries. In this country, regulatory
level for AFG1 and total aflatoxins is 15 ppb in raw peanuts and 5 ppb for others
(10). Due to all these reasons, selecting appropriate and accurate method of
analysis of AFG1 is absolutely necessary to determine AFG1 at the part-of-billion
(ppb) level.
Figure 1.0 Chemical structure of AFG1
There have been several reports for the determination of AFG1 including thin
layer chromatography (11,12), high performance liquid chromatography with
various type of detectors ( 13,14,15, 16 ) and polarographic technique (17) but
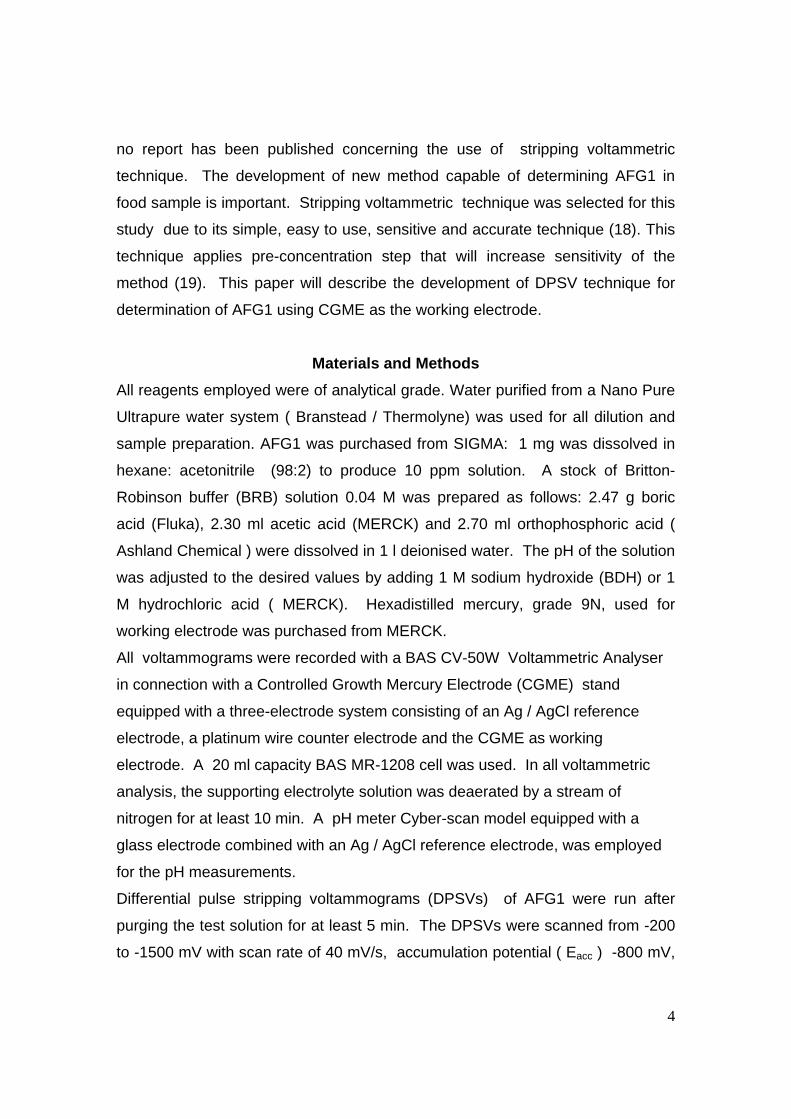
4
no report has been published concerning the use of stripping voltammetric
technique. The development of new method capable of determining AFG1 in
food sample is important. Stripping voltammetric technique was selected for this
study due to its simple, easy to use, sensitive and accurate technique (18). This
technique applies pre-concentration step that will increase sensitivity of the
method (19). This paper will describe the development of DPSV technique for
determination of AFG1 using CGME as the working electrode.
Materials and Methods
All reagents employed were of analytical grade. Water purified from a Nano Pure
Ultrapure water system ( Branstead / Thermolyne) was used for all dilution and
sample preparation. AFG1 was purchased from SIGMA: 1 mg was dissolved in
hexane: acetonitrile (98:2) to produce 10 ppm solution. A stock of Britton-
Robinson buffer (BRB) solution 0.04 M was prepared as follows: 2.47 g boric
acid (Fluka), 2.30 ml acetic acid (MERCK) and 2.70 ml orthophosphoric acid (
Ashland Chemical ) were dissolved in 1 l deionised water. The pH of the solution
was adjusted to the desired values by adding 1 M sodium hydroxide (BDH) or 1
M hydrochloric acid ( MERCK). Hexadistilled mercury, grade 9N, used for
working electrode was purchased from MERCK.
All voltammograms were recorded with a BAS CV-50W Voltammetric Analyser
in connection with a Controlled Growth Mercury Electrode (CGME) stand
equipped with a three-electrode system consisting of an Ag / AgCl reference
electrode, a platinum wire counter electrode and the CGME as working
electrode. A 20 ml capacity BAS MR-1208 cell was used. In all voltammetric
analysis, the supporting electrolyte solution was deaerated by a stream of
nitrogen for at least 10 min. A pH meter Cyber-scan model equipped with a
glass electrode combined with an Ag / AgCl reference electrode, was employed
for the pH measurements.
Differential pulse stripping voltammograms (DPSVs) of AFG1 were run after
purging the test solution for at least 5 min. The DPSVs were scanned from -200
to -1500 mV with scan rate of 40 mV/s, accumulation potential ( Eacc ) -800 mV,
5
accumulation time ( tacc ) 40 s, pulse amplitude 50 mV, pulse width 50-ms and
pulse period 200-ms.
Results and Discussion
From our previous studies on the cyclic voltammograms of AFG1 in BRB pH 9.0,
a reduction peak was observed at -1245 mV ( against Ag / AgCl) and no anodic
peak at oxidation wave. The results of this CVs showed that AFG1 underwent
irreversible reduction reaction at the mercury electrode (20). Due to this
electroanalytical properties, differential pulse cathodic stripping voltammetric
technique was applied in this study using the same supporting electrolyte. By
using initial parameters as mentioned before, the peak potential ( Ep ) of 0.15 uM
AFG1 was obtained at -1175 mV with peak current ( Ip ) of 34.73 nA ( Figure
2.0 ). Several parameters have been optimised so as to obtain a more
symmetrical and higher reduction peak.
Figure 2.0 Voltammograms of 0.15 uM AFG1 (b) in BRb pH 9.0 (a) . Condition;
scan rate; 40 mV/s, accumulation potential ( Eacc ); -800 mV, accumulation time
( tacc ); 40 s, pulse amplitude; 50 mV, pulse width; 50-ms and pulse period; 200-
ms.
Effect of pH of BRB
The effect of different pH medium of BRB have been studied. The results
showed that a reduction peak was first observed at pH 5.0 which increases in
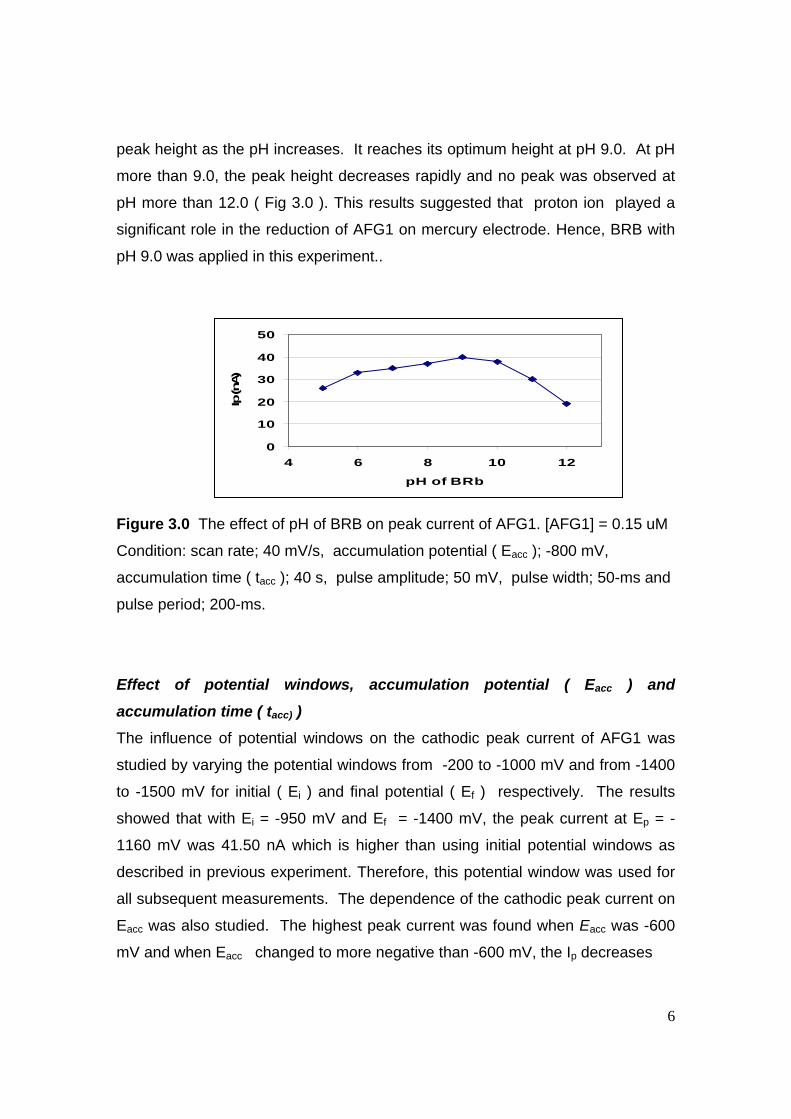
6
0
10
20
30
40
50
4 6 8 10 12
pH of BRb
Ip (n
A)
peak height as the pH increases. It reaches its optimum height at pH 9.0. At pH
more than 9.0, the peak height decreases rapidly and no peak was observed at
pH more than 12.0 ( Fig 3.0 ). This results suggested that proton ion played a
significant role in the reduction of AFG1 on mercury electrode. Hence, BRB with
pH 9.0 was applied in this experiment..
Figure 3.0 The effect of pH of BRB on peak current of AFG1. [AFG1] = 0.15 uM
Condition: scan rate; 40 mV/s, accumulation potential ( Eacc ); -800 mV,
accumulation time ( tacc ); 40 s, pulse amplitude; 50 mV, pulse width; 50-ms and
pulse period; 200-ms.
Effect of potential windows, accumulation potential ( Eacc ) and
accumulation time ( tacc) ) The influence of potential windows on the cathodic peak current of AFG1 was
studied by varying the potential windows from -200 to -1000 mV and from -1400
to -1500 mV for initial ( Ei ) and final potential ( Ef ) respectively. The results
showed that with Ei = -950 mV and Ef = -1400 mV, the peak current at Ep = -
1160 mV was 41.50 nA which is higher than using initial potential windows as
described in previous experiment. Therefore, this potential window was used for
all subsequent measurements. The dependence of the cathodic peak current on
Eacc was also studied. The highest peak current was found when Eacc was -600
mV and when Eacc changed to more negative than -600 mV, the Ip decreases
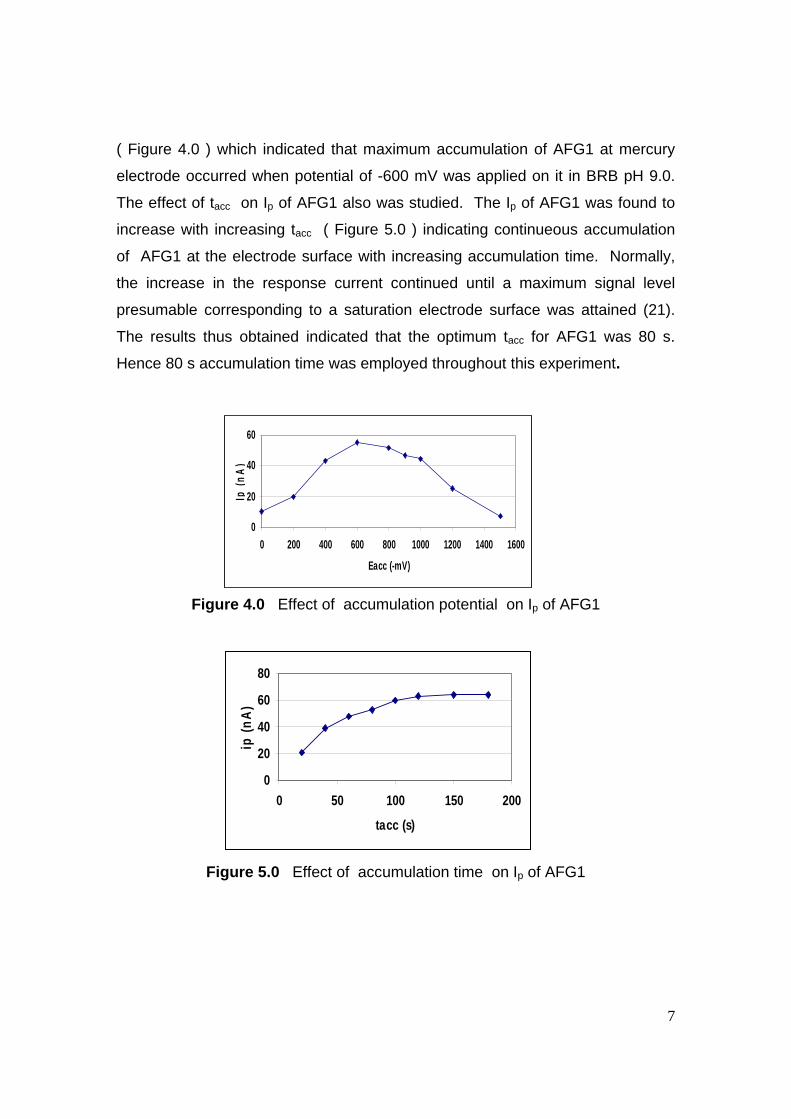
7
0
20
40
60
0 200 400 600 800 1000 1200 1400 1600
Eacc (-mV)
Ip (n
A)
0
20
40
60
80
0 50 100 150 200
tacc (s)
ip (n
A)
( Figure 4.0 ) which indicated that maximum accumulation of AFG1 at mercury
electrode occurred when potential of -600 mV was applied on it in BRB pH 9.0.
The effect of tacc on Ip of AFG1 also was studied. The Ip of AFG1 was found to
increase with increasing tacc ( Figure 5.0 ) indicating continueous accumulation
of AFG1 at the electrode surface with increasing accumulation time. Normally,
the increase in the response current continued until a maximum signal level
presumable corresponding to a saturation electrode surface was attained (21).
The results thus obtained indicated that the optimum tacc for AFG1 was 80 s.
Hence 80 s accumulation time was employed throughout this experiment.
Figure 4.0 Effect of accumulation potential on Ip of AFG1
Figure 5.0 Effect of accumulation time on Ip of AFG1
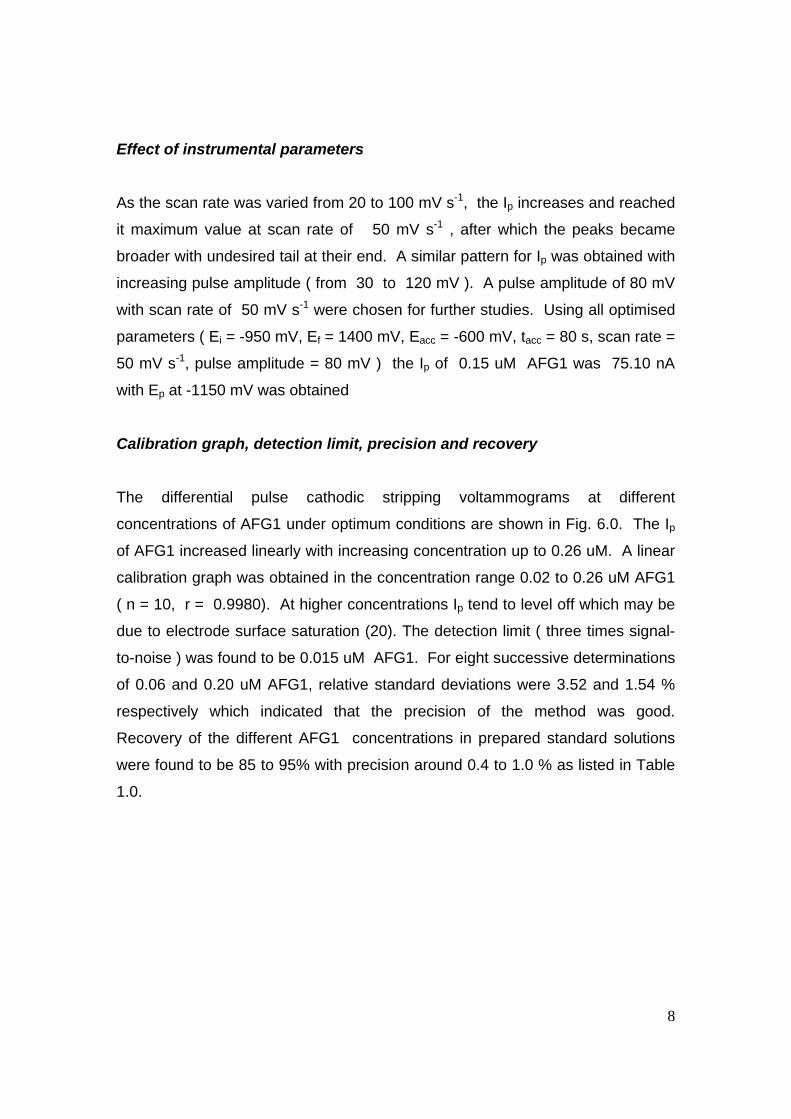
8
Effect of instrumental parameters
As the scan rate was varied from 20 to 100 mV s-1, the Ip increases and reached
it maximum value at scan rate of 50 mV s-1 , after which the peaks became
broader with undesired tail at their end. A similar pattern for Ip was obtained with
increasing pulse amplitude ( from 30 to 120 mV ). A pulse amplitude of 80 mV
with scan rate of 50 mV s-1 were chosen for further studies. Using all optimised
parameters ( Ei = -950 mV, Ef = 1400 mV, Eacc = -600 mV, tacc = 80 s, scan rate =
50 mV s-1, pulse amplitude = 80 mV ) the Ip of 0.15 uM AFG1 was 75.10 nA
with Ep at -1150 mV was obtained
Calibration graph, detection limit, precision and recovery
The differential pulse cathodic stripping voltammograms at different
concentrations of AFG1 under optimum conditions are shown in Fig. 6.0. The Ip
of AFG1 increased linearly with increasing concentration up to 0.26 uM. A linear
calibration graph was obtained in the concentration range 0.02 to 0.26 uM AFG1
( n = 10, r = 0.9980). At higher concentrations Ip tend to level off which may be
due to electrode surface saturation (20). The detection limit ( three times signal-
to-noise ) was found to be 0.015 uM AFG1. For eight successive determinations
of 0.06 and 0.20 uM AFG1, relative standard deviations were 3.52 and 1.54 %
respectively which indicated that the precision of the method was good.
Recovery of the different AFG1 concentrations in prepared standard solutions
were found to be 85 to 95% with precision around 0.4 to 1.0 % as listed in Table
1.0.
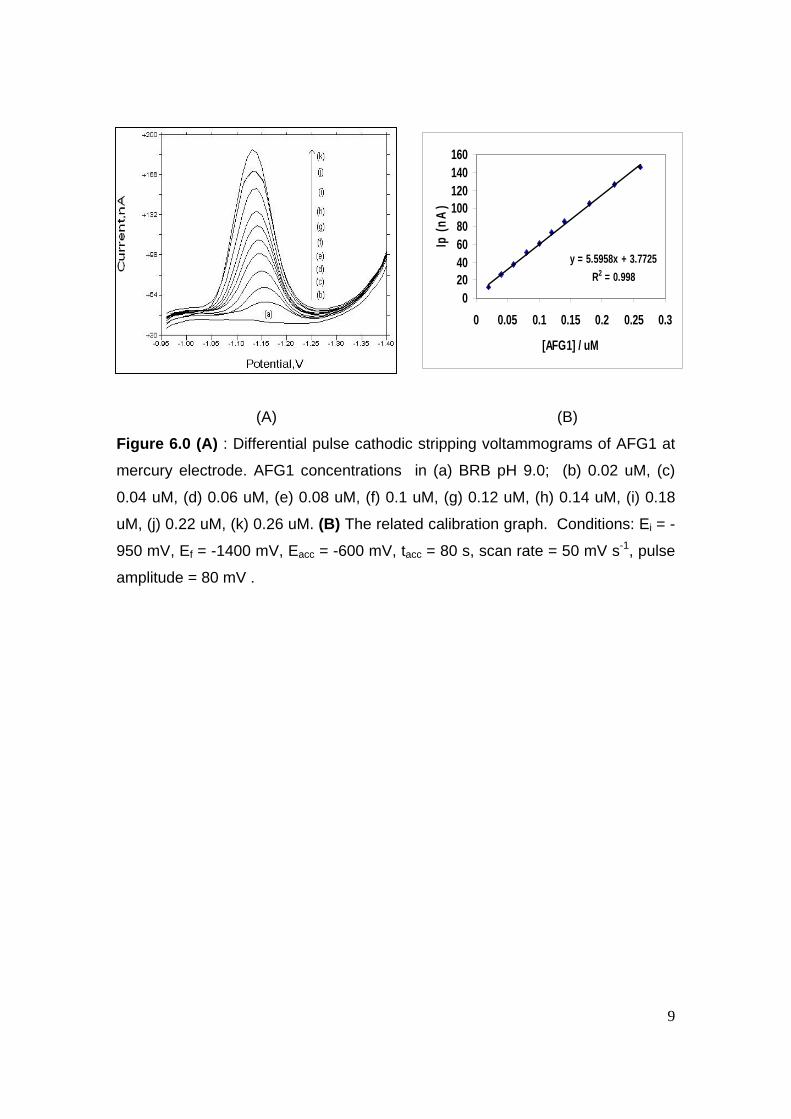
9
y = 5.5958x + 3.7725R2 = 0.998
020406080
100120140160
0 0.05 0.1 0.15 0.2 0.25 0.3
[AFG1] / uM
Ip (n
A)
(A) (B)
Figure 6.0 (A) : Differential pulse cathodic stripping voltammograms of AFG1 at
mercury electrode. AFG1 concentrations in (a) BRB pH 9.0; (b) 0.02 uM, (c)
0.04 uM, (d) 0.06 uM, (e) 0.08 uM, (f) 0.1 uM, (g) 0.12 uM, (h) 0.14 uM, (i) 0.18
uM, (j) 0.22 uM, (k) 0.26 uM. (B) The related calibration graph. Conditions: Ei = -
950 mV, Ef = -1400 mV, Eacc = -600 mV, tacc = 80 s, scan rate = 50 mV s-1, pulse
amplitude = 80 mV .
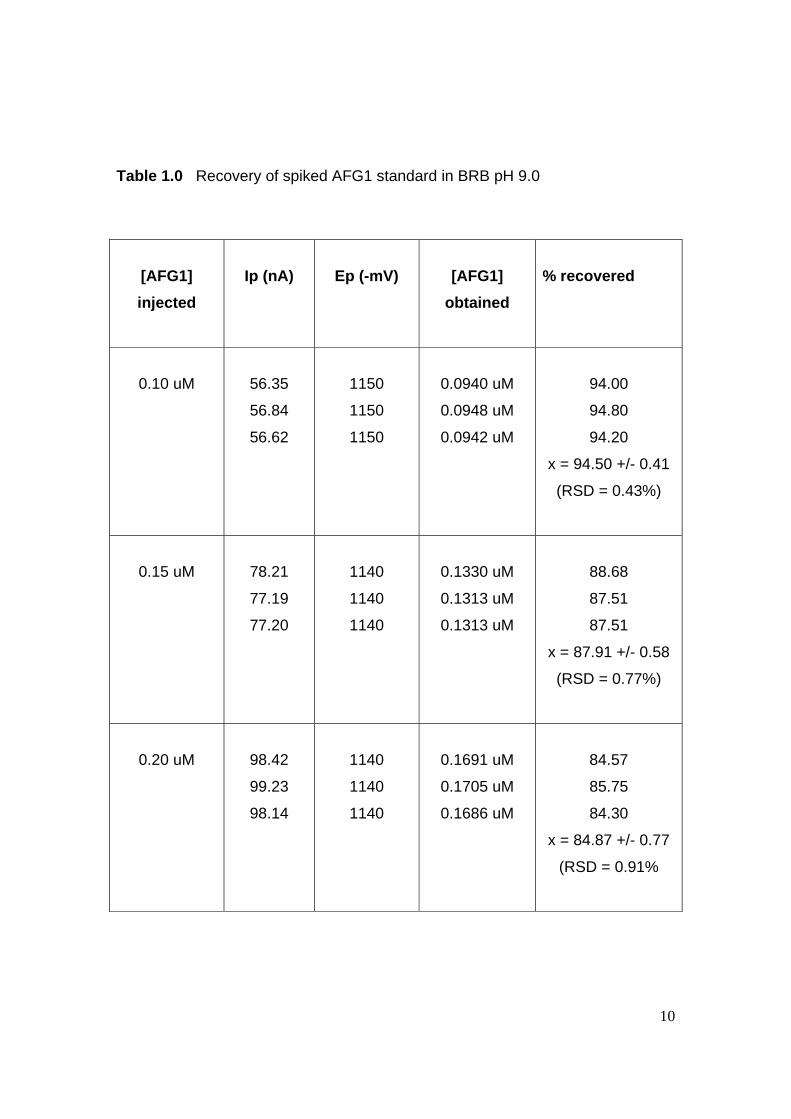
10
Table 1.0 Recovery of spiked AFG1 standard in BRB pH 9.0
[AFG1] injected
Ip (nA)
Ep (-mV)
[AFG1]
obtained
% recovered
0.10 uM
56.35
56.84
56.62
1150
1150
1150
0.0940 uM
0.0948 uM
0.0942 uM
94.00
94.80
94.20
x = 94.50 +/- 0.41
(RSD = 0.43%)
0.15 uM
78.21
77.19
77.20
1140
1140
1140
0.1330 uM
0.1313 uM
0.1313 uM
88.68
87.51
87.51
x = 87.91 +/- 0.58
(RSD = 0.77%)
0.20 uM
98.42
99.23
98.14
1140
1140
1140
0.1691 uM
0.1705 uM
0.1686 uM
84.57
85.75
84.30
x = 84.87 +/- 0.77
(RSD = 0.91%
11
Conclusion
A differential pulse cathodic stripping voltammetric technique using mercury
electrode as the working electrode for determination of AFG1 has been
developed. The method presented here is fast, reliable and sensitive technique
for analysis of AFG1 with good precision and recovery. Further study is currently
been carried out for analytical application of this method for quantitation of AFG1
in food sample.
Acknowledgement
The author gratefully acknowledge the University Science Malaysia for giving me
a study leave together with a scholarship under the Academic Staff For Higher
Education Scheme (ASHES). Also we would like to thank all Electroanalytical
group and Chemistry Department staff, UTM for their fully cooperation.
References [1] Goldblatt L.A. 1969. Aflatoxin:Scientific background, control and implication.
Academic Press, New York, pp 5-10
[2] Salleh B. 1998. Mikotoksin: Implikasinya terhadap kesihatan manusia dan
haiwan, USM, Penang, pp 32 - 49
[3] Begum F and Samajpathi N. 2000. Mycotoxin production in rice, pulses and
oilseeds, Naturwissenschaften, 87: 275-277.
[4] Ordaz J.J., Fente C.C., Vazquez B.I., Franco C.M. and Cepeda A. 2003.
Development of a method for direct visual determination of aflatoxin production
by colonies of the Asperfillus flavus group, Int. J. Food Microbiology, 83, 219-
225.
[5] Batista L. R., Chalfoun S.M., Prado G. Schwan R.F. and Wheals A. E. 2003.
Toxigenic fungi associated with processed (green) coffee beans ( Coffea arabica
L.) . Int. J. Food Microbiology, 85, 293-300.
12
[6] Akiyama H. Goda Y. Tanaka T and Toyoda M. 2001. Determination of
aflatoxins B1, B2, G1 and G2 in spices using a multifunctional column clean-up,
J. Of Chromatography A, 932. 153-157 [7] Aziz N.H., Youseff Y.A., El-Fouly M.Z. and Mousse L.A. 1998. Contamination
of some common medicinal plant samples and spices by fungi and their
mycotoxins. Bot. Bull. Acad. Sin 39, 279-285.
[8] World Health Organisation 1987 in: IARC Monograph on the Evaluation of
Carcinogenic Risk to Human, WHO, Lyon , pp 82 Supl. I
[9] Refai M.K. 1988. Aflatoxins and aflatoxicosis. J. Egypt Vet. Med. Ass. 48, 1-
19
[10] Ministry of Health, Malaysia, Food Act No 231. 1983. Reviewed 2003
[11] Shotwell O.L and Goulden M.L. 1977. Aflatoxins: Comparison of analysis of
corn by various methods, J. Assoc. Off. Anal. Chem 60: 83-88
[12] Gimeno A. and Martins M. L. 1983 Rapid thin layer chromatographic
determination of patulin, citrinin and aflatoxin in apples and pears and their juices
and jams, J. Assoc. Anal. Chem, 66, 85-91.
[13] Scholten J.M and Spanjer M.C. 1996. Determination of aflatoxin B1, B2, G1
and G2 in pastachio kernels and shells, , J. Assoc. Off. Anal. Chem 79: 1360-
1364
[14] Jeffery H.W., Lenorich L.M and Martin R. Jr. 1982. Liquid chromatography
determination of aflatoxins in artificially contaminated cocoa beans. , J. Assoc.
Off. Anal. Chem 80: 1215-1219
[15] Joshua, H. 1993 Determination of aflatoxin by reversed-phase high
performance liquid chromatography with post-column in-line photochemical
derivatization and fluorescence detection, J. Chromatography A, 654: 247-254
[16] Gonzalez M.P.E., Mattusch J. and Wennrich R 1998. Stability and
determination of aflatoxins by high-performance liquid chromatography with
amperometric detection, J. Chromatography A, 828: 439-444
[17] Smyth M. R., Lawellin D. W. and Osteryoung J.G 1979. Polarographic
Study of Aflatoxin B1, B2, G1 and G2: Application of Differential-pulse
13
Polarography to the Determination of Aflatoxin B1 in Various Foodstuffs, Analyst,
104: 73-78
[18] Braitina Kh. Z., Malakhova N.A. and Stojko Y. 2000 Stripping voltammetry
in environmental and food analysis, Fresenius J Anal Chem 368: 307-325
[19] Fifield, F.W. and Haines, P.J. 2000. .Environmental Analytical Chemistry
2nd Ed, Balckwell Science UK, pp 241-242
[20] Yaacob M.H., Mohd Yusof A.R., Ahamad R. and Yakob A.R. 2004. Cyclic
Voltammetry of AFG1 at mercury electrode, Paper will be presented at 3rd
Annual Seminar on Sustainable Science and Management, KUSTEM,
Terengganu, 4 – 5 May 2004.
[21] Wang. 2000. Analytical Electrochemistry. Wiley-VCH, USA.
PAPER SENT TO PROF BAREK
TO BE PUBLISHED IN
CHEMICAL ANALYSIS (WARSAW)
( IN PRESS)
2
DIFFERENTIAL PULSE STRIPPING VOLTAMMETRIC TECHNIQUE FOR THE DETERMINATION OF AFLATOXIN B2 AT THE MERCURY
ELECTRODE
Mohamad Hadzri Yaacob, Abdull Rahim Hj. Mohd. Yusoff and Rahmalan Ahamad
Chemistry Dept., Faculty Of Sciences, UTM, 81310 Skudai, Johor
ABSTRACT
Differential pulse voltammetric technique was developed for determination of aflatoxin B2 standard (AFB2) in Britton-Robinson Buffer (BRB). Hanging mercury drop electrode and Ag/AgCl have been used for working and reference electrodes respectively. In this experiment, the analyte was initially scanned from -1000 mV to -1500 mV in BRB pH 9.0. The effect of pH of supporting electrolyte, scan rate, accumulation potential, accumulation time and pulse amplitude on the peak potential and peak current of the analyte were observed. The results showed that AFB2 compound undergoes reduction reaction at a potential of -1230 mV ( versus Ag/AgCl ). BRB pH 9.0 was the best supporting electrolyte with the optimised parameters such as scan rate; 50 mV/s, accumulation potential; -800 mV, accumulation time; 80s and pulse amplitude; 80 mV which gave the maximum peak height. Under the optimum condition, the peak height of AFB2 was proportional to the concentrations of the AFB2 in the range of 0.02 to 0.32 uM with a limit of detection was 0.0159 uM. Relative standard deviation for a eplicate measurements of AFB2 ( n= 8) with the concentrations of 0.06 and 0.20 uM were 2.80% and 2.53% respectively. Recoveries of the different AFB2 concentrations in prepared standard solutions were found to be 85% to 95% with the precision around 0.7% to 2.0%.
Keywords: aflatoxin B2 compound, differential pulse stripping voltammetry, Britton-Robinson buffer and hanging mercury drop electrode (HMDE)
1. INTRODUCTION Aflatoxins are mycotoxins produced by certain fungi, especially, Aspergillus flavus and Aspergillus parasiticus which are found on crops and foodstuffs under certain conditions (1). They display strong carcinogenicity. Therefore, they are dangerous food contaminants. They were first identified as the causative agent of the severe outbreak of “Turkey X” disease, a toxicosis that killed more than 100,000 turkey poults in England in 1960 (2) There are a major concern as human hepatocarcinogens and are considered to play an important role in the high incidence of human hepatocellular carcinoma in certain areas of the world. Due to this reason, many countries including Malaysia have set regulatory demands on the level of aflatoxins permitted in imported and trade commodities.
3
O
O
O
OO
O
There are six main aflatoxin compounds such as Aflatoxin B1, B2, G1 and G2 ( designated as AFB1, AFB2, AFG1 and AFG2 ) and aflatoxin M1 and M2 ( designated as AFM1 and AFM2). The former four compounds are naturally prevalent and the others are hydroxylated metabolite of AFB1 and AFB2 and were found in the milk of lactating animals following ingestion of B1 and B2- contaminated feeds (3) Among them AFB1 exhibits potent carcinogenic and mutagenic characteristics in a numbers of human and animals. AFB2 has a similar chemical structure with AFB1 whereby the presence of an 8,9-double bond in the form of a vinyl ether at the terminal furan ring in AFB1, but not in AFB2. The chemical structure of AFB2 is shown in Figure 1.0. This small difference in structure is associated with very significant change in activity; whereby AFB1 is more toxic than AFB2 (4).
Figure 1.0: Chemical structure of AFB2
Due to their toxicity, it is important that the level of these contaminants be controlled in food, soils and water to prevent toxic effect. The way to achieve this is by monitor samples so that any problem can be identified and dealt with, by doing analysis of aflatoxins using the analytical techniques at the parts-per-billon (ppb) level. Current analysis is done by various methods including thin-layer chromatography (TLC) (5), liquid chromatography (LC) and high-performance liquid chromatography (6,7) and microtitre plate enzyme-linked immunosorbant assay (ELISA) (8). All these methods require special equipments operated by skilled personnel and time consume. With the aim of rapid, simple, accurate and relative low cost analysis, the voltammetric technique is proposed for this purposes (9). Voltammetric technique generally refer to a system that combines a triple electrodes system with a potentiostate for controlling applied potential. It measures the current response generated by mass transport of electroactive species in the solution to the working electrode while potential is scanned. The total current response is proportional to the amount of analyte present in the solution (10). This paper reports the differential pulse voltammetric determination of AFB2 at a mercury electrode using a cathodic stripping voltammetric technique.
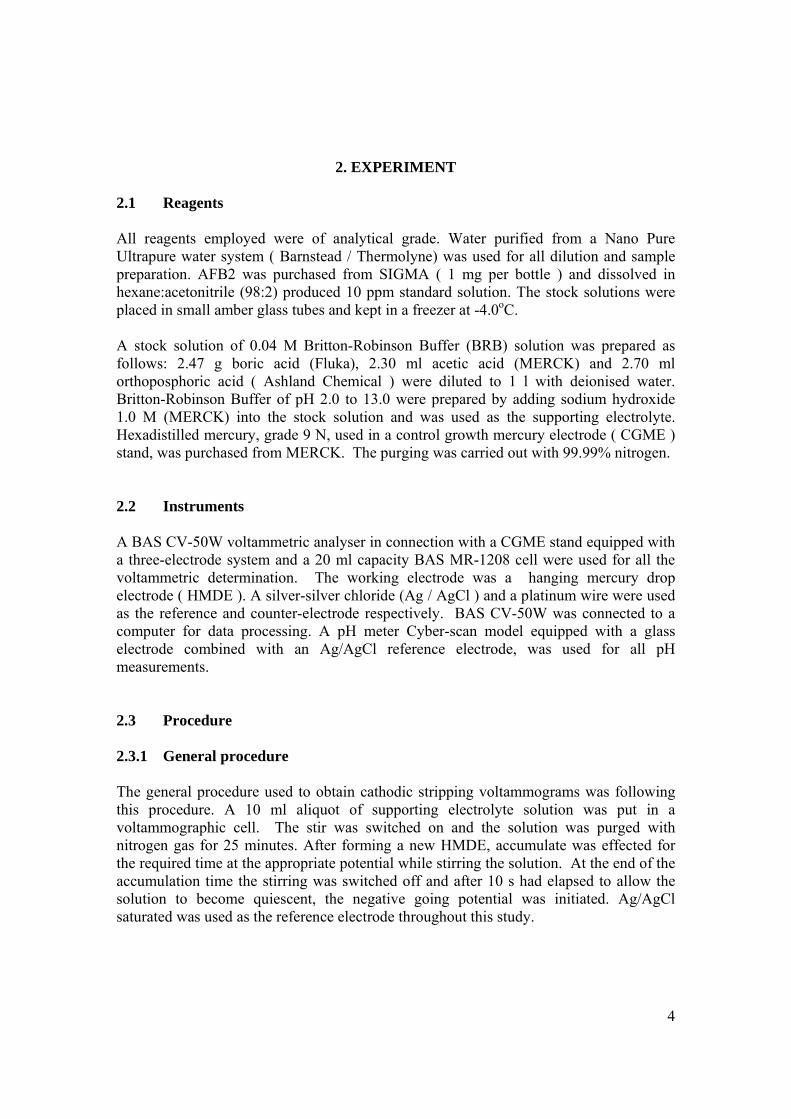
4
2. EXPERIMENT
2.1 Reagents All reagents employed were of analytical grade. Water purified from a Nano Pure Ultrapure water system ( Barnstead / Thermolyne) was used for all dilution and sample preparation. AFB2 was purchased from SIGMA ( 1 mg per bottle ) and dissolved in hexane:acetonitrile (98:2) produced 10 ppm standard solution. The stock solutions were placed in small amber glass tubes and kept in a freezer at -4.0oC. A stock solution of 0.04 M Britton-Robinson Buffer (BRB) solution was prepared as follows: 2.47 g boric acid (Fluka), 2.30 ml acetic acid (MERCK) and 2.70 ml orthoposphoric acid ( Ashland Chemical ) were diluted to 1 l with deionised water. Britton-Robinson Buffer of pH 2.0 to 13.0 were prepared by adding sodium hydroxide 1.0 M (MERCK) into the stock solution and was used as the supporting electrolyte. Hexadistilled mercury, grade 9 N, used in a control growth mercury electrode ( CGME ) stand, was purchased from MERCK. The purging was carried out with 99.99% nitrogen. 2.2 Instruments A BAS CV-50W voltammetric analyser in connection with a CGME stand equipped with a three-electrode system and a 20 ml capacity BAS MR-1208 cell were used for all the voltammetric determination. The working electrode was a hanging mercury drop electrode ( HMDE ). A silver-silver chloride (Ag / AgCl ) and a platinum wire were used as the reference and counter-electrode respectively. BAS CV-50W was connected to a computer for data processing. A pH meter Cyber-scan model equipped with a glass electrode combined with an Ag/AgCl reference electrode, was used for all pH measurements. 2.3 Procedure 2.3.1 General procedure The general procedure used to obtain cathodic stripping voltammograms was following this procedure. A 10 ml aliquot of supporting electrolyte solution was put in a voltammographic cell. The stir was switched on and the solution was purged with nitrogen gas for 25 minutes. After forming a new HMDE, accumulate was effected for the required time at the appropriate potential while stirring the solution. At the end of the accumulation time the stirring was switched off and after 10 s had elapsed to allow the solution to become quiescent, the negative going potential was initiated. Ag/AgCl saturated was used as the reference electrode throughout this study.
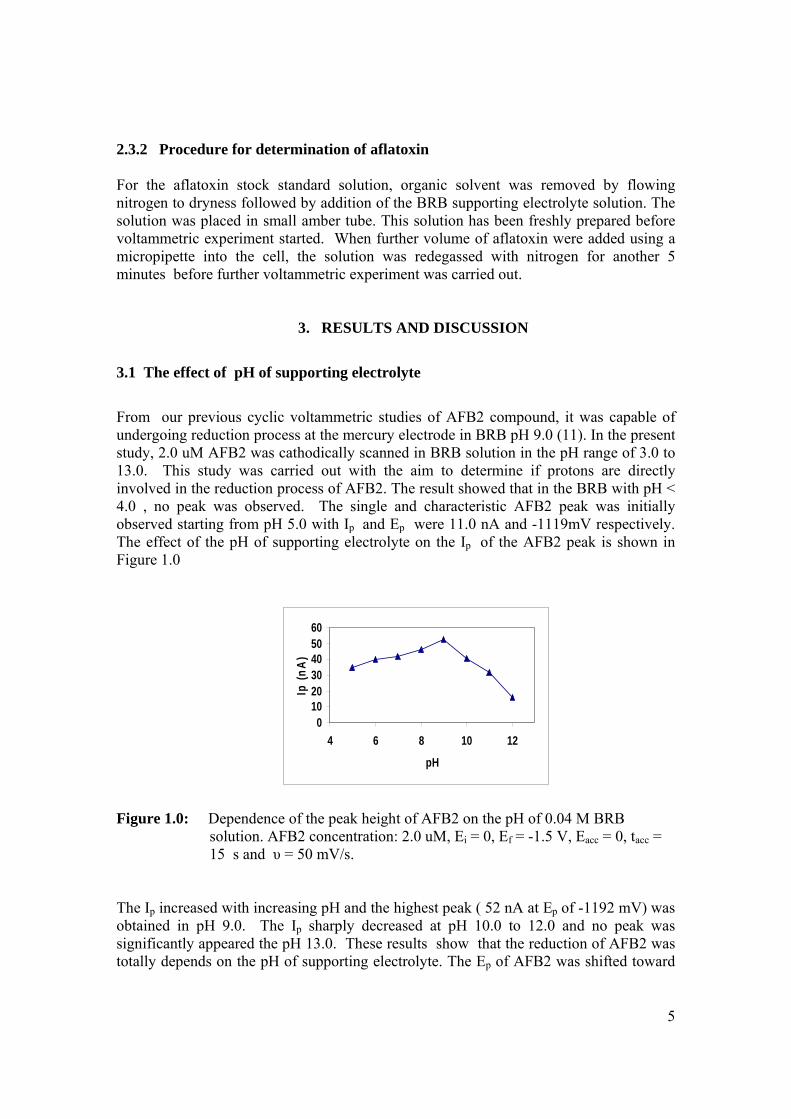
5
0102030405060
4 6 8 10 12
pH
Ip (n
A)
2.3.2 Procedure for determination of aflatoxin For the aflatoxin stock standard solution, organic solvent was removed by flowing nitrogen to dryness followed by addition of the BRB supporting electrolyte solution. The solution was placed in small amber tube. This solution has been freshly prepared before voltammetric experiment started. When further volume of aflatoxin were added using a micropipette into the cell, the solution was redegassed with nitrogen for another 5 minutes before further voltammetric experiment was carried out.
3. RESULTS AND DISCUSSION
3.1 The effect of pH of supporting electrolyte
From our previous cyclic voltammetric studies of AFB2 compound, it was capable of undergoing reduction process at the mercury electrode in BRB pH 9.0 (11). In the present study, 2.0 uM AFB2 was cathodically scanned in BRB solution in the pH range of 3.0 to 13.0. This study was carried out with the aim to determine if protons are directly involved in the reduction process of AFB2. The result showed that in the BRB with pH < 4.0 , no peak was observed. The single and characteristic AFB2 peak was initially observed starting from pH 5.0 with Ip and Ep were 11.0 nA and -1119mV respectively. The effect of the pH of supporting electrolyte on the Ip of the AFB2 peak is shown in Figure 1.0
Figure 1.0: Dependence of the peak height of AFB2 on the pH of 0.04 M BRB
solution. AFB2 concentration: 2.0 uM, Ei = 0, Ef = -1.5 V, Eacc = 0, tacc = 15 s and υ = 50 mV/s.
The Ip increased with increasing pH and the highest peak ( 52 nA at Ep of -1192 mV) was obtained in pH 9.0. The Ip sharply decreased at pH 10.0 to 12.0 and no peak was significantly appeared the pH 13.0. These results show that the reduction of AFB2 was totally depends on the pH of supporting electrolyte. The Ep of AFB2 was shifted toward
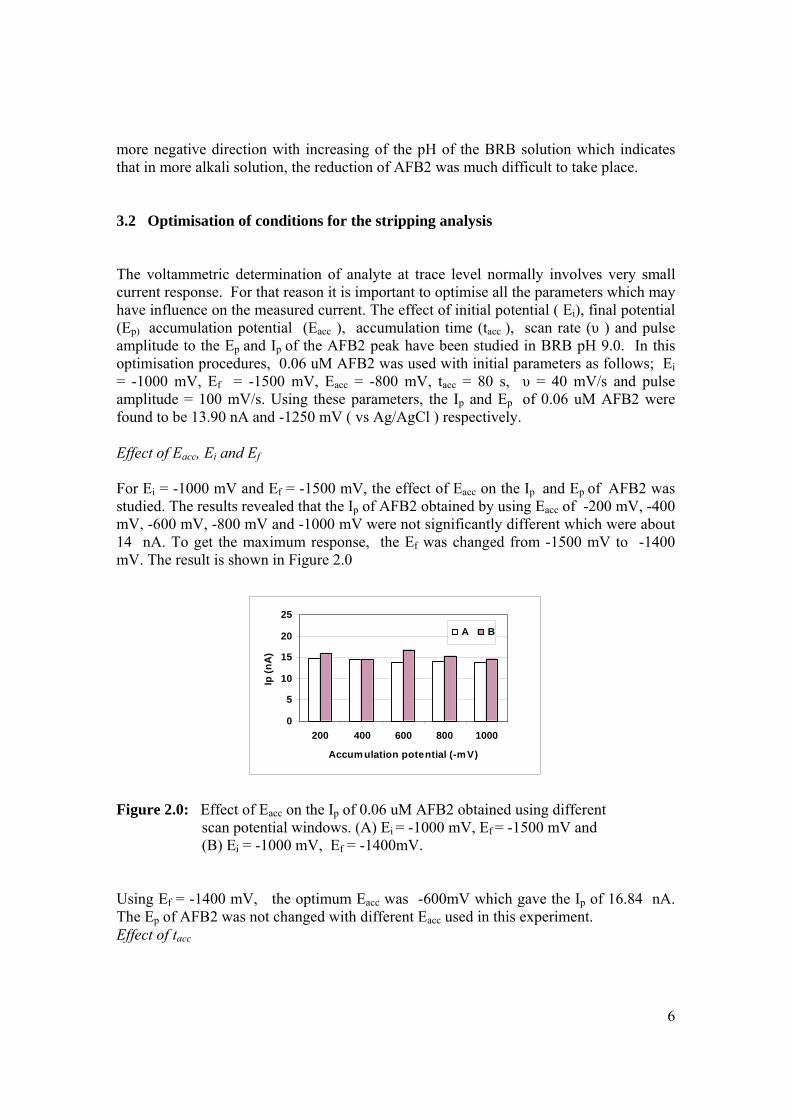
6
0
5
10
15
20
25
200 400 600 800 1000
Accum ulation potential (-m V)
Ip (n
A)
A B
more negative direction with increasing of the pH of the BRB solution which indicates that in more alkali solution, the reduction of AFB2 was much difficult to take place. 3.2 Optimisation of conditions for the stripping analysis
The voltammetric determination of analyte at trace level normally involves very small current response. For that reason it is important to optimise all the parameters which may have influence on the measured current. The effect of initial potential ( Ei), final potential (Ep) accumulation potential (Eacc ), accumulation time (tacc ), scan rate (υ ) and pulse amplitude to the Ep and Ip of the AFB2 peak have been studied in BRB pH 9.0. In this optimisation procedures, 0.06 uM AFB2 was used with initial parameters as follows; Ei = -1000 mV, Ef = -1500 mV, Eacc = -800 mV, tacc = 80 s, υ = 40 mV/s and pulse amplitude = 100 mV/s. Using these parameters, the Ip and Ep of 0.06 uM AFB2 were found to be 13.90 nA and -1250 mV ( vs Ag/AgCl ) respectively. Effect of Eacc, Ei and Ef For Ei = -1000 mV and Ef = -1500 mV, the effect of Eacc on the Ip and Ep of AFB2 was studied. The results revealed that the Ip of AFB2 obtained by using Eacc of -200 mV, -400 mV, -600 mV, -800 mV and -1000 mV were not significantly different which were about 14 nA. To get the maximum response, the Ef was changed from -1500 mV to -1400 mV. The result is shown in Figure 2.0 Figure 2.0: Effect of Eacc on the Ip of 0.06 uM AFB2 obtained using different
scan potential windows. (A) Ei = -1000 mV, Ef = -1500 mV and (B) Ei = -1000 mV, Ef = -1400mV.
Using Ef = -1400 mV, the optimum Eacc was -600mV which gave the Ip of 16.84 nA. The Ep of AFB2 was not changed with different Eacc used in this experiment. Effect of tacc
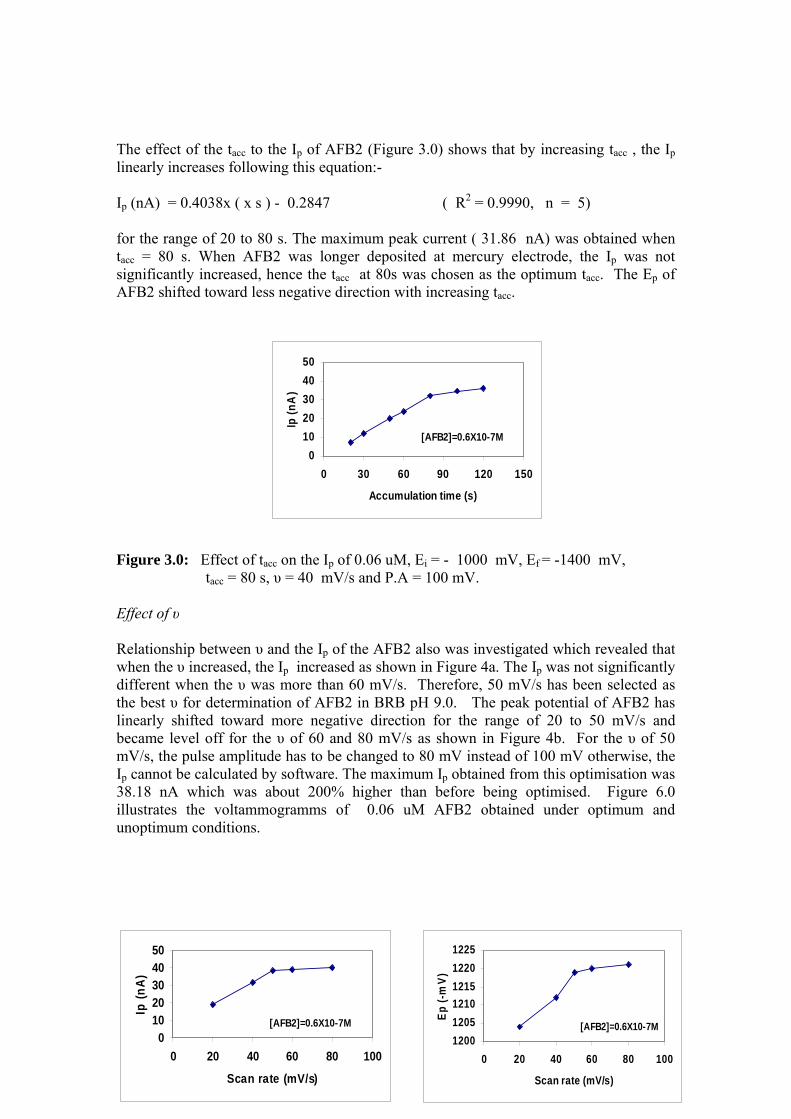
7
01020304050
0 30 60 90 120 150
Accumulation time (s)
Ip (n
A)
[AFB2]=0.6X10⁻⁷M
01020304050
0 20 40 60 80 100
Scan rate (mV/s)
Ip (n
A)
[AFB2]=0.6X10⁻⁷M120012051210121512201225
0 20 40 60 80 100
Scan rate (mV/s)
Ep (-
mV)
[AFB2]=0.6X10⁻⁷M
The effect of the tacc to the Ip of AFB2 (Figure 3.0) shows that by increasing tacc , the Ip linearly increases following this equation:- Ip (nA) = 0.4038x ( x s ) - 0.2847 ( R2 = 0.9990, n = 5) for the range of 20 to 80 s. The maximum peak current ( 31.86 nA) was obtained when tacc = 80 s. When AFB2 was longer deposited at mercury electrode, the Ip was not significantly increased, hence the tacc at 80s was chosen as the optimum tacc. The Ep of AFB2 shifted toward less negative direction with increasing tacc. Figure 3.0: Effect of tacc on the Ip of 0.06 uM, Ei = - 1000 mV, Ef = -1400 mV,
tacc = 80 s, υ = 40 mV/s and P.A = 100 mV. Effect of υ Relationship between υ and the Ip of the AFB2 also was investigated which revealed that when the υ increased, the Ip increased as shown in Figure 4a. The Ip was not significantly different when the υ was more than 60 mV/s. Therefore, 50 mV/s has been selected as the best υ for determination of AFB2 in BRB pH 9.0. The peak potential of AFB2 has linearly shifted toward more negative direction for the range of 20 to 50 mV/s and became level off for the υ of 60 and 80 mV/s as shown in Figure 4b. For the υ of 50 mV/s, the pulse amplitude has to be changed to 80 mV instead of 100 mV otherwise, the Ip cannot be calculated by software. The maximum Ip obtained from this optimisation was 38.18 nA which was about 200% higher than before being optimised. Figure 6.0 illustrates the voltammogramms of 0.06 uM AFB2 obtained under optimum and unoptimum conditions.
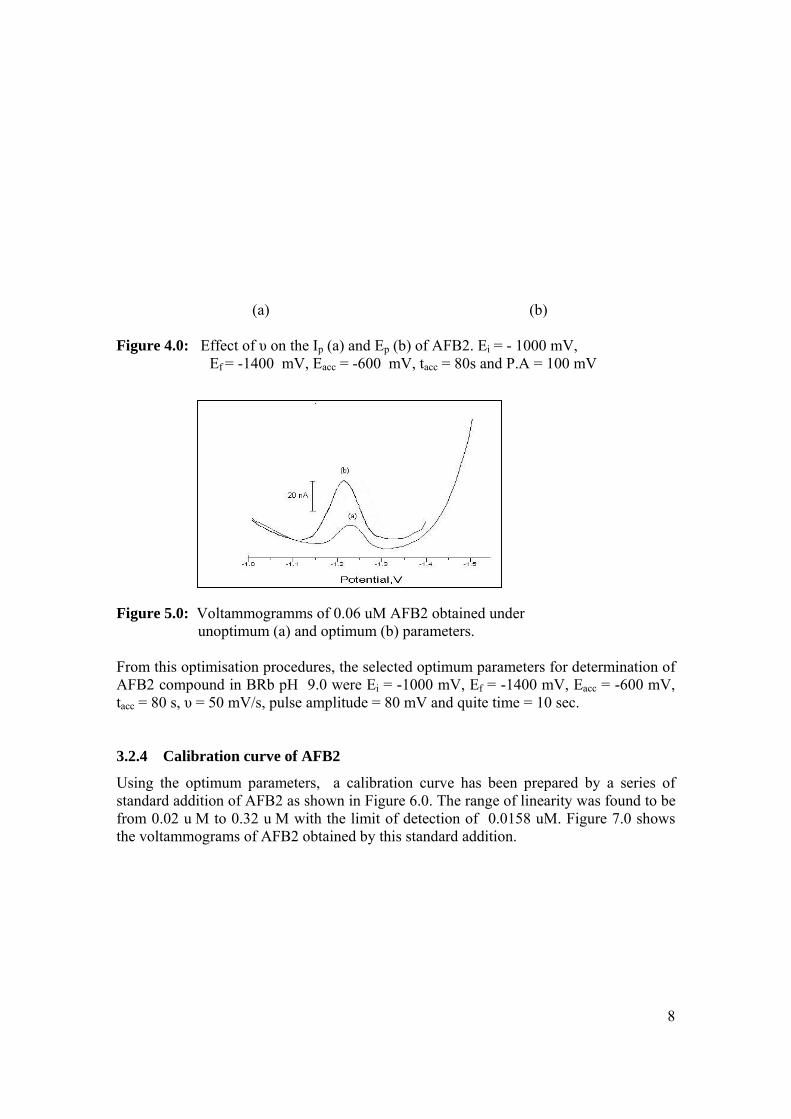
8
(a) (b)
Figure 4.0: Effect of υ on the Ip (a) and Ep (b) of AFB2. Ei = - 1000 mV,
Ef = -1400 mV, Eacc = -600 mV, tacc = 80s and P.A = 100 mV Figure 5.0: Voltammogramms of 0.06 uM AFB2 obtained under
unoptimum (a) and optimum (b) parameters.
From this optimisation procedures, the selected optimum parameters for determination of AFB2 compound in BRb pH 9.0 were Ei = -1000 mV, Ef = -1400 mV, Eacc = -600 mV, tacc = 80 s, υ = 50 mV/s, pulse amplitude = 80 mV and quite time = 10 sec. 3.2.4 Calibration curve of AFB2
Using the optimum parameters, a calibration curve has been prepared by a series of standard addition of AFB2 as shown in Figure 6.0. The range of linearity was found to be from 0.02 u M to 0.32 u M with the limit of detection of 0.0158 uM. Figure 7.0 shows the voltammograms of AFB2 obtained by this standard addition.
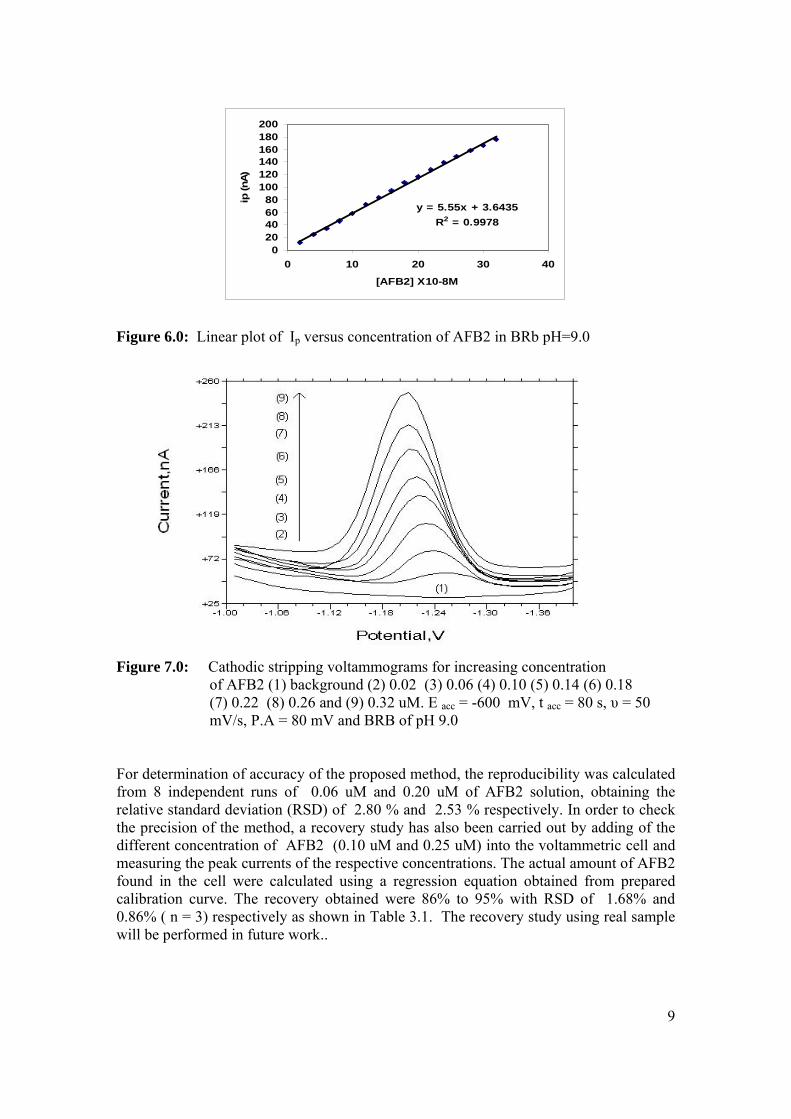
9
y = 5.55x + 3.6435R2 = 0.9978
020406080
100120140160180200
0 10 20 30 40
[AFB2] X10-8M
ip (n
A)
Figure 6.0: Linear plot of Ip versus concentration of AFB2 in BRb pH=9.0
Figure 7.0: Cathodic stripping voltammograms for increasing concentration of AFB2 (1) background (2) 0.02 (3) 0.06 (4) 0.10 (5) 0.14 (6) 0.18
(7) 0.22 (8) 0.26 and (9) 0.32 uM. E acc = -600 mV, t acc = 80 s, υ = 50 mV/s, P.A = 80 mV and BRB of pH 9.0
For determination of accuracy of the proposed method, the reproducibility was calculated from 8 independent runs of 0.06 uM and 0.20 uM of AFB2 solution, obtaining the relative standard deviation (RSD) of 2.80 % and 2.53 % respectively. In order to check the precision of the method, a recovery study has also been carried out by adding of the different concentration of AFB2 (0.10 uM and 0.25 uM) into the voltammetric cell and measuring the peak currents of the respective concentrations. The actual amount of AFB2 found in the cell were calculated using a regression equation obtained from prepared calibration curve. The recovery obtained were 86% to 95% with RSD of 1.68% and 0.86% ( n = 3) respectively as shown in Table 3.1. The recovery study using real sample will be performed in future work..
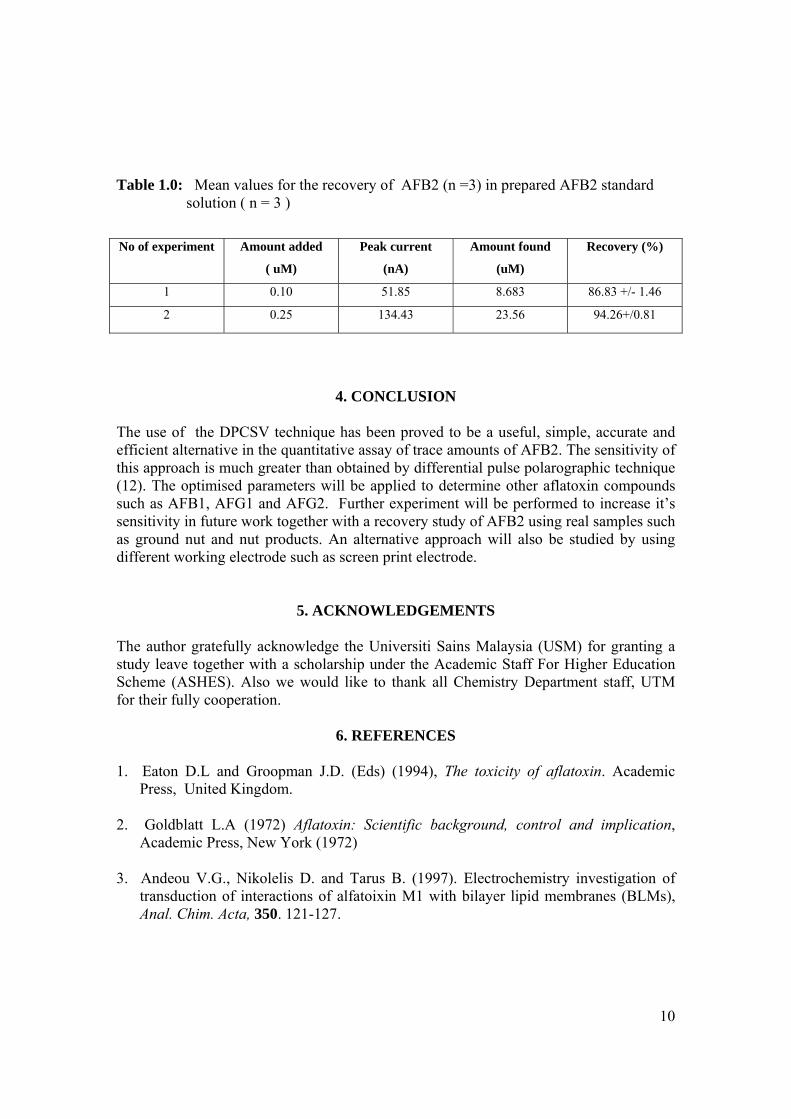
10
Table 1.0: Mean values for the recovery of AFB2 (n =3) in prepared AFB2 standard solution ( n = 3 )
No of experiment Amount added
( uM)
Peak current
(nA)
Amount found
(uM)
Recovery (%)
1 0.10 51.85 8.683 86.83 +/- 1.46
2 0.25 134.43 23.56 94.26+/0.81
4. CONCLUSION The use of the DPCSV technique has been proved to be a useful, simple, accurate and efficient alternative in the quantitative assay of trace amounts of AFB2. The sensitivity of this approach is much greater than obtained by differential pulse polarographic technique (12). The optimised parameters will be applied to determine other aflatoxin compounds such as AFB1, AFG1 and AFG2. Further experiment will be performed to increase it’s sensitivity in future work together with a recovery study of AFB2 using real samples such as ground nut and nut products. An alternative approach will also be studied by using different working electrode such as screen print electrode.
5. ACKNOWLEDGEMENTS
The author gratefully acknowledge the Universiti Sains Malaysia (USM) for granting a study leave together with a scholarship under the Academic Staff For Higher Education Scheme (ASHES). Also we would like to thank all Chemistry Department staff, UTM for their fully cooperation.
6. REFERENCES 1. Eaton D.L and Groopman J.D. (Eds) (1994), The toxicity of aflatoxin. Academic
Press, United Kingdom. 2. Goldblatt L.A (1972) Aflatoxin: Scientific background, control and implication,
Academic Press, New York (1972)
3. Andeou V.G., Nikolelis D. and Tarus B. (1997). Electrochemistry investigation of transduction of interactions of alfatoixin M1 with bilayer lipid membranes (BLMs), Anal. Chim. Acta, 350. 121-127.
11
4. Jaimez J., Fente C.A., Vazquez B.I., Franco C.M., Cepeda A., Mahuzier G. and Prognon P (2000). Application of the assay of aflatoxins by liquid chromatography with fluorescence detection in food analysis. J. Chromatography A.” 882: 1-10
5. Gimeno A. and Martins M. L (1983) Rapid thin layer chromatographic determination
of patulin, citrinin and aflatoxin in apples and pears and their juices and jams, J. Assoc. Anal. Chem, 66, 85-91.
6. Vahl M. and Jorgensen (1998). Determination of aflatoxins in food using LC/MS/MS,
Z Lebensm Unters Forsch A , 206. 243-245
7. Kussak A., Anderson B and Anderson K. (1995). Determination of aflatoxins in
airborne dust from feed factories by automated immunoaffinity column clean-up and liquid chromatography, J Of Chromatography A, 708. 55-60
8. Pesavento M., Domagala S., Baldini E. and Cucca L. (1997). Characterisation of enzyme linked immunosorbent assay for aflatoxin B1 based on commercial reagents, Talanta, 45. 91-104.
9. Braitina Kh.Z Malakhova N.A. and Stojko Y. (2000) Stripping voltammetry in
environmental and food analysis, Fresenius J Anal Chem 368: 307-325 10 Fifield F.W. and D. Kealey (2000), Principle and practice of analytical chemistry 3rd
Edition, Blackwell science, UK 11.Yaacob M.H, Yusoff A.R, Ahamad R and Yaakob A.R (2003), Cyclic voltammetric
study of aflatoxin B2 at the mercury electrode, Paper presented at 16th Symposium Of Chemical Analysis, 9-11th September 2003, Kucing, Sarawak, Malaysia.
12. Smyth M. R., Lawellin D. W. and Osteryoung J.G (1979) Polarographic Study of Aflatoxin B1, B2, G1 and G2: Application of Differential-pulse Polarography to the Determination of Aflatoxin B1 in Various Foodstuffs, Analyst, 104: 73-78

Paper will be published in
Malaysian Journal of Analytical Science
2
CYCLIC VOLTAMMETRIC STUDY OF AFLATOXIN B2 AT THE MERCURY ELECTRODE
Mohamad Hadzri Yaacoba, Abdull Rahim Hj. Mohd. Yusoffb and Rahmalan Ahamadb
a School Of Health Sciences, USM, 16150 Kubang Krian, Kelantan b Chemistry Dept., Faculty Of Sciences, UTM, 81310 Skudai, Johor
ABSTRACT
A cyclic voltammetry (CV) study of aflatoxin B2 (AFB2) in Britton-Robinson buffer using a HMDE is described. CV was carried out by anodic and cathodic potential scan through within the range of 0 to -1500 mV with no accumulation time. The effect of the different scan rate on the peak height and peak potential of the analyte were also studied. The results from this study showed that the reduction process on the hanging mercury electrode gives a single characteristic cathodic peak at -1315 mV ( versus Ag/AgCl ) in pH of 9.0. Effect of the scan rate on both responses has proved that the reduction of AFB2 is irreversible reaction and the limiting current is adsorption controlled.
Keywords: aflatoxin B2 compound, cyclic voltammetry, Britton-Robinson buffer and hanging mercury drop electrode (HMDE)
1. INTRODUCTION
Aflatoxins are mycotoxins produced by certain fungi, especially, Aspergillus
flavus and Aspergillus parasiticus which are found on crops and foodstuffs under certain conditions (1). They were first identified as the causative agent of the severe outbreak of “Turkey X” disease, a toxicosis that killed more than 100,000 turkey poults in England in 1960 (2) They display strong carcinogenicity. Therefore, they are dangerous food contaminants and many countries including Malaysia have set regulatory demands on the level of aflatoxins permitted in imported and trade commodities.
Aflatoxin B2 (AFB2) is one of the naturally occurrence aflatoxins. The chemical structure of this compound is shown in Figure 1.0. a Corresponding Address: Chemistry Dept, Faculty of Science, UTM, 81300 Skudai, Johor Tel: 07- 553 4540 e-mail: [email protected]
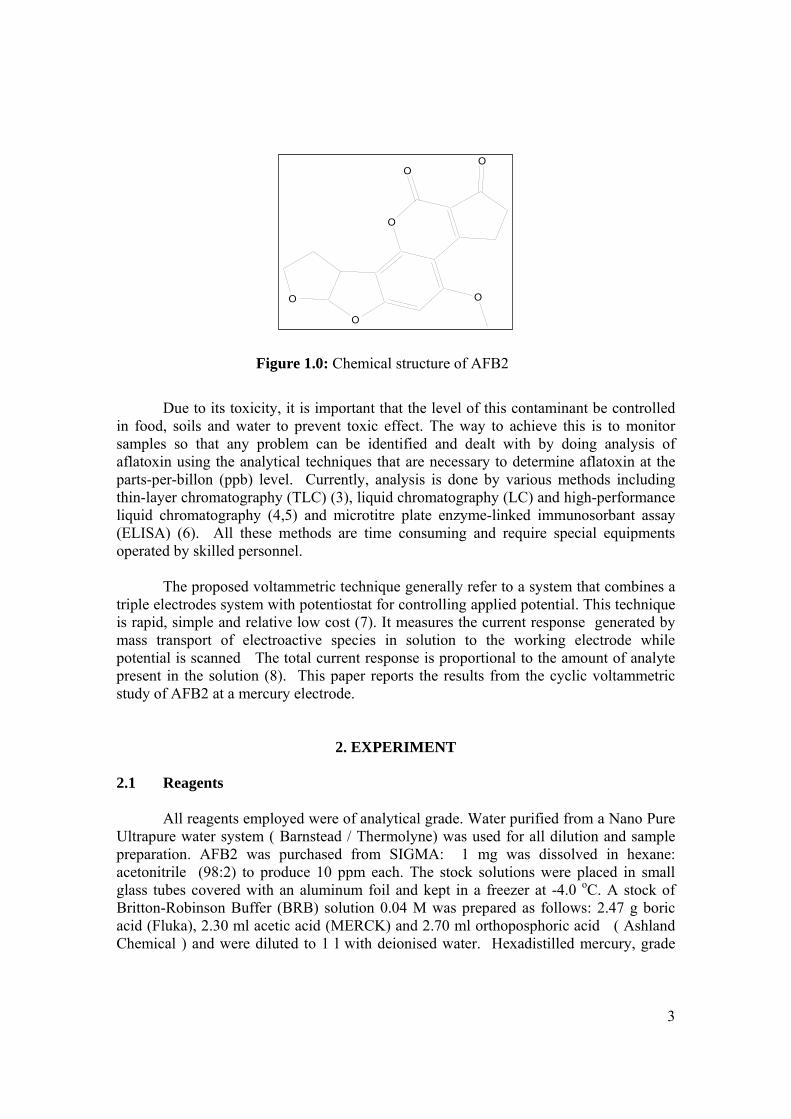
3
O
O
O
OO
O
Figure 1.0: Chemical structure of AFB2
Due to its toxicity, it is important that the level of this contaminant be controlled
in food, soils and water to prevent toxic effect. The way to achieve this is to monitor samples so that any problem can be identified and dealt with by doing analysis of aflatoxin using the analytical techniques that are necessary to determine aflatoxin at the parts-per-billon (ppb) level. Currently, analysis is done by various methods including thin-layer chromatography (TLC) (3), liquid chromatography (LC) and high-performance liquid chromatography (4,5) and microtitre plate enzyme-linked immunosorbant assay (ELISA) (6). All these methods are time consuming and require special equipments operated by skilled personnel.
The proposed voltammetric technique generally refer to a system that combines a triple electrodes system with potentiostat for controlling applied potential. This technique is rapid, simple and relative low cost (7). It measures the current response generated by mass transport of electroactive species in solution to the working electrode while potential is scanned The total current response is proportional to the amount of analyte present in the solution (8). This paper reports the results from the cyclic voltammetric study of AFB2 at a mercury electrode.
2. EXPERIMENT
2.1 Reagents
All reagents employed were of analytical grade. Water purified from a Nano Pure Ultrapure water system ( Barnstead / Thermolyne) was used for all dilution and sample preparation. AFB2 was purchased from SIGMA: 1 mg was dissolved in hexane: acetonitrile (98:2) to produce 10 ppm each. The stock solutions were placed in small glass tubes covered with an aluminum foil and kept in a freezer at -4.0 oC. A stock of Britton-Robinson Buffer (BRB) solution 0.04 M was prepared as follows: 2.47 g boric acid (Fluka), 2.30 ml acetic acid (MERCK) and 2.70 ml orthoposphoric acid ( Ashland Chemical ) and were diluted to 1 l with deionised water. Hexadistilled mercury, grade
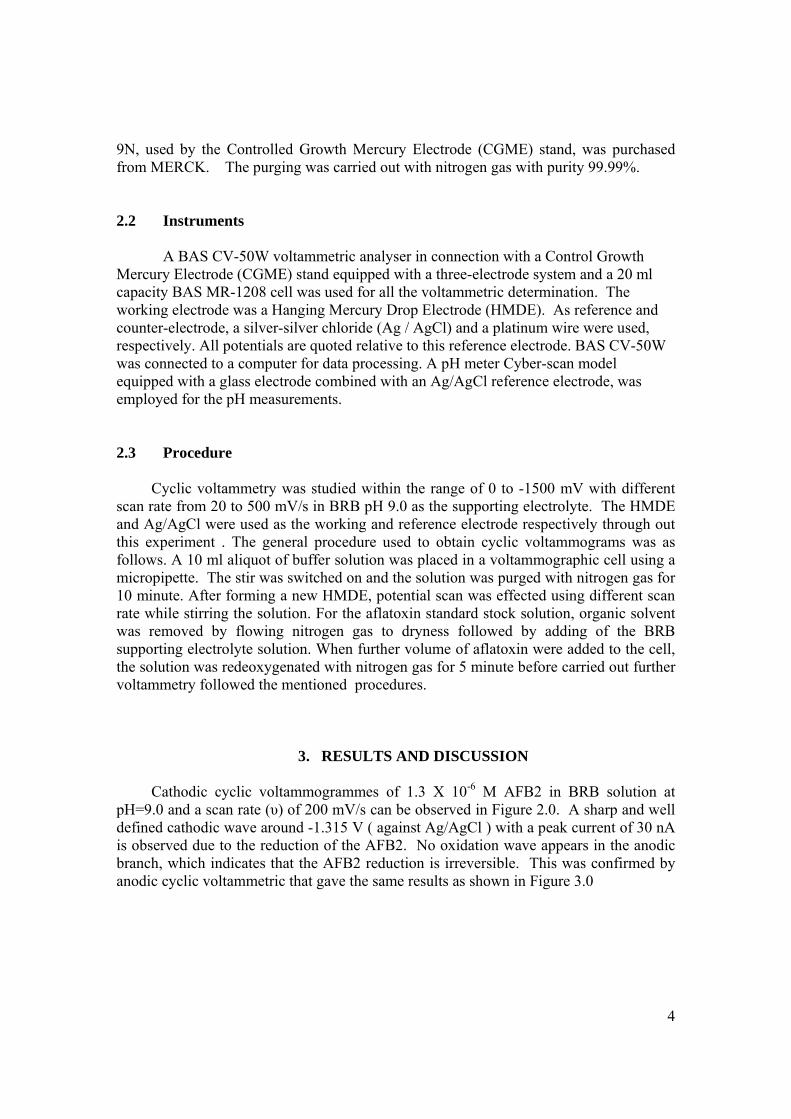
4
9N, used by the Controlled Growth Mercury Electrode (CGME) stand, was purchased from MERCK. The purging was carried out with nitrogen gas with purity 99.99%.
2.2 Instruments
A BAS CV-50W voltammetric analyser in connection with a Control Growth Mercury Electrode (CGME) stand equipped with a three-electrode system and a 20 ml capacity BAS MR-1208 cell was used for all the voltammetric determination. The working electrode was a Hanging Mercury Drop Electrode (HMDE). As reference and counter-electrode, a silver-silver chloride (Ag / AgCl) and a platinum wire were used, respectively. All potentials are quoted relative to this reference electrode. BAS CV-50W was connected to a computer for data processing. A pH meter Cyber-scan model equipped with a glass electrode combined with an Ag/AgCl reference electrode, was employed for the pH measurements. 2.3 Procedure
Cyclic voltammetry was studied within the range of 0 to -1500 mV with different scan rate from 20 to 500 mV/s in BRB pH 9.0 as the supporting electrolyte. The HMDE and Ag/AgCl were used as the working and reference electrode respectively through out this experiment . The general procedure used to obtain cyclic voltammograms was as follows. A 10 ml aliquot of buffer solution was placed in a voltammographic cell using a micropipette. The stir was switched on and the solution was purged with nitrogen gas for 10 minute. After forming a new HMDE, potential scan was effected using different scan rate while stirring the solution. For the aflatoxin standard stock solution, organic solvent was removed by flowing nitrogen gas to dryness followed by adding of the BRB supporting electrolyte solution. When further volume of aflatoxin were added to the cell, the solution was redeoxygenated with nitrogen gas for 5 minute before carried out further voltammetry followed the mentioned procedures.
3. RESULTS AND DISCUSSION
Cathodic cyclic voltammogrammes of 1.3 X 10⁻⁶ M AFB2 in BRB solution at pH=9.0 and a scan rate (υ) of 200 mV/s can be observed in Figure 2.0. A sharp and well defined cathodic wave around -1.315 V ( against Ag/AgCl ) with a peak current of 30 nA is observed due to the reduction of the AFB2. No oxidation wave appears in the anodic branch, which indicates that the AFB2 reduction is irreversible. This was confirmed by anodic cyclic voltammetric that gave the same results as shown in Figure 3.0
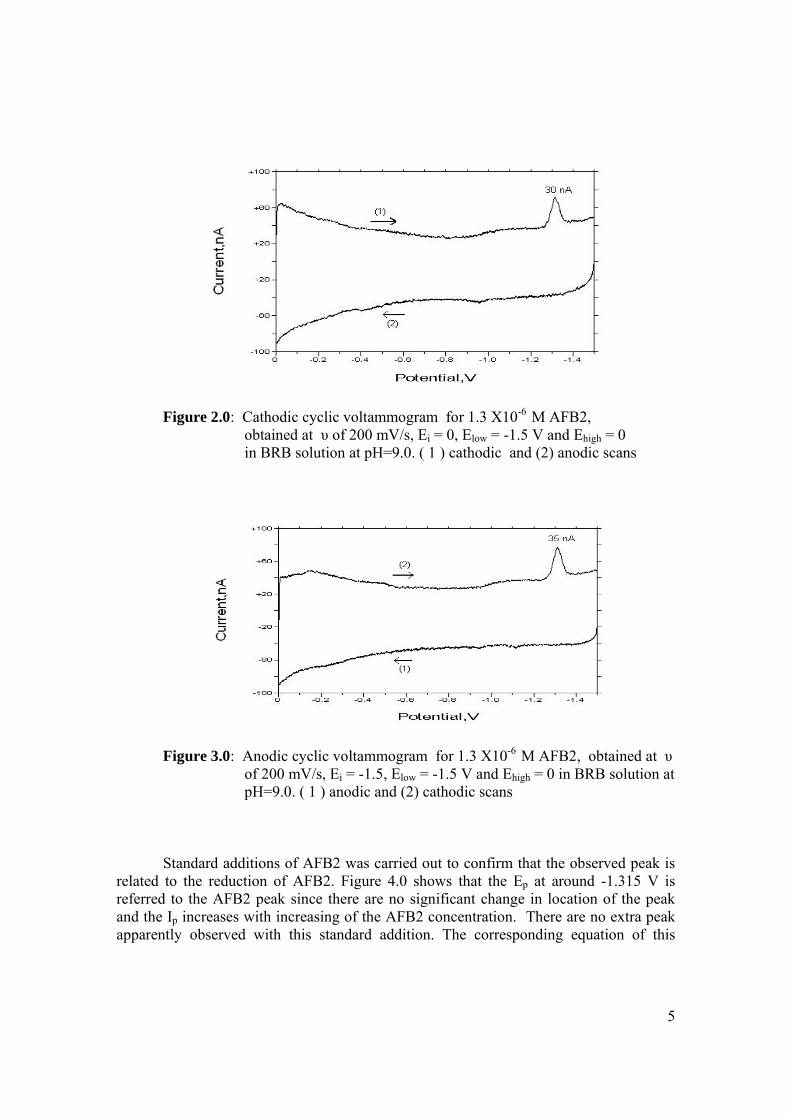
5
Figure 2.0: Cathodic cyclic voltammogram for 1.3 X10⁻⁶ M AFB2,
obtained at υ of 200 mV/s, Ei = 0, Elow = -1.5 V and Ehigh = 0 in BRB solution at pH=9.0. ( 1 ) cathodic and (2) anodic scans
Figure 3.0: Anodic cyclic voltammogram for 1.3 X10⁻⁶ M AFB2, obtained at υ
of 200 mV/s, Ei = -1.5, Elow = -1.5 V and Ehigh = 0 in BRB solution at pH=9.0. ( 1 ) anodic and (2) cathodic scans
Standard additions of AFB2 was carried out to confirm that the observed peak is related to the reduction of AFB2. Figure 4.0 shows that the Ep at around -1.315 V is referred to the AFB2 peak since there are no significant change in location of the peak and the Ip increases with increasing of the AFB2 concentration. There are no extra peak apparently observed with this standard addition. The corresponding equation of this
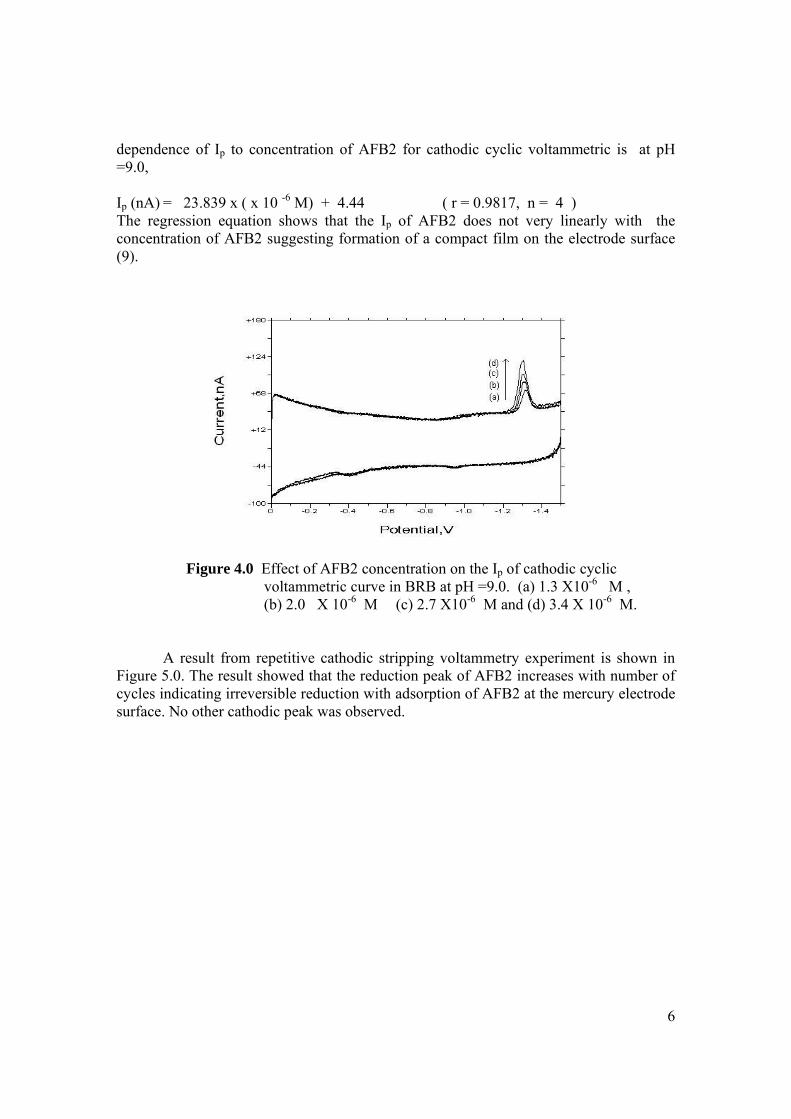
6
dependence of Ip to concentration of AFB2 for cathodic cyclic voltammetric is at pH =9.0, Ip (nA) = 23.839 x ( x 10 -6 M) + 4.44 ( r = 0.9817, n = 4 ) The regression equation shows that the Ip of AFB2 does not very linearly with the concentration of AFB2 suggesting formation of a compact film on the electrode surface (9).
Figure 4.0 Effect of AFB2 concentration on the Ip of cathodic cyclic voltammetric curve in BRB at pH =9.0. (a) 1.3 X10⁻⁶ M ,
(b) 2.0 X 10⁻⁶ M (c) 2.7 X10⁻⁶ M and (d) 3.4 X 10⁻⁶ M.
A result from repetitive cathodic stripping voltammetry experiment is shown in Figure 5.0. The result showed that the reduction peak of AFB2 increases with number of cycles indicating irreversible reduction with adsorption of AFB2 at the mercury electrode surface. No other cathodic peak was observed.
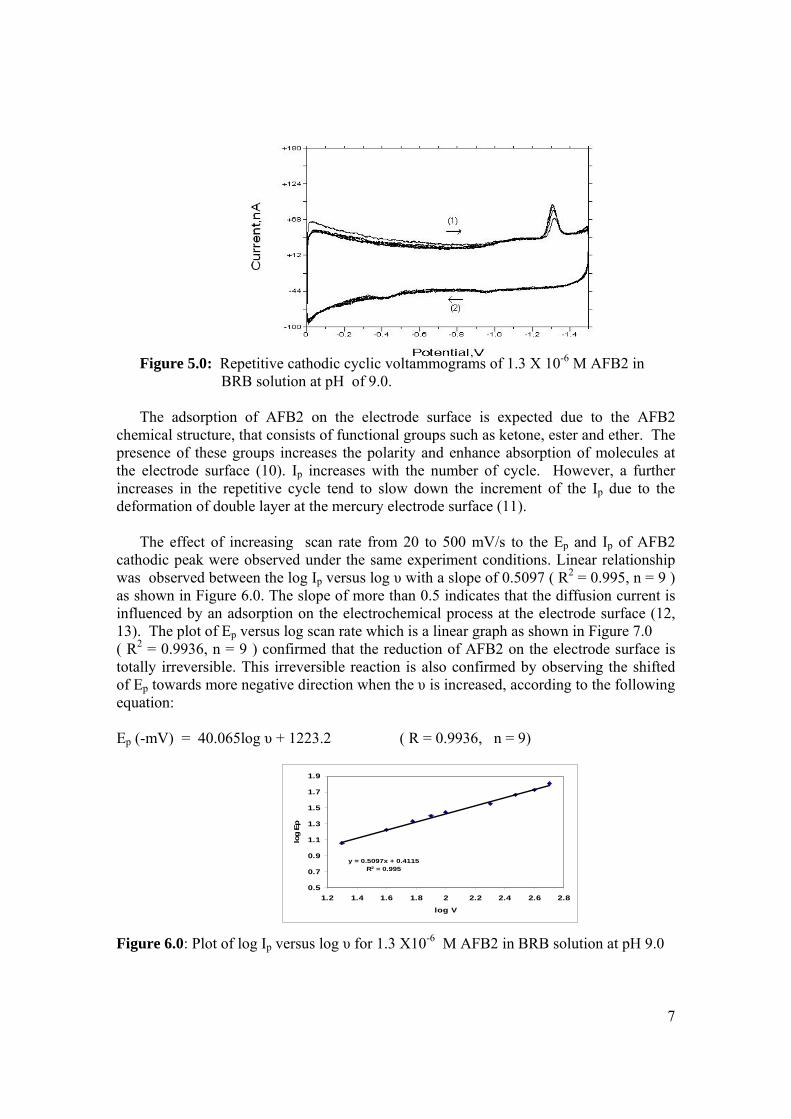
7
y = 0.5097x + 0.4115R2 = 0.995
0.5
0.7
0.9
1.1
1.3
1.5
1.7
1.9
1.2 1.4 1.6 1.8 2 2.2 2.4 2.6 2.8
log V
log
Ep
Figure 5.0: Repetitive cathodic cyclic voltammograms of 1.3 X 10⁻⁶ M AFB2 in
BRB solution at pH of 9.0. The adsorption of AFB2 on the electrode surface is expected due to the AFB2
chemical structure, that consists of functional groups such as ketone, ester and ether. The presence of these groups increases the polarity and enhance absorption of molecules at the electrode surface (10). Ip increases with the number of cycle. However, a further increases in the repetitive cycle tend to slow down the increment of the Ip due to the deformation of double layer at the mercury electrode surface (11).
The effect of increasing scan rate from 20 to 500 mV/s to the Ep and Ip of AFB2 cathodic peak were observed under the same experiment conditions. Linear relationship was observed between the log Ip versus log υ with a slope of 0.5097 ( R2 = 0.995, n = 9 ) as shown in Figure 6.0. The slope of more than 0.5 indicates that the diffusion current is influenced by an adsorption on the electrochemical process at the electrode surface (12, 13). The plot of Ep versus log scan rate which is a linear graph as shown in Figure 7.0 ( R2 = 0.9936, n = 9 ) confirmed that the reduction of AFB2 on the electrode surface is totally irreversible. This irreversible reaction is also confirmed by observing the shifted of Ep towards more negative direction when the υ is increased, according to the following equation: Ep (-mV) = 40.065log υ + 1223.2 ( R = 0.9936, n = 9)
Figure 6.0: Plot of log Ip versus log υ for 1.3 X10⁻⁶ M AFB2 in BRB solution at pH 9.0
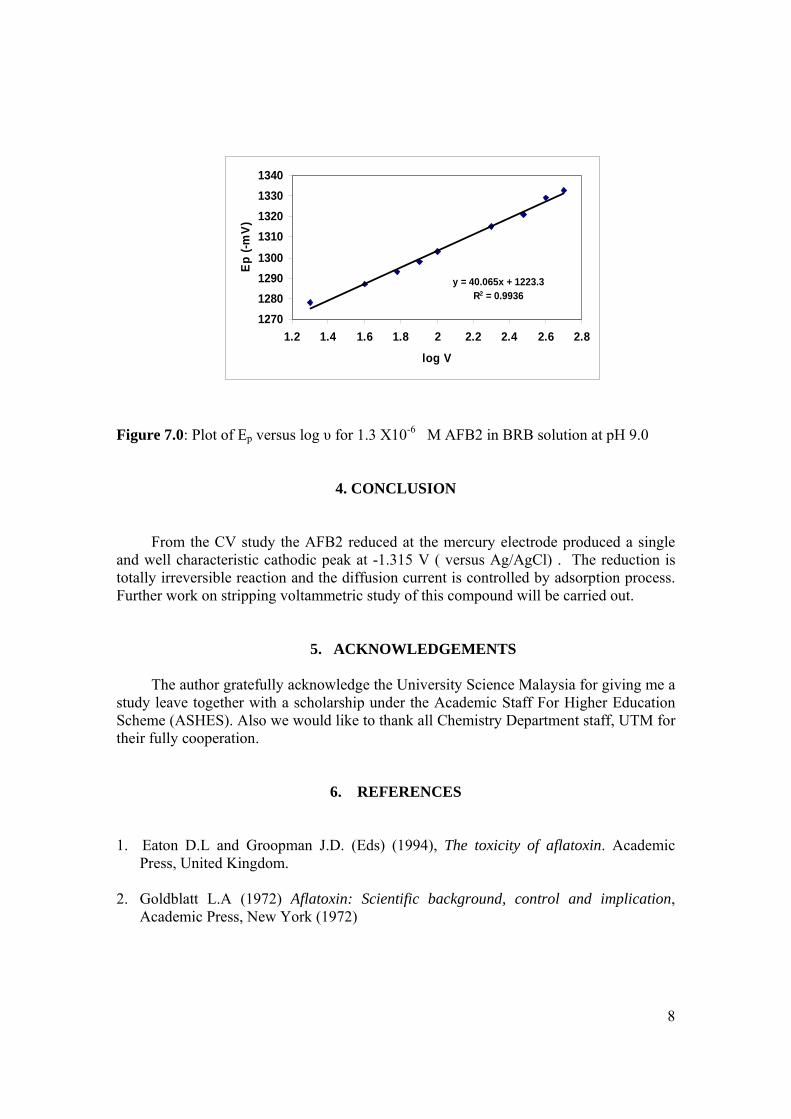
8
y = 40.065x + 1223.3R2 = 0.9936
1270128012901300
1310132013301340
1.2 1.4 1.6 1.8 2 2.2 2.4 2.6 2.8
log V
Ep
(-mV)
Figure 7.0: Plot of Ep versus log υ for 1.3 X10⁻⁶ M AFB2 in BRB solution at pH 9.0
4. CONCLUSION
From the CV study the AFB2 reduced at the mercury electrode produced a single and well characteristic cathodic peak at -1.315 V ( versus Ag/AgCl) . The reduction is totally irreversible reaction and the diffusion current is controlled by adsorption process. Further work on stripping voltammetric study of this compound will be carried out.
5. ACKNOWLEDGEMENTS
The author gratefully acknowledge the University Science Malaysia for giving me a study leave together with a scholarship under the Academic Staff For Higher Education Scheme (ASHES). Also we would like to thank all Chemistry Department staff, UTM for their fully cooperation.
6. REFERENCES
1. Eaton D.L and Groopman J.D. (Eds) (1994), The toxicity of aflatoxin. Academic
Press, United Kingdom. 2. Goldblatt L.A (1972) Aflatoxin: Scientific background, control and implication,
Academic Press, New York (1972)
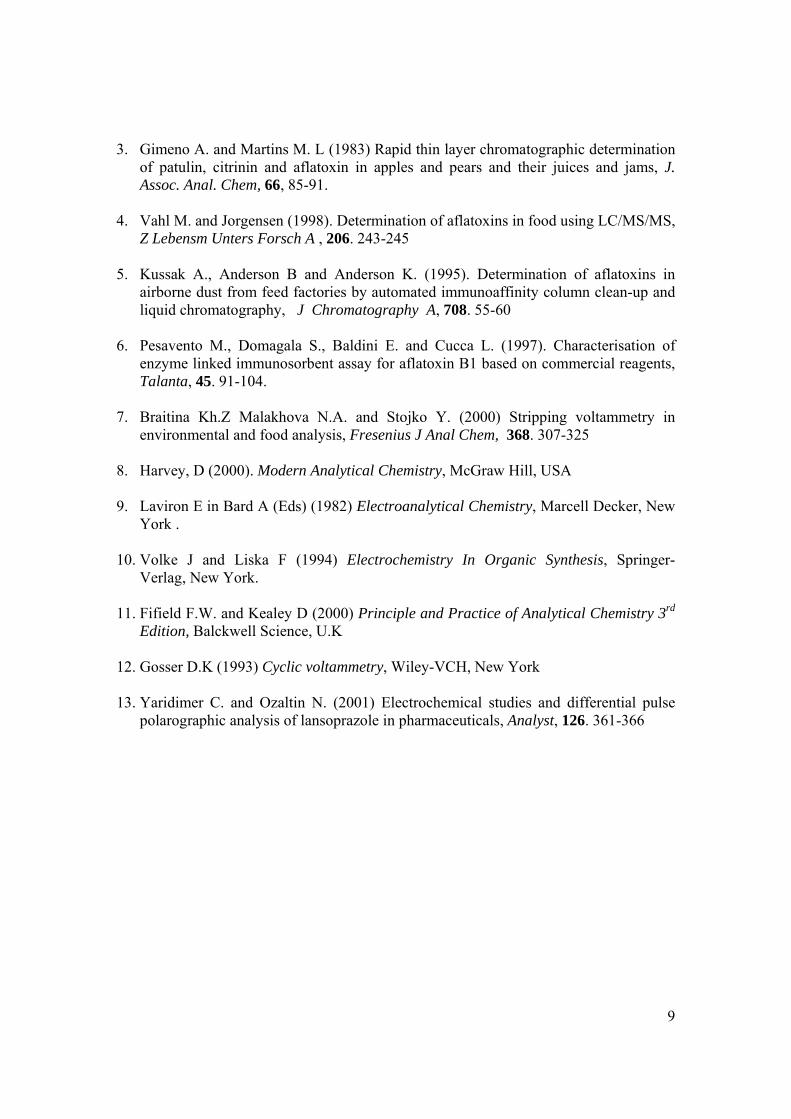
9
3. Gimeno A. and Martins M. L (1983) Rapid thin layer chromatographic determination of patulin, citrinin and aflatoxin in apples and pears and their juices and jams, J. Assoc. Anal. Chem, 66, 85-91.
4. Vahl M. and Jorgensen (1998). Determination of aflatoxins in food using LC/MS/MS,
Z Lebensm Unters Forsch A , 206. 243-245 5. Kussak A., Anderson B and Anderson K. (1995). Determination of aflatoxins in
airborne dust from feed factories by automated immunoaffinity column clean-up and liquid chromatography, J Chromatography A, 708. 55-60
6. Pesavento M., Domagala S., Baldini E. and Cucca L. (1997). Characterisation of enzyme linked immunosorbent assay for aflatoxin B1 based on commercial reagents, Talanta, 45. 91-104.
7. Braitina Kh.Z Malakhova N.A. and Stojko Y. (2000) Stripping voltammetry in
environmental and food analysis, Fresenius J Anal Chem, 368. 307-325 8. Harvey, D (2000). Modern Analytical Chemistry, McGraw Hill, USA
9. Laviron E in Bard A (Eds) (1982) Electroanalytical Chemistry, Marcell Decker, New
York . 10. Volke J and Liska F (1994) Electrochemistry In Organic Synthesis, Springer-
Verlag, New York. 11. Fifield F.W. and Kealey D (2000) Principle and Practice of Analytical Chemistry 3rd
Edition, Balckwell Science, U.K 12. Gosser D.K (1993) Cyclic voltammetry, Wiley-VCH, New York 13. Yaridimer C. and Ozaltin N. (2001) Electrochemical studies and differential pulse
polarographic analysis of lansoprazole in pharmaceuticals, Analyst, 126. 361-366
1
PAPER WAS PUBLISHED IN
J. Kimia Analisis (Universiti Sumatera Utara, Medan, Indonesia)
Yaacob, M.H., Mohd. Yusoff, A.R. and Ahamad, R. (2005). Application of Differential
Pulse Cathodic Stripping voltammetry (DPCSV) Technique in Studying Stability of
Aflatoxins. J. Sains Kimia. 9(3): 64-70.
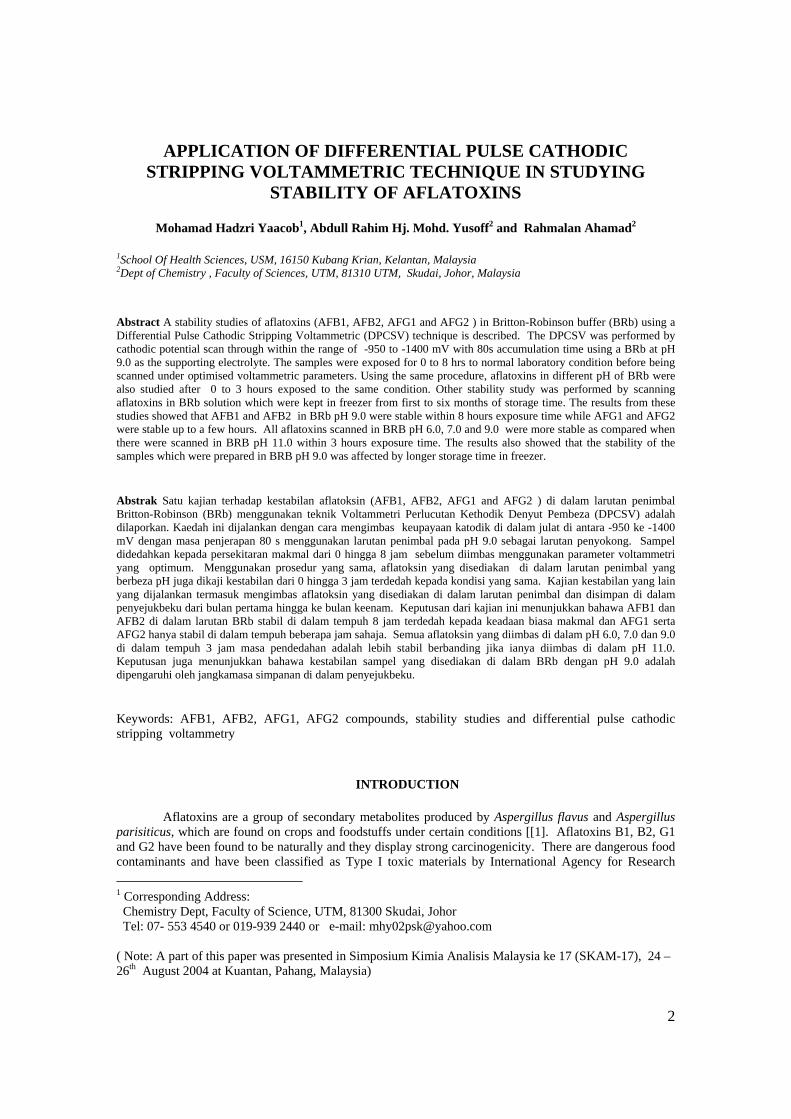
2
APPLICATION OF DIFFERENTIAL PULSE CATHODIC STRIPPING VOLTAMMETRIC TECHNIQUE IN STUDYING
STABILITY OF AFLATOXINS
Mohamad Hadzri Yaacob1, Abdull Rahim Hj. Mohd. Yusoff2 and Rahmalan Ahamad2 1School Of Health Sciences, USM, 16150 Kubang Krian, Kelantan, Malaysia 2Dept of Chemistry , Faculty of Sciences, UTM, 81310 UTM, Skudai, Johor, Malaysia Abstract A stability studies of aflatoxins (AFB1, AFB2, AFG1 and AFG2 ) in Britton-Robinson buffer (BRb) using a Differential Pulse Cathodic Stripping Voltammetric (DPCSV) technique is described. The DPCSV was performed by cathodic potential scan through within the range of -950 to -1400 mV with 80s accumulation time using a BRb at pH 9.0 as the supporting electrolyte. The samples were exposed for 0 to 8 hrs to normal laboratory condition before being scanned under optimised voltammetric parameters. Using the same procedure, aflatoxins in different pH of BRb were also studied after 0 to 3 hours exposed to the same condition. Other stability study was performed by scanning aflatoxins in BRb solution which were kept in freezer from first to six months of storage time. The results from these studies showed that AFB1 and AFB2 in BRb pH 9.0 were stable within 8 hours exposure time while AFG1 and AFG2 were stable up to a few hours. All aflatoxins scanned in BRB pH 6.0, 7.0 and 9.0 were more stable as compared when there were scanned in BRB pH 11.0 within 3 hours exposure time. The results also showed that the stability of the samples which were prepared in BRB pH 9.0 was affected by longer storage time in freezer. Abstrak Satu kajian terhadap kestabilan aflatoksin (AFB1, AFB2, AFG1 and AFG2 ) di dalam larutan penimbal Britton-Robinson (BRb) menggunakan teknik Voltammetri Perlucutan Kethodik Denyut Pembeza (DPCSV) adalah dilaporkan. Kaedah ini dijalankan dengan cara mengimbas keupayaan katodik di dalam julat di antara -950 ke -1400 mV dengan masa penjerapan 80 s menggunakan larutan penimbal pada pH 9.0 sebagai larutan penyokong. Sampel didedahkan kepada persekitaran makmal dari 0 hingga 8 jam sebelum diimbas menggunakan parameter voltammetri yang optimum. Menggunakan prosedur yang sama, aflatoksin yang disediakan di dalam larutan penimbal yang berbeza pH juga dikaji kestabilan dari 0 hingga 3 jam terdedah kepada kondisi yang sama. Kajian kestabilan yang lain yang dijalankan termasuk mengimbas aflatoksin yang disediakan di dalam larutan penimbal dan disimpan di dalam penyejukbeku dari bulan pertama hingga ke bulan keenam. Keputusan dari kajian ini menunjukkan bahawa AFB1 dan AFB2 di dalam larutan BRb stabil di dalam tempuh 8 jam terdedah kepada keadaan biasa makmal dan AFG1 serta AFG2 hanya stabil di dalam tempuh beberapa jam sahaja. Semua aflatoksin yang diimbas di dalam pH 6.0, 7.0 dan 9.0 di dalam tempuh 3 jam masa pendedahan adalah lebih stabil berbanding jika ianya diimbas di dalam pH 11.0. Keputusan juga menunjukkan bahawa kestabilan sampel yang disediakan di dalam BRb dengan pH 9.0 adalah dipengaruhi oleh jangkamasa simpanan di dalam penyejukbeku. Keywords: AFB1, AFB2, AFG1, AFG2 compounds, stability studies and differential pulse cathodic stripping voltammetry
INTRODUCTION
Aflatoxins are a group of secondary metabolites produced by Aspergillus flavus and Aspergillus parisiticus, which are found on crops and foodstuffs under certain conditions [[1]. Aflatoxins B1, B2, G1 and G2 have been found to be naturally and they display strong carcinogenicity. There are dangerous food contaminants and have been classified as Type I toxic materials by International Agency for Research 1 Corresponding Address: Chemistry Dept, Faculty of Science, UTM, 81300 Skudai, Johor Tel: 07- 553 4540 or 019-939 2440 or e-mail: [email protected] ( Note: A part of this paper was presented in Simposium Kimia Analisis Malaysia ke 17 (SKAM-17), 24 – 26th August 2004 at Kuantan, Pahang, Malaysia)
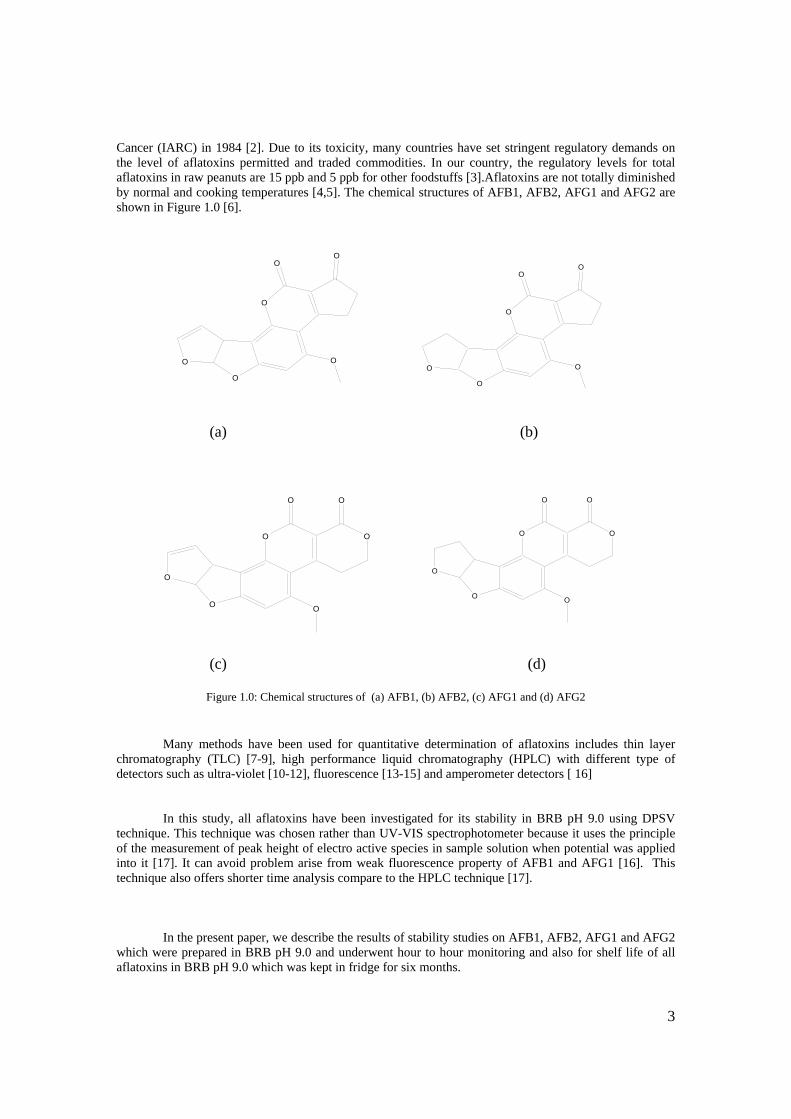
3
O O
O
O
OO
O
O
O
O
OO
O
O O
O
O
OO
O
O
O
O
OO
O
Cancer (IARC) in 1984 [2]. Due to its toxicity, many countries have set stringent regulatory demands on the level of aflatoxins permitted and traded commodities. In our country, the regulatory levels for total aflatoxins in raw peanuts are 15 ppb and 5 ppb for other foodstuffs [3].Aflatoxins are not totally diminished by normal and cooking temperatures [4,5]. The chemical structures of AFB1, AFB2, AFG1 and AFG2 are shown in Figure 1.0 [6].
(a) (b)
(c) (d)
Figure 1.0: Chemical structures of (a) AFB1, (b) AFB2, (c) AFG1 and (d) AFG2
Many methods have been used for quantitative determination of aflatoxins includes thin layer
chromatography (TLC) [7-9], high performance liquid chromatography (HPLC) with different type of detectors such as ultra-violet [10-12], fluorescence [13-15] and amperometer detectors [ 16]
In this study, all aflatoxins have been investigated for its stability in BRB pH 9.0 using DPSV technique. This technique was chosen rather than UV-VIS spectrophotometer because it uses the principle of the measurement of peak height of electro active species in sample solution when potential was applied into it [17]. It can avoid problem arise from weak fluorescence property of AFB1 and AFG1 [16]. This technique also offers shorter time analysis compare to the HPLC technique [17].
In the present paper, we describe the results of stability studies on AFB1, AFB2, AFG1 and AFG2 which were prepared in BRB pH 9.0 and underwent hour to hour monitoring and also for shelf life of all aflatoxins in BRB pH 9.0 which was kept in fridge for six months.
4
EXPERIMENTAL Reagents
All reagents employed were of analytical grade. Water purified from a Nano Pure Ultrapure water system ( Barnstead / Thermolyne) was used for all dilution and sample preparation. Aflatoxins were purchased from SIGMA ( 1 mg per bottle ) and dissolved in benzene:acetonitrile (98:2) to produce 10 ppm standard solution each. The stock solutions were placed in small amber glass tubes and kept in a freezer at -4.0oC. The solution was measured under UV-VIS spectrometer for it absorbance at 365 +/- nm before being used for voltammetric analysis.
A stock solution of 0.04 M Britton-Robinson Buffer (BRB) solution was prepared as follows: 2.47 g boric acid (Fluka), 2.30 ml acetic acid (MERCK) and 2.70 ml orthophosphoric acid ( Ashland Chemical ) were diluted to 1 l with deionised water. Britton-Robinson Buffer of pH 5, 7.0 and 11.0 were prepared by adding sodium hydroxide 1.0 M (MERCK) into the stock solution.. Hexadistilled mercury, grade 9 N, used in a control growth mercury electrode ( CGME ) stand, was purchased from MERCK. The purging was carried out with 99.99% nitrogen. Instruments
A BAS CV-50W voltammetric analyser in connection with a CGME stand equipped with a three-electrode system and a 20 ml capacity BAS MR-1208 cell were used for all the voltammetric determination. The working electrode was a hanging mercury drop electrode (HMDE). A silver-silver chloride (Ag / AgCl) and a platinum wire were used as the reference and counter-electrode respectively. BAS CV-50W was connected to a computer for data processing. A pH meter Cyber-scan model equipped with a glass electrode combined with an Ag/AgCl reference electrode, was used for all pH measurements. Procedure General procedure
The general procedure used to obtain cathodic stripping voltammograms was as follows. A 10 ml aliquot of supporting electrolyte solution was put in a voltammographic cell. The stir was switched on and the solution was purged with nitrogen gas for at least 10 minutes. After forming a new HMDE, accumulate was effected for the required time at the appropriate potential while stirring the solution. At the end of the accumulation time the stirring was switched off and after 10 s had elapsed to allow the solution to become quiescent, the negative going potential was initiated. Ag/AgCl saturated was used as the reference electrode throughout this study. Procedure for determination of aflatoxin
The aflatoxin standard solutions have been freshly prepared by removing of organic solvent in aflatoxin stock solutions until dryness followed by the addition of the BRb supporting electrolyte solution. The solution was placed in small amber bottles. When further volume of aflatoxin were added using a micropipette into the voltammetric cell, the solution was purged with nitrogen for another 2 minutes before further voltammetric experiment was carried out. Procedure for stability studies
For hour to hour stability studies, 312 ul, 315 ul, 328 ul and 330 ul of 1 ppm AFB1, AFB2, AFG1 and AFG2 standard solution in BRB pH 9.0 respectively were injected into 10 ml supporting electrolyte in the voltammetric cell separately and were scanned following the above stated procedures.
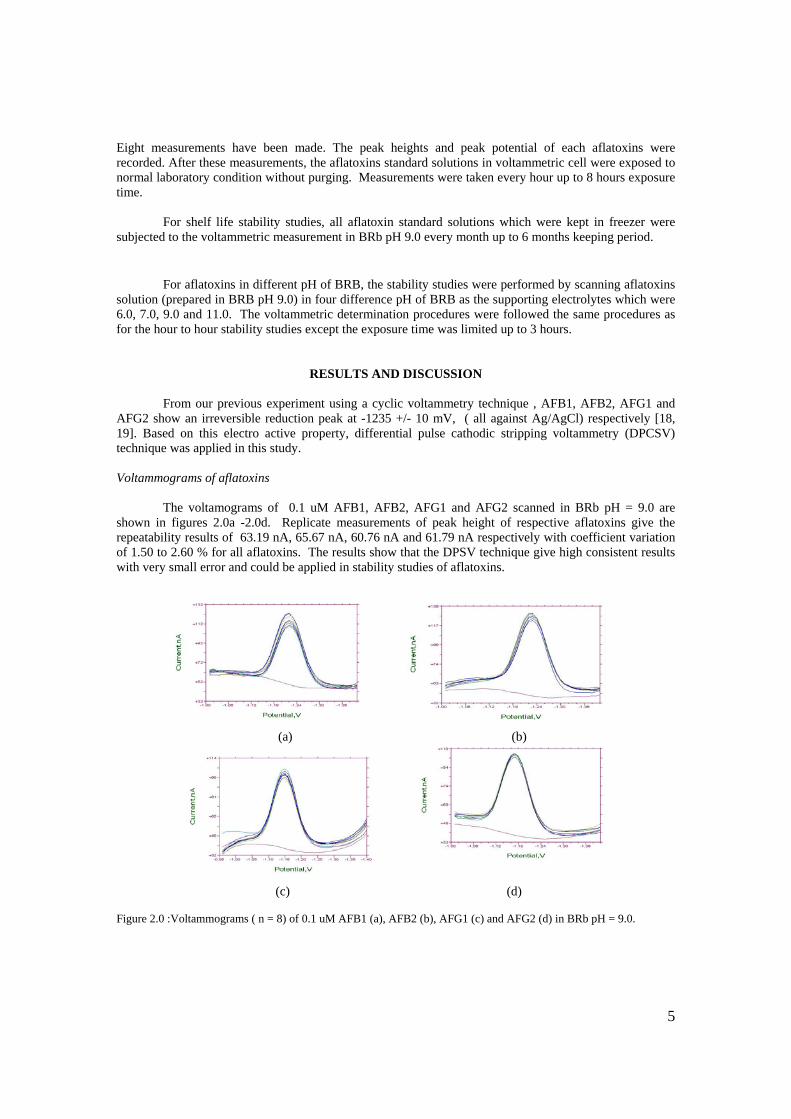
5
Eight measurements have been made. The peak heights and peak potential of each aflatoxins were recorded. After these measurements, the aflatoxins standard solutions in voltammetric cell were exposed to normal laboratory condition without purging. Measurements were taken every hour up to 8 hours exposure time.
For shelf life stability studies, all aflatoxin standard solutions which were kept in freezer were subjected to the voltammetric measurement in BRb pH 9.0 every month up to 6 months keeping period.
For aflatoxins in different pH of BRB, the stability studies were performed by scanning aflatoxins solution (prepared in BRB pH 9.0) in four difference pH of BRB as the supporting electrolytes which were 6.0, 7.0, 9.0 and 11.0. The voltammetric determination procedures were followed the same procedures as for the hour to hour stability studies except the exposure time was limited up to 3 hours.
RESULTS AND DISCUSSION
From our previous experiment using a cyclic voltammetry technique , AFB1, AFB2, AFG1 and AFG2 show an irreversible reduction peak at -1235 +/- 10 mV, ( all against Ag/AgCl) respectively [18, 19]. Based on this electro active property, differential pulse cathodic stripping voltammetry (DPCSV) technique was applied in this study. Voltammograms of aflatoxins
The voltamograms of 0.1 uM AFB1, AFB2, AFG1 and AFG2 scanned in BRb pH = 9.0 are shown in figures 2.0a -2.0d. Replicate measurements of peak height of respective aflatoxins give the repeatability results of 63.19 nA, 65.67 nA, 60.76 nA and 61.79 nA respectively with coefficient variation of 1.50 to 2.60 % for all aflatoxins. The results show that the DPSV technique give high consistent results with very small error and could be applied in stability studies of aflatoxins. (a) (b)
(c) (d)
Figure 2.0 :Voltammograms ( n = 8) of 0.1 uM AFB1 (a), AFB2 (b), AFG1 (c) and AFG2 (d) in BRb pH = 9.0.
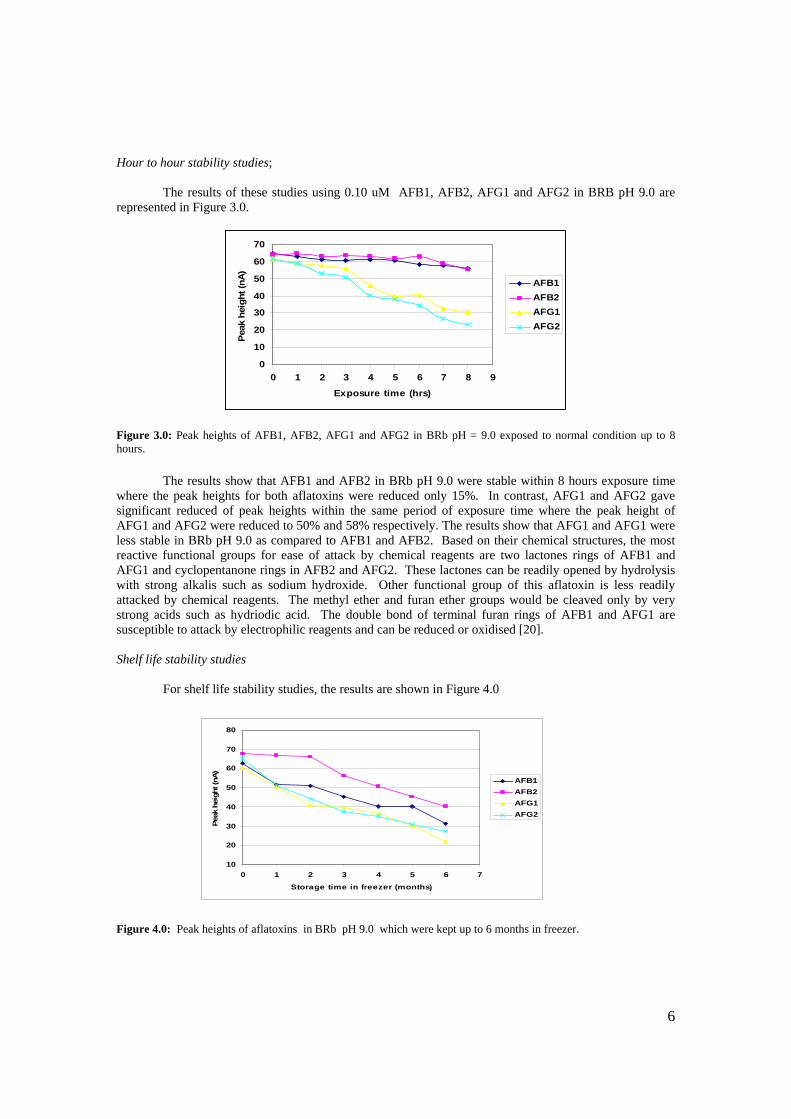
6
0
10
20
30
40
50
60
70
0 1 2 3 4 5 6 7 8 9
Exposure time (hrs)
Pea
k he
ight
(nA
)
AFB1AFB2AFG1AFG2
10
20
30
40
50
60
70
80
0 1 2 3 4 5 6 7
Storage time in freezer (months)
Peak
hei
ght (
nA)
AFB1AFB2AFG1AFG2
Hour to hour stability studies;
The results of these studies using 0.10 uM AFB1, AFB2, AFG1 and AFG2 in BRB pH 9.0 are represented in Figure 3.0. Figure 3.0: Peak heights of AFB1, AFB2, AFG1 and AFG2 in BRb pH = 9.0 exposed to normal condition up to 8 hours.
The results show that AFB1 and AFB2 in BRb pH 9.0 were stable within 8 hours exposure time
where the peak heights for both aflatoxins were reduced only 15%. In contrast, AFG1 and AFG2 gave significant reduced of peak heights within the same period of exposure time where the peak height of AFG1 and AFG2 were reduced to 50% and 58% respectively. The results show that AFG1 and AFG1 were less stable in BRb pH 9.0 as compared to AFB1 and AFB2. Based on their chemical structures, the most reactive functional groups for ease of attack by chemical reagents are two lactones rings of AFB1 and AFG1 and cyclopentanone rings in AFB2 and AFG2. These lactones can be readily opened by hydrolysis with strong alkalis such as sodium hydroxide. Other functional group of this aflatoxin is less readily attacked by chemical reagents. The methyl ether and furan ether groups would be cleaved only by very strong acids such as hydriodic acid. The double bond of terminal furan rings of AFB1 and AFG1 are susceptible to attack by electrophilic reagents and can be reduced or oxidised [20]. Shelf life stability studies
For shelf life stability studies, the results are shown in Figure 4.0
Figure 4.0: Peak heights of aflatoxins in BRb pH 9.0 which were kept up to 6 months in freezer.
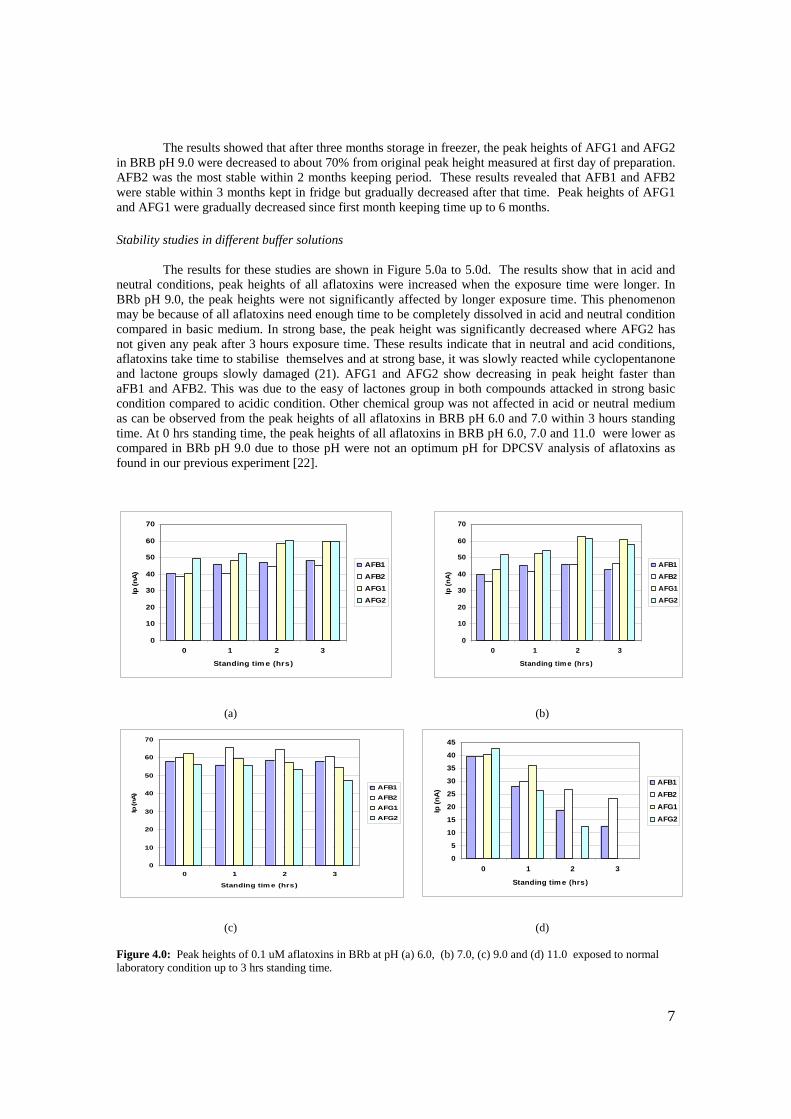
7
0
10
20
30
40
50
60
70
0 1 2 3
Standing tim e (hrs)
Ip (n
A)
AFB1AFB2AFG1AFG2
0
10
20
30
40
50
60
70
0 1 2 3
Standing tim e (hrs)
Ip (n
A)
AFB1AFB2AFG1AFG2
0
10
20
30
40
50
60
70
0 1 2 3
Standing tim e (hrs)
Ip (n
A)
AFB1AFB2AFG1AFG2
0
5
10
15
20
25
30
35
40
45
0 1 2 3
Standing tim e (hrs)
Ip (n
A)
AFB1AFB2AFG1AFG2
The results showed that after three months storage in freezer, the peak heights of AFG1 and AFG2 in BRB pH 9.0 were decreased to about 70% from original peak height measured at first day of preparation. AFB2 was the most stable within 2 months keeping period. These results revealed that AFB1 and AFB2 were stable within 3 months kept in fridge but gradually decreased after that time. Peak heights of AFG1 and AFG1 were gradually decreased since first month keeping time up to 6 months. Stability studies in different buffer solutions
The results for these studies are shown in Figure 5.0a to 5.0d. The results show that in acid and neutral conditions, peak heights of all aflatoxins were increased when the exposure time were longer. In BRb pH 9.0, the peak heights were not significantly affected by longer exposure time. This phenomenon may be because of all aflatoxins need enough time to be completely dissolved in acid and neutral condition compared in basic medium. In strong base, the peak height was significantly decreased where AFG2 has not given any peak after 3 hours exposure time. These results indicate that in neutral and acid conditions, aflatoxins take time to stabilise themselves and at strong base, it was slowly reacted while cyclopentanone and lactone groups slowly damaged (21). AFG1 and AFG2 show decreasing in peak height faster than aFB1 and AFB2. This was due to the easy of lactones group in both compounds attacked in strong basic condition compared to acidic condition. Other chemical group was not affected in acid or neutral medium as can be observed from the peak heights of all aflatoxins in BRB pH 6.0 and 7.0 within 3 hours standing time. At 0 hrs standing time, the peak heights of all aflatoxins in BRB pH 6.0, 7.0 and 11.0 were lower as compared in BRb pH 9.0 due to those pH were not an optimum pH for DPCSV analysis of aflatoxins as found in our previous experiment [22].
(a) (b)
(c) (d) Figure 4.0: Peak heights of 0.1 uM aflatoxins in BRb at pH (a) 6.0, (b) 7.0, (c) 9.0 and (d) 11.0 exposed to normal laboratory condition up to 3 hrs standing time.
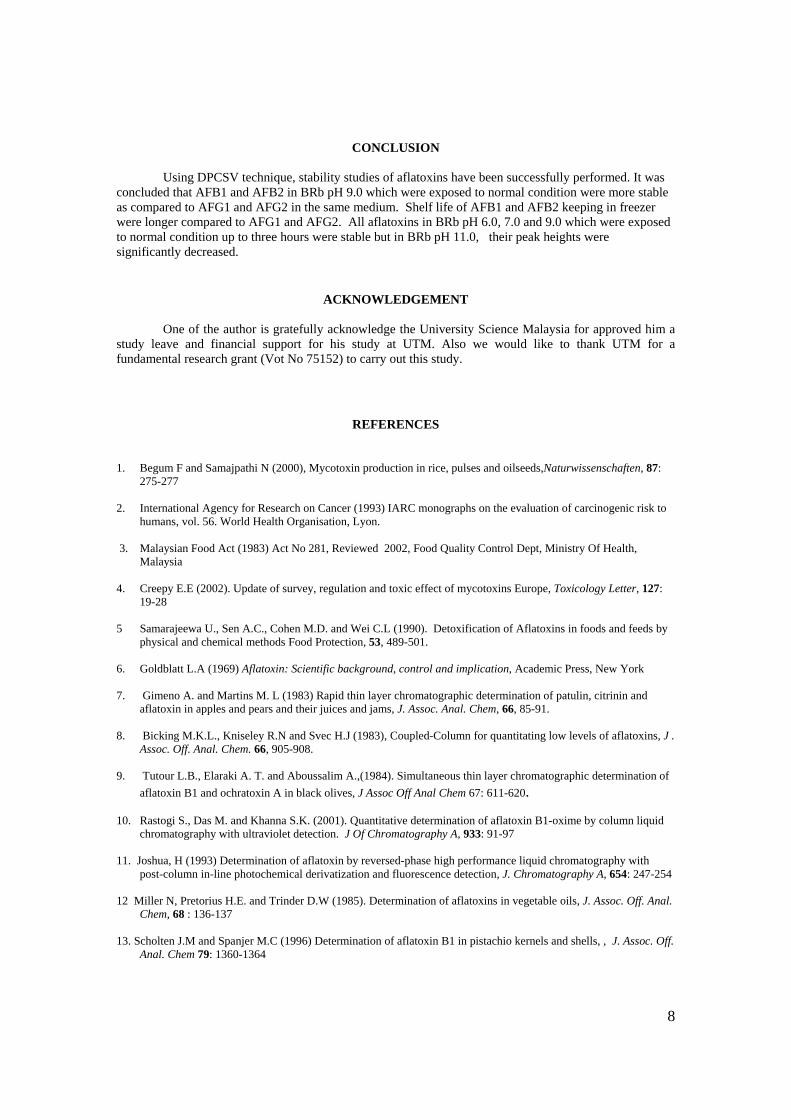
8
CONCLUSION
Using DPCSV technique, stability studies of aflatoxins have been successfully performed. It was concluded that AFB1 and AFB2 in BRb pH 9.0 which were exposed to normal condition were more stable as compared to AFG1 and AFG2 in the same medium. Shelf life of AFB1 and AFB2 keeping in freezer were longer compared to AFG1 and AFG2. All aflatoxins in BRb pH 6.0, 7.0 and 9.0 which were exposed to normal condition up to three hours were stable but in BRb pH 11.0, their peak heights were significantly decreased.
ACKNOWLEDGEMENT
One of the author is gratefully acknowledge the University Science Malaysia for approved him a study leave and financial support for his study at UTM. Also we would like to thank UTM for a fundamental research grant (Vot No 75152) to carry out this study.
REFERENCES
1. Begum F and Samajpathi N (2000), Mycotoxin production in rice, pulses and oilseeds,Naturwissenschaften, 87: 275-277
2. International Agency for Research on Cancer (1993) IARC monographs on the evaluation of carcinogenic risk to
humans, vol. 56. World Health Organisation, Lyon. 3. Malaysian Food Act (1983) Act No 281, Reviewed 2002, Food Quality Control Dept, Ministry Of Health,
Malaysia 4. Creepy E.E (2002). Update of survey, regulation and toxic effect of mycotoxins Europe, Toxicology Letter, 127:
19-28 5 Samarajeewa U., Sen A.C., Cohen M.D. and Wei C.L (1990). Detoxification of Aflatoxins in foods and feeds by
physical and chemical methods Food Protection, 53, 489-501. 6. Goldblatt L.A (1969) Aflatoxin: Scientific background, control and implication, Academic Press, New York 7. Gimeno A. and Martins M. L (1983) Rapid thin layer chromatographic determination of patulin, citrinin and
aflatoxin in apples and pears and their juices and jams, J. Assoc. Anal. Chem, 66, 85-91. 8. Bicking M.K.L., Kniseley R.N and Svec H.J (1983), Coupled-Column for quantitating low levels of aflatoxins, J .
Assoc. Off. Anal. Chem. 66, 905-908.
9. Tutour L.B., Elaraki A. T. and Aboussalim A.,(1984). Simultaneous thin layer chromatographic determination of aflatoxin B1 and ochratoxin A in black olives, J Assoc Off Anal Chem 67: 611-620.
10. Rastogi S., Das M. and Khanna S.K. (2001). Quantitative determination of aflatoxin B1-oxime by column liquid
chromatography with ultraviolet detection. J Of Chromatography A, 933: 91-97 11. Joshua, H (1993) Determination of aflatoxin by reversed-phase high performance liquid chromatography with
post-column in-line photochemical derivatization and fluorescence detection, J. Chromatography A, 654: 247-254 12 Miller N, Pretorius H.E. and Trinder D.W (1985). Determination of aflatoxins in vegetable oils, J. Assoc. Off. Anal.
Chem, 68 : 136-137
13. Scholten J.M and Spanjer M.C (1996) Determination of aflatoxin B1 in pistachio kernels and shells, , J. Assoc. Off. Anal. Chem 79: 1360-1364

9
14. Brera C., Caputi R., Miraglia M., Iavicoli I., Salerno A. and Carelli G. (2002). Exposure assessment to mycotoxins in workplace: aflatoxins and ochratoxin A occurrence in airborne dusts and human sera, Micro chemical J (uncorrected proof).
15. Garcia-Villanova R.J., Cordon C., Paramas A.M.G., Aparicio P. and Rosales M.E.G., (2004). Simultaneous
immunoaffinity column clean up and HPLC analysis of aflatoxins and ochratoxin A in Spanish bee pollen, J Agric. Food Chem.52; 7235-7239
16. Gonzalez M.P.E., Mattusch J. and Wennrich R ( 1998) Stability and determination of aflatoxins by high-
performance liquid chromatography with amperometric detection, J.Chromatography A, 828: 439-444
17. Fifield F.W. and Kealey D (2000) Principle and practice of analytical chemistry 3rd Edition, Blackwell science, UK
18. Yaacob M.H., Mohd Yusof A.R., and Ahamad R (2003), Cyclic Voltammetry of AFB2 at mercury electrode,
Paper presented at SKAM –VI, Unimas, Kucing, Sarawak, Malaysia, 9-11 September 2003 19. Yaacob M.H., Mohd Yusof A.R., and Ahamad R. (2004), Cyclic Voltammetry of AFG1 at mercury electrode,
Paper presented at 3rd Annual Seminar on Sustainable Science and Management, KUSTEM, Terengganu, Malaysia, 4 – 5 May 2004.
20. Jaimez J., Fente C.A., Vazquez B.I., Franco C.M., Cepeda A., Mahuzier G. and Prognon P (2000). “Application of
the assay of aflatoxins by liquid chromatography with fluorescence detection in food analysis.” J. Chromatography A.” 882: 1-10
21. Miller K (1987) Toxicology aspects of food. Elsevier Applied Science, New York 2.2. Yaacob M.H., Mohd Yusof A.R. and Ahamad R (2005). Differential pulse stripping voltammetric (DPSV)
technique for determination of AFB2 at the mercury electrode. To be published in Collection of Czechoslovak Chemical Communication. In process.
1
PAPER WAS PUBLISHED IN
J. Kimia Analisis (Universiti Sumatera Utara, Medan, Indonesia)
Yaacob, M.H., Mohd. Yusoff, A.R. and Ahamad, R. (2005). Development of Differential
Pulse Cathodic Stripping voltammetry (DPCSV) Technique for the Determination of
AFB1 in Ground Nut Samples. J. Sains Kimia. 9(3): 31-36.
2
DETERMINATION OF THE AFLATOXIN B1 IN GROUND NUT BY
DIFFERENTIAL PULSE CATHODIC STRIPPING VOLTAMMETRY (DPCSV) TECHNIQUE
Mohamad Hadzri Yaacob1, Abdull Rahim Hj. Mohd. Yusoff2, Rahmalan Ahamad2
and Marpongahton Mismi3
1School of Health Sciences, USM, 16150 Kubang Krian, Kelantan, Malaysia 2Dept. of Chemistry, Faculty of Sciences, UTM, 81310 UTM, Skudai, Johor, Malaysia 3Dept. of Chemistry, Faculty of Mathematic and Science, USU, Medan, Indonesia
ABSTRACT
An electro analytical method has been developed for the detection and determination of the 2,3,6a,9a-tetrahydro-4-methoxycyclo penta[c] furo[3’,2’:4,5] furo [2,3-h][l] benzopyran-1,11-dione (aflatoxin B1, AFB1) by a differential pulse cathodic stripping voltammetry on a hanging mercury drop electrode (HMDE) in aqueous solution with Britton-Robinson buffer (BRb) as supporting electrolyte. Effect of instrumental parameters such as accumulation potential (Eacc), accumulation time (tacc) and scan rate (v) were examined. The best condition were found to be pH 9.0, Eacc of -0.6 V, tacc of 80 s and v; 50 mV/s. Calibration curve is linear in the range of 0.02 to 0.32 uM with a detection limit of 0.75 x 10⁻⁸ M (3SDblank/m). Relative standard deviation for a replicate measurements of AFB1 ( n= 8) with the concentrations of 0.02 and 0.20 uM were 1.27% and 0.83% respectively. The method is applied for determination of the AFB1 in ground nut samples after extraction and clean-up steps. The recovery values obtained in spiked ground nut sample are 90.93 +/- 2.53 % for 3.0 ppb and 86.15 +/- 2.03 % for 15.0 ppb of AFB1.
ABSTRAK
Satu kaedah elektroanalisis telah dibangunkan untuk mengesan dan menentukan 2,3,6a,9a-tetrahydro-4-methoxycyclo penta[c] furo[3’,2’:4,5] furo [2,3-h][l] benzopyran-1,11-dione (aflatoxin B1, AFB1) menggunakan teknik voltammetri perlucutan katodik denyut pembeza di atas elektrod titisan raksa tergantung (HMDE) di dalam larutan akuas dengan larutan penimbal Britton-Robinson bertindak sebagai larutan penyokong. Kesan parameter peralatan seperti keupayaan pengumpulan (Eacc), masa pengumpulan (tacc) dan kadar imbasan (v) telah dikaji. Keadaan terbaik yang diperolehi adalah pH 9.0, Eacc; -0.6 V, tacc; 80 s dan v; 50 mV/s. Keluk kalibrasi adalah linear pada julat di antara 0.02 ke 0.32 uM dengan had pengesan pada 0.75 x 10⁻⁸ M (3SDblank/ m). Sisihan piawai relatif
1 Corresponding address: Chemistry Dept, Faculty of Science, UTM, 81300 Skudai, Johor, Malaysia tel: 07-553 4492 or 016-926 0354 or e-mail address: [email protected]
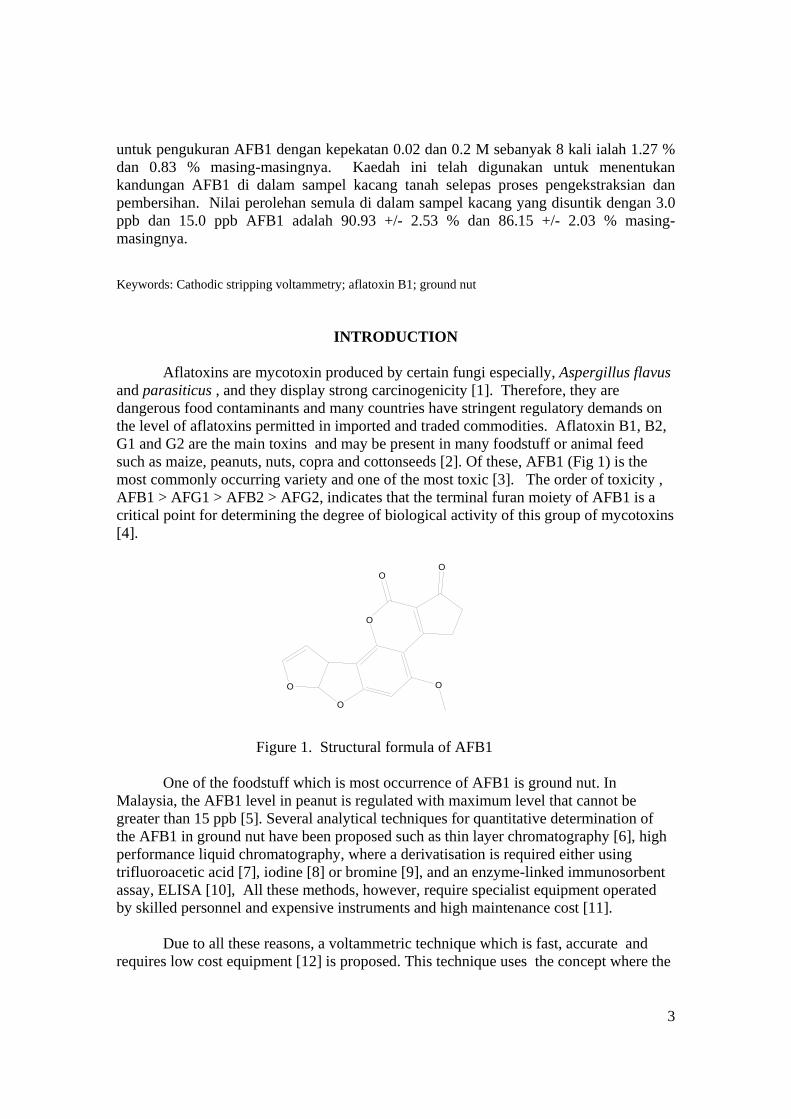
3
O
O
O
OO
O
untuk pengukuran AFB1 dengan kepekatan 0.02 dan 0.2 M sebanyak 8 kali ialah 1.27 % dan 0.83 % masing-masingnya. Kaedah ini telah digunakan untuk menentukan kandungan AFB1 di dalam sampel kacang tanah selepas proses pengekstraksian dan pembersihan. Nilai perolehan semula di dalam sampel kacang yang disuntik dengan 3.0 ppb dan 15.0 ppb AFB1 adalah 90.93 +/- 2.53 % dan 86.15 +/- 2.03 % masing-masingnya. Keywords: Cathodic stripping voltammetry; aflatoxin B1; ground nut
INTRODUCTION
Aflatoxins are mycotoxin produced by certain fungi especially, Aspergillus flavus and parasiticus , and they display strong carcinogenicity [1]. Therefore, they are dangerous food contaminants and many countries have stringent regulatory demands on the level of aflatoxins permitted in imported and traded commodities. Aflatoxin B1, B2, G1 and G2 are the main toxins and may be present in many foodstuff or animal feed such as maize, peanuts, nuts, copra and cottonseeds [2]. Of these, AFB1 (Fig 1) is the most commonly occurring variety and one of the most toxic [3]. The order of toxicity , AFB1 > AFG1 > AFB2 > AFG2, indicates that the terminal furan moiety of AFB1 is a critical point for determining the degree of biological activity of this group of mycotoxins [4].
Figure 1. Structural formula of AFB1
One of the foodstuff which is most occurrence of AFB1 is ground nut. In Malaysia, the AFB1 level in peanut is regulated with maximum level that cannot be greater than 15 ppb [5]. Several analytical techniques for quantitative determination of the AFB1 in ground nut have been proposed such as thin layer chromatography [6], high performance liquid chromatography, where a derivatisation is required either using trifluoroacetic acid [7], iodine [8] or bromine [9], and an enzyme-linked immunosorbent assay, ELISA [10], All these methods, however, require specialist equipment operated by skilled personnel and expensive instruments and high maintenance cost [11].
Due to all these reasons, a voltammetric technique which is fast, accurate and
requires low cost equipment [12] is proposed. This technique uses the concept where the
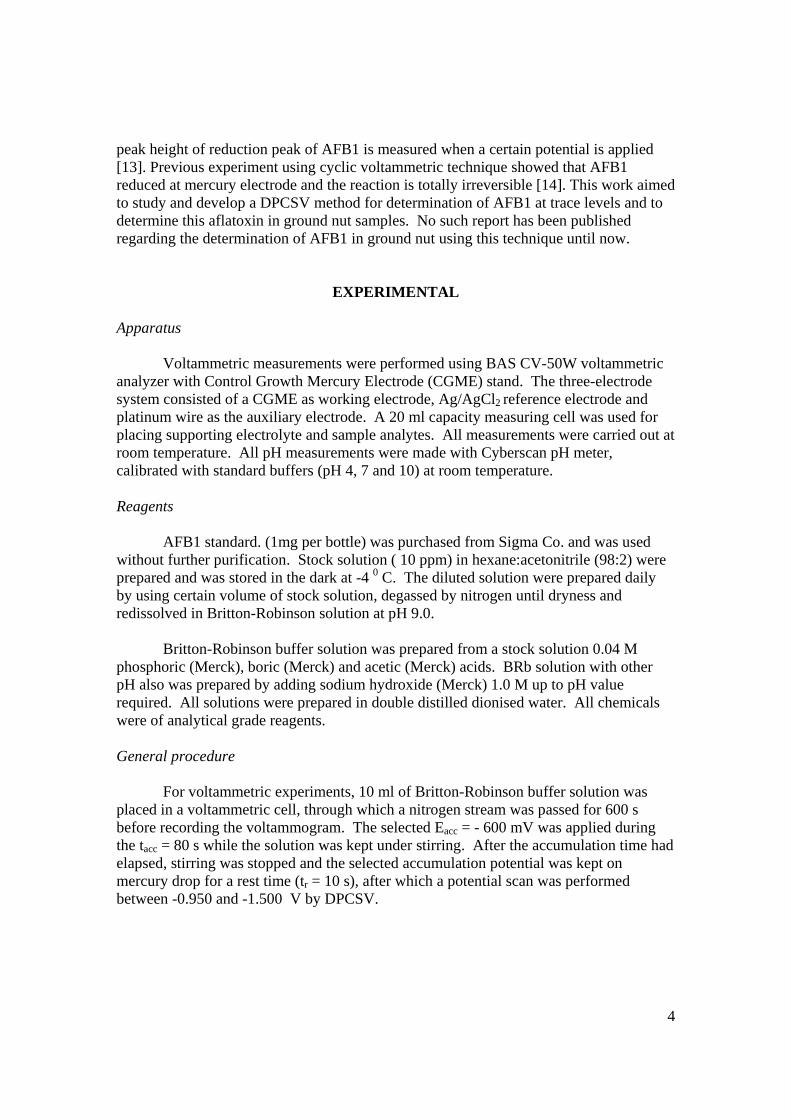
4
peak height of reduction peak of AFB1 is measured when a certain potential is applied [13]. Previous experiment using cyclic voltammetric technique showed that AFB1 reduced at mercury electrode and the reaction is totally irreversible [14]. This work aimed to study and develop a DPCSV method for determination of AFB1 at trace levels and to determine this aflatoxin in ground nut samples. No such report has been published regarding the determination of AFB1 in ground nut using this technique until now.
EXPERIMENTAL Apparatus Voltammetric measurements were performed using BAS CV-50W voltammetric analyzer with Control Growth Mercury Electrode (CGME) stand. The three-electrode system consisted of a CGME as working electrode, Ag/AgCl2 reference electrode and platinum wire as the auxiliary electrode. A 20 ml capacity measuring cell was used for placing supporting electrolyte and sample analytes. All measurements were carried out at room temperature. All pH measurements were made with Cyberscan pH meter, calibrated with standard buffers (pH 4, 7 and 10) at room temperature. Reagents AFB1 standard. (1mg per bottle) was purchased from Sigma Co. and was used without further purification. Stock solution ( 10 ppm) in hexane:acetonitrile (98:2) were prepared and was stored in the dark at -4 0 C. The diluted solution were prepared daily by using certain volume of stock solution, degassed by nitrogen until dryness and redissolved in Britton-Robinson solution at pH 9.0. Britton-Robinson buffer solution was prepared from a stock solution 0.04 M phosphoric (Merck), boric (Merck) and acetic (Merck) acids. BRb solution with other pH also was prepared by adding sodium hydroxide (Merck) 1.0 M up to pH value required. All solutions were prepared in double distilled dionised water. All chemicals were of analytical grade reagents. General procedure For voltammetric experiments, 10 ml of Britton-Robinson buffer solution was placed in a voltammetric cell, through which a nitrogen stream was passed for 600 s before recording the voltammogram. The selected Eacc = - 600 mV was applied during the tacc = 80 s while the solution was kept under stirring. After the accumulation time had elapsed, stirring was stopped and the selected accumulation potential was kept on mercury drop for a rest time (tr = 10 s), after which a potential scan was performed between -0.950 and -1.500 V by DPCSV.
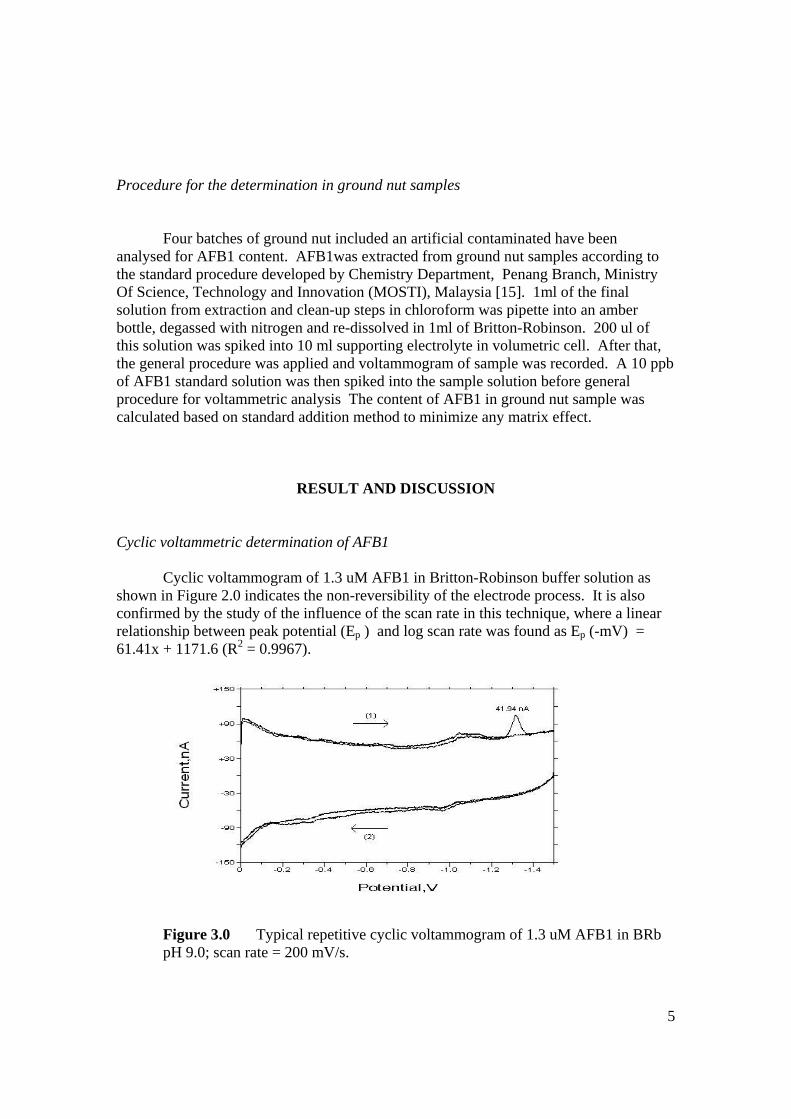
5
Procedure for the determination in ground nut samples Four batches of ground nut included an artificial contaminated have been analysed for AFB1 content. AFB1was extracted from ground nut samples according to the standard procedure developed by Chemistry Department, Penang Branch, Ministry Of Science, Technology and Innovation (MOSTI), Malaysia [15]. 1ml of the final solution from extraction and clean-up steps in chloroform was pipette into an amber bottle, degassed with nitrogen and re-dissolved in 1ml of Britton-Robinson. 200 ul of this solution was spiked into 10 ml supporting electrolyte in volumetric cell. After that, the general procedure was applied and voltammogram of sample was recorded. A 10 ppb of AFB1 standard solution was then spiked into the sample solution before general procedure for voltammetric analysis The content of AFB1 in ground nut sample was calculated based on standard addition method to minimize any matrix effect.
RESULT AND DISCUSSION Cyclic voltammetric determination of AFB1
Cyclic voltammogram of 1.3 uM AFB1 in Britton-Robinson buffer solution as
shown in Figure 2.0 indicates the non-reversibility of the electrode process. It is also confirmed by the study of the influence of the scan rate in this technique, where a linear relationship between peak potential (Ep ) and log scan rate was found as Ep (-mV) = 61.41x + 1171.6 (R2 = 0.9967).
Figure 3.0 Typical repetitive cyclic voltammogram of 1.3 uM AFB1 in BRb pH 9.0; scan rate = 200 mV/s.
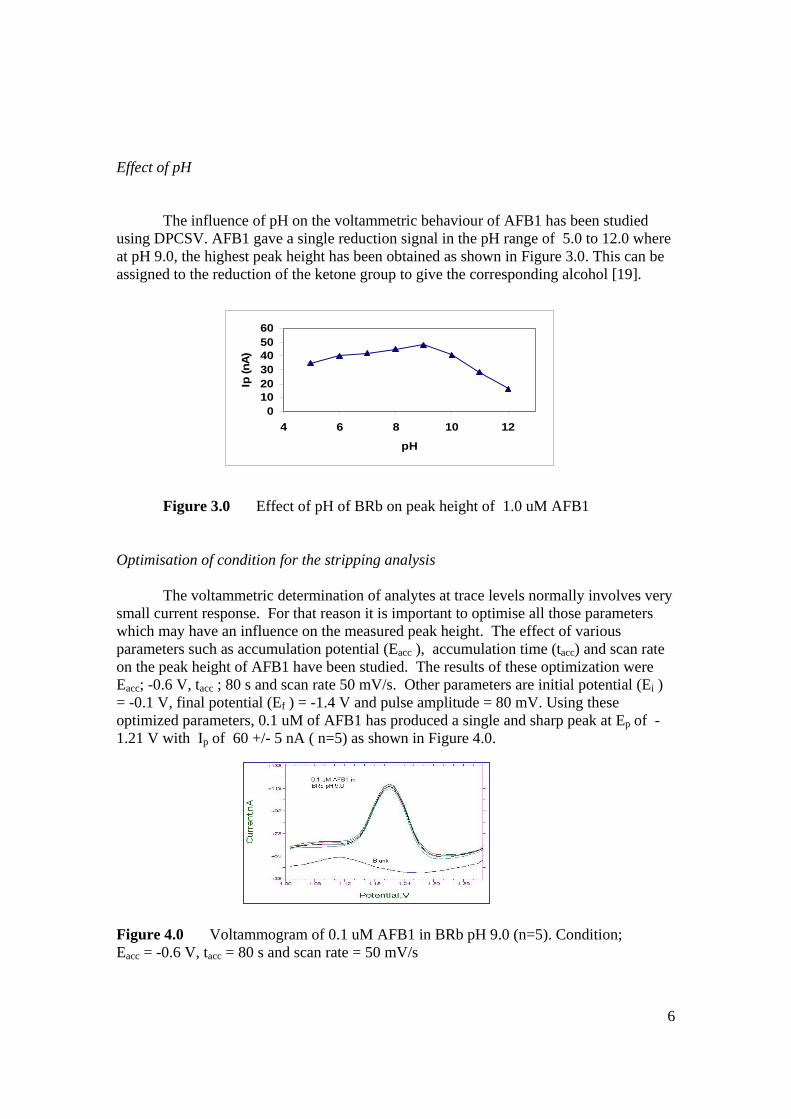
6
0102030405060
4 6 8 10 12
pH
Ip (n
A)
Effect of pH The influence of pH on the voltammetric behaviour of AFB1 has been studied using DPCSV. AFB1 gave a single reduction signal in the pH range of 5.0 to 12.0 where at pH 9.0, the highest peak height has been obtained as shown in Figure 3.0. This can be assigned to the reduction of the ketone group to give the corresponding alcohol [19]. Figure 3.0 Effect of pH of BRb on peak height of 1.0 uM AFB1 Optimisation of condition for the stripping analysis
The voltammetric determination of analytes at trace levels normally involves very small current response. For that reason it is important to optimise all those parameters which may have an influence on the measured peak height. The effect of various parameters such as accumulation potential (Eacc ), accumulation time (tacc) and scan rate on the peak height of AFB1 have been studied. The results of these optimization were Eacc; -0.6 V, tacc ; 80 s and scan rate 50 mV/s. Other parameters are initial potential (Ei ) = -0.1 V, final potential (Ef ) = -1.4 V and pulse amplitude = 80 mV. Using these optimized parameters, 0.1 uM of AFB1 has produced a single and sharp peak at Ep of -1.21 V with Ip of 60 +/- 5 nA ( n=5) as shown in Figure 4.0.
Figure 4.0 Voltammogram of 0.1 uM AFB1 in BRb pH 9.0 (n=5). Condition; Eacc = -0.6 V, tacc = 80 s and scan rate = 50 mV/s
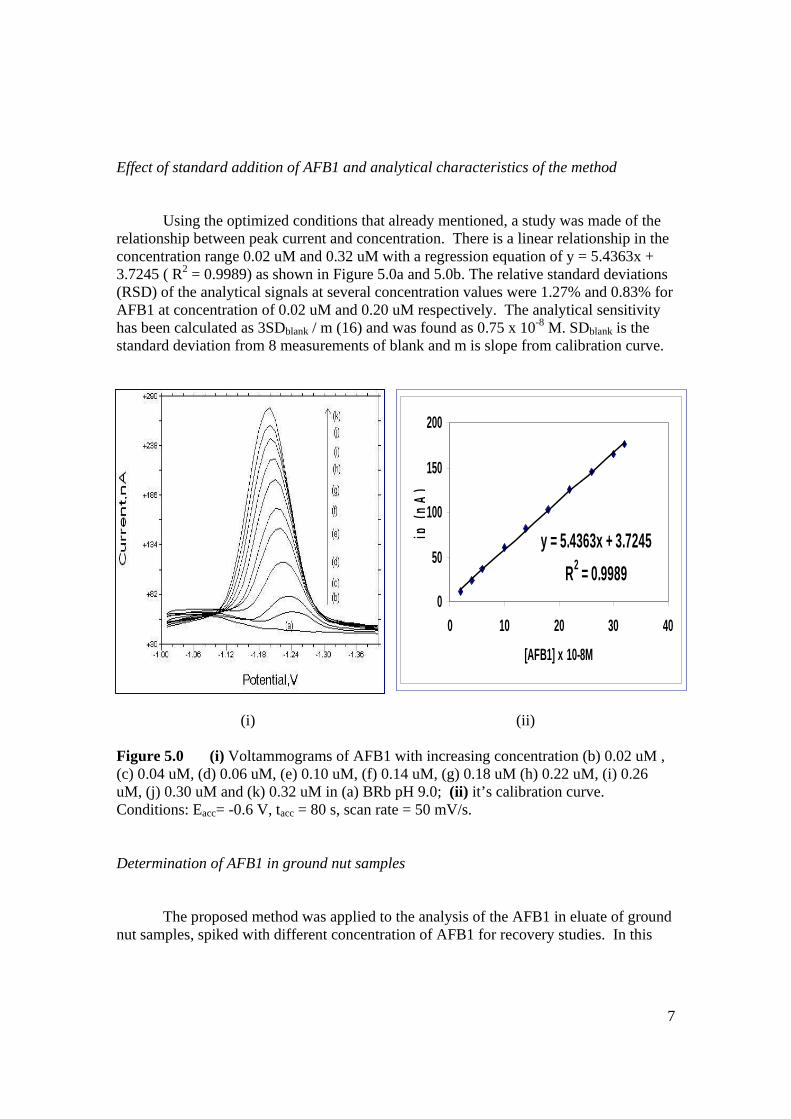
7
y = 5.4363x + 3.7245R2 = 0.9989
0
50
100
150
200
0 10 20 30 40
[AFB1] x 10-8M
ip(n
A)
Effect of standard addition of AFB1 and analytical characteristics of the method Using the optimized conditions that already mentioned, a study was made of the relationship between peak current and concentration. There is a linear relationship in the concentration range 0.02 uM and 0.32 uM with a regression equation of y = 5.4363x + 3.7245 ( R2 = 0.9989) as shown in Figure 5.0a and 5.0b. The relative standard deviations (RSD) of the analytical signals at several concentration values were 1.27% and 0.83% for AFB1 at concentration of 0.02 uM and 0.20 uM respectively. The analytical sensitivity has been calculated as 3SDblank / m (16) and was found as 0.75 x 10⁻⁸ M. SDblank is the standard deviation from 8 measurements of blank and m is slope from calibration curve.
(i) (ii)
Figure 5.0 (i) Voltammograms of AFB1 with increasing concentration (b) 0.02 uM , (c) 0.04 uM, (d) 0.06 uM, (e) 0.10 uM, (f) 0.14 uM, (g) 0.18 uM (h) 0.22 uM, (i) 0.26 uM, (j) 0.30 uM and (k) 0.32 uM in (a) BRb pH 9.0; (ii) it’s calibration curve. Conditions: Eacc= -0.6 V, tacc = 80 s, scan rate = 50 mV/s. Determination of AFB1 in ground nut samples The proposed method was applied to the analysis of the AFB1 in eluate of ground nut samples, spiked with different concentration of AFB1 for recovery studies. In this
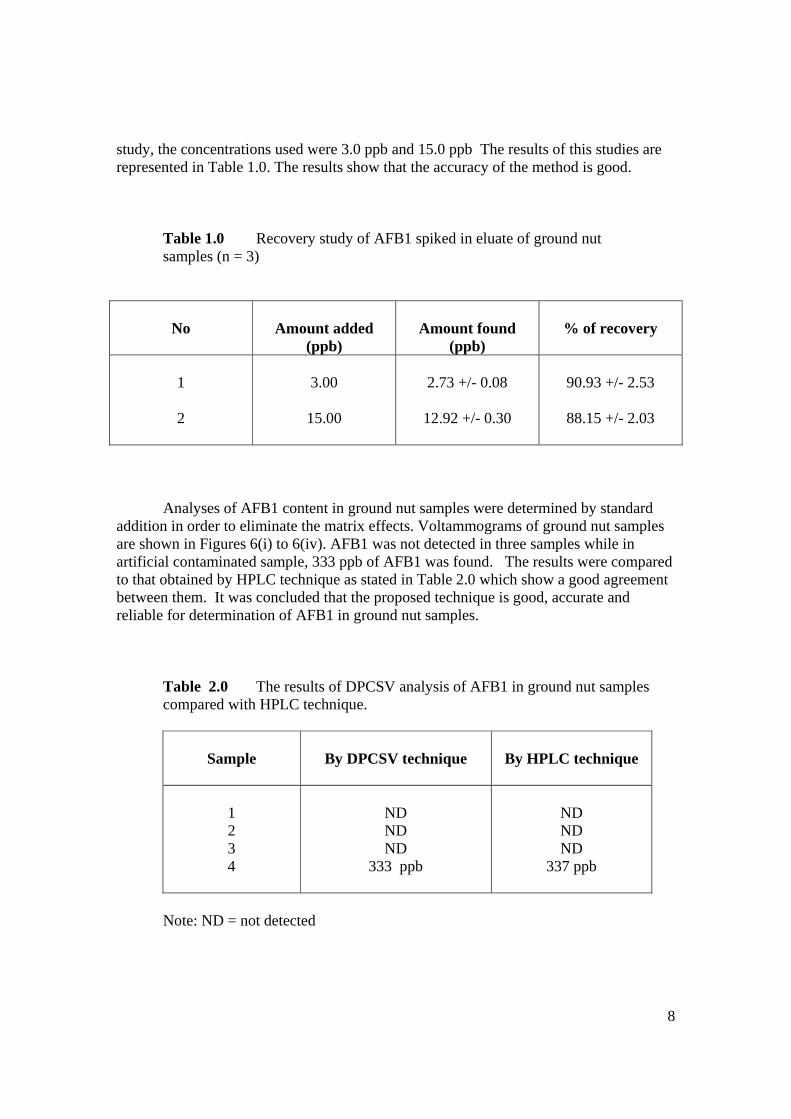
8
study, the concentrations used were 3.0 ppb and 15.0 ppb The results of this studies are represented in Table 1.0. The results show that the accuracy of the method is good. Table 1.0 Recovery study of AFB1 spiked in eluate of ground nut
samples (n = 3)
No
Amount added
(ppb)
Amount found
(ppb)
% of recovery
1
2
3.00
15.00
2.73 +/- 0.08
12.92 +/- 0.30
90.93 +/- 2.53
88.15 +/- 2.03
Analyses of AFB1 content in ground nut samples were determined by standard addition in order to eliminate the matrix effects. Voltammograms of ground nut samples are shown in Figures 6(i) to 6(iv). AFB1 was not detected in three samples while in artificial contaminated sample, 333 ppb of AFB1 was found. The results were compared to that obtained by HPLC technique as stated in Table 2.0 which show a good agreement between them. It was concluded that the proposed technique is good, accurate and reliable for determination of AFB1 in ground nut samples.
Table 2.0 The results of DPCSV analysis of AFB1 in ground nut samples compared with HPLC technique.
Sample
By DPCSV technique
By HPLC technique
1 2 3 4
ND ND ND
333 ppb
ND ND ND
337 ppb
Note: ND = not detected
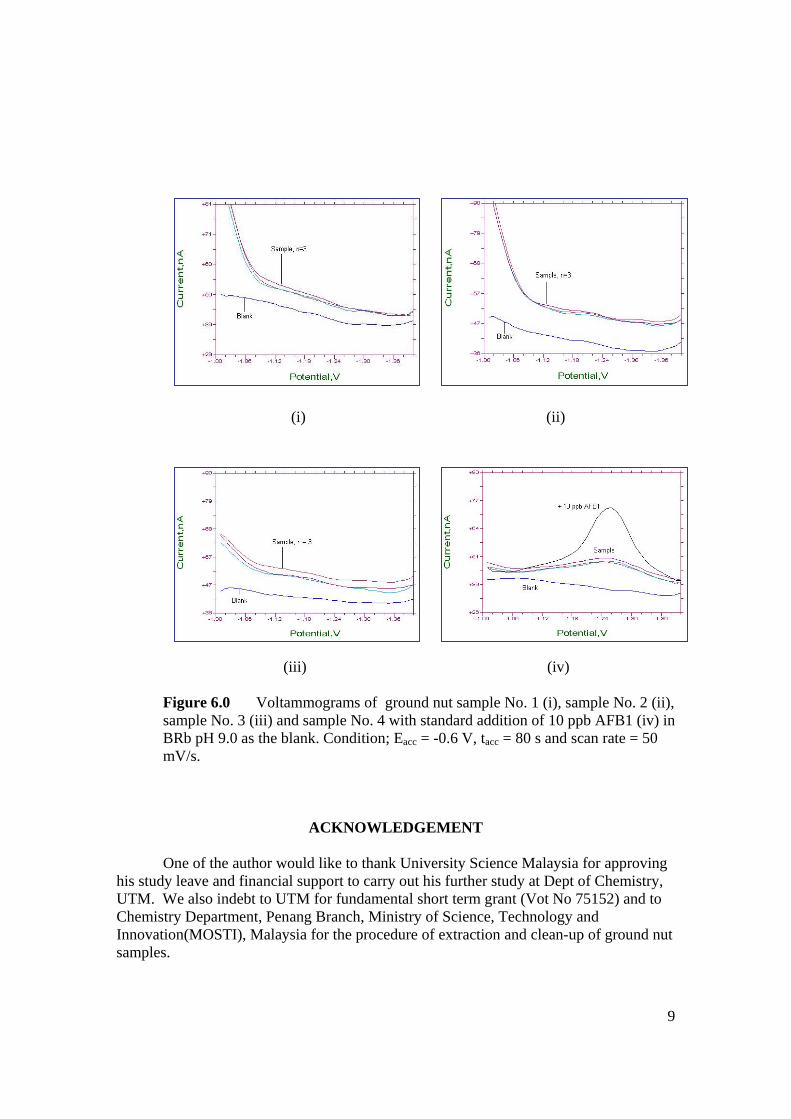
9
(i) (ii)
(iii) (iv)
Figure 6.0 Voltammograms of ground nut sample No. 1 (i), sample No. 2 (ii), sample No. 3 (iii) and sample No. 4 with standard addition of 10 ppb AFB1 (iv) in BRb pH 9.0 as the blank. Condition; Eacc = -0.6 V, tacc = 80 s and scan rate = 50 mV/s.
ACKNOWLEDGEMENT
One of the author would like to thank University Science Malaysia for approving his study leave and financial support to carry out his further study at Dept of Chemistry, UTM. We also indebt to UTM for fundamental short term grant (Vot No 75152) and to Chemistry Department, Penang Branch, Ministry of Science, Technology and Innovation(MOSTI), Malaysia for the procedure of extraction and clean-up of ground nut samples.
10
REFERENCES
1. Akiyama H. Goda Y. Tanaka T and Toyoda M. (2001). Determination of
aflatoxinsB1, B2, G1 and G2 in spices using a multifunctional column clean-up, J. Of Chromatography A, 932. 153-157.
2. Chiavaro E., Dall’Asta C., Galaverna G., Biancardi A., Gambarelli E., Dossena A.
and Marchelli R. (2001). New reversed-phase liquid chromatographic method to detect aflatoxins in food and feed with cyclodextrins as fluorescence enhancers added to the eluent, J Of Chromatography A, 937. 31-40.
3. World Health Organisation in: IARC Monograph on the evaluation of
carcinogenic risk to human, WHO, Lyon, 1987.
4. Hall A.J., Wild C.P in: Eaton D.L., Groopman J.D. (Eds). The toxicology of aflatoxins: Human Health, Veterinary and Agricultural Significance, Academic New York, 1994.
5. Malaysian Food Act (1983) Act No 281, Reviewed 2002, Food Quality Control
Dept, Ministry of Health, Malaysia.
6. Bicking M.K.L., Kniseley R.N and Svec H.J (1983), Coupled-Column for quantization low levels of aflatoxins, J . Assoc. Off. Anal. Chem. 66, 905-908.
7. Beebe B.M. (1978). Reverse phase high pressure liquid chromatographic
determination of aflatoxins in foods, J. Assoc. Off. Anal. Chem. 81. 1347-1352. 8. Cepeda A., Franco C.M., Fente C.A., Vazquez B.I., Rodriguez J.L., Prognon P.
and Mahuzier G. (1996). Post column excitation of aflatoxins using cyclodextrins in liquid chromatography for food analysis. J Of Chrom A. 721. 69-74.
9. Garner R.C., Whattam, M.M. , Taylor, P.J.L. and Stow M.W ( 1993) Analysis of
United Kingdom purchased spices for aflatoxins using immunoaffinity column clean up procedure followed up by high-performance liquid chromatographic analysis and post-column derivatization with pyridium bromide per bromide, J. Chromatography, 648: 485-490
10. Blesa J., Soriano J.M., Molto J.C., Marin R. and Manes J. (2003). Determination
of aflatoxins in peanuts by matrix solid-phase dispersion and liquid chromatography. J Of Chrom A. 1011. 49-54.
11. Garden S.R. and Strachan N.J.C.(2001). Novel colorimetric immunoassay for the
detection of aflatoxin B1, Anal Chim Acta, 444. 187-191.
11
12. Braitina Kh. Z., Malakhova N.A. and Stojko Y. (2000) Stripping voltammetry in
environmental and food analysis, Fresenius J Anal Chem 368: 307-325 13. Fifield F.W. and Kealey D (2000) Principle and practice of analytical chemistry
3rd Edition, Blackwell science, UK 14. Yaacob M.H., Mohd Yusoff A.R. and Ahmad R. (2003). Cyclic voltammetry of
AFB2 at the mercury electrode. Paper presented at Simposium Kimia Malaysia ke 13 (SKAM-13), 9 – 11th September 2003, Kucing, Sarawak, Malaysia.
15. Standard procedure for determination of aflatoxins (2000). Chemistry
Department, Penang Branch, Ministry of Science, Technology and Innovation (MOSTI), Malaysia (unpublished paper).
16. Smyth M. R., Lawellin D. W. and Osteryoung J.G (1979) Polarographic Study of
Aflatoxin B1, B2, G1 and G2: Application of Differential-pulse Polarography to the Determination of Aflatoxin B1 in Various Foodstuffs, Analyst, 104: 73-78
17. Sabry S.M. (1999). Adsorptive stripping voltammetric assay of phenazopyridine
hydrochloride in biological fluids and pharmaceutical preparation, Talanta 50: 133-140.