test of theoretical models for ultrafast heterogeneous electron transfer with femtosecond two-photon...
TRANSCRIPT
J. Chem. Sci., Vol. 121, No. 5, September 2009, pp. 561–574. © Indian Academy of Sciences.
561
†Dedicated to the memory of the late Professor S K Rangarajan*For correspondence
Test of theoretical models for ultrafast heterogeneous electron transfer
with femtosecond two-photon photoemission data†
LARS GUNDLACH1,*, TOBIAS LETZIG
2 and FRANK WILLIG
3,*
1Department of Chemistry, Rutgers University-Newark, 73 Warren St., Newark, NJ 07102-1811, USA 2Johanna Solar Technology, Muenstersche Strasse 24, 14772 Brandenburg, Germany 3Fritz Haber Institut der MPG, Faradayweg 4-6, 14195 Berlin, Germany
e-mail: [email protected]; [email protected]
Abstract. The energy distribution of electrons injected into acceptor states on the surface of TiO2 was measured with femtosecond two-photon photoemission. Shape and relative energetic position of these distribution curves with respect to the corresponding donor states, i.e. of perylene chromophores in the first excited singlet state attached via different bridge–anchor groups to the TiO2 surface, were compared with the predictions of different theoretical models for light-induced ultrafast heterogeneous electron transfer (HET). Gerischer’s early scenario for light-induced HET was considered and two recent explicit calculations, i.e. a fully quantum mechanical analytical model and a time-dependent density functional theory model based on molecular dynamics simulations for the vibrational modes were also considered. Based on the known vibrational structure in the photoionization spectrum of perylene in the gas phase and that measured in the linear absorption spectra of the perylene chromophores anchored on the TiO2 surface the energy distribution curves for the injected electrons were fitted assuming the excitation of the dominant 0⋅17 eV vibrational mode in the ionized perylene chromophore leading to a corresponding Franck–Condon dictated progression in the energy distribution curves. Each individual peak was fitted with a Voigt profile where the Lorentzian contribution was taken from the time-resolved HET data and the Gaussian contribution attributed to inhomogeneous broadening. The measured room temperature energy distribution curves for the injected electrons are explained with the fully quantum mechanical model for light-induced HET with the high energy, 0⋅17 eV, skeletal stretching mode excited in the ion-ized perylene chromophore. The corresponding energy distribution of the injected electrons is fully accommodated in acceptor states on the TiO2 surface fulfilling the wide band limit. Keywords. Fully quantum mechanical model; Gerischer model; heterogeneous electron transfer; femto-second two-photon photoemission; ultrafast dynamics.
1. Introduction
Light-induced heterogeneous electron transfer (HET)
involves the transfer of an electron from the excited
electronic state of a chromophore to the surface of a
semiconductor or metal. It is a fundamental process
in photoelectrochemistry,1 it is utilized in the AgBr
photographic process2 and in the dye-sensitized solar
cell.3 Experimental systems have been investigated
that consisted in most cases of chromophores like
Ru-bipyridyl with additional ligands3 or of aromatic
dye molecules like perylene,4 in both cases the
chromophore was covalently linked to an acidic
anchor group, e.g. –COOH, and the latter chemi-
sorbed on the surface of the wide bandgap semicon-
ductor TiO2. Ultrashort injection times of a few
femtoseconds have been reported for such experi-
mental systems when exposed to ultra high vac-
uum5–7
and also to the laboratory ambient.8,9
The
time scale of the HET process can be shifted to the
picosecond range.10,11
The general case of light-
induced HET is realized if the ground state of the
molecular donor is located in the wide bandgap of a
suitable semiconductor and the excited state of the
molecular donor above the lower conduction band
edge.1 In order to preserve monomeric behaviour the
perylene chromophores were equipped with two
bulky lateral spacer groups.4,6
The characteristic
vibrational structure of the monomer was indeed
maintained in the linear absorption spectra when
these modified perylene chromophores, labelled Pe’
in the following, were adsorbed on the surface of
TiO2.12
Ultrashort injection times of a few femtosec-
onds require that the chromophores are positioned
sufficiently close to the surface of the semiconduc-
Lars Gundlach et al
562
tor. In the above cases this was realized by the
–COOH anchor group which inserts the –C–O-link
between the organic chromophore and the TiO2 sur-
face.3,7,13
Recently, light-induced HET was time-
resolved also on a metal electrode with perylene
chromophores attached via the –CH2–SH anchor
group to the Ag(110) surface yielding an injection
time in the range of 10 fs.14 Rigid ring structures
consisting of saturated –C–C– bonds like cyclooc-
tane10 and adamantane
10,15 can be used as electronic
tunneling barriers to slow down HET. Similar ring
structures have been used earlier to slow down elec-
tron transfer in donor–bridge–acceptor mole-
cules.16,17
The electronic interaction at the interface
can be enhanced if a shorter bond is formed between
the chromophore and the semiconductor than is rea-
lized by the –COOH anchor group. For example, the
chromophore catechol binds directly via its two
oxygen atoms to one or two Ti atoms on the TiO2
surface.18,19
The thus formed molecular complex
gives rise to optical transitions where the electron is
lifted from the catechol ground state directly into the
many empty electronic states on the TiO2 surface
from where the electrons escape to bulk states of
TiO2.20
Direct optical charge transfer transitions
have been studied extensively for donor–acceptor
pairs in the gas phase and in solution,21 specifically
also a molecular complex formed between three
catechol moieties and one Ti-ion.22 Direct optical
charge transfer is completely different from light-
induced HET since in the latter case on photon
absorption the electron stays localized on the chro-
mophore prior to the electron transfer step. For
example, the first excited singlet state of perylene
attached via the –COOH anchor group extends only
very little onto the TiO2 surface.13
The yield of these
two different electron injection mechanisms has
been compared directly making use of a double
chromophore consisting of perylene covalently
linked to catechol and the latter chemisorbed on the
TiO2 surface. It turned out that direct optical charge
transfer from the ground state of the catechol moiety
has much smaller oscillator strength than optical
excitation of the first excited singlet state of pery-
lene.23
Thus, light-induced HET is the more efficient
process and consequently more attractive for device
applications than direct optical charge transfer tran-
sitions.
Recently, two different mechanisms have been
discussed for ultrafast light-induced HET. A non-
adiabatic HET mechanism without restriction in the
electronic coupling strength follows from a fully
quantum mechanical model for both the electronic
and the nuclear coordinates.24–27 A system of
reduced dimensions is considered. In order to obtain
quantitative predictions important parameters of this
model have to be determined from a fit to experi-
mental data. Alternatively, parameter values for the
model can be obtained also from independent ab ini-
tio calculations.13,28 On the other hand, an adiabatic
HET mechanism has been derived from time-
dependent ab initio DFT calculations29 where a para-
meter fit is not required. The TDDFT model is based,
however, on a classical treatment of the nuclear co-
ordinates. Hitherto, three different types of experi-
mental data are available that can be compared with
predictions of the theoretical models. Firstly, differ-
ent ultrashort injection times of the Pe’ chromo-
phore that are controlled by different anchor–bridge
groups,6,7
secondly, different line-widths in the lin-
ear absorption spectra of the Pe’ chromophore when
attached to TiO2 via different anchor–bridge groups,12
Thirdly, different orientations of the Pe’ chromopho-
res when attached via different anchor groups to the
rutile TiO2(110) surface.30
In this paper, energy dis-
tribution curves for the injected electrons are com-
pared with the predictions of different theoretical
models for light-induced HET.24–27,29,31,32 The energy
distribution curves for the injected electrons were
obtained applying surface science techniques com-
bined with optical spectroscopy, in particular femto-
second two-photon photoemission (2PPE).7
2. Methods
Details concerning sample preparation, Ultraviolet
Photoemission Spectroscopy (UPS) and two-photon
photoemission (2PPE) used to obtain the data for
this work have been described already in our earlier
papers.7,20
It is sufficient to summarize here some
important points. Several different ultra-high vacuum
(UHV) chambers, each equipped with a load-lock
port, were employed for preparing and characteriz-
ing the samples. A mobile UHV chamber served as
the shuttle for transporting the samples between the
different UHV chambers, thereby maintaining ultra-
high-vacuum conditions. The bare TiO2(110) crystal
surface was cleaned via sputtering and annealing
cycles. The perylene molecules with the different
bridge–anchor groups were adsorbed from solution
onto the TiO2(110) surface. This preparation step was
carried out in a specifically designed UHV chamber
Test of theoretical models for ultrafast heterogeneous electron transfer
563
allowing for an easy switch between UHV condi-
tions and exposure of the electrode to an inert gas
atmosphere and then to a liquid solution. The pery-
lene chromophores were always equipped with two
lateral spacer groups, tertiary butyl, and the thus
modified chromophore is labelled Pe’. The adsorp-
tion geometry of the Pe’ chromophores anchored
with different groups on the rutile TiO2(110) surface
was determined from angle and polarization dependent
2PPE signals.30
The 2PPE signals were measured with femto-
second resolution applying a pump–probe technique
which makes use of two ultrashort laser pulses. The
pump and the probe pulse were shifted against each
other on the time axis with the help of an optical
delay stage. 2PPE was chosen as the pump–probe
technique since it provides the necessary sensitivity
for addressing femtosecond lifetimes in a molecular
monolayer on a planar surface. The laser pulses en-
tered the UHV chamber through a quartz window at
an angle of 45° with respect to the TiO2(110) sur-
face. The laser system was driven by a commercial
Ti:sapphire oscillator followed by a 150 kHz regen-
erative amplifier. Two non-collinear optical para-
metric amplifiers (NOPAs) generated ultrashort
pulses and their frequency doubled output supplied
photons with two different central wavelengths, i.e.
440 nm (2⋅82 eV) for the pump and 280 nm (4⋅43 eV)
for the probe.33 The photoemitted electrons were de-
tected with a time of flight spectrometer (TOF) where
the arrival time is a measure of the kinetic energy of
the respective photoemitted electrons. The instru-
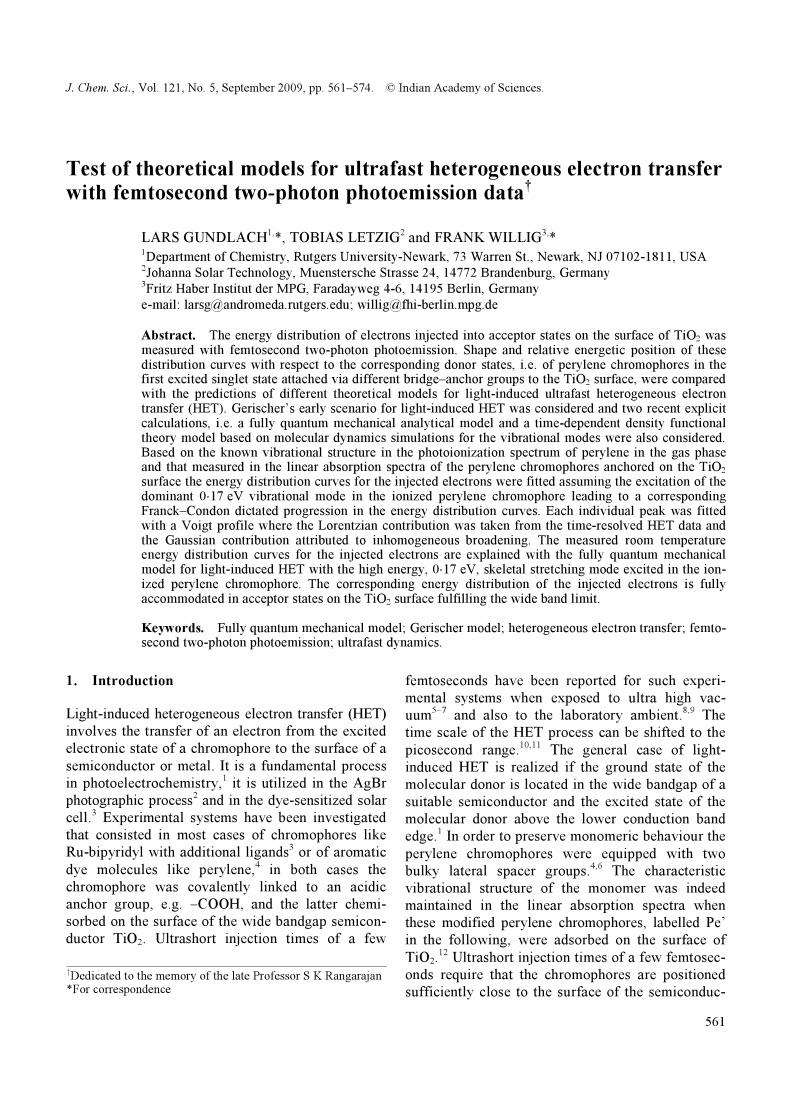
Figure 1. Pseudo 3D map of a 2PPE measurement with Pe’ achored via the propionic acid anchor–bridge group on the rutile TiO2 (110) surface. Details are explained in the text.
mental cross-correlation function was obtained as a
2PPE signal measured on a polycrystalline gold sur-
face where the intermediate state is known to have a
short enough lifetime not to add to the width of the
cross correlation function. The 2PPE signals col-
lected on a given sample can be arranged in the form
of a pseudo three-dimensional plot where different
signal amplitudes are represented by plateaus of dif-
ferent gray shades (colours) and the two axes of the
plot are: the time elapsed after a reference time
(time zero) and the kinetic energy of the photoemit-
ted electrons. A corresponding pseudo three-
dimensional plot is shown in figure 1 for Pe’
anchored via propionic acid on the rutile TiO2 (110)
surface. It is clear from figure 1 that a cross section
cut parallel to the time axis will yield the transient
behaviour of the 2PPE signal whereas a cross sec-
tion cut parallel to the energy axis will represent the
energy distribution at the respective time where the
cross section meets the time axis.
Linear absorption of adsorbed perylene chromo-
phores was measured with the Bruker spectrometer
IFS66v combined with an ultra-high-vacuum cham-
ber for the sample. Details of the set-up have been
described before.34 Compared to our earlier IR studies
two things were changed to perform linear absorp-
tion measurements in the visible spectral range: the
IR detector was replaced by a detector for visible
light (Si diode) and direct transmittance was meas-
ured in place of the ATR multi-pass arrangement for
the earlier IR studies.
3. Results and discussion
3.1 Vibrational structure in the linear absorption
spectrum
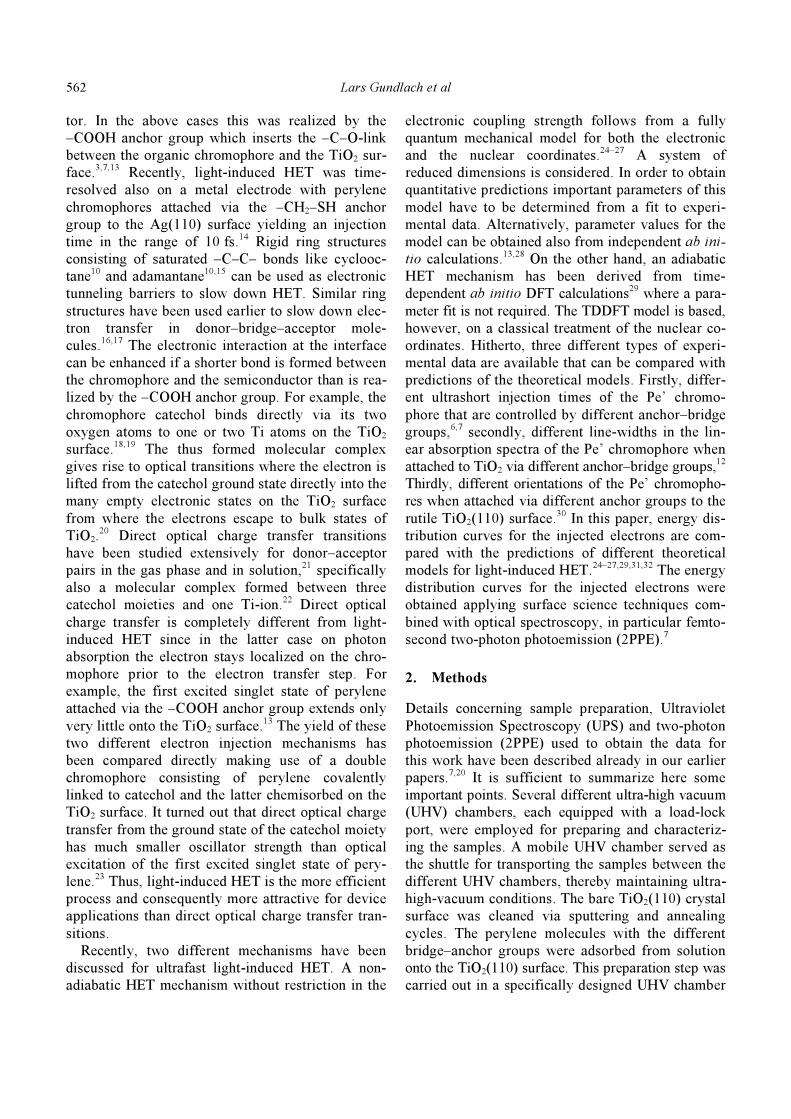
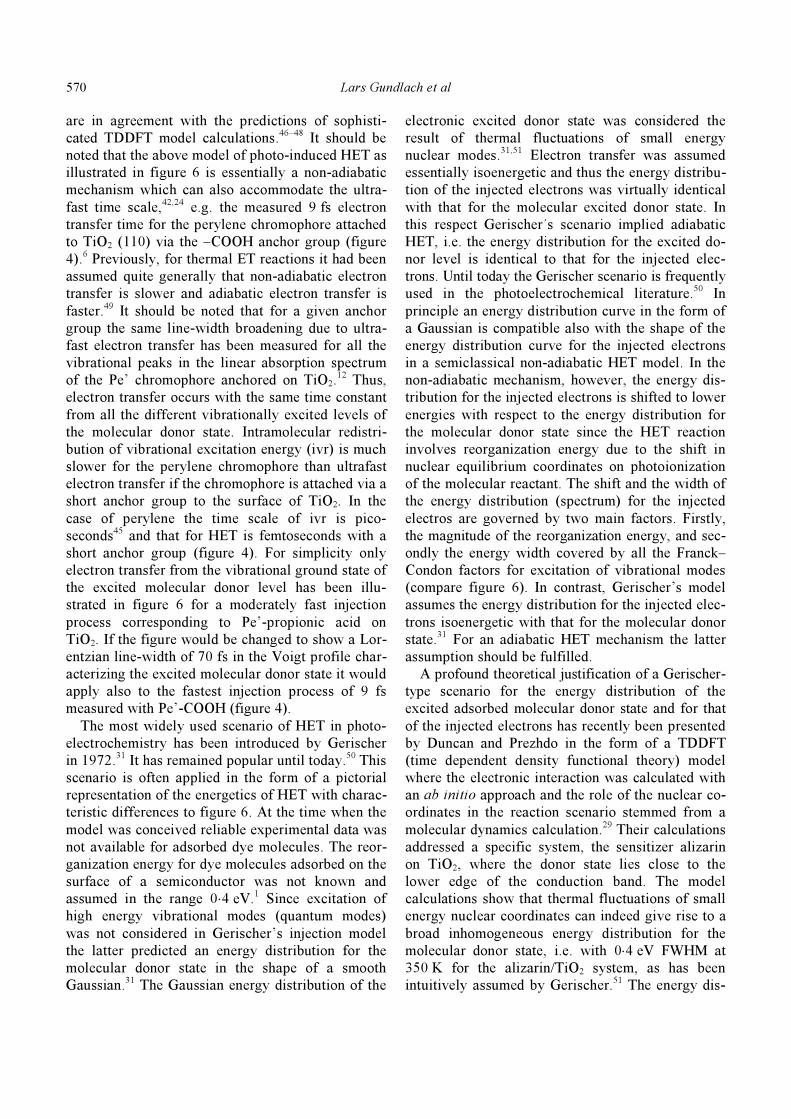
Figure 2 presents data points (open spheres) of the
linear absorption spectrum for the Pe’ chromophore
attached via the propionic acid to the rutile TiO2
(110) surface. The data points were obtained as the
difference of transmittance signals measured in the
absence and presence of the chromophores. The
drawn-out curve is a fit to the experimental data
points, i.e. the curve is a Voigt spectrum consisting
of a Gaussian of 145 meV FWHM and a Lorentzian
of 23 meV FWHM. The latter value was fixed
according to the measured HET time of 47 fs for this
system (see below). The halfwidth of the Gaussian
was obtained from the best fit to the experimental
data.
Lars Gundlach et al
564
The linear absorption spectrum of the same chro-
mophore measured on a colloidal anatase layer of
TiO2
35 is shown for comparison (dash-dotted curve).
The latter data was obtained as a smooth curve since
the inner surface of the nano-structured anatase
layer probed by the light beam was several hundred
times larger than the surface area probed on the
rutile single crystal. The linear absorption spectrum
of the same perylene compound dissolved in a mix-
ture of toluene and methanol (1 : 1) is also shown for
comparison (dashed curve). The following conclu-
sions can be drawn from the data shown in figure 2.
The linear absorption spectrum of perylene anchored
via –(CH2)2–COOH on the rutile TiO2 (110) surface
showed one clear vibrational peak with the maxi-
mum slightly red-shifted from the maximum for the
spectrum measured in the above solvent,35 it was
slightly more red-shifted from the maximum mea-
sured on the TiO2 layer composed of anatase col-
loids.12
The width of the vibrational peak measured
on rutile TiO2 (110) is dominated by inhomogeneous
broadening considering the halfwidth for the Gaus-
sian of 145 meV compared to the half-width for the
Lorentzian of 23 meV. We attribute this significant
inhomogeneous broadening on the surface of the
rutile single crystal to variations in the local envi-
ronments to which the individual perylene chromo-
phores in the ensemble are exposed. Figure 2 shows
that the inhomogeneous broadening on the rutile sur-
face is of the same order of magnitude as that on
the anatase surface. Light-induced HET showed
Figure 2. Linear absorption data (open spheres) for Pe’ chromophores anchored via propionic acid on the rutile TiO2 (110) single crystal surface. Other information con-tained in this figure is explained in the text.
very similar time constants on the two different
stoichiometric TiO2 crystal surfaces, i.e. of anatase
and rutile.7 Due to the 0⋅2 eV larger band gap
36
and the much thinner colloidal anatase sample com-
pared to the thick rutile single crystal one can meas-
ure all the vibrational peaks of perylene on the
surface of anatase35 whereas only the first vibra-
tional peak can be identified on the surface of rutile
(figure 2). Fitting only one peak on rutile compared
with four peaks on anatase is of course less reliable.
Thus, we refrain from interpreting apparent numeri-
cal differences in the fit to the one peak measured on
rutile compared to the four peaks measured on ana-
tase. The important result in figure 2 is the occur-
rence of one clear vibrational peak in the linear
absorption spectrum with a similar width as obser-
ved on anatase. The absorption peak due to the
adsorbed perylene chromphores can be separated
from the onset of the band to band transition in the
rutile crystal only if the peak is not broader than in
the above system. For example, with the –COOH
anchor group instead of propionic acid the line-
broadening of the Lorentzian is much stronger in
agreement with the much shorter injection time of
9 fs (compare below) or 10 fs6 for the latter com-
pound so that the vibrational structure is lost in the
absorption spectrum.12 It should be noted that a
much stronger inhomogeneous broadening than
observed in figure 2 could also wash out the vibra-
tional structure in a corresponding experimental
system.
3.2 Photoionization spectrum for the ground state
of perylene chromphores anchored on rutile TiO2
(110)
With Pe’ chromophores anchored on the rutile sur-
face the UPS spectrum showed a new pronounced
peak to the low energy side of the UPS spectrum of
the rutile crystal. The peak arose from photoioniza-
tion of the ground state of perylene. It is shown in
figure 3 for Pe’ anchored via propionic acid on the
rutile TiO2 (110) surface. The photoionization
energy for the ground state of the perylene chromo-
phore near the TiO2 surface (6⋅3 eV) is decreased by
about 0⋅6 eV compared to the photoionization
energy of 6⋅9 eV for the perylene chromophore in
the gas phase.37 This shift is ascribed to screening by
the π-electrons in the neighbouring perylene chro-
mophores. Screening in a close packed 2-dimensional
layer of aromatic molecules facilitates in most sys-
Test of theoretical models for ultrafast heterogeneous electron transfer
565
tems a decrease in the ionization energy by about
1⋅5 eV.38
In the present system the shift is smaller
due to the greater distance from the perylene
neighbours which is brought about by the lateral
spacer groups (tertiary butyl). There might be addi-
tional smaller contributions to the screening coming
from the electrons in the adjacent TiO2 electrode and
from the polarization of the TiO2 electrode which
has an optical dielectric constant of about 7 and a
static dielectric constant of 170.39 The chemical na-
ture of the anchor–bridge group has little influence
on the shape of the ionization peak since the latter
was similar with all the different anchor–bridge
groups that we have investigated. The onset energy
corresponding to the HOMO position in the band
gap of TiO2 (compare below) was shifting by smaller
amounts in the range of 0⋅1–0⋅2 eV according to the
specific anchor–bridge group employed. It should be
noted that the work function of the rutile TiO2 (110)
surface decreased on adsorption of the anchor–
bridge groups by 0⋅5 to 0⋅7 eV. The decrease in the
work function was caused by a corresponding shift
in the vacuum level.7 From electrochemical
experiments it is well-known that there is a down-
ward shift of the band edges of TiO2 with respect to
the energy of a reference electrode when the acidity
of the contact solution is increased.40
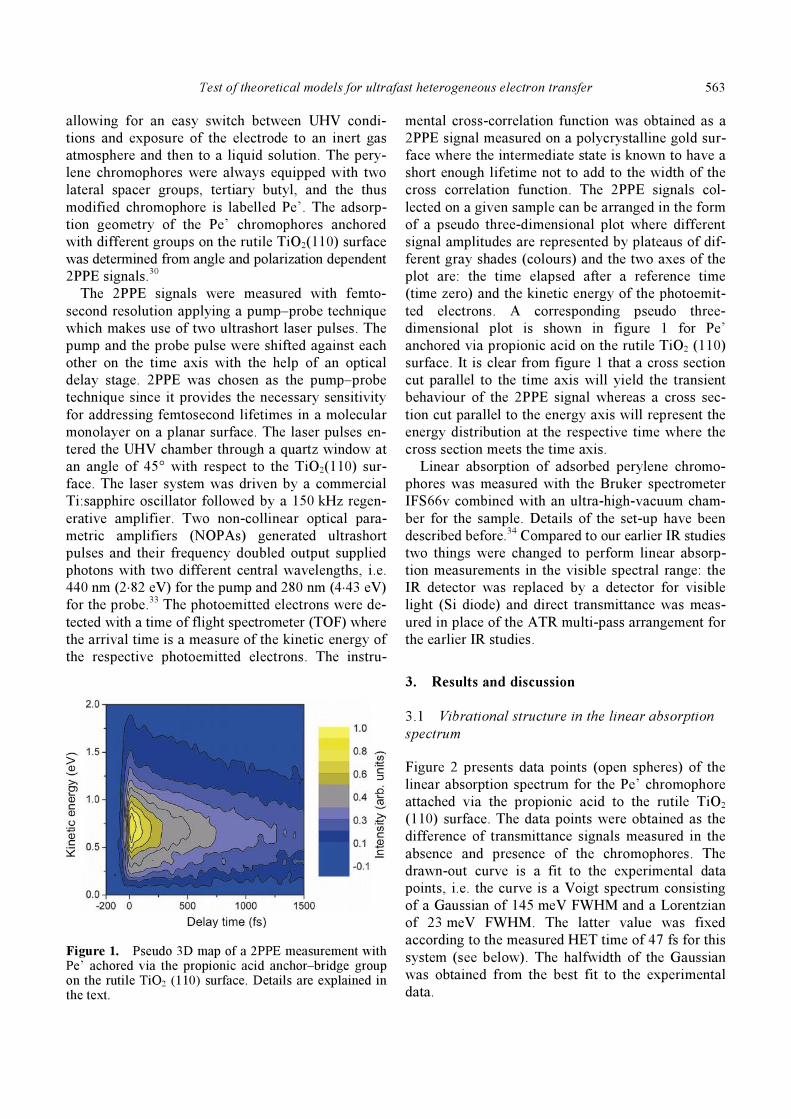
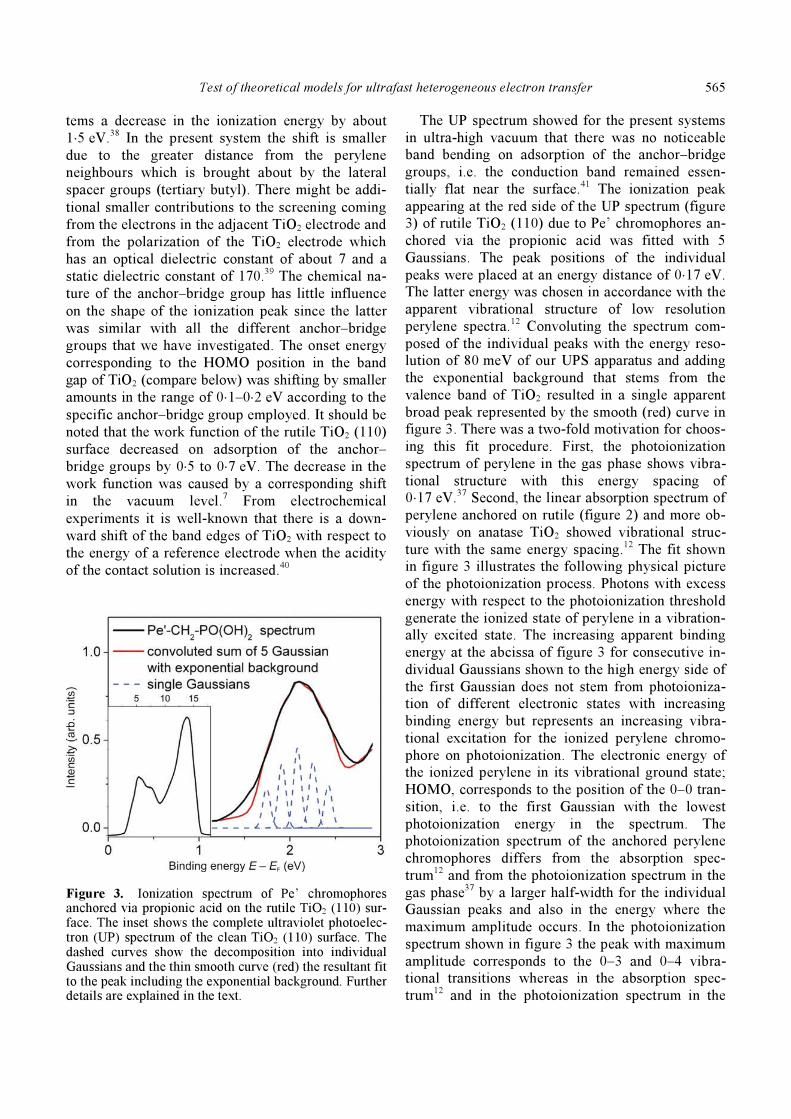
Figure 3. Ionization spectrum of Pe’ chromophores anchored via propionic acid on the rutile TiO2 (110) sur-face. The inset shows the complete ultraviolet photoelec-tron (UP) spectrum of the clean TiO2 (110) surface. The dashed curves show the decomposition into individual Gaussians and the thin smooth curve (red) the resultant fit to the peak including the exponential background. Further details are explained in the text.
The UP spectrum showed for the present systems
in ultra-high vacuum that there was no noticeable
band bending on adsorption of the anchor–bridge
groups, i.e. the conduction band remained essen-
tially flat near the surface.41
The ionization peak
appearing at the red side of the UP spectrum (figure
3) of rutile TiO2 (110) due to Pe’ chromophores an-
chored via the propionic acid was fitted with 5
Gaussians. The peak positions of the individual
peaks were placed at an energy distance of 0⋅17 eV.
The latter energy was chosen in accordance with the
apparent vibrational structure of low resolution
perylene spectra.12 Convoluting the spectrum com-
posed of the individual peaks with the energy reso-
lution of 80 meV of our UPS apparatus and adding
the exponential background that stems from the
valence band of TiO2 resulted in a single apparent
broad peak represented by the smooth (red) curve in
figure 3. There was a two-fold motivation for choos-
ing this fit procedure. First, the photoionization
spectrum of perylene in the gas phase shows vibra-
tional structure with this energy spacing of
0⋅17 eV.37
Second, the linear absorption spectrum of
perylene anchored on rutile (figure 2) and more ob-
viously on anatase TiO2 showed vibrational struc-
ture with the same energy spacing.12
The fit shown
in figure 3 illustrates the following physical picture
of the photoionization process. Photons with excess
energy with respect to the photoionization threshold
generate the ionized state of perylene in a vibration-
ally excited state. The increasing apparent binding
energy at the abcissa of figure 3 for consecutive in-
dividual Gaussians shown to the high energy side of
the first Gaussian does not stem from photoioniza-
tion of different electronic states with increasing
binding energy but represents an increasing vibra-
tional excitation for the ionized perylene chromo-
phore on photoionization. The electronic energy of
the ionized perylene in its vibrational ground state;
HOMO, corresponds to the position of the 0–0 tran-
sition, i.e. to the first Gaussian with the lowest
photoionization energy in the spectrum. The
photoionization spectrum of the anchored perylene
chromophores differs from the absorption spec-
trum12 and from the photoionization spectrum in the
gas phase37
by a larger half-width for the individual
Gaussian peaks and also in the energy where the
maximum amplitude occurs. In the photoionization
spectrum shown in figure 3 the peak with maximum
amplitude corresponds to the 0–3 and 0–4 vibra-
tional transitions whereas in the absorption spec-
trum12
and in the photoionization spectrum in the
Lars Gundlach et al
566
gas phase37
the first peak attains the highest ampli-
tude which corresponds to the 0–0 transition. The
shift of the maximum amplitude to a higher vibra-
tional excitation of ionized perylene is ascribed to a
larger value for the reorganization energy of pery-
lene anchored on TiO2 compared to perylene in the
gas phase. Placed near the TiO2 surface the perylene
chromophore must undergo a larger change in the
equilibrium nuclear coordinates on ionization than
the isolated perylene chromophore in the gas phase.
Also, the different shape of the absorption spec-
trum12 shows that the shift in the nuclear equilibrium
coordinates on the TiO2 surface must be much larger
for ionized perylene than for perylene in the first
excited singlet state. The interaction between the
positive charge on the ionized perylene and the sur-
face of TiO2 must be much stronger than that of the
dipole moment in the first excited singlet state of
perylene. We are not aware of any theoretical calcu-
lation that has addressed this behaviour for the pre-
sent system but the effect is not surprising in view
of the strong electronic and static polarizability of
TiO2
39 and the fact that the response to a change in
the electric charge should be stronger than to a
change in the dipole moment. The strong change
occurring in the nuclear equilibrium coordinates on
ionization of perylene near the TiO2 surface is un-
derlined by the fact that a fifth vibrational peak with
large amplitude is required for the fit in figure 3 in
contrast to the much smaller amplitude of the corre-
sponding fifth vibrational peak in the linear absorp-
tion spectrum of perylene anchored on TiO2.12
The
FWHM of 180 meV required for the individual
Gaussian indicates considerable inhomogeneous
broadening on the surface of the rutile TiO2 single
crystal even though the chromophores show a strong
alignment with respect to the crystal axes and a clear
orientation of the long axis of perylene with respect
to the surface plane which is controlled by the bonds
formed by the respective anchor group.30
3.3 Time dependence of the injected electrons
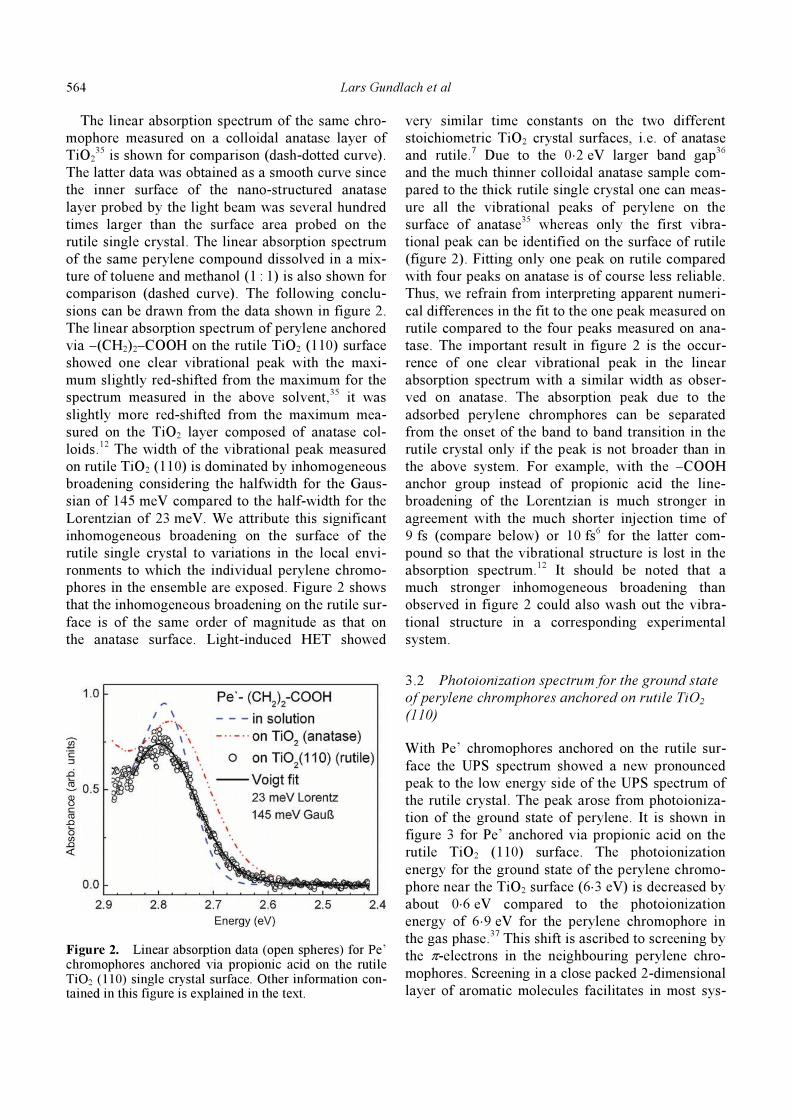
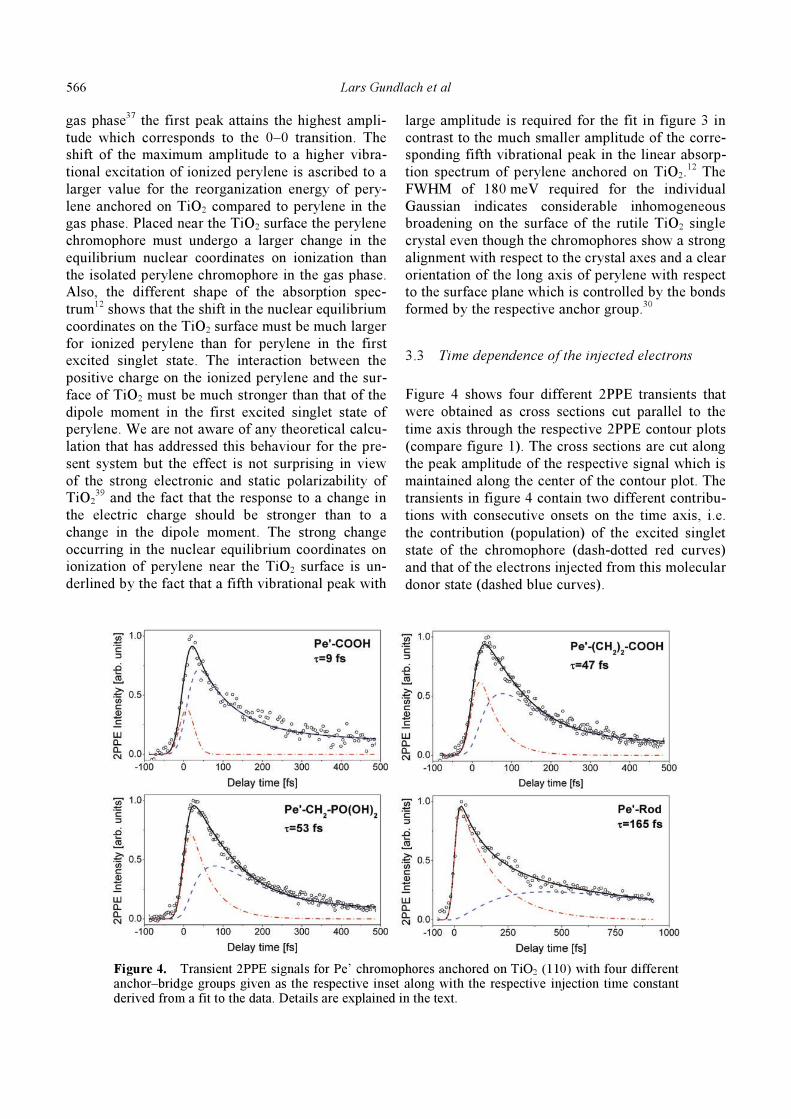
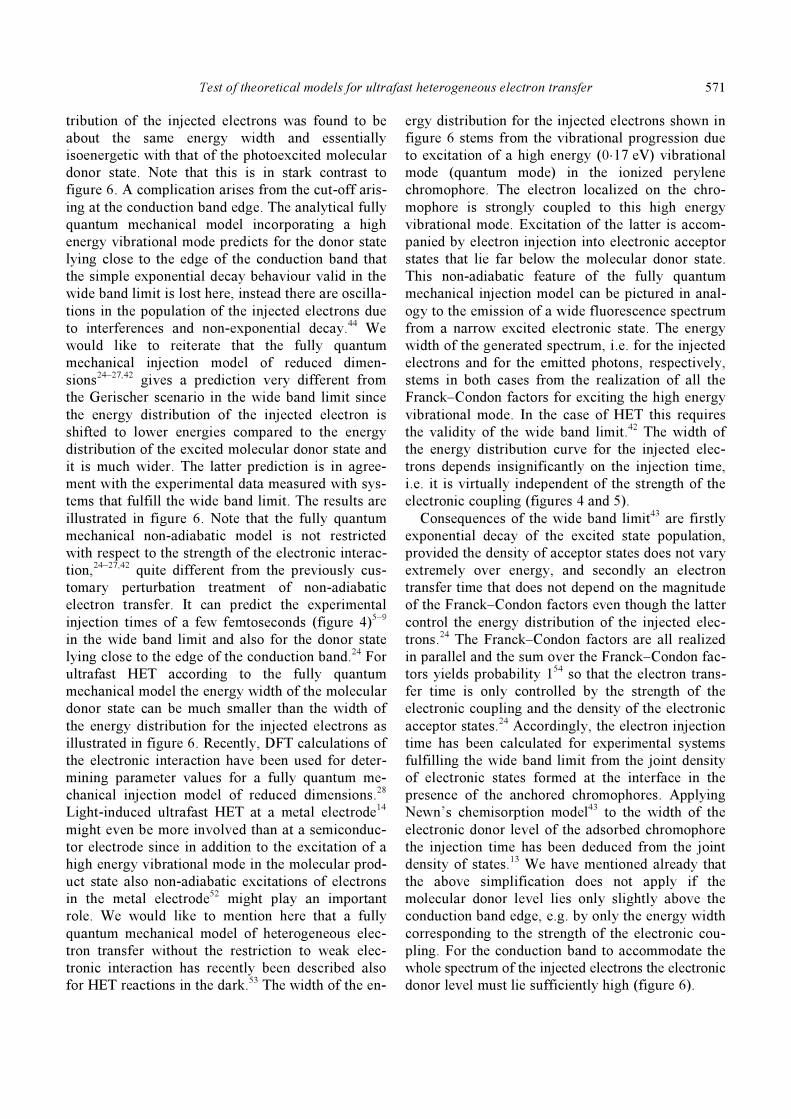
Figure 4 shows four different 2PPE transients that
were obtained as cross sections cut parallel to the
time axis through the respective 2PPE contour plots
(compare figure 1). The cross sections are cut along
the peak amplitude of the respective signal which is
maintained along the center of the contour plot. The
transients in figure 4 contain two different contribu-
tions with consecutive onsets on the time axis, i.e.
the contribution (population) of the excited singlet
state of the chromophore (dash-dotted red curves)
and that of the electrons injected from this molecular
donor state (dashed blue curves).
Figure 4. Transient 2PPE signals for Pe’ chromophores anchored on TiO2 (110) with four different anchor–bridge groups given as the respective inset along with the respective injection time constant derived from a fit to the data. Details are explained in the text.
Test of theoretical models for ultrafast heterogeneous electron transfer
567
To obtain a fit to the experimental 2PPE transient
the time dependence of the reactant state (excited
chromophore) can be modelled as a monoexponen-
tial decay and that of the product state (injected elec-
tron) correspondingly as a monoexponential rise,
both of course with the same time constant and each
contribution convoluted with the time response of
the apparatus. Thus the obtained electron transfer
time constants given as insets in figure 4 are in good
agreement with the time constants obtained with the
same Pe’ compounds adsorbed on the surface of ana-
tase colloids in a nano-structured layer, also meas-
ured in ultra-high vacuum.6,7 One can see smaller
deviations from monoexponential behaviour in the
transient absorption data,6 and there is some room
for smaller deviations also in the fit to the 2PPE
transients shown in figure 4. Such deviations remain
small, however, and it is not clear whether they are
due to the fact that the measurements are probing an
inhomogeneous ensemble or whether they are of a
more principle nature. Deviations from monoexpo-
nential behaviour have been suggested by recent
theoretical studies.28 Depending on the specific an-
chor–bridge group the injection time varied for the
four cases displayed in figure 4 between 9 fs and
165 fs. The injection time has been extended to 1 ps
when the Pe’ chromophore was attached to TiO2 via
the so called tripod anchor–bridge group containing
adamantane as an electronic tunneling barrier.10
It is
evident from figures 1 and 4 that the energy distri-
bution of the injected electrons can be obtained as a
cross section cut parallel to the energy axis through
the 2PPE contour plot and that the respective time
has to be chosen such that only the injected elec-
trons are addressed, i.e. at the time when the peak of
the contribution of the injected electrons is occur-
ring or later. It was checked in several 100 fs long
time windows that the energy distribution of the
injected electrons remained virtually constant, i.e.
there was no significant energy loss occurring for
the electrons in the initial acceptor states on the sur-
face prior to the electrons escaping into the bulk.7
Energy relaxation processes for the electrons in the
primary acceptor states on the TiO2 surface with
chemisorbed anchor groups turned out much slower
than for hot electrons that were photogenerated in
the form of electron-hole pairs in the bulk of TiO2.7
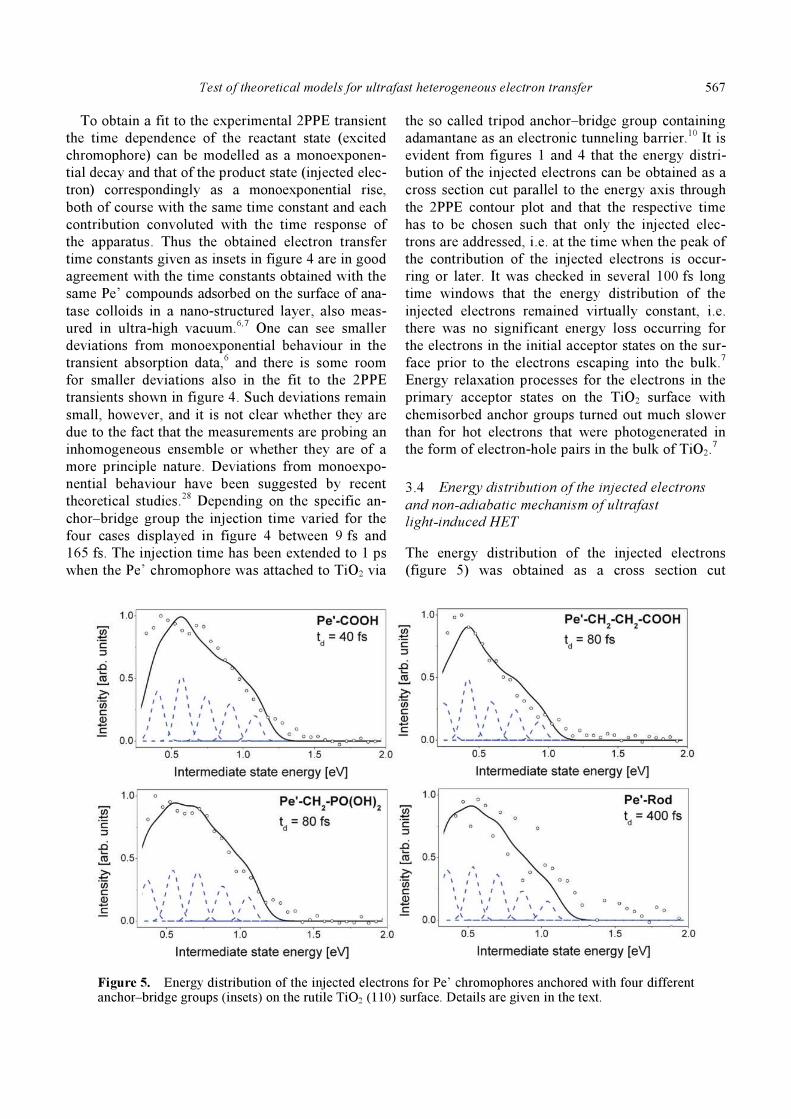
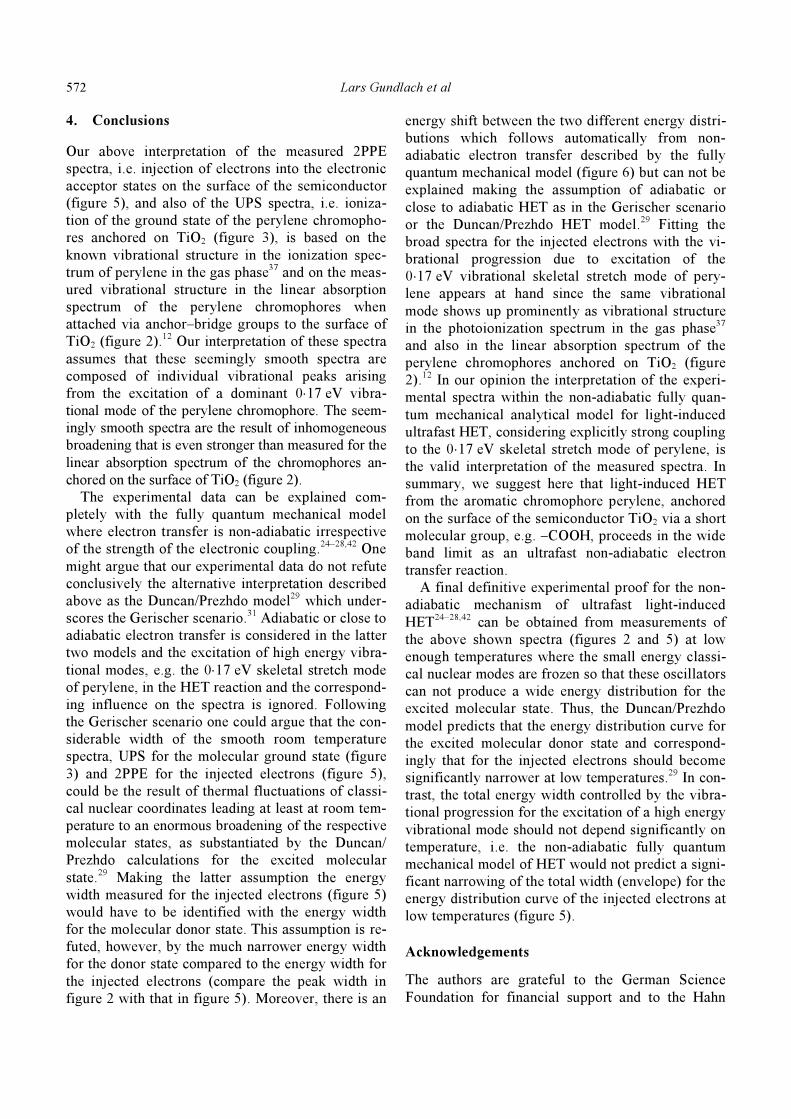
3.4 Energy distribution of the injected electrons
and non-adiabatic mechanism of ultrafast
light-induced HET
The energy distribution of the injected electrons
(figure 5) was obtained as a cross section cut
Figure 5. Energy distribution of the injected electrons for Pe’ chromophores anchored with four different anchor–bridge groups (insets) on the rutile TiO2 (110) surface. Details are given in the text.
Lars Gundlach et al
568
parallel to the energy axis through the respective
2PPE contour plots (figure 1) taken at the time at
which the contribution from the injected electrons to
the 2PPE signal attained its maximum amplitude
(compare figure 4).
It was found that the shape of the energy distribu-
tion curve was retained for at least 200 fs. A possi-
ble energy relaxation occurring on a longer time
scale was difficult to detect since the amplitude of
the 2PPE signal vanished due to the escape of the
injected electrons into the bulk. The escape process
brought the electrons out of the escape depth probed
by the 2PPE signal.20
There is considerable qualita-
tive similarity between the energy distribution seen
in the UPS spectrum, corresponding to photoioniza-
tion of the ground state of the anchored chromopho-
res (figure 2), and the 2PPE spectrum for the
injected electrons (figure 5). In both cases the product
state is a vibrationally excited ionized chromophore
but in the first case the other product state is the
electron in a vacuum state whereas in the second
case the injected electron is located in an acceptor
state on the surface of the semiconductor.7,24
The
simplest assumption about the matrix element
describing the electronic interaction between the
excited molecular electronic donor state and empty
electronic states of the semiconductor is a constant
value over the whole energy range spanned by the
conduction band.24,42
Ab initio calculations have
modified this simple physical picture, but not deci-
sively.28
The width of the energy distribution for the
injected electrons is controlled by the Franck–Condon
factors for generating a vibrationally excited ionized
chromophore. In the wide band limit this leads for
only one dominant mode with energy 0⋅17 eV to a
corresponding energy width n × 0⋅17 eV, where n is
the highest vibrational excitation of the ionized
chromophore corresponding to a finite value of the
corresponding Franck–Condon factor. To fit the en-
ergy distribution in the 2PPE signal five Gaussians
were required with energy spacing of 0⋅17 eV. The
maximum amplitude appeared for the fourth peak.
This decomposition is very similar to that of the
UPS spectrum (figure 3). The Gaussian with the
highest energy relative to the conduction band edge
in the distribution curve for the injected electrons
matches the energy of the Gaussian for the excited
molecular donor level. The latter is obtained from
the energy of the highest energy peak in the respec-
tive UPS spectrum, i.e. the HOMO level, by adding
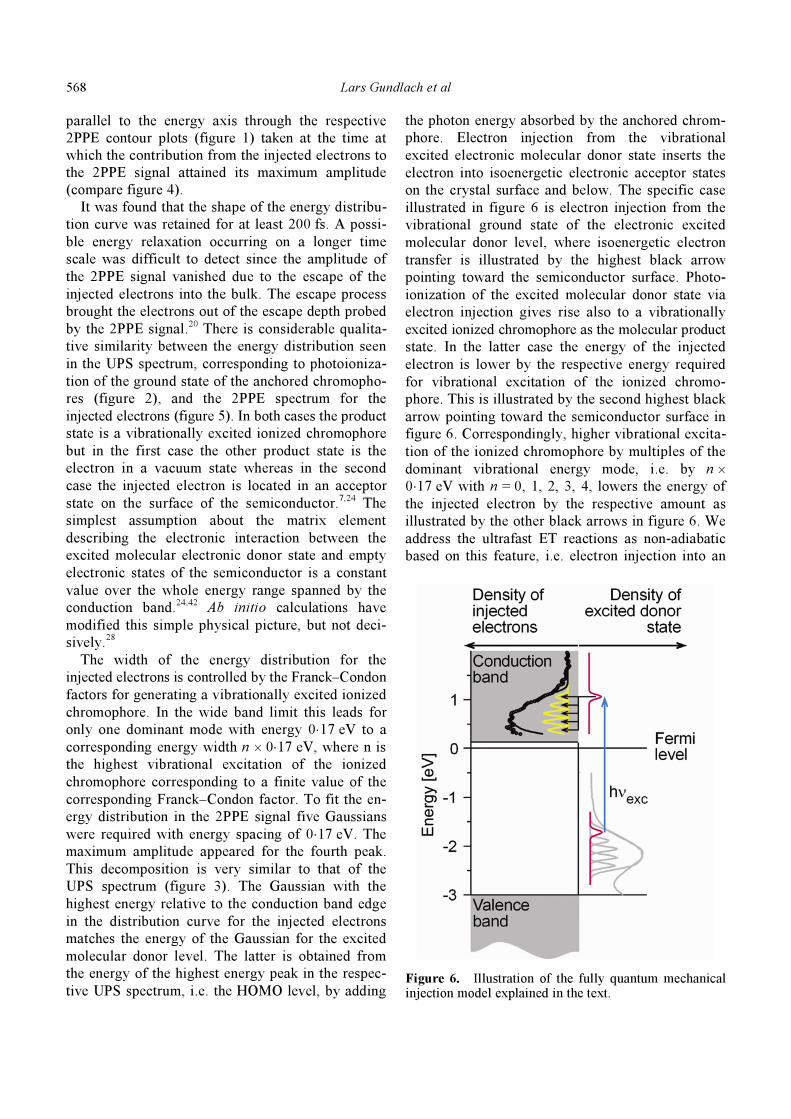
the photon energy absorbed by the anchored chrom-
phore. Electron injection from the vibrational
excited electronic molecular donor state inserts the
electron into isoenergetic electronic acceptor states
on the crystal surface and below. The specific case
illustrated in figure 6 is electron injection from the
vibrational ground state of the electronic excited
molecular donor level, where isoenergetic electron
transfer is illustrated by the highest black arrow
pointing toward the semiconductor surface. Photo-
ionization of the excited molecular donor state via
electron injection gives rise also to a vibrationally
excited ionized chromophore as the molecular product
state. In the latter case the energy of the injected
electron is lower by the respective energy required
for vibrational excitation of the ionized chromo-
phore. This is illustrated by the second highest black
arrow pointing toward the semiconductor surface in
figure 6. Correspondingly, higher vibrational excita-
tion of the ionized chromophore by multiples of the
dominant vibrational energy mode, i.e. by n ×
0⋅17 eV with n = 0, 1, 2, 3, 4, lowers the energy of
the injected electron by the respective amount as
illustrated by the other black arrows in figure 6. We
address the ultrafast ET reactions as non-adiabatic
based on this feature, i.e. electron injection into an
Figure 6. Illustration of the fully quantum mechanical injection model explained in the text.
Test of theoretical models for ultrafast heterogeneous electron transfer
569
electronic level 680 meV below the donor level
compared to the electronic interaction energy of
13 meV for this system.
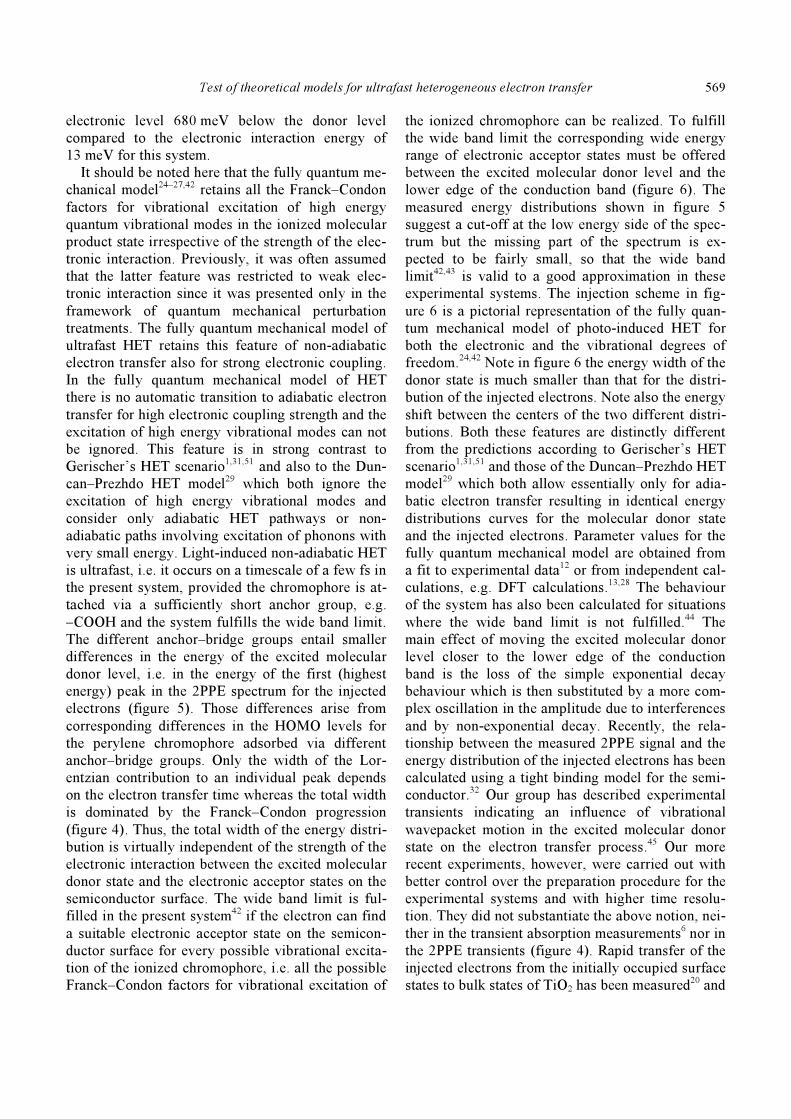
It should be noted here that the fully quantum me-
chanical model24–27,42 retains all the Franck–Condon
factors for vibrational excitation of high energy
quantum vibrational modes in the ionized molecular
product state irrespective of the strength of the elec-
tronic interaction. Previously, it was often assumed
that the latter feature was restricted to weak elec-
tronic interaction since it was presented only in the
framework of quantum mechanical perturbation
treatments. The fully quantum mechanical model of
ultrafast HET retains this feature of non-adiabatic
electron transfer also for strong electronic coupling.
In the fully quantum mechanical model of HET
there is no automatic transition to adiabatic electron
transfer for high electronic coupling strength and the
excitation of high energy vibrational modes can not
be ignored. This feature is in strong contrast to
Gerischer’s HET scenario1,31,51 and also to the Dun-
can–Prezhdo HET model29
which both ignore the
excitation of high energy vibrational modes and
consider only adiabatic HET pathways or non-
adiabatic paths involving excitation of phonons with
very small energy. Light-induced non-adiabatic HET
is ultrafast, i.e. it occurs on a timescale of a few fs in
the present system, provided the chromophore is at-
tached via a sufficiently short anchor group, e.g.
–COOH and the system fulfills the wide band limit.
The different anchor–bridge groups entail smaller
differences in the energy of the excited molecular
donor level, i.e. in the energy of the first (highest
energy) peak in the 2PPE spectrum for the injected
electrons (figure 5). Those differences arise from
corresponding differences in the HOMO levels for
the perylene chromophore adsorbed via different
anchor–bridge groups. Only the width of the Lor-
entzian contribution to an individual peak depends
on the electron transfer time whereas the total width
is dominated by the Franck–Condon progression
(figure 4). Thus, the total width of the energy distri-
bution is virtually independent of the strength of the
electronic interaction between the excited molecular
donor state and the electronic acceptor states on the
semiconductor surface. The wide band limit is ful-
filled in the present system42 if the electron can find
a suitable electronic acceptor state on the semicon-
ductor surface for every possible vibrational excita-
tion of the ionized chromophore, i.e. all the possible
Franck–Condon factors for vibrational excitation of
the ionized chromophore can be realized. To fulfill
the wide band limit the corresponding wide energy
range of electronic acceptor states must be offered
between the excited molecular donor level and the
lower edge of the conduction band (figure 6). The
measured energy distributions shown in figure 5
suggest a cut-off at the low energy side of the spec-
trum but the missing part of the spectrum is ex-
pected to be fairly small, so that the wide band
limit42,43 is valid to a good approximation in these
experimental systems. The injection scheme in fig-
ure 6 is a pictorial representation of the fully quan-
tum mechanical model of photo-induced HET for
both the electronic and the vibrational degrees of
freedom.24,42
Note in figure 6 the energy width of the
donor state is much smaller than that for the distri-
bution of the injected electrons. Note also the energy
shift between the centers of the two different distri-
butions. Both these features are distinctly different
from the predictions according to Gerischer’s HET
scenario1,31,51 and those of the Duncan–Prezhdo HET
model29
which both allow essentially only for adia-
batic electron transfer resulting in identical energy
distributions curves for the molecular donor state
and the injected electrons. Parameter values for the
fully quantum mechanical model are obtained from
a fit to experimental data12
or from independent cal-
culations, e.g. DFT calculations.13,28
The behaviour
of the system has also been calculated for situations
where the wide band limit is not fulfilled.44
The
main effect of moving the excited molecular donor
level closer to the lower edge of the conduction
band is the loss of the simple exponential decay
behaviour which is then substituted by a more com-
plex oscillation in the amplitude due to interferences
and by non-exponential decay. Recently, the rela-
tionship between the measured 2PPE signal and the
energy distribution of the injected electrons has been
calculated using a tight binding model for the semi-
conductor.32 Our group has described experimental
transients indicating an influence of vibrational
wavepacket motion in the excited molecular donor
state on the electron transfer process.45
Our more
recent experiments, however, were carried out with
better control over the preparation procedure for the
experimental systems and with higher time resolu-
tion. They did not substantiate the above notion, nei-
ther in the transient absorption measurements6 nor in
the 2PPE transients (figure 4). Rapid transfer of the
injected electrons from the initially occupied surface
states to bulk states of TiO2 has been measured20
and
Lars Gundlach et al
570
are in agreement with the predictions of sophisti-
cated TDDFT model calculations.46–48
It should be
noted that the above model of photo-induced HET as
illustrated in figure 6 is essentially a non-adiabatic
mechanism which can also accommodate the ultra-
fast time scale,42,24 e.g. the measured 9 fs electron
transfer time for the perylene chromophore attached
to TiO2 (110) via the –COOH anchor group (figure
4).6 Previously, for thermal ET reactions it had been
assumed quite generally that non-adiabatic electron
transfer is slower and adiabatic electron transfer is
faster.49
It should be noted that for a given anchor
group the same line-width broadening due to ultra-
fast electron transfer has been measured for all the
vibrational peaks in the linear absorption spectrum
of the Pe’ chromophore anchored on TiO2.12
Thus,
electron transfer occurs with the same time constant
from all the different vibrationally excited levels of
the molecular donor state. Intramolecular redistri-
bution of vibrational excitation energy (ivr) is much
slower for the perylene chromophore than ultrafast
electron transfer if the chromophore is attached via a
short anchor group to the surface of TiO2. In the
case of perylene the time scale of ivr is pico-
seconds45
and that for HET is femtoseconds with a
short anchor group (figure 4). For simplicity only
electron transfer from the vibrational ground state of
the excited molecular donor level has been illu-
strated in figure 6 for a moderately fast injection
process corresponding to Pe’-propionic acid on
TiO2. If the figure would be changed to show a Lor-
entzian line-width of 70 fs in the Voigt profile char-
acterizing the excited molecular donor state it would
apply also to the fastest injection process of 9 fs
measured with Pe’-COOH (figure 4).
The most widely used scenario of HET in photo-
electrochemistry has been introduced by Gerischer
in 1972.31 It has remained popular until today.
50 This
scenario is often applied in the form of a pictorial
representation of the energetics of HET with charac-
teristic differences to figure 6. At the time when the
model was conceived reliable experimental data was
not available for adsorbed dye molecules. The reor-
ganization energy for dye molecules adsorbed on the
surface of a semiconductor was not known and
assumed in the range 0⋅4 eV.1 Since excitation of
high energy vibrational modes (quantum modes)
was not considered in Gerischer’s injection model
the latter predicted an energy distribution for the
molecular donor state in the shape of a smooth
Gaussian.31
The Gaussian energy distribution of the
electronic excited donor state was considered the
result of thermal fluctuations of small energy
nuclear modes.31,51 Electron transfer was assumed
essentially isoenergetic and thus the energy distribu-
tion of the injected electrons was virtually identical
with that for the molecular excited donor state. In
this respect Gerischer´s scenario implied adiabatic
HET, i.e. the energy distribution for the excited do-
nor level is identical to that for the injected elec-
trons. Until today the Gerischer scenario is frequently
used in the photoelectrochemical literature.50 In
principle an energy distribution curve in the form of
a Gaussian is compatible also with the shape of the
energy distribution curve for the injected electrons
in a semiclassical non-adiabatic HET model. In the
non-adiabatic mechanism, however, the energy dis-
tribution for the injected electrons is shifted to lower
energies with respect to the energy distribution for
the molecular donor state since the HET reaction
involves reorganization energy due to the shift in
nuclear equilibrium coordinates on photoionization
of the molecular reactant. The shift and the width of
the energy distribution (spectrum) for the injected
electros are governed by two main factors. Firstly,
the magnitude of the reorganization energy, and sec-
ondly the energy width covered by all the Franck–
Condon factors for excitation of vibrational modes
(compare figure 6). In contrast, Gerischer’s model
assumes the energy distribution for the injected elec-
trons isoenergetic with that for the molecular donor
state.31 For an adiabatic HET mechanism the latter
assumption should be fulfilled.
A profound theoretical justification of a Gerischer-
type scenario for the energy distribution of the
excited adsorbed molecular donor state and for that
of the injected electrons has recently been presented
by Duncan and Prezhdo in the form of a TDDFT
(time dependent density functional theory) model
where the electronic interaction was calculated with
an ab initio approach and the role of the nuclear co-
ordinates in the reaction scenario stemmed from a
molecular dynamics calculation.29
Their calculations
addressed a specific system, the sensitizer alizarin
on TiO2, where the donor state lies close to the
lower edge of the conduction band. The model
calculations show that thermal fluctuations of small
energy nuclear coordinates can indeed give rise to a
broad inhomogeneous energy distribution for the
molecular donor state, i.e. with 0⋅4 eV FWHM at
350 K for the alizarin/TiO2 system, as has been
intuitively assumed by Gerischer.51
The energy dis-
Test of theoretical models for ultrafast heterogeneous electron transfer
571
tribution of the injected electrons was found to be
about the same energy width and essentially
isoenergetic with that of the photoexcited molecular
donor state. Note that this is in stark contrast to
figure 6. A complication arises from the cut-off aris-
ing at the conduction band edge. The analytical fully
quantum mechanical model incorporating a high
energy vibrational mode predicts for the donor state
lying close to the edge of the conduction band that
the simple exponential decay behaviour valid in the
wide band limit is lost here, instead there are oscilla-
tions in the population of the injected electrons due
to interferences and non-exponential decay.44 We
would like to reiterate that the fully quantum
mechanical injection model of reduced dimen-
sions24–27,42 gives a prediction very different from
the Gerischer scenario in the wide band limit since
the energy distribution of the injected electron is
shifted to lower energies compared to the energy
distribution of the excited molecular donor state and
it is much wider. The latter prediction is in agree-
ment with the experimental data measured with sys-
tems that fulfill the wide band limit. The results are
illustrated in figure 6. Note that the fully quantum
mechanical non-adiabatic model is not restricted
with respect to the strength of the electronic interac-
tion,24–27,42
quite different from the previously cus-
tomary perturbation treatment of non-adiabatic
electron transfer. It can predict the experimental
injection times of a few femtoseconds (figure 4)5–9
in the wide band limit and also for the donor state
lying close to the edge of the conduction band.24 For
ultrafast HET according to the fully quantum
mechanical model the energy width of the molecular
donor state can be much smaller than the width of
the energy distribution for the injected electrons as
illustrated in figure 6. Recently, DFT calculations of
the electronic interaction have been used for deter-
mining parameter values for a fully quantum me-
chanical injection model of reduced dimensions.28
Light-induced ultrafast HET at a metal electrode14
might even be more involved than at a semiconduc-
tor electrode since in addition to the excitation of a
high energy vibrational mode in the molecular prod-
uct state also non-adiabatic excitations of electrons
in the metal electrode52
might play an important
role. We would like to mention here that a fully
quantum mechanical model of heterogeneous elec-
tron transfer without the restriction to weak elec-
tronic interaction has recently been described also
for HET reactions in the dark.53
The width of the en-
ergy distribution for the injected electrons shown in
figure 6 stems from the vibrational progression due
to excitation of a high energy (0⋅17 eV) vibrational
mode (quantum mode) in the ionized perylene
chromophore. The electron localized on the chro-
mophore is strongly coupled to this high energy
vibrational mode. Excitation of the latter is accom-
panied by electron injection into electronic acceptor
states that lie far below the molecular donor state.
This non-adiabatic feature of the fully quantum
mechanical injection model can be pictured in anal-
ogy to the emission of a wide fluorescence spectrum
from a narrow excited electronic state. The energy
width of the generated spectrum, i.e. for the injected
electrons and for the emitted photons, respectively,
stems in both cases from the realization of all the
Franck–Condon factors for exciting the high energy
vibrational mode. In the case of HET this requires
the validity of the wide band limit.42 The width of
the energy distribution curve for the injected elec-
trons depends insignificantly on the injection time,
i.e. it is virtually independent of the strength of the
electronic coupling (figures 4 and 5).
Consequences of the wide band limit43
are firstly
exponential decay of the excited state population,
provided the density of acceptor states does not vary
extremely over energy, and secondly an electron
transfer time that does not depend on the magnitude
of the Franck–Condon factors even though the latter
control the energy distribution of the injected elec-
trons.24 The Franck–Condon factors are all realized
in parallel and the sum over the Franck–Condon fac-
tors yields probability 154 so that the electron trans-
fer time is only controlled by the strength of the
electronic coupling and the density of the electronic
acceptor states.24
Accordingly, the electron injection
time has been calculated for experimental systems
fulfilling the wide band limit from the joint density
of electronic states formed at the interface in the
presence of the anchored chromophores. Applying
Newn’s chemisorption model43 to the width of the
electronic donor level of the adsorbed chromophore
the injection time has been deduced from the joint
density of states.13
We have mentioned already that
the above simplification does not apply if the
molecular donor level lies only slightly above the
conduction band edge, e.g. by only the energy width
corresponding to the strength of the electronic cou-
pling. For the conduction band to accommodate the
whole spectrum of the injected electrons the electronic
donor level must lie sufficiently high (figure 6).
Lars Gundlach et al
572
4. Conclusions
Our above interpretation of the measured 2PPE
spectra, i.e. injection of electrons into the electronic
acceptor states on the surface of the semiconductor
(figure 5), and also of the UPS spectra, i.e. ioniza-
tion of the ground state of the perylene chromopho-
res anchored on TiO2 (figure 3), is based on the
known vibrational structure in the ionization spec-
trum of perylene in the gas phase37
and on the meas-
ured vibrational structure in the linear absorption
spectrum of the perylene chromophores when
attached via anchor–bridge groups to the surface of
TiO2 (figure 2).12
Our interpretation of these spectra
assumes that these seemingly smooth spectra are
composed of individual vibrational peaks arising
from the excitation of a dominant 0⋅17 eV vibra-
tional mode of the perylene chromophore. The seem-
ingly smooth spectra are the result of inhomogeneous
broadening that is even stronger than measured for the
linear absorption spectrum of the chromophores an-
chored on the surface of TiO2 (figure 2).
The experimental data can be explained com-
pletely with the fully quantum mechanical model
where electron transfer is non-adiabatic irrespective
of the strength of the electronic coupling.24–28,42 One
might argue that our experimental data do not refute
conclusively the alternative interpretation described
above as the Duncan/Prezhdo model29
which under-
scores the Gerischer scenario.31
Adiabatic or close to
adiabatic electron transfer is considered in the latter
two models and the excitation of high energy vibra-
tional modes, e.g. the 0⋅17 eV skeletal stretch mode
of perylene, in the HET reaction and the correspond-
ing influence on the spectra is ignored. Following
the Gerischer scenario one could argue that the con-
siderable width of the smooth room temperature
spectra, UPS for the molecular ground state (figure
3) and 2PPE for the injected electrons (figure 5),
could be the result of thermal fluctuations of classi-
cal nuclear coordinates leading at least at room tem-
perature to an enormous broadening of the respective
molecular states, as substantiated by the Duncan/
Prezhdo calculations for the excited molecular
state.29
Making the latter assumption the energy
width measured for the injected electrons (figure 5)
would have to be identified with the energy width
for the molecular donor state. This assumption is re-
futed, however, by the much narrower energy width
for the donor state compared to the energy width for
the injected electrons (compare the peak width in
figure 2 with that in figure 5). Moreover, there is an
energy shift between the two different energy distri-
butions which follows automatically from non-
adiabatic electron transfer described by the fully
quantum mechanical model (figure 6) but can not be
explained making the assumption of adiabatic or
close to adiabatic HET as in the Gerischer scenario
or the Duncan/Prezhdo HET model.29 Fitting the
broad spectra for the injected electrons with the vi-
brational progression due to excitation of the
0⋅17 eV vibrational skeletal stretch mode of pery-
lene appears at hand since the same vibrational
mode shows up prominently as vibrational structure
in the photoionization spectrum in the gas phase37
and also in the linear absorption spectrum of the
perylene chromophores anchored on TiO2 (figure
2).12
In our opinion the interpretation of the experi-
mental spectra within the non-adiabatic fully quan-
tum mechanical analytical model for light-induced
ultrafast HET, considering explicitly strong coupling
to the 0⋅17 eV skeletal stretch mode of perylene, is
the valid interpretation of the measured spectra. In
summary, we suggest here that light-induced HET
from the aromatic chromophore perylene, anchored
on the surface of the semiconductor TiO2 via a short
molecular group, e.g. –COOH, proceeds in the wide
band limit as an ultrafast non-adiabatic electron
transfer reaction.
A final definitive experimental proof for the non-
adiabatic mechanism of ultrafast light-induced
HET24–28,42
can be obtained from measurements of
the above shown spectra (figures 2 and 5) at low
enough temperatures where the small energy classi-
cal nuclear modes are frozen so that these oscillators
can not produce a wide energy distribution for the
excited molecular state. Thus, the Duncan/Prezhdo
model predicts that the energy distribution curve for
the excited molecular donor state and correspond-
ingly that for the injected electrons should become
significantly narrower at low temperatures.29 In con-
trast, the total energy width controlled by the vibra-
tional progression for the excitation of a high energy
vibrational mode should not depend significantly on
temperature, i.e. the non-adiabatic fully quantum
mechanical model of HET would not predict a signi-
ficant narrowing of the total width (envelope) for the
energy distribution curve of the injected electrons at
low temperatures (figure 5).
Acknowledgements
The authors are grateful to the German Science
Foundation for financial support and to the Hahn
Test of theoretical models for ultrafast heterogeneous electron transfer
573
Meitner Institut where experimental work was car-
ried out.
References
1. Gerischer H and Willig F 1976 In Topics in current chemistry (ed.) F Boschke (Berlin: Springer) vol 61, p. 31
2. James T H 1977 The theory of the photographic process (ed.) T H James (New York: Macmillan) 4th edn
3. O’Regan B and Grätzel M 1991 Nature 353 737 4. Burfeindt B, Hannappel T, Storck W and Willig F
1996 J. Phys. Chem. 100 16463; The electron transfer time reported here was found later to depend on de-tails of the preparation procedure. The spread in the values caused by unintentionally different preparation procedures was summarized as (40 ± 25) fs in our following paper: Burfeindt B, Zimmermann C, Ramakrishna S, Hannappel T, Meissner B, Storck W and Willig F 1999 Z. Physikal. Chemie 212 67. Later our group had learned to reproduce the preparation procedure giving the shortest time constant for a given system, and we consider this preparation the best. Compare the HET time constant of 53 fs for the same Pe’–CH2–CH2–COOH acid anchored on the rutile TiO2 (110) surface derived from the 2PPE tran-sients (figure 4 of this paper)
5. Hannappel T, Burfeindt B, Storck W and Willig F 1997 J. Phys. Chem. B101 6799
6. Ernstorfer R, Gundlach L, Felber S, Storck W, Eichberger R and Willig F 2006 J. Phys. Chem. B110 25383
7. Gundlach L, Ernstorfer R and Willig F 2007 Progress in Surface Science 82 355
8. Huber R, Moser J, Grätzel M and Wachtveitl J 2002 J. Phys. Chem. 106 6494
9. Benkö G, Kallioinen J, Korpi-Tommola J, Yartsev A and Sundström V 2002 J. Am. Chem. Soc. 124 489
10. Gundlach L, Ernstorfer R and Willig F 2007 J. Phys. Chem. C111 13586
11. Guo J, She C and Lian T 2007 J. Phys. Chem. C111 8979
12. Wang L, May V, Ernstorfer R and Willig F 2005 J. Phys. Chem. B109 9589
13. Persson P, Lundqvist M J, Ernstorfer R, Goddard III W A and Willig F 2006 J. Chem. Theory Comput. 2 441
14. Gundlach L and Willig F 2007 Chem. Phys. Lett. 449 82
15. Gundlach L, Felber S, Storck W, Galoppini E, Wei Q and Willig F 2005 Res. Chem. Intermed. 31 39
16. Paddon-Row M N, Oliver A M, Warman J M, Smit K J, de Haas H O and Verhoeven J W 1988 J. Phys. Chem. 92 6958
17. Koeberg M, de Groot M, Verhoeven J W, Lokan N R, Shephard M J and Paddon-Row M N 2001 J. Phys. Chem. A105 3417
18. Moser J, Punchihewa S, Infelta P P and Grätzel M 1991 Langmuir 7 3012
19. Duncan W R and Prezhdo O V 2005 J. Phys. Chem. 109 365
20. Gundlach L, Ernstorfer R and Willig F 2006 Phys. Rev. B74 035324
21. Mulliken R S and Person W B 1969 Molecular com-plexes (New York: Wiley)
22. Borgias B A, Cooper S R, Koh Y B and Raymond K N 1984 Inorg. Chem. 23 1009
23. Wang L, Willig F and May V 2007 J. Chem. Phys. 126 134110
24. Wang L, May V, Ernstorfer R, Gundlach L and Willig F 2007 In Analysis and control of ultrafast photo-induced reactions (eds) O Kühn and L Wöste (Berlin: Springer) vol 87
25. Wang L, Willig F and May V 2006 J. Chem. Phys. 124 014712
26. Sebastian K L and Tachya M 2006 J. Chem. Phys. 124 064713
27. Mohr J, Schmickler W and Badiali J P 2006 Chem. Phys. 324 140
28. Li J, Nilsing M, Kondov I, Wang H, Persson P, Lu-nell S and Thoss M 2008 J. Phys. Chem. C112 12326
29. Duncan W R and Prezhdo O V 2008 J. Am. Chem. Soc. 130 9756
30. Gundlach L, Szarko J, Socaciu-Siebert L D, Neubauer A, Ernstorfer R and Willig F 2007 Phys. Rev. B75 125320
31. Gerischer H 1972 Photochem. Photobiol. 16 243; The model for the energy distribution of the electronic excited molecular donor state Ddonor* in this paper is the extension of an earlier model for electron injec-tion in the dark where the corresponding occupied molecular donor state was labeled Dred. Gerischer H 1961 Z. Physikal. Chem. (Neue Folge) 27 49
32. Tsivlin D V, Willig F and May V 2008 Phys. Rev. B77 035319
33. Gundlach L, Ernstorfer R and Willig F 2007 Appl. Phys. A88 481
34. Letzig T, Schimper H-J, Hannappel T and Willig F 2005 Phys. Rev. B71 033308
35. Ernstorfer R 2004 Spectroscopic investigation of photoinduced heterogeneous electron transfer Ph D Thesis (Berlin: Freie Universität)
36. Pascual J, Camassel J and Mathieu H 1978 Phys. Rev. B18 5606; Gupta V P and Ravindra N M 1980 J. Phys. Chem. Solids 41 591
37. Boschi R, Murrell J N and Schmidt W 1972 Faraday Discuss. Chem. Soc. 54 116
38. Pope M and Swenberg C E 1999 Electronic processes in organic crystals and polymers (New York: Oxford University Press) 2nd edn
39. Cronemeyer D C 1951 MIT Laboratory for insulation research Rept. 46; Parker R A 1961 Phys. Rev. 124 1719
40. Dutoit E C, Cardon F and Gomez W P 1976 Ber. Bunsenges. Phys. Chem. 80 475
41. Gundlach L 2005 Surface electron transfer dynamics in the presence of organic chromophores Ph D Thesis (Berlin: Freie Universität)
42. Ramakrishna S, Willig F and May V 2000 Phys. Rev. B62 R16330

Lars Gundlach et al
574
43. Muscat J P and Newns D M 1978 Progress in Surface Science 9 1
44. Ramakrishna S, Willig F, May V and Knorr A 2003 J. Phys. Chem. B107 607
45. Zimmermann C, Willig F, Ramakrishna S, Burfeindt B, Pettinger B, Eichberger R and Storck W 2001 J. Phys. Chem. B105 9245
46. Rego L G C and Batista V S 2003 J. Am. Chem. Soc. 125 7989
47. Abuabara S G, Rego L G C and Batista V S 2005 J. Am. Chem. Soc. 127 18234
48. Duncan W R, Stier W M and Prezhdo O V 2005 J. Am. Chem. Soc. 127 7941
49. Marcus R A 1964 Annu. Rev. Phys. Chem. 15 155
50. Memming R 2001 Semiconductor electrochemistry (New York: Wiley)
51. Page 40 in ref 1, page 245 in ref 30, handwritten manuscript of H Gerischer given to F W
52. Shenvi N, Cheng H and Tully J C 2006 Phys. Rev. A74 062902
53. Mohr J-H and Schmickler W 2000 Phys. Rev. Lett. 84 1051
54. Miller R J D, McLendon G, Nozik A, Schmickler W and Willig F 1995 In Surface electron transfer proc-esses (New York: Wiley-VCH) ch. 5, p. 167