test marketing: go national or go broke?
TRANSCRIPT
| 25
Test Marketing: Go National or Go Broke? by Francis Buttle
Many consumer and industrial goods manufacturers practise test marketing before launching innovative products on a national or wider scale. The commercial, value of such testing is a direct function of both the accuracy with which the test results are interpreted, and the nature of the research design which is used to conduct the test, yet many companies fail at this most vital stage.
Test Marketing Defined A test market is a live marketing situation, analagous to an intended national or large scale operation. Whether their companies should test market is a question which bemuses many marketing executives. As product life cycles and development lead times have shortened because of the flexibility and pervasiveness of today's industrial technology, more companies are querying whether it is worth taking the risk of losing the advantage of time over competitors by allowing them first access to the national market. Industry is now much quicker than it used to be in matching competitors' activities—sophisticated research and marketing information systems ensure that this will continue to be so. Each company must assess the risk of being beaten to a success-ful national launch by a competitor, against the risks of allocating scarce investment capital to an ill-fated product without undertaking test marketing.
Purposes of Test Marketing Despite this risk of competitors being first into the national market, many companies still market their new product in a small area to test for consumer and trade acceptance. More precisely, you and your competitors may test market for many reasons, viz:
(a) to establish what level of sales or market share the product will obtain nationally;
(b) to test particular elements of the marketing mix, e.g. the package design or introductory promotional offer;
(c) to test the whole of the mix components as a total product offering in a microcosmic environment;
(d) to acquire information not obtainable by other, cheaper research methods. Conversely, there are equally good reasons for not test marketing:
26 | Management Decision 14,1
(a) you may need to conceal your product from competitors' attentions in case they imitate it (or improve on it!);
(b) lack of time—competitors may be launching a similar innovation; (c) you may have evidence that the product has succeeded in a similar target
market segment in a different country. Evidently then, test marketing can allow for more than a simple go/no go decision
to be made about a national launch. This article suggests a method of grossing-up test market results into national equivalents and briefly compares the results obtained with five other common methods. The method proposed involves:
(a) taking greater care in interpretation of test area results; (b) using a research design which includes a control group; (c) measuring test area results over a period of time.
Selection of Test Areas The primary requisites of good test marketing are:
(a) a precise statement of test objectives and the role of the test in the national launch;
(b) planning the research design so that it reasonably predicts the likelihood of national success.
This done, the next major step is to select the test and control areas. The criteria normally used for their selection are threefold. Firstly, the general demographic characteristics of the whole country should be reflected in the test and control areas; thus there should be a statistically non-significant difference in demographic characteristics such as age, income, social class, education between the nation and the test/control areas. Secondly, the selected test and control areas should reflect demo-graphic criteria specifically relevant to the product or service being offered. If a new product is found through previous marketing research to appeal particularly to young married couples with two children, then this profile should be reflected in the selected areas in the same proportion that it exists in the nation. Finally, the criteria should be relevant to the promotional media which would be used in the national launch. If television is included in the media schedule then choice of test and control areas can be difficult, particularly when the product has a regional appeal and no matched control area is available. There are in Great Britain today only fifteen such com-mercial TV regions, all of which cover large areas of the country. Where television is not scheduled for the new product, it is normally possible to match test and control towns. Ideally, one would like to have a compatible pairing of test and control areas to investigate each element of the marketing mix, but in a nation the size of the United Kingdom this is not normally possible because there are simply not enough television areas to use. Where, as in the Southern TV area, there are two transmitters broad-casting the same programmes to the different geographic areas within the TV region,
Test Marketing | 27
it is often possible to arrange for different advertisements to be broadcast at the same spot time in each area. Thus, by matching test and control towns in the transmission areas a measure of the advertisement's relative success in achieving the objectives set for them is feasible.
The University of Bradford Management Centre has used the computer-based technique, Cluster Analysis, to select homogeneous geographic areas for use as test locations. The technique allows comparison of cities and towns over various criteria: using 14 such criteria of a general demographic nature the computer matched Bradford, Huddersfield and Newport as being very similar areas.
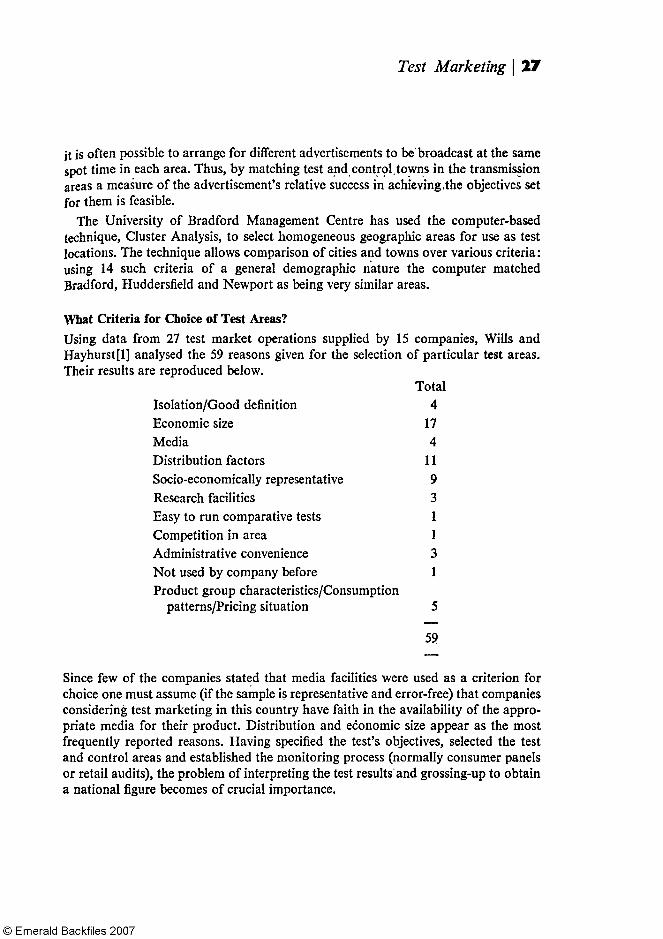
What Criteria for Choice of Test Areas? Using data from 27 test market operations supplied by 15 companies, Wills and Hayhurst[l] analysed the 59 reasons given for the selection of particular test areas. Their results are reproduced below.
Isolation/Good definition Economic size Media Distribution factors Socio-economically representative Research facilities Easy to run comparative tests Competition in area Administrative convenience Not used by company before Product group characteristics/Consumption
patterns/Pricing situation
Total 4
17 4
11 9 3 1 1 3 1
5
59
Since few of the companies stated that media facilities were used as a criterion for choice one must assume (if the sample is representative and error-free) that companies considering test marketing in this country have faith in the availability of the appro-priate media for their product. Distribution and economic size appear as the most frequently reported reasons. Having specified the test's objectives, selected the test and control areas and established the monitoring process (normally consumer panels or retail audits), the problem of interpreting the test results and grossing-up to obtain a national figure becomes of crucial importance.
2 8 | Management Decision 14,1
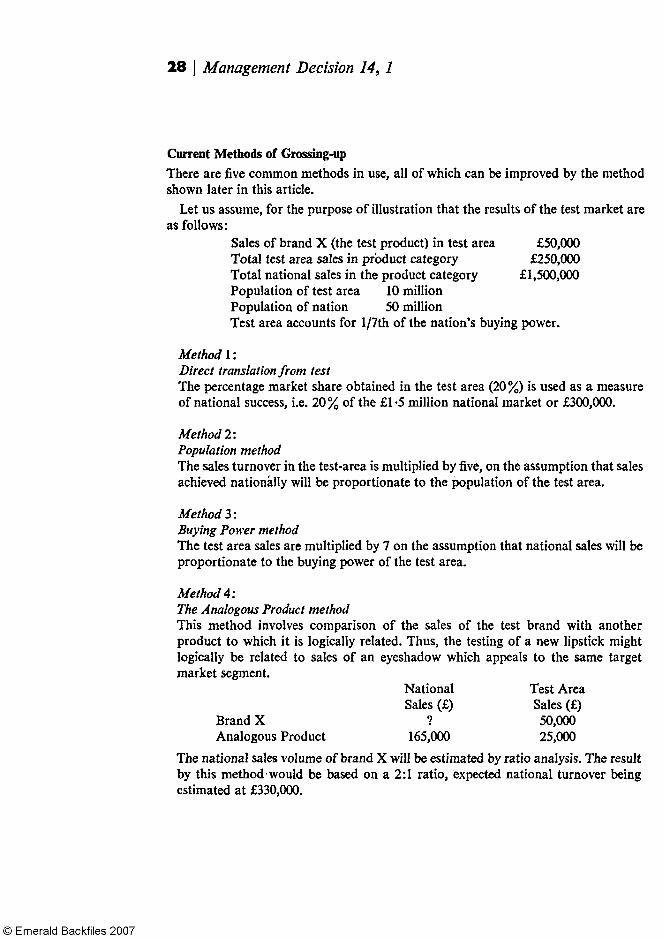
Current Methods of Grossing-up There are five common methods in use, all of which can be improved by the method shown later in this article.
Let us assume, for the purpose of illustration that the results of the test market are as follows:
Sales of brand X (the test product) in test area Total test area sales in product category Total national sales in the product category Population of test area 10 million Population of nation 50 million
£50,000 £250,000
£1,500,000
Test area accounts for l/7th of the nation's buying power.
Method 1: Direct translation from test The percentage market share obtained in the test area (20%) is used as a measure of national success, i.e. 20% of the £1·5 million national market or £300,000.
Method!: Population method The sales turnover in the test-area is multiplied by five, on the assumption that sales achieved nationally will be proportionate to the population of the test area.
Method 3: Buying Power method The test area sales are multiplied by 7 on the assumption that national sales will be proportionate to the buying power of the test area.
Method4: The Analogous Product method This method involves comparison of the sales of the test brand with another product to which it is logically related. Thus, the testing of a new lipstick might logically be related to sales of an eyeshadow which appeals to the same target market segment.
Brand X Analogous Product
National Sales (£)
? 165,000
Test Area Sales (£) 50,000 25,000
The national sales volume of brand X will be estimated by ratio analysis. The result by this method would be based on a 2:1 ratio, expected national turnover being estimated at £330,000.
Test Marketing | 29
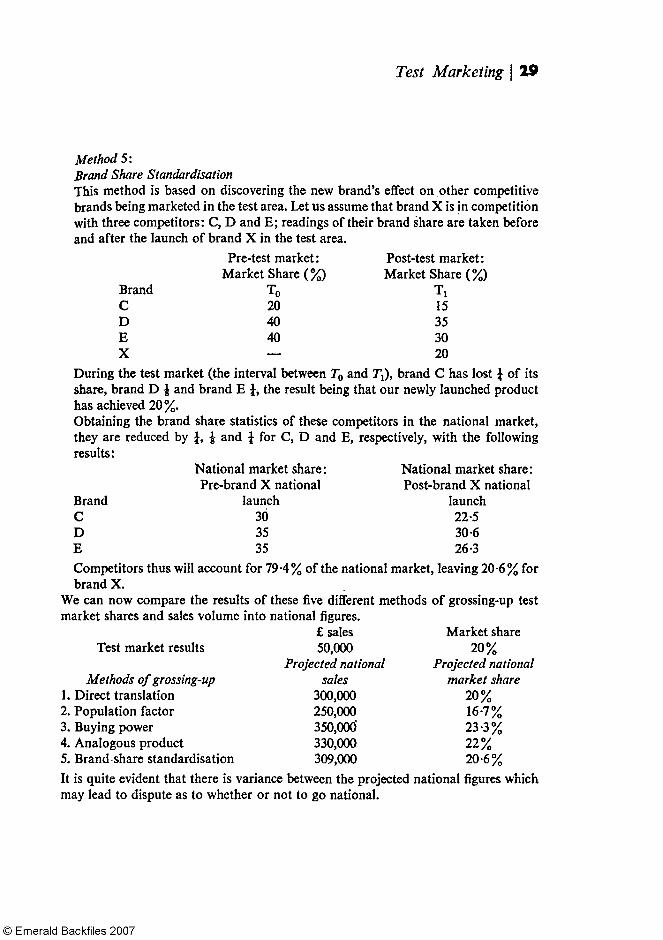
Method 5: Brand Share Standardisation This method is based on discovering the new brand's effect on other competitive brands being marketed in the test area. Let us assume that brand X is in competition with three competitors: C, D and E; readings of their brand share are taken before and after the launch of brand X in the test area.
Brand C D E X
Pre-test market: Market Share (%)
T0 20 40 40 —
Post-test market: Market Share (%)
T1
15 35 30 20
During the test market (the interval between T0 and T1), brand C has lost ¼ of its share, brand D ⅛ and brand E ¼, the result being that our newly launched product has achieved 20%. Obtaining the brand share statistics of these competitors in the national market, they are reduced by ¼, ⅛ and ¼ for C, D and E, respectively, with the following results:
Brand C D E
National market share: Pre-brand X national
launch 30 35 35
National market share: Post-brand X national
launch 22·5 30·6 26·3
Competitors thus will account for 79·4% of the national market, leaving 20·6% for brand X.
We can now compare the results of these five different methods of grossing-up test market shares and sales volume into national figures.
Test market results
Methods of grossing-up 1. Direct translation 2. Population factor 3. Buying power 4. Analogous product 5. Brand share standardisation
£ sales 50,000
Projected national sales
300,000 250,000 350,000' 330,000 309,000
Market share 20%
Projected national market share
20% 16·7% 23·3% 22% 20·6%
It is quite evident that there is variance between the projected national figures which may lead to dispute as to whether or not to go national.
30 | Management Decision 14,1
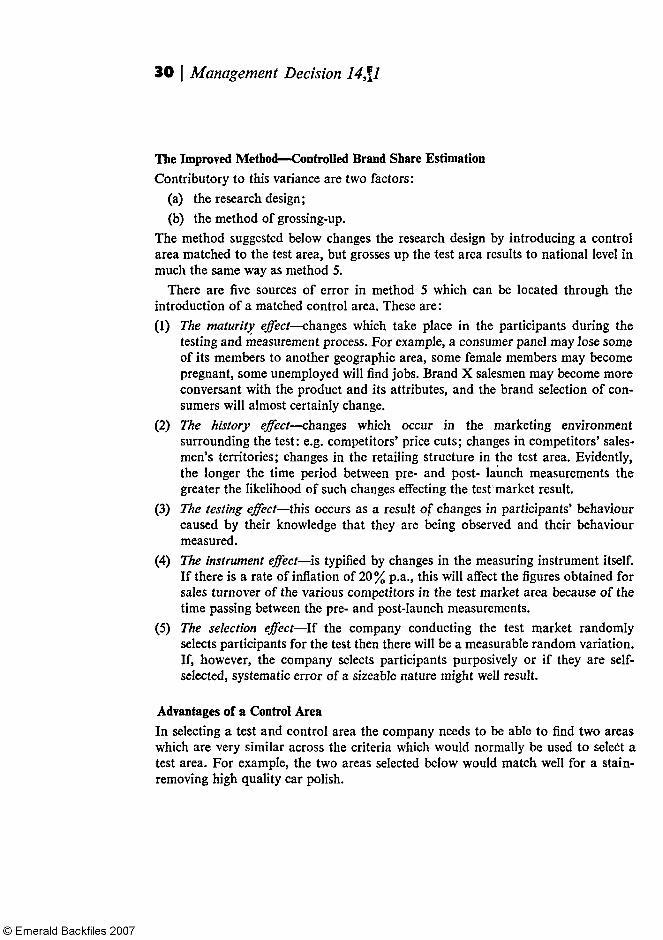
The Improved Method—Controlled Brand Share Estimation Contributory to this variance are two factors:
(a) the research design; (b) the method of grossing-up.
The method suggested below changes the research design by introducing a control area matched to the test area, but grosses up the test area results to national level in much the same way as method 5.
There are five sources of error in method 5 which can be located through the introduction of a matched control area. These are: (1) The maturity effect—changes which take place in the participants during the
testing and measurement process. For example, a consumer panel may lose some of its members to another geographic area, some female members may become pregnant, some unemployed will find jobs. Brand X salesmen may become more conversant with the product and its attributes, and the brand selection of con-sumers will almost certainly change.
(2) The history effect—changes which occur in the marketing environment surrounding the test: e.g. competitors' price cuts; changes in competitors' sales-men's territories; changes in the retailing structure in the test area. Evidently, the longer the time period between pre- and post- launch measurements the greater the likelihood of such changes effecting the test market result.
(3) The testing effect—this occurs as a result of changes in participants' behaviour caused by their knowledge that they are being observed and their behaviour measured.
(4) The instrument effect—is typified by changes in the measuring instrument itself. If there is a rate of inflation of 20% p.a., this will affect the figures obtained for sales turnover of the various competitors in the test market area because of the time passing between the pre- and post-launch measurements.
(5) The selection effect—If the company conducting the test market randomly selects participants for the test then there will be a measurable random variation. If, however, the company selects participants purposively or if they are self-selected, systematic error of a sizeable nature might well result.
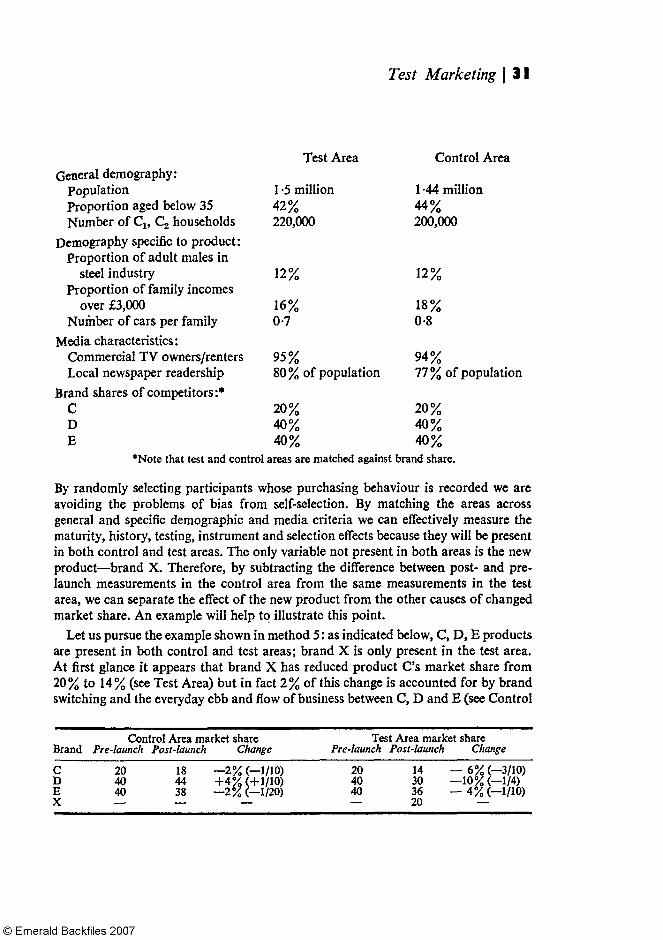
Advantages of a Control Area In selecting a test and control area the company needs to be able to find two areas which are very similar across the criteria which would normally be used to select a test area. For example, the two areas selected below would match well for a stain-removing high quality car polish.
Test Marketing | 31
General demography: Population Proportion aged below 35 Number of Cl' C1 households
Demography specific to product: Proportion of adult males in
steel industry Proportion of family incomes
over £3,000 Number of cars per family
Media characteristics: Commercial TV owners/renters Local newspaper readership
Brand shares of competitors:* C D E
*Note that test and control
Test Area
1·5 million 42% 220,000
12%
16% 0·7
95% 80% of population
20% 40% 40%
Control Area
1·44 million 44% 200,000
12%
18% 0·8
94% 77% of population
20% 40% 40%
areas are matched against brand share.
By randomly selecting participants whose purchasing behaviour is recorded we are avoiding the problems of bias from self-selection. By matching the areas across general and specific demographic and media criteria we can effectively measure the maturity, history, testing, instrument and selection effects because they will be present in both control and test areas. The only variable not present in both areas is the new product—brand X. Therefore, by subtracting the difference between post- and pre-launch measurements in the control area from the same measurements in the test area, we can separate the effect of the new product from the other causes of changed market share. An example will help to illustrate this point.
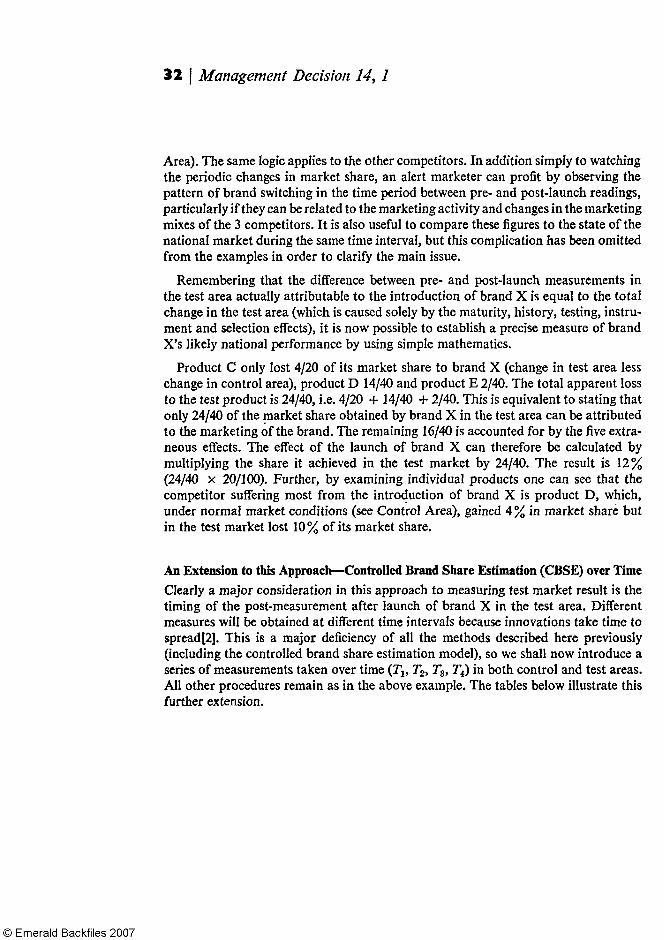
Let us pursue the example shown in method 5: as indicated below, C, D, E products are present in both control and test areas; brand X is only present in the test area. At first glance it appears that brand X has reduced product C's market share from 20% to 14% (see Test Area) but in fact 2% of this change is accounted for by brand switching and the everyday ebb and flow of business between C, D and E (see Control
Brand
C D E X
Control Area market share Pre-launch Post-launch Change
20 18 —2% (—1/10) 40 44 + 4 % (+1/10) 40 38 —2% (—1/20)
Test Area market share Pre-launch Post-launch Change
20 14 — 6% (—3/10) 40 30 —10% (—1/4) 40 36 — 4% (—1/10) — 20 —
32 | Management Decision 14, 1
Area). The same logic applies to the other competitors. In addition simply to watching the periodic changes in market share, an alert marketer can profit by observing the pattern of brand switching in the time period between pre- and post-launch readings, particularly if they can be related to the marketing activity and changes in the marketing mixes of the 3 competitors. It is also useful to compare these figures to the state of the national market during the same time interval, but this complication has been omitted from the examples in order to clarify the main issue.
Remembering that the difference between pre- and post-launch measurements in the test area actually attributable to the introduction of brand X is equal to the total change in the test area (which is caused solely by the maturity, history, testing, instru-ment and selection effects), it is now possible to establish a precise measure of brand X's likely national performance by using simple mathematics.
Product C only lost 4/20 of its market share to brand X (change in test area less change in control area), product D 14/40 and product E 2/40. The total apparent loss to the test product is 24/40, i.e. 4/20 + 14/40 + 2/40. This is equivalent to stating that only 24/40 of the market share obtained by brand X in the test area can be attributed to the marketing of the brand. The remaining 16/40 is accounted for by the five extra-neous effects. The effect of the launch of brand X can therefore be calculated by multiplying the share it achieved in the test market by 24/40. The result is 12% (24/40 x 20/100). Further, by examining individual products one can see that the competitor suffering most from the introduction of brand X is product D, which, under normal market conditions (see Control Area), gained 4 % in market share but in the test market lost 10% of its market share.
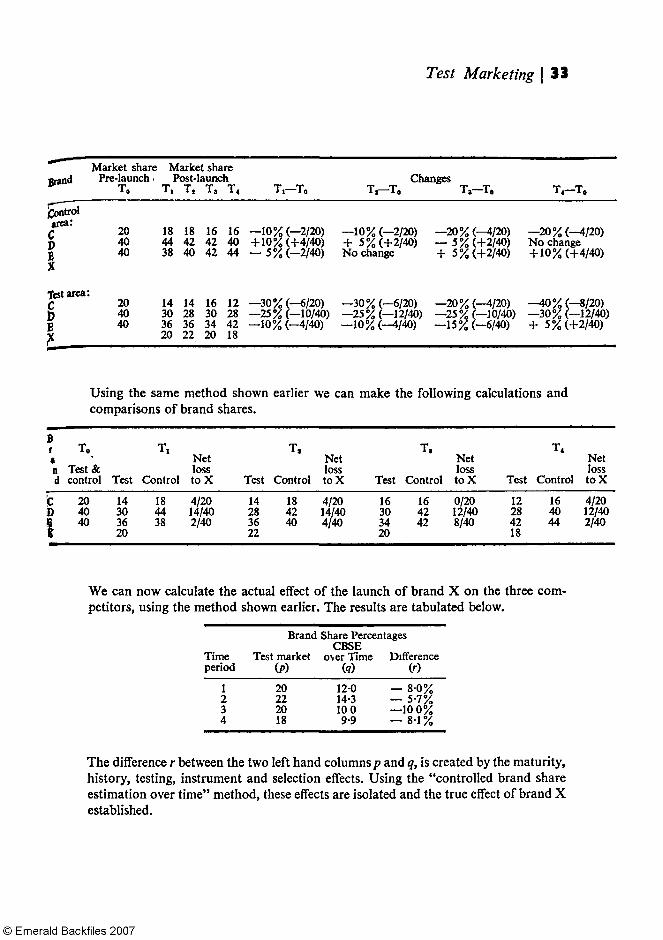
An Extension to this Approach—Controlled Brand Share Estimation (CBSE) over Time Clearly a major consideration in this approach to measuring test market result is the timing of the post-measurement after launch of brand X in the test area. Different measures will be obtained at different time intervals because innovations take time to spread[2]. This is a major deficiency of all the methods described here previously (including the controlled brand share estimation model), so we shall now introduce a series of measurements taken over time (T1, T2, T3, T4) in both control and test areas. All other procedures remain as in the above example. The tables below illustrate this further extension.
Test Marketing \ 33
Brand
(Control area:
C D
E X
Test area:
C D E X
Market share Pre-launch •
To
20 40 40
20 40 40
Market share Post-launch
T1 T2 T3 T4
18 44 38
14 30 36 20
18 42 40
14 28 36 22
16 42 42
16 30 34 20
16 40 44
12 28 42 18
T1—T0
—10% (—2/20) + 10% (+4/40) — 5% (—2/40)
—30% (—6/20) —25% (—10/40) —10% (—4/40)
Changes T1—T0 T3—T0
—10% (—2/20) + 5% (+2/40) No change
—30% (—6/20) —25% (—12/40) —10% (—4/40)
—20% (—4/20) — 5% (+2/40) + 5% (+2/40)
—20% (—4/20) —25% (—10/40) —15% (—6/40)
f U X i *
T4—T0
—20% (—4/20) No change + 10% (+4/40)
—0%(—8/20) —30% (—12/40) + 5% (+2/40)
Using the same method shown earlier we can make the following calculations and comparisons of brand shares.
B r a n d c
D E X
T0
Test& control
20 40 40
Test
14 30 36 20
T1
Control
18 44 38
Net loss to X
4/20 14/40 2/40
Test
14 28 36 22
T2
Control
18 42 40
Net loss to X
4/20 14/40 4/40
Test
16 30 34 20
T3
Control
16 42 42
Net loss to X
0/20 12/40 8/40
Test
12 28 42 18
T4
Control
16 40 44
Net loss to X
4/20 12/40 2/40
We can now calculate the actual effect of the launch of brand X on the three com-petitors, using the method shown earlier. The results are tabulated below.
Time period
1 2 3 4
Brand Share Percentages
Test market (p) 20 22 20 18
CBSE over Time
( q )
120 14·3 10 0 9·9
Difference (r)
— 8 0 % — 5·7% —10 ·0% —8·1%
The difference r between the two left hand columns p and q, is created by the maturity, history, testing, instrument and selection effects. Using the "controlled brand share estimation over time" method, these effects are isolated and the true effect of brand X established.
34 | Management Decision 14, 1
Conclusion The decision to go national after a test market can be made with disastrous results if the effects from the five sources of error are not accounted for. These may be calculated using a method involving the matched pairing of control and test areas. Furthermore, by measuring test market results and the parallel situation in the control area over a period of time, a likely estimation can be made of the brand's future behaviour in the national market. These measurements, (CBSE over time) may be used to estimate the early stages of the life cycle of the brand.
In addition to monitoring the brand's performance in the test area against the change in competitors' market share in the control area (created by brand switching, movements of population, changes in competitors' marketing mixes, etc.) it is also useful to make comparisons with the nation as a whole. Valuable insights (albeit qualitative) into the nature of phenomena such as consumer reactions to marketing mix components can thus be assessed. Since the success of many companies is deter-mined by their ability to market new products, this method is worth considering as a risk reducer in that process.
References 1. Wills, G., and Hayhurst, R., "Test Marketing: How Can wc Improve on Practice?", in the
proceedings of the 12th Annual Conference of the Market Research Society. 2. Rogers, E. M., The Diffusion of Innovation, Free Press, 1962.