go\'ernment of karnataka m
TRANSCRIPT

GO\'ERNMENT OF KARNATAKA
EQifrrv fN.V T - •
m

EQUITY IN EDUCATION IN KARNATAKA
By:
Shri. RAMESH KANBARGICentre for Social Development
No. 8, Shantishree, Nagarabhavi Post, Bangalore.
EDUCATION DEPARTMENTGovernment of Karnataka
Bangalore 2002
NIEPA DC
un683

JUHAB? a UyClflSMNIAlK^’ isf.tiiw ;f Ki«iC*tioaa|
Plflf* 4 A sicnnistratioa. 17'A- *■! Autobuid©New ( fibi-iie©i6 neqo .,

C O N T E N T S
CHAPTER I
CHAPTER H
INTRODUCTION
EQUITY IN EDUCATION IN KARNATAKA TRENDS AND PATTERNS
10
CHAPTER HI PROMOTING EQUITY IN EDUCATION ; THE PROGRAMME INTERVENTIONS IN KARNATAKA
38
CHAPTER IV THE PERSISTING REGIONAL INEQUITIES IN EDUCATION ; EVIDENCE FROM A FIELD INVESTIGATION
60
CHAPTER V SUMMARY OF THE FINDINGS AND RECOMMENDATIONS
69
ANNEX THE ROLE OF BEST PRACTICES IN PROMOTING EQUITY IN EDUCATIONREFERENCES
76
& & & & &

LIST OF TABLESTable Particulars Page
No No1 Some Key Indicators : Karnataka, some selected States and India 22 Literacy in Karnataka by Districts - Persons 43 Literacy Rates (per cent) Among The Scheduled Castes and 7
Scheduled Tribes in Karnataka By Districts4 Enrolment trends in Karnataka, 1992-93 to 2000-01 ( in lakhs) 115 Dropout rates in Primary Schools in Karnataka (I - V n classes) 13
during 1992-93 - 2000-01 by Gender6: Dropout Rates in Lower Primary School in Karnataka 13
(1992-93 - 2000-01)7 School Attendance by Age, Sex and Residence in Karnataka; 13
1992-93 to 1999-20008 Enrolment and Dropout in Karnataka : 1991-92 - 1997-98 149 Enrolment in Primary Schools by Districts/Regions and Sex 15
1990-91 - 1996-9710 Per cent Children Attending School by Age and Caste 2001 1711 Children in 6 -1 4 years Attending School and Out of school 18
(not enrolled + dropout) in the Districts of Karnataka by Social Classand Gender 2001
12 Examination Results of Class VII for Boys and Girls in Karnataka 22during 1998-2000 by Districts
13 Enrolment in Secondary Schools in Karnataka by Sex during 231966-67 - 1997-98
14 Enrolment of Boys and Girls in Secondary Schools during 241966-67 to 1997-98 by Districts
15 SSLC Results by Social Class in Karnataka ; 1990 - 1999 2516 S.S.L.C. Results by Rural/LIrban Areas 1990-1999 Karnataka 2517 S.S.L.C. Results by Gender 1990-1999 Karnataka (per cent pass) 2618 Proportion of Students Scoring above 50 per cent marks (at least Second 26
Class) across Districts in Karnataka during 1996-200019 SSLC Results by Type of School 1990-99 in Karnataka 2720 Enrolment in IPU C 1996-98 Karnataka 28
Contd.

Table Particulars PageNo No
21 Enrolment in IPU C in Karnataka during 1996-98 by Sex and 28Districts
22 PUC n Results (per cent Pass) in Karnataka during 1991-2000 29by Rural/Urban Areas
23 PUC n Results o f SC/ST students in Karnataka 301995-96 - 1999-2000 (per cent pass)
24 Per cent pass in PU II Arts, Science and Commerce by Sex 30Karnataka : 1995 - 2000
25 PU-Il Results by Districts, Karnataka : 1996-2000 (per cent pass) 3126 Enrolment and Dropout by Caste/Tribe 3427 Number of Primary Schools and Teachers in Karnataka 3928 Number of Primary Schools and Teachers in Karnataka 40
1966-69 - 1997-98 by Districts29. Number of High Schools and Teachers in Karnataka by Districts and 42
type; 1 9 6 8 -6 9 - 1997-9830 Distribution of PU Colleges (Total) in Karnataka by Districts in 2001 4331 Resource Allocation to Education in Karnataka : Trends and 44
Patterns 1990-2001 (Rs. In crores)32 Literacy in Raichur, Dakshina Kannada, Karnataka and India 6133 School Enrolment and Attendance in I - V n Classes 6234 Enrollment and Attendance of School in the Study Area (6-14 years) 6335 Per cent Distribution o f Children by their Occupation in the Study Area 64
(6-14 years)36 Parents Perception of Happiness in the Study Area 6637 Average years o f Schooling by Sector in Karnataka 73

a
CHAPTER I
INTRODUCTION
The 21®’ Century, it is said, belong to those nations that are educationally advanced as ideas and knowledge based industries that are going to play a crucial role in furthering development will thrive there. The emergence of Bangalore - capital city of Karnataka as the 'Software’ capital of Asia/Silicon Valley of India is an indicative of this. Though the success of Bangalore owes much to the rapid expansion of higher technical education in Karnataka and has benefited only a very insignificant segment of population of the state where still one out of three persons is illiterate, nevertheless, highlights the potential of technically skilled man power in the process of social and economic development.
The liberalisation of Indian economy and subsequent globalisation also bring out the need to examine education and man-power planning to prepare and exploit the opportunities in the coming years. Available evidence on globalisation and its impact observed in the developed nations illustrate that it occurs with radical changes in technology that may reshape the world economy. Studies on economic growth have pointed out the role of innovation in accelerating economic growth and spread of technology as an important determinant of growth that to a large extent, explains the observed disparities between rich and poor nations. The process of globalisation increases the potential for the spread of technology through trade and international investment. The development of electronics since 1960s demonstrate that while innovation primarily took place in rich nations, tew others also developed and became major exporters of electronic products. Multinationals do play an important role in diffusion of technology even to poorer countries if they have reached certain threshold of minimum standard of education and technology or ‘have absorptive capacity’. The percolation of such technology enhances the capabilities of the poor nations. An important issue is whether information technology alone can raise the threshold for less developed nations like India. The emergence of Bangalore city as major exporter of Information Technology Products is however, a clear indication of the fact that information technology is not reserved only for the rich nations and as noted early only a miniscule of the population is benefited from it. Therefore there is a need to broad base education and develop the skills of large number of people needed to face the challenges of globalisation and exploit the host of opportunities lying ahead.
The rapid economic growth observed in East Asian countries (known more as Asian tigers) and their experience is also very relevant for India where the demographic transition has set in some of the states. The Asian Development Bank (ADS) study reports that the high economic growth rates were achieved in East Asian countries because the government and the private sector there joined hands to mobilise the burgeoning labour force (an outcome of demographic changes) by investing in basic

education and exploiting global markets that enabled thenn to realise the economic growth potential. Similar demographic trends are observed in Karnataka now. The Census 2001 has reported a decline in population growth rate and the proportion of population in 0 - 6 years has declined from 18 per cent in 1991 to about 15 per cent in 2001 that in absolute terms account for 6.5 lakh fewer babies in the state that will have significant impact on health and schooling costs of the state. If the state has reached certain threshold in education it can certainly benefit immensely from the on going globalisation process.
In this background it would be in order to see how Karnataka is placed in the field of education and whether it is prepared to exploit the opportunities that lie ahead.
The Setting
Karnataka is a medium sized state with a population of about 52 million (2001). It is considered as an average state with most of the social and economic indicators compare well with national indicators. About a third of the population is urban. The state is ahead of many other states in decentralised system of governance and has a fairly good administrative set up. Within Southern States Karnataka’s performance in social sector - health and education is better than Andhra Pradesh but lags behind Kerala and Tamil Nadu (See Table 1).
Table 1: Some Key Indicators : Karnataka, some selected States and India
State
1
M
Literacy 1991
F Total
InfantMorality(Total)
LifeExp.
Percapita NSDP
Rs. (1995-96)
Karnataka 67.3 44.3 56.0 53 62.5 9384Andhra Pradesh 55.1 32.7 44.1 63 61.8 8938Tamil Nadu 73.1 51.3 62.7 53 63.3 10222Kerala 93.6 86.2 89.8 12 72.9 8924
Maharashtra 76.6 52.3 64.9 47 64.8 15457Uttar Pradesh 55.7 25.3 41.6 85 56.8 5874Rajasthan 55.0 20.4 38.6 85 59.1 6959Punjab 65.7 50.4 58.5 51 67.2 16044
India 64.1 39.3 52.2 71 60.3 9578
Source: Human Development Report, Karnataka 1999.
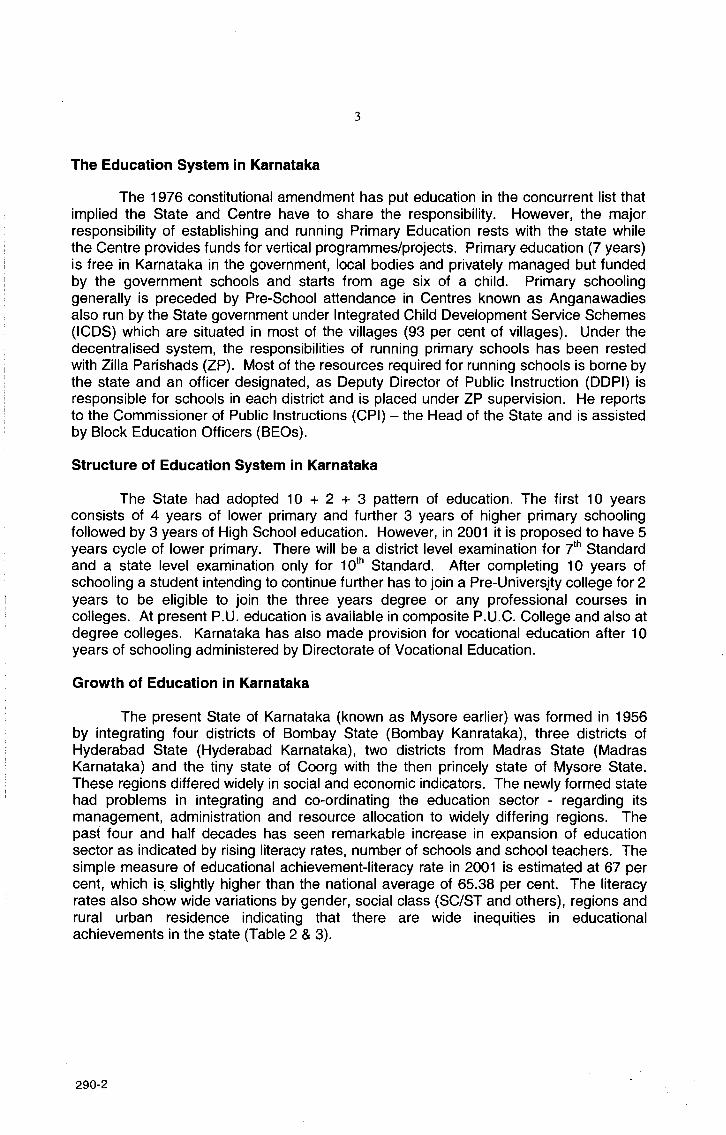
The 1976 constitutional amendment has put education in the concurrent list that implied the State and Centre have to share the responsibility. However, the major responsibility of establishing and running Primary Education rests with the state while the Centre provides funds for vertical programmes/projects. Primary education (7 years) is free in Karnataka in the government, local bodies and privately managed but funded by the government schools and starts from age six of a child. Primary schooling generally is preceded by Pre-School attendance in Centres known as Anganawadies also run by the State government under Integrated Child Development Service Schemes (ICDS) which are situated in most of the villages (93 per cent of villages). Under the decentralised system, the responsibilities of running primary schools has been rested with Zilla Parishads (ZP). Most of the resources required for running schools is borne by the state and an officer designated, as Deputy Director of Public Instruction (DDPI) is responsible for schools in each district and is placed under ZP supervision. He reports to the Commissioner of Public Instructions (CPI) - the Head of the State and is assisted by Block Education Officers (BEOs).
Structure of Education System in Karnataka
The State had adopted 10 + 2 + 3 pattern of education. The first 10 years consists of 4 years of lower primary and further 3 years of higher primary schooling followed by 3 years of High School education. However, in 2001 it is proposed to have 5 years cycle of lower primary. There will be a district level examination for 7"’ Standard and a state level examination only for 10' Standard. After completing 10 years of schooling a student intending to continue further has to join a Pre-Universjty college for 2 years to be eligible to join the three years degree or any professional courses in colleges. At present P.U. education is available in composite P.U.C. College and also at degree colleges. Karnataka has also made provision for vocational education after 10 years of schooling administered by Directorate of Vocational Education.
Growth of Education in Karnataka
The present State of Karnataka (known as Mysore earlier) was formed in 1956 by integrating four districts of Bombay State (Bombay Kanrataka), three districts of Hyderabad State (Hyderabad Karnataka), two districts from Madras State (Madras Karnataka) and the tiny state of Coorg with the then princely state of Mysore State. These regions differed widely in social and economic indicators. The newly formed state had problems in integrating and co-ordinating the education sector - regarding its management, administration and resource allocation to widely differing regions. The past four and half decades has seen remarkable increase in expansion of education sector as indicated by rising literacy rates, number of schools and school teachers. The simple measure of educational achievement-literacy rate in 2001 is estimated at 67 per cent, which is slightly higher than the national average of 65.38 per cent. The literacy rates also show wide variations by gender, social class (SC/ST and others), regions and rural urban residence indicating that there are wide inequities in educational achievements in the state (Table 2 & 3).

DKBangalore (U) Udupi Kodagu UKShimogaDharwadChickmagalurHassanBIjapurHaveriDavangereGadagTumkurBelgaumChitradurgaBagalkotMysoreKolarBangalore (R)MandyaBellaryBidarGulbargaKoppalChamarajnagarRalchur
76.3576.2774.4768.3566.73 63.9062.73 61.05 56.8556.2756.10 55.9655.8854.48 53.0052.28 52.2050.88 50.45 50.17 48.1545.8945.11 38.54 38.23 38.19 34.34
1
2
345678910 11
121314151617181920 21 2223242526 27
Bangalore (U)DKUdupiKodaguUKShimogaChickmagalurDharwadHassanHaveriDavangereTumkurGadagBangalore (R)ChitradurgaBelgaumMysoreKolarBidarMandyaBellaryBagalkotBijapurKoppalChamarajnagarGulbargaRaichur
83.9183.4779.8778.1776.5974.86 72.6371.87 68.75 68.09 67.67 67.19 66.27 65.0064.88 64.42 63.69 63.14 61.98 61.21 58.04 57.81 57.46 55.02 51.26 50.65 49.54
12
345678910 11
121314151617181920
21 2223242526 27

Percentage Percentage
DKUdupiBangalore (U) UKKodaguDharwadShimogaGadagChickmagaiurBijapurHassanHaveriBagalkotDavangereBelgaumTumkurChitradurgaKoiarBangalore (R)MysoreMandyaBellaryBidarKoppalGulbargaChamarajnagarRaichur
84.08 83.58 82.94 76.39 75.35 74.22 73.12 71.63 70.5670.18 68.87 68.0567.09 66.82 66.6566.4964.50 62.6961.51 59.7159.18 59.11 58.97 53.47 52.08 47.31 46.75
12345678910 11
12 13 U151617181920 21 2223242526 27
DKBangalore (U)UdupiUKKodaguShimogaDharwadChickmagaiurGadagHassanHaveriTumkurDavangereBelgaumChitradurgaBangalore (R)BidarKoiarBagalkotMysoreMandyaBellaryKoppalBijapurGulbargaRaichurChamarajnagar
89.7488.3686.59 84.48 83.80 82.32 81.04 80.68 79.5578.29 77.9476.88 76.4475.89 74.69 74.4373.2973.14 71.3171.30 70.7169.5969.15 68.10 62.52 62.02 59.25
12345678910 11
121314151617181920 21
2223242526 27

Percentage PercentageDKBangalore (U) Udupi Kodagu UKShimogaChickmagalurDharwadHassanDavangereHaveriTumkurMysoreBijapurGadagChitradurgaBelgaumBangalore (R)KolarBagalkotMandyaBellaryBidarChannarajnagar Gulbarga Koppal Raichur.
68.8468.8166.6461.2256.77 54.33 51.3150.41 44.9044.41 43.28 41.9341.60 41.5739.68 39.3838.69 38.15 37.75 37.1336.70 32.24 30.5328.60 24.4922.7821.70
123456
7 S
910 11 121314151617181920 21 2223242526 27
Bangalore (U)DKUdupiKodaguUKShimogaChickmagalurDharwadHassanDavangereHaveriTumkurMysoreBangalore (R)ChitradurgaKolarGadagBelgaumMandyaBidarBijapurBellaryBagalkotChamarajnagarKoppalGulbargaRaichur
78.9877.39 74.0272.53 68.48 67.24 64.47 62.20 59.32 58.45 57.6057.1855.81 55.1254.6252.81 52.5852.5351.6250.0146.19 46.16 44.1043.02 40.7638.40 36.84
1
2345678
910 11
121314151617181920
21 2223242526 27

Table 3 : Literacy Rates (per cent) Among The Scheduled Castes andScheduled Tribes in Karnataka By Districts
DistrictSC
M Total MST
Total
Bangalore (U)Bangalore (R)BelgaumBellaryBidarBijapurChickmaglurChitradurgaDKDharwadGulbargaHassanKodaguKolarMandyaMysoreRaichurShimogaTumkurUKState
67.0 47.756.642.046.158.045.448.764.853.737.046.555.448.649.944.131.948.148.861.449.7
46.822.8
25.817.221.428.224.623.447.226.9 12.8
23.535.925.227.8 25.410.6 25.024.638.725.9
57.335.641.429.734.143.235.236.456.140.625.835.145.737.039.135.021.336.937.050.238.1
71.649.248.428.542.858.849.452.069.062.533.352.729.343.647.9 40.227.955.456.545.747.9
51.325.0 19.215.114.929.130.124.751.430.19.427.421.518.726.722.56.5
30.930.523.823.6
62.037.634.0 26.829.244.339.938.7 60.246.9 21.6
40.125.531.437.631.5 17.343.543.835.1 36.0

1981SC ST
BangaloreBelgaumBellaryBidarBijapurChickmagalurChitradrugaDKDarwadGulbargaHassanKodaguKolarMandyaMysoreRaichurShimogaTumkurUKState
39.536.721.822.5 28.825.828.536.433.420.424.932.229.831.125.116.929.528.942.329.4
21.4 12.6 5.96.47.89.99.0
20.412.94.68.6 16.8 12.612.410.54.011.6 9.7
23.2 11.6
30.724.813.9 14.618.3 18.0 19.128.523.312.6 16.824.821.421.9 18.010.4 20.819.532.920.6
41.328.722.725.533.427.333.642.144.121.830.915.025.326.721.420.736.537.126.129.9
21.37.9 6.44.67.913.311.324.314.33.710.3 8.67.3 10.2 7.6 3.215.714.011.1 10.0
31.718.514.615.320.820.622.733.229.512.820.711.916.418.6 14.611.926.325.818.8 20.1
Note : Data for 2001 not available for SC/ST population.
The Present Study
In this background the present study has attempted to examine inequity in education-in enrolment, retention and educational attainment across districts in Karnataka from Primary level to Pre-University level. It will also study inequities by regions, rural/urban residence, gender and caste affiliation (SC/ST) subject to availability of data. The study will try to assess the efforts made by the State and Central governments to reduce disparities and bring in equity in education through appropriate strategies - programme interventions and the extent of their success.

Objectives:
The present study was carried out specifically with the following objectives.
1. Highlight the disparities in educational outcomes (measured as years of schooling completed) in Karnataka by gender, caste, residence and districts/regions.
2. Identify at what age these differentials start appearing and become more pronounced.
3. Identify factors and variables on the demand and supply sides that contribute to inequities in education in terms of caste, class and gender.
4. Review government measures to address these inequities and their effectiveness.
5. Understand the way schemes are being implemented within a district.6. Make policy and programme recommendations to promote equity based on
analysis of secondary data and field observations.
Methodology
The data available at the office of Commissioner of Public Instruction (CPI) and District Primary Education Project (DPEP) will be exploited to examine disparities in enrolment, retention, drop out and achievements in schooling over a time period. In addition, the estimates of National Family Health Survey I and II (1992-93 and 19992000) will be used.
To supplement the analysis of secondary data primary data will be collected from about 200 households trom two districts in the state that ditter maximally in schooling. The analysis would highlight differentials and determinants of schooling. The study would try to assess the efficacy of the schemes designed to improve schooling in the state such as free uniforms, text-books, cash incentives like scholarships etc. and see whether they had any impact on enrolments, retentions and achievement in schooling.
In addition, the discussion with the government officials at various levels, NGO Chief Executives, village leaders and community leaders would be held to elicit their perception and the outcomes of these discussions would be used to explain certain issues that quantitative data may not reveal.

CHAPTER II
EQUITY IN EDUCATION IN KARNATAKA : TRENDS AND PATTERNS
What Is Equity?
Earlier it was noted that technically skilled man power of a country or state within a country is going to play a crucial role in accelerating social and economic change in the coming years. But education is not only necessary to grab a job but has several externalities that are very pervasive. It is a basic ingredient for upgrading human resources leading to positive effects on efficiency of human beings as productive agents. Sociologists maintained that education promotes modern attitudes, values and beliefs about work and very quality of life. Political scientists observed that education improves governance and prepares them to create and become members of the civil society. As noted earlier, it enhances a person’s capabilities to absorb, diffuse and exploit new knowledge-technology and make him professionally more competent. Education brings competition at every level. It enhances health status, reduce high fertility through increasing age at marriage and increased contraception. Education also leads to higher agricultural production through adoption of modern cultivation system. In short, it has several far reaching impacts that are most valuable for any society.
It is necessary to know what is education and how much education is required to achieve benefits that were noted above. This is important particularly for many developing countries like India where a large proportion of population is below poverty line and poverty discourages schooling. The result is potentially productive talents of a large population remain untapped. Lack of education made people poor and poverty came in the way of their education. Alfred Marshall long back has rightly pointed ,out “There is no extravagance more prejudicial to the growth of national wealth than that wasteful negligence which allows geneous that happens to be born of lowly parentage to expend itself in lowly work” (Marshall 1925, p.211). The concept of equity in the study is perceived in this spirit - that being born as a girl, in Scheduled Caste family or a poor family or in a remote backward village should not be a deterrent to fulfill ones educational aspirations. The state has a responsibility to ensure that every child born has access to a minimum level of education of some good quality and prepare the child to persue higher education which also is made accessible. The educational opportunities that the state create and develop are to be accessible to all aspirants. These opportunities cannot be denied to an aspirant because of gender, residence, social class of origin and backwardness of the region of birth and/or such other factors.
Equity is not equality - a concept of too high level of abstraction and achieving perfect equality is not a realistic aim as it is highly value loaded it cannot be persued in a normative manner. The equity is a more realistic concept that holds promise to most of the less developed countries today that have experienced exceptionally rapid expansion in educational growth during last few decades. However, the expansion and growth is accompanied by inequities in achievements as noted in Table 2-3 earlier that are not only persisting but some time have shown a rising trend. Providing equal opportunity to all is the only alternative in the situation as further expansion of the system is not going to be very helpful in bringing equity. In addition, the demographic changes that are taking place, as noted earlier for Karnataka, is going to ease the pressure of expansion of educational facilities and if appropriate policy interventions are effected would improve quality and make the education broad based to exploit the benefits of globalisation by a larger population in the State.

This chapter will focus on three dimensions of equity i) Participation in educational process at primary and secondary levels by gender, rural-urban residence, social class and region (and also district), ii) The out comes of the participation as reflected in the examination results - per cent pass by class and iii) How well the participants are prepared for the job market.
Participation in Education
Childrens participation in education will be examined by analysing enrollments, dropouts and completion at various levels by gender, social class, residence and districts/regions. The data provided by the education department will be mainly used for this purpose. The data on enrollment is generally believed to be deficient in several respects. While a child has to be admitted in primary school at age six (five years 10 months to be precise) it is not strictly followed. Many may join at age 7 also and all may not be enrolled due to various reasons. The information has to be generated at school level by the teachers who have a vested interest in showing increasing numbers of children as enrolled and enrolment does not mean anything except a name in the school register and certainly does not mean that the child is attending school. But what is surprising is that all eligible children aged 5 years and 10 months or 6 years are not enrolled because it seems the parents have to come to school to admit the child - a formality and if the school Census figure (number of eligible children) are automatically registered and only the number of children attending school regularly is made an indicator it can reduce confusion arising out of enrolment rates or ratios that often are greater than 100 because of several reasons.
Enrolment in 1®' Standard in primary school is a function of fertility levels and accessibility to school in the vicinity of a family. Increasing number of children enrolled indicate persisting high fertility and expansion of schooling facilities controlled by willingness of parents to put their children and keep them in school. However, first we will exarriine the trends in enrolment given the changing demography in 1990 decade by years of schooling (in l-IV, V-VII; Table 4).
Table 4 : Enrolment trends in Karnataka, 1992-93 to 2000-01 ( in lakhs)
■Enrolment 19921993 93-94 94-95 95-96 96-97 97-98 98-99 99
20002000
01Class l - I V 51.4 52.7 53.8 53.5 55.4 54.1 54.5 52.7 53.5Class V-VII 23.5 24.7 24.9 26.1 26.7 28.1 29.3 29.5 30.8
Total l-V II 74.9 77.3 78.5 79.7 82.1 82.2 83.7 82.2 84.3
The data presented in Table 4 (Graph 1) suggest that while enrolment in Class I-IV (Lower Primary) during the decade has increased by 2.1 lakh reflecting on the declining fertility and improved enrolments continuing schooling in V - VII shows a rising trend from 23.5 lakhs in 1992-93 to 30.8 lakhs indicating increasing survival and declining dropouts due to various causes. Overall enrolment in primary schools has risen from 74.9 lakhs to 84.3 lakhs during the period. The table shows that during the decade dropouts of the primary schooling have declined recently though not consistently as seen by ups and downs over 1992-2001 in Karnataka (Table 5).

Graph -1

Table 5 : Dropout rates in Primary Schools in Karnataka (I - VII classes)during 1992-93 - 2000-01 by Gender
Gender 19921993 93-94 94-95 95-96 96-97 97-98 98-99 99
20002000
01Boys 43.8 50.4 47.1 49.4 45.6 41.3 38.7 35.0 35.0Girls 54.2 55.4 51.1 53.2' 48.0 46.3 43.3 38.0 41.0
Total 48.7 52.7 49.0 57.3 46.8 43.7 40.8 36.5 38.0
The overall dropout rates over the decade shows a declining trend though not smoothly, are still unacceptably high. What emerges from the table is if 100 children join the school in the first standard only 62 survive VII standard - 65 boys and only 59 girls suggesting more girls drop-out than boys.
The situation during the first four years of schooling provides a relatively better picture (Table 6).
Table 6 : Dropout Rates in Lower Primary School in Karnataka(1992-93- 2000-01)
GenderYear
199293 93-94 94-95 95-96 96-97 97-98 98-99 99-2000 2000-01
Boys 24.9 28.3 23.4 16.3 16.5 16.9 14.2 15.0 10.0Girls 29.4 34.0 30.3 27.4 23.2 16.1 12.3 12.0 11.0
Total 27.0 31.0 26.7 21.8 19.7 16.5 13.3 13.5 10.5
The dropout rates during the decade for boys have markedly declined from about25 per cent to 10 per cent and that of girls from 29.4 per cent to 11 per cent which is quite impressive. In other words of every 100 boys and girls who join school, 90 boys and 89 girls survive through four years. During the period the gender gap has declined considerably. The data presented seems to agree broadly with other data sources collected independently from households in the National Family Health Survey 1992-93 and 1998-99.
Table 7 School Attendance by Age, Sex and Residence in Karnataka:1992-93 to 1999-2000
Age Male Female TotalRural Urban Rural Urban Rural Urban Total
6 - 1 0 84.8 94.3 81.9 93 83.3 93.7 * 86.4(76.4) (87.6) (64.8) (85.4) (70.8) (86.5) (75.6)
11-14 72.2 81.3 60.7 82.9 66.4 82.1 71.6(67.2) (80.1) (46.4) (72.5) (56.8) (76.3) (62.9)
15 -17 44.8 64.6 27.1 56.1 36 60.5 44.9(N.A) (N.A) (N.A) (N.A) (N.A) . (N.A) (N.A)
Source; NFHS I and II. Figures in brackets refer to NFHS I - 1992-93.

The data drawn from Census, NFHS and other sources bring out that literacy rates have increased relatively faster during 1991-2001. School attendance by age reveal that gender disparity particularly in urban area has considerably narrowed down to just about one per cent and about 2 per cent in rural areas. School attendance however, in rural parts is comparatively lower for both males and females. However, universalisation of primary education (1-4 years of schooling) in Karnataka urban areas seems to be within reach in the coming couple of years while in rural areas it may be possible In the current decade if the tempo already built is sustained and further improved.
But what is distressing is the sharp decline in school attendance as the child grows to 11-14 years of age. Decline is seen in both rural and urban areas and also among both sexes though it is steeper for girls in rural areas. Several studies have shown that competing demands on child time become stronger as the child grows and able to engage in productive activities. Crucial age when such demand is very strong Is 11-12 years (Kanbargi, 1991) resulting in withdrawal of child from school and putting in some gainful activity.
Primary Schooling by Standard
It is interesting to examine the enrolment and dropout by each year of schooling to study whether there is any stage when dropouts are pronounced for boys and girls (see Table 8).
Table 8 : Enrolment and Dropout in Karnataka : 1991-92 -1997-98
Boys GirlsYear Standard Enrolment % Dropout Enrolment % Dropout
1991-92 1 762707 0.0 702818 0.0
1992-93 II * 715864 6.1 617302 12.2
1993-94 III 670879 12.0 583690 16.91994-95 IV 612038 . 19.8 572622 27.1
1995-96 V 535032 29.9 460265 . 34.5
1996-97 VI 477742 37.4 413703 41.1
1997-98 VII 451366 40.8 377494 46.3
Total l -V I I 4225627 45.46 3667894 48.09
The total population estimated for 1991-92 in 6-12 years was (l-VII Standard) 80,92,659 that gives an enrolment rate of 97 per cent - about 104 per cent boys and 91 per cent girls.

The data presented in Table 8 clearly brings out the fact that dropout starts from Standard 1 and by the time child reaches class IV, 20 per cent of boys and 27 per cent of girls are out of school indicating more girls dropout during first four years of schooling than boys. During V - VII class about 20 more boys and girls leave school.
District and Region-wise enrolment and dropouts for boys and girls for the period 1990-91 to 1996-97 is presented in Table 9 by class (I, IV, V, and VII).
The data presented in Table 9 show very interesting pattern of schooling among boys and girls across the districts of the State. The school dropout rates estimated for the cohort of boys and girls who joined school during 1990-91 reveal that during the first four years 16.5 per cent boys and 23.2 per cent girls leave school. As noted earlier dropping out of school starts from the first year itself and cumulative effect of 4 years is revealed here in the Table. The quality of data does not permit any reasoning for the considerable increase in the enrolment of boys and girls in Bangalore North district that vitiates the regional estimate of dropouts.
Table 9 : Enrolment in Primary Schools by Districts/Regions and1990-91 -1996-97
Sex
Class 1 Class IV Class V Class VIIBoys Girls Boys Girls Boys Girls Boys Girls
Bangalore N 26536 25365 31679 29006 30957 31317 28902 25837
Bangalore R 28307 27924 21372 18955 19773 17897 16678 14779
Bangalore S 35430 36206 32301 27153 24338 25561 22235 21818
Chitradurga 40019 35551 29143 24351 25409 22974 19561 18056Kolar 38233 36046 24791 20615 29504 24081 23748 19459Shimoga 30570 30324 26362 23018 25944 22725 20146 18395
Thumkur 38824 38739 32947 28065 25132 21755 24926 20672
Chickmaglur 14609 15004 14179 13040 11087 10043 8271 10766
Hassan 25104 26152 20305 19677 18170 13984 12712 12725
Mandya 25805 24892 21505 17905 20839 16526 17358 14207
Mysore 46371 43853 40447 38098 31543 30942 26369 22194
Old Mysore 349808 340056 295031 259883 262696 237805 220906 198908Belgaum 54992 48085 45188 39590 34428 30720 29471 21764
Bijapur 50805 42469 45424 34310 32077 22023 24016 17429
Dharwad 53756 49908 51016 43183 34166 32830 29777 22014
UK 18162 19823 16966 14298 14810 12568 10285 9267
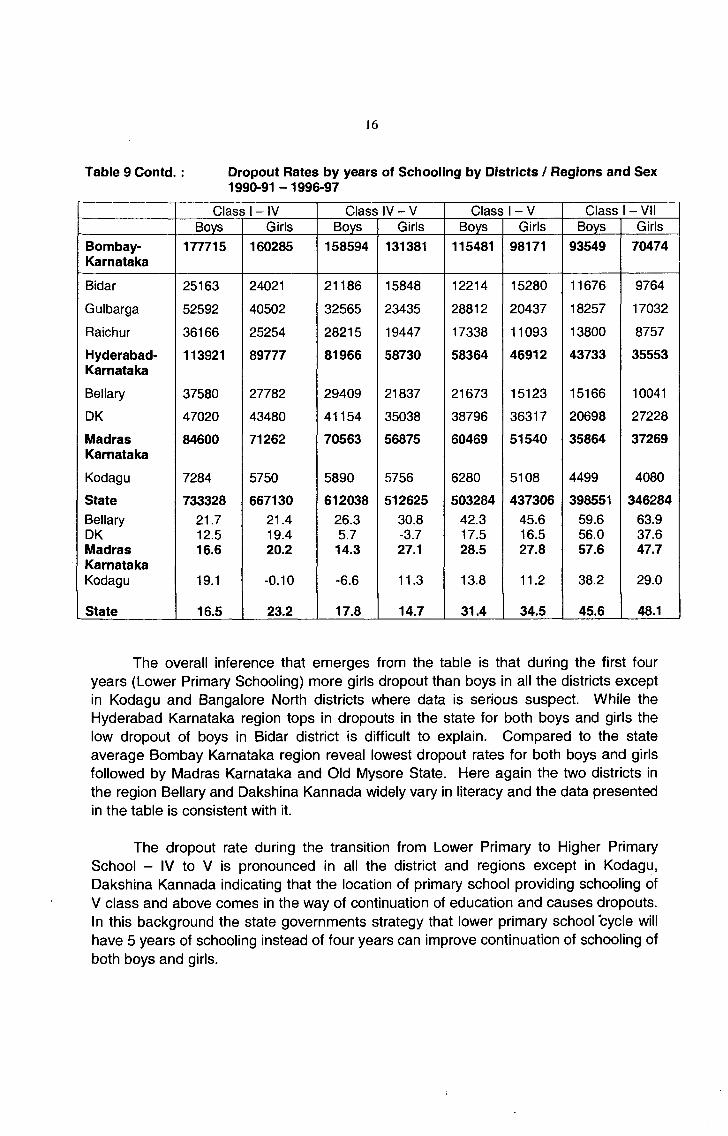
Dropout Rates by years of Schooling by Districts / Regions and Sex 1990-91 -1996-97
Class 1 - IV Class IV - V Class 1 - V Class 1 - VIIBoys Girls Boys Girls Boys Girls Boys Girls
Bombay-Karnatalca
177715 160285 158594 131381 115481 98171 93549 70474
Bidar 25163 24021 21186 15848 12214 15280 11676 9764
Gulbarga 52592 40502 32565 23435 28812 20437 18257 17032
Raichur 36166 25254 28215 19447 17338 11093 13800 8757
l-lyderabad-Karnataka
113921 89777 81966 58730 58364 46912 43733 35553
Bellary 37580 27782 29409 21837 21673 15123 15166 10041
DK 47020 43480 41154 35038 38796 36317 20698 27228
MadrasKarnataka
84600 71262 70563 56875 60469 51540 35864 37269
Kodagu 7284 5750 5890 5756 6280 5108 4499 4080
State 733328 667130 612038 512625 503284 437306 398551 346284Bellary 21.7 21.4 26.3 30.8 42.3 45.6 59.6 63.9DK 12.5 19.4 5.7 -3.7 17.5 16.5 56.0 37.6MadrasKarnataka
16.6 20.2 14.3 27.1 28.5 27.8 57.6 47.7
Kodagu 19.1 -0.10 -6.6 11.3 13.8 11.2 38.2 29.0
State 16.5 23.2 17.8 14.7 31.4 34.5 45.6 48.1
The overall inference that emerges from the table is that during the first four years (Lower Primary Schooling) more girls dropout than boys in all the districts except in Kodagu and Bangalore North districts where data is serious suspect. While the Hyderabad Karnataka region tops in dropouts in the state for both boys and girls the low dropout of boys in Bidar district is difficult to explain. Compared to the state average Bombay Karnataka region reveal lowest dropout rates for both boys and girls followed by Madras Karnataka and Old Mysore State. Here again the two districts in the region Bellary and Dakshina Kannada widely vary in literacy and the data presented in the table is consistent with it.
The dropout rate during the transition from Lower Primary to Higher Primary School - IV to V is pronounced in all the district and regions except in Kodagu, Dakshina Kannada indicating that the location of primary school providing schooling ofV class and above comes in the way of continuation of education and causes dropouts. In this background the state governments strategy that lower primary school cycle will have 5 years of schooling instead of four years can improve continuation of schooling of both boys and girls.

The overall dropout rates (l-VII) estimated by districts show that Hyderabad Karnataka tops among both boys and girls followed by Madras Karnataka, Bombay Karnataka, Old Mysore State and Kodagu among boys and girls.
The enrolment and retention data collected by the Department of Education in Karnataka just before the National Census of 2001 provide evidence of continuing improvements in schooling of children at Primary level. The data were collected for Scheduled Castes and Tribes in addition to all children for each district.
Tables 10 and 11 provide information on per cent children in school and out of school by age for girls and boys and social class (Scheduled Caste). It is observed here also that schoo[ tendance of girls is lower than the boys in all age groups except during 5-6 years. The school dropout begins, as mentioned earlier from class one only and accelerates after attaining age 10 years and is largest in 13-14 years when productive work may be available for children. The gender differentials are pronounced in higher age groups.
Table 10 : Per cent Children Attending School by Age and Caste 2001
All SCAge Boys Girls Total Boys Girls Total5 - 6 43.1 44.6 43.8 35.3 34.0 34.76 - 7 93.0 89.5 91.3 87.1 84.3 85.87 - 8 94.3 92.6 93.5 91.1 88.2 89.78 - 9 94.4 93.0 93.7 91.4 88.2 89.89 - 1 0 93.4 89.9 91.7 89.7 83.1 86.810-11 91.6 87.0 89.3 86.5 77.8 82.211 -1 2 90.1 85.0 87.9 84.5 74.6 79.612-13 87.5 80.6 84.0 80.8 67.7 74.413-14 88.0 79.6 83.8 81.0 61.9 71.6
Source; Department of Education, Karnataka, 2001.
The school attendance of children belonging to Scheduled Castes is much lower than others in all ages and within the Scheduled Castes gender disparities are much larger particularly in 10+ ages. The dropout of boys and girls in 13-14 years age group show that among the Scheduled Caste 19 per cent boys and 38.1 per cent girls dropout white among others it is only 12 and 20.9 per cent respectively.
The survey data presented in Table 11 shows that about 58 per cent of children who are out of school - either not enrolled or dropped out are from Raichur, Gulbarga, Koppal (early it was in Raichur district) Bijapur, Bagalkot (early it was in Bijapur district) and Bidar districts (about 57 per cent boys and 59 per cent girls.

Table 11 : Children in 6-14 years Attending School and Out of school(not enrolled dropout) in the Districts of Karnataka by Social Class and Gender 2001
Boys Girls Boys GirlsRaichurGulbargaKoppalBijapurBellaryBagalkotBidarChamarajnagarGadagHaveriKodaguDavangereChitradurgaBelgaumMysoreDharwadUKKolarChickmagalurShimogaHassanTumkurMandyaDKUdupi
75.6 75.979.5 81.8 83.4 86.3 88.8 88.189.090.090.291.391.892.291.891.892.093.293.493.093.894.794.698.298.8
71.0 72.676.181.1 80.8 83.586.487.887.589.590.490.690.590.8 91.391.691.592.093.093.793.6 94.295.097.998.9
24.424.220.518.216.613.711.3 11.9 11.0 10.09.88.7 8.2
7.8 8.2 8.2
8.06.8 6.6 7.0 6.25.35.41.8 1.2
29.027.423.918.919.216.5 13.712.212.6 10.5 9.69.49.59.2 SJ8.48.5 8.07.06.36.4 5.85.0
2.101.1
State 89.5 88.3 10.5 11.7
Among the SC children about 53 per cent who are out of school belong to erstwhile Raichur, Gulbarga, Bellary, Bijapur, Bidar, Mysore and Kolar districts. Similarly higher dropouts of ST children are seen in Gulbarga, Raichur, Bidar, Belgaum, Mysore, Chitradurga districts accounting for over 52 per cent.
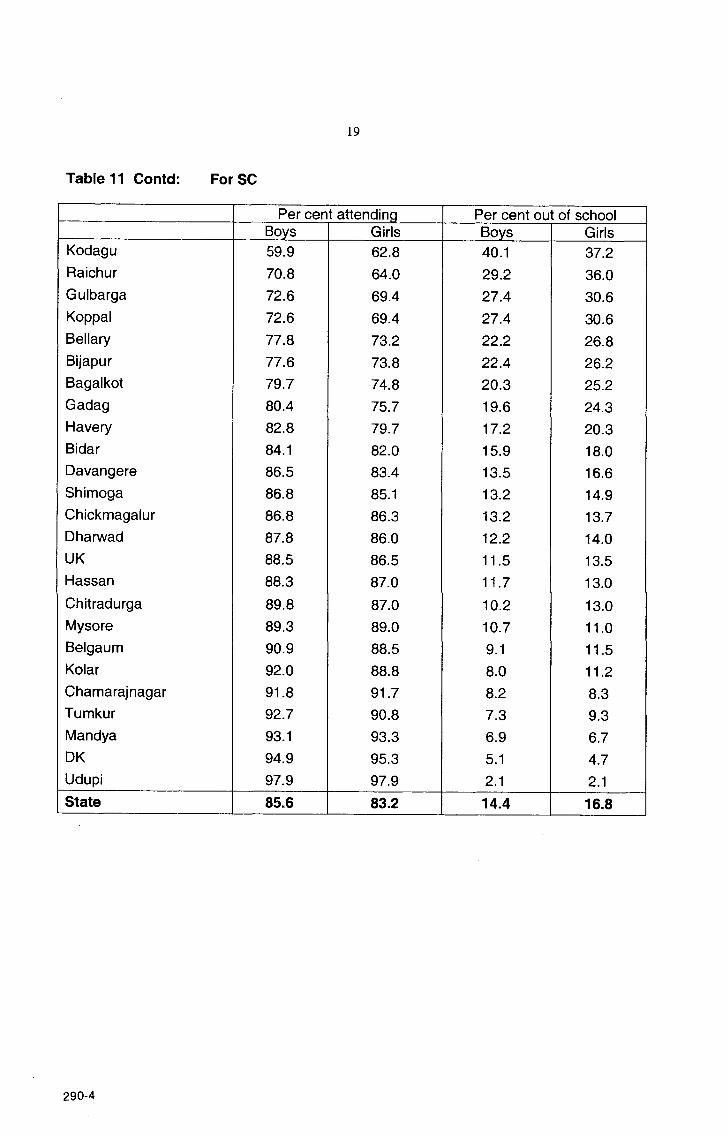
KodaguRaichurGulbargaKoppalBellaryBijapurBagalkotGadagHa veryBidarDavangereShimogaChickmagalurDharwadUKHassanChitradurgaMysoreBelgaumKolarChamarajnagarTumkurMandyaDKUdupi
Boys59.970.872.672.677.877.679.780.482.8 84.186.5 86.8 86.887.888.588.389.889.390.992.091.8 92.793.194.997.9
Girls62.864.069.469.473.273.874.875.779.782.083.4 85.186.3 86.086.587.087.089.088.588.891.790.893.395.397.9
Boys40.129.227.427.422.222.420.319.617.215.913.513.213.212.211.511.7 10.210.79.1 8.08.27.36.95.12.1
Girls37.236.030.630.6 26.826.225.224.320.318.016.6 14.913.714.013.513.013.011.011.5 11.28.39.36.74.7 2.1
State 85.6 83.2 14.4 16.8

Boys Girls Boys GirlsGulbargaRaichurKoppalKodaguBellaryBagalkotBijapurBidarBelgaumChamarajnagarMysoreGadagChitradurgaDharwadHassanUKDavanagereHaveriMandyaShimogaKolarChickmagalurTumkurDKUdupi
61.563.772.174.077.580.479.783.585.884.286.988.388.687.787.789.089.389.389.989.691.391.193.897.797.7
55.8 57.667.076.373.977.380.978.879.1 82.086.185.586.6 87.787.9 88.0 88.288.589.190.188.590.6 93.097.998.2
38.536.327.9 26.022.519.620.3 16.514.2 15.813.111.711.412.312.3 11.010.710.710.110.48.78.9 6.22.32.3
44.242.433.023.726.122.719.121.220.9 18.013.914.513.4 12.3 12.1 12.011.811.510.99.911.5 9.47.02.1 1.8
State 82.3 79.3 17.7 20.7
The analysis of district-wise dropouts reveal that Raichur, Gulbarga, Koppal, Bellary, Bidar, Bagalkot standout with very high rates. In all these districts girls dropout rates are relatively higher than boys. Dropout among SC/ST are also highest in Gulbarga, Raichur, Bellary and Bijapur districts.
The data on enrolment and survival, childpen in school and out of school and the latest Census data on literacy rates bring out clearly that boys participation is better than girls in all districts and widely differ across districts. The major finding of the analysis is that the Hyderabad Karnataka is the poorest performer in primary education sector. The special survey conducted by the Education department in 1997 on the occasion of 50' year of independence identified this region as educationally the most backward followed

by Bellary in enrolment and survival to VII class. The report notes that largest number of out of school children 26,935 were from Raichur and in 2001 survey found it to have increased to 1,16,892 children.
It may be noted here that the Hyderabad Karnataka region is also very backward in health sector showing higher Infant Mortality, Maternal Mortality and Domiciliary deliveries indicating inadequate exploitation of the resources put in the health sector as in Education sector in these districts. Perhaps human resource development of the region deserve more attention.
The Outcomes of Primary Education
It was observed in the previous section that in Karnataka enrolment of children in Primary Schools during 1991-92 to 2000-01 rose from about 75 lakhs to about 84 lakhs and 10.5 lakhs dropout during l-IV standard and another 27.5 lakhs later during V-VII standard. It would be necessary to see how the children who continue their schooling for seven years fare in the examination - the only test of their cumulative learning and teaching impact of 7 years. The VII class examination is conducted by the district authority in every district having common question papers for all children studying in the VII class.
The Karnataka State has a policy of No detention till Class V’ indicating all children who attend school for a minimum number of days are promoted to higher class irrespective of their learning achievements. This policy is followed because detention for any one year was found to encourage dropout. Automatic promotion eliminate repetition and increases the years of schooling. Certainly when there is no examination and assessment of learning dropouts are reduced. Perhaps the 90 per cent attendance in tower primary school is an evidence of that. During V and VI classes the school conducts examination. The data of DPEP districts suggest that about 4 per cent of children in V - VI are not able to get through the examination even at school level.
The Class VII examination conducted by the District authorities and the out comes are presented in Table 12 for each district by sex for the last 3 years 1998, 1999 and 2000. The results for the State show improvements over 1997-2000 from 89.8 per cent pass to 92.4 per cent pass - a rise of about 9 per cent. However, district wise differentials are visible in 1997 as 12 districts had lower percentage of pass as compared to the state average of 83.8. Lowest pass percentage is seen in Kolar and Beigaum where one in every 4 appeared for exam failed. Over the years there is improvement and in 2000 most of the districts show results that are closer to the state average of 92 per cent. What is surprising is Gulbarga and Raichur districts having largest dropouts and very low literacy rates show higher percentage of pass - 95.6 and96.2 per cent respectively. Udupi and Dakshina Kannada districts with lowest dropout and higher literacy rates have relatively lower percentage of pass. The results, therefore, may not indicate quality of schooling as they are not consistent with other available evidence. On the other hand as teachers are likely to be held responsible for the poor results manipulation of results may be in practice.

Table 12 : Examination Results of Class VII for Boys and Girls in Karnatakaduring 1998-2000 by Districts
District Boys Girls Boys Girls Boys Girls90.4 93.376.3 79.889.6 92.783.6 88.779.1 82.679.5 84.790.8 93.679.6 83.583.4 88.085.1 89.382.9 88.288.7 92.380.8 84.784.8 87.781.8 85.789.0 91.188.7 92.189.2 92.482.5 86.982.9 87.081.5 86.5
2000 1999 1998 1997Bangalore (N)Bangalore (R)Bangalore (S)BelgaumBellaryBidarBijapurChickmagalurChitradurgaDKDharwadGulbargaHassanKodaguKolarMandyaMysoreRaichurShimogaTumkurUKBagalkotChamarajnagarDavangereGadagHaveriKoppalaUdupi
State
94.890.294.093.790.790.895.092.690.288.288.195.688.6 89.3 89.792.990.294.985.183.188.395.494.594.592.991.596.488.4
91.3
96.492.9 96.296.193.292.697.094.592.992.693.597.191.792.992.594.592.7 96.488.386.792.197.4 96.095.995.793.896.591.2
93.7
93.083.293.6 90.9 85.889.093.384.079.480.187.493.182.389.385.787.8 87.794.579.687.386.795.194.790.087.489.893.288.0
88.3
95.186.1 96.194.089.891.795.786.984.187.692.795.285.792.589.790.891.397.383.890.190.696.7 96.092.793.292.293.990.8
91.3
95.691.495.1 94.891.7 91.695.893.5 91.490.390.696.290.291.091.093.791.490.586.784.890.196.295.295.2 94.192.596.489.8
92.4
94.0 84.6 94.992.287.490.194.285.481.583.889.8 94.083.990.887.588.389.395.581.6 88.688.595.895.391.289.890.993.589.4
89.7
91.8 93.778.0 82.491.1 90.485.8 80.580.5 75.281.7 79.791.9 87.081.5 77.985.5 81.087.2 88.785.2 83.390.1 81.382.7 80.686.2 89.983.5 75.390.0 82.490.2 88.690.4 85.484.6 83.784.8 78.683.8 88.3
86.5 83.8
The issue that arise from the observed results is whether there is any mechanism i fin the department to monitor the class room transactions during the seven years in the■ schools and based on that assessment, any policy interventions are designed to bring in■ the desired changes. It may be noted here that school inspection - a routine exercise that was existing for long is discontinued for last 8-10 years as revealed by our visits to about 70-80 schools in Raichur and Udupi districts in December - January months. As the pass percentages by districts do not reflect the reality it is necessary to review the policy of inspection of schools at least once a year.
The results, however, provide pattern of passing the examination of Class VII. Invariably in the state and all the districts, girls pass percentage is higher than the boys. The irony is that the dropout rates among girls is very high as compared to boys suggesting that there is some compensation in the end result of schooling for the loss that occurs in earlier years for girls. In March 2000, 4,37,572 boys and 3,71,390 girls

appeared for VII class examinations and about 4 lakh boys and 3.7 lakh girls passed - there were 14,515 more boys in failed category than girls in the State.
Participation in Secondary Schools
The previous section examined participation in Primary Schools - I - VII classes and the outcome of the participation in the district level examination that did not enlighten much on quality of schooling. It gave an impression that most of the children who join Class VII are likely to pass - more girls than boys and with some differentials across the districts.
Those who pass the VII class examination are eligible to join high schools that provide schooling for further 3 years - VIII, IX and X. There is a state level examination for those who stay in class X. As High Schools are fewer than primary schools many children have to find a conveniently located High School for enrolment. It is quite likely that if a high school is not situated nearby may lead to dropout. It may be noted here that 10 years of schooling (SSLC) is essential to get any low paid jobs like Drivers in Public Sector undertakings, Messengers in offices. Police Constables, Army Jawans etc. In addition, pass in SSLC is required for admission in Pre-University course to continue further for higher technical degrees in Engineering or medicine. Even for getting admissions in polytechnics that offer Diplomas in Engineering or in any vocational courses a good pass in SSLC is a must.
Table 13 ; Enrolment in Secondary Schools in Karnataka by Sex during 1966-67-1997-98
SexA'ear 1966-67 1977-78 1980-81 1990-91 1997-98
Boys 324119 413856 503482 819696 885571
Girls 114268 220721 286378 511070 672164
Total 438387 634577 789860 1330766 1557735
Sex Ratio Girls / 1000 boys
353 533 569 623 759
Table 13 provides enrolment of girls and boys during 1966-67 to 1997-98. During the three decades total enrolment has risen from 4.4 lakhs to 15.6 lakhs - that of boys from 3.2 to 8.9 lakhs and girls from 1.1 lakh to 6.7 lakhs. The rise in enrolment is followed by improved sex ratio of girls (number of girls per 1000 boys) from 353 to 759 indicating decline in disparity in enrolment of boys and girls in the State.
During the same period 1966-67 to 1997-98 all districts have also shown remarkable improvements in enrolment of varying degrees (Table 14).
The data also reveal (Table 14) improvements in secondary school enrolments in literacy poor districts like Bellary, Bidar, Gulbarga and Raichur during the three decades which are very impressive as they started at a low level. For example, in Raichur there were only 6057 boys and 855 girls in 1966-67 in the whole of the district that in 1997-98 rose to 26,582 - four times and that of girls to 12624 - over 14 times. Perhaps

expansion of high school facilities in these districts to a large extent explain such a rise. It also may suggest that those who started with relatively better performance continue the trend further after reorganization of the state while these districts like Gulbarga who lagged much behind then, though are improving gradually, the pace of improvement is not adequate to catch-up with those who are ahead of them.
Table 14 : Enrolment of Boys and Girls in Secondary Schools during1966-67 to 1997-98 by Districts
Districts1966-67
Boys Girls Sex Ratio1997-98
Boys Girls SexRatio
Bangalore (U)Bangalore (R)BelgaumBellaryBidarBijapurChickmagalurChitradurgaDKDharwadGulbargaHassanKodaguKolarMandyaMysoreRaichurShimogaTumkurUK
51195
2774792115968
215878464
15913236552666310827135306282
1728811568184216057
165082184011395
25770
79042021
617392331484201
136277828167545004645615623958178
855561953315875
503
285219103182372264576294155332739356207444141340244516
9263331350580303252221128615292066947114639766963153464369031003148611360155888726582319346226722295
949572850548825198791580934614162163923953670446862538728471
996533709265883799212624320384896520031
1025909841611748562785833839642475772993693738645475
1003775898
State 324119 114268 353 88557 672164 759
Source : Human Development in Karnataka, 1999.
Ten years of schooling (Secondary School Learning Certificate - SSLC) is complete when the students get through the state level examination. The results of the SSLC examination, perhaps, is the only indicator of some quality of schooling in Karnataka. The examination results during 1990-1999 are presented in Table 15 by SC/ST and others in Karnataka.

CategoryPer cent pass by years
All 54.30 58.72 48.71 51.48 52.09 44.98 43.46 45.33 44.55 56.72
SC/ST 41.26 46.78 36.58 40.83 39.73 32.46 30.29 32.14 31.95 43.84
General 57.12 61.15 51.47 53.56 54.96 47.81 46.44 48.35 47.31 59.62
The results reported show fluctuating trends 54.3 per cent students passed in 1990 whereas in 1999 it is 56.72. What is noticeable is the consistent lower performance of SC/ST children throughout the decade - their pass percentage is considerably lower than non-SC/ST students performance. In 1990 about 41.3 per cent passed that increased to 43.84 per cent in 1999 with fluctuations in between the period. Whenever there is rise in per cent pass it is reflected in rise in pass percentage of SC/ST also and the difference in pass percentage among SC/ST and non-SC/ST is in the range of 14 to 16 percentage points.
There is also disparity in the results of rural and urban areas/schools. The performance of rural schools is below that of urban over the years. Higher differences (10 percentage points or more) are observed during 1993-98 (see Table 16) that narrowed in 1999.
Table 16 : S.S.L.C. Results by Rural/Urban Areas 1990-1999 Karnataka
Residence Per cent pass by years1990 1991 1992 1993 1994 1995 1996 1997 1998 1999
Rural 52.35 57.26 48.37 46.44 47.08 40.46 38.77 40.27 39.54 54.08
Urban 56.43 60.23 49.03 56.40 57.13 48.83 48.64 57.22 50.36 57.97
Total 54.33 58.72 48.71 51.48 52.09 44.98 43.46 45.33 44.55 56.72
It is to be noted here that students in rural school come mostly from farming background and have to share some work with other family members that reduce their time-inputs in studies while urban students except few from slums / low income families have no such demands. In addition, urban schools are believed to be better than those in rural areas that explain to some extent the observed inequities.
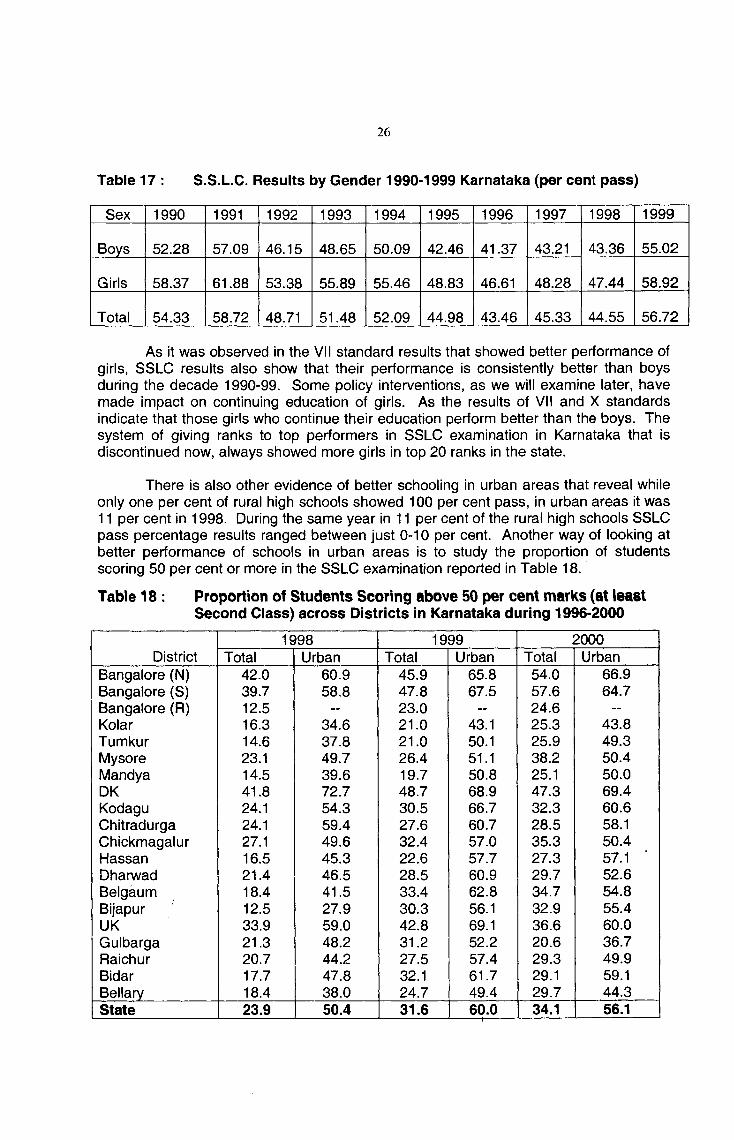
Boys 52.28 57.09 46.15 48.65 50.09 42.46 41.37 43.21 43.36 55.02
Girls 58.37 61.88 53.38 55.89 55.46 48.83 46.61 48.28 47.44 58.92
Total 54.33 58.72 48.71 51.48 52.09 44.98 43.46 45.33 44.55 56.72
As it was observed in the VII standard results that showed better performance of girls, SSLC results also show that their performance is consistently better than boys during the decade 1990-99. Some policy interventions, as we will examine later, have made impact on continuing education of girls. As the results of VII and X standards indicate that those girls who continue their education perform better than the boys. The system of giving ranks to top performers in SSLC examination in Karnataka that is discontinued now, always showed more girls in top 20 ranks in the state.
There is also other evidence of better schooling in urban areas that reveal while only one per cent of rural high schools showed 100 per cent pass, in urban areas it was11 per cent in 1998. During the same year in 11 per cent of the rural high schools SSLC pass percentage results ranged between just 0-10 per cent. Another way of looking at better performance of schools in urban areas is to study the proportion of students scoring 50 per cent or more in the SSLC examination reported in Table 18.
Table 18 : Proportion of Students Scoring above 50 per cent marks (at leastSecond Class) across Districts in Karnataka during 1996-2000
District1£98 1999 2000
Total Urban Total Urban Total UrbanBangalore (N) 42.0 60.9 45.9 65.8 54.0 66.9Bangalore (S) 39.7 58.8 47.8 67.5 57.6 64.7Bangalore (R) 12.5 - 23.0 - 24.6 -
Kolar 16.3 34.6 21.0 43.1 25.3 43.8Tumkur 14.6 37.8 21.0 50.1 25.9 49.3Mysore 23.1 49.7 26.4 51.1 38.2 50.4Mandya 14.5 39.6 19.7 50.8 25.1 50.0DK 41.8 72.7 48.7 68.9 47.3 69.4Kodagu 24.1 54.3 30.5 66.7 32.3 60.6Chitradurga 24.1 59.4 27.6 60.7 28.5 58.1Chickmagalur 27.1 49.6 32.4 57.0 35.3 50.4Hassan 16.5 45.3 22.6 57.7 27.3 57.1 ■Dharwad 21.4 46.5 28.5 60.9 29.7 52.6Belgaum 18.4 41.5 33.4 62.8 34.7 54.8Bijapur 12.5 27.9 30.3 56.1 32.9 55.4UK 33.9 59.0 42.8 69.1 36.6 60.0Gulbarga 21.3 48.2 31.2 52.2 20.6 36.7Raichur 20.7 44.2 27.5 57.4 29.3 49.9Bidar 17.7 47.8 32.1 61.7 29.1 59.1Bellary 18.4 38.0 24.7 49.4 29.7 44.3State 23.9 50.4 31.6 60.0 34.1 56.1

The SSLC pass with 50 per cent marks and/or more in urban areas is certainly a strong indicator of better performance. The difference between rural and urban are very large - Bangalore rural only with 12.5 per cent pass is lowest and Dakshina Kannada with 42 per cent is highest in the state. The rest of the districts range between these two districts. Dakshina Kannada also tops in urban area with 73 per cent scoring above 50 per cent marks and Bijapur lowest with only 28 per cent in 1998. Similar trend is observed in 1999-2000. It is clear that urban performance is consistently higher than the rural indicating better schooling in urban Karnataka than in rural areas of the state. Dakshina Kannada district has consistently shown best results in the state.
It is also seen that results in Government schools are poorer as compared to private schools (aided or unaided) in Karnataka reflecting poor teaching in the government schools (see Table 19).
Table 19 : SSLC Results by Type of School 1990-99 in Karnataka
Type 1990 1991 1992 1993 1994 1995 1996 1997 1998 1999
Govt. 45.35 48.26 32.45 39.82 40.46 30.56 30.14 32.51 33.56 47.28Non-Govt. 60.03 62.23 57.14 56.65 57.02 51.50 49.55 57.24 49.72 61.72
Total 54.33 58.72 48.71 57.48 52.09 44.98 43.46 45.33 44.55 56.72
The analysis of the data suggests that there are wide inequities in secondary school education. Enrolments are higher for boys than girls as it was in Primary Schools. The SSLC results that pave the way for either higher education or employment indicate urban areas, girls and non SC/ST and those who study in Private High Schools do well in Examination whereas students in rural areas, belonging to SC/ST, studying in government high schools show poor performance. These differentials also hold good across districts. During 1997-2000 region-wise results do not show consistent trends, Old Mysore region which many believe, is in the forefront, is belied by the results. It lagged behind the state average in 1997 (43.6 as against 45.3 state average), more or less on par in 1998 (44.57 and 44.55) again lagged in 1999 (53.63 as against 56.72). Hyderabad Karnataka, however, is on par in 1998, better in 1999 and lagged only in 1997 as compared to state average. Madras Karnataka (biased by D.Kannada) has consistently shown much better results as compared to state average (65.1, 66.9 and 77.3 against 45.3, 44.6 and 56.7 state average).
It also suggests though literacy poor districts such as Raichur, Gulbarga, Bidar, Bellary and Bijapur that lag behind others in literacy, enrolment and continuation, seem to be relatively more efficient in secondary education as seen in better performance in1999 and 2000. SSLC results in Bijapur district in 1997 showed only 12.5 per cent pass that rose to about 33 per cent in 2000. It also needs to be noted that with all the stern measures the State government takes to ensure orderly conduct of examination, newspapers often report instances of copying in SSLC examination in some districts.
Enrolment In Pre-University Courses
On completion of SSLC examination successfully, students desirous of continuing higher education leading to either technical or general courses will have to enroll in PU colleges. The number of students pass in SSLC and enrolled in PUC is presented in Table 20.

No. passed in SSLC
No. enrolled in PUC
Per cent discontinued
1996
1997
1998
272965
244218
235872
243966
211217
224585
89.38
86.49
95.21
10.62
13.51
4.79
The enrolment in I PUC during 1996-98 show that about 90 per cent of the students who passed SSLC got admissions in PU colleges in the state. In 1998 almost 95 per cent of students were enrolled - 9 percentage points higher than the previous years. It is to be noted that in addition to the SSLC examination conducted by the state, CBSC/ICSC also conducts X Standard examination at national level and those who pass in Karnataka are also eligible for admission in PU-I. There is a general impression that these two streams of students are better than the SSLC stream of the state. But there is no data available for them. Therefore the number of students enrolled in I PUC may not be only from SSLC pass from the state but also include those who pass supplementary examination of the state and CBSC/ICSC streams and under the circumstances about 10-15 per cent students may not get entry in PU Colleges in the State. The rush for admission in better known colleges indicate that those who score low marks in SSLC may find it difficult to join PU-I as such seek admission in lesser known colleges. The enrolment across the districts is given in Table 21.
Table 21 : Enrolment in I PUC in Karnataka during 1996-98 by Sex andDistricts
District1998 1996
Boys Girls Sex ratio Boys Girls Sex ratioBangalore (U) 17606 17615 1001 18907 18121 958Bangalore (R) 2525 2155 853 3619 2415 667Kolar 4813 2557 531 7482 3990 533Tumkur 5690 3760 661 8934 5899 660Mysore 9042 6648 735 9227 7185 779Mandya 3590 2570 716 4522 3458 765DK 10791 8460 784 8650 8610 995Kodagu 1225 915 747 1565 1090 695Chitradurga 11974 4934 412 10343 6086 588Chickmagalur 2392 1826 763 3517 1289 367Shimoga 4150 3662 882 5530 4878 882Hassan 3605 2920 810 5207 4140 795Dhanwad 12513 10698 855 11025 10129 919Belgaum 8711 5304 609 9889 6790 687Bijapur 10390 5457 525 11475 5572 486UK 3755 2285 609 3490 2199 630Gulbarga 6534 2686 411 6508 2760 424Raichur 5442 2284 419 4183 1850 442Bidar 5077 2572 495 4053 1594 393Bellary 3921 1589 405 4789 2996 626State 133746 90839 679 142915 101051 707

The enrolment in PU-I do not show a rising trend in the state. Similar trend is observed in the districts (Table 21). The number of girls enrolled per 1000 boys, infact, has markedly declined in 1996-98 period in Dakshina Kannada which is surprising. 10 other districts also show decline in sex ratios in enrolment. In absolute number there are over 10,000 fewer girls enrolled in 1998 as compared to 1996. Similarly the enrolment of boys show considerable decline is surprising.
PUC Examination Results
The outcome of PUC examination result is crucial for students as it determines admission to higher technical education. As noted in the Introductory chapter, the remarkable success in Information Technology and Computer Application in Karnataka has created greater demand in those subjects as it ensures well paid prestigious jobs. These degrees also have demand in USA and other advanced countries. In addition to engineering, medicine also is a very popular course of study in Karnataka and the state boasts of having largest number of medical and engineering colleges in the country. The state conducts an Entrance test and admissions depend on the merit (Marks obtained in PUC + Entrance test divided by 2). In addition to merit, admissions are also made to those who are not in merit list by levying higher fees. The philosophy seems to be that those who score well will get higher subsidy and others not scored well have to spend more for the chosen courses. There is provision for students from other states and countries also. In this background PUC has become the major determinant of students future. The two years period, naturally, is examination oriented and students are mainly prepared for it leading to higher education. The results of PUC II year are presented in Table 22.
Table 22 : PUC II Results (per cent Pass) in Karnataka during 1991-2000by Rural/Urban Areas
Year Urban Rural Total1991 38.34 33.03 35.161992 32.56 30.31 31.601993 40.37 36.84 38.831994 39.92 34.55 37.641995 44.24 42.65 43.561996 45.15 40.68 43.151997 39.73 33.83 37.081998 37.21 32.36 35.021999 40.31 37.53 47.882000 59.72 51.08 46.48
The pass percentage during the decade show that rural results are lower in every year as compared to urban and varies between 2 to 8 percentage points. The performance of SC/ST students during past five years (1995-2000) shows very poor results among them. *

PUC II Results of SC/ST students in Karnataka 1995-96 - 1999-2000 (per cent pass)
1995-961996-971997-981998-991999-2000
31.8324.4721.1613.6127.66
34.6926.3423.7614.8428.21
50.9944.0744.6447.8851.38
The per cent pass of SC/ST students is significantly lower than general population and within the Scheduled Category results of ST students are relatively higher throughout the 5 year period.
The gender differentials in PUC II Results are observed in Table 24 below in Arts, Science and Commerce streams.
Table 24 : Per cent pass In PU II Arts, Science and Commerce by SexKarnataka : 1995 - 2000
YearArts Science Commerce
Boys Girls Boys Girls Boys Girls1995-96 32.48 46.46 44.66 52.02 50.34 69.291996-97 32.78 49.88 38.14 49.70 57.28 71.821997-98 2198 38.69 33.0 44.70 44.06 65.621998-99 33.35 ■ 50.43 49.12 59.93 53.18 72.901999-2000 29.40 46.09 38.56 52.14 49.22 71.06
While the girls enrolment lags behind the boys their performance in the PU II examination is much better in all the three streams - Arts, Commerce gnd Science during the five year period like it was observed for VII and X class results.
The performance of districts in PU II results show that Dakshina Kannada tops the state with 70 per cent and above pass during the last five years. Results of SC/ST students in D.K. also show highest per cent pass in the state as also of girls. No other district in the state has shown 70 per cent pass results indicating better schooling and equity in the state and best practices followed there that must have benefited all sections. These practices if followed in other districts may improve the performance in education sector (see Table 25).
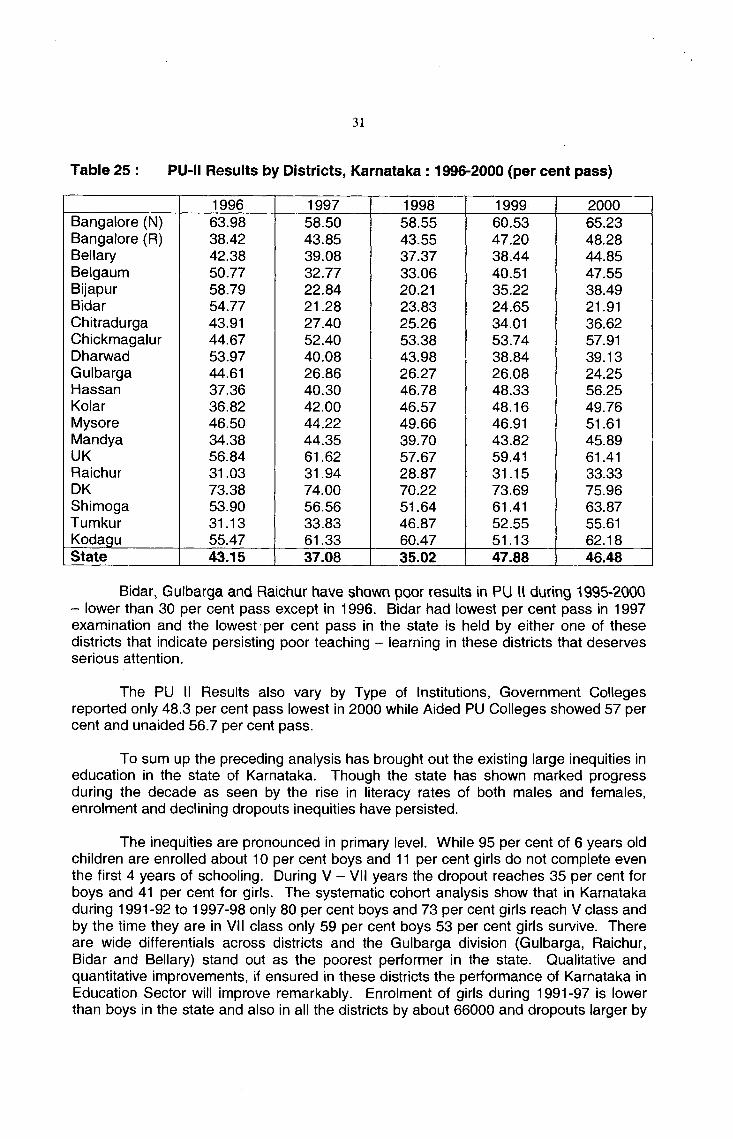
Bangalore (N)Bangalore (R)BellaryBelgaumBijapurBidarChitradurgaChickmagalurDhanwadGulbargaHassanKolarMysoreMandyaUKRaichurDKShimogaTumkurKodagu
63.9838.4242.3850.77 58.7954.77 43.91 44.67 53.97 44.61 37.36 36.82 46.5034.38 56.84 31.0373.38 53.90 31.13 55.47
58.5043.8539.08 32.77 22.84 21.2827.4052.4040.0826.86 40.3042.00 44.22 44.35 61.62 31.9474.00 56.56 33.83 61.33
58.5543.5537.37 33.06 20.21 23.8325.2653.38 43.9826.27 46.78 46.5749.66 39.7057.6728.87 70.22 51.6446.87 60.47
60.5347.2038.4440.5135.2224.6534.0153.7438.8426.0848.3348.1646.9143.8259.41 31.15 73.6961.41 52.55 51.13
65.2348.2844.8547.5538.4921.91 36.6257.91 39.1324.2556.25 49.7651.61 45.89 61.41 33.33 75.96 63.8755.61 62.18
State 43.15 37.08 35.02 47.88 46.48
Bidar, Gulbarga and Raichur have shown poor results in PU H during 1995*2000 - lower than 30 per cent pass except in 1996. Bidar had lowest per cent pass in 1997 examination and the lowest per cent pass in the state is held by either one of these districts that indicate persisting poor teaching - learning in these districts that deserves serious attention.
The PU II Results also vary by Type of Institutions, Government Colleges reported only 48.3 per cent pass lowest in 2000 while Aided PU Colleges showed 57 per cent and unaided 56.7 per cent pass.
To sum up the preceding analysis has brought out the existing large inequities in education in the state of Karnataka. Though the state has shown marked progress during the decade as seen by the rise in literacy rates of both males and females, enrolment and declining dropouts inequities have persisted.
The inequities are pronounced in primary level. While 95 per cent of 6 years old children are enrolled about 10 per cent boys and 11 per cent girls do not complete even the first 4 years of schooling. During V - VII years the dropout reaches 35 per cent for boys and 41 per cent for girls. The systematic cohort analysis show that in Karnataka during 1991 -92 to 1997-98 only 80 per cent boys and 73 per cent girls reach V class and by the time they are in VII class only 59 per cent boys 53 per cent girls survive. There are wide differentials across districts and the Gulbarga division (Gulbarga, Raichur, Bidar and Bellary) stand out as the poorest performer in the state. Qualitative and quantitative improvements, if ensured in these districts the performance of Karnataka in Education Sector will improve remarkably. Enrolment of girls during 1991-97 is lower than boys in the state and also in all the districts by about 66000 and dropouts larger by

13,931 as compared to boys. But girls who continue education perform better than boys as seen in the results of VII, SSLC and PU examinations during the decade. In other words while about 50 lakh children enrolled on an average in Karnataka during 19922001 decade about 31 lakh of them continued in Higher Primary - more boys than girls. There are, in addition differentials by rural-urban, regions and social class. Only about15 lakhs - more boys and less girls joined high school. Enrolment in PUC I is about 2.4 to 2.5 lakhs and only half or less of them pass the PU II Examination. The emerging conclusion is that years of schooling of 15+ age population remains lower because of high dropout at every stage more so during primary level. If the first seven years of schooling is improved qualitatively there could be marked improvement in secondary level of schooling.
General Issues in Disparities in Education in Karnataka : A Review
There are some general factors determining enrollment and retention in primary education. Significant among them is the fundamental lack of any value attached to education, an attitude especially prevalent among economically weak communities. A study conducted among the urban poor in India indicates that 25.18 per cent males and32.2 per cent females cited “lack of interest” as main reason for non-enrollment (Rangachar Govinda, 1998). The NFHS I! 1999 also tried to elicit reasons from parents for not enrolling their children in school, almost half the parents in urban and a third in rural area reported that their boys are not interested in studying. However, only about19 per cent parents gave similar response for girls not being enrolled. In the State as a whole one in three parents reported that their boys are not interested in studies while it was one in five parents for girls. At the family level, there are several determinants of education. Among them is socio-economic standing of the family, education of parents and their aspiration levels. Aspiration levels are influenced strongly by poverty and opportunity costs of schooling. In the case of families in which household income was less than Rs.750 to 1500 aspiration level was found to be lower (Rekha Kaul, 2001).
An intensive year round survey was conducted in 45 villages drawn from 10 districts - 5 districts from Coastal, Hilly and Southern Karnataka and 5 from Northern Karnataka that differed maximally in the incidence of child labour and schooling among children in 5-14 years. Based on the data on time-use, it was found that children in Karnataka spend on an average 4 hours a day on work - whether household or productive. Pattern of work differed among boys and girls - girls working more in household work and boys more in productive work. The analysis based on separate tabulations for school going and not school going children are supported by causal model. Significant negative reciprocal relationship was established between child labour and child schooling. This relation holds good at the child, household and village level. Income and related variables did not have any direct significant effect on child work as is widely believed (Kanbargi, 1991).
Another significant factor linked to child schooling in rural areas is the degree of modernisation of a given village. A village level study identifies various development indicators such as distance from the city, approachability of the village, number of government institutions in the village, availability of pijinted matter, etc. as determinants of the village’s “modernisation” score which had a direct and positive correlation with literacy levels (Rashmi Sharma, 1998).

Order of birth is a significant factor in determining enrollment and dropout. Firstborns are often made to lool< after younger children (especially in the case of girls) or in the case of male children, they are in paid or unpaid labour. The result is that the chances of younger born children receiving education are higher than that for first born children.
Poor Quality of Schooling
In examining education from the supply perspective, a predominant area of research points to the poor quality of schooling and the failure of the educational system to be responsive to the needs of the community it serves (Rekha Kaul 2001, PROBE 1999, Rukmini Banerji 1997). Poor quality refers to a range of issues that riddle the educational system; poor infrastructure, absent, irregular and unmotivated teachers, high Pupil Teacher Ratios (PTRs), poor teaching methods and various other factors contributing to low achievement levels.
In an environment where education is largely not recognised as having any value, poor schooling quality exacerbates poor enrollment, retention and achievement levels. High Pupil Teacher Ratios (PTRs) can hamper teaching-learning processes and result in low retention levels especially in developing countries (Rekha Kaul, 2001). In Karnataka, although there are 1.92 lakh teachers working in primary schools, the PTR is as high as 1:60 in rural areas and 1:47 in urban areas and there are 6074 single teaclier schools in the state (Human Development Report, Karnataka, 1999). .
A recent study also indicates that “teacher effects” including teacher absenteeism, low teaching time and corporal pur^ishment act as deterrents lor chiW schooling. The study found that schools were open for a minimum of 160 days rather than 210 days as stipulated by the government.
Specific Issues Related to Educational Inequities : Regions, SC/ST and Gender
Inequities in primary education are evident in literacy, enrollment, retention and achievement levels between the general population and SC/ST children, between boys and girls, and between high and low performing districts.
Regional Disparities
A quick look at the census figures clearly indicates the regional imbalances in education between the northern and southern parts of the state. Bidar, Gulbarga, Raichur and Bellary districts have occupied the lowest state ranks respectively for total literacy in the 1981 and 1991 census. On the other hand, the southern districts of Hassan, Shimoga and Tumkur occupy 8, 5 and 11 ranks in both the 1981 and 9, 5 and10 in the 1991 census.
These imbalances have, in some cases, existed since 1961 and seem chronic. Devdurga block in Raichur, for example, was ranked last at 175 with a rural female literacy of 6.2 in 1961, which increased to a mere 9 per cent in 1991, 30 years later. On the other hand, Dakshina Kannada continues to occupy first place within the state since 1961.

While the literacy levels reflect the general socio-economic status of the region, there is a strong case for positive discrimination in favour of the educationally backward districts through additional budgetary support to ensure that the gap between advanced and low performing areas is bridged.
Caste and Tribal Gaps
Historically, economically, socially and educationally disadvantaged members of Scheduled Caste and Scheduled Tribe communities have been targeted as beneficiaries for special schemes and programmes to promote their education. According to the 1991 census, there are 1091 SCs and 573 STs in India, constituting 16 and 8 per cent of the population respectively. Karnataka has the largest number of SCs (101) (World Bank, 1997).
Nationwide, the caste gap and tribal gap in net enrollment rates is 10-15 and 1520 percentage points respectively as per the 1981 census. In Karnataka, the caste and tribal gap in primary enrollment (1993-94) and dropout rates (1986-87) is as follows;
Table 26 : Enrolment and Dropout by Caste/Tribe
Gross enrollment Rate, 1993-94 Dropout rate, 1986-87Caste Gap Tribal . Gap Caste Gap Tribal Gap
State Grade 5 Grade 8 Grade 5 Grade 8 Urban Rural Urban Rural
Karnataka 32 0 18 -14 17 -7 20 U
All India 41 7 2 -17 10b 10b 12b 2b
b refers to average of selected states.
Source; Enrollment rates - Ministry of Human Resource Development, 1994c.Dropout rates NSSO 1993a and 1993b.
The Scheduled Castes and Tribes display lower attendance, lower achievement and higher dropout rates. The reasons for this are many such as these households have lower incomes, a result of historical discrimination, the percentage of working children in these communities is much higher (70 per cent in SCs compared to 24 per cent of other children - Aganwal and Sibou, cited in World Bank, 1997).
Poor achievement levels of SC/ST children result in higher dropout rates (Rashmi Sharma, 1998). According to data compiled by NCERT, the reasons for poor achievement levels are;
1) These groups seem to get fewer educational facilities such as buildings andadequate number of teachers.
2) SC/ST communities do not use or derive enough benefits from the facilitiesavailable.
3) Language of these groups is different from language of instruction in schools.

-Jatiaa*' Ui9»itu<« of M«o»«ioaal PI*,* >nd A^liainistratxon.1 7 - ' Ai»sol»iB4® M«t|*
og New Delbi-11®®! ^
Further, several studies point to both overt and subtle forms of discrimination against SC/ST children by upper-caste teachers (Jalaludin, Nambissan cited in World Bank, 1997). These practices range from making the children sit separately in class or refusing to drink water offered by them, etc. Many teachers display their own middle- class biases and treat SC/ST children as a burden imposed by the government. In our own study it was found that while upper-caste teachers vehemently denied the existence of any caste bias within the school, lower caste teachers confirmed that such; discrimination exists, even if in a subtle forms.
It is clear that various factors both within and outside the school operate to keep enrollment, retention and achievement levels of SC/ST children at low levels. The dropout rate for SCs in 1999-2000 is 23.60 percent at the Lower Primary School and 34.57 at the Higher Primary School.
In the case of Scheduled Tribes in particular, their separate and independent cultural and somewhat isolated social identity,' including language, makes it difficult for them to function effectively in a rigid, unresponsive schooling system.
Improper Implementation of Schemes and Programmes
Several schemes have been initiated to promote primary school enrollment and retention. Many of these schemes are especially aimed at disadvantaged groups such as SC/ST children and girls in particular. These schemes include provision of free textbooks and notebooks, uniforms, scholarships and hostels for girls and SC/ST children. However, they are poorly implemented. '
A 1993 study by NCAER indicates that while about 70 percent of students receive free textbooks in Karnataka, the number of beneficiaries for the midday meals is about 25 percent, for scholarships it is less than 5 percent and for transportation, is about 5 percent. Informal discussions with communities also clearly indicate that the difficulties inherent in accessing these scholarships which are a paltry amount to begin with, limits their effectiveness in promoting enrollment.
It has also been suggested that such welfare measures as free scholarships and hostels should be based on economic status rather than caste as is currently the case.' Even though SC/ST and other backward castes, typically constitute the poorest part of the population, only 3 percent of beneficiaries are from "financially weak" households and only 2 percent receive the incentive on a "merit plus income" criterion (World Bank, 1997).
What was started as a cooked nutritious midday meal for school-attending children has changed into the distribution of free food-grains every month for the family, diluting its intended direct effect of encouraging school enrollment and attendance.
Ancillary schemes such as transportation, anganwadis and creches (which especially influence girls' access to schooling) and upgradation of lower primary schools into higher primary schools would increase enrollment and retention. However, little attention has been paid to such efforts to reduce gender disparities in education.

Economic Factor
Almost all studies point to poverty as a significant factor contributing to inequity. A study by NCAER in 15 states indicates that the poverty gap in enrollment is 25 percentage points (World Bank, 1997). That is, the enrollment rate for children in the poorest households (those with annual incomes of less than Rs.3,000 per capita) is on average 25 percentage points lower than it is for children in the wealthiest households (with annual incomes of over Rs.10,000 per capita). The dropout rate for children from poorest households is also 4 times higher than for those from affluent households.
While different studies do not see a direct correlation between poverty and lack of education (PROBE, 1999) one study finds that below a certain threshold, poverty combined with unattractive schooling facilities does play a role in restricting enrollment and retention. In this study 45.72 percent of respondents cited economic compulsions as the main reason for dropout, followed by parental apathy (9.14 per cent), a boring school (6.28 percent) and miscellaneous reasons such as distance of the school, caste discrimination, etc., (3.42 percent) (Rekha Kaul, 2001).
Despite the various schemes and programmes, primary education in government schools is not really free. On an average, poor parents in rural areas spend Rs. 600-800 per child per annum while those in urban areas spend Rs.800/-1200 per child per annum (Rekha Kaul, 2001). The indirect costs of schooling - the opportunity cost of the child's labour - are estimated at Rs. 13 a day.
Social Discrimination Issues
Discrimination and abuse of dalit and other low caste children by upper caste teachers is another significant factor reported to be affecting enrollment and retention among these communities. Further, the low participation of low-castes in Village Education Committees through which these issues could be addressed contributes to the continuance of such attitudes and practices (Rekha Kaul, 2001).
Cultural Factor
Gender plays a significant role in educational disparities. NFHS data from 199293 indicate that the main reasons for girls not enrolling are economic activity (33 percent for rural girls and 30 percent for urban girls) and lack of interest (32 percent for rural girls and 33 percent for urban girls).
Within the state of Karnataka, the gender gap in literacy rate for age 7 + is -23 percentage points (1991) that declined to about 20 percentage points in 2001. The gender gap in literacy is mostly due to gaps in enrollment and retention which have narrowed in recent decades.
Widely prevalent is the parental attitude that investing in girls education is a waste since they will, in any case, go away to their husbands' homes. Girls' education is especially sacrificed if resources are stretched (Jeejibhoy, 1989). However, it must be noted that girls' education is not valued even in the presence of abundant resources. In Mandya district, for example, even families that were wealthy did not educate the girls since they placed no value on it. In the case of girls, the presence of male teachers sometimes acts as a deterrent, especially in higher classes.

The opportunity costs of education is also higher for girls than boys. Studies indicate that girls spend 15-20 percent more time working than do boys. The main reasons cited for girls' non-enrollment is household work (87 percent), including care of younger siblings especially in areas where adequate functioning day care centres and anganwadis are absent. (World Bank, 1997).
Time-use studies of children in India suggest that girls have fewer hours available for schooling than do boys, resulting in lower attendance. One study in Tamil Nadu found that on the day of the survey, 41 percent of registered girls in grade 2 and22 percent of girls in grade 5 were absent, compared with 30 percent and 16 percent of boys in the same grades (World Bank, 1997).
On the demand side, determinants of girls' education are: economic standing of the family, parents education and occupation and the danger of traditional occupations suffering as a result of girls' schooling. It was found that salaried parents encouraged girls schooling.
On the supply side, the absence of transportation, distance of school, coeducation, presence of male teachers and fears of sexual harassment and safety reduce girls' enrollment and retention, especially after Lower Primary School.
Evidence suggests that gender gaps In India are mostly due to cultural and economic constraints and can be reduced through awareness campaigns, anganwadis, direct incentives and the hiring of more female teachers (World Bank, 1997).
Communttv participationCommunity recognition of the value of education and participation in schooling is
an essential factor in high literacy areas. The establishment of School Betterment Committees (SBCs) or Village Education Committees (VECs) was meant to promote such community participation. However, evidence from some districts shows that lack of participation of women, SC/STs and uneducated people in VECs weakens community mobilisation element. In some cases, it results in further empowerment of the elites; in other cases, it was found that even when there is representation of women and lower caste communities, the participation tends to be really low.

CHAPTER III
PROMOTING EQUITY IN EDUCATION: THE PROGRAMME INTERVENTIONS IN KARNATAKA
This chapter attempts to document all the schemes, programmes and interventions designed and implemented by State and Central governments intended to promote equity in education in Karnataka. It will also try to examine them critically wherever possible and study their impact on schooling from primary to PU levels.
Considering the caste, gender and rural-urban disparities in Karnataka several schemes and programes are initiated in the State by the government. Though most of the schemes/programmes are implemented by the office of the Commissioner of Public Instructions, some other state government departments like Women and Child Development, Social Welfare, Labour and Integrated Tribal Development are also involved in programme implementation. However, an integrated approach to schooling is not visible in the state.
Accessibility to Schooling
The first important step taken by the State government to reach the goal of universalisation of primary education is by improving physical accessibility to school to all children in the state. The latest available information shows (VI All India Educational Survey; State Report, Government of Karnataka, 1998) that 91 per cent of habitations have a school within the habitation and another 5 per cent within one-kilometer distance. The proportion of habitations- having predominantly SC populations with a school within their habitation is 88.5 per cent and for ST population it is 92.3 per cent. In other words, the state has been able to provide schooling facility to all sections of population within easy reach of children. This is explained by the massive expansion in the number of schools established during the last three decades. There were 30,991 governntent and 1228 private Primary Schools in Karnataka in 1968-69 (total 32219) that has increased to 40,259 and 6641 (Total 46,900) during 1997-98 (HDR, Karnataka. 1999). The Task Force on Education has reported that there are 48,716 primary schools during 19992000 (for latest situation see Table 27).
The table 27 provides a glimpse of rapid expansion in the provision of primary schooling in Karnataka state during the decade 1992-2001. The data show the transition from l-IV years of schooling to V-VII years over the decade that rose from 17,157 to 27,611 that indicate the gradual rise in demand for higher primary education. The total number of teachers also increased from 1,43,000 to 2,34,100.

Y E A R
Type 199293
199394
199495
199596 1996-97 1997
981998
9919992000
2000
01
LowerPrimary
HigherPrimary
Total
23383
17157
40540
22678
18916
41594
22768
18916
41684
23447
19032
42479
24671
20345
45016
23116
23859
46975
23226
24909
48135
22533
27107
49640
22303
27611
49914
No.ofTeachers
143000 143000 148000 168000 183000 191000 204000 234100 234100
Source; CPI Office.
Similarly there is significant increase in the number of Teachers in Primary Schools in the state - 91,244 during 1966-67 to 1,91,929 during 1997-98. During the same period proportion of female teachers has doubled from about 22 per cent to 44 per cent (286 per 1000 male teachers to 773). The rise in sex ratio among Primary School Teachers (number of female teachers per 1000 male teachers) is accompanied by favourable sex ratio in enrolment from 757 girls enrolled for every 1000 boys during 1980-81 to 903 during 1997-98 (HDR, K, 1999). Though the exact relation is difficult to establish and is debatable, observations indicate clearly. The improved sex ratios are seen in every district (see Table 28).
It is revealing that largest number of the Private Schools (479) in the State were located in Dakshina Kannada District (39 per cent) in 1968-69 followed by 17.5 per cent in Bangalore Urban District (215) and least in Bidar and Raichur districts (see Table 28). Establishing Private Primary School is an indicator of effective demand for schooling and the participation of community in its provision. Large private participation in higher educational institutions like engineering or medicine is motivated by large profits. But private primary schools in rural areas suggest social commitment in the community as there is little scope for profits. In 1997-98 also Dakshina Kannada District had large number of (618) private primary schools next only to Bangalore urban district that had 1500 (see Table 28). This indicates clearly the continued effective demand in Dakshina Kannada for primary schooling. The higher demand for primary schooling is reflected in the highest literacy rates there in the state.

Table 28 : Number of Primary Schools and Teachers in Karnataka1966-69 -1997-98 by Districts
Primary schools Primary school teachers1968-69 1997-98 1966-67 1997-98
Govt. Pvt Govt. Pvt Male Female Sexratio
Male Female Sexratio
BangaloreUBangalore RBelgaumBellaryBidarBijapurChickmagalurChitradurgaDKDharwadGulbargaHassanKodaguKolarMandyaMysoreRaichurShimogaTumkurUK
386257819461119692
1933122716451083179215341824345
2115144921211395182625591422
215775421
4 26 10 12
479661226
8541289
5 21
829
1303235926221332
8212300146122381459220519002407
3873121175225341811228338852079
1500203332239195497
90262618398354 11557
355 209 406 182 302 243
90
1587519349522639126157092443 4048 4376 6148 3710 3223
9823623303540692697384949362444
3654883
2174436296886501428
28901186435552448
1080428
1452234643731983
2032170 439 165 235 155 205 106 660 193 117171 456 298 141 357
87167148402
355745718397526536239127360963274209813382004546
7886134418659596164574168232880
141673589473328992381331723503604582752585414301115733918183058392323339644033858
3983785564551657363651570
1384647660662
1996639437980377592645
1340
State 30991 1228 40259 6641 70924 20320 286 108239 83690 773
One of the indicators of quality of schooling is Pupil-Teacher-Ratio (Number of pupils per teacher) which is given below for all districts by region. PTR indicate number of enrolled pupils per teacher. The higher PTR in Hyderabad-Karnataka districts and most of the districts in Bombay-Karnataka gives an impression that there are more pupils per teacher and high PTR is an indicator of poor teaching. Our visit to randomly selected 30 schools in Raichur revealed that normal attendance on any school working day was about a third of enrolled that suggest that PTR is not a reliable indicator.
Pupil Teacher Ratio
Old Mysore Region PTR Hyderabad - Karnataka PTR Bombay -Karnataka PTRBangalore N 34 Bidar 42 Bagalkot 41Bangalore S 33 Gulbarga 44 Belgaum 38Bangalore R 25 Koppal 46 Bijapur 40Chitradurga 31 Raichur 43 Dhanwad 39Davanagere 33 Gadag 38Kolar 27 Haveri 36Shimoga 26 Madras-Karnataka UK 23Tumkur 27Chamarajnagar 33 DK 32Chickmagalur 23 Bellary 42 Kodagu 24Hassan 24Mandya 27Mysore 32

It is interesting to note that Government has near nnonopoly providing prinnary education in rural areas and it is only in large cities one observes presence of private primary schools. In the state about 78 per cent primary schools are government, 9 per cent privately managed but funded by government and only 13 per cent run by private managements without any financial support from government. The HDR(K) reports that the percentage of enrolment in government primary school was over 90 per cent in rural areas and less than 50 per cent in urban areas. The pattern was similar in higher primary schools with almost 90 per cent in rural areas going to government schools and55 per cent of urban children studying in private schools.
Majority of private schools are in targe cities and they charge very high tuition fees, donations in the form of building fund or development funds. Private schools pay poor salaries to the teachers and do not provide any job security unlike in the government schools where teachers get about 5-6 thousand rupees with tenured and retirement benefits. Private school teachers get around Rs.1000 and can be fired any time without any notice. Teachers in the government sector have to have PU pass with teachers training which is not the requirement in private sector. They may be graduates or post-graduates, but urban location, better transport, living conditions and students coming from educated families and from better off section, attracts teachers with higher qualification at low wages.
The irony is that the general public perceive private primary schools as much better, even though very expensive and prefer them. The poor infrastructure, very poor results in the government school are mainly responsible for their perception. It is almost an accepted fact that the rich, salaried people, urban residents have ensured themselves better schools and better education while rural residents in general, SC/ST population in particular has to opt for education provided by the government schools of poor quality. The results of SSLC and PUC have clearly indicated this trend.
In contrast to the government monopoly in provision of primary education asnoted earlier, high school education is mainly dominated by private sector with 66-68 percent of high schools managed by them. Perhaps the constitutional requirement ofproviding free and compulsory education to all children in the ages 5-14 years explainsthis pattern. The recent proposal to enhance lower primary cycle by one year (l-V) andhigher primary school from VI-VIII reflects the renewed interest in meeting theconstitutional obligation by the state government.
\
Provision of High School Education
As the number of students completing VII Class increased the demand for secondary schools also increased. The VI All India Education Survey reports that about 90 per cent of habitations are having access to a high school within 8 kms of distance and 75 per cent within 5 kms from the habitation that indicate that a student aged 13-14 years can reach a high school easily given some transport facility - bus or bicycle. The distribution of high schools in the district is given below (Table 29).
Table 29 provides information on number of high schools managed by Government / Private and Male and Female teachers working there at two points of time 1968-69 and 1993-94. During the three decades the number of High Schools in the state have increased from 1830 to 8168 - almost four and half times. The number of teachers during 1968-69 to 1993-94 rose from 20598 to 59641 - almost three times.

The number of female teachers though rose by four times, their proportion does not show likewise increase as observed in case of primary schools teachers. The sex ratio shows little improvement during the period from 256 to 362. Low sex ratios are also observed in many districts. For example, in Bijapur in 1968-69 there were just 62 female teachers. Bangalore urban district was an exception with female teachers outnumtering males in 1968-69 and near doubling their ratio during three decades. Almost all districts except Dakshina Kannada and Mysore had lower sex ratio than state average. In 199394 also situation showed marginal improvement as Kodagu was added to the earliff two districts.
Table 29 : Number of High Schools and Teachers in Karnataka by Districtsandtype: 1968-69-1997-98
Districts
High schools High school teachers1968-69 1997-98 ^ 1968-69 1993-J4
Govt. Pvt. Govt. Pvt. Male Female Sexratio
Male Femile Sexratio
Bangalore U 30 125 107 923 1156 1348 1166 2844 5S9 2085Bangalore R 27 71 110 214 775 126 163 1629 $ 9 220Belgaum 8 137 138 506 1613 258 160 4088 1C54 258Bellary 32 32 95 147 656 95 145 1593 3 9 213Bidar 29 16 95 72 462 66 143 1556 ?78 243Bijapur 17 82 111 322 1128 70 62 3156 478 151Chickmagalur 24 24 90 178 340 43 126 1418 248 175Chitradruga 24 65 133 503 684 76 111 2845 ^ 3 159DK 53 101 196 236 1447 585 404 2384 1 11 508Dharwad 13 133 145 508 1520 278 183 4408 1C91 316Gulbarga 50 25 204 198 915 118 129 1933 J35 277Hassan 48 20 156 100 472 98 208 1957 ^70 240Kodagu 6 36 34 76 357 90 252 478 :44 718Kolar 41 36 153 193 657 124 190 1823 676 371Mandya 34 32 149 146 487 74 152 1365 J34 245Mysore 55 55 180 345 807 347 430 1908 J90 466Raichur 35 15 147 103 586 73 125 1251 265 212Shimoga 45 40 170 240 730 80 109 1923 i31 224Tumkur 33 79 146 333 871 88 101 3547 591 167UK 7 95 78 1888 741 163 220 1349 *40 326
State 611 1219 2637 5531 16398 4200 256 43455 16i16 362
Source: HDR(K) 1999.
Provision of PU Education in Karnataica
PU Education in Karnataka is provided either through Government colleges or through privately managed but government funded colleges or privately managed and also funded colleges. In 1997-98 there were 2106 Institutions - 698 govemmtnt PU colleges (including the ones attached to degree colleges), Private Aided PU Colleges (including the ones attached to degree colleges) and Private Un-aided Cclleges (including the ones attached to degree colleges 710. Some PU colleges were closed due to lack of strength. As on 7.4.2001 the distribution of PU colleges acrcss the districts are given in Table 30 below.

Districts
Bangalore UBangalore RBellaryBelgaumBijapurBidarChitradurgaChickmagalurDharwadGulbargaHassanKolarMysoreMandyaNKRaich ur SKShimoga Tumkur Kodagu_____State
Number
2476251126126791744715511281751287958661577214532
2072
N0./100,000 population
5 43446 85 4453455364 6 7
it is observed that largest number of PU colleges are in Bangalore city and lowest in Kodagu. The Population Institutions (imparting PU education) ratio though uneven - do not correspond with the performance - either enrolment or outcomes. Indicating poor quality of instruction resulting in lack of demand. But it is observed in2001 academic year that many students with 80 per cent marks in SSLC were not able to get admission in their preferred college very clearly suggesting greater demand in PU colleges showing good results particularly in large cities like Bangalore. The reduced number of PU colleges during last couple of years clearly bring out the declining enrollment we saw earlier and strong increasing demand in better colleges with proven record of excellent results of 100 per cent pass with 70 to 80 per cent in first class with distinction who are likely to get admission in technical courses in engineering and medicine. Naturally most of them have better previous schooling and come from better strata of educated section in the society.
What emerges from the presentation in this section is while primary schooling is dominated by government secondary schooling is dominated by private sector participation. But it clearly brings out adequate number of Primary schools, high schools and PU colleges in the State. PU colleges are faced with the declining demand and their numbers are likely to decline in selected areas where quality of instruction is poor as seen by poor results. This is also indicated by difficulties faced by students in enrolling in good PU colleges in urban areas. There is need to examine and grade colleges by their infrastructure, results etc. to bring effective intervention to improve them which alone will be able to sustain these institutions and higher education.

Competing demands on scarce resources makes resource allocation to different sectors a complicated exercise. Historically in India and also her States the observed allocation pattern suggest that education and health have not received adequate resources because of various factors. While at national level 3.8 per cent of Gross National Product (GNP) is spent on education, Karnataka spends slightly less - 3.2 per cent of State Domestic Production (SDP) on education. The expansion noted before in the number of Schools and Teachers has of course increased the expenditure from 161 crores in 1980-81 to 2510 crores in 1998-99. However, as proportion of total State expenditure it has hovered around 15-16 per cent.
Within the Education sector Primary sector gets around 55 per cent of the allocation. The estimated percapita expenditure on Primary education at current price is about Rs.1350. It should be noted here that 90 per cent of the expenditure is accounted for salaries of teachers. This leaves little scope for bringing in any qualitative improvements in schooling. The visible dilapidated school buildings with hardly any facilities like drinking water, toilets and other educational materials that will greet any visitors to a randomly selected school is a reflection on this. The unprecedented population growth observed during 1961-1991 has played a havoc with the available public resource and poor community participation in building and running schools in educationally poor districts have contributed enough to the observed mess in schooling of children. Equally complicated would be the task of managing the sharp decline in fertility and initiating the needed policy changes to match the situation in the coming years. Trends and patterns of resource allocation to education is presented in Table 31 below.
Table 31 : Resource Allocation to Education in Karnataka : Trends andPatterns 1990-2001 (Rs. In crores)
Year Total revenue and
capital expenditure
Expenditure on education
Per cent for education
Per cent on primary
education
Per cent on secondary education
1990-91 4625.90 758.52 16.39 53.73 29.201991-92 5739.98 908.08 15.85 51.57 30.021992-93 6378.32 1040.05 16.30 50.89 32.931993-94 7321.08 1210.86 16.53 53.77 30.161994-95 8401.34 1368.99 16.29 52.34 30.801995-96 9721.63 1611.84 16.57 53.24 31.431996-97 11353.04 1805.53 15.90 53.97 30.731997-98 12942.32 2057.96 16.14 53.65 31.451998-99 15579.74 2435.23 16.73 53.64 31.951999-2000 17818.63 2747.45 16.61 53.29 31.542000-2001 20061.06 3489.67 17.67 49.21 28.03
Several studies and reports have argued that there is an urgent need to allocate more resources to education particularly Primary Education including the Report of the Education Ministers of all the states who met to work out a strategy to universaiise primary education by the turn of the century.

General Schemes For AN Children
Modified Akshaya Scheme
This is a toned down version of the controversial cash incentive scheme introduced in 1991-92. Under this sclieme students in Classes l-IV in government schools with parents whose annual income was less than Rs.6400/- were to get Re.1 per teaching day provided they had 80 per cent attendance in school during the month. There were an estimated 40 lakh beneficiaries under this scheme. The scheme was withdrawn in April 1993 due to several problems such as shortage of funds, its political and populist overtones etc. The focus is now on providing free uniforms and textbooks, supplementary nutrition, improving and constructing school buildings and play grounds etc. Expenditure under this scheme during 1993-94 was expected to cross Rs.44 crore with over 40 lakh beneficiaries (Human Development Report, South India, 2001).
Midday Meals/Free Food-grains
The provision of food as an incentive for primary school enrollment and retention has taken many forms. This originally started with the distribution of free, energy food as a midday meal under CARE between 1962-1992.
Between 1993-94 the Akshaya Ahara State scheme was launched through which 50 gm of energy food was given to each child in the l-IV classes for 20 days a month. The energy food is a mix of sugar, jaggery, wheat/rice powder and vitamins.
The National Programme for Nutritional Support to Primary Education (NP- NSPE) was introduced by GOI in August 1995 to enhance the nutritional status of school children and boost universal primary education. In 1995-96 it was introduced in 119 revenue taluks of 16 districts in the state. This involves distribution of 3 kg of free food- grains every month for 10 months to all children having a minimum of 80 per cent attendance in (flass l-IV in government and government-aided schools.
In 1995-96 the scheme was extended to 147 revenue taluks in 18 districts. In 1997-98 this was extended to urban taluks and is now functional in all 28 districts of Karnataka. Beneficiaries and distribution is based on enrollment figures. Though the reach and coverage of the food distribution is considered good, there have been some problems with the quality of the food grains distributed. Some rough data seems to indicate that the programme has some impact:
Extent of Dropout During Pre and Post Programme Period
Period % Dropouts
Pre-programme:Post programme:
Source: R eport P resented a t the February 2000 Regional A dvocacy W orkshop on N utrition in C henna i, on 15.2.2000.
Total Boys Girls SC ST38 39 36 40 4532 31 32 36 42

A comparative study of schools in Karnataka where the mid-day meal was functioning and where there was no mid-day meal scheme indicates better enrolment (p<0.05) and attendance (p<0.001), higher retention rate with reduced dropout rate (p<0.001), a marginally higher scholastic performance and marginally higher growth performance of children in schools that had the cooked mid-day meal (A Laxmiah, et.al., Indian Pediatrics 1999),
Other studies show that there has been an increase in enrollment in primary schools in Tamil Nadu since July 1982 following the introduction of the Noon meal scheme by 70 per cent (Brindavan C Moses, 1983: S Irudaya Rajan, A Jayakumar, 1992).
There is abundant evidence demonstrating the effectiveness of mid-day meals programme. A GOI evaluation indicates a reduction in dropouts from 45 per cent in1992-93 to 39.5 per cent in 1997 while other studies indicate a reduction in dropout rate from 40 to 22 per cent in Tamil Nadu (S Irudaya Rajan, A Jayakumar, 1992). Another study indicates that the chances of girls completing primary education are higher in general and 30 percentage points higher for girls living in villages with a mid-day meal scheme than others (School Participation in Rural India, Jean Dreze and Geeta Gandhi Kingdon, 1999).
Namma Magalu, Namma Shakti
Introduced in 1996-97, this Central scheme is open to any girl child between 5 and 6 years. If she’s enrolled in school gets LIC policy for a premium of Rs.2500, which is paid to her with full dividends if she continues her schooling and remains single at the age of 18, at that time she gets Rs.4,400. In the interim she gets annual dividends.
Children are identified through the anganwadi worker, who reports to the Block Child Development Project officer, for the Integrated Child Development Scheme (ICDS) who reports to the district officer of the DWCD. Monitoring is done by the zilla panchayat
A review of the annual statement for 1997-98 indicates that almost in all the districts the number of actual beneficiaries falls short of the number of beneficiaries identified. For example, Bangalore Rural, Raichur and Mangalore each have 2000, 810 and 1473 identified beneficiaries, but only 857, 810 and 716 actual beneficiaries. The scheme was temporarily discontinued for a year due to some problems with paper work at the LiC but has now been renewed.
Despite the complicated procedures involving more than one agency, available data show that during 1997-98 it was possible to identify 23,744 beneficiaries and Rs.375.07 lakhs were allocated of which 14,610 girls were provided Rs.365.26 lakhs. It may be noted that the number of beneficiaries was largest in Gulbarga (1234 girls) receiving 30.86 lakhs rupees. However, in Raichur where female literacy is lowest only 686 beneficiaries received Rs.17.15 lakhs.
During 1998-99 the Budget provided for this programme was Rs.795.51 lakhs. Out of which only 557.78 lakhs were released and only Rs.432.22 lakhs were actually spent on the total beneficiaries - 17529 girls, 2485 (14.2 per cent) belonged to Scheduled Castes and 791 (4.5) to Scheduled Tribes.

The number of beneficiaries under food grains distribution has risen from 29.9 million children during 1995-96 to 56.6 million during 1998-99. Among the beneficiaries 21.8 per cent belonged to Scheduled Castes and 8.08 per cent ST children. The total expenditure incurred was 6.23 crores in 1999-2000 of which about 14 per cent was incurred by the State.
The Vidya Vikas Scheme
This scheme was formulated in 1985 to ensure all children enrolled in school are retained till the end of the cycle and participate in every school activity. During the period several changes have been made in respect of coverage of children and number of uniforms supplied to the beneficiaries.
Presently, under the scheme, one set of uniforms are distributed to all students in l-IV classes and for SC/ST students from V-VII classes also in Government primary schools. The boys were supplied steel gray coloured half pants and blue striped polyester shirt. Girls were provided with a maroon coloured frocks and langa and maroon coloured blouse. During the year 2001-2002 based on the preference shown by children, parents and teachers light blue shirts - navy blue half pants were distributed to boys and to girls light blue blouse.
The Beneficiaries Under Vidya Vikas Scheme
Boys (in lakhs) Girls (in lakhs)
Expend-
Year Gen. SC ST Total Gen SC ST Total iture in Rs. Lakhs
1995-96 10.25 2.93 1.46 14.64 9.44 2.69 1.35 13.48 11351996-97 11.56 3.30 1.66 16.52 10.50 2.99 1.50 14.96 19551997-98 11.92 3.40 1.70 17.02 10.80 3.07 1.54 15.37 22691998-99 15.84 7.61 2.68 24.15 15.10 6.05 2.16 23.35 37711999- 9.78 6.45 2.61 18.84 9.32 5.70 2.24 17.26 280020002000- 15.96 7.16 2.86 25.98 14.90 6.41 2.53 23.84 3724.932001
The above table shows that the number of boys benefited from the scheme has increased gradually from 10.25 to 15.84 lakhs during 1995-96 to 1998-99 followed by a steep decline to 9.78 lakhs in 1999-2000 and again rose to about 16 lakhs next year. The number of beneficiaries among SC students has risen by 2.4 times - much higher than other caste students while the number of ST boys has also doubled. The increase in number of girls belonging to SC is also 2.4 times while it is lower among ST girls.
During 2000-01 the State Government to enhance schooling of girls has decided to provide free education to all girls up to Pre-University level and accordingly extendedV V scheme to Non-SC/ST girls from V-VII classes and all girls from VIII to X classes studying in Government Schools.

Balika Samriddhi Yojana (BSY)
BSY is a centrally sponsored scheme and extends 100 per cent assistance to States and Union Territories designed mainly with following objectives;
1) To change negative family and community attitude towards the girl child and towards her mother.
2) To improve enrolment and retention of girls in school and raise their age at marriage.
3) To provide financial assistance to girls to undertake income generating activities.
Balika Samriddhi Yojana applies to both rural and urban areas.
The eligibility criteria are:
1) Families should be below poverty line identified under Integrated Rural Development Programme.
2) in urban areas families covered under Targeted Public Distribution (TPDS) or living in slum areas engaged in sale of vegetables, flowers, fish etc. and pavement dwellers.
Those eligible under Balika Samriddhi Yojana are entitled to get
a) A post-birth grant of Rs.500.
b) When she starts attending school she wi l get during first three years Rs.300 per annum, Rs.500 during studying in class IV, Rs.600 in Class V, Rs.700 for two years in class VI and VII, Rs.800 in Class VIII and one thousand during class IX - and X on successfully completing each year in school.
The amount mentioned above should be kept under high interest earning deposit schemes which can not be withdrawn before its maturity on her 18' birthday if she is single she can withdraw the amount by producing a certificate to that effect from Gram Panchayat in her village. The Department of Women and Child Development in the state will release the annual scholarships and integrated Child Development Scheme will disburse the amount. This scheme is yet to take off effectively though during 1999-2000 there was a budgetary allocation of Rs.151,35 lakh. The allocation to the districts was determined on the proportion of females and SC and ST population in the district.
Funds released by GOI for 1997-98 and 1998-99 total Rs.166,91,500 132,06,500 respectively. The Utilisation Certificates for the same years are Rs. 142,30,840 and Rs. 156,67,152 respectively. For the year 1999-2000 the budgetary allocation is Rs.151.35. lakhs. A review of the budgetary allocations across districts indicates that the “backward” districts of Raichur and Gulbarga receive more than advanced districts such as Udupi. For example, in 1999-2000 Gulbarga received Rs.10,59,000 compared with Udupi which received Rs.3,38,000.

Confronted with the problem of universalisation of Primary Education Central Government initiated some programmes like Operation Black Board (1986), establishing District Institute of Education and Training (DIETS 1988), Total Literacy Mission (1988). In April 1993 the Central Government formulated broad guidelines for an innovative programme intervention known as District Primary Education Programme (DPEP) and launched in 42 districts drawn from 7 States having lower female literacy rates during1993-94 (first Phase) and after 4 years extended to 149 districts from 14 States.
DPEP is a unique effort made towards achieving the goal of UEE in India. It is based on micro-planning, participatory processes and empowerment of local communities and weaker sections. It also provides infrastructure to manage large-scale innovative educational projects. Decentralisation and Community Participation are its corner stone.
In Karnataka during Phase I four districts - Belgaum, Kolar, Mandya and Raichur were covered. Later in Phase II, 7 more districts - Bangalore Rural, Bellary, Bijapur, Bidar, Dharwad, Gulbarga and Mysore were added to DPEP.
Since its inception it has been able to provide schools in un served areas having a population of 200 or more and ensured 100 per cent access to schooling. But access to all out-of-school children could not be ensured of schooling as Non-Formal Education (NFE) Centres could be established at only those habitations where micro-planning was completed. To improve access to out-of-school children DPEP developed a new Strategy ‘Chinnara Angala’ by identifying out of school children through “Fast Track Micro-Planning” technique.
The DPEP’s overall strategies can be divided Into:
a) finance-requiring activities such as enrollment and retention drives, gender- specific programmes such as toilets, gender training, NFEs and creches, teacher quality improvement, infrastructure, use of local resources and health care.
b) Non-finance requiring activities such as community mobilisation, micro-level planning, priorities to backward regions, priorities to scheduled castes and tribes, backward castes and minorities.
There is provision to organise Melas to raise awareness about the need for primary education and particularly girls education, production and distribution of related lEC /naterial, establishment of Village Education Committees (VECs) school improvement funds, interaction by DPEP officials etc. are other activities.
Unfortunately even in the DPEP strategy, there is inadequate focus on demand side factors. Less than 5 per cent of the total allocation was set aside for gender and awareness generation especially among women and girls (Vijay Bhaskar 1999).
The DPEP’s community mobilisation efforts have increased awareness about the programme and created a platform for VECs to gear up further mobilisation. However, there are concerns relating to the sustainability of community mobilisation activities since there is no concrete methodology for this (PRIA Evaluation Report).

Since the school development and monitoring committee has been sensitised to act as watchdog, it is likely to increase awareness among parents on education, monitor teachers attendance and performance; plus there’s gram panchayat education committee, that has made teachers feel that they are unnecessarily bothered by illiterate parents’ “policing” attitude.
The DPEP in Karnataka, though, has been able to reduce dropout rates, tags behind its set target of bringing drop out rates below 10 per cent. The 12' Joint Review Mission (JRM), 2000 notes with satisfaction the drop-out of girls in 1-4 years is lower than that of boys (14 per cent for boys and 12 per cent for girls). The latest survey of Education Department (2001), however, estimates 26.7 per cent of children in 6-14 years (24.4 per cent of boys and 29.3 per cent girls) in Raichur, 25.8 per cent children in Gulbarga (24.2 boys and 27.4 per cent girls) were out of school. The out of school children in these two DPEP districts account for about 30 per cent of out of school children in the state (over 100,000 in absolute number out of 3.1 lakh total of the state). The picture for Scheduled Caste children is far more grim than the general population noted in these two districts SC girls out of school account for over 42-44 per cent. About 35 per cent of the total in the state. The proportion of SC boys, however, is slightly lower 25 per cent.
The proportion of children (6-14) out of school however, is lower among ST boys and ST girls in the two districts of Raichur and Gulbarga as compared to SC children (Boys about 25 per cent and girls 27-29 per cent).
However, several qualitative changes have been brought by DPEP interventions. Repetition rates for both boys and girls have declined to 3>45 per cent for boys and 4.16 per cent for girls during 1999-2000. For SC boys and girls it is 6 per cent and 7 per cent during the same period. Achievements in learning also is lower among SC/ST children particularly for language testing for Standard IV. Girls achievement is generally equivalent to or better than that for boys.
Teacher Training Programmes to improve the skills have been Implemented through DIETS. Identifying children with special needs is in progress which is an innovative step in the education sector. Upgrading schools to V Standard from IV has improved retention rates and interestingly efforts have been made to create awareness in the community to the existing gender and caste inequities in education.
A review of DPEP’s EMIS suggests that there has been significant progress in access, participation, quality and capacity building. The establishment of Block Resource Centres and Cluster Resource Centres have helped systematise teacher training, and resource support. The introduction of activity based text books has increased child-centred learning (Report of the Task Force). The introduction of innovative teaching methods such as the Nali Kali approach in 1995 have encouraged child centred and activity based teaching processes. In Mysore district alone the original group of 15 teachers was increased to 192.
The DPEP has also initiated a system of Minimum Levels of Learning (MLL) that establishes minimum standards for learning achievement and monitors quality of teaching.

In brief, several innovative steps have been initiated that have for the first time tried to bring in qualitative changes in prinnary education and there is evidence of improvements and its impact on non-DPEP areas also.
Jana Shala Programme
Another unique experiment initiated jointly by Government of India and Five United Nations Agencies - UNICEF, UNDP, ILO, UNESCO and UNFPA started in Karnataka recently called ‘Jana Shala’. Based on the baseline study and Social Assessment Study, 29 Education Blocks were identified on the criterion of I) Low Female Literacy, ii) Inaccessible areas (to schooling), iii) Tribal Population, iv) High fertility areas, v) Implementation of Total Literacy Campaigns and vi) Special problem areas.
These selected blocks are in non DPEP areas. The programme envisages a) Direct programme Interventions, b) Convergence with existing schemes of the Education Department, c) Convergence with other social sector departments and agencies. The programme is in its infancy and coming few years may show impact of this intervention.
Schemes for SC/ST Children
There are several schemes for children from SC/ST communities funded and implemented by the Department of Social Welfare. These programmes are mostly in the form of free hostels, residential schools and scholarships.
Free hostels are provided for boys and girls who live further than 8-10 kms from the school.
■ Ashram schools are established for SC/ST children in classes l-IV. There are a total of 88 ashram schools for SC and 94 for ST children statewide. Only 25 children are admitted each year into these hostels. Expenditure consists of Rs. 250/- for food per month per child, Rs. 150/- per student per year for uniforms. There are 8800 SC students in these schools and 5800 9T students.
■ 51 Morarji Desai residential schools offer quality education from 5" to 10” standard.
■ Annual Scholarships of Rs. 75 per child for classes l-IV, and Rs. 100/for those in 8' - 10‘ . High school SC/ST girls receive scholarships of Rs. 500 which is dispersed through school principals.
■ A scheme to provide free tuitions for SC/ST children was cancelled soon after its introduction.. Tuitions were to be provided from December through March, with teachers being paid an extra Rs. 300 during 3 months for this tuitions. However, very few teachers came forward since the remuneration was considered low.
■ Free uniforms for hostel kids (SC/ST from the department of Social Welfare).
The Social Welfare department has also set up free centres for children and women. Anganwadis have been set up each with 50 children, 25 percent of whom are OBCs. There are 461 such centres in the state for SC colonies.

• Special 6-month bridge schools for rehabilitation of child labourers and integrating them back into school are funded by social welfare department for those in 8-14 years age group. This scheme was introduced in 1997-1998 and it works during December to May.
• National Child Labour Project under the Department of Labour.
Hostels and strength
1971 1981 1991 2001ST 12 17 19 67ST student 600 944 1062 3135SC 310 368 635 1090SC student 15500 18400 31750 64770
It is also interesting to note that the SC/ST hostels in educationally advanced districts such as Udupi are mostly unoccupied, thanks to excellent transportation and a high density of schools. However, those in backward districts such as Raichur and Gulbarga are full, and there is a clear demand for more such hostels. Whether this demand stems from a real felt need for education or relieves parents of the burden of feeding all their children is a moot point.
The Programme Interventions
Most of the government Interventions to promote primary and secondary school enrollment and retention have been designed to make primary schooling a more attractive proposition to children in general and from poor family in particular. The list of such schemes is presented below.
INCENTIVES FOR PRIMARY SCHOOL CHILDREN (All)(2000-2001) .
SI.No
Incentives
No.of beneficiaries
(In Lakhs)
TotalExpenditure(Rs.inLakhs) •
Remarks
1. Free Text books 67.86 1487.06 All children studying in standard 1 to VII in Govt. Schools (Expenditure is being met by DPEP, Printing & stationery Dept, and DSERT)
2. School Uniforms 49.82 3738.00 All Children from standard 1 toIV and SC, ST children fromV to VII standard in Govt, primary schools. Govt, has extended this facility to non- SC, ST girls from V to VII standard and also to girl students from VIII to X standard in Govt, schools from the year 2000-01.

3. School Bags along With Six note Books
01.95 260.00 SC,ST girls studying from V to VII Standard in Govt. Primary Schools
4. Mid-day meals/free food grains
54.28 All children studying from 1 to V Standard in Govt, and aided Primary schools subject to 80% attendance. It is proposed to provide hot cooked food for 14.01 Lakh children in six backward districts (Gulbarga, Chamarajnagar, Bidar, Bellary. Raichur and Koppal) from the year 2001-02
Total 5485.06
INCENTIVES FOR PRIMARY SCHOOL CHILDREN (Girls)(2000-2001)
SI.No
Incentives
No.of beneficiaries
(In Lakhs)
TotalExpenditure(Rs.inLakhs)
Remarks
1. Free T Dxt books 25.50 315.00 All girls from classes 1 to VII in Govt.Pry.Schools
2. School Uniforms ^ 23.83 1818.00 All Girls in classes from 1 to IV and SC,ST girls in classes V to VII .
3. School Bags along With Six note Books
01.95 260.00 SC,ST girls in classes V to Vll in Govt.Primary Schools
4. Mid-day meals Wheat /Rice @ 3kgs/pm
28.32 All girls in classes 1 to V in Govt, and Aided Primary schools subject to 80% attendance in each month. Wheat/Rice is being given free of cost by Govt of India
5. Examination fees 3.62 60.15 All Girls appearing for Vll standard Examination are exempted from payment of examination fees.
Total 2453.15

INCENTIVES FOR PRIMARY SCHOOL CHILDREN (Girls)(2001-2002)
SI.No
Incentives
Estimated No.of
beneficiaries (In Lakhs)
EstimatedExpenditure(Rs.inLakhs)
Remarks
1. Free Text books 28.80 615.00 All girls from classes 1 to X in Govt. Schools
2. School Uniforms 35.33 2622.00 All Girls in classes from 1 to X in Govt. Schools.
3. School Bags along With Six note Books
02.96 394.00 SC,ST girls in classes V to VII in Govt. Primary Schools
4. Mid-day meals Wheat /Rice @ 3kgs/pm
28.32 All girls in classes 1 to V in Govt and Aided Primary schools subject to 80% attendance in each month. Wheat/Rice is being given free of cost by Govt of India & also Transportation.
5. , Examination fees 03.92 65.12 All Girls appearing for VII standard Examination are exempted from payment of eJcamination fees.
Total 3696.12
Incentives for Secondary Educations
There are incentive schemes offered by the government to encourage SC/ST and other backward caste students to continue their education. Different schemes are implemented by different departments. The following list provides the details. These schemes cover boys and girls studying in high schools and PU colleges in the state.
INCENTIVE SCHEMES OFFERED BY DEPARTMENT OF BACKWARD CLASSES FOR HIGH SCHOOL STUDENTS
SCHEMESBENEFICIARIES
1999-2000 1998-99Residential School for merited backward class students of V to X standard [under state sector]
3123 students 8 Navodaya & 11 Morarji Desai Schools
2709 students [Backward & Minorities]
Pre-metric hostels for backward students V to X standard [under State sector]
90 Hostels maintained 15 hostels exclusively for girls 4637 students
35 hostels4358 students [including minorities]
Sports schools maintained for backward and minorities [under state sector]
20 students

Award of pre-metric scholarship per month for backward class on merit cum means basis [under district sector]
28454 students 131902 students [including minorities]
Fee concession for backward students [district sector]
11057 students N.A.
INCENTIVE SCHEMES OFFERED BY TRIBAL WELFARE DEPARTMENT FOR HIGH SCHOOL STUDENTS
SCHEMES BENEFICIARIES[1999-20001
Pre-matric hostels for scheduled caste students from V to X standard
1071 hostels 2835 students
Grant-in-aid pre-metric hostels 16 hostels 888 students
Pre-matric scholarship for Scheduled caste students studying in V to X standard. In addition to above, girl students are given Rs.500
92403 students
Merit scholarships to Scheduled tribe students up to X standard who score more than sixty per cent in annual examination
7015 students
Prize money awarded to scheduled tribe students who secure First Class in first attempt in SSLC
N.A.
INCENTIVE SCHEMES OF DEPARTMENT OF SOCIAL WELFARE FOR HIGH SCHOOL STUDENTS
SCHEMESBENEFIC ARIES
1999-2000 1998-99Pre-matric hostels for Scheduled caste students [V to X standard] stationery, clothes, boarding and lodging included
1064 hostels 63665 students
293 hostels 15675 students
Grant-in-aid hostels for scheduled caste students financial support to voluntary organizations running hostels
289 Hostels 15632 students
Pre-matric scholarship per annum given to VIII to X standard scheduled caste students. In addition, girl students are given Rs.500/-
180942 students 10500 students
Merit scholarships for scheduled caste students up to IX standard who score sixty per cent and above in annual examination
22533 students 52642 students
Monthly pre-matric scholarship to children of those engaged in unclean occupation under centrally sponsored scheme for day scholars and hostlers
23 students’ ....
Navodaya and Morarji Desai residential school 7 schools under construction

Government pre-matric hostels and grant-in-aid pre-matric liostel for backward class, scheduled caste, scheduled tribe and minority students ofV to X standard from rural areas [district sector]
1120 hostels 53669 students
201 private hostel 9826 students
989 hostels 59915 students
125 private hostels 6250 students
Incentive to hostler who secure First class in annual examination [V to X standard] [district sector]____________________________________
N.A. N.A.
Scholarship Schemes at Pre-University Level
The government is providing different incentive schemes for student studying in Pre-University colleges to pursue their studies. From 2000-2001 onwards the government has exempted the girl students studying in government colleges from the payment of tuition fees. Some of the important scholarships are scheduled caste / scheduled tribe scholarship for scheduled caste / scheduled tribe students whose parents annual income is below Rs.44,500. The scholarship amount ranges between Rs.900 to Rs.1500. This amount is being given by District Social Welfare Officer. Fee compensation is being given by the Director, Backward Class and Minority office. Rs.300 is given for Science students and Rs.200 for Commerce and Arts students. This concession is given for all students who come under category-1. For other category students like lia, lib. Ilia, lllb and below the income of Rs.11000 has been fixed. Most of the students get the fee compensation.
Pre-matric Scholarships for SC and ST Students
of Beneficiaries Total Expenditure
SC 18,54,888 students ST 7,37,050 students
Rs.1,309.5 lakhs Rs.581,36 lakhs
SC/ST.Even under the municipality budget, 25 per cent is allocated to the upliftment of
Role and Contribution of NGOs
While most government initiatives have been on the supply side of education, some NGOs have made efforts to work with the community and increase the demand for education. However, it must be stated upfront that most NGOs work towards a more integrated approach to development and increasing primary education, enrollment and retention is not their key area of focus in the two districts - Udupi and Raichur where intensive investigation was carried out by the research team.
For the most part, NGO’s were conducting the of six-month "bridge courses" that facilitate children's entry or re-entry into the formal schooling system (since there are resources available), non-formal education including vocational training for girls, and rehabilitation of child labourers in Raichur district

NGOs in Raichur District Samuha
In some rare cases, NGOs have tried alternative methods such as adopting and running supplementary schooling hours for working children as in the case of Samuha, an NGO based in Raichur district. Between 1987-93 the NGO adopted 41 schools and arranged classes at supplementary hours for working children from 7-9 am and 4-6 pm. This supportive supplementary education was provided for children in the 8-14 age group, with a stipend of Rs. 100 per family per month. Out of 50, 26 children joined regular school after the bridge course, but some of them may drop out later because regular schools are too rigid and they fail.
Organisers of these classes were trained by District Institute for Education and Training (DIET) and there are teachers having education level up to PUC/BA . NGO professionals from Samuha say that rural communities prefer schools with segmented population groups rather than those that are completely heterogeneous. Local self-help group and mahila sanghas also promote primary education. Samuha also provided extra teachers in 24 villages in Jalahalli with the teachers living in the same village. Also started the Ranganatha Grameen Abhiruddhi Samiti to enable the villagers to manage their own affairs by training them towards this end.
A Rural Development Committee (ARDC) looks at a range of development issues affecting the community, among them is education which is the focus of a five- member "shiksha samuha" within the Committee. ARDC adopted 741 schools to tackle the issue of school improvements. The committee focussed on increasing awareness of education among parents, increasing the involvement of local panchayats, identifying dropouts and bringing them back to school.
Mahila Samakhya (MS) deals with education as one among many other things more in the context of women's empowerment such as functional literacy. NFE is a good option for them. Stree Shakti is an indigenous idea for income generation, supported by DWCD. It was reported that they (MS members) were not welcomed in the VECs. They also reported of male teacher’s misbehaviour with girls, burden of housework, distance of schools, etc are deterrents to improve schooling. Mahila Samakhya beliefs that education has to be part of larger effort to increase awareness and questioning attitude among students.
Our Reach - Works in school-less villages in Raichur and Deodurga blocks, started schools and conducted a survey.
Prerana - Is involved in irrigation, rehabilitation of street children and supporting of smaller NGOs. It has prepared a Report on Educational Status of Raichur District drawing data from HDR - Karnataka 1999.
The Human Resource Development Society (HRDS) - It has set up bridge courses to rehabilitate child laborers under the NCLP scheme. They established hostels with a capacity of 75 for children on their way to Navodaya schools. They complained that local panchayats are not interested and not active nor empowered. Unfortunately most NGOs run vertical rather than integrated programmes as reported by HRDS that has started 52 Self Help Groups.

NGO’s Role in Udupi
Udupi presents a vastly different scenario from Raichur in the sheer numbers of schools both government and private in this district. Also setting it apart is the high quality of its government schools, so much so that in recent months thanks to government and private sector collaborations, computers are being introduced in many government schools, offering a distinct advantage over private institutions.
Another noteworthy feature is the large number of excellent institutions for higher education within the district, triggering high achievement levels, aspirations and competition. People also make use of the facilities here lots more than elsewhere. Education is so valued here that everyone, both NGOs and government functionaries unanimously felt that even if all the incentives and schemes were stopped the demand for education and enrolment and retention levels would continue - 80 per cent attendance strictly enforced to avail of free food grains. In one school visited in Santoor Kopla, due to the shortage of teachers, the teachers themselves were paying a PUC passed former student to help with the teaching load.
Schools in both the Government and private sectors are considered equally good. In fact, in recent months government schools have acquired computers through a collaboration with a private software company thus gaining a decisive edge over private schools, whose strong features include English as a medium of instruction.
Within the district, however, very few disparities are observed in education between Udupi block and Kundapur block which is relatively poor performing. Again, this is simply reflective of the general socio-economic condition of the block. Kundapur block is more backward and has a small population thinly spread over a hilly region that makes transportation extremely difficult. It has a large tribal population known as Koragas. Who are considered as most backward - socially and economically in the State. Serious efforts are made to improve them and in the coming few years it is hoped all children are likely to be educated at least for 5-6 years,
ITDP in Kadbettu Koragara Colony
Because transportation is difficult in this hilly area of Kundapura students are more dependent on hostel accommodation, with the result that the SC/ST and girls hostels are full, unlike those in Udupi block. In Udupi block thanks to excellent transportation and large number of schools in given area, students prefer to commute to school rather than live in hostels.
Unlike in Raichur, there are a fair number of NGOs in Udupi whose on-going programmes contribute to increased enrollment and retention in primary schools. Among the NGOs we met was Ashika in Kundapur which works with the Koraga community, considered the most exploited and backward within the Scheduled Tribe community in Karnataka.
Under the rubric of the Integrated Tribal Devebpment Project (ITDP) the NGO has worked towards an integrated and holistic approach to the welfare of Koragas including education. Mr Shivram Karanth, Director, Ashika, says that the motivation for education among the Koragas is low, especially since they often live in remote hamlets cut off from the larger community. They rest content in their traditional lives making

cane and bamboo baskets for a living, and don’t iiave higher aspirations. Gender equality is high among the Koragas, so disparities in education of girls and boys are not as evident as in the rest of society. Under ITDP the panchayats are required to spend 25 per cent of their budget on Koraga development.
Under the DWCD, Ashika implemented a bridge course for rehabilitation of child labourers for 1-2 years but discontinued that for the excessive paper work and bureaucracy. Some of the children who joined regular schools following the course dropped out very soon due to the rigidity and incongruence of these schools with their lives. Ashika social workers testify that while discrimination against Koraga children in schools has decreased, it continues in different forms. The children are often called derogatory names, and are segregated from other children in most activities including sports-games and seating arrangements. On such occasions, interfacing with the community and increasing their hygiene and other practices and working with the teachers in schools has helped resolve some of these issues.
Another NGO, the Coastal Action for Rural Development (CARDS) in Udupi Block works on overall child development approach; rehabilitating alcoholic fathers so that their families can lead more constructive lives, encouraging sponsorship of children, providing tutions for children from poor families (with income less than Rs.1200). They also run adult literacy programmes and self-help groups for women.
SPOORTHI, another NGO in Thakette, also works with the Koraga community and provides one simple and direct intervention of free hostels for both boys and girls of the community that goes a long way in increasing enrollment and retention among these children both in school and college. The Director says that because the Koragas are the most exploited on the social rung, they are often “pushed out” of the common hostels and schools for SC/ST. The discrimination is mostly subtle, taking the form of providing all the incentives due to the children, but not encouraging them in the least to come to the school. In addition, language and socio-economic differences add to their problems. Hence their hostel serves very useful purpose. Their hostel currently houses students and provides non-formal education and confidence building for the students, many of whom stay 9 years or longer at the hostel to complete school and college.
SPOORTHI reported that the community participation and interest in Koraga welfare is minimal, and even though 37 of the 53 panchayat members are koraga women, it has not proved helpful to the community because of their low standing and inability to speak in the meetings. Unless the women members demand and fight for their due share of resources change for better will be a very slow process.

THE PERSISTING REGIONAL INEQUITIES IN EDUCATION :EVIDENCE FROM A FIELD INVESTIGATION
The analysis so far points out that all efforts made by the state and central governments to meet the constitutional obligations of UEE have only been able to improve the situation but have failed to reach the set goal. The latest data available clearly brings out the fact that most of the children in 6-10 years are enrolled in schools in Karnataka - both boys and girls. The NFHS II reports that in 1999, 94 per cent boys and 93 per cent girls were attending school in Urban Karnataka. It was 12-13 per cent less among the children in 11-14 years. It means that large number of them drop out soon. In rural area it is more chronic. Only 85 per cent boys and 82 per cent girls attend school in 6-10 years and 72 and 61 per cent boys and girls in 11-14 years. The data of the Education Department (2001) shows over ten and half lakh children in 6-14 years are out of school (about 11 per cent). Immediate concern should be how to reduce the drop out further and what should be the strategy for it to reach the constitutional goal. A small proportion ranging between 3-5 per cent children who are not enrolled have to be enrolled. They probably are the poorest or tribals residing in isolated localities that need to be identified and persuaded to send their children to school.
Another more serious issue is the unacceptable extent of deprivation of schooling in some districts of the state particularly Gulbarga, Raichur and Bidar that have reported lowest literacy rate in 2001 census. They \«|pre three districts of the total 15 districts in the state reporting lower literacy than the state level. The astonishing fact is the consistent lowest literacy rates reported in Raichur and some Taluks in the District during last 5 decades.
On the other hand Dakshina Kannada has remained at the top in Karnataka in literacy rate for both male/female and urban/rural next only to Bangalore district (urban) after it was formed during the last decade.
The State Government, as we understood, follows uniform policy in education that applies to all the districts in the state. Hardly there is evidence to show that there is any discrimination among districts in allocation of public resources to education sector deliberately. It was also evident during our discussion with higher level officials in the Department of Education that no special effort is made to enquire why certain districts are lagging so much behind in the state for so long and take corrective measures to rectify it with appropriate policy interventions. On the other hand it was revealing that poor performing districts, some time, are likely to receive less attention in distribution of resources like number of teachers, often because of powerful influences that work.

Table 32 : Literacy in Raichur, Dakshina Kannada, Karnataka and India
Year
19611971198119912001
Raichur DakshinaKannada
Karnataka India
18.3523.8430.1335.9646.75
38.2250.6363.1175.8683.47
29.8036.8346.2156.0467.04
24.025.536.252.2 65.4
ir is clear from the above table that the literacy rate in Raichur is persistingly lower as compared to state average and the rate at which literacy has grown over last four decades is much slower than the state. On the other hand Dakshina Kannada has shown consistently higher literacy rates than the state and national average and the pace at which the literacy has improved over is faster and is more than twice as compared to Raichur.
In order to explore the ground realities we first visited Raichur City and Deodurg town. We met the district level officers including Chief Executive Officer of ZP and DDPI in Raichur. We also met several office bearers of other departments, NGOs in the area to explore why the District and the Taluk have remained so backward in the education field for so long and how the district level administration looks at it and take effective measures to improve.
It was surprising that the CEO and ZP were not even aware that Raichur lags so much behind other districts in the state and Deodurg Taluk has remained the least literate taluk in the state during last decades. But the stock answer from all officials in various departments like Social Welfare, Labour, Education and Tribal Development, ZP was that the District is poorest in the State and it is difficult to bring in the desired level of changes in any sector in the district.
Our visits to several villages and discussions with teachers and residents provided insights into the problem area. Our visit to a couple of schools revealed that attendance of pupils in every class from l-VII was less than what was shown in the school registers. In Sankeshwarhal village School there were 34 children on the roll - 20 boys and 14 girls however, only 15 were present in the school in I Standard. The situation was the same in Standard II. Out of 35 children -13 boys and 22 girls, only 10 were attending school. But the attendance register in each class had marked all present. Previous months / days also showed that all children in each class were marked present in the register Indicating the data generated from schools in the district is not reliable. For ensuring the supply of food grains and uniforms to all such practice is followed that negates the very philosophy of incentives. The number of students in higher classes was similar. The information in Table 33 provides clearer picture of this school.

Enrolled Attending
This school rated as one of the very good schools in the district, had a Head Master having over two decades experience as Head Master and was on the verge of retirement. There were 44 boys and only 15 girls belonging to Scheduled Castes. The experience of visits to three other schools was similar. It raises the important question of adequacy of teachers in the district (or even in the State) while discussing poor quality primary schooling. The indicator-Pupil Teacher Ratio (PTR) is estimated taking into account the number of children enrolled and not attending and the high dropout that follows which needs to be considered to assess the adequacy of Teachers. The fact is each Teacher in the district has lower number of pupils to teach and less work and more wastage of resources.
There were several issues that surfaced during the discussion with school teachers. Most important was the indifference of the department with the problems that confront the school and teachers. For instance, an Incharge Head Master reported that he is placed in the position for last 8 years and yet the Head Master is not appointed. There is no inspection or monitoring of the school by the department and the laxity has made teachers almost fearless and indisciplined. Head Masters reported that absenteeism, late coming and closing schools early are very common in the district. The Primary School Teachers Association of the District is very strong and the Zilla Parishad is not bothered about school and its problems that have resulted in continued deterioration.
The majority of schools in the district are managed by Government. There were only 5 privately managed Primary Schools in the district as against 1395 Government Schools,that clearly indicate low demand in the district for education and is a contrast to Dakshina Kannada district. During 1997-98, however, the number has increased to 182 while the Government Schools numbered 1811. The enrolment of girls in the district is one of the lowest in the state - there were only 694 girls for every 1000 boys during 1980-81 in Primary Schools (I - IV class) that declined steeply to 586 during 1986-87 again increased to 771 during 1997-98. Under the situation it is not surprising that female literacy in the district has consistently remained the lowest - 6.11 per cent in 1961, 11 in 1971, 16.14 in 1981, 22.15 in 1991, 26.47 in 1996 and 36.84 in the year 2001.

The literacy among Scheduled Caste females Is still more depressing. It was 0.83 In 1961 that Increased to 10.61 per cent in 1991. The state average during the same period was 3.04 and 25.95 per cent.
The poor performance observed in education sector in Ralchur district is not surprising considering its performance In other sectors like health. It has remained most backward in health also.
The Field Study
Based on the observations, discussions with the district administration, NGOs and the Community members It was decided to conduct a sample household survey. The findings of the survey were to understand causes for poor schooling, strong gender bias observed and seek the reactions of the community that has been deprived of education and its benefits In Raichur District. To understand the success achieved (almost universalising elementary education) in DK district, Udupi the newly formed district was selected for the field study.
The Sample
From each of the two district 4 villages were selected - 2 from a better performing taluk and 2 villages from a poor performance taluk. In Udupi district, Udupl and Kundapur taluks and in Raichur district Ralchur and Deodurg taluks were thus selected.
Two villages were selected in each of the sample taluka based on total population, percent population belonging to SC/ST, and presence of Lower Primary and Higher Primary Schools. In each sample village efforts were made to cover more households belonging to SC/STs. The number of households thus selected was 100 In Udupl and 65 In Ralchur. The population covered was 1014 - 439 In Ralchur 575 in Udupl district.
The main findings from the field investigation will be briefly reported below. As the macro level data suggested enrolment In Ralchur Is lower, much lower among the girls and still lower among SC/ST girls. Even the low enrolments are not sustained as school attendance drops gradually and steeply as age of the children Increases. In Udupl most of the children continue schooling till they complete 14 years (Table 34). •
Table 34 : Enrollment and Attendance of School In the Study Area
Area YesEnrolled
No Total YesAttending
No Total
Raichur 129 (78.2) 36(21.8) 165 (100.0) 87 (67.4) 42 (32.6) 129 (100.0)
Udupi 207 (98.1) 4(1.9) 211 (100.0) 198 (95.7) 9 (4.3) 207(100.0)
Total 336 (89.4) 40(10.6) 376(100.0) 285 (84.8) 51 (15.2) 336(100.0)

Age
6-9
10-14
64
Attendance by age, sex and area
District Per cent Boys Per cent GirlsAttending Attending
Raichur 90.9 81.8Udupi 96.7 100.0Total 94.2 93.0
Raichur 69.0 46.5Udupi 98.5 90.9Total 86.9 75.0
Reasons reported for non enrollment were varied in Raichur. Important among them was that teacher refused td enroll, schooling not important for girls, ill treatment by Teacher/Schoolmate etc. Strikingly the reasons reported in Udupi for non enrolment was (only 3 boys and a girl) that a boy and a girl were mentally unwell and remaining children because of costs involved in schooling. Similarly only 2 boys who dropped out reported that they were not studying well so parents put them on some work. But in Raichur caring of younger siblings for girls, work in family farm, teacher used to beat etc. dominate the reasons. There were 27 girls and 15 boys who dropped out before completing schooling. Another important reason for girls to drop out was attaining puberty and the fear that she may be sexually abused that led to withdraw of 14 of the 27 girls from school.
How children keep themselves during studying ages of 6-14 years? The following Table 35 provides answers. It is observed that in Raichur area 31 per cent of boys are either working or idling and in 15^19 group 64 per cent are working which support the earlier data presented in Chapter II that as the child grows and is able to engage in some.productive work dropout rates increase.
Table 35 : Per cent Distribution of Cliildren by tlie ir Occupation in the Study Area
(6-14 years)
Occupation BoysRaichur Udupi
GirlsRaichur Udupi
Studying only 49 93 38 105(69.0) (94.9) (40.4) (92.9)
Dependant 8 4 11 3(No school or work) (11.3) (4.1) (11.7) (■2-7)
Some work 14 ' 1 45 5(19.7) (1.0) (48.9) . ('4.4)
Number 71 98 94 113

15 -19 years Children by Occupation
Studying only
Work
Dependant
Number
2(20.0)
8(80.0)
10(26.3)
28(73.7)
10 38
The pattern of work in Udupi is also different. They are engaged more in trade, petty business and very few children work as labourers. In Raichur most of the children work as labourers. The discussion with the parents in Udupi revealed that they do not took a t education as a step to grab a jo b but very righ tly ‘as an enabling fac to r’ tha t is absolutely necessary fo r im proving socio-econom ic leve l o f the fam ily. An educated boy, they argued, would succeed any where in Udupi Bangalore or Bombay - the most favoured destinations of people in the district. Why girls go to school in large proportion? The answer is very simple. Parents know by experience that an illiterate girl in that area cannot even think of getting married in her life now as the boys are always on the move, they want a girl who is educated and can adapt to any life situation. In Raichur it is distressing to learn that parents are scared to send their sons to a school that needs 10 minutes walk or 10 minutes bus drive. If it is daughter she will be at home waiting to get married as soon as she starts menstruating or often before that. Under the circumstances arguing that girls schooling is adversely affected because of absence of Toilets in the school for them is not very convincing.
Distance to School
It is often argued that poor accessibility to school - where a child has to walk some distance to reach a school is disproved by the survey data as earlier studies also had proved. In Udupi, only 2 per cent children were not required to walk any distance to reach school while 4 per cent walked 5 kms, 9 per cent 3 kms, 23 per cent at least 2 kms and 60 per ce/it walked one to two kms. In Raichur 95.5 per cent of children were not to walk as the school was in the vicinity of their home and 4.5 per cent had to walk about a km to reach the school.
The study tried to understand. the parents’ attitudes towards their children’s education through several questions. One of them how do they perceive happiness of their sons and daughters? (1) Is it by living in the same village continuing family traditions? (2) Getting education and a good job in the city? (3) Getting married and having children soon?

Table 36 : Parents Perception of Happiness in the Study Area
SINo
1
Item
Tradition
Education and Job
Early marriage
Education to improve
RaichurUdupi
RaichurUdupi
RaichurUdupi
RaichurUdupi
Boys % Yes
34.36.1
76.192.9
26.9 1.0
86.699.0
Girls % Yes
59.7 7.1
26.984.8
76.11.0
73.0100.0
It is evident from the above table that early marriage and early children are considered as the sure route to happiness for daughters in Raichur (60 per cent) while in Udupi it is only 7 per cent. Education to improve quality of life is almost universal for boys and girls in Upudp where as Raichur lags. These perceptions indicate the demand side deterrents in poor performing districts in Karnataka.
In continuation of the perception of children’s happiness, 37 per cent of Raichur Parents were firm in not allowing their sons to travel beyond primary level schooling and it was 43.0 per cent for girls. It was a total contrast in Udupi where not a single parent complained of any problem in sending their sons and daughters to even a far off school. Of cburse there were differentials in access to schooling in the study area - while 95 per cent parents had 7 year schooling within their vicinity it was only 64 per cent in Raichur.
Awareness of Incentives
In Raichur only 57 per cent of SC/ST parents were aware of the free school bag to girls studying in HPS, whereas it was 68 per cent in Udupi. 70 per cent in Raichur and 73 per cent parents in Udupi were aware of free hostel facilities for SC/ST children. But food grains distribution programme was known to almost all (98.5 and 99 per cent parents in Raichur and Udupi). Similarly 100 per cent parents knew about free text books and uniform distribution programme in the study area and they reported that their children attending school have availed of the facilities.
In Udupi all 14 SC/ST girls had received school bags and 67 per cent availed hostel facilities, it was less in Raichur only 5 of 8 (62.5 per cent) and 43 per cent respectively.
Childrens Performance in Schooling
In Udupi 82 per cent parents expressed satisfaction over the performance of their children in schooling whereas it was 64 per cent in Raichur. Parents complaining of their childrens failure in Examination was 35.5 per cent in Raichur and it was half of it in

Udupi (17.2 per cent). Therefore only 39 per cent parents in Raichur felt that sending children to school is very useful while it was 62 per cent in Udupi.
Parents Aspiration
Parents in Udupi had higher educational aspirations for their children as 98 per cent felt that at least their children should complete high school while it was about 89 per cent in Raichur. .
Do the Parents Need Children to Work in the Home?
It is often argued that children perform variety of useful activity for the family that affects their schooling adversely. We enquired in the study area and found that 96 per cent parents in Raichur reported that girls are needed in domestic work while, it was only 13 per cent in Udupi. It was 4 per cent for boys in Raichur and only 2 per cent in Udupi. But sons were mainly required to graze cattle in Raichur (78.4 per cent) that lead to either not enroll or withdraw soon from school. It was only 7 per cent in Udupi that accounts for small cattle population in the State.
The brief note on the survey data is very illuminating. More revealing is the data collected on the costs involved in Primary Schooling. It shows high direct costs of parents which is supposed to be not only free but carries several incentives to make it a more attractive proposition to rural parents. We were surprised to know that a family in Udupi spends about Rs.1133.8 per annum on schooling of their children while in Raichur it is estimated as Rs.315.2. The schooling costs are considered as an investment in children in Udupi while It Is still a waste in Raichur. Major share of the school expenses in Udupi goes to have a pair of additional uniforms and transport while in Raichur it is mainly on school stationery.
From the analysis of the valuable primary data collected in the survey the following conclusions emerge:
Regional disparities that are wide and persisting in Karnataka need special intervention to improve the situation. There are problems associated with both demand and supply side that has hindered the schooling of children in Raichur. As mentioned earlier educational backwardness is an important segment of overall backwardness - social and economic. It, however, does not mean that until and unless general improvement takes place in every sector, education sector has to wait for improvement. The activ ities in itia ted by the DPEP have show n that fo r the firs t tim e the m ost backw ard d is tric t has responded m agnificently by show ing during 1991-2001, 15 percentage po in t rise in overa ll lite racy which h is to rica lly never grew m ore than about 5 percentage points. The female literacy in the district which was unacceptably low and comparable with any other literacy poor districts in the northern states look more respectable now and certainly gives hope for faster improvements. But just improving supply side variables like more schools, more teachers, better facilities that the state has been doing for last few decades may not be adequate. There is a very dire need to involve Community Based Organisations (NGO) to work as change agents to accelerate demand for schooling. The experience in health sector that better service will create itself demand had cost much as it took long time to prove effective. If there is an ieffort to improve demand for schooling along with improved supply may prove more productive.

The supply side interventions of the state government are concentrated in improving accessibility to school (physical) infrastructure and providing teachers. The district and state administration has totally ignored their responsibility that should accompany investment to ensure returns. The system of inspection is eliminated for several years that almost left all the schools in the region without any supervision and free to function the way they like. The most shocking experience of our travel in the district (Raichur) and visits to several schools was that teachers complained of indifferent education department at district level to each and every problem of the school and the community members complained of irregular schooling in their village. Often, school is not open and when it is open, starts late and closes early to enable teachers to commute to their residence. Under the circumstances, without creating attractive environment in schools investing more is going to reduce the already low returns.

CHAPTER V
SUMMARY OF THE FINDINGS AND RECOMMENDATIONS
Karnataka has made remarkable progress in the field of education particularly during the last decade. The progress is reflected in the impressive expansion in the educational infrastructure - number of Primary Schools, High Schools and other higher educational institutions like Engineering and Medical Schools that have become envy of other states in the country. Most impressive is the observed private - public partnership that is steadily growing in the state at recent years. The literacy rates that indicate overall progress made in education, show impressive rise in the decade 1991-2001 from56 per cent to 67 per cent. If these observations are carefully dissected and examined would reveal that there are serious concerns demanding immediate attentions of the policy makers and their implementers. The most serious of all the concerns is that ‘education’ which is considered as an powerful equalizer, it self is bringing serious inequities in the society today faster than ever before.
The present study was conducted to examine the issue of equity in education in Karnataka with the limited data made available and it has tried to identify trends, patterns and extent of inequities. Based on the programme interventions that the state has designed developed and implemented the study has made some recommendations to set things in the right direction to reduce inequities.
As noted earlier, the literacy rates in the state since its formation in 1956 have increased from 30 per cent in 1961 to 67 in 2001 by less than one percentage point an year during the four decades. The male literacy is higher than female throughout the period at state, district and sub-district levels (up to village levels). Similarly literacy rates of males and females are lower in rural areas at state, district and sub-district levels. The Scheduled Caste and Scheduled Tribes literacy rates are lower than others in rural and urban areas for both males and females. In addition to these disparities, literacy rates across districts show a very clear and distinct pattern. Literacy rates of males/females of all castes, SC/ST in rural/urban areas differ widely throughout during the last five decades. Daksihina Kannada, Udupi, Kodagu, Uttar Kannada, Shimoga, Chickmagalur districts have remained at the top while Bidar, Raichur, Gulbarga, Bellary and Bijapur districts are at the bottom in terms of male, female, rural, urban, SC/ST and other castes literacy rates. While literacy rates indicate overall improvements in education, they hide the routes through which the observed disparities emerge. To understand more about this enrolment, survival and the outcome data have to be analysed to identify the determinants of literacy rates.
Enrolments
The process of schooling begin with enrolment of potential school going population in the schools. Enrolments are dependant on accessibility of a school in the vicinity of residence and willingness of the parents to send the child to school. Several studies in Karnataka have reported that even after enrolling a child in school, child may not attend school at all or may not attend school regularly because of the competing demands on child’s time particularly in rural areas and urban slums. The 1997 special survey conducted by the education department and the 2001 Childrens Census reported about 97 per cent enrolment of children in the schools for first standard-higher for boys than giris, lower in Bijapur, Raichur, Bidar, Gulbarga and Bellary districts. Enrolment of

Scheduled Caste/Tribe boys and girls is lower than all other castes in the state and also across the districts more so in Hyderabad Karnataka region. On the whole, the limited information reveal that about 10 per cent children are not enrolled in the state 5 to 7 per cent boys and10 to 15 per cent girls. About 15 per cent SC/ST children are not enrolled - 5 per cent more than non-Scheduled population. Those residing in isolated areas and urban slums that are newly formed or of mobile poor population who move from place to place for work are perhaps account for non enrolments.
Enrolment of children in primary schools (l-IV) do not show consistent trends and the observed variations such as marginal increase and decrease indicate more the limited systematic efforts made by school teachers in enrolling all children in age 6 who shoukJ be enrolled. However, enrolment in V-VII class shows a rising trend suggesting improved participation and declining dropouts. It also shows dropouts in lower primary has declined markedly from 27 per cent to 10.5 per cent during the decade 1992-93 to 2000-01. Decline being sharper among girls from 29 per cent to 11 per cent as compared to boys 25 to 10 gender gap has been reduced. The cohort analysis revealed that during 1991-92 to 1997-98 about 55 boys and 52 girls could continue schooling for 7 years of every 100 enrolled in the state. It varies across the districts and regions. While it is only 39 boys and 40 girls in Hyderabad Karnataka region, in old Mysore region 63 boys and 59 girls and 53 boys and 44 girls in Bombay Karnataka region.
As the state follows ‘no detention’ policy in primary schools, based on attendance all children are promoted to the next grade. Available data from DPEP'suggest that 3-4 per cent boys and girls repeat the same class as they fall short of attendance. It means that those who are kept on rolls and do not attend school regularly account for 3-4 per cent.
The outcome of seven years of schooling is reflected only in the examination conducted by the District authorities for 7" class students of each district. The results of
class do not reflect on the quality of teaching - learning as about 90 - 95 per cent who appear for examination are generally declared as pass. All children in Class VII do not appear for examination. In 1998 out of the 7.4 lakh students about 100,000 (62,000 boys and 38,000 girls), in 1999 of 7.8 lakh over 80,000 (50,000 boys and 31,000 girls) in the year 2000 of 8.1 lakh over 61,000 (38,000 boys and 23,000 girls) did not appear for the examination. In 1997-98 there were 8.3 lakh students in thq state on the roll of VII class and only 7.8 lakh continued and about 7 lakh passed that shows a dropout of 1.3 lakh in VII class itself.
Participation in Schooling
In brief during 1991-92 about 14.66 lakh (7.63 boys 7.03 lakh girls) children had joined school of which 7.40 lakh appeared for VII class examination and 6.40 lakh passed the examination (3.4 and 3.1 lakh boys and girls). It means only about 44 per cent of the enrolled could complete the primary schooling in the state (45 per cent boys and 44 per-cent girls). It also indicates that those boys and girls who successfully complete 7 years of schooling have very narrow gender gap (just one percentage point).
Similarly the number of boys who passed SSLC examination in the state constitute about only 15.5 per cent of those who had joined first standard in the Primary School and girls constitute about 14 per cent. Here also those boys and girls who continue high school education and complete SSLC have marginal gender gap. (Number

who joined I Standard in 1989 was 14.5 lakhs - 7.6 lakhs boys and 6.9 lakhs girls, Number of students who passed SSLC in 1998-99 was 2,12,844 - 1,18,101 boys 94,743 girls).
The PU r enrolments shows that about 90 per cent of those who pass SSLC could enroll and only less than half (about one lakh) of them pass PU II examination accounting for about 6 to 7 per cent in the state. The SSLC results show that per cent pass is higher in urban than rural, SC/ST per cent pass is lower in both urban/rural areas but percent pass of girls is consistently and significantly higher than boys among general population in rural and urban areas.
These findings (detailed in earlier chapters) raise several issues. Most important is that the remarkable expansion observed in primary education that enhanced enrolments and retentions consistently but marginally over the years failed to meet the constitutional obligation of providing free and compulsory education to all children in ages 6-14 years (of at least 8 years). As noted provisioning of schools in about 97 per cent of habitations in the state resulted in increasing number of children enrolling in school but accompanied by gradual dropout. The poor quality of teaching in primary schools is reflected in lower percentage of pass in SSLC and PU II examination conducted by the State level Boards.
The Deterioration In Quality
The massive expansion of education system was not accompanied by any measures to ensure quality. Infact, even the semblance of check on primary schools through ‘inspections that were carried out periodicaiiy and kept most o1 the schools, teachers and students alert has been withdrawn. In addition, school examinations that indicated quality of teaching and learning process in each class though crudely were replaced by ‘no detention’ policy. The result is children are kept on the rolls of the school for seven years without any test of their knowledge gained which would have reflected on the quality of teaching. To top it the only examination that will enable primary school children to join high school was conducted by each district separately for their own districts having their own standard. The 90-95 per cent pass results even in districts that showed only 10 per cent female literacy prove their unreliability. But the real test was only at X class examination results that varied widely in the range of 46 per cent to 61 per cent during the 1990s. Here also rural and SC/ST students results were much lower than urban results in general. The only surprising fact is consistent better results of girls as compared to boys.
The state was not able to ensure any qualitative improvement in primary schooling as there was always pressure of expanding the system, open more and more schools and appoint more and more teachers. The HDR(K) 1999 reports that 86,000 teachers were appointed during 1994-95 to 1997-98. Such a huge recruitment itself is an indicator of poor quality of teachers. The mushrooming of Teachers Training Colleges that ensure top grades for a fees provide further evidence of poor quality of teachers recruited enmass every year.
Expansion also required more resources and it is a fact that most of the resources altocated by the state hardly met the salary component of teachers (over 90 per cent). The infrastructure of the schools, teaching and educational materials could not keep pace with expansion and suffered deterioration. Teachers once join the school

will continue till their retirennent without any in-service training or a test of their teaching skills. There are no efforts to assess what goes on in vast number of schools and class rooms except an evaluation in some DPEP schools reporting improvement in mean scores in Maths and Language.
The poor quality of schooling in Primary Section of I - VII is reflected in SSLC examinations. That show about half of those appearing only can get through. The majority of students who appear for the examination come from the Government Primary Schools that account for over 70 per cent of total primary schools in the state.
The Interventions
The education department have designed and developed several schemes listed in chapter III to make schooling a more attractive proposition to the rural masses and urban poor. These schemes have also marginal impact as they have not been able to ensure school attendance of all children in general and of SC/ST children in particular.
The variety of programme interventions designed and developed to promote equity (listed in Chapter IV) is implemented all over the state where wide disparities in enrolments, retentions and outcomes are observed and implementation differs widely. The intensive investigation in Udupi and Raichur vividly demonstrated this. Whether a student attends school for a minimum school working days or not gets his food grains quota in Raichur that defeats the very purpose of the scheme. On the other hand attendance registers maintained in most of the schools visited showed all enrolled children present though only 30-40 per cent were present. It was totally different in Udupi where only eligible were given the incentives and incentives have worked. It is the way schemes are implemented by schools/teachers that is more important in proving its effectiveness. The desire for schooling is so high in Udupi incentives are considered by teachers as time consuming exercise adversely affecting their teaching time. Teachers have to make several rounds to collect uniforms and arrange for food grains distribution. Inability of the government to target the poor and needy has resulted in distribution of resources very thinly across the districts to all with very marginal gains.
The scholarship and hostel facilities provided to SC/ST also have not shown any visible impact. When the quality of schooling is so poor such incentives have failed to make effective change in their achievements. But enrolment of SC/ST students over time has shown a rise while results in SSLC and PU II show no improvement.
Education and Employment
We had raised the question in the beginning of Chapter II - what is education? And how much education is required in the contemporary situation of the state to benefit from the on going process of globalisation. The discussion in the chapter clearly brought out that innovation in technology would continue to challenge developing countries unless they ensure ‘absorptive capacity’. Which in other words ability to manage not only with the latest technology but also with ‘tomorrows technology’. The analysis show that only a small fraction of young labour force (accounting for 6-7 per cent) have about 10-12 years of schooling. If about 100,000 students pass PUC II examination about SOSO thousand go for a degree or diploma studies in Technical Colleges in the state (roughly 30,000 for degrees and 30000-35000 for diplomas in Engineering). This clearly

brings out the fact that technological gains will benefit only a select fraction of the society in the future also.
What is glaring is the observed vulnerability of rural population in general and rural females in particular. The NSS 1993-94 report reveals that rural females are completely devoid of any degrees in engineering/medicine or diplomas in these areas. In contrast, urban females have been steadily improving practically in all technical, professional degrees and diplomas. The expanding educational facilities in Karnataka have completely bypassed rural females. The situation in some taluks in Raichur, Gulbarga, Bidar, Bijapur and Bellary is pathetic indeed. For example, in Deodurg Taluk of Raichur district we literally searched for a SC/ST woman who had ever gone to school in her life and could find one in third village. It does not come as a surprise the literacy rate of rural SC/ST women is less than 10 per cent. Such absolute deprivation of education in some pockets in Karnataka is shocking and the indifferent attitude of the state is still more shocking that show about half of those appearing only can get through. The majority of students who appear for the examination come from the Government Primary Schools that account for over 70 per cent of total primary schools in the state.
The inequities observed in education is reflected in the labour force (in 15-59 age group) of the state. While about half the labour force (about 51 per cent) is illiterate the rural-urban disparities are very wide - 28 per cent illiterates in urban and more than double of that 58 per cent in rural and overwhelming majority of them engaged in Agriculture (about 88 per cent). The rural labour force in general and females in particular as their employability in non-agriculture is very bleak will continue to share the labour available in rural areas only in agriculture. This is reflected in declining number of days an agricultural labourer is able to get wage labour in a year. Educational achievements at state level is only 3.2 years (on an average a resident worker in Karnataka has 3.2 years of completed schooling). It is less than 2 years for those engaged in farming whereas over 11 years in well paid service sector (see Table 37 below).
Table 37 : Average years of Schooling by Sector in Karnataka
Sector Years of schoolingAgriculture 1.98Mining and quarrying 4.48Manufacturing 1 3.14Manufacturing II 4.54Manufacturing III 8.13Electricity, water and gas 2.79Construction 7.12Trade 4.79Transport and communication 6.05Services 4 11.36Services 5 7.46
All 3.21
The irony is that despite impressive growth in education sector during the last few decades, the labour force is poorly educated. To be employed in the modern sector of labour market at least ten years of schooling is required and in growing modern sector

of technology over 12 years. Effective policy interventions are urgently required to improve the situation.
Recommendations
1) The major determinant of inequities in education is the wider persisting inequities in the society at large. The only sure way to eliminate them is by enforcing the Karnataka Compulsory Education Act by deleting Rule 15 - the exception clause providing “Reasonable excuse for non-attendance” (like poverty, need for labour, etc) from the Rules, Enforcement of the Act should be accompanied by provision of quality of schooling of 8 years to all irrespective of rural/urban residence, social class and gender.
2) The unacceptable poor performance observed in primary schooling in Gulbarga division can not be rectified by only investing more resources in the region. The education department in the region first has to be activated. The schools and teachers need to be disciplined. Regular school working hours to be ensured to convince people to send their children to school. Absentee teachers services should be terminated to bring the missing seriousness in teaching fraternity. This can be done by eliciting cooperation of all departments in the districts, of political leadership, also of NGOs in the region and the community that has suffered for long.
3) Though observed inequities in education emerge from the wider persisting inequities in the society can be eliminated by suitable policies and programes. The first important intervention could be on the improvement of the primary schooling like quality of teaching, assessing the students performance every year in schools and once in four years at state level. The ‘no detention’ policy of the government has proved disastrous for children as it eliminated the presumed responsibility of teaching of the teachers for full seven years^ It is only after 10 years there is state level examination and is too late for many students to improve. There should be a state level examination at Class IV and VII.
4) The education department should take the responsibility of inspection of schools to assess the schooling activities such as teaching and learning. It can not transfer this to Village Education Committee or School Betterment Committees in the guise of community participation. It should be noted that the observed community participation in Udupi is informal and perhaps because of that it has worked. In low literacy districts where even a high school graduate may not be available in many villages forming a VEC and hoping that it will bring qualitative change would be futile. Community can participate in school functions and encourage schooling activities in general. The department has huge staff-perhaps the largest compared to any other departments in the state. The official inspection should be followed by appropriate action to rectify the observed deficiencies.
5) The remarkable expansion in primary education is not accompanied by increasing resources required to maintain minimum quality. The expansion also has not kept pace with time resulting in some private primary schools in urban areas having computers and post graduate teachers while most of the government primary schools have an old black board and not even benches to sit for students. There is need to upgrade school infrastructure and that needs more resources. The state budgets should respond to it fairly even though it may have to cut the budget of higher education.

6) The state follows decentralized system of governance and Is In the forefront in the country. The Zilla Parishads have to be enlightened of their responsibilities in the prinnary education sector. Our observation In low literacy districts showed indifferent and resigned attitude in ZPs. There is need to seriously involve thenn in the monitoring and assessment programmes.
7) The incentive schemes are followed uniformly across the districts in the state that widely differ. Incentives in primary education In the districts that are on the verge of unlversalisatlon (such as Kodagu, Udupl) should be transferred to secondary education which is reported by parents as more expensive and the poor cannot afford to encourage larger participation, in low literacy districts they should be Implemented properly - only those eligible should have access to them so that they will prove effective.
The Incentives meant for SC/ST will have weak Impact unless their learning capabilities also improve. For this, Udupi schools have shown the way by voluntarily providing special coaching to them and ensuring their success. There Is need to assess the Impact of such schemes atleast once in five years to streamline their effectiveness.8) Rural primary schools should introduce English language as early as possible as it is an important drawback as compared to urban primary schools.
9) DREP experiment has shown positive results and should be extended to other low female literacy districts and considered as a model to improve quality In primary schooling.
10) The policy followed in recruitment and transfer of teachers in primary or secondary schools Is not conducive to cross cultural assimilation. Teachers in low literacy districts like Gulbarga and Udupl differ vastly - one is very alert, productive and sensitive to the needs of students today while the other is a contrast even not regular to school. If he is transferred to other districts may change his attitudes and out looks. At present It is not possible. The work culture will change only by exposure and creating demand for efficiency.
11) The private participation In primary education which Is still in infancy and confined only to large cities should be extended to rural areas by suitable policies and programmes. The participation of corporate houses will Increase if the state- administration bring in efficiency in the system which is lacking now.
12) Improving the low mean years of schooling of the burgeoning labour force by ensuring a minimum of 10 years in the coming few years alone will ensure distribution of benefits of globalisation in the state and If not, the rich will become richer faster now than ever before and may lead to social tension. For this, enforcement of the Act noted earlier will prove effective and not the incentives. Provisioning of qualitative education not only In primary but also In secondary education Is necessary.
13) The education department should realize that just opening a school and appointing a teacher is not going to universalize primary education. Help, co-opeation and co-ordination with labour department can be very useful in reducing child labour the incidence of which is one of the highest in the state - next only to Andhra Pradesh. Elimination of child labour will ensure educational goal of the state faster.

THE ROLE OF BEST PRACTICES IN PROMOTING EQUITY IN EDUCATION
The preceeding pages clearly indicated tliat regional disparities in Karnataka have persisted during last four and half decades and Hyderabad Karnataka or Gulbarga division that includes Bellary in addition to the three districts have remained at the bottom. There are marginal improvements in literacy rates in each of these districts during 1961-2001 but the ranks have not changed. As a contrast Dakshina Kannada (Udupi was part of it) has remained at the top with the first rank. It is note worthy that the literacy rates, per cent pass in SSLC and PU II of even the Scheduled Caste/Tribe females is highest in the district. The achievement of the district is remarkable looking at the uniform policy that the state follows for all districts without any discrimination in resource allocation. In other words, every rupee that the state invest in education is much more productive in Udupi and least productive in Hyderabad Karnataka and few other districts like Bellary and Chamarajnagar.
It is valuable to document the observed best practices in Udupi district that have become part and parcel of the Primary School system and do not require any additional resources. It only needs change in work culture. They provide directions to other districts that are performing poorly for long. These practices are noted in this section.
Best practices In Udupi
1) The schools open on time and close on time.2) Teachers are punctual and are in school till school closes. As soon as the
school starts, there will be prayer and immediately classes start functioning.3) Teachers are committed to their profession, scliool and students.4) The teachers are proud of their work and put in their best for students.5) In every school we visited, the school teachers, it was observed make special
efforts, to improve the performance of students belonging to SC/ST. It was done with full enthusiasm and confidence that SC/ST students can perform as good as others or even better if they get some encouragement and support. The results show it.
6) Every teacher in all the schools we visited, personally knew the parents of allstudents in the school. They often meet and exchange views on schooling of the ward. If a student is absent even for a day, the parents need to write aletter to teacher explaining the reasons for absence. The result is absenteeism is insignificant.
7) Distribution of food-grains and uniforms was strictly according to the letter and spirit of the rule. If a student is not present for 80 per cent of school days in a month he will not get the grains. This strategy has produced very good results.
8) The concern for quality of Teaching was overwhelmingly visible in every school we visited in Udupi. Teachers contributed from their salary to pay an additional Teacher appointed in the vacancy not filled for long. This was done to ensure that students should not suffer because of administrative problems. Teachers help financially to deserving students coming from poor, non-SC/ST families who are in need of it.
9) Government officials of all departments in the district like Social Welfare, Integrated Tribal Development, Labour and Women and Child Development are concerned with education of children that indicates a semblance of

integrated approach to schooling in the district that has positively helped in accelerating literacy levels in the district and reducing disparities.
10) Good Teachers are recognized by the community and are respected. Community participation is seen in the financial contribution to school development, providing play grounds, honouring publicly retired teachers and in several other ways. It is also seen in opening primary schools in rural and isolated places with a goal of accessing schooling to all children.
11) Pre School Centres (Anganwadi) are effectively working in Udupi and have contributed a lot to improve schooling of particularly poor children. Anganwadi teachers are better and work closely with school and health centers. Centres attract children from poorer section and introduce them to the culture of education - coming to Centre on time, eating the nutritious food at a particular time and learning to be in the Centre for fixed hours all have contributed to the transition that takes place when the child attains 5 years 10 months to enroll in class I of the primary school. There is good co-ordination. The Anganwadi teacher goes from house to house to escort children to the Centre as residential pattern in the district needs it.
12) The district level education department is very active and responds to the needs and problems of teachers and schools without delay.

REFERENCES
Human Development Report, Kamataka, 1999, Planning Department, Government of Karnataka, Bangalore.
Kanbargi Ramesh and P M Kulkarni, 1991, ‘Child Work Schooling and Fertility in Karnataka in Child Labour in Indian Sub-Continent, Ed. Kanbargi, Sage, New Delhi.
Kanbargi Ramesh, 1991, Child Labour in Indian Sub-Continent : Dimensions and Implications, Sage, New Delhi.
Marshall Alfred, 1925, Principles of Economics, Mac Millan, London.
PROBE 1999, Public Report on Basic Education in India, Oxford University Press, New Delhi.
Rashmi Sharma, 1998, Universal Elementary Education : The Question is How? ERW, June 27, 1998.
Rukmini Banerjee, 2000, Poverty and Primary Schooling : Field Studies from Mumbai and Delhi, EPW, March 4, 2000.
Vijay Bhaskar, 1999, Improving Efliciency and Equity in Primary Education in Karnataka, IDDSP, University of Birmingham.
World Bank 1997, Primary Education in Karnataka, Washington DC, World Bank.
P l a . * '4 ,',iro in .str » tio n .
Soc. N O ...............-----------------------------
NIEPA DC
□11893Printed by : Director, Printing, Stationery and Publications, GBP, Tumkur, WD - 290 - 300 Copies, Dt; 25-02-2003.

The government of Karnataka has initiated an exercise to evolve a broad policy frame work on Education. As part of this effort, a series of studies have been undertaken on various sub-sectors in a bid to have an indepth analysis of the situation and of the needs of the entire spectrum of Education in Karnataka. The various sub sectors covered relate to Education & Child development, Education & Equity,Teacher Education, & Sec & P. U Education, Collegiate Education, the Role of private sector in Education, Technical Education,Etc. The available reports are being printed hereby in an attempt to share the same with the readers at large so that they can draw as much benefit from them as possible.
Printed a t : Government Press, Bangalore