test design and test development - oecd ilibrary
TRANSCRIPT
Test design and test development
27
2
PISA 2006 TECHNICAL REPORT – ISBN 978-92-64-04808-9 – © OECD 2009
Test scope and format .................................................................................................................................. 28Test design ........................................................................................................................................................... 28Test development centres .......................................................................................................................... 29Development timeline ................................................................................................................................. 30The PISA 2006 scientific literacy framework ............................................................................... 30Test development – cognitive items ................................................................................................... 31 • Item development process ............................................................................................................... 31 • National item submissions .............................................................................................................. 33 • National review of items ................................................................................................................... 34 • International item review ................................................................................................................. 35 • Preparation of dual (English and French) source versions .......................................... 35Test development – attitudinal items ................................................................................................. 35Field trial ............................................................................................................................................................... 38 • Field trial selection ................................................................................................................................ 38 • Field trial design ..................................................................................................................................... 39 • Despatch of field trial instruments ............................................................................................. 40 • Field trial coder training .................................................................................................................... 40 • Field trial coder queries ..................................................................................................................... 40 • Field trial outcomes .............................................................................................................................. 41 • National review of field trial items ............................................................................................ 42Main study ........................................................................................................................................................... 42 • Main study science items ................................................................................................................. 42 • Main study reading items ................................................................................................................. 44 • Main study mathematics items ..................................................................................................... 45
• Despatch of main study instruments ......................................................................................... 46
• Main study coder training ................................................................................................................ 46
• Main study coder query service ................................................................................................... 46
• Review of main study item analyses ......................................................................................... 47
2TesT design and TesT developmenT
28PISA 2006 TECHNICAL REPORT – ISBN 978-92-64-04808-9 – © OECD 2009
This chapter describes the test design for PISA 2006 and the processes by which the PISA consortium, led by ACER, developed the PISA 2006 paper-and-pencil test.
TesT scope and formaT
In PISA 2006 three subject domains were tested, with science as the major domain for the first time in a PISA administration and reading and mathematics as minor domains.
PISA items are arranged in units based around a common stimulus. Many different types of stimulus are used including passages of text, tables, graphs and diagrams, often in combination. Each unit contains up to four items assessing students’ scientific competencies and knowledge. In addition, for PISA 2006 about 60% of the science units contained one or two items designed to assess aspects of students’ attitudes towards science. Throughout this chapter the terms “cognitive items” and “attitudinal items” will be used to distinguish these two separate types of items.
There were 37 science units, comprising a total of 108 cognitive items and 31 embedded attitudinal items, representing approximately 210 minutes of testing time for science in PISA 2006. The same amount of time was allocated to the major domain for 2003 (mathematics), but there were no attitudinal items in the 2003 test. The reading assessment consisted of the same 31 items (8 units) as in 2003, representing approximately 60 minutes of testing time, and the mathematics assessment consisted of 48 items (31 units), representing approximately 120 minutes of testing time. The mathematics items were selected from the 167 items used in 2003.
The 108 science cognitive items used in the main study included 22 items from the 2003 test. The remaining 86 items were selected from a pool of 222 newly-developed items that had been tested in a field trial conducted in all countries in 2005, one year prior to the main study. There was no new item development for reading and mathematics.
Item formats employed with science cognitive items were multiple-choice, short closed-constructed response, and open- (extended) constructed response. Multiple-choice items were either standard multiple-choice with four responses from which students were required to select the best answer, or complex multiple-choice presenting several statements for each of which students were required to choose one of several possible responses (yes/no, true/false, correct/incorrect, etc.). Closed-constructed response items required students to construct a numeric response within very limited constraints, or only required a word or short phrase as the answer. Open-constructed response items required more extensive writing and frequently required some explanation or justification.
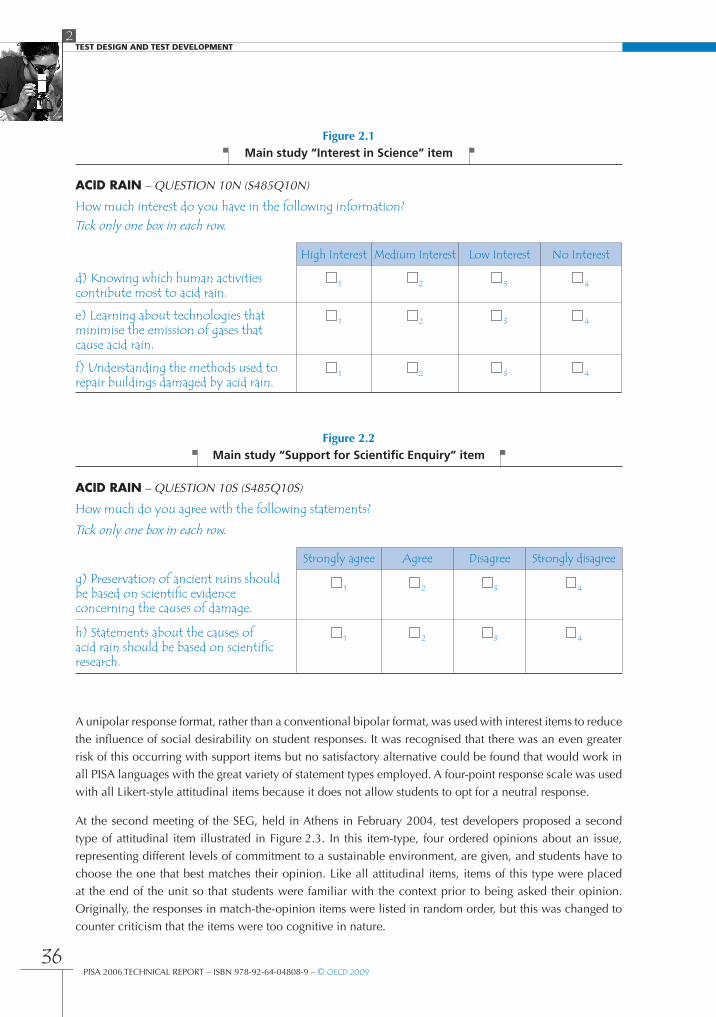
Each attitudinal item required students to express their level of agreement on a four-point scale with two or three statements expressing either interest in science or support for science. Each attitudinal item was formatted distinctively and appeared in a shaded box – see Figure 2.1 and Figure 2.2.
Pencils, erasers, rulers, and in some cases calculators, were provided. It was recommended that calculators be provided in countries where they were routinely used in the classroom. National centres decided whether calculators should be provided for their students on the basis of standard national practice. No test items required a calculator, but some mathematics items involved solution steps for which the use of a calculator could be of assistance to some students.
TesT design
The main study items were allocated to thirteen item clusters (seven science clusters, two reading clusters and four mathematics clusters) with each cluster representing 30 minutes of test time. The items were presented to students in thirteen test booklets, with each booklet being composed of four clusters according
2TesT design and TesT developmenT
29PISA 2006 TECHNICAL REPORT – ISBN 978-92-64-04808-9 – © OECD 2009
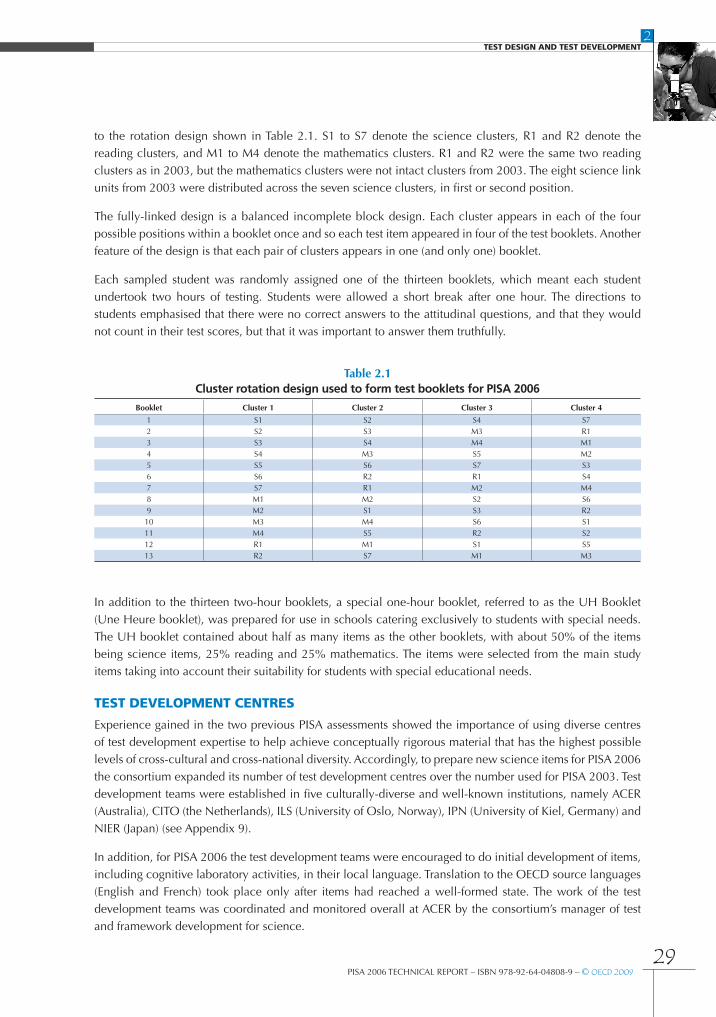
to the rotation design shown in Table 2.1. S1 to S7 denote the science clusters, R1 and R2 denote the reading clusters, and M1 to M4 denote the mathematics clusters. R1 and R2 were the same two reading clusters as in 2003, but the mathematics clusters were not intact clusters from 2003. The eight science link units from 2003 were distributed across the seven science clusters, in first or second position.
The fully-linked design is a balanced incomplete block design. Each cluster appears in each of the four possible positions within a booklet once and so each test item appeared in four of the test booklets. Another feature of the design is that each pair of clusters appears in one (and only one) booklet.
Each sampled student was randomly assigned one of the thirteen booklets, which meant each student undertook two hours of testing. Students were allowed a short break after one hour. The directions to students emphasised that there were no correct answers to the attitudinal questions, and that they would not count in their test scores, but that it was important to answer them truthfully.
Table 2.1Cluster rotation design used to form test booklets for PISA 2006
Booklet Cluster 1 Cluster 2 Cluster 3 Cluster 4
1 S1 S2 S4 S72 S2 S3 M3 R13 S3 S4 M4 M14 S4 M3 S5 M25 S5 S6 S7 S36 S6 R2 R1 S47 S7 R1 M2 M48 M1 M2 S2 S69 M2 S1 S3 R210 M3 M4 S6 S111 M4 S5 R2 S212 R1 M1 S1 S513 R2 S7 M1 M3
In addition to the thirteen two-hour booklets, a special one-hour booklet, referred to as the UH Booklet (Une Heure booklet), was prepared for use in schools catering exclusively to students with special needs. The UH booklet contained about half as many items as the other booklets, with about 50% of the items being science items, 25% reading and 25% mathematics. The items were selected from the main study items taking into account their suitability for students with special educational needs.
TesT developmenT cenTres
Experience gained in the two previous PISA assessments showed the importance of using diverse centres of test development expertise to help achieve conceptually rigorous material that has the highest possible levels of cross-cultural and cross-national diversity. Accordingly, to prepare new science items for PISA 2006 the consortium expanded its number of test development centres over the number used for PISA 2003. Test development teams were established in five culturally-diverse and well-known institutions, namely ACER (Australia), CITO (the Netherlands), ILS (University of Oslo, Norway), IPN (University of Kiel, Germany) and NIER (Japan) (see Appendix 9).
In addition, for PISA 2006 the test development teams were encouraged to do initial development of items, including cognitive laboratory activities, in their local language. Translation to the OECD source languages (English and French) took place only after items had reached a well-formed state. The work of the test development teams was coordinated and monitored overall at ACER by the consortium’s manager of test and framework development for science.
2TesT design and TesT developmenT
30PISA 2006 TECHNICAL REPORT – ISBN 978-92-64-04808-9 – © OECD 2009
developmenT Timeline
The PISA 2006 project started formally in September 2003, and concluded in December 2007. Planning for item development began in July 2003, with preparation of material for a three-day meeting of test developers from each team, which was held in Oslo in September, 2003. The meeting had the following purposes:
• To become familiar with the draft PISA 2006 scientific literacy framework, especially its implications for test development;
• To discuss the requirements for item development, including item presentation and formats, use of templates and styles, cognitive laboratory procedures and timelines;
• To be briefed on detailed guidelines, based on experience from the first two PISA administrations, for avoiding potential translation and cultural problems when developing items;
• To review sample items prepared for the meeting by each of the test development teams;
• To prepare advice to the PISA 2006 Science Expert Group (SEG) on the adequacy of the draft science framework as a basis for item development.
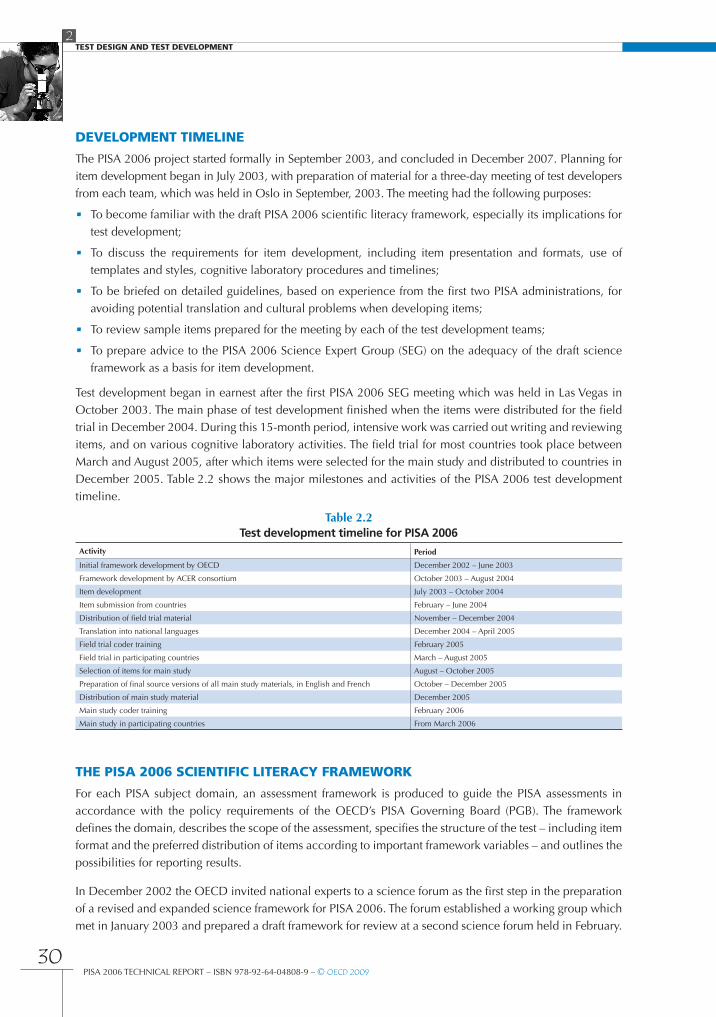
Test development began in earnest after the first PISA 2006 SEG meeting which was held in Las Vegas in October 2003. The main phase of test development finished when the items were distributed for the field trial in December 2004. During this 15-month period, intensive work was carried out writing and reviewing items, and on various cognitive laboratory activities. The field trial for most countries took place between March and August 2005, after which items were selected for the main study and distributed to countries in December 2005. Table 2.2 shows the major milestones and activities of the PISA 2006 test development timeline.
Table 2.2Test development timeline for PISA 2006
Activity Period
Initial framework development by OECD December 2002 – June 2003
Framework development by ACER consortium October 2003 – August 2004
Item development July 2003 – October 2004
Item submission from countries February – June 2004
Distribution of field trial material November – December 2004
Translation into national languages December 2004 – April 2005
Field trial coder training February 2005
Field trial in participating countries March – August 2005
Selection of items for main study August – October 2005
Preparation of final source versions of all main study materials, in English and French October – December 2005
Distribution of main study material December 2005
Main study coder training February 2006
Main study in participating countries From March 2006
The pisa 2006 scienTific liTeracy framework
For each PISA subject domain, an assessment framework is produced to guide the PISA assessments in accordance with the policy requirements of the OECD’s PISA Governing Board (PGB). The framework defines the domain, describes the scope of the assessment, specifies the structure of the test – including item format and the preferred distribution of items according to important framework variables – and outlines the possibilities for reporting results.
In December 2002 the OECD invited national experts to a science forum as the first step in the preparation of a revised and expanded science framework for PISA 2006. The forum established a working group which met in January 2003 and prepared a draft framework for review at a second science forum held in February.
2TesT design and TesT developmenT
31PISA 2006 TECHNICAL REPORT – ISBN 978-92-64-04808-9 – © OECD 2009
A further draft was then produced and considered by the PGB at its meeting in Mexico City in March. After
the PGB meeting a Science Framework Expansion Committee was established to continue development of
the framework until the PISA 2006 contract was let. This committee, like the forums and working group,
was chaired by Rodger Bybee who would subsequently be appointed chair of the PISA 2006 Science Expert
Group.
Many sections of the science framework presented to the consortium in October 2003 were well developed –
especially those concerning the definition of the domain and its organisational aspects (in particular, the
discussions of contexts, competencies and knowledge). Other sections, however, were not so well developed.
Over the next 10 months, through its Science Expert Group and test developers, and in consultation with
national centres and the science forum, the consortium further developed the framework and a final draft
was submitted to the OECD in August 2004. In the latter part of 2005, following the field trial, some revisions
were made to the framework and in early 2006 it was prepared for publication along with an extensive
set of example items. All three PISA 2006 frameworks were published in Assessing Scientific, Reading and
Mathematical Literacy: A Framework for PISA 2006 (OECD, 2006). The reading and mathematics frameworks
were unchanged from 2003.
TesT developmenT – cogniTive iTems
The test development process commenced with preparations for the meeting of test developers held in Oslo
in September 2003. This included the preparation of documentation to guide all parts of the process for the
development of cognitive items. The process continued with the calling of submissions from participating
countries, writing and reviewing items, carrying out pilot tests of items and conducting an extensive field
trial, producing final source versions of all items in both English and French, preparing coding guides and
coder training material, and selecting and preparing items for the main study.
Item development processCognitive item development was guided by a comprehensive set of guidelines prepared at the start of the
project and approved by the first meeting of the PISA 2006 Science Expert Group. The guidelines included
an overview of the development process and timelines, a specification of item requirements, including the
importance of framework fit, and a discussion of issues affecting item difficulty. A number of sample items
were also provided. These guidelines were expected to be followed by item developers at each of the five
test development centres.
A complete PISA unit consists of some stimulus material, one or more items (questions), and a guide to the
coding of responses to each question. Each coding guide comprises a list of response categories (full, partial
and no credit), each with its own scoring code, descriptions of the kinds of responses to be assigned each
code, and sample responses for each response category. As in PISA 2000 and 2003, double-digit coding was
used in some items to distinguish between cognitively distinct ways of achieving the same level of credit. In
a double-digit code, such as “12”, the first digit (1) indicates the score or level of response and the second
digit (2) indicates the method or approach used by the student.
First phase of development
Typically, the following steps were taken in the first phase of the development of science cognitive items
originating at a test development centre. The steps are described in a linear fashion, but in reality they were
often negotiated in a cyclical fashion, with items often going through the various steps more than once.
2TesT design and TesT developmenT
32PISA 2006 TECHNICAL REPORT – ISBN 978-92-64-04808-9 – © OECD 2009
Initial preparation
Test developers prepared units in the local language in a standard format, including stimulus, one or more items (questions), and a proposed coding guide for each item. Items were then subject to a series of cognitive laboratory activities: item panelling (also known as item shredding or cognitive walkthrough), cognitive interviews, and pilot or pre-trial testing (also known as cognitive comparison studies). All items were subject to panelling and underwent local piloting. In addition, cognitive interviews were employed for a significant proportion of items,.
Local item panelling
Each unit first underwent extensive scrutiny at a meeting of members of the relevant test development team. This stage of the cognitive laboratory process typically involved item writers in a vigorous analysis of all aspects of the items from the point of view of a student, and from the point of view of a coder.
Items were revised, often extensively, following item panelling. When substantial revisions were required, items went back to the panelling stage for further consideration.
Cognitive interviews
Many units were then prepared for individual students or small groups of students to attempt. A combination of think-aloud methods, individual interviews and group interviews were used with students to ascertain the thought processes typically employed as students attempted the items.
Items were revised, often extensively, following their use with individuals and small groups of students. This stage was particularly useful in clarifying wording of questions, and gave information on likely student responses that was used in refining the response coding guides.
Local pilot testing
As the final step in the first phase of item development, sets of units were piloted with several classes of 15-year-olds in schools in the country in which they were developed. As well as providing statistical data on item functioning, including the relative difficulty of items, this enabled real student responses derived under formal test conditions to be obtained, thereby enabling more detailed development of coding guides.
Pilot test data were used to inform further revision of items where necessary or sometimes to discard items altogether. Units that survived relatively unscathed were then formally submitted to the test development manager to undergo their second phase of development, after being translated into English if their initial development had taken place in another language.
Second phase of development
The second phase of item development began with the review of each unit by at least one test development team that was not responsible for its initial development. Each unit was then included in at least one of a series of pilot studies with a substantial number of students of the appropriate age.
International item panelling
The feedback provided following the scrutiny of items by international colleagues often resulted in further improvements to the items. Of particular importance was feedback relating to the operation of items in different cultures and national contexts, which sometimes led to items or even units being discarded. Surviving units were considered ready for further pilot testing and for circulation to national centres for review.
2TesT design and TesT developmenT
33PISA 2006 TECHNICAL REPORT – ISBN 978-92-64-04808-9 – © OECD 2009
International pilot testing
For each pilot study, test booklets were formed from a number of units developed at different test development centres. These booklets were trialled with several whole classes of students in several different schools. Field-testing of this kind mainly took place in schools in Australia because of translation and timeline constraints. Sometimes, multiple versions of items were trialled and the results were compared to ensure that the best alternative form was identified. Data from the pilot studies were analysed using standard item response techniques.
Many items were revised, usually in a minor fashion, following review of the results of pilot testing. If extensive revision was considered necessary, the item was either discarded or the revised version was again subject to panelling and piloting. One of the most important outputs of this pilot testing was the generation of many student responses to each constructed-response item. A selection of these responses was added to the coding guide for the item to further illustrate each response category and so provide more guidance for coders.
National item submissionsAn international comparative study should ideally draw items from as many participating countries as possible to ensure wide cultural and contextual diversity. A comprehensive set of guidelines, was developed to encourage and assist national submission of science cognitive items. A draft version of the guidelines was distributed to PISA 2003 NPMs in November 2003. The final version was distributed to PISA 2006 NPMs in February 2004.
The guidelines described the scope of the item development task for PISA 2006, the arrangements for national submissions of items and the item development timeline. In addition the guidelines contained a detailed discussion of item requirements and an overview of the full item development process for PISA 2006. Four complete sample units prepared at ACER were provided in an accompanying document.
The due date for national submission of items was 30 June 2004, as late as possible given field trial preparation deadlines. Items could be submitted in Chinese, Dutch, English, French, German, Italian, Japanese, Norwegian, Russian or Spanish, or any other language subject to prior consultation with the consortium. Countries were urged to submit items as they were developed, rather than waiting until close to the submission deadline. It was emphasised that before items were submitted they should have been subject to some cognitive laboratory activities involving students and revised accordingly. An item submission form was provided with the guidelines and a copy had to be completed for each unit, indicating the source of the material, any copyright issues, and the framework classifications of each item.
A total of 155 units were processed from 21 countries, commencing in mid-March 2004. Countries submitting units were: Austria, Belgium, Canada, Chinese Taipei, the Czech Republic, Chile, Finland, France, Greece, Ireland, Italy, Korea, Mexico, Norway, New Zealand, Poland, Serbia, the Slovak Republic, Sweden, Switzerland and the United Kingdom. Most countries chose to submit their material in English, but submissions were received in five other languages (Dutch, French, German, Spanish and Swedish).
Some submitted units had already undergone significant development work, including pilot testing, prior to submission. Others were in a much less developed state and consisted in some cases of little more than a brief introduction and ideas for possible items. Often items were far too open-ended for use in PISA. Some countries established national committees to develop units and trialled their units with students. Other countries sub-contracted the development of units to an individual and submitted them without any internal review. The former approach yielded better quality units in general.
2TesT design and TesT developmenT
34PISA 2006 TECHNICAL REPORT – ISBN 978-92-64-04808-9 – © OECD 2009
Each submitted unit was first reviewed by one of the test development centres to determine its general suitability for PISA 2006. Units initially deemed unsuitable were referred to another test development centre for a second and final opinion. About 25% of submitted units were deemed unsuitable for PISA 2006. The main reasons for assessing units as unsuitable were lack of context, inappropriate context, cultural bias, curriculum dependence, just school science and including content that was deemed to be too advanced.
The remaining 75% of submitted units were considered suitable in some form or other for use in PISA 2006. However, only a handful of these units were deemed not to need significant revision by consortium test developers. Various criteria were used to select those units to be further developed, including overall quality of the unit, amount of revision required and their framework coverage. Nevertheless, high importance was placed on including units from as wide a range of countries as possible. Some units were excluded because their content overlapped too much with existing units.
Units requiring further initial development were distributed among the test development centres. Typically, after local panelling and revision, they were fast-tracked into the second phase of item development as there was rarely time for cognitive interviews or pilot testing to be conducted locally. However, all these units underwent international pilot testing (as described above), along with the units that originated at test development centres and a handful of units that were developed from material supplied by individual members of the Science Expert Group.
A total of 40 units (150 items) arising from national submissions were included in the five bundles of items circulated to national centres for review. Feedback was provided to countries on their submitted units that were not used. This action, together with the provision of an item development workshop for national centre representatives early in a cycle, should improve the quality of national submissions in the future.
National review of itemsIn February 2004, NPMs were given a set of item review guidelines to assist them in reviewing cognitive items and providing feedback. A copy of a similar set of guidelines, prepared later for review of all items used in the field trial and including reference to attitudinal items was also available.
At the same time, NPMs were given a schedule for the distribution and review of bundles of draft items during the remainder of 2004. A central feature of those reviews was the requirement for national experts to rate items according to various aspects of their relevance to 15-year-olds, including whether they related to material included in the country’s curriculum, their relevance in preparing students for life, how interesting they would appear to students and their authenticity as real applications of science or technology. NPMs also were asked to identify any cultural concerns or other problems with the items, such as likely translation or marking difficulties, and to give each item an overall rating for retention in the item pool.
As items were developed to a sufficiently complete stage, they were despatched to national centres for review. Five bundles of items were distributed. The first bundle, including 65 cognitive items, was despatched in January 2004. National centres were provided with an Excel worksheet, already populated with unit names and item identification codes, in which to enter their ratings and other comments. Subsequent bundles were despatched in April (103 cognitive items), June (125 items), July (85 items) and August (114 items). In each case, about 4 weeks was scheduled for the submission of feedback.
For each bundle, a series of reports was generated summarising the feedback from NPMs. The feedback frequently resulted in further revision of the items. In particular, cultural issues related to the potential
2TesT design and TesT developmenT
35PISA 2006 TECHNICAL REPORT – ISBN 978-92-64-04808-9 – © OECD 2009
operation of items in different national contexts were highlighted and sometimes, as a result of this, items had to be discarded. Summaries of the ratings assigned to each item by the NPMs were used extensively in the selection of items for the field trial.
International item reviewAs well as the formal, structured process for national review of items, cognitive items were also considered in detail, as they were developed, at meetings of the Science Expert Group (SEG) that took place in October 2003 and February, July and September 2004.
The July 2004 SEG meeting, held in Warsaw, was immediately preceded by a science forum, and all items that had been developed at that stage were reviewed in detail by forum participants. All PISA countries were invited to send national science experts to the forum. The forum also provided advice on issues that had arisen during framework and student questionnaire development.
Preparation of dual (English and French) source versionsBoth English and French source versions of all test instruments were developed and distributed to countries as a basis for local adaptation and translation into national versions. An item-tracking database, with web interface, was used by both test developers and consortium translators to access items. This ensured accurate tracking of the English language versions and the parallel tracking of French translation versions.
Part of the translation process involved a technical review by French subject experts, who were able to identify issues with the English source version related to content and expression that needed to be addressed immediately, and that might be of significance later when items would be translated into other languages. Many revisions were made to items as a result of the translation and technical review process, affecting both the English and French source versions. This parallel development of the two source versions assisted in ensuring that items were as culturally neutral as possible, identified instances of wording that could be modified to simplify translation into other languages, and indicated where additional translation notes were needed to ensure the required accuracy in translating items to other languages.
TesT developmenT – aTTiTudinal iTems
The assessment of the affective domain was a major focus of the first meeting of the PISA 2006 Science Expert Group held in October 2003. It was recommended that the assessment be restricted to three attitude scales, rather than the five scales proposed by the Science Framework Expansion Committee:
• Interest in science;
• Value placed on scientific enquiry – eventually renamed Support for scientific enquiry; and
• Responsibility towards resources and environments.
For convenience, the names of the scales will often be shortened to interest, support and responsibility in the remainder of this chapter.
At the first meeting of PISA 2006 test developers, held in Oslo in September 2003, staff from the IPN test development centre proposed that suitable units should contain items requiring students to indicate their level of agreement with three statements. This proposal was then put to the October SEG meeting which gave its support for future development of such Likert-style attitudinal items. Two examples from the released main study unit ACID RAIN are shown in Figure 2.1 and Figure 2.2. Like the interest item, the support item originally contained three parts, but one was dropped because it exhibited poor psychometric properties in the field trial.
2TesT design and TesT developmenT
36PISA 2006 TECHNICAL REPORT – ISBN 978-92-64-04808-9 – © OECD 2009
AcId rAIN – QueStIon 10n (S485Q10n)
How much interest do you have in the following information?Tick only one box in each row.
High Interest Medium Interest Low Interest No Interest
d) Knowing which human activities contribute most to acid rain.
1 2 3 4
e) Learning about technologies that minimise the emission of gases that cause acid rain.
1 2 3 4
f) Understanding the methods used to repair buildings damaged by acid rain.
1 2 3 4
Figure 2.1Main study “Interest in Science” item
AcId rAIN – QueStIon 10S (S485Q10S)
How much do you agree with the following statements?
Tick only one box in each row.
Strongly agree Agree Disagree Strongly disagree
g) Preservation of ancient ruins should be based on scientific evidence concerning the causes of damage.
1 2 3 4
h) Statements about the causes of acid rain should be based on scientific research.
1 2 3 4
Figure 2.2Main study “Support for Scientific Enquiry” item
A unipolar response format, rather than a conventional bipolar format, was used with interest items to reduce the influence of social desirability on student responses. It was recognised that there was an even greater risk of this occurring with support items but no satisfactory alternative could be found that would work in all PISA languages with the great variety of statement types employed. A four-point response scale was used with all Likert-style attitudinal items because it does not allow students to opt for a neutral response.
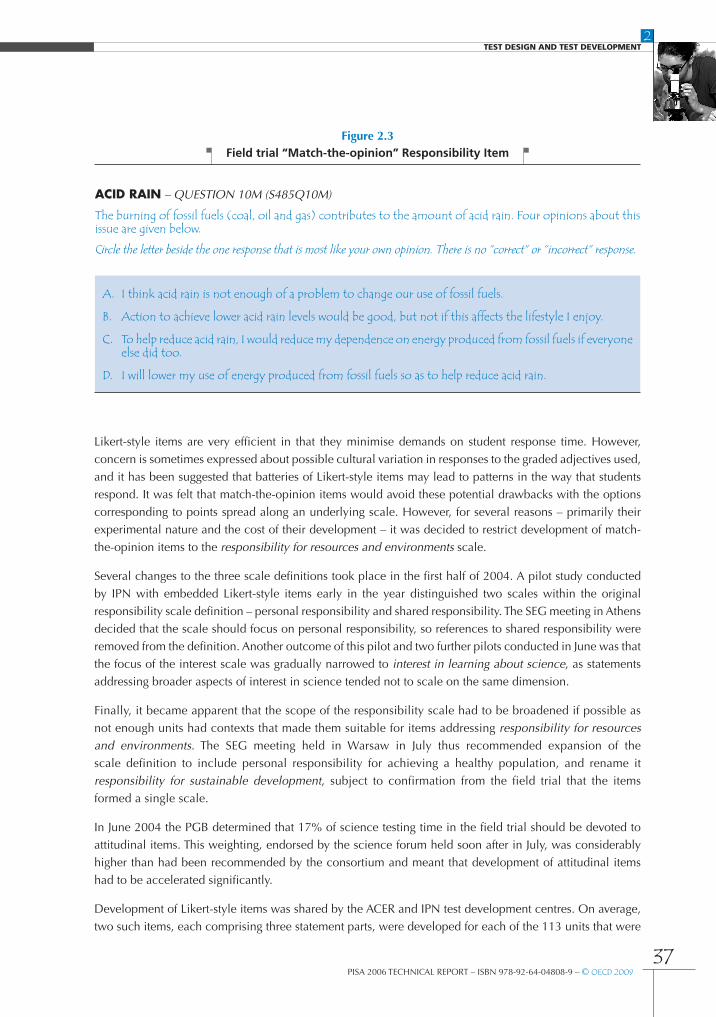
At the second meeting of the SEG, held in Athens in February 2004, test developers proposed a second type of attitudinal item illustrated in Figure 2.3. In this item-type, four ordered opinions about an issue, representing different levels of commitment to a sustainable environment, are given, and students have to choose the one that best matches their opinion. Like all attitudinal items, items of this type were placed at the end of the unit so that students were familiar with the context prior to being asked their opinion. Originally, the responses in match-the-opinion items were listed in random order, but this was changed to counter criticism that the items were too cognitive in nature.
2TesT design and TesT developmenT
37PISA 2006 TECHNICAL REPORT – ISBN 978-92-64-04808-9 – © OECD 2009
Figure 2.3Field trial “Match-the-opinion” Responsibility Item
AcId rAIN – QueStIon 10M (S485Q10M)
The burning of fossil fuels (coal, oil and gas) contributes to the amount of acid rain. Four opinions about this issue are given below.
Circle the letter beside the one response that is most like your own opinion. There is no “correct” or “incorrect” response.
A. I think acid rain is not enough of a problem to change our use of fossil fuels.
B. Action to achieve lower acid rain levels would be good, but not if this affects the lifestyle I enjoy.
C. To help reduce acid rain, I would reduce my dependence on energy produced from fossil fuels if everyone else did too.
D. I will lower my use of energy produced from fossil fuels so as to help reduce acid rain.
Likert-style items are very efficient in that they minimise demands on student response time. However, concern is sometimes expressed about possible cultural variation in responses to the graded adjectives used, and it has been suggested that batteries of Likert-style items may lead to patterns in the way that students respond. It was felt that match-the-opinion items would avoid these potential drawbacks with the options corresponding to points spread along an underlying scale. However, for several reasons – primarily their experimental nature and the cost of their development – it was decided to restrict development of match-the-opinion items to the responsibility for resources and environments scale.
Several changes to the three scale definitions took place in the first half of 2004. A pilot study conducted by IPN with embedded Likert-style items early in the year distinguished two scales within the original responsibility scale definition – personal responsibility and shared responsibility. The SEG meeting in Athens decided that the scale should focus on personal responsibility, so references to shared responsibility were removed from the definition. Another outcome of this pilot and two further pilots conducted in June was that the focus of the interest scale was gradually narrowed to interest in learning about science, as statements addressing broader aspects of interest in science tended not to scale on the same dimension.
Finally, it became apparent that the scope of the responsibility scale had to be broadened if possible as not enough units had contexts that made them suitable for items addressing responsibility for resources and environments. The SEG meeting held in Warsaw in July thus recommended expansion of the scale definition to include personal responsibility for achieving a healthy population, and rename it responsibility for sustainable development, subject to confirmation from the field trial that the items formed a single scale.
In June 2004 the PGB determined that 17% of science testing time in the field trial should be devoted to attitudinal items. This weighting, endorsed by the science forum held soon after in July, was considerably higher than had been recommended by the consortium and meant that development of attitudinal items had to be accelerated significantly.
Development of Likert-style items was shared by the ACER and IPN test development centres. On average, two such items, each comprising three statement parts, were developed for each of the 113 units that were
2TesT design and TesT developmenT
38PISA 2006 TECHNICAL REPORT – ISBN 978-92-64-04808-9 – © OECD 2009
circulated to national centres for review. Interest items were developed for all but three units, support items for two-thirds of the units and responsibility items for 40% of them. In addition, match-the-opinion responsibility items were developed for 25 units at ACER. More items were produced for the interest scale than for the other two scales because feedback from pilot studies and NPM meetings indicated that it was the most likely scale to survive through to the main study.
All the items were subject to at least two rounds of panelling but time constraints meant that only about one-third were piloted with classes of students. The items included in units selected for the field trial were panelled again before being distributed to NPMs for review and, at the same time, submitted for translation into French and for professional editing. Feedback from these processes resulted in most items being revised and many items being discarded. In particular, feedback from the French expert identified many potential translation issues, especially with the support statements as the expression for the word support in French, and presumably some other languages, does not refer to an opinion only, but to taking some action as well.
field Trial
A total of 113 science units (492 cognitive items) were circulated to national centres for review. After consideration of country feedback, 103 units (377 cognitive items) were retained as the pool of units considered by the SEG for inclusion in the field trial. Thirty-eight of these units (37%) originated in national submissions.
All units retained to this stage were subjected to an editorial check using the services of a professional editor. This helped uncover any remaining typographical errors, grammatical inconsistencies and layout irregularities, and provided a final check that the reading level of the material was appropriate for 15-year-olds.
Field trial selectionThe new cognitive items to be used in the 2005 field trial were selected from the item pool at the meeting of the SEG held in Bratislava in mid-September 2004. The selection process took two-and-a-half days to complete. Each SEG member first chose ten units to be included in the field trial, with 67 of the 103 units receiving at least one vote. The SEG then reviewed these units in detail, item-by-item. This resulted in 14 units being omitted from the initial selection and some items being omitted from the remaining units. Next, all the units not included in the selection were reviewed item-by-item, resulting in a further 28 units being added to the selection. Throughout this process, SEG members made numerous suggestions of ways to improve the final wording of items.
At this stage, 81 units remained in the item pool, about 25% more items than required. The characteristics of the items, including framework classifications and estimated difficulties, were then examined and a final selection of 62 new units (237 cognitive items) was made to match framework requirements as far as possible. The ratings assigned to items by countries were taken into account at each step of the selection process, and at no time were SEG members informed of the origin of any item. The SEG selection was presented to a meeting of National Project Managers in the week after the SEG meeting, together with nine units (25 items) from 2003 that had been kept secure for use as link material.
Subsequently, one new unit was dropped from the item pool as a result of NPM concerns about the appropriateness of its context in some cultures, and another unit was replaced because of lingering doubts about the veracity of the science content. In addition, a small number of items had to be dropped because of space and layout constraints when the consortium test developers assembled the units into clusters and booklets. The final field trial item pool included a total of 247 science cognitive items, comprising 25 link items and 222 new items. These figures have been adjusted for the late substitution of one unit (DANGEROUS WAVES) for sensitivity reasons following the South-East Asian tsunami in December 2004.
2TesT design and TesT developmenT
39PISA 2006 TECHNICAL REPORT – ISBN 978-92-64-04808-9 – © OECD 2009
Included in the pool were several units specifically designed to target students’ major misconceptions about fundamental scientific concepts.
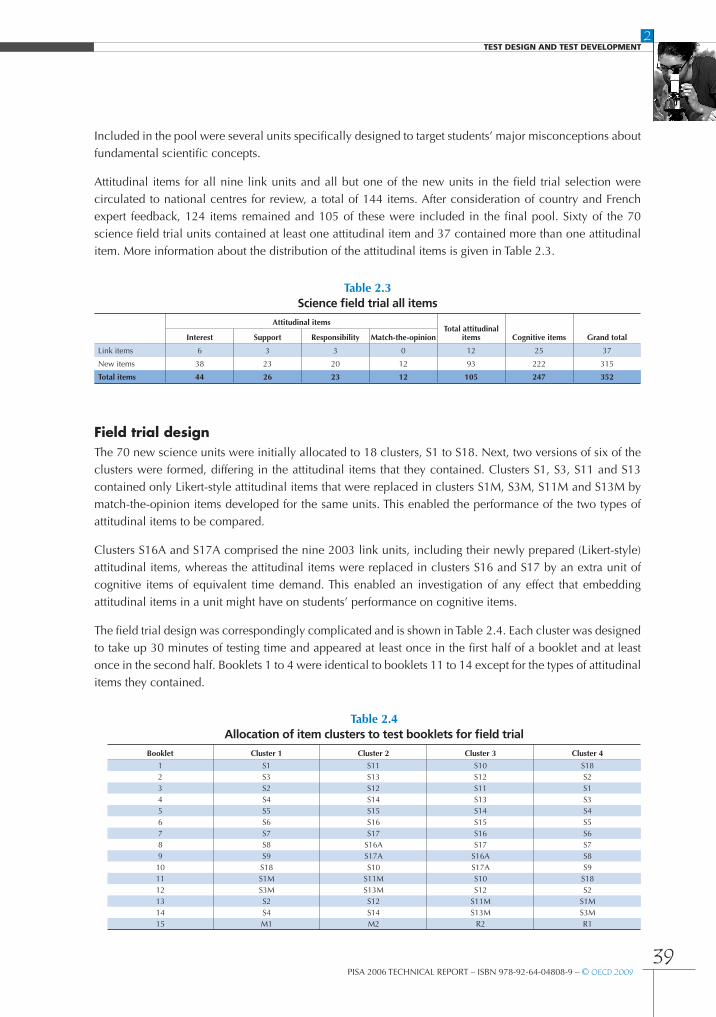
Attitudinal items for all nine link units and all but one of the new units in the field trial selection were circulated to national centres for review, a total of 144 items. After consideration of country and French expert feedback, 124 items remained and 105 of these were included in the final pool. Sixty of the 70 science field trial units contained at least one attitudinal item and 37 contained more than one attitudinal item. More information about the distribution of the attitudinal items is given in Table 2.3.
Table 2.3Science field trial all items
Attitudinal itemsTotal attitudinal
items Cognitive items Grand totalInterest Support Responsibility Match-the-opinion
Link items 6 3 3 0 12 25 37
New items 38 23 20 12 93 222 315
Total items 44 26 23 12 105 247 352
Field trial designThe 70 new science units were initially allocated to 18 clusters, S1 to S18. Next, two versions of six of the clusters were formed, differing in the attitudinal items that they contained. Clusters S1, S3, S11 and S13 contained only Likert-style attitudinal items that were replaced in clusters S1M, S3M, S11M and S13M by match-the-opinion items developed for the same units. This enabled the performance of the two types of attitudinal items to be compared.
Clusters S16A and S17A comprised the nine 2003 link units, including their newly prepared (Likert-style) attitudinal items, whereas the attitudinal items were replaced in clusters S16 and S17 by an extra unit of cognitive items of equivalent time demand. This enabled an investigation of any effect that embedding attitudinal items in a unit might have on students’ performance on cognitive items.
The field trial design was correspondingly complicated and is shown in Table 2.4. Each cluster was designed to take up 30 minutes of testing time and appeared at least once in the first half of a booklet and at least once in the second half. Booklets 1 to 4 were identical to booklets 11 to 14 except for the types of attitudinal items they contained.
Table 2.4Allocation of item clusters to test booklets for field trial
Booklet Cluster 1 Cluster 2 Cluster 3 Cluster 4
1 S1 S11 S10 S182 S3 S13 S12 S23 S2 S12 S11 S14 S4 S14 S13 S35 S5 S15 S14 S46 S6 S16 S15 S57 S7 S17 S16 S68 S8 S16A S17 S79 S9 S17A S16A S810 S18 S10 S17A S911 S1M S11M S10 S1812 S3M S13M S12 S213 S2 S12 S11M S1M14 S4 S14 S13M S3M15 M1 M2 R2 R1
2TesT design and TesT developmenT
40PISA 2006 TECHNICAL REPORT – ISBN 978-92-64-04808-9 – © OECD 2009
R1 and R2 were the same two reading clusters as in the PISA 2003 main study, comprising a total of 31 items
(8 units), although the units in R2 were ordered differently than in 2003. M1 and M2 were two mathematics
clusters formed from 2003 main study items, comprising a total of 26 items (17 units). The reading and
mathematics clusters only appeared in booklet 15. Countries that participated in PISA 2003 did not have
to do this booklet. Half of these countries were assigned booklets 1 to 12 and the other half were assigned
booklets 3 to 14. All countries new to PISA did booklet 15 and in addition were assigned either booklets
1 to 12 or 3 to 14.
despatch of field trial instrumentsFinal English and French source versions of field trial units were distributed to national centres in two
despatches, in October (link units) and November (new science units). Clusters and booklets were distributed
in December 2004 in both Word and PDF formats. All material could also be downloaded from the PISA
website from the time of despatch.
National centres then commenced the process of preparing national versions of all units, clusters and
booklets. All items went through an extremely rigorous process of adaptation, translation and external
verification in each country to ensure that the final test forms used were equivalent. That process and its
outcomes are described in Chapter 5.
Field trial coder trainingFollowing final selection and despatch of items to be included in the field trial, various documents and
materials were prepared to assist in the training of response coders. International coder training sessions
for science, reading and mathematics were scheduled for February 2005. Consolidated coding guides were
prepared, in both English and French, containing all those items that required manual coding. The guides
emphasised that coders were to code rather than score responses. That is, the guides separated different
kinds of possible responses, which did not all necessarily receive different scores. A separate training
workshop document was also produced for each subject area, once again in both English and French. These
documents contained additional student responses to the items that required manual coding, and were used
for practice coding and discussion at the coder training sessions.
Countries sent representatives to the training sessions, which were conducted in Marbella, Spain. Open
discussion of how the workshop examples should be coded was encouraged and showed the need to
introduce a small number of amendments to coding guides. These amendments were incorporated in a
final despatch of coding guides and training materials two weeks later. Following the international training
sessions, national centres conducted their own coder training activities using their verified translations of
the consolidated coding guides.
Field trial coder queriesThe consortium provided a coder query service to support the coding of scripts in each country. When there
was any uncertainty, national centres were able to submit queries by e-mail to the query service, and they
were immediately directed to the relevant consortium expert. Considered responses were quickly prepared,
ensuring greater consistency in the coding of responses to items.
The queries with the consortium’s responses were published on the PISA website. The queries report was
regularly updated as new queries were received and processed. This meant that all national coding centres
had prompt access to an additional source of advice about responses that had been found problematic in
2TesT design and TesT developmenT
41PISA 2006 TECHNICAL REPORT – ISBN 978-92-64-04808-9 – © OECD 2009
some sense. Coding supervisors in all countries found this to be a particularly useful resource though there was considerable variation in the number of queries that they submitted.
Field trial outcomesExtensive analyses were conducted on the field trial cognitive item response data. These analyses have been reported elsewhere, but included the standard ConQuest® item analysis (item fit, item discrimination, item difficulty, distracter analysis, mean ability and point-biserial correlations by coding category, item omission rates, and so on), as well as analyses of gender-by-item interactions and item-by-country interactions. On the basis of these critical measurement statistics, about 40 new items were removed from the pool of items that would be considered for the main study. The omissions included many of the items focussing on misconceptions and a few complete units. The statements in each complex multiple-choice item were also analysed separately and this led to some statements being dropped though the item itself was retained. Analyses also indicated that one of the nine PISA 2003 units should not be included in the main study.
Analyses of the responses to the attitudinal items, also reported elsewhere, showed that the presence of embedded attitudinal items in the main study test would have little, if any, effect on test performance. Each statement-part of an attitudinal item was considered a separate partial-credit item in these analyses. The analyses showed that the sets of interest and support items formed single scales, as did the match-the-opinion responsibility for resources and environments items. All but one of the 12 match-the-opinion items had sound psychometric properties.
Unfortunately, the analyses showed that Likert-style items designed to measure responsibility for sustainable development did not always load on one dimension and so could not be recommended for inclusion in the main study. Some of these items tended to load on the same dimension as items designed to measure support. Others loaded on a dimension representing concern for personal health and safety, together with some interest items that were consequently not considered for inclusion in the main study.
In accordance with the findings about responsibility items, the framework was revised following the field trial by removing reference to personal responsibility for achieving a healthy population from the responsibility scale definition and reinstating its original name, responsibility for resources and environments.
Timing study
A timing study was conducted to gather data on the average time taken to respond to items in the field trial, and the results were used to estimate the number of items that should be included in main study clusters. The timing information from clusters S16, S16A, S17 and S17A was used to estimate average time for embedded Likert-style attitudinal items. The estimated average time to complete a Likert-style attitudinal item was 0.75 minutes. The timing information from clusters S1 and S1M was used to estimate average time for embedded match-the-opinion attitudinal items. The estimated average time to complete a match-the-opinion item was 1.25 minutes.
Only the time taken to complete the first block (cluster) in booklets 1 to 14 was used to estimate average time for science cognitive items. Previous PISA timing studies have shown that there are far more missing responses as well as more guessing in the latter part of a test than in the earlier part. The estimated average time to complete each cognitive item in the first block of the test was 1.68 minutes.
It was concluded that main study science clusters should contain 17 cognitive items, less an allowance for embedded attitudinal items given approximately by the following formulas: about two Likert-style items (each containing 2-3 statements) per one cognitive item and five match-the-opinion items per four cognitive items.
2TesT design and TesT developmenT
42PISA 2006 TECHNICAL REPORT – ISBN 978-92-64-04808-9 – © OECD 2009
National review of field trial itemsA further round of national item review was carried out, this time informed by the experience at national
centres of how the items worked in the field trial in each country. A set of review guidelines, was designed to
assist national experts to focus on the most important features of possible concern. In addition, NPMs were
asked to assign a rating from 1 (low) to 5 (high) to each item, both cognitive and attitudinal, to indicate its
priority for inclusion in the main study. Almost all countries completed this review of all field trial items.
A comprehensive field trial review report also was prepared by all National Project Managers. These reports
included a further opportunity to comment on particular strengths and weaknesses of individual items
identified during the translation and verification process and during the coding of student responses.
main sTudyA science attitudes forum was held in Warsaw on 30–31 August 2005. Its main purpose was to consider the
results of the field trial analyses and hence provide advice on whether attitudinal items should be embedded
in science units in the main study. About 75% of national experts were in favour of including interest items
and about 25% were in favour of embedding support items as well. Consortium and SEG advice to the PGB
was that match-the-opinion items to assess Responsibility towards resources and environments also should
be included provided that this did not adversely affect the selection of cognitive items.
Main study science itemsThe Science Expert Group met in October 2005 in Melbourne to review all available material and recommend
which science items should be included in the main study. Before the selection process began, advice was
received from the concurrent PGB meeting in Reykjavik about the inclusion of embedded attitudinal items.
The PGB advised that only embedded interest (interest in [learning about] science) and support (support for
scientific enquiry) items should be used. The experimental nature of match-the-opinion items and the small
number available acted against their inclusion.
Based on the results of the field trial timing study, and making allowance for the inclusion of embedded
interest and support items, it was estimated that the main study selection needed to contain about 105
science cognitive items. This meant that about 83 new items had to be selected, as there were 22 items in
the eight remaining units available for linking purposes with PISA 2003.
As a first step in the selection process, each SEG member nominated eight new units that they thought
should be included in the selection because of their relevance to the assessment of scientific literacy. In
refining its selection, the SEG took into account all available information, including the field trial data,
national reviews and ratings, information from the translation process, information from the national field
trial reviews and the requirements of the framework. Attitudinal items were ignored until the final step of
the process, when it was confirmed that the selected units contained sufficient interest and support items to
enable robust scales to be constructed.
The selection had to satisfy the following conditions:
• The psychometric properties of all selected items had to be satisfactory;
• Items that generated coding problems had to be avoided unless those problems could be properly
addressed through modifications to the coding guides;
• Items given high priority ratings by national centres had to be preferred, and items with lower ratings had
to be avoided.
2TesT design and TesT developmenT
43PISA 2006 TECHNICAL REPORT – ISBN 978-92-64-04808-9 – © OECD 2009
In addition, the combined set of new and link items had to satisfy these additional conditions as far as possible:
• The major framework categories (competencies and knowledge) had to be populated as specified in the scientific literacy framework;
• There had to be an appropriate distribution of item difficulties;
• The proportion of items that required manual coding could not exceed 40%.
The final SEG selection contained 30 new units (92 cognitive items). This was slightly more items than needed and subsequently six of the items, including one complete unit, were dropped, while retaining the required balance of framework categories. The selection contained a few misconception items with less-than-desirable psychometric properties because of the importance that the SEG placed on their inclusion.
The average NPM priority rating of selected items was 3.91 and the average rating for the remaining items was 3.69. Eleven of the 29 units in the final selection originated from the national submissions of eight countries. Overall, the 29 units were developed in 12 countries in eight different languages, with eight units being originally developed in English.
Nine of the 29 new units included both interest and support items, nine included an interest item only, five included a support item only and the remaining six units had no embedded attitudinal item. Link units were retained exactly as they appeared in 2003, without embedded attitudinal items, so that the complete main study science item pool contained 37 units (eight link units and 29 new units), comprising 108 cognitive items and 32 attitudinal items (18 interest items and 14 support items).
The SEG identified 18 units not included in the field trial that would be suitable for release as sample PISA science units once minor revisions were incorporated. Sixteen of these units, comprising a total of 62 items, were included as an annex to Assessing Scientific, Reading and Mathematical Literacy: A Framework for PISA 2006 (OECD, 2006). The other two units were retained for possible use in a future PISA survey.
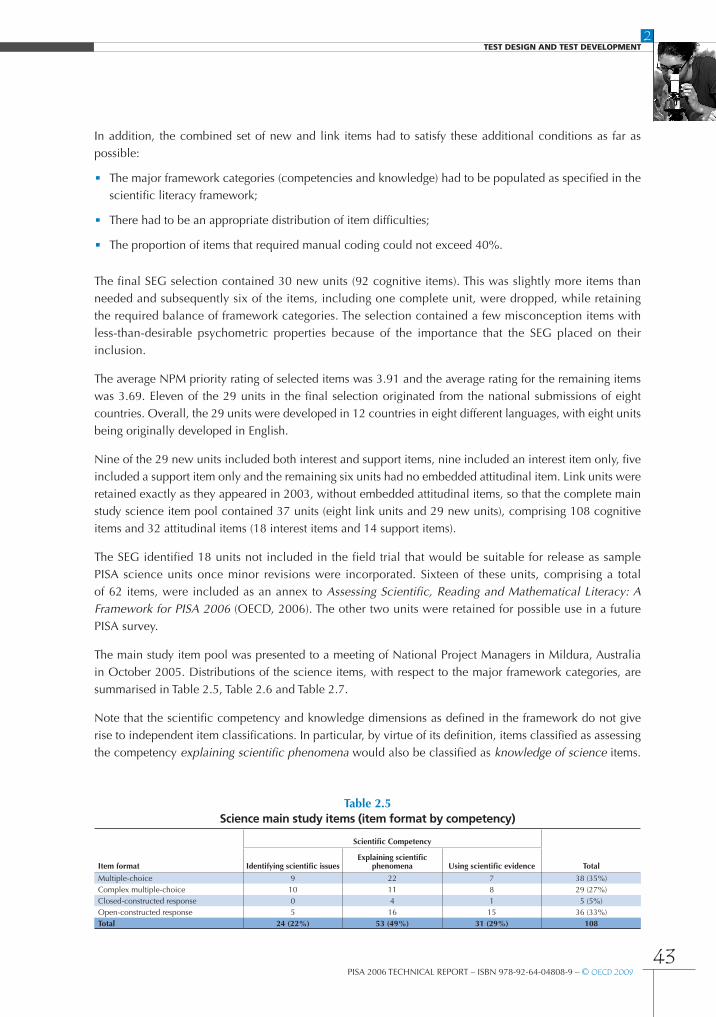
The main study item pool was presented to a meeting of National Project Managers in Mildura, Australia in October 2005. Distributions of the science items, with respect to the major framework categories, are summarised in Table 2.5, Table 2.6 and Table 2.7.
Note that the scientific competency and knowledge dimensions as defined in the framework do not give rise to independent item classifications. In particular, by virtue of its definition, items classified as assessing the competency explaining scientific phenomena would also be classified as knowledge of science items.
Table 2.5Science main study items (item format by competency)
Scientific Competency
TotalItem format Identifying scientific issuesExplaining scientific
phenomena Using scientific evidence
Multiple-choice 9 22 7 38 (35%)Complex multiple-choice 10 11 8 29 (27%)Closed-constructed response 0 4 1 5 (5%)Open-constructed response 5 16 15 36 (33%)Total 24 (22%) 53 (49%) 31 (29%) 108
2TesT design and TesT developmenT
44PISA 2006 TECHNICAL REPORT – ISBN 978-92-64-04808-9 – © OECD 2009
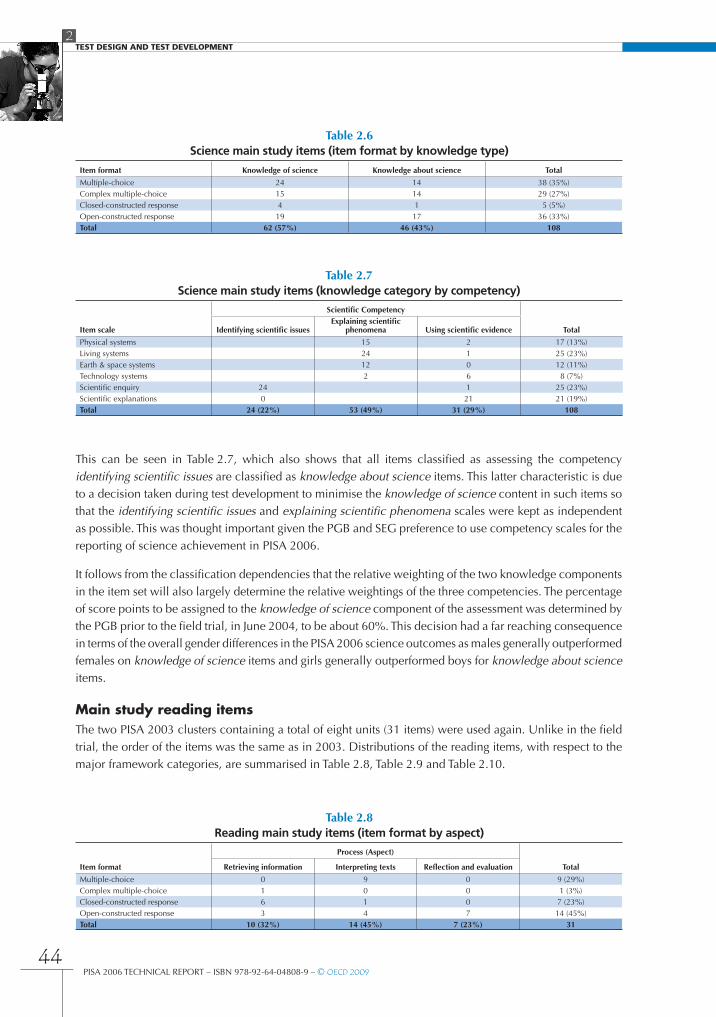
This can be seen in Table 2.7, which also shows that all items classified as assessing the competency identifying scientific issues are classified as knowledge about science items. This latter characteristic is due to a decision taken during test development to minimise the knowledge of science content in such items so that the identifying scientific issues and explaining scientific phenomena scales were kept as independent as possible. This was thought important given the PGB and SEG preference to use competency scales for the reporting of science achievement in PISA 2006.
It follows from the classification dependencies that the relative weighting of the two knowledge components in the item set will also largely determine the relative weightings of the three competencies. The percentage of score points to be assigned to the knowledge of science component of the assessment was determined by the PGB prior to the field trial, in June 2004, to be about 60%. This decision had a far reaching consequence in terms of the overall gender differences in the PISA 2006 science outcomes as males generally outperformed females on knowledge of science items and girls generally outperformed boys for knowledge about science items.
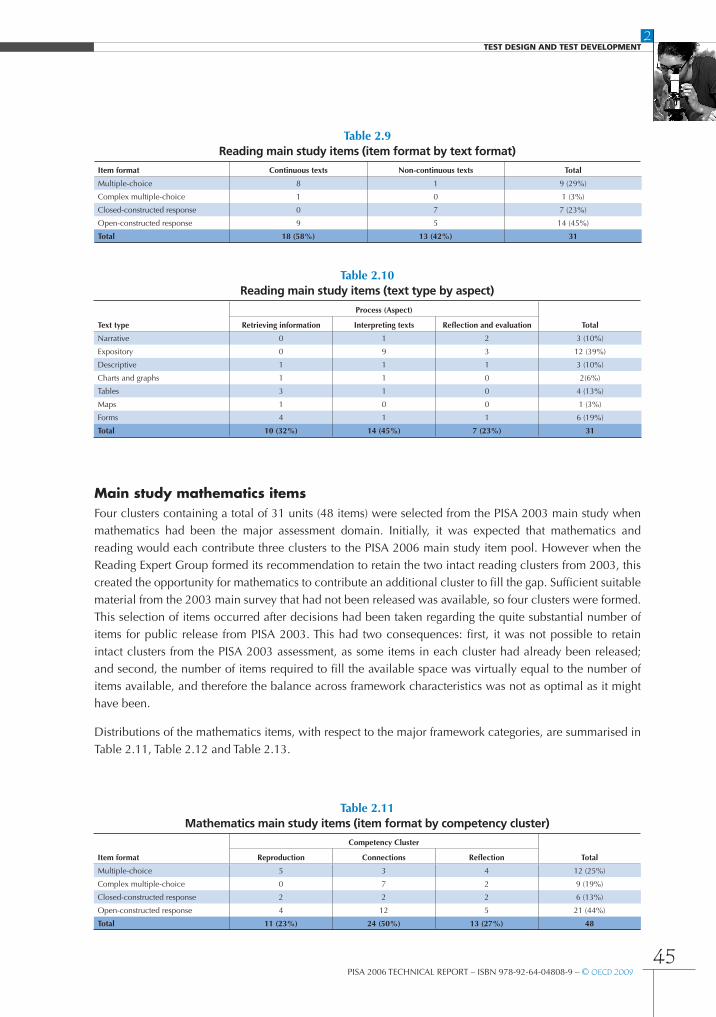
Main study reading itemsThe two PISA 2003 clusters containing a total of eight units (31 items) were used again. Unlike in the field trial, the order of the items was the same as in 2003. Distributions of the reading items, with respect to the major framework categories, are summarised in Table 2.8, Table 2.9 and Table 2.10.
Table 2.6Science main study items (item format by knowledge type)
Item format Knowledge of science Knowledge about science Total
Multiple-choice 24 14 38 (35%)Complex multiple-choice 15 14 29 (27%)Closed-constructed response 4 1 5 (5%)Open-constructed response 19 17 36 (33%)Total 62 (57%) 46 (43%) 108
Table 2.7Science main study items (knowledge category by competency)
Scientific Competency
TotalItem scale Identifying scientific issuesExplaining scientific
phenomena Using scientific evidence
Physical systems 15 2 17 (13%)Living systems 24 1 25 (23%)Earth & space systems 12 0 12 (11%)Technology systems 2 6 8 (7%)Scientific enquiry 24 1 25 (23%)Scientific explanations 0 21 21 (19%)Total 24 (22%) 53 (49%) 31 (29%) 108
Table 2.8Reading main study items (item format by aspect)
Process (Aspect)
TotalItem format Retrieving information Interpreting texts Reflection and evaluation
Multiple-choice 0 9 0 9 (29%)Complex multiple-choice 1 0 0 1 (3%)Closed-constructed response 6 1 0 7 (23%)Open-constructed response 3 4 7 14 (45%)Total 10 (32%) 14 (45%) 7 (23%) 31
2TesT design and TesT developmenT
45PISA 2006 TECHNICAL REPORT – ISBN 978-92-64-04808-9 – © OECD 2009
Main study mathematics itemsFour clusters containing a total of 31 units (48 items) were selected from the PISA 2003 main study when mathematics had been the major assessment domain. Initially, it was expected that mathematics and reading would each contribute three clusters to the PISA 2006 main study item pool. However when the Reading Expert Group formed its recommendation to retain the two intact reading clusters from 2003, this created the opportunity for mathematics to contribute an additional cluster to fill the gap. Sufficient suitable material from the 2003 main survey that had not been released was available, so four clusters were formed. This selection of items occurred after decisions had been taken regarding the quite substantial number of items for public release from PISA 2003. This had two consequences: first, it was not possible to retain intact clusters from the PISA 2003 assessment, as some items in each cluster had already been released; and second, the number of items required to fill the available space was virtually equal to the number of items available, and therefore the balance across framework characteristics was not as optimal as it might have been.
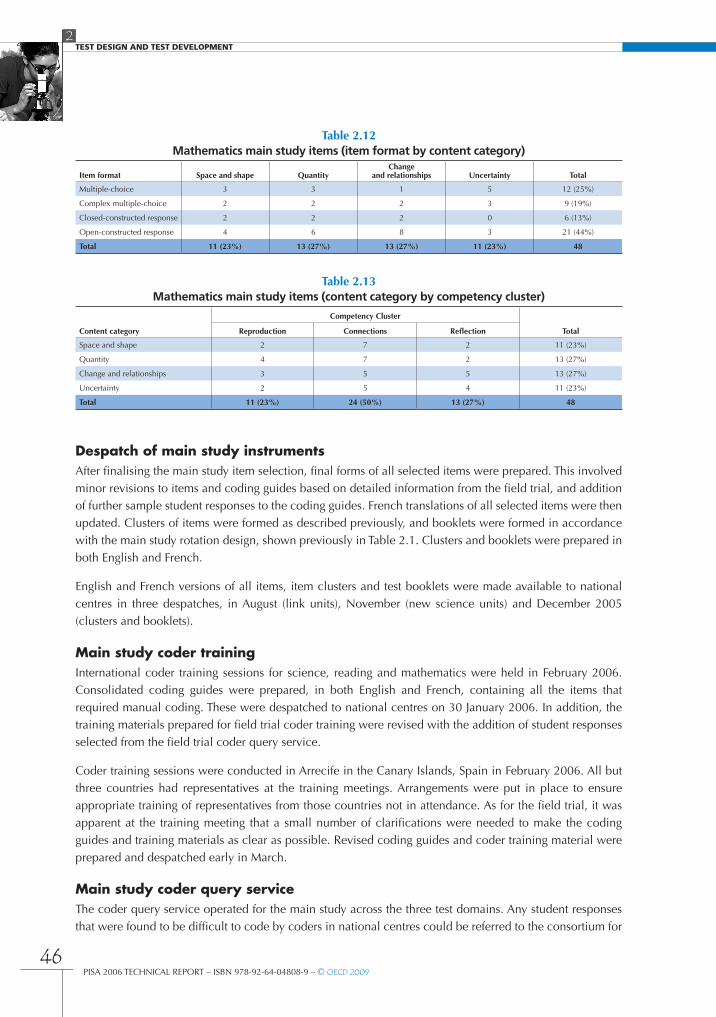
Distributions of the mathematics items, with respect to the major framework categories, are summarised in Table 2.11, Table 2.12 and Table 2.13.
Table 2.9Reading main study items (item format by text format)
Item format Continuous texts Non-continuous texts Total
Multiple-choice 8 1 9 (29%)
Complex multiple-choice 1 0 1 (3%)
Closed-constructed response 0 7 7 (23%)
Open-constructed response 9 5 14 (45%)
Total 18 (58%) 13 (42%) 31
Table 2.10Reading main study items (text type by aspect)
Process (Aspect)
TotalText type Retrieving information Interpreting texts Reflection and evaluation
Narrative 0 1 2 3 (10%)
Expository 0 9 3 12 (39%)
Descriptive 1 1 1 3 (10%)
Charts and graphs 1 1 0 2(6%)
Tables 3 1 0 4 (13%)
Maps 1 0 0 1 (3%)
Forms 4 1 1 6 (19%)
Total 10 (32%) 14 (45%) 7 (23%) 31
Table 2.11Mathematics main study items (item format by competency cluster)
Competency Cluster
TotalItem format Reproduction Connections Reflection
Multiple-choice 5 3 4 12 (25%)
Complex multiple-choice 0 7 2 9 (19%)
Closed-constructed response 2 2 2 6 (13%)
Open-constructed response 4 12 5 21 (44%)
Total 11 (23%) 24 (50%) 13 (27%) 48
2TesT design and TesT developmenT
46PISA 2006 TECHNICAL REPORT – ISBN 978-92-64-04808-9 – © OECD 2009
despatch of main study instrumentsAfter finalising the main study item selection, final forms of all selected items were prepared. This involved minor revisions to items and coding guides based on detailed information from the field trial, and addition of further sample student responses to the coding guides. French translations of all selected items were then updated. Clusters of items were formed as described previously, and booklets were formed in accordance with the main study rotation design, shown previously in Table 2.1. Clusters and booklets were prepared in both English and French.
English and French versions of all items, item clusters and test booklets were made available to national centres in three despatches, in August (link units), November (new science units) and December 2005 (clusters and booklets).
Main study coder trainingInternational coder training sessions for science, reading and mathematics were held in February 2006. Consolidated coding guides were prepared, in both English and French, containing all the items that required manual coding. These were despatched to national centres on 30 January 2006. In addition, the training materials prepared for field trial coder training were revised with the addition of student responses selected from the field trial coder query service.
Coder training sessions were conducted in Arrecife in the Canary Islands, Spain in February 2006. All but three countries had representatives at the training meetings. Arrangements were put in place to ensure appropriate training of representatives from those countries not in attendance. As for the field trial, it was apparent at the training meeting that a small number of clarifications were needed to make the coding guides and training materials as clear as possible. Revised coding guides and coder training material were prepared and despatched early in March.
Main study coder query serviceThe coder query service operated for the main study across the three test domains. Any student responses that were found to be difficult to code by coders in national centres could be referred to the consortium for
Table 2.13Mathematics main study items (content category by competency cluster)
Competency Cluster
TotalContent category Reproduction Connections Reflection
Space and shape 2 7 2 11 (23%)
Quantity 4 7 2 13 (27%)
Change and relationships 3 5 5 13 (27%)
Uncertainty 2 5 4 11 (23%)
Total 11 (23%) 24 (50%) 13 (27%) 48
Table 2.12Mathematics main study items (item format by content category)
Item format Space and shape QuantityChange
and relationships Uncertainty Total
Multiple-choice 3 3 1 5 12 (25%)
Complex multiple-choice 2 2 2 3 9 (19%)
Closed-constructed response 2 2 2 0 6 (13%)
Open-constructed response 4 6 8 3 21 (44%)
Total 11 (23%) 13 (27%) 13 (27%) 11 (23%) 48
2TesT design and TesT developmenT
47PISA 2006 TECHNICAL REPORT – ISBN 978-92-64-04808-9 – © OECD 2009
advice. The consortium was thereby able to provide consistent coding advice across countries. Reports of queries and the consortium responses were made available to all national centres via the consortium web site, and were regularly updated as new queries were received.
review of main study item analysesOn receipt of data from the main study testing, extensive analysis of item responses were carried out to identify any items that were not capable of generating useful student achievement data. Such items were removed from the international dataset, or in some cases from particular national datasets where an isolated problem occurred. Two science items were removed from the international data set. In addition, three other items that focussed on misconceptions were retained in the database, although they did not form part of the scale.1
Note
1. The variables are: S421Q02, S456Q01 and S456Q02.
25PISA 2006 TECHNICAL REPORT – ISBN 978-92-64-04808-9 – © OECD 2009
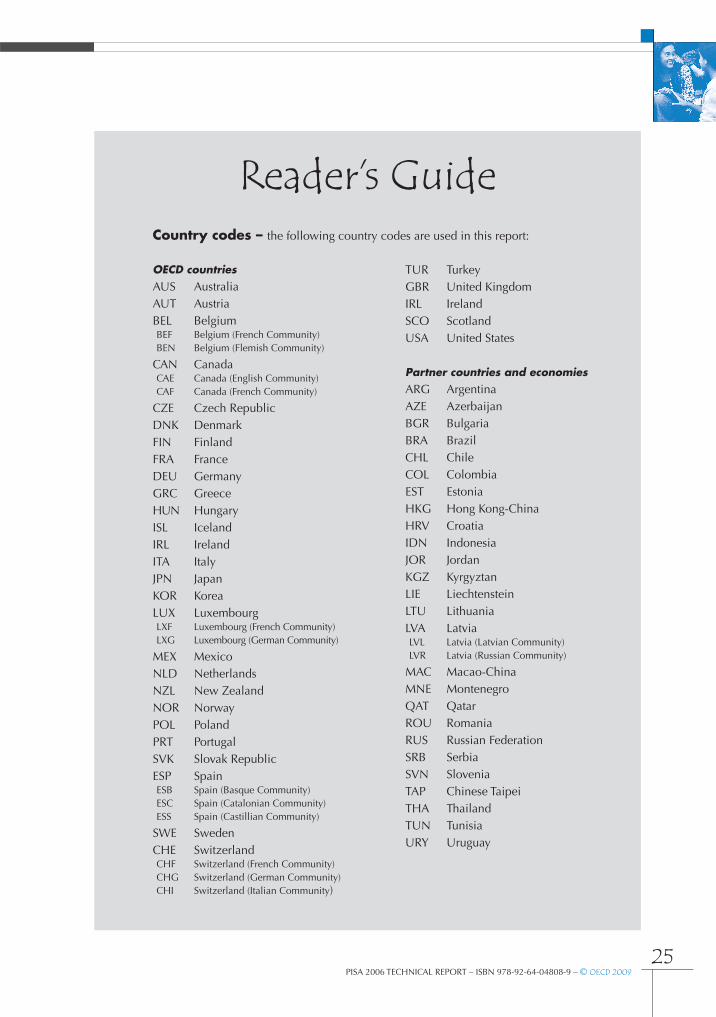
Reader’s Guide
OECD countriesAUS Australia AUT AustriaBEL BelgiumBEF Belgium (French Community)BEN Belgium (Flemish Community)
CAN CanadaCAE Canada (English Community)CAF Canada (French Community)
CZE Czech RepublicDNK Denmark FIN FinlandFRA FranceDEU GermanyGRC GreeceHUN HungaryISL IcelandIRL IrelandITA ItalyJPN Japan KOR KoreaLUX LuxembourgLXF Luxembourg (French Community)LXG Luxembourg (German Community)
MEX MexicoNLD NetherlandsNZL New ZealandNOR NorwayPOL PolandPRT PortugalSVK Slovak RepublicESP SpainESB Spain (Basque Community)ESC Spain (Catalonian Community)ESS Spain (Castillian Community)
SWE SwedenCHE SwitzerlandCHF Switzerland (French Community)CHG Switzerland (German Community)CHI Switzerland (Italian Community)
TUR TurkeyGBR United KingdomIRL IrelandSCO Scotland USA United States
Partner countries and economiesARG ArgentinaAZE AzerbaijanBGR BulgariaBRA BrazilCHL ChileCOL ColombiaEST EstoniaHKG Hong Kong-ChinaHRV CroatiaIDN IndonesiaJOR JordanKGZ KyrgyztanLIE LiechtensteinLTU LithuaniaLVA LatviaLVL Latvia (Latvian Community)LVR Latvia (Russian Community)
MAC Macao-ChinaMNE MontenegroQAT QatarROU RomaniaRUS Russian FederationSRB SerbiaSVN SloveniaTAP Chinese TaipeiTHA ThailandTUN TunisiaURY Uruguay
Country codes – the following country codes are used in this report:
375PISA 2006 TECHNICAL REPORT – ISBN 978-92-64-04808-9 – © OECD 2009
References
Adams, R.J., Wilson, M. & Wang, W.C. (1997), The multidimensional random coefficients multinomial logit model. Applied Psychological Measurement, No. 21, pp. 1-23.
Adams, R.J., Wilson, M. R. & Wu, M.L. (1997), Multilevel item response models: An approach to errors in variables regression, Journal of Educational and Behavioural Statistics, No. 22 (1), pp. 46-75.
Adams, R.J. & Wu, M.L. (2002), PISA 2000 Technical Report, OECD, Paris.
Bollen, K.A. & Long, S.J. (1993) (eds.), Testing Structural Equation Models, Newbury Park: London.
Beaton, A.E. (1987), Implementing the new design: The NAEP 1983-84 technical report (Rep. No. 15-TR-20), Princeton, NJ: Educational Testing Service.
Buchmann, C. (2000), Family structure, parental perceptions and child labor in Kenya: What factors determine who is enrolled in school? Soc. Forces, No. 78, pp. 1349-79.
Buchmann, C. (2002), Measuring Family Background in International Studies of Education: Conceptual Issues and Methodological Challenges, in Porter, A.C. and Gamoran, A. (eds.). Methodological Advances in Cross-National Surveys of Educational Achievement (pp. 150-97), Washington, DC: National Academy Press.
Creemers, B.P.M. (1994), The Effective Classroom, London: Cassell.
Cochran, W.G. (1977), Sampling techniques, third edition, New York, NY: John Wiley and Sons.
Ganzeboom, H.B.G., de Graaf, P.M. & Treiman, D.J. (1992), A standard international socio-economic index of occupational status, Social Science Research, No. 21, pp. 1-56.
Ganzeboom H.B. & Treiman, D.J. (1996), Internationally comparable measures of occupational status for the 1988 international standard classification of occupations, Social Science Research, No. 25, pp. 201-239.
Grisay, A. (2003), Translation procedures in OECD/PISA 2000 international assessment, Language Testing, No. 20 (2), pp. 225-240.
Hambleton, R.K., Swaminathan, H. & Rogers, H.J. (1991), Fundamentals of item response theory, Newbury Park, London, New Delhi: SAGE Publications.
Hambleton, R.K., Merenda, P.F. & Spielberger, C.D. (2005), Adapting Educational and Psychological Tests for Cross-Cultural Assessment, IEA Lawrence Erlbaum Associates, Publishers, Mahwah, New Jersey.
Harkness, J.A., Van de Vijver, F.J.R. & Mohler, P.Ph (2003), Cross-Cultural Survey Methods, Wiley-Interscience, John Wiley & Sons, Inc., Hoboken, New Jersey.
Harvey-Beavis, A. (2002), Student and School Questionnaire Development, in R.J. Adams and M.L. Wu (eds.), PISA 2000 Technical Report, (pp. 33-38), OECD, Paris.
International Labour Organisation (ILO) (1990), International Standard Classification of Occupations: ISCO-88. Geneva: International Labour Office.
Jöreskog, K.G. & Sörbom, Dag (1993), LISREL 8 User‘s Reference Guide, Chicago: SSI.
Judkins, D.R. (1990), Fay’s Method of Variance Estimation, Journal of Official Statistics, No. 6 (3), pp. 223-239.
Kaplan, D. (2000), Structural equation modeling: Foundation and extensions, Thousand Oaks: SAGE Publications.
Keyfitz, N. (1951), Sampling with probabilities proportionate to science: Adjustment for changes in probabilities, Journal of the American Statistical Association, No. 46, American Statistical Association, Alexandria, pp. 105-109.
Kish, L. (1992), Weighting for Unequal, Pi. Journal of Official Statistics, No. 8 (2), pp. 183-200.
LISREL (1993), K.G. Jöreskog & D. Sörbom, [computer software], Lincolnwood, IL: Scientific Software International, Inc.
Lohr, S.L. (1999), Sampling: Design and Analysis, Duxberry: Pacific Grove.
Macaskill, G., Adams, R.J. & Wu, M.L. (1998), Scaling methodology and procedures for the mathematics and science literacy, advanced mathematics and physics scale, in M. Martin and D.L. Kelly, Editors, Third International Mathematics and Science Study, technical report Volume 3: Implementation and analysis, Boston College, Chestnut Hill, MA.
Masters, G.N. & Wright, B.D. (1997), The Partial Credit Model, in W.J. van der Linden, & R.K. Hambleton (eds.), Handbook of Modern Item Response Theory (pp. 101-122), New York/Berlin/Heidelberg: Springer.
376PISA 2006 TECHNICAL REPORT – ISBN 978-92-64-04808-9 – © OECD 2009
RefeRences
Mislevy, R.J. (1991), Randomization-based inference about latent variables from complex samples, Psychometrika, No. 56, pp. 177-196.
Mislevy, R.J., Beaton, A., Kaplan, B.A. & Sheehan, K. (1992), Estimating population characteristics from sparse matrix samples of item responses, Journal of Educational Measurement, No. 29 (2), pp. 133-161.
Mislevy, R.J. & Sheehan, K.M. (1987), Marginal estimation procedures, in Beaton, A.E., Editor, 1987. The NAEP 1983-84 technical report, National Assessment of Educational Progress, Educational Testing Service, Princeton, pp. 293-360.
Mislevy, R.J. & Sheehan, K.M. (1989), Information matrices in latent-variable models, Journal of Educational Statistics, No. 14, pp. 335-350.
Mislevy, R.J. & Sheehan, K.M. (1989), The role of collateral information about examinees in item parameter estimation, Psychometrika, No. 54, pp. 661-679.
Monseur, C. & Berezner, A. (2007), The Computation of Equating Errors in International Surveys in Education, Journal of Applied Measurement, No. 8 (3), 2007, pp. 323-335.
Monseur, C. (2005), An exploratory alternative approach for student non response weight adjustment, Studies in Educational Evaluation, No. 31 (2-3), pp. 129-144.
Muthen, B. & L. Muthen (1998), [computer software], Mplus Los Angeles, CA: Muthen & Muthen.
Muthen, B., du Toit, S.H.C. & Spisic, D. (1997), Robust inference using weighted least squares and quadratic estimating equations in latent variable modeling with categorical and continuous outcomes, unpublished manuscript.
OECD (1999), Classifying Educational Programmes. Manual for ISCED-97 Implementation in OECD Countries, OECD, Paris.
OECD (2003), Literacy Skills for the World of Tomorrow: Further results from PISA 2000, OECD, Paris.
OECD (2004), Learning for Tomorrow’s World – First Results from PISA 2003, OECD, Paris.
OECD (2005), Technical Report for the OECD Programme for International Student Assessment 2003, OECD, Paris.
OECD (2006), Assessing Scientific, Reading and Mathematical Literacy: A framework for PISA 2006, OECD, Paris.
OECD (2007), PISA 2006: Science Competencies for Tomorrow’s World, OECD, Paris.
PISA Consortium (2006), PISA 2006 Main Study Data Management Manual, https://mypisa.acer.edu.au/images/mypisadoc/opmanual/pisa2006_data_management_manual.pdf
Rasch, G. (1960), Probabilistic models for some intelligence and attainment tests, Copenhagen: Nielsen & Lydiche.
Routitski A. & Berezner, A. (2006), Issues influencing the validity of cross-national comparisons of student performance. Data Entry Quality and Parameter Estimation. Paper presented at the Annual Meeting of the American Educational Research Association (AERA) in San Francisco, 7-11 April, https://mypisa.acer.edu.au/images/mypisadoc/aera06routitsky_berezner.pdf
Rust, K. (1985), Variance Estimation for Complex Estimators in Sample Surveys, Journal of Official Statistics, No. 1, pp. 381-397.
Rust, K.F. & Rao, J.N.K. (1996), Variance Estimation for Complex Surveys Using Replication Techniques, Survey Methods in Medical Research, No. 5, pp. 283-310.
Shao, J. (1996), Resampling Methods in Sample Surveys (with Discussion), Statistics, No. 27, pp. 203-254.
Särndal, C.-E., Swensson, B. & Wretman, J. (1992), Model Assisted Survey Sampling, New York: Springer-Verlag.
SAS® CALIS (1992), W. Hartmann [computer software], Cary, NC: SAS Institute Inc.
Scheerens, J. (1990), School effectiveness and the development of process indicators of school functioning, School effectiveness and school improvement, No. 1, pp. 61-80.
Scheerens, J. & Bosker, R.J. (1997), The Foundations of School Effectiveness, Oxford: Pergamon.
Schulz, W. (2002), Constructing and Validating the Questionnaire composites, in R.J. Adams and M.L. Wu (eds.), PISA 2000 Technical Report, OECD, Paris.
Schulz, W. (2004), Mapping Student Scores to Item Responses, in W. Schulz and H. Sibberns (eds.), IEA Civic Education Study, Technical Report (pp. 127-132), Amsterdam: IEA.
Schulz, W. (2006a), Testing Parameter Invariance for Questionnaire Indices using Confirmatory Factor Analysis and Item Response Theory, Paper presented at the Annual Meetings of the American Educational Research Association (AERA) in San Francisco, 7-11 April.
Schulz, W. (2006b), Measuring the socio-economic background of students and its effect on achievement in PISA 2000 and PISA 2003, Paper presented at the Annual Meetings of the American Educational Research Association (AERA) in San Francisco, 7-11 April.
Thorndike, R.L. (1973), Reading comprehension in fifteen countries, New York, Wiley: and Stockholm: Almqvist & Wiksell.
Travers, K.J. & Westbury, I. (1989), The IEA Study of Mathematics I: Analysis of Mathematics Curricula, Oxford: Pergamon Press.
377PISA 2006 TECHNICAL REPORT – ISBN 978-92-64-04808-9 – © OECD 2009
RefeRences
Travers, K.J., Garden R.A. & Rosier, M. (1989), Introduction to the Study, in Robitaille, D. A. and Garden, R. A. (eds), The IEA Study of Mathematics II: Contexts and Outcomes of School Mathematics Curricula, Oxford: Pergamon Press.
Verhelst, N. (2002), Coder and Marker Reliabilaity Studies, in R.J. Adams & M.L. Wu (eds.), PISA 2000 Technical Report. OECD, Paris.
Walberg, H.J. (1984), Improving the productivity of American schools, Educational Leadership, No. 41, pp. 19-27.
Walberg, H. (1986), Synthesis of research on teaching, in M. Wittrock (ed.), Handbook of research on teaching (pp. 214-229), New York: Macmillan.
Walker, M. (2006), The choice of Likert or dichotomous items to measure attitudes across culturally distinct countries in international comparative educational research. Paper presented at the Annual Meetings of the American Educational Research Association (AERA) in San Francisco, 7-11 April.
Walker, M. (2007), Ameliorating Culturally-Based Extreme Response Tendencies To Attitude items, Journal of Applied Measurement, No. 8, pp. 267-278.
Warm, T.A. (1989), Weighted Likelihood Estimation of Ability in Item Response Theory, Psychometrika, No. 54 (3), pp. 427-450.
Westat (2007), WesVar® 5.1 Computer software and manual, Rockville, MD: Author (also see http://www.westat.com/wesvar/).
Wilson, M. (1994), Comparing Attitude Across Different Cultures: Two Quantitative Approaches to Construct Validity, in M. Wilson (ed.), Objective measurement II: Theory into practice (pp. 271-292), Norwood, NJ: Ablex.
Wolter, K.M. (2007), Introduction to Variance Estimation. Second edition, Springer: New York.
Wu, M.L., Adams, R.J. & Wilson, M.R. (1997), ConQuest®: Multi-Aspect Test Software [computer program manual], Camberwell, Vic.: Australian Council for Educational Research.
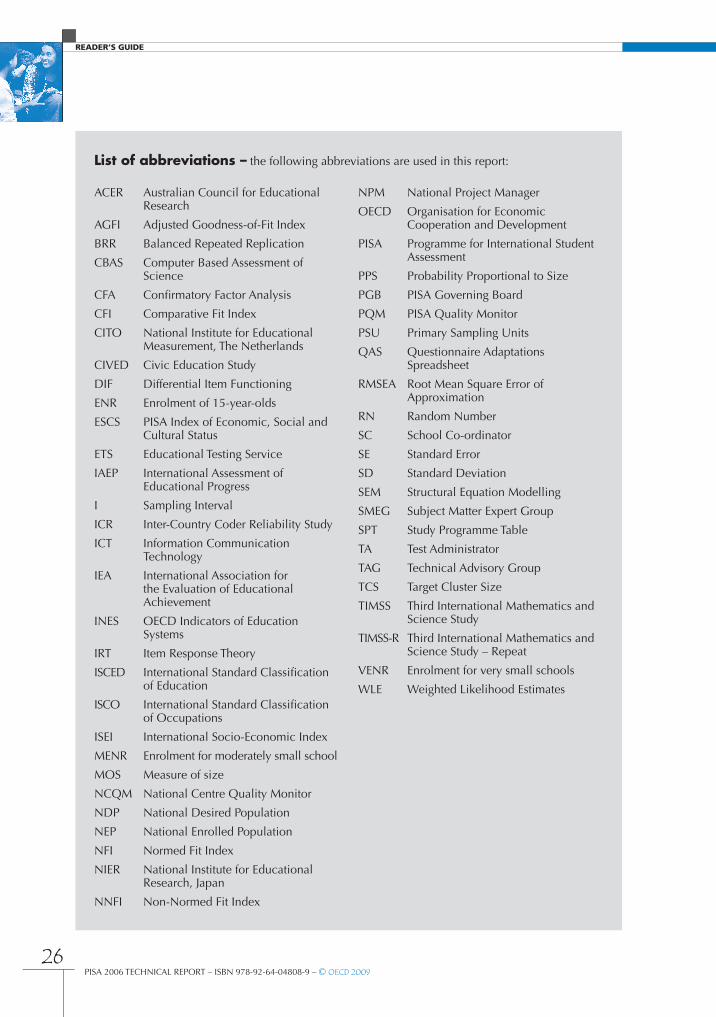
26PISA 2006 TECHNICAL REPORT – ISBN 978-92-64-04808-9 – © OECD 2009
ReadeR’s guide
ACER Australian Council for Educational Research
AGFI Adjusted Goodness-of-Fit Index
BRR Balanced Repeated Replication
CBAS Computer Based Assessment of Science
CFA Confirmatory Factor Analysis
CFI Comparative Fit Index
CITO National Institute for Educational Measurement, The Netherlands
CIVED Civic Education Study
DIF Differential Item Functioning
ENR Enrolment of 15-year-olds
ESCS PISA Index of Economic, Social and Cultural Status
ETS Educational Testing Service
IAEP International Assessment of Educational Progress
I Sampling Interval
ICR Inter-Country Coder Reliability Study
ICT Information Communication Technology
IEA International Association for the Evaluation of Educational Achievement
INES OECD Indicators of Education Systems
IRT Item Response Theory
ISCED International Standard Classification of Education
ISCO International Standard Classification of Occupations
ISEI International Socio-Economic Index
MENR Enrolment for moderately small school
MOS Measure of size
NCQM National Centre Quality Monitor
NDP National Desired Population
NEP National Enrolled Population
NFI Normed Fit Index
NIER National Institute for Educational Research, Japan
NNFI Non-Normed Fit Index
NPM National Project Manager
OECD Organisation for Economic Cooperation and Development
PISA Programme for International Student Assessment
PPS Probability Proportional to Size
PGB PISA Governing Board
PQM PISA Quality Monitor
PSU Primary Sampling Units
QAS Questionnaire Adaptations Spreadsheet
RMSEA Root Mean Square Error of Approximation
RN Random Number
SC School Co-ordinator
SE Standard Error
SD Standard Deviation
SEM Structural Equation Modelling
SMEG Subject Matter Expert Group
SPT Study Programme Table
TA Test Administrator
TAG Technical Advisory Group
TCS Target Cluster Size
TIMSS Third International Mathematics and Science Study
TIMSS-R Third International Mathematics and Science Study – Repeat
VENR Enrolment for very small schools
WLE Weighted Likelihood Estimates
List of abbreviations – the following abbreviations are used in this report:
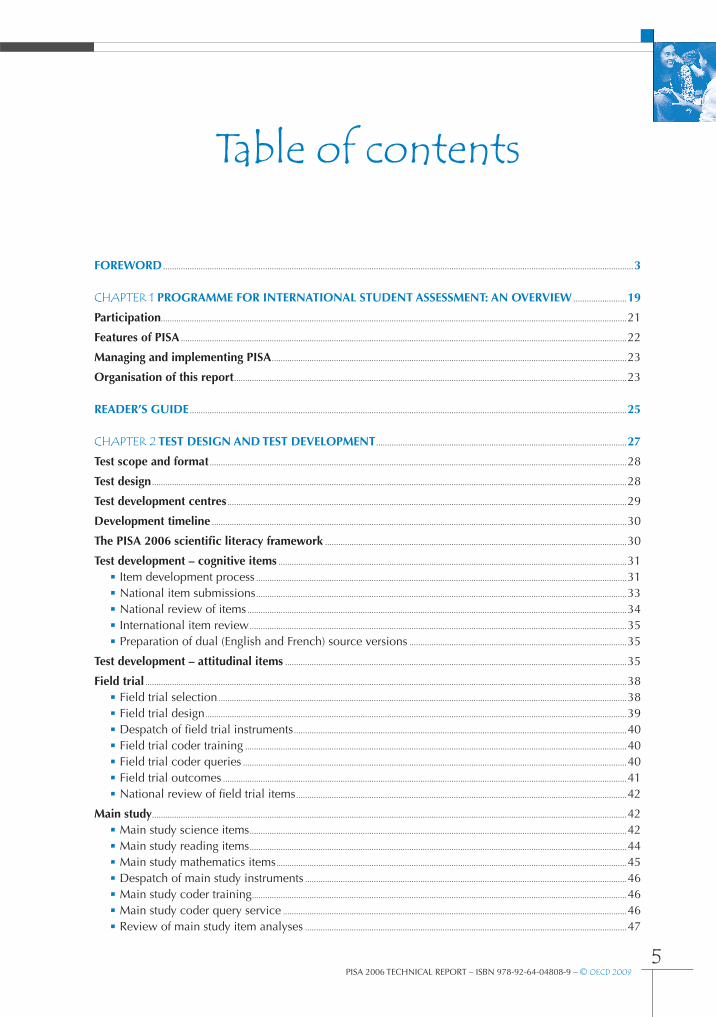
�PISA 2006 TECHNICAL REPORT – ISBN 978-92-64-04808-9 – © OECD 2009
Table of contents
Foreword ....................................................................................................................................................................................................................3
ChapTEr 1 Programme For InternatIonal Student aSSeSSment: an overvIew ........................19
Participation..................................................................................................................................................................................................................21
Features of PISa .........................................................................................................................................................................................................22
managing and implementing PISa ................................................................................................................................................................23
organisation of this report .................................................................................................................................................................................23
reader’S guIde .....................................................................................................................................................................................................25
ChapTEr 2 teSt deSIgn and teSt develoPment .................................................................................................................27
test scope and format ............................................................................................................................................................................................28
test design ......................................................................................................................................................................................................................28
test development centres ....................................................................................................................................................................................29
development timeline ...........................................................................................................................................................................................30
the PISa 2006 scientific literacy framework ........................................................................................................................................30
test development – cognitive items .............................................................................................................................................................31• Item development process .......................................................................................................................................................................31• National item submissions .......................................................................................................................................................................33• National review of items ...........................................................................................................................................................................34• International item review ..........................................................................................................................................................................35• Preparation of dual (English and French) source versions ..................................................................................................35
test development – attitudinal items ..........................................................................................................................................................35
Field trial .........................................................................................................................................................................................................................38• Field trial selection ........................................................................................................................................................................................38• Field trial design ..............................................................................................................................................................................................39• Despatch of field trial instruments ......................................................................................................................................................40• Field trial coder training ............................................................................................................................................................................40• Field trial coder queries .............................................................................................................................................................................40• Field trial outcomes ......................................................................................................................................................................................41• National review of field trial items .....................................................................................................................................................42
main study ......................................................................................................................................................................................................................42• Main study science items ..........................................................................................................................................................................42• Main study reading items ..........................................................................................................................................................................44• Main study mathematics items ..............................................................................................................................................................45• Despatch of main study instruments .................................................................................................................................................46• Main study coder training .........................................................................................................................................................................46• Main study coder query service ...........................................................................................................................................................46• Review of main study item analyses .................................................................................................................................................47
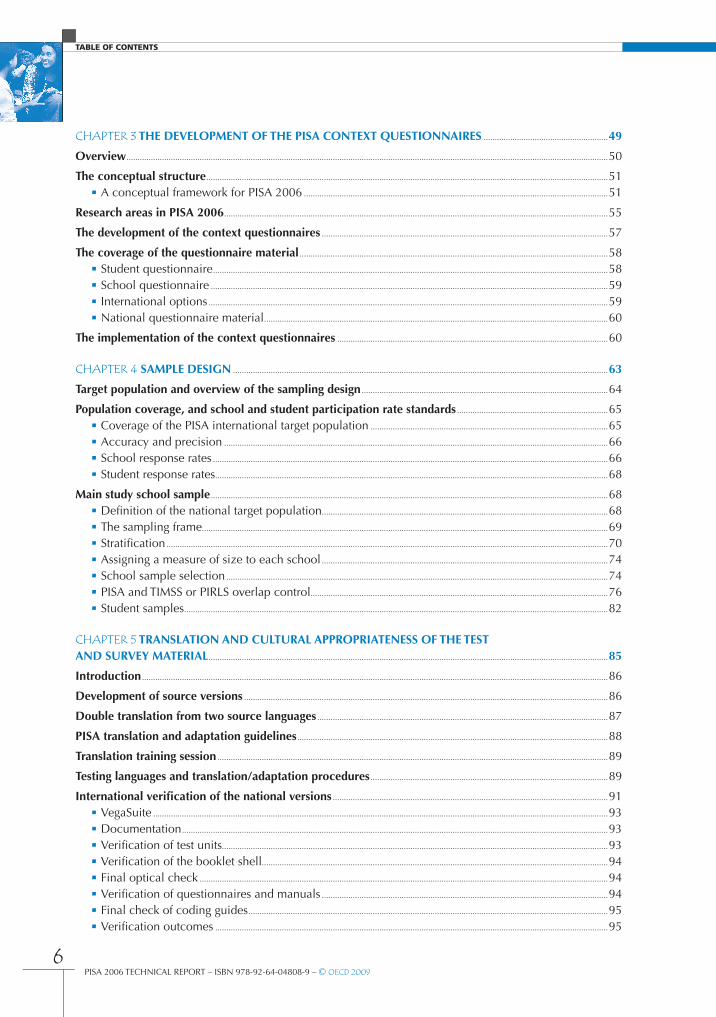
�PISA 2006 TECHNICAL REPORT – ISBN 978-92-64-04808-9 – © OECD 2009
Table of conTenTs
ChapTEr 3 the develoPment oF the PISa context queStIonnaIreS ........................................................49
overview .........................................................................................................................................................................................................................50
the conceptual structure .....................................................................................................................................................................................51• A conceptual framework for PISA 2006 .........................................................................................................................................51
research areas in PISa 2006 .............................................................................................................................................................................55
the development of the context questionnaires .................................................................................................................................57
the coverage of the questionnaire material ...........................................................................................................................................58• Student questionnaire ..................................................................................................................................................................................58• School questionnaire ...................................................................................................................................................................................59• International options ....................................................................................................................................................................................59• National questionnaire material ...........................................................................................................................................................60
the implementation of the context questionnaires ..........................................................................................................................60
ChapTEr 4 SamPle deSIgn .........................................................................................................................................................................63
target population and overview of the sampling design ...............................................................................................................64
Population coverage, and school and student participation rate standards ....................................................................65• Coverage of the PISA international target population ...........................................................................................................65• Accuracy and precision .............................................................................................................................................................................66• School response rates ..................................................................................................................................................................................66• Student response rates .................................................................................................................................................................................68
main study school sample ...................................................................................................................................................................................68• Definition of the national target population.................................................................................................................................68• The sampling frame.......................................................................................................................................................................................69• Stratification .......................................................................................................................................................................................................70• Assigning a measure of size to each school .................................................................................................................................74• School sample selection ............................................................................................................................................................................74• PISA and TIMSS or PIRLS overlap control ......................................................................................................................................76• Student samples ...............................................................................................................................................................................................82
ChapTEr � tranSlatIon and cultural aPProPrIateneSS oF the teSt and Survey materIal ....................................................................................................................................................................................85
Introduction ..................................................................................................................................................................................................................86
development of source versions ....................................................................................................................................................................86
double translation from two source languages ...................................................................................................................................87
PISa translation and adaptation guidelines ............................................................................................................................................88
translation training session ................................................................................................................................................................................89
testing languages and translation/adaptation procedures ...........................................................................................................89
International verification of the national versions ............................................................................................................................91• VegaSuite .............................................................................................................................................................................................................93• Documentation ................................................................................................................................................................................................93• Verification of test units..............................................................................................................................................................................93• Verification of the booklet shell............................................................................................................................................................94• Final optical check ........................................................................................................................................................................................94• Verification of questionnaires and manuals .................................................................................................................................94• Final check of coding guides ..................................................................................................................................................................95• Verification outcomes .................................................................................................................................................................................95
�PISA 2006 TECHNICAL REPORT – ISBN 978-92-64-04808-9 – © OECD 2009
Table of conTenTs
translation and verification outcomes – national version quality ..........................................................................................96• Analyses at the country level ..................................................................................................................................................................96• Analyses at the item level ......................................................................................................................................................................103• Summary of items lost at the national level, due to translation, printing or layout errors .........................104
ChapTEr � FIeld oPeratIonS ...............................................................................................................................................................105
overview of roles and responsibilities ....................................................................................................................................................106• National project managers ....................................................................................................................................................................106• School coordinators ...................................................................................................................................................................................107• Test administrators ......................................................................................................................................................................................107• School associates .........................................................................................................................................................................................108
the selection of the school sample ............................................................................................................................................................108
Preparation of test booklets, questionnaires and manuals........................................................................................................108
the selection of the student sample .........................................................................................................................................................109
Packaging and shipping materials ...............................................................................................................................................................110
receipt of materials at the national centre after testing ............................................................................................................110
coding of the tests and questionnaires ...................................................................................................................................................111• Preparing for coding ..................................................................................................................................................................................111• Logistics prior to coding .........................................................................................................................................................................113• Single coding design .................................................................................................................................................................................115• Multiple coding ............................................................................................................................................................................................117• Managing the process coding .............................................................................................................................................................118• Cross-national coding ..............................................................................................................................................................................120• Questionnaire coding ...............................................................................................................................................................................120
data entry, data checking and file submission ..................................................................................................................................120• Data entry .........................................................................................................................................................................................................120• Data checking ................................................................................................................................................................................................120• Data submission ...........................................................................................................................................................................................121• After data were submitted .....................................................................................................................................................................121
the main study review ........................................................................................................................................................................................121
ChapTEr � qualIty aSSurance .........................................................................................................................................................123
PISa quality control .............................................................................................................................................................................................124• Comprehensive operational manuals ............................................................................................................................................124• National level implementation planning document ............................................................................................................124
PISa quality monitoring ....................................................................................................................................................................................124• Field trial and main study review .....................................................................................................................................................124• Final optical check .....................................................................................................................................................................................126• National centre quality monitor (NCQM) visits .....................................................................................................................126• PISA quality monitor (PQM) visits ...................................................................................................................................................126• Test administration ......................................................................................................................................................................................127• Delivery .............................................................................................................................................................................................................128
ChapTEr 8 Survey weIghtIng and the calculatIon oF SamPlIng varIance ............................129
Survey weighting ....................................................................................................................................................................................................130
the school base weight ......................................................................................................................................................................................131• The school weight trimming factor ..................................................................................................................................................132
8PISA 2006 TECHNICAL REPORT – ISBN 978-92-64-04808-9 – © OECD 2009
Table of conTenTs
• The student base weight .........................................................................................................................................................................132• School non-response adjustment ......................................................................................................................................................132• Grade non-response adjustment .......................................................................................................................................................134• Student non-response adjustment ....................................................................................................................................................135• Trimming student weights......................................................................................................................................................................136• Comparing the PISA 2006 student non-response adjustment strategy with the strategy
used for PISA 2003 ....................................................................................................................................................................................136• The comparison ............................................................................................................................................................................................138
calculating sampling variance ......................................................................................................................................................................139• The balanced repeated replication variance estimator ......................................................................................................139• Reflecting weighting adjustments .....................................................................................................................................................141• Formation of variance strata .................................................................................................................................................................141• Countries where all students were selected for PISA ..........................................................................................................141
ChapTEr 9 ScalIng PISa cognItIve data ..............................................................................................................................143
the mixed coefficients multinomial logit model .............................................................................................................................144• The population model ..............................................................................................................................................................................145• Combined model .........................................................................................................................................................................................146
application to PISa ..............................................................................................................................................................................................146• National calibrations .................................................................................................................................................................................146• National reports ............................................................................................................................................................................................147• International calibration .........................................................................................................................................................................153• Student score generation ........................................................................................................................................................................153
Booklet effects ..........................................................................................................................................................................................................155
analysis of data with plausible values .....................................................................................................................................................156
developing common scales for the purposes of trends ..............................................................................................................157• Linking PISA 2003 and PISA 2006 for reading and mathematics ..............................................................................158• Uncertainty in the link .............................................................................................................................................................................158
ChapTEr 10 data management ProcedureS ....................................................................................................................163
Introduction ...............................................................................................................................................................................................................164
KeyQuest ......................................................................................................................................................................................................................167
data management at the national centre .............................................................................................................................................167• National modifications to the database .......................................................................................................................................167• Student sampling with KeyQuest ......................................................................................................................................................167• Data entry quality control .....................................................................................................................................................................167
data cleaning at acer ........................................................................................................................................................................................171• Recoding of national adaptations .....................................................................................................................................................171• Data cleaning organisation ...................................................................................................................................................................171• Cleaning reports ...........................................................................................................................................................................................171• General recodings .......................................................................................................................................................................................171
Final review of the data .....................................................................................................................................................................................172• Review of the test and questionnaire data .................................................................................................................................172• Review of the sampling data ...............................................................................................................................................................172
next steps in preparing the international database .......................................................................................................................172
9PISA 2006 TECHNICAL REPORT – ISBN 978-92-64-04808-9 – © OECD 2009
Table of conTenTs
ChapTEr 11 SamPlIng outcomeS ....................................................................................................................................................175
design effects and effective sample sizes .............................................................................................................................................187• Variability of the design effect ............................................................................................................................................................191• Design effects in PISA for performance variables ..................................................................................................................191
Summary analyses of the design effect ...................................................................................................................................................203• Countries with outlying standard errors .......................................................................................................................................205
ChapTEr 12 ScalIng outcomeS .......................................................................................................................................................207
International characteristics of the item pool ...................................................................................................................................208• Test targeting ...................................................................................................................................................................................................208• Test reliability .................................................................................................................................................................................................208• Domain inter-correlations .....................................................................................................................................................................208• Science scales ................................................................................................................................................................................................215
Scaling outcomes ...................................................................................................................................................................................................216• National item deletions ...........................................................................................................................................................................216• International scaling ..................................................................................................................................................................................219• Generating student scale scores ........................................................................................................................................................219
test length analysis................................................................................................................................................................................................219
Booklet effects ..........................................................................................................................................................................................................221• Overview of the PISA cognitive reporting scales ...................................................................................................................232• PISA overall literacy scales ...................................................................................................................................................................234• PISA literacy scales .....................................................................................................................................................................................234• Special purpose scales .............................................................................................................................................................................234
observations concerning the construction of the PISa overall literacy scales ..........................................................235• Framework development ........................................................................................................................................................................235• Testing time and item characteristics .............................................................................................................................................236• Characteristics of each of the links ..................................................................................................................................................237
transforming the plausible values to PISa scales ............................................................................................................................246• Reading ..............................................................................................................................................................................................................246• Mathematics ...................................................................................................................................................................................................246• Science ...............................................................................................................................................................................................................246• Attitudinal scales..........................................................................................................................................................................................247
link error .....................................................................................................................................................................................................................247
ChapTEr 13 codIng and marker relIaBIlIty StudIeS .............................................................................................249
homogeneity analyses ........................................................................................................................................................................................251
multiple marking study outcomes (variance components) ......................................................................................................254• Generalisability coefficients .................................................................................................................................................................254
International coding review ...........................................................................................................................................................................261• Background to changed procedures for PISA 2006 .............................................................................................................261• ICR procedures .............................................................................................................................................................................................261• Outcomes .........................................................................................................................................................................................................264• Cautions .............................................................................................................................................................................................................270
10PISA 2006 TECHNICAL REPORT – ISBN 978-92-64-04808-9 – © OECD 2009
Table of conTenTs
ChapTEr 14 data adjudIcatIon ......................................................................................................................................................271
Introduction ...............................................................................................................................................................................................................272• Implementing the standards – quality assurance ...................................................................................................................272• Information available for adjudication..........................................................................................................................................273• Data adjudication process.....................................................................................................................................................................273
general outcomes..................................................................................................................................................................................................274• Overview of response rate issues .....................................................................................................................................................274• Detailed country comments .................................................................................................................................................................275
ChapTEr 1� ProFIcIency Scale conStructIon ..............................................................................................................283
Introduction ...............................................................................................................................................................................................................284
development of the described scales ......................................................................................................................................................285• Stage 1: Identifying possible scales .................................................................................................................................................285• Stage 2: Assigning items to scales ....................................................................................................................................................286• Stage 3: Skills audit ....................................................................................................................................................................................286• Stage 4: Analysing field trial data .....................................................................................................................................................286• Stage 5: Defining the dimensions .....................................................................................................................................................287• Stage 6: Revising and refining with main study data ..........................................................................................................287• Stage 7: Validating ......................................................................................................................................................................................287
defining proficiency levels ..............................................................................................................................................................................287
reporting the results for PISa science ....................................................................................................................................................290• Building an item map ...............................................................................................................................................................................290• Levels of scientific literacy ....................................................................................................................................................................292• Interpreting the scientific literacy levels ......................................................................................................................................299
ChapTEr 1� ScalIng ProcedureS and conStruct valIdatIon oF context queStIonnaIre data...................................................................................................................................................................................303
overview ......................................................................................................................................................................................................................304
Simple questionnaire indices .........................................................................................................................................................................304• Student questionnaire indices .............................................................................................................................................................304• School questionnaire indices ..............................................................................................................................................................307• Parent questionnaire indices ................................................................................................................................................................309
Scaling methodology and construct validation .................................................................................................................................310• Scaling procedures .....................................................................................................................................................................................310• Construct validation ..................................................................................................................................................................................312• Describing questionnaire scale indices ........................................................................................................................................314
questionnaire scale indices ............................................................................................................................................................................315• Student scale indices.................................................................................................................................................................................315• School questionnaire scale indices .................................................................................................................................................340• Parent questionnaire scale indices ...................................................................................................................................................342• The PISA index of economic, social and cultural status (ESCS) ...................................................................................346
ChapTEr 1� valIdatIon oF the emBedded attItudInal ScaleS .....................................................................351
Introduction ...............................................................................................................................................................................................................352
International scalability .....................................................................................................................................................................................353• Analysis of item dimensionality with exploratory and confirmatory factor analysis .....................................353• Fit to item response model ....................................................................................................................................................................353
11PISA 2006 TECHNICAL REPORT – ISBN 978-92-64-04808-9 – © OECD 2009
Table of conTenTs
• Reliability ..........................................................................................................................................................................................................355• Differential item functioning ...............................................................................................................................................................355• Summary of scalability ............................................................................................................................................................................357
relationship and comparisons with other variables ......................................................................................................................357• Within-country student level correlations with achievement and selected background variables ...........358• Relationships between embedded scales and questionnaire ........................................................................................360• Country level correlations with achievement and selected background variables .........................................361• Variance decomposition .........................................................................................................................................................................363• Observations from other cross-national data collections .................................................................................................363• Summary of relations with other variables .................................................................................................................................364
conclusion ..................................................................................................................................................................................................................364
ChapTEr 18 InternatIonal dataBaSe ........................................................................................................................................367
Files in the database .............................................................................................................................................................................................368• Student files .....................................................................................................................................................................................................368• School file .........................................................................................................................................................................................................370• Parent file ..........................................................................................................................................................................................................370
records in the database .....................................................................................................................................................................................371• Records included in the database ....................................................................................................................................................371• Records excluded from the database .............................................................................................................................................371
representing missing data ...............................................................................................................................................................................371
how are students and schools identified? ............................................................................................................................................372
Further information ..............................................................................................................................................................................................373
reFerenceS ..............................................................................................................................................................................................................375
aPPendIceS .............................................................................................................................................................................................................379
appendix 1 PISA 2006 main study item pool characteristics .................................................................................................380
appendix 2 Contrast coding used in conditioning ........................................................................................................................389
appendix 3 Design effect tables .................................................................................................................................................................399
appendix 4 Changes to core questionnaire items from 2003 to 2006 ............................................................................405
appendix 5 Mapping of ISCED to years ................................................................................................................................................411
appendix 6 National household possession items ........................................................................................................................412
appendix 7 Exploratory and confirmatory factor analyses for the embedded items ..............................................414
appendix 8 PISA consortium, staff and consultants .....................................................................................................................416
12PISA 2006 TECHNICAL REPORT – ISBN 978-92-64-04808-9 – © OECD 2009
Table of conTenTs
List of Boxes
Box 1.1 Core features of PISA 2006 ................................................................................................................................22
List of figures
Figure 2.1 Main study Interest in Science item............................................................................................................................................36
Figure 2.2 Main study Support for Scientific Enquiry item .....................................................................................................................36
Figure 2.3 Field trial Match-the-opinion Responsibility item ................................................................................................................37
Figure 3.1 Conceptual grid of variable types................................................................................................................................................52
Figure 3.2 The two-dimensional conceptual matrix with examples of variables collected or available from other sources ....................................................................................................................................................................................................54
Figure 4.1 School response rate standard ......................................................................................................................................................67
Figure 6.1 Design for the single coding of science and mathematics ............................................................................................115
Figure 6.2 Design for the single coding of reading .................................................................................................................................116
Figure 9.1 Example of item statistics in Report 1 .....................................................................................................................................148
Figure 9.2 Example of item statistics in Report 2 .....................................................................................................................................149
Figure 9.3 Example of item statistics shown in Graph B ......................................................................................................................150
Figure 9.4 Example of item statistics shown in Graph C ......................................................................................................................151
Figure 9.5 Example of item statistics shown in Table D ........................................................................................................................151
Figure 9.6 Example of summary of dodgy items for a country in Report 3a ...............................................................................152
Figure 9.7 Example of summary of dodgy items in Report 3b ...........................................................................................................152
Figure 10.1 Data management in relation to other parts of PISA ........................................................................................................164
Figure 10.2 Major data management stages in PISA ................................................................................................................................166
Figure 10.3 Validity reports - general hierarchy ..........................................................................................................................................170
Figure 11.1 Standard error on a mean estimate depending on the intraclass correlation ........................................................188
Figure 11.2 Relationship between the standard error for the science performance mean and the intraclass correlation within explicit strata (PISA 2006)......................................................................................................................205
Figure 12.1 Item plot for mathematics items ................................................................................................................................................210
Figure 12.2 Item plot for reading items ..........................................................................................................................................................211
Figure 12.3 Item plot for science items ..........................................................................................................................................................212
Figure 12.4 Item plot for interest items ...........................................................................................................................................................213
Figure 12.5 Item plot for support items ..........................................................................................................................................................214
Figure 12.6 Scatter plot of per cent correct for reading link items in PISA 2000 and PISA 2003 .........................................238
Figure 12.7 Scatter plot of per cent correct for reading link items in PISA 2003 and PISA 2006 .........................................240
Figure 12.8 Scatter plot of per cent correct for mathematics link items in PISA 2003 and PISA 2006 ..............................242
Figure 12.9 Scatter plot of per cent correct for science link items in PISA 2000 and PISA 2003 .........................................244
Figure 12.10 Scatter plot of per cent correct for science link items in PISA 2003 and PISA 2006. ........................................245
13PISA 2006 TECHNICAL REPORT – ISBN 978-92-64-04808-9 – © OECD 2009
Table of conTenTs
Figure 13.1 Variability of the homogeneity indices for science items in field trial .....................................................................250
Figure 13.2 Average of the homogeneity indices for science items in field trial and main study .........................................251
Figure 13.3 Variability of the homogeneity indices for each science item in the main study ................................................252
Figure 13.4 Variability of the homogeneity indices for each reading item in the main study ................................................252
Figure 13.5 Variability of the homogeneity indices for each mathematics item ..........................................................................252
Figure 13.6 Variability of the homogeneity indices for the participating countries in the main study ...............................253
Figure 13.7 Example of ICR report (reading) ................................................................................................................................................269
Figure 14.1 Attained school response rates ..................................................................................................................................................274
Figure 15.1 The relationship between items and students on a proficiency scale .......................................................................285
Figure 15.2 What it means to be at a level ...................................................................................................................................................289
Figure 15.3 A map for selected science items .............................................................................................................................................291
Figure 15.4 Summary descriptions of the six proficiency levels on the science scale ...............................................................294
Figure 15.5 Summary descriptions of six proficiency levels in identifying scientific issues ....................................................295
Figure 15.6 Summary descriptions of six proficiency levels in explaining phenomena scientifically ................................297
Figure 15.7 Summary descriptions of six proficiency levels in using scientific evidence ........................................................300
Figure 16.1 Summed category probabilities for fictitious item ............................................................................................................314
Figure 16.2 Fictitious example of an item map ...........................................................................................................................................315
Figure 16.3 Scatterplot of country means for ESCS 2003 and ESCS 2006 ......................................................................................347
Figure 17.1 Distribution of item fit mean square statistics for embedded attitude items ..........................................................354
Figure 17.2 An example of the ESC plot for item S408RNA .................................................................................................................356
Figure 17.3 Scatterplot of mean mathematics interest against mean mathematics for PISA 2003 .......................................363
List of taBLes
Table 1.1 PISA 2006 participants .....................................................................................................................................................................21
Table 2.1 Cluster rotation design used to form test booklets for PISA 2006 .................................................................................29
Table 2.2 Test development timeline for PISA 2006 ................................................................................................................................30
Table 2.3 Science field trial all items .............................................................................................................................................................39
Table 2.4 Allocation of item clusters to test booklets for field trial ...................................................................................................39
Table 2.5 Science main study items (item format by competency) ...................................................................................................43
Table 2.6 Science main study items (item format by knowledge type) ...........................................................................................44
Table 2.7 Science main study items (knowledge category by competency) .................................................................................44
Table 2.8 Reading main study items (item format by aspect) ..............................................................................................................44
Table 2.9 Reading main study items (item format by text format) .....................................................................................................45
Table 2.10 Reading main study items (text type by aspect) ....................................................................................................................45
Table 2.11 Mathematics main study items (item format by competency cluster) ..........................................................................45
Table 2.12 Mathematics main study items (item format by content category) ...............................................................................46
Table 2.13 Mathematics main study items (content category by competency cluster) ...............................................................46
14PISA 2006 TECHNICAL REPORT – ISBN 978-92-64-04808-9 – © OECD 2009
Table of conTenTs
Table 3.1 Themes and constructs/variables in PISA 2006 .....................................................................................................................56
Table 4.1 Stratification variables ......................................................................................................................................................................71
Table 4.2 Schedule of school sampling activities .....................................................................................................................................78
Table 5.1 Countries sharing a common version with national adaptations ..................................................................................90
Table 5.2 PISA 2006 translation/adaptation procedures ........................................................................................................................91
Table 5.3 Mean deviation and root mean squared error of the item by country interactions for each version .............97
Table 5.4 Correlation between national item parameter estimates for Arabic versions ...........................................................99
Table 5.5 Correlation between national item parameter estimates for Chinese versions ........................................................99
Table 5.6 Correlation between national item parameter estimates for Dutch versions ............................................................99
Table 5.7 Correlation between national item parameter estimates for English versions ..........................................................99
Table 5.8 Correlation between national item parameter estimates for French versions...........................................................99
Table 5.9 Correlation between national item parameter estimates for German versions .....................................................100
Table 5.10 Correlation between national item parameter estimates for Hungarian versions................................................100
Table 5.11 Correlation between national item parameter estimates for Italian versions .........................................................100
Table 5.12 Correlation between national item parameter estimates for Portuguese versions ...............................................100
Table 5.13 Correlation between national item parameter estimates for Russian versions ......................................................100
Table 5.14 Correlation between national item parameter estimates for Spanish versions .....................................................100
Table 5.15 Correlation between national item parameter estimates for Swedish versions ....................................................100
Table 5.16 Correlation between national item parameter estimates within countries .............................................................101
Table 5.17 Variance estimate ............................................................................................................................................................................102
Table 5.18 Variance estimates ..........................................................................................................................................................................103
Table 6.1 Design for the multiple coding of science and mathematics .......................................................................................118
Table 6.2 Design for the multiple coding of reading ............................................................................................................................118
Table 8.1 Non-response classes ....................................................................................................................................................................133
Table 9.1 Deviation contrast coding scheme ..........................................................................................................................................154
Table 10.1 Double entry discrepancies per country: field trial data ................................................................................................169
Table 11.1 Sampling and coverage rates ......................................................................................................................................................178
Table 11.2 School response rates before replacement ...........................................................................................................................182
Table 11.3 School response rates after replacement ...............................................................................................................................184
Table 11.4 Student response rates after replacement ..............................................................................................................................185
Table 11.5 Standard errors for the PISA 2006 combined science scale .........................................................................................189
Table 11.6 Design effect 1 by country, by domain and cycle .............................................................................................................193
Table 11.7 Effective sample size 1 by country, by domain and cycle .............................................................................................194
Table 11.8 Design effect 2 by country, by domain and cycle .............................................................................................................195
Table 11.9 Effective sample size 2 by country, by domain and cycle .............................................................................................196
Table 11.10 Design effect 3 by country, by domain and by cycle .......................................................................................................197
1�PISA 2006 TECHNICAL REPORT – ISBN 978-92-64-04808-9 – © OECD 2009
Table of conTenTs
Table 11.11 Effective sample size 3 by country, by domain and cycle .............................................................................................198
Table 11.12 Design effect 4 by country, by domain and cycle .............................................................................................................199
Table 11.13 Effective sample size 4 by country, by domain and cycle .............................................................................................200
Table 11.14 Design effect 5 by country, by domain and cycle .............................................................................................................201
Table 11.15 Effective sample size 5 by country, by domain and cycle .............................................................................................202
Table 11.16 Median of the design effect 3 per cycle and per domain across the 35 countries that participated in every cycle ....................................................................................................................................................................................203
Table 11.17 Median of the standard errors of the student performance mean estimate for each domain and PISA cycle for the 35 countries that participated in every cycle .......................................................................203
Table 11.18 Median of the number of participating schools for each domain and PISA cycle for the 35 countries that participated in every cycle .................................................................................................................................................204
Table 11.19 Median of the school variance estimate for each domain and PISA cycle for the 35 countries that participated in every cycle .................................................................................................................................................204
Table 11.20 Median of the intraclass correlation for each domain and PISA cycle for the 35 countries that participated in every cycle .................................................................................................................................................204
Table 11.21 Median of the within explicit strata intraclass correlation for each domain and PISA cycle for the 35 countries that participated in every cycle ..............................................................................................................205
Table 11.22 Median of the percentages of school variances explained by explicit stratification variables, for each domain and PISA cycle for the 35 countries that participated in every cycle ....................................205
Table 12.1 Number of sampled student by country and booklet ......................................................................................................209
Table 12.2 Reliabilities of each of the four overall scales when scaled separately....................................................................215
Table 12.3 Latent correlation between the five domains ......................................................................................................................215
Table 12.4 Latent correlation between science scales ...........................................................................................................................215
Table 12.5 Items deleted at the national level ...........................................................................................................................................216
Table 12.6 Final reliability of the PISA scales ............................................................................................................................................216
Table 12.7 National reliabilities for the main domains..........................................................................................................................217
Table 12.8 National reliabilities for the science subscales ...................................................................................................................218
Table 12.9 Average number of not-reached items and missing items by booklet ......................................................................219
Table 12.10 Average number of not-reached items and missing items by country ......................................................................220
Table 12.11 Distribution of not-reached items by booklet .....................................................................................................................221
Table 12.12 Estimated booklet effects on the PISA scale .........................................................................................................................221
Table 12.13 Estimated booklet effects in logits ............................................................................................................................................221
Table 12.14 Variance in mathematics booklet means ..............................................................................................................................222
Table 12.15 Variance in reading booklet means .........................................................................................................................................224
Table 12.16 Variance in science booklet means .........................................................................................................................................226
Table 12.17 Variance in interest booklet means .........................................................................................................................................228
Table 12.18 Variance in support booklet means .........................................................................................................................................230
Table 12.19 Summary of PISA cognitive reporting scales .......................................................................................................................233
Table 12.20 Linkage types among PISA domains 2000-2006 ...............................................................................................................235
Table 12.21 Number of unique item minutes for each domain for each PISA assessments .....................................................237
Table 12.22 Numbers of link items between successive PISA assessments .....................................................................................237
Table 12.23 Per cent correct for reading link items in PISA 2000 and PISA 2003 .......................................................................238
Table 12.24 Per cent correct for reading link items in PISA 2003 and PISA 2006 .......................................................................239
Table 12.25 Per cent correct for mathematics link items in PISA 2003 and PISA 2006 ............................................................241
1�PISA 2006 TECHNICAL REPORT – ISBN 978-92-64-04808-9 – © OECD 2009
Table of conTenTs
Table 12.26 Per cent correct for science link items in PISA 2000 and PISA 2003 .......................................................................243
Table 12.27 Per cent correct for science link items in PISA 2003 and PISA 2006 .............................................................................245
Table 12.28 Link error estimates ........................................................................................................................................................................247
Table 13.1 Variance components for mathematics..................................................................................................................................255
Table 13.2 Variance components for science ............................................................................................................................................256
Table 13.3 Variance components for reading ............................................................................................................................................257
Table 13.4 Generalisability estimates for mathematics ..........................................................................................................................258
Table 13.5 Generalisability estimates for science ....................................................................................................................................259
Table 13.6 Generalisability estimates for reading ....................................................................................................................................260
Table 13.7 Examples of flagged cases ...........................................................................................................................................................263
Table 13.8 Count of analysis groups showing potential bias, by domain ......................................................................................264
Table 13.9 Comparison of codes assigned by verifier and adjudicator ..........................................................................................265
Table 13.10 Outcomes of ICR analysis part 1 ..............................................................................................................................................265
Table 13.11 ICR outcomes by country and domain ..................................................................................................................................266
Table 15.1 Scientific literacy performance band definitions on the PISA scale ..........................................................................293
Table 16.1 ISCO major group white-collar/blue-collar classification .............................................................................................306
Table 16.2 ISCO occupation categories classified as science-related occupations ..................................................................307
Table 16.3 OECD means and standard deviations of WL estimates ................................................................................................311
Table 16.4 Median, minimum and maximum percentages of between-school variance for student-level indices across countries ................................................................................................................................................................................313
Table 16.5 Household possessions and home background indices .................................................................................................316
Table 16.6 Scale reliabilities for home possession indices in OECD countries ..........................................................................317
Table 16.7 Scale reliabilities for home possession indices in partner countries/economies .................................................318
Table 16.8 Item parameters for interest in science learning (INTSCIE) ...........................................................................................318
Table 16.9 Item parameters for enjoyment of science (JOYSCIE) ......................................................................................................319
Table 16.10 Model fit and estimated latent correlations for interest in and enjoyment of science learning.....................319
Table 16.11 Scale reliabilities for interest in and enjoyment of science learning .........................................................................320
Table 16.12 Item parameters for instrumental motivation to learn science (INSTSCIE) .............................................................320
Table 16.13 Item parameters for future-oriented science motivation (SCIEFUT) ...........................................................................321
Table 16.14 Model fit and estimated latent correlations for motivation to learn science .........................................................321
Table 16.15 Scale reliabilities for instrumental and future-oriented science motivation ...........................................................322
Table 16.16 Item parameters for science self-efficacy (SCIEEFF) ..........................................................................................................322
Table 16.17 Item parameters for science self-concept (SCSCIE) ...........................................................................................................323
Table 16.18 Model fit and estimated latent correlations for science self-efficacy and science self-concept ....................323
Table 16.19 Scale reliabilities for science self-efficacy and science self-concept ........................................................................324
Table 16.20 Item parameters for general value of science (GENSCIE) ...............................................................................................324
Table 16.21 Item parameters for personal value of science (PERSCIE) ..............................................................................................325
Table 16.22 Model fit and estimated latent correlations for general and personal value of science ....................................325
Table 16.23 Scale reliabilities for general and personal value of science ........................................................................................326
Table 16.24 Item parameters for science activities (SCIEACT) ..............................................................................................................326
1�PISA 2006 TECHNICAL REPORT – ISBN 978-92-64-04808-9 – © OECD 2009
Table of conTenTs
Table 16.25 Scale reliabilities for the science activities index ..............................................................................................................327
Table 16.26 Item parameters for awareness of environmental issues (ENVAWARE) ...................................................................327
Table 16.27 Item parameters for perception of environmental issues (ENVPERC) .......................................................................328
Table 16.28 Item parameters for environmental optimism (ENVOPT) ...............................................................................................328
Table 16.29 Item parameters for responsibility for sustainable development (RESPDEV) .........................................................328
Table 16.30 Model fit environment-related constructs .............................................................................................................................329
Table 16.31 Estimated latent correlations for environment-related constructs ..............................................................................329
Table 16.32 Scale reliabilities for environment-related scales in OECD countries ......................................................................330
Table 16.33 Scale reliabilities for environment-related scales in non-OECD countries ............................................................330
Table 16.34 Item parameters for school preparation for science career (CARPREP) ...................................................................331
Table 16.35 Item parameters for student information on science careers (CARINFO) ...............................................................331
Table 16.36 Model fit and estimated latent correlations for science career preparation indices ...........................................332
Table 16.37 Scale reliabilities for science career preparation indices ...............................................................................................332
Table 16.38 Item parameters for science teaching: interaction (SCINTACT) ..................................................................................333
Table 16.39 Item parameters for science teaching: hands-on activities (SCHANDS)..................................................................333
Table 16.40 Item parameters for science teaching: student investigations (SCINVEST) .............................................................333
Table 16.41 Item parameters for science teaching: focus on models or applications (SCAPPLY) ..........................................334
Table 16.42 Model fit for CFA with science teaching and learning ....................................................................................................334
Table 16.43 Estimated latent correlations for constructs related to science teaching and learning ......................................335
Table 16.44 Scale reliabilities for scales to science teaching and learning in OECD countries .............................................336
Table 16.45 Scale reliabilities for scales to science teaching and learning in partner countries/economies ....................336
Table 16.46 Item parameters for ICT Internet/entertainment use (INTUSE) .....................................................................................337
Table 16.47 Item parameters for ICT program/software use (PRGUSE) .............................................................................................337
Table 16.48 Item parameters for ICT self-confidence in Internet tasks (INTCONF) .....................................................................337
Table 16.49 Item parameters for ICT self-confidence in high-level ICT tasks (HIGHCONF) ...................................................338
Table 16.50 Model fit for CFA with ICT familiarity items ........................................................................................................................338
Table 16.51 Estimated latent correlations for constructs related to ICT familiarity ......................................................................339
Table 16.52 Scale reliabilities for ICT familiarity scales ...........................................................................................................................339
Table 16.53 Item parameters for teacher shortage (TCSHORT) ............................................................................................................340
Table 16.54 Item parameters for quality of educational resources (SCMATEDU) ........................................................................340
Table 16.55 Item parameters for school activities to promote the learning of science (SCIPROM) ......................................341
Table 16.56 Item parameters for school activities for learning environmental topics (ENVLEARN) .....................................341
Table 16.57 Scale reliabilities for school-level scales in OECD countries .......................................................................................341
Table 16.58 Scale reliabilities for environment-related scales in partner countries/economies .............................................342
Table 16.59 Item parameters for science activities at age 10 (PQSCIACT) ......................................................................................343
Table 16.60 Item parameters for parent’s perception of school quality (PQSCHOOL) ..............................................................343
Table 16.61 Item parameters for parent’s views on importance of science (PQSCIMP) ............................................................343
Table 16.62 Item parameters for parent’s reports on science career motivation (PQSCCAR) ..................................................344
Table 16.63 Item parameters for parent’s view on general value of science (PQGENSCI) .......................................................344
Table 16.64 Item parameters for parent’s view on personal value of science (PQPERSCI) .......................................................344
Table 16.65 Item parameters for parent’s perception of environmental issues (PQENPERC) ..................................................345
Table 16.66 Item parameters for parent’s environmental optimism (PQENVOPT) .......................................................................345
18PISA 2006 TECHNICAL REPORT – ISBN 978-92-64-04808-9 – © OECD 2009
Table of conTenTs
Table 16.67 Scale reliabilities for parent questionnaire scales..............................................................................................................345
Table 16.68 Factor loadings and internal consistency of ESCS 2006 in OECD countries .........................................................347
Table 16.69 Factor loadings and internal consistency of ESCS 2006 in partner countries/economies ................................348
Table 17.1 Student-level latent correlations between mathematics, reading, science, embedded interest and embedded support ..........................................................................................................................................................................354
Table 17.2 Summary of the IRT scaling results across countries .......................................................................................................355
Table 17.3 Gender DIF table for embedded attitude items ..................................................................................................................357
Table 17.4 Correlation amongst attitudinal scales, performance scales and HISEI ...................................................................358
Table 17.5 Correlations for science scale ....................................................................................................................................................359
Table 17.6 Loadings of the achievement, interest and support variables on three varimax rotated components ........360
Table 17.7 Correlation between embedded attitude scales and questionnaire attitude scales ............................................361
Table 17.8 Rank order correlation five test domains, questionnaire attitude scales and HISEI ............................................362
Table 17.9 Intra-class correlation (rho) .........................................................................................................................................................362
Table A1.1 2006 Main study reading item classification .......................................................................................................................380
Table A1.2 2006 Main study mathematics item classification ............................................................................................................381
Table A1.3 2006 Main study science item classification (cognitive) ................................................................................................383
Table A1.4 2006 Main study science embedded item classification (interest in learning science topics) .......................387
Table A1.5 2006 Main study science embedded item classification (support for scientific enquiry) ................................388
Table A2.1 2006 Main study contrast coding used in conditioning for the student questionnaire variables .................389
Table A2.2 2006 Main study contrast coding used in conditioning for the ICT questionnaire variables .........................396
Table A2.3 2006 Main study contrast coding used in conditioning for the parent questionnaire variables and other variables .........................................................................................................................................................................397
Table A3.1 Standard errors of the student performance mean estimate by country, by domain and cycle .....................399
Table A3.2 Sample sizes by country and cycle ..........................................................................................................................................400
Table A3.3 School variance estimate by country, by domain and cycle .........................................................................................401
Table A3.4 Intraclass correlation by country, by domain and cycle .................................................................................................402
Table A3.5 Within explicit strata intraclass correlation by country, by domain and cycle .....................................................403
Table A3.6 Percentages of school variance explained by explicit stratification variables, by domain and cycle .........404
Table A4.1 Student questionnaire ....................................................................................................................................................................405
Table A4.2 ICT familiarity questionnaire ......................................................................................................................................................407
Table A4.3 School questionnaire .....................................................................................................................................................................408
Table A5.1 Mapping of ISCED to accumulated years of education ..................................................................................................411
Table A6.1 National household possession items ....................................................................................................................................412
Table A7.1 Exploratory and confirmatory factor analyses (EFA and CFA) for the embedded items ....................................414
From:PISA 2006 Technical Report
Access the complete publication at:https://doi.org/10.1787/9789264048096-en
Please cite this chapter as:
OECD (2009), “Test design and test development”, in PISA 2006 Technical Report, OECD Publishing, Paris.
DOI: https://doi.org/10.1787/9789264048096-3-en
This work is published under the responsibility of the Secretary-General of the OECD. The opinions expressed and argumentsemployed herein do not necessarily reflect the official views of OECD member countries.
This document and any map included herein are without prejudice to the status of or sovereignty over any territory, to thedelimitation of international frontiers and boundaries and to the name of any territory, city or area.
You can copy, download or print OECD content for your own use, and you can include excerpts from OECD publications,databases and multimedia products in your own documents, presentations, blogs, websites and teaching materials, providedthat suitable acknowledgment of OECD as source and copyright owner is given. All requests for public or commercial use andtranslation rights should be submitted to [email protected]. Requests for permission to photocopy portions of this material forpublic or commercial use shall be addressed directly to the Copyright Clearance Center (CCC) at [email protected] or theCentre français d’exploitation du droit de copie (CFC) at [email protected].