lessons from pisa for korea - oecd ilibrary
TRANSCRIPT
Consult this publication on line at http://dx.doi.org/10.1787/9789264190672-en.
This work is published on the OECD iLibrary, which gathers all OECD books, periodicals and statistical databases.Visit www.oecd-ilibrary.org for more information.
Strong Performers and Successful Reformers in Education
Lessons from PISA for Korea
Strong Performers and Successful Reformers in Education
Lessons from PISA for KoreaThe story of Korean education over the past 50 years is one of remarkable growth and achievement. Korea is one of the top performing countries in the Programme for International Student Assessment (PISA) survey and among those with the highest proportion of young people who have completed upper secondary and tertiary education. Korea is continuously exploring ways to improve its education system and has dramatically increased government investment in education over the last decade. Nevertheless, further reforms are needed to spur and sustain improvements. Rapid globalisation and modernisation are also posing new and demanding challenges to equip young people of today and tomorrow with skills relevant to the 21st century.
The report Strong Performers and Successful Reformers in Education: Lessons from PISA for Korea aims at helping Korea to identify and address education policy challenges in an international perspective. To this end, it examines the Korean education system through the prism of PISA 2009, considers recent policy developments and suggests specific policy options to foster improvements. The report also provides an in-depth analysis of the experience of other high-performing countries.
ContentsChapter 1. Strong performers and successful reformers: Korea
Chapter 2. Viewing education in Korea through the prism of PISA
Chapter 3. Supplementary education in East Asia
Chapter 4. Shanghai and Hong Kong-China: Learning to learn
Chapter 5. Singapore: Thinking ahead
Chapter 6. Ontario: Harnessing the skills of tomorrow
Chapter 7. Finland: A non-competitive education for a competitive economy
Chapter 8. Policy lessons for Korea
ISbn 978-92-64-19066-5 98 2013 02 1 P
Lesson
s from
PIS
A fo
r Ko
reaS
trong
Perfo
rmers an
d S
uccessful R
eform
ers in Ed
ucation
9HSTCQE*bjaggf+

Strong Performers and Successful Reformers in Education
Lessons from PISAfor Korea
This work is published on the responsibility of the Secretary-General of the OECD. The
opinions expressed and arguments employed herein do not necessarily reflect the official
views of the OECD or of the governments of its member countries.
This document and any map included herein are without prejudice to the status of or
sovereignty over any territory, to the delimitation of international frontiers and boundaries
and to the name of any territory, city or area.
ISBN 978-92-64-19066-5 (print)ISBN 978-92-64-19067-2 (PDF)
Series: Strong Performers and Successful Reformers in EducationISSN 2220-3621 (print)ISSN 2220-363X (online)
The statistical data for Israel are supplied by and under the responsibility of the relevant Israeli authorities. The useof such data by the OECD is without prejudice to the status of the Golan Heights, East Jerusalem and Israelisettlements in the West Bank under the terms of international law.
Photo credits: Cover © Fotolia.com/Ainoa, © Getty Images/John Foxx.
Corrigenda to OECD publications may be found on line at: www.oecd.org/about/publishing/corrigenda.htm.
© OECD 2014
You can copy, download or print OECD content for your own use, and you can include excerpts from OECD publications, databases and
multimedia products in your own documents, presentations, blogs, websites and teaching materials, provided that suitable
acknowledgment of the source and copyright owner is given. All requests for public or commercial use and translation rights should be
submitted to [email protected]. Requests for permission to photocopy portions of this material for public or commercial use shall be
addressed directly to the Copyright Clearance Center (CCC) at [email protected] or the Centre français d’exploitation du droit de copie
(CFC) at [email protected].
Please cite this publication as:OECD (2014), Lessons from PISA for Korea, Strong Performers and Successful Reformers in Education,OECD Publishing.http://dx.doi.org/10.1787/9789264190672-en
3STRONG PERFORMERS AND SUCCESSFUL REFORMERS IN EDUCATION: LESSONS FROM PISA FOR KOREA © OECD 2014
ForewordEducation plays a central role in the development of society and fuels a virtuous circle of improvement and growth. Korea has built a well-educated workforce that has propelled the country to the forefront of the global knowledge economy. The importance of education for economic growth and well-being creates high demands on the system. School leaders, teachers and parents expect every student to succeed and students push themselves to exceed those expectations. Correspondingly, teacher recruitment, training and support are focused on building a profession where quality has traditionally been a priority.
Korea strives to continuously improve its education system. Recent reforms have adjusted the curricula, teaching methods and materials to foster more well-rounded and creative talents in order to be more competitive in a fast-changing world. However, some areas of policy require further attention. Developing skills in response to today’s economy and ensuring a smooth school-to-work transition will be key to continued success. Developing skills in response to today’s economy and ensuring a smooth school-to-work transition will be key to continued success and Korea needs more effective policy responses to provide equitable education for social cohesion.
The report Strong Performers and Successful Reformers in Education: Lessons from PISA for Korea has a twofold purpose. Firstly, the report should help Korea to identify and address education policy challenges from an international perspective. To this end, it assesses the Korean education system through the prism of PISA, considers recent policy developments and suggests specific policy options to foster improvements. It also provides an in-depth analysis of the experience of other high-performing countries and economies, including Finland, Hong Kong (China) , Ontario (Canada), Shanghai (China), and Singapore. Secondly, the report should be a useful reference for countries seeking to improve their education systems.
I am grateful to the Korean authorities for their cooperation in the preparation of this report and hope that they will find it of value in better understanding the key ingredients for success, and will gain insights on how to achieve effective reform.
Barbara Ischinger Director for Education and Skills, Organisation for Economic Co-operation and Development

5STRONG PERFORMERS AND SUCCESSFUL REFORMERS IN EDUCATION: LESSONS FROM PISA FOR KOREA © OECD 2014
AcknowledgementsThis report is the result of a collaborative effort between Korea, the OECD Secretariat and international experts. The report was prepared under the leadership of Andreas Schleicher, Deputy Director and co-ordinated by Francisco Benavides, Analyst, from the OECD Directorate for Education and Skills. Seong Taeje, President, and Jimin Cho, Head of the Global Co-operation of the Korean Institute for Curriculum and Evaluation provided advice and feedback. The Korean Ministry of Education provided useful resources for the drafting of the report and participated in its review. The principal authors of this report are: Introduction (Chapter 1): Yuri Belfali and Hyo Jeong Yee, OECD, based on material in an earlier report in this series; Korea (Chapter 2): Francesca Borgonovi, OECD; Supplementary education in East Asia (Chapter 3): Julian Dierkes, University of British Columbia, and Anna Pons, OECD; Shanghai and Hong Kong-China, (Chapter 4): Kai-ming Cheng, University of Hong Kong, Hong Kong-China, Singapore (Chapter 5): Vivien Stewart, Asia Society; Ontario, Canada (Chapter 6): Robert Schwartz and Jal Mehta, Harvard University; Finland (Chapter 7): Pasi Sahlberg, Centre for International Mobility and Co-operation in Finland (CIMO); Policy lessons for Korea (Chapter 8): Andreas Schleicher, Richard Yelland, Yuri Belfali, Francisco Benavides and Hyo Jeong Yee, OECD. Marilyn Achiron, Elisabeth Villoutreix, Rachel Linden and Florence Wojtasinski, OECD, provided invaluable assistance in its production.

7
TABLE OF CONTENTS
STRONG PERFORMERS AND SUCCESSFUL REFORMERS IN EDUCATION: LESSONS FROM PISA FOR KOREA © OECD 2014
Table of Contents
EXECUTIVE SUMMARY ���������������������������������������������������������������������������������������������������������������������������������������������������������������������������������15
CHAPTER 1 STRONG PERFORMERS, SUCCESSFUL REFORMERS: KOREA �������������������������������������������������������������������������������������������17
A changing yardstick for educational success �������������������������������������������������������������������������������������������������������������������������������������18
Strong Performers and Successful Reformers in Education series ����������������������������������������������������������������������������������������������������18
About this report ������������������������������������������������������������������������������������������������������������������������������������������������������������������������������������19
Methodology ������������������������������������������������������������������������������������������������������������������������������������������������������������������������������������������19
Framework for analysis ��������������������������������������������������������������������������������������������������������������������������������������������������������������������������19
What is PISA and what can we learn from it? ��������������������������������������������������������������������������������������������������������������������������������������20
How can PISA be used to help improve education systems? ������������������������������������������������������������������������������������������������������������21
Research methods employed for the country chapters ���������������������������������������������������������������������������������������������������������������������23
Research methods employed to draw lessons for Korea �������������������������������������������������������������������������������������������������������������������23
Background on education in Korea and comparisons with selected high-performing countries �������������������������������������������������24
• Country comparisons ���������������������������������������������������������������������������������������������������������������������������������������������������������24
• Shaping of Education in Korea �������������������������������������������������������������������������������������������������������������������������������������������24
CHAPTER 2 VIEWING EDUCATION IN KOREA THROUGH THE PRISM OF PISA �����������������������������������������������������������������������������31
Consistently high mean performance among 15-year-old ����������������������������������������������������������������������������������������������������������������32
Relative shares of top-performing students: Above the OECD average and, in reading, an increase over time ��������������������������35
Low proportion of poor-performing students: Consistently among the lowest in the OECD (with a decline in science) ���������39
Korea: A favourable context for student achievement �����������������������������������������������������������������������������������������������������������������������41
Equity in the distribution of learning opportunities ���������������������������������������������������������������������������������������������������������������������������45
Changes in performance differences ���������������������������������������������������������������������������������������������������������������������������������������������������46
Access to resources and socio-economic background �����������������������������������������������������������������������������������������������������������������������47
Below-average impact of socio-economic background on learning outcomes ������������������������������������������������������������������������������48
Other factors related to poor student performance that emerge from PISA ����������������������������������������������������������������������������������49
What are the broader effects of a demanding education system? ����������������������������������������������������������������������������������������������������50
Other learning outcomes: Student engagement, strategies and practices ���������������������������������������������������������������������������������������50
Using effective learning strategies ��������������������������������������������������������������������������������������������������������������������������������������������������������54
Studying in a digital age: Digital reading performance and use of digital resources ����������������������������������������������������������������������55
• Relatively high proficiency in digital reading ���������������������������������������������������������������������������������������������������������������������55
• Differences in print versus digital reading ��������������������������������������������������������������������������������������������������������������������������56
• Gender and digital reading ������������������������������������������������������������������������������������������������������������������������������������������������56
• Online reading practices ����������������������������������������������������������������������������������������������������������������������������������������������������57
• Using computers and the Internet ��������������������������������������������������������������������������������������������������������������������������������������59
The learning environment in Korea ������������������������������������������������������������������������������������������������������������������������������������������������������60
The Korean education system and education policies that make a difference �������������������������������������������������������������������������������65
• Participation in early childhood education with a reliance on private institutions and funding �������������������������������������������65
Competition as a powerful source of innovation �������������������������������������������������������������������������������������������������������������������������������67
Setting standards and accountability arrangements ���������������������������������������������������������������������������������������������������������������������������74

8
TABLE OF CONTENTS
© OECD 2014 STRONG PERFORMERS AND SUCCESSFUL REFORMERS IN EDUCATION: LESSONS FROM PISA FOR KOREA
Dealing with diversity in the student population: Low levels of vertical differentiation and medium levels of horizontal differentiation �����������������������������������������������������������������������������������������������������������������������������������������������������������������������������������������76
The balance between public and private education ��������������������������������������������������������������������������������������������������������������������������77
CHAPTER 3 SUPPLEMENTARY EDUCATION IN EAST ASIA ������������������������������������������������������������������������������������������������������������������ 87
Towards a better understanding of supplementary education ����������������������������������������������������������������������������������������������������������88
• Defining supplementary education ������������������������������������������������������������������������������������������������������������������������������������88
• Mapping supplementary education ������������������������������������������������������������������������������������������������������������������������������������88
• Who receives supplementary education? ���������������������������������������������������������������������������������������������������������������������������89
The main drivers of supplementary education �����������������������������������������������������������������������������������������������������������������������������������90
• A head start to enter prestigious universities �����������������������������������������������������������������������������������������������������������������������91
• More pressure and chances to succeed ������������������������������������������������������������������������������������������������������������������������������91
• Mitigating the shortcomings of schools ������������������������������������������������������������������������������������������������������������������������������92
The impact of supplementary education ���������������������������������������������������������������������������������������������������������������������������������������������92
• The impact on the learning process������������������������������������������������������������������������������������������������������������������������������������92
The impact on academic performance and spill over effects ������������������������������������������������������������������������������������������������������������94
• The impact on academic performance is not clear-cut �������������������������������������������������������������������������������������������������������94
• Exacerbates socio-economic inequalities ���������������������������������������������������������������������������������������������������������������������������94
• A high cost for student well-being ��������������������������������������������������������������������������������������������������������������������������������������94
• A sizeable market ��������������������������������������������������������������������������������������������������������������������������������������������������������������95
Policy Responses to Supplementary Education ����������������������������������������������������������������������������������������������������������������������������������95
• Policies to downsize and limit supplementary education ���������������������������������������������������������������������������������������������������95
• Broaden access to supplementary education ����������������������������������������������������������������������������������������������������������������������96
• Foster research and public engagement for more effective policy responses �����������������������������������������������������������������������97
CHAPTER 4 SHANGHAI AND HONG KONG-CHINA: LEARNING TO LEARN ������������������������������������������������������������������������������� 103
Introduction ������������������������������������������������������������������������������������������������������������������������������������������������������������������������������������������104
The cultural context �����������������������������������������������������������������������������������������������������������������������������������������������������������������������������104
• Cultural paradoxes �����������������������������������������������������������������������������������������������������������������������������������������������������������104
The historical context���������������������������������������������������������������������������������������������������������������������������������������������������������������������������105
• Ideology-driven systems: 1905 to 1976 ����������������������������������������������������������������������������������������������������������������������������105
• The reconstruction of education: the late 1970s onwards �������������������������������������������������������������������������������������������������105
• The system today �������������������������������������������������������������������������������������������������������������������������������������������������������������106
Shanghai: A leader in reforms �������������������������������������������������������������������������������������������������������������������������������������������������������������107
• How education is practised ���������������������������������������������������������������������������������������������������������������������������������������������108
• Reform strategies: from teaching to learning ��������������������������������������������������������������������������������������������������������������������110
• Achievements and challenges ������������������������������������������������������������������������������������������������������������������������������������������115
Hong Kong-China’s education system: One Country, two systems ������������������������������������������������������������������������������������������������117
• Evolution of Hong Kong-China’s education system�����������������������������������������������������������������������������������������������������������118
• The drive for reform ���������������������������������������������������������������������������������������������������������������������������������������������������������119
• Achievements and challenges ������������������������������������������������������������������������������������������������������������������������������������������123
Lessons from Shanghai and Hong Kong-China ���������������������������������������������������������������������������������������������������������������������������������123
• Building legitimacy ����������������������������������������������������������������������������������������������������������������������������������������������������������124
• Breaking away from tradition �������������������������������������������������������������������������������������������������������������������������������������������124
• Root and branch reform versus superficial improvement ��������������������������������������������������������������������������������������������������124
• A focus on learning ����������������������������������������������������������������������������������������������������������������������������������������������������������125
• A holistic approach ����������������������������������������������������������������������������������������������������������������������������������������������������������125
• Accountability �����������������������������������������������������������������������������������������������������������������������������������������������������������������125
Final observations: Education for economic success ������������������������������������������������������������������������������������������������������������������������126
9
TABLE OF CONTENTS
STRONG PERFORMERS AND SUCCESSFUL REFORMERS IN EDUCATION: LESSONS FROM PISA FOR KOREA © OECD 2014
CHAPTER 5 SINGAPORE: THINKING AHEAD ���������������������������������������������������������������������������������������������������������������������������������������133
Introduction ������������������������������������������������������������������������������������������������������������������������������������������������������������������������������������������134
Singapore’s education system: The path to becoming a learning nation ���������������������������������������������������������������������������������������135
• The survival-driven phase (1959-1978) ����������������������������������������������������������������������������������������������������������������������������135
• Efficiency-driven phase (1979-1996) ��������������������������������������������������������������������������������������������������������������������������������135
• Ability-based, aspiration-driven phase (1997-present) ������������������������������������������������������������������������������������������������������136
• Current structure ��������������������������������������������������������������������������������������������������������������������������������������������������������������137
Singapore’s success in education ��������������������������������������������������������������������������������������������������������������������������������������������������������137
• A forward-looking, integrated planning system ����������������������������������������������������������������������������������������������������������������137
• Close links between policy implementers, researchers and educators ������������������������������������������������������������������������������139
• Policies and the means to implement them ����������������������������������������������������������������������������������������������������������������������139
• The advantages of a small scale ���������������������������������������������������������������������������������������������������������������������������������������139
• Commitment to equity and merit �������������������������������������������������������������������������������������������������������������������������������������139
• A strong focus on mathematics, science and technical skills ��������������������������������������������������������������������������������������������140
• Human resource management that matches the demands of the system���������������������������������������������������������������������������141
• A system that is continuously being improved �����������������������������������������������������������������������������������������������������������������143
Lessons from Singapore �����������������������������������������������������������������������������������������������������������������������������������������������������������������������143
Preparing Singaporeans for the future �����������������������������������������������������������������������������������������������������������������������������������������������145
• Curriculum 2015 �������������������������������������������������������������������������������������������������������������������������������������������������������������145
• Teacher preparation for the 21st century ��������������������������������������������������������������������������������������������������������������������������146
Challenges and needs ��������������������������������������������������������������������������������������������������������������������������������������������������������������������������147
CHAPTER 6 ONTARIO: HARNESSING THE SKILLS OF TOMORROW ������������������������������������������������������������������������������������������������153
Introduction ������������������������������������������������������������������������������������������������������������������������������������������������������������������������������������������154
Understanding the Canadian system��������������������������������������������������������������������������������������������������������������������������������������������������154
Canadian success factors ���������������������������������������������������������������������������������������������������������������������������������������������������������������������155
Ontario: reforming for the future �������������������������������������������������������������������������������������������������������������������������������������������������������156
• Focusing on a few clear goals ������������������������������������������������������������������������������������������������������������������������������������������156
• Building support among teachers, unions, and other stakeholders �����������������������������������������������������������������������������������157
• Creating the structures for solid implementation ��������������������������������������������������������������������������������������������������������������157
• Reforming literacy and numeracy in elementary schools ��������������������������������������������������������������������������������������������������157
• Reducing high school dropouts ����������������������������������������������������������������������������������������������������������������������������������������157
• Avoiding top-down mandates and clarifying roles ������������������������������������������������������������������������������������������������������������158
• Cultural support for universal high achievement by a diverse population �������������������������������������������������������������������������158
• A coherent system based on shared understanding and common purpose �����������������������������������������������������������������������159
• A strong focus on educator quality �����������������������������������������������������������������������������������������������������������������������������������159
• Strong and persistent leadership ���������������������������������������������������������������������������������������������������������������������������������������159
• Enhanced professional accountability ������������������������������������������������������������������������������������������������������������������������������160
Harnessing the skills of tomorrow, in both students and teachers ��������������������������������������������������������������������������������������������������160
• Strategies for developing critical thinking �������������������������������������������������������������������������������������������������������������������������160
• Allowing children to customise their education ���������������������������������������������������������������������������������������������������������������161
• A focus on big ideas ��������������������������������������������������������������������������������������������������������������������������������������������������������161
• Collaborative inquiry for teachers’ professional development ������������������������������������������������������������������������������������������163
• An emerging focus on creativity in assessment �����������������������������������������������������������������������������������������������������������������163
Lessons from Ontario ���������������������������������������������������������������������������������������������������������������������������������������������������������������������������164
10
TABLE OF CONTENTS
© OECD 2014 STRONG PERFORMERS AND SUCCESSFUL REFORMERS IN EDUCATION: LESSONS FROM PISA FOR KOREA
CHAPTER 7 FINLAND: A NON-COMPETITIVE EDUCATION FOR A COMPETITIVE ECONOMY �������������������������������������������������169
Introduction ������������������������������������������������������������������������������������������������������������������������������������������������������������������������������������������170
Finnish education: A brief history �������������������������������������������������������������������������������������������������������������������������������������������������������170
• Inauspicious beginnings: 1917-1970 �������������������������������������������������������������������������������������������������������������������������������170
• From backwater to watershed: Systemic reform in the 1970s �������������������������������������������������������������������������������������������171
• A world-class education system: Finland today ����������������������������������������������������������������������������������������������������������������172
Five drivers of successful reform���������������������������������������������������������������������������������������������������������������������������������������������������������173
• A focus on equity and well-being ������������������������������������������������������������������������������������������������������������������������������������173
• Teachers who are highly valued and highly trained ����������������������������������������������������������������������������������������������������������174
• Smart accountability policies �������������������������������������������������������������������������������������������������������������������������������������������175
• A culture of trust ��������������������������������������������������������������������������������������������������������������������������������������������������������������176
• Sustainable leadership and political coherence ����������������������������������������������������������������������������������������������������������������176
Education and national economic competitiveness �������������������������������������������������������������������������������������������������������������������������177
• Specific policies and desired practices for skills in a competitive knowledge economy ����������������������������������������������������178
Lessons from Finland ����������������������������������������������������������������������������������������������������������������������������������������������������������������������������181
• High-quality teachers �������������������������������������������������������������������������������������������������������������������������������������������������������181
• Highly efficient policies ���������������������������������������������������������������������������������������������������������������������������������������������������182
• Diagnosis and early intervention ��������������������������������������������������������������������������������������������������������������������������������������182
• Creativity �������������������������������������������������������������������������������������������������������������������������������������������������������������������������182
• Deep sectoral reforms ������������������������������������������������������������������������������������������������������������������������������������������������������183
The challenge ahead ����������������������������������������������������������������������������������������������������������������������������������������������������������������������������183
CHAPTER 8 POLICY LESSONS FOR KOREA��������������������������������������������������������������������������������������������������������������������������������������������189
Sustaining high performance: Strengths and policy challenges ������������������������������������������������������������������������������������������������������190
Education is a national priority �����������������������������������������������������������������������������������������������������������������������������������������������������������190
Improving the transition from school to work and the labour-market outcomes of education ��������������������������������������������������190
Ensuring the relevance of vocational education and training to the labour market ���������������������������������������������������������������������191
Developing and implementing a curriculum for the 21st Century��������������������������������������������������������������������������������������������������191
Attracting, supporting and retaining high quality teachers ��������������������������������������������������������������������������������������������������������������192
Making the most of Information and Communication Technology (ICT) for learning �����������������������������������������������������������������194
Strengthening the use of evaluation and assessment for quality improvement ����������������������������������������������������������������������������194
Equity in education for strengthening social cohesion ���������������������������������������������������������������������������������������������������������������������194
More effective policy responses to supplementary education �������������������������������������������������������������������������������������������������������195
Improving equity and quality in Early Childhood Education and Care (ECEC) ������������������������������������������������������������������������������196
Involving parents in school and in children’s learning ����������������������������������������������������������������������������������������������������������������������196
Conclusion ��������������������������������������������������������������������������������������������������������������������������������������������������������������������������������������������196
11
TABLE OF CONTENTS
STRONG PERFORMERS AND SUCCESSFUL REFORMERS IN EDUCATION: LESSONS FROM PISA FOR KOREA © OECD 2014
ANNEXES
Annex 3�A1� The policy response in Korea �������������������������������������������������������������������������������������������������������������������������������� 101
Annex 4�A1� Interview Partners (Shangai) ��������������������������������������������������������������������������������������������������������������������������������� 132
Annex 4�A1� Interview Partners (Hong Kong-China) ������������������������������������������������������������������������������������������������������������������ 132
Annex 5�A1� Interview Partners (Singapore) ������������������������������������������������������������������������������������������������������������������������������ 152
Annex 8�A1� Key facts for Korea in education at a glance 2013 ������������������������������������������������������������������������������������������������ 199
TABLES
Table 1�1� Basic data on the countries studied in this volume ��������������������������������������������������������������������������������������������� 25
Table 2�1� Korea’mean score in PISA reading, mathematics and science ���������������������������������������������������������������������������� 32
Table 2�2� Comparing countries’ performance in reading ��������������������������������������������������������������������������������������������������� 32
Table 2�3� Comparing countries’ performance in mathematics ������������������������������������������������������������������������������������������� 33
Table 2�4� Comparing countries’ performance in science ��������������������������������������������������������������������������������������������������� 33
Table 2�5� Similarities and differences between digital and print reading assessments in PISA 2009 ����������������������������������� 54
Table 2�6� Summary descriptions of the four levels of proficiency in digital reading ����������������������������������������������������������� 55
Table 2�7� Where countries rank in digital reading performance ����������������������������������������������������������������������������������������� 56
Table 2�8� Percentage of students who reported using laptops at school ����������������������������������������������������������������������������� 63
Table 2�9� Relationship between pre-primary school attendance and performance, by quality of pre-primary
school education ����������������������������������������������������������������������������������������������������������������������������������������������� 67
Table 2�10� Ratio of schools posting achievement data publicly and the relationship between school autonomy in
allocating resources and reading performance ��������������������������������������������������������������������������������������������������� 74
Table 2�11� How school systems select and group students for schools, grades and programmes ����������������������������������������� 76
Table 2�12� How school systems use student assessments ���������������������������������������������������������������������������������������������������� 78
Table 4�1� Shangai-China’s mean scores on reading, mathematics and science scales in PISA ������������������������������������������ 116
Table 4�2� Hong Kong-China’s mean scores on reading, mathematics and science scales in PISA ������������������������������������� 121
Table 5�1� Singapore’s mean scores on reading, mathematics and science scales in PISA 2009 ���������������������������������������� 134
Table 6�1� Canada’s mean scores on reading, mathematics and science scales in PISA ������� ��������������������������������������������� 154
Table 7�1� Finland’s mean scores on reading, mathematics and science scales in PISA ���������� ��������������������������������������������� 170
Table 7�2� Comparison of educational policies in Finland since 1990 ������������������������������������������������������������������������������ 179
12
TABLE OF CONTENTS
© OECD 2014 STRONG PERFORMERS AND SUCCESSFUL REFORMERS IN EDUCATION: LESSONS FROM PISA FOR KOREA
FIGURES
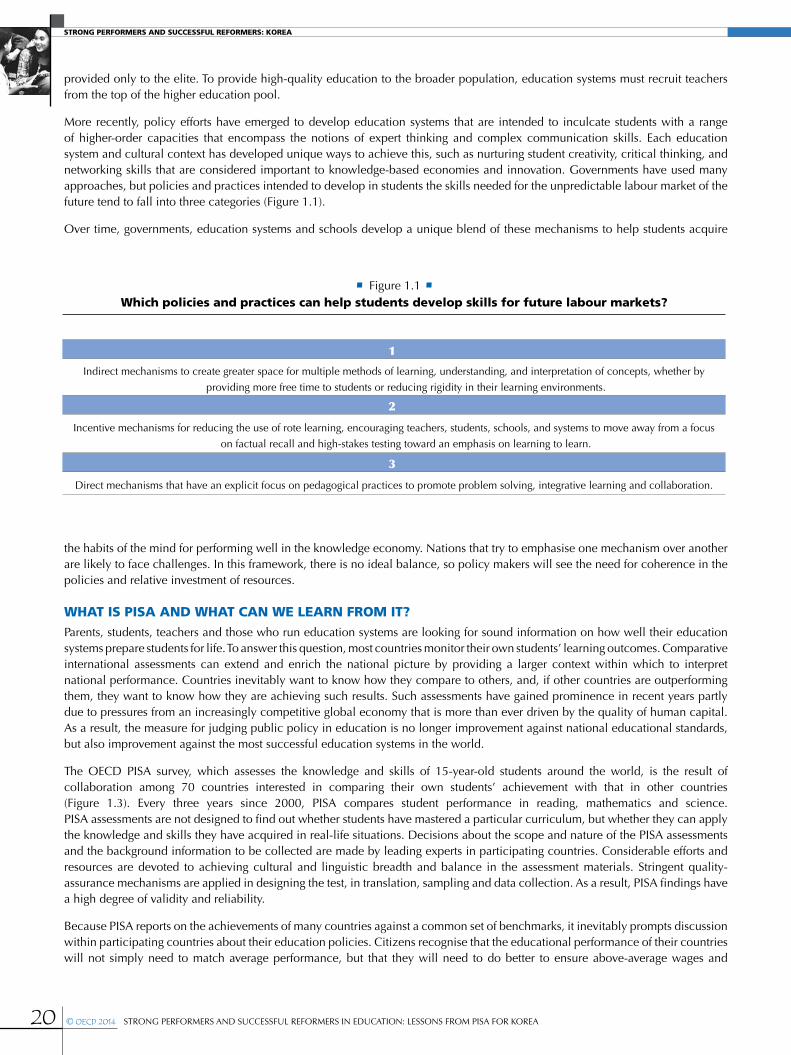
Figure 1�1� Which policies and practices can help students develop skills for future labour markets? ����������������������������������20
Figure 1�2� Framework of analysis for policies to nurture skills for the future �����������������������������������������������������������������������21
Figure 1�3� A map of PISA countries and economies ������������������������������������������������������������������������������������������������������������22
Figure 2�1� Change in reading performance between 2000 and 2009 ����������������������������������������������������������������������������������34
Figure 2�2� Comparison of gender differences in reading between 2000 and 2009 ��������������������������������������������������������������35
Figure 2�3� What percentage of students are high performers in reading? �����������������������������������������������������������������������������36
Figure 2�4� What percentage of students are high performers in mathematics? ���������������������������������������������������������������������36
Figure 2�5� What percentage of students are high performers in science? �����������������������������������������������������������������������������37
Figure 2�6� Percentage of top performers in reading in 2000 and 2009 ��������������������������������������������������������������������������������37
Figure 2�7� Percentage of top performers in mathematics in 2003 and 2009 ������������������������������������������������������������������������38
Figure 2�8� Percentage of top performers in science in 2006 and 2009 ��������������������������������������������������������������������������������38
Figure 2�9� Percentage of poor performers in reading in 2000 and 2009 ������������������������������������������������������������������������������39
Figure 2�10� Percentage of poor performers in mathematics in 2003 and 2009 ����������������������������������������������������������������������40
Figure 2�11� Percentage of poor performers in science in 2006 and 2009 ������������������������������������������������������������������������������40
Figure 2�12� Percentage of poor performing boys and girls in reading in 2000 and 2009 �������������������������������������������������������41
Figure 2�13� Changes in the number of students and changes in expenditures per student �����������������������������������������������������42
Figure 2�14� Reading performance and spending on education ���������������������������������������������������������������������������������������������43
Figure 2�15� Educational spending in 2009 and change since 2000, by level of education and sector �����������������������������������43
Figure 2�16� How school systems’ resources are related to educational outcomes �����������������������������������������������������������������44
Figure 2�17� Average class size in primary education and in lower secondary education (2000, 2010) ����������������������������������45
Figure 2�18� Relationship between students’ socio-economic background and their reading performance in
2000 and 2009 ��������������������������������������������������������������������������������������������������������������������������������������������������46
Figure 2�19� Change in variation and change in reading performance between 2000 and 2009 ��������������������������������������������47
Figure 2�20� Variation in reading performance between and within schools in 2000 and 2009 ���������������������������������������������48
Figure 2�21� Income inequality in the population and strength of the relationship between socio-economic background
and performance �����������������������������������������������������������������������������������������������������������������������������������������������49
Figure 2�22� Relationship between enjoying reading and performance in reading �����������������������������������������������������������������50
Figure 2�23� Percentage of students who read for enjoyment in 2000 and 2009���������������������������������������������������������������������51
Figure 2�24� Association between awareness of effective strategies to understand and remember information and
performance in reading �������������������������������������������������������������������������������������������������������������������������������������52
Figure 2�25� Association between awareness of effective strategies to summarise information and performance
in reading ����������������������������������������������������������������������������������������������������������������������������������������������������������53
Figure 2�26� Percentage of students at each proficiency level on the digital print reading scales ��������������������������������������������57
Figure 2�27� Percentage of top-performing boys and girls in digital and print reading ������������������������������������������������������������58
Figure 2�28� Percentage of low-performing boys and girls in digital and print reading �����������������������������������������������������������59
Figure 2�29� Comparison of gender gaps (in favour of girls) in digital and print reading ���������������������������������������������������������60
Figure 2�30� The index of online reading activities �����������������������������������������������������������������������������������������������������������������61
Figure 2�31� Percentage of students who reported using a computer at home and at school ���������������������������������������������������62
Figure 2�32� Teacher-student relations in Pisa 2000 and 2009 �����������������������������������������������������������������������������������������������64
Figure 2�33� Disciplinary climate in PISA 2000 and 2009 ������������������������������������������������������������������������������������������������������65
Figure 2�34� Korean’s education system ���������������������������������������������������������������������������������������������������������������������������������66
Figure 2�35� Enrolment rates of children under six in childcare and early education services, 2008 ���������������������������������������68
Figure 2�36� Countries in which parents can choose schools for their children ����������������������������������������������������������������������69
Figure 2�37� How the governance of school systems is related to education outcomes ����������������������������������������������������������69
Figure 2�38� Countries in which school governance is related to reading performance ����������������������������������������������������������70
Figure 2�39� How much autonomy individual schools have over resource allocation ������������������������������������������������������������72
Figure 2�40� How much autonomy individual schools have over curricula and assessments ��������������������������������������������������73
13
TABLE OF CONTENTS
STRONG PERFORMERS AND SUCCESSFUL REFORMERS IN EDUCATION: LESSONS FROM PISA FOR KOREA © OECD 2014
Figure 2�41� How school systems’ assessment and accountability policies are related to educational outcomes ��������������������77
Figure 2�42� Percentage of students attending private schools ������������������������������������������������������������������������������������������������79
Figure 2�43� Private - public differences in reading performance �������������������������������������������������������������������������������������������80
Figure 2�44� Difference in school characteristics between private and public schools in OECD countries ������������������������������81
Figure 2�45� Difference in school characteristics between private and public schools in partner countries and economies ����82
Figure 2�46� Expenditure on educational institutions as a percentage of GDP (2009) �������������������������������������������������������������83
Figure 3�1� Supplementary education is widespread in East Asian countries ������������������������������������������������������������������������90
Figure 3�2� Students with higher academic performance tend to participate and spend more in Korea ���������������������������������90
Figure 3�3� Low income students are less likely to participate in supplementary education in Korea ������������������������������������91
Figure 4�1� China’s education system, 2009 �����������������������������������������������������������������������������������������������������������������������106
Figure 4�2� Hong Kong-China’s education system: (a) before 2010 and (b) following reforms in 2012��������������������������������118
Figure 4�3� Shanghai and Hong Kong-China: Profile data ��������������������������������������������������������������������������������������������������127
Figure 5�1� Singapore’s education system���������������������������������������������������������������������������������������������������������������������������138
Figure 5�2� Singapore’s education system���������������������������������������������������������������������������������������������������������������������������147
Figure 5�3� Singapore: Profile data �������������������������������������������������������������������������������������������������������������������������������������148
Figure 6�1� Canada’s education system organisation ����������������������������������������������������������������������������������������������������������155
Figure 6�2� Canada: Profile data ����������������������������������������������������������������������������������������������������������������������������������������165
Figure 7�1� Finland’s education system ������������������������������������������������������������������������������������������������������������������������������171
Figure 7�2� Finnish educational improvements compared to the approximate global average ��������������������������������������������172
Figure 7�3� Finland: Profile data �����������������������������������������������������������������������������������������������������������������������������������������184
14
TABLE OF CONTENTS
© OECD 2014 STRONG PERFORMERS AND SUCCESSFUL REFORMERS IN EDUCATION: LESSONS FROM PISA FOR KOREA
BOXES
Box 1�1� Education reform trajectory in Korea ������������������������������������������������������������������������������������������������������������������26
Box 3�1� Supplementary education is widespread in East Asia countries ��������������������������������������������������������������������������89
Box 3A�1� The policy response in Korea ���������������������������������������������������������������������������������������������������������������������������101
Box 4�1 Oriental Green Ark ������������������������������������������������������������������������������������������������������������������������������������������109
Box 4�2� The principle of multiple approaches ���������������������������������������������������������������������������������������������������������������112
Box 4�3� Success education �������������������������������������������������������������������������������������������������������������������������������������������114
Box 4�4� The Qibao Education Group ����������������������������������������������������������������������������������������������������������������������������115
Box 4�5� Liberal studies for critical thinking and innovation �������������������������������������������������������������������������������������������122
Box 4�6� Building support for the latest reforms ��������������������������������������������������������������������������������������������������������������124
Box 5�1� Off to a good start in mathematics and science ������������������������������������������������������������������������������������������������141
Box 5�2� Singapore’s education philosophy evolves �������������������������������������������������������������������������������������������������������146
Box 5�3� ICT for the future ���������������������������������������������������������������������������������������������������������������������������������������������148
Box 6�1� Building the capacity for reform: the Literacy and Numeracy Secretariat ����������������������������������������������������������158
Box 6�2� Aligning school work with the real world���������������������������������������������������������������������������������������������������������161
Box 6�3� Building critical thinking through real-world activities �������������������������������������������������������������������������������������162
Box 7�1� Becoming a teacher in Finland�������������������������������������������������������������������������������������������������������������������������174
Box 7�2� Growing autonomy for teachers �����������������������������������������������������������������������������������������������������������������������176
Box 7�3� Learning schools ����������������������������������������������������������������������������������������������������������������������������������������������180
Box 7�4� Matching curricula to the needs of the economy ���������������������������������������������������������������������������������������������181
Box 7�5� Teaching less does not mean achieving less �����������������������������������������������������������������������������������������������������182
Box 8�1� Action research by teachers �����������������������������������������������������������������������������������������������������������������������������193
15STRONG PERFORMERS AND SUCCESSFUL REFORMERS IN EDUCATION: LESSONS FROM PISA FOR KOREA © OECD 2013
Executive SummaryThe story of Korean education over the past 50 years is one of remarkable growth and achievement. Korea is one of the top performing countries in PISA and among those with the highest proportion of young people who have completed upper secondary and tertiary education. Korea is continuously exploring ways to improve its education system and has dramatically increased government investment in education over the last decade. Nevertheless, further reforms are needed to spur and sustain improvements. Rapid globalisation and modernisation are also posing new and demanding challenges to equip young people of today and tomorrow with skills relevant to the 21st century.
The report Strong Performers and Successful Reformers in Education: Lessons from PISA for Korea has a twofold purpose. Firstly, the report should help Korea to identify and address education policy challenges in an international perspective. To this end, it assesses the Korean education system through the prism of PISA, considers recent policy developments and suggests specific policy options to foster improvements. It also provides an in-depth analysis of the experience of other high-performing countries, including Finland, Hong Kong (China), Ontario (Canada), Shanghai (China), and Singapore. Secondly, the report should be a useful reference for other countries seeking to improve their education systems.
Korea has consistently performed well, ranking near or at the top in all the rounds and fields of assessment in the PISA report. In PISA 2009, Korea was the top-performing OECD country in reading (rank 1), showing relatively high proficiency in digital reading, in mathematics (rank 1) and ranking among the top-performing OECD countries in science (rank 3). In addition, the relative share of top-performing students is above the OECD average and has doubled in just one decade. Korea also has the lowest proportion of low-performing students among OECD countries, although the gap between top- and low-performing students has increased over the past decade.
Korea has put policies and practices into place that, according to OECD research, can be related to higher performance. Resources tend to be allocated where they can have a greater impact. The quality of teachers has been traditionally prioritised over smaller classes. Schools with more favourable student-teacher ratios are usually the disadvantaged ones. Schools also have significant autonomy over curricular and assessment policies, including student assessment, and deciding which courses are offered, their content and the textbooks used.
A notable feature of Korea, and more generally of East Asia, is the widespread participation in supplementary education. In Korea, 81% of primary school students are estimated to receive private tutoring. Many students participate in supplementary education to gain a head start for competitive examinations, which can facilitate admission to top universities and thus improve their life prospects. Supplementary education adds input into learning, such as time and materials, and provides opportunities for different learning arrangements and instruction methods. However, the evidence of the impact of supplementary education on academic performance is still inconclusive. Besides, supplementary education exacerbates socio-economic inequalities, can be detrimental to student well-being and disrupt the normal functioning of schools. Some countries have regulated the provision of supplementary education, broadened access by using new technologies or introducing after-school classes, and reduced the emphasis on rote learning of examination. The Korean government should encourage increasing the available evidence on supplementary education, fostering research and creating spaces for public consultation.
High performing countries share a commitment to education and a culture of continuous improvement. In these countries, students believe that education is the route to advancement and that effort pays off, regardless of their ability and socio-economic background. In addition to putting the right policies in place, the experience of other high performing countries can provide examples and lessons relevant to Korea and illustrate that improvements require a policy infrastructure that drives performance and builds the capacity for educators to implement it in schools:
•Singapore: education is a central priority. The supply and demand of education and skills is continuously adapted. Curriculum, pedagogy and assessments have been reformed for a greater focus on 21st century skills. Particular attention has been paid in building teacher and leadership capacity to deliver at the school level. There is a vision for the education system, coherence and alignment between actors, an emphasis on building capacity and international benchmarking to identify the best practices. A comprehensive system to select, train, compensate and develop teachers and school principals actively ensures their quality.
•Finland: the comprehensive school reform, which educates all children together regardless of their ability and socio-economic background, is the bedrock of the high levels of equity achieved in education. Children who are having difficulty are identified
EXECUTIVE SUMMARY
16 © OECD 2014 STRONG PERFORMERS AND SUCCESSFUL REFORMERS IN EDUCATION: LESSONS FROM PISA FOR KOREA
and supported early on: each school has a specially trained intervention professional. Teacher preparation programmes focus on developing skills to diagnose problems and intervene early. Differentiated instruction engages all students in heterogeneously grouped classrooms. Moreover, teaching is a highly selective and valued profession with teachers having autonomy over their classrooms. Notably, high achievement is not equated with performance in two or three subjects in standardised tests, but the curriculum is broad and fosters an inquiry-based approach to learning.
•Shanghai and Hong Kong-China: education reforms in these two authorities have focused on examinations and curriculum to reduce the emphasis on rote learning and favour deep understanding. For example, Hong Kong-China has undergone a major reform that abolished public assessments after primary school, changed the curriculum at all levels to shift the focus from teaching to learning, and changed the structure of the education system. Shanghai has put into place a strategy to systematically strengthen weak schools, from improving school infrastructure to reinforcing the team of teachers and leaders.
•Ontario (Canada): specific strategies were successfully introduced to increase literacy and numeracy in primary schools, improve graduation rates, and reduce the number of low-performing schools. Strong central leadership, few clear goals to align the efforts of all the actors in the system, and extensive capacity-building and trust-building among teachers, unions, and other stakeholders were essential.
Even at the highest performance level, further improvements are possible and Korea can continue building on past reforms and explore ways to:
1. Improve the transition from school-to-work and the labour-market outcomes of education
•Improve Vocational Education and Training (VET) by increasing the provision, quality and relevance of workplace training, strengthening the links with the industry at all levels, recruiting teachers with previous relevant work experience, and aligning programmes with national technical qualifications.
•Develop a curriculum for the 21st century and ensure its implementation. The curriculum has been revised to better respond to the demands of the 21st century by, for example, fostering creativity, reducing the excessive academic burden, revising university entrance exams and introducing ‘creative experiential activities’. However, careful attention should be placed on its implementation as teachers might be under pressure to focus on the university entrance examination. Inquiry-based and student-centred learning may require substantial changes in instructional methodology.
•Continue attracting, supporting and retaining high quality teachers. Teachers are recruited among the top graduates and receive strong preparatory training, including induction and in-service training. Also, teachers spend less time teaching and more time on activities such as class preparation than in many other OECD countries. In addition, mutual learning among teachers is encouraged by, for example, promoting classroom observation or conducting research on teaching practices. To leverage teacher innovations and good practices, the role of school leaders is crucial and special attention on leadership development is necessary.
•Further integrate information communication technologies (ICTs) in education. To make the best use of ICT in learning, the Korean education system can continue building teacher capacity and school leadership to use ICT in the classroom.
•Strengthen the use of evaluation and assessment. It is important to sustain the current efforts to further refine the evaluation instruments, and to broaden the scope from student assessment to whole-system evaluation with a greater emphasis on accountability.
2. Promoting equity in education for strengthening social cohesion
•Enhance access to and improve the quality of early childhood education and care (ECEC). Financial support for attending pre-primary education should be sustained and could be particularly targeted at children from low-income families. In order to ensure even quality among providers and an effective information and monitoring system, common regulations and standards (e.g. staff qualifications, staff-child ratio) could be established for all children aged three to five, regardless of whether they attend kindergarten or childcare.
•Explore more effective policy responses to supplementary education. While Korea is the sole East Asian country that has persistently implemented policies to respond to supplementary education over several decades, its prevalence underlines the need for further research.
•Promote the involvement of parents in school matters and in helping their children’s learning more effectively. Supporting and developing the capacities of parents targeting disadvantaged families could help strengthen the parental involvement and the support to disadvantaged students.
17STRONG PERFORMERS AND SUCCESSFUL REFORMERS IN EDUCATION: LESSONS FROM PISA FOR KOREA © OECD 2014
1
Strong Performers and Successful Reformers: Korea
This chapter first introduces the purpose of the Strong Performers and Successful Reformers in Education series and the focus of this report on Korea. The second part describes the methodology employed for the report, including the framework for analysis and how PISA results are used in the analysis. Finally, the background of Korean education is summarised. Highlights on the education reform trajectory in Korea illustrate the shaping of the Korean education system.
STRONG PERFORMERS AND SUCCESSFUL REFORMERS: KOREA
18 © OECD 2014 STRONG PERFORMERS AND SUCCESSFUL REFORMERS IN EDUCATION: LESSONS FROM PISA FOR KOREA
A CHANGING YARDSTICK FOR EDUCATIONAL SUCCESSOnly two generations ago, the Republic of Korea was 23rd among OECD countries in terms of educational achievement. Today, Korea is among the top performers in terms of learning outcomes, ranking second in reading, fourth in mathematics and sixth in science according to the 2009 PISA assessment. Korea has also shown impressive improvements in the quality of its learning outcomes. Although Korea’s average performance was high in 2000, policy makers wanted to increase the proportion of high-performing students. Within less than a decade, Korea was able to double the proportion of students demonstrating excellence in reading literacy. Facing global socio-economic change, Korea has been making continuous progress in its quantitative and qualitative educational outputs and reforming its education system to better meet the needs of 21st century societies.
Rapid globalisation and modernisation pose new and demanding challenges to individuals and societies alike. Increasingly diverse and interconnected populations, rapid technological change in the workplace and in everyday life, and the instantaneous availability of vast amounts of information are just a few of the factors contributing to these new demands. In a globalised world, people compete for jobs locally and internationally. In this integrated labour market, highly paid workers in wealthier countries are competing directly with people with much the same skills in lower-wage countries. The same is true for people with low skills. The competition between countries now revolves around the quality of their human capital.
The effect of these developments is raising wages in less-developed countries and decreasing wages in the most industrialised countries. But these developments do not affect all workers equally. Job automation is proceeding even faster than the integration of the job market. If the work is routine, it is increasingly likely to be automated, although some jobs will always be performed by humans. The effect of automation, and more generally of the progress of technological change, is to reduce the demand for people who are only capable of doing routine work, and to increase the demand for people who are capable of doing knowledge-based work. This means that a greater proportion of people will need to be educated as professionals. High-wage countries will find that they can only maintain their relative wage levels if they can develop a high proportion of knowledge workers and keep them in their work force. Increasingly, such work will require very high skill levels and will demand increasing levels of creativity and innovation.
This is not a description of one possible future, but of the economic dynamics that are now at play. In the high-wage countries of the OECD, demand for highly-skilled workers is increasing faster than supply (which OECD indicators show in rising wage premiums for highly-skilled individuals); and demand for low-skilled workers is decreasing faster than supply (which OECD indicators reveal in growing unemployment rates or declining wages for low-skilled individuals). Jobs are moving rapidly to countries that can provide the skills needed for any particular operation at the best rates. In addition, the rate of automation of jobs is steadily increasing in both high and low-wage countries.
In this context, governments need to create education systems that are accessible to everyone, not just a favoured few; are globally competitive in quality; provide people from all classes a fair chance to get the right kind of education to succeed; and achieve all this at a price that the nation can afford. The aim is no longer only to provide a basic education for all, but to provide an education that will make it possible for everyone to become “knowledge workers”. Such education will need to build the very high-level of skills required to solve complex problems never seen before, to be creative, to synthesise material from a wide variety of sources, to see patterns in the information that computers cannot see, to work with others in productive ways, and to be able to both lead and to be a good team member when necessary. This is what is required in today’s “flat” world – where all work that cannot be digitised, automated and outsourced can be done by the most effective and competitive individuals, enterprises or countries, regardless of their location. The implication is that the yardstick for educational success is no longer simply improvement against national standards, but against the best-performing education systems worldwide.
THE STRONG PERFORMERS AND SUCCESSFUL REFORMERS IN EDUCATION SERIESThis report is part of the Strong Performers and Successful Reformers series in Education. The first volume – Strong Performers and Successful Reformers in Education: Lessons from PISA for the United States (OECD, 2010) – highlighted insights from the education systems of a selection of top scoring and rapidly improving countries as measured by the OECD Programme for International Student Assessment (PISA). The following reports analysed the contexts, recent reform paths and performance of the education system, drawing lessons for Mexico (OECD, 2011), Greece (OECD, 2011), Japan (OECD, 2012), and the Canary Islands, Spain (OECD, 2012). The focus of these reports is on how countries are reforming their education systems not only to produce better learning outcomes, but in particular, to ensure that their students acquire the skills needed for the unpredictable labour market of the future. While these volumes relate lessons to the education reform agenda in specific countries, they may have resonance for a wide range of countries and different types of education systems aspiring for excellence in educating their young people.
INTRODUCTION
19STRONG PERFORMERS AND SUCCESSFUL REFORMERS IN EDUCATION: LESSONS FROM PISA FOR KOREA © OECD 2014
ABOUT THIS REPORTThe aim of this report is to examine lessons in order for Korea to maintain its high performance and to further improve its education system. The story of Korean education over the past 60 years is one of remarkable growth and achievement. Today, the Republic of Korea is one of the top performing countries in PISA; it offers access to tertiary studies to a high proportion of its young people and it devotes a large share of its gross domestic product (GDP) to ensuring quality and innovation in education. Korea’s continuous efforts to improve and reform its education system in order to contribute to the development of human resources and economic progress can inspire other OECD countries in their own policy making.
Nevertheless, while Korea’s education system has seen very substantial improvement, there is always potential for further growth and better outcomes. There are a number of areas within the school and pre-school education system where quality, equity, and coherence can be developed further and can contribute to sustaining economic growth and social cohesion. Policies in these areas, such as Early Childhood Education and Care (ECEC) and supplementary education, will focus on student learning and wellbeing as their main priorities.
At the request of the Korean Ministry of Education, this volume builds on the results from PISA 2009 and the analysis from relevant OECD publications. This report also examines the issue of supplementary education and its policy implications in Korea and other East Asian countries. This analysis provides insight for Korea and other high performing countries on how to maximise the coexistence of formal and supplementary education while mitigating the negative effect of supplementary education on education systems.
The remainder of this chapter describes the framework of analysis for this report, the PISA measures used, the methodology for developing the country chapters, and the context of Korean education reform.
Chapter 2 sets the stage by analysing Korea’s performance in PISA 2009 in detail, and contrasting its relative strengths and weaknesses with those of other countries. Chapter 3 introduces the issue of supplementary education and explains how different dimensions of this type of education influence learning in Korea and other East Asian countries.
Chapters 4, 5, 6 and 7 present a detailed analysis of selected high-performing education systems – namely China (Shanghai and Hong Kong), Singapore, Canada (Ontario) and Finland. These chapters outline the main issues of the country’s education system and provide examples and lessons relevant to Korea. These elements vary across the education systems described, but generally include standards, examination systems, instructional systems, school finance, teacher quality, accountability and student motivation. Each chapter concludes by drawing wider lessons, highlighting the strengths of each system. Chapter 4 analyses the two distinct examples of education reform in China, specifically the cases of Shanghai and Hong Kong-China. Chapter 5 sheds light on the rapid improvement of Singapore followed by its strong performance. Chapter 6 outlines reforms in Ontario, Canada, that led to high achievement in a diverse context. Chapter 7 addresses the case of slow and steady reform for consistently high results in Finland.
The final chapter brings together the threads of the preceding chapters to present policy lessons to maintain Korea’s strengths and to address challenges for future reform. The lessons drawn for Korea might also be of interest for other countries facing similar challenges.
METHODOLOGYThis section outlines the research methods employed for this volume. This volume builds on the framework for analysis applied in the first volume (OECD, 2010). The chapters on selected high-performing countries – Chapters 4, 5, 6, and 7 –, are based on chapters published in the first volume, with slight adjustments. Chapters 2, 3 and 8, which examine the case of Korea, were developed specifically for this report based on desk reviews. The following explains in detail: i) the framework for analysis of the Strong Performers and Successful Reformers in Education series; ii) introduction to PISA; iii) research methods employed for the country chapters; and iv) research methods employed for the chapter on lessons for Korea.
FRAMEWORK FOR ANALYSISThis report builds on the framework for analysis applied in the first volume (OECD, 2010a), which suggests a continuum of approaches to education reform linked, in part, to a country’s economic advancement. Developing countries with few resources to invest in education are likely to invest more heavily in the education of a small elite to lead the country’s industries and government operations. As economies become more industrialised, citizens and policy makers tend to converge around a different philosophy: that the best way to compete in the global economy is to provide all citizens with the type and quality of education formerly
STRONG PERFORMERS AND SUCCESSFUL REFORMERS: KOREA
20 © OECD 2014 STRONG PERFORMERS AND SUCCESSFUL REFORMERS IN EDUCATION: LESSONS FROM PISA FOR KOREA
provided only to the elite. To provide high-quality education to the broader population, education systems must recruit teachers from the top of the higher education pool.
More recently, policy efforts have emerged to develop education systems that are intended to inculcate students with a range of higher-order capacities that encompass the notions of expert thinking and complex communication skills. Each education system and cultural context has developed unique ways to achieve this, such as nurturing student creativity, critical thinking, and networking skills that are considered important to knowledge-based economies and innovation. Governments have used many approaches, but policies and practices intended to develop in students the skills needed for the unpredictable labour market of the future tend to fall into three categories (Figure 1.1).
Over time, governments, education systems and schools develop a unique blend of these mechanisms to help students acquire
the habits of the mind for performing well in the knowledge economy. Nations that try to emphasise one mechanism over another are likely to face challenges. In this framework, there is no ideal balance, so policy makers will see the need for coherence in the policies and relative investment of resources.
WHAT IS PISA AND WHAT CAN WE LEARN FROM IT? Parents, students, teachers and those who run education systems are looking for sound information on how well their education systems prepare students for life. To answer this question, most countries monitor their own students’ learning outcomes. Comparative international assessments can extend and enrich the national picture by providing a larger context within which to interpret national performance. Countries inevitably want to know how they compare to others, and, if other countries are outperforming them, they want to know how they are achieving such results. Such assessments have gained prominence in recent years partly due to pressures from an increasingly competitive global economy that is more than ever driven by the quality of human capital. As a result, the measure for judging public policy in education is no longer improvement against national educational standards, but also improvement against the most successful education systems in the world.
The OECD PISA survey, which assesses the knowledge and skills of 15-year-old students around the world, is the result of collaboration among 70 countries interested in comparing their own students’ achievement with that in other countries (Figure 1.3). Every three years since 2000, PISA compares student performance in reading, mathematics and science. PISA assessments are not designed to find out whether students have mastered a particular curriculum, but whether they can apply the knowledge and skills they have acquired in real-life situations. Decisions about the scope and nature of the PISA assessments and the background information to be collected are made by leading experts in participating countries. Considerable efforts and resources are devoted to achieving cultural and linguistic breadth and balance in the assessment materials. Stringent quality-assurance mechanisms are applied in designing the test, in translation, sampling and data collection. As a result, PISA findings have a high degree of validity and reliability.
Because PISA reports on the achievements of many countries against a common set of benchmarks, it inevitably prompts discussion within participating countries about their education policies. Citizens recognise that the educational performance of their countries will not simply need to match average performance, but that they will need to do better to ensure above-average wages and
• Figure 1.1 •Which policies and practices can help students develop skills for future labour markets?
1
Indirect mechanisms to create greater space for multiple methods of learning, understanding, and interpretation of concepts, whether by
providing more free time to students or reducing rigidity in their learning environments.
2
Incentive mechanisms for reducing the use of rote learning, encouraging teachers, students, schools, and systems to move away from a focus
on factual recall and high-stakes testing toward an emphasis on learning to learn.
3
Direct mechanisms that have an explicit focus on pedagogical practices to promote problem solving, integrative learning and collaboration.
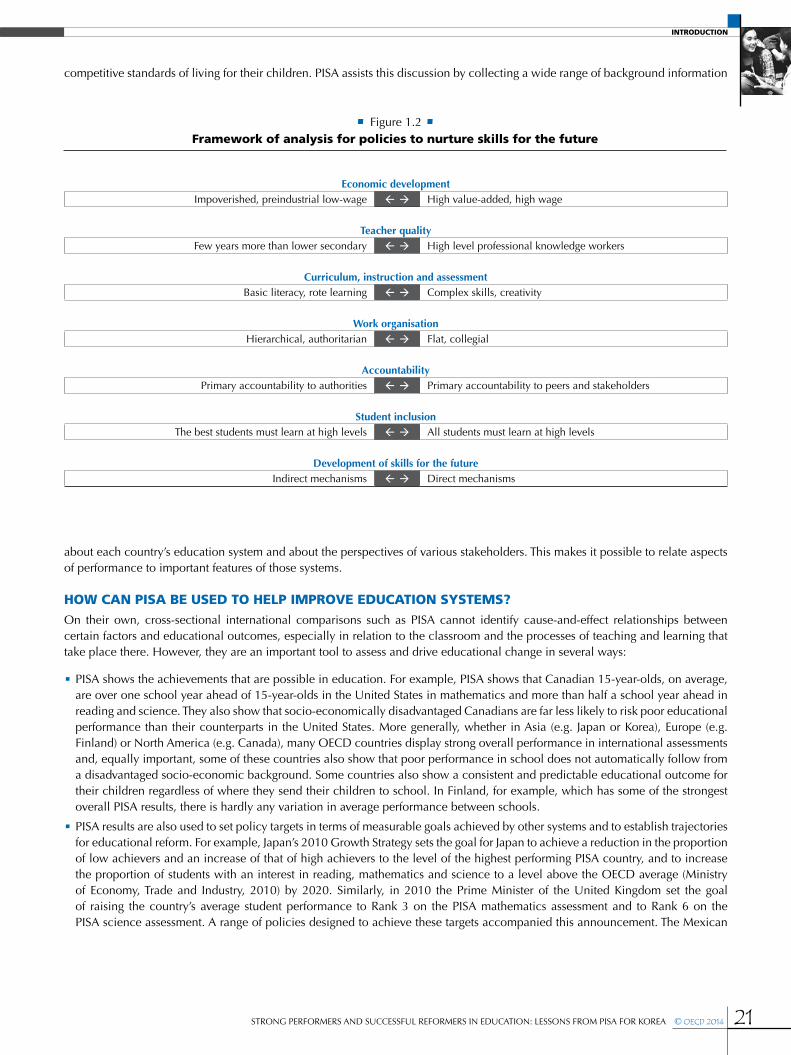
INTRODUCTION
21STRONG PERFORMERS AND SUCCESSFUL REFORMERS IN EDUCATION: LESSONS FROM PISA FOR KOREA © OECD 2014
competitive standards of living for their children. PISA assists this discussion by collecting a wide range of background information
about each country’s education system and about the perspectives of various stakeholders. This makes it possible to relate aspects of performance to important features of those systems.
HOW CAN PISA BE USED TO HELP IMPROVE EDUCATION SYSTEMS?On their own, cross-sectional international comparisons such as PISA cannot identify cause-and-effect relationships between certain factors and educational outcomes, especially in relation to the classroom and the processes of teaching and learning that take place there. However, they are an important tool to assess and drive educational change in several ways:
•PISA shows the achievements that are possible in education. For example, PISA shows that Canadian 15-year-olds, on average, are over one school year ahead of 15-year-olds in the United States in mathematics and more than half a school year ahead in reading and science. They also show that socio-economically disadvantaged Canadians are far less likely to risk poor educational performance than their counterparts in the United States. More generally, whether in Asia (e.g. Japan or Korea), Europe (e.g. Finland) or North America (e.g. Canada), many OECD countries display strong overall performance in international assessments and, equally important, some of these countries also show that poor performance in school does not automatically follow from a disadvantaged socio-economic background. Some countries also show a consistent and predictable educational outcome for their children regardless of where they send their children to school. In Finland, for example, which has some of the strongest overall PISA results, there is hardly any variation in average performance between schools.
•PISA results are also used to set policy targets in terms of measurable goals achieved by other systems and to establish trajectories for educational reform. For example, Japan’s 2010 Growth Strategy sets the goal for Japan to achieve a reduction in the proportion of low achievers and an increase of that of high achievers to the level of the highest performing PISA country, and to increase the proportion of students with an interest in reading, mathematics and science to a level above the OECD average (Ministry of Economy, Trade and Industry, 2010) by 2020. Similarly, in 2010 the Prime Minister of the United Kingdom set the goal of raising the country’s average student performance to Rank 3 on the PISA mathematics assessment and to Rank 6 on the PISA science assessment. A range of policies designed to achieve these targets accompanied this announcement. The Mexican
• Figure 1.2 •Framework of analysis for policies to nurture skills for the future
Economic developmentImpoverished, preindustrial low-wage High value-added, high wage
Teacher qualityFew years more than lower secondary High level professional knowledge workers
Curriculum, instruction and assessmentBasic literacy, rote learning Complex skills, creativity
Work organisationHierarchical, authoritarian Flat, collegial
AccountabilityPrimary accountability to authorities Primary accountability to peers and stakeholders
Student inclusionThe best students must learn at high levels All students must learn at high levels
Development of skills for the futureIndirect mechanisms Direct mechanisms
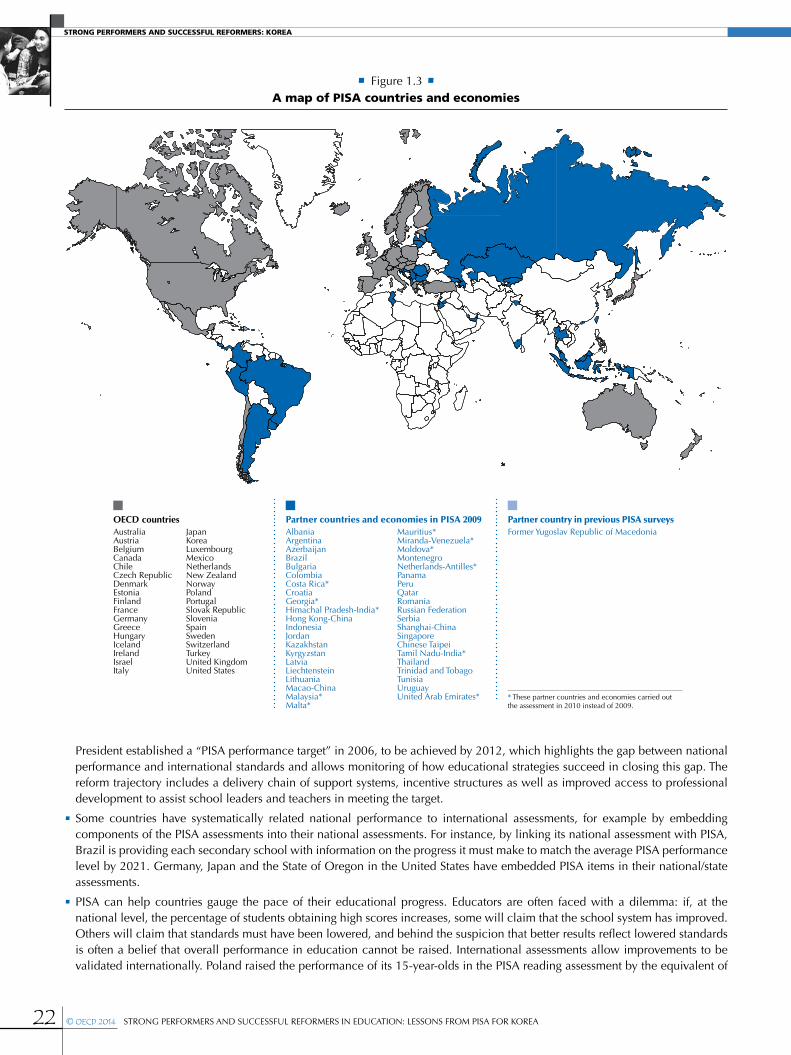
STRONG PERFORMERS AND SUCCESSFUL REFORMERS: KOREA
22 © OECD 2014 STRONG PERFORMERS AND SUCCESSFUL REFORMERS IN EDUCATION: LESSONS FROM PISA FOR KOREA
President established a “PISA performance target” in 2006, to be achieved by 2012, which highlights the gap between national performance and international standards and allows monitoring of how educational strategies succeed in closing this gap. The reform trajectory includes a delivery chain of support systems, incentive structures as well as improved access to professional development to assist school leaders and teachers in meeting the target.
•Some countries have systematically related national performance to international assessments, for example by embedding components of the PISA assessments into their national assessments. For instance, by linking its national assessment with PISA, Brazil is providing each secondary school with information on the progress it must make to match the average PISA performance level by 2021. Germany, Japan and the State of Oregon in the United States have embedded PISA items in their national/state assessments.
•PISA can help countries gauge the pace of their educational progress. Educators are often faced with a dilemma: if, at the national level, the percentage of students obtaining high scores increases, some will claim that the school system has improved. Others will claim that standards must have been lowered, and behind the suspicion that better results reflect lowered standards is often a belief that overall performance in education cannot be raised. International assessments allow improvements to be validated internationally. Poland raised the performance of its 15-year-olds in the PISA reading assessment by the equivalent of
• Figure 1.3 •A map of PISA countries and economies
OECD countries Partner countries and economies in PISA 2009 Partner country in previous PISA surveys Australia Japan Albania Mauritius* Former Yugoslav Republic of MacedoniaAustria Korea Argentina Miranda-Venezuela*Belgium Luxembourg Azerbaijan Moldova*Canada Mexico Brazil MontenegroChile Netherlands Bulgaria Netherlands-Antilles*Czech Republic New Zealand Colombia PanamaDenmark Norway Costa Rica* PeruEstonia Poland Croatia QatarFinland Portugal Georgia* RomaniaFrance Slovak Republic Himachal Pradesh-India* Russian FederationGermany Slovenia Hong Kong-China SerbiaGreece Spain Indonesia Shanghai-ChinaHungary Sweden Jordan SingaporeIceland Switzerland Kazakhstan Chinese Taipei Ireland Turkey Kyrgyzstan Tamil Nadu-India*Israel United Kingdom Latvia ThailandItaly United States Liechtenstein Trinidad and Tobago
Lithuania TunisiaMacao-China UruguayMalaysia* United Arab Emirates* * These partner countries and economies carried out
the assessment in 2010 instead of 2009.Malta*
INTRODUCTION
23STRONG PERFORMERS AND SUCCESSFUL REFORMERS IN EDUCATION: LESSONS FROM PISA FOR KOREA © OECD 2014
well over half a school year’s progress within six years, catching up with the performance of United States in 2009 from levels well below that in 2000. It also reduced the proportion of students performing below the baseline level of reading performance from 23% in 2000 to 15% in 2009 (the proportion of bottom performers remained unchanged at 18% in the United States during this time). Poland also succeeded in halving performance differences between schools.
•PISA can help governments optimise existing policies or consider more fundamental alternatives when researchers combine advanced forms of educational assessment with sophisticated survey research methods. For example, PISA collects reliable data on the ability of students to apply high levels of knowledge and highly complex thinking to real-world problems. The survey research from PISA also gathers a wide range of background data surrounding the education of the students being assessed. By linking these two bodies of data one can associate in great detail certain patterns of student performance with a multitude of background data such as the qualifications of their teachers, how much those teachers are paid, the degree to which decisions are devolved from higher authorities to the school faculty, the socioeconomic or minority status of the students, the nature of the assessments that students must take, the nature of the qualifications they might earn, etc. In this way, while the causal nature of such relationships might not be established, an extensive web of correlations can be drawn between certain dimensions of student performance and a large range of factors that could conceivably affect that performance.
RESEARCH METHODS EMPLOYED FOR THE COUNTRY CHAPTERSResearch into international policy experiences undertaken for this report entailed surveying historians, policy makers, economists, education experts, ordinary citizens, journalists, industrialists, and educators to enable alternative benchmarking. The research began with a document review and was enriched by interviews with current and former leading policy makers and other education stakeholders in the countries and education systems concerned. The PISA data provided the basis for country selection as well as important clues for the points of investigation.
This report complements the uses of PISA just described with a form of industrial benchmarking (Box 1.2). The aim of the research presented in this report is to relate differences in student achievement between one country and another to certain features of the education systems of those countries. Education is highly value-laden. Systems develop for historical reasons that reflect the values and preferences of parents, students, administrators, politicians and many others. Yet such values and preferences evolve and education systems must change to accommodate them. Decision-makers in the education arena can benefit from benchmarking research in the same way as heads of firms. This involves learning about the range of factors that lead to success, taking inspiration from the lessons of others, and then adapting the operational elements to the local context while adding unique elements that make their own education system one of a kind.
The intent of this report is not to specify a formula for success – this report contains no policy prescriptions. Rather the objective is to describe the experience of countries whose education systems have proven exceptionally successful to help identify policy options for consideration. It is intended as a resource for decision-making.
While quantitative analysis can be used to apportion the relative influence of a variety of factors in determining variations in student performance in PISA, the data collected by PISA alone leave many questions unanswered. For instance, it is not possible to determine from PISA results whether teachers in the schools of a particular country are using a very powerful instructional system that would be equally effective in another country with very different class sizes. PISA data does not reveal whether new political leadership reframed the issues in education policy in such a way that facilitated the introduction of new reforms. PISA data does not show how awareness of weak education performance can mobilise a country’s education establishment to reform and radically improve its education outcomes. Nor does PISA data reveal how a country’s industrial and educational institutions are able to work together to leverage a qualifications structure that produces incentives for high-level student performance.
The lessons suggested in this report emerge from instances in which PISA data and country analysis tend to converge. The report provides complementary qualitative analysis of high-performing and rapidly-reforming improving education systems to reveal possible contextual influences on education performance. The country studies have not only suggested some possible answers to interesting questions, but have also uncovered some new questions for consideration in future PISA assessments.
RESEARCH METHODS EMPLOYED TO DRAW LESSONS FOR KOREAThis report offers analysis of Korea’s recent reform and its outcome in Chapter 2 on PISA results, Chapter 3 on supplementary education and Chapter 8 on policy lessons for Korea. These chapters are produced specially for this volume and the last chapter draws lessons for Korea referring also to the chapters on the experiences of other countries adopted from the first volume of the Strong Performers and Successful Reformers in Education series.
STRONG PERFORMERS AND SUCCESSFUL REFORMERS: KOREA
24 © OECD 2014 STRONG PERFORMERS AND SUCCESSFUL REFORMERS IN EDUCATION: LESSONS FROM PISA FOR KOREA
Chapter 2 analyses the results of the PISA assessment for Korea. This analysis is based on the PISA 2009 data, which was the latest PISA data available when this report was being drafted. By presenting and interpreting data, this chapter examines the profile of education outcomes and the learning environment in Korea. The dimensions of analysis mirror those applied to the country PISA analysis for the United States (OECD, 2010) and for Japan (OECD, 2012).
Chapter 3 includes the review of supplementary education, a topic that is relevant to the context of education reforms in Korea and other countries today. The contents of this chapter were developed mainly through reviewing literature and employing knowledge gained by previous research. In addition, this chapter incorporated insights and recommendations on supplementary education that had been discussed with the Korean government through the last Economic Survey (OECD, 2012).
Chapter 8 draws lessons for Korea based on and summarising OECD publications. Building on the strengths and challenges of the Korean education system identified in Chapters 2 and 3, Chapter 8 further analyses and presents the way forward for Korea. The report refers to thematic reviews and country specific analysis which were conducted in the past and which provide relevant evidence for this chapter. Reports published by other Organisations are also entitled, as well as the chapters on other high-performing countries. Chapter 8 was prepared without conducting a country visit to Korea while taking into account the context of policy reform and implementation in Korea as much as possible. The lessons drawn in Chapter 8 are not prescriptions for Korea to further improve its education system, but rather elements of debate that Korea might add to its continuous dialogue among policy makers.
BACKGROUND ON EDUCATION IN KOREA AND COMPARISONS WITH SELECTED HIGH-PERFORMING COUNTRIES
Country comparisonsTable 1.1 compares the countries covered in this report according to learning outcomes, equity in the distribution of learning opportunities, spending on education, and the economic context. These countries were chosen not only to provide a variety of relevant policies and practices, and to illustrate a range of education structures and models, but also to build on the analyses begun in the first volume:
•Korea has been one of the highest-performing countries in PISA since 2000 and demonstrating continuous improvement. The proportion of high-performing students is high and growing.
•Canada has been among the top performers in PISA over the past decade. Given its decentralised education system, it is methodologically prudent to look at provincial education policies. Ontario, the most populous province, provides a window onto some key reforms.
•Finland was the highest-performing country in the first PISA assessment in 2000 and has performed consistently well in subsequent assessments.
•Singapore conducted its first PISA assessment in 2009, where it scored near the top, having improved its education system in dramatic ways since its independence in 1965.
•China is a country newly covered in PISA. This report focuses on the performance of the cities of Hong Kong-China and Shanghai, each with a population equally large or larger than some OECD countries. Hong Kong-China has long been a top performer on the PISA league tables; Shanghai was only assessed for the first time in PISA 2009, yet it is already among the star performers. These two cities, despite being in the same country, have markedly different histories and school systems with very different governance arrangements. Contrasting them provides valuable insights into the impressive accomplishments in education in a country now taking a prominent position on the world stage.
Shaping education in KoreaAs an introduction to the following chapters, this section summarises some of the major events and key educational reforms that have shaped the Korean education system and determined its current context.
The foundations of Korea’s strong performance are rooted in a long tradition of structured learning systems. In recent decades, Korea has successfully expanded its educational opportunities to elementary education, and then to secondary and tertiary education. Over the past 30 years, Korea’s education reform increasingly focused on quality improvement, which is translated in improved student outcomes over the last decade.
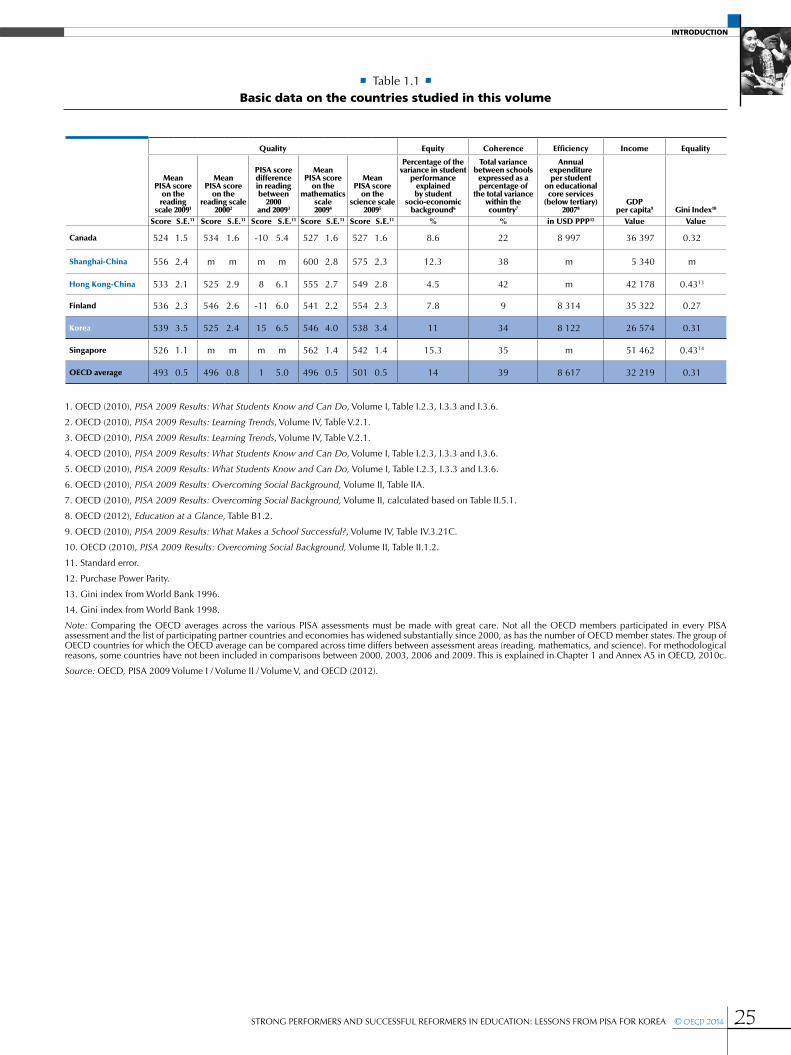
INTRODUCTION
25STRONG PERFORMERS AND SUCCESSFUL REFORMERS IN EDUCATION: LESSONS FROM PISA FOR KOREA © OECD 2014
1. OECD (2010), PISA 2009 Results: What Students Know and Can Do, Volume I, Table I.2.3, I.3.3 and I.3.6.
2. OECD (2010), PISA 2009 Results: Learning Trends, Volume IV, Table V.2.1.
3. OECD (2010), PISA 2009 Results: Learning Trends, Volume IV, Table V.2.1.
4. OECD (2010), PISA 2009 Results: What Students Know and Can Do, Volume I, Table I.2.3, I.3.3 and I.3.6.
5. OECD (2010), PISA 2009 Results: What Students Know and Can Do, Volume I, Table I.2.3, I.3.3 and I.3.6.
6. OECD (2010), PISA 2009 Results: Overcoming Social Background, Volume II, Table IIA.
7. OECD (2010), PISA 2009 Results: Overcoming Social Background, Volume II, calculated based on Table II.5.1.
8. OECD (2012), Education at a Glance, Table B1.2.
9. OECD (2010), PISA 2009 Results: What Makes a School Successful?, Volume IV, Table IV.3.21C.
10. OECD (2010), PISA 2009 Results: Overcoming Social Background, Volume II, Table II.1.2.
11. Standard error.
12. Purchase Power Parity.
13. Gini index from World Bank 1996.
14. Gini index from World Bank 1998.
Note: Comparing the OECD averages across the various PISA assessments must be made with great care. Not all the OECD members participated in every PISA assessment and the list of participating partner countries and economies has widened substantially since 2000, as has the number of OECD member states. The group of OECD countries for which the OECD average can be compared across time differs between assessment areas (reading, mathematics, and science). For methodological reasons, some countries have not been included in comparisons between 2000, 2003, 2006 and 2009. This is explained in Chapter 1 and Annex A5 in OECD, 2010c.
Source: OECD, PISA 2009 Volume I / Volume II / Volume V, and OECD (2012).
• Table 1.1 •Basic data on the countries studied in this volume
Quality Equity Coherence Efficiency Income Equality
Mean PISA score
on the reading
scale 20091
Mean PISA score
on the reading scale
20002
PISA score difference in reading between
2000 and 20093
Mean PISA score
on the mathematics
scale 20094
Mean PISA score
on the science scale
20095
Percentage of the variance in student
performance explained by student
socio-economic background6
Total variance between schools
expressed as a percentage of
the total variance within the country7
Annual expenditure per student
on educational core services
(below tertiary) 20078
GDP per capita9 Gini Index10
Score S.E.11 Score S.E.11 Score S.E.11 Score S.E.11 Score S.E.11 % % in USD PPP12 Value Value
Canada 524 1.5 534 1.6 -10 5.4 527 1.6 527 1.6 8.6 22 8 997 36 397 0.32
Shanghai-China 556 2.4 m m m m 600 2.8 575 2.3 12.3 38 m 5 340 m
Hong Kong-China 533 2.1 525 2.9 8 6.1 555 2.7 549 2.8 4.5 42 m 42 178 0.4313
Finland 536 2.3 546 2.6 -11 6.0 541 2.2 554 2.3 7.8 9 8 314 35 322 0.27
Korea 539 3.5 525 2.4 15 6.5 546 4.0 538 3.4 11 34 8 122 26 574 0.31
Singapore 526 1.1 m m m m 562 1.4 542 1.4 15.3 35 m 51 462 0.4314
OECD average 493 0.5 496 0.8 1 5.0 496 0.5 501 0.5 14 39 8 617 32 219 0.31
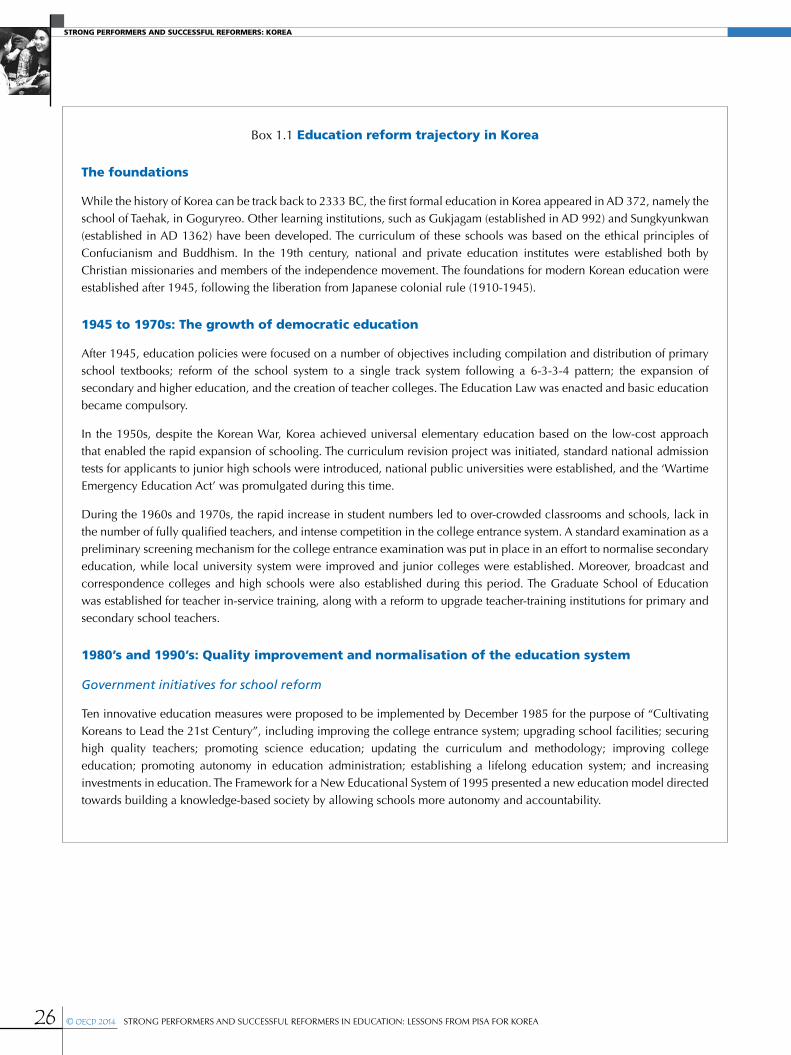
STRONG PERFORMERS AND SUCCESSFUL REFORMERS: KOREA
26 © OECD 2014 STRONG PERFORMERS AND SUCCESSFUL REFORMERS IN EDUCATION: LESSONS FROM PISA FOR KOREA
Box 1.1 Education reform trajectory in Korea
The foundations
While the history of Korea can be track back to 2333 BC, the first formal education in Korea appeared in AD 372, namely the school of Taehak, in Goguryreo. Other learning institutions, such as Gukjagam (established in AD 992) and Sungkyunkwan (established in AD 1362) have been developed. The curriculum of these schools was based on the ethical principles of Confucianism and Buddhism. In the 19th century, national and private education institutes were established both by Christian missionaries and members of the independence movement. The foundations for modern Korean education were established after 1945, following the liberation from Japanese colonial rule (1910-1945).
1945 to 1970s: The growth of democratic education
After 1945, education policies were focused on a number of objectives including compilation and distribution of primary school textbooks; reform of the school system to a single track system following a 6-3-3-4 pattern; the expansion of secondary and higher education, and the creation of teacher colleges. The Education Law was enacted and basic education became compulsory.
In the 1950s, despite the Korean War, Korea achieved universal elementary education based on the low-cost approach that enabled the rapid expansion of schooling. The curriculum revision project was initiated, standard national admission tests for applicants to junior high schools were introduced, national public universities were established, and the ‘Wartime Emergency Education Act’ was promulgated during this time.
During the 1960s and 1970s, the rapid increase in student numbers led to over-crowded classrooms and schools, lack in the number of fully qualified teachers, and intense competition in the college entrance system. A standard examination as a preliminary screening mechanism for the college entrance examination was put in place in an effort to normalise secondary education, while local university system were improved and junior colleges were established. Moreover, broadcast and correspondence colleges and high schools were also established during this period. The Graduate School of Education was established for teacher in-service training, along with a reform to upgrade teacher-training institutions for primary and secondary school teachers.
1980’s and 1990’s: Quality improvement and normalisation of the education system
Government initiatives for school reform
Ten innovative education measures were proposed to be implemented by December 1985 for the purpose of “Cultivating Koreans to Lead the 21st Century”, including improving the college entrance system; upgrading school facilities; securing high quality teachers; promoting science education; updating the curriculum and methodology; improving college education; promoting autonomy in education administration; establishing a lifelong education system; and increasing investments in education. The Framework for a New Educational System of 1995 presented a new education model directed towards building a knowledge-based society by allowing schools more autonomy and accountability.
INTRODUCTION
27STRONG PERFORMERS AND SUCCESSFUL REFORMERS IN EDUCATION: LESSONS FROM PISA FOR KOREA © OECD 2014
Increasing financial input for quality improvement
The increased financial resources for education, as a result of economic growth and following several policy measures for school funding, contributed to the quantitative expansion and qualitative improvement at both the primary and secondary levels of education. The Korean government also made special efforts to reduce class sizes, to increase the number of teachers and to improve pay for teachers.
Investment for information and communication technologies (ICT)
In the mid-90s, the Korean government set about strategic planning as to how best position Korea to achieve its potential within the emerging knowledge society in the context of globalisation, the impact of the ICT revolution, and the acceleration of the knowledge base in many disciplines. Korea established the National Education Information System (NESI), the Korean Education Research Information System (KERIS), the Educational Broadcast System (EBS), and learning sites operated by private education institutes.
Increasing access to tertiary education and lifelong learning
With the July 30 Education Reform Policy of 1980, Korea opened the way to increasing admission quotas for higher education. For education innovation to pursue science and lifelong learning, a broadcasting system for education programs was introduced. Moreover, a college graduation quota system was implemented (abolished in 1987) and secondary school achievements were given greater weight in determining qualification. Quality improvement in higher education also emerged in the 1990s, initiating new policies to boost the universities’ research competitiveness.
2000 to present: Responding to the new challenges of globalization, the knowledge-based society, and social polarisation
Master Plan for Educational Welfare Policies to ensure education for all
The Master Plan for Educational Welfare (2008-2012) aims to provide equal educational opportunities and a welfare system for all. Projects include reinforcement of vocational education (Meister high schools), financial support, active support systems for underachieving students and improvements in public education. From 2012, the Nuri programme, a common course for five-year-olds that combines education with childcare will be provided in kindergartens and daycare centres. Education and childcare programs for preschool children, previously divided between MEST and the Ministry of Health and Welfare will be integrated.
Fostering global talents with creativity and character through Creative Management Schools
Creativity and character-building education were the first priorities in the government’s educational policies in 2010 and thus, has been promoting fundamental changes in classroom instruction. The 2009 National Curriculum was implemented to replace the curricula that focused excessively on acquiring textbook knowledge. Creative Management Schools (CMS) aim at developing autonomous and creative schools that nurture self-directed students. MoE subsidises these schools in order to promote them as ‘the schools that nurture dreams and talents’ which help students to develop their individual characteristics and creativity.
STRONG PERFORMERS AND SUCCESSFUL REFORMERS: KOREA
28 © OECD 2014 STRONG PERFORMERS AND SUCCESSFUL REFORMERS IN EDUCATION: LESSONS FROM PISA FOR KOREA
Reinforcing public education and providing alternative public services to reduce private education
In 1980, Hagwons and other private tutoring was banned because they had been causing inequality in learning opportunities. Despite initial intentions, the private tutoring industry simply continued to exist and went underground. The Constitutional Court of Korea finally ruled the change unconstitutional in 2000, and the government made efforts to compete with private tutoring by improving the quality of schools. Continuous efforts have been made to limit private tutoring by limiting the cost of hagwons and imposing a 10 pm curfew on hagwons in five regions including Seoul.
The importance of the College Scholastic Ability Test (CSAT) in university admissions, which caused high demand of supplementary education, has been reduced by expanding the application of school reports to university admission.
The “Plan for the Reduction of Private Education Expenses through the Improvement of Public Education’s Competitiveness” and the “Plan for Creating a Virtuous Cycle by Reinforcing Public Education and Weakening Private Education” were introduced in 2009 and 2011 respectively. These measures are expected to reduce private education expenses by improving confidence and satisfaction of public education, rather than by directly regulating the private education market.
The ‘After School’ system, which emphasises learning that supplements regular educational curricula was first proposed by the Education Reform Commission (ERC) in 1995 and was introduced in full scale in 2006. The Education Broadcast System (EBS)’s CSAT courses that began in 2004, provides extra learning to prepare for the CSAT through the public education system.
Reforming recruitment and professional development for quality teachers and school principals
In order to train competent teachers, in 1995 the Presidential Committee on Education Reform suggested the establishment of a capability-oriented promotion and payroll system. The implementation of a new teacher appraisal system was proposed in the Educational Development Five-year Plan and the Comprehensive Teacher Development Plan in 2000 laid out reform measures for a teacher appraisal system.
Moreover, the Open Recruitment of Principals (ORP) system diversifies the appointment process and enables the selection of suitably qualified school principals with the skill and passion who will be able to lead the development of the school and the local community.
Integrating digital technology: SMART (Self-directed, Motivated, Adaptive, Resources Enriched, Technology Embedded) Education
The recently introduced “SMART Education” policy includes digitising Korea’s entire school curriculum by 2015. A core initiative is the introduction of ‘digital textbooks’, which are interactive versions of traditional textbooks that can be constantly updated in real time.
The Cyber Learning System (CLS) was launched in 2004 and is being promoted to provide on-line supplementary learning contents, to reduce the cost of private education and to eliminate the education gap between regions and classes.
INTRODUCTION
29STRONG PERFORMERS AND SUCCESSFUL REFORMERS IN EDUCATION: LESSONS FROM PISA FOR KOREA © OECD 2014
Improving school outcomes through evaluation and assessment
The evaluation and assessment framework to improve school outcomes in Korea is broadening its scope to encompass the whole education system: from student assessment to school evaluation, teacher appraisal, evaluation of principals, evaluation of local education authorities, evaluation of research institutes, evaluation of educational policies. Data collection and management are provided by the National Education Information System (NEIS), School Information Disclosure System, and statistical surveys of education. Measures are being taken to link the systems so that policy makers can better understand what is taking place at schools rather than simply looking at the outcomes of educational administrative bodies. Moreover, efforts are being made to link data collection/management systems with the evaluation systems.
The National Assessment of Educational Achievement (NAEA), a national evaluation system that expanded to all schools nationwide starting from 2008, is becoming recognised as a central link between the various systems of evaluation and assessment. The NAEA enables the user to compare how schools and metropolitan/provincial offices of education have performed over the current, and also in comparison to the previous, academic year. The results of evaluations conducted by metropolitan/provincial offices of education and the central government are now fully accessible to the public.
Adapted from:
Background material provided by Korean Institute for Curriculum and Evaluation (KICE).
Ministry of Education website: http://english.mest.go.kr/enMain.do.
Ministry of Education, Introduction, Education System, Overview. http://english.mest.go.kr/web/1692/site/contents/en/en_0203.jsp;jsessionid=n61E7Tw3PzcEauxbfyZJiuv6UrB0lac2XlHr sxpDvx7yzphsXuq2sJ91QWlhU26L.homepageAP2_servlet_engine2
C.J. Lee, L. Kim, S. Byun (2012), OECD (2010a), Pearson Foundation and OECD: Strong Performers Successful Reformers in Education – Korea Video.
OECD (2010d), Review on Evaluation and Assessment Frameworks for Improving School Outcomes – Country Background Report for Korea, OECD Publishing, Paris.
OECD (2012b), Economic Survey of Korea, OECD Publishing, Paris.
OECD, PISA in Focus, Issue 12.
STRONG PERFORMERS AND SUCCESSFUL REFORMERS: KOREA
30 © OECD 2014 STRONG PERFORMERS AND SUCCESSFUL REFORMERS IN EDUCATION: LESSONS FROM PISA FOR KOREA
References and further reading
Autor, D., F. Levy and R.J. Murnane (2003), “The skill content of recent technical change: An empirical investigation”, Quarterly Journal of
Economics, Vol. 118/4, pp. 1279-1334.
C.J. Lee, L. Kim, S. Byun (2012), “The rise of Korean education from the ashes of the Korean War”, Prospects: Quarterly Review of Comparative
Education, Vol. 3/163, pp. 303-318.
Levy, F. (2010), “How technology changes demand for human skills”, OECD Education Working Papers No. 45, OECD Publishing,
http://dx.doi.org/10.1787/5kmhds6czqzq-en.
Levy, F. and R.J. Murnane, (2005), The New Division of Labour: How Computers are Creating the Next Job Market, Princeton University Press,
Princeton.
Ministry of Economy, Trade and Industry (2010), The New Growth Strategy: Blueprint for Revitalizing Japan, METI Cabinet Decision, 18 June,
Tokyo, Japan.
Kang N. and M. Hong (2008), “Achieving excellence in teacher workforce and equity in learning opportunities in South Korea”, Educational
Researcher, Vol. 37/3, pp. 200-207.
OECD (2010a), Strong Performers and Successful Reformers in Education: Lessons from PISA for the United States, OECD Publishing. http://dx.doi.org/10.1787/9789264096660-en.
OECD (2010b), PISA 2009 Results: Students On Line: Digital Technologies and Performance (Volume VI), OECD Publishing. http://dx.doi.org/10.1787/9789264112995-en.
OECD (2010c), PISA 2009 Results: Learning Trends: Changes in Student Performance since 2000 (Volume V), OECD Publishing. http://dx.doi.org/10.1787/9789264091580-en.
OECD (2010d), Review on Evaluation and Assessment Frameworks for Improving School Outcomes Country Background Report for Korea, OECD Publishing. www.oecd.org/edu/school/49363138.pdf.
OECD (2012a), Education at a Glance 2012: OECD Indicators, OECD Publishing. http://dx.doi.org/10.1787/eag-2012-en.
OECD (2012b), Economic Survey of Korea, OECD Publishing. http://dx.doi.org/10.1787/eco_surveys-kor-2012-en.

2
31STRONG PERFORMERS AND SUCCESSFUL REFORMERS IN EDUCATION: LESSONS FROM PISA FOR KOREA © OECD 2014
Viewing Education in Korea Through the Prism of PISA
Ever since the first PISA assessment was launched in 2000, Korea has remained at or near the top of international assessments of student learning. This chapter reviews Korean students’ performance in PISA 2009. It also examines some of the key issues that PISA results demonstrate, such as spending on education, the relationship between socio-economic background and performance, equity in learning opportunities, students’ attitudes towards learning, digital literacy and the learning environment.
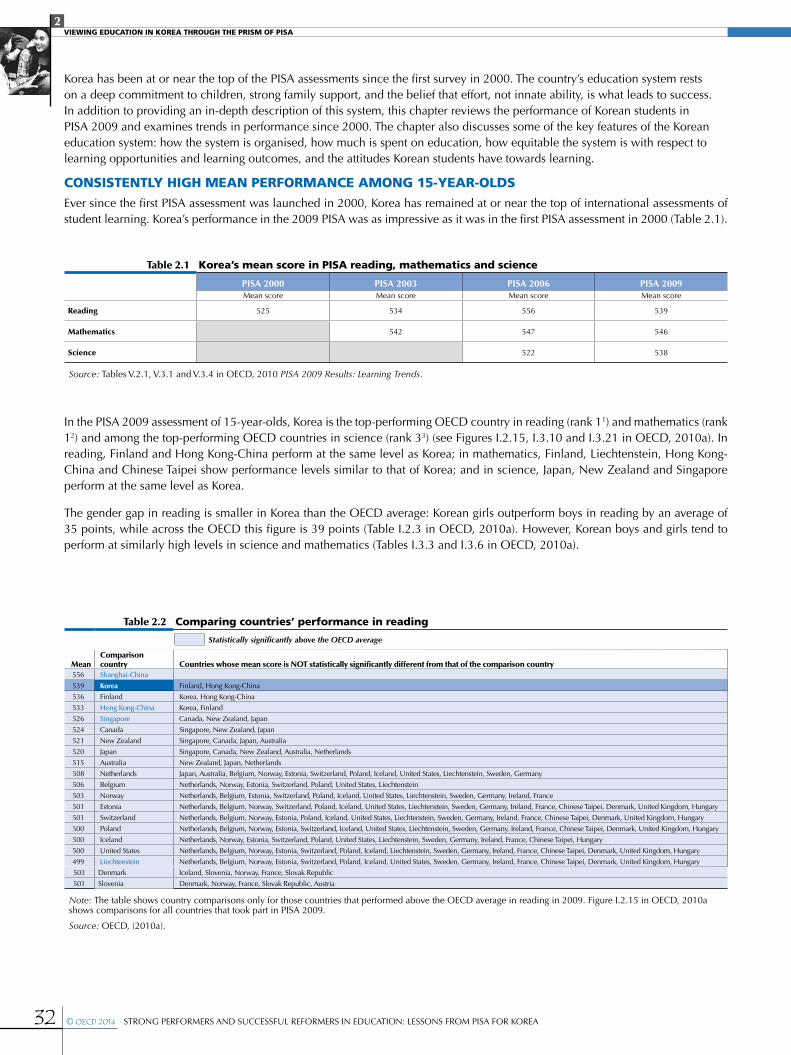
2VIEWING EDUCATION IN KOREA THROUGH THE PRISM OF PISA
32 © OECD 2014 STRONG PERFORMERS AND SUCCESSFUL REFORMERS IN EDUCATION: LESSONS FROM PISA FOR KOREA
Korea has been at or near the top of the PISA assessments since the first survey in 2000. The country’s education system rests on a deep commitment to children, strong family support, and the belief that effort, not innate ability, is what leads to success. In addition to providing an in-depth description of this system, this chapter reviews the performance of Korean students in PISA 2009 and examines trends in performance since 2000. The chapter also discusses some of the key features of the Korean education system: how the system is organised, how much is spent on education, how equitable the system is with respect to learning opportunities and learning outcomes, and the attitudes Korean students have towards learning.
CONSISTENTLY HIGH MEAN PERFORMANCE AMONG 15-YEAR-OLDSEver since the first PISA assessment was launched in 2000, Korea has remained at or near the top of international assessments of student learning. Korea’s performance in the 2009 PISA was as impressive as it was in the first PISA assessment in 2000 (Table 2.1).
In the PISA 2009 assessment of 15-year-olds, Korea is the top-performing OECD country in reading (rank 11) and mathematics (rank 12) and among the top-performing OECD countries in science (rank 33) (see Figures I.2.15, I.3.10 and I.3.21 in OECD, 2010a). In reading, Finland and Hong Kong-China perform at the same level as Korea; in mathematics, Finland, Liechtenstein, Hong Kong-China and Chinese Taipei show performance levels similar to that of Korea; and in science, Japan, New Zealand and Singapore perform at the same level as Korea.
The gender gap in reading is smaller in Korea than the OECD average: Korean girls outperform boys in reading by an average of 35 points, while across the OECD this figure is 39 points (Table I.2.3 in OECD, 2010a). However, Korean boys and girls tend to perform at similarly high levels in science and mathematics (Tables I.3.3 and I.3.6 in OECD, 2010a).
Table 2.1 Korea’s mean score in PISA reading, mathematics and science
PISA 2000 PISA 2003 PISA 2006 PISA 2009Mean score Mean score Mean score Mean score
Reading 525 534 556 539
Mathematics 542 547 546
Science 522 538
Source: Tables V.2.1, V.3.1 and V.3.4 in OECD, 2010 PISA 2009 Results: Learning Trends.
Table 2.2 Comparing countries’ performance in reading
Mean Comparison country Countries whose mean score is NOT statistically significantly different from that of the comparison country
556 Shanghai-China
539 Korea Finland, Hong Kong-China
536 Finland Korea, Hong Kong-China
533 Hong Kong-China Korea, Finland
526 Singapore Canada, New Zealand, Japan
524 Canada Singapore, New Zealand, Japan
521 New Zealand Singapore, Canada, Japan, Australia
520 Japan Singapore, Canada, New Zealand, Australia, Netherlands
515 Australia New Zealand, Japan, Netherlands
508 Netherlands Japan, Australia, Belgium, Norway, Estonia, Switzerland, Poland, Iceland, United States, Liechtenstein, Sweden, Germany
506 Belgium Netherlands, Norway, Estonia, Switzerland, Poland, United States, Liechtenstein
503 Norway Netherlands, Belgium, Estonia, Switzerland, Poland, Iceland, United States, Liechtenstein, Sweden, Germany, Ireland, France
501 Estonia Netherlands, Belgium, Norway, Switzerland, Poland, Iceland, United States, Liechtenstein, Sweden, Germany, Ireland, France, Chinese Taipei, Denmark, United Kingdom, Hungary
501 Switzerland Netherlands, Belgium, Norway, Estonia, Poland, Iceland, United States, Liechtenstein, Sweden, Germany, Ireland, France, Chinese Taipei, Denmark, United Kingdom, Hungary
500 Poland Netherlands, Belgium, Norway, Estonia, Switzerland, Iceland, United States, Liechtenstein, Sweden, Germany, Ireland, France, Chinese Taipei, Denmark, United Kingdom, Hungary
500 Iceland Netherlands, Norway, Estonia, Switzerland, Poland, United States, Liechtenstein, Sweden, Germany, Ireland, France, Chinese Taipei, Hungary
500 United States Netherlands, Belgium, Norway, Estonia, Switzerland, Poland, Iceland, Liechtenstein, Sweden, Germany, Ireland, France, Chinese Taipei, Denmark, United Kingdom, Hungary
499 Liechtenstein Netherlands, Belgium, Norway, Estonia, Switzerland, Poland, Iceland, United States, Sweden, Germany, Ireland, France, Chinese Taipei, Denmark, United Kingdom, Hungary
503 Denmark Iceland, Slovenia, Norway, France, Slovak Republic
501 Slovenia Denmark, Norway, France, Slovak Republic, Austria
Note: The table shows country comparisons only for those countries that performed above the OECD average in reading in 2009. Figure I.2.15 in OECD, 2010a shows comparisons for all countries that took part in PISA 2009.
Source: OECD, (2010a).
Statistically significantly above the OECD average
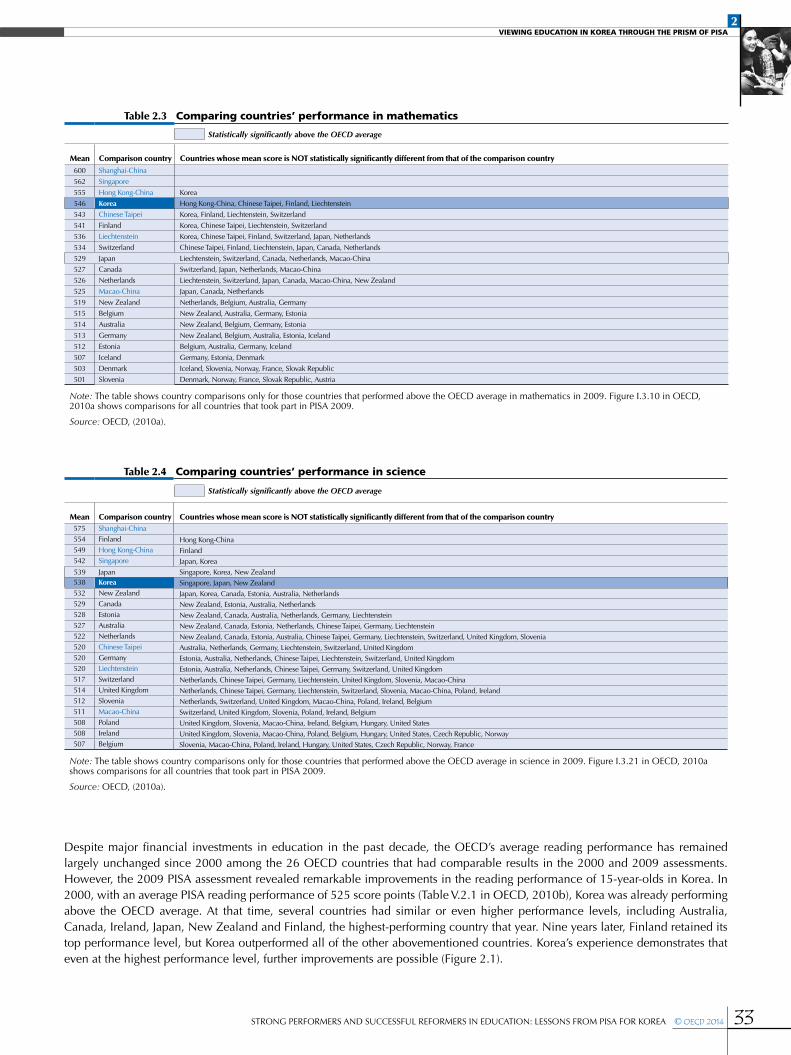
2VIEWING EDUCATION IN KOREA THROUGH THE PRISM OF PISA
33STRONG PERFORMERS AND SUCCESSFUL REFORMERS IN EDUCATION: LESSONS FROM PISA FOR KOREA © OECD 2014
Despite major financial investments in education in the past decade, the OECD’s average reading performance has remained largely unchanged since 2000 among the 26 OECD countries that had comparable results in the 2000 and 2009 assessments. However, the 2009 PISA assessment revealed remarkable improvements in the reading performance of 15-year-olds in Korea. In 2000, with an average PISA reading performance of 525 score points (Table V.2.1 in OECD, 2010b), Korea was already performing above the OECD average. At that time, several countries had similar or even higher performance levels, including Australia, Canada, Ireland, Japan, New Zealand and Finland, the highest-performing country that year. Nine years later, Finland retained its top performance level, but Korea outperformed all of the other abovementioned countries. Korea’s experience demonstrates that even at the highest performance level, further improvements are possible (Figure 2.1).
Table 2.3 Comparing countries’ performance in mathematics
Mean Comparison country Countries whose mean score is NOT statistically significantly different from that of the comparison country600 Shanghai-China
562 Singapore
555 Hong Kong-China Korea
546 Korea Hong Kong-China, Chinese Taipei, Finland, Liechtenstein
543 Chinese Taipei Korea, Finland, Liechtenstein, Switzerland
541 Finland Korea, Chinese Taipei, Liechtenstein, Switzerland
536 Liechtenstein Korea, Chinese Taipei, Finland, Switzerland, Japan, Netherlands
534 Switzerland Chinese Taipei, Finland, Liechtenstein, Japan, Canada, Netherlands
529 Japan Liechtenstein, Switzerland, Canada, Netherlands, Macao-China
527 Canada Switzerland, Japan, Netherlands, Macao-China
526 Netherlands Liechtenstein, Switzerland, Japan, Canada, Macao-China, New Zealand
525 Macao-China Japan, Canada, Netherlands
519 New Zealand Netherlands, Belgium, Australia, Germany
515 Belgium New Zealand, Australia, Germany, Estonia
514 Australia New Zealand, Belgium, Germany, Estonia
513 Germany New Zealand, Belgium, Australia, Estonia, Iceland
512 Estonia Belgium, Australia, Germany, Iceland
507 Iceland Germany, Estonia, Denmark
503 Denmark Iceland, Slovenia, Norway, France, Slovak Republic
501 Slovenia Denmark, Norway, France, Slovak Republic, Austria
Note: The table shows country comparisons only for those countries that performed above the OECD average in mathematics in 2009. Figure I.3.10 in OECD, 2010a shows comparisons for all countries that took part in PISA 2009.
Source: OECD, (2010a).
Statistically significantly above the OECD average
Table 2.4 Comparing countries’ performance in science
Mean Comparison country Countries whose mean score is NOT statistically significantly different from that of the comparison country575 Shanghai-China554 Finland Hong Kong-China 549 Hong Kong-China Finland 542 Singapore Japan, Korea 539 Japan Singapore, Korea, New Zealand 538 Korea Singapore, Japan, New Zealand 532 New Zealand Japan, Korea, Canada, Estonia, Australia, Netherlands 529 Canada New Zealand, Estonia, Australia, Netherlands 528 Estonia New Zealand, Canada, Australia, Netherlands, Germany, Liechtenstein 527 Australia New Zealand, Canada, Estonia, Netherlands, Chinese Taipei, Germany, Liechtenstein 522 Netherlands New Zealand, Canada, Estonia, Australia, Chinese Taipei, Germany, Liechtenstein, Switzerland, United Kingdom, Slovenia520 Chinese Taipei Australia, Netherlands, Germany, Liechtenstein, Switzerland, United Kingdom 520 Germany Estonia, Australia, Netherlands, Chinese Taipei, Liechtenstein, Switzerland, United Kingdom 520 Liechtenstein Estonia, Australia, Netherlands, Chinese Taipei, Germany, Switzerland, United Kingdom 517 Switzerland Netherlands, Chinese Taipei, Germany, Liechtenstein, United Kingdom, Slovenia, Macao-China 514 United Kingdom Netherlands, Chinese Taipei, Germany, Liechtenstein, Switzerland, Slovenia, Macao-China, Poland, Ireland 512 Slovenia Netherlands, Switzerland, United Kingdom, Macao-China, Poland, Ireland, Belgium 511 Macao-China Switzerland, United Kingdom, Slovenia, Poland, Ireland, Belgium 508 Poland United Kingdom, Slovenia, Macao-China, Ireland, Belgium, Hungary, United States508 Ireland United Kingdom, Slovenia, Macao-China, Poland, Belgium, Hungary, United States, Czech Republic, Norway 507 Belgium Slovenia, Macao-China, Poland, Ireland, Hungary, United States, Czech Republic, Norway, France
Note: The table shows country comparisons only for those countries that performed above the OECD average in science in 2009. Figure I.3.21 in OECD, 2010a shows comparisons for all countries that took part in PISA 2009.
Source: OECD, (2010a).
Statistically significantly above the OECD average
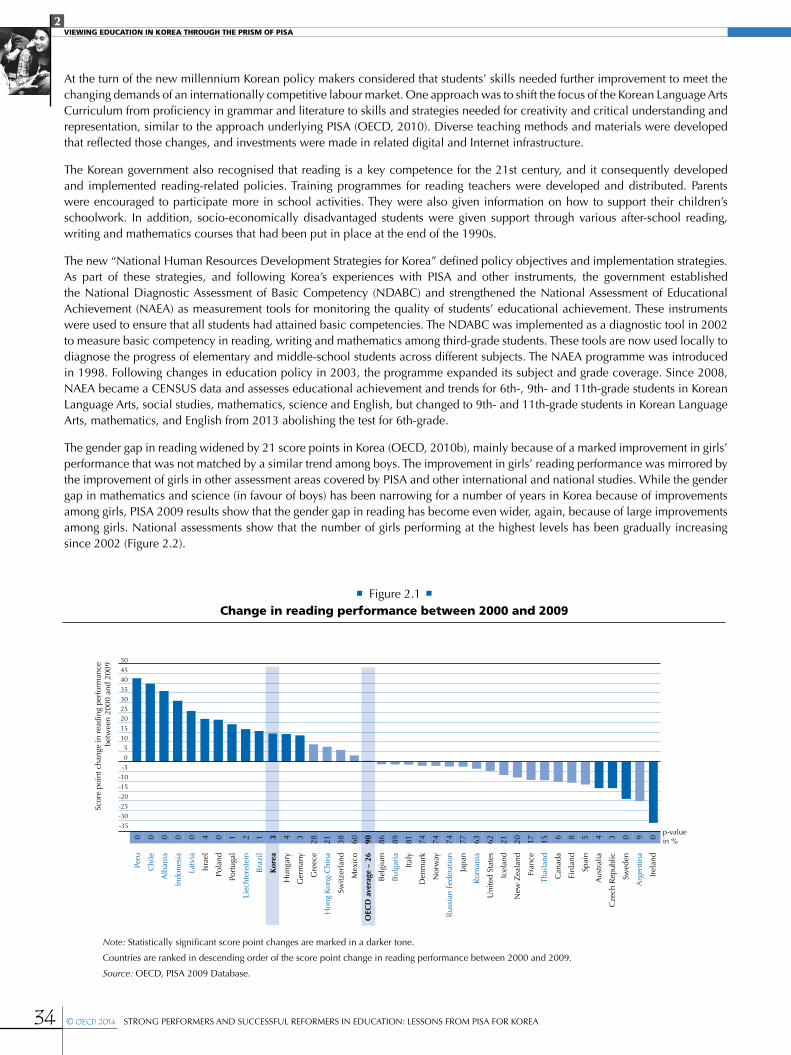
2VIEWING EDUCATION IN KOREA THROUGH THE PRISM OF PISA
34 © OECD 2014 STRONG PERFORMERS AND SUCCESSFUL REFORMERS IN EDUCATION: LESSONS FROM PISA FOR KOREA
At the turn of the new millennium Korean policy makers considered that students’ skills needed further improvement to meet the changing demands of an internationally competitive labour market. One approach was to shift the focus of the Korean Language Arts Curriculum from proficiency in grammar and literature to skills and strategies needed for creativity and critical understanding and representation, similar to the approach underlying PISA (OECD, 2010). Diverse teaching methods and materials were developed that reflected those changes, and investments were made in related digital and Internet infrastructure.
The Korean government also recognised that reading is a key competence for the 21st century, and it consequently developed and implemented reading-related policies. Training programmes for reading teachers were developed and distributed. Parents were encouraged to participate more in school activities. They were also given information on how to support their children’s schoolwork. In addition, socio-economically disadvantaged students were given support through various after-school reading, writing and mathematics courses that had been put in place at the end of the 1990s.
The new “National Human Resources Development Strategies for Korea” defined policy objectives and implementation strategies. As part of these strategies, and following Korea’s experiences with PISA and other instruments, the government established the National Diagnostic Assessment of Basic Competency (NDABC) and strengthened the National Assessment of Educational Achievement (NAEA) as measurement tools for monitoring the quality of students’ educational achievement. These instruments were used to ensure that all students had attained basic competencies. The NDABC was implemented as a diagnostic tool in 2002 to measure basic competency in reading, writing and mathematics among third-grade students. These tools are now used locally to diagnose the progress of elementary and middle-school students across different subjects. The NAEA programme was introduced in 1998. Following changes in education policy in 2003, the programme expanded its subject and grade coverage. Since 2008, NAEA became a CENSUS data and assesses educational achievement and trends for 6th-, 9th- and 11th-grade students in Korean Language Arts, social studies, mathematics, science and English, but changed to 9th- and 11th-grade students in Korean Language Arts, mathematics, and English from 2013 abolishing the test for 6th-grade.
The gender gap in reading widened by 21 score points in Korea (OECD, 2010b), mainly because of a marked improvement in girls’ performance that was not matched by a similar trend among boys. The improvement in girls’ reading performance was mirrored by the improvement of girls in other assessment areas covered by PISA and other international and national studies. While the gender gap in mathematics and science (in favour of boys) has been narrowing for a number of years in Korea because of improvements among girls, PISA 2009 results show that the gender gap in reading has become even wider, again, because of large improvements among girls. National assessments show that the number of girls performing at the highest levels has been gradually increasing since 2002 (Figure 2.2).
• Figure 2.1 •Change in reading performance between 2000 and 2009
-30
-25
-20
-15
-10
-5
0
5
10
15
20
25
30
35
40
45
50
Scor
e po
int c
hang
e in
rea
ding
per
form
ance
betw
een
2000
and
200
9
-35p-valuein %
Peru
0
Chi
le
0
Alb
ania
0
Indo
nesi
a
0
Latv
ia
0
Isra
el
4
Pola
nd
0
Port
ugal
1
Liec
hten
stei
n
2
Bra
zil
1
Kore
a
3
Hun
gary
4
Ger
man
y
3
Gre
ece
28
Hon
g Ko
ng- C
hina
2
1
Switz
erla
nd
38
Mex
ico
60
OEC
D a
vera
ge –
26
90
Bel
gium
8
6
Bul
gari
a
89
Italy
8
1
Den
mar
k
74
Nor
way
7
4
Rus
sian
Fed
erat
ion
74
Japa
n
77
Rom
ania
6
3
Uni
ted
Stat
es
62
Icel
and
21
New
Zea
land
2
0
Fran
ce
17
Thai
land
1
5
Can
ada
6
Finl
and
8
Spai
n
5
Aus
tral
ia
4
Cze
ch R
epub
lic
3
Swed
en
0
Arg
entin
a
9
Irel
and
0
Scor
e po
int c
hang
e in
rea
ding
per
form
ance
betw
een
2000
and
200
9
Note: Statistically significant score point changes are marked in a darker tone.
Countries are ranked in descending order of the score point change in reading performance between 2000 and 2009.
Source: OECD, PISA 2009 Database.
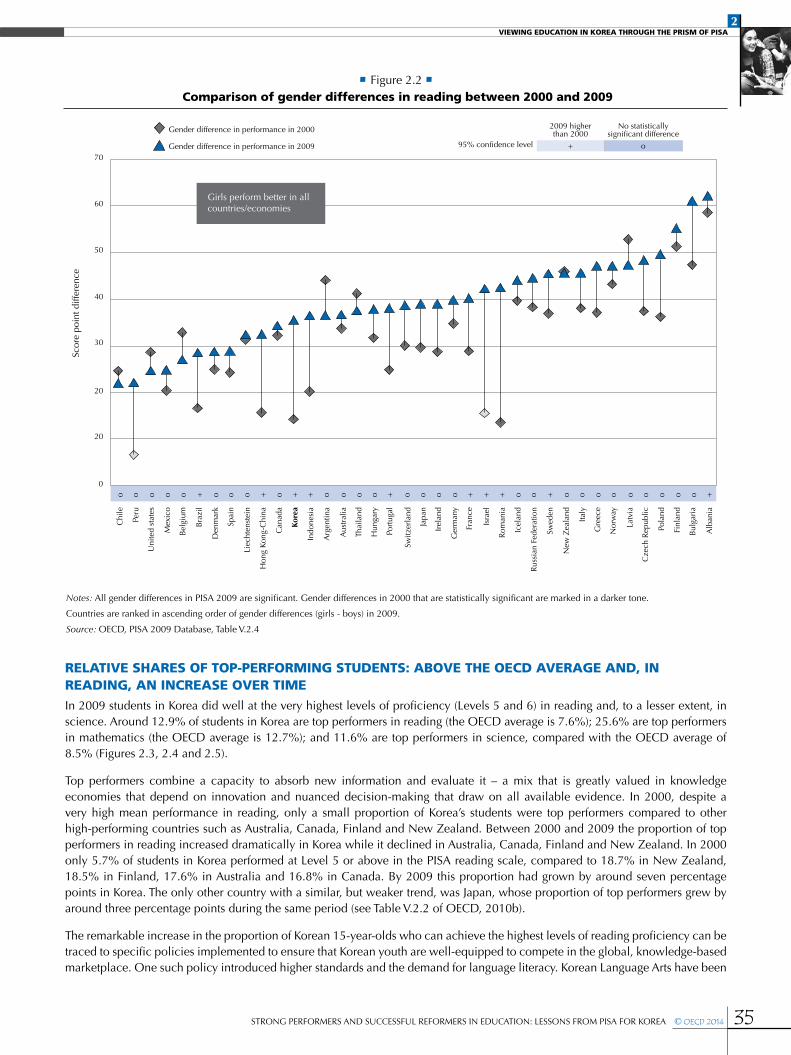
2VIEWING EDUCATION IN KOREA THROUGH THE PRISM OF PISA
35STRONG PERFORMERS AND SUCCESSFUL REFORMERS IN EDUCATION: LESSONS FROM PISA FOR KOREA © OECD 2014
RELATIVE SHARES OF TOP-PERFORMING STUDENTS: ABOVE THE OECD AVERAGE AND, IN READING, AN INCREASE OVER TIME In 2009 students in Korea did well at the very highest levels of proficiency (Levels 5 and 6) in reading and, to a lesser extent, in science. Around 12.9% of students in Korea are top performers in reading (the OECD average is 7.6%); 25.6% are top performers in mathematics (the OECD average is 12.7%); and 11.6% are top performers in science, compared with the OECD average of 8.5% (Figures 2.3, 2.4 and 2.5).
Top performers combine a capacity to absorb new information and evaluate it – a mix that is greatly valued in knowledge economies that depend on innovation and nuanced decision-making that draw on all available evidence. In 2000, despite a very high mean performance in reading, only a small proportion of Korea’s students were top performers compared to other high-performing countries such as Australia, Canada, Finland and New Zealand. Between 2000 and 2009 the proportion of top performers in reading increased dramatically in Korea while it declined in Australia, Canada, Finland and New Zealand. In 2000 only 5.7% of students in Korea performed at Level 5 or above in the PISA reading scale, compared to 18.7% in New Zealand, 18.5% in Finland, 17.6% in Australia and 16.8% in Canada. By 2009 this proportion had grown by around seven percentage points in Korea. The only other country with a similar, but weaker trend, was Japan, whose proportion of top performers grew by around three percentage points during the same period (see Table V.2.2 of OECD, 2010b).
The remarkable increase in the proportion of Korean 15-year-olds who can achieve the highest levels of reading proficiency can be traced to specific policies implemented to ensure that Korean youth are well-equipped to compete in the global, knowledge-based marketplace. One such policy introduced higher standards and the demand for language literacy. Korean Language Arts have been
• Figure 2.2 • Comparison of gender differences in reading between 2000 and 2009
Gender difference in performance in 2000
Gender difference in performance in 2009
Scor
e po
int d
iffer
ence
70
60
50
40
30
20
20
0
o o o o o o o o o o o o o o o o o o o o o o o o o o o o ++++++++++
Chi
le
Peru
Uni
ted
stat
es
Mex
ico
Bel
gium
Bra
zil
Den
mar
k
Spai
n
Liec
hten
stei
n
Hon
g Ko
ng-C
hina
Can
ada
Indo
nesi
a
Arg
entin
a
Aus
tral
ia
Thai
land
Hun
gary
Port
ugal
Switz
erla
nd
Japa
n
Irel
and
Ger
man
y
Fran
ce
Isra
el
Rom
ania
Icel
and
Rus
sian
Fed
erat
ion
Swed
en
New
Zea
land
Italy
Gre
ece
Nor
way
Latv
ia
Cze
ch R
epub
lic
Pola
nd
Finl
and
Bul
gari
a
Alb
ania
Kore
a
Girls perform better in all countries/economies
Notes: All gender differences in PISA 2009 are significant. Gender differences in 2000 that are statistically significant are marked in a darker tone.
Countries are ranked in ascending order of gender differences (girls - boys) in 2009.
Source: OECD, PISA 2009 Database, Table V.2.4
2009 higher than 2000
No statistically significant difference
95% confidence level + o
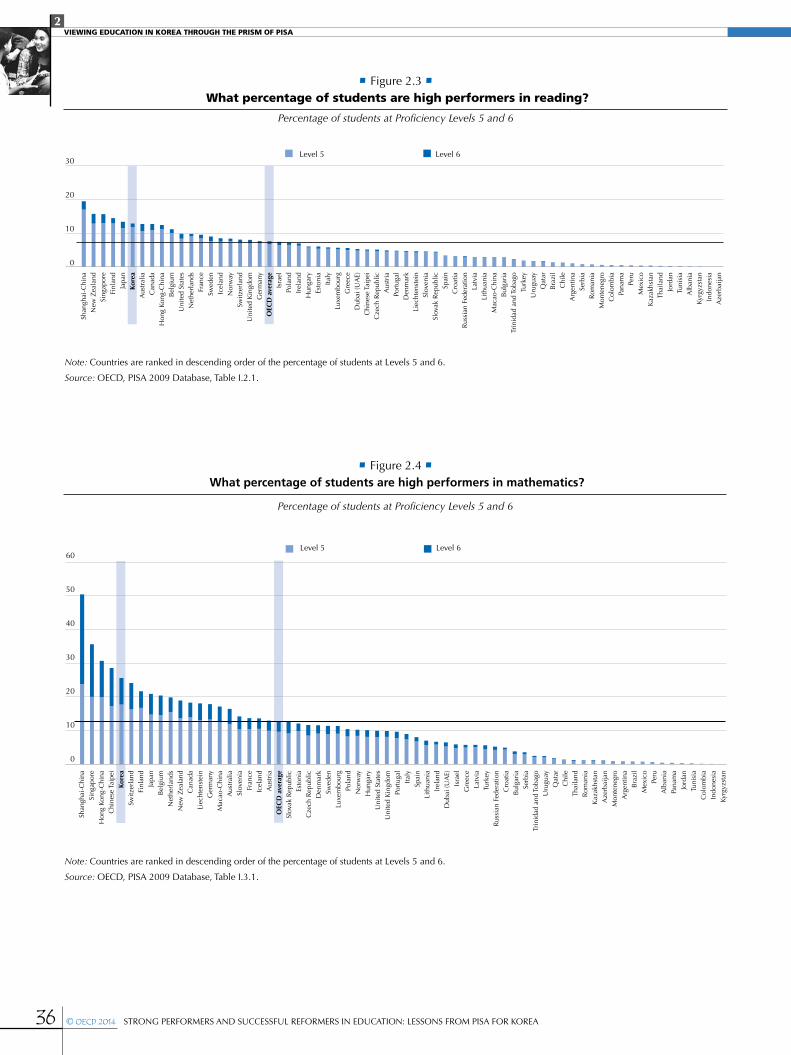
2VIEWING EDUCATION IN KOREA THROUGH THE PRISM OF PISA
36 © OECD 2014 STRONG PERFORMERS AND SUCCESSFUL REFORMERS IN EDUCATION: LESSONS FROM PISA FOR KOREA
• Figure 2.3 • What percentage of students are high performers in reading?
Percentage of students at Proficiency Levels 5 and 6
Shan
ghai
- Chi
naN
ew Z
eala
ndSi
ngap
ore
Finl
and
Japa
nKo
rea
Aus
tral
iaC
anad
aH
ong
Kong
- Chi
naB
elgi
umU
nite
d St
ates
Net
herl
ands
Fran
ceSw
eden
Icel
and
Nor
way
Switz
erla
ndU
nite
d K
ingd
omG
erm
any
OEC
D a
vera
geIs
rael
Pola
ndIr
elan
dH
unga
ryEs
toni
aIta
lyLu
xem
bour
gG
reec
eD
ubai
(UA
E)C
hine
se T
aipe
iC
zech
Rep
ublic
Aus
tria
Port
ugal
Den
mar
kLi
echt
enst
ein
Slov
enia
Slov
ak R
epub
licSp
ain
Cro
atia
Rus
sian
Fed
erat
ion
Latv
iaLi
thua
nia
Mac
ao- C
hina
Bul
gari
aTr
inid
ad a
nd T
obag
oTu
rkey
Uru
guay
Qat
arB
razi
lC
hile
Arg
entin
aSe
rbia
Rom
ania
Mon
tene
gro
Col
ombi
aPa
nam
aPe
ruM
exic
oK
azak
hsta
nTh
aila
ndJo
rdan
Tuni
sia
Alb
ania
Kyrg
yzst
anIn
done
sia
Aze
rbai
jan
Level 6Level 530
20
10
0
Note: Countries are ranked in descending order of the percentage of students at Levels 5 and 6.
Source: OECD, PISA 2009 Database, Table I.2.1.
Note: Countries are ranked in descending order of the percentage of students at Levels 5 and 6.
Source: OECD, PISA 2009 Database, Table I.3.1.
• Figure 2.4 • What percentage of students are high performers in mathematics?
Percentage of students at Proficiency Levels 5 and 6
Shan
ghai
-Chi
naSi
ngap
ore
Hon
g Ko
ng- C
hina
Chi
nese
Tai
pei
Kore
aSw
itzer
land
Finl
and
Japa
nB
elgi
umN
ethe
rlan
dsN
ew Z
eala
ndC
anad
aLi
echt
enst
ein
Ger
man
yM
acao
- Chi
naA
ustr
alia
Slov
enia
Fran
ceIc
elan
dA
ustr
iaO
ECD
ave
rage
Slov
ak R
epub
licEs
toni
aC
zech
Rep
ublic
Den
mar
kSw
eden
Luxe
mbo
urg
Pola
ndN
orw
ayH
unga
ryU
nite
d St
ates
Uni
ted
Kin
gdom
Port
ugal
Italy
Spai
nLi
thua
nia
Irel
and
Dub
ai (U
AE)
Isra
elG
reec
eLa
tvia
Turk
eyR
ussi
an F
eder
atio
nC
roat
iaB
ulga
ria
Serb
iaTr
inid
ad a
nd T
obag
oU
rugu
ayQ
atar
Chi
leTh
aila
ndR
oman
iaK
azak
hsta
nA
zerb
aija
nM
onte
negr
oA
rgen
tina
Bra
zil
Mex
ico
Peru
Alb
ania
Pana
ma
Jord
anTu
nisi
aC
olom
bia
Indo
nesi
aKy
rgyz
stan
Level 6Level 560
50
40
30
20
10
0
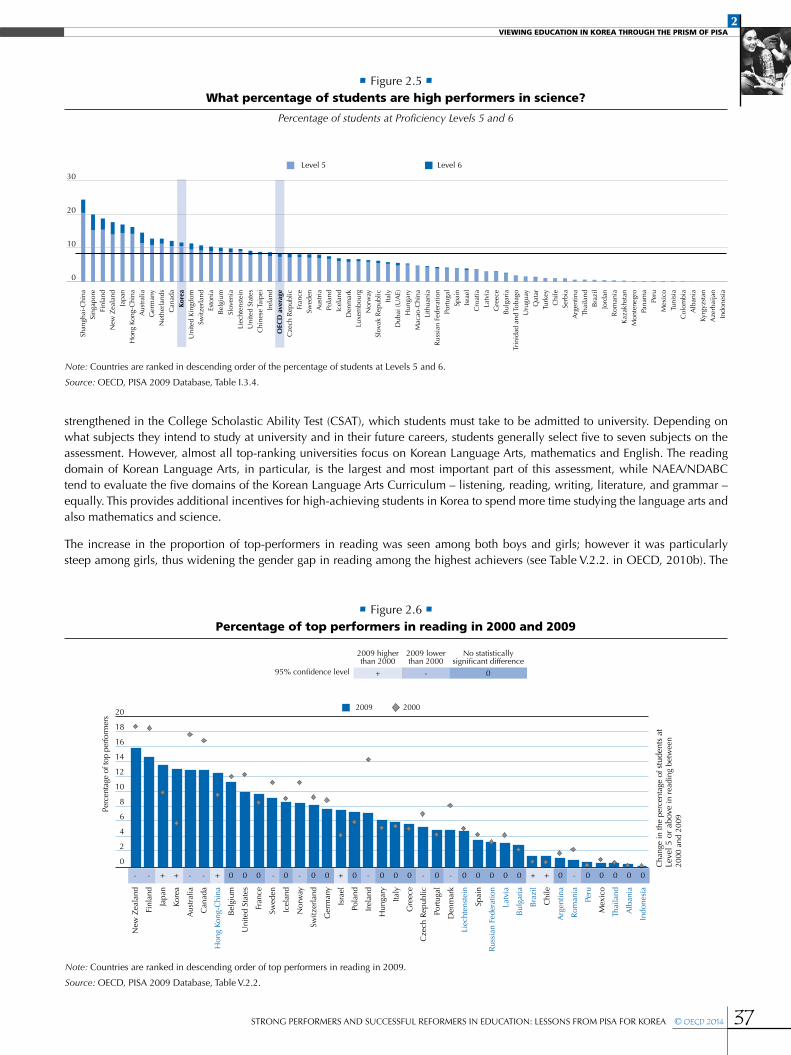
2VIEWING EDUCATION IN KOREA THROUGH THE PRISM OF PISA
37STRONG PERFORMERS AND SUCCESSFUL REFORMERS IN EDUCATION: LESSONS FROM PISA FOR KOREA © OECD 2014
strengthened in the College Scholastic Ability Test (CSAT), which students must take to be admitted to university. Depending on what subjects they intend to study at university and in their future careers, students generally select five to seven subjects on the assessment. However, almost all top-ranking universities focus on Korean Language Arts, mathematics and English. The reading domain of Korean Language Arts, in particular, is the largest and most important part of this assessment, while NAEA/NDABC tend to evaluate the five domains of the Korean Language Arts Curriculum – listening, reading, writing, literature, and grammar – equally. This provides additional incentives for high-achieving students in Korea to spend more time studying the language arts and also mathematics and science.
The increase in the proportion of top-performers in reading was seen among both boys and girls; however it was particularly steep among girls, thus widening the gender gap in reading among the highest achievers (see Table V.2.2. in OECD, 2010b). The
Note: Countries are ranked in descending order of the percentage of students at Levels 5 and 6.
Source: OECD, PISA 2009 Database, Table I.3.4.
• Figure 2.5 •What percentage of students are high performers in science?
Percentage of students at Proficiency Levels 5 and 6
Shan
ghai
-Chi
naSi
ngap
ore
Finl
and
New
Zea
land
Japa
nH
ong
Kong
- Chi
naA
ustr
alia
Ger
man
yN
ethe
rlan
dsC
anad
aKo
rea
Uni
ted
Kin
gdom
Switz
erla
ndEs
toni
aB
elgi
umSl
oven
iaLi
echt
enst
ein
Uni
ted
Stat
esC
hine
se T
aipe
iIr
elan
dO
ECD
ave
rage
Cze
ch R
epub
licFr
ance
Swed
enA
ustr
iaPo
land
Icel
and
Den
mar
kLu
xem
bour
gN
orw
aySl
ovak
Rep
ublic
Italy
Dub
ai (U
AE)
Hun
gary
Mac
ao- C
hina
Lith
uani
aR
ussi
an F
eder
atio
nPo
rtug
alSp
ain
Isra
elC
roat
iaLa
tvia
Gre
ece
Bul
gari
aTr
inid
ad a
nd T
obag
oU
rugu
ayQ
atar
Turk
eyC
hile
Serb
iaA
rgen
tina
Thai
land
Bra
zil
Jord
anR
oman
iaK
azak
hsta
nM
onte
negr
oPa
nam
aPe
ruM
exic
oTu
nisi
aC
olom
bia
Alb
ania
Kyrg
yzst
anA
zerb
aija
nIn
done
sia
Level 6Level 530
20
10
0
2009 higher than 2000
2009 lower than 2000
No statistically significant difference
95% confidence level + - 0
Note: Countries are ranked in descending order of top performers in reading in 2009.
Source: OECD, PISA 2009 Database, Table V.2.2.
• Figure 2.6 •Percentage of top performers in reading in 2000 and 2009
0
2
4
6
8
10
12
14
16
18
20
Perc
enta
ge o
f top
per
form
ers
2009 2000
N
ew Z
eala
nd
-
Finl
and
-
Ja
pan
+
Kore
a
+
A
ustr
alia
-
C
anad
a
-
Hon
g Ko
ng- C
hina
+
Bel
gium
0
U
nite
d St
ates
0
Fr
ance
0
Sw
eden
-
Ic
elan
d
0
N
orw
ay
-
Sw
itzer
land
0
G
erm
any
0
Is
rael
+
P
olan
d
0
Ire
land
-
Hun
gary
0
Ita
ly
0
Gre
ece
0
Cze
ch R
epub
lic
-
Port
ugal
0
Den
mar
k
-
Liec
hten
stei
n
0
Spai
n
0
Rus
sian
Fed
erat
ion
0
Latv
ia
0
Bul
gari
a
0
Bra
zil
+
Chi
le
+
Arg
entin
a
0
Rom
ania
-
Peru
0
Mex
ico
0
Thai
land
0
Alb
ania
0
Indo
nesi
a
0
Cha
nge
in th
e pe
rcen
tage
of s
tude
nts
at
Leve
l 5 o
r ab
ove
in r
eadi
ng b
etw
een
2000
and
200
9
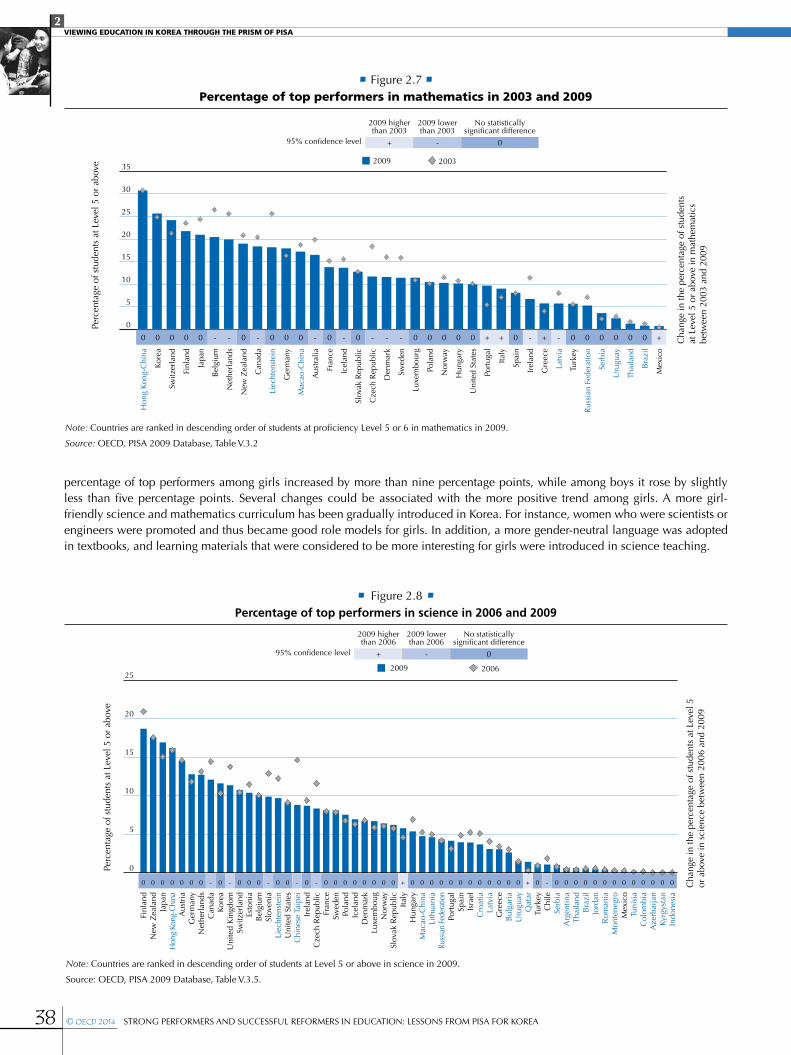
2VIEWING EDUCATION IN KOREA THROUGH THE PRISM OF PISA
38 © OECD 2014 STRONG PERFORMERS AND SUCCESSFUL REFORMERS IN EDUCATION: LESSONS FROM PISA FOR KOREA
percentage of top performers among girls increased by more than nine percentage points, while among boys it rose by slightly less than five percentage points. Several changes could be associated with the more positive trend among girls. A more girl-friendly science and mathematics curriculum has been gradually introduced in Korea. For instance, women who were scientists or engineers were promoted and thus became good role models for girls. In addition, a more gender-neutral language was adopted in textbooks, and learning materials that were considered to be more interesting for girls were introduced in science teaching.
• Figure 2.7 •Percentage of top performers in mathematics in 2003 and 2009
Note: Countries are ranked in descending order of students at proficiency Level 5 or 6 in mathematics in 2009.
Source: OECD, PISA 2009 Database, Table V.3.2
2009 higher than 2003
2009 lower than 2003
No statistically significant difference
95% confidence level + - 0
0
5
10
15
20
25
30
35 2009 2003
Hon
g Ko
ng-C
hina
0
Kore
a
0
Switz
erla
nd
0
Finl
and
0
Japa
n
0
Bel
gium
-
Net
herl
ands
-
New
Zea
land
0
Can
ada
-
Liec
hten
stei
n
0
Ger
man
y
0
Mac
ao -C
hina
0
Aus
tral
ia
-Fr
ance
0Ic
elan
d-
Slov
ak R
epub
lic
0
Cze
ch R
epub
lic
-
Den
mar
k
-
Swed
en
-
Luxe
mbo
urg
0
Pola
nd
0
Nor
way
0
Hun
gary
0
Uni
ted
Stat
es
0
Port
ugal
+
Italy
+
Spai
n
0
Irel
and
-
Gre
ece
+
Latv
ia
-
Turk
ey
0
Rus
sian
Fed
erat
ion
0
Serb
ia
0
Uru
guay
0
Thai
land
0
Bra
zil
0
Mex
ico
+ Cha
nge
in th
e pe
rcen
tage
of s
tude
nts
at L
evel
5 o
r ab
ove
in m
athe
mat
ics
betw
een
2003
and
200
9
Perc
enta
ge o
f stu
dent
s at
Lev
el 5
or
abov
e
Finl
and
0
New
Zea
land
0
Japa
n
0
Hon
g Ko
ng-C
hina
0
Aus
tria
0
Ger
man
y
0
Net
herl
ands
0
Can
ada
-
Kore
a
0
Uni
ted
Kin
gdom
-
Switz
erla
nd
0
Esto
nia
0
Bel
gium
0
Slov
enia
-
Liec
hten
stei
n
0
Uni
ted
Stat
es
0
Chi
nese
Tai
pei
-
Irel
and
0
Cze
ch R
epub
lic
-
Fran
ce
0
Swed
en
0
Pola
nd
0
Icel
and
0
Den
mar
k
0
Luxe
mbo
ug
0
Nor
way
0
Slov
ak R
epub
lic
0
Italy
+
Hun
gary
0
Mac
ao-C
hina
0
Lith
uani
a
0
Russ
ian
Fede
ratio
n
0
Port
ugal
0
Spai
n
0
Isra
el
0
Cro
atia
0
Latv
ia
0
Gre
ece
0
Bul
gari
a
0
Uru
guay
0
Qat
ar
+
Turk
ey
0
Chi
le
-
Serb
ia
0
Arg
entin
a
0
Thai
land
0
Bra
zil
0
Jord
an
0
Rom
ania
0
Mon
tene
gro
0
Mex
ico
0
Tuni
sia
0
Col
ombi
a
0
Aze
rbai
jan
0
Kyrg
ysta
n
0
Indo
nesi
a
0
Note: Countries are ranked in descending order of students at Level 5 or above in science in 2009.
Source: OECD, PISA 2009 Database, Table V.3.5.
2009 higher than 2006
2009 lower than 2006
No statistically significant difference
95% confidence level + - 0
• Figure 2.8 •Percentage of top performers in science in 2006 and 2009
0
5
10
15
20
25 2009 2006
Perc
enta
ge o
f stu
dent
s at
Lev
el 5
or
abov
e
Cha
nge
in th
e pe
rcen
tage
of s
tude
nts
at L
evel
5
or a
bove
in s
cien
ce b
etw
een
2006
and
200
9
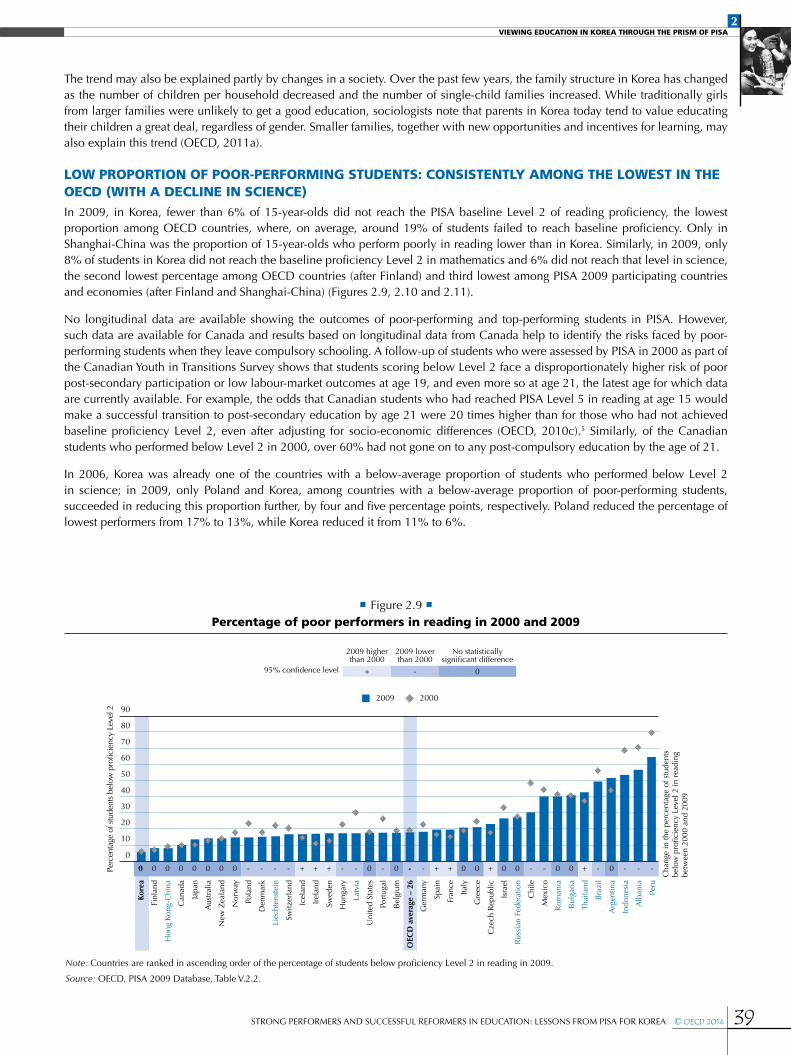
2VIEWING EDUCATION IN KOREA THROUGH THE PRISM OF PISA
39STRONG PERFORMERS AND SUCCESSFUL REFORMERS IN EDUCATION: LESSONS FROM PISA FOR KOREA © OECD 2014
The trend may also be explained partly by changes in a society. Over the past few years, the family structure in Korea has changed as the number of children per household decreased and the number of single-child families increased. While traditionally girls from larger families were unlikely to get a good education, sociologists note that parents in Korea today tend to value educating their children a great deal, regardless of gender. Smaller families, together with new opportunities and incentives for learning, may also explain this trend (OECD, 2011a).
LOW PROPORTION OF POOR-PERFORMING STUDENTS: CONSISTENTLY AMONG THE LOWEST IN THE OECD (WITH A DECLINE IN SCIENCE)In 2009, in Korea, fewer than 6% of 15-year-olds did not reach the PISA baseline Level 2 of reading proficiency, the lowest proportion among OECD countries, where, on average, around 19% of students failed to reach baseline proficiency. Only in Shanghai-China was the proportion of 15-year-olds who perform poorly in reading lower than in Korea. Similarly, in 2009, only 8% of students in Korea did not reach the baseline proficiency Level 2 in mathematics and 6% did not reach that level in science, the second lowest percentage among OECD countries (after Finland) and third lowest among PISA 2009 participating countries and economies (after Finland and Shanghai-China) (Figures 2.9, 2.10 and 2.11).
No longitudinal data are available showing the outcomes of poor-performing and top-performing students in PISA. However, such data are available for Canada and results based on longitudinal data from Canada help to identify the risks faced by poor-performing students when they leave compulsory schooling. A follow-up of students who were assessed by PISA in 2000 as part of the Canadian Youth in Transitions Survey shows that students scoring below Level 2 face a disproportionately higher risk of poor post-secondary participation or low labour-market outcomes at age 19, and even more so at age 21, the latest age for which data are currently available. For example, the odds that Canadian students who had reached PISA Level 5 in reading at age 15 would make a successful transition to post-secondary education by age 21 were 20 times higher than for those who had not achieved baseline proficiency Level 2, even after adjusting for socio-economic differences (OECD, 2010c).5 Similarly, of the Canadian students who performed below Level 2 in 2000, over 60% had not gone on to any post-compulsory education by the age of 21.
In 2006, Korea was already one of the countries with a below-average proportion of students who performed below Level 2 in science; in 2009, only Poland and Korea, among countries with a below-average proportion of poor-performing students, succeeded in reducing this proportion further, by four and five percentage points, respectively. Poland reduced the percentage of lowest performers from 17% to 13%, while Korea reduced it from 11% to 6%.
• Figure 2.9 •Percentage of poor performers in reading in 2000 and 2009
Kore
a
0
Finl
and
0
Hon
g Ko
ng- C
hina
0
C
anad
a
0
Ja
pan
0
A
ustr
alia
0
N
ew Z
eala
nd
0
N
orw
ay
0
Po
land
-
D
enm
ark
-
Li
echt
enst
ein
-
Sw
itzer
land
-
Ic
elan
d
+
Ir
elan
d
+
Sw
eden
+
H
unga
ry
-
La
tvia
-
U
nite
d St
ates
0
Po
rtug
al
-
B
elgi
um
0
O
ECD
ave
rage
– 2
6
-
G
erm
any
-
Sp
ain
+
Fr
ance
+
Ita
ly
0
G
reec
e
0
C
zech
Rep
ublic
+
Is
rael
0
R
ussi
an F
eder
atio
n
0
C
hile
-
M
exic
o
-
R
oman
ia
0
B
ulga
ria
0
Th
aila
nd
+
B
razi
l
-
A
rgen
tina
0
Indo
nesi
a
-
A
lban
ia
-
Pe
ru
-
2009 higher than 2000
2009 lower than 2000
No statistically significant difference
95% confidence level + - 0
Note: Countries are ranked in ascending order of the percentage of students below proficiency Level 2 in reading in 2009.
Source: OECD, PISA 2009 Database, Table V.2.2.
Cha
nge
in th
e pe
rcen
tage
of s
tude
nts
belo
w p
rofic
ienc
y Le
vel 2
in r
eadi
ng
betw
een
2000
and
200
9
0
10
20
30
40
50
60
70
80
90
Perc
enta
ge o
f stu
dent
s be
low
pro
ficie
ncy
Leve
l 2
2009 2000
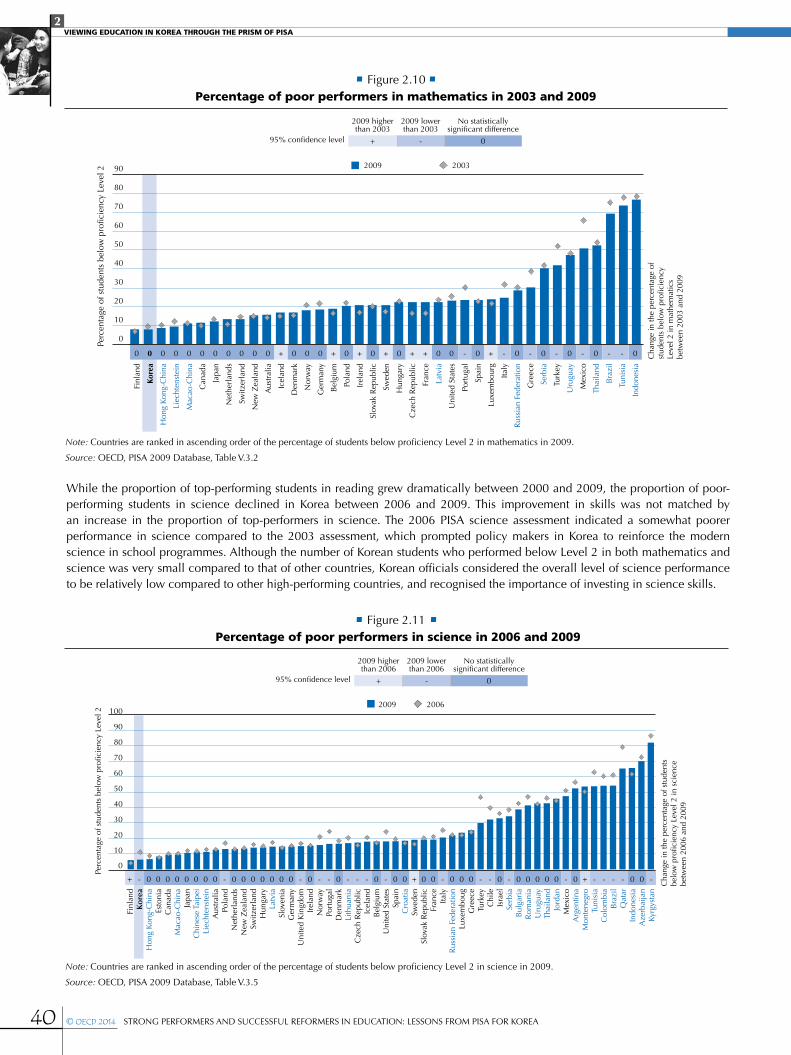
2VIEWING EDUCATION IN KOREA THROUGH THE PRISM OF PISA
40 © OECD 2014 STRONG PERFORMERS AND SUCCESSFUL REFORMERS IN EDUCATION: LESSONS FROM PISA FOR KOREA
While the proportion of top-performing students in reading grew dramatically between 2000 and 2009, the proportion of poor-performing students in science declined in Korea between 2006 and 2009. This improvement in skills was not matched by an increase in the proportion of top-performers in science. The 2006 PISA science assessment indicated a somewhat poorer performance in science compared to the 2003 assessment, which prompted policy makers in Korea to reinforce the modern science in school programmes. Although the number of Korean students who performed below Level 2 in both mathematics and science was very small compared to that of other countries, Korean officials considered the overall level of science performance to be relatively low compared to other high-performing countries, and recognised the importance of investing in science skills.
• Figure 2.10 •Percentage of poor performers in mathematics in 2003 and 2009
Perc
enta
ge o
f stu
dent
s be
low
pro
ficie
ncy
Leve
l 2
Cha
nge
in th
e pe
rcen
tage
of
stud
ents
bel
ow p
rofic
ienc
y Le
vel 2
in m
athe
mat
ics
betw
een
2003
and
200
9
Finl
and
0
Kore
a
0
Hon
g Ko
ng- C
hina
0
Liec
hten
stei
n
0
Mac
ao- C
hina
0
Can
ada
0
Japa
n
0
Net
herl
ands
0
Switz
erla
nd
0
New
Zea
land
0
Aus
tral
ia
0
Icel
and
+
Den
mar
k
0
Nor
way
0
Ger
man
y
0
Bel
gium
+Po
land
0Ir
elan
d+
Slov
ak R
epub
lic
0
Swed
en
+
Hun
gary
0
Cze
ch R
epub
lic
+
Fran
ce
+
Latv
ia
0
Uni
ted
Stat
es
0
Port
ugal
-
Spai
n
0
Luxe
mbo
urg
+
Italy
-
Rus
sian
Fed
erat
ion
0
Gre
ece
-
Serb
ia
0
Turk
ey
-
Uru
guay
0
Mex
ico
-
Thai
land
0
Bra
zil
-
Tuni
sia
-
Indo
nesi
a
0
Note: Countries are ranked in ascending order of the percentage of students below proficiency Level 2 in mathematics in 2009.
Source: OECD, PISA 2009 Database, Table V.3.2
0
10
20
30
40
50
60
70
80
90 2009 2003
2009 higher than 2003
2009 lower than 2003
No statistically significant difference
95% confidence level + - 0
• Figure 2.11 • Percentage of poor performers in science in 2006 and 2009
Note: Countries are ranked in ascending order of the percentage of students below proficiency Level 2 in science in 2009.
Source: OECD, PISA 2009 Database, Table V.3.5
Perc
enta
ge o
f stu
dent
s be
low
pro
ficie
ncy
Leve
l 2
Cha
nge
in th
e pe
rcen
tage
of s
tude
nts
belo
w p
rofic
ienc
y Le
vel 2
in s
cien
ce
betw
een
2006
and
200
9
Finl
and
+
Ko
rea
-
Hon
g Ko
ng-C
hina
0
Esto
nia
0
Can
ada
0
Mac
ao-C
hina
0
Japa
n
0
Chi
nese
Tai
pei
0
Liec
hten
stei
n
0
Aus
tral
ia
0
Pola
nd
-
Net
herl
ands
0
New
Zea
land
0
Switz
erla
nd
0
Hun
gary
0
Latv
ia
0
Slov
enia
0
Ger
man
y
0
Uni
ted
Kin
gdom
-
Irel
and
0
Nor
way
-
Port
ugal
-
Den
mar
k
0
Lith
uani
a
-
Cze
ch R
epub
lic
-
Icel
and
-
Bel
gium
0
Uni
ted
Stat
es
-
Spai
n
0
Cro
atia
0
Swed
en
+
Slov
ak R
epub
lic
0
Fran
ce
0
Italy
-
Rus
sian
Fed
erat
ion
0
Luxe
mbo
ug
0
Gre
ece
0
Turk
ey
-
Chi
le
-
Isra
el
0
Serb
ia
-
Bul
gari
a
0
Rom
ania
0
Uru
guay
0
Thai
land
0
Jord
an
0
Mex
ico
-
Arg
entin
a
0
Mon
tene
gro
+
Tuni
sia
-
Col
ombi
a
-
Bra
zil
-
Qat
ar
-
Indo
nesi
a
0
Aze
rbai
jan
0
Kyrg
ysta
n
-
2009 higher than 2006
2009 lower than 2006
No statistically significant difference
95% confidence level + - 0
10
0
20
30
40
50
60
70
80
90
100 2009 2006
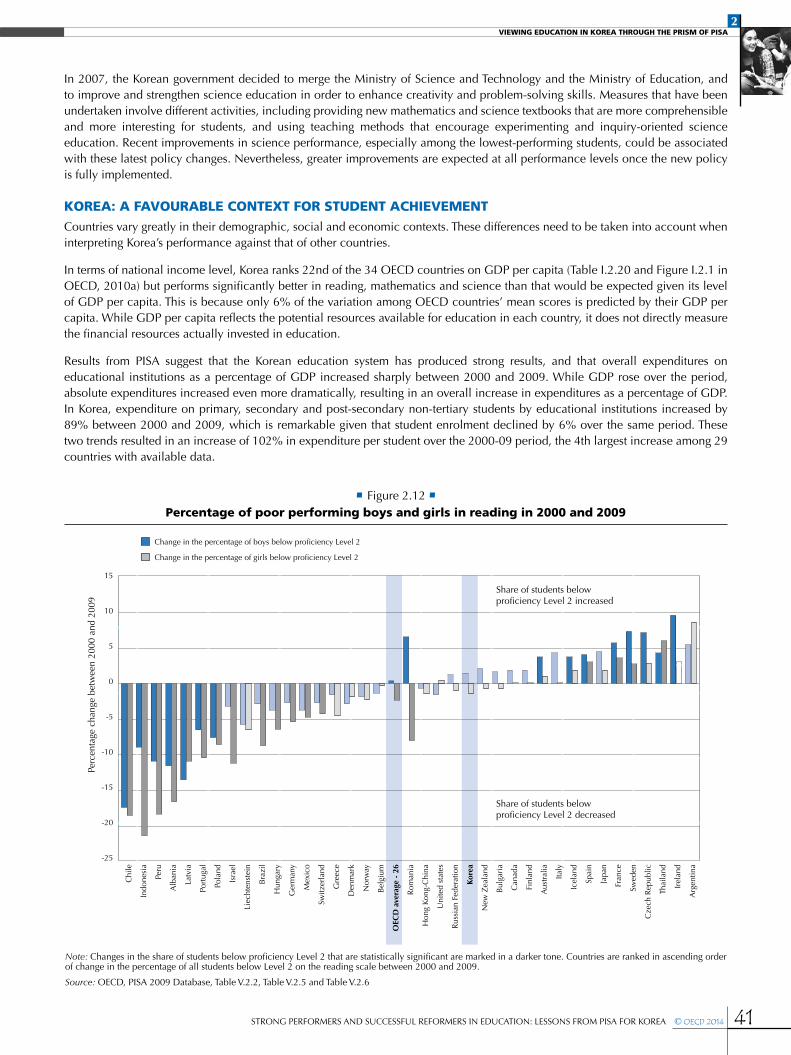
2VIEWING EDUCATION IN KOREA THROUGH THE PRISM OF PISA
41STRONG PERFORMERS AND SUCCESSFUL REFORMERS IN EDUCATION: LESSONS FROM PISA FOR KOREA © OECD 2014
In 2007, the Korean government decided to merge the Ministry of Science and Technology and the Ministry of Education, and to improve and strengthen science education in order to enhance creativity and problem-solving skills. Measures that have been undertaken involve different activities, including providing new mathematics and science textbooks that are more comprehensible and more interesting for students, and using teaching methods that encourage experimenting and inquiry-oriented science education. Recent improvements in science performance, especially among the lowest-performing students, could be associated with these latest policy changes. Nevertheless, greater improvements are expected at all performance levels once the new policy is fully implemented.
KOREA: A FAVOURABLE CONTEXT FOR STUDENT ACHIEVEMENTCountries vary greatly in their demographic, social and economic contexts. These differences need to be taken into account when interpreting Korea’s performance against that of other countries.
In terms of national income level, Korea ranks 22nd of the 34 OECD countries on GDP per capita (Table I.2.20 and Figure I.2.1 in OECD, 2010a) but performs significantly better in reading, mathematics and science than that would be expected given its level of GDP per capita. This is because only 6% of the variation among OECD countries’ mean scores is predicted by their GDP per capita. While GDP per capita reflects the potential resources available for education in each country, it does not directly measure the financial resources actually invested in education.
Results from PISA suggest that the Korean education system has produced strong results, and that overall expenditures on educational institutions as a percentage of GDP increased sharply between 2000 and 2009. While GDP rose over the period, absolute expenditures increased even more dramatically, resulting in an overall increase in expenditures as a percentage of GDP. In Korea, expenditure on primary, secondary and post-secondary non-tertiary students by educational institutions increased by 89% between 2000 and 2009, which is remarkable given that student enrolment declined by 6% over the same period. These two trends resulted in an increase of 102% in expenditure per student over the 2000-09 period, the 4th largest increase among 29 countries with available data.
• Figure 2.12 •Percentage of poor performing boys and girls in reading in 2000 and 2009
Note: Changes in the share of students below proficiency Level 2 that are statistically significant are marked in a darker tone. Countries are ranked in ascending order of change in the percentage of all students below Level 2 on the reading scale between 2000 and 2009.
Source: OECD, PISA 2009 Database, Table V.2.2, Table V.2.5 and Table V.2.6
Chi
le
Peru
Uni
ted
stat
es
Mex
ico
Bel
gium
OEC
D a
vera
ge -
26
Bra
zil
Den
mar
k
Spai
n
Liec
hten
stei
n
Hon
g Ko
ng-C
hina
Can
ada
Indo
nesi
a
Arg
entin
a
Aus
tral
ia
Thai
land
Hun
gary
Switz
erla
nd
Japa
n
Irel
and
Ger
man
y
Fran
ce
Rom
ania
Icel
and
Rus
sian
Fed
erat
ion
Swed
en
New
Zea
land
Italy
Gre
ece
Nor
way
Latv
ia
Cze
ch R
epub
lic
Port
ugal
Pola
nd
Isra
el
Finl
and
Bul
gari
a
Alb
ania
Kore
a
Change in the percentage of boys below proficiency Level 2
Perc
enta
ge c
hang
e be
twee
n 20
00 a
nd 2
009
Change in the percentage of girls below proficiency Level 2
15
10
5
0
-5
-10
-15
-20
-25
Share of students below proficiency Level 2 increased
Share of students below proficiency Level 2 decreased
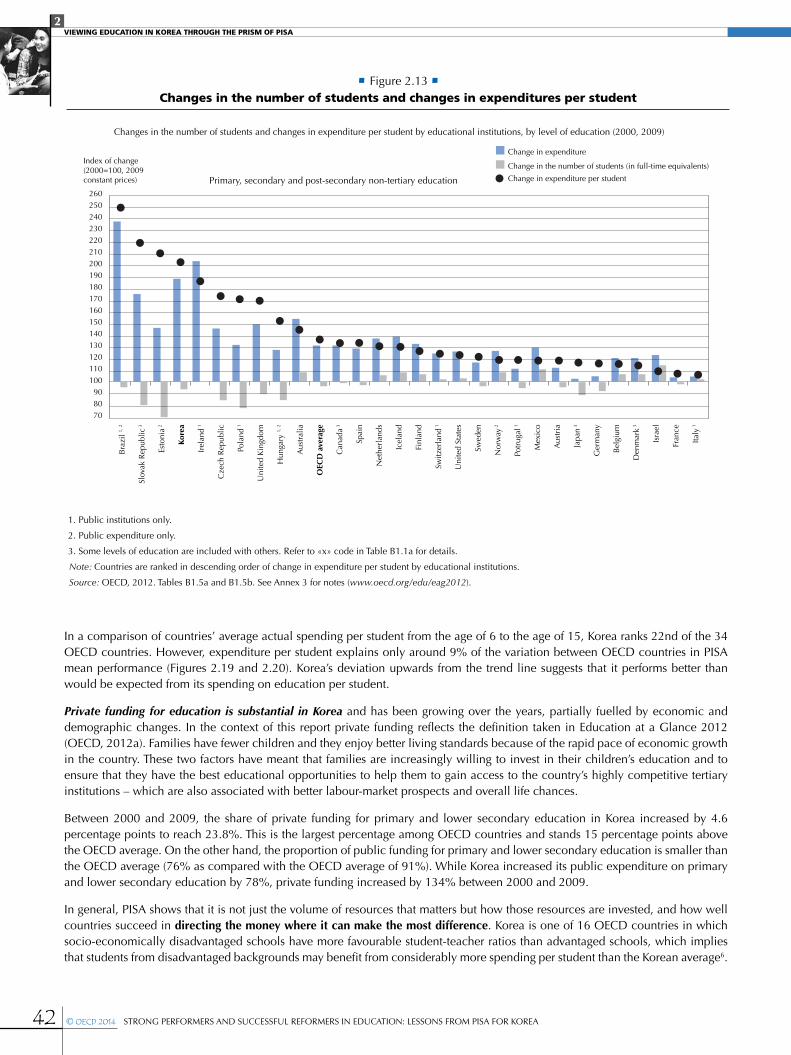
2VIEWING EDUCATION IN KOREA THROUGH THE PRISM OF PISA
42 © OECD 2014 STRONG PERFORMERS AND SUCCESSFUL REFORMERS IN EDUCATION: LESSONS FROM PISA FOR KOREA
In a comparison of countries’ average actual spending per student from the age of 6 to the age of 15, Korea ranks 22nd of the 34 OECD countries. However, expenditure per student explains only around 9% of the variation between OECD countries in PISA mean performance (Figures 2.19 and 2.20). Korea’s deviation upwards from the trend line suggests that it performs better than would be expected from its spending on education per student.
Private funding for education is substantial in Korea and has been growing over the years, partially fuelled by economic and demographic changes. In the context of this report private funding reflects the definition taken in Education at a Glance 2012 (OECD, 2012a). Families have fewer children and they enjoy better living standards because of the rapid pace of economic growth in the country. These two factors have meant that families are increasingly willing to invest in their children’s education and to ensure that they have the best educational opportunities to help them to gain access to the country’s highly competitive tertiary institutions – which are also associated with better labour-market prospects and overall life chances.
Between 2000 and 2009, the share of private funding for primary and lower secondary education in Korea increased by 4.6 percentage points to reach 23.8%. This is the largest percentage among OECD countries and stands 15 percentage points above the OECD average. On the other hand, the proportion of public funding for primary and lower secondary education is smaller than the OECD average (76% as compared with the OECD average of 91%). While Korea increased its public expenditure on primary and lower secondary education by 78%, private funding increased by 134% between 2000 and 2009.
In general, PISA shows that it is not just the volume of resources that matters but how those resources are invested, and how well countries succeed in directing the money where it can make the most difference. Korea is one of 16 OECD countries in which socio-economically disadvantaged schools have more favourable student-teacher ratios than advantaged schools, which implies that students from disadvantaged backgrounds may benefit from considerably more spending per student than the Korean average6.
• Figure 2.13 •Changes in the number of students and changes in expenditures per student
Primary, secondary and post-secondary non-tertiary education
Changes in the number of students and changes in expenditure per student by educational institutions, by level of education (2000, 2009)
Change in expenditure
Change in the number of students (in full-time equivalents) Change in expenditure per student
Index of change(2000=100, 2009constant prices)
260250240230220210200190180170160150140130120110100908070
Bra
zil 1,
2
Slov
ak R
epub
lic 3
Esto
nia 2
Irel
and 1
Cze
ch R
epub
lic
Pola
nd 1
Uni
ted
Kin
gdom
Hun
gary
1, 2
Aus
tral
ia
OEC
D a
vera
ge
Can
ada 3
Spai
n
Net
herl
ands
Icel
and
Finl
and
Switz
erla
nd 1
Uni
ted
Stat
es
Swed
en
Nor
way
2
Potr
ugal
1
Mex
ico
Aus
tria
Japa
n 3
Ger
man
y
Bel
gium
Den
mar
k 3
Isra
el
Fran
ce
Italy
1
Kore
a
1. Public institutions only.
2. Public expenditure only.
3. Some levels of education are included with others. Refer to «x» code in Table B1.1a for details.
Note: Countries are ranked in descending order of change in expenditure per student by educational institutions.
Source: OECD, 2012. Tables B1.5a and B1.5b. See Annex 3 for notes (www.oecd.org/edu/eag2012).
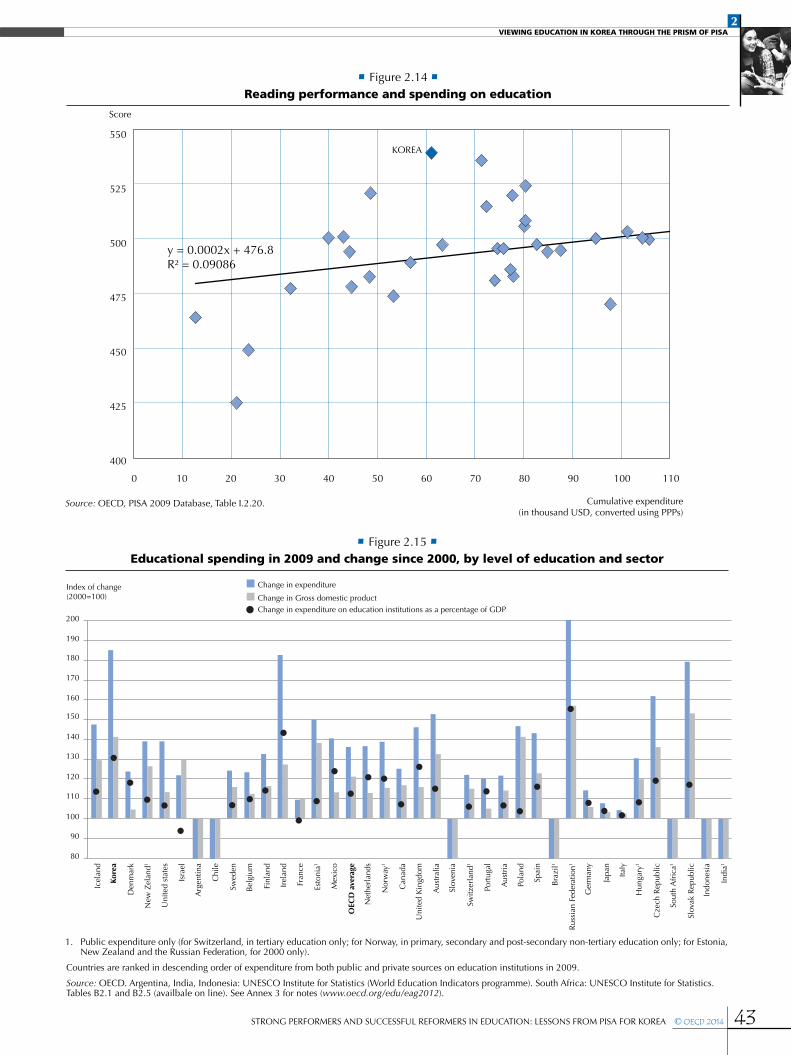
2VIEWING EDUCATION IN KOREA THROUGH THE PRISM OF PISA
43STRONG PERFORMERS AND SUCCESSFUL REFORMERS IN EDUCATION: LESSONS FROM PISA FOR KOREA © OECD 2014
• Figure 2.14 •Reading performance and spending on education
Source: OECD, PISA 2009 Database, Table I.2.20.
Score
Cumulative expenditure(in thousand USD, converted using PPPs)
0 10 20 30 40 50 60 70 80 11090 100
550
525
500
475
450
425
400
y = 0.0002x + 476.8R² = 0.09086
KOREA
• Figure 2.15 •Educational spending in 2009 and change since 2000, by level of education and sector
1. Public expenditure only (for Switzerland, in tertiary education only; for Norway, in primary, secondary and post-secondary non-tertiary education only; for Estonia, New Zealand and the Russian Federation, for 2000 only).
Countries are ranked in descending order of expenditure from both public and private sources on education institutions in 2009.
Source: OECD. Argentina, India, Indonesia: UNESCO Institute for Statistics (World Education Indicators programme). South Africa: UNESCO Institute for Statistics. Tables B2.1 and B2.5 (availbale on line). See Annex 3 for notes (www.oecd.org/edu/eag2012).
Index of change (2000=100)
200
190
180
170
160
150
140
130
120
110
100
90
80
Icel
and
Den
mar
k
New
Zel
and1
Uni
ted
stat
es
Isra
el
Arg
entin
a
Chi
le
Swed
en
Bel
gium
Finl
and
Irel
and
Fran
ce
Esto
nia1
Mex
ico
Net
herl
ands
Nor
way
1
Can
ada
Uni
ted
Kin
gdom
OEC
D a
vera
ge
Kore
a
Aus
tral
ia
Slov
enia
Switz
erla
nd1
Port
ugal
Aus
tria
Pola
nd
Spai
n
Bra
zil1
Rus
sian
Fed
erat
ion1
Ger
man
y
Japa
n
Italy
Hun
gary
1
Slov
ak R
epub
lic
Cze
ch R
epub
lic
Indo
nesi
a
Indi
a1
Sout
h A
fric
a1
Change in expenditure
Change in Gross domestic product Change in expenditure on education institutions as a percentage of GDP
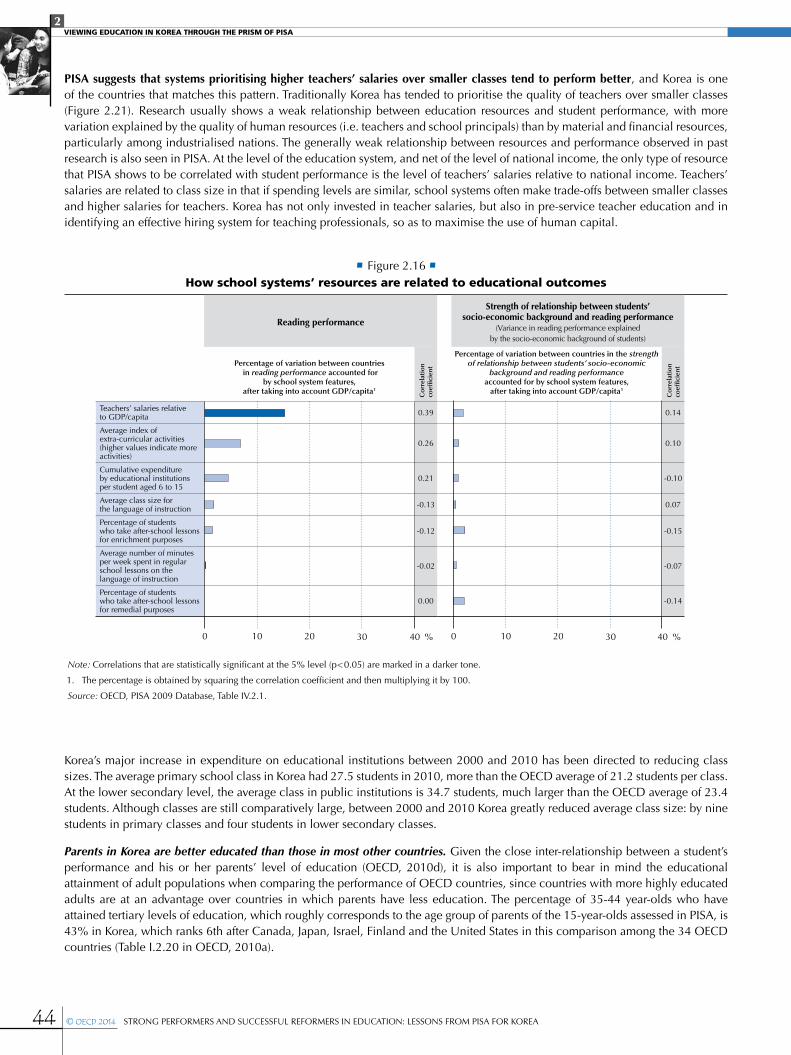
2VIEWING EDUCATION IN KOREA THROUGH THE PRISM OF PISA
44 © OECD 2014 STRONG PERFORMERS AND SUCCESSFUL REFORMERS IN EDUCATION: LESSONS FROM PISA FOR KOREA
PISA suggests that systems prioritising higher teachers’ salaries over smaller classes tend to perform better, and Korea is one of the countries that matches this pattern. Traditionally Korea has tended to prioritise the quality of teachers over smaller classes (Figure 2.21). Research usually shows a weak relationship between education resources and student performance, with more variation explained by the quality of human resources (i.e. teachers and school principals) than by material and financial resources, particularly among industrialised nations. The generally weak relationship between resources and performance observed in past research is also seen in PISA. At the level of the education system, and net of the level of national income, the only type of resource that PISA shows to be correlated with student performance is the level of teachers’ salaries relative to national income. Teachers’ salaries are related to class size in that if spending levels are similar, school systems often make trade-offs between smaller classes and higher salaries for teachers. Korea has not only invested in teacher salaries, but also in pre-service teacher education and in identifying an effective hiring system for teaching professionals, so as to maximise the use of human capital.
Korea’s major increase in expenditure on educational institutions between 2000 and 2010 has been directed to reducing class sizes. The average primary school class in Korea had 27.5 students in 2010, more than the OECD average of 21.2 students per class. At the lower secondary level, the average class in public institutions is 34.7 students, much larger than the OECD average of 23.4 students. Although classes are still comparatively large, between 2000 and 2010 Korea greatly reduced average class size: by nine students in primary classes and four students in lower secondary classes.
Parents in Korea are better educated than those in most other countries. Given the close inter-relationship between a student’s performance and his or her parents’ level of education (OECD, 2010d), it is also important to bear in mind the educational attainment of adult populations when comparing the performance of OECD countries, since countries with more highly educated adults are at an advantage over countries in which parents have less education. The percentage of 35-44 year-olds who have attained tertiary levels of education, which roughly corresponds to the age group of parents of the 15-year-olds assessed in PISA, is 43% in Korea, which ranks 6th after Canada, Japan, Israel, Finland and the United States in this comparison among the 34 OECD countries (Table I.2.20 in OECD, 2010a).
• Figure 2.16 •How school systems’ resources are related to educational outcomes
Note: Correlations that are statistically significant at the 5% level (p < 0.05) are marked in a darker tone.
1. The percentage is obtained by squaring the correlation coefficient and then multiplying it by 100.
Source: OECD, PISA 2009 Database, Table IV.2.1.
0 10 20 30 40 % 0 10 20 30 40 %
Reading performance
Strength of relationship between students’ socio-economic background and reading performance
(Variance in reading performance explained by the socio-economic background of students)
Percentage of variation between countries in reading performance accounted for
by school system features, after taking into account GDP/capita1
Co
rrel
atio
n co
effic
ient
Percentage of variation between countries in the strength of relationship between students’ socio-economic
background and reading performance accounted for by school system features,
after taking into account GDP/capita1
Co
rrel
atio
n co
effic
ient
Teachers’ salaries relative to GDP/capita 0.39 0.14
Average index of extra-curricular activities(higher values indicate more activities)
0.26 0.10
Cumulative expenditure by educational institutions per student aged 6 to 15
0.21 -0.10
Average class size for the language of instruction -0.13 0.07
Percentage of students who take after-school lessons for enrichment purposes
-0.12 -0.15
Average number of minutes per week spent in regular school lessons on the language of instruction
-0.02 -0.07
Percentage of students who take after-school lessons for remedial purposes
0.00 -0.14
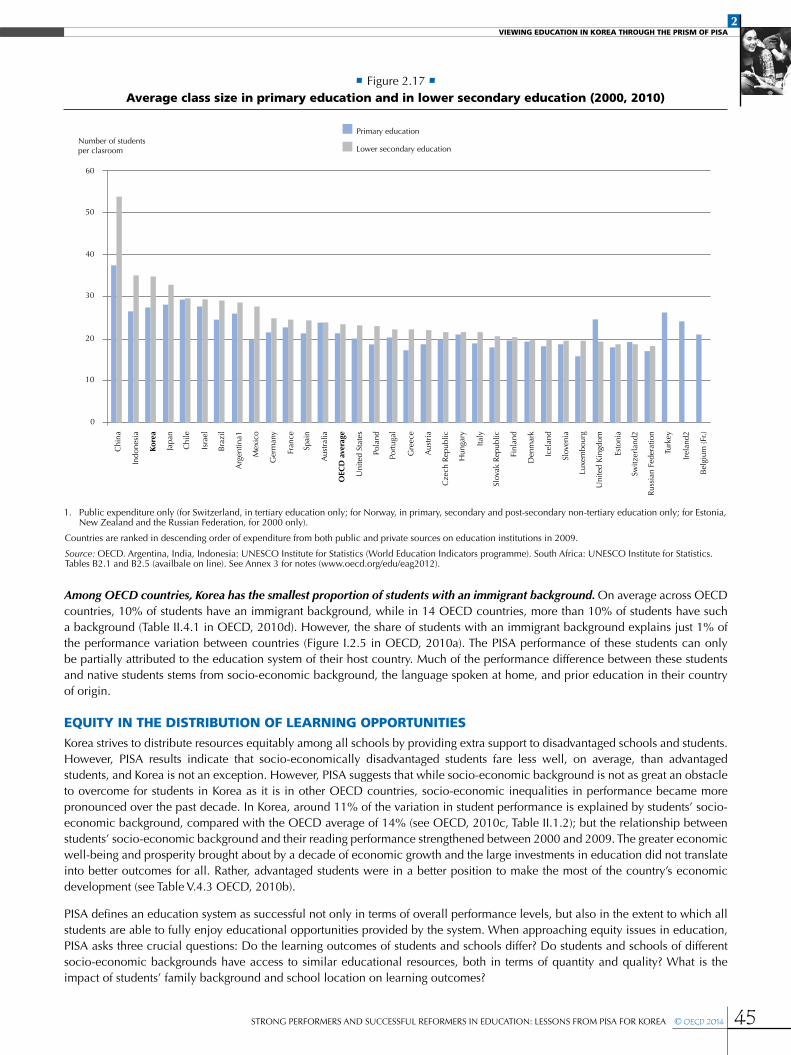
2VIEWING EDUCATION IN KOREA THROUGH THE PRISM OF PISA
45STRONG PERFORMERS AND SUCCESSFUL REFORMERS IN EDUCATION: LESSONS FROM PISA FOR KOREA © OECD 2014
Among OECD countries, Korea has the smallest proportion of students with an immigrant background. On average across OECD countries, 10% of students have an immigrant background, while in 14 OECD countries, more than 10% of students have such a background (Table II.4.1 in OECD, 2010d). However, the share of students with an immigrant background explains just 1% of the performance variation between countries (Figure I.2.5 in OECD, 2010a). The PISA performance of these students can only be partially attributed to the education system of their host country. Much of the performance difference between these students and native students stems from socio-economic background, the language spoken at home, and prior education in their country of origin.
EQUITY IN THE DISTRIBUTION OF LEARNING OPPORTUNITIESKorea strives to distribute resources equitably among all schools by providing extra support to disadvantaged schools and students. However, PISA results indicate that socio-economically disadvantaged students fare less well, on average, than advantaged students, and Korea is not an exception. However, PISA suggests that while socio-economic background is not as great an obstacle to overcome for students in Korea as it is in other OECD countries, socio-economic inequalities in performance became more pronounced over the past decade. In Korea, around 11% of the variation in student performance is explained by students’ socio-economic background, compared with the OECD average of 14% (see OECD, 2010c, Table II.1.2); but the relationship between students’ socio-economic background and their reading performance strengthened between 2000 and 2009. The greater economic well-being and prosperity brought about by a decade of economic growth and the large investments in education did not translate into better outcomes for all. Rather, advantaged students were in a better position to make the most of the country’s economic development (see Table V.4.3 OECD, 2010b).
PISA defines an education system as successful not only in terms of overall performance levels, but also in the extent to which all students are able to fully enjoy educational opportunities provided by the system. When approaching equity issues in education, PISA asks three crucial questions: Do the learning outcomes of students and schools differ? Do students and schools of different socio-economic backgrounds have access to similar educational resources, both in terms of quantity and quality? What is the impact of students’ family background and school location on learning outcomes?
• Figure 2.17 •Average class size in primary education and in lower secondary education (2000, 2010)
Primary education
Lower secondary educationNumber of students per clasroom
60
50
40
30
20
10
0
Chi
na
Indo
nesi
a
Japa
n
Chi
le
Isra
el
Bra
zil
Arg
entin
a1
Mex
ico
Ger
man
y
Fran
ce
Spai
n
Aus
tral
ia
Uni
ted
Stat
es
Pola
nd
Port
ugal
Gre
ece
Aus
tria
Cze
ch R
epub
lic
Hun
gary
Italy
Slov
ak R
epub
lic
Finl
and
Den
mar
k
Icel
and
Slov
enia
Luxe
mbo
urg
Uni
ted
Kin
gdom
Esto
nia
Switz
erla
nd2
Rus
sian
Fed
erat
ion
Turk
ey
Irel
and2
Bel
gium
(Fr.)
OEC
D a
vera
ge
Kore
a
1. Public expenditure only (for Switzerland, in tertiary education only; for Norway, in primary, secondary and post-secondary non-tertiary education only; for Estonia, New Zealand and the Russian Federation, for 2000 only).
Countries are ranked in descending order of expenditure from both public and private sources on education institutions in 2009.
Source: OECD. Argentina, India, Indonesia: UNESCO Institute for Statistics (World Education Indicators programme). South Africa: UNESCO Institute for Statistics. Tables B2.1 and B2.5 (availbale on line). See Annex 3 for notes (www.oecd.org/edu/eag2012).
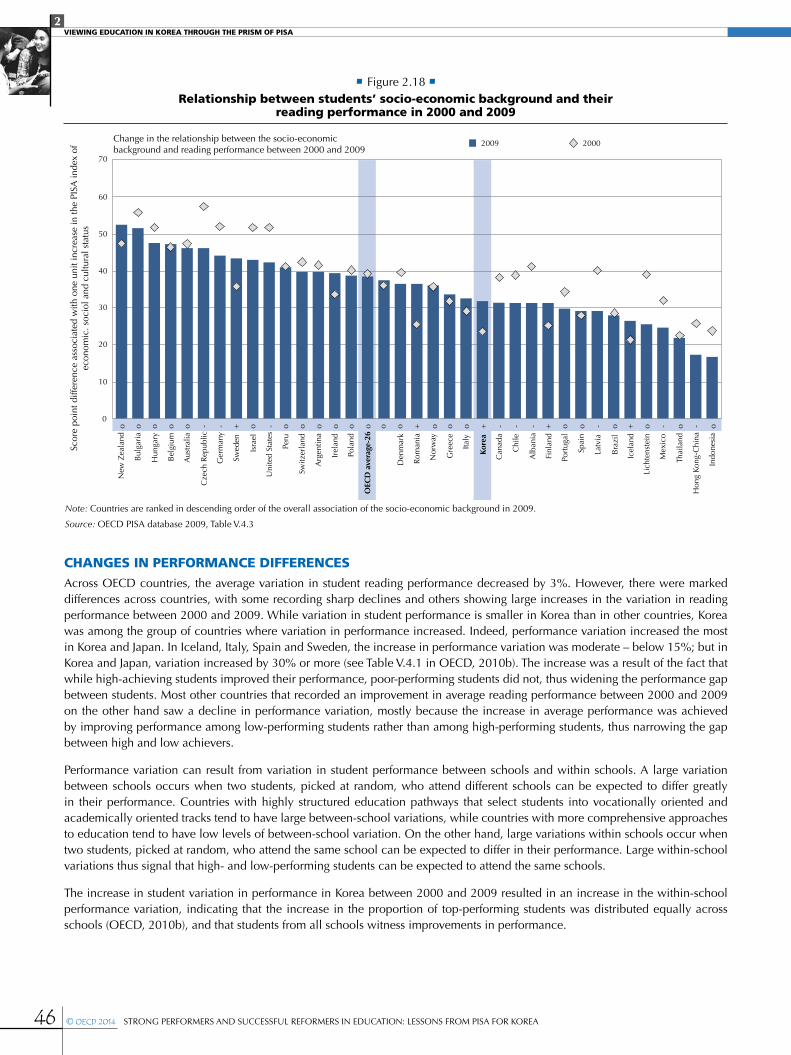
2VIEWING EDUCATION IN KOREA THROUGH THE PRISM OF PISA
46 © OECD 2014 STRONG PERFORMERS AND SUCCESSFUL REFORMERS IN EDUCATION: LESSONS FROM PISA FOR KOREA
CHANGES IN PERFORMANCE DIFFERENCESAcross OECD countries, the average variation in student reading performance decreased by 3%. However, there were marked differences across countries, with some recording sharp declines and others showing large increases in the variation in reading performance between 2000 and 2009. While variation in student performance is smaller in Korea than in other countries, Korea was among the group of countries where variation in performance increased. Indeed, performance variation increased the most in Korea and Japan. In Iceland, Italy, Spain and Sweden, the increase in performance variation was moderate – below 15%; but in Korea and Japan, variation increased by 30% or more (see Table V.4.1 in OECD, 2010b). The increase was a result of the fact that while high-achieving students improved their performance, poor-performing students did not, thus widening the performance gap between students. Most other countries that recorded an improvement in average reading performance between 2000 and 2009 on the other hand saw a decline in performance variation, mostly because the increase in average performance was achieved by improving performance among low-performing students rather than among high-performing students, thus narrowing the gap between high and low achievers.
Performance variation can result from variation in student performance between schools and within schools. A large variation between schools occurs when two students, picked at random, who attend different schools can be expected to differ greatly in their performance. Countries with highly structured education pathways that select students into vocationally oriented and academically oriented tracks tend to have large between-school variations, while countries with more comprehensive approaches to education tend to have low levels of between-school variation. On the other hand, large variations within schools occur when two students, picked at random, who attend the same school can be expected to differ in their performance. Large within-school variations thus signal that high- and low-performing students can be expected to attend the same schools.
The increase in student variation in performance in Korea between 2000 and 2009 resulted in an increase in the within-school performance variation, indicating that the increase in the proportion of top-performing students was distributed equally across schools (OECD, 2010b), and that students from all schools witness improvements in performance.
• Figure 2.18 •Relationship between students’ socio-economic background and their
reading performance in 2000 and 2009
Note: Countries are ranked in descending order of the overall association of the socio-economic background in 2009.
Source: OECD PISA database 2009, Table V.4.3
2009 2000
70
60
50
40
30
20
10
0
Scor
e po
int d
iffer
ence
ass
ocia
ted
with
one
uni
t inc
reas
e in
the
PISA
inde
x of
econ
omic
. soc
iol a
nd c
ultu
ral s
tatu
s
o o o o o o o o o o o o o o o o o o o o oo- - - - - - - - o-+ + + ++
New
Zea
land
Bul
gari
a
Hun
gary
Bel
gium
Aus
tral
ia
Cze
ch R
epub
lic
Ger
man
y
Swed
en
Isra
el
Uni
ted
Stat
es
Peru
Switz
erla
nd
Arg
entin
a
Irel
and
Pola
nd
Den
mar
k
Rom
ania
Nor
way
Gre
ece
Italy
Can
ada
Chi
le
Alb
ania
Finl
and
Port
ugal
Spai
n
Latv
ia
Bra
zil
Icel
and
Thai
land
Lich
tens
tein
Mex
ico
Hon
g Ko
ng-C
hina
Indo
nesi
a
Kore
a
OEC
D a
vera
ge-2
6
Change in the relationship between the socio-economic background and reading performance between 2000 and 2009
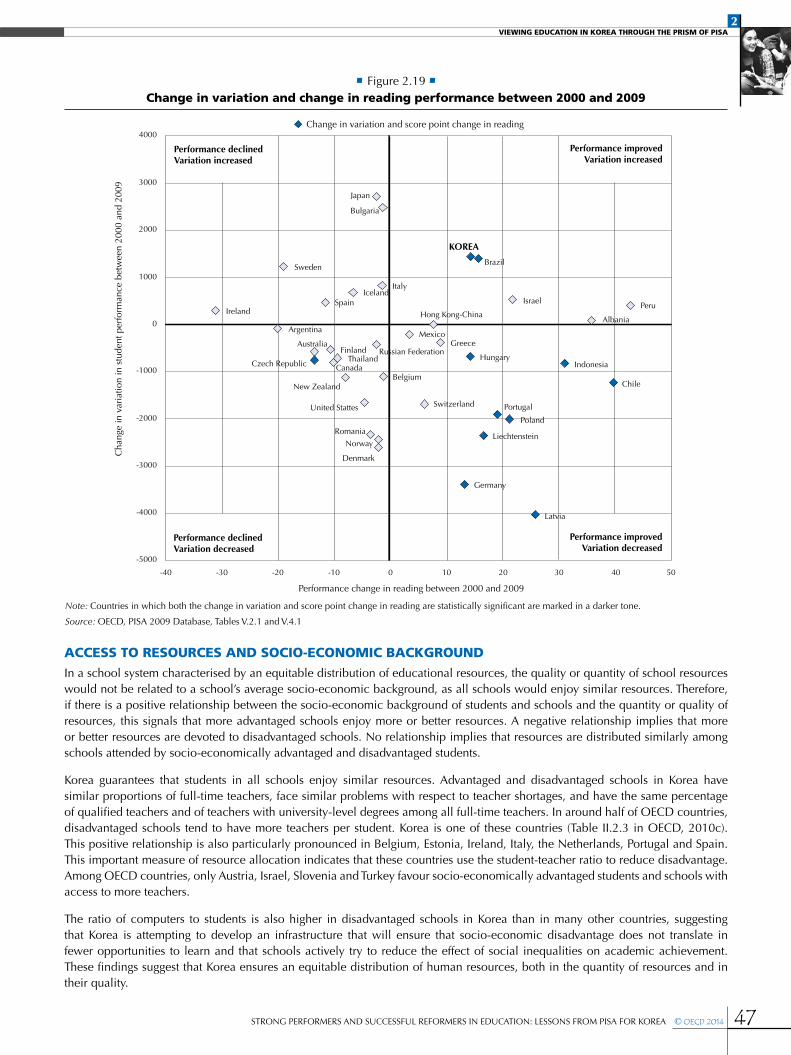
2VIEWING EDUCATION IN KOREA THROUGH THE PRISM OF PISA
47STRONG PERFORMERS AND SUCCESSFUL REFORMERS IN EDUCATION: LESSONS FROM PISA FOR KOREA © OECD 2014
ACCESS TO RESOURCES AND SOCIO-ECONOMIC BACKGROUNDIn a school system characterised by an equitable distribution of educational resources, the quality or quantity of school resources would not be related to a school’s average socio-economic background, as all schools would enjoy similar resources. Therefore, if there is a positive relationship between the socio-economic background of students and schools and the quantity or quality of resources, this signals that more advantaged schools enjoy more or better resources. A negative relationship implies that more or better resources are devoted to disadvantaged schools. No relationship implies that resources are distributed similarly among schools attended by socio-economically advantaged and disadvantaged students.
Korea guarantees that students in all schools enjoy similar resources. Advantaged and disadvantaged schools in Korea have similar proportions of full-time teachers, face similar problems with respect to teacher shortages, and have the same percentage of qualified teachers and of teachers with university-level degrees among all full-time teachers. In around half of OECD countries, disadvantaged schools tend to have more teachers per student. Korea is one of these countries (Table II.2.3 in OECD, 2010c). This positive relationship is also particularly pronounced in Belgium, Estonia, Ireland, Italy, the Netherlands, Portugal and Spain. This important measure of resource allocation indicates that these countries use the student-teacher ratio to reduce disadvantage. Among OECD countries, only Austria, Israel, Slovenia and Turkey favour socio-economically advantaged students and schools with access to more teachers.
The ratio of computers to students is also higher in disadvantaged schools in Korea than in many other countries, suggesting that Korea is attempting to develop an infrastructure that will ensure that socio-economic disadvantage does not translate in fewer opportunities to learn and that schools actively try to reduce the effect of social inequalities on academic achievement. These findings suggest that Korea ensures an equitable distribution of human resources, both in the quantity of resources and in their quality.
• Figure 2.19 •Change in variation and change in reading performance between 2000 and 2009
Note: Countries in which both the change in variation and score point change in reading are statistically significant are marked in a darker tone.
Source: OECD, PISA 2009 Database, Tables V.2.1 and V.4.1
Change in variation and score point change in reading
Performance declinedVariation increased
Performance declinedVariation decreased
Performance improvedVariation increased
Performance improvedVariation decreased
Japan
Bulgaria
Sweden
KOREA
Brazil
ItalyIceland
SpainIreland Hong Kong-China
Israel
Argentina
Australia
Peru
Albania
FinlandThailand
Canada
Mexico
Russian FederationGreece
Indonesia
Chile
Portugal
Hungary
Belgium
Switzerland
New Zealand
United Stattes
Poland
Liechtenstein
Germany
Latvia
Romania
Norway
DenmarkCha
nge
in v
aria
tion
in s
tude
nt p
erfo
rman
ce b
etw
een
2000
and
200
9
4000
3000
2000
1000
-1000
-2000
-3000
-4000
-5000
0
-40 -30 -20 -10 10 20 30 40 500
Performance change in reading between 2000 and 2009
Czech Republic
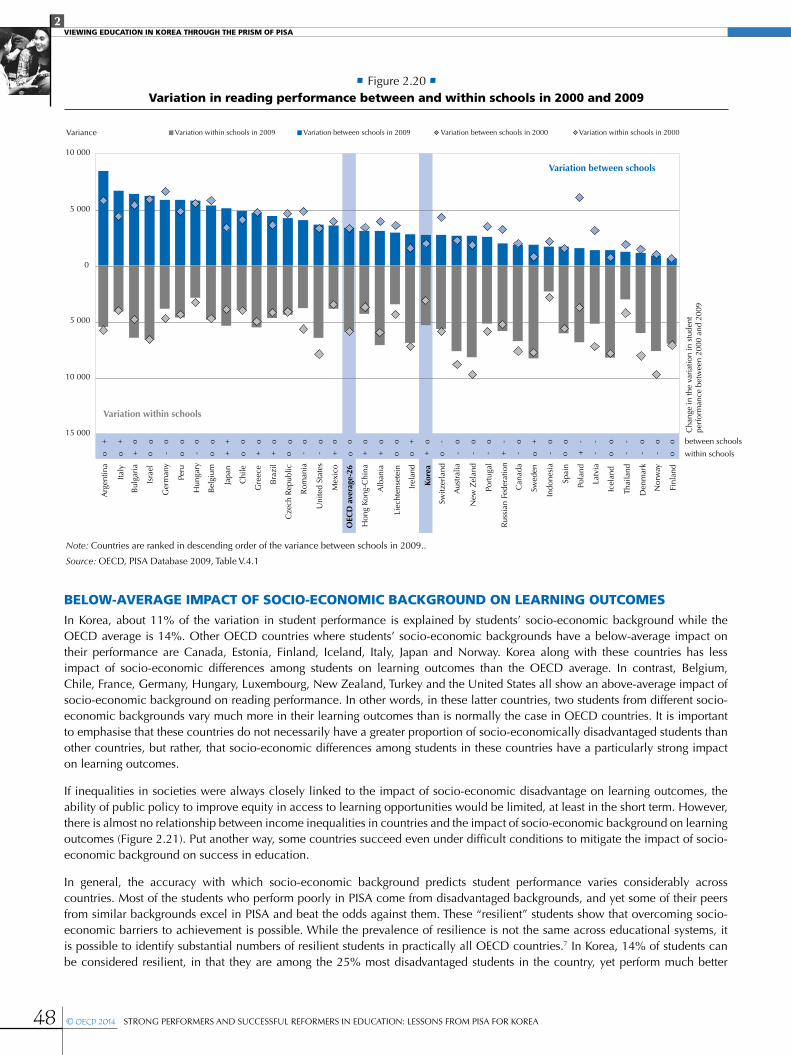
2VIEWING EDUCATION IN KOREA THROUGH THE PRISM OF PISA
48 © OECD 2014 STRONG PERFORMERS AND SUCCESSFUL REFORMERS IN EDUCATION: LESSONS FROM PISA FOR KOREA
BELOW-AVERAGE IMPACT OF SOCIO-ECONOMIC BACKGROUND ON LEARNING OUTCOMESIn Korea, about 11% of the variation in student performance is explained by students’ socio-economic background while the OECD average is 14%. Other OECD countries where students’ socio-economic backgrounds have a below-average impact on their performance are Canada, Estonia, Finland, Iceland, Italy, Japan and Norway. Korea along with these countries has less impact of socio-economic differences among students on learning outcomes than the OECD average. In contrast, Belgium, Chile, France, Germany, Hungary, Luxembourg, New Zealand, Turkey and the United States all show an above-average impact of socio-economic background on reading performance. In other words, in these latter countries, two students from different socio-economic backgrounds vary much more in their learning outcomes than is normally the case in OECD countries. It is important to emphasise that these countries do not necessarily have a greater proportion of socio-economically disadvantaged students than other countries, but rather, that socio-economic differences among students in these countries have a particularly strong impact on learning outcomes.
If inequalities in societies were always closely linked to the impact of socio-economic disadvantage on learning outcomes, the ability of public policy to improve equity in access to learning opportunities would be limited, at least in the short term. However, there is almost no relationship between income inequalities in countries and the impact of socio-economic background on learning outcomes (Figure 2.21). Put another way, some countries succeed even under difficult conditions to mitigate the impact of socio-economic background on success in education.
In general, the accuracy with which socio-economic background predicts student performance varies considerably across countries. Most of the students who perform poorly in PISA come from disadvantaged backgrounds, and yet some of their peers from similar backgrounds excel in PISA and beat the odds against them. These “resilient” students show that overcoming socio-economic barriers to achievement is possible. While the prevalence of resilience is not the same across educational systems, it is possible to identify substantial numbers of resilient students in practically all OECD countries.7 In Korea, 14% of students can be considered resilient, in that they are among the 25% most disadvantaged students in the country, yet perform much better
• Figure 2.20 •Variation in reading performance between and within schools in 2000 and 2009
Note: Countries are ranked in descending order of the variance between schools in 2009..
Source: OECD, PISA Database 2009, Table V.4.1
Variation between schools
Variation within schools
Variation within schools in 2009 Variation between schools in 2009 Variation between schools in 2000 Variation within schools in 2000
10 000
5 000
0
5 000
10 000
15 000 Cha
nge
in th
e va
riat
ion
in s
tude
ntpe
rfor
man
ce b
etw
een
2000
and
200
9
between schools
within schools
o o o o o o o o o o o o o o o o o o o o o o o oo ooooooooooooooo o
oo - - - ------------ - -
-+ + + +
+++++++++ +
+A
rgen
tina
Italy
Bul
gari
a
Isra
el
Hun
gary
Bel
gium
Japa
n
Chi
le
Gre
ece
Bra
zil
Cze
ch R
epub
lic
Rom
ania
Uni
ted
Stat
es
Mex
ico
Hon
g Ko
ng-C
hina
Alb
ania
Liec
hten
sete
in
Irel
and
Switz
erla
nd
Aus
tral
ia
New
Zel
and
Port
ugal
Rus
sian
Fed
erat
ion
Can
ada
Swed
en
Pola
nd
Indo
nesi
a
Spai
n
Kore
a
OEC
D a
vera
ge-2
6
Ger
man
y
Peru
Latv
ia
Icel
and
Thai
land
Den
mar
k
Nor
way
Finl
and
Variance
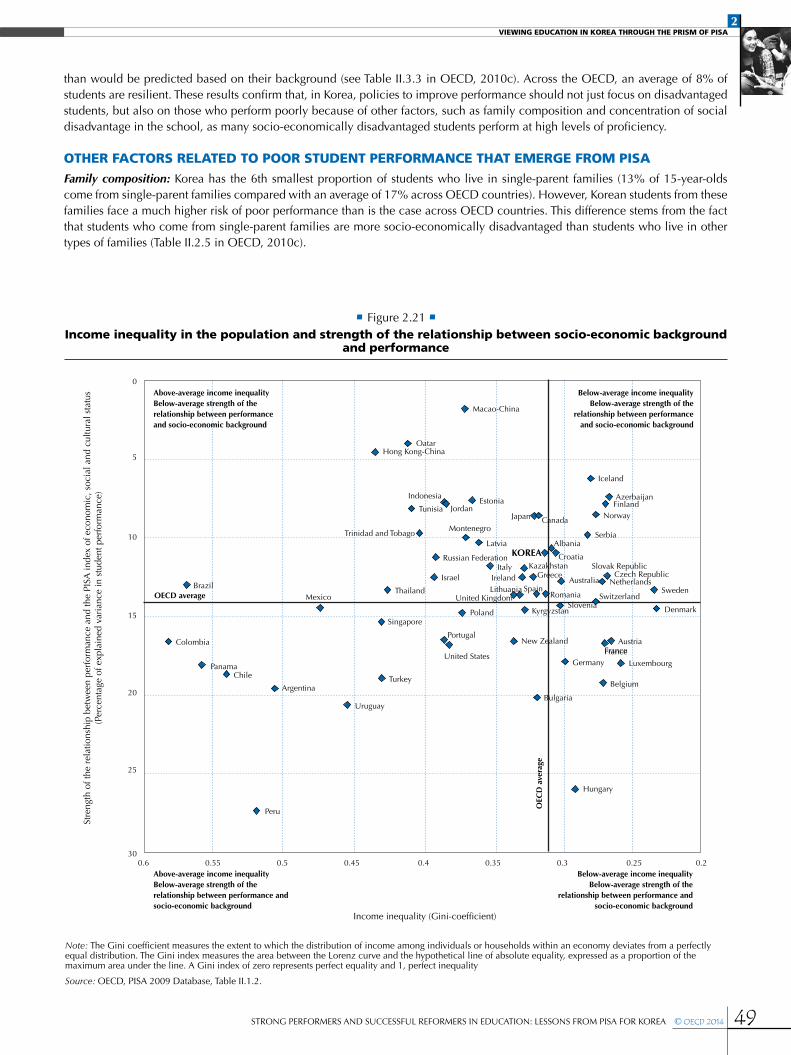
2VIEWING EDUCATION IN KOREA THROUGH THE PRISM OF PISA
49STRONG PERFORMERS AND SUCCESSFUL REFORMERS IN EDUCATION: LESSONS FROM PISA FOR KOREA © OECD 2014
than would be predicted based on their background (see Table II.3.3 in OECD, 2010c). Across the OECD, an average of 8% of students are resilient. These results confirm that, in Korea, policies to improve performance should not just focus on disadvantaged students, but also on those who perform poorly because of other factors, such as family composition and concentration of social disadvantage in the school, as many socio-economically disadvantaged students perform at high levels of proficiency.
OTHER FACTORS RELATED TO POOR STUDENT PERFORMANCE THAT EMERGE FROM PISAFamily composition: Korea has the 6th smallest proportion of students who live in single-parent families (13% of 15-year-olds come from single-parent families compared with an average of 17% across OECD countries). However, Korean students from these families face a much higher risk of poor performance than is the case across OECD countries. This difference stems from the fact that students who come from single-parent families are more socio-economically disadvantaged than students who live in other types of families (Table II.2.5 in OECD, 2010c).
• Figure 2.21 •Income inequality in the population and strength of the relationship between socio-economic background
and performance
Note: The Gini coefficient measures the extent to which the distribution of income among individuals or households within an economy deviates from a perfectly equal distribution. The Gini index measures the area between the Lorenz curve and the hypothetical line of absolute equality, expressed as a proportion of the maximum area under the line. A Gini index of zero represents perfect equality and 1, perfect inequality
Source: OECD, PISA 2009 Database, Table II.1.2.
Stre
ngth
of t
he r
elat
ions
hip
betw
een
perf
orm
ance
and
the
PISA
inde
x of
eco
nom
ic, s
ocia
l and
cul
tura
l sta
tus
(Per
cent
age
of e
xpla
ined
var
ianc
e in
stu
dent
per
form
ance
)
Income inequality (Gini-coefficient)
0
5
10
15
20
25
300.6 0.55 0.5 0.45 0.4 0.35 0.3 0.25 0.2
Above-average income inequalityBelow-average strength of the relationship between performance and socio-economic background
Above-average income inequalityBelow-average strength of the relationship between performance and socio-economic background
Below-average income inequality Below-average strength of the
relationship between performance and socio-economic background
Below-average income inequality Below-average strength of the
relationship between performance and socio-economic background
Macao-China
OatarHong Kong-China
IndonesiaEstonia
JordanTunisiaJapan Canada
Albania
Iceland
AzerbaijanFinland
Norway
Serbia
CroatiaSlovak Republic
Czech RepublicAustralia Netherlands
SwedenSwitzerland
SloveniaRomania
Kyrgyzstan DenmarkPoland
Portugal
United States
New Zealand
Turkey
Uruguay
Peru
Argentina
ChilePanama
Colombia
Singapore
AustriaFranceFrance
LuxembourgGermany
Belgium
Bulgaria
Hungary
OEC
D a
vera
ge
OECD average
MontenegroTrinidad and Tobago
IsraelItaly
Ireland
KazakhstanGreece
LithuaniaUnited Kingdom
ThailandMexico
Brazil Spain
Latvia
Russian Federation KOREA
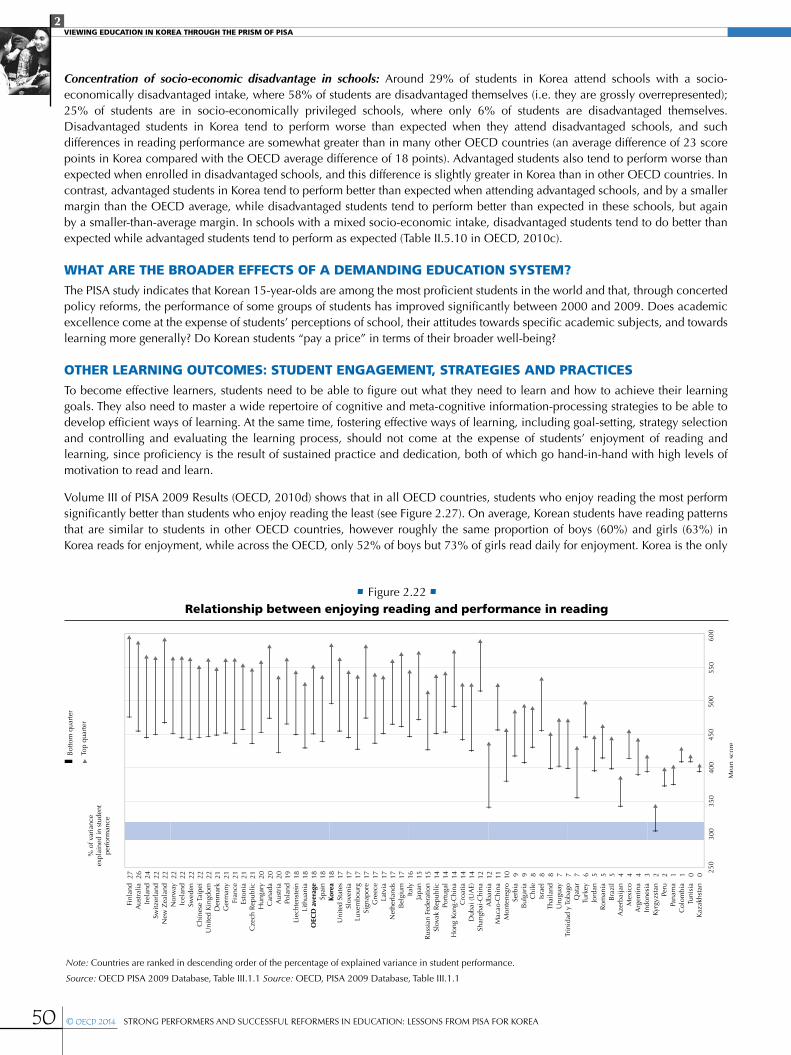
2VIEWING EDUCATION IN KOREA THROUGH THE PRISM OF PISA
50 © OECD 2014 STRONG PERFORMERS AND SUCCESSFUL REFORMERS IN EDUCATION: LESSONS FROM PISA FOR KOREA
Concentration of socio-economic disadvantage in schools: Around 29% of students in Korea attend schools with a socio-economically disadvantaged intake, where 58% of students are disadvantaged themselves (i.e. they are grossly overrepresented); 25% of students are in socio-economically privileged schools, where only 6% of students are disadvantaged themselves. Disadvantaged students in Korea tend to perform worse than expected when they attend disadvantaged schools, and such differences in reading performance are somewhat greater than in many other OECD countries (an average difference of 23 score points in Korea compared with the OECD average difference of 18 points). Advantaged students also tend to perform worse than expected when enrolled in disadvantaged schools, and this difference is slightly greater in Korea than in other OECD countries. In contrast, advantaged students in Korea tend to perform better than expected when attending advantaged schools, and by a smaller margin than the OECD average, while disadvantaged students tend to perform better than expected in these schools, but again by a smaller-than-average margin. In schools with a mixed socio-economic intake, disadvantaged students tend to do better than expected while advantaged students tend to perform as expected (Table II.5.10 in OECD, 2010c).
WHAT ARE THE BROADER EFFECTS OF A DEMANDING EDUCATION SYSTEM?The PISA study indicates that Korean 15-year-olds are among the most proficient students in the world and that, through concerted policy reforms, the performance of some groups of students has improved significantly between 2000 and 2009. Does academic excellence come at the expense of students’ perceptions of school, their attitudes towards specific academic subjects, and towards learning more generally? Do Korean students “pay a price” in terms of their broader well-being?
OTHER LEARNING OUTCOMES: STUDENT ENGAGEMENT, STRATEGIES AND PRACTICESTo become effective learners, students need to be able to figure out what they need to learn and how to achieve their learning goals. They also need to master a wide repertoire of cognitive and meta-cognitive information-processing strategies to be able to develop efficient ways of learning. At the same time, fostering effective ways of learning, including goal-setting, strategy selection and controlling and evaluating the learning process, should not come at the expense of students’ enjoyment of reading and learning, since proficiency is the result of sustained practice and dedication, both of which go hand-in-hand with high levels of motivation to read and learn.
Volume III of PISA 2009 Results (OECD, 2010d) shows that in all OECD countries, students who enjoy reading the most perform significantly better than students who enjoy reading the least (see Figure 2.27). On average, Korean students have reading patterns that are similar to students in other OECD countries, however roughly the same proportion of boys (60%) and girls (63%) in Korea reads for enjoyment, while across the OECD, only 52% of boys but 73% of girls read daily for enjoyment. Korea is the only
• Figure 2.22 •Relationship between enjoying reading and performance in reading
Note: Countries are ranked in descending order of the percentage of explained variance in student performance.
Source: OECD PISA 2009 Database, Table III.1.1 Source: OECD, PISA 2009 Database, Table III.1.1

2VIEWING EDUCATION IN KOREA THROUGH THE PRISM OF PISA
51STRONG PERFORMERS AND SUCCESSFUL REFORMERS IN EDUCATION: LESSONS FROM PISA FOR KOREA © OECD 2014
OECD country where similar proportions of boys and girls read for enjoyment. However, both Korean boys and girls have grown progressively less likely to read for enjoyment: while in 2000 70% of girls read for enjoyment daily and 69% of boys did, in 2009 these proportions decreased by 8 percentage points. Moreover, while there was a similar decline in many countries, that in Korea was larger than average across OECD countries, where readership declined by three percentage points among girls and by six percentage points among boys (see Figure 2.23).
Korean students’ motivation for reading has generally improved since 2000. Compared with students’ reports in 2000, fewer students find it hard to finish books (a 10 percentage-point improvement); more students like talking about books with other people (an 8 percentage-point improvement); fewer students cannot sit still and read for more than a few minutes (a 2 percentage-point improvement); fewer students read only to get the information they need (a 9 percentage-point improvement); more students report that reading is one of their favourite hobbies (a 5 percentage-point improvement); and fewer students feel that reading is a waste of time (a 3 percentage-point improvement; OECD, 2010b).
While in 2000 Korean students lagged behind their counterparts in many OECD countries with respect to motivation to read, by 2009 students in Korea reported similar levels of motivation to read in some domains as their counterparts and reported better motivation for reading in other domains than students in many other OECD countries. Some 40% of students in Korea reported that reading is one of their favourite hobbies (compared with the OECD average of 33%); 55% reported that they feel happy when they receive a book as a present (compared with the OECD average of 46%); 9% consider reading a waste of time (compared with the OECD average of 23%); 31% reported that they read only to get the information they need (compared with the OECD average of 45%); and 16% reported that that they cannot sit still and read for more than a few minutes (compared with the OECD average of 25%).
There has been considerable debate about what types of reading may be most effective in fostering reading skills and improving reading performance. Across OECD countries, students who read fiction regularly – at least several times a month – because they want to, tend to perform better in reading in all OECD countries except Mexico and Turkey. In most countries, students who regularly read magazines, non-fiction books or newspapers because they want to, tend to perform better in reading. In contrast,
• Figure 2.23•Percentage of students who read for enjoyment in 2000 and 2009
Note: Countries are ranked in descending order of percentage of students who read for enjoyment in 2009.
Source: OECD, PISA 2009 Database, Table V.5.1
2000 2009
Perc
enta
ge o
f stu
dent
s w
ho r
ead
for
enjo
ymen
t
100
90
80
70
60
50
40
30
Cha
nge
in th
e pe
rcen
tage
of
stud
ents
who
rea
d fo
r en
joym
ent
betw
een
2000
and
200
9
Alb
ania
Thai
land
Indo
nesi
a
Peru
Gre
ece
Hon
g Ko
ng-C
hina
Rus
sian
Fed
erat
ion
Bra
zil
Mex
ico
Hun
gary
Bul
gari
a
Latv
iaC
anad
aN
ew Z
elan
d
Pola
nd
Finl
and
Den
mar
kIta
lyIs
rael
Port
ugal
Aus
tral
ia
Swed
en
Icel
and
Fran
ceSp
ain
Nor
way
Ger
man
y
Arg
entin
a
Irel
and
Uni
ted
Stat
es
Cze
ch R
epub
lic
Japa
n
Switz
erla
nd
Bel
gium
Liec
hten
tein
Chi
le
Kore
a
Rom
ania
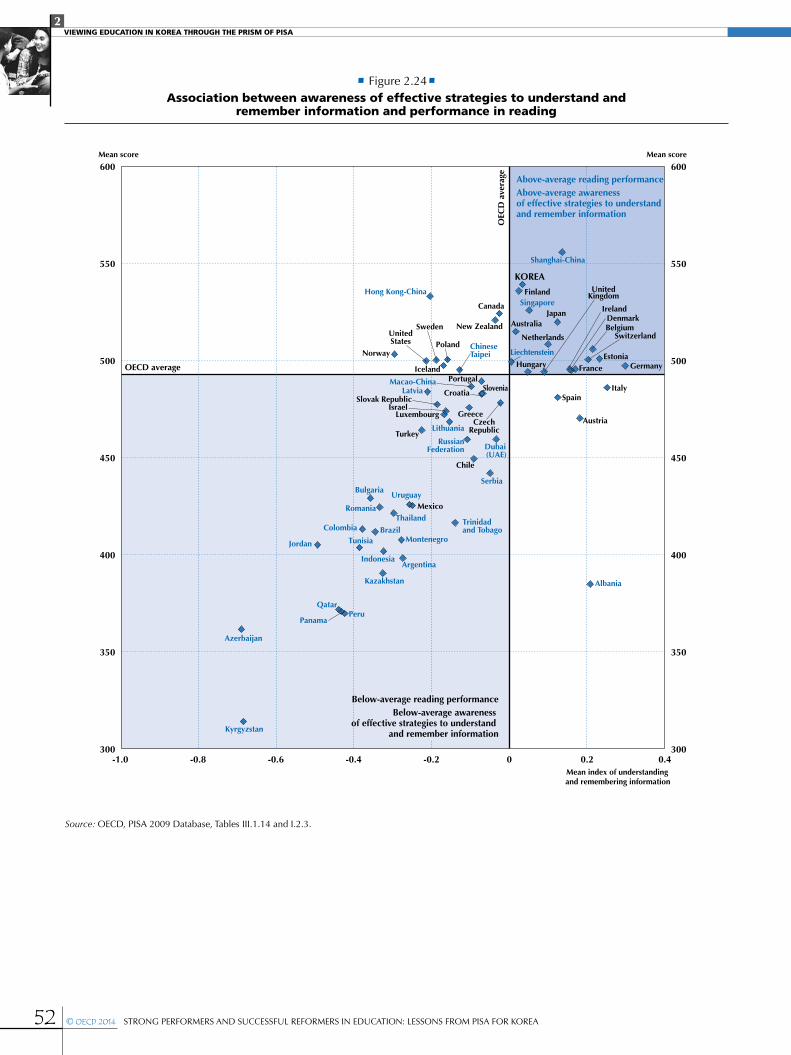
2VIEWING EDUCATION IN KOREA THROUGH THE PRISM OF PISA
52 © OECD 2014 STRONG PERFORMERS AND SUCCESSFUL REFORMERS IN EDUCATION: LESSONS FROM PISA FOR KOREA
Mean score
-1.0 -0.8 -0.6 -0.4 -0.2 0 0.2 0.4
600
550
500
450
400
350
300
600
550
500
450
400
350
300
Mean score
Mean index of understanding and remembering information
OEC
D a
vera
ge
Iceland
Japan
Argentina
Thailand
Peru
Russian Federation
Italy
Norway
Lithuania
Colombia
Macao-China
Netherlands
Bulgaria
Germany
Switzerland Belgium
United Kingdom
Romania
Denmark
Singapore
Sweden
Albania
Latvia
Brazil
Croatia
Israel
Kazakhstan
Panama
Montenegro
Finland
Luxembourg Austria
Turkey
Kyrgyzstan
Uruguay
Chinese Taipei
Canada
Poland
Spain
Mexico
Greece
Hungary
KOREA
Slovak Republic
Hong Kong-China
Tunisia
Estonia
Jordan
Qatar
Ireland
Chile
United States
Azerbaijan
France
New Zealand
Indonesia
Shanghai-China
Serbia
Trinidad and Tobago
Australia
Above-average reading performanceAbove-average awareness of effective strategies to understand and remember information
Below-average reading performanceBelow-average awareness
of effective strategies to understand and remember information
OECD average
Dubai (UAE)
Czech Republic
Liechtenstein
PortugalSlovenia
• Figure 2.24•Association between awareness of effective strategies to understand and
remember information and performance in reading
Source: OECD, PISA 2009 Database, Tables III.1.14 and I.2.3.
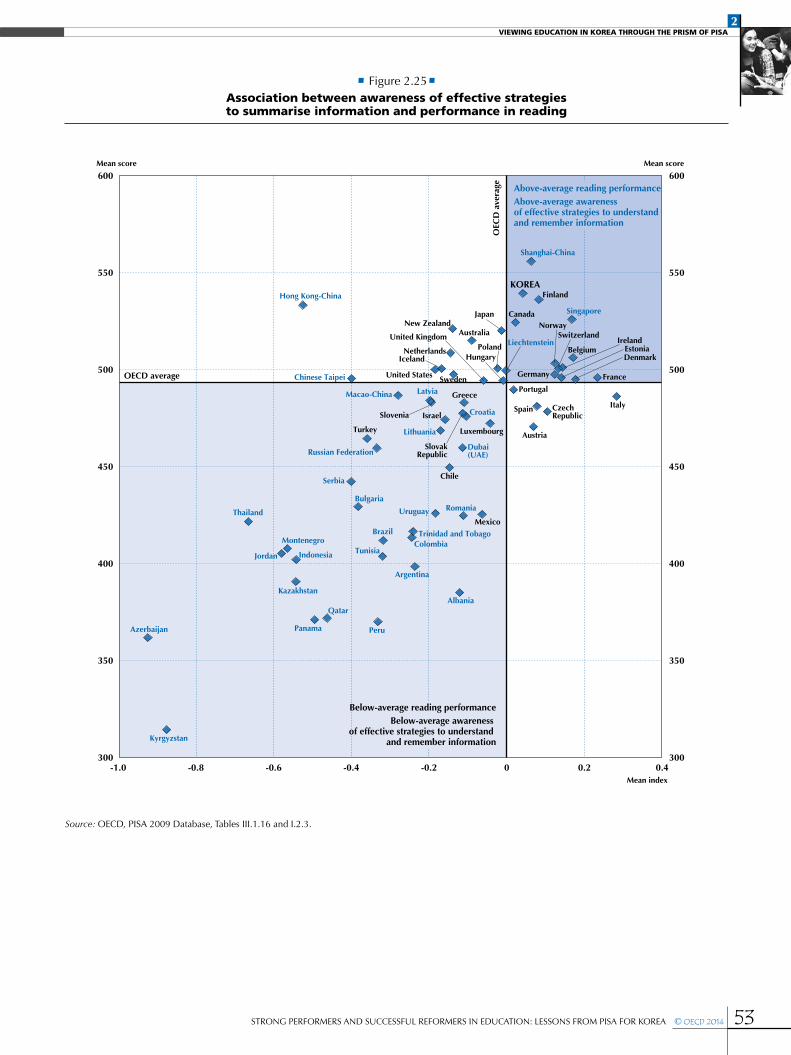
2VIEWING EDUCATION IN KOREA THROUGH THE PRISM OF PISA
53STRONG PERFORMERS AND SUCCESSFUL REFORMERS IN EDUCATION: LESSONS FROM PISA FOR KOREA © OECD 2014
Mean score
-1.0 -0.8 -0.6 -0.4 -0.2 0 0.2 0.4
600
550
500
450
400
350
300
600
550
500
450
400
350
300
Mean score
Mean index
OEC
D a
vera
ge Above-average reading performanceAbove-average awareness of effective strategies to understand and remember information
Below-average reading performanceBelow-average awareness
of effective strategies to understand and remember information
OECD average
Ireland
Italy
Iceland
Japan
Argentina
Thailand
Peru
Russian Federation
Norway
Lithuania
Colombia
Liechtenstein
Macao-China
Netherlands
Bulgaria
Germany
Switzerland
Dubai (UAE)
Belgium
United Kingdom
Romania
Denmark
Singapore
Sweden
Albania
Latvia
Brazil
Croatia Israel
Kazakhstan
Panama
Montenegro
Finland
Luxembourg Austria Turkey
Kyrgyzstan
Uruguay
Chinese Taipei
Canada
Poland
Portugal
Spain
Mexico
Greece
Hungary
KOREA
Czech Republic
Slovak Republic
Hong Kong-China
Tunisia
Estonia
Jordan
Qatar
Chile
United States
Azerbaijan
France
New Zealand
Indonesia
Shanghai-China
Serbia
Slovenia
Trinidad and Tobago
Australia
• Figure 2.25•Association between awareness of effective strategies to summarise information and performance in reading
Source: OECD, PISA 2009 Database, Tables III.1.16 and I.2.3.
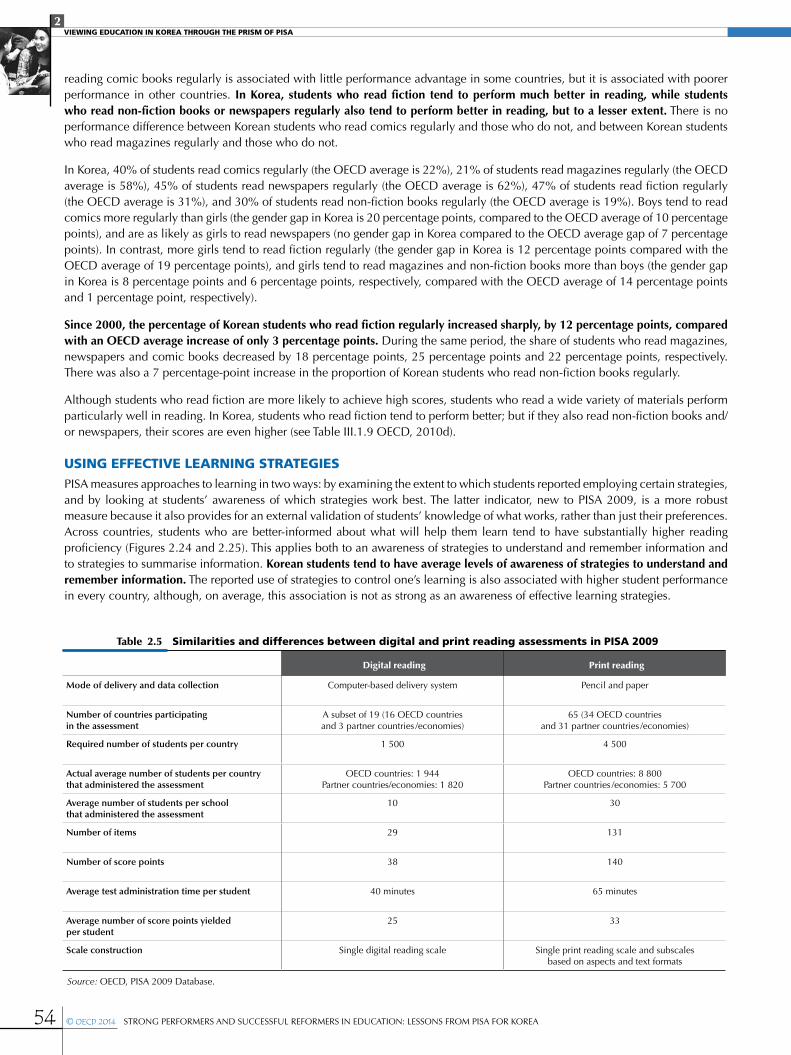
2VIEWING EDUCATION IN KOREA THROUGH THE PRISM OF PISA
54 © OECD 2014 STRONG PERFORMERS AND SUCCESSFUL REFORMERS IN EDUCATION: LESSONS FROM PISA FOR KOREA
reading comic books regularly is associated with little performance advantage in some countries, but it is associated with poorer performance in other countries. In Korea, students who read fiction tend to perform much better in reading, while students who read non-fiction books or newspapers regularly also tend to perform better in reading, but to a lesser extent. There is no performance difference between Korean students who read comics regularly and those who do not, and between Korean students who read magazines regularly and those who do not.
In Korea, 40% of students read comics regularly (the OECD average is 22%), 21% of students read magazines regularly (the OECD average is 58%), 45% of students read newspapers regularly (the OECD average is 62%), 47% of students read fiction regularly (the OECD average is 31%), and 30% of students read non-fiction books regularly (the OECD average is 19%). Boys tend to read comics more regularly than girls (the gender gap in Korea is 20 percentage points, compared to the OECD average of 10 percentage points), and are as likely as girls to read newspapers (no gender gap in Korea compared to the OECD average gap of 7 percentage points). In contrast, more girls tend to read fiction regularly (the gender gap in Korea is 12 percentage points compared with the OECD average of 19 percentage points), and girls tend to read magazines and non-fiction books more than boys (the gender gap in Korea is 8 percentage points and 6 percentage points, respectively, compared with the OECD average of 14 percentage points and 1 percentage point, respectively).
Since 2000, the percentage of Korean students who read fiction regularly increased sharply, by 12 percentage points, compared with an OECD average increase of only 3 percentage points. During the same period, the share of students who read magazines, newspapers and comic books decreased by 18 percentage points, 25 percentage points and 22 percentage points, respectively. There was also a 7 percentage-point increase in the proportion of Korean students who read non-fiction books regularly.
Although students who read fiction are more likely to achieve high scores, students who read a wide variety of materials perform particularly well in reading. In Korea, students who read fiction tend to perform better; but if they also read non-fiction books and/or newspapers, their scores are even higher (see Table III.1.9 OECD, 2010d).
USING EFFECTIVE LEARNING STRATEGIESPISA measures approaches to learning in two ways: by examining the extent to which students reported employing certain strategies, and by looking at students’ awareness of which strategies work best. The latter indicator, new to PISA 2009, is a more robust measure because it also provides for an external validation of students’ knowledge of what works, rather than just their preferences. Across countries, students who are better-informed about what will help them learn tend to have substantially higher reading proficiency (Figures 2.24 and 2.25). This applies both to an awareness of strategies to understand and remember information and to strategies to summarise information. Korean students tend to have average levels of awareness of strategies to understand and remember information. The reported use of strategies to control one’s learning is also associated with higher student performance in every country, although, on average, this association is not as strong as an awareness of effective learning strategies.
Digital reading Print reading
Mode of delivery and data collection Computer-based delivery system Pencil and paper
Number of countries participating in the assessment
A subset of 19 (16 OECD countries and 3 partner countries /economies)
65 (34 OECD countries and 31 partner countries /economies)
Required number of students per country 1 500 4 500
Actual average number of students per country that administered the assessment
OECD countries: 1 944 Partner countries/economies: 1 820
OECD countries: 8 800 Partner countries /economies: 5 700
Average number of students per school that administered the assessment
10 30
Number of items 29 131
Number of score points 38 140
Average test administration time per student 40 minutes 65 minutes
Average number of score points yielded per student
25 33
Scale construction Single digital reading scale Single print reading scale and subscales based on aspects and text formats
Source: OECD, PISA 2009 Database.
Table 2.5 Similarities and differences between digital and print reading assessments in PISA 2009
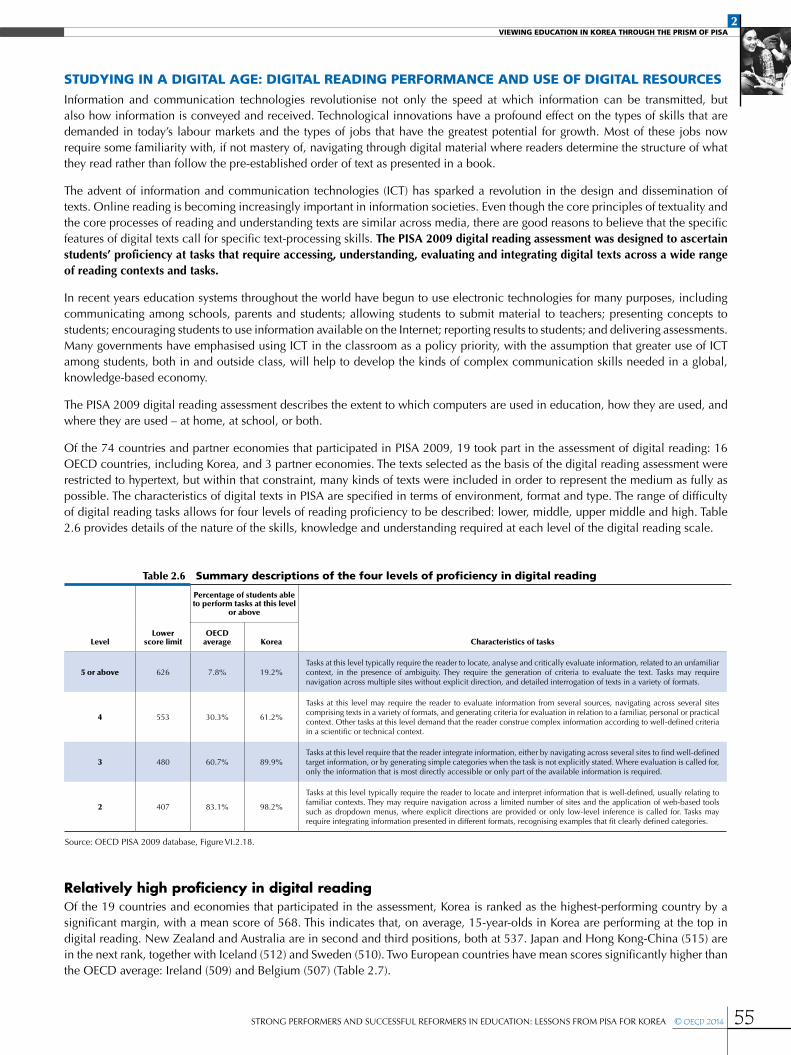
2VIEWING EDUCATION IN KOREA THROUGH THE PRISM OF PISA
55STRONG PERFORMERS AND SUCCESSFUL REFORMERS IN EDUCATION: LESSONS FROM PISA FOR KOREA © OECD 2014
STUDYING IN A DIGITAL AGE: DIGITAL READING PERFORMANCE AND USE OF DIGITAL RESOURCESInformation and communication technologies revolutionise not only the speed at which information can be transmitted, but also how information is conveyed and received. Technological innovations have a profound effect on the types of skills that are demanded in today’s labour markets and the types of jobs that have the greatest potential for growth. Most of these jobs now require some familiarity with, if not mastery of, navigating through digital material where readers determine the structure of what they read rather than follow the pre-established order of text as presented in a book.
The advent of information and communication technologies (ICT) has sparked a revolution in the design and dissemination of texts. Online reading is becoming increasingly important in information societies. Even though the core principles of textuality and the core processes of reading and understanding texts are similar across media, there are good reasons to believe that the specific features of digital texts call for specific text-processing skills. The PISA 2009 digital reading assessment was designed to ascertain students’ proficiency at tasks that require accessing, understanding, evaluating and integrating digital texts across a wide range of reading contexts and tasks.
In recent years education systems throughout the world have begun to use electronic technologies for many purposes, including communicating among schools, parents and students; allowing students to submit material to teachers; presenting concepts to students; encouraging students to use information available on the Internet; reporting results to students; and delivering assessments. Many governments have emphasised using ICT in the classroom as a policy priority, with the assumption that greater use of ICT among students, both in and outside class, will help to develop the kinds of complex communication skills needed in a global, knowledge-based economy.
The PISA 2009 digital reading assessment describes the extent to which computers are used in education, how they are used, and where they are used – at home, at school, or both.
Of the 74 countries and partner economies that participated in PISA 2009, 19 took part in the assessment of digital reading: 16 OECD countries, including Korea, and 3 partner economies. The texts selected as the basis of the digital reading assessment were restricted to hypertext, but within that constraint, many kinds of texts were included in order to represent the medium as fully as possible. The characteristics of digital texts in PISA are specified in terms of environment, format and type. The range of difficulty of digital reading tasks allows for four levels of reading proficiency to be described: lower, middle, upper middle and high. Table 2.6 provides details of the nature of the skills, knowledge and understanding required at each level of the digital reading scale.
Relatively high proficiency in digital readingOf the 19 countries and economies that participated in the assessment, Korea is ranked as the highest-performing country by a significant margin, with a mean score of 568. This indicates that, on average, 15-year-olds in Korea are performing at the top in digital reading. New Zealand and Australia are in second and third positions, both at 537. Japan and Hong Kong-China (515) are in the next rank, together with Iceland (512) and Sweden (510). Two European countries have mean scores significantly higher than the OECD average: Ireland (509) and Belgium (507) (Table 2.7).
Source: OECD PISA 2009 database, Figure VI.2.18.
LevelLower
score limit
Percentage of students able to perform tasks at this level
or above
Characteristics of tasksOECD
average Korea
5 or above 626 7.8% 19.2%Tasks at this level typically require the reader to locate, analyse and critically evaluate information, related to an unfamiliar context, in the presence of ambiguity. They require the generation of criteria to evaluate the text. Tasks may require navigation across multiple sites without explicit direction, and detailed interrogation of texts in a variety of formats.
4 553 30.3% 61.2%
Tasks at this level may require the reader to evaluate information from several sources, navigating across several sites comprising texts in a variety of formats, and generating criteria for evaluation in relation to a familiar, personal or practical context. Other tasks at this level demand that the reader construe complex information according to well-defined criteria in a scientific or technical context.
3 480 60.7% 89.9%Tasks at this level require that the reader integrate information, either by navigating across several sites to find well-defined target information, or by generating simple categories when the task is not explicitly stated. Where evaluation is called for, only the information that is most directly accessible or only part of the available information is required.
2 407 83.1% 98.2%
Tasks at this level typically require the reader to locate and interpret information that is well-defined, usually relating to familiar contexts. They may require navigation across a limited number of sites and the application of web-based tools such as dropdown menus, where explicit directions are provided or only low-level inference is called for. Tasks may require integrating information presented in different formats, recognising examples that fit clearly defined categories.
Table 2.6 Summary descriptions of the four levels of proficiency in digital reading
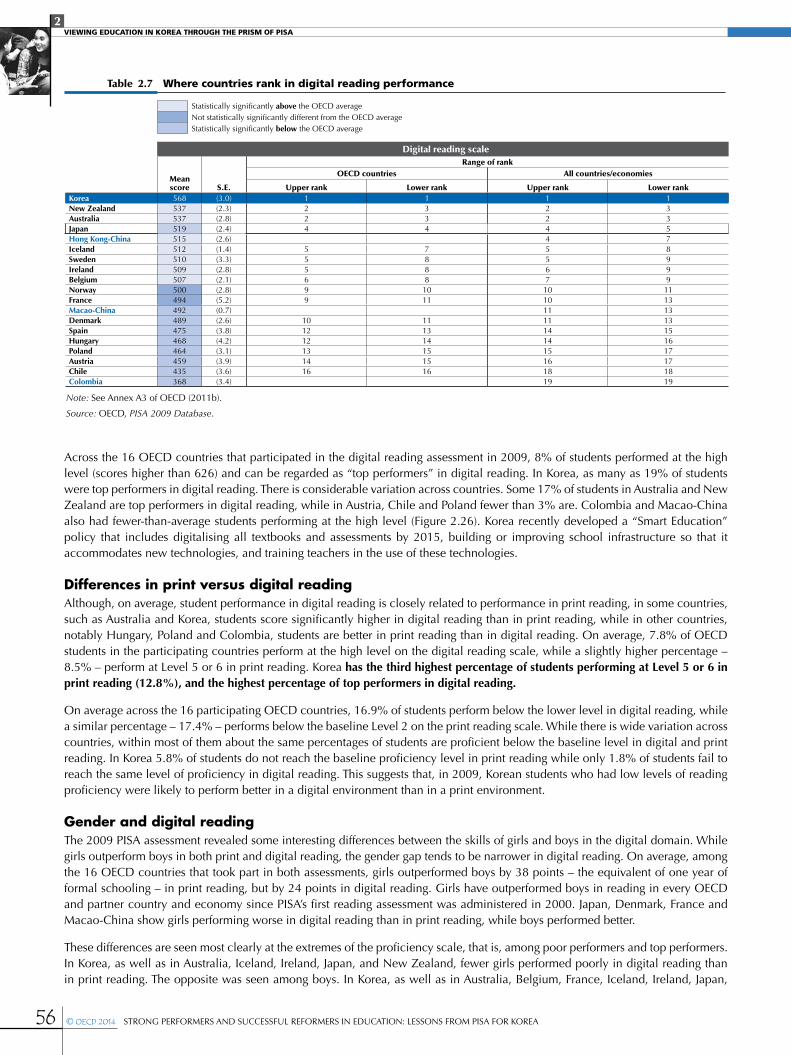
2VIEWING EDUCATION IN KOREA THROUGH THE PRISM OF PISA
56 © OECD 2014 STRONG PERFORMERS AND SUCCESSFUL REFORMERS IN EDUCATION: LESSONS FROM PISA FOR KOREA
Across the 16 OECD countries that participated in the digital reading assessment in 2009, 8% of students performed at the high level (scores higher than 626) and can be regarded as “top performers” in digital reading. In Korea, as many as 19% of students were top performers in digital reading. There is considerable variation across countries. Some 17% of students in Australia and New Zealand are top performers in digital reading, while in Austria, Chile and Poland fewer than 3% are. Colombia and Macao-China also had fewer-than-average students performing at the high level (Figure 2.26). Korea recently developed a “Smart Education” policy that includes digitalising all textbooks and assessments by 2015, building or improving school infrastructure so that it accommodates new technologies, and training teachers in the use of these technologies.
Differences in print versus digital readingAlthough, on average, student performance in digital reading is closely related to performance in print reading, in some countries, such as Australia and Korea, students score significantly higher in digital reading than in print reading, while in other countries, notably Hungary, Poland and Colombia, students are better in print reading than in digital reading. On average, 7.8% of OECD students in the participating countries perform at the high level on the digital reading scale, while a slightly higher percentage – 8.5% – perform at Level 5 or 6 in print reading. Korea has the third highest percentage of students performing at Level 5 or 6 in print reading (12.8%), and the highest percentage of top performers in digital reading.
On average across the 16 participating OECD countries, 16.9% of students perform below the lower level in digital reading, while a similar percentage – 17.4% – performs below the baseline Level 2 on the print reading scale. While there is wide variation across countries, within most of them about the same percentages of students are proficient below the baseline level in digital and print reading. In Korea 5.8% of students do not reach the baseline proficiency level in print reading while only 1.8% of students fail to reach the same level of proficiency in digital reading. This suggests that, in 2009, Korean students who had low levels of reading proficiency were likely to perform better in a digital environment than in a print environment.
Gender and digital readingThe 2009 PISA assessment revealed some interesting differences between the skills of girls and boys in the digital domain. While girls outperform boys in both print and digital reading, the gender gap tends to be narrower in digital reading. On average, among the 16 OECD countries that took part in both assessments, girls outperformed boys by 38 points – the equivalent of one year of formal schooling – in print reading, but by 24 points in digital reading. Girls have outperformed boys in reading in every OECD and partner country and economy since PISA’s first reading assessment was administered in 2000. Japan, Denmark, France and Macao-China show girls performing worse in digital reading than in print reading, while boys performed better.
These differences are seen most clearly at the extremes of the proficiency scale, that is, among poor performers and top performers. In Korea, as well as in Australia, Iceland, Ireland, Japan, and New Zealand, fewer girls performed poorly in digital reading than in print reading. The opposite was seen among boys. In Korea, as well as in Australia, Belgium, France, Iceland, Ireland, Japan,
Statistically significantly above the OECD average Not statistically significantly different from the OECD averageStatistically significantly below the OECD average
Digital reading scale
Mean score S.E.
Range of rankOECD countries All countries/economies
Upper rank Lower rank Upper rank Lower rankKorea 568 (3.0) 1 1 1 1New Zealand 537 (2.3) 2 3 2 3Australia 537 (2.8) 2 3 2 3Japan 519 (2.4) 4 4 4 5Hong Kong-China 515 (2.6) 4 7Iceland 512 (1.4) 5 7 5 8Sweden 510 (3.3) 5 8 5 9Ireland 509 (2.8) 5 8 6 9Belgium 507 (2.1) 6 8 7 9Norway 500 (2.8) 9 10 10 11France 494 (5.2) 9 11 10 13Macao-China 492 (0.7) 11 13Denmark 489 (2.6) 10 11 11 13Spain 475 (3.8) 12 13 14 15Hungary 468 (4.2) 12 14 14 16Poland 464 (3.1) 13 15 15 17Austria 459 (3.9) 14 15 16 17Chile 435 (3.6) 16 16 18 18Colombia 368 (3.4) 19 19
Note: See Annex A3 of OECD (2011b).
Source: OECD, PISA 2009 Database.
Table 2.7 Where countries rank in digital reading performance

2VIEWING EDUCATION IN KOREA THROUGH THE PRISM OF PISA
57STRONG PERFORMERS AND SUCCESSFUL REFORMERS IN EDUCATION: LESSONS FROM PISA FOR KOREA © OECD 2014
Sweden and Macao-China, there were far fewer low-performing boys in digital reading than in print reading. As for top performers, In Korea, as well as in Australia, and New Zealand, more girls were top performers in digital reading than in print reading. Regardless of the country, the increase in the percentage of top performers in digital reading over print reading was always greater among boys than among girls, as was the reduction in the percentage of poor performers.
Interestingly, when comparing girls and boys who were similarly proficient in print reading, boys scored an average of six points higher in digital reading. Among these students, boys outperformed girls in digital reading by between 5 and 22 score points in Korea as well as in Australia, Austria, Denmark, Hungary, Iceland, Poland, Spain, Sweden, Hong Kong-China and Macao-China. Only in Belgium did girls outperform boys. What could account for this difference? One explanation is that boys and girls do not share the same degree of ease in selecting and organising – or navigating – pieces of information found in hypertexts and that boys’ greater ease could be used to entice them to read more by exploiting boys’ greater proficiency with digital texts (see Figure 2.29).
Online reading practicesIn addition to the question about what kinds of print material they read, the PISA 2009 student questionnaire asked students to indicate how often they were involved in the following reading activities on line: reading e-mail messages, chatting on line, reading online news, using an online dictionary or encyclopaedia, searching online information to learn about a particular topic, taking part in online group discussions or forums, and searching for practical information on line. PISA found that students who
Korea
Japan
Australia
Hong Kong-China
New Zealand
Macao-China
Ireland
Iceland
Sweden
Norway
Belgium
Denmark
France
OECD average-16
Spain
Poland
Hungary
Austria
Chile
Colombia
Korea
Japan
Australia
Hong Kong-China
New Zealand
Macao-China
Ireland
Iceland
Sweden
Norway
Belgium
Denmark
France
OECD average-16
Spain
Poland
Hungary
Austria
Chile
Colombia
100 80 60 40 20 0 20 40 60 80 100 Percentage of students
Percentageof students
Percentage of students at Level 2 or above
Percentage of students below Level 2
Level 5 or above
Level 4
Level 3
Level 2
Below Level 2
Print readingDigital reading
• Figure 2.26 •Percentage of students at each proficiency level on the digital print reading scales
Note: Countries are ranked in descending order of the percentage of students at Level 2 or above in digital reading.
Source: OECD, PISA 2009 Database, Table VI.2.1.
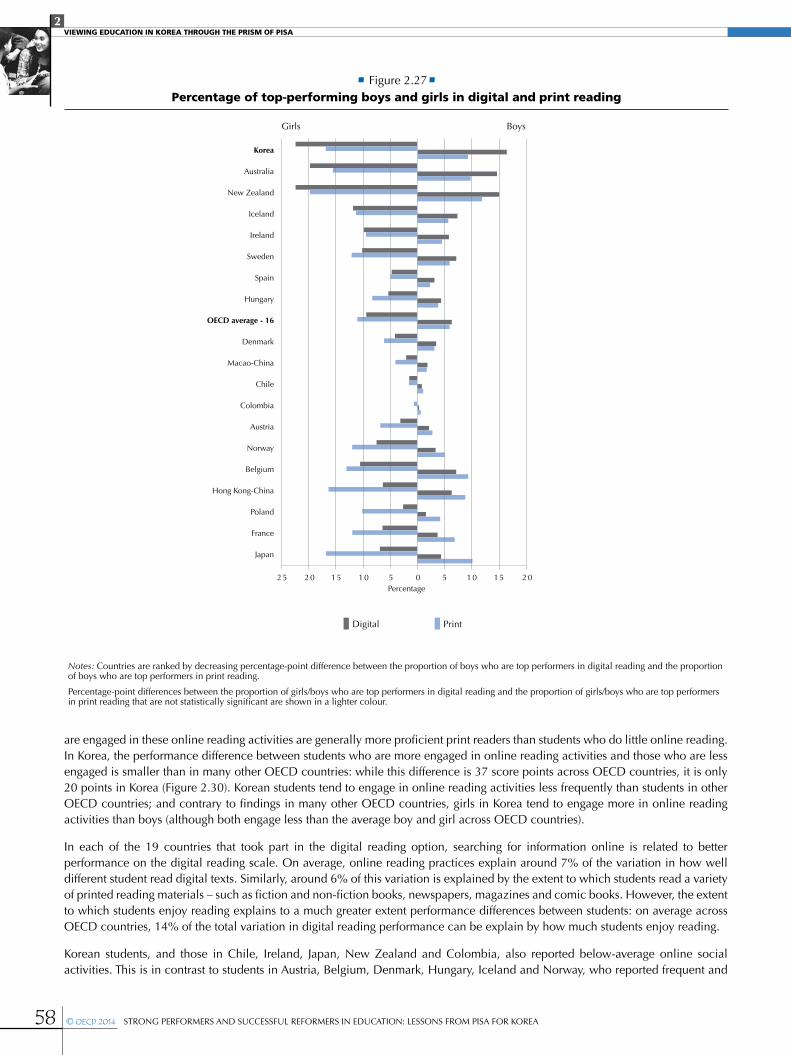
2VIEWING EDUCATION IN KOREA THROUGH THE PRISM OF PISA
58 © OECD 2014 STRONG PERFORMERS AND SUCCESSFUL REFORMERS IN EDUCATION: LESSONS FROM PISA FOR KOREA
are engaged in these online reading activities are generally more proficient print readers than students who do little online reading. In Korea, the performance difference between students who are more engaged in online reading activities and those who are less engaged is smaller than in many other OECD countries: while this difference is 37 score points across OECD countries, it is only 20 points in Korea (Figure 2.30). Korean students tend to engage in online reading activities less frequently than students in other OECD countries; and contrary to findings in many other OECD countries, girls in Korea tend to engage more in online reading activities than boys (although both engage less than the average boy and girl across OECD countries).
In each of the 19 countries that took part in the digital reading option, searching for information online is related to better performance on the digital reading scale. On average, online reading practices explain around 7% of the variation in how well different student read digital texts. Similarly, around 6% of this variation is explained by the extent to which students read a variety of printed reading materials – such as fiction and non-fiction books, newspapers, magazines and comic books. However, the extent to which students enjoy reading explains to a much greater extent performance differences between students: on average across OECD countries, 14% of the total variation in digital reading performance can be explain by how much students enjoy reading.
Korean students, and those in Chile, Ireland, Japan, New Zealand and Colombia, also reported below-average online social activities. This is in contrast to students in Austria, Belgium, Denmark, Hungary, Iceland and Norway, who reported frequent and
Notes: Countries are ranked by decreasing percentage-point difference between the proportion of boys who are top performers in digital reading and the proportion of boys who are top performers in print reading.
Percentage-point differences between the proportion of girls/boys who are top performers in digital reading and the proportion of girls/boys who are top performers in print reading that are not statistically significant are shown in a lighter colour.
• Figure 2.27•Percentage of top-performing boys and girls in digital and print reading
Digital Print
Percentage2 5 2 0 1 5 1 0 5 0 5 1 0 1 5 2 0
Girls Boys
Korea
Australia
New Zealand
Iceland
Ireland
Sweden
Spain
Hungary
OECD average - 16
Denmark
Macao-China
Chile
Colombia
Austria
Norway
Belgium
Hong Kong-China
Poland
France
Japan
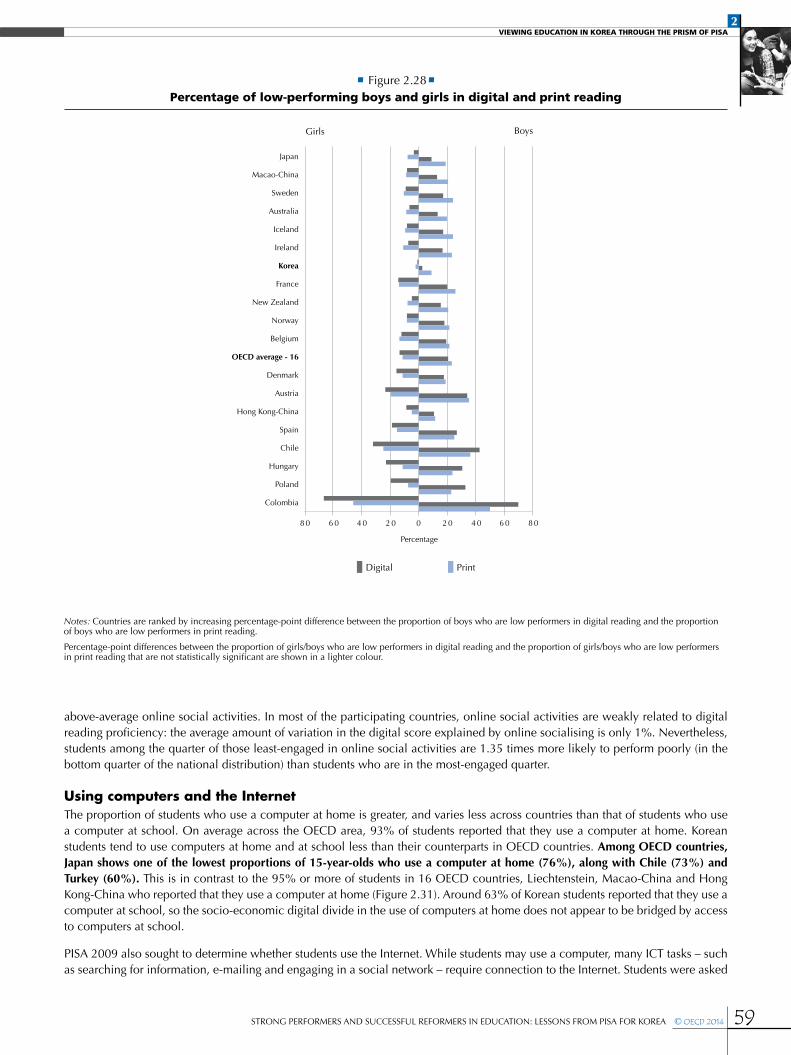
2VIEWING EDUCATION IN KOREA THROUGH THE PRISM OF PISA
59STRONG PERFORMERS AND SUCCESSFUL REFORMERS IN EDUCATION: LESSONS FROM PISA FOR KOREA © OECD 2014
above-average online social activities. In most of the participating countries, online social activities are weakly related to digital reading proficiency: the average amount of variation in the digital score explained by online socialising is only 1%. Nevertheless, students among the quarter of those least-engaged in online social activities are 1.35 times more likely to perform poorly (in the bottom quarter of the national distribution) than students who are in the most-engaged quarter.
Using computers and the InternetThe proportion of students who use a computer at home is greater, and varies less across countries than that of students who use a computer at school. On average across the OECD area, 93% of students reported that they use a computer at home. Korean students tend to use computers at home and at school less than their counterparts in OECD countries. Among OECD countries, Japan shows one of the lowest proportions of 15-year-olds who use a computer at home (76%), along with Chile (73%) and Turkey (60%). This is in contrast to the 95% or more of students in 16 OECD countries, Liechtenstein, Macao-China and Hong Kong-China who reported that they use a computer at home (Figure 2.31). Around 63% of Korean students reported that they use a computer at school, so the socio-economic digital divide in the use of computers at home does not appear to be bridged by access to computers at school.
PISA 2009 also sought to determine whether students use the Internet. While students may use a computer, many ICT tasks – such as searching for information, e-mailing and engaging in a social network – require connection to the Internet. Students were asked
Notes: Countries are ranked by increasing percentage-point difference between the proportion of boys who are low performers in digital reading and the proportion of boys who are low performers in print reading.
Percentage-point differences between the proportion of girls/boys who are low performers in digital reading and the proportion of girls/boys who are low performers in print reading that are not statistically significant are shown in a lighter colour.
• Figure 2.28•Percentage of low-performing boys and girls in digital and print reading
Digital Print
Percentage
8 0 8 06 0 6 04 0 4 02 0 2 00
Girls Boys
Japan
Macao-China
Sweden
Australia
Iceland
Ireland
Korea
France
New Zealand
Norway
Belgium
OECD average - 16
Denmark
Austria
Hong Kong-China
Spain
Chile
Hungary
Poland
Colombia

2VIEWING EDUCATION IN KOREA THROUGH THE PRISM OF PISA
60 © OECD 2014 STRONG PERFORMERS AND SUCCESSFUL REFORMERS IN EDUCATION: LESSONS FROM PISA FOR KOREA
whether they have an Internet connection available, and use it, at home and at school. Across the vast majority of countries, the proportion of students who reported that they use the Internet at home was greater than that of students who reported using the Internet at school. Across OECD countries, an average of 71% of students reported that they use the Internet at school. In the Australia, Denmark, Finland, the Netherlands, Norway, Sweden and Liechtenstein, 88% or more of students reported using the Internet at school. In Korea 65% of students reported using the Internet at school, while almost all students – 96% - reported using the Internet at home.
For the assessment of digital reading, students were asked to report how frequently computers were used as a teaching tool at school. There is substantial variation between countries and economies in how frequently students use computers in the classroom (see Table VI.5.18 in OECD, 2011b). Around 27% of students reported using computers in the classroom in language-of-instruction lessons, which is in line with the OECD average. On the other hand, students in Korea reported below-average use of computers in mathematics lessons: only 8% of students reported using computers in their regular mathematics lessons compared to the OECD average of 16%. Computer use in science lessons is more prevalent across OECD countries – 25% of students reported using them in science classes – and even more so in Korea, where 31% of students reported the same.
The use of laptops in school may help to integrate ICT into classrooms, as it obviates the need for a dedicated computer lab in school. In Korea, 20% of students reported using laptops in school, above the OECD average of 18.5%, and below levels (73%) found in Denmark and Norway (Table 2.8).
THE LEARNING ENVIRONMENT IN KOREAThe learning environment is also shaped by parents and school principals. Parents who are interested in their children’s education are more likely to support their school’s efforts and participate in school activities, thus adding to available resources. These parents also tend to have an advantaged socio-economic background. Meanwhile, school principals can define their schools’ educational objectives and guide their schools towards them. PISA shows that school principals’ perceptions of parents’ pressure to adopt high academic standards and raise student achievement tend to be positively related to higher school performance in 19 OECD countries, but after accounting for students’ and schools’ socio-economic backgrounds, they are positively related to performance in only four OECD countries.
PISA also shows that the socio-economic backgrounds of students and schools and key features of the learning environment are closely inter-related, and that both are linked to performance in important ways. This is perhaps because students from socio-economically advantaged backgrounds bring with them a higher level of discipline and more positive perceptions of school values,
Notes: Countries are ranked according to the size of the gender gap in digital reading.
Score-point differences between girls and boys in digital reading (gender gap in digital reading) and between girls and boys in print reading (gender gap in print reading) that are not statistically significant are shown in a lighter colour.
• Figure 2.29•Comparison of gender gaps (in favour of girls) in digital and print reading
Digital Print
New
Zea
land
Nor
way
Irel
and
Icel
and
Pola
nd
Aus
tral
ia
Swed
en
OEC
D a
vera
ge -
16
Bel
gium
Japa
n
Aus
tria
Hun
gary
Fran
ce
Spai
n
Chi
le
Kore
a
Mac
ao-C
hina
Hon
g Ko
ng-C
hina
Den
mar
k
Col
ombi
a
0
10
20
30
40
50
60
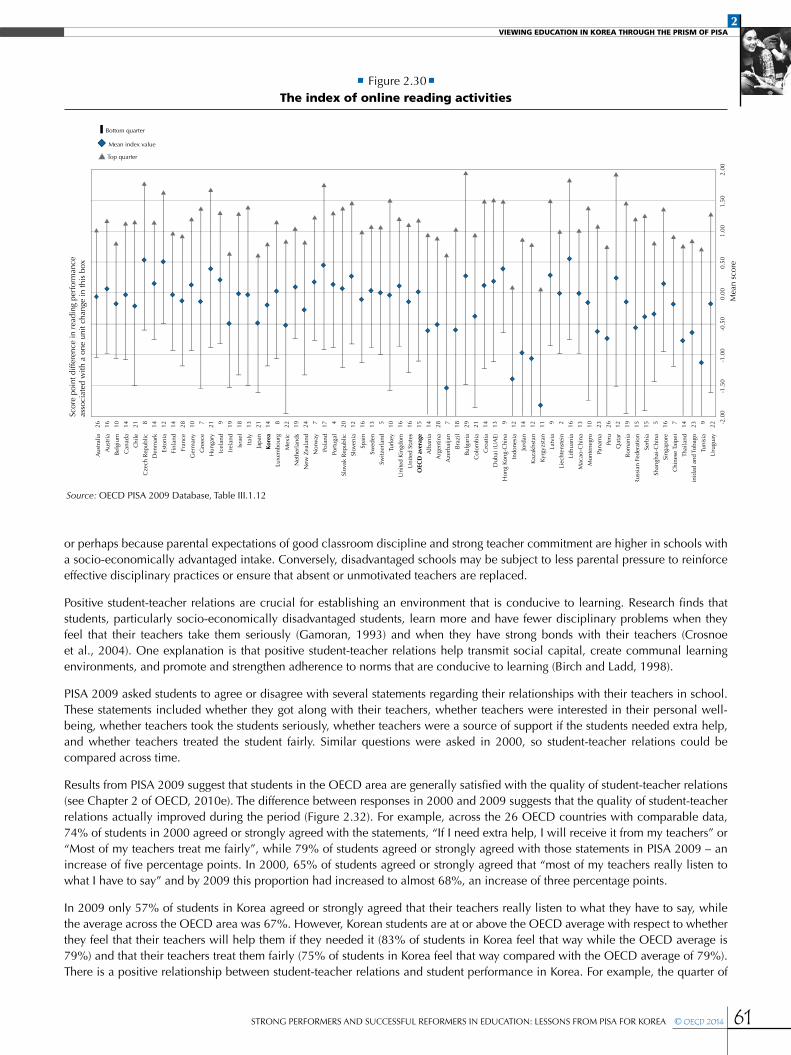
2VIEWING EDUCATION IN KOREA THROUGH THE PRISM OF PISA
61STRONG PERFORMERS AND SUCCESSFUL REFORMERS IN EDUCATION: LESSONS FROM PISA FOR KOREA © OECD 2014
or perhaps because parental expectations of good classroom discipline and strong teacher commitment are higher in schools with a socio-economically advantaged intake. Conversely, disadvantaged schools may be subject to less parental pressure to reinforce effective disciplinary practices or ensure that absent or unmotivated teachers are replaced.
Positive student-teacher relations are crucial for establishing an environment that is conducive to learning. Research finds that students, particularly socio-economically disadvantaged students, learn more and have fewer disciplinary problems when they feel that their teachers take them seriously (Gamoran, 1993) and when they have strong bonds with their teachers (Crosnoe et al., 2004). One explanation is that positive student-teacher relations help transmit social capital, create communal learning environments, and promote and strengthen adherence to norms that are conducive to learning (Birch and Ladd, 1998).
PISA 2009 asked students to agree or disagree with several statements regarding their relationships with their teachers in school. These statements included whether they got along with their teachers, whether teachers were interested in their personal well-being, whether teachers took the students seriously, whether teachers were a source of support if the students needed extra help, and whether teachers treated the student fairly. Similar questions were asked in 2000, so student-teacher relations could be compared across time.
Results from PISA 2009 suggest that students in the OECD area are generally satisfied with the quality of student-teacher relations (see Chapter 2 of OECD, 2010e). The difference between responses in 2000 and 2009 suggests that the quality of student-teacher relations actually improved during the period (Figure 2.32). For example, across the 26 OECD countries with comparable data, 74% of students in 2000 agreed or strongly agreed with the statements, “If I need extra help, I will receive it from my teachers” or “Most of my teachers treat me fairly”, while 79% of students agreed or strongly agreed with those statements in PISA 2009 – an increase of five percentage points. In 2000, 65% of students agreed or strongly agreed that “most of my teachers really listen to what I have to say” and by 2009 this proportion had increased to almost 68%, an increase of three percentage points.
In 2009 only 57% of students in Korea agreed or strongly agreed that their teachers really listen to what they have to say, while the average across the OECD area was 67%. However, Korean students are at or above the OECD average with respect to whether they feel that their teachers will help them if they needed it (83% of students in Korea feel that way while the OECD average is 79%) and that their teachers treat them fairly (75% of students in Korea feel that way compared with the OECD average of 79%). There is a positive relationship between student-teacher relations and student performance in Korea. For example, the quarter of
• Figure 2.30•The index of online reading activities
Source: OECD PISA 2009 Database, Table III.1.12
Scor
e po
int d
iffer
ence
in r
eadi
ng p
erfo
rman
ceas
soci
ated
with
a o
ne u
nit c
hang
e in
this
box
Mea
n sc
ore
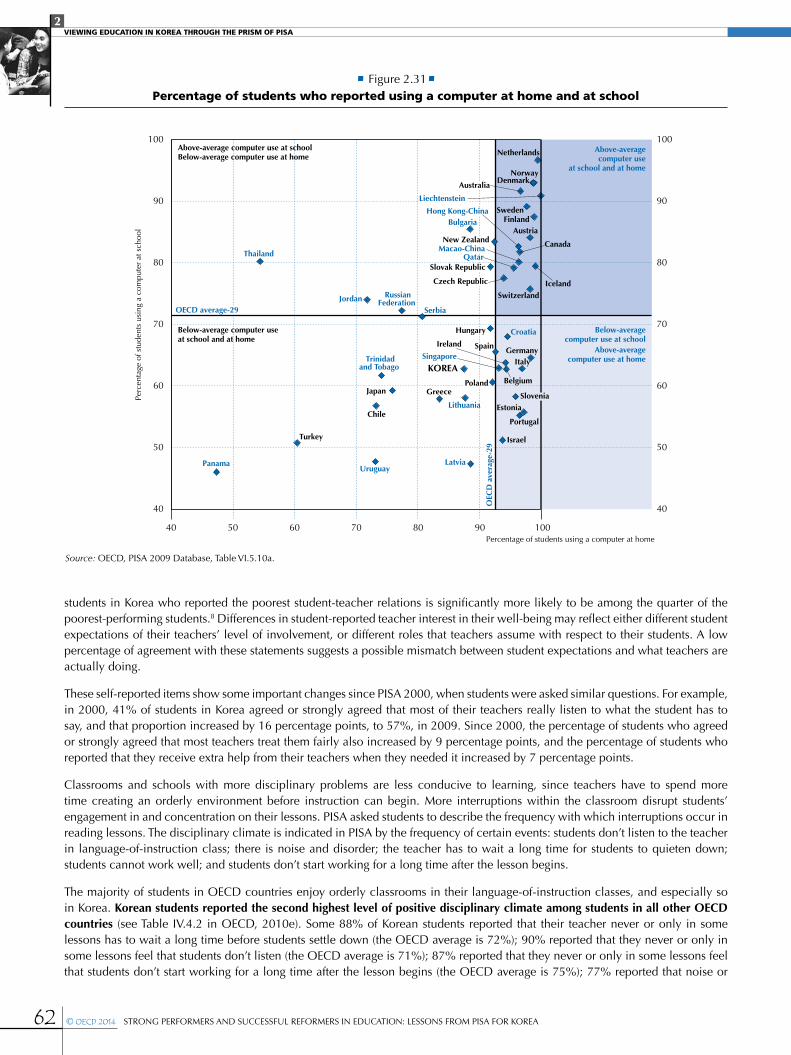
2VIEWING EDUCATION IN KOREA THROUGH THE PRISM OF PISA
62 © OECD 2014 STRONG PERFORMERS AND SUCCESSFUL REFORMERS IN EDUCATION: LESSONS FROM PISA FOR KOREA
students in Korea who reported the poorest student-teacher relations is significantly more likely to be among the quarter of the poorest-performing students.8 Differences in student-reported teacher interest in their well-being may reflect either different student expectations of their teachers’ level of involvement, or different roles that teachers assume with respect to their students. A low percentage of agreement with these statements suggests a possible mismatch between student expectations and what teachers are actually doing.
These self-reported items show some important changes since PISA 2000, when students were asked similar questions. For example, in 2000, 41% of students in Korea agreed or strongly agreed that most of their teachers really listen to what the student has to say, and that proportion increased by 16 percentage points, to 57%, in 2009. Since 2000, the percentage of students who agreed or strongly agreed that most teachers treat them fairly also increased by 9 percentage points, and the percentage of students who reported that they receive extra help from their teachers when they needed it increased by 7 percentage points.
Classrooms and schools with more disciplinary problems are less conducive to learning, since teachers have to spend more time creating an orderly environment before instruction can begin. More interruptions within the classroom disrupt students’ engagement in and concentration on their lessons. PISA asked students to describe the frequency with which interruptions occur in reading lessons. The disciplinary climate is indicated in PISA by the frequency of certain events: students don’t listen to the teacher in language-of-instruction class; there is noise and disorder; the teacher has to wait a long time for students to quieten down; students cannot work well; and students don’t start working for a long time after the lesson begins.
The majority of students in OECD countries enjoy orderly classrooms in their language-of-instruction classes, and especially so in Korea. Korean students reported the second highest level of positive disciplinary climate among students in all other OECD countries (see Table IV.4.2 in OECD, 2010e). Some 88% of Korean students reported that their teacher never or only in some lessons has to wait a long time before students settle down (the OECD average is 72%); 90% reported that they never or only in some lessons feel that students don’t listen (the OECD average is 71%); 87% reported that they never or only in some lessons feel that students don’t start working for a long time after the lesson begins (the OECD average is 75%); 77% reported that noise or
• Figure 2.31•Percentage of students who reported using a computer at home and at school
Above-averagecomputer use
at school and at home
Below-averagecomputer use at school
Above-averagecomputer use at home
Below-average computer use at school and at home
Above-average computer use at schoolBelow-average computer use at home
Perc
enta
ge o
f stu
dent
s us
ing
a co
mpu
ter
at s
choo
l
40 50 60 70 80 90 100
100
90
80
70
60
50
40
100
90
80
70
60
50
40OEC
D a
vera
ge-2
9
OECD average-29
Percentage of students using a computer at home
Austria
Belgium
Chile
Denmark
Estonia
Finland
Germany
Greece
Hungary
Ireland
Israel
Italy
Japan
KOREA
Netherlands
Norway
Portugal
Spain
Sweden
Switzerland
Turkey
Bulgaria
Croatia
Jordan
Latvia
Lithuania
Panama
Qatar
RussianFederation
Serbia
Singapore
Thailand
Trinidadand Tobago
Uruguay
Slovenia
Canada
Iceland
Australia
Liechtenstein
Macao-China
Hong Kong-China
Slovak Republic
Czech Republic
New Zealand
Poland
Source: OECD, PISA 2009 Database, Table VI.5.10a.
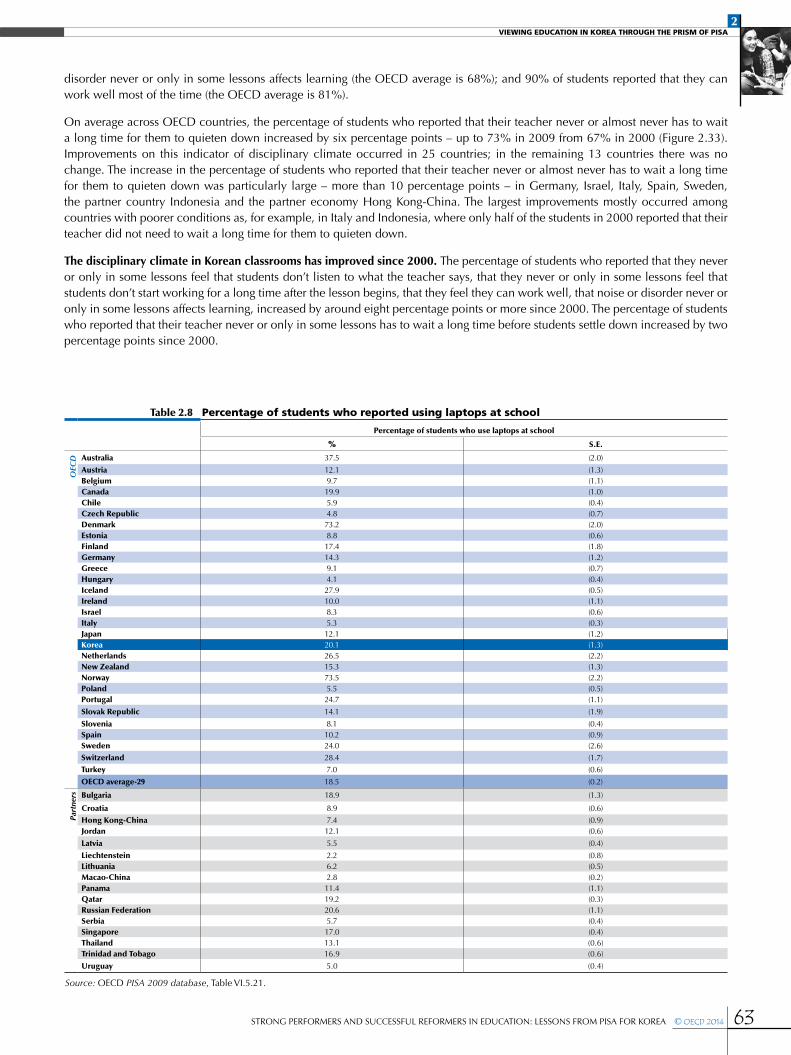
2VIEWING EDUCATION IN KOREA THROUGH THE PRISM OF PISA
63STRONG PERFORMERS AND SUCCESSFUL REFORMERS IN EDUCATION: LESSONS FROM PISA FOR KOREA © OECD 2014
disorder never or only in some lessons affects learning (the OECD average is 68%); and 90% of students reported that they can work well most of the time (the OECD average is 81%).
On average across OECD countries, the percentage of students who reported that their teacher never or almost never has to wait a long time for them to quieten down increased by six percentage points – up to 73% in 2009 from 67% in 2000 (Figure 2.33). Improvements on this indicator of disciplinary climate occurred in 25 countries; in the remaining 13 countries there was no change. The increase in the percentage of students who reported that their teacher never or almost never has to wait a long time for them to quieten down was particularly large – more than 10 percentage points – in Germany, Israel, Italy, Spain, Sweden, the partner country Indonesia and the partner economy Hong Kong-China. The largest improvements mostly occurred among countries with poorer conditions as, for example, in Italy and Indonesia, where only half of the students in 2000 reported that their teacher did not need to wait a long time for them to quieten down.
The disciplinary climate in Korean classrooms has improved since 2000. The percentage of students who reported that they never or only in some lessons feel that students don’t listen to what the teacher says, that they never or only in some lessons feel that students don’t start working for a long time after the lesson begins, that they feel they can work well, that noise or disorder never or only in some lessons affects learning, increased by around eight percentage points or more since 2000. The percentage of students who reported that their teacher never or only in some lessons has to wait a long time before students settle down increased by two percentage points since 2000.
Table 2.8 Percentage of students who reported using laptops at school
Percentage of students who use laptops at school
% S.E.
OEC
D Australia 37.5 (2.0)
Austria 12.1 (1.3)Belgium 9.7 (1.1)Canada 19.9 (1.0)Chile 5.9 (0.4)Czech Republic 4.8 (0.7)Denmark 73.2 (2.0)Estonia 8.8 (0.6)Finland 17.4 (1.8)Germany 14.3 (1.2)Greece 9.1 (0.7)Hungary 4.1 (0.4)Iceland 27.9 (0.5)Ireland 10.0 (1.1)Israel 8.3 (0.6)Italy 5.3 (0.3)Japan 12.1 (1.2)Korea 20.1 (1.3)Netherlands 26.5 (2.2)New Zealand 15.3 (1.3)Norway 73.5 (2.2)Poland 5.5 (0.5)Portugal 24.7 (1.1)
Slovak Republic 14.1 (1.9)
Slovenia 8.1 (0.4)Spain 10.2 (0.9)Sweden 24.0 (2.6)
Switzerland 28.4 (1.7)
Turkey 7.0 (0.6)
OECD average-29 18.5 (0.2)
Part
ners Bulgaria 18.9 (1.3)
Croatia 8.9 (0.6)
Hong Kong-China 7.4 (0.9)Jordan 12.1 (0.6)
Latvia 5.5 (0.4)
Liechtenstein 2.2 (0.8)Lithuania 6.2 (0.5)Macao-China 2.8 (0.2)Panama 11.4 (1.1)Qatar 19.2 (0.3)Russian Federation 20.6 (1.1)Serbia 5.7 (0.4)Singapore 17.0 (0.4)Thailand 13.1 (0.6)Trinidad and Tobago 16.9 (0.6)
Uruguay 5.0 (0.4)
Source: OECD PISA 2009 database, Table VI.5.21.
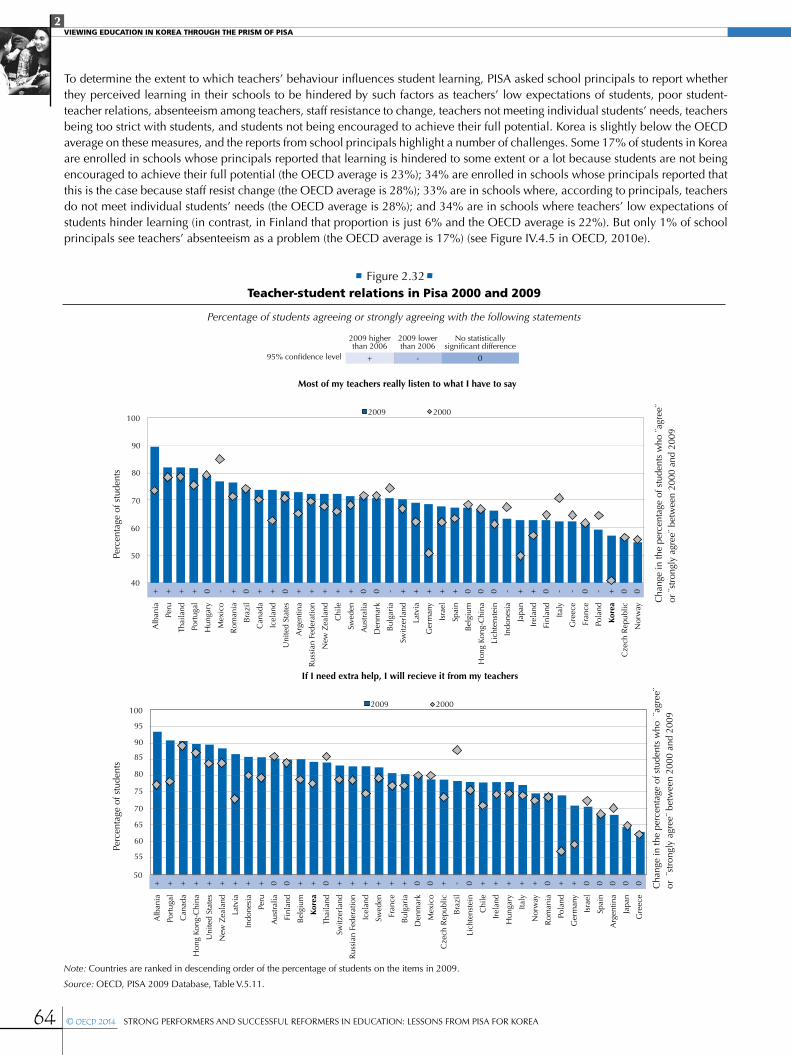
2VIEWING EDUCATION IN KOREA THROUGH THE PRISM OF PISA
64 © OECD 2014 STRONG PERFORMERS AND SUCCESSFUL REFORMERS IN EDUCATION: LESSONS FROM PISA FOR KOREA
To determine the extent to which teachers’ behaviour influences student learning, PISA asked school principals to report whether they perceived learning in their schools to be hindered by such factors as teachers’ low expectations of students, poor student-teacher relations, absenteeism among teachers, staff resistance to change, teachers not meeting individual students’ needs, teachers being too strict with students, and students not being encouraged to achieve their full potential. Korea is slightly below the OECD average on these measures, and the reports from school principals highlight a number of challenges. Some 17% of students in Korea are enrolled in schools whose principals reported that learning is hindered to some extent or a lot because students are not being encouraged to achieve their full potential (the OECD average is 23%); 34% are enrolled in schools whose principals reported that this is the case because staff resist change (the OECD average is 28%); 33% are in schools where, according to principals, teachers do not meet individual students’ needs (the OECD average is 28%); and 34% are in schools where teachers’ low expectations of students hinder learning (in contrast, in Finland that proportion is just 6% and the OECD average is 22%). But only 1% of school principals see teachers’ absenteeism as a problem (the OECD average is 17%) (see Figure IV.4.5 in OECD, 2010e).
• Figure 2.32•Teacher-student relations in Pisa 2000 and 2009
Percentage of students agreeing or strongly agreeing with the following statements
2009 2000
Alb
ania
Peru
Thai
land
Port
ugal
Hun
gary
Mex
ico
Rom
ania
Bra
zil
Can
ada
Icel
and
Uni
ted
Stat
es
Arg
entin
a
Rus
sian
Fed
erat
ion
New
Zea
land
Chi
le
Swed
en
Aus
tral
ia
Den
mar
k
Bul
gari
a
Switz
erla
nd
Latv
ia
Ger
man
y
Isra
el
Spai
n
Bel
gium
Hon
g Ko
ng-C
hina
Lich
tens
tein
Indo
nesi
a
Japa
n
Irel
and
Finl
and
Italy
Gre
ece
Fran
ce
Pola
nd
Kore
a
Cze
ch R
epub
lic
Nor
way
+ + + + 0 - + 0 + + 0 + + + + + 0 0 - + + + + + 0 0 0 - + + 0 - - 0 - + 0 0
100
90
80
70
60
50
40
Perc
enta
ge o
f stu
dent
s
Most of my teachers really listen to what I have to say
Cha
nge
in th
e pe
rcen
tage
of s
tude
nts
who
¨ag
ree¨
or
¨st
rong
ly a
gree
¨ be
twee
n 20
00 a
nd 2
009
2009 2000
Alb
ania
Port
ugal
Can
ada
Hon
g Ko
ng-C
hina
Uni
ted
Stat
es
New
Zea
land
Latv
ia
Indo
nesi
a
Peru
Aus
tral
ia
Finl
and
Bel
gium
Kore
a
Thai
land
Switz
erla
nd
Rus
sian
Fed
erat
ion
Icel
and
Swed
en
Fran
ce
Bul
gari
a
Den
mar
k
Mex
ico
Cze
ch R
epub
lic
Bra
zil
Lich
tens
tein
Chi
le
Irel
and
Hun
gary
Italy
Nor
way
Rom
ania
Pola
nd
Ger
man
y
Isra
el
Spai
n
Arg
entin
a
Japa
n
Gre
ece
+ + + + + + + + + 0 0 + + 0 + + + + + + 0 0 + - 0 + + + + + 0 + + 0 0 0 0 0
100
95
90
85
80
75
70
65
60
55
50
Perc
enta
ge o
f stu
dent
s
If I need extra help, I will recieve it from my teachers
Cha
nge
in th
e pe
rcen
tage
of s
tude
nts
who
¨ag
ree¨
or
¨st
rong
ly a
gree
¨ be
twee
n 20
00 a
nd 2
009
Note: Countries are ranked in descending order of the percentage of students on the items in 2009.
Source: OECD, PISA 2009 Database, Table V.5.11.
2009 higher than 2006
2009 lower than 2006
No statistically significant difference
95% confidence level + - 0
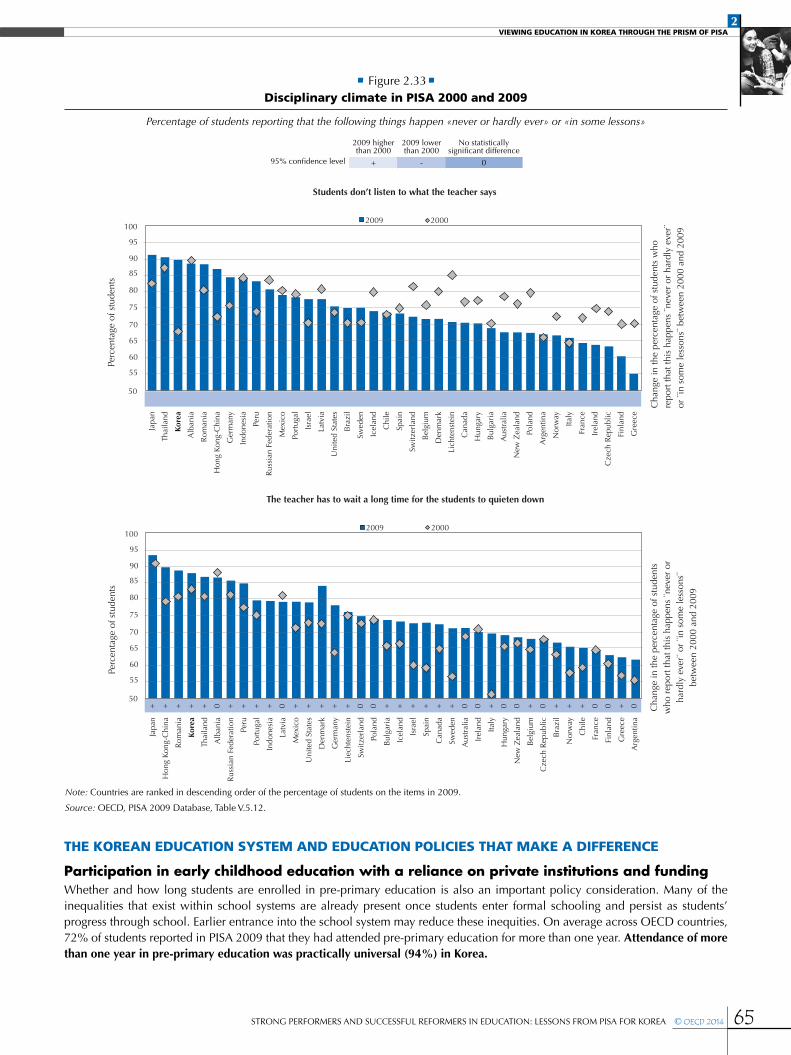
2VIEWING EDUCATION IN KOREA THROUGH THE PRISM OF PISA
65STRONG PERFORMERS AND SUCCESSFUL REFORMERS IN EDUCATION: LESSONS FROM PISA FOR KOREA © OECD 2014
THE KOREAN EDUCATION SYSTEM AND EDUCATION POLICIES THAT MAKE A DIFFERENCE
Participation in early childhood education with a reliance on private institutions and fundingWhether and how long students are enrolled in pre-primary education is also an important policy consideration. Many of the inequalities that exist within school systems are already present once students enter formal schooling and persist as students’ progress through school. Earlier entrance into the school system may reduce these inequities. On average across OECD countries, 72% of students reported in PISA 2009 that they had attended pre-primary education for more than one year. Attendance of more than one year in pre-primary education was practically universal (94%) in Korea.
• Figure 2.33•Disciplinary climate in PISA 2000 and 2009
Percentage of students reporting that the following things happen «never or hardly ever» or «in some lessons»
2009 2000
Japa
n
Thai
land
Kore
a
Alb
ania
Rom
ania
Hon
g Ko
ng-C
hina
Ger
man
y
Indo
nesi
a
Peru
Rus
sian
Fed
erat
ion
Mex
ico
Port
ugal
Isra
el
Latv
ia
Uni
ted
Stat
es
Bra
zil
Swed
en
Icel
and
Chi
le
Spai
n
Switz
erla
nd
Bel
gium
Den
mar
k
Lich
tens
tein
Can
ada
Hun
gary
Bul
gari
a
Aus
tral
ia
New
Zea
land
Pola
nd
Arg
entin
a
Nor
way
Italy
Fran
ce
Irel
and
Cze
ch R
epub
lic
Finl
and
Gre
ece
+ + + 0 + + + 0 + - 0 0 + - 0 + + - 0 0 - - - - - - 0 - - - 0 - 0 - - - - -
100
95
90
85
80
75
70
65
60
55
50
Perc
enta
ge o
f stu
dent
s
Students don’t listen to what the teacher says
Cha
nge
in th
e pe
rcen
tage
of s
tude
nts
who
re
port
that
this
hap
pens
¨ne
ver
or h
ardl
y ev
er¨
or ¨
in s
ome
less
ons¨
bet
wee
n 20
00 a
nd 2
009
2009 2000
Japa
n
Hon
g Ko
ng-C
hina
Rom
ania
Kore
a
Thai
land
Alb
ania
Rus
sian
Fed
erat
ion
Peru
Port
ugal
Indo
nesi
a
Latv
ia
Mex
ico
Uni
ted
Stat
es
Den
mar
k
Ger
man
y
Liec
hten
stei
n
Switz
erla
nd
Pola
nd
Bul
gari
a
Icel
and
Isra
el
Spai
n
Can
ada
Swed
en
Aus
tral
ia
Irel
and
Italy
Hun
gary
New
Zea
land
Bel
gium
Cze
ch R
epub
lic
Bra
zil
Nor
way
Chi
le
Fran
ce
Finl
and
Gre
ece
Arg
entin
a
+ + + + + 0 + + + + 0 + + + + + 0 0 + + + + + + 0 0 + 0 0 + 0 + + + 0 0 + 0
100
95
90
85
80
75
70
65
60
55
50
Perc
enta
ge o
f stu
dent
s
The teacher has to wait a long time for the students to quieten down
Cha
nge
in th
e pe
rcen
tage
of s
tude
nts
who
rep
ort t
hat t
his
happ
ens
¨nev
er o
rha
rdly
eve
r¨ o
r ¨i
n so
me
less
ons¨
betw
een
2000
and
200
9
2009 higher than 2000
2009 lower than 2000
No statistically significant difference
95% confidence level + - 0
Note: Countries are ranked in descending order of the percentage of students on the items in 2009.
Source: OECD, PISA 2009 Database, Table V.5.12.
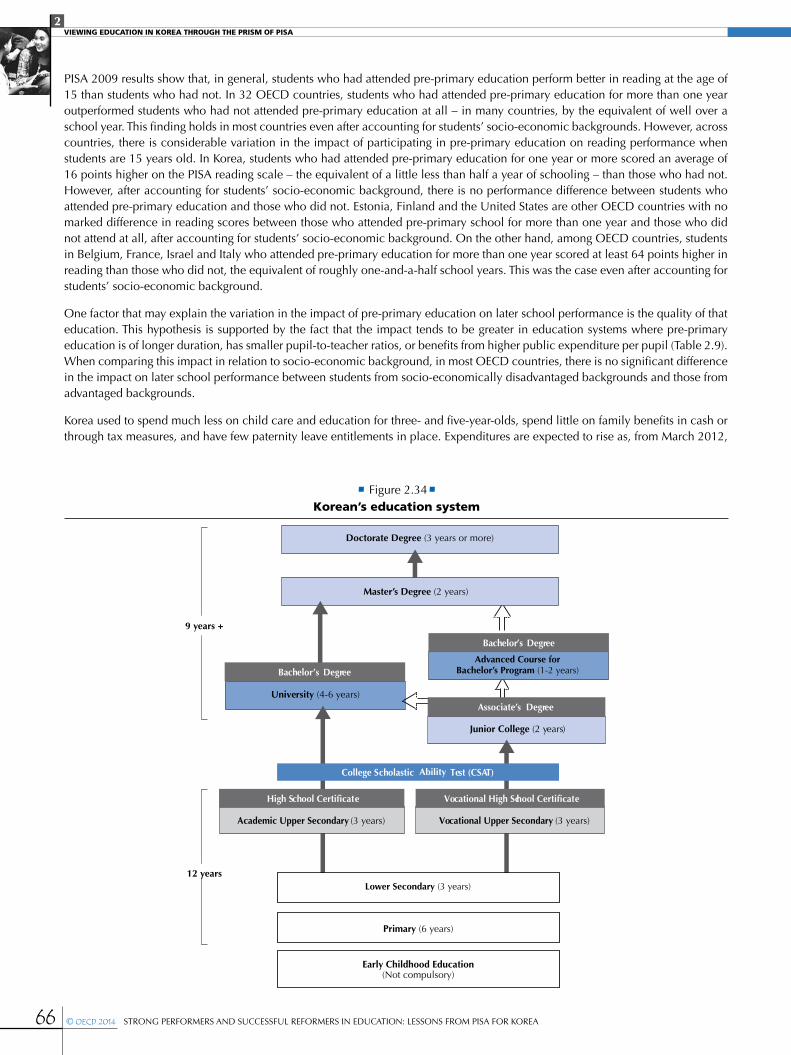
2VIEWING EDUCATION IN KOREA THROUGH THE PRISM OF PISA
66 © OECD 2014 Strong PerformerS and SucceSSful reformerS In educatIon: leSSonS from PISa for Korea
PISA 2009 results show that, in general, students who had attended pre-primary education perform better in reading at the age of 15 than students who had not. In 32 OECD countries, students who had attended pre-primary education for more than one year outperformed students who had not attended pre-primary education at all – in many countries, by the equivalent of well over a school year. This finding holds in most countries even after accounting for students’ socio-economic backgrounds. However, across countries, there is considerable variation in the impact of participating in pre-primary education on reading performance when students are 15 years old. In Korea, students who had attended pre-primary education for one year or more scored an average of 16 points higher on the PISA reading scale – the equivalent of a little less than half a year of schooling – than those who had not. However, after accounting for students’ socio-economic background, there is no performance difference between students who attended pre-primary education and those who did not. Estonia, Finland and the United States are other OECD countries with no marked difference in reading scores between those who attended pre-primary school for more than one year and those who did not attend at all, after accounting for students’ socio-economic background. On the other hand, among OECD countries, students in Belgium, France, Israel and Italy who attended pre-primary education for more than one year scored at least 64 points higher in reading than those who did not, the equivalent of roughly one-and-a-half school years. This was the case even after accounting for students’ socio-economic background.
One factor that may explain the variation in the impact of pre-primary education on later school performance is the quality of that education. This hypothesis is supported by the fact that the impact tends to be greater in education systems where pre-primary education is of longer duration, has smaller pupil-to-teacher ratios, or benefits from higher public expenditure per pupil (Table 2.9). When comparing this impact in relation to socio-economic background, in most OECD countries, there is no significant difference in the impact on later school performance between students from socio-economically disadvantaged backgrounds and those from advantaged backgrounds.
Korea used to spend much less on child care and education for three- and five-year-olds, spend little on family benefits in cash or through tax measures, and have few paternity leave entitlements in place. Expenditures are expected to rise as, from March 2012,
12 years
9 years +
University (4-6 years)
(1 year)
Doctorate Degree (3 years or more)
Master’s Degree (2 years)
Academic Upper Secondary (3 years)
Early Childhood Education (Not compulsory)
Primary (6 years)
Junior College (2 years)
Vocational Upper Secondary (3 years)
High School Certificate
Entrance Examination
College Scholastic Test (CSAT)
Vocational High School Certificate
Associate’s Degree
Bachelor’s Degree
Bachelor’s Degree
• Figure 2.34•Korean’s education system
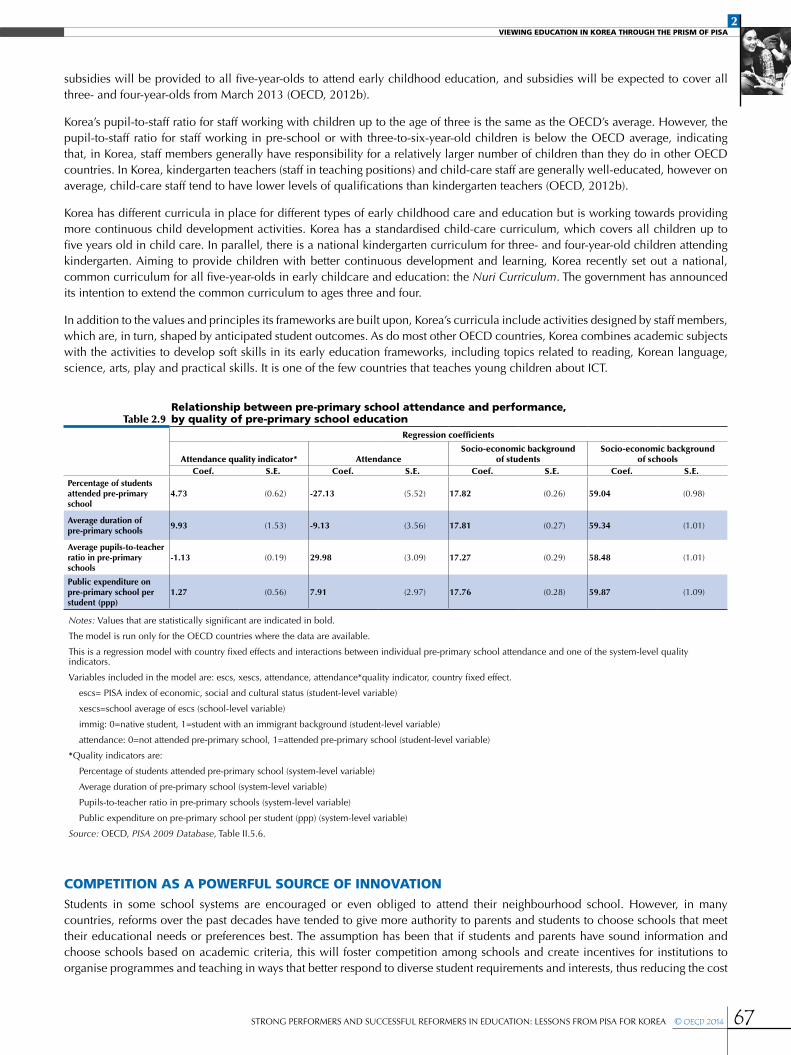
2VIEWING EDUCATION IN KOREA THROUGH THE PRISM OF PISA
67STRONG PERFORMERS AND SUCCESSFUL REFORMERS IN EDUCATION: LESSONS FROM PISA FOR KOREA © OECD 2014
subsidies will be provided to all five-year-olds to attend early childhood education, and subsidies will be expected to cover all three- and four-year-olds from March 2013 (OECD, 2012b).
Korea’s pupil-to-staff ratio for staff working with children up to the age of three is the same as the OECD’s average. However, the pupil-to-staff ratio for staff working in pre-school or with three-to-six-year-old children is below the OECD average, indicating that, in Korea, staff members generally have responsibility for a relatively larger number of children than they do in other OECD countries. In Korea, kindergarten teachers (staff in teaching positions) and child-care staff are generally well-educated, however on average, child-care staff tend to have lower levels of qualifications than kindergarten teachers (OECD, 2012b).
Korea has different curricula in place for different types of early childhood care and education but is working towards providing more continuous child development activities. Korea has a standardised child-care curriculum, which covers all children up to five years old in child care. In parallel, there is a national kindergarten curriculum for three- and four-year-old children attending kindergarten. Aiming to provide children with better continuous development and learning, Korea recently set out a national, common curriculum for all five-year-olds in early childcare and education: the Nuri Curriculum. The government has announced its intention to extend the common curriculum to ages three and four.
In addition to the values and principles its frameworks are built upon, Korea’s curricula include activities designed by staff members, which are, in turn, shaped by anticipated student outcomes. As do most other OECD countries, Korea combines academic subjects with the activities to develop soft skills in its early education frameworks, including topics related to reading, Korean language, science, arts, play and practical skills. It is one of the few countries that teaches young children about ICT.
COMPETITION AS A POWERFUL SOURCE OF INNOVATIONStudents in some school systems are encouraged or even obliged to attend their neighbourhood school. However, in many countries, reforms over the past decades have tended to give more authority to parents and students to choose schools that meet their educational needs or preferences best. The assumption has been that if students and parents have sound information and choose schools based on academic criteria, this will foster competition among schools and create incentives for institutions to organise programmes and teaching in ways that better respond to diverse student requirements and interests, thus reducing the cost
Table 2.9Relationship between pre-primary school attendance and performance, by quality of pre-primary school education
Regression coefficients
Attendance quality indicator* AttendanceSocio-economic background
of studentsSocio-economic background
of schoolsCoef. S.E. Coef. S.E. Coef. S.E. Coef. S.E.
Percentage of students attended pre-primary school
4.73 (0.62) -27.13 (5.52) 17.82 (0.26) 59.04 (0.98)
Average duration of pre-primary schools
9.93 (1.53) -9.13 (3.56) 17.81 (0.27) 59.34 (1.01)
Average pupils-to-teacher ratio in pre-primary schools
-1.13 (0.19) 29.98 (3.09) 17.27 (0.29) 58.48 (1.01)
Public expenditure on pre-primary school per student (ppp)
1.27 (0.56) 7.91 (2.97) 17.76 (0.28) 59.87 (1.09)
Notes: Values that are statistically significant are indicated in bold.
The model is run only for the OECD countries where the data are available.
This is a regression model with country fixed effects and interactions between individual pre-primary school attendance and one of the system-level quality indicators.
Variables included in the model are: escs, xescs, attendance, attendance*quality indicator, country fixed effect.
escs= PISA index of economic, social and cultural status (student-level variable)
xescs=school average of escs (school-level variable)
immig: 0=native student, 1=student with an immigrant background (student-level variable)
attendance: 0=not attended pre-primary school, 1=attended pre-primary school (student-level variable)
*Quality indicators are:
Percentage of students attended pre-primary school (system-level variable)
Average duration of pre-primary school (system-level variable)
Pupils-to-teacher ratio in pre-primary schools (system-level variable)
Public expenditure on pre-primary school per student (ppp) (system-level variable)
Source: OECD, PISA 2009 Database, Table II.5.6.
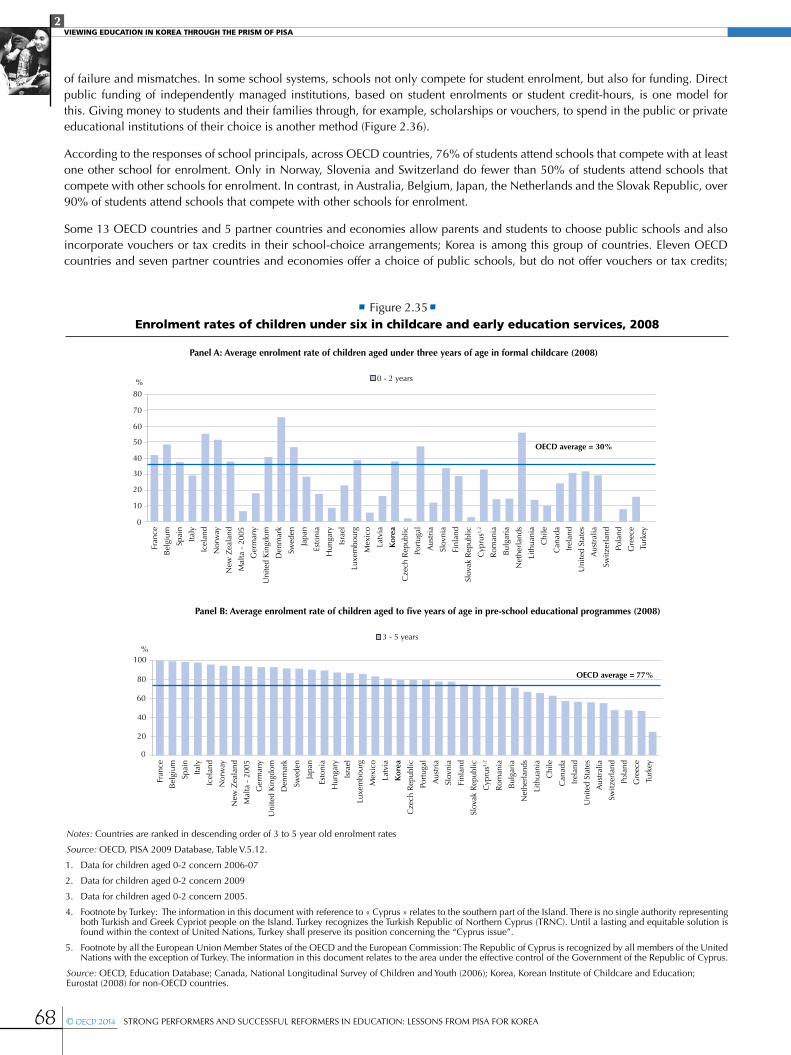
2VIEWING EDUCATION IN KOREA THROUGH THE PRISM OF PISA
68 © OECD 2014 STRONG PERFORMERS AND SUCCESSFUL REFORMERS IN EDUCATION: LESSONS FROM PISA FOR KOREA
of failure and mismatches. In some school systems, schools not only compete for student enrolment, but also for funding. Direct public funding of independently managed institutions, based on student enrolments or student credit-hours, is one model for this. Giving money to students and their families through, for example, scholarships or vouchers, to spend in the public or private educational institutions of their choice is another method (Figure 2.36).
According to the responses of school principals, across OECD countries, 76% of students attend schools that compete with at least one other school for enrolment. Only in Norway, Slovenia and Switzerland do fewer than 50% of students attend schools that compete with other schools for enrolment. In contrast, in Australia, Belgium, Japan, the Netherlands and the Slovak Republic, over 90% of students attend schools that compete with other schools for enrolment.
Some 13 OECD countries and 5 partner countries and economies allow parents and students to choose public schools and also incorporate vouchers or tax credits in their school-choice arrangements; Korea is among this group of countries. Eleven OECD countries and seven partner countries and economies offer a choice of public schools, but do not offer vouchers or tax credits;
• Figure 2.35•Enrolment rates of children under six in childcare and early education services, 2008
0 - 2 years
Panel A: Average enrolment rate of children aged under three years of age in formal childcare (2008)
80
70
60
50
40
30
20
10
0
OECD average = 30%
Fran
ce
Bel
gium
Spai
n
Italy
Icel
and
Nor
way
New
Zea
land
Mal
ta -
200
5
Ger
man
y
Uni
ted
Kin
gdom
Den
mar
k
Swed
en
Japa
n
Esto
nia
Hun
gary
Isra
el
Luxe
mbo
urg
Mex
ico
Latv
ia
Ko
rea
Cze
ch R
epub
lic
Port
ugal
Aus
tria
Slov
nia
Finl
and
Slov
ak R
epub
lic
Cyp
rus1,
2
Rom
ania
Bul
gari
a
Net
herl
ands
Lith
uani
a
Chi
le
Can
ada
Irel
and
Uni
ted
Stat
es
Aus
tral
ia
Switz
erla
nd
Pola
nd
Gre
ece
Turk
ey
%
3 - 5 years
Panel B: Average enrolment rate of children aged to five years of age in pre-school educational programmes (2008)
100
80
60
40
20
0
OECD average = 77%
Fran
ce
Bel
gium
Spai
n
Italy
Icel
and
Nor
way
New
Zea
land
Mal
ta -
200
5
Ger
man
y
Uni
ted
Kin
gdom
Den
mar
k
Swed
en
Japa
n
Esto
nia
Hun
gary
Isra
el
Luxe
mbo
urg
Mex
ico
Latv
ia
Ko
rea
Cze
ch R
epub
lic
Port
ugal
Aus
tria
Slov
nia
Finl
and
Slov
ak R
epub
lic
Cyp
rus1,
2
Rom
ania
Bul
gari
a
Net
herl
ands
Lith
uani
a
Chi
le
Can
ada
Irel
and
Uni
ted
Stat
es
Aus
tral
ia
Switz
erla
nd
Pola
nd
Gre
ece
Turk
ey%
Notes: Countries are ranked in descending order of 3 to 5 year old enrolment rates
Source: OECD, PISA 2009 Database, Table V.5.12.
1. Data for children aged 0-2 concern 2006-07
2. Data for children aged 0-2 concern 2009
3. Data for children aged 0-2 concern 2005.
4. Footnote by Turkey: The information in this document with reference to « Cyprus » relates to the southern part of the Island. There is no single authority representing both Turkish and Greek Cypriot people on the Island. Turkey recognizes the Turkish Republic of Northern Cyprus (TRNC). Until a lasting and equitable solution is found within the context of United Nations, Turkey shall preserve its position concerning the “Cyprus issue”.
5. Footnote by all the European Union Member States of the OECD and the European Commission: The Republic of Cyprus is recognized by all members of the United Nations with the exception of Turkey. The information in this document relates to the area under the effective control of the Government of the Republic of Cyprus.
Source: OECD, Education Database; Canada, National Longitudinal Survey of Children and Youth (2006); Korea, Korean Institute of Childcare and Education; Eurostat (2008) for non-OECD countries.
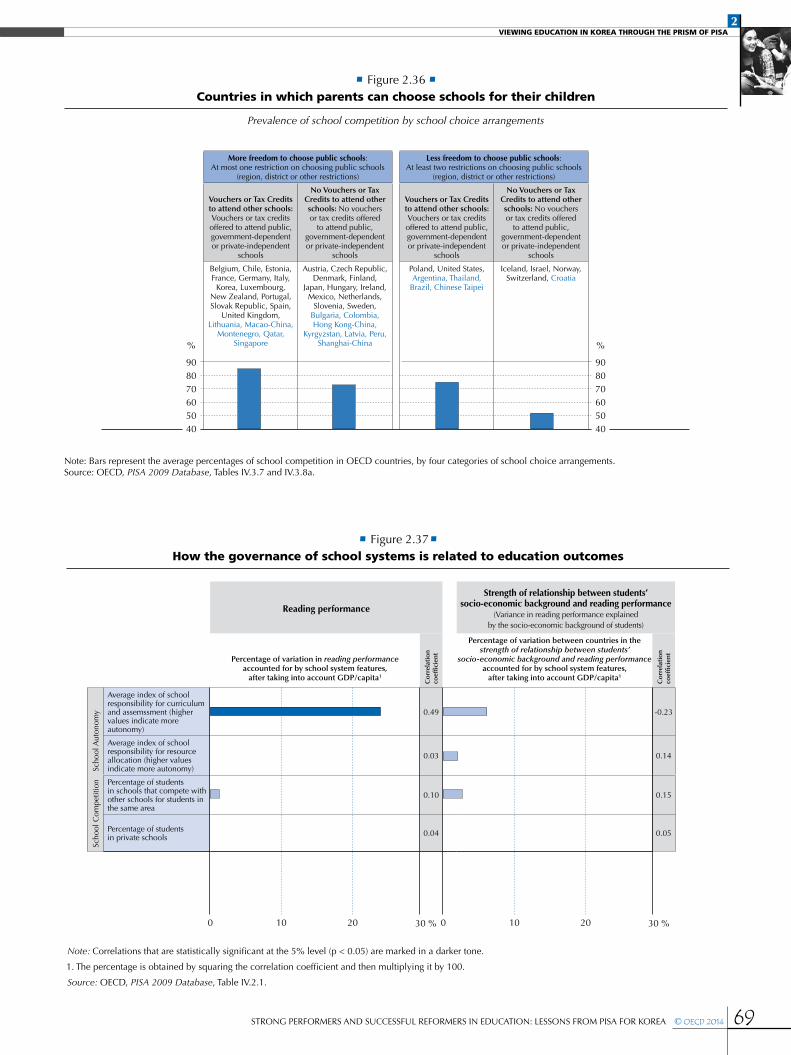
2VIEWING EDUCATION IN KOREA THROUGH THE PRISM OF PISA
69STRONG PERFORMERS AND SUCCESSFUL REFORMERS IN EDUCATION: LESSONS FROM PISA FOR KOREA © OECD 2014
Note: Bars represent the average percentages of school competition in OECD countries, by four categories of school choice arrangements.Source: OECD, PISA 2009 Database, Tables IV.3.7 and IV.3.8a.
More freedom to choose public schools: At most one restriction on choosing public schools
(region, district or other restrictions)
Less freedom to choose public schools: At least two restrictions on choosing public schools
(region, district or other restrictions)
Vouchers or Tax Credits to attend other schools: Vouchers or tax credits offered to attend public, government-dependent or private-independent
schools
No Vouchers or Tax Credits to attend other schools: No vouchers or tax credits offered
to attend public, government-dependent or private-independent
schools
Belgium, Chile, Estonia, France, Germany, Italy,
Korea, Luxembourg, New Zealand, Portugal, Slovak Republic, Spain,
United Kingdom, Lithuania, Macao-China,
Montenegro, Qatar, Singapore
Austria, Czech Republic, Denmark, Finland,
Japan, Hungary, Ireland, Mexico, Netherlands,
Slovenia, Sweden, Bulgaria, Colombia, Hong Kong-China,
Kyrgyzstan, Latvia, Peru, Shanghai-China
Poland, United States, Argentina, Thailand,
Brazil, Chinese Taipei
Iceland, Israel, Norway, Switzerland, Croatia
%
908070605040
%
908070605040
• Figure 2.36 •Countries in which parents can choose schools for their children
Prevalence of school competition by school choice arrangements
Reading performance
Strength of relationship between students’ socio-economic background and reading performance
(Variance in reading performance explained by the socio-economic background of students)
Percentage of variation in reading performance accounted for by school system features,
after taking into account GDP/capita1
Co
rrel
atio
n co
effic
ient
Percentage of variation between countries in the strength of relationship between students’
socio-economic background and reading performance accounted for by school system features,
after taking into account GDP/capita1
Co
rrel
atio
n co
effic
ient
Scho
ol A
uton
omy
Average index of school responsibility for curriculum and assemssment (higher values indicate more autonomy)
0.49 -0.23
Average index of school responsibility for resource allocation (higher values indicate more autonomy)
0.03 0.14
Scho
ol C
ompe
titio
n Percentage of students in schools that compete with other schools for students in the same area
0.10 0.15
Percentage of students in private schools 0.04 0.05
• Figure 2.37•How the governance of school systems is related to education outcomes
Note: Correlations that are statistically significant at the 5% level (p < 0.05) are marked in a darker tone.
1. The percentage is obtained by squaring the correlation coefficient and then multiplying it by 100.
Source: OECD, PISA 2009 Database, Table IV.2.1.
0 10 20 30 % 0 10 20 30 %
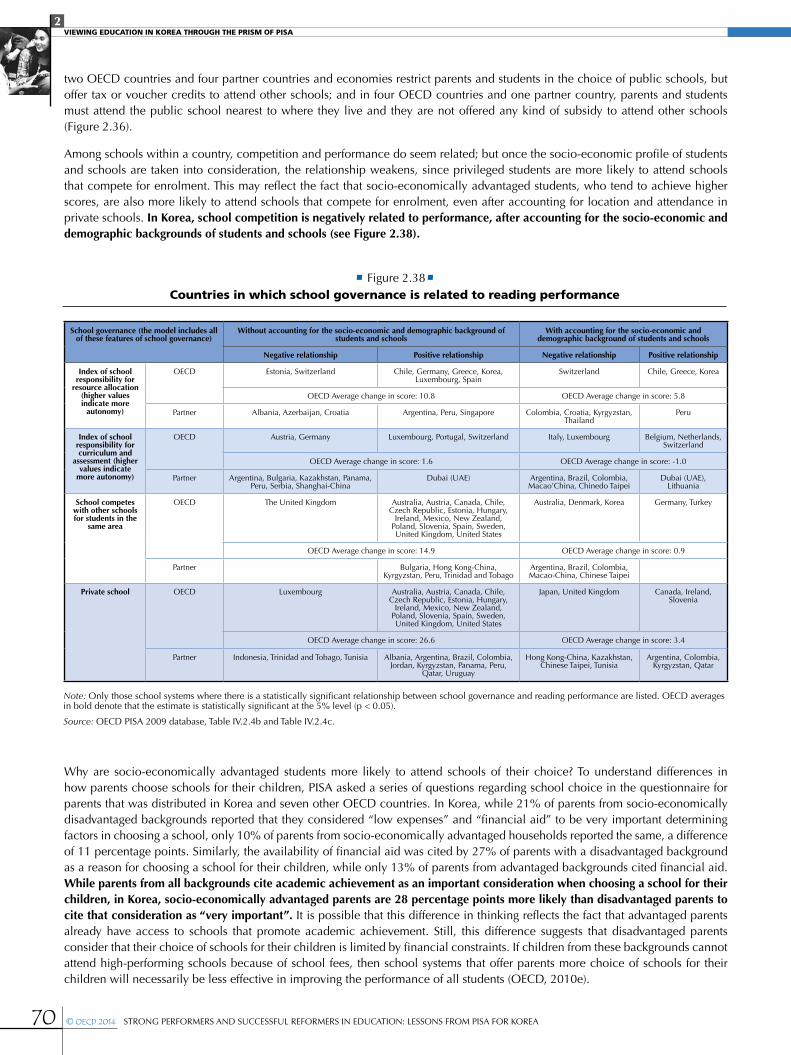
2VIEWING EDUCATION IN KOREA THROUGH THE PRISM OF PISA
70 © OECD 2014 STRONG PERFORMERS AND SUCCESSFUL REFORMERS IN EDUCATION: LESSONS FROM PISA FOR KOREA
two OECD countries and four partner countries and economies restrict parents and students in the choice of public schools, but offer tax or voucher credits to attend other schools; and in four OECD countries and one partner country, parents and students must attend the public school nearest to where they live and they are not offered any kind of subsidy to attend other schools (Figure 2.36).
Among schools within a country, competition and performance do seem related; but once the socio-economic profile of students and schools are taken into consideration, the relationship weakens, since privileged students are more likely to attend schools that compete for enrolment. This may reflect the fact that socio-economically advantaged students, who tend to achieve higher scores, are also more likely to attend schools that compete for enrolment, even after accounting for location and attendance in private schools. In Korea, school competition is negatively related to performance, after accounting for the socio-economic and demographic backgrounds of students and schools (see Figure 2.38).
Why are socio-economically advantaged students more likely to attend schools of their choice? To understand differences in how parents choose schools for their children, PISA asked a series of questions regarding school choice in the questionnaire for parents that was distributed in Korea and seven other OECD countries. In Korea, while 21% of parents from socio-economically disadvantaged backgrounds reported that they considered “low expenses” and “financial aid” to be very important determining factors in choosing a school, only 10% of parents from socio-economically advantaged households reported the same, a difference of 11 percentage points. Similarly, the availability of financial aid was cited by 27% of parents with a disadvantaged background as a reason for choosing a school for their children, while only 13% of parents from advantaged backgrounds cited financial aid. While parents from all backgrounds cite academic achievement as an important consideration when choosing a school for their children, in Korea, socio-economically advantaged parents are 28 percentage points more likely than disadvantaged parents to cite that consideration as “very important”. It is possible that this difference in thinking reflects the fact that advantaged parents already have access to schools that promote academic achievement. Still, this difference suggests that disadvantaged parents consider that their choice of schools for their children is limited by financial constraints. If children from these backgrounds cannot attend high-performing schools because of school fees, then school systems that offer parents more choice of schools for their children will necessarily be less effective in improving the performance of all students (OECD, 2010e).
• Figure 2.38•Countries in which school governance is related to reading performance
Note: Only those school systems where there is a statistically significant relationship between school governance and reading performance are listed. OECD averages in bold denote that the estimate is statistically significant at the 5% level (p < 0.05).
Source: OECD PISA 2009 database, Table IV.2.4b and Table IV.2.4c.
School governance (the model includes all of these features of school governance)
Without accounting for the socio-economic and demographic background of students and schools
With accounting for the socio-economic and demographic background of students and schools
Negative relationship Positive relationship Negative relationship Positive relationship
Index of school responsibility for
resource allocation (higher values indicate more
autonomy)
OECD Estonia, Switzerland Chile, Germany, Greece, Korea, Luxembourg, Spain
Switzerland Chile, Greece, Korea
OECD Average change in score: 10.8 OECD Average change in score: 5.8
Partner Albania, Azerbaijan, Croatia Argentina, Peru, Singapore Colombia, Croatia, Kyrgyzstan, Thailand
Peru
Index of school responsibility for curriculum and
assessment (higher values indicate
more autonomy)
OECD Austria, Germany Luxembourg, Portugal, Switzerland Italy, Luxembourg Belgium, Netherlands, Switzerland
OECD Average change in score: 1.6 OECD Average change in score: -1.0
Partner Argentina, Bulgaria, Kazakhstan, Panama, Peru, Serbia, Shanghai-China
Dubai (UAE) Argentina, Brazil, Colombia, Macao’China, Chinedo Taipei
Dubai (UAE), Lithuania
School competes with other schools for students in the
same area
OECD The United Kingdom Australia, Austria, Canada, Chile, Czech Republic, Estonia, Hungary,
Ireland, Mexico, New Zealand, Poland, Slovenia, Spain, Sweden, United Kingdom, United States
Australia, Denmark, Korea Germany, Turkey
OECD Average change in score: 14.9 OECD Average change in score: 0.9
Partner Bulgaria, Hong Kong-China, Kyrgyzstan, Peru, Trinidad and Tobago
Argentina, Brazil, Colombia, Macao-China, Chinese Taipei
Private school OECD Luxembourg Australia, Austria, Canada, Chile, Czech Republic, Estonia, Hungary,
Ireland, Mexico, New Zealand, Poland, Slovenia, Spain, Sweden, United Kingdom, United States
Japan, United Kingdom Canada, Ireland, Slovenia
OECD Average change in score: 26.6 OECD Average change in score: 3.4
Partner Indonesia, Trinidad and Tobago, Tunisia Albania, Argentina, Brazil, Colombia, Jordan, Kyrgyzstan, Panama, Peru,
Qatar, Uruguay
Hong Kong-China, Kazakhstan, Chinese Taipei, Tunisia
Argentina, Colombia, Kyrgyzstan, Qatar
2VIEWING EDUCATION IN KOREA THROUGH THE PRISM OF PISA
71STRONG PERFORMERS AND SUCCESSFUL REFORMERS IN EDUCATION: LESSONS FROM PISA FOR KOREA © OECD 2014
Governance structures: Little school-level autonomy in resource allocation, high levels of autonomy in curricular decisions and assessment practices.
Many countries have shifted public and government concern away from control over the resources and content of education to focus on outcomes. This becomes apparent when the distribution of decision-making responsibilities in education is reviewed across successive PISA assessments. In addition, some countries have made greater efforts to devolve responsibility to the frontline, encouraging responsiveness to local needs and strengthening accountability. PISA shows a clear relationship between the relative autonomy of schools in managing instructional policies and practices, and outcomes across systems when autonomy is coupled with accountability.
Korea shows below-average school autonomy in resource allocation (Figure 2.39). However, the centralisation of resources in Korea does not have a negative impact on student outcomes. Evidence from PISA shows that devolving some aspects of teaching directly to schools has a favourable impact on student learning, which appears to be the case in Korea. Students must meet high standards, but teachers are given broad latitude in how to instruct so that their students meet those standards.
The degree to which students and parents can choose schools, and the degree to which schools are considered autonomous entities that make organisational decisions independent of district, regional, or national entities, can affect student performance. Results from PISA suggest that school autonomy in defining curricula and assessments relates positively to the systems’ overall performance (Figure 2.37). For example, school systems that provide schools with greater discretion in making decisions regarding student-assessment policies, the courses offered, course content and the textbooks used, tend to be school systems that perform at higher levels.
PISA results show that Korea grants significant school autonomy over curricular and assessment policies and less autonomy over resource allocation. Some 92% of students in Korea are in schools whose principals reported that only principals and/or teachers have considerable responsibly in establishing student-assessment policies (the OECD average is 66%); 79% are in schools whose principals reported that only principals and/or teachers have considerable responsibility in deciding which courses are offered (the OECD average is 50%); 89% are in schools whose principals reported that only principals and/or teachers have considerable responsibility in determining course content (the OECD average is 45%); and 96% are in schools whose principals reported that only principals and/or teachers have considerable responsibility in choosing which textbooks are used (the OECD average is 78%) (Figure 2.40).
Data from PISA also show that in school systems where most schools post achievement data publicly, schools with greater discretion in managing their resources tend to show higher levels of performance. In school systems where schools do not post achievement data publicly, a student who attends a school with greater autonomy in resource management than the average OECD school tends to perform 3.2 score points lower in reading than a student attending a school with an average level of autonomy. In contrast, in school systems where schools do post achievement data publicly, a student who attends a school with above-average autonomy scores 2.6 points higher in reading than a student attending a school with an average level of autonomy (see OECD, 2010 Table IV.2.5.).
PISA classifies OECD countries into four groups that have similar profiles in the way that they allow schools and parents to make decisions that affect their children’s education. The grouping is based on levels of school autonomy and school competition. Two categories are identified for each dimension, and the interplay between these dimensions results in three groups: school systems that offer high levels of autonomy to schools in designing and using curricula and assessments and encourage more competition between schools; school systems that offer low levels of autonomy to schools and limit competition between schools; school systems that offer high levels of autonomy to schools, but with limited competition between schools; and school systems that offer low levels of autonomy to schools, but encourage more competition between schools.
•Six other OECD countries offer high levels of autonomy and choice, either in the form of a high prevalence of private schools or competition among schools for enrolment. In these school systems, schools have the freedom to choose teaching methods to meet learning objectives, and parents and students can choose among a variety of schools for enrolment. Korea falls into this category.
•Across OECD countries, the most common configuration is the one that gives schools the freedom to make curricular decisions, yet restricts competition for enrolment among schools. These school systems have relatively limited choice for parents and students, and there is little competition for enrolment among schools. Private schools are not widely available in these countries. Twenty-two OECD countries fall into this category.
•School systems that offer relatively low levels of autonomy to schools and low levels of choice to parents are also fairly common across OECD countries: four OECD countries and 11 partner countries and economies share this configuration.
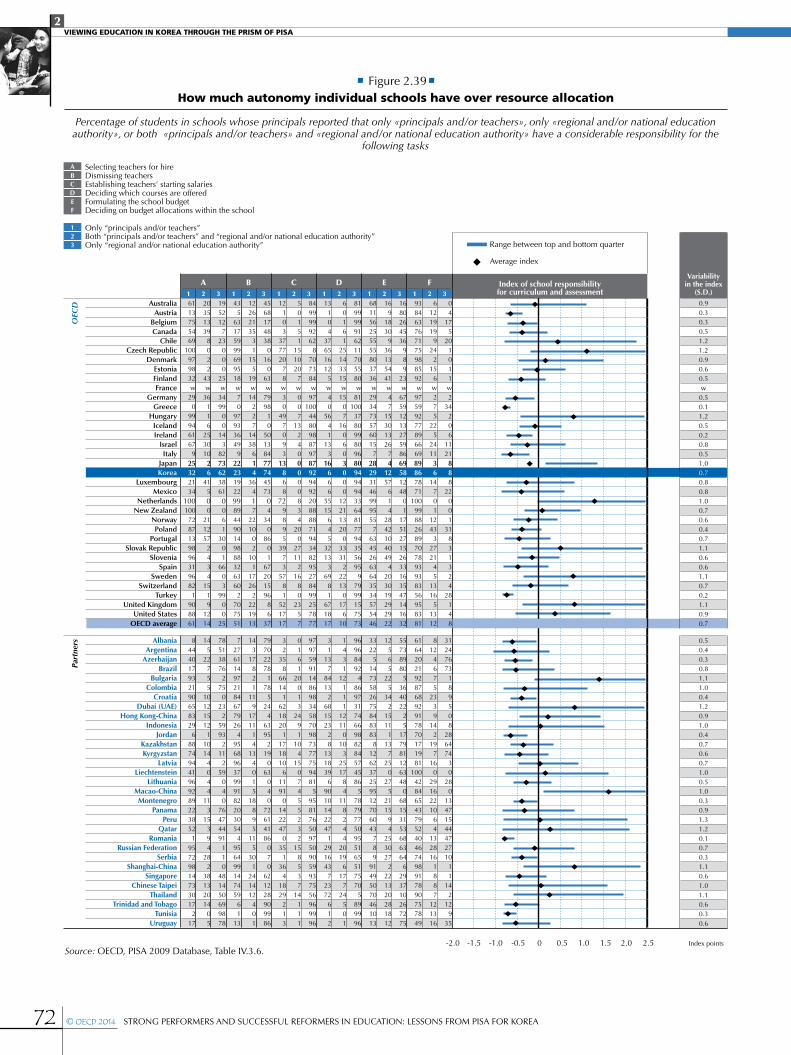
2VIEWING EDUCATION IN KOREA THROUGH THE PRISM OF PISA
72 © OECD 2014 STRONG PERFORMERS AND SUCCESSFUL REFORMERS IN EDUCATION: LESSONS FROM PISA FOR KOREA
• Figure 2.39•How much autonomy individual schools have over resource allocation
Index of school responsibility for curriculum and assessment
F3
04
175
201011w2
34206
1121888
22001
31831324
28148
31247673189508
28647430
280
1347154447271011
142
129
35
26
1219199
242
156w275
225
241136
14701
12433
272145
13165
1312
8124675
2339
142
197
160
2916221064
1328161887
121316
1938463767175988592w
9759927789666989867871
10099882689707893938356958381
6164202192876892917870171981
10042846543795240467498917890757849
E31680264536989
23w
675912132759866958124801
175127152633163547141632
557389805
36402225
1779811263480
681531536863646
293710267275
2169
18309
36135441w47
1530132674
1257614
28421040494
203019292922
12565
225
342
15111
137
250
275
211594
2530272
221320281812
1681156255555803736w
2934735760157
282931469995557
63452663643534575446
33225
14735826758483838
126237259512706043789
91495070461013
D3819999916211705580w
8110037809980968094949433648177943556959
7999157573
969684924
86973174669882845745865
787977509551655175705
899996
260161
25143315w
1507
160603000
122113200
33312
22130
176
10
1431
12111
12110
103
251784
118244
20196
177
24501
113104
376516125w40
5641
133
16666
5515645
32133
6981
671817
31
137
84132
68152328
1318396
90101422471
2916437
2372612
C384999992628
707384w
971004480988797879294922088887194348295278499257877
979759911486983458709873777594815
9581765097509059937556969996
250151
1510207w007
132400000834
200
27112
1680
2357
0161
20013
2491
104
1507455232
158537
14111
112103
37772078w30
497093
13868
729895
3973
5781
521717
32
358
66141
6218201
1718106
11910
1422470
351
364
1829213
B345681748380
160
63w
799810
5013847774457304
340
8601
6720159686
37
797022781
785
244
63952
190
63040
72614186070
621228909986
21226213531
155
19w
14227
1438614
36417
221002
101
17262
221913
143
17821
119
171114
134015
18895
115
301
241412401
1435
63175999699518w70
979336499
22231922998944901498883263602
707551
72761149721846779264
956896379991822030544
95649914745961
13
A31952127
23000
25w
349900
143
82736238610061
3001
6603
9900
25
785138762
750
232
59932
112
59040
76474491110
481450699878
2203513398022
43w
36116
25301026
41500
2112572434
1519
1214
145
22755
101215121
10144044
113
15394
282
3813201405
16113755469
100979832w
290
999461679
25322134
10010072871398963196821
908861
84440179321906583296
887494419692892238521
957298147330172
17
AustraliaAustria
BelgiumCanada
ChileCzech Republic
DenmarkEstoniaFinlandFrance
GermanyGreece
HungaryIcelandIreland
IsraelItaly
JapanKorea
LuxembourgMexico
NetherlandsNew Zealand
NorwayPoland
PortugalSlovak Republic
SloveniaSpain
SwedenSwitzerland
TurkeyUnited Kingdom
United StatesOECD average
AlbaniaArgentina
AzerbaijanBrazil
BulgariaColombia
CroatiaDubai (UAE)
Hong Kong-ChinaIndonesia
JordanKazakhstanKyrgyzstan
LatviaLiechtenstein
LithuaniaMacao-ChinaMontenegro
PanamaPeru
QatarRomania
Russian FederationSerbia
Shanghai-ChinaSingapore
Chinese TaipeiThailand
Trinidad and TobagoTunisia
Uruguay
OEC
DPa
rtne
rs
Source: OECD, PISA 2009 Database, Table IV.3.6.
Percentage of students in schools whose principals reported that only «principals and/or teachers», only «regional and/or national education authority», or both «principals and/or teachers» and «regional and/or national education authority» have a considerable responsibility for the
following tasks
A Selecting teachers for hireB Dismissing teachersC Establishing teachers’ starting salariesD Deciding which courses are offeredE Formulating the school budgetF Deciding on budget allocations within the school
1 Only “principals and/or teachers”2 Both “principals and/or teachers” and “regional and/or national education authority”3 Only “regional and/or national education authority”
Variability in the index
(S.D.)
0.90.30.30.51.21.20.90.60.5w
0.50.11.20.50.20.80.51.00.70.80.81.00.70.60.40.71.10.60.61.10.70.21.10.90.7
0.50.40.30.81.11.00.41.20.91.00.40.70.60.71.00.51.00.30.91.31.20.10.70.31.10.61.01.10.60.30.6
Index points-2.0 -1.0 1.0 2.00-1.5 -0.5 0.5 1.5 2.5
Range between top and bottom quarter
Average index
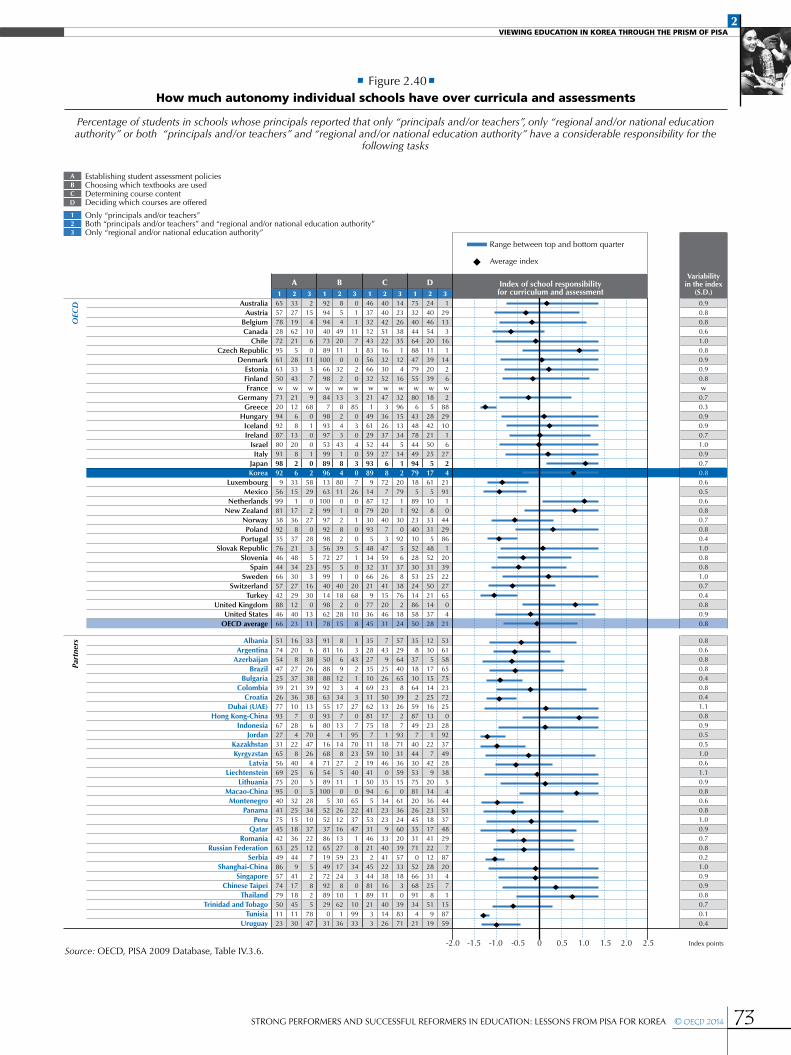
2VIEWING EDUCATION IN KOREA THROUGH THE PRISM OF PISA
73STRONG PERFORMERS AND SUCCESSFUL REFORMERS IN EDUCATION: LESSONS FROM PISA FOR KOREA © OECD 2014
• Figure 2.40•How much autonomy individual schools have over curricula and assessments
Index of school responsibility for curriculum and assessment
D31
29133
161
1426w2
88291016
2724
219110
4429861
203922276504
21
53615865752372250
28923749283854
44513748297
8720471
158759
2244046542011392039w
185
28422150255
17615
108
33315
485231255021143728
12305
171514251613231
227
429
2014362318174122122831258
519
19
1753240446488477955w
806
43487844499479185
8992234010522830532414865850
358
371810642
5987497
4044305375812026453531710
52666891344
21
C3
14232638351
124
16w
32961513345
1412
207911
300
9256
378
38762
1824
57296440658
392627
9371313659150
61362460203957331830
398371
2404042512216323052w
473
362637442768
727
12204073
475931264115204631
7439
252623501317181
1810460
356
3423239
33404122381611401426
1463732124383566632w
211
49612952599389
914877930935
48343266219
773645
352827351069116281757
1159194150945
41533146212
454481892133
B3011
1171020w3
8503040307
26001005100
20680
108
13
432143
2707
9570232
4010
6522374718
2334301
109933
2854
4920110
322w
138243
43184
801101282
392751
40182
2815
81669
123
34177
131
148
275
110
3026121613275917248
10621
36
1929494407389
1006698w
847
989397539989961363
10099979298567295994014986278
918150888892635593804
1668715489
1005
52523786651949729289290
31
A32
154
1060
1137w9
680100102
582902
270
2835
233
16300
1311
336
38263839381306
7047264655
283410372212752825
7847
233271962215
283343w
211268
1320826
33151
17368
37214834302729124023
16208
27372136107
284
228
4025200
322515183625449
411718451130
1655778287295616350w
712094928780919892
9569981389235764644665742884666
51745447253926779367273165566975954041754542634986577479501123
AustraliaAustria
BelgiumCanada
ChileCzech Republic
DenmarkEstoniaFinlandFrance
GermanyGreece
HungaryIcelandIreland
IsraelItaly
JapanKorea
LuxembourgMexico
NetherlandsNew Zealand
NorwayPoland
PortugalSlovak Republic
SloveniaSpain
SwedenSwitzerland
TurkeyUnited Kingdom
United StatesOECD average
AlbaniaArgentina
AzerbaijanBrazil
BulgariaColombia
CroatiaDubai (UAE)
Hong Kong-ChinaIndonesia
JordanKazakhstanKyrgyzstan
LatviaLiechtenstein
LithuaniaMacao-ChinaMontenegro
PanamaPeru
QatarRomania
Russian FederationSerbia
Shanghai-ChinaSingapore
Chinese TaipeiThailand
Trinidad and TobagoTunisia
Uruguay
OEC
DPa
rtne
rs
Source: OECD, PISA 2009 Database, Table IV.3.6.
Percentage of students in schools whose principals reported that only “principals and/or teachers”, only “regional and/or national education authority” or both “principals and/or teachers” and “regional and/or national education authority” have a considerable responsibility for the
following tasks
A Establishing student assessment policiesB Choosing which textbooks are usedC Determining course contentD Deciding which courses are offered
1 Only “principals and/or teachers”2 Both “principals and/or teachers” and “regional and/or national education authority”3 Only “regional and/or national education authority”
Variability in the index
(S.D.)
0.90.80.80.61.00.80.90.90.8w
0.70.30.90.90.71.00.90.70.80.60.50.60.80.70.80.41.00.80.81.00.70.40.80.90.8
0.80.60.80.80.40.80.41.10.80.90.50.51.00.61.10.90.80.60.81.00.90.70.80.21.00.90.90.80.70.10.4
Index points-2.0 -1.0 1.0 2.00-1.5 -0.5 0.5 1.5 2.5
Range between top and bottom quarter
Average index
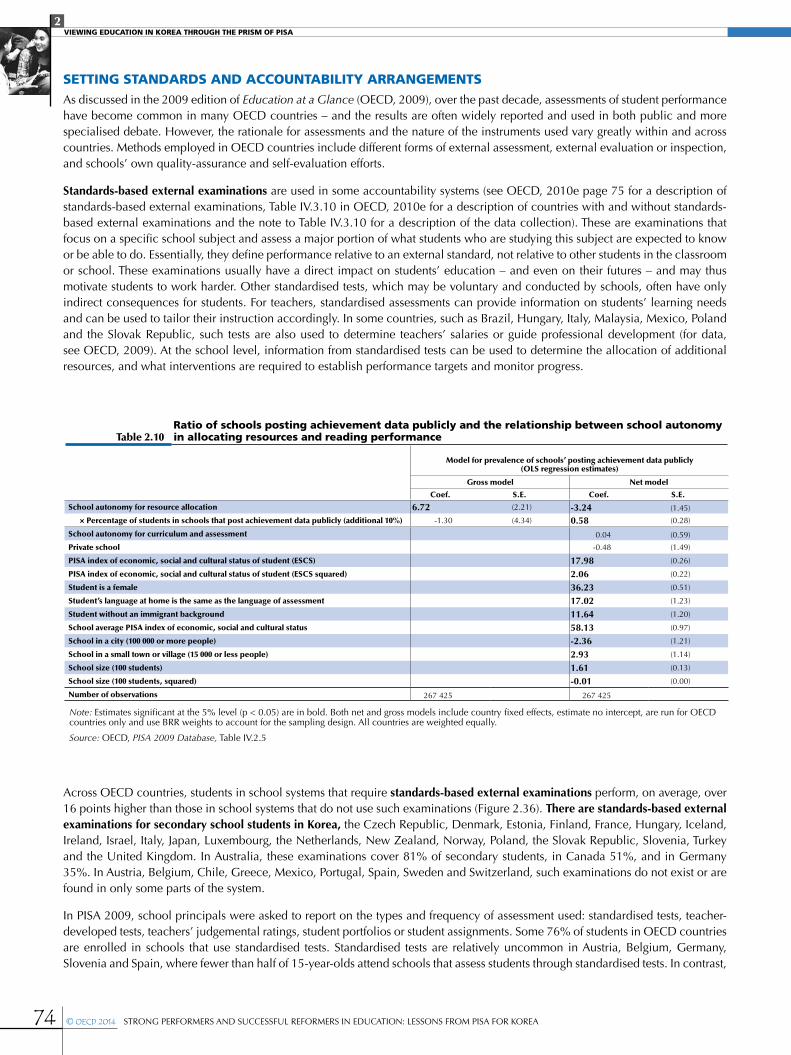
2VIEWING EDUCATION IN KOREA THROUGH THE PRISM OF PISA
74 © OECD 2014 STRONG PERFORMERS AND SUCCESSFUL REFORMERS IN EDUCATION: LESSONS FROM PISA FOR KOREA
SETTING STANDARDS AND ACCOUNTABILITY ARRANGEMENTSAs discussed in the 2009 edition of Education at a Glance (OECD, 2009), over the past decade, assessments of student performance have become common in many OECD countries – and the results are often widely reported and used in both public and more specialised debate. However, the rationale for assessments and the nature of the instruments used vary greatly within and across countries. Methods employed in OECD countries include different forms of external assessment, external evaluation or inspection, and schools’ own quality-assurance and self-evaluation efforts.
Standards-based external examinations are used in some accountability systems (see OECD, 2010e page 75 for a description of standards-based external examinations, Table IV.3.10 in OECD, 2010e for a description of countries with and without standards-based external examinations and the note to Table IV.3.10 for a description of the data collection). These are examinations that focus on a specific school subject and assess a major portion of what students who are studying this subject are expected to know or be able to do. Essentially, they define performance relative to an external standard, not relative to other students in the classroom or school. These examinations usually have a direct impact on students’ education – and even on their futures – and may thus motivate students to work harder. Other standardised tests, which may be voluntary and conducted by schools, often have only indirect consequences for students. For teachers, standardised assessments can provide information on students’ learning needs and can be used to tailor their instruction accordingly. In some countries, such as Brazil, Hungary, Italy, Malaysia, Mexico, Poland and the Slovak Republic, such tests are also used to determine teachers’ salaries or guide professional development (for data, see OECD, 2009). At the school level, information from standardised tests can be used to determine the allocation of additional resources, and what interventions are required to establish performance targets and monitor progress.
Across OECD countries, students in school systems that require standards-based external examinations perform, on average, over 16 points higher than those in school systems that do not use such examinations (Figure 2.36). There are standards-based external examinations for secondary school students in Korea, the Czech Republic, Denmark, Estonia, Finland, France, Hungary, Iceland, Ireland, Israel, Italy, Japan, Luxembourg, the Netherlands, New Zealand, Norway, Poland, the Slovak Republic, Slovenia, Turkey and the United Kingdom. In Australia, these examinations cover 81% of secondary students, in Canada 51%, and in Germany 35%. In Austria, Belgium, Chile, Greece, Mexico, Portugal, Spain, Sweden and Switzerland, such examinations do not exist or are found in only some parts of the system.
In PISA 2009, school principals were asked to report on the types and frequency of assessment used: standardised tests, teacher-developed tests, teachers’ judgemental ratings, student portfolios or student assignments. Some 76% of students in OECD countries are enrolled in schools that use standardised tests. Standardised tests are relatively uncommon in Austria, Belgium, Germany, Slovenia and Spain, where fewer than half of 15-year-olds attend schools that assess students through standardised tests. In contrast,
Table 2.10Ratio of schools posting achievement data publicly and the relationship between school autonomy in allocating resources and reading performance
Model for prevalence of schools’ posting achievement data publicly (OLS regression estimates)
Gross model Net model
Coef. S.E. Coef. S.E.
School autonomy for resource allocation 6.72 (2.21) -3.24 (1.45)
× Percentage of students in schools that post achievement data publicly (additional 10%) -1.30 (4.34) 0.58 (0.28)
School autonomy for curriculum and assessment 0.04 (0.59)
Private school -0.48 (1.49)
PISA index of economic, social and cultural status of student (ESCS) 17.98 (0.26)
PISA index of economic, social and cultural status of student (ESCS squared) 2.06 (0.22)
Student is a female 36.23 (0.51)
Student’s language at home is the same as the language of assessment 17.02 (1.23)
Student without an immigrant background 11.64 (1.20)
School average PISA index of economic, social and cultural status 58.13 (0.97)
School in a city (100 000 or more people) -2.36 (1.21)
School in a small town or village (15 000 or less people) 2.93 (1.14)
School size (100 students) 1.61 (0.13)
School size (100 students, squared) -0.01 (0.00)
Number of observations 267 425 267 425
Note: Estimates significant at the 5% level (p < 0.05) are in bold. Both net and gross models include country fixed effects, estimate no intercept, are run for OECD countries only and use BRR weights to account for the sampling design. All countries are weighted equally.
Source: OECD, PISA 2009 Database, Table IV.2.5
2VIEWING EDUCATION IN KOREA THROUGH THE PRISM OF PISA
75STRONG PERFORMERS AND SUCCESSFUL REFORMERS IN EDUCATION: LESSONS FROM PISA FOR KOREA © OECD 2014
the use of standardised tests is practically universal in Korea, where 98% of students attend schools that use standardised tests, and in Denmark, Finland, Luxembourg, Norway, Poland, Sweden and the United States, where over 95% of students attend schools that use this assessment at least once a year (OECD, 2010e).
Standards are typically reflected in accountability frameworks and mechanisms. The purposes of assessments vary greatly across countries. At the school level, these assessments can be used by schools to compare themselves to other schools, to monitor progress, or to make decisions about instruction. Some 59% of students across OECD countries are in schools that use achievement data to compare their students’ achievement levels with those in other schools or with regional/national benchmarks. This practice is most common in New Zealand, the United Kingdom and the United States, where over 90% of students attend schools that use achievement data for comparative purposes, but is also widely used in Korea, where 78% of students attend such schools. In many OECD countries, these data are used to make decisions about students’ retention or promotion: on average across OECD countries, 78% of students attend schools that do so. In Belgium, Luxembourg, Poland and Spain, over 98% of students are in schools that use achievement data to decide on grade retention or promotion, but in Korea, fewer than 37% of students are in such schools. Achievement data are much more likely to be used to monitor a Korean school’s progress from year to year and to identify aspects of instruction or aspects of the curriculum that could be improved – 83% and 88% of Korean students, respectively, attend such schools (see OECD, 2010e Table IV.3.12).
PISA does not show that the prevalence of standardised tests is systematically related to performance. This may be partly because the content and use of standardised tests vary considerably across schools and systems. However, education systems with a higher prevalence of standardised tests tend to show smaller socio-economic inequities between schools and consequently show a smaller impact of a school’s socio-economic background on performance. The same holds for the use of assessment data to identify aspects of instruction or the curriculum that could be improved and the high proportions of schools whose achievement data is tracked over time by administrative authorities.
PISA 2009 collected data on the nature of accountability systems and the ways in which the resulting information was used. Some school systems publicise achievement data to make stakeholders aware of the comparative performance of schools and, where school-choice programmes are available, to make parents aware of the choices available to them. In Korea, 33% of students attend schools that make achievement data available to the public; this proportion is similar to the OECD average. In Austria, Belgium, Finland, Japan, Spain and Switzerland, fewer than 10% of students attend such schools, while in the United Kingdom and the United States, more than 80% of students attend schools that make student achievement data publicly available. In seven OECD countries and nine partner countries and economies, schools whose principals reported that student achievement data are posted publicly perform better than schools that do not post such information, before accounting for the socio-economic and demographic backgrounds of students and schools. In Korea, however, no relationship is seen between reporting student achievement data and student performance (see Table IV.2.9b and Table IV.2.9c in OECD, 2010e), and this association is not apparent in any country, except Turkey, after controlling for the socio-economic background of students and schools. This is because, in most countries, the schools that post achievement data publicly tend to be socio-economically advantaged schools.
Across OECD countries, some 33% of students attend schools that use achievement data to determine how resources are distributed. In Korea, 39% of students attend such schools, while in Chile, Israel and the United States, more than 70% of students attend schools whose principal reported that instructional resources are allocated according to the school’s achievement data. The practice of using achievement data to determine how resources are distributed is least common in the Czech Republic, Finland, Greece, Iceland, and Japan, where fewer than 10% of students attend schools that use achievement data this way.
Some school systems make achievement data available to parents in the form of report cards and by sending teacher-formulated assessments home. Some school systems also provide information on the students’ academic standing compared with other students in the country or region or within the school. Across OECD countries, an average of 52% of students attends schools that use achievement data relative to national or regional benchmarks and/or as a group relative to students in the same grade in other schools. In Korea, 84% of students attend schools that provide information regarding the academic standing of the students in one or other of these ways. Other countries where this practice is particularly widespread are Chile, Norway, Sweden, Turkey and the United States, where more than 80% of students attend schools that provide parents with achievement data comparing their students with national or regional student populations (see Table IV.3.14 in OECD, 2010e).
An average of 59% of students across OECD countries attends schools whose student achievement data are used to monitor teacher practices (see Table IV.3.15 in OECD, 2010e). In Korea, 77% of students attend schools that use achievement data to monitor teacher practices. In Austria, Israel, Mexico, Poland, Turkey, the United Kingdom and the United States, over 80% of students attend such schools, while 30% or fewer of students in Finland, Greece, Sweden and Switzerland attend such schools. Many schools across OECD countries complement this information with qualitative assessments, such as teacher peer reviews, assessments by school principals or senior staff, or observations by inspectors or other people external to the school. Most schools across OECD countries use either student-derived, direct observations or reviews to monitor teachers. In Korea, 77% of students
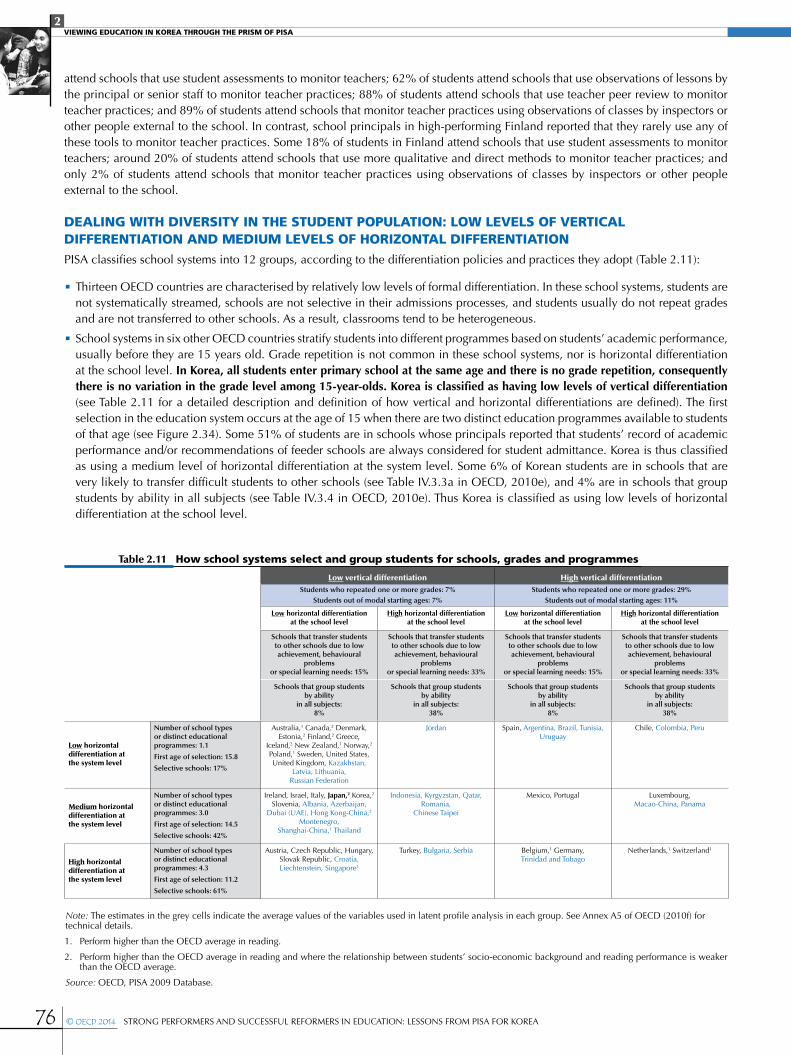
2VIEWING EDUCATION IN KOREA THROUGH THE PRISM OF PISA
76 © OECD 2014 STRONG PERFORMERS AND SUCCESSFUL REFORMERS IN EDUCATION: LESSONS FROM PISA FOR KOREA
attend schools that use student assessments to monitor teachers; 62% of students attend schools that use observations of lessons by the principal or senior staff to monitor teacher practices; 88% of students attend schools that use teacher peer review to monitor teacher practices; and 89% of students attend schools that monitor teacher practices using observations of classes by inspectors or other people external to the school. In contrast, school principals in high-performing Finland reported that they rarely use any of these tools to monitor teacher practices. Some 18% of students in Finland attend schools that use student assessments to monitor teachers; around 20% of students attend schools that use more qualitative and direct methods to monitor teacher practices; and only 2% of students attend schools that monitor teacher practices using observations of classes by inspectors or other people external to the school.
DEALING WITH DIVERSITY IN THE STUDENT POPULATION: LOW LEVELS OF VERTICAL DIFFERENTIATION AND MEDIUM LEVELS OF HORIZONTAL DIFFERENTIATIONPISA classifies school systems into 12 groups, according to the differentiation policies and practices they adopt (Table 2.11):
•Thirteen OECD countries are characterised by relatively low levels of formal differentiation. In these school systems, students are not systematically streamed, schools are not selective in their admissions processes, and students usually do not repeat grades and are not transferred to other schools. As a result, classrooms tend to be heterogeneous.
•School systems in six other OECD countries stratify students into different programmes based on students’ academic performance, usually before they are 15 years old. Grade repetition is not common in these school systems, nor is horizontal differentiation at the school level. In Korea, all students enter primary school at the same age and there is no grade repetition, consequently there is no variation in the grade level among 15-year-olds. Korea is classified as having low levels of vertical differentiation (see Table 2.11 for a detailed description and definition of how vertical and horizontal differentiations are defined). The first selection in the education system occurs at the age of 15 when there are two distinct education programmes available to students of that age (see Figure 2.34). Some 51% of students are in schools whose principals reported that students’ record of academic performance and/or recommendations of feeder schools are always considered for student admittance. Korea is thus classified as using a medium level of horizontal differentiation at the system level. Some 6% of Korean students are in schools that are very likely to transfer difficult students to other schools (see Table IV.3.3a in OECD, 2010e), and 4% are in schools that group students by ability in all subjects (see Table IV.3.4 in OECD, 2010e). Thus Korea is classified as using low levels of horizontal differentiation at the school level.
Low vertical differentiation High vertical differentiationStudents who repeated one or more grades: 7% Students who repeated one or more grades: 29%
Students out of modal starting ages: 7% Students out of modal starting ages: 11%
Low horizontal differentiation at the school level
High horizontal differentiation at the school level
Low horizontal differentiation at the school level
High horizontal differentiation at the school level
Schools that transfer students to other schools due to low achievement, behavioural
problems or special learning needs: 15%
Schools that transfer students to other schools due to low achievement, behavioural
problems or special learning needs: 33%
Schools that transfer students to other schools due to low achievement, behavioural
problems or special learning needs: 15%
Schools that transfer students to other schools due to low achievement, behavioural
problems or special learning needs: 33%
Schools that group students by ability
in all subjects: 8%
Schools that group students by ability
in all subjects: 38%
Schools that group students by ability
in all subjects: 8%
Schools that group students by ability
in all subjects: 38%
Low horizontal differentiation at the system level
Number of school types or distinct educational programmes: 1.1
First age of selection: 15.8
Selective schools: 17%
Australia,1 Canada,2 Denmark, Estonia,2 Finland,2 Greece,
Iceland,2 New Zealand,1 Norway,2 Poland,1 Sweden, United States, United Kingdom, Kazakhstan,
Latvia, Lithuania, Russian Federation
Jordan Spain, Argentina, Brazil, Tunisia, Uruguay
Chile, Colombia, Peru
Medium horizontal differentiation at the system level
Number of school types or distinct educational programmes: 3.0
First age of selection: 14.5
Selective schools: 42%
Ireland, Israel, Italy, Japan,2 Korea,2 Slovenia, Albania, Azerbaijan,
Dubai (UAE), Hong Kong-China,2 Montenegro,
Shanghai-China,1 Thailand
Indonesia, Kyrgyzstan, Qatar, Romania,
Chinese Taipei
Mexico, Portugal Luxembourg, Macao-China, Panama
High horizontal differentiation at the system level
Number of school types or distinct educational programmes: 4.3
First age of selection: 11.2
Selective schools: 61%
Austria, Czech Republic, Hungary, Slovak Republic, Croatia, Liechtenstein, Singapore1
Turkey, Bulgaria, Serbia Belgium,1 Germany, Trinidad and Tobago
Netherlands,1 Switzerland1
Table 2.11 How school systems select and group students for schools, grades and programmes
Note: The estimates in the grey cells indicate the average values of the variables used in latent profile analysis in each group. See Annex A5 of OECD (2010f) for technical details.
1. Perform higher than the OECD average in reading.
2. Perform higher than the OECD average in reading and where the relationship between students’ socio-economic background and reading performance is weaker than the OECD average.
Source: OECD, PISA 2009 Database.
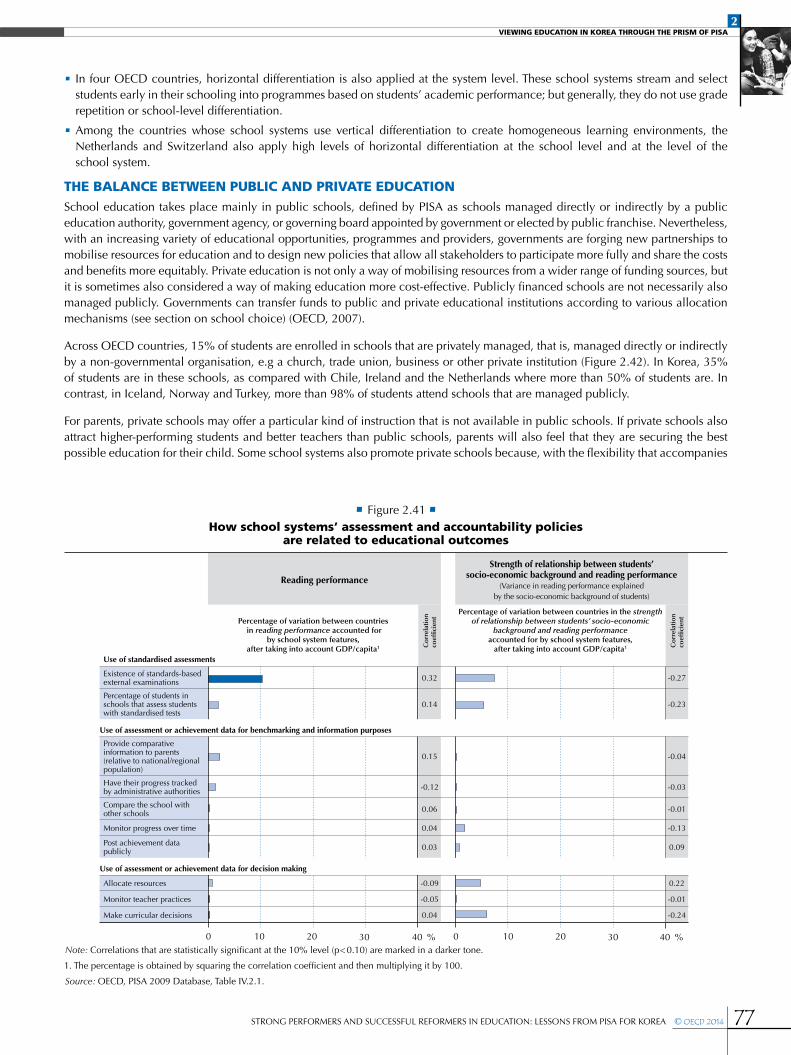
2VIEWING EDUCATION IN KOREA THROUGH THE PRISM OF PISA
77STRONG PERFORMERS AND SUCCESSFUL REFORMERS IN EDUCATION: LESSONS FROM PISA FOR KOREA © OECD 2014
•In four OECD countries, horizontal differentiation is also applied at the system level. These school systems stream and select students early in their schooling into programmes based on students’ academic performance; but generally, they do not use grade repetition or school-level differentiation.
•Among the countries whose school systems use vertical differentiation to create homogeneous learning environments, the Netherlands and Switzerland also apply high levels of horizontal differentiation at the school level and at the level of the school system.
THE BALANCE BETWEEN PUBLIC AND PRIVATE EDUCATIONSchool education takes place mainly in public schools, defined by PISA as schools managed directly or indirectly by a public education authority, government agency, or governing board appointed by government or elected by public franchise. Nevertheless, with an increasing variety of educational opportunities, programmes and providers, governments are forging new partnerships to mobilise resources for education and to design new policies that allow all stakeholders to participate more fully and share the costs and benefits more equitably. Private education is not only a way of mobilising resources from a wider range of funding sources, but it is sometimes also considered a way of making education more cost-effective. Publicly financed schools are not necessarily also managed publicly. Governments can transfer funds to public and private educational institutions according to various allocation mechanisms (see section on school choice) (OECD, 2007).
Across OECD countries, 15% of students are enrolled in schools that are privately managed, that is, managed directly or indirectly by a non-governmental organisation, e.g a church, trade union, business or other private institution (Figure 2.42). In Korea, 35% of students are in these schools, as compared with Chile, Ireland and the Netherlands where more than 50% of students are. In contrast, in Iceland, Norway and Turkey, more than 98% of students attend schools that are managed publicly.
For parents, private schools may offer a particular kind of instruction that is not available in public schools. If private schools also attract higher-performing students and better teachers than public schools, parents will also feel that they are securing the best possible education for their child. Some school systems also promote private schools because, with the flexibility that accompanies
40 %Note: Correlations that are statistically significant at the 10% level (p < 0.10) are marked in a darker tone.
1. The percentage is obtained by squaring the correlation coefficient and then multiplying it by 100.
Source: OECD, PISA 2009 Database, Table IV.2.1.
0 10 20 30 40 % 0 10 20 30
Reading performance
Strength of relationship between students’ socio-economic background and reading performance
(Variance in reading performance explained by the socio-economic background of students)
Percentage of variation between countries in reading performance accounted for
by school system features, after taking into account GDP/capita1 C
orr
elat
ion
coef
ficie
nt
Percentage of variation between countries in the strength of relationship between students’ socio-economic
background and reading performance accounted for by school system features,
after taking into account GDP/capita1 Co
rrel
atio
n co
effic
ient
Use of standardised assessments
Existence of standards-based external examinations 0.32 -0.27
Percentage of students in schools that assess students with standardised tests
0.14 -0.23
Use of assessment or achievement data for benchmarking and information purposes
Provide comparative information to parents (relative to national/regional population)
0.15 -0.04
Have their progress tracked by administrative authorities -0.12 -0.03
Compare the school with other schools 0.06 -0.01
Monitor progress over time 0.04 -0.13
Post achievement data publicly 0.03 0.09
Use of assessment or achievement data for decision making
Allocate resources -0.09 0.22
Monitor teacher practices -0.05 -0.01
Make curricular decisions 0.04 -0.24
• Figure 2.41 •How school systems’ assessment and accountability policies
are related to educational outcomes
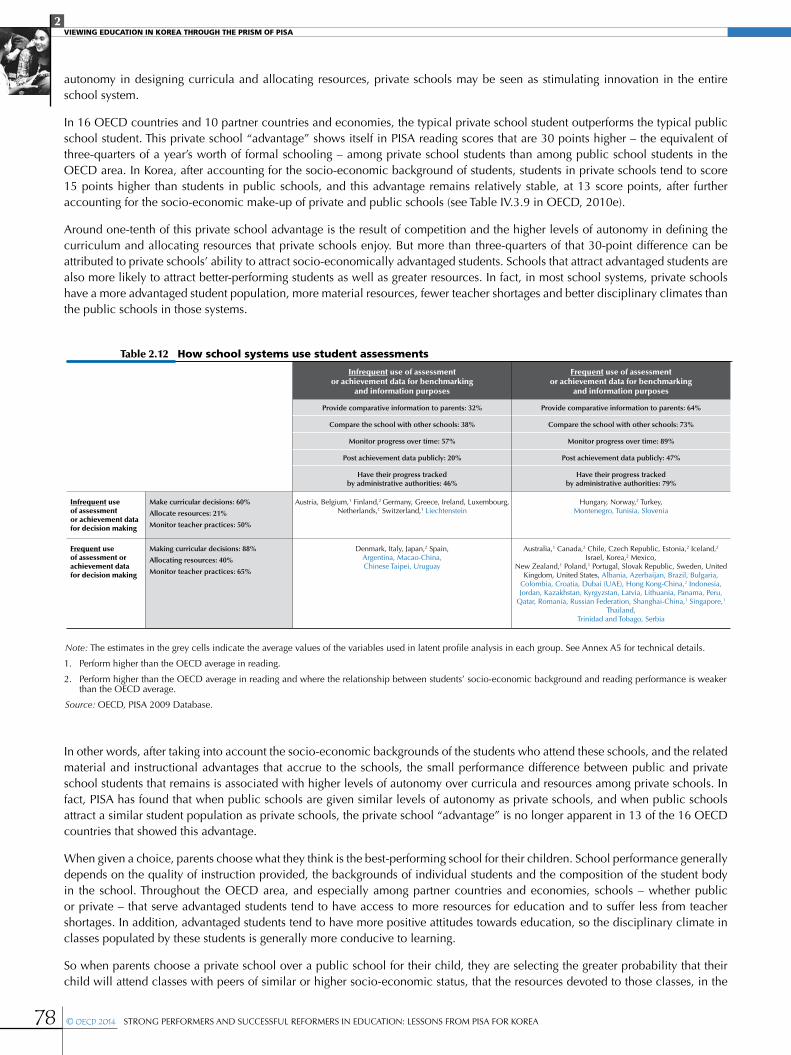
2VIEWING EDUCATION IN KOREA THROUGH THE PRISM OF PISA
78 © OECD 2014 STRONG PERFORMERS AND SUCCESSFUL REFORMERS IN EDUCATION: LESSONS FROM PISA FOR KOREA
autonomy in designing curricula and allocating resources, private schools may be seen as stimulating innovation in the entire school system.
In 16 OECD countries and 10 partner countries and economies, the typical private school student outperforms the typical public school student. This private school “advantage” shows itself in PISA reading scores that are 30 points higher – the equivalent of three-quarters of a year’s worth of formal schooling – among private school students than among public school students in the OECD area. In Korea, after accounting for the socio-economic background of students, students in private schools tend to score 15 points higher than students in public schools, and this advantage remains relatively stable, at 13 score points, after further accounting for the socio-economic make-up of private and public schools (see Table IV.3.9 in OECD, 2010e).
Around one-tenth of this private school advantage is the result of competition and the higher levels of autonomy in defining the curriculum and allocating resources that private schools enjoy. But more than three-quarters of that 30-point difference can be attributed to private schools’ ability to attract socio-economically advantaged students. Schools that attract advantaged students are also more likely to attract better-performing students as well as greater resources. In fact, in most school systems, private schools have a more advantaged student population, more material resources, fewer teacher shortages and better disciplinary climates than the public schools in those systems.
In other words, after taking into account the socio-economic backgrounds of the students who attend these schools, and the related material and instructional advantages that accrue to the schools, the small performance difference between public and private school students that remains is associated with higher levels of autonomy over curricula and resources among private schools. In fact, PISA has found that when public schools are given similar levels of autonomy as private schools, and when public schools attract a similar student population as private schools, the private school “advantage” is no longer apparent in 13 of the 16 OECD countries that showed this advantage.
When given a choice, parents choose what they think is the best-performing school for their children. School performance generally depends on the quality of instruction provided, the backgrounds of individual students and the composition of the student body in the school. Throughout the OECD area, and especially among partner countries and economies, schools – whether public or private – that serve advantaged students tend to have access to more resources for education and to suffer less from teacher shortages. In addition, advantaged students tend to have more positive attitudes towards education, so the disciplinary climate in classes populated by these students is generally more conducive to learning.
So when parents choose a private school over a public school for their child, they are selecting the greater probability that their child will attend classes with peers of similar or higher socio-economic status, that the resources devoted to those classes, in the
Infrequent use of assessment or achievement data for benchmarking
and information purposes
Frequent use of assessment or achievement data for benchmarking
and information purposes
Provide comparative information to parents: 32% Provide comparative information to parents: 64%
Compare the school with other schools: 38% Compare the school with other schools: 73%
Monitor progress over time: 57% Monitor progress over time: 89%
Post achievement data publicly: 20% Post achievement data publicly: 47%
Have their progress tracked by administrative authorities: 46%
Have their progress tracked by administrative authorities: 79%
Infrequent use of assessment or achievement data for decision making
Make curricular decisions: 60%
Allocate resources: 21%
Monitor teacher practices: 50%
Austria, Belgium,1 Finland,2 Germany, Greece, Ireland, Luxembourg, Netherlands,1 Switzerland,1 Liechtenstein
Hungary, Norway,2 Turkey, Montenegro, Tunisia, Slovenia
Frequent use of assessment or achievement data for decision making
Making curricular decisions: 88%
Allocating resources: 40%
Monitor teacher practices: 65%
Denmark, Italy, Japan,2 Spain, Argentina, Macao-China, Chinese Taipei, Uruguay
Australia,1 Canada,2 Chile, Czech Republic, Estonia,2 Iceland,2 Israel, Korea,2 Mexico,
New Zealand,1 Poland,1 Portugal, Slovak Republic, Sweden, United Kingdom, United States, Albania, Azerbaijan, Brazil, Bulgaria,
Colombia, Croatia, Dubai (UAE), Hong Kong-China,2 Indonesia, Jordan, Kazakhstan, Kyrgyzstan, Latvia, Lithuania, Panama, Peru,
Qatar, Romania, Russian Federation, Shanghai-China,1 Singapore,1 Thailand,
Trinidad and Tobago, Serbia
Table 2.12 How school systems use student assessments
Note: The estimates in the grey cells indicate the average values of the variables used in latent profile analysis in each group. See Annex A5 for technical details.
1. Perform higher than the OECD average in reading.
2. Perform higher than the OECD average in reading and where the relationship between students’ socio-economic background and reading performance is weaker than the OECD average.
Source: OECD, PISA 2009 Database.
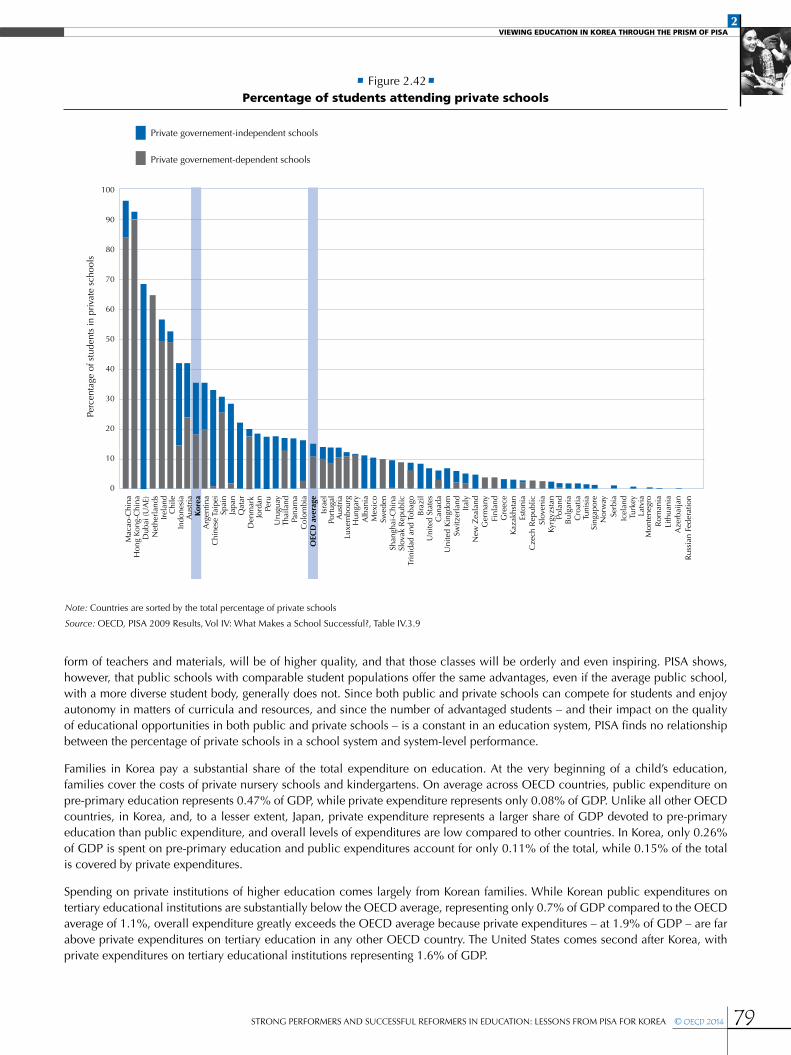
2VIEWING EDUCATION IN KOREA THROUGH THE PRISM OF PISA
79STRONG PERFORMERS AND SUCCESSFUL REFORMERS IN EDUCATION: LESSONS FROM PISA FOR KOREA © OECD 2014
form of teachers and materials, will be of higher quality, and that those classes will be orderly and even inspiring. PISA shows, however, that public schools with comparable student populations offer the same advantages, even if the average public school, with a more diverse student body, generally does not. Since both public and private schools can compete for students and enjoy autonomy in matters of curricula and resources, and since the number of advantaged students – and their impact on the quality of educational opportunities in both public and private schools – is a constant in an education system, PISA finds no relationship between the percentage of private schools in a school system and system-level performance.
Families in Korea pay a substantial share of the total expenditure on education. At the very beginning of a child’s education, families cover the costs of private nursery schools and kindergartens. On average across OECD countries, public expenditure on pre-primary education represents 0.47% of GDP, while private expenditure represents only 0.08% of GDP. Unlike all other OECD countries, in Korea, and, to a lesser extent, Japan, private expenditure represents a larger share of GDP devoted to pre-primary education than public expenditure, and overall levels of expenditures are low compared to other countries. In Korea, only 0.26% of GDP is spent on pre-primary education and public expenditures account for only 0.11% of the total, while 0.15% of the total is covered by private expenditures.
Spending on private institutions of higher education comes largely from Korean families. While Korean public expenditures on tertiary educational institutions are substantially below the OECD average, representing only 0.7% of GDP compared to the OECD average of 1.1%, overall expenditure greatly exceeds the OECD average because private expenditures – at 1.9% of GDP – are far above private expenditures on tertiary education in any other OECD country. The United States comes second after Korea, with private expenditures on tertiary educational institutions representing 1.6% of GDP.
• Figure 2.42•Percentage of students attending private schools
Note: Countries are sorted by the total percentage of private schools
Source: OECD, PISA 2009 Results, Vol IV: What Makes a School Successful?, Table IV.3.9
Private governement-independent schools
Private governement-dependent schools
Perc
enta
ge o
f stu
dent
s in
priv
ate
scho
ols
0
10
20
30
40
50
60
70
80
90
100
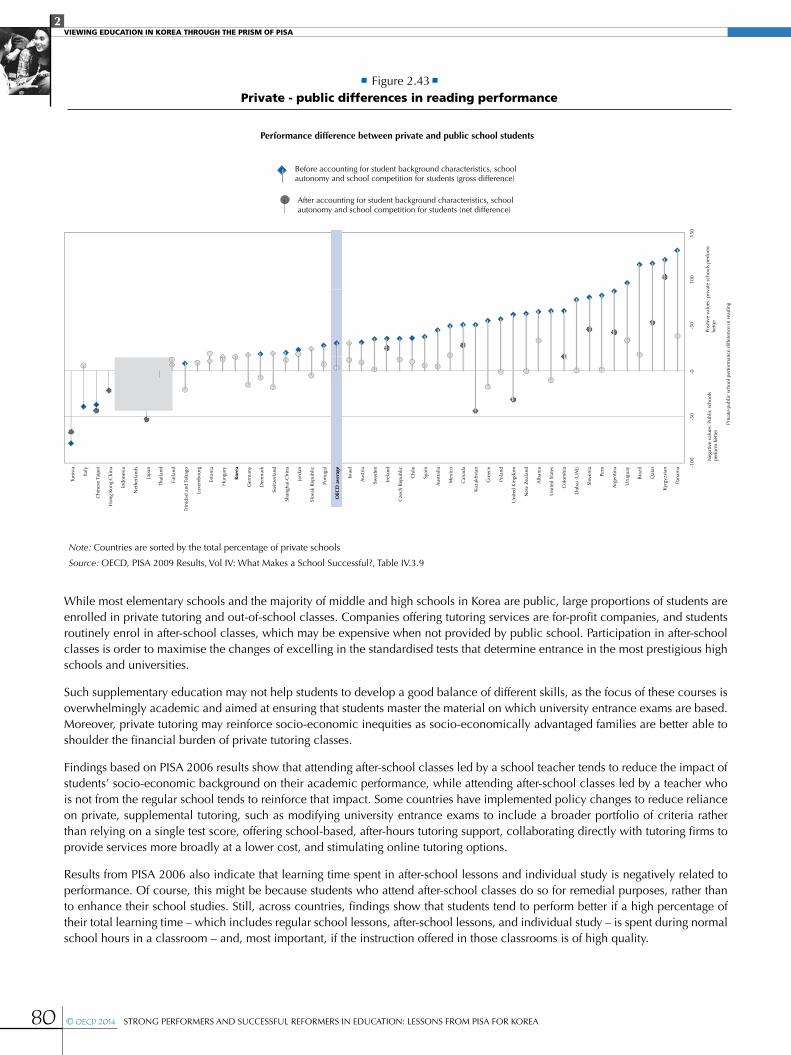
2VIEWING EDUCATION IN KOREA THROUGH THE PRISM OF PISA
80 © OECD 2014 STRONG PERFORMERS AND SUCCESSFUL REFORMERS IN EDUCATION: LESSONS FROM PISA FOR KOREA
While most elementary schools and the majority of middle and high schools in Korea are public, large proportions of students are enrolled in private tutoring and out-of-school classes. Companies offering tutoring services are for-profit companies, and students routinely enrol in after-school classes, which may be expensive when not provided by public school. Participation in after-school classes is order to maximise the changes of excelling in the standardised tests that determine entrance in the most prestigious high schools and universities.
Such supplementary education may not help students to develop a good balance of different skills, as the focus of these courses is overwhelmingly academic and aimed at ensuring that students master the material on which university entrance exams are based. Moreover, private tutoring may reinforce socio-economic inequities as socio-economically advantaged families are better able to shoulder the financial burden of private tutoring classes.
Findings based on PISA 2006 results show that attending after-school classes led by a school teacher tends to reduce the impact of students’ socio-economic background on their academic performance, while attending after-school classes led by a teacher who is not from the regular school tends to reinforce that impact. Some countries have implemented policy changes to reduce reliance on private, supplemental tutoring, such as modifying university entrance exams to include a broader portfolio of criteria rather than relying on a single test score, offering school-based, after-hours tutoring support, collaborating directly with tutoring firms to provide services more broadly at a lower cost, and stimulating online tutoring options.
Results from PISA 2006 also indicate that learning time spent in after-school lessons and individual study is negatively related to performance. Of course, this might be because students who attend after-school classes do so for remedial purposes, rather than to enhance their school studies. Still, across countries, findings show that students tend to perform better if a high percentage of their total learning time – which includes regular school lessons, after-school lessons, and individual study – is spent during normal school hours in a classroom – and, most important, if the instruction offered in those classrooms is of high quality.
• Figure 2.43•Private - public differences in reading performance
Note: Countries are sorted by the total percentage of private schools
Source: OECD, PISA 2009 Results, Vol IV: What Makes a School Successful?, Table IV.3.9
Performance difference between private and public school students
Before accounting for student background characteristics, schoolautonomy and school competition for students (gross difference)
After accounting for student background characteristics, schoolautonomy and school competition for students (net difference)
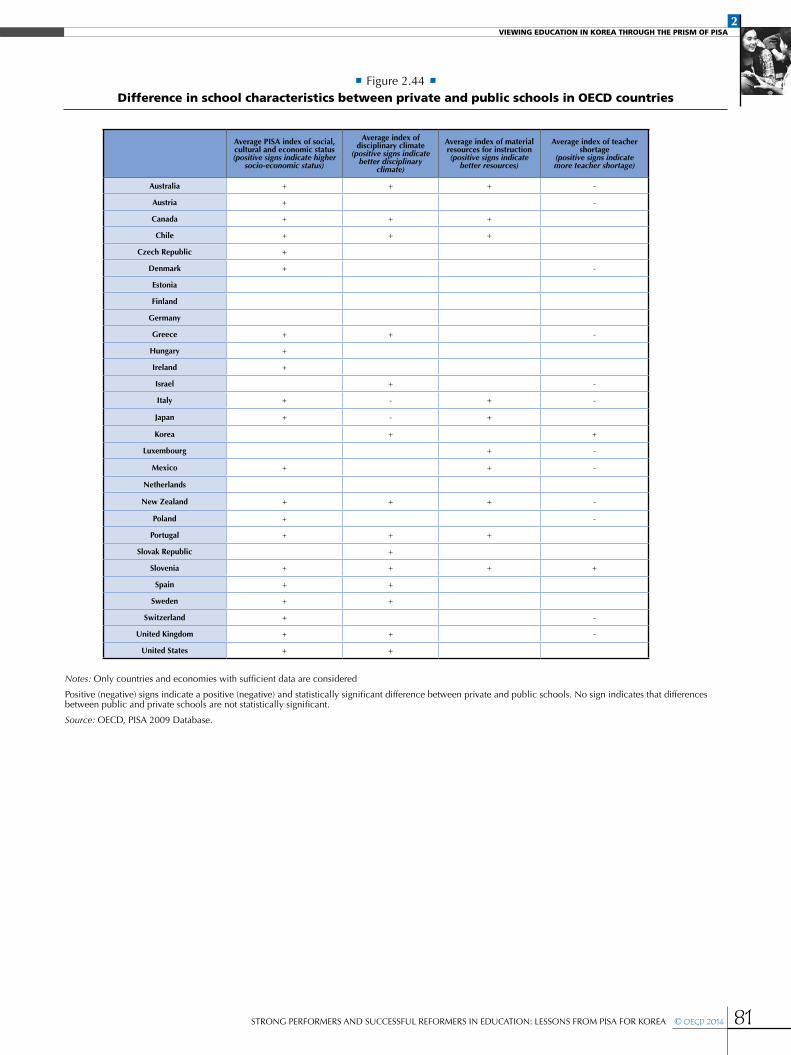
2VIEWING EDUCATION IN KOREA THROUGH THE PRISM OF PISA
81STRONG PERFORMERS AND SUCCESSFUL REFORMERS IN EDUCATION: LESSONS FROM PISA FOR KOREA © OECD 2014
• Figure 2.44 •Difference in school characteristics between private and public schools in OECD countries
Notes: Only countries and economies with sufficient data are considered
Positive (negative) signs indicate a positive (negative) and statistically significant difference between private and public schools. No sign indicates that differences between public and private schools are not statistically significant.
Source: OECD, PISA 2009 Database.
Average PISA index of social, cultural and economic status(positive signs indicate higher
socio-economic status)
Average index of disciplinary climate
(positive signs indicate better disciplinary
climate)
Average index of material resources for instruction(positive signs indicate
better resources)
Average index of teacher shortage
(positive signs indicate more teacher shortage)
Australia + + + -
Austria + -
Canada + + +
Chile + + +
Czech Republic +
Denmark + -
Estonia
Finland
Germany
Greece + + -
Hungary +
Ireland +
Israel + -
Italy + - + -
Japan + - +
Korea + +
Luxembourg + -
Mexico + + -
Netherlands
New Zealand + + + -
Poland + -
Portugal + + +
Slovak Republic +
Slovenia + + + +
Spain + +
Sweden + +
Switzerland + -
United Kingdom + + -
United States + +
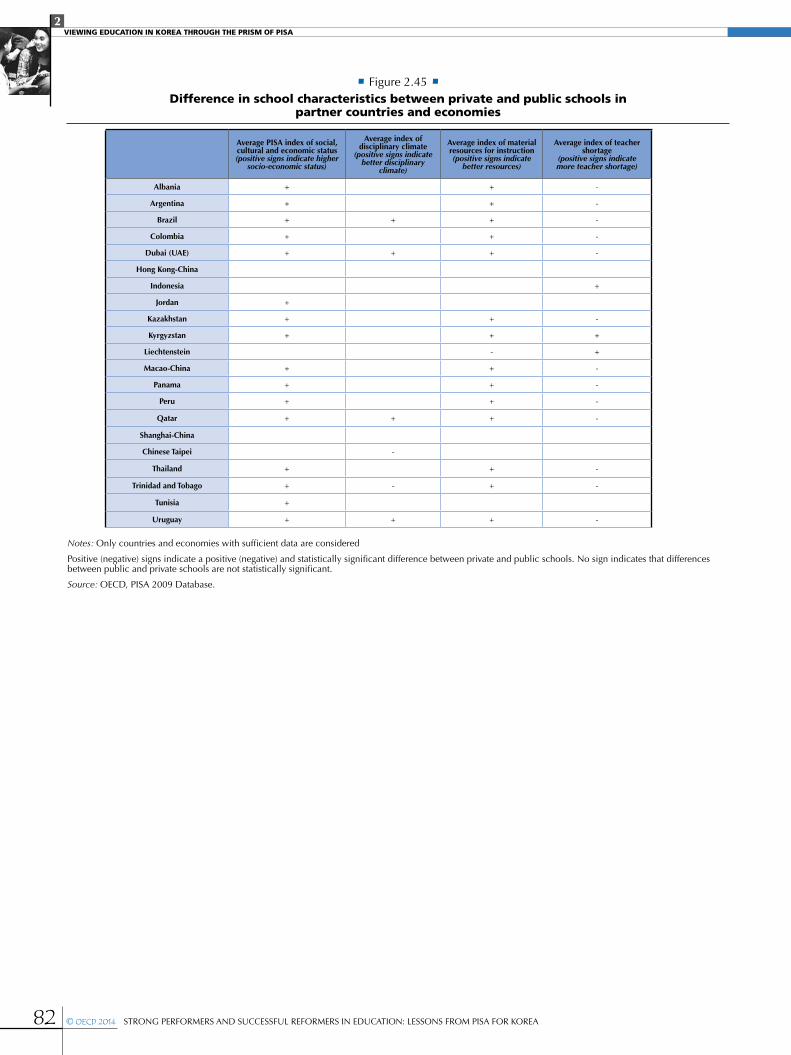
2VIEWING EDUCATION IN KOREA THROUGH THE PRISM OF PISA
82 © OECD 2014 STRONG PERFORMERS AND SUCCESSFUL REFORMERS IN EDUCATION: LESSONS FROM PISA FOR KOREA
• Figure 2.45 •Difference in school characteristics between private and public schools in
partner countries and economies
Notes: Only countries and economies with sufficient data are considered
Positive (negative) signs indicate a positive (negative) and statistically significant difference between private and public schools. No sign indicates that differences between public and private schools are not statistically significant.
Source: OECD, PISA 2009 Database.
Average PISA index of social, cultural and economic status(positive signs indicate higher
socio-economic status)
Average index of disciplinary climate
(positive signs indicate better disciplinary
climate)
Average index of material resources for instruction(positive signs indicate
better resources)
Average index of teacher shortage
(positive signs indicate more teacher shortage)
Albania + + -
Argentina + + -
Brazil + + + -
Colombia + + -
Dubai (UAE) + + + -
Hong Kong-China
Indonesia +
Jordan +
Kazakhstan + + -
Kyrgyzstan + + +
Liechtenstein - +
Macao-China + + -
Panama + + -
Peru + + -
Qatar + + + -
Shanghai-China
Chinese Taipei -
Thailand + + -
Trinidad and Tobago + - + -
Tunisia +
Uruguay + + + -
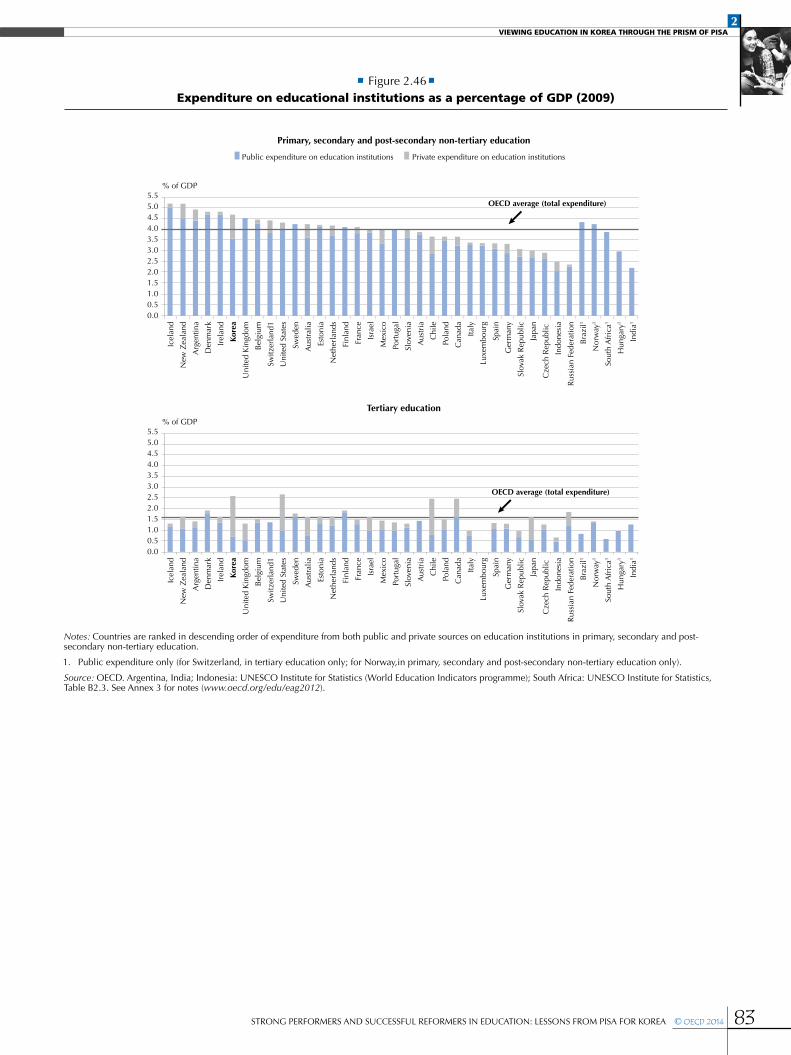
2VIEWING EDUCATION IN KOREA THROUGH THE PRISM OF PISA
83STRONG PERFORMERS AND SUCCESSFUL REFORMERS IN EDUCATION: LESSONS FROM PISA FOR KOREA © OECD 2014
• Figure 2.46•Expenditure on educational institutions as a percentage of GDP (2009)
% of GDP5.55.04.54.03.53.02.52.01.51.00.50.0
Public expenditure on education institutions Private expenditure on education institutions
Primary, secondary and post-secondary non-tertiary education
Tertiary education
Icel
and
New
Zea
land
Arg
entin
a
Den
mar
k
Irel
and
Kore
a
Uni
ted
Kin
gdom
Bel
gium
Switz
erla
nd1
Uni
ted
Stat
es
Swed
en
Aus
tral
ia
Esto
nia
Net
herl
ands
Finl
and
Fran
ce
Isra
el
Mex
ico
Port
ugal
Slov
enia
Aus
tria
Chi
le
Pola
nd
Can
ada
Italy
Luxe
mbo
urg
Spai
n
Ger
man
y
Slov
ak R
epub
lic
Japa
n
Cze
ch R
epub
lic
Indo
nesi
a
Rus
sian
Fed
erat
ion
Bra
zil1
Nor
way
1
Sout
h A
fric
a1
Hun
gary
1
Indi
a1
OECD average (total expenditure)
% of GDP5.55.04.54.03.53.02.52.01.51.00.50.0
Icel
and
New
Zea
land
Arg
entin
a
Den
mar
k
Irel
and
Kore
a
Uni
ted
Kin
gdom
Bel
gium
Switz
erla
nd1
Uni
ted
Stat
es
Swed
en
Aus
tral
ia
Esto
nia
Net
herl
ands
Finl
and
Fran
ce
Isra
el
Mex
ico
Port
ugal
Slov
enia
Aus
tria
Chi
le
Pola
nd
Can
ada
Italy
Luxe
mbo
urg
Spai
n
Ger
man
y
Slov
ak R
epub
lic
Japa
n
Cze
ch R
epub
lic
Indo
nesi
a
Rus
sian
Fed
erat
ion
Bra
zil1
Nor
way
1
Sout
h A
fric
a1
Hun
gary
1
Indi
a1
OECD average (total expenditure)
Notes: Countries are ranked in descending order of expenditure from both public and private sources on education institutions in primary, secondary and post-secondary non-tertiary education.
1. Public expenditure only (for Switzerland, in tertiary education only; for Norway,in primary, secondary and post-secondary non-tertiary education only).
Source: OECD. Argentina, India; Indonesia: UNESCO Institute for Statistics (World Education Indicators programme); South Africa: UNESCO Institute for Statistics, Table B2.3. See Annex 3 for notes (www.oecd.org/edu/eag2012).

2VIEWING EDUCATION IN KOREA THROUGH THE PRISM OF PISA
84 © OECD 2014 STRONG PERFORMERS AND SUCCESSFUL REFORMERS IN EDUCATION: LESSONS FROM PISA FOR KOREA
Notes
1. Though rank 1 is the best estimate, due to sampling and measurement error the rank could be between 1 and 2.
2. Though rank 1 is the best estimate, due to sampling and measurement error the rank could be between 1 and 2.
3. Though rank 3 is the best estimate, due to sampling and measurement error the rank could be between 2 and 4.
4. Summary descriptions for the levels of proficiency can be found in the Figure I.2.12, I.3.8 and I.3.19, OECD (2009), PISA 2009 Results: What Students Know and Can Do, Volume 1.
5. No such data are available for Korea.
6. See OECD, 2010c, Table II.2.3
7. Resilient students are those who come from a socio-economically disadvantaged background and perform much better than would be predicted by their background. To identify these students, first, the relationship between performance and socio-economic background across all students participating in the PISA 2009 assessment is established. Then the actual performance of each disadvantaged student is compared with the performance predicted by the average relationship among students from similar socio-economic backgrounds across countries. This difference is referred to as the student’s residual performance. A disadvantaged student is classified as resilient if his or her residual performance is found to be among the top quarter of students’ residual performance from all countries.
8. In Korea, one unit of the PISA index of teacher-student relations is positively associated with 11.4score points on the PISA reading scale (see Table IV.4.1 in OECD, 2010e).
9. Vertical differentiation refers to the ways in which students’ progress through the education system as they become older. Even though the student population is differentiated into grade levels in practically all schools in PISA-participating countries, in some countries, all 15-year-old students attend the same grade level, while in other countries they are dispersed throughout various grade levels as a result of policies governing the age of entrance into the school system and/or grade repetition. Horizontal differentiation refers to differences in instruction within a grade or education level. It can be applied by the education system or by individual schools that group students according to their interests and/or performance. At the system level, horizontal differentiation can be applied by schools that select students on the basis of their academic records, by offering specific programmes (vocational or academic, for example), and by setting the age at which students are admitted into these programmes. Individual schools can apply horizontal differentiation by grouping students according to ability or
transferring students out of the school because of low performance, behavioural problems or special needs.
2VIEWING EDUCATION IN KOREA THROUGH THE PRISM OF PISA
85STRONG PERFORMERS AND SUCCESSFUL REFORMERS IN EDUCATION: LESSONS FROM PISA FOR KOREA © OECD 2014
References and further reading
Birch, S. and G. Ladd (1998), “Children’s interpersonal behaviors and the teacher-child relationship”, Developmental Psychology, Vol. 34/ 5, pp 934-946.
Crosnoe, R., M. Johnson and G. Elder (2004), “Intergenerational bonding in school: The behavioral and contextual correlates of student-teacher relationships”, Sociology of Education, Vol. 77/1, pp. 60-81.
Gamoran, A. (1993), “Alternative uses of ability grouping in secondary schools: Can we bring high-quality instruction to low-ability classes?”, American Journal of Education, Vol. 102/1, pp. 1-12.
OECD (2012a), Education at a Glance 2012: OECD Indicators, OECD Publishing, http://dx.doi.org/10.1787/9789264112995-en.
OECD (2012b), Starting Strong III: A Quality Toolbox for Early Childhood Education and Care, OECD Publishing, http://dx.doi.org/10.1787/9789264123564-en.
OECD (2011a), Doing Better for Families, OECD Publishing. http://dx.doi.org/10.1787/9789264098732-en.
OECD (2011b), PISA 2009 Results: Students on Line: Digital Technologies and Performance (Volume VI), OECD Publishing, http://dx.doi.org/10.1787/9789264112995-en.
OECD (2010a), PISA 2009 Results: What Students Know and Can Do – Student Performance in Reading, Mathematics and Science (Volume I), OECD Publishing, http://dx.doi.org/10.1787/9789264091450-en.
OECD (2010), PISA 2009 Results: Learning Trends: Changes in Student Performance Since 2000 (Volume V), OECD Publishing, http://dx.doi.org/10.1787/9789264091580-en.
OECD (2010c), PISA 2009 Results: Overcoming Social Background – Equity in Learning Opportunities and Outcomes (Volume II), OECD Publishing, http://dx.doi.org/10.1787/9789264091504-en.
OECD (2010d), PISA 2009 Results: Learning to Learn – Student Engagement, Strategies and Practices (Volume III), OECD Publishing, http://dx.doi.org/10.1787/9789264083943-en.
OECD (2010e), PISA 2009 Results: What Makes a School Successful? – Resources, Policies and Practices (Volume IV), OECD Publishing, http://dx.doi.org/10.1787/9789264091559-en.
OECD (2009), Education at a Glance 2009, OECD Publishing, http://dx.doi.org/10.1787/eag-2009-en.

3
87STRONG PERFORMERS AND SUCCESSFUL REFORMERS IN EDUCATION: LESSONS FROM PISA FOR KOREA © OECD 2014
Supplementary Education in East Asia
This chapter looks into supplementary education, which is a notable feature of Korea and more generally of East Asia. It begins by defining and mapping out the participation in supplementary education as well as its main drivers. It also analyses the contribution of supplementary education to learning through additional inputs (e.g. time, materials) and different instruction methods and arrangements. The chapter argues that the impact of supplementary education on academic performance is still inconclusive, but that this form of education exacerbates socio-economic inequalities. It also provides evidence of its potential detrimental impact on student well-being and disrupt the normal functioning of schools. The chapter concludes by reviewing the main policy responses to supplementary education, which range from laissez-faire to implementing active policies limiting its extent or broadening access to supplementary education.
3SUPPLEMENTARY EDUCATION IN EAST ASIA
88 © OECD 2014 STRONG PERFORMERS AND SUCCESSFUL REFORMERS IN EDUCATION: LESSONS FROM PISA FOR KOREA
TOWARDS A BETTER UNDERSTANDING OF SUPPLEMENTARY EDUCATIONPrivate supplementary tutoring, widely known as shadow education, is spreading and intensifying around the world in different forms and scales. While supplementary education is far from being a recent phenomenon,1 its expansion has raised warnings in conventional education systems and motivated policy responses ranging from not recognising its existence to implementing active policies to limit or provide it. The high performance of East Asian countries2 in international assessments, where participation in supplementary education is widespread and intense, calls for a greater understanding of its impact.
Defining supplementary educationSupplementary education can be defined as more or less institutionalised and structured forms of instruction that generally exist outside and separated from the formal education system with the purpose of supplementing learning that occurs in schools.3 Two major types of supplementary education can be distinguished: one-on-one tutoring, in which tutors support students through home instruction or elsewhere, generally in an informal and unstructured manner, and shadow education, which is the focus of this chapter. Shadow education refers both to the close mimicking of the curricula of public schools and to their existence in somewhat of a shadow of legitimacy and legality (Bray, 1999; Bray and Lykins, 2012). Over the past decade or so, these institutions have emerged from the shadows, thus the term supplementary education is preferred in this discussion to shadow education.
While the global context and role of supplementary education continues to evolve and varies widely from country to country, it typically has the following key characteristics (Bray, 1999): i) adds to or deepens education provided in conventional schools rather than replacing it; ii) predominantly provided privately and mostly for profit, although there are some exceptions; iii) content follows formal education and focuses on core subjects and teaching guidelines issued by education authorities.4 Subjects most in demand for private supplementary tutoring are those that are most necessary to adequately progressing in the education system (i.e. mathematics, the national language, and a foreign language such as English) (Bray and Lykins, 2012).5
Mapping supplementary educationA wide spectrum emerges when considering the degree of intensity (i.e. level and scale of participation, financial costs, perceptions from parents, students, and educators) and the role that supplementary education plays vis-à-vis formal educational systems (Bray, 1999). Countries with a high or growing intensity of supplementary education are by no means limited to East Asia and span from the cursinhos that prepare Brazilian students to similar institutions in Egypt, Greece, Turkey or the tutoring centres of India. Even in educational systems where supplementary education has played a relatively small role, for example in Western Europe or North America, an increase has also been observed.
Many countries of East Asia are found at the high end of the scale, where well-institutionalised supplementary education systems are highly visible and participation is widespread. East Asian countries share perceptions that intergenerational social mobility is mostly driven by education; a social consensus on the efficacy of effort in education and on highly stratified higher education institutions. In these education systems, supplementary education is perceived as a necessary lever for further educational progress and its prominence tends to rule out any questioning on its actual impact (Lee and Shouse, 2011).
Many European countries are found at the lower end of the scale, where participation rates are small but have grown considerably in recent years. Reviewing the evidence for European countries, Bray (2011) distinguishes different geographic patterns: participation rates are relatively high in Eastern and Southern Europe, small in Western Europe and very small in Northern Europe.6 In Eastern Europe and Central Asia, supplementary education is prevalent but largely in the form of conventional schoolteachers offering additional instruction after hours. This allows teachers to compensate for their low wages, but might generate a risk of corruption and negatively impact their performance.
Many countries still lack reliable data about the number of students participating in supplementary education and research is limited to a few countries. Japan and Korea are exceptions as supplementary education has been a major point of public controversy since the 1960s and a significant body of quantitative and qualitative research has examined the phenomenon over the decades (Bray and Lykins, 2012).
Another approach to estimating the number of students attending supplementary education uses data on participation in after-school lessons drawn from the PISA survey, which also contains information about supplementary education’s intensity and subject matter. However, the PISA definition is broader than supplementary education.7 According to the PISA 2009 assessment of 15-year-old students, in Korea the participation of students attending after-school lessons is more than double the OECD average in every subject (OECD, 2010). Indeed, Korea ranks first in the share of students with after-school lessons in mathematics (see Figure 3.1) and science and second (after Japan) in national language learning. Moreover, Korea also has the highest percentage of students attending after-school mathematics lessons for four or more hours a week (30%).
3SUPPLEMENTARY EDUCATION IN EAST ASIA
89STRONG PERFORMERS AND SUCCESSFUL REFORMERS IN EDUCATION: LESSONS FROM PISA FOR KOREA © OECD 2014
Box 3.1 Supplementary education is widespread in East Asia countries
In China, the 2004 Urban Household Education and Employment Survey of 4 772 households indicated that 73.8% of primary students were receiving supplementary lessons, including non-academic subjects. Proportions in lower and upper secondary were 65.6% and 53.5% respectively. A 2010 survey of 6 474 students in Jinan found that 28.8% of lower secondary students were receiving tutoring in mathematics, and 29.3% in English.
In Hong Kong-China, a 2009 telephone survey of 521 students found that 72.5% of upper primary students had received tutoring; and a survey of 898 secondary students found that proportions in lower secondary and senior secondary were 81.9% and 85.5%, respectively.
In 2007, nearly one-quarter of Japanese primary school students and one-half of lower secondary school students received private, out-of-school academic instruction at institutions known as juku. Another 19.5% of primary students and 17.1% of lower secondary school students participated in distance learning, and 0.9% and 4.7%, respectively, in tutoring at home. The competition for university starts well before age 18, in part as many of the top institutions are vertically integrated with primary and secondary schools. The largest share of out-of-school instruction takes place in juku: the share of children attending juku in 2008 rose from 16% in the first grade of primary school to 65% in the third year of lower secondary school. According to other estimates, 64% of lower secondary school students attend juku.
In Korea, 80.9% of primary school students were estimated to be receiving private supplementary education in 2012. In lower secondary school the proportion was 70.6%; and in upper secondary school it was 50.7% (MEST, 2013).
In Singapore, a 2009 research study lamented the dearth of carefully collected empirical data on tutoring, but noted that the phenomenon had been highly visible for some decades. A 2008 newspaper article stated that 97% of students polled at the primary, lower secondary, and senior secondary levels were receiving tutoring.
Source: Bray, M. and C. Lykins (2012), Shadow Education: Private Supplementary Tutoring and Its Implications for Policy Makers in Asia, Asian Development Bank, See this report for further references.
Who receives supplementary education?A closer inspection of the data about those who participate in supplementary education reveals further information on its nature. The breakdown per education level shows that secondary school students tend to receive supplementary education more intensively than primary students, with some exceptions such as Singapore and Korea (Bray and Lykins, 2012). In Singapore, the incidence of supplementary education in primary is higher as the school leaving examination determines the secondary school stream (Tan, 2009 in Bray and Lykins, 2012). Similarly, in Korea, participation rates are higher in primary education than in lower secondary or upper secondary education, and attendance is already considerable at a very early age. Considering the type of programme pursued, students in vocational education and training (VET), who are less likely to compete for a university entrance exam, tend to participate significantly less than those in academic pathways.
Students with higher academic performance tend to participate more frequently, and invest more money, in supplementary education than those with lower academic performance. In Korea, participation in private tutoring by students in the top 30% of their class is over 80%, compared to less than 50% in the bottom 20% and outlays per student for the upper group are more than double those for the lower group (see Figure 3.2) (MEST, 2011).
There is no clear relationship across countries between participation in supplementary education and enrolment in either public or private schools (Bray and Lykins, 2012). Participation rates tend to be higher in urban areas than in rural ones, and greater in larger cities than in smaller ones. For example, in Korea, urban-rural differences in participation are relatively modest in primary education (89% in cities to 79% in towns) but marked in academic upper secondary education (61% in cities to 32% in towns) (Kim, 2010 in Bray and Lykins, 2012).
Participation in supplementary education is highly correlated with socio-economic background and other personal characteristics. Figure 3.3 shows the strength of the relationship in Korea for primary education students, which ranges from half of the poorest
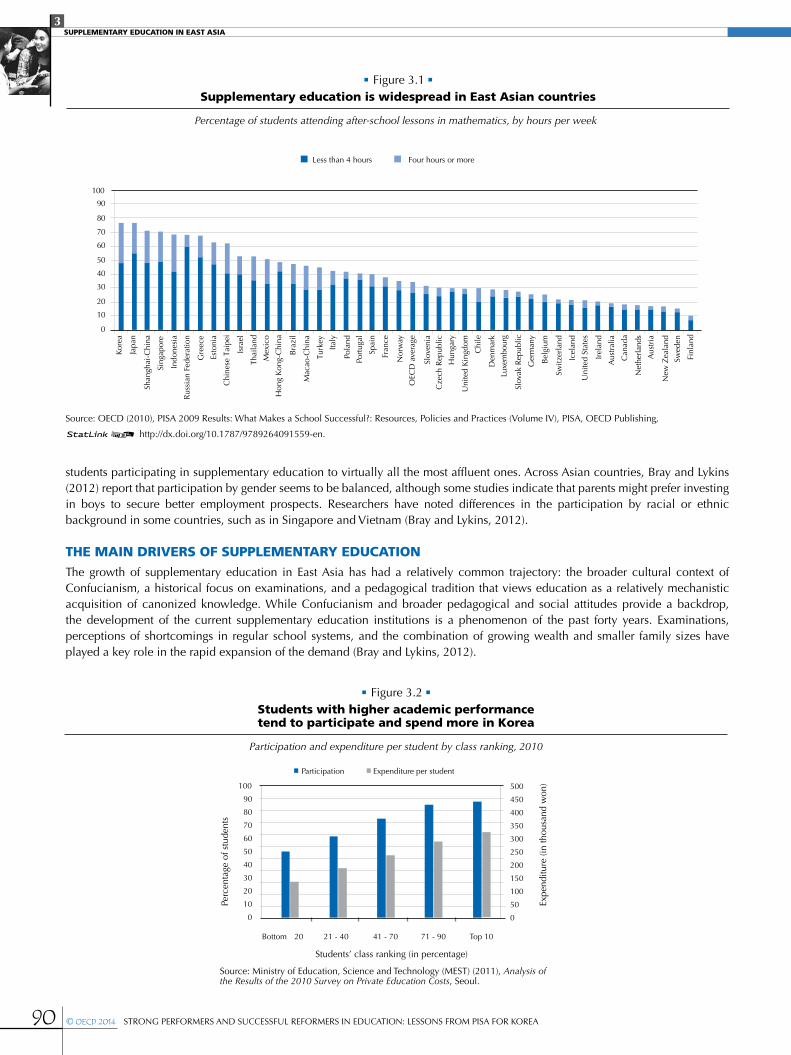
3SUPPLEMENTARY EDUCATION IN EAST ASIA
90 © OECD 2014 STRONG PERFORMERS AND SUCCESSFUL REFORMERS IN EDUCATION: LESSONS FROM PISA FOR KOREA
students participating in supplementary education to virtually all the most affluent ones. Across Asian countries, Bray and Lykins (2012) report that participation by gender seems to be balanced, although some studies indicate that parents might prefer investing in boys to secure better employment prospects. Researchers have noted differences in the participation by racial or ethnic background in some countries, such as in Singapore and Vietnam (Bray and Lykins, 2012).
THE MAIN DRIVERS OF SUPPLEMENTARY EDUCATIONThe growth of supplementary education in East Asia has had a relatively common trajectory: the broader cultural context of Confucianism, a historical focus on examinations, and a pedagogical tradition that views education as a relatively mechanistic acquisition of canonized knowledge. While Confucianism and broader pedagogical and social attitudes provide a backdrop, the development of the current supplementary education institutions is a phenomenon of the past forty years. Examinations, perceptions of shortcomings in regular school systems, and the combination of growing wealth and smaller family sizes have played a key role in the rapid expansion of the demand (Bray and Lykins, 2012).
Students’ class ranking (in percentage)
Perc
enta
ge o
f stu
dent
s
Expe
nditu
re (i
n th
ousa
nd w
on)
Bottom 20 21 - 40 41 - 70 71 - 90 Top 10
500
450
400
350
300
250
200
150
100
50
0
100
90
80
70
60
50
40
30
20
10
0
Participation Expenditure per student
• Figure 3.2 •Students with higher academic performance tend to participate and spend more in Korea
Participation and expenditure per student by class ranking, 2010
Source: Ministry of Education, Science and Technology (MEST) (2011), Analysis of the Results of the 2010 Survey on Private Education Costs, Seoul.
Indo
nesi
a
Japa
n
Shan
ghai
-Chi
na
Less than 4 hours Four hours or moreSi
ngap
ore
Slov
ak R
epub
lic
Gre
ece
Aus
tral
ia
Chi
nese
Tai
pei
Cze
ch R
epub
lic
Italy
Kore
a
0
10
20
30
40
50
60
70
80
90
100
Spai
n
Irel
and
Can
ada
Mex
ico
Hon
g K
ong-
Chi
na
Thai
land
Esto
nia
Pola
nd
New
Zea
land
Slov
enia
OEC
D a
vera
ge
Hun
gary
Uni
ted
Stat
es
Ger
man
y
Switz
erla
nd
Chi
le
Luxe
mbo
urg
Net
herla
nds
Aus
tria
Port
ugal
Uni
ted
Kin
gdom
Bra
zil
Turk
ey
Mac
ao-C
hina
Nor
way
Finl
and
Fran
ce
Bel
gium
Isra
el
Swed
en
Rus
sian
Fed
erat
ion
Den
mar
k
Icel
and
• Figure 3.1 •Supplementary education is widespread in East Asian countries
Percentage of students attending after-school lessons in mathematics, by hours per week
Source: OECD (2010), PISA 2009 Results: What Makes a School Successful?: Resources, Policies and Practices (Volume IV), PISA, OECD Publishing,
12 http://dx.doi.org/10.1787/9789264091559-en.
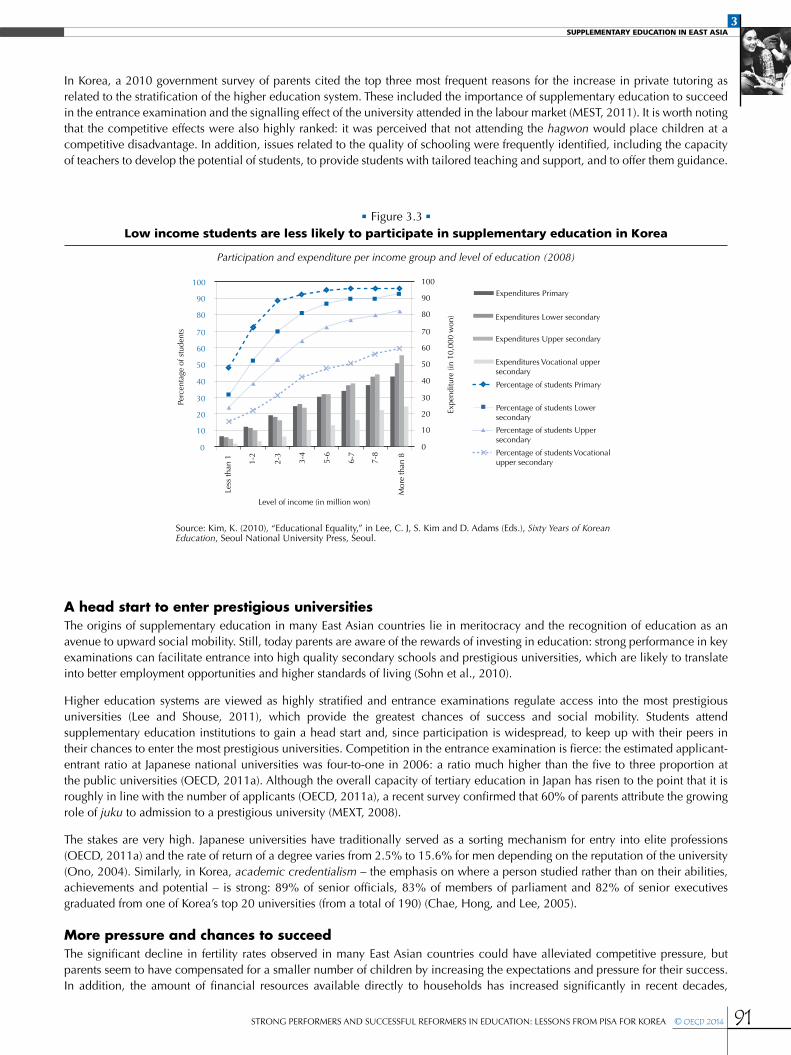
3SUPPLEMENTARY EDUCATION IN EAST ASIA
91STRONG PERFORMERS AND SUCCESSFUL REFORMERS IN EDUCATION: LESSONS FROM PISA FOR KOREA © OECD 2014
In Korea, a 2010 government survey of parents cited the top three most frequent reasons for the increase in private tutoring as related to the stratification of the higher education system. These included the importance of supplementary education to succeed in the entrance examination and the signalling effect of the university attended in the labour market (MEST, 2011). It is worth noting that the competitive effects were also highly ranked: it was perceived that not attending the hagwon would place children at a competitive disadvantage. In addition, issues related to the quality of schooling were frequently identified, including the capacity of teachers to develop the potential of students, to provide students with tailored teaching and support, and to offer them guidance.
A head start to enter prestigious universitiesThe origins of supplementary education in many East Asian countries lie in meritocracy and the recognition of education as an avenue to upward social mobility. Still, today parents are aware of the rewards of investing in education: strong performance in key examinations can facilitate entrance into high quality secondary schools and prestigious universities, which are likely to translate into better employment opportunities and higher standards of living (Sohn et al., 2010).
Higher education systems are viewed as highly stratified and entrance examinations regulate access into the most prestigious universities (Lee and Shouse, 2011), which provide the greatest chances of success and social mobility. Students attend supplementary education institutions to gain a head start and, since participation is widespread, to keep up with their peers in their chances to enter the most prestigious universities. Competition in the entrance examination is fierce: the estimated applicant-entrant ratio at Japanese national universities was four-to-one in 2006: a ratio much higher than the five to three proportion at the public universities (OECD, 2011a). Although the overall capacity of tertiary education in Japan has risen to the point that it is roughly in line with the number of applicants (OECD, 2011a), a recent survey confirmed that 60% of parents attribute the growing role of juku to admission to a prestigious university (MEXT, 2008).
The stakes are very high. Japanese universities have traditionally served as a sorting mechanism for entry into elite professions (OECD, 2011a) and the rate of return of a degree varies from 2.5% to 15.6% for men depending on the reputation of the university (Ono, 2004). Similarly, in Korea, academic credentialism – the emphasis on where a person studied rather than on their abilities, achievements and potential – is strong: 89% of senior officials, 83% of members of parliament and 82% of senior executives graduated from one of Korea’s top 20 universities (from a total of 190) (Chae, Hong, and Lee, 2005).
More pressure and chances to succeedThe significant decline in fertility rates observed in many East Asian countries could have alleviated competitive pressure, but parents seem to have compensated for a smaller number of children by increasing the expectations and pressure for their success. In addition, the amount of financial resources available directly to households has increased significantly in recent decades,
• Figure 3.3 •Low income students are less likely to participate in supplementary education in Korea
Participation and expenditure per income group and level of education (2008)
Source: Kim, K. (2010), “Educational Equality,” in Lee, C. J, S. Kim and D. Adams (Eds.), Sixty Years of Korean Education, Seoul National University Press, Seoul.
Perc
enta
ge o
f stu
dent
s
Less
than
1 1-2
2-3
3-4
5-6
6-7
7-8
Mor
e th
an 8
Expe
nditu
re (i
n 10
,000
won
)
Level of income (in million won)
100
90
80
70
60
50
40
30
20
10
0
100
90
80
70
60
50
40
30
20
10
0
Expenditures Upper secondary
Expenditures Lower secondary
Expenditures Primary
Expenditures Vocational uppersecondary
Percentage of students Primary
Percentage of students Lowersecondary
Percentage of students Uppersecondary
Percentage of students Vocationalupper secondary
3SUPPLEMENTARY EDUCATION IN EAST ASIA
92 © OECD 2014 STRONG PERFORMERS AND SUCCESSFUL REFORMERS IN EDUCATION: LESSONS FROM PISA FOR KOREA
paralleling overall growth patterns. For example, in Korea, fertility rates declined from above 6 births per woman in 1960 to the current rate of 1.2 and GDP per capita multiplied many times over. Similar developments are observed in Japan, where surveys have revealed that the number of children has an impact on the participation in supplementary education (Bray and Lykins, 2012).
Mitigating the shortcomings of schoolsDespite the very high levels of performance of East Asian students in international assessments, parents in these societies seem to lack trust in schools. Supplementary education often portrays itself and is seen as a substitute for the perceived shortcomings of schools. These shortcomings are perceived to exist particularly in areas that are subject to standardised examination.8 Also, the criticisms might not be supported by evidence. For example, research indicates that class size has a minimal impact on performance, and in East Asia big class sizes are portrayed as being key to success (OECD, 2012a). Yet some parents believe that smaller classes enable teachers to provide more attention and support to their children (Bray and Lykins, 2012).
Supplementary education can also play an important role in providing additional and more tailored learning support to students who are falling behind in a way that schools may not be able to offer. According to students’ self-reported data in PISA, in Korea, 48% of them take supplementary after-school lessons on the native language, mathematics or science and 69% remedial ones (compared to an OECD average of 28% and 26% respectively) (OECD, 2010). In addition, supplementary education institutions can also mitigate shortcomings in the provision of guidance to parents and students and support them in navigating increasingly complex and variegated educational opportunities. In Japan, for example, supplementary education is offering advice on school choice (Dierkes, 2008).
THE IMPACT OF SUPPLEMENTARY EDUCATIONWhat is the overall impact of supplementary education? Parents and students believe that it can help raise education outcomes. The argument is based either on the sheer volume of inputs (more resources lead to higher performance) or on the quality of its offerings (better quality leads to higher performance). However, research on the impact of supplementary education on academic performance is inconclusive and supplementary education can disrupt the functioning of schools. In addition, on an individual level, the prevalent aspects of high levels and intensity of supplementary education stand out as especially pernicious: supplementary education exacerbates socio-economic inequalities and deteriorates students’ well-being. In a wider perspective, the significance of supplementary education translates into a major services industry in many countries and externalities might also span to other sectors.9
The impact on the learning process
More opportunities for learningSupplementary education implies increasing the resources invested in education, including additional instruction time, personnel, and learning materials.
•Instruction time: supplementary education occurs after school hours on school days, and on weekends and during vacation periods. Even if a given student only participates in supplementary education for a few hours per week, at the end of the school year it adds up to a significant amount of time. For the most active participants in supplementary education, additional instruction may be 25 hours per week during periods that schools are in session. Supplementary education can also take place over vacation periods.
•Additional Materials: the supplementary education industry produces a large variety and quantity of educational support materials, from flash cards to self-study to textbooks, mock testing materials, and advice for parents to support students’ efforts. These are widely available and might also be purchased by those who cannot afford to enrol in supplementary education institutions. Additional materials and new delivery methods (e.g. media and ICTs) also allow for expanding the number of additional instructional hours by removing constraints related to the physical presence in an institution.
•More instructors: supplementary education provides students with more opportunities to interact with instructors. However, the knowledge and pedagogic skills of instructors might be of concern as qualification or certification requirements are usually absent (Dierkes, 2010). This is even the case of “star tutors”, whose reputation does not focus on their preparedness but rather on their individual qualities (Sharma, 2012).
Some supplementary education institutions aim at differentiating themselves from conventional schools by offering different learning arrangements and methods:
•Grouping students by ability: supplementary education institutions have thrived on the increasing perception that conventional schools are unable to target instruction and support to the abilities of each student and group same-grade students by ability. If supplementary education remains circumscribed by official curricula, the benefits of grouping students by ability are limited: the additional time available in the accelerated path might be devoted to review the subject matter already covered rather than to explore other subjects or the same subject in a greater depth.
3SUPPLEMENTARY EDUCATION IN EAST ASIA
93STRONG PERFORMERS AND SUCCESSFUL REFORMERS IN EDUCATION: LESSONS FROM PISA FOR KOREA © OECD 2014
•Tailored instruction: students seeking additional instruction on a specific subject matter (to overcome deficits or to advance further) can subscribe to these offerings, while the structured calendars and timetables of schools pose more difficulties to accommodate particular needs.
•Rote learning: since entrance examinations test knowledge rather than analysis or understanding, pedagogy and curricula are biased towards testable content and instruction focuses on providing the right responses. Therefore, supplementary education does not contribute to help students develop their skills to construct knowledge and solve novel problems. In Korea, nearly half of students attend hagwons focused mainly on rote learning and preparation for examinations (Byun, 2011).
•Greater curricular depth: instruction usually follows the curricula defined by education authorities, but supplementary education institutions can also expand the curriculum with additional material. In Japan, respondents to a 2008 Ministry of Education survey showed that more than 50% of grades 3–9 stated that they liked juku because they learned material that was not taught in their schools (Dawson, 2010).
•A different teacher-student relationship: Many supplementary education classrooms or tutorial sessions have different arrangements than a conventional school classroom with 40 or more students. A smaller number of students per teacher facilitates an individualised learning context and a different relationship between students and teachers (Dierkes, 2010). Moreover, the fact that students pay for these voluntary services changes the nature of the relationship and leads to clearer expectations of each other: students are free to quit at any moment and supplementary institutions are also able to dismiss students for any reasons.
•Using new technologies for learning: A small but rapidly growing part of the supplementary education market consists of tutoring at a distance, either conducted live or in the form of self-service lessons. New technologies can enable more students to benefit from high-quality teachers and provide access to more accelerated instruction in remote areas. In Korea, 19% of students take correspondence courses and 4% study on-line (Byun, 2011 in Bray and Lykins, 2012).
Changing learning in schoolsSupplementary education might disrupt learning in schools and place teachers into challenging situations by, for example:
•Disrupting the application of the curricula: Supplementary lessons might prepare students in advance for school lessons. This can disrupt the general functioning of classrooms by widening the differences between students, lowering the attention of those who already know the curricula and creating difficulties for teachers to apply the regular curriculum. For example, in Korea, some hagwons teach students over the summer holidays and during the school year to learn in advance the school curriculum (Lee et al., 2004 and Dawson, 2010 in Bray and Lykins, 2012).
•Disrupting classroom and school climate: students who work long hours may be short of energy for daytime schooling. For example, in Korea it has been reported that students who attend intensive supplementary education may be tired and fall asleep during lectures (Kim, 2007 in Bray and Lykins, 2012).
•Changing the student-teacher relationship: students who attend supplementary education may prefer to ask those instructors for help instead of schoolteachers. This might alleviate the workload of teachers in schools but distorts their professional role, particularly in following up and supporting students.
•Reduce the quality of the teaching workforce: supplementary education institutions might compete with schools for attracting and retaining the best teachers, which may generate difficulties in recruitment and a lower quality of the workforce. For example, Bray and Lykins (2012) note that in Hong Kong-China some tutors are former school teachers who have chosen to leave the schools in search of greater incomes and possibly greater autonomy.
Finally, supplementary education can undermine the formal education system. Some authors have gone as far as to describe private tutoring as the “enemy of the public school system” (Chung, 2002). Some argue that the fact that families have to pay for supplementary education while schooling is publicly subsidised might lead to a higher valuation of the latter at the expense of the former. Also, supplementary education generates inefficiencies in spending as, for example, teachers operate and students invest their time in less optimal ways since the overall investment in education is not taken into consideration. Inefficiencies can be of particular concern as expenditures on supplementary education are considerable: in Korea, expenditure on supplementary education was equivalent to about 80% of government expenditure on public education for primary and secondary students in 2006 (Kim and Lee, 2010 in Bray and Lykins, 2012).
A mixed impact on student engagementSupplementary education might also have an impact on the motivation, attitudes, and learning styles of students. Some argue that supplementary education may increase their engagement by developing student self-esteem and sense of achievement with opportunities to catch up, keep the pace or fulfil their desire to learn further. Also, it can contribute to develop studying habits, self-discipline and prepare students to face competition.
However, supplementary education usually provides students with skills to do well in exams rather than engaging them in a genuine pursuit of knowledge (Bray and Lykins, 2012). Participation in supplementary education might increase the likelihood of
3SUPPLEMENTARY EDUCATION IN EAST ASIA
94 © OECD 2014 STRONG PERFORMERS AND SUCCESSFUL REFORMERS IN EDUCATION: LESSONS FROM PISA FOR KOREA
being less attentive or frequently distracted in the classroom and participating in other activities in their free time. Also, the fact that students rely on additional support might undermine their capacity as self-learners. In addition, supplementary education places some students in an unequal footing. Those who cannot afford to participate or that are confined to lower quality institutions might lower their expectations, readiness to invest effort, feel less motivated and, in extreme cases may drop out.
THE IMPACT ON ACADEMIC PERFORMANCE AND SPILL OVER EFFECTS
The impact on academic performance is not clear-cutSome East Asian countries and economies (i.e. Shanghai, Korea, Hong Kong-China, Japan) exhibited high levels of performance in PISA 2009, the OECD international student assessment of 15 year-olds, and supplementary education. However, this might only indicate correlation rather than causation. After all, in other high performing countries, participation in supplementary education is very small, which suggests that it is not a necessary ingredient for high performance. Indeed, an in-depth study on after-school lessons based on PISA 2006 data indicates a negative correlation between after-school attendance and performance across countries (OECD, 2011b).
Across countries, findings from PISA show that students tend to perform better if a high percentage of their total learning time – which includes regular school lessons, after-school lessons and individual study – is spent during normal school hours in a classroom – and, most importantly, if the instruction offered in those classrooms is of high quality (OECD, 2011b). For example, attending after-school classes led by a schoolteacher tends to reduce the impact of the socio-economic background of students on their academic performance (OECD, 2011b).
Limited research is available on supplementary education, particularly in regard to its impact on performance and educational achievement (Maylor et al., 2007). Surveys and case study methodologies point to the positive impact of supplementary education on educational achievement in some contexts.11 However, no methodologically sound experiment has been conducted on a large scale yet to establish a clear link (Buchmann et al., 2010). It would require an experimental research design with treatment and control groups that are large enough or homogeneous enough to take account of other causal variables (e.g. socio-economic factors, study habits, aptitudes).
The impact of supplementary education on performance depends on the quality of the provision and the opportunity costs. Supplementary education might result in null or negligible learning gains when the additional time invested is detrimental or of low quality. Also, even in the case of the most enthusiastic participation, these additional hours spent in supplementary instruction may be substituting for hours of self-study or unsupervised study, tempering the volume of additional instruction somewhat and possibly equalising the additional volume of instruction between participants in supplementary instruction and students who do not participate or only participate sporadically.
Exacerbates socio-economic inequalitiesSupplementary education puts disadvantaged students in an even more unequal footing in university entrance examinations, thereby exacerbating social inequalities and perpetuating them across generations. While supplementary education has come to be seen as indispensable to success in high-stakes examinations, participation is costly and greatly varies by income, which also determines the type and intensity of provision.12
In Korea, participation and investing in private tutoring are highly correlated with family income (MEST, 2011). As Figure 3.3 shows, only 36% of students from families with a monthly income of less than 1 million won participated in private tutoring, compared to 80% for those from families earning 3 to 4 million won (OECD, 2012b). Similarly, the outlay per student in private tutoring is four times higher for the middle-income group than those in the lowest-income group. For households with income over 6 million won per month, enrolment rates rise to nearly 90%, while outlays per month reach around 450 thousand won. Moreover, differences between high and low income families seem to have widened over the last decade (Byun, 2011).
As a result, low-income students are overrepresented in universities at the bottom of the rankings, despite the expansion of tertiary education to a larger share of the population (OECD, 2012b). In Korea, one study found that 17% of students from the upper-middle income class attended upper-level universities compared to only 6% of lower-class students, while for lower-level universities the situation was reversed, with a much larger share of students from lower-income class households (KEDI, 2006).
A high cost for student well-beingTime is limited: supplementary education occurs to the exclusion of another activity. Very intensive participation in supplementary education may dominate students’ lives and restrict their leisure activities in ways that are detrimental to well-rounded development. At the end of secondary education, when students generally intensify their participation in supplementary education, they tend to abandon sports, music and arts, and limit their interpersonal relationships (Bray and Lykins, 2012).
3SUPPLEMENTARY EDUCATION IN EAST ASIA
95STRONG PERFORMERS AND SUCCESSFUL REFORMERS IN EDUCATION: LESSONS FROM PISA FOR KOREA © OECD 2014
While some pressure can prepare students for the future in an increasingly competitive world, supplementary education might lead to excessive stress and deep-seated anxiety. As mentioned earlier, competition among students can be fierce (Roesgaard, 2006). Beyond more immediate physiological risks due to exhaustion or safety risks associated with the late hours spent outside the home, the potential psychological costs to students and to society at large are referred by some as an “examination hell” that students must pass through on their way to higher education. Excessive pressure can cause social and health issues and, at the extreme, can contribute to suicide. Lee and Larson (2000) found that higher rates of clinical depression among Korean adolescents (as compared to their American peers) were related to supplementary education. In Japan, suicide rates are a major concern with this being the second leading cause of death in Japan among 15-24 year-olds and achievement-oriented pressure is often cited as a plausible cause (Desapriya and Iwase, 2003 in OECD, 2012a).
In addition, supplementary education institutions only host individual students for portions of their instructional time and thus are unlikely to detect when effort is beginning to be detrimental to student well-being. The focus on effort as the basis for achievement makes this situation especially dangerous: supplementary education institutions are likely to motivate students to invest as much effort as possible, even when detrimental to well-being, to achieve success.
A sizeable marketSupplementary education represents a sizeable industry in some East Asian countries. In 2010, expenditures on supplementary education were estimated at USD 12 billion in Japan and USD 17.3 billion in Korea, where expenditures represented 1.8% of GDP and more than doubled since 1997. Expenditures amounted to USD 255 million in 2011 only for secondary education in Hong Kong-China and USD 680 million in Singapore in 2008 including home-based tutoring (Bray and Lykins, 2012). The size of the industry is also reflected in the number of institutions. Korea currently has nearly 100 000 hagwons (OECD, 2012b). Juku represents a major service industry in Japan, with an estimated 50 000 institutions providing instruction to up to two million students at both the primary and lower secondary school levels and 21 juku are large enough to be publicly listed on the stock exchange (OECD, 2011a). Supplementary education has also become a significant form of employment. In Korea, the number of private tutors experienced an average yearly growth of 7.1% from 2001 to 2006, and this sector became the largest employer of graduates from the humanities and social sciences by 2009 (Kim and Park, 2012 in Bray and Lykins, 2012).
POLICY RESPONSES TO SUPPLEMENTARY EDUCATIONKorea has been the most prominent exception to a worldwide pattern of a laissez-faire approach to supplementary education. However, an awareness of supplementary education is slowly building and policy-makers increasingly take supplementary education into consideration when contemplating changes to their education systems. Yet, the size and impact of supplementary education require bringing it to the forefront of the education policy debate. Policy responses to supplementary education have been purported to strengthen the formal education system, reduce participation and intensity of supplementary education or make the access more equitable.
The Korean government has gone through a succession of different reforms since the 1960s that have focused on undermining family motivation in seeking supplementary education (Lee et al., 2010). From the abolition of lower secondary school entrance examinations to the introduction of public alternatives to supplementary education, policy-makers have persistently attempted to counter the prominence of supplementary education and its negative impact on equity (see Annex A3.1).
Policies to downsize and limit supplementary education
Revisit the selectivity of the education systemExpanding postsecondary intakes may not be an effective measure when the education system is stratified. Instead of decreasing the pressures on supplementary education, a higher intake might simply shift the focus of competition. For example, in Hong Kong-China, higher postsecondary education uptake moved the focus from the opportunity to access this education level to the type of institution. Similarly, in Japan, the falling birth rate made tertiary education accessible to nearly all secondary graduates who wish to attend, yet the proportion of lower secondary school students attending juku rose from 44% in 1985 to 53% in 2007 (OECD, 2011a).
Reducing stressful transitions and the stratification of the system can reduce the importance of supplementary education. In Singapore, selectivity starts at a very early age and so does the demand for supplementary education. In recent years, streaming in primary schools has been replaced by subject-based grouping (OECD, 2011c), which consists in allowing students to follow, for example, not only science and their mother tongue at the standard level, but also attend mathematics at the foundational level. In this way, students have the opportunity to improve in all subjects. More opportunities for students to move horizontally between streams at the secondary level and beyond have been introduced to enhance flexibility in the system. Supplementary education might also be useful to provide a competitive edge in the admission to a prestigious secondary school. In Korea, however, the impact of the equalisation policies, which abolished entrance examinations and introduced random school assignment, was positive in the short-run but moved competition up to a higher level (see Annex A3.1).
3SUPPLEMENTARY EDUCATION IN EAST ASIA
96 © OECD 2014 STRONG PERFORMERS AND SUCCESSFUL REFORMERS IN EDUCATION: LESSONS FROM PISA FOR KOREA
A better balance between tests and academic records overtime could be explored to lessen the prominence of supplementary education. In most East Asian countries, examinations are the primary mechanism for determining academic achievement and admission into schools or universities. In Korea, for example, the multiple-choice university entrance exam (College Scholastic Ability Test, CSAT) used to determine 70% of a student’s position in the ranking (OECD, 2009). Decreasing the importance of examinations can also be supported by the fact that its legitimacy as indicators of ability may be called into question as certain groups are systematically disadvantaged in the admissions process as they cannot afford private tutoring.
Finally, the curricula to be tested can be revised to decrease the emphasis on rote learning. In Japan, the yutori reforms aimed at reducing the amount of testable content in entrance examinations, thus reducing the rationale for attending supplementary education and promoting a less exam-oriented type of learning. The reform was based on an emerging consensus that the school system was too rigid and that a new approach was needed to encourage creativity. The key change was a 30% cut in the school curriculum, the most radical overhaul since its inception in the 1950s, and the introduction of a five-day school week in 2002. In addition, the government relaxed grading practices and introduced “integrated learning classes” without textbooks in an effort to help students think independently and reduce the importance of rote learning. Reducing the pressure from school was also intended to encourage children to spend more time with their family and in the community, helping them to acquire social skills. The yutori reforms were generally perceived as a failure even though evidence for a decline in academic achievement is scarce.
Regulate the provision of supplementary educationRegulations can be used as an instrument to exert control and shape the activity of supplementary education institutions. However, Bray and Lykins (2012) report that regulation of supplementary education mainly concerns business aspects, such as transparency in financial transactions, contractual relationships, and management of premises to ensure that fire escapes existed and were accessible. In contrast, teacher qualifications, pedagogy, class size, content of curriculum tend to be loosely or not regulated.
Although most countries require supplementary education institutions to register, the barriers to entry to the supplementary education market are very low and providers make use of distinctions that can be misleading. For example, Bray and Lykins (2012) report that in Hong Kong-China tutorial centres tend to show prominently that they are “registered with the Education Bureau” in order to imply approval for educational purposes rather than that they are simply subject to health and safety inspections.
Regulations can also set minimum teacher qualifications and other aspects of the learning environment. For example, in Hong Kong-China there is a maximum class size. To limit the time spent on supplementary education, operational hours can also be regulated. In Seoul (Korea), supplementary education institutions are forbidden to operate after 10pm due to concerns for students’ well-being. Also, some countries have regulations against teachers providing paid instruction to their students in schools and have also devised codes of conduct either at the school and national level.
The industry can self-regulate through its representative bodies, such as the Japanese Juku Association or the Korean Association of Hagwons, to set high standards in the interest of their members. However, industry associations can also introduce important obstacles to education reform as occurred in Korea in 2011 (Lee, 2012).
Provide more reliable and accurate informationA stricter regulation on the advertisements of supplementary education institutions as well as more information about them could enable students and their parents to make better-informed choices. In many countries, supplementary education institutions make aggressive advertising campaigns to attract students. The general public might face difficulties in fully understanding or verifying their claims in advertisements. Bray and Lykins (2012) alert that supplementary education institutions might use advertisements with misleading statistics such as “98% improvement guaranteed in 6 weeks”, claim ownership of students’ results; pretend that they have experience with the government, examination boards, or other authorities by, for example, using official-sounding names; and indicate unclear qualifications and skills.
Korea, for example, has recently heightened transparency requirements for private academic institutions, particularly regarding their operations and fees. For example, tuition fees must be disclosed on the websites of local offices of education and no extra or hidden cost can be charged. A reward system for reporting of illegally run institutes has also been introduced (Lee, 2012). In addition, the number of inspections has intensified from 50 100 in 2009 to 78 678 in 2012 (MEST, 2013).
Broaden access to supplementary education
Provide supplementary education, particularly for low-income studentsSome countries have designed policies to provide public alternatives to private supplementary education, particularly for disadvantaged students. In Japan, some local boards of education, especially in Tokyo, have in recent years signed contracts with supplementary education institutions to offer after-hours or weekend instruction in public schools at a subsidised rate. These experiments aim to attract more students and redress the decline in the reputation of public schools. Individual schools and local
3SUPPLEMENTARY EDUCATION IN EAST ASIA
97STRONG PERFORMERS AND SUCCESSFUL REFORMERS IN EDUCATION: LESSONS FROM PISA FOR KOREA © OECD 2014
Boards of Education have also organised activities to bring instructors from supplementary education institutions into schools to offer their lessons to public school teachers. All of these experiments appear to be tacitly accepted by national policy-makers, though they are not explicitly recognised.
In Korea, low-cost supplementary education after school hours is offered at virtually all primary and secondary schools in order to enable students to enrich and supplement knowledge of subjects and to develop their talent as well as career aptitude. The number of students participating in such programmes (both free and paid) rose from 43% when they were introduced in 2006 to 65% in 2011,14 with higher rates for low-income families and those in rural areas, who have less access to hagwons (OECD, 2012b). 57% of the instruction is provided by schoolteachers, and 43% of the instruction by external lecturers. . The satisfaction scores of students participating in after-school programmes provided by schools increased from 69.1 point out of 100 in 2008 to 79 point in 2013. For- and non-profit organizations are more engaged in the operation of programmes and eight of the 17 metropolitan and provincial offices of education allow the programmes to be contracted out to for-profit organisations.
In Singapore, the government has collaborated with the Malay and Indian community bodies since the 1980s to address racial imbalances in educational achievement by providing financial support to provide tutoring and to train tutors, who work voluntarily or for low fees (Tan, 2009 in Bray and Lykins, 2012). Community bodies can also help monitor the work of tutors and call attention to abuses. Due to social pressures from parents who are unable to afford extensive tuition or supplementary education for their children, many schools have taken upon themselves to offer supplementary education after school, especially for students facing national exams at the primary and secondary level. These initiatives are not explicitly sanctioned nor encouraged by the Ministry of Education.
Embrace new technologies to boost learning opportunitiesNew technologies can reduce the costs of providing supplementary education and enhance access. In Korea, the Educational Broadcasting System (EBS) was established in 1990 with high-quality radio and television programs, including lessons to prepare for CSAT examination since 2004, to provide an alternative to supplementary education. Lessons are provided by teachers and other professionals, including famous tutors. This system had 3.9 million users in 2011, with about 694 thousand visits per day, cutting private tutoring spending by another 816 billion won (OECD, 2012b). While sales of the accompanying books were modest at the elementary level (7.2% of students), it is estimated that 54.8% of upper secondary students purchased them (KNSO, 2011 in Bray and Lykins, 2012). Evaluations of the EBS have shown that it has been particularly effective in serving rural areas.
On-line education systems are a rapidly growing component of the private tutoring service industry in many countries and tend to be significantly less expensive (OECD, 2012b). The Cyber Learning System (CLS), which was launched by the Korean government in 2004, has 4.5 million users, with 100 000 visits per day. An evaluation reported by Kim (2009, in Bray and Lykins, 2012) and based on a survey of 55 272 students, 3 842 teachers, and 12 783 parents, presented positive findings. One third of the students indicated that their interest in the subject content had grown considerably, and 25% indicated that they had developed self-directed learning habits. Many of these were academically weak students who had relatively little home financial support for their studies. At the same time, the evaluators concluded that many students had been saved the expense of investing in private tutoring and therefore that overall tutoring expenditures had been reduced by the initiative. Indeed, the government estimates that it reduced private tutoring spending by 1.1 trillion won (5% of actual spending in 2011) (OECD, 2012b).
Foster research and public engagement for more effective policy responses Further research on supplementary education, including its causes and scale, and greater parental involvement in the design of policy responses could shed some light on more effective policy responses. The scope of the research should not be limited to learning outcomes but also encompass other relevant aspects, such as student well-being and potential synergies between school-based and supplementary education. It could further distinguish between different types and quality of supplementary education and pinpoint the mechanisms that can contribute to educational performance.
The findings should be widely disseminated to facilitate better informed decisions on participation in supplementary education. Bray and Lykins (2012) report that families may continue to invest in supplementary education even when learning gains are elusive. The authors suggest that when students do not make progress, tutors commonly blame the students rather than themselves, and families may accept this diagnosis and continue to invest, while students may continue to seek tutoring chiefly because most of their classmates seem to be doing so.
Public consultations about education and, in particular, on supplementary education can be an avenue to explore ways forward, push for reforms and pave the way towards effective implementation. In Korea, the government asked parents which policies would reduce spending on private tutoring. The main response was improving the quality of schools, particularly in the areas of creativity and character-building, English, support for those falling behind and teacher evaluation (MEST, 2011). In 2011, parental engagement also proved determinant in Korea to overcome lobbying pressures from supplementary education institutions and pass the revised legislation on private institutions (Lee, 2012).
3SUPPLEMENTARY EDUCATION IN EAST ASIA
98 © OECD 2014 STRONG PERFORMERS AND SUCCESSFUL REFORMERS IN EDUCATION: LESSONS FROM PISA FOR KOREA
Notes
1. Private tutors have existed in the presence and absence of formal education systems. In pre-modern society, such tutoring was only limited to particular classes and castes. Since the early 19th century, the emergence and development of formal public education systems has grafted such public education onto the remains of private tutoring and other private institutions in many countries. The consolidation of a formalised education system, either provided and funded by public or private sources, dwarfed entirely private tutoring in most OECD countries.
2. It mainly refers to Hong Kong-China, Korea, Japan, and Singapore in this report, although other countries might be referred in specific sections.
3. The discussion of this chapter also includes alternatives that have emerged to supplementary education as, for example, after-school programmes offered in public schools in Korea.
4. While there is a vast and significantly formalized sector of private instruction in subject matter such as traditional arts and crafts, sports, foreign languages for conversation purposes, etc. this sector does not fall within the scope of this chapter.
5. In Korea, 82% of the average monthly private education expenditures per student are devoted to subjects that are part of the general curriculum: 34% on English, 32% on mathematics, 7% on Korean and only 5% on science and social studies (MEST, 2013). In contrast, only 18% of the total expenditures are spent on arts and physical education.
6. However, the figures are not comparable as the research findings reviewed are based in different methodologies and significantly different scopes. In some countries, such as Greece and Portugal, very high rates are observed in the years preceding university entrance examinations.
7. It encompasses both enrichment and remedial courses with individual tutors or in group lessons provided by school teachers, or other independent courses. These lessons can be financed publicly, and offered as a free resource for students in need, or can be privately paid for.
8. In some countries, the shortcomings associated with conventional schooling might simply be short instruction hours, particularly in countries where double-shift schools are still prevalent (e.g. Cambodia, India, Vietnam) and thus covering the full curricula might be difficult in half a school day (Bray and Lykins, 2012).
9. For example, supplementary education might contribute to higher housing prices in the surrounding of the most prestigious institutions. The concentration of around 6 000 hagwons in the Kangnam district of Seoul is thought to be an important factor in the high housing prices in that area, which has become a major social issue (OECD, 2012b).
10. Although they might not be high-quality teachers, “star tutors” are a major phenomenon in Hong Kong-China. One «star tutor» reported earnings of about US$3.9 million per year on average as a mathematics tutor offering web-based classes to 50 000 students (Bray and Lykins, 2012).
11. For example, in the UK, where supplementary education is targeted at immigrant communities and the purpose is mixed with heritage language preservation, there are suggestions of a positive impact (Strand 2007, Maylor et al, 2010). Likewise a survey conducted in Bangladesh shows a positive impact (Nath, 2008). For the United States, Buchmann et al. (2010) conclude that participation in test preparation led to “small gains in SAT scores”, though even this mild conclusion is questioned by Grodsky (2010) for many of the same methodological reasons that other evidence is suggestive at best. Kim (2004, in Bray and Lykins, 2012) reports that the CSAT is made up of multiple-choice questions that offer five answer options. Consequently, students intent on learning test-taking skills that will ensure their ability to solve these multiple-choice questions in a limited amount of time. One of the best tactics to do so is to memorise the CSAT question types and solution methods. To learn these tactics and test-taking skills, many students take up supplementary education courses.
12. In Korea, for example, attending a supplementary education institution is the least affordable option on average. The monthly expenditure per person on private academic education in 2012 was much higher in private academic institutions (124 thousand won) than in private tutoring (33 thousand won), home-study materials (11 thousand won) and paid internet study (2 thousand won) (MEST, 2013).
13. A comparison of the results from the PISA 2000 and 2009 assessments suggests that much of the reforms have been implemented with success (OECD, 2012a).
14. Latest data at the moment of publication is 72% in 2013 (MoE (2013). The management status of After-school Programmes provided by schools in 2013).
3SUPPLEMENTARY EDUCATION IN EAST ASIA
99STRONG PERFORMERS AND SUCCESSFUL REFORMERS IN EDUCATION: LESSONS FROM PISA FOR KOREA © OECD 2014
References and further reading
Bray, M. (1999), The Shadow Education System: Private Tutoring and Its Implication for Planners, Paris, UNESCO Institute for Educational Planning.
Bray (2011), The Challenge of Shadow Education: Private Tutoring and its Implications for Policy Makers in the European Union, European Commission, Brussels. Available on-line: www.nesse.fr/nesse/activities/reports/the-challenge-of-shadow-education-1.
Bray, M. and C. Lykins (2012), Shadow Education: Private Supplementary Tutoring and Its Implications for Policy Makers in Asia, Asian Development Bank, Mandaluyong City.
Buchmann, C et al. (2010), “Shadow education, American style: Test preparation, the SAT and college enrollment”, Social Forces, Vol. 89/2, pp. 435-61.
Byun, S. (2011), “Shadow Education and Academic Success in South Korea”, Working paper, College of Education, Pennsylvania State University.
Chae, S., J-H. Hong, and T.J Lee (2005), Anatomy of the Rank Structure of Korean Universities: Toward a design of integrated policies for education reform in Korea, KEDI Publications, Seoul.
Chung, B. (2002), “Korea’s War on Private Tutoring”, Paper presented at The Second International Forum on Education Reform, 2-5 September, Bangkok.
Dang, H-A. (2007), “The determinants and impact of private tutoring classes in Vietnam”, Economics of Education Review, Vol. 26/6, pp. 648-699.
Dawson, W. (2010), “Private tutoring and mass schooling in East Asia: Reflections of inequality in Japan, South Korea, and Cambodia”, Asia Pacific Education Review, Vol. 11/1, pp. 14-24.
Dierkes, J. (2008), “Japanese shadow education: The consequences of school choice” in S Davies, M Forsey, G Walford, (eds.), The Globalisation of School Choice?, Symposium Books, Oxford pp. 231-248.
Dierkes, J. (2010), “Teaching in the shadow – Operators of small shadow education institutions in Japan”, Asia Pacific Education Review, Vol. 10/1, pp. 25-35.
Grodsky, E. (2010), “Learning in the shadows and in the light of day: A commentary on shadow education, American style”, Social Forces. Vol. 89/2, pp. 475-81.
Kim, K. (2010), “Educational Equality,” in Lee, C. J, S. Kim and D. Adams (Eds.), Sixty Years of Korean Education, Seoul National University Press, Seoul.
Korea Educational Development Institute (KEDI) (2006), OECD Thematic Review of Tertiary Education: Country Background Report for Korea, Seoul.
Lee, J-H. (2012), Positive Changes: The Education, Science & Technology Policies of Korea, Korea Economic Daily & Business Publications, Seoul.
Lee, C.J. et al (2010), “The history of policy responses to shadow education in South Korea: implications for the next cycle of policy”, Asia Pacific Education Review, Vol. 11, pp. 97-108.
Lee, M. and R. Larson. (2000), “The Korean ‘Examination Hell’: Long hours of studying, distress, and depression.” Journal of Youth and Adolescence, Vol. 29/2, pp. 249-271.
Lee, S. and R. Shouse (2011), “The impact of prestige orientation on shadow education in South Korea”. Sociology of Education, Vol. 84/3, pp. 212-224.
Maylor, U. et al (2010), “Impact of supplementary schools on pupils’ attainment: An investigation into what factors contribute to educational improvements”, Department for Children, Schools and Families, London Metropolitan University. http://dera.ioe.ac.uk/810/1/DCSF-RR210.pdf.
Ministry of Education, Culture, Sports, Science and Technology (MEXT) (2008) Kodomo no gakkôgai deno gakushûkatsudô no kan suru jittaichôsahôkoku [Report on the Survey of Academic Activities Outside of School]. www.mext.go.jp/b_menu/houdou/20/08/08080710.htm, accessed 20 March 2013.
Ministry of Education, Science and Technology (MEST) (2011), Analysis of the Results of the 2010 Survey on Private Education Costs, Seoul.
Nath, S.R. (2008), “Private supplementary tutoring among primary students in Bangladesh”. Educational Studies, Vol. 34/1, pp. 55-72.
OECD (2009), OECD Reviews of Tertiary Education: Korea, OECD Publishing. http://dx.doi.org/10.1787/9789264049055-en.
OECD (2010), PISA 2009 Results: What Makes a School Successful?: Resources, Policies and Practices (Volume IV), PISA, OECD Publishing. http://dx.doi.org/10.1787/9789264091559-en.
3SUPPLEMENTARY EDUCATION IN EAST ASIA
100 © OECD 2014 STRONG PERFORMERS AND SUCCESSFUL REFORMERS IN EDUCATION: LESSONS FROM PISA FOR KOREA
OECD (2011a), OECD Economic Surveys: Japan 2011, OECD Publishing. http://dx.doi.org/10.1787/eco_surveys-jpn-2011-en.
OECD (2011b), Quality Time for Students: Learning In and Out of School, PISA, OECD Publishing. http://dx.doi.org/10.1787/9789264087057-en.
OECD (2011c), Lessons from PISA for the United States, Strong Performers and Successful Reformers in Education, OECD Publishing. http://dx.doi.org/10.1787/9789264096660-en.
OECD (2012a), Lessons from PISA for Japan, Strong Performers and Successful Reformers in Education, OECD Publishing. http://dx.doi.org/10.1787/9789264118539-en.
OECD (2012b), OECD Economic Surveys: Korea 2012, OECD Publishing. http://dx.doi.org/10.1787/eco_surveys-kor-2012-en.
Ono, H. (2004), “College Quality and Earnings in the Japanese Labor Market”, Industrial Relations, Vol. 43.
Roesgaard M. (2006), Japanese Education and the Cram School Business: Functions, Challenges and Perspectives of the Juku, NIAS Press, Copenhagen.
Sharma, Y. ( 2012), “Meet the ‘Tutor Kings and Queens’”, BBC News. www.bbc.co.uk/news/business-20085558.
Sohn, H. et al., (2010), “Longitudinal relationship among private tutoring, student-parent conversation, and student achievement”, KEDI Journal of Educational Policy, Vol. 7/1, pp. 23-41.
Strand, S. (2007), “Surveying the views of pupils attending supplementary schools in England”. Educational Research, Vol. 49/1, pp. 1-19.
3SUPPLEMENTARY EDUCATION IN EAST ASIA
101STRONG PERFORMERS AND SUCCESSFUL REFORMERS IN EDUCATION: LESSONS FROM PISA FOR KOREA © OECD 2014
Annex 3.A1.
Box 3A.1 The policy response in Korea
The government has long tried to limit the role of hagwons and other forms of private tutoring. Among the most dramatic educational reforms in Korean history was the replacement of grade 6 examinations by a random lottery as part of a lower secondary-school equalization policy introduced in Seoul in 1969, in other major cities in 1970, and in the rest of the country in 1971. The reform aimed to permit the normal development of children by reducing stress, to prevent primary schools from focusing excessively on preparation for the lower secondary school examination, to discourage private tutoring, to narrow the gaps between different lower secondary schools, and to reduce the financial and psychological burden on households. The reform had some success, but schools found that they had greater variations in learning levels among their intakes; and abolition of the lower secondary school examination and expansion of enrolments meant that the watershed was simply transferred to the next level. Ambitious families who were dissatisfied with the mixed-ability classes of lower secondary schools invested in private tutoring to prepare for the upper secondary school entrance examination.
The next step, therefore, was the Upper Secondary School Equalisation Policy, launched in Seoul and Pusan in 1974 and gradually expanded to several major cities. By 2003, 72% of students in the country were subject to the policy. Like the lower secondary-school policy, this initiative abolished entrance examinations and introduced random school assignment. It had some effect, at least in the short run, but again the policy moved the competition up to a higher level; and the university entrance examinations still had a backwash on the lower secondary schools and primary schools.
The year 1980 brought a military government, which was determined to tackle supplementary education. In that year, an estimated 12.9% of primary school pupils, 15.3% of lower secondary school pupils, and 26.2% of upper secondary school pupils were receiving private tutoring. The government transferred control of the university entrance examinations from individual institutions to a new state-controlled body operating the University Entrance Achievement Test (CEAT). In the most radical measure to date, the authorities prohibited both additional upper secondary school classes and private tutoring in academic subjects. Again, however, the prohibition proved very difficult to enforce and as a result it was gradually relaxed. Parents continued to seek tutoring, and the prohibition was challenged in the courts. In 2000, the prohibition was declared unconstitutional by the Constitutional Court of Korea on the grounds that it “infringes on the basic rights of the people to educate their children”.
Another measure during the 1980s was the introduction of special purpose upper secondary schools. These institutions were a response to criticisms of mediocrity in the mainstream upper secondary schools to which students were allocated by lottery. The special purpose upper secondary schools served gifted students and focused on science, foreign languages, athletics, or other domains. By 2007, the special purpose upper secondary schools served 4.2% of all secondary pupils; and the fierce competition for entry fuelled private tutoring.
A further reform of the university entry system was introduced in 1994. The CEAT had been an achievement test based on specific subject matter rather than an academic aptitude test based on more general knowledge. The new College Scholastic Ability Test (CSAT) was designed to measure whether applicants had the general academic aptitudes required for higher education, and aimed to encourage high-level thinking rather than fragmented short-term memorisation. A study found that the CSAT did improve some of the teaching and learning methods in upper secondary schools, and that teachers and students realised that cramming fragmented information into instruction was no longer a viable method of study. However, the CSAT encourages a different kind of memorisation.
Despite the Constitutional Court of Korea ruling, there have been subsequent attempts to limit private tutoring in the 2000s. In 2008, for example, there were measures to limit the cost of hagwons and Seoul imposed a 10 pm curfew on hagwons. The measures to reduce private education expenditures through strengthening public education announced in 2009 consisted of: i) Strengthening public education, including reinforcing the accountability of schools and teachers; ii) Improvement of the upper secondary school entrance system and the university entrance system including the admission office system; iii) Strengthening the public alternatives to private supplementary education, including the EBS (Education Broadcasting System) and after-school programs; iv) Improving the reporting and recognition system for private institutions. The year 2010 was a tipping point: for the first time, total private education expenditures declined.
In 2012, the Korean government announced further measures to fundamentally change classroom lessons, improve school-based English and mathematics education, and increase the quality of after-school programs. Currently, the government is preparing more initiatives to strengthen the public school system, improve EBS services and tackle private expenditures with a mid and long-term vision (MEST, 2013).
Source: Adapted from Bray, M. and C. Lykins (2012), Shadow Education: Private Supplementary Tutoring and Its Implications for Policy
Makers in Asia. Mandaluyong City, Asian Development Bank. See Bray and Lykins (2012) for further references. MEST (2013), Progress on
Plans for the Reduction of Private Education Expenditures, Ministry of Education of Korea, Seoul.
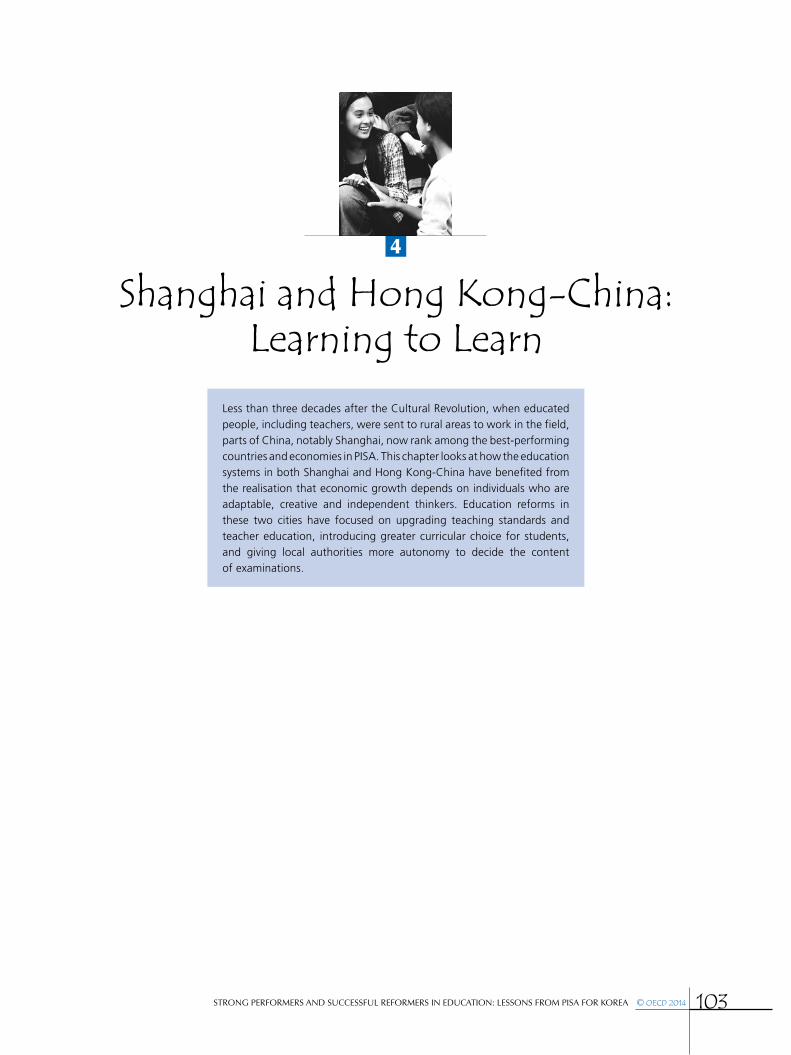
4
103STRONG PERFORMERS AND SUCCESSFUL REFORMERS IN EDUCATION: LESSONS FROM PISA FOR KOREA © OECD 2014
Shanghai and Hong Kong-China: Learning to Learn
Less than three decades after the Cultural Revolution, when educated people, including teachers, were sent to rural areas to work in the field, parts of China, notably Shanghai, now rank among the best-performing countries and economies in PISA. This chapter looks at how the education systems in both Shanghai and Hong Kong-China have benefited from the realisation that economic growth depends on individuals who are adaptable, creative and independent thinkers. Education reforms in these two cities have focused on upgrading teaching standards and teacher education, introducing greater curricular choice for students, and giving local authorities more autonomy to decide the content of examinations.
4SHANGHAI AND HONG KONG-CHINA: LEARNING TO LEARN
104 © OECD 2014 STRONG PERFORMERS AND SUCCESSFUL REFORMERS IN EDUCATION: LESSONS FROM PISA FOR KOREA
INTRODUCTIONDespite China’s emergence as one of the world’s most influential economies, relatively little is known in other countries about the country’s education system and how its students learn. The prevailing impression tends to be that students in China learn by rote, and that much in the schools is about memorising and cramming for examinations.
This chapter seeks to provide a more nuanced and accurate picture of education in China, using Shanghai and Hong Kong-China as examples. Shanghai is one of China’s most developed urban areas, while Hong Kong-China, despite having similar cultural roots, has a different society, and is more or less self-governing under the “one country, two systems” political arrangement. While Shanghai and Hong Kong-China may not be representative of all parts of such a diverse country, they can provide a window into education in China through their shared lessons and future ambitions. In both cases, student learning has become the focus, with other dimensions – such as teaching, school facilities and systemic strategies – providing the context and supporting various aspects of student learning.
This chapter begins by describing the cultural and historical context – essential for understanding China’s education systems and philosophy – before moving on to describe the education systems and recent reforms in Shanghai and Hong Kong-China.
THE CULTURAL CONTEXTObservers outside China frequently attribute the success of the students in Shanghai and Hong Kong-China to their cultural heritage. The most overwhelming cultural influence in this part of the world is Confucian philosophy, which originated in China.1 While it is complex and not easy to define, Confucianism sees human beings as teachable, improvable and perfectible through personal and communal endeavour, especially including self-cultivation and self-creation. There is a general observation that the Confucian heritage favours children’s education; hence education has the support of parents and society at large. Nevertheless, this heritage has also brought some limitations and struggles to the realm of education in these Confucian societies.
Certainly, China has a long tradition of valuing education highly. This was bolstered early on by the Civil Examination system, established in 603 AD, and which was later exported to Japan and Korea in the 7th century. It was a competitive, yet efficient, system for selecting officials, and was known for its rigor and fairness. The general approach was basically an essay test, in which the candidates were confined for days in an examination cell, fed with good food, and required to write essays of political relevance. Candidates prepared for years2 by reading the classics (the Four Books and Five Classics). In their essays, they had to recite and quote these ancient texts to support their arguments – hence the requirement for “rote learning”. The final selection procedure was usually held in the Examinations Department, which was often part of the imperial organisation. Whoever gained the appreciation of the Emperor, who was virtually the chief examiner, would be the champion, followed by a few runners-up.
These examinations evolved over many dynasties before they were abolished in 1905. There are several features of the Civil Examination that distinguished it from other systems of civil servant selection and recruitment. It involved a selection process open to all candidates regardless of their background and with virtually no pre-requisites, other than that of gender.3 In fact it was the only path for social mobility in ancient Chinese society; becoming an officer was the only way one could change one’s social status. The incentive was tremendous, and reinforced by the fact that Chinese folklore over hundreds of years – reflected in novels, operas, dramas and all art forms – included stories about scholars from poor families who endured years of hardship and poverty before triumphing in the Civil Examination, being appointed ministers, marrying princesses and enjoying glorious homecoming ceremonies. Even today, a large number of ancient novels and operas that refer to success in the Civil Examination by candidates from poor families are still popular.
The Civil Examination gave almost all families, regardless of socio-economic status, high hopes for their children’s (i.e. boys’) future, and such hopes translated into hard work and adaptability to difficult learning environments. However, it also led to an almost exclusive emphasis on examination results for validating genuine learning or knowledge. It meant that for more than 16 centuries, generation after generation of young people were trained only to face the challenges of examinations.
Cultural paradoxesThe heritage of the Civil Examination has brought several paradoxes to the education systems of Confucian societies:
Paradox One. Education is the most essential means of social mobility and, as such, is an overriding policy concern, and the most important item on parents’ agendas. However, this also explains the unanimous conclusion in the contemporary literature that motivation for student achievement in Confucian societies is largely extrinsic in nature. That is, success in education is not equivalent to learning more or better; it means succeeding in examinations.
Paradox Two. It is taken for granted that education is a matter of selection. It does not matter how well one achieves; it is about the degree to which you are better than others, or how resoundingly you could beat others. In this context, the Civil Examinations
4SHANGHAI AND HONG KONG-CHINA: LEARNING TO LEARN
105STRONG PERFORMERS AND SUCCESSFUL REFORMERS IN EDUCATION: LESSONS FROM PISA FOR KOREA © OECD 2014
put every candidate on a level playing field. Everybody who wanted to receive the prize had to follow the same rules. On the one hand, the Civil Examination reflected the collectivism in society and, in return, helped shape a collective culture. It bred both aggressiveness and adaptability among young people. On the other hand, everyone had to submit to uniform requirements, rather than what one might desire or feel one deserved. This reflected a general negligence, if not suppression, of individuality and diversity in human development.
Paradox Three. The Civil Examination legacy has instilled the virtue of hard work, and emphasised effort over innate ability (Stevenson and Stigler, 1992). This contrasts strongly with basic Western assumptions about ability versus effort, and indeed overturns the entire notion of ability. Many have attributed students’ success in Confucian societies to this belief in hard work. However, such a belief has also led to unrealistic expectations of students’ tolerance of pressures, examination pressures in particular. Indeed, while using the pressure for examination and competition has been attractive to many education reformers in the West, removing such pressure has become the major object of reform in Confucian societies.
THE HISTORICAL CONTEXT
Ideology-driven systems: 1905 to 1976In China, a school system in the contemporary sense only began in 1905 after the abolition of the Civil Examination. However, China’s mixed colonial history left a legacy of different school systems. For example, many of the schools in those early years were started in Shanghai (see below), largely because of the city’s early contacts with the West. Shanghai was divided into “concessions” under the “unequal treaties” signed in the mid and late 19th Century. Schools in the British Concession followed the British system, and those in the French Concession followed the French system. Nevertheless, at the national level, schools were often seen as symbols of modernisation and liberalisation, and were strongly influenced by American educational thinkers, particularly John Dewey.
Since the establishment of the socialist nation state in 1949, the national system on China’s mainland has undergone several stages of development. In the 1950s – the early years of the People’s Republic – the entire education system followed the Russian model, with very rigid specialisation and heavy doctrines of collectivism. Then with the weakening of the Soviet link in the early 1960s, there was a short “renaissance” in education, when many innovations and new thinking blossomed. Shanghai was known for many such innovations and new thoughts, especially in the realm of pedagogy.
This renaissance was very short, swept aside by the Cultural Revolution (1966-1976), which proved a national disaster in all respects and which ruined the education system. Schools were closed down, and formal learning was replaced by practical experiences in farming and factories, underpinned by dense ideologies of class struggle. Schools and higher education institutions were taken over by political committees comprising workers, peasants and soldiers who were seen as the only people who could represent the proletariat revolutionary ideology.
The reconstruction of education: the late 1970s onwardsIt would not be exaggerating to say that China had to completely rebuild its education system in the late 1970s and early 1980s after the collapse of the Cultural Revolution. Indeed, it has been in a continuous era of overhauling and reforms ever since. The achievements of these reforms have been many and varied; to highlight a few:
•China achieved almost universal enrolment in basic education in a very short space of time, between around 1980 and the early 1990s. In most urban areas, there are now also very high enrolment rates at senior secondary level, either in general schools or vocational schools. Higher education has also seen spectacular expansion since 1999.
•China has decentralised its school system in terms of management and finance. Schools are basically administered by authorities at the county level. The school curriculum, textbooks and public examinations are also decentralised. Moving away from a centralised uniform system was quite an undertaking.
•There has been a significant expansion of the private sector, which could be interpreted as either mobilisation of non-government resources or the privatisation of public resources. Although the status of private schools is still sometimes unclear, and their quality varies, this trend is here to stay.
•With decentralisation leading to disparity among regions, between urban and rural areas, within cities, and between different types of citizens (mainly minorities and migrants), China has enacted a range of policy measures to overcome or reduce these differences. The latest move, begun in 2006 and guaranteed by law, is to target subsidies from the central government to regions according to economic need.
•Since the late 1980s, successive waves of curriculum reform have aimed to improve the quality of education and to reform public examinations. The syllabus and textbooks were decentralised for the first time in 1988. In 2001, there was a major reform in the curriculum to support modern pedagogical theory. Another new wave of reform started in 2010.
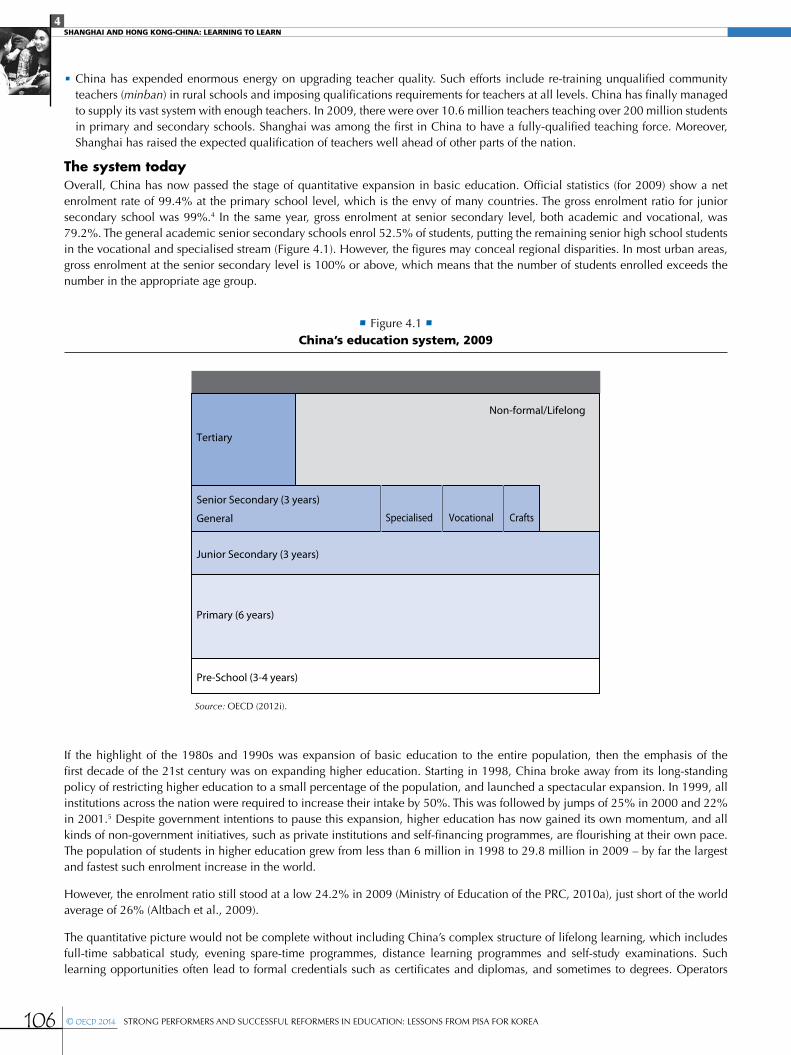
4SHANGHAI AND HONG KONG-CHINA: LEARNING TO LEARN
106 © OECD 2014 STRONG PERFORMERS AND SUCCESSFUL REFORMERS IN EDUCATION: LESSONS FROM PISA FOR KOREA
•China has expended enormous energy on upgrading teacher quality. Such efforts include re-training unqualified community teachers (minban) in rural schools and imposing qualifications requirements for teachers at all levels. China has finally managed to supply its vast system with enough teachers. In 2009, there were over 10.6 million teachers teaching over 200 million students in primary and secondary schools. Shanghai was among the first in China to have a fully-qualified teaching force. Moreover, Shanghai has raised the expected qualification of teachers well ahead of other parts of the nation.
The system todayOverall, China has now passed the stage of quantitative expansion in basic education. Official statistics (for 2009) show a net enrolment rate of 99.4% at the primary school level, which is the envy of many countries. The gross enrolment ratio for junior secondary school was 99%.4 In the same year, gross enrolment at senior secondary level, both academic and vocational, was 79.2%. The general academic senior secondary schools enrol 52.5% of students, putting the remaining senior high school students in the vocational and specialised stream (Figure 4.1). However, the figures may conceal regional disparities. In most urban areas, gross enrolment at the senior secondary level is 100% or above, which means that the number of students enrolled exceeds the number in the appropriate age group.
If the highlight of the 1980s and 1990s was expansion of basic education to the entire population, then the emphasis of the first decade of the 21st century was on expanding higher education. Starting in 1998, China broke away from its long-standing policy of restricting higher education to a small percentage of the population, and launched a spectacular expansion. In 1999, all institutions across the nation were required to increase their intake by 50%. This was followed by jumps of 25% in 2000 and 22% in 2001.5 Despite government intentions to pause this expansion, higher education has now gained its own momentum, and all kinds of non-government initiatives, such as private institutions and self-financing programmes, are flourishing at their own pace. The population of students in higher education grew from less than 6 million in 1998 to 29.8 million in 2009 – by far the largest and fastest such enrolment increase in the world.
However, the enrolment ratio still stood at a low 24.2% in 2009 (Ministry of Education of the PRC, 2010a), just short of the world average of 26% (Altbach et al., 2009).
The quantitative picture would not be complete without including China’s complex structure of lifelong learning, which includes full-time sabbatical study, evening spare-time programmes, distance learning programmes and self-study examinations. Such learning opportunities often lead to formal credentials such as certificates and diplomas, and sometimes to degrees. Operators
Pre-School (3-4 years)
Primary (6 years)
Junior Secondary (3 years)
Senior Secondary (3 years)
Non-formal/Lifelong
Tertiary
General Specialised Vocational Crafts
• Figure 4.1 •China’s education system, 2009
Source: OECD (2012i).
4SHANGHAI AND HONG KONG-CHINA: LEARNING TO LEARN
107STRONG PERFORMERS AND SUCCESSFUL REFORMERS IN EDUCATION: LESSONS FROM PISA FOR KOREA © OECD 2014
range from major institutions of higher education (as their extension programmes), to individual professionals and private for-profit enterprises.
Having set the cultural and historical scene, we now turn to look at education and learning in two major Chinese cities: Shanghai and Hong Kong-China. Both are vibrant economies and have undertaken major comprehensive education reforms in the past two decades. While they have both inherited the same cultural traditions in education, the two cities work under different political and ideological frameworks. Nevertheless, their reform efforts share a similar philosophy of making student learning central, although this is approached in different ways.
SHANGHAI: A LEADER IN REFORMSShanghai is a metropolitain area in China, whose urban population is now over 20.7 million, 13.8 million of whom are permanent residents and 5.4 million are considered temporary. In addition, there are around 1.5 million who can be classified as mobile or without a fixed home in Shanghai (Shanghai Municipal Statistics Bureau, 2010). The city is one of the four municipalities in China with the status of a province (the others are Beijing, Tianjin and Chongqing). In 2009, Shanghai’s GDP was USD 11 361 per capita (Figure 4.3). While its population and land account for just 1% and 0.06% of the nation’s total, respectively, the regional economy contributes to one-eighth of China’s overall income (Information Office of Shanghai Municipality and Shanghai Municipal Statistics Bureau, 2010). In 2009, the contribution of the service sector to economic growth in Shanghai was around 60%, the highest on the Chinese mainland.
While Beijing is China’s political centre, Shanghai is its undeniable business centre. Shanghai is also the country’s most international and open city. This is attributable to its prosperous and colonial past before the change of government in 1949. It was among the first ports forced open by international powers in the mid-19th century.6 After 1978, as China opened up to trade and began the transition to a market economy (the “socialist market economy”), Shanghai took on new approaches on almost all fronts, including education.
Shanghai was among the first cities to achieve universal primary and junior secondary education and was also among the first to achieve almost universal senior secondary education. According to the Shanghai Yearbook 2009 (Shanghai Municipal Government, 2010), enrolment at the age of compulsory education was above 99.9%, and 97% of the age cohort attended senior secondary school (general and vocational). It is notable that enrolment in preschool programmes was 98%, already surpassing the new national preschool education goal for 2020.
There are many dimensions in education in which Shanghai has been a pioneer. In 1980, Shanghai was the first city in China to create vocational high schools, from which graduates were free to seek jobs. This was an unprecedented break from the job-assignment convention, which was an essential element of the planned economy. In 1985, Shanghai was also the first to launch its own version of the higher education entrance examination, starting the trend of localising the national selection system. As will be discussed later, Shanghai was also the first to implement neighbourhood attendance in primary schools, confronting the tradition of early competition and selection. Moreover, Shanghai was among the first cities in China to aim at an all-graduate teaching force.
Statistics show that over 80% of the city’s higher education age cohort are admitted into higher education in one way or another, compared to the national figure of 24% (Ding, 2010). In other words, all those who would like to attend higher education are able to do so. There were 61 institutions of higher education in Shanghai in 2009, plus quite a few private institutions yet to be officially recognised. There would be higher education over-supply if only residents of Shanghai were counted,7 but Shanghai institutions also admit students from all over the nation.8 Indeed, Shanghai has always been a preferred place to pursue higher education, perhaps second only to Beijing, and has attracted the best students from the national pool of elite candidates.
Although Shanghai is the most internationalised city on the Chinese mainland, cultural traditions in education still prevail. Popular support for education means the city has had little difficulty in launching universal education. However, Shanghai still struggles with undue examination pressure. Even with the very generous admissions quota for local students, the sense of competition is still very keen. Reformers had thought that when the system became less selective, undue competition would also be reduced. This does not seem to have happened. One possible interpretation is that parents and students still see the system as a vertical hierarchy9 and everyone wants to be at the top. Indeed, educational institutions are ranked in parents’ minds; this is part of the cultural legacy. By the same token, parents would like to see their children become top of their class, and anything less than 100% is perceived as undesirable (Stevenson and Stigler, 1992). Another interpretation is that the cultural tradition cherishes hard work, and that to “study” (or “reading books” in the ancient tradition) is a student’s “responsibility”. Parents and teachers like to keep students busy studying, and do not feel comfortable if students spend less time studying.
Hence, despite the increase in higher education opportunities, examination pressure persists in Shanghai as in other parts of China. And, as hinted at above, a belief in competition has also led to a tolerance of disparity. Chinese societies seem to see disparity as necessary in a hierarchical system where people compete to climb to the top. Shanghai has tried hard to work against these
4SHANGHAI AND HONG KONG-CHINA: LEARNING TO LEARN
108 © OECD 2014 STRONG PERFORMERS AND SUCCESSFUL REFORMERS IN EDUCATION: LESSONS FROM PISA FOR KOREA
adverse cultural influences in order to overcome this tolerance of disparity and to fight undue examination pressures. The city has encouraged and embraced many unconventional experiments during this search.
How education is practisedThere are two core dimensions to the practice of education in Shanghai: student engagement and the organisation of teaching.
Student engagement One of the most essential influences of China’s cultural heritage is the intensity of students’ engagement in learning. In a typical Shanghai classroom, students are fully occupied and fully engaged. Inattentive students are not tolerated. For example, in one typical mathematics lesson observed for this research, students at Junior Secondary II were learning about parabolas. Students covered 15 problems at their desks, and selected students gave blackboard demonstrations. This is rather different from classrooms in other cultures, where students may not be required to be fully engaged or attentive throughout the entire lesson; and the amount of work expected is seldom comparable.
Such intense concentration is perhaps due to the heavy examination pressure and the accompanying culture of diligence. After all, to “study” is regarded as students’ responsibility, and having a large quantity of work is often seen as a proxy for working hard. When local educators are asked about the phenomenon, their first response is often one of surprise – “why not?”. Probing further often leads to explanations that working hard is a virtue. In Chinese society, when a student is not doing well in school, the usual explanation is that the student is “lazy”; ability is seldom blamed.
Student engagement in learning is not limited to lessons. Homework is an essential part of their learning activities and governs their home lives after school. Parents expect students to do homework every evening and are prepared to devote their family lives to student study, as ancient tradition dictates. In other words, the family is ready to sacrifice everything for their children’s education. This is very different from other cultures, for example in the West, where school work is not supposed to “invade” private family lives.
The intensity of students’ engagement goes well beyond school. As described in an interview with Zhang Mingsheng, former Deputy Secretary-General of the Shanghai Education Commission, there is a rather comprehensive “remedial system” of tutorial schools to help children with exam preparation. Although no formal statistics exist, it is estimated that over 80% of parents send their children to tutorial schools. Such schools are mostly for-profit, operate after school hours or at weekends, and tend to use small groups to focus on particular subjects. Parents see these tutorial schools as essential for enabling students to pass the public examinations with flying colours. Teachers are not totally against such schools either, because they also think that passing examinations is the prime aim of student study. Even parents who are against examination cramming often send their children to tutorial schools, almost as a matter of insurance. Those who go to such classes are not all weak students; even very strong students like to reinforce their strengths to achieve higher scores in the examinations.
Apart from this “remedial system”, there is also a “supplementary system” of institutions or programmes outside schools, where young people can learn music, fine arts, sports, martial arts and all kinds of experiences not offered by schools. Parents are quite prepared to invest in these learning activities, even though they can be expensive.
Another tradition, since China started its schools in the early 20th century, has been to focus on student development in five dimensions – moral, intellectual, physical, social and aesthetic, in that order. Since 1949, this has evolved into moral, intellectual and physical. Students are expected to be fully developed in all three dimensions. Hence, students are expected to take part in all kinds of other activities (see Box 4.1). In Shanghai schools, for example, there is a municipal requirement that every student should engage in at least one hour of physical education every day. Students start with a morning exercise before class; there is an “intermission exercise” in the middle of the morning; and other physical activities are held after school. Some schools practise “eye exercises” where student massage essential acupuncture points in order to prevent eyesight deterioration. Students also engage in all kinds of extracurricular activities in sports and the arts, where they are expected to learn organisation and leadership. Students take turns at “daily duties” in cleaning the classrooms and nearby corridors, for example. Students are also assigned teamwork in keeping the campus tidy. They are also organised to visit rural villages or deprived social groups as a matter of social or service learning. All these activities are co-ordinated by the municipal education authority.
Compared with other societies, young people in Shanghai may be much more immersed in structured learning in the broadest sense of the term. The logical conclusion is that they learn more, even though what they learn and how they learn are subjects of constant debate. Critics see young people as being “fed” learning because they are seldom left on their own to learn in a way of their choosing. They have little direct encounters with nature, for example, and little experience with society either. While they have learned a lot, they may not have learned how to learn. Students are often overwhelmed by all these learning activities, both within and outside schools, and most of which are imposed on them.
4SHANGHAI AND HONG KONG-CHINA: LEARNING TO LEARN
109STRONG PERFORMERS AND SUCCESSFUL REFORMERS IN EDUCATION: LESSONS FROM PISA FOR KOREA © OECD 2014
The Shanghai government is developing new policy interventions to reduce student workload and to refocus the quality of student learning experiences over quantity. Challenges from a changed and changing society maintain tension between such intense engagement and genuine learning in the broader sense. The national mid- and long-term education reform and development plan, the Outline 2020, calls for “reducing student workload” as a major theme of reform (Ministry of Education of the PRC, 2010b; Box 3.6). Shanghai is already much more engaged of this issue than many other places in China. Good schools often refrain from holding classes during evenings and weekends, and parents do not normally press for heavier workloads. Homework is such a burden to students that many local authorities in China have stipulated a maximum amount of homework, measured in hours and depending on the students’ age, that schools are allowed to assign. Shanghai was among the first to impose such limits as a municipal policy.
Teaching and teachers
OrganisationAs in other parts of China, Shanghai has developed a rather rigorous framework and system of teaching. At the grassroots level, subject-based “teaching-study groups” engage in study and improvement of teaching on a daily basis. For example, a physics teacher of Senior Secondary 2 (SS2) involved in a teaching-study group typically teaches 12-15 classes per week, teaching only one programme and nothing else. There are timetabled sessions when the study group meets, often with related personnel, such as laboratory assistants, to draw up more detailed lesson schemes for a particular topic the following week. Teachers are expected to teach according to the scheme, which is then translated into more detailed lesson plans by and for individual teachers.
The lesson plan serves not only as a guide for the teacher during the lesson, but also as documentation of the teacher’s professional performance. In many cases, teachers are observed by the school principal or by district education officers when they are being considered for promotions or awards. In short, a Chinese teacher sees a lesson more as a show or a performance, and puts in many hours of preparation to cover the standard 40-minute period.10
The “teaching-study group” is supervised for each of its subject areas by the “teaching-study office” in the Education Bureau (in a rural country or city district), which is, in turn, supervised by the relevant “teaching-study office” in the Education Department in the provincial or municipal government. Professionally, all these “teaching-study” setups work under the Basic Education Department II within the central government’s Ministry of Education. The Basic Education Department II is charged with all matters related to curriculum development, textbook production, pedagogy enhancement and school management for the whole nation. In this way, teaching in China is centrally organised.
Teachers may observe each other or may be observed by peers (for example, when teaching a new topic due to a change in the curriculum), by new teachers (so they can learn from more experienced teachers), by senior teachers (for mentoring), or by the school principal (for monitoring or for development purposes). Sometimes, teachers are expected to teach demonstration lessons, called public lessons, for a large number of other teachers to observe and comment upon. This structured organisation of teaching in China is thus not only a means for administration; it is also a major platform for professional enhancement.
Classes in mainland China are generally large: the national norm is 50 students. However, in rural or suburban areas where good schools are sparse, it is not unusual to see classes of over 80 or, in extreme cases, over 100 students. Parents often indicate their preference for better schools and better teachers over smaller classes. However, in Shanghai, as in other major cities, recent drastic declines in population have forced local governments to adopt small classes so as to minimise teacher layoffs. As is the case elsewhere, the actual effects of small classes are still under debate. Nonetheless, small classes have created room for new pedagogy by introducing student activities that would be impossible in large classes.
Box 4.1 Oriental Green Ark
A spectacular facility established by the Shanghai Municipal Education Department is the education base known as the Oriental Green Ark. This huge education park occupies more than 60 000 acres and includes activity centres, physical challenge centres, military training, museums, villas and hotels, as well as a convention centre. The villas and hotels follow the concept of a global village, with each block in the style of a particular nation. Every student in Shanghai primary and secondary schools experiences the Oriental Green Ark at least once as an organised school visit. Many parents also send their children to the Ark through individual bookings at their own cost. Children see it as an alternative amusement park.
4SHANGHAI AND HONG KONG-CHINA: LEARNING TO LEARN
110 © OECD 2014 STRONG PERFORMERS AND SUCCESSFUL REFORMERS IN EDUCATION: LESSONS FROM PISA FOR KOREA
Qualifications and professional developmentRecently, Shanghai has upgraded the qualifications required of teachers, and is moving towards an “all graduate, all trained” teaching force. This has meant a major reorganisation of the teacher-training institutions. The in-service College of Education has also been merged into the normal universities, although the effect of this is subject to some debate. At present, all primary school teachers must have a sub-degree diploma, and all teachers in secondary schools are degree-holders with professional certification. Many teachers also have master’s degrees.
Shanghai was the first province in China to require continuous professional development for teachers. Every teacher is expected to engage in 240 hours of professional development within five years. This rigorous system of professional development and pedagogical advancement means that teachers are perceived as autonomous professionals, and hence continuous enhancement of their individual professional capacities is emphasised. This is very different from pure performance-based monitoring, where teachers’ teaching productivity is entrusted to control mechanisms further up the hierarchy. In other words, teachers in China are fundamentally regarded as “generals” who can independently handle teaching and face any difficult student situations. This is very different from other systems where teachers are regarded as “staff members” or “foot-soldiers”, subject to commands and directives, and are expected to perform according to standard indicators. Thus, in contrast to a system where only a handful of principals or superintendents play the “general”, there are millions of “generals” in China.
Teachers in Shanghai, as part of a national system, are classified into four grades as an indication of their professional status. Promotion from one grade to the next often requires the capacity to give demonstration lessons, contribute to the induction of new teachers, publish in journals or magazines about education or teaching, and so forth. Of course, many other aspects of education are unique to China, but the teaching protocols are perhaps among the most relevant to this chapter.
While teachers in mainland China do not receive very high salaries, they often have other significant income on top of their salaries. This may come from additional assignments beyond normal responsibilities, income generated outside school, such as from private tutorials or invited talks, or school “bonuses” (e.g. sponsoring fees collected from students who come from other neighbourhoods or whose test scores are below the official admissions cut-off). In major cities, such as Beijing and Shanghai, where the economy is more open and incomes fluctuate more, teaching stands out as a preferred occupation because it guarantees a more stable income than many other professions. Over the years, because of the improvement in teachers’ salaries, teaching has risen up the ladder of preferred occupations.
This picture of teaching in Shanghai would not be complete without mentioning that almost all the officers in the government education authorities, both at municipal and district levels, started as school teachers. Most of them distinguished themselves as teachers or school principals with strong track records at the grassroots. This perhaps explains their devoted professional attention to teaching and learning amidst all the administrative chores and political issues they normally contend with. They manage, however, to maintain this teaching focus while at the same time relying on a strategic vision that enables them to navigate a policy arena well beyond education.
Reform strategies: from teaching to learningAll aspects of education are being, or have been, reformed in China and in Shanghai. There are reforms in curriculum, assessment and examinations, pedagogy, and teacher preparation, all aimed at enhancing the quality of education. However, crucial to all is the reform in assessments and examinations. In a culture where exams are of such central concern, Shanghai reformers see examinations, particularly public examinations, as preventing all the other reforms from having their maximum impact.
Curriculum reformAt the national level, a major curriculum reform was heralded by a document issued in 2001, which called for schools to:
•move away from pure knowledge transmission towards fostering learning attitudes and values;
•move away from discipline-based knowledge, towards more comprehensive and balanced learning experiences;
•move away from pure “bookish” knowledge and to improve relevance and interest in the content of a curriculum;
•move away from repetitive and mechanistic rote-learning towards increased student participation, real-life experience, capacity in communications and teamwork, and ability to acquire new knowledge and to analyse and solve problems;
•de-emphasise the screening and selective functions of assessments and instead to emphasise their formative and constructive functions; and
•move away from centralisation, so as to leave room for adaptation to local relevance and local needs (Ministry of Education of the PRC, 2001).
4SHANGHAI AND HONG KONG-CHINA: LEARNING TO LEARN
111STRONG PERFORMERS AND SUCCESSFUL REFORMERS IN EDUCATION: LESSONS FROM PISA FOR KOREA © OECD 2014
These principles are by no means political slogans or academic jargon. They apply not only to the curriculum, but also to pedagogy in the classrooms, as well as the entire system. These principles point to a new direction, running counter to the old traditions, to conventions of the former planned economy, as well as to tacit assumptions about education.
Concrete changes include dilution of the disciplined structure of “subjects” so as to re-organise content according to life relevance and progression in learning; the introduction of new integrated contents at the nexus between natural sciences and humanities; the creation of elective arts modules as a compulsory part of the curriculum; changing examination formats from fact regurgitation to analyses and solutions for stated problems; and so forth.
Shanghai has always been seen as a pioneer in education reform, with reform of the curriculum taking centre stage. Curriculum reform in Shanghai follows the general framework of national reform. But Shanghai is often given the privilege of experimenting with reforms before they are endorsed for other parts of the nation. Since 1989, Shanghai has launched two waves of curriculum reform. Their essence has been to overcome “examination orientation” practices in schools in order to build quality education (Ding, 2010).11
The first phase of curriculum reform in Shanghai started in 1988, with an attempt to allow students to select courses of personal interest. A curriculum comprising three blocks was established: compulsory courses, elective courses and extra-curricular activities. Textbooks and teaching materials were produced and phased in accordingly.
Curriculum reform moved into its second phase in 1998, with the aim of integrating natural sciences with the humanities, the national curriculum with school-based curricula, and knowledge acquisition with active inquiry. The purpose was to transform students from passive receivers of knowledge to active participants in learning, so as to improve their capacity for creativity and self-development and to fully achieve their potential. Traditional subjects were re-organised into eight “learning domains”: language and literature, mathematics, natural science, social sciences, technology, arts, physical education, and a practicum.
Schools were encouraged to make their own curricula specific to their conditions. Museums and other “youth education bases” (such as the Oriental Green Ark, Box 4.2) have now become crucial places in which the new curriculum is implemented.
The new curriculum has three components: the basic curriculum, delivered to all students, mainly through compulsory courses; the enriched curriculum, which aims to develop students’ potential and is realised mainly through elective courses, and an inquiry-based curriculum, which is mainly implemented through extra-curricular activities. The inquiry-based curriculum asks students, backed up by support and guidance from teachers, to identify research topics based on their experiences. It is hoped that through independent learning and exploration, students can learn to learn, think creatively and critically, participate in social life, and promote social welfare. Since 2008, the new curriculum has been implemented throughout the city.
Overall, the curriculum reform involves broadening students’ learning experiences, enhancing the relevance of subjects by relating them to broader human and social issues, and concentrating on the development of “capability” rather than the accumulation of information and knowledge. What is unprecedented in the reform is the intention to promote creative and independent thinking, which is very much against the collective and submissive tradition of Chinese culture. These are reflected in the reform of both examinations and pedagogy.
In order to facilitate the sharing of good practices of curriculum design, development and implementation, a web-based platform12 was constructed and put into use in 2008. Included on the website are resources for curriculum development and learning, success stories of curriculum implementation, and research papers on teaching and learning. However, reform does not stop there: a draft version of Shanghai’s plan for educational reform and development to 2020, which has been put out for public consultation, calls for school-based curricula and proposes a credit system at the senior secondary level to make learning more individualised and flexible (see later section).
Assessment reformIn China, examinations remain a major barrier to reforming student learning. Shanghai is no exception. No matter how well the curriculum reform is designed and explained, and no matter how committed teachers are, they feel unable to do anything about the examination pressure, shaped as it is by the broader culture and the pragmatic approach of students. Despite the general belief that emphasis on examinations jeopardises the genuine development of young people and is detrimental to the entire national population, social pressures have driven teachers to submit. Educators cynically describe the situation as follows: “High-sounding appeals for quality education, down-to-earth preparation for examinations.”
Given this context, instead of eliminating or reducing examinations, Shanghai has chosen to modify them so that they serve a better purpose. If ones see public examinations as the baton that conducts the entire symphony of school lives, rather than removing the baton, Shanghai has decided to modify the baton so that it conducts good music.
4SHANGHAI AND HONG KONG-CHINA: LEARNING TO LEARN
112 © OECD 2014 STRONG PERFORMERS AND SUCCESSFUL REFORMERS IN EDUCATION: LESSONS FROM PISA FOR KOREA
Since 2001, the higher education entrance examination in Shanghai has taken the form of “3+X”: the three core subjects of Chinese, English and mathematics, plus the “X” of any other subject(s) as required by individual institutions or faculties. The “X” component may take the form of paper-and-pencil examination, oral examination, test of practical skills and so on. The content may cover one discipline, one kind of ability, or several disciplines or abilities in integration. Individual institutions decide on the weighting of the three core subjects and the “X” component. For example, at Shanghai University for Science and Technology, the three core subjects contribute to 40% of the candidate’s overall scores and the “X” component is 60%.
From 2006, higher education institutions in Shanghai started to organise their own entrance examinations and set their own admission requirements (Shanghai Municipal Education Commission, 2008). The overall trend and intention is to diversify higher education entrance examinations so as to reduce the pressure from a single uniform exam. To lower exam pressures further, Shanghai has moved to allow admissions based on school recommendations at both senior secondary and university entrance levels. Other selected institutions, presumably the stronger, have also been given the autonomy to set their own admission criteria and entrance examinations. More recently, students have been allowed to recommend themselves for admissions at higher levels of education – and universities are now willing to consider such self-recommendations.
As part of the reform, Shanghai created a Record of Growth of Primary and Secondary School Students in 2004. This is a student portfolio which combines various evaluation aspects, such as basic, enriched, and inquiry-based curricula, and moral conduct. Methods of evaluation included quantitative and qualitative analysis, self-evaluation and peer evaluation. This is seen as major step to move away from taking examination scores as the sole indicator of student performance.
However the reform in examinations is most noteworthy in the introduction of new concepts and approaches in the mode of assessments. From Grade 7 on, teachers begin to set integrated papers that cross disciplinary boundaries and test students’ capacity to apply their knowledge to real-life problems. Students are provided with a hypothetical situation and are asked to analyse and comment on the situation from multiple perspectives. For example, the situation might be the dramatic increase in the number of private motor cars. An analysis could include the consumption of metals, increase in traffic, human habits, income-tax implications, employment of workers, etc. As another example, questions provide students with information not covered in the syllabi to test their analytical abilities or skills in processing new information for insights or problem-solving. Multiple-choice questions have basically disappeared from assessments and public examinations. All these are seen as important moves to free students from rote learning and to cultivate abilities in independent thinking and creativity, to “integrate their talents”.
Hence, it would be fair to say that teachers in Shanghai have moved to change their assessments to approaches and modes which are more conducive to integrated learning. In this study, when teachers who had no experience with PISA were asked about and understood the nature of the PISA tests, many of them responded: “That is more or less what we are doing!” There has apparently been a genuine paradigm shift among teachers about assessments and examinations, but in a culture that reveres examinations. However, educators and researchers comment that the changes to assessments are more effective within schools than in public examinations. There is an interesting paradox here. On the one hand, teachers and schools have moved ahead to more advanced thinking about assessments for authentic learning, and have mastered the expertise in practising such assessments within schools. On the other hand, the public examinations are only taking slow steps, and heavy examination pressure remains.
Pedagogical reformAlongside the curriculum reforms have come changes to pedagogy. One very significant change has been implemented in recent years through the slogan “return class time to students”. This involves allocating more time to student activities in classes and less to lecturing by teachers. This has caused a fundamental change in the perception of what a good class should look like. Once typified as involving well-designed presentations by teachers, videos of model teaching concentrated on teachers’ activities. Now, model
Box 4.2 The principle of multiple approaches
In a typical lesson to introduce addition of fractions, the teacher did not start by directly providing the methods of “common denominator”. Instead, she asked students to compare two fractions: 4/5 and 3/4. In a matter of around 15 minutes, student came up with five different ways of comparing the two fractions: drawing pies, drawing bars, subtracting from 1, common numerator, and common denominator. The teacher then introduced common denominator as one of the convenient ways of adding two fractions with different denominators. The principal said that in the conventional classroom, it normally took two to three weeks before students could master the method. Now, all are mastered within one lesson of 40 minutes.
4SHANGHAI AND HONG KONG-CHINA: LEARNING TO LEARN
113STRONG PERFORMERS AND SUCCESSFUL REFORMERS IN EDUCATION: LESSONS FROM PISA FOR KOREA © OECD 2014
classes are filmed using two cameras, one of which records student activities. Teachers’ performances are now also evaluated by the time given to student participation and how well student activities are organised.
A similar slogan is “to every question there should be more than a single answer”. This poses a challenge to the orthodoxy and authority of teachers over the information they teach (Box 4.2).
These add up to a sea change in classroom pedagogy. The use of slogans is a Chinese tradition, carefully crafted to capture the essence of the proposed change, yet to be easily understood and followed by grassroots teachers. This is particularly powerful in rural schools, where most theories are still foreign ideas. The use of slogans in pedagogy reform is also based on the culture of what could be called “constructive conformity” in China. That is, teachers do not mind replicating other teachers’ good practices, and indeed creative practices are meant to be copied. This is very different from the meaning of creativity in other countries, where practices are called creative only when they are different from others.
The changes in teacher and student activities in classes are a fundamental deviation from the Chinese tradition in pedagogy. It has been a huge step changing from a focus on teaching to a focus on learning. Student participation in classrooms is a pretty new idea to most teachers in China. It challenges and changes teachers’ authoritative role as the knowledge controller. However, these changes in classroom practices have allowed students to generate their own paths of learning, and hence creativity and independent thinking.
The reform in pedagogy has caused a fundamental change in the teacher-student relationship. It has empowered students in the process of learning and in the creation of knowledge. As a result, classrooms have become more liberal in terms of student thinking, despite the intensity of activities and strict discipline.
Reforms to eliminate disparitiesStrong performance in PISA means not only good individual student performance, but relatively small disparities among individual students.
In recent year, China has joined the international community in realising the importance of overcoming inequities in education – and in society at large. This is of particular significance since success in the overall reform has been based on a break from the extreme egalitarianism that prevailed during the Cultural Revolution. Deng Xiaoping pursued the concept of “let a few become rich first”. Disparity was at that time seen as an incentive to the growth of national wealth and a cure to national poverty. However, over the past 30 years of development, the uneven growth in the nation has given rise to significant inequality and disparity between different areas, and within regions. As a major metropolitan area where wealth accumulates, disparities within Shanghai can be quite stark.
Neighbourhood attendanceIn 1994, Shanghai was the first city in China to introduce neighbourhood attendance at primary and junior secondary levels, requiring students to attend their local schools and, in effect, eliminating the notion of key schools at these levels. This was a challenge to society and caused some unease among parents, who were bewildered that their children could no longer compete for admission to the best schools. The social pressure was so great that eventually a compromise was reached: students could choose schools in other neighbourhoods by paying a sponsorship fee. This is often known as the Chinese version of “school choice,” which was then a hot issue in America. Parents see the additional fees as fair, because otherwise preferential admissions could go to parents with political power or personal connections.
Neighbourhood attendance also prompted concern among teachers who were not used to teaching classes of students with mixed abilities. Now, however, teachers seem to be proud of being able to handle children of diverse backgrounds and different abilities, realising that diversity and disparity within schools are common features in contemporary societies. Neighbourhood attendance has allowed public examinations to be removed at the end of primary schooling, releasing primary teaching from examination pressure. As an immediate result, innovations and creativity now flourish in primary schools. Policy makers often see this as an essential factor in making Shanghai a champion of curriculum and pedagogy reforms.
A belief in the value of effortThe cultural heritage of believing in effort over innate ability can be positive. Shanghai is home to quite a few experimental programmes. One such example is “success education” which illustrates how hard work and innovative approaches can improve results for poor performing students (Box 4.3).
Migrant childrenNeighbourhood attendance also prepared the school system to face the challenges of educating migrant children. In the 1980s, migrant workers flooded in from rural villages to work in urban areas. Most are low-wage labourers in factories, while others are
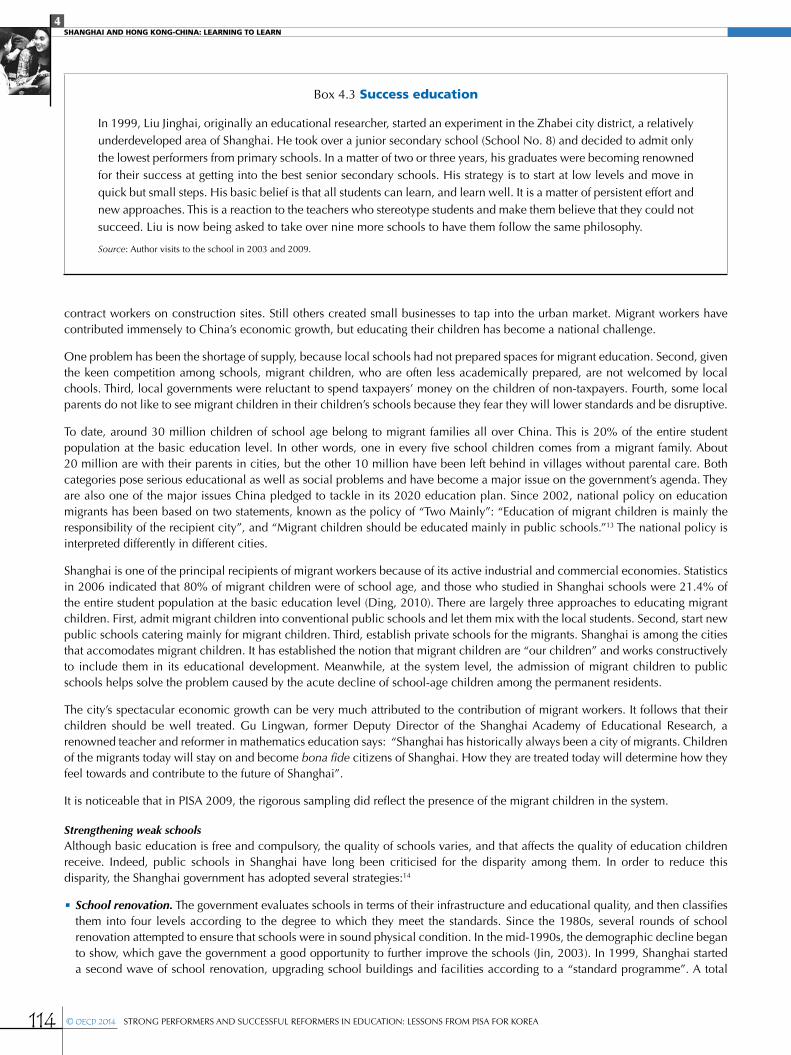
4SHANGHAI AND HONG KONG-CHINA: LEARNING TO LEARN
114 © OECD 2014 STRONG PERFORMERS AND SUCCESSFUL REFORMERS IN EDUCATION: LESSONS FROM PISA FOR KOREA
contract workers on construction sites. Still others created small businesses to tap into the urban market. Migrant workers have contributed immensely to China’s economic growth, but educating their children has become a national challenge.
One problem has been the shortage of supply, because local schools had not prepared spaces for migrant education. Second, given the keen competition among schools, migrant children, who are often less academically prepared, are not welcomed by local chools. Third, local governments were reluctant to spend taxpayers’ money on the children of non-taxpayers. Fourth, some local parents do not like to see migrant children in their children’s schools because they fear they will lower standards and be disruptive.
To date, around 30 million children of school age belong to migrant families all over China. This is 20% of the entire student population at the basic education level. In other words, one in every five school children comes from a migrant family. About 20 million are with their parents in cities, but the other 10 million have been left behind in villages without parental care. Both categories pose serious educational as well as social problems and have become a major issue on the government’s agenda. They are also one of the major issues China pledged to tackle in its 2020 education plan. Since 2002, national policy on education migrants has been based on two statements, known as the policy of “Two Mainly”: “Education of migrant children is mainly the responsibility of the recipient city”, and “Migrant children should be educated mainly in public schools.”13 The national policy is interpreted differently in different cities.
Shanghai is one of the principal recipients of migrant workers because of its active industrial and commercial economies. Statistics in 2006 indicated that 80% of migrant children were of school age, and those who studied in Shanghai schools were 21.4% of the entire student population at the basic education level (Ding, 2010). There are largely three approaches to educating migrant children. First, admit migrant children into conventional public schools and let them mix with the local students. Second, start new public schools catering mainly for migrant children. Third, establish private schools for the migrants. Shanghai is among the cities that accomodates migrant children. It has established the notion that migrant children are “our children” and works constructively to include them in its educational development. Meanwhile, at the system level, the admission of migrant children to public schools helps solve the problem caused by the acute decline of school-age children among the permanent residents.
The city’s spectacular economic growth can be very much attributed to the contribution of migrant workers. It follows that their children should be well treated. Gu Lingwan, former Deputy Director of the Shanghai Academy of Educational Research, a renowned teacher and reformer in mathematics education says: “Shanghai has historically always been a city of migrants. Children of the migrants today will stay on and become bona fide citizens of Shanghai. How they are treated today will determine how they feel towards and contribute to the future of Shanghai”.
It is noticeable that in PISA 2009, the rigorous sampling did reflect the presence of the migrant children in the system.
Strengthening weak schoolsAlthough basic education is free and compulsory, the quality of schools varies, and that affects the quality of education children receive. Indeed, public schools in Shanghai have long been criticised for the disparity among them. In order to reduce this disparity, the Shanghai government has adopted several strategies:14
•School renovation. The government evaluates schools in terms of their infrastructure and educational quality, and then classifies them into four levels according to the degree to which they meet the standards. Since the 1980s, several rounds of school renovation attempted to ensure that schools were in sound physical condition. In the mid-1990s, the demographic decline began to show, which gave the government a good opportunity to further improve the schools (Jin, 2003). In 1999, Shanghai started a second wave of school renovation, upgrading school buildings and facilities according to a “standard programme”. A total
Box 4.3 Success education
In 1999, Liu Jinghai, originally an educational researcher, started an experiment in the Zhabei city district, a relatively underdeveloped area of Shanghai. He took over a junior secondary school (School No. 8) and decided to admit only the lowest performers from primary schools. In a matter of two or three years, his graduates were becoming renowned for their success at getting into the best senior secondary schools. His strategy is to start at low levels and move in quick but small steps. His basic belief is that all students can learn, and learn well. It is a matter of persistent effort and new approaches. This is a reaction to the teachers who stereotype students and make them believe that they could not succeed. Liu is now being asked to take over nine more schools to have them follow the same philosophy.
Source: Author visits to the school in 2003 and 2009.
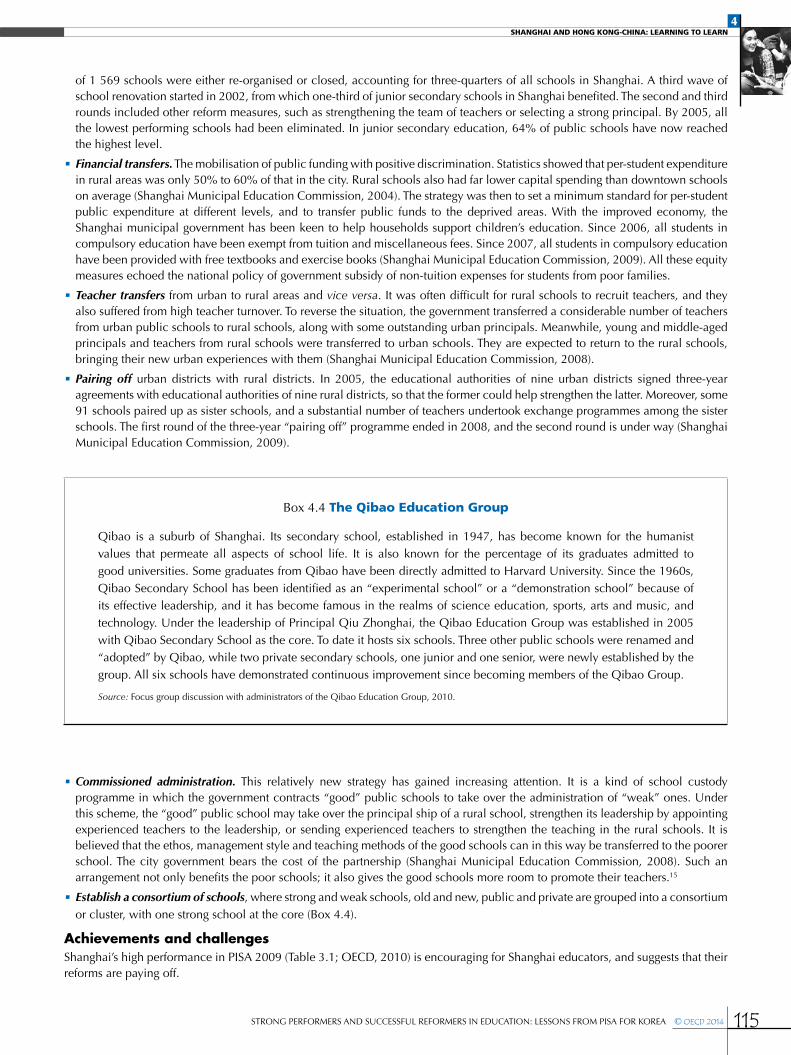
4SHANGHAI AND HONG KONG-CHINA: LEARNING TO LEARN
115STRONG PERFORMERS AND SUCCESSFUL REFORMERS IN EDUCATION: LESSONS FROM PISA FOR KOREA © OECD 2014
of 1 569 schools were either re-organised or closed, accounting for three-quarters of all schools in Shanghai. A third wave of school renovation started in 2002, from which one-third of junior secondary schools in Shanghai benefited. The second and third rounds included other reform measures, such as strengthening the team of teachers or selecting a strong principal. By 2005, all the lowest performing schools had been eliminated. In junior secondary education, 64% of public schools have now reached the highest level.
•Financial transfers. The mobilisation of public funding with positive discrimination. Statistics showed that per-student expenditure in rural areas was only 50% to 60% of that in the city. Rural schools also had far lower capital spending than downtown schools on average (Shanghai Municipal Education Commission, 2004). The strategy was then to set a minimum standard for per-student public expenditure at different levels, and to transfer public funds to the deprived areas. With the improved economy, the Shanghai municipal government has been keen to help households support children’s education. Since 2006, all students in compulsory education have been exempt from tuition and miscellaneous fees. Since 2007, all students in compulsory education have been provided with free textbooks and exercise books (Shanghai Municipal Education Commission, 2009). All these equity measures echoed the national policy of government subsidy of non-tuition expenses for students from poor families.
•Teacher transfers from urban to rural areas and vice versa. It was often difficult for rural schools to recruit teachers, and they also suffered from high teacher turnover. To reverse the situation, the government transferred a considerable number of teachers from urban public schools to rural schools, along with some outstanding urban principals. Meanwhile, young and middle-aged principals and teachers from rural schools were transferred to urban schools. They are expected to return to the rural schools, bringing their new urban experiences with them (Shanghai Municipal Education Commission, 2008).
•Pairing off urban districts with rural districts. In 2005, the educational authorities of nine urban districts signed three-year agreements with educational authorities of nine rural districts, so that the former could help strengthen the latter. Moreover, some 91 schools paired up as sister schools, and a substantial number of teachers undertook exchange programmes among the sister schools. The first round of the three-year “pairing off” programme ended in 2008, and the second round is under way (Shanghai Municipal Education Commission, 2009).
•Commissioned administration. This relatively new strategy has gained increasing attention. It is a kind of school custody programme in which the government contracts “good” public schools to take over the administration of “weak” ones. Under this scheme, the “good” public school may take over the principal ship of a rural school, strengthen its leadership by appointing experienced teachers to the leadership, or sending experienced teachers to strengthen the teaching in the rural schools. It is believed that the ethos, management style and teaching methods of the good schools can in this way be transferred to the poorer school. The city government bears the cost of the partnership (Shanghai Municipal Education Commission, 2008). Such an arrangement not only benefits the poor schools; it also gives the good schools more room to promote their teachers.15
•Establish a consortium of schools, where strong and weak schools, old and new, public and private are grouped into a consortium or cluster, with one strong school at the core (Box 4.4).
Achievements and challengesShanghai’s high performance in PISA 2009 (Table 3.1; OECD, 2010) is encouraging for Shanghai educators, and suggests that their reforms are paying off.
Box 4.4 The Qibao Education Group
Qibao is a suburb of Shanghai. Its secondary school, established in 1947, has become known for the humanist values that permeate all aspects of school life. It is also known for the percentage of its graduates admitted to good universities. Some graduates from Qibao have been directly admitted to Harvard University. Since the 1960s, Qibao Secondary School has been identified as an “experimental school” or a “demonstration school” because of its effective leadership, and it has become famous in the realms of science education, sports, arts and music, and technology. Under the leadership of Principal Qiu Zhonghai, the Qibao Education Group was established in 2005 with Qibao Secondary School as the core. To date it hosts six schools. Three other public schools were renamed and “adopted” by Qibao, while two private secondary schools, one junior and one senior, were newly established by the group. All six schools have demonstrated continuous improvement since becoming members of the Qibao Group.
Source: Focus group discussion with administrators of the Qibao Education Group, 2010.
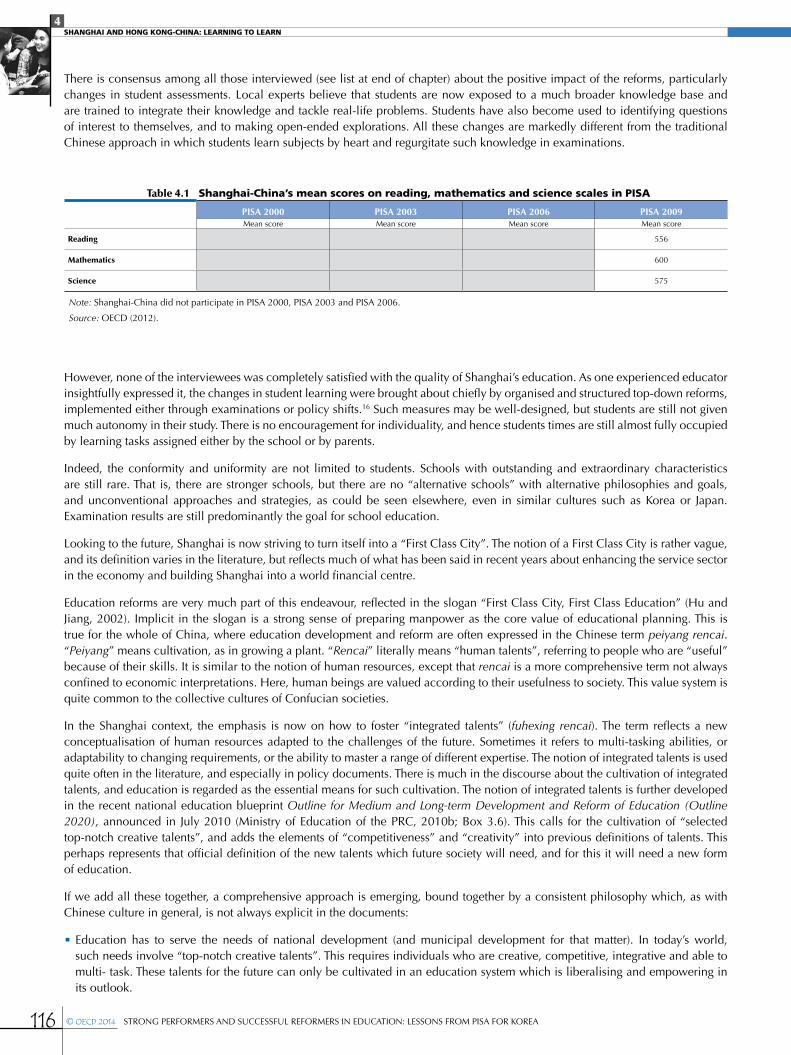
4SHANGHAI AND HONG KONG-CHINA: LEARNING TO LEARN
116 © OECD 2014 STRONG PERFORMERS AND SUCCESSFUL REFORMERS IN EDUCATION: LESSONS FROM PISA FOR KOREA
There is consensus among all those interviewed (see list at end of chapter) about the positive impact of the reforms, particularly changes in student assessments. Local experts believe that students are now exposed to a much broader knowledge base and are trained to integrate their knowledge and tackle real-life problems. Students have also become used to identifying questions of interest to themselves, and to making open-ended explorations. All these changes are markedly different from the traditional Chinese approach in which students learn subjects by heart and regurgitate such knowledge in examinations.
However, none of the interviewees was completely satisfied with the quality of Shanghai’s education. As one experienced educator insightfully expressed it, the changes in student learning were brought about chiefly by organised and structured top-down reforms, implemented either through examinations or policy shifts.16 Such measures may be well-designed, but students are still not given much autonomy in their study. There is no encouragement for individuality, and hence students times are still almost fully occupied by learning tasks assigned either by the school or by parents.
Indeed, the conformity and uniformity are not limited to students. Schools with outstanding and extraordinary characteristics are still rare. That is, there are stronger schools, but there are no “alternative schools” with alternative philosophies and goals, and unconventional approaches and strategies, as could be seen elsewhere, even in similar cultures such as Korea or Japan. Examination results are still predominantly the goal for school education.
Looking to the future, Shanghai is now striving to turn itself into a “First Class City”. The notion of a First Class City is rather vague, and its definition varies in the literature, but reflects much of what has been said in recent years about enhancing the service sector in the economy and building Shanghai into a world financial centre.
Education reforms are very much part of this endeavour, reflected in the slogan “First Class City, First Class Education” (Hu and Jiang, 2002). Implicit in the slogan is a strong sense of preparing manpower as the core value of educational planning. This is true for the whole of China, where education development and reform are often expressed in the Chinese term peiyang rencai. “Peiyang” means cultivation, as in growing a plant. “Rencai” literally means “human talents”, referring to people who are “useful” because of their skills. It is similar to the notion of human resources, except that rencai is a more comprehensive term not always confined to economic interpretations. Here, human beings are valued according to their usefulness to society. This value system is quite common to the collective cultures of Confucian societies.
In the Shanghai context, the emphasis is now on how to foster “integrated talents” (fuhexing rencai). The term reflects a new conceptualisation of human resources adapted to the challenges of the future. Sometimes it refers to multi-tasking abilities, or adaptability to changing requirements, or the ability to master a range of different expertise. The notion of integrated talents is used quite often in the literature, and especially in policy documents. There is much in the discourse about the cultivation of integrated talents, and education is regarded as the essential means for such cultivation. The notion of integrated talents is further developed in the recent national education blueprint Outline for Medium and Long-term Development and Reform of Education (Outline 2020), announced in July 2010 (Ministry of Education of the PRC, 2010b; Box 3.6). This calls for the cultivation of “selected top-notch creative talents”, and adds the elements of “competitiveness” and “creativity” into previous definitions of talents. This perhaps represents that official definition of the new talents which future society will need, and for this it will need a new form of education.
If we add all these together, a comprehensive approach is emerging, bound together by a consistent philosophy which, as with Chinese culture in general, is not always explicit in the documents:
•Education has to serve the needs of national development (and municipal development for that matter). In today’s world, such needs involve “top-notch creative talents”. This requires individuals who are creative, competitive, integrative and able to multi- task. These talents for the future can only be cultivated in an education system which is liberalising and empowering in its outlook.
Table 4.1 Shanghai-China’s mean scores on reading, mathematics and science scales in PISA
PISA 2000 PISA 2003 PISA 2006 PISA 2009Mean score Mean score Mean score Mean score
Reading 556
Mathematics 600
Science 575
Note: Shanghai-China did not participate in PISA 2000, PISA 2003 and PISA 2006.
Source: OECD (2012).
4SHANGHAI AND HONG KONG-CHINA: LEARNING TO LEARN
117STRONG PERFORMERS AND SUCCESSFUL REFORMERS IN EDUCATION: LESSONS FROM PISA FOR KOREA © OECD 2014
•The foremost task in achieving such an education system is to liberate students from the undue workload caused by the public examinations. This is being achieved not so much by reducing examinations, but by changing the aims and modes of publication examinations and internal assessments.
•The strategic first step is to expose teachers to new assessment concepts. Shanghai reformers have borrowed heavily from PISA’s goals and design. The existing system of teachers’ professional development plays a crucial role in disseminating and practising the basics.
•Students are already changing their learning styles, and have much broader learning experiences than the formal curriculum offers..
HONG KONG-CHINA’S EDUCATION SYSTEM: ONE COUNTRY, TWO SYSTEMS Hong Kong-China was originally a small fishing island that was ceded to the British government in 1842 after China’s defeat in the Sino-British War (“The Opium War”). In further treaties in the late 19th century, China also lost the Kowloon Peninsula and the New Territories to Britain on a 99-year lease. Hong Kong-China maintained its colonial status at the end of the Second World War when all other “unequal treaties” with China were terminated. In 1997 the 99-year lease ended. Following a surprise suggestion from Deng Xiaoping to British Prime Minister Margaret Thatcher, Hong Kong-China’s sovereignty was returned to China under the “one country, two systems” notion.
Under this arrangement, China resumed its sovereignty over Hong Kong-China in 1997, but Hong Kong-China remained a separate jurisdiction, governed by a “Basic Law” and enjoying autonomy in all areas except military defence and diplomatic relations. As a Special Administrative Region of China (SAR), Hong Kong-China maintains policies of its own, independent from the national government in Beijing. In the case of education, for example, Hong Kong-China maintains its own system of education under an Education Bureau (EDB) which reports only to the Hong Kong-China government and Hong Kong-China taxpayers, without direct relations with the Ministry of Education in Beijing. Meanwhile, Hong Kong-China is free to engage in bilateral relations with other jurisdictions and assume membership in other international organisations for finance, commercial, education, culture and so forth. Hong Kong-China’s education system has been and remains quite distinct from that of the rest of China, with a unique history, structure and reform trajectory.
Hong Kong-China has a population of around 7 million living in a small area of 1 000 square kilometres with an average GDP per capita (2011) USD 34 457 (Figure 4.3), putting it among the world’s top ten richest nations on most lists.17 The service sector of the economy accounts for 92% of Hong Kong-China’s economic growth (Census and Statistics Department of Hong Kong-China, 2010a). Across the border on the Chinese mainland, an estimated 80 million people work for Hong Kong-China investors.
The population is predominantly ethnic Chinese who increasingly come from mainland China, either as immigrants who stay on or as tourists or migrants who reside in Hong Kong-China temporarily. Small but significant portions of the population are from Indonesia and the Philippines, mostly with temporary permits to work as domestic helpers. Traditionally, long-term residents of South Asian origin include businessmen from India, manual or service workers from Pakistan and former Ghurkas from Nepal. The Caucasians from Western countries living in Hong Kong-China mostly work for influential multinationals or as professionals or academics. Hong Kong-China residents, both men and women, have life expectancies that are among the longest in the world.
Hong Kong-China’s education system comprises around 1 100 schools. However, the number is shrinking because of dramatic declines in population. Each age cohort has declined from around 9 000 members in the early 1980s to around 4 000 in recent years. The fertility rate is around 0.9 children per woman – far less than the “replacement” level of 2.1 children per woman (Census and Statistics Department of Hong Kong-China, 2010b and c).
The education system in Hong Kong-China has not followed the national pattern on the mainland. It is very much part of the British colonial legacy. Not only does Hong Kong-China follow the British O-Level and A-Level system, it has even adopted various policy changes made in England and Wales. However, since the 1970s, there has been a strong tendency to develop a more local identity, and policies began to depart from British trends. In a way, that prepared Hong Kong-China for the major reforms started in 1999 after the return of Hong Kong-China to Chinese sovereignty in 1997. The following are diagrams of the Hong Kong-China education system, before and after 2012 which is the dividing line for the reform in the structure.
In 2009, when PISA was conducted, Hong Kong-China’s education system was still very much part of the British colonial legacy. The school system still maintained the British approach of five-year secondary schooling (Forms 1-5) culminating in a Certificate of Education Examination. The certificate is a gateway for all young people, either to work or further study. It is followed by a two-year matriculation education (known as Forms 6 and 7) in preparation for the A-Level examinations for admissions to higher education.
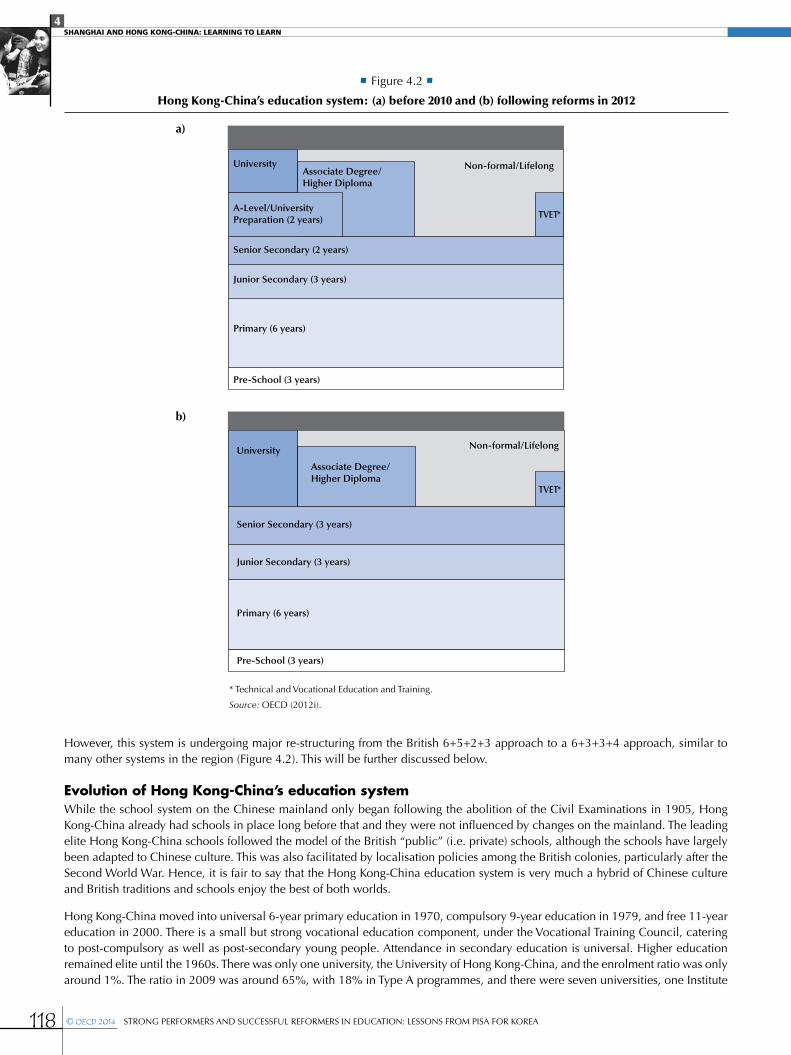
4SHANGHAI AND HONG KONG-CHINA: LEARNING TO LEARN
118 © OECD 2014 STRONG PERFORMERS AND SUCCESSFUL REFORMERS IN EDUCATION: LESSONS FROM PISA FOR KOREA
However, this system is undergoing major re-structuring from the British 6+5+2+3 approach to a 6+3+3+4 approach, similar to many other systems in the region (Figure 4.2). This will be further discussed below.
Evolution of Hong Kong-China’s education systemWhile the school system on the Chinese mainland only began following the abolition of the Civil Examinations in 1905, Hong Kong-China already had schools in place long before that and they were not influenced by changes on the mainland. The leading elite Hong Kong-China schools followed the model of the British “public” (i.e. private) schools, although the schools have largely been adapted to Chinese culture. This was also facilitated by localisation policies among the British colonies, particularly after the Second World War. Hence, it is fair to say that the Hong Kong-China education system is very much a hybrid of Chinese culture and British traditions and schools enjoy the best of both worlds.
Hong Kong-China moved into universal 6-year primary education in 1970, compulsory 9-year education in 1979, and free 11-year education in 2000. There is a small but strong vocational education component, under the Vocational Training Council, catering to post-compulsory as well as post-secondary young people. Attendance in secondary education is universal. Higher education remained elite until the 1960s. There was only one university, the University of Hong Kong-China, and the enrolment ratio was only around 1%. The ratio in 2009 was around 65%, with 18% in Type A programmes, and there were seven universities, one Institute
b)
a)
Pre-School (3 years)
Primary (6 years)
Junior Secondary (3 years)
Senior Secondary (2 years)
TVET*
UniversityAssociate Degree/Higher Diploma
A-Level/University Preparation (2 years)
Non-formal/Lifelong
* Technical and Vocational Education and Training.
Source: OECD (2012i).
Pre-School (3 years)
Primary (6 years)
Junior Secondary (3 years)
Senior Secondary (3 years)
University
Associate Degree/Higher Diploma
Non-formal/Lifelong
TVET*
• Figure 4.2 •
Hong Kong-China’s education system: (a) before 2010 and (b) following reforms in 2012
4SHANGHAI AND HONG KONG-CHINA: LEARNING TO LEARN
119STRONG PERFORMERS AND SUCCESSFUL REFORMERS IN EDUCATION: LESSONS FROM PISA FOR KOREA © OECD 2014
of Education, one Open University and one private university. The enrolment in higher education is still low compared with similar cultures, where there is “oversupply” of higher education places, such as in Taiwan, China, South Korea and Japan.
There have never been many government schools in Hong Kong-China. However, from the 1950s, the government started subsidising non-government, school-sponsoring bodies (mainly churches, charitable organisations and other associations or agencies) and with them formed a public school system. Many such schools once operated under marginal conditions (such as on the rooftops of public housing), but were given land and buildings in the 1970s and 1980s. Now they enjoy state-of-the-art facilities. In brief, the Hong Kong-China government provides most of the capital cost and almost the full recurrent cost of public schools, but expects the non-government sponsoring bodies to run them. The sponsoring bodies abide by a Code of Aid, a kind of contractual agreement with the government.
School quality varies, as is evident in the PISA findings in various years. There are attempts to provide the better schools with a “direct subsidy”, which is the same amount as given to other public schools, but direct subsidy schools are given more autonomy in spending, fee-charging and admissions. The direct subsidy schools are similar to the US concept of charter schools, except that there is no contract about performance.
Significant autonomyThe Hong Kong-China school system provides a textbook case of how school autonomy and teacher professionalism shape a culture among schools that is conducive to effective student learning. They also illustrate the kinds of challenges and problems that can arise from such an approach.
Over recent decades, Hong Kong-China has developed a culture of “school-based” orientation, which gives schools substantial autonomy over governance, curriculum design, appointment of principals and teachers, and the admission and graduation of students. In the past two decades there have been further changes to the system, so that administrative inspections (by inspectors) have been replaced by periodic reviews (by peers); approval of curricula is no longer required by law; and political censorship has been removed from the law. This has been further reinforced in recent years by making school governance boards legal entities.
Hong Kong-China’s school system has always cherished its freedom and autonomy. The school-based culture and orientation are the major impetus for the energetic and diverse innovations that take place in Hong Kong-China schools. Despite the traditional culture of conformity and the pressure of a uniform examination system, few schools in Hong Kong-China look alike, and this trend is growing with the new reforms. The autonomy of schools has provided fertile ground for teachers to develop their professional self-esteem and self-motivation for continuous and voluntary renewal and improvements. However, the flip-side is that teachers complain about being bogged down by administrative chores and meetings that would be unnecessary in a centralised system with standard procedures. In addition, disparity grows with diversity. The culture and the system do not allow easy government intervention, such as in handling poor performing schools. There is never an expectation that the government would directly interfere in a school’s affairs.
Hong Kong-China still has quite a few elite schools whose graduates are favoured candidates for admission to the best universities in the world. It is notable that such students are not necessarily from wealthy families. Hong Kong-China strongly exemplifies the Chinese belief that young people achieve because of hard work, regardless of family background. However, its schools are not only strong in academic achievements; often they are also champions in sports and music. Many graduates of these schools have become leaders in higher education, mainly because of their training in self-governance in student organisations at schools. The Hong Kong-China schools breed leaders.
Private schools, many of them for-profit, mushroomed in the 1970s in response to the shortage of school places. Such schools tended to offer low-quality education and as a result gradually disappeared during the 1980s because of expansion in the public sector. Since the turn of the century, however, a new breed of elite private schools has been established as international schools, though admitting mainly local students.
Hong Kong-China’s schools have not always been so successful, however. The section which follows charts the reforms that have led to this strong situation in which the city find itself today.
The drive for reformIn the late 1990s the discourse in Hong Kong-China shifted from one of expansion to one of “what should education offer”. The comprehensive education reform that began in 1999 emerged at a time of widespread dissatisfaction with the education system. Parents were not satisfied with the education schools were providing and many children were doing homework until almost midnight, and most of what they did was little more than regurgitation. They subjected their children, unwillingly, to tough competition in order to move to better schools. Those who could afford it sent their children to the international schools that were more liberal in their philosophies and where children seemed happier. Teachers in turn were dissatisfied with their students,
4SHANGHAI AND HONG KONG-CHINA: LEARNING TO LEARN
120 © OECD 2014 STRONG PERFORMERS AND SUCCESSFUL REFORMERS IN EDUCATION: LESSONS FROM PISA FOR KOREA
thinking standards and motivation were declining. Employers were also dissatisfied with the quality and calibre of graduates from local institutions, finding them less prepared to engage in an increasingly complex workplace. They were starting to recruit returnees from overseas.
In hindsight, this dissatisfaction can be explained by a few crucial factors. First, schools were unprepared for an intake that suddenly changed from a select few to almost everybody. The system now had greater student “mixability”, but teachers still maintained approaches generally used for teaching the elite, in which only the capable students would benefit and the slower students were abandoned. Second, the sense of responsibility changed following the introduction of compulsory education. Students had been blamed for performing poorly in schools they had struggled to enter. When education became compulsory, blame was laid on schools and teachers, for not helping students to achieve. Third, although there had been successful reforms in curriculum and pedagogy, the general environment still favoured a conventional curriculum and didactic teaching. This was reinforced by the highly competitive public examinations and keen selection process for higher education. Fourth, and perhaps most fundamental, employment patterns had undergone major changes. While young people with only a nine-year education could previously easily find employment as blue-collar unskilled labourers in manufacturing plants, such factories had mostly moved across the border into southern China where labour costs were much cheaper (thanks to China’s open policies). The corresponding expansion of Hong Kong-China’s service sector was accompanied by an expectation of greater knowledge in its labour force.
In sum, at the end of the 20th century, Hong Kong-China’s education system faced a multitude of structural crises, partly due to the efforts to accommodate more children and partly due to changes in society’s expectations for education. Seen from this perspective, the apparent failure of the system at that time was less a problem of government incompetence or ill-management than a demonstration of the widening gap between a rapidly changing society and the static approaches to education. The solution was not to do more and better of what schools had been doing, but to put education in a different framework. That was the starting point for Hong Kong-China’s comprehensive education reform which began in 1999 and continues today.
Matching reform to the needs of the workplaceThe reform was led by the Education Commission, the overseeing advisory body in education policies, and started with a “mobilisation phase”. Some 800 community leaders were invited to a major gathering to air their concerns. The meeting started with a presentation titled “Questioning Education”, which asked over 100 questions with no answers. Participants assumed the roles of parents, employers and corporate citizens, and expressed such anger that they fuelled the Education Committee with determination to never go back to the old ways. A subsequent campaign encouraged every school to establish a paper “tree of hope” onto which students hung tags with statements beginning, “I have a hope: Education should be …”.
The design phase followed. A document was published that asked questions about the “Aims of Education”. It described recent changes in society and proposed a list of fresh aims for education. Upon public invitation, more than 40 000 suggestions were submitted. It became a community campaign and greatly enriched the Education Commission’s understanding of how society was changing and its implications for education.
Meanwhile, as part of the learning process, the Education Commission carried out a series of innovative consultations to aid their decision making. Major professional bodies were interviewed to solicit their views. A typical example was the Society of Accountants, which suggested that the best action for a university to take towards accounting was to “not teach it”.18 Another study looked at manpower aspirations among the small and medium enterprises that were becoming the backbone of Hong Kong-China’s economy. This was a genuine learning process for the Education Commission, which was discovering that fundamental changes were occurring in society and the workplace, but that the general design for education had not kept pace.
The Education Commission also studied education reform in other systems, as well as patterns of lifelong learning in OECD countries,19 and supply and demand in the local market for lifelong learning. The commission looked at ways to retrain the newly unemployed and visited trade unions in order to understand the trends of employment in various industries.
This preparatory process brought about the following realisations:
•Society has changed and is still changing. The economy is changing so quickly and so precariously that it would be impossible and irresponsible to conceive an education system that could prepare the specific manpower needed for economic development. Instead, education should concentrate on developing individuals’ generic capacity so that they are able to face any future challenges.
•The need for a focus on “individual development” and “generic capacity” was substantiated by a new understanding of the workplace. Most of the registered companies in Hong Kong-China are small: 94% of them have fewer than 20 employees. Strict rules and procedures are no longer the norm in small work units. Combined with a growing diversity in products and services, and the customisation of production, individuals now have to tackle much more wide-ranging and complex tasks, for which specific skills are not required. Furthermore, individuals change jobs and careers with incredible frequency.

4SHANGHAI AND HONG KONG-CHINA: LEARNING TO LEARN
121STRONG PERFORMERS AND SUCCESSFUL REFORMERS IN EDUCATION: LESSONS FROM PISA FOR KOREA © OECD 2014
•In this context, preparing individuals for a particular occupation or training them in a particular skill will not ensure a sustained and healthy working life. There is ample evidence that an increasingly large percentage of university graduates go for jobs unrelated to their study. Rather than seeing this as “waste”, employers look for rich generic capacities in their recruits that can support the multiple and varying tasks they are expected to do. These generic capacities include effective communication skills, good human relations, willingness and capability to learn, senses of responsibility, ability for self-management, preparedness for risks and unplanned challenges, and creativity and innovation. Less explicit in these expectations is the importance of integrity. Individuals are now, more than ever, exposed to ethical decisions and moral dilemmas, which they would have previously been shielded from by bureaucratic protocols in huge industrial set-ups.
The move towards learningThe Education Commission’s first response was to set education targets for individuals to become “happy to learn, effective in communications, ready to commit, bold at innovations”. The adoption of individual development as the starting point for reform represented a paradigm shift in education policies. There has always been a dichotomy between national development and economic needs on the one hand, and individual needs and personal growth on the other. In a collective culture, policy thinking is often tilted towards national and economic needs. However, the paradigm shift is less a matter of submitting to the ideology of individualism, than a pragmatic consideration of how education can realistically contribute to societal advancement, including economic growth.
The decision makers became convinced that education is about learning, and that learning is a matter of experience, not transmission of knowledge. In 2001, a crucial reform document was published – Learning to Learn (Curriculum Development Institute, 2001). The title carries two major messages: the change of focus from “teaching” to “learning”, and a new emphasis on the process of learning rather than memorising facts. This document, still the basic reference for the entire reform effort, was informed by the contemporary theories of learning. In layman’s language, these theories hold that:20
•Learning is the active construction of knowledge by the learner.
•Learning is a process, achieved through activities called learning experiences.
•Similar experiences may lead to the construction of different kinds of knowledge, i.e. people learn differently.
•Learning is for understanding.
•Understanding is demonstrated by the effective application of the knowledge thus constructed.
•Effective learning experiences often require integration of knowledge.
•Learning is therefore best in real-life experiences with actual effects.
•Learning is also a social action, best achieved in groups.
The reform exercise in Hong Kong-China incorporates the main theories about learning, rather than committing itself to any particular school of “constructivism”. However, it is very much underpinned by the notion of constructive learning.
In 2001, as a major step in the reform, public assessments after primary schooling were abolished with immediate effect. This caused some confusion among school principals and teachers, who had to seek new frames of reference. However, the move has proved critical to primary schools, allowing teachers to develop more relevant school-based learning activities and changing the general discourse in primary schools from one of examinations and drills to one of learning. As a result, in less than a decade, secondary schools are seeing more active learners coming out of primary schools. Student reading literacy has improved according to international assessments. For example, in PIRLS (Progress in International Reading Literacy Study), Hong Kong-China’s primary schoolchildren’s reading literacy performance was elevated from 14th in 2001 to 2nd in 2006 in the international rankings (Mullis
Table 4.2 Hong Kong-China’s mean scores on reading, mathematics and science scales in PISA
PISA 2000 PISA 2003 PISA 2006 PISA 2009Mean score Mean score Mean score Mean score
Reading 525 510 536 533
Mathematics 550 547 555
Science 542 549
Source: OECD (2012).
4SHANGHAI AND HONG KONG-CHINA: LEARNING TO LEARN
122 © OECD 2014 STRONG PERFORMERS AND SUCCESSFUL REFORMERS IN EDUCATION: LESSONS FROM PISA FOR KOREA
et al., 2006). At the secondary school level, PISA measures for 15-year-olds show fairly consistent and high results across the three skills tested, including reading (Table 4.2; OECD, 2010).
The impact of the reform on secondary schools and higher educationAlthough the curriculum changes occurred at all levels, the consequences have been most noticeable at senior secondary level:
•The secondary school curriculum is now designed according to what learning experiences students need, rather than being guided by manpower needs in the economy.
•The curriculum is decided in secondary schools before seeking endorsement from universities. The latter’s concern is to select the best students, while the curriculum reform aims for lifelong benefits for all students.
•The curriculum is framed around eight “key learning areas”, rather than subjects: Chinese language, English language, mathematics, science and technology, social science and humanities, sports and arts, applied learning (to allow students to gain real-life workplace experience) and other learning experiences, including service learning, workplace visits and overseas experience. The latter two are new to both teachers and schools.
Following a long process of negotiation with higher education institutions, a compromise was reached in which secondary school students going on to university are expected to perform in four areas: Chinese, English, mathematics, and a new subject called liberal studies (Box 4.5). Institutions and programmes may also ask for one other “subject”. This reflects a change among higher education institutions: previously they had based their student selections on the number of subjects studied, as if that would guarantee better academic performance; now they understand the benefit of requiring fewer subjects, but broader learning experiences.
In higher education, the focus now is how to make the best use of the additional year in the new system (Figure 4.2b). Almost
all institutions have decided not to extend specialised studies to the additional year but to offer alternative learning experiences, following the spirit of the reform in secondary curricula. Such alternative learning experiences include a new common core curriculum, all kinds of experiential learning and expansion of overseas exchanges.
It is conceivable that after 2012, the higher education scene will be very different. After years of discussion and design, the New Senior Secondary (NSS) curriculum was launched towards the end of 2009 in anticipation of a new public examination in 2012, when university entrance requirements will change accordingly. As this chapter is being written, both secondary and higher education institutions are busy preparing for the change.
Critical to the reform is construction of a new assessment system to facilitate the changes in curriculum and pedagogy. This is underway, and faces the dual task of reflecting the new philosophy of learning and gaining international recognition for university admissions.
Key factors in managing the reformThe Hong Kong-China education reform has benefited from a long lead time, well-designed preparations and good perception management:
•From 2005, four years before implementation of the new curriculum, the government organised meticulous activities to prepare schools. These included whole-day information “retreats” covering all the schools, and middle managers, such as subject
Box 4.5 Liberal studies for critical thinking and innovation
The new subject of liberal studies has introduced a new area of assessment in secondary education in Hong Kong-China. It involves a learning experience with timetabled slots but no syllabus – only broad topics. Assessment is meant to be flexible. In effect, teachers allow students to design their own learning schemes in which they rely mostly on current affairs and non-textbook information, and develop high-order or critical thinking. This includes asking sensible questions; finding directions for analysis, synthesis and conceptualisation; and proposing hypotheses or theories. Higher education institutions have agreed to take liberal studies as a necessary subject for admissions. That has given some weight to the programme. The freedom of design had caused some confusion among teachers, but is now gradually understood as an opportunity to exercise their professional discretion, and to indeed open students’ minds for independent and critical thinking. Nonetheless, since it is a new approach to learning, its design has taken a lot of energy among teachers.
4SHANGHAI AND HONG KONG-CHINA: LEARNING TO LEARN
123STRONG PERFORMERS AND SUCCESSFUL REFORMERS IN EDUCATION: LESSONS FROM PISA FOR KOREA © OECD 2014
department heads. These eased schools into the changes, allowed them to develop ownership of the reforms, and minimised unnecessary resistance during the long reform process. This was essential given that the increased workload and disturbance for schools were by no means trivial. The bulk of preparation for the reform stayed with the schools. The reform could be seen as a combination of centralised design, school-based implementation and professional support.
•The media has been involved in the entire process, with seminars held for reporters on the fundamental principles of the reform philosophy and constant interactions with chief editors.
•The public’s focus has been kept on societal change and the need for student learning through documents, sustained discussions, seminars and conferences.
However, there is no uniform model of reform implementation for schools. Indeed, its very core was respect for individual needs, and hence the evolution of schools into more autonomous entities. Under the general theme, and with the pulling force of the public and university entrance exams, schools have developed rather diverse approaches to implementing the reform. Nonetheless, because of the change led by the reform, schools across the board have developed their own mechanisms of collective decision making and division of labour which respect their individual school cultures.
Achievements and challenges The Hong Kong-China education system has been reformed several times, but people tended to shun the word “reform” until the most recent overhaul. Overall, the Hong Kong-China government is known for its philosophy of “positive non-intervention”, although that has often been challenged in recent years. In the two decades after the war, the Hong Kong-China government did not intervene in the school system beyond providing subsidies. Even in later years, when government action in developing and reforming education became significant, the general understanding remained that government intervention should be minimal. This philosophy could be called the “governmentality” of Hong Kong-China, to use Foucault’s term.21 This is fundamentally different from other jurisdictions where governments see themselves as the comprehensive controllers of all things happening in schools.
The net result of this philosophy of non-intervention is to provide schools ample room for professional judgement and professional decisions on how to educate students in their respective schools. It could be seen as a empowerment of the teaching profession, but in the professional rather than political sense. However, it is also a challenge because it means great disparity among Hong Kong-China’s schools. Another consequence is that unlike practices in Shanghai and Singapore, where weaker schools are identified and measures taken to strengthen them, Hong Kong-China is reluctant even to rank schools. The result has been that some public schools receive standard public funding yet deliver sub-standard educational services. Parents see this as unfair. Changing the situation may not be straightforward, however, because it will mean allowing the government to actively intervene.
Nevertheless, Hong Kong-China’s comprehensive reform is succeeding because of its strong rationale: fundamental change in society requires new ways of looking at human learning. The reform challenges the very basics of student learning and how such learning can best be achieved.
LESSONS FROM SHANGHAI AND HONG KONG-CHINAShanghai and Hong Kong-China represent two different approaches to education, which makes it worth looking at them separately. Yet despite the differences, the students of both cities consistently perform well in international comparisons, as the PISA results testify. It is interesting to compare some of the common features of the two cities: they share a cultural heritage that treasures education, yet their students suffer from tremendous examination pressure. They share a colonial past, although colonial rule in Hong Kong-China lasted much longer. Both are major metropolitan centres in China, and indeed in Asia, and both prosper because of the vibrant cultures produced by highly-educated citizens.
While both cities launched major reforms more or less at the same time, they have followed very different development paths over the past six decades. Shanghai became a major industrial centre under the government of the People’s Republic, and later, at the opening of China, saw remarkable development in the service sector. Before 1997, Hong Kong-China remained outside China, and hence was relatively immune from its political fluctuations. It still hosts the country’s freest market and has become the centre of finance and management for the whole of Asia.
Shanghai belongs to an organised society and approached education reform in an organised way. It would be inaccurate to describe the Shanghai reform as top-down, because unmistakable and remarkable initiatives emerged from the grassroots. However, the municipal government not only designed the reform but also intervened in the process, such as by running schools and improving teaching.
Hong Kong-China has adopted almost the opposite approach. Its provides schools with a platform, supports them with resources and modifies the public examination as well as university admissions, but leaves the process of reform to the schools. Teachers may
4SHANGHAI AND HONG KONG-CHINA: LEARNING TO LEARN
124 © OECD 2014 STRONG PERFORMERS AND SUCCESSFUL REFORMERS IN EDUCATION: LESSONS FROM PISA FOR KOREA
have found this challenging because changes in the curriculum and examinations have upset their familiar habits. But the reform has pushed schools and teachers to take a professional stand, exercise autonomy and adapt the changes to best fit their respective student bodies.
Building legitimacyBoth Shanghai and Hong Kong-China aim high in their educational ambitions. They both use moralistic statements and slogans to guide their reforms. In the 1990s, Shanghai used the slogan of “first class city, first class education”. Although vague, the concept has driven the development of education and kept education high on the policy agenda.
Hong Kong-China has always felt insecure in international competitions, and much of its competitive edge is being challenged by mainland China and by other jurisdictions in the vicinity, such as Singapore, Malaysia, and even Macao. Hong Kong-China has identified “six pillars” for its further development, and building an “education hub” is one of them.22
The sustained emphasis on education carried in these statements attracts the attention and support of the entire society. It underpins the allocation of substantial government resources to education and helps mobilise community resources. And as good education cannot be achieved only by teachers, the statement is an appeal to support from all parts of society. In other words, a consistent continuous movement creates and reinforces the legitimacy of educational development (Box 4.6).
However, legitimacy means very different things in other societies and systems. There are diverse ways that governments can build and enhance the legitimacy of their policies. While the approaches in Shanghai and Hong Kong-China may not apply to other societies, the attention they give to building legitimacy for education is of crucial importance.
Breaking away from traditionIt is difficult to say which of the factors behind these cities’ successes are due to cultural heritage and which are due to policy interventions and practices. They are intertwined. However, in both Shanghai and Hong Kong-China, cultural traditions involving education, such as the emphasis on exams, were perceived as impediments to modernisation, to the move from elite to mass education, from emphasis on teaching to emphasis on learning, from fact memorisation to development of learning capacities, and from economic to individual needs. In both cities, the change in the nature and orientation of the entire education system has involved a struggle against culture and tradition.
This has also been the experience in Singapore (Chapter 5), which started its comprehensive education reforms in the late 1990s, and was also the intention of the reforms in Japan and South Korea23 in the mid-1980s. The degrees of success in these reforms vary, but intolerance of the ill effects of cultural heritage was a common factor.
Root and branch reform versus superficial improvementThese cases demonstrate that reform is much more than simply improvement. “Improvement” means doing what the system has been doing all along, but better. “Reform” involves paradigm shifts. In other words, it entails an awareness that further development of education is not only a matter of remedying perceived shortcomings; it means tackling more fundamental issues to allow education to catch up with changes in society. Without such an understanding, any “improvement” of the system and practices
Box 4.6 Building support for the latest reforms
China’s Outline of the Medium and Long Term Plan for Development and Reform of Education (Ministry of Education of the PRC, 2010b) is a blueprint for education in 2020 and perhaps beyond. The initial “consultation” draft, published in February 2010, took more than 18 months to produce. The process involved thousands of professionals and experts and more than 23 000 seminars and forums for brainstorming, and was accompanied by technical reports totalling more than five million words. It received 2.1 million submissions from all walks of society.
After the consultation draft launch in February, further discussion and revisions included provisional plans for interpretation and implementation. The exercise was chaired by Prime Minister Wen Jiabao and went through the State Council and then received endorsement from the Central Committee of the Chinese Communist Party and eventually the Politbureau, just to make sure of its high priority in the political arena. Such a strong effort in legitimacy-building is unusual, but will guarantee that the educational reform movement will carry huge momentum.
4SHANGHAI AND HONG KONG-CHINA: LEARNING TO LEARN
125STRONG PERFORMERS AND SUCCESSFUL REFORMERS IN EDUCATION: LESSONS FROM PISA FOR KOREA © OECD 2014
only reinforces what might have gone wrong. This is perhaps the problem with education policies in many other systems. Often, there is more worry about students’ under-performance in such areas as language and mathematics than concern that the entire curriculum and pedagogy might be obsolete. Any improvement without reform would mean the repetition and reinforcement of obsolete approaches to education.
A focus on learning A key factor behind the good performance of the two cities’ systems is that they took learning as the core concern in their educational reforms. It might sound odd that educators and policy makers must sometimes be reminded that learning should be the core business of education. However, reforms in some other systems emphasise systemic planning or finance, school management or accountability, without actually looking at the causes, environments and processes of student learning. It is easy to forget that structure, policy, standards, finance and so on make no difference at all unless they affect what and how students ultimately learn. In this sense, both systems are to be congratulated for moving away from the tradition in which education based on examination preparation is reaffirmed without actually understanding the process of learning.
In a typical industrial society, the prime function of education was to prepare manpower and provide the relevant credentials. Once in the workplace, individuals were protected by orders, procedures, rules and regulations, regardless of their personal knowledge and characteristics. This function is now diminishing as the pyramidal structure is being replaced by small work units where individuals have to directly face clients, solve problems, design products or solutions, endure risks and face moral and ethical dilemmas. It is notable that in both Shanghai and Hong Kong-China, the attention to learning is not so much a matter of puritan educational ideals but rather an awakening to the future needs of society. Attention to social change and attention to learning are two sides of the same coin.
Equally, both systems have made tremendous efforts to understand human learning. These include: a community of scholars concentrating on the “sciences of learning”; a framework based on learning that shapes the curriculum; professional discussions among educators in the form of debates, seminars, forums, conferences and experiments, where theories of learning are interpreted and translated into grassroots practices; effective methods of dissemination, such as slogans in Shanghai, among grassroots teachers; and perception management to convince parents and the media of the value of the changes. All these efforts have to be strategically co-ordinated and synchronised, which requires champions who are committed to the concepts.
One issue that merits special attention is the usual confusion of student learning with teaching or instruction. It is true that good teaching is a necessary condition of good learning. However, there is ample evidence that a lot of learning occurs outside teaching, with no teaching, or with minimal teaching. The appeal in Singapore (Chapter 5) to “Teach less, learn more” has much resonance in Shanghai and Hong Kong-China, where the net effect of education reform is often evidenced by active and independent learning by students. Shanghai’s powerful slogan: “return the time to students” has changed the classroom scene. In Hong Kong-China, the best schools are characterised by strong student self-governance, rather than the highest scores.
A holistic approachEducation reforms in the two cities do not concentrate only on certain aspects of education; they involve developing the student as a whole. Students’ academic achievements are not separate from the other aspects of their personal development. Extra-curricular experiences, for example, are treated in both systems as essential elements in students’ comprehensive learning experiences and their holistic development.
The reforms also try to mobilise all sectors of society and are seen as an undertaking that concerns everyone. Both societies positioned education as a core element in the city’s future. Hence, the reforms not only received priority consideration on the governments’ agenda, but all sectors of society were expected to participate and give support.
Accountability The term accountability, sometimes known as quality assurance, is pervasive in the literature on education policies. However, often people may assume that the existence of quality assurance procedures is an assurance of quality. This may not be true at all. First, as noted above, defining quality and the standards we expect should precede methods for assuring this quality. In other words, if we set low quality standards, any quality-assurance mechanism will only assure low quality. Second, quality assurance only works in a culture that has internalised high quality as a norm. This is the only way that there will be active efforts towards and understanding of quality across the board.
Shanghai and Hong Kong-China both have social norms that value quality in education. First, both have systems of quality assurance in the managerial sense. There is no shortage of performance indicators and appraisal mechanisms. Second, both education systems are basically transparent. While parents in these societies are not used to intervening in school activities as they do in many Western societies, they do have a very powerful influence over schools, either through their choice of schools
4SHANGHAI AND HONG KONG-CHINA: LEARNING TO LEARN
126 © OECD 2014 STRONG PERFORMERS AND SUCCESSFUL REFORMERS IN EDUCATION: LESSONS FROM PISA FOR KOREA
or through the media, which run constant reports comparing schools. The vibrant cyber-community has added to the tremendous pressures on schools to maintain a high quality of education. In Shanghai, schools and parents have very close relations, and information flows both ways on cell phones.
Principals and teachers therefore face a daily struggle to balance administrative accountability, client accountability and professional accountability. Dealing with the larger environment is not seen as an extra chore but as an integral part of professional responsibilities. This sense of accountability is built into programmes of teacher preparation, teachers’ continuing professional development and training for school leadership. Hence, unlike in other cultures, accountability in Shanghai and Hong Kong-China is not regarded as a separate machinery to assure quality. Instead, accountability is built into the system as social expectations, as fundamental in school leadership, as well as an essential part of teachers’ professionalism. It is not about procedures and indicators.
FINAL OBSERVATIONS: EDUCATION FOR ECONOMIC SUCCESSChina entered the global economy very late in the game, but has been making breakneck progress ever since. Both Hong Kong-China and Shanghai aim high and aspire to perform well in many areas of social development. Their ambitions are augmented by their prospering economic and financial sectors. Both societies also regard human resources as the only resources they can rely on, and hence they have made substantial investments in education. This is a virtuous circle. Their spectacular reforms in education have made possible a no less spectacular economic success, which has in turn made it possible to continue to ratchet up the quality of their education systems. Their cultural heritage has played an important role in these successes, but that heritage has been constantly modernised.
In all these ways, the experience in the two cities reflects the kind of reform in education that appears to be necessary and essential worldwide as the economy advances.
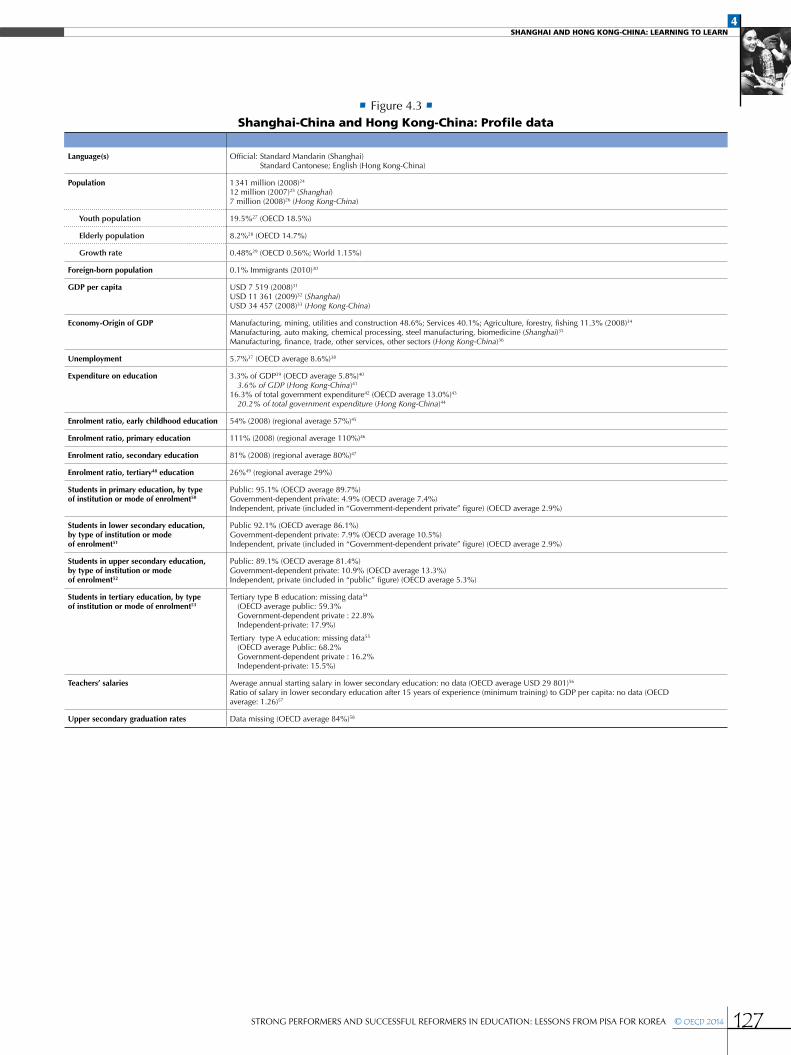
4SHANGHAI AND HONG KONG-CHINA: LEARNING TO LEARN
127STRONG PERFORMERS AND SUCCESSFUL REFORMERS IN EDUCATION: LESSONS FROM PISA FOR KOREA © OECD 2014
• Figure 4.3 •Shanghai-China and Hong Kong-China: Profile data
Language(s) Official: Standard Mandarin (Shanghai) Standard Cantonese; English (Hong Kong-China)
Population 1 341 million (2008)24
12 million (2007)25 (Shanghai)7 million (2008)26 (Hong Kong-China)
Youth population 19.5%27 (OECD 18.5%)
Elderly population 8.2%28 (OECD 14.7%)
Growth rate 0.48%29 (OECD 0.56%; World 1.15%)
Foreign-born population 0.1% Immigrants (2010)30
GDP per capita USD 7 519 (2008)31 USD 11 361 (2009)32 (Shanghai)USD 34 457 (2008)33 (Hong Kong-China)
Economy-Origin of GDP Manufacturing, mining, utilities and construction 48.6%; Services 40.1%; Agriculture, forestry, fishing 11.3% (2008)34
Manufacturing, auto making, chemical processing, steel manufacturing, biomedicine (Shanghai)35
Manufacturing, finance, trade, other services, other sectors (Hong Kong-China)36
Unemployment 5.7%37 (OECD average 8.6%)38
Expenditure on education 3.3% of GDP39 (OECD average 5.8%)40
3.6% of GDP (Hong Kong-China)41
16.3% of total government expenditure42 (OECD average 13.0%)43
20.2% of total government expenditure (Hong Kong-China)44
Enrolment ratio, early childhood education 54% (2008) (regional average 57%)45
Enrolment ratio, primary education 111% (2008) (regional average 110%)46
Enrolment ratio, secondary education 81% (2008) (regional average 80%)47
Enrolment ratio, tertiary48 education 26%49 (regional average 29%)
Students in primary education, by type of institution or mode of enrolment50
Public: 95.1% (OECD average 89.7%) Government-dependent private: 4.9% (OECD average 7.4%)Independent, private (included in “Government-dependent private” figure) (OECD average 2.9%)
Students in lower secondary education, by type of institution or mode of enrolment51
Public 92.1% (OECD average 86.1%)Government-dependent private: 7.9% (OECD average 10.5%)Independent, private (included in “Government-dependent private” figure) (OECD average 2.9%)
Students in upper secondary education, by type of institution or mode of enrolment52
Public: 89.1% (OECD average 81.4%)Government-dependent private: 10.9% (OECD average 13.3%)Independent, private (included in “public” figure) (OECD average 5.3%)
Students in tertiary education, by type of institution or mode of enrolment53
Tertiary type B education: missing data54
(OECD average public: 59.3%Government-dependent private : 22.8%Independent-private: 17.9%)
Tertiary type A education: missing data55
(OECD average Public: 68.2%Government-dependent private : 16.2%Independent-private: 15.5%)
Teachers’ salaries
Average annual starting salary in lower secondary education: no data (OECD average USD 29 801)56
Ratio of salary in lower secondary education after 15 years of experience (minimum training) to GDP per capita: no data (OECD average: 1.26)57
Upper secondary graduation rates Data missing (OECD average 84%)58
4SHANGHAI AND HONG KONG-CHINA: LEARNING TO LEARN
128 © OECD 2014 STRONG PERFORMERS AND SUCCESSFUL REFORMERS IN EDUCATION: LESSONS FROM PISA FOR KOREA
Notes
1. In this chapter we use the term “Confucius society” as a convenient shorthand for an array of jurisdictions: Japan, South Korea, North Korea, Vietnam and the Chinese communities (Mainland China, Taiwan, Hong Kong-China, Macao). While Singapore shares the same cultural heritage, it is also influenced by the Malay and Indian cultures. See more detailed discussions in Cheng (2011).
2. Researchers have found that the oldest candidate was 104.
3. In most dynasties, women were excluded from the exercise.
4. Gross enrolment ratio is used here because of age staggering at that level.
5. See more detailed discussion in Yang 2004.
6. This was due to the Nanking Sino-British Treaty of 1842, after China’s defeat in the Opium War.
7. This is comparable with South Korea and Japan, where the number of places in higher education exceeds the number of high school graduates.
8. Institutes in Shanghai belong to different categories in terms of their relations with the central and municipal governments, with different degrees of sponsorship from the two authorities. Accordingly, they are assigned admission quotas of different mixes between local and national candidates.
9. The best presentation of this cultural assumption is by Fei Hsiao-tung, a student of Malinovsky and the first renowned anthropologist in China. According to Fei, society is perceived by the Chinese in a “hierarchical configuration” that is vertical and structured, as opposed to the Western view of society as an “association configuration” that is flat and ad hoc. This was best presented in the lecture series Earthbound China (1947).
10. The curriculum reform reduced a class period to 35 minutes for primary school and 40 minutes for secondary school in Shanghai. In most of the other provinces in China, a class period is 40 minutes for primary school and 45 minutes for secondary school (Ding, 2010).
11. The following three sections are extracted and modified from a commissioned paper by Ding (2010).
12. See http://wljy.sherc.net/kgpt/
13. This is a policy started in 2002, widely quoted. One of the most recent discussions can be found in Shao, 2010.
14. These are extracted and modified from Ding (2010).
15. Data from a group interview with good public school leaders.
16. This is from an interview with Mr Gu Lingyuan, a nationally famous mathematics teacher turned researcher, who is influential in education reforms in Shanghai.
17. For example, it is 7th according to the International Monetary Fund (Economy Watch (2010). Data: Economic Statistics Database).
18. The Society of Accountants’ representative made the point that what had been taught in universities was not useful in the workplace, and hence graduates have to unlearn what they have learned. They’d rather they were not taught accounting, which they could learn on-the-job in a matter of months. The interview was carried out in 2000.
19. Including a special session with Dr Albert Tuijmann, then member of the OECD education team, in June 2000.
20. For the best summaries of these theories see Sawyer (2006) and Bransford et al (2000).
21. This is a concept development by Foucault in his later years. A brief introduction to the concept can be found in www.policyaddress.gov.hk/08-09/eng/policy.html
22. This is one of the main themes of the Chief Executive’s Policy Speech in 2009 (Tsang, 2009).
23. South Korea launched a few reforms in the 1980s which went against the elitist tradition of calling for equalisation of secondary schools and mass admission to higher education. See Cheng 2010.
24. OECD (2012), OECD Factbook 2011-2012, OECD Publishing.
25. OECD (2010b), OECD Economic Surveys: China 2010, OECD Publishing. Non-agricultural and total inhabitants (year of reference – 2007).
26. World Bank, World Development Indicators.
27. OECD (2012), OECD Factbook 2011-2012, OECD Publishing. Ratio of population aged less than 15 to the total population. (data from 2010).
28. OECD (2012), OECD Factbook 2011-2012, OECD Publishing. Ratio of population aged 65 and older to the total population. (data from 2010).
29. OECD (2012), OECD Factbook 2011-2012, OECD Publishing. Annual population growth rate. (data from 2009).
4SHANGHAI AND HONG KONG-CHINA: LEARNING TO LEARN
129STRONG PERFORMERS AND SUCCESSFUL REFORMERS IN EDUCATION: LESSONS FROM PISA FOR KOREA © OECD 2014
30. China is a sending country, with an estimated diaspora of 35 million worldwide (International Organisation for Migration, www.iom.int).
31. OECD (2012), OECD Factbook 2011-2012, OECD Publishing. Current prices and PPP. (data from 2010).
32. National Bureau of Statistics of China, www.stats.gov.cn/english/.
33. In current US dollars, derived from World Bank national accounts data, and OECD National Accounts data files. World Bank, World Development Indicators.
34. OECD (2010), OECD Economic Surveys: China 2010, OECD Publishing. Percentage of GDP 2008.
35. Shanghai municipal government.
36. Hong Kong Census and Statistics Department, www.censtatd.gov.hk.
37. OECD (2010), Employment Outlook 2010, OECD Publishing. Measured as a percentage of the estimated urban non-agricultural labour force (data from 2008).
38. OECD (2012), OECD Factbook 2011-2012, OECD Publishing. Total unemployment rates as percentage of total labour force (data from 2008).
39. OECD (2011), Education at a Glance 2011: OECD Indicators, OECD Publishing (year of reference – 2007).
40. OECD (2012), Education at a Glance 2012, OECD Publishing. Year of reference 2009.
41. UNESCO-UIS (UNESCO Institute for Statistics) (2011), Statistics in Brief: Hong Kong-China SAR. Year of reference 2010.
42. OECD (2011), Education at a Glance 2011, OECD Publishing. Year of reference 2008.
43. OECD (2012), Education at a Glance 2012, OECD Publishing. Year of reference 2009.
44. UNESCO-UIS (UNESCO Institute for Statistics) (2011), Statistics in Brief: Hong Kong-China SAR. Year of reference 2010.
45. UNESCO-UIS (UNESCO Institute for Statistics) (2011), UIS Statistics in Brief: China. Percentage represents gross enrolment rate for MF; Year of reference 2010.
46. UNESCO-UIS (UNESCO Institute for Statistics) (2011), UIS Statistics in Brief: China. Percentage represents gross enrolment rate for MF; Year of reference 2010.
47. UNESCO-UIS (UNESCO Institute for Statistics) (2011), UIS Statistics in Brief: China. Percentage represents gross enrolment rate for MF; Year of reference 2010.
48. The OECD follows standard international conventions in using the term “tertiary education” to refer to all post-secondary programmes at ISCED levels 5B, 5A and 6, regardless of the institutions in which they are offered. OECD (2008), Tertiary Education for the Knowledge Society: Volume 1, OECD Publishing.
49. UNESCO-UIS (UNESCO Institute for Statistics) (2011), UIS Statistics in Brief: China. Percentage represents gross enrolment rate for MF; Year of reference 2010.
50. Data from UNESCO Institute for Statistics, Data from 2010, cited in OECD (2012) Education at a Glance 2012, OECD Publishing.
51. Data from UNESCO Institute for Statistics, Data from 2010, cited in OECD (2012) Education at a Glance 2012, OECD Publishing.
52. Data from UNESCO Institute for Statistics, Data from 2010, cited in OECD (2012) Education at a Glance 2012, OECD Publishing.
53. Data from UNESCO Institute for Statistics, Data from 2010, cited in OECD (2012) Education at a Glance 2012, OECD Publishing.
54. Data missing from Education at a Glance 2012, OECD Publishing. (OECD, 2012).
55. Data missing from Education at a Glance 2012, OECD Publishing. (OECD, 2012).
56. OECD (2012), Education at a Glance 2012, OECD Publishing. Starting salary/minimum training in public institutions in USD adjusted for PPP. OECD Publishing.
57. OECD (2012), Education at a Glance 2012, OECD Publishing. Starting salary/minimum training in public institutions in USD adjusted for PPP. OECD Publishing.
58. OECD (2012), Education at a Glance 2012, OECD Publishing. Sum of upper secondary graduatation rates for a single year of age (Year of reference for OECD average 2010).
4SHANGHAI AND HONG KONG-CHINA: LEARNING TO LEARN
130 © OECD 2014 STRONG PERFORMERS AND SUCCESSFUL REFORMERS IN EDUCATION: LESSONS FROM PISA FOR KOREA
References and further reading
Altbach, P.G., L. Reisberg, and L.E. Rumbley (2009), “Trends in global higher education: Tracking an academic revolution”, a report prepared for the UNESCO 2009 World Conference on Higher Education, UNESCO, Paris.
Bransford, J.D. (ed.) (2000), How People Learn: Brain, Mind, Experience, and School, National Academy Press, Washington, DC.
Bray, M. (2009), Confronting the Shadow Education System: What Government Policies for What Private Tutoring? UNESCO/International Institute for Educational Planning, Paris.
Census and Statistics Department of Hong Kong (2010a), 2009 Economic Background and 2010 Prospects.
Census and Statistics Department of Hong Kong (2010b), Hong Kong Annual Digest of Statistics.
Census and Statistics Department of Hong Kong (2010c), Hong Kong Population Projections 2010-2039.
Cheng, K.M. (1987), The Concept of Legitimacy in Educational Policy-making: Alternative Explanations of Two Policy Episodes in Hong Kong, PhD Thesis, University of London Institute of Education, London.
Cheng, K.M. (1996), The Quality of Primary Education: A Case Study Of Zhejiang Province, China, UNESCO/International Institute for Educational Planning, Paris.
Cheng, K.M. (1997), “The Meaning of Decentralisation: Looking at the Case of China”, in W.K. Cummings & N.F. McGinn (eds.), International Handbook of Education and Development: Preparing Schools, Students And Nations For The Twenty-first Century, Pergamon, Oxford.
Cheng K.M. (2000), “Education and Development: The Neglected Dimension of Cross-Cultural Studies”, in R. Alexander, M. Osborn and D. Philips (eds.), Learning From Comparing: New Directions in Comparative Educational Research, Vol 2: Policy, Professionals and Development, Symposium Books, Oxford, pp. 81-92.
Cheng, K.M. (2004), “Turning a Bad Master into a Good Servant: Reforming Learning in China”, in I. Rotberg (ed.), Balancing Change and Tradition in Global Education Reform, Scarecrow Education, Washington, DC.
Cheng, K.M. (2007), “Reforming Education Beyond Education”, in Y.M. Yeung (ed.), The First Decade of the HKSAR, The Chinese University Press, z, pp. 251-72.
Cheng, K.M. (2010), “Developing education beyond manpower”, in UNDP (2010), Capacity is Development, UNDP, New York, available at www.capacityisdevelopment.org/doccs/capdev_research/Developing%20Education%20Beyond%20Manpower.pdf
Cheng, K.M. (2011), “Confucius education”, in J. Banks (ed) Encyclopedia of Diversity, Sage, Thousand Oaks.
Cheng, K.M. and H.K. Yip (2007), “Facing the Knowledge Society: Reforming Secondary Education in Shanghai and Hong Kong”, working paper, World Bank, Washington, DC.
Curriculum Development Institute (2001), Learning to Learn: The Way Forward in Curriculum, Curriculum Development Institute, Hong Kong-China, available at www.edb.gov.hk/index.aspx?langno=1&nodeID=2365.
Ding, X. (2010), “Educational Reform and Development in Shanghai”, paper commissioned by the Shanghai Academy of Education Research for this study.
Elman, B.A. (2000), A Cultural History of Civil Examinations in Late Imperial China, University of California Press, Berkeley.
Fei, H.T. (1947), Xiang Tu Zhong Guo (Earth-bound China), reprinted 2006, Shanghai People’s Press, Shanghai. English translation: G.G. Hamilton, and Z Wang (1992), From the Soil: The Foundations of Chinese Society, University of California Press, Berkeley.
Hu, R. and M. Jiang (2002), “First-rate City and First-rate Education”, Shanghai Education Press, in Chinese.
Illich, I. (1971), Deschooling Society, Calder and Boyars, London.
Information Office of Shanghai Municipality and Shanghai Municipal Statistics Bureau (2010), 2010 Shanghai Basic Facts, Shanghai Literature and Art Publishing Group, Shanghai.
Ji.L. (2010), “From integration to fusion”, in Shanghai Education, 7(4A), 12-19.
Jin, Ke (2003), The Project of Standardization of Primary and Secondary Schools was Completed in Three Years and 1569 Schools were Upgraded, in Chinese, SINA, Beijing, available at http://sh.sina.com.cn/news/20030102/08432422.shtml.
Min, W. (2008), “Higher Education Financing in East Asia: Policy Implications for China”, in J.Y. Lin and B. Pleskovic (eds.), Higher Education and Development, World Bank, Washington, DC, pp.41-46.
Ministry of Education of the PRC (2001), Guidelines for Curriculum Reform in Basic Education, draft, Ministry of Education, Beijing.
Ministry of Education of the PRC (People’s Republic of China) (2010a), National Statistics of Education Development in China 2009, Ministry of Education, Beijing, available at www.moe.edu.cn/publicfiles/business/htmlfiles/moe/moe_633/201008/93763.html.
4SHANGHAI AND HONG KONG-CHINA: LEARNING TO LEARN
131STRONG PERFORMERS AND SUCCESSFUL REFORMERS IN EDUCATION: LESSONS FROM PISA FOR KOREA © OECD 2014
Ministry of Education of the PRC (2010b), National Outline for Medium and Long-Term Education Reform and Development 2010-2020, in Chinese, Ministry of Education, Beijing, www.gov.cn/jrzg/2010-07/29/content_1667143.htm
Mullis, I.V.S. et al. (2006), PIRLS 2006 International Report: IEA’s Progress in International Reading Literacy Study in Primary School in 40 Countries, International Association for the Evaluation of Educational Achievement (IEA), Boston College, Chestnut Hill, Massachusetts.
OECD (2010a), PISA 2009 Volume I, What Students Know and Can Do: Student Performance in Reading, Mathematics and Science, OECD Publishing. http://dx.doi.org/10.1787/9789264091450-en.
OECD (2010b), OECD Economic Surveys: China 2010, OECD Publishing. http://dx.doi.org/10.1787/eco_surveys-chn-2010-en.
OECD (2010c), OECD Factbook 2010, OECD Publishing. http://dx.doi.org/10.1787/factbook-2010-en.
OECD (2010d), Employment Outlook 2010, OECD Publishing. http://dx.doi.org/10.1787/empl_outlook-2010-en.
OECD (2010e), Education at a Glance 2010: OECD Indicators, OECD Publishing. http://dx.doi.org/10.1787/eag-2010-en.
OECD (2012f), OECD Factbook 2011-2012, OECD Publishing. http://dx.doi.org/10.1787/factbook-2011-en.
OECD (2011g), Education at a Glance 2011: OECD Indicators, OECD Publishing. http://dx.doi.org/10.1787/eag-2011-en.
OECD (2012h), Education at a Glance 2012: OECD Indicators, OECD Publishing. http://dx.doi.org/10.1787/eag-2012-en.
OECD (2012i), Strong Performers and Successful Reformers: Lessons from PISA for JAPAN, OECD Publishing. http://dx.doi.org/10.1787/9789264118539-en.
Sawyer, K. (ed.) (2006), The Cambridge Handbook of the Learning Sciences, Cambridge University Press, Cambridge.
Shanghai Municipal Education Commission (2004), Shanghai Education Yearbook 2004, Shanghai Educational Publishing House, Shanghai.
Shanghai Municipal Education Commission (2008), Shanghai Education Yearbook 2008, Shanghai Educational Publishing House, Shanghai.
Shanghai Municipal Government (2010), Shanghai Yearbook 2009, Shanghai Municipal Government, Shanghai.
Shanghai Municipal Statistics Bureau (2010), Shanghai Statistical Yearbook 2010, China Statistics Press, Shanghai.
Shao, S. (2010) “Social Stratification and the Education of Migrant Children: A Sociological Analysis of the Policy Decisions of “Two Mainly”, Research in Education Development. 2010(11), available at www.cnsaes.org/homepage/html/magazine/jyfzyj/jyfzyj_jyysh/2674.html
Solomon, R.H. (1971), “Confucianism and the Chinese Life Cycle”, in Mao’s Revolution and the Chinese Political Culture, University of California Press, Berkeley, pp. 28-38.
Stevenson, H.W. and J.W. Stigler (1992), The Learning Gap: Why Our Schools are Failing and What We Can Learn from Japanese and Chinese Education, Summit Books, New York.
Tsang, D. (2009), Embracing New Vhallenge,. Policy Address 2009-10, Hong Kong-China Government, available at www.policyaddress.gov.hk/08-09/eng/policy.html.
UNESCO Institute of Statistics (2009), Global Education Digest, 2009: Comparing Education Statistics Across the World, UNESCO, Paris.
Yang, R. (2004), “Toward Massification: Higher Education Development in the People’s Republic of China since 1949,” in J. Smart (ed.) Higher Education: Handbook of Theory and Research. Springer, Dordrecht.
Shanghai Academy of Educational ScienceLu Jing, Associate professor, Vice director, Shanghai Institute for Basic Education Research and Shanghai PISA Centre, Shanghai Academy of Educational Sciences.
Gu Ling-yuan, professor, master teacher, former vice director of Shanghai Academy of Educational Sciences. He was honoured Shanghai Education Hero in 2003.
Dr. Wang Jie, Associate Professor, Director of Teacher Education Centre, Shanghai Academy of Educational Sciences.
Interviews at China Pu Dong Cadre CollegeShen Zu-yun, Director of Shanghai Educational News Centre.
Wang Mao-gong, Director of Education Bureau in Xuhui District, a central district in Shanghai.
Yin Hou-qin, Vice director general, Shanghai Municipal Education Commission.
Zhang Min-sheng, professor, Shanghai Education Society, former Vice Director General of Shanghai Municipal Education Commission.
Dr. Zhang Min-xuan, Professor, Vice Director General, Shanghai Municipal Education Commission, PGB and NPM of Shanghai PISA 2009.
Zhu Jian-wei, Director of Education Bureau in Minhang District, a suburb district in Shanghai.
Shanghai Teaching Research InstituteTan Yi-bin, Assistant Director, master teacher, teaching researcher in Chinese, Shanghai Teaching Research Institute, Leading Expert of PISA 2009 Reading Expert Group in Shanghai.
Xu Dian-fang, Director, Shanghai Teaching Research Institute.
Teachers and PrincipalsBai Bin, principal, Chinese teacher, Wen Lai Middle School, PISA School Co-ordinator in PISA 2009 Field Trial, which is held on April 25, 2008.
Ding Yi, Vice Principal, Middle School affiliated to Jing ’an Teacher Education College.
Li Xiao-yu, vice principal charges on teaching, Chinese teacher, Qibao High School.
Qiu Zhong-hai, Master teacher and master principal, Shanghai Qibao High School, he was honoured Shanghai Education Hero in 2008.
Shi Ju, mathematics teacher, Wen Lai Middle School.
Wang Hong, Chinese teacher, Wen Lai Middle School.
Xu Feng, vice principal, politics teacher, Wen Lai Middle School.
Mr Zhou. Vice Principal, Wen Lai High School.
Zhou Ming-jun, English teacher, Wen Lai Middle School.
The material for the section on Hong Kong-China is based on the experience of Professor Kai-ming Cheng, Chair of Education, University of Hong Kong (1995 to present), Senior Advisor to the Vice-Chancellor, University of Hong Kong (2003 to present), and former Vice-Chancelor, University of Hong Kong (1997-2003).
Annex 4.A1. Interview Partners (Shanghai)
Annex 4.A2. Interview Partners (Hong Kong-China)
5
133STRONG PERFORMERS AND SUCCESSFUL REFORMERS IN EDUCATION: LESSONS FROM PISA FOR KOREA © OECD 2014
Singapore: Thinking ahead
Singapore has transformed itself from a developing country into a modern industrial economy in one generation. In the past decade, Singapore’s education system has remained at or near the top of most major world education rankings. This chapter examines how Singapore has achieved so much so quickly, focusing on the government’s ability to match skills supply with demand; the prevailing belief in the centrality of education; the emphasis on building teacher and leadership capacity to deliver reforms at the school level; and a culture of continuous improvement that benchmarks its own education practices against the best in the world.
5SINGAPORE: THINKING AHEAD
134 © OECD 2014 STRONG PERFORMERS AND SUCCESSFUL REFORMERS IN EDUCATION: LESSONS FROM PISA FOR KOREA
IntroductionWhen Singapore became independent in 1965, it was a poor, small (about 700 sq km), tropical island with few natural resources, little fresh water, rapid population growth, substandard housing and recurring conflict among the ethnic and religious groups that made up its population. At that time there was no compulsory education and only a small number of high school and college graduates and skilled workers. Today, Singapore is a gleaming global hub of trade, finance and transportation. Its transformation “from third world to first” in one generation is one of Asia’s great success stories (Yew, 2000).
All children in Singapore receive a minimum of 10 years of education in one of the country’s 360 schools. Singapore’s students were among the top in the world in mathematics and science on the Trends in International Math and Science Study (TIMSS) in 1995, 1999, 2003 and 2007. They came fourth in literacy in the 2006 Progress in International Reading Literacy Study (PIRLS). Their excellence is further underlined by the fact that Singapore was one of the top-performing countries in the 2009 PISA survey (Table 5.1 and Figure 5.1), the first PISA survey in which it participated. Singapore was rated as one of the best performing education systems in a 2007 McKinsey study of teachers (Barber and Mourshed, 2007), and was rated first in the 2007 IMD World Competitiveness Yearbook (IMD, 2007) for having an education system that best meets the needs of a competitive economy. At the higher education level, the National University of Singapore was ranked 34th in the world and 4th in Asia in the Times Higher Education Supplement Rankings of World Universities in 2010 (Times Higher Education Supplement, 2010). How has this little red dot on the map, as Singaporeans frequently refer to their country, a nation that is not even 50 years old, evolved from a backwater undeveloped economy into a world economic and educational leader in such a short period of time? What education policies and practices has Singapore employed? Are the lessons from Singapore’s experience relevant for other countries? And how is its education system adapting to the fast-changing demands of a global and digital 21st century? This chapter attempts to provide some answers to these questions. First, however, we look at the broader context.
Under British colonial rule, from 1819 onwards, Singapore developed as a major seaport at the mouth of the Malacca Straits, on the shipping lanes between Britain, India and China. During this period, it attracted large numbers of immigrants, primarily from southern China, India and the Malay Archipelago. At independence from Britain in 1959 and then separation from Malaysia in 1965, Singapore had no assets other than its deepwater port. There was no real economy, no defence, and simmering tensions with neighbouring countries. Moreover, it had to import most of its food, water and energy. The Republic of Singapore seemed an unlikely candidate to become a world-class economic and educational powerhouse.
The risks facing this nation at birth – the sense of political and economic vulnerability to larger countries and global changes – created a sense of urgency which influences policy to this day. Lee KuanYew, Singapore’s first Prime Minister, set out two overarching goals: to build a modern economy and to create a sense of Singaporean national identity. He recruited the best and brightest people into his early government and sought to promote economic growth and job creation. In the 1960s, the emphasis was on attracting labour-intensive foreign manufacturing to provide jobs for its low-skilled workforce. In the 1970s and 1980s, a shift to more skill-intensive manufacturing led to an emphasis on technical fields. From the mid-1990s on, Singapore has sought to become a player in the global knowledge economy, encouraging more research and innovation-intensive industries and seeking to attract scientists and scientific companies from around the globe. The results of the government’s economic policies have been stunning – rapid economic growth to reach developed country levels and an average per capita income in 2009 of about SGD 52 000 (USD 39 000) estimated at current market prices. One of the so-called Asian Tigers, Singapore is a free market, business-friendly and globally- oriented economy, shaped by an active and interventionist government.
The government of Singapore is a highly efficient, honest and flexible meritocracy with a strong focus on integrated strategic planning and detailed execution. “Dream, Design, Deliver” aptly characterises its approach to policy development and implementation. Singapore’s small size and political stability (the same People’s Action Party has ruled Singapore since independence) have kept the vision of making Singapore a great global city constant, but have also enabled it to be versatile in responding to rapidly changing environments. With a small limited domestic market, Singapore has had to become highly integrated in the global
Table 5.1 Singapore’s mean scores on reading, mathematics and science scales in PISA 2009
PISA 2000 PISA 2003 PISA 2006 PISA 2009Mean score Mean score Mean score Mean score
Reading 526
Mathematics 562
Science 542
Note: Singapore did not participate in the 2000, 2003 and 2006 assessments.
Source: OECD (2012h).
5SINGAPORE: THINKING AHEAD
135STRONG PERFORMERS AND SUCCESSFUL REFORMERS IN EDUCATION: LESSONS FROM PISA FOR KOREA © OECD 2014
economy. To survive several global recessions and the ever-present uncertainties of the global economy, continuous innovation has been essential.
With respect to Lee Kuan Yew’s second goal of nation building, early race riots led to a profound commitment to creating a multi-racial and multi-ethnic society. At independence, Singapore had multiple religious groups (Buddhist, Muslim, Taoist, Hindu and Christian), multiple ethnic groups (Singapore’s population is about 74% Chinese, 13% Malay, 9% Indian and 3% other), and no common language. Nor did it have a common school system or a common curriculum. A series of measures was gradually put in place to realise the Singapore pledge: “One united people regardless of race, language or religion”. Singapore recognises and teaches four official languages – Chinese, English, Malay and Tamil – although English is the language of government and, since 1978, the medium of instruction in schools.1 Two years of compulsory national service unite different ethnic groups, as does the policy of mixing groups within the government-built housing where most Singaporeans live. This has helped avoid the racial and ethnic segregation that afflicts many countries. Schools play a major role in inculcating Singaporean values and character, and civic and moral education play a major role in schools. Honesty, commitment to excellence, teamwork, discipline, loyalty, humility, national pride and an emphasis on the common good have been instilled throughout government and society.
Lacking other resources, human resources were and still are seen as the island republic’s most precious asset. Education was, from the beginning, seen as central to building both the economy and the nation. Its job was to deliver the human capital engine for economic growth and to create a sense of Singaporean identity. The economic goals of education have given education policy a very pragmatic bent and a strong focus on scientific and technical fields. Singapore’s education system has evolved over the past 40 years in tandem with the changing economy.
SINGAPORE’S EDUCATION SYSTEM: THE PATH TO BECOMING A LEARNING NATIONOver the past 40 years, Singapore has been able to raise its education level from one similar to that of many developing countries to match the best in the OECD. The current system did not emerge perfectly-formed, but has developed in three broad phases as it was adapted to changing circumstances and ideas:
The survival-driven phase (1959-1978)According to then-Prime Minister Lee Kuan Yew, the aim of Singaporean education in its early days was to “produce a good man and a useful citizen”. This first phase of education has been dubbed the “survival-driven” phase. In the late 1950s, 70% of GDP was from port and warehousing activities. This was not enough to sustain, let alone grow, the economy which was suffering from high population growth and significant unemployment. The government decided that there was a need to expand the industrial base and, because of the small size of the domestic market, to make it export-oriented. It set about trying to attract foreign manufacturers who needed low-skilled labour (e.g. textiles, garments, wood products), both to provide jobs and to gain expertise.
Prior to independence, only the affluent were educated. At independence, most of Singapore’s two million people were illiterate and unskilled. Therefore the focus of this “survival” period was on expanding basic education as quickly as possible. Schools were built rapidly. Teachers were recruited on a large scale. The schools that had been established by different ethnic groups were merged into a single Singaporean education system. A bilingual policy was introduced so that all children would learn both their own language and English. A textbook agency was created to provide textbooks. The expansion was so rapid that universal primary education was attained in 1965 and universal lower secondary by the early 1970s. By the end of the “survival-driven phase”, Singapore had created a national system of public education.
However, the quality of education was not very high. In the early 1970s, out of every 1 000 pupils entering primary grade one, only 444 reached secondary grade four after 10 years. And of these, only 350 (35% of the cohort) gained three or more passes in O-level examinations. A significant report by Dutch economic advisor Dr. Albert Winsemius estimated that every year between 1970 and 1975, Singapore would be short of 500 engineers and 1 000 technical workers and would have a severe shortage of people with management skills (Lee et al., 2008). The oil crisis of 1973 and the increasing competition from other Asian countries for low-skilled, labour-intensive industry led to a growing realisation that Singapore’s comparative advantage was eroding and that it needed to evolve to a higher-skill economy. However, a large number of policy changes and changes of ministers of education caused confusion. Teacher morale was low and there was considerable attrition. Although there were attempts to expand vocational education, it had low status and was viewed as a dumping ground. In 1979, a watershed education report highlighted the high dropout rates and low standards and ushered in the next phase of reform (Goh, 1979).
Efficiency-driven phase (1979-1996)During this phase of education, the focus shifted. The government’s economic strategy was to move Singapore from a third-league, labour-intensive economy to a second-league, capital and skill-intensive country. So in January 1979, a new education system was introduced. Singapore moved away from its earlier one-size-fits-all approach to schooling to create multiple pathways for students in order to reduce the drop-out rate, improve quality and produce the more technically-skilled labour force needed to

5SINGAPORE: THINKING AHEAD
136 © OECD 2014 STRONG PERFORMERS AND SUCCESSFUL REFORMERS IN EDUCATION: LESSONS FROM PISA FOR KOREA
achieve the new economic goals. Streaming (tracking) based on academic ability was introduced, starting in elementary schools, with the goal of “enabling all students to reach their potential while recognising that all students do not grow academically at the same pace” (Interview with Ho Peng, Director General of Education, Ministry of Education). Students could have more time, for example, to complete different stages of schooling. The multiple pathways included three types of high school: 1) academic high schools, which prepared students for college; 2) polytechnic high schools, which focused on advanced occupational and technical training and that could also lead to college; and 3) technical institutes, which focused on occupational and technical training for the lowest fifth of students. The Curriculum Development Institute of Singapore was established to produce high-quality textbooks and instructional materials for the different pathways. While streaming was unpopular when it was introduced, drop-out rates did, in fact, decline significantly: by 1986, only 6% of students were leaving school with fewer than 10 years of education.2 The range of efforts to raise standards also yielded results: performance in the O-level English examinations went from a 60% failure rate to a 90% pass rate by 1984, and by 1995 Singapore led the world in mathematics and science on TIMSS.
As Singapore sought to attract companies with a more sophisticated technological base (e.g. silicon wafers, computers), a major goal of this second phase was to produce technical workers at all levels. Concerned about the low status of blue-collar jobs, from 1992 Singapore invested significantly in the Institute for Technical Education (ITE). With a number of campuses around the city, the ITE provides high-quality technical and vocational education, with high-tech facilities and amenities that are comparable to those of modern universities elsewhere. Each technical field is advised by industries in that sector to keep it current with changing demands and new technologies. New programmes can be built for multinational companies looking to locate in Singapore. There has been strong market demand for ITE graduates, and it is possible for the top graduates from the ITE to go on to polytechnics and then to university. As a result of these changes, the image and attractiveness of vocational education vastly improved. At the top end of the technical workforce, the number of university and polytechnic places was also expanded during this period to increase the pool of scientists and engineers.
Ability-based, aspiration-driven phase (1997-present)By the early 1990s, the efficiency-driven education system had yielded clear results. But, as became clear during the Asian financial crisis of 1997, the world economy was shifting to a global knowledge economy. The competitive framework of nations was being redefined and national progress would increasingly be determined by the discovery and application of new and marketable ideas. The growth of the global knowledge economy required a paradigm shift in Singapore’s education system towards a focus on innovation, creativity and research.
A key instrument as Singapore intentionally navigated towards the global knowledge economy has been the government Agency for Science, Technology and Research (A*Star), which provides generous funding for research and aims to attract top scientists and scientific companies. One million foreign nationals with scientific, technical or managerial skills have been encouraged to work in Singapore in international corporations and in higher education. Singapore’s three universities, and especially the National University of Singapore and Nanyang Technological University, have research partnerships with leading universities around the world with a focus in selected fields, including bioinformatics, information sciences and medical technologies.
At the school level, Singapore created a new educational vision, “Thinking Schools, Learning Nation”. This major milestone in Singapore’s education journey recognised Prime Minister Goh Chok Tong’s belief that “A nation’s wealth in the 21st century will depend on the capacity of its people to learn” (Goh, 1979). “Thinking Schools represented a vision of a school system that can develop creative thinking skills, lifelong learning passion and nationalistic commitment in the young. Learning nation is a vision of learning as a national culture, where creativity and innovation flourish at every level of society” (Lee et al., 2008).
Thinking Schools, Learning Nation encompassed a wide range of initiatives over a number of years that were designed to tailor education to the abilities and interests of students, to provide more flexibility and choice for students and to transform the structures of education. Career paths and incentives for teachers were revamped and teacher education upgraded, as described in more detail later. Curricula and assessment changes put greater emphasis on project work and creative thinking. A major resource commitment, involving three successive master plans, was made to information and communication technology (ICT). A broader array of subject matter courses was created for students and a portfolio of different types of schools encouraged – specialising in arts, mathematics and science, and sports – and a number of independent schools established. “We need a mountain range of excellence, not just one peak, to inspire all our young to find their passions and climb as far as they can,” explained Tharman Shanmugaratnam, then Minister for Education (cited in Lee et al., 2008).
Major changes were also made in the management of schools. Moving away from the centralised top-down system of control, schools were organised into geographic clusters and given more autonomy. Cluster Superintendents – successful former principals – were appointed to mentor others and to promote innovation. Along with greater autonomy came new forms of accountability. The old inspection system was abolished and replaced with a school excellence model. It was felt that no single accountability model could fit all schools. Each school therefore sets its own goals and annually assesses its progress towards them against nine functional areas: five “enablers”, as well as four results areas in academic performance (Ng, 2008a).3 Every six years there is an external review by the School Appraisal Branch of the Ministry of Education. Greater autonomy for schools also led to a laser-like
5SINGAPORE: THINKING AHEAD
137STRONG PERFORMERS AND SUCCESSFUL REFORMERS IN EDUCATION: LESSONS FROM PISA FOR KOREA © OECD 2014
focus on identifying and developing highly effective school leaders who can lead school transformation. This is also described in more detail later.
Current structureIn Singapore’s education system today, students receive six years of primary education, and four to five years of secondary education, followed by two years at junior college, polytechnic or the Institute for Technical Education (ITE; see Figure 5.1).4
Primary education consists of a four-year foundation stage during which all students follow a common curriculum that emphasises English, mother-tongue language and mathematics. Science is introduced from primary grade 3. Other subjects taught in primary school are civics and moral education, social studies, health, physical education, art and music. Streaming, which was a key feature of the Singapore education system, was designed to allow students to progress at their own pace from primary grade 5 onwards. However, in 2008, streaming was replaced with subject-based banding. At the end of primary grade 6, all students sit for the Primary School Leaving Examination in English, mathematics, mother-tongue language and science. Based on the results of this examination, students are admitted to an express (60% of students), normal academic (25%) or normal technical (15%) course in secondary school.
Students in the express course follow a four-year programme culminating in the general certificate of education (GCE) O-level exam. Students in the normal academic course follow a four-year course to GCE N-level and may sit for O-levels in year five (Figure 5.1). The normal technical programme prepares students for technical higher education, jobs or the postsecondary ITE after a four-year programme leading to the GCE-N level. In recent years, more choice has been offered to students in secondary school, with a wider range of subjects at O-level and elective modules. Students who are clearly of university calibre may study in Integrated Programme Schools where they can skip O-levels; this arrangement allows them to engage in broader learning experiences that develop their leadership potential and capacity for creative thinking. There is now more horizontal mobility between courses, and students who do well are allowed to transfer between streams. The ratio among streams is further enhanced with students being able to follow subjects from a different stream. Schools specialising in sports, art, mathematics and sciences are also available, as well as a small number of independent schools.
After 10 years of general education, students go to post-secondary education: junior colleges (31% of students), polytechnics (43%) or ITE (22%). Academically inclined students can take A-levels during this period and then proceed to university. Students may also take diploma courses in technical or business subjects at polytechnics. Many polytechnic graduates who have done well also go on to university. Students with GCE O or N-levels can take skill-based certificates in technical or vocational subjects at ITE. Outstanding ITE graduates can also go on to polytechnics or universities. About 25% of a cohort goes on to university in Singapore (the number of places will rise to 30% in 2015). Many students also go abroad to university (see Figure 5.3).
SINGAPORE’S SUCCESS IN EDUCATIONSingapore has pursued its vision of a high-quality education system over a long period of time and has accomplished significant improvements at each stage of its journey. What are some of the key features that have helped Singapore become so successful?
A forward-looking, integrated planning systemIn modern Singapore, education has consistently been the building block for economic and national development. As Prime Minister Goh Chok Thong famously stated: “The wealth of a nation lies in its people”.
Since the founding of the republic, the high value placed on education as the key to economic development and national cohesion in a country with no natural resources is evident in the statements by Singapore’s senior leaders. But the statements about “nurturing every child” are not just political rhetoric. They have been accompanied by willingness at each stage to invest considerable financial resources in education. Education spending rose to 3.6% of GDP in 2010, approximately 20% of total government expenditure and second only to defence.
The linkage to economic development is tight and is driven from the top of the government. As Singapore evolved from an economy based on port and warehousing activities, through a low-wage, labour-intensive manufacturing economy, and then to a more capital and skill-intensive industry and finally to its current focus on knowledge-intensive industrial clusters, the education system was expected to ramp up the quality of its education and the supply of specific skills needed to make Singapore globally competitive.
Singapore has a uniquely integrated system of planning. The Manpower Ministry works with various economic agencies (such as the Economic Development Board) responsible for promoting specific industry groups to identify critical manpower needs and project demands for future skills. These are then fed back both into pre-employment training and continuing education and training. In other countries, labour and education markets make these adjustments slowly over time, but the Singapore government believes that its manpower planning approach helps students to move faster into growing sectors, reduces oversupply in areas of
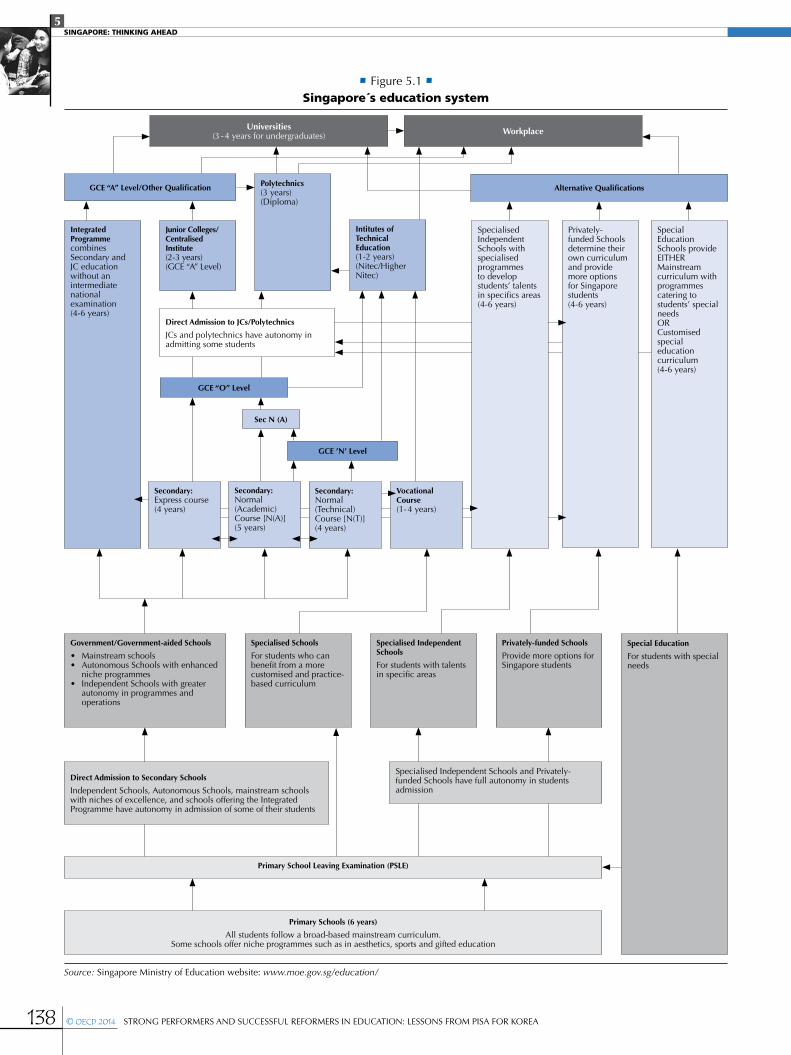
5SINGAPORE: THINKING AHEAD
138 © OECD 2014 STRONG PERFORMERS AND SUCCESSFUL REFORMERS IN EDUCATION: LESSONS FROM PISA FOR KOREA
• Figure 5.1 •Singapore´s education system
Specialised Schools
For students who can benefit from a more customised and practice-based curriculum
Privately-funded Schools determine their own curriculum and provide more options for Singapore students(4-6 years)
Universities(3 - 4 years for undergraduates) Workplace
GCE “A” Level/Other Qualification Polytechnics(3 years)(Diploma)
Alternative Qualifications
Integrated Programmecombines Secondary and JC education without an intermediate national examination(4-6 years)
Junior Colleges/Centralised Institute(2-3 years)(GCE “A” Level)
Intitutes of Technical Education(1-2 years)(Nitec/Higher Nitec)
Special Education Schools provide EITHER Mainstream curriculum with programmes catering to students’ special needs OR Customised special education curriculum(4-6 years)
Direct Admission to JCs/Polytechnics
JCs and polytechnics have autonomy in admitting some students
GCE “O” Level
Sec N (A)
GCE ’N’ Level
Secondary:Express course(4 years)
Government/Government-aided Schools
• Mainstream schools• Autonomous Schools with enhanced
niche programmes• Independent Schools with greater
autonomy in programmes and operations
Specialised Independent Schools
For students with talents in specific areas
Privately-funded Schools
Provide more options for Singapore students
Special Education
For students with special needs
Direct Admission to Secondary Schools
Independent Schools, Autonomous Schools, mainstream schools with niches of excellence, and schools offering the Integrated Programme have autonomy in admission of some of their students
Specialised Independent Schools and Privately-funded Schools have full autonomy in students admission
Primary School Leaving Examination (PSLE)
Primary Schools (6 years)
All students follow a broad-based mainstream curriculum. Some schools offer niche programmes such as in aesthetics, sports and gifted education
Specialised Independent Schools with specialised programmes to develop students’ talents in specifics areas(4-6 years)
Secondary:Normal (Academic) Course [N(A)](5 years)
Secondary:Normal (Technical) Course [N(T)](4 years)
Vocational Course(1- 4 years)
Source: Singapore Ministry of Education website: www.moe.gov.sg/education/

5SINGAPORE: THINKING AHEAD
139STRONG PERFORMERS AND SUCCESSFUL REFORMERS IN EDUCATION: LESSONS FROM PISA FOR KOREA © OECD 2014
declining demand more quickly, and targets public funds more efficiently for post-secondary education. The Ministry of Education and the institutions of higher and post-secondary education then use these skill projections to inform their own education planning, especially for universities, polytechnics and technical institutes.
In short, the ability of the government to successfully manage supply and demand of education and skills is a major source of Singapore’s competitive advantage. As Singapore seeks to become a global scientific hub, it is bringing together all aspects of the government – the finance ministry, economic development board, manpower ministry, education ministry, urban and environmental planning bodies, housing and immigration authorities – to create the next platform for Singapore’s growth.
Singapore demonstrates strong alignment among policies and practices. One of the most striking things on visiting Singapore is that wherever one goes – whether the ministries of manpower, national development, community development, or education; the universities, technical institutes, or schools – one hears the same clear focus on the same bold outcomes: careful attention to implementation and evaluation, and orientation towards the future. “Milestone” courses bring together top officials from all the ministries to create a shared understanding of national goals. And a focus on effective implementation is shared throughout government. Because of the value placed on human resource development and the understanding of its critical relationship to economic development, Singapore’s government provides a very clear vision of what is needed in education. This means that the Ministry of Education can then design the policies and implement the practices that will meet this vision.
Close links between policy implementers, researchers and educatorsAt the institutional level, both policy coherence and implementation consistency are ensured by the very close tripartite relationship between the Ministry of Education, the National Institute of Education (NIE, the country’s only teacher training institution), and the schools. The ministry is responsible for policy development, while NIE conducts research and trains teachers. NIE’s research is fed back to the ministry and is used to inform policy development. Since NIE professors are regularly involved in ministry discussions and decisions, it is relatively easy for NIE’s work to be aligned with ministry policies. NIE is Singapore’s only institution for training prospective teachers, but professional in-service development for teachers comes from various institutions/sources besides NIE (see below).
Policies and the means to implement themAccording to David Hogan, Senior Research Scientist at NIE and interviewed for this report, the degree of institutional alignment in Singapore is very unusual in global terms. Singapore is a “tightly coupled” system in which the key leaders of the ministry, NIE, and the schools share responsibility and accountability. Its remarkable strength is that no policy is announced without a plan for building the capacity to meet it. And while there is variation in performance within schools, there is relatively little variation between schools. By contrast, more loosely-coupled systems have a much harder time bringing about reform initiatives and are often typified by an endless parade of new, sometimes conflicting policies, without building the capacity to meet them. The teacher preparation programmes in universities are also often not aligned with the reform policies. Consequently, practitioners become cynical and wait for successive reform waves to pass. There are usually also large discrepancies between schools in the extent to which reforms are carried out.
In recent years, Singapore has loosened its tight coupling somewhat. More autonomy has been given to schools so as to encourage more innovation, and NIE has the appropriate independence for an institute in a modern research-oriented university. However, there is still strong alignment among the curriculum, examinations and assessments; incentives for students to work hard; and accountability measures for teachers and principals. This makes policy making and implementation much easier and more effective than in loosely-coupled systems.
The advantages of a small scaleIn trying to understand Singapore’s success, it is also important to remember its small size. Singapore’s national education system is more like that of a city or a small state, with approximately 522 000 students and 360 schools. Professor Lee Sing Kong, Director of the NIE, likens it to “turning around a kayak rather than a battleship”. The stability of the government and the broad popular consensus on the purposes of education also make it possible to pursue policies for long enough to see if they have any impact.
Commitment to equity and meritSingapore has demonstrated an unfailing commitment to equity and meritocracy. Meritocracy was a cornerstone philosophy of Lee Kuan Yew’s government from the beginning. He believed it was the most efficient way to run a government and the only way to create a peaceful multi-ethnic society. The system of education during colonial times was highly elitist and separated by ethnicity and religion; he sought to replace it with a universal state-funded system in which talent and hard work would prevail.
At independence, there were large attendance and achievement gaps between the Chinese population, on the one hand, and the Tamil and Malay populations on the other. These gaps threatened the political stability of Singapore, as well as its economic development. In the first education phase, the survival phase, rapid expansion of schooling led to universal elementary and lower
5SINGAPORE: THINKING AHEAD
140 © OECD 2014 STRONG PERFORMERS AND SUCCESSFUL REFORMERS IN EDUCATION: LESSONS FROM PISA FOR KOREA
secondary education by the early 1970s. In the second phase, streaming was introduced to reduce the high drop-out rates from the system; although controversial, it was successful. Today, with a secondary school graduation rate of 98% (10th grade), the gaps in educational attainment have been substantially reduced. However, there is more work to be done. In the TIMSS results, for example, Singapore has very high mean achievement scores in mathematics and science but there is also a long tail to the achievement distribution. On other measures too, socio-economic status has a significant impact on achievement.
According to Professor Lee, the measures Singapore has taken to reduce the achievement gap have been both social and educational. Believing that the causes of underachievement lie in social structures such as single-parent families, Singapore has developed a system of local town and community councils that identify families in need and can provide a range of support, including financial assistance. In addition, each of the ethnic communities has a self-help community group, the Malay Mendaki, Indian Sinda and Chinese CDAC. These organisations are funded by members of each community and support children in need.
It would be interesting to explore whether Singapore’s housing policies have an impact on its small achievement gap; 80% of people live in government-built, but self-owned apartments and ethnic groups are deliberately mixed in each housing block. When asked about this during interviews for this report, Professor Lee said that he did not know of any empirical studies, but thought that it seemed plausible that being in a community with high expectations for academic achievement would have an overall positive effect on children.
On the educational side, children who require additional support in learning to read are identified through screening tests at the start of first grade. These children are provided with daily systematic intervention by teachers in small groups (8-10 students) in learning support programmes so that they do not fall behind. About 12-14% of children need such support for reading. The curriculum includes phonics and English language development since many of the children speak languages other than English at home. Learning support programmes also exist in mathematics. In addition, while most preschools in Singapore are privately funded, the government provides funding support to preschools that cater for low-income students.
In recent years, Singapore has replaced streaming in elementary schools with subject matter banding. It has also created more opportunities for students to move horizontally between streams at the secondary level and beyond – to create more flexibility in the system and to recognise “late bloomers”. Another remarkable feature of the Singapore education system is the value, attention and resources it devotes to lower level achievers, not just high achievers. This focus on “levelling up”, so that the lowest stream gets very high quality training, exemplifies the “many pathways” approach and is discussed in the section below on the Institute for Technical Education. The resources devoted to vocational and technical training are immense and the vocational and technical system is perhaps the best in the world – a significant element of the Singapore success story.
The goal of the education system is to nurture every child, no matter what their ability or achievement level. The ecology of education reform rests on these shared values. Parents want good opportunities for their children, high levels of social mobility and rising levels of income. The government has delivered them, so most parents believe in the fairness of the system.
We have avoided the large disparities in educational standards seen elsewhere, between schools for the privileged and those for the masses. We have achieved high standards across a spectrum of abilities, allowing a large proportion of Singaporeans to proceed to high-quality post-secondary and tertiary education. (Tharman Shanmugaratnam, former Minister of Education, cited in Lee et al., 2008).
A strong focus on mathematics, science and technical skillsSingapore has focused on the universal development of strong mathematics, science and technical skills (Box 5.1). The country’s solid foundation in mathematics and science for all students in the elementary grades seems to be a core part of students’ later success. At the primary and secondary levels, mathematics and science are core subjects that every student must take. Mathematics begins when students enter school in primary 1 and science is taught from primary 3 onwards. Students have specialist teachers in mathematics and science from upper primary onwards. Deployment of teachers is a school-based decision. Some schools deploy specialist teachers in mathematics and science, although often teachers teach English, mathematics and science. From upper secondary onwards, there is a range of specialised mathematics courses at higher levels for those students who are interested. At the tertiary level, more than half the programmes are oriented towards science and technology.
In many countries, technical education is looked down upon as a dead-end option, of low quality and typically out of step with the changing needs of employers. But vocational education has been an important pathway in Singapore’s journey to educational excellence. In 1992, Singapore took a hard look at its own poorly-regarded vocational education and decided to transform and reposition it so that it was not seen as a place of last resort. Dr Law Song Seng led the creation of the Institute for Technical Education (ITE), which transformed the content, quality and image of vocational education. Its goal was to build a world-class technical education institution that is “effective, relevant and responsive to the knowledge-based economy” (Lee et al., 2008). ITE’s founders brought in leaders with a broad vision and staff committed to caring for students. They completely revamped the curriculum and workforce certification system, developed courses in new industries and consolidated existing technical campuses
5SINGAPORE: THINKING AHEAD
141STRONG PERFORMERS AND SUCCESSFUL REFORMERS IN EDUCATION: LESSONS FROM PISA FOR KOREA © OECD 2014
into three mega campuses with a sophisticated technology base and close ties to international corporations. To combat the societal prejudice against less academically-inclined students, ITE promoted and rebranded its kind of “hands-on, minds-on, hearts-on” applied learning. The result has been a doubling of enrolment since 1995, and ITE students now constitute about 25% of the post- secondary cohort. More than 82% of students in 2009 completed their training and are placed in jobs. Pay levels for ITE graduates have also been strong, and the ITE track is now seen by students as a legitimate path to a bright future. Part of the reason for the success of the technical education at ITE is that students get a strong academic foundation early in their academic careers so they can acquire the more sophisticated skills required by leading edge employers. The ITE received the IBM Innovations Award in Transforming Government, given by the Ash Center for Democratic Governance and Innovation at the Harvard Kennedy School, and has been recognised world-wide as a global leader in technical education.
Human resource management that matches the demands of the systemThe high quality of Singapore’s workforce today is the result of deliberate policy actions, especially dating from the 1990s onward. Since then, high-quality teachers and school leaders have formed the cornerstone of the education system and are a major reason for its high performance. Rather than focusing on just one element, Singapore has developed a comprehensive system for selecting, training, compensating and developing teachers and principals, thereby creating tremendous capacity at the point of education delivery. Key elements of that system are described below:
Recruitment: Prospective teachers are carefully selected from the top one-third of the secondary school graduating class, by panels that include current principals. Strong academic ability is essential, as is commitment to the profession and to serving diverse student bodies. Prospective teachers receive a monthly stipend that is competitive with the monthly salary for fresh graduates in other fields. They must commit to teaching for at least three years. Interest in teaching is seeded early through teaching internships for high school students; there is also a system for mid-career entry, which is a way of bringing real-world experience to students.
Training: All teachers receive training in the Singapore curriculum at the National Institute of Education (NIE) at Nanyang Technological University. They take either a diploma or a degree course depending on their level of education at entry. There is a close working relationship between NIE and the schools, where all new teachers are mentored for the first few years. As NIE’s primary purpose is training all Singapore teachers, there are no divisions between arts and sciences and education faculties.
Box 5.1 Off to a good start in mathematics and science
The Singapore approach to mathematics is distinctive and renowned worldwide because of students’ success in international assessments of mathematics. The mathematics curriculum states that the role of the mathematics teacher is to instil “maths sense”. In a Singapore mathematics classroom, the focus is on helping students understand how to solve problems and master mathematical concepts, rather than on the rote production of correct answers or memorising formulae. Teachers cover far less material, but cover it in depth. This saves time because there is less re-teaching of material.
The Singapore “model method” makes extensive use of visual aids to help students understand mathematics. It follows a progression from concrete, to pictorial, to abstract representation, based on an understanding of how children learn mathematics. Explanations are extremely simple and clear, which benefits the many ESL students in Singapore classrooms. By 4th grade, students are mastering fractions, and by 6th grade, they are doing complex multi-step problems. Teachers are all trained to teach the curriculum and they meet regularly to fine-tune exercises and hone lessons. The combination of focusing on mastery of essential mathematics skills, providing simple and clear explanations and guidance, using the model method of problem-solving, and employing well-trained teachers is highly effective.
The Singapore science curriculum in primary and lower secondary grades focuses on developing the idea of science as a process of inquiry. It does so through three domains: 1) knowledge, understanding and application; 2) skills and processes; and 3) ethics and attitudes. To awaken students’ interest in science as a useful skill, inquiry projects are based on the roles played by science in daily life, society and the environment. Co-curricular activities such as mathematics and science fairs, competitions and learning trails (applying mathematics and science in outdoor settings) are designed to generate interest among students. The DNA Centre at the Singapore Science Centre develops hands-on activities for life sciences, and the government science agency, A*STAR, introduces students to research done by working scientists.
Mathematics and science teachers are selected from the top one-third of their cohort, receive initial training on the national math and science curricula during their pre-service training, and are entitled to 100 hours of professional development each year.
5SINGAPORE: THINKING AHEAD
142 © OECD 2014 STRONG PERFORMERS AND SUCCESSFUL REFORMERS IN EDUCATION: LESSONS FROM PISA FOR KOREA
Thus, according to Lee Sing Kong, the conflicting priorities that plague many Western teacher education programmes are less significant and there is a stronger focus on pedagogical content. NIE has put in place a matrix organisational structure whereby programme offices (e.g. Office for Teacher Education) liaise with individual academic groups in drawing up initial teacher training programmes. This means that these programmes are designed with the teacher in mind, rather than to suit the interests of the various academic departments. As such, there is a stronger focus on pedagogical content and greater synergies among modules within each programme.
Compensation: The Ministry of Education keeps a close watch on occupational starting salaries and adjusts the salaries for new teachers to ensure that teaching is seen as equally attractive as other occupations for new graduates. Teachers’ salaries do not increase as much over time as those in private sector jobs, but there are many other career opportunities within education for teachers. Teaching is also regarded as a 12-month position. There are retention bonuses and high-performing teachers can also earn significant amounts in performance bonuses.
Professional development: In recognising the need for teachers to keep up with the rapid changes occurring in the world and to be able to constantly improve their practice, they are entitled to 100 hours of professional development per year. This may be undertaken in several ways. Courses at the National Institute of Education focus on subject matter and pedagogical knowledge and lead towards higher degrees or advanced diplomas. Much professional development is school-based, led by staff developers. Their job is to identify teaching-based problems in a school, for example, with a group’s mathematics performance; or to introduce new practices such as project-based learning or new uses of ICT. Each school also has a fund through which it can support teacher growth, including developing fresh perspectives by going abroad to learn about aspects of education in other countries. Teachers’ networks and professional learning communities encourage peer-to-peer learning.
Performance appraisal: Like every other profession in Singapore, teachers’ performance is appraised annually by a number of people and against 16 different competencies. Included in this Enhanced Performance Management System is teachers’ contribution to the academic and character development of the students in their charge, their collaboration with parents and community groups, and their contribution to their colleagues and the school as a whole. Teachers who do outstanding work receive a bonus from the school’s bonus pool. This individual appraisal system sits within the context of great attention to the school’s overall plan for educational excellence, since all students in Singapore have multiple teachers, even in primary school.
Career development: Throughout Singapore, talent is identified and nurtured rather than being left to chance. After three years of teaching, teachers are assessed annually to see which of three career paths would best suit them – master teacher, specialist in curriculum or research or school leader. Each path has salary increments. Teachers with potential as school leaders are moved to middle management teams and receive training to prepare them for their new roles. Middle managers’ performance is assessed for their potential to become vice principals, and later, principals. Each stage involves a range of experience and training to prepare candidates for school leadership and innovation.
Leadership selection and training: Singapore has a clear understanding that high-quality teaching and strong school performance require effective leaders. Poor quality leadership is a key factor in teacher attrition in many countries (Ng, 2008b). Singapore’s approach to leadership is modelled on the approach of large corporations. The key is not just the training programme, but the whole approach to identifying and developing talent. This differs from the US or UK approach, for example, in which a teacher can apply to train as a principal or school head, and then apply for a position in a school. In Singapore, young teachers are continuously assessed for their leadership potential and given opportunities to demonstrate and learn, for example, by serving on committees, then being promoted to head of department at a relatively young age. Some are transferred to the ministry for a period. After these experiences are monitored, potential principals are selected for interviews and go through leadership situational exercises. If they pass these, then they go to NIE for six months of executive leadership training, with their salaries paid. The process is comprehensive and intensive and includes an international study trip and a project on school innovation. Only 35 people per year are selected for the executive leadership training. Asked why Singapore uses the “select then train” rather than the “train then select” model, Professor Lee Sing Kong said that while the train-then-select approach is feasible, it carries a higher risk. Singapore is very confident that they consistently have the best possible leaders for their schools and that there is a wide range of inputs into their selection. Principals are transferred between schools periodically as part of Singapore’s continuous improvement strategy.
By putting its energy in the front end of recruiting high-quality people and giving them good training and continuing support, Singapore does not have the massive problems of attrition and persistently ineffective teachers and principals that plague many systems around the world. Teaching has developed into a competitive and well-regarded occupation. It is also now considered to be an honour to be a teacher in Singapore.
Finally, another critical aspect of the human resource capacity of the Singapore system is the civil service. Lee Kuan Yew’s philosophy of governance was to recruit very high quality people into public service. Singapore has an extremely competent civil service, including in the Ministry of Education. Top civil servants are carefully selected, well trained (many at the best universities in the world), pragmatic, hard working and well paid. They have a global outlook, paying attention to education developments around
5SINGAPORE: THINKING AHEAD
143STRONG PERFORMERS AND SUCCESSFUL REFORMERS IN EDUCATION: LESSONS FROM PISA FOR KOREA © OECD 2014
the world, and are accustomed to using data and evidence in decision making. They have clear responsibility for the efficiency and effectiveness of the Singapore education system.
A system that is continuously being improvedWhile Singapore has devolved considerable authority to schools in recent years, it is still a centrally-driven government system. In many countries, government bureaucracies are sclerotic and move very slowly. But Singapore has inculcated an attitude and developed mechanisms for continuous improvement. In addition to the ties to economic planning that drove the major shifts in educational goals between the three major phases, there is a multitude of smaller changes and improvements being made, seemingly constantly.
Officials from the ministry and NIE frequently visit schools and have a good informal idea of what is going on, unlike the remote government departments and universities in many countries. They also pay a great deal of attention to data such as the School Cockpit and Student Hub data systems (internal ministry data systems).
There is now also a high level of investment in research relative to the size of the country (Hogan interview). The publication of the policy document, Thinking Schools, Learning Nation in 1997 led to a national education research agenda costing SGD 50 million (about USD 38 million). A wide range of different types of research has been carried out, with research design decided by researchers not the government. One major set of studies was carried out by David Hogan, former Dean and now Senior Research Scientist at the Centre for Research on Pedagogy and Practices at NIE. This six-year effort aimed to understand to what extent modern pedagogical practices were being used in Singapore classrooms. It piloted interventions to demonstrate how to move classrooms from a predominantly knowledge transmission model to a 21st century model where students engage in complex knowledge construction. This research does not just sit on a shelf, but is regularly referred to in the ministry’s deliberations.
Singapore has also made extensive use of international benchmarking as a tool for improvement and to move up the educational value chain. Staff of the ministry, NIE, and the schools all visit other systems and explore international best practice. Typically, the visits and research focus on very specific issues and on what does and doesn’t work in implementing particular policies. For example:
•Singapore’s mathematics curriculum was developed after reviewing mathematics research and practice from around the world.
•Recently, Ministry of Education personnel visited the United States and other countries to examine language teaching to non- heritage speakers (heritage speakers of a language are those who learn it at home).
•Ministry staff have also visited a number of countries, including Hong Kong-China, Australia, Scotland and Sweden, to examine new kinds of assessments.
As a result, Singapore classrooms incorporate a wide range of pedagogical styles. Principals and master teachers are also encouraged to examine innovations in other countries and explore how they could be adapted for use in Singapore schools. A couple of years ago, a Washington Post reporter covered a visit by a group of Singapore principals to several schools in northern Virginia. “Why,” she asked, “since Singapore is best in the world on the TIMSS international mathematics and science assessments, was a group of Singapore principals visiting science classes in northern Virginia schools?” The Singapore response: “There is no perfect system in the world. There are pockets of excellence in many places; the key is how to adapt them to the local context and implement them well.”
Whenever Singapore seeks to create a new institution, it routinely benchmarks its planning to the best in the world. If Singapore is not in a position to create a world-class institution in a particular field, it will try to import the expertise. For example it did this in its recent partnerships with Duke University to create a new medical centre, and with Yale University to create a liberal arts college. All Singapore educational institutions – from the National University of Singapore (“A global university centred in Asia”) to individual schools – are being encouraged to create global connections.
LESSONS FROM SINGAPORESingapore is both a “rapid improver” and a “continuing high performer”. To those who believe that large-scale change in educational performance is not possible, Singapore has shown several times over that significant change is possible. Singapore has developed a high-quality system in terms of educational retention, quality and efficiency. To become and remain high-performing, countries need a policy infrastructure that drives performance and builds the capacity for educators to deliver it in schools. Singapore has developed both. Where Singapore is today is no accident. It is the result of several decades of judicious policy and effective implementation. On the spectrum of national reform models, Singapore’s is both comprehensive – the goal has been to move the whole system – and public policy-driven.
While the small-scale and tightly-coupled nature of the education system in Singapore may make its approaches seem inapplicable elsewhere, in fact Singapore is the size of many states/provinces or large cities in other countries. Many of its principles and practices are applicable to countries of a different scale and governance structure, although their implementation would have to take a different form. Some of the key lessons learned from Singapore are as follows:
5SINGAPORE: THINKING AHEAD
144 © OECD 2014 STRONG PERFORMERS AND SUCCESSFUL REFORMERS IN EDUCATION: LESSONS FROM PISA FOR KOREA
•Vision and leadership: Leaders with a bold long-term vision of the role of education in a society and economy are essential for creating educational excellence. Changing any system takes five to ten years – where there are frequent changes of political leadership, a guiding coalition needs to be created to keep the vision moving forward rather than having a change of direction with every change of government.
•Alignment of the education system to economic development goals: The strong link between education and economic development in Singapore has kept investment in education a central priority, made education policies highly pragmatic, led to high-quality mathematics and science and also to world-class vocational/technical education – an area where most countries fail. It has also kept education dynamic, expecting to change as conditions change rather than being mired in the past. While the tightness of the link may not be possible in less planned economies, bringing together economic and education policy makers, business and education leaders to continually assess changes in economic conditions and how education and economic development could better work together would strengthen both.
•Coherence of the education system: In many countries there is an enormous gap between policies and their implementation at the school level. In Singapore, whenever a policy is developed or changed, there is meticulous attention to the details of implementation – from the Ministry of Education, to the National Institute of Education, cluster superintendents, principals and teachers. The result is remarkable fidelity of implementation and relatively little variation across schools. While different mechanisms would be needed in larger, more multi-layered or decentralised systems, finding ways to bring greater alignment and to make all the parts work together is essential for producing results in the classroom in other nations’ systems.
•Clear goals, rigorous standards and high-stakes gateways: Singapore’s education system is extremely rigorous. The academic standards set by its Primary School Leaving Examination and O and A-levels are as high as anywhere in the world. Rigour is the watchword. Students, teachers and principals all work very hard towards these important gateways. All students have a strong early foundation in the core subjects of mathematics, science, and literacy in two languages.
•Curriculum, instruction and assessment to match the standards: Singapore does not just establish high standards and then leave it to individual teachers to figure out how to achieve them. Serious attention to curriculum development has produced strong programmes in mathematics, science, technical education and languages, in particular, and has ensured that teachers are well-trained to teach them. Having been very successful as a knowledge transmission education system, Singapore is now working on curriculum, pedagogy and assessments that will lead to a greater focus on high-level, complex skills (see below).
•High-quality teachers and principals: In earlier times, Singapore often had teacher shortages and was not always able to attract the highest quality people into teaching. In the 1990s, Singapore put in place a comprehensive and intensive human resource system to obtain high-quality teachers and school leaders who could meet its ambitions for its students. The system rests on active recruitment of talent, accompanied by coherent training and serious and continuing support. Education policies in Singapore today are less focused on structure and more on maintaining and increasing the quality of the educational professions. In 2007, it introduced the GROW package, consisting of measures to promote teacher Growth, Recognition, Opportunity and Well-Being.
•Strong central capacity and authority to act: The Ministry of Education in Singapore is staffed by knowledgeable, pragmatic individuals, trained at some of the best universities in the world. They function in a culture of continuous improvement, constantly assessing what is and isn’t working using both data and practitioner experience. They respect and are respected by professionals in the schools. While countries vary in whether the locus of authority is at the national state/province or local level, whoever is charged with developing strategy and holding authority would do well to emulate the competence and capacity of the Singapore Ministry of Education.
•Accountability: Singapore runs on performance management. Teachers, principals, ministry and NIE staff, students – all have incentives to work hard. To maintain the performance of teachers and principals, serious attention is paid to setting annual goals, to garnering the needed support to meet them and to assessing whether they have been met. Data on student performance are included, but so too are a range of other measures, such as contribution to school and community, and judgements by a number of senior practitioners. Reward and recognition systems include honours and salary bonuses. Individual appraisals take place within the context of school excellence plans. While no country believes it has got accountability exactly right, Singapore’s system uses a wide range of indicators and involves a wide range of professionals in making judgements about the performance of adults in the system.
•Meritocratic values: Underpinning the whole Singaporean system is the belief – for students of all ethnic backgrounds and all ranges of ability – that education is the route to advancement and that hard work and effort pay off. The government has developed a wide range of educational and social policies to advance this goal, with early intervention and multiple pathways to education and career. The success of the government’s economic and educational policies has brought about immense social mobility that has created a shared sense of national mission and made cultural support for education a near-universal value. Lee Kuan Yew’s greatest fear was that his little country would fall prey to the kinds of ethnic and religious rivalries that have thwarted the development of so many other societies. He realised that what happens in the schools could be one of the most important antidotes to this threat. So the schools became a theatre in which the country would do everything possible to give all students the skills and knowledge needed to succeed, independent of their socio-economic status. Singapore makes sure that every school has a fair share of the best teachers, and assigns their best teachers to the students who are struggling. The belief
5SINGAPORE: THINKING AHEAD
145STRONG PERFORMERS AND SUCCESSFUL REFORMERS IN EDUCATION: LESSONS FROM PISA FOR KOREA © OECD 2014
that achieving high standards is a function of effort is stoutly embraced in Singapore and extends to the great emphasis put on raising the quality of the educators.
•Adaptation of proven practices from abroad: The design of Singapore’s education system owes a lot to lessons from other parts of the world. Focused and universal use of international benchmarking and, more recently, significant funds for research, have enabled Singapore to move up the value chain and foster a culture in which it never stands still. This system recognises the rapidity of change around the world and has the capacity and inclination to learn and adapt. In the words of Tan Chorh Chuan, President of the National University of Singapore, Singaporeans must be ready to “scale new heights in a changed world”.
While the specific details of Singapore’s education system remain particular to Singapore, the lessons from its education journey to excellence can be generalised for other settings. Success requires a clear vision and belief in the centrality of education for students and the nation; persistent political leadership and alignment between policy and practice; a focus on building teacher and leadership capacity to deliver reforms at the school level; ambitious standards and assessments; broad support in the population; and a culture of continuous improvement and future orientation that benchmarks educational practices against the best in the world.
PREPARING SINGAPOREANS FOR THE FUTURE“If we are teaching the children today what we were taught yesterday, then we are robbing them of tomorrow.” This oft-repeated quote from American educator, John Dewey, is as profound today as when he wrote it in the early part of the 20th century. Countries around the world are wrestling with globalisation, the ubiquity of digital technologies, the abundance of information, and the need to prepare students for the unpredictable world of the future.
This final section asks what skills does Singapore consider to be essential for the future and what policies and mechanisms is the government using to develop them? How do these policies build on earlier reform efforts?
Singapore is obsessed with the future, and over the past few years it has made a number of changes to adapt its strong academically focused, knowledge-transmission school system in order to prepare its students to thrive in a fast-changing and highly-connected world. The main expression of this is the policy document Curriculum 2015 (Singapore Ministry of Education, 2010b), which builds on and expands on earlier efforts (notably the “teach less, learn more” concept and the Primary School Review; Box 5.2).
Curriculum 2015In 2008, the Ministry of Education began a future visioning exercise. This involved extensive conversations within the ministry and among educators, a review of international literature, and consultations with industry leaders. This exercise resulted in a new framework for building 21st century skills and results, Curriculum 2015, published in March 2010 (Figure 5.2; and see Singapore Ministry of Education, 2010b). The goal is to provide “a holistic education to better prepare our students to thrive in a fast-changing and highly connected world.
Curriculum 2015 aims for every student to become (shown on the outermost ring of Figure 5.2):
•A confident person who thinks independently and critically and communicates effectively;
•A self-directed learner who questions, reflects and takes responsibility for his or her own learning;
•An active contributor who is innovative, exercises initiative, takes risks and strives for excellence; and
•A concerned citizen who is informed about world and local affairs, has a strong sense of civic responsibility and participates actively in improving the lives of others.
The core of this framework is its values – the beliefs and attitudes that underpin knowledge and skills. The next ring represents the socio-emotional competencies, or “soft skills”, that are needed to establish positive relationships and handle challenging situations effectively. The next ring out represents Singapore’s perspective on the 21st century skills necessary for the globalised world in which we live. These are described as:
•Civic literacy, global awareness and cross-cultural skills;
•Critical and inventive thinking; and
•Information and communication skills.
Curriculum 2015 points out that while many of these skills are already being taught in Singapore’s schools, the aim now is to strike a better balance between content knowledge and skills (Interview with Wong Siew Hoong, Director of Schools, Ministry of Education). Curriculum 2015 will be implemented in a number of ways, each described in turn below.
Updating the curriculumThe next curriculum review cycle will take place between 2012 and 2014. The skills targeted in Curriculum 2015 will be incorporated into this review. Singapore aims to maintain its traditional strengths in the core academic areas of mathematics,
5SINGAPORE: THINKING AHEAD
146 © OECD 2014 STRONG PERFORMERS AND SUCCESSFUL REFORMERS IN EDUCATION: LESSONS FROM PISA FOR KOREA
science, and literacy, but to further integrate 21st century competencies, such as problem-solving, inquiry and use of ICT, into each subject.
There will be a much stronger emphasis on physical education, arts and music to enable students to develop physical robustness and enhance their creative and expressive capacities. More time and facilities for each of these subjects will be added to schools and, over time, single subject specialisation for art and music teachers will be required. In addition, more extra-curricular activities – sport, art and outdoor activities – will be encouraged since they can help students acquire many of the “soft skills” targeted by Curriculum 2015.
School pilotsSingapore has set up a number of specialised schools for sports, arts and music. In addition, every school is encouraged to innovate as it sees fit. For example, each school has a fund to allow teachers to travel overseas and learn about innovations and best practices in their discipline and bring the lessons home. Similarly, many schools are trying to upgrade ICT applications (Box 5.3). A number of primary schools are piloting holistic student assessments. These prototypes will then be reviewed for possible dissemination throughout the system.
Teacher preparation for the 21st centuryIn 2009, recognising the rapid pace of change occurring in the world, an institution-wide review of teacher preparation was conducted by NIE, leading to NIE’s new Teacher Education Model for the 21st Century (TE21). Its theme is that 21st century learners need 21st century teachers who not only possess 21st century literacies themselves, but can create the learning environments that enable their students to develop such skills (NIE, 2009). Many of the changes being made under TE21 echo the teacher-education reforms now being implemented in a number of countries:
•Clear standards for what teaching graduates should know and be able to do in each subject;
•Accountability built into teacher-preparation programmes for ensuring that teachers have these competencies;
•More emphasis right from the start on guided practice for trainee teachers in classroom settings;
•More involvement by teacher-education institutions in mentoring new teachers in schools;
•Giving trainee teachers a wider pedagogical repertoire, including co-operative and inquiry-based learning;
Box 5.2 Singapore’s education philosophy evolves
Teach less, learn more
In 2004, despite the country’s widely-recognised successes, Singaporeans were concerned that their students were too passive, overloaded with content and driven to perform, but not necessarily inspired. Prime Minister Lee Hsien Loong introduced the idea of “teach less, learn more” as a fundamental change in the way teaching and learning happens in Singapore classrooms. Its aim was to engage students more deeply in learning by opening up more “white space” in the curriculum and changing the types of pedagogy used. “Teach less, learn more” aims to “touch the hearts and engage the minds of learners by promoting a different learning paradigm in which there is less dependence on rote learning, repetitive tests and instruction, and more on engaged learning, discovery through experiences, differentiated teaching, learning of lifelong skills, and the building of character through innovative and effective teaching approaches and strategies” (interview with Ho Peng). The content of the curriculum was reduced by 10%-20% in certain subjects and a wide range of different approaches to teaching, assessment and curriculum design was introduced.
Primary Education Review
In 2008-2009 the government conducted a review of primary education. The recommendations of the Primary Education Review and Implementation Committee (PERI) aimed “to strike a better balance between the teaching of knowledge and the development of skills and values” by using more active and engaging teaching methods, limiting the importance of written examinations, and using more holistic assessments in primary schools. They also recommended greatly expanding art, music and physical education. All schools are to move to single sessions rather than double sessions, and social service providers will be given space in schools to better support disadvantaged students. Approximately USD 4.8 billion will be spent over 10 years to develop new programmes, recruit new teachers, build new schools or upgrade old ones, and reduce class sizes by 20% by 2015.
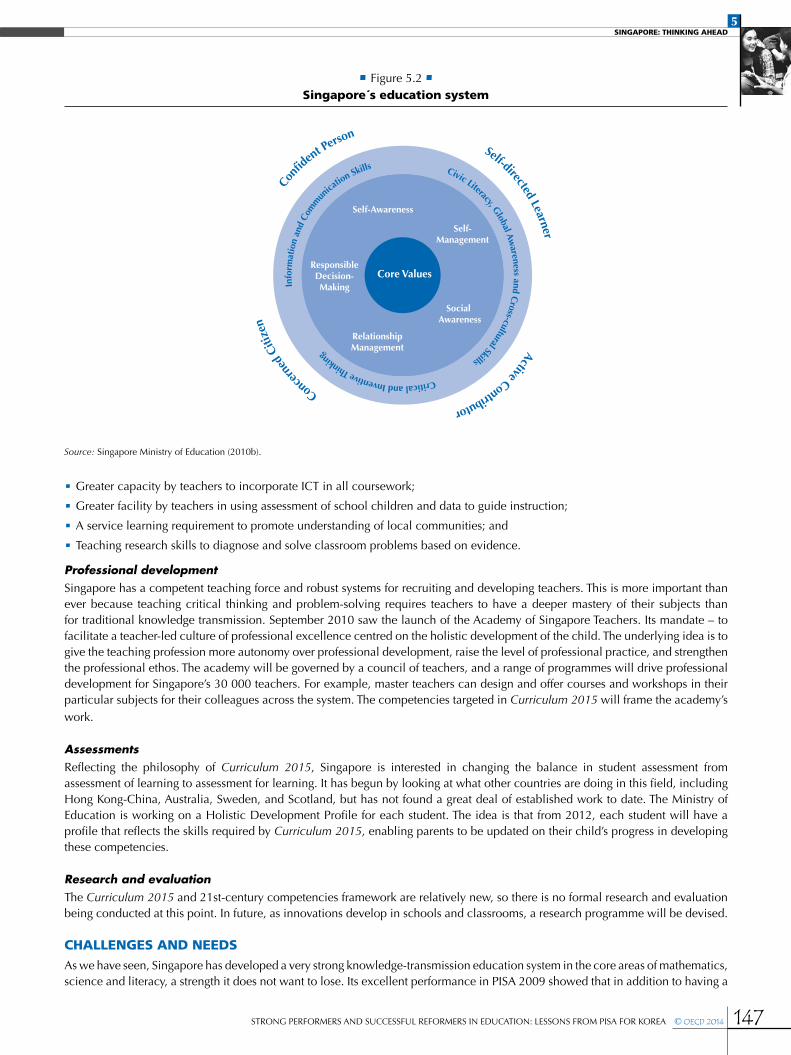
5SINGAPORE: THINKING AHEAD
147STRONG PERFORMERS AND SUCCESSFUL REFORMERS IN EDUCATION: LESSONS FROM PISA FOR KOREA © OECD 2014
•Greater capacity by teachers to incorporate ICT in all coursework;
•Greater facility by teachers in using assessment of school children and data to guide instruction;
•A service learning requirement to promote understanding of local communities; and
•Teaching research skills to diagnose and solve classroom problems based on evidence.
Professional developmentSingapore has a competent teaching force and robust systems for recruiting and developing teachers. This is more important than ever because teaching critical thinking and problem-solving requires teachers to have a deeper mastery of their subjects than for traditional knowledge transmission. September 2010 saw the launch of the Academy of Singapore Teachers. Its mandate – to facilitate a teacher-led culture of professional excellence centred on the holistic development of the child. The underlying idea is to give the teaching profession more autonomy over professional development, raise the level of professional practice, and strengthen the professional ethos. The academy will be governed by a council of teachers, and a range of programmes will drive professional development for Singapore’s 30 000 teachers. For example, master teachers can design and offer courses and workshops in their particular subjects for their colleagues across the system. The competencies targeted in Curriculum 2015 will frame the academy’s work.
AssessmentsReflecting the philosophy of Curriculum 2015, Singapore is interested in changing the balance in student assessment from assessment of learning to assessment for learning. It has begun by looking at what other countries are doing in this field, including Hong Kong-China, Australia, Sweden, and Scotland, but has not found a great deal of established work to date. The Ministry of Education is working on a Holistic Development Profile for each student. The idea is that from 2012, each student will have a profile that reflects the skills required by Curriculum 2015, enabling parents to be updated on their child’s progress in developing these competencies.
Research and evaluationThe Curriculum 2015 and 21st-century competencies framework are relatively new, so there is no formal research and evaluation being conducted at this point. In future, as innovations develop in schools and classrooms, a research programme will be devised.
CHALLENGES AND NEEDSAs we have seen, Singapore has developed a very strong knowledge-transmission education system in the core areas of mathematics, science and literacy, a strength it does not want to lose. Its excellent performance in PISA 2009 showed that in addition to having a
• Figure 5.2 •Singapore´s education system
Source: Singapore Ministry of Education (2010b).
Confi
dent P
ersonSelf-directed Learner
Self-Awareness
Self-Management
Social Awareness
RelationshipManagement
ResponsibleDecision-Making
Core ValuesActive Contributor
Conc
erne
d Ci
tizen
Info
rmat
ion
and
Com
mun
icatio
n Skills Civic Literacy, Global Aw
areness and Cross-cultural Skills
Critical and Inventive Thinking
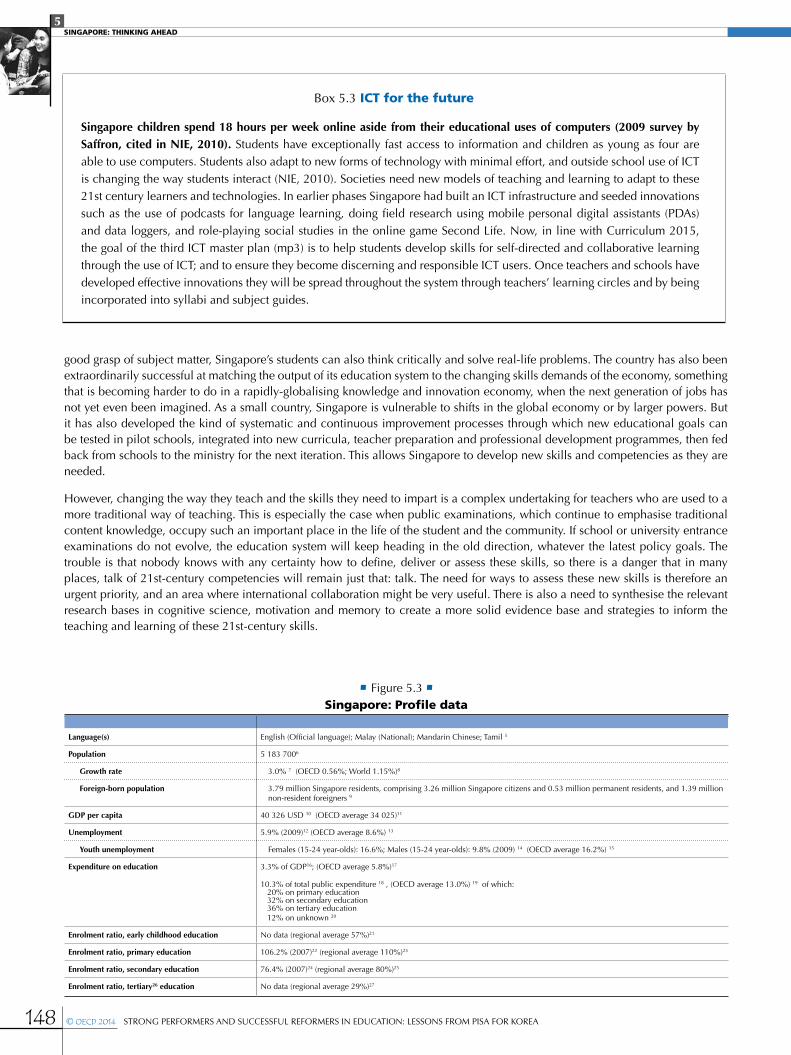
5SINGAPORE: THINKING AHEAD
148 © OECD 2014 STRONG PERFORMERS AND SUCCESSFUL REFORMERS IN EDUCATION: LESSONS FROM PISA FOR KOREA
good grasp of subject matter, Singapore’s students can also think critically and solve real-life problems. The country has also been extraordinarily successful at matching the output of its education system to the changing skills demands of the economy, something that is becoming harder to do in a rapidly-globalising knowledge and innovation economy, when the next generation of jobs has not yet even been imagined. As a small country, Singapore is vulnerable to shifts in the global economy or by larger powers. But it has also developed the kind of systematic and continuous improvement processes through which new educational goals can be tested in pilot schools, integrated into new curricula, teacher preparation and professional development programmes, then fed back from schools to the ministry for the next iteration. This allows Singapore to develop new skills and competencies as they are needed.
However, changing the way they teach and the skills they need to impart is a complex undertaking for teachers who are used to a more traditional way of teaching. This is especially the case when public examinations, which continue to emphasise traditional content knowledge, occupy such an important place in the life of the student and the community. If school or university entrance examinations do not evolve, the education system will keep heading in the old direction, whatever the latest policy goals. The trouble is that nobody knows with any certainty how to define, deliver or assess these skills, so there is a danger that in many places, talk of 21st-century competencies will remain just that: talk. The need for ways to assess these new skills is therefore an urgent priority, and an area where international collaboration might be very useful. There is also a need to synthesise the relevant research bases in cognitive science, motivation and memory to create a more solid evidence base and strategies to inform the teaching and learning of these 21st-century skills.
Box 5.3 ICT for the future
Singapore children spend 18 hours per week online aside from their educational uses of computers (2009 survey by Saffron, cited in NIE, 2010). Students have exceptionally fast access to information and children as young as four are able to use computers. Students also adapt to new forms of technology with minimal effort, and outside school use of ICT is changing the way students interact (NIE, 2010). Societies need new models of teaching and learning to adapt to these 21st century learners and technologies. In earlier phases Singapore had built an ICT infrastructure and seeded innovations such as the use of podcasts for language learning, doing field research using mobile personal digital assistants (PDAs) and data loggers, and role-playing social studies in the online game Second Life. Now, in line with Curriculum 2015, the goal of the third ICT master plan (mp3) is to help students develop skills for self-directed and collaborative learning through the use of ICT; and to ensure they become discerning and responsible ICT users. Once teachers and schools have developed effective innovations they will be spread throughout the system through teachers’ learning circles and by being incorporated into syllabi and subject guides.
• Figure 5.3 •Singapore: Profile data
Language(s) English (Official language); Malay (National); Mandarin Chinese; Tamil 5
Population 5 183 7006
Growth rate 3.0% 7 (OECD 0.56%; World 1.15%)8
Foreign-born population 3.79 million Singapore residents, comprising 3.26 million Singapore citizens and 0.53 million permanent residents, and 1.39 million non-resident foreigners 9
GDP per capita 40 326 USD 10 (OECD average 34 025)11
Unemployment 5.9% (2009)12 (OECD average 8.6%) 13
Youth unemployment Females (15-24 year-olds): 16.6%; Males (15-24 year-olds): 9.8% (2009) 14 (OECD average 16.2%) 15
Expenditure on education 3.3% of GDP16; (OECD average 5.8%)17
10.3% of total public expenditure 18 , (OECD average 13.0%) 19 of which: 20% on primary education 32% on secondary education 36% on tertiary education 12% on unknown 20
Enrolment ratio, early childhood education No data (regional average 57%)21
Enrolment ratio, primary education 106.2% (2007)22 (regional average 110%)23
Enrolment ratio, secondary education 76.4% (2007)24 (regional average 80%)25
Enrolment ratio, tertiary26 education No data (regional average 29%)27
5SINGAPORE: THINKING AHEAD
149STRONG PERFORMERS AND SUCCESSFUL REFORMERS IN EDUCATION: LESSONS FROM PISA FOR KOREA © OECD 2014
Notes
1. This evolution from four languages to English was a result of parental choice, rather than government decree.
2. This figure dropped to 4% in 2000, 2% in 2006 and 1.2% in 2009.
3. The five enablers are leadership, staff management, strategic planning, resources and student-focused processes. The four result areas are outcomes of holistic development of students (which includes academic results), staff well-being results, administrative and operational results and results of engagement with partners and community.
4. Polytechnic education lasts three years, leading to a diploma; ITE education lasts two to three years, depending on the qualifications sought.
5. Republic of Singapore Independence Act. http://statutes.agc.gov.sg/non_version/cgi-bin/cgi_getdata.pl?actno=1997-REVED-RSI&doctitle=REPUBLIC%20OF%20SINGAPORE%20INDEPENDENCE%20ACT%0A&date=latest&method=whole.
6. Population (Mid Year Estimates) & Land Area 2011, Statistics Singapore, 2011, http://www.singstat.gov.sg/stats/keyind.html#popnarea.
7. Annual population growth rate of Singapore 2009,http://data.worldbank.org/country.
8. OECD (2012), OECD Factbook 2011-2012, OECD Publishing, Annual population growth rate of the OECD and the World. Data from 2010.
9. Department of Statistics Singapore (2011), Population Trends 2011, Statistics Singapore, Singapore. Total population comprises Singapore residents and non-residents. Resident population comprises Singapore citizens and permanent residents. Non-resident population comprises foreigners who were working, studying or living in Singapore but not granted permanent residence, excluding tourists and short-term visitors. Data refers to 2011.
10. International Monetary Fund (2010), World Economic Outlook Database. Data from 2008.
11. OECD (2012), OECD Factbook 2011-2012, OECD Publishing. current prices and PPPs. (data from 2010).
12. World Bank country data, http://data.worldbank.org/country, accessed 3 August 2012.
13. OECD (2012), OECD Factbook 2011-2012, OECD Publishing. Total unemployment rates as percentage of total labour force. (data from 2010).
14. World Bank country data, http://data.worldbank.org/country, accessed 3 August 2012.
15. OECD (2012), OECD Employment Outlook 2012, OECD Publishing. Unemployed as a percentage of the labour force in the age group: youth aged 15-24. Data from 2011.
16. UNESCO-UIS (2011), UIS Statistics in Brief: Singapore, (data from 2010).
17. OECD (2012), Education at a Glance 2012, OECD Publishing. Public expenditure presented in this table includes public subsidies to households for living costs (scholarships and grants to students/households and students loans), which are not spent on educational institutions. (data from 2009).
18. UNESCO-UIS (2011), UIS Statistics in Brief: Singapore, (data from 2010).
19. OECD (2012), Education at a Glance 2012, OECD Publishing. Public expenditure presented in this table includes public subsidies to households for living costs (scholarships and grants to students/households and students loans), which are not spent on educational institutions. (data from 2009).
20. UNESCO-UIS (2011), UIS Statistics in Brief: Singapore, (data from 2010).
21. UNESCO-UIS (2011), UIS Statistics in Brief: Singapore. Percentage represents gross enrolment rate for MF; Year of reference 2010.
22. World Bank country data, http://data.worldbank.org/country, accessed 3 May 2011.
23. UNESCO-UIS (2011), UIS Statistics in Brief: Singapore. Percentage represents gross enrolment rate for MF; Year of reference 2010.
24. World Bank country data, http://data.worldbank.org/country, accessed 3 May 2011.
25. UNESCO-UIS (2011), UIS Statistics in Brief: Singapore. Percentage represents gross enrolment rate for MF; Year of reference 2010.
26. The OECD follows standard international conventions in using the term “tertiary education” to refer to all post-secondary programmes at ISCED levels 5B, 5A and 6, regardless of the institutions in which they are offered. OECD (2008), Tertiary Education for the Knowledge Society: Volume 1, OECD Publishing.
27. UNESCO-UIS (2011), UIS Statistics in Brief: Singapore. Year of reference 2010.
5SINGAPORE: THINKING AHEAD
150 © OECD 2014 STRONG PERFORMERS AND SUCCESSFUL REFORMERS IN EDUCATION: LESSONS FROM PISA FOR KOREA
References and further reading
Asia Society (2007), Learning in a Global Age: Knowledge and Skills for a Flat World, Asia Society, New York.
Asia Society and Council of Chief State School Officers (2010), International Perspectives on US Policy and Practice, Asia Society, New York, available at http://asiasociety.org/files/learningwiththeworld.pdf.
Barber, M. and M. Mourshed (2007), How the World’s Best-Performing School Systems Come Out on Top, McKinsey and Company, London.
Darling-Hammond, L. (2010), The Flat World and Education, Teachers College Press, New York.
Goh, K.S. (1979), Report on the Ministry of Education 1978, Singapore National Printers, Singapore.
Hong, K.T., Y.S. Mei, and J. Lim (2009), The Singapore Model Method for Learning Mathematics, Curriculum Planning and Development Division, Ministry of Education, Singapore.
IMD (2007), IMD World Competitiveness Yearbook, IMD, Lausanne.
Quek, G. et al. (eds) (2007), TIMSS Encylopedia: A Guide to Mathematics and Science Education Around the World, Vol. 1, TIMSS, International Association for the Evaluation of Educational Achievement, Boston College, Massachusetts.
Lee, S.K. et al. (eds) (2008), Toward a Better Future: Education and Training for Economic Development in Singapore since 1965, The World Bank, Washington, DC.
Low, E. (2010), Educating Teachers for the 21st Century: The Singapore Model, National Institute of Education, Singapore.
NIE (National Institute of Education) (2009), TE21: A Teacher Education Model for the 21st Century, National Institute of Education, Singapore.
NIE (2010), Perspectives in Motivating Educators and Learners, Motivation in Education Research Lab, National Institute of Education, Singapore.
National University of Singapore (2009), State of the University 2009, National University of Singapore, Singapore.
Ng, E.H. (2008), Speech by Dr Ng Eng Hen, Minister for Education, Ministry of Education website, www.moe.gov.sg.
Ng, P.T. (2008a), “Education reform in Singapore: From quantity to quality”, Educational Research for Policy and Practice, Vol. 7, pp. 5-15.
Ng, P.T. (2008b), “Developing forward-looking and innovative school leaders: The Singapore leaders in education program”, Journal of In-Service Education, Vol. 34/2, pp. 237-255.
OECD (2010a), PISA 2009 Volume I, What Students Know and Can Do: Student Performance in Reading, Mathematics and Science, OECD Publishing. http://dx.doi.org/10.1787/9789264091450-en.
OECD (2010b), OECD Factbook 2010, OECD Publishing. http://dx.doi.org/10.1787/factbook-2010-en.
OECD (2010c), Employment Outlook 2010, OECD Publishing. http://dx.doi.org/10.1787/empl_outlook-2010-en.
OECD (2010d), Education at a Glance 2010: OECD Indicators, OECD Publishing. http://dx.doi.org/10.1787/eag-2010-en.
OECD (2012e), OECD Factbook 2011-2012, OECD Publishing. http://dx.doi.org/10.1787/factbook-2011-en.
OECD (2012f), OECD Employment Outlook 2012, OECD Publishing. http://dx.doi.org/10.1787/empl_outlook-2012-en.
OECD (2012g), Education at a Glance 2012: OECD Indicators, OECD Publishing. http://dx.doi.org/10.1787/eag-2012-en.
OECD (2012h), Strong Performers and Successful Reformers: Lessons from PISA for JAPAN, OECD Publishing. http://dx.doi.org/10.1787/9789264118539-en.
Schmidt, W. (2005), “The Role of Curriculum”, American Educator, Vol.23/4.
Sclafani, S. and E. Lim (2008), Rethinking Human Capital in Education: Singapore as a Model for Human Development, Aspen Institute, Washington, DC.
Singapore Ministry of Education (2009), “Government accepts recommendations on primary education”, Ministry of Education Press Release, 14 April 2009, www.moe.gov.sg.
Singapore Ministry of Education (2010a), “MOE to enhance learning of 21st century competencies and strengthen art, music, and physical education”, Ministry of Education Press Release, March 2010, www.moe.gov.sg.
5SINGAPORE: THINKING AHEAD
151STRONG PERFORMERS AND SUCCESSFUL REFORMERS IN EDUCATION: LESSONS FROM PISA FOR KOREA © OECD 2014
Singapore Ministry of Education (2010b), Nurturing our Young for the Future: Competencies for the 21st Century, Ministry of Education, Singapore, available at www.moe.gov.sg/committee-of-supply-debate/files/nurturing-our-young.pdf.
Stewart, V. (2010), Dream, Design, Deliver: How Singapore Developed a High-Quality Teacher Workforce, Phi Delta Kappa International, Bloomington, Indiana.
Times Higher Education Supplement (2010), Rankings of World Universities 2010, available online at www.timeshighereducation.co.uk/world-university-rankings/.
Yew, L.K. (2000), From Third World to First, Harper Collins, New York.

5SINGAPORE: THINKING AHEAD
152 © OECD 2014 STRONG PERFORMERS AND SUCCESSFUL REFORMERS IN EDUCATION: LESSONS FROM PISA FOR KOREA
Annex 5.A1. Interview Partners (Singapore)
Ho, Peng, Director General of Education, Ministry of Education, Singapore.
Hogan, David, Principal Research Scientist, National Institute of Education, Singapore.
Lee, Sing Kong, Director, National Institute of Education, Singapore.
Low, Ee Ling, Associate Professor, National Institute of Education.
Pang, Elizabeth, Programme Director, Literacy Development, Curriculum Planning and Development Division, Ministry of Education, Singapore.
Suppiah, Mangoran, Executive Director, Academy of Singapore Teachers.
Wong, Siew Hoong, Director of Schools, Schools Division, Ministry of Education, Singapore.
Representatives from the Economic Development Board, Housing Development Board, Ministry of Manpower, National University of
Singapore, Ministry of National Development, NUS School of Science and Math, Victoria High School, Chongfu Primary School,
Assumption Pathway School, Institute of Technical Education, National Institute of Education, A*Star, Keppel Offshore and Marine, and
Marshall Cavendish who met with a delegation from North Carolina State Board of Education, January 2010.
6
153STRONG PERFORMERS AND SUCCESSFUL REFORMERS IN EDUCATION: LESSONS FROM PISA FOR KOREA © OECD 2014
Ontario: Harnessing the Skills of Tomorrow
Not only do Canadian students perform well in PISA, they do so despite their socio-economic status, first language or whether they are native Canadians or recent immigrants. Canada has achieved success within a highly federated system that accommodates a diverse student population. This chapter examines Canada’s success through an in-depth look at the education system of the country’s largest province, Ontario. It describes how the province combines a demand for excellence with extensive capacity-building, and fosters a climate of trust and mutual respect among all stakeholders.
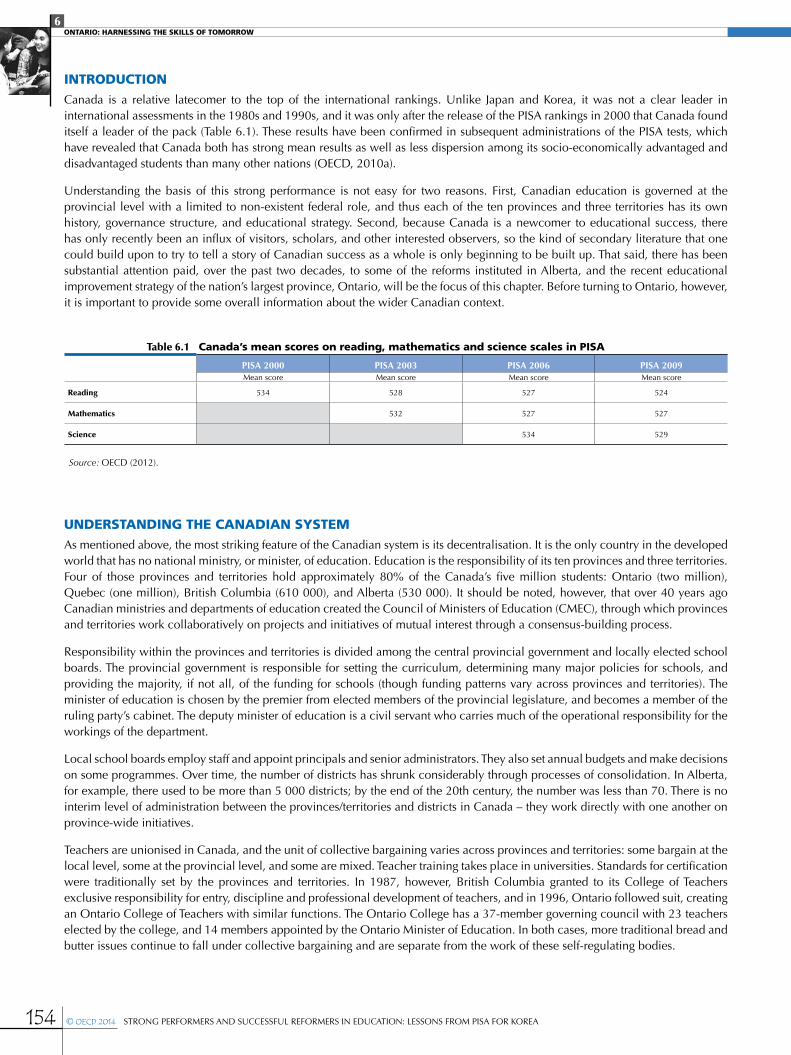
6ONTARIO: HARNESSING THE SKILLS OF TOMORROW
154 © OECD 2014 STRONG PERFORMERS AND SUCCESSFUL REFORMERS IN EDUCATION: LESSONS FROM PISA FOR KOREA
INTRODUCTIONCanada is a relative latecomer to the top of the international rankings. Unlike Japan and Korea, it was not a clear leader in international assessments in the 1980s and 1990s, and it was only after the release of the PISA rankings in 2000 that Canada found itself a leader of the pack (Table 6.1). These results have been confirmed in subsequent administrations of the PISA tests, which have revealed that Canada both has strong mean results as well as less dispersion among its socio-economically advantaged and disadvantaged students than many other nations (OECD, 2010a).
Understanding the basis of this strong performance is not easy for two reasons. First, Canadian education is governed at the provincial level with a limited to non-existent federal role, and thus each of the ten provinces and three territories has its own history, governance structure, and educational strategy. Second, because Canada is a newcomer to educational success, there has only recently been an influx of visitors, scholars, and other interested observers, so the kind of secondary literature that one could build upon to try to tell a story of Canadian success as a whole is only beginning to be built up. That said, there has been substantial attention paid, over the past two decades, to some of the reforms instituted in Alberta, and the recent educational improvement strategy of the nation’s largest province, Ontario, will be the focus of this chapter. Before turning to Ontario, however, it is important to provide some overall information about the wider Canadian context.
UNDERSTANDING THE CANADIAN SYSTEMAs mentioned above, the most striking feature of the Canadian system is its decentralisation. It is the only country in the developed world that has no national ministry, or minister, of education. Education is the responsibility of its ten provinces and three territories. Four of those provinces and territories hold approximately 80% of the Canada’s five million students: Ontario (two million), Quebec (one million), British Columbia (610 000), and Alberta (530 000). It should be noted, however, that over 40 years ago Canadian ministries and departments of education created the Council of Ministers of Education (CMEC), through which provinces and territories work collaboratively on projects and initiatives of mutual interest through a consensus-building process.
Responsibility within the provinces and territories is divided among the central provincial government and locally elected school boards. The provincial government is responsible for setting the curriculum, determining many major policies for schools, and providing the majority, if not all, of the funding for schools (though funding patterns vary across provinces and territories). The minister of education is chosen by the premier from elected members of the provincial legislature, and becomes a member of the ruling party’s cabinet. The deputy minister of education is a civil servant who carries much of the operational responsibility for the workings of the department.
Local school boards employ staff and appoint principals and senior administrators. They also set annual budgets and make decisions on some programmes. Over time, the number of districts has shrunk considerably through processes of consolidation. In Alberta, for example, there used to be more than 5 000 districts; by the end of the 20th century, the number was less than 70. There is no interim level of administration between the provinces/territories and districts in Canada – they work directly with one another on province-wide initiatives.
Teachers are unionised in Canada, and the unit of collective bargaining varies across provinces and territories: some bargain at the local level, some at the provincial level, and some are mixed. Teacher training takes place in universities. Standards for certification were traditionally set by the provinces and territories. In 1987, however, British Columbia granted to its College of Teachers exclusive responsibility for entry, discipline and professional development of teachers, and in 1996, Ontario followed suit, creating an Ontario College of Teachers with similar functions. The Ontario College has a 37-member governing council with 23 teachers elected by the college, and 14 members appointed by the Ontario Minister of Education. In both cases, more traditional bread and butter issues continue to fall under collective bargaining and are separate from the work of these self-regulating bodies.
Table 6.1 Canada’s mean scores on reading, mathematics and science scales in PISA
PISA 2000 PISA 2003 PISA 2006 PISA 2009Mean score Mean score Mean score Mean score
Reading 534 528 527 524
Mathematics 532 527 527
Science 534 529
Source: OECD (2012).
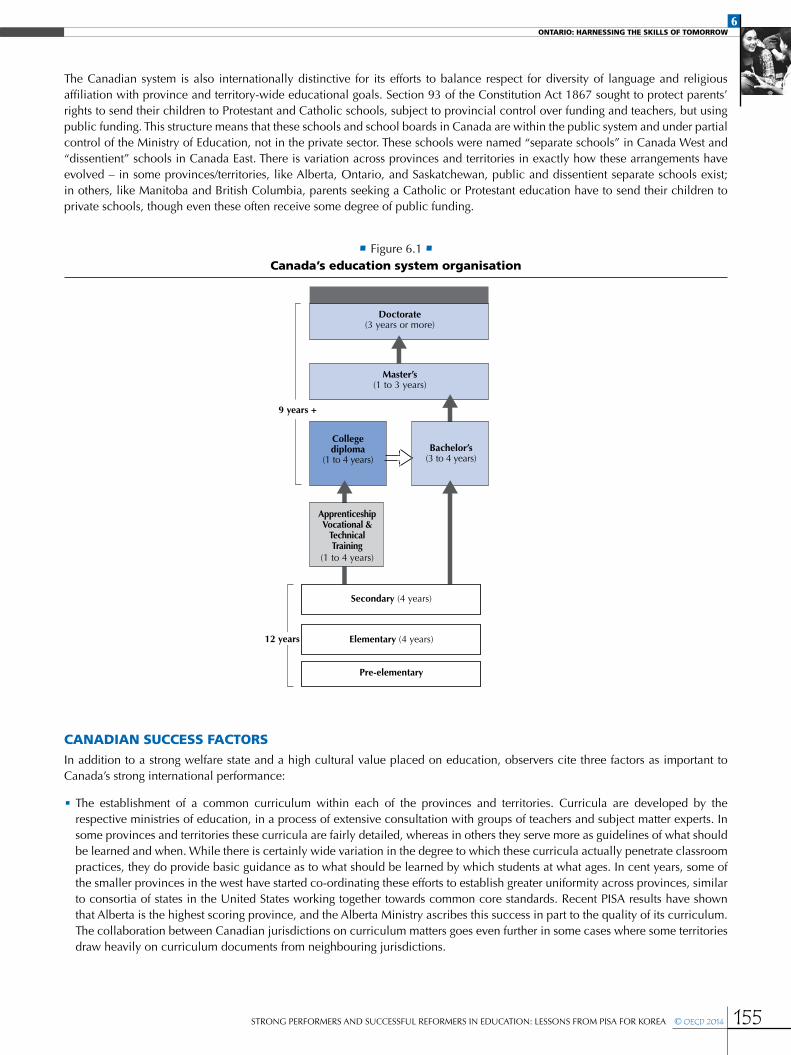
6ONTARIO: HARNESSING THE SKILLS OF TOMORROW
155STRONG PERFORMERS AND SUCCESSFUL REFORMERS IN EDUCATION: LESSONS FROM PISA FOR KOREA © OECD 2014
The Canadian system is also internationally distinctive for its efforts to balance respect for diversity of language and religious affiliation with province and territory-wide educational goals. Section 93 of the Constitution Act 1867 sought to protect parents’ rights to send their children to Protestant and Catholic schools, subject to provincial control over funding and teachers, but using public funding. This structure means that these schools and school boards in Canada are within the public system and under partial control of the Ministry of Education, not in the private sector. These schools were named “separate schools” in Canada West and “dissentient” schools in Canada East. There is variation across provinces and territories in exactly how these arrangements have evolved – in some provinces/territories, like Alberta, Ontario, and Saskatchewan, public and dissentient separate schools exist; in others, like Manitoba and British Columbia, parents seeking a Catholic or Protestant education have to send their children to private schools, though even these often receive some degree of public funding.
CANADIAN SUCCESS FACTORSIn addition to a strong welfare state and a high cultural value placed on education, observers cite three factors as important to Canada’s strong international performance:
•The establishment of a common curriculum within each of the provinces and territories. Curricula are developed by the respective ministries of education, in a process of extensive consultation with groups of teachers and subject matter experts. In some provinces and territories these curricula are fairly detailed, whereas in others they serve more as guidelines of what should be learned and when. While there is certainly wide variation in the degree to which these curricula actually penetrate classroom practices, they do provide basic guidance as to what should be learned by which students at what ages. In cent years, some of the smaller provinces in the west have started co-ordinating these efforts to establish greater uniformity across provinces, similar to consortia of states in the United States working together towards common core standards. Recent PISA results have shown that Alberta is the highest scoring province, and the Alberta Ministry ascribes this success in part to the quality of its curriculum. The collaboration between Canadian jurisdictions on curriculum matters goes even further in some cases where some territories draw heavily on curriculum documents from neighbouring jurisdictions.
• Figure 6.1 •Canada’s education system organisation
12 years
9 years +
Collegediploma
(1 to 4 years)
Doctorate(3 years or more)
Master’s(1 to 3 years)
ApprenticeshipVocational &
TechnicalTraining
(1 to 4 years)
Pre-elementary
Elementary (4 years)
Bachelor’s(3 to 4 years)
Secondary (4 years)
6ONTARIO: HARNESSING THE SKILLS OF TOMORROW
156 © OECD 2014 STRONG PERFORMERS AND SUCCESSFUL REFORMERS IN EDUCATION: LESSONS FROM PISA FOR KOREA
•The high degree of selectivity in choosing teachers. The 2007 McKinsey report on PISA leaders emphasised that one factor which differentiated PISA leaders from those further down the chart was the degree to which teacher education programmes were able to draw their students from th top end of the talent pool (Barber and Mourshed, 2007). According to Ben Levin, former deputy minister in Ontario and a widely cited scholar on Canadian education, Canadian applicants to teachers colleges are in the “top 30%” of their college cohorts. The education within Canada’s teacher training institutions is seen by some to be of high quality; Levin estimates there are perhaps 50 across Canada, as opposed to hundreds across the United States, which allows for greater monitoring of training quality. Other respondents agreed that teacher selectivity was high, but were more sceptical about the quality of the training institutions.
•Equalised funding. Since funding responsibility lies entirely, or almost entirely, at the province/territory level, they are able to provide funding to offset the greater neediness of some of their students. Public funding for education comes either directly from the provincial or territorial government or through a mix of provincial transfers and local taxes collected either by the local government or by the boards with taxing powers. Provincial and territorial regulations, revised yearly, provide the grant structure that sets the level of funding for each school board based on factors such as the number of students, special needs, and location. Funding from the provinces and territories to districts is generally split into three categories: block grants based on number of students; categorical grants which are either used to fund particular programmatic needs (e.g. special education) or to help those districts struggling to provide basic services (e.g. more geographically-dispersed districts need more funds for transportation); and equalisation funding, which is used in the districts that retain some local funding to top up the poorer districts.
ONTARIO: REFORMING FOR THE FUTUREBetween 2003 and 2010, Ontario was a world leader in its sustained strategy of professionally-driven education reform. Initiated by Premier Dalton McGuinty on his election in 2003, the Ontario strategy has achieved widespread positive results in increasing elementary literacy and numeracy, improving graduation rates, and reducing the number of low-performing schools. The constellation of elements that came together to fuel the success of this strategy is described below.
Ontario is the largest province in Canada, with an area of about 1 100 000 square kilometres and a population of approximately 13 million: 40% of all Canadians. It has a major role in the Canadian economy contributing about 37% of the country’s GDP. It is a highly urbanised province, with 80% of students located in metropolitan areas. In terms of diversity, 27% of Ontario students are born outside of Canada and 20% are visible minorities. Toronto, the main city in Ontario, is one of the most diverse cities in the world.
There are four sets of locally elected school boards in Ontario, in order to fulfil Canada’s constitutional requirements for public support of minority languages and religious minorities:
•31 English public school boards serve about 1.4 million students;
•29 English Catholic school boards serve about 590 000 students;
•8 French Catholic boards have 70 000 students; and
•4 French public boards have 23 000 students.
This means that any given area of the province will be served by four boards, allowing for some degree of choice in the system. There are about 5 000 schools in the public system; there is no public funding for private schools.
Focusing on a few clear goalsFrom the beginning, central to Ontario’s theory of change was that systemic reform across several layers of government and 5 000 schools would require a steady and coherent focus on a very limited number of goals. Too often, school systems are easily distracted and drawn into many questions and controversies that have little or no relationship to improving student learning and educational attainment. McGuinty had made two central commitments that guided the work of the ministry: to increase literacy and numeracy performance in elementary schools, and to increase the high school graduation rate. The government also set ambitious, but realistic, long-term numerical targets for each of these goals: to increase the proportion of students achieving at the provincial standard – a high standard, equivalent to a B grade – in reading, writing, and mathematics from 55% to 75%; and to increase the high school graduation rate from 68% to 85%.
To achieve these goals, the ministry introduced a multifaceted strategy for improvement based on a clearly articulated hypothesis: that system pressure combined with targeted school-level support would yield greater results than top-down pressure accompanied by punitive consequences for persistently low performance. This work was informed by a careful analysis of the failings of previous initiatives. Most top-down initiatives, they concluded, were unable to achieve deep and lasting changes in practice because: 1) the reforms were focused on things that were too distant from the instructional core of teaching and learning; 2) the reforms assumed that teachers would know how to do things they didn’t know how to do; 3) blizzards of conflicting reforms asked teachers to do too many things simultaneously; and 4) teachers and schools did not buy-in to the reform strategy.
6ONTARIO: HARNESSING THE SKILLS OF TOMORROW
157STRONG PERFORMERS AND SUCCESSFUL REFORMERS IN EDUCATION: LESSONS FROM PISA FOR KOREA © OECD 2014
To achieve sustained change, then, would require:
•strategies directly focused on improving the act of teaching;
•careful and detailed attention to implementation along with opportunities for teachers to practise new ideas and learn from their colleagues;
•a single integrated strategy and one set of expectations for teachers and students; and
•a commitment to build partnerships with teachers and school boards.
Both province and district policies would need to be crafted with all of these goals in mind.
Building support among teachers, unions, and other stakeholdersOf all of these points, the last one (gaining teacher support) was perhaps most important to the new strategy. To improve results Of all of these points, the last one (gaining teacher support) was perhaps most important to the new strategy. To improve results across 5 000 schools would require a continuous and sustained effort on the part of hundreds of thousands of teachers to try to improve their practice. This, they thought, could only happen if teachers were “onside” (to use their word).
To this end, the ministry drew a sharp contrast between its capacity-building approach to reform and the more punitive versions of accountability used in some other countries. Its focus was on supporting the continuous improvement of all schools, with special attention and support to the lowest performers. In that context, it did not use public reporting of results to shame or blame, but to mobilise additional resources and assistance to struggling schools, while being accountable to parents and the broader community for results.
Politically, it is clear that the ministry acted extremely skilfully to engage the support of teachers, schools, and unions in a shared vision of reform. Appointing Gerard Kennedy as Education Minister (widely seen as someone who supported public education and was sensitive to the needs of teachers) and Ben Levin (a deeply knowledgeable academic and practitioner) as his Deputy signalled a commitment to a more consultative, coalition-building style of leadership in education. The Deputy Minister met quarterly with the major teachers’ unions, superintendents’ organisations, and principal associations to discuss ongoing reform strategies. The ministry also created the Ontario Education Partnership Table where a wider range of stakeholders could meet with ministry officials two to four times a year; this led to working tables, where smaller groups of stakeholders worked in more detail on particular issues.
Of particular importance to these efforts was the signing in 2005 of four-year collective bargaining agreements between the four major teachers’ unions and provincial trustee associations. These agreements were the result of a set of provincial dialogues convened by the government, and which created a framework that advanced the government’s educational improvement strategy while addressing teacher workload issues. Specifically, McGuinty had pledged to increase investments in elementary education and reduce class size, which provided the funding for 5 000 new elementary teaching positions in music, art, physical education and languages, while providing regular classroom teachers with additional preparation time. The government also provided money for hiring a full or part-time Student Success Officer (see below) in each secondary school. These agreements thus both pushed forward the educational agenda and created a sustained period of labour peace that allowed for a continued focus on educational improvement.
Creating the structures for solid implementation
There were two major initiatives pursued by the Ontario Education Ministry over this time period: the first focused on elementary Schools, the second on high schools. These initiatives, however, need to be seen in the context of a broader government commitment to the education and development of children that begins in the pre-school years and culminates in post-secondary success in higher education or the workforce.
Reforming literacy and numeracy in elementary schoolsThe ministry’s first initiative focused on literacy and numeracy, and its strategy revolved around the creation of a new school assistance unit, the Literacy and Numeracy Secretariat (LNS; Box 6.1). The aim here was to increase reading and maths results in elementary schools. Through a deep capacity-building strategy, this initiative has succeeded in raising the proportion of students meeting the provincial standard on provincial assessments from roughly 55% (2003) to roughly 68% (2010) in reading, mathematics and writing in third grade. Similar gains of about 10-12 percentage points are apparent in the same subjects in sixth grade.
Reducing high school dropoutsThe second ministry initiative was called Student Success and aimed to increase the high school graduation rate. From the outset, the Student Success strategy was comprised of three main pillars: increased focus on literacy and numeracy achievement; clearly
6ONTARIO: HARNESSING THE SKILLS OF TOMORROW
158 © OECD 2014 STRONG PERFORMERS AND SUCCESSFUL REFORMERS IN EDUCATION: LESSONS FROM PISA FOR KOREA
demarked pathways to post-secondary destinations; and supportive, caring school communities designed to strengthen student engagement. The insight behind this programme was that the road to dropping out of high school starts early: by tracking students who have failed one or more courses in ninth grade, it is possible to identify potential dropouts quickly.
For this initiative, the government pursued a different strategy. Rather than sending out a team from the ministry, they gave money to each district to hire a Student Success Teacher responsible for co-ordinating efforts in their district. The ministry also gave money to allow the district leaders to meet and share strategies. Again each high school was given support to hire a provincially-funded Student Success Teacher and required to create a Student Success team to track data on which students failed one or more courses in ninth grade and then design appropriate early interventions. Programmes of “credit recovery” were also created, allowing students to make up the parts of courses that they failed. These strategies have helped increase graduation rates from 68% to 75%.
Avoiding top-down mandates and clarifying rolesAnother element of success was that the ministry tried to ensure that reform was really a two-way street, rather than simply something imposed from the top. As described by Michael Fullan, an internationally known expert on education reform who served as Special Advisor to the Ontario Premier and Minister of Education, this was one of the lessons learned from the British model:
Michael Barber in the English strategy eventually called their strategy ‘Informed Prescription.’ So the idea of Informed Prescription was that you do your homework at the centre, you get informed and then you pretty much prescribe the curriculum and the instructional methods and use of time, including such things as the literacy hour. By contrast, when we set up our Secretariat, we said to the field, to our 72 districts, ‘Don’t worry, we are not going to come up with Informed Prescription and start advocating particular usages. Rather, what we are going to do is join in partnership with you in the field, the sector, and identify good practices and consolidate those and spread them. They might eventually come to have a certain kind of status that comes close to being non-negotiable, but we are not in the business at the centre of telling you what to do. We are in the business of jointly co-discovering it’. So that’s what we did and that’s how we did it. (Interview conducted for this report)
The ministry also pursued a clear theory of comparative advantage in terms of who should do what in implementing to the reforms. The role of the ministry was to set clear expectations and targets, to provide funding, to create a working collective bargaining agreement that would support improved teaching and learning, to provide external expertise, and to intervene with support in struggling schools. The role of the district was to align its personnel and hiring policies with the overall strategy, and to support the schools as they went through continuous processes of learning. Much of the real action had to happen in schools, which was where teachers worked in communities to think about problems of practice, and to learn from one another. While the mission and sustained pressure came from the top, there was a clear recognition that it was at the school level in which change had to happen, and that the role of other actors in the system was to support the learning and change that had to happen there.
Cultural support for universal high achievement by a diverse populationOntario attracts almost one-third of all immigrants to Canada, and immigrant children succeed at high levels in Ontario’s schools. PISA results suggest that within three years, Canadian immigrants average a score of 500 (OECD average) on the PISA assessment,
Box 6.1 Building the capacity for reform: the Literacy and Numeracy Secretariat
The LNS was a new 100-person unit responsible for building the capacity and expertise to do the work in schools. Organisationally independent of the ministry, it was able to start afresh without the usual bureaucratic obstacles. The ministry also required that teams be created in each district and each school in order to lead the work on literacy and numeracy. By so doing, they paired external expertise with sustained internal time and leadership to push the initiative. Avis Glaze, who was responsible for leading the LNS, said that the effort succeeded in part because of its field base:
“We recruited a new team of people who had deep experience in the field – teachers, principals, subject matter specialists – people who were deeply respected by teachers and schools, and were not seen primarily as representatives of the department. This mini-organisation was largely based in the field – we had six regional teams plus one French language team, each of six to eight people. This means that the majority of the people in the Secretariat were actively working in the field, building relationships with schools, principals and teachers, rather than in the home office back at the Ministry.” (Interview conducted for this report).
6ONTARIO: HARNESSING THE SKILLS OF TOMORROW
159STRONG PERFORMERS AND SUCCESSFUL REFORMERS IN EDUCATION: LESSONS FROM PISA FOR KOREA © OECD 2014
which is remarkably strong by international standards (OECD, 2010). For comparison’s sake, on the 2003 PISA reading survey, Canadian first-generation immigrants scored an average of more than 510 points, ranking second, compared to less than 460 points in the United States and less than 430 points in France (OECD, 2003). Canada is also one of very few countries where there is no gap between its immigrant and native students on the PISA. Second-generation Canadians perform significantly better than first-generation Canadians, suggesting that the pattern is one of progress over time. Finally, Canada is one of only two countries (along with Australia), where there is no difference in performance between students who do not speak the language of instruction at home and those who do.
The performance of Ontario’s immigrant student population mirrors that of the nation and largely reflects the provincial government’s investment in creating diverse, equitable, and inclusive learning environments, and engaging students, parents, and communities in meaningful ways. It is also a reflection, however, of the high expectations immigrant families have for their children, and of the fact that those high expectations seem by and large to be held by educators as well. Because Canada has historically seen its immigrants as important members of Canadian society, crucial to the continuing development of the country, and because its immigration policies reflect those values, schools see their role as integrating children into the mainstream culture as rapidly as possible. If anything, the value placed on high achievement for immigrant children seems to have positive spillover effects onto the expectations for Canadian-born children, rather than the other way round.
A coherent system based on shared understanding and common purposeAlthough some observers complained about the sheer number of initiatives launched by the McGuinty government over the years, it is apparent that the Ontario reform designers worked hard to develop and implement a systemic response to the problems and challenges they inherited. An important, but often underestimated, barrier to achieving system coherence is the lack of a shared understanding among key stakeholders about how key government leaders see the problems of the system and what lies behind the policies and programmes they have designed in response. The McGuinty government worked tirelessly to build a sense of shared understanding and common purpose among key stakeholder groups, and consequently their two major systemic initiatives – the Literacy and Numeracy Secretariat (Box 6.1) and the Student Success/Learning to 18 strategy – enjoyed broad public understanding and support.
A strong focus on educator quality Ontario’s reforms rested heavily on the government’s confidence in the quality of the province’s teaching force. The Literacy and Numeracy Secretariat decided not to follow England’s “informed prescription” model, but rather to put seed money into the field to encourage local experimentation and innovation. This sent a strong signal that teacher-generated solutions to weaknesses in reading and maths performance were likely to be more successful than solutions imposed from above. The fact that teaching has historically been a respected profession in Canada, one that continues to draw its candidates from the top one-third of secondary school graduates, meant that the government had a solid basis for believing that its trust would pay off. The Student Success Teachers worked in teams to develop workable solutions for individual students because they were capable of doing so successfully. This show of trust in the competence and professionalism of the teaching force was an essential ingredient in forming a partnership between the profession and the government.
Ontario has paid special attention to leadership development, especially for school principals and vice-principals. In 2008 the government initiated the Ontario Leadership Strategy, based upon the Ontario Leadership Framework that spells out the leadership practices and the skills, knowledge and attitudes of effective leaders. Among the elements of the strategy are a strong mentoring programme that has now reached over 5 000 principals and vice-principals and a new province-wide performance system for school leaders. Additionally, funding and other resources have been provided for districts to develop and implement a Board Leadership Development Strategy that includes talent development and succession planning to ensure a pipeline of strong, committed candidates to fill leadership positions.
Strong and persistent leadershipAll accounts of Ontario agree that sustained political leadership by Premier McGuinty has been fundamental to the success of the reforms. McGuinty ran on a platform of becoming the “education premier”, and throughout his election, and re-election in 2007, he has kept a steady focus on educational improvement. He built on the foundations of national assessments and accountability that had been established by previous governments. McGuinty was personally involved in the reforms, and has met repeatedly with key educational stakeholders over the course of his premiership to emphasise the importance of the reforms. Michael Fullan, a major architect of the strategy, said of McGuinty during interviews for this report:
The Premier is key, obviously. If Premier McGuinty had left it would have been a different story. I said to him in the first term, when you get re-elected….[don’t] lose the plot, fail to keep the sustainability and focus on it. And the week after he got re-elected, he said to me, Not only am I not going to lose the plot, I’m going to intensify it, become even more committed and more confident and more impatient.
6ONTARIO: HARNESSING THE SKILLS OF TOMORROW
160 © OECD 2014 STRONG PERFORMERS AND SUCCESSFUL REFORMERS IN EDUCATION: LESSONS FROM PISA FOR KOREA
The combination of skilled, sustained political leadership from the Premier and a succession of capable ministers, and very strong professional leadership from Ben Levin and his successors in the Deputy Minister role, accounts for a big part of Ontario’s success. While the initial decision to create the Literacy and Numeracy Secretariat outside the bureaucracy suggests that the political leadership did not have confidence that the Education Department could carry out such an ambitious, high-profile initiative, one of Levin’s key goals was to make the department more attentive and responsive to the field, and it seems he and his successors have made significant progress in that regard, as evidenced by the decision to re-integrate the LNS into the ministry.
Enhanced professional accountability Ontario has managed to balance administrative and professional accountability well. The McGuinty government made no attempt to dismantle or weaken the assessment regime put in place by the previous government, and it has consistently communicated the message to the field and the public that results matter, as defined by performance on the provincial assessments. However, its response to weak performance has consistently been intervention and support, not blame and punishment. The underlying assumption of Ontario’s leaders seems to be that teachers are professionals who are trying to do the right thing, and that performance problems are much more likely to be a product of lack of knowledge than lack of motivation. Consequently, teachers seem to own more responsibility for performance than is often the case in countries with a more punitive approach to external accountability. Teachers’ success is celebrated when they are included in provincial Innovation Awards along with members of other professions and recognised by the Premier’s Awards for Teaching Excellence.
HARNESSING THE SKILLS OF TOMORROW, IN BOTH STUDENTS AND TEACHERSIn his 2008 budget Premier McGuinty asked a research institute at the University of Toronto to undertake a study of the changing composition of Ontario’s economy and workforce and to examine historical changes and projected future trends affecting Ontario. The aim was “to provide recommendations to the province on how to ensure Ontario’s economy and people remain economically competitive”. The resulting report, Ontario in the Creative Age (Florida and Martin, 2009), made a powerful case for the centrality of creativity and innovation as key to Ontario’s future prosperity, an argument with clear implications for education as well as for other units of government more directly focused on workforce development and the economy. In subsequent speeches the Premier has continued to sound the theme that the future belongs to places that can harness the creativity, skills, knowledge, and drive of their people. In this section we describe some of the strategies Ontario has put in place to develop these elements through the education system.
Strategies for developing critical thinking One of the most striking things about Ontario’s success in moving the needle on its most important measures – academic proficiency in the elementary grades, graduation rates in the high schools – has been that these gains have not been achieved as a consequence of narrowing the curriculum or focusing on teaching to the test. Rather, this progress has occurred in the context of a deliberate province-wide focus on ensuring that all schools offer a rich curriculum and an instructional focus on the development of critical, higher-order thinking skills. This emphasis on critical thinking is not limited to language arts, mathematics, and science, but permeates all subjects in the Ontario curriculum, as does the development of metacognitive skills (thinking about thinking). It is also woven into the fabric of everyday life in Ontario’s schools. It can be seen in the curriculum documents that frame the goals of education in the province, the professional development supports offered to teachers, the structure and diversity of programme offerings for students in the high schools, and in the language the government uses in its publications to communicate with Ontario parents and citizens. It is clear from a recent set of interviews with Toronto-area administrators and from reviewing a set of teacher- developed units of study that these more ambitious learning goals for young people – what economists Frank Levy and Richard Murnane refer to as “expert thinking” and “complex communications” – exist not simply in official documents but are making their way into Ontario classrooms (Levy and Murnane, 2004).
Early in Premier McGuinty’s second term the government released a policy paper entitled Reach Every Student – Energizing Ontario Education (Ontario Ministry of Education, 2008). Rather than declaring victory on his three major first-term priorities and moving on to a new set of initiatives, the government asserted its intention to go “deeper and wider” on literacy and numeracy and get 75% of students to an advanced level on these skills. It defined advanced literacy for the 21st century as follows:
Literacy is defined as the ability to use language and images in rich and varied forms to read, write, listen, view, represent, and think critically about ideas. It involves the capacity to access, manage, and evaluate information; to think imaginatively and analytically; and to communicate thoughts and ideas effectively. Literacy includes critical thinking and reasoning to solve problems and make decisions related to issues of fairness, equity and social justice. Literacy connects individuals and communities and is an essential tool for personal growth and active participation in a cohesive, democratic society. (Ontario Ministry of Education, 2008)
6ONTARIO: HARNESSING THE SKILLS OF TOMORROW
161STRONG PERFORMERS AND SUCCESSFUL REFORMERS IN EDUCATION: LESSONS FROM PISA FOR KOREA © OECD 2014
The government’s definition of advanced numeracy is equally focused on higher order thinking and application, as evidenced by the following sentence:
Through mathematical activities that are practical and relevant to their lives, students develop mathematic understanding, problem-solving skills, and related technological skills they can apply in their daily lives and in the future workplace. (Ontario Ministry of Education, 2008)
Allowing children to customise their educationIn Ontario, advanced literacy and numeracy skills are framed as a means to enable students to solve real-world problems. This focus on application of knowledge and skills is accompanied by a very strong commitment to an individualised, customised approach to education. The Reach Every Child motto assumes that each child is different and that no single approach can work for all students. This philosophy can be seen most clearly in Ontario’s high schools, where as part of its Student Success Strategy the government has been steadily expanding the array of choices and options available to students, including dual credit programmes, co-operative education, youth apprenticeship, and most prominently, the Specialist High Skills Majors (SHSM) programme (Box 6.2).
In order to receive credit toward their high skills major, students must participate in specially designed “contextualised learning activities” (CLAs) in one of their academic subjects. Contextualised learning makes learning more relevant for many students because the activities relate to a recognisable issue and the activities are set in the context in which they would be used in real life. This approach makes knowledge concrete and easier to learn while engaging young minds in critical thinking and problem solving.
These CLAs draw on knowledge and skills relevant to the occupational sector while meeting the curriculum requirements of the course. The CLAs are created by teachers, and after review for accuracy and bias by the ministry are then made available to other teachers. Box 5.3 presents two examples which highlight how contextualised, applied learning can build critical thinking skills and allow for student creativity in responding to the assignment.
A focus on big ideasThe SHSM programme is primarily a strategy for engaging young people for whom an academics-only curriculum might not be compelling enough to hold them in school through graduation. But what curricular strategies does Ontario employ in the earlier grades to help all students see the relevance of what they are studying to the world around them, and to encourage them to move beyond the mastery of facts to the development of higher order thinking skills?
Ontario’s Grades 1-8 Science Curriculum provides a powerful example of the ministry’s orientation. The Science Curriculum document begins by setting out three broad goals for science education in these grades, the first of which is to relate science and technology to society and the environment (Ontario Ministry of Education, 2007). The document then describes six fundamental concepts – matter, energy, systems and interactions, structure and function, sustainability and stewardship, and change and continuity – around which the science curriculum is organised, concepts that not only provide a framework for acquiring scientific
Box 6.2 Aligning school work with the real world
The Specialist High Skills Majors (SHSM) programme offers high school juniors and seniors an opportunity to customise their educational programme by aligning their academic courses with an occupational area they want to explore. There are 18 majors, covering a broad range of occupational sectors, e.g. arts, construction, energy, environment, ICT and sports. Each major is differentiated within the design of the programme to meet a wide range of student skills and interests. All school districts offer at least one major, and some schools offer as many as seven. The idea is to strengthen student engagement and motivation both by making language arts and maths courses more relevant to student interests by drawing on examples and projects linked to the major and by providing more opportunities for experiential learning through job shadowing and internships. Students who meet the requirements of the programme get a red seal embossed on their high school diploma, recognition for SHSM credits on their transcript, and an SHSM record or portfolio of their accomplishments. SHSM credits can count toward post-secondary education or an occupational certificate. The programme has grown exponentially since its inception in 2006-07, when it enrolled 600 students in 27 programmes in 44 schools. In 2010-11 over 28 000 students are enrolled in 1 050 programmes in 540 schools. This has now become a mainstream programme.
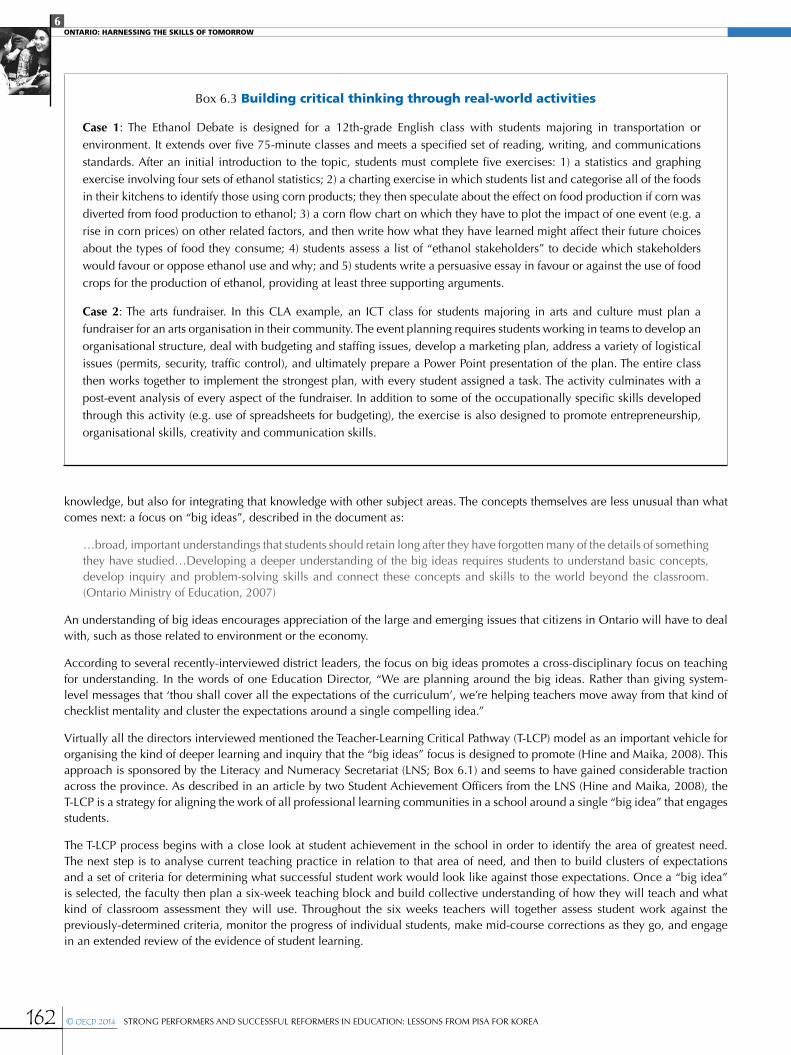
6ONTARIO: HARNESSING THE SKILLS OF TOMORROW
162 © OECD 2014 STRONG PERFORMERS AND SUCCESSFUL REFORMERS IN EDUCATION: LESSONS FROM PISA FOR KOREA
knowledge, but also for integrating that knowledge with other subject areas. The concepts themselves are less unusual than what comes next: a focus on “big ideas”, described in the document as:
…broad, important understandings that students should retain long after they have forgotten many of the details of something they have studied…Developing a deeper understanding of the big ideas requires students to understand basic concepts, develop inquiry and problem-solving skills and connect these concepts and skills to the world beyond the classroom. (Ontario Ministry of Education, 2007)
An understanding of big ideas encourages appreciation of the large and emerging issues that citizens in Ontario will have to deal with, such as those related to environment or the economy.
According to several recently-interviewed district leaders, the focus on big ideas promotes a cross-disciplinary focus on teaching for understanding. In the words of one Education Director, “We are planning around the big ideas. Rather than giving system- level messages that ‘thou shall cover all the expectations of the curriculum’, we’re helping teachers move away from that kind of checklist mentality and cluster the expectations around a single compelling idea.”
Virtually all the directors interviewed mentioned the Teacher-Learning Critical Pathway (T-LCP) model as an important vehicle for organising the kind of deeper learning and inquiry that the “big ideas” focus is designed to promote (Hine and Maika, 2008). This approach is sponsored by the Literacy and Numeracy Secretariat (LNS; Box 6.1) and seems to have gained considerable traction across the province. As described in an article by two Student Achievement Officers from the LNS (Hine and Maika, 2008), the T-LCP is a strategy for aligning the work of all professional learning communities in a school around a single “big idea” that engages students.
The T-LCP process begins with a close look at student achievement in the school in order to identify the area of greatest need.The next step is to analyse current teaching practice in relation to that area of need, and then to build clusters of expectations and a set of criteria for determining what successful student work would look like against those expectations. Once a “big idea” is selected, the faculty then plan a six-week teaching block and build collective understanding of how they will teach and what kind of classroom assessment they will use. Throughout the six weeks teachers will together assess student work against the previously-determined criteria, monitor the progress of individual students, make mid-course corrections as they go, and engage in an extended review of the evidence of student learning.
Box 6.3 Building critical thinking through real-world activities
Case 1: The Ethanol Debate is designed for a 12th-grade English class with students majoring in transportation or environment. It extends over five 75-minute classes and meets a specified set of reading, writing, and communications standards. After an initial introduction to the topic, students must complete five exercises: 1) a statistics and graphing exercise involving four sets of ethanol statistics; 2) a charting exercise in which students list and categorise all of the foods in their kitchens to identify those using corn products; they then speculate about the effect on food production if corn was diverted from food production to ethanol; 3) a corn flow chart on which they have to plot the impact of one event (e.g. a rise in corn prices) on other related factors, and then write how what they have learned might affect their future choices about the types of food they consume; 4) students assess a list of “ethanol stakeholders” to decide which stakeholders would favour or oppose ethanol use and why; and 5) students write a persuasive essay in favour or against the use of food crops for the production of ethanol, providing at least three supporting arguments.
Case 2: The arts fundraiser. In this CLA example, an ICT class for students majoring in arts and culture must plan a fundraiser for an arts organisation in their community. The event planning requires students working in teams to develop an organisational structure, deal with budgeting and staffing issues, develop a marketing plan, address a variety of logistical issues (permits, security, traffic control), and ultimately prepare a Power Point presentation of the plan. The entire class then works together to implement the strongest plan, with every student assigned a task. The activity culminates with a post-event analysis of every aspect of the fundraiser. In addition to some of the occupationally specific skills developed through this activity (e.g. use of spreadsheets for budgeting), the exercise is also designed to promote entrepreneurship, organisational skills, creativity and communication skills.
6ONTARIO: HARNESSING THE SKILLS OF TOMORROW
163STRONG PERFORMERS AND SUCCESSFUL REFORMERS IN EDUCATION: LESSONS FROM PISA FOR KOREA © OECD 2014
This is a way of promoting teacher learning as well as student learning by focusing discussion and action on examining “the interdependence of curriculum expectations, assessment of and for learning, thinking strategies, teaching strategies, and reflection” (Hine and Maika, 2008).
Collaborative inquiry for teachers’ professional developmentThe research literature suggests that most professional development has very little impact on changing teacher practice, and consequently virtually no impact on improving student outcomes (Hill, 2007). Teachers in the United States refer derisively to “drive-by” or “spray and pray” forms of professional development, in which hundreds of teachers are herded into a vast auditorium at the end of a tiring day of teaching to be treated to a lecture by a well-known guru urging teachers to adopt some new classroom strategy guaranteed to elicit more student engagement in learning.
Ontario has placed its bets on a much deeper, more sustained approach to teacher learning, one that is less dependent on external “experts” and more focused on providing the time and support for teachers in their own collaborative inquiry. T-LCP is only one example of this innovative kind of professional development that is spreading across Ontario. An unstated but implicit premise undergirding Ontario’s push toward a more ambitious form of learning for its students has been that if teachers are engaged in professional learning focused on strengthening their own critical thinking and inquiry skills, they are more likely to model such learning in their own teaching practice.
In the words of a director whose district has shown strong improvement in mathematics in the last few years, “I believe it’s the kind of focused capacity-building and support for collaborative inquiry that makes the difference when you are talking about the development of critical and higher order thinking.” This director goes on to generalise about the reasons for high performance in Ontario:
I would suggest that the reason why as a province we are doing better on PISA is because in the last seven years all of us have moved away from the notion of ‘throw all the teachers into a big room, talk to them about problem-solving in math or comprehensive literacy or individualized instruction and then send them home and expect them to do something different’. Today you’d be hard pressed to find any boards, including mine that do this. Now we use our professional development dollars for collaborative inquiry, where professionals get around the table, using protocols to focus deep discussion on analysis of student work, and then moving from reflection to figure out what we are going to do next.
We’ve become much more concrete about asking for evidence from teachers about what they’re implementing and why they believe it is or isn’t working. We can talk about the concepts and we can understand the concepts, but implementation is the name of the game. We’re no longer providing professional development ‘programmes’; rather, we’re providing time, protocols, expectations, all of which leads to increased collaboration focused on students and their work. It’s a different use of release dollars and PD dollars than five or ten years ago and a different use of consultants, as well as a different set of expectations around the de-privatisation of practice.
An emerging focus on creativity in assessmentThe contextualised learning activities described above are one example of the focus on creativity that is making its way into Ontario classrooms. A second more subtle, yet pervasive, example is the shift in the province’s assessment philosophy, as reflected in the 2010 Ontario Ministry of Education policy document, Growing Success: Assessment, Evaluation, and Reporting in Ontario’s Schools. In the introduction to the document, the commitment to a more individualised approach to assessment is stated as follows:
The Ontario government is committed to enabling all students to reach their potential, and to succeed. Our challenge is that every student is unique and each must have opportunities to achieve success according to his or her own interests, abilities, and goals. We have defined high expectations and standards for graduation, while introducing a range of options that allow students to learn in ways that suit them best and enable them to earn their diplomas. We are proud that our students regularly place among the world’s best on international standardized tests. (Ontario Ministry of Education, 2010)
The policy document also discusses the “learning skills and work habits” that teachers observe, assess and report on, and cites a list of 16 “habits of mind” developed by two American researchers, Costa and Kallick. Their list includes such things as “gathering data through all senses […] creating, imagining, and innovating […] responding with wonder and awe […] thinking about thinking (metacognition) […] and […] taking responsible risks”. (Costa and Kallick, cited in Ontario Ministry of Education, 2010).)
In policy and through professional development, Ontario has put significant emphasis on assessment for learning and as learning, not just assessment of learning. Ontario teachers are expected to engage in assessment for learning by integrating assessment with instruction, developing a shared understanding of learning goals and success criteria with students, modelling effective learning, and providing feedback on student learning. Teachers engage in assessment as learning by helping all students to become creative
6ONTARIO: HARNESSING THE SKILLS OF TOMORROW
164 © OECD 2014 STRONG PERFORMERS AND SUCCESSFUL REFORMERS IN EDUCATION: LESSONS FROM PISA FOR KOREA
and critical thinkers and independent learners who are able to set individual goals, monitor their own progress, and reflect on their thinking and learning.
Ontario has sought a balance between using assessment information for system accountability and fostering the best in individualised teaching and learning. Ontario educators are encouraged to use their informed professional judgment to incorporate a range of evidence through conversations, observations and products, such as student portfolios and project work, in the assessment of student learning. Through the integration of assessment for learning with differentiated instruction, teachers empower students to make choices and express preferences in their learning and to explore more creative modes of inquiry. In the words of a principal of a relatively new K-8 school with a strong creative arts emphasis, “I’m not worried that the heat will be shut off at my school or that my budget will be slashed if my kids don’t perform well in math. We don’t have that degree of surveillance, so I feel free to experiment with things. I’ve always thought all education should be highly experimental.”
This particular principal is a devotee of Ken Robinson, a British writer and educator well known for his work on creativity and student learning. Citing Robinson’s view that creativity should be driving education, this principal has placed the arts at the centre of his school’s curriculum, bringing in arts specialists not only to engage students in making art, but more generally to promote a school culture that continuously experiments with different strategies to reach all students. In this school, at least, Premier McGuinty’s message of the importance of rewarding creativity and innovation seems to have taken hold, as it has in the high school SHSM programmes cited above.
LESSONS FROM ONTARIOIf there is a big lesson from Ontario’s approach to critical thinking and creativity, it is that the development of these skills and habits of mind are not the subject of a single course or strand of the curriculum, but rather are woven into virtually all aspects of schooling. In the words of a senior ministry official, “critical thinking and creativity skills are embedded within our existing policies and initiatives.” This focus can be found across the curriculum as well as in the increasing attention Ontario schools have paid to the use of formative assessments at the classroom level. But most critically, this focus has driven deep, sustained investments in building the capacity of Ontario’s teaching force to work collaboratively to examine their own practices and the effect of those practices on the quality of student work. As Ontario’s curriculum, assessment and reporting system has moved from an emphasis on mastery of facts to an understanding of “big ideas” and the ability to apply one’s knowledge to the problems one confronts in everyday life, the teacher-learning agenda has kept pace accordingly. Interdisciplinary approaches, systems thinking, and collaborative inquiry into problems of practice is increasingly the norm in Ontario schools, strongly supported by the work of the Literacy and Numeracy Secretariat, the Student Success/Learning to 18 team, and other units in the ministry. Ontario’s strong PISA results would suggest that this emphasis on building the critical thinking and problem-solving skills of teachers has strengthened the capacity of teachers to enable the development of these same kinds of skills in their students.
There are important lessons as well from Ontario’s overall reform efforts, and it is important not to lose sight of them, for Ontario has created a broad set of enabling conditions that help account for the continuing strong performance of its schools. One such condition has been a major investment in the development of a comprehensive early learning and childcare system, now under the umbrella of the Ministry of Education. A second such condition is the strong cultural commitment to the importance of education. This seems to be an important underlying national value that helps explain Canada’s overall strong performance, despite the absence of any visible national governmental role in education. The commitment to the welfare of children, as expressed in Canada’s strong social safety net, helps explain why Ontario’s achievement gaps, while still worrisome, are nowhere near as profound as those in many other countries.
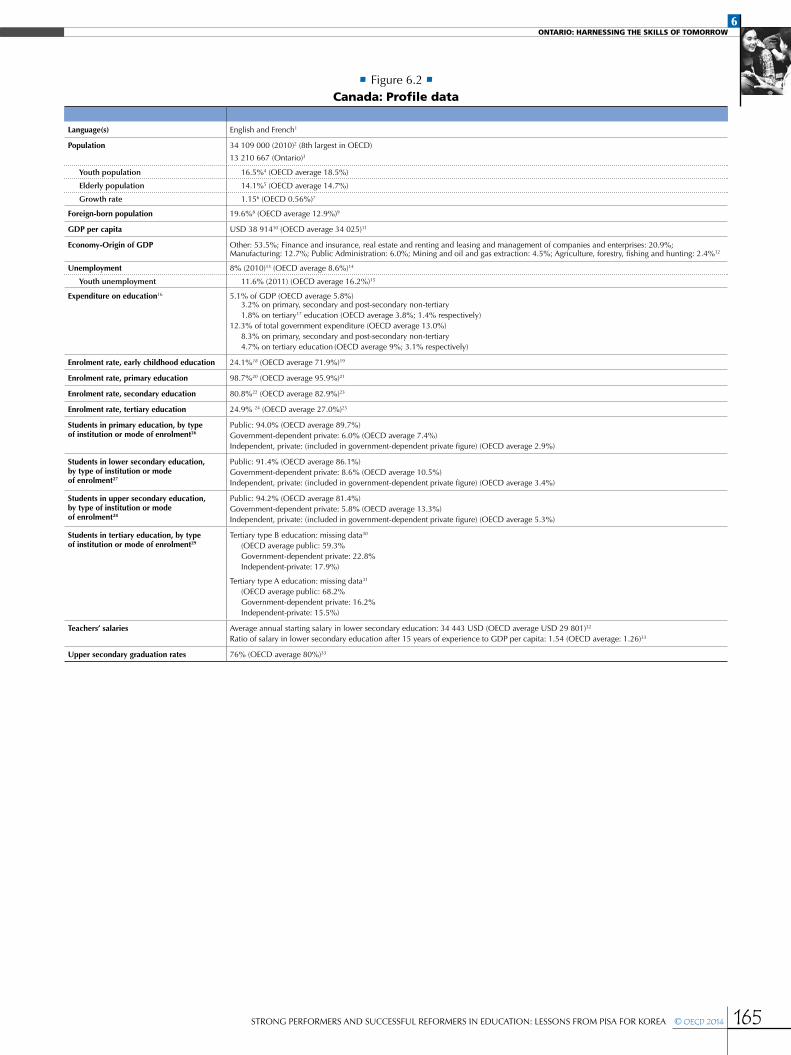
6ONTARIO: HARNESSING THE SKILLS OF TOMORROW
165STRONG PERFORMERS AND SUCCESSFUL REFORMERS IN EDUCATION: LESSONS FROM PISA FOR KOREA © OECD 2014
• Figure 6.2 •Canada: Profile data
Language(s) English and French1
Population 34 109 000 (2010)2 (8th largest in OECD)
13 210 667 (Ontario)3
Youth population 16.5%4 (OECD average 18.5%)
Elderly population 14.1%5 (OECD average 14.7%)
Growth rate 1.156 (OECD 0.56%)7
Foreign-born population 19.6%8 (OECD average 12.9%)9
GDP per capita USD 38 91410 (OECD average 34 025)11
Economy-Origin of GDP Other: 53.5%; Finance and insurance, real estate and renting and leasing and management of companies and enterprises: 20.9%; Manufacturing: 12.7%; Public Administration: 6.0%; Mining and oil and gas extraction: 4.5%; Agriculture, forestry, fishing and hunting: 2.4%12
Unemployment 8% (2010)13 (OECD average 8.6%)14
Youth unemployment 11.6% (2011) (OECD average 16.2%)15
Expenditure on education16 5.1% of GDP (OECD average 5.8%)3.2% on primary, secondary and post-secondary non-tertiary1.8% on tertiary17 education (OECD average 3.8%; 1.4% respectively)
12.3% of total government expenditure (OECD average 13.0%)8.3% on primary, secondary and post-secondary non-tertiary4.7% on tertiary education (OECD average 9%; 3.1% respectively)
Enrolment rate, early childhood education 24.1%18 (OECD average 71.9%)19
Enrolment rate, primary education 98.7%20 (OECD average 95.9%)21
Enrolment rate, secondary education 80.8%22 (OECD average 82.9%)23
Enrolment rate, tertiary education 24.9% 24 (OECD average 27.0%)25
Students in primary education, by type of institution or mode of enrolment26
Public: 94.0% (OECD average 89.7%) Government-dependent private: 6.0% (OECD average 7.4%)Independent, private: (included in government-dependent private figure) (OECD average 2.9%)
Students in lower secondary education, by type of institution or mode of enrolment27
Public: 91.4% (OECD average 86.1%) Government-dependent private: 8.6% (OECD average 10.5%)Independent, private: (included in government-dependent private figure) (OECD average 3.4%)
Students in upper secondary education, by type of institution or mode of enrolment28
Public: 94.2% (OECD average 81.4%) Government-dependent private: 5.8% (OECD average 13.3%)Independent, private: (included in government-dependent private figure) (OECD average 5.3%)
Students in tertiary education, by type of institution or mode of enrolment29
Tertiary type B education: missing data30
(OECD average public: 59.3%Government-dependent private: 22.8%Independent-private: 17.9%)
Tertiary type A education: missing data31
(OECD average public: 68.2%Government-dependent private: 16.2%Independent-private: 15.5%)
Teachers’ salaries Average annual starting salary in lower secondary education: 34 443 USD (OECD average USD 29 801)32
Ratio of salary in lower secondary education after 15 years of experience to GDP per capita: 1.54 (OECD average: 1.26)33
Upper secondary graduation rates 76% (OECD average 80%)33
6ONTARIO: HARNESSING THE SKILLS OF TOMORROW
166 © OECD 2014 STRONG PERFORMERS AND SUCCESSFUL REFORMERS IN EDUCATION: LESSONS FROM PISA FOR KOREA
Notes
1. OECD (2008), OECD Economic Surveys: Canada, OECD Publishing.
2. OECD (2012), OECD Factbook 2011-2012, OECD Publishing.
3. Statistics Canada (2010), Canada Year Book 2011, http://www.statcan.gc.ca. Data from 2010. Data from 2010.
4. OECD (2012), OECD Factbook 2011-2012, OECD Publishing. Ratio of population aged less than 15 to the total population. (data from 2010).
5. OECD (2012), OECD Factbook 2011-2012, OECD Publishing. Ratio of population aged 65 and older to the total population. (data from 2010).
6. OECD (2008), Jobs for Youth Canada, OECD Publishing. Ontario’s population growth depends largely on immigration. Ontario, Alberta and British Columbia are the only provinces in which the projected average annual growth would exceed the growth rate for Canada as a whole.
7. OECD (2012), OECD Factbook 2011-2012, OECD Publishing. Annual population OECD total, growth in percentage, year of reference 2010.
8. OECD (2012), OECD Factbook 2011-2012, OECD Publishing. Foreign-born population as percent of the total population. (data from 2009).
9. OECD (2010), OECD Factbook 2010, OECD Publishing. Foreign-born population as percent of the total population. (data from 2007).
10. OECD (2012), OECD Factbook 2011-2012, OECD Publishing. Current prices and PPPs. (data from 2010).
11. OECD (2012), OECD Factbook 2011-2012, OECD Publishing. Current prices and PPPs. (data from 2010).
12. OECD (2012), OECD Economic Surveys: Canada, OECD Publishing. Origin of GDP, percent of total. (data from 2011).
13. OECD (2012), OECD Factbook 2011-2012, OECD Publishing. Total unemployment rates as percentage of total labour force. (data from 2010).
14. OECD (2012), OECD Factbook 2011-2012, OECD Publishing. Total unemployment rates as percentage of total labour force. (data from 2010).
15. OECD (2012), OECD Employment Outlook, OECD Publishing. Unemployed as a percentage of the labour force in the age group: youth aged 15-24.
16. OECD (2012), Education at a Glance 2012, OECD Publishing. Data for Canada from 2008 and for the OECD average from 2009. In Canada, some levels of education may be included with others. Public expenditure presented in this table includes public subsidies to households for living costs (scholarships and grants to students/households and students loans), which are not spent on educational institutions.
17. The OECD follows standard international conventions in using the term “tertiary education” to refer to all post-secondary programmes at ISCED levels 5B, 5A and 6, regardless of the institutions in which they are offered. OECD (2008), Tertiary Education for the Knowledge Society: Volume 1, OECD Publishing.
18. OECD (2012), Education at a Glance 2012, OECD Publishing. OECD average net enrolment rates of ages 3 and 4 as a percentage of the population of this age group. (data from 2009).
19. OECD (2012), Education at a Glance 2012, OECD average net enrolment rates of ages 3 and 4 as a percentage of the population of this age group. Year of reference 2010.
20. OECD (2012), Education at a Glance 2012, OECD Publishing. OECD average net enrolment rates of ages 5 to 14 as a percentage of the population aged 5 to 14, (data from 2009).
21. OECD (2012), Education at a Glance 2012, OECD Publishing. OECD average net enrolment rates of ages 5 to 14 as a percentage of the population aged 5 to 14, year of reference 2010.
22. OECD (2012), Education at a Glance 2012, OECD Publishing. Net enrolment rates of ages 15 to 19 as a percentage of the population aged 15 to 19. (data from 2009).
23. OECD (2012), Education at a Glance 2012, OECD Publishing. OECD average net enrolment rates of ages 15 to 19 as a percentage of the population aged 15 to 19, year of reference 2010.
24. OECD (2012), Education at a Glance 2012, OECD Publishing. Net enrolment rates of ages 20 to 29 as a percentage of the population aged 20 to 29. (data from 2009). This figure includes includes all 20-29 year olds, including those in employment, etc. The Gross Enrolment Ratio (GER), measured by the UN as the number of actual students enrolled / number of potential students enrolled, is generally higher. The GER for tertiary education in Canada in 2002 is 60%, compared to the regional avg of 76% in 2010, UNESCO-UIS (UNESCO Institute for Statistics) (2011), Statistics in Brief: Canada.
25. OECD (2012), Education at a Glance 2012, OECD Publishing. OECD average net enrolment rates of ages 20 to 29 as a percentage of the population aged 20 to 29, year of reference 2010.
26. OECD (2012), Education at a Glance 2012, OECD Publishing. Data from 2009 for Canada and 2010 for OECD average.
6ONTARIO: HARNESSING THE SKILLS OF TOMORROW
167STRONG PERFORMERS AND SUCCESSFUL REFORMERS IN EDUCATION: LESSONS FROM PISA FOR KOREA © OECD 2014
27. OECD (2012), Education at a Glance 2012, OECD Publishing. Data from 2009 for Canada and 2010 for OECD average.
28. OECD (2012), Education at a Glance 2012, OECD Publishing. Data from 2009 for Canada and 2010 for OECD average.
29. OECD (2012), Education at a Glance 2012, OECD Publishing. Data from 2010.
30. Data missing from Education at a Glance 2012, OECD Publishing.
31. Data missing from Education at a Glance 2012, OECD Publishing.
32. OECD (2012), Education at a Glance 2012, OECD Publishing. Starting salary/minimum training in public institutions in USD adjusted for PPP, (data from 2010).
33. OECD (2012), Education at a Glance 2012. OECD Publishing. (data from 2010).
34. OECD (2012), Education at a Glance 2012. OECD Publishing. Sum of upper secondary graduation rates for a single year of age in 2009 (Year of reference for OECD average 2010).
6ONTARIO: HARNESSING THE SKILLS OF TOMORROW
168 © OECD 2014 STRONG PERFORMERS AND SUCCESSFUL REFORMERS IN EDUCATION: LESSONS FROM PISA FOR KOREA
References and further reading
Barber, M. and M. Mourshed (2007), How the World’s Best-Performing School Systems Come Out on Top, McKinsey and Company, London, available at mckinsey.com/App_Media/Reports/SSO/Worlds_School_Systems_Final.pdf.
Florida, R. and R. Martin (2009), Ontario in the Creative Age, Rotman School of Management, University of Toronto, available at http://martinprosperity.org/research-and-publications/publication/ontario-in-the-creative-age-project.
Hill, H. (2007), “Teachers’ Ongoing Learning: Evidence from Research and Practice,” The Future of Children 17: 111-128.
Hine, E. and D. Maika (2008), “Why the Teaching-Learning Critical Pathway and Why Now?”, Principal Connections 12 (1): 16-19.
Institute for Education Leadership (2008), Putting Ontario’s Leadership Framework into Action: A Guide for School and System Leaders, Toronto, ON: Institute for Education Leadership, available at: http://www.education-leadership-ontario.ca.
Levy, F. and R. Murnane (2004), The New Division of Labor: How Computers are Creating the Next Job Market, Princeton University Press, Princeton, New Jersey.
OECD (2003), Learning for Tomorrow’s World: First Results from PISA 2003, OECD Publishing. http://dx.doi.org/10.1787/9789264006416-en.
OECD (2010a), PISA 2009 Volume I, What Students Know and Can Do: Student Performance in Reading, Mathematics and Science, OECD Publishing. http://dx.doi.org/10.1787/9789264091450-en.
OECD (2010b), OECD Factbook 2010, OECD Publishing. http://dx.doi.org/10.1787/factbook-2010-en.
OECD (2010c), Employment Outlook 2010, OECD Publishing. http://dx.doi.org/10.1787/empl_outlook-2010-en.
OECD (2010d), Education at a Glance 2010: OECD Indicators, OECD Publishing. http://dx.doi.org/10.1787/eag-2010-en.
OECD (2008e), OECD Economic Surveys: Canada, OECD Publishing. http://dx.doi.org/10.1787/eco_surveys-can-2008-en.
OECD (2012f), OECD Factbook 2011-2012, OECD Publishing. http://dx.doi.org/10.1787/factbook-2011-en.
OECD (2012g), OECD Economic Surveys: Canada, OECD Publishing. http://dx.doi.org/10.1787/eco_surveys-can-2012-en.
OECD (2012h), OECD Employment Outlook 2012, OECD Publishing. http://dx.doi.org/10.1787/empl_outlook-2012-en.
OECD (2012i), Education at a Glance 2012: OECD Indicators, OECD Publishing. http://dx.doi.org/10.1787/eag-2012-en.
OECD (2012j), Strong Performers and Successful Reformers: Lessons from PISA for JAPAN, OECD Publishing. http://dx.doi.org/10.1787/9789264118539-en.
Ontario Ministry of Education (2010), Board Leadership Development Strategy: Requirements Manual, Toronto, available at http://www.edu.gov.on.ca/eng/policyfunding/leadership/strategy.html
Ontario Ministry of Education (2007), The Ontario Curriculum Grades 1-8, Science and Technology, Revised Edition, Ontario Ministry of Education, available at www,edu.gov.on.ca/eng/curriculum/elementary/scientic18currb.pdf.
Ontario Ministry of Education (2008), Reach Every Student – Engaging Ontario Education, Ontario Ministry of Education, available at www.edu.gov.on.ca/eng/document/energize/energize.pdf.
Ontario Ministry of Education (2010), Growing Success: Assessment, Evaluation and Reporting in Ontario’s Schools, First Edition Covering Grades 1 to 12, Ontario Ministry of Education, available at www.edu.gov.on.ca/eng/policyfunding/success.html.
7
169STRONG PERFORMERS AND SUCCESSFUL REFORMERS IN EDUCATION: LESSONS FROM PISA FOR KOREA © OECD 2014
Finland: A non-Competitive Education for a Competitive Economy
Finland has been ranked as one of the top-performing countries in PISA for the past decade. During the same period, it has also been cited as one of the world’s most competitive economies. This chapter looks at some of the factors that contribute to this double success, including an emphasis on co-operation and networking, rather than competition; education policies that favour informality, flexibility and quick decision making; career guidance and work placements that bridge formal education and the world of work; and an emphasis on teaching skills and creativity.
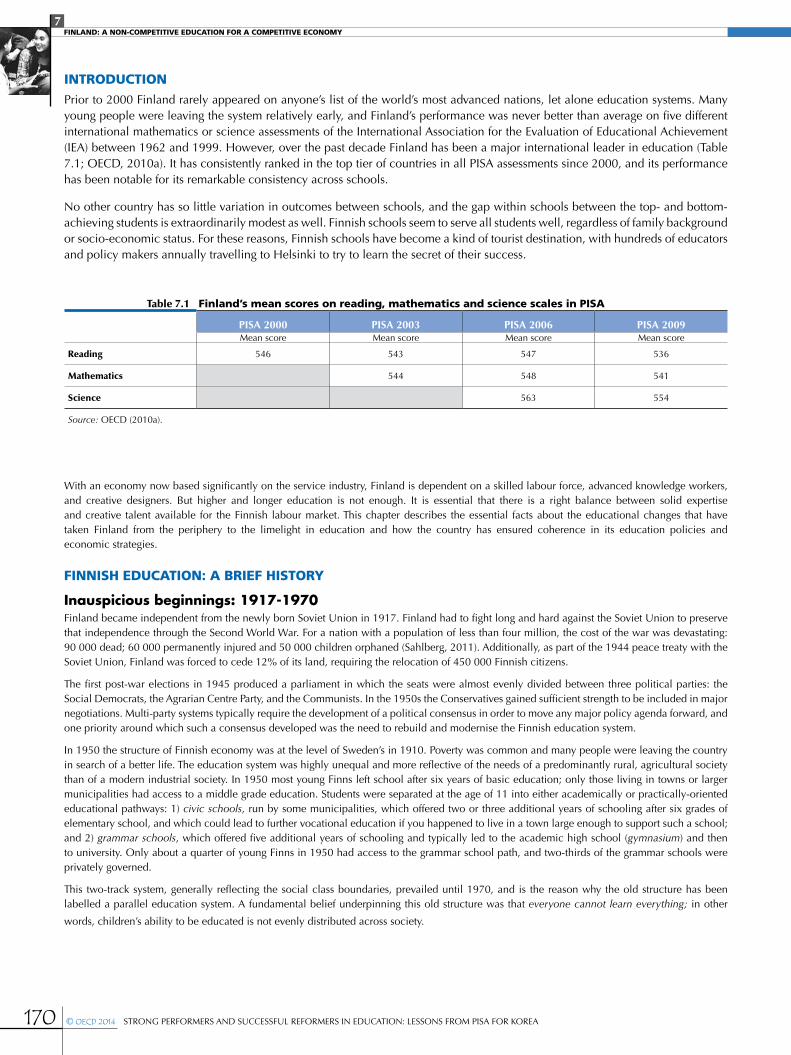
7FINLAND: A NON-COMPETITIVE EDUCATION FOR A COMPETITIVE ECONOMY
170 © OECD 2014 STRONG PERFORMERS AND SUCCESSFUL REFORMERS IN EDUCATION: LESSONS FROM PISA FOR KOREA
INTRODUCTIONPrior to 2000 Finland rarely appeared on anyone’s list of the world’s most advanced nations, let alone education systems. Many young people were leaving the system relatively early, and Finland’s performance was never better than average on five different international mathematics or science assessments of the International Association for the Evaluation of Educational Achievement (IEA) between 1962 and 1999. However, over the past decade Finland has been a major international leader in education (Table 7.1; OECD, 2010a). It has consistently ranked in the top tier of countries in all PISA assessments since 2000, and its performance has been notable for its remarkable consistency across schools.
No other country has so little variation in outcomes between schools, and the gap within schools between the top- and bottom- achieving students is extraordinarily modest as well. Finnish schools seem to serve all students well, regardless of family background or socio-economic status. For these reasons, Finnish schools have become a kind of tourist destination, with hundreds of educators and policy makers annually travelling to Helsinki to try to learn the secret of their success.
With an economy now based significantly on the service industry, Finland is dependent on a skilled labour force, advanced knowledge workers, and creative designers. But higher and longer education is not enough. It is essential that there is a right balance between solid expertise and creative talent available for the Finnish labour market. This chapter describes the essential facts about the educational changes that have taken Finland from the periphery to the limelight in education and how the country has ensured coherence in its education policies and economic strategies.
FINNISH EDUCATION: A BRIEF HISTORY
Inauspicious beginnings: 1917-1970Finland became independent from the newly born Soviet Union in 1917. Finland had to fight long and hard against the Soviet Union to preserve that independence through the Second World War. For a nation with a population of less than four million, the cost of the war was devastating: 90 000 dead; 60 000 permanently injured and 50 000 children orphaned (Sahlberg, 2011). Additionally, as part of the 1944 peace treaty with the Soviet Union, Finland was forced to cede 12% of its land, requiring the relocation of 450 000 Finnish citizens.
The first post-war elections in 1945 produced a parliament in which the seats were almost evenly divided between three political parties: the Social Democrats, the Agrarian Centre Party, and the Communists. In the 1950s the Conservatives gained sufficient strength to be included in major negotiations. Multi-party systems typically require the development of a political consensus in order to move any major policy agenda forward, and one priority around which such a consensus developed was the need to rebuild and modernise the Finnish education system.
In 1950 the structure of Finnish economy was at the level of Sweden’s in 1910. Poverty was common and many people were leaving the country in search of a better life. The education system was highly unequal and more reflective of the needs of a predominantly rural, agricultural society than of a modern industrial society. In 1950 most young Finns left school after six years of basic education; only those living in towns or larger municipalities had access to a middle grade education. Students were separated at the age of 11 into either academically or practically-oriented educational pathways: 1) civic schools, run by some municipalities, which offered two or three additional years of schooling after six grades of elementary school, and which could lead to further vocational education if you happened to live in a town large enough to support such a school; and 2) grammar schools, which offered five additional years of schooling and typically led to the academic high school (gymnasium) and then to university. Only about a quarter of young Finns in 1950 had access to the grammar school path, and two-thirds of the grammar schools were privately governed.
This two-track system, generally reflecting the social class boundaries, prevailed until 1970, and is the reason why the old structure has been labelled a parallel education system. A fundamental belief underpinning this old structure was that everyone cannot learn everything; in other
words, children’s ability to be educated is not evenly distributed across society.
Table 7.1 Finland’s mean scores on reading, mathematics and science scales in PISA
PISA 2000 PISA 2003 PISA 2006 PISA 2009Mean score Mean score Mean score Mean score
Reading 546 543 547 536
Mathematics 544 548 541
Science 563 554
Source: OECD (2010a).
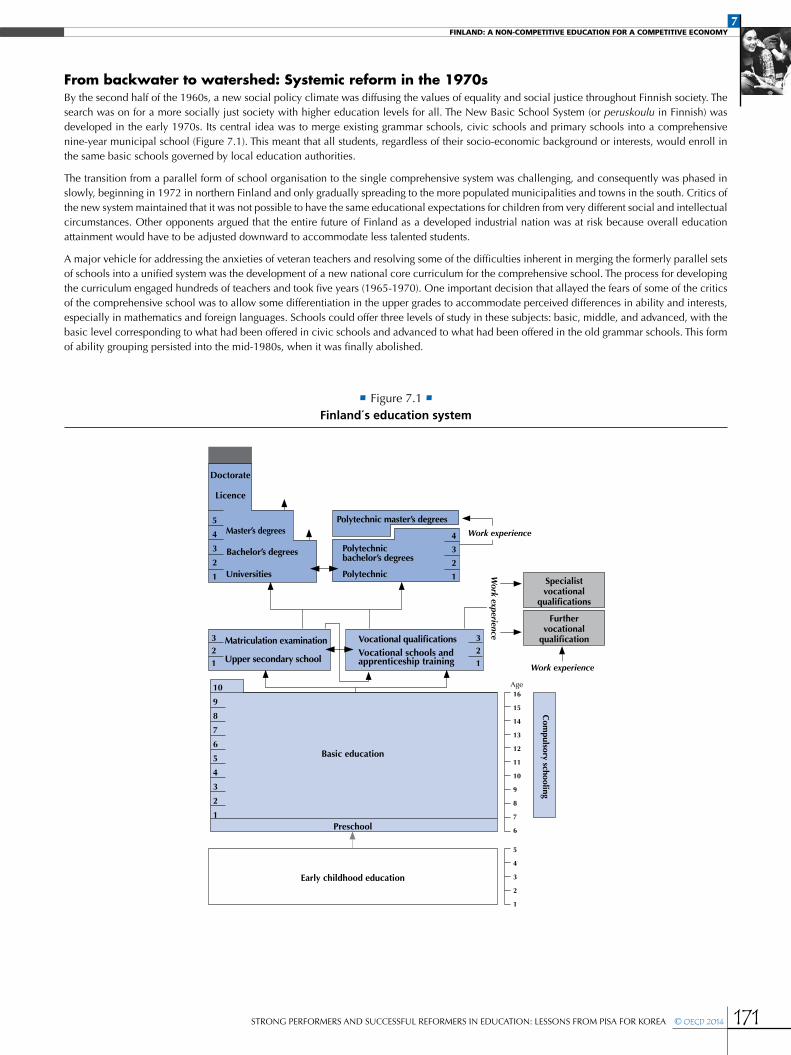
7FINLAND: A NON-COMPETITIVE EDUCATION FOR A COMPETITIVE ECONOMY
171STRONG PERFORMERS AND SUCCESSFUL REFORMERS IN EDUCATION: LESSONS FROM PISA FOR KOREA © OECD 2014
From backwater to watershed: Systemic reform in the 1970sBy the second half of the 1960s, a new social policy climate was diffusing the values of equality and social justice throughout Finnish society. The search was on for a more socially just society with higher education levels for all. The New Basic School System (or peruskoulu in Finnish) was developed in the early 1970s. Its central idea was to merge existing grammar schools, civic schools and primary schools into a comprehensive nine-year municipal school (Figure 7.1). This meant that all students, regardless of their socio-economic background or interests, would enroll in the same basic schools governed by local education authorities.
The transition from a parallel form of school organisation to the single comprehensive system was challenging, and consequently was phased in slowly, beginning in 1972 in northern Finland and only gradually spreading to the more populated municipalities and towns in the south. Critics of the new system maintained that it was not possible to have the same educational expectations for children from very different social and intellectual circumstances. Other opponents argued that the entire future of Finland as a developed industrial nation was at risk because overall education attainment would have to be adjusted downward to accommodate less talented students.
A major vehicle for addressing the anxieties of veteran teachers and resolving some of the difficulties inherent in merging the formerly parallel sets of schools into a unified system was the development of a new national core curriculum for the comprehensive school. The process for developing the curriculum engaged hundreds of teachers and took five years (1965-1970). One important decision that allayed the fears of some of the critics of the comprehensive school was to allow some differentiation in the upper grades to accommodate perceived differences in ability and interests, especially in mathematics and foreign languages. Schools could offer three levels of study in these subjects: basic, middle, and advanced, with the basic level corresponding to what had been offered in civic schools and advanced to what had been offered in the old grammar schools. This form of ability grouping persisted into the mid-1980s, when it was finally abolished.
• Figure 7.1 •Finland´s education system
10
9
8
7
6
5
4
3
2
1
16
15
14
13
12
11
10
9
8
7
6
5
4
3
2
1
5
4
3
2
1
4
3
2
1
321
321
Work experience
Work experience
Age
Work experience
Doctorate
Master’s degrees
Matriculation examination
Upper secondary school
Specialistvocational
qualifications
Further vocational
qualificationVocational qualificationsVocational schools and apprenticeship training
Polytechnic master’s degrees
Bachelor’s degrees Polytechnic bachelor’s degrees
Basic education
Com
pulsory schooling
Preschool
Early childhood education
Universities Polytechnic
Licence
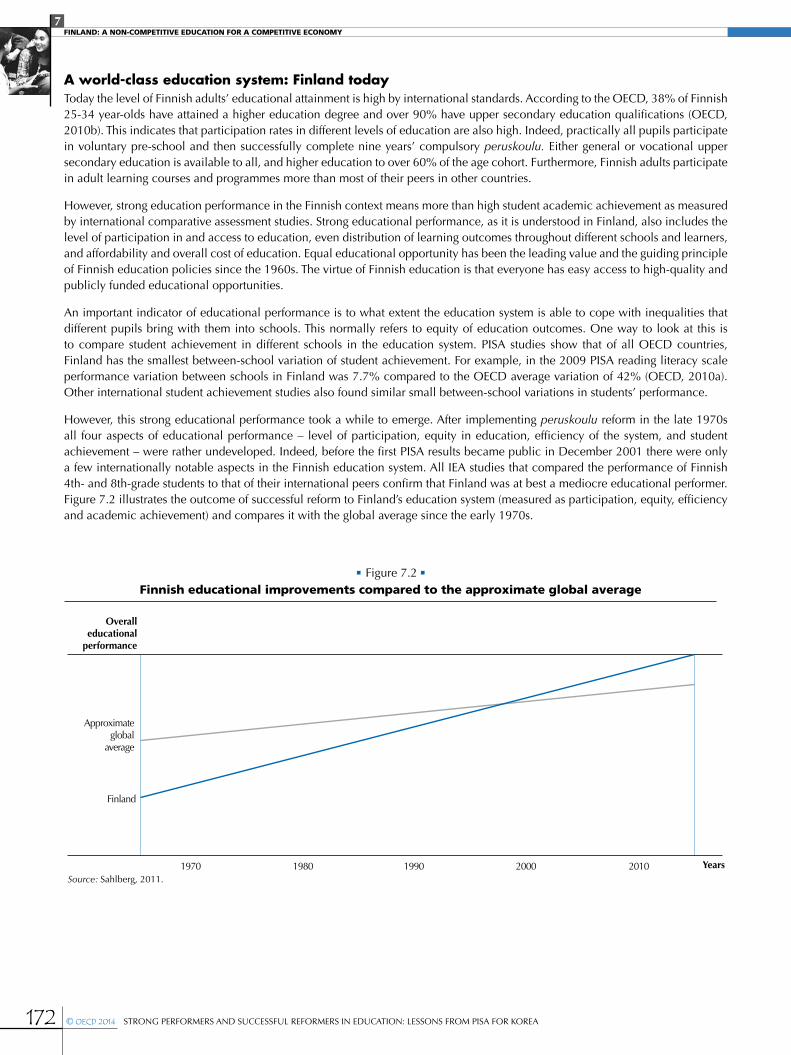
7FINLAND: A NON-COMPETITIVE EDUCATION FOR A COMPETITIVE ECONOMY
172 © OECD 2014 STRONG PERFORMERS AND SUCCESSFUL REFORMERS IN EDUCATION: LESSONS FROM PISA FOR KOREA
A world-class education system: Finland todayToday the level of Finnish adults’ educational attainment is high by international standards. According to the OECD, 38% of Finnish 25-34 year-olds have attained a higher education degree and over 90% have upper secondary education qualifications (OECD, 2010b). This indicates that participation rates in different levels of education are also high. Indeed, practically all pupils participate in voluntary pre-school and then successfully complete nine years’ compulsory peruskoulu. Either general or vocational upper secondary education is available to all, and higher education to over 60% of the age cohort. Furthermore, Finnish adults participate in adult learning courses and programmes more than most of their peers in other countries.
However, strong education performance in the Finnish context means more than high student academic achievement as measured by international comparative assessment studies. Strong educational performance, as it is understood in Finland, also includes the level of participation in and access to education, even distribution of learning outcomes throughout different schools and learners, and affordability and overall cost of education. Equal educational opportunity has been the leading value and the guiding principle of Finnish education policies since the 1960s. The virtue of Finnish education is that everyone has easy access to high-quality and publicly funded educational opportunities.
An important indicator of educational performance is to what extent the education system is able to cope with inequalities that different pupils bring with them into schools. This normally refers to equity of education outcomes. One way to look at this is to compare student achievement in different schools in the education system. PISA studies show that of all OECD countries, Finland has the smallest between-school variation of student achievement. For example, in the 2009 PISA reading literacy scale performance variation between schools in Finland was 7.7% compared to the OECD average variation of 42% (OECD, 2010a). Other international student achievement studies also found similar small between-school variations in students’ performance.
However, this strong educational performance took a while to emerge. After implementing peruskoulu reform in the late 1970s all four aspects of educational performance – level of participation, equity in education, efficiency of the system, and student achievement – were rather undeveloped. Indeed, before the first PISA results became public in December 2001 there were only a few internationally notable aspects in the Finnish education system. All IEA studies that compared the performance of Finnish 4th- and 8th-grade students to that of their international peers confirm that Finland was at best a mediocre educational performer. Figure 7.2 illustrates the outcome of successful reform to Finland’s education system (measured as participation, equity, efficiency and academic achievement) and compares it with the global average since the early 1970s.
• Figure 7.2 •Finnish educational improvements compared to the approximate global average
1970 1980 1990 2000 2010
Overalleducational
performance
Approximateglobal
average
Finland
YearsSource: Sahlberg, 2011.
7FINLAND: A NON-COMPETITIVE EDUCATION FOR A COMPETITIVE ECONOMY
173STRONG PERFORMERS AND SUCCESSFUL REFORMERS IN EDUCATION: LESSONS FROM PISA FOR KOREA © OECD 2014
FIVE DRIVERS OF SUCCESSFUL REFORMSAs with all education systems that achieve good results, Finland’s success is a function of the network of several different factors that work together to create a coherent approach that supports consistent system-wide development and performance. Some of these factors are cultural. Finland’s history and geography – caught between the powerful kingdom in the west and the even bigger empire in the east – compelled it to put the nation’s interest first and not allow education policy to become victim to partisan politics. Finland is a small nation that the rest of the world sees as a strange place that speaks a language nobody else understands. Over the past half-century Finns have adopted an understanding that the only way to survive as a small, independent nation is by educating all people. This is the only hope amid the competition between bigger nations and all those who have other benefits Finns don’t have. Building a welfare state and its public education system driven by this spirit of survival is an important cultural context that explains, among other things, why Finns have succeeded in reaching consensus on such complicated issues as the comprehensive school system in the 1960s or upper secondary education for all in the 1970s.
The following five interrelated factors are often offered as the reasons behind successful reform and strong educational performance in Finland.
A focus on equity and well-beingWhile Finland has guarded its hard-won independence, in many areas of social policy it has been much influenced by its Scandinavian neighbours, especially Sweden. As noted above, the idea of the comprehensive school emerged in Finland as part of a larger movement in the 1960s for more social and economic equality, and over the next two decades the Finns adopted many features of the Swedish welfare state. Consequently, Finnish schools are embedded in a society with strong social safety nets and a broad and deep commitment to the healthy development and well-being of children. Education in Finland is not just about teaching and learning, but it also has a strong element of child well-being and care. Schools are expected to maintain strong support systems for all learners – healthful nutrition, health services, psychological counselling and student guidance are normal practice.
Equality in educational opportunities also lies at the heart of Finland’s education policy. Education policies emphasise equity and well-being in schools and rely on the principle of inclusive education. The aim is for all children to find their neighborhood school sufficient and appropriate to their needs and to their parents’ expectations. However, parents still have freedom to choose any school they like in their own municipality.
Optional pre-school at the age of six is available for all children. More than 98% of this age group participates in pre-school, combined with half-day school and another half daycare. All Finnish children start their formal schooling in August of the year they turn seven. Normally, primary school lasts six years followed by a three-year lower secondary school, although the new law allows some variation. Today it is widely recognised that the six-year primary school provides a solid basis for high educational performance. Finnish experience and international research show that investment in primary education pays off in later grades through better aptitude and learning skills, as well as through positive overall outcomes. Schools are typically small, with class sizes ranging from 15 to 30 students. In 2004, more than one-third of Finnish comprehensive schools had fewer than 50 pupils; just 4% of all schools had 500 or more pupils (Statistics Finland, 2011)1. Lower grades (1 to 6) typically have fewer than 300 pupils and often operate separately from upper grades (7 to 9), although the unified peruskoulu is gradually closing the gap between these two. Compulsory education lasts until completion of nine years of basic school or until a young person turns 16, whichever comes first. Grade repetition is rare and over 99% of young Finns successfully complete nine years of basic school.
Dealing with differenceBringing together students with often very different life circumstances and aspirations to learn together in the same schools and classrooms required a fundamentally new approach to education. This was especially so for those with special educational needs. The equal opportunity principle insisted that all students must be offered a fair chance to be successful and to enjoy learning. From early on, it was understood that educating pupils with special needs would only be successful if learning difficulties and other individual deficits were identified early on and treated promptly. Special education and pedagogical differentiation quickly became integral parts of school curricula, and all municipalities and schools soon housed experts trained to support special needs pupils.
Every comprehensive school has a student welfare team that meets at least twice a month for two hours. The team consists of the principal, the special education teacher, the school nurse, the school psychologist, a social worker, and the teachers whose students are being discussed. The parents of any child being discussed are contacted prior to the meeting and are sometimes asked to be present.
7FINLAND: A NON-COMPETITIVE EDUCATION FOR A COMPETITIVE ECONOMY
174 © OECD 2014 STRONG PERFORMERS AND SUCCESSFUL REFORMERS IN EDUCATION: LESSONS FROM PISA FOR KOREA
Funding efficiencyThe vast majority of primary, secondary and tertiary education is financed from the public coffers, with only about 2% of total education expenditure coming from private sources (OECD, 2010b). Parents rarely contribute financially to their children’s education and therefore private tutoring or after-school academic classes – common in many other high-performing countries – don’t exist in Finland. Finland’s education system is also highly efficient: in 2007 Finland spent 5.6% of its GDP on education, less than the OECD total average of 6.2% (OECD, 2010b). This efficiency is discussed further in the conclusions to this chapter.
Teachers who are highly valued and highly trainedThe peruskoulu reform was not just an organisational change, it was a new educational philosophy. This philosophy included the beliefs that all pupils can learn if they are given proper opportunities and support, that understanding of and learning through human diversity is an important educational goal, and that schools should function as small-scale democracies, just as John Dewey had insisted decades before. Peruskoulu required that teachers, who had previously worked in very different schools, had to now all work in the same type of school with students with diverse abilities. This meant that teachers needed new instructional methods, they needed to design learning environments that enable differentiated learning for different pupils, and they needed to perceive teaching as a top profession. These expectations led to a wide-scale teacher education reform in 1979 that emphasised the professional development and research-based learning that have been the key drivers of Finland’s rapid educational improvement.
Until the mid-1970s, primary school teachers were prepared in teacher colleges. Middle and high school teachers studied in subject departments of Finnish universities. By the end of the 1970s, all teacher-education programmes became university-based. At the same time, scientific content and educational research methodologies began to enrich the teacher education curriculum. Teacher education is now research-based, meaning that it must be supported by scientific knowledge and focus on thinking processes and cognitive skills used in conducting research (Toom et al., 2010).
Among young Finns, teaching is consistently the most admired profession in regular opinion polls of high school graduates (Sahlberg, 2011). Classroom teaching is considered an independent and creative, high-status profession that attracts some of the best secondary school graduates each year (Box 7.1). The entry requirement for permanent employment as a teacher in all Finnish basic and high schools today is a Master’s degree. Pre-school and kindergarten teachers must have a bachelor’s degree.
Wages are not the main reason young people become teachers in Finland. Teachers earn very close to the national average salary level, typically equivalent to what mid-career, middle-school teachers earn annually in the nations – about USD 41 000 (Figure 7.3, OECD, 2010b). More important than salaries are such factors as high social prestige, professional autonomy in schools, and the ethos of teaching as a service to society and the public good. Thus, young Finns see teaching as a career on a par with other professions where people work independently and rely on scientific knowledge and skills that they gained through university studies. Another reason for teaching’s high appeal is the fact that the master’s degree also opens up other career options. A teacher with a master’s degree often interests human resource departments within Finnish private sector and third-sector organisations. These teachers also have open access to doctoral studies in Finnish universities. Over the past decade, Finnish schools have noted an upsurge in school principals and teachers who possess a PhD in education.
The teacher-education programmes for prospective primary and upper grade teachers are somewhat different in structure, but not in rigour. Primary-grade teachers major in education, but they are expected to minor in at least two of the subjects included in the primary school curriculum. This means, for example, that they are studying mathematics in the mathematics department, not in the education department. Upper-grade teachers major in the subject they will be teaching, but they do substantial work in education
Box 7.1 Becoming a teacher in Finland
Becoming a primary school teacher in Finland is a very competitive process, and only Finland’s best and brightest are able to fulfill those professional dreams. Every spring, thousands of high school graduates submit their applications to the Departments of Teacher Education in eight Finnish universities. Normally it’s not enough to complete high school and pass a rigorous national Matriculation Examination; successful candidates must have the highest scores and excellent interpersonal skills. Annually only about one in every ten applicants will be accepted to study to become a teacher in Finnish primary schools. In 2011 the University of Helsinki received 2 300 application for 120 study places in its primary teacher education programme. Among all categories of teacher education, about 5 000 teachers are selected from about 20 000 applicants.

7FINLAND: A NON-COMPETITIVE EDUCATION FOR A COMPETITIVE ECONOMY
175STRONG PERFORMERS AND SUCCESSFUL REFORMERS IN EDUCATION: LESSONS FROM PISA FOR KOREA © OECD 2014
as well, either in an integrated five-year programme or in a concentrated fifth year after they have completed their work in their subject field. It is also possible for a master’s degree holder to take one year of pedagogical studies in the faculty of education to gain a formal teacher qualification.
Teacher education in Finland has at least four distinguishing qualities:
•Research-based. Teacher candidates are not only expected to become experts in pedagogical content knowledge, but they are required to write a research-based dissertation as the final requirement for the master’s degree. Upper-grade teachers major in an academic subject area of their choice; primary-grade teachers major in educational sciences. The rationale for requiring a research-based dissertation is that teachers are expected to be able to have a holistic view of teaching and learning process, and be able to engage in continuous professional development in their career as a teacher.
•Strong focus on developing pedagogical content knowledge. Traditional teacher-preparation programmes too often treat good pedagogy as generic, assuming that good questioning skills, for example, are equally applicable to all subjects. Because teacher education in Finland is a shared responsibility between the teacher education faculty and the academic subject faculty, there is substantial attention to subject-specific pedagogy for prospective primary as well as upper-grade teachers.
•Good training for all Finnish teachers in diagnosing students with learning difficulties and in adapting their instruction to the varying learning needs and styles of their students. Special education belongs to all teacher-education programmes and all teachers are expected to have at least basic knowledge and skills related to students with special educational needs.
•A strong clinical component. There are two main kinds of practicum within teacher-education programmes in Finland. The first – a minor portion of clinical training – occurs in seminars and small-group classes in the Department of Education, where students practice basic teaching skills in front of their peers. The second – the major teaching practice – happens mostly in special Teacher Training Schools governed by the universities, which have similar curricula and practices as normal public schools. Some student teachers also practice in a network of selected Field Schools (normal public schools). Primary-school teacher-education students devote approximately 15% of their intended study time to practice teaching in schools. In subject teacher education, practice teaching comprises about one-third of the curriculum.
The result is that today the Finnish teaching profession is on par with other highly skilled professions: teachers can diagnose problems in their classrooms and schools, apply evidence-based and often alternative solutions to them and evaluate and analyse the impact of implemented procedures. Parents trust teachers as professionals who know what is best for their children.
An OECD review on equity in education in Finland describes how Finland has created a virtuous circle surrounding teaching:
High status and good working conditions – small classes, adequate support for counsellors and special needs teachers, a voice in school decisions, low levels of discipline problems, high levels of professional autonomy – create large pools of applicants, leading to highly selective and intensive teacher-preparation programmes. This, in turn, leads to success in the early years of teaching, relative stability of the teacher workforce, success in teaching (of which PISA results are only one example), and a continuation of the high status of teaching. (OECD, 2005).
Smart accountability policiesFinland has not followed the global educational accountability movement that assumes that making schools and teachers more accountable for their performance is the key to raising student achievement. Finns don’t think that frequent testing of students’ achievement and schools’ performance using standardised assessments is required. There are three primary reasons for this:
•While assessment practice is grounded in the national curriculum, education policy in Finland gives a high priority to individualised education and creativity as an important part of how schools operate. Therefore each student is judged more against his or her individual progress and abilities rather than against statistical indicators.
•Policy makers realised early on that teaching is the key element that makes a difference in what students learn in school – not externally set standards, standardised testing or alternative instructional programmes. Education developers insist that curriculum, teaching, and learning should drive teachers’ practice in schools, rather than testing. Student assessment in Finnish schools is embedded in the teaching and learning process and used to improve both teachers’ and students’ work throughout the academic year.
•Finns want to avoid the disadvantages often associated with external standardised testing – narrowing of the curriculum, teaching to the test, and unhealthy competition among schools. Finnish education leaders think that the success of a high-stakes testing policy is whether it positively affects student learning, not whether it increases student scores on a particular test. If student learning remains unaffected, or if testing leads to biased teaching, the validity of such high-stakes tests must be questioned. Finnish school principals, and especially teachers, are not convinced that frequent external census-based testing and accountability built on test results are beneficial to students and their learning.
7FINLAND: A NON-COMPETITIVE EDUCATION FOR A COMPETITIVE ECONOMY
176 © OECD 2014 STRONG PERFORMERS AND SUCCESSFUL REFORMERS IN EDUCATION: LESSONS FROM PISA FOR KOREA
Along with curriculum design (Box 7.2), teachers play a key role in assessing students. Since Finnish teachers must design and conduct appropriate curriculum-based assessments to document student progress, classroom assessments and school-based evaluations are important parts of teacher education and professional development. All assessments of student learning are based on teacher-made tests within each school. Normally Finnish pupils are not assessed using numerical grades that would enable direct comparison with one another before 5th grade. Only descriptive assessments and feedback are used, depending on how student assessment is described in the school curriculum or municipal education plan. Finnish schools accept that there may be some limitations on comparability when teachers do all the grading of students. But the fact that primary school is, to a large extent, free from standardised testing enables teachers to use creative teaching methods and pupils to concentrate on learning and sustaining their natural curiosity. The national PISA report concludes that only 7% of 15-year-old Finnish students said they feel anxious when working on mathematics tasks at home compared to 52% in Japan (Kupari & Välijärvi, 2005).
Smart accountability in the Finnish education context preserves and enhances trust among teachers, students, school leaders and education authorities and involves them in the process, offering them a strong sense of professional responsibility and initiative. Shared responsibility for teaching and learning characterises education in Finland; parents, students and teachers alike prefer an approach that allows schools to keep the focus on learning and permits more freedom in curriculum planning than the external standardised testing culture prevailing in some other nations.
A culture of trustMuch of what has been previously noted is possible only if parents, students, and authorities trust teachers and school principals. The Finnish education system was highly centralised until the early 1990s. Schools were strictly regulated by the central agencies; a dense network of rules and orders governed the daily work of teachers. The gradual shift towards trusting schools and teachers began in the late 1980s. In the early 1990s, the era of a trust-based school culture formally started in Finland.
The culture of trust means that education authorities and political leaders believe that teachers, together with principals, parents and their communities, know how to provide the best possible education for their children and youth. Trust can only flourish in an environment that is built upon honesty, confidence, professionalism and good governance. Tellingly, Finland also performs well in international transparency rankings that indicate the perceptions of corruption among citizens (Sahlberg, 2010). Public institutions generally enjoy high public trust in Finland. Trusting schools and teachers is a consequence of a well-functioning civil society and high social capital. Honesty and trust are often seen as among the most basic values and the building blocks of Finnish society (Lewis, 2005).
The degree of Finnish social cohesion and trust in government is partly a function of the country’s size and relative cultural homogeneity, but also reflects the national temperament. Social cohesion and trust are difficult factors to isolate and quantify, but they clearly are part of the explanation for why teaching has become such an attractive profession for talented young people in Finland.
Sustainable leadership and political coherenceThe success of Finnish education reform from an international perspective is mainly based on institutions and institutional structures established in the 1970s and 1980s, rather than on changes and improvements implemented from the 1990s. Changes in Finnish education after 1990 have been more about ideas and innovation than about new institutional structures. Institutional changes in
Box 7.2 Growing autonomy for teachers
During the course of Finland’s education reforms, teachers have demanded more autonomy and responsibility for curriculum and student assessment (Aho et al., 2006). While the National Curriculum Framework for Basic School and similar documents for upper secondary education provide guidance to teachers, curriculum planning is the responsibility of schools and municipalities. Local education authorities approve curricula for schools, but teachers and school principals play a key role in curriculum design. Teacher education provides them with adequate curriculum knowledge and planning skills. Moreover, the importance of curriculum design in teacher practice has helped shift the focus of professional development from fragmented in-service training towards more systemic, theoretically grounded school- wide improvement efforts.
7FINLAND: A NON-COMPETITIVE EDUCATION FOR A COMPETITIVE ECONOMY
177STRONG PERFORMERS AND SUCCESSFUL REFORMERS IN EDUCATION: LESSONS FROM PISA FOR KOREA © OECD 2014
the 1990s have been smaller, except in tertiary education where a new polytechnic system was introduced. Nonetheless, directions remain clear and are based on the earlier policies.
Education policies are intertwined with other social policies, and with the overall political culture. Education in Finland is seen as a public good that contributes to the well-being of all and therefore has a strong nation-building function. The key success factor in Finland’s development of a well-performing knowledge economy with good governance and a respected education system has been its ability to reach broad consensus on most major issues concerning the country’s future directions. The conclusion is that Finland seems particularly successful in implementing and maintaining the policies and practices that constitute sustainable leadership and renewal.
Increased interaction among various public-sector policies has strengthened the coherence of economic and social reforms and created conditions for sustainable leadership in Finnish society in general and the education sector in particular. This has enabled systematic commitment to a long-term vision and inter-sector co-operation among different policies and strategies.
Governments from the political left and right have respected education as the key public service for all citizens and maintained their belief that only a highly and widely educated nation will be successful in world markets.
EDUCATION AND NATIONAL ECONOMIC COMPETITIVENESSIs there a correlation between a country’s educational performance and its national economic competitiveness? Using available international studies and surveys the simple answer is “no” (Schwab, 2010; OECD, 2010a). Countries like the United States and Norway rank high in the global competitiveness ratings – such as those of the World Economic Forum (Schwab, 2010) – but only modestly in the assessments of their students’ learning achievement, such as PISA. On the other hand, Korea, Canada and the Netherlands are high in the student learning comparisons but not at the top of economic competitiveness rankings. Many countries seem to reach similar opposite positions in these two ratings, simultaneously at the high and low ends of the scales; therefore we cannot assume that these two measures correlate. Nevertheless, some countries do manage to do consistently well in both rankings.
Finland has been ranked as one of the most competitive economies since the early 2000s (Routti and Ylä-Anttila, 2006). Two major events occurred in the early 1990s that triggered a significant shift in the economic development strategy promoted by Finland’s governmental and private sector leaders. The first was the initiation of the accession process that led to Finland’s acceptance into the European Union in 1995. With the collapse of the Soviet Union (a major trading partner), Finland had no choice but to diversify its export strategy and begin to move away from its historic reliance on forest products and other traditional industries. The second and more powerful stimulus was a major economic recession in the early 1990s, set off by a collapse of the financial sector reminiscent of the banking crisis the US has recently experienced. Unemployment in Finland approached 20%; gross domestic product (GDP) declined by 13% and public debt exceeded 60% of GDP (Aho et al., 2006). The government used this crisis as an opportunity to develop a new national competitiveness policy designed to support private sector innovation and focused heavily on the development of the telecommunications sector, with Nokia as the central player. In a remarkably short time, Finland managed not only to dig itself out of recession but to reduce its historical reliance on its natural resources and transform its economy into one based on information and knowledge. Investments in research and development provided the fuel for this growth. In 1991 only five Finnish workers out of 1 000 were in the research and development (R&D) labour force. By 2003 this number had increased to 22, almost three times the OECD average (Routti and Ylä-Anttila, 2006). By 2001 Finland’s ranking in the World Economic Forum’s global competitiveness index had climbed from 15th to 1st, and it has remained at or near the top in these rankings ever since.
Economists have been interested to find out why Finland has been able to become the most competitive economy in the world since 1990. Good governance, strong social cohesiveness and an extensive social safety net provided by the welfare state made this exceptionally rapid economic recovery possible. Educational performance has to be seen in the context of other systems in society, e.g. health, environment, rule of law, governance, economy and technology. It is not only that education functions well in Finland, but that it is a part of well-functioning democratic welfare state (Castells and Himanen, 2002). Attempts to explain the success of the education system in Finland should be set in this wider context and seen as a part of overall function of democratic civil society.
There are some interesting parallels between education and economic development policies in Finland during the period of transformation and related rapid growth in the 1990s. Table 7.2 summarises some of the key policies and strategies that have been driving education system development and economic growth since 1990.
Four common features are often mentioned as contributing to positive educational and economic progress:
•Policy development has been based on integration rather than exclusive sub-sector policies. Education sector development is driven by medium-term policy decisions that rely on sustainable basic values, such as equal opportunities to good education for
7FINLAND: A NON-COMPETITIVE EDUCATION FOR A COMPETITIVE ECONOMY
178 © OECD 2014 STRONG PERFORMERS AND SUCCESSFUL REFORMERS IN EDUCATION: LESSONS FROM PISA FOR KOREA
all, inclusion of all students in mainstream publicly financed education and strong trust in public education as a civil right rather than an obligation. These medium-term policies integrate education and training and involve the private sector and industry in the creation and monitoring of their results. Similarly, economic and industrial policies have integrated science and technology policies and innovation system with industrial clusters (Routti and Ylä-Anttila, 2006). Integrated policies have enhanced the systemic development and interconnectedness of these sectors and have thus promoted more sustainable and coherent political leadership for their successful implementation.
•Strategic framework development and change have been built upon longer-term vision. National development strategies – for example the Information Society Programme (Ministry of Finance, 1995), National Lifelong Learning Strategy (Ministry of Education, 1997) and Ministry of Education Strategy 2015 (Ministry of Education, 2003) – have served as overarching frameworks for the sector strategies. These and other strategies have emphasised increasing flexibility, coherence among various sectors, and the development of local and regional responsiveness and creativity in institutions.
•The roles of governance and public institutions have been central in policy developments and implementation of both education and economic reforms. Good governance, high quality public institutions and rule of law play important roles in policy development and implementation of planned changes. Evaluation approaches in both sectors are development-oriented and various players in the system are held accountable for process and outcomes. Particular institutions, for example the Committee of the Future and the Committee of Vocational Education and Training, are shared by private and public representatives as well as the key stakeholders of the society for consensus-making purposes.
•A highly educated labor force and broad participation in education at all levels guarantee the stock of human capital that is necessary for both good education service delivery and economic growth. For instance, all teachers are required to hold a master’s degree and most workers are encouraged to participate in continuous professional development as part of their work. Teachers are professionals in their schools and therefore actively involved in planning and implementing changes in their work.
Specific policies and desired practices for skills in a competitive knowledge economyAgainst this background, what Finnish policies and educational reforms have had a significant impact on its national economic competitiveness? The following education policies have addressed the aspects of teaching and learning that encourage risk-taking in classrooms, creativity in schools and flexibility in the education system. The key assumption is that expert thinking and complex communication require less regulation and more opportunities for real co-operation in schools.
Less competition, more collaborationA key Finnish lesson is that to prepare themselves for a more competitive economy, schools and students must compete less. Instead, schools should increase internal collaboration. Co-operation and networking rather than competition and disconnectedness should lead the education policies and development of education systems. Schools and other educational institutions should cultivate attitudes, cultures and skills that are necessary in creative and collaborative learning environments. Finnish education policies assume that expert thinking, complex communication and creative problem solving can only flourish when collaboration is maximised and competition is minimised.
Economic competitiveness can be promoted and enhanced by fostering co-operation and interaction at three levels in education: schools, teachers and students. This has been the key strategic principle in educational development in Finland (Box 7.3). It means that supporting school networking has to be given a high priority in education reforms. In almost any education system necessary innovations and ideas for improvement already exist in the system. The challenge is to share them among schools. Therefore, developing the education system in a way that encourages and enables schools to create partnerships and information exchange networks is likely to spread existing good practices. Helping teachers to work as professional communities combats the isolation that is common to many teaching cultures. Learning to teach in new ways is not easy. A safe and supportive professional climate in schools is a necessary condition for the professional improvement of teachers. Designing education reforms in a way that will provide teachers with opportunities and incentives to collaborate more will increase the likelihood of sustainable implementation of intended changes. A national school improvement initiative, the Aquarium Project, implemented in the 1990s in Finland is an example of networking and collaboration at the system level to enhance implementation of intended policies (Sahlberg, 2011).
Economic competitiveness can be promoted and enhanced by fostering co-operation and interaction at three levels in education: schools, teachers and students. This has been the key strategic principle in educational development in Finland (Box 7.3). It means that supporting school networking has to be given a high priority in education reforms. In almost any education system necessary innovations and ideas for improvement already exist in the system. The challenge is to share them among schools. Therefore, developing the education system in a way that encourages and enables schools to create partnerships and information exchange networks is likely to spread existing good practices. Helping teachers to work as professional communities combats the isolation that is common to many teaching cultures. Learning to teach in new ways is not easy. A safe and supportive professional climate in schools is a necessary condition for the professional improvement of teachers. Designing education reforms in a way that will provide teachers with opportunities and incentives to collaborate more will increase the likelihood of sustainable implementation
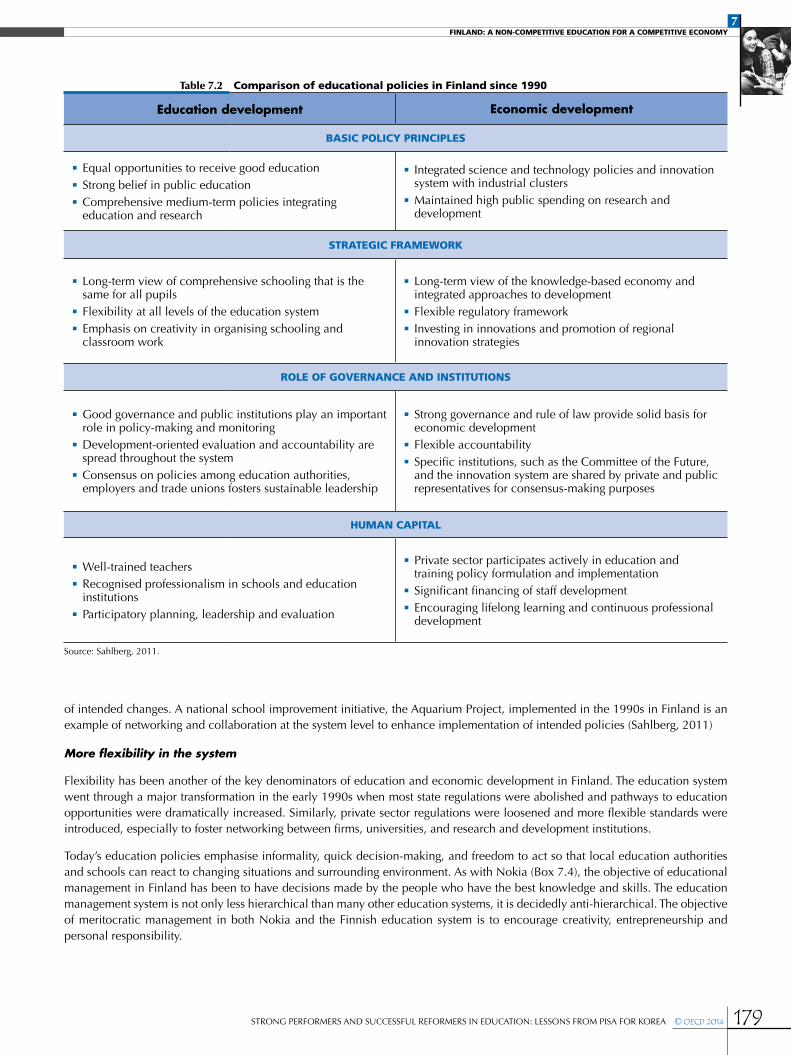
7FINLAND: A NON-COMPETITIVE EDUCATION FOR A COMPETITIVE ECONOMY
179STRONG PERFORMERS AND SUCCESSFUL REFORMERS IN EDUCATION: LESSONS FROM PISA FOR KOREA © OECD 2014
Table 7.2 Comparison of educational policies in Finland since 1990
Education development Economic development
BASIC POLICY PRINCIPLES
•Equal opportunities to receive good education•Strong belief in public education•Comprehensive medium-term policies integrating
education and research
•Integrated science and technology policies and innovation system with industrial clusters
•Maintained high public spending on research and development
STRATEGIC FRAMEWORK
•Long-term view of comprehensive schooling that is the same for all pupils
•Flexibility at all levels of the education system •Emphasis on creativity in organising schooling and
classroom work
•Long-term view of the knowledge-based economy and integrated approaches to development
•Flexible regulatory framework•Investing in innovations and promotion of regional
innovation strategies
ROLE OF GOVERNANCE AND INSTITUTIONS
•Good governance and public institutions play an important role in policy-making and monitoring
•Development-oriented evaluation and accountability are spread throughout the system
•Consensus on policies among education authorities, employers and trade unions fosters sustainable leadership
•Strong governance and rule of law provide solid basis for economic development
•Flexible accountability•Specific institutions, such as the Committee of the Future,
and the innovation system are shared by private and public representatives for consensus-making purposes
HUMAN CAPITAL
•Well-trained teachers•Recognised professionalism in schools and education
institutions •Participatory planning, leadership and evaluation
•Private sector participates actively in education and training policy formulation and implementation
•Significant financing of staff development •Encouraging lifelong learning and continuous professional
development
Source: Sahlberg, 2011.
of intended changes. A national school improvement initiative, the Aquarium Project, implemented in the 1990s in Finland is an example of networking and collaboration at the system level to enhance implementation of intended policies (Sahlberg, 2011)
More flexibility in the system
Flexibility has been another of the key denominators of education and economic development in Finland. The education system went through a major transformation in the early 1990s when most state regulations were abolished and pathways to education opportunities were dramatically increased. Similarly, private sector regulations were loosened and more flexible standards were introduced, especially to foster networking between firms, universities, and research and development institutions.
Today’s education policies emphasise informality, quick decision-making, and freedom to act so that local education authorities and schools can react to changing situations and surrounding environment. As with Nokia (Box 7.4), the objective of educational management in Finland has been to have decisions made by the people who have the best knowledge and skills. The education management system is not only less hierarchical than many other education systems, it is decidedly anti-hierarchical. The objective of meritocratic management in both Nokia and the Finnish education system is to encourage creativity, entrepreneurship and personal responsibility.
7FINLAND: A NON-COMPETITIVE EDUCATION FOR A COMPETITIVE ECONOMY
180 © OECD 2014 STRONG PERFORMERS AND SUCCESSFUL REFORMERS IN EDUCATION: LESSONS FROM PISA FOR KOREA
Sound career pathwaysCareer guidance and counselling became a compulsory part of the peruskoulu curricula in all schools. Career guidance was intended to minimise the risk of students making irreversible choices about their educational futures. Career guidance and counselling soon became a cornerstone of both lower and upper secondary education, and has been an important factor in explaining Finland’s very low drop-out rates and grade repetition. Career guidance has also served as a bridge between formal education and the world of work. As part of the overall career guidance curriculum, each student in basic school spends two weeks in a selected workplace to learn about the work environment.
Value experimentation and creativityImproving economic competitiveness requires well-educated and trained people, technological and network readiness, and the knowledge and skills to work in an innovation-rich world. In order to be on the cutting edge of creative design and continuous innovation in high-tech industries, Finland has contended that people and their creative talent must be the key (Box 7.4). Creativity will not flourish and be sustained in schools unless people feel secure to take risks and explore the unknown. Moreover, working with and understanding innovations require creative and risk-intensive contexts. In other words, economic competitiveness is promoted by creating safe and inspiring learning environments in schools. In such schools teachers and principals will step beyond their conventional territories of thinking and doing that are often conditions for making a difference in students’ learning and schools’ performance.
Making learning interesting for students is the imperative for achieving sustainable development and change in schools. Economic competitiveness is above all about sustained learning. When individuals or societies have severe learning difficulties the economic forecasts will not look good. If students do not learn to love learning in their schools and universities, they will not find learning and change attractive afterwards. Therefore, education policies should first and foremost try to make learning in schools interesting and creative for all students without sacrificing the other important goals of education.
Linda Darling-Hammond, a leading US scholar and practitioner of teacher education, describes how Finnish teacher preparation can instill creativity:
Student teachers participate in problem-solving groups, a common feature in Finnish schools. The problem-solving groups engage in a cycle of planning, action, and reflection/evaluation that is reinforced throughout the teacher education program and is, in fact, a model for what teachers will plan for their own students, who are expected to use similar kinds of research and inquiry in their own studies. Indeed, the entire system is intended to improve through continual reflection, evaluation, and problem-solving, at the level of the classroom, school, municipality, and nation. (Darling-Hammond, 2010).
Box 7.3 Learning schools
Education policies in Finland encourage local education leaders, principals and teachers to take risks, find new solutions to make education more meaningful to all, and put creativity at the centre of play in schools. As the level of teacher professionalism gradually increased in schools during the 1990s, the prevalence of effective teaching methods and pedagogical classroom and school designs increased. A new flexibility within the Finnish education system enabled schools to learn from each other, and thus make best practices universal by adopting innovative approaches to organise schooling. It also encouraged teachers and schools to continue to expand their repertoires of teaching methods, and to individualise teaching in order to meet the needs of all students.
Another aspect of the education system in Finland is the role of networks of schools and communities of teachers in school improvement and teachers’ professional development. Andreas Schleicher, who leads the PISA in the OECD, concluded in his analysis of Finnish education that building networks of schools that stimulate and spread innovations helps to explain Finland’s greatest success in making “strong school performance a consistent and predictable outcome throughout the education system, with less than 5% variation in student performance between schools” (Schleicher, 2006).
7FINLAND: A NON-COMPETITIVE EDUCATION FOR A COMPETITIVE ECONOMY
181STRONG PERFORMERS AND SUCCESSFUL REFORMERS IN EDUCATION: LESSONS FROM PISA FOR KOREA © OECD 2014
LESSONS FROM FINLANDFor all of Finland’s perceived advantages of size, relative cultural homogeneity and economic strength, it is important to remember that as recently as 1970 only 14% of Finnish adults had completed upper secondary school (Sahlberg, 2010). In 1993 Finland was in near economic collapse due to the banking crisis. Finland’s ascent into the very top tier of educational performance was by no means inevitable: it was at least as much the result of a set of policy decisions deliberately taken, implemented thoughtfully, and sustained over a very long period of time as of factors endemic to the country’s culture and history.
There are five main lessons from the story of Finland’s path to the head of the international pack in educational performance. The overall conclusion from the Finnish experience has to do with time, i.e. with understanding that changing a country’s education system is a complex process that requires stability and continuity of both politics and policy over decades, not years. Finland’s leaders took the time to build a solid political consensus across party lines before enacting the comprehensive school legislation in the early 1960s, and then took several more years to phase in the implementation of the law. Everything that has followed has been built upon that consensus-based foundation.
High-quality teachersThere is now strong evidence that the quality of teachers and teaching is by far the most important school-based determinant of educational performance and student achievement, especially for students from less advantaged backgrounds (Hanushek and Wössmann, 2007; Auguste et al., 2010). Many countries pay lip-service to the importance of attracting and retaining a high- quality teacher force, but few have pursued this goal as single-mindedly as Finland. While teachers have always enjoyed a degree of respect in Finnish society, through a combination of raising the bar for entry into the profession and granting teachers greater autonomy and control over their classrooms and working conditions than their peers enjoy elsewhere, Finland has managed to make teaching one of the most desirable career choices among young Finns. Consequently, teaching is now a highly selective occupation in Finland, with well-trained professionals spread throughout the country. This fact, more than any other, accounts for the high level of consistency across Finnish schools.
Some of the noteworthy successful practices in Finland appear to be:
•The development of rigorous, research-based teacher-education programmes that prepare teachers in content, pedagogy, and educational theory, as well as the capacity to do their own research and craft creative pedagogical solutions for teaching.
Box 7.4 Matching curricula to the needs of the economy
In many Finnish companies today the objective is to hire the most innovative as well as collaborative people they can find and to give them the freedom to work together and take risks. In a meeting for the new national curriculum for science and technology in the early 1990s, as part of a task force on the national science curriculum, Finnish business leaders and employers were asked what their expectations were from schools. They explained that if people work or learn in an environment where avoidance of mistakes and fear of failure are dominant, they typically don’t think for themselves. Fear of failure does not engender creativity. A senior Nokia manager put it this way:
“If we hire a youngster who doesn’t know all the mathematics or physics that is needed to work here, we have colleagues here who can easily teach those things. But if we get somebody who doesn’t know how to work with other people, how to think differently or how to create original ideas and somebody who is afraid of making a mistake, there is nothing we can do here. Do what you have to do to keep our education system up-to-date but don’t take away creativity and open-mindedness that we now have in our schools.” (Sahlberg, 2011).
This was an important message for those education experts crafting the new national curriculum frameworks in mathematics and science at that time. In my recent interviews with some of the main Finnish service and technology companies’ human resource heads a similar trend was confirmed. Successful applicants’ academic merits normally weigh less than their personality and attitude. As one informant said, “we are hiring attitudes and talents, not credits or diplomas”. Policy makers and schools listen closely to what employers expect of their new human resources. Curriculum policy today is in the balance between children’s personal development needs, and the expectations of the Finnish economy.
7FINLAND: A NON-COMPETITIVE EDUCATION FOR A COMPETITIVE ECONOMY
182 © OECD 2014 STRONG PERFORMERS AND SUCCESSFUL REFORMERS IN EDUCATION: LESSONS FROM PISA FOR KOREA
•Significant financial support for teacher education, professional development, reasonable and equitable salaries, and supportive working conditions.
•The creation of a respected profession in which teachers have considerable authority and autonomy, including responsibility for curriculum design and student assessment, which engages them in the ongoing analysis and refinement of practice.
Highly efficient policiesWith such policies and reforms, Finland appears to get more for less in education. Finland differs from many other countries in its minimalistic approach to educational effectiveness. Finnish children start formal schooling later than most other children, at the age of seven. According to international surveys they also are expected to do much less school-related homework than others. Comparisons of intended instructional hours during compulsory education reveal that pupils in Finland have less classroom-based learning time than pupils in other developed countries (Box 7.5). Last but not least, Finnish children experience little or no external standardised testing of what they have learned. This minimalistic approach to education policy and practice might suggest that the education system is mediocre. That does not seem to be the case. Some Finnish analysts suggest that a golden balance has been struck in Finnish schools between formal instruction and informal learning that allows both students and teachers to use their creative potential and imagination to complement the effect of education. These smart education policies optimise inputs and limit the use of expensive quality control and data mechanisms that are common in many other countries.
Diagnosis and early interventionFinnish teachers are trained to accept that all children can learn, and to intervene before struggling children become discouraged and fall too far behind their classmates. The proximity of help in the form of specially trained intervention experts in every school – the special education teacher – means that the regular classroom teacher has easy access to support and that struggling children are much less likely to go unnoticed or to fall through the cracks. The small size of Finland’s schools is an important factor here, as is the co-ordination of resources embodied in the pupils’ care group. Most primary school teachers also teach the same class of pupils for several years, i.e. from first grade to sixth, allowing them to become very familiar with the needs and personalities of each student. Again, this combination of elements helps explain why the gap between the top and bottom performing schools and students in Finland is so narrow compared with virtually all other nations.
Creativity
Creativity and innovation are overused words in education, especially by merchants of the latest pieces of hardware or software that promise to revolutionise teaching and learning. However, in this chapter creativity refers to the emphasis in Finnish schools on the importance of cultivating in young people those dispositions and habits of mind that are often associated with innovators: risk- taking, flexibility, initiative, collaboration, and the ability to apply knowledge to novel situations. Some skeptics about Finland’s success attribute its consistently high performance on PISA to the degree of alignment between the kind of learning PISA measures and values and the goals of the Finnish education system. There is clearly some truth to this observation, but this hardly constitutes
Box 7.5. Teaching less does not mean achieving less
From an international perspective, Finnish teachers devote less time to teaching than do teachers in many other nations. For example, a typical middle-school teacher in Finland teaches just less than 600 hours annually, corresponding to about four 45-minute lessons a day. In the United States, by contrast, a teacher at the same level devotes 1 080 hours to teaching over 180 school days (OECD, 2010b). This means that, on average, a middle-school teacher in the United States devotes almost twice as much time to teaching compared with his or her counterpart in Finland.
This, however, does not imply that teachers in Finland work less than they do elsewhere. An important – and still voluntary – part of Finnish teachers’ work is devoted to improving classroom practice, the school as a whole, and working with the community. Formally, teacher’s working time in Finland consists of classroom teaching, preparation for teaching, and two hours a week planning school work with colleagues. But because Finnish teachers take on significant responsibility for curriculum and assessment, as well as experimentation with and improvement of teaching methods, some of the most important aspects of their work are conducted outside of classrooms.
7FINLAND: A NON-COMPETITIVE EDUCATION FOR A COMPETITIVE ECONOMY
183STRONG PERFORMERS AND SUCCESSFUL REFORMERS IN EDUCATION: LESSONS FROM PISA FOR KOREA © OECD 2014
a criticism of the Finnish system. The Finns are not the least bit apologetic about their focus on preparing people for an economy in which creativity, innovation and entrepreneurship will continue to be drivers of progress.
Deep sectoral reformsMost governments enact education reform through new programmes – e.g. smaller class size, more ambitious external assessments, increased professional development. Reforms like these take the basic features of the system as given. The Finnish reforms, by contrast, especially the creation of the comprehensive school, created a sector that functioned in a radically different way. It is the shape of this new sector, not continued programmatic initiatives from a central government, which accounts for Finland’s success. Closer analysis of Finnish education policies and reforms since the 1970s reveals that Finland has employed different solutions to transforming its education system compared with many other OECD countries (Darling-Hammond, 2010; Hargreaves and Shirley, 2009; Sahlberg, 2011). This is sometimes called the Finnish Way of educational reform. The Finnish experience shows that successful reform of the education system is possible without strong emphasis on competition, choice, external inspection, standardised testing or non-public governance of schools (such as charter schools). Finnish policies have endorsed the systematic building of professionalism among teachers and leaders, the gradual creation of trust in schools and teachers, and the importance of personalisation of teaching and learning. Moreover, Finnish education policies have put creativity and experimentation on a par with teaching for academic achievement. One of the key lessons from Finland is therefore a notion of hope: it is possible to turn around an education system if the change strategies are based on right things.
THE CHALLENGE AHEADThe big question all high-performing systems need to face is whether or not the policies and practices that have brought about their current high performance will be sufficient to sustain them in a rapidly-changing, globalising world. Like all other countries, Finland needs to put serious effort into renewing its education system to meet the needs of a society that will be more globalised, complex and unpredictable than today’s. The following challenges to the Finnish education system are likely to need rapid attention:
•Although the educational performance of Finnish schools, as measured by international student assessments, is remarkably even, the gap between individuals in Finland is increasing. In reading literacy, for example, differences between girls and boys are already significant. Domestic research also reveals that the number of adolescents who find no or little value in studying at school is growing. Education policies need to address these indifferences in achievement and engagement. One option is to have more personalised learning and customised schools that would better meet the interests and needs of individuals and communities (Sahlberg, 2011).
•The global economic downturn is reducing available funds for the public sector in Finland. Many Finnish municipalities are in serious fiscal crisis and spending in education is at stake. In some cases local decision makers argue that good enough results can be accomplished with a reduced education budget. But continuous renewal of the education system requires both human and financial resources. The risk is that shrinking resources will eventually jeopardise the process of renewal.
•During times of economic downturn, professional development budgets are often the first to vanish. Concerns have been raised recently about the variability of in-service professional development for teachers. Municipalities, as the overseers of primary, middle and high schools, are responsible for providing teachers with learning opportunities, based on their needs. Therefore, some schools receive greater allocations for professional development and school improvement than others. In response to concerns that participation in professional development may be decreasing, the government is planning substantial increases in professional development budgets and considering ways to require that all teachers have access to adequate professional training financed by municipalities. The state budget annually allocates some USD 30 million to professional development of teachers and school principals through various forms of pre-tertiary and continuing education. The government determines the focus of the training, based on current national educational development needs, and the training is contracted out to service providers on a competitive basis. The Finnish Ministry of Education, in collaboration with municipalities, plans to double the public funding for teacher professional development by 2016.
•Finally, creativity is the central power of Finnish education system. Lack of fear, and the freedom to find one’s own personal way to learn are the main drivers of the risk-taking and relaxed atmosphere in Finnish schools. Increasing diversity in classrooms also helps teachers to look for new ways to make learning inspiring for all. It is paramount to maintain that diversity and further develop creative approaches in schools and classrooms. Having more creativity and innovation in education is not only a methodological or curricular issue. This is first and foremost a cultural issue, and the challenge is to organise schools to make the best use of everybody’s imagination and creative talent. Minimising external control of schools and maximising trust will be the success factors of Finnish education for the decades to come.
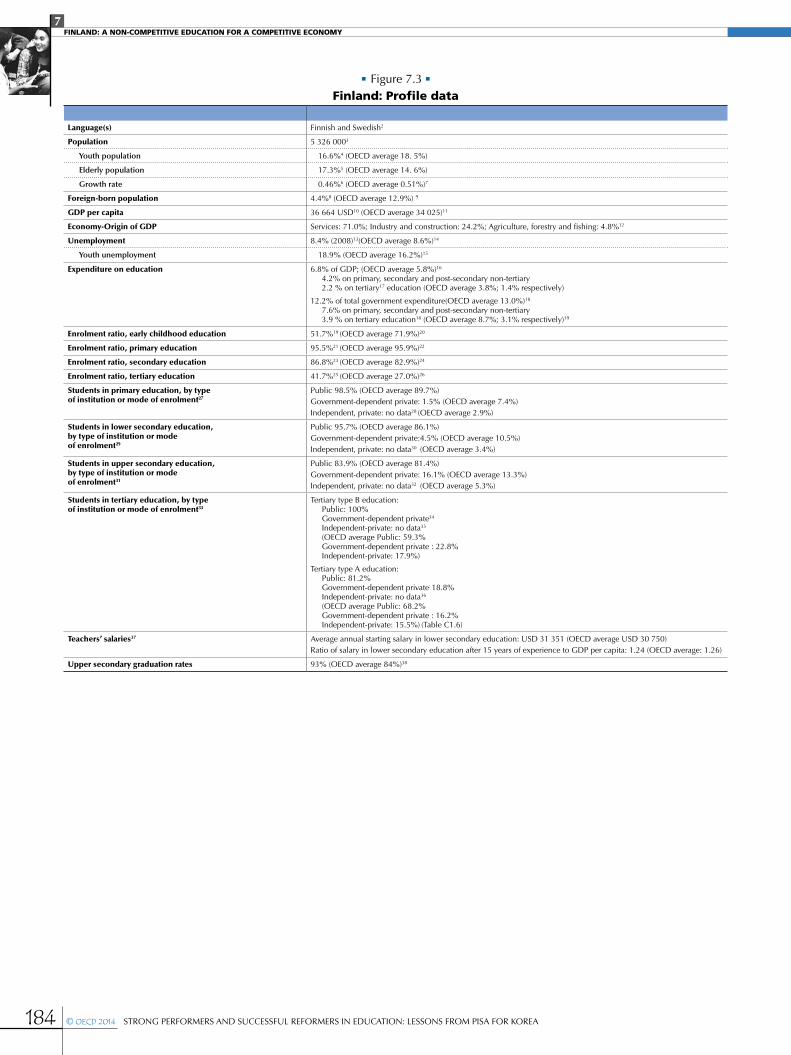
7FINLAND: A NON-COMPETITIVE EDUCATION FOR A COMPETITIVE ECONOMY
184 © OECD 2014 STRONG PERFORMERS AND SUCCESSFUL REFORMERS IN EDUCATION: LESSONS FROM PISA FOR KOREA
• Figure 7.3 •Finland: Profile data
Language(s) Finnish and Swedish2
Population 5 326 0003
Youth population 16.6%4 (OECD average 18. 5%)
Elderly population 17.3%5 (OECD average 14. 6%)
Growth rate 0.46%6 (OECD average 0.51%)7
Foreign-born population 4.4%8 (OECD average 12.9%) 9
GDP per capita 36 664 USD10 (OECD average 34 025)11
Economy-Origin of GDP Services: 71.0%; Industry and construction: 24.2%; Agriculture, forestry and fishing: 4.8%12
Unemployment 8.4% (2008)13(OECD average 8.6%)14
Youth unemployment 18.9% (OECD average 16.2%)15
Expenditure on education 6.8% of GDP; (OECD average 5.8%)16
4.2% on primary, secondary and post-secondary non-tertiary2.2 % on tertiary17 education (OECD average 3.8%; 1.4% respectively)
12.2% of total government expenditure(OECD average 13.0%)18
7.6% on primary, secondary and post-secondary non-tertiary3.9 % on tertiary education18 (OECD average 8.7%; 3.1% respectively)19
Enrolment ratio, early childhood education 51.7%19 (OECD average 71.9%)20
Enrolment ratio, primary education 95.5%21 (OECD average 95.9%)22
Enrolment ratio, secondary education 86.8%23 (OECD average 82.9%)24
Enrolment ratio, tertiary education 41.7%25 (OECD average 27.0%)26
Students in primary education, by type of institution or mode of enrolment27
Public 98.5% (OECD average 89.7%)Government-dependent private: 1.5% (OECD average 7.4%)Independent, private: no data28 (OECD average 2.9%)
Students in lower secondary education, by type of institution or mode of enrolment29
Public 95.7% (OECD average 86.1%)Government-dependent private:4.5% (OECD average 10.5%)Independent, private: no data30 (OECD average 3.4%)
Students in upper secondary education, by type of institution or mode of enrolment31
Public 83.9% (OECD average 81.4%)Government-dependent private: 16.1% (OECD average 13.3%)Independent, private: no data32 (OECD average 5.3%)
Students in tertiary education, by type of institution or mode of enrolment33
Tertiary type B education: Public: 100%Government-dependent private34
Independent-private: no data35
(OECD average Public: 59.3%Government-dependent private : 22.8%Independent-private: 17.9%)
Tertiary type A education:Public: 81.2%Government-dependent private: 18.8%Independent-private: no data36
(OECD average Public: 68.2%Government-dependent private : 16.2%Independent-private: 15.5%) (Table C1.6)
Teachers’ salaries37 Average annual starting salary in lower secondary education: USD 31 351 (OECD average USD 30 750)Ratio of salary in lower secondary education after 15 years of experience to GDP per capita: 1.24 (OECD average: 1.26)
Upper secondary graduation rates 93% (OECD average 84%)38
7FINLAND: A NON-COMPETITIVE EDUCATION FOR A COMPETITIVE ECONOMY
185STRONG PERFORMERS AND SUCCESSFUL REFORMERS IN EDUCATION: LESSONS FROM PISA FOR KOREA © OECD 2014
Notes
1. As a consequence of the tightening financial conditions in Finnish municipalities, about 1 000 basic schools were shut down during the first decade of this century. Many of them were small rural schools.
2. “Population according to language and the number of foreigners and land area km2 by area”. Statistics Finland’s PX-Web databases. Helsinki: Statistics Finland. 2008-12-31.
3. OECD (2012), OECD Factbook 2011-2012, OECD Publishing. (data from 2010).
4. OECD (2012), OECD Factbook 2011-2012, OECD Publishing. Ratio of population aged less than 15 to the total population. (data from 2010).
5. OECD (2012), OECD Factbook 2011-2012, OECD Publishing. Ratio of population aged 65 and older to the total population. (data from 2010).
6. OECD (2012), OECD Factbook 2011-2012, OECD Publishing. Annual population growth rate. (data from 2010).
7. OECD (2012), OECD Factbook 2011-2012, OECD Publishing. OECD total, Annual population growth in percentage, year of reference 2010.
8. OECD (2012), OECD Factbook 2011-2012, OECD Publishing. Foreign-born population as percent of the total population, (data from 2009).
9. OECD (2010), OECD Factbook 2010, OECD Publishing. Foreign-born population as percent of the total population, (data from 2007).
10. OECD (2012), OECD Factbook 2011-2012, OECD Publishing.
11. OECD (2012), OECD Factbook 2011-2012, OECD Publishing. Current prices and PPPs. (data from 2010).
12. OECD (2012), OECD Economic Surveys: Finland 2012. OECD Publishing.
13. OECD (2012), OECD Factbook 2011-2012, OECD Publishing. Total unemployment rates as percentage of total labour force. (data from 2010).
14. OECD (2012), OECD Factbook 2011-2012, OECD Publishing. Total unemployment rates as percentage of total labour force. (data from 2010).
15. OECD (2012), OECD Employment Outlook 2012, OECD Publishing. Unemployed as a percentage of the labour force in the age group: youth aged 15-24. (data from 2011).
16. OECD (2012), Education at a Glance 2012, OECD Publishing. Data from 2009. Public expenditure presented in this table includes public subsidies to households for living costs (scholarships and grants to students/households and students loans), which are not spent on educational institutions.
17. The OECD follows standard international conventions in using the term “tertiary education” to refer to all post-secondary programmes at ISCED levels 5B, 5A and 6, regardless of the institutions in which they are offered. OECD (2008), Tertiary Education for the Knowledge Society: Volume 1, OECD Publishing.
18. OECD (2012), Education at a Glance 2012, OECD Publishing. Data from 2009. Public expenditure presented in this table includes public subsidies to households for living costs (scholarships and grants to students/households and students loans), which are not spent on educational institutions.
19. OECD (2012), Education at a Glance 2012, OECD Publishing. Data from 2010 on net enrolment rates of ages 3 and 4 as a percentage of the population of this age group.
20. OECD (2012), Education at a Glance 2012, OECD Publishing. OECD average net enrolment rates of ages 3 and 4 as a percentage of the population of this age group year of reference 2010.
21. OECD (2012), Education at a Glance 2012, OECD Publishing. Data from 2010 on net enrolment rates of ages 5 to 14 as a percentage of the population aged 5 to 14.
22. OECD (2012), Education at a Glance 2012, OECD Publishing. OECD average net enrolment rates of ages 5 to 14 as a percentage of the population aged 5 to 14, year of reference 2010.
23. OECD (2012), Education at a Glance 2012, OECD Publishing. Data from 2010 on net enrolment rates of ages 15 to 19 as a percentage of the population aged 15 to 19.
24. OECD (2012), Education at a Glance 2012, OECD Publishing. OECD average net enrolment rates of ages 15 to 19 as a percentage of the population aged 15 to 19, year of reference 2010.
25. OECD (2012), Education at a Glance 2012, OECD Publishing. Data from 2010 on net enrolment rates of ages 20 to 29 as a percentage of the population aged 20 to 29. This figure includes includes all 20-29 year olds, including those in employment, etc. The Gross Enrolment Ratio (GER), measured by the UN as the number of actual students enrolled / number of potential students enrolled, is generally higher. The GER for tertiary education in Finland in 2010 is 94%, compared to the regional avg of 76%,UNESCO-UIS (UNESCO Institute for Statistics) (2011), Statistics in Brief: Finland.
7FINLAND: A NON-COMPETITIVE EDUCATION FOR A COMPETITIVE ECONOMY
186 © OECD 2014 STRONG PERFORMERS AND SUCCESSFUL REFORMERS IN EDUCATION: LESSONS FROM PISA FOR KOREA
26. OECD (2012), Education at a Glance 2012, OECD Publishing. OECD average net enrolment rates of ages 20 to 29 as a percentage of the population aged 20 to 29, year of reference 2010.
27. OECD (2012), Education at a Glance 2012, OECD Publishing. (data from 2010).
28. Data is not applicable because category does not apply.
29. OECD (2012), Education at a Glance 2012, OECD Publishing. (data from 2010).
30. Data is not applicable because category does not apply.
31. OECD (2012), Education at a Glance 2012, OECD Publishing. (data from 2010).
32. Data is not applicable because category does not apply.
33. OECD (2012), Education at a Glance 2012, OECD Publishing. (data from 2010).
34. Magnitude is either negligible or zero.
35. Data is not applicable because category does not apply.
36. Data is not applicable because category does not apply.
37. OECD (2012), Education at a Glance 2012, OECD Publishing. Starting salary/ minimum training in public institutions in USD adjusted for PPP. (data from 2010).
38. OECD (2012), Education at a Glance 2012, OECD Publishing. Sum of upper secondary graduation rates for a single year of age, (Year of reference 2010).
7FINLAND: A NON-COMPETITIVE EDUCATION FOR A COMPETITIVE ECONOMY
187STRONG PERFORMERS AND SUCCESSFUL REFORMERS IN EDUCATION: LESSONS FROM PISA FOR KOREA © OECD 2014
References and further reading
Aho, E., K. Pitkänen, K. and P. Sahlberg (2006), Policy Development and Reform Principles of Basic and Secondary Education in Finland Since 1968, The World Bank, Washington, DC.
Auguste, B., P. Kihn, P. and M. Miller (2010), Closing the Talent Gap: Attracting and Retaining Top Third Graduates to a Career in Teaching, McKinsey & Company, London.
Castells, M. and P. Himanen (2002), The Information Society and the Welfare State: The Finnish Model, Oxford University Press, Oxford.
Darling-Hammond, L. (2010), The Flat World and Education. How America’s Commitment to Equity Will Determine our Future, Teachers College Press, New York.
Hanushek, E. and L. Wössmann (2007), Education Quality and Economic Growth, The World Bank, Washington, DC.
Hargreaves, A. and D. Shirley (2009), The Fourth Way. The Inspiring Future for Educational Change, Corwin, Thousand Oaks.
Kupari, P. and J. Välijärvi (Eds.) (2005), Osaaminen kestävällä pohjalla. PISA 2003 Suomessa [Competences on Solid Ground. PISA 2003 in Finland], Institute for Educational Research, University of Jyväskylä, Jyväskylä.
Lewis, R. (2005), Finland, Cultural Lone Wolf, Intercultural Press, Yarmouth.
Ministry of Education (1997), National Lifelong Learning Strategy, Ministry of Education, Helsinki.
Ministry of Education (2003), Ministry of Education Strategy 2015, Ministry of Education, Helsinki.
Ministry of Finance (1995), Finnish Information Society Program, Ministry of Finance, Helsinki.
OECD (2005), Equity in Education. Thematic Review of Finland, OECD Publishing. www.oecd.org/education/country-studies/36376641.pdf.
OECD (2010a), PISA 2009 Volume I, What Students Know and Can Do: Student Performance in Reading, Mathematics and Science, OECD Publishing. http://dx.doi.org/10.1787/9789264091450-en.
OECD (2010b), Education at a Glance 2010: OECD Indicators, OECD Publishing. http://dx.doi.org/10.1787/eag-2010-en.
OECD (2010c), OECD Economic Surveys: Finland 2010, OECD Publishing. http://dx.doi.org/10.1787/eco_surveys-fin-2010-en.
OECD (2010d), OECD Factbook 2010, Ratio of Population Aged Less Than 15 to the Total Population, OECD Publishing. http://dx.doi.org/10.1787/factbook-2010-en.
OECD (2010e) Employment Outlook 2010, OECD Publishing. http://dx.doi.org/10.1787/empl_outlook-2010-en.
OECD (2012f), OECD Factbook 2011-2012, OECD Publishing. http://dx.doi.org/10.1787/factbook-2011-en.
OECD (2012g), OECD Economic Surveys: Finland 2012, OECD Publishing. http://dx.doi.org/10.1787/eco_surveys-fin-2012-en.
OECD (2012h), OECD Employment Outlook 2012, OECD Publishing. http://dx.doi.org/10.1787/empl_outlook-2012-en.
OECD (2012i), Education at a Glance 2012: OECD Indicators, OECD Publishing. http://dx.doi.org/10.1787/eag-2012-en.
OECD (2012j), Strong Performers and Successful Reformers: Lessons from PISA for JAPAN, OECD Publishing. http://dx.doi.org/10.1787/9789264118539-en.
Routti, J. and P. Ylä-Anttila (2006), Finland as a Knowledge Economy. Elements of Success and Lessons Learned, The World Bank, Washington, DC.
Sahlberg, P. (2010), “Educational change in Finland”, in A. Hargreaves, A. Lieberman, M. Fullan and D. Hopkins (Eds.), Second International Handbook of Educational Change, Springer, New York.
Sahlberg, P. (2011), Finnish Lessons: What Can the World Learn from Educational Change in Finland, Teachers College Press, New York.
Schleicher, A. (2006), The Economics of Knowledge: Why Education is Key for Europe’s Success, The Lisbon Council, Brussels.
7FINLAND: A NON-COMPETITIVE EDUCATION FOR A COMPETITIVE ECONOMY
188 © OECD 2014 STRONG PERFORMERS AND SUCCESSFUL REFORMERS IN EDUCATION: LESSONS FROM PISA FOR KOREA
Schwab, K. (Ed.) (2010), The Global Competitiveness report 2010-2011, World Economic Forum, Geneva, available at www3.weforum.org/docs/WEF_GlobalCompetitivenessReport_2010-11.pdf.
Statistics Finland (2011), Education, available at www.stat.fi/til/kou_en.html.
Toom, A., H. Kynäslahti, L. Krokfors, R. Jyrhämä, R. Byman, K. Stenberg, K. Maaranen, and P. Kansanen (2010), “Experiences of research-based approach to teacher education: Suggestion for the future policies”, European Journal of Education, Vol. 45/2, pp. 331-344.
8
189STRONG PERFORMERS AND SUCCESSFUL REFORMERS IN EDUCATION: LESSONS FROM PISA FOR KOREA © OECD 2014
Policy Lessonsfor Korea
Korea has one of the most educated workforces and is among the highest-performing countries in international educational assessments. Success in education has been the result of the strong capacity to foster rapid and remarkable improvements in the education system. This chapter summarises the key strengths of, and some policy challenges to, Korea’s education system. This chapter highlights ways to improve the education system, firstly by improving the transition from school-to-work and the labour-market outcomes of education, focusing on quality and relevance of education. Secondly, improvement can be seen as a result of strengthening equity and social cohesion through education, in particular by addressing effective policy responses to Early Childhood Education and Care (ECEC) and supplementary education.
8POLICY LESSONS FOR KOREA
190 © OECD 2014 STRONG PERFORMERS AND SUCCESSFUL REFORMERS IN EDUCATION: LESSONS FROM PISA FOR KOREA
SUSTAINING HIGH PERFORMANCE: STRENGTHS AND POLICY CHALLENGESOver the last fifty years, Korea’s educational progress has been extraordinary. An estimated 78% of the population were illiterate at the end of the Second World War, while today Korea is near or at the top of international assessments and indicators on education. PISA data and other research suggest a number of conditions and factors that have led to Korea’s success in education. This research also suggests areas where further reforms are needed.
This chapter analyses the main strengths that have contributed to Korea’s strong performance. It also highlights current policy challenges in the Korean education system. The experience of other high- performing systems has shed light on ways to further strengthen the Korean education system. In turn, policy lessons for Korea will be of interest in other countries facing similar challenges.
EDUCATION IS A NATIONAL PRIORITYAs a society and as a country, Korea attaches great importance to education and this commitment has contributed to the educational achievements seen today. A long tradition of valuing education and hard work, founded on Confucianism, is a contributing factor to the success of several East Asian countries and economies, but it does not of itself explain the rapid progress of Korea in the last decades. The willingness of Korea to invest in education is reflected in a high education budget, increased expenditure per student, significant financial contributions by families, high teacher salaries, and reducing class size.
The high commitment to and prominence of education in Korea are reflected in the very high levels of public and private investment. The investment represents 7.6% of the GDP, which is significantly more than the OECD average of 6.3% and places Korea third only to Denmark and Iceland (OECD, 2013a). Public expenditure on primary, secondary and post-secondary non-tertiary education has increased by 89% between 2000 and 2009, and 102% as measured per student – the 4th largest increase among 29 countries with available data. In contrast, the proportion of the total public budget spent on education is less, yet remains above the OECD average (OECD, 2013c). Families also shoulder an important share of the cost of education. Private expenditure for primary and lower secondary education in Korea accounts for 21.5% of the total investment, one of the highest proportions among OECD countries. Most of the increase in expenditure in recent years can be related to the reduction of class size in Korea (OECD, 2012b). Although class size is still comparatively high, there has been a significant reduction over the past ten years: the average primary class has shrunk by nine students and the average lower secondary class by four students (OECD, 2012b, 2013b). In 2011, the average class size in a Korean primary school was 26.3 students (21.2 in OECD) and 34 students at the lower secondary level (23.3 in OECD).
Neither national wealth nor expenditure on education guarantees better student performance. PISA data shows that the way in which resources are employed rather than the total figure is most important in high-income countries. The strongest performers among high-income economies tend to prioritise the quality of teachers over class size. In Korea, teachers are better paid than those in most other OECD countries (OECD, 2013c). For example, lower secondary teachers earn more than twice the GDP per capita (OECD, 2013c).
While continuing its efforts to increase investment in education, Korea faces challenges to prioritise policy areas that are to be the most privileged. Looking at the most effective way to use resources could help Korea achieve higher performance. The following sections provide elements of reflexion for Korea in identifying challenges, and thus the areas where Korea can most concentrate its efforts. Better matching the education system with the changing economy and society is one area where Korea can focus and ensure the convergence of policy measures to strengthen school-to-work transition through curriculum reform, vocational education and training, quality and innovative teaching. Addressing social cohesion is another area of policy challenge in Korea. Supplementary education, as discussed in Chapter 3, requires policy responses to maximise supplementary learning opportunities and to limit the downside, and also to provide equitable educational opportunities to all young people. Policy measures to address the equity in learning in school also should be considered. Some examples of recent policy responses on Early Childhood Education and Care (ECEC) and parental involvement are presented where Korea has been demonstrating strong commitment to improve the equity and quality of education.
IMPROVING THE TRANSITION FROM SCHOOL TO WORK AND THE LABOUR-MARKET OUTCOMES OF EDUCATIONDeveloping relevant skills and helping students transition into the workforce is one of the most important outcomes of the education system today. In the context of the changing economy, the nature and structure of employment has changed and thus has the demand for skills. PISA demonstrates that Korea has been developing and improving the basic skills and the capacity of application of the skills of 15-year-old students. Korea can build on the strong skill base and high secondary and tertiary education attainment to develop relevant skills and to ensure the labour-market outcomes of the education system.
8POLICY LESSONS FOR KOREA
191STRONG PERFORMERS AND SUCCESSFUL REFORMERS IN EDUCATION: LESSONS FROM PISA FOR KOREA © OECD 2014
In order to develop relevant skills, the Korean education system needs to respond to changing skill demand through the design and implementation of curricula, and education and training programmes corresponding to the needs of the economy. Support for the transition from school to work is also central for matching the right skills with the right work places and for guiding students to the most appropriate paths to optimise their skill potential and career aspiration. Above all, education and training must be of a high quality, supported by the quality of teachers and innovation in teaching matter.
This section introduces the efforts put in place in, and the remaining challenges for, Korea in the field of vocational education and curriculum reform. It also highlights teachers, information communication technology (ICT) in education and evaluation as factors to support the delivery of quality education.
ENSURING THE RELEVANCE OF VOCATIONAL EDUCATION AND TRAINING TO THE LABOUR MARKETThe Korean government considers vocational education and training (VET) as one of its priorities. Several policies have been implemented to improve the educational system and improve its correlation to labour market needs. For example, more avenues for employer involvement in policy development and implementation are under consideration. Also, Meister Schools have been created, which are VET schools where workplace training is an important part of the programme (OECD, 2009).
VET is mainly school-based, although in some programmes students may participate in workplace training with local employers, and thus VET graduates might not be equipped with the relevant skills to be readily employable. VET institutions often see themselves as having a largely academic orientation, although they are expected to provide job-ready recruits for industry. They typically develop their own curricula and qualifications within the broad guidelines provided by the Ministry of Education, which are not systematically aligned with the national technical qualifications (and underlying standards).
An OECD Review of the VET upper secondary system conducted in 2009 recommended (OECD, 2009) providing an institutional framework for enhancing industry participation in VET. Under this framework, permanent bodies should engage industry stakeholders at all levels in the development and implementation of VET policy. All relevant ministries should be represented in these bodies:
•Improve the provision, quality and relevance of initial workplace training by strengthening incentives for partnerships between VET institutions and firms, and by developing and implementing standards for quality;
•Introduce measures to ensure that VET teachers, experienced and newly hired, have relevant work experience and regularly update their skills in the vocational area, including their knowledge of technologies and working practices;
•Derive the vocational part of the curriculum used by VET institutions from, or adapt it to, the national technical standards to deliver two certificates: one from the VET institution and the other based on the national technical qualification (NTQ) examination. The NTQ examinations should be evaluated by the Ministry of Labour, and reformed if necessary, to improve quality and matching to labour market needs.
Currently, the Korean government targets VET among its priorities and has been implementing several VET related policies in collaboration with concerned ministries. Several Ministries share responsibility for VET (Education; Strategy and Finance; Trade, Industry and Energy; Employment and Labour; National Defense; and the Small and Medium Business Administration) and they have been building co-operation through memoranda of understanding. Recent reforms include the policy for advancement of high school vocational education, and measures to establish the school-apprenticeship dual education programme, and the establishment of National Competency Standards1. These measures are expected to respond to the challenges and to contribute to the improvement of VET in Korea.
DEVELOPING AND IMPLEMENTING A CURRICULUM FOR THE 21ST CENTURYIn the context of the changing economy and technological progress, adapting learning to the needs of the market and society has never been more important. Developing a curriculum for the 21st Century is a core concern of education reform in many countries. It requires adapting curriculum so that it fosters knowledge, character (behaviour, attitudes, values), and skills including ‘soft’ skills such as creativity, critical thinking, communication and collaboration. Korea has been seizing opportunities to make learning more relevant through educational reform.
Korea has pushed forward reforms to prepare for globalisation, the ICT revolution, and the growth of the knowledge base in many disciplines. The Report of the Presidential Commission on Education Reform (1996) set out a radical new direction for the education system by stating:
“A nation’s level of creativity in the fields of science and technology, and knowledge and culture is the most potent determinant of its fate. A reservoir of the nation’s assets relies on the learning capability and creativity of its people. Education plays the most vital role in developing a nation’s intellectual power”.
8POLICY LESSONS FOR KOREA
192 © OECD 2014 STRONG PERFORMERS AND SUCCESSFUL REFORMERS IN EDUCATION: LESSONS FROM PISA FOR KOREA
While recognising the educational achievements of the past, the Report stated that the inherited system “will no longer be appropriate in the era of information technology and globalisation”.
The educational reforms reflect this philosophy and seek to build a system characterised by open education and lifelong learning. The latest curricular revision (2009) provides directions to foster 21st Century skills. It includes focusing on creativity and character, reduction of the excessive academic burden, and introduction of ‘creative experiential activities’ to foster consideration for and sharing with others (KICE, 2012). Diverse teaching methods and materials as well as cutting-edge technology and ICT have been introduced (UNESCO, 2006).
Despite regular and transformative reforms, Korea can more explicitly introduce curriculum designed to match learning with the skills demanded by the labour market. Based on the foundation developed in elementary school education, Korea’s secondary education curriculum emphasises the development of basic abilities essential for learning and daily life, the formation of character and citizenship, and the ability to find a career path in accordance with their aptitudes and talents (KICE, 2012). This already involves learning creative and critical thinking and specialised subjects that will nurture skills for future jobs. Nevertheless, Korea can further explore an appropriate mix of general and occupation-specific skills in general and vocational education to better match the curriculum with relevant skill demand.
Continuous shifting from learning to testing through highly academic oriented education, to learning for holistic skills development, needs to be considered in the process of curricula reform. In Korea, the evaluation content and method of College Scholastic Ability Test (CSAT) influences teaching (KICE 2012). CSAT aims to measure student scholastic ability as required for college education. This test also serves as one of the tools to normalise high school education. As entering a good university is important for individuals and for schools, the way the college admission process is conducted has a great impact on teaching and learning in schools. Korea can embark on the reforms in revising university entrance examinations along with its curriculum reform.
The introduction of the Admission Officer’s system is one step forward to select university entrance candidates without limiting the criteria to test scores, and thus reducing the excessive focus of test preparation in high schools. In this regard, Japan’s experience of curriculum and university admission system reforms provides Korea with cases responding to similar challenges. In the education reform of the late 1990s, Japan promoted the curriculum that enhances so-called ‘Zest of Living’ through education. This ‘Zest of Living’ reform intended to set the conditions that would enable students to develop a well-rounded personality and promote the development of cognitive and non-cognitive competencies that are needed in Japan’s changing economy and society. This vision has coupled with the reform of the university admission system, shifting from a heavy focus on a one-shot standard test for assessing subject knowledge to the system of diverse and integrated student evaluations to assess the motivation, skills, and aptitude (OECD, 2012h; MEXT, 2012). Japan’s challenge was to find the best equilibrium between reducing the intensity and stress of learning (or promoting so-called ‘relaxed education’) and strengthening the skills of high school graduates and motivating for learning to maintain high performance without pressures of university entrance examinations.
Moreover, attention should be paid to ensure that curricula reform is effectively implemented. In Korea, teachers sometimes find themselves at the centre of conflict due to the dominant role of the College Scholastic Ability Test (CSAT) and thus parental pressures to ensure preparation for the exam, while the curriculum requires teachers to get away from teaching-to-the-test (OECD, 2004). Japan’s case underlines the point that curricular reform should be aligned to the student assessment, especially university entrance examinations, and substantial changes in instructional methodology and require leadership of schools and teachers in designing and implementing programmes of integrated study for inquiry-based and student-centred learning. Japan’s reform also faced resistance from teachers and from the general public. In the face of criticism about the decline of the quality of education, PISA results show improvement in teacher-student relations and increased performance on tasks requiring open-ended, higher-order thinking skills (OECD, 2012h).
This case of curriculum and entrance exam reform implies that Korea can continuously strive for and update the best match between skills that students can develop and are motivated to learn in schools and skills demanded by the changing and evolving economy.
ATTRACTING, SUPPORTING AND RETAINING HIGH QUALITY TEACHERSTeachers play an important role, not only in guiding the learning and development of student skills through the implementation of curriculum, but also supporting the preparation of students for their future lives. Korea knows that quality teacher matters for the strong performance of the education system and has built a high-quality teacher workforce. Culturally and historically, the teaching profession in Korea has been well regarded and respected. Teachers are held to high standards and benefit from job stability, high pay, and good working conditions, including important levels of teacher collaboration (Kang and Hong, 2008). Teachers also benefit from a high degree of school autonomy in curricular decision-making and assessment practices in Korea. OECD studies

8POLICY LESSONS FOR KOREA
193STRONG PERFORMERS AND SUCCESSFUL REFORMERS IN EDUCATION: LESSONS FROM PISA FOR KOREA © OECD 2014
show that, in general, students tend to perform better in countries where schools have greater autonomy over curriculum and how students are assessed, thus the teacher’s role in curriculum innovation and student assessment is critical (OECD, 2012a).
Many talented students are attracted to the profession and entrance is highly competitive. Barber and Mourshed (2007) found that the highest-performing educational systems recruit their teachers from the top third of each cohort of graduates (top 5% in Korea, 10% in Finland and 30% in Singapore and Japan). In Korea, initial teacher education graduates receive a teacher certificate that enables them to work in private schools or on a contractual basis (OECD, 2004). However, they have to take the Teacher Employment Examination to obtain a permanent teaching position in a public school. The exam consists of two steps: a written test, followed by an in-depth interview to assess aptitude, lesson plan, instructional ability including mock teaching and practical test.
Teachers are rewarded with high salaries, career stability and important social status. Korean primary and lower secondary school teachers with at least 15 years of experience receive statutory salaries that are much higher than the OECD average (USD 48 251 compared to USD 38 136 in OECD countries for primary teachers, and USD 48 146 compared to USD 39 934 in OECD countries for lower secondary teachers) (OECD, 2013b).
Korean teachers also spend less time teaching in the classroom than in many other OECD countries, and more time on activities such as class preparation and administrative work (OECD, 2013c). Many primary and secondary schools have shared offices for teachers, which promote greater exchange among staff and more involvement in school activities. In addition, an OECD Review found that teaching facilities and instructional materials are of good quality, particularly the ICT infrastructure.
Another strength of Korea is its professional development of teachers. Induction and in-service training are considered important in teacher development. Teachers traditionally begin in-service training, sometimes shouldering part of the cost or training during their personal time. There are school-based teacher development opportunities, even if these do not necessarily have external support or assistance (OECD, 2004). In response to teacher needs and in order to make teacher development more active and relevant to classroom practices, Korea has been promoting action research by teachers and mutual learning between teachers from their experiences (Box 8.1).
Korea’s effort to support inter-school learning embeds the possibility of offering teacher-generated solutions to systematic weaknesses and encourages the continuous professional development of teachers. As in the cases of Ontario (Canada) and Singapore, successful reforms encourage local experimentation and innovation by teachers. Indeed, high-performing countries generally consider teaching a profession in which teachers work together to frame what they believe to be good practices, conduct field-based research to confirm or disprove the approaches they develop, and then judge their colleagues by the degree to which they use proven effective practices in their classrooms. The continuous search for more effective teaching practices and institutionalising the improved practices allow improvement in teaching over time (OECD, 2013c).
Box 8.1 Action research by teachers
Korea funds action research by teachers and counts these efforts toward their professional development requirements. Districts make grants available to schools that lead their own research projects – each school can select a research topic, conduct research, publish the results and invite teachers from other schools to peer-review their findings. The districts also fund inter-school learning, whereby teachers from a number of different schools in a district can apply to jointly conduct research spanning all their schools. Anticipation in all types of research is an important consideration in Korea’s annual teacher reviews, incentive allocation, and promotions. In pursuit of this same theme of “making practice public,” schools encourage teachers to open up their classrooms to others two or three times a month, at which times other teachers can come and visit and observe their lessons.
Source: Mourshed, M, C. Chinezi Chijioke, and M. Barber (2010), How’s the World Most Improved School Systems Getting Better, McKinsey&Company.
Available at: http://www.mckinsey.com/client_service/social_sector/latest_thinking/worlds_most_improved_schools
8POLICY LESSONS FOR KOREA
194 © OECD 2014 STRONG PERFORMERS AND SUCCESSFUL REFORMERS IN EDUCATION: LESSONS FROM PISA FOR KOREA
In order that teacher innovation can be linked to school level reform, it is necessary to place special attention to leadership development, in particular for school principals. Ontario’s Leadership Strategy and Singapore’s comprehensive teacher policy reform can provide relevant policy experiences for Korea to focus on maintaining and increasing the quality of the educational professions by offering coherent training and continuing support.
MAKING THE MOST OF INFORMATION AND COMMUNICATION TECHNOLOGY (ICT) FOR LEARNINGDigital literacy and ICT skills are requirements for success in today’s knowledge economy and society. ICT is also a source of innovation in education systems and potentially offers a wide range of instruments to improve educational practices (OECD 2013c). Korea is successfully integrating ICT in education and creating new approaches to teaching and learning that provides more students with easier access to education materials and with opportunities to develop and apply 21st century skills. Although the computer and Internet use at school is not significantly higher than other OECD countries2, Korea performed at the top of the digital reading assessment in PISA 2009. In the 1990s, the potential of ICT in education was quickly recognised in Korea and a master plan was launched to develop ICT infrastructure with one PC per teacher and Internet access for students in classrooms. More recent developments include the SMART Education Policy and the Cyber Learning Service, which are described in Chapters 1 and 3. Yet, concerns about the effects of digital devices on students have prompted research and the distribution of guidelines to schools.
To maximise the use of ICT for learning, Korea should continue building teacher capacity in ICT and school leadership. A notable feature of the SMART Education Policy is that it delivers ICT equipment to schools and related teaching and learning resources (e.g. developing digital textbooks and teacher training). Other aspects of the SMART Education Policy include schools deciding the budget allocation for ICTs, and teachers receiving training on teaching practices using ICT. Teachers follow research and participate in trial initiatives on using digital devices for teaching and learning in the classroom.
STRENGTHENING THE USE OF EVALUATION AND ASSESSMENT FOR QUALITY IMPROVEMENTEvaluation and assessment help government understand how well an education system is performing. Indeed, these are tools that provide information and feedback on educational performance and drive improvement of the school, school leadership and teaching practices (OECD, 2013e). In view of the considerable efforts made to improve accountability, school evaluation reports and school performance in the Korean national assessment have been publicly available since 2008 (OECD, 2012a). In this way, a greater devolution of authority to schools is likely to lead to better outcomes (OECD, 2012a). PISA data shows that systems where schools publicly announce achievement data tend to show higher levels of performance compared to schools who manage their resources more discreetly.
The evaluation and assessment framework to improve school outcomes in Korea is broadening its scope from student assessment to a thorough examination of the whole of the education system (see Chapter 1). The Korean National Assessment of Educational Achievement (NAEA) is intended to be the central link between the various systems of evaluation and assessment to relate the findings of different elements more effectively in order to achieve a greater impact. While less emphasis has been placed on accountability based on evaluation results compared to many other OECD countries, significant efforts are underway to improve the available data (i.e. objectivity, assessment criteria) in order to use it more effectively.
EQUITY IN EDUCATION FOR STRENGTHENING SOCIAL COHESIONKorea’s commitment to education is reflected in the high level of private household spending on primary and secondary education. Society’s high valuation of education is reinforced by the decreasing number of children per couple and the increasing willingness to invest in the education of children for the success of both the children and the family. The substantial private funding is also driven by reliance on supplementary education, in part fuelled by the importance of university entrance examinations.
OECD’s report on Strengthening Social Cohesion in Korea pointed out that the high level of private spending on education raises issues of equity in education for children from early childhood to tertiary education levels (OECD, 2013d). As mentioned in Chapter 2, between 2000 and 2009 the relationship between students’ socio-economic background and their performance grew stronger, although the association between family background and student outcomes was weaker than the OECD average. However, PISA shows the high prevalence of resilient students in Korea, meaning that more disadvantaged students than the OECD average perform far better than would be predicted based on their socio-economic background. This implies that in order to enhance social cohesion through education, Korea should not solely focus on disadvantaged students, but also on those who perform poorly due to factors such as family composition and the concentration of social disadvantage in the school.
Korea has introduced policy measures to support students from rural areas, low-income families, and those struggling to make progress. For example, multiple incentives are offered to teachers who work in disadvantaged schools (e.g. additional salary,
8POLICY LESSONS FOR KOREA
195STRONG PERFORMERS AND SUCCESSFUL REFORMERS IN EDUCATION: LESSONS FROM PISA FOR KOREA © OECD 2014
smaller class size, less instructional time, career benefits, and choice of the next school) (Kang and Hong, 2008). As a result, students from lower socio-economic backgrounds are actually more likely than those of higher socio-economic backgrounds to be taught by high quality mathematics teachers, as measured by characteristics such as: full certification, mathematics or a mathematic education degree and at least 3 years of experience (Kang and Hong, 2008).
Steps have also been taken to improve the gender balance throughout the Korean educational system, such as adopting gender-neutral language, adapting textbooks and teaching in science and mathematics to make learning more attractive to both girls and boys. However, to greatly improve equity, Korea could enhance access to learning opportunities, in particular to ECEC, and improve schooling. This section presents issues that can mitigate the challenges of social cohesion through education. It also illustrates recent efforts undertaken by Korea to provide policy measures as well as recommendations for further improvement. Firstly, potential policy responses to supplementary education are summarised based on Chapter 3 of this report. Secondly, challenges and actions taken in the area of ECEC are presented. Finally, the strength of parental involvement in education is highlighted.
MORE EFFECTIVE POLICY RESPONSES TO SUPPLEMENTARY EDUCATIONSupplementary education, as discussed in Chapter 3, plays a significant role within the Korean education system. The percentage of students attending after-school lessons in Korea is exceptionally high compared to other OECD countries. According to the PISA 2009 assessment of 15-year-old students, in Korea, attendance of after-school lessons is more than double the OECD average in every subject (OECD, 2010).
Despite the prominence of supplementary education, research on its impact on educational performance is inconclusive (see Chapter 3). Supplementary education provides additional inputs for learning, such as additional hours of instruction, learning materials and teachers. It might also facilitate student learning through different learning arrangements (e.g. grouping of students, methods of instruction, teacher-student relationships). However, supplementary education can undermine the formal education system by, for example, disrupting the application of the curricula or classroom and school climate. Moreover, supplementary education exacerbates social inequalities as participation is closely linked to socio-economic background of students and can be detrimental to student well-being.
Over several decades, Korea has been the most active East Asian country to implement policies responding to supplementary education (See Annex 1 in Chapter 3). In parallel with strengthening the formal education system, Korea has introduced measures to mitigate the negative impact of, and to promote more equitable access to, supplementary education. Korea has created avenues for participation of parents and other key stakeholders in policy formulation. For example, the Ministry of Education conducted a survey on policies to reduce spending on private tutoring and implemented certain policy options that parents proposed, including further developing on-line education and after-school programmes.
In the context of interaction and coexistence of the formal school system and supplementary education, and given the latter’s advantages and downsides, Korea could continue looking into ways to:
Reduce the prominence of supplementary education and improve its quality. For example, Korea could consider mechanisms to ensure that the new curriculum is implemented well and continue to explore ways to decrease the emphasis on rote learning and on the university entrance exam. Similarly, reducing the quality differences between universities, which might include closing those institutions that offer very poor quality, could lead to a less stratified system. Regulation of supplementary education providers could be further revised to introduce mechanisms to ensure quality control. If new legislation is effectively implemented, transparency on supplementary education providers, particularly on student fees, would increase. However, more information on the quality of supplementary education provided could enable students and families to make better-informed decisions. Additionally, measures to limit the negative impact on student well-being, such as limited opening hours, could be further considered and expanded.
Korea could provide public alternatives to private supplementary education. To promote more equitable access, Korea should continue offering after-school lessons and exploring the potential of new technologies to improve learning opportunities, particularly for low-income students and those in rural areas with limited access to private supplementary education institutions.
Korea could foster research and public engagement to implement more effective policy responses. Most research focuses on policy impact on educational achievement. Further research is needed on other dimensions, such as its effects on formal schooling, student well-being and equity. Research findings should also be widely disseminated in order to improve informed public debate around supplementary education, and Korea should continue engaging parents and other key stakeholders in the design of policy responses.
8POLICY LESSONS FOR KOREA
196 © OECD 2014 STRONG PERFORMERS AND SUCCESSFUL REFORMERS IN EDUCATION: LESSONS FROM PISA FOR KOREA
IMPROVING EQUITY AND QUALITY IN EARLY CHILDHOOD EDUCATION AND CARE (ECEC)Good quality pre-primary education can give children strong foundations that facilitate later educational achievements, thereby yielding high rates of return to the investment, and even more so for disadvantaged children (OECD, 2012a; OECD, 2013d). In Korea, expenditure on pre-primary education as a percentage of GDP has been one of the lowest in the OECD and is much lower than spending on other education levels (OECD, 2012a, OECD, 2012e), but in recent years public financial support has increased for all households. Expenditures have increased to USD 6 739 per student between 2000 and 2010, close to the OECD average of USD 6 762 (OECD, 2013c; OECD, 2012a), and are expected to continue to increase over the coming years (OECD, 2013c). For example, the programme that provides tuition fees for all 5-year-olds has been extended to 3 and 4-year-olds in 2013 with the implementation of the Nuri Curriculum in 2012. As a result, parental contributions to tuition have decreased by 23% (Korean Statistical Information Service, 2013). Korea plans to prioritise extending public support for ECEC to all 3- and 4-year-olds starting in 2013, and one option is to ensure implementation of the Act to increase the capacity of public kindergartens (OECD, 2013d).
In addition to these measures to improve equity in access and to ensure quality ECEC for all children, Korea should establish common regulations and standards (e.g. staff qualifications, staff-child ratio) for all children aged 3 to 5, regardless of whether they attend kindergarten or child care. The ECEC sector is fragmented with different standards and regulations with separate facilities under two administrative bodies (kindergarten is under the responsibility of the Ministry of Education and child care is under the Ministry of Health and Welfare). Childcare centres tend to have a lower educational orientation and to cater children from low-income families, while kindergartens tend to cater children from middle and upper-income families, thus perpetuating inequality (OECD, 2012a). In addition, higher-income families also tend to enrol their children in hagwons (OECD, 2012a).
While some progress has been made towards establishing a common curriculum between the two sectors, there is still a gap in quality standards for the workforce. The existence of two administrative systems hampers the ability to monitor and report about the quality and costs, which are of particular importance in order to increase transparency (OECD, 2012e; OECD, 2013d). The Korean government has already taken some steps in this direction, such as the pilot projects to integrate kindergarten and childcare, to improve quality management, and to disclose information about kindergartens.
INVOLVING PARENTS IN SCHOOL AND IN CHILDREN’S LEARNINGParents can help their children succeed in education and, in Korea, parents are encouraged to be actively involved in their children’s schools.3 The Ministry of Education has unveiled a new set of initiatives to expand the parental role in and access to their child’s education (CIEB, 2012). These initiatives range from school monitoring programs, in which parents gain a clear sense of the activities and curriculum in their child’s school, to parental training programmes and support centres. All of these programmes are intended to encourage parents to understand their child’s progress, to be aware of their school resources and to get involved by volunteering or joining a parents’ group.
Parental commitment to education is also reflected in their financial investment and illustrates the role that education plays in Korean society today. Total spending on private tutoring accounts for 7.9% of the average household disposable income, which means that a family with three children might spend a quarter of their income on private tutoring (OECD, 2012a).
Korea could make greater use of the high parental interest in and support for education by further developing parents’ ability to help their children, in particular those from disadvantaged families. Options to encourage schools to strengthen parental and community involvement include aligning their goals, improving their skills and resources to communicate more effectively, granting them autonomy to develop partnerships, and taking parental engagement into consideration in school appraisal (OECD, 2012g; OECD, 2013c).
CONCLUSIONKorea has one of the most educated workforces and is among the highest performing countries in international assessments. Success in education has been the result of the strong capacity to foster rapid and remarkable improvements in the education system. A notable feature of the Korean education system is the high quality of teachers, who are carefully selected, prepared, supported and rewarded. Notwithstanding past achievements, Korea continues to strive to improve its education system and better prepare its younger generations. The curriculum has been revised to develop the skills of the 21st Century and ICTs are increasingly integrated into learning.
Education should remain a priority in order to successfully confront the current challenges, sustain past achievements and foster further improvements. This chapter has highlighted ways to improve the education system, first by improving the transition from school to work and the labour-market outcomes of education, focusing on quality and relevance of education. Strengthening equity and social cohesion can be improved through education, in particular by effective policy responses to ECEC and supplementary education, albeit in East Asia, Korea is the only country to have undertaken this task through increased policy efforts.

8POLICY LESSONS FOR KOREA
197STRONG PERFORMERS AND SUCCESSFUL REFORMERS IN EDUCATION: LESSONS FROM PISA FOR KOREA © OECD 2014
Notes
1. Korean National Competency Standard is a concept which identifies and standardizes competencies which are required for successful job performance. It is a comprehensive concept including ability such as knowledge, skill and attitude necessary to perform a job, and assessment of the ability (Human Resource Development Service of Korea Website: http://ncs.hrdkorea.or.kr/nos/dispatcher.jsp?p_menu=86)
2. Internet use at school in Korea is 65%, below an OECD average of 71%, although almost all students in Korea – 96% - reported using the Internet at home. Computers are more used in science classes: 31% of students reported using them, whereas computer use in mathematics lessons is only by 8% of students.
3. For example, the performance advantage among students whose parents read to them in their early school years is evident regardless of the family`s socio-economic background. Analysis of PISA data also shows that the genuine interest and active engagement of parents count, and many parent-child activities that are associated with better reading performance involve relatively little time and no specialised knowledge (OECD, 2012b).
References
Center on International Education Benchmarking (CIEB), South Korea: Instructional systems, CIEB, Washington D.C., www.ncee.org/programs-affiliates/center-on-international-education-benchmarking/top-performing-countries/south-korea-overview/south-korea-instructional-systems/.
Barber, M. and M. Mourshed (2007), “How the world´s best performing school systems came out on the top”, McKinsey&Company, http://mckinseyonsociety.com/downloads/reports/Education/Worlds_School_Systems_Final.pdf.
Kang, N., and M. Hong (2008), “Achieving excellence in teacher workforce and equity in learning opportunities in South Korea”, Educational Researcher, No. 37, pp. 200-207.
Korea Institute for Curriculum and Evaluation (KICE) (2012), Education in Korea: Research report, KICE, Seoul.
Ministry of Education, Culture, Sports, Science and Technology – Japan (MEXT) (2012), Daigaku Kaikaku Jikko Plan.
Ministry of Education, Science and Technology, http://english.mest.go.kr/enMain.do, background information provided by Korea.
Mourshed, M, C. Chinezi Chijioke, and M. Barber (2010), How’s the World Most Improved School Systems Getting Better, McKinsey&Company, available at: www.mckinsey.com/client_service/social_sector/latest_thinking/worlds_most_improved_schools.
OECD (2004), Attracting, Developing and Retaining Effective Teachers, Country Note, Korea.
OECD (2005), Teachers Matter: Attracting, Developing and Retaining Effective Teachers, OECD Publishing. http://dx.doi.org/10.1787/9789264018044-en.
OECD (2007), Education and Training Policy, No More Failures: Ten Steps to Equity in Education, OECD Publishing. http://dx.doi.org/10.1787/9789264032606-en.
OECD (2009), Learning for Job: OECD Review of Vocational Education and Training. Korea, OECD Publishing. http://dx.doi.org/10.1787/9789264179806-en.
OECD (2010), PISA 2009 Results: What Makes a School Successful?: Resources, Policies and Practices (Volume IV), PISA, OECD Publishing. http://dx.doi.org/10.1787/9789264091559-en.
OECD (2011a), “Country note: Korea”, Education at a Glance 2011: OECD Indicators, OECD Publishing, http://dx.doi.org/10.1787/eag-2011-en.
OECD (2011b), PISA in Focus 3: Does Investing in After-School Classes Pay Off?, OECD Publishing. http://dx.doi.org/10.1787/5k9h362rftmq-en.
OECD (2011c), PISA in Focus 10: What Can Parents Do to Help Their Children Succeed in School?, OECD Publishing. http://dx.doi.org/10.1787/5k9h362jdgnq-en.
8POLICY LESSONS FOR KOREA
198 © OECD 2014 STRONG PERFORMERS AND SUCCESSFUL REFORMERS IN EDUCATION: LESSONS FROM PISA FOR KOREA
OECD (2011d), PISA in Focus 9: School Autonomy and Accountability: Are They Related to Student Performance?, OECD Publishing. http://dx.doi.org/10.1787/5k9h362kcx9w-en.
OECD (2012a), Economic Survey, Korea, OECD Publishing. http://dx.doi.org/10.1787/eco_surveys-kor-2012-en.
OECD (2012b), “Country note: Korea”, Education at a Glance 2012: OECD Indicators, OECD Publishing. http://dx.doi.org/10.1787/eag-2012-en.
OECD (2012c), PISA in Focus 13: Does Money Buy Strong Performance in PISA?, OECD Publishing. http://dx.doi.org/10.1787/5k9fhmfzc4xx-en.
OECD (2012d), “Promoting social cohesion in Korea”, OECD Economics Department Working Papers, No. 963, OECD Publishing. http://dx.doi.org/10.1787/5k97gkdfjqf3-en.
OECD (2012e), Quality Matters in Early Childhood Education and Care: Korea, OECD Publishing. http://dx.doi.org/10.1787/9789264175648-en.
OECD (2012f), Equity and Quality in Education. Supporting Disadvantaged Students and Schools, OECD Publishing. http://dx.doi.org/10.1787/9789264130852-en.
OECD (2012g), Let’s Read Them a Story! The Parent Factor in Education, PISA, OECD Publishing. http://dx.doi.org/10.1787/9789264176232-en.
OECD (2012h), Strong Performers and Successful Reformers: Lessons from PISA for JAPAN, OECD Publishing. http://dx.doi.org/10.1787/9789264118539-en.
OECD (2013a), Education at a Glance 2013: OECD Indicators, OECD Publishing. http://dx.doi.org/10.1787/eag-2013-en.
OECD (2013b), “Country note: Korea”, Education at a Glance 2013: OECD Indicators, OECD Publishing. http://dx.doi.org/10.1787/eag-2013-en.
OECD (2013c), Education Today 2013, the OECD Perspective, OECD Publishing. http://dx.doi.org/10.1787/edu_today-2013-en.
OECD (2013d), Strengthening Social Cohesion in Korea, OECD Publishing. http://dx.doi.org/10.1787/9789264188945-en.
OECD (2013e), Synergies for Better Learning: An International Perspective on Evaluation and Assessment, OECD Publishing. http://dx.doi.org/10.1787/9789264190658-en.
Presidential Commission on Education Reform (1996), The Report of the Presidential Commission on Education Reform.
Schleicher, A. (2012), Preparing Teachers and Developing School Leaders for the 21st Century: Lessons From Around the World, OECD Publishing. http://dx.doi.org/ 10.1787/9789264174559-en.
UNESCO (2006/2007), World Data on Education, 6th Education, Republic of Korea. http://www.ibe.unesco.org/fileadmin/user_upload/archive/Countries/WDE/2006/ASIA_and_the_PACIFIC/Republic_of_Korea/Republic_of_Korea.pdf.
Center on International Education Benchmarking (CIEB), South Korea, http://www.ncee.org/programs-affiliates/center-on-international-education-benchmarking/top-performing-countries/south-korea-overview/south-korea-instructional-systems/.
Korea Institute for Curriculum and Evaluation (KICE) website, http://kice.re.kr/en/index.do.
Pearson Foundation – OECD: Strong Performers and Successful Reformers in Education website, http://pearsonfoundation.org/oecd/korea.html.
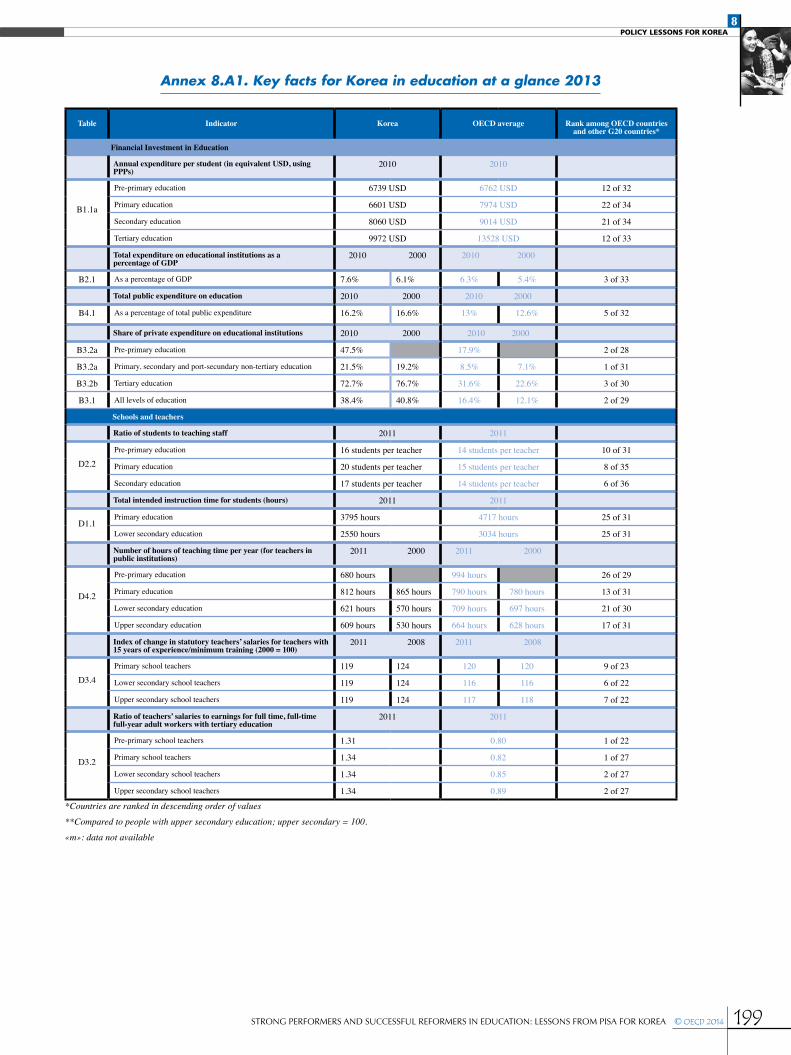
8POLICY LESSONS FOR KOREA
199STRONG PERFORMERS AND SUCCESSFUL REFORMERS IN EDUCATION: LESSONS FROM PISA FOR KOREA © OECD 2014
Table Indicator Korea OECD average Rank among OECD countries and other G20 countries*
Financial Investment in Education
Annual expenditure per student (in equivalent USD, using PPPs)
2010 2010
B1.1a
Pre-primary education 6739 USD 6762 USD 12 of 32
Primary education 6601 USD 7974 USD 22 of 34
Secondary education 8060 USD 9014 USD 21 of 34
Tertiary education 9972 USD 13528 USD 12 of 33
Total expenditure on educational institutions as a percentage of GDP
2010 2000 2010 2000
B2.1 As a percentage of GDP 7.6% 6.1% 6.3% 5.4% 3 of 33
Total public expenditure on education 2010 2000 2010 2000
B4.1 As a percentage of total public expenditure 16.2% 16.6% 13% 12.6% 5 of 32
Share of private expenditure on educational institutions 2010 2000 2010 2000
B3.2a Pre-primary education 47.5% 17.9% 2 of 28
B3.2a Primary, secondary and port-secundary non-tertiary education 21.5% 19.2% 8.5% 7.1% 1 of 31
B3.2b Tertiary education 72.7% 76.7% 31.6% 22.6% 3 of 30
B3.1 All levels of education 38.4% 40.8% 16.4% 12.1% 2 of 29
Schools and teachers
Ratio of students to teaching staff 2011 2011
D2.2Pre-primary education 16 students per teacher 14 students per teacher 10 of 31
Primary education 20 students per teacher 15 students per teacher 8 of 35
Secondary education 17 students per teacher 14 students per teacher 6 of 36
Total intended instruction time for students (hours) 2011 2011
D1.1Primary education 3795 hours 4717 hours 25 of 31
Lower secondary education 2550 hours 3034 hours 25 of 31
Number of hours of teaching time per year (for teachers in public institutions)
2011 2000 2011 2000
D4.2
Pre-primary education 680 hours 994 hours 26 of 29
Primary education 812 hours 865 hours 790 hours 780 hours 13 of 31
Lower secondary education 621 hours 570 hours 709 hours 697 hours 21 of 30
Upper secondary education 609 hours 530 hours 664 hours 628 hours 17 of 31
Index of change in statutory teachers’ salaries for teachers with 15 years of experience/minimum training (2000 = 100)
2011 2008 2011 2008
D3.4Primary school teachers 119 124 120 120 9 of 23
Lower secondary school teachers 119 124 116 116 6 of 22
Upper secondary school teachers 119 124 117 118 7 of 22
Ratio of teachers’ salaries to earnings for full time, full-time full-year adult workers with tertiary education
2011 2011
D3.2
Pre-primary school teachers 1.31 0.80 1 of 22
Primary school teachers 1.34 0.82 1 of 27
Lower secondary school teachers 1.34 0.85 2 of 27
Upper secondary school teachers 1.34 0.89 2 of 27
*Countries are ranked in descending order of values
**Compared to people with upper secondary education; upper secondary = 100.
«m»: data not available
Annex 8.A1. Key facts for Korea in education at a glance 2013

ORGANISATION FOR ECONOMIC CO-OPERATIONAND DEVELOPMENT
The OECD is a unique forum where governments work together to address the economic, social and
environmental challenges of globalisation. The OECD is also at the forefront of efforts to understand and
to help governments respond to new developments and concerns, such as corporate governance, the
information economy and the challenges of an ageing population. The Organisation provides a setting
where governments can compare policy experiences, seek answers to common problems, identify good
practice and work to co-ordinate domestic and international policies.
The OECD member countries are: Australia, Austria, Belgium, Canada, Chile, the Czech Republic,
Denmark, Estonia, Finland, France, Germany, Greece, Hungary, Iceland, Ireland, Israel, Italy, Japan, Korea,
Luxembourg, Mexico, the Netherlands, New Zealand, Norway, Poland, Portugal, the Slovak Republic, Slovenia,
Spain, Sweden, Switzerland, Turkey, the United Kingdom and the United States. The European Union takes
part in the work of the OECD.
OECD Publishing disseminates widely the results of the Organisation’s statistics gathering and
research on economic, social and environmental issues, as well as the conventions, guidelines and
standards agreed by its members.
OECD PUBLISHING, 2, rue André-Pascal, 75775 PARIS CEDEX 16
(98 2013 02 1 P) ISBN 978-92-64-19066-5 – 2014
Consult this publication on line at http://dx.doi.org/10.1787/9789264190672-en.
This work is published on the OECD iLibrary, which gathers all OECD books, periodicals and statistical databases.Visit www.oecd-ilibrary.org for more information.
Strong Performers and Successful Reformers in Education
Lessons from PISA for Korea
Strong Performers and Successful Reformers in Education
Lessons from PISA for KoreaThe story of Korean education over the past 50 years is one of remarkable growth and achievement. Korea is one of the top performing countries in the Programme for International Student Assessment (PISA) survey and among those with the highest proportion of young people who have completed upper secondary and tertiary education. Korea is continuously exploring ways to improve its education system and has dramatically increased government investment in education over the last decade. Nevertheless, further reforms are needed to spur and sustain improvements. Rapid globalisation and modernisation are also posing new and demanding challenges to equip young people of today and tomorrow with skills relevant to the 21st century.
The report Strong Performers and Successful Reformers in Education: Lessons from PISA for Korea aims at helping Korea to identify and address education policy challenges in an international perspective. To this end, it examines the Korean education system through the prism of PISA 2009, considers recent policy developments and suggests specific policy options to foster improvements. The report also provides an in-depth analysis of the experience of other high-performing countries.
ContentsChapter 1. Strong performers and successful reformers: Korea
Chapter 2. Viewing education in Korea through the prism of PISA
Chapter 3. Supplementary education in East Asia
Chapter 4. Shanghai and Hong Kong-China: Learning to learn
Chapter 5. Singapore: Thinking ahead
Chapter 6. Ontario: Harnessing the skills of tomorrow
Chapter 7. Finland: A non-competitive education for a competitive economy
Chapter 8. Policy lessons for Korea
ISbn 978-92-64-19066-5 98 2013 02 1 P
Lesson
s from
PIS
A fo
r Ko
reaS
trong
Perfo
rmers an
d S
uccessful R
eform
ers in Ed
ucation
9HSTCQE*bjaggf+