education at a glance - oecd ilibrary
TRANSCRIPT
Education at a GlanceOECD INDICATORS 2006
Ed
uc
atio
n a
t a G
lan
ce
OE
CD
IND
ICA
TO
RS
-:HSTCQE=UWZXV]:
Across OECD countries, governments are seeking policies to make education more effective while searching for additional resources to meet the increasing demand for education.
The 2006 edition of Education at a Glance enables countries to see themselves in the light of other countries’ performance. It provides a rich, comparable and up-to-date array of indicators on the performance of education systems and represents the consensus of professional thinking on how to measure the current state of education internationally.
The indicators look at who participates in education, what is spent on it and how education systems operate and at the results achieved. The latter includes indicators on a wide range of outcomes, from comparisons of student’s performance in key subject areas to the impact of education on earnings and on adults’ chances of employment.
New material in this edition includes:
• Further analysis of results of the 2003 survey of the OECD’s Programme for International Student Assessment (PISA) , including student access to and use of ICT, analysis of the lowest performing students and the effects on students performance of family background and the way classes are organised in schools.
• Trend data on tertiary qualifications, including projections for the year 2014.• Trend data on survival rates in tertiary education. • The impact of demographic trends on education systems, as well as projections on expenditure
for the year 2015.• Trend data on expected years of education.• Instruction time per subject for 9-to-14-year-olds.• A picture of student mobility and the significance of internationalisation of higher education.
The Excel™ spreadsheets used to create the tables and charts in this book are available via the StatLinks printed in this book. The tables, charts and the complete Education Database are freely available via the OECD Education Web site at www.oecd.org/edu/eag2006.
FURTHER READINGEducation Policy Analysis
2006
www.oecd.org
2006
The full text of this book is available on line via these links:http://www.sourceoecd.org/education/9264025316http://www.sourceoecd.org/emergingeconomies/9264025316http://www.sourceoecd.org/transitioneconomies/9264025316
Those with access to all OECD books on line should use this link:http://www.sourceoecd.org/9264025316
SourceOECD is the OECD's online library of books, periodicals and statistical databases. For more information about this award-winning service and free trials ask your librarian, or write to us at:
2006
«Education at a GlanceOECD INDICATORS 2006
ISBN 92-64-02531-6 96 2006 06 1 P

ORGANISATION FOR ECONOMIC CO-OPERATION AND DEVELOPMENT
Education at a Glance
OECD INDICATORS
2006 Edition
ORGANISATION FOR ECONOMIC CO-OPERATION AND DEVELOPMENT
The OECD is a unique forum where the governments of 30 democracies work together to
address the economic, social and environmental challenges of globalisation. The OECD is also at
the forefront of efforts to understand and to help governments respond to new developments and
concerns, such as corporate governance, the information economy and the challenges of an
ageing population. The Organisation provides a setting where governments can compare policy
experiences, seek answers to common problems, identify good practice and work to co-ordinate
domestic and international policies.
The OECD member countries are: Australia, Austria, Belgium, Canada, the Czech Republic,
Denmark, Finland, France, Germany, Greece, Hungary, Iceland, Ireland, Italy, Japan, Korea,
Luxembourg, Mexico, the Netherlands, New Zealand, Norway, Poland, Portugal, the Slovak Republic,
Spain, Sweden, Switzerland, Turkey, the United Kingdom and the United States. The Commission of
the European Communities takes part in the work of the OECD.
OECD Publishing disseminates widely the results of the Organisation’s statistics gathering and
research on economic, social and environmental issues, as well as the conventions, guidelines and
standards agreed by its members.
Also available in french under the title:
Regards sur l’éducation
LES INDICATEURS DE L’OCDE - ÉDITION 2006
© OECD 2006
No reproduction, copy, transmission or translation of this publication may be made without written permission. Applications should be sent to
OECD Publishing: [email protected] or by fax (33 1) 45 24 13 91. Permission to photocopy a portion of this work should be addressed to the Centre
français d'exploitation du droit de copie, 20, rue des Grands-Augustins, 75006 Paris, France ([email protected]).
This work is published on the responsibility of the Secretary-General of the OECD. The
opinions expressed and arguments employed herein do not necessarily reflect the officialviews of the Organisation or of the governments of its member countries.
Education at a Glance © OECD 2006 �
Foreword
Governments are paying increasing attention to international comparisons as they search for effective policies that enhance individuals’ social and economic prospects, provide incentives for greater efficiency in schooling and help to mobilise resources to meet rising demands. As part of its response, the OECD Directorate for Education devotes a major effort to the development and analysis of the quantitative, internationally comparable indicators that it publishes annually in Education at a Glance. These indicators enable governments to see their education systems in the light of other countries’ performances and, together with OECD’s country policy reviews, are designed to support and review the efforts that governments are making towards policy reform.
Education at a Glance addresses the needs of a range of users, from governments seeking to learn policy lessons and academics requiring data for further analysis to the general public wanting to monitor how its nation’s schools are progressing in producing world-class students. The publication examines the quality of learning outcomes, the policy levers and contextual factors that shape these outcomes, and the broader private and social returns that accrue to investments in education.
Education at a Glance is the product of a long-standing, collaborative effort between OECD governments, the experts and institutions working within the framework of the OECD’s indicators of education systems (INES) programme and the OECD Secretariat. The publication was drafted by the Indicators and Analysis Division of the OECD Directorate for Education, under the responsibility of Andreas Schleicher, in co-operation with Etienne Albiser, Eric Charbonnier, Michael Davidson, Stéphane Guillot, Bo Hansson, Corinne Heckmann, Ben Jensen, Karinne Logez, Alistair Nolan, Annette Panzera, Claire Shewbridge, Karine Tremblay and Sophie Vayssettes. Administrative and editorial support were provided by Cécile Bily, Fionnuala Canning, Juliet Evans and Kate Lancaster. The development of the publication was steered by INES National Co-ordinators in member countries and facilitated by the financial and material support of the three countries responsible for co-ordinating the INES Networks – the Netherlands, Sweden and the United States. The members of the various bodies as well as the individual experts who have contributed to this publication and to OECD INES more generally are listed at the end of the book.
While much progress has been accomplished in recent years, member countries and the OECD continue to strengthen the link between policy needs and the best available internationally comparable data. In doing so, various challenges and tradeoffs must be faced. First, the indicators need to respond to educational issues that are high on national policy agendas, and where the international comparative perspective can offer important added value to what can be accomplished through national analysis and evaluation. Second, while the indicators need to be as comparable as possible, they also need to be as country-specific as is necessary to allow for
Foreword
Education at a Glance © OECD 2006�
historical, systemic and cultural differences between countries. Third, the indicators need to be presented in as straightforward a manner as possible, while remaining sufficiently complex to reflect multi-faceted educational realities. Fourth, there is a general desire to keep the indicator set as small as possible, but it needs to be large enough to be useful to policy makers across countries that face different educational challenges.
The OECD will continue to address these challenges vigorously and to pursue not just the development of indicators in areas where it is feasible and promising to develop data, but also to advance in areas where a considerable investment still needs to be made in conceptual work. The further development of the OECD’s Programme for International Student Assessment (PISA) and the launch of a new survey on teachers, teaching and learning will be major efforts to this end.
The report is published on the responsibility of the Secretary-General of the OECD.
Education at a Glance © OECD 2006 �
Table of ConTenTsName of
the indicator in the
2005 edition
Foreword....................................................................................................................................................3
Editorial................................................................................................................................................... 13
Introduction.......................................................................................................................................... 19
Reader’s Guide..................................................................................................................................... 23
ChaptER a thE Output OF EduCatIOnal InstItutIOns and thE ImpaCt OF lEaRnInG.......................................................... 27Indicator a1 Educational attainment of the adult population........................... 28. Table.A1.1a.. Educational.attainment:.adult.population.(2004)................................ 37. Table.A1.2a.. Population.that.has.attained.at.least.upper.secondary... . education.(2004)................................................................................................... 38. Table.A1.3a.. Population.that.has.attained.tertiary.education.(2004)..................... 39. Table.A1.4.. Distribution.of.population.aged.3�-to-64.with.tertiary.type.�A/6..
qualifications.by.country.(2004.and.projected.to.2014)................... 40. Table.A1.�.. Educational.attainment.expressed.in.average.number.of.years..
in.formal.education.(2004)............................................................................. 41
Indicator a2 Current upper secondary graduation rates..................................... 42. Table.A2.1.. Upper.secondary.graduation.rates.(2004)............................................... 48. Table.A2.2.. Post-secondary.non-tertiary.graduation.rates.(2004)........................ 49
Indicator a3 Current tertiary graduation and survival rates............................. �0. Table.A3.1.. Tertiary.graduation.rates.(2000,.2004)..................................................... �8. Table.A3.2.. Survival.rates.in.tertiary.education.(2004)............................................. �9
Indicator a4 What 15-year-olds can do in mathematics........................................ 60. Table.A4.1.. Percentage.of.students.at.each.level.of.proficiency..
on.the.OECD.PISA.mathematics.scale.(2003)...................................... 70. Table.A4.2.. Mean.student.performance.and.variation.on.different.aspects..
of.the.OECD.PISA.mathematics.scale.(2003)....................................... 71. Table.A4.3.. Mean.score.and.variation.in.student.performance..
on.the.OECD.PISA.mathematics.scale.(2003)...................................... 72
Indicator a5 Between- and within-school variation in the mathematics performance of 15-year-olds..................................................................... 74
. Table.A�.1.. Between-school.and.within-school.variance.in.student.performance.on.the.OECD.PISA.mathematics.scale.(2003).......... 80
Indicator a6 Fifteen-year-old students who perform at the lowest levels of proficiency in mathematics (2003).................................................... 82
. Table.A6.1...Odds.ratios.of.the.likelihood.of.students.with.the.lowest..socio-economic.status.to.be.lowest.mathematics.performers.relative.to.the.likelihood.of.students.with.the.highest.socio-economic.status.to.be.lowest.mathematics.peformers.(2003)............................................ 91
a1
a2
a3
a4
a6
Table of ConTenTs
Education at a Glance © OECD 20066
Name of the indicator
in the 2005 edition
. Table.A6.2...Reading.performance.of.lowest.mathematics..
. . performers.(2003).............................................................................................. 92
. Table.A6.3...Mathematics.performance.of.lowest.reading..
. . performers.(2003).............................................................................................. 93
Indicator a7 Institutional differentiation, socio-economic status and 15-year-old students’ mathematics performance (2003)........... 94
. Table.A7.1.. Institutional.differentiation,.variance.in.mathematics..performance,.and.economic,.social..and.cultural.status.(ESCS),.(2003)............................................................102
Indicator a8 labour force participation by level of educational attainment...............................................................................104. Table.A8.1a.. Employment.rates.and.educational.attainment,... . by.gender.(2004)................................................................................................112. Table.A8.2a...Unemployment.rates.and.educational.attainment,.. . by.gender.(2004)................................................................................................114. Table.A8.3a. Trends.in.employment.rates,.by.educational.attainment... . (1991-2004).........................................................................................................116. Table.A8.4a. Trends.in.unemployment.rates,.by.educational.attainment... . (1991-2004).........................................................................................................118
Indicator a9 the returns to education: education and earnings...................120. Table.A9.1a...Relative.earnings.of.the.population.with.income.from.
employment.(2004.or.latest.available.year)..........................................13�. Table.A9.1b.. Differences.in.earnings.between.females.and.males..
(2004.or.latest.available.year)......................................................................137. Table.A9.2a.. Trends.in.relative.earnings:.adult.population.(1997-2004)...........138. Table.A9.3.. Trends.in.differences.in.earnings.between.females.and.males.
(1997-2004).........................................................................................................139. Table.A9.4a.. Distribution.of.the.2�-to-64-year-old.population,..
by.level.of.earnings.and.educational.attainment..(2004.or.latest.available.year)......................................................................141
. Table.A9.4b.. Distribution.of.the.2�-to-64-year-old.males.by.level.of.earnings..and.educational.attainment.(2004.or.latest.available.year)...................144
. Table.A9.4c.. Distribution.of.the.2�-to-64-year-old.females.by.level.of.earnings..and.educational.attainment.(2004.or.latest.available.year)...................147
. Table.A9.�.. Private.internal.rates.of.return.for.an.individual.obtaining.an.upper.secondary.or.post-secondary.non-tertiary.education,.ISCED.3/4.(2003)............................................................................................1�0
. Table.A9.6.. Private.internal.rates.of.return.for.an.individual.obtaining..a.university-level.degree,.ISCED.�/6.(2003)......................................1�0
. Table.A9.7.. Public.internal.rates.of.return.for.an.individual.obtaining..an.upper.secondary.or.post-secondary.non-tertiary.education,.ISCED.3/4.(2003)............................................................................................1�1
. Table.A9.8.. Public.internal.rates.of.return.for.an.individual.obtaining..a.university-level.degree,.ISCED.�/6.(2003)......................................1�1
Name of the indicator
in the 2005 edition
a8
a9
Table of ConTenTs
Education at a Glance © OECD 2006 7
Name of the indicator
in the 2005 edition
Indicator a10 the returns to education: links between education, economic growth and social outcomes.............................................1�2
Indicator a11 Impact of demographic trends on education provision........160. Table.A11.1.. Demographic.trends.between.200�.and.201�.and.indicative.
impact.on.educational.expenditure,.student.enrolments..and.graduate.numbers.....................................................................................166
ChaptER B FInanCIal and human REsOuRCEs InvEstEd In EduCatIOn................................................................................................167Indicator B1 Educational expenditure per student................................................170. Table.B1.1a.. Annual.expenditure.on.educational.institutions.per.student..
for.all.services.(2003)......................................................................................186. Table.B1.1b.. Annual.expenditure.on.educational.institutions.per.student..
for.all.services,.by.type.of.programme.(2003)....................................187. Table.B1.1c.. Annual.expenditure.per.student.on.core.services,..
ancillary.services.and.R&D.(2003)...........................................................188. Table.B1.2.. Distribution.of.expenditure.(as.a.percentage).on.educational.
institutions.compared.to.number.of.students.enrolled..at.each.level.of.education.(2003)...............................................................189
. Table.B1.3a.. Cumulative.expenditure.on.educational.institutions.per..student.over.the.theoretical.duration.of.primary.and..secondary.studies.(2003)...............................................................................190
. Table.B1.3b.. Cumulative.expenditure.on.educational.institutions.per.student..over.the.average.duration.of.tertiary.studies.(2003)........................191
. Table.B1.4.. Annual.expenditure.on.educational.institutions.per.student..for.all.services.relative.to.GDP.per.capita.(2003).............................192
. Table.B1.�.. Change.in.expenditure.on.educational.institutions.for.all.services.per.student.relative.to.different.factors,.by.level.of.education.(199�,.2003)........................................................................................................193
Indicator B2 Expenditure on educational institutions relative to Gross domestic product.......................................................................194
. Table.B2.1a.. Expenditure.on.educational.institutions.as.a.percentage.of.GDP,..for.all.levels.of.education.(199�,.2000,.2003)....................................20�
. Table.B2.1b.. Expenditure.on.educational.institutions.as.a.percentage.of.GDP,..by.level.of.education.(199�,.2000,.2003)..............................................206
. Table.B2.1c.. Expenditure.on.educational.institutions.as.a.percentage.of.GDP,..by.level.of.education.(2003).........................................................................207
. Table.B2.2.. Change.in.expenditure.on.educational.institutions..(199�,.2003)........................................................................................................208
. Table.B2.3.. Change.in.expenditure.on.educational.institutions..(199�,.2000,.2001,.2002,.2003)................................................................209
Indicator B3 public and private investment in educational institutions.........210. Table.B3.1.. Relative.proportions.of.public.and.private.expenditure..
on.educational.institutions.for.all.levels.of.education..(199�,.2003)........................................................................................................218
a10
B1
B2
B3
Table of ConTenTs
Education at a Glance © OECD 20068
Name of the indicator
in the 2005 edition
. Table.B3.2a.. Relative.proportions.of.public.and.private.expenditure.on.educational.institutions,.as.a.percentage,.by.level.of.education.(199�,.2003)........................................................................................................219
. Table.B3.2b.. Relative.proportions.of.public.and.private.expenditure.on.educational.institutions,.as.a.percentage,.for.tertiary.education.(199�,.2003)........................................................................................................220
. Table.B3.3.. Trends.in.relative.proportions.of.public.expenditure.on.educational.institutions,.for.tertiary.education..(199�,.2000,.2001,.2002,.2003)................................................................221
Indicator B4 total public expenditure on education............................................222. Table.B4.1.. Total.public.expenditure.on.education.(199�,.2003).......................228. Table.B4.2. Distribution.of.total.public.expenditure.on.education.(2003)........229
Indicator B5 tuition fees charged by tertiary institutions and support for students and households through public subsidies..........230
. Table.B�.1.. Estimated.annual.average.tuition.fees.charged.by.tertiary-type.A.educational.institutions.(school.year.2003-2004)..............................240
. Table.B�.2.. Public.subsidies.for.households.and.other.private.entities.as.a.percentage.of.total.public.expenditure.on.education.and.GDP,..for.tertiary.education.(2003)..........................................................................242
Indicator B6 Expenditure in institutions by service category and by resource category....................................................................................244
. Table.B6.1.. Expenditure.on.institutions.by.service.category..as.a.percentage.of.GDP.(2003)...................................................................2�2
. Table.B6.2.. Expenditure.on.educational.institutions.by.resource.category..and.level.of.education.(2003)......................................................................2�3
ChaptER C aCCEss tO EduCatIOn, paRtICIpatIOn and pROGREssIOn..................................................................................................2��
Indicator C1 Enrolment in education from primary education to adult life..........................................................................................................2�6
. Table.C1.1. Education.expectancy.(2004)......................................................................26�
. Table.C1.2. Enrolment.rates,.by.age.(2004)..................................................................266
. Table.C1.3. Transition.characteristics.from.age.1�.to.20,..by.level.of.education.(2004)...........................................................................267
Indicator C2 participation in secondary and tertiary education...................268. Table.C2.1.. Entry.rates.into.tertiary.education.and.age.distribution..
of.new.entrants.(2004)....................................................................................277. Table.C2.2.. Expected.years.in.tertiary.education.and.changes..
in.tertiary.enrolment.(2004)........................................................................278. Table.C2.3. Students.in.tertiary.education.by.type.of.institution..
or.mode.of.study.(2004)................................................................................279. Table.C2.4. Students.in.primary.and.secondary.education.by.type.of.
institution.or.mode.of.study.(2004).........................................................280. Table.C2.�. Upper.secondary.enrolment.patterns.(2004)......................................281
B4
B5
B6
C1
C2
Table of ConTenTs
Education at a Glance © OECD 2006 9
Name of the indicator
in the 2005 edition
Indicator C3 student mobility and foreign students in tertiary education..........................................................................................282
. Table.C3.1.. Student.mobility.and.foreign.students.in.tertiary.education..(2000,.2004)........................................................................................................303
. Table.C3.2.. Distribution.of.international.and.foreign.students.in.tertiary.education,.by.country.of.origin.(2004)...................................................304
. Table.C3.3.. Citizens.studying.abroad.in.tertiary.education,..by.country.of.destination.(2004)................................................................308
. Table.C3.4.. Distribution.of.international.and.foreign.students.in.tertiary.education,.by.level.and.type.of.tertiary.education.(2004).............310
. Table.C3.�.. Distribution.of.international.and.foreign.students.in.tertiary.education,.by.field.of.education.(2004)..................................................311
. Table.C3.6.. Trends.in.the.number.of.foreign.students.enrolled.outside..their.country.of.origin.(2000.to.2004)...................................................312
. Table.C3.7.. Percentage.of.tertiary.qualifications.awarded.to.international..and.foreign.students,.by.type.of.tertiary.education.(2004)...........313
Indicator C4 Education and work status of the youth population................314.. Table.C4.1a. Expected.years.in.education.and.not.in.education..
for.1�-to-29-year-olds.(2004).....................................................................323. Table.C4.2a.. Percentage.of.the.youth.population.in.education..
and.not.in.education.(2004).........................................................................32�. Table.C4.3.. Percentage.of.the.cohort.population.not.in.education..
and.unemployed.(2004)..................................................................................327. Table.C4.4a.. Trends.in.the.percentage.of.the.youth.population..
in.education.and.not.in.education.(199�-2004)..................................329
Indicator C5 participation in adult learning...............................................................334. Table.C�.1a.. Participation.rate.and.expected.number.of.hours.in.non-formal.
job-related.education.and.training,.by.level.of.educational.attainment.(2003)..............................................................................................341
. Table.C�.1b.. Expected.number.of.hours.in.non-formal.job-related.education..and.training,.by.age.group.and.labour.force.status.(2003)...................343
. Table.C�.1c.. Expected.number.of.hours.in.non-formal.job-related.education..and.training,.by.level.of.educational.attainment.(2003).................34�
ChaptER d thE lEaRnInG EnvIROnmEnt and ORGanIsatIOn OF sChOOls......................................................................................................347
Indicator d1 total intended instruction time for students in primary and secondary education...........................................................................348
. Table.D1.1.. Compulsory.and.intended.instruction.time..in.public.institutions.(2004).........................................................................3�6
. Table.D1.2a.. Instruction.time.per.subject.as.a.percentage.of.total..compulsory.instruction.time.for.9-to-11-year-olds.(2004)..........3�7
. Table.D1.2b.. Instruction.time.per.subject.as.a.percentage.of.total..compulsory.instruction.time.for.12-to-14-year-olds.(2004).......3�8
C3
C4
C6
d1
Table of ConTenTs
Education at a Glance © OECD 200610
Name of the indicator
in the 2005 edition
Indicator d2 Class size and ratio of students to teaching staff.........................360. Table.D2.1.. Average.class.size,.by.type.of.institution.and.level..
of.education.(2004)..........................................................................................370. Table.D2.2. Ratio.of.students.to.teaching.staff.in.educational..
institutions.(2004).............................................................................................371. Table.D2.3.. Ratio.of.students.to.teaching.staff.by.type.of.institution.(2004)........372
Indicator d3 teachers’ salaries.............................................................................................374. Table.D3.1. Teachers’.salaries.(2004)................................................................................384. Table.D3.2a...Adjustments.to.base.salary.for.teachers..
in.public.institutions.(2004).........................................................................386. Table.D3.2b...Adjustments.to.base.salary.for.teachers.in.public.institutions..
made.by.school.principal.(2004)................................................................388. Table.D3.2c.. Adjustments.to.base.salary.for.teachers.in.public.institutions..
made.by.local.or.regional.authority.(2004)..........................................390. Table.D3.2d...Adjustments.to.base.salary.for.teachers.in.public.institutions..
made.by.the.national.authority.(2004)....................................................392. Table.D3.3.. Change.in.teachers’.salaries.(1996.and.2004).....................................394
Indicator d4 teaching time and teachers’ working time.....................................396. Table.D4.1. Organisation.of.teachers’.working.time.(2004)..................................40�
Indicator d5 access to and use of ICt.............................................................................406. Table.D�.1.. Various.ICT.resources.in.secondary.schools.and.percentage..
of.various.types.of.computers.in.schools.(2003)................................414. Table.D�.2.. Percentage.of.students.in.secondary.schools.whose.principals.
report.that.instruction.is.hindered.by.a.shortage..of.ICT.resources.(2003).................................................................................41�
. Table.D�.3.. Percentage.of.1�-year-old.students.using.computers.at.home,..school.or.other.places,.by.frequency.of.use.(2003)..........................417
a n n E x 1 Characteristics of Educational systems.............................................419. Table.X1.1a.. Typical.graduation.ages.in.upper.secondary.education....................420. Table.X1.1b.. Typical.graduation.ages.in.post-secondary.non-tertiary..
education................................................................................................................421. Table.X1.1c.. Typical.graduation.ages.in.tertiary.education.......................................422. Table.X1.2a.. School.year.and.financial.year.used.for.the.calculation..
of.indicators..........................................................................................................423. Table.X1.2b.. School.year.and.financial.year.used.for.the.calculation..
of.indicators..........................................................................................................424. Table.X1.3. Summary.of.completion.requirements..
for.upper.secondary.(ISCED.3).programmes......................................42�
a n n E x 2 Reference statistics........................................................................................429. Table.X2.1. Overview.of.the.economic.context.using.basic.variables..
(reference.period:.calendar.year.2003,.2003.current.prices)......430. Table.X2.2.. Basic.reference.statistics..
(reference.period:.calendar.year.2003,.2003.current.prices)......431
d2
d3
d4
Table of ConTenTs
Education at a Glance © OECD 2006 11
Name of the indicator
in the 2005 edition
. Table.X2.3.. Basic.reference.statistics..(reference.period:.calendar.year.199�,.199�.current.prices)......432
. Table.X2.4.. Annual.expenditure.on.educational.institutions.per.student..for.all.services.(2003)......................................................................................433
. Table.X2.�.. Annual.expenditure.on.educational.institutions.per.student..for.all.services.(2003)......................................................................................434
. Table.X2.6a.. Reference.statistics.used.in.the.calculation.of..teachers’.salaries,.by.level.of.education.(1996,.2004).....................43�
. Table.X2.6b. Reference.statistics.used.in.the.calculation.of.teachers’.salaries.(1996,.2003).........................................................................................................437
. Table.X2.6c. Teachers’.salaries.(2004)................................................................................438
annEx 3 (sources, methods and technical notes)....................................................441
References............................................................................................................................................443
Contributors to this publication.............................................................................................44�
Related OECd publications........................................................................................................449

Education at a Glance © OECD 2006 13
Editorial
The OECD education indicators show – consistently and over time – that individuals and countries that invest in education and skills benefit economically and socially from that choice. Human capital is a major factor driving economic growth, both in the world’s most advanced economies and in those experiencing rapid development. Not least, it contributes tangibly to social outcomes, including health and social cohesion (Indicators A8, A9 and A10). What is noteworthy is that rising tertiary education levels among citizens seem generally not to have led to an “inflation” of the labour-market value of qualifications: Among the countries with the largest expansion of tertiary education, in which the proportion of 25-to-64-year-olds with tertiary qualifications increased by more than 5 percentage points since 1995 – Australia, Austria, Belgium, Canada, Denmark, Finland, Iceland, Ireland, Japan, Korea, Mexico, Poland, Spain, Sweden, Switzerland and the United States – most have seen stable or rising earnings benefits among tertiary graduates. This suggests that an increase in knowledge workers does not necessarily lead to a decrease in their pay in the way it does for low-skilled workers.
Technology too has played a key role in economic and social development, through the direct contribution of the technology sector to overall industrial production, through the expansion of the capital intensity of production in the economy at large resulting from massive investments in information and communication technology (ICT) during the 1990s and from spill-over effects such as organisational improvements brought about by the new technologies, in particular the spread of the internet. However, technological development depends on educational progress as well, not just because the knowledge workers and innovators require high levels of education, but also because a highly educated workforce is a pre-requisite for adopting new technologies throughout the economy, thereby increasing total factor productivity.
Together, skills and technology have profoundly changed economies and societies (Friedman, 2005). Their coincidence with the deregulation of telecommunications launched the “fibre-optic bubble”: telecommunication companies spent billions on wiring the world with fibre-optic cables. This excess supply of connectivity meant that the cost of phone calls, Internet connections and data transmission declined dramatically, indeed so dramatically that many of the companies that laid these cables went bankrupt. But the world was wired and, as a result, all work that can be digitised, automatised and outsourced can increasingly be done by the most effective and competitive individuals or enterprises, wherever they are located. The impact of these developments on OECD countries and their education systems was magnified by the collapse of communism in the Soviet Union, India’s turn away from economic insularism, and China’s shift to market capitalism. This allowed another three to four billion people in places like China, India, the Russian Federation, Eastern Europe, Latin America and Central Asia, that had previously been locked out of the global economy because they lived in largely closed economies with vertical, hierarchical political and economic structures, to collaborate and compete with everyone else (Friedman, 2005).
By Barbara Ischinger, Director for Education
Editorial
Education at a Glance © OECD 200614
In the first instance, the OECD countries found themselves mainly competing with new countries that offered low skills at low costs and this was reflected in rising unemployment in OECD labour markets at the lower skill end (Indicator A8). In addition, entire industries have disappeared as ICT made them superfluous. Certainly, these developments created important new opportunities for OECD countries, because it meant opening up new markets, but generally this led to better employment opportunities and higher earnings only for the better skilled, as the related low-skilled jobs have been largely created in the countries where these new markets were located. More significantly than this, in recent years countries like China or India have rapidly expanded the supply of high-level qualifications as well, and their current investment levels in high skills may suggest that for countries like China competition through lower industrial production costs is merely a transitional strategy, on their way to matching the OECD countries at the top of the product range.
Together, these developments will pose phenomenal changes to education systems in OECD countries (Schleicher and Tremblay, 2006). While the education indicators in this publication focus on the performance of education systems in OECD countries, this editorial provides an opportunity to examine some of these challenges in a wider perspective.
The quantity challenge
Indicator A1 illustrates the pace of change with which education systems have responded to the increase in the demand for better qualifications. It shows how the educational landscape in the OECD area looked in the 1960s, in terms of today’s 55-to-64-year-old population who had successfully completed upper-secondary education, which the indicators on the labour-market returns to education identify as the baseline qualification in the knowledge economy. Two generations ago, the United States was well ahead of all other OECD countries, and it is reasonable to assume that the economic success of the United States today derives at least in part from its first-mover advantage in offering high baseline standards of human capital. However, the indicator also shows that many countries had caught up with the United States in the 1980s and eventually overtook it. The same holds for tertiary qualifications. Today, all of the OECD’s members are producing more university graduates than they did in 1960, but the pace of change has varied widely. Most of Europe’s major economies, including France, Italy and the United Kingdom, have just held their ground or, in the case of Germany, have fallen significantly behind. Looking at today’s university entry rates suggests that differences in educational attainment between countries are likely to widen in the years to come (Indicator C2).
However, what is most striking is that both Europe and the United States find themselves increasingly outperformed in education by countries in East Asia. Korea illustrates the pace of improvement that is possible: just two generations ago, it had the standard of living of Afghanistan today and it was among the lowest performers in education among OECD countries. Today, 97% of all 25-to-34-year-olds in Korea have completed upper-secondary education (Indicator A1), the highest rate among the OECD countries, and Korea can compare itself with the best performing countries in the world. Many factors helped Korea do better than other countries that started from a low base. Perhaps most importantly, society and educators in Korea never accepted the systemic and structural barriers that have hindered learning and reinforced inequities in many other countries. When demand for education began to outpace supply, students were not sent home. Instead, class size and schooling hours were extended and parents were ready to complement public provision with high levels of private investment into learning (Indicator B3).
Editorial
Education at a Glance © OECD 2006 15
These reforms were driven by merit-based learning opportunities, where progress depended on what children were able to do, not where they came from (Indicator A5).
The experience of Korea is not unique. Japan has seen a somewhat slower expansion as it started from a higher base than did Korea in the 1960s. But measured by the OECD indicators, it too is among today’s best performing education systems in the OECD area. Indeed, in many Asian countries, the combined effect of growing populations and rising access to education has resulted in a dramatic increase in student numbers and will potentially result in increased attainment rates. Between 1995 and 2004 alone the number of students attending university more than doubled in China and Malaysia, and expanded by 83% in Thailand and 51% in India. Even if graduation rates in China and India still remain well below the OECD average, the mere size of the populations at the upper secondary and tertiary levels in these countries translates into a vast graduate output in absolute terms: in 2005, China already produced 10.8 million upper secondary graduates, two and a half times the graduate output of the EU countries; it has also surpassed the EU for the number of tertiary graduates, with 4.4 million graduates of Chinese tertiary institutions compared to 2.5 million in the EU, even if a significant proportion of the Chinese qualifications result from shorter vocationally oriented programmes and major quality challenges remain (OECD, 2005d; Ministry of Education of China, 2006). In 2003, India too produced nearly as many upper secondary graduates as the EU countries.
This suggests that the time when OECD countries competed mostly with countries that offered low-skilled work at low wages is gone. Today, countries like China or India are starting to deliver high skills at moderate cost and at an ever increasing pace, and OECD countries cannot switch off the pressures that result from this except at great cost to our own economic well being.
And yet, the biggest challenge may lie in the competition for advanced skills. In the past, the economies of countries like China or India could not provide adequate jobs for their own talent and OECD countries became major beneficiaries of their educational investments. For example, the proportion of science and engineering occupations in the United States that are filled by tertiary-educated workers born abroad increased from 14 to 22% between 1990 and 2000, and from 24 to 38% when considering only doctorate-level science and engineering workers (United States National Science Board, 2003). But with technology flattening the world the time in which the only route to success for these students lay in emigrating to Europe or the United States is coming to an end. Indian engineers, for instance, can increasingly plug into the world from India, whether they are working for Indian companies or for companies in the OECD area that are outsourcing their services to India.
The quality challenge
The OECD countries’ capacity to compete in the global knowledge economy will therefore depend on whether they can meet the fast-growing demand for high-level skills. This, in turn, will hinge on significant improvements in the quality of schooling outcomes and a more equitable distribution in learning opportunities.
Time is running out and the clock keeps ticking. Every eight seconds, one student in the OECD area leaves school without completing an upper secondary qualification, with a gloomy outlook for their future: on average, 26% of adults without upper secondary qualifications earn half or less than half the national median earnings. In only two countries are more then 5% of these adults found in the group whose average earnings exceed twice the country median
Editorial
Education at a Glance © OECD 200616
(Indicator A9). Moreover, as the same indicator show, the penalties for not obtaining strong baseline qualifications continue to rise year after year.
The OECD’s Programme for International Student Assessment (PISA) makes it now also possible to regularly and directly compare the quality of educational outcomes in the principal industrialised countries that make up almost 90% of the world economy. The latest PISA assessment in 2003 focused on the capacity of students to analyse, reason and communicate effectively as they posed, solved and interpreted mathematical problems in a variety of situations. Although these capacities reflect goals emphasised in many national curricula, the PISA assessment showed that 15-year-olds in the United States and most of Europe’s large economies only performed around or below the OECD average. In contrast, the six East Asian education systems that took part in PISA 2003 were among the top ten performers. It is also noteworthy that most of East Asia’s education systems succeed without leaving many students behind, even if Finland, Canada and the Netherlands also did well in this respect (Indicator A5). In contrast, 20% of 15-year-olds on average in the EU, over a quarter in Italy, Mexico, Portugal, Turkey, and the United States performed at Level 1 or below on the PISA mathematics assessment (Indicator A6). They are at risk, as they fail to demonstrate baseline mathematical skills that will enable them to expand their own horizon in their further schooling and beyond. These are not just large proportions but also large numbers in absolute terms: in the OECD area, 3.6 million 15-year-olds performed at Level 1 or below in 2003.
Nevertheless, the OECD indicators also highlight important challenges for the East Asian education systems. At a time when the future success of school students will derive largely from their capacity to expand their horizons and continue learning throughout life, students need not merely to acquire strong subject matter skills but also positive attitudes and effective learning strategies. This is an area where most of the East Asian countries performed comparatively poorly. For example, despite Japan’s strong mathematics performance, only about one-quarter of Japanese 15-year-olds report doing mathematics because they enjoy it, roughly half the proportion found in Denmark, the country with the strongest results on this aspect. One might argue that what counts is what students know and not their interest in the subject. However, the PISA data reveal that the relationship between motivation and performance is as high in Japan as it is in Denmark. Beyond their general interest in mathematics, 15-year-olds in many Asian countries also assess the relevance of the mathematics taught in their schools to their own future life comparatively poorly.
The equity challenge
Many education systems make ambitious claims when it comes to securing equity in learning opportunities. However, here lies perhaps the biggest disappointment. PISA reveals that social background plays an even larger role in determining a student’s performance in countries such as Germany, France and Italy than in the United States and in both Europe and the United States socio-economic inequalities are larger than in any of the Asian countries for which comparable data are available (Indicator A5). The results show that students from difficult socio-economic backgrounds do not receive the same educational opportunities as children from middle- and upper-class families. The data even suggest that schools in many OECD countries reinforce existing socio-economic inequities.
In contrast, Finland and Canada, as well as five out of the six East and South-East Asian countries for which PISA data are available are among the countries in which social background has the smallest impact on student success. This suggests that these education systems succeed better in
Editorial
Education at a Glance © OECD 2006 17
creating meritocracies that maximise the human potential of their countries more effectively. The data also provide some explanations for this. First of all, they show that overall variation in student performance, performance differences between schools and the social clustering of school performance, tend to be greater in countries with rigid stratification practices at early ages between types of programme and school than in systems in which the curriculum does not vary significantly between schools (Indicator A7). The German school system, for example, divides children as young as 10 years old into vocational or academic tracks. In the end, those with parents in white-collar, high-skilled occupations are four times more likely to enrol in tracks leading to universities than those with parents from blue-collar or low-skilled occupations, even if the students display the same level of educational performance at an early age. Europe was able to get by with these kind of systems for so long because in the last century, when these systems were established and when industrial mass production was dominant, they were well adapted to what they intended to do, namely to equip a large group of mass production workers with baseline qualifications and at the same time focussing resources on a small elite that could innovate. This was adequate at a time when there were plenty of jobs requiring only baseline qualifications, but no longer works in a world made flat by technology.
Nor does the story end in high school or even at the tertiary level. Initial education alone is not enough to meet the rising and changing demand for skills, and lifelong learning has become a central part of national policy agendas. However, the reality is that the people who most need post-school education and training opportunities, such as those who have not completed high school, the unemployed or those with low-skilled jobs, get the fewest opportunities. Indeed, such opportunities are most common for full-time or established workers in a firm and are more prevalent for management and senior posts. They are also more frequent for young and mid-career workers than for older workers. More worrying still is the sizeable proportion of young people with low levels of education who are neither in work or education, with this population approaching more than 10% of 15-to-19-year-olds in countries such as Italy, Mexico, the Slovak Republic and Turkey.
The ambition challenge
The outsourcing of manufacturing or services from Europe or North America to countries like China and India is not just motivated by obtaining cheaper and more efficient services, but also through boosts in quality and productivity. To some extent, this can be explained by the fact that low-wage, low-prestige jobs in OECD countries easily translate into high-wage, high-prestige jobs in countries with generally lower income levels. However, there is more to this. The indicators also suggest a lack of ambition in many OECD countries that is mirrored in poor educational outcomes and aspirations. By contrast, in countries like Japan, Korea or Hong Kong-China, students, parents and teachers, whatever the socio-economic context from which they come, invest their time and resources in achieving as best as they possibly can in school and university, well aware that this is the most powerful lever for their own future success and that of their country. A recent survey carried out in China to estimate total learning time also suggests that Chinese 15-year-old students spent an average of nearly 3 000 hours in learning activities in 2002 – in school, extra tutoring classes or preparing homework – nearly twice as much as their peers of OECD countries (Indicator D2; Zhen, 2006).
PISA also asked 15-year-old students about their own expectations for their educational future. Although students’ own expectations at that age may not always be realistic, they provide some
Editorial
Education at a Glance © OECD 200618
indication as to what young people are striving for. The results show that 15-year old students in all Asian countries with available data have very high tertiary aspirations, with about 60 to 70% of them expecting to attain tertiary level education in Japan, Hong Kong-China, Macao-China and Thailand. Tertiary expectations even reach 95% of 15-year-old students in Korea. In stark contrast, the level of tertiary aspirations is low among European students, with only half of them expecting to obtain a tertiary qualification during their lifetime. These comparatively low tertiary aspirations of European students relative to their Asian peers derive in part from the lack of social inclusiveness in many European education systems: a comparison of the aspirations of students for tertiary education by quartile of the students’ economic, social and cultural status index underlines that the difference between aspirations of students from the top and bottom quartiles of the index is significantly smaller in most Asian countries than in Europe. Korea and Macao-China stand out, in particular, with high expectations of all students irrespective of their economic, social and cultural family background.
It should not be ignored, though, that the highly competitive nature of East Asian education systems combined with exceedingly high expectations of teachers are reflected in extraordinary pressure on students and generally high levels of anxiety among students, with all of the East Asian countries that took part in the PISA 2003 assessment reporting levels of helplessness and emotional stress when dealing with mathematics that were well above the OECD average levels. In Hong Kong-China, however, high expectations for students go hand in hand with a highly supportive learning environment where students consistently report that teachers show an interest in every student’s learning, give extra help when students need it, and continue teaching until all students understand. In contrast, students in all of Europe’s major economies, and most notably Germany, France, Italy, Poland and the Netherlands, reported significantly lower levels of teacher support. The lack of ambition combined with a lack of support in Europe’s education system is a troublesome base for the future success of its people.
ConclusionThe education systems in OECD countries will have to make considerable headway if they are to meet the demands of modern societies. Some of these changes will require additional investment, but the evidence also suggests that money is a necessary but not sufficient guarantee for strong results. Put simply, education systems need to develop more challenging and more supportive learning environments and learn to be more flexible and effective in improving learning outcomes. And, they must scale back the inherent class bias and sometimes catastrophically regressive way of funding existing educational opportunities – taxing the poor to subsidize educational opportunity for the rich – in existing systems.
At the same time, the OECD indicators show that the challenges of quality, equity and efficiency are being successfully addressed in some countries. These countries set ambitious goals to which others can aspire. The beginning lies in accepting international benchmarking in educational performance as a basis for improvement, rather than seeking reasons why education systems should not or cannot be compared. It is only through such benchmarking that countries can understand relative strengths and weaknesses of their education system and identify best practices and ways forward. The world is indifferent to tradition and past reputations, unforgiving of frailty and ignorant of custom or practice. Success will go to those individuals and countries which are swift to adapt, slow to complain and open to change. The task of governments will be to ensure that countries rise to this challenge.
Education at a Glance © OECD 2006 19
IntroductIon: the IndIcators and theIr Framework
The organising framework
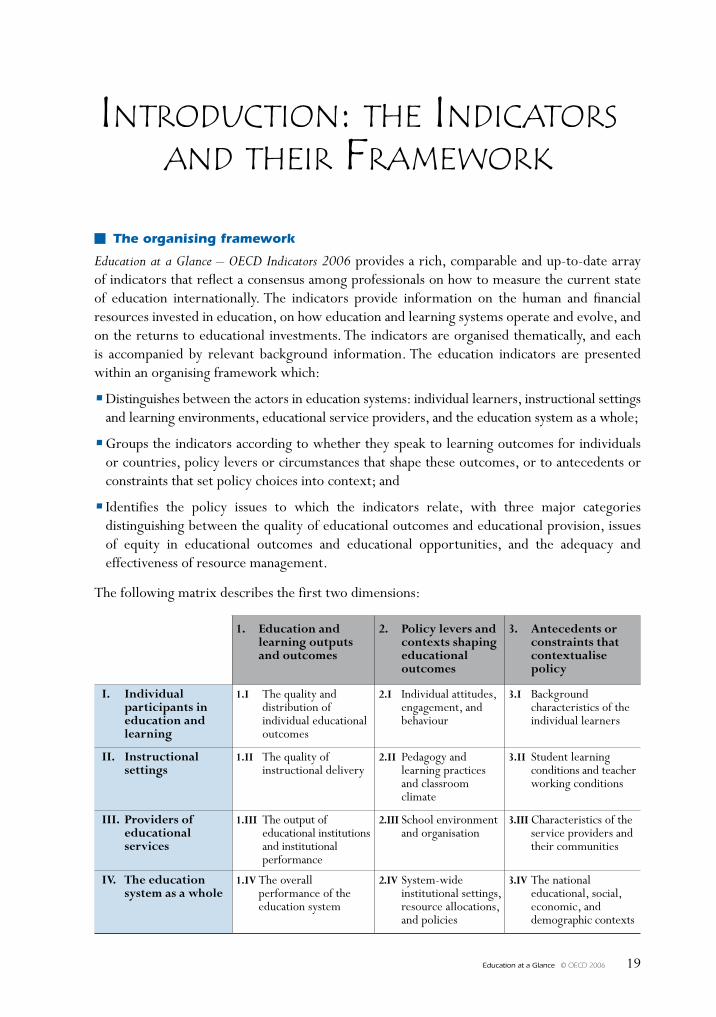
Education at a Glance – OECD Indicators 2006 provides a rich, comparable and up-to-date array of indicators that reflect a consensus among professionals on how to measure the current state of education internationally. The indicators provide information on the human and financial resources invested in education, on how education and learning systems operate and evolve, and on the returns to educational investments. The indicators are organised thematically, and each is accompanied by relevant background information. The education indicators are presented within an organising framework which:
• Distinguishes between the actors in education systems: individual learners, instructional settings and learning environments, educational service providers, and the education system as a whole;
• Groups the indicators according to whether they speak to learning outcomes for individuals or countries, policy levers or circumstances that shape these outcomes, or to antecedents or constraints that set policy choices into context; and
• Identifies the policy issues to which the indicators relate, with three major categories distinguishing between the quality of educational outcomes and educational provision, issues of equity in educational outcomes and educational opportunities, and the adequacy and effectiveness of resource management.
The following matrix describes the first two dimensions:
1. Educationandlearningoutputsandoutcomes
2. Policyleversandcontextsshapingeducationaloutcomes
3. Antecedentsorconstraintsthatcontextualisepolicy
I. Individualparticipantsineducationandlearning
1.I The quality and distribution of individual educational outcomes
2.I Individual attitudes, engagement, and behaviour
3.I Background characteristics of the individual learners
II. Instructionalsettings
1.II The quality of instructional delivery
2.II Pedagogy and learning practices and classroom climate
3.II Student learning conditions and teacher working conditions
III. Providersofeducationalservices
1.III The output of educational institutions and institutional performance
2.III School environment and organisation
3.III Characteristics of the service providers and their communities
IV. Theeducationsystemasawhole
1.IVThe overall performance of the education system
2.IV System-wide institutional settings, resource allocations, and policies
3.IV The national educational, social, economic, and demographic contexts
IntroductIon
Education at a Glance © OECD 200620
The following sections discuss the matrix dimensions in more detail:
Actors in education systemsThe OECD Education Indicators programme seeks to gauge the performance of national education systems as a whole, rather than to compare individual institutional or other sub-national entities. However, there is increasing recognition that many important features of the development, functioning and impact of education systems can only be assessed through an understanding of learning outcomes and their relationships to inputs and processes at the level of individuals and institutions. To account for this, the indicator framework distinguishes between a macro level, two meso-levels and a micro-level of education systems. These relate to:
• The education system as a whole;
• The educational institutions and providers of educational services;
• The instructional setting and the learning environment within the institutions; and
• The individual participants in education and learning.
To some extent, these levels correspond to the entities from which data are being collected but their importance mainly centres on the fact that many features of the education system play out quite differently at different levels of the system. For example, at the level of students within a classroom, the relationship between student achievement and class size may be negative, if students in small classes benefit from improved contact with teachers. At the class or school level, however, students are often intentionally grouped such that weaker or disadvantaged students are placed in smaller classes so that they receive more individual attention. At the school level, therefore, the observed relationship between class size and student achievement is often positive (suggesting that students in larger classes perform better than students in smaller classes). At higher aggregated levels of education systems, the relationship between student achievement and class size is further confounded, e.g. by the socio-economic intake of schools or by factors relating to the learning culture in different countries. Past analyses which have relied on macro-level data alone have therefore sometimes led to misleading conclusions.
Outcomes, policy leavers and antecedentsThe second dimension in the organising framework further groups the indicators at each of the above levels:
• Indicators on observed outputs of education systems, as well as indicators related to the impact of knowledge and skills for individuals, societies and economies, are grouped under the sub-heading output and outcomes of education and learning;
• The sub-heading policy levers and contexts groups activities seeking information on the policy levers or circumstances which shape the outputs and outcomes at each level; and
• These policy levers and contexts typically have antecedents – factors that define or constrain policy. These are represented by the sub-heading antecedents and constraints. It should be noted that the antecedents or constraints are usually specific for a given level of the education system and that antecedents at a lower level of the system may well be policy levers at a higher level. For teachers and students in a school, for example, teacher qualifications are a given constraint while, at the level of the education system, professional development of teachers is a key policy lever.
IntroductIon
Education at a Glance © OECD 2006 21
Policy issuesEach of the resulting cells in the framework can then be used to address a variety of issues from different policy perspectives. For the purpose of this framework, policy perspectives are grouped into the following three classes which constitute the third dimension in the organising framework for INES:
• Quality of educational outcomes and educational provision;
• Equality of educational outcomes and equity in educational opportunities; and
• Adequacy and effectiveness of resource management.
In addition to the dimensions mentioned above, the time perspective as an additional dimension in the framework, allows dynamic aspects in the development of education systems to be modelled also.
The indicators that are published in Education at a Glance 2006 fit within this framework, though often they speak to more than one cell.
Most of the indicators in ChapterA The output of educational institutions and impact of learning relate to the first column of the matrix describing outputs and outcomes of education. Even so, indicators in ChapterA measuring educational attainment for different generations, for instance, not only provide a measure of the output of the educational system but also provide context for current educational policies, helping to shape polices on, for example, lifelong learning.
ChapterB Financial and human resources invested in education provides indicators that are either policy levers or antecedents to policy, or sometimes both. For example, expenditure per student is a key policy measure which most directly impacts on the individual learner as it acts as a constraint on the learning environment in schools and student learning conditions in the classroom.
ChapterC Access to education, participation and progression provides indicators that are a mixture of outcome indicators, policy levers and context indicators. Entry rates and progression rates are, for instance, outcomes measures to the extent that they indicate the results of policies and practices in the classroom, school and system levels. But they can also provide contexts for establishing policy by identifying areas where policy intervention is necessary to, for instance, address issues of inequity.
Chapter D Learning environment and organisation of schools provides indicators on instruction time, teachers working time and teachers’ salaries not only represent policy levers which can be manipulated but also provide contexts for the quality of instruction in instructional settings and for the outcomes of learners at the individual level.

Education at a Glance © OECD 2006 23
ReadeR’s Guide
Coverage of the statisticsAlthough a lack of data still limits the scope of the indicators in many countries, the coverage extends, in principle, to the entire national education system (within the national territory) regardless of the ownership or sponsorship of the institutions concerned and regardless of education delivery mechanisms. With one exception described below, all types of students and all age groups are meant to be included: children (including students with special needs), adults, nationals, foreigners, as well as students in open distance learning, in special education programmes or in educational programmes organised by ministries other than the Ministry of Education, provided the main aim of the programme is the educational development of the individual. However, vocational and technical training in the workplace, with the exception of combined school and work-based programmes that are explicitly deemed to be parts of the education system, is not included in the basic education expenditure and enrolment data.
Educational activities classified as “adult” or “non-regular” are covered, provided that the activities involve studies or have a subject matter content similar to “regular” education studies or that the underlying programmes lead to potential qualifications similar to corresponding regular educational programmes. Courses for adults that are primarily for general interest, personal enrichment, leisure or recreation are excluded.
Calculation of international meansFor many indicators an OECD average is presented and for some an OECD total.
The OECD average is calculated as the unweighted mean of the data values of all OECD countries for which data are available or can be estimated. The OECD average therefore refers to an average of data values at the level of the national systems and can be used to answer the question of how an indicator value for a given country compares with the value for a typical or average country. It does not take into account the absolute size of the education system in each country.
The OECD total is calculated as a weighted mean of the data values of all OECD countries for which data are available or can be estimated. It reflects the value for a given indicator when the OECD area is considered as a whole. This approach is taken for the purpose of comparing, for example, expenditure charts for individual countries with those of the entire OECD area for which valid data are available, with this area considered as a single entity.
Note that both the OECD average and the OECD total can be significantly affected by missing data. Given the relatively small number of countries, no statistical methods are used to compensate for this. In cases where a category is not applicable (code “a”) in a country or where the data value is negligible (code “n”) for the corresponding calculation, the value zero is imputed for the purpose of calculating OECD averages. In cases where both the numerator and the denominator of a ratio are not applicable (code “a”) for a certain country, this country is not included in the OECD average.
ReadeR’s Guide
Education at a Glance © OECD 200624
For financial tables using 1995 data, both the OECD average and OECD total are calculated for countries providing both 1995 and 2004 data. This allows comparison of the OECD average and OECD total over time with no distortion due to the exclusion of certain countries in the different years.
For many indicators an EU19 average is also presented. It is calculated as the unweighted mean of the data values of the 19 OECD countries that are members of the European Union for which data are available or can be estimated. These 19 countries are Austria, Belgium, the Czech Republic, Denmark, Finland, France, Germany, Greece, Hungary, Italy, Ireland, Luxembourg, the Netherlands, Poland, Portugal, the Slovak Republic, Spain, Sweden and the United Kingdom.
Classification of levels of educationThe classification of the levels of education is based on the revised International Standard Classification of Education (ISCED-97). The biggest change between the revised ISCED and the former ISCED (ISCED-76) is the introduction of a multi-dimensional classification framework, allowing for the alignment of the educational content of programmes using multiple classification criteria. ISCED is an instrument for compiling statistics on education internationally and distinguishes among six levels of education. The Glossary at www.oecd.org/edu/eag2006 describes in detail the ISCED levels of education, and Annex 1 shows corresponding typical graduation ages of the main educational programmes by ISCED level.
Symbols for missing dataSix symbols are employed in the tables and charts to denote missing data:
a Data is not applicable because the category does not apply.
c There are too few observations to provide reliable estimates (i.e. there are fewer than 3% of students for this cell or too few schools for valid inferences). However, these statistics were included in the calculation of cross-country averages.
m Data is not available.
n Magnitude is either negligible or zero.
w Data has been withdrawn at the request of the country concerned.
x Data included in another category or column of the table (e.g. x(2) means that data are included in column 2 of the table).
~ Average is not comparable with other levels of education
Further resourcesThe Web site www.oecd.org/edu/eag2006 provides a rich source of information on the methods employed for the calculation of the indicators, the interpretation of the indicators in the respective national contexts and the data sources involved. The Web site also provides access to the data underlying the indicators as well as to a comprehensive glossary for technical terms used in this publication.
ReadeR’s Guide
Education at a Glance © OECD 2006 25
Any post-production changes to this publication are listed at www.oecd.org/edu/eag2006.
The Web site www.pisa.oecd.org provides information on the OECD Programme for International Student Assessment (PISA), on which many of the indicators in this publication draw.
As in the preceding edition, Education at a Glance is using the OECD’s innovative StatLinks service. Below each table and chart in Education at Glance 2006 is a url which leads to a corresponding Excel workbook containing the underlying data for the indicator. These urls are stable and will remain unchanged over time. In addition, readers of the Education at a Glance e-book will be able to click directly on these links and the workbook will open in a separate window.
Education Policy Analysis is a companion volume to Education at a Glance, which takes up selected themes of key importance for governments. The forthcoming edition contains four chapters that draw together key findings and policy developments under the following headings: Valuing teachers: how to meet aspirations and enhance motivation; new tools for teaching and learning: formative assessment to help all students succeed; gender differences and mathematics: performance, attitudes and motivation; policy directions in higher education.
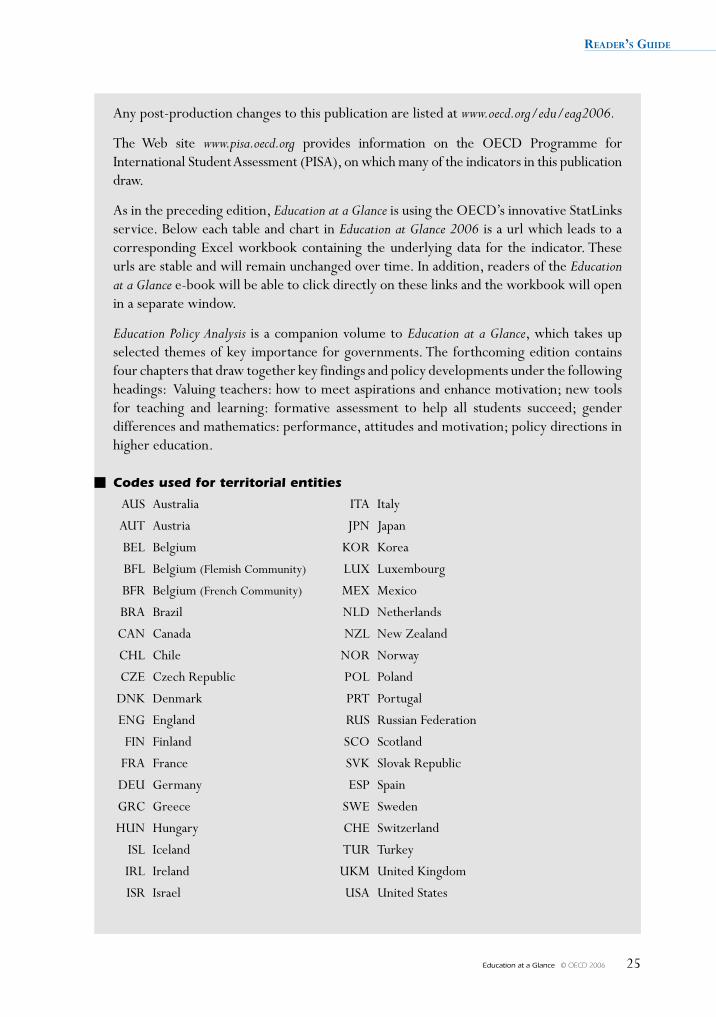
Codes used for territorial entities
AUS Australia ITA Italy
AUT Austria JPN Japan
BEL Belgium KOR Korea
BFL Belgium (Flemish Community) LUX Luxembourg
BFR Belgium (French Community) MEX Mexico
BRA Brazil NLD Netherlands
CAN Canada NZL New Zealand
CHL Chile NOR Norway
CZE Czech Republic POL Poland
DNK Denmark PRT Portugal
ENG England RUS Russian Federation
FIN Finland SCO Scotland
FRA France SVK Slovak Republic
DEU Germany ESP Spain
GRC Greece SWE Sweden
HUN Hungary CHE Switzerland
ISL Iceland TUR Turkey
IRL Ireland UKM United Kingdom
ISR Israel USA United States

Education at a Glance © OECD 2006 27
The OuTpuT OfeducaTiOnal insTiTuTiOns
and The impacT Of learning
Chapter
a
Education at a Glance © OECD 200628
INDICATOR A1 EDUCATIONAL ATTAINmENT Of ThE ADULT pOpULATION
This indicator profiles the educational attainment of the adult population, as captured through formal educational qualifications. As such it provides a proxy for the knowledge and skills available to national economies and societies. Data on educational attainment by age groups are also used in this indicator both to project educational attainment of countries’ adult populations ten years in the future and to view changes over time in each country’s contribution to the OECD-wide pool of tertiary-level graduates.
Key results
16
14
12
10
8
6
4
2
0
Number of years in education
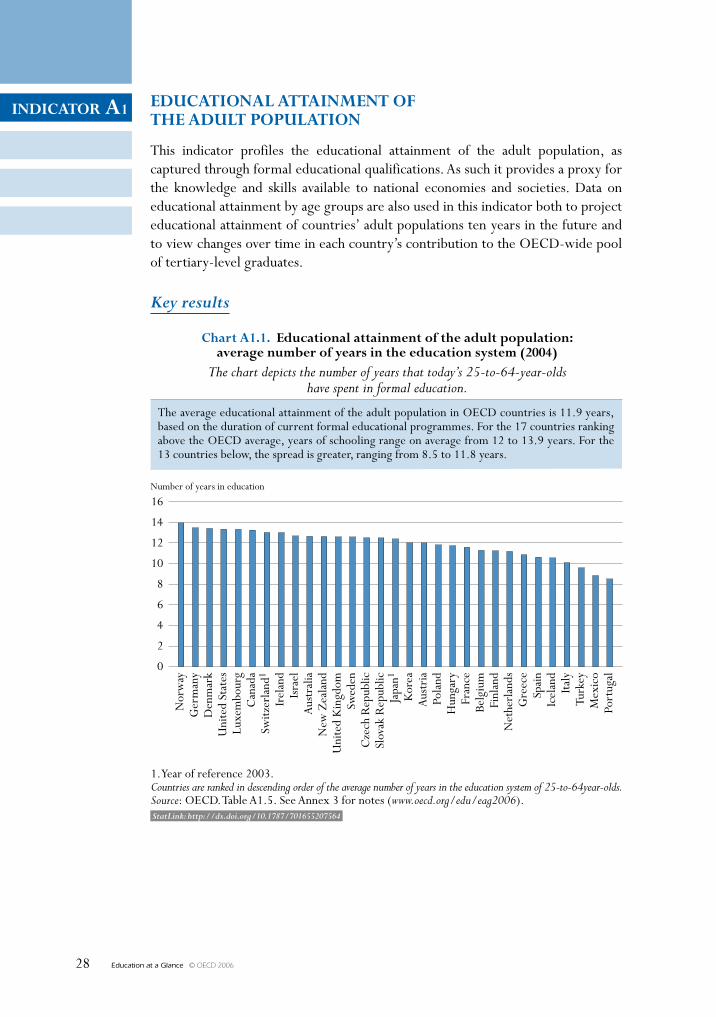
Chart A1.1. Educational attainment of the adult population:average number of years in the education system (2004)
The chart depicts the number of years that today’s 25-to-64-year-oldshave spent in formal education.
1. Year of reference 2003.Countries are ranked in descending order of the average number of years in the education system of 25-to-64year-olds.Source: OECD. Table A1.5. See Annex 3 for notes (www.oecd.org/edu/eag2006).
Nor
way
Ger
man
yD
enm
ark
Uni
ted
Stat
esLu
xem
bour
gC
anad
aSw
itzer
land
1
Irel
and
Isra
elA
ustr
alia
New
Zea
land
Uni
ted
Kin
gdom
Swed
enC
zech
Rep
ublic
Slov
ak R
epub
licJa
pan1
Kor
eaA
ustr
iaPo
land
Hun
gary
Fran
ceBe
lgiu
mFi
nlan
dN
ethe
rlan
dsG
reec
eSp
ain
Icel
and
Italy
Turk
eyM
exic
oPo
rtug
al
The average educational attainment of the adult population in OECD countries is 11.9 years,based on the duration of current formal educational programmes. For the 17 countries rankingabove the OECD average, years of schooling range on average from 12 to 13.9 years. For the13 countries below, the spread is greater, ranging from 8.5 to 11.8 years.
StatLink: http://dx.doi.org/10.1787/701655207564
INDICATOR A1
Education at a Glance © OECD 2006 29
Other highlights of this indicator
• The proportion of individuals who have completed upper secondary education has been growing in almost all OECD countries, rapidly in some: in 22 countries, the proportion ranges from 73 to 97% among 25-to-34-year-olds. Many countries with traditionally low levels of education are catching up and completion of upper secondary education has grown almost everywhere, becoming the norm for youth cohorts.
• In 18 OECD countries, the level of educational attainment among males – measured by the average number of years in schooling – is still higher than that of females, and sometimes considerably so, as in Switzerland and Korea. Nonetheless the difference between males and females is less than 0.4 years in 10 out of these 18 countries.
chapter a The OuTpuT Of educaTiOnal insTiTuTiOns and The impacT Of learning
Education at a Glance © OECD 200630
A1Policy context
A well-educated and well-trained population is central to the social and economic well-being of countries and individuals (see Indicator A10). Education plays a key role in providing individuals with the knowledge, skills and competencies needed to participate effectively in society and in the economy. Education also contributes to an expansion of scientific and cultural knowledge.
The level of educational attainment of the population is a commonly used proxy for the stock of “human capital”, that is, the skills available in the population and labour force. Assuming that one year of education is equivalent at all levels, the educational attainment of the adult population can be summarised by the average years of schooling completed. It must be noted, however, that the calculation is based on the length of current educational programmes, rather than an estimate of the actual average duration of studies attained by past populations. Comparing different countries by average years of schooling also presupposes that the amount and sequence of imparted skills and knowledge per year of education are similar in each country.
Current policy debates also focus on the particular role of tertiary-level attainment as a facilitator of innovation and economy-wide productivity. Accordingly, this indicator examines each country’s share of the OECD pool of tertiary-level graduates, as well as how that share is likely to change over a period of ten years.
Evidence and explanations
On average, across OECD countries, 42% of the adult population have completed only an upper secondary education. Less than one-third of adults (30%) have obtained only the primary or lower secondary levels of education and one-quarter (25%) have achieved a tertiary level of education (Table A1.1a). However, countries differ widely in the distribution of educational attainment across their populations.
In 23 out of the 30 OECD countries, as well as the partner countries Israel and the Russian Federation, 60% or more of the population aged 25 to 64 years has completed at least upper secondary education (Table A1.2a). Some countries show a different profile, however. For instance, in Italy, Mexico, Portugal, Spain and Turkey, more than half of the population aged 25 to 64 years has not completed upper secondary education. Overall, a comparison of the levels of educational attainment in younger and older age groups indicates marked progress with regard to the achievement of upper secondary education (Chart A1.2). On average across OECD member countries, the proportion of 25-to-34-year-olds having attained upper secondary education is 13 percentage points higher than that of the 45-to-54-year-old age group. This increase has been particularly dramatic in Belgium, France, Greece, Ireland, Italy, Korea, Portugal and Spain, as well as the partner country Chile, which have all seen growth of 20 or more percentage points across these age groups.
In countries whose adult population generally has a high attainment level, differences among age groups in the level of educational attainment are less pronounced (Table A1.2a). An exception to this is Korea – where the difference in upper secondary attainment between those aged 25 to 34 years and those aged 45 to 54 years reaches 40 percentage points. Nevertheless, in countries where more than 80% of 25-to-64-year-olds achieve at least upper secondary attainment, the difference in the share of 25-to-34-year-olds who have attained the upper secondary level and the share of 45-to-54-year-olds who have attained this level is, on average, only 7 percentage points.
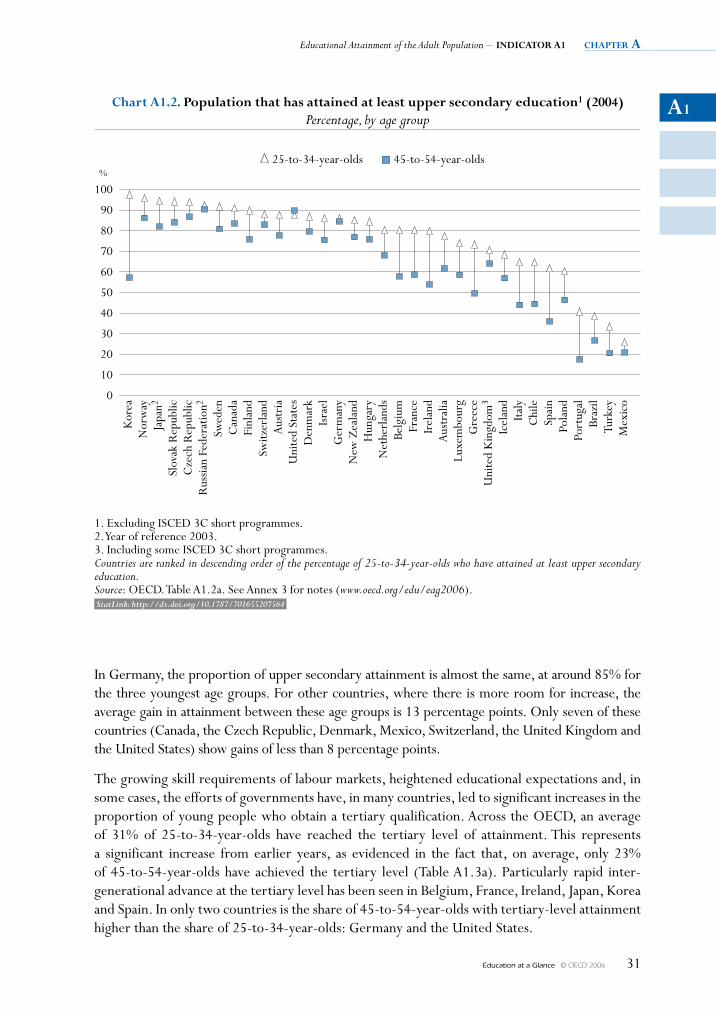
A1
Educational Attainment of the Adult Population – INDICATOR A1 chapter a
Education at a Glance © OECD 2006 31
In Germany, the proportion of upper secondary attainment is almost the same, at around 85% for the three youngest age groups. For other countries, where there is more room for increase, the average gain in attainment between these age groups is 13 percentage points. Only seven of these countries (Canada, the Czech Republic, Denmark, Mexico, Switzerland, the United Kingdom and the United States) show gains of less than 8 percentage points.
The growing skill requirements of labour markets, heightened educational expectations and, in some cases, the efforts of governments have, in many countries, led to significant increases in the proportion of young people who obtain a tertiary qualification. Across the OECD, an average of 31% of 25-to-34-year-olds have reached the tertiary level of attainment. This represents a significant increase from earlier years, as evidenced in the fact that, on average, only 23% of 45-to-54-year-olds have achieved the tertiary level (Table A1.3a). Particularly rapid inter-generational advance at the tertiary level has been seen in Belgium, France, Ireland, Japan, Korea and Spain. In only two countries is the share of 45-to-54-year-olds with tertiary-level attainment higher than the share of 25-to-34-year-olds: Germany and the United States.
100
90
80
70
60
50
40
30
20
10
0
%
Chart A1.2. population that has attained at least upper secondary education1 (2004)Percentage, by age group
25-to-34-year-olds 45-to-54-year-olds
1. Excluding ISCED 3C short programmes.2. Year of reference 2003.3. Including some ISCED 3C short programmes.Countries are ranked in descending order of the percentage of 25-to-34-year-olds who have attained at least upper secondaryeducation.Source: OECD. Table A1.2a. See Annex 3 for notes (www.oecd.org/edu/eag2006).
Kor
eaN
orw
ayJa
pan2
Slov
ak R
epub
licC
zech
Rep
ublic
Rus
sian
Fede
ratio
n2
Swed
enC
anad
aFi
nlan
dSw
itzer
land
Aus
tria
Uni
ted
Stat
esD
enm
ark
Isra
elG
erm
any
New
Zea
land
Hun
gary
Net
herl
ands
Belg
ium
Fran
ceIr
elan
dA
ustr
alia
Luxe
mbo
urg
Gre
ece
Uni
ted
Kin
gdom
3
Icel
and
Italy
Chi
leSp
ain
Pola
ndPo
rtug
alBr
azil
Turk
eyM
exic
o
StatLink: http://dx.doi.org/10.1787/701655207564
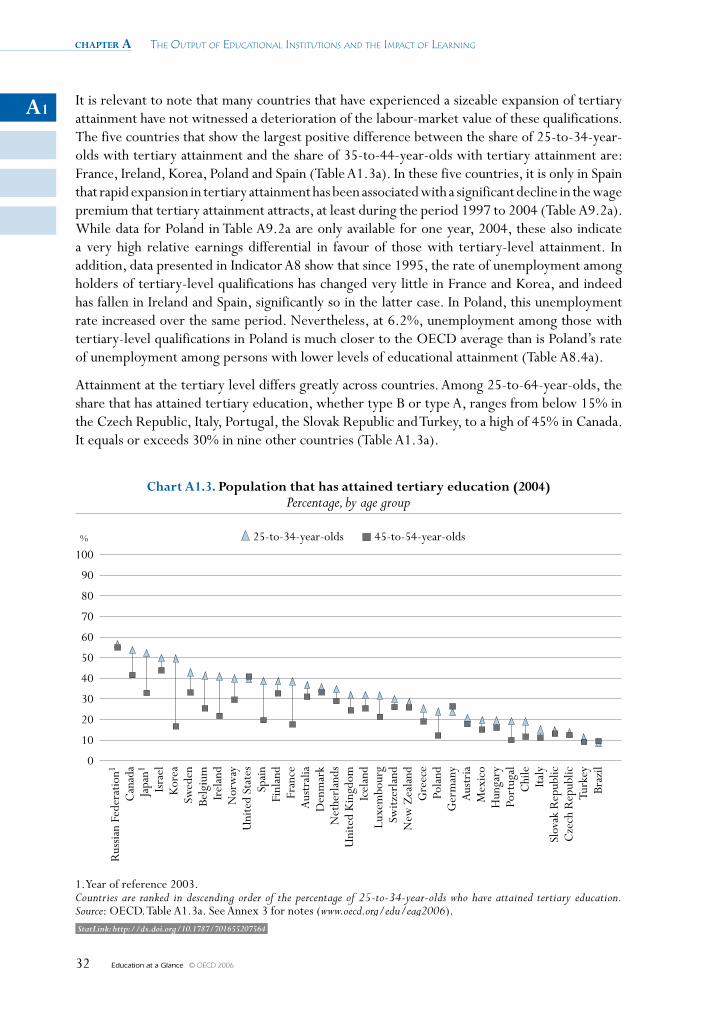
chapter a The OuTpuT Of educaTiOnal insTiTuTiOns and The impacT Of learning
Education at a Glance © OECD 200632
A1It is relevant to note that many countries that have experienced a sizeable expansion of tertiary attainment have not witnessed a deterioration of the labour-market value of these qualifications. The five countries that show the largest positive difference between the share of 25-to-34-year-olds with tertiary attainment and the share of 35-to-44-year-olds with tertiary attainment are: France, Ireland, Korea, Poland and Spain (Table A1.3a). In these five countries, it is only in Spain that rapid expansion in tertiary attainment has been associated with a significant decline in the wage premium that tertiary attainment attracts, at least during the period 1997 to 2004 (Table A9.2a). While data for Poland in Table A9.2a are only available for one year, 2004, these also indicate a very high relative earnings differential in favour of those with tertiary-level attainment. In addition, data presented in Indicator A8 show that since 1995, the rate of unemployment among holders of tertiary-level qualifications has changed very little in France and Korea, and indeed has fallen in Ireland and Spain, significantly so in the latter case. In Poland, this unemployment rate increased over the same period. Nevertheless, at 6.2%, unemployment among those with tertiary-level qualifications in Poland is much closer to the OECD average than is Poland’s rate of unemployment among persons with lower levels of educational attainment (Table A8.4a).
Attainment at the tertiary level differs greatly across countries. Among 25-to-64-year-olds, the share that has attained tertiary education, whether type B or type A, ranges from below 15% in the Czech Republic, Italy, Portugal, the Slovak Republic and Turkey, to a high of 45% in Canada. It equals or exceeds 30% in nine other countries (Table A1.3a).
100
90
80
70
60
50
40
30
20
10
0
%
Chart A1.3. population that has attained tertiary education (2004)Percentage, by age group
25-to-34-year-olds 45-to-54-year-olds
1. Year of reference 2003.Countries are ranked in descending order of the percentage of 25-to-34-year-olds who have attained tertiary education.Source: OECD. Table A1.3a. See Annex 3 for notes (www.oecd.org/edu/eag2006).
Rus
sian
Fede
ratio
n1
Can
ada
Japa
n1
Isra
elK
orea
Swed
enBe
lgiu
mIr
elan
dN
orw
ayU
nite
d St
ates
Spai
nFi
nlan
dFr
ance
Aus
tral
iaD
enm
ark
Net
herl
ands
Uni
ted
Kin
gdom
Icel
and
Luxe
mbo
urg
Switz
erla
ndN
ew Z
eala
ndG
reec
ePo
land
Ger
man
yA
ustr
iaM
exic
oH
unga
ryPo
rtug
alC
hile
Italy
Slov
ak R
epub
licC
zech
Rep
ublic
Turk
eyBr
azil
StatLink: http://dx.doi.org/10.1787/701655207564
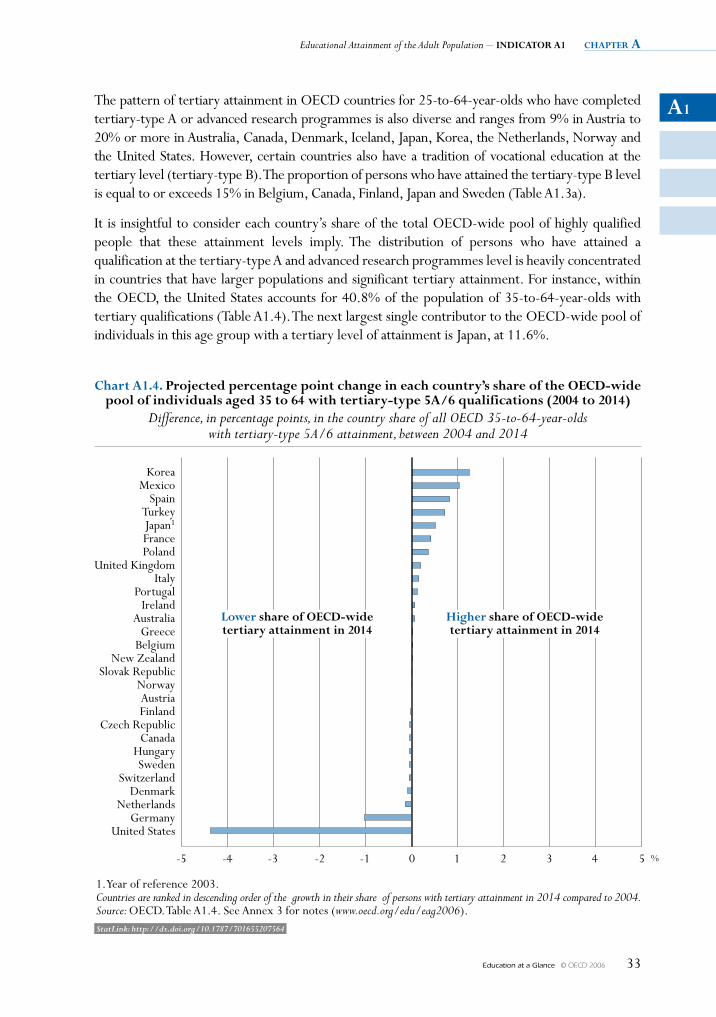
A1
Educational Attainment of the Adult Population – INDICATOR A1 chapter a
Education at a Glance © OECD 2006 33
The pattern of tertiary attainment in OECD countries for 25-to-64-year-olds who have completed tertiary-type A or advanced research programmes is also diverse and ranges from 9% in Austria to 20% or more in Australia, Canada, Denmark, Iceland, Japan, Korea, the Netherlands, Norway and the United States. However, certain countries also have a tradition of vocational education at the tertiary level (tertiary-type B). The proportion of persons who have attained the tertiary-type B level is equal to or exceeds 15% in Belgium, Canada, Finland, Japan and Sweden (Table A1.3a).
It is insightful to consider each country’s share of the total OECD-wide pool of highly qualified people that these attainment levels imply. The distribution of persons who have attained a qualification at the tertiary-type A and advanced research programmes level is heavily concentrated in countries that have larger populations and significant tertiary attainment. For instance, within the OECD, the United States accounts for 40.8% of the population of 35-to-64-year-olds with tertiary qualifications (Table A1.4). The next largest single contributor to the OECD-wide pool of individuals in this age group with a tertiary level of attainment is Japan, at 11.6%.
5 %43210-1-2-3-5 -4
Chart A1.4. projected percentage point change in each country’s share of the OECD-widepool of individuals aged 35 to 64 with tertiary-type 5A/6 qualifications (2004 to 2014)
Difference, in percentage points, in the country share of all OECD 35-to-64-year-oldswith tertiary-type 5A/6 attainment, between 2004 and 2014
1. Year of reference 2003.Countries are ranked in descending order of the growth in their share of persons with tertiary attainment in 2014 compared to 2004.Source: OECD. Table A1.4. See Annex 3 for notes (www.oecd.org/edu/eag2006).
KoreaMexico
SpainTurkeyJapan1
FrancePoland
United KingdomItaly
PortugalIreland
AustraliaGreece
BelgiumNew Zealand
Slovak RepublicNorwayAustriaFinland
Czech RepublicCanada
HungarySweden
SwitzerlandDenmark
NetherlandsGermany
United States
Lower share of OECD-widetertiary attainment in 2014
higher share of OECD-widetertiary attainment in 2014
StatLink: http://dx.doi.org/10.1787/701655207564
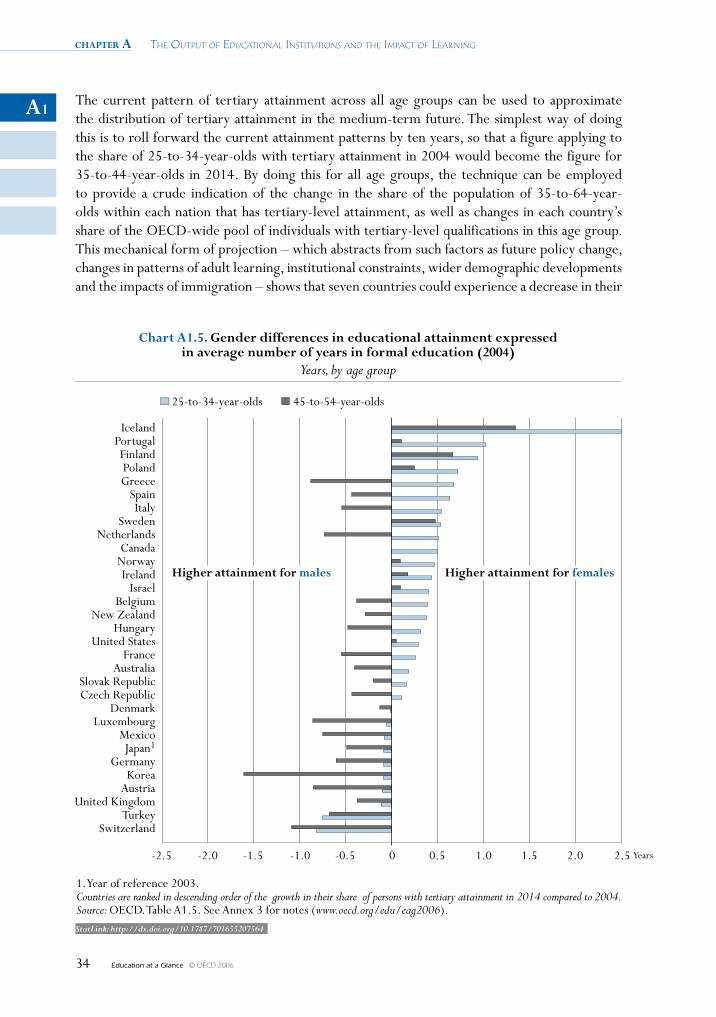
chapter a The OuTpuT Of educaTiOnal insTiTuTiOns and The impacT Of learning
Education at a Glance © OECD 200634
A1The current pattern of tertiary attainment across all age groups can be used to approximate the distribution of tertiary attainment in the medium-term future. The simplest way of doing this is to roll forward the current attainment patterns by ten years, so that a figure applying to the share of 25-to-34-year-olds with tertiary attainment in 2004 would become the figure for 35-to-44-year-olds in 2014. By doing this for all age groups, the technique can be employed to provide a crude indication of the change in the share of the population of 35-to-64-year-olds within each nation that has tertiary-level attainment, as well as changes in each country’s share of the OECD-wide pool of individuals with tertiary-level qualifications in this age group. This mechanical form of projection – which abstracts from such factors as future policy change, changes in patterns of adult learning, institutional constraints, wider demographic developments and the impacts of immigration – shows that seven countries could experience a decrease in their
2.5 Years2.01.51.00.50-0.5-1.0-1.5-2.5 -2.0
Chart A1.5. Gender differences in educational attainment expressedin average number of years in formal education (2004)
Years, by age group
1. Year of reference 2003.Countries are ranked in descending order of the growth in their share of persons with tertiary attainment in 2014 compared to 2004.Source: OECD. Table A1.5. See Annex 3 for notes (www.oecd.org/edu/eag2006).
IcelandPortugalFinlandPolandGreece
SpainItaly
SwedenNetherlands
CanadaNorwayIreland
IsraelBelgium
New ZealandHungary
United StatesFrance
AustraliaSlovak RepublicCzech Republic
DenmarkLuxembourg
MexicoJapan1
GermanyKorea
AustriaUnited Kingdom
TurkeySwitzerland
higher attainment for males higher attainment for females
25-to-34-year-olds 45-to-54-year-olds
StatLink: http://dx.doi.org/10.1787/701655207564
A1
Educational Attainment of the Adult Population – INDICATOR A1 chapter a
Education at a Glance © OECD 2006 35
share of the pool of individuals with tertiary attainment: Austria, Denmark, Germany, Hungary, the Netherlands, Sweden and the United States. Sizeable increases in the OECD-wide share will occur in countries such as Japan, Korea, Mexico, Poland, Spain, Turkey and the United Kingdom that combine relatively large populations with significantly higher tertiary attainment in younger generations (Table A1.4 and Chart A1.4).
The average educational attainment of the adult population within OECD countries, considered in terms of years of schooling (of the existing programmes), is 11.9 years. For the 17 countries ranking above the OECD average, the number of years of schooling range on average from 12 to 13.9 years. For the 13 countries below the average the spread is greater, ranging from 8.5 to 11.8 years (Table A1.5).
In 18 OECD countries, males’ level of educational attainment – measured by the average number of years of schooling – is still higher than that of females, sometimes considerably, as in Korea and Switzerland. In 8 OECD countries (Canada, Finland, Iceland, Ireland, Poland, Portugal, Sweden and the United States), the educational attainment of females aged 25 to 64 – measured by the average number of years of schooling – is higher than that of men.
The difference in educational attainment between males and females varies considerably depending on the age group (Chart A1.5). For 55-to-64-year-olds, the gender difference, expressed in average duration of formal study, favours females in only three countries (Table A1.5). By contrast, the situation of 25-to-34-year-olds exhibits a different picture. For this group, the average number of years of study completed is higher among females in 20 out of 30 OECD countries, and only 2 of the remaining 10 countries − Switzerland and Turkey − register differences of more than 0.5 years in favour of males.
Definitions and methodologies
Data on population and educational attainment are taken from OECD and EUROSTAT databases, which are compiled from National Labour Force Surveys. See Annex 3 (www.oecd.org/edu/eag2006) for national sources.
Attainment profiles are based on the percentage of the population aged 25 to 64 years that has completed a specified level of education. The International Standard Classification of Education (ISCED-97) is used to define the levels of education. See Annex 3 (www.oecd.org/edu/eag2006) for a description of ISCED-97 education programmes and attainment levels and their mappings for each country.
Successful completion of upper secondary education means the achievement of upper secondary programmes type A, B or C of a similar length; completion of type C programmes (labour market destination) of significantly shorter duration is not classified as upper secondary attainment.
The distribution of tertiary attainment among countries shown in table A1.4 is derived by summing the numbers of persons with tertiary-type 5A/6 qualifications across all OECD countries for which there are data and calculating the percentage share of this number that each country represents. The projection to 2014 of these shares, also shown in table A1.4, are obtained by rolling forward the data for each age cohort by ten years, so that a figure applying to the share of 25-to-34-year-olds with tertiary attainment in 2004 would become
chapter a The OuTpuT Of educaTiOnal insTiTuTiOns and The impacT Of learning
Education at a Glance © OECD 200636
A1the figure for 35-to-44-year-olds in 2014. In 2014, the figures for all age groups are therefore the same as those for the preceding cohort ten years earlier. In this way, tertiary education attainment for 35-to-64-year-olds is projected for the year 2014.
The calculation of the average number of years in formal education is based upon the weighted theoretical duration of schooling to achieve a given level of education, according to the current duration of educational programmes as reported in the UNESCO, OECD, Eurostat (UOE) data collection.
Further references
The following additional material relevant to this indicator is available on the Web athttp://dx.doi.org/10.1787/701655207564
• Educational attainment: adult population, by gender (2004) Table A1.1b: Males Table A1.1c: Females
• Population that has attained at least upper secondary education, by gender (2004) Table A1.2b: Males Table A1.2c: Females
• Population that has attained tertiary education, by gender (2004) Table A1.3b: Males Table A1.3c: Females
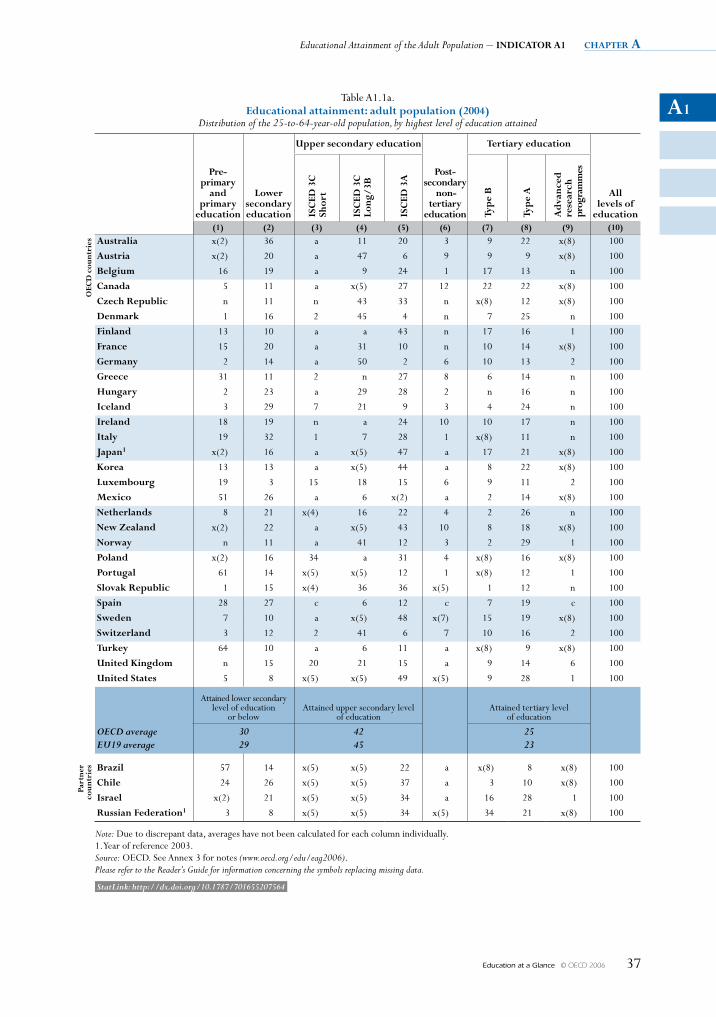
A1
Educational Attainment of the Adult Population – INDICATOR A1 chapter a
Education at a Glance © OECD 2006 37
Table A1.1a. Educational attainment: adult population (2004)
Distribution of the 25-to-64-year-old population, by highest level of education attained
pre- primary
and primary
education
Lower secondary education
Upper secondary education
post- secondary
non- tertiary
education
Tertiary education
All levels of
educationISC
ED 3
C
Shor
t
ISC
ED 3
C
Long
/3B
ISC
ED 3
A
Typ
e B
Typ
e A
Adv
ance
d
rese
arch
pr
ogra
mm
es
(1) (2) (3) (4) (5) (6) (7) (8) (9) (10)
OEC
D c
ount
ries Australia x(2) 36 a 11 20 3 9 22 x(8) 100
Austria x(2) 20 a 47 6 9 9 9 x(8) 100
Belgium 16 19 a 9 24 1 17 13 n 100
Canada 5 11 a x(5) 27 12 22 22 x(8) 100
Czech Republic n 11 n 43 33 n x(8) 12 x(8) 100
Denmark 1 16 2 45 4 n 7 25 n 100
finland 13 10 a a 43 n 17 16 1 100
france 15 20 a 31 10 n 10 14 x(8) 100
Germany 2 14 a 50 2 6 10 13 2 100
Greece 31 11 2 n 27 8 6 14 n 100
hungary 2 23 a 29 28 2 n 16 n 100
Iceland 3 29 7 21 9 3 4 24 n 100
Ireland 18 19 n a 24 10 10 17 n 100
Italy 19 32 1 7 28 1 x(8) 11 n 100
Japan1 x(2) 16 a x(5) 47 a 17 21 x(8) 100
Korea 13 13 a x(5) 44 a 8 22 x(8) 100
Luxembourg 19 3 15 18 15 6 9 11 2 100
mexico 51 26 a 6 x(2) a 2 14 x(8) 100
Netherlands 8 21 x(4) 16 22 4 2 26 n 100
New Zealand x(2) 22 a x(5) 43 10 8 18 x(8) 100
Norway n 11 a 41 12 3 2 29 1 100
poland x(2) 16 34 a 31 4 x(8) 16 x(8) 100
portugal 61 14 x(5) x(5) 12 1 x(8) 12 1 100
Slovak Republic 1 15 x(4) 36 36 x(5) 1 12 n 100
Spain 28 27 c 6 12 c 7 19 c 100
Sweden 7 10 a x(5) 48 x(7) 15 19 x(8) 100
Switzerland 3 12 2 41 6 7 10 16 2 100
Turkey 64 10 a 6 11 a x(8) 9 x(8) 100
United Kingdom n 15 20 21 15 a 9 14 6 100
United States 5 8 x(5) x(5) 49 x(5) 9 28 1 100
Attained lower secondary level of education
or belowAttained upper secondary level
of educationAttained tertiary level
of education
OECD average 30 42 25EU19 average 29 45 23
part
ner
coun
trie
s Brazil 57 14 x(5) x(5) 22 a x(8) 8 x(8) 100
Chile 24 26 x(5) x(5) 37 a 3 10 x(8) 100
Israel x(2) 21 x(5) x(5) 34 a 16 28 1 100
Russian federation1 3 8 x(5) x(5) 34 x(5) 34 21 x(8) 100
Note: Due to discrepant data, averages have not been calculated for each column individually. 1. Year of reference 2003. Source: OECD. See Annex 3 for notes (www.oecd.org/edu/eag2006).Please refer to the Reader’s Guide for information concerning the symbols replacing missing data.
StatLink: http://dx.doi.org/10.1787/701655207564
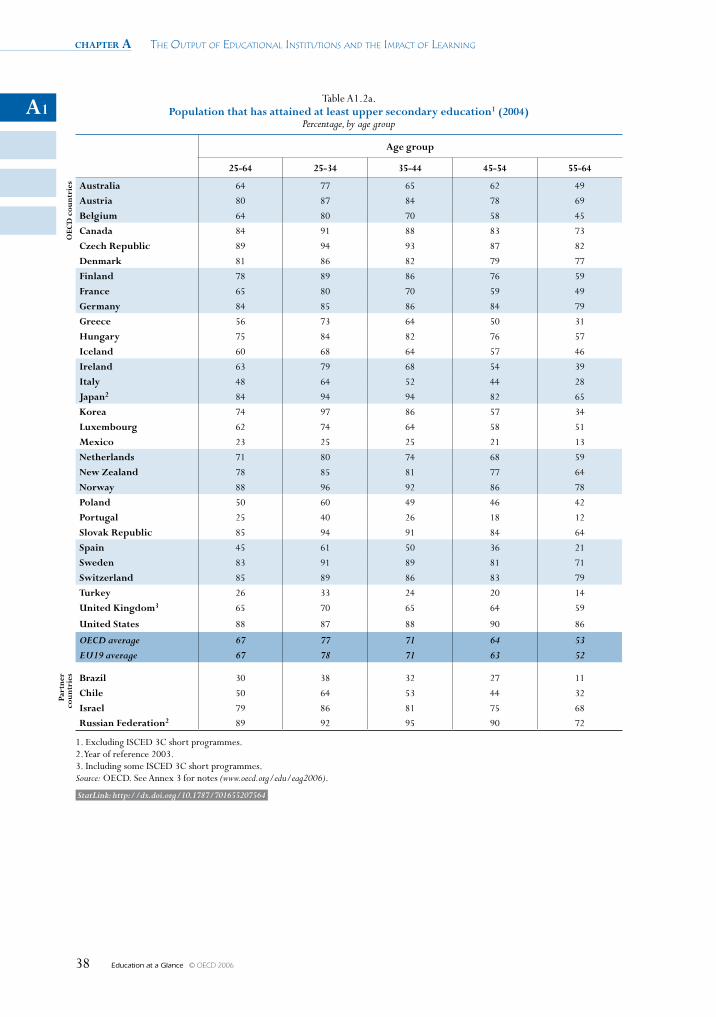
chapter a The OuTpuT Of educaTiOnal insTiTuTiOns and The impacT Of learning
Education at a Glance © OECD 200638
A1Table A1.2a.
population that has attained at least upper secondary education1 (2004) Percentage, by age group
Age group
25-64 25-34 35-44 45-54 55-64
OEC
D c
ount
ries Australia 64 77 65 62 49
Austria 80 87 84 78 69
Belgium 64 80 70 58 45
Canada 84 91 88 83 73
Czech Republic 89 94 93 87 82
Denmark 81 86 82 79 77
finland 78 89 86 76 59
france 65 80 70 59 49
Germany 84 85 86 84 79
Greece 56 73 64 50 31
hungary 75 84 82 76 57
Iceland 60 68 64 57 46
Ireland 63 79 68 54 39
Italy 48 64 52 44 28
Japan2 84 94 94 82 65
Korea 74 97 86 57 34
Luxembourg 62 74 64 58 51
mexico 23 25 25 21 13
Netherlands 71 80 74 68 59
New Zealand 78 85 81 77 64
Norway 88 96 92 86 78
poland 50 60 49 46 42
portugal 25 40 26 18 12
Slovak Republic 85 94 91 84 64
Spain 45 61 50 36 21
Sweden 83 91 89 81 71
Switzerland 85 89 86 83 79
Turkey 26 33 24 20 14
United Kingdom3 65 70 65 64 59
United States 88 87 88 90 86
OECD average 67 77 71 64 53EU19 average 67 78 71 63 52
part
ner
coun
trie
s Brazil 30 38 32 27 11
Chile 50 64 53 44 32
Israel 79 86 81 75 68
Russian federation2 89 92 95 90 72
1. Excluding ISCED 3C short programmes.2. Year of reference 2003. 3. Including some ISCED 3C short programmes. Source: OECD. See Annex 3 for notes (www.oecd.org/edu/eag2006).
StatLink: http://dx.doi.org/10.1787/701655207564
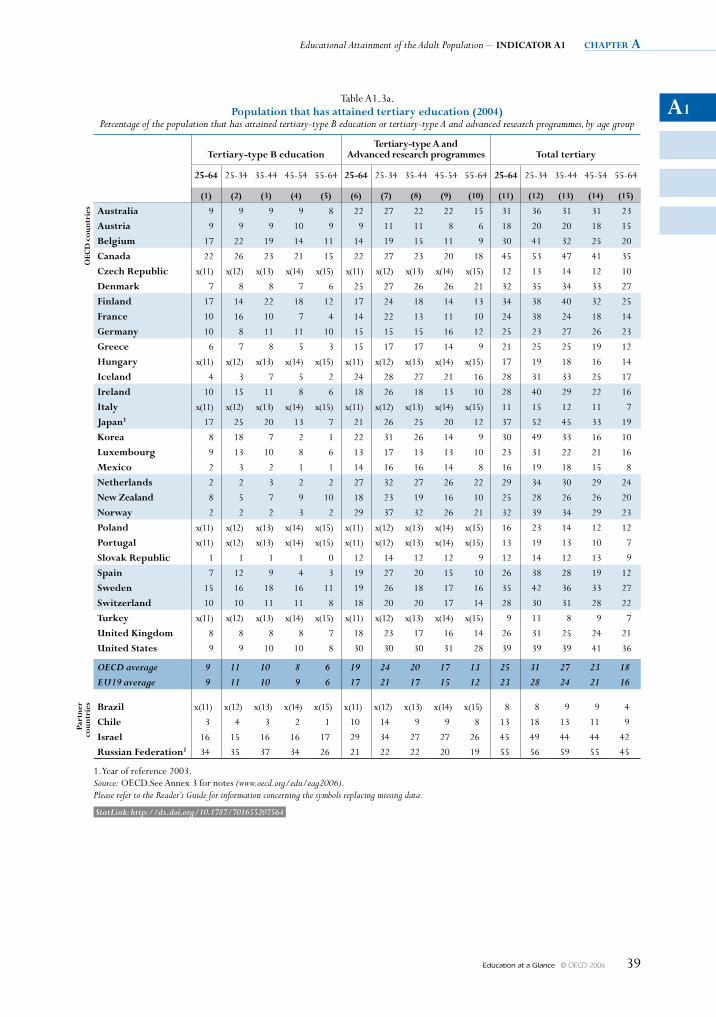
A1
Educational Attainment of the Adult Population – INDICATOR A1 chapter a
Education at a Glance © OECD 2006 39
Table A1.3a. population that has attained tertiary education (2004)
Percentage of the population that has attained tertiary-type B education or tertiary-type A and advanced research programmes, by age group
Tertiary-type B educationTertiary-type A and
Advanced research programmes Total tertiary
25-64 25-34 35-44 45-54 55-64 25-64 25-34 35-44 45-54 55-64 25-64 25-34 35-44 45-54 55-64
(1) (2) (3) (4) (5) (6) (7) (8) (9) (10) (11) (12) (13) (14) (15)
OEC
D c
ount
ries Australia 9 9 9 9 8 22 27 22 22 15 31 36 31 31 23
Austria 9 9 9 10 9 9 11 11 8 6 18 20 20 18 15
Belgium 17 22 19 14 11 14 19 15 11 9 30 41 32 25 20
Canada 22 26 23 21 15 22 27 23 20 18 45 53 47 41 35
Czech Republic x(11) x(12) x(13) x(14) x(15) x(11) x(12) x(13) x(14) x(15) 12 13 14 12 10
Denmark 7 8 8 7 6 25 27 26 26 21 32 35 34 33 27
finland 17 14 22 18 12 17 24 18 14 13 34 38 40 32 25
france 10 16 10 7 4 14 22 13 11 10 24 38 24 18 14
Germany 10 8 11 11 10 15 15 15 16 12 25 23 27 26 23
Greece 6 7 8 5 3 15 17 17 14 9 21 25 25 19 12
hungary x(11) x(12) x(13) x(14) x(15) x(11) x(12) x(13) x(14) x(15) 17 19 18 16 14
Iceland 4 3 7 5 2 24 28 27 21 16 28 31 33 25 17
Ireland 10 15 11 8 6 18 26 18 13 10 28 40 29 22 16
Italy x(11) x(12) x(13) x(14) x(15) x(11) x(12) x(13) x(14) x(15) 11 15 12 11 7
Japan1 17 25 20 13 7 21 26 25 20 12 37 52 45 33 19
Korea 8 18 7 2 1 22 31 26 14 9 30 49 33 16 10
Luxembourg 9 13 10 8 6 13 17 13 13 10 23 31 22 21 16
mexico 2 3 2 1 1 14 16 16 14 8 16 19 18 15 8
Netherlands 2 2 3 2 2 27 32 27 26 22 29 34 30 29 24
New Zealand 8 5 7 9 10 18 23 19 16 10 25 28 26 26 20
Norway 2 2 2 3 2 29 37 32 26 21 32 39 34 29 23
poland x(11) x(12) x(13) x(14) x(15) x(11) x(12) x(13) x(14) x(15) 16 23 14 12 12
portugal x(11) x(12) x(13) x(14) x(15) x(11) x(12) x(13) x(14) x(15) 13 19 13 10 7
Slovak Republic 1 1 1 1 0 12 14 12 12 9 12 14 12 13 9
Spain 7 12 9 4 3 19 27 20 15 10 26 38 28 19 12
Sweden 15 16 18 16 11 19 26 18 17 16 35 42 36 33 27
Switzerland 10 10 11 11 8 18 20 20 17 14 28 30 31 28 22
Turkey x(11) x(12) x(13) x(14) x(15) x(11) x(12) x(13) x(14) x(15) 9 11 8 9 7
United Kingdom 8 8 8 8 7 18 23 17 16 14 26 31 25 24 21
United States 9 9 10 10 8 30 30 30 31 28 39 39 39 41 36
OECD average 9 11 10 8 6 19 24 20 17 13 25 31 27 23 18EU19 average 9 11 10 9 6 17 21 17 15 12 23 28 24 21 16
part
ner
coun
trie
s Brazil x(11) x(12) x(13) x(14) x(15) x(11) x(12) x(13) x(14) x(15) 8 8 9 9 4
Chile 3 4 3 2 1 10 14 9 9 8 13 18 13 11 9
Israel 16 15 16 16 17 29 34 27 27 26 45 49 44 44 42
Russian federation1 34 35 37 34 26 21 22 22 20 19 55 56 59 55 45
1. Year of reference 2003. Source: OECD.See Annex 3 for notes (www.oecd.org/edu/eag2006).Please refer to the Reader’s Guide for information concerning the symbols replacing missing data.
StatLink: http://dx.doi.org/10.1787/701655207564
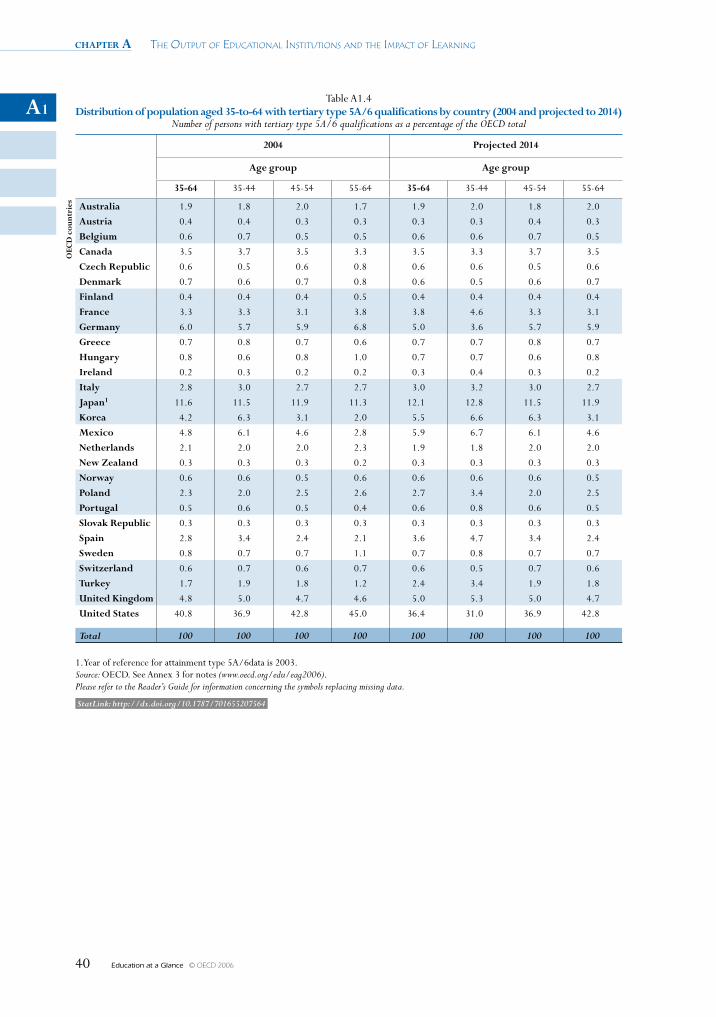
chapter a The OuTpuT Of educaTiOnal insTiTuTiOns and The impacT Of learning
Education at a Glance © OECD 200640
A1Table A1.4
Distribution of population aged 35-to-64 with tertiary type 5A/6 qualifications by country (2004 and projected to 2014) Number of persons with tertiary type 5A/6 qualifications as a percentage of the OECD total
2004 Projected 2014
Age group Age group
35-64 35-44 45-54 55-64 35-64 35-44 45-54 55-64
oec
D c
ount
ries Australia 1.9 1.8 2.0 1.7 1.9 2.0 1.8 2.0
Austria 0.4 0.4 0.3 0.3 0.3 0.3 0.4 0.3
Belgium 0.6 0.7 0.5 0.5 0.6 0.6 0.7 0.5
canada 3.5 3.7 3.5 3.3 3.5 3.3 3.7 3.5
czech Republic 0.6 0.5 0.6 0.8 0.6 0.6 0.5 0.6
Denmark 0.7 0.6 0.7 0.8 0.6 0.5 0.6 0.7
Finland 0.4 0.4 0.4 0.5 0.4 0.4 0.4 0.4
France 3.3 3.3 3.1 3.8 3.8 4.6 3.3 3.1
Germany 6.0 5.7 5.9 6.8 5.0 3.6 5.7 5.9
Greece 0.7 0.8 0.7 0.6 0.7 0.7 0.8 0.7
Hungary 0.8 0.6 0.8 1.0 0.7 0.7 0.6 0.8
Ireland 0.2 0.3 0.2 0.2 0.3 0.4 0.3 0.2
Italy 2.8 3.0 2.7 2.7 3.0 3.2 3.0 2.7
Japan1 11.6 11.5 11.9 11.3 12.1 12.8 11.5 11.9
Korea 4.2 6.3 3.1 2.0 5.5 6.6 6.3 3.1
Mexico 4.8 6.1 4.6 2.8 5.9 6.7 6.1 4.6
Netherlands 2.1 2.0 2.0 2.3 1.9 1.8 2.0 2.0
New Zealand 0.3 0.3 0.3 0.2 0.3 0.3 0.3 0.3
Norway 0.6 0.6 0.5 0.6 0.6 0.6 0.6 0.5
Poland 2.3 2.0 2.5 2.6 2.7 3.4 2.0 2.5
Portugal 0.5 0.6 0.5 0.4 0.6 0.8 0.6 0.5
Slovak Republic 0.3 0.3 0.3 0.3 0.3 0.3 0.3 0.3
Spain 2.8 3.4 2.4 2.1 3.6 4.7 3.4 2.4
Sweden 0.8 0.7 0.7 1.1 0.7 0.8 0.7 0.7
Switzerland 0.6 0.7 0.6 0.7 0.6 0.5 0.7 0.6
Turkey 1.7 1.9 1.8 1.2 2.4 3.4 1.9 1.8
United Kingdom 4.8 5.0 4.7 4.6 5.0 5.3 5.0 4.7
United States 40.8 36.9 42.8 45.0 36.4 31.0 36.9 42.8
Total 100 100 100 100 100 100 100 100
1. Year of reference for attainment type 5A/6data is 2003. Source: OECD. See Annex 3 for notes (www.oecd.org/edu/eag2006).Please refer to the Reader’s Guide for information concerning the symbols replacing missing data.
StatLink: http://dx.doi.org/10.1787/701655207564
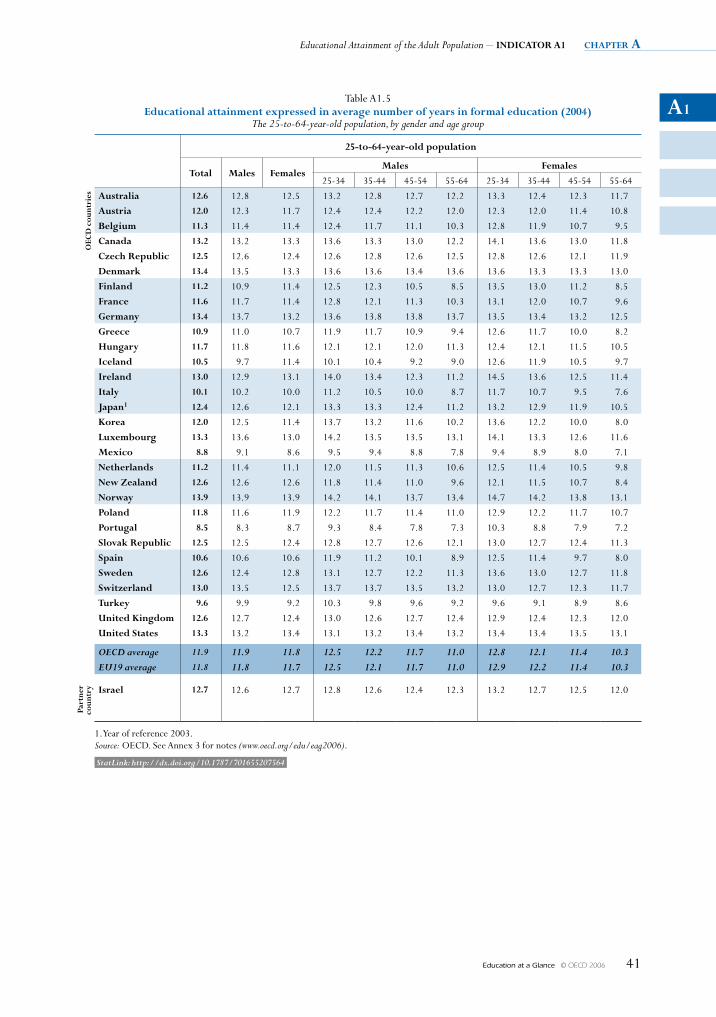
A1
Educational Attainment of the Adult Population – INDICATOR A1 chapter a
Education at a Glance © OECD 2006 41
Table A1.5 Educational attainment expressed in average number of years in formal education (2004)
The 25-to-64-year-old population, by gender and age group
25-to-64-year-old population
Total males femalesmales females
25-34 35-44 45-54 55-64 25-34 35-44 45-54 55-64
OEC
D c
ount
ries Australia 12.6 12.8 12.5 13.2 12.8 12.7 12.2 13.3 12.4 12.3 11.7
Austria 12.0 12.3 11.7 12.4 12.4 12.2 12.0 12.3 12.0 11.4 10.8
Belgium 11.3 11.4 11.4 12.4 11.7 11.1 10.3 12.8 11.9 10.7 9.5
Canada 13.2 13.2 13.3 13.6 13.3 13.0 12.2 14.1 13.6 13.0 11.8
Czech Republic 12.5 12.6 12.4 12.6 12.8 12.6 12.5 12.8 12.6 12.1 11.9
Denmark 13.4 13.5 13.3 13.6 13.6 13.4 13.6 13.6 13.3 13.3 13.0
finland 11.2 10.9 11.4 12.5 12.3 10.5 8.5 13.5 13.0 11.2 8.5
france 11.6 11.7 11.4 12.8 12.1 11.3 10.3 13.1 12.0 10.7 9.6
Germany 13.4 13.7 13.2 13.6 13.8 13.8 13.7 13.5 13.4 13.2 12.5
Greece 10.9 11.0 10.7 11.9 11.7 10.9 9.4 12.6 11.7 10.0 8.2
hungary 11.7 11.8 11.6 12.1 12.1 12.0 11.3 12.4 12.1 11.5 10.5
Iceland 10.5 9.7 11.4 10.1 10.4 9.2 9.0 12.6 11.9 10.5 9.7
Ireland 13.0 12.9 13.1 14.0 13.4 12.3 11.2 14.5 13.6 12.5 11.4
Italy 10.1 10.2 10.0 11.2 10.5 10.0 8.7 11.7 10.7 9.5 7.6
Japan1 12.4 12.6 12.1 13.3 13.3 12.4 11.2 13.2 12.9 11.9 10.5
Korea 12.0 12.5 11.4 13.7 13.2 11.6 10.2 13.6 12.2 10.0 8.0
Luxembourg 13.3 13.6 13.0 14.2 13.5 13.5 13.1 14.1 13.3 12.6 11.6
mexico 8.8 9.1 8.6 9.5 9.4 8.8 7.8 9.4 8.9 8.0 7.1
Netherlands 11.2 11.4 11.1 12.0 11.5 11.3 10.6 12.5 11.4 10.5 9.8
New Zealand 12.6 12.6 12.6 11.8 11.4 11.0 9.6 12.1 11.5 10.7 8.4
Norway 13.9 13.9 13.9 14.2 14.1 13.7 13.4 14.7 14.2 13.8 13.1
poland 11.8 11.6 11.9 12.2 11.7 11.4 11.0 12.9 12.2 11.7 10.7
portugal 8.5 8.3 8.7 9.3 8.4 7.8 7.3 10.3 8.8 7.9 7.2
Slovak Republic 12.5 12.5 12.4 12.8 12.7 12.6 12.1 13.0 12.7 12.4 11.3
Spain 10.6 10.6 10.6 11.9 11.2 10.1 8.9 12.5 11.4 9.7 8.0
Sweden 12.6 12.4 12.8 13.1 12.7 12.2 11.3 13.6 13.0 12.7 11.8
Switzerland 13.0 13.5 12.5 13.7 13.7 13.5 13.2 13.0 12.7 12.3 11.7
Turkey 9.6 9.9 9.2 10.3 9.8 9.6 9.2 9.6 9.1 8.9 8.6
United Kingdom 12.6 12.7 12.4 13.0 12.6 12.7 12.4 12.9 12.4 12.3 12.0
United States 13.3 13.2 13.4 13.1 13.2 13.4 13.2 13.4 13.4 13.5 13.1
OECD average 11.9 11.9 11.8 12.5 12.2 11.7 11.0 12.8 12.1 11.4 10.3EU19 average 11.8 11.8 11.7 12.5 12.1 11.7 11.0 12.9 12.2 11.4 10.3
part
ner
coun
try Israel 12.7 12.6 12.7 12.8 12.6 12.4 12.3 13.2 12.7 12.5 12.0
1. Year of reference 2003. Source: OECD. See Annex 3 for notes (www.oecd.org/edu/eag2006).
StatLink: http://dx.doi.org/10.1787/701655207564
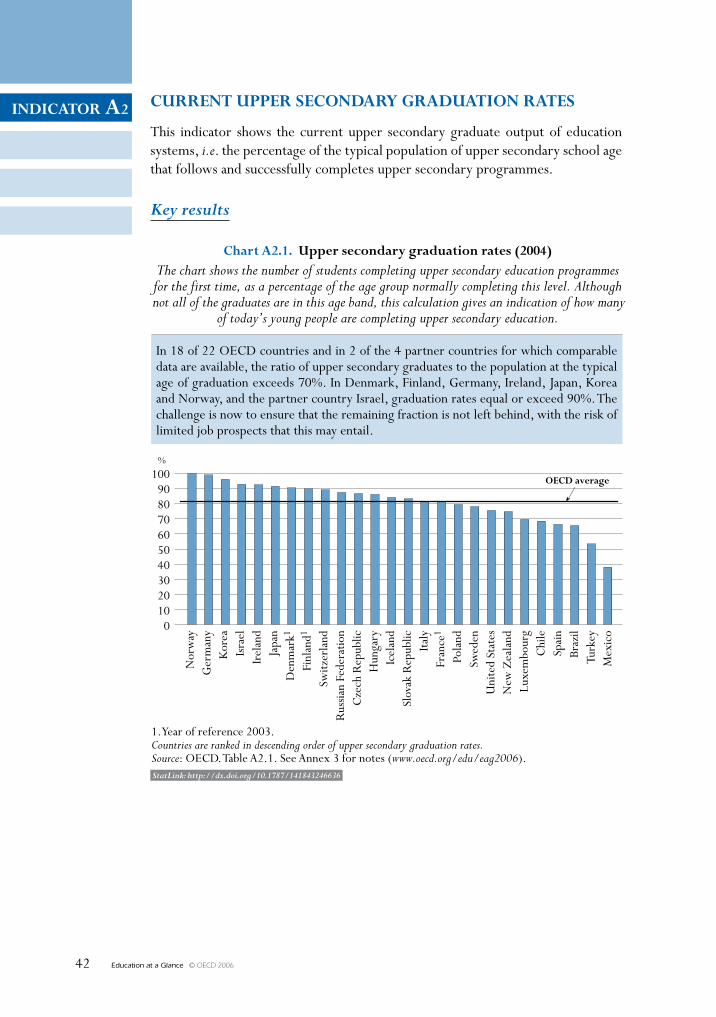
Education at a Glance © OECD 200642
INDICATOR A2 CuRReNT uppeR seCONDARy gRADuATION RATes
This indicator shows the current upper secondary graduate output of education systems, i.e. the percentage of the typical population of upper secondary school age that follows and successfully completes upper secondary programmes.
Key results
100908070605040302010
0
%
Chart A2.1. upper secondary graduation rates (2004)The chart shows the number of students completing upper secondary education programmesfor the first time, as a percentage of the age group normally completing this level. Althoughnot all of the graduates are in this age band, this calculation gives an indication of how many
of today’s young people are completing upper secondary education.
1. Year of reference 2003.Countries are ranked in descending order of upper secondary graduation rates.Source: OECD. Table A2.1. See Annex 3 for notes (www.oecd.org/edu/eag2006).
Nor
way
Ger
man
yK
orea
Isra
elIr
elan
dJa
pan
Den
mar
k1
Finl
and1
Switz
erla
ndR
ussia
n Fe
dera
tion
Cze
ch R
epub
licH
unga
ryIc
elan
dSl
ovak
Rep
ublic
Italy
Fran
ce1
Pola
ndSw
eden
Uni
ted
Stat
esN
ew Z
eala
ndLu
xem
bour
gC
hile
Spai
nBr
azil
Turk
eyM
exic
o
OeCD average
StatLink: http://dx.doi.org/10.1787/141843246636
In 18 of 22 OECD countries and in 2 of the 4 partner countries for which comparable data are available, the ratio of upper secondary graduates to the population at the typical age of graduation exceeds 70%. In Denmark, Finland, Germany, Ireland, Japan, Korea and Norway, and the partner country Israel, graduation rates equal or exceed 90%. The challenge is now to ensure that the remaining fraction is not left behind, with the risk of limited job prospects that this may entail.
INDICATOR A2
Education at a Glance © OECD 2006 43
Other highlights of this indicator
• Females are now more likely to complete upper secondary education than males in almost every OECD country, a reversal of the historical pattern. Today, only in Turkey are graduation rates for females below those for males.
• The vast majority of students who graduate from upper secondary programmes graduate from programmes that are designed to provide access to further tertiary education.
• Most students obtain upper secondary qualifications giving them access to university-level study (ISCED 5A), although the extent to which students go on to take up such study varies significantly between countries.
• In many countries, males are more likely to be on vocational courses. Still, in nearly half of the countries represented there is either no gender difference or a higher proportion of females on such courses.
• In some countries, a significant proportion of students broaden their knowledge at the post-secondary non-tertiary level after completing a first upper secondary programme. In the Czech Republic, Hungary and Ireland, 20% or more of a typical age cohort complete a post-secondary non-tertiary programme.
chapter a The OuTpuT Of educaTiOnal insTiTuTiOns and The impacT Of learning
Education at a Glance © OECD 200644
A2Policy context
Rising skill demands in OECD countries have made qualifications at the upper secondary level the minimum credential for successful labour market entry. Upper secondary education serves as the foundation for advanced learning and training opportunities, as well as preparation for direct entry into the labour market. Although many countries do allow students to leave the education system at the end of the lower secondary level, young people in OECD countries who leave without an upper secondary qualification tend to face severe difficulties in entering the labour market (see Indicators A8, A9 and A10).
High upper secondary graduation rates do not guarantee that an education system has adequately equipped its graduates with the basic skills and knowledge necessary to enter the labour market because this indicator does not capture the quality of educational outcomes. But these graduation rates do give an indication of the extent to which educational systems succeed in preparing students to meet the minimum requirements of the labour market.
Evidence and explanations
Graduation from upper secondary education is becoming the norm in most OECD countries. In 18 of 22 OECD countries and in 2 of the 4 partner countries for which comparable data are available, upper secondary graduation rates exceed 70% (Chart A2.1). In Denmark, Finland, Germany, Ireland, Japan, Korea and Norway and the partner country Israel, graduation rates equal or exceed 90%.
The challenge is now to ensure that the remaining fraction is not left behind, with the risk of limited job prospects that this could entail.
Gender differences
The balance of educational attainment between males and females in the adult population is unequal in most countries. In the past, females did not have sufficient opportunities and/or incentives to reach the same level of education as males. Females have generally been overrepresented among those who did not proceed to upper secondary education and underrepresented at the higher levels of education. However, these gender differences are most evident in older age groups and have been significantly reduced or reversed among younger age groups (see Indicator A1).
Today, it is males who trail behind females in upper secondary graduation in almost every OECD country (Table A2.1). Graduation rates for females exceed those for males in 19 of 22 OECD countries and in the 3 partner countries for which total upper secondary graduation rates can be compared between the genders. The exception is Turkey, where graduation rates are higher for males. In Korea and Switzerland, graduation rates are similar for both genders, with a less than one percentage point difference. The gender gap is greatest in Denmark, Finland, Iceland, Ireland, New Zealand, Norway, Poland and Spain, and in the partner country Brazil, where female graduation rates exceed those of males by more than 10 percentage points.
Transitions following educational programmes
Graduation from upper secondary education is becoming the norm in most OECD and partner countries, but curriculum content in upper secondary programmes can vary depending on the type of education or occupation for which the programmes are designed. Most upper secondary
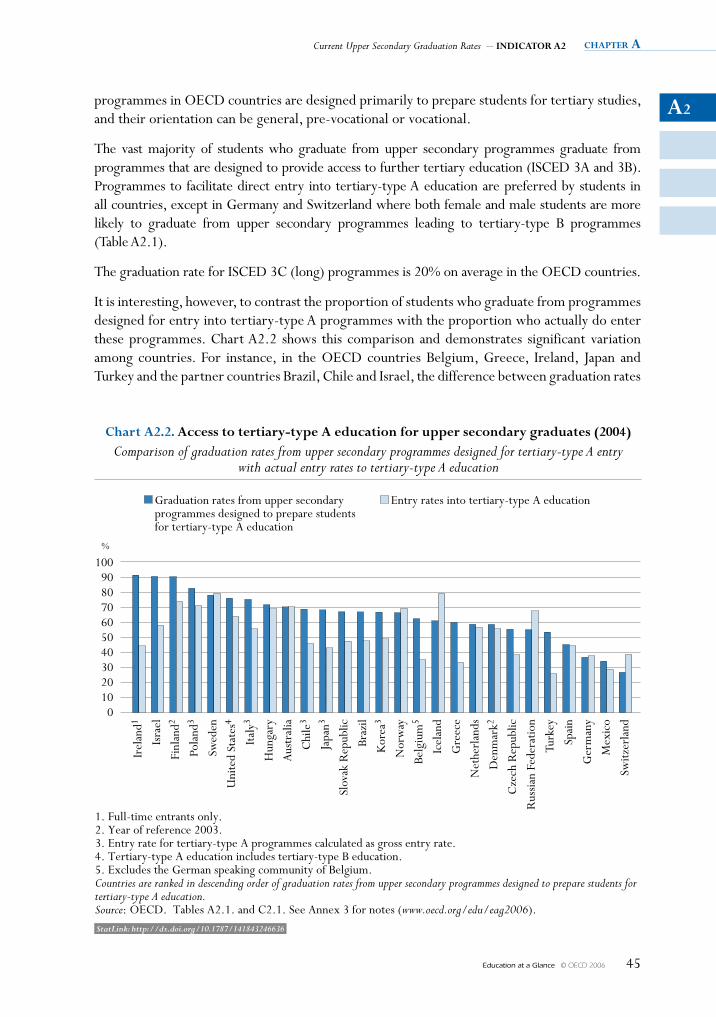
A2
Current Upper Secondary Graduation Rates – IndIcAtor A2 chapter a
Education at a Glance © OECD 2006 45
programmes in OECD countries are designed primarily to prepare students for tertiary studies, and their orientation can be general, pre-vocational or vocational.
The vast majority of students who graduate from upper secondary programmes graduate from programmes that are designed to provide access to further tertiary education (ISCED 3A and 3B). Programmes to facilitate direct entry into tertiary-type A education are preferred by students in all countries, except in Germany and Switzerland where both female and male students are more likely to graduate from upper secondary programmes leading to tertiary-type B programmes (Table A2.1).
The graduation rate for ISCED 3C (long) programmes is 20% on average in the OECD countries.
It is interesting, however, to contrast the proportion of students who graduate from programmes designed for entry into tertiary-type A programmes with the proportion who actually do enter these programmes. Chart A2.2 shows this comparison and demonstrates significant variation among countries. For instance, in the OECD countries Belgium, Greece, Ireland, Japan and Turkey and the partner countries Brazil, Chile and Israel, the difference between graduation rates
100908070605040302010
0
%
chart A2.2. Access to tertiary-type A education for upper secondary graduates (2004)Comparison of graduation rates from upper secondary programmes designed for tertiary-type A entry
with actual entry rates to tertiary-type A education
Graduation rates from upper secondaryprogrammes designed to prepare studentsfor tertiary-type A education
1. Full-time entrants only.2. Year of reference 2003.3. Entry rate for tertiary-type A programmes calculated as gross entry rate.4. Tertiary-type A education includes tertiary-type B education.5. Excludes the German speaking community of Belgium.Countries are ranked in descending order of graduation rates from upper secondary programmes designed to prepare students fortertiary-type A education.Source: OECD. Tables A2.1. and C2.1. See Annex 3 for notes (www.oecd.org/edu/eag2006).
Irel
and1
Isra
el
Finl
and2
Pola
nd3
Swed
en
Uni
ted
Stat
es4
Italy
3
Hun
gary
Aus
tral
ia
Chi
le3
Japa
n3
Slov
ak R
epub
lic
Braz
il
Kor
ea3
Nor
way
Belg
ium
5
Icel
and
Gre
ece
Net
herl
ands
Den
mar
k2
Cze
ch R
epub
lic
Rus
sian
Fede
ratio
n
Turk
ey
Spai
n
Ger
man
y
Mex
ico
Switz
erla
nd
Entry rates into tertiary-type A education
StatLink: http://dx.doi.org/10.1787/141843246636
chapter a The OuTpuT Of educaTiOnal insTiTuTiOns and The impacT Of learning
Education at a Glance © OECD 200646
A2from upper secondary programmes designed for tertiary-type A programmes and the eventual entry rate to these tertiary-type A programmes is relatively large (more than 20 percentage points). This suggests that many students who achieve qualifications designed for university level entrance do not in fact go on to take up university studies, although at least in Belgium such upper secondary programmes may also give access to tertiary-type B programmes. In contrast, in countries such as Australia, Denmark, Germany, Hungary, Netherlands, Norway, Spain and Sweden, where the comparative graduation and entry rates are similar, the reverse seems to be true.
In 14 out of 25 OECD countries for which comparable data are available, more males than females graduate from pre-vocational and vocational upper secondary programmes. Graduation rates for these programmes are higher for females in seven OECD countries – Belgium, Denmark, Finland, Ireland, the Netherlands, Norway and Spain – and are the same for males and females in the four remaining OECD countries.
Graduation from post-secondary non-tertiary programmes
Post-secondary non-tertiary programmes of various kinds are offered in 26 OECD countries. From an international comparative point of view such programmes straddle the boundary between upper secondary and post-secondary education, even though they might clearly be considered either upper secondary or post-secondary programmes in a national context. Although the content of these programmes may not be significantly more advanced than upper secondary programmes, post-secondary non-tertiary programmes programs serve to broaden the knowledge of participants who have already gained an upper secondary qualification. The students tend to be older than those enrolled at the upper secondary level.
Typical examples of such programmes are trade and vocational certificates in Canada and the United States, nursery teacher training in Austria and Switzerland or vocational training in the dual system for holders of general upper secondary qualifications in Germany. In most countries, post-secondary non-tertiary programmes are vocationally oriented.
In 12 of the 19 OECD countries with available data, the majority of, if not all, post-secondary non-tertiary students graduate from ISCED 4C programmes, which are designed primarily to prepare graduates for direct entry into the labour market.
Apprenticeships that are designed for students who have already graduated from an upper secondary programme are also included in the post-secondary non-tertiary programmes. However, in 7 out of 20 OECD countries, 50% or more of post-secondary non-tertiary graduates have completed programmes designed to provide direct access to either tertiary-type A or B education. In Switzerland, 72% graduate from ISCED 4B programmes.
Definitions and methodologies
The data for the school year 2003-2004 are based on the UOE data collection on education statistics administered annually by the OECD.
In Table A2.1, upper secondary graduates are those who successfully complete the final year of upper secondary education, regardless of age. In some countries, successful completion requires a final examination, and in others it does not (see Annex 1).
A2
Current Upper Secondary Graduation Rates – INDICATOR A2 chapter a
Education at a Glance © OECD 2006 47
Upper secondary graduation rates are estimated as the number of students, regardless of age, who graduate for the first time from upper secondary programmes, divided by the population at the age at which students typically graduate from upper secondary education (see Annex 1). The graduation rates take into account students graduating from upper secondary education at the typical (modal) graduation ages, as well as older students (e.g. those in “second chance” programmes). The unduplicated total count of graduates is calculated by netting out those students who have graduated from another upper secondary programme in a previous year.
Counts of students for ISCED 3A, 3B and 3C programmes are not unduplicated, however. Gross graduation rates cannot be added, as some individuals graduate from more than one upper secondary programme and would thus be counted twice. The same applies for graduation rates by programme orientation, i.e. general or vocational.
Pre-vocational and vocational programmes include both school-based programmes and combined school- and work-based programmes that are recognised as part of the education system. Entirely work-based education and training that is not overseen by a formal education authority is not taken into account.
In Table A2.2, post-secondary non-tertiary graduates are those who successfully complete the final year of post-secondary non-tertiary education, regardless of age. In some countries, successful completion requires a final examination, and in others it does not.
Post-secondary non-tertiary graduation rates are estimated as the number of students, regardless of age, who graduate for the first time from post-secondary non-tertiary programmes, divided by the population at the age at which students typically graduate from these programmes (see Annex 1). The graduation rates take into account students graduating at the typical (modal) graduation ages, as well as older students. The unduplicated total count of graduates is calculated by netting out those students who have graduated from another post-secondary non-tertiary programme in a previous year.
For some countries, an unduplicated count of post-secondary non-tertiary graduates is unavailable and graduation rates may be overestimated because of graduates who have completed multiple programmes at the same level. These countries are marked with a footnote in the Table A2.2.
Counts of students for ISCED 4A, 4B and 4C programmes are not unduplicated. Gross graduation rates cannot be added, as some individuals graduate from more than one post-secondary non-tertiary programme and would thus be counted twice.
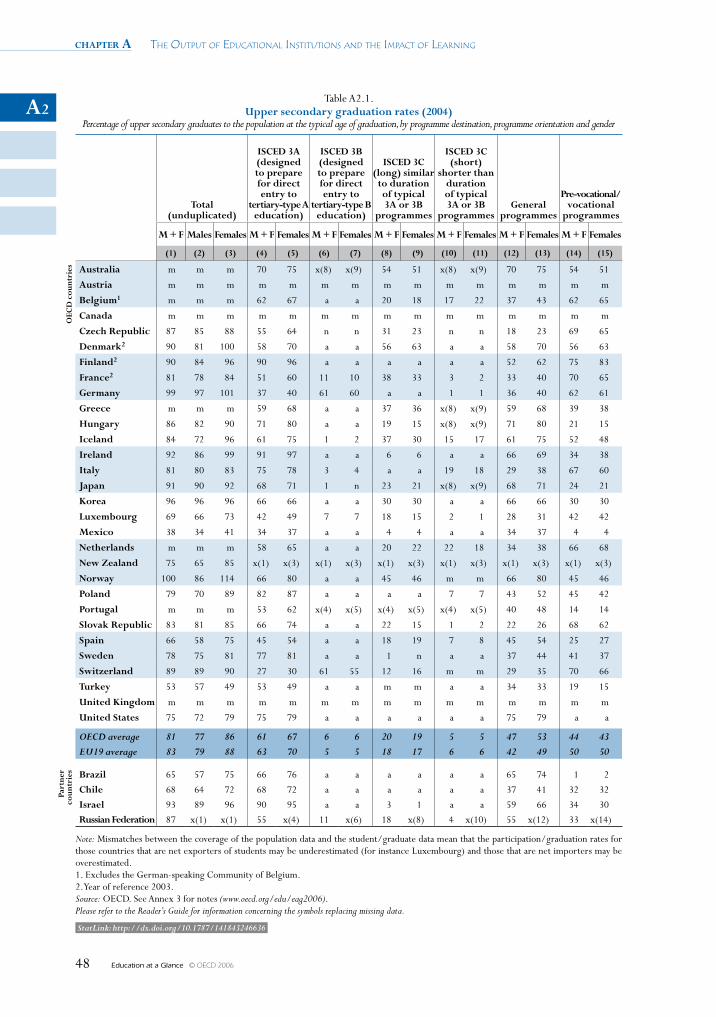
chapter a The OuTpuT Of educaTiOnal insTiTuTiOns and The impacT Of learning
Education at a Glance © OECD 200648
A2Table A2.1.
upper secondary graduation rates (2004) Percentage of upper secondary graduates to the population at the typical age of graduation, by programme destination, programme orientation and gender
Total (unduplicated)
IsCeD 3A (designed to prepare for direct entry to
tertiary-type A education)
IsCeD 3B (designed to prepare for direct entry to
tertiary-type B education)
IsCeD 3C (long) similar
to duration of typical 3A or 3B
programmes
IsCeD 3C (short)
shorter than duration of typical 3A or 3B
programmesgeneral
programmes
pre-vocational/ vocational
programmes
M + F Males Females M + F Females M + F Females M + F Females M + F Females M + F Females M + F Females
(1) (2) (3) (4) (5) (6) (7) (8) (9) (10) (11) (12) (13) (14) (15)
OeC
D c
ount
ries Australia m m m 70 75 x(8) x(9) 54 51 x(8) x(9) 70 75 54 51
Austria m m m m m m m m m m m m m m m
Belgium1 m m m 62 67 a a 20 18 17 22 37 43 62 65
Canada m m m m m m m m m m m m m m m
Czech Republic 87 85 88 55 64 n n 31 23 n n 18 23 69 65
Denmark2 90 81 100 58 70 a a 56 63 a a 58 70 56 63
Finland2 90 84 96 90 96 a a a a a a 52 62 75 83
France2 81 78 84 51 60 11 10 38 33 3 2 33 40 70 65
germany 99 97 101 37 40 61 60 a a 1 1 36 40 62 61
greece m m m 59 68 a a 37 36 x(8) x(9) 59 68 39 38
Hungary 86 82 90 71 80 a a 19 15 x(8) x(9) 71 80 21 15
Iceland 84 72 96 61 75 1 2 37 30 15 17 61 75 52 48
Ireland 92 86 99 91 97 a a 6 6 a a 66 69 34 38
Italy 81 80 83 75 78 3 4 a a 19 18 29 38 67 60
Japan 91 90 92 68 71 1 n 23 21 x(8) x(9) 68 71 24 21
Korea 96 96 96 66 66 a a 30 30 a a 66 66 30 30
Luxembourg 69 66 73 42 49 7 7 18 15 2 1 28 31 42 42
Mexico 38 34 41 34 37 a a 4 4 a a 34 37 4 4
Netherlands m m m 58 65 a a 20 22 22 18 34 38 66 68
New Zealand 75 65 85 x(1) x(3) x(1) x(3) x(1) x(3) x(1) x(3) x(1) x(3) x(1) x(3)
Norway 100 86 114 66 80 a a 45 46 m m 66 80 45 46
poland 79 70 89 82 87 a a a a 7 7 43 52 45 42
portugal m m m 53 62 x(4) x(5) x(4) x(5) x(4) x(5) 40 48 14 14
slovak Republic 83 81 85 66 74 a a 22 15 1 2 22 26 68 62
spain 66 58 75 45 54 a a 18 19 7 8 45 54 25 27
sweden 78 75 81 77 81 a a 1 n a a 37 44 41 37
switzerland 89 89 90 27 30 61 55 12 16 m m 29 35 70 66
Turkey 53 57 49 53 49 a a m m a a 34 33 19 15
united Kingdom m m m m m m m m m m m m m m m
united states 75 72 79 75 79 a a a a a a 75 79 a a
OECD average 81 77 86 61 67 6 6 20 19 5 5 47 53 44 43 EU19 average 83 79 88 63 70 5 5 18 17 6 6 42 49 50 50
part
ner
coun
trie
s Brazil 65 57 75 66 76 a a a a a a 65 74 1 2
Chile 68 64 72 68 72 a a a a a a 37 41 32 32
Israel 93 89 96 90 95 a a 3 1 a a 59 66 34 30
Russian Federation 87 x(1) x(1) 55 x(4) 11 x(6) 18 x(8) 4 x(10) 55 x(12) 33 x(14)
Note: Mismatches between the coverage of the population data and the student/graduate data mean that the participation/graduation rates for those countries that are net exporters of students may be underestimated (for instance Luxembourg) and those that are net importers may be overestimated.1. Excludes the German-speaking Community of Belgium. 2. Year of reference 2003. Source: OECD. See Annex 3 for notes (www.oecd.org/edu/eag2006).Please refer to the Reader’s Guide for information concerning the symbols replacing missing data.
StatLink: http://dx.doi.org/10.1787/141843246636
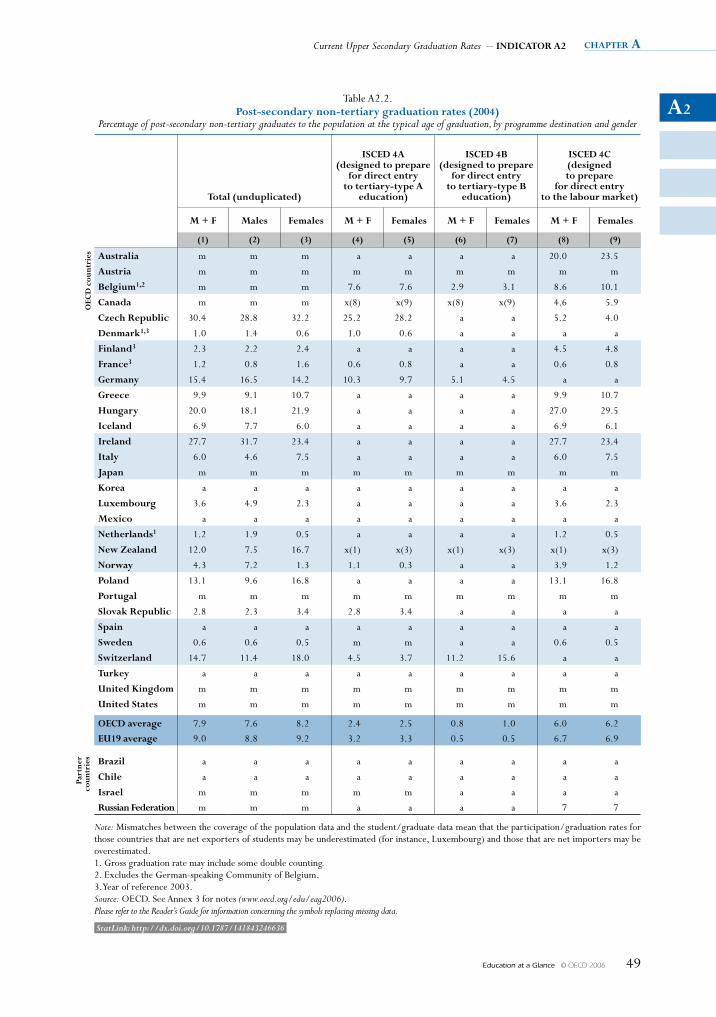
A2
Current Upper Secondary Graduation Rates – INDICATOR A2 chapter a
Education at a Glance © OECD 2006 49
Table A2.2. post-secondary non-tertiary graduation rates (2004)
Percentage of post-secondary non-tertiary graduates to the population at the typical age of graduation, by programme destination and gender
Total (unduplicated)
IsCeD 4A (designed to prepare
for direct entry to tertiary-type A
education)
IsCeD 4B (designed to prepare
for direct entry to tertiary-type B
education)
IsCeD 4C (designed to prepare
for direct entry to the labour market)
M + F Males Females M + F Females M + F Females M + F Females
(1) (2) (3) (4) (5) (6) (7) (8) (9)
OeC
D c
ount
ries Australia m m m a a a a 20.0 23.5
Austria m m m m m m m m m
Belgium1,2 m m m 7.6 7.6 2.9 3.1 8.6 10.1
Canada m m m x(8) x(9) x(8) x(9) 4.6 5.9
Czech Republic 30.4 28.8 32.2 25.2 28.2 a a 5.2 4.0
Denmark1,3 1.0 1.4 0.6 1.0 0.6 a a a a
Finland3 2.3 2.2 2.4 a a a a 4.5 4.8
France3 1.2 0.8 1.6 0.6 0.8 a a 0.6 0.8
germany 15.4 16.5 14.2 10.3 9.7 5.1 4.5 a a
greece 9.9 9.1 10.7 a a a a 9.9 10.7
Hungary 20.0 18.1 21.9 a a a a 27.0 29.5
Iceland 6.9 7.7 6.0 a a a a 6.9 6.1
Ireland 27.7 31.7 23.4 a a a a 27.7 23.4
Italy 6.0 4.6 7.5 a a a a 6.0 7.5
Japan m m m m m m m m m
Korea a a a a a a a a a
Luxembourg 3.6 4.9 2.3 a a a a 3.6 2.3
Mexico a a a a a a a a a
Netherlands1 1.2 1.9 0.5 a a a a 1.2 0.5
New Zealand 12.0 7.5 16.7 x(1) x(3) x(1) x(3) x(1) x(3)
Norway 4.3 7.2 1.3 1.1 0.3 a a 3.9 1.2
poland 13.1 9.6 16.8 a a a a 13.1 16.8
portugal m m m m m m m m m
slovak Republic 2.8 2.3 3.4 2.8 3.4 a a a a
spain a a a a a a a a a
sweden 0.6 0.6 0.5 m m a a 0.6 0.5
switzerland 14.7 11.4 18.0 4.5 3.7 11.2 15.6 a a
Turkey a a a a a a a a a
united Kingdom m m m m m m m m m
united states m m m m m m m m m
OeCD average 7.9 7.6 8.2 2.4 2.5 0.8 1.0 6.0 6.2
eu19 average 9.0 8.8 9.2 3.2 3.3 0.5 0.5 6.7 6.9
part
ner
coun
trie
s Brazil a a a a a a a a a
Chile a a a a a a a a a
Israel m m m m m a a a a
Russian Federation m m m a a a a 7 7
Note: Mismatches between the coverage of the population data and the student/graduate data mean that the participation/graduation rates for those countries that are net exporters of students may be underestimated (for instance, Luxembourg) and those that are net importers may be overestimated.1. Gross graduation rate may include some double counting. 2. Excludes the German-speaking Community of Belgium. 3. Year of reference 2003. Source: OECD. See Annex 3 for notes (www.oecd.org/edu/eag2006).Please refer to the Reader’s Guide for information concerning the symbols replacing missing data.
StatLink: http://dx.doi.org/10.1787/141843246636
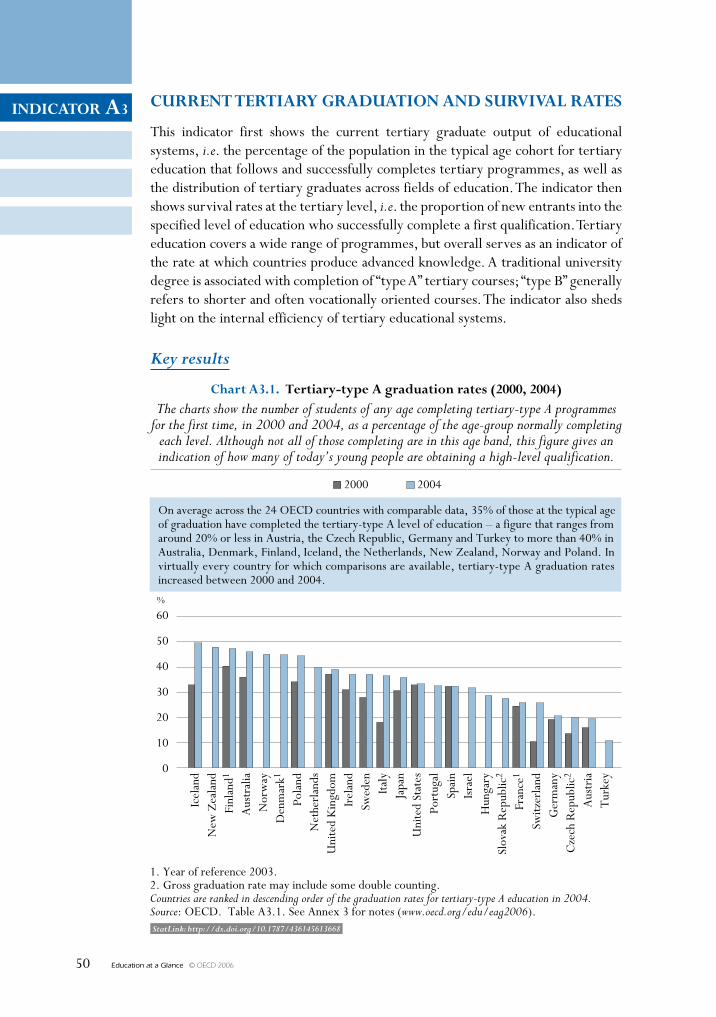
Education at a Glance © OECD 200650
INDICATOR A3
StatLink: http://dx.doi.org/10.1787/436145613668
CuRReNT TeRTIARy gRADuATION AND SuRVIVAL RATeS
This indicator first shows the current tertiary graduate output of educational systems, i.e. the percentage of the population in the typical age cohort for tertiary education that follows and successfully completes tertiary programmes, as well as the distribution of tertiary graduates across fields of education. The indicator then shows survival rates at the tertiary level, i.e. the proportion of new entrants into the specified level of education who successfully complete a first qualification. Tertiary education covers a wide range of programmes, but overall serves as an indicator of the rate at which countries produce advanced knowledge. A traditional university degree is associated with completion of “type A” tertiary courses; “type B” generally refers to shorter and often vocationally oriented courses. The indicator also sheds light on the internal efficiency of tertiary educational systems.
Key results
60
50
40
30
20
10
0
%
Chart A3.1. Tertiary-type A graduation rates (2000, 2004)The charts show the number of students of any age completing tertiary-type A programmes
for the first time, in 2000 and 2004, as a percentage of the age-group normally completingeach level. Although not all of those completing are in this age band, this figure gives anindication of how many of today’s young people are obtaining a high-level qualification.
2000 2004
1. Year of reference 2003.2. Gross graduation rate may include some double counting.Countries are ranked in descending order of the graduation rates for tertiary-type A education in 2004.Source: OECD. Table A3.1. See Annex 3 for notes (www.oecd.org/edu/eag2006).
Icel
and
New
Zea
land
Finl
and1
Aus
tral
iaN
orw
ayD
enm
ark1
Pola
ndN
ethe
rlan
dsU
nite
d K
ingd
omIr
elan
dSw
eden
Italy
Japa
nU
nite
d St
ates
Port
ugal
Spai
nIs
rael
Hun
gary
Slov
ak R
epub
lic2
Fran
ce1
Switz
erla
ndG
erm
any
Cze
ch R
epub
lic2
Aus
tria
Tur
key
On average across the 24 OECD countries with comparable data, 35% of those at the typical ageof graduation have completed the tertiary-type A level of education – a figure that ranges fromaround 20% or less in Austria, the Czech Republic, Germany and Turkey to more than 40% inAustralia, Denmark, Finland, Iceland, the Netherlands, New Zealand, Norway and Poland. Invirtually every country for which comparisons are available, tertiary-type A graduation ratesincreased between 2000 and 2004.
INDICATOR A3
Education at a Glance © OECD 2006 51
Other highlights of this indicator
• Tertiary-type A graduation rates tend to be higher in countries where the programmes provided are mainly of shorter duration.
• The graduation rate is 9% at the tertiary-type B level and 1.3% for programmes leading to advanced research qualifications.
• On average, some 30% of tertiary-type A students fail to successfully complete these programmes though there is marked variation from country to country. The highest tertiary-type A “survival rates” are reported by Ireland, Japan and Korea, at over 80% while the survival rates for Mexico, New Zealand and the United States are just over 50%. Tertiary-type B survival rates are on average lower than those for type A programmes.
chapter a The OuTpuT Of educaTiOnal insTiTuTiOns and The impacT Of learning
Education at a Glance © OECD 200652
A3Policy context
Not only is upper secondary graduation becoming the norm, but also, the majority of students are now graduating from upper secondary programmes designed to provide access to tertiary education; this is leading to increased enrolment in tertiary programmes (see Indicators A2 and C2). Countries with high graduation rates at the tertiary level are also the ones most likely to be developing or maintaining a highly skilled labour force.
Moreover, specific skills and knowledge in science are of particular interest as they increasingly represent a principal source of innovation and growth in knowledge-based economies (see Indicator A10). Differences among countries in the output of tertiary graduates by field of education are likely to be influenced by the relative rewards in the labour market for different fields, as well as the degree to which the market drives field selection in a particular country.
Tertiary level drop out and survival rates can be useful indicators of the internal efficiency of tertiary education systems. However, students’ specific reasons for leaving a tertiary programme are varied: students may realise that they have chosen the wrong subject or educational programme; they may fail to meet the standards set by their educational institution, particularly in tertiary systems that provide relatively broad access; or they may find attractive employment before completing their programme. Dropping out is not necessarily an indication of failure by individual students, but high dropout rates may well indicate that the education system is not meeting the needs of its clients. Students may not find that the educational programmes offered meet their expectations or their labour market needs. It may also be that programmes take longer than the number of years which students can justify being outside the labour market.
Evidence and explanations
Tertiary graduation rates show the rate at which each country’s education system produces advanced knowledge. But tertiary programmes vary widely in structure and scope among countries. Tertiary graduation rates are influenced both by the degree of access to tertiary programmes and by the demand for higher skills in the labour market. They are also affected by the way in which the degree and qualification structures are organised within countries.
Graduation rates at the tertiary level
This indicator distinguishes among three different categories of tertiary qualifications: degrees at the tertiary-type B level (ISCED 5B); degrees at the tertiary-type A level (ISCED 5A); and advanced research qualifications at the doctorate level (ISCED 6).
Tertiary-type A programmes are largely theoretically based and are designed to provide qualifications for entry into advanced research programmes and professions with high skill requirements. Countries differ in the way in which tertiary-type A programmes are organised. The institutional framework may be universities or other institutions. The duration of programmes leading to a first tertiary-type A qualification ranges from three years (e.g. the Bachelor’s degree in many colleges in Ireland and the United Kingdom in most fields of study, and the Licence in France) to five years or more (e.g. the Diplom in Germany).
Whereas in many countries there is a clear distinction between first and second university degrees, (i.e. undergraduate and graduate programmes), this distinction does not exist everywhere. In some systems, degrees that are comparable internationally to a Master’s degree level are
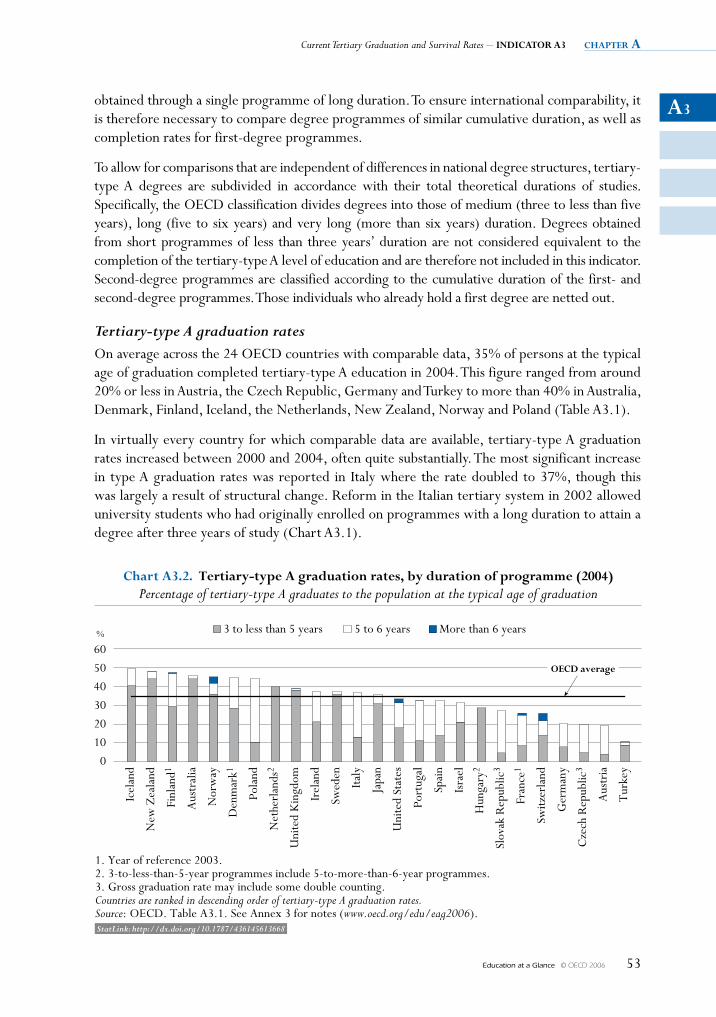
A3
Current Tertiary Graduation and Survival Rates – INDICATOR A3 chapter a
Education at a Glance © OECD 2006 53
obtained through a single programme of long duration. To ensure international comparability, it is therefore necessary to compare degree programmes of similar cumulative duration, as well as completion rates for first-degree programmes.
To allow for comparisons that are independent of differences in national degree structures, tertiary-type A degrees are subdivided in accordance with their total theoretical durations of studies. Specifically, the OECD classification divides degrees into those of medium (three to less than five years), long (five to six years) and very long (more than six years) duration. Degrees obtained from short programmes of less than three years’ duration are not considered equivalent to the completion of the tertiary-type A level of education and are therefore not included in this indicator. Second-degree programmes are classified according to the cumulative duration of the first- and second-degree programmes. Those individuals who already hold a first degree are netted out.
Tertiary-type A graduation ratesOn average across the 24 OECD countries with comparable data, 35% of persons at the typical age of graduation completed tertiary-type A education in 2004. This figure ranged from around 20% or less in Austria, the Czech Republic, Germany and Turkey to more than 40% in Australia, Denmark, Finland, Iceland, the Netherlands, New Zealand, Norway and Poland (Table A3.1).
In virtually every country for which comparable data are available, tertiary-type A graduation rates increased between 2000 and 2004, often quite substantially. The most significant increase in type A graduation rates was reported in Italy where the rate doubled to 37%, though this was largely a result of structural change. Reform in the Italian tertiary system in 2002 allowed university students who had originally enrolled on programmes with a long duration to attain a degree after three years of study (Chart A3.1).
%
60
50
40
30
20
10
0
Chart A3.2. Tertiary-type A graduation rates, by duration of programme (2004)Percentage of tertiary-type A graduates to the population at the typical age of graduation
3 to less than 5 years 5 to 6 years More than 6 years
1. Year of reference 2003.2. 3-to-less-than-5-year programmes include 5-to-more-than-6-year programmes.3. Gross graduation rate may include some double counting.Countries are ranked in descending order of tertiary-type A graduation rates.Source: OECD. Table A3.1. See Annex 3 for notes (www.oecd.org/edu/eag2006).
Icel
and
New
Zea
land
Finl
and1
Aus
tral
ia
Nor
way
Den
mar
k1
Pola
nd
Net
herl
ands
2
Uni
ted
Kin
gdom
Irel
and
Swed
en
Italy
Japa
n
Uni
ted
Stat
es
Port
ugal
Spai
n
Isra
el
Hun
gary
2
Slov
ak R
epub
lic3
Fran
ce1
Switz
erla
nd
Ger
man
y
Cze
ch R
epub
lic3
Aus
tria
Tur
key
OeCD average
StatLink: http://dx.doi.org/10.1787/436145613668
chapter a The OuTpuT Of educaTiOnal insTiTuTiOns and The impacT Of learning
Education at a Glance © OECD 200654
A3Similarly, in Switzerland, the increase in tertiary-type A graduation rates is largely due to reforms in the system which not only shortened the duration of the first degree but also created new universities focusing on applied sciences.
Tertiary-type A: the shorter the programme, the higher the participation and graduation rates
There is considerable variation in the form and structure of tertiary-type A programmes among countries, notably in the length of programmes that are offered (Chart A3.2). What is evident is that overall, tertiary-type A graduation rates tend to be higher in countries where the programmes provided are mainly of a shorter duration. For example, in Austria, the Czech Republic, France, Germany, the Slovak Republic and Switzerland, the majority of students complete programmes of at least five years’ duration and the tertiary-type A graduation rates are below 30%. In contrast, type A graduation rates are around 40% or more in Australia, New Zealand and the United Kingdom, where programmes of three to less than five years are the norm. Turkey provides a notable exception to this trend: despite typically providing short tertiary-type A programmes, its tertiary-type A graduation rate is the lowest among OECD countries.
To summarise this trend, the tertiary-type A graduation rate for OECD countries where the majority of first degrees are obtained in shorter programmes averages some 40% of the typical age cohort, compared with 29% for OECD countries where the majority of first degrees are obtained in programmes of long or very long duration.
Tertiary-type B graduation rates
Tertiary-type B programmes are classified at the same level of competencies as tertiary-type A programmes, but are more occupationally oriented and usually lead to direct labour market access. The programmes are typically of shorter duration than type A programmes – usually two to three years – and generally are not intended to lead to university-level degrees. Graduation rates for tertiary-type B programmes averaged some 9% of an age cohort amongst the 21 OECD countries with comparable data. (Table A3.1). In fact, graduation from tertiary-type B programmes is a sizeable feature of the tertiary system in only a few OECD countries, most notably in Ireland, Japan and New Zealand, where over 20% of the age cohort obtained type B qualifications in 2004.
Trends in the provision of and graduation from tertiary-type B programmes are variable among countries (Chart A3.3). For instance, in Spain, a sharp rise in type B graduation rates between 2000 and 2004 is attributable to the development of a new advanced level, specific vocational training programmes. In contrast, type B programmes in Finland are being phased out and the proportion of the age cohort graduating from these programmes has consequently fallen rapidly over the same period.
Advanced research qualification rates
Across the 29 OECD countries with comparable data, an average of 1.3% of the population obtained an advanced research qualification (such as a PhD) in 2004. The percentages range from 0.1% in Mexico to over 2% in Austria, Germany, Portugal, and Switzerland, to over 3% in Sweden (Table A3.1).
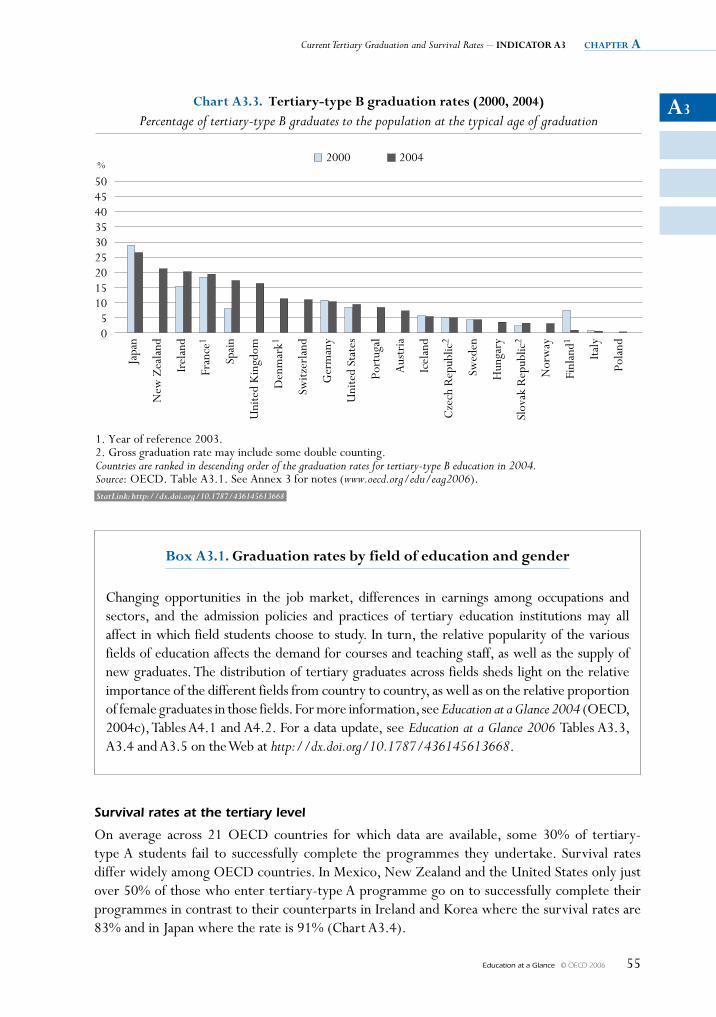
A3
Current Tertiary Graduation and Survival Rates – INDICATOR A3 chapter a
Education at a Glance © OECD 2006 55
504540353025201510
50
%
Chart A3.3. Tertiary-type B graduation rates (2000, 2004)Percentage of tertiary-type B graduates to the population at the typical age of graduation
1. Year of reference 2003.2. Gross graduation rate may include some double counting.Countries are ranked in descending order of the graduation rates for tertiary-type B education in 2004.Source: OECD. Table A3.1. See Annex 3 for notes (www.oecd.org/edu/eag2006).
Japa
n
New
Zea
land
Irel
and
Fran
ce1
Spai
n
Uni
ted
Kin
gdom
Den
mar
k1
Switz
erla
nd
Ger
man
y
Uni
ted
Stat
es
Port
ugal
Aus
tria
Icel
and
Cze
ch R
epub
lic2
Swed
en
Hun
gary
Slov
ak R
epub
lic2
Nor
way
Finl
and1
Italy
Pola
nd
2000 2004
StatLink: http://dx.doi.org/10.1787/436145613668
Box A3.1. graduation rates by field of education and gender
Changing opportunities in the job market, differences in earnings among occupations and sectors, and the admission policies and practices of tertiary education institutions may all affect in which field students choose to study. In turn, the relative popularity of the various fields of education affects the demand for courses and teaching staff, as well as the supply of new graduates. The distribution of tertiary graduates across fields sheds light on the relative importance of the different fields from country to country, as well as on the relative proportion of female graduates in those fields. For more information, see Education at a Glance 2004 (OECD, 2004c), Tables A4.1 and A4.2. For a data update, see Education at a Glance 2006 Tables A3.3, A3.4 and A3.5 on the Web at http://dx.doi.org/10.1787/436145613668.
Survival rates at the tertiary level
On average across 21 OECD countries for which data are available, some 30% of tertiary-type A students fail to successfully complete the programmes they undertake. Survival rates differ widely among OECD countries. In Mexico, New Zealand and the United States only just over 50% of those who enter tertiary-type A programme go on to successfully complete their programmes in contrast to their counterparts in Ireland and Korea where the survival rates are 83% and in Japan where the rate is 91% (Chart A3.4).
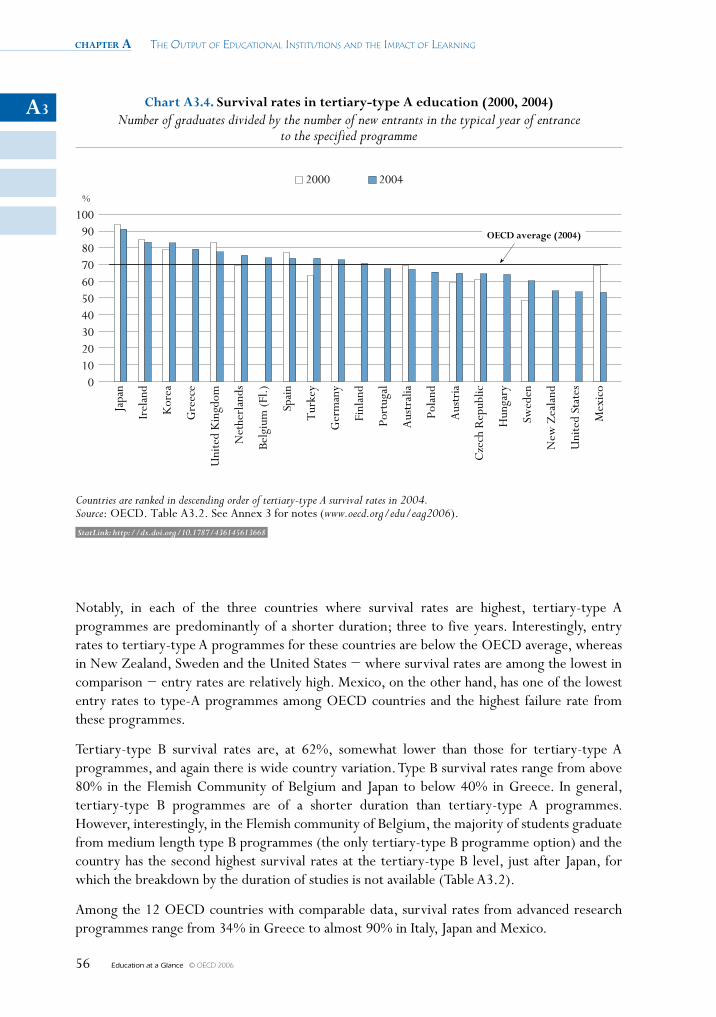
chapter a The OuTpuT Of educaTiOnal insTiTuTiOns and The impacT Of learning
Education at a Glance © OECD 200656
A3
Notably, in each of the three countries where survival rates are highest, tertiary-type A programmes are predominantly of a shorter duration; three to five years. Interestingly, entry rates to tertiary-type A programmes for these countries are below the OECD average, whereas in New Zealand, Sweden and the United States − where survival rates are among the lowest in comparison − entry rates are relatively high. Mexico, on the other hand, has one of the lowest entry rates to type-A programmes among OECD countries and the highest failure rate from these programmes.
Tertiary-type B survival rates are, at 62%, somewhat lower than those for tertiary-type A programmes, and again there is wide country variation. Type B survival rates range from above 80% in the Flemish Community of Belgium and Japan to below 40% in Greece. In general, tertiary-type B programmes are of a shorter duration than tertiary-type A programmes. However, interestingly, in the Flemish community of Belgium, the majority of students graduate from medium length type B programmes (the only tertiary-type B programme option) and the country has the second highest survival rates at the tertiary-type B level, just after Japan, for which the breakdown by the duration of studies is not available (Table A3.2).
Among the 12 OECD countries with comparable data, survival rates from advanced research programmes range from 34% in Greece to almost 90% in Italy, Japan and Mexico.
100908070605040302010
0
%
Chart A3.4. Survival rates in tertiary-type A education (2000, 2004)Number of graduates divided by the number of new entrants in the typical year of entrance
to the specified programme
Countries are ranked in descending order of tertiary-type A survival rates in 2004.Source: OECD. Table A3.2. See Annex 3 for notes (www.oecd.org/edu/eag2006).
Japa
n
Irel
and
Kor
ea
Gre
ece
Uni
ted
Kin
gdom
Net
herl
ands
Belg
ium
(Fl.)
Spai
n
Tur
key
Ger
man
y
Finl
and
Port
ugal
Aus
tral
ia
Pola
nd
Aus
tria
Cze
ch R
epub
lic
Hun
gary
Swed
en
New
Zea
land
Uni
ted
Stat
es
Mex
ico
OeCD average (2004)
2000 2004
StatLink: http://dx.doi.org/10.1787/436145613668
A3
Current Tertiary Graduation and Survival Rates – INDICATOR A3 chapter a
Education at a Glance © OECD 2006 57
Definitions and methodologies
The data for the academic year 2003-2004 are based on the UOE data collection on education statistics that is administered annually by the OECD.
Tertiary graduates are those who obtain a tertiary qualification in the specified reference year. This indicator distinguishes among different categories of tertiary qualifications: i) tertiary-type B qualifications (ISCED 5B); ii) tertiary-type A qualifications (ISCED 5A); and iii) advanced research degrees of doctorate standard (ISCED 6). For some countries, data are not available for the categories requested. In such cases, the OECD has assigned graduates to the most appropriate category (see Annex 3 at www.oecd.org/edu/eag2006 for a list of programmes included for each country at the tertiary-type A and tertiary-type B levels). Tertiary-type A degrees are also subdivided by their corresponding total theoretical duration of studies, to allow for comparisons that are independent of differences in national degree structures.
In Table A3.1, graduation rates for first tertiary programmes (tertiary-type A and tertiary-type B) are calculated as gross graduation rates. In order to calculate gross graduation rates, countries identify the age at which graduation typically occurs (see Annex 1). The number of graduates, regardless of their age, is divided by the population at the typical graduation age. In many countries, defining a typical age of graduation is difficult, however, because graduates are dispersed over a wide range of ages.
A net graduation rate is calculated for advanced research programmes (where duplication of certificates awarded does not pose a problem) as the sum of age-specific graduation rates. The net graduation rate can be interpreted as the percentage of persons within an age cohort who obtain a tertiary qualification and is thus unaffected by changes in population size or typical graduation age. Gross graduation rates are presented for those countries that cannot provide such detailed data.
The survival rate is calculated as the ratio of the number of students who graduated from an initial degree during the reference year to the number of new entrants into this degree n years before, with n being the number of years of full-time study required to complete the degree. The calculation of the survival rate is not defined from a cohort analysis. This estimation assumes constant student flows at the tertiary level, implied by the need for consistency between the graduate cohort in the reference year with the entrant cohort n years before. This assumption may be an oversimplification of the reality in countries (see Annex 3 at www.oecd.org/edu/eag2006).
Dropouts are defined as those students who leave the specified level without graduating from a first qualification at that level. The first qualification refers to any degree, regardless of the duration of study, obtained at the end of a programme which does not have a previous degree at the same level as a pre-requisite.
Further references
Examining the number of science graduates per 100 000 25-to-34-year-olds in employment provides another way of gauging the recent output of high-level skills from different education systems. For more information, see Education at a Glance 2005 (OECD, 2005c), Table A3.2. For a data update, see Education at a Glance 2006, Table A3.5 on the Web at http://dx.doi.org/10.1787/436145613668.
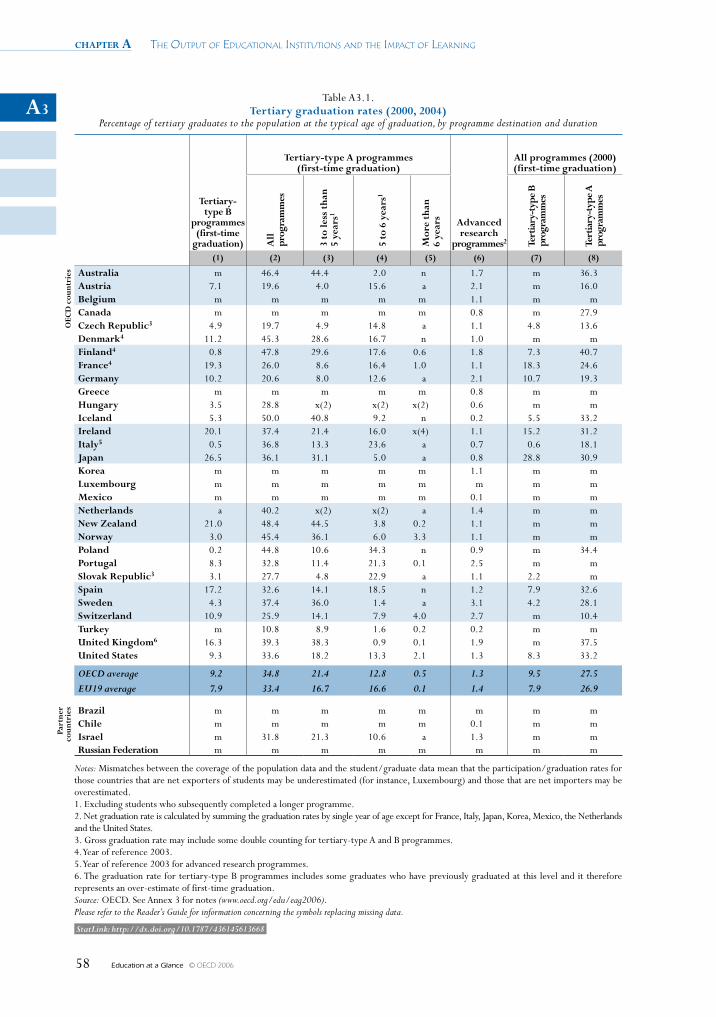
chapter a The OuTpuT Of educaTiOnal insTiTuTiOns and The impacT Of learning
Education at a Glance © OECD 200658
A3Table A3.1.
Tertiary graduation rates (2000, 2004) Percentage of tertiary graduates to the population at the typical age of graduation, by programme destination and duration
Tertiary- type B
programmes (first-time
graduation)
Tertiary-type A programmes (first-time graduation)
Advanced research
programmes2
All programmes (2000) (first-time graduation)
All
pr
ogra
mm
es
3 to
less
tha
n 5
year
s1
5 to
6 y
ears
1
Mor
e th
an
6 ye
ars
Tert
iary
-typ
e B
pr
ogra
mm
es
Tert
iary
-typ
e A
prog
ram
mes
(1) (2) (3) (4) (5) (6) (7) (8)
OeC
D c
ount
ries Australia m 46.4 44.4 2.0 n 1.7 m 36.3
Austria 7.1 19.6 4.0 15.6 a 2.1 m 16.0Belgium m m m m m 1.1 m mCanada m m m m m 0.8 m 27.9Czech Republic3 4.9 19.7 4.9 14.8 a 1.1 4.8 13.6Denmark4 11.2 45.3 28.6 16.7 n 1.0 m mFinland4 0.8 47.8 29.6 17.6 0.6 1.8 7.3 40.7France4 19.3 26.0 8.6 16.4 1.0 1.1 18.3 24.6germany 10.2 20.6 8.0 12.6 a 2.1 10.7 19.3greece m m m m m 0.8 m mHungary 3.5 28.8 x(2) x(2) x(2) 0.6 m mIceland 5.3 50.0 40.8 9.2 n 0.2 5.5 33.2Ireland 20.1 37.4 21.4 16.0 x(4) 1.1 15.2 31.2Italy5 0.5 36.8 13.3 23.6 a 0.7 0.6 18.1Japan 26.5 36.1 31.1 5.0 a 0.8 28.8 30.9Korea m m m m m 1.1 m mLuxembourg m m m m m m m mMexico m m m m m 0.1 m mNetherlands a 40.2 x(2) x(2) a 1.4 m mNew Zealand 21.0 48.4 44.5 3.8 0.2 1.1 m mNorway 3.0 45.4 36.1 6.0 3.3 1.1 m mPoland 0.2 44.8 10.6 34.3 n 0.9 m 34.4Portugal 8.3 32.8 11.4 21.3 0.1 2.5 m mSlovak Republic3 3.1 27.7 4.8 22.9 a 1.1 2.2 mSpain 17.2 32.6 14.1 18.5 n 1.2 7.9 32.6Sweden 4.3 37.4 36.0 1.4 a 3.1 4.2 28.1Switzerland 10.9 25.9 14.1 7.9 4.0 2.7 m 10.4Turkey m 10.8 8.9 1.6 0.2 0.2 m munited Kingdom6 16.3 39.3 38.3 0.9 0.1 1.9 m 37.5united States 9.3 33.6 18.2 13.3 2.1 1.3 8.3 33.2
OECD average 9.2 34.8 21.4 12.8 0.5 1.3 9.5 27.5EU19 average 7.9 33.4 16.7 16.6 0.1 1.4 7.9 26.9
Part
ner
coun
trie
s Brazil m m m m m m m mChile m m m m m 0.1 m mIsrael m 31.8 21.3 10.6 a 1.3 m mRussian Federation m m m m m m m m
Notes: Mismatches between the coverage of the population data and the student/graduate data mean that the participation/graduation rates for those countries that are net exporters of students may be underestimated (for instance, Luxembourg) and those that are net importers may be overestimated.1. Excluding students who subsequently completed a longer programme.2. Net graduation rate is calculated by summing the graduation rates by single year of age except for France, Italy, Japan, Korea, Mexico, the Netherlands and the United States.3. Gross graduation rate may include some double counting for tertiary-type A and B programmes.4. Year of reference 2003.5. Year of reference 2003 for advanced research programmes.6. The graduation rate for tertiary-type B programmes includes some graduates who have previously graduated at this level and it therefore represents an over-estimate of first-time graduation.Source: OECD. See Annex 3 for notes (www.oecd.org/edu/eag2006). Please refer to the Reader’s Guide for information concerning the symbols replacing missing data.
StatLink: http://dx.doi.org/10.1787/436145613668
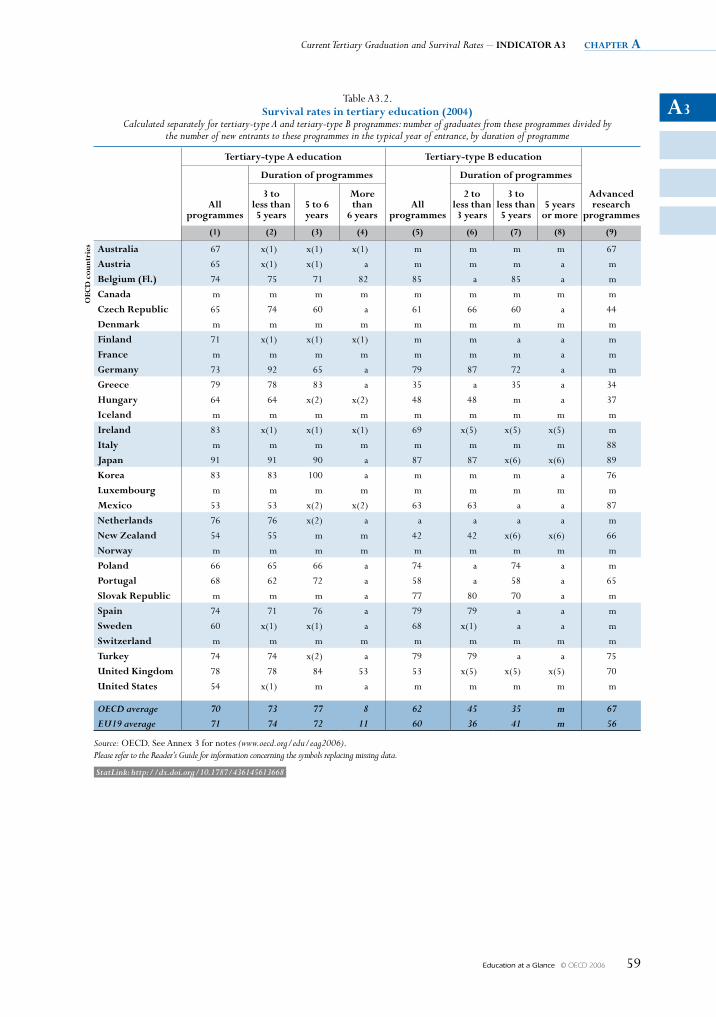
A3
Current Tertiary Graduation and Survival Rates – INDICATOR A3 chapter a
Education at a Glance © OECD 2006 59
Table A3.2. Survival rates in tertiary education (2004)
Calculated separately for tertiary-type A and teriary-type B programmes: number of graduates from these programmes divided by the number of new entrants to these programmes in the typical year of entrance, by duration of programme
Tertiary-type A education Tertiary-type B education
Advanced research
programmesAll
programmes
Duration of programmes
All programmes
Duration of programmes
3 to less than 5 years
5 to 6 years
More than
6 years
2 to less than 3 years
3 to less than 5 years
5 years or more
(1) (2) (3) (4) (5) (6) (7) (8) (9)
OeC
D c
ount
ries Australia 67 x(1) x(1) x(1) m m m m 67
Austria 65 x(1) x(1) a m m m a m
Belgium (Fl.) 74 75 71 82 85 a 85 a m
Canada m m m m m m m m m
Czech Republic 65 74 60 a 61 66 60 a 44
Denmark m m m m m m m m m
Finland 71 x(1) x(1) x(1) m m a a m
France m m m m m m m a m
germany 73 92 65 a 79 87 72 a m
greece 79 78 83 a 35 a 35 a 34
Hungary 64 64 x(2) x(2) 48 48 m a 37
Iceland m m m m m m m m m
Ireland 83 x(1) x(1) x(1) 69 x(5) x(5) x(5) m
Italy m m m m m m m m 88
Japan 91 91 90 a 87 87 x(6) x(6) 89
Korea 83 83 100 a m m m a 76
Luxembourg m m m m m m m m m
Mexico 53 53 x(2) x(2) 63 63 a a 87
Netherlands 76 76 x(2) a a a a a m
New Zealand 54 55 m m 42 42 x(6) x(6) 66
Norway m m m m m m m m m
Poland 66 65 66 a 74 a 74 a m
Portugal 68 62 72 a 58 a 58 a 65
Slovak Republic m m m a 77 80 70 a m
Spain 74 71 76 a 79 79 a a m
Sweden 60 x(1) x(1) a 68 x(1) a a m
Switzerland m m m m m m m m m
Turkey 74 74 x(2) a 79 79 a a 75
united Kingdom 78 78 84 53 53 x(5) x(5) x(5) 70
united States 54 x(1) m a m m m m m
OECD average 70 73 77 8 62 45 35 m 67EU19 average 71 74 72 11 60 36 41 m 56
Source: OECD. See Annex 3 for notes (www.oecd.org/edu/eag2006). Please refer to the Reader’s Guide for information concerning the symbols replacing missing data.
StatLink: http://dx.doi.org/10.1787/436145613668
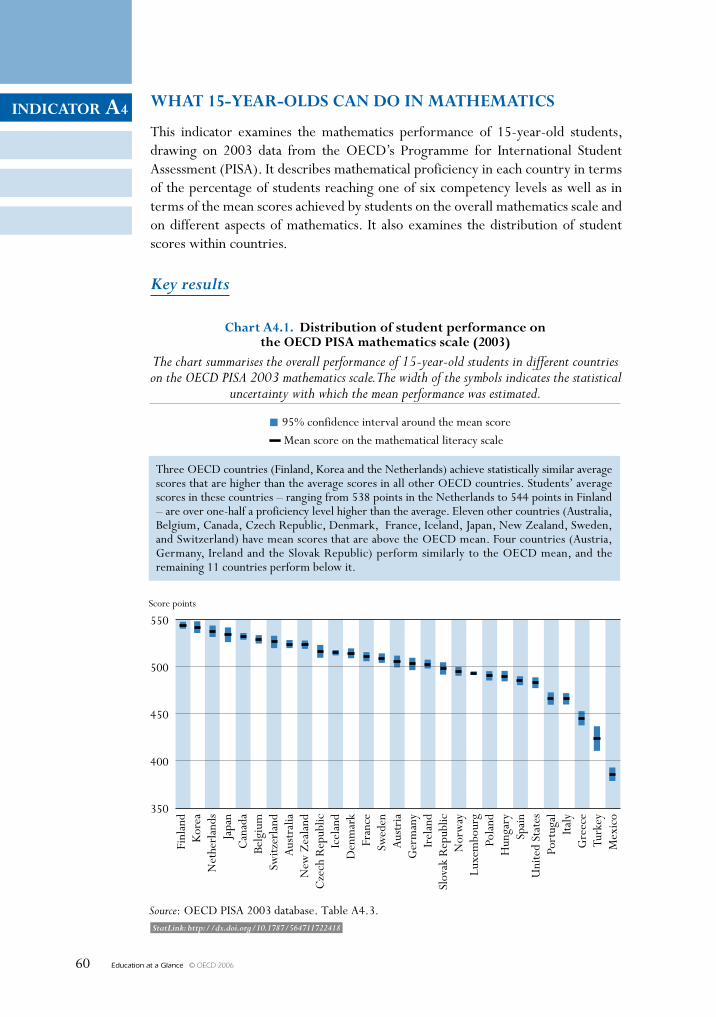
Education at a Glance © OECD 200660
INDICATOR A4
StatLink: http://dx.doi.org/10.1787/564711722418
WhAT 15-yeAR-OlDs CAN DO IN mAThemATICs
This indicator examines the mathematics performance of 15-year-old students, drawing on 2003 data from the OECD’s Programme for International Student Assessment (PISA). It describes mathematical proficiency in each country in terms of the percentage of students reaching one of six competency levels as well as in terms of the mean scores achieved by students on the overall mathematics scale and on different aspects of mathematics. It also examines the distribution of student scores within countries.
Key results
550
500
450
400
350
Score points
Chart A4.1. Distribution of student performance onthe OeCD PIsA mathematics scale (2003)
The chart summarises the overall performance of 15-year-old students in different countrieson the OECD PISA 2003 mathematics scale. The width of the symbols indicates the statistical
uncertainty with which the mean performance was estimated.
95% confidence interval around the mean scoreMean score on the mathematical literacy scale
Source: OECD PISA 2003 database. Table A4.3.
Finl
and
Kor
eaN
ethe
rlan
dsJa
pan
Can
ada
Belg
ium
Switz
erla
ndA
ustr
alia
New
Zea
land
Cze
ch R
epub
licIc
elan
dD
enm
ark
Fran
ceSw
eden
Aus
tria
Ger
man
yIr
elan
dSl
ovak
Rep
ublic
Nor
way
Luxe
mbo
urg
Pola
ndH
unga
rySp
ain
Uni
ted
Stat
esPo
rtug
alIta
lyG
reec
eTu
rkey
Mex
ico
Three OECD countries (Finland, Korea and the Netherlands) achieve statistically similar averagescores that are higher than the average scores in all other OECD countries. Students’ averagescores in these countries – ranging from 538 points in the Netherlands to 544 points in Finland– are over one-half a proficiency level higher than the average. Eleven other countries (Australia,Belgium, Canada, Czech Republic, Denmark, France, Iceland, Japan, New Zealand, Sweden,and Switzerland) have mean scores that are above the OECD mean. Four countries (Austria,Germany, Ireland and the Slovak Republic) perform similarly to the OECD mean, and theremaining 11 countries perform below it.
INDICATOR A4
Education at a Glance © OECD 2006 61
Other highlights of this indicator
• At least 7% of students in Belgium, Japan, Korea, the Netherlands and Switzerland reach the highest level of mathematics proficiency (Level 6). Furthermore, in these countries and in Canada, Finland and New Zealand, over 20% of students reach at least Level 5. In Greece, Mexico, Portugal and Turkey, however, less than 6% of students reach these two levels of proficiency.
• With the exception of Finland and Korea, all OECD countries have at least 10% of students that perform at Level 1 or below, and there are 12 countries in which this exceeds one-fifth of all students. In Mexico and Turkey, a majority of students perform only at Level 1 or below.
• In the majority of countries, the range of performance in the middle half of the students exceeds the magnitude of two proficiency levels, and in Belgium and Germany it is around 2.4 proficiency levels. This suggests that educational programmes, schools and teachers need to cope with a wide range of student knowledge and skills.
chapter a The OuTpuT Of educaTiOnal insTiTuTiOns and The impacT Of learning
Education at a Glance © OECD 200662
A4Policy contextFor much of the last century, the content of school mathematics and science curricula was dominated by the need to provide the foundations for the professional training of a small number of mathematicians, scientists and engineers. With the growing role of science, mathematics and technology in modern life, however, the objectives of personal fulfilment, employment and full participation in society increasingly require that all adults – not just those aspiring to a scientific career – be mathematically, scientifically and technologically literate.
The performance of a country’s best students in mathematics and related subjects may have implications for the part a country will play in tomorrow’s advanced technology sector and for its general international competitiveness. Conversely, deficiencies of students in key competency areas can have negative consequences for individuals’ labour market and earnings prospects and for their capacity to participate fully in society.
Evidence and explanations
PISA starts with a concept of mathematical literacy that is concerned with the capacity of students to analyse, reason and communicate effectively as they pose, solve and interpret mathematical problems in a variety of situations involving quantitative, spatial, probabilistic or other mathematical concepts. When thinking about what mathematics might mean for individuals, one must consider both the extent to which they possess mathematical knowledge and understanding, and the extent to which they can activate their mathematical competencies to solve problems they encounter in life. PISA therefore presents students with problems mainly set in real-world situations. These are crafted in such a way that aspects of mathematics would be of genuine benefit in solving the problem. The objective of the PISA assessment is to obtain measures of the extent to which students presented with these problems can activate their mathematical knowledge and competencies to solve such problems successfully.
Proficiency in mathematics
Chart A4.2 presents an overall profile of students’ proficiency on the mathematics literacy scale with the length of the coloured components of the bars showing the percentage of students proficient at each of six levels that were based on substantive considerations relating to the nature of the underlying competencies (Box A4.2). Across OECD countries, on average, 4% of students reach Level 6 (the highest level of performance), 15% reach Level 5 or higher, 34% reach Level 4 or higher, 58% reach Level 3 or higher, and 79% reach Level 2 or higher. Thirteen percent of students reach Level 1, although 8% of students across OECD countries perform below this level (Table A4.1).
Examining individual countries’ performance by proficiency level shows that in Belgium, Japan, Korea, the Netherlands and Switzerland, 7% or more of students reach the highest level of proficiency. In these countries and in Canada, Finland and New Zealand, a significant proportion of students also reach Level 5 or above (over 20% in each case). In contrast, in Greece, Mexico, Portugal and Turkey, less than 6% of students reach these two levels of proficiency.
Although there is general tendency among countries with a high proportion of 15-year-old students scoring at Levels 5 and 6 to have fewer students below the lowest level of proficiency (see, e.g., Korea), this is not always the case. For example, while 9% of students in Belgium perform at Level 6, 7% do not reach Level 1.
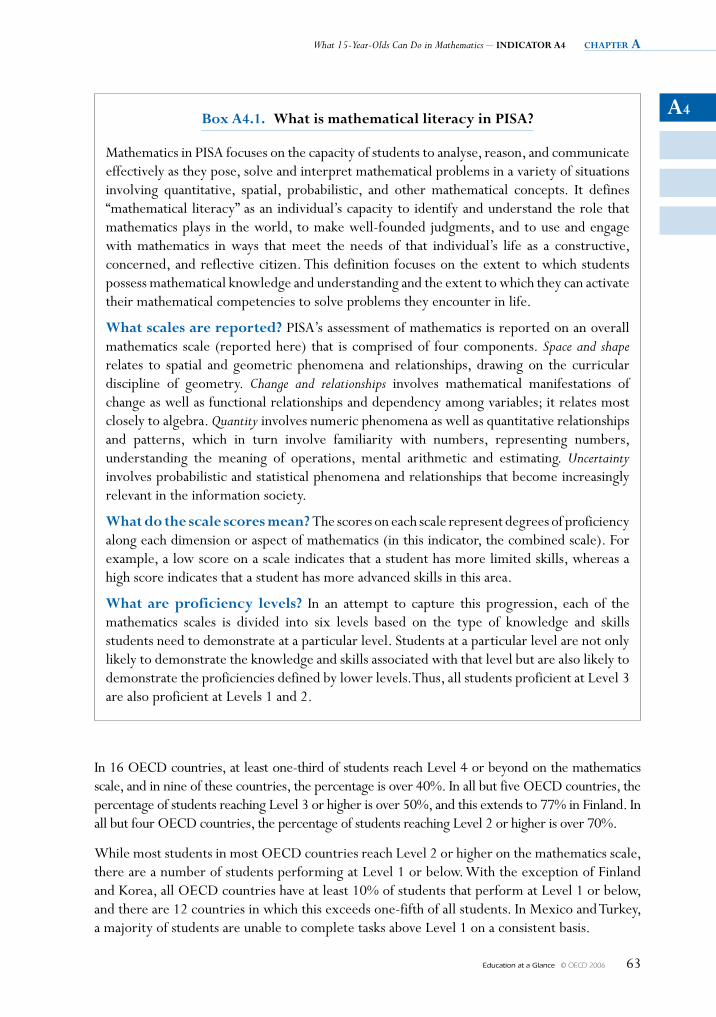
A4
What 15-Year-Olds Can Do in Mathematics – INDICATOR A4 chapter a
Education at a Glance © OECD 2006 63
In 16 OECD countries, at least one-third of students reach Level 4 or beyond on the mathematics scale, and in nine of these countries, the percentage is over 40%. In all but five OECD countries, the percentage of students reaching Level 3 or higher is over 50%, and this extends to 77% in Finland. In all but four OECD countries, the percentage of students reaching Level 2 or higher is over 70%.
While most students in most OECD countries reach Level 2 or higher on the mathematics scale, there are a number of students performing at Level 1 or below. With the exception of Finland and Korea, all OECD countries have at least 10% of students that perform at Level 1 or below, and there are 12 countries in which this exceeds one-fifth of all students. In Mexico and Turkey, a majority of students are unable to complete tasks above Level 1 on a consistent basis.
Box A4.1. What is mathematical literacy in PIsA?
Mathematics in PISA focuses on the capacity of students to analyse, reason, and communicate effectively as they pose, solve and interpret mathematical problems in a variety of situations involving quantitative, spatial, probabilistic, and other mathematical concepts. It defines “mathematical literacy” as an individual’s capacity to identify and understand the role that mathematics plays in the world, to make well-founded judgments, and to use and engage with mathematics in ways that meet the needs of that individual’s life as a constructive, concerned, and reflective citizen. This definition focuses on the extent to which students possess mathematical knowledge and understanding and the extent to which they can activate their mathematical competencies to solve problems they encounter in life.
What scales are reported? PISA’s assessment of mathematics is reported on an overall mathematics scale (reported here) that is comprised of four components. Space and shape relates to spatial and geometric phenomena and relationships, drawing on the curricular discipline of geometry. Change and relationships involves mathematical manifestations of change as well as functional relationships and dependency among variables; it relates most closely to algebra. Quantity involves numeric phenomena as well as quantitative relationships and patterns, which in turn involve familiarity with numbers, representing numbers, understanding the meaning of operations, mental arithmetic and estimating. Uncertainty involves probabilistic and statistical phenomena and relationships that become increasingly relevant in the information society.
What do the scale scores mean? The scores on each scale represent degrees of proficiency along each dimension or aspect of mathematics (in this indicator, the combined scale). For example, a low score on a scale indicates that a student has more limited skills, whereas a high score indicates that a student has more advanced skills in this area.
What are proficiency levels? In an attempt to capture this progression, each of the mathematics scales is divided into six levels based on the type of knowledge and skills students need to demonstrate at a particular level. Students at a particular level are not only likely to demonstrate the knowledge and skills associated with that level but are also likely to demonstrate the proficiencies defined by lower levels. Thus, all students proficient at Level 3 are also proficient at Levels 1 and 2.
chapter a The OuTpuT Of educaTiOnal insTiTuTiOns and The impacT Of learning
Education at a Glance © OECD 200664
A4
Mean scores in mathematics
Another way to summarise student performance and to compare the relative standing of countries in terms of student performance is through the mean scores for students in each country. To the extent that high average performance at age 15 can be considered predictive of a highly skilled future workforce, countries with high average performance will have an important economic and social advantage. This section describes country means on the overall scale, as well as briefly describing countries’ relative strengths and weakness on the four scales identified in Box A4.1. (See also Box A4.3 for an indication of how mean scores on select scales differed from the 2000 to the 2003 assessments of PISA.)
Chart A4.3 gives a summary of overall student performance in different countries on the combined mathematics scale, in terms of the mean student score, and indicates which countries perform above, at, or below the OECD average, and compares mean scores among pairs of countries. It also indicates the comparative performance of individual countries with each of the other countries.
Percentage of students100
75
50
25
0
25
50
75
100
Chart A4.2. Percentage of students at each level of proficiencyon the OECD PISA mathematics scale (2003)
Countries are ranked in descending order of percentage of 15-year-olds in Levels 2, 3, 4, 5 and 6.Source: OECD PISA 2003 database. Table A4.1.
Finl
and
Kor
eaC
anad
aN
ethe
rlan
dsJa
pan
Aus
tral
iaSw
itzer
land
Icel
and
New
Zea
land
Den
mar
kBe
lgiu
mC
zech
Rep
ublic
Fran
ceIr
elan
dSw
eden
Aus
tria
Slov
ak R
epub
licN
orw
ayG
erm
any
Luxe
mbo
urg
Pola
ndSp
ain
Hun
gary
Uni
ted
Stat
esPo
rtug
alIta
lyG
reec
eTu
rkey
Mex
ico
Below Level 1 Level 1 Level 2 Level 3 Level 4 Level 5 Level 6
StatLink: http://dx.doi.org/10.1787/564711722418
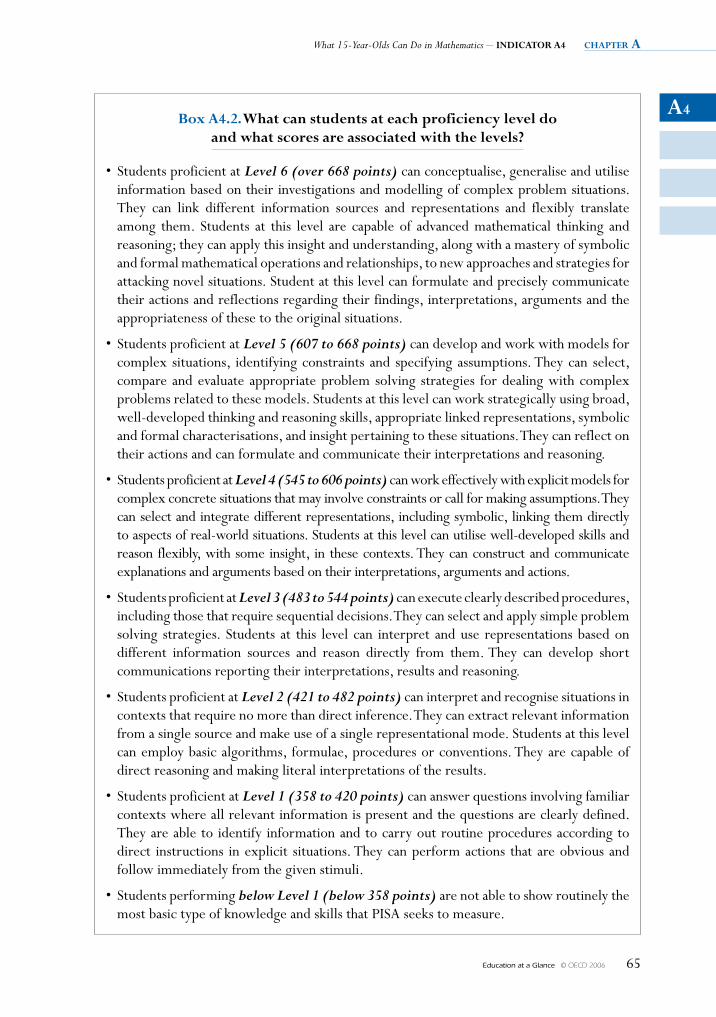
A4
What 15-Year-Olds Can Do in Mathematics – INDICATOR A4 chapter a
Education at a Glance © OECD 2006 65
Box A4.2. What can students at each proficiency level do and what scores are associated with the levels?
• Students proficient at Level 6 (over 668 points) can conceptualise, generalise and utilise information based on their investigations and modelling of complex problem situations. They can link different information sources and representations and flexibly translate among them. Students at this level are capable of advanced mathematical thinking and reasoning; they can apply this insight and understanding, along with a mastery of symbolic and formal mathematical operations and relationships, to new approaches and strategies for attacking novel situations. Student at this level can formulate and precisely communicate their actions and reflections regarding their findings, interpretations, arguments and the appropriateness of these to the original situations.
• Students proficient at Level 5 (607 to 668 points) can develop and work with models for complex situations, identifying constraints and specifying assumptions. They can select, compare and evaluate appropriate problem solving strategies for dealing with complex problems related to these models. Students at this level can work strategically using broad, well-developed thinking and reasoning skills, appropriate linked representations, symbolic and formal characterisations, and insight pertaining to these situations. They can reflect on their actions and can formulate and communicate their interpretations and reasoning.
• Students proficient at Level 4 (545 to 606 points) can work effectively with explicit models for complex concrete situations that may involve constraints or call for making assumptions. They can select and integrate different representations, including symbolic, linking them directly to aspects of real-world situations. Students at this level can utilise well-developed skills and reason flexibly, with some insight, in these contexts. They can construct and communicate explanations and arguments based on their interpretations, arguments and actions.
• Students proficient at Level 3 (483 to 544 points) can execute clearly described procedures, including those that require sequential decisions. They can select and apply simple problem solving strategies. Students at this level can interpret and use representations based on different information sources and reason directly from them. They can develop short communications reporting their interpretations, results and reasoning.
• Students proficient at Level 2 (421 to 482 points) can interpret and recognise situations in contexts that require no more than direct inference. They can extract relevant information from a single source and make use of a single representational mode. Students at this level can employ basic algorithms, formulae, procedures or conventions. They are capable of direct reasoning and making literal interpretations of the results.
• Students proficient at Level 1 (358 to 420 points) can answer questions involving familiar contexts where all relevant information is present and the questions are clearly defined. They are able to identify information and to carry out routine procedures according to direct instructions in explicit situations. They can perform actions that are obvious and follow immediately from the given stimuli.
• Students performing below Level 1 (below 358 points) are not able to show routinely the most basic type of knowledge and skills that PISA seeks to measure.
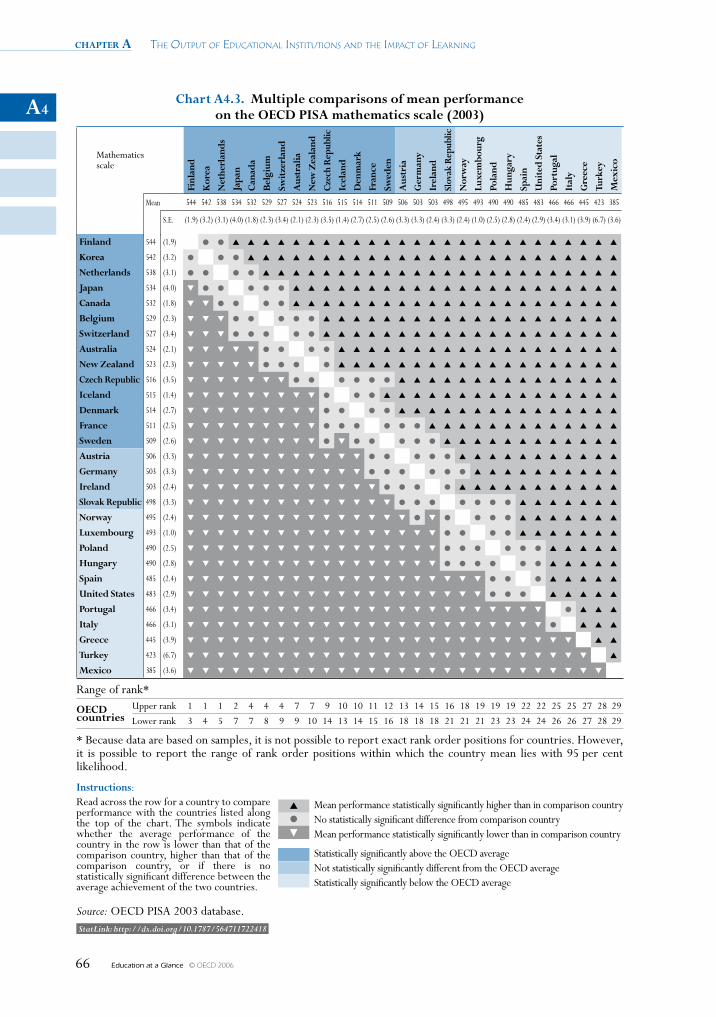
chapter a The OuTpuT Of educaTiOnal insTiTuTiOns and The impacT Of learning
Education at a Glance © OECD 200666
A4
Mathematics scale
Mean
S.E.
Finland 544 (1.9)
Korea 542 (3.2)
Netherlands 538 (3.1)
Japan 534 (4.0)
Canada 532 (1.8)
Belgium 529 (2.3)
switzerland 527 (3.4)
Australia 524 (2.1)
New Zealand 523 (2.3)
Czech Republic 516 (3.5)
Iceland 515 (1.4)
Denmark 514 (2.7)
France 511 (2.5)
sweden 509 (2.6)
Austria 506 (3.3)
Germany 503 (3.3)
Ireland 503 (2.4)
slovak Republic 498 (3.3)
Norway 495 (2.4)
luxembourg 493 (1.0)
Poland 490 (2.5)
hungary 490 (2.8)
spain 485 (2.4)
United states 483 (2.9)
Portugal 466 (3.4)
Italy 466 (3.1)
Greece 445 (3.9)
Turkey 423 (6.7)
mexico 385 (3.6)
Finl
and
Kor
ea
Net
herl
ands
Japa
n
Can
ada
Bel
gium
swit
zerl
and
Aus
tral
ia
New
Zea
land
Czec
h R
epub
lic
Icel
and
Den
mar
k
Fran
ce
swed
en
Aus
tria
Ger
man
y
Irel
and
slov
ak R
epub
lic
Nor
way
luxe
mbo
urg
Pola
nd
hun
gary
spai
n
Uni
ted
stat
es
Port
ugal
Ital
y
Gre
ece
Turk
ey
mex
ico
544 542 538 534 532 529 527 524 523 516 515 514 511 509 506 503 503 498 495 493 490 490 485 483 466 466 445 423 385
(1.9) (3.2) (3.1) (4.0) (1.8) (2.3) (3.4) (2.1) (2.3) (3.5) (1.4) (2.7) (2.5) (2.6) (3.3) (3.3) (2.4) (3.3) (2.4) (1.0) (2.5) (2.8) (2.4) (2.9) (3.4) (3.1) (3.9) (6.7) (3.6)
l l s s s s s s s s s s s s s s s s s s s s s s s s s s
l l l s s s s s s s s s s s s s s s s s s s s s s s s s
l l l l s s s s s s s s s s s s s s s s s s s s s s s s
t l l l l l s s s s s s s s s s s s s s s s s s s s s s
t t l l l l s s s s s s s s s s s s s s s s s s s s s s
t t t l l l l l s s s s s s s s s s s s s s s s s s s s
t t t l l l l l s s s s s s s s s s s s s s s s s s s s
t t t t t l l l l s s s s s s s s s s s s s s s s s s s
t t t t t l l l l s s s s s s s s s s s s s s s s s s s
t t t t t t t l l l l l l s s s s s s s s s s s s s s s
t t t t t t t t t l l l s s s s s s s s s s s s s s s s
t t t t t t t t t l l l l s s s s s s s s s s s s s s s
t t t t t t t t t l l l l l l s s s s s s s s s s s s s
t t t t t t t t t l t l l l l l s s s s s s s s s s s s
t t t t t t t t t t t t l l l l l s s s s s s s s s s s
t t t t t t t t t t t t l l l l l l s s s s s s s s s s
t t t t t t t t t t t t t l l l l s s s s s s s s s s s
t t t t t t t t t t t t t t l l l l l l l s s s s s s s
t t t t t t t t t t t t t t t l t l l l l s s s s s s s
t t t t t t t t t t t t t t t t t l l l l s s s s s s s
t t t t t t t t t t t t t t t t t l l l l l l s s s s s
t t t t t t t t t t t t t t t t t l l l l l l s s s s s
t t t t t t t t t t t t t t t t t t t t l l l s s s s s
t t t t t t t t t t t t t t t t t t t t l l l s s s s s
t t t t t t t t t t t t t t t t t t t t t t t t l s s s
t t t t t t t t t t t t t t t t t t t t t t t t l s s s
t t t t t t t t t t t t t t t t t t t t t t t t t t s s
t t t t t t t t t t t t t t t t t t t t t t t t t t t s
t t t t t t t t t t t t t t t t t t t t t t t t t t t t
* Because data are based on samples, it is not possible to report exact rank order positions for countries. However, it is possible to report the range of rank order positions within which the country mean lies with 95 per cent likelihood.
Range of rank*
Instructions: Read across the row for a country to compare performance with the countries listed along the top of the chart. The symbols indicate whether the average performance of the country in the row is lower than that of the comparison country, higher than that of the comparison country, or if there is no statistically significant difference between the average achievement of the two countries.
Source: OECD PISA 2003 database.
Mean performance statistically significantly higher than in comparison countryNo statistically significant difference from comparison countryMean performance statistically significantly lower than in comparison country
Statistically significantly above the OECD averageNot statistically significantly different from the OECD averageStatistically significantly below the OECD average
s
l
OeCD countries
Upper rank 1 1 1 2 4 4 4 7 7 9 10 10 11 12 13 14 15 16 18 19 19 19 22 22 25 25 27 28 29
Lower rank 3 4 5 7 7 8 9 9 10 14 13 14 15 16 18 18 18 21 21 21 23 23 24 24 26 26 27 28 29
StatLink: http://dx.doi.org/10.1787/564711722418
Chart A4.3. multiple comparisons of mean performance on the OeCD PIsA mathematics scale (2003)
A4
What 15-Year-Olds Can Do in Mathematics – INDICATOR A4 chapter a
Education at a Glance © OECD 2006 67
On the combined mathematics scale, Finland, Korea and the Netherlands are the best performing OECD countries. Students’ average scores in these countries – ranging from 538 points in the Netherlands to 544 points in Finland – are over one-half a proficiency level higher than the OECD average. Eleven other OECD countries (Australia, Belgium, Canada, Czech Republic, Denmark, France, Iceland, Japan, New Zealand, Sweden and Switzerland) have mean scores that are above the OECD mean. Four countries (Austria, Germany, Ireland and the Slovak Republic) perform similarly to the OECD mean, and the remaining 11 OECD countries perform below it.
Table A4.2 compares the performance results in the different content areas of mathematics, allowing an assessment of the relative strengths and weaknesses of countries. Although it is not appropriate to compare numerical scale scores directly between the different content areas of mathematics, it is possible to determine the relative strengths of countries in the different content areas of mathematics, on the basis of their relative positions on the respective scales. The relative probability that a country will assume each position on each scale is determined from the country mean scores, their standard errors and the covariance between the performance scales of two domains. From this, it can be concluded, with a likelihood of 95%, whether a country would rank statistically significantly higher, not statistically differently, or statistically significantly lower in one domain than in the other domain. For details on the methods employed, see the PISA 2003 Technical Report (OECD, 2005c).
For some countries – most notably Greece, Italy, Korea, Mexico, Portugal, Spain and Turkey – the relative standing is similar across the four mathematics content areas. By contrast, in Austria, Canada, the Czech Republic, France, Germany, Ireland, Japan, New Zealand, Norway, the Slovak Republic and Switzerland, performance differences among the content areas are particularly large and may warrant attention in curriculum development and implementation. For additional details, see Learning for Tomorrow’s World – First Results from PISA 2003 (OECD, 2004a).
For some countries – most notably Japan – the relative standing is broadly similar in the content areas that were assessed in both 2000 and 2003, while performance is lower on the quantity and uncertainty scales that were newly introduced in 2003. While it would be wrong to conclude that mathematics performance in these countries has declined, the results do suggest that the introduction of the new content areas into the assessment shed a slightly different light on the overall performance of these countries.
Distribution of student performance
While average performance figures can provide a good indication of the overall performance of a country, they may mask significant variation in performance within countries, possibly reflecting different performance among different student groups. Thus, this section presents information on the distribution of mathematics scores, examining the range of performance within countries.
Table A4.3 shows the distribution of student performance within countries. This analysis is different from the examination of the distribution of student performance across the PISA proficiency levels discussed in the first section in the following way. Whereas the distribution of students across proficiency levels indicates the proportion of students in each country that can demonstrate a specified level of knowledge and skills, and thus compares countries on the basis of absolute benchmarks of student performance, the analysis below focuses on the relative distribution of scores, i.e. the gap that exists between students with the highest and the lowest levels of performance within each country. This is an important indicator of the equality of educational outcomes in mathematics.
chapter a The OuTpuT Of educaTiOnal insTiTuTiOns and The impacT Of learning
Education at a Glance © OECD 200668
A4The results show that there is wide variation in overall student performance on the combined mathematics scale within countries. The middle 90% of the population exceeds by far the range between the mean scores of the highest and lowest performing countries. In almost all OECD countries, this group includes some students proficient at Level 5 and others not proficient above Level 1 (Table A4.3).
In addition, the range of performance in the middle half of the students (i.e. the difference between the 75th and 25th percentiles) on the combined mathematics scale ranges from less than 120 score points in Canada, Finland, Ireland and Mexico to more than 140 score points in Belgium and Germany. In the majority of countries, this range exceeds the magnitude of two proficiency levels and in Belgium and Germany it is around 2.4 proficiency levels. In Belgium, this difference can be explained partially by the difference in performance between the Flemish and French Communities). For additional details, see Learning for Tomorrow’s World – First Results from PISA 2003 (OECD, 2004a).
Box A4.3. Differences in mathematics in PIsA 2000 and PIsA 2003
PISA was first administered in 2000, and thus it is possible to estimate differences in mathematics performance between PISA 2000 and PISA 2003 for the two scales that were used in the 2000 assessment: space and shape and change and relationships. However, in both cases, data should be interpreted with caution. First, since data are only available from two points in time, it is not possible to assess to what extent the observed differences are indicative of trends. Second, while the overall approach to measurement used by PISA is consistent across cycles, small refinements continue to be made, so it would not be prudent to read too much into small changes in results at this stage. Furthermore, sampling and measurement error limit the reliability of comparisons of results over time. Both types of error inevitably arise when assessments are linked through a limited number of common items over time. To account for the effects of such error, the confidence band for comparisons over time has been broadened correspondingly.
With these caveats in mind, performance on the space and shape scale has remained broadly similar across countries between 2000 (494 points) and 2003 (496 points), though this varies for individual countries. In four OECD countries, there were statistically significant increases on this scale, ranging from 15 points in Italy to 28 points in Belgium. On the other hand, average performance in Mexico and Iceland decreased by 18 and 15 points, respectively.
On the change and relationships scale, among the 25 countries for which data can be compared, the OECD average increased from 488 points in 2000 to 499 points in 2003, the largest observed difference in any areas of the PISA assessment. Again, however, there is wide variation across countries and more countries saw differences on this scale than on the space and shape scale. The Czech Republic and Poland both saw increases of around 30 score points (equivalent to about one-half a proficiency level); and in Belgium, Canada, Finland, Germany, Hungary, Korea, Portugal, and Spain, increases were between 13 and 22 points. There were no statistically significant increases or decreases in average scores of the remaining countries.
Source: Learning for Tomorrow’s World – First Results from PISA 2003 (OECD, 2004a), Tables 2.1c, 2.1d, 2.2c and 2.2d.
A4
What 15-Year-Olds Can Do in Mathematics – INDICATOR A4 chapter a
Education at a Glance © OECD 2006 69
Even countries with similar levels of average performance show considerable variation in the disparities of student performance. For example, Germany and Ireland both have mean scores around the OECD average, but while Ireland shows one of the narrowest distributions, the difference between the 75th and 25th percentiles in Germany is among the widest. Similarly, towards the lower end of the scale, Italy and Portugal show similar levels of average performance, but Italy shows much larger performance variation than Portugal. Among the top performing countries, Finland displays much less performance variation than Korea or the Netherlands (Table A4.3).
Finally, a comparison between the range of performance within a country and its average performance reveals that wide disparities in performance are not a necessary condition for a country to attain a high level of overall performance. For example, Canada, Denmark, Finland, Iceland and Korea all have above-average performance but below-average differences between the 75th and 25th percentiles.
Definitions and methodologies
The achievement scores are based on assessments administered in 2003 as part of the Programme for International Student Assessment (PISA) undertaken by the OECD.
The target population studied for this indicator was 15-year-old students. Operationally, this referred to students who were from 15 years and 3 (completed) months to 16 years and 2 (completed) months at the beginning of the testing period and who were enrolled in an educational institution at the secondary level, irrespective of the grade levels or type of institutions in which they were enrolled, and irrespective of whether they participated in school full-time or part-time.
Further references
For further information about PISA 2003, see Learning for Tomorrow’s World – First Results from PISA 2003 (OECD, 2004a), Problem Solving for Tomorrow’s World – First Measures of Cross-Curricular Competencies from PISA 2003 (OECD, 2004b) and the PISA 2003 Technical Report (OECD, 2005c). PISA data is also available on the PISA Web site: www.pisa.oecd.org.
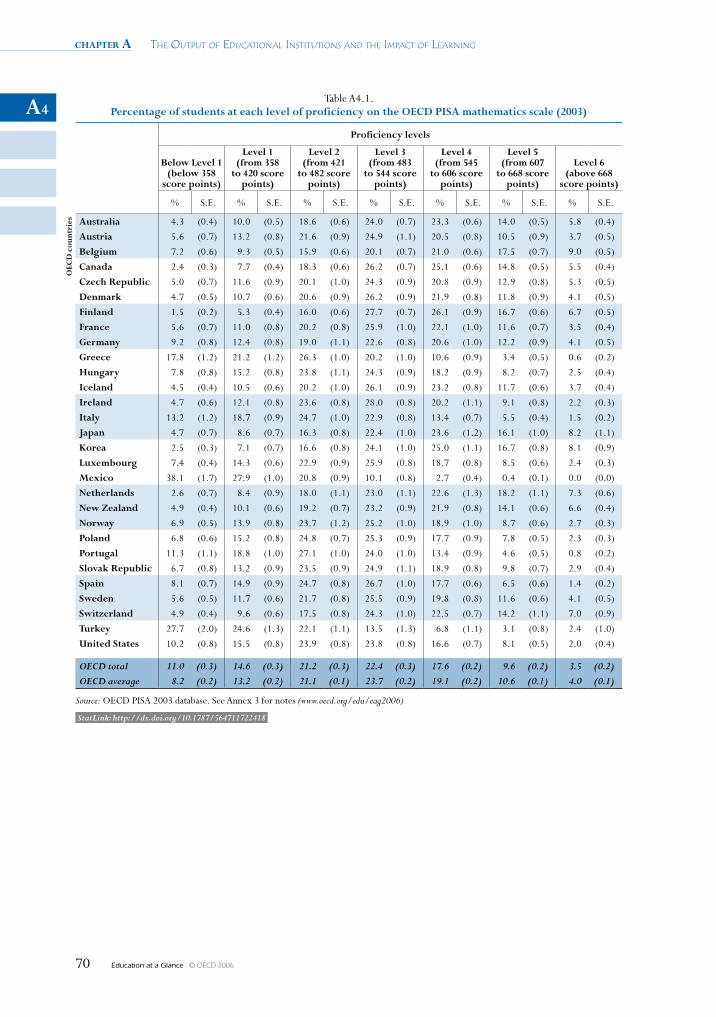
chapter a The OuTpuT Of educaTiOnal insTiTuTiOns and The impacT Of learning
Education at a Glance © OECD 200670
A4Table A4.1.
Percentage of students at each level of proficiency on the OeCD PIsA mathematics scale (2003)
Proficiency levels
Below level 1 (below 358
score points)
level 1 (from 358
to 420 score points)
level 2 (from 421
to 482 score points)
level 3 (from 483
to 544 score points)
level 4 (from 545
to 606 score points)
level 5 (from 607
to 668 score points)
level 6 (above 668
score points)
% S.E. % S.E. % S.E. % S.E. % S.E. % S.E. % S.E.
OeC
D c
ount
ries Australia 4.3 (0.4) 10.0 (0.5) 18.6 (0.6) 24.0 (0.7) 23.3 (0.6) 14.0 (0.5) 5.8 (0.4)
Austria 5.6 (0.7) 13.2 (0.8) 21.6 (0.9) 24.9 (1.1) 20.5 (0.8) 10.5 (0.9) 3.7 (0.5)
Belgium 7.2 (0.6) 9.3 (0.5) 15.9 (0.6) 20.1 (0.7) 21.0 (0.6) 17.5 (0.7) 9.0 (0.5)
Canada 2.4 (0.3) 7.7 (0.4) 18.3 (0.6) 26.2 (0.7) 25.1 (0.6) 14.8 (0.5) 5.5 (0.4)
Czech Republic 5.0 (0.7) 11.6 (0.9) 20.1 (1.0) 24.3 (0.9) 20.8 (0.9) 12.9 (0.8) 5.3 (0.5)
Denmark 4.7 (0.5) 10.7 (0.6) 20.6 (0.9) 26.2 (0.9) 21.9 (0.8) 11.8 (0.9) 4.1 (0.5)
Finland 1.5 (0.2) 5.3 (0.4) 16.0 (0.6) 27.7 (0.7) 26.1 (0.9) 16.7 (0.6) 6.7 (0.5)
France 5.6 (0.7) 11.0 (0.8) 20.2 (0.8) 25.9 (1.0) 22.1 (1.0) 11.6 (0.7) 3.5 (0.4)
Germany 9.2 (0.8) 12.4 (0.8) 19.0 (1.1) 22.6 (0.8) 20.6 (1.0) 12.2 (0.9) 4.1 (0.5)
Greece 17.8 (1.2) 21.2 (1.2) 26.3 (1.0) 20.2 (1.0) 10.6 (0.9) 3.4 (0.5) 0.6 (0.2)
hungary 7.8 (0.8) 15.2 (0.8) 23.8 (1.1) 24.3 (0.9) 18.2 (0.9) 8.2 (0.7) 2.5 (0.4)
Iceland 4.5 (0.4) 10.5 (0.6) 20.2 (1.0) 26.1 (0.9) 23.2 (0.8) 11.7 (0.6) 3.7 (0.4)
Ireland 4.7 (0.6) 12.1 (0.8) 23.6 (0.8) 28.0 (0.8) 20.2 (1.1) 9.1 (0.8) 2.2 (0.3)
Italy 13.2 (1.2) 18.7 (0.9) 24.7 (1.0) 22.9 (0.8) 13.4 (0.7) 5.5 (0.4) 1.5 (0.2)
Japan 4.7 (0.7) 8.6 (0.7) 16.3 (0.8) 22.4 (1.0) 23.6 (1.2) 16.1 (1.0) 8.2 (1.1)
Korea 2.5 (0.3) 7.1 (0.7) 16.6 (0.8) 24.1 (1.0) 25.0 (1.1) 16.7 (0.8) 8.1 (0.9)
luxembourg 7.4 (0.4) 14.3 (0.6) 22.9 (0.9) 25.9 (0.8) 18.7 (0.8) 8.5 (0.6) 2.4 (0.3)
mexico 38.1 (1.7) 27.9 (1.0) 20.8 (0.9) 10.1 (0.8) 2.7 (0.4) 0.4 (0.1) 0.0 (0.0)
Netherlands 2.6 (0.7) 8.4 (0.9) 18.0 (1.1) 23.0 (1.1) 22.6 (1.3) 18.2 (1.1) 7.3 (0.6)
New Zealand 4.9 (0.4) 10.1 (0.6) 19.2 (0.7) 23.2 (0.9) 21.9 (0.8) 14.1 (0.6) 6.6 (0.4)
Norway 6.9 (0.5) 13.9 (0.8) 23.7 (1.2) 25.2 (1.0) 18.9 (1.0) 8.7 (0.6) 2.7 (0.3)
Poland 6.8 (0.6) 15.2 (0.8) 24.8 (0.7) 25.3 (0.9) 17.7 (0.9) 7.8 (0.5) 2.3 (0.3)
Portugal 11.3 (1.1) 18.8 (1.0) 27.1 (1.0) 24.0 (1.0) 13.4 (0.9) 4.6 (0.5) 0.8 (0.2)
slovak Republic 6.7 (0.8) 13.2 (0.9) 23.5 (0.9) 24.9 (1.1) 18.9 (0.8) 9.8 (0.7) 2.9 (0.4)
spain 8.1 (0.7) 14.9 (0.9) 24.7 (0.8) 26.7 (1.0) 17.7 (0.6) 6.5 (0.6) 1.4 (0.2)
sweden 5.6 (0.5) 11.7 (0.6) 21.7 (0.8) 25.5 (0.9) 19.8 (0.8) 11.6 (0.6) 4.1 (0.5)
switzerland 4.9 (0.4) 9.6 (0.6) 17.5 (0.8) 24.3 (1.0) 22.5 (0.7) 14.2 (1.1) 7.0 (0.9)
Turkey 27.7 (2.0) 24.6 (1.3) 22.1 (1.1) 13.5 (1.3) 6.8 (1.1) 3.1 (0.8) 2.4 (1.0)
United states 10.2 (0.8) 15.5 (0.8) 23.9 (0.8) 23.8 (0.8) 16.6 (0.7) 8.1 (0.5) 2.0 (0.4)
OECD total 11.0 (0.3) 14.6 (0.3) 21.2 (0.3) 22.4 (0.3) 17.6 (0.2) 9.6 (0.2) 3.5 (0.2)OECD average 8.2 (0.2) 13.2 (0.2) 21.1 (0.1) 23.7 (0.2) 19.1 (0.2) 10.6 (0.1) 4.0 (0.1)
Source: OECD PISA 2003 database. See Annex 3 for notes (www.oecd.org/edu/eag2006)
StatLink: http://dx.doi.org/10.1787/564711722418
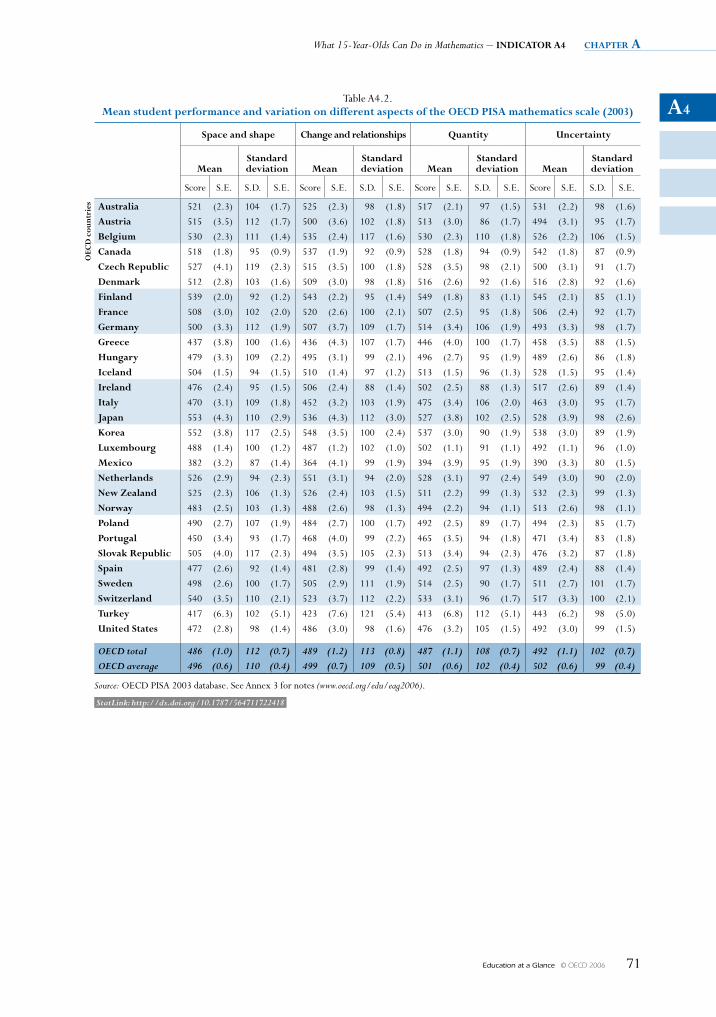
A4
What 15-Year-Olds Can Do in Mathematics – INDICATOR A4 chapter a
Education at a Glance © OECD 2006 71
Table A4.2. mean student performance and variation on different aspects of the OeCD PIsA mathematics scale (2003)
space and shape Change and relationships Quantity Uncertainty
meanstandard deviation mean
standard deviation mean
standard deviation mean
standard deviation
Score S.E. S.D. S.E. Score S.E. S.D. S.E. Score S.E. S.D. S.E. Score S.E. S.D. S.E.
OeC
D c
ount
ries Australia 521 (2.3) 104 (1.7) 525 (2.3) 98 (1.8) 517 (2.1) 97 (1.5) 531 (2.2) 98 (1.6)
Austria 515 (3.5) 112 (1.7) 500 (3.6) 102 (1.8) 513 (3.0) 86 (1.7) 494 (3.1) 95 (1.7)
Belgium 530 (2.3) 111 (1.4) 535 (2.4) 117 (1.6) 530 (2.3) 110 (1.8) 526 (2.2) 106 (1.5)
Canada 518 (1.8) 95 (0.9) 537 (1.9) 92 (0.9) 528 (1.8) 94 (0.9) 542 (1.8) 87 (0.9)
Czech Republic 527 (4.1) 119 (2.3) 515 (3.5) 100 (1.8) 528 (3.5) 98 (2.1) 500 (3.1) 91 (1.7)
Denmark 512 (2.8) 103 (1.6) 509 (3.0) 98 (1.8) 516 (2.6) 92 (1.6) 516 (2.8) 92 (1.6)
Finland 539 (2.0) 92 (1.2) 543 (2.2) 95 (1.4) 549 (1.8) 83 (1.1) 545 (2.1) 85 (1.1)
France 508 (3.0) 102 (2.0) 520 (2.6) 100 (2.1) 507 (2.5) 95 (1.8) 506 (2.4) 92 (1.7)
Germany 500 (3.3) 112 (1.9) 507 (3.7) 109 (1.7) 514 (3.4) 106 (1.9) 493 (3.3) 98 (1.7)
Greece 437 (3.8) 100 (1.6) 436 (4.3) 107 (1.7) 446 (4.0) 100 (1.7) 458 (3.5) 88 (1.5)
hungary 479 (3.3) 109 (2.2) 495 (3.1) 99 (2.1) 496 (2.7) 95 (1.9) 489 (2.6) 86 (1.8)
Iceland 504 (1.5) 94 (1.5) 510 (1.4) 97 (1.2) 513 (1.5) 96 (1.3) 528 (1.5) 95 (1.4)
Ireland 476 (2.4) 95 (1.5) 506 (2.4) 88 (1.4) 502 (2.5) 88 (1.3) 517 (2.6) 89 (1.4)
Italy 470 (3.1) 109 (1.8) 452 (3.2) 103 (1.9) 475 (3.4) 106 (2.0) 463 (3.0) 95 (1.7)
Japan 553 (4.3) 110 (2.9) 536 (4.3) 112 (3.0) 527 (3.8) 102 (2.5) 528 (3.9) 98 (2.6)
Korea 552 (3.8) 117 (2.5) 548 (3.5) 100 (2.4) 537 (3.0) 90 (1.9) 538 (3.0) 89 (1.9)
luxembourg 488 (1.4) 100 (1.2) 487 (1.2) 102 (1.0) 502 (1.1) 91 (1.1) 492 (1.1) 96 (1.0)
mexico 382 (3.2) 87 (1.4) 364 (4.1) 99 (1.9) 394 (3.9) 95 (1.9) 390 (3.3) 80 (1.5)
Netherlands 526 (2.9) 94 (2.3) 551 (3.1) 94 (2.0) 528 (3.1) 97 (2.4) 549 (3.0) 90 (2.0)
New Zealand 525 (2.3) 106 (1.3) 526 (2.4) 103 (1.5) 511 (2.2) 99 (1.3) 532 (2.3) 99 (1.3)
Norway 483 (2.5) 103 (1.3) 488 (2.6) 98 (1.3) 494 (2.2) 94 (1.1) 513 (2.6) 98 (1.1)
Poland 490 (2.7) 107 (1.9) 484 (2.7) 100 (1.7) 492 (2.5) 89 (1.7) 494 (2.3) 85 (1.7)
Portugal 450 (3.4) 93 (1.7) 468 (4.0) 99 (2.2) 465 (3.5) 94 (1.8) 471 (3.4) 83 (1.8)
slovak Republic 505 (4.0) 117 (2.3) 494 (3.5) 105 (2.3) 513 (3.4) 94 (2.3) 476 (3.2) 87 (1.8)
spain 477 (2.6) 92 (1.4) 481 (2.8) 99 (1.4) 492 (2.5) 97 (1.3) 489 (2.4) 88 (1.4)
sweden 498 (2.6) 100 (1.7) 505 (2.9) 111 (1.9) 514 (2.5) 90 (1.7) 511 (2.7) 101 (1.7)
switzerland 540 (3.5) 110 (2.1) 523 (3.7) 112 (2.2) 533 (3.1) 96 (1.7) 517 (3.3) 100 (2.1)
Turkey 417 (6.3) 102 (5.1) 423 (7.6) 121 (5.4) 413 (6.8) 112 (5.1) 443 (6.2) 98 (5.0)
United states 472 (2.8) 98 (1.4) 486 (3.0) 98 (1.6) 476 (3.2) 105 (1.5) 492 (3.0) 99 (1.5)
OECD total 486 (1.0) 112 (0.7) 489 (1.2) 113 (0.8) 487 (1.1) 108 (0.7) 492 (1.1) 102 (0.7)OECD average 496 (0.6) 110 (0.4) 499 (0.7) 109 (0.5) 501 (0.6) 102 (0.4) 502 (0.6) 99 (0.4)
Source: OECD PISA 2003 database. See Annex 3 for notes (www.oecd.org/edu/eag2006).
StatLink: http://dx.doi.org/10.1787/564711722418
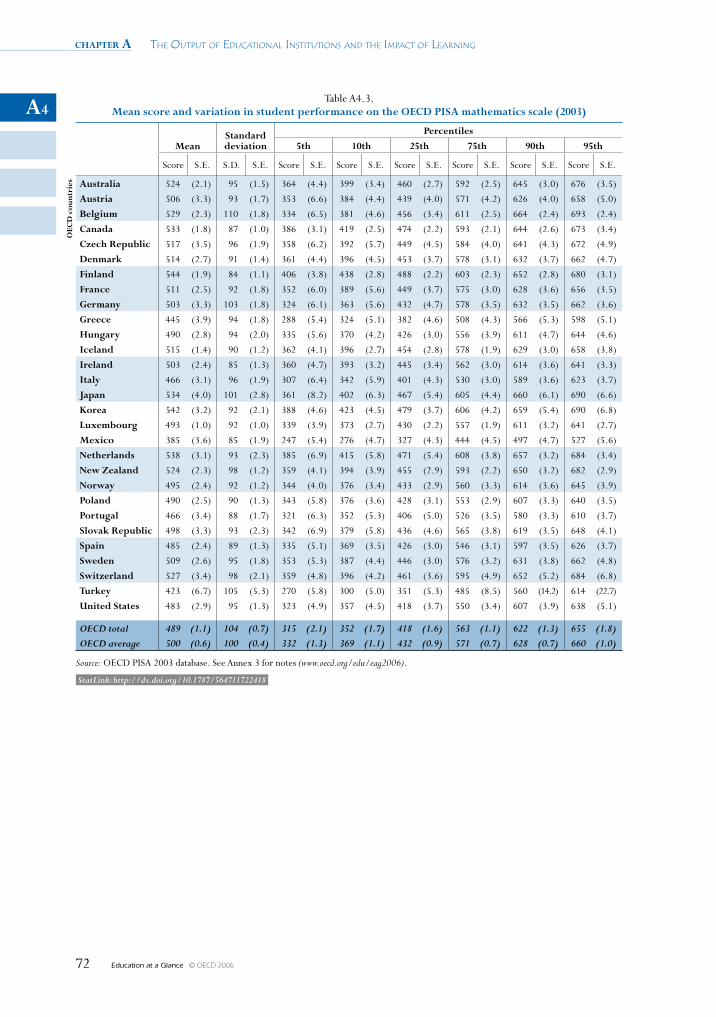
chapter a The OuTpuT Of educaTiOnal insTiTuTiOns and The impacT Of learning
Education at a Glance © OECD 200672
A4Table A4.3.
mean score and variation in student performance on the OeCD PIsA mathematics scale (2003)
meanstandard deviation
Percentiles
5th 10th 25th 75th 90th 95th
Score S.E. S.D. S.E. Score S.E. Score S.E. Score S.E. Score S.E. Score S.E. Score S.E.
OeC
D c
ount
ries Australia 524 (2.1) 95 (1.5) 364 (4.4) 399 (3.4) 460 (2.7) 592 (2.5) 645 (3.0) 676 (3.5)
Austria 506 (3.3) 93 (1.7) 353 (6.6) 384 (4.4) 439 (4.0) 571 (4.2) 626 (4.0) 658 (5.0)
Belgium 529 (2.3) 110 (1.8) 334 (6.5) 381 (4.6) 456 (3.4) 611 (2.5) 664 (2.4) 693 (2.4)
Canada 533 (1.8) 87 (1.0) 386 (3.1) 419 (2.5) 474 (2.2) 593 (2.1) 644 (2.6) 673 (3.4)
Czech Republic 517 (3.5) 96 (1.9) 358 (6.2) 392 (5.7) 449 (4.5) 584 (4.0) 641 (4.3) 672 (4.9)
Denmark 514 (2.7) 91 (1.4) 361 (4.4) 396 (4.5) 453 (3.7) 578 (3.1) 632 (3.7) 662 (4.7)
Finland 544 (1.9) 84 (1.1) 406 (3.8) 438 (2.8) 488 (2.2) 603 (2.3) 652 (2.8) 680 (3.1)
France 511 (2.5) 92 (1.8) 352 (6.0) 389 (5.6) 449 (3.7) 575 (3.0) 628 (3.6) 656 (3.5)
Germany 503 (3.3) 103 (1.8) 324 (6.1) 363 (5.6) 432 (4.7) 578 (3.5) 632 (3.5) 662 (3.6)
Greece 445 (3.9) 94 (1.8) 288 (5.4) 324 (5.1) 382 (4.6) 508 (4.3) 566 (5.3) 598 (5.1)
hungary 490 (2.8) 94 (2.0) 335 (5.6) 370 (4.2) 426 (3.0) 556 (3.9) 611 (4.7) 644 (4.6)
Iceland 515 (1.4) 90 (1.2) 362 (4.1) 396 (2.7) 454 (2.8) 578 (1.9) 629 (3.0) 658 (3.8)
Ireland 503 (2.4) 85 (1.3) 360 (4.7) 393 (3.2) 445 (3.4) 562 (3.0) 614 (3.6) 641 (3.3)
Italy 466 (3.1) 96 (1.9) 307 (6.4) 342 (5.9) 401 (4.3) 530 (3.0) 589 (3.6) 623 (3.7)
Japan 534 (4.0) 101 (2.8) 361 (8.2) 402 (6.3) 467 (5.4) 605 (4.4) 660 (6.1) 690 (6.6)
Korea 542 (3.2) 92 (2.1) 388 (4.6) 423 (4.5) 479 (3.7) 606 (4.2) 659 (5.4) 690 (6.8)
luxembourg 493 (1.0) 92 (1.0) 339 (3.9) 373 (2.7) 430 (2.2) 557 (1.9) 611 (3.2) 641 (2.7)
mexico 385 (3.6) 85 (1.9) 247 (5.4) 276 (4.7) 327 (4.3) 444 (4.5) 497 (4.7) 527 (5.6)
Netherlands 538 (3.1) 93 (2.3) 385 (6.9) 415 (5.8) 471 (5.4) 608 (3.8) 657 (3.2) 684 (3.4)
New Zealand 524 (2.3) 98 (1.2) 359 (4.1) 394 (3.9) 455 (2.9) 593 (2.2) 650 (3.2) 682 (2.9)
Norway 495 (2.4) 92 (1.2) 344 (4.0) 376 (3.4) 433 (2.9) 560 (3.3) 614 (3.6) 645 (3.9)
Poland 490 (2.5) 90 (1.3) 343 (5.8) 376 (3.6) 428 (3.1) 553 (2.9) 607 (3.3) 640 (3.5)
Portugal 466 (3.4) 88 (1.7) 321 (6.3) 352 (5.3) 406 (5.0) 526 (3.5) 580 (3.3) 610 (3.7)
slovak Republic 498 (3.3) 93 (2.3) 342 (6.9) 379 (5.8) 436 (4.6) 565 (3.8) 619 (3.5) 648 (4.1)
spain 485 (2.4) 89 (1.3) 335 (5.1) 369 (3.5) 426 (3.0) 546 (3.1) 597 (3.5) 626 (3.7)
sweden 509 (2.6) 95 (1.8) 353 (5.3) 387 (4.4) 446 (3.0) 576 (3.2) 631 (3.8) 662 (4.8)
switzerland 527 (3.4) 98 (2.1) 359 (4.8) 396 (4.2) 461 (3.6) 595 (4.9) 652 (5.2) 684 (6.8)
Turkey 423 (6.7) 105 (5.3) 270 (5.8) 300 (5.0) 351 (5.3) 485 (8.5) 560 (14.2) 614 (22.7)
United states 483 (2.9) 95 (1.3) 323 (4.9) 357 (4.5) 418 (3.7) 550 (3.4) 607 (3.9) 638 (5.1)
OECD total 489 (1.1) 104 (0.7) 315 (2.1) 352 (1.7) 418 (1.6) 563 (1.1) 622 (1.3) 655 (1.8)OECD average 500 (0.6) 100 (0.4) 332 (1.3) 369 (1.1) 432 (0.9) 571 (0.7) 628 (0.7) 660 (1.0)
Source: OECD PISA 2003 database. See Annex 3 for notes (www.oecd.org/edu/eag2006).
StatLink: http://dx.doi.org/10.1787/564711722418

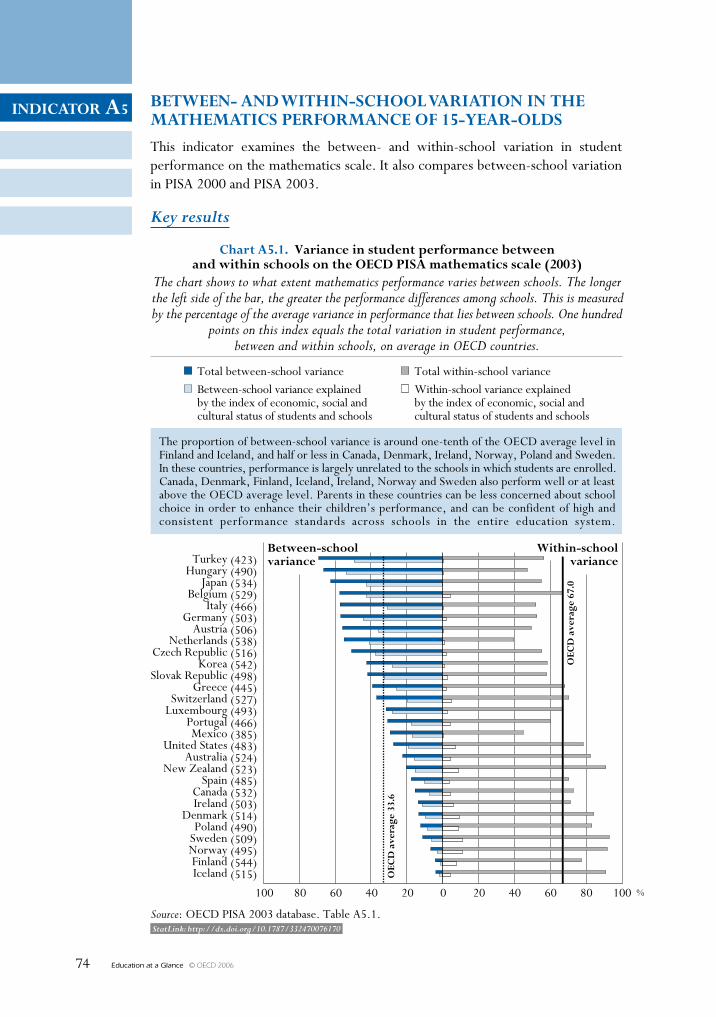
Education at a Glance © OECD 200674
INDICATOR A5
StatLink: http://dx.doi.org/10.1787/332470076170
BeTweeN- AND wIThIN-sChOOl VARIATION IN The mAThemATICs PeRfORmANCe Of 15-yeAR-OlDsThis indicator examines the between- and within-school variation in student performance on the mathematics scale. It also compares between-school variation in PISA 2000 and PISA 2003.
Key results
Chart A5.1. Variance in student performance betweenand within schools on the OeCD PIsA mathematics scale (2003)
The chart shows to what extent mathematics performance varies between schools. The longerthe left side of the bar, the greater the performance differences among schools. This is measuredby the percentage of the average variance in performance that lies between schools. One hundred
points on this index equals the total variation in student performance,between and within schools, on average in OECD countries.
Total between-school varianceBetween-school variance explainedby the index of economic, social andcultural status of students and schools
Source: OECD PISA 2003 database. Table A5.1.
Between-schoolvariance
OeC
D a
vera
ge 6
7.0
The proportion of between-school variance is around one-tenth of the OECD average level inFinland and Iceland, and half or less in Canada, Denmark, Ireland, Norway, Poland and Sweden.In these countries, performance is largely unrelated to the schools in which students are enrolled.Canada, Denmark, Finland, Iceland, Ireland, Norway and Sweden also perform well or at leastabove the OECD average level. Parents in these countries can be less concerned about schoolchoice in order to enhance their children’s performance, and can be confident of high andconsistent performance standards across schools in the entire education system.
OeC
D a
vera
ge 3
3.6
Total within-school varianceWithin-school variance explainedby the index of economic, social andcultural status of students and schools
within-schoolvarianceTurkey
HungaryJapan
BelgiumItaly
GermanyAustria
NetherlandsCzech Republic
KoreaSlovak Republic
GreeceSwitzerland
LuxembourgPortugalMexico
United StatesAustralia
New ZealandSpain
CanadaIreland
DenmarkPoland
SwedenNorwayFinlandIceland
%100 80 60 40 20 0 20 40 60 80 100
(423)(490)(534)(529)(466)(503)(506)(538)(516)(542)(498)(445)(527)(493)(466)(385)(483)(524)(523)(485)(532)(503)(514)(490)(509)(495)(544)(515)
INDICATOR A5
Education at a Glance © OECD 2006 75
Other highlights of this indicator
• Students in all OECD countries show widely varying performance, but countries vary widely in the extent to which students in different schools perform differently. On average across OECD countries, differences in the performance in mathematics between schools account for 34% of total variation in achievement. However, in nine countries between-school variation is above half the overall variation in OECD countries, while in three countries it is below 10%.
• While some between-school variance is attributable to students’ socio-economic backgrounds, some of it also likely reflects the structural features of schools and/or education systems, and/or the policies and practices of school administrators and teachers. Thus, there may be an added value associated with attending a particular school.
• Some, though not all, countries that performed well in PISA also showed low or modest levels of between-school variance, suggesting that securing similar student performance among schools is a policy goal that is both important in itself and compatible with the goal of high overall performance standards.
chapter a The OuTpuT Of educaTiOnal insTiTuTiOns and The impacT Of learning
Education at a Glance © OECD 200676
A5Policy context
Catering for the needs of a diverse student body and narrowing the gaps in student performance represent formidable challenges for all countries. The approaches that countries have chosen to address these demands vary. Some countries have comprehensive school systems with no, or only limited, institutional differentiation. They seek to provide all students with similar opportunities for learning by requiring each school and teacher to provide for the full range of student abilities, interests and backgrounds. Other countries respond to diversity by grouping students through tracking or streaming, whether between schools or between classes within schools, with the aim of serving students according to their academic potential and/or interests in specific programs. In many countries, combinations of the two approaches occur. Even in comprehensive school systems, there may be variation in performance levels between schools, due to the socio-economic and cultural characteristics of the communities that are served, or due to geographical differences (such as between regions, provinces or states in federal systems, or between rural and urban areas). Finally, there may be differences between individual schools, such as the type or quality of instruction. As a result, even in comprehensive systems, the performance levels attained by students may still vary across schools. This indicator examines the between- and within-school variation in students’ performance on the mathematics scale.
Evidence and explanations
Chart A5.1 above shows considerable differences in the extent to which mathematics competencies of 15-year-old students vary within each country (Table 5.1). The total length of the bars indicates the observed variance in student performance on the PISA mathematics scale. The values in Chart A5.1 are expressed as percentages of the average variance between OECD countries in student performance on the PISA mathematics scale.
The average is calculated over the OECD countries included in the table. A value larger than 100 indicates that variance in student performance is greater in the corresponding country than on average among OECD countries. Similarly, a value smaller than 100 indicates below-average variance in student performance. For example, the variance in student performance in Finland, Ireland and Mexico is more than 15% below the OECD average variance. By contrast, in Belgium, Japan and Turkey, variance in student performance is at least 15% above the OECD average level. The OECD average level is calculated simply as the arithmetic mean of the respective country values. This average differs from the square of the OECD average standard deviation shown in Chapter 2 of Learning for Tomorrow’s World – First Results from PISA 2003 (OECD, 2004a), since the latter includes the performance variation among countries whereas the former simply averages the within-country performance variation across countries.
In Chart A5.1, a distinction is made for each country between the variation attributable to differences in student results attained by students in different schools (between-school differences) and that attributable to the range of student results within schools (within-school differences). Note that, because of the manner in which students were sampled, the within-school variation includes variation between classes as well as between students. The length of the bars to the left
A5
Between- and Within-School Variation in the Mathematics Performance of 15-Year-Olds – IndIcAtor A5 chapter a
Education at a Glance © OECD 2006 77
of the central line shows between-school differences, and also serves to order countries in the figure. The length of the bars to the right of the central line shows the within-school differences. Therefore, longer segments to the left of the central line indicate greater variation in the mean performance of different schools while longer segments to the right of the central line indicate greater variation among students within schools.
As presented in Chart A5.1, while all countries show considerable within-school variance, in most countries variance in student performance between schools is also considerable. On average across OECD countries, differences in the performance of 15-year-olds between schools account for 34% of the total variation in student performance in OECD countries. See Box A5.1 for an indication of how between-school variation in PISA 2003 compares to PISA 2000.
In Hungary and Turkey, variation in performance between schools is particularly large and is about twice the OECD average between-school variance. In Austria, Belgium, the Czech Republic, Germany, Italy, Japan and the Netherlands, the proportion of between-school variance is still over one-and-a-half times that of the OECD average level (third column, Table A5.1). Where there is substantial variation in performance between schools and less variation between students within schools, students tend to be grouped in schools in which other students perform at levels similar to their own. This may reflect school choices made by families or residential location, as well as policies on school enrolment or the allocation of students to different curricula. To capture variation between education systems and regions within countries, some countries have undertaken the PISA assessment at regional levels.
The proportion of between-school variance is around one-tenth of the OECD average level in Finland and Iceland, and half or less in Canada, Denmark, Ireland, Norway, Poland and Sweden. In these countries, performance is largely unrelated to the schools in which students are enrolled (see Table 5.1). This suggests that the learning environment is similar in the ways that it affects the performance of students. It is noteworthy that Canada, Denmark, Finland, Iceland, Ireland, Norway and Sweden also perform close to or above the OECD average level. Parents in these countries can be less concerned about school choice in order to enhance their children’s performance, and can be confident of high and consistent performance standards across schools in the entire education system.
While some of the variance between schools is attributable to the socio-economic background of students entering the school, some of it is also likely to reflect certain structural features of schools and education systems, particularly in systems where students are tracked by ability. Some of the variance in performance between schools also may be attributable to the policies and practices of school administrators and teachers. In other words, there is an added value associated with attending a particular school.
It is important to note that some, though not all, high-performing countries also show low or modest levels of between-school variance. This suggests that securing similar student performance among schools, perhaps most importantly by identifying and reforming poorly performing schools, is a policy goal that is both important in itself and compatible with the goal of high overall performance standards.
chapter a The OuTpuT Of educaTiOnal insTiTuTiOns and The impacT Of learning
Education at a Glance © OECD 200678
A5Box A5.1. Comparing between-school variation in PIsA 2000 and PIsA 2003
For most countries, the 2003 results are similar to those observed in the PISA 2000 assessment. However, there are some exceptions. For instance, in Poland, the move towards a more integrated education system since 1999 – as a consequence of which institutional differentiation now occurs mainly after the age of 15 – may have contributed to the observed dramatic reduction in the between-school variation in mathematics performance of 15-year-old students. Between-school variance in Poland fell from more than half of the overall performance variation in Poland in 2000 (see Learning for Tomorrow’s World – First Results from PISA 2003 [OECD, 2004a], Table 4.1b) to just 13% in 2003 (see the same publication, Table 4.1a). Note that in all countries, the changes between 2000 and 2003 are very similar for the two mathematics subscales for which trend data can be estimated. For the purpose of this comparison, results are only shown for the overall mathematics scale, even though the PISA 2000 data did not include two of the four mathematical content areas used in PISA 2003. Simultaneously, the average performance of 15-year-olds in Poland is significantly higher in both mathematical content areas, and the overall performance gap between the lower and higher achievers is narrower than it was in 2000. The increase in average mathematics performance is thus mainly attributable to an increase in performance at the lower end of the performance distribution (i.e. the 5th, 10th and 25th percentiles). This has occurred to such an extent that in 2003 fewer than 5% of students fell below the performance standards that 10% of Polish students had failed to attain in 2000 (for data, see www.pisa.oecd.org).
Performance differences among schools were also lower in some other countries in 2003: for example, in Belgium, Greece and Mexico, the proportion of national variation in student performance attributable to between-school variance is between 8 to 10 percentage points lower than in 2000. Note that in Belgium some of this difference may likely be attributable to changes in the ways in which schools were defined for the purposes of sampling in PISA. In contrast, in Italy, the proportion of variance that lies between schools increased by more than 10 percentage points.
Definitions and methodology
The achievement scores are based on assessments administered in 2003 as part of the Programme for International Student Assessment (PISA) undertaken by the OECD.
The target population studied for this indicator was 15-year-old students. Operationally, this referred to students who were from 15 years and 3 (completed) months to 16 years and 2 (completed) months at the beginning of the testing period and who were enrolled in an educational institution, irrespective of the grade levels or type of institutions in which they were enrolled, and irrespective of whether they participated in school full-time or part-time.
A5
Between- and Within-School Variation in the Mathematics Performance of 15-Year-Olds – IndIcAtor A5 chapter a
Education at a Glance © OECD 2006 79
Variation in this indicator is expressed by statistical variance. This is obtained by squaring the standard deviation. The statistical variance rather than the standard deviation is used for this comparison to allow for the decomposition of the components of variation in student performance. For reasons explained in the PISA 2003 Technical Report (OECD, 2005c), and most importantly because the data in this table only account for students with valid data on their socio-economic background, the variance may differ from the square of the standard deviation.
The between-school variation is influenced by the ways in which schools are defined and organised within countries and by the units that were chosen for sampling purposes. For example, in some countries some of the schools in the PISA sample were defined as administrative units (even if they spanned several geographically separate institutions, as in Italy; in others they were defined as those parts of larger educational institutions that serve 15-year-olds; in others they were defined as physical school buildings; and in yet others they were defined from a management perspective (e.g. entities having a principal). The PISA 2003 Technical Report (OECD, 2005c) provides an overview of how schools were defined.
Further references
For further information about PISA 2003, see Learning for Tomorrow’s World – First Results from PISA 2003 (OECD, 2004a), Problem Solving for Tomorrow’s World – First Measures of Cross-Curricular Competencies from PISA 2003 (OECD, 2004b) and the PISA 2003 Technical Report (OECD, 2005c). PISA data is also available on the PISA Web site: www.pisa.oecd.org.
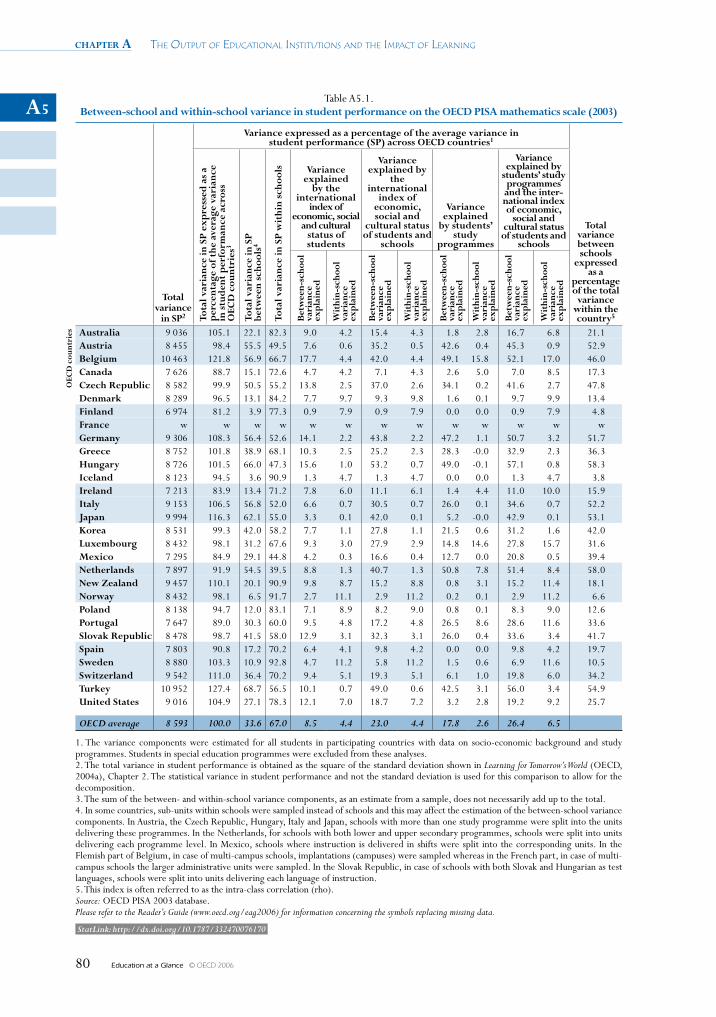
chapter a The OuTpuT Of educaTiOnal insTiTuTiOns and The impacT Of learning
Education at a Glance © OECD 200680
A5Table A5.1.
Between-school and within-school variance in student performance on the OeCD PIsA mathematics scale (2003)
Total variance
in sP2
Variance expressed as a percentage of the average variance in student performance (sP) across OeCD countries1
Total variance between schools
expressed as a
percentage of the total
variance within the country5To
tal v
aria
nce
in s
P ex
pre
ssed
as
a p
erce
ntag
e of
the
ave
rage
var
ianc
e
in s
tud
ent
per
form
ance
acr
oss
O
eCD
cou
ntri
es3
Tota
l var
ianc
e in
sP
be
twee
n sc
hool
s4
Tota
l var
ianc
e in
sP
wit
hin
scho
ols Variance
explained by the
international index of
economic, social and cultural
status of students
Variance explained by
the international
index of economic, social and
cultural status of students and
schools
Variance explained
by students’ study
programmes
Variance explained by
students’ study programmes and the inter-national index of economic,
social and cultural status of students and
schools
Bet
wee
n-sc
hool
va
rian
ce
expl
aine
d
wit
hin-
scho
ol
vari
ance
ex
plai
ned
Bet
wee
n-sc
hool
va
rian
ce
expl
aine
d
wit
hin-
scho
ol
vari
ance
ex
plai
ned
Bet
wee
n-sc
hool
va
rian
ce
expl
aine
d
wit
hin-
scho
ol
vari
ance
ex
plai
ned
Bet
wee
n-sc
hool
va
rian
ce
expl
aine
d
wit
hin-
scho
ol
vari
ance
ex
plai
ned
OeC
D c
ount
ries Australia 9 036 105.1 22.1 82.3 9.0 4.2 15.4 4.3 1.8 2.8 16.7 6.8 21.1
Austria 8 455 98.4 55.5 49.5 7.6 0.6 35.2 0.5 42.6 0.4 45.3 0.9 52.9Belgium 10 463 121.8 56.9 66.7 17.7 4.4 42.0 4.4 49.1 15.8 52.1 17.0 46.0Canada 7 626 88.7 15.1 72.6 4.7 4.2 7.1 4.3 2.6 5.0 7.0 8.5 17.3Czech Republic 8 582 99.9 50.5 55.2 13.8 2.5 37.0 2.6 34.1 0.2 41.6 2.7 47.8Denmark 8 289 96.5 13.1 84.2 7.7 9.7 9.3 9.8 1.6 0.1 9.7 9.9 13.4finland 6 974 81.2 3.9 77.3 0.9 7.9 0.9 7.9 0.0 0.0 0.9 7.9 4.8france w w w w w w w w w w w w wGermany 9 306 108.3 56.4 52.6 14.1 2.2 43.8 2.2 47.2 1.1 50.7 3.2 51.7Greece 8 752 101.8 38.9 68.1 10.3 2.5 25.2 2.3 28.3 -0.0 32.9 2.3 36.3hungary 8 726 101.5 66.0 47.3 15.6 1.0 53.2 0.7 49.0 -0.1 57.1 0.8 58.3Iceland 8 123 94.5 3.6 90.9 1.3 4.7 1.3 4.7 0.0 0.0 1.3 4.7 3.8Ireland 7 213 83.9 13.4 71.2 7.8 6.0 11.1 6.1 1.4 4.4 11.0 10.0 15.9Italy 9 153 106.5 56.8 52.0 6.6 0.7 30.5 0.7 26.0 0.1 34.6 0.7 52.2Japan 9 994 116.3 62.1 55.0 3.3 0.1 42.0 0.1 5.2 -0.0 42.9 0.1 53.1Korea 8 531 99.3 42.0 58.2 7.7 1.1 27.8 1.1 21.5 0.6 31.2 1.6 42.0luxembourg 8 432 98.1 31.2 67.6 9.3 3.0 27.9 2.9 14.8 14.6 27.8 15.7 31.6mexico 7 295 84.9 29.1 44.8 4.2 0.3 16.6 0.4 12.7 0.0 20.8 0.5 39.4Netherlands 7 897 91.9 54.5 39.5 8.8 1.3 40.7 1.3 50.8 7.8 51.4 8.4 58.0New Zealand 9 457 110.1 20.1 90.9 9.8 8.7 15.2 8.8 0.8 3.1 15.2 11.4 18.1Norway 8 432 98.1 6.5 91.7 2.7 11.1 2.9 11.2 0.2 0.1 2.9 11.2 6.6Poland 8 138 94.7 12.0 83.1 7.1 8.9 8.2 9.0 0.8 0.1 8.3 9.0 12.6Portugal 7 647 89.0 30.3 60.0 9.5 4.8 17.2 4.8 26.5 8.6 28.6 11.6 33.6slovak Republic 8 478 98.7 41.5 58.0 12.9 3.1 32.3 3.1 26.0 0.4 33.6 3.4 41.7spain 7 803 90.8 17.2 70.2 6.4 4.1 9.8 4.2 0.0 0.0 9.8 4.2 19.7sweden 8 880 103.3 10.9 92.8 4.7 11.2 5.8 11.2 1.5 0.6 6.9 11.6 10.5switzerland 9 542 111.0 36.4 70.2 9.4 5.1 19.3 5.1 6.1 1.0 19.8 6.0 34.2Turkey 10 952 127.4 68.7 56.5 10.1 0.7 49.0 0.6 42.5 3.1 56.0 3.4 54.9United states 9 016 104.9 27.1 78.3 12.1 7.0 18.7 7.2 3.2 2.8 19.2 9.2 25.7
OECD average 8 593 100.0 33.6 67.0 8.5 4.4 23.0 4.4 17.8 2.6 26.4 6.5
1. The variance components were estimated for all students in participating countries with data on socio-economic background and study programmes. Students in special education programmes were excluded from these analyses.2. The total variance in student performance is obtained as the square of the standard deviation shown in Learning for Tomorrow’s World (OECD, 2004a), Chapter 2. The statistical variance in student performance and not the standard deviation is used for this comparison to allow for the decomposition.3. The sum of the between- and within-school variance components, as an estimate from a sample, does not necessarily add up to the total.4. In some countries, sub-units within schools were sampled instead of schools and this may affect the estimation of the between-school variance components. In Austria, the Czech Republic, Hungary, Italy and Japan, schools with more than one study programme were split into the units delivering these programmes. In the Netherlands, for schools with both lower and upper secondary programmes, schools were split into units delivering each programme level. In Mexico, schools where instruction is delivered in shifts were split into the corresponding units. In the Flemish part of Belgium, in case of multi-campus schools, implantations (campuses) were sampled whereas in the French part, in case of multi-campus schools the larger administrative units were sampled. In the Slovak Republic, in case of schools with both Slovak and Hungarian as test languages, schools were split into units delivering each language of instruction.5. This index is often referred to as the intra-class correlation (rho).Source: OECD PISA 2003 database.Please refer to the Reader’s Guide (www.oecd.org/eag2006) for information concerning the symbols replacing missing data.
StatLink: http://dx.doi.org/10.1787/332470076170

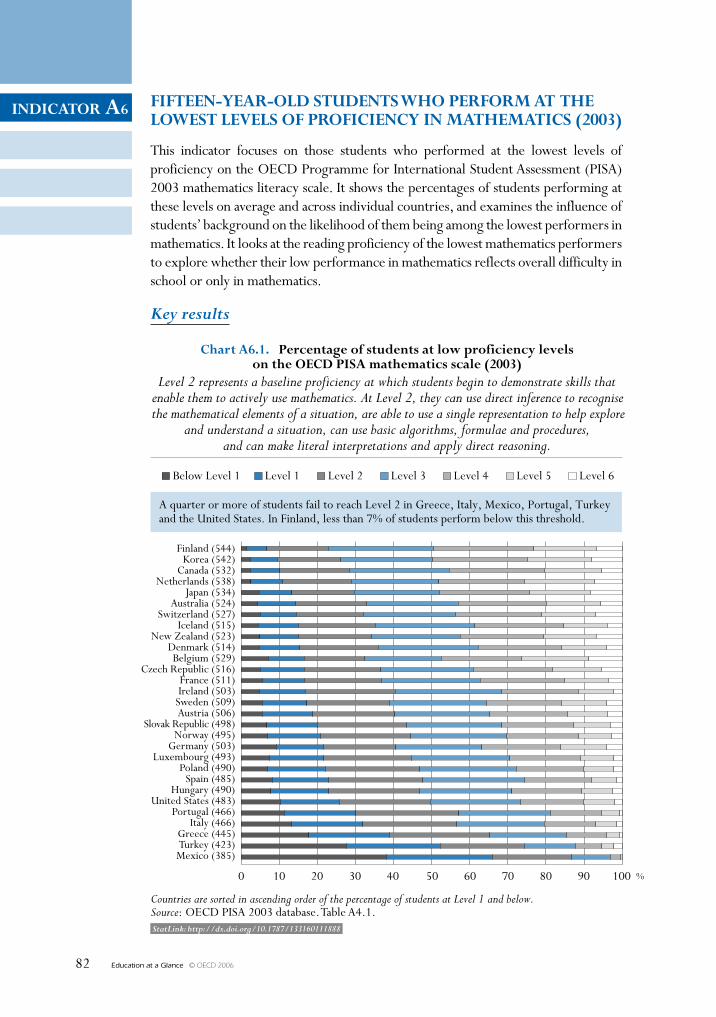
Education at a Glance © OECD 200682
INDICATOR A6
StatLink: http://dx.doi.org/10.1787/133160111888
FIFTeeN-yeAR-OlD sTuDeNTs whO peRFORm AT The lOwesT levels OF pROFICIeNCy IN mAThemATICs (2003)
This indicator focuses on those students who performed at the lowest levels of proficiency on the OECD Programme for International Student Assessment (PISA) 2003 mathematics literacy scale. It shows the percentages of students performing at these levels on average and across individual countries, and examines the influence of students’ background on the likelihood of them being among the lowest performers in mathematics. It looks at the reading proficiency of the lowest mathematics performers to explore whether their low performance in mathematics reflects overall difficulty in school or only in mathematics.
Key results
0 100908070605040302010 %
Chart A6.1. percentage of students at low proficiency levelson the OeCD pIsA mathematics scale (2003)
Level 2 represents a baseline proficiency at which students begin to demonstrate skills thatenable them to actively use mathematics. At Level 2, they can use direct inference to recognisethe mathematical elements of a situation, are able to use a single representation to help explore
and understand a situation, can use basic algorithms, formulae and procedures,and can make literal interpretations and apply direct reasoning.
Below Level 1 Level 1 Level 2 Level 3 Level 4 Level 5
Countries are sorted in ascending order of the percentage of students at Level 1 and below.Source: OECD PISA 2003 database. Table A4.1.
Finland (544)Korea (542)
Canada (532)Netherlands (538)
Japan (534)Australia (524)
Switzerland (527)Iceland (515)
New Zealand (523)Denmark (514)Belgium (529)
Czech Republic (516)France (511)Ireland (503)
Sweden (509)Austria (506)
Slovak Republic (498)Norway (495)
Germany (503)Luxembourg (493)
Poland (490)Spain (485)
Hungary (490)United States (483)
Portugal (466)Italy (466)
Greece (445)Turkey (423)Mexico (385)
A quarter or more of students fail to reach Level 2 in Greece, Italy, Mexico, Portugal, Turkeyand the United States. In Finland, less than 7% of students perform below this threshold.
Level 6
INDICATOR A6
Education at a Glance © OECD 2006 83
Other highlights of this indicator
• Across OECD countries, students from the least socio-economically advantaged backgrounds are on average 3.5 times more likely to be low mathematics performers, i.e. at or below Level 1, than those from the most socio-economically advantaged backgrounds.
• Countries vary in the percentage of students who perform both the least well in mathematics and reading, and in the mean reading scores for these lowest mathematics performers. In six countries, students who perform the least well in mathematics have reading scores below the average for all the lowest mathematics performers across all countries and there are higher-than-average percentages of low mathematics students who are also among the lowest performing readers. In six other countries, the situation is reversed: the lowest performers in mathematics have above-average reading scores compared to their peers, as well as lower-than-average representation among the lowest performing readers.
chapter a The OuTpuT Of educaTiOnal insTiTuTiOns and The impacT Of learning
Education at a Glance © OECD 200684
A6Policy context
Knowledge and skills in mathematics are important outcomes of education; therefore, countries are increasingly focusing on enhancing students’ mathematical achievements. Findings from PISA 2003, however, indicate that over 20% of students in OECD countries display a limited level of mathematical literacy i.e. they are able to perform only the most routine mathematical functions in the most familiar contexts. Low-achieving students are the focus of this indicator because of their sizeable numbers and the potentially serious effect their lack of mathematical understanding may have on social and economic well-being. Achieving a better understanding of countries’ lowest achievers may provide information for the development of policies that are more successful at providing all students with the necessary skills in mathematics to lead productive lives.
Evidence and explanations
This indicator focuses on those students who performed at the lowest levels of proficiency on the PISA 2003 mathematics literacy assessment. It begins with an overview of the percentages of students performing at these levels on average and across individual countries, to set the context for later analyses. The indicator then extends earlier research using PISA’s composite measure of economic, social, and cultural status (ESCS) to examine the influence of students’ backgrounds on the likelihood of them being among the lowest performers in mathematics. Finally, the indicator looks at the reading proficiency of the lowest mathematics performers to explore whether these students demonstrate difficulty in mathematics only or whether their difficulty in mathematics could reflect overall difficulty in school.
Overall performance on the PISA 2003 mathematics literacy assessment
The PISA 2003 mathematics literacy assessment measures the extent to which 15-year-old students are able to analyse, reason and communicate effectively as they pose, solve and interpret mathematical problems in a variety of situations involving quantitative, spatial, probabilistic or other mathematical concepts. One of the key features of PISA is that students’ performance can be reported according to proficiency levels. The use of proficiency levels, as a supplement to summary statistics such as mean scores, provides policy makers with a descriptive picture of students’ skills and abilities as well as examples of the types of tasks they are likely to be able to perform.
The PISA mathematics assessment identifies six levels of proficiency, representing tasks of increasing difficulty. At the highest level of proficiency, students are able to apply advanced mathematical thinking and reasoning, conceptualise and work with complex mathematical models, as well as reflect upon and apply the outcomes of models to other situations. At the lowest level of proficiency, Level 1, students are able to follow direct and explicit instructions and take obvious actions applying simple models to simple problems as long as they are presented within familiar contexts. Students performing below Level 1 are unable to routinely apply the most basic forms of mathematical knowledge and skills that the PISA assessment measures. A complete description of the PISA mathematics proficiency levels and examples of mathematics items are given in OECD’s Learning for Tomorrow’s World – First Results from PISA 2003 (OECD 2004).
Chart A6.1 (and Table A6.3 available on the Web at http://dx.doi.org/10.1787/133160111888) displays an overall profile of 15-year-olds’ proficiency on the combined mathematics literacy assessment with the length of the coloured bars showing the percentages of students who are competent at each of the six levels of proficiency. This indicator focuses on those students
A6
Fifteen-Year-Old Students Who Perform at the Lowest Levels of Proficiency in Mathematics (2003) – INDICATOR A6 chapter a
Education at a Glance © OECD 2006 85
represented by the darkest coloured bars, i.e. those at Level 1 and below. These are the students who, as described above, can apply only the most basic mathematics skills.
Across OECD countries, more than one-fifth (21.4% of 15-year-old students) performed at Level 1 and below. This is also true for 13 of the 29 OECD countries individually. For all countries except one (Finland), there are at least 10% of students at Level 1 and below in mathematics. This is a sizeable percentage of a country’s human capital.
There is also considerable variation across countries with respect to the percentages of students who perform at these levels. The percentages of students displaying minimal or less-than-minimal functioning in mathematics ranges from a low of 6.8% in Finland to a high of 66.0% in Mexico. Limiting the analysis to those countries which perform above the OECD average (500 points), the variation remains marked, from 6.8% in Finland to 21.6% in Germany. Additionally, some countries that perform similarly in terms of mean score have different percentages of students performing at Level 1 and below. For example, while there is no statistically significant difference in the mean scores of students in the top-performing countries of Canada and Belgium, Canada has a statistically significantly lower rate of low achievers than the Belgium by 6.4 percentage points. Similar examples can be found among countries at other levels of overall performance, such as in Germany and Ireland – both perform around the OECD average – where the percentages of low-achievers are 21.6% versus 16.8%, respectively. These findings show how mean scores can mask varying degrees of dispersion in countries, and that some countries do demonstrate both high scores and low variation.
Socio-economic background and low mathematics performance
Universally, students’ home backgrounds exert a powerful influence on their academic performance. Consistently, students from disadvantaged socio-economic backgrounds have been found to perform less well in mathematics (and other subjects) than students from more advantaged backgrounds. Although this is not true in all cases: many students from disadvantaged backgrounds excel in school, while many students from advantaged backgrounds perform badly. Earlier research using PISA found strong relationships between students’ mathematics performance and a variety of measures of students’ backgrounds. For example, one finding was that across OECD countries, students in the highest quarter of an index of parents’ occupational status scored 93 points more in mathematics than their peers in the lowest quarter of this index.
Another major component of initial reporting from PISA 2003 was the use of a composite index, ESCS, to provide an overall measure of students’ socio-economic status. This indicator extends this earlier research on the relationship between students’ socio-economic backgrounds and their mathematics performance, by employing “odds ratios” to examine the probability of students performing at the lowest proficiency levels in mathematics. Specifically, odds ratios indicate, in this case, the greater (or lesser) chances for a student of performing at Level 1 or below that is associated with belonging to the lowest quarter of students on the PISA composite socio-economic index.
For example, an odds ratio of 1 means that students from the lowest and highest quarters have an equal chance of performing at or below Level 1 and thus that the education system is achieving equitable results for students of varied socio-economic backgrounds. However, odds ratios greater than 1 mean that students from the lowest quarter have a greater chance than students
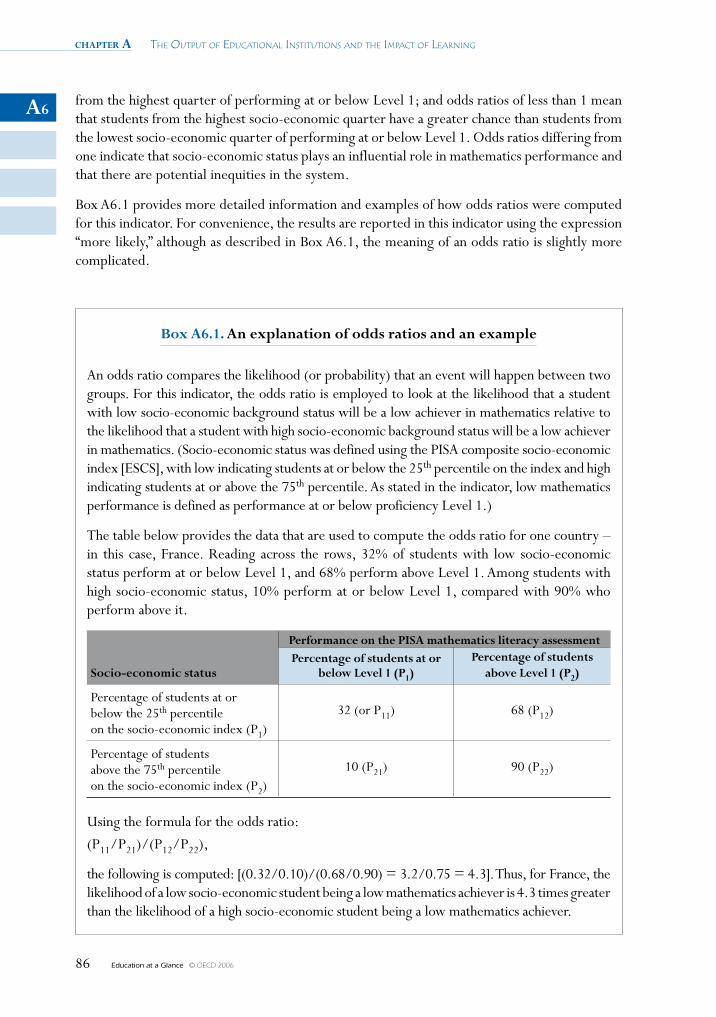
chapter a The OuTpuT Of educaTiOnal insTiTuTiOns and The impacT Of learning
Education at a Glance © OECD 200686
A6from the highest quarter of performing at or below Level 1; and odds ratios of less than 1 mean that students from the highest socio-economic quarter have a greater chance than students from the lowest socio-economic quarter of performing at or below Level 1. Odds ratios differing from one indicate that socio-economic status plays an influential role in mathematics performance and that there are potential inequities in the system.
Box A6.1 provides more detailed information and examples of how odds ratios were computed for this indicator. For convenience, the results are reported in this indicator using the expression “more likely,” although as described in Box A6.1, the meaning of an odds ratio is slightly more complicated.
Box A6.1. An explanation of odds ratios and an example
An odds ratio compares the likelihood (or probability) that an event will happen between two groups. For this indicator, the odds ratio is employed to look at the likelihood that a student with low socio-economic background status will be a low achiever in mathematics relative to the likelihood that a student with high socio-economic background status will be a low achiever in mathematics. (Socio-economic status was defined using the PISA composite socio-economic index [ESCS], with low indicating students at or below the 25th percentile on the index and high indicating students at or above the 75th percentile. As stated in the indicator, low mathematics performance is defined as performance at or below proficiency Level 1.)
The table below provides the data that are used to compute the odds ratio for one country – in this case, France. Reading across the rows, 32% of students with low socio-economic status perform at or below Level 1, and 68% perform above Level 1. Among students with high socio-economic status, 10% perform at or below Level 1, compared with 90% who perform above it.
socio-economic status
performance on the pIsA mathematics literacy assessmentpercentage of students at or
below level 1 (p1)percentage of students
above level 1 (p2)
Percentage of students at or below the 25th percentile on the socio-economic index (P1)
32 (or P11) 68 (P12)
Percentage of students above the 75th percentile on the socio-economic index (P2)
10 (P21) 90 (P22)
Using the formula for the odds ratio:
(P11/P21)/(P12/P22),
the following is computed: [(0.32/0.10)/(0.68/0.90) = 3.2/0.75 = 4.3]. Thus, for France, the likelihood of a low socio-economic student being a low mathematics achiever is 4.3 times greater than the likelihood of a high socio-economic student being a low mathematics achiever.
A6
Fifteen-Year-Old Students Who Perform at the Lowest Levels of Proficiency in Mathematics (2003) – INDICATOR A6 chapter a
Education at a Glance © OECD 2006 87
Table A6.1 reports the odds ratios for individual countries and overall. As the table shows, across all countries, students who come from the lowest economically, culturally and socially well-off families are more likely to perform at or below Level 1 than students who come from the highest economically, culturally and socially well-off families. Although odds ratios vary across countries, all OECD countries have ratios greater than 1, indicating inequitable outcomes for students of different socio-economic backgrounds, albeit to differing degrees. Across all OECD countries, students from the lowest quarter on the socio-economic index are 3.5 times more likely, on average, to perform at or below Level 1 on the mathematics literacy assessment than students from the highest quarter.
In four countries, Belgium, Germany, Hungary, and the Slovak Republic, the likelihood of the lowest socio-economic status students relative to the highest socio-economic status students to perform at or below Level 1 was higher than the OECD average. In other words, in these countries, students’ minimal competence in mathematics is more strongly associated with their backgrounds, with the likelihood of students from the lowest quarter on the socio-economic index to perform at or below Level 1 in mathematics at least 4.6 times higher than it is for students from the highest quarter of the index.
The likelihood of the most disadvantaged students relative to the most advantaged students to perform at or below Level 1 was lower than the OECD average in eight countries (Canada, Greece, Iceland, Japan, Norway, Spain, Sweden and Turkey), indicating a weaker association in these countries between 15-year-olds’ mathematical competence and family backgrounds. In these countries, students from the lowest quarter on the socio-economic index were 2.1 to 2.9 times more likely on the economic index to perform at Level 1 or below in mathematics.
While the previous analysis compared countries’ odds ratios to the OECD average as one way of looking at relative influence of socio-economic status on low mathematics performance across countries, this subsequent analysis compares countries’ odds ratios to one another. If countries show consistently high or low odds ratios in these one-on-one comparisons, then stronger statements may be made about their systems’ ability to foster equitable outcomes for students with different socio-economic backgrounds than can be made simply by comparing their odds ratios to the overall mean.
Chart A6.2 compares odds ratios among pairs of countries, identifying whether or not the odds ratio is significantly higher or lower than that of the comparison country. Two distinct groupings of countries are evident in this chart: those with consistently higher odds ratios than other countries and those with consistently lower odds ratios than other countries. Ten countries – Belgium, the Czech Republic, Denmark, France, Germany, Hungary, Mexico, the Slovak Republic, Switzerland, and the United States – have higher odds ratios than at least eight other countries; this represents one-third of the OECD countries participating in PISA. Eight countries – Canada, Finland, Greece, Iceland, Japan, Norway, Sweden, and Turkey – have lower odds ratios than at least ten other countries.
Reading proficiency of low mathematics performers
Another useful analysis is to examine how those students performing at or below Level 1 in mathematics are performing in reading. This may shed light on the extent to which these students
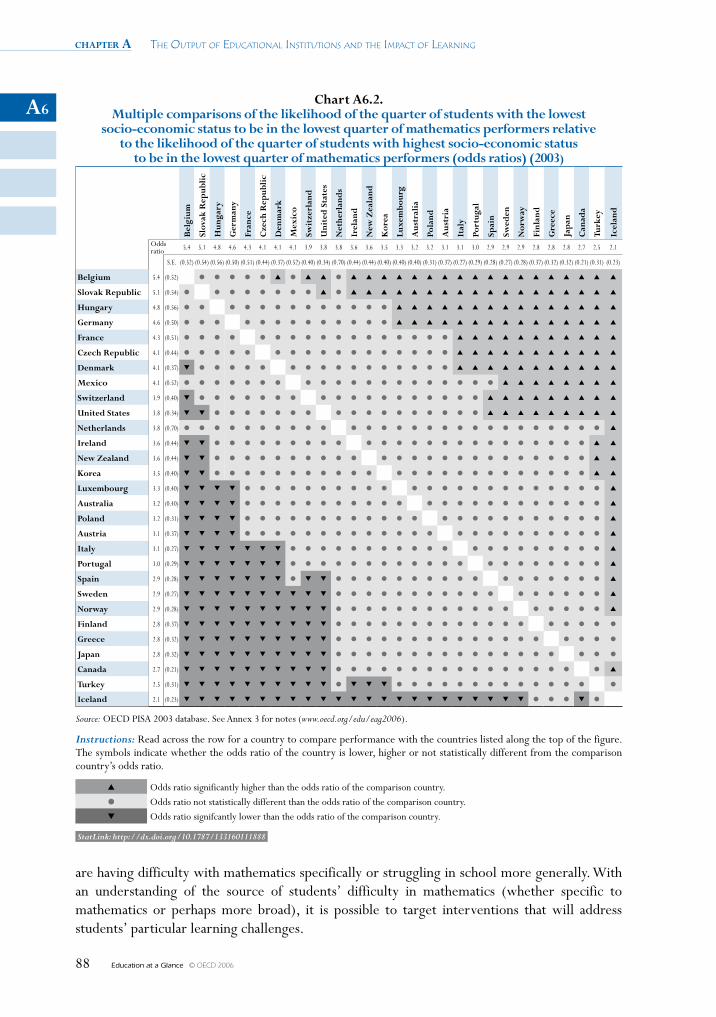
chapter a The OuTpuT Of educaTiOnal insTiTuTiOns and The impacT Of learning
Education at a Glance © OECD 200688
A6Chart A6.2.
Multiple comparisons of the likelihood of the quarter of students with the lowest socio-economic status to be in the lowest quarter of mathematics performers relative
to the likelihood of the quarter of students with highest socio-economic status to be in the lowest quarter of mathematics performers (odds ratios) (2003)
Bel
gium
Slov
ak R
epub
lic
Hun
gary
Ger
man
y
Fran
ce
Cze
ch R
epub
lic
Den
mar
k
Mex
ico
Swit
zerl
and
Uni
ted
Sta
tes
Net
herl
and
s
Irel
and
New
Zea
land
Kor
ea
Luxe
mbo
urg
Aus
tral
ia
Pola
nd
Aus
tria
Ital
y
Port
ugal
Spai
n
Swed
en
Nor
way
Finl
and
Gre
ece
Jap
an
Can
ada
Turk
ey
Icel
and
Odds ratio 5.4 5.1 4.8 4.6 4.3 4.1 4.1 4.1 3.9 3.8 3.8 3.6 3.6 3.5 3.3 3.2 3.2 3.1 3.1 3.0 2.9 2.9 2.9 2.8 2.8 2.8 2.7 2.5 2.1
S.E. (0.52) (0.54) (0.56) (0.50) (0.51) (0.44) (0.37) (0.52) (0.40) (0.34) (0.70) (0.44) (0.44) (0.40) (0.40) (0.40) (0.31) (0.37) (0.27) (0.29) (0.28) (0.27) (0.28) (0.37) (0.32) (0.32) (0.21) (0.31) (0.23)
Belgium 5.4 (0.52) ● ● ● ● ● ▲ ● ▲ ▲ ● ▲ ▲ ▲ ▲ ▲ ▲ ▲ ▲ ▲ ▲ ▲ ▲ ▲ ▲ ▲ ▲ ▲ ▲
Slovak Republic 5.1 (0.54) ● ● ● ● ● ● ● ● ▲ ● ▲ ▲ ▲ ▲ ▲ ▲ ▲ ▲ ▲ ▲ ▲ ▲ ▲ ▲ ▲ ▲ ▲ ▲
Hungary 4.8 (0.56) ● ● ● ● ● ● ● ● ● ● ● ● ● ▲ ▲ ▲ ▲ ▲ ▲ ▲ ▲ ▲ ▲ ▲ ▲ ▲ ▲ ▲
Germany 4.6 (0.50) ● ● ● ● ● ● ● ● ● ● ● ● ● ▲ ▲ ▲ ▲ ▲ ▲ ▲ ▲ ▲ ▲ ▲ ▲ ▲ ▲ ▲
France 4.3 (0.51) ● ● ● ● ● ● ● ● ● ● ● ● ● ● ● ● ● ▲ ▲ ▲ ▲ ▲ ▲ ▲ ▲ ▲ ▲ ▲
Czech Republic 4.1 (0.44) ● ● ● ● ● ● ● ● ● ● ● ● ● ● ● ● ● ▲ ▲ ▲ ▲ ▲ ▲ ▲ ▲ ▲ ▲ ▲
Denmark 4.1 (0.37) ▼ ● ● ● ● ● ● ● ● ● ● ● ● ● ● ● ● ▲ ▲ ▲ ▲ ▲ ▲ ▲ ▲ ▲ ▲ ▲
Mexico 4.1 (0.52) ● ● ● ● ● ● ● ● ● ● ● ● ● ● ● ● ● ● ● ● ▲ ▲ ▲ ▲ ▲ ▲ ▲ ▲
Switzerland 3.9 (0.40) ▼ ● ● ● ● ● ● ● ● ● ● ● ● ● ● ● ● ● ● ▲ ▲ ▲ ▲ ▲ ▲ ▲ ▲ ▲
United States 3.8 (0.34) ▼ ▼ ● ● ● ● ● ● ● ● ● ● ● ● ● ● ● ● ● ▲ ▲ ▲ ▲ ▲ ▲ ▲ ▲ ▲
Netherlands 3.8 (0.70) ● ● ● ● ● ● ● ● ● ● ● ● ● ● ● ● ● ● ● ● ● ● ● ● ● ● ● ▲
Ireland 3.6 (0.44) ▼ ▼ ● ● ● ● ● ● ● ● ● ● ● ● ● ● ● ● ● ● ● ● ● ● ● ● ▲ ▲
New Zealand 3.6 (0.44) ▼ ▼ ● ● ● ● ● ● ● ● ● ● ● ● ● ● ● ● ● ● ● ● ● ● ● ● ▲ ▲
Korea 3.5 (0.40) ▼ ▼ ● ● ● ● ● ● ● ● ● ● ● ● ● ● ● ● ● ● ● ● ● ● ● ● ▲ ▲
Luxembourg 3.3 (0.40) ▼ ▼ ▼ ▼ ● ● ● ● ● ● ● ● ● ● ● ● ● ● ● ● ● ● ● ● ● ● ● ▲
Australia 3.2 (0.40) ▼ ▼ ▼ ▼ ● ● ● ● ● ● ● ● ● ● ● ● ● ● ● ● ● ● ● ● ● ● ● ▲
Poland 3.2 (0.31) ▼ ▼ ▼ ▼ ● ● ● ● ● ● ● ● ● ● ● ● ● ● ● ● ● ● ● ● ● ● ● ▲
Austria 3.1 (0.37) ▼ ▼ ▼ ▼ ● ● ● ● ● ● ● ● ● ● ● ● ● ● ● ● ● ● ● ● ● ● ● ▲
Italy 3.1 (0.27) ▼ ▼ ▼ ▼ ▼ ▼ ▼ ● ● ● ● ● ● ● ● ● ● ● ● ● ● ● ● ● ● ● ● ▲
Portugal 3.0 (0.29) ▼ ▼ ▼ ▼ ▼ ▼ ▼ ● ● ● ● ● ● ● ● ● ● ● ● ● ● ● ● ● ● ● ● ▲
Spain 2.9 (0.28) ▼ ▼ ▼ ▼ ▼ ▼ ▼ ● ▼ ▼ ● ● ● ● ● ● ● ● ● ● ● ● ● ● ● ● ● ▲
Sweden 2.9 (0.27) ▼ ▼ ▼ ▼ ▼ ▼ ▼ ▼ ▼ ▼ ● ● ● ● ● ● ● ● ● ● ● ● ● ● ● ● ● ▲
Norway 2.9 (0.28) ▼ ▼ ▼ ▼ ▼ ▼ ▼ ▼ ▼ ▼ ● ● ● ● ● ● ● ● ● ● ● ● ● ● ● ● ● ▲
Finland 2.8 (0.37) ▼ ▼ ▼ ▼ ▼ ▼ ▼ ▼ ▼ ▼ ● ● ● ● ● ● ● ● ● ● ● ● ● ● ● ● ● ●
Greece 2.8 (0.32) ▼ ▼ ▼ ▼ ▼ ▼ ▼ ▼ ▼ ▼ ● ● ● ● ● ● ● ● ● ● ● ● ● ● ● ● ● ●
Japan 2.8 (0.32) ▼ ▼ ▼ ▼ ▼ ▼ ▼ ▼ ▼ ▼ ● ● ● ● ● ● ● ● ● ● ● ● ● ● ● ● ● ●
Canada 2.7 (0.21) ▼ ▼ ▼ ▼ ▼ ▼ ▼ ▼ ▼ ▼ ● ● ● ● ● ● ● ● ● ● ● ● ● ● ● ● ● ▲
Turkey 2.5 (0.31) ▼ ▼ ▼ ▼ ▼ ▼ ▼ ▼ ▼ ▼ ● ▼ ▼ ▼ ● ● ● ● ● ● ● ● ● ● ● ● ● ●
Iceland 2.1 (0.23) ▼ ▼ ▼ ▼ ▼ ▼ ▼ ▼ ▼ ▼ ▼ ▼ ▼ ▼ ▼ ▼ ▼ ▼ ▼ ▼ ▼ ▼ ▼ ● ● ● ▼ ●
Source: OECD PISA 2003 database. See Annex 3 for notes (www.oecd.org/edu/eag2006).
Instructions: Read across the row for a country to compare performance with the countries listed along the top of the figure. The symbols indicate whether the odds ratio of the country is lower, higher or not statistically different from the comparison country’s odds ratio.
▲ Odds ratio significantly higher than the odds ratio of the comparison country.● Odds ratio not statistically different than the odds ratio of the comparison country.▼ Odds ratio signifcantly lower than the odds ratio of the comparison country.
StatLink: http://dx.doi.org/10.1787/133160111888
are having difficulty with mathematics specifically or struggling in school more generally. With an understanding of the source of students’ difficulty in mathematics (whether specific to mathematics or perhaps more broad), it is possible to target interventions that will address students’ particular learning challenges.
A6
Fifteen-Year-Old Students Who Perform at the Lowest Levels of Proficiency in Mathematics (2003) – INDICATOR A6 chapter a
Education at a Glance © OECD 2006 89
Table A6.2 presents the average reading scores for the lowest mathematics performers as well as the percentages of those who also are at or below the lowest proficiency level in reading. In six countries – Belgium, Germany, Japan, Luxembourg, Mexico, and the Slovak Republic – the lowest mathematics performers have reading scores below the average for the lowest mathematics performers across countries and there are higher-than-average percentages of low mathematics students who also are among the lowest readers. This suggests that, in these countries, students who are struggling in mathematics are also struggling in reading.
Spain also has a higher-than-average percentage of low-performing students in mathematic who are among the lowest performing readers, although the average reading score for this group is not significantly different from the OECD average. In Iceland, however, the percentage of low-performing students in mathematics who also are the lowest performing readers is similar to the OECD average, although the reading scores of these students are below the average for the lowest mathematics students across countries.
In six other countries – Finland, Greece, Ireland, Korea, Poland, and Sweden – the situation is reversed: the lowest mathematics performers have above-average reading scores compared to their peers, as well as lower-than-average representation among the lowest performing readers. This suggests that in these countries, students’ difficulty with mathematics may represent a specialised learning effect – these students are not necessarily doing poorly in mathematics because of poor reading or an overall difficulty with school, but perhaps a specific deficiency in mathematics.
Of course, the picture is very complex and to get a deeper understanding of whether students have generalised or specialised learning problems, one must also look at how the lowest reading performers perform in mathematics. These results are presented in Table A6.3. Looking at this and the previous table together, two countries show consistent patterns. In Mexico, there are high percentages of students at the lowest levels in reading who also are at the lowest levels in mathematics, and vice versa, suggesting that Mexican students who are at the lowest levels on the PISA scale are struggling in school generally. In Finland, there are low percentages of students at the lowest levels in reading who also are at the lowest levels in mathematics, and vice versa, suggesting that students in Finland who do poorly in PISA are struggling with one subject area more than the other.
Definitions and methodologies
The achievement scores are based on assessments administered in 2003 as part of the Programme for International Student Assessment (PISA) undertaken by the OECD.
The target population studied for this indicator was 15-year-old students. Operationally, this referred to students who were from 15 years and 3 (completed) months to 16 years and 2 (completed) months at the beginning of the testing period and who were enrolled in an educational institution, irrespective of the grade levels or type of institutions in which they were enrolled, and irrespective of whether they participated in school full-time or part-time. Subsets of the target population were examined in Chart A6.2 and Tables A6.2 and A6.3. Fifteen-year-olds who were the lowest performers on the PISA mathematics literacy assessment – defined as performing at or below proficiency Level 1 – who were also in the highest or lowest quarters of the economic, social and cultural status (ESCS) index were examined in Chart A6.2. Fifteen-year-olds who were the lowest
chapter a The OuTpuT Of educaTiOnal insTiTuTiOns and The impacT Of learning
Education at a Glance © OECD 200690
A6performers on the PISA mathematics literacy assessment who were also the lowest performers on the PISA reading literacy assessment – defined as performing at or below proficiency Level 1 – were examined in Table A6.2. Fifteen-year-olds who were the lowest performers on the PISA reading literacy assessment who were also the lowest performers on the PISA mathematics literacy assessment were examined in Table A6.3.
To test the robustness of the odds ratios findings, analysts compared these results with OECD’s earlier results for “relative risk” and socio-economic status (SES) gradients. There was a strong correlation with relative risk and a relatively strong correlation with the SES gradients. Further exploration of the few cases in which there were differences with the latter measure would be an interesting area for further analysis.
Analyses were performed for 29 of 30 countries participating in PISA 2003. The United Kingdom failed to reach PISA’s unit response rate standard, which precluded the country from being included in OECD averages, although estimates for the United Kingdom are still reported in charts and tables dealing with subsets of the population for the purposes of comparison within the country. When estimates for the United Kingdom are reported, they are reported at the end of charts and tables separate from the estimates of other countries as a cautionary reminder that the estimate may not be as reliable as the estimates of countries that met PISA’s unit response rate standard.
It should be noted that across OECD countries, mathematics and reading performance are highly correlated and that, because of the PISA design, some students’ reading scores were imputed on the basis of their mathematics scores, both of which may have an influence on the results reported in this section. Additionally, it should be noted that the proficiency levels for mathematics and reading are not equivalent.
Further references
For further information about PISA 2003, see Learning for Tomorrow’s World – First Results from PISA 2003 (OECD, 2004a), and the PISA 2003 Technical Report (OECD, 2005c). PISA data are also available on the PISA Web site: www.pisa.oecd.org. See also Education at a Glance: OECD Indicators – 2005 Edition (OECD 2005d).
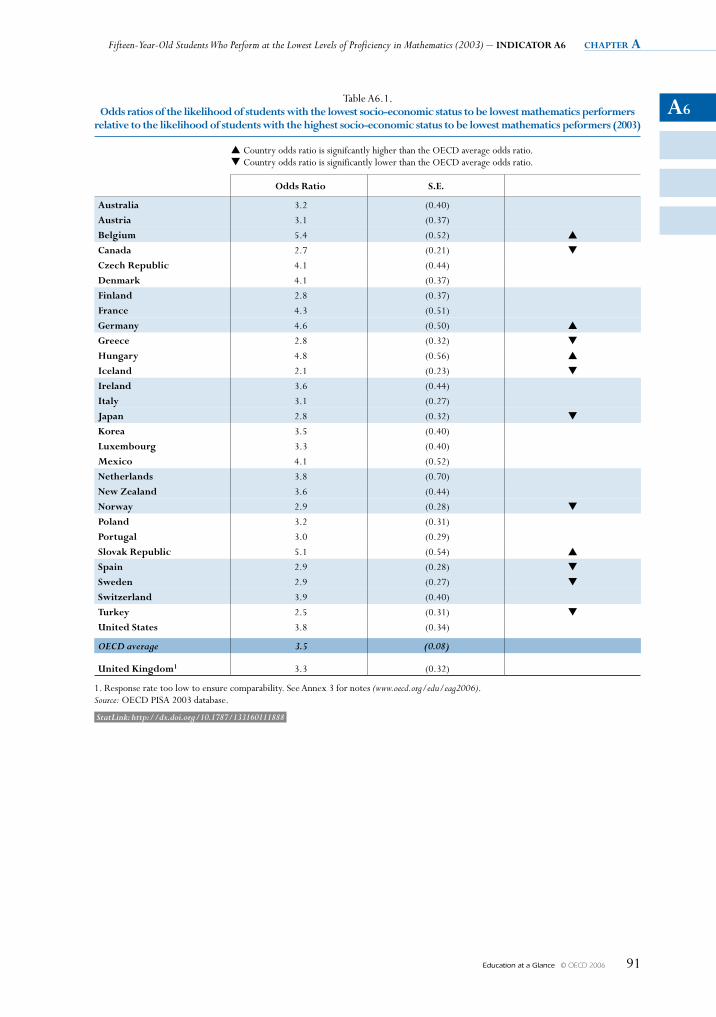
A6
Fifteen-Year-Old Students Who Perform at the Lowest Levels of Proficiency in Mathematics (2003) – INDICATOR A6 chapter a
Education at a Glance © OECD 2006 91
Table A6.1. Odds ratios of the likelihood of students with the lowest socio-economic status to be lowest mathematics performers
relative to the likelihood of students with the highest socio-economic status to be lowest mathematics peformers (2003)
▲ Country odds ratio is signifcantly higher than the OECD average odds ratio.▼ Country odds ratio is significantly lower than the OECD average odds ratio.
Odds Ratio s.e.
Australia 3.2 (0.40)
Austria 3.1 (0.37)
Belgium 5.4 (0.52) ▲
Canada 2.7 (0.21) ▼
Czech Republic 4.1 (0.44)
Denmark 4.1 (0.37)
Finland 2.8 (0.37)
France 4.3 (0.51)
Germany 4.6 (0.50) ▲
Greece 2.8 (0.32) ▼
hungary 4.8 (0.56) ▲
Iceland 2.1 (0.23) ▼
Ireland 3.6 (0.44)
Italy 3.1 (0.27)
Japan 2.8 (0.32) ▼
Korea 3.5 (0.40)
luxembourg 3.3 (0.40)
mexico 4.1 (0.52)
Netherlands 3.8 (0.70)
New Zealand 3.6 (0.44)
Norway 2.9 (0.28) ▼
poland 3.2 (0.31)
portugal 3.0 (0.29)
slovak Republic 5.1 (0.54) ▲
spain 2.9 (0.28) ▼
sweden 2.9 (0.27) ▼
switzerland 3.9 (0.40)
Turkey 2.5 (0.31) ▼
united states 3.8 (0.34)
OECD average 3.5 (0.08)
united Kingdom1 3.3 (0.32)
1. Response rate too low to ensure comparability. See Annex 3 for notes (www.oecd.org/edu/eag2006).Source: OECD PISA 2003 database.
StatLink: http://dx.doi.org/10.1787/133160111888
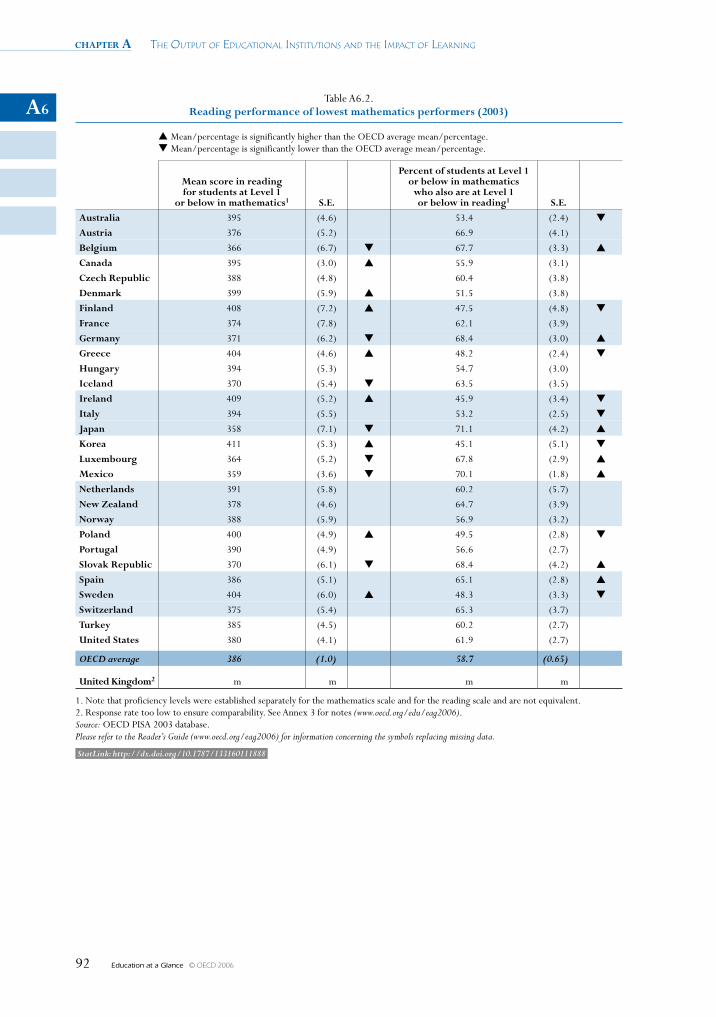
chapter a The OuTpuT Of educaTiOnal insTiTuTiOns and The impacT Of learning
Education at a Glance © OECD 200692
A6Table A6.2.
Reading performance of lowest mathematics performers (2003)
▲ Mean/percentage is significantly higher than the OECD average mean/percentage.▼ Mean/percentage is significantly lower than the OECD average mean/percentage.
mean score in reading for students at level 1
or below in mathematics1 s.e.
percent of students at level 1 or below in mathematics
who also are at level 1 or below in reading1 s.e.
Australia 395 (4.6) 53.4 (2.4) ▼
Austria 376 (5.2) 66.9 (4.1)
Belgium 366 (6.7) ▼ 67.7 (3.3) ▲
Canada 395 (3.0) ▲ 55.9 (3.1)
Czech Republic 388 (4.8) 60.4 (3.8)
Denmark 399 (5.9) ▲ 51.5 (3.8)
Finland 408 (7.2) ▲ 47.5 (4.8) ▼
France 374 (7.8) 62.1 (3.9)
Germany 371 (6.2) ▼ 68.4 (3.0) ▲
Greece 404 (4.6) ▲ 48.2 (2.4) ▼
hungary 394 (5.3) 54.7 (3.0)
Iceland 370 (5.4) ▼ 63.5 (3.5)
Ireland 409 (5.2) ▲ 45.9 (3.4) ▼
Italy 394 (5.5) 53.2 (2.5) ▼
Japan 358 (7.1) ▼ 71.1 (4.2) ▲
Korea 411 (5.3) ▲ 45.1 (5.1) ▼
luxembourg 364 (5.2) ▼ 67.8 (2.9) ▲
mexico 359 (3.6) ▼ 70.1 (1.8) ▲
Netherlands 391 (5.8) 60.2 (5.7)
New Zealand 378 (4.6) 64.7 (3.9)
Norway 388 (5.9) 56.9 (3.2)
poland 400 (4.9) ▲ 49.5 (2.8) ▼
portugal 390 (4.9) 56.6 (2.7)
slovak Republic 370 (6.1) ▼ 68.4 (4.2) ▲
spain 386 (5.1) 65.1 (2.8) ▲
sweden 404 (6.0) ▲ 48.3 (3.3) ▼
switzerland 375 (5.4) 65.3 (3.7)
Turkey 385 (4.5) 60.2 (2.7)
united states 380 (4.1) 61.9 (2.7)
OECD average 386 (1.0) 58.7 (0.65)
united Kingdom2 m m m m
1. Note that proficiency levels were established separately for the mathematics scale and for the reading scale and are not equivalent.2. Response rate too low to ensure comparability. See Annex 3 for notes (www.oecd.org/edu/eag2006).Source: OECD PISA 2003 database. Please refer to the Reader’s Guide (www.oecd.org/eag2006) for information concerning the symbols replacing missing data.
StatLink: http://dx.doi.org/10.1787/133160111888
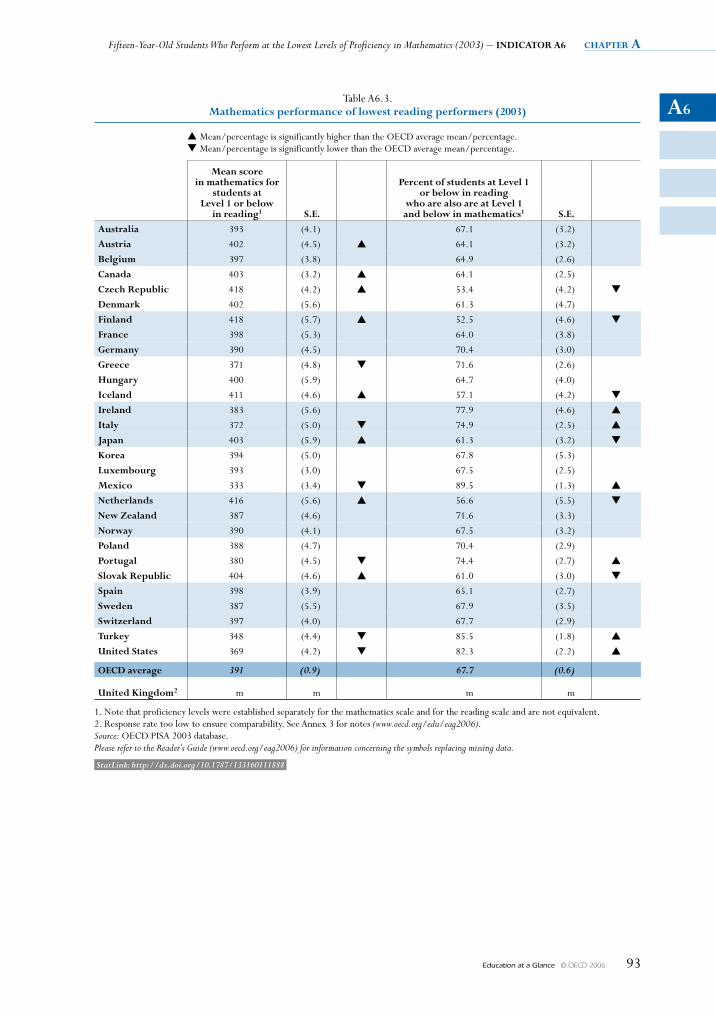
A6
Fifteen-Year-Old Students Who Perform at the Lowest Levels of Proficiency in Mathematics (2003) – INDICATOR A6 chapter a
Education at a Glance © OECD 2006 93
Table A6.3. mathematics performance of lowest reading performers (2003)
▲ Mean/percentage is significantly higher than the OECD average mean/percentage.▼ Mean/percentage is significantly lower than the OECD average mean/percentage.
mean score in mathematics for
students at level 1 or below
in reading1 s.e.
percent of students at level 1 or below in reading
who are also are at level 1 and below in mathematics1 s.e.
Australia 393 (4.1) 67.1 (3.2)
Austria 402 (4.5) ▲ 64.1 (3.2)
Belgium 397 (3.8) 64.9 (2.6)
Canada 403 (3.2) ▲ 64.1 (2.5)
Czech Republic 418 (4.2) ▲ 53.4 (4.2) ▼
Denmark 402 (5.6) 61.3 (4.7)
Finland 418 (5.7) ▲ 52.5 (4.6) ▼
France 398 (5.3) 64.0 (3.8)
Germany 390 (4.5) 70.4 (3.0)
Greece 371 (4.8) ▼ 71.6 (2.6)
hungary 400 (5.9) 64.7 (4.0)
Iceland 411 (4.6) ▲ 57.1 (4.2) ▼
Ireland 383 (5.6) 77.9 (4.6) ▲
Italy 372 (5.0) ▼ 74.9 (2.5) ▲
Japan 403 (5.9) ▲ 61.3 (3.2) ▼
Korea 394 (5.0) 67.8 (5.3)
luxembourg 393 (3.0) 67.5 (2.5)
mexico 333 (3.4) ▼ 89.5 (1.3) ▲
Netherlands 416 (5.6) ▲ 56.6 (5.5) ▼
New Zealand 387 (4.6) 71.6 (3.3)
Norway 390 (4.1) 67.5 (3.2)
poland 388 (4.7) 70.4 (2.9)
portugal 380 (4.5) ▼ 74.4 (2.7) ▲
slovak Republic 404 (4.6) ▲ 61.0 (3.0) ▼
spain 398 (3.9) 65.1 (2.7)
sweden 387 (5.5) 67.9 (3.5)
switzerland 397 (4.0) 67.7 (2.9)
Turkey 348 (4.4) ▼ 85.5 (1.8) ▲
united states 369 (4.2) ▼ 82.3 (2.2) ▲
OeCD average 391 (0.9) 67.7 (0.6)
united Kingdom2 m m m m
1. Note that proficiency levels were established separately for the mathematics scale and for the reading scale and are not equivalent.2. Response rate too low to ensure comparability. See Annex 3 for notes (www.oecd.org/edu/eag2006).Source: OECD PISA 2003 database.Please refer to the Reader’s Guide (www.oecd.org/eag2006) for information concerning the symbols replacing missing data.
StatLink: http://dx.doi.org/10.1787/133160111888
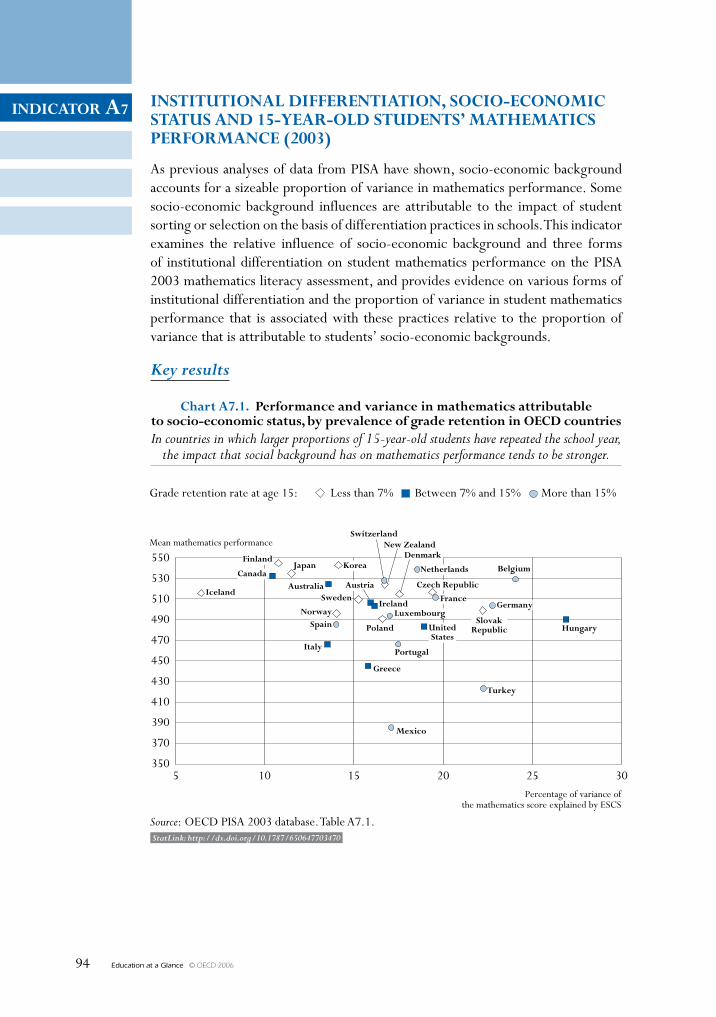
Education at a Glance © OECD 200694
INDICATOR A7
StatLink: http://dx.doi.org/10.1787/650647703470
INsTITuTIONAl DIffeReNTIATION, sOCIO-eCONOmIC sTATus AND 15-yeAR-OlD sTuDeNTs’ mAThemATICs peRfORmANCe (2003)
As previous analyses of data from PISA have shown, socio-economic background accounts for a sizeable proportion of variance in mathematics performance. Some socio-economic background influences are attributable to the impact of student sorting or selection on the basis of differentiation practices in schools. This indicator examines the relative influence of socio-economic background and three forms of institutional differentiation on student mathematics performance on the PISA 2003 mathematics literacy assessment, and provides evidence on various forms of institutional differentiation and the proportion of variance in student mathematics performance that is associated with these practices relative to the proportion of variance that is attributable to students’ socio-economic backgrounds.
Key results
Chart A7.1. performance and variance in mathematics attributableto socio-economic status, by prevalence of grade retention in OeCD countriesIn countries in which larger proportions of 15-year-old students have repeated the school year,
the impact that social background has on mathematics performance tends to be stronger.
Grade retention rate at age 15: Less than 7% Between 7% and 15% More than 15%
Source: OECD PISA 2003 database. Table A7.1.
finland
Canada
Iceland
Japan Korea Netherlands Belgium
Germany
hungaryslovak
Republic
Turkey
mexico
Greece
portugal
unitedstates
Italy
spainNorway
swedenAustralia
switzerlandNew Zealand
Denmark
Czech Republic
france
luxembourg
poland
Austria
Ireland
Mean mathematics performance
Percentage of variance ofthe mathematics score explained by ESCS
550
530
510
490
470
450
430
410
390
370
35030252015105
INDICATOR A7
Education at a Glance © OECD 2006 95
Other highlights of this indicator
• The relationship between mathematics performance and between-school differences is stronger in countries that offer more distinct education programmes. For example, in countries with one or two programmes, the proportion of variance in mathematics performance associated with differences between schools is 19.2% compared with 42.2% in countries offering four or five programmes.
• On average, differences between grades (related largely to the degree to which students have been retained at some point during their school careers) account for less of the variance in mathematics performance than do differences between schools and differences between programmes. However, the relationship between mathematics performance and between-grade differences is generally stronger among countries in which higher percentages of students have repeated a school year, even though in some countries different starting ages for schools in different regions also play a role.
• Across OECD countries, as the number of distinct education programmes available to 15-year-olds increases, the proportion of variance in mathematics scores associated with socio-economic background also tends to increase. The average proportion of variance in mathematics scores accounted for by differences in students’ socio-economic background ranges from 13.8% in countries with one or two programmes to 19.3% in countries with four or five programmes.
chapter a The OuTpuT Of educaTiOnal insTiTuTiOns and The impacT Of learning
Education at a Glance © OECD 200696
A7Policy context
Catering for the diverse needs of students and narrowing the gaps in their performance represent formidable challenges for all countries. Countries have chosen various approaches to address these demands. Some countries have comprehensive school systems with no, or only limited institutional differentiation. They seek to provide all students with similar opportunities for learning by requiring each school and teacher to provide for the full range of student abilities, interests and backgrounds. Other countries respond to diversity by grouping students through tracking or streaming, whether between schools or between classes within schools, with the aim of serving students according to their academic potential and/or interests in specific programmes. And in many countries, combinations of the two approaches occur.
Even in comprehensive school systems, there may be significant variation in performance levels between schools, due to practices in which students are sorted on the basis of interest or ability through curriculum tracking or grade retention, or due to the socio-economic and cultural characteristics of the communities that are served, or geographical differences (such as between regions, provinces or states in federal systems, or between rural and urban areas). Finally, there may be differences between individual schools that are more difficult to quantify or describe, part of which could result from differences in the quality or effectiveness of the instruction that those schools deliver. As a result, even in comprehensive systems, the performance levels attained by students may still vary across schools.
How do the policies and historical patterns that shape each country’s school system affect and relate to the variation in student performance between and within schools? Do countries with explicit tracking and streaming policies show a higher degree of overall disparity in student performance than countries that have non-selective education systems? Research on curriculum tracking and other forms of institutional differentiation suggests that the greater the differentiation of students’ educational experiences, the more their educational outcomes will be socially stratified (Garet and Delaney, 1988; Lucas, 2001; Ready, Lee and Welner, 2004). This suggests that some portion of socio-economic background influences might be attributable to the influences of differentiation practices. This indicator explores the influences of several forms of institutional differentiation on students’ mathematics literacy relative to the influence of their socio-economic backgrounds.
Evidence and explanations
This indicator examines three features of countries’ education systems related to differentiation among students. The first feature is the number of distinct programmes that are included in the secondary education system and that are available to 15-year-old students. The second feature is the students’ age at the time of their first decision to continue to the next stage of a country’s secondary education process or to select (or be selected for) educational programmes. The third feature is the degree to which countries engage in the practice of retaining students to repeat a grade (grade retention).
The indicator provides descriptive information about countries on these features, as well as information on the proportion of variance in mathematics performance that is associated with between-school differences, between-grade differences, and between-programme differences. The variances associated with these structural factors also are discussed relative to the proportion
A7
Institutional Differentiation, Socio-Economic Status and 15-Year-Old Students’ Mathematics Performance (2003) – INDICATOR A7 chapter a
Education at a Glance © OECD 2006 97
of variance in mathematics performance that is attributable to differences in students’ socio-economic background.
Table A7.1 presents the three institutional differentiation practices examined in this indicator for the OECD countries reporting results. Columns 1 and 2 present statistics on student mathematics performance for each country: the mean and the standard deviation of the distribution of mathematics performance. Columns 3 to 5 display the institutional differentiation practices in which countries engage. Column 6 shows the proportion of variance in socio-economic background – measured by the PISA index of students’ economic, social and cultural status (ESCS) – that is attributable to differences between schools. Columns 7 to 9 display the proportion of variance in mathematics scores that is associated with differences between schools, differences between grades, and differences between programmes. Column 10 shows the proportion of variance in mathematics scores that is attributable to socio-economic background differences; this percentage indicates the strength of the relationship between mathematics performance and socio-economic background. Countries are presented in ascending order, first, by the number of distinct programmes or school types countries offer to 15-year-olds (column 3) and, second, by the total variance in mathematics performance attributed to differences in socio-economic status (column 10).
The relative influence of the number of distinct programmes available to 15-year-olds, age at first selection and socio-economic background on student mathematics performance
One device to differentiate among students is the use of different institutions or programmes that seek to group students, in accordance with their performance or other characteristics. Sorting students according to their performance often assumes that their talents will best develop in a learning environment where their intellectual stimulation is equal, and that an intellectually homogeneous student body will favour effective teaching. Looking first at the number of distinct programmes, Table A7.1 shows that OECD countries vary: some have essentially undivided secondary education until the age of 15 years, others have four or more school types or distinct educational programmes (Austria, Belgium, the Czech Republic, Germany, Ireland, Luxembourg, the Netherlands, the Slovak Republic and Switzerland). Simple cross-country comparisons show that, while the number of school types or distinct educational programmes available to 15-year-olds is, across countries, not related to average country performance in mathematics, it accounts for 39% of the share of the OECD average variation that lies between schools (see Figure 5.20b in Learning for Tomorrow’s World – First Results from PISA 2003, [OECD, 2004a]). No less important, it accounts for 26% of the cross-country variation among countries in the strength of the relationship between socio-economic background and student performance. In other words, in countries with a larger number of distinct programme types, socio-economic background tends to have a significantly larger impact on student performance. It is therefore much harder to achieve equity.
An important dimension of tracking and streaming is the age at which decisions between different types of school are generally made, and the impact this has on students and their parents who are faced with these choices. Such decisions occur very early in Austria and Germany, at around age 10. By contrast, in countries such as New Zealand, Spain and the United States no institutional differentiation takes place, at least between schools, until the completion of secondary education. There is no statistically significant correlation between the age of selection and country mean performance in mathematics. However, the share of the OECD average variation in student
chapter a The OuTpuT Of educaTiOnal insTiTuTiOns and The impacT Of learning
Education at a Glance © OECD 200698
A7performance that lies between students and schools tends to be much higher in countries with early selection policies. In fact, the age of selection accounts for half of the between-school differences. While this, in itself, is not surprising because variation in school performance is an intended outcome of stratification, the findings also show that education systems with lower ages of selection tend to show much larger social disparities, with the age of selection explaining 28% of the country average of the strength of the relationship between the PISA index of economic, social and cultural status and student performance in mathematics.
Box A7.1. Notes on data
This indicator uses data from the PISA 2003 mathematics literacy assessment (for mathematics performance statistics), the student background questionnaires (for percentage of students retained in grade by age 15) and macro-level data provided by PISA National Project Managers (for number of distinct educational programmes and students’ age at first selection). This box provides information on the macro-level data sources. Notes on the student background data are presented in the text in the final section of the indicator
In this indicator, number of programmes refers to the number of distinct programmes that are available to students at age 15 and which can be defined in relation to the International Standard Classification of Education (ISCED) levels. One inconsistency to point out in the table accompanying this indicator is that, in some countries with a single, comprehensive education programme, a small proportion of the variance in mathematics scores is attributable to differences between programmes. In these cases, despite there being only one distinct programme, implicit differentiation practices (particularly curriculum tracking) within the programme are accounting for the variance in students’ performance in mathematics that between-school differences do not pick up.
Table A7.1 also illustrates the extent to which the number of programmes or school types is related to between-school differences in mathematics performance. Across OECD countries two general patterns emerge.
First, the relationship between student mathematics performance and between-school differences is generally stronger in countries that offer more distinct programmes or school types. The average strength of the relationship between mathematics performance and between-school differences in one- and two-programme countries is 19.2%, compared to 41.9% and 42.2% in countries offering three and four or five distinct programmes, respectively.
Second, the variance in mathematics scores attributable to between-school differences and the variance in mathematics scores attributable to between-programme differences are positively related: high proportions of variance in mathematics scores attributable to between-school differences tend to be accompanied by high proportions of variance in mathematics scores attributable to between-programme differences. (The converse is true as well, with low proportions of variance in mathematics scores attributable to between-school differences accompanied by low proportions attributable to between-programme differences.) With the exception of single-programme
A7
Institutional Differentiation, Socio-Economic Status and 15-Year-Old Students’ Mathematics Performance (2003) – INDICATOR A7 chapter a
Education at a Glance © OECD 2006 99
countries, this suggests that between-programme differences make up a considerable proportion – at least half, if not more for most countries – of the variance in mathematics scores that is being attributed to between-school differences.
There are a number of interesting exceptions to this pattern, however. In four countries, Belgium Luxembourg, the Netherlands and Portugal, between-programme differences account for a greater proportion of variance in mathematics scores than between-school differences. In these countries, school differences may be all programme differences. Another exception is Japan in which between-school differences account for a much greater portion of variance in mathematics scores than between-programme differences. With two distinct programmes, between-school differences account for a sizeable 53% of differences in student mathematics performance, yet between-programme differences account for only 4.8%. This suggests that in Japan, schools within distinct programmes are more differentiated than they are across Japan’s two programmes. Examining the different proportions of variance in mathematics scores attributable to different features of countries’ educational systems relative to one another offers insight into how student learning may be taking place, and the features of education systems that may facilitate or hold back mathematics performance. When interpreting the data, the Netherlands provide an interesting case, in which the overall performance of students is so high, that even the lower performing students do relatively well in an international comparative perspective.
The relative influence of grade retention by age 15 and socio-economic background on mathematics performance
The third form of institutional differentiation examined in this indicator is the practice of grade retention. As defined by Jackson (1975), “grade retention is the practice of requiring students who have been in a given grade level for a full year to remain at that grade level for a subsequent year”. The practice is generally used by schools to remediate poor academic performance, though it may also be used – particularly in the lower grades – to retain students who are judged too young or too immature compared to their peers to proceed.
As with other forms of institutional differentiation, grade retention is considered by some, primarily teachers and administrators, to be an effective and efficient strategy for facilitating learning and raising performance, as struggling students are grouped together in homogeneous classes where instruction can be delivered more to their level. Additionally, retention often operates as an incentive for students to study (Cosnefroy and Rocher, 2004). Despite the popularity of retention, considerable research has shown that retained students are no more likely to perform well than their non-retained, similarly achieving classmates (Jimerson, 2001).
Table A7.1 shows the percentage of 15-year-old students who have repeated at least one grade, based on students’ responses to the PISA background questionnaire. Because these figures are based on self-reports and because students’ answers reflect the entirety of their educational experiences (which, for small percentages of students, may not have occurred in their present systems), they are a proxy for their countries’ actual retention policies.
As the table shows, three countries clearly do not have a retention policy (Iceland, Japan, and Norway), with no students reporting having repeated a grade by the age of 15. Additionally, eight countries have only a limited number of students having repeated a grade, including: the Czech Republic, Denmark, Finland, Korea, New Zealand, Poland, the Slovak Republic and Sweden.
chapter a The OuTpuT Of educaTiOnal insTiTuTiOns and The impacT Of learning
Education at a Glance © OECD 2006100
A7In at least two of those countries, Sweden and New Zealand, there is no explicit retention policy, so the small percentages of students in those countries reporting having repeated a grade may be reflective of other factors.
However, in the majority of OECD countries, grade retention is much more prevalent, with the percentage of students reporting having repeated a grade ranging from 7% in Greece up to 38% in France. Grouping these countries further, eight countries have between 7 and 15% of students reporting having repeated a grade, while ten countries (one-third of all OECD countries) have over 15% of students having repeated a grade. The three groupings of countries emerge from an examination of the data and knowledge of countries’ retention policies. In general, countries in which fewer than 7% of students are retained tend to have automatic promotion policies or no explicit policies related to retention, whereas countries in which over 15% of students have been retained tend to have explicit, long-standing policies and a culture in which retention is a common feature.
Chart A7.1 illustrates where countries in these groupings fall along the dimensions of mean mathematics performance and the percentage of variance in mathematics scores attributable to students’ socio-economic backgrounds, which represents the strength of the relationship between mathematics performance and socio-economic background (measured with the ESCS index).
Across the percentage groupings (i.e. less than 7%, 7 to 15%, and over 15%), between-grade differences (retention), on average, account for less variance in student mathematics performance than both between-school differences and between-programme differences (and socio-economic background, but more will be said separately on this issue). Across countries in which less than 7% of 15-year-olds have repeated a grade, the proportion of variance in mathematics scores attributable to retention is, on average, 3.9%, compared to 8.5% for countries in which 7 to 15% of 15-year-olds have repeated, and 24% for countries in which more than 15% have repeated. By contrast, the proportion of variance in mathematics scores accounted for by between-school differences is 23.1%, 35.0%, and 41.0% and the proportion of variance in mathematics scores attributable to between-programme differences is 9.0%, 18.4% and 36.2%, respectively for the same groupings. Although not additive, it is not surprising to find the variance in mathematics scores attributable to between-school differences to be larger than the variances attributable to between-programme differences and between-grade differences. Variance in mathematics scores attributable to between-school differences includes variance accounted for by both programme differences and grade differences. Similarly, variance accounted for by between-programme differences encompasses variance accounted for by between-grade differences, and some, but not all, variance accounted for by between-school differences.
There are exceptions to this general pattern, and they occur among countries in which retention is among the most prevalent. In Spain and Portugal, where 28.6% and 29.5% of 15-year-olds have been retained by age 15, respectively, differences between grades account for more variance in mathematics performance than do differences between schools and differences between programmes. In Spain, with one distinct compulsory secondary education programme until age 16, this suggests a possibly high rate of multiple repeaters. Multiple repeaters are students who have been held back for several years. Their performance on the PISA mathematics assessment may be reflecting the much lower grade in which they are enrolled (and the much lower curriculum they are being taught) more so than any differences that exist among schools in
A7
Institutional Differentiation, Socio-Economic Status and 15-Year-Old Students’ Mathematics Performance (2003) – INDICATOR A7 chapter a
Education at a Glance © OECD 2006 101
Spain. This explanation applies equally to Portugal’s high proportion of variance attributable to retention. Students’ performance on the mathematics assessment is reflecting the much lower grade in which they are enrolled, more so than the different schools and programmes in which they are enrolled.
The earlier examination of distinct programmes or schools types and age at first selection found that both forms of institutional differentiation are associated with an increased strength of the relationship between students’ mathematics performance and socio-economic backgrounds. That is, greater social stratification in mathematics performance was observed in countries that engaged in greater differentiation. The same observation holds true for the practice of grade retention. In countries with higher a percentage of students having repeated a grade, student mathematics performance is more socially stratified. Across OECD countries in which less than 7% of 15-year-olds have been retained, students’ socio-economic background accounts for 15% of the variance in students’ mathematics performance. In countries in which 7 to 15% of 15-year-olds have been retained, socio-economic status accounts for 16.5% of the variance in students’ mathematics performance. And, in countries retaining over 15% of their 15-year-olds, 19% of the variance in students’ mathematics performance is attributable to students’ socio-economic backgrounds.
Definitions and methodologies
The achievement scores are based on assessments administered in 2003 as part of the Programme for International Student Assessment (PISA) undertaken by the OECD.
The target population studied for this indicator was 15-year-old students. Operationally, this referred to students who were from 15 years and 3 (completed) months to 16 years and 2 (completed) months at the beginning of the testing period and who were enrolled in an educational institution, irrespective of the grade levels or type of institutions in which they were enrolled, and irrespective of whether they participated in school full-time or part-time.
Further references
For further information about PISA 2003, see Learning for Tomorrow’s World – First Results from PISA 2003 (OECD, 2004a), and the PISA 2003 Technical Report (OECD, 2005c). PISA data are also available on the PISA Web site: www.pisa.oecd.org.
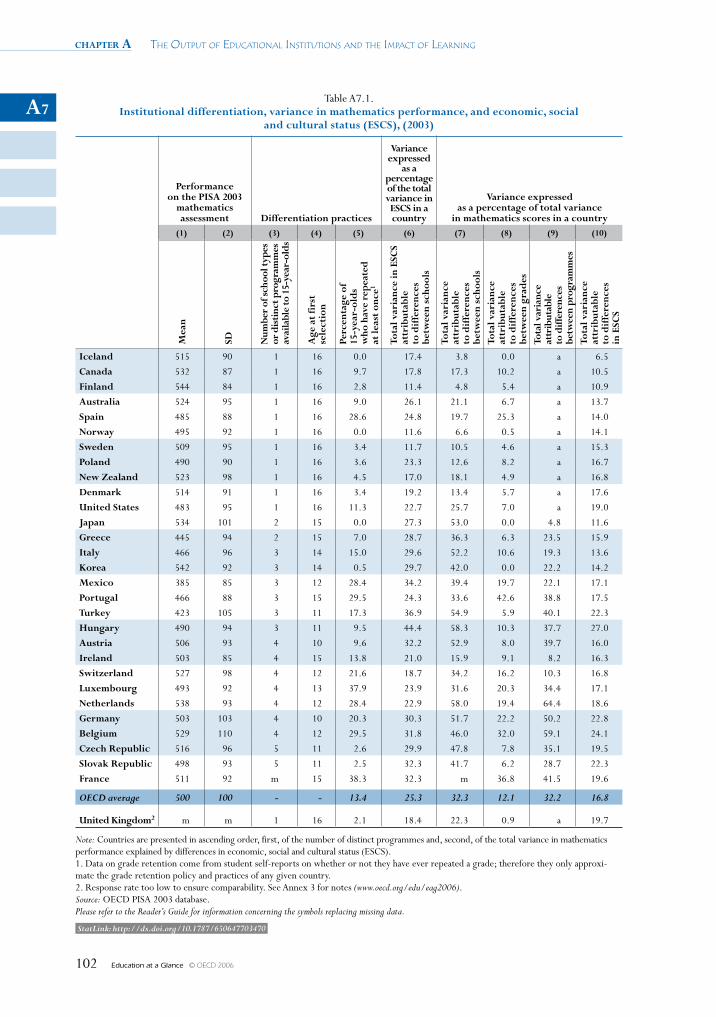
chapter a The OuTpuT Of educaTiOnal insTiTuTiOns and The impacT Of learning
Education at a Glance © OECD 2006102
A7Table A7.1.
Institutional differentiation, variance in mathematics performance, and economic, social and cultural status (esCs), (2003)
performance on the pIsA 2003
mathematics assessment Differentiation practices
Variance expressed
as a percentage of the total variance in esCs in a country
Variance expressed as a percentage of total variance
in mathematics scores in a country(1) (2) (3) (4) (5) (6) (7) (8) (9) (10)
mea
n
sD Num
ber
of sc
hool
type
s or
dis
tinc
t pro
gram
mes
av
aila
ble
to 1
5-ye
ar-o
lds
Age
at
firs
t
sele
ctio
n
perc
enta
ge o
f 15
-yea
r-ol
ds
w
ho h
ave
repe
ated
at
leas
t on
ce1
Tota
l var
ianc
e in
esC
s at
trib
utab
le
to d
iffe
renc
es
betw
een
scho
ols
Tota
l var
ianc
e
attr
ibut
able
to
dif
fere
nces
be
twee
n sc
hool
sTo
tal v
aria
nce
at
trib
utab
le
to d
iffe
renc
es
betw
een
grad
esTo
tal v
aria
nce
attr
ibut
able
to
diff
eren
ces
be
twee
n pr
ogra
mm
esTo
tal v
aria
nce
at
trib
utab
le
to d
iffe
renc
es
in e
sCs
Iceland 515 90 1 16 0.0 17.4 3.8 0.0 a 6.5
Canada 532 87 1 16 9.7 17.8 17.3 10.2 a 10.5
finland 544 84 1 16 2.8 11.4 4.8 5.4 a 10.9
Australia 524 95 1 16 9.0 26.1 21.1 6.7 a 13.7
spain 485 88 1 16 28.6 24.8 19.7 25.3 a 14.0
Norway 495 92 1 16 0.0 11.6 6.6 0.5 a 14.1
sweden 509 95 1 16 3.4 11.7 10.5 4.6 a 15.3
poland 490 90 1 16 3.6 23.3 12.6 8.2 a 16.7
New Zealand 523 98 1 16 4.5 17.0 18.1 4.9 a 16.8
Denmark 514 91 1 16 3.4 19.2 13.4 5.7 a 17.6
united states 483 95 1 16 11.3 22.7 25.7 7.0 a 19.0
Japan 534 101 2 15 0.0 27.3 53.0 0.0 4.8 11.6
Greece 445 94 2 15 7.0 28.7 36.3 6.3 23.5 15.9
Italy 466 96 3 14 15.0 29.6 52.2 10.6 19.3 13.6
Korea 542 92 3 14 0.5 29.7 42.0 0.0 22.2 14.2
mexico 385 85 3 12 28.4 34.2 39.4 19.7 22.1 17.1
portugal 466 88 3 15 29.5 24.3 33.6 42.6 38.8 17.5
Turkey 423 105 3 11 17.3 36.9 54.9 5.9 40.1 22.3
hungary 490 94 3 11 9.5 44.4 58.3 10.3 37.7 27.0
Austria 506 93 4 10 9.6 32.2 52.9 8.0 39.7 16.0
Ireland 503 85 4 15 13.8 21.0 15.9 9.1 8.2 16.3
switzerland 527 98 4 12 21.6 18.7 34.2 16.2 10.3 16.8
luxembourg 493 92 4 13 37.9 23.9 31.6 20.3 34.4 17.1
Netherlands 538 93 4 12 28.4 22.9 58.0 19.4 64.4 18.6
Germany 503 103 4 10 20.3 30.3 51.7 22.2 50.2 22.8
Belgium 529 110 4 12 29.5 31.8 46.0 32.0 59.1 24.1
Czech Republic 516 96 5 11 2.6 29.9 47.8 7.8 35.1 19.5
slovak Republic 498 93 5 11 2.5 32.3 41.7 6.2 28.7 22.3
france 511 92 m 15 38.3 32.3 m 36.8 41.5 19.6
OECD average 500 100 - - 13.4 25.3 32.3 12.1 32.2 16.8
united Kingdom2 m m 1 16 2.1 18.4 22.3 0.9 a 19.7
Note: Countries are presented in ascending order, first, of the number of distinct programmes and, second, of the total variance in mathematics performance explained by differences in economic, social and cultural status (ESCS).1. Data on grade retention come from student self-reports on whether or not they have ever repeated a grade; therefore they only approxi-mate the grade retention policy and practices of any given country.2. Response rate too low to ensure comparability. See Annex 3 for notes (www.oecd.org/edu/eag2006).Source: OECD PISA 2003 database. Please refer to the Reader’s Guide for information concerning the symbols replacing missing data.
StatLink: http://dx.doi.org/10.1787/650647703470

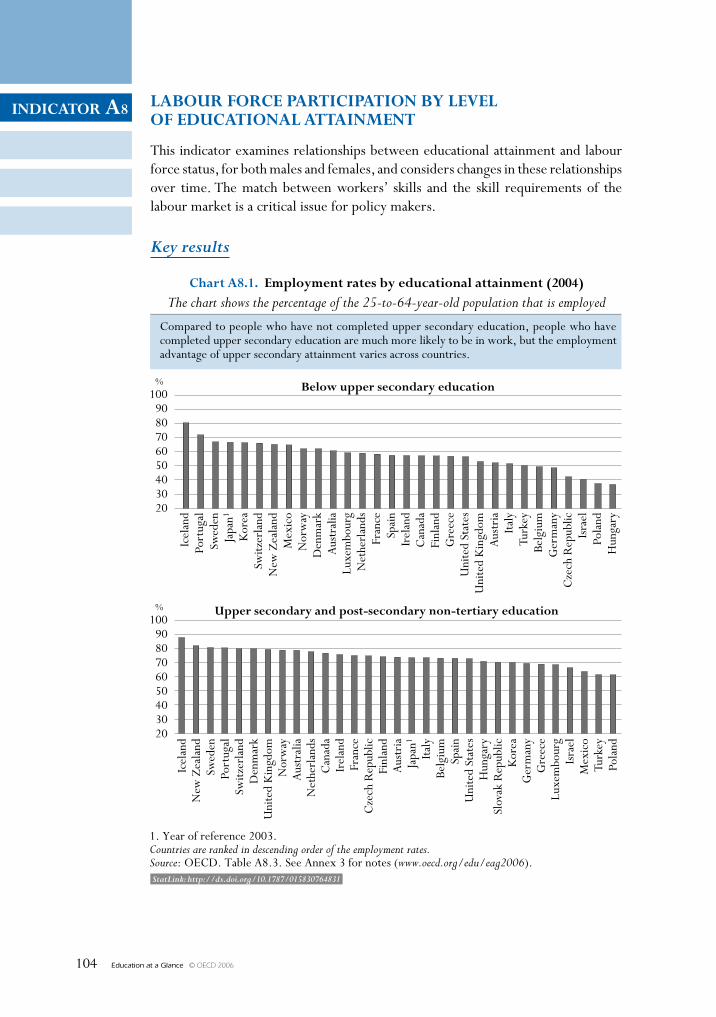
Education at a Glance © OECD 2006104
INDICATOR A8
StatLink: http://dx.doi.org/10.1787/015830764831
LAbOuR fORCe pARTICIpATION by LeveL Of eDuCATIONAL ATTAINmeNT
This indicator examines relationships between educational attainment and labour force status, for both males and females, and considers changes in these relationships over time. The match between workers’ skills and the skill requirements of the labour market is a critical issue for policy makers.
Key results
1009080706050403020
%
1009080706050403020
%
Chart A8.1. employment rates by educational attainment (2004)The chart shows the percentage of the 25-to-64-year-old population that is employed
1. Year of reference 2003.Countries are ranked in descending order of the employment rates.Source: OECD. Table A8.3. See Annex 3 for notes (www.oecd.org/edu/eag2006).
Icel
and
Port
ugal
Swed
enJa
pan1
Kor
eaSw
itzer
land
New
Zea
land
Mex
ico
Nor
way
Den
mar
kA
ustr
alia
Luxe
mbo
urg
Net
herl
ands
Fran
ceSp
ain
Irel
and
Can
ada
Finl
and
Gre
ece
Uni
ted
Stat
esU
nite
d K
ingd
omA
ustr
iaIta
lyTu
rkey
Belg
ium
Ger
man
yC
zech
Rep
ublic
Isra
elPo
land
Hun
gary
below upper secondary education
Compared to people who have not completed upper secondary education, people who havecompleted upper secondary education are much more likely to be in work, but the employmentadvantage of upper secondary attainment varies across countries.
Icel
and
New
Zea
land
Swed
enPo
rtug
alSw
itzer
land
Den
mar
kU
nite
d K
ingd
omN
orw
ayA
ustr
alia
Net
herl
ands
Can
ada
Irel
and
Fran
ceC
zech
Rep
ublic
Finl
and
Aus
tria
Japa
n1
Italy
Belg
ium
Spai
nU
nite
d St
ates
Hun
gary
Slov
ak R
epub
licK
orea
Ger
man
yG
reec
eLu
xem
bour
gIs
rael
Mex
ico
Turk
eyPo
land
upper secondary and post-secondary non-tertiary education
INDICATOR A8
Education at a Glance © OECD 2006 105
Other highlights of this indicator
• Employment rates rise with educational attainment in most OECD countries. With few exceptions, the employment rate for graduates of tertiary education is markedly higher than the rate for upper secondary graduates. For males, the gap is particularly wide between upper secondary graduates and those without an upper secondary qualification.
• Differences in employment rates between males and females are wider among less educated groups. The chance of being in employment is 23 points higher for males than for females among those without upper secondary qualifications, falling to 10 points for the most highly qualified.
• Those with low educational attainment are both less likely to be labour force participants and more likely to be unemployed. Unemployment rates fall with higher educational attainment. The greatest gender differences in unemployment rates are seen among lower-qualified adults (Chart A8.3).
• Unemployment rates are higher for females at each level of educational attainment in 12 OECD countries. Unemployment rates are higher for males at each level of educational attainment in only three countries (Chart A8.3).
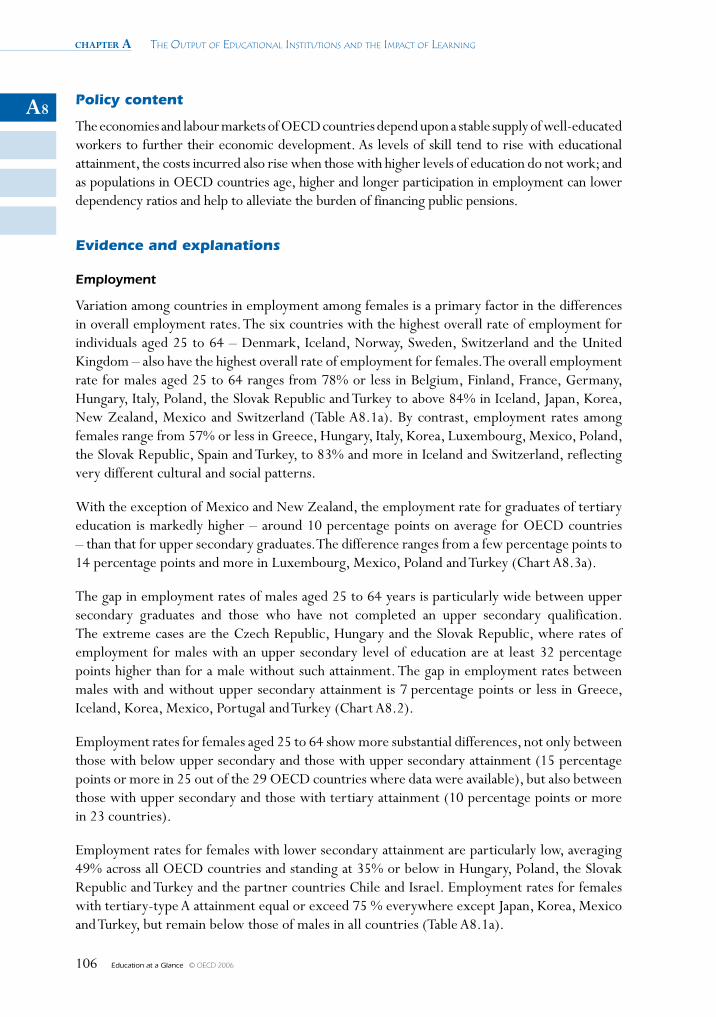
chapter a The OuTpuT Of educaTiOnal insTiTuTiOns and The impacT Of learning
Education at a Glance © OECD 2006106
A8Policy content
The economies and labour markets of OECD countries depend upon a stable supply of well-educated workers to further their economic development. As levels of skill tend to rise with educational attainment, the costs incurred also rise when those with higher levels of education do not work; and as populations in OECD countries age, higher and longer participation in employment can lower dependency ratios and help to alleviate the burden of financing public pensions.
Evidence and explanations
Employment
Variation among countries in employment among females is a primary factor in the differences in overall employment rates. The six countries with the highest overall rate of employment for individuals aged 25 to 64 – Denmark, Iceland, Norway, Sweden, Switzerland and the United Kingdom – also have the highest overall rate of employment for females. The overall employment rate for males aged 25 to 64 ranges from 78% or less in Belgium, Finland, France, Germany, Hungary, Italy, Poland, the Slovak Republic and Turkey to above 84% in Iceland, Japan, Korea, New Zealand, Mexico and Switzerland (Table A8.1a). By contrast, employment rates among females range from 57% or less in Greece, Hungary, Italy, Korea, Luxembourg, Mexico, Poland, the Slovak Republic, Spain and Turkey, to 83% and more in Iceland and Switzerland, reflecting very different cultural and social patterns.
With the exception of Mexico and New Zealand, the employment rate for graduates of tertiary education is markedly higher – around 10 percentage points on average for OECD countries – than that for upper secondary graduates. The difference ranges from a few percentage points to 14 percentage points and more in Luxembourg, Mexico, Poland and Turkey (Chart A8.3a).
The gap in employment rates of males aged 25 to 64 years is particularly wide between upper secondary graduates and those who have not completed an upper secondary qualification. The extreme cases are the Czech Republic, Hungary and the Slovak Republic, where rates of employment for males with an upper secondary level of education are at least 32 percentage points higher than for a male without such attainment. The gap in employment rates between males with and without upper secondary attainment is 7 percentage points or less in Greece, Iceland, Korea, Mexico, Portugal and Turkey (Chart A8.2).
Employment rates for females aged 25 to 64 show more substantial differences, not only between those with below upper secondary and those with upper secondary attainment (15 percentage points or more in 25 out of the 29 OECD countries where data were available), but also between those with upper secondary and those with tertiary attainment (10 percentage points or more in 23 countries).
Employment rates for females with lower secondary attainment are particularly low, averaging 49% across all OECD countries and standing at 35% or below in Hungary, Poland, the Slovak Republic and Turkey and the partner countries Chile and Israel. Employment rates for females with tertiary-type A attainment equal or exceed 75 % everywhere except Japan, Korea, Mexico and Turkey, but remain below those of males in all countries (Table A8.1a).
A8
Labour Force Participation by Level of Educational Attainment – INDICATOR A8 chapter a
Education at a Glance © OECD 2006 107
%100
9080706050403020
%
%
1009080706050403020
1009080706050403020
Chart A8.2. employment rates, by educational attainment (2004)Percentage of the 25-to-64-year-old population that is employed
Males Females
1. Year of reference 2003.Countries are ranked in descending order of the employment rate of males having attained less than upper secondary education.Source: OECD. Table A8.3b and A8.3c. See Annex 3 for notes (www.oecd.org/edu/eag2006).
Mex
ico
Icel
and
Port
ugal
Kor
eaJa
pan1
Gre
ece
Switz
erla
ndSp
ain
New
Zea
land
Turk
eyN
ethe
rlan
dsA
ustr
alia
Irel
and
Swed
enLu
xem
bour
gIta
lyD
enm
ark
Nor
way
Uni
ted
Stat
esC
anad
aFr
ance
Aus
tria
Belg
ium
Finl
and
Uni
ted
Kin
gdom
Ger
man
yIs
rael
Cze
ch R
epub
licPo
land
Hun
gary
Slov
ak R
epub
lic
below upper secondary education
upper secondary and post-secondary non-tertiary education
Tertiary education
Mex
ico
Icel
and
Port
ugal
Kor
eaJa
pan1
Gre
ece
Switz
erla
ndSp
ain
New
Zea
land
Turk
eyN
ethe
rlan
dsA
ustr
alia
Irel
and
Swed
enLu
xem
bour
gIta
lyD
enm
ark
Nor
way
Uni
ted
Stat
esC
anad
aFr
ance
Aus
tria
Belg
ium
Finl
and
Uni
ted
Kin
gdom
Ger
man
yIs
rael
Cze
ch R
epub
licPo
land
Hun
gary
Slov
ak R
epub
lic
StatLink: http://dx.doi.org/10.1787/015830764831
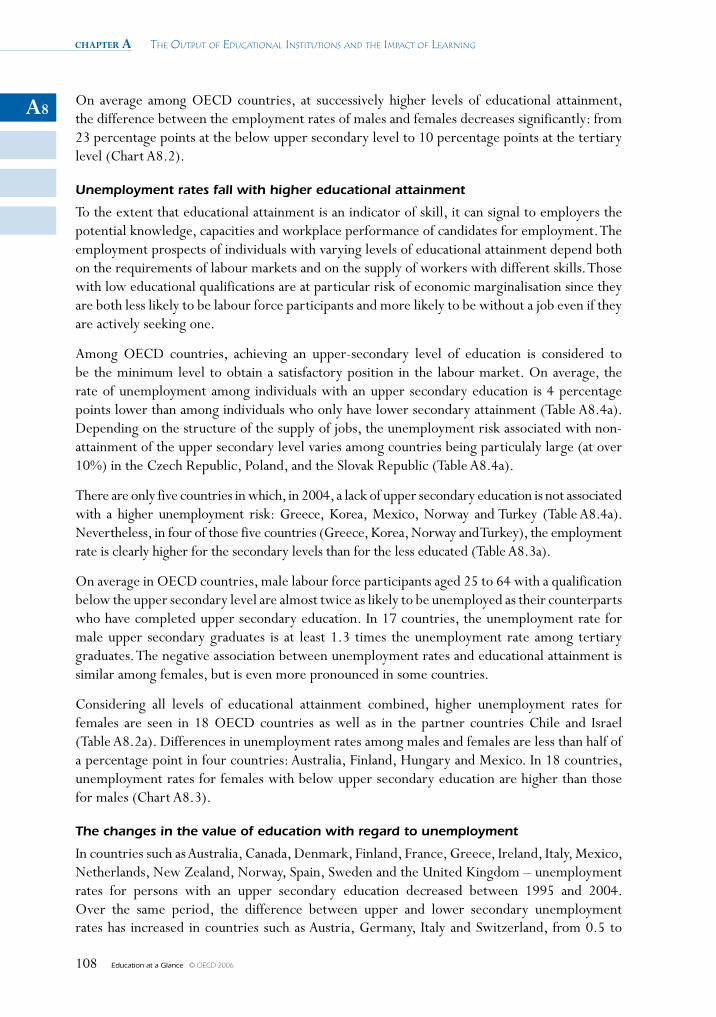
chapter a The OuTpuT Of educaTiOnal insTiTuTiOns and The impacT Of learning
Education at a Glance © OECD 2006108
A8On average among OECD countries, at successively higher levels of educational attainment, the difference between the employment rates of males and females decreases significantly: from 23 percentage points at the below upper secondary level to 10 percentage points at the tertiary level (Chart A8.2).
Unemployment rates fall with higher educational attainment
To the extent that educational attainment is an indicator of skill, it can signal to employers the potential knowledge, capacities and workplace performance of candidates for employment. The employment prospects of individuals with varying levels of educational attainment depend both on the requirements of labour markets and on the supply of workers with different skills. Those with low educational qualifications are at particular risk of economic marginalisation since they are both less likely to be labour force participants and more likely to be without a job even if they are actively seeking one.
Among OECD countries, achieving an upper-secondary level of education is considered to be the minimum level to obtain a satisfactory position in the labour market. On average, the rate of unemployment among individuals with an upper secondary education is 4 percentage points lower than among individuals who only have lower secondary attainment (Table A8.4a). Depending on the structure of the supply of jobs, the unemployment risk associated with non-attainment of the upper secondary level varies among countries being particulaly large (at over 10%) in the Czech Republic, Poland, and the Slovak Republic (Table A8.4a).
There are only five countries in which, in 2004, a lack of upper secondary education is not associated with a higher unemployment risk: Greece, Korea, Mexico, Norway and Turkey (Table A8.4a). Nevertheless, in four of those five countries (Greece, Korea, Norway and Turkey), the employment rate is clearly higher for the secondary levels than for the less educated (Table A8.3a).
On average in OECD countries, male labour force participants aged 25 to 64 with a qualification below the upper secondary level are almost twice as likely to be unemployed as their counterparts who have completed upper secondary education. In 17 countries, the unemployment rate for male upper secondary graduates is at least 1.3 times the unemployment rate among tertiary graduates. The negative association between unemployment rates and educational attainment is similar among females, but is even more pronounced in some countries.
Considering all levels of educational attainment combined, higher unemployment rates for females are seen in 18 OECD countries as well as in the partner countries Chile and Israel (Table A8.2a). Differences in unemployment rates among males and females are less than half of a percentage point in four countries: Australia, Finland, Hungary and Mexico. In 18 countries, unemployment rates for females with below upper secondary education are higher than those for males (Chart A8.3).
The changes in the value of education with regard to unemployment
In countries such as Australia, Canada, Denmark, Finland, France, Greece, Ireland, Italy, Mexico, Netherlands, New Zealand, Norway, Spain, Sweden and the United Kingdom – unemployment rates for persons with an upper secondary education decreased between 1995 and 2004. Over the same period, the difference between upper and lower secondary unemployment rates has increased in countries such as Austria, Germany, Italy and Switzerland, from 0.5 to
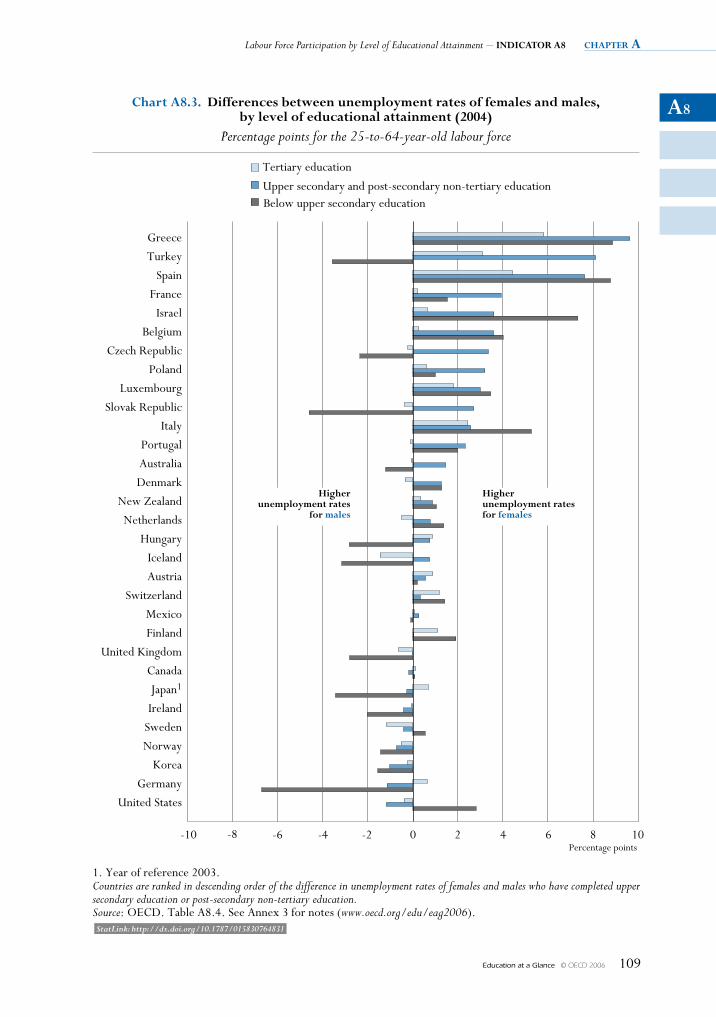
A8
Labour Force Participation by Level of Educational Attainment – INDICATOR A8 chapter a
Education at a Glance © OECD 2006 109
Percentage points-10 -8 -6 -4 -2 0 2 4 6 8 10
Chart A8.3. Differences between unemployment rates of females and males,by level of educational attainment (2004)
Percentage points for the 25-to-64-year-old labour force
Below upper secondary educationUpper secondary and post-secondary non-tertiary education
Tertiary education
1. Year of reference 2003.Countries are ranked in descending order of the difference in unemployment rates of females and males who have completed uppersecondary education or post-secondary non-tertiary education.Source: OECD. Table A8.4. See Annex 3 for notes (www.oecd.org/edu/eag2006).
Greece
Turkey
Spain
France
Israel
Belgium
Czech Republic
Poland
Luxembourg
Slovak Republic
Italy
Portugal
Australia
Denmark
New Zealand
Netherlands
Hungary
Iceland
Austria
Switzerland
Mexico
Finland
United Kingdom
Canada
Japan1
Ireland
Sweden
Norway
Korea
Germany
United States
Higherunemployment ratesfor females
Higherunemployment rates
for males
StatLink: http://dx.doi.org/10.1787/015830764831
chapter a The OuTpuT Of educaTiOnal insTiTuTiOns and The impacT Of learning
Education at a Glance © OECD 2006110
A83.9 percentage points and by as much as 7.6, 11.0 and 18.7 percentage points in Poland, the Czech Republic and the Slovak Republic respectively. Although the difference between the unemployment rate among individuals with upper and lower secondary levels of education is on average greater than between tertiary and upper secondary levels, achieving an upper secondary education makes less of a difference in the labour market than the achievement of tertiary education since the tertiary-level unemployment rate is almost always lower than the upper secondary level rate (Table A8.4a).
Higher educational attainment is usually associated with lower unemployment, but there are exceptions. In Mexico and New Zealand the 2004 unemployment rate for those with tertiary education was almost the same as for those who attained upper secondary education. Nevertheless, in both countries the employment rate for those with a tertiary-level education remained higher than for those with a secondary-level of attainment.
Since 1995, there has been a small decrease in the difference between the unemployment rate among individuals with tertiary education and for those with an upper secondary level of education (considering the OECD as a whole). In 2004, unemployment rates for those with tertiary education were on average 2.3 percentage points lower than those for persons with upper secondary education. This compares with a difference of 2.7 percentage points in 1995. This trend has been most apparent in Denmark, Finland and Sweden. The reverse situation can also be seen, with tertiary graduates having a greater labour market advantage, in countries such as the Czech Republic, Poland and the Slovak Republic (Table A8.4a).
Definition and methodologies
Under the auspices of the International Labour Organisation (ILO) and the conferences of labour statisticians, concepts and definitions were progressively established and are now used as a common reference (see the “Resolution Concerning Statistics of the Economically Active Population, Employment, Unemployment and Underemployment” (1982), adopted by the 13th International Conference of Labour Statisticians). The employment rate refers to the number of persons in employment as a percentage of the population of working age. Unemployment rates refer to unemployed persons as a percentage of the civilian labour force.
The unemployed are defined as individuals who are without work, actively seeking employment and currently available to start work. The employed are defined as those who during the survey reference week: i) work for pay (employees) or profit (self-employed and unpaid family workers) for at least one hour; or ii) have a job but are temporarily not at work (through injury, illness, holiday, strike or lock-out, educational or training leave, maternity or parental leave, etc.).
Further references
The following additional material relevant to this indicator is available on the Web athttp://dx.doi.org/10.1787/015830764831
• Employment rates and educational attainment Table A8.1b: Total adult population
• Unemployment rates and educational attainment Table A8.2b: Total adult population
A8
Labour Force Participation by Level of Educational Attainment – INDICATOR A8 chapter a
Education at a Glance © OECD 2006 111
• Trends in employment rates by educational attainment, by gender Table A8.3b: Males Table A8.3c: Females
• Trends in unemployment rates by educational attainment, by gender Table A8.4b: Males Table A8.4c: Females
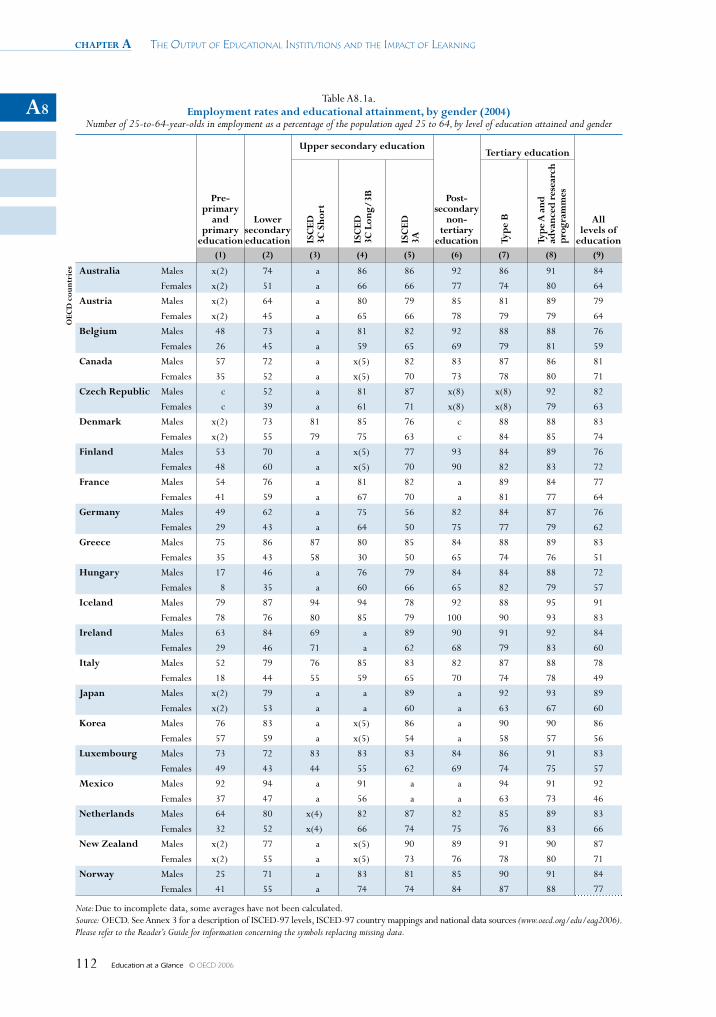
chapter a The OuTpuT Of educaTiOnal insTiTuTiOns and The impacT Of learning
Education at a Glance © OECD 2006112
A8Table A8.1a.
Employment rates and educational attainment, by gender (2004) Number of 25-to-64-year-olds in employment as a percentage of the population aged 25 to 64, by level of education attained and gender
Pre- primary
and primary
education
Lower secondary education
Upper secondary education
Post- secondary
non- tertiary
education
Tertiary education
All levels of
educationISC
ED
3C S
hort
ISC
ED
3C L
ong/
3B
ISC
ED
3A
Typ
e B
Type
A a
nd
adva
nced
res
earc
h pr
ogra
mm
es
(1) (2) (3) (4) (5) (6) (7) (8) (9)
oEC
D c
ount
ries Australia Males x(2) 74 a 86 86 92 86 91 84
Females x(2) 51 a 66 66 77 74 80 64
Austria Males x(2) 64 a 80 79 85 81 89 79
Females x(2) 45 a 65 66 78 79 79 64
Belgium Males 48 73 a 81 82 92 88 88 76
Females 26 45 a 59 65 69 79 81 59
Canada Males 57 72 a x(5) 82 83 87 86 81
Females 35 52 a x(5) 70 73 78 80 71
Czech Republic Males c 52 a 81 87 x(8) x(8) 92 82
Females c 39 a 61 71 x(8) x(8) 79 63
Denmark Males x(2) 73 81 85 76 c 88 88 83
Females x(2) 55 79 75 63 c 84 85 74
Finland Males 53 70 a x(5) 77 93 84 89 76
Females 48 60 a x(5) 70 90 82 83 72
France Males 54 76 a 81 82 a 89 84 77
Females 41 59 a 67 70 a 81 77 64
Germany Males 49 62 a 75 56 82 84 87 76
Females 29 43 a 64 50 75 77 79 62
Greece Males 75 86 87 80 85 84 88 89 83
Females 35 43 58 30 50 65 74 76 51
Hungary Males 17 46 a 76 79 84 84 88 72
Females 8 35 a 60 66 65 82 79 57
Iceland Males 79 87 94 94 78 92 88 95 91
Females 78 76 80 85 79 100 90 93 83
Ireland Males 63 84 69 a 89 90 91 92 84
Females 29 46 71 a 62 68 79 83 60
Italy Males 52 79 76 85 83 82 87 88 78
Females 18 44 55 59 65 70 74 78 49
Japan Males x(2) 79 a a 89 a 92 93 89
Females x(2) 53 a a 60 a 63 67 60
Korea Males 76 83 a x(5) 86 a 90 90 86
Females 57 59 a x(5) 54 a 58 57 56
Luxembourg Males 73 72 83 83 83 84 86 91 83
Females 49 43 44 55 62 69 74 75 57
Mexico Males 92 94 a 91 a a 94 91 92
Females 37 47 a 56 a a 63 73 46
Netherlands Males 64 80 x(4) 82 87 82 85 89 83
Females 32 52 x(4) 66 74 75 76 83 66
New Zealand Males x(2) 77 a x(5) 90 89 91 90 87
Females x(2) 55 a x(5) 73 76 78 80 71
Norway Males 25 71 a 83 81 85 90 91 84
Females 41 55 a 74 74 84 87 88 77
Note: Due to incomplete data, some averages have not been calculated.Source: OECD. See Annex 3 for a description of ISCED-97 levels, ISCED-97 country mappings and national data sources (www.oecd.org/edu/eag2006). Please refer to the Reader’s Guide for information concerning the symbols replacing missing data.
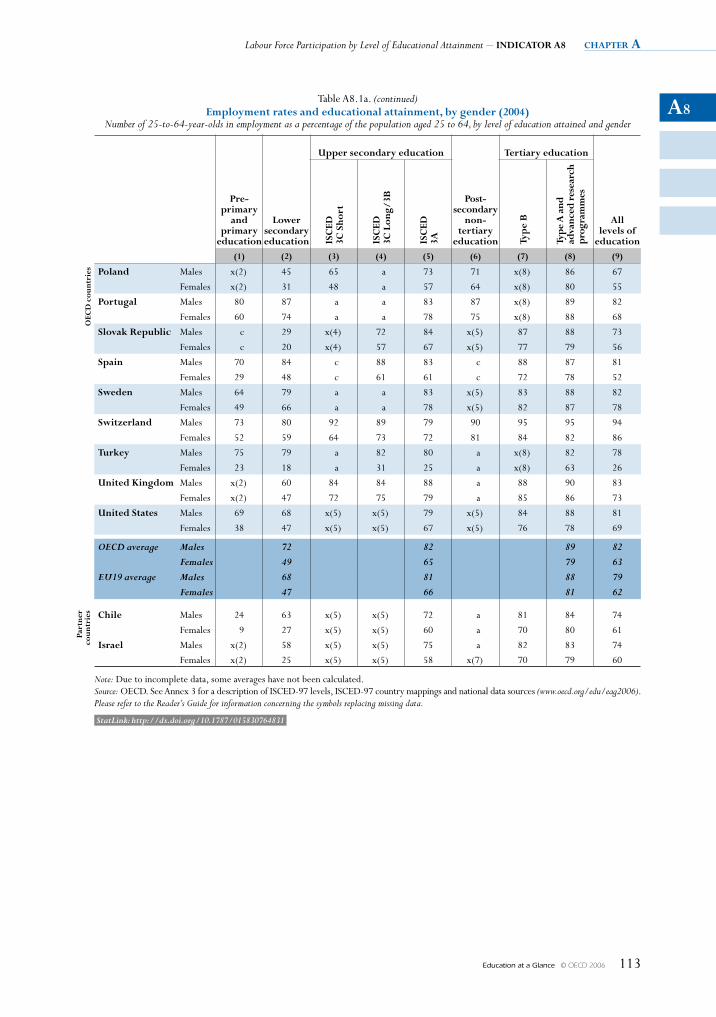
A8
Labour Force Participation by Level of Educational Attainment – INDICATOR A8 chapter a
Education at a Glance © OECD 2006 113
Table A8.1a. (continued)employment rates and educational attainment, by gender (2004)
Number of 25-to-64-year-olds in employment as a percentage of the population aged 25 to 64, by level of education attained and gender
pre- primary
and primary
education
Lower secondary education
upper secondary education
post- secondary
non- tertiary
education
Tertiary education
All levels of
educationISC
eD
3C S
hort
ISC
eD
3C L
ong/
3b
ISC
eD
3A
Typ
e b
Type
A a
nd
adva
nced
res
earc
h pr
ogra
mm
es
(1) (2) (3) (4) (5) (6) (7) (8) (9)
OeC
D c
ount
ries poland Males x(2) 45 65 a 73 71 x(8) 86 67
Females x(2) 31 48 a 57 64 x(8) 80 55
portugal Males 80 87 a a 83 87 x(8) 89 82
Females 60 74 a a 78 75 x(8) 88 68
Slovak Republic Males c 29 x(4) 72 84 x(5) 87 88 73
Females c 20 x(4) 57 67 x(5) 77 79 56
Spain Males 70 84 c 88 83 c 88 87 81
Females 29 48 c 61 61 c 72 78 52
Sweden Males 64 79 a a 83 x(5) 83 88 82
Females 49 66 a a 78 x(5) 82 87 78
Switzerland Males 73 80 92 89 79 90 95 95 94
Females 52 59 64 73 72 81 84 82 86
Turkey Males 75 79 a 82 80 a x(8) 82 78
Females 23 18 a 31 25 a x(8) 63 26
united Kingdom Males x(2) 60 84 84 88 a 88 90 83
Females x(2) 47 72 75 79 a 85 86 73
united States Males 69 68 x(5) x(5) 79 x(5) 84 88 81
Females 38 47 x(5) x(5) 67 x(5) 76 78 69
OECD average Males 72 82 89 82Females 49 65 79 63
EU19 average Males 68 81 88 79Females 47 66 81 62
part
ner
cou
ntri
es Chile Males 24 63 x(5) x(5) 72 a 81 84 74
Females 9 27 x(5) x(5) 60 a 70 80 61
Israel Males x(2) 58 x(5) x(5) 75 a 82 83 74
Females x(2) 25 x(5) x(5) 58 x(7) 70 79 60
Note: Due to incomplete data, some averages have not been calculated.Source: OECD. See Annex 3 for a description of ISCED-97 levels, ISCED-97 country mappings and national data sources (www.oecd.org/edu/eag2006). Please refer to the Reader’s Guide for information concerning the symbols replacing missing data.
StatLink: http://dx.doi.org/10.1787/015830764831
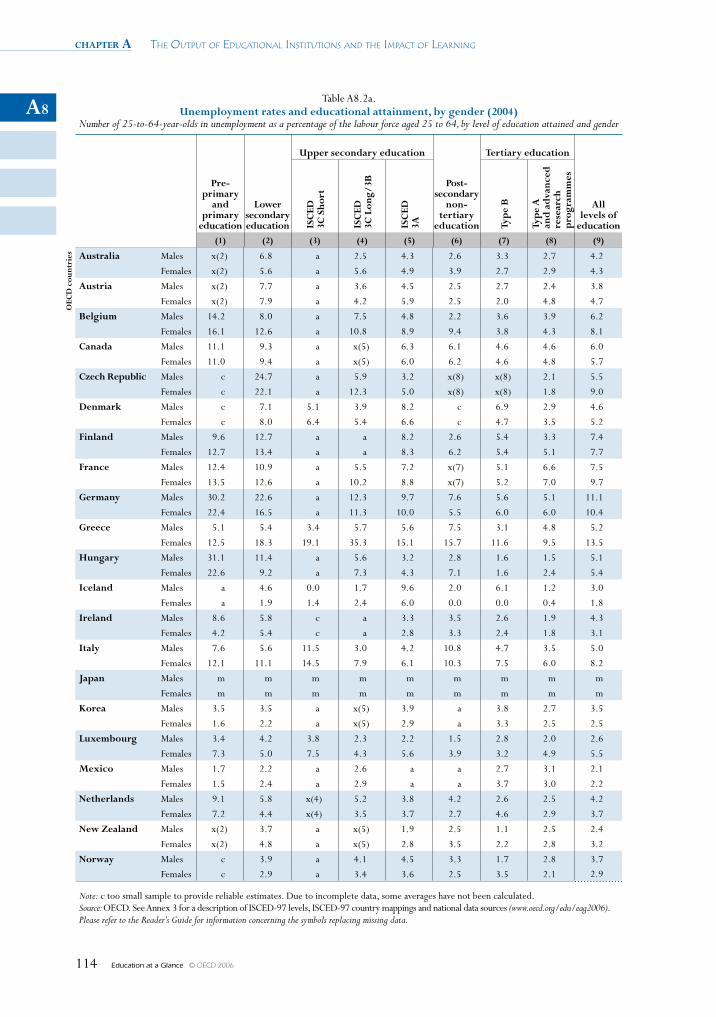
chapter a The OuTpuT Of educaTiOnal insTiTuTiOns and The impacT Of learning
Education at a Glance © OECD 2006114
A8Table A8.2a.
unemployment rates and educational attainment, by gender (2004) Number of 25-to-64-year-olds in unemployment as a percentage of the labour force aged 25 to 64, by level of education attained and gender
pre- primary
and primary
education
Lower secondary education
upper secondary education
post- secondary
non- tertiary
education
Tertiary education
All levels of
educationISC
eD
3C S
hort
ISC
eD
3C L
ong/
3b
ISC
eD
3A
Typ
e b
Typ
e A
an
d a
dvan
ced
re
sear
ch
pro
gram
mes
(1) (2) (3) (4) (5) (6) (7) (8) (9)
OeC
D c
ount
ries Australia Males x(2) 6.8 a 2.5 4.3 2.6 3.3 2.7 4.2
Females x(2) 5.6 a 5.6 4.9 3.9 2.7 2.9 4.3
Austria Males x(2) 7.7 a 3.6 4.5 2.5 2.7 2.4 3.8
Females x(2) 7.9 a 4.2 5.9 2.5 2.0 4.8 4.7
belgium Males 14.2 8.0 a 7.5 4.8 2.2 3.6 3.9 6.2
Females 16.1 12.6 a 10.8 8.9 9.4 3.8 4.3 8.1
Canada Males 11.1 9.3 a x(5) 6.3 6.1 4.6 4.6 6.0
Females 11.0 9.4 a x(5) 6.0 6.2 4.6 4.8 5.7
Czech Republic Males c 24.7 a 5.9 3.2 x(8) x(8) 2.1 5.5
Females c 22.1 a 12.3 5.0 x(8) x(8) 1.8 9.0
Denmark Males c 7.1 5.1 3.9 8.2 c 6.9 2.9 4.6
Females c 8.0 6.4 5.4 6.6 c 4.7 3.5 5.2
finland Males 9.6 12.7 a a 8.2 2.6 5.4 3.3 7.4
Females 12.7 13.4 a a 8.3 6.2 5.4 5.1 7.7
france Males 12.4 10.9 a 5.5 7.2 x(7) 5.1 6.6 7.5
Females 13.5 12.6 a 10.2 8.8 x(7) 5.2 7.0 9.7
Germany Males 30.2 22.6 a 12.3 9.7 7.6 5.6 5.1 11.1
Females 22.4 16.5 a 11.3 10.0 5.5 6.0 6.0 10.4
Greece Males 5.1 5.4 3.4 5.7 5.6 7.5 3.1 4.8 5.2
Females 12.5 18.3 19.1 35.3 15.1 15.7 11.6 9.5 13.5
Hungary Males 31.1 11.4 a 5.6 3.2 2.8 1.6 1.5 5.1
Females 22.6 9.2 a 7.3 4.3 7.1 1.6 2.4 5.4
Iceland Males a 4.6 0.0 1.7 9.6 2.0 6.1 1.2 3.0
Females a 1.9 1.4 2.4 6.0 0.0 0.0 0.4 1.8
Ireland Males 8.6 5.8 c a 3.3 3.5 2.6 1.9 4.3
Females 4.2 5.4 c a 2.8 3.3 2.4 1.8 3.1
Italy Males 7.6 5.6 11.5 3.0 4.2 10.8 4.7 3.5 5.0
Females 12.1 11.1 14.5 7.9 6.1 10.3 7.5 6.0 8.2
Japan Males m m m m m m m m m
Females m m m m m m m m m
Korea Males 3.5 3.5 a x(5) 3.9 a 3.8 2.7 3.5
Females 1.6 2.2 a x(5) 2.9 a 3.3 2.5 2.5
Luxembourg Males 3.4 4.2 3.8 2.3 2.2 1.5 2.8 2.0 2.6
Females 7.3 5.0 7.5 4.3 5.6 3.9 3.2 4.9 5.5
mexico Males 1.7 2.2 a 2.6 a a 2.7 3.1 2.1
Females 1.5 2.4 a 2.9 a a 3.7 3.0 2.2
Netherlands Males 9.1 5.8 x(4) 5.2 3.8 4.2 2.6 2.5 4.2
Females 7.2 4.4 x(4) 3.5 3.7 2.7 4.6 2.9 3.7
New Zealand Males x(2) 3.7 a x(5) 1.9 2.5 1.1 2.5 2.4
Females x(2) 4.8 a x(5) 2.8 3.5 2.2 2.8 3.2
Norway Males c 3.9 a 4.1 4.5 3.3 1.7 2.8 3.7
Females c 2.9 a 3.4 3.6 2.5 3.5 2.1 2.9
Note: c too small sample to provide reliable estimates. Due to incomplete data, some averages have not been calculated.Source: OECD. See Annex 3 for a description of ISCED-97 levels, ISCED-97 country mappings and national data sources (www.oecd.org/edu/eag2006). Please refer to the Reader’s Guide for information concerning the symbols replacing missing data.
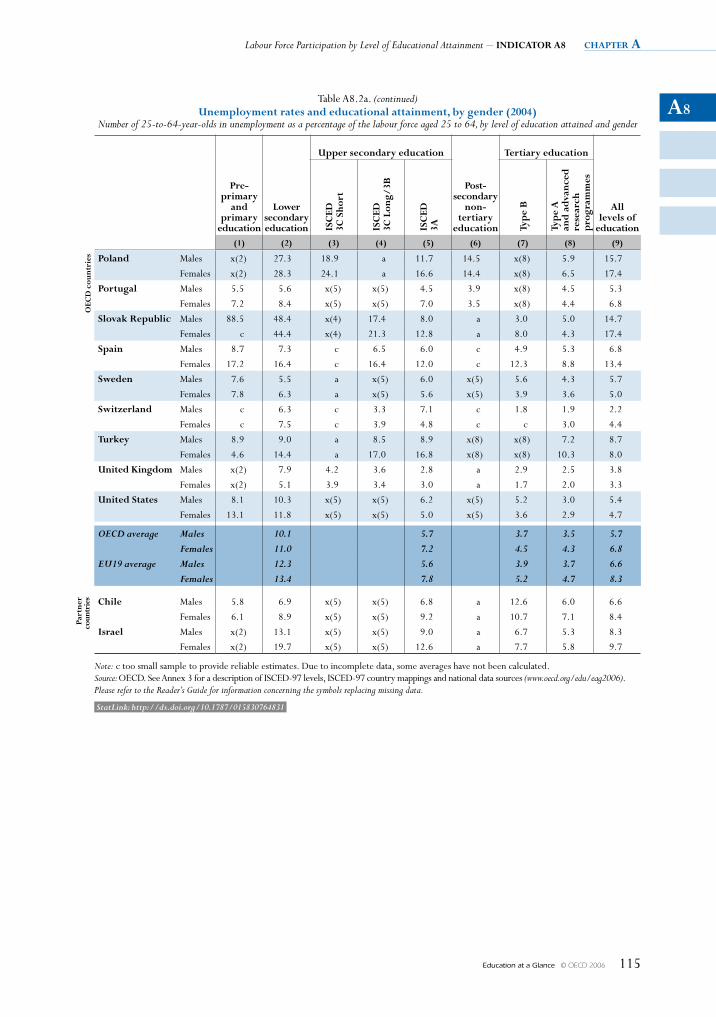
A8
Labour Force Participation by Level of Educational Attainment – INDICATOR A8 chapter a
Education at a Glance © OECD 2006 115
Table A8.2a. (continued) unemployment rates and educational attainment, by gender (2004)
Number of 25-to-64-year-olds in unemployment as a percentage of the labour force aged 25 to 64, by level of education attained and gender
pre- primary
and primary
education
Lower secondary education
upper secondary education
post- secondary
non- tertiary
education
Tertiary education
All levels of
educationISC
eD
3C S
hort
ISC
eD
3C L
ong/
3b
ISC
eD
3A
Typ
e b
Typ
e A
an
d a
dvan
ced
re
sear
ch
pro
gram
mes
(1) (2) (3) (4) (5) (6) (7) (8) (9)
OeC
D c
ount
ries poland Males x(2) 27.3 18.9 a 11.7 14.5 x(8) 5.9 15.7
Females x(2) 28.3 24.1 a 16.6 14.4 x(8) 6.5 17.4
portugal Males 5.5 5.6 x(5) x(5) 4.5 3.9 x(8) 4.5 5.3
Females 7.2 8.4 x(5) x(5) 7.0 3.5 x(8) 4.4 6.8
Slovak Republic Males 88.5 48.4 x(4) 17.4 8.0 a 3.0 5.0 14.7
Females c 44.4 x(4) 21.3 12.8 a 8.0 4.3 17.4
Spain Males 8.7 7.3 c 6.5 6.0 c 4.9 5.3 6.8
Females 17.2 16.4 c 16.4 12.0 c 12.3 8.8 13.4
Sweden Males 7.6 5.5 a x(5) 6.0 x(5) 5.6 4.3 5.7
Females 7.8 6.3 a x(5) 5.6 x(5) 3.9 3.6 5.0
Switzerland Males c 6.3 c 3.3 7.1 c 1.8 1.9 2.2
Females c 7.5 c 3.9 4.8 c c 3.0 4.4
Turkey Males 8.9 9.0 a 8.5 8.9 x(8) x(8) 7.2 8.7
Females 4.6 14.4 a 17.0 16.8 x(8) x(8) 10.3 8.0
united Kingdom Males x(2) 7.9 4.2 3.6 2.8 a 2.9 2.5 3.8
Females x(2) 5.1 3.9 3.4 3.0 a 1.7 2.0 3.3
united States Males 8.1 10.3 x(5) x(5) 6.2 x(5) 5.2 3.0 5.4
Females 13.1 11.8 x(5) x(5) 5.0 x(5) 3.6 2.9 4.7
OECD average Males 10.1 5.7 3.7 3.5 5.7Females 11.0 7.2 4.5 4.3 6.8
EU19 average Males 12.3 5.6 3.9 3.7 6.6Females 13.4 7.8 5.2 4.7 8.3
part
ner
cou
ntri
es Chile Males 5.8 6.9 x(5) x(5) 6.8 a 12.6 6.0 6.6
Females 6.1 8.9 x(5) x(5) 9.2 a 10.7 7.1 8.4
Israel Males x(2) 13.1 x(5) x(5) 9.0 a 6.7 5.3 8.3
Females x(2) 19.7 x(5) x(5) 12.6 a 7.7 5.8 9.7
Note: c too small sample to provide reliable estimates. Due to incomplete data, some averages have not been calculated.Source: OECD. See Annex 3 for a description of ISCED-97 levels, ISCED-97 country mappings and national data sources (www.oecd.org/edu/eag2006). Please refer to the Reader’s Guide for information concerning the symbols replacing missing data.
StatLink: http://dx.doi.org/10.1787/015830764831
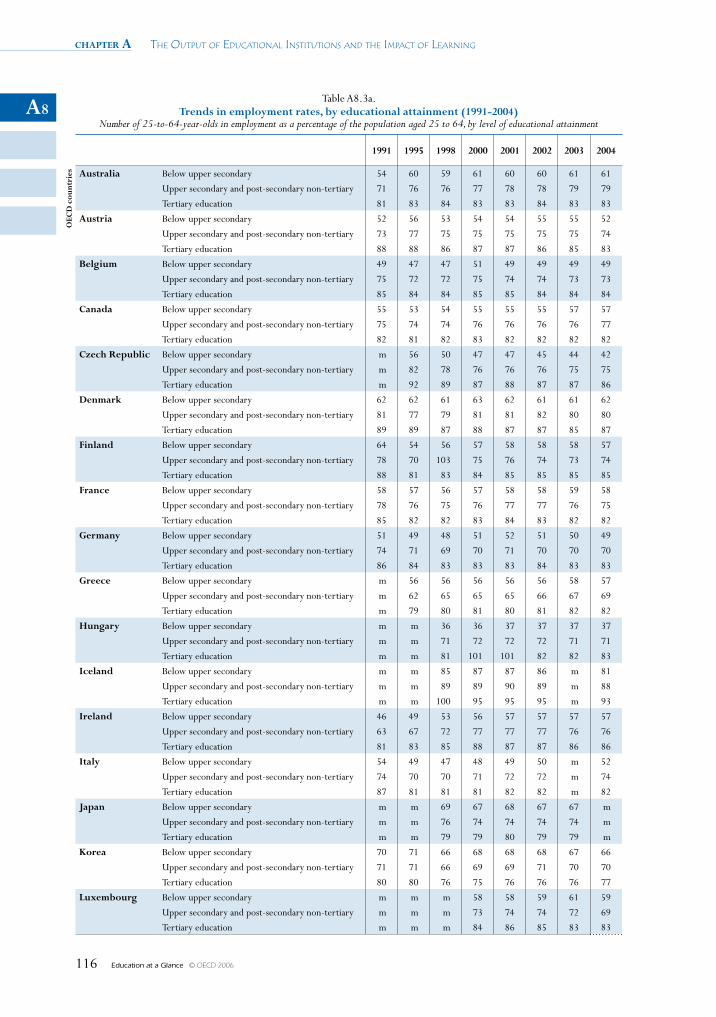
chapter a The OuTpuT Of educaTiOnal insTiTuTiOns and The impacT Of learning
Education at a Glance © OECD 2006116
A8Table A8.3a.
Trends in employment rates, by educational attainment (1991-2004) Number of 25-to-64-year-olds in employment as a percentage of the population aged 25 to 64, by level of educational attainment
1991 1995 1998 2000 2001 2002 2003 2004
OeC
D c
ount
ries Australia Below upper secondary 54 60 59 61 60 60 61 61
Upper secondary and post-secondary non-tertiary 71 76 76 77 78 78 79 79
Tertiary education 81 83 84 83 83 84 83 83
Austria Below upper secondary 52 56 53 54 54 55 55 52
Upper secondary and post-secondary non-tertiary 73 77 75 75 75 75 75 74
Tertiary education 88 88 86 87 87 86 85 83
belgium Below upper secondary 49 47 47 51 49 49 49 49
Upper secondary and post-secondary non-tertiary 75 72 72 75 74 74 73 73
Tertiary education 85 84 84 85 85 84 84 84
Canada Below upper secondary 55 53 54 55 55 55 57 57
Upper secondary and post-secondary non-tertiary 75 74 74 76 76 76 76 77
Tertiary education 82 81 82 83 82 82 82 82
Czech Republic Below upper secondary m 56 50 47 47 45 44 42
Upper secondary and post-secondary non-tertiary m 82 78 76 76 76 75 75
Tertiary education m 92 89 87 88 87 87 86
Denmark Below upper secondary 62 62 61 63 62 61 61 62
Upper secondary and post-secondary non-tertiary 81 77 79 81 81 82 80 80
Tertiary education 89 89 87 88 87 87 85 87
finland Below upper secondary 64 54 56 57 58 58 58 57
Upper secondary and post-secondary non-tertiary 78 70 103 75 76 74 73 74
Tertiary education 88 81 83 84 85 85 85 85
france Below upper secondary 58 57 56 57 58 58 59 58
Upper secondary and post-secondary non-tertiary 78 76 75 76 77 77 76 75
Tertiary education 85 82 82 83 84 83 82 82
Germany Below upper secondary 51 49 48 51 52 51 50 49
Upper secondary and post-secondary non-tertiary 74 71 69 70 71 70 70 70
Tertiary education 86 84 83 83 83 84 83 83
Greece Below upper secondary m 56 56 56 56 56 58 57
Upper secondary and post-secondary non-tertiary m 62 65 65 65 66 67 69
Tertiary education m 79 80 81 80 81 82 82
Hungary Below upper secondary m m 36 36 37 37 37 37
Upper secondary and post-secondary non-tertiary m m 71 72 72 72 71 71
Tertiary education m m 81 101 101 82 82 83
Iceland Below upper secondary m m 85 87 87 86 m 81
Upper secondary and post-secondary non-tertiary m m 89 89 90 89 m 88
Tertiary education m m 100 95 95 95 m 93
Ireland Below upper secondary 46 49 53 56 57 57 57 57
Upper secondary and post-secondary non-tertiary 63 67 72 77 77 77 76 76
Tertiary education 81 83 85 88 87 87 86 86
Italy Below upper secondary 54 49 47 48 49 50 m 52
Upper secondary and post-secondary non-tertiary 74 70 70 71 72 72 m 74
Tertiary education 87 81 81 81 82 82 m 82
Japan Below upper secondary m m 69 67 68 67 67 m
Upper secondary and post-secondary non-tertiary m m 76 74 74 74 74 m
Tertiary education m m 79 79 80 79 79 m
Korea Below upper secondary 70 71 66 68 68 68 67 66
Upper secondary and post-secondary non-tertiary 71 71 66 69 69 71 70 70
Tertiary education 80 80 76 75 76 76 76 77
Luxembourg Below upper secondary m m m 58 58 59 61 59
Upper secondary and post-secondary non-tertiary m m m 73 74 74 72 69
Tertiary education m m m 84 86 85 83 83
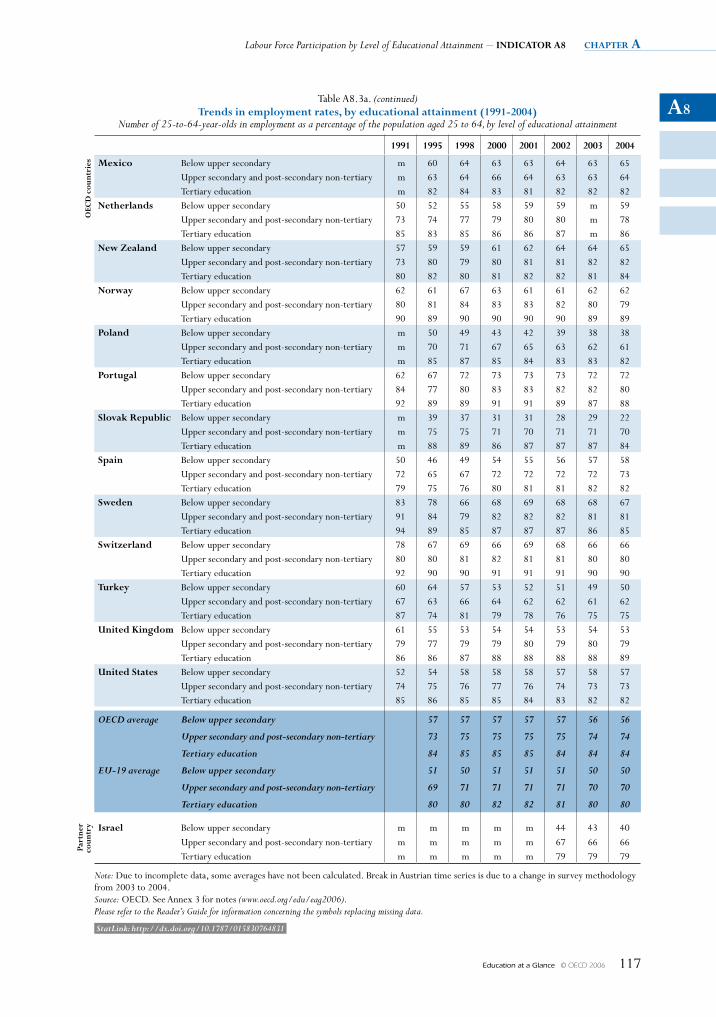
A8
Labour Force Participation by Level of Educational Attainment – INDICATOR A8 chapter a
Education at a Glance © OECD 2006 117
Table A8.3a. (continued)Trends in employment rates, by educational attainment (1991-2004)
Number of 25-to-64-year-olds in employment as a percentage of the population aged 25 to 64, by level of educational attainment
1991 1995 1998 2000 2001 2002 2003 2004
OeC
D c
ount
ries mexico Below upper secondary m 60 64 63 63 64 63 65
Upper secondary and post-secondary non-tertiary m 63 64 66 64 63 63 64Tertiary education m 82 84 83 81 82 82 82
Netherlands Below upper secondary 50 52 55 58 59 59 m 59Upper secondary and post-secondary non-tertiary 73 74 77 79 80 80 m 78Tertiary education 85 83 85 86 86 87 m 86
New Zealand Below upper secondary 57 59 59 61 62 64 64 65Upper secondary and post-secondary non-tertiary 73 80 79 80 81 81 82 82Tertiary education 80 82 80 81 82 82 81 84
Norway Below upper secondary 62 61 67 63 61 61 62 62Upper secondary and post-secondary non-tertiary 80 81 84 83 83 82 80 79Tertiary education 90 89 90 90 90 90 89 89
poland Below upper secondary m 50 49 43 42 39 38 38Upper secondary and post-secondary non-tertiary m 70 71 67 65 63 62 61Tertiary education m 85 87 85 84 83 83 82
portugal Below upper secondary 62 67 72 73 73 73 72 72Upper secondary and post-secondary non-tertiary 84 77 80 83 83 82 82 80Tertiary education 92 89 89 91 91 89 87 88
Slovak Republic Below upper secondary m 39 37 31 31 28 29 22Upper secondary and post-secondary non-tertiary m 75 75 71 70 71 71 70Tertiary education m 88 89 86 87 87 87 84
Spain Below upper secondary 50 46 49 54 55 56 57 58Upper secondary and post-secondary non-tertiary 72 65 67 72 72 72 72 73Tertiary education 79 75 76 80 81 81 82 82
Sweden Below upper secondary 83 78 66 68 69 68 68 67Upper secondary and post-secondary non-tertiary 91 84 79 82 82 82 81 81Tertiary education 94 89 85 87 87 87 86 85
Switzerland Below upper secondary 78 67 69 66 69 68 66 66Upper secondary and post-secondary non-tertiary 80 80 81 82 81 81 80 80Tertiary education 92 90 90 91 91 91 90 90
Turkey Below upper secondary 60 64 57 53 52 51 49 50Upper secondary and post-secondary non-tertiary 67 63 66 64 62 62 61 62Tertiary education 87 74 81 79 78 76 75 75
united Kingdom Below upper secondary 61 55 53 54 54 53 54 53Upper secondary and post-secondary non-tertiary 79 77 79 79 80 79 80 79Tertiary education 86 86 87 88 88 88 88 89
united States Below upper secondary 52 54 58 58 58 57 58 57Upper secondary and post-secondary non-tertiary 74 75 76 77 76 74 73 73Tertiary education 85 86 85 85 84 83 82 82
OECD average Below upper secondary 57 57 57 57 57 56 56
Upper secondary and post-secondary non-tertiary 73 75 75 75 75 74 74
Tertiary education 84 85 85 85 84 84 84
EU-19 average Below upper secondary 51 50 51 51 51 50 50
Upper secondary and post-secondary non-tertiary 69 71 71 71 71 70 70
Tertiary education 80 80 82 82 81 80 80
part
ner
coun
try Israel Below upper secondary m m m m m 44 43 40
Upper secondary and post-secondary non-tertiary m m m m m 67 66 66Tertiary education m m m m m 79 79 79
Note: Due to incomplete data, some averages have not been calculated. Break in Austrian time series is due to a change in survey methodology from 2003 to 2004.Source: OECD. See Annex 3 for notes (www.oecd.org/edu/eag2006).Please refer to the Reader’s Guide for information concerning the symbols replacing missing data.
StatLink: http://dx.doi.org/10.1787/015830764831
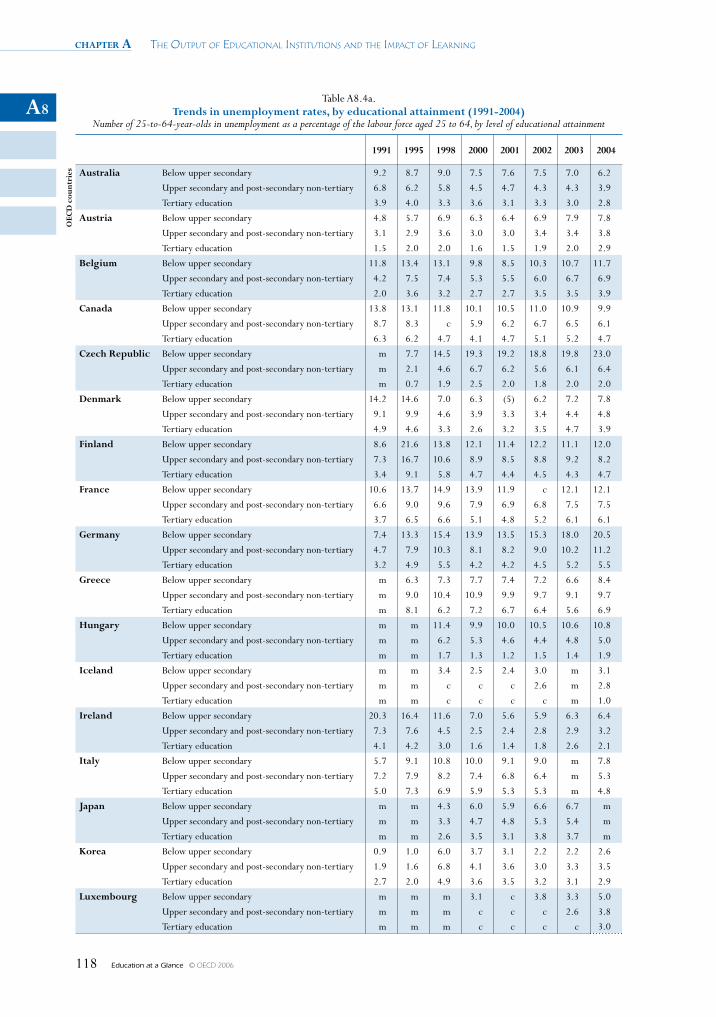
chapter a The OuTpuT Of educaTiOnal insTiTuTiOns and The impacT Of learning
Education at a Glance © OECD 2006118
A8Table A8.4a.
Trends in unemployment rates, by educational attainment (1991-2004) Number of 25-to-64-year-olds in unemployment as a percentage of the labour force aged 25 to 64, by level of educational attainment
1991 1995 1998 2000 2001 2002 2003 2004
OeC
D c
ount
ries Australia Below upper secondary 9.2 8.7 9.0 7.5 7.6 7.5 7.0 6.2
Upper secondary and post-secondary non-tertiary 6.8 6.2 5.8 4.5 4.7 4.3 4.3 3.9
Tertiary education 3.9 4.0 3.3 3.6 3.1 3.3 3.0 2.8
Austria Below upper secondary 4.8 5.7 6.9 6.3 6.4 6.9 7.9 7.8
Upper secondary and post-secondary non-tertiary 3.1 2.9 3.6 3.0 3.0 3.4 3.4 3.8
Tertiary education 1.5 2.0 2.0 1.6 1.5 1.9 2.0 2.9
belgium Below upper secondary 11.8 13.4 13.1 9.8 8.5 10.3 10.7 11.7
Upper secondary and post-secondary non-tertiary 4.2 7.5 7.4 5.3 5.5 6.0 6.7 6.9
Tertiary education 2.0 3.6 3.2 2.7 2.7 3.5 3.5 3.9
Canada Below upper secondary 13.8 13.1 11.8 10.1 10.5 11.0 10.9 9.9
Upper secondary and post-secondary non-tertiary 8.7 8.3 c 5.9 6.2 6.7 6.5 6.1
Tertiary education 6.3 6.2 4.7 4.1 4.7 5.1 5.2 4.7
Czech Republic Below upper secondary m 7.7 14.5 19.3 19.2 18.8 19.8 23.0
Upper secondary and post-secondary non-tertiary m 2.1 4.6 6.7 6.2 5.6 6.1 6.4
Tertiary education m 0.7 1.9 2.5 2.0 1.8 2.0 2.0
Denmark Below upper secondary 14.2 14.6 7.0 6.3 (5) 6.2 7.2 7.8
Upper secondary and post-secondary non-tertiary 9.1 9.9 4.6 3.9 3.3 3.4 4.4 4.8
Tertiary education 4.9 4.6 3.3 2.6 3.2 3.5 4.7 3.9
finland Below upper secondary 8.6 21.6 13.8 12.1 11.4 12.2 11.1 12.0
Upper secondary and post-secondary non-tertiary 7.3 16.7 10.6 8.9 8.5 8.8 9.2 8.2
Tertiary education 3.4 9.1 5.8 4.7 4.4 4.5 4.3 4.7
france Below upper secondary 10.6 13.7 14.9 13.9 11.9 c 12.1 12.1
Upper secondary and post-secondary non-tertiary 6.6 9.0 9.6 7.9 6.9 6.8 7.5 7.5
Tertiary education 3.7 6.5 6.6 5.1 4.8 5.2 6.1 6.1
Germany Below upper secondary 7.4 13.3 15.4 13.9 13.5 15.3 18.0 20.5
Upper secondary and post-secondary non-tertiary 4.7 7.9 10.3 8.1 8.2 9.0 10.2 11.2
Tertiary education 3.2 4.9 5.5 4.2 4.2 4.5 5.2 5.5
Greece Below upper secondary m 6.3 7.3 7.7 7.4 7.2 6.6 8.4
Upper secondary and post-secondary non-tertiary m 9.0 10.4 10.9 9.9 9.7 9.1 9.7
Tertiary education m 8.1 6.2 7.2 6.7 6.4 5.6 6.9
Hungary Below upper secondary m m 11.4 9.9 10.0 10.5 10.6 10.8
Upper secondary and post-secondary non-tertiary m m 6.2 5.3 4.6 4.4 4.8 5.0
Tertiary education m m 1.7 1.3 1.2 1.5 1.4 1.9
Iceland Below upper secondary m m 3.4 2.5 2.4 3.0 m 3.1
Upper secondary and post-secondary non-tertiary m m c c c 2.6 m 2.8
Tertiary education m m c c c c m 1.0
Ireland Below upper secondary 20.3 16.4 11.6 7.0 5.6 5.9 6.3 6.4
Upper secondary and post-secondary non-tertiary 7.3 7.6 4.5 2.5 2.4 2.8 2.9 3.2
Tertiary education 4.1 4.2 3.0 1.6 1.4 1.8 2.6 2.1
Italy Below upper secondary 5.7 9.1 10.8 10.0 9.1 9.0 m 7.8
Upper secondary and post-secondary non-tertiary 7.2 7.9 8.2 7.4 6.8 6.4 m 5.3
Tertiary education 5.0 7.3 6.9 5.9 5.3 5.3 m 4.8
Japan Below upper secondary m m 4.3 6.0 5.9 6.6 6.7 m
Upper secondary and post-secondary non-tertiary m m 3.3 4.7 4.8 5.3 5.4 m
Tertiary education m m 2.6 3.5 3.1 3.8 3.7 m
Korea Below upper secondary 0.9 1.0 6.0 3.7 3.1 2.2 2.2 2.6
Upper secondary and post-secondary non-tertiary 1.9 1.6 6.8 4.1 3.6 3.0 3.3 3.5
Tertiary education 2.7 2.0 4.9 3.6 3.5 3.2 3.1 2.9
Luxembourg Below upper secondary m m m 3.1 c 3.8 3.3 5.0
Upper secondary and post-secondary non-tertiary m m m c c c 2.6 3.8
Tertiary education m m m c c c c 3.0
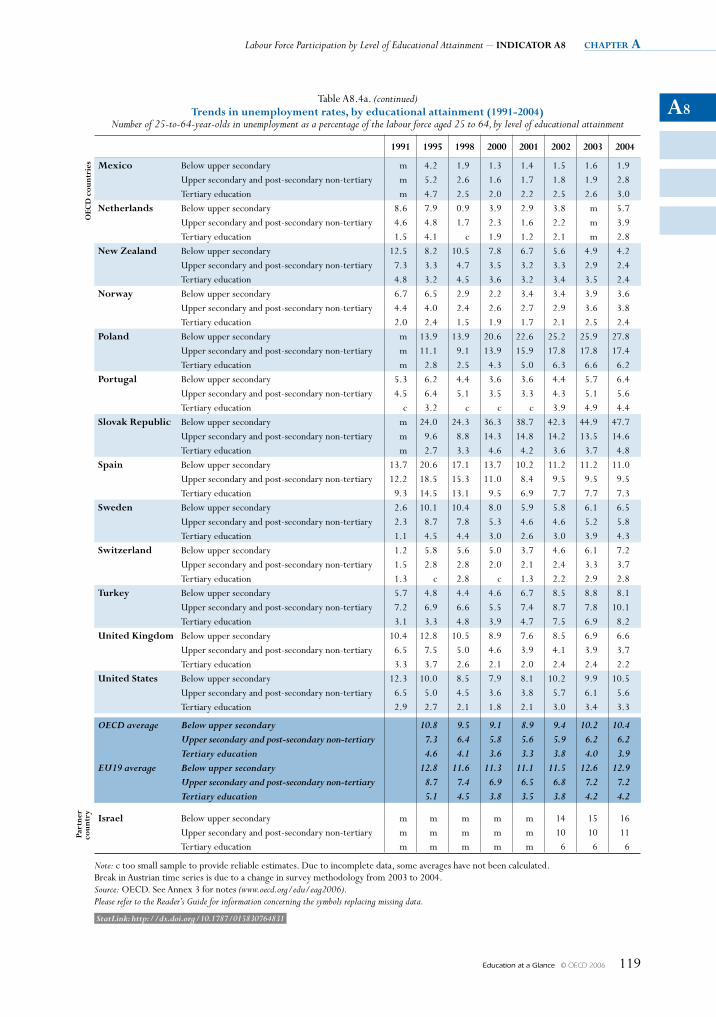
A8
Labour Force Participation by Level of Educational Attainment – INDICATOR A8 chapter a
Education at a Glance © OECD 2006 119
Table A8.4a. (continued)Trends in unemployment rates, by educational attainment (1991-2004)
Number of 25-to-64-year-olds in unemployment as a percentage of the labour force aged 25 to 64, by level of educational attainment
1991 1995 1998 2000 2001 2002 2003 2004
OeC
D c
ount
ries mexico Below upper secondary m 4.2 1.9 1.3 1.4 1.5 1.6 1.9
Upper secondary and post-secondary non-tertiary m 5.2 2.6 1.6 1.7 1.8 1.9 2.8Tertiary education m 4.7 2.5 2.0 2.2 2.5 2.6 3.0
Netherlands Below upper secondary 8.6 7.9 0.9 3.9 2.9 3.8 m 5.7Upper secondary and post-secondary non-tertiary 4.6 4.8 1.7 2.3 1.6 2.2 m 3.9Tertiary education 1.5 4.1 c 1.9 1.2 2.1 m 2.8
New Zealand Below upper secondary 12.5 8.2 10.5 7.8 6.7 5.6 4.9 4.2Upper secondary and post-secondary non-tertiary 7.3 3.3 4.7 3.5 3.2 3.3 2.9 2.4Tertiary education 4.8 3.2 4.5 3.6 3.2 3.4 3.5 2.4
Norway Below upper secondary 6.7 6.5 2.9 2.2 3.4 3.4 3.9 3.6Upper secondary and post-secondary non-tertiary 4.4 4.0 2.4 2.6 2.7 2.9 3.6 3.8Tertiary education 2.0 2.4 1.5 1.9 1.7 2.1 2.5 2.4
poland Below upper secondary m 13.9 13.9 20.6 22.6 25.2 25.9 27.8Upper secondary and post-secondary non-tertiary m 11.1 9.1 13.9 15.9 17.8 17.8 17.4Tertiary education m 2.8 2.5 4.3 5.0 6.3 6.6 6.2
portugal Below upper secondary 5.3 6.2 4.4 3.6 3.6 4.4 5.7 6.4Upper secondary and post-secondary non-tertiary 4.5 6.4 5.1 3.5 3.3 4.3 5.1 5.6Tertiary education c 3.2 c c c 3.9 4.9 4.4
Slovak Republic Below upper secondary m 24.0 24.3 36.3 38.7 42.3 44.9 47.7Upper secondary and post-secondary non-tertiary m 9.6 8.8 14.3 14.8 14.2 13.5 14.6Tertiary education m 2.7 3.3 4.6 4.2 3.6 3.7 4.8
Spain Below upper secondary 13.7 20.6 17.1 13.7 10.2 11.2 11.2 11.0Upper secondary and post-secondary non-tertiary 12.2 18.5 15.3 11.0 8.4 9.5 9.5 9.5Tertiary education 9.3 14.5 13.1 9.5 6.9 7.7 7.7 7.3
Sweden Below upper secondary 2.6 10.1 10.4 8.0 5.9 5.8 6.1 6.5Upper secondary and post-secondary non-tertiary 2.3 8.7 7.8 5.3 4.6 4.6 5.2 5.8Tertiary education 1.1 4.5 4.4 3.0 2.6 3.0 3.9 4.3
Switzerland Below upper secondary 1.2 5.8 5.6 5.0 3.7 4.6 6.1 7.2Upper secondary and post-secondary non-tertiary 1.5 2.8 2.8 2.0 2.1 2.4 3.3 3.7Tertiary education 1.3 c 2.8 c 1.3 2.2 2.9 2.8
Turkey Below upper secondary 5.7 4.8 4.4 4.6 6.7 8.5 8.8 8.1Upper secondary and post-secondary non-tertiary 7.2 6.9 6.6 5.5 7.4 8.7 7.8 10.1Tertiary education 3.1 3.3 4.8 3.9 4.7 7.5 6.9 8.2
united Kingdom Below upper secondary 10.4 12.8 10.5 8.9 7.6 8.5 6.9 6.6Upper secondary and post-secondary non-tertiary 6.5 7.5 5.0 4.6 3.9 4.1 3.9 3.7Tertiary education 3.3 3.7 2.6 2.1 2.0 2.4 2.4 2.2
united States Below upper secondary 12.3 10.0 8.5 7.9 8.1 10.2 9.9 10.5Upper secondary and post-secondary non-tertiary 6.5 5.0 4.5 3.6 3.8 5.7 6.1 5.6Tertiary education 2.9 2.7 2.1 1.8 2.1 3.0 3.4 3.3
OECD average Below upper secondary 10.8 9.5 9.1 8.9 9.4 10.2 10.4Upper secondary and post-secondary non-tertiary 7.3 6.4 5.8 5.6 5.9 6.2 6.2Tertiary education 4.6 4.1 3.6 3.3 3.8 4.0 3.9
EU19 average Below upper secondary 12.8 11.6 11.3 11.1 11.5 12.6 12.9Upper secondary and post-secondary non-tertiary 8.7 7.4 6.9 6.5 6.8 7.2 7.2Tertiary education 5.1 4.5 3.8 3.5 3.8 4.2 4.2
part
ner
coun
try
Israel Below upper secondary m m m m m 14 15 16Upper secondary and post-secondary non-tertiary m m m m m 10 10 11Tertiary education m m m m m 6 6 6
Note: c too small sample to provide reliable estimates. Due to incomplete data, some averages have not been calculated. Break in Austrian time series is due to a change in survey methodology from 2003 to 2004.Source: OECD. See Annex 3 for notes (www.oecd.org/edu/eag2006).Please refer to the Reader’s Guide for information concerning the symbols replacing missing data.
StatLink: http://dx.doi.org/10.1787/015830764831
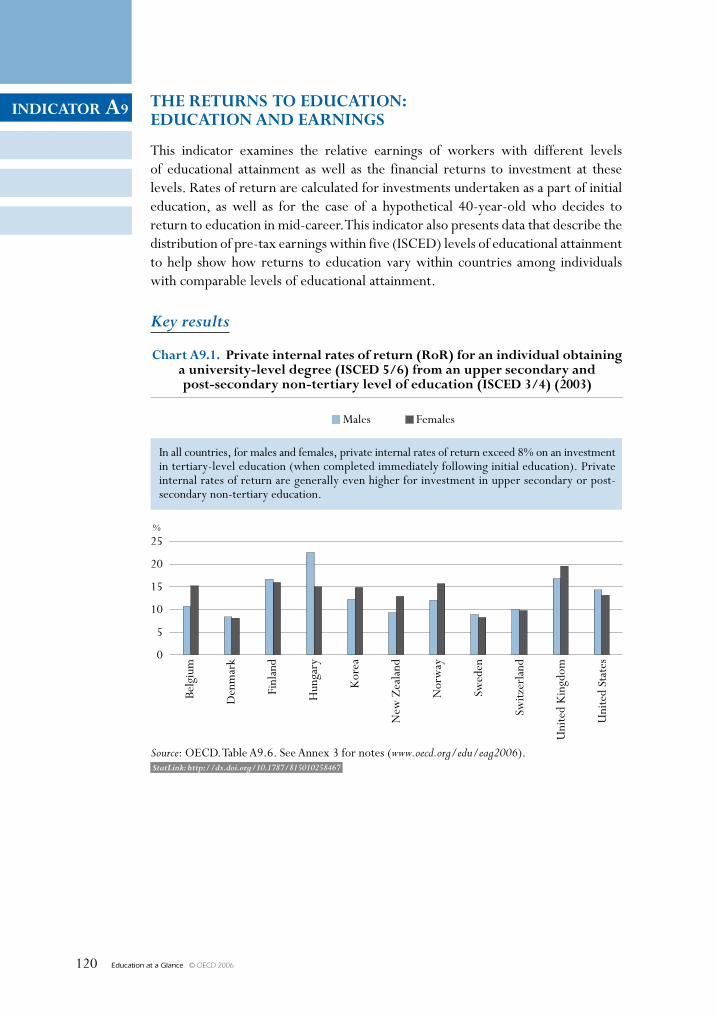
Education at a Glance © OECD 2006120
INDICATOR A9
StatLink: http://dx.doi.org/10.1787/815010258467
THE RETURNS TO EDUCATION: EDUCATION AND EARNINGS
This indicator examines the relative earnings of workers with different levels of educational attainment as well as the financial returns to investment at these levels. Rates of return are calculated for investments undertaken as a part of initial education, as well as for the case of a hypothetical 40-year-old who decides to return to education in mid-career. This indicator also presents data that describe the distribution of pre-tax earnings within five (ISCED) levels of educational attainment to help show how returns to education vary within countries among individuals with comparable levels of educational attainment.
Key results
25
20
15
10
5
0
%
Chart A9.1. Private internal rates of return (RoR) for an individual obtaininga university-level degree (ISCED 5/6) from an upper secondary andpost-secondary non-tertiary level of education (ISCED 3/4) (2003)
Males Females
Source: OECD. Table A9.6. See Annex 3 for notes (www.oecd.org/edu/eag2006).
Belg
ium
Den
mar
k
Finl
and
Hun
gary
Kor
ea
New
Zea
land
Nor
way
Swed
en
Switz
erla
nd
Uni
ted
Kin
gdom
Uni
ted
Stat
es
In all countries, for males and females, private internal rates of return exceed 8% on an investmentin tertiary-level education (when completed immediately following initial education). Privateinternal rates of return are generally even higher for investment in upper secondary or post-secondary non-tertiary education.
INDICATOR A9
Education at a Glance © OECD 2006 121
Other highlights of this indicator
• Attaining higher levels of education can be viewed as an economic investment in which there are costs paid by the individual (including reductions in earnings while receiving education) that typically result in higher earnings over the individual’s lifetime. In this context, the investment to obtain a university level degree, when undertaken as part of initial education, can produce private annual returns as high as 22.6%, with all countries showing a rate of return above 8%.
• Countries differ significantly in the dispersion of earnings among individuals with similar levels of educational attainment. Although individuals with higher levels of education are more likely to be in the highest earnings group, this is not always the case.
• Countries differ in the relative share of men and women in the upper and lower categories of earnings.
• Females earn less than males with similar levels of educational attainment in all countries (Table A9.3). For a given level of educational attainment, they typically earn between 50 and 80% of what males earn.
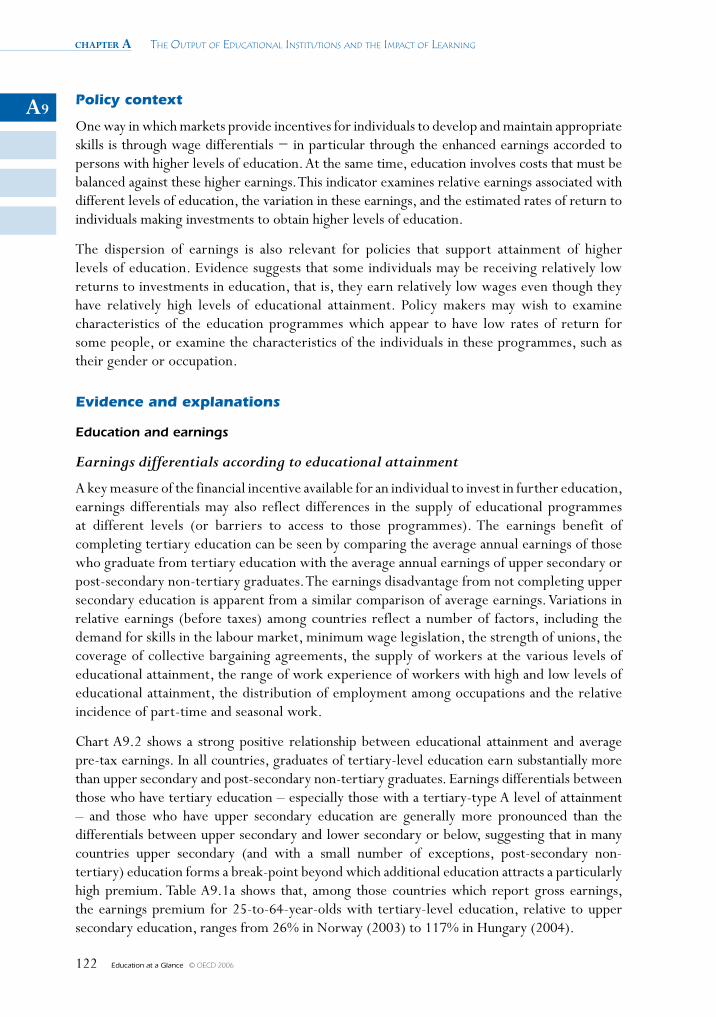
chapter a The OuTpuT Of educaTiOnal insTiTuTiOns and The impacT Of learning
Education at a Glance © OECD 2006122
A9Policy context
One way in which markets provide incentives for individuals to develop and maintain appropriate skills is through wage differentials − in particular through the enhanced earnings accorded to persons with higher levels of education. At the same time, education involves costs that must be balanced against these higher earnings. This indicator examines relative earnings associated with different levels of education, the variation in these earnings, and the estimated rates of return to individuals making investments to obtain higher levels of education.
The dispersion of earnings is also relevant for policies that support attainment of higher levels of education. Evidence suggests that some individuals may be receiving relatively low returns to investments in education, that is, they earn relatively low wages even though they have relatively high levels of educational attainment. Policy makers may wish to examine characteristics of the education programmes which appear to have low rates of return for some people, or examine the characteristics of the individuals in these programmes, such as their gender or occupation.
Evidence and explanations
Education and earnings
Earnings differentials according to educational attainment
A key measure of the financial incentive available for an individual to invest in further education, earnings differentials may also reflect differences in the supply of educational programmes at different levels (or barriers to access to those programmes). The earnings benefit of completing tertiary education can be seen by comparing the average annual earnings of those who graduate from tertiary education with the average annual earnings of upper secondary or post-secondary non-tertiary graduates. The earnings disadvantage from not completing upper secondary education is apparent from a similar comparison of average earnings. Variations in relative earnings (before taxes) among countries reflect a number of factors, including the demand for skills in the labour market, minimum wage legislation, the strength of unions, the coverage of collective bargaining agreements, the supply of workers at the various levels of educational attainment, the range of work experience of workers with high and low levels of educational attainment, the distribution of employment among occupations and the relative incidence of part-time and seasonal work.
Chart A9.2 shows a strong positive relationship between educational attainment and average pre-tax earnings. In all countries, graduates of tertiary-level education earn substantially more than upper secondary and post-secondary non-tertiary graduates. Earnings differentials between those who have tertiary education – especially those with a tertiary-type A level of attainment – and those who have upper secondary education are generally more pronounced than the differentials between upper secondary and lower secondary or below, suggesting that in many countries upper secondary (and with a small number of exceptions, post-secondary non-tertiary) education forms a break-point beyond which additional education attracts a particularly high premium. Table A9.1a shows that, among those countries which report gross earnings, the earnings premium for 25-to-64-year-olds with tertiary-level education, relative to upper secondary education, ranges from 26% in Norway (2003) to 117% in Hungary (2004).
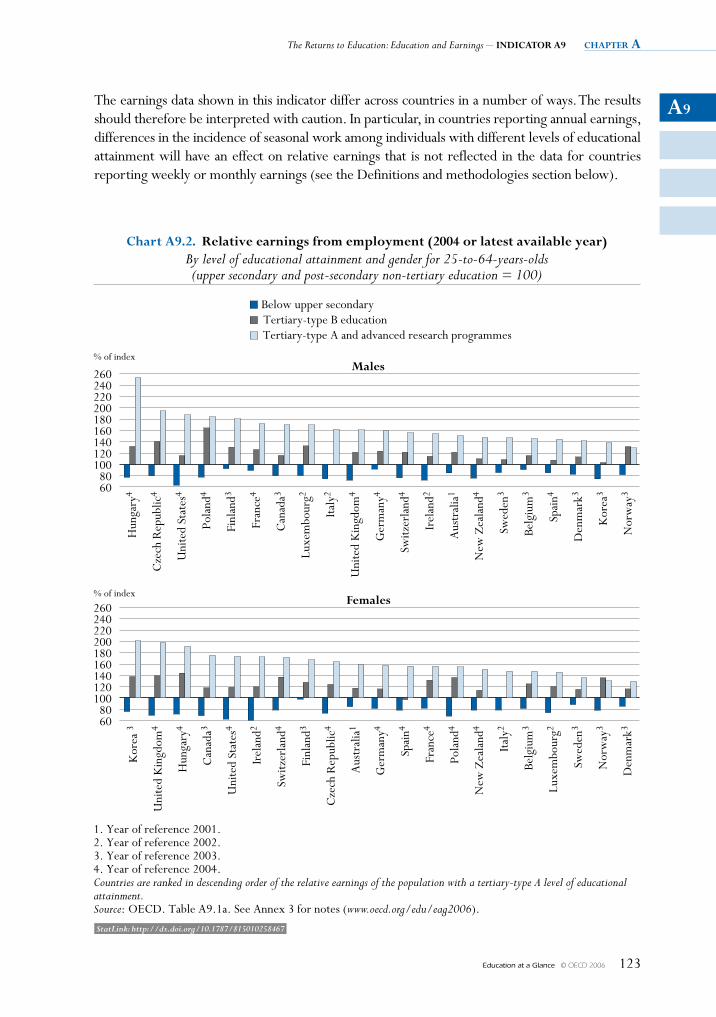
A9
The Returns to Education: Education and Earnings – INDICATOR A9 chapter a
Education at a Glance © OECD 2006 123
The earnings data shown in this indicator differ across countries in a number of ways. The results should therefore be interpreted with caution. In particular, in countries reporting annual earnings, differences in the incidence of seasonal work among individuals with different levels of educational attainment will have an effect on relative earnings that is not reflected in the data for countries reporting weekly or monthly earnings (see the Definitions and methodologies section below).
260240220200180160140120100
8060
% of index
260240220200180160140120100
8060
% of index
Chart A9.2. Relative earnings from employment (2004 or latest available year)By level of educational attainment and gender for 25-to-64-years-olds(upper secondary and post-secondary non-tertiary education = 100)
Below upper secondaryTertiary-type B educationTertiary-type A and advanced research programmes
1. Year of reference 2001.2. Year of reference 2002.3. Year of reference 2003.4. Year of reference 2004.Countries are ranked in descending order of the relative earnings of the population with a tertiary-type A level of educationalattainment.Source: OECD. Table A9.1a. See Annex 3 for notes (www.oecd.org/edu/eag2006).
Hun
gary
4
Cze
ch R
epub
lic4
Uni
ted
Stat
es4
Pola
nd4
Finl
and3
Fran
ce4
Can
ada3
Luxe
mbo
urg2
Italy
2
Uni
ted
Kin
gdom
4
Ger
man
y4
Switz
erla
nd4
Irel
and2
Aus
tral
ia1
New
Zea
land
4
Swed
en3
Belg
ium
3
Spai
n4
Den
mar
k3
Kor
ea3
Nor
way
3
Males
Females
Kor
ea 3
Uni
ted
Kin
gdom
4
Hun
gary
4
Can
ada3
Uni
ted
Stat
es4
Irel
and2
Switz
erla
nd4
Finl
and3
Cze
ch R
epub
lic4
Aus
tral
ia1
Ger
man
y4
Spai
n4
Fran
ce4
Pola
nd4
New
Zea
land
4
Italy
2
Belg
ium
3
Luxe
mbo
urg2
Swed
en3
Nor
way
3
Den
mar
k3
StatLink: http://dx.doi.org/10.1787/815010258467
chapter a The OuTpuT Of educaTiOnal insTiTuTiOns and The impacT Of learning
Education at a Glance © OECD 2006124
A9Education and gender disparity in earnings
For 25-to-64-year-olds, financial rewards from tertiary education benefit females more than males in Australia, Canada, Ireland, Korea, the Netherlands, Norway, Spain, Switzerland and the United Kingdom. The reverse is true in the remaining countries, with the exception of Belgium where, relative to upper secondary education, the earnings of males and females are equally enhanced by tertiary education (Table A9.1a).
Although both males and females with upper secondary, post-secondary non-tertiary or tertiary attainment have substantial earnings advantages (compared with those of the same gender who do not complete upper secondary education), earnings differentials between males and females with the same educational attainment remain substantial. In all countries, and at all levels of educational attainment, females in the 30-to-44 age group earn less than their male counterparts (Chart A9.3 and Table A9.1b). The relative differential between men and women must be treated with caution, however, since in most countries earnings data include part-time work. Part-time work is often a major characteristic of women’s employment although its prevalence is likely to vary a lot from one country to another.
100908070605040302010
0
%
Chart A9.3. Differences in earnings between females and males(2004 or latest available year)
Average female earnings as a percentage of male earnings (30-to-44 age group),by level of educational attainment
1. Year of reference 2001.2. Year of reference 2002.3. Year of reference 2003.4. Year of reference 2004.Countries are ranked in descending order of the relative earnings of the population at all levels of education taken together.Source: OECD. Table A9.1b. See Annex 3 for notes (www.oecd.org/edu/eag2006).
Hun
gary
4
Luxe
mbo
urg2
Pola
nd4
Belg
ium
3
Spai
n4
Fran
ce4
Italy
2
Swed
en3
Den
mar
k3
Finl
and3
Cze
ch R
epub
lic4
Nor
way
3
Irel
and2
Uni
ted
Stat
es4
Can
ada3
New
Zea
land
4
Aus
tral
ia1
Net
herl
ands
2
Ger
man
y4
Uni
ted
Kin
gdom
4
Kor
ea3
Switz
erla
nd4
Below upper secondaryUpper secondary and post-secondary non tertiary educationAll levels of educationTertiary-type A and advanced research programmes
StatLink: http://dx.doi.org/10.1787/815010258467
A9
The Returns to Education: Education and Earnings – INDICATOR A9 chapter a
Education at a Glance © OECD 2006 125
When all levels of education are taken together (i.e. total earnings are divided by the total number of income earners, by gender), average earnings of females between the ages of 30 and 44 range from 51% of those of males, in Korea and Switzerland, to over 74% in Belgium (Chart A9.3 and Table A9.1b). In Hungary, Luxembourg and Poland, where part-time work and part-year earnings are excluded, the earnings of females between the ages of 30 and 44 range from 81% to over 87% of those of males.
The gap in earnings between males and females is explained in part by different choices of career and occupation, differences in the amount of time that males and females spend in the labour force, and the relatively high incidence of part-time work among females.
The distribution of earnings within levels of educational attainmentTables A9.4a, A9.4b and A9.4c show the distributions of earnings among 25-to-64-year-olds with data for 21 countries. Distributions are given for the combined male and female populations, as well as for males and females separately. There are five categories of the earnings distribution, ranging from “At or below half of the median” to “More than twice the median”. For example, in Table A9.4a, for Australia, the figure of 24.5% is found in the row “Below upper secondary” under the column “At or below half of the median”. This means that 24.5% of Australians who are between the ages of 25 and 64 and whose highest educational attainment is below the upper secondary level have pre-tax earnings at or below half of the median earnings of all Australian 25-to-64-year-olds who had earnings from work during the reference period of the national survey. Tables A9.4b and A9.4c also present earnings distributions among males and females relative to the median of the entire adult population with earnings from work.
Data on the distribution of earnings among individuals of similar educational attainment provide information beyond that obtained by looking only at average earnings, which can be affected by having small numbers of individuals with very low or high earnings.
The data show that in most countries the share of individuals in the lowest earnings categories falls as the level of educational attainment rises. This result is another way of viewing the well-established positive relationship between earnings and educational attainment. However, it is notable that even at higher levels of education there are individuals in the lower earnings categories, indicating that they have experienced a relatively low rate of return to education.
Still, countries differ significantly in the dispersion of earnings. For instance, Table A9.4a shows that in most countries the majority of the population has earnings above half of the median but less than 1.5 times the median. Yet this percentage ranges from 45% in Canada and 51% in the United States to 79% in the Czech Republic. Across all levels of education, countries such as Belgium, the Czech Republic, France and Luxembourg have relatively few individuals with earnings either at or below half the median. Conversely, while across all countries an average of 21% of individuals between the ages of 25 and 64 has pre-tax earnings above 1.5 times the median, this population share is as low as 15% in Sweden.
Countries also differ significantly in the gender distribution of individuals in the lowest earnings group. For example, taking into account all levels of educational attainment, Hungary is the only country in which the percentage of females in the lowest earnings category is smaller than the percentage of males in the same category. At the opposite end of the spectrum, in Switzerland, 44% of females and 16% of males are found in the lowest earnings category (Table A9.4b and A9.4c).
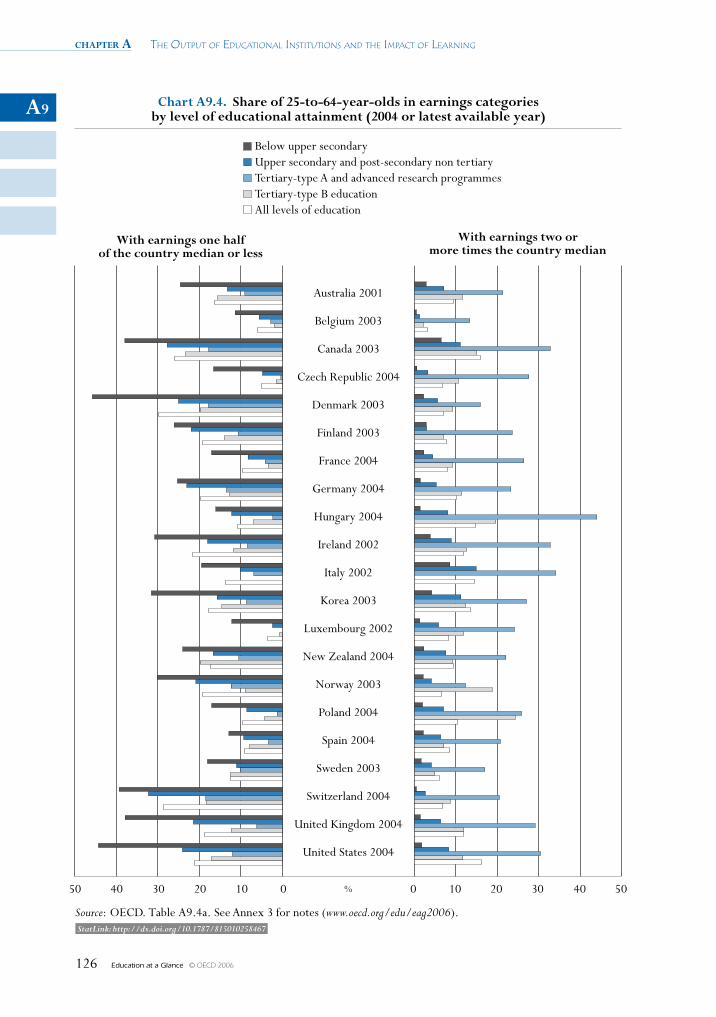
chapter a The OuTpuT Of educaTiOnal insTiTuTiOns and The impacT Of learning
Education at a Glance © OECD 2006126
A9
%50 40 30 20 10 0 50403020100
Chart A9.4. Share of 25-to-64-year-olds in earnings categoriesby level of educational attainment (2004 or latest available year)
Source: OECD. Table A9.4a. See Annex 3 for notes (www.oecd.org/edu/eag2006).
Australia 2001
Belgium 2003
Canada 2003
Czech Republic 2004
Denmark 2003
Finland 2003
France 2004
Germany 2004
Hungary 2004
Ireland 2002
Italy 2002
Korea 2003
Luxembourg 2002
New Zealand 2004
Norway 2003
Poland 2004
Spain 2004
Sweden 2003
Switzerland 2004
United Kingdom 2004
United States 2004
With earnings one halfof the country median or less
Below upper secondaryUpper secondary and post-secondary non tertiaryTertiary-type A and advanced research programmesTertiary-type B educationAll levels of education
With earnings two ormore times the country median
StatLink: http://dx.doi.org/10.1787/815010258467
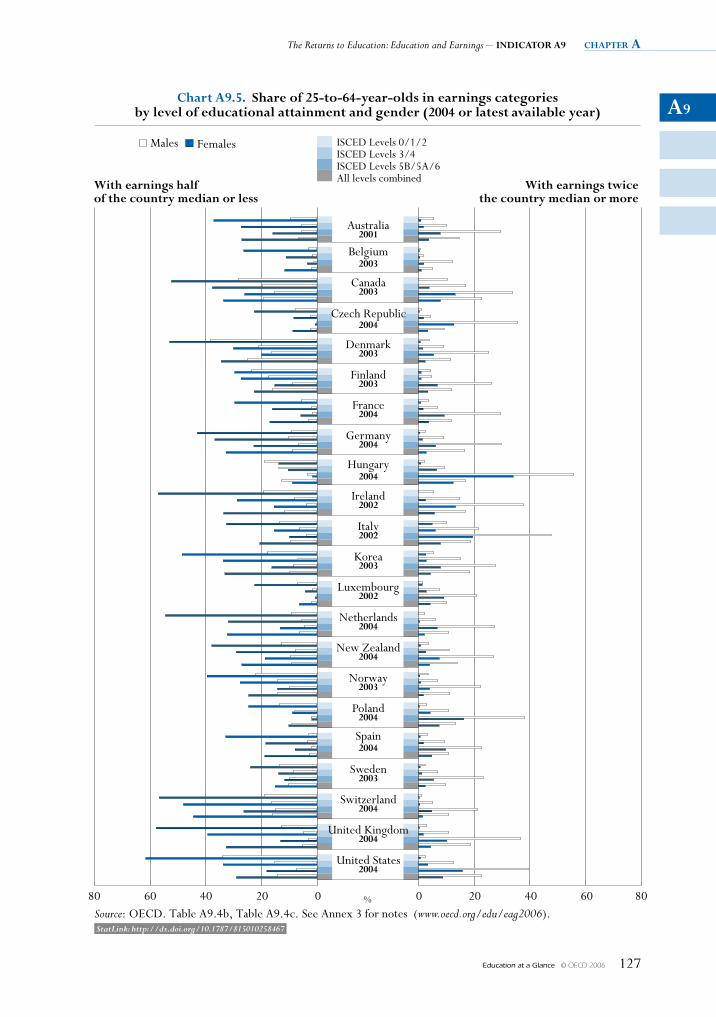
A9
The Returns to Education: Education and Earnings – IndIcAtor A9 chapter a
Education at a Glance © OECD 2006 127
80 %60 40 20 0 806040200
chart A9.5. Share of 25-to-64-year-olds in earnings categoriesby level of educational attainment and gender (2004 or latest available year)
Source: OECD. Table A9.4b, Table A9.4c. See Annex 3 for notes (www.oecd.org/edu/eag2006).
With earnings halfof the country median or less
With earnings twicethe country median or more
ISCED Levels 0/1/2ISCED Levels 3/4ISCED Levels 5B/5A/6All levels combined
Males Females
Australia2001
Belgium2003
Canada2003
Czech Republic2004
Denmark2003
Finland2003
France2004
Germany2004
Hungary2004
Ireland2002
Italy2002
Korea2003
Luxembourg2002
Netherlands2004
New Zealand2004
Norway2003
Poland2004
Spain2004
Sweden2003
Switzerland2004
United Kingdom2004
United States2004
StatLink: http://dx.doi.org/10.1787/815010258467
chapter a The OuTpuT Of educaTiOnal insTiTuTiOns and The impacT Of learning
Education at a Glance © OECD 2006128
A9The interpretation of earnings dispersion dataA wide range of factors – from differences in institutional arrangements to variation in individual abilities – is likely to determine the extent of earnings dispersion among individuals of similar educational attainment. At an institutional level, countries in which wage setting is more centralised would tend to see lower earnings dispersion, owing to a degree of convergence between occupational status and educational attainment. More broadly, earnings dispersions also reflect the fact that educational attainment cannot be fully equated with proficiency and skills: skills other than those indicated by educational attainment, as well as experience, are rewarded in the labour market. Differences in the scale and operation of training systems for adult learners also influence national patterns of earnings dispersion, as do non-skills-related recruitment considerations − such as gender, race or age discrimination (and, consequently, the relative effectiveness of national legislative frameworks in countering such problems).
However, the data do show that in all countries, earnings dispersion falls as educational attainment rises. This trend has many possible interpretations, including that greater educational attainment could be providing more information on an individual’s skills to potential employers, resulting in a closer link between education and wages.
More generally, the data point to gaps in the understanding of earnings determination. Research in the United States has shown that for individuals of the same race and sex, over half of the variance in earnings is not explained by quantifiable factors such as a person’s years of schooling, age, duration of labour market experience, or indeed the schooling, occupation and income of their parents. Some research on the determinants of earnings has highlighted the importance that employers give to so-called non-cognitive skills – such as persistence, reliability and self-discipline – as well as raising questions for policy-oriented research on the role of education systems, and particularly early childhood education, in developing and signalling such skills (see the Definitions and methodologies section below).
Rates of return to investment in education
The impact of education on earnings can be evaluated in the framework of investment analysis in which an individual incurs costs of getting an education (direct costs such as tuition while in school, and indirect costs such as reduced earnings while in school). The effectiveness of this investment can be assessed by estimating the economic rate of return to the investment, which measures the degree to which the costs of attaining higher levels of education are translated into higher levels of earnings. The measure of return used here is the internal rate of return. This is the rate that equates the costs required to attain the next highest level of education with the present value of a lifetime stream of additional earnings associated with the higher level of attainment. This indicator is analysed from two different points of view: rates of return to the individual (Tables A9.5 and A9.6), which reflect only the individual’s earnings and costs and rates of return to government (Tables A9.7 and A9.8). The return to government includes higher income tax and social contributions collected, as well as costs borne by the government. These private and public returns are calculated for 11 OECD countries.
Internal rates of return are computed for the attainment of two different levels of education: upper secondary education and post-secondary non-tertiary education, following from a lower upper secondary level of attainment (Tables A9.5 and A9.7); and tertiary education, following from
A9
The Returns to Education: Education and Earnings – INDICATOR A9 chapter a
Education at a Glance © OECD 2006 129
an upper secondary and post-secondary non-tertiary level of educational attainment (Tables A9.6 and A9.8). Internal rates of return are computed for two different periods in the individual’s lifetime: immediately following initial education, and at the age of 40. In addition, when calculating the internal rate of return at the age of 40, the analysis explores the impact on rates of return – for individuals and government – of the costs of education. All results are presented separately for males and females.
Private internal rates of return to investment in educationThe private internal rate of return for the individual is estimated on the basis of the additions to after-tax earnings that result from a higher level of educational attainment, net of the additional private costs (private expenditures and foregone earnings) that attaining this higher level of education requires. In general, the living expenses of students (cost of housing, meals, clothing, recreation, etc.) are excluded from these private expenditures.
Estimates of private rates of return are presented in Tables A9.5 (private rates of return for an individual who has invested in obtaining upper secondary or post-secondary non-tertiary education from an original lower upper secondary level of education) and A9.6 (estimates for an individual who has invested in obtaining a tertiary-level education, up to the attainment of an advanced research qualification starting from an upper secondary level of education).
Private rates of return were calculated for the following two scenarios:
1. The individual has continued directly to the next highest level of education before entering the labour market.
2. Attaining the next highest level of education has been postponed until the age of 40, when education is resumed on a full-time basis. Two cases are examined in this scenario: i) the individual bears the direct costs of tuition (as reported by national education authorities) and foregoes earnings (net of taxes) while studying; and ii) the individual bears no direct tuition costs, but again bears the cost of foregoing earnings.
The results show that for males, in all countries except Hungary and Switzerland, the rates of return to the attainment of upper secondary or post-secondary non tertiary education exceed those for tertiary education. At the tertiary level, all countries except Denmark, New Zealand, Sweden and Switzerland register private rates of return above 10%, for both males and females (Table A9.6). Private rates of return at the tertiary level are seen to be higher for females than males in five countries: Belgium, Korea, New Zealand, Norway and the United Kingdom.
The results also show that when an individual attains the next higher level of education at age 40, private rates of return to tertiary education are generally higher than those for the achievement of upper secondary education, except in Denmark, New Zealand and the United States. At the tertiary level, the additional incentive created by eliminating tuition costs tends to be weak. At the upper secondary level, eliminating tuition costs results on average in 0.4 of a percentage point increase in the private rate of return for males and a 1.0 percentage point increase for females. At the tertiary level, eliminating tuition costs increases the private rate of return by 0.9 of a percentage point for males and 1.7 percentage points for females. Nevertheless, while in countries such as Denmark, Finland and Norway the impact on private rates of return from eliminating the student’s tertiary-level tuition costs is small, the impact is significantly larger in Belgium, Hungary, Korea, the United Kingdom and the United States.
chapter a The OuTpuT Of educaTiOnal insTiTuTiOns and The impacT Of learning
Education at a Glance © OECD 2006130
A9Public internal rates of return to investment in education
The public internal rate of return is one way of examining the effect on public-sector accounts of individuals’ choices to invest in education and the effect of the different policy settings that affect these investments. For the public sector, the costs of education include direct expenditures on educational institutions (such as direct payment of teachers’ salaries, direct payments for the construction of school buildings, and buying textbooks, etc.) and public private transfers (such as public subsidies to households for scholarships and other grants and to other private entities for the provision of training at the workplace, etc.). The public costs of education also include lost income tax revenues on students’ foregone earnings. The benefits include increased revenues from income taxes on higher wages, plus social insurance payments. In practice, the achievement of higher levels of education will give rise to a complex set of fiscal effects on the benefit side, beyond the effects of wage and government payments-based revenue growth. For instance, better educated individuals generally experience superior health status, lowering public expenditure on the provision of health care. And, for some individuals, achieving higher levels of educational attainment may lower the likelihood of committing certain types of crime (see Indicator A10); this in turn reduces public expenditure. However, tax and expenditure data on such indirect effects of education are not readily available for inclusion in these rate-of-return calculations.
Estimates of public rates of return are shown in Tables A9.7 and A9.8. Table A9.7 presents public rates of return for an individual who has invested in obtaining upper secondary or post-secondary non-tertiary education (ISCED level 3/4), from an original lower secondary level of education (ISCED level 0/1/2). Table A9.8 concerns an individual who has invested in obtaining a tertiary-level education, up to the attainment of an advanced research qualification (ISCED level 5(A, B)/6), starting from an upper secondary level of education (ISCED level 3/4).
As with the estimation of private rates of return, the calculation considered two scenarios:
1. Following initial education, the individual has continued directly to the next highest level of education before entering the labour market.
2. Attaining the next highest level of education has been postponed until the age of 40, when education is resumed on a full-time basis. Two cases are examined in this scenario: i) the individual bears the direct costs of tuition (as reported by national education authorities) and foregoes earnings (net of taxes) while studying; and ii) the individual bears no direct tuition costs, but again bears the cost of foregoing earnings.
The results show that, for the achievement of the tertiary level of attainment during initial education, the public rate of return is in all cases lower than the private rate of return (except for Belgium, Korea and, for males, New Zealand). When the individual goes back to full-time education in mid-career, and bears the direct costs of tuition and foregone earnings, public rates of return for completing tertiary education are lower than private rates of return in all countries (Table A9.8). Nevertheless, these public rates of return are still high – for instance well above the interest rate offered on long-term government bonds – in a number of countries. Particularly low public rates of return are seen in Denmark, New Zealand, Sweden and Switzerland. These low rates are driven by a number of factors including the high costs of providing education and high losses in tax receipts (when the individual in study foregoes earnings) relative to tax revenues (when the individual returns to work).
A9
The Returns to Education: Education and Earnings – INDICATOR A9 chapter a
Education at a Glance © OECD 2006 131
The results show that, for upper secondary education, the effect of the public sector bearing the individual’s tuition costs is to lower the public rate of return by an average of 0.2 percentage points for males and 0.3 percentage points for females (Table A9.7). At the tertiary level, the average effect is to lower the public rate of return by about 0.7 of a percentage point for males and 1 percentage point for females. The magnitude of this decline in the public rate of return in the United States is noteworthy – 2.3 percentage points for males and 2.8 percentage points for females (Table A9.8) – which is partially explained by the high private contributions to the costs of tertiary education in the United States.
The interpretation of internal rates of return
For those who acquire upper secondary or tertiary education, high private internal rates of return in most countries (though not in all) indicate that human capital investment appears to be an attractive way for the average person to build wealth. Furthermore, and with some exceptions, policies that reduce or eliminate the direct costs of education are seen to have only a modest impact on individuals’ decisions to invest in mid-career learning.
In many cases, the reported private internal rates of return are above – and in a number of countries significantly above – the risk-free real interest rate, which is typically measured with reference to rates applying on long-term government bonds. However, returns on human capital accumulation are not risk-free, as indicated by the wide distribution of earnings among the better educated. Moreover, not everybody who invests in a course of education actually completes the course. Rates of return will be low, and possibly negative, for individuals who drop out. Therefore, individuals contemplating an investment in education are likely to require a compensating risk premium. However, in a number of countries, the size of the premium of the internal rates of return over the real interest rate is higher than would seem to be warranted by considerations of risk alone. If returns to this form of investment are high, relative to investments of similar risk, there is some obstacle to individuals making the investment. High risk-adjusted private rates of return provide initial grounds for policy intervention to alleviate the relevant constraints.
For one, high rates of return indicate a shortage of better-educated workers, driving up earnings for these workers. Such a situation might be temporary, with high returns to education eventually generating enough supply response to push the rates into line with returns to other productive assets. However, the speed of adjustment would depend largely on the capacity of the education system to respond to the derived increase in demand and the capacity of the labour market to absorb the changing relative supplies of labour. The rebalancing mechanism could be accelerated by making better information about the returns to different courses of study available to students, helping them to make more informed choices.
Part of the high returns may also be compatible with market stability. This will be the case if the marginal rates are significantly lower than the average rates. The marginal rate will be lower than the average rate if students at the margin are of lower ability and motivation than average students, and therefore unlikely to be able to command the average wage premium. According to this interpretation, the high internal rates of return would partly reflect economic rents on a scarce resource, namely ability and motivation. If the returns to education at the margin are lower, the case for public intervention to stimulate human capital accumulation is lessened if the quality of the marginal student cannot be improved. However, to the extent that the education
chapter a The OuTpuT Of educaTiOnal insTiTuTiOns and The impacT Of learning
Education at a Glance © OECD 2006132
A9system can improve both cognitive and non-cognitive skills of young people, education policy can make a significant contribution to efficiency and equity in the long run. The results from PISA suggest that some countries succeed much better than others in securing high and equitable educational performances at the age of 15 years.
Internal rates of return to investment in education can also be viewed from a societal perspective. Such a perspective would combine both the private and public costs and benefits of additional education. For instance, the social cost of education would include foregone production of output during study periods as well as the full cost of providing education, rather than just the cost borne by the individual. A social rate of return should also include a range of possible indirect benefits of education, which also have economic repercussions, such as better health, more social cohesion and more informed and effective citizens. While data on social costs are available for most OECD countries, information on the full range of social benefits is less readily available. Indeed, for a number of possible external factors associated with education, current understanding of the nature and size of the effects is incomplete.
It is important to consider some of the broad conceptual limitations to estimating internal rates of return in the manner done here:
• The data reported are accounting rates of return only. The results would no doubt differ from econometric estimates that control for the inherent ability, and other features, of those who decide to invest in education.
• Estimates relate to levels of formal educational attainment only. They do not reflect the effects of learning outside of formal education.
• The approach used here estimates future earnings for individuals with different levels of educational attainment based on knowledge of how average gross earnings in the present vary by level of attainment and age. However, the relationship between different levels of educational attainment and earnings may not be the same in the future as it is today. Technological, economic and social change could all alter how wage levels relate to the level of educational attainment.
• As with the discussion of the interpretation of earnings dispersion data, differences in internal rates of return across countries will in part reflect different institutional and non-market conditions that bear on earnings. Institutional settings that limit flexibility in relative earnings are a case in point.
• Estimates are based on average pre-tax earnings for persons at different levels of educational attainment. However, at a given level of educational attainment, individuals who have chosen different courses of study or who come from different social groups may register different rates of return.
• In estimating benefits, the effect of education in increasing the likelihood of employment is taken into account. However, this also makes the estimate sensitive to the stage in the economic cycle when the data were collected.
The rate-of-return calculations also involve a number of restrictive assumptions necessary for international comparability. In particular, it was not possible to include the effects on public accounts of changes in social transfer payments resulting from changes in wages. This is largely because the rules that govern eligibility for a broad range of social entitlements vary greatly across countries as well as by marital or civic status (and sometimes other criteria).
A9
The Returns to Education: Education and Earnings – INDICATOR A9 chapter a
Education at a Glance © OECD 2006 133
Consequently, to ensure comparability, the rates of return have been calculated on the assumption that the individual in question is single and childless.
The above analyses could be extended in a number of ways, subject to data availability. In particular, more differentiated and comparable data relative to costs per student and a range of social transfer payments would be useful. Estimating changes in value added tax receipts resulting from the increased earnings acquired through obtaining higher levels of educational would also contribute to a more complete assessment of impact on public accounts. The calculations do not consider that those with high earnings can often generate higher levels of income after age 64 as a consequence of their having superior pension arrangements.
Definitions and methodologies
Earnings data in Table A9.1a are based on an annual reference period in Canada, the Czech Republic, Denmark, Finland, Ireland, Italy, Korea, Luxembourg, Norway, Spain, Sweden and the United States. Earnings are reported weekly in Australia, New Zealand and the United Kingdom, and monthly in Belgium, France, Germany, Hungary, Poland and Switzerland. Data on earnings are before income tax, while earnings for Belgium and Korea are net of income tax. Data on earnings for individuals in part-time work are excluded for the Czech Republic, Hungary, Luxembourg and Poland, while data on part-year earnings are excluded for Hungary, Luxembourg and Poland.
The research regarding earnings determination in the United States is described in Bowles and Gintis (2000).
Earnings assumptions were made in calculating rates of return for an individual who starts work again in mid-career after having attained the next highest level of education. The assumptions concerned the immediate earnings increase (10% relative to the level of earnings at the previous level of educational attainment) and the time required for convergence with the average wage of individuals already holding the next highest level of educational qualification (two years). These assumptions are somewhat ad hoc. Empirical evidence on the earnings of adults who return to work following part-time or full-time studies is scarce, especially for individuals attaining an upper secondary qualification. However, Canadian data indicate a convergence period of just two years for 30-to-49-year-olds who obtain a university degree, with a still shorter catch-up time for those who obtain a tertiary degree (OECD, 2003). It should be noted, nevertheless, that the Canadian data are derived from a small sample of individuals and do not control for the fact that those who invested in education may differ in important ways – such as motivation and inherent ability – by comparison with those who did not.
The rate of return estimates presented here are not fully compatible with those published in Education at a Glance 2005 on account of changes in assumptions used. In particular, in Education at a Glance 2005, a generic figure for the rate of productivity increase of 1% was used to project growth of earnings. This year, country-specific figures that reflect labour productivity have been used. Also, an earnings catch-up period of two years was used this year, instead of the three-year period assumed last year (see above). Finally, estimates of the public rate of return also include the effects of social insurance payments made by the employed.
For the methods employed for the calculation of the rates of return in Tables A9.5 to A9.8, see Annex 3 at www.oecd.org/edu/eag2006.
chapter a The OuTpuT Of educaTiOnal insTiTuTiOns and The impacT Of learning
Education at a Glance © OECD 2006134
A9Further references
The following additional material relevant to this indicator is available on the Web athttp://dx.doi.org/10.1787/815010258467
• Trends in relative earnings, by gender (1997-2004) Table A9.2b Trends in relative earnings: male population (1997-2004) Table A9.2c Trends in relative earnings: female population (1997-2004) Table A9.3 Trends in differences in earnings between females and males (1997-2004)
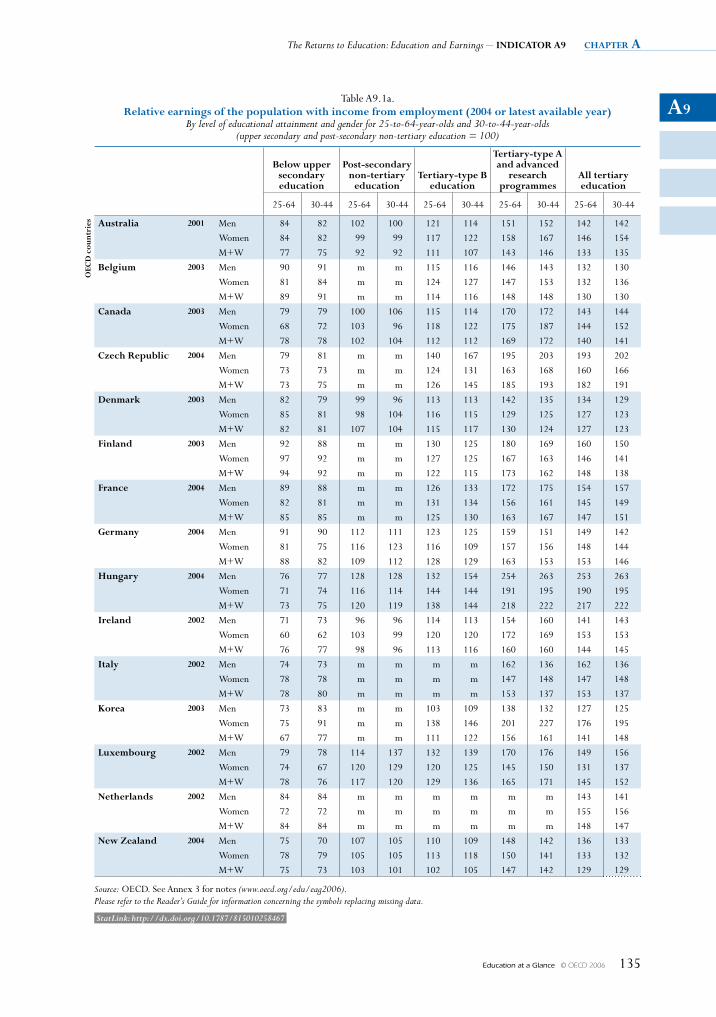
A9
The Returns to Education: Education and Earnings – INDICATOR A9 chapter a
Education at a Glance © OECD 2006 135
Table A9.1a. Relative earnings of the population with income from employment (2004 or latest available year)
By level of educational attainment and gender for 25-to-64-year-olds and 30-to-44-year-olds (upper secondary and post-secondary non-tertiary education = 100)
Below upper secondary education
Post-secondary non-tertiary
educationTertiary-type B
education
Tertiary-type A and advanced
research programmes
All tertiary education
25-64 30-44 25-64 30-44 25-64 30-44 25-64 30-44 25-64 30-44
OEC
D c
ount
ries Australia 2001 Men 84 82 102 100 121 114 151 152 142 142
Women 84 82 99 99 117 122 158 167 146 154M+W 77 75 92 92 111 107 143 146 133 135
Belgium 2003 Men 90 91 m m 115 116 146 143 132 130Women 81 84 m m 124 127 147 153 132 136M+W 89 91 m m 114 116 148 148 130 130
Canada 2003 Men 79 79 100 106 115 114 170 172 143 144Women 68 72 103 96 118 122 175 187 144 152M+W 78 78 102 104 112 112 169 172 140 141
Czech Republic 2004 Men 79 81 m m 140 167 195 203 193 202Women 73 73 m m 124 131 163 168 160 166M+W 73 75 m m 126 145 185 193 182 191
Denmark 2003 Men 82 79 99 96 113 113 142 135 134 129Women 85 81 98 104 116 115 129 125 127 123M+W 82 81 107 104 115 117 130 124 127 123
Finland 2003 Men 92 88 m m 130 125 180 169 160 150Women 97 92 m m 127 125 167 163 146 141M+W 94 92 m m 122 115 173 162 148 138
France 2004 Men 89 88 m m 126 133 172 175 154 157Women 82 81 m m 131 134 156 161 145 149M+W 85 85 m m 125 130 163 167 147 151
Germany 2004 Men 91 90 112 111 123 125 159 151 149 142Women 81 75 116 123 116 109 157 156 148 144M+W 88 82 109 112 128 129 163 153 153 146
Hungary 2004 Men 76 77 128 128 132 154 254 263 253 263Women 71 74 116 114 144 144 191 195 190 195M+W 73 75 120 119 138 144 218 222 217 222
Ireland 2002 Men 71 73 96 96 114 113 154 160 141 143Women 60 62 103 99 120 120 172 169 153 153M+W 76 77 98 96 113 116 160 160 144 145
Italy 2002 Men 74 73 m m m m 162 136 162 136Women 78 78 m m m m 147 148 147 148M+W 78 80 m m m m 153 137 153 137
Korea 2003 Men 73 83 m m 103 109 138 132 127 125Women 75 91 m m 138 146 201 227 176 195M+W 67 77 m m 111 122 156 161 141 148
Luxembourg 2002 Men 79 78 114 137 132 139 170 176 149 156Women 74 67 120 129 120 125 145 150 131 137M+W 78 76 117 120 129 136 165 171 145 152
Netherlands 2002 Men 84 84 m m m m m m 143 141Women 72 72 m m m m m m 155 156M+W 84 84 m m m m m m 148 147
New Zealand 2004 Men 75 70 107 105 110 109 148 142 136 133Women 78 79 105 105 113 118 150 141 133 132M+W 75 73 103 101 102 105 147 142 129 129
Source: OECD. See Annex 3 for notes (www.oecd.org/edu/eag2006).Please refer to the Reader’s Guide for information concerning the symbols replacing missing data.
StatLink: http://dx.doi.org/10.1787/815010258467
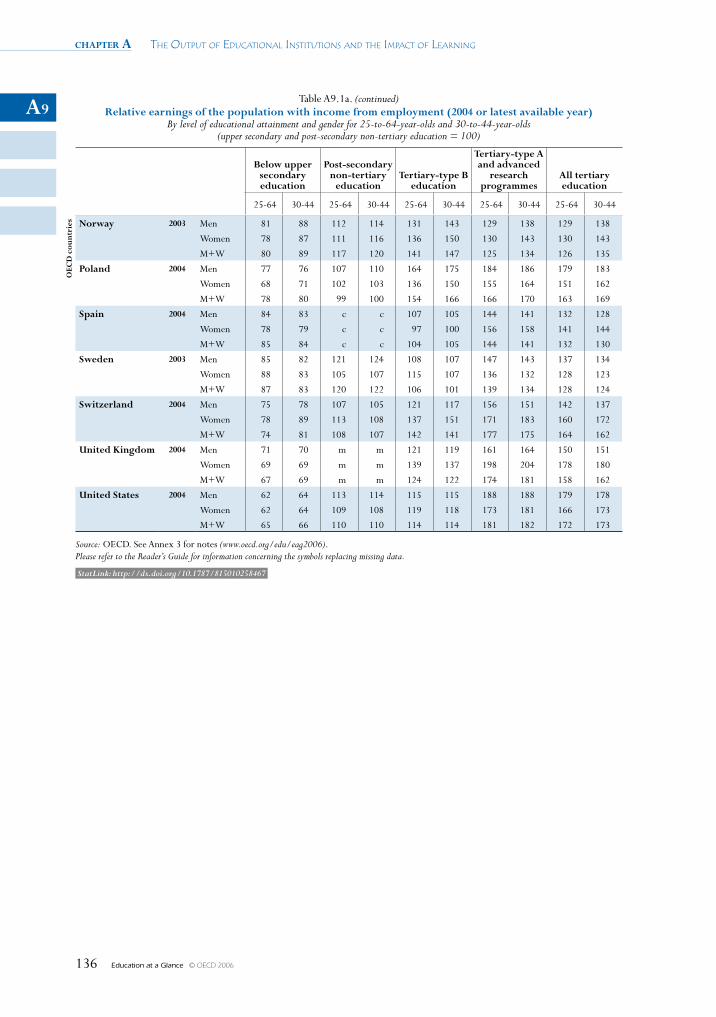
chapter a The OuTpuT Of educaTiOnal insTiTuTiOns and The impacT Of learning
Education at a Glance © OECD 2006136
A9Table A9.1a. (continued)
Relative earnings of the population with income from employment (2004 or latest available year) By level of educational attainment and gender for 25-to-64-year-olds and 30-to-44-year-olds
(upper secondary and post-secondary non-tertiary education = 100)
Below upper secondary education
Post-secondary non-tertiary
educationTertiary-type B
education
Tertiary-type A and advanced
research programmes
All tertiary education
25-64 30-44 25-64 30-44 25-64 30-44 25-64 30-44 25-64 30-44
OEC
D c
ount
ries Norway 2003 Men 81 88 112 114 131 143 129 138 129 138
Women 78 87 111 116 136 150 130 143 130 143
M+W 80 89 117 120 141 147 125 134 126 135
Poland 2004 Men 77 76 107 110 164 175 184 186 179 183
Women 68 71 102 103 136 150 155 164 151 162
M+W 78 80 99 100 154 166 166 170 163 169
Spain 2004 Men 84 83 c c 107 105 144 141 132 128
Women 78 79 c c 97 100 156 158 141 144
M+W 85 84 c c 104 105 144 141 132 130
Sweden 2003 Men 85 82 121 124 108 107 147 143 137 134
Women 88 83 105 107 115 107 136 132 128 123
M+W 87 83 120 122 106 101 139 134 128 124
Switzerland 2004 Men 75 78 107 105 121 117 156 151 142 137
Women 78 89 113 108 137 151 171 183 160 172
M+W 74 81 108 107 142 141 177 175 164 162
United Kingdom 2004 Men 71 70 m m 121 119 161 164 150 151
Women 69 69 m m 139 137 198 204 178 180
M+W 67 69 m m 124 122 174 181 158 162
United States 2004 Men 62 64 113 114 115 115 188 188 179 178
Women 62 64 109 108 119 118 173 181 166 173
M+W 65 66 110 110 114 114 181 182 172 173
Source: OECD. See Annex 3 for notes (www.oecd.org/edu/eag2006).Please refer to the Reader’s Guide for information concerning the symbols replacing missing data.
StatLink: http://dx.doi.org/10.1787/815010258467
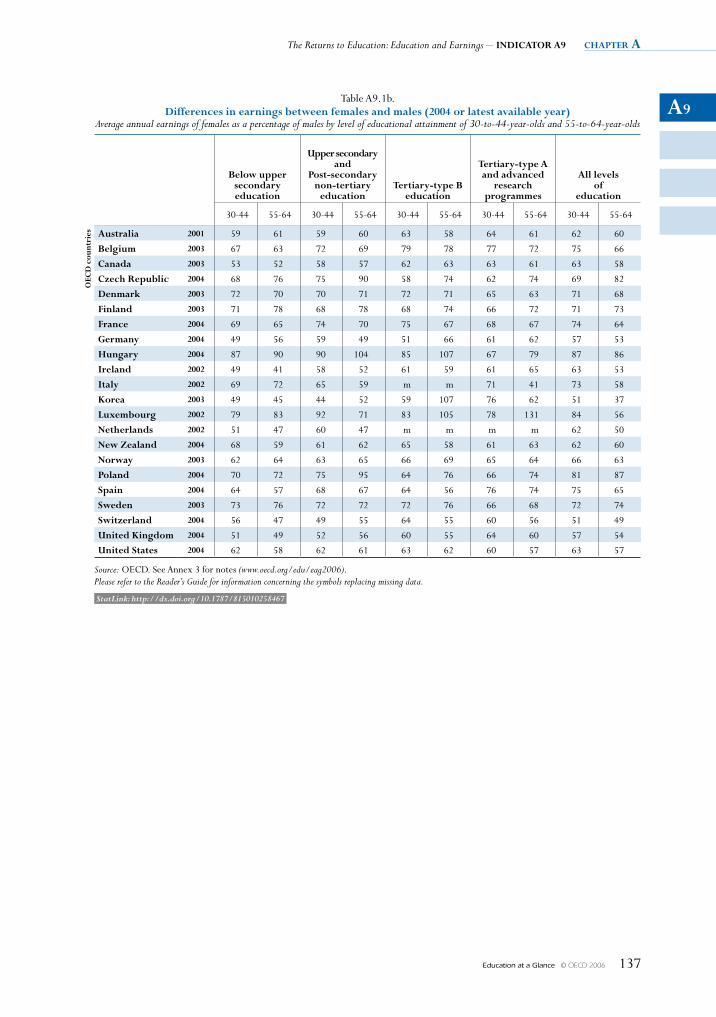
A9
The Returns to Education: Education and Earnings – INDICATOR A9 chapter a
Education at a Glance © OECD 2006 137
Table A9.1b. Differences in earnings between females and males (2004 or latest available year)
Average annual earnings of females as a percentage of males by level of educational attainment of 30-to-44-year-olds and 55-to-64-year-olds
Below upper secondary education
Upper secondary and
Post-secondary non-tertiary
educationTertiary-type B
education
Tertiary-type A and advanced
research programmes
All levels of
education
30-44 55-64 30-44 55-64 30-44 55-64 30-44 55-64 30-44 55-64
OEC
D c
ount
ries Australia 2001 59 61 59 60 63 58 64 61 62 60
Belgium 2003 67 63 72 69 79 78 77 72 75 66
Canada 2003 53 52 58 57 62 63 63 61 63 58
Czech Republic 2004 68 76 75 90 58 74 62 74 69 82
Denmark 2003 72 70 70 71 72 71 65 63 71 68
Finland 2003 71 78 68 78 68 74 66 72 71 73
France 2004 69 65 74 70 75 67 68 67 74 64
Germany 2004 49 56 59 49 51 66 61 62 57 53
Hungary 2004 87 90 90 104 85 107 67 79 87 86
Ireland 2002 49 41 58 52 61 59 61 65 63 53
Italy 2002 69 72 65 59 m m 71 41 73 58
Korea 2003 49 45 44 52 59 107 76 62 51 37
Luxembourg 2002 79 83 92 71 83 105 78 131 84 56
Netherlands 2002 51 47 60 47 m m m m 62 50
New Zealand 2004 68 59 61 62 65 58 61 63 62 60
Norway 2003 62 64 63 65 66 69 65 64 66 63
Poland 2004 70 72 75 95 64 76 66 74 81 87
Spain 2004 64 57 68 67 64 56 76 74 75 65
Sweden 2003 73 76 72 72 72 76 66 68 72 74
Switzerland 2004 56 47 49 55 64 55 60 56 51 49
United Kingdom 2004 51 49 52 56 60 55 64 60 57 54
United States 2004 62 58 62 61 63 62 60 57 63 57
Source: OECD. See Annex 3 for notes (www.oecd.org/edu/eag2006).Please refer to the Reader’s Guide for information concerning the symbols replacing missing data.
StatLink: http://dx.doi.org/10.1787/815010258467
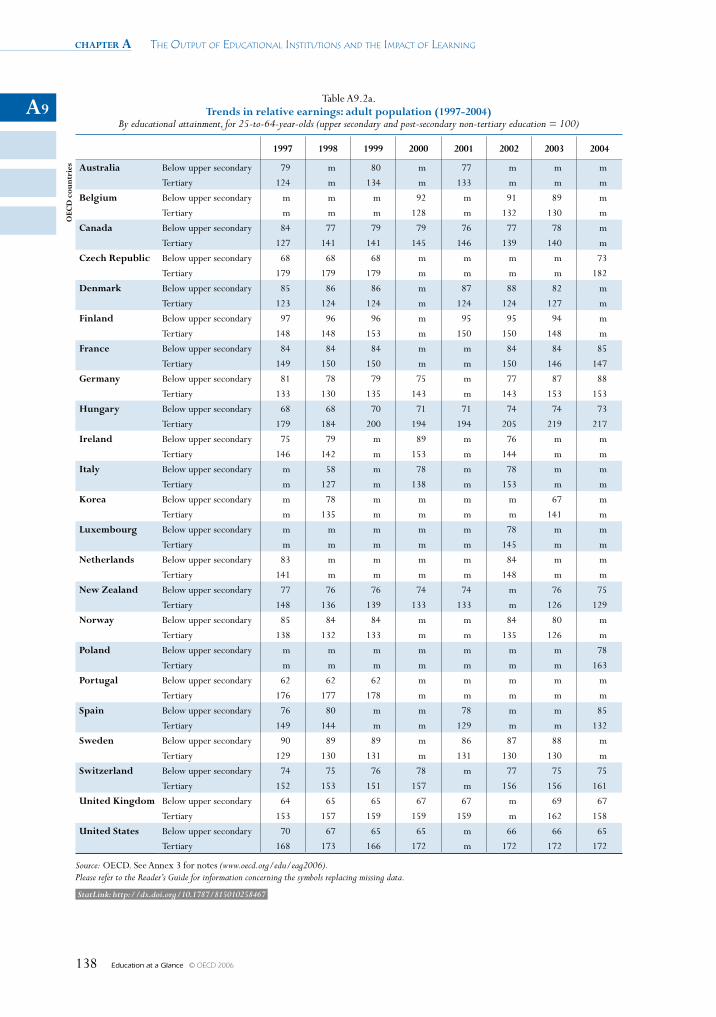
chapter a The OuTpuT Of educaTiOnal insTiTuTiOns and The impacT Of learning
Education at a Glance © OECD 2006138
A9Table A9.2a.
Trends in relative earnings: adult population (1997-2004) By educational attainment, for 25-to-64-year-olds (upper secondary and post-secondary non-tertiary education = 100)
1997 1998 1999 2000 2001 2002 2003 2004
OEC
D c
ount
ries Australia Below upper secondary 79 m 80 m 77 m m m
Tertiary 124 m 134 m 133 m m m
Belgium Below upper secondary m m m 92 m 91 89 m
Tertiary m m m 128 m 132 130 m
Canada Below upper secondary 84 77 79 79 76 77 78 m
Tertiary 127 141 141 145 146 139 140 m
Czech Republic Below upper secondary 68 68 68 m m m m 73
Tertiary 179 179 179 m m m m 182
Denmark Below upper secondary 85 86 86 m 87 88 82 m
Tertiary 123 124 124 m 124 124 127 m
Finland Below upper secondary 97 96 96 m 95 95 94 m
Tertiary 148 148 153 m 150 150 148 m
France Below upper secondary 84 84 84 m m 84 84 85
Tertiary 149 150 150 m m 150 146 147
Germany Below upper secondary 81 78 79 75 m 77 87 88
Tertiary 133 130 135 143 m 143 153 153
Hungary Below upper secondary 68 68 70 71 71 74 74 73
Tertiary 179 184 200 194 194 205 219 217
Ireland Below upper secondary 75 79 m 89 m 76 m m
Tertiary 146 142 m 153 m 144 m m
Italy Below upper secondary m 58 m 78 m 78 m m
Tertiary m 127 m 138 m 153 m m
Korea Below upper secondary m 78 m m m m 67 m
Tertiary m 135 m m m m 141 m
Luxembourg Below upper secondary m m m m m 78 m m
Tertiary m m m m m 145 m m
Netherlands Below upper secondary 83 m m m m 84 m m
Tertiary 141 m m m m 148 m m
New Zealand Below upper secondary 77 76 76 74 74 m 76 75
Tertiary 148 136 139 133 133 m 126 129
Norway Below upper secondary 85 84 84 m m 84 80 m
Tertiary 138 132 133 m m 135 126 m
Poland Below upper secondary m m m m m m m 78
Tertiary m m m m m m m 163
Portugal Below upper secondary 62 62 62 m m m m m
Tertiary 176 177 178 m m m m m
Spain Below upper secondary 76 80 m m 78 m m 85
Tertiary 149 144 m m 129 m m 132
Sweden Below upper secondary 90 89 89 m 86 87 88 m
Tertiary 129 130 131 m 131 130 130 m
Switzerland Below upper secondary 74 75 76 78 m 77 75 75
Tertiary 152 153 151 157 m 156 156 161
United Kingdom Below upper secondary 64 65 65 67 67 m 69 67
Tertiary 153 157 159 159 159 m 162 158
United States Below upper secondary 70 67 65 65 m 66 66 65
Tertiary 168 173 166 172 m 172 172 172
Source: OECD. See Annex 3 for notes (www.oecd.org/edu/eag2006).Please refer to the Reader’s Guide for information concerning the symbols replacing missing data.
StatLink: http://dx.doi.org/10.1787/815010258467
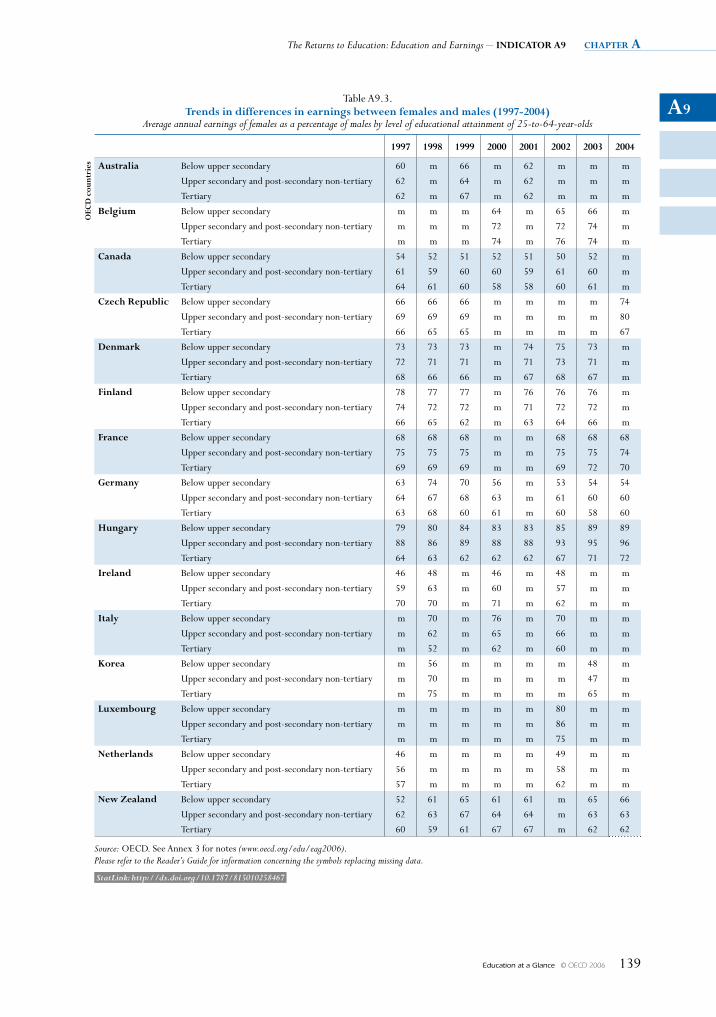
A9
The Returns to Education: Education and Earnings – INDICATOR A9 chapter a
Education at a Glance © OECD 2006 139
Table A9.3. Trends in differences in earnings between females and males (1997-2004)
Average annual earnings of females as a percentage of males by level of educational attainment of 25-to-64-year-olds
1997 1998 1999 2000 2001 2002 2003 2004
OEC
D c
ount
ries Australia Below upper secondary 60 m 66 m 62 m m m
Upper secondary and post-secondary non-tertiary 62 m 64 m 62 m m m
Tertiary 62 m 67 m 62 m m m
Belgium Below upper secondary m m m 64 m 65 66 m
Upper secondary and post-secondary non-tertiary m m m 72 m 72 74 m
Tertiary m m m 74 m 76 74 m
Canada Below upper secondary 54 52 51 52 51 50 52 m
Upper secondary and post-secondary non-tertiary 61 59 60 60 59 61 60 m
Tertiary 64 61 60 58 58 60 61 m
Czech Republic Below upper secondary 66 66 66 m m m m 74
Upper secondary and post-secondary non-tertiary 69 69 69 m m m m 80
Tertiary 66 65 65 m m m m 67
Denmark Below upper secondary 73 73 73 m 74 75 73 m
Upper secondary and post-secondary non-tertiary 72 71 71 m 71 73 71 m
Tertiary 68 66 66 m 67 68 67 m
Finland Below upper secondary 78 77 77 m 76 76 76 m
Upper secondary and post-secondary non-tertiary 74 72 72 m 71 72 72 m
Tertiary 66 65 62 m 63 64 66 m
France Below upper secondary 68 68 68 m m 68 68 68
Upper secondary and post-secondary non-tertiary 75 75 75 m m 75 75 74
Tertiary 69 69 69 m m 69 72 70
Germany Below upper secondary 63 74 70 56 m 53 54 54
Upper secondary and post-secondary non-tertiary 64 67 68 63 m 61 60 60
Tertiary 63 68 60 61 m 60 58 60
Hungary Below upper secondary 79 80 84 83 83 85 89 89
Upper secondary and post-secondary non-tertiary 88 86 89 88 88 93 95 96
Tertiary 64 63 62 62 62 67 71 72
Ireland Below upper secondary 46 48 m 46 m 48 m m
Upper secondary and post-secondary non-tertiary 59 63 m 60 m 57 m m
Tertiary 70 70 m 71 m 62 m m
Italy Below upper secondary m 70 m 76 m 70 m m
Upper secondary and post-secondary non-tertiary m 62 m 65 m 66 m m
Tertiary m 52 m 62 m 60 m m
Korea Below upper secondary m 56 m m m m 48 m
Upper secondary and post-secondary non-tertiary m 70 m m m m 47 m
Tertiary m 75 m m m m 65 m
Luxembourg Below upper secondary m m m m m 80 m m
Upper secondary and post-secondary non-tertiary m m m m m 86 m m
Tertiary m m m m m 75 m m
Netherlands Below upper secondary 46 m m m m 49 m m
Upper secondary and post-secondary non-tertiary 56 m m m m 58 m m
Tertiary 57 m m m m 62 m m
New Zealand Below upper secondary 52 61 65 61 61 m 65 66
Upper secondary and post-secondary non-tertiary 62 63 67 64 64 m 63 63
Tertiary 60 59 61 67 67 m 62 62
Source: OECD. See Annex 3 for notes (www.oecd.org/edu/eag2006).Please refer to the Reader’s Guide for information concerning the symbols replacing missing data.
StatLink: http://dx.doi.org/10.1787/815010258467
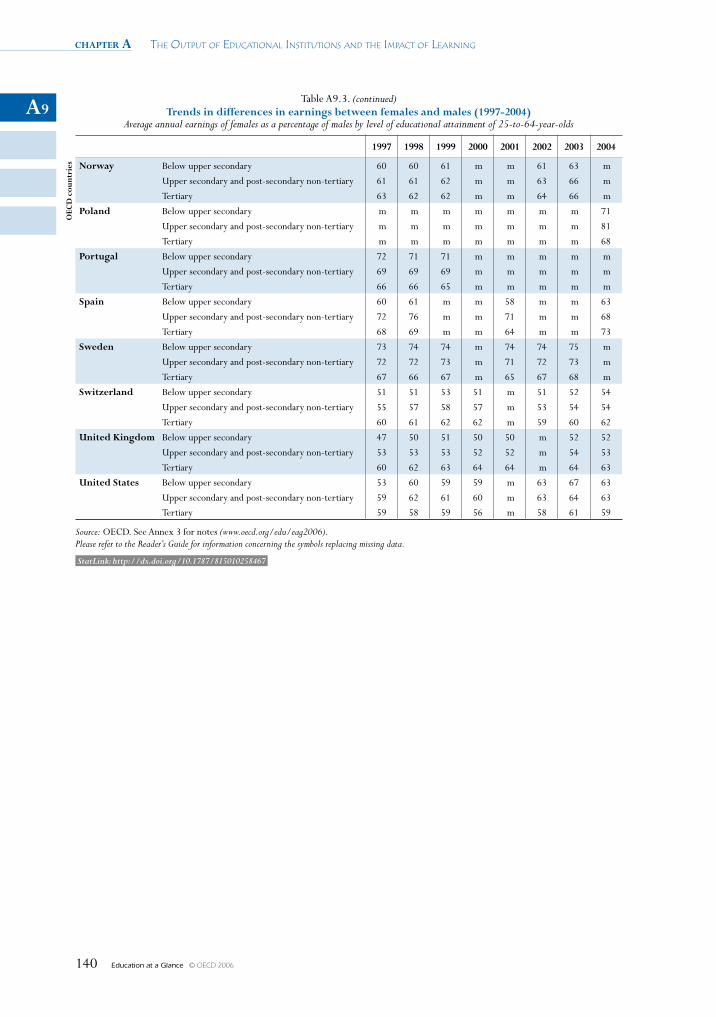
chapter a The OuTpuT Of educaTiOnal insTiTuTiOns and The impacT Of learning
Education at a Glance © OECD 2006140
A9Table A9.3. (continued)
Trends in differences in earnings between females and males (1997-2004) Average annual earnings of females as a percentage of males by level of educational attainment of 25-to-64-year-olds
1997 1998 1999 2000 2001 2002 2003 2004
OEC
D c
ount
ries Norway Below upper secondary 60 60 61 m m 61 63 m
Upper secondary and post-secondary non-tertiary 61 61 62 m m 63 66 m
Tertiary 63 62 62 m m 64 66 m
Poland Below upper secondary m m m m m m m 71
Upper secondary and post-secondary non-tertiary m m m m m m m 81
Tertiary m m m m m m m 68
Portugal Below upper secondary 72 71 71 m m m m m
Upper secondary and post-secondary non-tertiary 69 69 69 m m m m m
Tertiary 66 66 65 m m m m m
Spain Below upper secondary 60 61 m m 58 m m 63
Upper secondary and post-secondary non-tertiary 72 76 m m 71 m m 68
Tertiary 68 69 m m 64 m m 73
Sweden Below upper secondary 73 74 74 m 74 74 75 m
Upper secondary and post-secondary non-tertiary 72 72 73 m 71 72 73 m
Tertiary 67 66 67 m 65 67 68 m
Switzerland Below upper secondary 51 51 53 51 m 51 52 54
Upper secondary and post-secondary non-tertiary 55 57 58 57 m 53 54 54
Tertiary 60 61 62 62 m 59 60 62
United Kingdom Below upper secondary 47 50 51 50 50 m 52 52
Upper secondary and post-secondary non-tertiary 53 53 53 52 52 m 54 53
Tertiary 60 62 63 64 64 m 64 63
United States Below upper secondary 53 60 59 59 m 63 67 63
Upper secondary and post-secondary non-tertiary 59 62 61 60 m 63 64 63
Tertiary 59 58 59 56 m 58 61 59
Source: OECD. See Annex 3 for notes (www.oecd.org/edu/eag2006).Please refer to the Reader’s Guide for information concerning the symbols replacing missing data.
StatLink: http://dx.doi.org/10.1787/815010258467
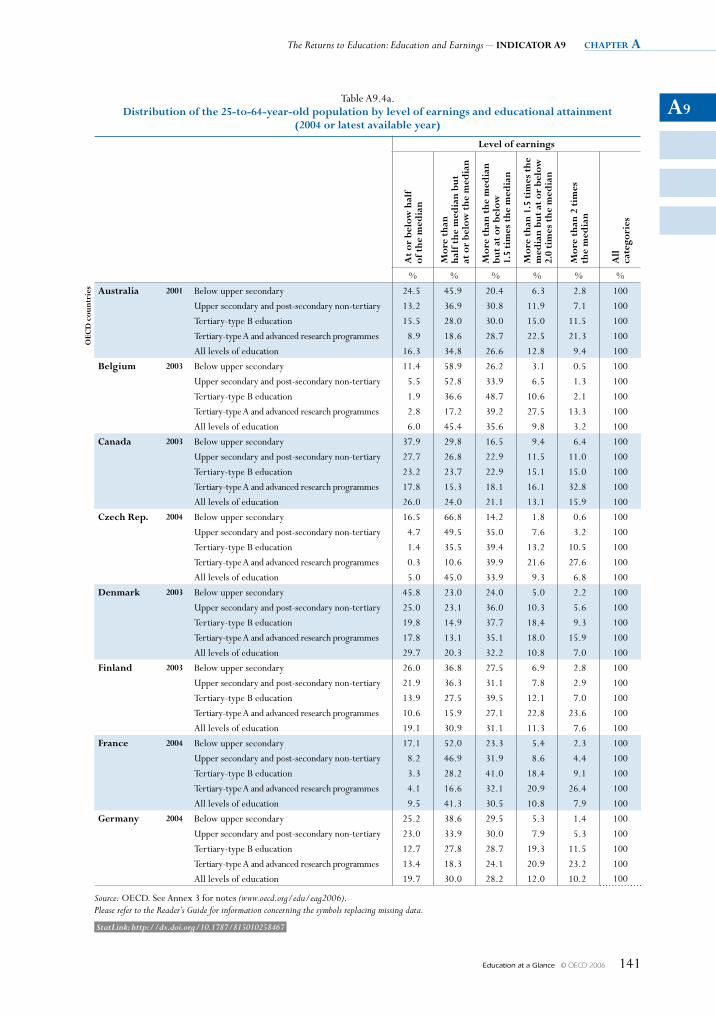
A9
The Returns to Education: Education and Earnings – INDICATOR A9 chapter a
Education at a Glance © OECD 2006 141
Table A9.4a. Distribution of the 25-to-64-year-old population by level of earnings and educational attainment
(2004 or latest available year)
Level of earnings
At
or b
elow
hal
f of
the
med
ian
Mor
e th
an
half
the
med
ian
but
at
or
belo
w t
he m
edia
n
Mor
e th
an t
he m
edia
n
but
at o
r be
low
1.
5 ti
mes
the
med
ian
Mor
e th
an 1
.5 t
imes
the
m
edia
n bu
t at
or
belo
w
2.0
tim
es t
he m
edia
n
Mor
e th
an 2
tim
es
the
med
ian
All
ca
tego
ries
% % % % % %
OEC
D c
ount
ries Australia 2001 Below upper secondary 24.5 45.9 20.4 6.3 2.8 100
Upper secondary and post-secondary non-tertiary 13.2 36.9 30.8 11.9 7.1 100
Tertiary-type B education 15.5 28.0 30.0 15.0 11.5 100
Tertiary-type A and advanced research programmes 8.9 18.6 28.7 22.5 21.3 100
All levels of education 16.3 34.8 26.6 12.8 9.4 100
Belgium 2003 Below upper secondary 11.4 58.9 26.2 3.1 0.5 100
Upper secondary and post-secondary non-tertiary 5.5 52.8 33.9 6.5 1.3 100
Tertiary-type B education 1.9 36.6 48.7 10.6 2.1 100
Tertiary-type A and advanced research programmes 2.8 17.2 39.2 27.5 13.3 100
All levels of education 6.0 45.4 35.6 9.8 3.2 100
Canada 2003 Below upper secondary 37.9 29.8 16.5 9.4 6.4 100
Upper secondary and post-secondary non-tertiary 27.7 26.8 22.9 11.5 11.0 100
Tertiary-type B education 23.2 23.7 22.9 15.1 15.0 100
Tertiary-type A and advanced research programmes 17.8 15.3 18.1 16.1 32.8 100
All levels of education 26.0 24.0 21.1 13.1 15.9 100
Czech Rep. 2004 Below upper secondary 16.5 66.8 14.2 1.8 0.6 100
Upper secondary and post-secondary non-tertiary 4.7 49.5 35.0 7.6 3.2 100
Tertiary-type B education 1.4 35.5 39.4 13.2 10.5 100
Tertiary-type A and advanced research programmes 0.3 10.6 39.9 21.6 27.6 100
All levels of education 5.0 45.0 33.9 9.3 6.8 100
Denmark 2003 Below upper secondary 45.8 23.0 24.0 5.0 2.2 100
Upper secondary and post-secondary non-tertiary 25.0 23.1 36.0 10.3 5.6 100
Tertiary-type B education 19.8 14.9 37.7 18.4 9.3 100
Tertiary-type A and advanced research programmes 17.8 13.1 35.1 18.0 15.9 100
All levels of education 29.7 20.3 32.2 10.8 7.0 100
Finland 2003 Below upper secondary 26.0 36.8 27.5 6.9 2.8 100
Upper secondary and post-secondary non-tertiary 21.9 36.3 31.1 7.8 2.9 100
Tertiary-type B education 13.9 27.5 39.5 12.1 7.0 100
Tertiary-type A and advanced research programmes 10.6 15.9 27.1 22.8 23.6 100
All levels of education 19.1 30.9 31.1 11.3 7.6 100
France 2004 Below upper secondary 17.1 52.0 23.3 5.4 2.3 100
Upper secondary and post-secondary non-tertiary 8.2 46.9 31.9 8.6 4.4 100
Tertiary-type B education 3.3 28.2 41.0 18.4 9.1 100
Tertiary-type A and advanced research programmes 4.1 16.6 32.1 20.9 26.4 100
All levels of education 9.5 41.3 30.5 10.8 7.9 100
Germany 2004 Below upper secondary 25.2 38.6 29.5 5.3 1.4 100
Upper secondary and post-secondary non-tertiary 23.0 33.9 30.0 7.9 5.3 100
Tertiary-type B education 12.7 27.8 28.7 19.3 11.5 100
Tertiary-type A and advanced research programmes 13.4 18.3 24.1 20.9 23.2 100
All levels of education 19.7 30.0 28.2 12.0 10.2 100
Source: OECD. See Annex 3 for notes (www.oecd.org/edu/eag2006).Please refer to the Reader’s Guide for information concerning the symbols replacing missing data.
StatLink: http://dx.doi.org/10.1787/815010258467

chapter a The OuTpuT Of educaTiOnal insTiTuTiOns and The impacT Of learning
Education at a Glance © OECD 2006142
A9Table A9.4a. (continued-1)
Distribution of the 25-to-64-year-old population by level of earnings and educational attainment (2004 or latest available year)
Level of earnings
At
or b
elow
hal
f of
the
med
ian
Mor
e th
an
half
the
med
ian
but
at
or
belo
w t
he m
edia
n
Mor
e th
an t
he m
edia
n
but
at o
r be
low
1.
5 ti
mes
the
med
ian
Mor
e th
an 1
.5 t
imes
the
m
edia
n bu
t at
or
belo
w
2.0
tim
es t
he m
edia
n
Mor
e th
an 2
tim
es
the
med
ian
All
ca
tego
ries
% % % % % %
OEC
D c
ount
ries Hungary 2004 Below upper secondary 16.0 64.0 15.6 3.0 1.3 100
Upper secondary and post-secondary non-tertiary 12.2 43.6 25.9 10.3 8.0 100
Tertiary-type B education 6.8 25.4 34.2 13.9 19.6 100
Tertiary-type A and advanced research programmes 2.2 6.8 21.9 25.1 43.9 100
All levels of education 10.7 39.3 23.1 12.2 14.7 100
Ireland 2002 Below upper secondary 30.8 34.4 23.9 7.2 3.8 100
Upper secondary and post-secondary non-tertiary 18.0 33.8 26.0 13.3 8.9 100
Tertiary-type B education 11.7 32.0 28.7 14.9 12.6 100
Tertiary-type A and advanced research programmes 8.3 14.7 21.4 22.8 32.7 100
All levels of education 21.5 29.8 23.9 12.8 12.0 100
Italy 2002 Below upper secondary 19.5 42.3 22.2 7.5 8.5 100
Upper secondary and post-secondary non-tertiary 10.1 35.0 29.3 10.8 14.9 100
Tertiary-type B education m m m m m m
Tertiary-type A and advanced research programmes 6.8 19.9 27.4 11.8 34.1 100
All levels of education 13.8 36.2 25.9 9.5 14.6 100
Korea 2003 Below upper secondary 31.5 42.8 19.0 2.5 4.2 100
Upper secondary and post-secondary non-tertiary 15.7 34.9 29.6 8.6 11.2 100
Tertiary-type B education 14.5 30.8 31.0 11.3 12.4 100
Tertiary-type A and advanced research programmes 8.6 17.5 29.7 17.1 27.0 100
All levels of education 17.8 32.1 27.1 9.5 13.5 100
Luxembourg 2002 Below upper secondary 12.1 60.1 21.6 4.9 1.3 100
Upper secondary and post-secondary non-tertiary 2.3 52.2 28.0 11.7 5.8 100
Tertiary-type B education 0.6 28.6 41.7 17.2 11.8 100
Tertiary-type A and advanced research programmes 0.0 14.4 36.6 24.9 24.1 100
All levels of education 3.5 45.4 30.0 13.0 8.2 100
Netherlands 2002 Below upper secondary 26.9 37.9 29.0 5.0 1.3 100
Upper secondary and post-secondary non-tertiary 17.4 36.5 33.2 9.3 3.6 100
All tertiary 8.3 20.8 30.5 21.9 18.6 100
All levels of education 17.4 32.6 31.3 11.6 7.1 100
New Zealand 2004 Below upper secondary 24.0 47.6 20.2 5.9 2.3 100
Upper secondary and post-secondary non-tertiary 16.6 34.0 30.5 11.2 7.6 100
Tertiary-type B education 10.5 19.7 29.3 18.4 22.1 100
Tertiary-type A and advanced research programmes 19.8 28.8 30.0 12.3 9.2 100
All levels of education 17.2 33.1 28.4 11.8 9.5 100
Source: OECD. See Annex 3 for notes (www.oecd.org/edu/eag2006).Please refer to the Reader’s Guide for information concerning the symbols replacing missing data.
StatLink: http://dx.doi.org/10.1787/815010258467
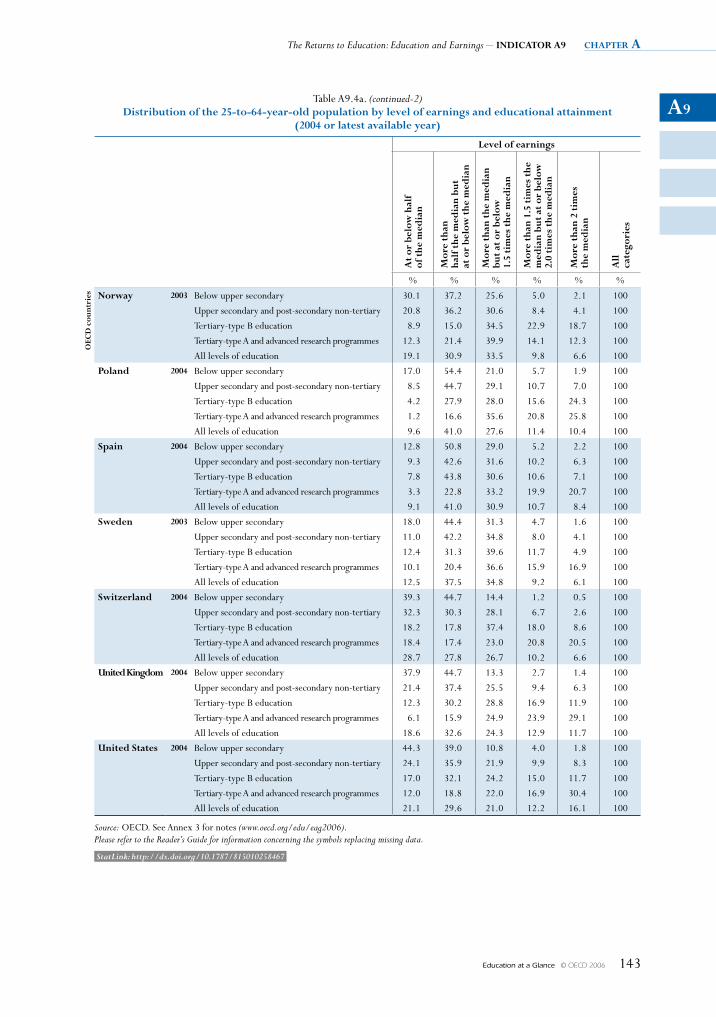
A9
The Returns to Education: Education and Earnings – INDICATOR A9 chapter a
Education at a Glance © OECD 2006 143
Table A9.4a. (continued-2) Distribution of the 25-to-64-year-old population by level of earnings and educational attainment
(2004 or latest available year)
Level of earnings
At
or b
elow
hal
f of
the
med
ian
Mor
e th
an
half
the
med
ian
but
at
or
belo
w t
he m
edia
n
Mor
e th
an t
he m
edia
n
but
at o
r be
low
1.
5 ti
mes
the
med
ian
Mor
e th
an 1
.5 t
imes
the
m
edia
n bu
t at
or
belo
w
2.0
tim
es t
he m
edia
n
Mor
e th
an 2
tim
es
the
med
ian
All
ca
tego
ries
% % % % % %
OEC
D c
ount
ries Norway 2003 Below upper secondary 30.1 37.2 25.6 5.0 2.1 100
Upper secondary and post-secondary non-tertiary 20.8 36.2 30.6 8.4 4.1 100
Tertiary-type B education 8.9 15.0 34.5 22.9 18.7 100
Tertiary-type A and advanced research programmes 12.3 21.4 39.9 14.1 12.3 100
All levels of education 19.1 30.9 33.5 9.8 6.6 100
Poland 2004 Below upper secondary 17.0 54.4 21.0 5.7 1.9 100
Upper secondary and post-secondary non-tertiary 8.5 44.7 29.1 10.7 7.0 100
Tertiary-type B education 4.2 27.9 28.0 15.6 24.3 100
Tertiary-type A and advanced research programmes 1.2 16.6 35.6 20.8 25.8 100
All levels of education 9.6 41.0 27.6 11.4 10.4 100
Spain 2004 Below upper secondary 12.8 50.8 29.0 5.2 2.2 100
Upper secondary and post-secondary non-tertiary 9.3 42.6 31.6 10.2 6.3 100
Tertiary-type B education 7.8 43.8 30.6 10.6 7.1 100
Tertiary-type A and advanced research programmes 3.3 22.8 33.2 19.9 20.7 100
All levels of education 9.1 41.0 30.9 10.7 8.4 100
Sweden 2003 Below upper secondary 18.0 44.4 31.3 4.7 1.6 100
Upper secondary and post-secondary non-tertiary 11.0 42.2 34.8 8.0 4.1 100
Tertiary-type B education 12.4 31.3 39.6 11.7 4.9 100
Tertiary-type A and advanced research programmes 10.1 20.4 36.6 15.9 16.9 100
All levels of education 12.5 37.5 34.8 9.2 6.1 100
Switzerland 2004 Below upper secondary 39.3 44.7 14.4 1.2 0.5 100
Upper secondary and post-secondary non-tertiary 32.3 30.3 28.1 6.7 2.6 100
Tertiary-type B education 18.2 17.8 37.4 18.0 8.6 100
Tertiary-type A and advanced research programmes 18.4 17.4 23.0 20.8 20.5 100
All levels of education 28.7 27.8 26.7 10.2 6.6 100
United Kingdom 2004 Below upper secondary 37.9 44.7 13.3 2.7 1.4 100
Upper secondary and post-secondary non-tertiary 21.4 37.4 25.5 9.4 6.3 100
Tertiary-type B education 12.3 30.2 28.8 16.9 11.9 100
Tertiary-type A and advanced research programmes 6.1 15.9 24.9 23.9 29.1 100
All levels of education 18.6 32.6 24.3 12.9 11.7 100
United States 2004 Below upper secondary 44.3 39.0 10.8 4.0 1.8 100
Upper secondary and post-secondary non-tertiary 24.1 35.9 21.9 9.9 8.3 100
Tertiary-type B education 17.0 32.1 24.2 15.0 11.7 100
Tertiary-type A and advanced research programmes 12.0 18.8 22.0 16.9 30.4 100
All levels of education 21.1 29.6 21.0 12.2 16.1 100
Source: OECD. See Annex 3 for notes (www.oecd.org/edu/eag2006).Please refer to the Reader’s Guide for information concerning the symbols replacing missing data.
StatLink: http://dx.doi.org/10.1787/815010258467
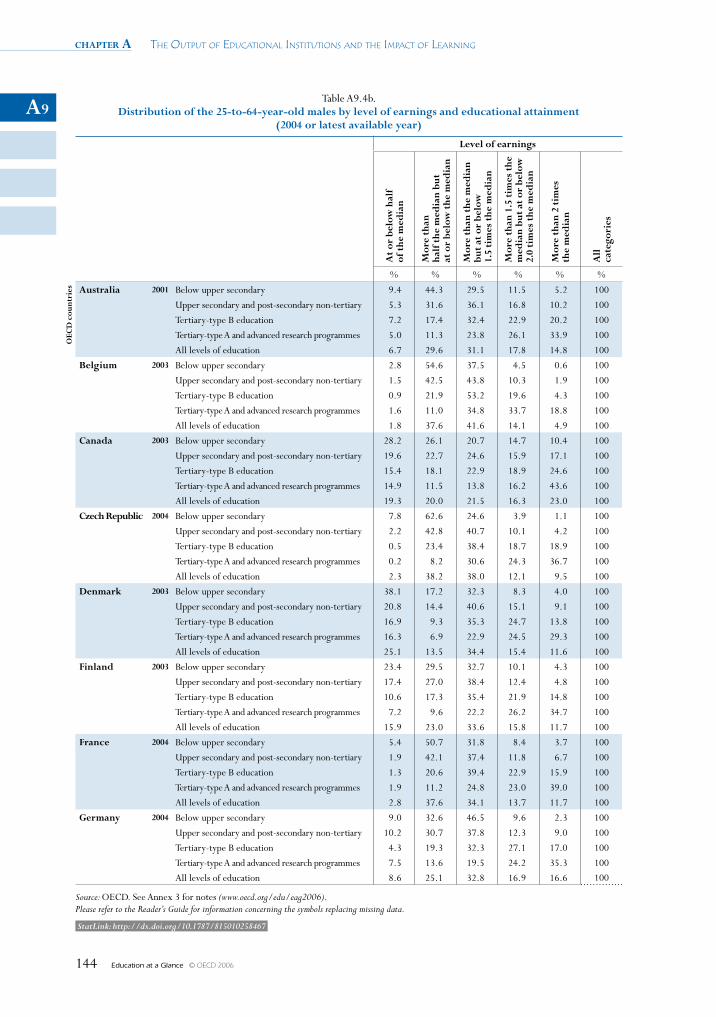
chapter a The OuTpuT Of educaTiOnal insTiTuTiOns and The impacT Of learning
Education at a Glance © OECD 2006144
A9Table A9.4b.
Distribution of the 25-to-64-year-old males by level of earnings and educational attainment (2004 or latest available year)
Level of earnings
At
or b
elow
hal
f of
the
med
ian
Mor
e th
an
half
the
med
ian
but
at
or
belo
w t
he m
edia
n
Mor
e th
an t
he m
edia
n
but
at o
r be
low
1.
5 ti
mes
the
med
ian
Mor
e th
an 1
.5 t
imes
the
m
edia
n bu
t at
or
belo
w
2.0
tim
es t
he m
edia
n
Mor
e th
an 2
tim
es
the
med
ian
All
ca
tego
ries
% % % % % %
OEC
D c
ount
ries Australia 2001 Below upper secondary 9.4 44.3 29.5 11.5 5.2 100
Upper secondary and post-secondary non-tertiary 5.3 31.6 36.1 16.8 10.2 100
Tertiary-type B education 7.2 17.4 32.4 22.9 20.2 100
Tertiary-type A and advanced research programmes 5.0 11.3 23.8 26.1 33.9 100
All levels of education 6.7 29.6 31.1 17.8 14.8 100
Belgium 2003 Below upper secondary 2.8 54.6 37.5 4.5 0.6 100
Upper secondary and post-secondary non-tertiary 1.5 42.5 43.8 10.3 1.9 100
Tertiary-type B education 0.9 21.9 53.2 19.6 4.3 100
Tertiary-type A and advanced research programmes 1.6 11.0 34.8 33.7 18.8 100
All levels of education 1.8 37.6 41.6 14.1 4.9 100
Canada 2003 Below upper secondary 28.2 26.1 20.7 14.7 10.4 100
Upper secondary and post-secondary non-tertiary 19.6 22.7 24.6 15.9 17.1 100
Tertiary-type B education 15.4 18.1 22.9 18.9 24.6 100
Tertiary-type A and advanced research programmes 14.9 11.5 13.8 16.2 43.6 100
All levels of education 19.3 20.0 21.5 16.3 23.0 100
Czech Republic 2004 Below upper secondary 7.8 62.6 24.6 3.9 1.1 100
Upper secondary and post-secondary non-tertiary 2.2 42.8 40.7 10.1 4.2 100
Tertiary-type B education 0.5 23.4 38.4 18.7 18.9 100
Tertiary-type A and advanced research programmes 0.2 8.2 30.6 24.3 36.7 100
All levels of education 2.3 38.2 38.0 12.1 9.5 100
Denmark 2003 Below upper secondary 38.1 17.2 32.3 8.3 4.0 100
Upper secondary and post-secondary non-tertiary 20.8 14.4 40.6 15.1 9.1 100
Tertiary-type B education 16.9 9.3 35.3 24.7 13.8 100
Tertiary-type A and advanced research programmes 16.3 6.9 22.9 24.5 29.3 100
All levels of education 25.1 13.5 34.4 15.4 11.6 100
Finland 2003 Below upper secondary 23.4 29.5 32.7 10.1 4.3 100
Upper secondary and post-secondary non-tertiary 17.4 27.0 38.4 12.4 4.8 100
Tertiary-type B education 10.6 17.3 35.4 21.9 14.8 100
Tertiary-type A and advanced research programmes 7.2 9.6 22.2 26.2 34.7 100
All levels of education 15.9 23.0 33.6 15.8 11.7 100
France 2004 Below upper secondary 5.4 50.7 31.8 8.4 3.7 100
Upper secondary and post-secondary non-tertiary 1.9 42.1 37.4 11.8 6.7 100
Tertiary-type B education 1.3 20.6 39.4 22.9 15.9 100
Tertiary-type A and advanced research programmes 1.9 11.2 24.8 23.0 39.0 100
All levels of education 2.8 37.6 34.1 13.7 11.7 100
Germany 2004 Below upper secondary 9.0 32.6 46.5 9.6 2.3 100
Upper secondary and post-secondary non-tertiary 10.2 30.7 37.8 12.3 9.0 100
Tertiary-type B education 4.3 19.3 32.3 27.1 17.0 100
Tertiary-type A and advanced research programmes 7.5 13.6 19.5 24.2 35.3 100
All levels of education 8.6 25.1 32.8 16.9 16.6 100
Source: OECD. See Annex 3 for notes (www.oecd.org/edu/eag2006).Please refer to the Reader’s Guide for information concerning the symbols replacing missing data.
StatLink: http://dx.doi.org/10.1787/815010258467
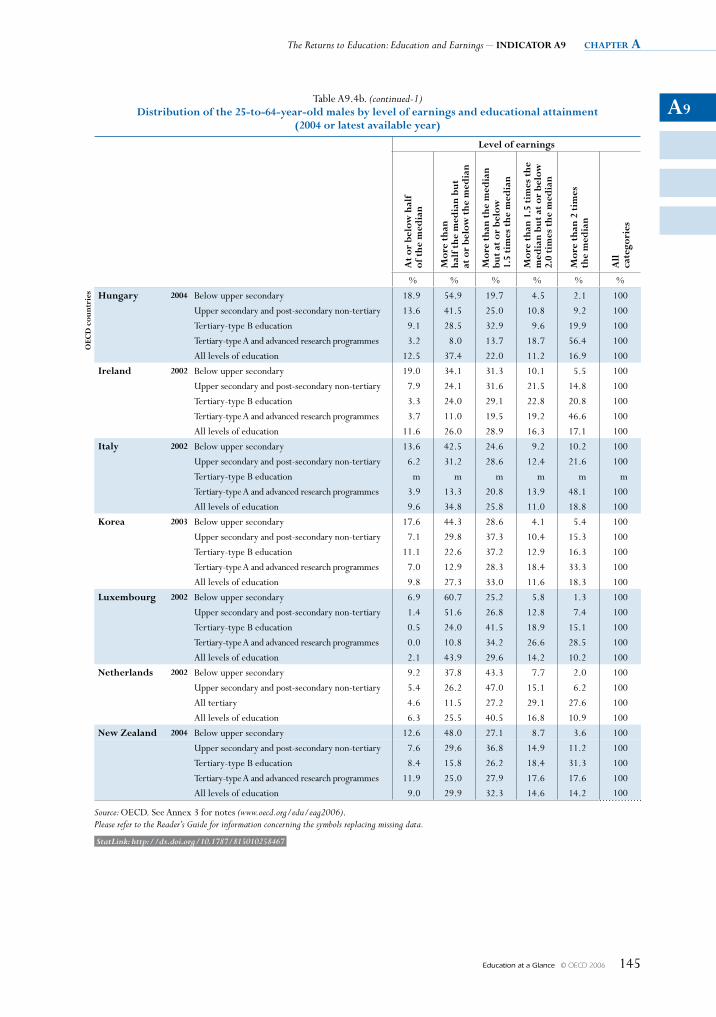
A9
The Returns to Education: Education and Earnings – INDICATOR A9 chapter a
Education at a Glance © OECD 2006 145
Table A9.4b. (continued-1) Distribution of the 25-to-64-year-old males by level of earnings and educational attainment
(2004 or latest available year)
Level of earnings
At
or b
elow
hal
f of
the
med
ian
Mor
e th
an
half
the
med
ian
but
at
or
belo
w t
he m
edia
n
Mor
e th
an t
he m
edia
n
but
at o
r be
low
1.
5 ti
mes
the
med
ian
Mor
e th
an 1
.5 t
imes
the
m
edia
n bu
t at
or
belo
w
2.0
tim
es t
he m
edia
n
Mor
e th
an 2
tim
es
the
med
ian
All
ca
tego
ries
% % % % % %
OEC
D c
ount
ries Hungary 2004 Below upper secondary 18.9 54.9 19.7 4.5 2.1 100
Upper secondary and post-secondary non-tertiary 13.6 41.5 25.0 10.8 9.2 100
Tertiary-type B education 9.1 28.5 32.9 9.6 19.9 100
Tertiary-type A and advanced research programmes 3.2 8.0 13.7 18.7 56.4 100
All levels of education 12.5 37.4 22.0 11.2 16.9 100
Ireland 2002 Below upper secondary 19.0 34.1 31.3 10.1 5.5 100
Upper secondary and post-secondary non-tertiary 7.9 24.1 31.6 21.5 14.8 100
Tertiary-type B education 3.3 24.0 29.1 22.8 20.8 100
Tertiary-type A and advanced research programmes 3.7 11.0 19.5 19.2 46.6 100
All levels of education 11.6 26.0 28.9 16.3 17.1 100
Italy 2002 Below upper secondary 13.6 42.5 24.6 9.2 10.2 100
Upper secondary and post-secondary non-tertiary 6.2 31.2 28.6 12.4 21.6 100
Tertiary-type B education m m m m m m
Tertiary-type A and advanced research programmes 3.9 13.3 20.8 13.9 48.1 100
All levels of education 9.6 34.8 25.8 11.0 18.8 100
Korea 2003 Below upper secondary 17.6 44.3 28.6 4.1 5.4 100
Upper secondary and post-secondary non-tertiary 7.1 29.8 37.3 10.4 15.3 100
Tertiary-type B education 11.1 22.6 37.2 12.9 16.3 100
Tertiary-type A and advanced research programmes 7.0 12.9 28.3 18.4 33.3 100
All levels of education 9.8 27.3 33.0 11.6 18.3 100
Luxembourg 2002 Below upper secondary 6.9 60.7 25.2 5.8 1.3 100
Upper secondary and post-secondary non-tertiary 1.4 51.6 26.8 12.8 7.4 100
Tertiary-type B education 0.5 24.0 41.5 18.9 15.1 100
Tertiary-type A and advanced research programmes 0.0 10.8 34.2 26.6 28.5 100
All levels of education 2.1 43.9 29.6 14.2 10.2 100
Netherlands 2002 Below upper secondary 9.2 37.8 43.3 7.7 2.0 100
Upper secondary and post-secondary non-tertiary 5.4 26.2 47.0 15.1 6.2 100
All tertiary 4.6 11.5 27.2 29.1 27.6 100
All levels of education 6.3 25.5 40.5 16.8 10.9 100
New Zealand 2004 Below upper secondary 12.6 48.0 27.1 8.7 3.6 100
Upper secondary and post-secondary non-tertiary 7.6 29.6 36.8 14.9 11.2 100
Tertiary-type B education 8.4 15.8 26.2 18.4 31.3 100
Tertiary-type A and advanced research programmes 11.9 25.0 27.9 17.6 17.6 100
All levels of education 9.0 29.9 32.3 14.6 14.2 100
Source: OECD. See Annex 3 for notes (www.oecd.org/edu/eag2006).Please refer to the Reader’s Guide for information concerning the symbols replacing missing data.
StatLink: http://dx.doi.org/10.1787/815010258467
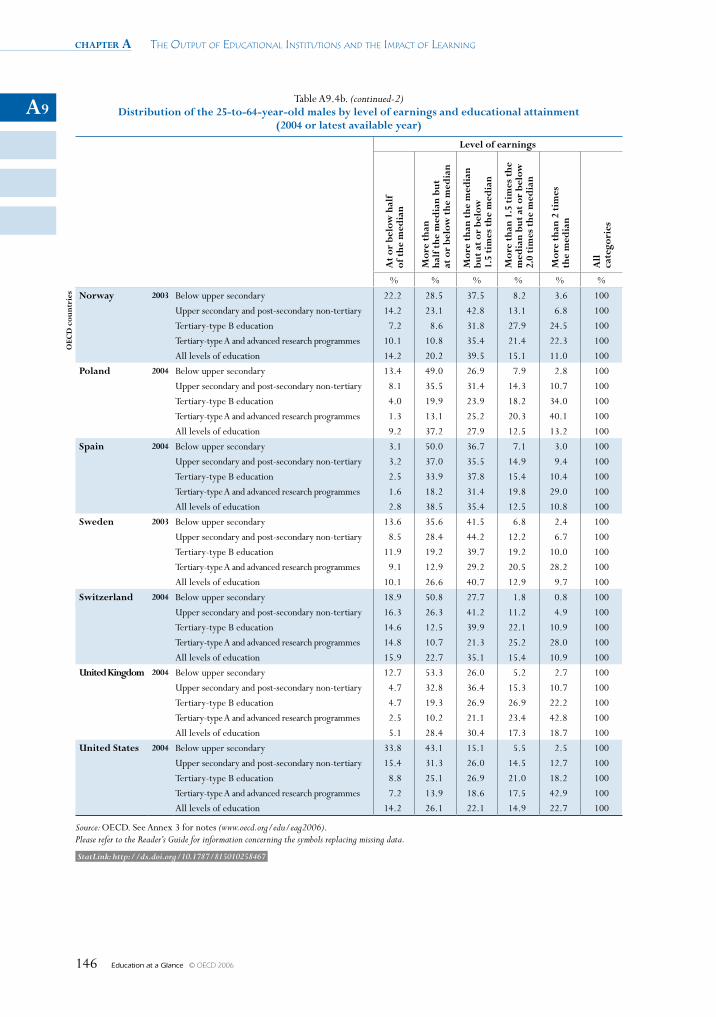
chapter a The OuTpuT Of educaTiOnal insTiTuTiOns and The impacT Of learning
Education at a Glance © OECD 2006146
A9Table A9.4b. (continued-2)
Distribution of the 25-to-64-year-old males by level of earnings and educational attainment (2004 or latest available year)
Level of earnings
At
or b
elow
hal
f of
the
med
ian
Mor
e th
an
half
the
med
ian
but
at
or
belo
w t
he m
edia
n
Mor
e th
an t
he m
edia
n
but
at o
r be
low
1.
5 ti
mes
the
med
ian
Mor
e th
an 1
.5 t
imes
the
m
edia
n bu
t at
or
belo
w
2.0
tim
es t
he m
edia
n
Mor
e th
an 2
tim
es
the
med
ian
All
ca
tego
ries
% % % % % %
OEC
D c
ount
ries Norway 2003 Below upper secondary 22.2 28.5 37.5 8.2 3.6 100
Upper secondary and post-secondary non-tertiary 14.2 23.1 42.8 13.1 6.8 100
Tertiary-type B education 7.2 8.6 31.8 27.9 24.5 100
Tertiary-type A and advanced research programmes 10.1 10.8 35.4 21.4 22.3 100
All levels of education 14.2 20.2 39.5 15.1 11.0 100
Poland 2004 Below upper secondary 13.4 49.0 26.9 7.9 2.8 100
Upper secondary and post-secondary non-tertiary 8.1 35.5 31.4 14.3 10.7 100
Tertiary-type B education 4.0 19.9 23.9 18.2 34.0 100
Tertiary-type A and advanced research programmes 1.3 13.1 25.2 20.3 40.1 100
All levels of education 9.2 37.2 27.9 12.5 13.2 100
Spain 2004 Below upper secondary 3.1 50.0 36.7 7.1 3.0 100
Upper secondary and post-secondary non-tertiary 3.2 37.0 35.5 14.9 9.4 100
Tertiary-type B education 2.5 33.9 37.8 15.4 10.4 100
Tertiary-type A and advanced research programmes 1.6 18.2 31.4 19.8 29.0 100
All levels of education 2.8 38.5 35.4 12.5 10.8 100
Sweden 2003 Below upper secondary 13.6 35.6 41.5 6.8 2.4 100
Upper secondary and post-secondary non-tertiary 8.5 28.4 44.2 12.2 6.7 100
Tertiary-type B education 11.9 19.2 39.7 19.2 10.0 100
Tertiary-type A and advanced research programmes 9.1 12.9 29.2 20.5 28.2 100
All levels of education 10.1 26.6 40.7 12.9 9.7 100
Switzerland 2004 Below upper secondary 18.9 50.8 27.7 1.8 0.8 100
Upper secondary and post-secondary non-tertiary 16.3 26.3 41.2 11.2 4.9 100
Tertiary-type B education 14.6 12.5 39.9 22.1 10.9 100
Tertiary-type A and advanced research programmes 14.8 10.7 21.3 25.2 28.0 100
All levels of education 15.9 22.7 35.1 15.4 10.9 100
United Kingdom 2004 Below upper secondary 12.7 53.3 26.0 5.2 2.7 100
Upper secondary and post-secondary non-tertiary 4.7 32.8 36.4 15.3 10.7 100
Tertiary-type B education 4.7 19.3 26.9 26.9 22.2 100
Tertiary-type A and advanced research programmes 2.5 10.2 21.1 23.4 42.8 100
All levels of education 5.1 28.4 30.4 17.3 18.7 100
United States 2004 Below upper secondary 33.8 43.1 15.1 5.5 2.5 100
Upper secondary and post-secondary non-tertiary 15.4 31.3 26.0 14.5 12.7 100
Tertiary-type B education 8.8 25.1 26.9 21.0 18.2 100
Tertiary-type A and advanced research programmes 7.2 13.9 18.6 17.5 42.9 100
All levels of education 14.2 26.1 22.1 14.9 22.7 100
Source: OECD. See Annex 3 for notes (www.oecd.org/edu/eag2006).Please refer to the Reader’s Guide for information concerning the symbols replacing missing data.
StatLink: http://dx.doi.org/10.1787/815010258467
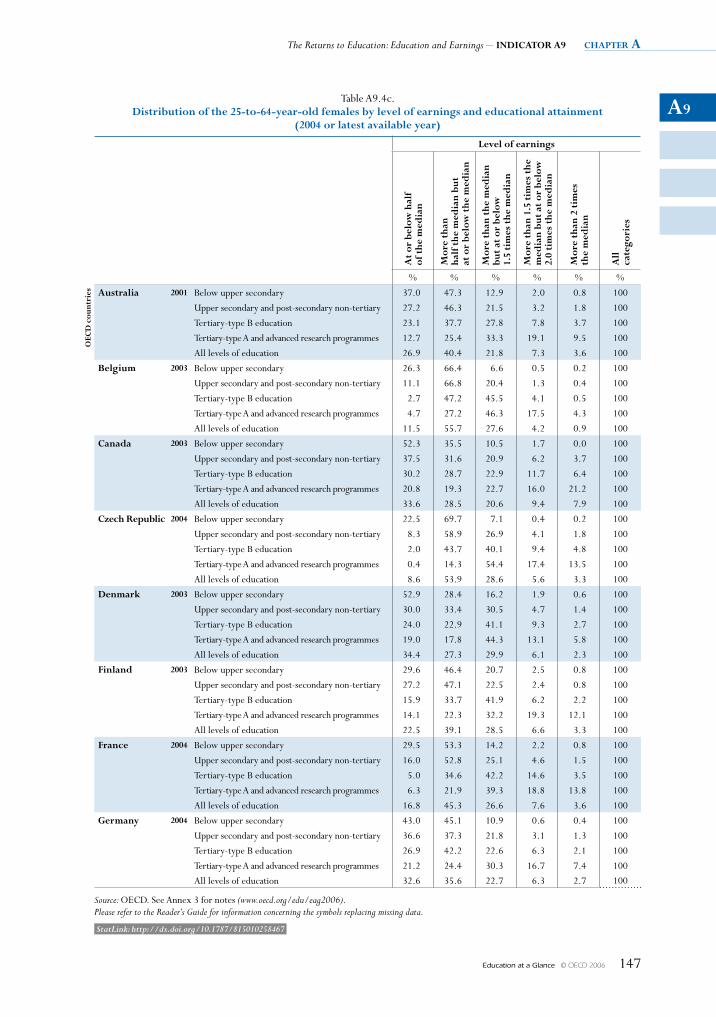
A9
The Returns to Education: Education and Earnings – INDICATOR A9 chapter a
Education at a Glance © OECD 2006 147
Table A9.4c. Distribution of the 25-to-64-year-old females by level of earnings and educational attainment
(2004 or latest available year)
Level of earnings
At
or b
elow
hal
f of
the
med
ian
Mor
e th
an
half
the
med
ian
but
at
or
belo
w t
he m
edia
n
Mor
e th
an t
he m
edia
n
but
at o
r be
low
1.
5 ti
mes
the
med
ian
Mor
e th
an 1
.5 t
imes
the
m
edia
n bu
t at
or
belo
w
2.0
tim
es t
he m
edia
n
Mor
e th
an 2
tim
es
the
med
ian
All
ca
tego
ries
% % % % % %
OEC
D c
ount
ries Australia 2001 Below upper secondary 37.0 47.3 12.9 2.0 0.8 100
Upper secondary and post-secondary non-tertiary 27.2 46.3 21.5 3.2 1.8 100
Tertiary-type B education 23.1 37.7 27.8 7.8 3.7 100
Tertiary-type A and advanced research programmes 12.7 25.4 33.3 19.1 9.5 100
All levels of education 26.9 40.4 21.8 7.3 3.6 100
Belgium 2003 Below upper secondary 26.3 66.4 6.6 0.5 0.2 100
Upper secondary and post-secondary non-tertiary 11.1 66.8 20.4 1.3 0.4 100
Tertiary-type B education 2.7 47.2 45.5 4.1 0.5 100
Tertiary-type A and advanced research programmes 4.7 27.2 46.3 17.5 4.3 100
All levels of education 11.5 55.7 27.6 4.2 0.9 100
Canada 2003 Below upper secondary 52.3 35.5 10.5 1.7 0.0 100
Upper secondary and post-secondary non-tertiary 37.5 31.6 20.9 6.2 3.7 100
Tertiary-type B education 30.2 28.7 22.9 11.7 6.4 100
Tertiary-type A and advanced research programmes 20.8 19.3 22.7 16.0 21.2 100
All levels of education 33.6 28.5 20.6 9.4 7.9 100
Czech Republic 2004 Below upper secondary 22.5 69.7 7.1 0.4 0.2 100
Upper secondary and post-secondary non-tertiary 8.3 58.9 26.9 4.1 1.8 100
Tertiary-type B education 2.0 43.7 40.1 9.4 4.8 100
Tertiary-type A and advanced research programmes 0.4 14.3 54.4 17.4 13.5 100
All levels of education 8.6 53.9 28.6 5.6 3.3 100
Denmark 2003 Below upper secondary 52.9 28.4 16.2 1.9 0.6 100
Upper secondary and post-secondary non-tertiary 30.0 33.4 30.5 4.7 1.4 100
Tertiary-type B education 24.0 22.9 41.1 9.3 2.7 100
Tertiary-type A and advanced research programmes 19.0 17.8 44.3 13.1 5.8 100
All levels of education 34.4 27.3 29.9 6.1 2.3 100
Finland 2003 Below upper secondary 29.6 46.4 20.7 2.5 0.8 100
Upper secondary and post-secondary non-tertiary 27.2 47.1 22.5 2.4 0.8 100
Tertiary-type B education 15.9 33.7 41.9 6.2 2.2 100
Tertiary-type A and advanced research programmes 14.1 22.3 32.2 19.3 12.1 100
All levels of education 22.5 39.1 28.5 6.6 3.3 100
France 2004 Below upper secondary 29.5 53.3 14.2 2.2 0.8 100
Upper secondary and post-secondary non-tertiary 16.0 52.8 25.1 4.6 1.5 100
Tertiary-type B education 5.0 34.6 42.2 14.6 3.5 100
Tertiary-type A and advanced research programmes 6.3 21.9 39.3 18.8 13.8 100
All levels of education 16.8 45.3 26.6 7.6 3.6 100
Germany 2004 Below upper secondary 43.0 45.1 10.9 0.6 0.4 100
Upper secondary and post-secondary non-tertiary 36.6 37.3 21.8 3.1 1.3 100
Tertiary-type B education 26.9 42.2 22.6 6.3 2.1 100
Tertiary-type A and advanced research programmes 21.2 24.4 30.3 16.7 7.4 100
All levels of education 32.6 35.6 22.7 6.3 2.7 100
Source: OECD. See Annex 3 for notes (www.oecd.org/edu/eag2006).Please refer to the Reader’s Guide for information concerning the symbols replacing missing data.
StatLink: http://dx.doi.org/10.1787/815010258467
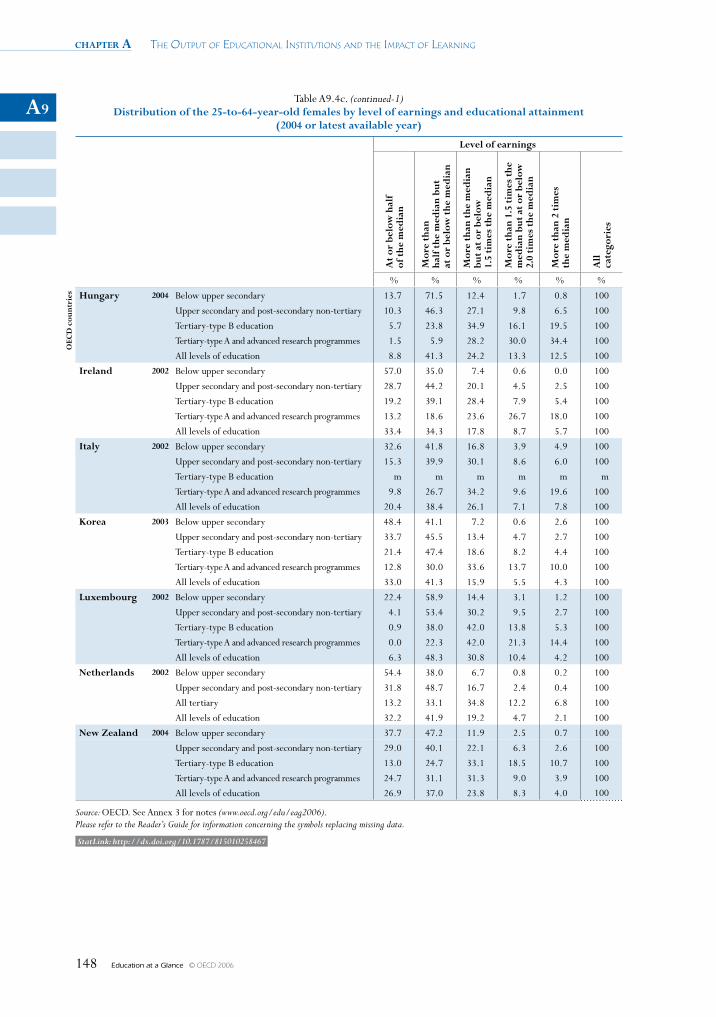
chapter a The OuTpuT Of educaTiOnal insTiTuTiOns and The impacT Of learning
Education at a Glance © OECD 2006148
A9Table A9.4c. (continued-1)
Distribution of the 25-to-64-year-old females by level of earnings and educational attainment (2004 or latest available year)
Level of earnings
At
or b
elow
hal
f of
the
med
ian
Mor
e th
an
half
the
med
ian
but
at
or
belo
w t
he m
edia
n
Mor
e th
an t
he m
edia
n
but
at o
r be
low
1.
5 ti
mes
the
med
ian
Mor
e th
an 1
.5 t
imes
the
m
edia
n bu
t at
or
belo
w
2.0
tim
es t
he m
edia
n
Mor
e th
an 2
tim
es
the
med
ian
All
ca
tego
ries
% % % % % %
OEC
D c
ount
ries Hungary 2004 Below upper secondary 13.7 71.5 12.4 1.7 0.8 100
Upper secondary and post-secondary non-tertiary 10.3 46.3 27.1 9.8 6.5 100
Tertiary-type B education 5.7 23.8 34.9 16.1 19.5 100
Tertiary-type A and advanced research programmes 1.5 5.9 28.2 30.0 34.4 100
All levels of education 8.8 41.3 24.2 13.3 12.5 100
Ireland 2002 Below upper secondary 57.0 35.0 7.4 0.6 0.0 100
Upper secondary and post-secondary non-tertiary 28.7 44.2 20.1 4.5 2.5 100
Tertiary-type B education 19.2 39.1 28.4 7.9 5.4 100
Tertiary-type A and advanced research programmes 13.2 18.6 23.6 26.7 18.0 100
All levels of education 33.4 34.3 17.8 8.7 5.7 100
Italy 2002 Below upper secondary 32.6 41.8 16.8 3.9 4.9 100
Upper secondary and post-secondary non-tertiary 15.3 39.9 30.1 8.6 6.0 100
Tertiary-type B education m m m m m m
Tertiary-type A and advanced research programmes 9.8 26.7 34.2 9.6 19.6 100
All levels of education 20.4 38.4 26.1 7.1 7.8 100
Korea 2003 Below upper secondary 48.4 41.1 7.2 0.6 2.6 100
Upper secondary and post-secondary non-tertiary 33.7 45.5 13.4 4.7 2.7 100
Tertiary-type B education 21.4 47.4 18.6 8.2 4.4 100
Tertiary-type A and advanced research programmes 12.8 30.0 33.6 13.7 10.0 100
All levels of education 33.0 41.3 15.9 5.5 4.3 100
Luxembourg 2002 Below upper secondary 22.4 58.9 14.4 3.1 1.2 100
Upper secondary and post-secondary non-tertiary 4.1 53.4 30.2 9.5 2.7 100
Tertiary-type B education 0.9 38.0 42.0 13.8 5.3 100
Tertiary-type A and advanced research programmes 0.0 22.3 42.0 21.3 14.4 100
All levels of education 6.3 48.3 30.8 10.4 4.2 100
Netherlands 2002 Below upper secondary 54.4 38.0 6.7 0.8 0.2 100
Upper secondary and post-secondary non-tertiary 31.8 48.7 16.7 2.4 0.4 100
All tertiary 13.2 33.1 34.8 12.2 6.8 100
All levels of education 32.2 41.9 19.2 4.7 2.1 100
New Zealand 2004 Below upper secondary 37.7 47.2 11.9 2.5 0.7 100
Upper secondary and post-secondary non-tertiary 29.0 40.1 22.1 6.3 2.6 100
Tertiary-type B education 13.0 24.7 33.1 18.5 10.7 100
Tertiary-type A and advanced research programmes 24.7 31.1 31.3 9.0 3.9 100
All levels of education 26.9 37.0 23.8 8.3 4.0 100
Source: OECD. See Annex 3 for notes (www.oecd.org/edu/eag2006).Please refer to the Reader’s Guide for information concerning the symbols replacing missing data.
StatLink: http://dx.doi.org/10.1787/815010258467

A9
The Returns to Education: Education and Earnings – INDICATOR A9 chapter a
Education at a Glance © OECD 2006 149
Table A9.4c. (continued-2)Distribution of the 25-to-64-year-old females by level of earnings and educational attainment
(2004 or latest available year)
Level of earnings
At
or b
elow
hal
f of
the
med
ian
Mor
e th
an
half
the
med
ian
but
at
or
belo
w t
he m
edia
n
Mor
e th
an t
he m
edia
n
but
at o
r be
low
1.
5 ti
mes
the
med
ian
Mor
e th
an 1
.5 t
imes
the
m
edia
n bu
t at
or
belo
w
2.0
tim
es t
he m
edia
n
Mor
e th
an 2
tim
es
the
med
ian
All
ca
tego
ries
% % % % % %
OEC
D c
ount
ries Norway 2003 Below upper secondary 39.5 47.5 11.5 1.1 0.4 100
Upper secondary and post-secondary non-tertiary 27.6 49.8 19.6 2.3 0.7 100
Tertiary-type B education 12.9 30.4 41.0 10.7 4.9 100
Tertiary-type A and advanced research programmes 14.2 30.3 43.7 7.8 3.9 100
All levels of education 24.5 42.6 27.0 4.1 1.8 100
Poland 2004 Below upper secondary 24.5 65.5 8.6 1.1 0.2 100
Upper secondary and post-secondary non-tertiary 8.8 51.8 27.4 7.9 4.2 100
Tertiary-type B education 4.5 36.0 32.1 13.0 14.4 100
Tertiary-type A and advanced research programmes 1.1 18.8 42.1 21.1 16.9 100
All levels of education 10.1 44.9 27.4 10.2 7.4 100
Spain 2004 Below upper secondary 32.8 52.5 13.2 1.1 0.5 100
Upper secondary and post-secondary non-tertiary 18.4 50.9 25.9 3.2 1.7 100
Tertiary-type B education 16.3 59.6 19.2 3.1 1.8 100
Tertiary-type A and advanced research programmes 5.0 27.5 35.0 20.1 12.4 100
All levels of education 18.7 44.7 23.9 7.9 4.8 100
Sweden 2003 Below upper secondary 23.9 55.9 17.8 1.9 0.5 100
Upper secondary and post-secondary non-tertiary 13.8 57.4 24.3 3.3 1.2 100
Tertiary-type B education 12.7 38.1 39.6 7.6 2.1 100
Tertiary-type A and advanced research programmes 11.0 26.9 42.9 11.9 7.3 100
All levels of education 15.0 48.6 28.7 5.3 2.4 100
Switzerland 2004 Below upper secondary 56.6 39.4 3.1 0.6 0.2 100
Upper secondary and post-secondary non-tertiary 47.9 34.2 15.2 2.2 0.4 100
Tertiary-type B education 28.0 33.0 30.2 6.6 2.2 100
Tertiary-type A and advanced research programmes 25.4 30.3 26.3 12.1 5.9 100
All levels of education 44.3 34.2 16.3 3.8 1.3 100
United Kingdom 2004 Below upper secondary 57.7 38.0 3.2 0.7 0.3 100
Upper secondary and post-secondary non-tertiary 39.2 42.3 13.8 3.1 1.6 100
Tertiary-type B education 18.9 39.6 30.4 8.2 2.9 100
Tertiary-type A and advanced research programmes 10.2 22.2 29.2 24.5 13.8 100
All levels of education 32.6 36.9 17.9 8.3 4.4 100
United States 2004 Below upper secondary 61.5 32.4 3.9 1.6 0.6 100
Upper secondary and post-secondary non-tertiary 33.7 40.9 17.4 4.7 3.3 100
Tertiary-type B education 24.6 38.5 21.7 9.5 5.7 100
Tertiary-type A and advanced research programmes 17.0 23.9 25.5 16.2 17.5 100
All levels of education 28.8 33.5 19.7 9.2 8.7 100
Source: OECD. See Annex 3 for notes (www.oecd.org/edu/eag2006).Please refer to the Reader’s Guide for information concerning the symbols replacing missing data.
StatLink: http://dx.doi.org/10.1787/815010258467
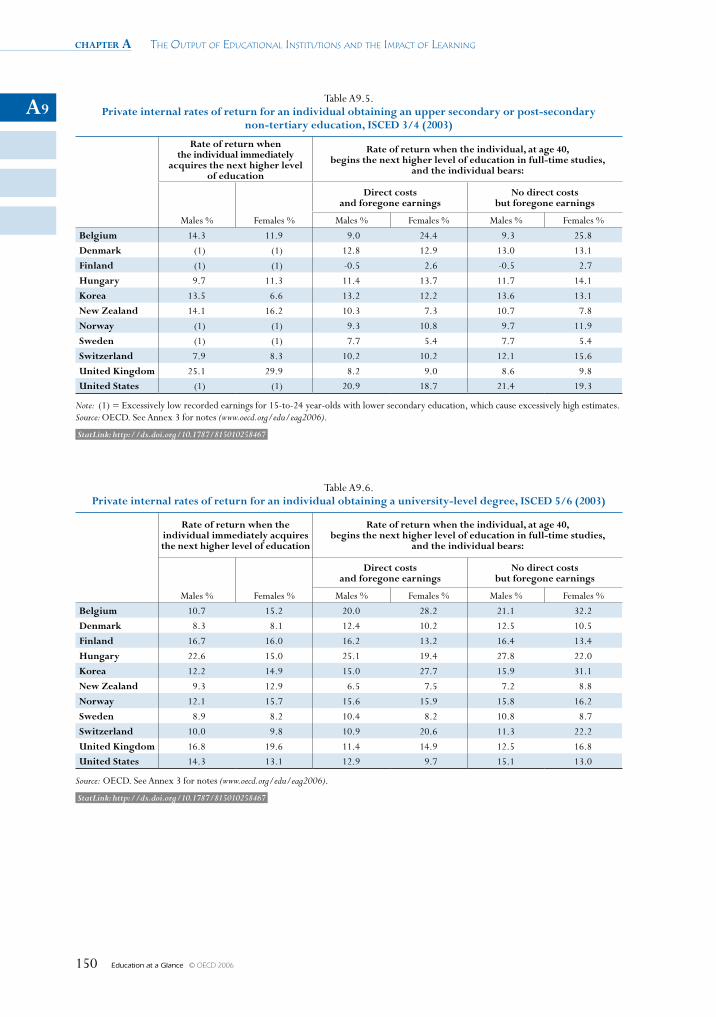
chapter a The OuTpuT Of educaTiOnal insTiTuTiOns and The impacT Of learning
Education at a Glance © OECD 2006150
A9Table A9.5.
Private internal rates of return for an individual obtaining an upper secondary or post-secondary non-tertiary education, ISCED 3/4 (2003)
Rate of return when the individual immediately
acquires the next higher level of education
Rate of return when the individual, at age 40, begins the next higher level of education in full-time studies,
and the individual bears:
Males % Females %
Direct costs and foregone earnings
No direct costs but foregone earnings
Males % Females % Males % Females %
Belgium 14.3 11.9 9.0 24.4 9.3 25.8
Denmark (1) (1) 12.8 12.9 13.0 13.1
Finland (1) (1) -0.5 2.6 -0.5 2.7
Hungary 9.7 11.3 11.4 13.7 11.7 14.1
Korea 13.5 6.6 13.2 12.2 13.6 13.1
New Zealand 14.1 16.2 10.3 7.3 10.7 7.8
Norway (1) (1) 9.3 10.8 9.7 11.9
Sweden (1) (1) 7.7 5.4 7.7 5.4
Switzerland 7.9 8.3 10.2 10.2 12.1 15.6
United Kingdom 25.1 29.9 8.2 9.0 8.6 9.8
United States (1) (1) 20.9 18.7 21.4 19.3
Note: (1) = Excessively low recorded earnings for 15-to-24 year-olds with lower secondary education, which cause excessively high estimates.Source: OECD. See Annex 3 for notes (www.oecd.org/edu/eag2006).
StatLink: http://dx.doi.org/10.1787/815010258467
Table A9.6. Private internal rates of return for an individual obtaining a university-level degree, ISCED 5/6 (2003)
Rate of return when the individual immediately acquires the next higher level of education
Rate of return when the individual, at age 40, begins the next higher level of education in full-time studies,
and the individual bears:
Males % Females %
Direct costs and foregone earnings
No direct costs but foregone earnings
Males % Females % Males % Females %
Belgium 10.7 15.2 20.0 28.2 21.1 32.2
Denmark 8.3 8.1 12.4 10.2 12.5 10.5
Finland 16.7 16.0 16.2 13.2 16.4 13.4
Hungary 22.6 15.0 25.1 19.4 27.8 22.0
Korea 12.2 14.9 15.0 27.7 15.9 31.1
New Zealand 9.3 12.9 6.5 7.5 7.2 8.8
Norway 12.1 15.7 15.6 15.9 15.8 16.2
Sweden 8.9 8.2 10.4 8.2 10.8 8.7
Switzerland 10.0 9.8 10.9 20.6 11.3 22.2
United Kingdom 16.8 19.6 11.4 14.9 12.5 16.8
United States 14.3 13.1 12.9 9.7 15.1 13.0
Source: OECD. See Annex 3 for notes (www.oecd.org/edu/eag2006).
StatLink: http://dx.doi.org/10.1787/815010258467
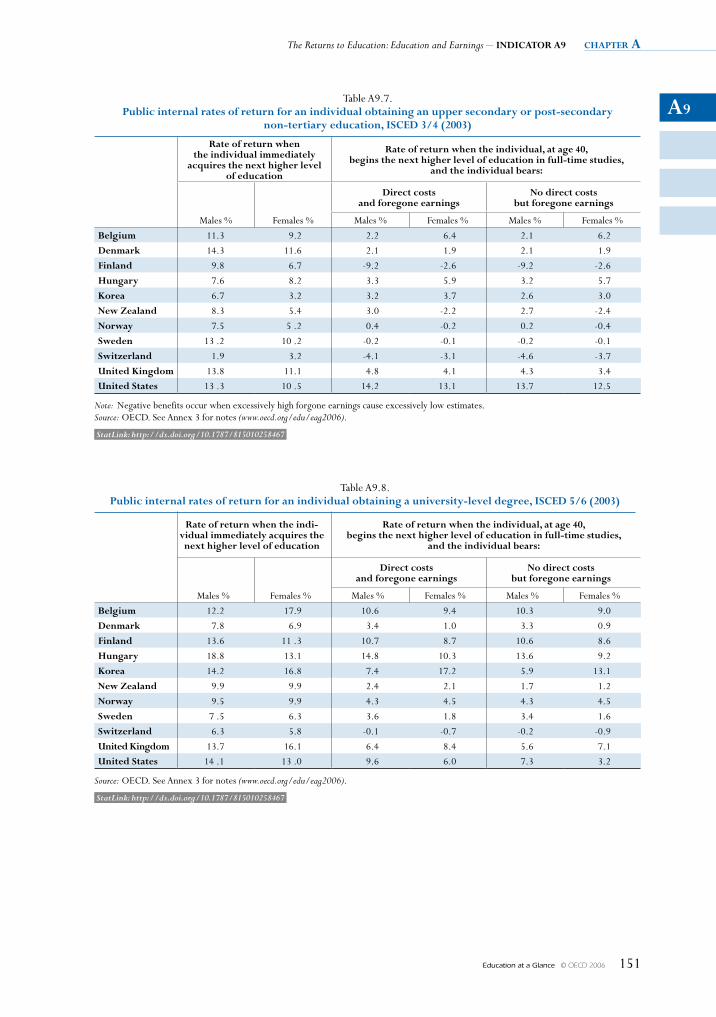
A9
The Returns to Education: Education and Earnings – INDICATOR A9 chapter a
Education at a Glance © OECD 2006 151
Table A9.7. Public internal rates of return for an individual obtaining an upper secondary or post-secondary
non-tertiary education, ISCED 3/4 (2003)
Rate of return when the individual immediately
acquires the next higher level of education
Rate of return when the individual, at age 40, begins the next higher level of education in full-time studies,
and the individual bears:
Males % Females %
Direct costs and foregone earnings
No direct costs but foregone earnings
Males % Females % Males % Females %
Belgium 11.3 9.2 2.2 6.4 2.1 6.2
Denmark 14.3 11.6 2.1 1.9 2.1 1.9
Finland 9.8 6.7 -9.2 -2.6 -9.2 -2.6
Hungary 7.6 8.2 3.3 5.9 3.2 5.7
Korea 6.7 3.2 3.2 3.7 2.6 3.0
New Zealand 8.3 5.4 3.0 -2.2 2.7 -2.4
Norway 7.5 5 .2 0.4 -0.2 0.2 -0.4
Sweden 13 .2 10 .2 -0.2 -0.1 -0.2 -0.1
Switzerland 1.9 3.2 -4.1 -3.1 -4.6 -3.7
United Kingdom 13.8 11.1 4.8 4.1 4.3 3.4
United States 13 .3 10 .5 14.2 13.1 13.7 12.5
Note: Negative benefits occur when excessively high forgone earnings cause excessively low estimates.Source: OECD. See Annex 3 for notes (www.oecd.org/edu/eag2006).
StatLink: http://dx.doi.org/10.1787/815010258467
Table A9.8. Public internal rates of return for an individual obtaining a university-level degree, ISCED 5/6 (2003)
Rate of return when the indi-vidual immediately acquires the next higher level of education
Rate of return when the individual, at age 40, begins the next higher level of education in full-time studies,
and the individual bears:
Males % Females %
Direct costs and foregone earnings
No direct costs but foregone earnings
Males % Females % Males % Females %
Belgium 12.2 17.9 10.6 9.4 10.3 9.0
Denmark 7.8 6.9 3.4 1.0 3.3 0.9
Finland 13.6 11 .3 10.7 8.7 10.6 8.6
Hungary 18.8 13.1 14.8 10.3 13.6 9.2
Korea 14.2 16.8 7.4 17.2 5.9 13.1
New Zealand 9.9 9.9 2.4 2.1 1.7 1.2
Norway 9.5 9.9 4.3 4.5 4.3 4.5
Sweden 7 .5 6.3 3.6 1.8 3.4 1.6
Switzerland 6.3 5.8 -0.1 -0.7 -0.2 -0.9
United Kingdom 13.7 16.1 6.4 8.4 5.6 7.1
United States 14 .1 13 .0 9.6 6.0 7.3 3.2
Source: OECD. See Annex 3 for notes (www.oecd.org/edu/eag2006).
StatLink: http://dx.doi.org/10.1787/815010258467
Education at a Glance © OECD 2006152
INDICATOR A10 THE RETURNS TO EDUCATION: LINKS BETWEEN EDUCATION, ECONOMIC GROWTH AND SOCIAL OUTCOMES
This indicator focuses on the role of human capital as a determinant of the level and rate of growth of output per capita within countries. The indicator complements Indicator A9, which examines the relationship between human capital and economic returns at the individual and public levels. While Indicator A9 depicts what happens to the earnings of an individual as his or her level of schooling rises, Indicator A10 seeks to capture the effects of changes in a country’s overall stock of human capital on labour productivity and health status.
Key results
• The estimated long-term effect on economic output of one additional year of education in the OECD area is generally between 3 and 6%. Analyses of human capital across 14 OECD economies – based on literacy scores – also suggest significant positive effects on growth.
• An analysis by the OECD secretariat of the causes of economic growth shows that rising labour productivity accounted for at least half of GDP per capita growth in most OECD countries from 1994 to 2004.
• Many national analyses indicate a positive causal relationship between higher educational attainment and better mental and physical health.
A10
The Returns to Education: Links Between Education, Economic Growth and Social Outcomes – INDICATOR A10 chapter a
Education at a Glance © OECD 2006 153
Policy context
Since the mid-1980s, economic growth has occupied centre-stage in macroeconomic research. Research has gained impetus from new theoretical insights – in particular new-growth theory – and new approaches to the empirics of growth. Human capital – the knowledge and skills embodied in workers – has been critical to this question. Significant differences among OECD member countries in their recent macroeconomic performance have also spurred interest in the causes of economic growth.
Comparisons of micro-level estimates of returns to education for individuals (such as those portrayed in Indicator A9) and macro-econometric estimates as reflected in this indicator, are potentially of great policy relevance. Discrepancies between the two approaches can point to differences in the private and public returns on schooling that may call for corrective policy action. For instance, following a rise in school attainment, if productivity at the aggregate level of the economy is raised in ways additional to the increases in productivity of each worker, then this will generate a tendency for underinvestment in education, because individuals will fail to take into account the wider economic benefits that could arise from their schooling choices. In this context, micro-econometric estimates of wage equations with individual cross-section data for a given country only pick up the effects on individuals of schooling, whereas macro-econometric estimates with cross-country data should also capture the wider economic impacts.
This year, Indicator A10 also reviews linkages between educational attainment and physical and mental health. Interest in this relationship is likely to grow in light of a range of challenges to social cohesion associated with globalisation and immigration. Though much is already known about a variety of positive associations between educational attainment and physical and mental well-being, definitive evidence is lacking on the forms, magnitudes and causal nature of these benefits. Further evidence on these relationships could have significant policy implications. This is especially so given that in many countries, the overall cost of health care is rising faster than the rate of economic growth.
Evidence and explanations
The critical roles of labour productivity and human capital
Chart A10.1 illustrates the relative importance of the key drivers of growth in GDP per capita over the years 1994 to 2004. For each country, changes in GDP per capita are broken down into three effects: demographic, labour utilisation and labour productivity. The demographic effect refers to the ratio of the working age population to total population. In most countries, this effect accounted for only a minor part of per capita output growth over time, with the exceptions of Ireland, Mexico and Turkey. However, in some OECD countries (such as Austria, Belgium, Denmark, Germany, Iceland, Italy, Japan, Luxembourg, the Netherlands and Switzerland) demographic trends have begun (in this accounting sense) to act as a slight drag on growth in GDP per capita. This tendency is set to strengthen in the future as the total population ages more rapidly.
In most countries, improvements in the utilisation of available labour (i.e. an increase in the share of the working age population that is in employment) had a much larger impact on change in per capita output. Improved labour utilisation accounted for from 2 to approximately 2.5% per annum increases in GDP per capita in countries such as Ireland, Luxembourg and Spain.
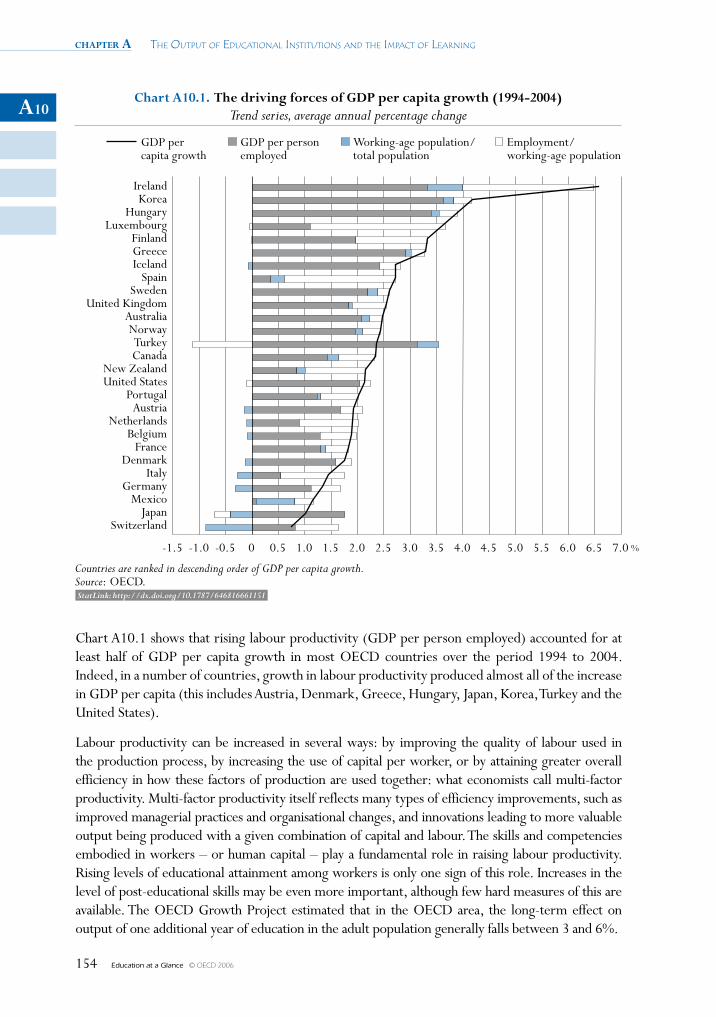
chapter a The OuTpuT Of educaTiOnal insTiTuTiOns and The impacT Of learning
Education at a Glance © OECD 2006154
A10
Chart A10.1 shows that rising labour productivity (GDP per person employed) accounted for at least half of GDP per capita growth in most OECD countries over the period 1994 to 2004. Indeed, in a number of countries, growth in labour productivity produced almost all of the increase in GDP per capita (this includes Austria, Denmark, Greece, Hungary, Japan, Korea, Turkey and the United States).
Labour productivity can be increased in several ways: by improving the quality of labour used in the production process, by increasing the use of capital per worker, or by attaining greater overall efficiency in how these factors of production are used together: what economists call multi-factor productivity. Multi-factor productivity itself reflects many types of efficiency improvements, such as improved managerial practices and organisational changes, and innovations leading to more valuable output being produced with a given combination of capital and labour. The skills and competencies embodied in workers – or human capital – play a fundamental role in raising labour productivity. Rising levels of educational attainment among workers is only one sign of this role. Increases in the level of post-educational skills may be even more important, although few hard measures of this are available. The OECD Growth Project estimated that in the OECD area, the long-term effect on output of one additional year of education in the adult population generally falls between 3 and 6%.
%-1.5 -1.0 -0.5 0 0.5 1.0 1.5 2.0 2.5 3.0 3.5 4.0 4.5 5.0 5.5 6.0 6.5 7.0
Chart A10.1. The driving forces of GDP per capita growth (1994-2004)Trend series, average annual percentage change
GDP per personemployed
Working-age population/total population
Employment/working-age population
Countries are ranked in descending order of GDP per capita growth.Source: OECD.
Ireland Korea
Hungary Luxembourg
Finland Greece Iceland
Spain Sweden
United Kingdom Australia Norway
Turkey Canada
New Zealand United States
Portugal Austria
Netherlands Belgium
France Denmark
Italy Germany
Mexico Japan
Switzerland
GDP percapita growth
StatLink: http://dx.doi.org/10.1787/646816661151
A10
The Returns to Education: Links Between Education, Economic Growth and Social Outcomes – INDICATOR A10 chapter a
Education at a Glance © OECD 2006 155
Box A10.1. Literacy and growth in 14 OECD member countries
Recent research has sought to estimate the relationship between human capital and economic growth using internationally comparable literacy scores. This approach helps avoid the problem of the imperfect comparability of measures of educational attainment across different national education systems. The literacy measures were obtained from the 1994 International Adult Literacy Survey (IALS), which tested the skills of 16-to-64-year-olds in prose, quantitative and document literacy. The data cover 14 OECD countries. Using these survey findings, a synthetic time series was constructed for 1960-1995. The literacy results of 17-to-25-year-olds in a given period were then used as proxies for investment in human capital during the previous period.
The research indicates that literacy scores, as a direct measure of human capital, perform better in growth regressions than indicators of schooling. A country able to attain literacy scores 1% higher than the international average will achieve levels of labour productivity and GDP per capita that are 2.5 and 1.5% higher, respectively, than those of other countries. IALS offers two explanations as to why literacy data should contain more information on the relative well-being of nations than data on years of schooling: that literacy might be a superior measure of some key driver of growth, such as social infrastructure; and that data on literacy skills might be more comparable across countries than data on years of schooling. To assess these interpretations, the study proposes future research using both indicators to compare growth effects across regions within a given country. This could help to surmount problems of imperfect international comparability, as the relative performance of the two would reveal which performed best as a measure of human capital and which was most closely associated with economic growth.
Measures based on average literacy scores across all individuals were shown to serve as much better indicators of aggregate human capital than measures based on the share of individuals attaining high levels of literacy. This finding is in line with the idea that the principal impact of education on growth is to raise the productivity of the whole workforce, rather than to increase the number of individuals able to bring about radical innovations. Strikingly, increases in literacy skills among women have a much larger effect on growth than increases in literacy among men. Various explanations are possible: investment in the education of women may have been provided to particularly high-ability individuals who were previously held back by social barriers; the rate of return to education among women may have been high owing to low initial levels of literacy; increased education might allow a reallocation of male and female labour across occupations, allowing more men and women to subsequently work in occupations for which they have a comparative advantage; if male and female labour is not perfectly substitutable, increased education of women might be associated with a period of rapid growth, rebalancing of the stock of human and physical capital prior to achieving a new steady state level; possible statistical effects stemming from greater variation in women’s literacy scores across countries; and the possible association of women’s literacy with omitted variables that affect growth, such as a country’s level of social development.
Source: Coulombe et al. (2004).
chapter a The OuTpuT Of educaTiOnal insTiTuTiOns and The impacT Of learning
Education at a Glance © OECD 2006156
A10Estimating the macroeconomic returns to education: challenges and outstanding questions
A large body of empirical research has confirmed a positive link between education and productivity. Better educated employees are generally more productive, and may also raise the productivity of co-workers. Higher stocks of human capital facilitate investments in physical capital and enhance the development and diffusion of new technologies, which in turn affects output per worker. A range of indirect benefits from education are also likely to have positive economic consequences. For instance, greater education is associated with superior health status and increases in some aspects of social cohesion and political participation.
Studies of the macroeconomic returns to education are methodologically diverse and based on two broad theoretical approaches. The first, a neo-classical approach, models the relationship between the stock of education and the long-run level of GDP. Most studies follow this tradition. A second approach derives from new-growth theory and models the relationship between the stock of education and the rate of growth of GDP. Whether increases in the stock of education primarily affect the level of output or its growth rate is still unclear. Concerning the magnitude of the returns, the available studies indicate that in the neo-classical models a one-year increase in average education raises the level of output per capita by between 3 to 6%. Studies of the new-growth variety find that the same increase in average education raises the rate of growth of output by around 1%. The two theoretical approaches yield results that differ significantly in magnitude over the medium-to-long term. This is because the absolute effect on output of a cumulative one percentage point increase in the rate of growth soon exceeds a once-only increment to the level of output of even 6 percentage points (the upper boundary). However, over a period of a few years the absolute size of the predicted effects on output is comparable in both theoretical frameworks.
Various conceptual and methodological hurdles have hindered the estimation of education’s impact on growth. A central issue relates to the direction of causality in the growth relationship: does education spur growth, or does growth cause individuals to consume more education? In practice, it is likely that causality operates in both directions. In a related manner, efficiency in producing educational outputs may simply be positively associated with efficiency in other areas of the economy. The results of many studies have also been weakened by data deficiencies. For instance, low correlations have been observed between measures of education from some key sources of educational data. Furthermore, growth studies have relied on a variety of proxies for human capital, such as average years of education, adult literacy rates and school enrolment ratios, and different studies have used a variety of dependent variables. Such proxies pose a number of difficulties. For instance, they include formal education only, omitting the skills acquired through on-the-job training, experience and other channels, as well as the loss of skills caused, for example, by disuse. Similarly, adult literacy rates capture only one dimension of human capital, omitting such competencies as numeracy and technical knowledge. Indeed, different specifications of human capital lead to major divergences in estimates of the stock of human capital across countries. And variations in the quality of education systems mean that indicators of educational attainment are often not fully comparable across countries. Different types of education can also be expected to have different impacts on growth: a cohort of graduates in engineering disciplines is likely to affect productivity in different ways than a similar-sized cohort of graduates in the arts. But this differential effect is not captured in the usual aggregated proxies of human capital. However,
A10
The Returns to Education: Links Between Education, Economic Growth and Social Outcomes – INDICATOR A10 chapter a
Education at a Glance © OECD 2006 157
international surveys, such as the Adult Literacy and Life Skills survey or the Programme for the International Assessment of Adult Competencies (PIAAC), which the OECD is currently developing, can provide internationally comparable multidimensional skills assessments.
Cross-country growth regressions usually assume that the impact of education is linear and constant across countries. However, research suggests that the assumption of constant growth effects of education across countries is unfounded. There is also evidence of diminishing effects on growth above an average of 7.5 years of education (see the Definitions and methodologies section). This is well below the OECD average of 11.8 years in formal education (see Indicator A1).
Much remains uncertain in education-growth research. As noted above, it is still unclear whether education and increases in the stock of human capital affect the level of GDP or its growth rate. Policy-relevant questions that could be addressed by further research include:
• How is growth affected by investment in different stages of education (from pre-school to advanced tertiary education and work-related training)?
• After how many years, and at which levels of education, do diminishing growth returns become important?
• How is growth affected by investment in different types of education, such as engineering disciplines or the arts?
• How is growth affected by the quality of education?
• How, if at all, are growth effects from the expansion of one stage of education affected by the level of attainment achieved at an earlier stage?
Education and health: an overview of the connections
More education and higher levels of qualification are associated with a lower incidence of a variety of physical and mental health disorders. Such relationships have been observed across countries, as well as across income, age and ethnic groups. The interactions involved are both direct and indirect, and in some instances vary over the lifecycle (an ongoing OECD project, entitled the Social Outcomes of Learning, examines a range of outcomes from education, including those in health). Better identification of the full range and magnitude of the effects of education on health could provide a new calculus for public investment decisions in education.
A large number of studies suggest that education has a positive causal impact on good health. However, the methodological challenges to establishing causality are significant. For instance, physical and mental ability, as well as the characteristics of parents, may bring about both higher educational attainment and better health status. Similarly, individuals’ time preferences – whether they are more oriented to the present or future – may partly determine their investments in both education and health. From the other direction, health status itself is positively associated with educational attainment, although the effect of health on educational achievement may be small for adults. Research suggests three key routes through which higher levels of education can affect health status:
• Effects on incomes and employment Education lowers probabilities of unemployment and economic inactivity: states associated with low physical and mental health. People with higher levels of educational attainment are also more likely to work in occupations that they find fulfilling, and in which physical hazards are less serious. The better educated also generally have higher wages and occupational status. Higher incomes can facilitate access to health care (depending
chapter a The OuTpuT Of educaTiOnal insTiTuTiOns and The impacT Of learning
Education at a Glance © OECD 2006158
A10on the terms of health care provision in each country) and help to avoid stresses resulting from financial insecurity. Higher wages brought about by higher educational attainment also raise the opportunity cost of behaviours likely to impair health. In the United States, it is estimated that economic factors are responsible for around half of the impact of education on physical health in adults over the age of 60.
• Effects on health-related behaviours Health-related behavioural change may have many causes, including increased awareness of health issues and superior access to and comprehension of relevant information (although some studies show schooling to have a positive effect on health even when health knowledge is held constant). Education may also make individuals more future oriented, thus raising their incentives to make longer-term investments in health. The impact of behavioural change stemming from more education varies across health conditions. Research has found positive associations between higher levels of education and healthier dietary practices, a lower incidence of smoking and excessive alcohol consumption, increased levels of exercise, and even the more frequent use of seat belts.
Education is also associated in positive ways with the use of health-related services. For instance, evidence from the United States indicates that more literate men tend to present for prostate cancer at an earlier stage of the disease. Similarly, lower reading ability in women is associated with lower utilisation of mammography. Research on women in the United Kingdom has shown adult learning to have an important impact on the use of preventative screening, independently of income, occupation or social class. Better educated individuals may even exercise influence on the design of health services, for instance through lobbying activities.
In this context, analytical and policy interest has recently focused on ‘health literacy’ – the capacities of individuals to “obtain, process, and understand basic health information and services needed to make appropriate health decisions” (Rudd et al., 1999). Large numbers of adults possess a level of literacy below the reading requirements of health-related documentation, especially among at-risk population subgroups. Research on 958 English-speaking patients presenting for non-urgent care at a walk-in clinic in Atlanta, Georgia (United States), showed that almost half of those studied were unable or limited in their ability to understand directions for medication or hospital documents (Rudd et al., 1999). When health literacy is inadequate, access to care can be curtailed and the efficacy of treatment impaired. Lower functional health literacy may also be associated with higher overall costs in health care. Furthermore, deficient literacy skills give rise to ethical considerations in the context of procedures that require informed consent from patients. Indeed, the full impact of inadequate health literacy has not yet been measured.
• Psychosocial effects In a variety of ways, education affects how people cope with a range of stresses encountered in daily life. Education can augment individuals’ self-esteem, problem-solving and social skills, personal control, and social engagement, all of which can increase the capacity to respond positively to adversity. Evidence from the United Kingdom has shown that among both men and women a low level of basic skills more than doubles the likelihood of experiencing depressive symptoms.
A positive relationship between education and better health does not hold across all conditions (and in some instances, the relationship only exists for lower levels of education). For example, more education is not linked to lower rates of anxiety disorders. And higher levels of education are associated with a higher incidence of eating disorders and complaints such as allergies and
A10
The Returns to Education: Links Between Education, Economic Growth and Social Outcomes – IndIcAtor A10 chapter a
Education at a Glance © OECD 2006 159
chronic fatigue syndrome (a relationship that may reflect diagnostic biases). Research indicating a decline in mental health among adolescents and young adults in a number of OECD countries has also raised concern about the possible damaging effects of academic stress and competitive and/or unsupportive learning environments.
The educational attainment of parents also affects the health of their children in a variety of ways. Greater parental schooling has been found to have a positive effect on childhood and adolescent health, even accounting for such variables as birth-weight, the age at which a woman becomes a mother, family income and congenital abnormalities. And more educated mothers are less likely to engage in a range of behaviours damaging to the foetus or young child.
The existing evidence suggests that the magnitude of education’s effects on health is sizeable. As the average age of OECD populations rises, and as the costs of providing health care increases more rapidly than GDP growth in many countries, policy makers may need to pay increased attention to the implications of such evidence: the better educated are more likely to invest in preventative care, more likely to use a range of medical services in effective and efficient ways, and more likely to be in better health.
Still, more research is required on the ways in which education affects health. For instance, the precise role of education and instructional modalities in the mental health of young adults is unclear, and merits further research, as does the complex issue of how education affects the ability to cope with different kinds of stress. Research might also help to elucidate how specific interventions in education affect health outcomes. For instance, due in part to the difficulty of directly measuring time preference, evidence on the relationship between schooling and time preference is incomplete. Confirmation that schooling and parental practices cause time preferences to change could be of direct policy relevance. For example, such evidence might lead to a conclusion that general interventions focused on increasing students’ future orientation could be more beneficial than specific health campaigns (in this regard, it is noteworthy that in many countries information on the dangers of smoking is readily available, and yet more educated individuals still smoke less then others. This fact might reflect greater future orientation stemming from greater educational attainment).
Definitions and methodologies
In connection with the sub-section “Estimating the macroeconomic returns to education: challenges and outstanding questions”, an assessment of how different specifications of human capital affect international comparative estimates of stocks of human capital is provided in Wösmann (2003). Evidence that the growth effects of education are not constant across countries and diminish above an average of 7.5 years of education is provided in Krueger and Lindhal (2001). This section has also drawn heavily on Sianesi and Van Reenan (2003) and on De la Fuente and Ciccone (2003).
With reference to the Evidence and explanations section, see The Sources of Economic Growth in OECD Countries (OECD, 2003b) and The New Economy: Beyond the Hype (OECD, 2001a).
The sub-section “Education and health: an overview of the connections” has drawn on Grossman and Kaestner (1997), Hammond (2002), Groot and van den Brink (2004), The Nuffield Foundation (2004), Rudd et al. (1999) and Feinstein et al. (2005).
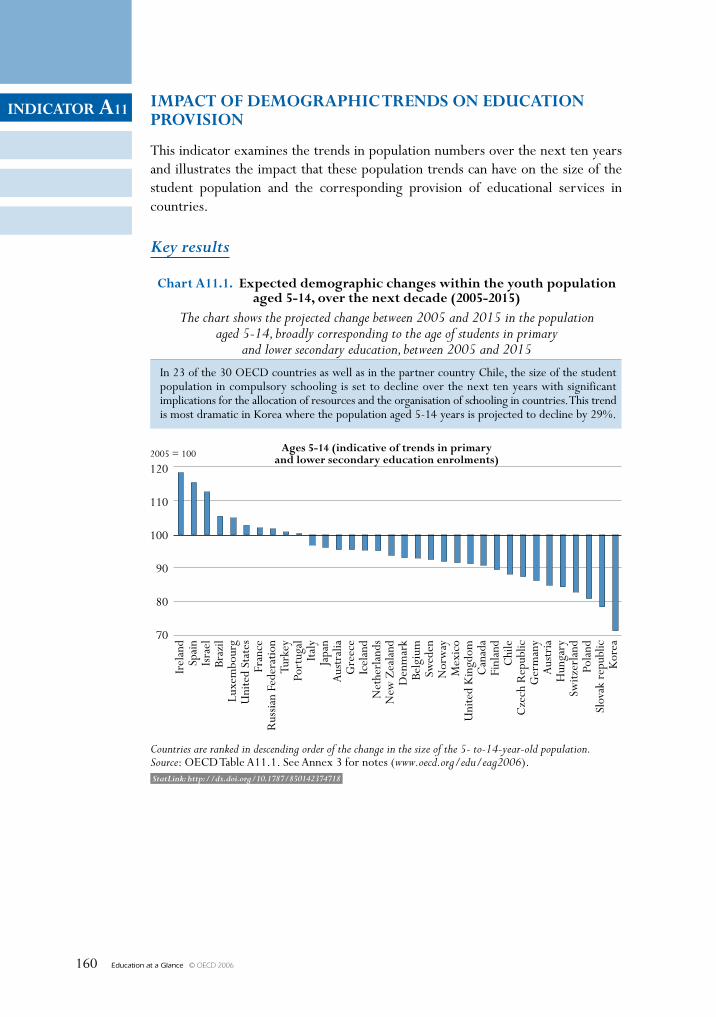
Education at a Glance © OECD 2006160
INDICATOR A11
StatLink: http://dx.doi.org/10.1787/850142374718
ImpACT Of DemOgRAphIC TReNDs ON eDuCATION pROvIsION
This indicator examines the trends in population numbers over the next ten years and illustrates the impact that these population trends can have on the size of the student population and the corresponding provision of educational services in countries.
Key results
120
110
100
90
80
70
2005 = 100
Chart A11.1. expected demographic changes within the youth populationaged 5-14, over the next decade (2005-2015)
The chart shows the projected change between 2005 and 2015 in the populationaged 5-14, broadly corresponding to the age of students in primary
and lower secondary education, between 2005 and 2015
Countries are ranked in descending order of the change in the size of the 5- to-14-year-old population.Source: OECD Table A11.1. See Annex 3 for notes (www.oecd.org/edu/eag2006).
Irel
and
Spai
nIs
rael
Braz
ilLu
xem
bour
gU
nite
d St
ates
Fran
ceR
ussia
n Fe
dera
tion
Turk
eyPo
rtug
alIta
lyJa
pan
Aus
tral
iaG
reec
eIc
elan
dN
ethe
rlan
dsN
ew Z
eala
ndD
enm
ark
Belg
ium
Swed
enN
orw
ayM
exic
oU
nite
d K
ingd
omC
anad
aFi
nlan
dC
hile
Cze
ch R
epub
licG
erm
any
Aus
tria
Hun
gary
Switz
erla
ndPo
land
Slov
ak r
epub
licK
orea
Ages 5-14 (indicative of trends in primaryand lower secondary education enrolments)
In 23 of the 30 OECD countries as well as in the partner country Chile, the size of the studentpopulation in compulsory schooling is set to decline over the next ten years with significantimplications for the allocation of resources and the organisation of schooling in countries. This trendis most dramatic in Korea where the population aged 5-14 years is projected to decline by 29%.
INDICATOR A11
Education at a Glance © OECD 2006 161
Other highlights of this indicator
• Sharp downward trends of 30% or more are projected in the population aged 15-to-19 years, broadly corresponding to upper secondary school age, in the Czech Republic, Poland and the Slovak Republic and in the partner country the Russian Federation, with likely impacts on the numbers graduating from upper secondary education and therefore on the pool of students entering tertiary education.
• In some countries, the population decline in the school age population has occurred earlier, and ten years from now will be impacting on the adult population and correspondingly to the flow of new graduates and highly qualified people in the population. For instance, in Spain, the population aged 20-to-29 years is set to decline by 34% over the next ten years.
• Taken together, the population trends over the next ten years present both opportunities and challenges to countries for resourcing education services.
chapter a The OuTpuT Of educaTiOnal insTiTuTiOns and The impacT Of learning
Education at a Glance © OECD 2006162
A11Policy contextThe number of young people in the population influences both the rate of renewal of labour force qualifications and the amount of resources and organisational effort which a country must invest in its education system. Other things being equal, countries with larger proportions of young people in the population must allocate a larger proportion of their national income to initial education and training than those with smaller youth populations but similar participation rates (see also Indicator B2).
Projections of the relative size of the school-age population help to predict changes in the number of students and resources needed. However, these predictions have to be interpreted with caution. At the lowest level of education enrolment rates are close to 100% (see Indicator C1) and the number of students closely follows demographic changes. This is not the case in upper secondary and higher education.
Evidence and explanationsThe size of the population aged 5-to-14 years, broadly equivalent to the population of compulsory age schooling, is set to decline in 23 of the 30 OECD countries and in the partner country Chile over the next ten years. These trends can have significant implications for the organisation and resourcing of the educational services, presenting difficult management challenges such as surplus capacity in schools, school reorganisation and even school closures. Countries where these challenges appear to be greatest over the next decade are Poland and the Slovak Republic where student numbers in primary and lower secondary education can be expected to fall by around 20% and even more so in Korea where the population is set to decline by almost 30% (Chart A11.1).
Ireland and Spain, however, present notable exceptions to this trend. In both of these countries, the decline in numbers of the young school-age population, which had been a feature of their demography, has now been reversed and the population of compulsory school age is expected to increase by 19 and 16% respectively over the next decade.
For the population aged 15-to-19 years, broadly corresponding to the ages of the upper secondary school population, the trends are similarly downward overall but it is evident that countries are at different stages in their demographic cycles. The Czech Republic, Poland and the Slovak Republic and the partner country the Russian Federation face the largest reductions in the population corresponding to upper secondary education over the next ten year with reductions of around 30% or more in each case. Without corresponding increases in school participation and graduation rates at this level (see Indicators C1 and A2 for current levels), this can have a significant impact on the numbers graduating from upper secondary education and correspondingly the numbers eligible for entry to tertiary education (Chart A11.2).
Among 20-to-29 year olds, the age group broadly corresponding to tertiary education, there is a more mixed picture of population trends, although overall the projection is for a decline in population numbers of 3%. Demographic decline is particularly evident in Spain, where the population aged 20-to-29 years is projected to reduce by some 34% over the next ten years. Again, unless there are corresponding increases in participation rates in tertiary education (see Indicators C1 and C2 for current levels), this trend can be expected to result in a significant reduction in the flow of new graduates and highly qualified people in the population. Countries
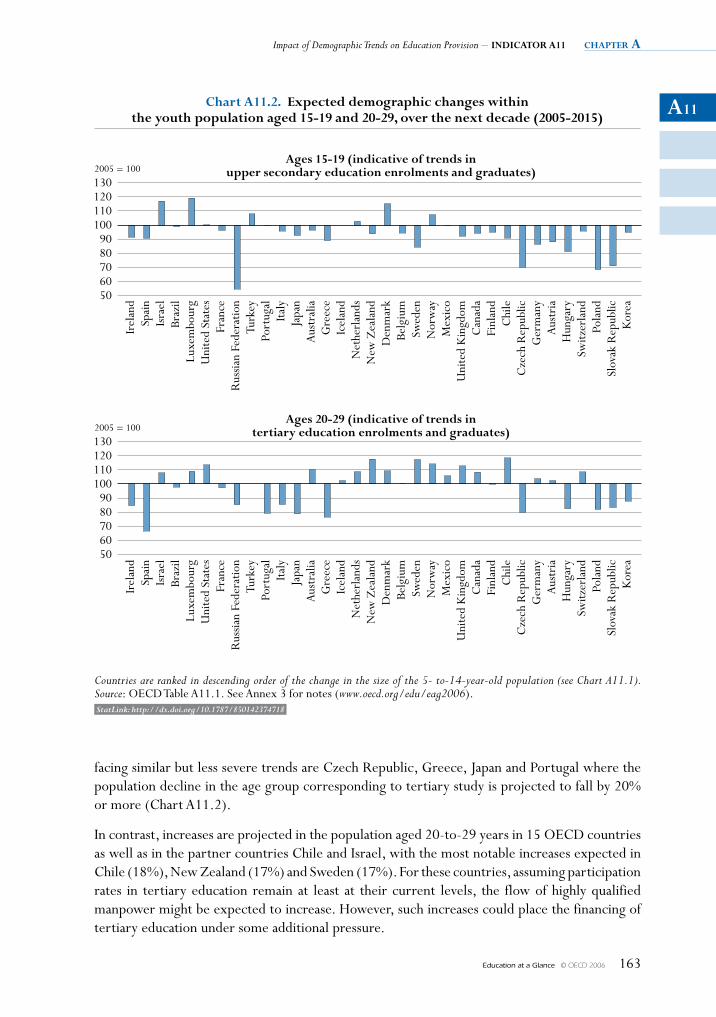
A11
Impact of Demographic Trends on Education Provision – IndIcAtor A11 chapter a
Education at a Glance © OECD 2006 163
facing similar but less severe trends are Czech Republic, Greece, Japan and Portugal where the population decline in the age group corresponding to tertiary study is projected to fall by 20% or more (Chart A11.2).
In contrast, increases are projected in the population aged 20-to-29 years in 15 OECD countries as well as in the partner countries Chile and Israel, with the most notable increases expected in Chile (18%), New Zealand (17%) and Sweden (17%). For these countries, assuming participation rates in tertiary education remain at least at their current levels, the flow of highly qualified manpower might be expected to increase. However, such increases could place the financing of tertiary education under some additional pressure.
StatLink: http://dx.doi.org/10.1787/850142374718
130120110100
9080706050
2005 = 100
130120110100
9080706050
2005 = 100
chart A11.2. Expected demographic changes withinthe youth population aged 15-19 and 20-29, over the next decade (2005-2015)
Countries are ranked in descending order of the change in the size of the 5- to-14-year-old population (see Chart A11.1).Source: OECD Table A11.1. See Annex 3 for notes (www.oecd.org/edu/eag2006).
Irel
and
Spai
nIs
rael
Braz
ilLu
xem
bour
gU
nite
d St
ates
Fran
ceR
ussia
n Fe
dera
tion
Turk
eyPo
rtug
alIta
lyJa
pan
Aus
tral
iaG
reec
eIc
elan
dN
ethe
rlan
dsN
ew Z
eala
ndD
enm
ark
Belg
ium
Swed
enN
orw
ayM
exic
oU
nite
d K
ingd
omC
anad
aFi
nlan
dC
hile
Cze
ch R
epub
licG
erm
any
Aus
tria
Hun
gary
Switz
erla
ndPo
land
Slov
ak R
epub
licK
orea
Ages 20-29 (indicative of trends intertiary education enrolments and graduates)
Ages 15-19 (indicative of trends inupper secondary education enrolments and graduates)
Irel
and
Spai
nIs
rael
Braz
ilLu
xem
bour
gU
nite
d St
ates
Fran
ceR
ussia
n Fe
dera
tion
Turk
eyPo
rtug
alIta
lyJa
pan
Aus
tral
iaG
reec
eIc
elan
dN
ethe
rlan
dsN
ew Z
eala
ndD
enm
ark
Belg
ium
Swed
enN
orw
ayM
exic
oU
nite
d K
ingd
omC
anad
aFi
nlan
dC
hile
Cze
ch R
epub
licG
erm
any
Aus
tria
Hun
gary
Switz
erla
ndPo
land
Slov
ak R
epub
licK
orea
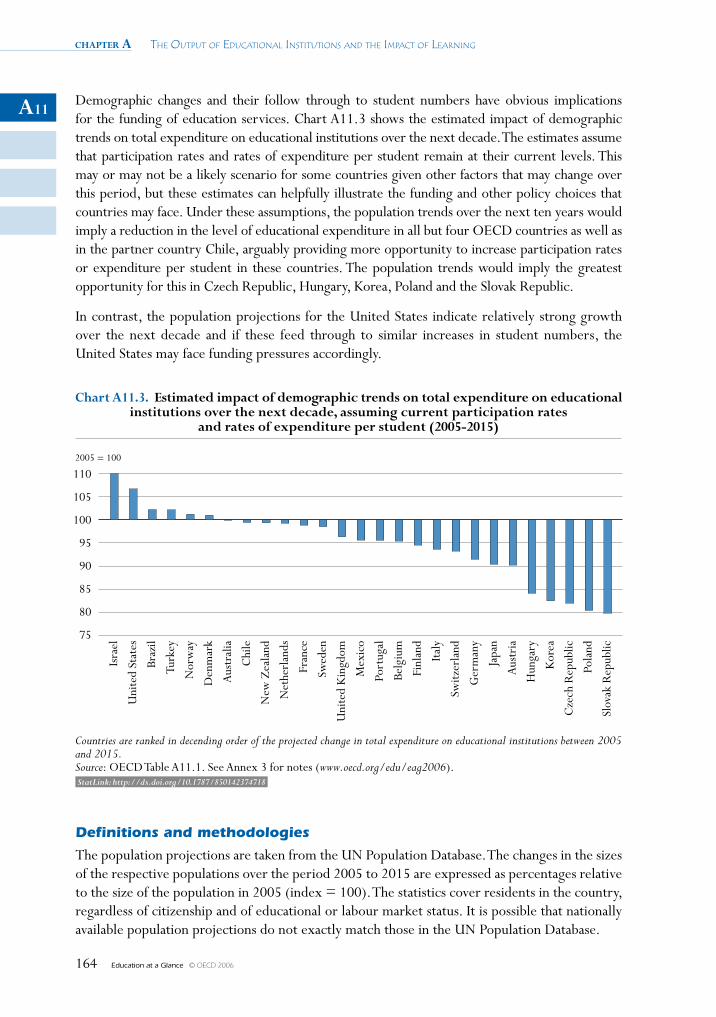
chapter a The OuTpuT Of educaTiOnal insTiTuTiOns and The impacT Of learning
Education at a Glance © OECD 2006164
A11Demographic changes and their follow through to student numbers have obvious implications for the funding of education services. Chart A11.3 shows the estimated impact of demographic trends on total expenditure on educational institutions over the next decade. The estimates assume that participation rates and rates of expenditure per student remain at their current levels. This may or may not be a likely scenario for some countries given other factors that may change over this period, but these estimates can helpfully illustrate the funding and other policy choices that countries may face. Under these assumptions, the population trends over the next ten years would imply a reduction in the level of educational expenditure in all but four OECD countries as well as in the partner country Chile, arguably providing more opportunity to increase participation rates or expenditure per student in these countries. The population trends would imply the greatest opportunity for this in Czech Republic, Hungary, Korea, Poland and the Slovak Republic.
In contrast, the population projections for the United States indicate relatively strong growth over the next decade and if these feed through to similar increases in student numbers, the United States may face funding pressures accordingly.
110
105
100
95
90
85
80
75
2005 = 100
Chart A11.3. Estimated impact of demographic trends on total expenditure on educationalinstitutions over the next decade, assuming current participation rates
and rates of expenditure per student (2005-2015)
Countries are ranked in decending order of the projected change in total expenditure on educational institutions between 2005and 2015.Source: OECD Table A11.1. See Annex 3 for notes (www.oecd.org/edu/eag2006).
Isra
el
Uni
ted
Stat
es
Braz
il
Turk
ey
Nor
way
Den
mar
k
Aus
tral
ia
Chi
le
New
Zea
land
Net
herl
ands
Fran
ce
Swed
en
Uni
ted
Kin
gdom
Mex
ico
Port
ugal
Belg
ium
Finl
and
Italy
Switz
erla
nd
Ger
man
y
Japa
n
Aus
tria
Hun
gary
Kor
ea
Cze
ch R
epub
lic
Pola
nd
Slov
ak R
epub
lic
StatLink: http://dx.doi.org/10.1787/850142374718
Definitions and methodologies
The population projections are taken from the UN Population Database. The changes in the sizes of the respective populations over the period 2005 to 2015 are expressed as percentages relative to the size of the population in 2005 (index = 100). The statistics cover residents in the country, regardless of citizenship and of educational or labour market status. It is possible that nationally available population projections do not exactly match those in the UN Population Database.
A11
Impact of Demographic Trends on Education Provision – INDICATOR A11 chapter a
Education at a Glance © OECD 2006 165
The estimates of the projected change in the level of total expenditure on educational institutions between 2005 and 2015 are derived from a weighted average of the projected change in student numbers by level, weighted by expenditure by level. The projected change in student numbers is estimated from the projected population changes as follows: 0-to-4-year-olds for pre-primary, 5-to-14-year-olds for primary and lower secondary, 15-to-19-year-olds for upper secondary and 20-to-29-year-olds for tertiary education. The proportions of expenditure by level used in the calculation are derived from Table B2.1c which shows expenditure by level as a percentage of GDP.
Thus, the projected change in expenditure assumes current participation rates and current rates of expenditure per student.
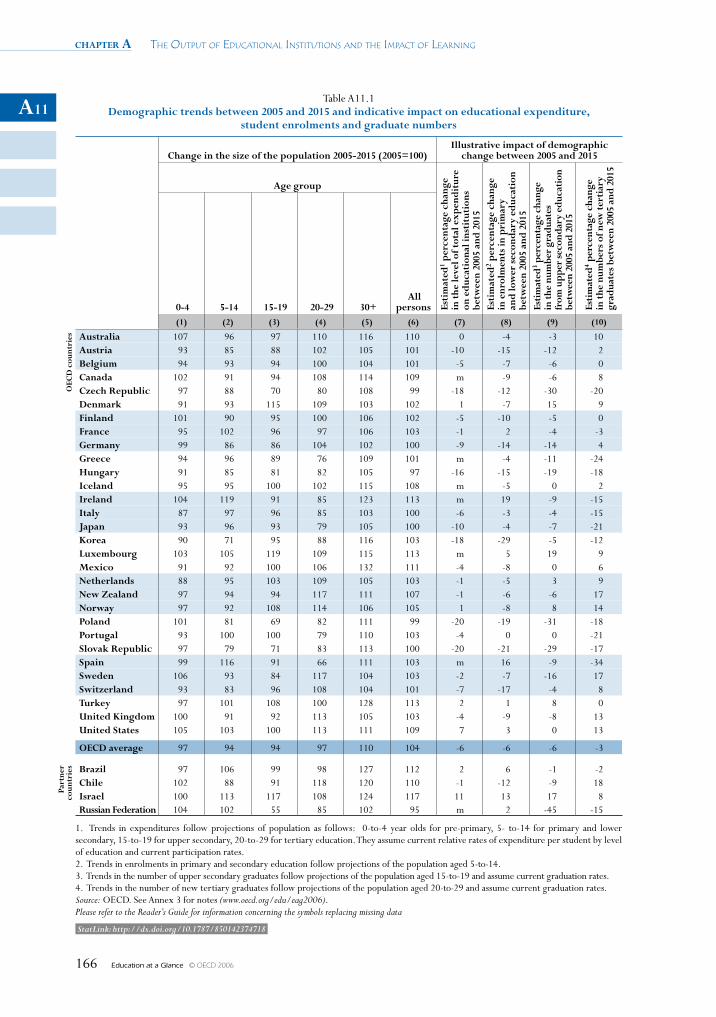
chapter a The OuTpuT Of educaTiOnal insTiTuTiOns and The impacT Of learning
Education at a Glance © OECD 2006166
A11Table A11.1
Demographic trends between 2005 and 2015 and indicative impact on educational expenditure, student enrolments and graduate numbers
Change in the size of the population 2005-2015 (2005=100)Illustrative impact of demographic
change between 2005 and 2015
Age group
esti
mat
ed1 p
erce
ntag
e ch
ange
in
the
leve
l of t
otal
exp
endi
ture
on
edu
cati
onal
inst
itut
ions
be
twee
n 20
05 a
nd 2
015
esti
mat
ed2 p
erce
ntag
e ch
ange
in
enr
olm
ents
in p
rim
ary
an
d lo
wer
sec
onda
ry e
duca
tion
be
twee
n 20
05 a
nd 2
015
esti
mat
ed3 p
erce
ntag
e ch
ange
in
the
num
ber
grad
uate
s fr
om u
pper
seco
ndar
y ed
ucat
ion
be
twee
n 20
05 a
nd 2
015
esti
mat
ed4 p
erce
ntag
e ch
ange
in
the
num
bers
of n
ew te
rtia
ry
grad
uate
s bet
wee
n 20
05 a
nd 2
015
0-4 5-14 15-19 20-29 30+ All
persons(1) (2) (3) (4) (5) (6) (7) (8) (9) (10)
OeC
D c
ount
ries Australia 107 96 97 110 116 110 0 -4 -3 10
Austria 93 85 88 102 105 101 -10 -15 -12 2Belgium 94 93 94 100 104 101 -5 -7 -6 0Canada 102 91 94 108 114 109 m -9 -6 8Czech Republic 97 88 70 80 108 99 -18 -12 -30 -20Denmark 91 93 115 109 103 102 1 -7 15 9finland 101 90 95 100 106 102 -5 -10 -5 0france 95 102 96 97 106 103 -1 2 -4 -3germany 99 86 86 104 102 100 -9 -14 -14 4greece 94 96 89 76 109 101 m -4 -11 -24hungary 91 85 81 82 105 97 -16 -15 -19 -18Iceland 95 95 100 102 115 108 m -5 0 2Ireland 104 119 91 85 123 113 m 19 -9 -15Italy 87 97 96 85 103 100 -6 -3 -4 -15Japan 93 96 93 79 105 100 -10 -4 -7 -21Korea 90 71 95 88 116 103 -18 -29 -5 -12Luxembourg 103 105 119 109 115 113 m 5 19 9mexico 91 92 100 106 132 111 -4 -8 0 6Netherlands 88 95 103 109 105 103 -1 -5 3 9New Zealand 97 94 94 117 111 107 -1 -6 -6 17Norway 97 92 108 114 106 105 1 -8 8 14poland 101 81 69 82 111 99 -20 -19 -31 -18portugal 93 100 100 79 110 103 -4 0 0 -21slovak Republic 97 79 71 83 113 100 -20 -21 -29 -17spain 99 116 91 66 111 103 m 16 -9 -34sweden 106 93 84 117 104 103 -2 -7 -16 17switzerland 93 83 96 108 104 101 -7 -17 -4 8Turkey 97 101 108 100 128 113 2 1 8 0united Kingdom 100 91 92 113 105 103 -4 -9 -8 13united states 105 103 100 113 111 109 7 3 0 13
OeCD average 97 94 94 97 110 104 -6 -6 -6 -3
part
ner
coun
trie
s Brazil 97 106 99 98 127 112 2 6 -1 -2Chile 102 88 91 118 120 110 -1 -12 -9 18Israel 100 113 117 108 124 117 11 13 17 8Russian federation 104 102 55 85 102 95 m 2 -45 -15
1. Trends in expenditures follow projections of population as follows: 0-to-4 year olds for pre-primary, 5- to-14 for primary and lower secondary, 15-to-19 for upper secondary, 20-to-29 for tertiary education. They assume current relative rates of expenditure per student by level of education and current participation rates.2. Trends in enrolments in primary and secondary education follow projections of the population aged 5-to-14.3. Trends in the number of upper secondary graduates follow projections of the population aged 15-to-19 and assume current graduation rates.4. Trends in the number of new tertiary graduates follow projections of the population aged 20-to-29 and assume current graduation rates.Source: OECD. See Annex 3 for notes (www.oecd.org/edu/eag2006).Please refer to the Reader’s Guide for information concerning the symbols replacing missing data
StatLink: http://dx.doi.org/10.1787/850142374718
Education at a Glance © OECD 2006 167
Financial and Human ResouRces
invested in education
Chapter
B
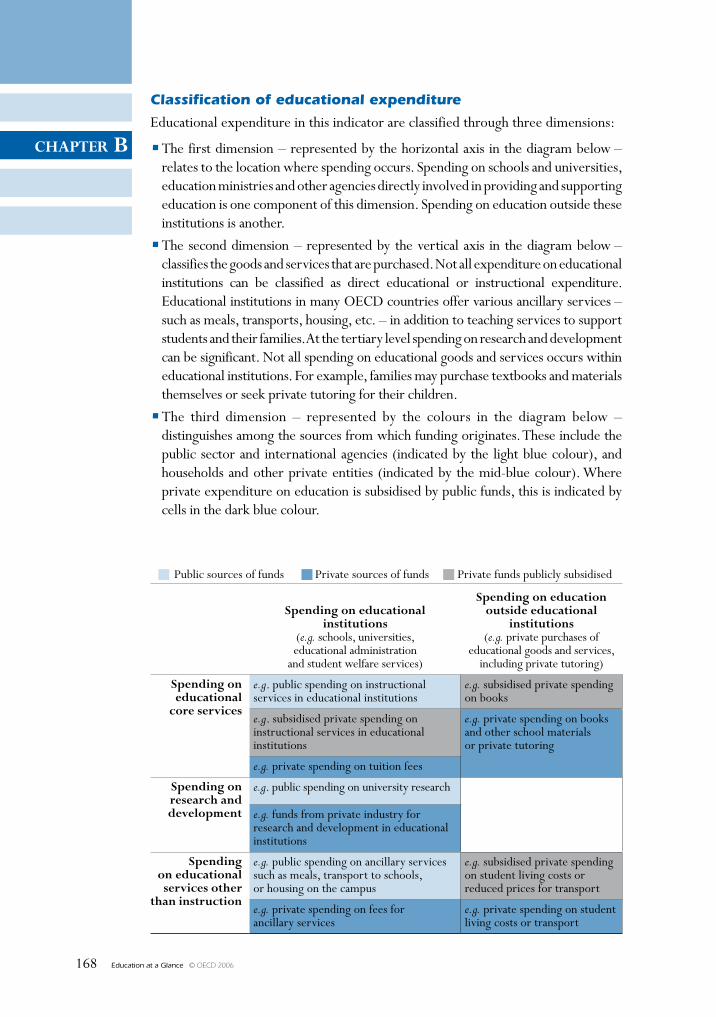
Education at a Glance © OECD 2006168
chapter B
Classification of educational expenditure
Educational expenditure in this indicator are classified through three dimensions:
• The first dimension – represented by the horizontal axis in the diagram below – relates to the location where spending occurs. Spending on schools and universities, education ministries and other agencies directly involved in providing and supporting education is one component of this dimension. Spending on education outside these institutions is another.
• The second dimension – represented by the vertical axis in the diagram below – classifies the goods and services that are purchased. Not all expenditure on educational institutions can be classified as direct educational or instructional expenditure. Educational institutions in many OECD countries offer various ancillary services – such as meals, transports, housing, etc. – in addition to teaching services to support students and their families. At the tertiary level spending on research and development can be significant. Not all spending on educational goods and services occurs within educational institutions. For example, families may purchase textbooks and materials themselves or seek private tutoring for their children.
• The third dimension – represented by the colours in the diagram below – distinguishes among the sources from which funding originates. These include the public sector and international agencies (indicated by the light blue colour), and households and other private entities (indicated by the mid-blue colour). Where private expenditure on education is subsidised by public funds, this is indicated by cells in the dark blue colour.
Spending on educational institutions
(e.g. schools, universities, educational administration
and student welfare services)
Spending on education outside educational
institutions(e.g. private purchases of
educational goods and services, including private tutoring)
Spending on educational
core services
e.g. public spending on instructional services in educational institutions
e.g. subsidised private spending on books
e.g. subsidised private spending on instructional services in educational institutions
e.g. private spending on books and other school materials or private tutoring
e.g. private spending on tuition fees
Spending on research and development
e.g. public spending on university research
e.g. funds from private industry for research and development in educational institutions
Spending on educational services other
than instruction
e.g. public spending on ancillary services such as meals, transport to schools, or housing on the campus
e.g. subsidised private spending on student living costs or reduced prices for transport
e.g. private spending on fees for ancillary services
e.g. private spending on student living costs or transport
Public sources of funds Private sources of funds Private funds publicly subsidised
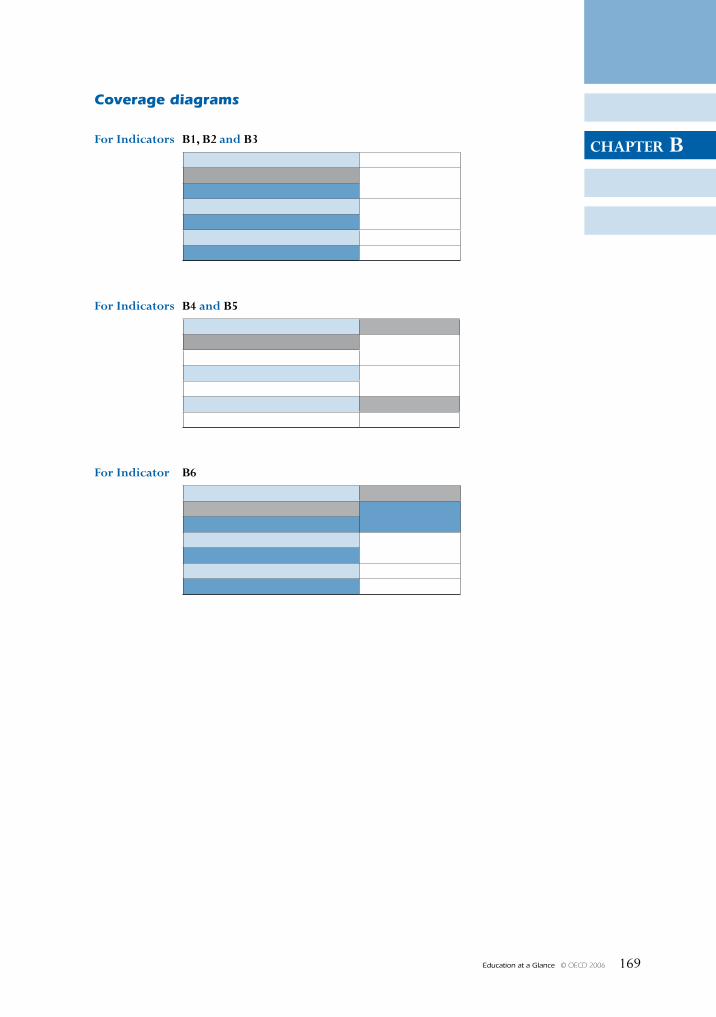
Education at a Glance © OECD 2006 169
chapter B
Coverage diagrams
For Indicators B1, B2 and B3
For Indicators B4 and B5
For Indicator B6
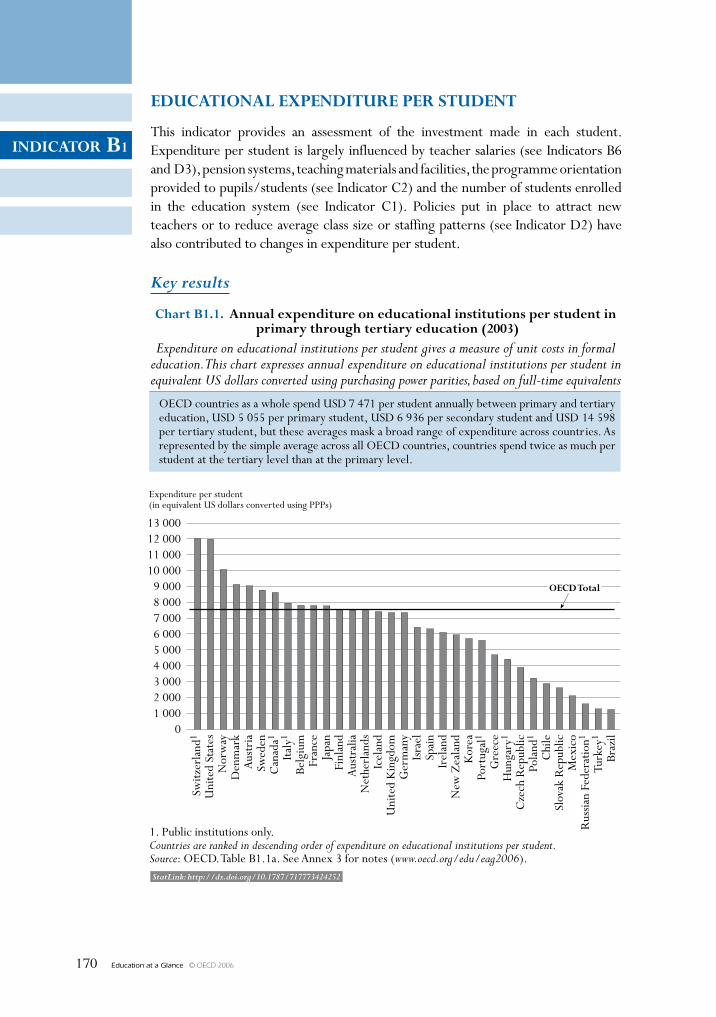
Education at a Glance © OECD 2006170
INDICATOR B1
EDuCATIONAl ExpENDITuRE pER sTuDENT
This indicator provides an assessment of the investment made in each student. Expenditure per student is largely influenced by teacher salaries (see Indicators B6 and D3), pension systems, teaching materials and facilities, the programme orientation provided to pupils/students (see Indicator C2) and the number of students enrolled in the education system (see Indicator C1). Policies put in place to attract new teachers or to reduce average class size or staffing patterns (see Indicator D2) have also contributed to changes in expenditure per student.
13 00012 00011 00010 000
9 0008 0007 0006 0005 0004 0003 0002 0001 000
0
Expenditure per student(in equivalent US dollars converted using PPPs)
Chart B1.1. Annual expenditure on educational institutions per student in primary through tertiary education (2003)
Expenditure on educational institutions per student gives a measure of unit costs in formaleducation. This chart expresses annual expenditure on educational institutions per student inequivalent US dollars converted using purchasing power parities, based on full-time equivalents
1. Public institutions only.Countries are ranked in descending order of expenditure on educational institutions per student.Source: OECD. Table B1.1a. See Annex 3 for notes (www.oecd.org/edu/eag2006).
Switz
erla
nd1
Uni
ted
Stat
esN
orw
ayD
enm
ark
Aus
tria
Swed
enC
anad
a1
Italy
1
Belg
ium
Fran
ceJa
pan
Finl
and
Aus
tral
iaN
ethe
rlan
dsIc
elan
dU
nite
d K
ingd
omG
erm
any
Isra
elSp
ain
Irel
and
New
Zea
land
Kor
eaPo
rtug
al1
Gre
ece
Hun
gary
1
Cze
ch R
epub
licPo
land
1
Chi
leSl
ovak
Rep
ublic
Mex
ico
Rus
sian
Fede
ratio
n1
Turk
ey1
Braz
il
OECD Total
OECD countries as a whole spend USD 7 471 per student annually between primary and tertiaryeducation, USD 5 055 per primary student, USD 6 936 per secondary student and USD 14 598per tertiary student, but these averages mask a broad range of expenditure across countries. Asrepresented by the simple average across all OECD countries, countries spend twice as much perstudent at the tertiary level than at the primary level.
StatLink: http://dx.doi.org/10.1787/717773424252
Key results
Education at a Glance © OECD 2006 171
INDIcatOr B1
Other highlights of this indicator
• Excluding R&D activities and ancillary services, expenditure on educational core services in tertiary institutions represents on average USD 7 774 and ranges from USD 4 500 or below in Greece, Poland, the Slovak Republic and Turkey to more than USD 9 000 in Canada, Denmark, Norway, Switzerland, the United Kingdom and the United States.
• The programme orientation provided to students at secondary level influences the level of expenditure per student in most of the OECD and partner countries. The 14 OECD countries for which data are available spend on average USD 1 130 more per student in upper secondary vocational programmes than in general programmes.
• OECD countries spend on average USD 77 204 per student over the theoretical duration of primary and secondary studies. The cumulative expenditure for each primary and secondary student ranges from less than USD 40 000 in Mexico, Poland, the Slovak Republic and Turkey, and the partner countries Brazil, Chile and the Russian Federation, to USD 100 000 or more in Austria, Denmark, Iceland, Italy, Luxembourg, Norway, Switzerland and the United States.
• Lower unit expenditure does not necessarily lead to lower achievement and it would be misleading to equate lower unit expenditure generally with lower quality of educational services. For example, the cumulative expenditure per student between primary and secondary education of Korea and the Netherlands are below the OECD average and yet both were among the best-performing countries in the PISA 2003 survey.
• In some OECD countries, low annual expenditure per student at the tertiary level still translates into high overall costs per tertiary student because students participate in tertiary studies over a long period of time.
• Countries with low levels of expenditure per student can nevertheless show distributions of investment relative to GDP per capita similar to those countries with high levels of spending per student. For example, Hungary, Korea, Poland and Portugal – countries with expenditure per student and GDP per capita below the OECD average at primary, secondary and post-secondary non-tertiary level of education – spend a higher proportion of money per student relative to GDP per capita than the OECD average.
• Expenditure on education tends to rise over time in real terms, as teachers’ pay (the main component of costs) rises in line with general earnings. However the rate of the rise may indicate the extent to which countries contain costs and raise productivity. This differs considerably across educational sectors. Expenditure per student at primary, secondary and post-secondary non-tertiary levels increased by 30% or more between 1995 and 2003 in Australia, Greece, Hungary, Ireland, Mexico, the Netherlands, Poland, Portugal, the Slovak Republic and Turkey, and in the partner country Chile. At the tertiary level, however, spending per student has in some cases fallen, as expenditure does not keep up with expanding student numbers.
chapter B Financial and Human ResouRces invested in education
Education at a Glance © OECD 2006172
B1
Policy context
Annual and cumulative expenditure on education per student in absolute terms and relative to GDP per capita
Effective schools require the right combination of trained and talented personnel, adequate facilities, state-of-the-art equipment and motivated students ready to learn. The demand for high-quality education, which can translate into higher costs per student, must be balanced against placing undue burden on taxpayers.
As a result, the question of whether the resources devoted to education yield adequate returns to the investments made figures prominently in the public debate. Although it is difficult to assess the optimal volume of resources required to prepare each student for life and work in modern societies, international comparisons of spending on education per student can provide a starting point for evaluating the effectiveness of different models of educational provision.
Trends in the development of expenditure on education per student
Policy makers must balance the importance of improving the quality of educational services with the desirability of expanding access to educational opportunities, notably at the tertiary level. The comparative review of how trends in educational expenditure per student have evolved shows that in many OECD countries the expansion of enrolments, particularly in tertiary education, has not always been paralleled by changes in educational investment.
Finally, decisions on the allocation of funds among the various levels of education are also important. For example, some OECD countries emphasise broad access to higher education while others invest in near-universal education for children as young as three or four years of age.
Evidence and explanations
What this indicator covers and what it does not cover
The indicator shows direct public and private expenditure on educational institutions in relation to the number of full-time equivalent students enrolled in these institutions.
Public subsidies for students’ living expenses have been excluded to ensure international comparability of the data. Expenditure data for students in private educational institutions are not available for certain OECD countries, and some other countries do not provide complete data on independent private institutions. Where this is the case, only the expenditure on public and government-dependent private institutions has been taken into account. Note that variation in expenditure on education per student may reflect not only variation in the material resources provided to students (e.g. variations in the ratio of students to teaching staff) but also variation in relative salary and price levels.
At the primary and secondary levels, educational expenditure is dominated by spending on instructional services; at the tertiary level, other services – particularly those related to R&D activities or ancillary services – can account for a significant proportion of educational spending. Indicator B6 provides further information on how spending is distributed by different types of services provided.
Educational Expenditure per Student – INDIcatOr B1 chapter B
Education at a Glance © OECD 2006 173
B1
Expenditure on education per student in equivalent US dollars
Annual expenditure per student on educational institutions from primary through tertiary education provides an assessment of the investment made in each student. OECD countries as a whole spend on average USD 7 471 per student annually for students enrolled in primary through tertiary education. In 10 out of 33 OECD and partner countries, spending on education falls between USD 7 000 and 8 000 per student. Spending on education at these levels ranges from USD 4 000 per student or less in the Czech Republic, Mexico, Poland, the Slovak Republic and Turkey, and the partner countries Brazil, Chile and the Russian Federation, to more than USD 9 000 per student in Austria, Denmark, Norway, Switzerland and the United States (Table B1.1a). The drivers of expenditure per student vary across countries: among the five countries with the highest expenditure per student enrolled in primary through tertiary education, Switzerland and the United States are two of the countries with the highest teachers’ salaries at the secondary level (see Indicator D3), whereas Austria, Denmark and Norway are among the countries with the lowest student to teaching staff ratio (see Indicator D2).
Even if overall spending per student is similar in some OECD countries, the ways in which resources are allocated across the different levels of education vary widely. OECD countries as a whole spend USD 5 055 per student at the primary level, USD 6 936 per student at the secondary level and USD 14 598 per student at the tertiary level. At the tertiary level, these totals are influenced by high expenditure in a few large OECD countries, most notably Canada and the United States. Spending on education per student in a typical OECD country (as represented by the simple mean across all OECD countries) amounts to USD 5 450 at the primary level, USD 6 962 at the secondary level and USD 11 254 at the tertiary level (Table B1.1a and Chart B1.2).
These averages mask a broad range of expenditure on education per student across OECD and partner countries. At the primary level, expenditure on educational institutions ranges from less than USD 1 000 per student in Turkey and the partner country Brazil to USD 11 481 per student in Luxembourg. Differences among OECD countries are even greater at the secondary level, where spending on education per student varies by a factor of 15, from USD 1 121 in Brazil to USD 17 078 in Luxembourg. Expenditure on education per tertiary student ranges from USD 2 451 in the Russian Federation to more than USD 24 000 in Switzerland and the United States (Table B1.1a).
These comparisons are based on purchasing power parities for GDP, not on market exchange rates. They therefore reflect the amount of a national currency required to produce the same basket of goods and services in a given country as that produced by the US dollar in the United States.
Differences in educational expenditure per student between general and vocational programmes
The programme orientation provided to students at the secondary level influences the level of expenditure per student in most of the OECD and partner countries. In the 14 OECD countries for which data are available, expenditure per student in upper secondary vocational programmes represents USD 1 130 more than in general programmes. Only Austria, the Czech Republic, Luxembourg and Mexico show less than 15 % difference between expenditure per student in upper secondary general and vocational programmes (Table B1.1b).
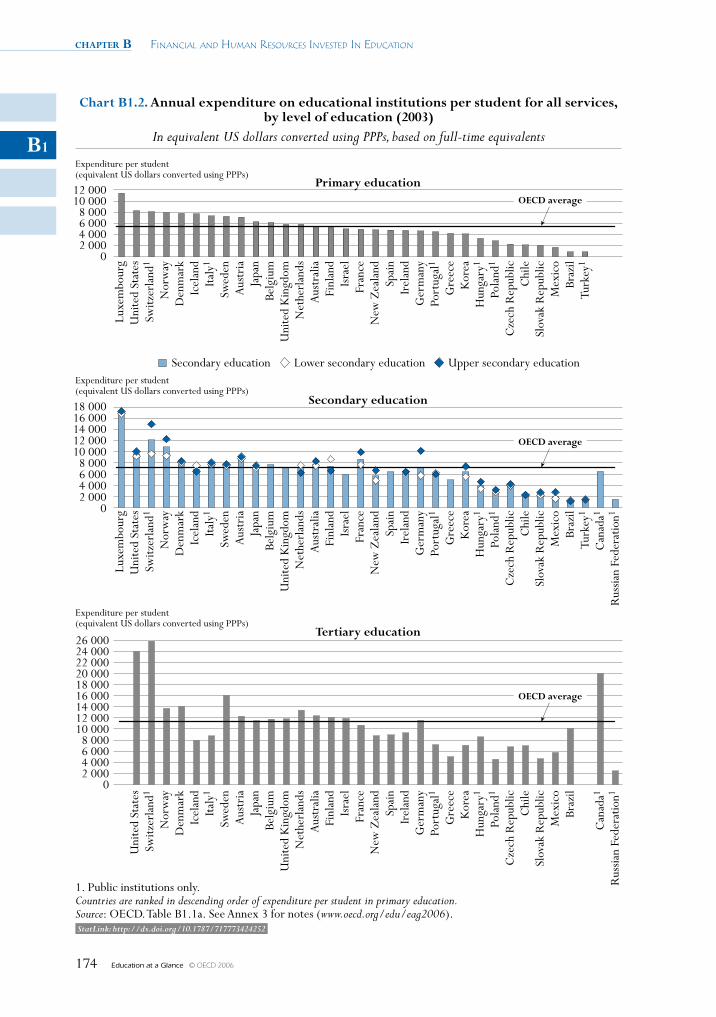
chapter B Financial and Human ResouRces invested in education
Education at a Glance © OECD 2006174
B1
12 00010 000
8 0006 0004 0002 000
0
Expenditure per student(equivalent US dollars converted using PPPs)
26 00024 00022 00020 00018 00016 00014 00012 00010 000
8 0006 0004 0002 000
0
Expenditure per student(equivalent US dollars converted using PPPs)
18 00016 00014 00012 00010 000
8 0006 0004 0002 000
0
Expenditure per student(equivalent US dollars converted using PPPs)
Chart B1.2. Annual expenditure on educational institutions per student for all services,by level of education (2003)
In equivalent US dollars converted using PPPs, based on full-time equivalents
Secondary education Lower secondary education Upper secondary education
1. Public institutions only.Countries are ranked in descending order of expenditure per student in primary education.Source: OECD. Table B1.1a. See Annex 3 for notes (www.oecd.org/edu/eag2006).
Luxe
mbo
urg
Uni
ted
Stat
esSw
itzer
land
1
Nor
way
Den
mar
kIc
elan
dIta
ly1
Swed
enA
ustr
iaJa
pan
Belg
ium
Uni
ted
Kin
gdom
Net
herl
ands
Aus
tral
iaFi
nlan
dIs
rael
Fran
ceN
ew Z
eala
ndSp
ain
Irel
and
Ger
man
yPo
rtug
al1
Gre
ece
Kor
eaH
unga
ry1
Pola
nd1
Cze
ch R
epub
licC
hile
Slov
ak R
epub
licM
exic
oBr
azil
Turk
ey1
Can
ada1
Rus
sian
Fede
ratio
n1
Primary educationOECD average
Tertiary education
OECD average
Secondary education
OECD average
Luxe
mbo
urg
Uni
ted
Stat
esSw
itzer
land
1
Nor
way
Den
mar
kIc
elan
dIta
ly1
Swed
enA
ustr
iaJa
pan
Belg
ium
Uni
ted
Kin
gdom
Net
herl
ands
Aus
tral
iaFi
nlan
dIs
rael
Fran
ceN
ew Z
eala
ndSp
ain
Irel
and
Ger
man
yPo
rtug
al1
Gre
ece
Kor
eaH
unga
ry1
Pola
nd1
Cze
ch R
epub
licC
hile
Slov
ak R
epub
licM
exic
oBr
azil
Turk
ey1
Can
ada1
Rus
sian
Fede
ratio
n1
StatLink: http://dx.doi.org/10.1787/717773424252
Educational Expenditure per Student – INDIcatOr B1 chapter B
Education at a Glance © OECD 2006 175
B1
The countries with large dual-system apprenticeship programmes (e.g. Austria, Germany, Luxembourg, the Netherlands and Switzerland) at upper secondary level tend to be those with the higher difference between expenditure per student enrolled in general and vocational programmes. Austria, Germany and Switzerland spend respectively USD 929, 6 782 and 5 310 more per student in vocational programmes than in general programmes. Exceptions to this pattern are Luxembourg, with approximately the same expenditure per student between the two types of programme, and the Netherlands, where expenditure per student enrolled in general programmes is higher than that for apprenticeship programmes. The latter is partly explained by the underestimation of the expenditures of private enterprises on dual vocational programmes in Luxembourg and the Netherlands. Among the four other countries – Australia, the Czech Republic, Finland and the Slovak Republic – with 60% or more of upper secondary students enrolled in vocational programmes, Australia is the only country that spends more per student enrolled in general programmes than in vocational programmes (Table B1.1b and Table C2.5).
Expenditure on educational core services per student
On average, OECD countries for which data are available spend USD 5 332 on core educational services at primary, secondary and post secondary non-tertiary levels, which corresponds to 85% of the total expenditure per student at these levels. In 14 out of the 24 OECD and partner countries with available data, ancillary services provided by primary, secondary and post-secondary non-tertiary institutions account for less than 5% of the total expenditure per student. This proportion exceeds 10% of the total expenditure per student in a small group of countries including Finland, France, Hungary and the Slovak Republic.
More differences in expenditure per student on core educational services compared to total expenditure are observed at the tertiary level. Naturally, OECD countries in which most R&D is performed by tertiary educational institutions tend to report higher expenditure per tertiary student than countries in which a large part of R&D is performed in other public institutions or by industry. Excluding R&D activities and ancillary services, expenditure on core educational services in tertiary institutions represents on average USD 7 774 and ranges from USD 4 500 or below in Greece, Poland, the Slovak Republic and Turkey to more than USD 9 000 in Canada, Denmark, Norway, Switzerland, the United Kingdom and the United States (Table B1.1c).
On average, expenditure on R&D and ancillary services at the tertiary level represents respectively 29 and 4% of all tertiary expenditure per student. In 8 out of 25 OECD countries for which tertiary expenditure is available for every service category – Australia, Finland, France, Germany, Italy, the Netherlands, Sweden and Switzerland – R&D expenditure and ancillary services in tertiary institutions represents 35% or more of total tertiary expenditure per student. On a per student basis this can translate into significant amounts, as in Australia, Finland, Germany, the Netherlands, Norway, Sweden, Switzerland and the United States expenditure for R&D and ancillary services in tertiary institutions amounts to more than USD 4 500 per student (Chart B1.3 and Tables B1.1c).
Differences in educational expenditure per student between levels of education
Expenditure on education per student exhibits a common pattern throughout OECD countries: in each OECD country, spending rises sharply from primary to tertiary education. This pattern can be understood by looking at the main determinants of expenditure, particularly the location and mode of educational provision. The vast majority of education still takes place in traditional
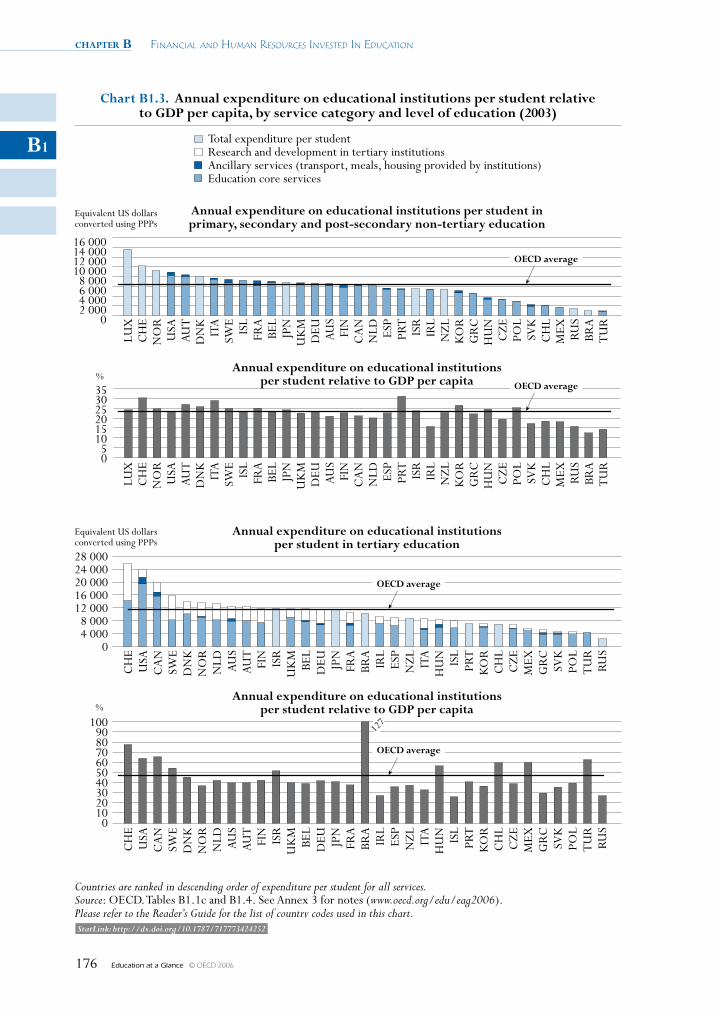
chapter B Financial and Human ResouRces invested in education
Education at a Glance © OECD 2006176
B1
127
16 00014 00012 00010 000
8 0006 0004 0002 000
0
Equivalent US dollarsconverted using PPPs
353025201510
50
%
28 00024 00020 00016 00012 000
8 0004 000
0
Equivalent US dollarsconverted using PPPs
100908070605040302010
0
%
chart B1.3. annual expenditure on educational institutions per student relativeto GDp per capita, by service category and level of education (2003)
Total expenditure per studentResearch and development in tertiary institutionsAncillary services (transport, meals, housing provided by institutions)Education core services
Countries are ranked in descending order of expenditure per student for all services.Source: OECD. Tables B1.1c and B1.4. See Annex 3 for notes (www.oecd.org/edu/eag2006).Please refer to the Reader’s Guide for the list of country codes used in this chart.
annual expenditure on educational institutions per student inprimary, secondary and post-secondary non-tertiary education
OecD average
annual expenditure on educational institutionsper student relative to GDp per capita
annual expenditure on educational institutionsper student in tertiary education
annual expenditure on educational institutionsper student relative to GDp per capita
OecD average
OecD average
OecD average
LUX
CH
EN
OR
USA
AUT
DN
KIT
ASW
EIS
LFR
ABE
LJP
NU
KM
DEU AU
SFI
NC
AN
NLD ES
PPR
TIS
RIR
LN
ZL
KO
RG
RC
HU
NC
ZE
POL
SVK
CH
LM
EX RUS
BRA
TU
R
LUX
CH
EN
OR
USA
AUT
DN
KIT
ASW
EIS
LFR
ABE
LJP
NU
KM
DEU AU
SFI
NC
AN
NLD ES
PPR
TIS
RIR
LN
ZL
KO
RG
RC
HU
NC
ZE
POL
SVK
CH
LM
EX RUS
BRA
TU
R
CH
EU
SAC
AN
SWE
DN
KN
OR
NLD AU
SAU
TFI
NIS
RU
KM
BEL
DEU JP
NFR
ABR
AIR
LES
PN
ZL
ITA
HU
N ISL
PRT
KO
RC
HL
CZ
EM
EXG
RC
SVK
POL
TU
RRU
S
CH
EU
SAC
AN
SWE
DN
KN
OR
NLD AU
SAU
TFI
NIS
RU
KM
BEL
DEU JP
NFR
ABR
AIR
LES
PN
ZL
ITA
HU
N ISL
PRT
KO
RC
HL
CZ
EM
EXG
RC
SVK
POL
TU
RRU
S
StatLink: http://dx.doi.org/10.1787/717773424252
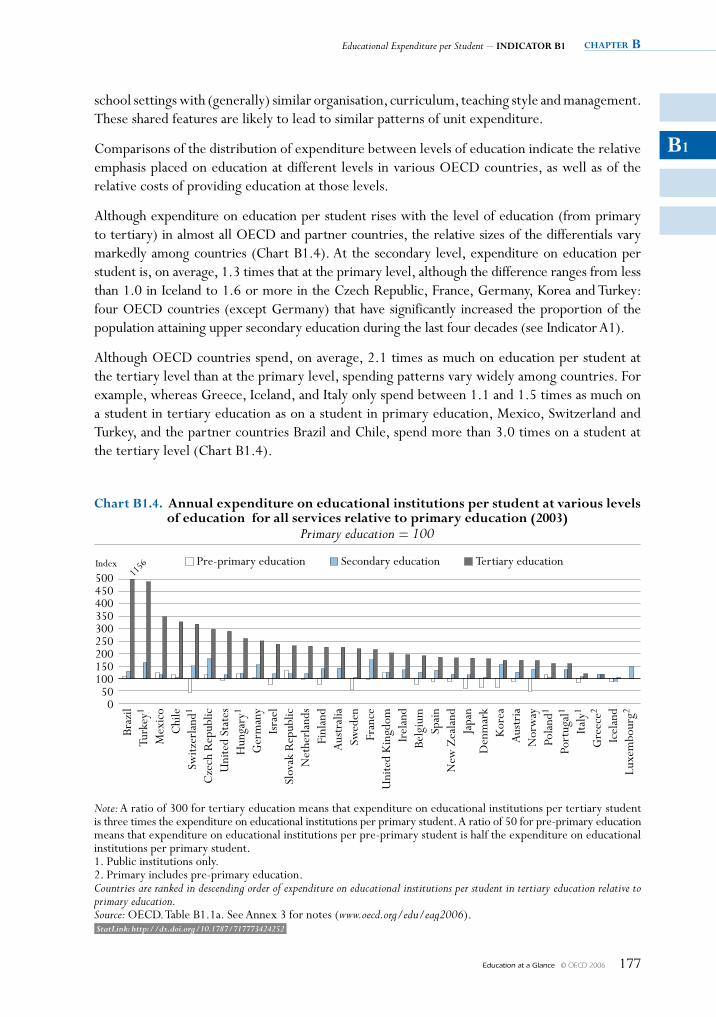
Educational Expenditure per Student – INDIcatOr B1 chapter B
Education at a Glance © OECD 2006 177
B1
school settings with (generally) similar organisation, curriculum, teaching style and management. These shared features are likely to lead to similar patterns of unit expenditure.
Comparisons of the distribution of expenditure between levels of education indicate the relative emphasis placed on education at different levels in various OECD countries, as well as of the relative costs of providing education at those levels.
Although expenditure on education per student rises with the level of education (from primary to tertiary) in almost all OECD and partner countries, the relative sizes of the differentials vary markedly among countries (Chart B1.4). At the secondary level, expenditure on education per student is, on average, 1.3 times that at the primary level, although the difference ranges from less than 1.0 in Iceland to 1.6 or more in the Czech Republic, France, Germany, Korea and Turkey: four OECD countries (except Germany) that have significantly increased the proportion of the population attaining upper secondary education during the last four decades (see Indicator A1).
Although OECD countries spend, on average, 2.1 times as much on education per student at the tertiary level than at the primary level, spending patterns vary widely among countries. For example, whereas Greece, Iceland, and Italy only spend between 1.1 and 1.5 times as much on a student in tertiary education as on a student in primary education, Mexico, Switzerland and Turkey, and the partner countries Brazil and Chile, spend more than 3.0 times on a student at the tertiary level (Chart B1.4).
500450400350300250200150100
500
Index
chart B1.4. annual expenditure on educational institutions per student at various levelsof education for all services relative to primary education (2003)
Primary education = 100
Pre-primary education Secondary education Tertiary education
Note: A ratio of 300 for tertiary education means that expenditure on educational institutions per tertiary studentis three times the expenditure on educational institutions per primary student. A ratio of 50 for pre-primary educationmeans that expenditure on educational institutions per pre-primary student is half the expenditure on educationalinstitutions per primary student.1. Public institutions only.2. Primary includes pre-primary education.Countries are ranked in descending order of expenditure on educational institutions per student in tertiary education relative toprimary education.Source: OECD. Table B1.1a. See Annex 3 for notes (www.oecd.org/edu/eag2006).
Braz
ilTu
rkey
1
Mex
ico
Chi
leSw
itzer
land
1
Cze
ch R
epub
licU
nite
d St
ates
Hun
gary
1
Ger
man
yIs
rael
Slov
ak R
epub
licN
ethe
rlan
dsFi
nlan
dA
ustr
alia
Swed
enFr
ance
Uni
ted
Kin
gdom
Irel
and
Belg
ium
Spai
nN
ew Z
eala
ndJa
pan
Den
mar
kK
orea
Aus
tria
Nor
way
Pola
nd1
Port
ugal
1
Italy
1
Gre
ece2
Icel
and
Luxe
mbo
urg2
1156
StatLink: http://dx.doi.org/10.1787/717773424252
chapter B Financial and Human ResouRces invested in education
Education at a Glance © OECD 2006178
B1
Distribution of expenditure on educational institutions relative to number of students enrolled
The money invested in the education system of OECD countries can be compared to the proportion of students enrolled at each level of education. Table B1.2 shows the relationship between the two and analyses the different strategies put in place by countries to allocate the expenditure between the levels of education.
On average among the 28 OECD countries for which data are available, 66% of all expenditure on educational institutions is allocated to primary, secondary and post-secondary non-tertiary education while 74% of students are enrolled at this level of education. The difference between the two figures exceeds 10 percentage points in Australia, Canada, Hungary, Japan, Mexico, the Slovak Republic, Switzerland, Turkey and the United States, and the partner countries Brazil, Chile and Israel (Table B1.2).
Compared to primary, secondary and post-secondary non-tertiary education, there are significant differences between the proportion of money invested and the proportion of students enrolled in tertiary education. On average among the 28 OECD countries for which data are available, 25% of all expenditure on educational institutions is allocated to tertiary education, whereas only 15% of students are enrolled in tertiary education. The difference between the two proportions in tertiary education ranges from below 7 percentage points in Austria, France, Greece, Iceland, Italy, Korea, Norway, Poland and Portugal to more than 15 percentage points in Canada, Switzerland, Turkey, the United States, and the partner countries Brazil and Chile (Table B1.2).
Educational expenditure per student over the theoretical duration of primary and secondary education
OECD countries spend on average USD 77 204 per student over the theoretical duration of primary and secondary studies. Although the theoretical duration of primary and secondary studies is quite similar − between 12 and 13 years in 30 out of 34 OECD and partner countries − the cumulative expenditure per student varies considerably. The cumulative expenditure for each primary and secondary student ranges from less than USD 40 000 in Mexico, Poland, the Slovak Republic and Turkey, and the partner countries Brazil, Chile and the Russian Federation, to USD 100 000 or more in Austria, Denmark, Iceland, Italy, Luxembourg, Norway, Switzerland and the United States (Table B1.3a and Chart B1.5a).
Lower unit expenditure does not necessarily produce lower achievement and it would be misleading to equate lower unit expenditure generally with lower quality of educational services. Cumulative spending per student between primary and secondary education is moderate in Korea and the Netherlands, and both were among the best-performing countries in the PISA 2003 survey. By contrast, spending per student exceeds USD 100 000 in Italy and the United States, while both performed below the OECD average in the PISA 2003 survey.
Educational expenditure per student over the average duration of tertiary studies
Both the typical duration and the intensity of tertiary education vary among OECD countries. Therefore, the differences among countries in annual expenditure on educational services per student (as shown in Chart B1.2) do not necessarily reflect the variation in the total cost of educating the typical tertiary student.
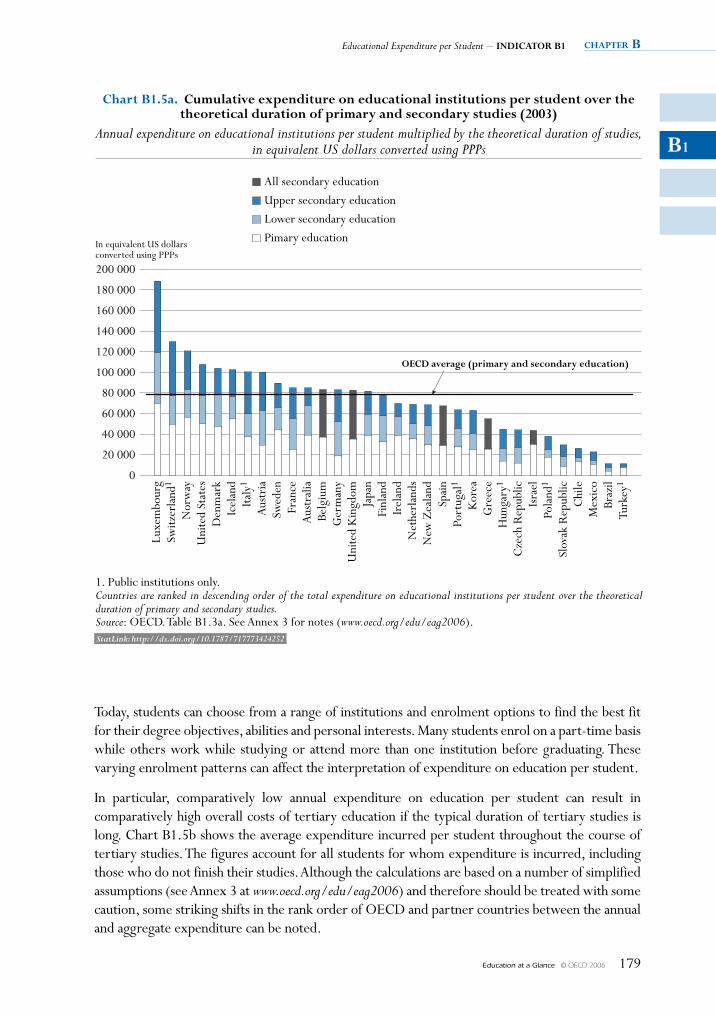
Educational Expenditure per Student – INDIcatOr B1 chapter B
Education at a Glance © OECD 2006 179
B1
Today, students can choose from a range of institutions and enrolment options to find the best fit for their degree objectives, abilities and personal interests. Many students enrol on a part-time basis while others work while studying or attend more than one institution before graduating. These varying enrolment patterns can affect the interpretation of expenditure on education per student.
In particular, comparatively low annual expenditure on education per student can result in comparatively high overall costs of tertiary education if the typical duration of tertiary studies is long. Chart B1.5b shows the average expenditure incurred per student throughout the course of tertiary studies. The figures account for all students for whom expenditure is incurred, including those who do not finish their studies. Although the calculations are based on a number of simplified assumptions (see Annex 3 at www.oecd.org/edu/eag2006) and therefore should be treated with some caution, some striking shifts in the rank order of OECD and partner countries between the annual and aggregate expenditure can be noted.
200 000
180 000
160 000
140 000
120 000
100 000
80 000
60 000
40 000
20 000
0
In equivalent US dollarsconverted using PPPs
All secondary education
chart B1.5a. cumulative expenditure on educational institutions per student over thetheoretical duration of primary and secondary studies (2003)
Annual expenditure on educational institutions per student multiplied by the theoretical duration of studies,in equivalent US dollars converted using PPPs
Pimary education
Lower secondary education
Upper secondary education
1. Public institutions only.Countries are ranked in descending order of the total expenditure on educational institutions per student over the theoreticalduration of primary and secondary studies.Source: OECD. Table B1.3a. See Annex 3 for notes (www.oecd.org/edu/eag2006).
Luxe
mbo
urg
Switz
erla
nd1
Nor
way
Uni
ted
Stat
esD
enm
ark
Icel
and
Italy
1
Aus
tria
Swed
enFr
ance
Aus
tral
iaBe
lgiu
mG
erm
any
Uni
ted
Kin
gdom
Japa
nFi
nlan
dIr
elan
dN
ethe
rlan
dsN
ew Z
eala
ndSp
ain
Port
ugal
1
Kor
eaG
reec
eH
unga
ry1
Cze
ch R
epub
licIs
rael
Pola
nd1
Slov
ak R
epub
licC
hile
Mex
ico
Braz
ilTu
rkey
1
OecD average (primary and secondary education)
StatLink: http://dx.doi.org/10.1787/717773424252
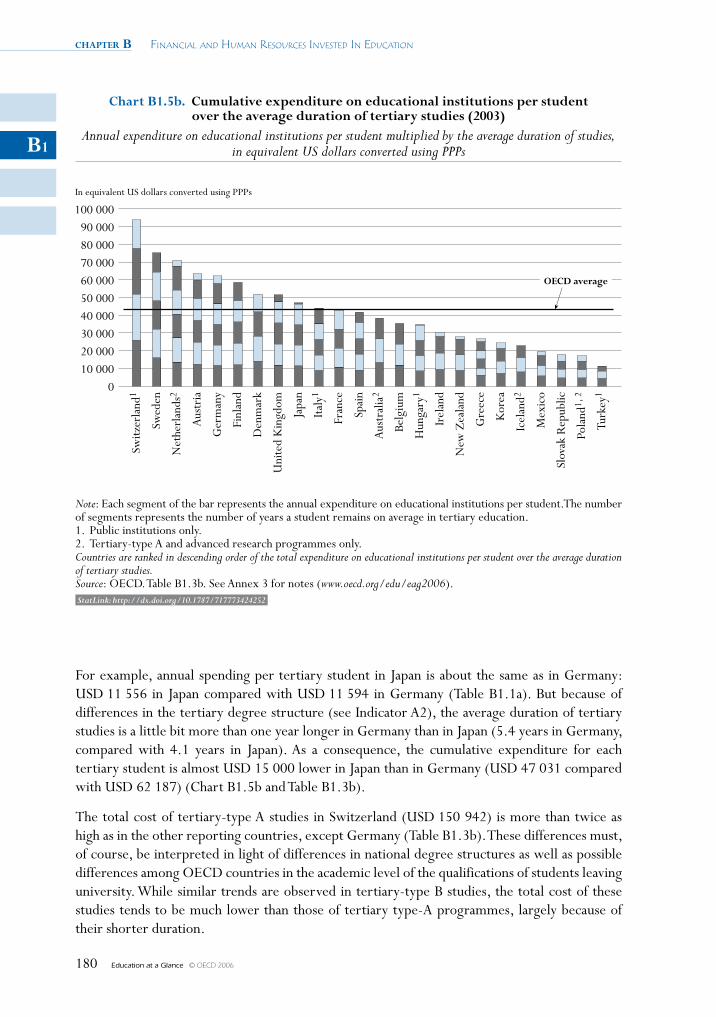
chapter B Financial and Human ResouRces invested in education
Education at a Glance © OECD 2006180
B1
For example, annual spending per tertiary student in Japan is about the same as in Germany: USD 11 556 in Japan compared with USD 11 594 in Germany (Table B1.1a). But because of differences in the tertiary degree structure (see Indicator A2), the average duration of tertiary studies is a little bit more than one year longer in Germany than in Japan (5.4 years in Germany, compared with 4.1 years in Japan). As a consequence, the cumulative expenditure for each tertiary student is almost USD 15 000 lower in Japan than in Germany (USD 47 031 compared with USD 62 187) (Chart B1.5b and Table B1.3b).
The total cost of tertiary-type A studies in Switzerland (USD 150 942) is more than twice as high as in the other reporting countries, except Germany (Table B1.3b). These differences must, of course, be interpreted in light of differences in national degree structures as well as possible differences among OECD countries in the academic level of the qualifications of students leaving university. While similar trends are observed in tertiary-type B studies, the total cost of these studies tends to be much lower than those of tertiary type-A programmes, largely because of their shorter duration.
100 00090 00080 00070 00060 00050 00040 00030 00020 00010 000
0
In equivalent US dollars converted using PPPs
chart B1.5b. cumulative expenditure on educational institutions per studentover the average duration of tertiary studies (2003)
Annual expenditure on educational institutions per student multiplied by the average duration of studies,in equivalent US dollars converted using PPPs
Note: Each segment of the bar represents the annual expenditure on educational institutions per student. The numberof segments represents the number of years a student remains on average in tertiary education.1. Public institutions only.2. Tertiary-type A and advanced research programmes only.Countries are ranked in descending order of the total expenditure on educational institutions per student over the average durationof tertiary studies.Source: OECD. Table B1.3b. See Annex 3 for notes (www.oecd.org/edu/eag2006).
Switz
erla
nd1
Swed
en
Net
herl
ands
2
Aus
tria
Ger
man
y
Finl
and
Den
mar
k
Uni
ted
Kin
gdom
Japa
n
Italy
1
Fran
ce
Spai
n
Aus
tral
ia2
Belg
ium
Hun
gary
1
Irel
and
New
Zea
land
Gre
ece
Kor
ea
Icel
and2
Mex
ico
Slov
ak R
epub
lic
Pola
nd1,
2
Turk
ey1
OecD average
StatLink: http://dx.doi.org/10.1787/717773424252
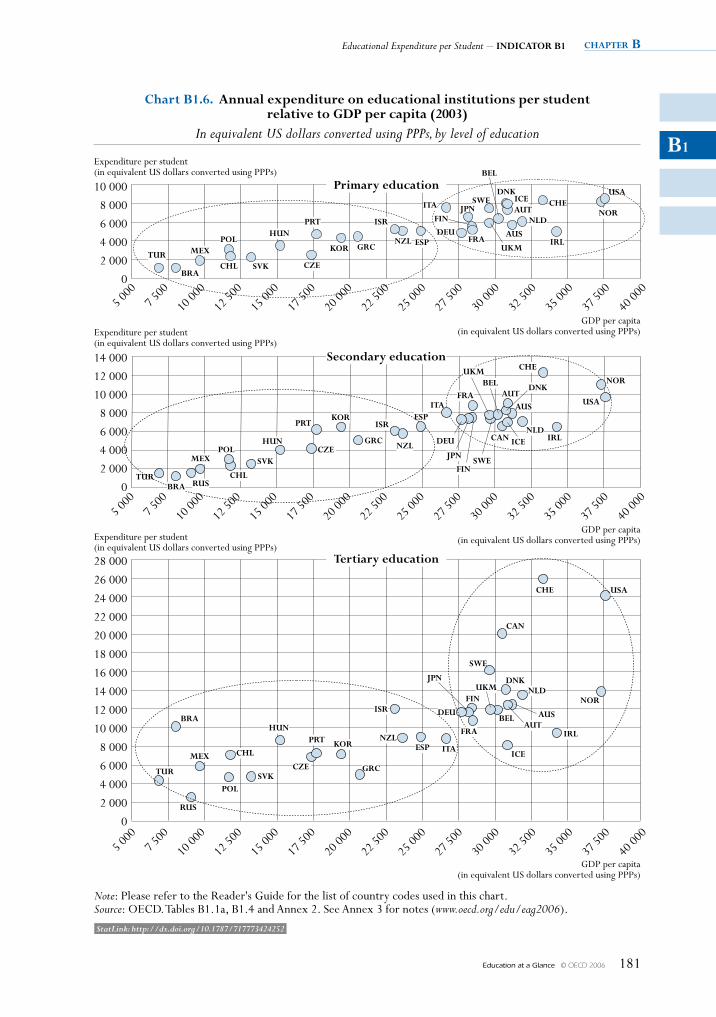
Educational Expenditure per Student – INDIcatOr B1 chapter B
Education at a Glance © OECD 2006 181
B1
Bel
tur
MexcZe
KOr
FIN
caN
SWe
DNK
NOr
tur
MexpOl
chl
huN
KOr eSpIta
Fra
Ice
autauS
NOr
MexpOl
uSa
NOrNlD
cheDNK
Iceaut
auS
SWeJpN
5 000
7 500
10 00
0
12 50
0
15 00
0
17 50
0
20 00
0
22 50
0
25 00
0
27 50
0
30 00
0
32 50
0
35 00
0
37 50
0
40 00
0
28 000
26 000
24 000
22 000
20 000
18 000
16 000
14 000
12 000
10 000
8 000
6 000
4 000
2 000
0
14 000
12 000
10 000
8 000
6 000
4 000
2 000
0
10 000
8 000
6 000
4 000
2 000
0
5 000
7 500
10 00
0
12 50
0
15 00
0
17 50
0
20 00
0
22 50
0
25 00
0
27 50
0
30 00
0
32 50
0
35 00
0
37 50
0
40 00
0
5 000
7 500
10 00
0
12 50
0
15 00
0
17 50
0
20 00
0
22 50
0
25 00
0
27 50
0
30 00
0
32 50
0
35 00
0
37 50
0
40 00
0
Bel
Deu
FIN
FraeSpNZl
ISr
GrcKOr
prt
cZe
huN
SVKchlBra
tur
che
uSa
NlDcaN
DNKBel
SWeJpN
FIN
DeuNZl
ISr
Grc
prt
cZeSVK
Bra ruS
che uSa
NlD
Ice
autauSDeu
Fra
JpN
ItaeSpNZl
ISr
prthuN
chl
SVKpOl
Bra
ruS
IrluKM
Ita
Irl
uKM
Irl
Grc
uKM
chart B1.6. annual expenditure on educational institutions per studentrelative to GDp per capita (2003)
In equivalent US dollars converted using PPPs, by level of education
Note: Please refer to the Reader's Guide for the list of country codes used in this chart.Source: OECD. Tables B1.1a, B1.4 and Annex 2. See Annex 3 for notes (www.oecd.org/edu/eag2006).
tertiary education
Expenditure per student(in equivalent US dollars converted using PPPs)
GDP per capita(in equivalent US dollars converted using PPPs)
Secondary education
primary education
GDP per capita(in equivalent US dollars converted using PPPs)
GDP per capita(in equivalent US dollars converted using PPPs)Expenditure per student
(in equivalent US dollars converted using PPPs)
Expenditure per student(in equivalent US dollars converted using PPPs)
StatLink: http://dx.doi.org/10.1787/717773424252
chapter B Financial and Human ResouRces invested in education
Education at a Glance © OECD 2006182
B1
Educational expenditure per student in relation to GDP per capita
Expenditure on education per student relative to GDP per capita is a spending measure that takes OECD countries’ relative wealth into account. Since education is universal at lower levels, spending on education per student at the lower levels of education relative to GDP per capita can be interpreted as the resources spent on young people relative to a country’s ability to pay. At higher levels of education, this measure is affected by a combination of national income, spending and enrolment rates. At the tertiary level, for example, OECD countries can be relatively high on this measure if a large proportion of their wealth is spent on educating a relatively small number of students.
The relationship between GDP per capita and expenditure per student is multifaceted and complex. Chart B1.6 shows the co-existence of two different relationships between two distinct groups of countries (see ovals in Chart B1.6). Countries with a GDP per capita equivalent to less than USD 25 000 demonstrate a clear positive relationship between spending on education per student and GDP per capita at primary and secondary levels of education (the Czech Republic, Greece, Hungary, Korea, Mexico, New Zealand, Poland, Portugal, the Slovak Republic, Spain and Turkey, and the partner countries Brazil, Chile, Israel and the Russian Federation). Poorer OECD countries tend to spend less per student than richer OECD countries.
By contrast, there is a considerable variation in spending on education per student among OECD countries with a GDP per capita greater than USD 25 000 (see the ovals in Chart B1.6). Finland, France and Japan, for example, are countries with similar levels of GDP per capita that spend very different proportions of their GDP per capita on both the secondary and tertiary levels of education. Thus, the proportion of GDP per capita spent per secondary student in Finland and Japan at 26 % is at the level of the OECD average, while for France (at 30%) the proportion is above average. However, France spends 38% of GDP per capita per tertiary student, whereas Finland and Japan spent 43 and 41% respectively (Table B1.4 and Chart B1.3).
Expenditure on education per student averages 20% of GDP per capita at the primary level, 26% at the secondary level and 43% at the tertiary level (Table B1.4). Countries with low levels of expenditure per student can nevertheless show distributions of investment relative to GDP per capita which are similar to countries with a high level of spending per student. For example, Hungary, Korea, Poland and Portugal – countries with expenditure per student and GDP per capita below the OECD average at primary, secondary and post-secondary non-tertiary level of education – spend more per student relative to GDP per capita than the OECD average. Similarly, Hungary, Mexico and Turkey and the partner country Chile spend more than 56% of GDP per capita on each tertiary-level student, which is among the highest proportions after Canada, Switzerland and the United States which spend respectively 66, 78 and 64 % of GDP per capita on each tertiary-level student. Brazil has the highest proportion, with 127% of GDP per capita spent per each tertiary-level student. However, this high level of expenditure is allocated to a small number of students because only 2% of the students enrolled in all levels of education combined are enrolled at the tertiary level in Brazil (Tables B1.2 and B1.4 and Chart B1.3).
Change in expenditure on education per student between 1995 and 2003
The number of young people in a population influences both the enrolment rate and the amount of resources and organisational effort which a country must invest in its education system.
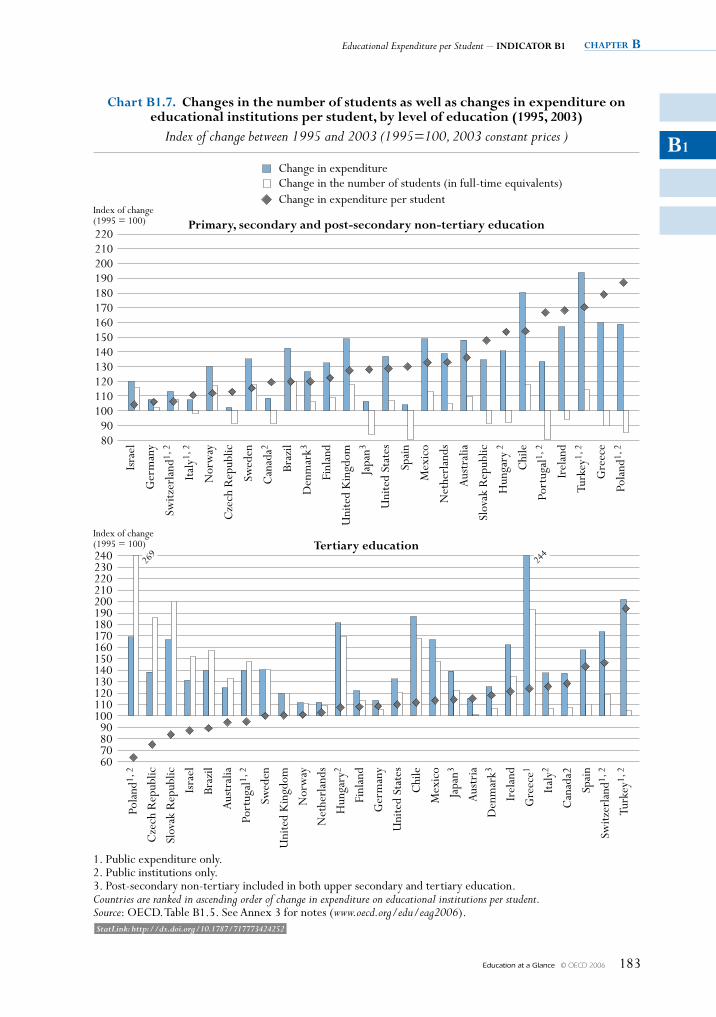
Educational Expenditure per Student – IndIcator B1 chapter B
Education at a Glance © OECD 2006 183
B1
220210200190180170160150140130120110100
9080
Index of change(1995 = 100)
240230220210200190180170160150140130120110100
90807060
Index of change(1995 = 100)
chart B1.7. changes in the number of students as well as changes in expenditure oneducational institutions per student, by level of education (1995, 2003)
Index of change between 1995 and 2003 (1995=100, 2003 constant prices )
Change in expenditureChange in the number of students (in full-time equivalents)Change in expenditure per student
1. Public expenditure only.2. Public institutions only.3. Post-secondary non-tertiary included in both upper secondary and tertiary education.Countries are ranked in ascending order of change in expenditure on educational institutions per student.Source: OECD. Table B1.5. See Annex 3 for notes (www.oecd.org/edu/eag2006).
Isra
el
Ger
man
y
Switz
erla
nd1,
2
Italy
1, 2
Nor
way
Cze
ch R
epub
lic
Swed
en
Can
ada2
Braz
il
Den
mar
k3
Finl
and
Uni
ted
Kin
gdom
Japa
n3
Uni
ted
Stat
es
Spai
n
Mex
ico
Net
herl
ands
Aus
tral
ia
Slov
ak R
epub
lic
Hun
gary
2
Chi
le
Port
ugal
1, 2
Irel
and
Turk
ey1,
2
Gre
ece
Pola
nd1,
2
Primary, secondary and post-secondary non-tertiary education
tertiary education26
924
4
Pola
nd1,
2
Cze
ch R
epub
lic
Slov
ak R
epub
lic
Isra
el
Braz
il
Aus
tral
ia
Port
ugal
1, 2
Swed
en
Uni
ted
Kin
gdom
Nor
way
Net
herl
ands
Hun
gary
2
Finl
and
Ger
man
y
Uni
ted
Stat
es
Chi
le
Mex
ico
Japa
n3
Aus
tria
Den
mar
k3
Irel
and
Gre
ece1
Italy
2
Can
ada2
Spai
n
Switz
erla
nd1,
2
Turk
ey1,
2
StatLink: http://dx.doi.org/10.1787/717773424252
chapter B Financial and Human ResouRces invested in education
Education at a Glance © OECD 2006184
B1
Thus, the size of the youth population in a given country shapes the potential demand for initial education and training. The higher the number of young people, the greater the potential demand for educational services. Table B1.5 and Chart B1.7 show, in absolute terms and at 2003 constant prices, the effects of changes in enrolment and total expenditure between 1995 and 2003 on educational expenditure per student.
Expenditure per primary, secondary and post-secondary non-tertiary student increased in every country between 1995 and 2003. In 16 out of the 26 OECD and partner countries for which data are available, changes exceed 20% between 1995 and 2003 and this increase is of 30% or more in Australia, Greece, Hungary, Ireland, Mexico, the Netherlands, Poland, Portugal, the Slovak Republic, and Turkey, and the partner country Chile. The only countries where the increase in expenditure on education per primary, secondary and post-secondary non-tertiary student is 10% or below for the same period are Germany, Italy and Switzerland, and the partner country Israel. (Table B1.5 and Chart B1.7).
Although institutional arrangements are often slow in adapting to changing demographic conditions, changes in enrolments do not seem to have been the main factor driving changes in expenditure per primary, secondary and post-secondary non-tertiary student. Japan, Poland, Portugal and Spain are exceptions to this pattern, where a drop of more than 10% in enrolments combined with a slight rise in expenditure on education for Japan and Spain, and a sharp spending increase for Poland and Portugal have led to a significant increase in spending on education per student. By contrast, in Greece, Hungary, Ireland, and the Slovak Republic, an increase of more than 30% in education budgets, coupled with a slight decrease in enrolments, has emphasised the increase in spending per primary, secondary and post-secondary non-tertiary student (Table B1.5 and Chart B1.7).
Other exceptions are Mexico, Norway, Sweden, Turkey and the United Kingdom, and the partner countries Brazil, Chile and Israel: the eight OECD and partner countries with the highest increase in the aggregate number of primary, secondary and post-secondary non-tertiary students between 1995 and 2003. In Mexico, Norway, Turkey and the United Kingdom, and partner countries Brazil and Chile, increases in expenditure outpaced rising enrolments, leading to an increase in expenditure per student whereas in partner country Israel, an increase in student numbers was counterbalanced by a similar increase in educational spending (Table B1.5 and Chart B1.7).
The pattern is different at the tertiary level of education. In 7 out of 27 OECD and partner countries for which data are available – Australia, the Czech Republic, Poland, Portugal and the Slovak Republic, and in the partner countries Brazil and Israel – expenditure on tertiary education per student declined between 1995 and 2003. In all of these countries, this decline was mainly the result of a rapid increase (more than 30%) in the number of tertiary students during the same period (Chart B1.7). On the other hand, expenditure per student at the tertiary level rose significantly in Greece, Hungary, Ireland and Mexico, and in the partner country Chile despite a growth in enrolment of 93, 70, 34, 48 and 68%, respectively. Among the 27 OECD and partner countries, Austria, Canada, Denmark, Germany, Italy, the Netherlands and Turkey were the only countries in which the number of tertiary students increased by less than 10% (Table B1.5 and Chart B1.7).
Definitions and methodologies
Data refer to the financial year 2003 and are based on the UOE data collection on education statistics administered by the OECD in 2005 (for details see Annex 3 at www.oecd.org/edu/eag2006). Expenditure on education per student at a particular level of education is calculated by dividing the
Educational Expenditure per Student – INDIcatOr B1 chapter B
Education at a Glance © OECD 2006 185
B1
total expenditure on educational institutions at that level by the corresponding full-time equivalent enrolment. Only those educational institutions and programmes for which both enrolment and expenditure data are available are taken into account. Expenditure in national currency is converted into equivalent US dollars by dividing the national currency figure by the purchasing power parity (PPP) index for GDP. The PPP exchange rate is used because the market exchange rate is affected by many factors (interest rates, trade policies, expectations of economic growth, etc.) that have little to do with current relative domestic purchasing power in different OECD countries (Annex 2 gives further details).
The OECD average is calculated as the simple average over all OECD countries for which data are available. The OECD total reflects the value of the indicator if the OECD region is considered as a whole (see the Reader’s Guide for details).
Table B1.5 shows the changes in expenditure on educational institutions per student between the financial years 1995 and 2003. OECD countries were asked to collect the 1995 data according to the definitions and the coverage of UOE 2005 data collection. All expenditure data, as well as the GDP for 1995, are adjusted to 2003 prices using the GDP price deflator.
Expenditure on education per student relative to GDP per capita is calculated by expressing expenditure on education per student in units of national currency as a percentage of GDP per capita, also in national currency. In cases where the educational expenditure data and the GDP data pertain to different reference periods, the expenditure data are adjusted to the same reference period as the GDP data, using inflation rates for the OECD country in question (see Annex 2).
Expected expenditure over the average duration of tertiary studies (Table B1.3b) is calculated by multiplying current annual expenditure by the typical duration of tertiary studies. The methodology used for the estimation of the typical duration of tertiary studies is described in Annex 3 (www.oecd.org/edu/eag2006). For the estimation of the duration of tertiary education, data are based on a special survey carried out in OECD countries in 2005.
The ranking of OECD countries by annual expenditure on educational services per student is affected by differences in how countries define full-time, part-time and full-time equivalent enrolment. Some OECD countries count every participant at the tertiary level as a full-time student while others determine a student’s intensity of participation by the credits which he or she obtains for successful completion of specific course units during a specified reference period. OECD countries that can accurately account for part-time enrolment will have higher expenditure per full-time equivalent student than OECD countries that cannot differentiate between different modes of student attendance.
Note that data appearing in earlier editions of this publication may not always be comparable to data shown in the 2006 edition due to changes in definitions and coverage that were made as a result of the OECD expenditure comparability study (see Annex 3 at www.oecd.org/edu/eag2006 for details on changes).
Further references
The following additional material relevant to this indicator is available on the Web at http://dx.doi.org/10.1787/717773424252
• Table B1.1d Annual expenditure on educational institutions per student for core services (2003)
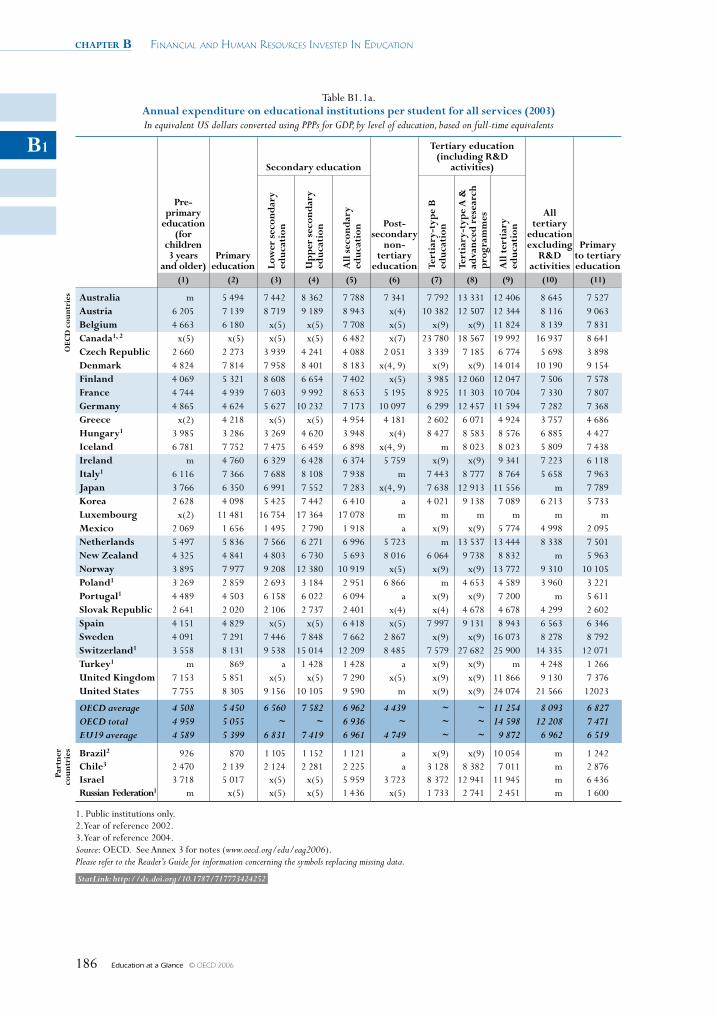
chapter B Financial and Human ResouRces invested in education
Education at a Glance © OECD 2006186
B1
Table B1.1a. annual expenditure on educational institutions per student for all services (2003) In equivalent US dollars converted using PPPs for GDP, by level of education, based on full-time equivalents
pre- primary
education (for
children 3 years
and older)primary
education
Secondary education
post- secondary
non- tertiary
education
tertiary education (including r&D
activities)
all tertiary
education excluding
r&D activities
primary to tertiary educationlo
wer
sec
ond
ary
educ
atio
n
up
per
sec
ond
ary
educ
atio
n
all
sec
ond
ary
educ
atio
n
tert
iary
-typ
e B
ed
ucat
ion
tert
iary
-typ
e a
&
adva
nced
res
earc
h p
rogr
amm
es
all
ter
tiar
y ed
ucat
ion
(1) (2) (3) (4) (5) (6) (7) (8) (9) (10) (11)
Oec
D c
ount
ries australia m 5 494 7 442 8 362 7 788 7 341 7 792 13 331 12 406 8 645 7 527
austria 6 205 7 139 8 719 9 189 8 943 x(4) 10 382 12 507 12 344 8 116 9 063 Belgium 4 663 6 180 x(5) x(5) 7 708 x(5) x(9) x(9) 11 824 8 139 7 831 canada1, 2 x(5) x(5) x(5) x(5) 6 482 x(7) 23 780 18 567 19 992 16 937 8 641 czech republic 2 660 2 273 3 939 4 241 4 088 2 051 3 339 7 185 6 774 5 698 3 898 Denmark 4 824 7 814 7 958 8 401 8 183 x(4, 9) x(9) x(9) 14 014 10 190 9 154 Finland 4 069 5 321 8 608 6 654 7 402 x(5) 3 985 12 060 12 047 7 506 7 578 France 4 744 4 939 7 603 9 992 8 653 5 195 8 925 11 303 10 704 7 330 7 807 Germany 4 865 4 624 5 627 10 232 7 173 10 097 6 299 12 457 11 594 7 282 7 368 Greece x(2) 4 218 x(5) x(5) 4 954 4 181 2 602 6 071 4 924 3 757 4 686 hungary1 3 985 3 286 3 269 4 620 3 948 x(4) 8 427 8 583 8 576 6 885 4 427 Iceland 6 781 7 752 7 475 6 459 6 898 x(4, 9) m 8 023 8 023 5 809 7 438 Ireland m 4 760 6 329 6 428 6 374 5 759 x(9) x(9) 9 341 7 223 6 118 Italy1 6 116 7 366 7 688 8 108 7 938 m 7 443 8 777 8 764 5 658 7 963 Japan 3 766 6 350 6 991 7 552 7 283 x(4, 9) 7 638 12 913 11 556 m 7 789 Korea 2 628 4 098 5 425 7 442 6 410 a 4 021 9 138 7 089 6 213 5 733 luxembourg x(2) 11 481 16 754 17 364 17 078 m m m m m m Mexico 2 069 1 656 1 495 2 790 1 918 a x(9) x(9) 5 774 4 998 2 095 Netherlands 5 497 5 836 7 566 6 271 6 996 5 723 m 13 537 13 444 8 338 7 501 New Zealand 4 325 4 841 4 803 6 730 5 693 8 016 6 064 9 738 8 832 m 5 963 Norway 3 895 7 977 9 208 12 380 10 919 x(5) x(9) x(9) 13 772 9 310 10 105 poland1 3 269 2 859 2 693 3 184 2 951 6 866 m 4 653 4 589 3 960 3 221 portugal1 4 489 4 503 6 158 6 022 6 094 a x(9) x(9) 7 200 m 5 611 Slovak republic 2 641 2 020 2 106 2 737 2 401 x(4) x(4) 4 678 4 678 4 299 2 602 Spain 4 151 4 829 x(5) x(5) 6 418 x(5) 7 997 9 131 8 943 6 563 6 346 Sweden 4 091 7 291 7 446 7 848 7 662 2 867 x(9) x(9) 16 073 8 278 8 792 Switzerland1 3 558 8 131 9 538 15 014 12 209 8 485 7 579 27 682 25 900 14 335 12 071 turkey1 m 869 a 1 428 1 428 a x(9) x(9) m 4 248 1 266 united Kingdom 7 153 5 851 x(5) x(5) 7 290 x(5) x(9) x(9) 11 866 9 130 7 376 united States 7 755 8 305 9 156 10 105 9 590 m x(9) x(9) 24 074 21 566 12023
OECD average 4 508 5 450 6 560 7 582 6 962 4 439 ~ ~ 11 254 8 093 6 827 OECD total 4 959 5 055 ~ ~ 6 936 ~ ~ ~ 14 598 12 208 7 471 EU19 average 4 589 5 399 6 831 7 419 6 961 4 749 ~ ~ 9 872 6 962 6 519
part
ner
coun
trie
s Brazil2 926 870 1 105 1 152 1 121 a x(9) x(9) 10 054 m 1 242 chile3 2 470 2 139 2 124 2 281 2 225 a 3 128 8 382 7 011 m 2 876 Israel 3 718 5 017 x(5) x(5) 5 959 3 723 8 372 12 941 11 945 m 6 436 russian Federation1 m x(5) x(5) x(5) 1 436 x(5) 1 733 2 741 2 451 m 1 600
1. Public institutions only. 2.Year of reference 2002. 3.Year of reference 2004. Source: OECD. See Annex 3 for notes (www.oecd.org/edu/eag2006).Please refer to the Reader’s Guide for information concerning the symbols replacing missing data.
StatLink: http://dx.doi.org/10.1787/717773424252
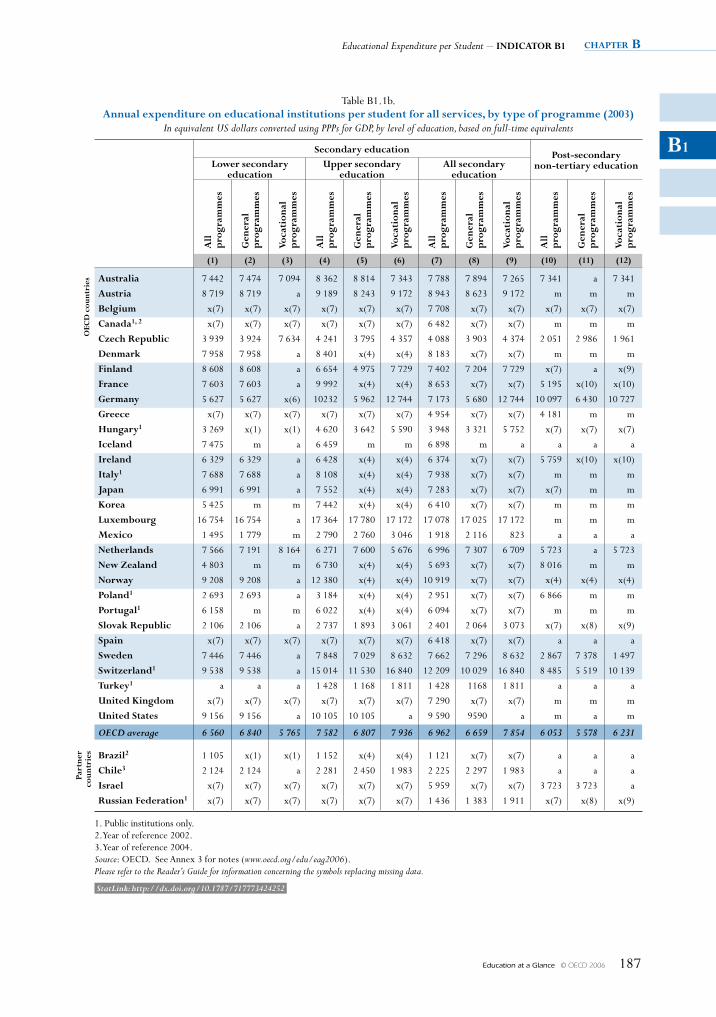
Educational Expenditure per Student – INDIcatOr B1 chapter B
Education at a Glance © OECD 2006 187
B1
Table B1.1b. annual expenditure on educational institutions per student for all services, by type of programme (2003)
In equivalent US dollars converted using PPPs for GDP, by level of education, based on full-time equivalents
Secondary education post-secondary non-tertiary educationlower secondary
educationupper secondary
educationall secondary
education
all
p
rogr
amm
es
Gen
eral
p
rogr
amm
es
Voca
tion
al
pro
gram
mes
all
p
rogr
amm
es
Gen
eral
p
rogr
amm
es
Voca
tion
al
pro
gram
mes
all
p
rogr
amm
es
Gen
eral
p
rogr
amm
es
Voca
tion
al
pro
gram
mes
all
p
rogr
amm
es
Gen
eral
p
rogr
amm
es
Voca
tion
al
pro
gram
mes
(1) (2) (3) (4) (5) (6) (7) (8) (9) (10) (11) (12)
Oec
D c
ount
ries australia 7 442 7 474 7 094 8 362 8 814 7 343 7 788 7 894 7 265 7 341 a 7 341
austria 8 719 8 719 a 9 189 8 243 9 172 8 943 8 623 9 172 m m m
Belgium x(7) x(7) x(7) x(7) x(7) x(7) 7 708 x(7) x(7) x(7) x(7) x(7)
canada1, 2 x(7) x(7) x(7) x(7) x(7) x(7) 6 482 x(7) x(7) m m m
czech republic 3 939 3 924 7 634 4 241 3 795 4 357 4 088 3 903 4 374 2 051 2 986 1 961
Denmark 7 958 7 958 a 8 401 x(4) x(4) 8 183 x(7) x(7) m m m
Finland 8 608 8 608 a 6 654 4 975 7 729 7 402 7 204 7 729 x(7) a x(9)
France 7 603 7 603 a 9 992 x(4) x(4) 8 653 x(7) x(7) 5 195 x(10) x(10)
Germany 5 627 5 627 x(6) 10232 5 962 12 744 7 173 5 680 12 744 10 097 6 430 10 727
Greece x(7) x(7) x(7) x(7) x(7) x(7) 4 954 x(7) x(7) 4 181 m m
hungary1 3 269 x(1) x(1) 4 620 3 642 5 590 3 948 3 321 5 752 x(7) x(7) x(7)
Iceland 7 475 m a 6 459 m m 6 898 m a a a a
Ireland 6 329 6 329 a 6 428 x(4) x(4) 6 374 x(7) x(7) 5 759 x(10) x(10)
Italy1 7 688 7 688 a 8 108 x(4) x(4) 7 938 x(7) x(7) m m m
Japan 6 991 6 991 a 7 552 x(4) x(4) 7 283 x(7) x(7) x(7) m m
Korea 5 425 m m 7 442 x(4) x(4) 6 410 x(7) x(7) m m m
luxembourg 16 754 16 754 a 17 364 17 780 17 172 17 078 17 025 17 172 m m m
Mexico 1 495 1 779 m 2 790 2 760 3 046 1 918 2 116 823 a a a
Netherlands 7 566 7 191 8 164 6 271 7 600 5 676 6 996 7 307 6 709 5 723 a 5 723
New Zealand 4 803 m m 6 730 x(4) x(4) 5 693 x(7) x(7) 8 016 m m
Norway 9 208 9 208 a 12 380 x(4) x(4) 10 919 x(7) x(7) x(4) x(4) x(4)
poland1 2 693 2 693 a 3 184 x(4) x(4) 2 951 x(7) x(7) 6 866 m m
portugal1 6 158 m m 6 022 x(4) x(4) 6 094 x(7) x(7) m m m
Slovak republic 2 106 2 106 a 2 737 1 893 3 061 2 401 2 064 3 073 x(7) x(8) x(9)
Spain x(7) x(7) x(7) x(7) x(7) x(7) 6 418 x(7) x(7) a a a
Sweden 7 446 7 446 a 7 848 7 029 8 632 7 662 7 296 8 632 2 867 7 378 1 497
Switzerland1 9 538 9 538 a 15 014 11 530 16 840 12 209 10 029 16 840 8 485 5 519 10 139
turkey1 a a a 1 428 1 168 1 811 1 428 1168 1 811 a a a
united Kingdom x(7) x(7) x(7) x(7) x(7) x(7) 7 290 x(7) x(7) m m m
united States 9 156 9 156 a 10 105 10 105 a 9 590 9590 a m a m
OECD average 6 560 6 840 5 765 7 582 6 807 7 936 6 962 6 659 7 854 6 053 5 578 6 231
part
ner
coun
trie
s Brazil2 1 105 x(1) x(1) 1 152 x(4) x(4) 1 121 x(7) x(7) a a a
chile3 2 124 2 124 a 2 281 2 450 1 983 2 225 2 297 1 983 a a a
Israel x(7) x(7) x(7) x(7) x(7) x(7) 5 959 x(7) x(7) 3 723 3 723 a
russian Federation1 x(7) x(7) x(7) x(7) x(7) x(7) 1 436 1 383 1 911 x(7) x(8) x(9)
1. Public institutions only. 2.Year of reference 2002. 3.Year of reference 2004. Source: OECD. See Annex 3 for notes (www.oecd.org/edu/eag2006).Please refer to the Reader’s Guide for information concerning the symbols replacing missing data.
StatLink: http://dx.doi.org/10.1787/717773424252
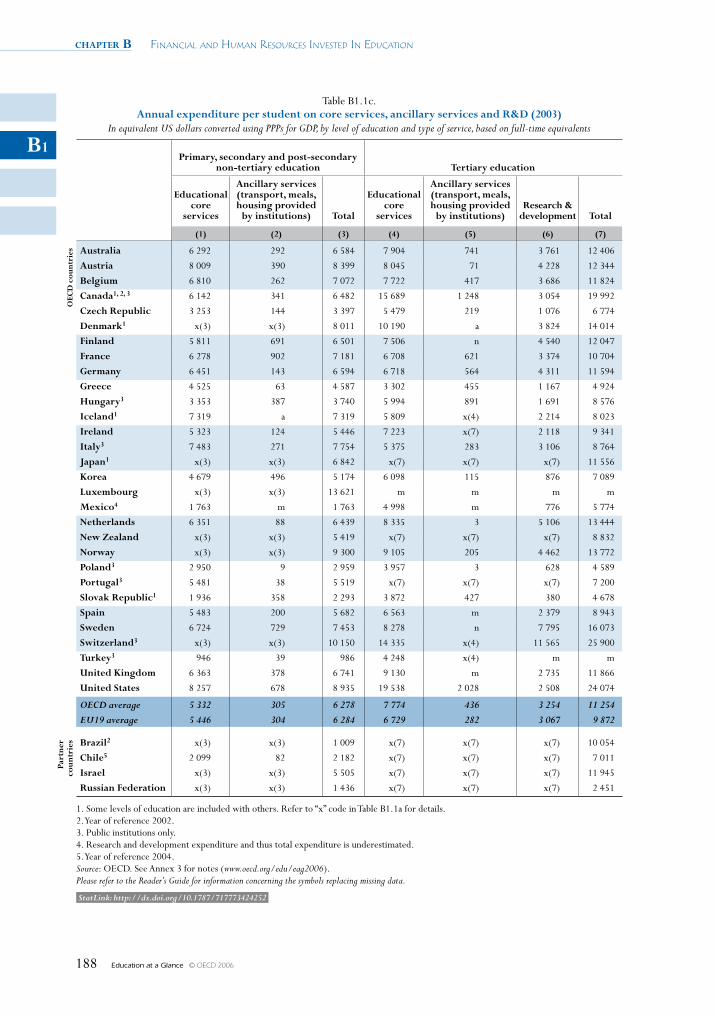
chapter B Financial and Human ResouRces invested in education
Education at a Glance © OECD 2006188
B1
Table B1.1c. annual expenditure per student on core services, ancillary services and r&D (2003)
In equivalent US dollars converted using PPPs for GDP, by level of education and type of service, based on full-time equivalents
primary, secondary and post-secondary non-tertiary education tertiary education
educational core
services
ancillary services (transport, meals, housing provided
by institutions) total
educational core
services
ancillary services (transport, meals, housing provided
by institutions)research &
development total
(1) (2) (3) (4) (5) (6) (7)
Oec
D c
ount
ries australia 6 292 292 6 584 7 904 741 3 761 12 406
austria 8 009 390 8 399 8 045 71 4 228 12 344
Belgium 6 810 262 7 072 7 722 417 3 686 11 824
canada1, 2, 3 6 142 341 6 482 15 689 1 248 3 054 19 992
czech republic 3 253 144 3 397 5 479 219 1 076 6 774
Denmark1 x(3) x(3) 8 011 10 190 a 3 824 14 014
Finland 5 811 691 6 501 7 506 n 4 540 12 047
France 6 278 902 7 181 6 708 621 3 374 10 704
Germany 6 451 143 6 594 6 718 564 4 311 11 594
Greece 4 525 63 4 587 3 302 455 1 167 4 924
hungary3 3 353 387 3 740 5 994 891 1 691 8 576
Iceland1 7 319 a 7 319 5 809 x(4) 2 214 8 023
Ireland 5 323 124 5 446 7 223 x(7) 2 118 9 341
Italy3 7 483 271 7 754 5 375 283 3 106 8 764
Japan1 x(3) x(3) 6 842 x(7) x(7) x(7) 11 556
Korea 4 679 496 5 174 6 098 115 876 7 089
luxembourg x(3) x(3) 13 621 m m m m
Mexico4 1 763 m 1 763 4 998 m 776 5 774
Netherlands 6 351 88 6 439 8 335 3 5 106 13 444
New Zealand x(3) x(3) 5 419 x(7) x(7) x(7) 8 832
Norway x(3) x(3) 9 300 9 105 205 4 462 13 772
poland3 2 950 9 2 959 3 957 3 628 4 589
portugal3 5 481 38 5 519 x(7) x(7) x(7) 7 200
Slovak republic1 1 936 358 2 293 3 872 427 380 4 678
Spain 5 483 200 5 682 6 563 m 2 379 8 943
Sweden 6 724 729 7 453 8 278 n 7 795 16 073
Switzerland3 x(3) x(3) 10 150 14 335 x(4) 11 565 25 900
turkey3 946 39 986 4 248 x(4) m m
united Kingdom 6 363 378 6 741 9 130 m 2 735 11 866
united States 8 257 678 8 935 19 538 2 028 2 508 24 074
OECD average 5 332 305 6 278 7 774 436 3 254 11 254 EU19 average 5 446 304 6 284 6 729 282 3 067 9 872
part
ner
coun
trie
s Brazil2 x(3) x(3) 1 009 x(7) x(7) x(7) 10 054
chile5 2 099 82 2 182 x(7) x(7) x(7) 7 011
Israel x(3) x(3) 5 505 x(7) x(7) x(7) 11 945
russian Federation x(3) x(3) 1 436 x(7) x(7) x(7) 2 451
1. Some levels of education are included with others. Refer to “x” code in Table B1.1a for details.2. Year of reference 2002.3. Public institutions only.4. Research and development expenditure and thus total expenditure is underestimated.5. Year of reference 2004.Source: OECD. See Annex 3 for notes (www.oecd.org/edu/eag2006).Please refer to the Reader’s Guide for information concerning the symbols replacing missing data.
StatLink: http://dx.doi.org/10.1787/717773424252
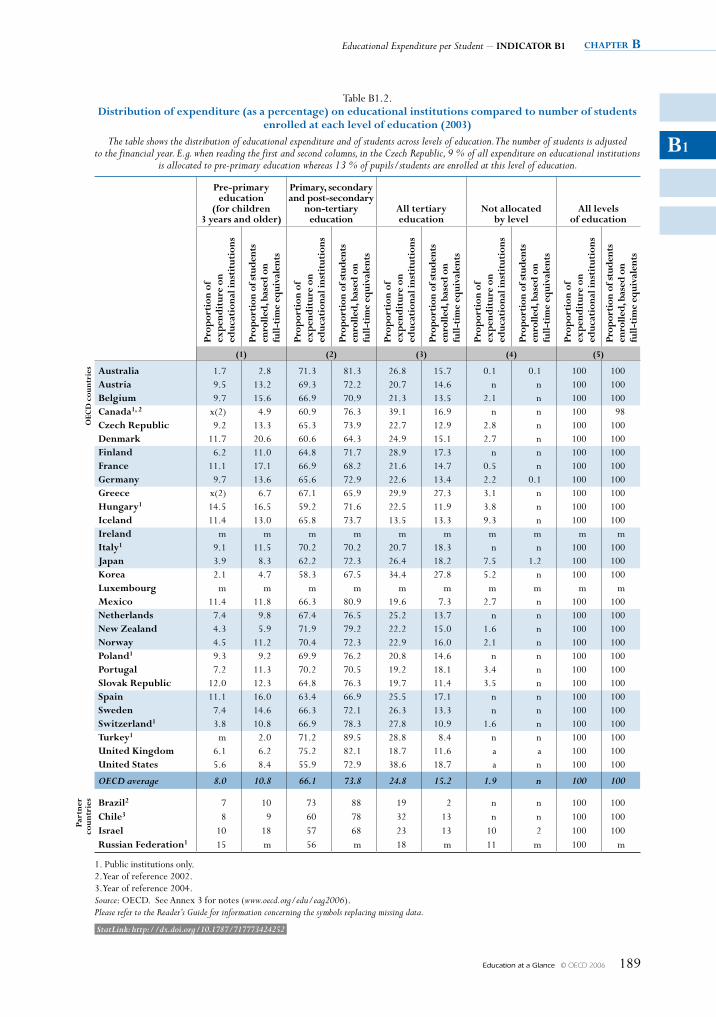
Educational Expenditure per Student – INDIcatOr B1 chapter B
Education at a Glance © OECD 2006 189
B1
Table B1.2. Distribution of expenditure (as a percentage) on educational institutions compared to number of students
enrolled at each level of education (2003) The table shows the distribution of educational expenditure and of students across levels of education. The number of students is adjusted
to the financial year. E.g. when reading the first and second columns, in the Czech Republic, 9 % of all expenditure on educational institutions is allocated to pre-primary education whereas 13 % of pupils/students are enrolled at this level of education.
pre-primary education
(for children 3 years and older)
primary, secondary and post-secondary
non-tertiary education
all tertiary education
Not allocated by level
all levels of education
prop
orti
on o
f ex
pend
itur
e on
ed
ucat
iona
l ins
titu
tion
s
prop
orti
on o
f stu
dent
s en
rolle
d, b
ased
on
fu
ll-ti
me
equi
vale
nts
prop
orti
on o
f ex
pend
itur
e on
ed
ucat
iona
l ins
titu
tion
s
prop
orti
on o
f stu
dent
s en
rolle
d, b
ased
on
fu
ll-ti
me
equi
vale
nts
prop
orti
on o
f ex
pend
itur
e on
ed
ucat
iona
l ins
titu
tion
s
prop
orti
on o
f stu
dent
s en
rolle
d, b
ased
on
fu
ll-ti
me
equi
vale
nts
prop
orti
on o
f ex
pend
itur
e on
ed
ucat
iona
l ins
titu
tion
s
prop
orti
on o
f stu
dent
s en
rolle
d, b
ased
on
fu
ll-ti
me
equi
vale
nts
prop
orti
on o
f ex
pend
itur
e on
ed
ucat
iona
l ins
titu
tion
s
prop
orti
on o
f stu
dent
s en
rolle
d, b
ased
on
fu
ll-ti
me
equi
vale
nts
(1) (2) (3) (4) (5)
Oec
D c
ount
ries australia 1.7 2.8 71.3 81.3 26.8 15.7 0.1 0.1 100 100
austria 9.5 13.2 69.3 72.2 20.7 14.6 n n 100 100Belgium 9.7 15.6 66.9 70.9 21.3 13.5 2.1 n 100 100canada1, 2 x(2) 4.9 60.9 76.3 39.1 16.9 n n 100 98czech republic 9.2 13.3 65.3 73.9 22.7 12.9 2.8 n 100 100Denmark 11.7 20.6 60.6 64.3 24.9 15.1 2.7 n 100 100Finland 6.2 11.0 64.8 71.7 28.9 17.3 n n 100 100France 11.1 17.1 66.9 68.2 21.6 14.7 0.5 n 100 100Germany 9.7 13.6 65.6 72.9 22.6 13.4 2.2 0.1 100 100Greece x(2) 6.7 67.1 65.9 29.9 27.3 3.1 n 100 100hungary1 14.5 16.5 59.2 71.6 22.5 11.9 3.8 n 100 100Iceland 11.4 13.0 65.8 73.7 13.5 13.3 9.3 n 100 100Ireland m m m m m m m m m mItaly1 9.1 11.5 70.2 70.2 20.7 18.3 n n 100 100Japan 3.9 8.3 62.2 72.3 26.4 18.2 7.5 1.2 100 100Korea 2.1 4.7 58.3 67.5 34.4 27.8 5.2 n 100 100luxembourg m m m m m m m m m mMexico 11.4 11.8 66.3 80.9 19.6 7.3 2.7 n 100 100Netherlands 7.4 9.8 67.4 76.5 25.2 13.7 n n 100 100New Zealand 4.3 5.9 71.9 79.2 22.2 15.0 1.6 n 100 100Norway 4.5 11.2 70.4 72.3 22.9 16.0 2.1 n 100 100poland1 9.3 9.2 69.9 76.2 20.8 14.6 n n 100 100portugal 7.2 11.3 70.2 70.5 19.2 18.1 3.4 n 100 100Slovak republic 12.0 12.3 64.8 76.3 19.7 11.4 3.5 n 100 100Spain 11.1 16.0 63.4 66.9 25.5 17.1 n n 100 100Sweden 7.4 14.6 66.3 72.1 26.3 13.3 n n 100 100Switzerland1 3.8 10.8 66.9 78.3 27.8 10.9 1.6 n 100 100turkey1 m 2.0 71.2 89.5 28.8 8.4 n n 100 100united Kingdom 6.1 6.2 75.2 82.1 18.7 11.6 a a 100 100united States 5.6 8.4 55.9 72.9 38.6 18.7 a n 100 100
OECD average 8.0 10.8 66.1 73.8 24.8 15.2 1.9 n 100 100
part
ner
coun
trie
s Brazil2 7 10 73 88 19 2 n n 100 100 chile3 8 9 60 78 32 13 n n 100 100 Israel 10 18 57 68 23 13 10 2 100 100 russian Federation1 15 m 56 m 18 m 11 m 100 m
1. Public institutions only. 2.Year of reference 2002. 3.Year of reference 2004. Source: OECD. See Annex 3 for notes (www.oecd.org/edu/eag2006).Please refer to the Reader’s Guide for information concerning the symbols replacing missing data.
StatLink: http://dx.doi.org/10.1787/717773424252
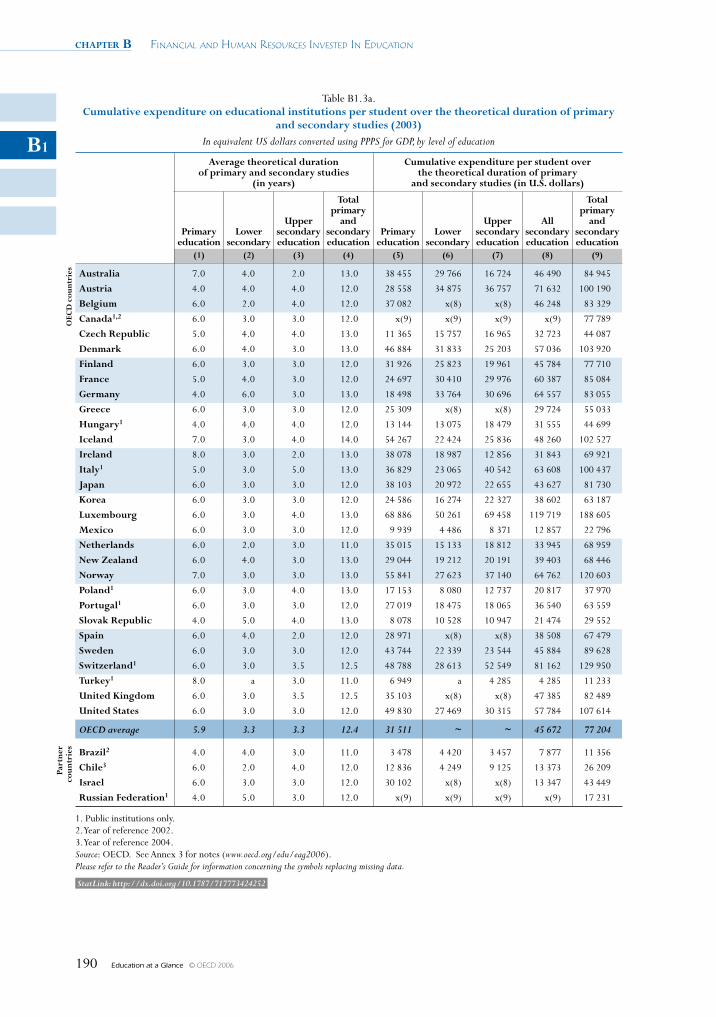
chapter B Financial and Human ResouRces invested in education
Education at a Glance © OECD 2006190
B1
Table B1.3a. cumulative expenditure on educational institutions per student over the theoretical duration of primary
and secondary studies (2003) In equivalent US dollars converted using PPPS for GDP, by level of education
average theoretical duration of primary and secondary studies
(in years)
cumulative expenditure per student over the theoretical duration of primary
and secondary studies (in u.S. dollars)
primary education
lower secondary
upper secondary education
total primary
and secondary education
primary education
lower secondary
upper secondary education
all secondary education
total primary
and secondary education
(1) (2) (3) (4) (5) (6) (7) (8) (9)
Oec
D c
ount
ries australia 7.0 4.0 2.0 13.0 38 455 29 766 16 724 46 490 84 945
austria 4.0 4.0 4.0 12.0 28 558 34 875 36 757 71 632 100 190
Belgium 6.0 2.0 4.0 12.0 37 082 x(8) x(8) 46 248 83 329
canada1,2 6.0 3.0 3.0 12.0 x(9) x(9) x(9) x(9) 77 789
czech republic 5.0 4.0 4.0 13.0 11 365 15 757 16 965 32 723 44 087
Denmark 6.0 4.0 3.0 13.0 46 884 31 833 25 203 57 036 103 920
Finland 6.0 3.0 3.0 12.0 31 926 25 823 19 961 45 784 77 710
France 5.0 4.0 3.0 12.0 24 697 30 410 29 976 60 387 85 084
Germany 4.0 6.0 3.0 13.0 18 498 33 764 30 696 64 557 83 055
Greece 6.0 3.0 3.0 12.0 25 309 x(8) x(8) 29 724 55 033
hungary1 4.0 4.0 4.0 12.0 13 144 13 075 18 479 31 555 44 699
Iceland 7.0 3.0 4.0 14.0 54 267 22 424 25 836 48 260 102 527
Ireland 8.0 3.0 2.0 13.0 38 078 18 987 12 856 31 843 69 921
Italy1 5.0 3.0 5.0 13.0 36 829 23 065 40 542 63 608 100 437
Japan 6.0 3.0 3.0 12.0 38 103 20 972 22 655 43 627 81 730
Korea 6.0 3.0 3.0 12.0 24 586 16 274 22 327 38 602 63 187
luxembourg 6.0 3.0 4.0 13.0 68 886 50 261 69 458 119 719 188 605
Mexico 6.0 3.0 3.0 12.0 9 939 4 486 8 371 12 857 22 796
Netherlands 6.0 2.0 3.0 11.0 35 015 15 133 18 812 33 945 68 959
New Zealand 6.0 4.0 3.0 13.0 29 044 19 212 20 191 39 403 68 446
Norway 7.0 3.0 3.0 13.0 55 841 27 623 37 140 64 762 120 603
poland1 6.0 3.0 4.0 13.0 17 153 8 080 12 737 20 817 37 970
portugal1 6.0 3.0 3.0 12.0 27 019 18 475 18 065 36 540 63 559
Slovak republic 4.0 5.0 4.0 13.0 8 078 10 528 10 947 21 474 29 552
Spain 6.0 4.0 2.0 12.0 28 971 x(8) x(8) 38 508 67 479
Sweden 6.0 3.0 3.0 12.0 43 744 22 339 23 544 45 884 89 628
Switzerland1 6.0 3.0 3.5 12.5 48 788 28 613 52 549 81 162 129 950
turkey1 8.0 a 3.0 11.0 6 949 a 4 285 4 285 11 233
united Kingdom 6.0 3.0 3.5 12.5 35 103 x(8) x(8) 47 385 82 489
united States 6.0 3.0 3.0 12.0 49 830 27 469 30 315 57 784 107 614
OECD average 5.9 3.3 3.3 12.4 31 511 ~ ~ 45 672 77 204
part
ner
coun
trie
s Brazil2 4.0 4.0 3.0 11.0 3 478 4 420 3 457 7 877 11 356
chile3 6.0 2.0 4.0 12.0 12 836 4 249 9 125 13 373 26 209
Israel 6.0 3.0 3.0 12.0 30 102 x(8) x(8) 13 347 43 449
russian Federation1 4.0 5.0 3.0 12.0 x(9) x(9) x(9) x(9) 17 231
1. Public institutions only. 2. Year of reference 2002. 3. Year of reference 2004. Source: OECD. See Annex 3 for notes (www.oecd.org/edu/eag2006).Please refer to the Reader’s Guide for information concerning the symbols replacing missing data.
StatLink: http://dx.doi.org/10.1787/717773424252
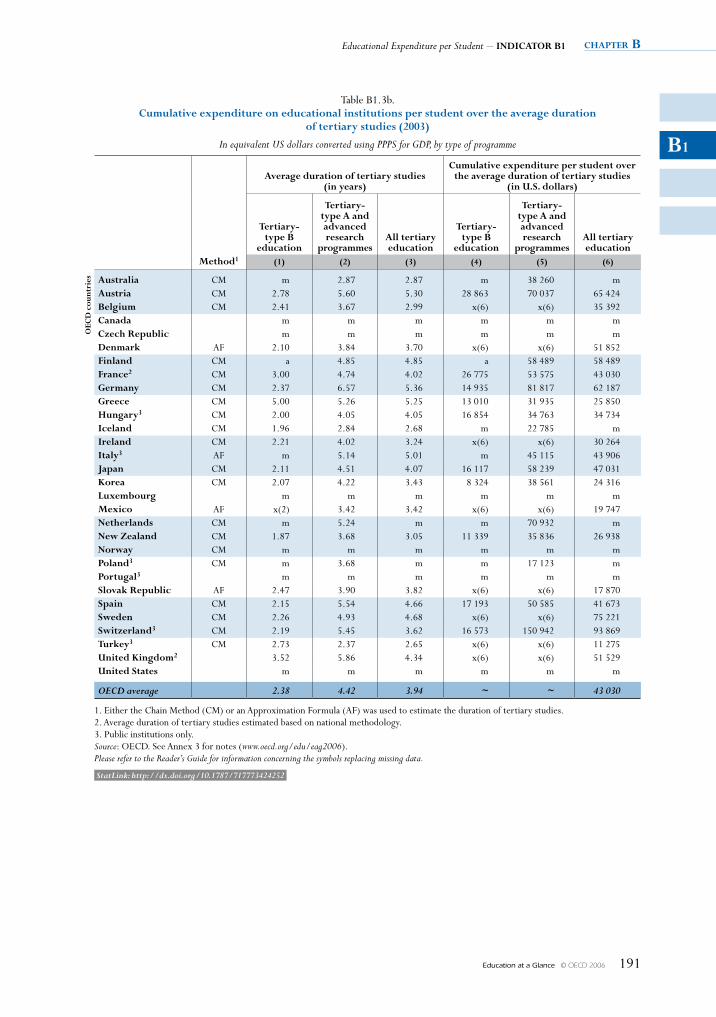
Educational Expenditure per Student – INDIcatOr B1 chapter B
Education at a Glance © OECD 2006 191
B1
Table B1.3b. cumulative expenditure on educational institutions per student over the average duration
of tertiary studies (2003)
In equivalent US dollars converted using PPPS for GDP, by type of programme
Method1
average duration of tertiary studies (in years)
cumulative expenditure per student over the average duration of tertiary studies
(in u.S. dollars)
tertiary- type B
education
tertiary-type a and advanced research
programmesall tertiary education
tertiary- type B
education
tertiary-type a and advanced research
programmesall tertiary education
(1) (2) (3) (4) (5) (6)
Oec
D c
ount
ries australia CM m 2.87 2.87 m 38 260 m
austria CM 2.78 5.60 5.30 28 863 70 037 65 424Belgium CM 2.41 3.67 2.99 x(6) x(6) 35 392canada m m m m m mczech republic m m m m m mDenmark AF 2.10 3.84 3.70 x(6) x(6) 51 852Finland CM a 4.85 4.85 a 58 489 58 489France2 CM 3.00 4.74 4.02 26 775 53 575 43 030Germany CM 2.37 6.57 5.36 14 935 81 817 62 187Greece CM 5.00 5.26 5.25 13 010 31 935 25 850hungary3 CM 2.00 4.05 4.05 16 854 34 763 34 734Iceland CM 1.96 2.84 2.68 m 22 785 mIreland CM 2.21 4.02 3.24 x(6) x(6) 30 264Italy3 AF m 5.14 5.01 m 45 115 43 906Japan CM 2.11 4.51 4.07 16 117 58 239 47 031Korea CM 2.07 4.22 3.43 8 324 38 561 24 316luxembourg m m m m m mMexico AF x(2) 3.42 3.42 x(6) x(6) 19 747Netherlands CM m 5.24 m m 70 932 mNew Zealand CM 1.87 3.68 3.05 11 339 35 836 26 938Norway CM m m m m m mpoland3 CM m 3.68 m m 17 123 mportugal3 m m m m m mSlovak republic AF 2.47 3.90 3.82 x(6) x(6) 17 870Spain CM 2.15 5.54 4.66 17 193 50 585 41 673Sweden CM 2.26 4.93 4.68 x(6) x(6) 75 221Switzerland3 CM 2.19 5.45 3.62 16 573 150 942 93 869turkey3 CM 2.73 2.37 2.65 x(6) x(6) 11 275united Kingdom2 3.52 5.86 4.34 x(6) x(6) 51 529united States m m m m m m
OECD average 2.38 4.42 3.94 ~ ~ 43 030
1. Either the Chain Method (CM) or an Approximation Formula (AF) was used to estimate the duration of tertiary studies. 2. Average duration of tertiary studies estimated based on national methodology.3. Public institutions only. Source: OECD. See Annex 3 for notes (www.oecd.org/edu/eag2006).Please refer to the Reader’s Guide for information concerning the symbols replacing missing data.
StatLink: http://dx.doi.org/10.1787/717773424252
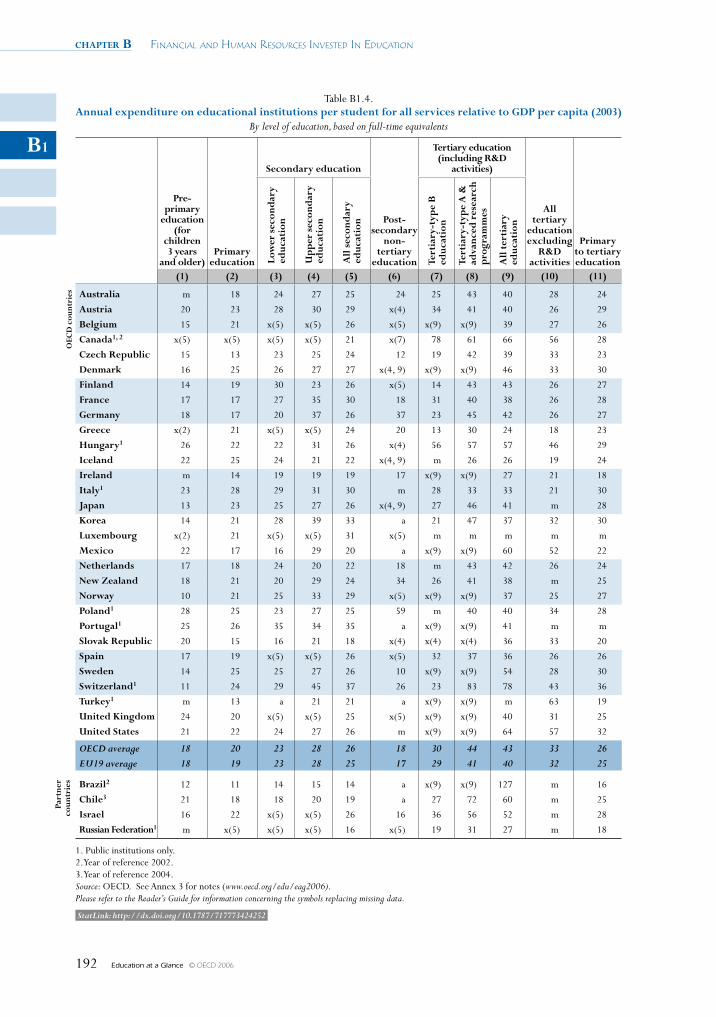
chapter B Financial and Human ResouRces invested in education
Education at a Glance © OECD 2006192
B1
Table B1.4. annual expenditure on educational institutions per student for all services relative to GDp per capita (2003)
By level of education, based on full-time equivalents
pre- primary
education (for
children 3 years
and older)primary
education
Secondary education
post-secondary
non-tertiary
education
tertiary education (including r&D
activities)
all tertiary
education excluding
r&D activities
primary to tertiary educationlo
wer
sec
ond
ary
educ
atio
n
up
per
sec
ond
ary
educ
atio
n
all
sec
ond
ary
educ
atio
n
tert
iary
-typ
e B
ed
ucat
ion
tert
iary
-typ
e a
&
adva
nced
res
earc
h p
rogr
amm
es
all
ter
tiar
y ed
ucat
ion
(1) (2) (3) (4) (5) (6) (7) (8) (9) (10) (11)
Oec
D c
ount
ries australia m 18 24 27 25 24 25 43 40 28 24
austria 20 23 28 30 29 x(4) 34 41 40 26 29
Belgium 15 21 x(5) x(5) 26 x(5) x(9) x(9) 39 27 26
canada1, 2 x(5) x(5) x(5) x(5) 21 x(7) 78 61 66 56 28
czech republic 15 13 23 25 24 12 19 42 39 33 23
Denmark 16 25 26 27 27 x(4, 9) x(9) x(9) 46 33 30
Finland 14 19 30 23 26 x(5) 14 43 43 26 27
France 17 17 27 35 30 18 31 40 38 26 28
Germany 18 17 20 37 26 37 23 45 42 26 27
Greece x(2) 21 x(5) x(5) 24 20 13 30 24 18 23
hungary1 26 22 22 31 26 x(4) 56 57 57 46 29
Iceland 22 25 24 21 22 x(4, 9) m 26 26 19 24
Ireland m 14 19 19 19 17 x(9) x(9) 27 21 18
Italy1 23 28 29 31 30 m 28 33 33 21 30
Japan 13 23 25 27 26 x(4, 9) 27 46 41 m 28
Korea 14 21 28 39 33 a 21 47 37 32 30
luxembourg x(2) 21 x(5) x(5) 31 x(5) m m m m m
Mexico 22 17 16 29 20 a x(9) x(9) 60 52 22
Netherlands 17 18 24 20 22 18 m 43 42 26 24
New Zealand 18 21 20 29 24 34 26 41 38 m 25
Norway 10 21 25 33 29 x(5) x(9) x(9) 37 25 27
poland1 28 25 23 27 25 59 m 40 40 34 28
portugal1 25 26 35 34 35 a x(9) x(9) 41 m m
Slovak republic 20 15 16 21 18 x(4) x(4) x(4) 36 33 20
Spain 17 19 x(5) x(5) 26 x(5) 32 37 36 26 26
Sweden 14 25 25 27 26 10 x(9) x(9) 54 28 30
Switzerland1 11 24 29 45 37 26 23 83 78 43 36
turkey1 m 13 a 21 21 a x(9) x(9) m 63 19
united Kingdom 24 20 x(5) x(5) 25 x(5) x(9) x(9) 40 31 25
united States 21 22 24 27 26 m x(9) x(9) 64 57 32
OECD average 18 20 23 28 26 18 30 44 43 33 26 EU19 average 18 19 23 28 25 17 29 41 40 32 25
part
ner
coun
trie
s Brazil2 12 11 14 15 14 a x(9) x(9) 127 m 16
chile3 21 18 18 20 19 a 27 72 60 m 25
Israel 16 22 x(5) x(5) 26 16 36 56 52 m 28
russian Federation1 m x(5) x(5) x(5) 16 x(5) 19 31 27 m 18
1. Public institutions only. 2.Year of reference 2002. 3.Year of reference 2004. Source: OECD. See Annex 3 for notes (www.oecd.org/edu/eag2006).Please refer to the Reader’s Guide for information concerning the symbols replacing missing data.
StatLink: http://dx.doi.org/10.1787/717773424252
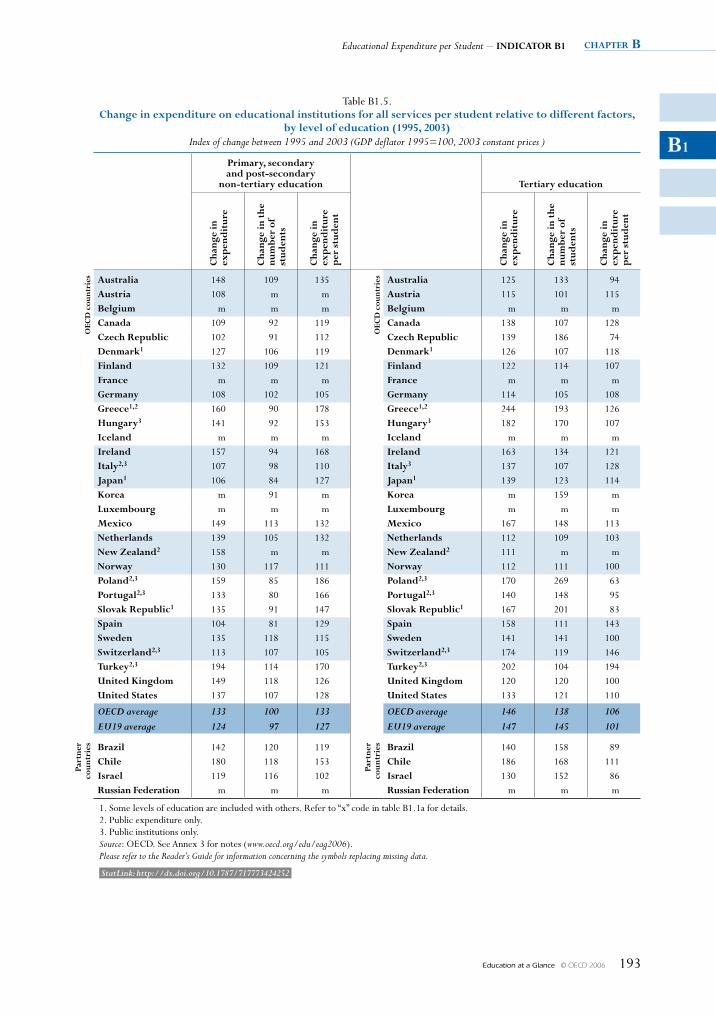
Educational Expenditure per Student – INDIcatOr B1 chapter B
Education at a Glance © OECD 2006 193
B1
Table B1.5. change in expenditure on educational institutions for all services per student relative to different factors,
by level of education (1995, 2003)Index of change between 1995 and 2003 (GDP deflator 1995=100, 2003 constant prices )
primary, secondary and post-secondary
non-tertiary education tertiary education
cha
nge
in
exp
end
itur
e
cha
nge
in t
he
num
ber
of
stud
ents
cha
nge
in
exp
end
itur
e p
er s
tud
ent
cha
nge
in
exp
end
itur
e
cha
nge
in t
he
num
ber
of
stud
ents
cha
nge
in
exp
end
itur
e p
er s
tud
ent
Oec
D c
ount
ries australia 148 109 135
Oec
D c
ount
ries australia 125 133 94
austria 108 m m austria 115 101 115Belgium m m m Belgium m m mcanada 109 92 119 canada 138 107 128czech republic 102 91 112 czech republic 139 186 74Denmark1 127 106 119 Denmark1 126 107 118Finland 132 109 121 Finland 122 114 107France m m m France m m mGermany 108 102 105 Germany 114 105 108Greece1,2 160 90 178 Greece1,2 244 193 126hungary3 141 92 153 hungary3 182 170 107Iceland m m m Iceland m m mIreland 157 94 168 Ireland 163 134 121Italy2,3 107 98 110 Italy3 137 107 128Japan1 106 84 127 Japan1 139 123 114Korea m 91 m Korea m 159 mluxembourg m m m luxembourg m m mMexico 149 113 132 Mexico 167 148 113Netherlands 139 105 132 Netherlands 112 109 103New Zealand2 158 m m New Zealand2 111 m mNorway 130 117 111 Norway 112 111 100poland2,3 159 85 186 poland2,3 170 269 63portugal2,3 133 80 166 portugal2,3 140 148 95Slovak republic1 135 91 147 Slovak republic1 167 201 83Spain 104 81 129 Spain 158 111 143Sweden 135 118 115 Sweden 141 141 100Switzerland2,3 113 107 105 Switzerland2,3 174 119 146turkey2,3 194 114 170 turkey2,3 202 104 194united Kingdom 149 118 126 united Kingdom 120 120 100united States 137 107 128 united States 133 121 110
OECD average 133 100 133 OECD average 146 138 106EU19 average 124 97 127 EU19 average 147 145 101
part
ner
coun
trie
s Brazil 142 120 119
part
ner
coun
trie
s Brazil 140 158 89chile 180 118 153 chile 186 168 111Israel 119 116 102 Israel 130 152 86russian Federation m m m russian Federation m m m
1. Some levels of education are included with others. Refer to “x” code in table B1.1a for details.2. Public expenditure only.3. Public institutions only.Source: OECD. See Annex 3 for notes (www.oecd.org/edu/eag2006).Please refer to the Reader’s Guide for information concerning the symbols replacing missing data.
StatLink: http://dx.doi.org/10.1787/717773424252
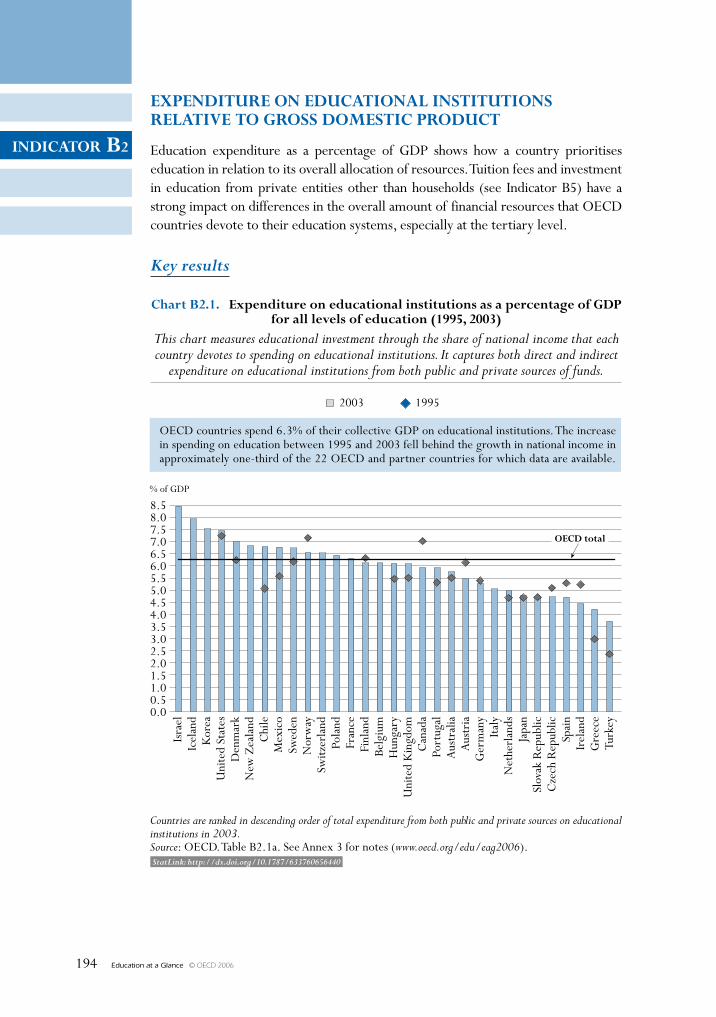
Education at a Glance © OECD 2006194
INDICATOR B2
ExpENDITuRE ON EDuCATIONAl INsTITuTIONs RElATIvE TO GROss DOmEsTIC pRODuCT
Education expenditure as a percentage of GDP shows how a country prioritises education in relation to its overall allocation of resources. Tuition fees and investment in education from private entities other than households (see Indicator B5) have a strong impact on differences in the overall amount of financial resources that OECD countries devote to their education systems, especially at the tertiary level.
Key results
8.58.07.57.06.56.05.55.04.54.03.53.02.52.01.51.00.50.0
% of GDP
Chart B2.1. Expenditure on educational institutions as a percentage of GDpfor all levels of education (1995, 2003)
This chart measures educational investment through the share of national income that eachcountry devotes to spending on educational institutions. It captures both direct and indirect
expenditure on educational institutions from both public and private sources of funds.
2003 1995
Countries are ranked in descending order of total expenditure from both public and private sources on educationalinstitutions in 2003.Source: OECD. Table B2.1a. See Annex 3 for notes (www.oecd.org/edu/eag2006).
Isra
elIc
elan
dK
orea
Uni
ted
Stat
esD
enm
ark
New
Zea
land
Chi
leM
exic
oSw
eden
Nor
way
Switz
erla
ndPo
land
Fran
ceFi
nlan
dBe
lgiu
mH
unga
ryU
nite
d K
ingd
omC
anad
aPo
rtug
alA
ustr
alia
Aus
tria
Ger
man
yIta
lyN
ethe
rlan
dsJa
pan
Slov
ak R
epub
licC
zech
Rep
ublic
Spai
nIr
elan
dG
reec
eTu
rkey
OECD total
OECD countries spend 6.3% of their collective GDP on educational institutions. The increasein spending on education between 1995 and 2003 fell behind the growth in national income inapproximately one-third of the 22 OECD and partner countries for which data are available.
StatLink: http://dx.doi.org/10.1787/633760656440
Education at a Glance © OECD 2006 195
INDICATOR B2
Other highlights of this indicator
• Around two-thirds of expenditure on educational institutions, or 3.9% of the combined GDP in the OECD area, is devoted to primary, secondary and post-secondary non-tertiary education.
• Tertiary education accounts for more than one-quarter of the combined OECD expenditure on educational institutions (1.9% of the combined GDP).
• Canada, Korea and the United States spend 2.4, 2.6 and 2.9% of their GDP respectively on tertiary institutions. These three countries, along with the partner country Chile, show the highest proportions of private expenditure at the tertiary level of education.
• More people are completing upper secondary and tertiary education than ever before, and in many countries the expansion has been accompanied by massive financial investments. In total, expenditure on educational institutions increased in all countries between 1995 and 2003. The increase is usually larger for tertiary education than for the combined primary to post-secondary non-tertiary level of education.
• At the tertiary level of education, over the period 1995-2003, the increase of expenditure is more pronounced from 2000 than before 2000 in half of the countries. Between 2000 and 2003, expenditure increased by more than 30 percentage points in the Czech Republic, Greece, Hungary, Mexico, Poland, the Slovak Republic and Switzerland.
• The size of the school-age population shapes the potential demand for initial education and training and therefore affects expenditure on educational institutions. If the structure of the population in each country were adjusted to the OECD average level, total educational expenditure as a percentage of GDP would be expected to be more than 15% higher in Germany, Italy and Japan, while it would be lower by approximately 30% in Mexico and Turkey. Expenditure at the tertiary level as a percentage of GDP would decrease by 25% in Turkey and increase by up to 18% in Sweden.
chapter B Financial and Human ResouRces invested in education
Education at a Glance © OECD 2006196
B2
Policy context
This indicator provides a measure of the relative proportion of a nation’s wealth that is invested in educational institutions. Expenditure on education is an investment that can help foster economic growth, enhance productivity, contribute to personal and social development, and reduce social inequality. Relative to gross domestic product, expenditure on education shows the priority given to education by each country in terms of allocating its overall resources. The proportion of total financial resources devoted to education is one of the key choices made in each OECD country; this is an aggregate choice made by government, enterprise and individual students and their families. If the social and private returns on investment in education are sufficiently large, there is an incentive for enrolment to expand and total investment to increase.
The indicator also includes a comparative review of changes in educational investment over time. In deciding how much is allocated to education, governments must assess demands for increased spending in areas such as teachers’ salaries and educational facilities. This indicator can provide a point of reference as it shows how the volume of educational spending, relative to the size of national wealth and in absolute terms, has evolved over time in various OECD countries.
Evidence and explanations
What this indicator does and does not cover
This indicator covers expenditure on schools, universities and other public and private institutions involved in delivering or supporting educational services. Expenditure on institutions is not limited to expenditure on instructional services but also includes public and private expenditure on ancillary services for students and families, where these services are provided through educational institutions. At the tertiary level, spending on research and development can also be significant and is included in this indicator, to the extent that the research is performed by educational institutions.
Not all spending on educational goods and services occurs within educational institutions. For example, families may purchase textbooks and materials commercially or seek private tutoring for their children outside educational institutions. At the tertiary level, student living costs and forgone earnings can also account for a significant proportion of the costs of education. All such expenditure outside educational institutions is excluded from this indicator, even if it is publicly subsidised. Public subsidies for educational expenditure outside institutions are discussed in Indicators B4 and B5.
Overall investment relative to GDP
All OECD countries invest a substantial proportion of national resources in education. Taking into account both public and private sources of funds, OECD countries as a whole spend 6.3% of their collective GDP on educational institutions at the pre-primary, primary, secondary and tertiary levels. Under current conditions of tight constraints on public budgets, such a large spending item is subject to close scrutiny by governments looking for ways to reduce or limit the growth of expenditure.
The highest spending on educational institutions can be observed in Denmark, Iceland, Korea and the United States, and the partner country Israel, with at least 7.0% of GDP accounted for
Expenditure on Educational Institutions Relative to Gross Domestic Product – INDICATOR B2 chapter B
Education at a Glance © OECD 2006 197
B2
by public and private spending on educational institutions, followed by Mexico, New Zealand, Norway, Sweden and Switzerland, and the partner country Chile with more than 6.5%. Seven out of 29 OECD countries for which data are available, however, spend less than 5% of GDP on educational institutions, and in Greece, Ireland and Turkey this figure is only between 3.7 and 4.5% (Table B2.1a).
The national resources devoted to education depend on a number of interrelated factors of supply and demand. For example, OECD countries with high spending levels may be enrolling larger numbers of students, while countries with low spending levels may either be limiting access to higher levels of education or delivering educational services in a particularly efficient manner. The distribution of enrolment among sectors and fields of study may also differ, as may the duration of studies and the scale and organisation of related educational research. Finally, large differences in GDP among OECD countries imply that similar percentages of GDP spent on education can translate into very different absolute amounts per student (see Indicator B1).
Expenditure on educational institutions by level of education
Differences in spending on educational institutions are most striking at the pre-primary level of education. Here, spending ranges from less than 0.1% of GDP in Australia to 0.8% or more in Denmark, Hungary, Iceland and Mexico, and the partner country Israel (Table B2.1c). Differences at the pre-primary level can be explained mainly by participation rates among younger children (see Indicator C1), but are also sometimes a result of the extent to which private early childhood education is covered by this indicator. In Ireland, for example, the majority of early childhood education is delivered in private institutions that are not yet covered in the Irish data collection. Moreover, high-quality early childhood education and care are not only provided by the educational institutions covered by this indicator but often also in more informal settings. Inferences on access to and quality of early childhood education and care should therefore be made with caution.
On average, among OECD countries, around two-thirds of expenditure on educational institutions is devoted to primary, secondary and post-secondary non-tertiary education. Because enrolment in primary and lower secondary education is almost universal in OECD countries, and participation rates in upper secondary education are high (see Indicators C1 and C2), these levels account for the bulk of expenditure on educational institutions: 3.9% of the combined OECD GDP (Chart B2.2). At the same time, significantly higher spending on education per student at the upper secondary and tertiary levels causes the overall investment in these levels to be higher than enrolment numbers alone would suggest.
More than one-quarter of combined OECD expenditure on educational institutions is accounted for by tertiary education. At this level of education, pathways available to students, programme durations and the organisation of teaching vary greatly among OECD countries, leading to greater differences in the level of expenditure allocated to tertiary education. On the one hand, Korea and the United States spend respectively 2.6 and 2.9% of their GDP on tertiary institutions and these two countries are also two of the three countries with the highest proportion of private expenditure on tertiary education. Canada, Denmark, Finland and Sweden, as well as the partner countries Chile and Israel, also show high levels of spending, with 1.8% or more of GDP devoted to tertiary institutions. On the other hand, the proportion of GDP spent on
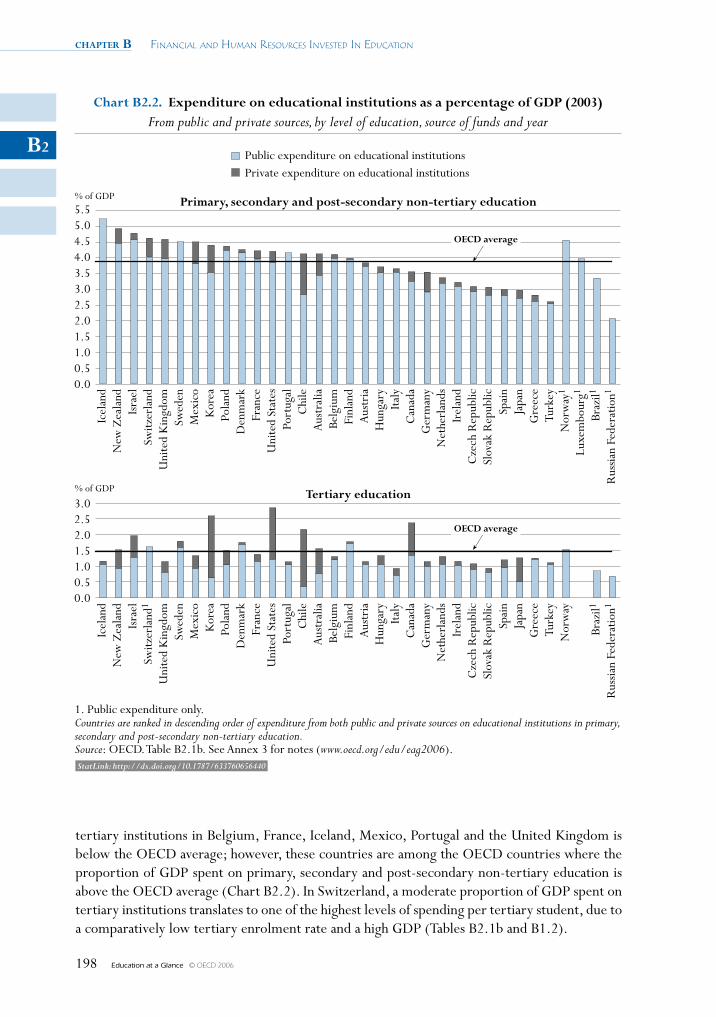
chapter B Financial and Human ResouRces invested in education
Education at a Glance © OECD 2006198
B2
tertiary institutions in Belgium, France, Iceland, Mexico, Portugal and the United Kingdom is below the OECD average; however, these countries are among the OECD countries where the proportion of GDP spent on primary, secondary and post-secondary non-tertiary education is above the OECD average (Chart B2.2). In Switzerland, a moderate proportion of GDP spent on tertiary institutions translates to one of the highest levels of spending per tertiary student, due to a comparatively low tertiary enrolment rate and a high GDP (Tables B2.1b and B1.2).
5.55.04.54.03.53.02.52.01.51.00.50.0
% of GDP
3.02.52.01.51.00.50.0
% of GDP
Chart B2.2. Expenditure on educational institutions as a percentage of GDp (2003)From public and private sources, by level of education, source of funds and year
Public expenditure on educational institutionsPrivate expenditure on educational institutions
1. Public expenditure only.Countries are ranked in descending order of expenditure from both public and private sources on educational institutions in primary,secondary and post-secondary non-tertiary education.Source: OECD. Table B2.1b. See Annex 3 for notes (www.oecd.org/edu/eag2006).
primary, secondary and post-secondary non-tertiary education
Tertiary education
OECD average
OECD average
Icel
and
New
Zea
land
Isra
elSw
itzer
land
Uni
ted
Kin
gdom
Swed
enM
exic
oK
orea
Pola
ndD
enm
ark
Fran
ceU
nite
d St
ates
Port
ugal
Chi
leA
ustr
alia
Belg
ium
Finl
and
Aus
tria
Hun
gary
Italy
Can
ada
Ger
man
yN
ethe
rlan
dsIr
elan
dC
zech
Rep
ublic
Slov
ak R
epub
licSp
ain
Japa
nG
reec
eTu
rkey
Nor
way
1
Luxe
mbo
urg1
Braz
il1
Rus
sian
Fede
ratio
n1
Icel
and
New
Zea
land
Isra
elSw
itzer
land
1
Uni
ted
Kin
gdom
Swed
enM
exic
oK
orea
Pola
ndD
enm
ark
Fran
ceU
nite
d St
ates
Port
ugal
Chi
leA
ustr
alia
Belg
ium
Finl
and
Aus
tria
Hun
gary
Italy
Can
ada
Ger
man
yN
ethe
rlan
dsIr
elan
dC
zech
Rep
ublic
Slov
ak R
epub
licSp
ain
Japa
nG
reec
eTu
rkey
Nor
way
Luxe
mbo
urg
Braz
il1
Rus
sian
Fede
ratio
n1
StatLink: http://dx.doi.org/10.1787/633760656440
Expenditure on Educational Institutions Relative to Gross Domestic Product – INDICATOR B2 chapter B
Education at a Glance © OECD 2006 199
B2
Changes in overall educational spending between 1995 and 2003
More people are completing upper secondary and tertiary education than ever before (see Indicator A1), and in many countries, this expansion has been accompanied by massive financial investment. In the 18 OECD countries for which comparable trend data are available for all levels of education combined, public and private investment in education increased by 7% or more between 1995 and 2003 in real terms. Australia, Denmark, Finland, the Netherlands, the Slovak Republic, Sweden, the United Kingdom and the United States increased expenditure on education by 30 to 50% while Hungary, Ireland and Mexico increased spending by more than 50%. The trend is similar when public investment is considered separately: public expenditure on educational institutions rose by 6% or more in all the 24 OECD countries for which data are available between 1995 and 2003 for all levels of education combined. Of the OECD countries for which no data on private spending are available – Greece, Italy, New Zealand, Poland, Portugal, Switzerland and Turkey – all except Italy showed an increase in public spending on educational institutions of over 25% (Table B2.2).
Countries vary in the levels of education at which spending has increased over the period 1995 to 2003, but in most countries, expenditure in tertiary education increased in higher proportions compared to primary, secondary and post-secondary non-tertiary education. Denmark, Finland and the United States – OECD countries with a comparably high increase (about 30%) in absolute spending on educational institutions between 1995 and 2003 for all levels of education combined – as well as Austria, Germany, Ireland, Sweden and Turkey invested additional resources in similar proportions in primary, secondary and post-secondary non-tertiary and tertiary education combined (Table B2.2). Australia, the Netherlands, New Zealand, Norway and the United Kingdom invested most of the increases between 1995 and 2003 in primary, secondary and post-secondary non-tertiary education. Conversely, in Canada, the Czech Republic, Greece, Hungary, Japan, the Slovak Republic, Spain and Switzerland, increases in spending on tertiary education surpassed increases at the primary, secondary and post-secondary non-tertiary levels by more than 20 percentage points (Table B2.3).
During the period 1995 to 2003, the variation of expenditure on educational institutions was not necessarily constant over time – whether for all levels of education combined or for each level of education considered separately. Across OECD countries, the increase of expenditure for all levels of education is greater before 2000 than from 2000 in nearly two-thirds of the countries with available data. This does not solely result from the difference in the length of time over which the variation is measured, as the average annual variation is larger over the period 1995 to 2000 than over the period 2000 to 2003 for more than one-third of the countries. This slower growth of expenditure for 2000 to 2003 is particularly marked in Denmark, Portugal, Sweden and Turkey. The reverse pattern is true for the Czech Republic, Hungary, Mexico, the Slovak Republic and the United Kingdom (Table B2.3 and Chart B2.3a).
Over the period 1995 to 2003, spending on the various levels of education evolved quite differently. Expenditure on primary to post-secondary non-tertiary education follow the same trends as for all levels of education combined. At the tertiary level, however, the increase is more pronounced from 2000 than before 2000 in more than half of the countries (and in two-thirds of the countries if based on the average annual variation). The increase of expenditure is more marked from 2000 than before 2000 particularly in the Czech Republic, Greece, New Zealand, Norway,
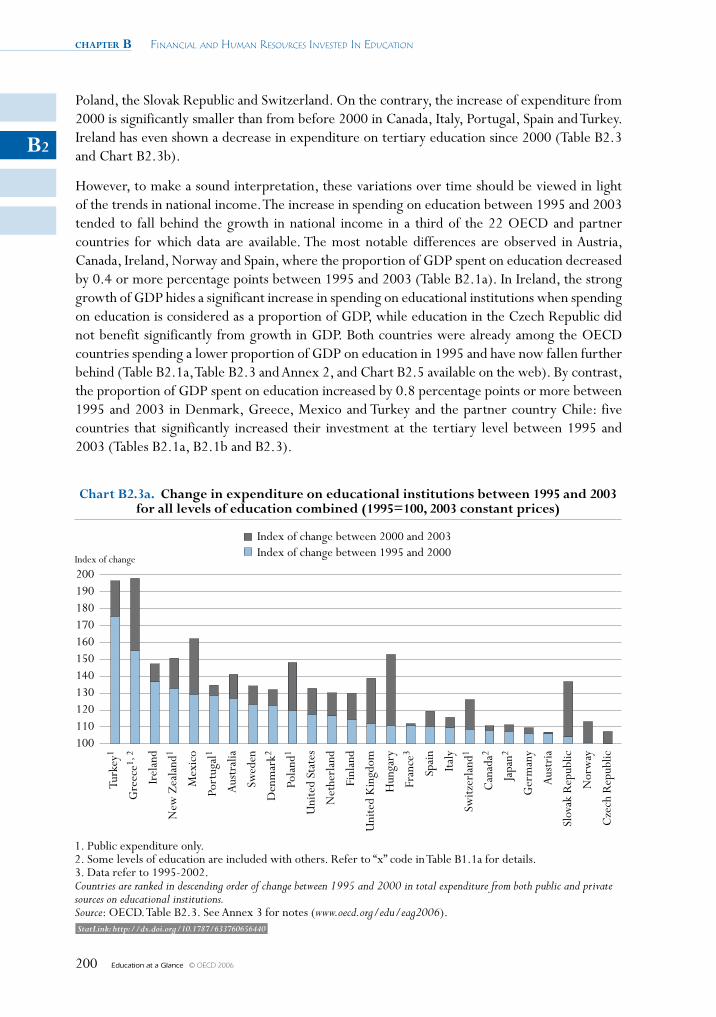
chapter B Financial and Human ResouRces invested in education
Education at a Glance © OECD 2006200
B2
Poland, the Slovak Republic and Switzerland. On the contrary, the increase of expenditure from 2000 is significantly smaller than from before 2000 in Canada, Italy, Portugal, Spain and Turkey. Ireland has even shown a decrease in expenditure on tertiary education since 2000 (Table B2.3 and Chart B2.3b).
However, to make a sound interpretation, these variations over time should be viewed in light of the trends in national income. The increase in spending on education between 1995 and 2003 tended to fall behind the growth in national income in a third of the 22 OECD and partner countries for which data are available. The most notable differences are observed in Austria, Canada, Ireland, Norway and Spain, where the proportion of GDP spent on education decreased by 0.4 or more percentage points between 1995 and 2003 (Table B2.1a). In Ireland, the strong growth of GDP hides a significant increase in spending on educational institutions when spending on education is considered as a proportion of GDP, while education in the Czech Republic did not benefit significantly from growth in GDP. Both countries were already among the OECD countries spending a lower proportion of GDP on education in 1995 and have now fallen further behind (Table B2.1a, Table B2.3 and Annex 2, and Chart B2.5 available on the web). By contrast, the proportion of GDP spent on education increased by 0.8 percentage points or more between 1995 and 2003 in Denmark, Greece, Mexico and Turkey and the partner country Chile: five countries that significantly increased their investment at the tertiary level between 1995 and 2003 (Tables B2.1a, B2.1b and B2.3).
200190180170160150140130120110100
Index of change
Chart B2.3a. Change in expenditure on educational institutions between 1995 and 2003for all levels of education combined (1995=100, 2003 constant prices)
Index of change between 2000 and 2003Index of change between 1995 and 2000
1. Public expenditure only.2. Some levels of education are included with others. Refer to “x” code in Table B1.1a for details.3. Data refer to 1995-2002.Countries are ranked in descending order of change between 1995 and 2000 in total expenditure from both public and privatesources on educational institutions.Source: OECD. Table B2.3. See Annex 3 for notes (www.oecd.org/edu/eag2006).
Turk
ey1
Gre
ece1,
2
Irel
and
New
Zea
land
1
Mex
ico
Port
ugal
1
Aus
tral
ia
Swed
en
Den
mar
k2
Pola
nd1
Uni
ted
Stat
es
Net
herl
and
Finl
and
Uni
ted
Kin
gdom
Hun
gary
Fran
ce3
Spai
n
Italy
Switz
erla
nd1
Can
ada2
Japa
n2
Ger
man
y
Aus
tria
Slov
ak R
epub
lic
Nor
way
Cze
ch R
epub
lic
StatLink: http://dx.doi.org/10.1787/633760656440
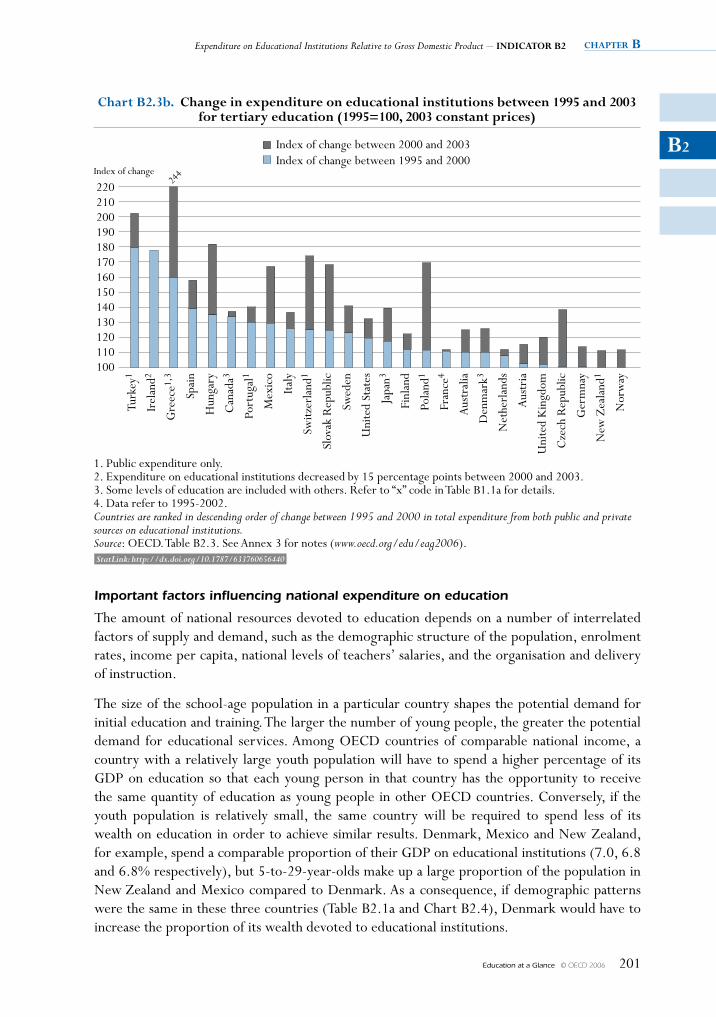
Expenditure on Educational Institutions Relative to Gross Domestic Product – INDICATOR B2 chapter B
Education at a Glance © OECD 2006 201
B2
Important factors influencing national expenditure on education
The amount of national resources devoted to education depends on a number of interrelated factors of supply and demand, such as the demographic structure of the population, enrolment rates, income per capita, national levels of teachers’ salaries, and the organisation and delivery of instruction.
The size of the school-age population in a particular country shapes the potential demand for initial education and training. The larger the number of young people, the greater the potential demand for educational services. Among OECD countries of comparable national income, a country with a relatively large youth population will have to spend a higher percentage of its GDP on education so that each young person in that country has the opportunity to receive the same quantity of education as young people in other OECD countries. Conversely, if the youth population is relatively small, the same country will be required to spend less of its wealth on education in order to achieve similar results. Denmark, Mexico and New Zealand, for example, spend a comparable proportion of their GDP on educational institutions (7.0, 6.8 and 6.8% respectively), but 5-to-29-year-olds make up a large proportion of the population in New Zealand and Mexico compared to Denmark. As a consequence, if demographic patterns were the same in these three countries (Table B2.1a and Chart B2.4), Denmark would have to increase the proportion of its wealth devoted to educational institutions.
244
220210200190180170160150140130120110100
Index of change
Chart B2.3b. Change in expenditure on educational institutions between 1995 and 2003for tertiary education (1995=100, 2003 constant prices)
Index of change between 2000 and 2003Index of change between 1995 and 2000
1. Public expenditure only.2. Expenditure on educational institutions decreased by 15 percentage points between 2000 and 2003.3. Some levels of education are included with others. Refer to “x” code in Table B1.1a for details.4. Data refer to 1995-2002.Countries are ranked in descending order of change between 1995 and 2000 in total expenditure from both public and privatesources on educational institutions.Source: OECD. Table B2.3. See Annex 3 for notes (www.oecd.org/edu/eag2006).
Turk
ey1
Irel
and2
Gre
ece1,
3
Spai
n
Hun
gary
Can
ada3
Port
ugal
1
Mex
ico
Italy
Switz
erla
nd1
Slov
ak R
epub
lic
Swed
en
Uni
ted
Stat
es
Japa
n3
Finl
and
Pola
nd1
Fran
ce4
Aus
tral
ia
Den
mar
k3
Net
herl
ands
Aus
tria
Uni
ted
Kin
gdom
Cze
ch R
epub
lic
Ger
mna
y
New
Zea
land
1
Nor
way
StatLink: http://dx.doi.org/10.1787/633760656440
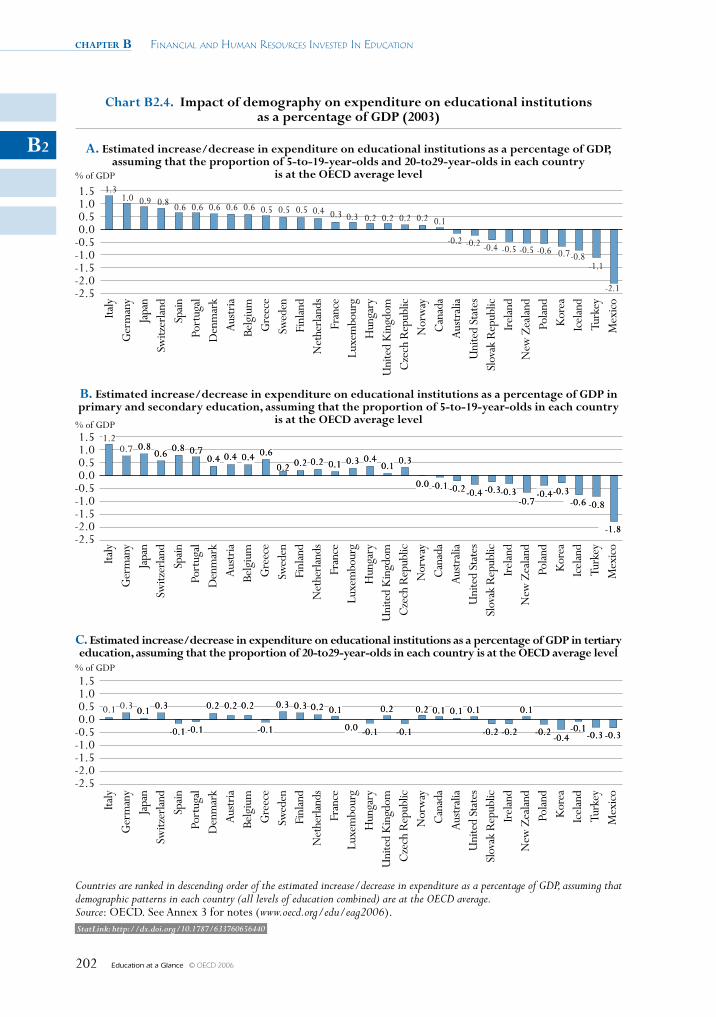
chapter B Financial and Human ResouRces invested in education
Education at a Glance © OECD 2006202
B2
% of GDP
% of GDP
0.30.7
1.20.7 0.8
0.6 0.80.4 0.4 0.4 0.6
0.2 0.2 0.2 0.1 0.3 0.40.1
0.0 -0.1 -0.2-0.4 -0.3-0.3-0.7
-0.4-0.3-0.6 -0.8
-1.8
% of GDP
0.10.10.2 0.10.20.10.30.1 0.3 0.1 0.3
-0.1 -0.1
0.2 0.20.2 0.3
-0.1
0.2
0.0 -0.1 -0.1
0.1
-0.2 -0.2 -0.2-0.4
-0.1-0.3 -0.3
-0.5
0.50.50.9
1.31.0 0.8 0.6 0.6 0.6 0.6 0.6 0.5 0.4 0.3 0.3 0.2 0.2 0.2 0.2 0.1
-0.2 -0.2 -0.4 -0.5 -0.6
-1.1
-2.1
1.51.00.50.0
-0.5-1.0-1.5-2.0-2.5
1.51.00.50.0
-0.5-1.0-1.5-2.0-2.5
-0.7-0.8
1.51.00.50.0
-0.5-1.0-1.5-2.0-2.5
Chart B2.4. Impact of demography on expenditure on educational institutionsas a percentage of GDp (2003)
Countries are ranked in descending order of the estimated increase/decrease in expenditure as a percentage of GDP, assuming thatdemographic patterns in each country (all levels of education combined) are at the OECD average.Source: OECD. See Annex 3 for notes (www.oecd.org/edu/eag2006).
A. Estimated increase/decrease in expenditure on educational institutions as a percentage of GDp,assuming that the proportion of 5-to-19-year-olds and 20-to29-year-olds in each country
is at the OECD average level
B. Estimated increase/decrease in expenditure on educational institutions as a percentage of GDp inprimary and secondary education, assuming that the proportion of 5-to-19-year-olds in each country
is at the OECD average level
C. Estimated increase/decrease in expenditure on educational institutions as a percentage of GDp in tertiaryeducation, assuming that the proportion of 20-to29-year-olds in each country is at the OECD average level
Italy
Ger
man
yJa
pan
Switz
erla
ndSp
ainPo
rtug
alD
enm
ark
Aust
riaBe
lgiu
mG
reec
eSw
eden
Finl
and
Net
herla
nds
Fran
ceLu
xem
bour
gH
unga
ryU
nite
d K
ingd
omC
zech
Rep
ublic
Nor
way
Can
ada
Aust
ralia
Uni
ted
Stat
esSl
ovak
Rep
ublic
Irel
and
New
Zea
land
Pola
ndK
orea
Icel
and
Turk
eyM
exic
o
StatLink: http://dx.doi.org/10.1787/633760656440
Expenditure on Educational Institutions Relative to Gross Domestic Product – INDICATOR B2 chapter B
Education at a Glance © OECD 2006 203
B2
In order to show the effect of demography on educational expenditure, Chart B2.4 presents the variation in expenditure as a percentage of GDP if the structure of the population in each country were adjusted to the OECD average level. The impact of such a demographic change on educational expenditure varies according to the extent of the difference in the proportion of youth in the population between a specific country and the OECD average level.
In Germany, Italy and Japan, countries among those with the lowest proportion of 5-to-29-year-olds in the total population, educational expenditure as a percentage of GDP would be expected to rise by more than 15% (increases of 1.0, 1.3 and 0.9 percentage points of GDP respectively) if the relative size of the youth population were at the level of the OECD average. In Mexico and Turkey, by contrast, expenditure on education would be expected to decrease by about 30% (decrease of 2.1 and 1.1 percentage points of GDP) if the proportion of 5-to-29-year-olds were at the level of the OECD average. In countries with a proportion of youth population close to the OECD average level, the expenditure on educational institutions would change very slightly. This is the case of Canada and Australia for example (Chart B2.4).
As the proportion of the population enrolled in tertiary education is smaller than the proportion of the population enrolled in primary, secondary and post-secondary non-tertiary education (and is quite small whatever the country) the demographic change depicted here would be expected to mainly affect expenditure at the primary to post-secondary non-tertiary level rather than expenditure at the tertiary level. Chart B2.4 confirms this pattern: expenditure on educational institutions in tertiary education as a percentage of GDP would increase or decrease by a maximum of 0.4 percentage points. However, these changes can still represent a decrease of as much as 25% of expenditure at the tertiary level (Turkey) or an increase of as much as 18% (Sweden).
Definitions and methodologies
Data refer to the financial year 2003 and are based on the UOE data collection on education statistics administered by the OECD in 2005 (for details see Annex 3 at www.oecd.org/edu/eag2006). Expenditure on educational institutions, as covered by this indicator, includes expenditure on both instructional and non-instructional educational institutions. Instructional educational institutions are educational institutions which directly provide instructional programmes (i.e. teaching) to individuals in an organised group setting or through distance education. Business enterprises or other institutions providing short-term courses of training or instruction to individuals on a one-to-one basis are not included. Non-instructional educational institutions provide administrative, advisory or professional services to other educational institutions, although they do not enrol students themselves. Examples include national, state and provincial ministries or departments of education; other bodies that administer education at various levels of government or analogous bodies in the private sector: and organisations that provide such education-related services as vocational or psychological counselling, placement, testing, financial aid to students, curriculum development, educational research, building operations and maintenance services, transportation of students, and student meals and housing.
This broad definition of institutions ensures that expenditure on services, which are provided in some OECD countries by schools and universities and in others by agencies other than schools, are covered on a comparable basis.
chapter B Financial and Human ResouRces invested in education
Education at a Glance © OECD 2006204
B2
The distinction by source of funds is based on the initial source of funds and does not reflect subsequent public-to-private or private-to-public transfers. For this reason, subsidies to households and other entities, such as subsidies for tuition fees and other payments to educational institutions, are included in public expenditure in this indicator. Payments from households and other private entities to educational institutions include tuition and other fees, net of offsetting public subsidies. A detailed discussion of public subsidies can be found in Indicator B5.
The OECD average is calculated as the simple average of all OECD countries for which data are available. The OECD total reflects the value of the indicator if the OECD region is considered as a whole (see the Reader’s Guide for details).
Tables B2.1a, B2.1b and B2.2 show expenditure on educational institutions for the financial year 1995. The data on expenditure for 1995 were obtained by a special survey in 2002 and updated in 2003; expenditure for 1995 was adjusted to methods and definitions used in the 2003 UOE data collection.
Data for 1995 are expressed in 2003 price levels. Charts B2.1, B2.3a and B2.3b and Tables B2.2 and B2.3 present an index of change in expenditure on institutions and GDP between 1995 and 2003. All expenditure, as well as 1995 GDP, is adjusted to 2003 prices using the GDP deflator.
For comparisons over time, the OECD average accounts only for those OECD countries for which data are available for all reported reference years.
Note that data appearing in earlier editions of this publication may not always be comparable to data shown in the 2006 edition due to changes in definitions and coverage that were made as a result of the OECD expenditure comparability study (for details on changes, see Annex 3 at www.oecd.org/edu/eag2006).
Further references
The following additional information relevant to this indicator is available on the Web athttp://dx.doi.org/10.1787/633760656440
• Chart B2.5. Changes in expenditure on educational insitutions from public and private sources and changes in GDP (1995, 2003)
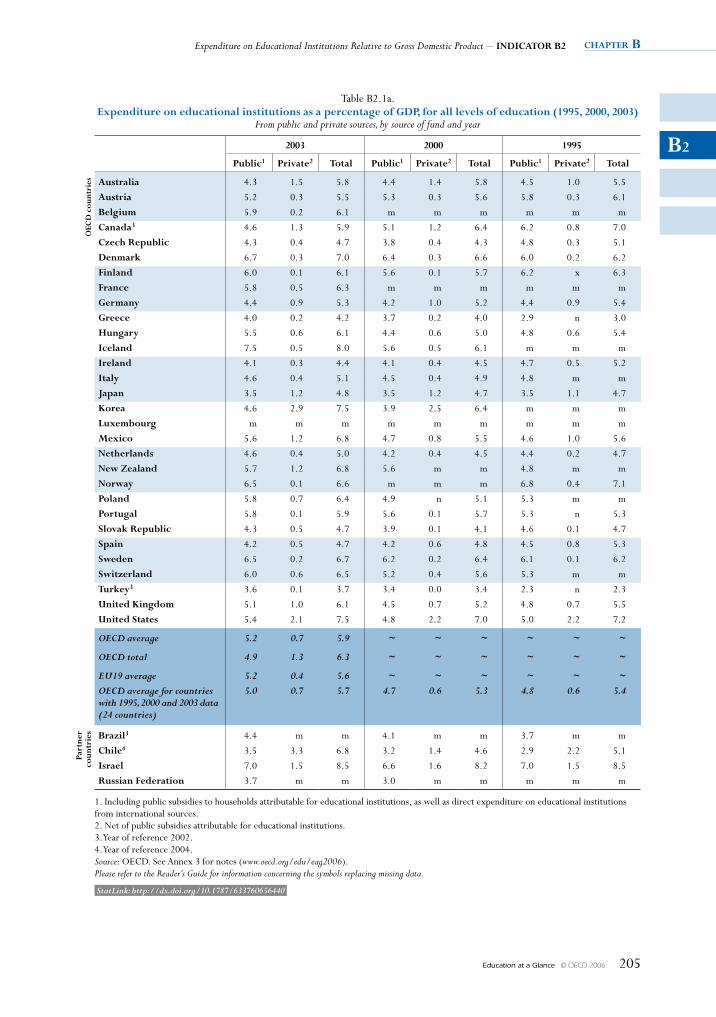
Expenditure on Educational Institutions Relative to Gross Domestic Product – INDICATOR B2 chapter B
Education at a Glance © OECD 2006 205
B2
Table B2.1a. Expenditure on educational institutions as a percentage of GDp, for all levels of education (1995, 2000, 2003)
From public and private sources, by source of fund and year
2003 2000 1995
public1 private2 Total public1 private2 Total public1 private2 Total
OEC
D c
ount
ries Australia 4.3 1.5 5.8 4.4 1.4 5.8 4.5 1.0 5.5
Austria 5.2 0.3 5.5 5.3 0.3 5.6 5.8 0.3 6.1
Belgium 5.9 0.2 6.1 m m m m m m
Canada3 4.6 1.3 5.9 5.1 1.2 6.4 6.2 0.8 7.0
Czech Republic 4.3 0.4 4.7 3.8 0.4 4.3 4.8 0.3 5.1
Denmark 6.7 0.3 7.0 6.4 0.3 6.6 6.0 0.2 6.2
Finland 6.0 0.1 6.1 5.6 0.1 5.7 6.2 x 6.3
France 5.8 0.5 6.3 m m m m m m
Germany 4.4 0.9 5.3 4.2 1.0 5.2 4.4 0.9 5.4
Greece 4.0 0.2 4.2 3.7 0.2 4.0 2.9 n 3.0
Hungary 5.5 0.6 6.1 4.4 0.6 5.0 4.8 0.6 5.4
Iceland 7.5 0.5 8.0 5.6 0.5 6.1 m m m
Ireland 4.1 0.3 4.4 4.1 0.4 4.5 4.7 0.5 5.2
Italy 4.6 0.4 5.1 4.5 0.4 4.9 4.8 m m
Japan 3.5 1.2 4.8 3.5 1.2 4.7 3.5 1.1 4.7
Korea 4.6 2.9 7.5 3.9 2.5 6.4 m m m
luxembourg m m m m m m m m m
mexico 5.6 1.2 6.8 4.7 0.8 5.5 4.6 1.0 5.6
Netherlands 4.6 0.4 5.0 4.2 0.4 4.5 4.4 0.2 4.7
New Zealand 5.7 1.2 6.8 5.6 m m 4.8 m m
Norway 6.5 0.1 6.6 m m m 6.8 0.4 7.1
poland 5.8 0.7 6.4 4.9 n 5.1 5.3 m m
portugal 5.8 0.1 5.9 5.6 0.1 5.7 5.3 n 5.3
slovak Republic 4.3 0.5 4.7 3.9 0.1 4.1 4.6 0.1 4.7
spain 4.2 0.5 4.7 4.2 0.6 4.8 4.5 0.8 5.3
sweden 6.5 0.2 6.7 6.2 0.2 6.4 6.1 0.1 6.2
switzerland 6.0 0.6 6.5 5.2 0.4 5.6 5.3 m m
Turkey3 3.6 0.1 3.7 3.4 0.0 3.4 2.3 n 2.3
united Kingdom 5.1 1.0 6.1 4.5 0.7 5.2 4.8 0.7 5.5
united states 5.4 2.1 7.5 4.8 2.2 7.0 5.0 2.2 7.2
OECD average 5.2 0.7 5.9 ~ ~ ~ ~ ~ ~
OECD total 4.9 1.3 6.3 ~ ~ ~ ~ ~ ~
EU19 average 5.2 0.4 5.6 ~ ~ ~ ~ ~ ~ OECD average for countries with 1995, 2000 and 2003 data (24 countries)
5.0 0.7 5.7 4.7 0.6 5.3 4.8 0.6 5.4
part
ner
coun
trie
s Brazil3 4.4 m m 4.1 m m 3.7 m m
Chile4 3.5 3.3 6.8 3.2 1.4 4.6 2.9 2.2 5.1
Israel 7.0 1.5 8.5 6.6 1.6 8.2 7.0 1.5 8.5
Russian Federation 3.7 m m 3.0 m m m m m
1. Including public subsidies to households attributable for educational institutions, as well as direct expenditure on educational institutions from international sources. 2. Net of public subsidies attributable for educational institutions.3. Year of reference 2002. 4. Year of reference 2004.Source: OECD. See Annex 3 for notes (www.oecd.org/edu/eag2006).Please refer to the Reader’s Guide for information concerning the symbols replacing missing data.
StatLink: http://dx.doi.org/10.1787/633760656440
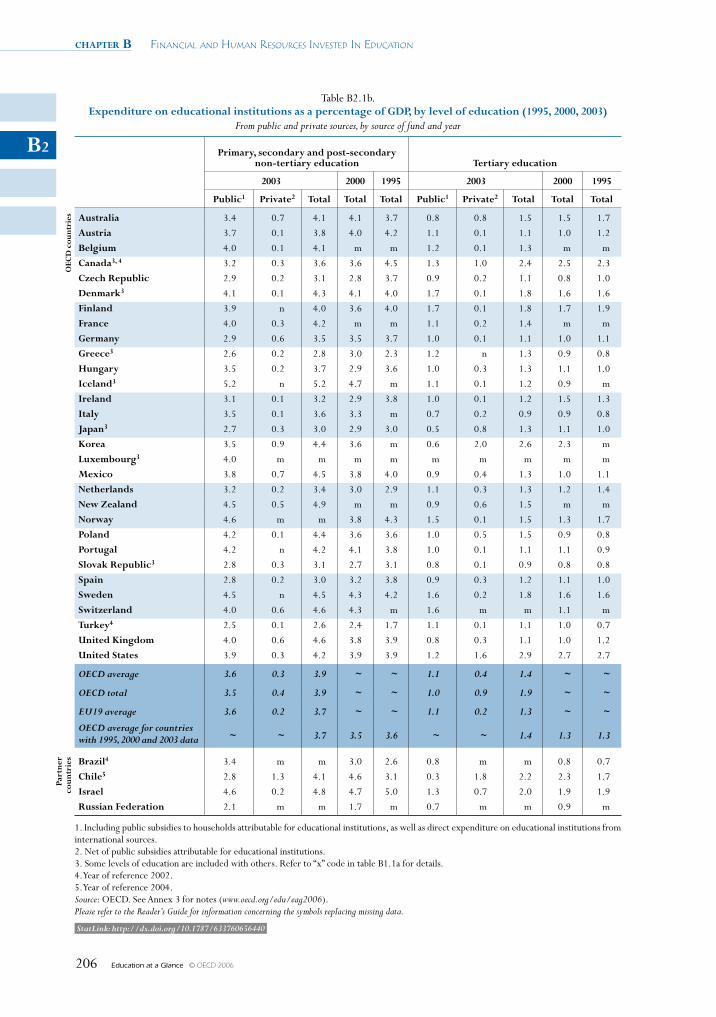
chapter B Financial and Human ResouRces invested in education
Education at a Glance © OECD 2006206
B2
Table B2.1b. Expenditure on educational institutions as a percentage of GDp, by level of education (1995, 2000, 2003)
From public and private sources, by source of fund and year
primary, secondary and post-secondary non-tertiary education Tertiary education
2003 2000 1995 2003 2000 1995
public1 private2 Total Total Total public1 private2 Total Total Total
OEC
D c
ount
ries Australia 3.4 0.7 4.1 4.1 3.7 0.8 0.8 1.5 1.5 1.7
Austria 3.7 0.1 3.8 4.0 4.2 1.1 0.1 1.1 1.0 1.2
Belgium 4.0 0.1 4.1 m m 1.2 0.1 1.3 m m
Canada3, 4 3.2 0.3 3.6 3.6 4.5 1.3 1.0 2.4 2.5 2.3
Czech Republic 2.9 0.2 3.1 2.8 3.7 0.9 0.2 1.1 0.8 1.0
Denmark3 4.1 0.1 4.3 4.1 4.0 1.7 0.1 1.8 1.6 1.6
Finland 3.9 n 4.0 3.6 4.0 1.7 0.1 1.8 1.7 1.9
France 4.0 0.3 4.2 m m 1.1 0.2 1.4 m m
Germany 2.9 0.6 3.5 3.5 3.7 1.0 0.1 1.1 1.0 1.1
Greece3 2.6 0.2 2.8 3.0 2.3 1.2 n 1.3 0.9 0.8
Hungary 3.5 0.2 3.7 2.9 3.6 1.0 0.3 1.3 1.1 1.0
Iceland3 5.2 n 5.2 4.7 m 1.1 0.1 1.2 0.9 m
Ireland 3.1 0.1 3.2 2.9 3.8 1.0 0.1 1.2 1.5 1.3
Italy 3.5 0.1 3.6 3.3 m 0.7 0.2 0.9 0.9 0.8
Japan3 2.7 0.3 3.0 2.9 3.0 0.5 0.8 1.3 1.1 1.0
Korea 3.5 0.9 4.4 3.6 m 0.6 2.0 2.6 2.3 m
luxembourg3 4.0 m m m m m m m m m
mexico 3.8 0.7 4.5 3.8 4.0 0.9 0.4 1.3 1.0 1.1
Netherlands 3.2 0.2 3.4 3.0 2.9 1.1 0.3 1.3 1.2 1.4
New Zealand 4.5 0.5 4.9 m m 0.9 0.6 1.5 m m
Norway 4.6 m m 3.8 4.3 1.5 0.1 1.5 1.3 1.7
poland 4.2 0.1 4.4 3.6 3.6 1.0 0.5 1.5 0.9 0.8
portugal 4.2 n 4.2 4.1 3.8 1.0 0.1 1.1 1.1 0.9
slovak Republic3 2.8 0.3 3.1 2.7 3.1 0.8 0.1 0.9 0.8 0.8
spain 2.8 0.2 3.0 3.2 3.8 0.9 0.3 1.2 1.1 1.0
sweden 4.5 n 4.5 4.3 4.2 1.6 0.2 1.8 1.6 1.6
switzerland 4.0 0.6 4.6 4.3 m 1.6 m m 1.1 m
Turkey4 2.5 0.1 2.6 2.4 1.7 1.1 0.1 1.1 1.0 0.7
united Kingdom 4.0 0.6 4.6 3.8 3.9 0.8 0.3 1.1 1.0 1.2
united states 3.9 0.3 4.2 3.9 3.9 1.2 1.6 2.9 2.7 2.7
OECD average 3.6 0.3 3.9 ~ ~ 1.1 0.4 1.4 ~ ~
OECD total 3.5 0.4 3.9 ~ ~ 1.0 0.9 1.9 ~ ~
EU19 average 3.6 0.2 3.7 ~ ~ 1.1 0.2 1.3 ~ ~
OECD average for countries with 1995, 2000 and 2003 data ~ ~ 3.7 3.5 3.6 ~ ~ 1.4 1.3 1.3
part
ner
coun
trie
s Brazil4 3.4 m m 3.0 2.6 0.8 m m 0.8 0.7
Chile5 2.8 1.3 4.1 4.6 3.1 0.3 1.8 2.2 2.3 1.7
Israel 4.6 0.2 4.8 4.7 5.0 1.3 0.7 2.0 1.9 1.9
Russian Federation 2.1 m m 1.7 m 0.7 m m 0.9 m
1. Including public subsidies to households attributable for educational institutions, as well as direct expenditure on educational institutions from international sources.2. Net of public subsidies attributable for educational institutions. 3. Some levels of education are included with others. Refer to “x” code in table B1.1a for details.4. Year of reference 2002. 5. Year of reference 2004.Source: OECD. See Annex 3 for notes (www.oecd.org/edu/eag2006).Please refer to the Reader’s Guide for information concerning the symbols replacing missing data.
StatLink: http://dx.doi.org/10.1787/633760656440
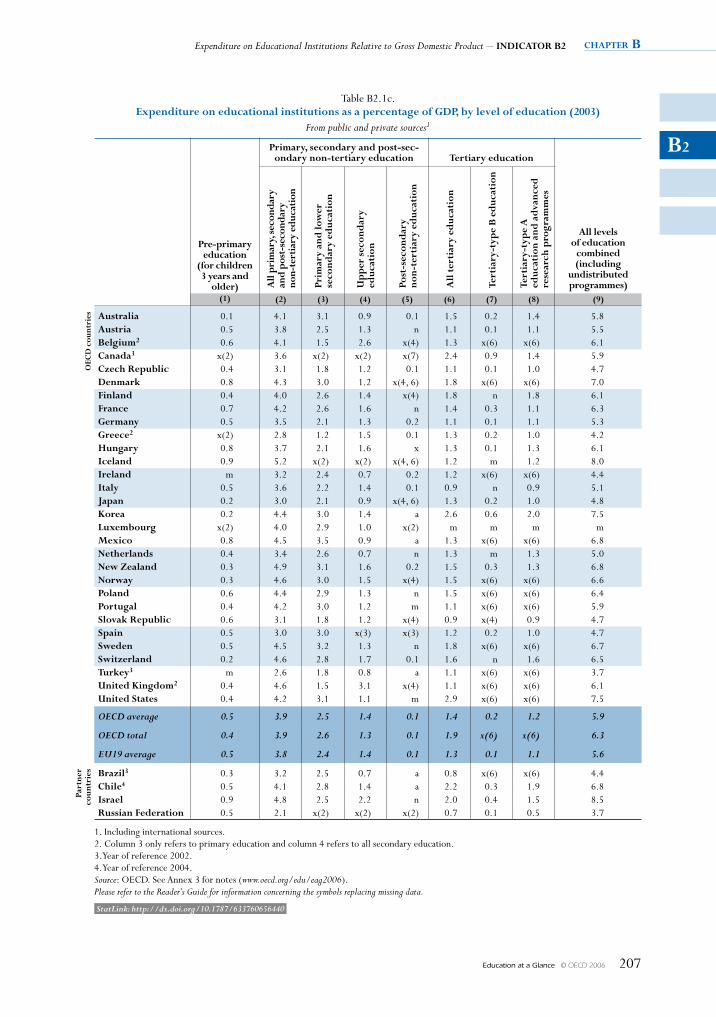
Expenditure on Educational Institutions Relative to Gross Domestic Product – INDICATOR B2 chapter B
Education at a Glance © OECD 2006 207
B2
Table B2.1c. Expenditure on educational institutions as a percentage of GDp, by level of education (2003)
From public and private sources1
pre-primary education
(for children 3 years and
older)
primary, secondary and post-sec-ondary non-tertiary education Tertiary education
All levels of education
combined (including
undistributed programmes)A
ll pr
imar
y, se
cond
ary
and
post
-sec
onda
ry
non-
tert
iary
edu
cati
on
prim
ary
and
low
er
seco
ndar
y ed
ucat
ion
up
per
sec
ond
ary
educ
atio
n
post
-sec
ond
ary
no
n-te
rtia
ry e
duc
atio
n
All
ter
tiar
y ed
ucat
ion
Tert
iary
-typ
e B
ed
ucat
ion
Tert
iary
-typ
e A
ed
ucat
ion
and
adv
ance
d
rese
arch
pro
gram
mes
(1) (2) (3) (4) (5) (6) (7) (8) (9)
OEC
D c
ount
ries Australia 0.1 4.1 3.1 0.9 0.1 1.5 0.2 1.4 5.8
Austria 0.5 3.8 2.5 1.3 n 1.1 0.1 1.1 5.5 Belgium2 0.6 4.1 1.5 2.6 x(4) 1.3 x(6) x(6) 6.1 Canada3 x(2) 3.6 x(2) x(2) x(7) 2.4 0.9 1.4 5.9 Czech Republic 0.4 3.1 1.8 1.2 0.1 1.1 0.1 1.0 4.7 Denmark 0.8 4.3 3.0 1.2 x(4, 6) 1.8 x(6) x(6) 7.0 Finland 0.4 4.0 2.6 1.4 x(4) 1.8 n 1.8 6.1 France 0.7 4.2 2.6 1.6 n 1.4 0.3 1.1 6.3 Germany 0.5 3.5 2.1 1.3 0.2 1.1 0.1 1.1 5.3 Greece2 x(2) 2.8 1.2 1.5 0.1 1.3 0.2 1.0 4.2 Hungary 0.8 3.7 2.1 1.6 x 1.3 0.1 1.3 6.1 Iceland 0.9 5.2 x(2) x(2) x(4, 6) 1.2 m 1.2 8.0 Ireland m 3.2 2.4 0.7 0.2 1.2 x(6) x(6) 4.4 Italy 0.5 3.6 2.2 1.4 0.1 0.9 n 0.9 5.1 Japan 0.2 3.0 2.1 0.9 x(4, 6) 1.3 0.2 1.0 4.8 Korea 0.2 4.4 3.0 1.4 a 2.6 0.6 2.0 7.5 luxembourg x(2) 4.0 2.9 1.0 x(2) m m m m mexico 0.8 4.5 3.5 0.9 a 1.3 x(6) x(6) 6.8 Netherlands 0.4 3.4 2.6 0.7 n 1.3 m 1.3 5.0 New Zealand 0.3 4.9 3.1 1.6 0.2 1.5 0.3 1.3 6.8 Norway 0.3 4.6 3.0 1.5 x(4) 1.5 x(6) x(6) 6.6 poland 0.6 4.4 2.9 1.3 n 1.5 x(6) x(6) 6.4 portugal 0.4 4.2 3.0 1.2 m 1.1 x(6) x(6) 5.9 slovak Republic 0.6 3.1 1.8 1.2 x(4) 0.9 x(4) 0.9 4.7 spain 0.5 3.0 3.0 x(3) x(3) 1.2 0.2 1.0 4.7 sweden 0.5 4.5 3.2 1.3 n 1.8 x(6) x(6) 6.7 switzerland 0.2 4.6 2.8 1.7 0.1 1.6 n 1.6 6.5 Turkey3 m 2.6 1.8 0.8 a 1.1 x(6) x(6) 3.7 united Kingdom2 0.4 4.6 1.5 3.1 x(4) 1.1 x(6) x(6) 6.1 united states 0.4 4.2 3.1 1.1 m 2.9 x(6) x(6) 7.5
OECD average 0.5 3.9 2.5 1.4 0.1 1.4 0.2 1.2 5.9
OECD total 0.4 3.9 2.6 1.3 0.1 1.9 x(6) x(6) 6.3
EU19 average 0.5 3.8 2.4 1.4 0.1 1.3 0.1 1.1 5.6
part
ner
coun
trie
s Brazil3 0.3 3.2 2.5 0.7 a 0.8 x(6) x(6) 4.4 Chile4 0.5 4.1 2.8 1.4 a 2.2 0.3 1.9 6.8 Israel 0.9 4.8 2.5 2.2 n 2.0 0.4 1.5 8.5 Russian Federation 0.5 2.1 x(2) x(2) x(2) 0.7 0.1 0.5 3.7
1. Including international sources. 2. Column 3 only refers to primary education and column 4 refers to all secondary education.3.Year of reference 2002. 4.Year of reference 2004. Source: OECD. See Annex 3 for notes (www.oecd.org/edu/eag2006).Please refer to the Reader’s Guide for information concerning the symbols replacing missing data.
StatLink: http://dx.doi.org/10.1787/633760656440
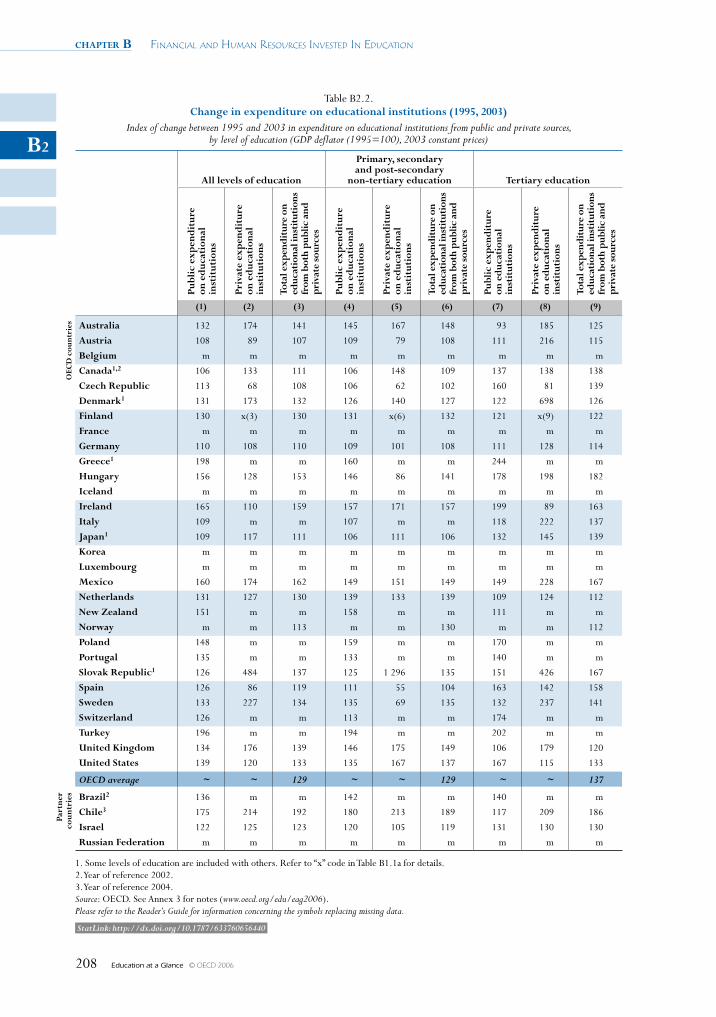
chapter B Financial and Human ResouRces invested in education
Education at a Glance © OECD 2006208
B2
Table B2.2. Change in expenditure on educational institutions (1995, 2003)
Index of change between 1995 and 2003 in expenditure on educational institutions from public and private sources, by level of education (GDP deflator (1995=100), 2003 constant prices)
All levels of education
primary, secondary and post-secondary
non-tertiary education Tertiary educationpu
blic
exp
end
itur
e on
ed
ucat
iona
l in
stit
utio
ns
priv
ate
exp
end
itur
e on
ed
ucat
iona
l in
stit
utio
ns
Tota
l exp
endi
ture
on
educ
atio
nal i
nsti
tuti
ons
from
bot
h pu
blic
and
pr
ivat
e so
urce
s
publ
ic e
xpen
dit
ure
on e
duc
atio
nal
inst
itut
ions
priv
ate
exp
end
itur
e on
ed
ucat
iona
l in
stit
utio
ns
Tota
l exp
endi
ture
on
educ
atio
nal i
nsti
tuti
ons
from
bot
h pu
blic
and
pr
ivat
e so
urce
s
publ
ic e
xpen
ditu
re
on e
duca
tion
al
inst
itut
ions
priv
ate
expe
ndit
ure
on
edu
cati
onal
in
stit
utio
ns
Tota
l exp
endi
ture
on
educ
atio
nal i
nsti
tuti
ons
from
bot
h pu
blic
and
pr
ivat
e so
urce
s
(1) (2) (3) (4) (5) (6) (7) (8) (9)
OEC
D c
ount
ries Australia 132 174 141 145 167 148 93 185 125
Austria 108 89 107 109 79 108 111 216 115
Belgium m m m m m m m m m
Canada1,2 106 133 111 106 148 109 137 138 138
Czech Republic 113 68 108 106 62 102 160 81 139
Denmark1 131 173 132 126 140 127 122 698 126
Finland 130 x(3) 130 131 x(6) 132 121 x(9) 122
France m m m m m m m m m
Germany 110 108 110 109 101 108 111 128 114
Greece1 198 m m 160 m m 244 m m
Hungary 156 128 153 146 86 141 178 198 182
Iceland m m m m m m m m m
Ireland 165 110 159 157 171 157 199 89 163
Italy 109 m m 107 m m 118 222 137
Japan1 109 117 111 106 111 106 132 145 139
Korea m m m m m m m m m
luxembourg m m m m m m m m m
mexico 160 174 162 149 151 149 149 228 167
Netherlands 131 127 130 139 133 139 109 124 112
New Zealand 151 m m 158 m m 111 m m
Norway m m 113 m m 130 m m 112
poland 148 m m 159 m m 170 m m
portugal 135 m m 133 m m 140 m m
slovak Republic1 126 484 137 125 1 296 135 151 426 167
spain 126 86 119 111 55 104 163 142 158
sweden 133 227 134 135 69 135 132 237 141
switzerland 126 m m 113 m m 174 m m
Turkey 196 m m 194 m m 202 m m
united Kingdom 134 176 139 146 175 149 106 179 120
united states 139 120 133 135 167 137 167 115 133
OECD average ~ ~ 129 ~ ~ 129 ~ ~ 137
part
ner
coun
trie
s Brazil2 136 m m 142 m m 140 m m
Chile3 175 214 192 180 213 189 117 209 186
Israel 122 125 123 120 105 119 131 130 130
Russian Federation m m m m m m m m m
1. Some levels of education are included with others. Refer to “x” code in Table B1.1a for details.2. Year of reference 2002.3. Year of reference 2004.Source: OECD. See Annex 3 for notes (www.oecd.org/edu/eag2006).Please refer to the Reader’s Guide for information concerning the symbols replacing missing data.
StatLink: http://dx.doi.org/10.1787/633760656440
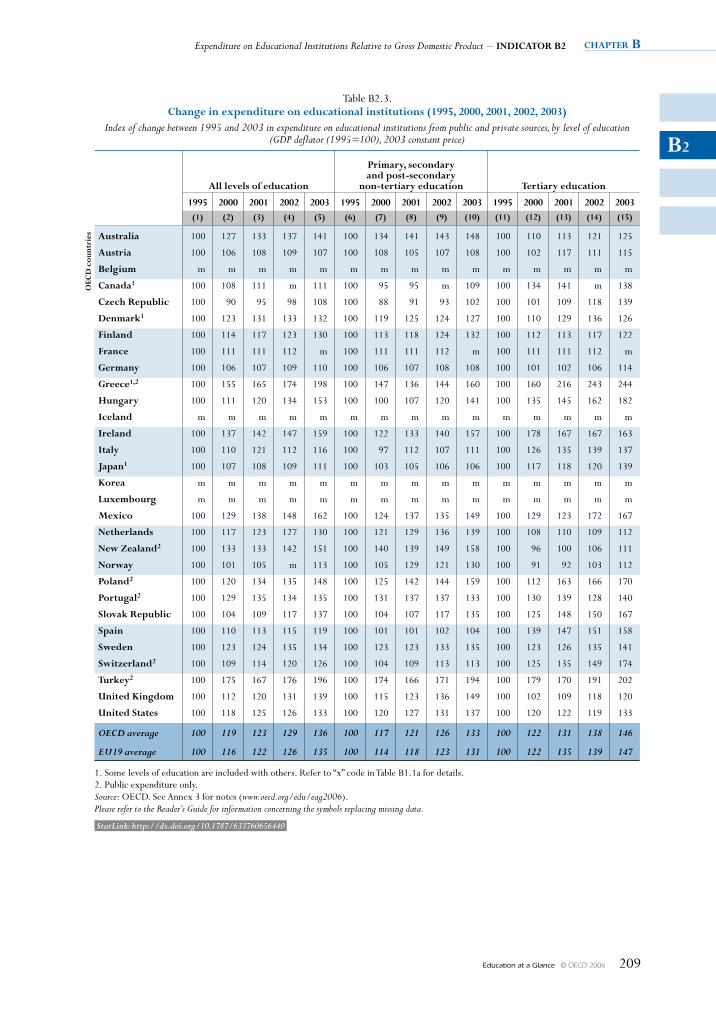
Expenditure on Educational Institutions Relative to Gross Domestic Product – INDICATOR B2 chapter B
Education at a Glance © OECD 2006 209
B2
Table B2.3. Change in expenditure on educational institutions (1995, 2000, 2001, 2002, 2003)
Index of change between 1995 and 2003 in expenditure on educational institutions from public and private sources, by level of education (GDP deflator (1995=100), 2003 constant price)
All levels of education
primary, secondary and post-secondary
non-tertiary education Tertiary education
1995 2000 2001 2002 2003 1995 2000 2001 2002 2003 1995 2000 2001 2002 2003(1) (2) (3) (4) (5) (6) (7) (8) (9) (10) (11) (12) (13) (14) (15)
OEC
D c
ount
ries Australia 100 127 133 137 141 100 134 141 143 148 100 110 113 121 125
Austria 100 106 108 109 107 100 108 105 107 108 100 102 117 111 115
Belgium m m m m m m m m m m m m m m m
Canada1 100 108 111 m 111 100 95 95 m 109 100 134 141 m 138
Czech Republic 100 90 95 98 108 100 88 91 93 102 100 101 109 118 139
Denmark1 100 123 131 133 132 100 119 125 124 127 100 110 129 136 126
Finland 100 114 117 123 130 100 113 118 124 132 100 112 113 117 122
France 100 111 111 112 m 100 111 111 112 m 100 111 111 112 m
Germany 100 106 107 109 110 100 106 107 108 108 100 101 102 106 114
Greece1,2 100 155 165 174 198 100 147 136 144 160 100 160 216 243 244
Hungary 100 111 120 134 153 100 100 107 120 141 100 135 145 162 182
Iceland m m m m m m m m m m m m m m m
Ireland 100 137 142 147 159 100 122 133 140 157 100 178 167 167 163
Italy 100 110 121 112 116 100 97 112 107 111 100 126 135 139 137
Japan1 100 107 108 109 111 100 103 105 106 106 100 117 118 120 139
Korea m m m m m m m m m m m m m m m
luxembourg m m m m m m m m m m m m m m m
mexico 100 129 138 148 162 100 124 137 135 149 100 129 123 172 167
Netherlands 100 117 123 127 130 100 121 129 136 139 100 108 110 109 112
New Zealand2 100 133 133 142 151 100 140 139 149 158 100 96 100 106 111
Norway 100 101 105 m 113 100 105 129 121 130 100 91 92 103 112
poland2 100 120 134 135 148 100 125 142 144 159 100 112 163 166 170
portugal2 100 129 135 134 135 100 131 137 137 133 100 130 139 128 140
slovak Republic 100 104 109 117 137 100 104 107 117 135 100 125 148 150 167
spain 100 110 113 115 119 100 101 101 102 104 100 139 147 151 158
sweden 100 123 124 135 134 100 123 123 133 135 100 123 126 135 141
switzerland2 100 109 114 120 126 100 104 109 113 113 100 125 135 149 174
Turkey2 100 175 167 176 196 100 174 166 171 194 100 179 170 191 202
united Kingdom 100 112 120 131 139 100 115 123 136 149 100 102 109 118 120
united states 100 118 125 126 133 100 120 127 131 137 100 120 122 119 133
OECD average 100 119 123 129 136 100 117 121 126 133 100 122 131 138 146
EU19 average 100 116 122 126 135 100 114 118 123 131 100 122 135 139 147
1. Some levels of education are included with others. Refer to “x” code in Table B1.1a for details.2. Public expenditure only.Source: OECD. See Annex 3 for notes (www.oecd.org/edu/eag2006).Please refer to the Reader’s Guide for information concerning the symbols replacing missing data.
StatLink: http://dx.doi.org/10.1787/633760656440
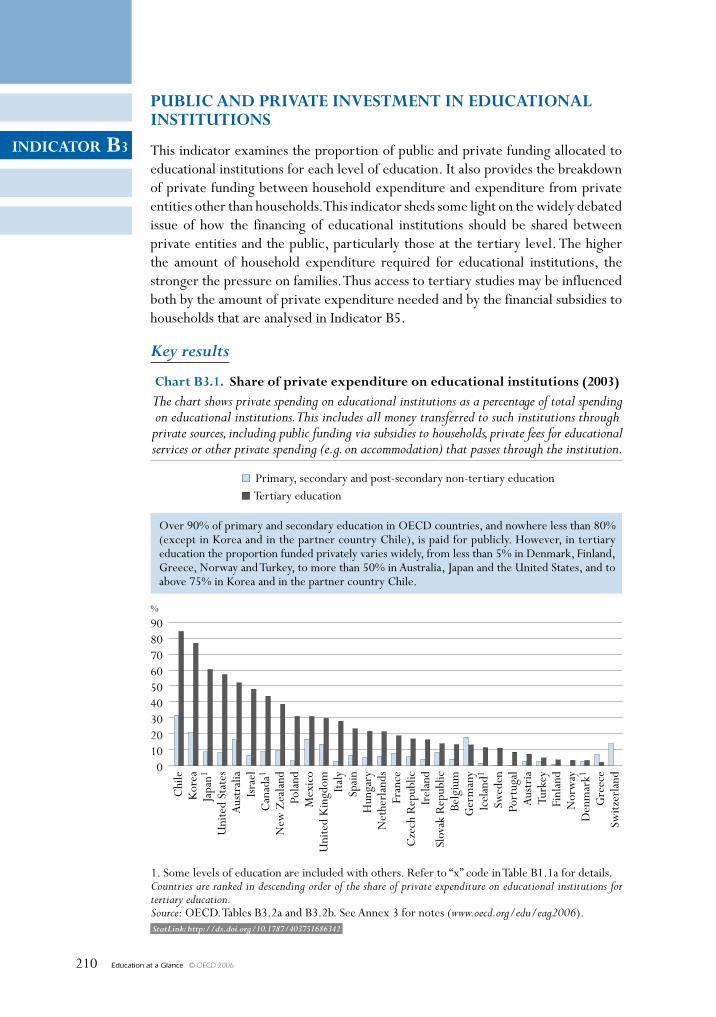
Education at a Glance © OECD 2006210
INDICATOR B3
PUBLIC AND PRIVATE INVESTMENT IN EDUCATIONAL INSTITUTIONS
This indicator examines the proportion of public and private funding allocated to educational institutions for each level of education. It also provides the breakdown of private funding between household expenditure and expenditure from private entities other than households. This indicator sheds some light on the widely debated issue of how the financing of educational institutions should be shared between private entities and the public, particularly those at the tertiary level. The higher the amount of household expenditure required for educational institutions, the stronger the pressure on families. Thus access to tertiary studies may be influenced both by the amount of private expenditure needed and by the financial subsidies to households that are analysed in Indicator B5.
Key results
908070605040302010
0
%
Chart B3.1. Share of private expenditure on educational institutions (2003)The chart shows private spending on educational institutions as a percentage of total spendingon educational institutions. This includes all money transferred to such institutions throughprivate sources, including public funding via subsidies to households, private fees for educationalservices or other private spending (e.g. on accommodation) that passes through the institution.
Primary, secondary and post-secondary non-tertiary educationTertiary education
Chi
leK
orea
Japa
n1
Uni
ted
Stat
esA
ustr
alia
Isra
elC
anad
a1
New
Zea
land
Pola
ndM
exic
oU
nite
d K
ingd
om Italy
Spai
nH
unga
ryN
ethe
rlan
dsFr
ance
Cze
ch R
epub
licIr
elan
dSl
ovak
Rep
ublic
Belg
ium
Ger
man
yIc
elan
d1
Swed
enPo
rtug
alA
ustr
iaTu
rkey
Finl
and
Nor
way
Den
mar
k1
Gre
ece
Switz
erla
nd
Over 90% of primary and secondary education in OECD countries, and nowhere less than 80%(except in Korea and in the partner country Chile), is paid for publicly. However, in tertiaryeducation the proportion funded privately varies widely, from less than 5% in Denmark, Finland,Greece, Norway and Turkey, to more than 50% in Australia, Japan and the United States, and toabove 75% in Korea and in the partner country Chile.
1. Some levels of education are included with others. Refer to “x” code in Table B1.1a for details.Countries are ranked in descending order of the share of private expenditure on educational institutions fortertiary education.Source: OECD. Tables B3.2a and B3.2b. See Annex 3 for notes (www.oecd.org/edu/eag2006). StatLink: http://dx.doi.org/10.1787/403751686342
Education at a Glance © OECD 2006 211
INDICATOR B3
Other highlights of this indicator
• Between 1995 and 2003, among countries for which comparable data are available, the share of public funding for all levels of education combined decreased in as many countries as it increased.
• The share of tertiary spending from private sources rose substantially in some countries between 1995 and 2003, but this was not the case at other levels of education.
• On average among the 18 OECD countries for which trend data are available, the share of public funding in tertiary institutions slightly decreased between 1995 and 2000 and every year between 2001 and 2003.
• The share of public funding at the tertiary level in OECD countries represents on average 76% in 2003.
• Compared to other levels of education, tertiary institutions and to a lesser extent pre-primary institutions obtain the largest proportions of funds from private sources: respectively 24% and 19% of funds at these levels come from private sources.
• In tertiary education, households cover 76% of all private expenditure. Private expenditure from other entities than households is still significant, representing 10% or more in Australia, Canada, Hungary, Korea, the Netherlands, Sweden, the United Kingdom and the United States, and the partner country Israel.
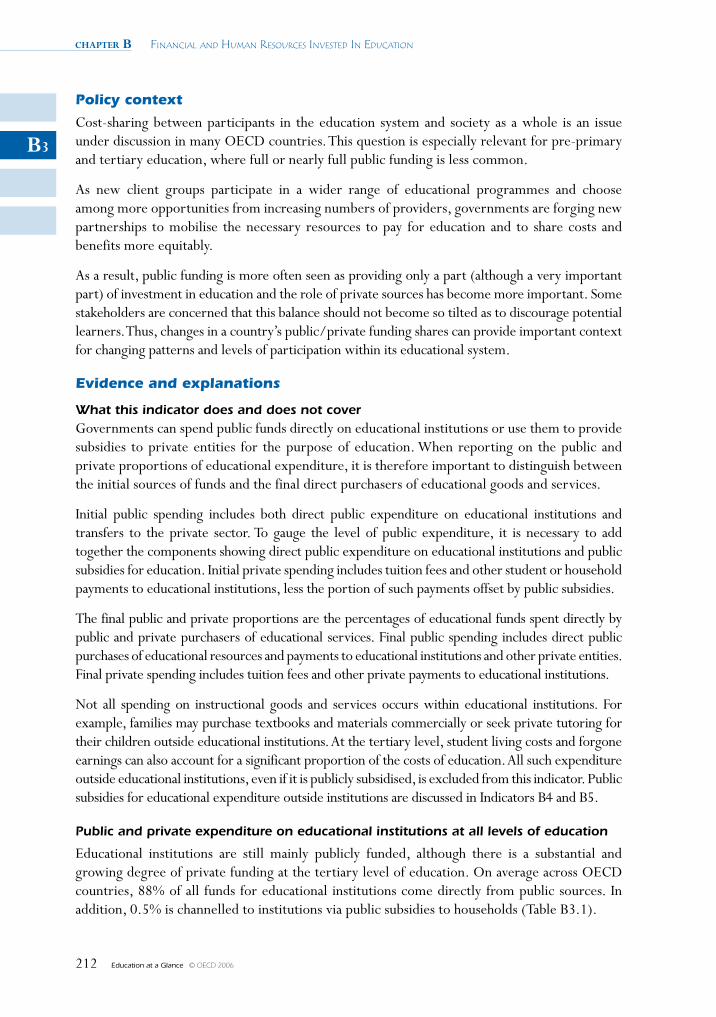
chapter B Financial and Human ResouRces invested in education
Education at a Glance © OECD 2006212
B3
Policy context
Cost-sharing between participants in the education system and society as a whole is an issue under discussion in many OECD countries. This question is especially relevant for pre-primary and tertiary education, where full or nearly full public funding is less common.
As new client groups participate in a wider range of educational programmes and choose among more opportunities from increasing numbers of providers, governments are forging new partnerships to mobilise the necessary resources to pay for education and to share costs and benefits more equitably.
As a result, public funding is more often seen as providing only a part (although a very important part) of investment in education and the role of private sources has become more important. Some stakeholders are concerned that this balance should not become so tilted as to discourage potential learners. Thus, changes in a country’s public/private funding shares can provide important context for changing patterns and levels of participation within its educational system.
Evidence and explanations
What this indicator does and does not cover Governments can spend public funds directly on educational institutions or use them to provide subsidies to private entities for the purpose of education. When reporting on the public and private proportions of educational expenditure, it is therefore important to distinguish between the initial sources of funds and the final direct purchasers of educational goods and services.
Initial public spending includes both direct public expenditure on educational institutions and transfers to the private sector. To gauge the level of public expenditure, it is necessary to add together the components showing direct public expenditure on educational institutions and public subsidies for education. Initial private spending includes tuition fees and other student or household payments to educational institutions, less the portion of such payments offset by public subsidies.
The final public and private proportions are the percentages of educational funds spent directly by public and private purchasers of educational services. Final public spending includes direct public purchases of educational resources and payments to educational institutions and other private entities. Final private spending includes tuition fees and other private payments to educational institutions.
Not all spending on instructional goods and services occurs within educational institutions. For example, families may purchase textbooks and materials commercially or seek private tutoring for their children outside educational institutions. At the tertiary level, student living costs and forgone earnings can also account for a significant proportion of the costs of education. All such expenditure outside educational institutions, even if it is publicly subsidised, is excluded from this indicator. Public subsidies for educational expenditure outside institutions are discussed in Indicators B4 and B5.
Public and private expenditure on educational institutions at all levels of education
Educational institutions are still mainly publicly funded, although there is a substantial and growing degree of private funding at the tertiary level of education. On average across OECD countries, 88% of all funds for educational institutions come directly from public sources. In addition, 0.5% is channelled to institutions via public subsidies to households (Table B3.1).
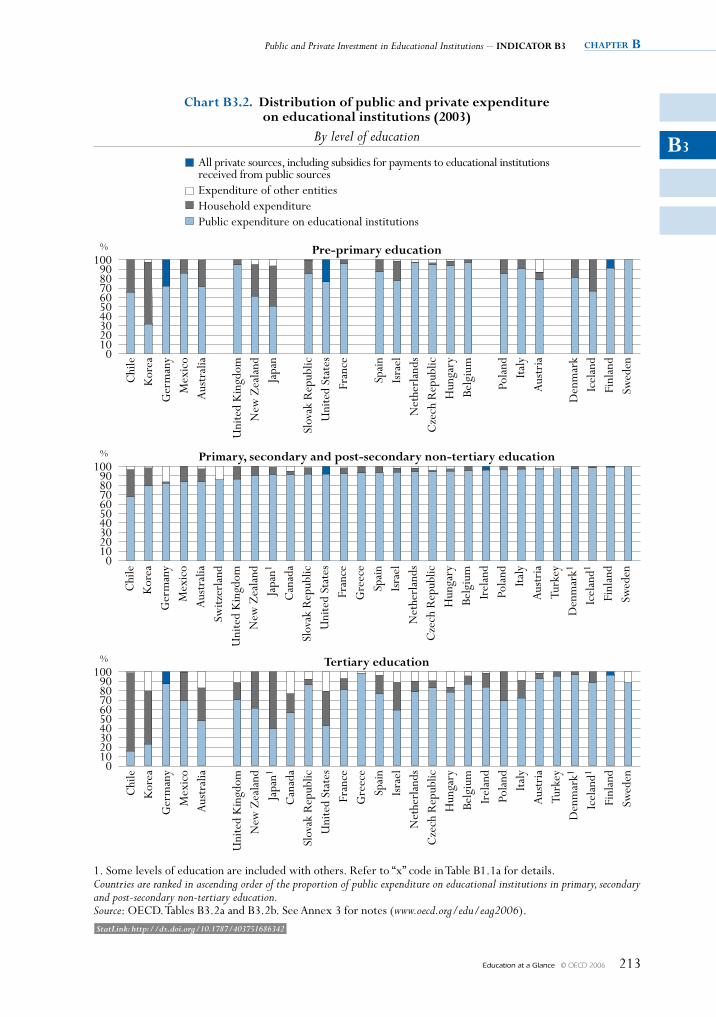
Public and Private Investment in Educational Institutions – IndIcator B3 chapter B
Education at a Glance © OECD 2006 213
B3
100908070605040302010
0
%
100908070605040302010
0
%
100908070605040302010
0
%
chart B3.2. distribution of public and private expenditureon educational institutions (2003)
By level of education
All private sources, including subsidies for payments to educational institutionsreceived from public sourcesExpenditure of other entitiesHousehold expenditurePublic expenditure on educational institutions
1. Some levels of education are included with others. Refer to “x” code in Table B1.1a for details.Countries are ranked in ascending order of the proportion of public expenditure on educational institutions in primary, secondaryand post-secondary non-tertiary education.Source: OECD. Tables B3.2a and B3.2b. See Annex 3 for notes (www.oecd.org/edu/eag2006).
Chi
leK
orea
Ger
man
yM
exic
oA
ustr
alia
Switz
erla
ndU
nite
d K
ingd
omN
ew Z
eala
ndJa
pan
Can
ada
Slov
ak R
epub
licU
nite
d St
ates
Fran
ceG
reec
eSp
ain
Isra
elN
ethe
rlan
dsC
zech
Rep
ublic
Hun
gary
Belg
ium
Irel
and
Pola
ndIta
lyA
ustr
iaTu
rkey
Den
mar
kIc
elan
dFi
nlan
dSw
eden
Pre-primary education
Chi
leK
orea
Ger
man
yM
exic
oA
ustr
alia
Switz
erla
ndU
nite
d K
ingd
omN
ew Z
eala
ndJa
pan1
Can
ada
Slov
ak R
epub
licU
nite
d St
ates
Fran
ceG
reec
eSp
ain
Isra
elN
ethe
rlan
dsC
zech
Rep
ublic
Hun
gary
Belg
ium
Irel
and
Pola
ndIta
lyA
ustr
iaTu
rkey
Den
mar
k1
Icel
and1
Finl
and
Swed
en
Primary, secondary and post-secondary non-tertiary education
Chi
leK
orea
Ger
man
yM
exic
oA
ustr
alia
Switz
erla
ndU
nite
d K
ingd
omN
ew Z
eala
ndJa
pan1
Can
ada
Slov
ak R
epub
licU
nite
d St
ates
Fran
ceG
reec
eSp
ain
Isra
elN
ethe
rlan
dsC
zech
Rep
ublic
Hun
gary
Belg
ium
Irel
and
Pola
ndIta
lyA
ustr
iaTu
rkey
Den
mar
k1
Icel
and1
Finl
and
Swed
en
tertiary education
StatLink: http://dx.doi.org/10.1787/403751686342
chapter B Financial and Human ResouRces invested in education
Education at a Glance © OECD 2006214
B3
In all the OECD countries for which comparable data are available, private funding represents 12% of all funds on average. This proportion varies widely among countries and only nine OECD and two partner countries report a share of private funding above the OECD average. In Australia, Canada, Japan and the United States, private funds constitute around one-quarter of all educational expenditure and exceed 39% in Korea and partner country Chile (Table B3.1).
Public and private expenditure on educational institutions in pre-primary, primary, secondary and post-secondary non-tertiary education
The share of private expenditure on education and how this varies among countries depends on the level of education.
Investment in early childhood education is of key importance in order to build a strong foundation for lifelong learning and to ensure equitable access to learning opportunities later in school. In pre-primary education, the private share of total payments to educational institutions is more important than for all levels of education combined and represents on average 19%, but this proportion is very uneven between countries, ranging from 5% or less in the Czech Republic, France, the Netherlands and Sweden, to well over 25% in Australia, Germany, Iceland, New Zealand and partner country Chile, to around 50% in Japan, and over 68% in Korea (Table B3.2a). Except in Austria and the Netherlands, the major part of private funding is covered by households.
Public funding dominates the primary, secondary and post-secondary non-tertiary levels of education in OECD and partner countries: on average the rate among OECD countries is 93%. Nevertheless, the proportions of private funding exceed 13% in Australia, Germany, Korea, Mexico, Switzerland and the United Kingdom, and the partner country Chile (Table B3.2a and Chart B3.2). The importance of public funding may result from the fact that primary, secondary and post-secondary non-tertiary education are usually perceived as a public good with mainly public returns. In most countries, at the primary, secondary and post-secondary non-tertiary level, the share of private expenditure results from household expenditure and comprises mainly expenditure on tuition. In Germany and Switzerland, however, most private expenditure is accounted for by contributions from the business sector to the dual system of apprenticeship at the upper secondary and post-secondary non-tertiary levels.
Between 1995 and 2003, among the 20 OECD and partner countries with comparable data available, there was a small decrease in the share of public funding at primary, secondary and post-secondary non-tertiary levels in approximately two-thirds of countries. Twelve countries recorded shifts from public to private funding, but the increase in the private share is more than 2 percentage points only in Canada (from 6.3 to 8.7%), the Slovak Republic (from 0.9 to 8.2%), Switzerland (10.9 to 13.6%) and the United Kingdom (from 11.5 to 13.5), as well as in the partner country Chile (from 28.2 to 31.7%). Funding shifts in the opposite direction, towards public funding, are notable in other countries; the share of public funding increased by between 3 and 7 percentage points in the Czech Republic (from 90.9 to 94.5%), Hungary (from 91.7 to 94.9%) and Spain (86.6 to 93.4%) (Chart B3.3 and Table B3.2a).
Public and private expenditure on educational institutions in tertiary institutions
In all OECD and partner countries except Germany and Greece, the private proportion of educational expenditure is far higher at the tertiary level than at the primary, secondary and
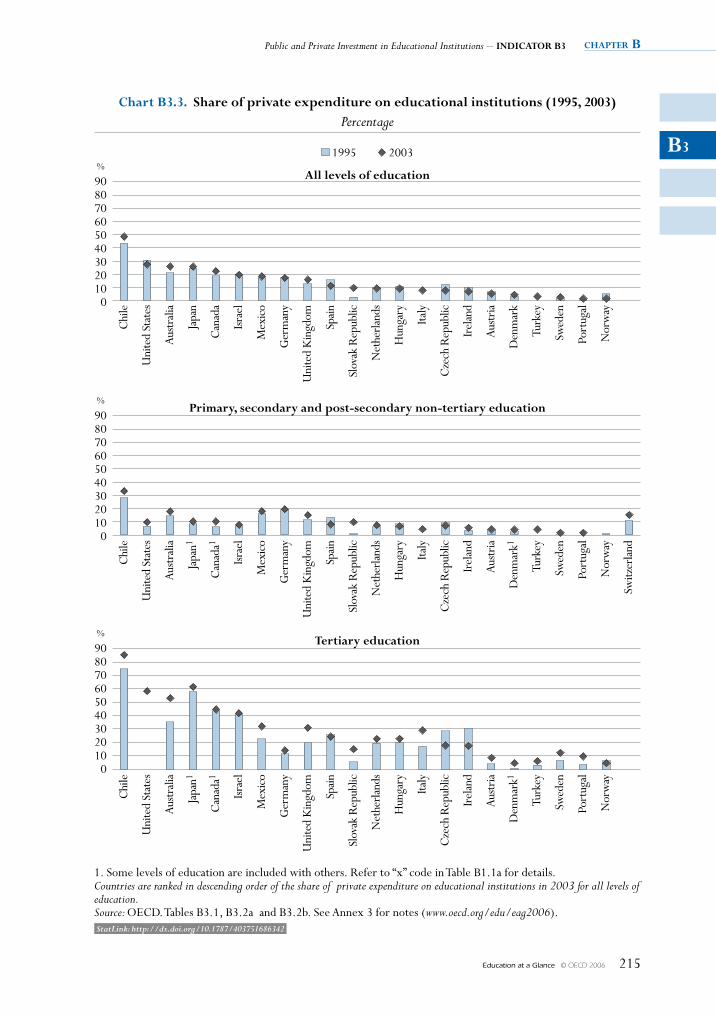
Public and Private Investment in Educational Institutions – INDICATOR B3 chapter B
Education at a Glance © OECD 2006 215
B3
908070605040302010
0
%
908070605040302010
0
%
908070605040302010
0
%
1995 2003
Chart B3.3. Share of private expenditure on educational institutions (1995, 2003)Percentage
1. Some levels of education are included with others. Refer to “x” code in Table B1.1a for details.Countries are ranked in descending order of the share of private expenditure on educational institutions in 2003 for all levels ofeducation.Source: OECD. Tables B3.1, B3.2a and B3.2b. See Annex 3 for notes (www.oecd.org/edu/eag2006).
Chi
le
Uni
ted
Stat
es
Aust
ralia
Japa
n
Can
ada
Israe
l
Mex
ico
Ger
man
y
Uni
ted
Kin
gdom
Spain
Slov
ak R
epub
lic
Net
herla
nds
Hun
gary
Italy
Cze
ch R
epub
lic
Irel
and
Aust
ria
Den
mar
k
Turk
ey
Swed
en
Port
ugal
Nor
way
Switz
erla
nd
All levels of education
Primary, secondary and post-secondary non-tertiary education
Tertiary education
Chi
le
Uni
ted
Stat
es
Aust
ralia
Japa
n1
Can
ada1
Israe
l
Mex
ico
Ger
man
y
Uni
ted
Kin
gdom
Spain
Slov
ak R
epub
lic
Net
herla
nds
Hun
gary
Italy
Cze
ch R
epub
lic
Irel
and
Aust
ria
Den
mar
k1
Turk
ey
Swed
en
Port
ugal
Nor
way
Switz
erla
nd
Chi
le
Uni
ted
Stat
es
Aust
ralia
Japa
n1
Can
ada1
Israe
l
Mex
ico
Ger
man
y
Uni
ted
Kin
gdom
Spain
Slov
ak R
epub
lic
Net
herla
nds
Hun
gary
Italy
Cze
ch R
epub
lic
Irel
and
Aust
ria
Den
mar
k1
Turk
ey
Swed
en
Port
ugal
Nor
way
Switz
erla
nd
StatLink: http://dx.doi.org/10.1787/403751686342
chapter B Financial and Human ResouRces invested in education
Education at a Glance © OECD 2006216
B3
post-secondary non-tertiary levels and represents on average more than one-fifth of total expenditure on educational institutions at this level. At the tertiary level, the high private returns in the form of better employment and income opportunities (see Indicator A9) suggest that a greater contribution by individuals to the costs of tertiary education may be justified, provided, of course, that governments can ensure that funding is accessible to students irrespective of their economic background (see Indicator B5).
The proportion of expenditure on tertiary institutions covered by individuals, businesses and other private sources, including subsidised private payments, ranges from less than 5% in Denmark, Finland, Greece, Norway and Turkey, to more than 50% in Australia, Japan and the United States, and over 75% in Korea and the partner country Chile (Chart B3.2 and Table B3.2b). In Korea, around 80% of tertiary students are enrolled in private universities, where more than 70% of budgets are derived from tuition fees. The contribution of private entities other than households to the financing of educational institutions is on average higher for tertiary education than for other levels of education. In one-quarter of OECD and partner countries – Australia, Canada, Hungary, Korea, the Netherlands, Sweden, the United Kingdom, the United States, and the partner country Israel – the proportion of expenditure on tertiary institutions covered by private entities other than households represents 10% or more.
In many OECD countries, the growth in tertiary participation (see Indicator C2) represents a response to heavy demand, both individual and social. Just as many tertiary structures and programmes were designed for a different era, so too were its funding mechanisms. The share of public funding at the tertiary level represents on average in OECD countries 76% in 2003. On average among the 18 OECD countries for which trend data are available, the share of public funding in tertiary institutions slightly decreased between 1995 and 2000 and every year between 2001 and 2003 (Table B3.3).
In one-half of the OECD and partner countries with comparable data in 1995 and 2003, private share increased by more than 3 percentage points. This increase exceeds 9 percentage points in Australia, Italy and the United Kingdom, as well as the partner country Chile, whereas only the Czech Republic, Ireland and to a lesser extent Norway and Spain show significant decrease in the private share allocated to tertiary educational institutions (Table B3.2b and Chart B3.3). In Australia, the main reason for the increase in the private share of spending on tertiary institutions between 1995 and 2003 was changes to the Higher Education Contribution Scheme (HECS) that took place in 1997. The changes in HECS were part of a reform process aimed at providing more funds for higher education, partly through increased student/former student contributions (see Indicator B5).
The amounts paid by students and their families to cover tuition fees and other education-related expenditures differ among OECD countries according to taxation and spending policies, and the willingness of governments to support students (see Table B5.2 and Chart B5.3). This willingness is influenced by students’ enrolment status (full-time or part-time), age and residency (whether they are living at home). To some extent, however, the guidelines used in establishing eligibility for these subsidies are breaking down. Mature students, whose numbers are increasing, are more likely to have established their own households and to prefer part-time or distance learning to full-time, on-campus study.
Public and Private Investment in Educational Institutions – INDICATOR B3 chapter B
Education at a Glance © OECD 2006 217
B3
Changes in the proportion of private expenditure compared to changes in the real level of public-sector spending on tertiary education
It is notable that rises in private educational expenditure have not generally gone hand in hand with cuts (in real terms) in public expenditure on education at the tertiary level or at the primary, secondary and post-secondary non-tertiary level. On the contrary, public investment in education has increased in most of the OECD countries for which 1995 to 2003 data are available, regardless of changes in private spending (see Table B2.2). In fact, many OECD countries with the highest growth in private spending have also shown the highest increase in public funding of education. This indicates that increasing private spending on tertiary education tends to complement, rather than replace, public investment. The main exception to this is Australia, where the shift towards private expenditure at tertiary level has been accompanied both by a fall in the level of public expenditure in real terms and by a significant increase of public subsidies provided to tertiary students.
Definitions and methodologies
Data refer to the financial year 2003 and are based on the UOE data collection on education statistics administered by the OECD in 2005 (for details see Annex 3 at www.oecd.org/edu/eag2006).
The public and private proportions of expenditure on educational institutions are the percentages of total spending originating in, or generated by, the public and private sectors. Private spending includes all direct expenditure on educational institutions, whether partially covered by public subsidies or not. Public subsidies attributable to households, included in private spending, are shown separately.
A portion of the budgets of educational institutions is related to ancillary services offered to students, including student welfare services (student meals, housing and transportation). Part of the cost for these services is covered by fees collected from students and is included in the indicator.
Other private entities include private businesses and non-profit organisations, including religious organisations, charitable organisations, and business and labour associations. Expenditure by private companies on the work-based element of school and work-based training of apprentices and students are also taken into account.
The data on expenditure for 1995 were obtained by a special survey updated in 2003 in which expenditure for 1995 was adjusted to methods and definitions used in the current UOE data collection.
Note that data appearing in earlier editions of this publication may not always be comparable to data shown in the 2006 edition due to changes in definitions and coverage that were made as a result of the OECD expenditure comparability study (for details on changes, see Annex 3 at www.oecd.org/edu/eag2006).
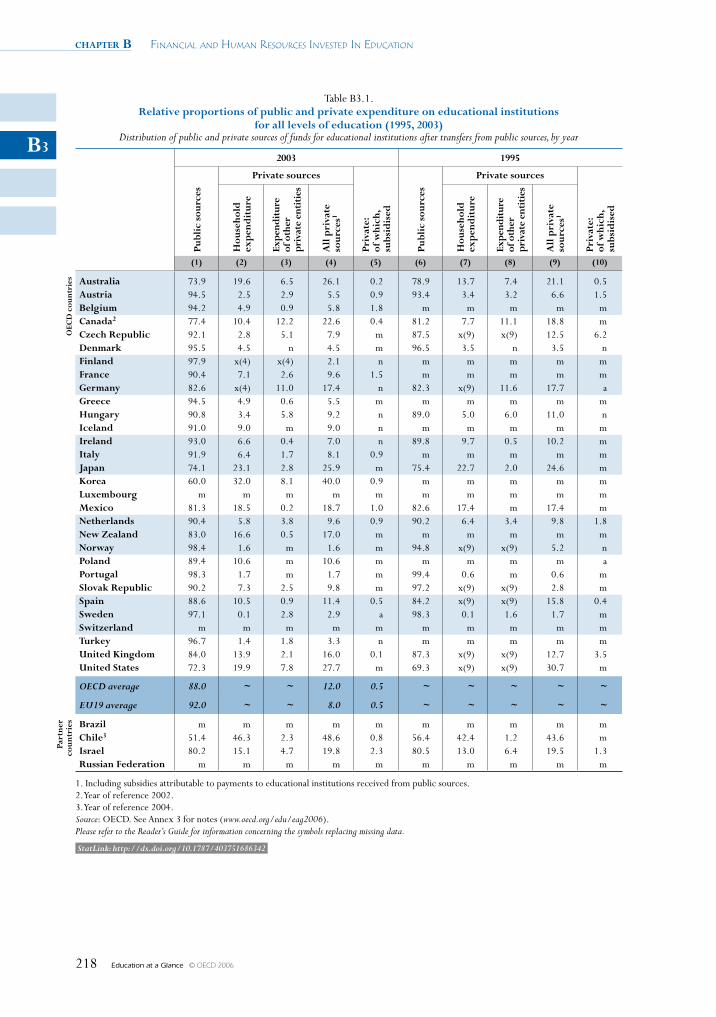
chapter B Financial and Human ResouRces invested in education
Education at a Glance © OECD 2006218
B3
Table B3.1. Relative proportions of public and private expenditure on educational institutions
for all levels of education (1995, 2003) Distribution of public and private sources of funds for educational institutions after transfers from public sources, by year
2003 1995
Publ
ic s
ourc
es
Private sources
Priv
ate:
of
whi
ch,
subs
idis
ed
Publ
ic s
ourc
es
Private sources
Priv
ate:
of
whi
ch,
subs
idis
ed
Hou
seho
ld
exp
end
itur
e
Expe
ndit
ure
of
oth
er
priv
ate
enti
ties
All
pri
vate
so
urce
s1
Hou
seho
ld
exp
end
itur
e
Expe
ndit
ure
of
oth
er
priv
ate
enti
ties
All
pri
vate
so
urce
s1
(1) (2) (3) (4) (5) (6) (7) (8) (9) (10)
OEC
D c
ount
ries Australia 73.9 19.6 6.5 26.1 0.2 78.9 13.7 7.4 21.1 0.5
Austria 94.5 2.5 2.9 5.5 0.9 93.4 3.4 3.2 6.6 1.5Belgium 94.2 4.9 0.9 5.8 1.8 m m m m mCanada2 77.4 10.4 12.2 22.6 0.4 81.2 7.7 11.1 18.8 mCzech Republic 92.1 2.8 5.1 7.9 m 87.5 x(9) x(9) 12.5 6.2Denmark 95.5 4.5 n 4.5 m 96.5 3.5 n 3.5 nFinland 97.9 x(4) x(4) 2.1 n m m m m mFrance 90.4 7.1 2.6 9.6 1.5 m m m m mGermany 82.6 x(4) 11.0 17.4 n 82.3 x(9) 11.6 17.7 aGreece 94.5 4.9 0.6 5.5 m m m m m mHungary 90.8 3.4 5.8 9.2 n 89.0 5.0 6.0 11.0 nIceland 91.0 9.0 m 9.0 n m m m m mIreland 93.0 6.6 0.4 7.0 n 89.8 9.7 0.5 10.2 mItaly 91.9 6.4 1.7 8.1 0.9 m m m m mJapan 74.1 23.1 2.8 25.9 m 75.4 22.7 2.0 24.6 mKorea 60.0 32.0 8.1 40.0 0.9 m m m m mLuxembourg m m m m m m m m m mMexico 81.3 18.5 0.2 18.7 1.0 82.6 17.4 m 17.4 mNetherlands 90.4 5.8 3.8 9.6 0.9 90.2 6.4 3.4 9.8 1.8New Zealand 83.0 16.6 0.5 17.0 m m m m m mNorway 98.4 1.6 m 1.6 m 94.8 x(9) x(9) 5.2 nPoland 89.4 10.6 m 10.6 m m m m m aPortugal 98.3 1.7 m 1.7 m 99.4 0.6 m 0.6 mSlovak Republic 90.2 7.3 2.5 9.8 m 97.2 x(9) x(9) 2.8 mSpain 88.6 10.5 0.9 11.4 0.5 84.2 x(9) x(9) 15.8 0.4Sweden 97.1 0.1 2.8 2.9 a 98.3 0.1 1.6 1.7 mSwitzerland m m m m m m m m m mTurkey 96.7 1.4 1.8 3.3 n m m m m mUnited Kingdom 84.0 13.9 2.1 16.0 0.1 87.3 x(9) x(9) 12.7 3.5United States 72.3 19.9 7.8 27.7 m 69.3 x(9) x(9) 30.7 m
OECD average 88.0 ~ ~ 12.0 0.5 ~ ~ ~ ~ ~
EU19 average 92.0 ~ ~ 8.0 0.5 ~ ~ ~ ~ ~
Part
ner
coun
trie
s Brazil m m m m m m m m m mChile3 51.4 46.3 2.3 48.6 0.8 56.4 42.4 1.2 43.6 mIsrael 80.2 15.1 4.7 19.8 2.3 80.5 13.0 6.4 19.5 1.3Russian Federation m m m m m m m m m m
1. Including subsidies attributable to payments to educational institutions received from public sources. 2. Year of reference 2002.3. Year of reference 2004.Source: OECD. See Annex 3 for notes (www.oecd.org/edu/eag2006).Please refer to the Reader’s Guide for information concerning the symbols replacing missing data.
StatLink: http://dx.doi.org/10.1787/403751686342
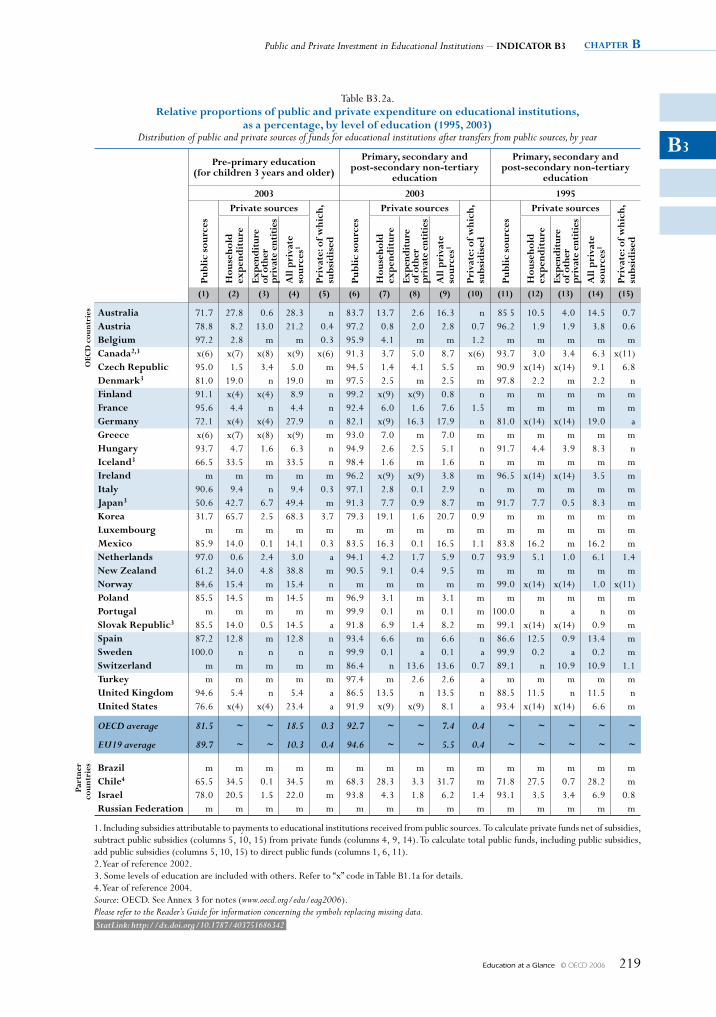
Public and Private Investment in Educational Institutions – INDICATOR B3 chapter B
Education at a Glance © OECD 2006 219
B3
Table B3.2a. Relative proportions of public and private expenditure on educational institutions,
as a percentage, by level of education (1995, 2003)Distribution of public and private sources of funds for educational institutions after transfers from public sources, by year
Pre-primary education (for children 3 years and older)
Primary, secondary and post-secondary non-tertiary
education
Primary, secondary and post-secondary non-tertiary
education
2003 2003 1995Pu
blic
sou
rces
Private sources
Priv
ate:
of w
hich
, su
bsid
ised
Publ
ic s
ourc
es
Private sources
Priv
ate:
of w
hich
, su
bsid
ised
Publ
ic s
ourc
es
Private sources
Priv
ate:
of w
hich
, su
bsid
ised
Hou
seho
ld
exp
end
itur
e
Expe
ndit
ure
of
oth
er
priv
ate
enti
ties
All
pri
vate
so
urce
s1
Hou
seho
ld
exp
end
itur
e
Expe
ndit
ure
of
oth
er
priv
ate
enti
ties
All
pri
vate
so
urce
s1
Hou
seho
ld
exp
end
itur
e
Expe
ndit
ure
of
oth
er
priv
ate
enti
ties
All
pri
vate
so
urce
s1
(1) (2) (3) (4) (5) (6) (7) (8) (9) (10) (11) (12) (13) (14) (15)
OEC
D c
ount
ries Australia 71.7 27.8 0.6 28.3 n 83.7 13.7 2.6 16.3 n 85 5 10.5 4.0 14.5 0.7
Austria 78.8 8.2 13.0 21.2 0.4 97.2 0.8 2.0 2.8 0.7 96.2 1.9 1.9 3.8 0.6Belgium 97.2 2.8 m m 0.3 95.9 4.1 m m 1.2 m m m m mCanada2,3 x(6) x(7) x(8) x(9) x(6) 91.3 3.7 5.0 8.7 x(6) 93.7 3.0 3.4 6.3 x(11)Czech Republic 95.0 1.5 3.4 5.0 m 94.5 1.4 4.1 5.5 m 90.9 x(14) x(14) 9.1 6.8Denmark3 81.0 19.0 n 19.0 m 97.5 2.5 m 2.5 m 97.8 2.2 m 2.2 nFinland 91.1 x(4) x(4) 8.9 n 99.2 x(9) x(9) 0.8 n m m m m mFrance 95.6 4.4 n 4.4 n 92.4 6.0 1.6 7.6 1.5 m m m m mGermany 72.1 x(4) x(4) 27.9 n 82.1 x(9) 16.3 17.9 n 81.0 x(14) x(14) 19.0 aGreece x(6) x(7) x(8) x(9) m 93.0 7.0 m 7.0 m m m m m mHungary 93.7 4.7 1.6 6.3 n 94.9 2.6 2.5 5.1 n 91.7 4.4 3.9 8.3 nIceland3 66.5 33.5 m 33.5 n 98.4 1.6 m 1.6 n m m m m mIreland m m m m m 96.2 x(9) x(9) 3.8 m 96.5 x(14) x(14) 3.5 mItaly 90.6 9.4 n 9.4 0.3 97.1 2.8 0.1 2.9 n m m m m mJapan3 50.6 42.7 6.7 49.4 m 91.3 7.7 0.9 8.7 m 91.7 7.7 0.5 8.3 mKorea 31.7 65.7 2.5 68.3 3.7 79.3 19.1 1.6 20.7 0.9 m m m m mLuxembourg m m m m m m m m m m m m m m mMexico 85.9 14.0 0.1 14.1 0.3 83.5 16.3 0.1 16.5 1.1 83.8 16.2 m 16.2 mNetherlands 97.0 0.6 2.4 3.0 a 94.1 4.2 1.7 5.9 0.7 93.9 5.1 1.0 6.1 1.4New Zealand 61.2 34.0 4.8 38.8 m 90.5 9.1 0.4 9.5 m m m m m mNorway 84.6 15.4 m 15.4 n m m m m m 99.0 x(14) x(14) 1.0 x(11)Poland 85.5 14.5 m 14.5 m 96.9 3.1 m 3.1 m m m m m mPortugal m m m m m 99.9 0.1 m 0.1 m 100.0 n a n mSlovak Republic3 85.5 14.0 0.5 14.5 a 91.8 6.9 1.4 8.2 m 99.1 x(14) x(14) 0.9 mSpain 87.2 12.8 m 12.8 n 93.4 6.6 m 6.6 n 86.6 12.5 0.9 13.4 mSweden 100.0 n n n n 99.9 0.1 a 0.1 a 99.9 0.2 a 0.2 mSwitzerland m m m m m 86.4 n 13.6 13.6 0.7 89.1 n 10.9 10.9 1.1Turkey m m m m m 97.4 m 2.6 2.6 a m m m m mUnited Kingdom 94.6 5.4 n 5.4 a 86.5 13.5 n 13.5 n 88.5 11.5 n 11.5 nUnited States 76.6 x(4) x(4) 23.4 a 91.9 x(9) x(9) 8.1 a 93.4 x(14) x(14) 6.6 m
OECD average 81.5 ~ ~ 18.5 0.3 92.7 ~ ~ 7.4 0.4 ~ ~ ~ ~ ~
EU19 average 89.7 ~ ~ 10.3 0.4 94.6 ~ ~ 5.5 0.4 ~ ~ ~ ~ ~
Part
ner
coun
trie
s Brazil m m m m m m m m m m m m m m mChile4 65.5 34.5 0.1 34.5 m 68.3 28.3 3.3 31.7 m 71.8 27.5 0.7 28.2 mIsrael 78.0 20.5 1.5 22.0 m 93.8 4.3 1.8 6.2 1.4 93.1 3.5 3.4 6.9 0.8Russian Federation m m m m m m m m m m m m m m m
1. Including subsidies attributable to payments to educational institutions received from public sources. To calculate private funds net of subsidies, subtract public subsidies (columns 5, 10, 15) from private funds (columns 4, 9, 14). To calculate total public funds, including public subsidies, add public subsidies (columns 5, 10, 15) to direct public funds (columns 1, 6, 11).2. Year of reference 2002.3. Some levels of education are included with others. Refer to “x” code in Table B1.1a for details.4. Year of reference 2004.Source: OECD. See Annex 3 for notes (www.oecd.org/edu/eag2006).Please refer to the Reader’s Guide for information concerning the symbols replacing missing data. StatLink: http://dx.doi.org/10.1787/403751686342
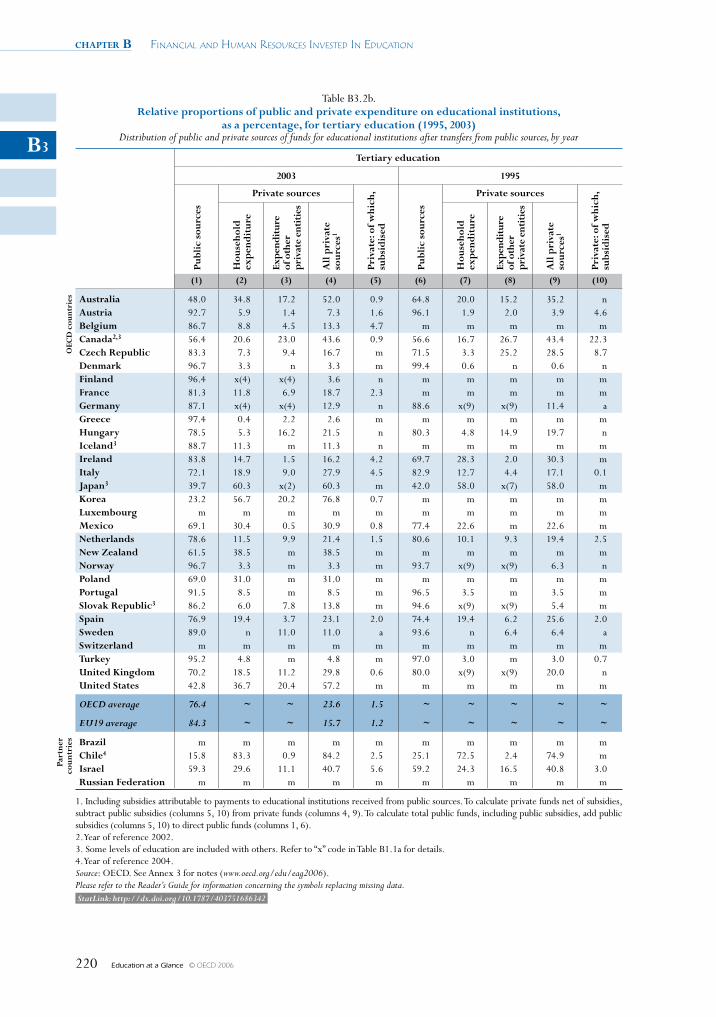
chapter B Financial and Human ResouRces invested in education
Education at a Glance © OECD 2006220
B3
Table B3.2b. Relative proportions of public and private expenditure on educational institutions,
as a percentage, for tertiary education (1995, 2003) Distribution of public and private sources of funds for educational institutions after transfers from public sources, by year
Tertiary education
2003 1995
Publ
ic s
ourc
esPrivate sources
Priv
ate:
of w
hich
, su
bsid
ised
Publ
ic s
ourc
es
Private sources
Priv
ate:
of w
hich
,su
bsid
ised
Hou
seho
ld
exp
end
itur
e
Expe
ndit
ure
of
oth
er
priv
ate
enti
ties
All
pri
vate
so
urce
s1
Hou
seho
ld
exp
end
itur
e
Expe
ndit
ure
of
oth
er
priv
ate
enti
ties
All
pri
vate
so
urce
s1
(1) (2) (3) (4) (5) (6) (7) (8) (9) (10)
OEC
D c
ount
ries Australia 48.0 34.8 17.2 52.0 0.9 64.8 20.0 15.2 35.2 n
Austria 92.7 5.9 1.4 7.3 1.6 96.1 1.9 2.0 3.9 4.6Belgium 86.7 8.8 4.5 13.3 4.7 m m m m mCanada2,3 56.4 20.6 23.0 43.6 0.9 56.6 16.7 26.7 43.4 22.3Czech Republic 83.3 7.3 9.4 16.7 m 71.5 3.3 25.2 28.5 8.7Denmark 96.7 3.3 n 3.3 m 99.4 0.6 n 0.6 nFinland 96.4 x(4) x(4) 3.6 n m m m m mFrance 81.3 11.8 6.9 18.7 2.3 m m m m mGermany 87.1 x(4) x(4) 12.9 n 88.6 x(9) x(9) 11.4 aGreece 97.4 0.4 2.2 2.6 m m m m m mHungary 78.5 5.3 16.2 21.5 n 80.3 4.8 14.9 19.7 nIceland3 88.7 11.3 m 11.3 n m m m m mIreland 83.8 14.7 1.5 16.2 4.2 69.7 28.3 2.0 30.3 mItaly 72.1 18.9 9.0 27.9 4.5 82.9 12.7 4.4 17.1 0.1Japan3 39.7 60.3 x(2) 60.3 m 42.0 58.0 x(7) 58.0 mKorea 23.2 56.7 20.2 76.8 0.7 m m m m mLuxembourg m m m m m m m m m mMexico 69.1 30.4 0.5 30.9 0.8 77.4 22.6 m 22.6 mNetherlands 78.6 11.5 9.9 21.4 1.5 80.6 10.1 9.3 19.4 2.5New Zealand 61.5 38.5 m 38.5 m m m m m mNorway 96.7 3.3 m 3.3 m 93.7 x(9) x(9) 6.3 nPoland 69.0 31.0 m 31.0 m m m m m mPortugal 91.5 8.5 m 8.5 m 96.5 3.5 m 3.5 mSlovak Republic3 86.2 6.0 7.8 13.8 m 94.6 x(9) x(9) 5.4 mSpain 76.9 19.4 3.7 23.1 2.0 74.4 19.4 6.2 25.6 2.0Sweden 89.0 n 11.0 11.0 a 93.6 n 6.4 6.4 aSwitzerland m m m m m m m m m mTurkey 95.2 4.8 m 4.8 m 97.0 3.0 m 3.0 0.7United Kingdom 70.2 18.5 11.2 29.8 0.6 80.0 x(9) x(9) 20.0 nUnited States 42.8 36.7 20.4 57.2 m m m m m m
OECD average 76.4 ~ ~ 23.6 1.5 ~ ~ ~ ~ ~
EU19 average 84.3 ~ ~ 15.7 1.2 ~ ~ ~ ~ ~
Part
ner
coun
trie
s Brazil m m m m m m m m m mChile4 15.8 83.3 0.9 84.2 2.5 25.1 72.5 2.4 74.9 mIsrael 59.3 29.6 11.1 40.7 5.6 59.2 24.3 16.5 40.8 3.0Russian Federation m m m m m m m m m m
1. Including subsidies attributable to payments to educational institutions received from public sources. To calculate private funds net of subsidies, subtract public subsidies (columns 5, 10) from private funds (columns 4, 9). To calculate total public funds, including public subsidies, add public subsidies (columns 5, 10) to direct public funds (columns 1, 6).2. Year of reference 2002.3. Some levels of education are included with others. Refer to “x” code in Table B1.1a for details.4. Year of reference 2004.Source: OECD. See Annex 3 for notes (www.oecd.org/edu/eag2006).Please refer to the Reader’s Guide for information concerning the symbols replacing missing data. StatLink: http://dx.doi.org/10.1787/403751686342
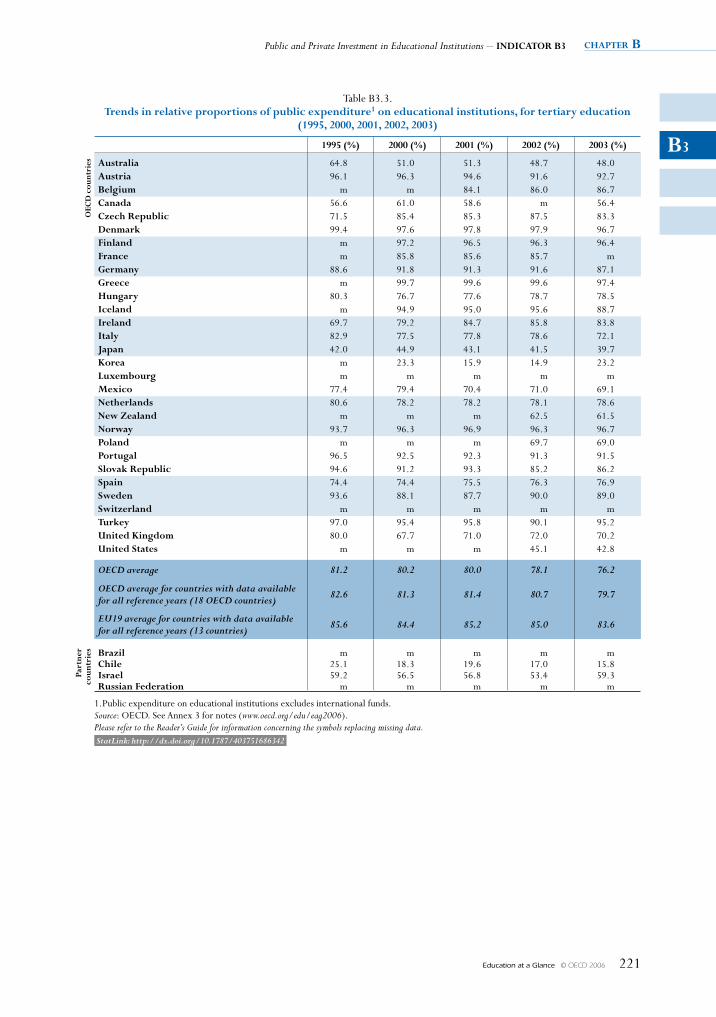
Public and Private Investment in Educational Institutions – INDICATOR B3 chapter B
Education at a Glance © OECD 2006 221
B3
Table B3.3. Trends in relative proportions of public expenditure1 on educational institutions, for tertiary education
(1995, 2000, 2001, 2002, 2003)
1995 (%) 2000 (%) 2001 (%) 2002 (%) 2003 (%)
OEC
D c
ount
ries Australia 64.8 51.0 51.3 48.7 48.0
Austria 96.1 96.3 94.6 91.6 92.7Belgium m m 84.1 86.0 86.7Canada 56.6 61.0 58.6 m 56.4Czech Republic 71.5 85.4 85.3 87.5 83.3Denmark 99.4 97.6 97.8 97.9 96.7Finland m 97.2 96.5 96.3 96.4France m 85.8 85.6 85.7 mGermany 88.6 91.8 91.3 91.6 87.1Greece m 99.7 99.6 99.6 97.4Hungary 80.3 76.7 77.6 78.7 78.5Iceland m 94.9 95.0 95.6 88.7Ireland 69.7 79.2 84.7 85.8 83.8Italy 82.9 77.5 77.8 78.6 72.1Japan 42.0 44.9 43.1 41.5 39.7Korea m 23.3 15.9 14.9 23.2Luxembourg m m m m mMexico 77.4 79.4 70.4 71.0 69.1Netherlands 80.6 78.2 78.2 78.1 78.6New Zealand m m m 62.5 61.5Norway 93.7 96.3 96.9 96.3 96.7Poland m m m 69.7 69.0Portugal 96.5 92.5 92.3 91.3 91.5Slovak Republic 94.6 91.2 93.3 85.2 86.2Spain 74.4 74.4 75.5 76.3 76.9Sweden 93.6 88.1 87.7 90.0 89.0Switzerland m m m m mTurkey 97.0 95.4 95.8 90.1 95.2United Kingdom 80.0 67.7 71.0 72.0 70.2United States m m m 45.1 42.8
OECD average 81.2 80.2 80.0 78.1 76.2
OECD average for countries with data available for all reference years (18 OECD countries) 82.6 81.3 81.4 80.7 79.7
EU19 average for countries with data available for all reference years (13 countries) 85.6 84.4 85.2 85.0 83.6
Part
ner
coun
trie
s Brazil m m m m mChile 25.1 18.3 19.6 17.0 15.8Israel 59.2 56.5 56.8 53.4 59.3Russian Federation m m m m m
1.Public expenditure on educational institutions excludes international funds.Source: OECD. See Annex 3 for notes (www.oecd.org/edu/eag2006).Please refer to the Reader’s Guide for information concerning the symbols replacing missing data. StatLink: http://dx.doi.org/10.1787/403751686342
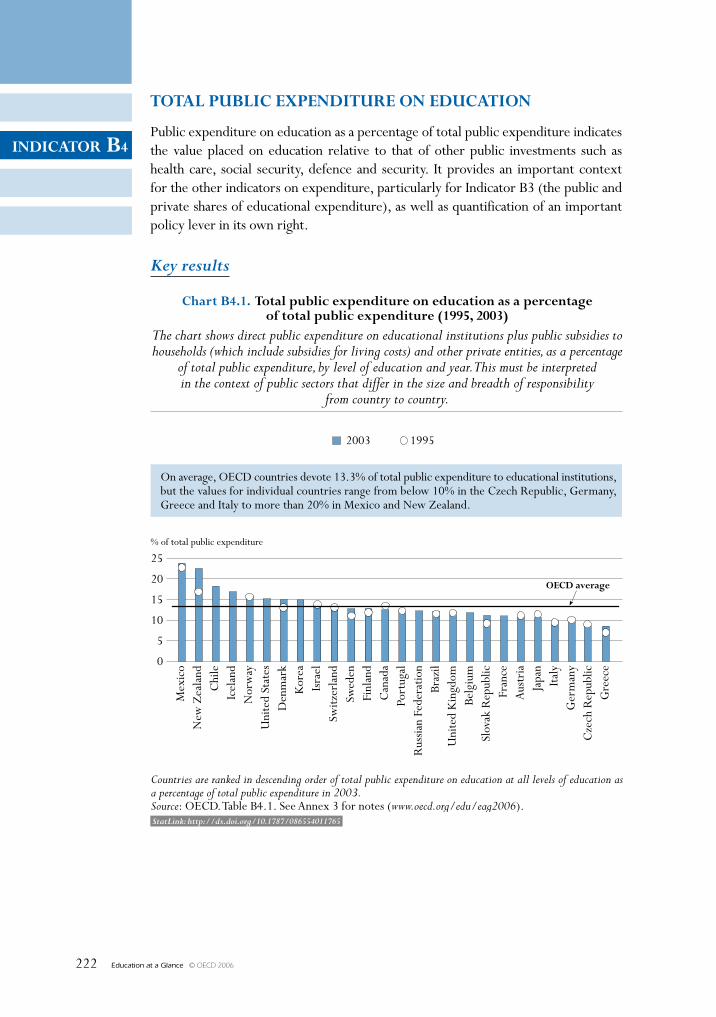
Education at a Glance © OECD 2006222
INDICATOR B4
TOTAl puBlIC expeNDITuRe ON eDuCATION
Public expenditure on education as a percentage of total public expenditure indicates the value placed on education relative to that of other public investments such as health care, social security, defence and security. It provides an important context for the other indicators on expenditure, particularly for Indicator B3 (the public and private shares of educational expenditure), as well as quantification of an important policy lever in its own right.
Key results
25
20
15
10
5
0
% of total public expenditure
Chart B4.1. Total public expenditure on education as a percentageof total public expenditure (1995, 2003)
The chart shows direct public expenditure on educational institutions plus public subsidies tohouseholds (which include subsidies for living costs) and other private entities, as a percentage
of total public expenditure, by level of education and year. This must be interpretedin the context of public sectors that differ in the size and breadth of responsibility
from country to country.
2003 1995
Countries are ranked in descending order of total public expenditure on education at all levels of education asa percentage of total public expenditure in 2003.Source: OECD. Table B4.1. See Annex 3 for notes (www.oecd.org/edu/eag2006).
Mex
ico
New
Zea
land
Chi
leIc
elan
dN
orw
ayU
nite
d St
ates
Den
mar
kK
orea
Isra
elSw
itzer
land
Swed
enFi
nlan
dC
anad
aPo
rtug
alR
ussia
n Fe
dera
tion
Braz
ilU
nite
d K
ingd
omBe
lgiu
mSl
ovak
Rep
ublic
Fran
ceA
ustr
iaJa
pan
Italy
Ger
man
yC
zech
Rep
ublic
Gre
ece
OeCD average
On average, OECD countries devote 13.3% of total public expenditure to educational institutions,but the values for individual countries range from below 10% in the Czech Republic, Germany,Greece and Italy to more than 20% in Mexico and New Zealand.
StatLink: http://dx.doi.org/10.1787/086554011765
Education at a Glance © OECD 2006 223
INDICATOR B4
Other highlights of this indicator
• Public funding of education is a social priority, even in OECD countries with little public involvement in other areas.
• In OECD countries, public funding of primary, secondary and post-secondary non-tertiary education is on average three times that of tertiary education, mainly due to largely universal enrolment rates but also because the private share in expenditure tends to be higher at the tertiary level. This ratio varies by country from less than double in Canada, Denmark and Finland to more than five times in Korea and partner country Chile. The latter figure is indicative of the relatively high proportion of private funds that go into tertiary education in Korea and the partner country Chile.
• Between 1995 and 2003, public budgets as a percentage of GDP tended to decline. Education, however, took a growing share of total public expenditure in most countries, although it did not on average grow as fast as GDP. In Denmark, Greece, New Zealand, the Slovak Republic and Sweden, there have been particularly significant shifts in public funding in favour of education.
• On average among OECD countries, 83% of public expenditure on education is transferred to public institutions. In three-quarters of the OECD countries as well as in the partner country Brazil, the share of public expenditure on education transferred to public institutions exceeds 80%. The share of public expenditure transferred to the private sector is larger at the tertiary level than at primary to post-secondary non-tertiary levels and reaches 28% on average among OECD countries with available data.
chapter B Financial and Human ResouRces invested in education
Education at a Glance © OECD 2006224
B4
Policy context
If the public benefits from a particular service are greater than the private benefits, then markets alone may fail to provide these services adequately and governments may need to become involved. Education is one area where all governments intervene to fund or direct the provision of services. As there is no guarantee that markets will provide equal access to educational opportunities, government funding of educational services ensures that education is not beyond the reach of some members of society.
This indicator focuses on public expenditure on education but also evaluates how public expenditure has changed over time in absolute terms and relative to total governmental spending. Since the second half of the 1990s, most OECD countries have made serious efforts to consolidate public budgets. Education has had to compete with a wide range of other areas covered in government budgets for public financial support. To examine this evolution, the indicator evaluates the change in educational expenditure in absolute terms, and relative to changes in the size of public budgets.
Evidence and explanations
What this indicator does and does not cover
This indicator shows total public expenditure on education, which includes direct public expenditure on educational institutions as well as public subsidies to households (e.g. scholarships and loans to students for tuition fees and student living costs) and to other private entities for education (e.g. subsidies to companies or labour organisations that operate apprenticeship programmes). Unlike the preceding indicators, this indicator also includes public subsidies that are not attributable to household payments for educational institutions, such as subsidies for student living costs.
OECD countries differ in the ways in which they use public money for education. Public funds may flow directly to schools or may be channelled to institutions via government programmes or via households; they may also be restricted to the purchase of educational services or be used to support student living costs.
Total public expenditure on all services, excluding education, includes expenditure on debt servicing (e.g. interest payments) that are not included in public expenditure on education. The reason for this exclusion is that some countries cannot separate interest payment outlays for education from those for other services. This means that public expenditure on education as a percentage of total public expenditure can be underestimated in countries where interest payments represent a high proportion of total public expenditure on all services.
It is important to examine public investment in education in conjunction with private investment, as shown in Indicator B3, in order to get a total picture of investment in education.
Overall level of public resources invested in education
On average, OECD countries devoted 13.3% of total public expenditure to education in 2003. However, the values for individual countries range from below 10% in the Czech Republic, Germany, Greece and Italy, to more than 20% in Mexico and New Zealand (Chart B4.1).
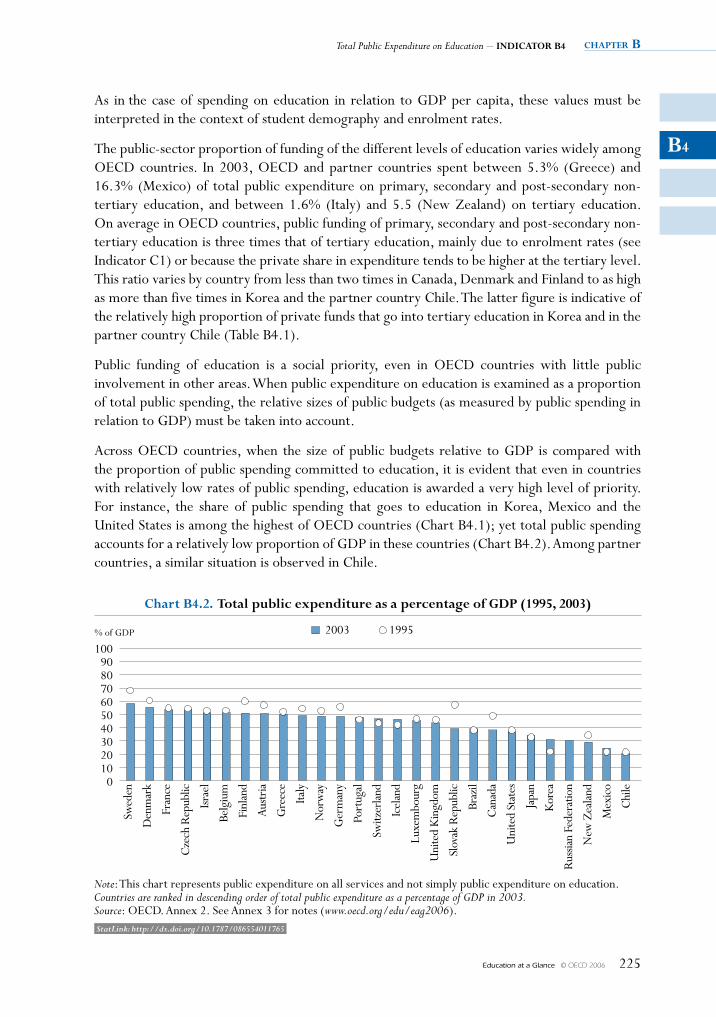
Total Public Expenditure on Education – INDICATOR B4 chapter B
Education at a Glance © OECD 2006 225
B4
As in the case of spending on education in relation to GDP per capita, these values must be interpreted in the context of student demography and enrolment rates.
The public-sector proportion of funding of the different levels of education varies widely among OECD countries. In 2003, OECD and partner countries spent between 5.3% (Greece) and 16.3% (Mexico) of total public expenditure on primary, secondary and post-secondary non-tertiary education, and between 1.6% (Italy) and 5.5 (New Zealand) on tertiary education. On average in OECD countries, public funding of primary, secondary and post-secondary non-tertiary education is three times that of tertiary education, mainly due to enrolment rates (see Indicator C1) or because the private share in expenditure tends to be higher at the tertiary level. This ratio varies by country from less than two times in Canada, Denmark and Finland to as high as more than five times in Korea and the partner country Chile. The latter figure is indicative of the relatively high proportion of private funds that go into tertiary education in Korea and in the partner country Chile (Table B4.1).
Public funding of education is a social priority, even in OECD countries with little public involvement in other areas. When public expenditure on education is examined as a proportion of total public spending, the relative sizes of public budgets (as measured by public spending in relation to GDP) must be taken into account.
Across OECD countries, when the size of public budgets relative to GDP is compared with the proportion of public spending committed to education, it is evident that even in countries with relatively low rates of public spending, education is awarded a very high level of priority. For instance, the share of public spending that goes to education in Korea, Mexico and the United States is among the highest of OECD countries (Chart B4.1); yet total public spending accounts for a relatively low proportion of GDP in these countries (Chart B4.2). Among partner countries, a similar situation is observed in Chile.
100908070605040302010
0
% of GDP
Chart B4.2. Total public expenditure as a percentage of GDp (1995, 2003)
Note: This chart represents public expenditure on all services and not simply public expenditure on education.Countries are ranked in descending order of total public expenditure as a percentage of GDP in 2003.Source: OECD. Annex 2. See Annex 3 for notes (www.oecd.org/edu/eag2006).
Swed
en
Den
mar
k
Fran
ce
Cze
ch R
epub
lic
Israe
l
Belg
ium
Finl
and
Aust
ria
Gre
ece
Italy
Nor
way
Ger
man
y
Port
ugal
Switz
erla
nd
Icel
and
Luxe
mbo
urg
Uni
ted
Kin
gdom
Slov
ak R
epub
lic
Braz
il
Can
ada
Uni
ted
Stat
es
Japa
n
Kor
ea
Rus
sian
Fede
ratio
n
New
Zea
land
Mex
ico
Chi
le2003 1995
StatLink: http://dx.doi.org/10.1787/086554011765
chapter B Financial and Human ResouRces invested in education
Education at a Glance © OECD 2006226
B4
Although the overall pattern is not clear, there is some evidence to suggest that countries with high rates of public spending spend proportionately less on education; only two of the top ten countries for public spending on public services overall – Denmark and the partner country Israel – are among the top ten public spenders on education (Charts B4.1 and B4.2).
Typically, from 1995 to 2003, public expenditure on education grew faster than total public spending, but not as fast as national income. The process of budget consolidation puts pressure on education along with every other service. Nevertheless, with the exception of Canada, the Czech Republic and Japan, spending on education grew at least as fast as spending in other public areas between 1995 and 2003; on average, the proportion of public budgets spent on education in OECD countries grew from 12.0% in 1995 to 13.3% in 2003. The figures suggest that the greatest increases in the share of public expenditure on education between 1995 and 2003 took place in Denmark (increasing from 12.7% to 15.1%), Greece (6.6% to 8.6%) New Zealand (16.5% to 22.6%), the Slovak Republic (8.8% to 11.2%) and Sweden (10.7% to 12.8%).
Distribution of public expenditure to the public and private sectors
The vast majority of public funds on education are directed at public institutions: an average of 83% of public expenditure is transferred to public institutions among OECD countries. In three-quarters of the OECD countries, as well as in Brazil, the share of public expenditure on education transferred to public institutions exceeds 80%. However, significant public funds are transferred to private institutions or given directly to households to spend in the institution of their choice in a number of countries: more than 20% of public expenditure is distributed (directly or indirectly) to the private sector in Denmark, New Zealand, Norway, the United Kingdom and in the partner countries Chile and Israel. In Belgium and the Netherlands, the majority of public funds goes to government-dependant institutions that are managed by private bodies but operate otherwise under the aegis of the regular education system (Table B4.2).
On average among OECD countries, at the primary, secondary and post-secondary non-tertiary levels, 11% of public funding designated for educational institutions is spent in privately managed institutions. Belgium and the Netherlands are the only countries where the majority of funds goes to privately managed institutions. Public funding transfers to private households and other private entities are generally not a significant feature at primary, secondary and post-secondary non-tertiary levels. On average among OECD countries, these transfers represent 3% of public expenditure on education and exceed 10% only in Denmark.
At the tertiary level, on average among OECD countries, the majority of public funds are still directed at public institutions, but the share of public expenditure transferred to the private sector is larger than at primary to post-secondary non-tertiary level and reaches 28% on average among countries with available data. There are, however, substantial variations among countries in the share of public expenditure devoted to the private sector. In the United Kingdom (where there are no public tertiary institutions), Belgium and the Netherlands, as well as the partner country Israel, public expenditure is mainly devoted to privately managed institutions. The share of public expenditure indirectly transferred to the private sector is larger at the tertiary level than below as it is more typical for households/students to receive some transfers of public funding at the tertiary level than at other levels. On average, 17% of public funding is indirectly transferred to the private sector at the tertiary level. These transfers result partly from financial
Total Public Expenditure on Education – INDICATOR B4 chapter B
Education at a Glance © OECD 2006 227
B4
aid attributed to tertiary students through scholarships, grants and loans (see Indicator B5). The proportion of public expenditure indirectly transferred to the private sector is superior to 30% in Australia, Denmark, New Zealand and Norway and, among partner countries, in Chile.
Definitions and methodologies
Data refer to the financial year 2003 and are based on the UOE data collection on education statistics administered by the OECD in 2005 (for details see Annex 3 at www.oecd.org/edu/eag2006). Educational expenditure is expressed as a percentage of a country’s total public sector expenditure and as a percentage of GDP. Public educational expenditure includes expenditure on educational institutions and subsidies for students’ living costs and for other private expenditure outside institutions. Public expenditure on education includes expenditure by all public entities, including ministries other than the ministry of education, local and regional governments and other public agencies.
Total public expenditure, also referred to as total public spending, corresponds to the non-repayable current and capital expenditure of all levels of government: central, regional and local. Current expenditure includes final consumption expenditure, property income paid, subsidies and other current transfers (e.g. social security, social assistance, pensions and other welfare benefits). Figures for total public expenditure have been taken from the OECD National Accounts Database (see Annex 2) and use the System of National Accounts 1993.
The glossary at www.oecd.org/edu/eag2006 gives a definition of public, government-dependent private and independent private institutions.
Note that data appearing in earlier editions of this publication may not always be comparable to data shown in the 2006 edition due to changes in definitions and coverage that were made as a result of the OECD expenditure comparability study (for details on changes, see Annex 3 at www.oecd.org/edu/eag2006).
Further references
The following additional material relevant to this indicator is available on the Web athttp://dx.doi.org/10.1787/086554011765
• Table B4.3a. Initial sources of public educational funds and final purchasers of educational resources by level of government for primary, secondary and post-secondary non-tertiary education (2003)
• Table B4.3b. Initial sources of public educational funds and final purchasers of educational resources by level of government for tertiary education (2003)
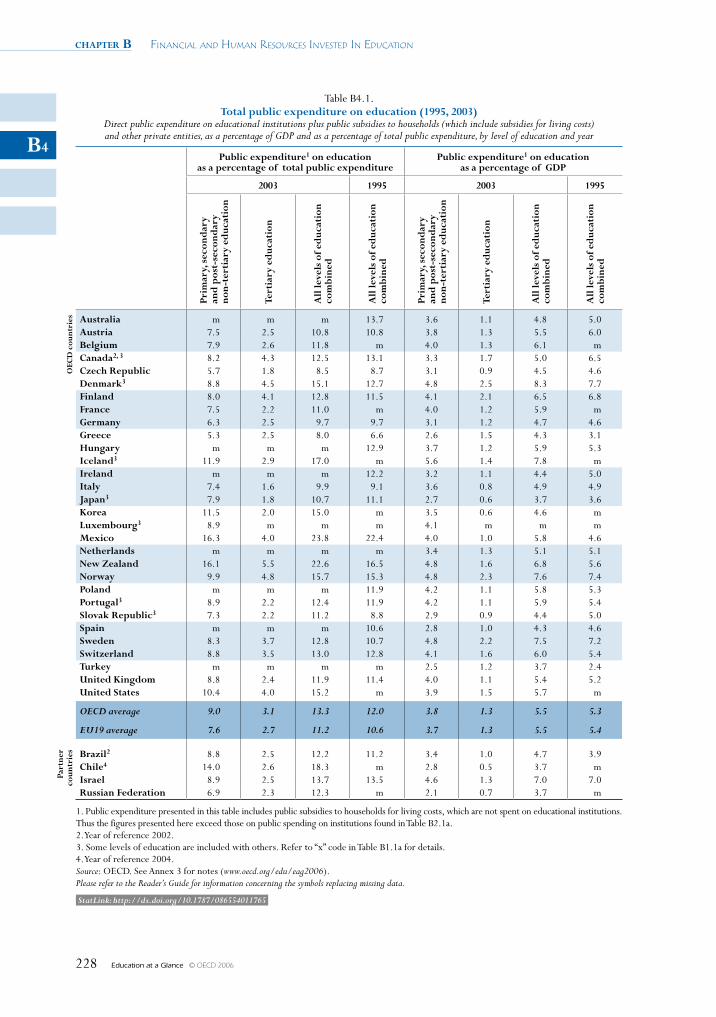
chapter B Financial and Human ResouRces invested in education
Education at a Glance © OECD 2006228
B4
Table B4.1. Total public expenditure on education (1995, 2003)
Direct public expenditure on educational institutions plus public subsidies to households (which include subsidies for living costs) and other private entities, as a percentage of GDP and as a percentage of total public expenditure, by level of education and year
public expenditure1 on education as a percentage of total public expenditure
public expenditure1 on education as a percentage of GDp
2003 1995 2003 1995
prim
ary,
sec
ond
ary
and
pos
t-se
cond
ary
non-
tert
iary
ed
ucat
ion
Tert
iary
ed
ucat
ion
All
leve
ls o
f ed
ucat
ion
com
bine
d
All
leve
ls o
f ed
ucat
ion
com
bine
d
prim
ary,
sec
ond
ary
and
pos
t-se
cond
ary
non-
tert
iary
ed
ucat
ion
Tert
iary
ed
ucat
ion
All
leve
ls o
f ed
ucat
ion
com
bine
d
All
leve
ls o
f ed
ucat
ion
com
bine
d
OeC
D c
ount
ries Australia m m m 13.7 3.6 1.1 4.8 5.0
Austria 7.5 2.5 10.8 10.8 3.8 1.3 5.5 6.0Belgium 7.9 2.6 11.8 m 4.0 1.3 6.1 mCanada2, 3 8.2 4.3 12.5 13.1 3.3 1.7 5.0 6.5Czech Republic 5.7 1.8 8.5 8.7 3.1 0.9 4.5 4.6Denmark3 8.8 4.5 15.1 12.7 4.8 2.5 8.3 7.7Finland 8.0 4.1 12.8 11.5 4.1 2.1 6.5 6.8France 7.5 2.2 11.0 m 4.0 1.2 5.9 mGermany 6.3 2.5 9.7 9.7 3.1 1.2 4.7 4.6Greece 5.3 2.5 8.0 6.6 2.6 1.5 4.3 3.1Hungary m m m 12.9 3.7 1.2 5.9 5.3Iceland3 11.9 2.9 17.0 m 5.6 1.4 7.8 mIreland m m m 12.2 3.2 1.1 4.4 5.0Italy 7.4 1.6 9.9 9.1 3.6 0.8 4.9 4.9Japan3 7.9 1.8 10.7 11.1 2.7 0.6 3.7 3.6Korea 11.5 2.0 15.0 m 3.5 0.6 4.6 mluxembourg3 8.9 m m m 4.1 m m mMexico 16.3 4.0 23.8 22.4 4.0 1.0 5.8 4.6Netherlands m m m m 3.4 1.3 5.1 5.1New Zealand 16.1 5.5 22.6 16.5 4.8 1.6 6.8 5.6Norway 9.9 4.8 15.7 15.3 4.8 2.3 7.6 7.4poland m m m 11.9 4.2 1.1 5.8 5.3portugal3 8.9 2.2 12.4 11.9 4.2 1.1 5.9 5.4Slovak Republic3 7.3 2.2 11.2 8.8 2.9 0.9 4.4 5.0Spain m m m 10.6 2.8 1.0 4.3 4.6Sweden 8.3 3.7 12.8 10.7 4.8 2.2 7.5 7.2Switzerland 8.8 3.5 13.0 12.8 4.1 1.6 6.0 5.4Turkey m m m m 2.5 1.2 3.7 2.4united Kingdom 8.8 2.4 11.9 11.4 4.0 1.1 5.4 5.2united States 10.4 4.0 15.2 m 3.9 1.5 5.7 m
OECD average 9.0 3.1 13.3 12.0 3.8 1.3 5.5 5.3
EU19 average 7.6 2.7 11.2 10.6 3.7 1.3 5.5 5.4
part
ner
coun
trie
s Brazil2 8.8 2.5 12.2 11.2 3.4 1.0 4.7 3.9Chile4 14.0 2.6 18.3 m 2.8 0.5 3.7 mIsrael 8.9 2.5 13.7 13.5 4.6 1.3 7.0 7.0Russian Federation 6.9 2.3 12.3 m 2.1 0.7 3.7 m
1. Public expenditure presented in this table includes public subsidies to households for living costs, which are not spent on educational institutions. Thus the figures presented here exceed those on public spending on institutions found in Table B2.1a.2. Year of reference 2002.3. Some levels of education are included with others. Refer to “x” code in Table B1.1a for details.4. Year of reference 2004.Source: OECD. See Annex 3 for notes (www.oecd.org/edu/eag2006).Please refer to the Reader’s Guide for information concerning the symbols replacing missing data.
StatLink: http://dx.doi.org/10.1787/086554011765
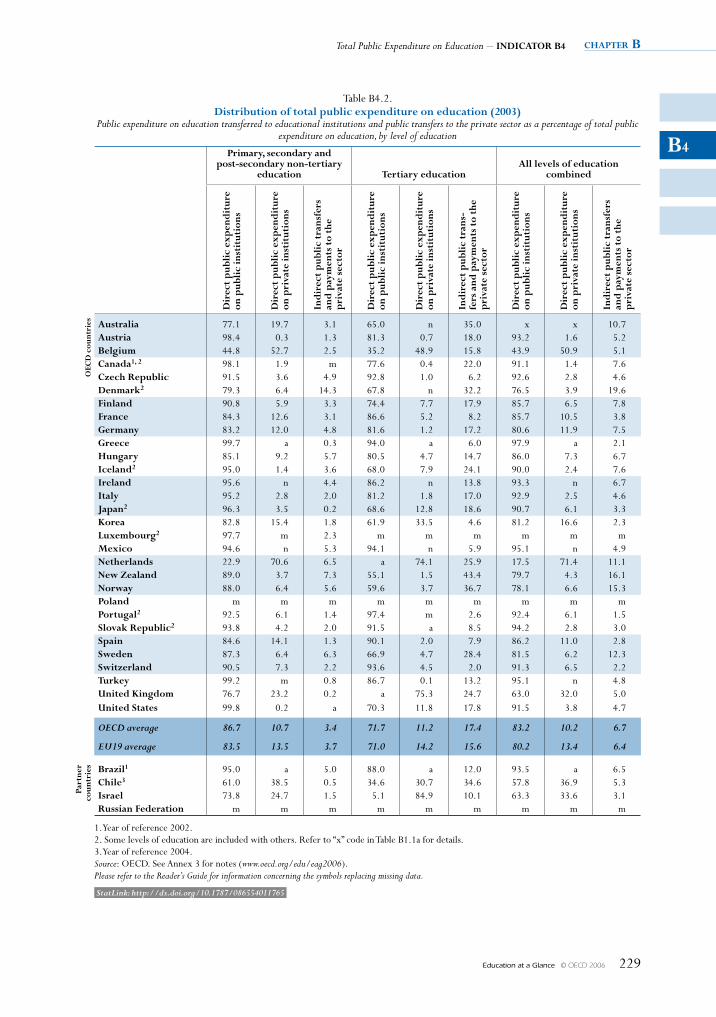
Total Public Expenditure on Education – INDICATOR B4 chapter B
Education at a Glance © OECD 2006 229
B4
Table B4.2.Distribution of total public expenditure on education (2003)
Public expenditure on education transferred to educational institutions and public transfers to the private sector as a percentage of total public expenditure on education, by level of education
primary, secondary and post-secondary non-tertiary
education Tertiary educationAll levels of education
combined
Dir
ect
pub
lic
exp
end
itur
e on
pub
lic
inst
itut
ions
Dir
ect
pub
lic
exp
end
itur
e on
pri
vate
inst
itut
ions
Ind
irec
t p
ubli
c tr
ansf
ers
and
pay
men
ts t
o th
e
pri
vate
sec
tor
Dir
ect
pub
lic
exp
end
itur
e on
pub
lic
inst
itut
ions
Dir
ect
pub
lic
exp
end
itur
e on
pri
vate
inst
itut
ions
Ind
irec
t p
ubli
c tr
ans-
fers
and
pay
men
ts t
o th
e p
riva
te s
ecto
r
Dir
ect
pub
lic
exp
end
itur
e on
pub
lic
inst
itut
ions
Dir
ect
pub
lic
exp
end
itur
e on
pri
vate
inst
itut
ions
Ind
irec
t p
ubli
c tr
ansf
ers
and
pay
men
ts t
o th
e
pri
vate
sec
tor
OeC
D c
ount
ries Australia 77.1 19.7 3.1 65.0 n 35.0 x x 10.7
Austria 98.4 0.3 1.3 81.3 0.7 18.0 93.2 1.6 5.2Belgium 44.8 52.7 2.5 35.2 48.9 15.8 43.9 50.9 5.1Canada1, 2 98.1 1.9 m 77.6 0.4 22.0 91.1 1.4 7.6Czech Republic 91.5 3.6 4.9 92.8 1.0 6.2 92.6 2.8 4.6Denmark2 79.3 6.4 14.3 67.8 n 32.2 76.5 3.9 19.6Finland 90.8 5.9 3.3 74.4 7.7 17.9 85.7 6.5 7.8France 84.3 12.6 3.1 86.6 5.2 8.2 85.7 10.5 3.8Germany 83.2 12.0 4.8 81.6 1.2 17.2 80.6 11.9 7.5Greece 99.7 a 0.3 94.0 a 6.0 97.9 a 2.1Hungary 85.1 9.2 5.7 80.5 4.7 14.7 86.0 7.3 6.7Iceland2 95.0 1.4 3.6 68.0 7.9 24.1 90.0 2.4 7.6Ireland 95.6 n 4.4 86.2 n 13.8 93.3 n 6.7Italy 95.2 2.8 2.0 81.2 1.8 17.0 92.9 2.5 4.6Japan2 96.3 3.5 0.2 68.6 12.8 18.6 90.7 6.1 3.3Korea 82.8 15.4 1.8 61.9 33.5 4.6 81.2 16.6 2.3luxembourg2 97.7 m 2.3 m m m m m mMexico 94.6 n 5.3 94.1 n 5.9 95.1 n 4.9Netherlands 22.9 70.6 6.5 a 74.1 25.9 17.5 71.4 11.1New Zealand 89.0 3.7 7.3 55.1 1.5 43.4 79.7 4.3 16.1Norway 88.0 6.4 5.6 59.6 3.7 36.7 78.1 6.6 15.3poland m m m m m m m m mportugal2 92.5 6.1 1.4 97.4 m 2.6 92.4 6.1 1.5Slovak Republic2 93.8 4.2 2.0 91.5 a 8.5 94.2 2.8 3.0Spain 84.6 14.1 1.3 90.1 2.0 7.9 86.2 11.0 2.8Sweden 87.3 6.4 6.3 66.9 4.7 28.4 81.5 6.2 12.3Switzerland 90.5 7.3 2.2 93.6 4.5 2.0 91.3 6.5 2.2Turkey 99.2 m 0.8 86.7 0.1 13.2 95.1 n 4.8united Kingdom 76.7 23.2 0.2 a 75.3 24.7 63.0 32.0 5.0united States 99.8 0.2 a 70.3 11.8 17.8 91.5 3.8 4.7
OECD average 86.7 10.7 3.4 71.7 11.2 17.4 83.2 10.2 6.7
EU19 average 83.5 13.5 3.7 71.0 14.2 15.6 80.2 13.4 6.4
part
ner
coun
trie
s Brazil1 95.0 a 5.0 88.0 a 12.0 93.5 a 6.5Chile3 61.0 38.5 0.5 34.6 30.7 34.6 57.8 36.9 5.3Israel 73.8 24.7 1.5 5.1 84.9 10.1 63.3 33.6 3.1Russian Federation m m m m m m m m m
1. Year of reference 2002.2. Some levels of education are included with others. Refer to “x” code in Table B1.1a for details.3. Year of reference 2004.Source: OECD. See Annex 3 for notes (www.oecd.org/edu/eag2006).Please refer to the Reader’s Guide for information concerning the symbols replacing missing data.
StatLink: http://dx.doi.org/10.1787/086554011765
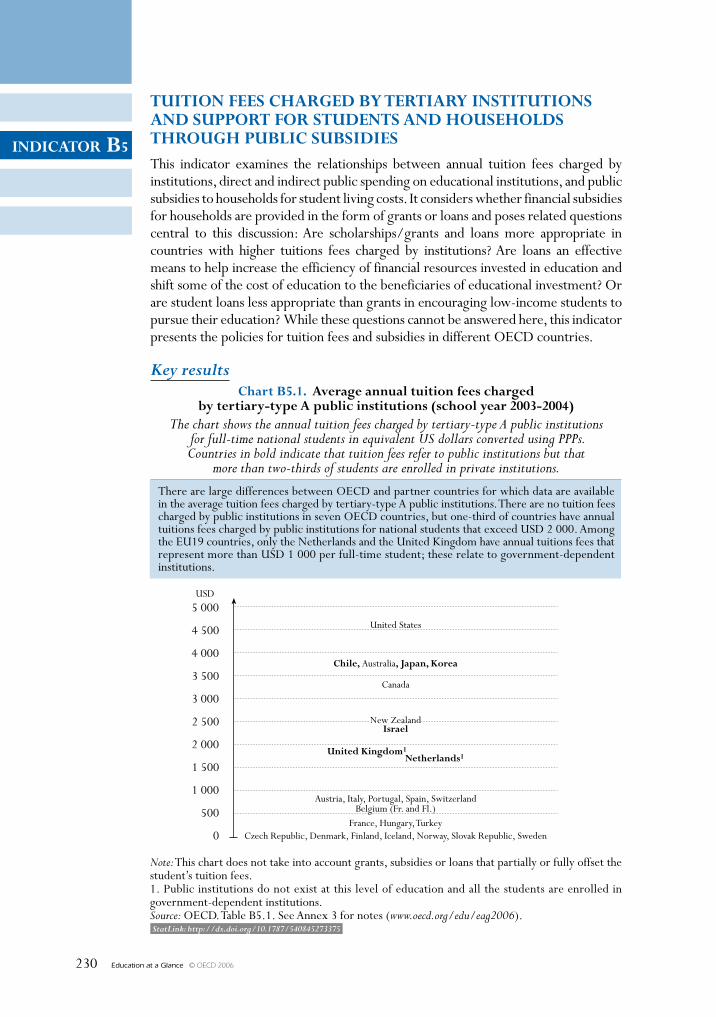
Education at a Glance © OECD 2006230
INDICATOR B5
TUITION FEES CHARGED BY TERTIARY INSTITUTIONS AND SUppORT FOR STUDENTS AND HOUSEHOlDS THROUGH pUBlIC SUBSIDIESThis indicator examines the relationships between annual tuition fees charged by institutions, direct and indirect public spending on educational institutions, and public subsidies to households for student living costs. It considers whether financial subsidies for households are provided in the form of grants or loans and poses related questions central to this discussion: Are scholarships/grants and loans more appropriate in countries with higher tuitions fees charged by institutions? Are loans an effective means to help increase the efficiency of financial resources invested in education and shift some of the cost of education to the beneficiaries of educational investment? Or are student loans less appropriate than grants in encouraging low-income students to pursue their education? While these questions cannot be answered here, this indicator presents the policies for tuition fees and subsidies in different OECD countries.
Key results
5 000USD
4 000
3 000
2 000
1 000
0
500
1 500
2 500
3 500
4 500
Chart B5.1. Average annual tuition fees chargedby tertiary-type A public institutions (school year 2003-2004)
The chart shows the annual tuition fees charged by tertiary-type A public institutions for full-time national students in equivalent US dollars converted using PPPs.Countries in bold indicate that tuition fees refer to public institutions but that
more than two-thirds of students are enrolled in private institutions.
Note: This chart does not take into account grants, subsidies or loans that partially or fully offset thestudent’s tuition fees.1. Public institutions do not exist at this level of education and all the students are enrolled ingovernment-dependent institutions.Source: OECD. Table B5.1. See Annex 3 for notes (www.oecd.org/edu/eag2006).
There are large differences between OECD and partner countries for which data are availablein the average tuition fees charged by tertiary-type A public institutions. There are no tuition feescharged by public institutions in seven OECD countries, but one-third of countries have annualtuitions fees charged by public institutions for national students that exceed USD 2 000. Amongthe EU19 countries, only the Netherlands and the United Kingdom have annual tuitions fees thatrepresent more than USD 1 000 per full-time student; these relate to government-dependentinstitutions.
United States
Chile, Australia, Japan, Korea
Canada
New ZealandIsrael
Austria, Italy, Portugal, Spain, SwitzerlandBelgium (Fr. and Fl.)
France, Hungary, TurkeyCzech Republic, Denmark, Finland, Iceland, Norway, Slovak Republic, Sweden
United Kingdom1Netherlands1
StatLink: http://dx.doi.org/10.1787/540845273375
Education at a Glance © OECD 2006 231
INDICATOR B5
Other highlights of this indicator
• In OECD countries where students are required to pay tuition fees, public subsidies are of particular importance in providing students with access to educational opportunities regardless of their financial situation. In, for example, Australia, New Zealand and the United Kingdom, and the partner country Chile, closely regulated public subsidies are earmarked for payments to educational institutions.
• Low annual tuition fees charged by tertiary-type A institutions are not associated systematically with a low proportion of subsidies provided to households/students. Except Iceland, all the Nordic countries with no tuition fees devote more than 10% of total public expenditure on tertiary education for scholarships/grants designed to help students cover their living expenses.
• An average of 17% of public spending on tertiary education is devoted to supporting students, households and other private entities. In Australia, Denmark, New Zealand, Norway and Sweden, and the partner country Chile, public subsidies to households account for about 28% or more of public tertiary education budgets.
• Subsidised student loan systems operate in some countries with high levels of participation at the tertiary level. It is notable, for instance, that Australia, New Zealand, Norway and Sweden, which are among OECD countries reporting the largest subsidies in the form of student loans at tertiary education, also have some of the highest rates of entry into tertiary education of OECD countries.
chapter B Financial and Human ResouRces invested in education
Education at a Glance © OECD 2006232
B5
Policy context
Decisions taken by policy makers on the amount of tuition fees charged by educational institutions have an influence both on the cost of tertiary studies to students and on the resources available to institutions at the tertiary level. Subsidies to students and their families also act as policy levers through which governments can encourage participation in education − particularly among students from low-income families − by covering part of the cost of education and related expenses. Governments can thereby seek to address issues of access and equality of opportunity. The success of such subsidies must therefore be judged, at least in part, through examination of indicators of participation, retention and completion. Furthermore, public subsidies play an important role in indirectly financing educational institutions.
Channelling funding for institutions through students may also help to increase competition between institutions. Since aid for student living costs can serve as a substitute for work, public subsidies may enhance educational attainment by enabling students to study full-time and to work fewer hours or not at all.
Public subsidies come in many forms: as means-based subsidies, as family allowances for all students, as tax allowances for students or their parents, or as other household transfers. Unconditional subsidies (such as tax reductions or family allowances) may provide less of an incentive for low-income students to participate in education than means-tested subsidies. However, they may still help reduce disparities between households with and without children in education.
Evidence and explanations
What this indicator does and does not cover
This indicator shows average tuition fees charged in public and private institutions at tertiary-type A level. The indicator does not distinguish tuition fees by type of programmes but shows an overview of tuition fees at tertiary-type A level by type of institution and presents the proportions of students that do or do not receive scholarships/grants fully or partially covering tuition fees. Amounts of tuition fees and associated proportions of students should be interpreted with caution as they result from the weighted average of the main Tertiary-type A programmes and do not cover all the educational institutions.
This indicator also shows the proportion of public spending on tertiary education transferred to students, families and other private entities. Some of these funds are spent indirectly on educational institutions, for example, when subsidies are used to cover tuition fees. Other subsidies for education do not relate to educational institutions, such as subsidies for student living costs.
The indicator distinguishes between scholarships and grants, which are non-repayable subsidies, and loans, which must be repaid. It does not, however, distinguish among different types of grants or loans, such as scholarships, family allowances and subsidies in kind.
Governments can also support students and their families by providing tax reductions and tax credits. These subsidies are not covered here.
The indicator reports the full volume of student loans in order to provide information on the level of support which current students receive. It does not take repayments into account,
Tuition Fees Charged by Tertiary Institutions and Support for Students and Households through Public Subsidies – INDICATOR B5 chapter B
Education at a Glance © OECD 2006 233
B5
even though these can reduce the real costs of loans substantially. The gross amount of loans, including scholarships and grants, provides an appropriate measure of financial aid to current participants in education. Although interest payments and repayments of the principal by borrowers would be taken into account in order to assess the net cost of student loans to public and private lenders, such payments are not usually made by current students but rather by former students. In most countries, moreover, loan repayments do not flow to the education authorities, and thus the money is not available to them to cover other educational expenditures.
Given that no internationally comparable method is currently available to calculate the net costs of student loan programmes, loans must be treated according to the likely use of the data. The OECD indicators therefore take the full amount of scholarships and loans (gross) into account when discussing financial aid to current students.
It is also common for governments to guarantee the repayment of loans to students made by private lenders. In some OECD countries, this indirect form of subsidy is as significant as, or more significant than, direct financial aid to students. However, for reasons of comparability, the indicator only takes into account the amounts relating to public transfers for private loans that are made to private entities (not the total value of loans generated).
Some OECD countries also have difficulties quantifying the amount of loans attributable to students. Therefore, data on student loans should be treated with some caution.
Annual tuition fees charged by tertiary-type A educational institutions
Large differences are observed among OECD and partner counties in the average tuition fees charged by tertiary-type A educational institutions. There are no tuition fees charged by public institutions in seven OECD countries including the Nordic countries, the Czech Republic and the Slovak Republic. By contrast, one-third of countries have annual tuitions fees for national students charged by public institutions that exceed USD 2 000. In the United States, tuition fees for national students reach more than USD 4 500 in public institutions. Among the EU19 countries, only the Netherlands and the United Kingdom have annual tuitions fees that represent more than USD 1 000 per full-time national student, but these fees related to government dependent private institutions (Table B5.1 and Chart B5.1).
There is no unique model observed in OECD and partner countries for the financing of tertiary-type A institutions and no clear relationship between the amount of tuition fees charged to students and the amount of financial support that these students may receive to cover tuition fees. Thus OECD countries with high levels of tuition fees are not necessarily those where the proportions of students receiving scholarships/grants to cover tuition fees are the highest. The five countries where tuition fees charged by tertiary-type A public educational institutions exceed USD 3 600 – Australia, Korea, Japan and the United States, and partner country Chile – present different patterns. In Japan, full-time students enrolled in tertiary-type A programmes do not receive scholarship/grants in support of the tuition fees from the government, whereas this is the case for around three out of four students in Australia, almost one out of two in Korea and one out of four students in the United States. In Japan, some students who excel academically but have difficulty in financing their studies may benefit from reduced tuition and/or admission fees or be exempt from paying these fees entirely.
chapter B Financial and Human ResouRces invested in education
Education at a Glance © OECD 2006234
B5
On the contrary, countries among those with the lowest levels of tuition fees charged in public institutions for tertiary-type A programmes may have quite significant proportions of students who receive scholarships and grants that fully cover tuition fees. In the Flemish community of Belgium, as well as in France, Portugal and Spain, tuition fees represent less than USD 900 per year, and still around one or more students out of five receives a public subsidy that fully covers the tuition fees (Table B5.1).
The amount of tuition fees charged by public educational institutions may differ among students enrolled in the same programme. Several countries make a distinction in the amount of tuition fees charged according to the citizenship of students. In Austria, for example, average tuition fees charged by public institutions for students who are not citizens from EU or EEA countries are twice the amount of fees charged for other students. This kind of differentiation also appears in Australia, Canada, the Slovak Republic, Turkey, the United Kingdom and the United States and will be extended to Denmark from the 2006-2007 academic year. In those countries, the variation of tuition fees according to citizenship is always significant except in the Slovak Republic. In other countries, the non-national students may pay from twice to nearly ten times the amount charged to a national student and the difference is most striking in the United Kingdom where EU citizens are charged on average USD 1 794 against up to USD 17 874 for students with another citizenship (Table B5.1). This type of policy differentiation may check the flows of international students (see Indicator C3) unless those students receive some financial support from their country of citizenship.
Annual tuition fees charged by private institutionsAnnual tuition fees charged by private institutions vary considerably across OECD and partner countries as well as within countries themselves. Most OECD and partner countries charge higher tuition fees in private institutions than in public institutions. Finland and Sweden are the only countries where there are no tuition fees in either public or private institutions. However, variation within countries tends to be highest in countries with the biggest proportions of student enrolled in tertiary-type A independent private institutions. By contrast, tuition fees charged by public and government dependent institutions are not so different in most countries. The greater autonomy of independent private institutions compared with public and government-dependent institutions partly explains this fact. Korea and Japan, for example, have around three-quarters of students enrolled in independent private institutions and at the same time show the highest variation between their own independent private institutions (Indicator C2 and Table B5.1).
Public subsidies to households and other private entitiesOECD countries spend an average of 0.4% of their GDP on public subsidies to households and other private entities for all levels of education combined. The proportion of educational budgets spent on subsidies to households and private entities is much higher at the tertiary level than at primary, secondary and post-secondary non-tertiary levels and represents 0.25% of GDP. The subsidies are the largest in relation to GDP at tertiary level in Norway (0.85% of GDP), followed by Denmark (0.80%), New Zealand (0.72%), Sweden (0.61%) and Australia (0.40%) (Table B5.2, as well as Table B5.3 available on the Web).
OECD countries spend, on average, 17% of their public budgets for tertiary education on subsidies to households and other private entities (Chart B5.2). In Australia, Denmark, New Zealand, Norway and Sweden, and the partner country Chile, public subsidies account for 28% or more of public
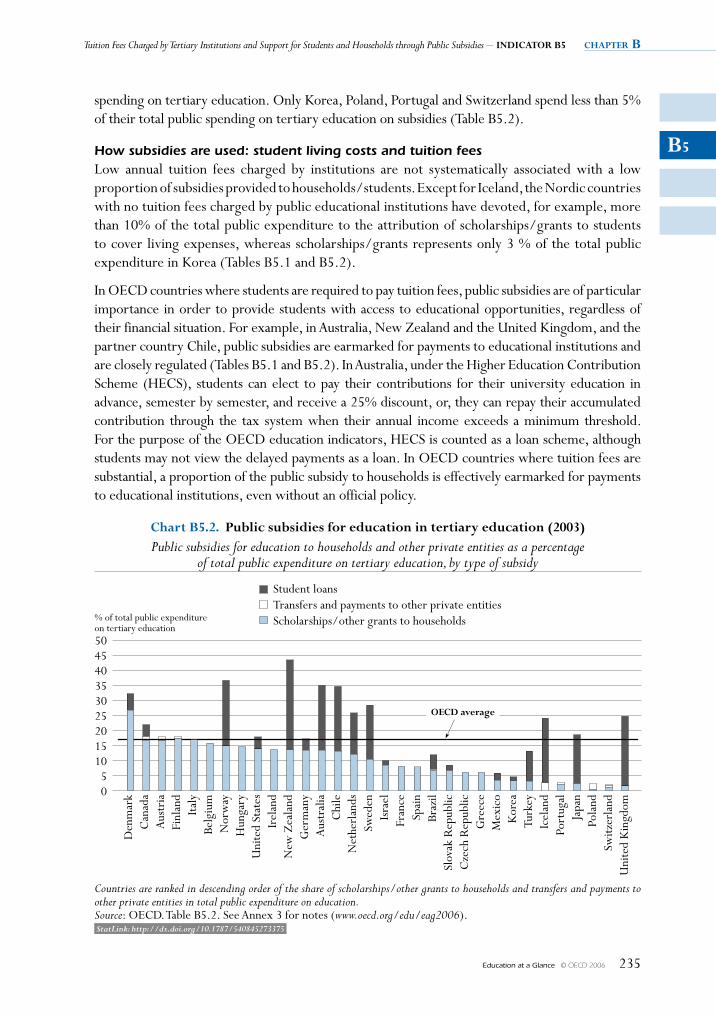
Tuition Fees Charged by Tertiary Institutions and Support for Students and Households through Public Subsidies – INDICATOR B5 chapter B
Education at a Glance © OECD 2006 235
B5
spending on tertiary education. Only Korea, Poland, Portugal and Switzerland spend less than 5% of their total public spending on tertiary education on subsidies (Table B5.2).
How subsidies are used: student living costs and tuition feesLow annual tuition fees charged by institutions are not systematically associated with a low proportion of subsidies provided to households/students. Except for Iceland, the Nordic countries with no tuition fees charged by public educational institutions have devoted, for example, more than 10% of the total public expenditure to the attribution of scholarships/grants to students to cover living expenses, whereas scholarships/grants represents only 3 % of the total public expenditure in Korea (Tables B5.1 and B5.2).
In OECD countries where students are required to pay tuition fees, public subsidies are of particular importance in order to provide students with access to educational opportunities, regardless of their financial situation. For example, in Australia, New Zealand and the United Kingdom, and the partner country Chile, public subsidies are earmarked for payments to educational institutions and are closely regulated (Tables B5.1 and B5.2). In Australia, under the Higher Education Contribution Scheme (HECS), students can elect to pay their contributions for their university education in advance, semester by semester, and receive a 25% discount, or, they can repay their accumulated contribution through the tax system when their annual income exceeds a minimum threshold. For the purpose of the OECD education indicators, HECS is counted as a loan scheme, although students may not view the delayed payments as a loan. In OECD countries where tuition fees are substantial, a proportion of the public subsidy to households is effectively earmarked for payments to educational institutions, even without an official policy.
OECD average
504540353025201510
50
% of total public expenditureon tertiary education
Chart B5.2. public subsidies for education in tertiary education (2003)Public subsidies for education to households and other private entities as a percentage
of total public expenditure on tertiary education, by type of subsidy
Student loansTransfers and payments to other private entitiesScholarships/other grants to households
Countries are ranked in descending order of the share of scholarships/other grants to households and transfers and payments toother private entities in total public expenditure on education.Source: OECD. Table B5.2. See Annex 3 for notes (www.oecd.org/edu/eag2006).
Den
mar
kC
anad
aA
ustr
iaFi
nlan
dIta
lyBe
lgiu
mN
orw
ayH
unga
ryU
nite
d St
ates
Irel
and
New
Zea
land
Ger
man
yA
ustr
alia
Chi
leN
ethe
rlan
dsSw
eden
Isra
elFr
ance
Spai
nBr
azil
Slov
ak R
epub
licC
zech
Rep
ublic
Gre
ece
Mex
ico
Kor
eaTu
rkey
Icel
and
Port
ugal
Japa
nPo
land
Switz
erla
ndU
nite
d K
ingd
om
StatLink: http://dx.doi.org/10.1787/540845273375

chapter B Financial and Human ResouRces invested in education
Education at a Glance © OECD 2006236
B5
OECD countries use different mixtures of grants and loans to subsidise students’ educational costs
A key question in many OECD countries is whether financial subsidies for households should primarily be provided in the form of grants or loans. Governments subsidise students’ living costs or educational costs through different mixtures of grants and loans. Advocates of student loans argue that money spent on loans goes further: if the amount spent on grants were used to guarantee or subsidise loans instead, more aid would be available to students in total, and overall access would be increased. Loans also shift some of the cost of education to those who benefit most from educational investment. Opponents of loans argue that student loans are less effective than grants in encouraging low-income students to pursue their education. They also argue that loans may be less efficient than anticipated because of the various subsidies provided to borrowers or lenders, and due to costs of administration and servicing. Cultural differences across and within countries may also affect students’ willingness to take out a student loan.
Chart B5.2 presents the proportion of public educational expenditure dedicated to loans, grants and scholarships, and other subsidies to households at the tertiary level. Grants and scholarships include family allowances and other specific subsidies, but exclude tax reductions. Around one-half of the 31 reporting OECD and partner countries rely exclusively on grants/scholarships and transfers/payments to other private entities. The remaining OECD countries provide both grants or scholarships and loans to students (except Iceland, which relies only on student loans). In general, the highest subsidies to students are provided by those OECD countries offering student loans; in most cases these countries spend an above-average proportion of their budgets on grants and scholarships alone (Chart B5.2 and Table B5.2).
The motivation for governments to introduce a student loan system can often be to reduce the cost of an expanding tertiary sector. The largest subsidies in the form of student loans generally occur in countries with the highest tertiary participation rates, such as Australia, New Zealand, Norway and Sweden (see Indicator C2). Exceptions include Finland, with the third highest tertiary-type A entry rates but without a publicly-funded student loan system, and the United Kingdom, which has tertiary-type A entry rates below the average but one of the largest subsidies in the form of student loans.
Repayment of loans
Repayment of public loans can be a substantial source of income for governments and can decrease the costs of loan programmes significantly. The current reporting of household expenditure on education as part of private expenditure (see Indicator B3) does not take into account the repayment by previous recipients of public loans. These repayments can be a substantial burden to individuals and have an impact on the decision to participate in tertiary education. However, many OECD countries make the repayment of loans dependent on graduates’ level of income.
Given that loan repayments are made by former students who took out loans several years earlier, it is difficult to estimate the real costs of loan programmes. Loans are therefore reported on a gross basis only. International comparisons of total repayments in the same reference period cannot be made, since they are heavily influenced by changes in schemes for the distribution of loans and by changes in the numbers of students receiving loans.
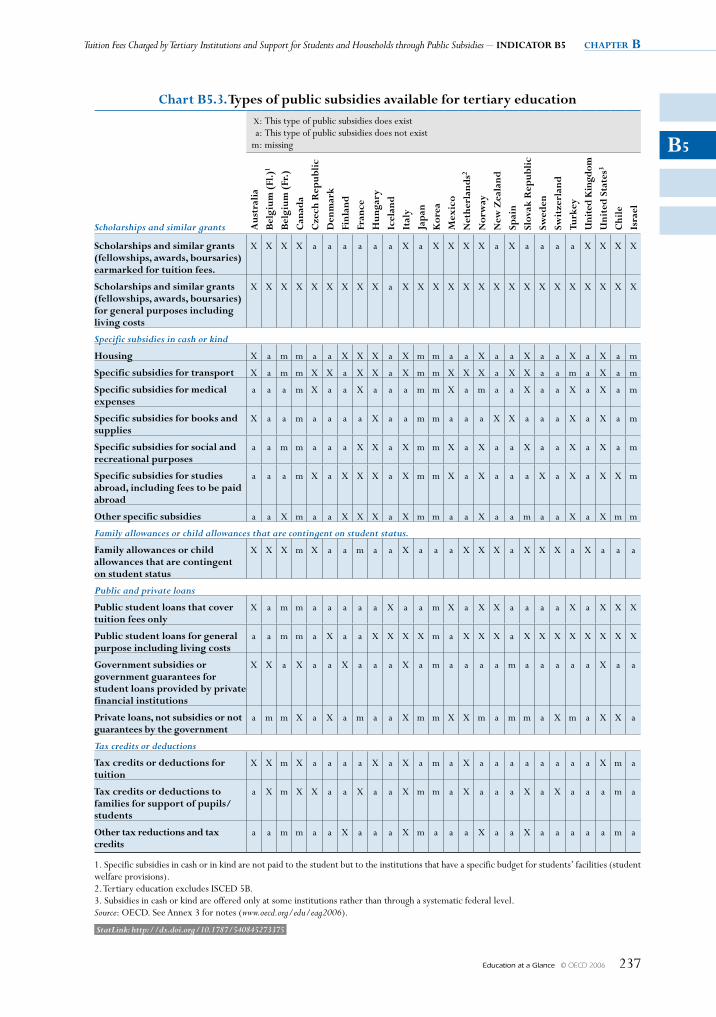
Tuition Fees Charged by Tertiary Institutions and Support for Students and Households through Public Subsidies – INDICATOR B5 chapter B
Education at a Glance © OECD 2006 237
B5
Chart B5.3. Types of public subsidies available for tertiary education X: This type of public subsidies does exist a: This type of public subsidies does not exist m: missing
Aus
tral
ia
Bel
gium
(Fl
.)1
Bel
gium
(Fr
.)
Can
ada
Cze
ch R
epub
lic
Den
mar
k
Finl
and
Fran
ce
Hun
gary
Icel
and
Ital
y
Jap
an
Kor
ea
Mex
ico
Net
herl
and
s2
Nor
way
New
Zea
land
Spai
n
Slov
ak R
epub
lic
Swed
en
Swit
zerl
and
Turk
ey
Uni
ted
Kin
gdom
Uni
ted
Sta
tes3
Chi
le
Isra
el
Scholarships and similar grants
Scholarships and similar grants (fellowships, awards, boursaries) earmarked for tuition fees.
X X X X a a a a a a X a X X X X a X a a a a X X X X
Scholarships and similar grants (fellowships, awards, boursaries) for general purposes including living costs
X X X X X X X X X a X X X X X X X X X X X X X X X X
Specific subsidies in cash or kind
Housing X a m m a a X X X a X m m a a X a a X a a X a X a m
Specific subsidies for transport X a m m X X a X X a X m m X X X a X X a a m a X a m
Specific subsidies for medical expenses
a a a m X a a X a a a m m X a m a a X a a X a X a m
Specific subsidies for books and supplies
X a a m a a a a X a a m m a a a X X a a a X a X a m
Specific subsidies for social and recreational purposes
a a m m a a a X X a X m m X a X a a X a a X a X a m
Specific subsidies for studies abroad, including fees to be paid abroad
a a a m X a X X X a X m m X a X a a a X a X a X X m
Other specific subsidies a a X m a a X X X a X m m a a X a a m a a X a X m m
Family allowances or child allowances that are contingent on student status.
Family allowances or child allowances that are contingent on student status
X X X m X a a m a a X a a a X X X a X X X a X a a a
Public and private loans
public student loans that cover tuition fees only
X a m m a a a a a X a a m X a X X a a a a X a X X X
public student loans for general purpose including living costs
a a m m a X a a X X X X m a X X X a X X X X X X X X
Government subsidies or government guarantees for student loans provided by private financial institutions
X X a X a a X a a a X a m a a a a m a a a a a X a a
private loans, not subsidies or not guarantees by the government
a m m X a X a m a a X m m X X m a m m a X m a X X a
Tax credits or deductions
Tax credits or deductions for tuition
X X m X a a a a X a X a m a X a a a a a a a a X m a
Tax credits or deductions to families for support of pupils/students
a X m X X a a X a a X m m a X a a a X a X a a a m a
Other tax reductions and tax credits
a a m m a a X a a a X m a a a X a a X a a a a a m a
1. Specific subsidies in cash or in kind are not paid to the student but to the institutions that have a specific budget for students’ facilities (student welfare provisions).2. Tertiary education excludes ISCED 5B.3. Subsidies in cash or kind are offered only at some institutions rather than through a systematic federal level.Source: OECD. See Annex 3 for notes (www.oecd.org/edu/eag2006).
StatLink: http://dx.doi.org/10.1787/540845273375
chapter B Financial and Human ResouRces invested in education
Education at a Glance © OECD 2006238
B5
Different forms of public subsidy
Students in 11 out of the 22 reporting OECD and partner countries receive at least three of the specific subsidies in cash and kind listed in Chart B5.3. France, Hungary, Italy, Norway, Turkey and the United States show the biggest diversity in subsidies in cash and kind with at least five types of subsidies provided to tertiary students (see Chart B5.3). The most common subsidies (provided by 11 countries) are for transportation and for studies abroad, followed by specific subsidies for housing and social and recreational purposes available in respectively nine and eight OECD and partner countries. Other specific subsidies for medical services (in the Czech Republic, France, Mexico, the Slovak Republic, Turkey and the United States) and for books and supplies (in Australia, Hungary, New Zealand, Spain, Turkey and the United States) are found in only six countries with available data. Data on specific subsidies, especially those given in kind rather than in cash, are not available for many countries. In Canada, Japan, Korea and the United Kingdom, as well as in the partner country Israel, these specific subsidies exist but cannot be quantified; they are reported as missing in Chart B5.3.
Family and child allowances contingent on student status exist in one half of OECD and partner countries. It varies between countries, however, whether such allowances are provided to the family in which the student grew up (i.e. to the student’s parents), or to the student’s family as an adult (i.e. the student’s spouse and children). Tax reductions are another important form of public subsidy, but these exist in a limited number of countries compared with family and child allowances contingent on student status. Whereas most scholarships and grants are means-tested or targeted in some other way, tax reductions and family allowances in many cases do not take into account the needs and income of students or their families. Tax reductions are part of the subsidy system in Australia, Belgium (Fl.), Canada, the Czech Republic, Finland, France, Hungary, Italy, the Netherlands, Norway, the Slovak Republic, Switzerland and the United States (Chart B5.3). In some countries, repayments of loans by previous students are subject to tax reductions. Tax reductions do not exist or are negligible in Denmark, Mexico, New Zealand, Spain, Sweden, Turkey and the United Kingdom, and the partner country Israel.
Definitions and methodologies
Data refer to the financial year 2003 and are based on the UOE data collection on education statistics administered by the OECD in 2005 (for details see Annex 3 at www.oecd.org/edu/eag2006). Data on tuition fees charged by educational institutions were collected through a special survey undertaken in 2006 and refer to the school year 2003-2004. Amounts of tuition fees and associated proportions of students should be interpreted with caution as they result from the weighted average of the main Tertiary-type A programmes and do not cover all the educational institutions.
Public subsidies to households include the following categories: i) grants/scholarships; ii) public student loans; iii) family or child allowances contingent on student status; iv) public subsidies in cash or in kind, specifically for housing, transportation, medical expenses, books and supplies, social, recreational and other purposes; and v) interest-related subsidies for private loans.
Expenditure on student loans is reported on a gross basis, that is, without subtracting or netting out repayments or interest payments from the borrowers (students or households). This is because the gross amount of loans including scholarships and grants provides an appropriate measure of the financial aid to current participants in education.
Tuition Fees Charged by Tertiary Institutions and Support for Students and Households through Public Subsidies – INDICATOR B5 chapter B
Education at a Glance © OECD 2006 239
B5
Public costs related to private loans guaranteed by governments are included as subsidies to other private entities. Unlike public loans, only the net cost of these loans is included.
The value of tax reductions or credits to households and students is not included.
Note that data appearing in earlier editions of this publication may not always be comparable to data shown in the 2006 edition due to changes in definitions and coverage that were made as a result of the OECD expenditure comparability study (for details on changes, see Annex 3 at www.oecd.org/edu/eag2006).
Further references
The following additional material relevant to this indicator is available on the Web athttp://dx.doi.org/10.1787/540845273375
• Table B5.3. Public subsidies for households and other private entities as a percentage of total public expenditure on education and GDP, for primary, secondary and post-secondary non-tertiary education (2003)
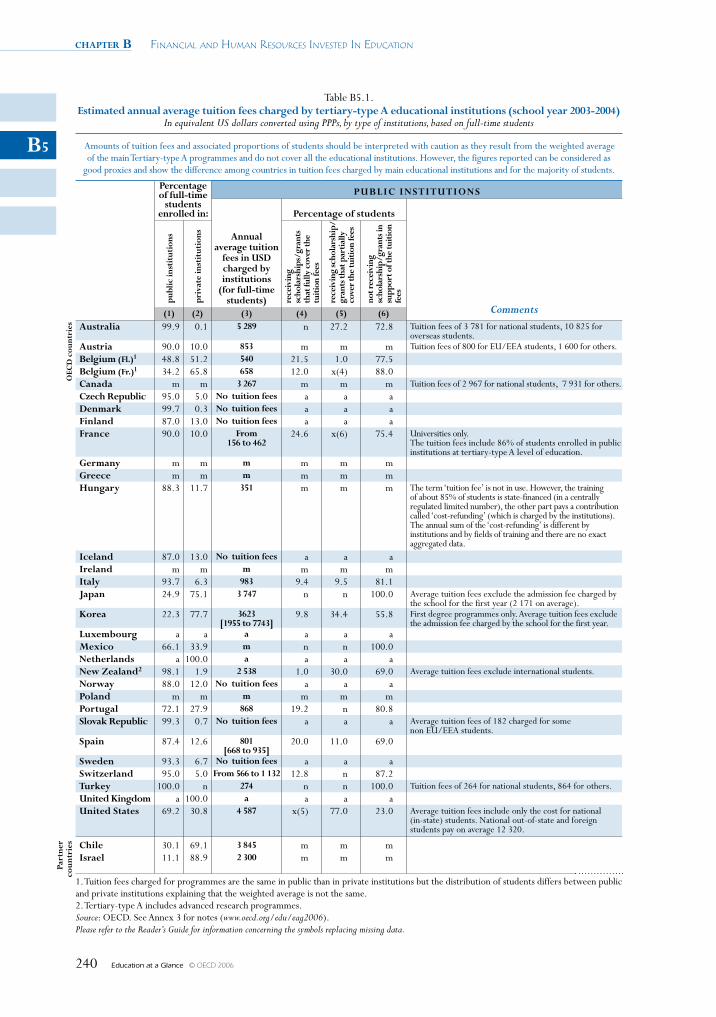
chapter B Financial and Human ResouRces invested in education
Education at a Glance © OECD 2006240
B5
Table B5.1. Estimated annual average tuition fees charged by tertiary-type A educational institutions (school year 2003-2004)
In equivalent US dollars converted using PPPs, by type of institutions, based on full-time students
Amounts of tuition fees and associated proportions of students should be interpreted with caution as they result from the weighted average of the main Tertiary-type A programmes and do not cover all the educational institutions. However, the figures reported can be considered as
good proxies and show the difference among countries in tuition fees charged by main educational institutions and for the majority of students.
Percentage of full-time
students enrolled in:
PuBlic institutions
Annual average tuition
fees in usD charged by institutions
(for full-time students)
Percentage of students
Comments
publ
ic in
stit
utio
ns
priv
ate
inst
itut
ions
rece
ivin
g sc
hola
rshi
ps/g
rant
s th
at fu
lly c
over
the
tuit
ion
fees
rece
ivin
g sc
hola
rshi
p/gr
ants
that
par
tial
ly
cove
r the
tuit
ion
fees
not r
ecei
ving
sc
hola
rshi
p/gr
ants
in
supp
ort o
f the
tuit
ion
fees
(1) (2) (3) (4) (5) (6)
oEc
D c
ount
ries Australia 99.9 0.1 5 289 n 27.2 72.8 Tuition fees of 3 781 for national students, 10 825 for
overseas students.Austria 90.0 10.0 853 m m m Tuition fees of 800 for EU/EEA students, 1 600 for others.Belgium (Fl.)1 48.8 51.2 540 21.5 1.0 77.5Belgium (Fr.)1 34.2 65.8 658 12.0 x(4) 88.0canada m m 3 267 m m m Tuition fees of 2 967 for national students, 7 931 for others.czech Republic 95.0 5.0 no tuition fees a a aDenmark 99.7 0.3 no tuition fees a a aFinland 87.0 13.0 no tuition fees a a aFrance 90.0 10.0 From
156 to 46224.6 x(6) 75.4 Universities only.
The tuition fees include 86% of students enrolled in public institutions at tertiary-type A level of education.
Germany m m m m m mGreece m m m m m mHungary 88.3 11.7 351 m m m The term ‘tuition fee’ is not in use. However, the training
of about 85% of students is state-financed (in a centrally regulated limited number), the other part pays a contribution called ‘cost-refunding’ (which is charged by the institutions). The annual sum of the ‘cost-refunding’ is different by institutions and by fields of training and there are no exact aggregated data.
iceland 87.0 13.0 no tuition fees a a aireland m m m m m mitaly 93.7 6.3 983 9.4 9.5 81.1Japan 24.9 75.1 3 747 n n 100.0 Average tuition fees exclude the admission fee charged by
the school for the first year (2 171 on average).Korea 22.3 77.7 3623
[1955 to 7743] 9.8 34.4 55.8 First degree programmes only. Average tuition fees exclude
the admission fee charged by the school for the first year.luxembourg a a a a a aMexico 66.1 33.9 m n n 100.0netherlands a 100.0 a a a anew Zealand2 98.1 1.9 2 538 1.0 30.0 69.0 Average tuition fees exclude international students.norway 88.0 12.0 no tuition fees a a aPoland m m m m m mPortugal 72.1 27.9 868 19.2 n 80.8slovak Republic 99.3 0.7 no tuition fees a a a Average tuition fees of 182 charged for some
non EU/EEA students.spain 87.4 12.6 801
[668 to 935]20.0 11.0 69.0
sweden 93.3 6.7 no tuition fees a a aswitzerland 95.0 5.0 From 566 to 1 132 12.8 n 87.2turkey 100.0 n 274 n n 100.0 Tuition fees of 264 for national students, 864 for others.united Kingdom a 100.0 a a a aunited states 69.2 30.8 4 587 x(5) 77.0 23.0 Average tuition fees include only the cost for national
(in-state) students. National out-of-state and foreign students pay on average 12 320.
Part
ner
coun
trie
s chile 30.1 69.1 3 845 m m misrael 11.1 88.9 2 300 m m m
1. Tuition fees charged for programmes are the same in public than in private institutions but the distribution of students differs between public and private institutions explaining that the weighted average is not the same.2. Tertiary-type A includes advanced research programmes.Source: OECD. See Annex 3 for notes (www.oecd.org/edu/eag2006).Please refer to the Reader’s Guide for information concerning the symbols replacing missing data.
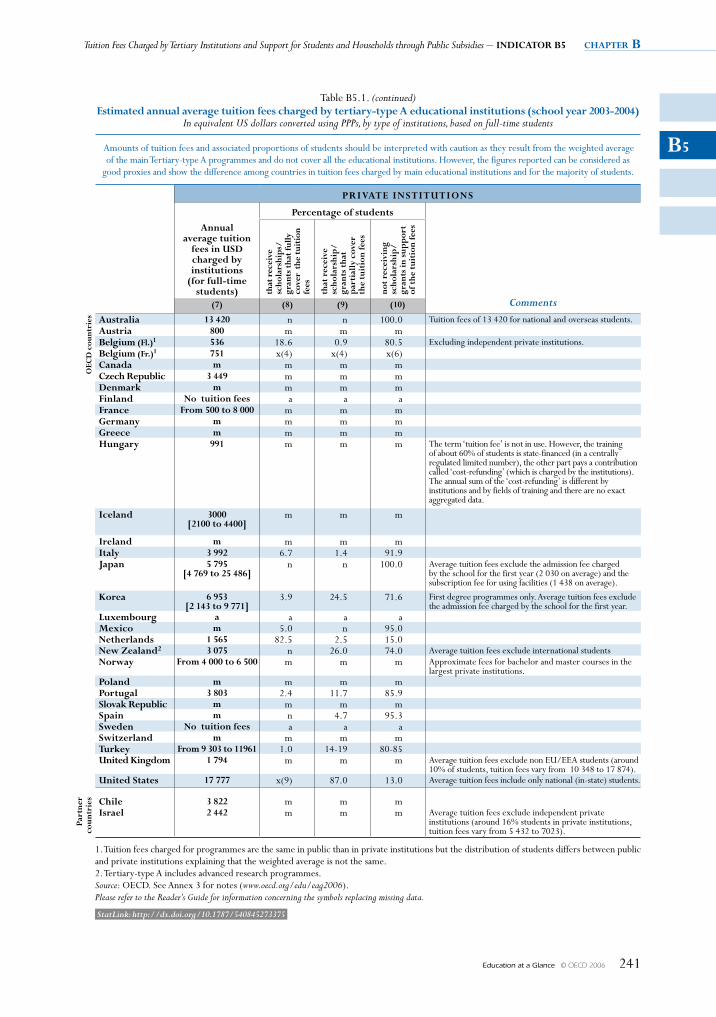
Tuition Fees Charged by Tertiary Institutions and Support for Students and Households through Public Subsidies – inDicAtoR B5 chapter B
Education at a Glance © OECD 2006 241
B5
Table B5.1. (continued)Estimated annual average tuition fees charged by tertiary-type A educational institutions (school year 2003-2004)
In equivalent US dollars converted using PPPs, by type of institutions, based on full-time students
Amounts of tuition fees and associated proportions of students should be interpreted with caution as they result from the weighted average of the main Tertiary-type A programmes and do not cover all the educational institutions. However, the figures reported can be considered as
good proxies and show the difference among countries in tuition fees charged by main educational institutions and for the majority of students.
PRivAtE institutions
Annual average tuition
fees in usD charged by institutions
(for full-time students)
Percentage of students
Comments
that
rec
eive
sc
hola
rshi
ps/
gran
ts th
at fu
lly
cove
r th
e tu
itio
n fe
es
that
rec
eive
sc
hola
rshi
p/
gran
ts t
hat
par
tial
ly c
over
th
e tu
itio
n fe
es
not
rece
ivin
g sc
hola
rshi
p/
gran
ts in
sup
por
t of
the
tui
tion
fees
(7) (8) (9) (10)
oEc
D c
ount
ries Australia 13 420 n n 100.0 Tuition fees of 13 420 for national and overseas students.
Austria 800 m m mBelgium (Fl.)1 536 18.6 0.9 80.5 Excluding independent private institutions.Belgium (Fr.)1 751 x(4) x(4) x(6)canada m m m mczech Republic 3 449 m m mDenmark m m m mFinland no tuition fees a a aFrance From 500 to 8 000 m m mGermany m m m mGreece m m m mHungary 991 m m m The term ‘tuition fee’ is not in use. However, the training
of about 60% of students is state-financed (in a centrally regulated limited number), the other part pays a contribution called ‘cost-refunding’ (which is charged by the institutions). The annual sum of the ‘cost-refunding’ is different by institutions and by fields of training and there are no exact aggregated data.
iceland 3000 [2100 to 4400]
m m m
ireland m m m mitaly 3 992 6.7 1.4 91.9Japan 5 795
[4 769 to 25 486]n n 100.0 Average tuition fees exclude the admission fee charged
by the school for the first year (2 030 on average) and the subscription fee for using facilities (1 438 on average).
Korea 6 953 [2 143 to 9 771]
3.9 24.5 71.6 First degree programmes only. Average tuition fees exclude the admission fee charged by the school for the first year.
luxembourg a a a aMexico m 5.0 n 95.0netherlands 1 565 82.5 2.5 15.0new Zealand2 3 075 n 26.0 74.0 Average tuition fees exclude international studentsnorway From 4 000 to 6 500 m m m Approximate fees for bachelor and master courses in the
largest private institutions.Poland m m m mPortugal 3 803 2.4 11.7 85.9slovak Republic m m m mspain m n 4.7 95.3sweden no tuition fees a a aswitzerland m m m mturkey From 9 303 to 11961 1.0 14-19 80-85united Kingdom 1 794 m m m Average tuition fees exclude non EU/EEA students (around
10% of students, tuition fees vary from 10 348 to 17 874).united states 17 777 x(9) 87.0 13.0 Average tuition fees include only national (in-state) students.
Part
ner
coun
trie
s chile 3 822 m m misrael 2 442 m m m Average tuition fees exclude independent private
institutions (around 16% students in private institutions, tuition fees vary from 5 432 to 7023).
1. Tuition fees charged for programmes are the same in public than in private institutions but the distribution of students differs between public and private institutions explaining that the weighted average is not the same.2. Tertiary-type A includes advanced research programmes.Source: OECD. See Annex 3 for notes (www.oecd.org/edu/eag2006).Please refer to the Reader’s Guide for information concerning the symbols replacing missing data.
StatLink: http://dx.doi.org/10.1787/540845273375
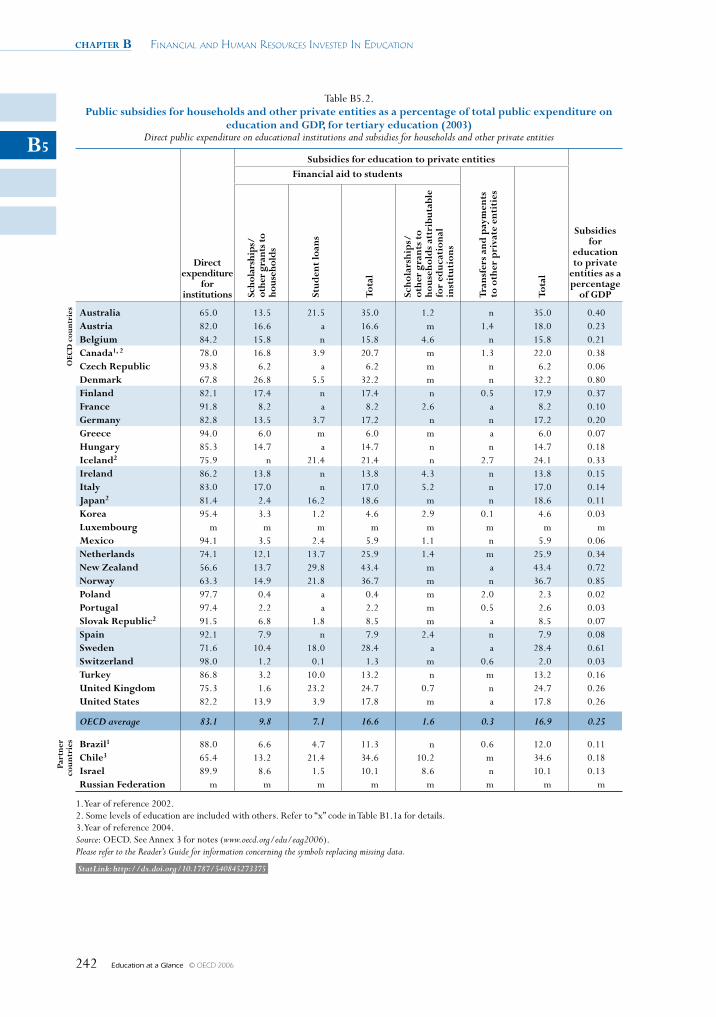
chapter B Financial and Human ResouRces invested in education
Education at a Glance © OECD 2006242
B5
Table B5.2. public subsidies for households and other private entities as a percentage of total public expenditure on
education and GDp, for tertiary education (2003)Direct public expenditure on educational institutions and subsidies for households and other private entities
Direct expenditure
for institutions
Subsidies for education to private entities
Subsidies for
education to private
entities as a percentage
of GDp
Financial aid to students
Tran
sfer
s an
d p
aym
ents
to
oth
er p
riva
te e
ntit
ies
Tota
l
Scho
lars
hips
/
othe
r gr
ants
to
hous
ehol
ds
Stud
ent
loan
s
Tota
l
Scho
lars
hip
s/
othe
r gr
ants
to
ho
useh
old
s at
trib
utab
le
for
educ
atio
nal
inst
itut
ions
OEC
D c
ount
ries Australia 65.0 13.5 21.5 35.0 1.2 n 35.0 0.40
Austria 82.0 16.6 a 16.6 m 1.4 18.0 0.23Belgium 84.2 15.8 n 15.8 4.6 n 15.8 0.21Canada1, 2 78.0 16.8 3.9 20.7 m 1.3 22.0 0.38Czech Republic 93.8 6.2 a 6.2 m n 6.2 0.06Denmark 67.8 26.8 5.5 32.2 m n 32.2 0.80Finland 82.1 17.4 n 17.4 n 0.5 17.9 0.37France 91.8 8.2 a 8.2 2.6 a 8.2 0.10Germany 82.8 13.5 3.7 17.2 n n 17.2 0.20Greece 94.0 6.0 m 6.0 m a 6.0 0.07Hungary 85.3 14.7 a 14.7 n n 14.7 0.18Iceland2 75.9 n 21.4 21.4 n 2.7 24.1 0.33Ireland 86.2 13.8 n 13.8 4.3 n 13.8 0.15Italy 83.0 17.0 n 17.0 5.2 n 17.0 0.14Japan2 81.4 2.4 16.2 18.6 m n 18.6 0.11Korea 95.4 3.3 1.2 4.6 2.9 0.1 4.6 0.03luxembourg m m m m m m m mMexico 94.1 3.5 2.4 5.9 1.1 n 5.9 0.06Netherlands 74.1 12.1 13.7 25.9 1.4 m 25.9 0.34New Zealand 56.6 13.7 29.8 43.4 m a 43.4 0.72Norway 63.3 14.9 21.8 36.7 m n 36.7 0.85poland 97.7 0.4 a 0.4 m 2.0 2.3 0.02portugal 97.4 2.2 a 2.2 m 0.5 2.6 0.03Slovak Republic2 91.5 6.8 1.8 8.5 m a 8.5 0.07Spain 92.1 7.9 n 7.9 2.4 n 7.9 0.08Sweden 71.6 10.4 18.0 28.4 a a 28.4 0.61Switzerland 98.0 1.2 0.1 1.3 m 0.6 2.0 0.03Turkey 86.8 3.2 10.0 13.2 n m 13.2 0.16United Kingdom 75.3 1.6 23.2 24.7 0.7 n 24.7 0.26United States 82.2 13.9 3.9 17.8 m a 17.8 0.26
OECD average 83.1 9.8 7.1 16.6 1.6 0.3 16.9 0.25
part
ner
coun
trie
s Brazil1 88.0 6.6 4.7 11.3 n 0.6 12.0 0.11Chile3 65.4 13.2 21.4 34.6 10.2 m 34.6 0.18Israel 89.9 8.6 1.5 10.1 8.6 n 10.1 0.13Russian Federation m m m m m m m m
1. Year of reference 2002.2. Some levels of education are included with others. Refer to “x” code in Table B1.1a for details.3. Year of reference 2004.Source: OECD. See Annex 3 for notes (www.oecd.org/edu/eag2006).Please refer to the Reader’s Guide for information concerning the symbols replacing missing data.
StatLink: http://dx.doi.org/10.1787/540845273375

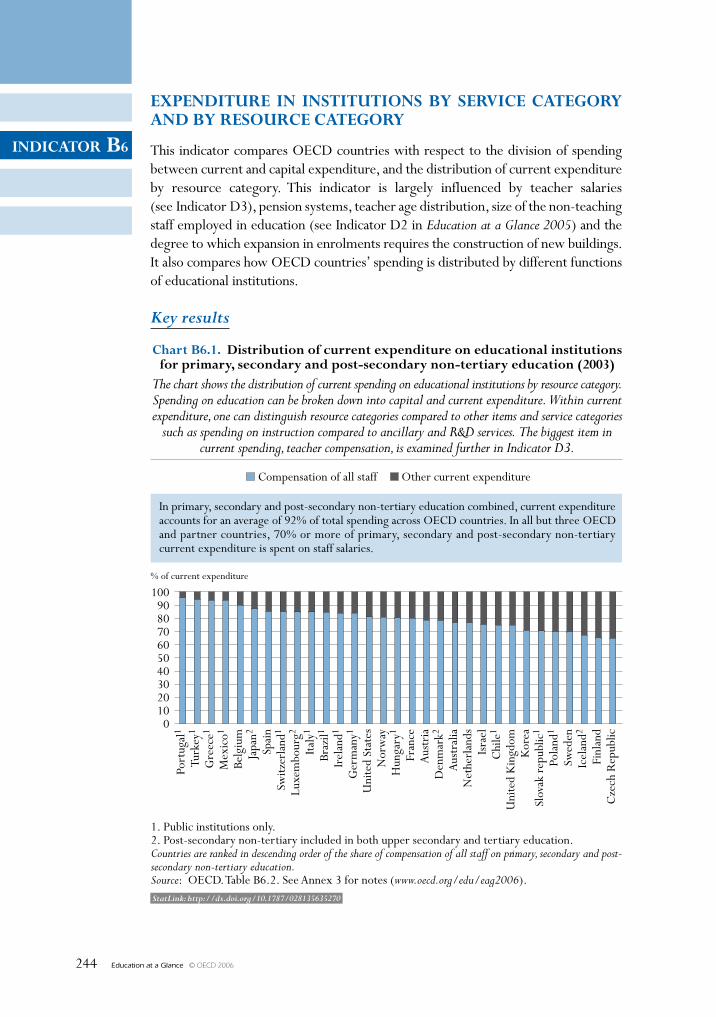
Education at a Glance © OECD 2006244
INDICATOR B6
ExpENDITuRE IN INsTITuTIONs By sERvICE CATEgORy AND By REsOuRCE CATEgORy
This indicator compares OECD countries with respect to the division of spending between current and capital expenditure, and the distribution of current expenditure by resource category. This indicator is largely influenced by teacher salaries (see Indicator D3), pension systems, teacher age distribution, size of the non-teaching staff employed in education (see Indicator D2 in Education at a Glance 2005) and the degree to which expansion in enrolments requires the construction of new buildings. It also compares how OECD countries’ spending is distributed by different functions of educational institutions.
Key results
100908070605040302010
0
% of current expenditure
Chart B6.1. Distribution of current expenditure on educational institutionsfor primary, secondary and post-secondary non-tertiary education (2003)
The chart shows the distribution of current spending on educational institutions by resource category.Spending on education can be broken down into capital and current expenditure. Within currentexpenditure, one can distinguish resource categories compared to other items and service categories
such as spending on instruction compared to ancillary and R&D services. The biggest item incurrent spending, teacher compensation, is examined further in Indicator D3.
Compensation of all staff Other current expenditure
1. Public institutions only.2. Post-secondary non-tertiary included in both upper secondary and tertiary education.Countries are ranked in descending order of the share of compensation of all staff on primary, secondary and post-secondary non-tertiary education.Source: OECD. Table B6.2. See Annex 3 for notes (www.oecd.org/edu/eag2006).
Port
ugal
1
Turk
ey1
Gre
ece1
Mex
ico1
Belg
ium
Japa
n2
Spai
nSw
itzer
land
1
Luxe
mbo
urg2
Italy
1
Braz
il1
Irel
and1
Ger
man
y1
Uni
ted
Stat
esN
orw
ayH
unga
ry1
Fran
ceA
ustr
iaD
enm
ark2
Aus
tral
iaN
ethe
rlan
dsIs
rael
Chi
le1
Uni
ted
Kin
gdom
Kor
eaSl
ovak
rep
ublic
1
Pola
nd1
Swed
enIc
elan
d2
Finl
and
Cze
ch R
epub
lic
In primary, secondary and post-secondary non-tertiary education combined, current expenditureaccounts for an average of 92% of total spending across OECD countries. In all but three OECDand partner countries, 70% or more of primary, secondary and post-secondary non-tertiarycurrent expenditure is spent on staff salaries.
StatLink: http://dx.doi.org/10.1787/028135635270
Education at a Glance © OECD 2006 245
INDICATOR B6
Other highlights of this indicator
• OECD countries spend an average of 35% of current expenditure at the tertiary level on purposes other than the compensation of educational personnel. This is explained by the higher cost of facilities and equipment in higher education.
• On average, OECD countries spend 0.2% of their GDP on subsidies for ancillary services provided by primary, secondary and post-secondary non-tertiary institutions. This represents 5% of total spending. At the high end, Finland, France, Korea, the Slovak Republic and Sweden allocate about 10% or more of total spending on educational institutions in percentage of GDP on ancillary services.
• A distinctive feature of tertiary institutions is high spending on R&D, which on average comprises over one-quarter of spending at this level. The fact that some countries spend much more on this item than others helps explain the wide differences in overall tertiary spending. Significant differences among OECD countries in the emphasis on R&D in tertiary institutions also contribute to the observed variation.
• The payment of instructional staff is not as great a share of spending in tertiary institutions as at other levels, because of the higher cost of facilities and equipment.
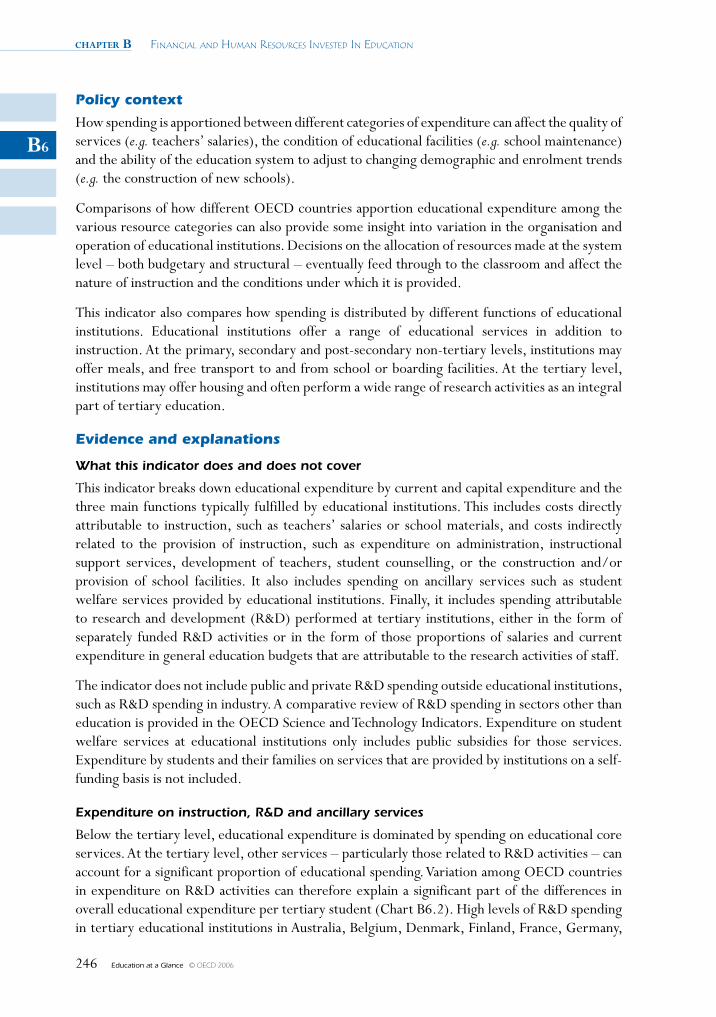
chapter B Financial and Human ResouRces invested in education
Education at a Glance © OECD 2006246
B6
Policy context
How spending is apportioned between different categories of expenditure can affect the quality of services (e.g. teachers’ salaries), the condition of educational facilities (e.g. school maintenance) and the ability of the education system to adjust to changing demographic and enrolment trends (e.g. the construction of new schools).
Comparisons of how different OECD countries apportion educational expenditure among the various resource categories can also provide some insight into variation in the organisation and operation of educational institutions. Decisions on the allocation of resources made at the system level – both budgetary and structural – eventually feed through to the classroom and affect the nature of instruction and the conditions under which it is provided.
This indicator also compares how spending is distributed by different functions of educational institutions. Educational institutions offer a range of educational services in addition to instruction. At the primary, secondary and post-secondary non-tertiary levels, institutions may offer meals, and free transport to and from school or boarding facilities. At the tertiary level, institutions may offer housing and often perform a wide range of research activities as an integral part of tertiary education.
Evidence and explanations
What this indicator does and does not cover
This indicator breaks down educational expenditure by current and capital expenditure and the three main functions typically fulfilled by educational institutions. This includes costs directly attributable to instruction, such as teachers’ salaries or school materials, and costs indirectly related to the provision of instruction, such as expenditure on administration, instructional support services, development of teachers, student counselling, or the construction and/or provision of school facilities. It also includes spending on ancillary services such as student welfare services provided by educational institutions. Finally, it includes spending attributable to research and development (R&D) performed at tertiary institutions, either in the form of separately funded R&D activities or in the form of those proportions of salaries and current expenditure in general education budgets that are attributable to the research activities of staff.
The indicator does not include public and private R&D spending outside educational institutions, such as R&D spending in industry. A comparative review of R&D spending in sectors other than education is provided in the OECD Science and Technology Indicators. Expenditure on student welfare services at educational institutions only includes public subsidies for those services. Expenditure by students and their families on services that are provided by institutions on a self-funding basis is not included.
Expenditure on instruction, R&D and ancillary services
Below the tertiary level, educational expenditure is dominated by spending on educational core services. At the tertiary level, other services – particularly those related to R&D activities – can account for a significant proportion of educational spending. Variation among OECD countries in expenditure on R&D activities can therefore explain a significant part of the differences in overall educational expenditure per tertiary student (Chart B6.2). High levels of R&D spending in tertiary educational institutions in Australia, Belgium, Denmark, Finland, France, Germany,
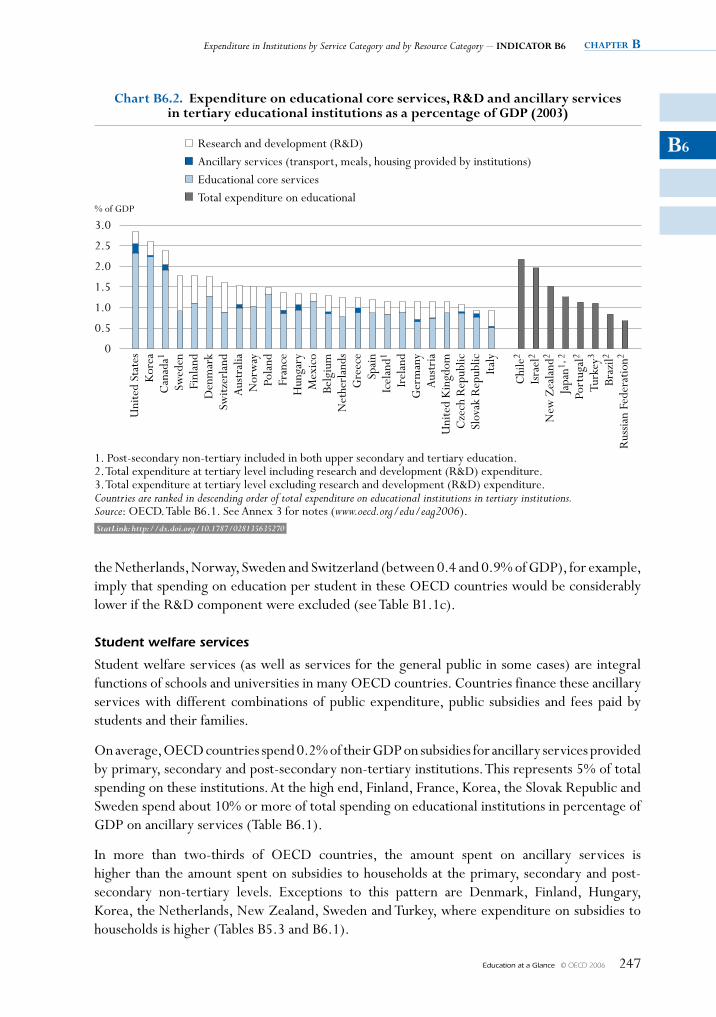
Expenditure in Institutions by Service Category and by Resource Category – INDICATOR B6 chapter B
Education at a Glance © OECD 2006 247
B6
the Netherlands, Norway, Sweden and Switzerland (between 0.4 and 0.9% of GDP), for example, imply that spending on education per student in these OECD countries would be considerably lower if the R&D component were excluded (see Table B1.1c).
Student welfare services
Student welfare services (as well as services for the general public in some cases) are integral functions of schools and universities in many OECD countries. Countries finance these ancillary services with different combinations of public expenditure, public subsidies and fees paid by students and their families.
On average, OECD countries spend 0.2% of their GDP on subsidies for ancillary services provided by primary, secondary and post-secondary non-tertiary institutions. This represents 5% of total spending on these institutions. At the high end, Finland, France, Korea, the Slovak Republic and Sweden spend about 10% or more of total spending on educational institutions in percentage of GDP on ancillary services (Table B6.1).
In more than two-thirds of OECD countries, the amount spent on ancillary services is higher than the amount spent on subsidies to households at the primary, secondary and post-secondary non-tertiary levels. Exceptions to this pattern are Denmark, Finland, Hungary, Korea, the Netherlands, New Zealand, Sweden and Turkey, where expenditure on subsidies to households is higher (Tables B5.3 and B6.1).
3.0
2.5
2.0
1.5
1.0
0.5
0
% of GDP
Chart B6.2. Expenditure on educational core services, R&D and ancillary servicesin tertiary educational institutions as a percentage of gDp (2003)
Research and development (R&D)Ancillary services (transport, meals, housing provided by institutions)Educational core servicesTotal expenditure on educational
1. Post-secondary non-tertiary included in both upper secondary and tertiary education.2. Total expenditure at tertiary level including research and development (R&D) expenditure.3. Total expenditure at tertiary level excluding research and development (R&D) expenditure.Countries are ranked in descending order of total expenditure on educational institutions in tertiary institutions.Source: OECD. Table B6.1. See Annex 3 for notes (www.oecd.org/edu/eag2006).
Uni
ted
Stat
esK
orea
Can
ada1
Swed
enFi
nlan
dD
enm
ark
Switz
erla
ndA
ustr
alia
Nor
way
Pola
ndFr
ance
Hun
gary
Mex
ico
Belg
ium
Net
herl
ands
Gre
ece
Spai
nIc
elan
d1
Irel
and
Ger
man
yA
ustr
iaU
nite
d K
ingd
omC
zech
Rep
ublic
Slov
ak R
epub
licIta
ly
Chi
le2
Isra
el2
New
Zea
land
2
Japa
n1, 2
Port
ugal
2
Turk
ey3
Braz
il2
Rus
sian
Fede
ratio
n2
StatLink: http://dx.doi.org/10.1787/028135635270
chapter B Financial and Human ResouRces invested in education
Education at a Glance © OECD 2006248
B6
At the tertiary level, ancillary services are more often provided on a self-financed basis. On average, expenditure on subsidies for ancillary services at the tertiary level amounts to less than 0.1% of GDP and represents up to 0.23% in the United States (Tables B6.1).
Current and capital expenditures, and the distribution of current expenditure by resource category
Educational expenditure can first be divided into current and capital expenditure. Capital expenditure comprises spending on assets that last longer than one year and includes spending on the construction, renovation and major repair of buildings. Current expenditure comprises spending on school resources used each year for the operation of schools.
Current expenditure can be further sub-divided into three broad functional categories, which are the compensation of teachers, the compensation of other staff, and other current expenditures (e.g. teaching materials and supplies, maintenance of school buildings, preparation of student meals and renting of school facilities). The amount allocated to each of these functional categories will depend in part on current and projected changes in enrolment, on the salaries of educational personnel and on costs of maintenance and construction of educational facilities.
Education takes place mostly in school and university settings. The labour-intensive technology of education explains the large proportion of current spending within total educational expenditure. In primary, secondary, and post-secondary non-tertiary education combined, current expenditure accounts for nearly 92% of total spending on average across all OECD countries.
There is some noticeable variation among OECD countries with respect to the relative proportions of current and capital expenditure: at the primary, secondary and post-secondary non-tertiary levels combined, the proportion of current expenditure ranges from less than 85% in Korea and Luxembourg and the partner country Chile to 97% or more in Austria, Belgium, Canada, Mexico and Portugal (Chart B6.3).
The salaries of teachers and other staff employed in education account for the largest proportion of current expenditure in all OECD countries. On average across the OECD countries, expenditure on the compensation of educational personnel accounts for 80% of current expenditure at the primary, secondary and post-secondary non-tertiary levels of education combined. In all except three OECD countries – the Czech Republic, Finland and Iceland – 70% or more of current expenditure at the primary, secondary and post-secondary non-tertiary levels is spent on staff salaries. The proportion devoted to the compensation of educational personnel is 90% or more in Greece, Mexico, Portugal and Turkey (Chart B6.1).
OECD countries with relatively small education budgets (e.g. Mexico, Portugal and Turkey) tend to devote a larger proportion of current educational expenditure to the compensation of personnel and a smaller proportion to services that are sub-contracted, such as support services (e.g. maintenance of school buildings), ancillary services (e.g. preparation of meals for students), and renting of school buildings and other facilities.
Proportions of current expenditure allocated to the compensation of teachers and other staff
In Denmark, France and the United States, around one-quarter of current expenditure in primary, secondary and post-secondary non-tertiary education combined goes towards compensation of non-teaching staff, while in Austria, Ireland and Korea this figure is 10% or less. These differences
Expenditure in Institutions by Service Category and by Resource Category – INDICATOR B6 chapter B
Education at a Glance © OECD 2006 249
B6
are likely to reflect the degree to which educational personnel such as principals, guidance counsellors, bus drivers, school nurses, janitors and maintenance workers specialise in non-teaching activities (Table B6.2).
At the tertiary level, the proportion of total expenditure spent on capital outlays is larger than at the primary, secondary and post-secondary non-tertiary levels, generally because of more differentiated and advanced teaching facilities. In 13 out of the 30 OECD and partner countries
100908070605040302010
0
% of total expenditrue
100908070605040302010
0
% of total expenditrue
Chart B6.3. Distribution of current and capital expenditureon educational institutions (2003)
By resource category and level of education
Current expenditure Capital expenditure
1. Public institutions only.2. Post-secondary non-tertiary included in both upper secondary and tertiary education.Countries are ranked in descending order of the share of current expenditure on primary, secondary and post-secondary non-tertiaryeducation.Source: OECD. Table B6.2. See Annex 3 for notes (www.oecd.org/edu/eag2006).
Can
ada1
Belg
ium
Mex
ico1
Port
ugal
1
Aus
tria
Pola
nd1
Icel
and2
Hun
gary
1
Net
herl
ands
Slov
ak r
epub
lic1
Italy
1
Ger
man
ySw
eden
Cze
ch R
epub
licD
enm
ark2
Isra
elA
ustr
alia
Uni
ted
Kin
gdom
Irel
and1
Fran
ceSp
ain
Switz
erla
nd1
Finl
and
Japa
n2
Uni
ted
Stat
esBr
azil1
Nor
way
Gre
ece1
Turk
ey1
Chi
le1
primary, secondary andpost-secondary non-tertiary education
Tertiary education
OECDaverage
for currentexpenditure
OECDaverage
for currentexpenditure
Can
ada1
Belg
ium
Mex
ico1
Port
ugal
1
Aus
tria
Pola
nd1
Icel
and2
Hun
gary
1
Net
herl
ands
Slov
ak r
epub
lic1
Italy
1
Ger
man
ySw
eden
Cze
ch R
epub
licD
enm
ark2
Isra
elA
ustr
alia
Uni
ted
Kin
gdom
Irel
and1
Fran
ceSp
ain
Switz
erla
nd1
Finl
and
Japa
n2
Uni
ted
Stat
esBr
azil1
Nor
way
Gre
ece1
Turk
ey1
Chi
le1
StatLink: http://dx.doi.org/10.1787/028135635270
chapter B Financial and Human ResouRces invested in education
Education at a Glance © OECD 2006250
B6
for which data are available, the proportion spent on capital expenditure at the tertiary level is 10% or more, and in Greece, Spain and Turkey it is above 17% (Chart B6.3).
Differences are likely to reflect how tertiary education is organised in each OECD country, as well as the degree to which expansion in enrolments requires the construction of new buildings.
OECD countries, on average, spend 35% of current expenditure at the tertiary level on purposes other than the compensation of educational personnel. This is explained by the higher cost of facilities and equipment in higher education (Table B6.2).
Definitions and methodologies
Data refer to the financial year 2003 and are based on the UOE data collection on education statistics administered by the OECD in 2005 (for details see Annex 3 at www.oecd.org/edu/eag2006).
The distinction between current and capital expenditure is taken from the standard definition used in national income accounting. Current expenditure refers to goods and services consumed within the current year, and requiring recurrent production in order to sustain the provision of educational services. Capital expenditure refers to assets which last longer than one year, including spending on construction, renovation or major repair of buildings and new or replacement equipment. The capital expenditure reported here represents the value of educational capital acquired or created during the year in question − that is, the amount of capital formation − regardless of whether the capital expenditure was financed from current revenue or by borrowing. Neither current nor capital expenditure includes debt servicing.
Calculations cover expenditure by public institutions or, where available, that of public and private institutions combined.
Current expenditure other than on the compensation of personnel includes expenditure on services which are sub-contracted, such as support services (e.g. maintenance of school buildings), ancillary services (e.g. preparation of meals for students) and renting of school buildings and other facilities. These services are obtained from outside providers, unlike the services provided by the education authorities or by the educational institutions themselves using their own personnel.
Expenditure on R&D includes all expenditure on research performed at universities and other tertiary education institutions, regardless of whether the research is financed from general institutional funds or through separate grants or contracts from public or private sponsors. The classification of expenditure is based on data collected from the institutions carrying out R&D rather than on the sources of funds.
Ancillary services are services provided by educational institutions that are peripheral to the main educational mission. The two main components of ancillary services are student welfare services and services for the general public. At primary, secondary, and post-secondary non-tertiary levels, student welfare services include meals, school health services, and transportation to and from school. At the tertiary level, it includes residence halls (dormitories), dining halls, and health care. Services for the general public include museums, radio and television broadcasting, sports and recreational and cultural programmes. Expenditure on ancillary services, including fees from students or households, is excluded.
Expenditure in Institutions by Service Category and by Resource Category – INDICATOR B6 chapter B
Education at a Glance © OECD 2006 251
B6
Educational core services are estimated as the residual of all expenditure, i.e. total expenditure on educational institutions net of expenditure on R&D and ancillary services.
Note that data appearing in earlier editions of this publication may not always be comparable to data shown in the 2006 edition due to changes in definitions and coverage that were made as a result of the OECD expenditure comparability study (see Annex 3 at www.oecd.org/edu/eag2006 for details on changes).
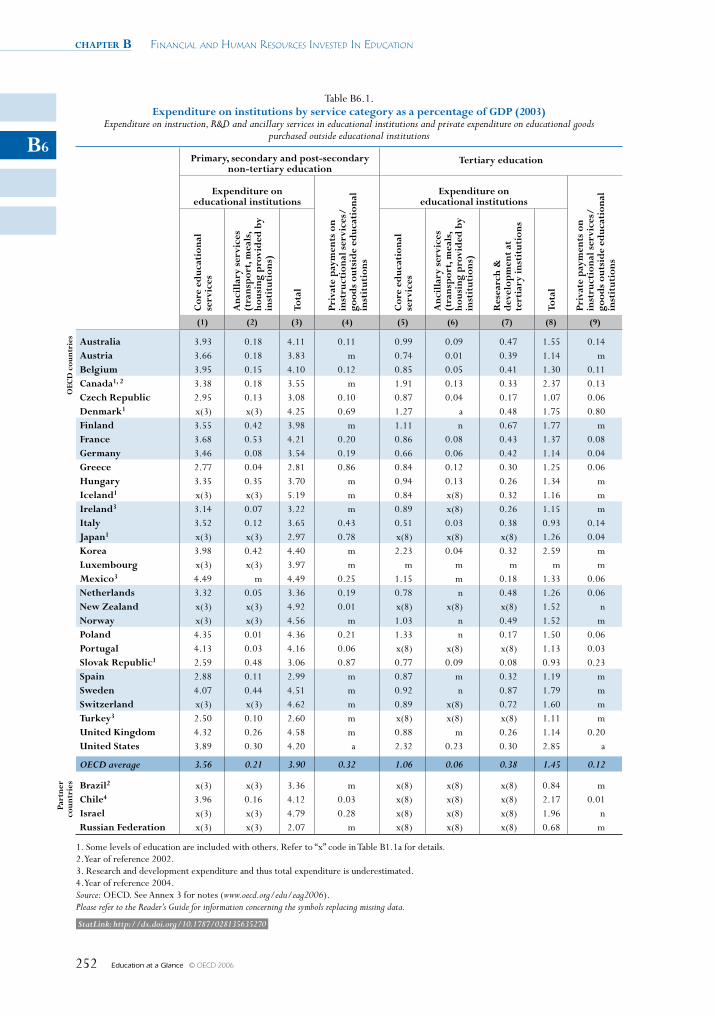
chapter B Financial and Human ResouRces invested in education
Education at a Glance © OECD 2006252
B6
Table B6.1. Expenditure on institutions by service category as a percentage of gDp (2003)
Expenditure on instruction, R&D and ancillary services in educational institutions and private expenditure on educational goods purchased outside educational institutions
primary, secondary and post-secondary non-tertiary education
Tertiary education
Expenditure on educational institutions
priv
ate
pay
men
ts o
n
inst
ruct
iona
l ser
vice
s/go
ods
outs
ide
educ
atio
nal
inst
itut
ions
Expenditure on educational institutions
priv
ate
pay
men
ts o
n in
stru
ctio
nal s
ervi
ces/
good
s ou
tsid
e ed
ucat
iona
l in
stit
utio
ns
Cor
e ed
ucat
iona
l se
rvic
es
Anc
illa
ry s
ervi
ces
(tra
nsp
ort,
mea
ls,
hous
ing
pro
vid
ed b
y in
stit
utio
ns)
Tota
l
Cor
e ed
ucat
iona
l se
rvic
es
Anc
illa
ry s
ervi
ces
(tra
nsp
ort,
mea
ls,
hous
ing
pro
vid
ed b
y in
stit
utio
ns)
Res
earc
h &
d
evel
opm
ent
at
tert
iary
inst
itut
ions
Tota
l
(1) (2) (3) (4) (5) (6) (7) (8) (9)
OEC
D c
ount
ries Australia 3.93 0.18 4.11 0.11 0.99 0.09 0.47 1.55 0.14
Austria 3.66 0.18 3.83 m 0.74 0.01 0.39 1.14 mBelgium 3.95 0.15 4.10 0.12 0.85 0.05 0.41 1.30 0.11Canada1, 2 3.38 0.18 3.55 m 1.91 0.13 0.33 2.37 0.13Czech Republic 2.95 0.13 3.08 0.10 0.87 0.04 0.17 1.07 0.06Denmark1 x(3) x(3) 4.25 0.69 1.27 a 0.48 1.75 0.80Finland 3.55 0.42 3.98 m 1.11 n 0.67 1.77 mFrance 3.68 0.53 4.21 0.20 0.86 0.08 0.43 1.37 0.08germany 3.46 0.08 3.54 0.19 0.66 0.06 0.42 1.14 0.04greece 2.77 0.04 2.81 0.86 0.84 0.12 0.30 1.25 0.06Hungary 3.35 0.35 3.70 m 0.94 0.13 0.26 1.34 mIceland1 x(3) x(3) 5.19 m 0.84 x(8) 0.32 1.16 mIreland3 3.14 0.07 3.22 m 0.89 x(8) 0.26 1.15 mItaly 3.52 0.12 3.65 0.43 0.51 0.03 0.38 0.93 0.14Japan1 x(3) x(3) 2.97 0.78 x(8) x(8) x(8) 1.26 0.04Korea 3.98 0.42 4.40 m 2.23 0.04 0.32 2.59 mLuxembourg x(3) x(3) 3.97 m m m m m mMexico3 4.49 m 4.49 0.25 1.15 m 0.18 1.33 0.06Netherlands 3.32 0.05 3.36 0.19 0.78 n 0.48 1.26 0.06New Zealand x(3) x(3) 4.92 0.01 x(8) x(8) x(8) 1.52 nNorway x(3) x(3) 4.56 m 1.03 n 0.49 1.52 mpoland 4.35 0.01 4.36 0.21 1.33 n 0.17 1.50 0.06portugal 4.13 0.03 4.16 0.06 x(8) x(8) x(8) 1.13 0.03slovak Republic1 2.59 0.48 3.06 0.87 0.77 0.09 0.08 0.93 0.23spain 2.88 0.11 2.99 m 0.87 m 0.32 1.19 msweden 4.07 0.44 4.51 m 0.92 n 0.87 1.79 mswitzerland x(3) x(3) 4.62 m 0.89 x(8) 0.72 1.60 mTurkey3 2.50 0.10 2.60 m x(8) x(8) x(8) 1.11 munited Kingdom 4.32 0.26 4.58 m 0.88 m 0.26 1.14 0.20united states 3.89 0.30 4.20 a 2.32 0.23 0.30 2.85 a
OECD average 3.56 0.21 3.90 0.32 1.06 0.06 0.38 1.45 0.12
part
ner
coun
trie
s Brazil2 x(3) x(3) 3.36 m x(8) x(8) x(8) 0.84 mChile4 3.96 0.16 4.12 0.03 x(8) x(8) x(8) 2.17 0.01Israel x(3) x(3) 4.79 0.28 x(8) x(8) x(8) 1.96 nRussian Federation x(3) x(3) 2.07 m x(8) x(8) x(8) 0.68 m
1. Some levels of education are included with others. Refer to “x” code in Table B1.1a for details.2. Year of reference 2002.3. Research and development expenditure and thus total expenditure is underestimated.4. Year of reference 2004.Source: OECD. See Annex 3 for notes (www.oecd.org/edu/eag2006).Please refer to the Reader’s Guide for information concerning the symbols replacing missing data.
StatLink: http://dx.doi.org/10.1787/028135635270
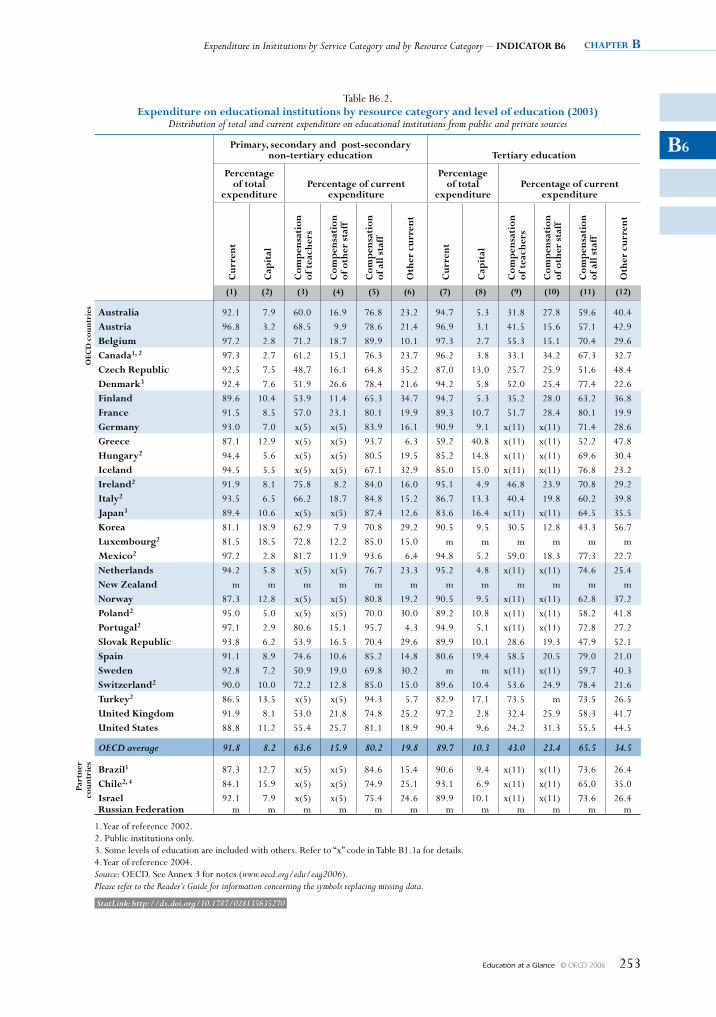
Expenditure in Institutions by Service Category and by Resource Category – INDICATOR B6 chapter B
Education at a Glance © OECD 2006 253
B6
Table B6.2. Expenditure on educational institutions by resource category and level of education (2003)
Distribution of total and current expenditure on educational institutions from public and private sources
primary, secondary and post-secondary non-tertiary education Tertiary education
percentage of total
expenditurepercentage of current
expenditure
percentage of total
expenditurepercentage of current
expenditure
Cur
rent
Cap
ital
Com
pen
sati
on
of t
each
ers
Com
pen
sati
on
of o
ther
sta
ff
Com
pen
sati
on
of a
ll s
taff
Oth
er c
urre
nt
Cur
rent
Cap
ital
Com
pen
sati
on
of t
each
ers
Com
pen
sati
on
of o
ther
sta
ff
Com
pen
sati
on
of a
ll s
taff
Oth
er c
urre
nt
(1) (2) (3) (4) (5) (6) (7) (8) (9) (10) (11) (12)
OEC
D c
ount
ries Australia 92.1 7.9 60.0 16.9 76.8 23.2 94.7 5.3 31.8 27.8 59.6 40.4
Austria 96.8 3.2 68.5 9.9 78.6 21.4 96.9 3.1 41.5 15.6 57.1 42.9 Belgium 97.2 2.8 71.2 18.7 89.9 10.1 97.3 2.7 55.3 15.1 70.4 29.6 Canada1, 2 97.3 2.7 61.2 15.1 76.3 23.7 96.2 3.8 33.1 34.2 67.3 32.7 Czech Republic 92.5 7.5 48.7 16.1 64.8 35.2 87.0 13.0 25.7 25.9 51.6 48.4 Denmark3 92.4 7.6 51.9 26.6 78.4 21.6 94.2 5.8 52.0 25.4 77.4 22.6 Finland 89.6 10.4 53.9 11.4 65.3 34.7 94.7 5.3 35.2 28.0 63.2 36.8 France 91.5 8.5 57.0 23.1 80.1 19.9 89.3 10.7 51.7 28.4 80.1 19.9 germany 93.0 7.0 x(5) x(5) 83.9 16.1 90.9 9.1 x(11) x(11) 71.4 28.6 greece 87.1 12.9 x(5) x(5) 93.7 6.3 59.2 40.8 x(11) x(11) 52.2 47.8 Hungary2 94.4 5.6 x(5) x(5) 80.5 19.5 85.2 14.8 x(11) x(11) 69.6 30.4 Iceland 94.5 5.5 x(5) x(5) 67.1 32.9 85.0 15.0 x(11) x(11) 76.8 23.2 Ireland2 91.9 8.1 75.8 8.2 84.0 16.0 95.1 4.9 46.8 23.9 70.8 29.2 Italy2 93.5 6.5 66.2 18.7 84.8 15.2 86.7 13.3 40.4 19.8 60.2 39.8 Japan3 89.4 10.6 x(5) x(5) 87.4 12.6 83.6 16.4 x(11) x(11) 64.5 35.5 Korea 81.1 18.9 62.9 7.9 70.8 29.2 90.5 9.5 30.5 12.8 43.3 56.7 Luxembourg2 81.5 18.5 72.8 12.2 85.0 15.0 m m m m m m Mexico2 97.2 2.8 81.7 11.9 93.6 6.4 94.8 5.2 59.0 18.3 77.3 22.7 Netherlands 94.2 5.8 x(5) x(5) 76.7 23.3 95.2 4.8 x(11) x(11) 74.6 25.4 New Zealand m m m m m m m m m m m m Norway 87.3 12.8 x(5) x(5) 80.8 19.2 90.5 9.5 x(11) x(11) 62.8 37.2 poland2 95.0 5.0 x(5) x(5) 70.0 30.0 89.2 10.8 x(11) x(11) 58.2 41.8 portugal2 97.1 2.9 80.6 15.1 95.7 4.3 94.9 5.1 x(11) x(11) 72.8 27.2 slovak Republic 93.8 6.2 53.9 16.5 70.4 29.6 89.9 10.1 28.6 19.3 47.9 52.1 spain 91.1 8.9 74.6 10.6 85.2 14.8 80.6 19.4 58.5 20.5 79.0 21.0 sweden 92.8 7.2 50.9 19.0 69.8 30.2 m m x(11) x(11) 59.7 40.3 switzerland2 90.0 10.0 72.2 12.8 85.0 15.0 89.6 10.4 53.6 24.9 78.4 21.6 Turkey2 86.5 13.5 x(5) x(5) 94.3 5.7 82.9 17.1 73.5 m 73.5 26.5 united Kingdom 91.9 8.1 53.0 21.8 74.8 25.2 97.2 2.8 32.4 25.9 58.3 41.7 united states 88.8 11.2 55.4 25.7 81.1 18.9 90.4 9.6 24.2 31.3 55.5 44.5
OECD average 91.8 8.2 63.6 15.9 80.2 19.8 89.7 10.3 43.0 23.4 65.5 34.5
part
ner
coun
trie
s
Brazil1 87.3 12.7 x(5) x(5) 84.6 15.4 90.6 9.4 x(11) x(11) 73.6 26.4 Chile2, 4 84.1 15.9 x(5) x(5) 74.9 25.1 93.1 6.9 x(11) x(11) 65.0 35.0 Israel 92.1 7.9 x(5) x(5) 75.4 24.6 89.9 10.1 x(11) x(11) 73.6 26.4 Russian Federation m m m m m m m m m m m m
1. Year of reference 2002.2. Public institutions only.3. Some levels of education are included with others. Refer to “x” code in Table B1.1a for details.4. Year of reference 2004.Source: OECD. See Annex 3 for notes (www.oecd.org/edu/eag2006).Please refer to the Reader’s Guide for information concerning the symbols replacing missing data.
StatLink: http://dx.doi.org/10.1787/028135635270

Education at a Glance © OECD 2006 255
Access to educAtion, PArticiPAtion
And Progression
Chapter
c
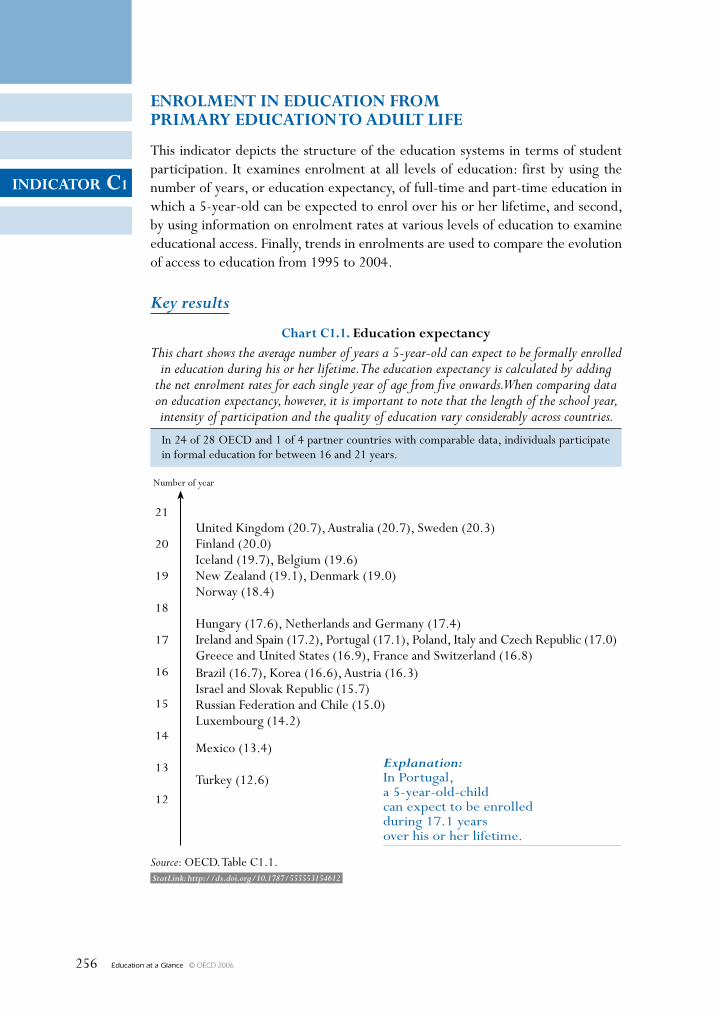
Education at a Glance © OECD 2006256
INDICATOR C1
StatLink: http://dx.doi.org/10.1787/555553154612
ENROLMENT IN EDUCATION FROM PRIMARY EDUCATION TO ADULT LIFE
This indicator depicts the structure of the education systems in terms of student participation. It examines enrolment at all levels of education: first by using the number of years, or education expectancy, of full-time and part-time education in which a 5-year-old can be expected to enrol over his or her lifetime, and second, by using information on enrolment rates at various levels of education to examine educational access. Finally, trends in enrolments are used to compare the evolution of access to education from 1995 to 2004.
Key results
Chart C1.1. Education expectancyThis chart shows the average number of years a 5-year-old can expect to be formally enrolled
in education during his or her lifetime. The education expectancy is calculated by adding the net enrolment rates for each single year of age from five onwards. When comparing data on education expectancy, however, it is important to note that the length of the school year, intensity of participation and the quality of education vary considerably across countries.
United Kingdom (20.7), Australia (20.7), Sweden (20.3) Finland (20.0) Iceland (19.7), Belgium (19.6) New Zealand (19.1), Denmark (19.0) Norway (18.4)
Hungary (17.6), Netherlands and Germany (17.4) Ireland and Spain (17.2), Portugal (17.1), Poland, Italy and Czech Republic (17.0) Greece and United States (16.9), France and Switzerland (16.8)
21
20
19
18
17
16
15
14
13
12
In 24 of 28 OECD and 1 of 4 partner countries with comparable data, individuals participate in formal education for between 16 and 21 years.
Source: OECD. Table C1.1.
Number of year
Brazil (16.7), Korea (16.6), Austria (16.3)Israel and Slovak Republic (15.7) Russian Federation and Chile (15.0) Luxembourg (14.2)
Mexico (13.4) Turkey (12.6)
Explanation: In Portugal, a 5-year-old-child can expect to be enrolled during 17.1 years over his or her lifetime.
Education at a Glance © OECD 2006 257
INDICATOR C1
Other highlights of this indicator
• In most OECD countries, virtually all young people have access to at least 12 years of formal education. At least 90% of students are enrolled in an age band spanning 14 or more years in Belgium, Czech Republic, France, Iceland, Japan and Spain. By contrast, Mexico and Turkey have enrolment rates exceeding 90% for a period of only nine and six years. For partner countries Brazil, Chile, Israel and the Russian Federation, the corresponding number of years is respectively 10, 9, 12 and 9 years.
• In more than half of the OECD countries, 70% of children aged 3 to 4 are enrolled in either pre-primary or primary programmes.
• A child can expect to be enrolled at age 4 and under more often in the 19 European countries that are members of the OECD (EU19) than in the other OECD countries. On average, the enrolment rate for children aged 3 to 4 is 73.5% for the EU19 whereas the OECD average is 66.3%.
• Education expectancy for all levels of education combined increased by 1.5 years between 1995 and 2004 in all OECD countries reporting comparable data. A student in an OECD member country can expect to receive 0.6 years more pre-primary, primary, secondary and post-secondary non-tertiary education and 0.9 years more tertiary education in 2004 than in 1995.
• In OECD countries, a 5-year-old can expect to have 17.4 years of education, with females receiving 0.8 more years of education, on average, than males. Australia, Sweden and United Kingdom which have educational expectancy of more than 20 years count between three and six years of part-time education.
• A 17-year-old can expect to spend an average of three years in tertiary education.
chapter c Access to educAtion, PArticiPAtion And Progression
Education at a Glance © OECD 2006258
C1
Policy context
A well-educated population is critical for a country’s economic and social development. Societies therefore have an intrinsic interest in ensuring broad access to a wide variety of educational opportunities for children and adults. Early childhood programmes prepare children for primary education, and can help combat linguistic and social disadvantages as well as provide opportunities to enhance and complement home educational experiences. Primary and secondary education lay down the foundations for a wide range of competencies, and prepare young people to become lifelong learners and productive members of society. Tertiary education, either directly after initial schooling or later in life, provides a range of options for acquiring advanced knowledge and skills.
Evidence and explanations
Virtually all young people in OECD countries have access to basic education. But patterns of participation in and progression through education over the life cycle vary widely among countries.
Overall participation in education
Both the timing and the rate of participation in the pre-school years and after the end of compulsory education differ considerably among countries.
Average length of schooling in 2004In 24 of 28 OECD and 1 of 4 partner countries, individuals are expected to participate in formal education for between 16 and 21 years. A child in Luxembourg, Mexico, the Slovak Republic, Turkey and the partner countries Chile, Israel and the Russian Federation can expect to be in education for less than 16 years, compared to 19 or more years in Australia, Belgium, Denmark, Finland, Iceland, New Zealand, Sweden and the United Kingdom (Chart C1.2).
Most of the variation in education expectancy among OECD countries comes from differences in enrolment rates in upper secondary education. Relative differences in participation are large at the tertiary level, but apply to a smaller proportion of the cohort and therefore have less of an effect on education expectancy (Table C1.1 and Chart C1.2).
Measures of the average length of schooling like education expectancy are affected by enrolment rates over the life cycle and therefore underestimate the actual number of years of schooling in systems where access to education is expanding.
Nor does this measure distinguish between full-time and part-time participation. OECD countries with a relatively large proportion of part-time enrolments will therefore tend to have relatively high values. In Australia, Belgium, New Zealand, Sweden and the United Kingdom, part-time education accounts for three or more years of education expectancy (Table C1.1).
Education expectancy can be influenced by the status of enrolment (part-time or full-time), the proportion of adults enrolled in education and mainly by those who repeat a grade and the proportion of school leavers. In OECD and partner countries where education expectancy at a given level of education exceeds the number of grades at that level, repeating a level (or, in the case of Australia, the number of adults enrolling in those programmes) has a greater impact on education expectancy than the proportion of students leaving school before completing that level of education.
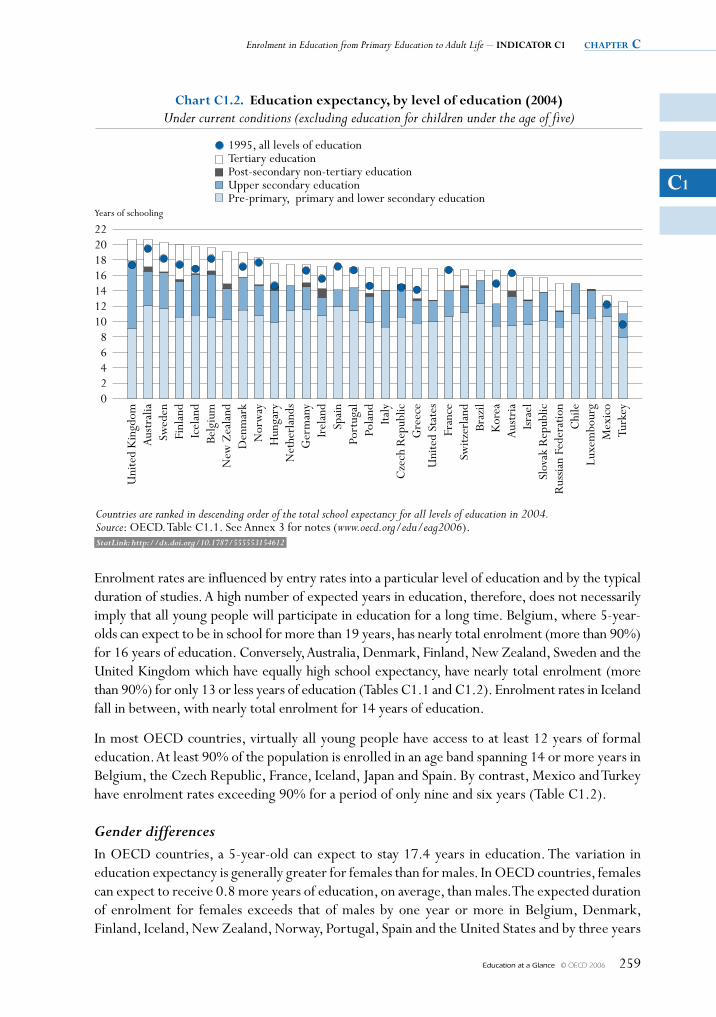
Enrolment in Education from Primary Education to Adult Life – INDICATOR C1 chapter c
Education at a Glance © OECD 2006 259
C1
Enrolment rates are influenced by entry rates into a particular level of education and by the typical duration of studies. A high number of expected years in education, therefore, does not necessarily imply that all young people will participate in education for a long time. Belgium, where 5-year-olds can expect to be in school for more than 19 years, has nearly total enrolment (more than 90%) for 16 years of education. Conversely, Australia, Denmark, Finland, New Zealand, Sweden and the United Kingdom which have equally high school expectancy, have nearly total enrolment (more than 90%) for only 13 or less years of education (Tables C1.1 and C1.2). Enrolment rates in Iceland fall in between, with nearly total enrolment for 14 years of education.
In most OECD countries, virtually all young people have access to at least 12 years of formal education. At least 90% of the population is enrolled in an age band spanning 14 or more years in Belgium, the Czech Republic, France, Iceland, Japan and Spain. By contrast, Mexico and Turkey have enrolment rates exceeding 90% for a period of only nine and six years (Table C1.2).
Gender differencesIn OECD countries, a 5-year-old can expect to stay 17.4 years in education. The variation in education expectancy is generally greater for females than for males. In OECD countries, females can expect to receive 0.8 more years of education, on average, than males. The expected duration of enrolment for females exceeds that of males by one year or more in Belgium, Denmark, Finland, Iceland, New Zealand, Norway, Portugal, Spain and the United States and by three years
22201816141210
86420
Years of schooling
Chart C1.2. Education expectancy, by level of education (2004)Under current conditions (excluding education for children under the age of five)
1995, all levels of educationTertiary educationPost-secondary non-tertiary educationUpper secondary educationPre-primary, primary and lower secondary education
Countries are ranked in descending order of the total school expectancy for all levels of education in 2004.Source: OECD. Table C1.1. See Annex 3 for notes (www.oecd.org/edu/eag2006).
Uni
ted
Kin
gdom
Aus
tral
iaSw
eden
Finl
and
Icel
and
Belg
ium
New
Zea
land
Den
mar
kN
orw
ayH
unga
ryN
ethe
rlan
dsG
erm
any
Irel
and
Spai
nPo
rtug
alPo
land
Italy
Cze
ch R
epub
licG
reec
eU
nite
d St
ates
Fran
ceSw
itzer
land
Braz
ilK
orea
Aus
tria
Isra
elSl
ovak
Rep
ublic
Rus
sian
Fede
ratio
nC
hile
Luxe
mbo
urg
Mex
ico
Turk
ey
StatLink: http://dx.doi.org/10.1787/555553154612
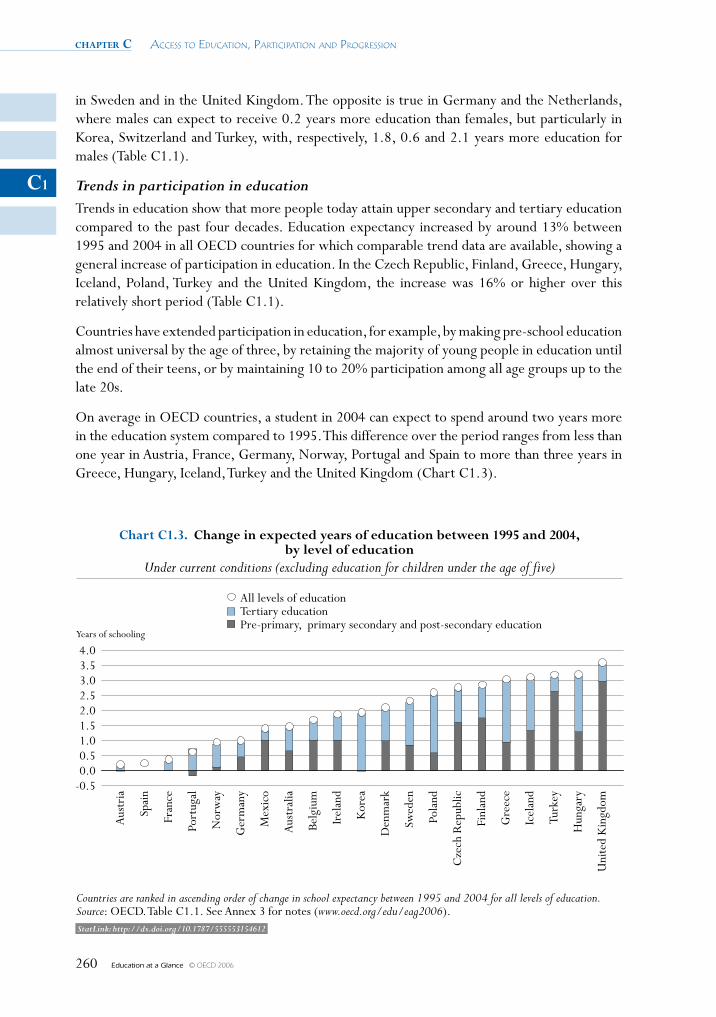
chapter c Access to educAtion, PArticiPAtion And Progression
Education at a Glance © OECD 2006260
C1
in Sweden and in the United Kingdom. The opposite is true in Germany and the Netherlands, where males can expect to receive 0.2 years more education than females, but particularly in Korea, Switzerland and Turkey, with, respectively, 1.8, 0.6 and 2.1 years more education for males (Table C1.1).
Trends in participation in educationTrends in education show that more people today attain upper secondary and tertiary education compared to the past four decades. Education expectancy increased by around 13% between 1995 and 2004 in all OECD countries for which comparable trend data are available, showing a general increase of participation in education. In the Czech Republic, Finland, Greece, Hungary, Iceland, Poland, Turkey and the United Kingdom, the increase was 16% or higher over this relatively short period (Table C1.1).
Countries have extended participation in education, for example, by making pre-school education almost universal by the age of three, by retaining the majority of young people in education until the end of their teens, or by maintaining 10 to 20% participation among all age groups up to the late 20s.
On average in OECD countries, a student in 2004 can expect to spend around two years more in the education system compared to 1995. This difference over the period ranges from less than one year in Austria, France, Germany, Norway, Portugal and Spain to more than three years in Greece, Hungary, Iceland, Turkey and the United Kingdom (Chart C1.3).
4.03.53.02.52.01.51.00.50.0
-0.5
Years of schooling
Chart C1.3. Change in expected years of education between 1995 and 2004,by level of education
Under current conditions (excluding education for children under the age of five)
Countries are ranked in ascending order of change in school expectancy between 1995 and 2004 for all levels of education.Source: OECD. Table C1.1. See Annex 3 for notes (www.oecd.org/edu/eag2006).
Aus
tria
Spai
n
Fran
ce
Port
ugal
Nor
way
Ger
man
y
Mex
ico
Aus
tral
ia
Belg
ium
Irel
and
Kor
ea
Den
mar
k
Swed
en
Pola
nd
Cze
ch R
epub
lic
Finl
and
Gre
ece
Icel
and
Turk
ey
Hun
gary
Uni
ted
Kin
gdom
All levels of educationTertiary educationPre-primary, primary secondary and post-secondary education
StatLink: http://dx.doi.org/10.1787/555553154612
Enrolment in Education from Primary Education to Adult Life – INDICATOR C1 chapter c
Education at a Glance © OECD 2006 261
C1
OECD countries present different patterns in their change in school expectancy between 1995 and 2004. On the one hand, in Greece, Hungary, Iceland, Korea, Poland and Sweden, the change is mainly due to an increase in participation at the tertiary level; on the other hand, the Czech Republic, Finland, Turkey and the United Kingdom, have mainly extended participation in their pre-primary, primary, secondary and post-secondary non-tertiary education.
Conversely, Austria, France and Spain present stabilised school expectancy between 1995 and 2004 for all levels of education. These three countries were also among those with higher enrolment rates of the young population aged between 5 and 14.
Participation in early childhood education
A child can expect to be enrolled at age 4 and under more often in the EU19 countries than in the other OECD countries. On average, the enrolment rate for children aged 3 to 4 is 73.5% for the EU19 countries whereas the OECD average is 66.3%.
In the majority of OECD and partner countries, full enrolment, which is defined here as enrolment rates exceeding 90%, begins between the ages of 5 and 6. However, in Belgium, the Czech Republic, Denmark, France, Germany, Hungary, Iceland, Italy, Japan, New Zealand, Norway, Portugal, the Slovak Republic, Spain, Sweden and the United Kingdom, at least 70% of children aged 3 to 4 are already enrolled in either pre-primary or primary programmes. Enrolment rates for early childhood education range from less than 25% in Ireland, Korea, Switzerland and Turkey, to over 90% in Belgium, France, Iceland, Italy and Spain, and the partner country Israel (Table C1.2).
Given the impact that early childhood education and care has on building a strong foundation for lifelong learning and on ensuring equitable access to learning opportunities later, pre-primary education is very important. However, institutionally based pre-primary programmes covered by this indicator are not the only form of quality early childhood education and care available. Inferences about access to and quality of pre-primary education and care should therefore be made with caution.
Participation towards the end of compulsory education and beyond
Several factors influence the decision to stay enrolled beyond the end of compulsory education. Young people with insufficient education for example are at a higher risk of unemployment and other forms of exclusion than their well-educated peers. In many OECD countries, the transition from education to employment has become a longer and more complex process that provides the opportunity or the obligation for students to combine learning and work to develop marketable skills (see Indicator C4).
The age at which compulsory education in OECD and partner countries ends, ranges from 14 in Korea, Portugal and Turkey, and the partner countries Brazil and Chile, to 18 in Belgium, Germany and the Netherlands. All other countries lie between the two extremes with compulsory education ending at the ages 15 or 16 (Table C1.2). However, the statutory age at which compulsory education ends does not always correspond to the age at which enrolment is universal.
While participation rates in most OECD and partner countries tend to be high until the end of compulsory education, in Germany, Mexico, the Netherlands, New Zealand, Turkey, the United States and the partner country the Russian Federation, rates drop to below 90% before
chapter c Access to educAtion, PArticiPAtion And Progression
Education at a Glance © OECD 2006262
C1
the age at which students are no longer legally required to be enrolled in school. More than 10% of students also never finish compulsory education in these countries. In Germany, the Netherlands and the United States, this may be due, in part, to the fact that compulsory education ends relatively late at age 18 (age 17, on average, in the United States).
In most OECD and partner countries, enrolment rates gradually decline during the last years of upper secondary education (Table C1.3). More than 20% of the population aged between 15 and 19 is not enrolled in education in Austria, Italy, Luxembourg, Mexico, New Zealand, Portugal, Spain, Turkey, the United Kingdom and the United States, and in the partner countries Brazil, Chile and Israel. By contrast, enrolment rates remain relatively high until the age of 20 to 29 in Australia, Denmark, Finland, Iceland, Poland and Sweden, where enrolment rates for 20-to-29-year-olds still exceed 30% (Table C1.2).
Graduates from upper secondary programmes who decide not to enter the labour market directly as well as people who are already working and want to upgrade their skills can choose from a wide range of post-secondary programmes.
The transition to post-secondary education
Upper secondary students in many education systems can enrol in relatively short programmes (less than two years) to prepare for a certain trade or specific vocational fields. Some OECD countries delay vocational training until after graduation from upper secondary education. While these programmes are offered as advanced upper secondary programmes in some OECD countries (e.g. Austria, Hungary and Spain), they are offered as post-secondary education in others (e.g. Canada and the United States), although these post-secondary programmes often resemble upper secondary level programmes.
From an internationally comparable point of view, these programmes straddle upper secondary and tertiary education and are therefore classified as a distinct level of education (post-secondary non-tertiary education).
In 26 of the 30 OECD countries, these kinds of programmes are offered to upper secondary graduates. A 17-year-old can expect to receive 0.3 years of post-secondary non-tertiary education on average in OECD countries. This expectation ranges from 0.1 years in Iceland, Italy, Norway, the Slovak Republic, Sweden and the United States to 0.6 years and more in Australia, Austria, the Czech Republic, Hungary, Ireland and New Zealand (Table C1.1).
Participation in tertiary education
Graduates from upper secondary programmes and those in the workforce who want to upgrade their skills can also choose from a wide range of tertiary programmes.
This indicator distinguishes among different categories of tertiary qualifications: i) programmes at tertiary-type B level (ISCED 5B); ii) programmes at tertiary-type A level (ISCED 5A); and iii) advanced research programmes at the doctorate level (ISCED 6). Tertiary-type A programmes are largely theoretically based and designed to provide qualifications for entry into advanced research programmes and highly skilled professions. Tertiary-type B programmes are classified at the same level of competence as tertiary-type A programmes, but are more occupationally oriented and lead to direct labour market access. The programmes are tend not to last as long
Enrolment in Education from Primary Education to Adult Life – INDICATOR C1 chapter c
Education at a Glance © OECD 2006 263
C1
as type A programmes (typically two to three years), and generally are not deemed to lead to university-level degrees. The institutional location of programmes is used to give a relatively clear idea of their nature (e.g. university versus non-university institutions of higher education), but these distinctions have become blurred and are therefore not applied in the OECD indicators.
On average in OECD countries, a 17-year-old can expect to receive 3 years of tertiary education. Tertiary entry rates, drop-out rates and the typical duration of study affect the expectancy of tertiary education. In Australia, Belgium, Denmark, Finland, Greece, Iceland, Korea, New Zealand, Norway, Poland, Spain, Sweden and the United States, tertiary studies typically last for three years or more. By contrast, in Mexico, the Slovak Republic and Turkey, tertiary education usually lasts less than 2 years (Table C1.1 and Indicator C2).
Policies to expand education have put pressure on gaining greater access to tertiary education in many OECD countries. Thus far, this pressure has more than compensated the declines in cohort sizes which had led, until recently, to predictions of stable or declining demand from school leavers in several OECD countries. Whereas some OECD countries are now showing signs of a levelling demand for tertiary education, the overall trend remains on an upward course.
End of compulsory education and decline in enrolment rates
An analysis of the rate of participation by level of education and single year of age shows that there is no close relationship between the end of compulsory education and the decline in enrolment rates. The sharpest decline in enrolment rates occurs in most of the OECD and partner countries, not at the end of compulsory education but at the end of upper secondary education. After the age of 16, however, enrolment rates begin to decline in almost all OECD countries (except in Belgium). On average in the OECD countries, the enrolment rate in secondary education falls from 91% at the age of 16 to 82% at the age of 17, 53% at the age of 18, and 28% at the age of 19. In Belgium, the Czech Republic, Finland, Germany, Japan, Korea, Norway, Poland and Sweden, more than 90% of all 17-year-olds are still enrolled at this level, even though the age at which compulsory education ends is under 17 in most of the countries (Table C1.3).
Definitions and methodologies
Data for the school year 2003-2004 are based on the UOE data collection on education statistics that is administered annually by the OECD, and on the 2005 World Education Indicators Programme.
Except where otherwise noted, figures are based on head counts; that is, they do not distinguish between full-time and part-time study. A standardised distinction between full-time and part-time participants is very difficult because the concept of part-time study is not recognised by some countries. For other OECD countries, part-time education is covered only partially by the reported data.
The average length of time a 5-year-old can expect to be formally enrolled in education during his/her lifetime, or education expectancy, is calculated by adding the net enrolment rates for each single year of age from five onwards (Table C1.1). The education expectancy for a cohort will reflect any tendency to lengthen (or shorten) studies in subsequent years. When comparing data on education expectancy, however, it must be borne in mind that neither the length of the school year nor the quality of education is necessarily the same in each country.
chapter c Access to educAtion, PArticiPAtion And Progression
Education at a Glance © OECD 2006264
C1
Education expectancy gives a domestic measure of the overall participation in education for a country as the UOE data collection covers all of a country’s domestic educational activity (i.e. within its own territory), regardless of the delivery mechanism and of the ownership or sponsorship (public or private, national or foreign) of the institution which organises the activity. Table C1.1 also shows the index of change in education expectancy between 1995 and 2004.
Net enrolment rates expressed as percentages in Table C1.2 are calculated by dividing the number of students of a particular age group enrolled in all levels of education by the size of the population of that age group.
Data for 1994-1995 are based on a special survey carried out in OECD countries in 2000. OECD countries were asked to report according to the ISCED-97 classification.
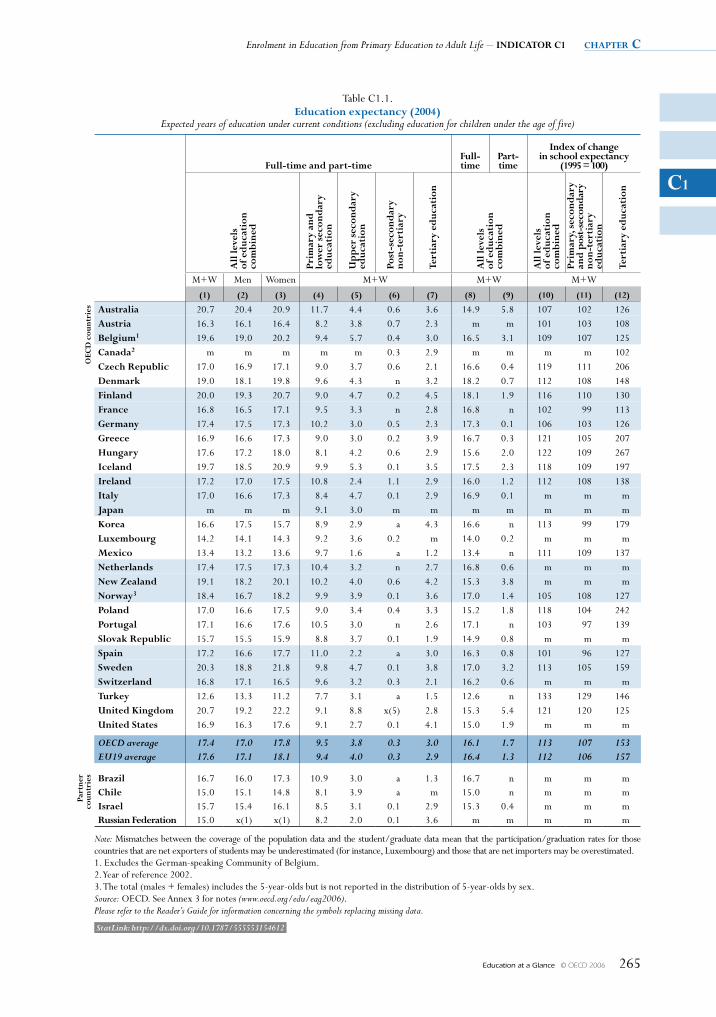
Enrolment in Education from Primary Education to Adult Life – IndIcator c1 chapter c
Education at a Glance © OECD 2006 265
c1
Table C1.1.Education expectancy (2004)
Expected years of education under current conditions (excluding education for children under the age of five)
Full-time and part-timeFull-time
Part-time
Index of change in school expectancy
(1995 = 100)
all
leve
ls
of e
duc
atio
n
com
bine
d
Prim
ary
and
lo
wer
sec
ond
ary
educ
atio
n
Up
per
sec
ond
ary
educ
atio
n
Post
-sec
ond
ary
no
n-te
rtia
ry
tert
iary
ed
ucat
ion
all
leve
ls
of e
duc
atio
n
com
bine
d
all
leve
ls
of e
duc
atio
n
com
bine
dPr
imar
y, s
econ
dar
y an
d p
ost-
seco
ndar
y no
n-te
rtia
ry
educ
atio
n
tert
iary
ed
ucat
ion
M+W Men Women M+W M+W M+W
(1) (2) (3) (4) (5) (6) (7) (8) (9) (10) (11) (12)
oEc
d c
ount
ries australia 20.7 20.4 20.9 11.7 4.4 0.6 3.6 14.9 5.8 107 102 126
austria 16.3 16.1 16.4 8.2 3.8 0.7 2.3 m m 101 103 108 Belgium1 19.6 19.0 20.2 9.4 5.7 0.4 3.0 16.5 3.1 109 107 125 canada2 m m m m m 0.3 2.9 m m m m 102 czech republic 17.0 16.9 17.1 9.0 3.7 0.6 2.1 16.6 0.4 119 111 206 denmark 19.0 18.1 19.8 9.6 4.3 n 3.2 18.2 0.7 112 108 148 Finland 20.0 19.3 20.7 9.0 4.7 0.2 4.5 18.1 1.9 116 110 130 France 16.8 16.5 17.1 9.5 3.3 n 2.8 16.8 n 102 99 113 Germany 17.4 17.5 17.3 10.2 3.0 0.5 2.3 17.3 0.1 106 103 126 Greece 16.9 16.6 17.3 9.0 3.0 0.2 3.9 16.7 0.3 121 105 207 Hungary 17.6 17.2 18.0 8.1 4.2 0.6 2.9 15.6 2.0 122 109 267 Iceland 19.7 18.5 20.9 9.9 5.3 0.1 3.5 17.5 2.3 118 109 197 Ireland 17.2 17.0 17.5 10.8 2.4 1.1 2.9 16.0 1.2 112 108 138 Italy 17.0 16.6 17.3 8.4 4.7 0.1 2.9 16.9 0.1 m m m Japan m m m 9.1 3.0 m m m m m m m Korea 16.6 17.5 15.7 8.9 2.9 a 4.3 16.6 n 113 99 179 Luxembourg 14.2 14.1 14.3 9.2 3.6 0.2 m 14.0 0.2 m m m Mexico 13.4 13.2 13.6 9.7 1.6 a 1.2 13.4 n 111 109 137 netherlands 17.4 17.5 17.3 10.4 3.2 n 2.7 16.8 0.6 m m m new Zealand 19.1 18.2 20.1 10.2 4.0 0.6 4.2 15.3 3.8 m m m norway3 18.4 16.7 18.2 9.9 3.9 0.1 3.6 17.0 1.4 105 108 127 Poland 17.0 16.6 17.5 9.0 3.4 0.4 3.3 15.2 1.8 118 104 242 Portugal 17.1 16.6 17.6 10.5 3.0 n 2.6 17.1 n 103 97 139 Slovak republic 15.7 15.5 15.9 8.8 3.7 0.1 1.9 14.9 0.8 m m m Spain 17.2 16.6 17.7 11.0 2.2 a 3.0 16.3 0.8 101 96 127 Sweden 20.3 18.8 21.8 9.8 4.7 0.1 3.8 17.0 3.2 113 105 159 Switzerland 16.8 17.1 16.5 9.6 3.2 0.3 2.1 16.2 0.6 m m m turkey 12.6 13.3 11.2 7.7 3.1 a 1.5 12.6 n 133 129 146 United Kingdom 20.7 19.2 22.2 9.1 8.8 x(5) 2.8 15.3 5.4 121 120 125 United States 16.9 16.3 17.6 9.1 2.7 0.1 4.1 15.0 1.9 m m m
OECD average 17.4 17.0 17.8 9.5 3.8 0.3 3.0 16.1 1.7 113 107 153 EU19 average 17.6 17.1 18.1 9.4 4.0 0.3 2.9 16.4 1.3 112 106 157
Part
ner
coun
trie
s Brazil 16.7 16.0 17.3 10.9 3.0 a 1.3 16.7 n m m m chile 15.0 15.1 14.8 8.1 3.9 a m 15.0 n m m m Israel 15.7 15.4 16.1 8.5 3.1 0.1 2.9 15.3 0.4 m m m russian Federation 15.0 x(1) x(1) 8.2 2.0 0.1 3.6 m m m m m
Note: Mismatches between the coverage of the population data and the student/graduate data mean that the participation/graduation rates for those countries that are net exporters of students may be underestimated (for instance, Luxembourg) and those that are net importers may be overestimated.1. Excludes the German-speaking Community of Belgium.2. Year of reference 2002.3. The total (males + females) includes the 5-year-olds but is not reported in the distribution of 5-year-olds by sex.Source: OECD. See Annex 3 for notes (www.oecd.org/edu/eag2006).Please refer to the Reader’s Guide for information concerning the symbols replacing missing data.
StatLink: http://dx.doi.org/10.1787/555553154612
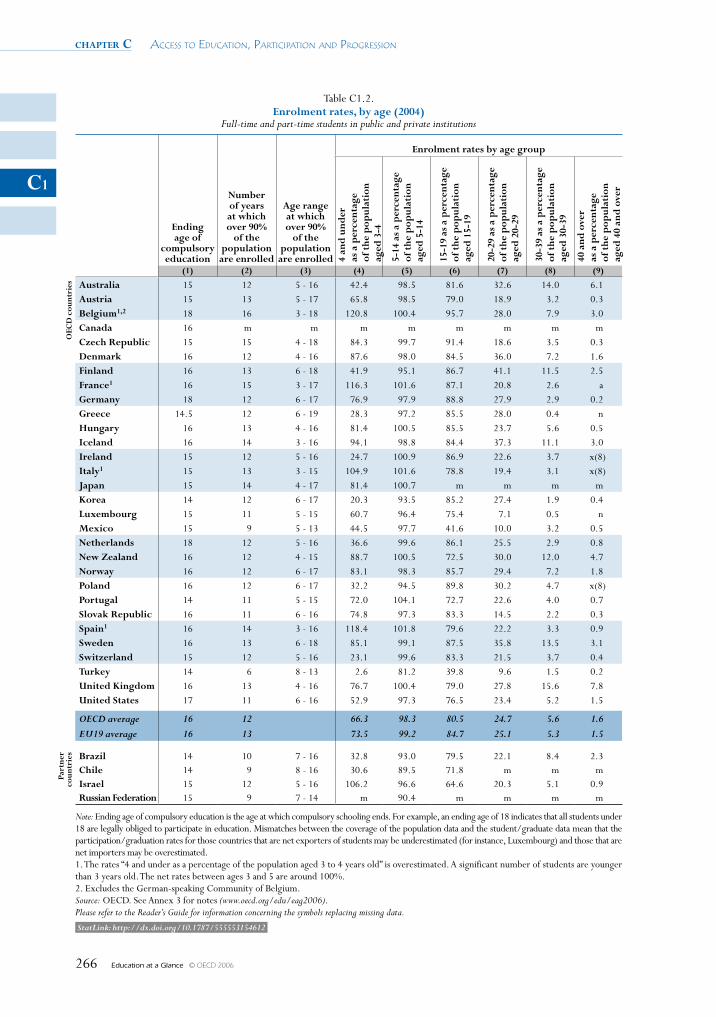
chapter c Access to educAtion, PArticiPAtion And Progression
Education at a Glance © OECD 2006266
C1
Table C1.2.Enrolment rates, by age (2004)
Full-time and part-time students in public and private institutions
Ending age of
compulsory education
Number of years at which over 90%
of the population are enrolled
Age range at which over 90%
of the population are enrolled
Enrolment rates by age group
4 an
d u
nder
as
a p
erce
ntag
e
of t
he p
opul
atio
nag
ed 3
-4
5-14
as
a p
erce
ntag
e
of t
he p
opul
atio
nag
ed 5
-14
15-1
9 as
a p
erce
ntag
e
of t
he p
opul
atio
nag
ed 1
5-19
20-2
9 as
a p
erce
ntag
e
of t
he p
opul
atio
nag
ed 2
0-29
30-3
9 as
a p
erce
ntag
e
of t
he p
opul
atio
nag
ed 3
0-39
40 a
nd o
ver
as
a p
erce
ntag
e
of t
he p
opul
atio
n
aged
40
and
ove
r
(1) (2) (3) (4) (5) (6) (7) (8) (9)
OEC
D c
ount
ries Australia 15 12 5 - 16 42.4 98.5 81.6 32.6 14.0 6.1
Austria 15 13 5 - 17 65.8 98.5 79.0 18.9 3.2 0.3 Belgium1,2 18 16 3 - 18 120.8 100.4 95.7 28.0 7.9 3.0 Canada 16 m m m m m m m m Czech Republic 15 15 4 - 18 84.3 99.7 91.4 18.6 3.5 0.3 Denmark 16 12 4 - 16 87.6 98.0 84.5 36.0 7.2 1.6 Finland 16 13 6 - 18 41.9 95.1 86.7 41.1 11.5 2.5 France1 16 15 3 - 17 116.3 101.6 87.1 20.8 2.6 a Germany 18 12 6 - 17 76.9 97.9 88.8 27.9 2.9 0.2 Greece 14.5 12 6 - 19 28.3 97.2 85.5 28.0 0.4 n Hungary 16 13 4 - 16 81.4 100.5 85.5 23.7 5.6 0.5 Iceland 16 14 3 - 16 94.1 98.8 84.4 37.3 11.1 3.0 Ireland 15 12 5 - 16 24.7 100.9 86.9 22.6 3.7 x(8) Italy1 15 13 3 - 15 104.9 101.6 78.8 19.4 3.1 x(8) Japan 15 14 4 - 17 81.4 100.7 m m m m Korea 14 12 6 - 17 20.3 93.5 85.2 27.4 1.9 0.4 Luxembourg 15 11 5 - 15 60.7 96.4 75.4 7.1 0.5 n Mexico 15 9 5 - 13 44.5 97.7 41.6 10.0 3.2 0.5 Netherlands 18 12 5 - 16 36.6 99.6 86.1 25.5 2.9 0.8 New Zealand 16 12 4 - 15 88.7 100.5 72.5 30.0 12.0 4.7 Norway 16 12 6 - 17 83.1 98.3 85.7 29.4 7.2 1.8 Poland 16 12 6 - 17 32.2 94.5 89.8 30.2 4.7 x(8) Portugal 14 11 5 - 15 72.0 104.1 72.7 22.6 4.0 0.7 Slovak Republic 16 11 6 - 16 74.8 97.3 83.3 14.5 2.2 0.3 Spain1 16 14 3 - 16 118.4 101.8 79.6 22.2 3.3 0.9 Sweden 16 13 6 - 18 85.1 99.1 87.5 35.8 13.5 3.1 Switzerland 15 12 5 - 16 23.1 99.6 83.3 21.5 3.7 0.4 Turkey 14 6 8 - 13 2.6 81.2 39.8 9.6 1.5 0.2 United Kingdom 16 13 4 - 16 76.7 100.4 79.0 27.8 15.6 7.8 United States 17 11 6 - 16 52.9 97.3 76.5 23.4 5.2 1.5
OECD average 16 12 66.3 98.3 80.5 24.7 5.6 1.6 EU19 average 16 13 73.5 99.2 84.7 25.1 5.3 1.5
Part
ner
coun
trie
s Brazil 14 10 7 - 16 32.8 93.0 79.5 22.1 8.4 2.3 Chile 14 9 8 - 16 30.6 89.5 71.8 m m m Israel 15 12 5 - 16 106.2 96.6 64.6 20.3 5.1 0.9 Russian Federation 15 9 7 - 14 m 90.4 m m m m
Note: Ending age of compulsory education is the age at which compulsory schooling ends. For example, an ending age of 18 indicates that all students under 18 are legally obliged to participate in education. Mismatches between the coverage of the population data and the student/graduate data mean that the participation/graduation rates for those countries that are net exporters of students may be underestimated (for instance, Luxembourg) and those that are net importers may be overestimated.1. The rates “4 and under as a percentage of the population aged 3 to 4 years old” is overestimated. A significant number of students are younger than 3 years old. The net rates between ages 3 and 5 are around 100%.2. Excludes the German-speaking Community of Belgium.Source: OECD. See Annex 3 for notes (www.oecd.org/edu/eag2006).Please refer to the Reader’s Guide for information concerning the symbols replacing missing data.
StatLink: http://dx.doi.org/10.1787/555553154612
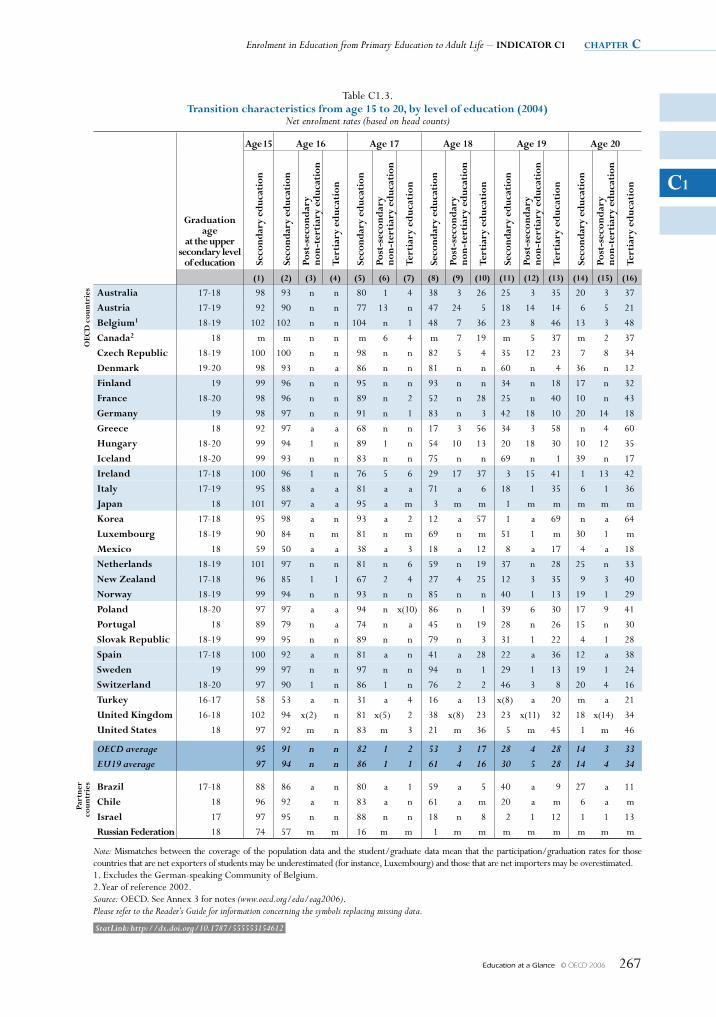
Enrolment in Education from Primary Education to Adult Life – INDICATOR C1 chapter c
Education at a Glance © OECD 2006 267
C1
Table C1.3.Transition characteristics from age 15 to 20, by level of education (2004)
Net enrolment rates (based on head counts)
Graduation age
at the upper secondary level
of education
Age 15 Age 16 Age 17 Age 18 Age 19 Age 20
Seco
ndar
y ed
ucat
ion
Seco
ndar
y ed
ucat
ion
Post
-sec
ond
ary
no
n-te
rtia
ry e
duca
tion
Tert
iary
ed
ucat
ion
Seco
ndar
y ed
ucat
ion
Post
-sec
ond
ary
no
n-te
rtia
ry e
duca
tion
Tert
iary
ed
ucat
ion
Seco
ndar
y ed
ucat
ion
Post
-sec
ond
ary
no
n-te
rtia
ry e
duca
tion
Tert
iary
ed
ucat
ion
Seco
ndar
y ed
ucat
ion
Post
-sec
ond
ary
no
n-te
rtia
ry e
duca
tion
Tert
iary
ed
ucat
ion
Seco
ndar
y ed
ucat
ion
Post
-sec
ond
ary
no
n-te
rtia
ry e
duca
tion
Tert
iary
ed
ucat
ion
(1) (2) (3) (4) (5) (6) (7) (8) (9) (10) (11) (12) (13) (14) (15) (16)
OEC
D c
ount
ries Australia 17-18 98 93 n n 80 1 4 38 3 26 25 3 35 20 3 37
Austria 17-19 92 90 n n 77 13 n 47 24 5 18 14 14 6 5 21
Belgium1 18-19 102 102 n n 104 n 1 48 7 36 23 8 46 13 3 48
Canada2 18 m m n n m 6 4 m 7 19 m 5 37 m 2 37
Czech Republic 18-19 100 100 n n 98 n n 82 5 4 35 12 23 7 8 34
Denmark 19-20 98 93 n a 86 n n 81 n n 60 n 4 36 n 12
Finland 19 99 96 n n 95 n n 93 n n 34 n 18 17 n 32
France 18-20 98 96 n n 89 n 2 52 n 28 25 n 40 10 n 43
Germany 19 98 97 n n 91 n 1 83 n 3 42 18 10 20 14 18
Greece 18 92 97 a a 68 n n 17 3 56 34 3 58 n 4 60
Hungary 18-20 99 94 1 n 89 1 n 54 10 13 20 18 30 10 12 35
Iceland 18-20 99 93 n n 83 n n 75 n n 69 n 1 39 n 17
Ireland 17-18 100 96 1 n 76 5 6 29 17 37 3 15 41 1 13 42
Italy 17-19 95 88 a a 81 a a 71 a 6 18 1 35 6 1 36
Japan 18 101 97 a a 95 a m 3 m m 1 m m m m m
Korea 17-18 95 98 a n 93 a 2 12 a 57 1 a 69 n a 64
Luxembourg 18-19 90 84 n m 81 n m 69 n m 51 1 m 30 1 m
Mexico 18 59 50 a a 38 a 3 18 a 12 8 a 17 4 a 18
Netherlands 18-19 101 97 n n 81 n 6 59 n 19 37 n 28 25 n 33
New Zealand 17-18 96 85 1 1 67 2 4 27 4 25 12 3 35 9 3 40
Norway 18-19 99 94 n n 93 n n 85 n n 40 1 13 19 1 29
Poland 18-20 97 97 a a 94 n x(10) 86 n 1 39 6 30 17 9 41
Portugal 18 89 79 n a 74 n a 45 n 19 28 n 26 15 n 30
Slovak Republic 18-19 99 95 n n 89 n n 79 n 3 31 1 22 4 1 28
Spain 17-18 100 92 a n 81 a n 41 a 28 22 a 36 12 a 38
Sweden 19 99 97 n n 97 n n 94 n 1 29 1 13 19 1 24
Switzerland 18-20 97 90 1 n 86 1 n 76 2 2 46 3 8 20 4 16
Turkey 16-17 58 53 a n 31 a 4 16 a 13 x(8) a 20 m a 21
United Kingdom 16-18 102 94 x(2) n 81 x(5) 2 38 x(8) 23 23 x(11) 32 18 x(14) 34
United States 18 97 92 m n 83 m 3 21 m 36 5 m 45 1 m 46
OECD average 95 91 n n 82 1 2 53 3 17 28 4 28 14 3 33 EU19 average 97 94 n n 86 1 1 61 4 16 30 5 28 14 4 34
Part
ner
coun
trie
s Brazil 17-18 88 86 a n 80 a 1 59 a 5 40 a 9 27 a 11
Chile 18 96 92 a n 83 a n 61 a m 20 a m 6 a m
Israel 17 97 95 n n 88 n n 18 n 8 2 1 12 1 1 13
Russian Federation 18 74 57 m m 16 m m 1 m m m m m m m m
Note: Mismatches between the coverage of the population data and the student/graduate data mean that the participation/graduation rates for those countries that are net exporters of students may be underestimated (for instance, Luxembourg) and those that are net importers may be overestimated.1. Excludes the German-speaking Community of Belgium.2. Year of reference 2002.Source: OECD. See Annex 3 for notes (www.oecd.org/edu/eag2006).Please refer to the Reader’s Guide for information concerning the symbols replacing missing data.
StatLink: http://dx.doi.org/10.1787/555553154612
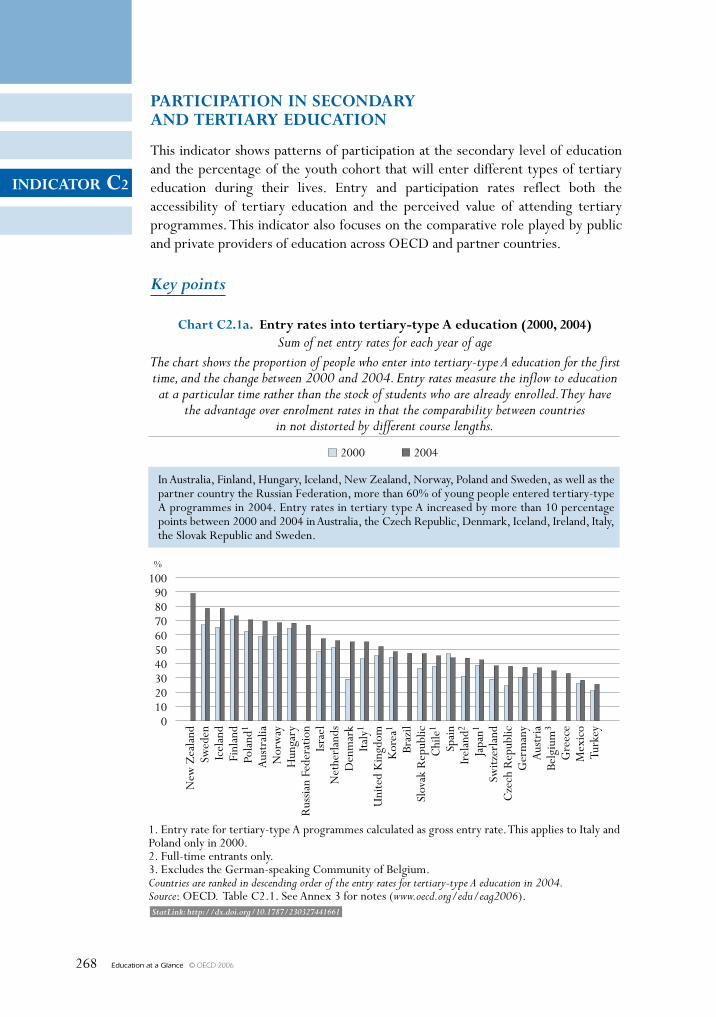
Education at a Glance © OECD 2006268
INDICATOR C2
StatLink: http://dx.doi.org/10.1787/230327441661
PARTICIPATION IN seCONDARy AND TeRTIARy eDuCATION
This indicator shows patterns of participation at the secondary level of education and the percentage of the youth cohort that will enter different types of tertiary education during their lives. Entry and participation rates reflect both the accessibility of tertiary education and the perceived value of attending tertiary programmes. This indicator also focuses on the comparative role played by public and private providers of education across OECD and partner countries.
Key points
100908070605040302010
0
%
Chart C2.1a. entry rates into tertiary-type A education (2000, 2004)Sum of net entry rates for each year of age
The chart shows the proportion of people who enter into tertiary-type A education for the firsttime, and the change between 2000 and 2004. Entry rates measure the inflow to educationat a particular time rather than the stock of students who are already enrolled. They have
the advantage over enrolment rates in that the comparability between countriesin not distorted by different course lengths.
2000 2004
1. Entry rate for tertiary-type A programmes calculated as gross entry rate. This applies to Italy andPoland only in 2000.2. Full-time entrants only.3. Excludes the German-speaking Community of Belgium.Countries are ranked in descending order of the entry rates for tertiary-type A education in 2004.Source: OECD. Table C2.1. See Annex 3 for notes (www.oecd.org/edu/eag2006).
New
Zea
land
Swed
enIc
elan
dFi
nlan
dPo
land
1
Aus
tral
iaN
orw
ayH
unga
ryR
ussia
n Fe
dera
tion
Isra
elN
ethe
rlan
dsD
enm
ark
Italy
1
Uni
ted
Kin
gdom
Kor
ea1
Braz
ilSl
ovak
Rep
ublic
Chi
le1
Spai
nIr
elan
d2
Japa
n1
Switz
erla
ndC
zech
Rep
ublic
Ger
man
yA
ustr
iaBe
lgiu
m3
Gre
ece
Mex
ico
Turk
ey
In Australia, Finland, Hungary, Iceland, New Zealand, Norway, Poland and Sweden, as well as thepartner country the Russian Federation, more than 60% of young people entered tertiary-typeA programmes in 2004. Entry rates in tertiary type A increased by more than 10 percentagepoints between 2000 and 2004 in Australia, the Czech Republic, Denmark, Iceland, Ireland, Italy,the Slovak Republic and Sweden.
Education at a Glance © OECD 2006 269
INDICATOR C2
Other highlights of this indicator
• Today, 53% of young people in OECD countries will enter tertiary-type A programmes during their lifetime whereas 2% of young people in the 17 OECD countries for which data are comparable, will enter advanced and research programmes during their lifetime.
• The proportion of students who enter tertiary-type B programmes is generally smaller than for tertiary-type A programmes. In OECD countries with available data, 16% of young people, on average, will enter tertiary-type B programmes. The figures range from 4% or less in Italy, Mexico, Norway, Poland and the Slovak Republic to more than 30% in Belgium, Japan, Korea and New Zealand. Changes from 2000 to 2004 are rather contrasted between countries.
• In Belgium, and to a lesser extent in Japan and Korea, wide access to tertiary-type B programmes counterbalances comparatively low rates of entry into tertiary-type A programmes. By contrast, Iceland, Norway, Poland and Sweden have entry rates above the OECD average for tertiary-type A programmes and comparatively very low rates of entry into tertiary-type B programmes. New Zealand stands out as a country with entry rates at both levels that are the highest among OECD countries.
• Traditionally, students typically enter tertiary-type A programmes immediately after having completed upper secondary education. This remains true in many OECD countries.
• In 14 OECD countries, the majority of upper secondary students attend vocational or apprenticeship programmes. Vocational education is school based in most OECD countries.
• Across OECD countries, education at all levels is still predominantly a publicly provided service – 89% of students in primary education are in public institutions –though the private sector is becoming more prominent beyond compulsory education. Privately managed schools now enrol, on average, 11% of primary students, 15% of lower secondary students and 20% of upper secondary students.
• On average among OECD countries, 12% of students enrolled at tertiary-type A education (including advanced research programmes) will follow their studies in independent private institutions. This proportion is two times higher than the EU19 country average.
chapter c Access to educAtion, PArticiPAtion And Progression
Education at a Glance © OECD 2006270
C2
Policy contextA range of factors, including an increased risk of unemployment and other forms of exclusion for young people with insufficient education, has strengthened the incentive for young people to stay enrolled beyond the end of compulsory education and to graduate from upper secondary education. Graduation from upper secondary education is also becoming the norm in most OECD countries. Most of these upper secondary programmes are primarily designed to prepare students for tertiary studies (see Indicator A2).
High tertiary entry and participation rates help to ensure the development and maintenance of a highly educated population and labour force. Moreover, tertiary education programmes are generally associated with better access to employment (see Indicator A8) and higher earnings (see Indicator A9). Rates of entry into tertiary education are a partial indication of the degree to which a population is acquiring high-level skills and knowledge valued by the labour market in today’s knowledge society.
As students have become more aware of the economic and social benefits of tertiary education, entry rates into tertiary-type A and tertiary-type B programmes have risen (see Indicator A3). Tertiary-type A programmes dominate the stock of tertiary enrolments and therefore the volume of resources required as they tend to be longer than other tertiary programmes (see Indicator B1, Table B1.3).
The continued growth in participation and a widening diversity of the backgrounds and interests of those aspiring to tertiary studies means that tertiary institutions will need to expand admissions and adapt their programmes and teaching to the diverse needs of new generations of students.
Evidence and explanationsThe curricular content in upper secondary programmes varies, depending on the type of education or occupation for which the programmes are designed. Students can also choose from a wide range of post-secondary programmes as well (see Indicator C1).
Overall access to tertiary education
In OECD countries, tertiary programmes vary in the extent to which they are theoretically based and designed to prepare students for advanced research programmes or professions with high skill requirements (tertiary-type A), or focus on occupationally specific skills so that students can directly enter the labour market (tertiary-type B). For a classification of national educational programmes into these categories, see Annex 3 (www.oecd.org/edu/eag2006).
Today, 53% of young people in OECD countries (52% in the EU19 countries) will enter tertiary-type A programmes during their lifetime, assuming that current entry rates continue. In fact, in Australia, Finland, Hungary, Iceland, New Zealand, Norway, Poland and Sweden, as well as in the partner country the Russian Federation, more than 60% of young people enter tertiary-type A programmes. The United States has an entry rate of 63%, but both type A and type B programmes are included in the type A columns as noted in Table C2.1.
In other OECD countries, the rates of first-time entry into tertiary-type A programmes are considerably lower: the estimated first-time entry rates for Austria, Belgium, the Czech Republic, Germany, Greece and Switzerland are around 35%. The first-time entry rates are particularly low in Mexico and Turkey with respectively 29% and 26%.
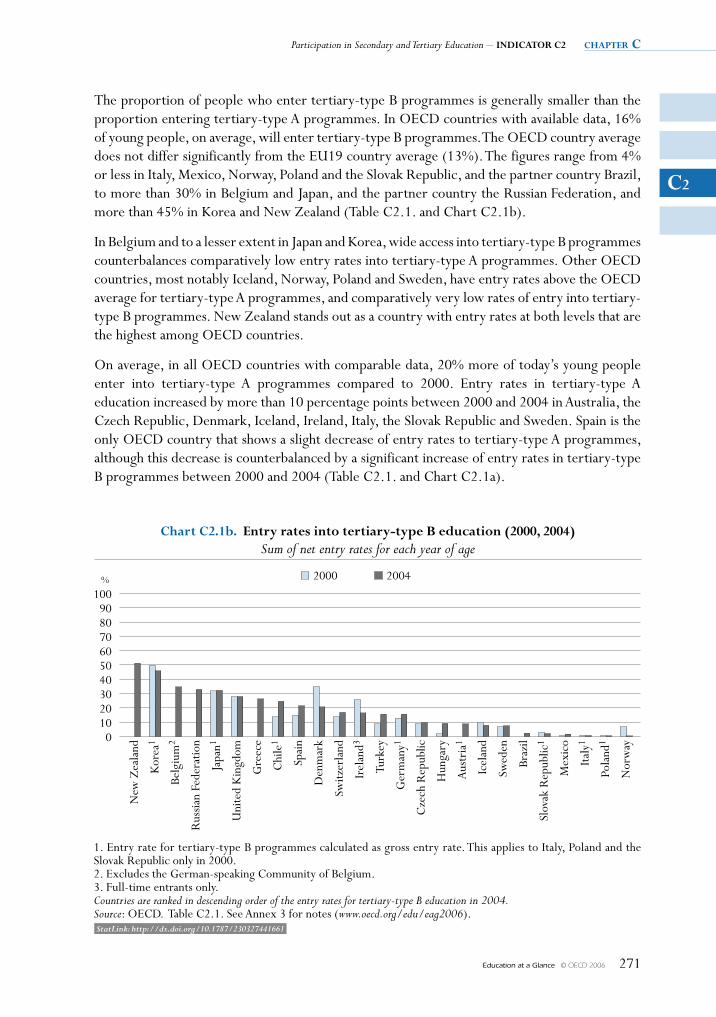
Participation in Secondary and Tertiary Education – IndIcator c2 chapter c
Education at a Glance © OECD 2006 271
c2
The proportion of people who enter tertiary-type B programmes is generally smaller than the proportion entering tertiary-type A programmes. In OECD countries with available data, 16% of young people, on average, will enter tertiary-type B programmes. The OECD country average does not differ significantly from the EU19 country average (13%). The figures range from 4% or less in Italy, Mexico, Norway, Poland and the Slovak Republic, and the partner country Brazil, to more than 30% in Belgium and Japan, and the partner country the Russian Federation, and more than 45% in Korea and New Zealand (Table C2.1. and Chart C2.1b).
In Belgium and to a lesser extent in Japan and Korea, wide access into tertiary-type B programmes counterbalances comparatively low entry rates into tertiary-type A programmes. Other OECD countries, most notably Iceland, Norway, Poland and Sweden, have entry rates above the OECD average for tertiary-type A programmes, and comparatively very low rates of entry into tertiary-type B programmes. New Zealand stands out as a country with entry rates at both levels that are the highest among OECD countries.
On average, in all OECD countries with comparable data, 20% more of today’s young people enter into tertiary-type A programmes compared to 2000. Entry rates in tertiary-type A education increased by more than 10 percentage points between 2000 and 2004 in Australia, the Czech Republic, Denmark, Iceland, Ireland, Italy, the Slovak Republic and Sweden. Spain is the only OECD country that shows a slight decrease of entry rates to tertiary-type A programmes, although this decrease is counterbalanced by a significant increase of entry rates in tertiary-type B programmes between 2000 and 2004 (Table C2.1. and Chart C2.1a).
100908070605040302010
0
%
chart c2.1b. Entry rates into tertiary-type B education (2000, 2004)Sum of net entry rates for each year of age
2000 2004
1. Entry rate for tertiary-type B programmes calculated as gross entry rate. This applies to Italy, Poland and theSlovak Republic only in 2000.2. Excludes the German-speaking Community of Belgium.3. Full-time entrants only.Countries are ranked in descending order of the entry rates for tertiary-type B education in 2004.Source: OECD. Table C2.1. See Annex 3 for notes (www.oecd.org/edu/eag2006).
New
Zea
land
Kor
ea1
Belg
ium
2
Rus
sian
Fede
ratio
n
Japa
n1
Uni
ted
Kin
gdom
Gre
ece
Chi
le1
Spai
n
Den
mar
k
Switz
erla
nd
Irel
and3
Turk
ey
Ger
man
y1
Cze
ch R
epub
lic
Hun
gary
Aus
tria
1
Icel
and
Swed
en
Braz
il
Slov
ak R
epub
lic1
Mex
ico
Italy
1
Pola
nd1
Nor
way
StatLink: http://dx.doi.org/10.1787/230327441661
chapter c Access to educAtion, PArticiPAtion And Progression
Education at a Glance © OECD 2006272
C2
Changes of net entry rates into tertiary-type B programmes between 2000 and 2004 vary among OECD countries, with an increase on average of only two percentage points over this period. This entry rate has slightly increased in most countries, except Denmark, Iceland, Ireland, Korea, Norway and the Slovak Republic, where it has decreased, and in Italy, Japan and Poland where it has been stable (Chart C2.1b). The reclassification of tertiary-type B to tertiary-type A programmes in Denmark after 2000 partly explained the changes observed between 2000 and 2004 (Charts C2.1a and C2.1b).
Almost 2% of today’s young people in the 17 OECD countries with comparable data will enter advanced and research programmes during their lifetime. The figures range from less than 1% in Australia, Austria, Iceland, Mexico, Norway and in the partner country Chile, to 3% or more in the Slovak Republic, Sweden and Switzerland (Table C2.1).
Rates of entry into tertiary education should also be considered in light of participation in post-secondary non-tertiary programmes, which are an important alternative to tertiary education in some OECD countries (see Indicator C1).
Age of new entrants into tertiary education
The age structure of entrants into tertiary education varies among OECD countries. Upper secondary graduates may have gone directly to the labour market before enrolling in a tertiary education programme. People entering tertiary-type B programmes may also enter tertiary-type A programmes later in their lives. Tertiary-type A and B entry rates cannot therefore be added together to obtain overall tertiary-level entry rates because entrants might be counted twice.
Traditionally, students enter tertiary-type A programmes immediately after having completed upper secondary education, and this remains true in many OECD countries. For example, in Belgium, the Czech Republic, Greece, Ireland, Italy, the Netherlands, Poland and Spain, more than 80% of all first-time entrants into tertiary-type A programmes are under 23 years of age (Table C2.1).
In other OECD and partner countries, the transition to the tertiary level is often delayed, in some cases by some time spent in the labour force. In these countries, first-time entrants into tertiary-type A programmes are typically older and show a much wider range of age at entry. In Denmark, Iceland, Sweden, the United Kingdom and the partner countries Brazil and Israel, more than half the students enter this level for the first time at the age of 22 or older (Table C2.1). The proportion of older first-time entrants to tertiary-type A programmes may reflect, among other factors, the flexibility of these programmes and their suitability to students outside the typical or modal age cohort. It may also reflect a specific view of the value of work experience for higher education studies, which is characteristic of the Nordic countries and common in Australia, the Czech Republic, Hungary, New Zealand and Switzerland, where a sizeable proportion of new entrants is much older than the typical age of entry. In Australia, Hungary, Iceland, New Zealand and the Nordic countries, more than 20% of first-time entrants are aged 27 or older.
Participation in upper secondary vocational education
In most OECD countries, students do not follow a uniform curriculum at the upper secondary level. Programmes at the upper secondary level are subdivided into three categories based on the degree to which they are oriented towards a specific class of occupations or trades and lead to a labour-market relevant qualification:
Participation in Secondary and Tertiary Education – INDICATOR C2 chapter c
Education at a Glance © OECD 2006 273
C2
• Type 1 (general) education programmes are not designed explicitly to prepare participants for specific occupations or trades, or for entry into further vocational or technical education programmes. Less than 25% of the programme content is vocational or technical.
• Type 2 (pre-vocational or pre-technical) education programmes are mainly designed to introduce participants to the world of work and to prepare them for entry into further vocational or technical education programmes. Successful completion of such programmes does not lead to a labour-market relevant vocational or technical qualification. At least 25% of the programme content should be vocational or technical.
• Type 3 (vocational or technical) education programmes prepare participants for direct entry into specific occupations without further training. Successful completion of such programmes leads to a labour-market relevant vocational or technical qualification.
The degree to which a programme has a vocational or general orientation does not necessarily determine whether participants have access to tertiary education. In several OECD countries, vocationally oriented programmes are designed to prepare students for further studies at the tertiary level, while in other countries many general programmes do not provide direct access to further education. In all OECD countries, students can choose vocational, pre-vocational or general programmes.
In 14 OECD countries, the majority of upper secondary students attend vocational or apprenticeship programmes. In OECD countries with dual-system apprenticeship programmes (Austria, Germany, Luxembourg, the Netherlands and Switzerland) and in Australia, Belgium, the Czech Republic, Finland, Italy, Norway, the Slovak Republic and the United Kingdom, 60% or more of upper secondary students are enrolled in pre-vocational or vocational programmes. The exceptions are Hungary, Iceland, Spain and Turkey where the majority of students are enrolled in general programmes even though dual-system apprenticeship programmes are offered (Table C2.5).
In most OECD countries, vocational education is school based, with the exception of the United Kingdom, where many vocational programmes correspond to further education programmes. In Austria, the Czech Republic, Iceland and the Slovak Republic, however, about half of the vocational programmes have combined school-based and work-based elements. In Denmark, Germany, Hungary and Switzerland, around 80% or more of students enrolled in vocational programmes have both school-based and work-based elements.
Beyond the secondary level, a number of options exist for further education. One avenue is relatively short, vocationally oriented programmes at the tertiary level. Another is theoretically based programmes, designed to provide sufficient qualifications for entry into advanced research programmes and professions with high skill requirements. These are mainly, but not exclusively, taught at universities.
Participation in tertiary education
Enrolment rates provide another perspective on participation in tertiary education. They reflect both the total number of individuals entering tertiary education and the duration of their studies. The sum of net enrolment rates for each year of age, referred to as the expectancy of tertiary education, gives an overall measure of the amount of tertiary education undertaken by an age cohort rather than by individual participants. In contrast to entry rates, expectancy of tertiary
chapter c Access to educAtion, PArticiPAtion And Progression
Education at a Glance © OECD 2006274
C2
education, which is based on enrolments in both tertiary-type A and tertiary-type B programmes, can be added together.
On average in OECD countries, a 17-year-old can expect to receive three years of tertiary education of which 2.3 years will be full-time. In Finland, Korea, New Zealand and the United States, a student can expect to receive at least four years of tertiary education (full-time and part-time). By contrast, the expectancy of tertiary education is less than two years in Mexico, the Slovak Republic and Turkey, and the partner country Brazil (Table C2.2).
On average in OECD countries, expectancy of enrolment in tertiary-type A programmes (2.4 years) is far higher than that in tertiary-type B programmes (0.5 years), partly because of the shorter duration of tertiary-type B programmes.
Trends in participation
At the tertiary level, changes in enrolment rates are less closely tied to changes in the size of the relevant age cohort than are such changes in primary and secondary education. Chart C2.2 breaks down the change in the number of students enrolled into two components: changes in cohort sizes and changes in enrolment rates.
Participation in tertiary education grew in absolute terms in all OECD countries between 1995 and 2004, on average by 50%. In half of the OECD countries with available data, the number of students enrolled in tertiary education increased by over 30%, and more than doubled in Greece, Hungary, Iceland and Poland (Table C2.2).
Growing demand, reflected in higher enrolment rates, is the main factor driving expansion in tertiary enrolments. Australia, Canada, Iceland, Mexico and Turkey are the only OECD countries where population increases have significantly contributed to higher tertiary enrolments. The actual increase in tertiary students would have been significantly higher in many OECD countries (in particular Denmark, Germany, Hungary and Korea) had the population not decreased.
The relative size of the public and the private sector
In OECD and partner countries, education at all levels is still predominantly publicly provided. On average, 89% of primary education students are enrolled in public institutions in the OECD countries, while the figures decline a bit in secondary education, with 83% of lower secondary students and 80% of upper secondary students being taught in public institutions. Private providers generally play a more significant role in tertiary education, with 33% of students of tertiary-type B programmes and 23% of students in tertiary-type A and advanced research programmes studying in private institutions. Moreover, only in tertiary education do independent private providers cater to a significant share of the student population (Tables C2.3 and C2.4).
The pattern varies for individual countries. Belgium and the Netherlands stand out as the only countries where private providers dominate primary and secondary education, with over 50% of students enrolled in the private sector. In both countries (as is generally the case across all countries at primary and secondary level), the private providers are institutions that receive more than 50% of their funding from public sources but have autonomy in their governance. Australia, and Spain comprise a group where similar institutions enrol about 20% or more
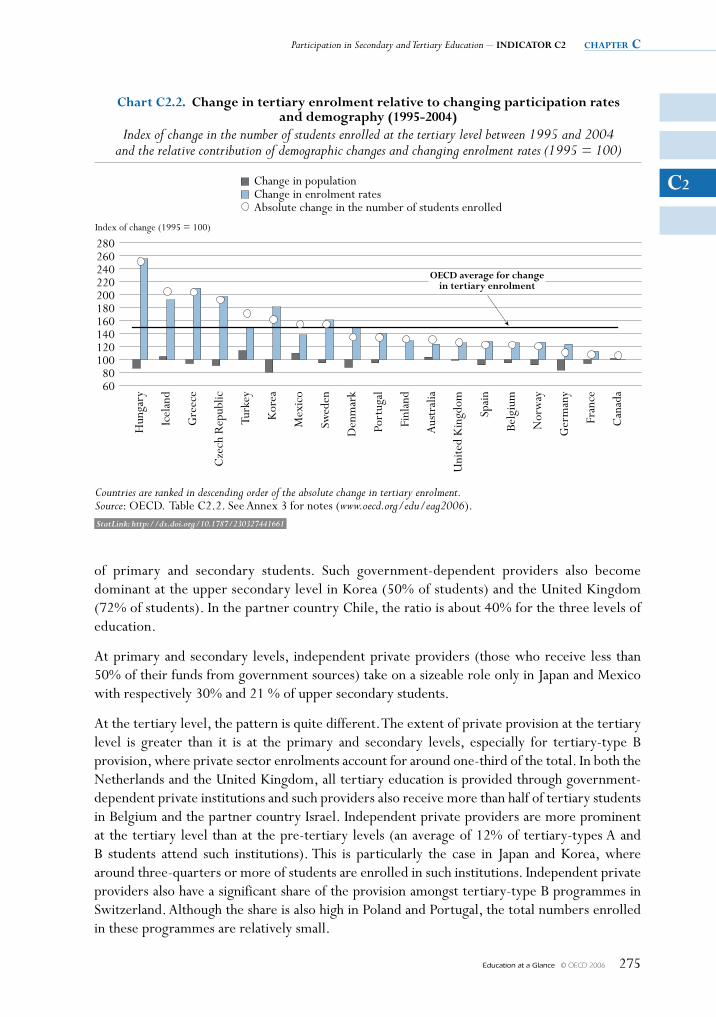
Participation in Secondary and Tertiary Education – INDICATOR C2 chapter c
Education at a Glance © OECD 2006 275
C2
of primary and secondary students. Such government-dependent providers also become dominant at the upper secondary level in Korea (50% of students) and the United Kingdom (72% of students). In the partner country Chile, the ratio is about 40% for the three levels of education.
At primary and secondary levels, independent private providers (those who receive less than 50% of their funds from government sources) take on a sizeable role only in Japan and Mexico with respectively 30% and 21 % of upper secondary students.
At the tertiary level, the pattern is quite different. The extent of private provision at the tertiary level is greater than it is at the primary and secondary levels, especially for tertiary-type B provision, where private sector enrolments account for around one-third of the total. In both the Netherlands and the United Kingdom, all tertiary education is provided through government-dependent private institutions and such providers also receive more than half of tertiary students in Belgium and the partner country Israel. Independent private providers are more prominent at the tertiary level than at the pre-tertiary levels (an average of 12% of tertiary-types A and B students attend such institutions). This is particularly the case in Japan and Korea, where around three-quarters or more of students are enrolled in such institutions. Independent private providers also have a significant share of the provision amongst tertiary-type B programmes in Switzerland. Although the share is also high in Poland and Portugal, the total numbers enrolled in these programmes are relatively small.
280260240220200180160140120100
8060
Index of change (1995 = 100)
Chart C2.2. Change in tertiary enrolment relative to changing participation ratesand demography (1995-2004)
Index of change in the number of students enrolled at the tertiary level between 1995 and 2004and the relative contribution of demographic changes and changing enrolment rates (1995 = 100)
Countries are ranked in descending order of the absolute change in tertiary enrolment.Source: OECD. Table C2.2. See Annex 3 for notes (www.oecd.org/edu/eag2006).
Hun
gary
Icel
and
Gre
ece
Cze
ch R
epub
lic
Turk
ey
Kor
ea
Mex
ico
Swed
en
Den
mar
k
Port
ugal
Finl
and
Aus
tral
ia
Uni
ted
Kin
gdom
Spai
n
Belg
ium
Nor
way
Ger
man
y
Fran
ce
Can
ada
OeCD average for changein tertiary enrolment
Change in populationChange in enrolment ratesAbsolute change in the number of students enrolled
StatLink: http://dx.doi.org/10.1787/230327441661
chapter c Access to educAtion, PArticiPAtion And Progression
Education at a Glance © OECD 2006276
C2
Definitions and methodologiesData for the school year 2003-2004 are based on the UOE data collection on education statistics administered annually by the OECD.
Table C2.1 shows the sum of net entry rates for all ages. The net entry rate for a specific age is obtained by dividing the number of first-time entrants of that age to each type of tertiary education by the total population in the corresponding age group. The sum of net entry rates is calculated by adding the rates for each year of age. The result represents the proportion of people in a synthetic age cohort who enter tertiary education, irrespective of changes in population sizes and of differences between OECD countries in the typical entry age. Table C2.1 also shows the 20th, 50th and 80th percentiles of the age distribution of first-time entrants, i.e. the age below which 20, 50 and 80% of first-time entrants are to be found.
New (first-time) entrants are students who enrol at the relevant level of education for the first time. Foreign students enrolling for the first time in a post-graduate programme are considered first-time entrants.
Not all OECD countries can distinguish between students entering a tertiary programme for the first time and those transferring between different levels of tertiary education or repeating or re-entering a level after an absence. Thus first-time entry rates for each level of tertiary education cannot be added up to a total tertiary-level entrance rate because it would result in counting entrants twice.
Table C2.2 shows the expected number of years for which 17-year-olds will be enrolled in tertiary education, or the sum of net enrolment rates for people aged 17 and over (divided by 100). This measure is a function of the number of participants in tertiary education and the duration of tertiary studies. Since the denominator also includes those who have never participated in tertiary education, the indicator cannot be interpreted as the average number of years an individual student requires to complete tertiary education.
Table C2.5 shows the distribution of enrolled students in upper secondary education by programme orientation. Pre-vocational and vocational programmes include both school-based programmes and combined school- and work-based programmes that are recognised as part of the education system. Entirely work-based education and training that is not overseen by a formal education authority is not taken into account.
Data for 1994-1995 are based on a special survey carried out in OECD countries in 2000. OECD countries were asked to report according to the ISCED-97 classification.
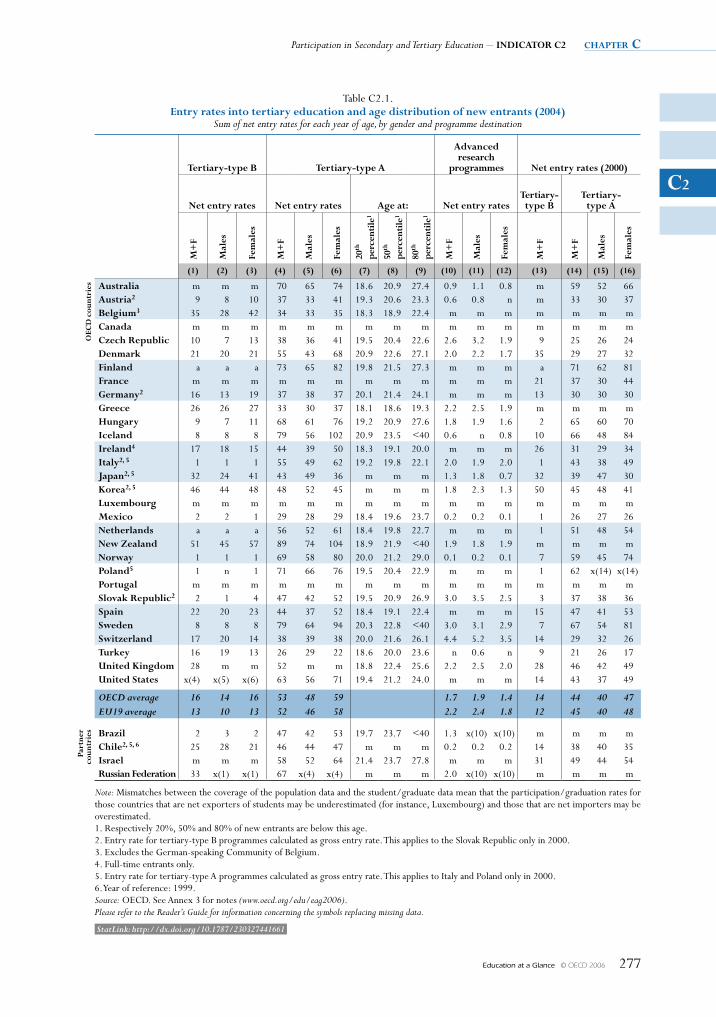
Participation in Secondary and Tertiary Education – INDICATOR C2 chapter c
Education at a Glance © OECD 2006 277
C2
Table C2.1. entry rates into tertiary education and age distribution of new entrants (2004)
Sum of net entry rates for each year of age, by gender and programme destination
Tertiary-type B Tertiary-type A
Advanced research
programmes Net entry rates (2000)
Net entry rates Net entry rates Age at: Net entry ratesTertiary-type B
Tertiary-type A
M+
F
Mal
es
Fem
ales
M+
F
Mal
es
Fem
ales
20th
pe
rcen
tile
1
50th
pe
rcen
tile
1
80th
pe
rcen
tile
1
M+
F
Mal
es
Fem
ales
M+
F
M+
F
Mal
es
Fem
ales
(1) (2) (3) (4) (5) (6) (7) (8) (9) (10) (11) (12) (13) (14) (15) (16)
OeC
D c
ount
ries Australia m m m 70 65 74 18.6 20.9 27.4 0.9 1.1 0.8 m 59 52 66
Austria2 9 8 10 37 33 41 19.3 20.6 23.3 0.6 0.8 n m 33 30 37 Belgium3 35 28 42 34 33 35 18.3 18.9 22.4 m m m m m m m Canada m m m m m m m m m m m m m m m m Czech Republic 10 7 13 38 36 41 19.5 20.4 22.6 2.6 3.2 1.9 9 25 26 24 Denmark 21 20 21 55 43 68 20.9 22.6 27.1 2.0 2.2 1.7 35 29 27 32 Finland a a a 73 65 82 19.8 21.5 27.3 m m m a 71 62 81 France m m m m m m m m m m m m 21 37 30 44 Germany2 16 13 19 37 38 37 20.1 21.4 24.1 m m m 13 30 30 30 Greece 26 26 27 33 30 37 18.1 18.6 19.3 2.2 2.5 1.9 m m m m Hungary 9 7 11 68 61 76 19.2 20.9 27.6 1.8 1.9 1.6 2 65 60 70 Iceland 8 8 8 79 56 102 20.9 23.5 <40 0.6 n 0.8 10 66 48 84 Ireland4 17 18 15 44 39 50 18.3 19.1 20.0 m m m 26 31 29 34 Italy2, 5 1 1 1 55 49 62 19.2 19.8 22.1 2.0 1.9 2.0 1 43 38 49 Japan2, 5 32 24 41 43 49 36 m m m 1.3 1.8 0.7 32 39 47 30 Korea2, 5 46 44 48 48 52 45 m m m 1.8 2.3 1.3 50 45 48 41 Luxembourg m m m m m m m m m m m m m m m m Mexico 2 2 1 29 28 29 18.4 19.6 23.7 0.2 0.2 0.1 1 26 27 26 Netherlands a a a 56 52 61 18.4 19.8 22.7 m m m 1 51 48 54 New Zealand 51 45 57 89 74 104 18.9 21.9 <40 1.9 1.8 1.9 m m m m Norway 1 1 1 69 58 80 20.0 21.2 29.0 0.1 0.2 0.1 7 59 45 74 Poland5 1 n 1 71 66 76 19.5 20.4 22.9 m m m 1 62 x(14) x(14) Portugal m m m m m m m m m m m m m m m m slovak Republic2 2 1 4 47 42 52 19.5 20.9 26.9 3.0 3.5 2.5 3 37 38 36 spain 22 20 23 44 37 52 18.4 19.1 22.4 m m m 15 47 41 53 sweden 8 8 8 79 64 94 20.3 22.8 <40 3.0 3.1 2.9 7 67 54 81 switzerland 17 20 14 38 39 38 20.0 21.6 26.1 4.4 5.2 3.5 14 29 32 26 Turkey 16 19 13 26 29 22 18.6 20.0 23.6 n 0.6 n 9 21 26 17 united Kingdom 28 m m 52 m m 18.8 22.4 25.6 2.2 2.5 2.0 28 46 42 49 united states x(4) x(5) x(6) 63 56 71 19.4 21.2 24.0 m m m 14 43 37 49
OECD average 16 14 16 53 48 59 1.7 1.9 1.4 14 44 40 47 EU19 average 13 10 13 52 46 58 2.2 2.4 1.8 12 45 40 48
Part
ner
coun
trie
s Brazil 2 3 2 47 42 53 19.7 23.7 <40 1.3 x(10) x(10) m m m m Chile2, 5, 6 25 28 21 46 44 47 m m m 0.2 0.2 0.2 14 38 40 35 Israel m m m 58 52 64 21.4 23.7 27.8 m m m 31 49 44 54Russian Federation 33 x(1) x(1) 67 x(4) x(4) m m m 2.0 x(10) x(10) m m m m
Note: Mismatches between the coverage of the population data and the student/graduate data mean that the participation/graduation rates for those countries that are net exporters of students may be underestimated (for instance, Luxembourg) and those that are net importers may be overestimated.1. Respectively 20%, 50% and 80% of new entrants are below this age.2. Entry rate for tertiary-type B programmes calculated as gross entry rate. This applies to the Slovak Republic only in 2000.3. Excludes the German-speaking Community of Belgium.4. Full-time entrants only.5. Entry rate for tertiary-type A programmes calculated as gross entry rate. This applies to Italy and Poland only in 2000.6. Year of reference: 1999.Source: OECD. See Annex 3 for notes (www.oecd.org/edu/eag2006).Please refer to the Reader’s Guide for information concerning the symbols replacing missing data.
StatLink: http://dx.doi.org/10.1787/230327441661
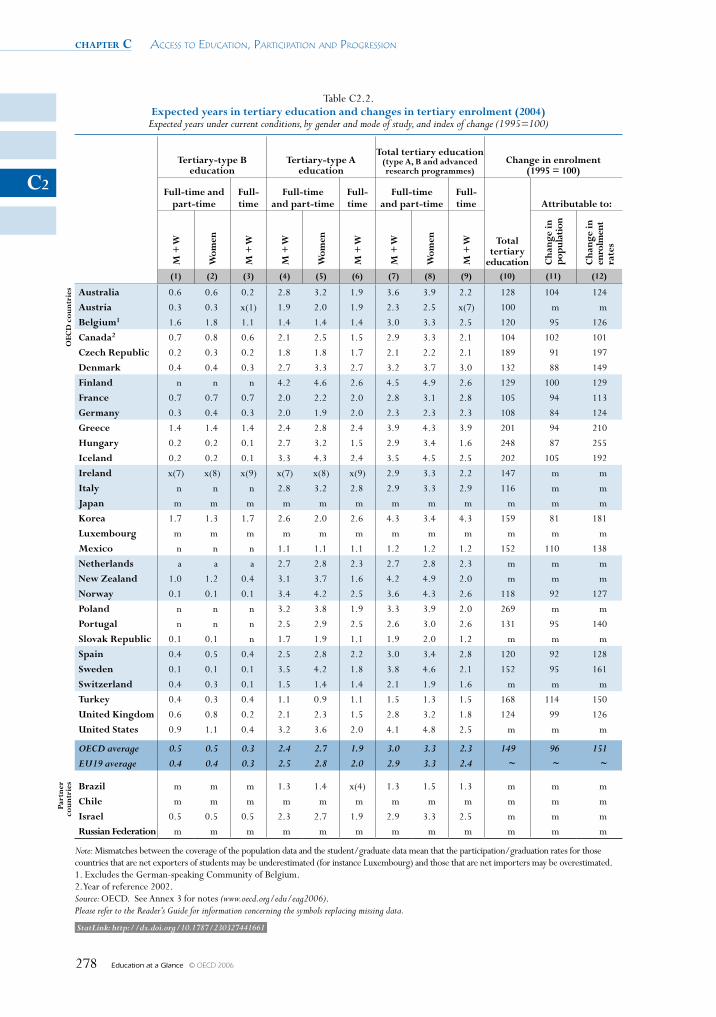
chapter c Access to educAtion, PArticiPAtion And Progression
Education at a Glance © OECD 2006278
C2
Table C2.2. expected years in tertiary education and changes in tertiary enrolment (2004)
Expected years under current conditions, by gender and mode of study, and index of change (1995=100)
Tertiary-type B education
Tertiary-type A education
Total tertiary education (type A, B and advanced research programmes)
Change in enrolment (1995 = 100)
Full-time and part-time
Full-time
Full-time and part-time
Full-time
Full-time and part-time
Full-time
Total tertiary
education
Attributable to:
M +
W
Wom
en
M +
W
M +
W
Wom
en
M +
W
M +
W
Wom
en
M +
W
Cha
nge
in
popu
lati
on
Cha
nge
in
enro
lmen
t ra
tes
(1) (2) (3) (4) (5) (6) (7) (8) (9) (10) (11) (12)
OeC
D c
ount
ries Australia 0.6 0.6 0.2 2.8 3.2 1.9 3.6 3.9 2.2 128 104 124
Austria 0.3 0.3 x(1) 1.9 2.0 1.9 2.3 2.5 x(7) 100 m m
Belgium1 1.6 1.8 1.1 1.4 1.4 1.4 3.0 3.3 2.5 120 95 126
Canada2 0.7 0.8 0.6 2.1 2.5 1.5 2.9 3.3 2.1 104 102 101
Czech Republic 0.2 0.3 0.2 1.8 1.8 1.7 2.1 2.2 2.1 189 91 197
Denmark 0.4 0.4 0.3 2.7 3.3 2.7 3.2 3.7 3.0 132 88 149
Finland n n n 4.2 4.6 2.6 4.5 4.9 2.6 129 100 129
France 0.7 0.7 0.7 2.0 2.2 2.0 2.8 3.1 2.8 105 94 113
Germany 0.3 0.4 0.3 2.0 1.9 2.0 2.3 2.3 2.3 108 84 124
Greece 1.4 1.4 1.4 2.4 2.8 2.4 3.9 4.3 3.9 201 94 210
Hungary 0.2 0.2 0.1 2.7 3.2 1.5 2.9 3.4 1.6 248 87 255
Iceland 0.2 0.2 0.1 3.3 4.3 2.4 3.5 4.5 2.5 202 105 192
Ireland x(7) x(8) x(9) x(7) x(8) x(9) 2.9 3.3 2.2 147 m m
Italy n n n 2.8 3.2 2.8 2.9 3.3 2.9 116 m m
Japan m m m m m m m m m m m m
Korea 1.7 1.3 1.7 2.6 2.0 2.6 4.3 3.4 4.3 159 81 181
Luxembourg m m m m m m m m m m m m
Mexico n n n 1.1 1.1 1.1 1.2 1.2 1.2 152 110 138
Netherlands a a a 2.7 2.8 2.3 2.7 2.8 2.3 m m m
New Zealand 1.0 1.2 0.4 3.1 3.7 1.6 4.2 4.9 2.0 m m m
Norway 0.1 0.1 0.1 3.4 4.2 2.5 3.6 4.3 2.6 118 92 127
Poland n n n 3.2 3.8 1.9 3.3 3.9 2.0 269 m m
Portugal n n n 2.5 2.9 2.5 2.6 3.0 2.6 131 95 140
slovak Republic 0.1 0.1 n 1.7 1.9 1.1 1.9 2.0 1.2 m m m
spain 0.4 0.5 0.4 2.5 2.8 2.2 3.0 3.4 2.8 120 92 128
sweden 0.1 0.1 0.1 3.5 4.2 1.8 3.8 4.6 2.1 152 95 161
switzerland 0.4 0.3 0.1 1.5 1.4 1.4 2.1 1.9 1.6 m m m
Turkey 0.4 0.3 0.4 1.1 0.9 1.1 1.5 1.3 1.5 168 114 150
united Kingdom 0.6 0.8 0.2 2.1 2.3 1.5 2.8 3.2 1.8 124 99 126
united states 0.9 1.1 0.4 3.2 3.6 2.0 4.1 4.8 2.5 m m m
OECD average 0.5 0.5 0.3 2.4 2.7 1.9 3.0 3.3 2.3 149 96 151 EU19 average 0.4 0.4 0.3 2.5 2.8 2.0 2.9 3.3 2.4 ~ ~ ~
Part
ner
coun
trie
s Brazil m m m 1.3 1.4 x(4) 1.3 1.5 1.3 m m m
Chile m m m m m m m m m m m m
Israel 0.5 0.5 0.5 2.3 2.7 1.9 2.9 3.3 2.5 m m m
Russian Federation m m m m m m m m m m m m
Note: Mismatches between the coverage of the population data and the student/graduate data mean that the participation/graduation rates for those countries that are net exporters of students may be underestimated (for instance Luxembourg) and those that are net importers may be overestimated.1. Excludes the German-speaking Community of Belgium.2. Year of reference 2002.Source: OECD. See Annex 3 for notes (www.oecd.org/edu/eag2006).Please refer to the Reader’s Guide for information concerning the symbols replacing missing data.
StatLink: http://dx.doi.org/10.1787/230327441661
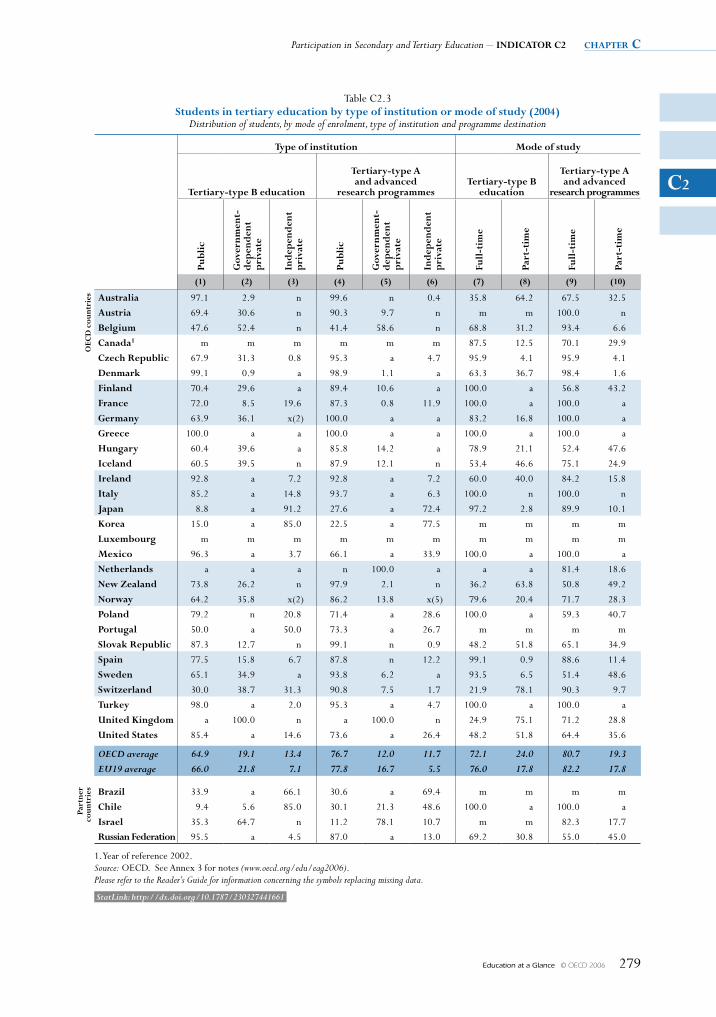
Participation in Secondary and Tertiary Education – INDICATOR C2 chapter c
Education at a Glance © OECD 2006 279
C2
Table C2.3students in tertiary education by type of institution or mode of study (2004)
Distribution of students, by mode of enrolment, type of institution and programme destination
Type of institution Mode of study
Tertiary-type B education
Tertiary-type A and advanced
research programmesTertiary-type B
education
Tertiary-type A and advanced
research programmesPu
blic
Gov
ernm
ent-
dep
end
ent
pri
vate
Ind
epen
den
t p
riva
te
Publ
ic
Gov
ernm
ent-
dep
end
ent
pri
vate
Ind
epen
den
t p
riva
te
Full
-tim
e
Part
-tim
e
Full
-tim
e
Part
-tim
e
(1) (2) (3) (4) (5) (6) (7) (8) (9) (10)
OeC
D c
ount
ries Australia 97.1 2.9 n 99.6 n 0.4 35.8 64.2 67.5 32.5
Austria 69.4 30.6 n 90.3 9.7 n m m 100.0 n
Belgium 47.6 52.4 n 41.4 58.6 n 68.8 31.2 93.4 6.6
Canada1 m m m m m m 87.5 12.5 70.1 29.9
Czech Republic 67.9 31.3 0.8 95.3 a 4.7 95.9 4.1 95.9 4.1
Denmark 99.1 0.9 a 98.9 1.1 a 63.3 36.7 98.4 1.6
Finland 70.4 29.6 a 89.4 10.6 a 100.0 a 56.8 43.2
France 72.0 8.5 19.6 87.3 0.8 11.9 100.0 a 100.0 a
Germany 63.9 36.1 x(2) 100.0 a a 83.2 16.8 100.0 a
Greece 100.0 a a 100.0 a a 100.0 a 100.0 a
Hungary 60.4 39.6 a 85.8 14.2 a 78.9 21.1 52.4 47.6
Iceland 60.5 39.5 n 87.9 12.1 n 53.4 46.6 75.1 24.9
Ireland 92.8 a 7.2 92.8 a 7.2 60.0 40.0 84.2 15.8
Italy 85.2 a 14.8 93.7 a 6.3 100.0 n 100.0 n
Japan 8.8 a 91.2 27.6 a 72.4 97.2 2.8 89.9 10.1
Korea 15.0 a 85.0 22.5 a 77.5 m m m m
Luxembourg m m m m m m m m m m
Mexico 96.3 a 3.7 66.1 a 33.9 100.0 a 100.0 a
Netherlands a a a n 100.0 a a a 81.4 18.6
New Zealand 73.8 26.2 n 97.9 2.1 n 36.2 63.8 50.8 49.2
Norway 64.2 35.8 x(2) 86.2 13.8 x(5) 79.6 20.4 71.7 28.3
Poland 79.2 n 20.8 71.4 a 28.6 100.0 a 59.3 40.7
Portugal 50.0 a 50.0 73.3 a 26.7 m m m m
slovak Republic 87.3 12.7 n 99.1 n 0.9 48.2 51.8 65.1 34.9
spain 77.5 15.8 6.7 87.8 n 12.2 99.1 0.9 88.6 11.4
sweden 65.1 34.9 a 93.8 6.2 a 93.5 6.5 51.4 48.6
switzerland 30.0 38.7 31.3 90.8 7.5 1.7 21.9 78.1 90.3 9.7
Turkey 98.0 a 2.0 95.3 a 4.7 100.0 a 100.0 a
united Kingdom a 100.0 n a 100.0 n 24.9 75.1 71.2 28.8
united states 85.4 a 14.6 73.6 a 26.4 48.2 51.8 64.4 35.6
OECD average 64.9 19.1 13.4 76.7 12.0 11.7 72.1 24.0 80.7 19.3 EU19 average 66.0 21.8 7.1 77.8 16.7 5.5 76.0 17.8 82.2 17.8
Part
ner
coun
trie
s Brazil 33.9 a 66.1 30.6 a 69.4 m m m m
Chile 9.4 5.6 85.0 30.1 21.3 48.6 100.0 a 100.0 a
Israel 35.3 64.7 n 11.2 78.1 10.7 m m 82.3 17.7
Russian Federation 95.5 a 4.5 87.0 a 13.0 69.2 30.8 55.0 45.0
1. Year of reference 2002.Source: OECD. See Annex 3 for notes (www.oecd.org/edu/eag2006).Please refer to the Reader’s Guide for information concerning the symbols replacing missing data.
StatLink: http://dx.doi.org/10.1787/230327441661
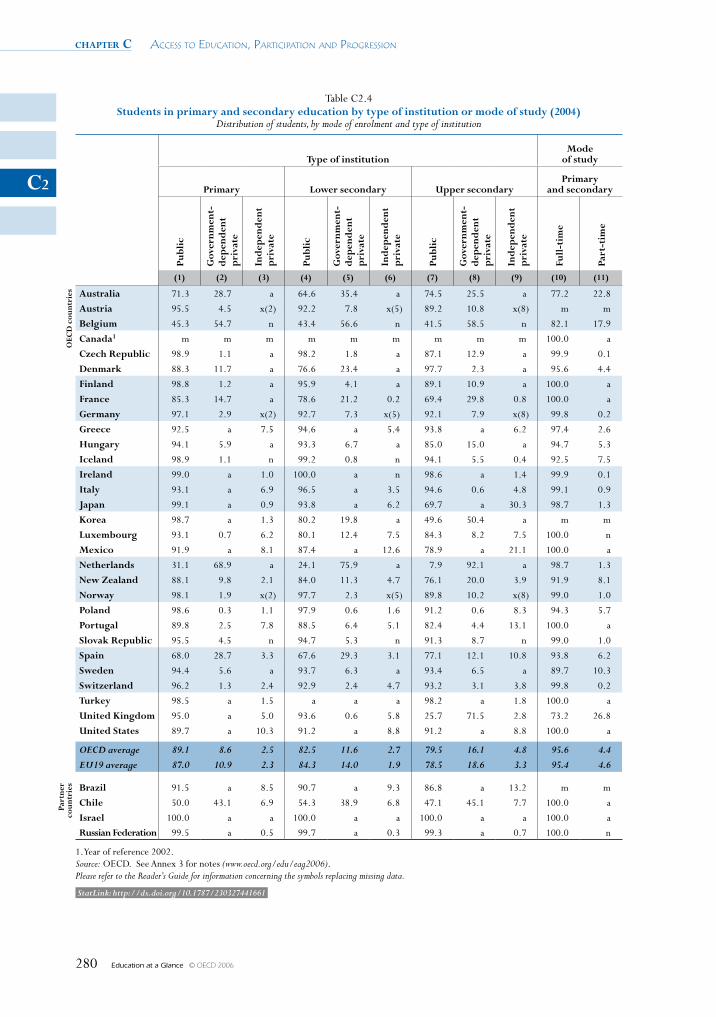
chapter c Access to educAtion, PArticiPAtion And Progression
Education at a Glance © OECD 2006280
C2
Table C2.4students in primary and secondary education by type of institution or mode of study (2004)
Distribution of students, by mode of enrolment and type of institution
Type of institutionMode
of study
Primary Lower secondary upper secondaryPrimary
and secondaryPu
blic
Gov
ernm
ent-
dep
end
ent
pri
vate
Ind
epen
den
t p
riva
te
Publ
ic
Gov
ernm
ent-
dep
end
ent
pri
vate
Ind
epen
den
t p
riva
te
Publ
ic
Gov
ernm
ent-
dep
end
ent
pri
vate
Ind
epen
den
t p
riva
te
Full
-tim
e
Part
-tim
e
(1) (2) (3) (4) (5) (6) (7) (8) (9) (10) (11)
OeC
D c
ount
ries Australia 71.3 28.7 a 64.6 35.4 a 74.5 25.5 a 77.2 22.8
Austria 95.5 4.5 x(2) 92.2 7.8 x(5) 89.2 10.8 x(8) m m
Belgium 45.3 54.7 n 43.4 56.6 n 41.5 58.5 n 82.1 17.9
Canada1 m m m m m m m m m 100.0 a
Czech Republic 98.9 1.1 a 98.2 1.8 a 87.1 12.9 a 99.9 0.1
Denmark 88.3 11.7 a 76.6 23.4 a 97.7 2.3 a 95.6 4.4
Finland 98.8 1.2 a 95.9 4.1 a 89.1 10.9 a 100.0 a
France 85.3 14.7 a 78.6 21.2 0.2 69.4 29.8 0.8 100.0 a
Germany 97.1 2.9 x(2) 92.7 7.3 x(5) 92.1 7.9 x(8) 99.8 0.2
Greece 92.5 a 7.5 94.6 a 5.4 93.8 a 6.2 97.4 2.6
Hungary 94.1 5.9 a 93.3 6.7 a 85.0 15.0 a 94.7 5.3
Iceland 98.9 1.1 n 99.2 0.8 n 94.1 5.5 0.4 92.5 7.5
Ireland 99.0 a 1.0 100.0 a n 98.6 a 1.4 99.9 0.1
Italy 93.1 a 6.9 96.5 a 3.5 94.6 0.6 4.8 99.1 0.9
Japan 99.1 a 0.9 93.8 a 6.2 69.7 a 30.3 98.7 1.3
Korea 98.7 a 1.3 80.2 19.8 a 49.6 50.4 a m m
Luxembourg 93.1 0.7 6.2 80.1 12.4 7.5 84.3 8.2 7.5 100.0 n
Mexico 91.9 a 8.1 87.4 a 12.6 78.9 a 21.1 100.0 a
Netherlands 31.1 68.9 a 24.1 75.9 a 7.9 92.1 a 98.7 1.3
New Zealand 88.1 9.8 2.1 84.0 11.3 4.7 76.1 20.0 3.9 91.9 8.1
Norway 98.1 1.9 x(2) 97.7 2.3 x(5) 89.8 10.2 x(8) 99.0 1.0
Poland 98.6 0.3 1.1 97.9 0.6 1.6 91.2 0.6 8.3 94.3 5.7
Portugal 89.8 2.5 7.8 88.5 6.4 5.1 82.4 4.4 13.1 100.0 a
slovak Republic 95.5 4.5 n 94.7 5.3 n 91.3 8.7 n 99.0 1.0
spain 68.0 28.7 3.3 67.6 29.3 3.1 77.1 12.1 10.8 93.8 6.2
sweden 94.4 5.6 a 93.7 6.3 a 93.4 6.5 a 89.7 10.3
switzerland 96.2 1.3 2.4 92.9 2.4 4.7 93.2 3.1 3.8 99.8 0.2
Turkey 98.5 a 1.5 a a a 98.2 a 1.8 100.0 a
united Kingdom 95.0 a 5.0 93.6 0.6 5.8 25.7 71.5 2.8 73.2 26.8
united states 89.7 a 10.3 91.2 a 8.8 91.2 a 8.8 100.0 a
OECD average 89.1 8.6 2.5 82.5 11.6 2.7 79.5 16.1 4.8 95.6 4.4 EU19 average 87.0 10.9 2.3 84.3 14.0 1.9 78.5 18.6 3.3 95.4 4.6
Part
ner
coun
trie
s Brazil 91.5 a 8.5 90.7 a 9.3 86.8 a 13.2 m m
Chile 50.0 43.1 6.9 54.3 38.9 6.8 47.1 45.1 7.7 100.0 a
Israel 100.0 a a 100.0 a a 100.0 a a 100.0 a
Russian Federation 99.5 a 0.5 99.7 a 0.3 99.3 a 0.7 100.0 n
1. Year of reference 2002.Source: OECD. See Annex 3 for notes (www.oecd.org/edu/eag2006).Please refer to the Reader’s Guide for information concerning the symbols replacing missing data.
StatLink: http://dx.doi.org/10.1787/230327441661
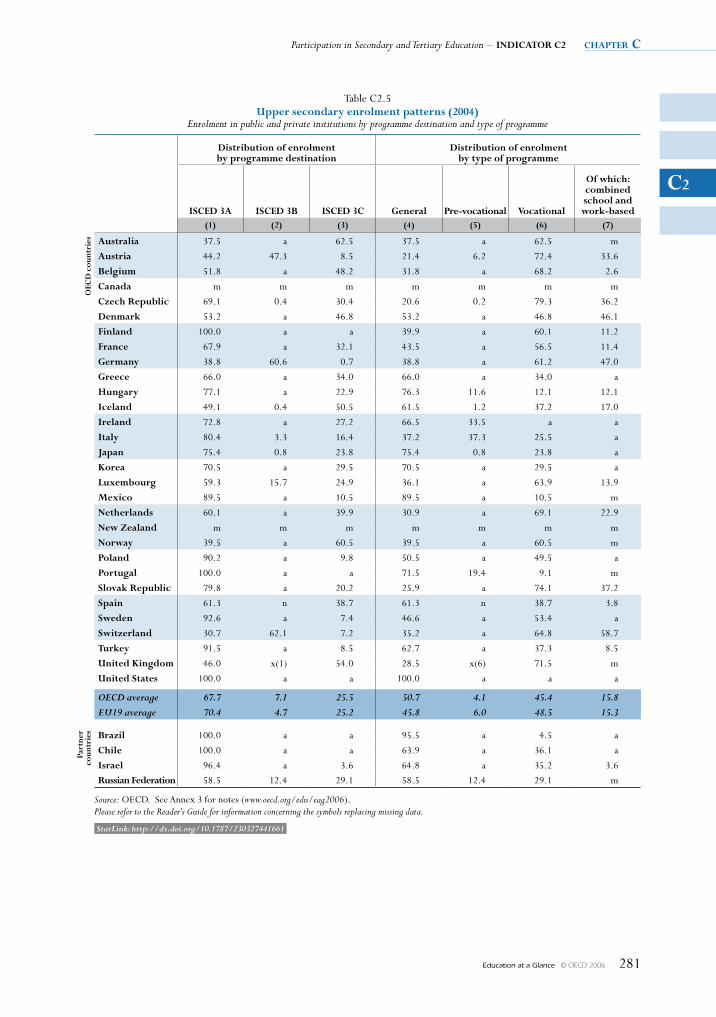
Participation in Secondary and Tertiary Education – INDICATOR C2 chapter c
Education at a Glance © OECD 2006 281
C2
Table C2.5upper secondary enrolment patterns (2004)
Enrolment in public and private institutions by programme destination and type of programme
Distribution of enrolment by programme destination
Distribution of enrolment by type of programme
IsCeD 3A IsCeD 3B IsCeD 3C General Pre-vocational Vocational
Of which: combined school and work-based
(1) (2) (3) (4) (5) (6) (7)
OeC
D c
ount
ries Australia 37.5 a 62.5 37.5 a 62.5 m
Austria 44.2 47.3 8.5 21.4 6.2 72.4 33.6
Belgium 51.8 a 48.2 31.8 a 68.2 2.6
Canada m m m m m m m
Czech Republic 69.1 0.4 30.4 20.6 0.2 79.3 36.2
Denmark 53.2 a 46.8 53.2 a 46.8 46.1
Finland 100.0 a a 39.9 a 60.1 11.2
France 67.9 a 32.1 43.5 a 56.5 11.4
Germany 38.8 60.6 0.7 38.8 a 61.2 47.0
Greece 66.0 a 34.0 66.0 a 34.0 a
Hungary 77.1 a 22.9 76.3 11.6 12.1 12.1
Iceland 49.1 0.4 50.5 61.5 1.2 37.2 17.0
Ireland 72.8 a 27.2 66.5 33.5 a a
Italy 80.4 3.3 16.4 37.2 37.3 25.5 a
Japan 75.4 0.8 23.8 75.4 0.8 23.8 a
Korea 70.5 a 29.5 70.5 a 29.5 a
Luxembourg 59.3 15.7 24.9 36.1 a 63.9 13.9
Mexico 89.5 a 10.5 89.5 a 10.5 m
Netherlands 60.1 a 39.9 30.9 a 69.1 22.9
New Zealand m m m m m m m
Norway 39.5 a 60.5 39.5 a 60.5 m
Poland 90.2 a 9.8 50.5 a 49.5 a
Portugal 100.0 a a 71.5 19.4 9.1 m
slovak Republic 79.8 a 20.2 25.9 a 74.1 37.2
spain 61.3 n 38.7 61.3 n 38.7 3.8
sweden 92.6 a 7.4 46.6 a 53.4 a
switzerland 30.7 62.1 7.2 35.2 a 64.8 58.7
Turkey 91.5 a 8.5 62.7 a 37.3 8.5
united Kingdom 46.0 x(1) 54.0 28.5 x(6) 71.5 m
united states 100.0 a a 100.0 a a a
OECD average 67.7 7.1 25.5 50.7 4.1 45.4 15.8 EU19 average 70.4 4.7 25.2 45.8 6.0 48.5 15.3
Part
ner
coun
trie
s Brazil 100.0 a a 95.5 a 4.5 a
Chile 100.0 a a 63.9 a 36.1 a
Israel 96.4 a 3.6 64.8 a 35.2 3.6
Russian Federation 58.5 12.4 29.1 58.5 12.4 29.1 m
Source: OECD. See Annex 3 for notes (www.oecd.org/edu/eag2006).Please refer to the Reader’s Guide for information concerning the symbols replacing missing data.
StatLink: http://dx.doi.org/10.1787/230327441661
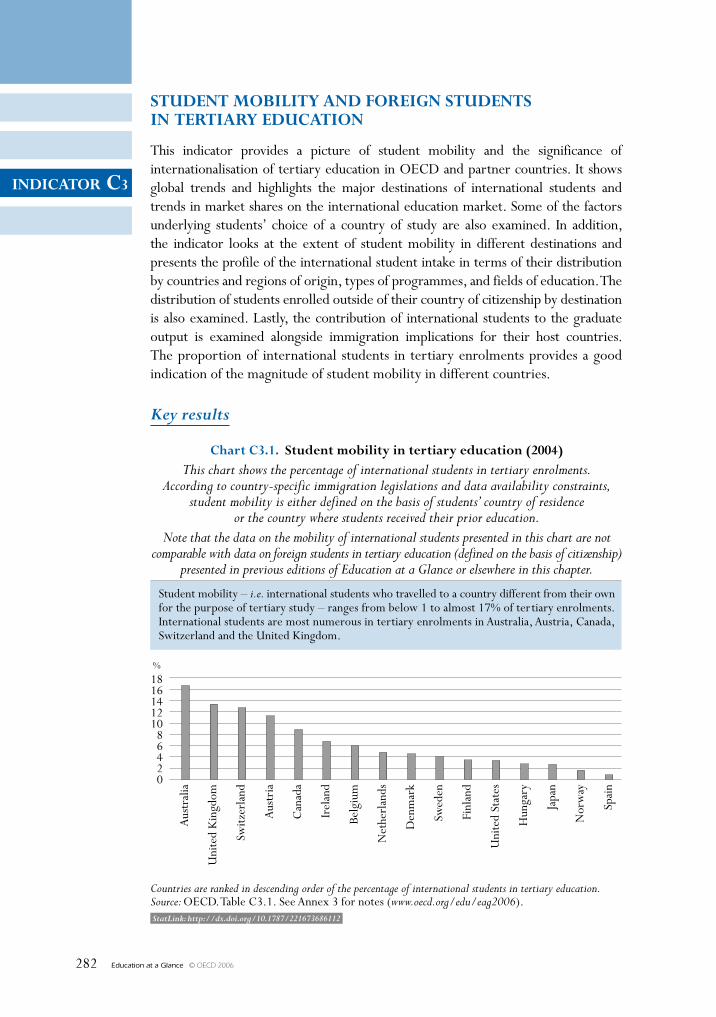
Education at a Glance © OECD 2006282
INDICATOR C3
StatLink: http://dx.doi.org/10.1787/221673686112
STuDeNT MObIlITy AND FOReIgN STuDeNTS IN TeRTIARy eDuCATION
This indicator provides a picture of student mobility and the significance of internationalisation of tertiary education in OECD and partner countries. It shows global trends and highlights the major destinations of international students and trends in market shares on the international education market. Some of the factors underlying students’ choice of a country of study are also examined. In addition, the indicator looks at the extent of student mobility in different destinations and presents the profile of the international student intake in terms of their distribution by countries and regions of origin, types of programmes, and fields of education. The distribution of students enrolled outside of their country of citizenship by destination is also examined. Lastly, the contribution of international students to the graduate output is examined alongside immigration implications for their host countries. The proportion of international students in tertiary enrolments provides a good indication of the magnitude of student mobility in different countries.
Key results
1816141210
86420
%
Chart C3.1. Student mobility in tertiary education (2004)This chart shows the percentage of international students in tertiary enrolments.
According to country-specific immigration legislations and data availability constraints,student mobility is either defined on the basis of students’ country of residence
or the country where students received their prior education.Note that the data on the mobility of international students presented in this chart are not
comparable with data on foreign students in tertiary education (defined on the basis of citizenship)presented in previous editions of Education at a Glance or elsewhere in this chapter.
Countries are ranked in descending order of the percentage of international students in tertiary education.Source: OECD. Table C3.1. See Annex 3 for notes (www.oecd.org/edu/eag2006).
Aus
tral
ia
Uni
ted
Kin
gdom
Switz
erla
nd
Aus
tria
Can
ada
Irel
and
Belg
ium
Net
herl
ands
Den
mar
k
Swed
en
Finl
and
Uni
ted
Stat
es
Hun
gary
Japa
n
Nor
way
Spai
nStudent mobility – i.e. international students who travelled to a country different from their ownfor the purpose of tertiary study – ranges from below 1 to almost 17% of tertiary enrolments.International students are most numerous in tertiary enrolments in Australia, Austria, Canada,Switzerland and the United Kingdom.
Education at a Glance © OECD 2006 283
INDICATOR C3
Other highlights of this indicator
• In 2004, 2.7 million tertiary students were enrolled outside their country of citizenship. This represented a 8% increase in total foreign student intake reported to the OECD and the UNESCO Institute for Statistics since the previous year.
• France, Germany, the United Kingdom and the United States receive more than 50% of all foreign students worldwide.
• In absolute numbers, international students from France, Germany, Japan and Korea represent the largest numbers from OECD countries. Students from China and India comprise the largest numbers of international students from partner countries.
• In Finland, Spain and Switzerland, more than 14% of international students are enrolled in highly theoretical advanced research programmes. The same holds for foreign students enrolled in France.
• As far as fields of education are concerned, 30% or more of international students are enrolled in sciences, agriculture or engineering in Australia, Finland, Germany, Hungary, Sweden, Switzerland, the United Kingdom and the United States. The same holds for foreign students enrolled in Portugal and the Slovak Republic.
• International graduates contribute to 20% or more of the graduate output for tertiary-type A or advanced research programmes in Australia, Canada, Switzerland and the United Kingdom. The same holds for foreigners graduating from advanced research programmes in Belgium, France and the United States. The contribution of international and foreign graduates to the tertiary graduate output is especially high for advanced research programmes in Belgium, Canada, France, Switzerland, the United Kingdom and the United States.
chapter c Access to educAtion, PArticiPAtion And Progression
Education at a Glance © OECD 2006284
C3
Policy context
The general trend towards freely circulating capital, goods and services coupled with changes in the openness of labour markets have increased the demand for new kinds of educational provision in OECD countries.
Governments as well as individuals are looking to higher education to play a role in broadening the horizons of students and allowing them to develop a deeper understanding of the multiplicity of languages, cultures and business methods in the world. One way for students to expand their knowledge of other societies and languages and hence to leverage their labour market prospects is to study in tertiary educational institutions in countries other than their own. Indeed, several OECD governments – especially so in the European Union (EU) countries – have set up schemes and policies to promote such mobility to foster intercultural contacts and help to build social networks for the future.
From the macroeconomic perspective, international negotiations on trade liberalisation of services highlight the trade implications of the internationalisation of education service provision. Some OECD countries already show signs of specialisation in education exports. The long term trend towards greater internationalisation of education (Box C3.1) is likely to have a growing impact on countries’ balances of payments as a result of tuition fee revenues and domestic consumption of international students. In this perspective, it is worth noting that in addition to student mobility, the cross-border electronic delivery of flexible educational programmes and campuses abroad are also relevant to the trade dimension of international tertiary education, although no comparable data exist yet.
The internationalisation of tertiary education, however, has many more economic outcomes in addition to the short term monetary costs and benefits reflected in the current account balance. It can also provide an opportunity for smaller and/or less developed educational systems to improve the cost efficiency of their education provision. Indeed, training opportunities abroad may constitute a cost-efficient alternative to national provision, and allow countries to focus limited resources on educational programmes where economies of scale can be generated, or expand tertiary education participation despite bottlenecks in education provision.
For individuals, the returns to studying abroad depend to a large extent on both the policies of sending countries regarding financial aid to students going abroad and the policies of countries of destination on tuition fees (Box C3.3) and financial support for international students. The cost of living in countries of study and exchange rates also impact on the cost of international education. On the other side, the long-term returns of an international educational experience depend to a large extent on how international degrees are signalled and valued by local labour markets.
From the perspective of educational institutions, international enrolments constrain the instructional settings and processes insofar as the curriculum and teaching methods may have to be adapted to a culturally and linguistically diverse student body. These constraints are, however, outweighed by the numerous benefits to host institutions. Indeed, the presence of a potential international client base compels institutions to offer programmes that stand out among competitors, a factor that may contribute to the development of a highly reactive, client-driven quality tertiary education. International enrolments can also help institutions to reach the
Student Mobility and Foreign Students in Tertiary Education – INDICATOR C3 chapter c
Education at a Glance © OECD 2006 285
C3
critical mass needed to diversify the range of educational programmes offered as well as increase tertiary institutions’ financial resources when foreign students bear the full cost of their education (Box C3.3). Given these advantages, institutions might privilege the enrolment of international students thereby restricting access to domestic students. Yet there is limited evidence of such a phenomenon, with the exception of some prestigious, highly demanded programmes of elite institutions (OECD, 2004d).
The numbers and trends in students enrolled in other countries can provide some idea of the extent of internationalisation of tertiary education. In the future, it will also be important to develop ways to quantify and measure other components of cross-border education.
Evidence and explanations
Concepts and terminology conventions used in this indicator
It is important to specify the concepts and terminology conventions used in this indicator since they have changed this year in comparison with previous editions of Education at a Glance.
Previous versions of indicator C3 have focused on foreign students in tertiary education, defined as non-citizens of the country in which they study. Although practical, this concept of foreign students was inappropriate to measure student mobility to the extent that not all foreign students have come to their country of study expressly with the intention to study. In particular, foreign students who are permanent residents in their country of study as a result of immigration – by themselves or by their parents – are included in the total. This results in an overestimation of foreign students’ numbers in countries with comparatively low naturalisation rates of their immigrant populations.
In an effort to improve the measurement of student mobility and the comparability of internationalisation data, the OECD – together with Eurostat and the UNESCO Institute for Statistics – revised the instruments in 2005 to gather data on student mobility. According to this new concept, the term “international students” refers to students who have crossed borders expressly with the intention to study. Yet, the measurement of student mobility depends to a large extent on country-specific immigration legislations and data availability constraints. For instance, the free mobility of individuals within the EU and broader European Economic Area (EEA) makes it impossible to derive numbers of international students from visa statistics. In acknowledgment of these country specificities, the data collected by the UNESCO, OECD and Eurostat allow countries to define as international students who are not residents of their country of study or alternatively students who received their prior education in another country, depending on which operational definition is most appropriate in their national context. Overall, the country of prior education is considered a better operational criterion for EU countries in order not to omit intra-EU student mobility (Kelo, Teichler and Wächter, 2005), while the residence criterion is usually a good proxy in countries that require a student visa to enter the country for educational purposes.
The convention adopted here is to use the terminology “international student” when referring to student mobility while the terminology “foreign student” relates to non citizens enrolled in a country (i.e. comprises some permanent residents and provides an overestimated proxy of actual student mobility). However since not all countries are yet able to report data on student
chapter c Access to educAtion, PArticiPAtion And Progression
Education at a Glance © OECD 2006286
C3
mobility on the basis of students’ country of residence or their country of prior education, some tables and charts present indicators on both international and foreign students – albeit separately to emphasize the need for caution in international comparisons.
It should be noted that all trend analyses are based on numbers of foreign students at different points in time since no time series on student mobility are available yet. Current work aims at filling this gap, and developing retrospective time series on student mobility for future editions of Education at a Glance.
Overall picture and trends in foreign student numbers
Trends in foreign student numbersIn 2004, 2.7 million tertiary students were enrolled outside their country of citizenship, of which 2.3 million (or 85%) studied in the OECD area. This represented a 8% increase in total foreign enrolments worldwide since the previous year – or 193 000 additional individuals in absolute numbers. In the OECD area, the increase was even larger with a 9% increase in foreign student numbers over just one academic year.
Since 2000, the number of foreign tertiary students enrolled in the OECD area and worldwide increased by 41%. This amounts to a 9% annual increase on average (Table C3.6).
Compared to 2000, the number of foreign students enrolled in tertiary education increased noticeably in Australia, the Czech Republic, France, Greece, Ireland, Italy, Japan, Korea, the Netherlands, New Zealand and Spain, and in the partner countries Chile and Russian Federation, with indexes of change of 150 or above. By contrast, the number of foreign students enrolled in Austria, Belgium, Canada, the Slovak Republic and the United States grew by about 20% or less and even shrunk in Turkey (Table C3.1).
Interestingly, changes in foreign student numbers between 2000 and 2004 indicate that the growth in foreign enrolments has been larger in the OECD on average than in the 19 EU countries of the OECD with 61 and 52% growth respectively. This pattern suggests that although foreign enrolments increased throughout the OECD with the exception of Turkey, the recent growth in foreign enrolments was even higher outside of the EU area than inside (Table C3.1).
The combination of OECD data with those of the UNESCO Institute for Statistics allows the examination of longer term trends and illustrates the dramatic growth in foreign enrolments over the past 30 years (Box C3.1).
Over the past three decades, the number of students enrolled outside their country of citizenship has grown dramatically from 0.6 million worldwide in 1975 to 2.7 millions in 2004 – a more than four-fold increase. This growth in the internationalisation of tertiary education has accelerated during the past ten years, mirroring the growing globalisation of economies and societies.
The growth in the number of students enrolled abroad since 1975 stems from various driving factors. During the early years, public policies aimed at promoting and nurturing academic, cultural, social and political ties between countries played a key role, especially in the context of the European construction in which building mutual understanding between young Europeans was a major policy objective. Similar rationales motivated North American policies of academic cooperation.
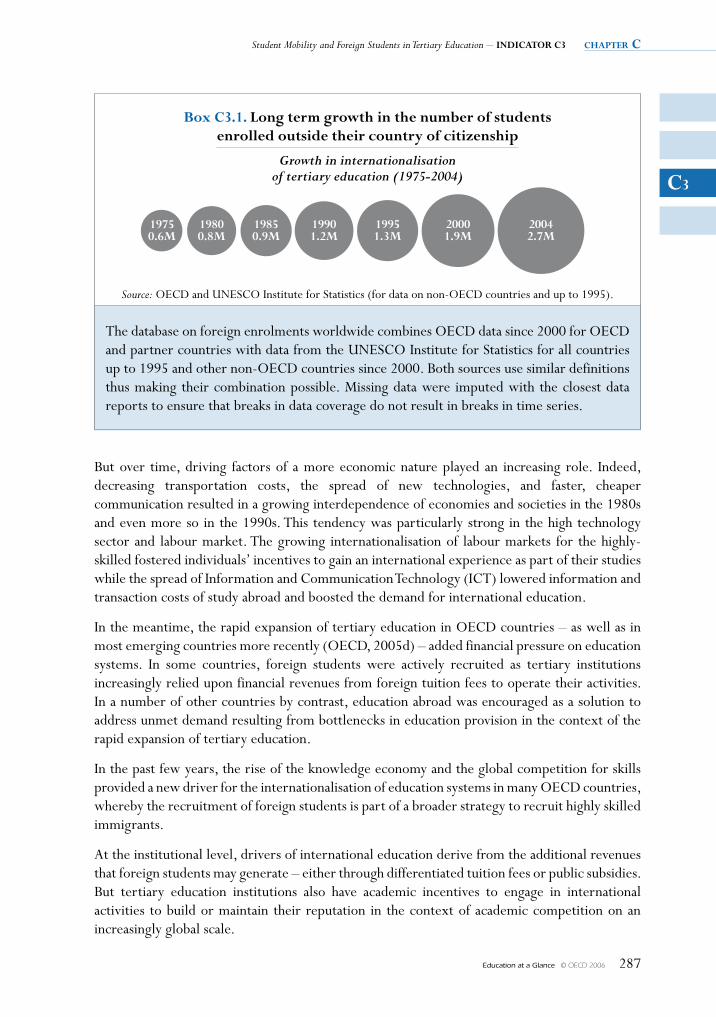
Student Mobility and Foreign Students in Tertiary Education – INDICATOR C3 chapter c
Education at a Glance © OECD 2006 287
C3
But over time, driving factors of a more economic nature played an increasing role. Indeed, decreasing transportation costs, the spread of new technologies, and faster, cheaper communication resulted in a growing interdependence of economies and societies in the 1980s and even more so in the 1990s. This tendency was particularly strong in the high technology sector and labour market. The growing internationalisation of labour markets for the highly-skilled fostered individuals’ incentives to gain an international experience as part of their studies while the spread of Information and Communication Technology (ICT) lowered information and transaction costs of study abroad and boosted the demand for international education.
In the meantime, the rapid expansion of tertiary education in OECD countries – as well as in most emerging countries more recently (OECD, 2005d) – added financial pressure on education systems. In some countries, foreign students were actively recruited as tertiary institutions increasingly relied upon financial revenues from foreign tuition fees to operate their activities. In a number of other countries by contrast, education abroad was encouraged as a solution to address unmet demand resulting from bottlenecks in education provision in the context of the rapid expansion of tertiary education.
In the past few years, the rise of the knowledge economy and the global competition for skills provided a new driver for the internationalisation of education systems in many OECD countries, whereby the recruitment of foreign students is part of a broader strategy to recruit highly skilled immigrants.
At the institutional level, drivers of international education derive from the additional revenues that foreign students may generate – either through differentiated tuition fees or public subsidies. But tertiary education institutions also have academic incentives to engage in international activities to build or maintain their reputation in the context of academic competition on an increasingly global scale.
box C3.1. long term growth in the number of students enrolled outside their country of citizenship
Source: OECD and UNESCO Institute for Statistics (for data on non-OECD countries and up to 1995).
The database on foreign enrolments worldwide combines OECD data since 2000 for OECD and partner countries with data from the UNESCO Institute for Statistics for all countries up to 1995 and other non-OECD countries since 2000. Both sources use similar definitions thus making their combination possible. Missing data were imputed with the closest data reports to ensure that breaks in data coverage do not result in breaks in time series.
Growth in internationalisation of tertiary education (1975-2004)
19750.6M
19800.8M
19850.9M
19901.2M
19951.3M
20001.9M
20042.7M
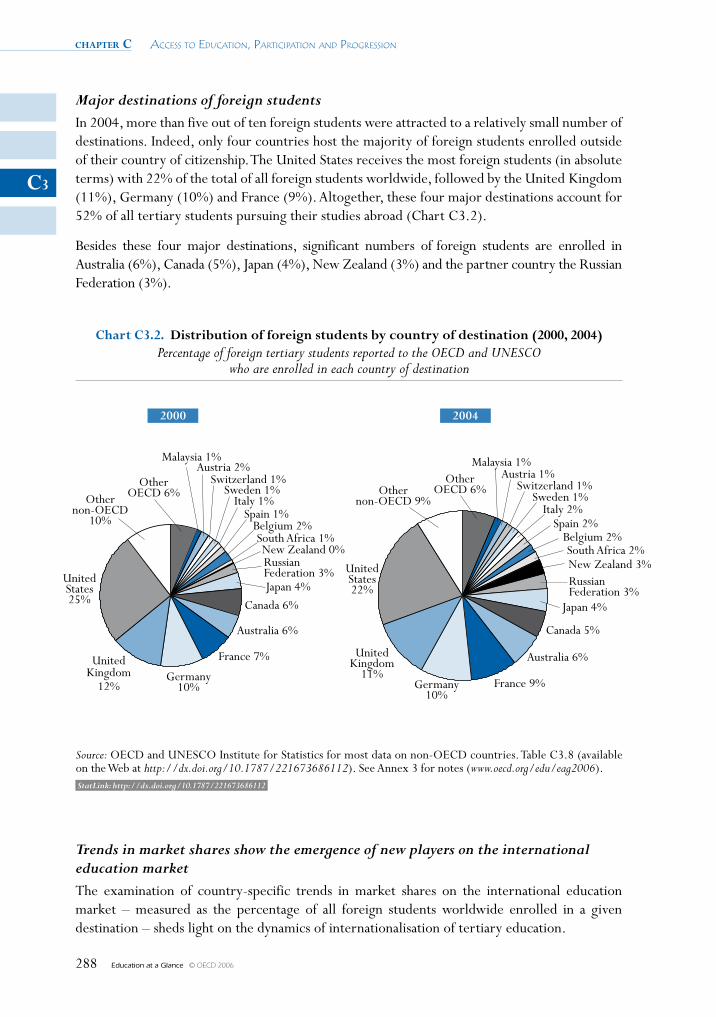
chapter c Access to educAtion, PArticiPAtion And Progression
Education at a Glance © OECD 2006288
C3
Major destinations of foreign studentsIn 2004, more than five out of ten foreign students were attracted to a relatively small number of destinations. Indeed, only four countries host the majority of foreign students enrolled outside of their country of citizenship. The United States receives the most foreign students (in absolute terms) with 22% of the total of all foreign students worldwide, followed by the United Kingdom (11%), Germany (10%) and France (9%). Altogether, these four major destinations account for 52% of all tertiary students pursuing their studies abroad (Chart C3.2).
Besides these four major destinations, significant numbers of foreign students are enrolled in Australia (6%), Canada (5%), Japan (4%), New Zealand (3%) and the partner country the Russian Federation (3%).
Source: OECD and UNESCO Institute for Statistics for most data on non-OECD countries. Table C3.8 (availableon the Web at http://dx.doi.org/10.1787/221673686112). See Annex 3 for notes (www.oecd.org/edu/eag2006).
Chart C3.2. distribution of foreign students by country of destination (2000, 2004)Percentage of foreign tertiary students reported to the OECD and UNESCO
who are enrolled in each country of destination
Malaysia 1%
2000
Austria 1%Switzerland 1%
Sweden 1%Italy 2%
Spain 2%Belgium 2%South Africa 2%New Zealand 3%RussianFederation 3%
Japan 4%
Canada 5%
Australia 6%
France 9%Germany10%
UnitedKingdom
11%
UnitedStates22%
Othernon-OECD 9%
OtherOECD 6%Other
OECD 6%Othernon-OECD
10%
UnitedStates25%
UnitedKingdom
12%Germany
10%
France 7%
Australia 6%
Canada 6%
Japan 4%
RussianFederation 3%
New Zealand 0%South Africa 1%
Belgium 2%Spain 1%
Italy 1%Sweden 1%
Switzerland 1%Austria 2%
Malaysia 1%
2004
StatLink: http://dx.doi.org/10.1787/221673686112
Trends in market shares show the emergence of new players on the international education marketThe examination of country-specific trends in market shares on the international education market – measured as the percentage of all foreign students worldwide enrolled in a given destination – sheds light on the dynamics of internationalisation of tertiary education.
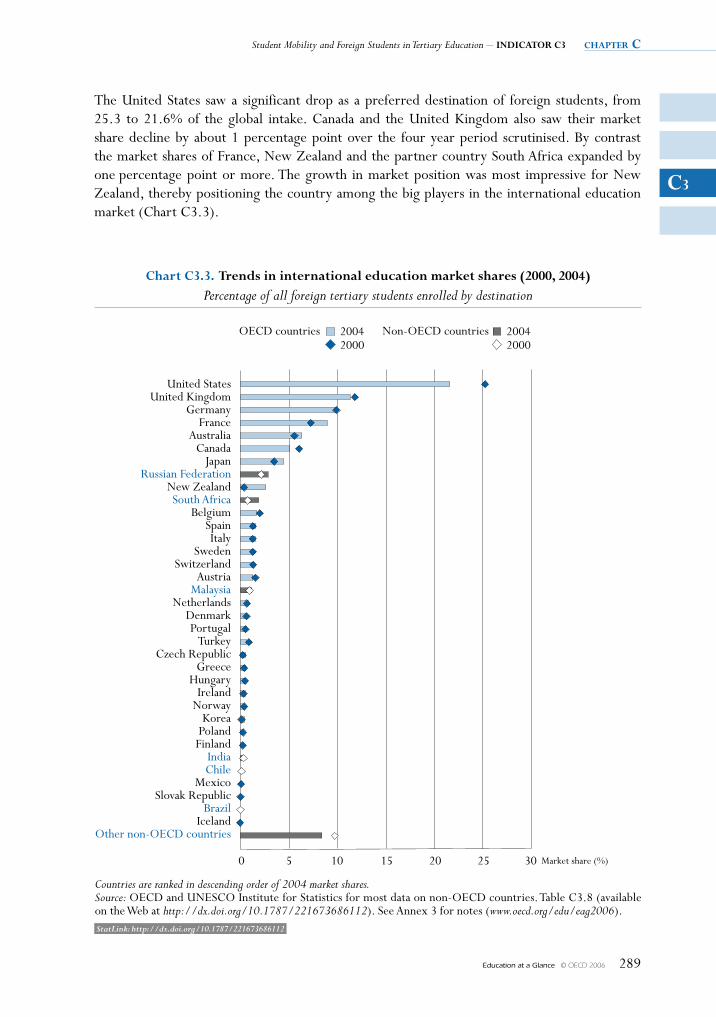
Student Mobility and Foreign Students in Tertiary Education – INDICATOR C3 chapter c
Education at a Glance © OECD 2006 289
C3
The United States saw a significant drop as a preferred destination of foreign students, from 25.3 to 21.6% of the global intake. Canada and the United Kingdom also saw their market share decline by about 1 percentage point over the four year period scrutinised. By contrast the market shares of France, New Zealand and the partner country South Africa expanded by one percentage point or more. The growth in market position was most impressive for New Zealand, thereby positioning the country among the big players in the international education market (Chart C3.3).
Market share (%)302520151050
20042000
20042000
OECD countries Non-OECD countries
Chart C3.3. Trends in international education market shares (2000, 2004)Percentage of all foreign tertiary students enrolled by destination
Countries are ranked in descending order of 2004 market shares.Source: OECD and UNESCO Institute for Statistics for most data on non-OECD countries. Table C3.8 (availableon the Web at http://dx.doi.org/10.1787/221673686112). See Annex 3 for notes (www.oecd.org/edu/eag2006).
United StatesUnited Kingdom
GermanyFrance
AustraliaCanada
JapanRussian Federation
New ZealandSouth Africa
BelgiumSpainItaly
SwedenSwitzerland
AustriaMalaysia
NetherlandsDenmarkPortugal
TurkeyCzech Republic
GreeceHungary
IrelandNorway
KoreaPoland
FinlandIndiaChile
MexicoSlovak Republic
BrazilIceland
Other non-OECD countries
StatLink: http://dx.doi.org/10.1787/221673686112
chapter c Access to educAtion, PArticiPAtion And Progression
Education at a Glance © OECD 2006290
C3
These trends underline the different dynamics of international education in OECD and non-OECD countries, and reflect different emphases of internationalisation policies, ranging from pro-active marketing policies in the Asia-Pacific region to a more passive approach in the traditionally dominant United States whose foreign student intakes were also affected by the tightening of the conditions of entry for international students in the aftermath of the events of 11 September 2001 (see Indicator C3, Education at a Glance 2005 [OECD, 2005d]).
Underlying factors in students’ choice of a country of study
Language of instruction: a critical factor in the choice of a country of studyThe language spoken and used in instruction is critical for selecting a foreign country in which to study. Therefore, countries whose language of instruction is widely spoken and read (e.g. English, French, German and Russian) dominate in the destinations of foreign students, be it in absolute or relative terms. A notable exception is Japan which enrols large numbers of foreign students despite a less widespread language of instruction (Chart C3.3).
The dominance of English-speaking destinations such as Australia, Canada, the United Kingdom and the United States (in absolute numbers) may be largely attributable to the fact that students intending to study abroad are most likely to have learnt English in their home country, and/or wish to improve their English language skills through immersion and study abroad. The rapid increase in foreign enrolments in Australia (index change of 158), Ireland (171) and most importantly New Zealand (456) between 2000 and 2004 can to some extent be attributed to similar linguistic considerations (Table C3.1).
Given this pattern, an increasing number of institutions in non-English-speaking countries now offer courses in English to overcome their linguistic disadvantage in attracting foreign students. This trend is especially noticeable in Nordic countries (Box C3.2).
Impact of tuition fees and cost of living on foreign student destinationsTuition fees and cost of living are equally important factors for prospective international students when deciding in which country to study.
In the Czech Republic, Denmark, Finland, Iceland, Norway and Sweden, tuition fees do not exist for domestic and international students alike (Box C3.3). This cost pattern associated with the existence of programmes in English probably explains part of the robust growth in the number of foreign students enrolled in some of these countries between 2000 and 2004 (Table C3.1). However, high unit costs in tertiary education at no fee incur a high monetary burden of international students for their countries of destination (see Table B1.1). As a result, Denmark has recently adopted tuition fees for non-EU and non-EEA international students. Similar debates are currently underway in Finland, Norway and Sweden where foreign enrolments grew by more than 40% between 2000 and 2004.
Indeed, the trade benefits of international education are all the more important as countries charge the full cost of education to their international students. Several countries in the Asia-Pacific region have actually made international education an explicit part of their socio-economic development strategies and have initiated policies to attract international students on a revenue-generating or at least self-financing basis. Australia and New Zealand have successfully adopted differentiated tuition fees for international students. In Japan and Korea, although tuition fees
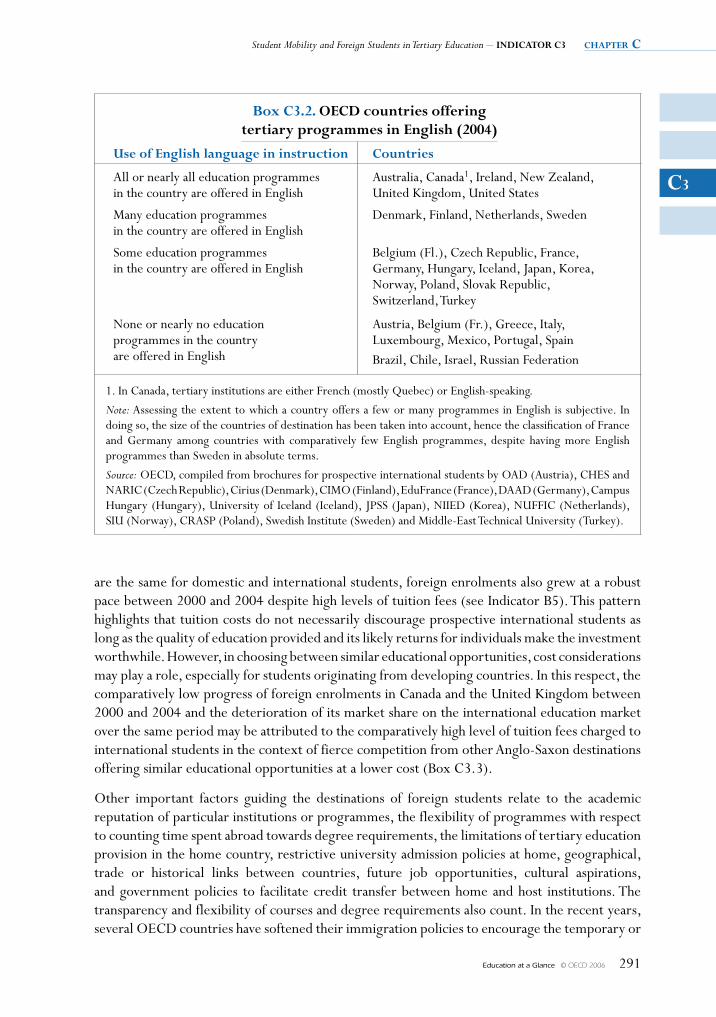
Student Mobility and Foreign Students in Tertiary Education – INDICATOR C3 chapter c
Education at a Glance © OECD 2006 291
C3
are the same for domestic and international students, foreign enrolments also grew at a robust pace between 2000 and 2004 despite high levels of tuition fees (see Indicator B5). This pattern highlights that tuition costs do not necessarily discourage prospective international students as long as the quality of education provided and its likely returns for individuals make the investment worthwhile. However, in choosing between similar educational opportunities, cost considerations may play a role, especially for students originating from developing countries. In this respect, the comparatively low progress of foreign enrolments in Canada and the United Kingdom between 2000 and 2004 and the deterioration of its market share on the international education market over the same period may be attributed to the comparatively high level of tuition fees charged to international students in the context of fierce competition from other Anglo-Saxon destinations offering similar educational opportunities at a lower cost (Box C3.3).
Other important factors guiding the destinations of foreign students relate to the academic reputation of particular institutions or programmes, the flexibility of programmes with respect to counting time spent abroad towards degree requirements, the limitations of tertiary education provision in the home country, restrictive university admission policies at home, geographical, trade or historical links between countries, future job opportunities, cultural aspirations, and government policies to facilitate credit transfer between home and host institutions. The transparency and flexibility of courses and degree requirements also count. In the recent years, several OECD countries have softened their immigration policies to encourage the temporary or
box C3.2. OeCD countries offering tertiary programmes in english (2004)
use of english language in instruction Countries
All or nearly all education programmes in the country are offered in English
Australia, Canada1, Ireland, New Zealand, United Kingdom, United States
Many education programmes in the country are offered in English
Denmark, Finland, Netherlands, Sweden
Some education programmes in the country are offered in English
Belgium (Fl.), Czech Republic, France, Germany, Hungary, Iceland, Japan, Korea, Norway, Poland, Slovak Republic, Switzerland, Turkey
None or nearly no education programmes in the country are offered in English
Austria, Belgium (Fr.), Greece, Italy, Luxembourg, Mexico, Portugal, SpainBrazil, Chile, Israel, Russian Federation
1. In Canada, tertiary institutions are either French (mostly Quebec) or English-speaking.
Note: Assessing the extent to which a country offers a few or many programmes in English is subjective. In doing so, the size of the countries of destination has been taken into account, hence the classification of France and Germany among countries with comparatively few English programmes, despite having more English programmes than Sweden in absolute terms.
Source: OECD, compiled from brochures for prospective international students by OAD (Austria), CHES and NARIC (Czech Republic), Cirius (Denmark), CIMO (Finland), EduFrance (France), DAAD (Germany), Campus Hungary (Hungary), University of Iceland (Iceland), JPSS (Japan), NIIED (Korea), NUFFIC (Netherlands), SIU (Norway), CRASP (Poland), Swedish Institute (Sweden) and Middle-East Technical University (Turkey).
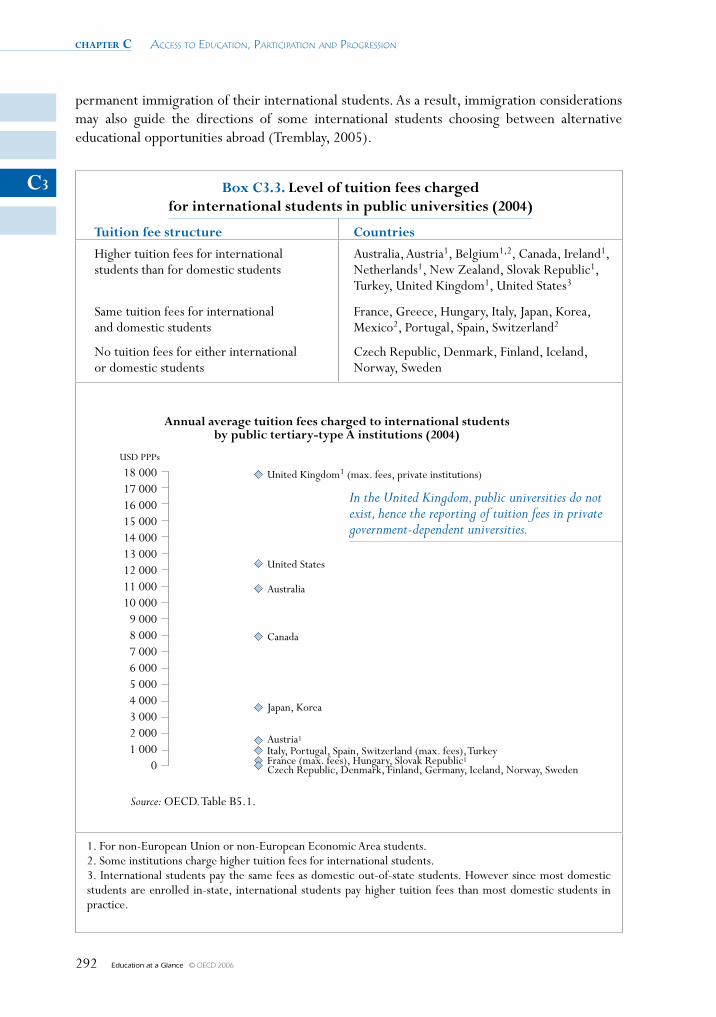
chapter c Access to educAtion, PArticiPAtion And Progression
Education at a Glance © OECD 2006292
C3
permanent immigration of their international students. As a result, immigration considerations may also guide the directions of some international students choosing between alternative educational opportunities abroad (Tremblay, 2005).
box C3.3. level of tuition fees charged for international students in public universities (2004)
Tuition fee structure Countries
Higher tuition fees for international students than for domestic students
Australia, Austria1, Belgium1,2, Canada, Ireland1, Netherlands1, New Zealand, Slovak Republic1, Turkey, United Kingdom1, United States3
Same tuition fees for international and domestic students
France, Greece, Hungary, Italy, Japan, Korea, Mexico2, Portugal, Spain, Switzerland2
No tuition fees for either international or domestic students
Czech Republic, Denmark, Finland, Iceland, Norway, Sweden
United Kingdom1 (max. fees, private institutions)
Italy, Portugal, Spain, Switzerland (max. fees), TurkeyFrance (max. fees), Hungary, Slovak Republic1
Czech Republic, Denmark, Finland, Germany, Iceland, Norway, Sweden
United States
Australia
Canada
Japan, Korea
Austria1
18 00017 00016 00015 00014 00013 00012 00011 00010 000
9 0008 0007 0006 0005 0004 0003 0002 0001 000
0
USD PPPs
1. For non-European Union or non-European Economic Area students.Source: OECD. Table B5.1.
Annual average tuition fees charged to international studentsby public tertiary-type A institutions (2004)
1. For non-European Union or non-European Economic Area students.2. Some institutions charge higher tuition fees for international students.3. International students pay the same fees as domestic out-of-state students. However since most domestic students are enrolled in-state, international students pay higher tuition fees than most domestic students in practice.
In the United Kingdom, public universities do not exist, hence the reporting of tuition fees in private government-dependent universities.
Student Mobility and Foreign Students in Tertiary Education – IndIcator c3 chapter c
Education at a Glance © OECD 2006 293
c3
Extent of student mobility in tertiary education
The foregoing analysis has focused on trends in the absolute numbers of foreign students and their distribution by countries of destination since no time series or global aggregates exist on student mobility.
It is also possible to measure the extent of student mobility in each country of destination if not at the global level, then by examining the proportion of international students in total tertiary enrolments. The advantage of this indicator is that it takes the size of the different tertiary education systems into account and highlights the highly internationalised education systems regardless of their size and the importance of their absolute market share.
Wide variations in the proportion of international students enrolled in OECD and partner countriesAustralia, Austria, Switzerland and the United Kingdom display the highest levels of incoming student mobility, measured as the proportion of international students in their total tertiary enrolment. In Australia, 16.6% of tertiary students enrolled in the country have come to the country expressly to pursue their studies. Similarly, international students represent 13.4% of total tertiary enrolments in the United Kingdom, 12.7% in Switzerland and 11.3% in Austria. International enrolments are also significant in relative terms in Canada. By contrast, incoming student mobility remains below 2% of total tertiary enrolments in Norway and Spain (Chart C3.1).
Among countries where data on student mobility are not available, foreign enrolments constitute a large group of tertiary students in France (11%), Germany (11.2%) and New Zealand (28.3%), suggesting significant levels of incoming student mobility. However foreign enrolments – and student mobility – represent 2% or less of total tertiary enrolments in Italy, Korea, Poland, the Slovak Republic, Turkey and the partner countries Chile and Russian Federation (Table C3.1).
Student mobility at different levels of tertiary educationLooking at the proportions of international students at different levels of tertiary education in each country of destination sheds light on patterns on student mobility. A first observation is that with the exception of Canada, tertiary-type B programmes are far less internationalised than tertiary-type A programmes, suggesting that international students are mostly attracted to traditional academic programmes where degree transferability is easier. Among countries where data on student mobility are not available, tertiary-type B programmes also enrol a higher proportion of foreign students than tertiary-type A programmes in Finland, Italy and Spain (Table C3.1).
In Australia and Sweden, the proportions of international students are roughly the same in tertiary-type A and advanced research programmes, suggesting that these countries of destination are successful at attracting students from abroad from the start of their tertiary education, and/or keeping them beyond their first degrees. Among countries where data on student mobility are not available, a similar pattern can be observed in New Zealand and the Slovak Republic.
By contrast, other countries display significantly higher incoming student mobility relative to total enrolments in advanced research programmes than in the tertiary-type A programmes that precede advanced research studies. This pattern is most obvious in Belgium, Canada, Hungary,
chapter c Access to educAtion, PArticiPAtion And Progression
Education at a Glance © OECD 2006294
C3
Spain, Switzerland and the United Kingdom, and in France and Iceland among countries where data on student mobility are not available. It may reflect a strong attractiveness of advanced research programmes in these countries, or a preferred recruitment of international students at higher levels of education to capitalise on their contribution to domestic research and development or in anticipation of their subsequent recruitment as highly qualified immigrants.
Profile of international student intake in different destinations
Importance of Asia among regions of originAsian students form the largest group of international students enrolled in countries reporting data to the OECD or the UNESCO Institute for Statistics, with 45% of the total in OECD countries, and 52% of the total in non-OECD countries. In the OECD, the Asian group is followed by Europeans (25%), in particular citizens of the European Union (15%). Students from Africa account for 12% of all international students, while those from North America account for only 4%. Finally, students from South America represent 6% of the total. Altogether, a third of international students enrolled in the OECD area originate from another OECD country (Table C3.2).
In Australia, Canada and the United Kingdom, three of the top destinations of international students in 2004, the numbers of international students originating from Asia have increased significantly over the previous year. The same holds for foreign students in Turkey among countries where data on student mobility are not available.
Main countries of origin of international studentsThe predominance of students from Asia and Europe among international intakes is also notable. Students from Japan and Korea comprise the largest groups of international students enrolled in the OECD, at 2.8 and 4.3% of the total respectively, followed by students from France and Germany at 2.6% each (Table C3.2).
With respect to international students originating from partner countries, students from China represent by far the largest group, with 15.2% of all international students enrolled in the OECD area (not including an additional 1.6% from Hong Kong, China). Students from China are followed by those from India (5.7%), Morocco, Malaysia and the Russian Federation. Significant numbers of international students also originate from Singapore and Thailand (see Table C3.8, available on the Web at http://dx.doi.org/10.1787/221673686112).
International students’ intake by level and type of tertiary education highlights specialisationsIn some countries a comparatively large proportion of international students are enrolled in tertiary-type B programmes. This is the case in Belgium (26.1%), Canada (29.5%) and Japan (24.3%). Among countries where data on student mobility are not available, foreign enrolments in tertiary-type B programmes also constitute a large group of foreign students in Greece (28.7%) and New Zealand (24.3%) (Table C3.4).
By contrast, other countries see a large proportion of their international students enrolling in highly theoretical advanced research programmes. This is most notably the case in Finland (14.5%), Spain (28.2%) and Switzerland (27%). Among countries where data on student mobility are not available, foreign enrolments in advanced research programmes are also high in France (14.5%).
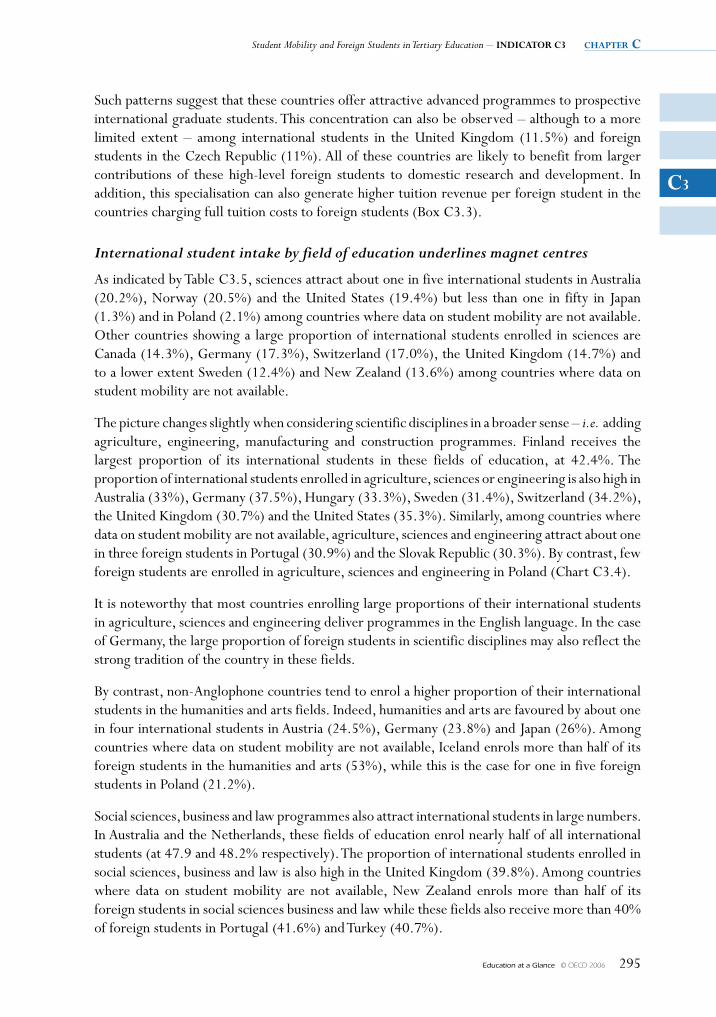
Student Mobility and Foreign Students in Tertiary Education – INDICATOR C3 chapter c
Education at a Glance © OECD 2006 295
C3
Such patterns suggest that these countries offer attractive advanced programmes to prospective international graduate students. This concentration can also be observed – although to a more limited extent – among international students in the United Kingdom (11.5%) and foreign students in the Czech Republic (11%). All of these countries are likely to benefit from larger contributions of these high-level foreign students to domestic research and development. In addition, this specialisation can also generate higher tuition revenue per foreign student in the countries charging full tuition costs to foreign students (Box C3.3).
International student intake by field of education underlines magnet centres
As indicated by Table C3.5, sciences attract about one in five international students in Australia (20.2%), Norway (20.5%) and the United States (19.4%) but less than one in fifty in Japan (1.3%) and in Poland (2.1%) among countries where data on student mobility are not available. Other countries showing a large proportion of international students enrolled in sciences are Canada (14.3%), Germany (17.3%), Switzerland (17.0%), the United Kingdom (14.7%) and to a lower extent Sweden (12.4%) and New Zealand (13.6%) among countries where data on student mobility are not available.
The picture changes slightly when considering scientific disciplines in a broader sense – i.e. adding agriculture, engineering, manufacturing and construction programmes. Finland receives the largest proportion of its international students in these fields of education, at 42.4%. The proportion of international students enrolled in agriculture, sciences or engineering is also high in Australia (33%), Germany (37.5%), Hungary (33.3%), Sweden (31.4%), Switzerland (34.2%), the United Kingdom (30.7%) and the United States (35.3%). Similarly, among countries where data on student mobility are not available, agriculture, sciences and engineering attract about one in three foreign students in Portugal (30.9%) and the Slovak Republic (30.3%). By contrast, few foreign students are enrolled in agriculture, sciences and engineering in Poland (Chart C3.4).
It is noteworthy that most countries enrolling large proportions of their international students in agriculture, sciences and engineering deliver programmes in the English language. In the case of Germany, the large proportion of foreign students in scientific disciplines may also reflect the strong tradition of the country in these fields.
By contrast, non-Anglophone countries tend to enrol a higher proportion of their international students in the humanities and arts fields. Indeed, humanities and arts are favoured by about one in four international students in Austria (24.5%), Germany (23.8%) and Japan (26%). Among countries where data on student mobility are not available, Iceland enrols more than half of its foreign students in the humanities and arts (53%), while this is the case for one in five foreign students in Poland (21.2%).
Social sciences, business and law programmes also attract international students in large numbers. In Australia and the Netherlands, these fields of education enrol nearly half of all international students (at 47.9 and 48.2% respectively). The proportion of international students enrolled in social sciences, business and law is also high in the United Kingdom (39.8%). Among countries where data on student mobility are not available, New Zealand enrols more than half of its foreign students in social sciences business and law while these fields also receive more than 40% of foreign students in Portugal (41.6%) and Turkey (40.7%).
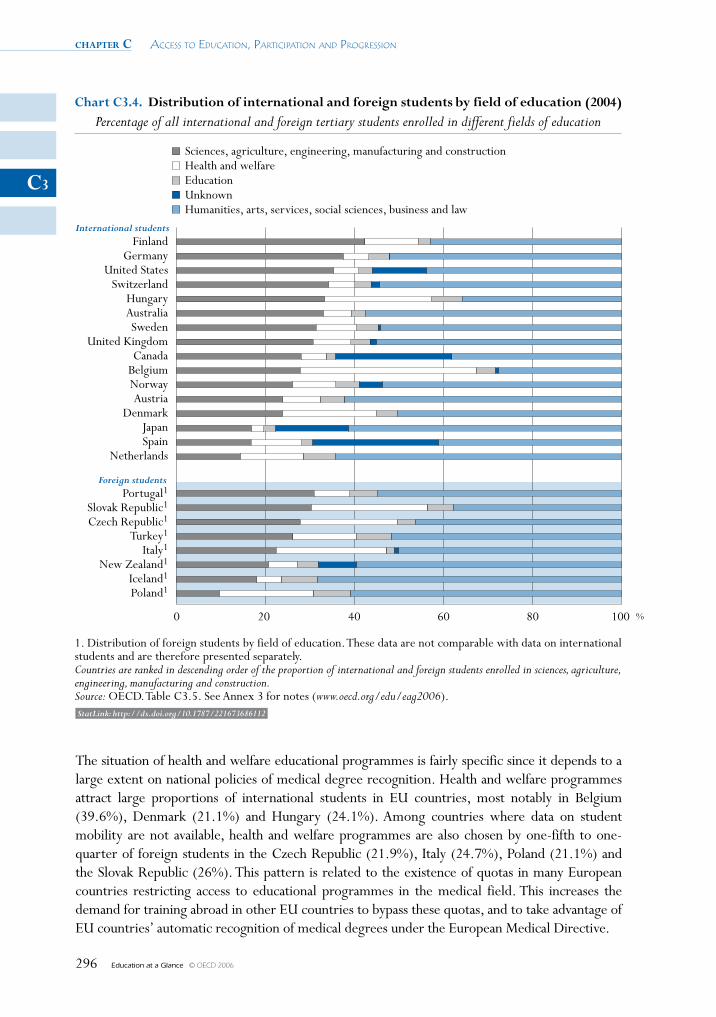
chapter c Access to educAtion, PArticiPAtion And Progression
Education at a Glance © OECD 2006296
C3
The situation of health and welfare educational programmes is fairly specific since it depends to a large extent on national policies of medical degree recognition. Health and welfare programmes attract large proportions of international students in EU countries, most notably in Belgium (39.6%), Denmark (21.1%) and Hungary (24.1%). Among countries where data on student mobility are not available, health and welfare programmes are also chosen by one-fifth to one-quarter of foreign students in the Czech Republic (21.9%), Italy (24.7%), Poland (21.1%) and the Slovak Republic (26%). This pattern is related to the existence of quotas in many European countries restricting access to educational programmes in the medical field. This increases the demand for training abroad in other EU countries to bypass these quotas, and to take advantage of EU countries’ automatic recognition of medical degrees under the European Medical Directive.
0 %20 40 60 80 100
International students
Foreign students
Chart C3.4. Distribution of international and foreign students by field of education (2004)Percentage of all international and foreign tertiary students enrolled in different fields of education
Sciences, agriculture, engineering, manufacturing and constructionHealth and welfareEducationUnknownHumanities, arts, services, social sciences, business and law
1. Distribution of foreign students by field of education. These data are not comparable with data on internationalstudents and are therefore presented separately.Countries are ranked in descending order of the proportion of international and foreign students enrolled in sciences, agriculture,engineering, manufacturing and construction.Source: OECD. Table C3.5. See Annex 3 for notes (www.oecd.org/edu/eag2006).
FinlandGermany
United StatesSwitzerland
HungaryAustraliaSweden
United KingdomCanada
BelgiumNorwayAustria
DenmarkJapanSpain
Netherlands
Portugal1Slovak Republic1
Czech Republic1
Turkey1
Italy1
New Zealand1
Iceland1
Poland1
StatLink: http://dx.doi.org/10.1787/221673686112
Student Mobility and Foreign Students in Tertiary Education – INDICATOR C3 chapter c
Education at a Glance © OECD 2006 297
C3
Overall, the concentration of international students in specific disciplines in each country of destination highlights magnet programmes that attract students from abroad in large numbers. This attraction results from many factors on both the supply and demand side.
On the supply side, some destinations offer centres of excellence or traditional expertise able to attract students from other countries in large numbers (e.g. Finland and Germany in sciences and engineering). In the humanities and arts, some destinations also have a natural monopoly on some programmes. This is especially obvious for linguistic or cultural studies (e.g. Austria, Germany, Iceland and Japan).
On the demand side, the characteristics of international students can help to explain their concentration in some fields of education. For instance, students in scientific disciplines are usually less likely to be fluent in many different languages, which may explain their stronger propensity to study in countries offering education programmes in English, and their lesser propensity to enrol in countries where these are less common (e.g. Japan). Similarly, the demand of many Asian students for business training may explain the strong concentration of international students in social sciences, business and law in neighbouring Australia and New Zealand – and to a lesser extent in Japan. Last, EU provisions for the recognition of medical degrees clearly drive the concentration of international students in health and welfare programmes in EU countries.
Destinations of citizens enrolled abroad
When studying in tertiary education outside of their country of citizenship, the vast majority of OECD students enrol in another country of the OECD area. Nevertheless, more than 10% of citizens enrolled abroad do so outside of the OECD area in Greece, Italy, Turkey and the United States. Among partner countries, students from Brazil, Chile, Israel and the Russian Federation also enrol in significant numbers in non-OECD countries to acquire their tertiary education. By contrast, students from Austria, Belgium, France, Iceland, Ireland, Japan, Luxembourg, the Netherlands, New Zealand, Norway, the Slovak Republic and Switzerland display an extremely low propensity to study outside of the OECD area (Table C3.3).
Language considerations, geographic proximity and similarity of education systems are important determinants of the choice of destination. Geographic considerations and differences in entry requirements are likely explanations of the concentration of students from Austria in Germany, from Belgium in France and the Netherlands, from Canada in the United States, from New Zealand in Australia etc. Language issues as well as academic traditions also shed light on the propensity for Anglo-Saxon students to concentrate in other countries of the Commonwealth or in the United States, even those geographically distant. Migration networks also play a role, as illustrated by the concentration of students of Portuguese citizenship in France, students from Turkey in Germany or from Mexico in the United States.
Lastly, international students’ destinations also highlight the attractiveness of specific education systems, be it due to considerations of academic reputation, or as a result of subsequent immigration opportunities. In this respect, it is noteworthy that students from China are mostly concentrated in Australia, Germany, Japan, New Zealand, the United Kingdom and the United States – most of which have set up schemes to facilitate the immigration of international students. Similarly, students from India favour Australia, the United Kingdom and the United States; these three destinations attract five in six Indian citizens enrolled abroad.
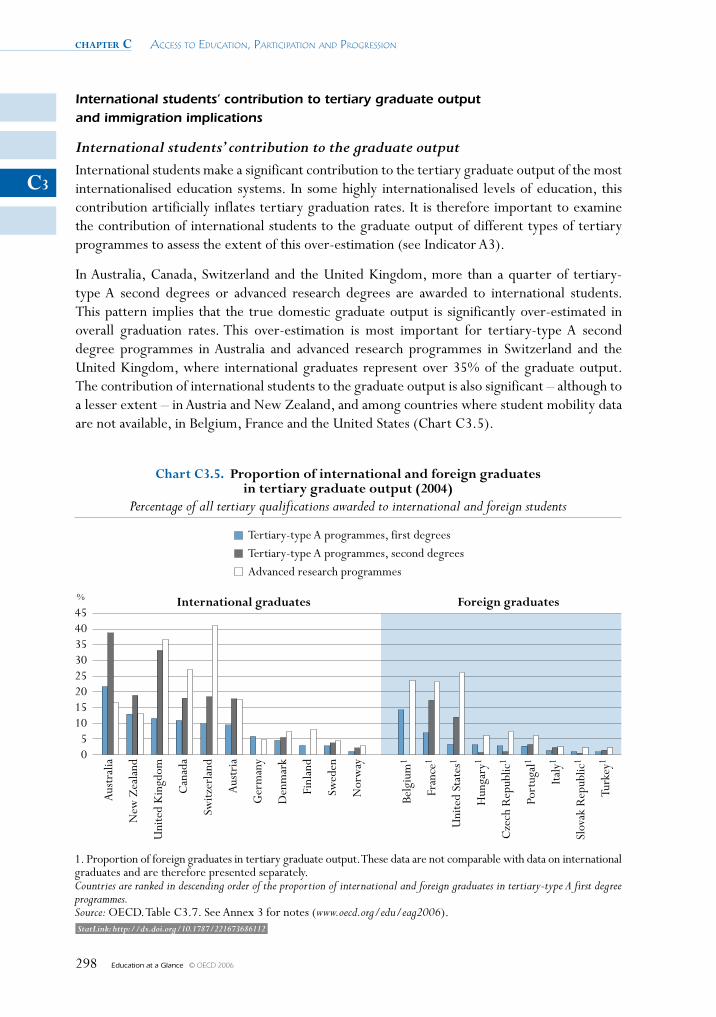
chapter c Access to educAtion, PArticiPAtion And Progression
Education at a Glance © OECD 2006298
C3
International students’ contribution to tertiary graduate output and immigration implications
International students’ contribution to the graduate outputInternational students make a significant contribution to the tertiary graduate output of the most internationalised education systems. In some highly internationalised levels of education, this contribution artificially inflates tertiary graduation rates. It is therefore important to examine the contribution of international students to the graduate output of different types of tertiary programmes to assess the extent of this over-estimation (see Indicator A3).
In Australia, Canada, Switzerland and the United Kingdom, more than a quarter of tertiary-type A second degrees or advanced research degrees are awarded to international students. This pattern implies that the true domestic graduate output is significantly over-estimated in overall graduation rates. This over-estimation is most important for tertiary-type A second degree programmes in Australia and advanced research programmes in Switzerland and the United Kingdom, where international graduates represent over 35% of the graduate output. The contribution of international students to the graduate output is also significant – although to a lesser extent – in Austria and New Zealand, and among countries where student mobility data are not available, in Belgium, France and the United States (Chart C3.5).
4540353025201510
50
%
Chart C3.5. Proportion of international and foreign graduatesin tertiary graduate output (2004)
Percentage of all tertiary qualifications awarded to international and foreign students
Tertiary-type A programmes, first degreesTertiary-type A programmes, second degreesAdvanced research programmes
1. Proportion of foreign graduates in tertiary graduate output. These data are not comparable with data on internationalgraduates and are therefore presented separately.Countries are ranked in descending order of the proportion of international and foreign graduates in tertiary-type A first degreeprogrammes.Source: OECD. Table C3.7. See Annex 3 for notes (www.oecd.org/edu/eag2006).
Aus
tral
ia
New
Zea
land
Uni
ted
Kin
gdom
Can
ada
Switz
erla
nd
Aus
tria
Ger
man
y
Den
mar
k
Finl
and
Swed
en
Nor
way
Belg
ium
1
Fran
ce1
Uni
ted
Stat
es1
Hun
gary
1
Cze
ch R
epub
lic1
Port
ugal
1
Italy
1
Slov
ak R
epub
lic1
Turk
ey1
International graduates Foreign graduates
StatLink: http://dx.doi.org/10.1787/221673686112
Student Mobility and Foreign Students in Tertiary Education – INDICATOR C3 chapter c
Education at a Glance © OECD 2006 299
C3
By contrast, the contribution of international students to the tertiary graduate output of Denmark, Finland, Germany, Norway and Sweden is more limited. The same holds for the Czech Republic, Hungary, Italy, Portugal, the Slovak Republic and Turkey (Table C3.7). This makes it more difficult for these countries to capitalise on this external contribution to domestic human capital production
Immigration implicationsIndeed, the growth of the new economy over the past two decades has magnified the importance of human capital and educated workforces to economic growth (see Indicator A10). In this context, worldwide competition for highly skilled workers is strong, and international students are increasingly regarded as a potential source of highly skilled immigrants by some OECD countries. Upon completion of their studies, international students master the language of their country of study, are familiar with its culture and their diplomas are known to local employers for those who completed a full programme abroad. This makes them directly employable on the labour market in their country of destination.
Several OECD countries have recently softened their immigration policies to encourage the temporary or permanent immigration of some international students (OECD, 2005a and Tremblay, 2005). Interestingly, the education systems where international students contribute most to the graduate output are those of countries with a long tradition of immigration favouring skilled individuals (Australia, Canada, New Zealand) or countries where the economy relies extensively upon foreign highly skilled workers (Switzerland, United Kingdom, United States).
In this perspective, the contribution of international graduates to the total graduate output can also be seen as a measure of the size of the potential pool of highly skilled immigrants upon which host countries can capitalise to enhance human capital availability in the economy.
Definitions and methodologies
Data sources, definitions and reference period
Data on international and foreign students are based on the UOE data collection on education statistics administered annually by the UNESCO, OECD and Eurostat.
Students are classified as international students if they left their country of origin and moved to another country for the purpose of study. Depending on country-specific immigration legislations, mobility arrangements (e.g. free mobility of individuals within the EU and EEA areas) and data availability, international students may be defined as students who are not permanent or usual residents of their country of study or alternatively as students who obtained their prior education in a different country (e.g. EU countries).
Permanent or usual residence in the reporting country is defined according to national legislations. In practice, this means holding a student visa or permit, or electing a foreign country of domicile in the year prior to entering the education system of the country reporting data. The country of prior education is defined as the country in which students obtained the qualification required to enrol in their current level of education, i.e. the country where they obtained their upper secondary or post-secondary non-tertiary education for international students enrolled in tertiary-type A and tertiary-type B programmes and the country where they obtained their
chapter c Access to educAtion, PArticiPAtion And Progression
Education at a Glance © OECD 2006300
C3
tertiary-type A education for international students enrolled in advanced research programmes. Country-specific operational definitions of international students are indicated in the tables as well as in Annex 3 (www.oecd.org/edu/eag2006).
Students are classified as foreign students if they are not citizens of the country in which the data are collected. While pragmatic and operational, this classification is inappropriate to capture student mobility as a result of differing national policies regarding the naturalisation of immigrants. For instance, while Australia and Switzerland report similar intakes of foreign students relative to their tertiary enrolments – 19.9 and 18.2% respectively – these proportions reflect significant differences in the actual levels of student mobility – 16.6% of tertiary enrolments in Australia and 12.7% in Switzerland. This is because Australia is an immigration country and has a higher propensity to grant permanent residence to its immigrant populations than Switzerland. Therefore, interpretations of data based on the concept of foreign students in terms of student mobility and bilateral comparisons need to be made with caution.
Unless mentioned otherwise, data refer to the academic year 2003-2004.
Methodologies
Data on international and foreign students are obtained from enrolments in their countries of destination. The method of obtaining data on international and foreign students is therefore the same as that used for collecting data on total enrolments, i.e. records of regularly enrolled students in an educational programme. Domestic and international students are usually counted on a specific day or period of the year. This procedure allows to measure the proportion of international enrolments in an education system, but the actual number of individuals involved in foreign exchange may be much higher since many students study abroad for less than a full academic year, or participate in exchange programmes that do not require enrolment (e.g. inter-university exchange or advanced research short-term mobility). On the other hand, the international student body comprises some distance-learning students who are not, strictly speaking, mobile students. This pattern of distance enrolments is fairly common in tertiary institutions of Australia and the United Kingdom (OECD, 2004d).
Since data on international and foreign students are obtained from tertiary enrolments in their country of destination, the data therefore relate to students that are coming in rather than to students going abroad. Countries of destination covered by this indicator include all of the OECD countries (with the exception of Luxembourg and Mexico) and the partner countries Chile and the Russian Federation, as well as non-OECD countries reporting similar data to the UNESCO Institute for Statistics to derive global figures and to examine the destinations of students and trends in market shares.
Data on students enrolled abroad as well as trend analyses are not based on the numbers of international students, but instead on the numbers of foreign citizens where data consistent across countries and over time are readily available. Yet the data do not include students enrolled in OECD and non-OECD countries that did not report foreign students to the OECD nor to the UNESCO Institute for Statistics. All statements on students enrolled abroad may therefore underestimate the real number of citizens studying abroad (Table C3.3), especially so for countries where numerous citizens study in countries that do not report their foreign students to the OECD or UNESCO Institute for Statistics (e.g. China, India).
Student Mobility and Foreign Students in Tertiary Education – INDICATOR C3 chapter c
Education at a Glance © OECD 2006 301
C3
Table C3.1. displays international as well as foreign enrolments as a proportion of the total enrolment at each level of tertiary education. Total enrolment, used as a denominator, comprises all persons studying in the country (including domestic and international students) but excludes students from that country who study abroad. The table also exhibits changes between 2000 and 2004 in foreign enrolments for all tertiary education.
Tables C3.2, C3.4 and C3.5 show the distribution of international students enrolled in an education system – or foreign students for countries that do not have information on student mobility – according to their country of origin in Table C3.2, according to their level and type of tertiary education in Table C3.4, and according to the field of education they are enrolled in for Table C3.5.
Table C3.3 presents the distribution of citizens of a given country enrolled abroad according to their country of destination (or country of study). As mentioned above, the total number of students enrolled abroad used as a denominator covers only students enrolled in other countries reporting data to the OECD or the UNESCO Institute for Statistics. Therefore, the resulting proportions can be biased and overestimated for countries where large numbers of students study in non-reporting countries.
Table C3.6 shows trends in the absolute number of foreign students reported by OECD countries and worldwide, and the indexes of change between 2003 and 2004 and since 2000 and 2002. It should be noted that the figures are based on the number of foreign students enrolled in countries reporting data to the OECD and to the UNESCO Institute for Statistics. Since data for non-OECD countries that are not OECD partner countries were not included in the past, the figures are not strictly comparable with those published in previous editions of Education at a Glance.
Table C3.7 presents the percentage of tertiary qualifications awarded to international students – or foreign students for countries that do not have information on student mobility. It provides an indication of the contribution of international or foreign students to the graduate output of different levels and types of tertiary education.
Last, Table C3.8 (available on the Web at http://dx.doi.org/10.1787/221673686112) provides the matrix of foreign students’ numbers by country of origin and country of destination, as well as the total number of foreign students in each destination in 2000 and the corresponding market shares in 2000 and 2004.
Further references
The number of expected years of tertiary education is biased upwards in countries with a large proportion of international students in tertiary enrolments. This pattern should be borne in mind when interpreting trends or differences between countries in expected years of tertiary education (see Indicators C1 and C2).
Similarly, the relative importance of international students in the education system affects tertiary graduation rates and may artificially increase them in some fields or levels of education (see Indicator A3).
International students contribute significantly to the tertiary graduate output of some countries. This gives highly internationalised education systems an opportunity to capitalise upon international students to enhance human capital in the economy, and thereby stimulate economic growth (see Indicator A10).
chapter c Access to educAtion, PArticiPAtion And Progression
Education at a Glance © OECD 2006302
C3
In countries where differentiated tuition fees are applied to international students, student mobility may boost the financial resources of tertiary educational institutions and contribute to the financing of the education system. By contrast, international students may represent a high financial burden for countries where tertiary tuition fees are low or inexistent given the high level of unit costs in tertiary education (see Indicators B1 and B5)
International students enrolled in a country different from their own are only one aspect of the internationalisation of tertiary education. New forms of cross-border education have emerged in the last decade, including the mobility of educational programmes and institutions across borders. Yet, cross-border post-secondary education has developed quite differently and in response to different rationales in different world regions. For a detailed analysis of these issues, as well as trade and policy implications of the internationalisation of tertiary education see Internationalisation and Trade in Higher Education: Opportunities and Challenges (OECD, 2004d).
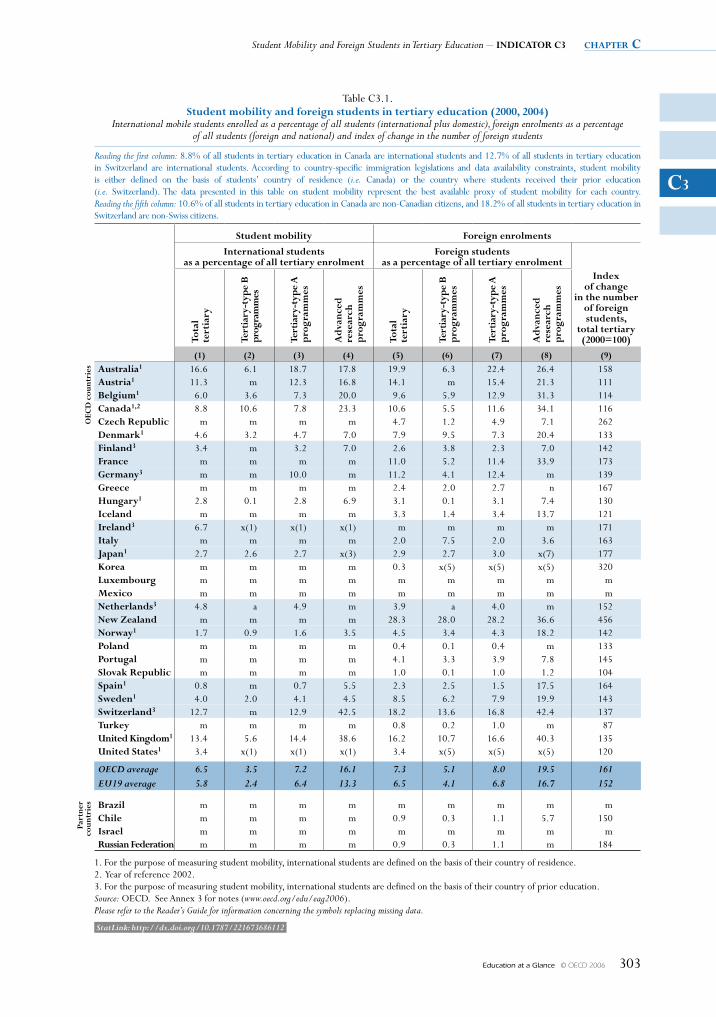
Student Mobility and Foreign Students in Tertiary Education – INDICATOR C3 chapter c
Education at a Glance © OECD 2006 303
C3
Table C3.1. Student mobility and foreign students in tertiary education (2000, 2004)
International mobile students enrolled as a percentage of all students (international plus domestic), foreign enrolments as a percentage of all students (foreign and national) and index of change in the number of foreign students
Reading the first column: 8.8% of all students in tertiary education in Canada are international students and 12.7% of all students in tertiary education in Switzerland are international students. According to country-specific immigration legislations and data availability constraints, student mobility is either defined on the basis of students’ country of residence (i.e. Canada) or the country where students received their prior education (i.e. Switzerland). The data presented in this table on student mobility represent the best available proxy of student mobility for each country. Reading the fifth column: 10.6% of all students in tertiary education in Canada are non-Canadian citizens, and 18.2% of all students in tertiary education in Switzerland are non-Swiss citizens.
Student mobility Foreign enrolments
International students as a percentage of all tertiary enrolment
Foreign students as a percentage of all tertiary enrolment
Index of change
in the number of foreign students,
total tertiary (2000=100)To
tal
tert
iary
Tert
iary
-typ
e b
pr
ogra
mm
es
Tert
iary
-typ
e A
p
rogr
amm
es
Adv
ance
d
rese
arch
p
rogr
amm
es
Tota
l te
rtia
ry
Tert
iary
-typ
e b
p
rogr
amm
es
Tert
iary
-typ
e A
p
rogr
amm
es
Adv
ance
d
rese
arch
p
rogr
amm
es
(1) (2) (3) (4) (5) (6) (7) (8) (9)
OeC
D c
ount
ries Australia1 16.6 6.1 18.7 17.8 19.9 6.3 22.4 26.4 158
Austria1 11.3 m 12.3 16.8 14.1 m 15.4 21.3 111 belgium1 6.0 3.6 7.3 20.0 9.6 5.9 12.9 31.3 114 Canada1,2 8.8 10.6 7.8 23.3 10.6 5.5 11.6 34.1 116 Czech Republic m m m m 4.7 1.2 4.9 7.1 262 Denmark1 4.6 3.2 4.7 7.0 7.9 9.5 7.3 20.4 133 Finland3 3.4 m 3.2 7.0 2.6 3.8 2.3 7.0 142 France m m m m 11.0 5.2 11.4 33.9 173 germany3 m m 10.0 m 11.2 4.1 12.4 m 139 greece m m m m 2.4 2.0 2.7 n 167 Hungary1 2.8 0.1 2.8 6.9 3.1 0.1 3.1 7.4 130 Iceland m m m m 3.3 1.4 3.4 13.7 121 Ireland3 6.7 x(1) x(1) x(1) m m m m 171 Italy m m m m 2.0 7.5 2.0 3.6 163 Japan1 2.7 2.6 2.7 x(3) 2.9 2.7 3.0 x(7) 177 Korea m m m m 0.3 x(5) x(5) x(5) 320 luxembourg m m m m m m m m m Mexico m m m m m m m m m Netherlands3 4.8 a 4.9 m 3.9 a 4.0 m 152 New Zealand m m m m 28.3 28.0 28.2 36.6 456 Norway1 1.7 0.9 1.6 3.5 4.5 3.4 4.3 18.2 142 Poland m m m m 0.4 0.1 0.4 m 133 Portugal m m m m 4.1 3.3 3.9 7.8 145 Slovak Republic m m m m 1.0 0.1 1.0 1.2 104 Spain1 0.8 m 0.7 5.5 2.3 2.5 1.5 17.5 164 Sweden1 4.0 2.0 4.1 4.5 8.5 6.2 7.9 19.9 143 Switzerland3 12.7 m 12.9 42.5 18.2 13.6 16.8 42.4 137 Turkey m m m m 0.8 0.2 1.0 m 87 united Kingdom1 13.4 5.6 14.4 38.6 16.2 10.7 16.6 40.3 135 united States1 3.4 x(1) x(1) x(1) 3.4 x(5) x(5) x(5) 120
OECD average 6.5 3.5 7.2 16.1 7.3 5.1 8.0 19.5 161 EU19 average 5.8 2.4 6.4 13.3 6.5 4.1 6.8 16.7 152
Part
ner
coun
trie
s brazil m m m m m m m m m Chile m m m m 0.9 0.3 1.1 5.7 150 Israel m m m m m m m m m Russian Federation m m m m 0.9 0.3 1.1 m 184
1. For the purpose of measuring student mobility, international students are defined on the basis of their country of residence.2. Year of reference 2002.3. For the purpose of measuring student mobility, international students are defined on the basis of their country of prior education.Source: OECD. See Annex 3 for notes (www.oecd.org/edu/eag2006).Please refer to the Reader’s Guide for information concerning the symbols replacing missing data.
StatLink: http://dx.doi.org/10.1787/221673686112
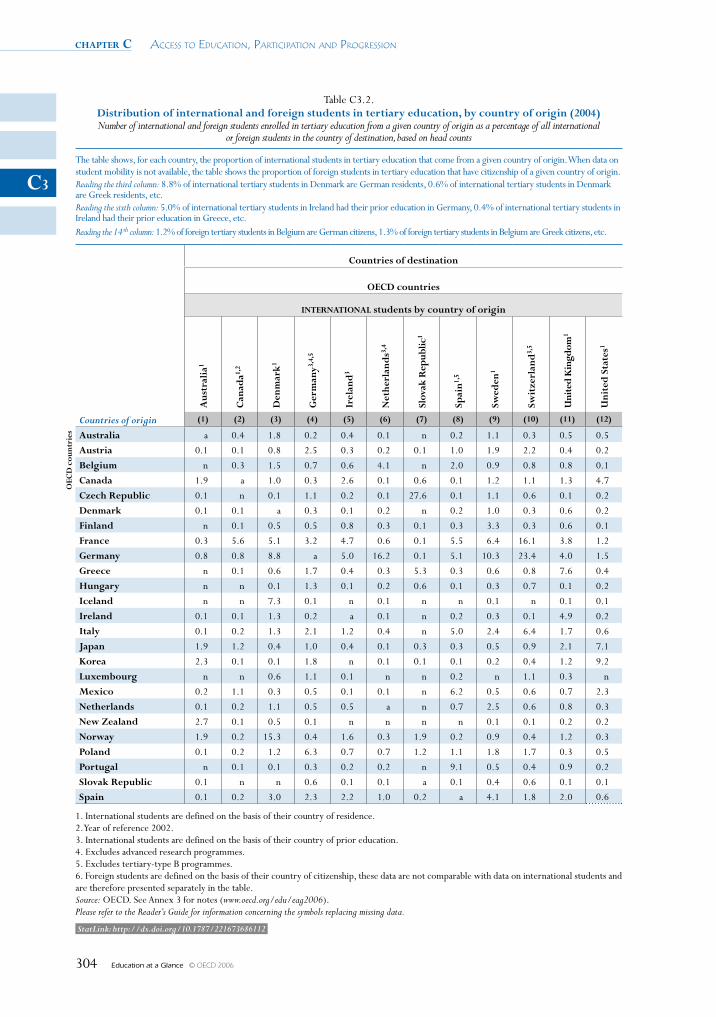
chapter c Access to educAtion, PArticiPAtion And Progression
Education at a Glance © OECD 2006304
C3
Table C3.2. Distribution of international and foreign students in tertiary education, by country of origin (2004)Number of international and foreign students enrolled in tertiary education from a given country of origin as a percentage of all international
or foreign students in the country of destination, based on head counts
The table shows, for each country, the proportion of international students in tertiary education that come from a given country of origin. When data on student mobility is not available, the table shows the proportion of foreign students in tertiary education that have citizenship of a given country of origin.Reading the third column: 8.8% of international tertiary students in Denmark are German residents, 0.6% of international tertiary students in Denmark are Greek residents, etc.Reading the sixth column: 5.0% of international tertiary students in Ireland had their prior education in Germany, 0.4% of international tertiary students in Ireland had their prior education in Greece, etc.Reading the 14 th column: 1.2% of foreign tertiary students in Belgium are German citizens, 1.3% of foreign tertiary students in Belgium are Greek citizens, etc.
Countries of destination
OeCD countries
INTeRNATIONAl students by country of origin
Aus
tral
ia1
Can
ada1,
2
Den
mar
k1
ger
man
y3,4,
5
Irel
and
3
Net
herl
and
s3,4
Slov
ak R
epub
lic1
Spai
n1,5
Swed
en1
Swit
zerl
and
3,5
uni
ted
Kin
gdom
1
uni
ted
Sta
tes1
Countries of origin (1) (2) (3) (4) (5) (6) (7) (8) (9) (10) (11) (12)
OeC
D c
ount
ries Australia a 0.4 1.8 0.2 0.4 0.1 n 0.2 1.1 0.3 0.5 0.5
Austria 0.1 0.1 0.8 2.5 0.3 0.2 0.1 1.0 1.9 2.2 0.4 0.2
belgium n 0.3 1.5 0.7 0.6 4.1 n 2.0 0.9 0.8 0.8 0.1
Canada 1.9 a 1.0 0.3 2.6 0.1 0.6 0.1 1.2 1.1 1.3 4.7
Czech Republic 0.1 n 0.1 1.1 0.2 0.1 27.6 0.1 1.1 0.6 0.1 0.2
Denmark 0.1 0.1 a 0.3 0.1 0.2 n 0.2 1.0 0.3 0.6 0.2
Finland n 0.1 0.5 0.5 0.8 0.3 0.1 0.3 3.3 0.3 0.6 0.1
France 0.3 5.6 5.1 3.2 4.7 0.6 0.1 5.5 6.4 16.1 3.8 1.2
germany 0.8 0.8 8.8 a 5.0 16.2 0.1 5.1 10.3 23.4 4.0 1.5
greece n 0.1 0.6 1.7 0.4 0.3 5.3 0.3 0.6 0.8 7.6 0.4
Hungary n n 0.1 1.3 0.1 0.2 0.6 0.1 0.3 0.7 0.1 0.2
Iceland n n 7.3 0.1 n 0.1 n n 0.1 n 0.1 0.1
Ireland 0.1 0.1 1.3 0.2 a 0.1 n 0.2 0.3 0.1 4.9 0.2
Italy 0.1 0.2 1.3 2.1 1.2 0.4 n 5.0 2.4 6.4 1.7 0.6
Japan 1.9 1.2 0.4 1.0 0.4 0.1 0.3 0.3 0.5 0.9 2.1 7.1
Korea 2.3 0.1 0.1 1.8 n 0.1 0.1 0.1 0.2 0.4 1.2 9.2
luxembourg n n 0.6 1.1 0.1 n n 0.2 n 1.1 0.3 n
Mexico 0.2 1.1 0.3 0.5 0.1 0.1 n 6.2 0.5 0.6 0.7 2.3
Netherlands 0.1 0.2 1.1 0.5 0.5 a n 0.7 2.5 0.6 0.8 0.3
New Zealand 2.7 0.1 0.5 0.1 n n n n 0.1 0.1 0.2 0.2
Norway 1.9 0.2 15.3 0.4 1.6 0.3 1.9 0.2 0.9 0.4 1.2 0.3
Poland 0.1 0.2 1.2 6.3 0.7 0.7 1.2 1.1 1.8 1.7 0.3 0.5
Portugal n 0.1 0.1 0.3 0.2 0.2 n 9.1 0.5 0.4 0.9 0.2
Slovak Republic 0.1 n n 0.6 0.1 0.1 a 0.1 0.4 0.6 0.1 0.1
Spain 0.1 0.2 3.0 2.3 2.2 1.0 0.2 a 4.1 1.8 2.0 0.6
1. International students are defined on the basis of their country of residence.2. Year of reference 2002.3. International students are defined on the basis of their country of prior education. 4. Excludes advanced research programmes.5. Excludes tertiary-type B programmes.6. Foreign students are defined on the basis of their country of citizenship, these data are not comparable with data on international students and are therefore presented separately in the table.Source: OECD. See Annex 3 for notes (www.oecd.org/edu/eag2006).Please refer to the Reader’s Guide for information concerning the symbols replacing missing data.
StatLink: http://dx.doi.org/10.1787/221673686112
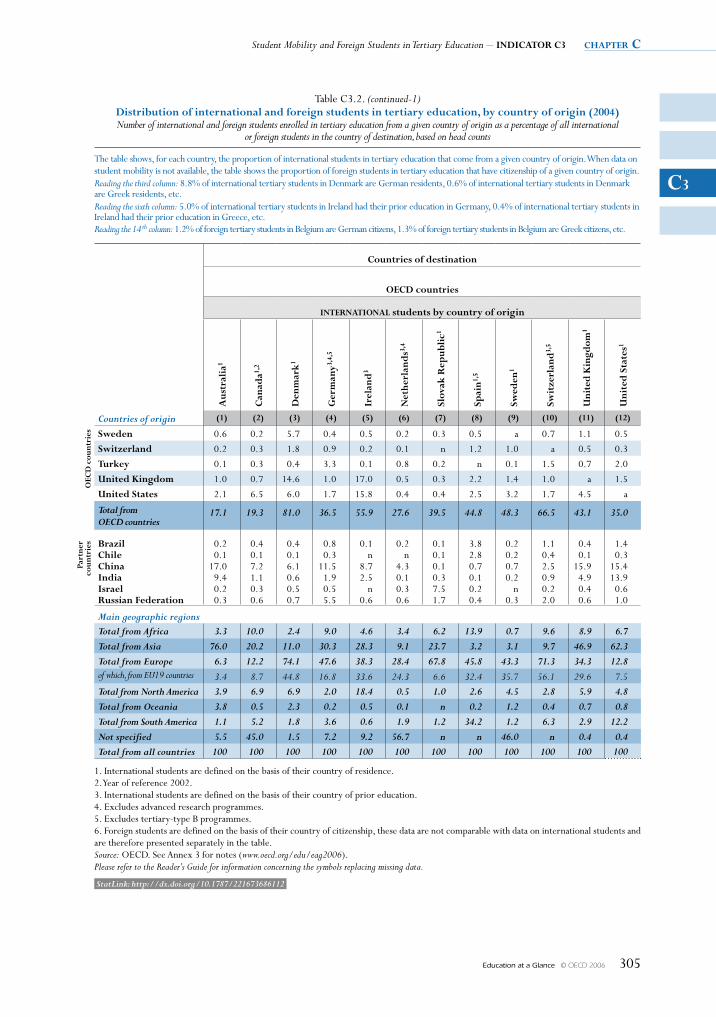
Student Mobility and Foreign Students in Tertiary Education – IndICator C3 chapter c
Education at a Glance © OECD 2006 305
C3
Table C3.2. (continued-1)distribution of international and foreign students in tertiary education, by country of origin (2004)Number of international and foreign students enrolled in tertiary education from a given country of origin as a percentage of all international
or foreign students in the country of destination, based on head counts
The table shows, for each country, the proportion of international students in tertiary education that come from a given country of origin. When data on student mobility is not available, the table shows the proportion of foreign students in tertiary education that have citizenship of a given country of origin.Reading the third column: 8.8% of international tertiary students in Denmark are German residents, 0.6% of international tertiary students in Denmark are Greek residents, etc.Reading the sixth column: 5.0% of international tertiary students in Ireland had their prior education in Germany, 0.4% of international tertiary students in Ireland had their prior education in Greece, etc.Reading the 14 th column: 1.2% of foreign tertiary students in Belgium are German citizens, 1.3% of foreign tertiary students in Belgium are Greek citizens, etc.
Countries of destination
oECd countries
IntErnatIonal students by country of origin
aus
tral
ia1
Can
ada1,
2
den
mar
k1
Ger
man
y3,4,
5
Irel
and
3
net
herl
and
s3,4
Slov
ak r
epub
lic1
Spai
n1,5
Swed
en1
Swit
zerl
and
3,5
Uni
ted
Kin
gdom
1
Uni
ted
Sta
tes1
Countries of origin (1) (2) (3) (4) (5) (6) (7) (8) (9) (10) (11) (12)
oEC
d c
ount
ries Sweden 0.6 0.2 5.7 0.4 0.5 0.2 0.3 0.5 a 0.7 1.1 0.5
Switzerland 0.2 0.3 1.8 0.9 0.2 0.1 n 1.2 1.0 a 0.5 0.3
turkey 0.1 0.3 0.4 3.3 0.1 0.8 0.2 n 0.1 1.5 0.7 2.0
United Kingdom 1.0 0.7 14.6 1.0 17.0 0.5 0.3 2.2 1.4 1.0 a 1.5
United States 2.1 6.5 6.0 1.7 15.8 0.4 0.4 2.5 3.2 1.7 4.5 a
Total from OECD countries
17.1 19.3 81.0 36.5 55.9 27.6 39.5 44.8 48.3 66.5 43.1 35.0
Part
ner
coun
trie
s Brazil 0.2 0.4 0.4 0.8 0.1 0.2 0.1 3.8 0.2 1.1 0.4 1.4Chile 0.1 0.1 0.1 0.3 n n 0.1 2.8 0.2 0.4 0.1 0.3China 17.0 7.2 6.1 11.5 8.7 4.3 0.1 0.7 0.7 2.5 15.9 15.4India 9.4 1.1 0.6 1.9 2.5 0.1 0.3 0.1 0.2 0.9 4.9 13.9Israel 0.2 0.3 0.5 0.5 n 0.3 7.5 0.2 n 0.2 0.4 0.6russian Federation 0.3 0.6 0.7 5.5 0.6 0.6 1.7 0.4 0.3 2.0 0.6 1.0
Main geographic regionsTotal from Africa 3.3 10.0 2.4 9.0 4.6 3.4 6.2 13.9 0.7 9.6 8.9 6.7Total from Asia 76.0 20.2 11.0 30.3 28.3 9.1 23.7 3.2 3.1 9.7 46.9 62.3Total from Europe 6.3 12.2 74.1 47.6 38.3 28.4 67.8 45.8 43.3 71.3 34.3 12.8of which, from EU19 countries 3.4 8.7 44.8 16.8 33.6 24.3 6.6 32.4 35.7 56.1 29.6 7.5
Total from North America 3.9 6.9 6.9 2.0 18.4 0.5 1.0 2.6 4.5 2.8 5.9 4.8Total from Oceania 3.8 0.5 2.3 0.2 0.5 0.1 n 0.2 1.2 0.4 0.7 0.8Total from South America 1.1 5.2 1.8 3.6 0.6 1.9 1.2 34.2 1.2 6.3 2.9 12.2Not specified 5.5 45.0 1.5 7.2 9.2 56.7 n n 46.0 n 0.4 0.4Total from all countries 100 100 100 100 100 100 100 100 100 100 100 100
1. International students are defined on the basis of their country of residence.2. Year of reference 2002.3. International students are defined on the basis of their country of prior education. 4. Excludes advanced research programmes.5. Excludes tertiary-type B programmes.6. Foreign students are defined on the basis of their country of citizenship, these data are not comparable with data on international students and are therefore presented separately in the table.Source: OECD. See Annex 3 for notes (www.oecd.org/edu/eag2006).Please refer to the Reader’s Guide for information concerning the symbols replacing missing data.
StatLink: http://dx.doi.org/10.1787/221673686112
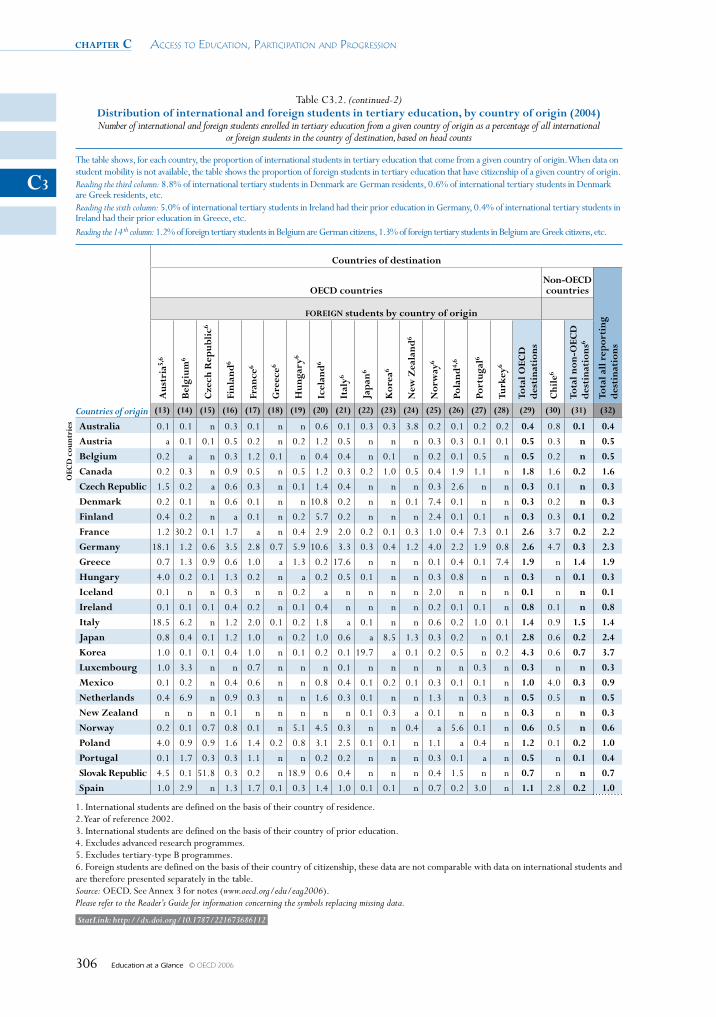
chapter c Access to educAtion, PArticiPAtion And Progression
Education at a Glance © OECD 2006306
C3
Table C3.2. (continued-2)Distribution of international and foreign students in tertiary education, by country of origin (2004)Number of international and foreign students enrolled in tertiary education from a given country of origin as a percentage of all international
or foreign students in the country of destination, based on head counts
The table shows, for each country, the proportion of international students in tertiary education that come from a given country of origin. When data on student mobility is not available, the table shows the proportion of foreign students in tertiary education that have citizenship of a given country of origin.Reading the third column: 8.8% of international tertiary students in Denmark are German residents, 0.6% of international tertiary students in Denmark are Greek residents, etc.Reading the sixth column: 5.0% of international tertiary students in Ireland had their prior education in Germany, 0.4% of international tertiary students in Ireland had their prior education in Greece, etc.Reading the 14 th column: 1.2% of foreign tertiary students in Belgium are German citizens, 1.3% of foreign tertiary students in Belgium are Greek citizens, etc.
Countries of destination
OeCD countriesNon-OeCD countries
Tota
l all
rep
orti
ng
des
tina
tion
s
FOReIgN students by country of origin
Aus
tria
5,6
bel
gium
6
Cze
ch R
epub
lic6
Finl
and
6
Fran
ce6
gre
ece6
Hun
gary
6
Icel
and
6
Ital
y6
Jap
an6
Kor
ea6
New
Zea
land
6
Nor
way
6
Pola
nd4,
6
Port
ugal
6
Turk
ey6
Tota
l OeC
D
des
tina
tion
s
Chi
le6
Tota
l non
-OeC
D
des
tina
tion
s6
Countries of origin (13) (14) (15) (16) (17) (18) (19) (20) (21) (22) (23) (24) (25) (26) (27) (28) (29) (30) (31) (32)
OeC
D c
ount
ries Australia 0.1 0.1 n 0.3 0.1 n n 0.6 0.1 0.3 0.3 3.8 0.2 0.1 0.2 0.2 0.4 0.8 0.1 0.4
Austria a 0.1 0.1 0.5 0.2 n 0.2 1.2 0.5 n n n 0.3 0.3 0.1 0.1 0.5 0.3 n 0.5
belgium 0.2 a n 0.3 1.2 0.1 n 0.4 0.4 n 0.1 n 0.2 0.1 0.5 n 0.5 0.2 n 0.5
Canada 0.2 0.3 n 0.9 0.5 n 0.5 1.2 0.3 0.2 1.0 0.5 0.4 1.9 1.1 n 1.8 1.6 0.2 1.6
Czech Republic 1.5 0.2 a 0.6 0.3 n 0.1 1.4 0.4 n n n 0.3 2.6 n n 0.3 0.1 n 0.3
Denmark 0.2 0.1 n 0.6 0.1 n n 10.8 0.2 n n 0.1 7.4 0.1 n n 0.3 0.2 n 0.3
Finland 0.4 0.2 n a 0.1 n 0.2 5.7 0.2 n n n 2.4 0.1 0.1 n 0.3 0.3 0.1 0.2
France 1.2 30.2 0.1 1.7 a n 0.4 2.9 2.0 0.2 0.1 0.3 1.0 0.4 7.3 0.1 2.6 3.7 0.2 2.2
germany 18.1 1.2 0.6 3.5 2.8 0.7 5.9 10.6 3.3 0.3 0.4 1.2 4.0 2.2 1.9 0.8 2.6 4.7 0.3 2.3
greece 0.7 1.3 0.9 0.6 1.0 a 1.3 0.2 17.6 n n n 0.1 0.4 0.1 7.4 1.9 n 1.4 1.9
Hungary 4.0 0.2 0.1 1.3 0.2 n a 0.2 0.5 0.1 n n 0.3 0.8 n n 0.3 n 0.1 0.3
Iceland 0.1 n n 0.3 n n 0.2 a n n n n 2.0 n n n 0.1 n n 0.1
Ireland 0.1 0.1 0.1 0.4 0.2 n 0.1 0.4 n n n n 0.2 0.1 0.1 n 0.8 0.1 n 0.8
Italy 18.5 6.2 n 1.2 2.0 0.1 0.2 1.8 a 0.1 n n 0.6 0.2 1.0 0.1 1.4 0.9 1.5 1.4
Japan 0.8 0.4 0.1 1.2 1.0 n 0.2 1.0 0.6 a 8.5 1.3 0.3 0.2 n 0.1 2.8 0.6 0.2 2.4
Korea 1.0 0.1 0.1 0.4 1.0 n 0.1 0.2 0.1 19.7 a 0.1 0.2 0.5 n 0.2 4.3 0.6 0.7 3.7
luxembourg 1.0 3.3 n n 0.7 n n n 0.1 n n n n n 0.3 n 0.3 n n 0.3
Mexico 0.1 0.2 n 0.4 0.6 n n 0.8 0.4 0.1 0.2 0.1 0.3 0.1 0.1 n 1.0 4.0 0.3 0.9
Netherlands 0.4 6.9 n 0.9 0.3 n n 1.6 0.3 0.1 n n 1.3 n 0.3 n 0.5 0.5 n 0.5
New Zealand n n n 0.1 n n n n n 0.1 0.3 a 0.1 n n n 0.3 n n 0.3
Norway 0.2 0.1 0.7 0.8 0.1 n 5.1 4.5 0.3 n n 0.4 a 5.6 0.1 n 0.6 0.5 n 0.6
Poland 4.0 0.9 0.9 1.6 1.4 0.2 0.8 3.1 2.5 0.1 0.1 n 1.1 a 0.4 n 1.2 0.1 0.2 1.0
Portugal 0.1 1.7 0.3 0.3 1.1 n n 0.2 0.2 n n n 0.3 0.1 a n 0.5 n 0.1 0.4
Slovak Republic 4.5 0.1 51.8 0.3 0.2 n 18.9 0.6 0.4 n n n 0.4 1.5 n n 0.7 n n 0.7Spain 1.0 2.9 n 1.3 1.7 0.1 0.3 1.4 1.0 0.1 0.1 n 0.7 0.2 3.0 n 1.1 2.8 0.2 1.0
1. International students are defined on the basis of their country of residence.2. Year of reference 2002.3. International students are defined on the basis of their country of prior education. 4. Excludes advanced research programmes.5. Excludes tertiary-type B programmes.6. Foreign students are defined on the basis of their country of citizenship, these data are not comparable with data on international students and are therefore presented separately in the table.Source: OECD. See Annex 3 for notes (www.oecd.org/edu/eag2006).Please refer to the Reader’s Guide for information concerning the symbols replacing missing data.
StatLink: http://dx.doi.org/10.1787/221673686112
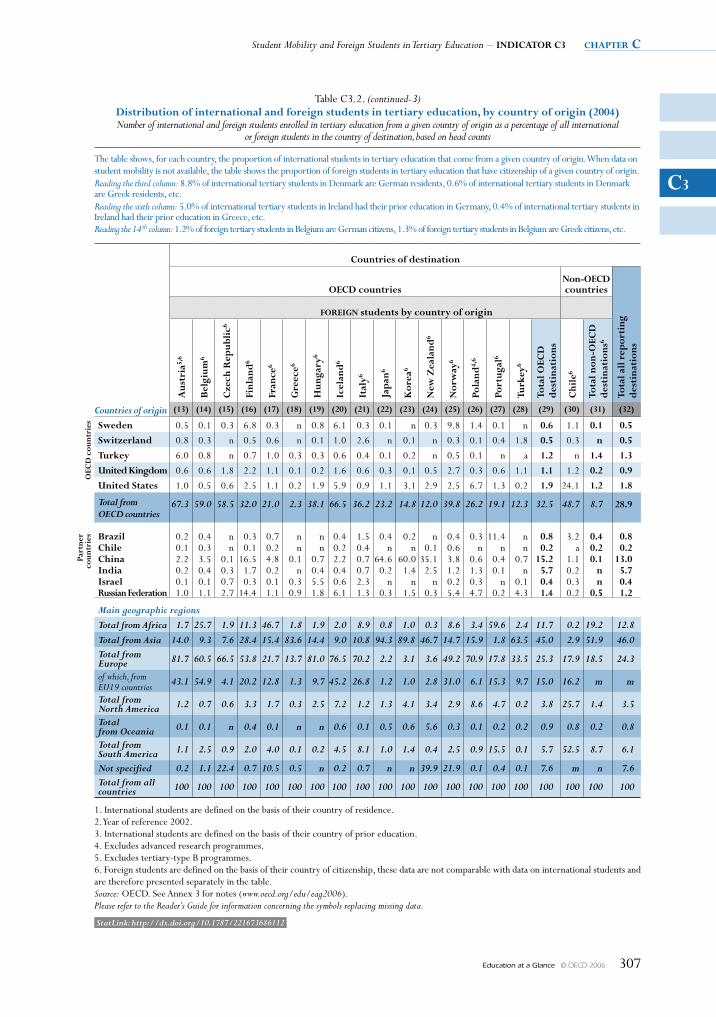
Student Mobility and Foreign Students in Tertiary Education – INDICATOR C3 chapter c
Education at a Glance © OECD 2006 307
C3
Table C3.2. (continued-3)Distribution of international and foreign students in tertiary education, by country of origin (2004)Number of international and foreign students enrolled in tertiary education from a given country of origin as a percentage of all international
or foreign students in the country of destination, based on head counts
The table shows, for each country, the proportion of international students in tertiary education that come from a given country of origin. When data on student mobility is not available, the table shows the proportion of foreign students in tertiary education that have citizenship of a given country of origin.Reading the third column: 8.8% of international tertiary students in Denmark are German residents, 0.6% of international tertiary students in Denmark are Greek residents, etc.Reading the sixth column: 5.0% of international tertiary students in Ireland had their prior education in Germany, 0.4% of international tertiary students in Ireland had their prior education in Greece, etc.Reading the 14 th column: 1.2% of foreign tertiary students in Belgium are German citizens, 1.3% of foreign tertiary students in Belgium are Greek citizens, etc.
Countries of destination
OeCD countriesNon-OeCD countries
Tota
l all
rep
orti
ng
des
tina
tion
s
FOReIgN students by country of origin
Aus
tria
5,6
bel
gium
6
Cze
ch R
epub
lic6
Finl
and
6
Fran
ce6
gre
ece6
Hun
gary
6
Icel
and
6
Ital
y6
Jap
an6
Kor
ea6
New
Zea
land
6
Nor
way
6
Pola
nd4,
6
Port
ugal
6
Turk
ey6
Tota
l OeC
D
des
tina
tion
s
Chi
le6
Tota
l non
-OeC
D
des
tina
tion
s6
Countries of origin (13) (14) (15) (16) (17) (18) (19) (20) (21) (22) (23) (24) (25) (26) (27) (28) (29) (30) (31) (32)
OeC
D c
ount
ries Sweden 0.5 0.1 0.3 6.8 0.3 n 0.8 6.1 0.3 0.1 n 0.3 9.8 1.4 0.1 n 0.6 1.1 0.1 0.5
Switzerland 0.8 0.3 n 0.5 0.6 n 0.1 1.0 2.6 n 0.1 n 0.3 0.1 0.4 1.8 0.5 0.3 n 0.5
Turkey 6.0 0.8 n 0.7 1.0 0.3 0.3 0.6 0.4 0.1 0.2 n 0.5 0.1 n a 1.2 n 1.4 1.3
united Kingdom 0.6 0.6 1.8 2.2 1.1 0.1 0.2 1.6 0.6 0.3 0.1 0.5 2.7 0.3 0.6 1.1 1.1 1.2 0.2 0.9
united States 1.0 0.5 0.6 2.5 1.1 0.2 1.9 5.9 0.9 1.1 3.1 2.9 2.5 6.7 1.3 0.2 1.9 24.1 1.2 1.8
Total from OECD countries
67.3 59.0 58.5 32.0 21.0 2.3 38.1 66.5 36.2 23.2 14.8 12.0 39.8 26.2 19.1 12.3 32.5 48.7 8.7 28.9
Part
ner
coun
trie
s brazil 0.2 0.4 n 0.3 0.7 n n 0.4 1.5 0.4 0.2 n 0.4 0.3 11.4 n 0.8 3.2 0.4 0.8Chile 0.1 0.3 n 0.1 0.2 n n 0.2 0.4 n n 0.1 0.6 n n n 0.2 a 0.2 0.2China 2.2 3.5 0.1 16.5 4.8 0.1 0.7 2.2 0.7 64.6 60.0 35.1 3.8 0.6 0.4 0.7 15.2 1.1 0.1 13.0India 0.2 0.4 0.3 1.7 0.2 n 0.4 0.4 0.7 0.2 1.4 2.5 1.2 1.3 0.1 n 5.7 0.2 n 5.7Israel 0.1 0.1 0.7 0.3 0.1 0.3 5.5 0.6 2.3 n n n 0.2 0.3 n 0.1 0.4 0.3 n 0.4Russian Federation 1.0 1.1 2.7 14.4 1.1 0.9 1.8 6.1 1.3 0.3 1.5 0.3 5.4 4.7 0.2 4.3 1.4 0.2 0.5 1.2
Main geographic regionsTotal from Africa 1.7 25.7 1.9 11.3 46.7 1.8 1.9 2.0 8.9 0.8 1.0 0.3 8.6 3.4 59.6 2.4 11.7 0.2 19.2 12.8Total from Asia 14.0 9.3 7.6 28.4 15.4 83.6 14.4 9.0 10.8 94.3 89.8 46.7 14.7 15.9 1.8 63.5 45.0 2.9 51.9 46.0Total from Europe 81.7 60.5 66.5 53.8 21.7 13.7 81.0 76.5 70.2 2.2 3.1 3.6 49.2 70.9 17.8 33.5 25.3 17.9 18.5 24.3
of which, from EU19 countries 43.1 54.9 4.1 20.2 12.8 1.3 9.7 45.2 26.8 1.2 1.0 2.8 31.0 6.1 15.3 9.7 15.0 16.2 m m
Total from North America 1.2 0.7 0.6 3.3 1.7 0.3 2.5 7.2 1.2 1.3 4.1 3.4 2.9 8.6 4.7 0.2 3.8 25.7 1.4 3.5
Total from Oceania 0.1 0.1 n 0.4 0.1 n n 0.6 0.1 0.5 0.6 5.6 0.3 0.1 0.2 0.2 0.9 0.8 0.2 0.8
Total from South America 1.1 2.5 0.9 2.0 4.0 0.1 0.2 4.5 8.1 1.0 1.4 0.4 2.5 0.9 15.5 0.1 5.7 52.5 8.7 6.1
Not specified 0.2 1.1 22.4 0.7 10.5 0.5 n 0.2 0.7 n n 39.9 21.9 0.1 0.4 0.1 7.6 m n 7.6Total from all countries 100 100 100 100 100 100 100 100 100 100 100 100 100 100 100 100 100 100 100 100
1. International students are defined on the basis of their country of residence.2. Year of reference 2002.3. International students are defined on the basis of their country of prior education. 4. Excludes advanced research programmes.5. Excludes tertiary-type B programmes.6. Foreign students are defined on the basis of their country of citizenship, these data are not comparable with data on international students and are therefore presented separately in the table.Source: OECD. See Annex 3 for notes (www.oecd.org/edu/eag2006).Please refer to the Reader’s Guide for information concerning the symbols replacing missing data.
StatLink: http://dx.doi.org/10.1787/221673686112
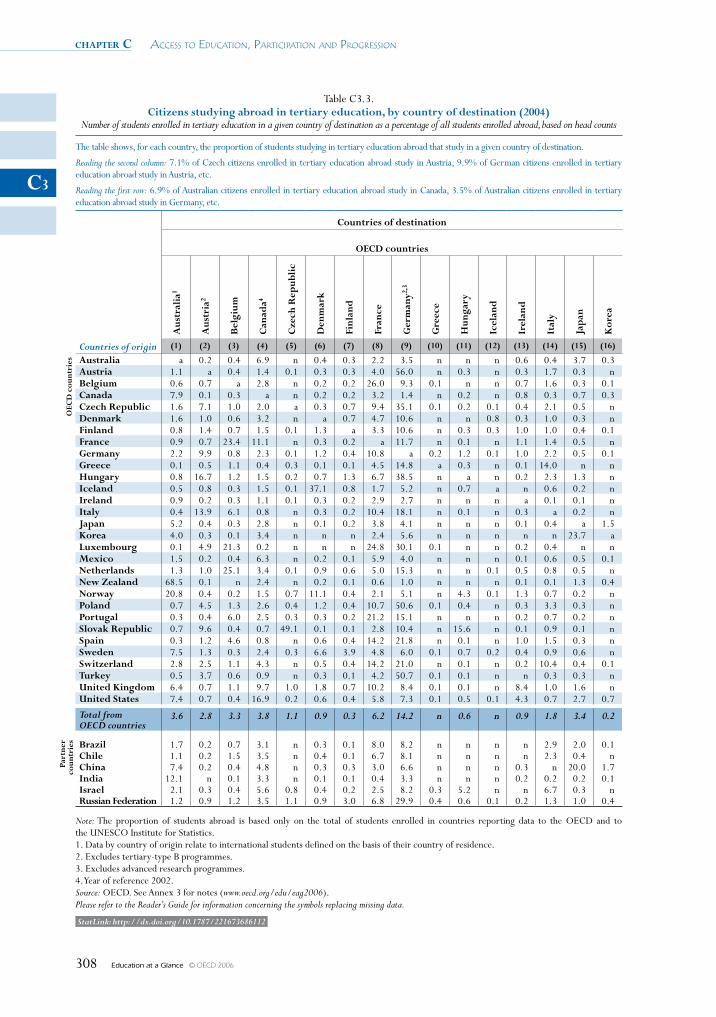
chapter c Access to educAtion, PArticiPAtion And Progression
Education at a Glance © OECD 2006308
C3
Table C3.3. Citizens studying abroad in tertiary education, by country of destination (2004)
Number of students enrolled in tertiary education in a given country of destination as a percentage of all students enrolled abroad, based on head counts
The table shows, for each country, the proportion of students studying in tertiary education abroad that study in a given country of destination.
Reading the second column: 7.1% of Czech citizens enrolled in tertiary education abroad study in Austria, 9.9% of German citizens enrolled in tertiary education abroad study in Austria, etc.
Reading the first row: 6.9% of Australian citizens enrolled in tertiary education abroad study in Canada, 3.5% of Australian citizens enrolled in tertiary education abroad study in Germany, etc.
Countries of destination
OeCD countries
Aus
tral
ia1
Aus
tria
2
bel
gium
Can
ada4
Cze
ch R
epub
lic
Den
mar
k
Finl
and
Fran
ce
ger
man
y2,3
gre
ece
Hun
gary
Icel
and
Irel
and
Ital
y
Jap
an
Kor
ea
Countries of origin (1) (2) (3) (4) (5) (6) (7) (8) (9) (10) (11) (12) (13) (14) (15) (16)
OeC
D c
ount
ries Australia a 0.2 0.4 6.9 n 0.4 0.3 2.2 3.5 n n n 0.6 0.4 3.7 0.3
Austria 1.1 a 0.4 1.4 0.1 0.3 0.3 4.0 56.0 n 0.3 n 0.3 1.7 0.3 nbelgium 0.6 0.7 a 2.8 n 0.2 0.2 26.0 9.3 0.1 n n 0.7 1.6 0.3 0.1Canada 7.9 0.1 0.3 a n 0.2 0.2 3.2 1.4 n 0.2 n 0.8 0.3 0.7 0.3Czech Republic 1.6 7.1 1.0 2.0 a 0.3 0.7 9.4 35.1 0.1 0.2 0.1 0.4 2.1 0.5 nDenmark 1.6 1.0 0.6 3.2 n a 0.7 4.7 10.6 n n 0.8 0.3 1.0 0.3 nFinland 0.8 1.4 0.7 1.5 0.1 1.3 a 3.3 10.6 n 0.3 0.3 1.0 1.0 0.4 0.1France 0.9 0.7 23.4 11.1 n 0.3 0.2 a 11.7 n 0.1 n 1.1 1.4 0.5 ngermany 2.2 9.9 0.8 2.3 0.1 1.2 0.4 10.8 a 0.2 1.2 0.1 1.0 2.2 0.5 0.1greece 0.1 0.5 1.1 0.4 0.3 0.1 0.1 4.5 14.8 a 0.3 n 0.1 14.0 n nHungary 0.8 16.7 1.2 1.5 0.2 0.7 1.3 6.7 38.5 n a n 0.2 2.3 1.3 nIceland 0.5 0.8 0.3 1.5 0.1 37.1 0.8 1.7 5.2 n 0.7 a n 0.6 0.2 nIreland 0.9 0.2 0.3 1.1 0.1 0.3 0.2 2.9 2.7 n n n a 0.1 0.1 nItaly 0.4 13.9 6.1 0.8 n 0.3 0.2 10.4 18.1 n 0.1 n 0.3 a 0.2 nJapan 5.2 0.4 0.3 2.8 n 0.1 0.2 3.8 4.1 n n n 0.1 0.4 a 1.5Korea 4.0 0.3 0.1 3.4 n n n 2.4 5.6 n n n n n 23.7 aluxembourg 0.1 4.9 21.3 0.2 n n n 24.8 30.1 0.1 n n 0.2 0.4 n nMexico 1.5 0.2 0.4 6.3 n 0.2 0.1 5.9 4.0 n n n 0.1 0.6 0.5 0.1Netherlands 1.3 1.0 25.1 3.4 0.1 0.9 0.6 5.0 15.3 n n 0.1 0.5 0.8 0.5 nNew Zealand 68.5 0.1 n 2.4 n 0.2 0.1 0.6 1.0 n n n 0.1 0.1 1.3 0.4Norway 20.8 0.4 0.2 1.5 0.7 11.1 0.4 2.1 5.1 n 4.3 0.1 1.3 0.7 0.2 nPoland 0.7 4.5 1.3 2.6 0.4 1.2 0.4 10.7 50.6 0.1 0.4 n 0.3 3.3 0.3 nPortugal 0.3 0.4 6.0 2.5 0.3 0.3 0.2 21.2 15.1 n n n 0.2 0.7 0.2 nSlovak Republic 0.7 9.6 0.4 0.7 49.1 0.1 0.1 2.8 10.4 n 15.6 n 0.1 0.9 0.1 nSpain 0.3 1.2 4.6 0.8 n 0.6 0.4 14.2 21.8 n 0.1 n 1.0 1.5 0.3 nSweden 7.5 1.3 0.3 2.4 0.3 6.6 3.9 4.8 6.0 0.1 0.7 0.2 0.4 0.9 0.6 nSwitzerland 2.8 2.5 1.1 4.3 n 0.5 0.4 14.2 21.0 n 0.1 n 0.2 10.4 0.4 0.1Turkey 0.5 3.7 0.6 0.9 n 0.3 0.1 4.2 50.7 0.1 0.1 n n 0.3 0.3 nunited Kingdom 6.4 0.7 1.1 9.7 1.0 1.8 0.7 10.2 8.4 0.1 0.1 n 8.4 1.0 1.6 nunited States 7.4 0.7 0.4 16.9 0.2 0.6 0.4 5.8 7.3 0.1 0.5 0.1 4.3 0.7 2.7 0.7
Total from OECD countries
3.6 2.8 3.3 3.8 1.1 0.9 0.3 6.2 14.2 n 0.6 n 0.9 1.8 3.4 0.2
Part
ner
coun
trie
s brazil 1.7 0.2 0.7 3.1 n 0.3 0.1 8.0 8.2 n n n n 2.9 2.0 0.1Chile 1.1 0.2 1.5 3.5 n 0.4 0.1 6.7 8.1 n n n n 2.3 0.4 nChina 7.4 0.2 0.4 4.8 n 0.3 0.3 3.0 6.6 n n n 0.3 n 20.0 1.7India 12.1 n 0.1 3.3 n 0.1 0.1 0.4 3.3 n n n 0.2 0.2 0.2 0.1Israel 2.1 0.3 0.4 5.6 0.8 0.4 0.2 2.5 8.2 0.3 5.2 n n 6.7 0.3 nRussian Federation 1.2 0.9 1.2 3.5 1.1 0.9 3.0 6.8 29.9 0.4 0.6 0.1 0.2 1.3 1.0 0.4
Note: The proportion of students abroad is based only on the total of students enrolled in countries reporting data to the OECD and to the UNESCO Institute for Statistics.1. Data by country of origin relate to international students defined on the basis of their country of residence. 2. Excludes tertiary-type B programmes.3. Excludes advanced research programmes.4. Year of reference 2002.Source: OECD. See Annex 3 for notes (www.oecd.org/edu/eag2006).Please refer to the Reader’s Guide for information concerning the symbols replacing missing data.
StatLink: http://dx.doi.org/10.1787/221673686112
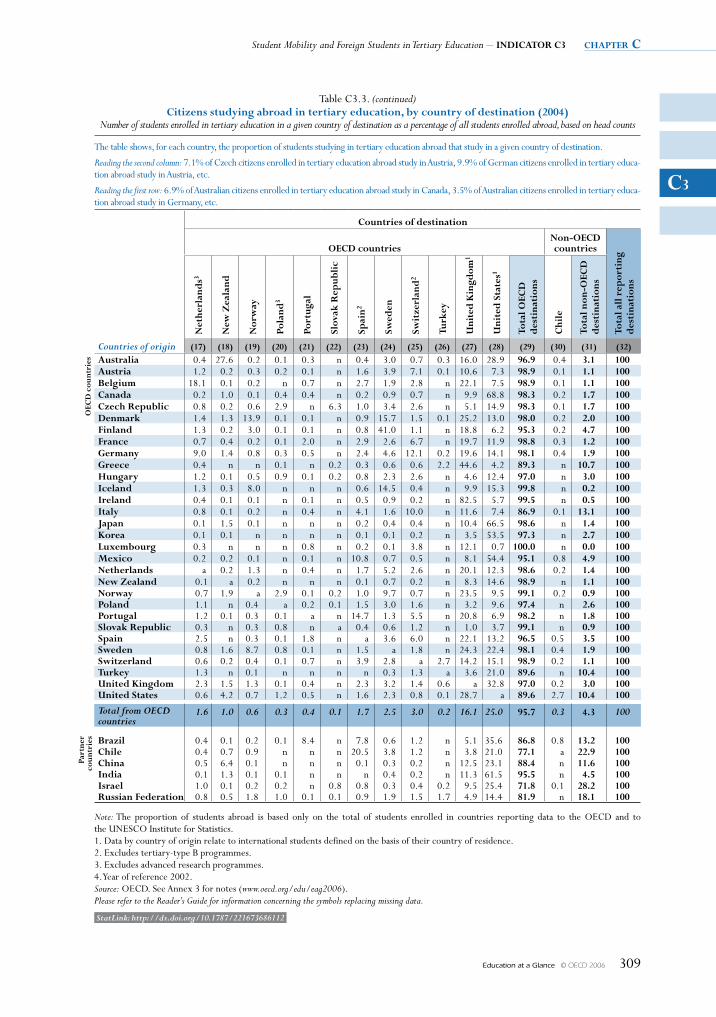
Student Mobility and Foreign Students in Tertiary Education – INDICATOR C3 chapter c
Education at a Glance © OECD 2006 309
C3
Table C3.3. (continued)Citizens studying abroad in tertiary education, by country of destination (2004)
Number of students enrolled in tertiary education in a given country of destination as a percentage of all students enrolled abroad, based on head counts
The table shows, for each country, the proportion of students studying in tertiary education abroad that study in a given country of destination.
Reading the second column: 7.1% of Czech citizens enrolled in tertiary education abroad study in Austria, 9.9% of German citizens enrolled in tertiary educa-tion abroad study in Austria, etc.
Reading the first row: 6.9% of Australian citizens enrolled in tertiary education abroad study in Canada, 3.5% of Australian citizens enrolled in tertiary educa-tion abroad study in Germany, etc.
Countries of destination
OeCD countriesNon-OeCD countries
Tota
l all
rep
orti
ng
des
tina
tion
s
Net
herl
and
s3
New
Zea
land
Nor
way
Pola
nd3
Port
ugal
Slov
ak R
epub
lic
Spai
n2
Swed
en
Swit
zerl
and
2
Turk
ey
uni
ted
Kin
gdom
1
uni
ted
Sta
tes1
Tota
l OeC
D
des
tina
tion
s
Chi
le
Tota
l non
-OeC
D
des
tina
tion
s
Countries of origin (17) (18) (19) (20) (21) (22) (23) (24) (25) (26) (27) (28) (29) (30) (31) (32)
OeC
D c
ount
ries Australia 0.4 27.6 0.2 0.1 0.3 n 0.4 3.0 0.7 0.3 16.0 28.9 96.9 0.4 3.1 100
Austria 1.2 0.2 0.3 0.2 0.1 n 1.6 3.9 7.1 0.1 10.6 7.3 98.9 0.1 1.1 100belgium 18.1 0.1 0.2 n 0.7 n 2.7 1.9 2.8 n 22.1 7.5 98.9 0.1 1.1 100Canada 0.2 1.0 0.1 0.4 0.4 n 0.2 0.9 0.7 n 9.9 68.8 98.3 0.2 1.7 100Czech Republic 0.8 0.2 0.6 2.9 n 6.3 1.0 3.4 2.6 n 5.1 14.9 98.3 0.1 1.7 100Denmark 1.4 1.3 13.9 0.1 0.1 n 0.9 15.7 1.5 0.1 25.2 13.0 98.0 0.2 2.0 100Finland 1.3 0.2 3.0 0.1 0.1 n 0.8 41.0 1.1 n 18.8 6.2 95.3 0.2 4.7 100France 0.7 0.4 0.2 0.1 2.0 n 2.9 2.6 6.7 n 19.7 11.9 98.8 0.3 1.2 100germany 9.0 1.4 0.8 0.3 0.5 n 2.4 4.6 12.1 0.2 19.6 14.1 98.1 0.4 1.9 100greece 0.4 n n 0.1 n 0.2 0.3 0.6 0.6 2.2 44.6 4.2 89.3 n 10.7 100Hungary 1.2 0.1 0.5 0.9 0.1 0.2 0.8 2.3 2.6 n 4.6 12.4 97.0 n 3.0 100Iceland 1.3 0.3 8.0 n n n 0.6 14.5 0.4 n 9.9 15.3 99.8 n 0.2 100Ireland 0.4 0.1 0.1 n 0.1 n 0.5 0.9 0.2 n 82.5 5.7 99.5 n 0.5 100Italy 0.8 0.1 0.2 n 0.4 n 4.1 1.6 10.0 n 11.6 7.4 86.9 0.1 13.1 100Japan 0.1 1.5 0.1 n n n 0.2 0.4 0.4 n 10.4 66.5 98.6 n 1.4 100Korea 0.1 0.1 n n n n 0.1 0.1 0.2 n 3.5 53.5 97.3 n 2.7 100luxembourg 0.3 n n n 0.8 n 0.2 0.1 3.8 n 12.1 0.7 100.0 n 0.0 100Mexico 0.2 0.2 0.1 n 0.1 n 10.8 0.7 0.5 n 8.1 54.4 95.1 0.8 4.9 100Netherlands a 0.2 1.3 n 0.4 n 1.7 5.2 2.6 n 20.1 12.3 98.6 0.2 1.4 100New Zealand 0.1 a 0.2 n n n 0.1 0.7 0.2 n 8.3 14.6 98.9 n 1.1 100Norway 0.7 1.9 a 2.9 0.1 0.2 1.0 9.7 0.7 n 23.5 9.5 99.1 0.2 0.9 100Poland 1.1 n 0.4 a 0.2 0.1 1.5 3.0 1.6 n 3.2 9.6 97.4 n 2.6 100Portugal 1.2 0.1 0.3 0.1 a n 14.7 1.3 5.5 n 20.8 6.9 98.2 n 1.8 100Slovak Republic 0.3 n 0.3 0.8 n a 0.4 0.6 1.2 n 1.0 3.7 99.1 n 0.9 100Spain 2.5 n 0.3 0.1 1.8 n a 3.6 6.0 n 22.1 13.2 96.5 0.5 3.5 100Sweden 0.8 1.6 8.7 0.8 0.1 n 1.5 a 1.8 n 24.3 22.4 98.1 0.4 1.9 100Switzerland 0.6 0.2 0.4 0.1 0.7 n 3.9 2.8 a 2.7 14.2 15.1 98.9 0.2 1.1 100Turkey 1.3 n 0.1 n n n n 0.3 1.3 a 3.6 21.0 89.6 n 10.4 100united Kingdom 2.3 1.5 1.3 0.1 0.4 n 2.3 3.2 1.4 0.6 a 32.8 97.0 0.2 3.0 100united States 0.6 4.2 0.7 1.2 0.5 n 1.6 2.3 0.8 0.1 28.7 a 89.6 2.7 10.4 100
Total from OECD countries
1.6 1.0 0.6 0.3 0.4 0.1 1.7 2.5 3.0 0.2 16.1 25.0 95.7 0.3 4.3 100
Part
ner
coun
trie
s brazil 0.4 0.1 0.2 0.1 8.4 n 7.8 0.6 1.2 n 5.1 35.6 86.8 0.8 13.2 100Chile 0.4 0.7 0.9 n n n 20.5 3.8 1.2 n 3.8 21.0 77.1 a 22.9 100China 0.5 6.4 0.1 n n n 0.1 0.3 0.2 n 12.5 23.1 88.4 n 11.6 100India 0.1 1.3 0.1 0.1 n n n 0.4 0.2 n 11.3 61.5 95.5 n 4.5 100Israel 1.0 0.1 0.2 0.2 n 0.8 0.8 0.3 0.4 0.2 9.5 25.4 71.8 0.1 28.2 100Russian Federation 0.8 0.5 1.8 1.0 0.1 0.1 0.9 1.9 1.5 1.7 4.9 14.4 81.9 n 18.1 100
Note: The proportion of students abroad is based only on the total of students enrolled in countries reporting data to the OECD and to the UNESCO Institute for Statistics.1. Data by country of origin relate to international students defined on the basis of their country of residence. 2. Excludes tertiary-type B programmes.3. Excludes advanced research programmes.4. Year of reference 2002.Source: OECD. See Annex 3 for notes (www.oecd.org/edu/eag2006).Please refer to the Reader’s Guide for information concerning the symbols replacing missing data.
StatLink: http://dx.doi.org/10.1787/221673686112
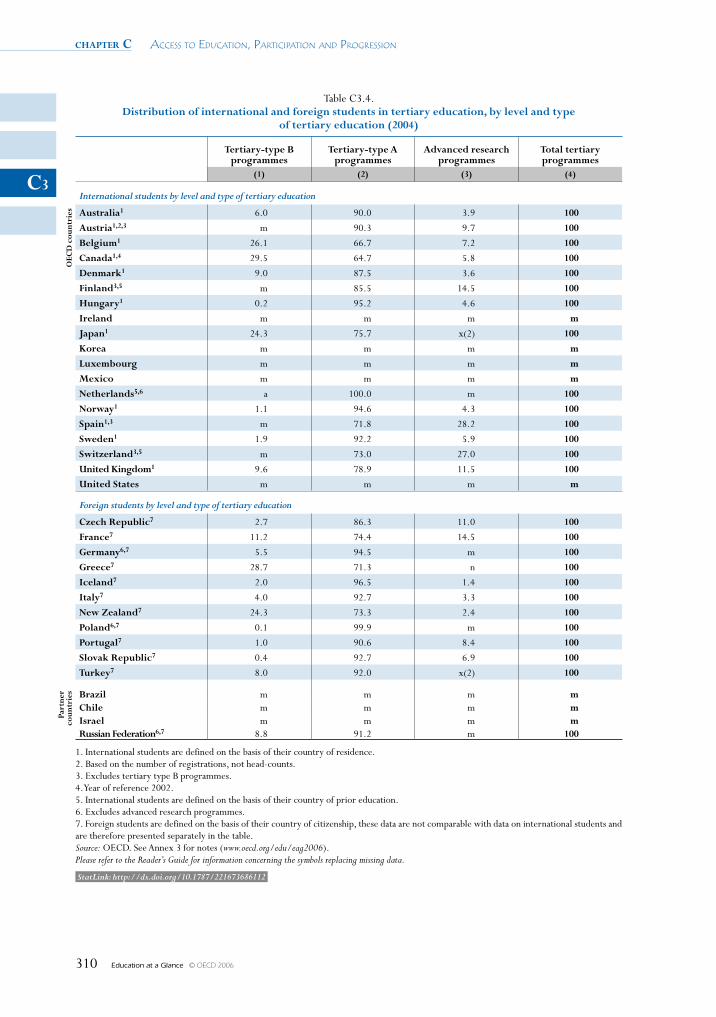
chapter c Access to educAtion, PArticiPAtion And Progression
Education at a Glance © OECD 2006310
C3
Table C3.4. Distribution of international and foreign students in tertiary education, by level and type
of tertiary education (2004)
Tertiary-type b programmes
Tertiary-type A programmes
Advanced research programmes
Total tertiary programmes
(1) (2) (3) (4)
International students by level and type of tertiary education
OeC
D c
ount
ries Australia1 6.0 90.0 3.9 100
Austria1,2,3 m 90.3 9.7 100
belgium1 26.1 66.7 7.2 100
Canada1,4 29.5 64.7 5.8 100
Denmark1 9.0 87.5 3.6 100
Finland3,5 m 85.5 14.5 100
Hungary1 0.2 95.2 4.6 100
Ireland m m m m
Japan1 24.3 75.7 x(2) 100
Korea m m m m
luxembourg m m m m
Mexico m m m m
Netherlands5,6 a 100.0 m 100
Norway1 1.1 94.6 4.3 100
Spain1,3 m 71.8 28.2 100
Sweden1 1.9 92.2 5.9 100
Switzerland3,5 m 73.0 27.0 100
united Kingdom1 9.6 78.9 11.5 100 united States m m m m
Foreign students by level and type of tertiary education
Czech Republic7 2.7 86.3 11.0 100
France7 11.2 74.4 14.5 100
germany6,7 5.5 94.5 m 100
greece7 28.7 71.3 n 100
Iceland7 2.0 96.5 1.4 100
Italy7 4.0 92.7 3.3 100
New Zealand7 24.3 73.3 2.4 100
Poland6,7 0.1 99.9 m 100
Portugal7 1.0 90.6 8.4 100
Slovak Republic7 0.4 92.7 6.9 100
Turkey7 8.0 92.0 x(2) 100
Part
ner
coun
trie
s brazil m m m m Chile m m m m Israel m m m m Russian Federation6,7 8.8 91.2 m 100
1. International students are defined on the basis of their country of residence.2. Based on the number of registrations, not head-counts. 3. Excludes tertiary type B programmes.4. Year of reference 2002.5. International students are defined on the basis of their country of prior education. 6. Excludes advanced research programmes.7. Foreign students are defined on the basis of their country of citizenship, these data are not comparable with data on international students and are therefore presented separately in the table.Source: OECD. See Annex 3 for notes (www.oecd.org/edu/eag2006).Please refer to the Reader’s Guide for information concerning the symbols replacing missing data.
StatLink: http://dx.doi.org/10.1787/221673686112
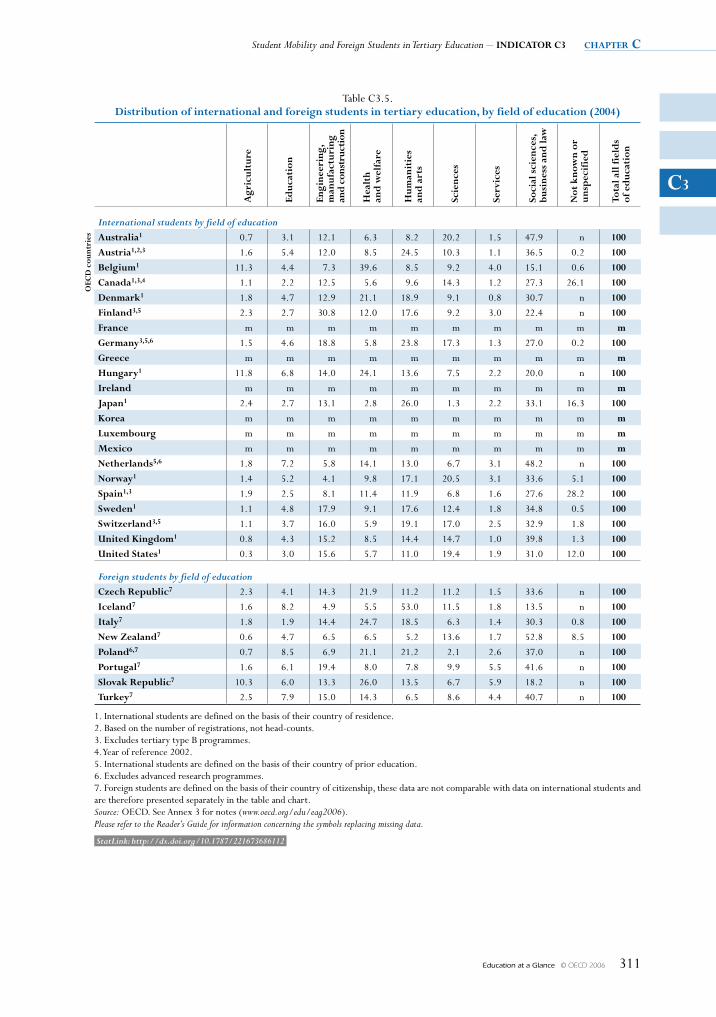
Student Mobility and Foreign Students in Tertiary Education – INDICATOR C3 chapter c
Education at a Glance © OECD 2006 311
C3
Table C3.5. Distribution of international and foreign students in tertiary education, by field of education (2004)
Agr
icul
ture
educ
atio
n
engi
neer
ing,
m
anuf
actu
ring
an
d co
nstr
ucti
on
Hea
lth
an
d w
elfa
re
Hum
anit
ies
an
d a
rts
Scie
nces
Serv
ices
Soci
al s
cien
ces,
bu
sine
ss a
nd la
w
Not
kno
wn
or
unsp
ecif
ied
Tota
l all
fiel
ds
of
ed
ucat
ion
International students by field of education
OeC
D c
ount
ries Australia1 0.7 3.1 12.1 6.3 8.2 20.2 1.5 47.9 n 100
Austria1,2,3 1.6 5.4 12.0 8.5 24.5 10.3 1.1 36.5 0.2 100
belgium1 11.3 4.4 7.3 39.6 8.5 9.2 4.0 15.1 0.6 100
Canada1,3,4 1.1 2.2 12.5 5.6 9.6 14.3 1.2 27.3 26.1 100
Denmark1 1.8 4.7 12.9 21.1 18.9 9.1 0.8 30.7 n 100
Finland3,5 2.3 2.7 30.8 12.0 17.6 9.2 3.0 22.4 n 100
France m m m m m m m m m m
germany3,5,6 1.5 4.6 18.8 5.8 23.8 17.3 1.3 27.0 0.2 100
greece m m m m m m m m m m
Hungary1 11.8 6.8 14.0 24.1 13.6 7.5 2.2 20.0 n 100
Ireland m m m m m m m m m m
Japan1 2.4 2.7 13.1 2.8 26.0 1.3 2.2 33.1 16.3 100
Korea m m m m m m m m m m
luxembourg m m m m m m m m m m
Mexico m m m m m m m m m m
Netherlands5,6 1.8 7.2 5.8 14.1 13.0 6.7 3.1 48.2 n 100
Norway1 1.4 5.2 4.1 9.8 17.1 20.5 3.1 33.6 5.1 100
Spain1,3 1.9 2.5 8.1 11.4 11.9 6.8 1.6 27.6 28.2 100
Sweden1 1.1 4.8 17.9 9.1 17.6 12.4 1.8 34.8 0.5 100
Switzerland3,5 1.1 3.7 16.0 5.9 19.1 17.0 2.5 32.9 1.8 100
united Kingdom1 0.8 4.3 15.2 8.5 14.4 14.7 1.0 39.8 1.3 100united States1 0.3 3.0 15.6 5.7 11.0 19.4 1.9 31.0 12.0 100
Foreign students by field of educationCzech Republic7 2.3 4.1 14.3 21.9 11.2 11.2 1.5 33.6 n 100
Iceland7 1.6 8.2 4.9 5.5 53.0 11.5 1.8 13.5 n 100
Italy7 1.8 1.9 14.4 24.7 18.5 6.3 1.4 30.3 0.8 100
New Zealand7 0.6 4.7 6.5 6.5 5.2 13.6 1.7 52.8 8.5 100
Poland6,7 0.7 8.5 6.9 21.1 21.2 2.1 2.6 37.0 n 100
Portugal7 1.6 6.1 19.4 8.0 7.8 9.9 5.5 41.6 n 100
Slovak Republic7 10.3 6.0 13.3 26.0 13.5 6.7 5.9 18.2 n 100Turkey7 2.5 7.9 15.0 14.3 6.5 8.6 4.4 40.7 n 100
1. International students are defined on the basis of their country of residence.2. Based on the number of registrations, not head-counts.3. Excludes tertiary type B programmes.4. Year of reference 2002.5. International students are defined on the basis of their country of prior education. 6. Excludes advanced research programmes.7. Foreign students are defined on the basis of their country of citizenship, these data are not comparable with data on international students and are therefore presented separately in the table and chart.Source: OECD. See Annex 3 for notes (www.oecd.org/edu/eag2006).Please refer to the Reader’s Guide for information concerning the symbols replacing missing data.
StatLink: http://dx.doi.org/10.1787/221673686112
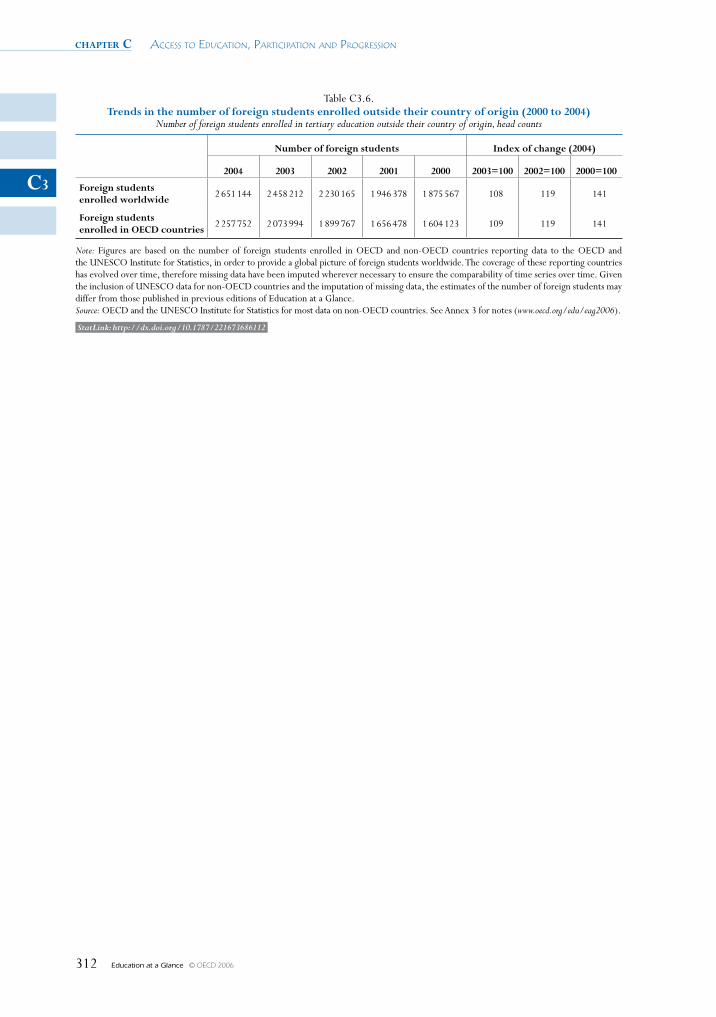
chapter c Access to educAtion, PArticiPAtion And Progression
Education at a Glance © OECD 2006312
C3
Table C3.6. Trends in the number of foreign students enrolled outside their country of origin (2000 to 2004)
Number of foreign students enrolled in tertiary education outside their country of origin, head counts
Number of foreign students Index of change (2004)
2004 2003 2002 2001 2000 2003=100 2002=100 2000=100
Foreign students enrolled worldwide 2 651 144 2 458 212 2 230 165 1 946 378 1 875 567 108 119 141
Foreign students enrolled in OeCD countries 2 257 752 2 073 994 1 899 767 1 656 478 1 604 123 109 119 141
Note: Figures are based on the number of foreign students enrolled in OECD and non-OECD countries reporting data to the OECD and the UNESCO Institute for Statistics, in order to provide a global picture of foreign students worldwide. The coverage of these reporting countries has evolved over time, therefore missing data have been imputed wherever necessary to ensure the comparability of time series over time. Given the inclusion of UNESCO data for non-OECD countries and the imputation of missing data, the estimates of the number of foreign students may differ from those published in previous editions of Education at a Glance.Source: OECD and the UNESCO Institute for Statistics for most data on non-OECD countries. See Annex 3 for notes (www.oecd.org/edu/eag2006).
StatLink: http://dx.doi.org/10.1787/221673686112
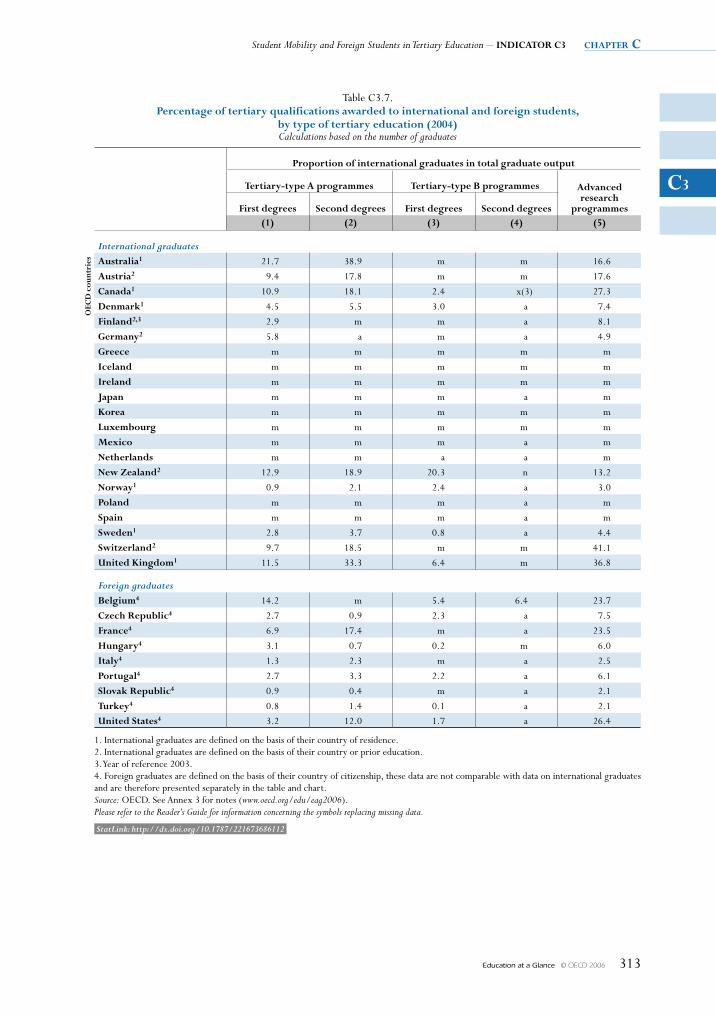
Student Mobility and Foreign Students in Tertiary Education – INDICATOR C3 chapter c
Education at a Glance © OECD 2006 313
C3
Table C3.7. Percentage of tertiary qualifications awarded to international and foreign students,
by type of tertiary education (2004) Calculations based on the number of graduates
Proportion of international graduates in total graduate output
Tertiary-type A programmes Tertiary-type b programmes Advanced research
programmesFirst degrees Second degrees First degrees Second degrees(1) (2) (3) (4) (5)
International graduates
OeC
D c
ount
ries Australia1 21.7 38.9 m m 16.6
Austria2 9.4 17.8 m m 17.6
Canada1 10.9 18.1 2.4 x(3) 27.3
Denmark1 4.5 5.5 3.0 a 7.4
Finland2,3 2.9 m m a 8.1
germany2 5.8 a m a 4.9
greece m m m m m
Iceland m m m m m
Ireland m m m m m
Japan m m m a m
Korea m m m m m
luxembourg m m m m m
Mexico m m m a m
Netherlands m m a a m
New Zealand2 12.9 18.9 20.3 n 13.2
Norway1 0.9 2.1 2.4 a 3.0
Poland m m m a m
Spain m m m a m
Sweden1 2.8 3.7 0.8 a 4.4
Switzerland2 9.7 18.5 m m 41.1
united Kingdom1 11.5 33.3 6.4 m 36.8
Foreign graduatesbelgium4 14.2 m 5.4 6.4 23.7
Czech Republic4 2.7 0.9 2.3 a 7.5
France4 6.9 17.4 m a 23.5
Hungary4 3.1 0.7 0.2 m 6.0
Italy4 1.3 2.3 m a 2.5
Portugal4 2.7 3.3 2.2 a 6.1
Slovak Republic4 0.9 0.4 m a 2.1
Turkey4 0.8 1.4 0.1 a 2.1
united States4 3.2 12.0 1.7 a 26.4
1. International graduates are defined on the basis of their country of residence.2. International graduates are defined on the basis of their country or prior education.3. Year of reference 2003.4. Foreign graduates are defined on the basis of their country of citizenship, these data are not comparable with data on international graduates and are therefore presented separately in the table and chart.Source: OECD. See Annex 3 for notes (www.oecd.org/edu/eag2006).Please refer to the Reader’s Guide for information concerning the symbols replacing missing data.
StatLink: http://dx.doi.org/10.1787/221673686112
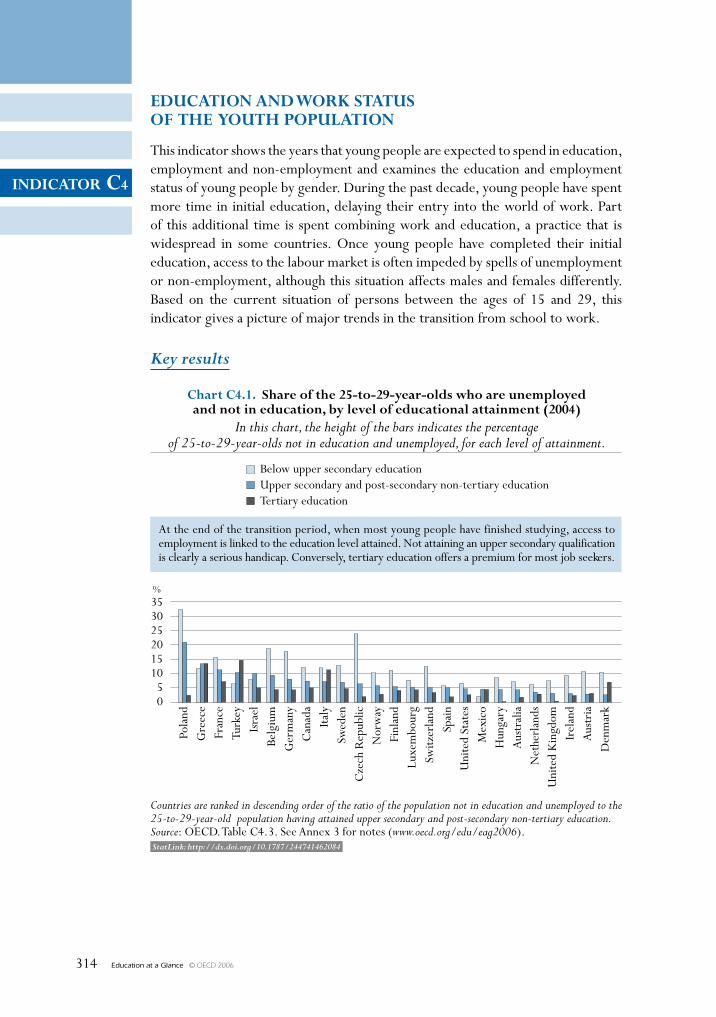
Education at a Glance © OECD 2006314
INDICATOR C4
StatLink: http://dx.doi.org/10.1787/244741462084
EDuCATION AND wORk sTATus Of ThE yOuTh POPulATION
This indicator shows the years that young people are expected to spend in education, employment and non-employment and examines the education and employment status of young people by gender. During the past decade, young people have spent more time in initial education, delaying their entry into the world of work. Part of this additional time is spent combining work and education, a practice that is widespread in some countries. Once young people have completed their initial education, access to the labour market is often impeded by spells of unemployment or non-employment, although this situation affects males and females differently. Based on the current situation of persons between the ages of 15 and 29, this indicator gives a picture of major trends in the transition from school to work.
Key results
353025201510
50
%
Chart C4.1. share of the 25-to-29-year-olds who are unemployedand not in education, by level of educational attainment (2004)
In this chart, the height of the bars indicates the percentageof 25-to-29-year-olds not in education and unemployed, for each level of attainment.
Below upper secondary educationUpper secondary and post-secondary non-tertiary educationTertiary education
Countries are ranked in descending order of the ratio of the population not in education and unemployed to the25-to-29-year-old population having attained upper secondary and post-secondary non-tertiary education.Source: OECD. Table C4.3. See Annex 3 for notes (www.oecd.org/edu/eag2006).
Pola
ndG
reec
eFr
ance
Turk
eyIs
rael
Belg
ium
Ger
man
yC
anad
aIta
lySw
eden
Cze
ch R
epub
licN
orw
ayFi
nlan
dLu
xem
bour
gSw
itzer
land
Spai
nU
nite
d St
ates
Mex
ico
Hun
gary
Aus
tral
iaN
ethe
rlan
dsU
nite
d K
ingd
omIr
elan
dA
ustr
iaD
enm
ark
At the end of the transition period, when most young people have finished studying, access toemployment is linked to the education level attained. Not attaining an upper secondary qualificationis clearly a serious handicap. Conversely, tertiary education offers a premium for most job seekers.
Education at a Glance © OECD 2006 315
INDICATOR C4
Other highlights of this indicator
• On average across OECD member countries, a young person aged 15 in 2004 can expect to continue in formal education for a little under seven years. In 18 of the 29 countries for which data are available, including Israel, this period ranges from five and a half years to seven and a half years. However, the range of this figure is wide, from a low of 3 years to a high of 9.7 years.
• In addition to the expected number of years spent in education, a young person aged 15 can expect to hold a job for 6 of the 15 years to come, to be unemployed for a total of 0.9 years and to be out of the labour market for 1.3 years.
• The percentage of 20-to-24-year-olds not in education ranges from 50 to 70% in 19 out of 27 OECD countries for which data are available. In 19 OECD countries, a higher proportion of female 15-to-19-year-olds take part in education than do males of the same age group. Males in the 15-to-19-year-old age group are more likely to be employed.
• In some countries, education and work largely occur consecutively, while in other countries they are concurrent. Work-study programmes, relatively common in European countries, offer coherent vocational education routes to recognised occupational qualifications. In other countries, initial education and work are rarely associated.
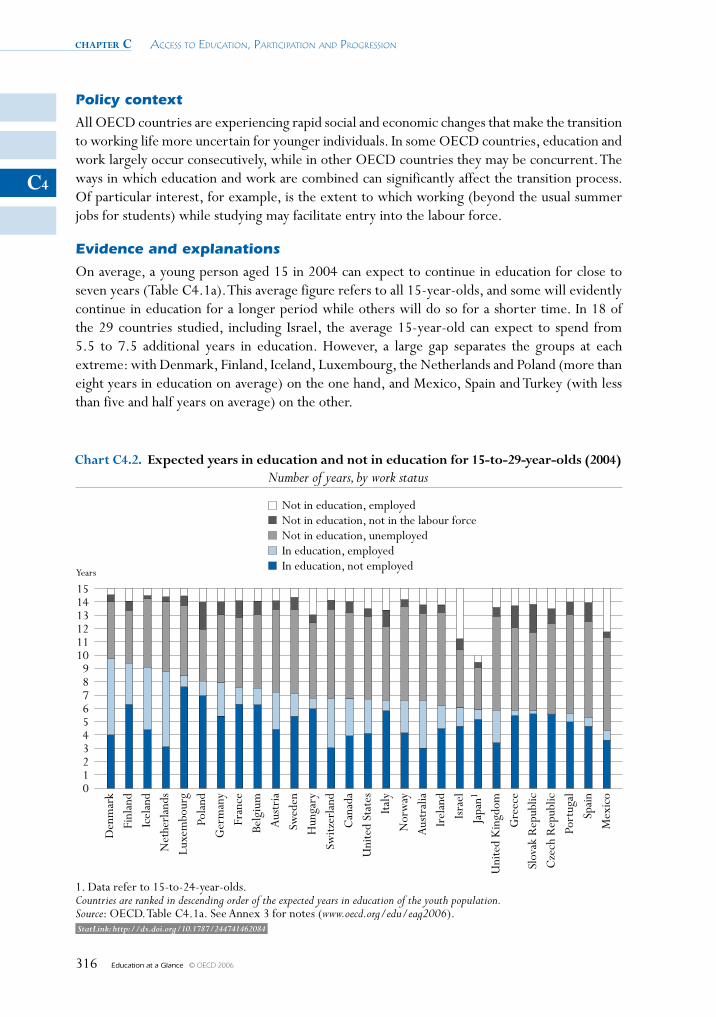
chapter c Access to educAtion, PArticiPAtion And Progression
Education at a Glance © OECD 2006316
C4
Policy context
All OECD countries are experiencing rapid social and economic changes that make the transition to working life more uncertain for younger individuals. In some OECD countries, education and work largely occur consecutively, while in other OECD countries they may be concurrent. The ways in which education and work are combined can significantly affect the transition process. Of particular interest, for example, is the extent to which working (beyond the usual summer jobs for students) while studying may facilitate entry into the labour force.
Evidence and explanations
On average, a young person aged 15 in 2004 can expect to continue in education for close to seven years (Table C4.1a). This average figure refers to all 15-year-olds, and some will evidently continue in education for a longer period while others will do so for a shorter time. In 18 of the 29 countries studied, including Israel, the average 15-year-old can expect to spend from 5.5 to 7.5 additional years in education. However, a large gap separates the groups at each extreme: with Denmark, Finland, Iceland, Luxembourg, the Netherlands and Poland (more than eight years in education on average) on the one hand, and Mexico, Spain and Turkey (with less than five and half years on average) on the other.
151413121110
9876543210
Years
Chart C4.2. Expected years in education and not in education for 15-to-29-year-olds (2004)Number of years, by work status
Not in education, employedNot in education, not in the labour forceNot in education, unemployedIn education, employedIn education, not employed
Den
mar
kFi
nlan
dIc
elan
dN
ethe
rlan
ds
Luxe
mbo
urg
Pola
ndG
erm
any
Fran
ceBe
lgiu
mA
ustr
iaSw
eden
Hun
gary
Switz
erla
nd
Can
ada
Uni
ted
Stat
es
Italy
Nor
way
Aus
tral
iaIr
elan
dIs
rael
Japa
n1
Uni
ted
Kin
gdom
Gre
ece
Slov
ak R
epub
lic
Cze
ch R
epub
lic
Port
ugal
Spai
nM
exic
o
1. Data refer to 15-to-24-year-olds.Countries are ranked in descending order of the expected years in education of the youth population.Source: OECD. Table C4.1a. See Annex 3 for notes (www.oecd.org/edu/eag2006). StatLink: http://dx.doi.org/10.1787/244741462084
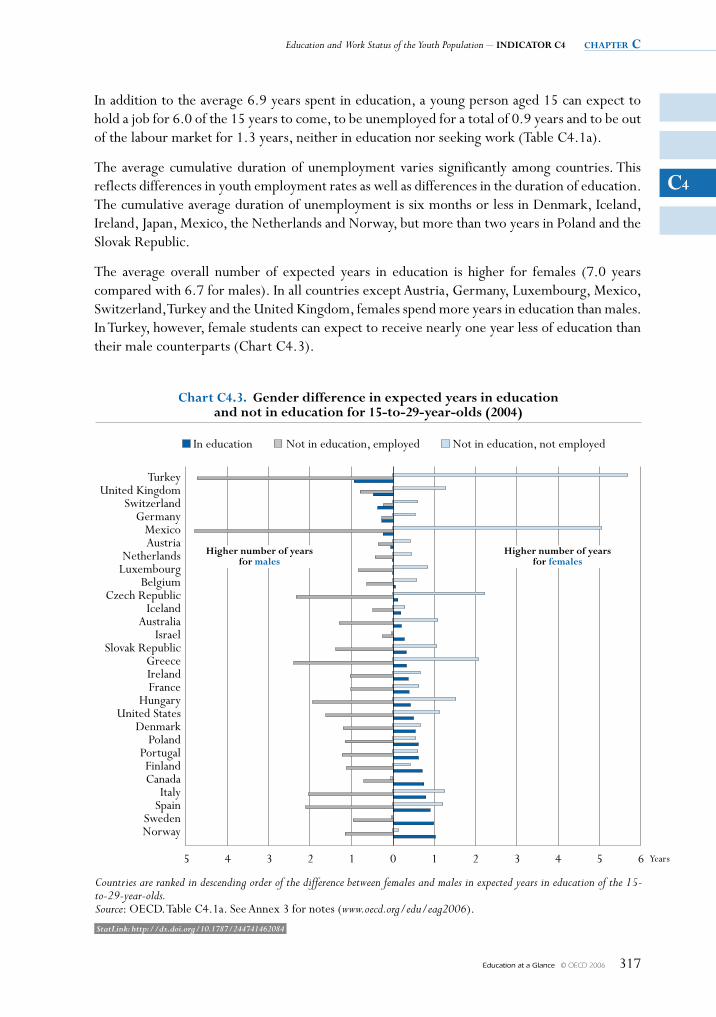
Education and Work Status of the Youth Population – INDICATOR C4 chapter c
Education at a Glance © OECD 2006 317
C4
In addition to the average 6.9 years spent in education, a young person aged 15 can expect to hold a job for 6.0 of the 15 years to come, to be unemployed for a total of 0.9 years and to be out of the labour market for 1.3 years, neither in education nor seeking work (Table C4.1a).
The average cumulative duration of unemployment varies significantly among countries. This reflects differences in youth employment rates as well as differences in the duration of education. The cumulative average duration of unemployment is six months or less in Denmark, Iceland, Ireland, Japan, Mexico, the Netherlands and Norway, but more than two years in Poland and the Slovak Republic.
The average overall number of expected years in education is higher for females (7.0 years compared with 6.7 for males). In all countries except Austria, Germany, Luxembourg, Mexico, Switzerland, Turkey and the United Kingdom, females spend more years in education than males. In Turkey, however, female students can expect to receive nearly one year less of education than their male counterparts (Chart C4.3).
5 Years4 3 2 1 0 1 2 3 4 5 6
Chart C4.3. Gender difference in expected years in educationand not in education for 15-to-29-year-olds (2004)
Countries are ranked in descending order of the difference between females and males in expected years in education of the 15-to-29-year-olds.Source: OECD. Table C4.1a. See Annex 3 for notes (www.oecd.org/edu/eag2006).
TurkeyUnited Kingdom
SwitzerlandGermany
MexicoAustria
NetherlandsLuxembourg
BelgiumCzech Republic
IcelandAustralia
IsraelSlovak Republic
GreeceIrelandFrance
HungaryUnited States
DenmarkPoland
PortugalFinlandCanada
ItalySpain
SwedenNorway
higher number of yearsfor females
In education
higher number of yearsfor males
Not in education, employed Not in education, not employed
StatLink: http://dx.doi.org/10.1787/244741462084
chapter c Access to educAtion, PArticiPAtion And Progression
Education at a Glance © OECD 2006318
C4
By and large, males and females differ very little in terms of the expected number of years in unemployment, even though expected periods of unemployment tend to be longer for males. While the situation is similar for both genders in many countries, females appear to be at a particular advantage in Canada, Finland, Germany, Poland, the Slovak Republic and Turkey. Periods of unemployment for females exceed those for males in only six countries: Denmark, Greece, Luxembourg, Portugal, Spain and Switzerland (Table C4.1a).
Whereas young males can expect to spend 1.6 years neither in education nor in employment between the ages of 15 and 29, the average figure for females is 2.7 years. In the Czech Republic, Greece, Hungary, Mexico, the Slovak Republic and Turkey, there is a much stronger tendency for young females to leave the labour market and to spend time out of the educational system and not working. In some countries – Austria, Canada, Finland, Germany, Iceland, Japan, Norway, Portugal and Sweden – young males and young females do not differ by more than half a year in this measure.
Conversely, relative to males, females between the ages of 15 and 29 in all OECD countries can expect a lower duration of employment after education; this is partially a consequence of the time spent in education, but is also attributable to other factors such as time spent in childrearing (Table C4.1a).
Combining work and education
Countries differ not only in the duration of education, but also in how education is combined with work experience. The 27 OECD countries which provide data on youth transitions show differences in both the duration of education and how education is combined with work experience or work study programmes (Table C4.2a). On average, 16.5% of 15-to-19-year-olds combine education with work. However, in Austria, Germany, Norway and the United States this figure is equal to or above 20%. In Australia, Canada, Switzerland and the United Kingdom, the figure is close to or above 30%.
The employment status of males and females during the years spent in education is broadly similar, except in Australia, Austria, the Czech Republic, Germany, the Slovak Repubic and the United Kingdom, where noticeably more men participate in work-study programmes among 15-to-19-year-olds. In Australia, Canada, the United Kingdom and the United States, more females than males in the 20-to-24-year-old age group combine work outside school hours with education (Tables C4.2b and C4.2c).
Entry into the labour market after initial education
The transition from education to work occurs at different points in time in different OECD countries, depending on a range of educational and labour market characteristics. As they grow older, young people spend less time in education and more in the labour force. On average, almost 17% of 15-to-19-year-olds are not in education. This average rises to almost 60% for 20-to-24-year-olds and above 84% for 25-to-29-year-olds (Table C4.2a). However, in many OECD countries young people begin their transition to work later, and in some cases over a longer period. This reflects not only the demand for education, but also the general state of the labour market, the length and orientation of educational programmes in relation to the labour market and the prevalence of part-time education.
Education and Work Status of the Youth Population – INDICATOR C4 chapter c
Education at a Glance © OECD 2006 319
C4
Overall, older non-students are much more likely to be employed than non-students aged 15 to 19, while a higher percentage of male than female non-students are working. A significantly higher share of females than males are out of the labour force. This is particularly so for the 25-to-29-year-old age group, which is likely to reflect, in part, time spent in child-bearing and child-rearing (Tables C4.2b and C4.2c).
Employment-to-population ratios among young adults not in education provide information on the effectiveness of transition frameworks and thus help policy makers to evaluate transition policies. In 17 out of 27 OECD countries, and in the partner country Israel, 10% or less of 15-to-19-year-olds are not in education and working, which may suggest that few young people have left school early. While the average of employment-to-population ratios for 20-to-24-year-olds not in education exceeds 42 %, the ratios in some OECD countries such as Denmark and Finland are considerably lower (Table C4.2a).
Unemployment among young non-students
Young people represent the principal source of new skills. In most OECD countries, education policy seeks to encourage young people to complete at least upper secondary education. Since many jobs in the current labour market require ever higher general skill levels, persons with low attainment are often penalised. Differences in unemployment rates among young non-students by level of educational attainment are an indicator of the degree to which further education improves the economic opportunities of young adults.
The unemployment rate by age group is the most common measure used for describing the labour market status of young people. However, unemployment rates do not take educational circumstances into account. For instance, an unemployed young person counted in the numerator may, in some OECD countries, be enrolled in education. And the denominator may include young people in vocational training, provided they are apprenticed. Hence, if almost all young people in a particular age group are still in education, the unemployment rate will reflect only the few present in the labour market. It may therefore appear very high, particularly among the youngest cohort who have usually left the education system with particularly low qualifications.
The ratio of unemployed non-students to the total age cohort is therefore a more appropriate way to reflect the likelihood of youth unemployment (Table C4.3). This is because young people who are looking for a job while still in education are usually seeking part-time or temporary work while studying, unlike those entering the labour market after leaving school.
On average, completing upper secondary education reduces this unemployment ratio (i.e. unemployment among non-students as a percentage of the age cohort) among 20-to-24-year-olds by 6.4 percentage points and that of 25-to-29-year-olds by 4.9 percentage points (Table C4.3). In 16 out of 27 OECD countries, the unemployment ratio among 20-to-24-year-olds not in education is equal to or less than 8% for those with upper secondary or post-secondary non-tertiary education. In the same age group, this proportion remains below 8% for those without upper secondary education in only five OECD countries: Denmark, Mexico, the Netherlands, Spain and Turkey. Since it has become the norm in most OECD countries to complete upper secondary education, many young persons who do not complete this level of education are much more likely to have employment difficulties during entry to the labour market.
chapter c Access to educAtion, PArticiPAtion And Progression
Education at a Glance © OECD 2006320
C4
At the end of the transition period, between the ages of 25 and 29, when most young people have finished studying, differences in access to employment are linked to the education level attained. Not attaining an upper secondary qualification is clearly a serious handicap. Conversely, tertiary education offers a premium for most job seekers.
In 15 OECD countries, for upper secondary graduates aged 25 to 29, the ratio of persons not in education and unemployed to the cohort population is at or above 5%. In a few OECD countries, even young people who have completed tertiary-level education are subject to considerable unemployment risk when they enter the labour market. At the tertiary level of attainment, among 20-to-24-year-olds, the ratio of unemployed non-students to the cohort population is on average 6.3% – and in some cases significantly more than 10% – in Greece, Italy, the Slovak Republic and Turkey (Table C4.3).
Focusing on the key transition period (i.e. ages 20 to 24) illustrates the changes both in the prevalence of unemployment and in withdrawal from the labour force – both representing non-employment – among individuals who have left education. Between 1998 and 2004, important changes are evident in several countries (Table C4.4). In some Mediterranean countries, where the proportion of non-employment is rather high, the improvement is notable, such as in Greece, Italy and Spain. Turkey presents an exception, with a non-employment ratio that is the highest of the OECD countries. Central and Eastern European countries have mixed profiles over this time period: there is a regular decrease of non-employment in Hungary, while the Czech Republic has remained unchanged.
However, the situation has been remarkably stable over the last six years for several countries: at a low level of the non-employment ratio in Denmark, Iceland and Luxembourg, at an intermediate level in France and the United Kingdom, and at a high level in Turkey. Other profiles are less pronounced, but a general picture appears. With the exception of Norway , which show a trend increase in the non-employment ratio, and Switzerland, with a pronounced ‘V’ curve with a low point in 2000, most countries show a regular fall of unemployment and withdrawal from the labour force from 1998 to 2001, followed by a stabilization or even an increase of unemployment and withdrawal from the labour force to 2004. In Australia, Canada, Finland, Greece, Hungary, Italy and the Slovak Republic, the decrease continues into 2004.
Definition and methodologies
The statistics presented here are calculated from labour force survey data on age-specific proportions of young people in each of the specified categories. These proportions are then totalled over the 15-to-29-year-old age group to yield the expected number of years spent in various states. For countries providing data from the age of 16 only, it is assumed that all 15-year-olds are in education and out of the labour force. This assumption tends to increase the average number of expected years in education compared to Education at a Glance 2004 (OECD, 2004c).
Persons in education include those attending part-time as well as full-time, where the coverage of education should be as close as possible to that of formal education in administrative sources on enrolment. Therefore, non-formal education or educational activities of very short duration (for example, at the work place) should be excluded.
Education and Work Status of the Youth Population – INDICATOR C4 chapter c
Education at a Glance © OECD 2006 321
C4
Data for this indicator are collected as part of the annual OECD Labour Force Survey (for certain European countries the data come from the annual European Labour Force Survey, see Annex 3) and usually refer to the first quarter, or the average of the first three months of the calendar year, thereby excluding summer employment. The labour force status categories shown in this section are defined according to International Labour Organisation (ILO) guidelines, with one exception. For the purposes of these indicators, persons in work-study programmes (see below) have been classified separately as being in education and employed, without reference to their ILO labour force status during the survey reference week, since they may not necessarily be in the work component of their programmes during that week and may therefore not be employed then. The category other employed includes individuals employed according to the ILO definition, but excludes those attending work-study programmes who are already counted as employed. Finally, the category not in the labour force includes individuals who are not working and who are not unemployed, i.e. individuals who are not looking for a job.
Work-study programmes combine work and education as parts of an integrated, formal education or training activity, such as the dual system in Germany; apprentissage or formation en alternance in France and Belgium; internship or co-operative education in Canada; and apprenticeship in Ireland. Vocational education and training take place both in school settings and working environments. Students or trainees can be paid or not, usually depending on the type of job and the course or training.
Enrolment counts are estimated on the basis of self-reports collected during labour force surveys that often correspond only imprecisely with enrolments obtained from administrative sources shown elsewhere in this publication, for several reasons. First, age may not be measured in the same way. For example, in administrative data, both enrolment and age are measured on 1 January in OECD countries in the northern hemisphere, whereas in some labour force surveys, enrolment is measured in the reference week, while the age recorded is the age that will be attained at the end of the calendar year, even if the survey is conducted in the early part of the year. This means that recorded enrolment rates may occasionally reflect a population that is almost one year younger than the specified age range. At ages when movements out of education may be significant, this affects enrolment rates. Second, young people may be enrolled in several programmes and can sometimes be counted twice in administrative statistics but only once in a labour force survey. Moreover, not all enrolments may be captured in administrative statistics, particularly in profit-making institutions. Third, the programme classification used in the self-reports in labour force surveys does not always correspond to the qualification standards used for administrative data collections.
The principle behind the estimation of expected years in education is that knowledge of the share of young adults in or out of education is used as a basis for assumptions about how long a typical individual will spend in different labour and educational states.
The unemployment-to-population and the employment-to-population ratios are calculated by dividing the total number of persons unemployed or employed by the number of persons in the population.
With respect to Table C4.4b, a break in the time series is noted for Finland. In 2004, military conscripts in Finland were not included in the data, whereas in previous years conscripts were included in the category “Not in education, not employed”.
chapter c Access to educAtion, PArticiPAtion And Progression
Education at a Glance © OECD 2006322
C4
Further references
The following additional material relevant to this indicator is available on the Web athttp://dx.doi.org/10.1787/244741462084
• Expected years in education and not in education for 15-to 29-year-olds (1998-2004) Table C4.1b: Trends by gender
• Percentage of the youth population in education and not in education (2004) Table C4.2b Young males Table C4.2c: Young females
• Trends in the percentage of young population in education and not in education (1995-2004) Table C4.4b: Trends for young males Table C4.4c: Trends for young females
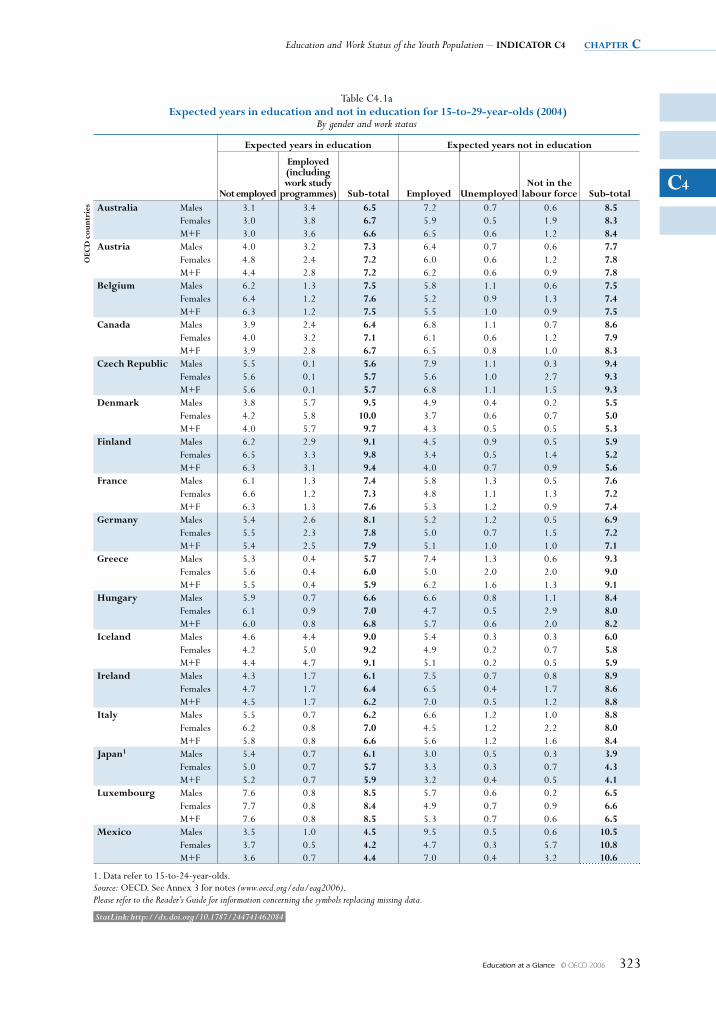
Education and Work Status of the Youth Population – INDICATOR C4 chapter c
Education at a Glance © OECD 2006 323
C4
Table C4.1a Expected years in education and not in education for 15-to-29-year-olds (2004)
By gender and work status
Expected years in education Expected years not in education
Not employed
Employed (including work study
programmes) sub-total Employed unemployedNot in the
labour force sub-total
OEC
D c
ount
ries Australia Males 3.1 3.4 6.5 7.2 0.7 0.6 8.5
Females 3.0 3.8 6.7 5.9 0.5 1.9 8.3M+F 3.0 3.6 6.6 6.5 0.6 1.2 8.4
Austria Males 4.0 3.2 7.3 6.4 0.7 0.6 7.7Females 4.8 2.4 7.2 6.0 0.6 1.2 7.8M+F 4.4 2.8 7.2 6.2 0.6 0.9 7.8
Belgium Males 6.2 1.3 7.5 5.8 1.1 0.6 7.5Females 6.4 1.2 7.6 5.2 0.9 1.3 7.4M+F 6.3 1.2 7.5 5.5 1.0 0.9 7.5
Canada Males 3.9 2.4 6.4 6.8 1.1 0.7 8.6Females 4.0 3.2 7.1 6.1 0.6 1.2 7.9M+F 3.9 2.8 6.7 6.5 0.8 1.0 8.3
Czech Republic Males 5.5 0.1 5.6 7.9 1.1 0.3 9.4Females 5.6 0.1 5.7 5.6 1.0 2.7 9.3M+F 5.6 0.1 5.7 6.8 1.1 1.5 9.3
Denmark Males 3.8 5.7 9.5 4.9 0.4 0.2 5.5Females 4.2 5.8 10.0 3.7 0.6 0.7 5.0M+F 4.0 5.7 9.7 4.3 0.5 0.5 5.3
finland Males 6.2 2.9 9.1 4.5 0.9 0.5 5.9Females 6.5 3.3 9.8 3.4 0.5 1.4 5.2M+F 6.3 3.1 9.4 4.0 0.7 0.9 5.6
france Males 6.1 1.3 7.4 5.8 1.3 0.5 7.6Females 6.6 1.2 7.3 4.8 1.1 1.3 7.2M+F 6.3 1.3 7.6 5.3 1.2 0.9 7.4
Germany Males 5.4 2.6 8.1 5.2 1.2 0.5 6.9Females 5.5 2.3 7.8 5.0 0.7 1.5 7.2M+F 5.4 2.5 7.9 5.1 1.0 1.0 7.1
Greece Males 5.3 0.4 5.7 7.4 1.3 0.6 9.3Females 5.6 0.4 6.0 5.0 2.0 2.0 9.0M+F 5.5 0.4 5.9 6.2 1.6 1.3 9.1
hungary Males 5.9 0.7 6.6 6.6 0.8 1.1 8.4Females 6.1 0.9 7.0 4.7 0.5 2.9 8.0M+F 6.0 0.8 6.8 5.7 0.6 2.0 8.2
Iceland Males 4.6 4.4 9.0 5.4 0.3 0.3 6.0Females 4.2 5.0 9.2 4.9 0.2 0.7 5.8M+F 4.4 4.7 9.1 5.1 0.2 0.5 5.9
Ireland Males 4.3 1.7 6.1 7.5 0.7 0.8 8.9Females 4.7 1.7 6.4 6.5 0.4 1.7 8.6M+F 4.5 1.7 6.2 7.0 0.5 1.2 8.8
Italy Males 5.5 0.7 6.2 6.6 1.2 1.0 8.8Females 6.2 0.8 7.0 4.5 1.2 2.2 8.0M+F 5.8 0.8 6.6 5.6 1.2 1.6 8.4
Japan1 Males 5.4 0.7 6.1 3.0 0.5 0.3 3.9Females 5.0 0.7 5.7 3.3 0.3 0.7 4.3M+F 5.2 0.7 5.9 3.2 0.4 0.5 4.1
luxembourg Males 7.6 0.8 8.5 5.7 0.6 0.2 6.5Females 7.7 0.8 8.4 4.9 0.7 0.9 6.6M+F 7.6 0.8 8.5 5.3 0.7 0.6 6.5
Mexico Males 3.5 1.0 4.5 9.5 0.5 0.6 10.5Females 3.7 0.5 4.2 4.7 0.3 5.7 10.8M+F 3.6 0.7 4.4 7.0 0.4 3.2 10.6
1. Data refer to 15-to-24-year-olds.Source: OECD. See Annex 3 for notes (www.oecd.org/edu/eag2006).Please refer to the Reader’s Guide for information concerning the symbols replacing missing data.
StatLink: http://dx.doi.org/10.1787/244741462084
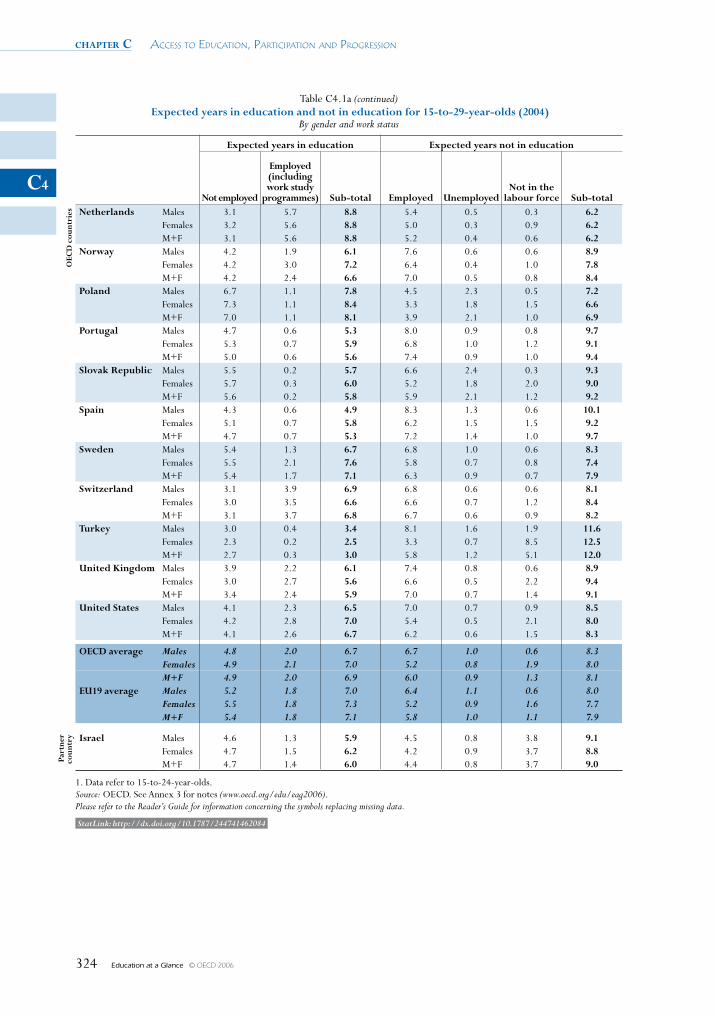
chapter c Access to educAtion, PArticiPAtion And Progression
Education at a Glance © OECD 2006324
C4
Table C4.1a (continued) Expected years in education and not in education for 15-to-29-year-olds (2004)
By gender and work status
Expected years in education Expected years not in education
Not employed
Employed (including work study
programmes) sub-total Employed unemployedNot in the
labour force sub-total
OEC
D c
ount
ries Netherlands Males 3.1 5.7 8.8 5.4 0.5 0.3 6.2
Females 3.2 5.6 8.8 5.0 0.3 0.9 6.2M+F 3.1 5.6 8.8 5.2 0.4 0.6 6.2
Norway Males 4.2 1.9 6.1 7.6 0.6 0.6 8.9Females 4.2 3.0 7.2 6.4 0.4 1.0 7.8M+F 4.2 2.4 6.6 7.0 0.5 0.8 8.4
Poland Males 6.7 1.1 7.8 4.5 2.3 0.5 7.2Females 7.3 1.1 8.4 3.3 1.8 1.5 6.6M+F 7.0 1.1 8.1 3.9 2.1 1.0 6.9
Portugal Males 4.7 0.6 5.3 8.0 0.9 0.8 9.7Females 5.3 0.7 5.9 6.8 1.0 1.2 9.1M+F 5.0 0.6 5.6 7.4 0.9 1.0 9.4
slovak Republic Males 5.5 0.2 5.7 6.6 2.4 0.3 9.3Females 5.7 0.3 6.0 5.2 1.8 2.0 9.0M+F 5.6 0.2 5.8 5.9 2.1 1.2 9.2
spain Males 4.3 0.6 4.9 8.3 1.3 0.6 10.1Females 5.1 0.7 5.8 6.2 1.5 1.5 9.2M+F 4.7 0.7 5.3 7.2 1.4 1.0 9.7
sweden Males 5.4 1.3 6.7 6.8 1.0 0.6 8.3Females 5.5 2.1 7.6 5.8 0.7 0.8 7.4M+F 5.4 1.7 7.1 6.3 0.9 0.7 7.9
switzerland Males 3.1 3.9 6.9 6.8 0.6 0.6 8.1Females 3.0 3.5 6.6 6.6 0.7 1.2 8.4M+F 3.1 3.7 6.8 6.7 0.6 0.9 8.2
Turkey Males 3.0 0.4 3.4 8.1 1.6 1.9 11.6Females 2.3 0.2 2.5 3.3 0.7 8.5 12.5M+F 2.7 0.3 3.0 5.8 1.2 5.1 12.0
united kingdom Males 3.9 2.2 6.1 7.4 0.8 0.6 8.9Females 3.0 2.7 5.6 6.6 0.5 2.2 9.4M+F 3.4 2.4 5.9 7.0 0.7 1.4 9.1
united states Males 4.1 2.3 6.5 7.0 0.7 0.9 8.5Females 4.2 2.8 7.0 5.4 0.5 2.1 8.0M+F 4.1 2.6 6.7 6.2 0.6 1.5 8.3
OECD average Males 4.8 2.0 6.7 6.7 1.0 0.6 8.3Females 4.9 2.1 7.0 5.2 0.8 1.9 8.0M+F 4.9 2.0 6.9 6.0 0.9 1.3 8.1
Eu19 average Males 5.2 1.8 7.0 6.4 1.1 0.6 8.0Females 5.5 1.8 7.3 5.2 0.9 1.6 7.7M+F 5.4 1.8 7.1 5.8 1.0 1.1 7.9
Part
ner
coun
try Israel Males 4.6 1.3 5.9 4.5 0.8 3.8 9.1
Females 4.7 1.5 6.2 4.2 0.9 3.7 8.8M+F 4.7 1.4 6.0 4.4 0.8 3.7 9.0
1. Data refer to 15-to-24-year-olds.Source: OECD. See Annex 3 for notes (www.oecd.org/edu/eag2006).Please refer to the Reader’s Guide for information concerning the symbols replacing missing data.
StatLink: http://dx.doi.org/10.1787/244741462084
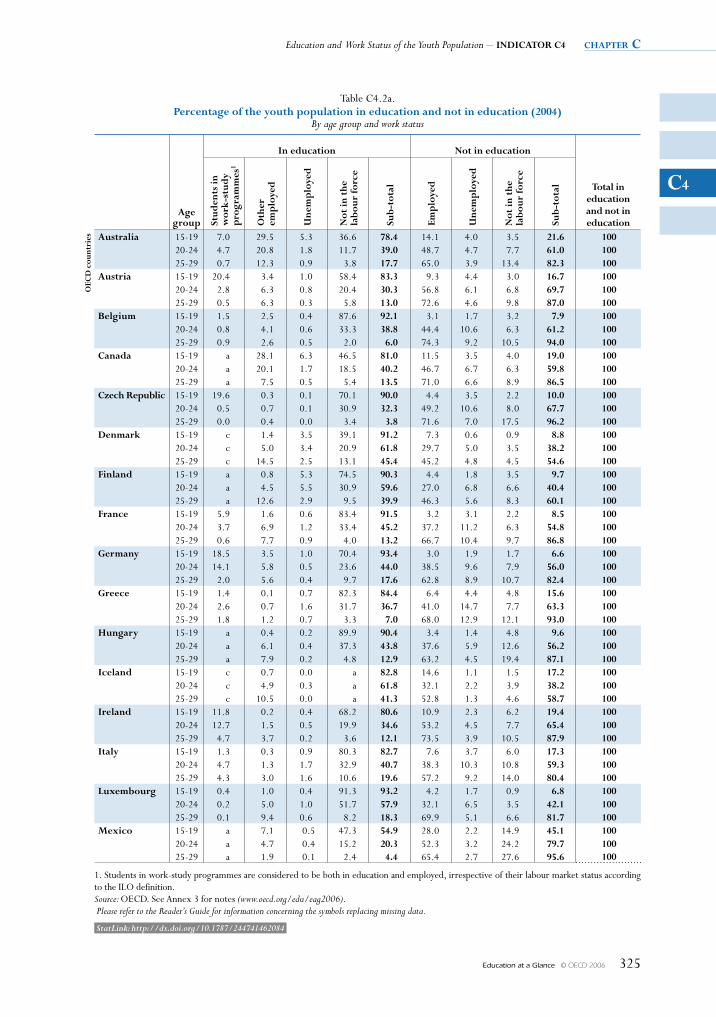
Education and Work Status of the Youth Population – INDICATOR C4 chapter c
Education at a Glance © OECD 2006 325
C4
Table C4.2a. Percentage of the youth population in education and not in education (2004)
By age group and work status
Age group
In education Not in education
Total in education and not in educationst
uden
ts in
w
ork-
stud
y p
rogr
amm
es1
Oth
er
emp
loye
d
une
mp
loye
d
Not
in t
he
labo
ur fo
rce
sub-
tota
l
Emp
loye
d
une
mp
loye
d
Not
in t
he
labo
ur fo
rce
sub-
tota
l
OEC
D c
ount
ries Australia 15-19 7.0 29.5 5.3 36.6 78.4 14.1 4.0 3.5 21.6 100
20-24 4.7 20.8 1.8 11.7 39.0 48.7 4.7 7.7 61.0 10025-29 0.7 12.3 0.9 3.8 17.7 65.0 3.9 13.4 82.3 100
Austria 15-19 20.4 3.4 1.0 58.4 83.3 9.3 4.4 3.0 16.7 10020-24 2.8 6.3 0.8 20.4 30.3 56.8 6.1 6.8 69.7 10025-29 0.5 6.3 0.3 5.8 13.0 72.6 4.6 9.8 87.0 100
Belgium 15-19 1.5 2.5 0.4 87.6 92.1 3.1 1.7 3.2 7.9 10020-24 0.8 4.1 0.6 33.3 38.8 44.4 10.6 6.3 61.2 10025-29 0.9 2.6 0.5 2.0 6.0 74.3 9.2 10.5 94.0 100
Canada 15-19 a 28.1 6.3 46.5 81.0 11.5 3.5 4.0 19.0 10020-24 a 20.1 1.7 18.5 40.2 46.7 6.7 6.3 59.8 10025-29 a 7.5 0.5 5.4 13.5 71.0 6.6 8.9 86.5 100
Czech Republic 15-19 19.6 0.3 0.1 70.1 90.0 4.4 3.5 2.2 10.0 10020-24 0.5 0.7 0.1 30.9 32.3 49.2 10.6 8.0 67.7 10025-29 0.0 0.4 0.0 3.4 3.8 71.6 7.0 17.5 96.2 100
Denmark 15-19 c 1.4 3.5 39.1 91.2 7.3 0.6 0.9 8.8 10020-24 c 5.0 3.4 20.9 61.8 29.7 5.0 3.5 38.2 10025-29 c 14.5 2.5 13.1 45.4 45.2 4.8 4.5 54.6 100
finland 15-19 a 0.8 5.3 74.5 90.3 4.4 1.8 3.5 9.7 10020-24 a 4.5 5.5 30.9 59.6 27.0 6.8 6.6 40.4 10025-29 a 12.6 2.9 9.5 39.9 46.3 5.6 8.3 60.1 100
france 15-19 5.9 1.6 0.6 83.4 91.5 3.2 3.1 2.2 8.5 10020-24 3.7 6.9 1.2 33.4 45.2 37.2 11.2 6.3 54.8 10025-29 0.6 7.7 0.9 4.0 13.2 66.7 10.4 9.7 86.8 100
Germany 15-19 18.5 3.5 1.0 70.4 93.4 3.0 1.9 1.7 6.6 10020-24 14.1 5.8 0.5 23.6 44.0 38.5 9.6 7.9 56.0 10025-29 2.0 5.6 0.4 9.7 17.6 62.8 8.9 10.7 82.4 100
Greece 15-19 1.4 0.1 0.7 82.3 84.4 6.4 4.4 4.8 15.6 10020-24 2.6 0.7 1.6 31.7 36.7 41.0 14.7 7.7 63.3 10025-29 1.8 1.2 0.7 3.3 7.0 68.0 12.9 12.1 93.0 100
hungary 15-19 a 0.4 0.2 89.9 90.4 3.4 1.4 4.8 9.6 10020-24 a 6.1 0.4 37.3 43.8 37.6 5.9 12.6 56.2 10025-29 a 7.9 0.2 4.8 12.9 63.2 4.5 19.4 87.1 100
Iceland 15-19 c 0.7 0.0 a 82.8 14.6 1.1 1.5 17.2 10020-24 c 4.9 0.3 a 61.8 32.1 2.2 3.9 38.2 10025-29 c 10.5 0.0 a 41.3 52.8 1.3 4.6 58.7 100
Ireland 15-19 11.8 0.2 0.4 68.2 80.6 10.9 2.3 6.2 19.4 10020-24 12.7 1.5 0.5 19.9 34.6 53.2 4.5 7.7 65.4 10025-29 4.7 3.7 0.2 3.6 12.1 73.5 3.9 10.5 87.9 100
Italy 15-19 1.3 0.3 0.9 80.3 82.7 7.6 3.7 6.0 17.3 10020-24 4.7 1.3 1.7 32.9 40.7 38.3 10.3 10.8 59.3 10025-29 4.3 3.0 1.6 10.6 19.6 57.2 9.2 14.0 80.4 100
luxembourg 15-19 0.4 1.0 0.4 91.3 93.2 4.2 1.7 0.9 6.8 10020-24 0.2 5.0 1.0 51.7 57.9 32.1 6.5 3.5 42.1 10025-29 0.1 9.4 0.6 8.2 18.3 69.9 5.1 6.6 81.7 100
Mexico 15-19 a 7.1 0.5 47.3 54.9 28.0 2.2 14.9 45.1 10020-24 a 4.7 0.4 15.2 20.3 52.3 3.2 24.2 79.7 10025-29 a 1.9 0.1 2.4 4.4 65.4 2.7 27.6 95.6 100
1. Students in work-study programmes are considered to be both in education and employed, irrespective of their labour market status according to the ILO definition.Source: OECD. See Annex 3 for notes (www.oecd.org/edu/eag2006). Please refer to the Reader’s Guide for information concerning the symbols replacing missing data.
StatLink: http://dx.doi.org/10.1787/244741462084
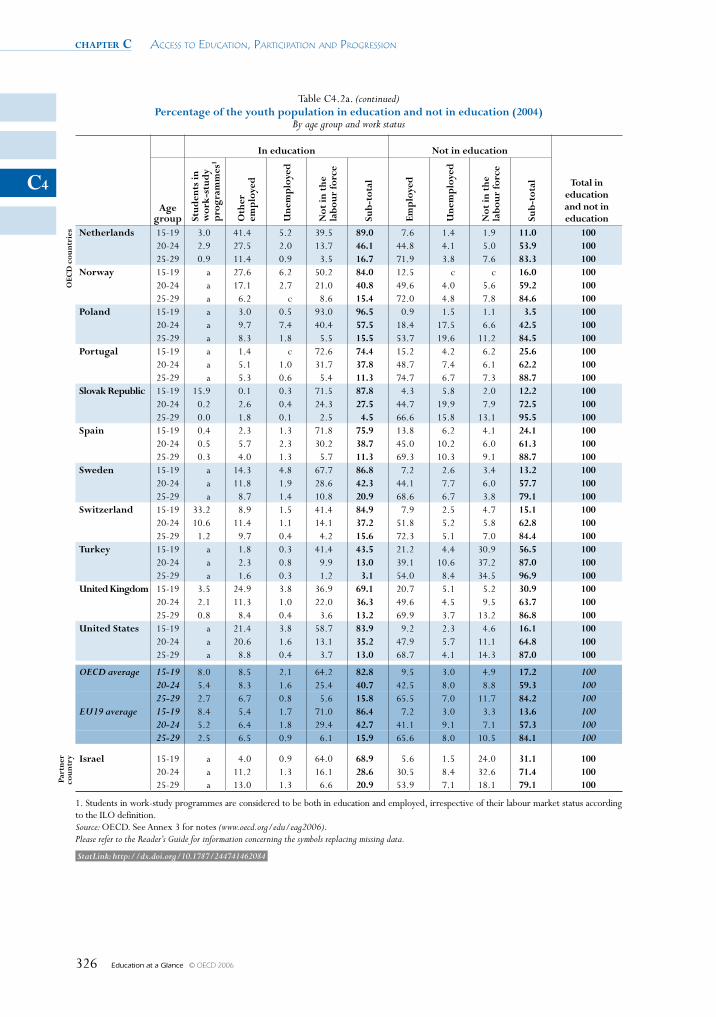
chapter c Access to educAtion, PArticiPAtion And Progression
Education at a Glance © OECD 2006326
C4
Table C4.2a. (continued) Percentage of the youth population in education and not in education (2004)
By age group and work status
In education Not in education
Total in education and not in education
Age group st
uden
ts in
w
ork-
stud
y p
rogr
amm
es1
Oth
er
emp
loye
d
une
mp
loye
d
Not
in t
he
labo
ur fo
rce
sub-
tota
l
Emp
loye
d
une
mp
loye
d
Not
in t
he
labo
ur fo
rce
sub-
tota
l
OEC
D c
ount
ries Netherlands 15-19 3.0 41.4 5.2 39.5 89.0 7.6 1.4 1.9 11.0 100
20-24 2.9 27.5 2.0 13.7 46.1 44.8 4.1 5.0 53.9 10025-29 0.9 11.4 0.9 3.5 16.7 71.9 3.8 7.6 83.3 100
Norway 15-19 a 27.6 6.2 50.2 84.0 12.5 c c 16.0 10020-24 a 17.1 2.7 21.0 40.8 49.6 4.0 5.6 59.2 10025-29 a 6.2 c 8.6 15.4 72.0 4.8 7.8 84.6 100
Poland 15-19 a 3.0 0.5 93.0 96.5 0.9 1.5 1.1 3.5 10020-24 a 9.7 7.4 40.4 57.5 18.4 17.5 6.6 42.5 10025-29 a 8.3 1.8 5.5 15.5 53.7 19.6 11.2 84.5 100
Portugal 15-19 a 1.4 c 72.6 74.4 15.2 4.2 6.2 25.6 10020-24 a 5.1 1.0 31.7 37.8 48.7 7.4 6.1 62.2 10025-29 a 5.3 0.6 5.4 11.3 74.7 6.7 7.3 88.7 100
slovak Republic 15-19 15.9 0.1 0.3 71.5 87.8 4.3 5.8 2.0 12.2 10020-24 0.2 2.6 0.4 24.3 27.5 44.7 19.9 7.9 72.5 10025-29 0.0 1.8 0.1 2.5 4.5 66.6 15.8 13.1 95.5 100
spain 15-19 0.4 2.3 1.3 71.8 75.9 13.8 6.2 4.1 24.1 10020-24 0.5 5.7 2.3 30.2 38.7 45.0 10.2 6.0 61.3 10025-29 0.3 4.0 1.3 5.7 11.3 69.3 10.3 9.1 88.7 100
sweden 15-19 a 14.3 4.8 67.7 86.8 7.2 2.6 3.4 13.2 10020-24 a 11.8 1.9 28.6 42.3 44.1 7.7 6.0 57.7 10025-29 a 8.7 1.4 10.8 20.9 68.6 6.7 3.8 79.1 100
switzerland 15-19 33.2 8.9 1.5 41.4 84.9 7.9 2.5 4.7 15.1 10020-24 10.6 11.4 1.1 14.1 37.2 51.8 5.2 5.8 62.8 10025-29 1.2 9.7 0.4 4.2 15.6 72.3 5.1 7.0 84.4 100
Turkey 15-19 a 1.8 0.3 41.4 43.5 21.2 4.4 30.9 56.5 10020-24 a 2.3 0.8 9.9 13.0 39.1 10.6 37.2 87.0 10025-29 a 1.6 0.3 1.2 3.1 54.0 8.4 34.5 96.9 100
united kingdom 15-19 3.5 24.9 3.8 36.9 69.1 20.7 5.1 5.2 30.9 10020-24 2.1 11.3 1.0 22.0 36.3 49.6 4.5 9.5 63.7 10025-29 0.8 8.4 0.4 3.6 13.2 69.9 3.7 13.2 86.8 100
united states 15-19 a 21.4 3.8 58.7 83.9 9.2 2.3 4.6 16.1 10020-24 a 20.6 1.6 13.1 35.2 47.9 5.7 11.1 64.8 10025-29 a 8.8 0.4 3.7 13.0 68.7 4.1 14.3 87.0 100
OECD average 15-19 8.0 8.5 2.1 64.2 82.8 9.5 3.0 4.9 17.2 10020-24 5.4 8.3 1.6 25.4 40.7 42.5 8.0 8.8 59.3 10025-29 2.7 6.7 0.8 5.6 15.8 65.5 7.0 11.7 84.2 100
EU19 average 15-19 8.4 5.4 1.7 71.0 86.4 7.2 3.0 3.3 13.6 10020-24 5.2 6.4 1.8 29.4 42.7 41.1 9.1 7.1 57.3 10025-29 2.5 6.5 0.9 6.1 15.9 65.6 8.0 10.5 84.1 100
Part
ner
coun
try Israel 15-19 a 4.0 0.9 64.0 68.9 5.6 1.5 24.0 31.1 100
20-24 a 11.2 1.3 16.1 28.6 30.5 8.4 32.6 71.4 10025-29 a 13.0 1.3 6.6 20.9 53.9 7.1 18.1 79.1 100
1. Students in work-study programmes are considered to be both in education and employed, irrespective of their labour market status according to the ILO definition.Source: OECD. See Annex 3 for notes (www.oecd.org/edu/eag2006).Please refer to the Reader’s Guide for information concerning the symbols replacing missing data.
StatLink: http://dx.doi.org/10.1787/244741462084
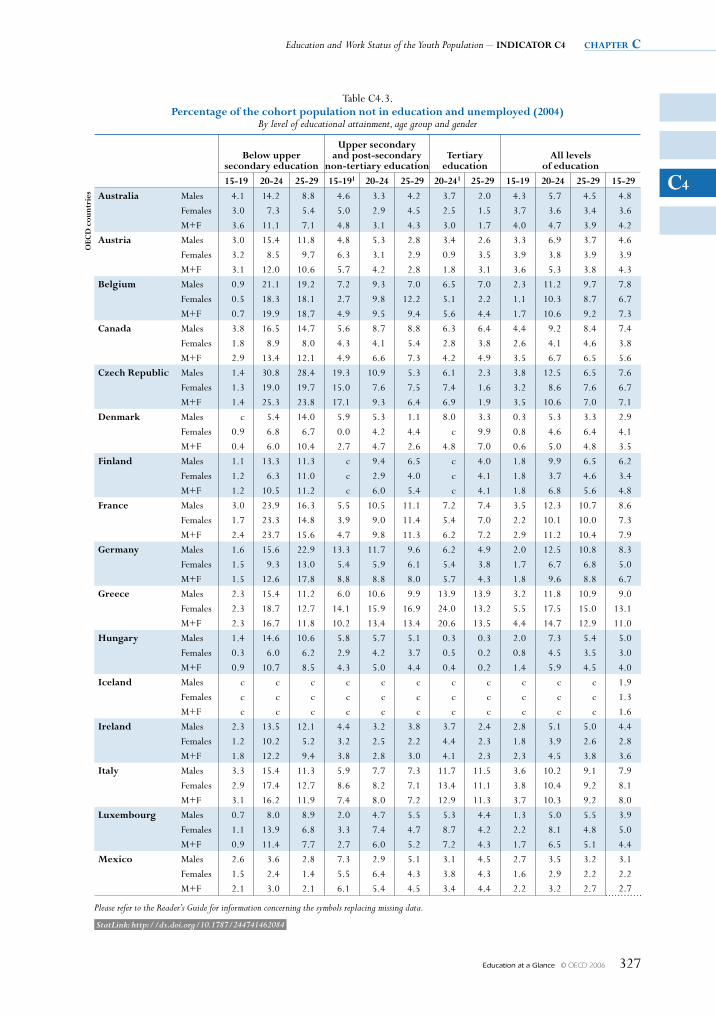
Education and Work Status of the Youth Population – INDICATOR C4 chapter c
Education at a Glance © OECD 2006 327
C4
Table C4.3. Percentage of the cohort population not in education and unemployed (2004)
By level of educational attainment, age group and gender
Below upper secondary education
upper secondary and post-secondary
non-tertiary educationTertiary
educationAll levels
of education
15-19 20-24 25-29 15-191 20-24 25-29 20-241 25-29 15-19 20-24 25-29 15-29
OEC
D c
ount
ries Australia Males 4.1 14.2 8.8 4.6 3.3 4.2 3.7 2.0 4.3 5.7 4.5 4.8
Females 3.0 7.3 5.4 5.0 2.9 4.5 2.5 1.5 3.7 3.6 3.4 3.6M+F 3.6 11.1 7.1 4.8 3.1 4.3 3.0 1.7 4.0 4.7 3.9 4.2
Austria Males 3.0 15.4 11.8 4.8 5.3 2.8 3.4 2.6 3.3 6.9 3.7 4.6Females 3.2 8.5 9.7 6.3 3.1 2.9 0.9 3.5 3.9 3.8 3.9 3.9M+F 3.1 12.0 10.6 5.7 4.2 2.8 1.8 3.1 3.6 5.3 3.8 4.3
Belgium Males 0.9 21.1 19.2 7.2 9.3 7.0 6.5 7.0 2.3 11.2 9.7 7.8Females 0.5 18.3 18.1 2.7 9.8 12.2 5.1 2.2 1.1 10.3 8.7 6.7M+F 0.7 19.9 18.7 4.9 9.5 9.4 5.6 4.4 1.7 10.6 9.2 7.3
Canada Males 3.8 16.5 14.7 5.6 8.7 8.8 6.3 6.4 4.4 9.2 8.4 7.4Females 1.8 8.9 8.0 4.3 4.1 5.4 2.8 3.8 2.6 4.1 4.6 3.8M+F 2.9 13.4 12.1 4.9 6.6 7.3 4.2 4.9 3.5 6.7 6.5 5.6
Czech Republic Males 1.4 30.8 28.4 19.3 10.9 5.3 6.1 2.3 3.8 12.5 6.5 7.6Females 1.3 19.0 19.7 15.0 7.6 7.5 7.4 1.6 3.2 8.6 7.6 6.7M+F 1.4 25.3 23.8 17.1 9.3 6.4 6.9 1.9 3.5 10.6 7.0 7.1
Denmark Males c 5.4 14.0 5.9 5.3 1.1 8.0 3.3 0.3 5.3 3.3 2.9Females 0.9 6.8 6.7 0.0 4.2 4.4 c 9.9 0.8 4.6 6.4 4.1M+F 0.4 6.0 10.4 2.7 4.7 2.6 4.8 7.0 0.6 5.0 4.8 3.5
finland Males 1.1 13.3 11.3 c 9.4 6.5 c 4.0 1.8 9.9 6.5 6.2Females 1.2 6.3 11.0 c 2.9 4.0 c 4.1 1.8 3.7 4.6 3.4M+F 1.2 10.5 11.2 c 6.0 5.4 c 4.1 1.8 6.8 5.6 4.8
france Males 3.0 23.9 16.3 5.5 10.5 11.1 7.2 7.4 3.5 12.3 10.7 8.6Females 1.7 23.3 14.8 3.9 9.0 11.4 5.4 7.0 2.2 10.1 10.0 7.3M+F 2.4 23.7 15.6 4.7 9.8 11.3 6.2 7.2 2.9 11.2 10.4 7.9
Germany Males 1.6 15.6 22.9 13.3 11.7 9.6 6.2 4.9 2.0 12.5 10.8 8.3Females 1.5 9.3 13.0 5.4 5.9 6.1 5.4 3.8 1.7 6.7 6.8 5.0M+F 1.5 12.6 17.8 8.8 8.8 8.0 5.7 4.3 1.8 9.6 8.8 6.7
Greece Males 2.3 15.4 11.2 6.0 10.6 9.9 13.9 13.9 3.2 11.8 10.9 9.0Females 2.3 18.7 12.7 14.1 15.9 16.9 24.0 13.2 5.5 17.5 15.0 13.1M+F 2.3 16.7 11.8 10.2 13.4 13.4 20.6 13.5 4.4 14.7 12.9 11.0
hungary Males 1.4 14.6 10.6 5.8 5.7 5.1 0.3 0.3 2.0 7.3 5.4 5.0Females 0.3 6.0 6.2 2.9 4.2 3.7 0.5 0.2 0.8 4.5 3.5 3.0M+F 0.9 10.7 8.5 4.3 5.0 4.4 0.4 0.2 1.4 5.9 4.5 4.0
Iceland Males c c c c c c c c c c c 1.9Females c c c c c c c c c c c 1.3M+F c c c c c c c c c c c 1.6
Ireland Males 2.3 13.5 12.1 4.4 3.2 3.8 3.7 2.4 2.8 5.1 5.0 4.4Females 1.2 10.2 5.2 3.2 2.5 2.2 4.4 2.3 1.8 3.9 2.6 2.8M+F 1.8 12.2 9.4 3.8 2.8 3.0 4.1 2.3 2.3 4.5 3.8 3.6
Italy Males 3.3 15.4 11.3 5.9 7.7 7.3 11.7 11.5 3.6 10.2 9.1 7.9Females 2.9 17.4 12.7 8.6 8.2 7.1 13.4 11.1 3.8 10.4 9.2 8.1M+F 3.1 16.2 11.9 7.4 8.0 7.2 12.9 11.3 3.7 10.3 9.2 8.0
luxembourg Males 0.7 8.0 8.9 2.0 4.7 5.5 5.3 4.4 1.3 5.0 5.5 3.9Females 1.1 13.9 6.8 3.3 7.4 4.7 8.7 4.2 2.2 8.1 4.8 5.0M+F 0.9 11.4 7.7 2.7 6.0 5.2 7.2 4.3 1.7 6.5 5.1 4.4
Mexico Males 2.6 3.6 2.8 7.3 2.9 5.1 3.1 4.5 2.7 3.5 3.2 3.1Females 1.5 2.4 1.4 5.5 6.4 4.3 3.8 4.3 1.6 2.9 2.2 2.2M+F 2.1 3.0 2.1 6.1 5.4 4.5 3.4 4.4 2.2 3.2 2.7 2.7
Please refer to the Reader’s Guide for information concerning the symbols replacing missing data.
StatLink: http://dx.doi.org/10.1787/244741462084
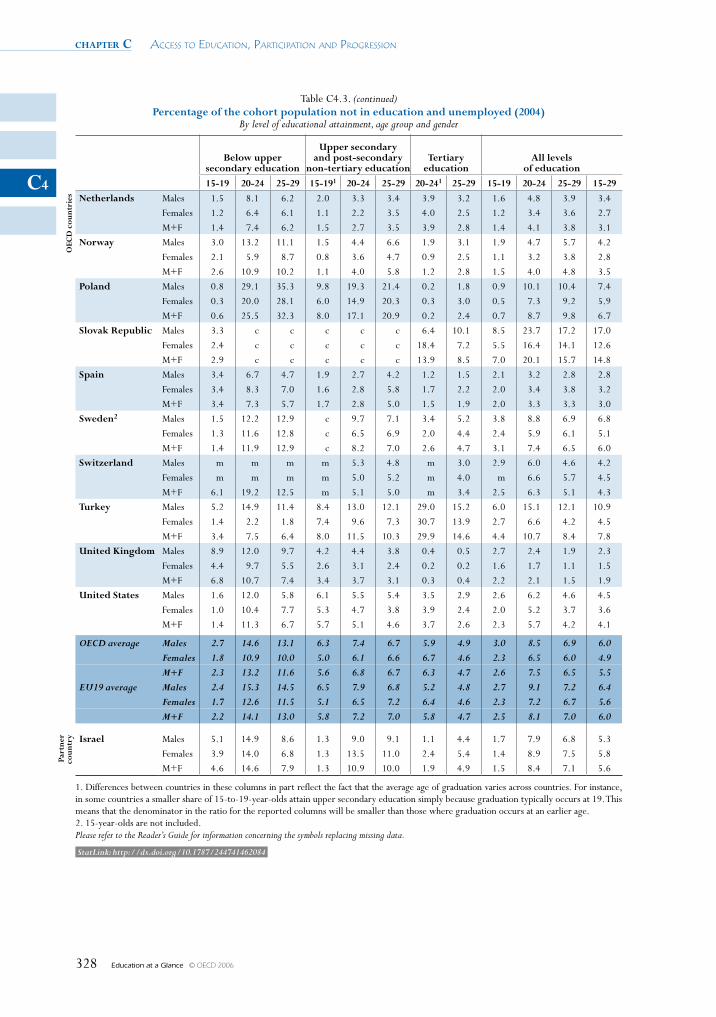
chapter c Access to educAtion, PArticiPAtion And Progression
Education at a Glance © OECD 2006328
C4
Table C4.3. (continued)Percentage of the cohort population not in education and unemployed (2004)
By level of educational attainment, age group and gender
Below upper secondary education
upper secondary and post-secondary
non-tertiary educationTertiary
educationAll levels
of education
15-19 20-24 25-29 15-191 20-24 25-29 20-241 25-29 15-19 20-24 25-29 15-29
OEC
D c
ount
ries Netherlands Males 1.5 8.1 6.2 2.0 3.3 3.4 3.9 3.2 1.6 4.8 3.9 3.4
Females 1.2 6.4 6.1 1.1 2.2 3.5 4.0 2.5 1.2 3.4 3.6 2.7M+F 1.4 7.4 6.2 1.5 2.7 3.5 3.9 2.8 1.4 4.1 3.8 3.1
Norway Males 3.0 13.2 11.1 1.5 4.4 6.6 1.9 3.1 1.9 4.7 5.7 4.2Females 2.1 5.9 8.7 0.8 3.6 4.7 0.9 2.5 1.1 3.2 3.8 2.8M+F 2.6 10.9 10.2 1.1 4.0 5.8 1.2 2.8 1.5 4.0 4.8 3.5
Poland Males 0.8 29.1 35.3 9.8 19.3 21.4 0.2 1.8 0.9 10.1 10.4 7.4Females 0.3 20.0 28.1 6.0 14.9 20.3 0.3 3.0 0.5 7.3 9.2 5.9M+F 0.6 25.5 32.3 8.0 17.1 20.9 0.2 2.4 0.7 8.7 9.8 6.7
slovak Republic Males 3.3 c c c c c 6.4 10.1 8.5 23.7 17.2 17.0Females 2.4 c c c c c 18.4 7.2 5.5 16.4 14.1 12.6M+F 2.9 c c c c c 13.9 8.5 7.0 20.1 15.7 14.8
spain Males 3.4 6.7 4.7 1.9 2.7 4.2 1.2 1.5 2.1 3.2 2.8 2.8Females 3.4 8.3 7.0 1.6 2.8 5.8 1.7 2.2 2.0 3.4 3.8 3.2M+F 3.4 7.3 5.7 1.7 2.8 5.0 1.5 1.9 2.0 3.3 3.3 3.0
sweden2 Males 1.5 12.2 12.9 c 9.7 7.1 3.4 5.2 3.8 8.8 6.9 6.8Females 1.3 11.6 12.8 c 6.5 6.9 2.0 4.4 2.4 5.9 6.1 5.1M+F 1.4 11.9 12.9 c 8.2 7.0 2.6 4.7 3.1 7.4 6.5 6.0
switzerland Males m m m m 5.3 4.8 m 3.0 2.9 6.0 4.6 4.2Females m m m m 5.0 5.2 m 4.0 m 6.6 5.7 4.5M+F 6.1 19.2 12.5 m 5.1 5.0 m 3.4 2.5 6.3 5.1 4.3
Turkey Males 5.2 14.9 11.4 8.4 13.0 12.1 29.0 15.2 6.0 15.1 12.1 10.9Females 1.4 2.2 1.8 7.4 9.6 7.3 30.7 13.9 2.7 6.6 4.2 4.5M+F 3.4 7.5 6.4 8.0 11.5 10.3 29.9 14.6 4.4 10.7 8.4 7.8
united kingdom Males 8.9 12.0 9.7 4.2 4.4 3.8 0.4 0.5 2.7 2.4 1.9 2.3Females 4.4 9.7 5.5 2.6 3.1 2.4 0.2 0.2 1.6 1.7 1.1 1.5M+F 6.8 10.7 7.4 3.4 3.7 3.1 0.3 0.4 2.2 2.1 1.5 1.9
united states Males 1.6 12.0 5.8 6.1 5.5 5.4 3.5 2.9 2.6 6.2 4.6 4.5Females 1.0 10.4 7.7 5.3 4.7 3.8 3.9 2.4 2.0 5.2 3.7 3.6M+F 1.4 11.3 6.7 5.7 5.1 4.6 3.7 2.6 2.3 5.7 4.2 4.1
OECD average Males 2.7 14.6 13.1 6.3 7.4 6.7 5.9 4.9 3.0 8.5 6.9 6.0Females 1.8 10.9 10.0 5.0 6.1 6.6 6.7 4.6 2.3 6.5 6.0 4.9M+F 2.3 13.2 11.6 5.6 6.8 6.7 6.3 4.7 2.6 7.5 6.5 5.5
EU19 average Males 2.4 15.3 14.5 6.5 7.9 6.8 5.2 4.8 2.7 9.1 7.2 6.4Females 1.7 12.6 11.5 5.1 6.5 7.2 6.4 4.6 2.3 7.2 6.7 5.6M+F 2.2 14.1 13.0 5.8 7.2 7.0 5.8 4.7 2.5 8.1 7.0 6.0
Part
ner
coun
try Israel Males 5.1 14.9 8.6 1.3 9.0 9.1 1.1 4.4 1.7 7.9 6.8 5.3
Females 3.9 14.0 6.8 1.3 13.5 11.0 2.4 5.4 1.4 8.9 7.5 5.8M+F 4.6 14.6 7.9 1.3 10.9 10.0 1.9 4.9 1.5 8.4 7.1 5.6
1. Differences between countries in these columns in part reflect the fact that the average age of graduation varies across countries. For instance, in some countries a smaller share of 15-to-19-year-olds attain upper secondary education simply because graduation typically occurs at 19. This means that the denominator in the ratio for the reported columns will be smaller than those where graduation occurs at an earlier age.2. 15-year-olds are not included.Please refer to the Reader’s Guide for information concerning the symbols replacing missing data.
StatLink: http://dx.doi.org/10.1787/244741462084
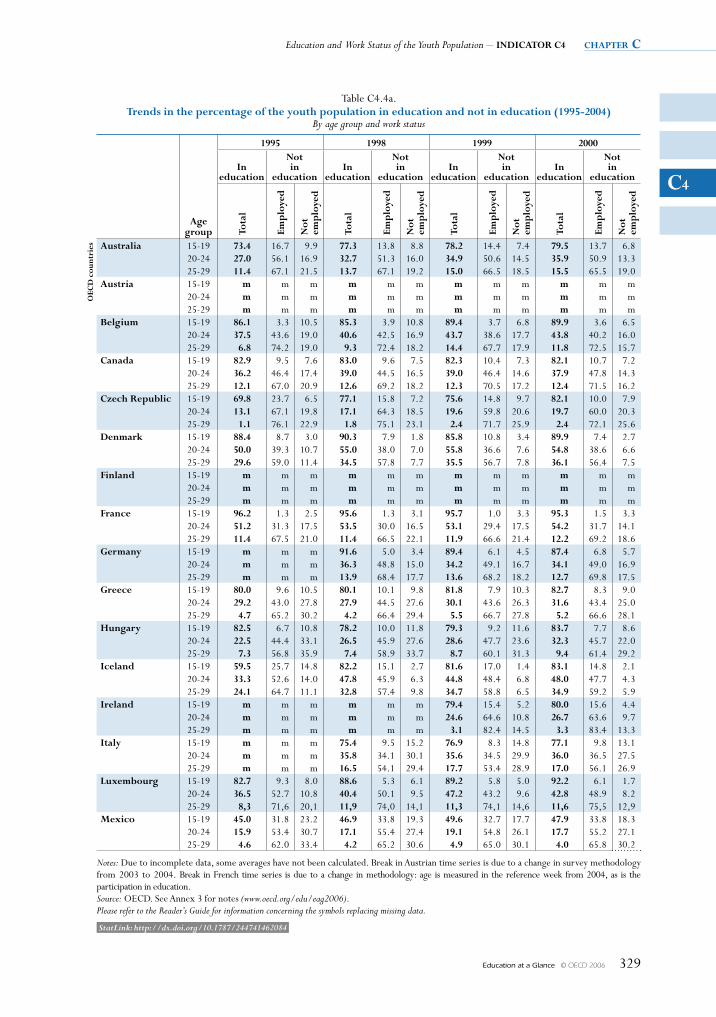
Education and Work Status of the Youth Population – INDICATOR C4 chapter c
Education at a Glance © OECD 2006 329
C4
Table C4.4a. Trends in the percentage of the youth population in education and not in education (1995-2004)
By age group and work status
Age group
1995 1998 1999 2000
In education
Not in
educationIn
education
Not in
educationIn
education
Not in
educationIn
education
Not in
education
Tota
l
Emp
loye
d
Not
em
plo
yed
Tota
l
Emp
loye
d
Not
em
plo
yed
Tota
l
Emp
loye
d
Not
em
plo
yed
Tota
l
Emp
loye
d
Not
em
plo
yed
OEC
D c
ount
ries Australia 15-19 73.4 16.7 9.9 77.3 13.8 8.8 78.2 14.4 7.4 79.5 13.7 6.8
20-24 27.0 56.1 16.9 32.7 51.3 16.0 34.9 50.6 14.5 35.9 50.9 13.325-29 11.4 67.1 21.5 13.7 67.1 19.2 15.0 66.5 18.5 15.5 65.5 19.0
Austria 15-19 m m m m m m m m m m m m20-24 m m m m m m m m m m m m25-29 m m m m m m m m m m m m
Belgium 15-19 86.1 3.3 10.5 85.3 3.9 10.8 89.4 3.7 6.8 89.9 3.6 6.520-24 37.5 43.6 19.0 40.6 42.5 16.9 43.7 38.6 17.7 43.8 40.2 16.025-29 6.8 74.2 19.0 9.3 72.4 18.2 14.4 67.7 17.9 11.8 72.5 15.7
Canada 15-19 82.9 9.5 7.6 83.0 9.6 7.5 82.3 10.4 7.3 82.1 10.7 7.220-24 36.2 46.4 17.4 39.0 44.5 16.5 39.0 46.4 14.6 37.9 47.8 14.325-29 12.1 67.0 20.9 12.6 69.2 18.2 12.3 70.5 17.2 12.4 71.5 16.2
Czech Republic 15-19 69.8 23.7 6.5 77.1 15.8 7.2 75.6 14.8 9.7 82.1 10.0 7.920-24 13.1 67.1 19.8 17.1 64.3 18.5 19.6 59.8 20.6 19.7 60.0 20.325-29 1.1 76.1 22.9 1.8 75.1 23.1 2.4 71.7 25.9 2.4 72.1 25.6
Denmark 15-19 88.4 8.7 3.0 90.3 7.9 1.8 85.8 10.8 3.4 89.9 7.4 2.720-24 50.0 39.3 10.7 55.0 38.0 7.0 55.8 36.6 7.6 54.8 38.6 6.625-29 29.6 59.0 11.4 34.5 57.8 7.7 35.5 56.7 7.8 36.1 56.4 7.5
finland 15-19 m m m m m m m m m m m m20-24 m m m m m m m m m m m m25-29 m m m m m m m m m m m m
france 15-19 96.2 1.3 2.5 95.6 1.3 3.1 95.7 1.0 3.3 95.3 1.5 3.320-24 51.2 31.3 17.5 53.5 30.0 16.5 53.1 29.4 17.5 54.2 31.7 14.125-29 11.4 67.5 21.0 11.4 66.5 22.1 11.9 66.6 21.4 12.2 69.2 18.6
Germany 15-19 m m m 91.6 5.0 3.4 89.4 6.1 4.5 87.4 6.8 5.720-24 m m m 36.3 48.8 15.0 34.2 49.1 16.7 34.1 49.0 16.925-29 m m m 13.9 68.4 17.7 13.6 68.2 18.2 12.7 69.8 17.5
Greece 15-19 80.0 9.6 10.5 80.1 10.1 9.8 81.8 7.9 10.3 82.7 8.3 9.020-24 29.2 43.0 27.8 27.9 44.5 27.6 30.1 43.6 26.3 31.6 43.4 25.025-29 4.7 65.2 30.2 4.2 66.4 29.4 5.5 66.7 27.8 5.2 66.6 28.1
hungary 15-19 82.5 6.7 10.8 78.2 10.0 11.8 79.3 9.2 11.6 83.7 7.7 8.620-24 22.5 44.4 33.1 26.5 45.9 27.6 28.6 47.7 23.6 32.3 45.7 22.025-29 7.3 56.8 35.9 7.4 58.9 33.7 8.7 60.1 31.3 9.4 61.4 29.2
Iceland 15-19 59.5 25.7 14.8 82.2 15.1 2.7 81.6 17.0 1.4 83.1 14.8 2.120-24 33.3 52.6 14.0 47.8 45.9 6.3 44.8 48.4 6.8 48.0 47.7 4.325-29 24.1 64.7 11.1 32.8 57.4 9.8 34.7 58.8 6.5 34.9 59.2 5.9
Ireland 15-19 m m m m m m 79.4 15.4 5.2 80.0 15.6 4.420-24 m m m m m m 24.6 64.6 10.8 26.7 63.6 9.725-29 m m m m m m 3.1 82.4 14.5 3.3 83.4 13.3
Italy 15-19 m m m 75.4 9.5 15.2 76.9 8.3 14.8 77.1 9.8 13.120-24 m m m 35.8 34.1 30.1 35.6 34.5 29.9 36.0 36.5 27.525-29 m m m 16.5 54.1 29.4 17.7 53.4 28.9 17.0 56.1 26.9
luxembourg 15-19 82.7 9.3 8.0 88.6 5.3 6.1 89.2 5.8 5.0 92.2 6.1 1.720-24 36.5 52.7 10.8 40.4 50.1 9.5 47.2 43.2 9.6 42.8 48.9 8.225-29 8,3 71,6 20,1 11,9 74,0 14,1 11,3 74,1 14,6 11,6 75,5 12,9
Mexico 15-19 45.0 31.8 23.2 46.9 33.8 19.3 49.6 32.7 17.7 47.9 33.8 18.320-24 15.9 53.4 30.7 17.1 55.4 27.4 19.1 54.8 26.1 17.7 55.2 27.125-29 4.6 62.0 33.4 4.2 65.2 30.6 4.9 65.0 30.1 4.0 65.8 30.2
Notes: Due to incomplete data, some averages have not been calculated. Break in Austrian time series is due to a change in survey methodology from 2003 to 2004. Break in French time series is due to a change in methodology: age is measured in the reference week from 2004, as is the participation in education.Source: OECD. See Annex 3 for notes (www.oecd.org/edu/eag2006).Please refer to the Reader’s Guide for information concerning the symbols replacing missing data.
StatLink: http://dx.doi.org/10.1787/244741462084
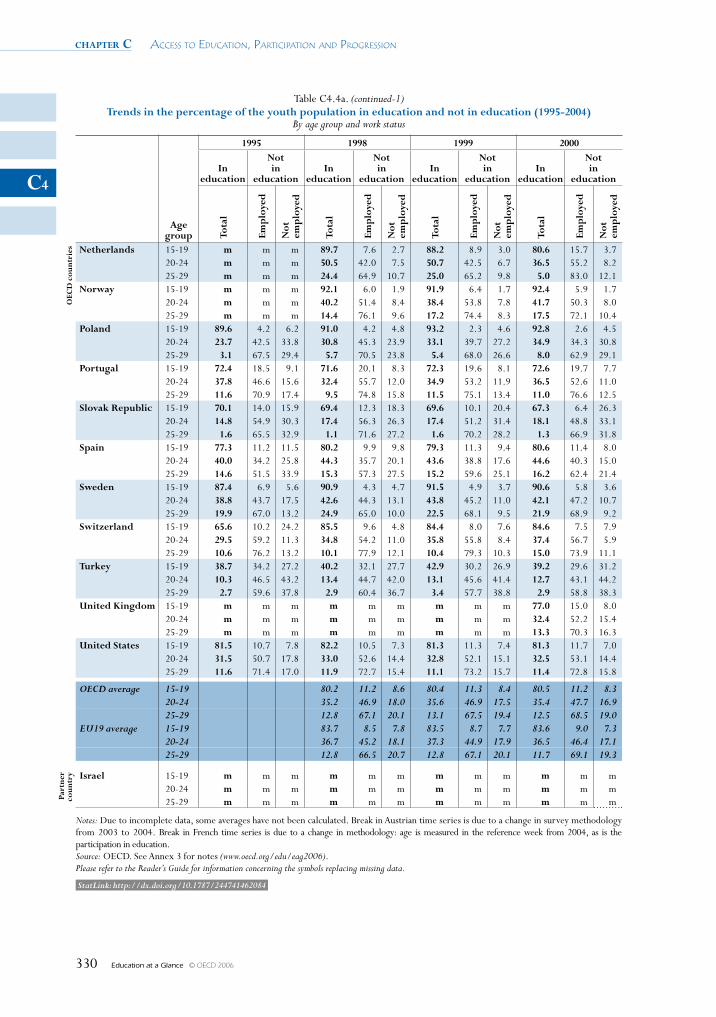
chapter c Access to educAtion, PArticiPAtion And Progression
Education at a Glance © OECD 2006330
C4
Table C4.4a. (continued-1) Trends in the percentage of the youth population in education and not in education (1995-2004)
By age group and work status
Age group
1995 1998 1999 2000
In education
Not in
educationIn
education
Not in
educationIn
education
Not in
educationIn
education
Not in
education
Tota
l
Emp
loye
d
Not
em
plo
yed
Tota
l
Emp
loye
d
Not
em
plo
yed
Tota
l
Emp
loye
d
Not
em
plo
yed
Tota
l
Emp
loye
d
Not
em
plo
yed
OEC
D c
ount
ries Netherlands 15-19 m m m 89.7 7.6 2.7 88.2 8.9 3.0 80.6 15.7 3.7
20-24 m m m 50.5 42.0 7.5 50.7 42.5 6.7 36.5 55.2 8.225-29 m m m 24.4 64.9 10.7 25.0 65.2 9.8 5.0 83.0 12.1
Norway 15-19 m m m 92.1 6.0 1.9 91.9 6.4 1.7 92.4 5.9 1.720-24 m m m 40.2 51.4 8.4 38.4 53.8 7.8 41.7 50.3 8.025-29 m m m 14.4 76.1 9.6 17.2 74.4 8.3 17.5 72.1 10.4
Poland 15-19 89.6 4.2 6.2 91.0 4.2 4.8 93.2 2.3 4.6 92.8 2.6 4.520-24 23.7 42.5 33.8 30.8 45.3 23.9 33.1 39.7 27.2 34.9 34.3 30.825-29 3.1 67.5 29.4 5.7 70.5 23.8 5.4 68.0 26.6 8.0 62.9 29.1
Portugal 15-19 72.4 18.5 9.1 71.6 20.1 8.3 72.3 19.6 8.1 72.6 19.7 7.720-24 37.8 46.6 15.6 32.4 55.7 12.0 34.9 53.2 11.9 36.5 52.6 11.025-29 11.6 70.9 17.4 9.5 74.8 15.8 11.5 75.1 13.4 11.0 76.6 12.5
slovak Republic 15-19 70.1 14.0 15.9 69.4 12.3 18.3 69.6 10.1 20.4 67.3 6.4 26.320-24 14.8 54.9 30.3 17.4 56.3 26.3 17.4 51.2 31.4 18.1 48.8 33.125-29 1.6 65.5 32.9 1.1 71.6 27.2 1.6 70.2 28.2 1.3 66.9 31.8
spain 15-19 77.3 11.2 11.5 80.2 9.9 9.8 79.3 11.3 9.4 80.6 11.4 8.020-24 40.0 34.2 25.8 44.3 35.7 20.1 43.6 38.8 17.6 44.6 40.3 15.025-29 14.6 51.5 33.9 15.3 57.3 27.5 15.2 59.6 25.1 16.2 62.4 21.4
sweden 15-19 87.4 6.9 5.6 90.9 4.3 4.7 91.5 4.9 3.7 90.6 5.8 3.620-24 38.8 43.7 17.5 42.6 44.3 13.1 43.8 45.2 11.0 42.1 47.2 10.725-29 19.9 67.0 13.2 24.9 65.0 10.0 22.5 68.1 9.5 21.9 68.9 9.2
switzerland 15-19 65.6 10.2 24.2 85.5 9.6 4.8 84.4 8.0 7.6 84.6 7.5 7.920-24 29.5 59.2 11.3 34.8 54.2 11.0 35.8 55.8 8.4 37.4 56.7 5.925-29 10.6 76.2 13.2 10.1 77.9 12.1 10.4 79.3 10.3 15.0 73.9 11.1
Turkey 15-19 38.7 34.2 27.2 40.2 32.1 27.7 42.9 30.2 26.9 39.2 29.6 31.220-24 10.3 46.5 43.2 13.4 44.7 42.0 13.1 45.6 41.4 12.7 43.1 44.225-29 2.7 59.6 37.8 2.9 60.4 36.7 3.4 57.7 38.8 2.9 58.8 38.3
united kingdom 15-19 m m m m m m m m m 77.0 15.0 8.020-24 m m m m m m m m m 32.4 52.2 15.425-29 m m m m m m m m m 13.3 70.3 16.3
united states 15-19 81.5 10.7 7.8 82.2 10.5 7.3 81.3 11.3 7.4 81.3 11.7 7.020-24 31.5 50.7 17.8 33.0 52.6 14.4 32.8 52.1 15.1 32.5 53.1 14.425-29 11.6 71.4 17.0 11.9 72.7 15.4 11.1 73.2 15.7 11.4 72.8 15.8
OECD average 15-19 80.2 11.2 8.6 80.4 11.3 8.4 80.5 11.2 8.320-24 35.2 46.9 18.0 35.6 46.9 17.5 35.4 47.7 16.925-29 12.8 67.1 20.1 13.1 67.5 19.4 12.5 68.5 19.0
EU19 average 15-19 83.7 8.5 7.8 83.5 8.7 7.7 83.6 9.0 7.320-24 36.7 45.2 18.1 37.3 44.9 17.9 36.5 46.4 17.125-29 12.8 66.5 20.7 12.8 67.1 20.1 11.7 69.1 19.3
Part
ner
coun
try Israel 15-19 m m m m m m m m m m m m
20-24 m m m m m m m m m m m m 25-29 m m m m m m m m m m m m
Notes: Due to incomplete data, some averages have not been calculated. Break in Austrian time series is due to a change in survey methodology from 2003 to 2004. Break in French time series is due to a change in methodology: age is measured in the reference week from 2004, as is the participation in education.Source: OECD. See Annex 3 for notes (www.oecd.org/edu/eag2006).Please refer to the Reader’s Guide for information concerning the symbols replacing missing data.
StatLink: http://dx.doi.org/10.1787/244741462084
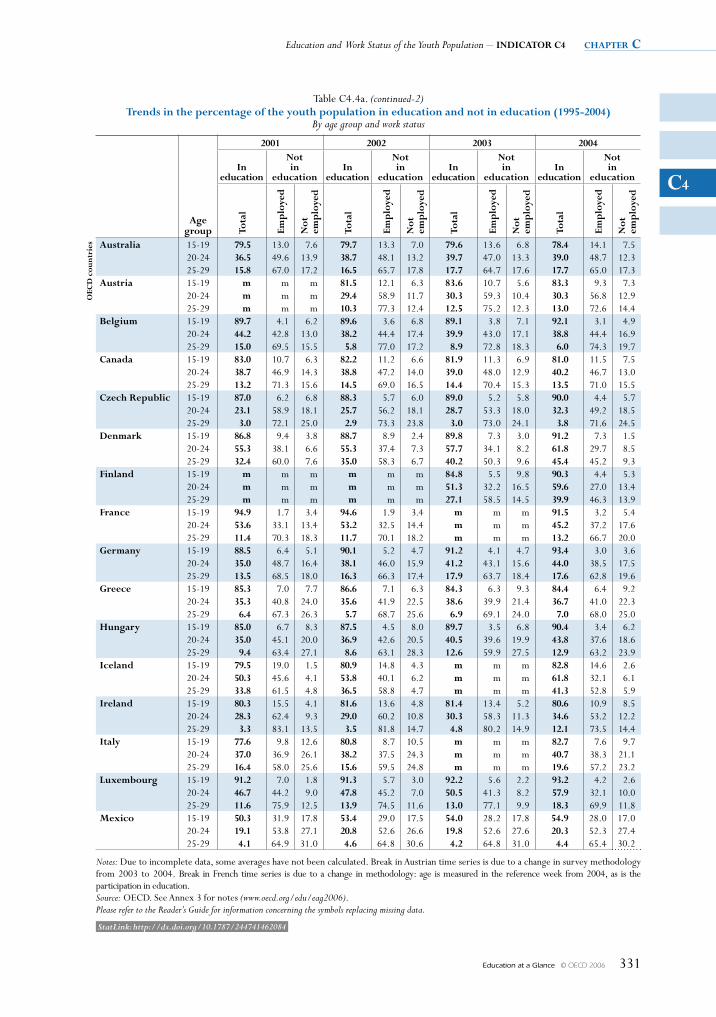
Education and Work Status of the Youth Population – INDICATOR C4 chapter c
Education at a Glance © OECD 2006 331
C4
Table C4.4a. (continued-2)Trends in the percentage of the youth population in education and not in education (1995-2004)
By age group and work status
Age group
2001 2002 2003 2004
In education
Not in
educationIn
education
Not in
educationIn
education
Not in
educationIn
education
Not in
education
Tota
l
Emp
loye
d
Not
em
plo
yed
Tota
l
Emp
loye
d
Not
em
plo
yed
Tota
l
Emp
loye
d
Not
em
plo
yed
Tota
l
Emp
loye
d
Not
em
plo
yed
OEC
D c
ount
ries Australia 15-19 79.5 13.0 7.6 79.7 13.3 7.0 79.6 13.6 6.8 78.4 14.1 7.5
20-24 36.5 49.6 13.9 38.7 48.1 13.2 39.7 47.0 13.3 39.0 48.7 12.325-29 15.8 67.0 17.2 16.5 65.7 17.8 17.7 64.7 17.6 17.7 65.0 17.3
Austria 15-19 m m m 81.5 12.1 6.3 83.6 10.7 5.6 83.3 9.3 7.320-24 m m m 29.4 58.9 11.7 30.3 59.3 10.4 30.3 56.8 12.925-29 m m m 10.3 77.3 12.4 12.5 75.2 12.3 13.0 72.6 14.4
Belgium 15-19 89.7 4.1 6.2 89.6 3.6 6.8 89.1 3.8 7.1 92.1 3.1 4.920-24 44.2 42.8 13.0 38.2 44.4 17.4 39.9 43.0 17.1 38.8 44.4 16.925-29 15.0 69.5 15.5 5.8 77.0 17.2 8.9 72.8 18.3 6.0 74.3 19.7
Canada 15-19 83.0 10.7 6.3 82.2 11.2 6.6 81.9 11.3 6.9 81.0 11.5 7.520-24 38.7 46.9 14.3 38.8 47.2 14.0 39.0 48.0 12.9 40.2 46.7 13.025-29 13.2 71.3 15.6 14.5 69.0 16.5 14.4 70.4 15.3 13.5 71.0 15.5
Czech Republic 15-19 87.0 6.2 6.8 88.3 5.7 6.0 89.0 5.2 5.8 90.0 4.4 5.720-24 23.1 58.9 18.1 25.7 56.2 18.1 28.7 53.3 18.0 32.3 49.2 18.525-29 3.0 72.1 25.0 2.9 73.3 23.8 3.0 73.0 24.1 3.8 71.6 24.5
Denmark 15-19 86.8 9.4 3.8 88.7 8.9 2.4 89.8 7.3 3.0 91.2 7.3 1.520-24 55.3 38.1 6.6 55.3 37.4 7.3 57.7 34.1 8.2 61.8 29.7 8.525-29 32.4 60.0 7.6 35.0 58.3 6.7 40.2 50.3 9.6 45.4 45.2 9.3
finland 15-19 m m m m m m 84.8 5.5 9.8 90.3 4.4 5.320-24 m m m m m m 51.3 32.2 16.5 59.6 27.0 13.425-29 m m m m m m 27.1 58.5 14.5 39.9 46.3 13.9
france 15-19 94.9 1.7 3.4 94.6 1.9 3.4 m m m 91.5 3.2 5.420-24 53.6 33.1 13.4 53.2 32.5 14.4 m m m 45.2 37.2 17.625-29 11.4 70.3 18.3 11.7 70.1 18.2 m m m 13.2 66.7 20.0
Germany 15-19 88.5 6.4 5.1 90.1 5.2 4.7 91.2 4.1 4.7 93.4 3.0 3.620-24 35.0 48.7 16.4 38.1 46.0 15.9 41.2 43.1 15.6 44.0 38.5 17.525-29 13.5 68.5 18.0 16.3 66.3 17.4 17.9 63.7 18.4 17.6 62.8 19.6
Greece 15-19 85.3 7.0 7.7 86.6 7.1 6.3 84.3 6.3 9.3 84.4 6.4 9.220-24 35.3 40.8 24.0 35.6 41.9 22.5 38.6 39.9 21.4 36.7 41.0 22.325-29 6.4 67.3 26.3 5.7 68.7 25.6 6.9 69.1 24.0 7.0 68.0 25.0
hungary 15-19 85.0 6.7 8.3 87.5 4.5 8.0 89.7 3.5 6.8 90.4 3.4 6.220-24 35.0 45.1 20.0 36.9 42.6 20.5 40.5 39.6 19.9 43.8 37.6 18.625-29 9.4 63.4 27.1 8.6 63.1 28.3 12.6 59.9 27.5 12.9 63.2 23.9
Iceland 15-19 79.5 19.0 1.5 80.9 14.8 4.3 m m m 82.8 14.6 2.620-24 50.3 45.6 4.1 53.8 40.1 6.2 m m m 61.8 32.1 6.125-29 33.8 61.5 4.8 36.5 58.8 4.7 m m m 41.3 52.8 5.9
Ireland 15-19 80.3 15.5 4.1 81.6 13.6 4.8 81.4 13.4 5.2 80.6 10.9 8.520-24 28.3 62.4 9.3 29.0 60.2 10.8 30.3 58.3 11.3 34.6 53.2 12.225-29 3.3 83.1 13.5 3.5 81.8 14.7 4.8 80.2 14.9 12.1 73.5 14.4
Italy 15-19 77.6 9.8 12.6 80.8 8.7 10.5 m m m 82.7 7.6 9.720-24 37.0 36.9 26.1 38.2 37.5 24.3 m m m 40.7 38.3 21.125-29 16.4 58.0 25.6 15.6 59.5 24.8 m m m 19.6 57.2 23.2
luxembourg 15-19 91.2 7.0 1.8 91.3 5.7 3.0 92.2 5.6 2.2 93.2 4.2 2.620-24 46.7 44.2 9.0 47.8 45.2 7.0 50.5 41.3 8.2 57.9 32.1 10.025-29 11.6 75.9 12.5 13.9 74.5 11.6 13.0 77.1 9.9 18.3 69.9 11.8
Mexico 15-19 50.3 31.9 17.8 53.4 29.0 17.5 54.0 28.2 17.8 54.9 28.0 17.020-24 19.1 53.8 27.1 20.8 52.6 26.6 19.8 52.6 27.6 20.3 52.3 27.425-29 4.1 64.9 31.0 4.6 64.8 30.6 4.2 64.8 31.0 4.4 65.4 30.2
Notes: Due to incomplete data, some averages have not been calculated. Break in Austrian time series is due to a change in survey methodology from 2003 to 2004. Break in French time series is due to a change in methodology: age is measured in the reference week from 2004, as is the participation in education.Source: OECD. See Annex 3 for notes (www.oecd.org/edu/eag2006).Please refer to the Reader’s Guide for information concerning the symbols replacing missing data.
StatLink: http://dx.doi.org/10.1787/244741462084
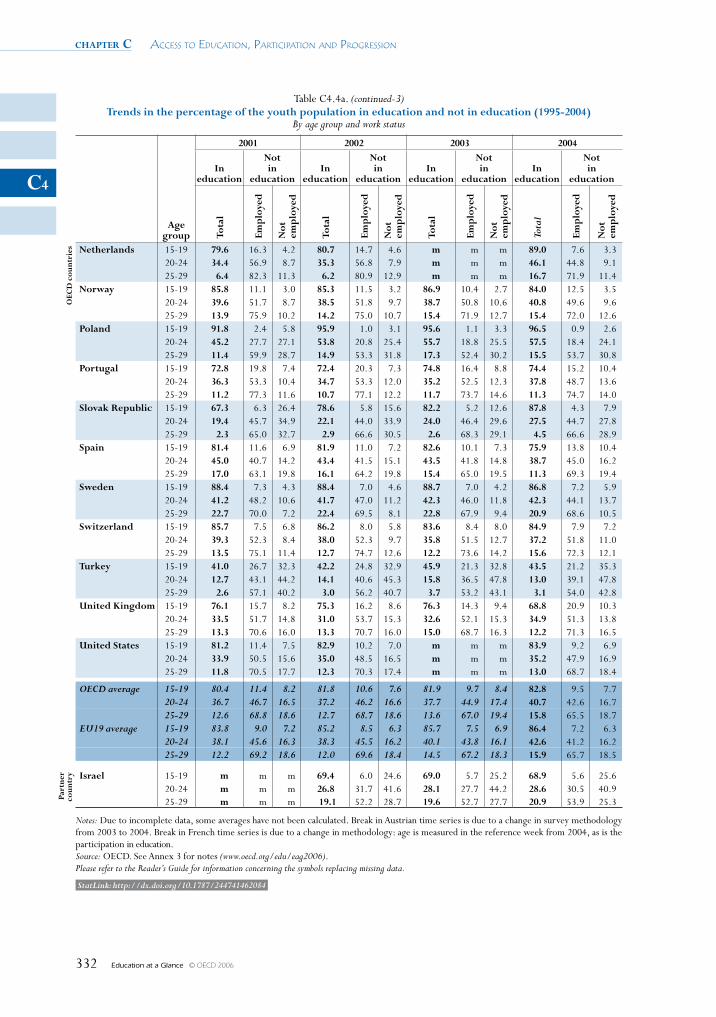
chapter c Access to educAtion, PArticiPAtion And Progression
Education at a Glance © OECD 2006332
C4
Table C4.4a. (continued-3)Trends in the percentage of the youth population in education and not in education (1995-2004)
By age group and work status
Age group
2001 2002 2003 2004
In education
Not in
educationIn
education
Not in
educationIn
education
Not in
educationIn
education
Not in
education
Tota
l
Emp
loye
d
Not
em
plo
yed
Tota
l
Emp
loye
d
Not
em
plo
yed
Tota
l
Emp
loye
d
Not
em
plo
yed
Tota
l
Emp
loye
d
Not
em
plo
yed
OEC
D c
ount
ries Netherlands 15-19 79.6 16.3 4.2 80.7 14.7 4.6 m m m 89.0 7.6 3.3
20-24 34.4 56.9 8.7 35.3 56.8 7.9 m m m 46.1 44.8 9.125-29 6.4 82.3 11.3 6.2 80.9 12.9 m m m 16.7 71.9 11.4
Norway 15-19 85.8 11.1 3.0 85.3 11.5 3.2 86.9 10.4 2.7 84.0 12.5 3.520-24 39.6 51.7 8.7 38.5 51.8 9.7 38.7 50.8 10.6 40.8 49.6 9.625-29 13.9 75.9 10.2 14.2 75.0 10.7 15.4 71.9 12.7 15.4 72.0 12.6
Poland 15-19 91.8 2.4 5.8 95.9 1.0 3.1 95.6 1.1 3.3 96.5 0.9 2.620-24 45.2 27.7 27.1 53.8 20.8 25.4 55.7 18.8 25.5 57.5 18.4 24.125-29 11.4 59.9 28.7 14.9 53.3 31.8 17.3 52.4 30.2 15.5 53.7 30.8
Portugal 15-19 72.8 19.8 7.4 72.4 20.3 7.3 74.8 16.4 8.8 74.4 15.2 10.420-24 36.3 53.3 10.4 34.7 53.3 12.0 35.2 52.5 12.3 37.8 48.7 13.625-29 11.2 77.3 11.6 10.7 77.1 12.2 11.7 73.7 14.6 11.3 74.7 14.0
slovak Republic 15-19 67.3 6.3 26.4 78.6 5.8 15.6 82.2 5.2 12.6 87.8 4.3 7.920-24 19.4 45.7 34.9 22.1 44.0 33.9 24.0 46.4 29.6 27.5 44.7 27.825-29 2.3 65.0 32.7 2.9 66.6 30.5 2.6 68.3 29.1 4.5 66.6 28.9
spain 15-19 81.4 11.6 6.9 81.9 11.0 7.2 82.6 10.1 7.3 75.9 13.8 10.420-24 45.0 40.7 14.2 43.4 41.5 15.1 43.5 41.8 14.8 38.7 45.0 16.225-29 17.0 63.1 19.8 16.1 64.2 19.8 15.4 65.0 19.5 11.3 69.3 19.4
sweden 15-19 88.4 7.3 4.3 88.4 7.0 4.6 88.7 7.0 4.2 86.8 7.2 5.920-24 41.2 48.2 10.6 41.7 47.0 11.2 42.3 46.0 11.8 42.3 44.1 13.725-29 22.7 70.0 7.2 22.4 69.5 8.1 22.8 67.9 9.4 20.9 68.6 10.5
switzerland 15-19 85.7 7.5 6.8 86.2 8.0 5.8 83.6 8.4 8.0 84.9 7.9 7.220-24 39.3 52.3 8.4 38.0 52.3 9.7 35.8 51.5 12.7 37.2 51.8 11.025-29 13.5 75.1 11.4 12.7 74.7 12.6 12.2 73.6 14.2 15.6 72.3 12.1
Turkey 15-19 41.0 26.7 32.3 42.2 24.8 32.9 45.9 21.3 32.8 43.5 21.2 35.320-24 12.7 43.1 44.2 14.1 40.6 45.3 15.8 36.5 47.8 13.0 39.1 47.825-29 2.6 57.1 40.2 3.0 56.2 40.7 3.7 53.2 43.1 3.1 54.0 42.8
united kingdom 15-19 76.1 15.7 8.2 75.3 16.2 8.6 76.3 14.3 9.4 68.8 20.9 10.320-24 33.5 51.7 14.8 31.0 53.7 15.3 32.6 52.1 15.3 34.9 51.3 13.825-29 13.3 70.6 16.0 13.3 70.7 16.0 15.0 68.7 16.3 12.2 71.3 16.5
united states 15-19 81.2 11.4 7.5 82.9 10.2 7.0 m m m 83.9 9.2 6.920-24 33.9 50.5 15.6 35.0 48.5 16.5 m m m 35.2 47.9 16.925-29 11.8 70.5 17.7 12.3 70.3 17.4 m m m 13.0 68.7 18.4
OECD average 15-19 80.4 11.4 8.2 81.8 10.6 7.6 81.9 9.7 8.4 82.8 9.5 7.720-24 36.7 46.7 16.5 37.2 46.2 16.6 37.7 44.9 17.4 40.7 42.6 16.725-29 12.6 68.8 18.6 12.7 68.7 18.6 13.6 67.0 19.4 15.8 65.5 18.7
EU19 average 15-19 83.8 9.0 7.2 85.2 8.5 6.3 85.7 7.5 6.9 86.4 7.2 6.320-24 38.1 45.6 16.3 38.3 45.5 16.2 40.1 43.8 16.1 42.6 41.2 16.225-29 12.2 69.2 18.6 12.0 69.6 18.4 14.5 67.2 18.3 15.9 65.7 18.5
Part
ner
coun
try Israel 15-19 m m m 69.4 6.0 24.6 69.0 5.7 25.2 68.9 5.6 25.6
20-24 m m m 26.8 31.7 41.6 28.1 27.7 44.2 28.6 30.5 40.9 25-29 m m m 19.1 52.2 28.7 19.6 52.7 27.7 20.9 53.9 25.3
Notes: Due to incomplete data, some averages have not been calculated. Break in Austrian time series is due to a change in survey methodology from 2003 to 2004. Break in French time series is due to a change in methodology: age is measured in the reference week from 2004, as is the participation in education.Source: OECD. See Annex 3 for notes (www.oecd.org/edu/eag2006).Please refer to the Reader’s Guide for information concerning the symbols replacing missing data.
StatLink: http://dx.doi.org/10.1787/244741462084

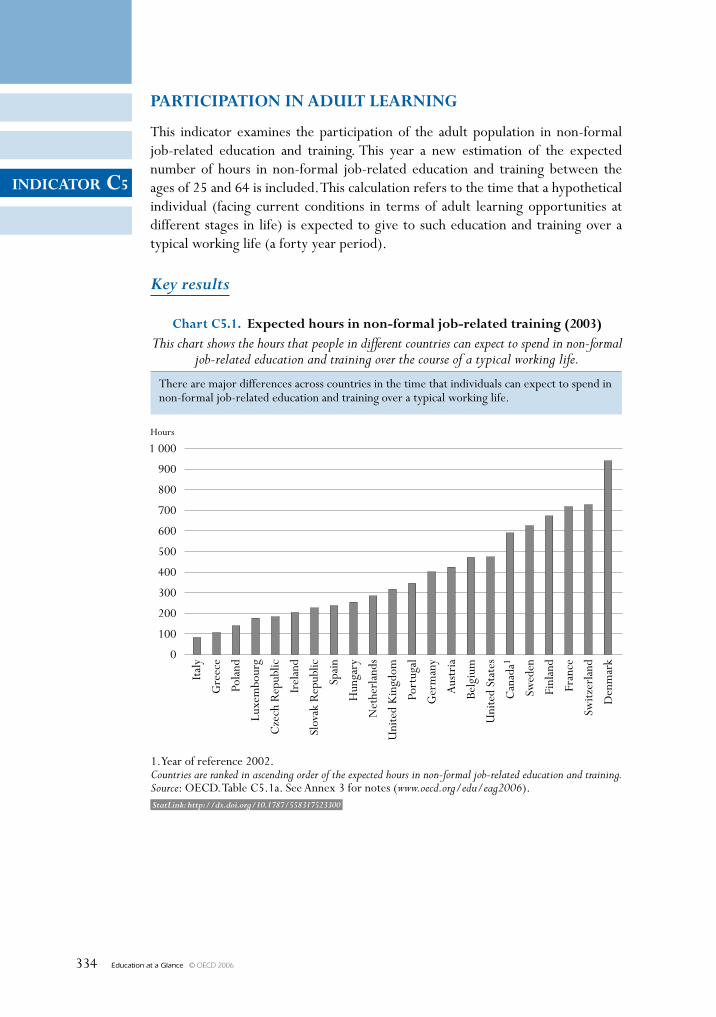
Education at a Glance © OECD 2006334
INDICATOR C5
StatLink: http://dx.doi.org/10.1787/558317523300
PARTICIPATION IN ADULT LEARNING
This indicator examines the participation of the adult population in non-formal job-related education and training. This year a new estimation of the expected number of hours in non-formal job-related education and training between the ages of 25 and 64 is included. This calculation refers to the time that a hypothetical individual (facing current conditions in terms of adult learning opportunities at different stages in life) is expected to give to such education and training over a typical working life (a forty year period).
Key results
1 000
900
800
700
600
500
400
300
200
100
0
Hours
Chart C5.1. Expected hours in non-formal job-related training (2003)This chart shows the hours that people in different countries can expect to spend in non-formal
job-related education and training over the course of a typical working life.
1. Year of reference 2002.Countries are ranked in ascending order of the expected hours in non-formal job-related education and training.Source: OECD. Table C5.1a. See Annex 3 for notes (www.oecd.org/edu/eag2006).
Italy
Gre
ece
Pola
nd
Luxe
mbo
urg
Cze
ch R
epub
lic
Irel
and
Slov
ak R
epub
lic
Spai
n
Hun
gary
Net
herl
ands
Uni
ted
Kin
gdom
Port
ugal
Ger
man
y
Aus
tria
Belg
ium
Uni
ted
Stat
es
Can
ada1
Swed
en
Finl
and
Fran
ce
Switz
erla
nd
Den
mar
k
There are major differences across countries in the time that individuals can expect to spend innon-formal job-related education and training over a typical working life.
Education at a Glance © OECD 2006 335
INDICATOR C5
Other highlights of this indicator
• Adults with higher levels of educational attainment – whether upper-secondary and post-secondary non-tertiary education or tertiary-level education – are more likely to participate in non-formal job-related continuing education and training than adults with lower educational attainment.
• There are major differences in the number of hours that individuals can expect to spend in non-formal job-related education and training over a typical working life. At the tertiary level, this ranges from below 350 hours in Greece, Italy and the Netherlands to more than 1 000 hours in Denmark, Finland, France and Switzerland.
• In all but six countries – Finland, France, Greece, Hungary the Netherlands and Portugal – men can expect to spend more hours in non-formal job-related continuing and education and training than women.
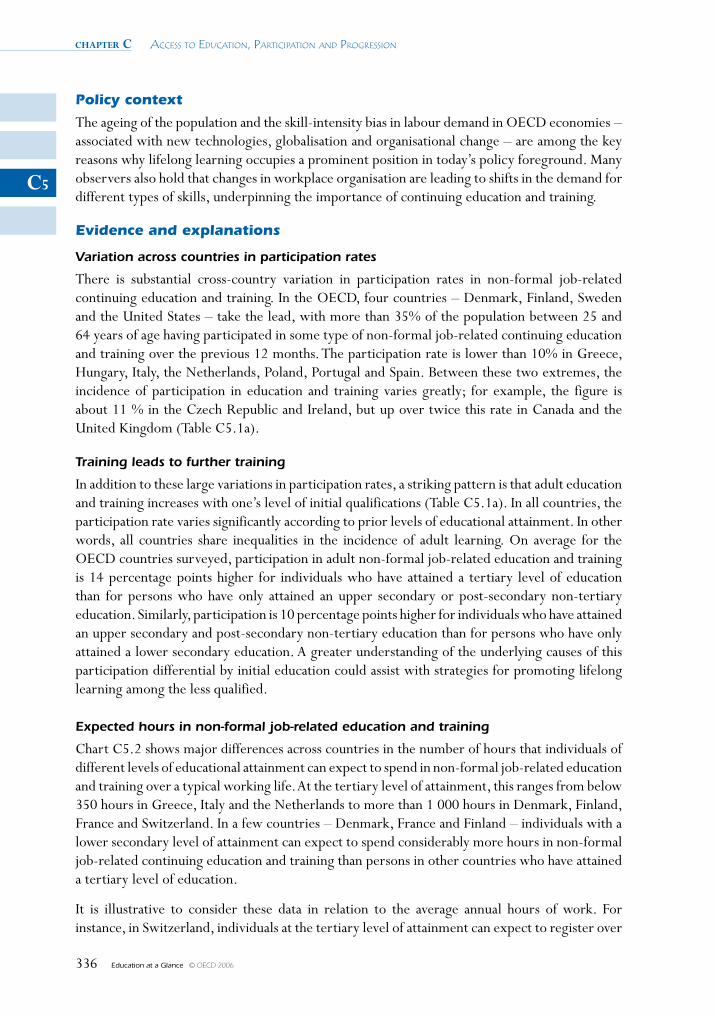
chapter c Access to educAtion, PArticiPAtion And Progression
Education at a Glance © OECD 2006336
C5
Policy context
The ageing of the population and the skill-intensity bias in labour demand in OECD economies – associated with new technologies, globalisation and organisational change – are among the key reasons why lifelong learning occupies a prominent position in today’s policy foreground. Many observers also hold that changes in workplace organisation are leading to shifts in the demand for different types of skills, underpinning the importance of continuing education and training.
Evidence and explanations
Variation across countries in participation rates
There is substantial cross-country variation in participation rates in non-formal job-related continuing education and training. In the OECD, four countries – Denmark, Finland, Sweden and the United States – take the lead, with more than 35% of the population between 25 and 64 years of age having participated in some type of non-formal job-related continuing education and training over the previous 12 months. The participation rate is lower than 10% in Greece, Hungary, Italy, the Netherlands, Poland, Portugal and Spain. Between these two extremes, the incidence of participation in education and training varies greatly; for example, the figure is about 11 % in the Czech Republic and Ireland, but up over twice this rate in Canada and the United Kingdom (Table C5.1a).
Training leads to further training
In addition to these large variations in participation rates, a striking pattern is that adult education and training increases with one’s level of initial qualifications (Table C5.1a). In all countries, the participation rate varies significantly according to prior levels of educational attainment. In other words, all countries share inequalities in the incidence of adult learning. On average for the OECD countries surveyed, participation in adult non-formal job-related education and training is 14 percentage points higher for individuals who have attained a tertiary level of education than for persons who have only attained an upper secondary or post-secondary non-tertiary education. Similarly, participation is 10 percentage points higher for individuals who have attained an upper secondary and post-secondary non-tertiary education than for persons who have only attained a lower secondary education. A greater understanding of the underlying causes of this participation differential by initial education could assist with strategies for promoting lifelong learning among the less qualified.
Expected hours in non-formal job-related education and training
Chart C5.2 shows major differences across countries in the number of hours that individuals of different levels of educational attainment can expect to spend in non-formal job-related education and training over a typical working life. At the tertiary level of attainment, this ranges from below 350 hours in Greece, Italy and the Netherlands to more than 1 000 hours in Denmark, Finland, France and Switzerland. In a few countries – Denmark, France and Finland – individuals with a lower secondary level of attainment can expect to spend considerably more hours in non-formal job-related continuing education and training than persons in other countries who have attained a tertiary level of education.
It is illustrative to consider these data in relation to the average annual hours of work. For instance, in Switzerland, individuals at the tertiary level of attainment can expect to register over
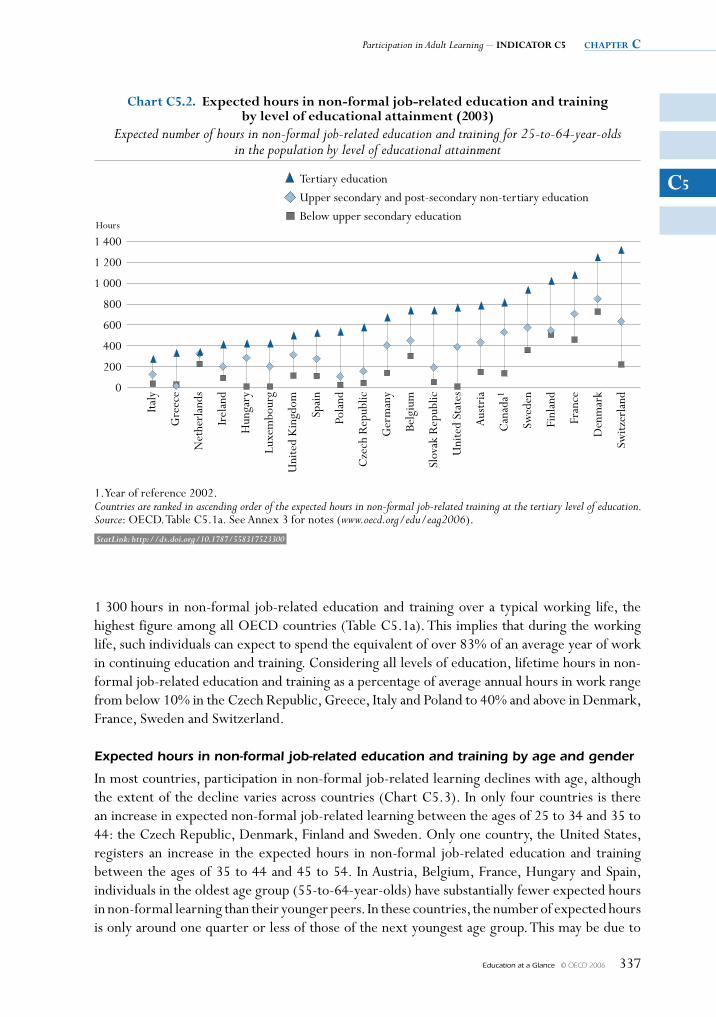
Participation in Adult Learning – INDICATOR C5 chapter c
Education at a Glance © OECD 2006 337
C5
1 300 hours in non-formal job-related education and training over a typical working life, the highest figure among all OECD countries (Table C5.1a). This implies that during the working life, such individuals can expect to spend the equivalent of over 83% of an average year of work in continuing education and training. Considering all levels of education, lifetime hours in non-formal job-related education and training as a percentage of average annual hours in work range from below 10% in the Czech Republic, Greece, Italy and Poland to 40% and above in Denmark, France, Sweden and Switzerland.
Expected hours in non-formal job-related education and training by age and gender
In most countries, participation in non-formal job-related learning declines with age, although the extent of the decline varies across countries (Chart C5.3). In only four countries is there an increase in expected non-formal job-related learning between the ages of 25 to 34 and 35 to 44: the Czech Republic, Denmark, Finland and Sweden. Only one country, the United States, registers an increase in the expected hours in non-formal job-related education and training between the ages of 35 to 44 and 45 to 54. In Austria, Belgium, France, Hungary and Spain, individuals in the oldest age group (55-to-64-year-olds) have substantially fewer expected hours in non-formal learning than their younger peers. In these countries, the number of expected hours is only around one quarter or less of those of the next youngest age group. This may be due to
1 400
1 200
1 000
800
600
400
200
0
Hours
Chart C5.2. Expected hours in non-formal job-related education and trainingby level of educational attainment (2003)
Expected number of hours in non-formal job-related education and training for 25-to-64-year-oldsin the population by level of educational attainment
Tertiary education
Upper secondary and post-secondary non-tertiary education
Below upper secondary education
1. Year of reference 2002.Countries are ranked in ascending order of the expected hours in non-formal job-related training at the tertiary level of education.Source: OECD. Table C5.1a. See Annex 3 for notes (www.oecd.org/edu/eag2006).
Italy
Gre
ece
Net
herl
ands
Irel
and
Hun
gary
Luxe
mbo
urg
Uni
ted
Kin
gdom
Spai
n
Pola
nd
Cze
ch R
epub
lic
Ger
man
y
Belg
ium
Slov
ak R
epub
lic
Uni
ted
Stat
es
Aus
tria
Can
ada1
Swed
en
Finl
and
Fran
ce
Den
mar
k
Switz
erla
nd
StatLink: http://dx.doi.org/10.1787/558317523300
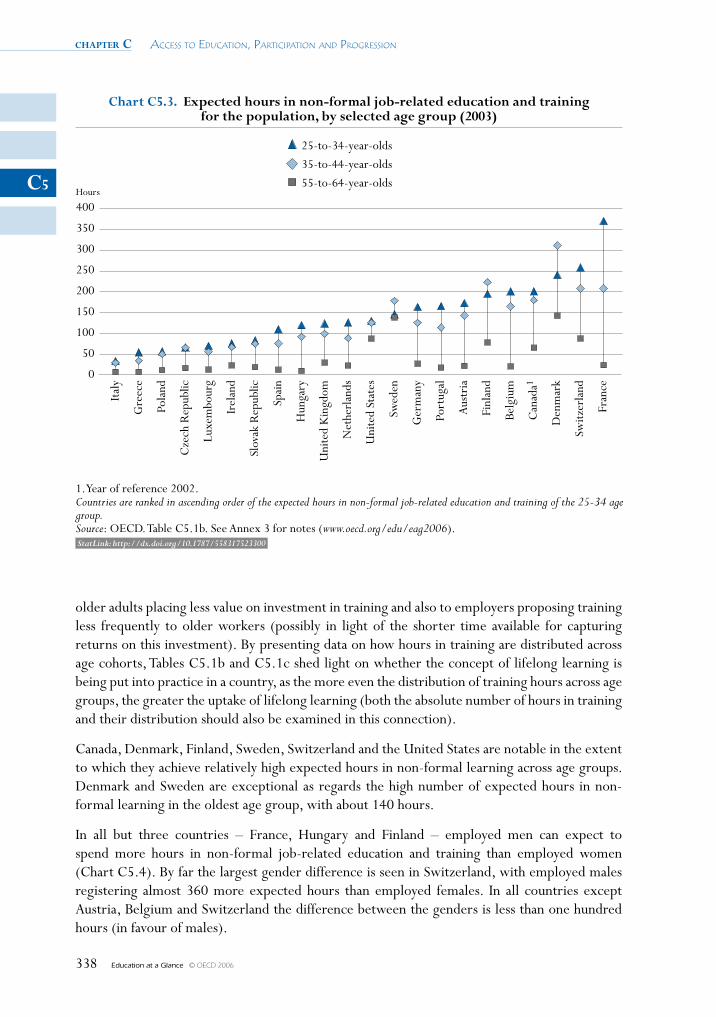
chapter c Access to educAtion, PArticiPAtion And Progression
Education at a Glance © OECD 2006338
C5
older adults placing less value on investment in training and also to employers proposing training less frequently to older workers (possibly in light of the shorter time available for capturing returns on this investment). By presenting data on how hours in training are distributed across age cohorts, Tables C5.1b and C5.1c shed light on whether the concept of lifelong learning is being put into practice in a country, as the more even the distribution of training hours across age groups, the greater the uptake of lifelong learning (both the absolute number of hours in training and their distribution should also be examined in this connection).
Canada, Denmark, Finland, Sweden, Switzerland and the United States are notable in the extent to which they achieve relatively high expected hours in non-formal learning across age groups. Denmark and Sweden are exceptional as regards the high number of expected hours in non-formal learning in the oldest age group, with about 140 hours.
In all but three countries – France, Hungary and Finland – employed men can expect to spend more hours in non-formal job-related education and training than employed women (Chart C5.4). By far the largest gender difference is seen in Switzerland, with employed males registering almost 360 more expected hours than employed females. In all countries except Austria, Belgium and Switzerland the difference between the genders is less than one hundred hours (in favour of males).
400
350
300
250
200
150
100
50
0
Hours
Chart C5.3. Expected hours in non-formal job-related education and trainingfor the population, by selected age group (2003)
25-to-34-year-olds
35-to-44-year-olds
55-to-64-year-olds
1. Year of reference 2002.Countries are ranked in ascending order of the expected hours in non-formal job-related education and training of the 25-34 agegroup.Source: OECD. Table C5.1b. See Annex 3 for notes (www.oecd.org/edu/eag2006).
Italy
Gre
ece
Pola
nd
Cze
ch R
epub
lic
Luxe
mbo
urg
Irel
and
Slov
ak R
epub
lic
Spai
n
Hun
gary
Uni
ted
Kin
gdom
Net
herl
ands
Uni
ted
Stat
es
Swed
en
Ger
man
y
Port
ugal
Aus
tria
Finl
and
Belg
ium
Can
ada1
Den
mar
k
Switz
erla
nd
Fran
ce
StatLink: http://dx.doi.org/10.1787/558317523300
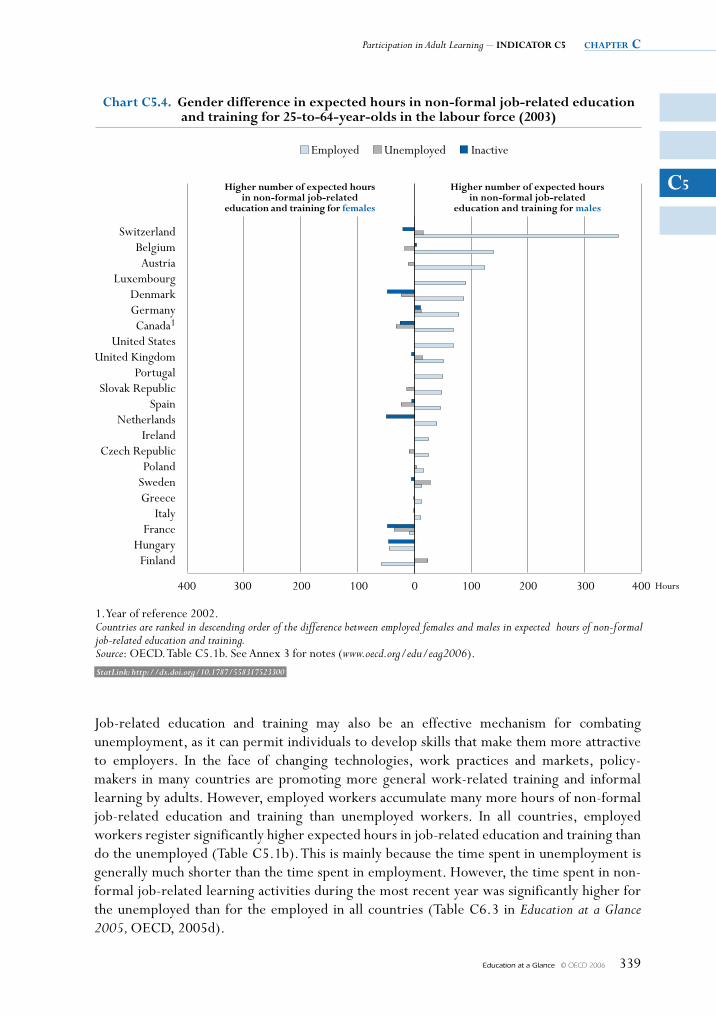
Participation in Adult Learning – IndIcator c5 chapter c
Education at a Glance © OECD 2006 339
c5
Job-related education and training may also be an effective mechanism for combating unemployment, as it can permit individuals to develop skills that make them more attractive to employers. In the face of changing technologies, work practices and markets, policy-makers in many countries are promoting more general work-related training and informal learning by adults. However, employed workers accumulate many more hours of non-formal job-related education and training than unemployed workers. In all countries, employed workers register significantly higher expected hours in job-related education and training than do the unemployed (Table C5.1b). This is mainly because the time spent in unemployment is generally much shorter than the time spent in employment. However, the time spent in non-formal job-related learning activities during the most recent year was significantly higher for the unemployed than for the employed in all countries (Table C6.3 in Education at a Glance 2005, OECD, 2005d).
400 Hours300 200 100 0 100 200 300 400
Unemployed Inactive
chart c5.4. Gender difference in expected hours in non-formal job-related educationand training for 25-to-64-year-olds in the labour force (2003)
1. Year of reference 2002.Countries are ranked in descending order of the difference between employed females and males in expected hours of non-formaljob-related education and training.Source: OECD. Table C5.1b. See Annex 3 for notes (www.oecd.org/edu/eag2006).
SwitzerlandBelgiumAustria
LuxembourgDenmarkGermanyCanada1
United StatesUnited Kingdom
PortugalSlovak Republic
SpainNetherlands
IrelandCzech Republic
PolandSwedenGreece
ItalyFrance
HungaryFinland
Higher number of expected hoursin non-formal job-related
education and training for males
Employed
Higher number of expected hoursin non-formal job-related
education and training for females
StatLink: http://dx.doi.org/10.1787/558317523300
chapter c Access to educAtion, PArticiPAtion And Progression
Education at a Glance © OECD 2006340
C5
Definition and methodologies
Data for non-European countries were calculated from country-specific household surveys (see Annex 3 at www.oecd.org/edu/eag2006). Data for countries in the European statistical system come from the January 2006 version of the European Labour Force Survey ad hoc module “Lifelong Learning 2003”. For most European countries, data on hours in job-related activities are available for up to three most recent non-formal learning activities. Data for Canada cover up to five job-related training activities per training participant. Data for the United States cover up to four job-related training activities per training participant.
The analysis in this indicator is focused on non-formal job-related continuing education and training. Non-formal education is defined as any organised and sustained educational activities that cannot be considered as formal education according to ISCED and do not lead to a corresponding qualification. Non-formal education may therefore take place both within and outside educational institutions, and may cater to persons of all ages. Depending on country contexts, it may cover educational programmes to impart adult literacy, basic education for out-of-school children, life skills, work skills and general culture. Non-formal education programmes do not necessarily follow the educational ladder system, and may have a differing duration. The term “job-related” refers to education and training activities intended mainly for professional reasons as opposed to personal or social reasons. That is, the respondent takes part in the activity in order to obtain knowledge and/or learn new skills for a current or a future job, increase earnings, improve career opportunities and generally improve his or her opportunities for advancement and promotion.
The calculation of time spent in non-formal job-related learning activities by labour force status (Table C5.1C) is weighted by the time that a hypothetical person is expected to spend as “employed”, “unemployed” and “inactive” respectively. For most countries the data refer to the labour force status during a reference week, while the time spent in learning activities refers to all activities during a one-year reference period (prior to the interview), regardless of the labour force status when participating in the learning activity.
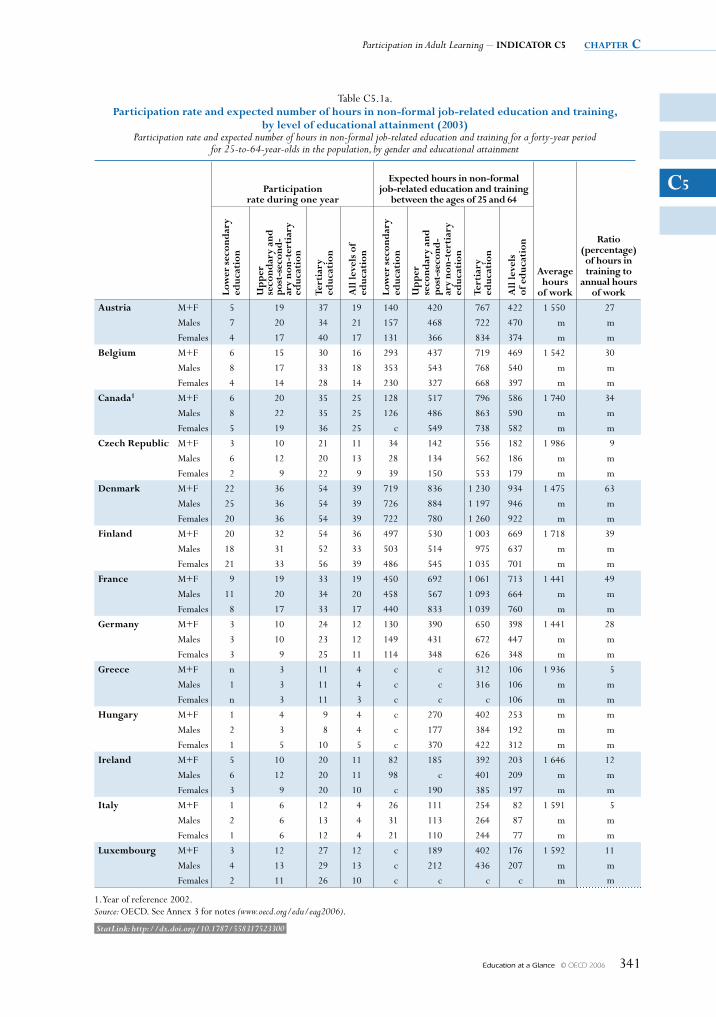
Participation in Adult Learning – INDICATOR C5 chapter c
Education at a Glance © OECD 2006 341
C5
Table C5.1a. Participation rate and expected number of hours in non-formal job-related education and training,
by level of educational attainment (2003) Participation rate and expected number of hours in non-formal job-related education and training for a forty-year period
for 25-to-64-year-olds in the population, by gender and educational attainment
Participation rate during one year
Expected hours in non-formal job-related education and training
between the ages of 25 and 64
Average hours
of work
Ratio (percentage) of hours in training to
annual hours of workLo
wer
sec
ond
ary
educ
atio
n
Up
per
se
cond
ary
and
po
st-s
econ
d-ar
y no
n-te
rtia
ry
educ
atio
n
Tert
iary
ed
ucat
ion
All
leve
ls o
f ed
ucat
ion
Low
er s
econ
dar
y ed
ucat
ion
Up
per
se
cond
ary
and
po
st-s
econ
d-ar
y no
n-te
rtia
ry
educ
atio
n
Tert
iary
ed
ucat
ion
All
leve
ls
of e
duc
atio
n
Austria M+F 5 19 37 19 140 420 767 422 1 550 27
Males 7 20 34 21 157 468 722 470 m m
Females 4 17 40 17 131 366 834 374 m m
Belgium M+F 6 15 30 16 293 437 719 469 1 542 30
Males 8 17 33 18 353 543 768 540 m m
Females 4 14 28 14 230 327 668 397 m m
Canada1 M+F 6 20 35 25 128 517 796 586 1 740 34
Males 8 22 35 25 126 486 863 590 m m
Females 5 19 36 25 c 549 738 582 m m
Czech Republic M+F 3 10 21 11 34 142 556 182 1 986 9
Males 6 12 20 13 28 134 562 186 m m
Females 2 9 22 9 39 150 553 179 m m
Denmark M+F 22 36 54 39 719 836 1 230 934 1 475 63
Males 25 36 54 39 726 884 1 197 946 m m
Females 20 36 54 39 722 780 1 260 922 m m
Finland M+F 20 32 54 36 497 530 1 003 669 1 718 39
Males 18 31 52 33 503 514 975 637 m m
Females 21 33 56 39 486 545 1 035 701 m m
France M+F 9 19 33 19 450 692 1 061 713 1 441 49
Males 11 20 34 20 458 567 1 093 664 m m
Females 8 17 33 17 440 833 1 039 760 m m
Germany M+F 3 10 24 12 130 390 650 398 1 441 28
Males 3 10 23 12 149 431 672 447 m m
Females 3 9 25 11 114 348 626 348 m m
Greece M+F n 3 11 4 c c 312 106 1 936 5
Males 1 3 11 4 c c 316 106 m m
Females n 3 11 3 c c c 106 m m
Hungary M+F 1 4 9 4 c 270 402 253 m m
Males 2 3 8 4 c 177 384 192 m m
Females 1 5 10 5 c 370 422 312 m m
Ireland M+F 5 10 20 11 82 185 392 203 1 646 12
Males 6 12 20 11 98 c 401 209 m m
Females 3 9 20 10 c 190 385 197 m m
Italy M+F 1 6 12 4 26 111 254 82 1 591 5
Males 2 6 13 4 31 113 264 87 m m
Females 1 6 12 4 21 110 244 77 m m
Luxembourg M+F 3 12 27 12 c 189 402 176 1 592 11
Males 4 13 29 13 c 212 436 207 m m
Females 2 11 26 10 c c c c m m
1. Year of reference 2002.Source: OECD. See Annex 3 for notes (www.oecd.org/edu/eag2006).
StatLink: http://dx.doi.org/10.1787/558317523300
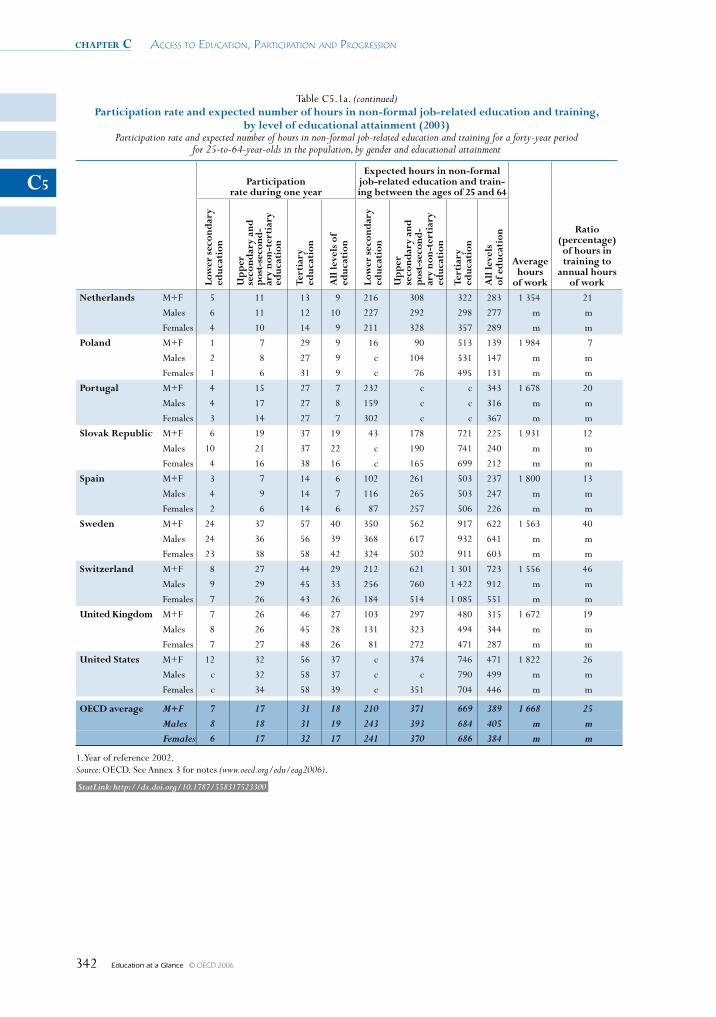
chapter c Access to educAtion, PArticiPAtion And Progression
Education at a Glance © OECD 2006342
C5
Table C5.1a. (continued)Participation rate and expected number of hours in non-formal job-related education and training,
by level of educational attainment (2003) Participation rate and expected number of hours in non-formal job-related education and training for a forty-year period
for 25-to-64-year-olds in the population, by gender and educational attainment
Participation rate during one year
Expected hours in non-formal job-related education and train-ing between the ages of 25 and 64
Average hours
of work
Ratio (percentage) of hours in training to
annual hours of workLo
wer
sec
ond
ary
educ
atio
n
Up
per
se
cond
ary
and
po
st-s
econ
d-ar
y no
n-te
rtia
ry
educ
atio
n
Tert
iary
ed
ucat
ion
All
leve
ls o
f ed
ucat
ion
Low
er s
econ
dar
y ed
ucat
ion
Up
per
se
cond
ary
and
po
st-s
econ
d-ar
y no
n-te
rtia
ry
educ
atio
n
Tert
iary
ed
ucat
ion
All
leve
ls
of e
duc
atio
n
Netherlands M+F 5 11 13 9 216 308 322 283 1 354 21
Males 6 11 12 10 227 292 298 277 m m
Females 4 10 14 9 211 328 357 289 m m
Poland M+F 1 7 29 9 16 90 513 139 1 984 7
Males 2 8 27 9 c 104 531 147 m m
Females 1 6 31 9 c 76 495 131 m m
Portugal M+F 4 15 27 7 232 c c 343 1 678 20
Males 4 17 27 8 159 c c 316 m m
Females 3 14 27 7 302 c c 367 m m
Slovak Republic M+F 6 19 37 19 43 178 721 225 1 931 12
Males 10 21 37 22 c 190 741 240 m m
Females 4 16 38 16 c 165 699 212 m m
Spain M+F 3 7 14 6 102 261 503 237 1 800 13
Males 4 9 14 7 116 265 503 247 m m
Females 2 6 14 6 87 257 506 226 m m
Sweden M+F 24 37 57 40 350 562 917 622 1 563 40
Males 24 36 56 39 368 617 932 641 m m
Females 23 38 58 42 324 502 911 603 m m
Switzerland M+F 8 27 44 29 212 621 1 301 723 1 556 46
Males 9 29 45 33 256 760 1 422 912 m m
Females 7 26 43 26 184 514 1 085 551 m m
United Kingdom M+F 7 26 46 27 103 297 480 315 1 672 19
Males 8 26 45 28 131 323 494 344 m m
Females 7 27 48 26 81 272 471 287 m m
United States M+F 12 32 56 37 c 374 746 471 1 822 26
Males c 32 58 37 c c 790 499 m m
Females c 34 58 39 c 351 704 446 m m
OECD average M+F 7 17 31 18 210 371 669 389 1 668 25Males 8 18 31 19 243 393 684 405 m mFemales 6 17 32 17 241 370 686 384 m m
1. Year of reference 2002.Source: OECD. See Annex 3 for notes (www.oecd.org/edu/eag2006).
StatLink: http://dx.doi.org/10.1787/558317523300
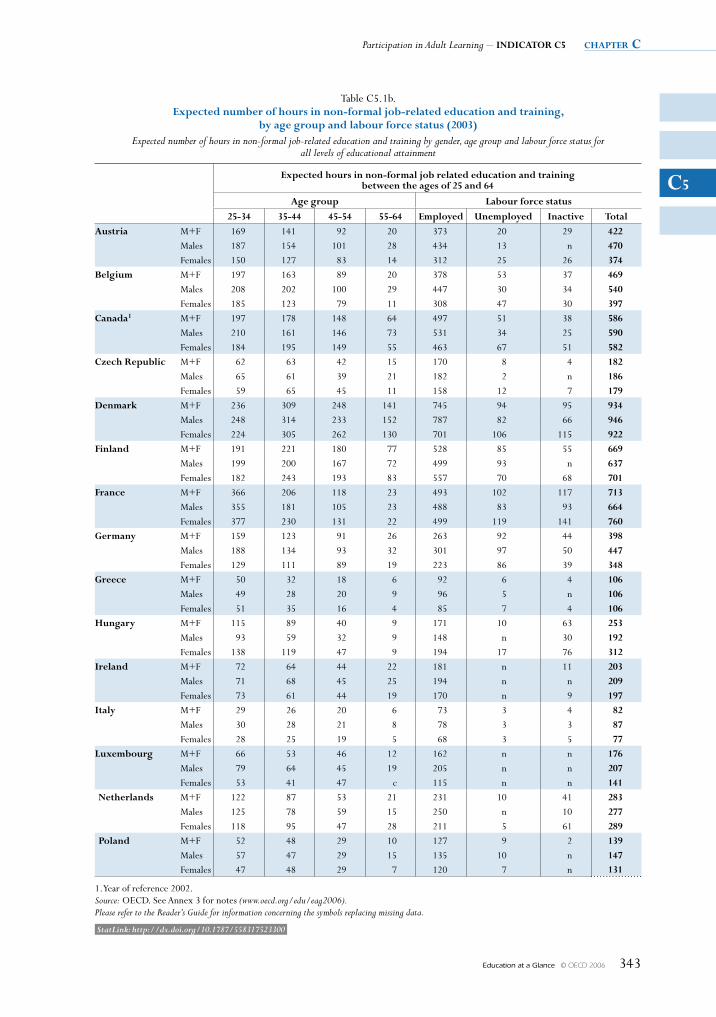
Participation in Adult Learning – INDICATOR C5 chapter c
Education at a Glance © OECD 2006 343
C5
Table C5.1b. Expected number of hours in non-formal job-related education and training,
by age group and labour force status (2003)Expected number of hours in non-formal job-related education and training by gender, age group and labour force status for
all levels of educational attainment
Expected hours in non-formal job related education and training between the ages of 25 and 64
Age group Labour force status
25-34 35-44 45-54 55-64 Employed Unemployed Inactive TotalAustria M+F 169 141 92 20 373 20 29 422
Males 187 154 101 28 434 13 n 470Females 150 127 83 14 312 25 26 374
Belgium M+F 197 163 89 20 378 53 37 469Males 208 202 100 29 447 30 34 540Females 185 123 79 11 308 47 30 397
Canada1 M+F 197 178 148 64 497 51 38 586Males 210 161 146 73 531 34 25 590Females 184 195 149 55 463 67 51 582
Czech Republic M+F 62 63 42 15 170 8 4 182Males 65 61 39 21 182 2 n 186Females 59 65 45 11 158 12 7 179
Denmark M+F 236 309 248 141 745 94 95 934Males 248 314 233 152 787 82 66 946Females 224 305 262 130 701 106 115 922
Finland M+F 191 221 180 77 528 85 55 669Males 199 200 167 72 499 93 n 637Females 182 243 193 83 557 70 68 701
France M+F 366 206 118 23 493 102 117 713Males 355 181 105 23 488 83 93 664Females 377 230 131 22 499 119 141 760
Germany M+F 159 123 91 26 263 92 44 398Males 188 134 93 32 301 97 50 447Females 129 111 89 19 223 86 39 348
Greece M+F 50 32 18 6 92 6 4 106Males 49 28 20 9 96 5 n 106Females 51 35 16 4 85 7 4 106
Hungary M+F 115 89 40 9 171 10 63 253Males 93 59 32 9 148 n 30 192Females 138 119 47 9 194 17 76 312
Ireland M+F 72 64 44 22 181 n 11 203Males 71 68 45 25 194 n n 209Females 73 61 44 19 170 n 9 197
Italy M+F 29 26 20 6 73 3 4 82Males 30 28 21 8 78 3 3 87Females 28 25 19 5 68 3 5 77
Luxembourg M+F 66 53 46 12 162 n n 176Males 79 64 45 19 205 n n 207Females 53 41 47 c 115 n n 141
Netherlands M+F 122 87 53 21 231 10 41 283Males 125 78 59 15 250 n 10 277Females 118 95 47 28 211 5 61 289
Poland M+F 52 48 29 10 127 9 2 139Males 57 47 29 15 135 10 n 147Females 47 48 29 7 120 7 n 131
1. Year of reference 2002.Source: OECD. See Annex 3 for notes (www.oecd.org/edu/eag2006).Please refer to the Reader’s Guide for information concerning the symbols replacing missing data.
StatLink: http://dx.doi.org/10.1787/558317523300
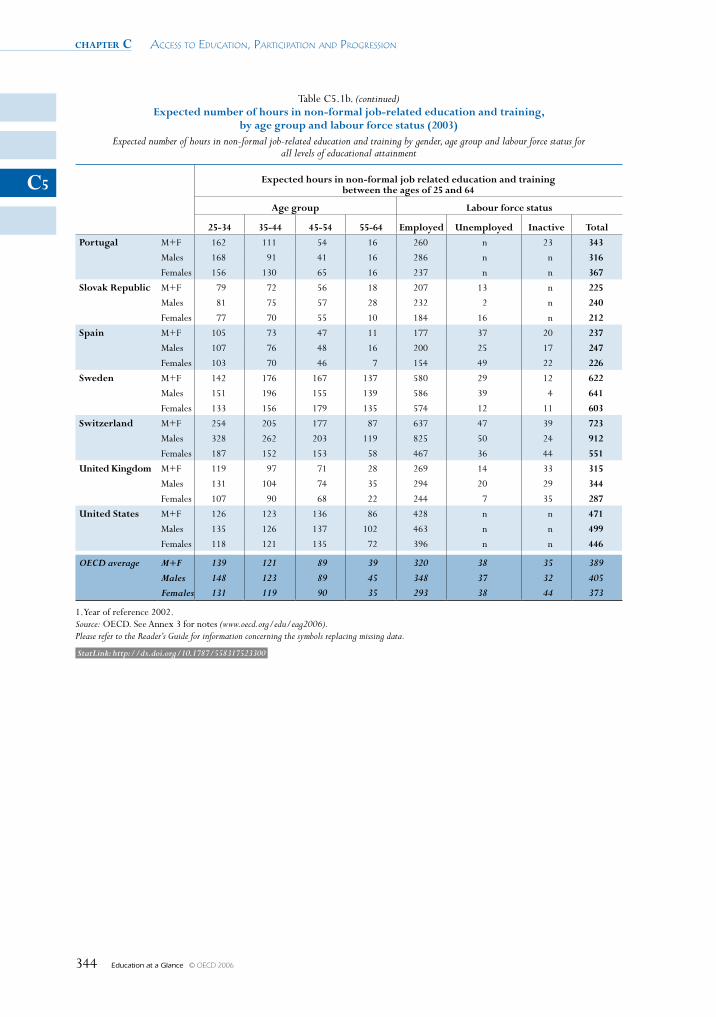
chapter c Access to educAtion, PArticiPAtion And Progression
Education at a Glance © OECD 2006344
C5
Table C5.1b. (continued)Expected number of hours in non-formal job-related education and training,
by age group and labour force status (2003)Expected number of hours in non-formal job-related education and training by gender, age group and labour force status for
all levels of educational attainment
Expected hours in non-formal job related education and training between the ages of 25 and 64
Age group Labour force status
25-34 35-44 45-54 55-64 Employed Unemployed Inactive Total
Portugal M+F 162 111 54 16 260 n 23 343
Males 168 91 41 16 286 n n 316
Females 156 130 65 16 237 n n 367
Slovak Republic M+F 79 72 56 18 207 13 n 225
Males 81 75 57 28 232 2 n 240
Females 77 70 55 10 184 16 n 212
Spain M+F 105 73 47 11 177 37 20 237
Males 107 76 48 16 200 25 17 247
Females 103 70 46 7 154 49 22 226
Sweden M+F 142 176 167 137 580 29 12 622
Males 151 196 155 139 586 39 4 641
Females 133 156 179 135 574 12 11 603
Switzerland M+F 254 205 177 87 637 47 39 723
Males 328 262 203 119 825 50 24 912
Females 187 152 153 58 467 36 44 551
United Kingdom M+F 119 97 71 28 269 14 33 315
Males 131 104 74 35 294 20 29 344
Females 107 90 68 22 244 7 35 287
United States M+F 126 123 136 86 428 n n 471
Males 135 126 137 102 463 n n 499
Females 118 121 135 72 396 n n 446
OECD average M+F 139 121 89 39 320 38 35 389Males 148 123 89 45 348 37 32 405Females 131 119 90 35 293 38 44 373
1. Year of reference 2002.Source: OECD. See Annex 3 for notes (www.oecd.org/edu/eag2006).Please refer to the Reader’s Guide for information concerning the symbols replacing missing data.
StatLink: http://dx.doi.org/10.1787/558317523300
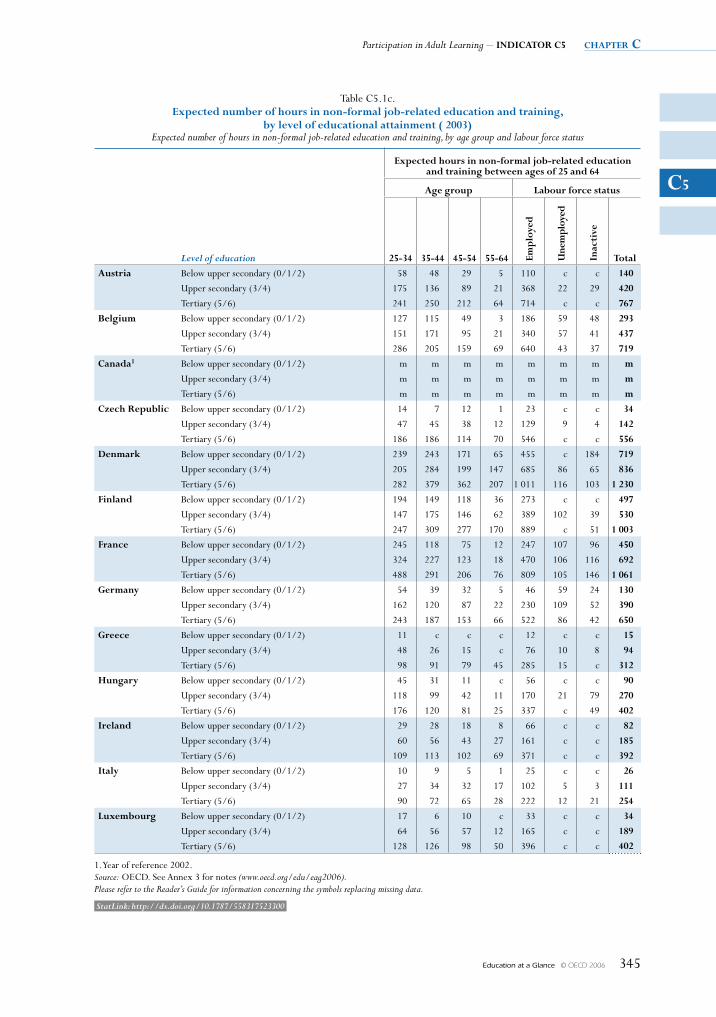
Participation in Adult Learning – INDICATOR C5 chapter c
Education at a Glance © OECD 2006 345
C5
Table C5.1c. Expected number of hours in non-formal job-related education and training,
by level of educational attainment ( 2003) Expected number of hours in non-formal job-related education and training, by age group and labour force status
Expected hours in non-formal job-related education and training between ages of 25 and 64
Age group Labour force status
Level of education 25-34 35-44 45-54 55-64 Emp
loye
d
Une
mpl
oyed
Inac
tive
Total
Austria Below upper secondary (0/1/2) 58 48 29 5 110 c c 140
Upper secondary (3/4) 175 136 89 21 368 22 29 420
Tertiary (5/6) 241 250 212 64 714 c c 767
Belgium Below upper secondary (0/1/2) 127 115 49 3 186 59 48 293
Upper secondary (3/4) 151 171 95 21 340 57 41 437
Tertiary (5/6) 286 205 159 69 640 43 37 719
Canada1 Below upper secondary (0/1/2) m m m m m m m m
Upper secondary (3/4) m m m m m m m m
Tertiary (5/6) m m m m m m m m
Czech Republic Below upper secondary (0/1/2) 14 7 12 1 23 c c 34
Upper secondary (3/4) 47 45 38 12 129 9 4 142
Tertiary (5/6) 186 186 114 70 546 c c 556
Denmark Below upper secondary (0/1/2) 239 243 171 65 455 c 184 719
Upper secondary (3/4) 205 284 199 147 685 86 65 836
Tertiary (5/6) 282 379 362 207 1 011 116 103 1 230
Finland Below upper secondary (0/1/2) 194 149 118 36 273 c c 497
Upper secondary (3/4) 147 175 146 62 389 102 39 530
Tertiary (5/6) 247 309 277 170 889 c 51 1 003
France Below upper secondary (0/1/2) 245 118 75 12 247 107 96 450
Upper secondary (3/4) 324 227 123 18 470 106 116 692
Tertiary (5/6) 488 291 206 76 809 105 146 1 061
Germany Below upper secondary (0/1/2) 54 39 32 5 46 59 24 130
Upper secondary (3/4) 162 120 87 22 230 109 52 390
Tertiary (5/6) 243 187 153 66 522 86 42 650
Greece Below upper secondary (0/1/2) 11 c c c 12 c c 15
Upper secondary (3/4) 48 26 15 c 76 10 8 94
Tertiary (5/6) 98 91 79 45 285 15 c 312
Hungary Below upper secondary (0/1/2) 45 31 11 c 56 c c 90
Upper secondary (3/4) 118 99 42 11 170 21 79 270
Tertiary (5/6) 176 120 81 25 337 c 49 402
Ireland Below upper secondary (0/1/2) 29 28 18 8 66 c c 82
Upper secondary (3/4) 60 56 43 27 161 c c 185
Tertiary (5/6) 109 113 102 69 371 c c 392
Italy Below upper secondary (0/1/2) 10 9 5 1 25 c c 26
Upper secondary (3/4) 27 34 32 17 102 5 3 111
Tertiary (5/6) 90 72 65 28 222 12 21 254
Luxembourg Below upper secondary (0/1/2) 17 6 10 c 33 c c 34
Upper secondary (3/4) 64 56 57 12 165 c c 189
Tertiary (5/6) 128 126 98 50 396 c c 402
1. Year of reference 2002.Source: OECD. See Annex 3 for notes (www.oecd.org/edu/eag2006).Please refer to the Reader’s Guide for information concerning the symbols replacing missing data.
StatLink: http://dx.doi.org/10.1787/558317523300
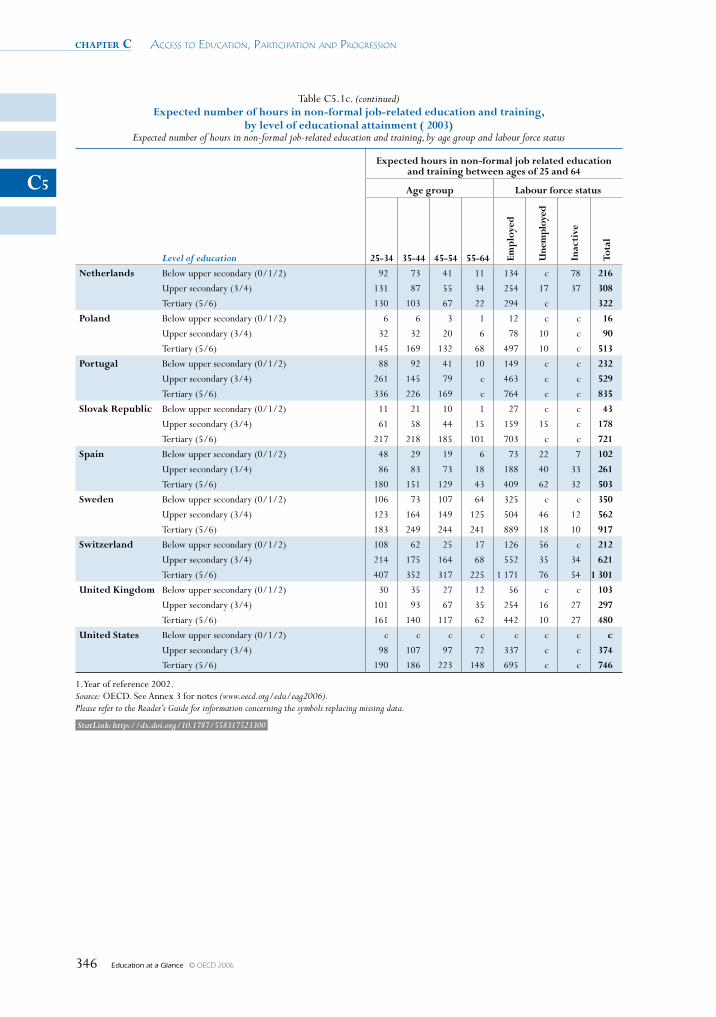
chapter c Access to educAtion, PArticiPAtion And Progression
Education at a Glance © OECD 2006346
C5
Table C5.1c. (continued)Expected number of hours in non-formal job-related education and training,
by level of educational attainment ( 2003) Expected number of hours in non-formal job-related education and training, by age group and labour force status
Expected hours in non-formal job related education and training between ages of 25 and 64
Age group Labour force status
Level of education 25-34 35-44 45-54 55-64 Emp
loye
d
Une
mpl
oyed
Inac
tive
Tota
l
Netherlands Below upper secondary (0/1/2) 92 73 41 11 134 c 78 216
Upper secondary (3/4) 131 87 55 34 254 17 37 308
Tertiary (5/6) 130 103 67 22 294 c 322
Poland Below upper secondary (0/1/2) 6 6 3 1 12 c c 16
Upper secondary (3/4) 32 32 20 6 78 10 c 90
Tertiary (5/6) 145 169 132 68 497 10 c 513
Portugal Below upper secondary (0/1/2) 88 92 41 10 149 c c 232
Upper secondary (3/4) 261 145 79 c 463 c c 529
Tertiary (5/6) 336 226 169 c 764 c c 835
Slovak Republic Below upper secondary (0/1/2) 11 21 10 1 27 c c 43
Upper secondary (3/4) 61 58 44 15 159 15 c 178
Tertiary (5/6) 217 218 185 101 703 c c 721
Spain Below upper secondary (0/1/2) 48 29 19 6 73 22 7 102
Upper secondary (3/4) 86 83 73 18 188 40 33 261
Tertiary (5/6) 180 151 129 43 409 62 32 503
Sweden Below upper secondary (0/1/2) 106 73 107 64 325 c c 350
Upper secondary (3/4) 123 164 149 125 504 46 12 562
Tertiary (5/6) 183 249 244 241 889 18 10 917
Switzerland Below upper secondary (0/1/2) 108 62 25 17 126 56 c 212
Upper secondary (3/4) 214 175 164 68 552 35 34 621
Tertiary (5/6) 407 352 317 225 1 171 76 54 1 301
United Kingdom Below upper secondary (0/1/2) 30 35 27 12 56 c c 103
Upper secondary (3/4) 101 93 67 35 254 16 27 297
Tertiary (5/6) 161 140 117 62 442 10 27 480
United States Below upper secondary (0/1/2) c c c c c c c c
Upper secondary (3/4) 98 107 97 72 337 c c 374Tertiary (5/6) 190 186 223 148 695 c c 746
1. Year of reference 2002.Source: OECD. See Annex 3 for notes (www.oecd.org/edu/eag2006).Please refer to the Reader’s Guide for information concerning the symbols replacing missing data.
StatLink: http://dx.doi.org/10.1787/558317523300
Education at a Glance © OECD 2006 347
The Learning environmenT and organisaTion
of schooLs
Chapter
d
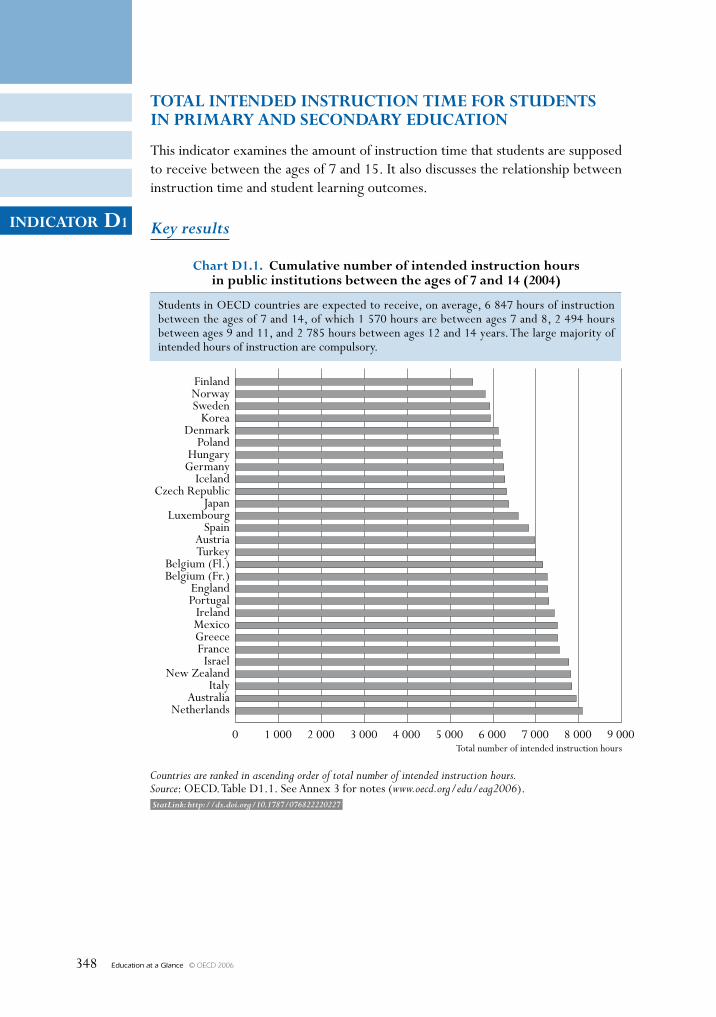
Education at a Glance © OECD 2006348
INDICATOR D1
StatLink: http://dx.doi.org/10.1787/076822220227
TOTAl INTeNDeD INsTRuCTION TIme fOR sTuDeNTs IN pRImARy AND seCONDARy eDuCATION
This indicator examines the amount of instruction time that students are supposed to receive between the ages of 7 and 15. It also discusses the relationship between instruction time and student learning outcomes.
Key results
9 000Total number of intended instruction hours
8 0007 0006 0005 0004 0003 0002 0001 0000
Chart D1.1. Cumulative number of intended instruction hoursin public institutions between the ages of 7 and 14 (2004)
Countries are ranked in ascending order of total number of intended instruction hours.Source: OECD. Table D1.1. See Annex 3 for notes (www.oecd.org/edu/eag2006).
FinlandNorwaySweden
KoreaDenmark
PolandHungary
GermanyIceland
Czech RepublicJapan
LuxembourgSpain
AustriaTurkey
Belgium (Fl.)Belgium (Fr.)
EnglandPortugal
IrelandMexicoGreeceFrance
IsraelNew Zealand
ItalyAustralia
Netherlands
Students in OECD countries are expected to receive, on average, 6 847 hours of instructionbetween the ages of 7 and 14, of which 1 570 hours are between ages 7 and 8, 2 494 hoursbetween ages 9 and 11, and 2 785 hours between ages 12 and 14 years. The large majority ofintended hours of instruction are compulsory.
Education at a Glance © OECD 2006 349
INDICATOR D1
Other highlights of this indicator
• In OECD countries, students between the ages of 7 and 8 receive an average of 758 hours per year of compulsory instruction time and 785 hours per year of intended instruction time in the classroom. Students between the ages of 9 and 11 receive about 50 hours more per year and those aged between 12 and 14 receive nearly 100 hours more per year than those aged between 9 and 11.
• On average among OECD countries, the teaching of reading and writing, mathematics and science comprises nearly 50% of the compulsory instruction time of students aged 9 to 11 and 41% for students aged 12 to 14. For 9-to-11-year-olds, there is great variation among countries in the proportion of compulsory curriculum devoted to reading and writing: from 13% or less in Australia and partner countries Chile and Israel to 30% in France, Mexico and the Netherlands.
chapter D The Learning environmenT and organisaTion of schooLs
Education at a Glance © OECD 2006350
D1
Policy context
The amount and quality of time that people spend learning between early childhood and the start of their working lives shape much of their lives both socially and economically. Countries make a variety of choices about instruction, concerning the length of time devoted to instruction overall and the subjects that are compulsorily taught at schools. These choices reflect national priorities and preferences for the education received by students at different ages, as well as general priorities placed on different subject areas.
Instruction time in formal classroom settings comprises a large part of the public investment in student learning. Matching resources with students’ needs and using time in an optimal manner, from the perspective of the learner and of public investment, are major challenges for education policy. The costs of education primarily include teacher labour, institutional maintenance and other educational resources. The length of time during which these resources are made available to students (as shown in this indicator) is thus an important factor in the allocation of funding.
Evidence and explanations
What this indicator shows
Intended instruction time is an important indicator of the public resources invested in education. This indicator captures intended instruction time as a measure of exposure to learning in formal classroom settings as per public regulations. It also shows how instruction time is allocated to different curricular areas. However, the instruction time in classroom settings is only one aspect of student learning time and this indicator does not cover out-of-school learning activities. The indicator is calculated as the intended net hours of instruction for the grades in which the majority of students are 7 to 15 years of age. Although such data are difficult to compare among countries because of different curriculum policies, they nevertheless provide an indication of how much formal instruction time is considered necessary in order for students to achieve the desired educational goals.
Total intended instruction time: an average of 6 848 hours between ages 7 and 14
Total intended instruction time is an estimate of the number of hours during which students are taught both compulsory and non-compulsory parts of the curriculum.
The total number of instruction hours that students are intended to receive between ages 7 and 14 averages 6 848 hours among OECD countries. However, formal requirements range from 5 523 hours in Finland to over 8 000 hours in the Netherlands. These hours comprise compulsory and non-compulsory hours during which the school is obliged to offer instruction to students. Whereas the total intended instruction time within this age range is a good indicator of students’ theoretical workload, it cannot be interpreted as actual instruction students receive over the years they spend in initial education. In some countries with greater student workload, the age band of compulsory education is less and students drop out of the school system earlier, whereas in other countries a more even distribution of study time over more years amounts in the end to a larger number of total instruction hours for all. Table D1.1 shows the age range at which over 90% of the population is in education and Chart D1.2 shows the total amount of intended instruction time students receive between ages 7 and 14.
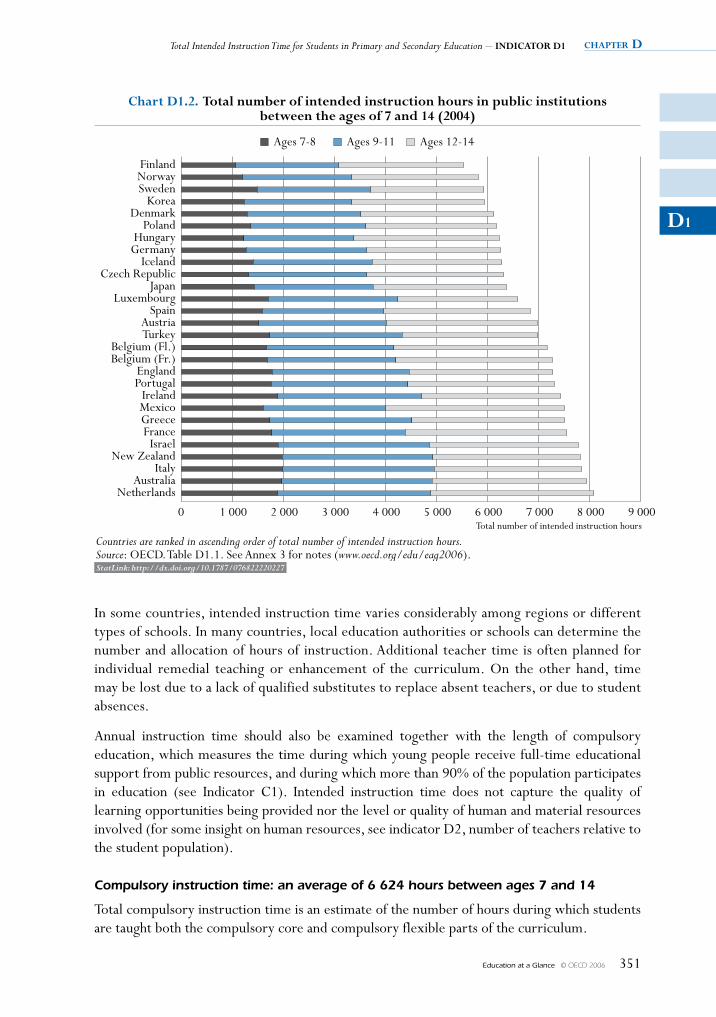
Total Intended Instruction Time for Students in Primary and Secondary Education – INDICATOR D1 chapter D
Education at a Glance © OECD 2006 351
D1
In some countries, intended instruction time varies considerably among regions or different types of schools. In many countries, local education authorities or schools can determine the number and allocation of hours of instruction. Additional teacher time is often planned for individual remedial teaching or enhancement of the curriculum. On the other hand, time may be lost due to a lack of qualified substitutes to replace absent teachers, or due to student absences.
Annual instruction time should also be examined together with the length of compulsory education, which measures the time during which young people receive full-time educational support from public resources, and during which more than 90% of the population participates in education (see Indicator C1). Intended instruction time does not capture the quality of learning opportunities being provided nor the level or quality of human and material resources involved (for some insight on human resources, see indicator D2, number of teachers relative to the student population).
Compulsory instruction time: an average of 6 624 hours between ages 7 and 14
Total compulsory instruction time is an estimate of the number of hours during which students are taught both the compulsory core and compulsory flexible parts of the curriculum.
Total number of intended instruction hours9 0008 0007 0006 0005 0004 0003 0002 0001 0000
Chart D1.2. Total number of intended instruction hours in public institutionsbetween the ages of 7 and 14 (2004)
Ages 7-8 Ages 9-11 Ages 12-14
Countries are ranked in ascending order of total number of intended instruction hours.Source: OECD. Table D1.1. See Annex 3 for notes (www.oecd.org/edu/eag2006).
FinlandNorwaySweden
KoreaDenmark
PolandHungary
GermanyIceland
Czech RepublicJapan
LuxembourgSpain
AustriaTurkey
Belgium (Fl.)Belgium (Fr.)
EnglandPortugal
IrelandMexicoGreeceFrance
IsraelNew Zealand
ItalyAustralia
Netherlands
StatLink: http://dx.doi.org/10.1787/076822220227
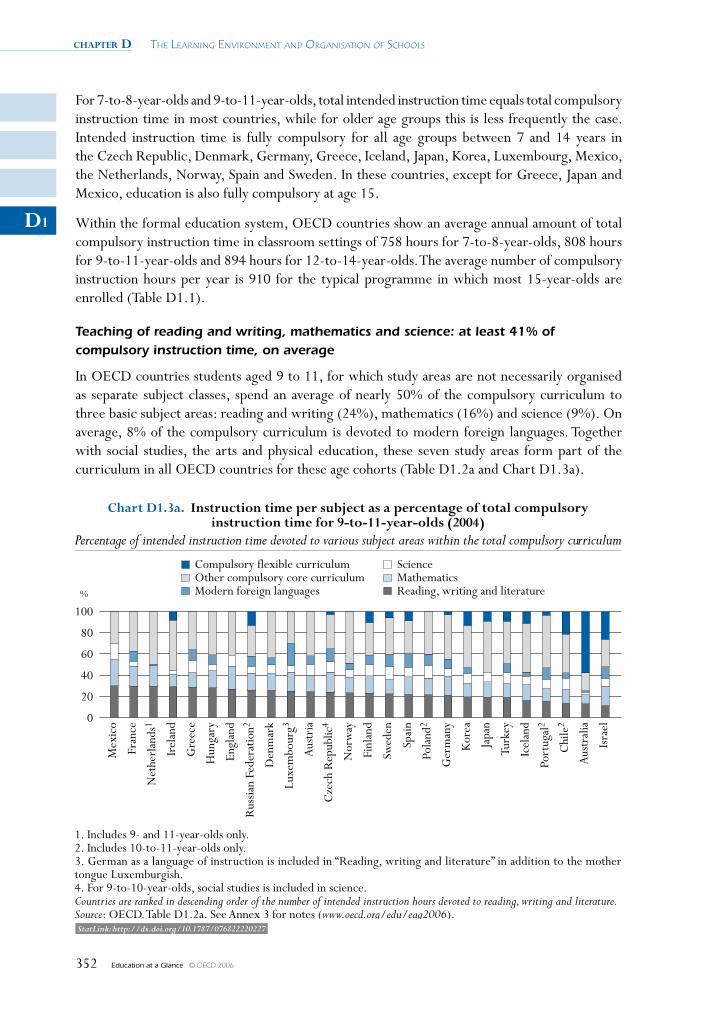
chapter D The Learning environmenT and organisaTion of schooLs
Education at a Glance © OECD 2006352
D1
For 7-to-8-year-olds and 9-to-11-year-olds, total intended instruction time equals total compulsory instruction time in most countries, while for older age groups this is less frequently the case. Intended instruction time is fully compulsory for all age groups between 7 and 14 years in the Czech Republic, Denmark, Germany, Greece, Iceland, Japan, Korea, Luxembourg, Mexico, the Netherlands, Norway, Spain and Sweden. In these countries, except for Greece, Japan and Mexico, education is also fully compulsory at age 15.
Within the formal education system, OECD countries show an average annual amount of total compulsory instruction time in classroom settings of 758 hours for 7-to-8-year-olds, 808 hours for 9-to-11-year-olds and 894 hours for 12-to-14-year-olds. The average number of compulsory instruction hours per year is 910 for the typical programme in which most 15-year-olds are enrolled (Table D1.1).
Teaching of reading and writing, mathematics and science: at least 41% of compulsory instruction time, on average
In OECD countries students aged 9 to 11, for which study areas are not necessarily organised as separate subject classes, spend an average of nearly 50% of the compulsory curriculum to three basic subject areas: reading and writing (24%), mathematics (16%) and science (9%). On average, 8% of the compulsory curriculum is devoted to modern foreign languages. Together with social studies, the arts and physical education, these seven study areas form part of the curriculum in all OECD countries for these age cohorts (Table D1.2a and Chart D1.3a).
100
80
60
40
20
0
%
ScienceMathematicsReading, writing and literature
Compulsory flexible curriculumOther compulsory core curriculumModern foreign languages
Chart D1.3a. Instruction time per subject as a percentage of total compulsoryinstruction time for 9-to-11-year-olds (2004)
Percentage of intended instruction time devoted to various subject areas within the total compulsory curriculum
1. Includes 9- and 11-year-olds only.2. Includes 10-to-11-year-olds only.3. German as a language of instruction is included in “Reading, writing and literature” in addition to the mothertongue Luxemburgish.4. For 9-to-10-year-olds, social studies is included in science.Countries are ranked in descending order of the number of intended instruction hours devoted to reading, writing and literature.Source: OECD. Table D1.2a. See Annex 3 for notes (www.oecd.org/edu/eag2006).
Mex
ico
Fran
ce
Net
herl
ands
1
Irel
and
Gre
ece
Hun
gary
Engl
and
Rus
sian
Fede
ratio
n2
Den
mar
k
Luxe
mbo
urg3
Aus
tria
Cze
ch R
epub
lic4
Nor
way
Finl
and
Swed
en
Spai
n
Pola
nd2
Ger
man
y
Kor
ea
Japa
n
Turk
ey
Icel
and
Port
ugal
2
Chi
le2
Aus
tral
ia
Isra
el
StatLink: http://dx.doi.org/10.1787/076822220227
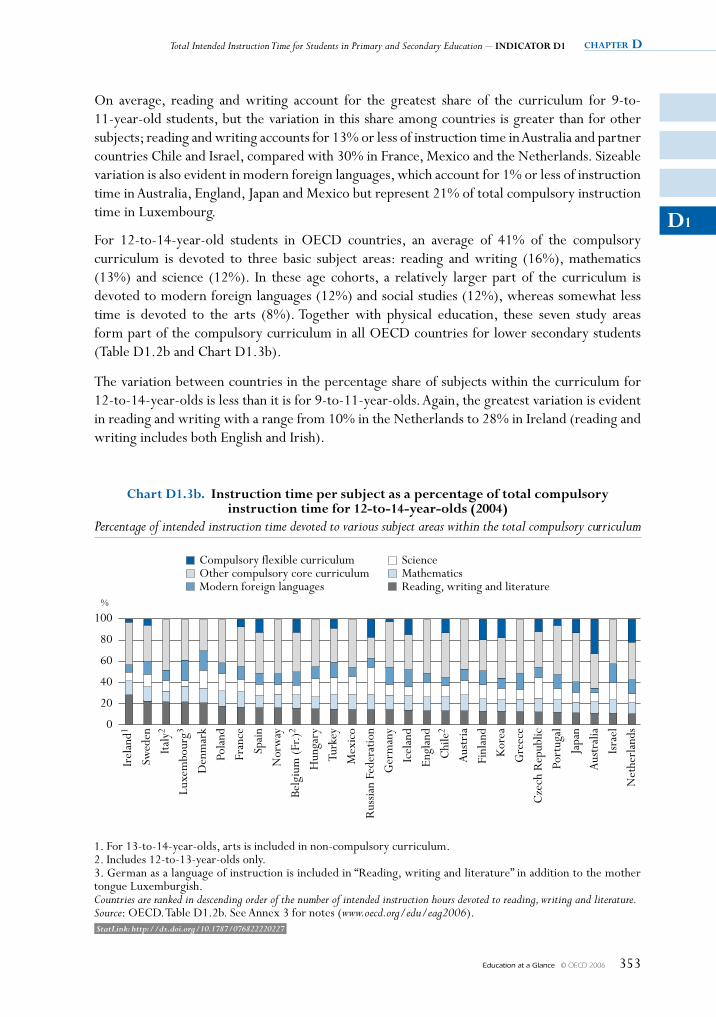
Total Intended Instruction Time for Students in Primary and Secondary Education – INDICATOR D1 chapter D
Education at a Glance © OECD 2006 353
D1
On average, reading and writing account for the greatest share of the curriculum for 9-to-11-year-old students, but the variation in this share among countries is greater than for other subjects; reading and writing accounts for 13% or less of instruction time in Australia and partner countries Chile and Israel, compared with 30% in France, Mexico and the Netherlands. Sizeable variation is also evident in modern foreign languages, which account for 1% or less of instruction time in Australia, England, Japan and Mexico but represent 21% of total compulsory instruction time in Luxembourg.
For 12-to-14-year-old students in OECD countries, an average of 41% of the compulsory curriculum is devoted to three basic subject areas: reading and writing (16%), mathematics (13%) and science (12%). In these age cohorts, a relatively larger part of the curriculum is devoted to modern foreign languages (12%) and social studies (12%), whereas somewhat less time is devoted to the arts (8%). Together with physical education, these seven study areas form part of the compulsory curriculum in all OECD countries for lower secondary students (Table D1.2b and Chart D1.3b).
The variation between countries in the percentage share of subjects within the curriculum for 12-to-14-year-olds is less than it is for 9-to-11-year-olds. Again, the greatest variation is evident in reading and writing with a range from 10% in the Netherlands to 28% in Ireland (reading and writing includes both English and Irish).
100
80
60
40
20
0
%
Chart D1.3b. Instruction time per subject as a percentage of total compulsoryinstruction time for 12-to-14-year-olds (2004)
Percentage of intended instruction time devoted to various subject areas within the total compulsory curriculum
1. For 13-to-14-year-olds, arts is included in non-compulsory curriculum.2. Includes 12-to-13-year-olds only.3. German as a language of instruction is included in “Reading, writing and literature” in addition to the mothertongue Luxemburgish.Countries are ranked in descending order of the number of intended instruction hours devoted to reading, writing and literature.Source: OECD. Table D1.2b. See Annex 3 for notes (www.oecd.org/edu/eag2006).
Irel
and1
Swed
en
Italy
2
Luxe
mbo
urg3
Den
mar
k
Pola
nd
Fran
ce
Spai
n
Nor
way
Belg
ium
(Fr.)
2
Hun
gary
Turk
ey
Mex
ico
Rus
sian
Fede
ratio
n
Ger
man
y
Icel
and
Engl
and
Chi
le2
Aus
tria
Finl
and
Kor
ea
Gre
ece
Cze
ch R
epub
lic
Port
ugal
Japa
n
Aus
tral
ia
Isra
el
Net
herl
ands
ScienceMathematicsReading, writing and literature
Compulsory flexible curriculumOther compulsory core curriculumModern foreign languages
StatLink: http://dx.doi.org/10.1787/076822220227
chapter D The Learning environmenT and organisaTion of schooLs
Education at a Glance © OECD 2006354
D1
There is also substantial variation in the percentage of compulsory instruction time devoted to particular subjects for 9-to-11-year-olds compared to 12-to-14-year-olds. On average across OECD countries, the time of compulsory instruction for 12-to-14-year-olds devoted to reading, writing and literature is 33% lower than for 9-to-11-year-olds. Conversely, the time devoted to social studies and modern foreign languages is 33% higher than for 9-to-11-year-olds.
For some countries, these differences are larger than in other countries. The percentage of compulsory instruction time devoted to reading, writing and literature for 12-to-14-year-olds is less than half of that for 9-to-11-year-olds in the Czech Republic, England, Greece, Mexico and the Netherlands. Yet, for Ireland and partner countries Chile and Israel, the difference between the shares is less than 5%. Clearly, countries place a different emphasis upon particular subjects and when those subjects should be taught to students.
On average among OECD countries, the non-compulsory part of the curriculum comprises 3 to 4% of the total intended instruction time for 9-to-11-year-old students as well as for 12-to-14-year-old students. However, among partner countries, non compulsory curriculum represents nearly a third of the compulsory instruction time in Israel for 9-to-11-year-old students. Nevertheless, a considerable amount of additional non-compulsory instruction time can sometimes be provided. For 9-to-11-year-olds, all intended instruction time is compulsory for students in most countries, but the additional non-compulsory part is as high as, 20% in Poland and Turkey, and 15% in Hungary and 32% in partner country Israel. For 12-to-14-year-old students, non-compulsory instruction time is a feature in Australia, the French Community of Belgium, England, Finland, France, Hungary, Ireland, Italy, Poland, Portugal and Turkey, and ranges from 2% in Finland and Portugal to 28% in Hungary (Tables D1.2a and D1.2b).
On average, 4% of compulsory instruction time belongs to the flexible part of the curriculum in the grades where most students are 9-to-11 years of age while the corresponding proportion is 8% for students aged 12 to 14.
In most OECD countries, the number of hours of compulsory instruction is defined. Within the compulsory part of the curriculum, students have varying degrees of freedom to choose the subjects they want to learn. However, for 9-to-11-year-olds, 58% of the compulsory curriculum is operated on a flexible basis in Australia, and up to 81% in the French Community of Belgium. For 12-to-14-year-olds, Australia again has the highest degree of flexibility in the compulsory curriculum (33%), although several other countries allow more than 10% flexibility in the compulsory curriculum (the French Community of Belgium, the Czech Republic, Finland, Iceland, Japan, Korea, the Netherlands and Spain, and the partner countries Chile and the Russian Federation) (Tables D1.2a and D1.2b).
Definitions and methodologies
Data on instruction time are from the 2005 OECD-INES Survey on Teachers and the Curriculum and refer to the school year 2003-2004.
Instruction time for 7-to-15-year-olds refers to the formal number of 60-minute hours per school year organised by the school for class instructional activities for students in the reference school year 2003-2004. For countries with no formal policy on instruction time, the number of hours was estimated from survey data. Hours lost when schools are closed for festivities and
Total Intended Instruction Time for Students in Primary and Secondary Education – INDICATOR D1 chapter D
Education at a Glance © OECD 2006 355
D1
celebrations, such as national holidays, are excluded. Intended instruction time does not include non-compulsory time outside the school day, homework, individual tutoring, or private study done before or after school.• Compulsory curriculum refers to the amount and allocation of instruction time that almost
every public school must provide and almost all public sector students must attend. The measurement of the time devoted to specific study areas (subjects) focuses on the minimum common core rather than on the average time spent on study areas, since the data sources (policy documents) do not allow more precise measurement. Total compulsory curriculum comprises the compulsory core curriculum as well as the compulsory flexible curriculum.
• The non-compulsory part of the curriculum refers to the average time of instruction to which students are entitled above the compulsory hours of instruction. These subjects often vary from school to school or from region to region, and may take the form of “non-compulsory elective” subjects.
• Intended instruction time refers to the number of hours per year during which students receive instruction in the compulsory and non-compulsory parts of the curriculum.
For 15-year-olds in Table D1.1, typical instruction time refers to the programme in which most 15-year-olds are enrolled. This can be a programme in lower or upper secondary education, and in most countries it refers to a general programme. If the system channels students into different programme types at this age, an estimation of the average instruction time may have been necessary for the most important mainstream programmes weighted by the proportion of students in the grade level where most 15-year-olds are enrolled. Where vocational programmes are also taken into account in typical instruction time, only the school-based part of the programme should be included in the calculations.
The instruction time for the least demanding programme refers to programmes stipulated for students who are least likely to continue studying beyond mandatory school age or beyond lower secondary education. Such programmes may or may not exist in a country depending on streaming and selection policies. In many countries students are offered the same amount of instruction time in all or most programmes, but there is flexibility in the choice of study areas or subjects. Often such choices have to be made quite early if programmes are long and differ substantially.
Further references
Specific notes on definitions and methodologies regarding this indicator for each country are given in Annex 3 at www.oecd.org/edu/eag2006. In addition, a more comprehensive analysis of decision making was published in Indicator D6 of Education at a Glance 2004 (OECD, 2004c). Information on the underlying decision-making survey is available in Education at a Glance 2004, Annex 3 (www.oecd.org/edu/eag2004) under the heading “Indicator D6 Locus of decision making at lower secondary levels”. The complete decision-making data are available under the heading “Underlying data on decision making for indicator D6”.
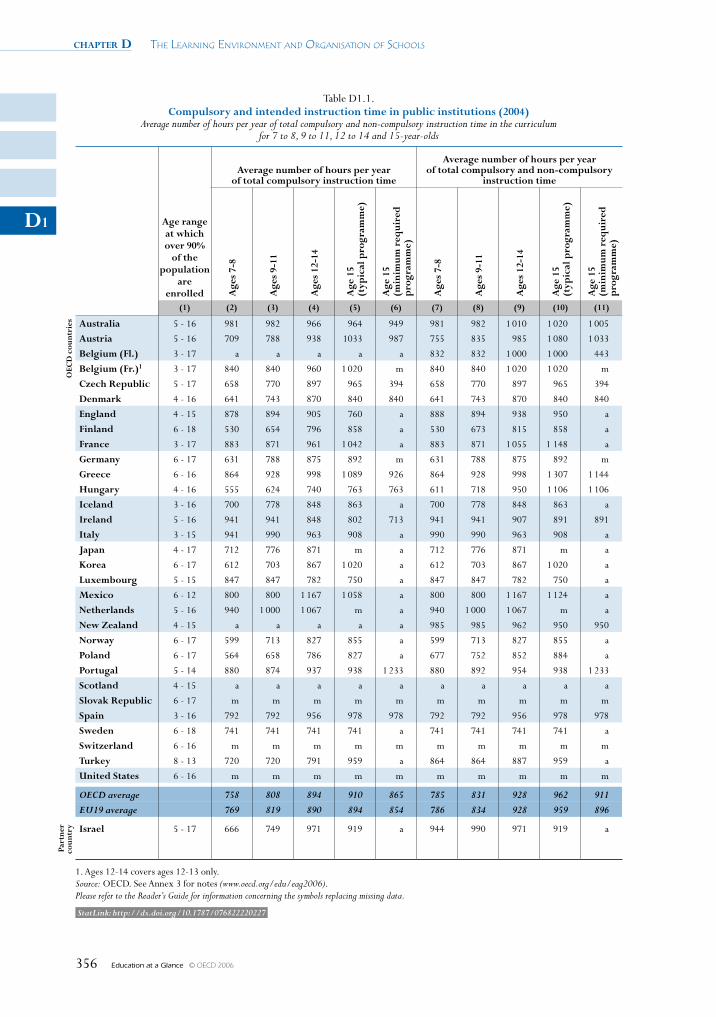
chapter D The Learning environmenT and organisaTion of schooLs
Education at a Glance © OECD 2006356
D1
Table D1.1. Compulsory and intended instruction time in public institutions (2004)
Average number of hours per year of total compulsory and non-compulsory instruction time in the curriculum for 7 to 8, 9 to 11, 12 to 14 and 15-year-olds
Age range at which over 90%
of the population
are enrolled
Average number of hours per year of total compulsory instruction time
Average number of hours per year of total compulsory and non-compulsory
instruction time
Age
s 7-
8
Age
s 9-
11
Age
s 12
-14
Age
15
(t
ypic
al p
rogr
amm
e)
Age
15
(m
inim
um r
equi
red
p
rogr
amm
e)
Age
s 7-
8
Age
s 9-
11
Age
s 12
-14
Age
15
(t
ypic
al p
rogr
amm
e)
Age
15
(m
inim
um r
equi
red
p
rogr
amm
e)
(1) (2) (3) (4) (5) (6) (7) (8) (9) (10) (11)
OeC
D c
ount
ries Australia 5 - 16 981 982 966 964 949 981 982 1 010 1 020 1 005
Austria 5 - 16 709 788 938 1033 987 755 835 985 1 080 1 033
Belgium (fl.) 3 - 17 a a a a a 832 832 1 000 1 000 443
Belgium (fr.)1 3 - 17 840 840 960 1 020 m 840 840 1 020 1 020 m
Czech Republic 5 - 17 658 770 897 965 394 658 770 897 965 394
Denmark 4 - 16 641 743 870 840 840 641 743 870 840 840
england 4 - 15 878 894 905 760 a 888 894 938 950 a
finland 6 - 18 530 654 796 858 a 530 673 815 858 a
france 3 - 17 883 871 961 1 042 a 883 871 1 055 1 148 a
Germany 6 - 17 631 788 875 892 m 631 788 875 892 m
Greece 6 - 16 864 928 998 1 089 926 864 928 998 1 307 1 144
Hungary 4 - 16 555 624 740 763 763 611 718 950 1 106 1 106
Iceland 3 - 16 700 778 848 863 a 700 778 848 863 a
Ireland 5 - 16 941 941 848 802 713 941 941 907 891 891
Italy 3 - 15 941 990 963 908 a 990 990 963 908 a
Japan 4 - 17 712 776 871 m a 712 776 871 m a
Korea 6 - 17 612 703 867 1 020 a 612 703 867 1 020 a
luxembourg 5 - 15 847 847 782 750 a 847 847 782 750 a
mexico 6 - 12 800 800 1 167 1 058 a 800 800 1 167 1 124 a
Netherlands 5 - 16 940 1 000 1 067 m a 940 1 000 1 067 m a
New Zealand 4 - 15 a a a a a 985 985 962 950 950
Norway 6 - 17 599 713 827 855 a 599 713 827 855 a
poland 6 - 17 564 658 786 827 a 677 752 852 884 a
portugal 5 - 14 880 874 937 938 1 233 880 892 954 938 1 233
scotland 4 - 15 a a a a a a a a a a
slovak Republic 6 - 17 m m m m m m m m m m
spain 3 - 16 792 792 956 978 978 792 792 956 978 978
sweden 6 - 18 741 741 741 741 a 741 741 741 741 a
switzerland 6 - 16 m m m m m m m m m m
Turkey 8 - 13 720 720 791 959 a 864 864 887 959 a
united states 6 - 16 m m m m m m m m m m
OECD average 758 808 894 910 865 785 831 928 962 911 EU19 average 769 819 890 894 854 786 834 928 959 896
part
ner
coun
try Israel 5 - 17 666 749 971 919 a 944 990 971 919 a
1. Ages 12-14 covers ages 12-13 only.Source: OECD. See Annex 3 for notes (www.oecd.org/edu/eag2006).Please refer to the Reader’s Guide for information concerning the symbols replacing missing data.
StatLink: http://dx.doi.org/10.1787/076822220227
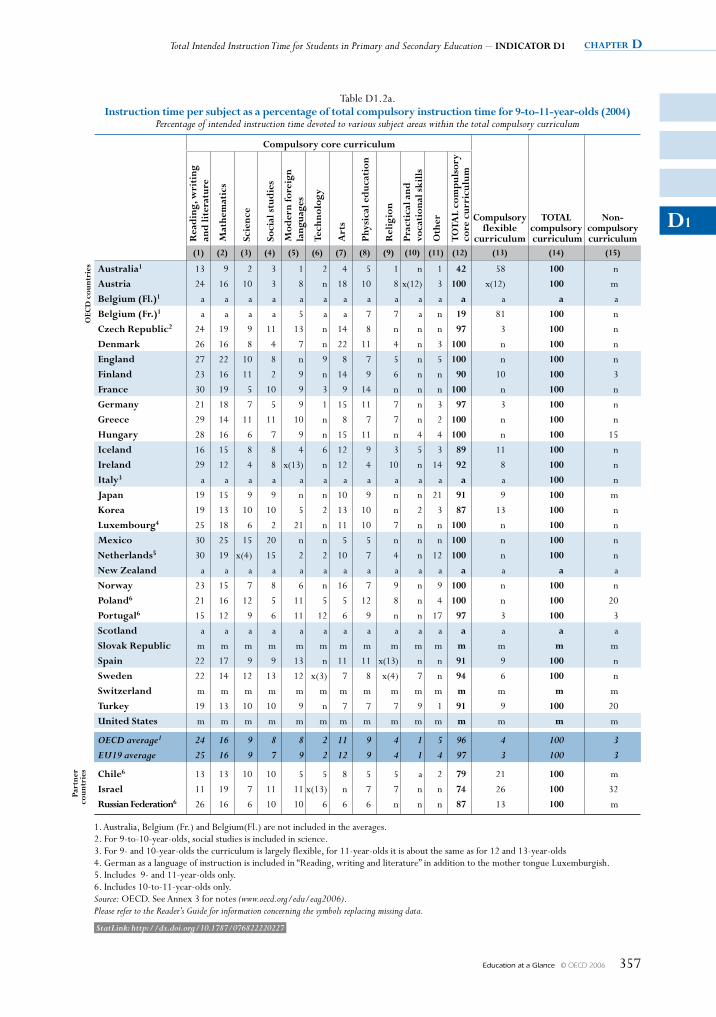
Total Intended Instruction Time for Students in Primary and Secondary Education – INDICATOR D1 chapter D
Education at a Glance © OECD 2006 357
D1
Table D1.2a. Instruction time per subject as a percentage of total compulsory instruction time for 9-to-11-year-olds (2004)
Percentage of intended instruction time devoted to various subject areas within the total compulsory curriculum
Compulsory core curriculum
Compulsory flexible
curriculum
TOTAl compulsory curriculum
Non- compulsory curriculumR
ead
ing,
wri
ting
an
d li
tera
ture
mat
hem
atic
s
scie
nce
soci
al s
tud
ies
mod
ern
fore
ign
lang
uage
s
Tech
nolo
gy
Art
s
phys
ical
ed
ucat
ion
Rel
igio
n
prac
tica
l and
vo
cati
onal
ski
lls
Oth
er
TOTA
l co
mp
ulso
ry
core
cur
ricu
lum
(1) (2) (3) (4) (5) (6) (7) (8) (9) (10) (11) (12) (13) (14) (15)
OeC
D c
ount
ries Australia1 13 9 2 3 1 2 4 5 1 n 1 42 58 100 n
Austria 24 16 10 3 8 n 18 10 8 x(12) 3 100 x(12) 100 m
Belgium (fl.)1 a a a a a a a a a a a a a a a
Belgium (fr.)1 a a a a 5 a a 7 7 a n 19 81 100 n
Czech Republic2 24 19 9 11 13 n 14 8 n n n 97 3 100 n
Denmark 26 16 8 4 7 n 22 11 4 n 3 100 n 100 n
england 27 22 10 8 n 9 8 7 5 n 5 100 n 100 n
finland 23 16 11 2 9 n 14 9 6 n n 90 10 100 3
france 30 19 5 10 9 3 9 14 n n n 100 n 100 n
Germany 21 18 7 5 9 1 15 11 7 n 3 97 3 100 n
Greece 29 14 11 11 10 n 8 7 7 n 2 100 n 100 n
Hungary 28 16 6 7 9 n 15 11 n 4 4 100 n 100 15
Iceland 16 15 8 8 4 6 12 9 3 5 3 89 11 100 n
Ireland 29 12 4 8 x(13) n 12 4 10 n 14 92 8 100 n
Italy3 a a a a a a a a a a a a a 100 n
Japan 19 15 9 9 n n 10 9 n n 21 91 9 100 m
Korea 19 13 10 10 5 2 13 10 n 2 3 87 13 100 n
luxembourg4 25 18 6 2 21 n 11 10 7 n n 100 n 100 n
mexico 30 25 15 20 n n 5 5 n n n 100 n 100 n
Netherlands5 30 19 x(4) 15 2 2 10 7 4 n 12 100 n 100 n
New Zealand a a a a a a a a a a a a a a a
Norway 23 15 7 8 6 n 16 7 9 n 9 100 n 100 n
poland6 21 16 12 5 11 5 5 12 8 n 4 100 n 100 20
portugal6 15 12 9 6 11 12 6 9 n n 17 97 3 100 3
scotland a a a a a a a a a a a a a a a
slovak Republic m m m m m m m m m m m m m m m
spain 22 17 9 9 13 n 11 11 x(13) n n 91 9 100 n
sweden 22 14 12 13 12 x(3) 7 8 x(4) 7 n 94 6 100 n
switzerland m m m m m m m m m m m m m m m
Turkey 19 13 10 10 9 n 7 7 7 9 1 91 9 100 20
united states m m m m m m m m m m m m m m m
OECD average1 24 16 9 8 8 2 11 9 4 1 5 96 4 100 3 EU19 average 25 16 9 7 9 2 12 9 4 1 4 97 3 100 3
part
ner
coun
trie
s Chile6 13 13 10 10 5 5 8 5 5 a 2 79 21 100 m
Israel 11 19 7 11 11 x(13) n 7 7 n n 74 26 100 32
Russian federation6 26 16 6 10 10 6 6 6 n n n 87 13 100 m
1. Australia, Belgium (Fr.) and Belgium(Fl.) are not included in the averages.2. For 9-to-10-year-olds, social studies is included in science.3. For 9- and 10-year-olds the curriculum is largely flexible, for 11-year-olds it is about the same as for 12 and 13-year-olds4. German as a language of instruction is included in “Reading, writing and literature” in addition to the mother tongue Luxemburgish.5. Includes 9- and 11-year-olds only.6. Includes 10-to-11-year-olds only.Source: OECD. See Annex 3 for notes (www.oecd.org/edu/eag2006).Please refer to the Reader’s Guide for information concerning the symbols replacing missing data.
StatLink: http://dx.doi.org/10.1787/076822220227
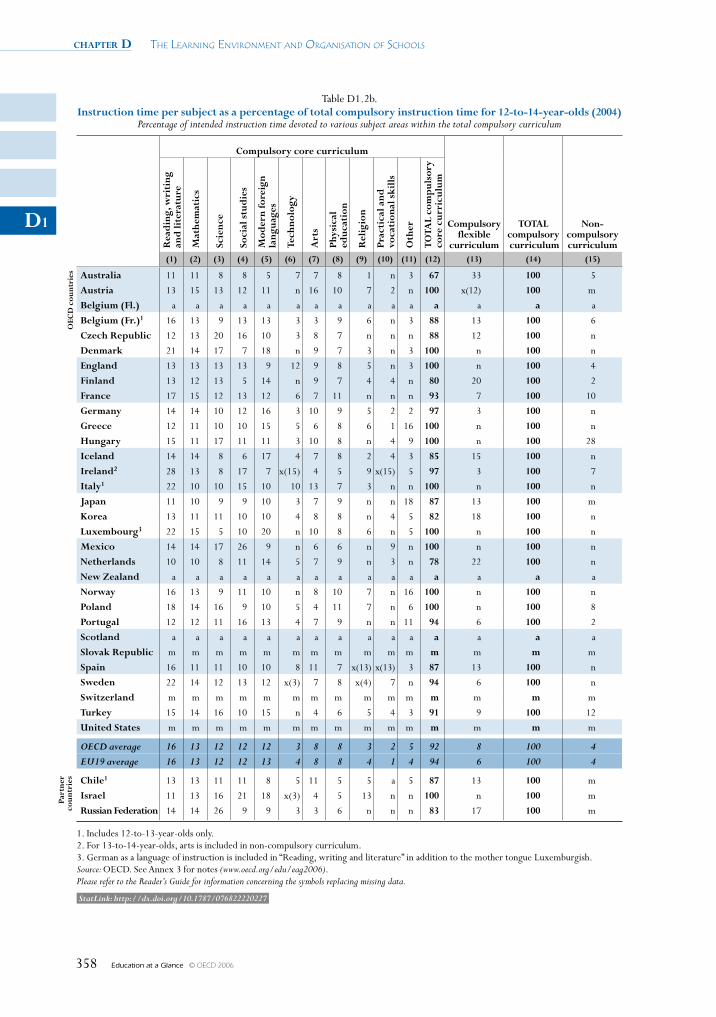
chapter D The Learning environmenT and organisaTion of schooLs
Education at a Glance © OECD 2006358
D1
Table D1.2b. Instruction time per subject as a percentage of total compulsory instruction time for 12-to-14-year-olds (2004)
Percentage of intended instruction time devoted to various subject areas within the total compulsory curriculum
Compulsory core curriculum
Compulsory flexible
curriculum
TOTAl compulsory curriculum
Non- compulsory curriculumR
ead
ing,
wri
ting
an
d li
tera
ture
mat
hem
atic
s
scie
nce
soci
al s
tud
ies
mod
ern
fore
ign
lang
uage
s
Tech
nolo
gy
Art
s
phys
ical
ed
ucat
ion
Rel
igio
n
prac
tica
l and
vo
cati
onal
ski
lls
Oth
er
TOTA
l co
mp
ulso
ry
core
cur
ricu
lum
(1) (2) (3) (4) (5) (6) (7) (8) (9) (10) (11) (12) (13) (14) (15)
OeC
D c
ount
ries Australia 11 11 8 8 5 7 7 8 1 n 3 67 33 100 5
Austria 13 15 13 12 11 n 16 10 7 2 n 100 x(12) 100 m
Belgium (fl.) a a a a a a a a a a a a a a a
Belgium (fr.)1 16 13 9 13 13 3 3 9 6 n 3 88 13 100 6
Czech Republic 12 13 20 16 10 3 8 7 n n n 88 12 100 n
Denmark 21 14 17 7 18 n 9 7 3 n 3 100 n 100 n
england 13 13 13 13 9 12 9 8 5 n 3 100 n 100 4
finland 13 12 13 5 14 n 9 7 4 4 n 80 20 100 2
france 17 15 12 13 12 6 7 11 n n n 93 7 100 10
Germany 14 14 10 12 16 3 10 9 5 2 2 97 3 100 n
Greece 12 11 10 10 15 5 6 8 6 1 16 100 n 100 n
Hungary 15 11 17 11 11 3 10 8 n 4 9 100 n 100 28
Iceland 14 14 8 6 17 4 7 8 2 4 3 85 15 100 n
Ireland2 28 13 8 17 7 x(15) 4 5 9 x(15) 5 97 3 100 7
Italy1 22 10 10 15 10 10 13 7 3 n n 100 n 100 n
Japan 11 10 9 9 10 3 7 9 n n 18 87 13 100 m
Korea 13 11 11 10 10 4 8 8 n 4 5 82 18 100 n
luxembourg3 22 15 5 10 20 n 10 8 6 n 5 100 n 100 n
mexico 14 14 17 26 9 n 6 6 n 9 n 100 n 100 n
Netherlands 10 10 8 11 14 5 7 9 n 3 n 78 22 100 n
New Zealand a a a a a a a a a a a a a a a
Norway 16 13 9 11 10 n 8 10 7 n 16 100 n 100 n
poland 18 14 16 9 10 5 4 11 7 n 6 100 n 100 8
portugal 12 12 11 16 13 4 7 9 n n 11 94 6 100 2
scotland a a a a a a a a a a a a a a a
slovak Republic m m m m m m m m m m m m m m m
spain 16 11 11 10 10 8 11 7 x(13) x(13) 3 87 13 100 n
sweden 22 14 12 13 12 x(3) 7 8 x(4) 7 n 94 6 100 n
switzerland m m m m m m m m m m m m m m m
Turkey 15 14 16 10 15 n 4 6 5 4 3 91 9 100 12
united states m m m m m m m m m m m m m m m
OECD average 16 13 12 12 12 3 8 8 3 2 5 92 8 100 4 EU19 average 16 13 12 12 13 4 8 8 4 1 4 94 6 100 4
part
ner
coun
trie
s Chile1 13 13 11 11 8 5 11 5 5 a 5 87 13 100 m
Israel 11 13 16 21 18 x(3) 4 5 13 n n 100 n 100 m
Russian federation 14 14 26 9 9 3 3 6 n n n 83 17 100 m
1. Includes 12-to-13-year-olds only.2. For 13-to-14-year-olds, arts is included in non-compulsory curriculum.3. German as a language of instruction is included in “Reading, writing and literature” in addition to the mother tongue Luxemburgish.Source: OECD. See Annex 3 for notes (www.oecd.org/edu/eag2006).Please refer to the Reader’s Guide for information concerning the symbols replacing missing data.
StatLink: http://dx.doi.org/10.1787/076822220227

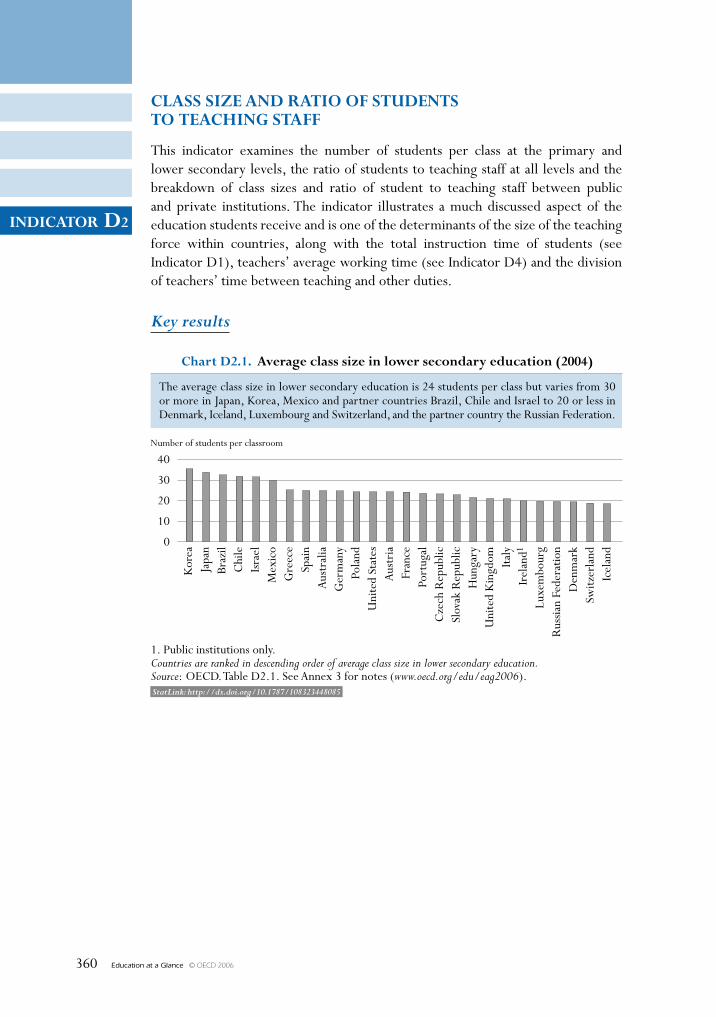
Education at a Glance © OECD 2006360
INDICATOR D2
StatLink: http://dx.doi.org/10.1787/108323448085
ClAss sIze AND RATIO Of sTuDeNTs TO TeAChINg sTAff
This indicator examines the number of students per class at the primary and lower secondary levels, the ratio of students to teaching staff at all levels and the breakdown of class sizes and ratio of student to teaching staff between public and private institutions. The indicator illustrates a much discussed aspect of the education students receive and is one of the determinants of the size of the teaching force within countries, along with the total instruction time of students (see Indicator D1), teachers’ average working time (see Indicator D4) and the division of teachers’ time between teaching and other duties.
Key results
40
30
20
10
0
Number of students per classroom
Chart D2.1. Average class size in lower secondary education (2004)
1. Public institutions only.Countries are ranked in descending order of average class size in lower secondary education.Source: OECD. Table D2.1. See Annex 3 for notes (www.oecd.org/edu/eag2006).
Kor
eaJa
pan
Braz
ilC
hile
Isra
elM
exic
oG
reec
eSp
ain
Aus
tral
iaG
erm
any
Pola
ndU
nite
d St
ates
Aus
tria
Fran
cePo
rtug
alC
zech
Rep
ublic
Slov
ak R
epub
licH
unga
ryU
nite
d K
ingd
om Italy
Irel
and1
Luxe
mbo
urg
Rus
sian
Fede
ratio
nD
enm
ark
Switz
erla
ndIc
elan
d
The average class size in lower secondary education is 24 students per class but varies from 30or more in Japan, Korea, Mexico and partner countries Brazil, Chile and Israel to 20 or less inDenmark, Iceland, Luxembourg and Switzerland, and the partner country the Russian Federation.
Education at a Glance © OECD 2006 361
INDICATOR D2
Other highlights of this indicator
• The average class size in primary education is 21, but varies between countries from 34 students per class in Korea to half of that number or less in Iceland, Luxembourg and Portugal, and the partner country the Russian Federation.
• The number of students per class increases by an average of nearly three students between primary and lower secondary education, but ratios of students to teaching staff tend to decrease with increasing levels of education due to more annual instruction time, though this pattern is not uniform among countries.
• On average across OECD countries, the availability of teaching resources relative to student numbers in secondary education is more favourable in private institutions than in public institutions. This is most striking in Mexico where, at the secondary level, there are around 13 more students per teacher in public institutions than there are in private institutions. Consistently, at the lower secondary level, there is one student more per class on average in public institutions than in private institutions.
chapter D The Learning environmenT and organisaTion of schooLs
Education at a Glance © OECD 2006362
D2
Policy context
Class size, education quality and education systems
Class size is a hotly debated topic and an important aspect of education policy in many OECD countries. Smaller classes are often perceived to allow teachers to focus more on the individual needs of students and reduce the amount of class time teachers spend dealing with disruptions. Smaller class sizes may also influence parents when they choose schools for their children. In this respect, class size is considered as a way to assess the quality of the school system. For those countries that emphasise the importance of school choice in their education system, class size may be an important determinant of the movement of students between sectors and schools.
Yet evidence on the effects of variations in class size upon student performance is mixed. In what has evolved as a contentious area of research that has produced little in the way of consistent results, there is some evidence that smaller classes may have an impact upon specific groups of students (e.g. disadvantaged students).
Numerous factors influence the interaction between teachers and students with class size being just one of them. Other influences include the number of classes or students for which a teacher is responsible, the subject taught, the division of the teacher’s time between teaching and other duties, the grouping of students within classes and the practice of team-teaching.
A further reason why there is mixed evidence on the impact of class size may be because there is not sufficient variation in class size to estimate the true effects of this variable on student performance. Also policies to group lower-performing students into smaller classes in order to devote more attention to them may compensate for increased performance gains from smaller classes net of such effects. Finally, the fact that the relationship between class size and student performance is often non-linear makes the effects difficult to estimate.
It should also be considered that the predominance of teacher costs in educational expenditure means that reducing class sizes leads to sharp increases in the costs of education. Therefore, the costs associated with making the large reductions in class size that would be necessary to identify a positive impact upon student performance may be prohibitive for many countries.
The ratio of students to teaching staff is obtained by dividing the number of full-time equivalent students at a given level of education by the number of full-time equivalent teachers at that level and in similar types of institutions. However, this ratio does not take into account instruction time compared to the length of a teacher’s working day, nor how much time teachers spend teaching, and therefore it cannot be interpreted in terms of class size. The number of students per class summarises different factors, but distinguishing between them would allow an understanding of the differences between countries in terms of the quality of the educational system (Box D2.1).
The ratio of students to teaching staff is also an important indicator of the resources devoted to education. A smaller ratio of students to teaching staff may have to be weighted against higher salaries for teachers, increased professional development and teacher training, greater investment in teaching technology, or more widespread use of assistant teachers and other paraprofessionals whose salaries are often considerably lower than those of qualified teachers. Moreover, as larger numbers of children with special educational needs are integrated into normal classes, more use of specialised personnel and support services may limit the resources available for reducing the ratio of students to teaching staff.
Class Size and Ratio of Students to Teaching Staff – INDICATOR D2 chapter D
Education at a Glance © OECD 2006 363
D2
The number of teaching and non-teaching staff employed in education per 1 000 students is an indicator of the proportion of a country’s human resources devoted to educating the population. The number of persons employed as either teachers or educational support personnel and the level of compensation of educational staff (see Indicator D3) are both important factors affecting the financial resources that countries commit to education.
Evidence and explanations
Average class size in primary and lower secondary education
At the primary level, the average class size across OECD countries is 21 students per class, but varies widely among countries. It ranges from 34 students per primary class in Korea to fewer than 20 in Denmark, Greece, Iceland, Italy, Luxembourg, Portugal, the Slovak Republic and Switzerland, and the partner country the Russian Federation. At the lower secondary level, the average class size across OECD countries is 24 students per class and varies from 35 students per class in Korea to fewer than 20 in Denmark, Iceland, Ireland (public institutions only), Luxembourg and Switzerland, and the partner country the Russian Federation (Table D2.1).
Box D2.1. Relationship between class size and ratio of students to teaching staff
The number of students per class results from a number of different elements: the ratio of students to teaching staff, the number of classes or students for which a teacher is responsible, the instruction time of students compared to the length of teachers’ working days, the proportion of time teachers spend teaching, the grouping of students within classes and team teaching.
For example, in a school of 48 full-time students and 8 full-time teachers, the ratio of students to teaching staff equals 6. If teachers’ working week is estimated to be 35 hours including 10 hours teaching, and if instruction time for each student is 40 hours per week, then whatever the grouping of students in this school, average class size can be estimated as follows:
Estimated class size = 6 students per teacher * (40 hours of instruction time per student / 10 hours of teaching per teacher) = 24 students.
Compared to this estimated figure, class size presented in Table D2.1 is defined as the division of students who are following a common course of study, based on the highest number of common courses (usually compulsory studies), and excludes teaching in sub-groups. Thus the estimated class size will be close to the average class size of Table D2.1 where teaching in sub-groups is less frequent (as is the case in primary and lower secondary education).
Because of these definitions, similar student-to-teacher ratios between countries can lead to different class sizes. For example, in primary education, although the Czech Republic and Hungary have different ratios of students to teaching staff (17.9 and 10.7 – see Table D2.2), the class size is similar in both countries (20.6 in the Czech Republic and 20.2 in Hungary – see Table D2.1). The explanation for this lies in the higher proportion of teaching time: in the Czech Republic teachers spend 47.5% of their working time teaching compared with 41.7% in Hungary (see Indicator D4).
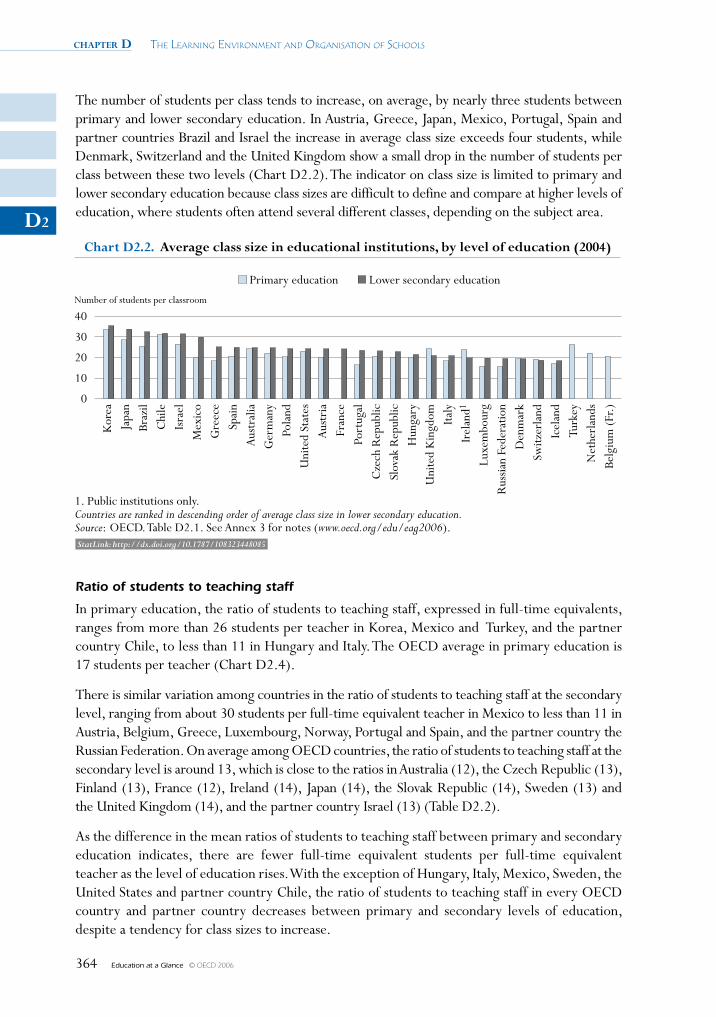
chapter D The Learning environmenT and organisaTion of schooLs
Education at a Glance © OECD 2006364
D2
The number of students per class tends to increase, on average, by nearly three students between primary and lower secondary education. In Austria, Greece, Japan, Mexico, Portugal, Spain and partner countries Brazil and Israel the increase in average class size exceeds four students, while Denmark, Switzerland and the United Kingdom show a small drop in the number of students per class between these two levels (Chart D2.2). The indicator on class size is limited to primary and lower secondary education because class sizes are difficult to define and compare at higher levels of education, where students often attend several different classes, depending on the subject area.
40
30
20
10
0
Number of students per classroom
Chart D2.2. Average class size in educational institutions, by level of education (2004)
Primary education Lower secondary education
1. Public institutions only.Countries are ranked in descending order of average class size in lower secondary education.Source: OECD. Table D2.1. See Annex 3 for notes (www.oecd.org/edu/eag2006).
Kor
eaJa
pan
Braz
ilC
hile
Isra
elM
exic
oG
reec
eSp
ain
Aus
tral
iaG
erm
any
Pola
ndU
nite
d St
ates
Aus
tria
Fran
cePo
rtug
alC
zech
Rep
ublic
Slov
ak R
epub
licH
unga
ryU
nite
d K
ingd
om Italy
Irel
and1
Luxe
mbo
urg
Rus
sian
Fede
ratio
nD
enm
ark
Switz
erla
ndIc
elan
dTu
rkey
Net
herl
ands
Belg
ium
(Fr.)
StatLink: http://dx.doi.org/10.1787/108323448085
Ratio of students to teaching staff
In primary education, the ratio of students to teaching staff, expressed in full-time equivalents, ranges from more than 26 students per teacher in Korea, Mexico and Turkey, and the partner country Chile, to less than 11 in Hungary and Italy. The OECD average in primary education is 17 students per teacher (Chart D2.4).
There is similar variation among countries in the ratio of students to teaching staff at the secondary level, ranging from about 30 students per full-time equivalent teacher in Mexico to less than 11 in Austria, Belgium, Greece, Luxembourg, Norway, Portugal and Spain, and the partner country the Russian Federation. On average among OECD countries, the ratio of students to teaching staff at the secondary level is around 13, which is close to the ratios in Australia (12), the Czech Republic (13), Finland (13), France (12), Ireland (14), Japan (14), the Slovak Republic (14), Sweden (13) and the United Kingdom (14), and the partner country Israel (13) (Table D2.2).
As the difference in the mean ratios of students to teaching staff between primary and secondary education indicates, there are fewer full-time equivalent students per full-time equivalent teacher as the level of education rises. With the exception of Hungary, Italy, Mexico, Sweden, the United States and partner country Chile, the ratio of students to teaching staff in every OECD country and partner country decreases between primary and secondary levels of education, despite a tendency for class sizes to increase.
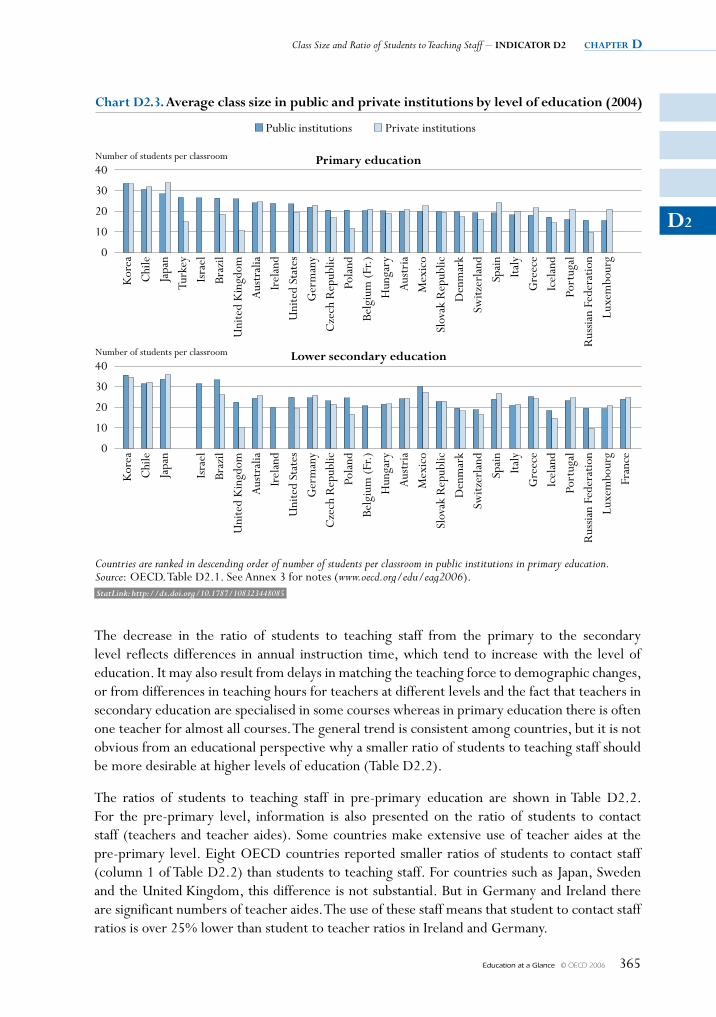
Class Size and Ratio of Students to Teaching Staff – INDICATOR D2 chapter D
Education at a Glance © OECD 2006 365
D2
Number of students per classroom40
30
20
10
0
Number of students per classroom40
30
20
10
0
Chart D2.3. Average class size in public and private institutions by level of education (2004)
Primary education
Public institutions Private institutions
Countries are ranked in descending order of number of students per classroom in public institutions in primary education.Source: OECD. Table D2.1. See Annex 3 for notes (www.oecd.org/edu/eag2006).
Kor
ea
Chi
le
Japa
n
Turk
ey
Isra
el
Braz
il
Uni
ted
Kin
gdom
Aus
tral
ia
Irel
and
Uni
ted
Stat
es
Ger
man
y
Cze
ch R
epub
lic
Pola
nd
Belg
ium
(Fr.)
Hun
gary
Aus
tria
Mex
ico
Slov
ak R
epub
lic
Den
mar
k
Switz
erla
nd
Spai
n
Italy
Gre
ece
Icel
and
Port
ugal
Rus
sian
Fede
ratio
n
Luxe
mbo
urg
Fran
ce
lower secondary education
Kor
ea
Chi
le
Japa
n
Turk
ey
Isra
el
Braz
il
Uni
ted
Kin
gdom
Aus
tral
ia
Irel
and
Uni
ted
Stat
es
Ger
man
y
Cze
ch R
epub
lic
Pola
nd
Belg
ium
(Fr.)
Hun
gary
Aus
tria
Mex
ico
Slov
ak R
epub
lic
Den
mar
k
Switz
erla
nd
Spai
n
Italy
Gre
ece
Icel
and
Port
ugal
Rus
sian
Fede
ratio
n
Luxe
mbo
urg
Fran
ce
StatLink: http://dx.doi.org/10.1787/108323448085
The decrease in the ratio of students to teaching staff from the primary to the secondary level reflects differences in annual instruction time, which tend to increase with the level of education. It may also result from delays in matching the teaching force to demographic changes, or from differences in teaching hours for teachers at different levels and the fact that teachers in secondary education are specialised in some courses whereas in primary education there is often one teacher for almost all courses. The general trend is consistent among countries, but it is not obvious from an educational perspective why a smaller ratio of students to teaching staff should be more desirable at higher levels of education (Table D2.2).
The ratios of students to teaching staff in pre-primary education are shown in Table D2.2. For the pre-primary level, information is also presented on the ratio of students to contact staff (teachers and teacher aides). Some countries make extensive use of teacher aides at the pre-primary level. Eight OECD countries reported smaller ratios of students to contact staff (column 1 of Table D2.2) than students to teaching staff. For countries such as Japan, Sweden and the United Kingdom, this difference is not substantial. But in Germany and Ireland there are significant numbers of teacher aides. The use of these staff means that student to contact staff ratios is over 25% lower than student to teacher ratios in Ireland and Germany.
chapter D The Learning environmenT and organisaTion of schooLs
Education at a Glance © OECD 2006366
D2
At the tertiary level, the ratio of students to teaching staff ranges from about 28 students per teacher in Greece to 11 or below in Iceland, Japan, the Slovak Republic and Sweden (Table D2.2). Such comparisons in tertiary education, however, should be made with caution since it is still difficult to calculate full-time equivalent students and teachers on a comparable basis at this level.
In 11 out of the 15 OECD and partner countries with comparable data, the ratio of students to teaching staff is lower in the more occupationally specific tertiary-type B programmes than in tertiary-type A and advanced research programmes (Table D2.2). Germany, Hungary, Ireland and Turkey are the only countries with a higher ratio in tertiary-type B programmes.
Teaching resources in public and private institutions
Table D2.3 focuses on the secondary level and illustrates the comparative provision of teaching resources between public and private institutions by examining the ratio of students to teaching staff between the two types of providers. There are numerous reasons why countries possess public and private school sectors. In many countries, a rationale for this division is to facilitate school choice, that is, to broaden the choices available to students and families in their schooling. Considering the importance of class size in discussions of schooling in many countries, differences in class size between public and private schools and institutions may be a driver of differences in enrolment between these sectors.
On average across the OECD countries (and also in partner countries) for which there are data, there are more favourable ratios of students to teaching staff in private institutions at both lower secondary and upper secondary levels, with slightly more than one more student per teacher in public institutions than in private institutions. The most striking examples of this are Mexico and the United Kingdom where, at the lower secondary level, there are at least 12 more students per teacher in public institutions than in private institutions. The difference in Mexico at the upper secondary level is similarly large.
But the reverse pattern in favour of students in public institutions is also evident in some countries. This is most pronounced in Spain at the lower secondary level, where there are some 17 students per teacher in private institutions compared with only 12 students per teacher in public institutions.
While ratios of students to teaching staff provide a measure of the teaching resources available, average class size is more a quality-related measure. In terms of average class size (Chart D2.3 and Table D2.1), on average across the OECD countries for which there are data, average class sizes do not differ between public and private institutions from more than one student per class for primary and lower secondary education. However, this trend disguises marked variation between countries. At the primary level, in the Czech Republic, Poland, Turkey, the United Kingdom and the United States, and in the partner countries Brazil and the Russian Federation, for example, average class sizes in public institutions are notably higher – four students or more per class – though in the first four cases as well as in partner country Russian Federation, the private sector is small (at most 5% of students at the primary level). In contrast, class sizes in private institutions exceed those in public institutions to a similar degree in Japan, Luxembourg, Portugal and Spain.
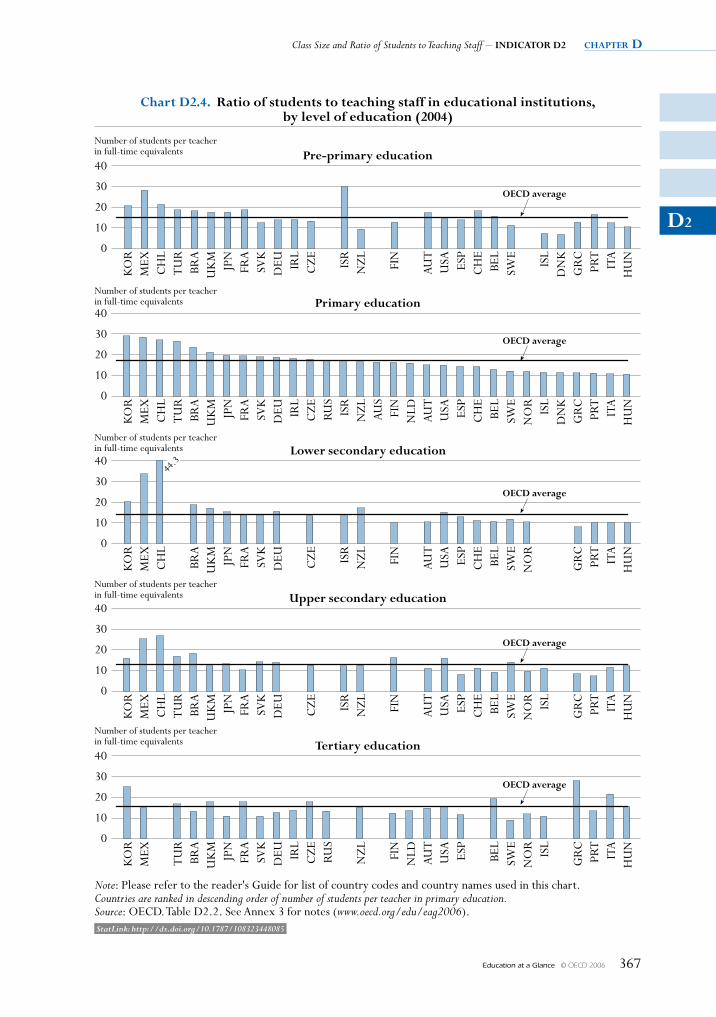
Class Size and Ratio of Students to Teaching Staff – INDICATOR D2 chapter D
Education at a Glance © OECD 2006 367
D2
44.3
Number of students per teacherin full-time equivalents
40
30
20
10
0
40
30
20
10
0
40
30
20
10
0
40
30
20
10
0
40
30
20
10
0
Number of students per teacherin full-time equivalents
Number of students per teacherin full-time equivalents
Number of students per teacherin full-time equivalents
Number of students per teacherin full-time equivalents
Chart D2.4. Ratio of students to teaching staff in educational institutions,by level of education (2004)
Note: Please refer to the reader's Guide for list of country codes and country names used in this chart.Countries are ranked in descending order of number of students per teacher in primary education.Source: OECD. Table D2.2. See Annex 3 for notes (www.oecd.org/edu/eag2006).
OeCD average
Pre-primary education
KO
RM
EXC
HL
TU
RBR
AU
KM
JPN
FRA
SVK
DEU IR
LC
ZE
RUS
ISR
NZ
LAU
SFI
NN
LDAU
TU
SA ESP
CH
EBE
LSW
EN
OR
ISL
DN
KG
RC
PRT
ITA
HU
N
Primary education
KO
RM
EXC
HL
TU
RBR
AU
KM
JPN
FRA
SVK
DEU IR
LC
ZE
RUS
ISR
NZ
LAU
SFI
NN
LDAU
TU
SA ESP
CH
EBE
LSW
EN
OR
ISL
DN
KG
RC
PRT
ITA
HU
N
lower secondary education
KO
RM
EXC
HL
TU
RBR
AU
KM
JPN
FRA
SVK
DEU IR
LC
ZE
RUS
ISR
NZ
LAU
SFI
NN
LDAU
TU
SA ESP
CH
EBE
LSW
EN
OR
ISL
DN
KG
RC
PRT
ITA
HU
N
upper secondary education
KO
RM
EXC
HL
TU
RBR
AU
KM
JPN
FRA
SVK
DEU IR
LC
ZE
RUS
ISR
NZ
LAU
SFI
NN
LDAU
TU
SA ESP
CH
EBE
LSW
EN
OR
ISL
DN
KG
RC
PRT
ITA
HU
N
Tertiary education
KO
RM
EXC
HL
TU
RBR
AU
KM
JPN
FRA
SVK
DEU IR
LC
ZE
RUS
ISR
NZ
LAU
SFI
NN
LDAU
TU
SA ESP
CH
EBE
LSW
EN
OR
ISL
DN
KG
RC
PRT
ITA
HU
N
OeCD average
OeCD average
OeCD average
OeCD average
StatLink: http://dx.doi.org/10.1787/108323448085
chapter D The Learning environmenT and organisaTion of schooLs
Education at a Glance © OECD 2006368
D2
It is interesting to note that in the OECD countries with a substantial private sector (see Table C2.4), there are, on average, only marginal differences in class size between public and private institutions. In these countries (Australia, Belgium [French Community], Denmark, France, Korea, Luxembourg, the Netherlands and Spain, and the partner country Chile), private institutions have only 1.5 students fewer than public institutions. This indicates that in countries where a substantial proportion of students and families have decided to choose private education institutions, class size was not, on average, a significant determinant of those decisions.
The class size comparison between public and private institutions also shows a mixed picture at the lower secondary level, where private education is more prevalent. Lower-secondary average class sizes are larger in private institutions than in public institutions in ten OECD countries and one partner country, though differences tend to be smaller than is the case in primary.
Definitions and methodologies
Data refer to the school year 2003-2004, and are based on the UOE data collection on education statistics that is administered annually by the OECD.
Class sizes have been calculated by dividing the number of students enrolled by the number of classes. In order to ensure comparability among countries, special needs programmes have been excluded. Data include only regular programmes at primary and lower secondary levels of education and exclude teaching in sub-groups outside the regular classroom setting.
The ratio of students to teaching staff has been calculated by dividing the number of full-time equivalent students at a given level of education by the number of full-time equivalent teachers at that level and in the specified type of institution.
The breakdown of the ratio of students to teaching staff by type of institution distinguishes between students and teachers in public institutions and in private institutions (government-dependent private institutions and independent private institutions). In some countries the proportion of students in private institutions is small (see Table C2.4).
Instructional personnel:
• Teaching staff refers to professional personnel directly involved in teaching students. The classification includes classroom teachers; special education teachers; and other teachers who work with a whole class of students in a classroom, in small groups in a resource room, or in one-to-one teaching situations inside or outside a regular classroom. Teaching staff also includes department chairpersons whose duties include some teaching, but excludes non-professional personnel who support teachers in providing instruction to students, such as teacher aides and other paraprofessional personnel.
• Teacher aides and teaching/research assistants include non-professional personnel or students who support teachers in providing instruction to students.
Non-instructional personnel:
• Professional support for students includes professional staff who provide services to students that support their learning. In many cases, these staff originally qualified as teachers but then moved into other professional positions within the education system. This category also includes
Class Size and Ratio of Students to Teaching Staff – INDICATOR D2 chapter D
Education at a Glance © OECD 2006 369
D2
all personnel employed in education systems who provide health and social support services to students, such as guidance counsellors, librarians, doctors, dentists, nurses, psychiatrists and psychologists, and other staff with similar responsibilities.
• School and higher level management includes professional personnel who are responsible for school management and administration and personnel whose primary responsibility is the quality control and management of higher levels of the education system. This category covers principals, assistant principals, headmasters, assistant headmasters, superintendents of schools, associate and assistant superintendents, commissioners of education and other management staff with similar responsibilities.
• School and higher level administrative personnel includes all personnel who support the administration and management of schools and of higher levels of the education system. The category includes: receptionists, secretaries, typists and word processing staff, book-keepers and clerks, analysts, computer programmers, network administrators, and others with similar functions and responsibilities.
• Maintenance and operations personnel include personnel who support the maintenance and operation of schools, the transportation of students to and from school, school security and catering. This category includes the following types of personnel: masons, carpenters, electricians, maintenance repairers, painters and paperhangers, plasterers, plumbers and vehicle mechanics. It also includes bus drivers and other vehicle operators, construction workers, gardeners and grounds staff, bus monitors and crossing guards, cooks, custodians, food servers and others with similar functions.
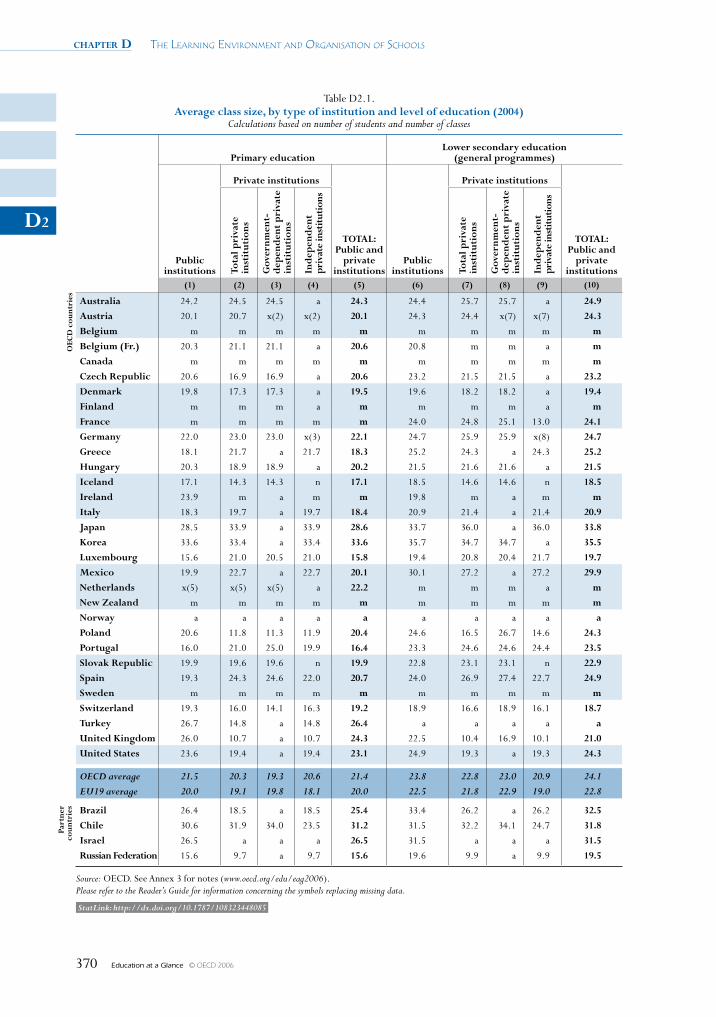
chapter D The Learning environmenT and organisaTion of schooLs
Education at a Glance © OECD 2006370
D2
Table D2.1. Average class size, by type of institution and level of education (2004)
Calculations based on number of students and number of classes
Primary educationlower secondary education
(general programmes)
Public institutions
Private institutions
TOTAl: Public and
private institutions
Public institutions
Private institutions
TOTAl: Public and
private institutions
Tota
l pri
vate
in
stit
utio
ns
gov
ernm
ent-
d
epen
den
t p
riva
te
inst
itut
ions
Ind
epen
den
t
priv
ate
inst
itut
ions
Tota
l pri
vate
in
stit
utio
ns
gov
ernm
ent-
d
epen
den
t p
riva
te
inst
itut
ions
Ind
epen
den
t
priv
ate
inst
itut
ions
(1) (2) (3) (4) (5) (6) (7) (8) (9) (10)
OeC
D c
ount
ries Australia 24.2 24.5 24.5 a 24.3 24.4 25.7 25.7 a 24.9
Austria 20.1 20.7 x(2) x(2) 20.1 24.3 24.4 x(7) x(7) 24.3
Belgium m m m m m m m m m m
Belgium (fr.) 20.3 21.1 21.1 a 20.6 20.8 m m a m
Canada m m m m m m m m m m
Czech Republic 20.6 16.9 16.9 a 20.6 23.2 21.5 21.5 a 23.2
Denmark 19.8 17.3 17.3 a 19.5 19.6 18.2 18.2 a 19.4
finland m m m a m m m m a m
france m m m m m 24.0 24.8 25.1 13.0 24.1
germany 22.0 23.0 23.0 x(3) 22.1 24.7 25.9 25.9 x(8) 24.7
greece 18.1 21.7 a 21.7 18.3 25.2 24.3 a 24.3 25.2
hungary 20.3 18.9 18.9 a 20.2 21.5 21.6 21.6 a 21.5
Iceland 17.1 14.3 14.3 n 17.1 18.5 14.6 14.6 n 18.5
Ireland 23.9 m a m m 19.8 m a m m
Italy 18.3 19.7 a 19.7 18.4 20.9 21.4 a 21.4 20.9
Japan 28.5 33.9 a 33.9 28.6 33.7 36.0 a 36.0 33.8
Korea 33.6 33.4 a 33.4 33.6 35.7 34.7 34.7 a 35.5
luxembourg 15.6 21.0 20.5 21.0 15.8 19.4 20.8 20.4 21.7 19.7
Mexico 19.9 22.7 a 22.7 20.1 30.1 27.2 a 27.2 29.9
Netherlands x(5) x(5) x(5) a 22.2 m m m a m
New zealand m m m m m m m m m m
Norway a a a a a a a a a a
Poland 20.6 11.8 11.3 11.9 20.4 24.6 16.5 26.7 14.6 24.3
Portugal 16.0 21.0 25.0 19.9 16.4 23.3 24.6 24.6 24.4 23.5
slovak Republic 19.9 19.6 19.6 n 19.9 22.8 23.1 23.1 n 22.9
spain 19.3 24.3 24.6 22.0 20.7 24.0 26.9 27.4 22.7 24.9
sweden m m m m m m m m m m
switzerland 19.3 16.0 14.1 16.3 19.2 18.9 16.6 18.9 16.1 18.7
Turkey 26.7 14.8 a 14.8 26.4 a a a a a
united Kingdom 26.0 10.7 a 10.7 24.3 22.5 10.4 16.9 10.1 21.0
united states 23.6 19.4 a 19.4 23.1 24.9 19.3 a 19.3 24.3
OECD average 21.5 20.3 19.3 20.6 21.4 23.8 22.8 23.0 20.9 24.1 EU19 average 20.0 19.1 19.8 18.1 20.0 22.5 21.8 22.9 19.0 22.8
Part
ner
coun
trie
s Brazil 26.4 18.5 a 18.5 25.4 33.4 26.2 a 26.2 32.5
Chile 30.6 31.9 34.0 23.5 31.2 31.5 32.2 34.1 24.7 31.8
Israel 26.5 a a a 26.5 31.5 a a a 31.5
Russian federation 15.6 9.7 a 9.7 15.6 19.6 9.9 a 9.9 19.5
Source: OECD. See Annex 3 for notes (www.oecd.org/edu/eag2006).Please refer to the Reader’s Guide for information concerning the symbols replacing missing data.
StatLink: http://dx.doi.org/10.1787/108323448085
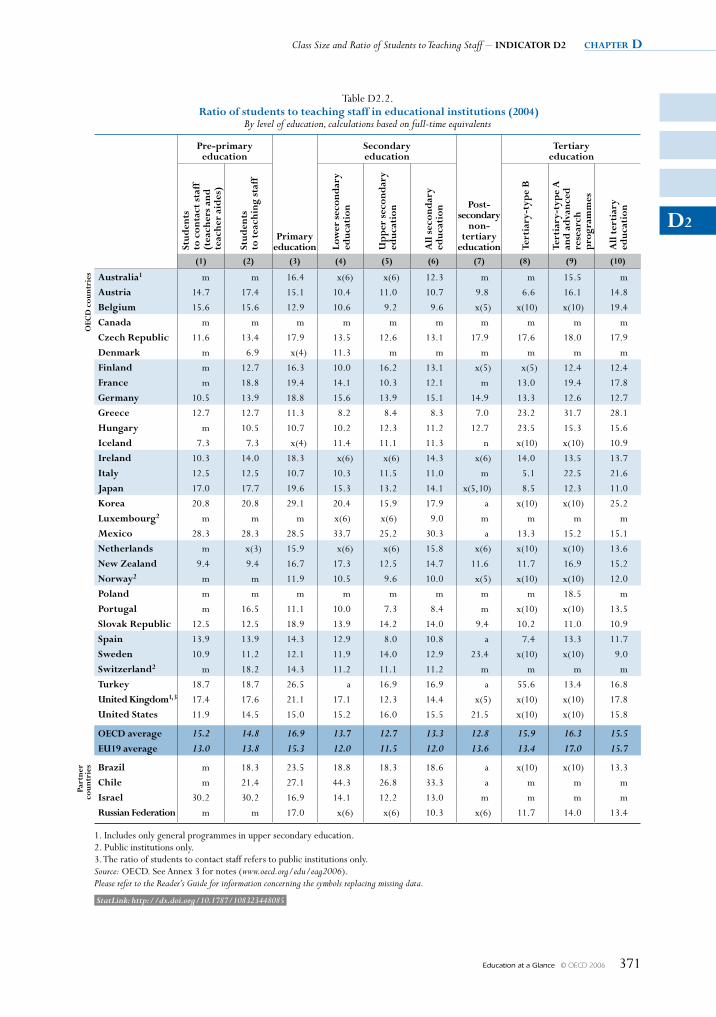
Class Size and Ratio of Students to Teaching Staff – INDICATOR D2 chapter D
Education at a Glance © OECD 2006 371
D2
Table D2.2. Ratio of students to teaching staff in educational institutions (2004)
By level of education, calculations based on full-time equivalents
Pre-primary education
Primary education
secondary education
Post- secondary
non-tertiary
education
Tertiary education
stud
ents
to
con
tact
sta
ff
(tea
cher
s an
d
teac
her
aid
es)
stud
ents
to
tea
chin
g st
aff
low
er s
econ
dar
y ed
ucat
ion
up
per
sec
ond
ary
educ
atio
n
All
sec
ond
ary
educ
atio
n
Tert
iary
-typ
e B
Tert
iary
-typ
e A
an
d a
dvan
ced
re
sear
ch
pro
gram
mes
All
ter
tiar
y
educ
atio
n
(1) (2) (3) (4) (5) (6) (7) (8) (9) (10)
OeC
D c
ount
ries Australia1 m m 16.4 x(6) x(6) 12.3 m m 15.5 m
Austria 14.7 17.4 15.1 10.4 11.0 10.7 9.8 6.6 16.1 14.8
Belgium 15.6 15.6 12.9 10.6 9.2 9.6 x(5) x(10) x(10) 19.4
Canada m m m m m m m m m m
Czech Republic 11.6 13.4 17.9 13.5 12.6 13.1 17.9 17.6 18.0 17.9
Denmark m 6.9 x(4) 11.3 m m m m m m
finland m 12.7 16.3 10.0 16.2 13.1 x(5) x(5) 12.4 12.4
france m 18.8 19.4 14.1 10.3 12.1 m 13.0 19.4 17.8
germany 10.5 13.9 18.8 15.6 13.9 15.1 14.9 13.3 12.6 12.7
greece 12.7 12.7 11.3 8.2 8.4 8.3 7.0 23.2 31.7 28.1
hungary m 10.5 10.7 10.2 12.3 11.2 12.7 23.5 15.3 15.6
Iceland 7.3 7.3 x(4) 11.4 11.1 11.3 n x(10) x(10) 10.9
Ireland 10.3 14.0 18.3 x(6) x(6) 14.3 x(6) 14.0 13.5 13.7
Italy 12.5 12.5 10.7 10.3 11.5 11.0 m 5.1 22.5 21.6
Japan 17.0 17.7 19.6 15.3 13.2 14.1 x(5, 10) 8.5 12.3 11.0
Korea 20.8 20.8 29.1 20.4 15.9 17.9 a x(10) x(10) 25.2
luxembourg2 m m m x(6) x(6) 9.0 m m m m
Mexico 28.3 28.3 28.5 33.7 25.2 30.3 a 13.3 15.2 15.1
Netherlands m x(3) 15.9 x(6) x(6) 15.8 x(6) x(10) x(10) 13.6
New zealand 9.4 9.4 16.7 17.3 12.5 14.7 11.6 11.7 16.9 15.2
Norway2 m m 11.9 10.5 9.6 10.0 x(5) x(10) x(10) 12.0
Poland m m m m m m m m 18.5 m
Portugal m 16.5 11.1 10.0 7.3 8.4 m x(10) x(10) 13.5
slovak Republic 12.5 12.5 18.9 13.9 14.2 14.0 9.4 10.2 11.0 10.9
spain 13.9 13.9 14.3 12.9 8.0 10.8 a 7.4 13.3 11.7
sweden 10.9 11.2 12.1 11.9 14.0 12.9 23.4 x(10) x(10) 9.0
switzerland2 m 18.2 14.3 11.2 11.1 11.2 m m m m
Turkey 18.7 18.7 26.5 a 16.9 16.9 a 55.6 13.4 16.8
united Kingdom1, 3 17.4 17.6 21.1 17.1 12.3 14.4 x(5) x(10) x(10) 17.8
united states 11.9 14.5 15.0 15.2 16.0 15.5 21.5 x(10) x(10) 15.8
OeCD average 15.2 14.8 16.9 13.7 12.7 13.3 12.8 15.9 16.3 15.5
eu19 average 13.0 13.8 15.3 12.0 11.5 12.0 13.6 13.4 17.0 15.7
Part
ner
coun
trie
s Brazil m 18.3 23.5 18.8 18.3 18.6 a x(10) x(10) 13.3
Chile m 21.4 27.1 44.3 26.8 33.3 a m m m
Israel 30.2 30.2 16.9 14.1 12.2 13.0 m m m m
Russian federation m m 17.0 x(6) x(6) 10.3 x(6) 11.7 14.0 13.4
1. Includes only general programmes in upper secondary education.2. Public institutions only.3. The ratio of students to contact staff refers to public institutions only.Source: OECD. See Annex 3 for notes (www.oecd.org/edu/eag2006).Please refer to the Reader’s Guide for information concerning the symbols replacing missing data.
StatLink: http://dx.doi.org/10.1787/108323448085
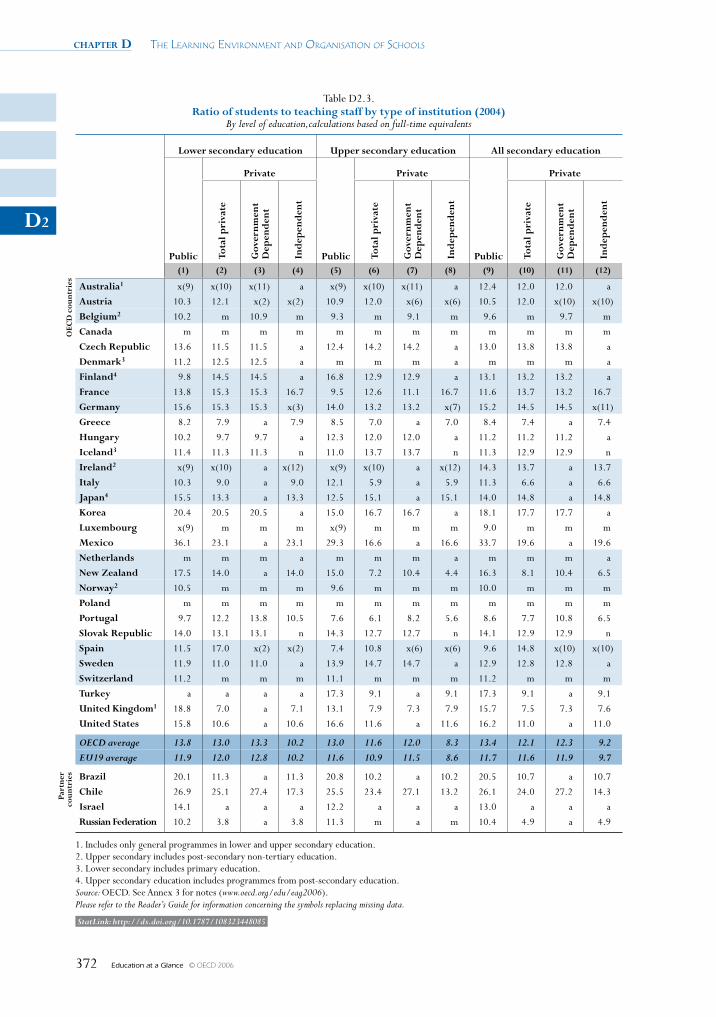
chapter D The Learning environmenT and organisaTion of schooLs
Education at a Glance © OECD 2006372
D2
Table D2.3. Ratio of students to teaching staff by type of institution (2004)
By level of education,calculations based on full-time equivalents
lower secondary education upper secondary education All secondary education
Public
Private
Public
Private
Public
Private
Tota
l pri
vate
gov
ernm
ent
Dep
end
ent
Ind
epen
den
t
Tota
l pri
vate
gov
ernm
ent
Dep
end
ent
Ind
epen
den
t
Tota
l pri
vate
gov
ernm
ent
Dep
end
ent
Ind
epen
den
t
(1) (2) (3) (4) (5) (6) (7) (8) (9) (10) (11) (12)
OeC
D c
ount
ries Australia1 x(9) x(10) x(11) a x(9) x(10) x(11) a 12.4 12.0 12.0 a
Austria 10.3 12.1 x(2) x(2) 10.9 12.0 x(6) x(6) 10.5 12.0 x(10) x(10)
Belgium2 10.2 m 10.9 m 9.3 m 9.1 m 9.6 m 9.7 m
Canada m m m m m m m m m m m m
Czech Republic 13.6 11.5 11.5 a 12.4 14.2 14.2 a 13.0 13.8 13.8 a
Denmark3 11.2 12.5 12.5 a m m m a m m m a
finland4 9.8 14.5 14.5 a 16.8 12.9 12.9 a 13.1 13.2 13.2 a
france 13.8 15.3 15.3 16.7 9.5 12.6 11.1 16.7 11.6 13.7 13.2 16.7
germany 15.6 15.3 15.3 x(3) 14.0 13.2 13.2 x(7) 15.2 14.5 14.5 x(11)
greece 8.2 7.9 a 7.9 8.5 7.0 a 7.0 8.4 7.4 a 7.4
hungary 10.2 9.7 9.7 a 12.3 12.0 12.0 a 11.2 11.2 11.2 a
Iceland3 11.4 11.3 11.3 n 11.0 13.7 13.7 n 11.3 12.9 12.9 n
Ireland2 x(9) x(10) a x(12) x(9) x(10) a x(12) 14.3 13.7 a 13.7
Italy 10.3 9.0 a 9.0 12.1 5.9 a 5.9 11.3 6.6 a 6.6
Japan4 15.5 13.3 a 13.3 12.5 15.1 a 15.1 14.0 14.8 a 14.8
Korea 20.4 20.5 20.5 a 15.0 16.7 16.7 a 18.1 17.7 17.7 a
luxembourg x(9) m m m x(9) m m m 9.0 m m m
Mexico 36.1 23.1 a 23.1 29.3 16.6 a 16.6 33.7 19.6 a 19.6
Netherlands m m m a m m m a m m m a
New zealand 17.5 14.0 a 14.0 15.0 7.2 10.4 4.4 16.3 8.1 10.4 6.5
Norway2 10.5 m m m 9.6 m m m 10.0 m m m
Poland m m m m m m m m m m m m
Portugal 9.7 12.2 13.8 10.5 7.6 6.1 8.2 5.6 8.6 7.7 10.8 6.5
slovak Republic 14.0 13.1 13.1 n 14.3 12.7 12.7 n 14.1 12.9 12.9 n
spain 11.5 17.0 x(2) x(2) 7.4 10.8 x(6) x(6) 9.6 14.8 x(10) x(10)
sweden 11.9 11.0 11.0 a 13.9 14.7 14.7 a 12.9 12.8 12.8 a
switzerland 11.2 m m m 11.1 m m m 11.2 m m m
Turkey a a a a 17.3 9.1 a 9.1 17.3 9.1 a 9.1
united Kingdom1 18.8 7.0 a 7.1 13.1 7.9 7.3 7.9 15.7 7.5 7.3 7.6
united states 15.8 10.6 a 10.6 16.6 11.6 a 11.6 16.2 11.0 a 11.0
OECD average 13.8 13.0 13.3 10.2 13.0 11.6 12.0 8.3 13.4 12.1 12.3 9.2 EU19 average 11.9 12.0 12.8 10.2 11.6 10.9 11.5 8.6 11.7 11.6 11.9 9.7
Part
ner
coun
trie
s Brazil 20.1 11.3 a 11.3 20.8 10.2 a 10.2 20.5 10.7 a 10.7
Chile 26.9 25.1 27.4 17.3 25.5 23.4 27.1 13.2 26.1 24.0 27.2 14.3
Israel 14.1 a a a 12.2 a a a 13.0 a a a
Russian federation 10.2 3.8 a 3.8 11.3 m a m 10.4 4.9 a 4.9
1. Includes only general programmes in lower and upper secondary education.2. Upper secondary includes post-secondary non-tertiary education.3. Lower secondary includes primary education.4. Upper secondary education includes programmes from post-secondary education.Source: OECD. See Annex 3 for notes (www.oecd.org/edu/eag2006).Please refer to the Reader’s Guide for information concerning the symbols replacing missing data.
StatLink: http://dx.doi.org/10.1787/108323448085

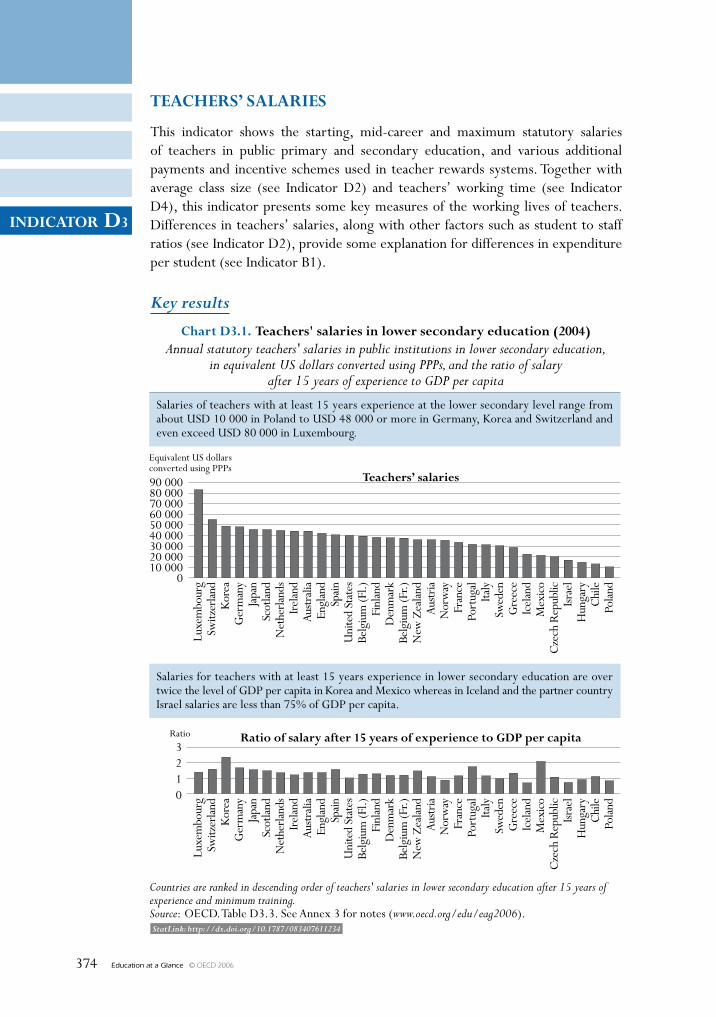
Education at a Glance © OECD 2006374
INDICATOR D3
StatLink: http://dx.doi.org/10.1787/083407611234
TEACHERS’ SAlARIES
This indicator shows the starting, mid-career and maximum statutory salaries of teachers in public primary and secondary education, and various additional payments and incentive schemes used in teacher rewards systems. Together with average class size (see Indicator D2) and teachers’ working time (see Indicator D4), this indicator presents some key measures of the working lives of teachers. Differences in teachers’ salaries, along with other factors such as student to staff ratios (see Indicator D2), provide some explanation for differences in expenditure per student (see Indicator B1).
Key results
90 00080 00070 00060 00050 00040 00030 00020 00010 000
0
Equivalent US dollarsconverted using PPPs
3210
Ratio of salary after 15 years of experience to GDP per capitaRatio
Chart D3.1. Teachers' salaries in lower secondary education (2004)Annual statutory teachers' salaries in public institutions in lower secondary education,
in equivalent US dollars converted using PPPs, and the ratio of salaryafter 15 years of experience to GDP per capita
Countries are ranked in descending order of teachers' salaries in lower secondary education after 15 years ofexperience and minimum training.Source: OECD. Table D3.3. See Annex 3 for notes (www.oecd.org/edu/eag2006).
Luxe
mbo
urg
Switz
erla
ndK
orea
Ger
man
yJa
pan
Scot
land
Net
herla
nds
Irel
and
Aust
ralia
Engl
and
Spain
Uni
ted
Stat
esBe
lgiu
m (F
l.)Fi
nlan
dD
enm
ark
Belg
ium
(Fr.)
New
Zea
land
Aust
riaN
orw
ayFr
ance
Port
ugal
Italy
Swed
enG
reec
eIc
elan
dM
exic
oC
zech
Rep
ublic
Israe
lH
unga
ryC
hile
Pola
nd
Salaries of teachers with at least 15 years experience at the lower secondary level range fromabout USD 10 000 in Poland to USD 48 000 or more in Germany, Korea and Switzerland andeven exceed USD 80 000 in Luxembourg.
Salaries for teachers with at least 15 years experience in lower secondary education are overtwice the level of GDP per capita in Korea and Mexico whereas in Iceland and the partner countryIsrael salaries are less than 75% of GDP per capita.
Luxe
mbo
urg
Switz
erla
ndK
orea
Ger
man
yJa
pan
Scot
land
Net
herla
nds
Irel
and
Aust
ralia
Engl
and
Spain
Uni
ted
Stat
esBe
lgiu
m (F
l.)Fi
nlan
dD
enm
ark
Belg
ium
(Fr.)
New
Zea
land
Aust
riaN
orw
ayFr
ance
Port
ugal
Italy
Swed
enG
reec
eIc
elan
dM
exic
oC
zech
Rep
ublic
Israe
lH
unga
ryC
hile
Pola
nd
Teachers’ salaries
Education at a Glance © OECD 2006 375
INDICATOR D3
Other highlights of this indicator
• Teachers’ salaries have risen in real terms between 1996 and 2004 in virtually all countries, with the largest increases evident in Finland, Hungary and Mexico. Salaries at the primary and upper secondary levels in Spain fell in real terms over the same period, even if they remain above the OECD average level.
• On average, upper secondary teachers’ salary per teaching hour exceeds that of primary teachers by 42%, though the difference is lower than 5% in New Zealand and Poland and is greater than 75% in the Netherlands and Spain, where the difference between teaching time at primary and upper secondary level is greatest.
• Salaries at the top of the scale are on average around 70% higher than starting salaries for both primary and secondary education, though this differential usually varies between countries largely in line with the number of years it takes for a teacher to progress through the scale. For instance, top-of-the-scale salaries in Korea are almost three times that of starting salaries, but it takes 37 years to reach the top of the scale. In Portugal, however, the ratio of salaries at the top of the scale to starting salaries is close to that in Korea, but teachers reach the top of salary after 26 years of service.
chapter D The Learning environmenT and organisaTion of schooLs
Education at a Glance © OECD 2006376
D3
Policy context
Education systems employ a large number of professionals in an increasingly competitive labour market. Ensuring a sufficient number of skilled teachers is a key concern in all OECD countries. Salaries and working conditions can be important influences in attracting, developing and retaining skilled and effective teachers.
Salary levels are also important in that they reflect the career progression and promotion possibilities available within the teaching profession. Theoretically, a career structure with an age-earnings profile (which depicts salary increases across workers’ job tenure) that is flat offers greater incentives to attract qualified individuals into the teaching profession but fewer incentives to reward continued development. In constrast, a steep age-earnings profile offers workers substantial salary increases throughout their work lives. These factors are among those that could influence the career decisions of potential teachers and the types of people who are attracted to the teaching profession.
Teachers’ salaries are the largest single cost in providing education, making compensation a critical consideration for policy makers seeking to maintain both the quality of teaching and a balanced education budget. The size of education budgets naturally reflects trade-offs among many interrelated factors, including teachers’ salaries, the ratio of students to teaching staff, the instruction time planned for students, and the designated number of teaching hours.
Evidence and explanations
Comparing teachers’ salaries
The first part of this indicator compares the starting, mid-career and maximum statutory salaries of teachers with the minimum level of qualifications required for certification in public primary and secondary education. First, teachers’ salaries are examined in absolute terms at three career points: starting, mid-career, and top-of-the-scale. Incentive schemes and additional payments made to teachers are illustrated next, followed by teachers’ salary changes between 1996 and 2004.
International comparisons of salaries provide simplified illustrations of the compensation received by teachers for their work. This provides only an overall picture of the comparisons of the complete system of compensations and the resultant welfare inferences that can be made. Large differences between the taxing and social benefit systems in OECD countries as well as the use of financial incentives (including regional allowances for teaching in remote regions, family allowances, reduced rates on public transportation, tax allowances on purchasing cultural goods, and other quasi-pecuniary entitlements that contribute to a teacher’s basic income) make it important to exercise caution when comparing teachers’ salaries.
Statutory salaries as reported in this indicator must be distinguished from the actual wage expenditures incurred by governments and from teachers’ average salaries, which are also influenced by other factors such as the age structure of the teaching force or the prevalence of part-time work. Indicator B6 shows the total amounts paid in compensation to teachers. Furthermore, since teaching time and teachers’ workload can vary considerably among countries, these factors should be considered when comparing statutory salaries for teachers in different countries (see Indicator D4).
Teachers’ Salaries – INDICATOR D3 chapter D
Education at a Glance © OECD 2006 377
D3
The annual statutory salaries of lower secondary teachers with 15 years of experience range from about USD 10 000 in Poland to over USD 48 000 in Germany, Korea and Switzerland and reach USD 80 000 in Luxembourg (Table D3.1).
In most OECD countries, teachers’ salaries increase with the level of education being taught. For example, in Belgium (Fl.), Belgium (Fr.), Finland, Iceland, Luxembourg, the Netherlands and Switzerland, the salary of an upper secondary teacher with at least 15 years experience is at least 29% higher than that of a primary school teacher with the same experience. In contrast, in Australia, England, Greece, Ireland, Japan, Korea, New Zealand, Norway, Poland, Portugal, Scotland and the United States, and the partner country Israel, upper secondary and primary teachers’ salaries are more comparable (Table D3.1). The extent of the variation would be influenced by the structure of teachers’ salaries up to the mid-career point. In some countries, such as the United States, teachers’ salaries are influenced by the educational attainment of teachers. As this attainment is not constant across teachers at all levels across their career, care should be taken in interpreting the extent of differences in salaries of teachers at different levels of primary and secondary education.
Substantial differences in these wage levels could reflect substantial differences in the labour market for teachers. Comparatively large differences in the salaries of teachers at different levels may influence how schools and school systems attract and retain teachers of different levels. It may also influence the extent to which teachers move across different education levels and, with that, the degree of segmentation in the teacher labour market.
Statutory salaries relative to GDP per capita
Among other considerations, countries invest in teaching resources relative to their ability to fund educational expenditure. Comparing statutory salaries to GDP per capita is thus another way of assessing the relative value of teachers’ salaries among countries. Comparative data on salaries for comparable professions would provide a better benchmark for teacher salaries; since such data are not yet available, comparisons with GDP per capita provide some basis for standardised comparisons.
Salaries for teachers with at least 15 years experience (in primary and lower secondary education) relative to GDP per capita are lowest in Hungary (0.91), Iceland (0.69), Norway (0.87) and Poland (0.83), and the partner country Israel (0.73), and highest in Korea (2.37 in primary and 2.36 in lower secondary), Mexico (2.09, lower secondary) and Turkey (2.44, primary). In upper secondary general education, the lowest ratios are found in Norway (0.87), Poland (0.83), Iceland (0.94) and partner country Israel (0.73), and mid-career salaries relative to the GDP are highest in Korea (2.36) and Turkey (2.30) (Table D3.1).
Some countries, such as the Czech Republic, Hungary, Poland and Turkey, as well as the partner countries Chile and Israel, have both relatively low GDP per capita and low teachers’ salaries. Others (e.g. Korea, New Zealand, Portugal and Spain) have a relatively low GDP per capita but teachers’ salaries that are comparable to those in countries with much higher GDP per capita. Germany, Luxembourg and Switzerland have a high GDP per capita and high teachers’ salaries (Chart D3.2 and Table D3.1), whereas Norway has a high GDP per capita, but average mid-career salaries.
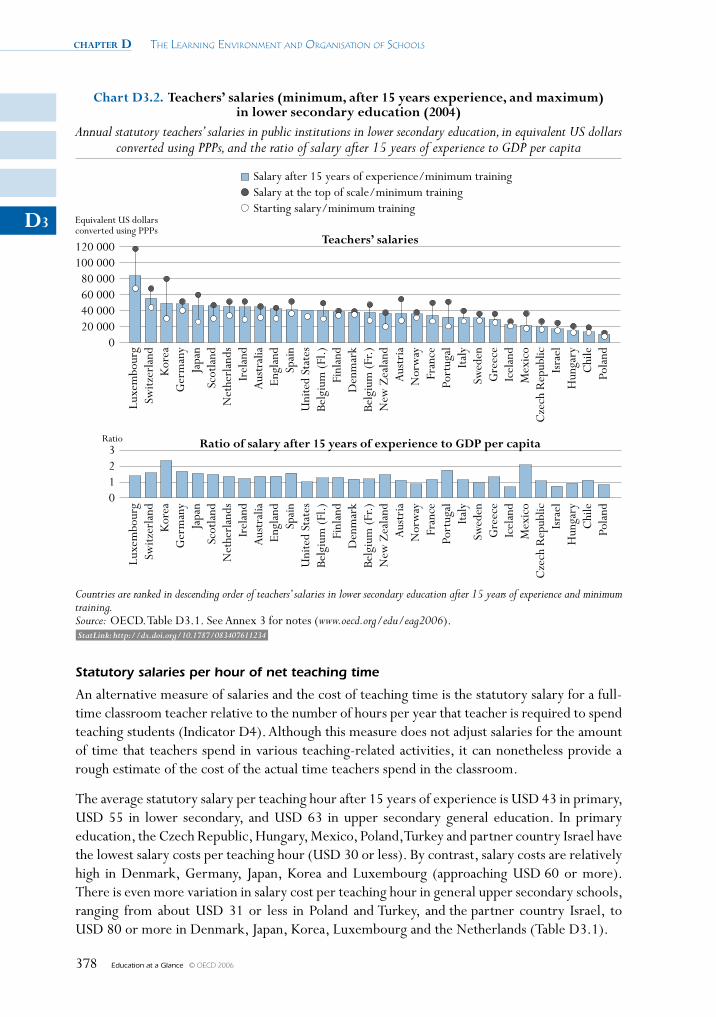
chapter D The Learning environmenT and organisaTion of schooLs
Education at a Glance © OECD 2006378
D3
Statutory salaries per hour of net teaching time
An alternative measure of salaries and the cost of teaching time is the statutory salary for a full-time classroom teacher relative to the number of hours per year that teacher is required to spend teaching students (Indicator D4). Although this measure does not adjust salaries for the amount of time that teachers spend in various teaching-related activities, it can nonetheless provide a rough estimate of the cost of the actual time teachers spend in the classroom.
The average statutory salary per teaching hour after 15 years of experience is USD 43 in primary, USD 55 in lower secondary, and USD 63 in upper secondary general education. In primary education, the Czech Republic, Hungary, Mexico, Poland, Turkey and partner country Israel have the lowest salary costs per teaching hour (USD 30 or less). By contrast, salary costs are relatively high in Denmark, Germany, Japan, Korea and Luxembourg (approaching USD 60 or more). There is even more variation in salary cost per teaching hour in general upper secondary schools, ranging from about USD 31 or less in Poland and Turkey, and the partner country Israel, to USD 80 or more in Denmark, Japan, Korea, Luxembourg and the Netherlands (Table D3.1).
120 000100 000
80 00060 00040 00020 000
0
Equivalent US dollarsconverted using PPPs
3210
Ratio Ratio of salary after 15 years of experience to GDP per capita
Chart D3.2. Teachers’ salaries (minimum, after 15 years experience, and maximum)in lower secondary education (2004)
Annual statutory teachers’ salaries in public institutions in lower secondary education, in equivalent US dollarsconverted using PPPs, and the ratio of salary after 15 years of experience to GDP per capita
Salary after 15 years of experience/minimum trainingSalary at the top of scale/minimum trainingStarting salary/minimum training
Countries are ranked in descending order of teachers’ salaries in lower secondary education after 15 years of experience and minimumtraining.Source: OECD. Table D3.1. See Annex 3 for notes (www.oecd.org/edu/eag2006).
Luxe
mbo
urg
Switz
erla
ndK
orea
Ger
man
yJa
pan
Scot
land
Net
herl
ands
Irel
and
Aus
tral
iaEn
glan
dSp
ain
Uni
ted
Stat
esBe
lgiu
m (F
l.)Fi
nlan
dD
enm
ark
Belg
ium
(Fr.)
New
Zea
land
Aus
tria
Nor
way
Fran
cePo
rtug
alIta
lySw
eden
Gre
ece
Icel
and
Mex
ico
Cze
ch R
epub
licIs
rael
Hun
gary
Chi
lePo
land
Teachers’ salaries
StatLink: http://dx.doi.org/10.1787/083407611234
Teachers’ Salaries – INDICATOR D3 chapter D
Education at a Glance © OECD 2006 379
D3
Even in countries where statutory salaries are the same in primary and secondary education, salaries per teaching hour are usually higher in upper secondary education than in primary education, since in most countries, secondary teachers are required to teach fewer hours than primary teachers (see Indicator D4). On average among OECD countries, upper secondary teachers’ salary per teaching hour exceeds that of primary teachers by around 40%. In Australia, New Zealand, Poland, Scotland and Turkey, this difference is only 10% or less, whereas it is around 60% or more in Finland, France, Greece, Hungary, Iceland and Luxembourg and close to or above 80% in the Netherlands and Spain (Table D3.1). In Spain, the difference between teaching time at primary and upper secondary level is greater than in any other country but the working time required of these teachers at school is the same (Table D4.1). Hence, the large difference between primary and upper secondary teachers’ salary per teaching hour does not exist when comparing salary per hour of working time required at school.
Teaching experience and qualifications influence teachers’ salary scales
Comparing teachers’ gross salaries at the point of entry into the teaching profession, after 15 years of experience, and at the top of the salary scale provides information on the career structure of teachers within countries. Theoretically, a system that offers greater rewards to experience and performance provides greater incentives to perform at a higher level and to stay within the profession.
On average among OECD countries, statutory salaries for primary, lower and upper secondary general teachers with 15 years of experience are 38, 38 and 42% higher, respectively, than starting salaries. The increase to the top of the salary scale is, on average, 69, 70 and 71%. These figures provide an indication of the age-earnings profiles of these teachers across countries. For lower secondary teachers, the average starting salary was USD 27 560 (PPP). After 15 years experience, with minimum training, this figure increases to USD 37 488, and then it reaches USD 45 277 at the top of the salary scale. A similar increase is therefore evident between first, the starting salary and that at 15 years of experience and second, the salary increase between 15 years of experience and the top of the salary scale (reached, on average, after 24 years of experience).
Increases in salaries between points on the age-earnings profile should be seen in the context of the number of years that it takes for a teacher to proceed through the salary scale, a factor which varies substantially across countries. In lower secondary education, teachers in Australia, Denmark, England, New Zealand and Scotland reach the highest step on the salary scale relatively quickly (within 5 to 9 years), while in Austria, the Czech Republic, France, Greece, Hungary, Italy, Japan, Korea, Luxembourg and Spain, and the partner country Israel, teachers reach the top of the salary scale after more than 30 years of service (Table D3.1).
Teachers in Denmark, Finland, Germany, Iceland, Norway and Turkey have, on average, considerably flatter age-earnings profiles than other teachers in the OECD. With the exception of upper secondary teachers in Denmark, teachers at the top of the salary scale only earn up to 30% more than teachers at the bottom of the salary scale in these countries (Table D3.1). Even within this group of countries, there are substantial differences in the age-earnings profiles of teachers. The source of these differences is in the time it takes to reach various levels in the salary scales. On average in OECD countries, it takes just under 24 years for a lower secondary teacher to reach the top of the salary scale. But the increase is not linear across countries. In Denmark, lower secondary teachers reach the top of their salary scale in only 8 years while in Germany it takes 28 years.
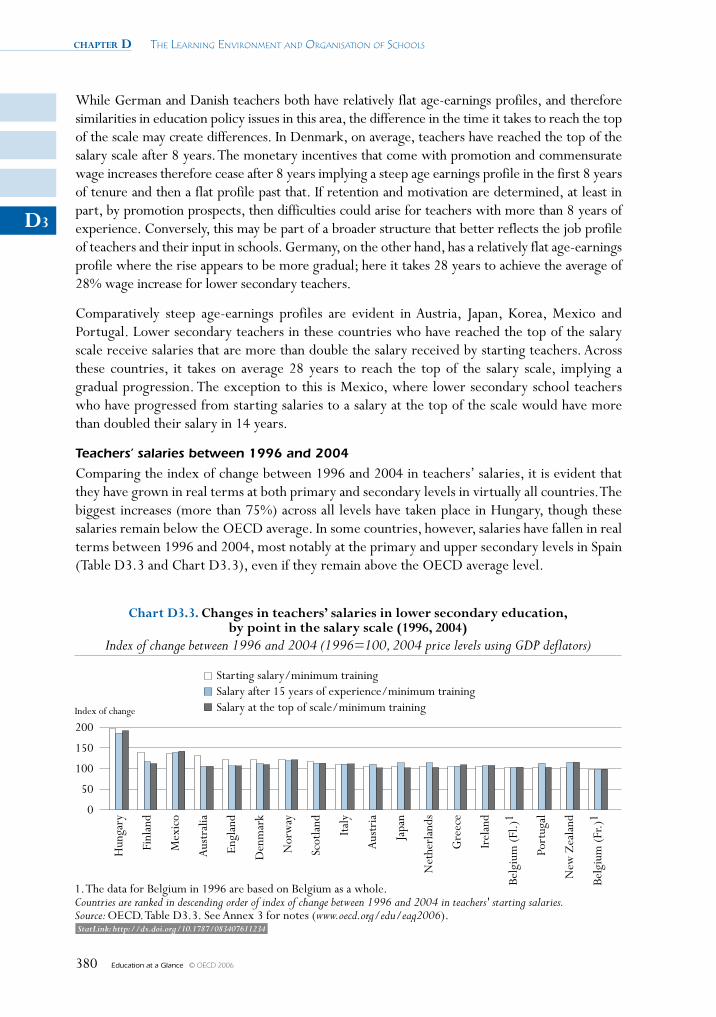
chapter D The Learning environmenT and organisaTion of schooLs
Education at a Glance © OECD 2006380
D3
While German and Danish teachers both have relatively flat age-earnings profiles, and therefore similarities in education policy issues in this area, the difference in the time it takes to reach the top of the scale may create differences. In Denmark, on average, teachers have reached the top of the salary scale after 8 years. The monetary incentives that come with promotion and commensurate wage increases therefore cease after 8 years implying a steep age earnings profile in the first 8 years of tenure and then a flat profile past that. If retention and motivation are determined, at least in part, by promotion prospects, then difficulties could arise for teachers with more than 8 years of experience. Conversely, this may be part of a broader structure that better reflects the job profile of teachers and their input in schools. Germany, on the other hand, has a relatively flat age-earnings profile where the rise appears to be more gradual; here it takes 28 years to achieve the average of 28% wage increase for lower secondary teachers.
Comparatively steep age-earnings profiles are evident in Austria, Japan, Korea, Mexico and Portugal. Lower secondary teachers in these countries who have reached the top of the salary scale receive salaries that are more than double the salary received by starting teachers. Across these countries, it takes on average 28 years to reach the top of the salary scale, implying a gradual progression. The exception to this is Mexico, where lower secondary school teachers who have progressed from starting salaries to a salary at the top of the scale would have more than doubled their salary in 14 years.
Teachers’ salaries between 1996 and 2004
Comparing the index of change between 1996 and 2004 in teachers’ salaries, it is evident that they have grown in real terms at both primary and secondary levels in virtually all countries. The biggest increases (more than 75%) across all levels have taken place in Hungary, though these salaries remain below the OECD average. In some countries, however, salaries have fallen in real terms between 1996 and 2004, most notably at the primary and upper secondary levels in Spain (Table D3.3 and Chart D3.3), even if they remain above the OECD average level.
200
150
100
50
0
Index of change
Chart D3.3. Changes in teachers’ salaries in lower secondary education,by point in the salary scale (1996, 2004)
Index of change between 1996 and 2004 (1996=100, 2004 price levels using GDP deflators)
1. The data for Belgium in 1996 are based on Belgium as a whole.Countries are ranked in descending order of index of change between 1996 and 2004 in teachers' starting salaries.Source: OECD. Table D3.3. See Annex 3 for notes (www.oecd.org/edu/eag2006).
Hun
gary
Finl
and
Mex
ico
Aus
tral
ia
Engl
and
Den
mar
k
Nor
way
Scot
land
Italy
Aus
tria
Japa
n
Net
herl
ands
Gre
ece
Irel
and
Belg
ium
(Fl.)
1
Port
ugal
New
Zea
land
Belg
ium
(Fr.)
1
Starting salary/minimum trainingSalary after 15 years of experience/minimum trainingSalary at the top of scale/minimum training
StatLink: http://dx.doi.org/10.1787/083407611234
Teachers’ Salaries – INDICATOR D3 chapter D
Education at a Glance © OECD 2006 381
D3
Salary trends have also varied between different points on the salary scale. For instance, starting salaries have risen faster than mid-career or top-of-the-scale salaries for all education levels in Australia, Denmark, England, Finland and Scotland. By contrast, salaries of teachers with at least 15 years experience have risen relatively more quickly (than stating salary) in Austria, Japan, the Netherlands and Portugal, and in the case of New Zealand, top-of-the-scale salaries have risen faster than starting salaries. However, with a relatively short salary scale (eight years to reach the top of the scale), teacher recruitment is in fact a key focus in New Zealand.
The reasons for these changes vary across countries. A possible rationale for increases in starting salaries is a desire to attract new teachers. However, unless salaries also increase at other points, teachers will face flatter age-earnings profiles. Theoretically, the prospect of mostly smaller salary increases across teachers’ career span has a negative impact on incentives.
Additional payments: Incentives and allowances
In addition to basic pay scales, many school systems have developed schemes that offer additional payments for teachers, which may take the form of financial remuneration and/or a reduction in the number of teaching hours. Together with the starting salary, such additional payments may affect a person’s decision to enter into and stay in the teaching profession. Early career additional payments for graduate teachers may include family allowances and bonuses for working in certain locations, higher initial salaries for higher-than-minimum teaching certification or qualifications and additional compensation for those holding educational qualifications in multiple subjects or with certification to teach students with special educational needs.
In some countries, the reduction of required teaching hours is used to reward experience or long service (e.g. in Greece and Iceland). In other countries such as Portugal, teachers can be compensated by a reduction of teaching hours for carrying out special tasks or activities (leading a drama club, or acting as teacher supervisor of student teachers, etc.). Adjustments to base salary may be awarded to teachers in public schools either by the head teacher or school principal, or by government at the local, regional or national level.
Types of additional payments
Data on additional payments can be grouped into three broad areas:
1. Additional payments based on responsibilities assumed by teachers and particular conditions of teaching (e.g. additional management responsibilities and/or teaching in high-need regions, disadvantaged schools)
2. Additional payments based upon the demographic characteristics of teachers (e.g. age and/or family status)
3. Additional payments based upon teachers’ qualifications, training and performance (e.g. holding higher than the minimum qualifications and/or completing professional development activities)
Data have not been collected on payment amounts but on whether they are available to teachers and at what level the decision to award such payments are taken (see Tables D3.2a, D3.2b, D3.2c and D3.2d, and Annex 3 at www.oecd.org/edu/eag2006).
chapter D The Learning environmenT and organisaTion of schooLs
Education at a Glance © OECD 2006382
D3
Additional payments are most often given for particular responsibilities or working conditions. Additional payments for teaching in disadvantaged schools are provided in two-thirds of OECD and partner countries, and seven countries also offer additional payments for teachers who teach in certain fields. These payments may be offered in response to a shortage of teachers in these areas.
Half of OECD countries offer additional payments based on demographic characteristics of teachers. Additional payments to teachers based upon their qualifications, training and performance are less common across OECD and partner countries. Of these, five types of additional payments are offered based upon teachers’ initial education and qualification for teaching examination. The most common types of these payments are available for holding either an initial education qualification higher than the minimum requirement and/or a higher than minimum level of teacher certification and training. These are available in just over half of OECD and partner countries with most offering both types of additional payments. Eleven OECD and partner countries offer additional payments for the successful completion of professional development activities.
Another type of additional payment is that made to teachers for outstanding performance in teaching. Thirteen countries offer this payment − the only additional payment that could be classified as a performance incentive. In seven of the thirteen countries (the Czech Republic, Denmark, England, Finland, Hungary, New Zealand and Sweden) that offer this incentive, the decision to award the additional payment can be made at the school-level.
The form of incentive and the method for identifying outstanding performance varies across the thirteen countries that offer this incentive. In Mexico, outstanding performance is calculated based upon the learning achievements of students. Performance rewards can also be based on the assessment of the head teacher (Portugal), or on assessments performed by education administrations (the provincial directorate of education and the ministry of education in Turkey).
Definitions and methodologies
Data are from the 2005 OECD-INES Survey on Teachers and the Curriculum and refer to the school year 2003-2004.
Data on statutory teachers’ salaries and bonuses (Tables D3.1 and D3.2) are derived from the 2005 OECD-INES Survey on Teachers and the Curriculum. Data refer to the school year 2003-2004, and are reported in accordance with formal policies for public institutions.
Statutory salaries (Table D3.1) refer to scheduled salaries according to official pay scales. The salaries reported are gross (total sum of money paid by the employer) less the employer’s contribution to social security and pension (according to existing salary scales). Salaries are “before tax” (i.e., before deductions for income taxes). In table D3.1 salary per hour of net contact divides the annual statutory salary of a teacher (table D3.1) by the annual net teaching time in hours (table D4.1).
Gross teachers’ salaries were converted using GDP and purchasing power parities (PPPs) exchange rate data from the OECD National Accounts database. The reference date for GDP per capita is the calendar year 2004, while the period of reference for teachers’ salaries is 30 June 2003 to 30 June 2004. The reference date for PPPs is 2003-2004. Data are adjusted for inflation with reference to January 2004. For countries with different financial years (i.e. Australia and New Zealand) and countries with slightly different salary periods (e.g. Hungary, Iceland, Norway
Teachers’ Salaries – INDICATOR D3 chapter D
Education at a Glance © OECD 2006 383
D3
and Spain) from the general OECD norm, a correction to the deflator is made only if this results in an adjustment of over 1%. Small adjustments have been discounted because even for salaries referring to 2003-2004, the exact period for which they apply will only be slightly different. Reference statistics and reference years for teachers’ salaries are provided in Annex 2.
For the calculation of changes in teacher salaries (Table D3.3), the GDP deflator is used to convert 1996 salaries to 2004 prices.
Starting salaries refer to the average scheduled gross salary per year for a full-time teacher with the minimum training necessary to be fully qualified at the beginning of the teaching career.
Salaries after 15 years of experience refer to the scheduled annual salary of a full-time classroom teacher with the minimum training necessary to be fully qualified plus 15 years of experience. The maximum salaries reported refer to the scheduled maximum annual salary (top of the salary scale) of a full-time classroom teacher with the minimum training to be fully qualified for the job.
An adjustment to base salary is defined as any difference in salary between what a particular teacher actually receives for work performed at a school and the amount that he or she would be expected to receive on the basis of level of experience (i.e., number of years in the teaching profession). Adjustments may be temporary or permanent, and they can effectively move a teacher off the scale and onto a different salary scale or onto a higher step on the same salary scale.
The data on decision making are taken from the 2003 OECD-INES survey on decision making in public, lower secondary education and refer to the school year 2003-2004. On teacher salary scales, the survey asked which level in the education system decides on the salary scales (excluding bonuses) of teaching staff and how autonomously these decisions are taken.
Further references
Specific notes on definitions and methodologies regarding this indicator for each country are given in Annex 3 at www.oecd.org/edu/eag2006.
In addition, a more comprehensive analysis of decision making was published in Education at a Glance 2004 (OECD, 2004c), Indicator D6. Information on the underlying decision-making survey is available in Education at a Glance 2004, Annex 3 (www.oecd.org/edu/eag2004) under the heading Indicator D6 Locus of decision making at lower secondary levels. The complete decision-making data are available under the heading Underlying data on decision making for Indicator D6 (www.oecd.org/edu/eag2004). As a complement to Table D3.1, which presents teachers’ salaries in equivalent US dollars using PPPs, a table with teachers’ salaries in equivalent Euros converted using PPPs is included in Annex 2.
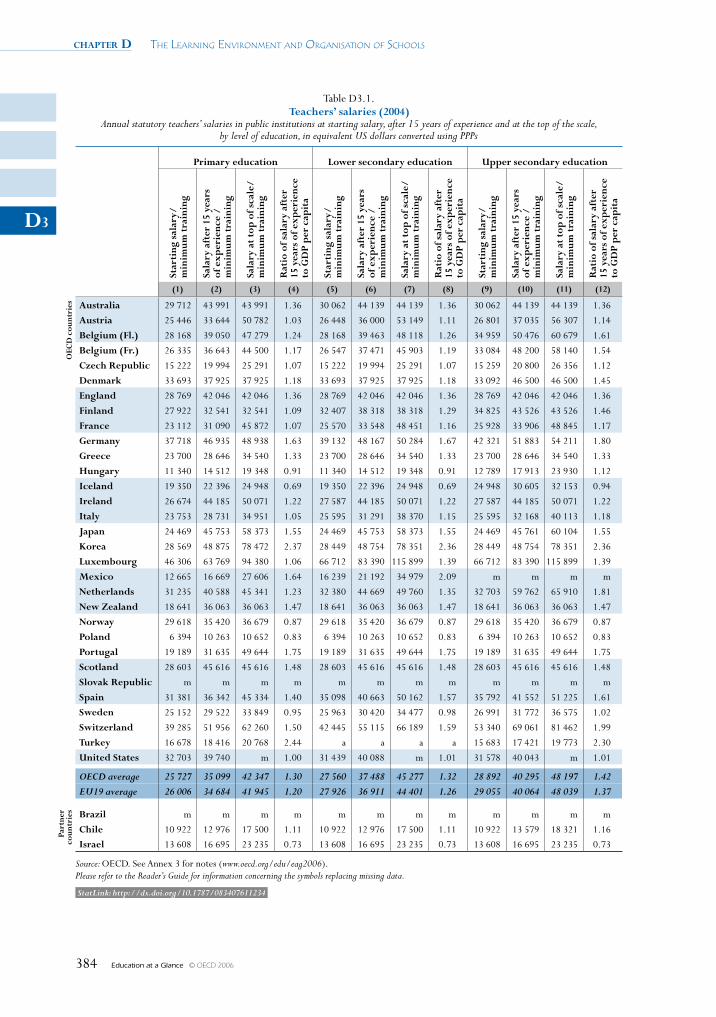
chapter D The Learning environmenT and organisaTion of schooLs
Education at a Glance © OECD 2006384
D3
Table D3.1. Teachers’ salaries (2004)
Annual statutory teachers’ salaries in public institutions at starting salary, after 15 years of experience and at the top of the scale, by level of education, in equivalent US dollars converted using PPPs
Primary education lower secondary education Upper secondary educationSt
arti
ng s
alar
y/
min
imum
tra
inin
g
Sala
ry a
fter
15
year
s
of e
xper
ienc
e /
min
imum
tra
inin
g
Sala
ry a
t to
p o
f sca
le/
min
imum
tra
inin
g
Rat
io o
f sal
ary
afte
r
15 y
ears
of e
xper
ienc
e to
GD
P p
er c
apit
a
Star
ting
sal
ary/
m
inim
um t
rain
ing
Sala
ry a
fter
15
year
s
of e
xper
ienc
e /
min
imum
tra
inin
g
Sala
ry a
t to
p o
f sca
le/
min
imum
tra
inin
g
Rat
io o
f sal
ary
afte
r
15 y
ears
of e
xper
ienc
e to
GD
P p
er c
apit
a
Star
ting
sal
ary/
m
inim
um t
rain
ing
Sala
ry a
fter
15
year
s
of e
xper
ienc
e /
min
imum
tra
inin
g
Sala
ry a
t to
p o
f sca
le/
min
imum
tra
inin
g
Rat
io o
f sal
ary
afte
r
15 y
ears
of e
xper
ienc
e to
GD
P p
er c
apit
a
(1) (2) (3) (4) (5) (6) (7) (8) (9) (10) (11) (12)
OEC
D c
ount
ries Australia 29 712 43 991 43 991 1.36 30 062 44 139 44 139 1.36 30 062 44 139 44 139 1.36
Austria 25 446 33 644 50 782 1.03 26 448 36 000 53 149 1.11 26 801 37 035 56 307 1.14
Belgium (Fl.) 28 168 39 050 47 279 1.24 28 168 39 463 48 118 1.26 34 959 50 476 60 679 1.61
Belgium (Fr.) 26 335 36 643 44 500 1.17 26 547 37 471 45 903 1.19 33 084 48 200 58 140 1.54
Czech Republic 15 222 19 994 25 291 1.07 15 222 19 994 25 291 1.07 15 259 20 800 26 356 1.12
Denmark 33 693 37 925 37 925 1.18 33 693 37 925 37 925 1.18 33 092 46 500 46 500 1.45
England 28 769 42 046 42 046 1.36 28 769 42 046 42 046 1.36 28 769 42 046 42 046 1.36
Finland 27 922 32 541 32 541 1.09 32 407 38 318 38 318 1.29 34 825 43 526 43 526 1.46
France 23 112 31 090 45 872 1.07 25 570 33 548 48 451 1.16 25 928 33 906 48 845 1.17
Germany 37 718 46 935 48 938 1.63 39 132 48 167 50 284 1.67 42 321 51 883 54 211 1.80
Greece 23 700 28 646 34 540 1.33 23 700 28 646 34 540 1.33 23 700 28 646 34 540 1.33
Hungary 11 340 14 512 19 348 0.91 11 340 14 512 19 348 0.91 12 789 17 913 23 930 1.12
Iceland 19 350 22 396 24 948 0.69 19 350 22 396 24 948 0.69 24 948 30 605 32 153 0.94
Ireland 26 674 44 185 50 071 1.22 27 587 44 185 50 071 1.22 27 587 44 185 50 071 1.22
Italy 23 753 28 731 34 951 1.05 25 595 31 291 38 370 1.15 25 595 32 168 40 113 1.18
Japan 24 469 45 753 58 373 1.55 24 469 45 753 58 373 1.55 24 469 45 761 60 104 1.55
Korea 28 569 48 875 78 472 2.37 28 449 48 754 78 351 2.36 28 449 48 754 78 351 2.36
luxembourg 46 306 63 769 94 380 1.06 66 712 83 390 115 899 1.39 66 712 83 390 115 899 1.39
Mexico 12 665 16 669 27 606 1.64 16 239 21 192 34 979 2.09 m m m m
Netherlands 31 235 40 588 45 341 1.23 32 380 44 669 49 760 1.35 32 703 59 762 65 910 1.81
New Zealand 18 641 36 063 36 063 1.47 18 641 36 063 36 063 1.47 18 641 36 063 36 063 1.47
Norway 29 618 35 420 36 679 0.87 29 618 35 420 36 679 0.87 29 618 35 420 36 679 0.87
Poland 6 394 10 263 10 652 0.83 6 394 10 263 10 652 0.83 6 394 10 263 10 652 0.83
Portugal 19 189 31 635 49 644 1.75 19 189 31 635 49 644 1.75 19 189 31 635 49 644 1.75
Scotland 28 603 45 616 45 616 1.48 28 603 45 616 45 616 1.48 28 603 45 616 45 616 1.48
Slovak Republic m m m m m m m m m m m m
Spain 31 381 36 342 45 334 1.40 35 098 40 663 50 162 1.57 35 792 41 552 51 225 1.61
Sweden 25 152 29 522 33 849 0.95 25 963 30 420 34 477 0.98 26 991 31 772 36 575 1.02
Switzerland 39 285 51 956 62 260 1.50 42 445 55 115 66 189 1.59 53 340 69 061 81 462 1.99
Turkey 16 678 18 416 20 768 2.44 a a a a 15 683 17 421 19 773 2.30
United States 32 703 39 740 m 1.00 31 439 40 088 m 1.01 31 578 40 043 m 1.01
OECD average 25 727 35 099 42 347 1.30 27 560 37 488 45 277 1.32 28 892 40 295 48 197 1.42 EU19 average 26 006 34 684 41 945 1.20 27 926 36 911 44 401 1.26 29 055 40 064 48 039 1.37
Part
ner
coun
trie
s Brazil m m m m m m m m m m m m
Chile 10 922 12 976 17 500 1.11 10 922 12 976 17 500 1.11 10 922 13 579 18 321 1.16
Israel 13 608 16 695 23 235 0.73 13 608 16 695 23 235 0.73 13 608 16 695 23 235 0.73
Source: OECD. See Annex 3 for notes (www.oecd.org/edu/eag2006).Please refer to the Reader’s Guide for information concerning the symbols replacing missing data.
StatLink: http://dx.doi.org/10.1787/083407611234
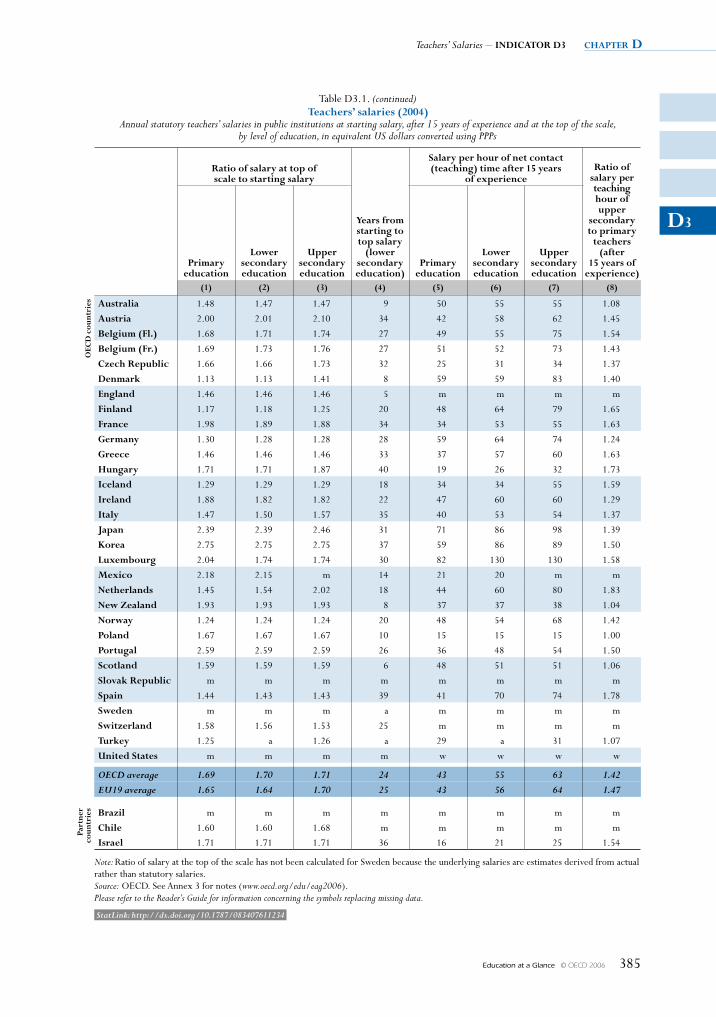
Teachers’ Salaries – INDICATOR D3 chapter D
Education at a Glance © OECD 2006 385
D3
Table D3.1. (continued) Teachers’ salaries (2004)
Annual statutory teachers’ salaries in public institutions at starting salary, after 15 years of experience and at the top of the scale, by level of education, in equivalent US dollars converted using PPPs
Ratio of salary at top of scale to starting salary
Years from starting to top salary
(lower secondary education)
Salary per hour of net contact (teaching) time after 15 years
of experienceRatio of
salary per teaching hour of upper
secondary to primary
teachers (after
15 years of experience)
Primary education
lower secondary education
Upper secondary education
Primary education
lower secondary education
Upper secondary education
(1) (2) (3) (4) (5) (6) (7) (8)
OEC
D c
ount
ries Australia 1.48 1.47 1.47 9 50 55 55 1.08
Austria 2.00 2.01 2.10 34 42 58 62 1.45
Belgium (Fl.) 1.68 1.71 1.74 27 49 55 75 1.54
Belgium (Fr.) 1.69 1.73 1.76 27 51 52 73 1.43
Czech Republic 1.66 1.66 1.73 32 25 31 34 1.37
Denmark 1.13 1.13 1.41 8 59 59 83 1.40
England 1.46 1.46 1.46 5 m m m m
Finland 1.17 1.18 1.25 20 48 64 79 1.65
France 1.98 1.89 1.88 34 34 53 55 1.63
Germany 1.30 1.28 1.28 28 59 64 74 1.24
Greece 1.46 1.46 1.46 33 37 57 60 1.63
Hungary 1.71 1.71 1.87 40 19 26 32 1.73
Iceland 1.29 1.29 1.29 18 34 34 55 1.59
Ireland 1.88 1.82 1.82 22 47 60 60 1.29
Italy 1.47 1.50 1.57 35 40 53 54 1.37
Japan 2.39 2.39 2.46 31 71 86 98 1.39
Korea 2.75 2.75 2.75 37 59 86 89 1.50
luxembourg 2.04 1.74 1.74 30 82 130 130 1.58
Mexico 2.18 2.15 m 14 21 20 m m
Netherlands 1.45 1.54 2.02 18 44 60 80 1.83
New Zealand 1.93 1.93 1.93 8 37 37 38 1.04
Norway 1.24 1.24 1.24 20 48 54 68 1.42
Poland 1.67 1.67 1.67 10 15 15 15 1.00
Portugal 2.59 2.59 2.59 26 36 48 54 1.50
Scotland 1.59 1.59 1.59 6 48 51 51 1.06
Slovak Republic m m m m m m m m
Spain 1.44 1.43 1.43 39 41 70 74 1.78
Sweden m m m a m m m m
Switzerland 1.58 1.56 1.53 25 m m m m
Turkey 1.25 a 1.26 a 29 a 31 1.07
United States m m m m w w w w
OECD average 1.69 1.70 1.71 24 43 55 63 1.42 EU19 average 1.65 1.64 1.70 25 43 56 64 1.47
Part
ner
coun
trie
s Brazil m m m m m m m m
Chile 1.60 1.60 1.68 m m m m m
Israel 1.71 1.71 1.71 36 16 21 25 1.54
Note: Ratio of salary at the top of the scale has not been calculated for Sweden because the underlying salaries are estimates derived from actual rather than statutory salaries.Source: OECD. See Annex 3 for notes (www.oecd.org/edu/eag2006).Please refer to the Reader’s Guide for information concerning the symbols replacing missing data.
StatLink: http://dx.doi.org/10.1787/083407611234
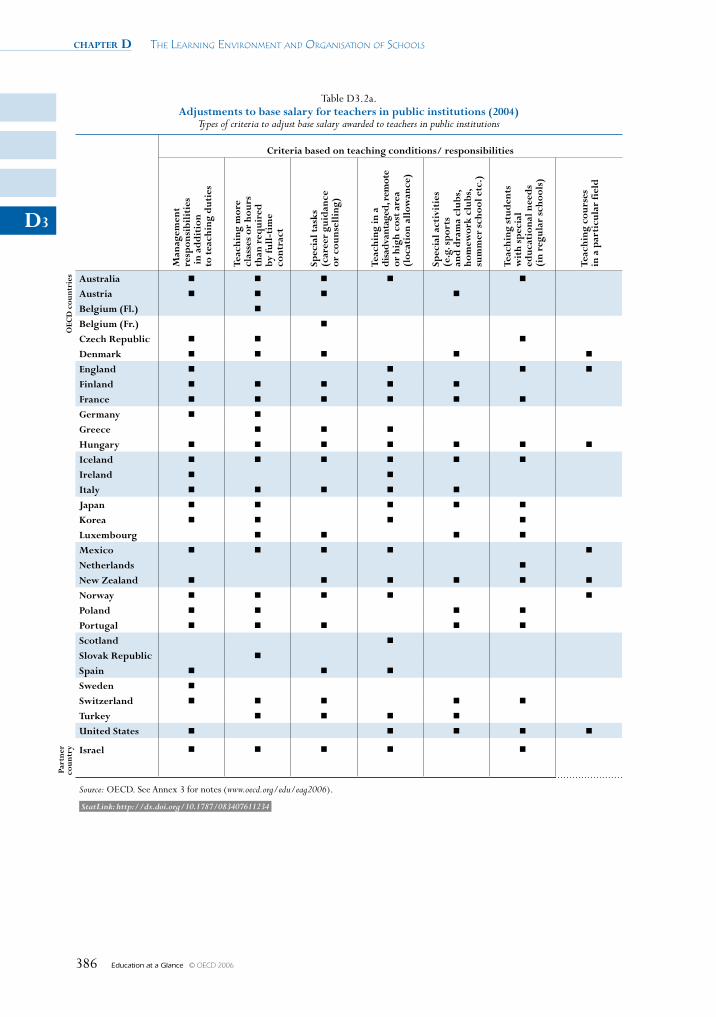
chapter D The Learning environmenT and organisaTion of schooLs
Education at a Glance © OECD 2006386
D3
Table D3.2a. Adjustments to base salary for teachers in public institutions (2004)
Types of criteria to adjust base salary awarded to teachers in public institutions
Criteria based on teaching conditions/ responsibilities
Man
agem
ent
re
spon
sibi
liti
es
in a
ddit
ion
to
tea
chin
g d
utie
s
Teac
hing
mor
e
clas
ses
or h
ours
th
an r
equi
red
by
full
-tim
e
cont
ract
Spec
ial t
asks
(c
aree
r gu
idan
ce
or c
ouns
elli
ng)
Teac
hing
in a
di
sadv
anta
ged,
rem
ote
or
hig
h co
st a
rea
(l
ocat
ion
allo
wan
ce)
Spec
ial a
ctiv
itie
s
(e.g
. sp
orts
an
d d
ram
a cl
ubs,
ho
mew
ork
club
s,
sum
mer
sch
ool e
tc.)
Teac
hing
stu
den
ts
wit
h sp
ecia
l ed
ucat
iona
l nee
ds
(i
n re
gula
r sc
hool
s)
Teac
hing
cou
rses
in
a p
arti
cula
r fi
eld
OEC
D c
ount
ries Australia ■ ■ ■ ■ ■
Austria ■ ■ ■ ■
Belgium (Fl.) ■
Belgium (Fr.) ■
Czech Republic ■ ■ ■
Denmark ■ ■ ■ ■ ■
England ■ ■ ■ ■
Finland ■ ■ ■ ■ ■
France ■ ■ ■ ■ ■ ■
Germany ■ ■
Greece ■ ■ ■
Hungary ■ ■ ■ ■ ■ ■ ■
Iceland ■ ■ ■ ■ ■ ■
Ireland ■ ■
Italy ■ ■ ■ ■ ■
Japan ■ ■ ■ ■ ■
Korea ■ ■ ■ ■
luxembourg ■ ■ ■ ■
Mexico ■ ■ ■ ■ ■
Netherlands ■
New Zealand ■ ■ ■ ■ ■ ■
Norway ■ ■ ■ ■ ■
Poland ■ ■ ■ ■
Portugal ■ ■ ■ ■ ■
Scotland ■
Slovak Republic ■
Spain ■ ■ ■
Sweden ■
Switzerland ■ ■ ■ ■ ■
Turkey ■ ■ ■ ■
United States ■ ■ ■ ■ ■
Part
ner
coun
try Israel ■ ■ ■ ■ ■
Source: OECD. See Annex 3 for notes (www.oecd.org/edu/eag2006).
StatLink: http://dx.doi.org/10.1787/083407611234
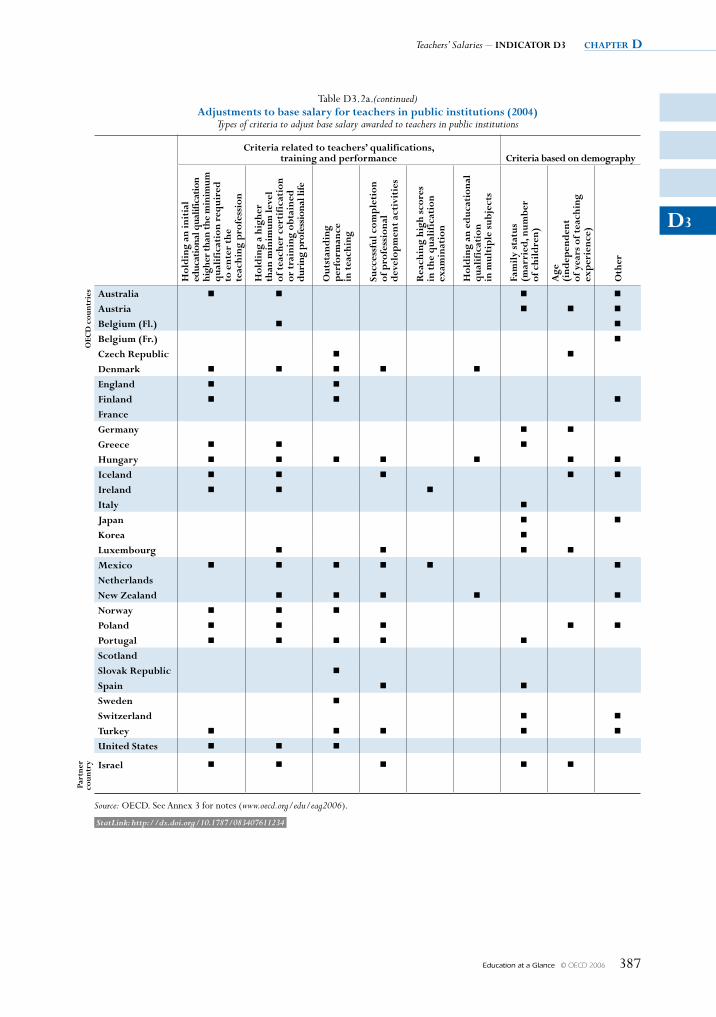
Teachers’ Salaries – INDICATOR D3 chapter D
Education at a Glance © OECD 2006 387
D3
Table D3.2a.(continued)Adjustments to base salary for teachers in public institutions (2004)
Types of criteria to adjust base salary awarded to teachers in public institutions
Criteria related to teachers’ qualifications, training and performance Criteria based on demography
Hol
din
g an
init
ial
educ
atio
nal q
ualif
icat
ion
hi
gher
than
the
min
imum
q
uali
fica
tion
req
uire
d
to e
nter
the
te
achi
ng p
rofe
ssio
n
Hol
din
g a
high
er
than
min
imum
leve
l of
tea
cher
cer
tifi
cati
on
or t
rain
ing
obta
ined
du
ring
pro
fess
iona
l life
Out
stan
din
g
per
form
ance
in
tea
chin
g
Succ
essf
ul c
omp
leti
on
of p
rofe
ssio
nal
dev
elop
men
t ac
tivi
ties
Rea
chin
g hi
gh s
core
s
in t
he q
uali
fica
tion
ex
amin
atio
n
Hol
din
g an
ed
ucat
iona
l q
uali
fica
tion
in
mul
tip
le s
ubje
cts
Fam
ily s
tatu
s
(mar
ried
, num
ber
of
chi
ldre
n)
Age
(i
ndep
end
ent
of
yea
rs o
f tea
chin
g
exp
erie
nce)
Oth
er
OEC
D c
ount
ries Australia ■ ■ ■ ■
Austria ■ ■ ■
Belgium (Fl.) ■ ■
Belgium (Fr.) ■
Czech Republic ■ ■
Denmark ■ ■ ■ ■ ■
England ■ ■
Finland ■ ■ ■
France
Germany ■ ■
Greece ■ ■ ■
Hungary ■ ■ ■ ■ ■ ■ ■
Iceland ■ ■ ■ ■ ■
Ireland ■ ■ ■
Italy ■
Japan ■ ■
Korea ■
luxembourg ■ ■ ■ ■
Mexico ■ ■ ■ ■ ■ ■
Netherlands
New Zealand ■ ■ ■ ■ ■
Norway ■ ■ ■
Poland ■ ■ ■ ■ ■
Portugal ■ ■ ■ ■ ■
Scotland
Slovak Republic ■
Spain ■ ■
Sweden ■
Switzerland ■ ■
Turkey ■ ■ ■ ■ ■
United States ■ ■ ■
Part
ner
coun
try Israel ■ ■ ■ ■ ■
Source: OECD. See Annex 3 for notes (www.oecd.org/edu/eag2006).
StatLink: http://dx.doi.org/10.1787/083407611234
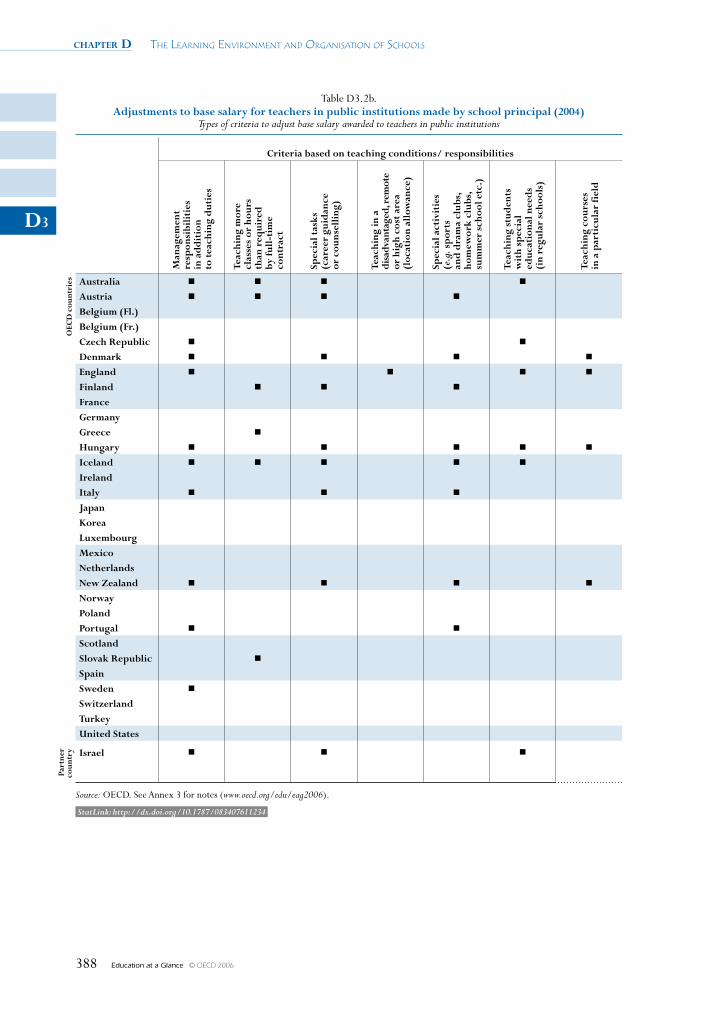
chapter D The Learning environmenT and organisaTion of schooLs
Education at a Glance © OECD 2006388
D3
Table D3.2b. Adjustments to base salary for teachers in public institutions made by school principal (2004)
Types of criteria to adjust base salary awarded to teachers in public institutions
Criteria based on teaching conditions/ responsibilities
Man
agem
ent
re
spon
sibi
liti
es
in a
ddit
ion
to
tea
chin
g d
utie
s
Teac
hing
mor
e
clas
ses
or h
ours
th
an r
equi
red
by
full
-tim
e
cont
ract
Spec
ial t
asks
(c
aree
r gu
idan
ce
or c
ouns
elli
ng)
Teac
hing
in a
di
sadv
anta
ged,
rem
ote
or
hig
h co
st a
rea
(l
ocat
ion
allo
wan
ce)
Spec
ial a
ctiv
itie
s
(e.g
. sp
orts
an
d d
ram
a cl
ubs,
ho
mew
ork
club
s,
sum
mer
sch
ool e
tc.)
Teac
hing
stu
den
ts
wit
h sp
ecia
l ed
ucat
iona
l nee
ds
(i
n re
gula
r sc
hool
s)
Teac
hing
cou
rses
in
a p
arti
cula
r fi
eld
OEC
D c
ount
ries Australia ■ ■ ■ ■
Austria ■ ■ ■ ■
Belgium (Fl.)
Belgium (Fr.)
Czech Republic ■ ■
Denmark ■ ■ ■ ■
England ■ ■ ■ ■
Finland ■ ■ ■
France
Germany
Greece ■
Hungary ■ ■ ■ ■ ■
Iceland ■ ■ ■ ■ ■
Ireland
Italy ■ ■ ■
Japan
Korea
luxembourg
Mexico
Netherlands
New Zealand ■ ■ ■ ■
Norway
Poland
Portugal ■ ■
Scotland
Slovak Republic ■
Spain
Sweden ■
Switzerland
Turkey
United States
Part
ner
coun
try Israel ■ ■ ■
Source: OECD. See Annex 3 for notes (www.oecd.org/edu/eag2006).
StatLink: http://dx.doi.org/10.1787/083407611234
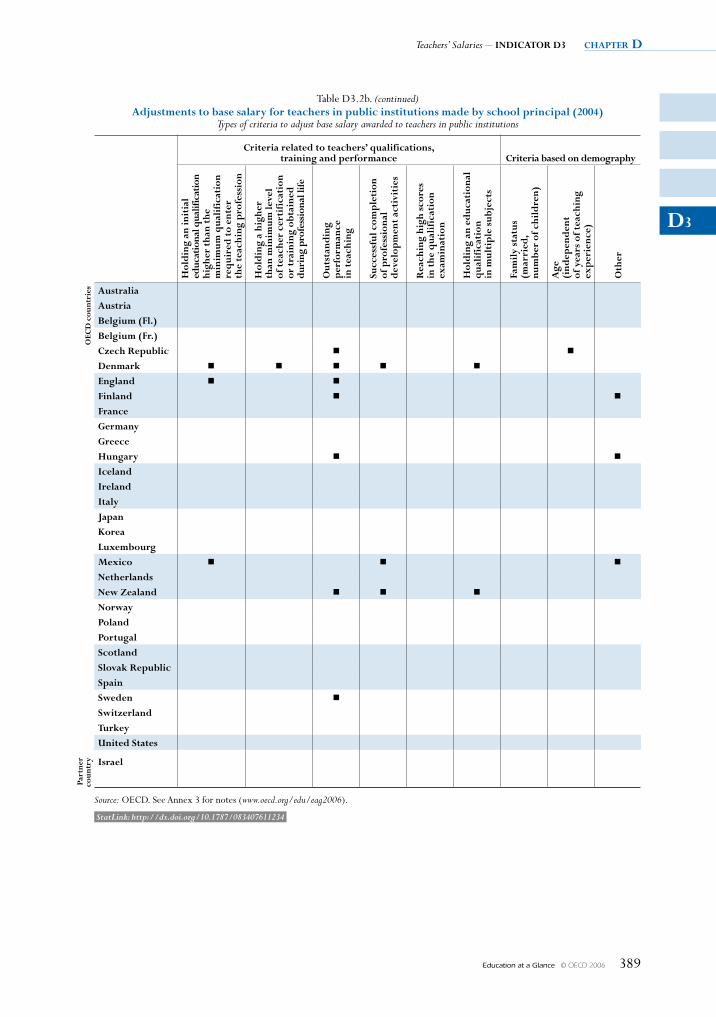
Teachers’ Salaries – INDICATOR D3 chapter D
Education at a Glance © OECD 2006 389
D3
Table D3.2b. (continued) Adjustments to base salary for teachers in public institutions made by school principal (2004)
Types of criteria to adjust base salary awarded to teachers in public institutions
Criteria related to teachers’ qualifications, training and performance Criteria based on demography
Hol
din
g an
init
ial
educ
atio
nal q
ualif
icat
ion
high
er t
han
the
min
imum
qua
lifi
cati
on
req
uire
d t
o en
ter
th
e te
achi
ng p
rofe
ssio
n
Hol
din
g a
high
er
than
min
imum
leve
l of
tea
cher
cer
tifi
cati
on
or t
rain
ing
obta
ined
du
ring
pro
fess
iona
l life
Out
stan
din
g
per
form
ance
in
tea
chin
g
Succ
essf
ul c
omp
leti
on
of p
rofe
ssio
nal
dev
elop
men
t ac
tivi
ties
Rea
chin
g hi
gh s
core
s in
the
qua
lifi
cati
on
exam
inat
ion
Hol
din
g an
ed
ucat
iona
l q
uali
fica
tion
in
mul
tip
le s
ubje
cts
Fam
ily s
tatu
s
(mar
ried
, nu
mbe
r of
chi
ldre
n)
Age
(i
ndep
end
ent
of
yea
rs o
f tea
chin
g ex
per
ienc
e)
Oth
er
OEC
D c
ount
ries Australia
Austria
Belgium (Fl.)
Belgium (Fr.)
Czech Republic ■ ■
Denmark ■ ■ ■ ■ ■
England ■ ■
Finland ■ ■
France
Germany
Greece
Hungary ■ ■
Iceland
Ireland
Italy
Japan
Korea
luxembourg
Mexico ■ ■ ■
Netherlands
New Zealand ■ ■ ■
Norway
Poland
Portugal
Scotland
Slovak Republic
Spain
Sweden ■
Switzerland
Turkey
United States
Part
ner
coun
try Israel
Source: OECD. See Annex 3 for notes (www.oecd.org/edu/eag2006).
StatLink: http://dx.doi.org/10.1787/083407611234
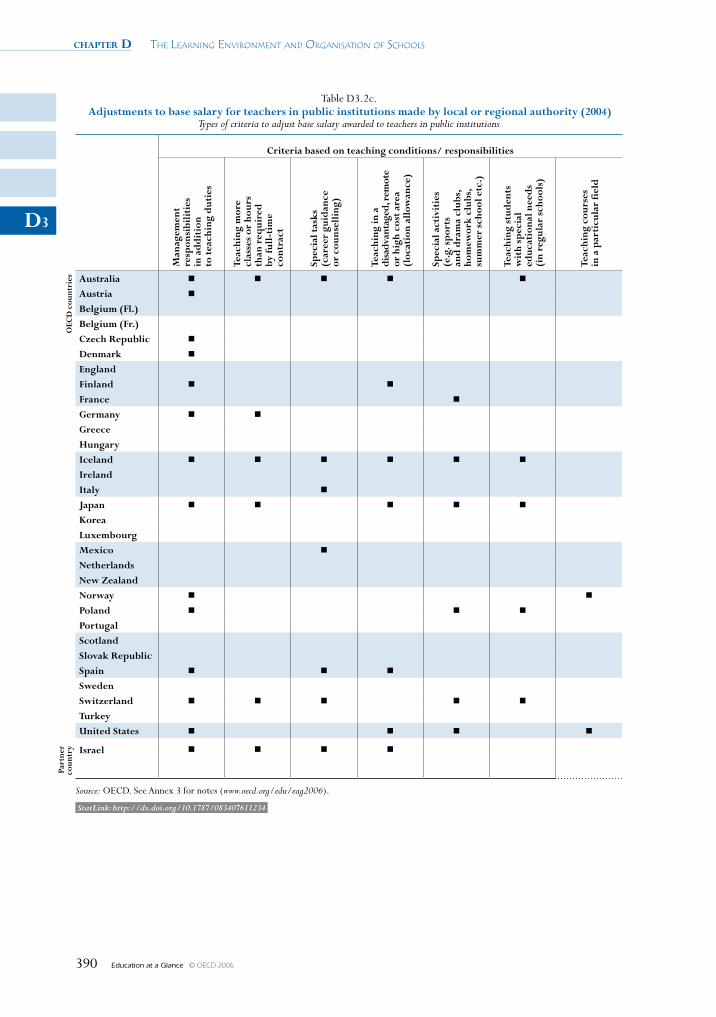
chapter D The Learning environmenT and organisaTion of schooLs
Education at a Glance © OECD 2006390
D3
Table D3.2c. Adjustments to base salary for teachers in public institutions made by local or regional authority (2004)
Types of criteria to adjust base salary awarded to teachers in public institutions
Criteria based on teaching conditions/ responsibilities
Man
agem
ent
re
spon
sibi
liti
es
in a
ddit
ion
to
tea
chin
g d
utie
s
Teac
hing
mor
e
clas
ses
or h
ours
th
an r
equi
red
by
full
-tim
e
cont
ract
Spec
ial t
asks
(c
aree
r gu
idan
ce
or c
ouns
elli
ng)
Teac
hing
in a
di
sadv
anta
ged,
rem
ote
or
hig
h co
st a
rea
(l
ocat
ion
allo
wan
ce)
Spec
ial a
ctiv
itie
s
(e.g
. sp
orts
an
d d
ram
a cl
ubs,
ho
mew
ork
club
s,
sum
mer
sch
ool e
tc.)
Teac
hing
stu
den
ts
wit
h sp
ecia
l ed
ucat
iona
l nee
ds
(i
n re
gula
r sc
hool
s)
Teac
hing
cou
rses
in
a p
arti
cula
r fi
eld
OEC
D c
ount
ries Australia ■ ■ ■ ■ ■
Austria ■
Belgium (Fl.)
Belgium (Fr.)
Czech Republic ■
Denmark ■
England
Finland ■ ■
France ■
Germany ■ ■
Greece
Hungary
Iceland ■ ■ ■ ■ ■ ■
Ireland
Italy ■
Japan ■ ■ ■ ■ ■
Korea
luxembourg
Mexico ■
Netherlands
New Zealand
Norway ■ ■
Poland ■ ■ ■
Portugal
Scotland
Slovak Republic
Spain ■ ■ ■
Sweden
Switzerland ■ ■ ■ ■ ■
Turkey
United States ■ ■ ■ ■
Part
ner
coun
try Israel ■ ■ ■ ■
Source: OECD. See Annex 3 for notes (www.oecd.org/edu/eag2006).
StatLink: http://dx.doi.org/10.1787/083407611234
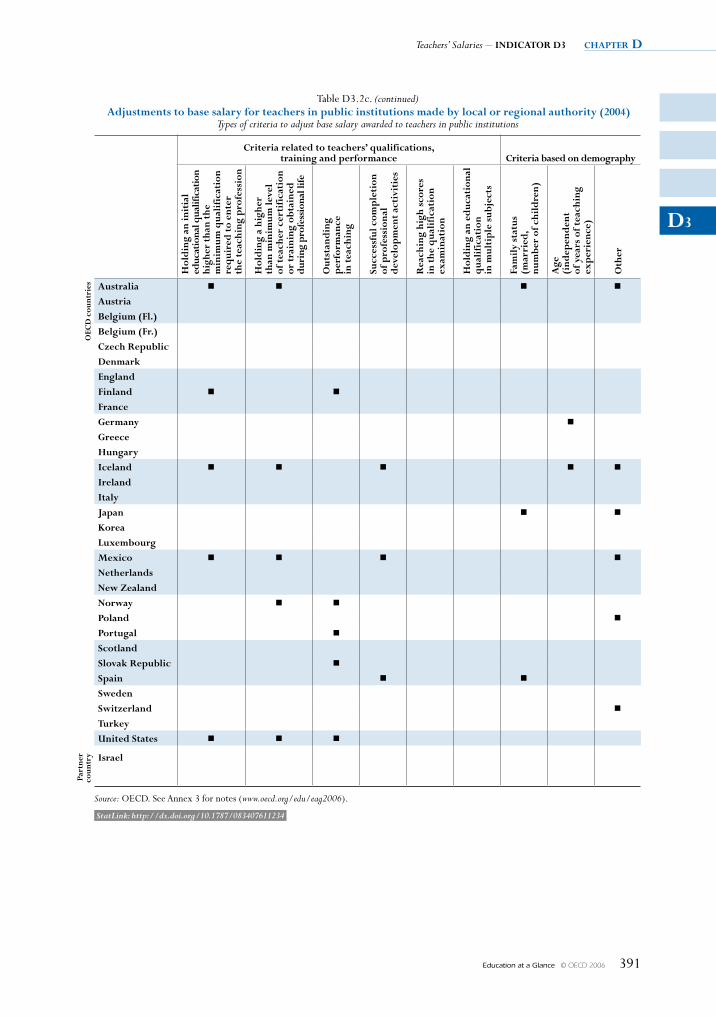
Teachers’ Salaries – INDICATOR D3 chapter D
Education at a Glance © OECD 2006 391
D3
Table D3.2c. (continued) Adjustments to base salary for teachers in public institutions made by local or regional authority (2004)
Types of criteria to adjust base salary awarded to teachers in public institutions
Criteria related to teachers’ qualifications, training and performance Criteria based on demography
Hol
din
g an
init
ial
educ
atio
nal q
ualif
icat
ion
high
er t
han
the
min
imum
qua
lifi
cati
on
req
uire
d t
o en
ter
th
e te
achi
ng p
rofe
ssio
n
Hol
din
g a
high
er
than
min
imum
leve
l of
tea
cher
cer
tifi
cati
on
or t
rain
ing
obta
ined
du
ring
pro
fess
iona
l life
Out
stan
din
g
per
form
ance
in
tea
chin
g
Succ
essf
ul c
omp
leti
on
of p
rofe
ssio
nal
dev
elop
men
t ac
tivi
ties
Rea
chin
g hi
gh s
core
s in
the
qua
lifi
cati
on
exam
inat
ion
Hol
din
g an
ed
ucat
iona
l q
uali
fica
tion
in
mul
tip
le s
ubje
cts
Fam
ily s
tatu
s
(mar
ried
, nu
mbe
r of
chi
ldre
n)
Age
(i
ndep
end
ent
of
yea
rs o
f tea
chin
g ex
per
ienc
e)
Oth
er
OEC
D c
ount
ries Australia ■ ■ ■ ■
Austria
Belgium (Fl.)
Belgium (Fr.)
Czech Republic
Denmark
England
Finland ■ ■
France
Germany ■
Greece
Hungary
Iceland ■ ■ ■ ■ ■
Ireland
Italy
Japan ■ ■
Korea
luxembourg
Mexico ■ ■ ■ ■
Netherlands
New Zealand
Norway ■ ■
Poland ■
Portugal ■
Scotland
Slovak Republic ■
Spain ■ ■
Sweden
Switzerland ■
Turkey
United States ■ ■ ■
Part
ner
coun
try Israel
Source: OECD. See Annex 3 for notes (www.oecd.org/edu/eag2006).
StatLink: http://dx.doi.org/10.1787/083407611234
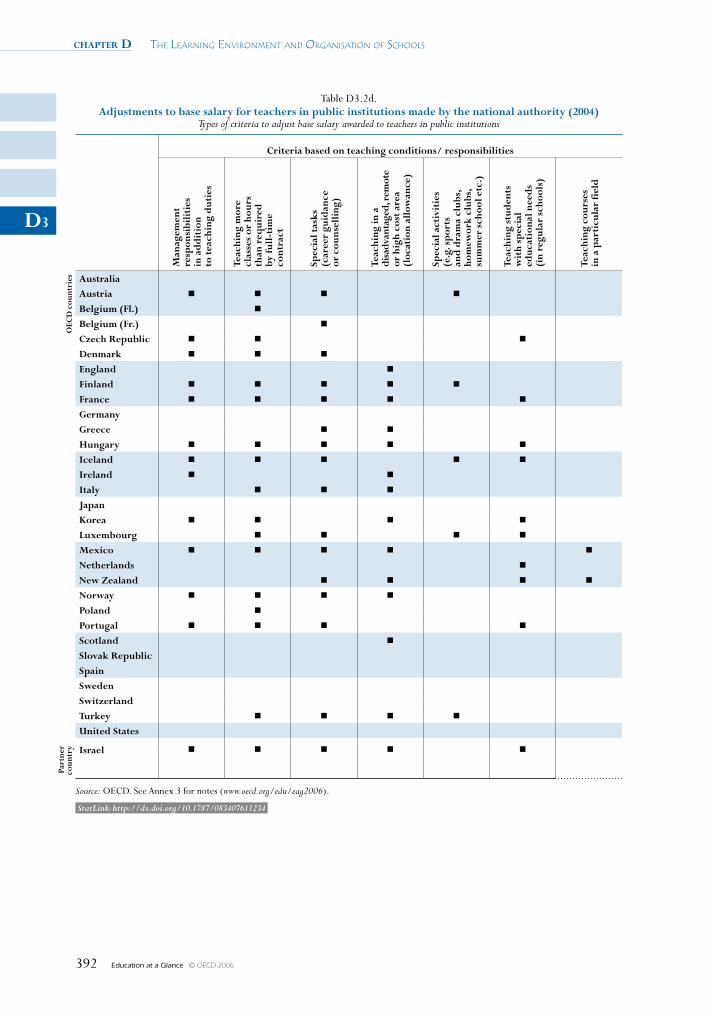
chapter D The Learning environmenT and organisaTion of schooLs
Education at a Glance © OECD 2006392
D3
Table D3.2d. Adjustments to base salary for teachers in public institutions made by the national authority (2004)
Types of criteria to adjust base salary awarded to teachers in public institutions
Criteria based on teaching conditions/ responsibilities
Man
agem
ent
re
spon
sibi
liti
es
in a
ddit
ion
to
tea
chin
g d
utie
s
Teac
hing
mor
e
clas
ses
or h
ours
th
an r
equi
red
by
full
-tim
e
cont
ract
Spec
ial t
asks
(c
aree
r gu
idan
ce
or c
ouns
elli
ng)
Teac
hing
in a
di
sadv
anta
ged,
rem
ote
or
hig
h co
st a
rea
(l
ocat
ion
allo
wan
ce)
Spec
ial a
ctiv
itie
s
(e.g
. sp
orts
an
d d
ram
a cl
ubs,
ho
mew
ork
club
s,
sum
mer
sch
ool e
tc.)
Teac
hing
stu
den
ts
wit
h sp
ecia
l ed
ucat
iona
l nee
ds
(i
n re
gula
r sc
hool
s)
Teac
hing
cou
rses
in
a p
arti
cula
r fi
eld
OEC
D c
ount
ries Australia
Austria ■ ■ ■ ■
Belgium (Fl.) ■
Belgium (Fr.) ■
Czech Republic ■ ■ ■
Denmark ■ ■ ■
England ■
Finland ■ ■ ■ ■ ■
France ■ ■ ■ ■ ■
Germany
Greece ■ ■
Hungary ■ ■ ■ ■ ■
Iceland ■ ■ ■ ■ ■
Ireland ■ ■
Italy ■ ■ ■
Japan
Korea ■ ■ ■ ■
luxembourg ■ ■ ■ ■
Mexico ■ ■ ■ ■ ■
Netherlands ■
New Zealand ■ ■ ■ ■
Norway ■ ■ ■ ■
Poland ■
Portugal ■ ■ ■ ■
Scotland ■
Slovak Republic
Spain
Sweden
Switzerland
Turkey ■ ■ ■ ■
United States
Part
ner
coun
try Israel ■ ■ ■ ■ ■
Source: OECD. See Annex 3 for notes (www.oecd.org/edu/eag2006).
StatLink: http://dx.doi.org/10.1787/083407611234
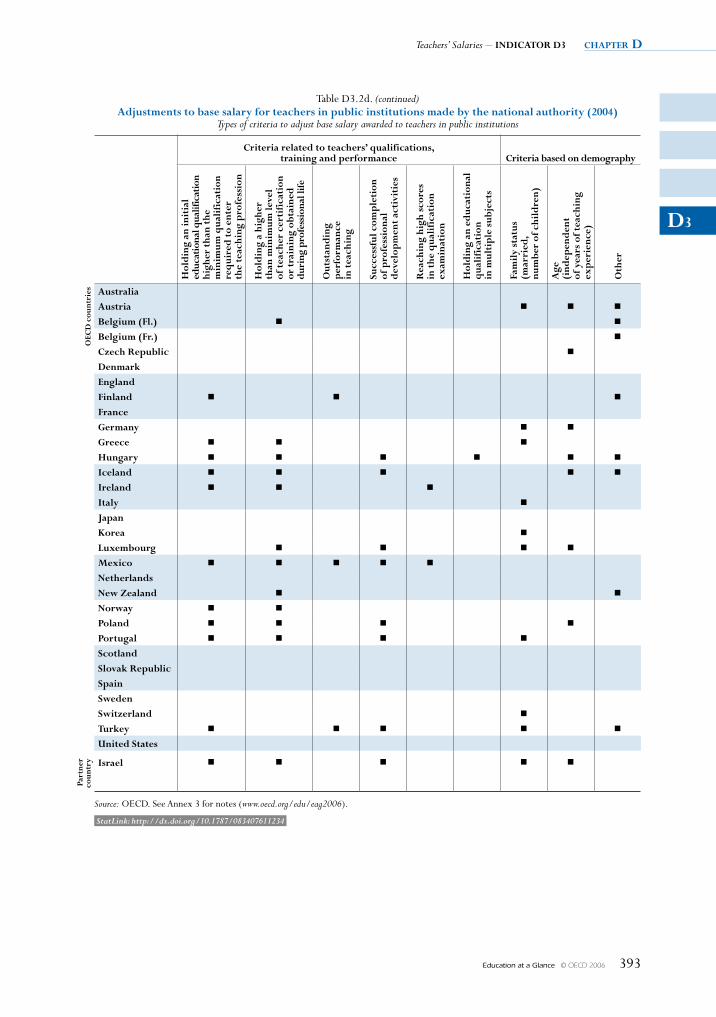
Teachers’ Salaries – INDICATOR D3 chapter D
Education at a Glance © OECD 2006 393
D3
Table D3.2d. (continued) Adjustments to base salary for teachers in public institutions made by the national authority (2004)
Types of criteria to adjust base salary awarded to teachers in public institutions
Criteria related to teachers’ qualifications, training and performance Criteria based on demography
Hol
din
g an
init
ial
educ
atio
nal q
ualif
icat
ion
high
er t
han
the
min
imum
qua
lifi
cati
on
req
uire
d t
o en
ter
th
e te
achi
ng p
rofe
ssio
n
Hol
din
g a
high
er
than
min
imum
leve
l of
tea
cher
cer
tifi
cati
on
or t
rain
ing
obta
ined
du
ring
pro
fess
iona
l life
Out
stan
din
g
per
form
ance
in
tea
chin
g
Succ
essf
ul c
omp
leti
on
of p
rofe
ssio
nal
dev
elop
men
t ac
tivi
ties
Rea
chin
g hi
gh s
core
s in
the
qua
lifi
cati
on
exam
inat
ion
Hol
din
g an
ed
ucat
iona
l q
uali
fica
tion
in
mul
tip
le s
ubje
cts
Fam
ily s
tatu
s
(mar
ried
, nu
mbe
r of
chi
ldre
n)
Age
(i
ndep
end
ent
of
yea
rs o
f tea
chin
g ex
per
ienc
e)
Oth
er
OEC
D c
ount
ries Australia
Austria ■ ■ ■
Belgium (Fl.) ■ ■
Belgium (Fr.) ■
Czech Republic ■
Denmark
England
Finland ■ ■ ■
France
Germany ■ ■
Greece ■ ■ ■
Hungary ■ ■ ■ ■ ■ ■
Iceland ■ ■ ■ ■ ■
Ireland ■ ■ ■
Italy ■
Japan
Korea ■
luxembourg ■ ■ ■ ■
Mexico ■ ■ ■ ■ ■
Netherlands
New Zealand ■ ■
Norway ■ ■
Poland ■ ■ ■ ■
Portugal ■ ■ ■ ■
Scotland
Slovak Republic
Spain
Sweden
Switzerland ■
Turkey ■ ■ ■ ■ ■
United States
Part
ner
coun
try Israel ■ ■ ■ ■ ■
Source: OECD. See Annex 3 for notes (www.oecd.org/edu/eag2006).
StatLink: http://dx.doi.org/10.1787/083407611234
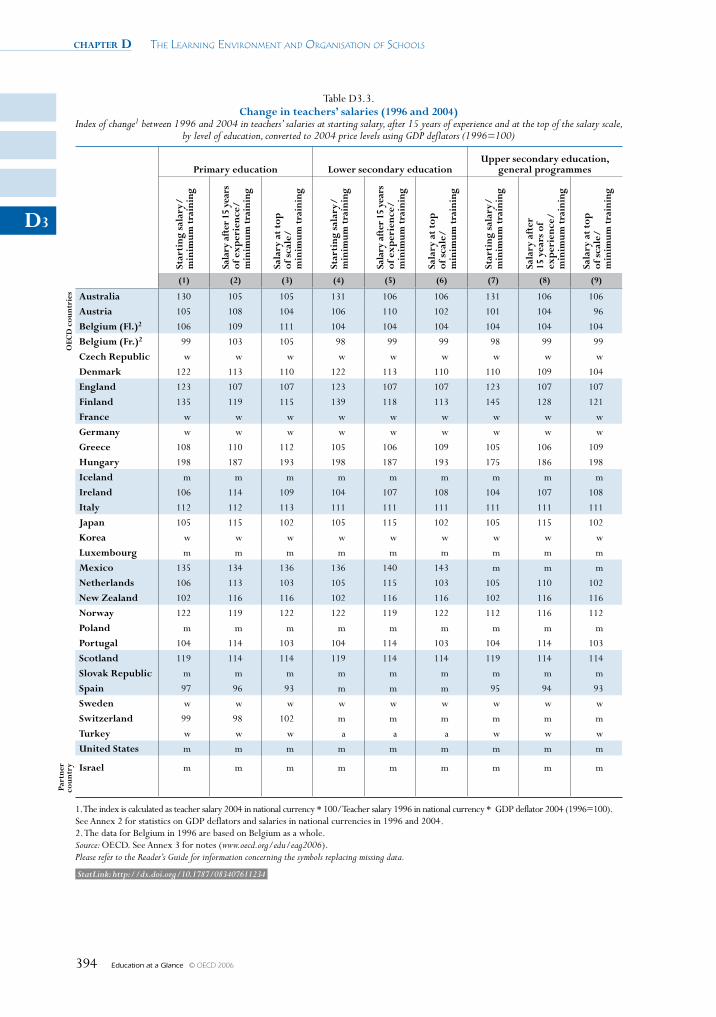
chapter D The Learning environmenT and organisaTion of schooLs
Education at a Glance © OECD 2006394
D3
Table D3.3. Change in teachers’ salaries (1996 and 2004)
Index of change1 between 1996 and 2004 in teachers’ salaries at starting salary, after 15 years of experience and at the top of the salary scale, by level of education, converted to 2004 price levels using GDP deflators (1996=100)
Primary education lower secondary educationUpper secondary education,
general programmesSt
arti
ng s
alar
y/
min
imum
trai
ning
Sala
ry a
fter
15
year
s
of e
xper
ienc
e/
min
imum
trai
ning
Sala
ry a
t to
p
of s
cale
/ m
inim
um tr
aini
ng
Star
ting
sal
ary/
min
imum
trai
ning
Sala
ry a
fter
15
year
s of
exp
erie
nce/
m
inim
um tr
aini
ng
Sala
ry a
t to
p
of s
cale
/ m
inim
um tr
aini
ng
Star
ting
sal
ary/
min
imum
trai
ning
Sala
ry a
fter
15
yea
rs o
f ex
per
ienc
e/
min
imum
trai
ning
Sala
ry a
t to
p
of s
cale
/ m
inim
um tr
aini
ng
(1) (2) (3) (4) (5) (6) (7) (8) (9)
OEC
D c
ount
ries Australia 130 105 105 131 106 106 131 106 106
Austria 105 108 104 106 110 102 101 104 96
Belgium (Fl.)2 106 109 111 104 104 104 104 104 104
Belgium (Fr.)2 99 103 105 98 99 99 98 99 99
Czech Republic w w w w w w w w w
Denmark 122 113 110 122 113 110 110 109 104
England 123 107 107 123 107 107 123 107 107
Finland 135 119 115 139 118 113 145 128 121
France w w w w w w w w w
Germany w w w w w w w w w
Greece 108 110 112 105 106 109 105 106 109
Hungary 198 187 193 198 187 193 175 186 198
Iceland m m m m m m m m m
Ireland 106 114 109 104 107 108 104 107 108
Italy 112 112 113 111 111 111 111 111 111
Japan 105 115 102 105 115 102 105 115 102
Korea w w w w w w w w w
luxembourg m m m m m m m m m
Mexico 135 134 136 136 140 143 m m m
Netherlands 106 113 103 105 115 103 105 110 102
New Zealand 102 116 116 102 116 116 102 116 116
Norway 122 119 122 122 119 122 112 116 112
Poland m m m m m m m m m
Portugal 104 114 103 104 114 103 104 114 103
Scotland 119 114 114 119 114 114 119 114 114
Slovak Republic m m m m m m m m m
Spain 97 96 93 m m m 95 94 93
Sweden w w w w w w w w w
Switzerland 99 98 102 m m m m m m
Turkey w w w a a a w w w
United States m m m m m m m m m
Part
ner
coun
try Israel m m m m m m m m m
1. The index is calculated as teacher salary 2004 in national currency * 100/Teacher salary 1996 in national currency * GDP deflator 2004 (1996=100).See Annex 2 for statistics on GDP deflators and salaries in national currencies in 1996 and 2004.2. The data for Belgium in 1996 are based on Belgium as a whole.Source: OECD. See Annex 3 for notes (www.oecd.org/edu/eag2006).Please refer to the Reader’s Guide for information concerning the symbols replacing missing data.
StatLink: http://dx.doi.org/10.1787/083407611234

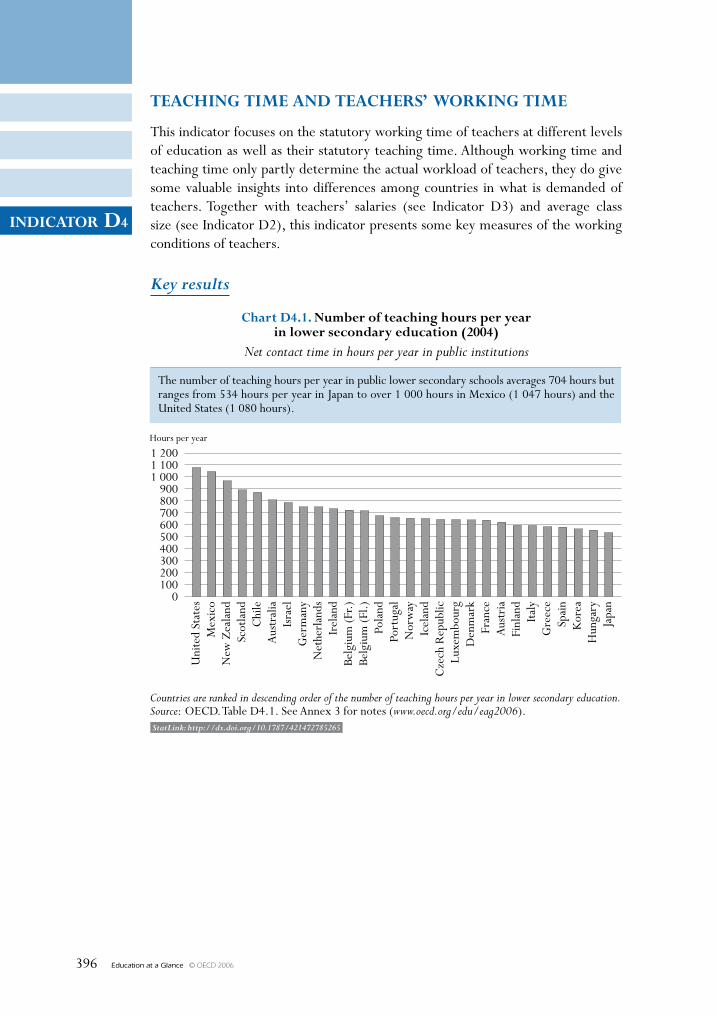
Education at a Glance © OECD 2006396
INDICATOR D4
StatLink: http://dx.doi.org/10.1787/421472785265
TeAChINg TIme AND TeACheRs’ wORkINg TIme
This indicator focuses on the statutory working time of teachers at different levels of education as well as their statutory teaching time. Although working time and teaching time only partly determine the actual workload of teachers, they do give some valuable insights into differences among countries in what is demanded of teachers. Together with teachers’ salaries (see Indicator D3) and average class size (see Indicator D2), this indicator presents some key measures of the working conditions of teachers.
Key results
1 2001 1001 000
900800700600500400300200100
0
Hours per year
Chart D4.1. Number of teaching hours per yearin lower secondary education (2004)
Net contact time in hours per year in public institutions
Countries are ranked in descending order of the number of teaching hours per year in lower secondary education.Source: OECD. Table D4.1. See Annex 3 for notes (www.oecd.org/edu/eag2006).
Uni
ted
Stat
esM
exic
oN
ew Z
eala
ndSc
otla
ndC
hile
Aus
tral
iaIs
rael
Ger
man
yN
ethe
rlan
dsIr
elan
dBe
lgiu
m (F
r.)Be
lgiu
m (F
l.)Po
land
Port
ugal
Nor
way
Icel
and
Cze
ch R
epub
licLu
xem
bour
gD
enm
ark
Fran
ceA
ustr
iaFi
nlan
dIta
lyG
reec
eSp
ain
Kor
eaH
unga
ryJa
pan
The number of teaching hours per year in public lower secondary schools averages 704 hours butranges from 534 hours per year in Japan to over 1 000 hours in Mexico (1 047 hours) and theUnited States (1 080 hours).
Education at a Glance © OECD 2006 397
INDICATOR D4
Other highlights of this indicator
• The number of teaching hours per year in public primary schools averages 805 hours (10 more than in 2003), but ranges from around 650 hours or less in Denmark, Japan and Turkey to 1 080 hours in the United States.
• The average number of teaching hours in upper secondary general education is 663 hours, but ranges from less than 500 in Japan (466 hours) to more than 1 000 hours in the United States (1 080 hours).
• The composition, in terms of days, weeks and hours per day, of teachers’ annual teaching time varies considerably. For instance, while teachers in Denmark teach for 42 weeks in the year (at all ISCED levels) compared with 36 weeks per year in Iceland, the total teaching time (in hours) for teachers in Iceland is greater than for teachers in Denmark.
• Regulations of teachers’ working time also vary. In most countries, teachers are formally required to work a specific number of hours; in others, teaching time is only specified as the number of lessons per week.
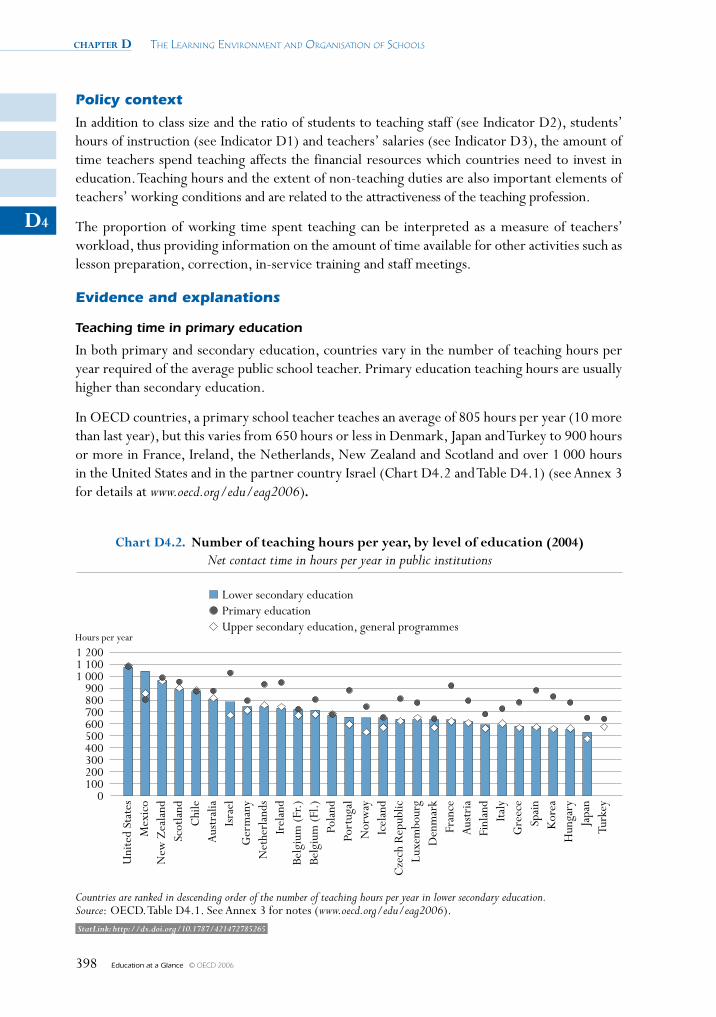
chapter D The Learning environmenT and organisaTion of schooLs
Education at a Glance © OECD 2006398
D4
Policy context
In addition to class size and the ratio of students to teaching staff (see Indicator D2), students’ hours of instruction (see Indicator D1) and teachers’ salaries (see Indicator D3), the amount of time teachers spend teaching affects the financial resources which countries need to invest in education. Teaching hours and the extent of non-teaching duties are also important elements of teachers’ working conditions and are related to the attractiveness of the teaching profession.
The proportion of working time spent teaching can be interpreted as a measure of teachers’ workload, thus providing information on the amount of time available for other activities such as lesson preparation, correction, in-service training and staff meetings.
Evidence and explanations
Teaching time in primary education
In both primary and secondary education, countries vary in the number of teaching hours per year required of the average public school teacher. Primary education teaching hours are usually higher than secondary education.
In OECD countries, a primary school teacher teaches an average of 805 hours per year (10 more than last year), but this varies from 650 hours or less in Denmark, Japan and Turkey to 900 hours or more in France, Ireland, the Netherlands, New Zealand and Scotland and over 1 000 hours in the United States and in the partner country Israel (Chart D4.2 and Table D4.1) (see Annex 3 for details at www.oecd.org/edu/eag2006).
1 2001 1001 000
900800700600500400300200100
0
Hours per year
Chart D4.2. Number of teaching hours per year, by level of education (2004)Net contact time in hours per year in public institutions
Lower secondary educationPrimary educationUpper secondary education, general programmes
Countries are ranked in descending order of the number of teaching hours per year in lower secondary education.Source: OECD. Table D4.1. See Annex 3 for notes (www.oecd.org/edu/eag2006).
Uni
ted
Stat
esM
exic
oN
ew Z
eala
ndSc
otla
ndC
hile
Aus
tral
iaIs
rael
Ger
man
yN
ethe
rlan
dsIr
elan
dBe
lgiu
m (F
r.)Be
lgiu
m (F
l.)Po
land
Port
ugal
Nor
way
Icel
and
Cze
ch R
epub
licLu
xem
bour
gD
enm
ark
Fran
ceA
ustr
iaFi
nlan
dIta
lyG
reec
eSp
ain
Kor
eaH
unga
ryJa
pan
Turk
ey
StatLink: http://dx.doi.org/10.1787/421472785265
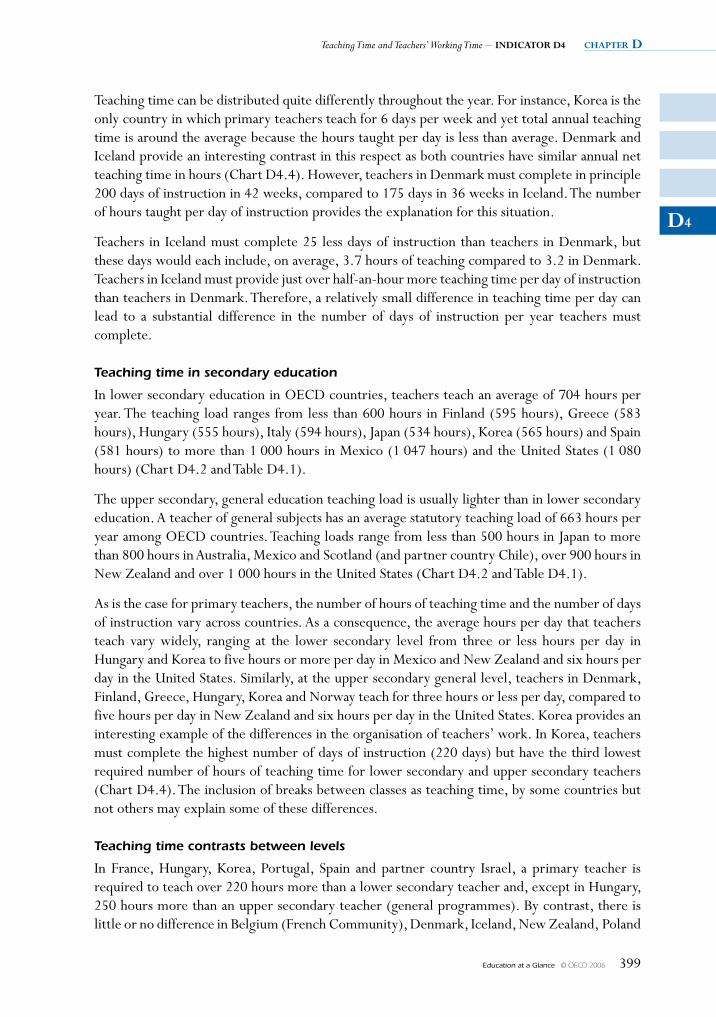
Teaching Time and Teachers’ Working Time – INDICATOR D4 chapter D
Education at a Glance © OECD 2006 399
D4
Teaching time can be distributed quite differently throughout the year. For instance, Korea is the only country in which primary teachers teach for 6 days per week and yet total annual teaching time is around the average because the hours taught per day is less than average. Denmark and Iceland provide an interesting contrast in this respect as both countries have similar annual net teaching time in hours (Chart D4.4). However, teachers in Denmark must complete in principle 200 days of instruction in 42 weeks, compared to 175 days in 36 weeks in Iceland. The number of hours taught per day of instruction provides the explanation for this situation.
Teachers in Iceland must complete 25 less days of instruction than teachers in Denmark, but these days would each include, on average, 3.7 hours of teaching compared to 3.2 in Denmark. Teachers in Iceland must provide just over half-an-hour more teaching time per day of instruction than teachers in Denmark. Therefore, a relatively small difference in teaching time per day can lead to a substantial difference in the number of days of instruction per year teachers must complete.
Teaching time in secondary education
In lower secondary education in OECD countries, teachers teach an average of 704 hours per year. The teaching load ranges from less than 600 hours in Finland (595 hours), Greece (583 hours), Hungary (555 hours), Italy (594 hours), Japan (534 hours), Korea (565 hours) and Spain (581 hours) to more than 1 000 hours in Mexico (1 047 hours) and the United States (1 080 hours) (Chart D4.2 and Table D4.1).
The upper secondary, general education teaching load is usually lighter than in lower secondary education. A teacher of general subjects has an average statutory teaching load of 663 hours per year among OECD countries. Teaching loads range from less than 500 hours in Japan to more than 800 hours in Australia, Mexico and Scotland (and partner country Chile), over 900 hours in New Zealand and over 1 000 hours in the United States (Chart D4.2 and Table D4.1).
As is the case for primary teachers, the number of hours of teaching time and the number of days of instruction vary across countries. As a consequence, the average hours per day that teachers teach vary widely, ranging at the lower secondary level from three or less hours per day in Hungary and Korea to five hours or more per day in Mexico and New Zealand and six hours per day in the United States. Similarly, at the upper secondary general level, teachers in Denmark, Finland, Greece, Hungary, Korea and Norway teach for three hours or less per day, compared to five hours per day in New Zealand and six hours per day in the United States. Korea provides an interesting example of the differences in the organisation of teachers’ work. In Korea, teachers must complete the highest number of days of instruction (220 days) but have the third lowest required number of hours of teaching time for lower secondary and upper secondary teachers (Chart D4.4). The inclusion of breaks between classes as teaching time, by some countries but not others may explain some of these differences.
Teaching time contrasts between levels
In France, Hungary, Korea, Portugal, Spain and partner country Israel, a primary teacher is required to teach over 220 hours more than a lower secondary teacher and, except in Hungary, 250 hours more than an upper secondary teacher (general programmes). By contrast, there is little or no difference in Belgium (French Community), Denmark, Iceland, New Zealand, Poland
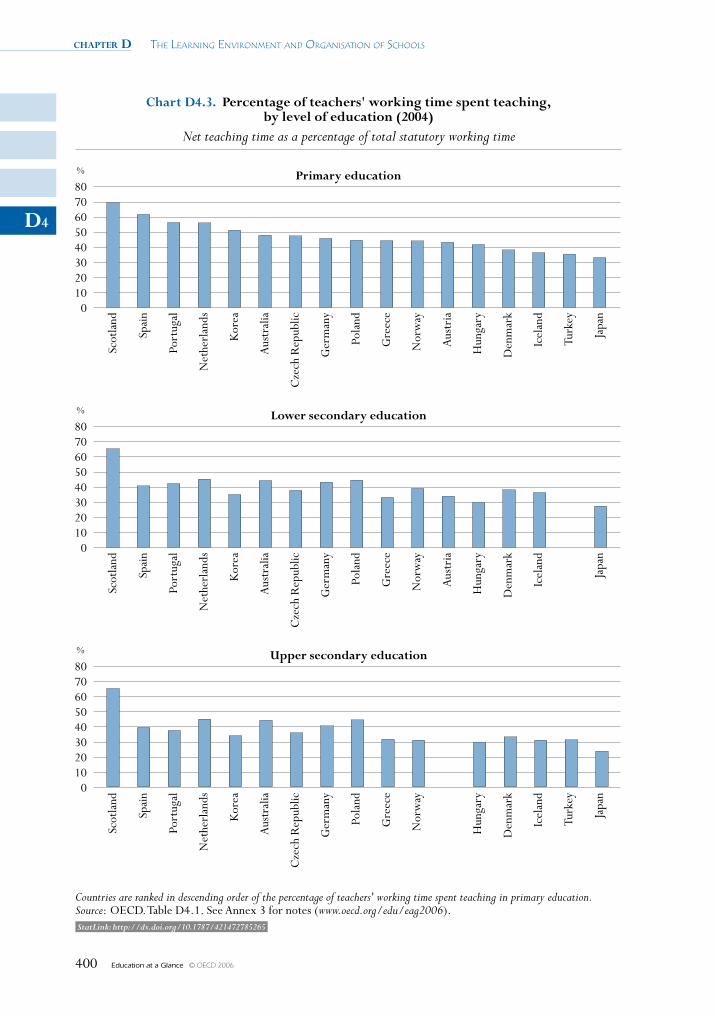
chapter D The Learning environmenT and organisaTion of schooLs
Education at a Glance © OECD 2006400
D4
8070605040302010
0
%
8070605040302010
0
%
8070605040302010
0
%
Chart D4.3. Percentage of teachers' working time spent teaching,by level of education (2004)
Net teaching time as a percentage of total statutory working time
Countries are ranked in descending order of the percentage of teachers' working time spent teaching in primary education.Source: OECD. Table D4.1. See Annex 3 for notes (www.oecd.org/edu/eag2006).
Scot
land
Spai
n
Port
ugal
Net
herl
ands
Kor
ea
Aus
tral
ia
Cze
ch R
epub
lic
Ger
man
y
Pola
nd
Gre
ece
Nor
way
Aus
tria
Hun
gary
Den
mar
k
Icel
and
Turk
ey
Japa
n
Primary education
Lower secondary education
Upper secondary education
Scot
land
Spai
n
Port
ugal
Net
herl
ands
Kor
ea
Aus
tral
ia
Cze
ch R
epub
lic
Ger
man
y
Pola
nd
Gre
ece
Nor
way
Aus
tria
Hun
gary
Den
mar
k
Icel
and
Turk
ey
Japa
n
Scot
land
Spai
n
Port
ugal
Net
herl
ands
Kor
ea
Aus
tral
ia
Cze
ch R
epub
lic
Ger
man
y
Pola
nd
Gre
ece
Nor
way
Aus
tria
Hun
gary
Den
mar
k
Icel
and
Turk
ey
Japa
n
StatLink: http://dx.doi.org/10.1787/421472785265
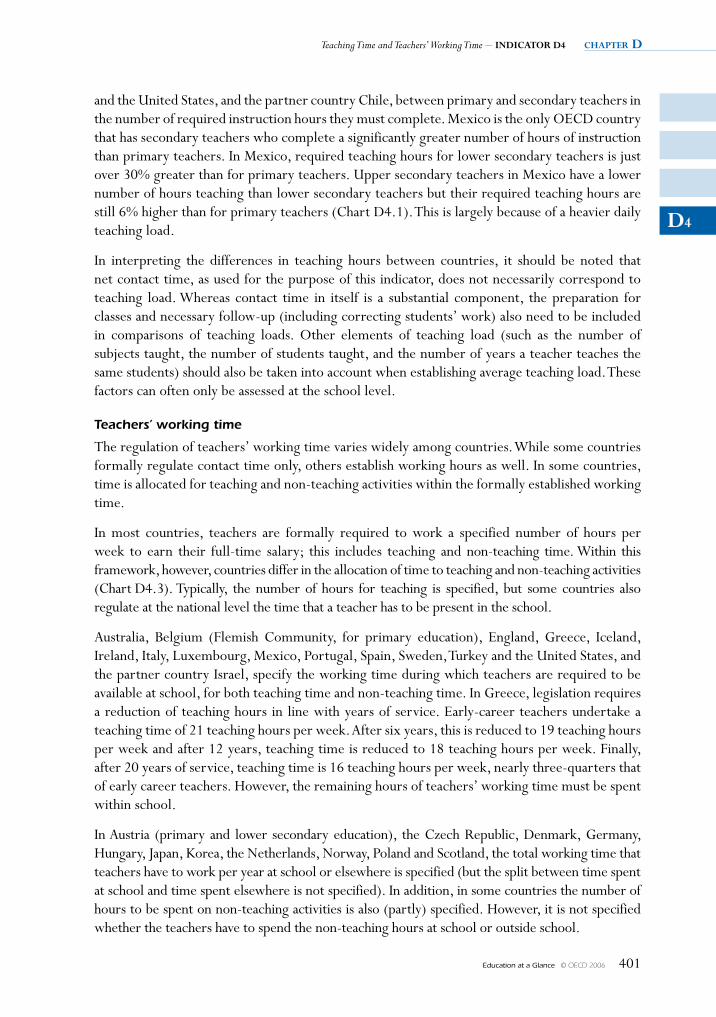
Teaching Time and Teachers’ Working Time – INDICATOR D4 chapter D
Education at a Glance © OECD 2006 401
D4
and the United States, and the partner country Chile, between primary and secondary teachers in the number of required instruction hours they must complete. Mexico is the only OECD country that has secondary teachers who complete a significantly greater number of hours of instruction than primary teachers. In Mexico, required teaching hours for lower secondary teachers is just over 30% greater than for primary teachers. Upper secondary teachers in Mexico have a lower number of hours teaching than lower secondary teachers but their required teaching hours are still 6% higher than for primary teachers (Chart D4.1). This is largely because of a heavier daily teaching load.
In interpreting the differences in teaching hours between countries, it should be noted that net contact time, as used for the purpose of this indicator, does not necessarily correspond to teaching load. Whereas contact time in itself is a substantial component, the preparation for classes and necessary follow-up (including correcting students’ work) also need to be included in comparisons of teaching loads. Other elements of teaching load (such as the number of subjects taught, the number of students taught, and the number of years a teacher teaches the same students) should also be taken into account when establishing average teaching load. These factors can often only be assessed at the school level.
Teachers’ working time
The regulation of teachers’ working time varies widely among countries. While some countries formally regulate contact time only, others establish working hours as well. In some countries, time is allocated for teaching and non-teaching activities within the formally established working time.
In most countries, teachers are formally required to work a specified number of hours per week to earn their full-time salary; this includes teaching and non-teaching time. Within this framework, however, countries differ in the allocation of time to teaching and non-teaching activities (Chart D4.3). Typically, the number of hours for teaching is specified, but some countries also regulate at the national level the time that a teacher has to be present in the school.
Australia, Belgium (Flemish Community, for primary education), England, Greece, Iceland, Ireland, Italy, Luxembourg, Mexico, Portugal, Spain, Sweden, Turkey and the United States, and the partner country Israel, specify the working time during which teachers are required to be available at school, for both teaching time and non-teaching time. In Greece, legislation requires a reduction of teaching hours in line with years of service. Early-career teachers undertake a teaching time of 21 teaching hours per week. After six years, this is reduced to 19 teaching hours per week and after 12 years, teaching time is reduced to 18 teaching hours per week. Finally, after 20 years of service, teaching time is 16 teaching hours per week, nearly three-quarters that of early career teachers. However, the remaining hours of teachers’ working time must be spent within school.
In Austria (primary and lower secondary education), the Czech Republic, Denmark, Germany, Hungary, Japan, Korea, the Netherlands, Norway, Poland and Scotland, the total working time that teachers have to work per year at school or elsewhere is specified (but the split between time spent at school and time spent elsewhere is not specified). In addition, in some countries the number of hours to be spent on non-teaching activities is also (partly) specified. However, it is not specified whether the teachers have to spend the non-teaching hours at school or outside school.
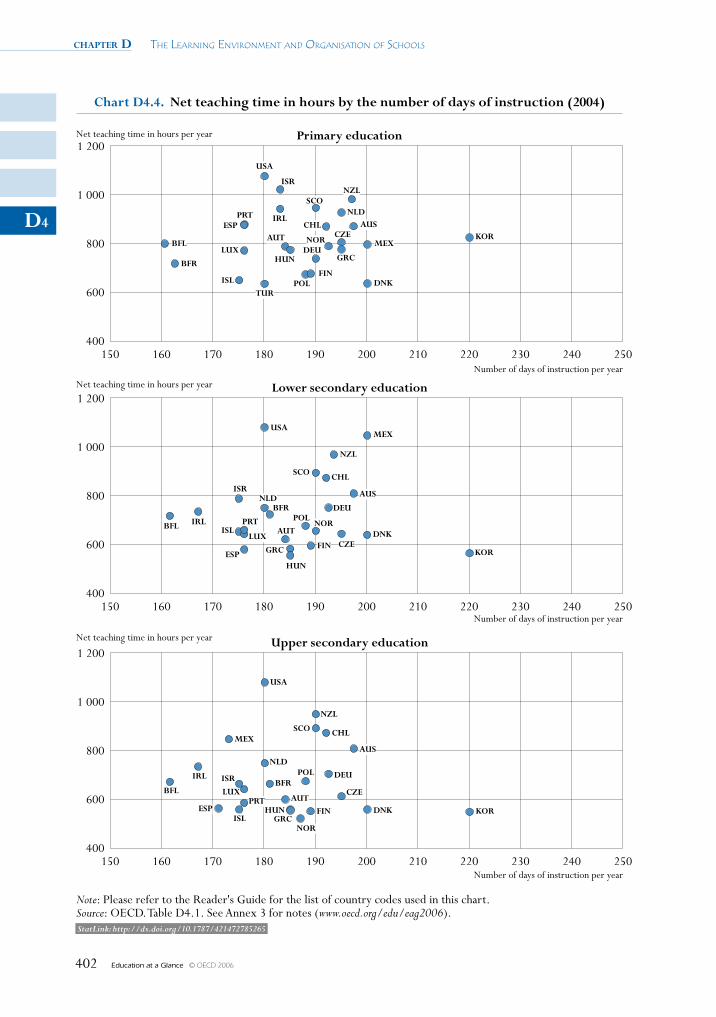
chapter D The Learning environmenT and organisaTion of schooLs
Education at a Glance © OECD 2006402
D4
PRTBFL
IsR
LUXAUT
AUTLUX
PRT
IsR
BFR
UsA
IsR
PRT
AUT CZe
sCO
POL
NLD
NORPOL
gRC
NORDeU
1 200
1 000
800
600
400150 160 170 180 190 200 210 220 230 240 250
1 200
1 000
800
600
400150 160 170 180 190 200 210 220 230 240 250
1 200
1 000
800
600
400
Net teaching time in hours per year
150 160 170 180 190 200 210 220 230 240 250
Number of days of instruction per year
Number of days of instruction per year
Number of days of instruction per year
Net teaching time in hours per year
Net teaching time in hours per year
kOR
NZL
NLDAUs
meX
DNkPOLFIN
meX
kOR
DNk
gRC FIN
DeU
AUs
NZL
kORDNk
DeU
AUs
NZL
NOR
FIN
NLD
meX
gRC
hUN
TURIsL
LUX
esP
BFL
BFR
IRLChL
sCO ChL
UsA
BFL IRLIsL
esPhUN
CZe
CZe
hUN
BFRIRL
esPIsL
sCO ChL
UsA
Chart D4.4. Net teaching time in hours by the number of days of instruction (2004)
Note: Please refer to the Reader's Guide for the list of country codes used in this chart.Source: OECD. Table D4.1. See Annex 3 for notes (www.oecd.org/edu/eag2006).
Primary education
Lower secondary education
Upper secondary education
StatLink: http://dx.doi.org/10.1787/421472785265
Teaching Time and Teachers’ Working Time – INDICATOR D4 chapter D
Education at a Glance © OECD 2006 403
D4
Non-teaching time
In Belgium (French community), Finland, France and New Zealand there are no formal requirements for how much time should be spent on non-teaching duties. However, this does not mean that teachers are totally free in carrying out other tasks. In Austria, provisions concerning teaching time are based on the assumption that the duties of the teacher (including preparing lessons and tests, marking and correcting papers, examinations, and administrative tasks) amount to a total working time of 40 hours per week. In Belgium (French community), the additional non-teaching hours within the school are set at the school level. There are no regulations regarding lesson preparation, correction of tests and marking students’ papers, etc. The government defines only the minimum and maximum number of teaching periods (of 50 minutes each) per week at each level of education (Table D4.1).
Definitions and methodologies
Data are from the 2005 OECD-INES Survey on Teachers and the Curriculum and refer to the school year 2003-2004.
Teaching time
Teaching time is defined as the number of hours per year that a full-time teacher teaches a group or class of students according to policy. It is normally calculated as the number of teaching days per annum multiplied by the number of hours a teacher teaches per day (excluding periods of time formally allowed for breaks between lessons or groups of lessons). Some countries, however, provide estimates of teaching time based on survey data.
At the primary level, short breaks between lessons are included if the classroom teacher is responsible for the class during these breaks.
Working time
Working time refers to the normal working hours of a full-time teacher. According to formal policy in a given country, working time can refer to:
• Only the time directly associated with teaching (and other curricular activities for students such as assignments and tests, but excluding annual examinations); or
• The time directly associated with teaching and hours devoted to other activities related to teaching, such as lesson preparation, counselling students, correcting assignments and tests, professional development, meetings with parents, staff meetings and general school tasks.
Working time does not include paid overtime.
Working time in school
Working time in school refers to the time teachers are supposed to spend at work, including teaching and non-teaching time.
Number of teaching weeks and days
The number of teaching weeks refers to the number of weeks of instruction excluding holiday weeks. The number of teaching days is the number of teaching weeks multiplied by the number of days a teacher teaches per week, less the number of days that the school is closed for festivities.
chapter D The Learning environmenT and organisaTion of schooLs
Education at a Glance © OECD 2006404
D4
Further references
The following additional material relevant to this indicator is available on the Web athttp://dx.doi.org/10.1787/421472785265
• Table D4.2. Number of teaching hours per year (1996, 2004)
Specific notes on definitions and methodologies regarding this indicator for each country are given in Annex 3 (www.oecd.org/edu/eag2006).
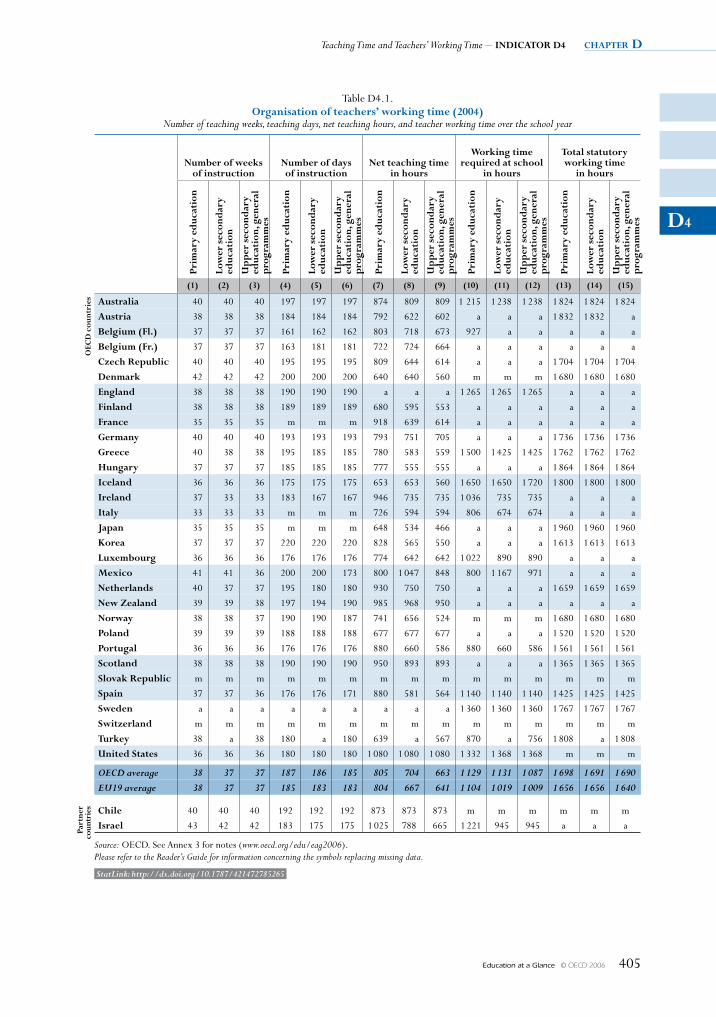
Teaching Time and Teachers’ Working Time – INDICATOR D4 chapter D
Education at a Glance © OECD 2006 405
D4
Table D4.1.Organisation of teachers’ working time (2004)
Number of teaching weeks, teaching days, net teaching hours, and teacher working time over the school year
Number of weeks of instruction
Number of days of instruction
Net teaching time in hours
working time required at school
in hours
Total statutory working time
in hours
Prim
ary
educ
atio
n
Low
er s
econ
dar
y ed
ucat
ion
Up
per
sec
ond
ary
educ
atio
n, g
ener
al
pro
gram
mes
Prim
ary
educ
atio
n
Low
er s
econ
dar
y ed
ucat
ion
Up
per
sec
ond
ary
educ
atio
n, g
ener
al
pro
gram
mes
Prim
ary
educ
atio
n
Low
er s
econ
dar
y ed
ucat
ion
Up
per
sec
ond
ary
educ
atio
n, g
ener
al
pro
gram
mes
Prim
ary
educ
atio
n
Low
er s
econ
dar
y ed
ucat
ion
Up
per
sec
ond
ary
educ
atio
n, g
ener
al
pro
gram
mes
Prim
ary
educ
atio
n
Low
er s
econ
dar
y ed
ucat
ion
Up
per
sec
ond
ary
educ
atio
n, g
ener
al
pro
gram
mes
(1) (2) (3) (4) (5) (6) (7) (8) (9) (10) (11) (12) (13) (14) (15)
OeC
D c
ount
ries Australia 40 40 40 197 197 197 874 809 809 1 215 1 238 1 238 1 824 1 824 1 824
Austria 38 38 38 184 184 184 792 622 602 a a a 1 832 1 832 a
Belgium (Fl.) 37 37 37 161 162 162 803 718 673 927 a a a a a
Belgium (Fr.) 37 37 37 163 181 181 722 724 664 a a a a a a
Czech Republic 40 40 40 195 195 195 809 644 614 a a a 1 704 1 704 1 704
Denmark 42 42 42 200 200 200 640 640 560 m m m 1 680 1 680 1 680
england 38 38 38 190 190 190 a a a 1 265 1 265 1 265 a a a
Finland 38 38 38 189 189 189 680 595 553 a a a a a a
France 35 35 35 m m m 918 639 614 a a a a a a
germany 40 40 40 193 193 193 793 751 705 a a a 1 736 1 736 1 736
greece 40 38 38 195 185 185 780 583 559 1 500 1 425 1 425 1 762 1 762 1 762
hungary 37 37 37 185 185 185 777 555 555 a a a 1 864 1 864 1 864
Iceland 36 36 36 175 175 175 653 653 560 1 650 1 650 1 720 1 800 1 800 1 800
Ireland 37 33 33 183 167 167 946 735 735 1 036 735 735 a a a
Italy 33 33 33 m m m 726 594 594 806 674 674 a a a
Japan 35 35 35 m m m 648 534 466 a a a 1 960 1 960 1 960
korea 37 37 37 220 220 220 828 565 550 a a a 1 613 1 613 1 613
Luxembourg 36 36 36 176 176 176 774 642 642 1 022 890 890 a a a
mexico 41 41 36 200 200 173 800 1 047 848 800 1 167 971 a a a
Netherlands 40 37 37 195 180 180 930 750 750 a a a 1 659 1 659 1 659
New Zealand 39 39 38 197 194 190 985 968 950 a a a a a a
Norway 38 38 37 190 190 187 741 656 524 m m m 1 680 1 680 1 680
Poland 39 39 39 188 188 188 677 677 677 a a a 1 520 1 520 1 520
Portugal 36 36 36 176 176 176 880 660 586 880 660 586 1 561 1 561 1 561
scotland 38 38 38 190 190 190 950 893 893 a a a 1 365 1 365 1 365
slovak Republic m m m m m m m m m m m m m m m
spain 37 37 36 176 176 171 880 581 564 1 140 1 140 1 140 1 425 1 425 1 425
sweden a a a a a a a a a 1 360 1 360 1 360 1 767 1 767 1 767
switzerland m m m m m m m m m m m m m m m
Turkey 38 a 38 180 a 180 639 a 567 870 a 756 1 808 a 1 808
United states 36 36 36 180 180 180 1 080 1 080 1 080 1 332 1 368 1 368 m m m
OECD average 38 37 37 187 186 185 805 704 663 1 129 1 131 1 087 1 698 1 691 1 690EU19 average 38 37 37 185 183 183 804 667 641 1 104 1 019 1 009 1 656 1 656 1 640
Part
ner
coun
trie
s Chile 40 40 40 192 192 192 873 873 873 m m m m m m
Israel 43 42 42 183 175 175 1 025 788 665 1 221 945 945 a a a
Source: OECD. See Annex 3 for notes (www.oecd.org/edu/eag2006).Please refer to the Reader’s Guide for information concerning the symbols replacing missing data.
StatLink: http://dx.doi.org/10.1787/421472785265
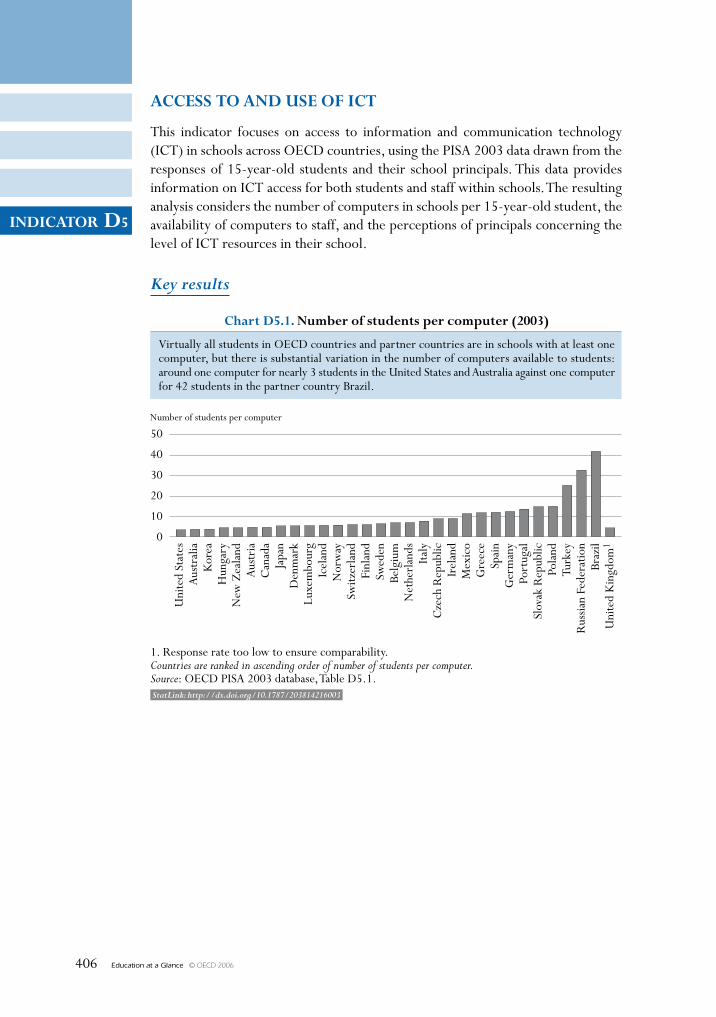
Education at a Glance © OECD 2006406
INDICATOR D5
StatLink: http://dx.doi.org/10.1787/203814216003
ACCess TO AND use Of ICT
This indicator focuses on access to information and communication technology (ICT) in schools across OECD countries, using the PISA 2003 data drawn from the responses of 15-year-old students and their school principals. This data provides information on ICT access for both students and staff within schools. The resulting analysis considers the number of computers in schools per 15-year-old student, the availability of computers to staff, and the perceptions of principals concerning the level of ICT resources in their school.
Key results
50
40
30
20
10
0
Number of students per computer
Chart D5.1. Number of students per computer (2003)
1. Response rate too low to ensure comparability.Countries are ranked in ascending order of number of students per computer.Source: OECD PISA 2003 database, Table D5.1.
Uni
ted
Stat
esA
ustr
alia
Kor
eaH
unga
ryN
ew Z
eala
ndA
ustr
iaC
anad
aJa
pan
Den
mar
kLu
xem
bour
gIc
elan
dN
orw
aySw
itzer
land
Finl
and
Swed
enBe
lgiu
mN
ethe
rlan
dsIta
lyC
zech
Rep
ublic
Irel
and
Mex
ico
Gre
ece
Spai
nG
erm
any
Port
ugal
Slov
ak R
epub
licPo
land
Turk
eyR
ussia
n Fe
dera
tion
Braz
ilU
nite
d K
ingd
om1
Virtually all students in OECD countries and partner countries are in schools with at least onecomputer, but there is substantial variation in the number of computers available to students:around one computer for nearly 3 students in the United States and Australia against one computerfor 42 students in the partner country Brazil.
Education at a Glance © OECD 2006 407
INDICATOR D5
Other highlights of this indicator
•On average among OECD countries, the number of computers per student in schools has increased since PISA 2000. This increase has occurred in all but three OECD countries (Denmark, Poland and Portugal).
•There is substantial variation in the level of access students have to computers at schools. Some OECD countries have more than one computer for every five students, while eight OECD countries have, on average, less than one computer per ten students (Germany, Greece, Mexico, Poland, Portugal, the Slovak Republic, Spain and Turkey).
•Even though access to computers is greater at school than at home, 15-year-old students use their computers at home more frequently. Nearly three-quarters of students are using computers at home several times each week.
•Twenty-six per cent of school principals believe that ICT resources are at a level that does not hinder instruction in OECD countries. But there is substantial variation within and between countries. On average across OECD countries, 11% of school principals believe that a lack of ICT resources in their school hinders the instruction of students “a lot”.
chapter D The Learning environmenT and organisaTion of schooLs
Education at a Glance © OECD 2006408
D5
Policy context
Information technology continues to be an essential element of economic growth in all OECD countries. This is true not just for the growth in the ICT sector, but in the importance of ICT to blue and particularly white-collar employment and across industries as diverse as agriculture, finance, and medicine. For students, ICT skills and abilities will affect employment opportunities as well as how they integrate an increasingly technology-oriented society.
Arguably, students will need a sufficient level of familiarity and mastery of ICT to be successful in their further education and work-life. Following this assumption, schools require sufficient ICT resources for student use and learning, and for teachers and school administrators to operate functionally effective schools and school programmes.
The distribution of resources across and within education systems has long been an important issue for both educational equality and efficiency. Advances in technology in recent years beg the question of whether those without access to ICT resources will be disadvantaged – unable to share the benefits of technological growth. From the perspective of education policy-makers, it is important to consider whether schools in poorer communities provide the ICT resources that are otherwise lacking within the local community.
ICT resources within schools
Computersperstudent
Across OECD countries, virtually all students attend schools with at least one computer. It is clear that virtually all schools have at least some level of ICT resources. In Australia, Austria, Canada, Hungary, Korea, New Zealand, the United Kingdom and the United States the number of computers per student is more than 0.2, implying five or fewer students per computer. In Germany, Greece, Mexico, Poland, Portugal, the Slovak Republic and Spain, the number of computers per student is less than 0.1, implying 10 or more students per computer. In Turkey and the partner countries Brazil and the Russian Federation there are fewer computers per student, with 25 or more students enrolled at schools per computer (Table D5.1 and Chart D5.1).
The number of computers per student has increased between 2000 and 2003. In 2000, there were 0.13 computers per student in schools (OECD average). By 2003, this had increased to 0.16 computers per student. This is equivalent to a decrease of nearly 1.5 students per computer in three years so that in 2003 there was 1 computer for every 6.25 students in schools in OECD countries. It is not possible to determine from this data whether this increase in computers is due to policy decisions to increase funding in ICT for schools or because of decreases in the price of computers and other ICT resources between 2000 and 2003.
Growth in the numbers of computers per student has occurred in most OECD countries. However, the number of computers per student has stayed the same in Denmark and has decreased in Norway, Poland and Portugal.
Student,teacherandadministrativeaccesstoICT
The number of computers per students illustrates only a portion of the question of the access to ICT. To better comprehend this issue, it is important to analyse who actually has access to the computers. The data used here show the percentage of computers in schools that are available to: 15-year-old students; only to teachers; only to administrative staff (Table D5.1 and Chart D5.2).
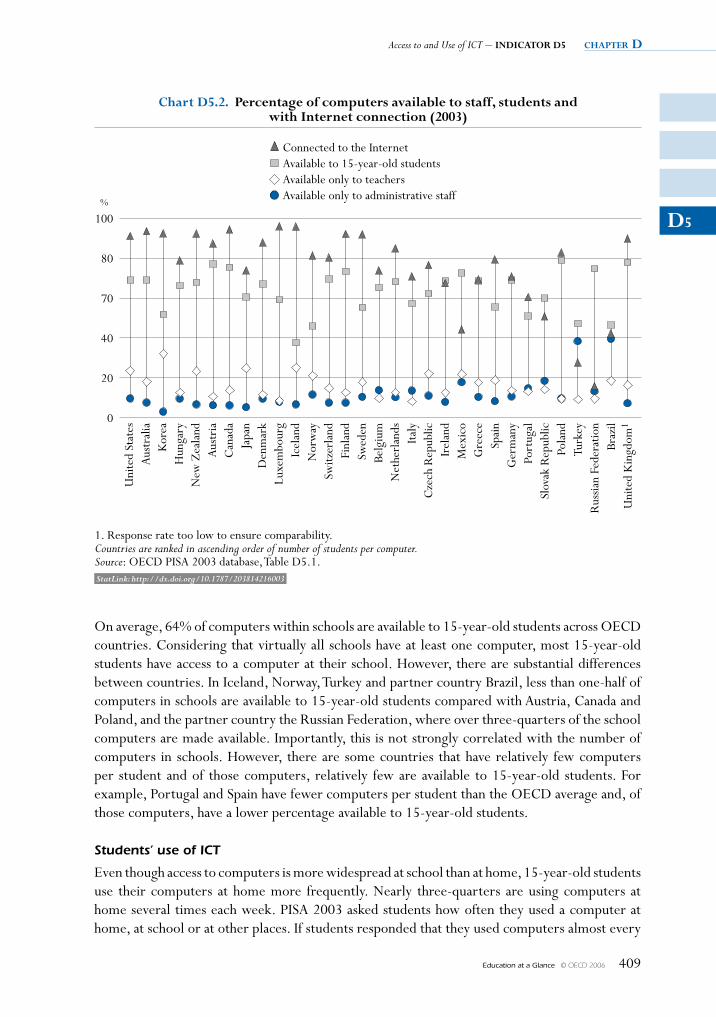
Access to and Use of ICT – INDICATOR D5 chapter D
Education at a Glance © OECD 2006 409
D5100
80
70
40
20
0
%
Chart D5.2. Percentage of computers available to staff, students andwith Internet connection (2003)
Connected to the InternetAvailable to 15-year-old studentsAvailable only to teachersAvailable only to administrative staff
1. Response rate too low to ensure comparability.Countries are ranked in ascending order of number of students per computer.Source: OECD PISA 2003 database, Table D5.1.
Uni
ted
Stat
esA
ustr
alia
Kor
eaH
unga
ryN
ew Z
eala
ndA
ustr
iaC
anad
aJa
pan
Den
mar
kLu
xem
bour
gIc
elan
dN
orw
aySw
itzer
land
Finl
and
Swed
enBe
lgiu
mN
ethe
rlan
dsIta
lyC
zech
Rep
ublic
Irel
and
Mex
ico
Gre
ece
Spai
nG
erm
any
Port
ugal
Slov
ak R
epub
licPo
land
Turk
eyR
ussia
n Fe
dera
tion
Braz
ilU
nite
d K
ingd
om1
StatLink: http://dx.doi.org/10.1787/203814216003
On average, 64% of computers within schools are available to 15-year-old students across OECD countries. Considering that virtually all schools have at least one computer, most 15-year-old students have access to a computer at their school. However, there are substantial differences between countries. In Iceland, Norway, Turkey and partner country Brazil, less than one-half of computers in schools are available to 15-year-old students compared with Austria, Canada and Poland, and the partner country the Russian Federation, where over three-quarters of the school computers are made available. Importantly, this is not strongly correlated with the number of computers in schools. However, there are some countries that have relatively few computers per student and of those computers, relatively few are available to 15-year-old students. For example, Portugal and Spain have fewer computers per student than the OECD average and, of those computers, have a lower percentage available to 15-year-old students.
Students’useofICT
Even though access to computers is more widespread at school than at home, 15-year-old students use their computers at home more frequently. Nearly three-quarters are using computers at home several times each week. PISA 2003 asked students how often they used a computer at home, at school or at other places. If students responded that they used computers almost every
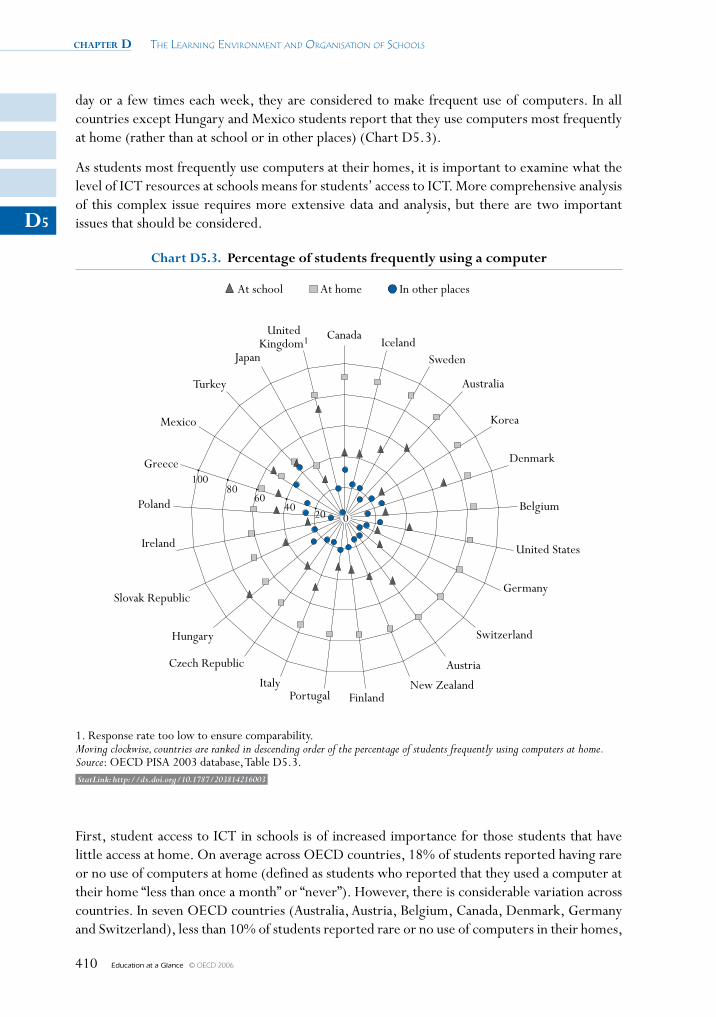
chapter D The Learning environmenT and organisaTion of schooLs
Education at a Glance © OECD 2006410
D5
day or a few times each week, they are considered to make frequent use of computers. In all countries except Hungary and Mexico students report that they use computers most frequently at home (rather than at school or in other places) (Chart D5.3).
As students most frequently use computers at their homes, it is important to examine what the level of ICT resources at schools means for students’ access to ICT. More comprehensive analysis of this complex issue requires more extensive data and analysis, but there are two important issues that should be considered.
Canada
02040
6080
100
IcelandSweden
Australia
Korea
Denmark
United States
Germany
Switzerland
Belgium
Austria
New ZealandFinlandPortugal
Italy
Czech Republic
Hungary
Slovak Republic
Ireland
Poland
Greece
Mexico
Turkey
Japan
UnitedKingdom1
Chart D5.3. Percentage of students frequently using a computer
At school
1. Response rate too low to ensure comparability.Moving clockwise, countries are ranked in descending order of the percentage of students frequently using computers at home.Source: OECD PISA 2003 database, Table D5.3.
At home In other places
StatLink: http://dx.doi.org/10.1787/203814216003
First, student access to ICT in schools is of increased importance for those students that have little access at home. On average across OECD countries, 18% of students reported having rare or no use of computers at home (defined as students who reported that they used a computer at their home “less than once a month” or “never”). However, there is considerable variation across countries. In seven OECD countries (Australia, Austria, Belgium, Canada, Denmark, Germany and Switzerland), less than 10% of students reported rare or no use of computers in their homes,
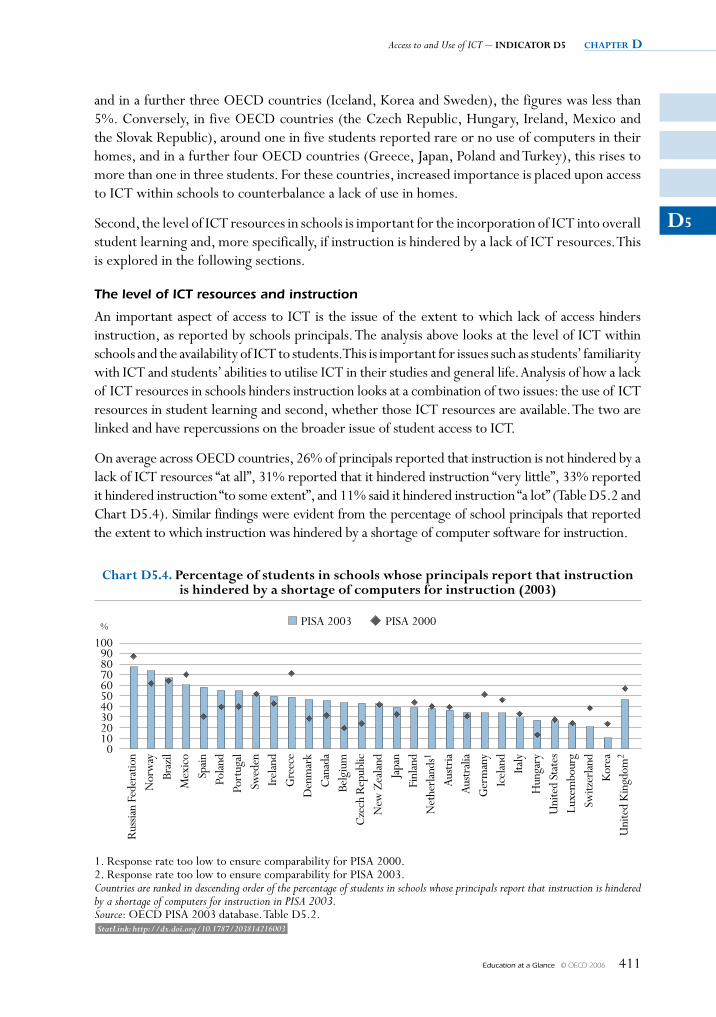
Access to and Use of ICT – IndIcator d5 chapter D
Education at a Glance © OECD 2006 411
d5
and in a further three OECD countries (Iceland, Korea and Sweden), the figures was less than 5%. Conversely, in five OECD countries (the Czech Republic, Hungary, Ireland, Mexico and the Slovak Republic), around one in five students reported rare or no use of computers in their homes, and in a further four OECD countries (Greece, Japan, Poland and Turkey), this rises to more than one in three students. For these countries, increased importance is placed upon access to ICT within schools to counterbalance a lack of use in homes.
Second, the level of ICT resources in schools is important for the incorporation of ICT into overall student learning and, more specifically, if instruction is hindered by a lack of ICT resources. This is explored in the following sections.
The level of ICT resources and instruction
An important aspect of access to ICT is the issue of the extent to which lack of access hinders instruction, as reported by schools principals. The analysis above looks at the level of ICT within schools and the availability of ICT to students. This is important for issues such as students’ familiarity with ICT and students’ abilities to utilise ICT in their studies and general life. Analysis of how a lack of ICT resources in schools hinders instruction looks at a combination of two issues: the use of ICT resources in student learning and second, whether those ICT resources are available. The two are linked and have repercussions on the broader issue of student access to ICT.
On average across OECD countries, 26% of principals reported that instruction is not hindered by a lack of ICT resources “at all”, 31% reported that it hindered instruction “very little”, 33% reported it hindered instruction “to some extent”, and 11% said it hindered instruction “a lot” (Table D5.2 and Chart D5.4). Similar findings were evident from the percentage of school principals that reported the extent to which instruction was hindered by a shortage of computer software for instruction.
StatLink: http://dx.doi.org/10.1787/203814216003
100908070605040302010
0
%
chart d5.4. Percentage of students in schools whose principals report that instructionis hindered by a shortage of computers for instruction (2003)
PISA 2003 PISA 2000
1. Response rate too low to ensure comparability for PISA 2000.2. Response rate too low to ensure comparability for PISA 2003.Countries are ranked in descending order of the percentage of students in schools whose principals report that instruction is hinderedby a shortage of computers for instruction in PISA 2003.Source: OECD PISA 2003 database. Table D5.2.
Rus
sian
Fede
ratio
nN
orw
ayBr
azil
Mex
ico
Spain
Pola
ndPo
rtug
alSw
eden
Irel
and
Gre
ece
Den
mar
kC
anad
aBe
lgiu
mC
zech
Rep
ublic
New
Zea
land
Japa
nFi
nlan
dN
ethe
rland
s1
Aust
riaAu
stra
liaG
erm
any
Icel
and
Italy
Hun
gary
Uni
ted
Stat
esLu
xem
bour
gSw
itzer
land
Kor
eaU
nite
d K
ingd
om2
chapter D The Learning environmenT and organisaTion of schooLs
Education at a Glance © OECD 2006412
D5
As stated earlier, principals’ perceptions of the extent that instruction is hindered by a shortage of computers for instruction involve two issues: first, the extent of the use of ICT resources in student learning and second, whether those ICT resources are available. This issue can, at least partly, be separated. Analysis of principals’ perceptions can be nuanced by comparing these perceptions with the number of computers per student in schools. Across OECD countries, on average, principals who reported that instruction is hindered by a lack of ICT resources had fewer computers per student across their schools (Table D5.2). This would imply that principals believe that fewer computers per student hinders instruction to those students. This magnifies problems in schools where students have poor access to computers and thus less opportunity to gain familiarity and increase their general ICT skills and abilities.
Change has occurred in most countries between 2000 and 2003. In some countries the situation appears to have improved; in others, it seems to have worsened. For most countries, these changes are relatively minor but in others, the percentage of students in schools whose principals report that a shortage of computers hinders instruction to some extent or a lot has changed substantially between 2000 and 2003. In Belgium, Canada, the Czech Republic, Denmark,
Box D5.1. findings on students’ access and use of ICT and their performance in PIsA 2003
This indicator includes a comparison of student access to ICT and principals’ perceptions of the extent that instruction is hindered by a shortage of ICT resources in their schools. But this does not necessarily translate into an effect upon student performance. A thematic report from PISA 2003 entitled Are Students Ready for a Technology-Rich World? What PISA Studies Tell Us (OECD, 2005e) provides a comprehensive analysis of these issues. In regard to the effect upon student performance, the report’s main findings were that:
• There is a consistent and significant positive relationship between the years of experience in computer use and mathematics performance, both before and after accounting for socio-economic and systemic variables.
• There is a consistent and significant positive curvilinear relationship between the frequency of computer use at home and mathematics performance, both before and after accounting for socio-economic and systemic variables.
• There is a curvilinear relationship between the frequency of computer use at school and mathematics performance, with moderate users of computers showing the highest mathematics performance while rare and frequent computer users perform at similar levels, once socio-economic and systemic variables have been accounted for.
• With the introduction of a multi-level structure of modelling using selected control variables, the performance gaps between students with access to computers at home and those without are less pronounced than those in the simple linear regression models, but in one-half of OECD countries students with computer access at home perform higher in mathematics than those without. Similarly, there is a performance advantage for students with access to computers at school in at least 10 out of 25 OECD even when the multi-level structure and various background factors are taken into account.
Access to and Use of ICT – INDICATOR D5 chapter D
Education at a Glance © OECD 2006 413
D5
Hungary, Norway, Poland, Portugal and Spain, the hindering of instruction to some extent or a lot due to a shortage of computers has increased. In Belgium, Hungary and Spain, the proportion of students whose principals report this shortage has even doubled between 2000 and 2003. Conversely, the reported effects of shortages have substantially lessened in Germany, Greece, Iceland and Korea, and the partner country the Russian Federation, although not to the same extent.
Definitions and methodologies
The target population studied for this indicator was 15-year-old students. Operationally, this referred to students who were from 15 years and 3 (completed) months to 16 years and 2 (completed) months at the beginning of the testing period and who were enrolled in an educational institution, irrespective of the grade levels or type of institutions in which they were enrolled, and irrespective of whether they participated in school full-time or part-time.
Further references
For further information about PISA 2003, see Learning for Tomorrow’s World – First Results from PISA 2003 (OECD 2004a), Are Students Ready for a Technology-Rich World? What PISA Studies Tell Us (OECD, 2005e) and the PISA 2003 Technical Report (OECD 2005c) PISA data are also available on the PISA Web site: www.pisa.oecd.org.
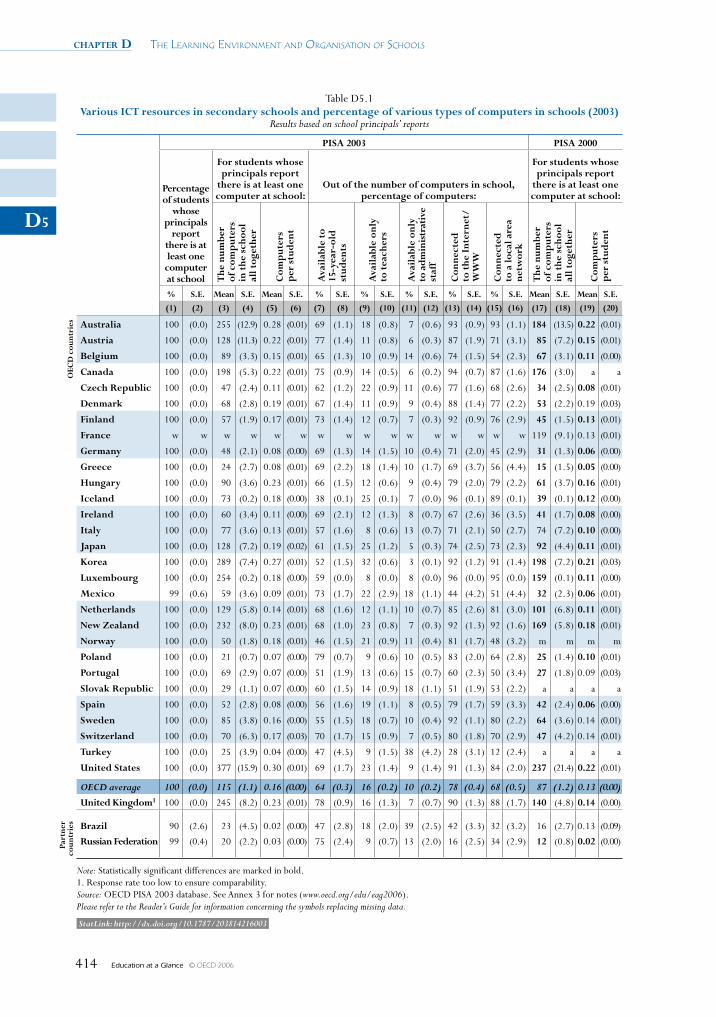
chapter D The Learning environmenT and organisaTion of schooLs
Education at a Glance © OECD 2006414
D5
Table D5.1 Various ICT resources in secondary schools and percentage of various types of computers in schools (2003)
Results based on school principals’ reports
PISA 2003 PISA 2000
Percentage of students
whose principals
report there is at least one
computer at school
For students whose principals report
there is at least one computer at school:
Out of the number of computers in school, percentage of computers:
For students whose principals report
there is at least one computer at school:
The
num
ber
of
com
put
ers
in
the
sch
ool
all t
oget
her
Com
put
ers
p
er s
tud
ent
Ava
ilab
le t
o
15-y
ear-
old
st
uden
ts
Ava
ilab
le o
nly
to
tea
cher
s
Ava
ilab
le o
nly
to
adm
inis
trat
ive
staf
f
Con
nect
ed
to t
he I
nter
net/
WW
W
Con
nect
ed
to a
loca
l are
a ne
twor
k
The
num
ber
of
com
put
ers
in
the
sch
ool
all t
oget
her
Com
put
ers
p
er s
tud
ent
% S.E. Mean S.E. Mean S.E. % S.E. % S.E. % S.E. % S.E. % S.E. Mean S.E. Mean S.E.
(1) (2) (3) (4) (5) (6) (7) (8) (9) (10) (11) (12) (13) (14) (15) (16) (17) (18) (19) (20)
OEC
D c
ount
ries Australia 100 (0.0) 255 (12.9) 0.28 (0.01) 69 (1.1) 18 (0.8) 7 (0.6) 93 (0.9) 93 (1.1) 184 (13.5) 0.22 (0.01)
Austria 100 (0.0) 128 (11.3) 0.22 (0.01) 77 (1.4) 11 (0.8) 6 (0.3) 87 (1.9) 71 (3.1) 85 (7.2) 0.15 (0.01)
Belgium 100 (0.0) 89 (3.3) 0.15 (0.01) 65 (1.3) 10 (0.9) 14 (0.6) 74 (1.5) 54 (2.3) 67 (3.1) 0.11 (0.00)
Canada 100 (0.0) 198 (5.3) 0.22 (0.01) 75 (0.9) 14 (0.5) 6 (0.2) 94 (0.7) 87 (1.6) 176 (3.0) a a
Czech Republic 100 (0.0) 47 (2.4) 0.11 (0.01) 62 (1.2) 22 (0.9) 11 (0.6) 77 (1.6) 68 (2.6) 34 (2.5) 0.08 (0.01)
Denmark 100 (0.0) 68 (2.8) 0.19 (0.01) 67 (1.4) 11 (0.9) 9 (0.4) 88 (1.4) 77 (2.2) 53 (2.2) 0.19 (0.03)
Finland 100 (0.0) 57 (1.9) 0.17 (0.01) 73 (1.4) 12 (0.7) 7 (0.3) 92 (0.9) 76 (2.9) 45 (1.5) 0.13 (0.01)
France w w w w w w w w w w w w w w w w 119 (9.1) 0.13 (0.01)
Germany 100 (0.0) 48 (2.1) 0.08 (0.00) 69 (1.3) 14 (1.5) 10 (0.4) 71 (2.0) 45 (2.9) 31 (1.3) 0.06 (0.00)
Greece 100 (0.0) 24 (2.7) 0.08 (0.01) 69 (2.2) 18 (1.4) 10 (1.7) 69 (3.7) 56 (4.4) 15 (1.5) 0.05 (0.00)
Hungary 100 (0.0) 90 (3.6) 0.23 (0.01) 66 (1.5) 12 (0.6) 9 (0.4) 79 (2.0) 79 (2.2) 61 (3.7) 0.16 (0.01)
Iceland 100 (0.0) 73 (0.2) 0.18 (0.00) 38 (0.1) 25 (0.1) 7 (0.0) 96 (0.1) 89 (0.1) 39 (0.1) 0.12 (0.00)
Ireland 100 (0.0) 60 (3.4) 0.11 (0.00) 69 (2.1) 12 (1.3) 8 (0.7) 67 (2.6) 36 (3.5) 41 (1.7) 0.08 (0.00)
Italy 100 (0.0) 77 (3.6) 0.13 (0.01) 57 (1.6) 8 (0.6) 13 (0.7) 71 (2.1) 50 (2.7) 74 (7.2) 0.10 (0.00)
Japan 100 (0.0) 128 (7.2) 0.19 (0.02) 61 (1.5) 25 (1.2) 5 (0.3) 74 (2.5) 73 (2.3) 92 (4.4) 0.11 (0.01)
Korea 100 (0.0) 289 (7.4) 0.27 (0.01) 52 (1.5) 32 (0.6) 3 (0.1) 92 (1.2) 91 (1.4) 198 (7.2) 0.21 (0.03)
Luxembourg 100 (0.0) 254 (0.2) 0.18 (0.00) 59 (0.0) 8 (0.0) 8 (0.0) 96 (0.0) 95 (0.0) 159 (0.1) 0.11 (0.00)
Mexico 99 (0.6) 59 (3.6) 0.09 (0.01) 73 (1.7) 22 (2.9) 18 (1.1) 44 (4.2) 51 (4.4) 32 (2.3) 0.06 (0.01)
Netherlands 100 (0.0) 129 (5.8) 0.14 (0.01) 68 (1.6) 12 (1.1) 10 (0.7) 85 (2.6) 81 (3.0) 101 (6.8) 0.11 (0.01)
New Zealand 100 (0.0) 232 (8.0) 0.23 (0.01) 68 (1.0) 23 (0.8) 7 (0.3) 92 (1.3) 92 (1.6) 169 (5.8) 0.18 (0.01)
Norway 100 (0.0) 50 (1.8) 0.18 (0.01) 46 (1.5) 21 (0.9) 11 (0.4) 81 (1.7) 48 (3.2) m m m m
Poland 100 (0.0) 21 (0.7) 0.07 (0.00) 79 (0.7) 9 (0.6) 10 (0.5) 83 (2.0) 64 (2.8) 25 (1.4) 0.10 (0.01)
Portugal 100 (0.0) 69 (2.9) 0.07 (0.00) 51 (1.9) 13 (0.6) 15 (0.7) 60 (2.3) 50 (3.4) 27 (1.8) 0.09 (0.03)
Slovak Republic 100 (0.0) 29 (1.1) 0.07 (0.00) 60 (1.5) 14 (0.9) 18 (1.1) 51 (1.9) 53 (2.2) a a a a
Spain 100 (0.0) 52 (2.8) 0.08 (0.00) 56 (1.6) 19 (1.1) 8 (0.5) 79 (1.7) 59 (3.3) 42 (2.4) 0.06 (0.00)
Sweden 100 (0.0) 85 (3.8) 0.16 (0.00) 55 (1.5) 18 (0.7) 10 (0.4) 92 (1.1) 80 (2.2) 64 (3.6) 0.14 (0.01)
Switzerland 100 (0.0) 70 (6.3) 0.17 (0.03) 70 (1.7) 15 (0.9) 7 (0.5) 80 (1.8) 70 (2.9) 47 (4.2) 0.14 (0.01)
Turkey 100 (0.0) 25 (3.9) 0.04 (0.00) 47 (4.5) 9 (1.5) 38 (4.2) 28 (3.1) 12 (2.4) a a a a
United States 100 (0.0) 377 (15.9) 0.30 (0.01) 69 (1.7) 23 (1.4) 9 (1.4) 91 (1.3) 84 (2.0) 237 (21.4) 0.22 (0.01)
OECD average 100 (0.0) 115 (1.1) 0.16 (0.00) 64 (0.3) 16 (0.2) 10 (0.2) 78 (0.4) 68 (0.5) 87 (1.2) 0.13 (0.00)
United Kingdom1 100 (0.0) 245 (8.2) 0.23 (0.01) 78 (0.9) 16 (1.3) 7 (0.7) 90 (1.3) 88 (1.7) 140 (4.8) 0.14 (0.00)
Part
ner
coun
trie
s Brazil 90 (2.6) 23 (4.5) 0.02 (0.00) 47 (2.8) 18 (2.0) 39 (2.5) 42 (3.3) 32 (3.2) 16 (2.7) 0.13 (0.09)
Russian Federation 99 (0.4) 20 (2.2) 0.03 (0.00) 75 (2.4) 9 (0.7) 13 (2.0) 16 (2.5) 34 (2.9) 12 (0.8) 0.02 (0.00)
Note: Statistically significant differences are marked in bold.1. Response rate too low to ensure comparability.Source: OECD PISA 2003 database. See Annex 3 for notes (www.oecd.org/edu/eag2006).Please refer to the Reader’s Guide for information concerning the symbols replacing missing data.
StatLink: http://dx.doi.org/10.1787/203814216003
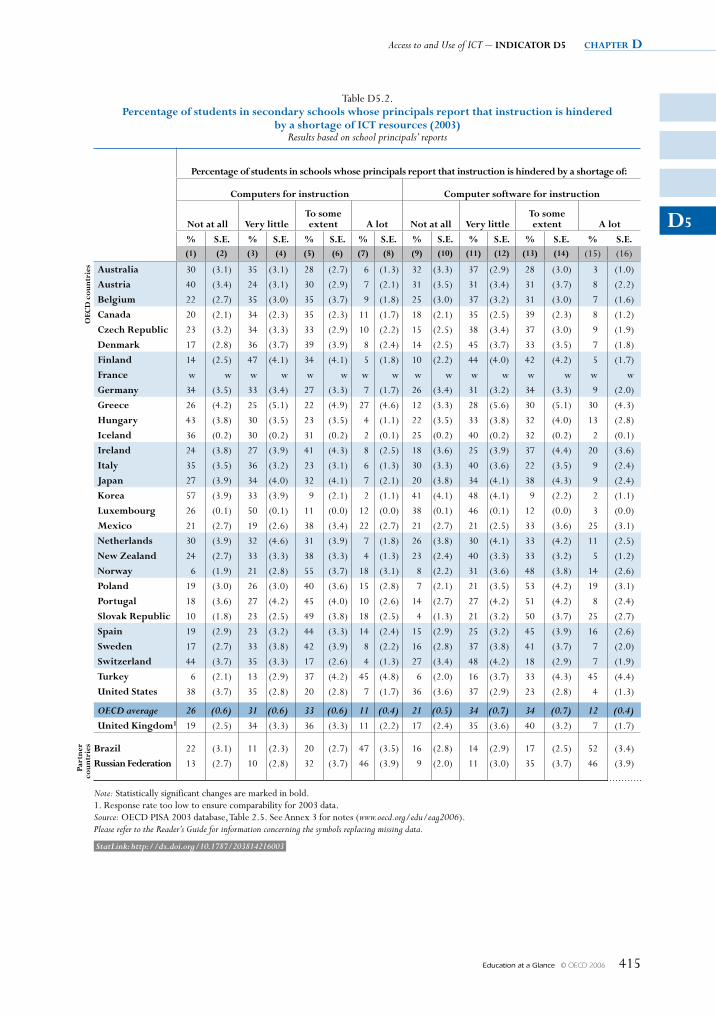
Access to and Use of ICT – INDICATOR D5 chapter D
Education at a Glance © OECD 2006 415
D5
Table D5.2. Percentage of students in secondary schools whose principals report that instruction is hindered
by a shortage of ICT resources (2003) Results based on school principals’ reports
Percentage of students in schools whose principals report that instruction is hindered by a shortage of:
Computers for instruction Computer software for instruction
Not at all Very littleTo some extent A lot Not at all Very little
To some extent A lot
% s.e. % s.e. % s.e. % s.e. % s.e. % s.e. % s.e. % s.e.(1) (2) (3) (4) (5) (6) (7) (8) (9) (10) (11) (12) (13) (14) (15) (16)
OeC
D c
ount
ries Australia 30 (3.1) 35 (3.1) 28 (2.7) 6 (1.3) 32 (3.3) 37 (2.9) 28 (3.0) 3 (1.0)
Austria 40 (3.4) 24 (3.1) 30 (2.9) 7 (2.1) 31 (3.5) 31 (3.4) 31 (3.7) 8 (2.2)
Belgium 22 (2.7) 35 (3.0) 35 (3.7) 9 (1.8) 25 (3.0) 37 (3.2) 31 (3.0) 7 (1.6)
Canada 20 (2.1) 34 (2.3) 35 (2.3) 11 (1.7) 18 (2.1) 35 (2.5) 39 (2.3) 8 (1.2)
Czech Republic 23 (3.2) 34 (3.3) 33 (2.9) 10 (2.2) 15 (2.5) 38 (3.4) 37 (3.0) 9 (1.9)
Denmark 17 (2.8) 36 (3.7) 39 (3.9) 8 (2.4) 14 (2.5) 45 (3.7) 33 (3.5) 7 (1.8)
finland 14 (2.5) 47 (4.1) 34 (4.1) 5 (1.8) 10 (2.2) 44 (4.0) 42 (4.2) 5 (1.7)
france w w w w w w w w w w w w w w w w
Germany 34 (3.5) 33 (3.4) 27 (3.3) 7 (1.7) 26 (3.4) 31 (3.2) 34 (3.3) 9 (2.0)
Greece 26 (4.2) 25 (5.1) 22 (4.9) 27 (4.6) 12 (3.3) 28 (5.6) 30 (5.1) 30 (4.3)
Hungary 43 (3.8) 30 (3.5) 23 (3.5) 4 (1.1) 22 (3.5) 33 (3.8) 32 (4.0) 13 (2.8)
Iceland 36 (0.2) 30 (0.2) 31 (0.2) 2 (0.1) 25 (0.2) 40 (0.2) 32 (0.2) 2 (0.1)
Ireland 24 (3.8) 27 (3.9) 41 (4.3) 8 (2.5) 18 (3.6) 25 (3.9) 37 (4.4) 20 (3.6)
Italy 35 (3.5) 36 (3.2) 23 (3.1) 6 (1.3) 30 (3.3) 40 (3.6) 22 (3.5) 9 (2.4)
Japan 27 (3.9) 34 (4.0) 32 (4.1) 7 (2.1) 20 (3.8) 34 (4.1) 38 (4.3) 9 (2.4)
Korea 57 (3.9) 33 (3.9) 9 (2.1) 2 (1.1) 41 (4.1) 48 (4.1) 9 (2.2) 2 (1.1)
Luxembourg 26 (0.1) 50 (0.1) 11 (0.0) 12 (0.0) 38 (0.1) 46 (0.1) 12 (0.0) 3 (0.0)
Mexico 21 (2.7) 19 (2.6) 38 (3.4) 22 (2.7) 21 (2.7) 21 (2.5) 33 (3.6) 25 (3.1)
Netherlands 30 (3.9) 32 (4.6) 31 (3.9) 7 (1.8) 26 (3.8) 30 (4.1) 33 (4.2) 11 (2.5)
New Zealand 24 (2.7) 33 (3.3) 38 (3.3) 4 (1.3) 23 (2.4) 40 (3.3) 33 (3.2) 5 (1.2)
Norway 6 (1.9) 21 (2.8) 55 (3.7) 18 (3.1) 8 (2.2) 31 (3.6) 48 (3.8) 14 (2.6)
Poland 19 (3.0) 26 (3.0) 40 (3.6) 15 (2.8) 7 (2.1) 21 (3.5) 53 (4.2) 19 (3.1)
Portugal 18 (3.6) 27 (4.2) 45 (4.0) 10 (2.6) 14 (2.7) 27 (4.2) 51 (4.2) 8 (2.4)
slovak Republic 10 (1.8) 23 (2.5) 49 (3.8) 18 (2.5) 4 (1.3) 21 (3.2) 50 (3.7) 25 (2.7)
spain 19 (2.9) 23 (3.2) 44 (3.3) 14 (2.4) 15 (2.9) 25 (3.2) 45 (3.9) 16 (2.6)
sweden 17 (2.7) 33 (3.8) 42 (3.9) 8 (2.2) 16 (2.8) 37 (3.8) 41 (3.7) 7 (2.0)
switzerland 44 (3.7) 35 (3.3) 17 (2.6) 4 (1.3) 27 (3.4) 48 (4.2) 18 (2.9) 7 (1.9)
Turkey 6 (2.1) 13 (2.9) 37 (4.2) 45 (4.8) 6 (2.0) 16 (3.7) 33 (4.3) 45 (4.4)
united states 38 (3.7) 35 (2.8) 20 (2.8) 7 (1.7) 36 (3.6) 37 (2.9) 23 (2.8) 4 (1.3)
OECD average 26 (0.6) 31 (0.6) 33 (0.6) 11 (0.4) 21 (0.5) 34 (0.7) 34 (0.7) 12 (0.4)united Kingdom1 19 (2.5) 34 (3.3) 36 (3.3) 11 (2.2) 17 (2.4) 35 (3.6) 40 (3.2) 7 (1.7)
Part
ner
coun
trie
s Brazil 22 (3.1) 11 (2.3) 20 (2.7) 47 (3.5) 16 (2.8) 14 (2.9) 17 (2.5) 52 (3.4)
Russian federation 13 (2.7) 10 (2.8) 32 (3.7) 46 (3.9) 9 (2.0) 11 (3.0) 35 (3.7) 46 (3.9)
Note: Statistically significant changes are marked in bold.1. Response rate too low to ensure comparability for 2003 data.Source: OECD PISA 2003 database, Table 2.5. See Annex 3 for notes (www.oecd.org/edu/eag2006).Please refer to the Reader’s Guide for information concerning the symbols replacing missing data.
StatLink: http://dx.doi.org/10.1787/203814216003
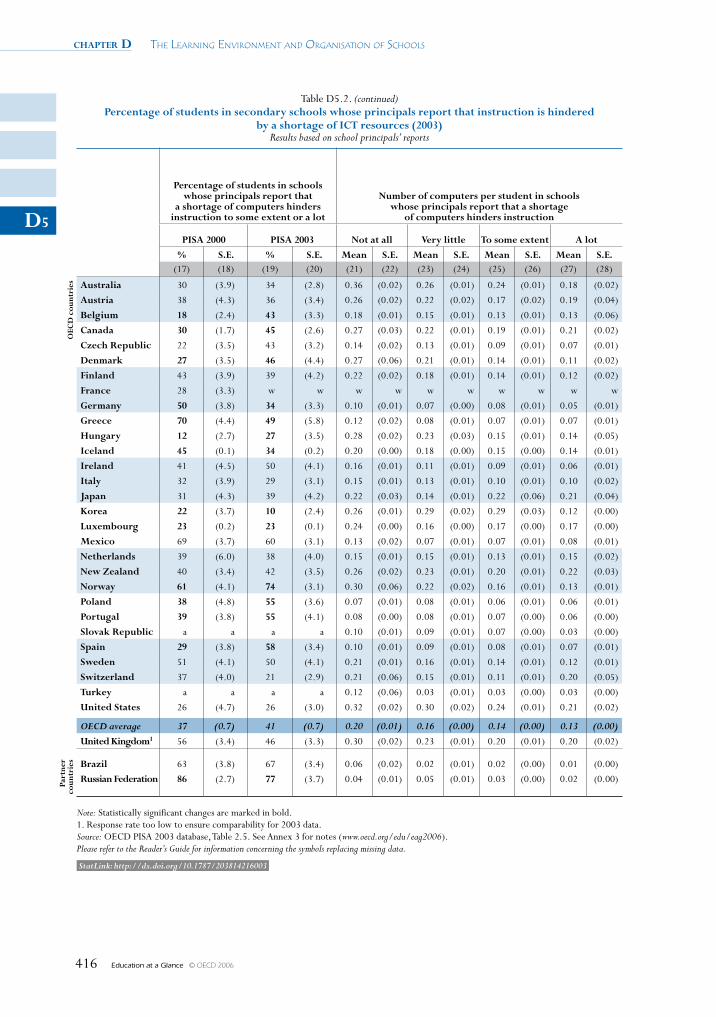
chapter D The Learning environmenT and organisaTion of schooLs
Education at a Glance © OECD 2006416
D5
Table D5.2. (continued)Percentage of students in secondary schools whose principals report that instruction is hindered
by a shortage of ICT resources (2003) Results based on school principals’ reports
Percentage of students in schools whose principals report that
a shortage of computers hinders instruction to some extent or a lot
Number of computers per student in schools whose principals report that a shortage
of computers hinders instruction
PIsA 2000 PIsA 2003 Not at all Very little To some extent A lot
% s.e. % s.e. Mean s.e. Mean s.e. Mean s.e. Mean s.e.(17) (18) (19) (20) (21) (22) (23) (24) (25) (26) (27) (28)
OeC
D c
ount
ries Australia 30 (3.9) 34 (2.8) 0.36 (0.02) 0.26 (0.01) 0.24 (0.01) 0.18 (0.02)
Austria 38 (4.3) 36 (3.4) 0.26 (0.02) 0.22 (0.02) 0.17 (0.02) 0.19 (0.04)
Belgium 18 (2.4) 43 (3.3) 0.18 (0.01) 0.15 (0.01) 0.13 (0.01) 0.13 (0.06)
Canada 30 (1.7) 45 (2.6) 0.27 (0.03) 0.22 (0.01) 0.19 (0.01) 0.21 (0.02)
Czech Republic 22 (3.5) 43 (3.2) 0.14 (0.02) 0.13 (0.01) 0.09 (0.01) 0.07 (0.01)
Denmark 27 (3.5) 46 (4.4) 0.27 (0.06) 0.21 (0.01) 0.14 (0.01) 0.11 (0.02)
finland 43 (3.9) 39 (4.2) 0.22 (0.02) 0.18 (0.01) 0.14 (0.01) 0.12 (0.02)
france 28 (3.3) w w w w w w w w w w
Germany 50 (3.8) 34 (3.3) 0.10 (0.01) 0.07 (0.00) 0.08 (0.01) 0.05 (0.01)
Greece 70 (4.4) 49 (5.8) 0.12 (0.02) 0.08 (0.01) 0.07 (0.01) 0.07 (0.01)
Hungary 12 (2.7) 27 (3.5) 0.28 (0.02) 0.23 (0.03) 0.15 (0.01) 0.14 (0.05)
Iceland 45 (0.1) 34 (0.2) 0.20 (0.00) 0.18 (0.00) 0.15 (0.00) 0.14 (0.01)
Ireland 41 (4.5) 50 (4.1) 0.16 (0.01) 0.11 (0.01) 0.09 (0.01) 0.06 (0.01)
Italy 32 (3.9) 29 (3.1) 0.15 (0.01) 0.13 (0.01) 0.10 (0.01) 0.10 (0.02)
Japan 31 (4.3) 39 (4.2) 0.22 (0.03) 0.14 (0.01) 0.22 (0.06) 0.21 (0.04)
Korea 22 (3.7) 10 (2.4) 0.26 (0.01) 0.29 (0.02) 0.29 (0.03) 0.12 (0.00)
Luxembourg 23 (0.2) 23 (0.1) 0.24 (0.00) 0.16 (0.00) 0.17 (0.00) 0.17 (0.00)
Mexico 69 (3.7) 60 (3.1) 0.13 (0.02) 0.07 (0.01) 0.07 (0.01) 0.08 (0.01)
Netherlands 39 (6.0) 38 (4.0) 0.15 (0.01) 0.15 (0.01) 0.13 (0.01) 0.15 (0.02)
New Zealand 40 (3.4) 42 (3.5) 0.26 (0.02) 0.23 (0.01) 0.20 (0.01) 0.22 (0.03)
Norway 61 (4.1) 74 (3.1) 0.30 (0.06) 0.22 (0.02) 0.16 (0.01) 0.13 (0.01)
Poland 38 (4.8) 55 (3.6) 0.07 (0.01) 0.08 (0.01) 0.06 (0.01) 0.06 (0.01)
Portugal 39 (3.8) 55 (4.1) 0.08 (0.00) 0.08 (0.01) 0.07 (0.00) 0.06 (0.00)
slovak Republic a a a a 0.10 (0.01) 0.09 (0.01) 0.07 (0.00) 0.03 (0.00)
spain 29 (3.8) 58 (3.4) 0.10 (0.01) 0.09 (0.01) 0.08 (0.01) 0.07 (0.01)
sweden 51 (4.1) 50 (4.1) 0.21 (0.01) 0.16 (0.01) 0.14 (0.01) 0.12 (0.01)
switzerland 37 (4.0) 21 (2.9) 0.21 (0.06) 0.15 (0.01) 0.11 (0.01) 0.20 (0.05)
Turkey a a a a 0.12 (0.06) 0.03 (0.01) 0.03 (0.00) 0.03 (0.00)
united states 26 (4.7) 26 (3.0) 0.32 (0.02) 0.30 (0.02) 0.24 (0.01) 0.21 (0.02)
OECD average 37 (0.7) 41 (0.7) 0.20 (0.01) 0.16 (0.00) 0.14 (0.00) 0.13 (0.00)united Kingdom1 56 (3.4) 46 (3.3) 0.30 (0.02) 0.23 (0.01) 0.20 (0.01) 0.20 (0.02)
Part
ner
coun
trie
s Brazil 63 (3.8) 67 (3.4) 0.06 (0.02) 0.02 (0.01) 0.02 (0.00) 0.01 (0.00)
Russian federation 86 (2.7) 77 (3.7) 0.04 (0.01) 0.05 (0.01) 0.03 (0.00) 0.02 (0.00)
Note: Statistically significant changes are marked in bold.1. Response rate too low to ensure comparability for 2003 data.Source: OECD PISA 2003 database, Table 2.5. See Annex 3 for notes (www.oecd.org/edu/eag2006).Please refer to the Reader’s Guide for information concerning the symbols replacing missing data.
StatLink: http://dx.doi.org/10.1787/203814216003
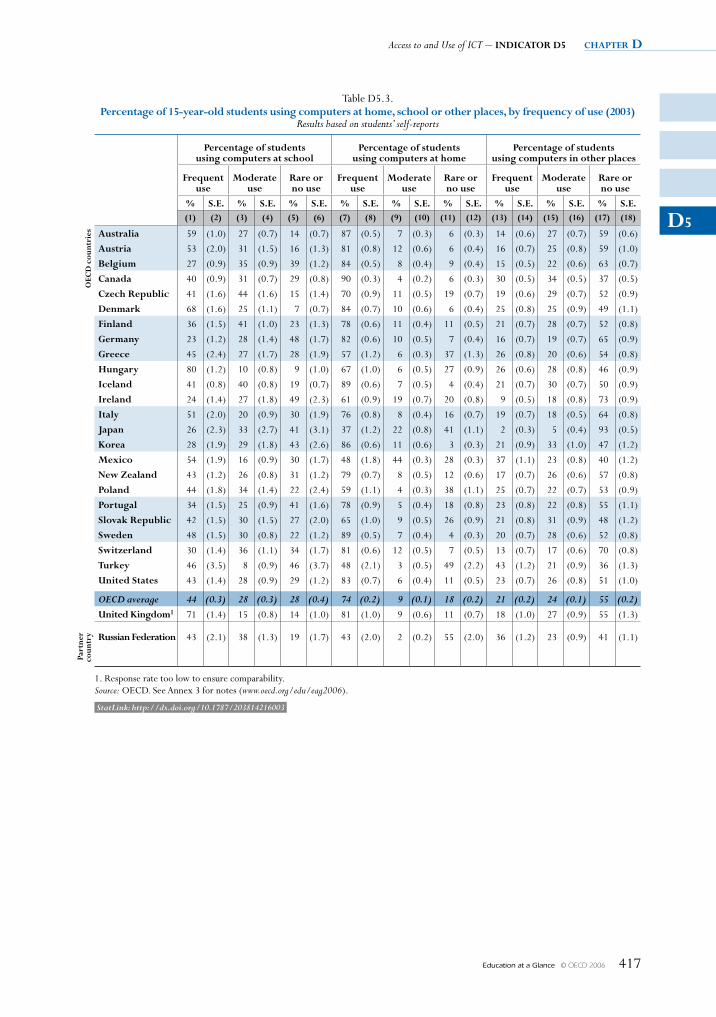
Access to and Use of ICT – INDICATOR D5 chapter D
Education at a Glance © OECD 2006 417
D5
Table D5.3. Percentage of 15-year-old students using computers at home, school or other places, by frequency of use (2003)
Results based on students’ self-reports
Percentage of students using computers at school
Percentage of students using computers at home
Percentage of students using computers in other places
frequent use
Moderate use
Rare or no use
frequent use
Moderate use
Rare or no use
frequent use
Moderate use
Rare or no use
% s.e. % s.e. % s.e. % s.e. % s.e. % s.e. % s.e. % s.e. % s.e.(1) (2) (3) (4) (5) (6) (7) (8) (9) (10) (11) (12) (13) (14) (15) (16) (17) (18)
OeC
D c
ount
ries Australia 59 (1.0) 27 (0.7) 14 (0.7) 87 (0.5) 7 (0.3) 6 (0.3) 14 (0.6) 27 (0.7) 59 (0.6)
Austria 53 (2.0) 31 (1.5) 16 (1.3) 81 (0.8) 12 (0.6) 6 (0.4) 16 (0.7) 25 (0.8) 59 (1.0)
Belgium 27 (0.9) 35 (0.9) 39 (1.2) 84 (0.5) 8 (0.4) 9 (0.4) 15 (0.5) 22 (0.6) 63 (0.7)
Canada 40 (0.9) 31 (0.7) 29 (0.8) 90 (0.3) 4 (0.2) 6 (0.3) 30 (0.5) 34 (0.5) 37 (0.5)
Czech Republic 41 (1.6) 44 (1.6) 15 (1.4) 70 (0.9) 11 (0.5) 19 (0.7) 19 (0.6) 29 (0.7) 52 (0.9)
Denmark 68 (1.6) 25 (1.1) 7 (0.7) 84 (0.7) 10 (0.6) 6 (0.4) 25 (0.8) 25 (0.9) 49 (1.1)
finland 36 (1.5) 41 (1.0) 23 (1.3) 78 (0.6) 11 (0.4) 11 (0.5) 21 (0.7) 28 (0.7) 52 (0.8)
Germany 23 (1.2) 28 (1.4) 48 (1.7) 82 (0.6) 10 (0.5) 7 (0.4) 16 (0.7) 19 (0.7) 65 (0.9)
Greece 45 (2.4) 27 (1.7) 28 (1.9) 57 (1.2) 6 (0.3) 37 (1.3) 26 (0.8) 20 (0.6) 54 (0.8)
Hungary 80 (1.2) 10 (0.8) 9 (1.0) 67 (1.0) 6 (0.5) 27 (0.9) 26 (0.6) 28 (0.8) 46 (0.9)
Iceland 41 (0.8) 40 (0.8) 19 (0.7) 89 (0.6) 7 (0.5) 4 (0.4) 21 (0.7) 30 (0.7) 50 (0.9)
Ireland 24 (1.4) 27 (1.8) 49 (2.3) 61 (0.9) 19 (0.7) 20 (0.8) 9 (0.5) 18 (0.8) 73 (0.9)
Italy 51 (2.0) 20 (0.9) 30 (1.9) 76 (0.8) 8 (0.4) 16 (0.7) 19 (0.7) 18 (0.5) 64 (0.8)
Japan 26 (2.3) 33 (2.7) 41 (3.1) 37 (1.2) 22 (0.8) 41 (1.1) 2 (0.3) 5 (0.4) 93 (0.5)
Korea 28 (1.9) 29 (1.8) 43 (2.6) 86 (0.6) 11 (0.6) 3 (0.3) 21 (0.9) 33 (1.0) 47 (1.2)
Mexico 54 (1.9) 16 (0.9) 30 (1.7) 48 (1.8) 44 (0.3) 28 (0.3) 37 (1.1) 23 (0.8) 40 (1.2)
New Zealand 43 (1.2) 26 (0.8) 31 (1.2) 79 (0.7) 8 (0.5) 12 (0.6) 17 (0.7) 26 (0.6) 57 (0.8)
Poland 44 (1.8) 34 (1.4) 22 (2.4) 59 (1.1) 4 (0.3) 38 (1.1) 25 (0.7) 22 (0.7) 53 (0.9)
Portugal 34 (1.5) 25 (0.9) 41 (1.6) 78 (0.9) 5 (0.4) 18 (0.8) 23 (0.8) 22 (0.8) 55 (1.1)
slovak Republic 42 (1.5) 30 (1.5) 27 (2.0) 65 (1.0) 9 (0.5) 26 (0.9) 21 (0.8) 31 (0.9) 48 (1.2)
sweden 48 (1.5) 30 (0.8) 22 (1.2) 89 (0.5) 7 (0.4) 4 (0.3) 20 (0.7) 28 (0.6) 52 (0.8)
switzerland 30 (1.4) 36 (1.1) 34 (1.7) 81 (0.6) 12 (0.5) 7 (0.5) 13 (0.7) 17 (0.6) 70 (0.8)
Turkey 46 (3.5) 8 (0.9) 46 (3.7) 48 (2.1) 3 (0.5) 49 (2.2) 43 (1.2) 21 (0.9) 36 (1.3)
united states 43 (1.4) 28 (0.9) 29 (1.2) 83 (0.7) 6 (0.4) 11 (0.5) 23 (0.7) 26 (0.8) 51 (1.0)
OECD average 44 (0.3) 28 (0.3) 28 (0.4) 74 (0.2) 9 (0.1) 18 (0.2) 21 (0.2) 24 (0.1) 55 (0.2)united Kingdom1 71 (1.4) 15 (0.8) 14 (1.0) 81 (1.0) 9 (0.6) 11 (0.7) 18 (1.0) 27 (0.9) 55 (1.3)
Part
ner
coun
try Russian federation 43 (2.1) 38 (1.3) 19 (1.7) 43 (2.0) 2 (0.2) 55 (2.0) 36 (1.2) 23 (0.9) 41 (1.1)
1. Response rate too low to ensure comparability.Source: OECD. See Annex 3 for notes (www.oecd.org/edu/eag2006).
StatLink: http://dx.doi.org/10.1787/203814216003

Education at a Glance © OECD 2006 419
CharaCteristiCs of eduCational systems
Annex
1
The typical graduation age is the age at the end of the last school/academic year of the corresponding level and programme when the degree is obtained. The age is the age that normally corresponds to the age of graduation. (Note that at some levels of education the term “graduation age” may not translate literally
and is used here purely as a convention.)
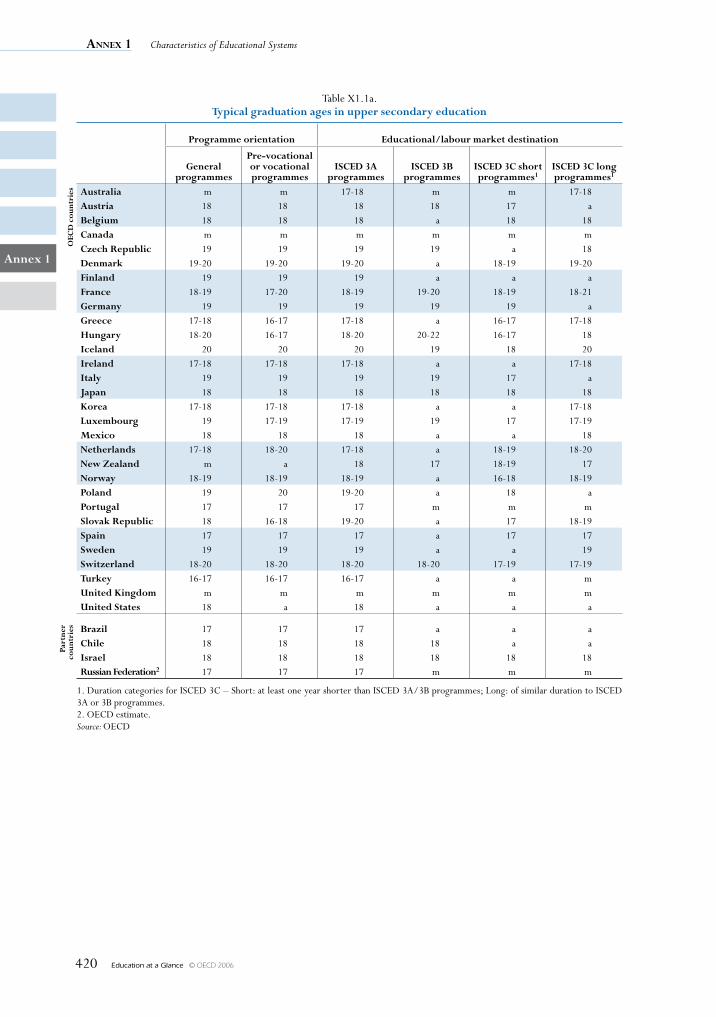
Annex 1 Characteristics of Educational Systems
Education at a Glance © OECD 2006420
Annex 1
Table X1.1a. Typical graduation ages in upper secondary education
Programme orientation Educational/labour market destination
General programmes
Pre-vocational or vocational programmes
ISCED 3A programmes
ISCED 3B programmes
ISCED 3C short programmes1
ISCED 3C long programmes1
OEC
D c
ount
ries Australia m m 17-18 m m 17-18
Austria 18 18 18 18 17 aBelgium 18 18 18 a 18 18Canada m m m m m mCzech Republic 19 19 19 19 a 18Denmark 19-20 19-20 19-20 a 18-19 19-20Finland 19 19 19 a a aFrance 18-19 17-20 18-19 19-20 18-19 18-21Germany 19 19 19 19 19 aGreece 17-18 16-17 17-18 a 16-17 17-18Hungary 18-20 16-17 18-20 20-22 16-17 18Iceland 20 20 20 19 18 20Ireland 17-18 17-18 17-18 a a 17-18Italy 19 19 19 19 17 aJapan 18 18 18 18 18 18Korea 17-18 17-18 17-18 a a 17-18Luxembourg 19 17-19 17-19 19 17 17-19Mexico 18 18 18 a a 18Netherlands 17-18 18-20 17-18 a 18-19 18-20New Zealand m a 18 17 18-19 17Norway 18-19 18-19 18-19 a 16-18 18-19Poland 19 20 19-20 a 18 aPortugal 17 17 17 m m mSlovak Republic 18 16-18 19-20 a 17 18-19Spain 17 17 17 a 17 17Sweden 19 19 19 a a 19Switzerland 18-20 18-20 18-20 18-20 17-19 17-19Turkey 16-17 16-17 16-17 a a mUnited Kingdom m m m m m mUnited States 18 a 18 a a a
Part
ner
coun
trie
s Brazil 17 17 17 a a aChile 18 18 18 18 a aIsrael 18 18 18 18 18 18Russian Federation2 17 17 17 m m m
1. Duration categories for ISCED 3C – Short: at least one year shorter than ISCED 3A/3B programmes; Long: of similar duration to ISCED 3A or 3B programmes.2. OECD estimate.Source: OECD
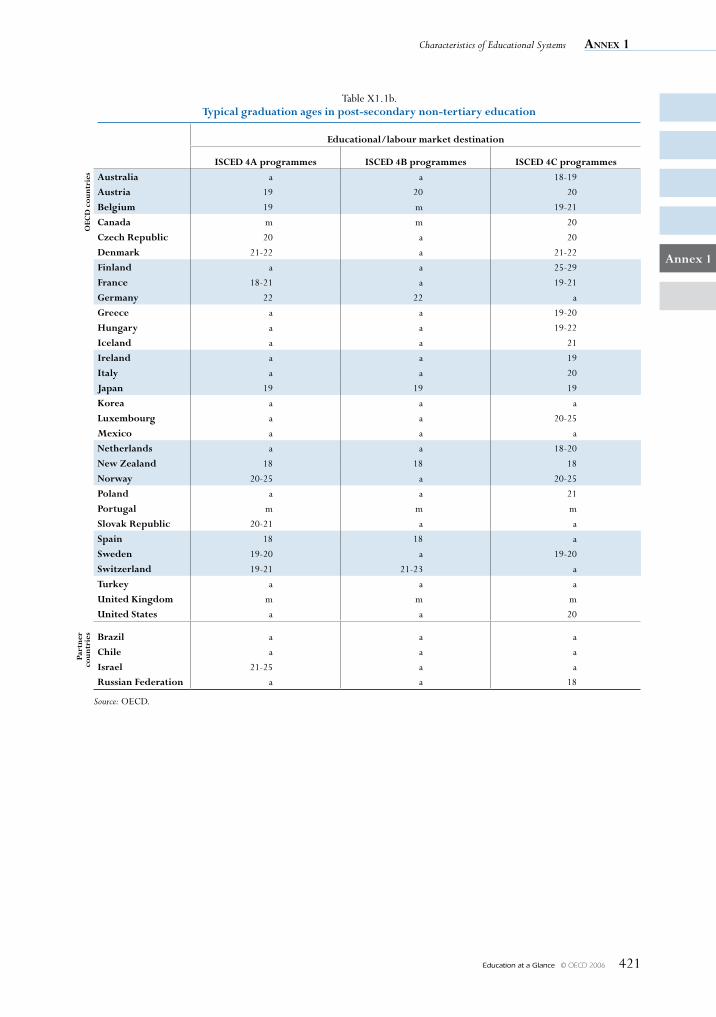
Characteristics of Educational Systems Annex 1
Education at a Glance © OECD 2006 421
Annex 1
Table X1.1b. Typical graduation ages in post-secondary non-tertiary education
Educational/labour market destination
ISCED 4A programmes ISCED 4B programmes ISCED 4C programmes
OEC
D c
ount
ries Australia a a 18-19
Austria 19 20 20
Belgium 19 m 19-21
Canada m m 20
Czech Republic 20 a 20
Denmark 21-22 a 21-22
Finland a a 25-29
France 18-21 a 19-21
Germany 22 22 a
Greece a a 19-20
Hungary a a 19-22
Iceland a a 21
Ireland a a 19
Italy a a 20
Japan 19 19 19
Korea a a a
Luxembourg a a 20-25
Mexico a a a
Netherlands a a 18-20
New Zealand 18 18 18
Norway 20-25 a 20-25
Poland a a 21
Portugal m m m
Slovak Republic 20-21 a a
Spain 18 18 a
Sweden 19-20 a 19-20
Switzerland 19-21 21-23 a
Turkey a a a
United Kingdom m m m
United States a a 20
Part
ner
coun
trie
s Brazil a a a
Chile a a a
Israel 21-25 a a
Russian Federation a a 18
Source: OECD.
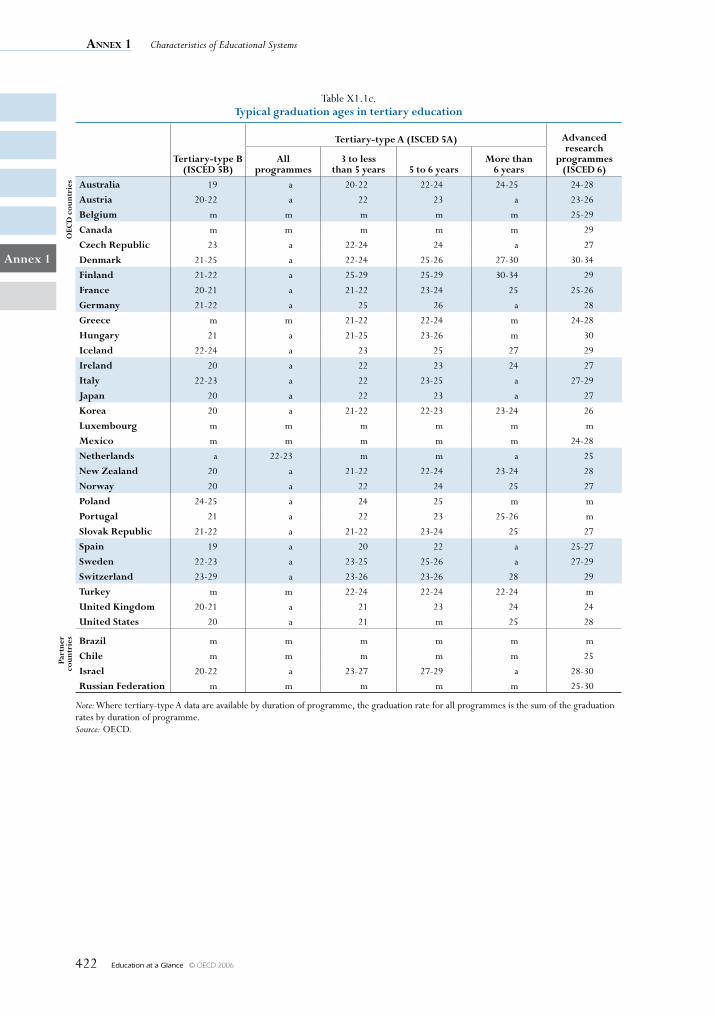
Annex 1 Characteristics of Educational Systems
Education at a Glance © OECD 2006422
Annex 1
Table X1.1c. Typical graduation ages in tertiary education
Tertiary-type B (ISCED 5B)
Tertiary-type A (ISCED 5A) Advanced research
programmes (ISCED 6)
All programmes
3 to less than 5 years 5 to 6 years
More than 6 years
OEC
D c
ount
ries Australia 19 a 20-22 22-24 24-25 24-28
Austria 20-22 a 22 23 a 23-26
Belgium m m m m m 25-29
Canada m m m m m 29
Czech Republic 23 a 22-24 24 a 27
Denmark 21-25 a 22-24 25-26 27-30 30-34
Finland 21-22 a 25-29 25-29 30-34 29
France 20-21 a 21-22 23-24 25 25-26
Germany 21-22 a 25 26 a 28
Greece m m 21-22 22-24 m 24-28
Hungary 21 a 21-25 23-26 m 30
Iceland 22-24 a 23 25 27 29
Ireland 20 a 22 23 24 27
Italy 22-23 a 22 23-25 a 27-29
Japan 20 a 22 23 a 27
Korea 20 a 21-22 22-23 23-24 26
Luxembourg m m m m m m
Mexico m m m m m 24-28
Netherlands a 22-23 m m a 25
New Zealand 20 a 21-22 22-24 23-24 28
Norway 20 a 22 24 25 27
Poland 24-25 a 24 25 m m
Portugal 21 a 22 23 25-26 m
Slovak Republic 21-22 a 21-22 23-24 25 27
Spain 19 a 20 22 a 25-27
Sweden 22-23 a 23-25 25-26 a 27-29
Switzerland 23-29 a 23-26 23-26 28 29
Turkey m m 22-24 22-24 22-24 m
United Kingdom 20-21 a 21 23 24 24
United States 20 a 21 m 25 28
Part
ner
coun
trie
s Brazil m m m m m m
Chile m m m m m 25
Israel 20-22 a 23-27 27-29 a 28-30
Russian Federation m m m m m 25-30
Note: Where tertiary-type A data are available by duration of programme, the graduation rate for all programmes is the sum of the graduation rates by duration of programme.Source: OECD.
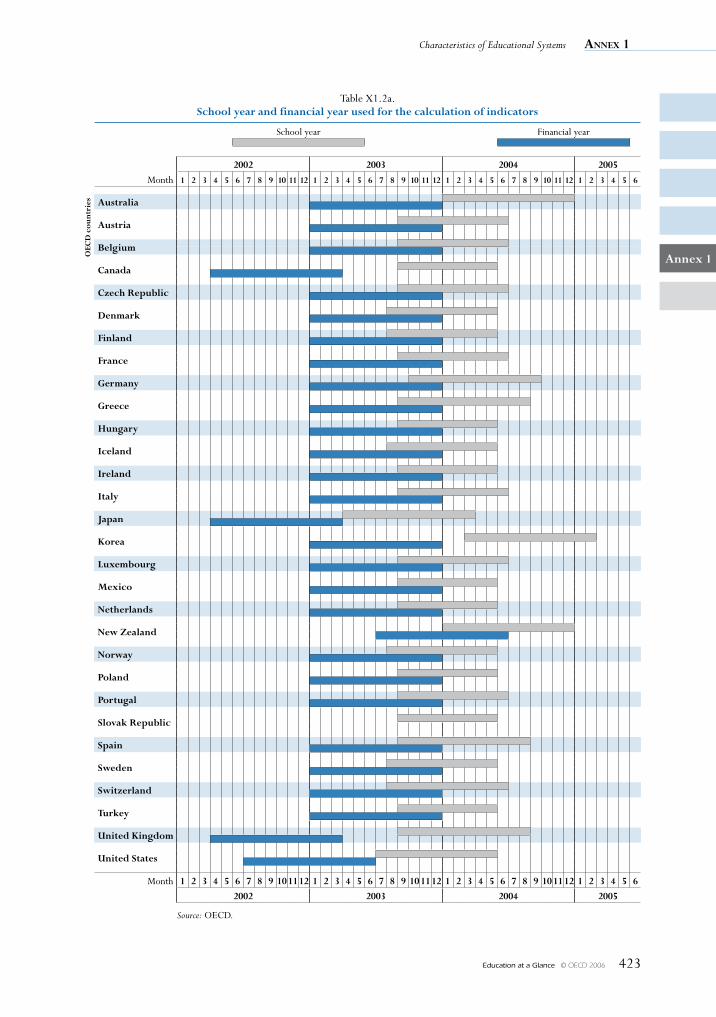
Characteristics of Educational Systems Annex 1
Education at a Glance © OECD 2006 423
Annex 1
Table X1.2a. School year and financial year used for the calculation of indicators
School year Financial year
2002 2003 2004 2005
Month 1 2 3 4 5 6 7 8 9 10 11 12 1 2 3 4 5 6 7 8 9 10 11 12 1 2 3 4 5 6 7 8 9 10 11 12 1 2 3 4 5 6
OEC
D c
ount
ries Australia
Austria
Belgium
Canada
Czech Republic
Denmark
Finland
France
Germany
Greece
Hungary
Iceland
Ireland
Italy
Japan
Korea
Luxembourg
Mexico
Netherlands
New Zealand
Norway
Poland
Portugal
Slovak Republic
Spain
Sweden
Switzerland
Turkey
United Kingdom
United States
Month 1 2 3 4 5 6 7 8 9 10 11 12 1 2 3 4 5 6 7 8 9 10 11 12 1 2 3 4 5 6 7 8 9 10 11 12 1 2 3 4 5 6
2002 2003 2004 2005
Source: OECD.
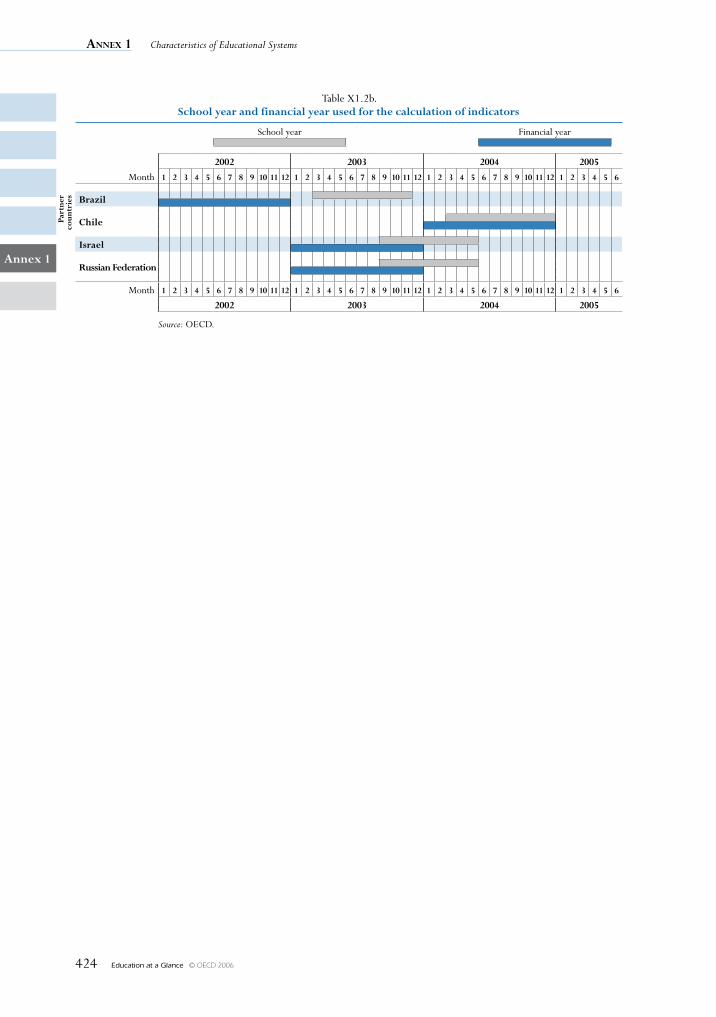
Annex 1 Characteristics of Educational Systems
Education at a Glance © OECD 2006424
Annex 1
Table X1.2b. School year and financial year used for the calculation of indicators
School year Financial year
2002 2003 2004 2005
Month 1 2 3 4 5 6 7 8 9 10 11 12 1 2 3 4 5 6 7 8 9 10 11 12 1 2 3 4 5 6 7 8 9 10 11 12 1 2 3 4 5 6
Part
ner
coun
trie
s Brazil
Chile
Israel
Russian Federation
Month 1 2 3 4 5 6 7 8 9 10 11 12 1 2 3 4 5 6 7 8 9 10 11 12 1 2 3 4 5 6 7 8 9 10 11 12 1 2 3 4 5 6
2002 2003 2004 2005
Source: OECD.
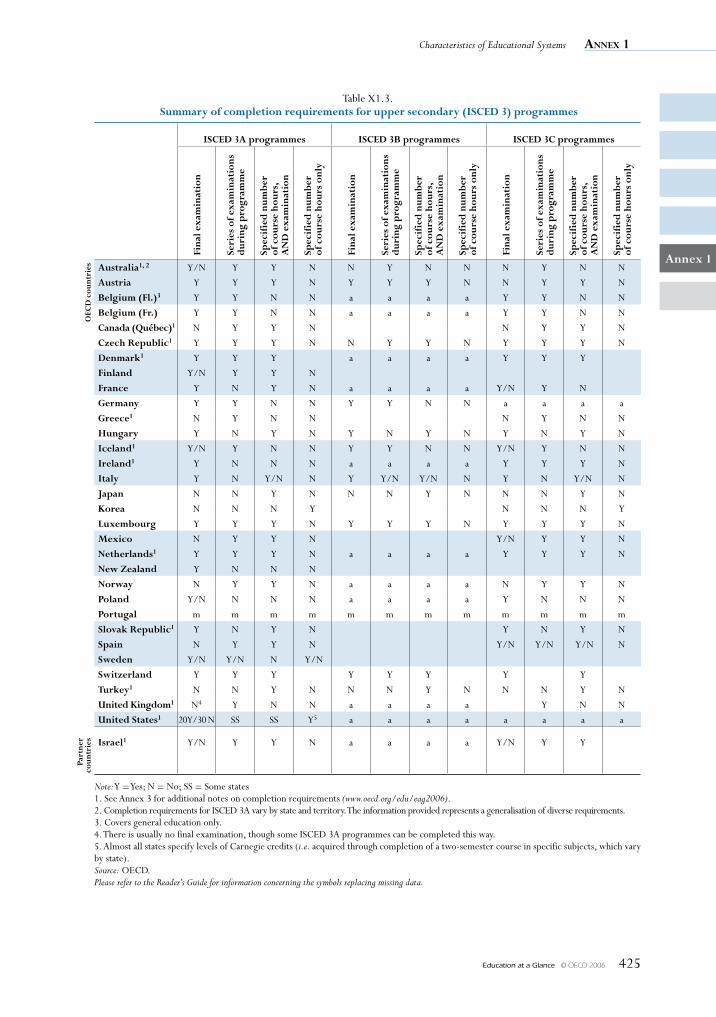
Characteristics of Educational Systems Annex 1
Education at a Glance © OECD 2006 425
Annex 1
Table X1.3. Summary of completion requirements for upper secondary (ISCED 3) programmes
ISCED 3A programmes ISCED 3B programmes ISCED 3C programmes
Fina
l exa
min
atio
n
Seri
es o
f exa
min
atio
ns
dur
ing
pro
gram
me
Spec
ifie
d n
umbe
r
of c
ours
e ho
urs,
A
ND
exa
min
atio
n
Spec
ifie
d n
umbe
r
of c
ours
e ho
urs
only
Fina
l exa
min
atio
n
Seri
es o
f exa
min
atio
ns
dur
ing
pro
gram
me
Spec
ifie
d n
umbe
r
of c
ours
e ho
urs,
A
ND
exa
min
atio
n
Spec
ifie
d n
umbe
r of
cou
rse
hour
s on
ly
Fina
l exa
min
atio
n
Seri
es o
f exa
min
atio
ns
dur
ing
pro
gram
me
Spec
ifie
d n
umbe
r
of c
ours
e ho
urs,
A
ND
exa
min
atio
n
Spec
ifie
d n
umbe
r
of c
ours
e ho
urs
only
OEC
D c
ount
ries Australia1, 2 Y/N Y Y N N Y N N N Y N N
Austria Y Y Y N Y Y Y N N Y Y N
Belgium (Fl.)3 Y Y N N a a a a Y Y N N
Belgium (Fr.) Y Y N N a a a a Y Y N N
Canada (Québec)1 N Y Y N N Y Y N
Czech Republic1 Y Y Y N N Y Y N Y Y Y N
Denmark1 Y Y Y a a a a Y Y Y
Finland Y/N Y Y N
France Y N Y N a a a a Y/N Y N
Germany Y Y N N Y Y N N a a a a
Greece1 N Y N N N Y N N
Hungary Y N Y N Y N Y N Y N Y N
Iceland1 Y/N Y N N Y Y N N Y/N Y N N
Ireland1 Y N N N a a a a Y Y Y N
Italy Y N Y/N N Y Y/N Y/N N Y N Y/N N
Japan N N Y N N N Y N N N Y N
Korea N N N Y N N N Y
Luxembourg Y Y Y N Y Y Y N Y Y Y N
Mexico N Y Y N Y/N Y Y N
Netherlands1 Y Y Y N a a a a Y Y Y N
New Zealand Y N N N
Norway N Y Y N a a a a N Y Y N
Poland Y/N N N N a a a a Y N N N
Portugal m m m m m m m m m m m m
Slovak Republic1 Y N Y N Y N Y N
Spain N Y Y N Y/N Y/N Y/N N
Sweden Y/N Y/N N Y/N
Switzerland Y Y Y Y Y Y Y Y
Turkey1 N N Y N N N Y N N N Y N
United Kingdom1 N4 Y N N a a a a Y N N
United States1 20 Y/30 N SS SS Y5 a a a a a a a a
Part
ner
coun
trie
s Israel1 Y/N Y Y N a a a a Y/N Y Y
Note: Y = Yes; N = No; SS = Some states1. See Annex 3 for additional notes on completion requirements (www.oecd.org/edu/eag2006).2. Completion requirements for ISCED 3A vary by state and territory. The information provided represents a generalisation of diverse requirements.3. Covers general education only.4. There is usually no final examination, though some ISCED 3A programmes can be completed this way.5. Almost all states specify levels of Carnegie credits (i.e. acquired through completion of a two-semester course in specific subjects, which vary by state).Source: OECD.Please refer to the Reader’s Guide for information concerning the symbols replacing missing data.
Annex 1 Characteristics of Educational Systems
Education at a Glance © OECD 2006426
Annex 1
Table X1.3. (Country notes) Summary of completion requirements for upper secondary (ISCED 3) programmes
AustrAliA: Requirements for graduates in senior secondary education on ISCED 3A level are different in each state and territory as State/Territory Governments are responsible for their education. The information in the table attempts to generalise those diverse requirements. Note that for ISCED3A, programme requirements are different in every state, and for several states, different in every school. However, schools require a number of course hours to be attended and set various special requirements. For example, in senior secondary schools in New South Wales compulsory studies of English language are classified as a special requirement.
Y/N for “final exams” means that in Australia compulsory external exams are required to complete senior secondary schools in some states only. “Y” for “Series of exams and course hours” means series of school based assessments and course hours.
Requirements for ISCED 3B and ISCED 3C vocational courses are nationally unified as educational institutions in every state have to follow nationally agreed standards for vocational training. For ISCED 3B and ISCED 3C, school or work place based assessments, called competencies or outcomes, are required to be passed in order to complete a course. Competency based approach to training allows learners to achieve outcomes in flexible time, therefore hours of learning or training do not determine completion of competencies.
CAnAdA (QuebeC): ISCED 3A covers 2nd cycle programmes of general secondary level education leading to the diploma in secondary studies (DES). To obtain the DES, the student must pass exams in the language of instruction, second language and history as well as completing certain course units.
ISCED 3C covers secondary level professional training programmes which lead to the DEP (Diplôme d’études professionnelles), ASP (Attestation de spécialisation professionnelle) or AFP (Attestation de formation professionnelle). To obtain the DEP or ASP, the students must pass all the courses in the programme and meet any specific pre-conditions of the programmes. To obtain the AFP, the student must pass a certain number of courses such as determined by the college that offers the programme such as general training courses or courses preparing for entry to the labour market.
CzeCh republiC: For each of ISECD 3A, 3B and 3C, certificates are awarded at the end of each year based on current assessment. The final examinations in each case are comprehensive.
denmArk: ISCED 3C – The main course in vocational training is normally completed with a journeyman’s test or a similar examination. The test may also be taken after the school period as an actual journeyman’s test performed with an employer.
GreeCe: ISCED 3A – Students are examined twice, at the end of each year, after compulsory attendance. ISCED 3C – Students are examined at the end of each year, after compulsory attendance.
iCelAnd: ISCED 3C – Vocational training/Sailing time and training required to get qualifications.
irelAnd: The Leaving Certificate Applied assessment takes place over two years under three headings: Satisfactory Completion of Modules, Performance of Student Tasks and Performance in the Terminal Examinations. The two-year programme consists of four half-year blocks called Sessions and achievements are credited in each of these Sessions. At the end of each Session a student is credited on satisfactory completion of the appropriate modules. Student Tasks are assessed by external examiners appointed by the Department of Education and Science. These Tasks may be in a variety of formats – written, audio, video, artefact etc. Each student is also required to produce a report on the process of completing the Task. This report may be incorporated in the evidence of task performance. Terminal Examinations are provided in the following areas: English and Communication, Two Vocational Specialisms, Mathematical Applications, Language (Gaeilge Chumarsáideach & Modern European Languages) and Social Education.
isrAel: Students who complete 12th grade, are considered as upper secondary graduates. Matriculation exams are used as an extra indicator for the completion but not the only one.
Characteristics of Educational Systems Annex 1
Education at a Glance © OECD 2006 427
Annex 1
Number of hours per student in upper secondary education to complete the programme is 110 hours within three years of studying (10th to 12th grade).
the netherlAnds: ISCED 3A – Each course can be finalised by an exam. Together with the result of the final exam the results of these exams determine the final result for the respective study subject.
Since 1999 the Netherlands introduced a new second phase of secondary education. This means that pupils are encouraged and taught to study independently. The number of course hours prescribed by the government now describe the number of hours that a “normal” pupil is expected to need to get familiar with the contents of the course. For each course this number is given by the government. The total number of these “course hours” amounts 1600/year. 1000 hours of them are taken care of during schooltime as part of the educational programme. For the remaining hours pupils are expected to study themselves.
ISCED 3C – Minimum entrance requirement is ISCED 2.
slovAk republiC: ISCED 3A – Includes practical training in grade 2 and 3 for 2 weeks and in some cases up to 4 weeks for all grades e.g. in veterinary medicine
A typical apprenticeship programme comprises one third of practical training (certificate on apprenticeship) extended by increased portion of general subjects which are also included in final examination (matura examination) and which also gives access to higher education.
ISCED 3C – In training for children with special needs, two thirds of the programme represents practical training. The final examination consists only of vocational subjects, including a practical part.
Typical apprenticeship programme comprises one third of practical training.
turkey: ISCED 3C – Obligatory vocational training of at least 8 hours per week. Candidates have to pass the assistant mastership exam after 3 years of study or 5 years of work experience.
united kinGdom: There is usually no final exam, though some ISCED 3A programmes could be completed this way. For the majority of general ISCED 3A programmes such as A levels and Scottish highers there are modular examinations at intervals during the programme as well as at the end. For most subjects, assessed coursework also contributes to the grade. For each separate subject within the programme, there is a range of possible attainment grades. For vocational ISCED 3A programmes such as NVQs there may be some formal tests but the pass criterion is demonstrable competence in the workplace (or simulated workplace). Evidence for the assessment is gathered mainly by direct observation of the candidate performing in a workplace setting, often supplemented by a portfolio of documentary evidence relating to work task undertaken by the candidate.
There are typical course hours especially for general ISCED 3A and general ISCED 3C programmes (less so for vocational programmes), but these are not strictly mandatory and for most programmes it is possible to register for the assessment whether or not the candidate is enrolled in the regular education system.
So, in summary the completion requirements are:
ISCED 3A – General programmes: modular examinations plus assessed coursework. Vocational programmes: direct observation of workplace performance plus portfolios of evidence.
ISCED 3C – General programmes: examinations plus assessed coursework. Vocational programmes: direct observation of workplace performance plus portfolios of evidence.
united stAtes: The number of states with specific levels of Carnegie credits (i.e. academic year course of two semesters) required for high school graduation has remained consistent between 48-50 states. As of 2002, a total of 38 states require 4 credits in english, 25 states require 2.5 or more credits in mathematics, 22 states require 2.5 credits or more in science, and 36 states require 2.5 or more credits in social studies.

Education at a Glance © OECD 2006 429
RefeRence StatiSticS
Annex
2
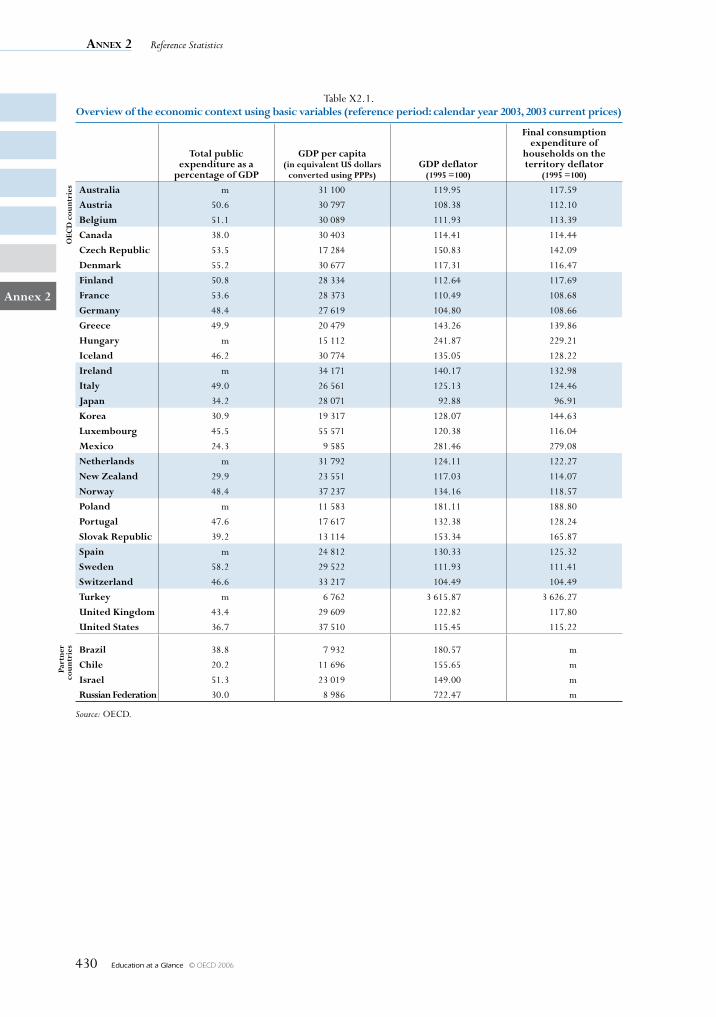
Annex 2 Reference Statistics
Education at a Glance © OECD 2006430
Annex 2
Table X2.1.Overview of the economic context using basic variables (reference period: calendar year 2003, 2003 current prices)
Total public expenditure as a
percentage of GDP
GDP per capita (in equivalent US dollars
converted using PPPs) GDP deflator
(1995 =100)
Final consumption expenditure of
households on the territory deflator
(1995 =100)
OEC
D c
ount
ries Australia m 31 100 119.95 117.59
Austria 50.6 30 797 108.38 112.10
Belgium 51.1 30 089 111.93 113.39
Canada 38.0 30 403 114.41 114.44
Czech Republic 53.5 17 284 150.83 142.09
Denmark 55.2 30 677 117.31 116.47
Finland 50.8 28 334 112.64 117.69
France 53.6 28 373 110.49 108.68
Germany 48.4 27 619 104.80 108.66
Greece 49.9 20 479 143.26 139.86
Hungary m 15 112 241.87 229.21
Iceland 46.2 30 774 135.05 128.22
Ireland m 34 171 140.17 132.98
Italy 49.0 26 561 125.13 124.46
Japan 34.2 28 071 92.88 96.91
Korea 30.9 19 317 128.07 144.63
Luxembourg 45.5 55 571 120.38 116.04
Mexico 24.3 9 585 281.46 279.08
Netherlands m 31 792 124.11 122.27
New Zealand 29.9 23 551 117.03 114.07
Norway 48.4 37 237 134.16 118.57
Poland m 11 583 181.11 188.80
Portugal 47.6 17 617 132.38 128.24
Slovak Republic 39.2 13 114 153.34 165.87
Spain m 24 812 130.33 125.32
Sweden 58.2 29 522 111.93 111.41
Switzerland 46.6 33 217 104.49 104.49
Turkey m 6 762 3 615.87 3 626.27
United Kingdom 43.4 29 609 122.82 117.80
United States 36.7 37 510 115.45 115.22
Part
ner
coun
trie
s Brazil 38.8 7 932 180.57 m
Chile 20.2 11 696 155.65 m
Israel 51.3 23 019 149.00 m
Russian Federation 30.0 8 986 722.47 m
Source: OECD.
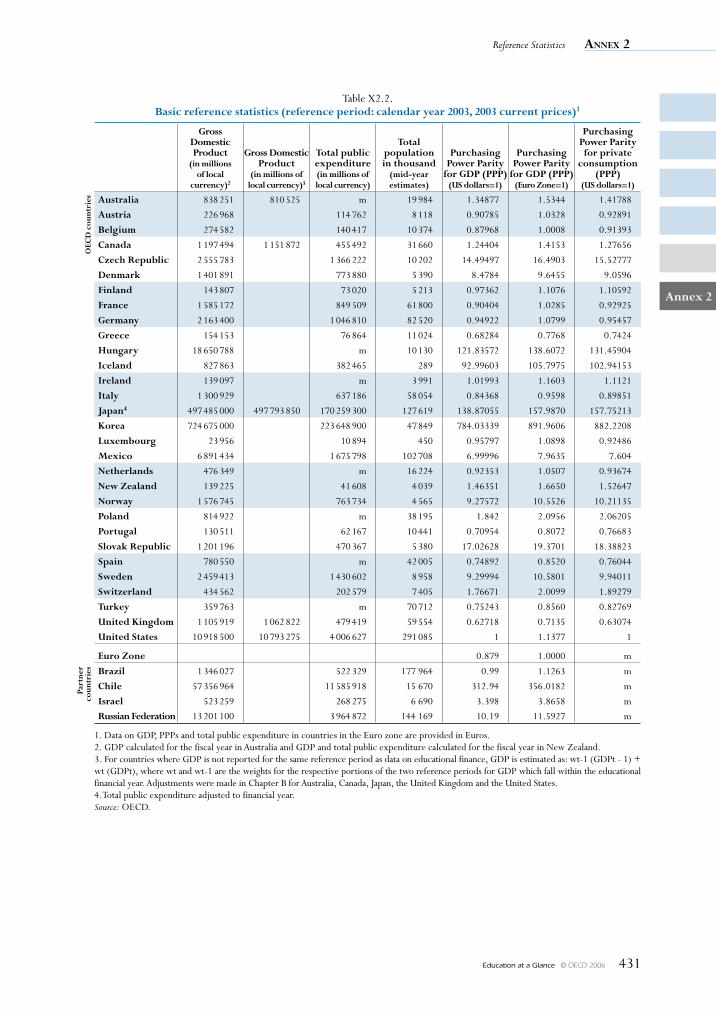
Reference Statistics Annex 2
Education at a Glance © OECD 2006 431
Annex 2
Table X2.2. Basic reference statistics (reference period: calendar year 2003, 2003 current prices)1
Gross Domestic Product
(in millions of local
currency)2
Gross Domestic Product
(in millions of local currency)3
Total public expenditure (in millions of local currency)
Total population in thousand
(mid-year estimates)
Purchasing Power Parity
for GDP (PPP) (US dollars=1)
Purchasing Power Parity
for GDP (PPP) (Euro Zone=1)
Purchasing Power Parity for private
consumption (PPP)
(US dollars=1)
OEC
D c
ount
ries Australia 838 251 810 525 m 19 984 1.34877 1.5344 1.41788
Austria 226 968 114 762 8 118 0.90785 1.0328 0.92891
Belgium 274 582 140 417 10 374 0.87968 1.0008 0.91393
Canada 1 197 494 1 151 872 455 492 31 660 1.24404 1.4153 1.27656
Czech Republic 2 555 783 1 366 222 10 202 14.49497 16.4903 15.52777
Denmark 1 401 891 773 880 5 390 8.4784 9.6455 9.0596
Finland 143 807 73 020 5 213 0.97362 1.1076 1.10592
France 1 585 172 849 509 61 800 0.90404 1.0285 0.92925
Germany 2 163 400 1 046 810 82 520 0.94922 1.0799 0.95457
Greece 154 153 76 864 11 024 0.68284 0.7768 0.7424
Hungary 18 650 788 m 10 130 121.83572 138.6072 131.45904
Iceland 827 863 382 465 289 92.99603 105.7975 102.94153
Ireland 139 097 m 3 991 1.01993 1.1603 1.1121
Italy 1 300 929 637 186 58 054 0.84368 0.9598 0.89851
Japan4 497 485 000 497 793 850 170 259 300 127 619 138.87055 157.9870 157.75213
Korea 724 675 000 223 648 900 47 849 784.03339 891.9606 882.2208
Luxembourg 23 956 10 894 450 0.95797 1.0898 0.92486
Mexico 6 891 434 1 675 798 102 708 6.99996 7.9635 7.604
Netherlands 476 349 m 16 224 0.92353 1.0507 0.93674
New Zealand 139 225 41 608 4 039 1.46351 1.6650 1.52647
Norway 1 576 745 763 734 4 565 9.27572 10.5526 10.21135
Poland 814 922 m 38 195 1.842 2.0956 2.06205
Portugal 130 511 62 167 10 441 0.70954 0.8072 0.76683
Slovak Republic 1 201 196 470 367 5 380 17.02628 19.3701 18.38823
Spain 780 550 m 42 005 0.74892 0.8520 0.76044
Sweden 2 459 413 1 430 602 8 958 9.29994 10.5801 9.94011
Switzerland 434 562 202 579 7 405 1.76671 2.0099 1.89279
Turkey 359 763 m 70 712 0.75243 0.8560 0.82769
United Kingdom 1 105 919 1 062 822 479 419 59 554 0.62718 0.7135 0.63074
United States 10 918 500 10 793 275 4 006 627 291 085 1 1.1377 1
Euro Zone 0.879 1.0000 m
Part
ner
coun
trie
s Brazil 1 346 027 522 329 177 964 0.99 1.1263 m
Chile 57 356 964 11 585 918 15 670 312.94 356.0182 m
Israel 523 259 268 275 6 690 3.398 3.8658 m
Russian Federation 13 201 100 3 964 872 144 169 10.19 11.5927 m
1. Data on GDP, PPPs and total public expenditure in countries in the Euro zone are provided in Euros.2. GDP calculated for the fiscal year in Australia and GDP and total public expenditure calculated for the fiscal year in New Zealand.3. For countries where GDP is not reported for the same reference period as data on educational finance, GDP is estimated as: wt-1 (GDPt - 1) + wt (GDPt), where wt and wt-1 are the weights for the respective portions of the two reference periods for GDP which fall within the educational financial year. Adjustments were made in Chapter B for Australia, Canada, Japan, the United Kingdom and the United States. 4.Total public expenditure adjusted to financial year.Source: OECD.
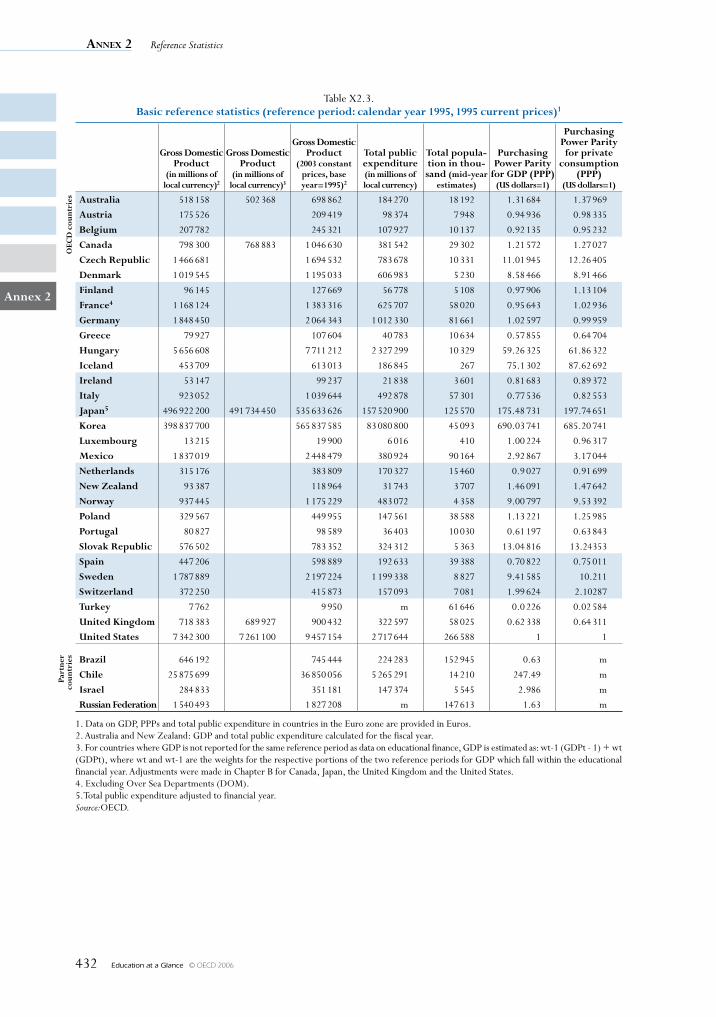
Annex 2 Reference Statistics
Education at a Glance © OECD 2006432
Annex 2
Table X2.3. Basic reference statistics (reference period: calendar year 1995, 1995 current prices)1
Gross Domestic Product
(in millions of local currency)2
Gross Domestic Product
(in millions of local currency)3
Gross Domestic Product
(2003 constant prices, base year=1995)2
Total public expenditure (in millions of local currency)
Total popula-tion in thou-sand (mid-year
estimates)
Purchasing Power Parity
for GDP (PPP) (US dollars=1)
Purchasing Power Parity for private
consumption (PPP)
(US dollars=1)
OEC
D c
ount
ries Australia 518 158 502 368 698 862 184 270 18 192 1.31 684 1.37 969
Austria 175 526 209 419 98 374 7 948 0.94 936 0.98 335
Belgium 207 782 245 321 107 927 10 137 0.92 135 0.95 232
Canada 798 300 768 883 1 046 630 381 542 29 302 1.21 572 1.27 027
Czech Republic 1 466 681 1 694 532 783 678 10 331 11.01 945 12.26 405
Denmark 1 019 545 1 195 033 606 983 5 230 8.58 466 8.91 466
Finland 96 145 127 669 56 778 5 108 0.97 906 1.13 104
France4 1 168 124 1 383 316 625 707 58 020 0.95 643 1.02 936
Germany 1 848 450 2 064 343 1 012 330 81 661 1.02 597 0.99 959
Greece 79 927 107 604 40 783 10 634 0.57 855 0.64 704
Hungary 5 656 608 7 711 212 2 327 299 10 329 59.26 325 61.86 322
Iceland 453 709 613 013 186 845 267 75.1 302 87.62 692
Ireland 53 147 99 237 21 838 3 601 0.81 683 0.89 372
Italy 923 052 1 039 644 492 878 57 301 0.77 536 0.82 553
Japan5 496 922 200 491 734 450 535 633 626 157 520 900 125 570 175.48 731 197.74 651
Korea 398 837 700 565 837 585 83 080 800 45 093 690.03 741 685.20 741
Luxembourg 13 215 19 900 6 016 410 1.00 224 0.96 317
Mexico 1 837 019 2 448 479 380 924 90 164 2.92 867 3.17 044
Netherlands 315 176 383 809 170 327 15 460 0.9 027 0.91 699
New Zealand 93 387 118 964 31 743 3 707 1.46 091 1.47 642
Norway 937 445 1 175 229 483 072 4 358 9.00 797 9.53 392
Poland 329 567 449 955 147 561 38 588 1.13 221 1.25 985
Portugal 80 827 98 589 36 403 10 030 0.61 197 0.63 843
Slovak Republic 576 502 783 352 324 312 5 363 13.04 816 13.24353
Spain 447 206 598 889 192 633 39 388 0.70 822 0.75 011
Sweden 1 787 889 2 197 224 1 199 338 8 827 9.41 585 10.211
Switzerland 372 250 415 873 157 093 7 081 1.99 624 2.10287
Turkey 7 762 9 950 m 61 646 0.0 226 0.02 584
United Kingdom 718 383 689 927 900 432 322 597 58 025 0.62 338 0.64 311
United States 7 342 300 7 261 100 9 457 154 2 717 644 266 588 1 1
Part
ner
coun
trie
s Brazil 646 192 745 444 224 283 152 945 0.63 m
Chile 25 875 699 36 850 056 5 265 291 14 210 247.49 m
Israel 284 833 351 181 147 374 5 545 2.986 m
Russian Federation 1 540 493 1 827 208 m 147 613 1.63 m
1. Data on GDP, PPPs and total public expenditure in countries in the Euro zone are provided in Euros.2. Australia and New Zealand: GDP and total public expenditure calculated for the fiscal year.3. For countries where GDP is not reported for the same reference period as data on educational finance, GDP is estimated as: wt-1 (GDPt - 1) + wt (GDPt), where wt and wt-1 are the weights for the respective portions of the two reference periods for GDP which fall within the educational financial year. Adjustments were made in Chapter B for Canada, Japan, the United Kingdom and the United States. 4. Excluding Over Sea Departments (DOM). 5.Total public expenditure adjusted to financial year.Source:OECD.
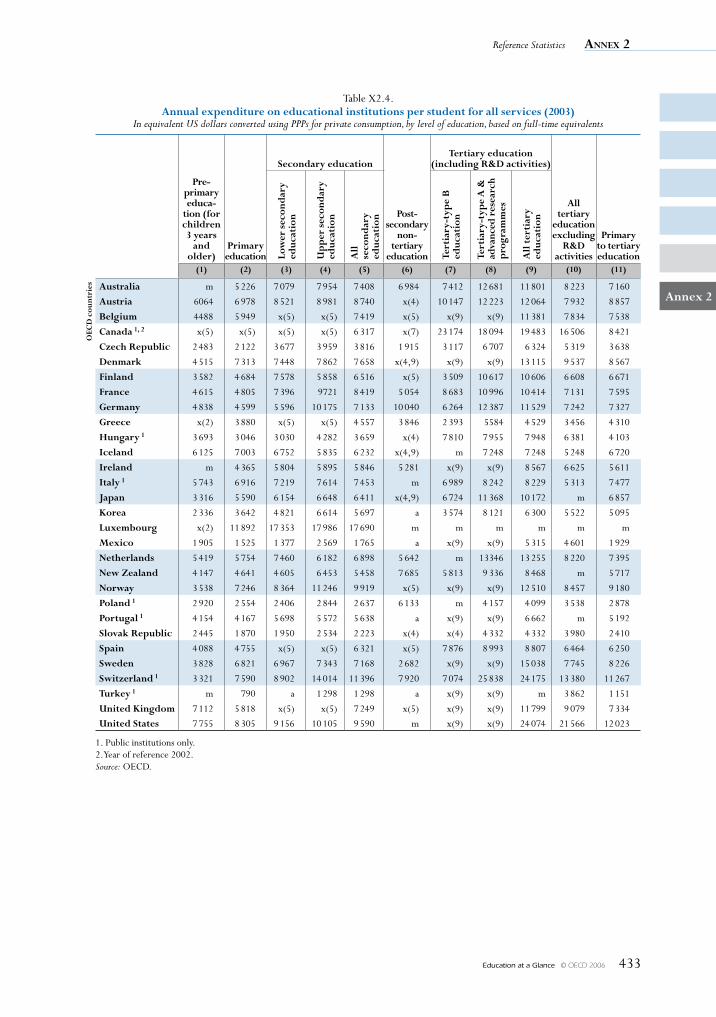
Reference Statistics Annex 2
Education at a Glance © OECD 2006 433
Annex 2
Table X2.4. Annual expenditure on educational institutions per student for all services (2003)
In equivalent US dollars converted using PPPs for private consumption, by level of education, based on full-time equivalents
Pre- primary educa-
tion (for children 3 years
and older)
Primary education
Secondary education
Post- secondary
non- tertiary
education
Tertiary education (including R&D activities)
All tertiary
education excluding
R&D activities
Primary to tertiary educationLo
wer
sec
ond
ary
ed
ucat
ion
Up
per
sec
ond
ary
ed
ucat
ion
All
se
cond
ary
ed
ucat
ion
Tert
iary
-typ
e B
ed
ucat
ion
Tert
iary
-typ
e A
&
adva
nced
res
earc
h p
rogr
amm
es
All
ter
tiar
y ed
ucat
ion
(1) (2) (3) (4) (5) (6) (7) (8) (9) (10) (11)
OEC
D c
ount
ries Australia m 5 226 7 079 7 954 7 408 6 984 7 412 12 681 11 801 8 223 7 160
Austria 6064 6 978 8 521 8 981 8 740 x(4) 10 147 12 223 12 064 7 932 8 857
Belgium 4488 5 949 x(5) x(5) 7 419 x(5) x(9) x(9) 11 381 7 834 7 538
Canada 1, 2 x(5) x(5) x(5) x(5) 6 317 x(7) 23 174 18 094 19 483 16 506 8 421
Czech Republic 2 483 2 122 3 677 3 959 3 816 1 915 3 117 6 707 6 324 5 319 3 638
Denmark 4 515 7 313 7 448 7 862 7 658 x(4,9) x(9) x(9) 13 115 9 537 8 567
Finland 3 582 4 684 7 578 5 858 6 516 x(5) 3 509 10 617 10 606 6 608 6 671
France 4 615 4 805 7 396 9721 8 419 5 054 8 683 10 996 10 414 7 131 7 595
Germany 4 838 4 599 5 596 10 175 7 133 10 040 6 264 12 387 11 529 7 242 7 327
Greece x(2) 3 880 x(5) x(5) 4 557 3 846 2 393 5584 4 529 3 456 4 310
Hungary 1 3 693 3 046 3 030 4 282 3 659 x(4) 7 810 7 955 7 948 6 381 4 103
Iceland 6 125 7 003 6 752 5 835 6 232 x(4,9) m 7 248 7 248 5 248 6 720
Ireland m 4 365 5 804 5 895 5 846 5 281 x(9) x(9) 8 567 6 625 5 611
Italy 1 5 743 6 916 7 219 7 614 7 453 m 6 989 8 242 8 229 5 313 7 477
Japan 3 316 5 590 6 154 6 648 6 411 x(4,9) 6 724 11 368 10 172 m 6 857
Korea 2 336 3 642 4 821 6 614 5 697 a 3 574 8 121 6 300 5 522 5 095
Luxembourg x(2) 11 892 17 353 17 986 17 690 m m m m m m
Mexico 1 905 1 525 1 377 2 569 1 765 a x(9) x(9) 5 315 4 601 1 929
Netherlands 5 419 5 754 7 460 6 182 6 898 5 642 m 13346 13 255 8 220 7 395
New Zealand 4 147 4 641 4 605 6 453 5 458 7 685 5 813 9 336 8 468 m 5 717
Norway 3 538 7 246 8 364 11 246 9 919 x(5) x(9) x(9) 12 510 8 457 9 180
Poland 1 2 920 2 554 2 406 2 844 2 637 6 133 m 4 157 4 099 3 538 2 878
Portugal 1 4 154 4 167 5 698 5 572 5 638 a x(9) x(9) 6 662 m 5 192
Slovak Republic 2 445 1 870 1 950 2 534 2 223 x(4) x(4) 4 332 4 332 3 980 2 410
Spain 4 088 4 755 x(5) x(5) 6 321 x(5) 7 876 8 993 8 807 6 464 6 250
Sweden 3 828 6 821 6 967 7 343 7 168 2 682 x(9) x(9) 15 038 7 745 8 226
Switzerland 1 3 321 7 590 8 902 14 014 11 396 7 920 7 074 25 838 24 175 13 380 11 267
Turkey 1 m 790 a 1 298 1 298 a x(9) x(9) m 3 862 1 151
United Kingdom 7 112 5 818 x(5) x(5) 7 249 x(5) x(9) x(9) 11 799 9 079 7 334
United States 7 755 8 305 9 156 10 105 9 590 m x(9) x(9) 24 074 21 566 12 023
1. Public institutions only. 2.Year of reference 2002. Source: OECD.
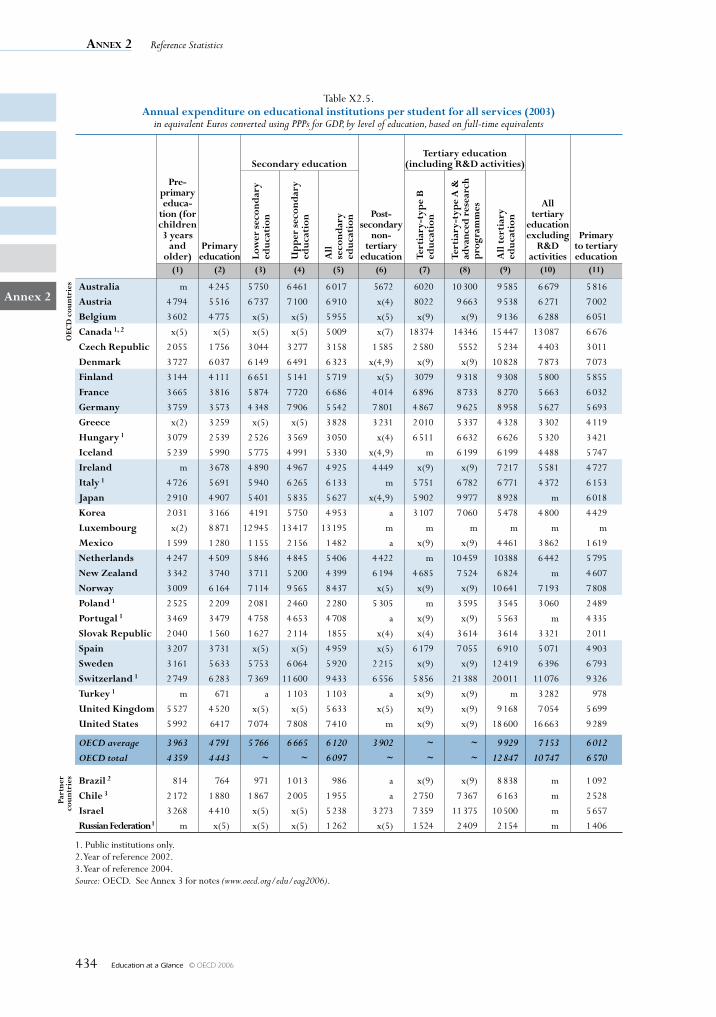
Annex 2 Reference Statistics
Education at a Glance © OECD 2006434
Annex 2
Table X2.5. Annual expenditure on educational institutions per student for all services (2003)
in equivalent Euros converted using PPPs for GDP, by level of education, based on full-time equivalents
Pre- primary educa-
tion (for children 3 years
and older)
Primary education
Secondary education
Post- secondary
non- tertiary
education
Tertiary education (including R&D activities)
All tertiary
education excluding
R&D activities
Primary to tertiary educationLo
wer
sec
ond
ary
ed
ucat
ion
Up
per
sec
ond
ary
ed
ucat
ion
All
se
cond
ary
ed
ucat
ion
Tert
iary
-typ
e B
ed
ucat
ion
Tert
iary
-typ
e A
&
adva
nced
res
earc
h p
rogr
amm
es
All
ter
tiar
y ed
ucat
ion
(1) (2) (3) (4) (5) (6) (7) (8) (9) (10) (11)
OEC
D c
ount
ries Australia m 4 245 5 750 6 461 6 017 5672 6020 10 300 9 585 6 679 5 816
Austria 4 794 5 516 6 737 7 100 6 910 x(4) 8022 9 663 9 538 6 271 7 002
Belgium 3 602 4 775 x(5) x(5) 5 955 x(5) x(9) x(9) 9 136 6 288 6 051
Canada 1, 2 x(5) x(5) x(5) x(5) 5 009 x(7) 18374 14346 15 447 13 087 6 676
Czech Republic 2 055 1 756 3 044 3 277 3 158 1 585 2 580 5552 5 234 4 403 3 011
Denmark 3 727 6 037 6 149 6 491 6 323 x(4,9) x(9) x(9) 10 828 7 873 7 073
Finland 3 144 4 111 6 651 5 141 5 719 x(5) 3079 9 318 9 308 5 800 5 855
France 3 665 3 816 5 874 7 720 6 686 4 014 6 896 8 733 8 270 5 663 6 032
Germany 3 759 3 573 4 348 7 906 5 542 7 801 4 867 9 625 8 958 5 627 5 693
Greece x(2) 3 259 x(5) x(5) 3 828 3 231 2 010 5 337 4 328 3 302 4 119
Hungary 1 3 079 2 539 2 526 3 569 3 050 x(4) 6 511 6 632 6 626 5 320 3 421
Iceland 5 239 5 990 5 775 4 991 5 330 x(4,9) m 6 199 6 199 4 488 5 747
Ireland m 3 678 4 890 4 967 4 925 4 449 x(9) x(9) 7 217 5 581 4 727
Italy 1 4 726 5 691 5 940 6 265 6 133 m 5 751 6 782 6 771 4 372 6 153
Japan 2 910 4 907 5 401 5 835 5 627 x(4,9) 5 902 9 977 8 928 m 6 018
Korea 2 031 3 166 4191 5 750 4 953 a 3 107 7 060 5 478 4 800 4 429
Luxembourg x(2) 8 871 12 945 13 417 13 195 m m m m m m
Mexico 1 599 1 280 1 155 2 156 1 482 a x(9) x(9) 4 461 3 862 1 619
Netherlands 4 247 4 509 5 846 4 845 5 406 4 422 m 10 459 10388 6 442 5 795
New Zealand 3 342 3 740 3 711 5 200 4 399 6 194 4 685 7 524 6 824 m 4 607
Norway 3 009 6 164 7 114 9 565 8 437 x(5) x(9) x(9) 10 641 7 193 7 808
Poland 1 2 525 2 209 2 081 2 460 2 280 5 305 m 3 595 3 545 3 060 2 489
Portugal 1 3 469 3 479 4 758 4 653 4 708 a x(9) x(9) 5 563 m 4 335
Slovak Republic 2 040 1 560 1 627 2 114 1855 x(4) x(4) 3 614 3 614 3 321 2 011
Spain 3 207 3 731 x(5) x(5) 4 959 x(5) 6 179 7 055 6 910 5 071 4 903
Sweden 3 161 5 633 5 753 6 064 5 920 2 215 x(9) x(9) 12 419 6 396 6 793
Switzerland 1 2 749 6 283 7 369 11 600 9 433 6 556 5 856 21 388 20 011 11 076 9 326
Turkey 1 m 671 a 1 103 1 103 a x(9) x(9) m 3 282 978
United Kingdom 5 527 4 520 x(5) x(5) 5 633 x(5) x(9) x(9) 9 168 7 054 5 699
United States 5 992 6417 7 074 7 808 7 410 m x(9) x(9) 18 600 16 663 9 289
OECD average 3 963 4 791 5 766 6 665 6 120 3 902 ~ ~ 9 929 7 153 6 012 OECD total 4 359 4 443 ~ ~ 6 097 ~ ~ ~ 12 847 10 747 6 570
Part
ner
coun
trie
s Brazil 2 814 764 971 1 013 986 a x(9) x(9) 8 838 m 1 092
Chile 3 2 172 1 880 1 867 2 005 1 955 a 2 750 7 367 6 163 m 2 528
Israel 3 268 4 410 x(5) x(5) 5 238 3 273 7 359 11 375 10 500 m 5 657
Russian Federation 1 m x(5) x(5) x(5) 1 262 x(5) 1 524 2 409 2 154 m 1 406
1. Public institutions only. 2. Year of reference 2002. 3. Year of reference 2004. Source: OECD. See Annex 3 for notes (www.oecd.org/edu/eag2006).
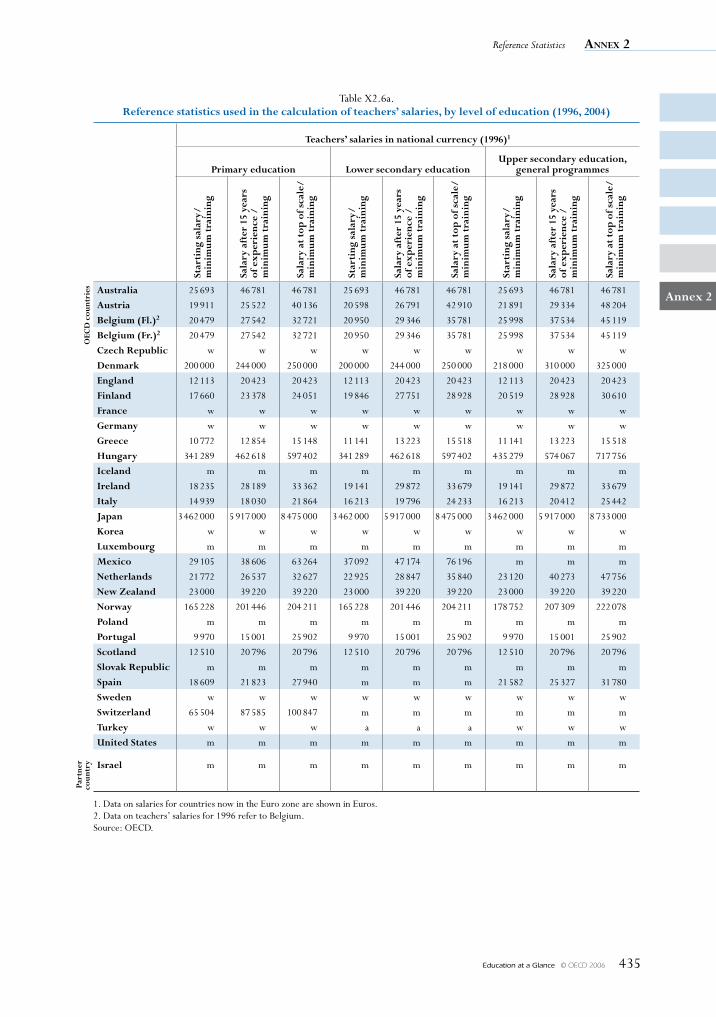
Reference Statistics Annex 2
Education at a Glance © OECD 2006 435
Annex 2
Table X2.6a. Reference statistics used in the calculation of teachers’ salaries, by level of education (1996, 2004)
Teachers’ salaries in national currency (1996)1
Primary education Lower secondary educationUpper secondary education,
general programmes
Star
ting
sal
ary/
m
inim
um t
rain
ing
Sala
ry a
fter
15
year
s
of e
xper
ienc
e /
min
imum
tra
inin
g
Sala
ry a
t to
p o
f sca
le/
min
imum
tra
inin
g
Star
ting
sal
ary/
m
inim
um t
rain
ing
Sala
ry a
fter
15
year
s
of e
xper
ienc
e /
min
imum
tra
inin
g
Sala
ry a
t to
p o
f sca
le/
min
imum
tra
inin
g
Star
ting
sal
ary/
m
inim
um t
rain
ing
Sala
ry a
fter
15
year
s
of e
xper
ienc
e /
min
imum
tra
inin
g
Sala
ry a
t to
p o
f sca
le/
min
imum
tra
inin
g
OEC
D c
ount
ries Australia 25 693 46 781 46 781 25 693 46 781 46 781 25 693 46 781 46 781
Austria 19 911 25 522 40 136 20 598 26 791 42 910 21 891 29 334 48 204
Belgium (Fl.)2 20 479 27 542 32 721 20 950 29 346 35 781 25 998 37 534 45 119
Belgium (Fr.)2 20 479 27 542 32 721 20 950 29 346 35 781 25 998 37 534 45 119
Czech Republic w w w w w w w w w
Denmark 200 000 244 000 250 000 200 000 244 000 250 000 218 000 310 000 325 000
England 12 113 20 423 20 423 12 113 20 423 20 423 12 113 20 423 20 423
Finland 17 660 23 378 24 051 19 846 27 751 28 928 20 519 28 928 30 610
France w w w w w w w w w
Germany w w w w w w w w w
Greece 10 772 12 854 15 148 11 141 13 223 15 518 11 141 13 223 15 518
Hungary 341 289 462 618 597 402 341 289 462 618 597 402 435 279 574 067 717 756
Iceland m m m m m m m m m
Ireland 18 235 28 189 33 362 19 141 29 872 33 679 19 141 29 872 33 679
Italy 14 939 18 030 21 864 16 213 19 796 24 233 16 213 20 412 25 442
Japan 3 462 000 5 917 000 8 475 000 3 462 000 5 917 000 8 475 000 3 462 000 5 917 000 8 733 000
Korea w w w w w w w w w
Luxembourg m m m m m m m m m
Mexico 29 105 38 606 63 264 37 092 47 174 76 196 m m m
Netherlands 21 772 26 537 32 627 22 925 28 847 35 840 23 120 40 273 47 756
New Zealand 23 000 39 220 39 220 23 000 39 220 39 220 23 000 39 220 39 220
Norway 165 228 201 446 204 211 165 228 201 446 204 211 178 752 207 309 222 078
Poland m m m m m m m m m
Portugal 9 970 15 001 25 902 9 970 15 001 25 902 9 970 15 001 25 902
Scotland 12 510 20 796 20 796 12 510 20 796 20 796 12 510 20 796 20 796
Slovak Republic m m m m m m m m m
Spain 18 609 21 823 27 940 m m m 21 582 25 327 31 780
Sweden w w w w w w w w w
Switzerland 65 504 87 585 100 847 m m m m m m
Turkey w w w a a a w w w
United States m m m m m m m m m
Part
ner
coun
try Israel m m m m m m m m m
1. Data on salaries for countries now in the Euro zone are shown in Euros.2. Data on teachers’ salaries for 1996 refer to Belgium.Source: OECD.
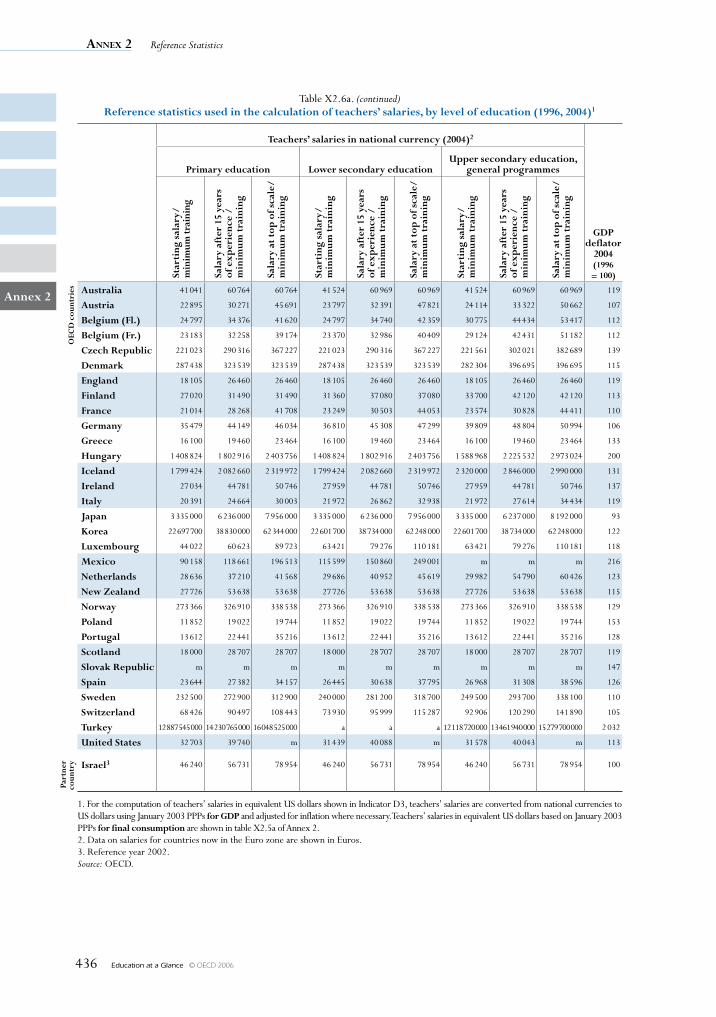
Annex 2 Reference Statistics
Education at a Glance © OECD 2006436
Annex 2
Table X2.6a. (continued)Reference statistics used in the calculation of teachers’ salaries, by level of education (1996, 2004)1
Teachers’ salaries in national currency (2004)2
GDP deflator
2004 (1996 = 100)
Primary education Lower secondary educationUpper secondary education,
general programmesSt
arti
ng s
alar
y/
min
imum
trai
ning
Sala
ry a
fter
15
year
s
of e
xper
ienc
e /
min
imum
tra
inin
g
Sala
ry a
t to
p o
f sca
le/
min
imum
tra
inin
g
Star
ting
sal
ary/
m
inim
um t
rain
ing
Sala
ry a
fter
15
year
s
of e
xper
ienc
e /
min
imum
tra
inin
g
Sala
ry a
t to
p o
f sca
le/
min
imum
tra
inin
g
Star
ting
sal
ary/
m
inim
um t
rain
ing
Sala
ry a
fter
15
year
s
of e
xper
ienc
e /
min
imum
tra
inin
g
Sala
ry a
t to
p o
f sca
le/
min
imum
tra
inin
g
OEC
D c
ount
ries Australia 41 041 60 764 60 764 41 524 60 969 60 969 41 524 60 969 60 969 119
Austria 22 895 30 271 45 691 23 797 32 391 47 821 24 114 33 322 50 662 107
Belgium (Fl.) 24 797 34 376 41 620 24 797 34 740 42 359 30 775 44 434 53 417 112
Belgium (Fr.) 23 183 32 258 39 174 23 370 32 986 40 409 29 124 42 431 51 182 112
Czech Republic 221 023 290 316 367 227 221 023 290 316 367 227 221 561 302 021 382 689 139
Denmark 287 438 323 539 323 539 287 438 323 539 323 539 282 304 396 695 396 695 115
England 18 105 26 460 26 460 18 105 26 460 26 460 18 105 26 460 26 460 119
Finland 27 020 31 490 31 490 31 360 37 080 37 080 33 700 42 120 42 120 113
France 21 014 28 268 41 708 23 249 30 503 44 053 23 574 30 828 44 411 110
Germany 35 479 44 149 46 034 36 810 45 308 47 299 39 809 48 804 50 994 106
Greece 16 100 19 460 23 464 16 100 19 460 23 464 16 100 19 460 23 464 133
Hungary 1 408 824 1 802 916 2 403 756 1 408 824 1 802 916 2 403 756 1 588 968 2 225 532 2 973 024 200
Iceland 1 799 424 2 082 660 2 319 972 1 799 424 2 082 660 2 319 972 2 320 000 2 846 000 2 990 000 131
Ireland 27 034 44 781 50 746 27 959 44 781 50 746 27 959 44 781 50 746 137
Italy 20 391 24 664 30 003 21 972 26 862 32 938 21 972 27 614 34 434 119
Japan 3 335 000 6 236 000 7 956 000 3 335 000 6 236 000 7 956 000 3 335 000 6 237 000 8 192 000 93
Korea 22 697 700 38 830 000 62 344 000 22 601 700 38 734 000 62 248 000 22 601 700 38 734 000 62 248 000 122
Luxembourg 44 022 60 623 89 723 63 421 79 276 110 181 63 421 79 276 110 181 118
Mexico 90 158 118 661 196 513 115 599 150 860 249 001 m m m 216
Netherlands 28 636 37 210 41 568 29 686 40 952 45 619 29 982 54 790 60 426 123
New Zealand 27 726 53 638 53 638 27 726 53 638 53 638 27 726 53 638 53 638 115
Norway 273 366 326 910 338 538 273 366 326 910 338 538 273 366 326 910 338 538 129
Poland 11 852 19 022 19 744 11 852 19 022 19 744 11 852 19 022 19 744 153
Portugal 13 612 22 441 35 216 13 612 22 441 35 216 13 612 22 441 35 216 128
Scotland 18 000 28 707 28 707 18 000 28 707 28 707 18 000 28 707 28 707 119
Slovak Republic m m m m m m m m m 147
Spain 23 644 27 382 34 157 26 445 30 638 37 795 26 968 31 308 38 596 126
Sweden 232 500 272 900 312 900 240 000 281 200 318 700 249 500 293 700 338 100 110
Switzerland 68 426 90 497 108 443 73 930 95 999 115 287 92 906 120 290 141 890 105
Turkey 12 887 545 000 14 230 765 000 16 048 525 000 a a a 12 118 720 000 13 461 940 000 15 279 700 000 2 032
United States 32 703 39 740 m 31 439 40 088 m 31 578 40 043 m 113
Part
ner
coun
try Israel3 46 240 56 731 78 954 46 240 56 731 78 954 46 240 56 731 78 954 100
1. For the computation of teachers’ salaries in equivalent US dollars shown in Indicator D3, teachers’ salaries are converted from national currencies to US dollars using January 2003 PPPs for GDP and adjusted for inflation where necessary.Teachers’ salaries in equivalent US dollars based on January 2003 PPPs for final consumption are shown in table X2.5a of Annex 2.2. Data on salaries for countries now in the Euro zone are shown in Euros.3. Reference year 2002.Source: OECD.
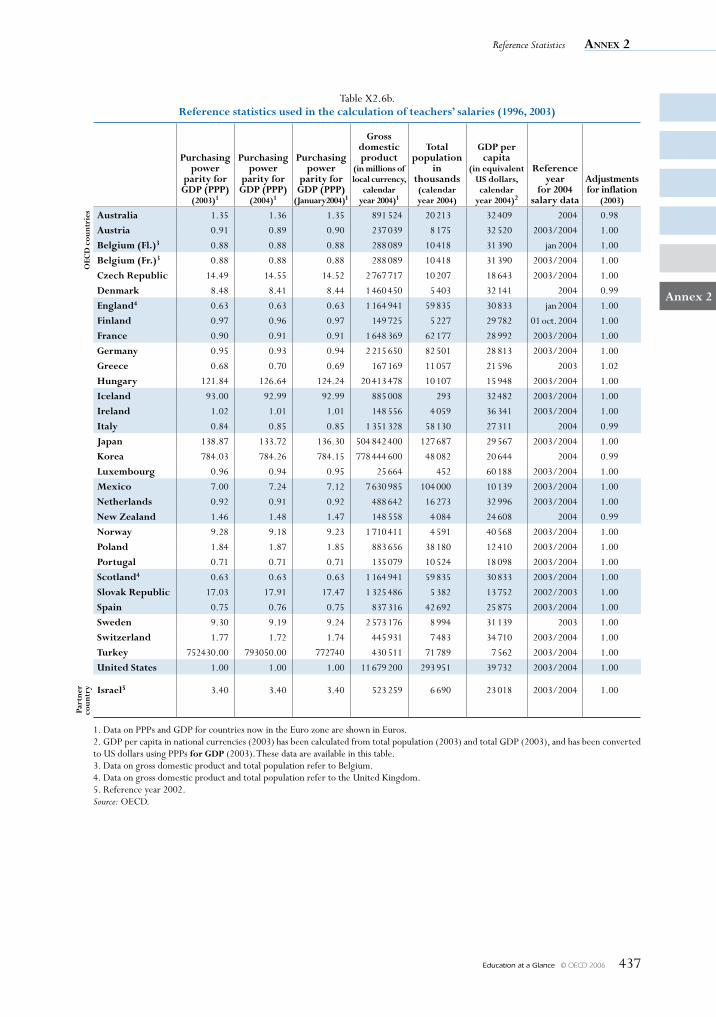
Reference Statistics Annex 2
Education at a Glance © OECD 2006 437
Annex 2
Table X2.6b.Reference statistics used in the calculation of teachers’ salaries (1996, 2003)
Purchasing power
parity for GDP (PPP)
(2003)1
Purchasing power
parity for GDP (PPP)
(2004)1
Purchasing power
parity for GDP (PPP)
(January2004)1
Gross domestic product
(in millions of local currency,
calendar year 2004)1
Total population
in thousands
(calendar year 2004)
GDP per capita
(in equivalent US dollars, calendar
year 2004)2
Reference year
for 2004 salary data
Adjustments for inflation
(2003)
OEC
D c
ount
ries Australia 1.35 1.36 1.35 891 524 20 213 32 409 2004 0.98
Austria 0.91 0.89 0.90 237 039 8 175 32 520 2003/2004 1.00
Belgium (Fl.)3 0.88 0.88 0.88 288 089 10 418 31 390 jan 2004 1.00
Belgium (Fr.)3 0.88 0.88 0.88 288 089 10 418 31 390 2003/2004 1.00
Czech Republic 14.49 14.55 14.52 2 767 717 10 207 18 643 2003/2004 1.00
Denmark 8.48 8.41 8.44 1 460 450 5 403 32 141 2004 0.99
England4 0.63 0.63 0.63 1 164 941 59 835 30 833 jan 2004 1.00
Finland 0.97 0.96 0.97 149 725 5 227 29 782 01 oct. 2004 1.00
France 0.90 0.91 0.91 1 648 369 62 177 28 992 2003/2004 1.00
Germany 0.95 0.93 0.94 2 215 650 82 501 28 813 2003/2004 1.00
Greece 0.68 0.70 0.69 167 169 11 057 21 596 2003 1.02
Hungary 121.84 126.64 124.24 20 413 478 10 107 15 948 2003/2004 1.00
Iceland 93.00 92.99 92.99 885 008 293 32 482 2003/2004 1.00
Ireland 1.02 1.01 1.01 148 556 4 059 36 341 2003/2004 1.00
Italy 0.84 0.85 0.85 1 351 328 58 130 27 311 2004 0.99
Japan 138.87 133.72 136.30 504 842 400 127 687 29 567 2003/2004 1.00
Korea 784.03 784.26 784.15 778 444 600 48 082 20 644 2004 0.99
Luxembourg 0.96 0.94 0.95 25 664 452 60 188 2003/2004 1.00
Mexico 7.00 7.24 7.12 7 630 985 104 000 10 139 2003/2004 1.00
Netherlands 0.92 0.91 0.92 488 642 16 273 32 996 2003/2004 1.00
New Zealand 1.46 1.48 1.47 148 558 4 084 24 608 2004 0.99
Norway 9.28 9.18 9.23 1 710 411 4 591 40 568 2003/2004 1.00
Poland 1.84 1.87 1.85 883 656 38 180 12 410 2003/2004 1.00
Portugal 0.71 0.71 0.71 135 079 10 524 18 098 2003/2004 1.00
Scotland4 0.63 0.63 0.63 1 164 941 59 835 30 833 2003/2004 1.00
Slovak Republic 17.03 17.91 17.47 1 325 486 5 382 13 752 2002/2003 1.00
Spain 0.75 0.76 0.75 837 316 42 692 25 875 2003/2004 1.00
Sweden 9.30 9.19 9.24 2 573 176 8 994 31 139 2003 1.00
Switzerland 1.77 1.72 1.74 445 931 7 483 34 710 2003/2004 1.00
Turkey 752430.00 793050.00 772740 430 511 71 789 7 562 2003/2004 1.00
United States 1.00 1.00 1.00 11 679 200 293 951 39 732 2003/2004 1.00
Part
ner
coun
try Israel5 3.40 3.40 3.40 523 259 6 690 23 018 2003/2004 1.00
1. Data on PPPs and GDP for countries now in the Euro zone are shown in Euros.2. GDP per capita in national currencies (2003) has been calculated from total population (2003) and total GDP (2003), and has been converted to US dollars using PPPs for GDP (2003). These data are available in this table.3. Data on gross domestic product and total population refer to Belgium.4. Data on gross domestic product and total population refer to the United Kingdom.5. Reference year 2002.Source: OECD.
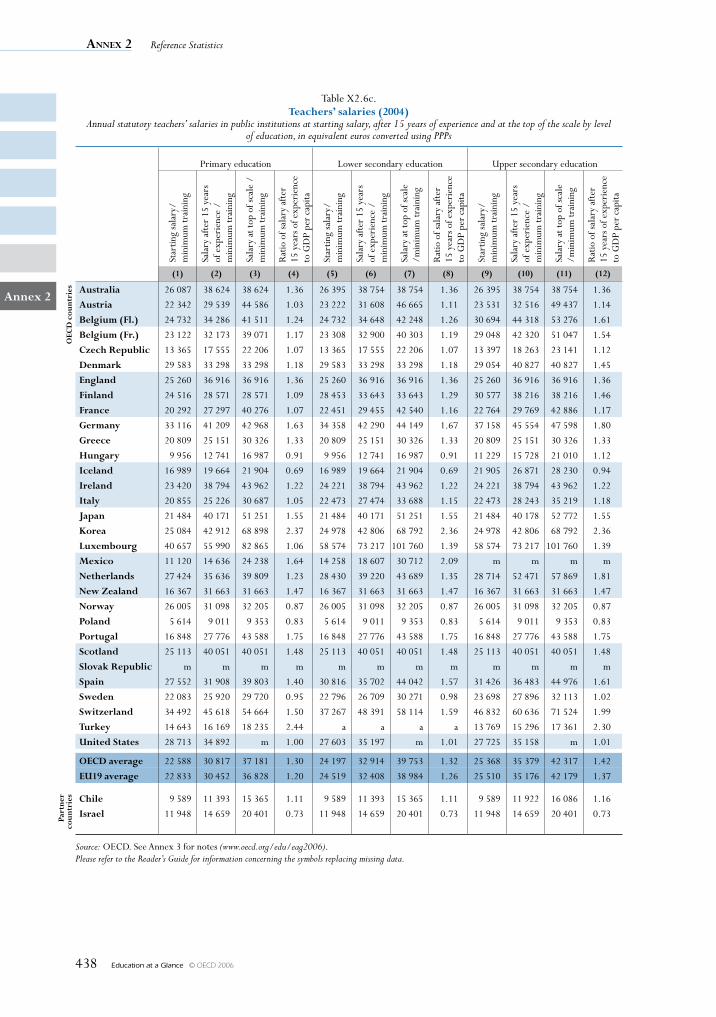
Annex 2 Reference Statistics
Education at a Glance © OECD 2006438
Annex 2
Table X2.6c.Teachers’ salaries (2004)
Annual statutory teachers’ salaries in public institutions at starting salary, after 15 years of experience and at the top of the scale by level of education, in equivalent euros converted using PPPs
Primary education Lower secondary education Upper secondary educationSt
artin
g sa
lary
/
min
imum
trai
ning
Sala
ry a
fter
15 y
ears
of
exp
erie
nce
/ m
inim
um tr
aini
ng
Sala
ry a
t top
of s
cale
/m
inim
um tr
aini
ng
Rat
io o
f sal
ary
afte
r
15 y
ears
of e
xper
ienc
e to
GD
P pe
r ca
pita
Star
ting
sala
ry/
m
inim
um tr
aini
ng
Sala
ry a
fter
15 y
ears
of
exp
erie
nce
/ m
inim
um tr
aini
ng
Sala
ry a
t top
of s
cale
/m
inim
um tr
aini
ng
Rat
io o
f sal
ary
afte
r
15 y
ears
of e
xper
ienc
e to
GD
P pe
r ca
pita
Star
ting
sala
ry/
m
inim
um tr
aini
ng
Sala
ry a
fter
15 y
ears
of
exp
erie
nce
/ m
inim
um tr
aini
ng
Sala
ry a
t top
of s
cale
/m
inim
um tr
aini
ng
Rat
io o
f sal
ary
afte
r
15 y
ears
of e
xper
ienc
e to
GD
P pe
r ca
pita
(1) (2) (3) (4) (5) (6) (7) (8) (9) (10) (11) (12)
OEC
D c
ount
ries Australia 26 087 38 624 38 624 1.36 26 395 38 754 38 754 1.36 26 395 38 754 38 754 1.36
Austria 22 342 29 539 44 586 1.03 23 222 31 608 46 665 1.11 23 531 32 516 49 437 1.14
Belgium (Fl.) 24 732 34 286 41 511 1.24 24 732 34 648 42 248 1.26 30 694 44 318 53 276 1.61
Belgium (Fr.) 23 122 32 173 39 071 1.17 23 308 32 900 40 303 1.19 29 048 42 320 51 047 1.54
Czech Republic 13 365 17 555 22 206 1.07 13 365 17 555 22 206 1.07 13 397 18 263 23 141 1.12
Denmark 29 583 33 298 33 298 1.18 29 583 33 298 33 298 1.18 29 054 40 827 40 827 1.45
England 25 260 36 916 36 916 1.36 25 260 36 916 36 916 1.36 25 260 36 916 36 916 1.36
Finland 24 516 28 571 28 571 1.09 28 453 33 643 33 643 1.29 30 577 38 216 38 216 1.46
France 20 292 27 297 40 276 1.07 22 451 29 455 42 540 1.16 22 764 29 769 42 886 1.17
Germany 33 116 41 209 42 968 1.63 34 358 42 290 44 149 1.67 37 158 45 554 47 598 1.80
Greece 20 809 25 151 30 326 1.33 20 809 25 151 30 326 1.33 20 809 25 151 30 326 1.33
Hungary 9 956 12 741 16 987 0.91 9 956 12 741 16 987 0.91 11 229 15 728 21 010 1.12
Iceland 16 989 19 664 21 904 0.69 16 989 19 664 21 904 0.69 21 905 26 871 28 230 0.94
Ireland 23 420 38 794 43 962 1.22 24 221 38 794 43 962 1.22 24 221 38 794 43 962 1.22
Italy 20 855 25 226 30 687 1.05 22 473 27 474 33 688 1.15 22 473 28 243 35 219 1.18
Japan 21 484 40 171 51 251 1.55 21 484 40 171 51 251 1.55 21 484 40 178 52 772 1.55
Korea 25 084 42 912 68 898 2.37 24 978 42 806 68 792 2.36 24 978 42 806 68 792 2.36
Luxembourg 40 657 55 990 82 865 1.06 58 574 73 217 101 760 1.39 58 574 73 217 101 760 1.39
Mexico 11 120 14 636 24 238 1.64 14 258 18 607 30 712 2.09 m m m m
Netherlands 27 424 35 636 39 809 1.23 28 430 39 220 43 689 1.35 28 714 52 471 57 869 1.81
New Zealand 16 367 31 663 31 663 1.47 16 367 31 663 31 663 1.47 16 367 31 663 31 663 1.47
Norway 26 005 31 098 32 205 0.87 26 005 31 098 32 205 0.87 26 005 31 098 32 205 0.87
Poland 5 614 9 011 9 353 0.83 5 614 9 011 9 353 0.83 5 614 9 011 9 353 0.83
Portugal 16 848 27 776 43 588 1.75 16 848 27 776 43 588 1.75 16 848 27 776 43 588 1.75
Scotland 25 113 40 051 40 051 1.48 25 113 40 051 40 051 1.48 25 113 40 051 40 051 1.48
Slovak Republic m m m m m m m m m m m m
Spain 27 552 31 908 39 803 1.40 30 816 35 702 44 042 1.57 31 426 36 483 44 976 1.61
Sweden 22 083 25 920 29 720 0.95 22 796 26 709 30 271 0.98 23 698 27 896 32 113 1.02
Switzerland 34 492 45 618 54 664 1.50 37 267 48 391 58 114 1.59 46 832 60 636 71 524 1.99
Turkey 14 643 16 169 18 235 2.44 a a a a 13 769 15 296 17 361 2.30
United States 28 713 34 892 m 1.00 27 603 35 197 m 1.01 27 725 35 158 m 1.01
OECD average 22 588 30 817 37 181 1.30 24 197 32 914 39 753 1.32 25 368 35 379 42 317 1.42
EU19 average 22 833 30 452 36 828 1.20 24 519 32 408 38 984 1.26 25 510 35 176 42 179 1.37
Part
ner
coun
trie
s Chile 9 589 11 393 15 365 1.11 9 589 11 393 15 365 1.11 9 589 11 922 16 086 1.16
Israel 11 948 14 659 20 401 0.73 11 948 14 659 20 401 0.73 11 948 14 659 20 401 0.73
Source: OECD. See Annex 3 for notes (www.oecd.org/edu/eag2006).Please refer to the Reader’s Guide for information concerning the symbols replacing missing data.
Reference Statistics Annex 2
Education at a Glance © OECD 2006 439
Annex 2
General notes
DefinitionsGross domestic product (GDP) refers to the producers’ value of the gross outputs of resident producers, including distributive trades and transport, less the value of purchasers’ intermediate consumption plus import duties. GDP is expressed in local money (in millions). For countries which provide this information for a reference year that is different from the calendar year (such as Australia and New Zealand), adjustments are made by linearly weighting their GDP between two adjacent national reference years to match the calendar year.
The GDP deflator is obtained by dividing the GDP expressed at current prices by the GDP expressed at constant prices. This provides an indication of the relative price level in a country. Data are based on the year 1995.
GDP per capita is the gross domestic product (in equivalent US dollars converted using PPPs) divided by the population.
Purchasing power parity exchange rates (PPP) are the currency exchange rates that equalise the purchasing power of different currencies. This means that a given sum of money when converted into different currencies at the PPP rates will buy the same basket of goods and services in all countries. In other words, PPPs are the rates of currency conversion which eliminate the differences in price levels among countries. Thus, when expenditure on GDP for different countries is converted into a common currency by means of PPPs, it is, in effect, expressed at the same set of international prices so that comparisons between countries reflect only differences in the volume of goods and services purchased.
Total public expenditure as used for the calculation of the education indicators, corresponds to the non-repayable current and capital expenditure of all levels of government. Current expenditure includes final consumption expenditure (e.g. compensation of employees, consumption intermediate goods and services, consumption of fixed capital, and military expenditure), property income paid, subsidies, and other current transfers paid (e.g., social security, social assistance, pensions and other welfare benefits). Capital expenditure is spending to acquire and/or improve fixed capital assets, land, intangible assets, government stocks, and non-military, non-financial assets, and spending to finance net capital transfers.
SourcesThe 2006 edition of the National Accounts of OECD Countries: Main Aggregates, Volume I.
The theoretical framework underpinning national accounts has been provided for many years by the United Nations’ publication A System of National Accounts, which was released in 1968. An updated version was released in 1993 (commonly referred to as SNA93).
OECD Analytical Data Base, January 2006.

Education at a Glance © OECD 2006 441
Annex
3
Annex 3 on sources and methods is available in electronic form only. It can be found at:
www.oecd.org/edu/eag2006
SourceS, MethodSand technical noteS

referenceS
Education at a Glance © OECD 2006 443
RefeRences
Coulombe, S., J-F. Tremblay and S. Marchand (2004), Literacy Scores, Human Capital and Growth across Fourteen OECD Countries, Statistics Canada/Human Resources and Skills Development Canada, Ottawa.
Cosnefroy, O. and T. Rocher (2004), “Le redoublement au cours de la scolarité obligatoire: nouvelles analyses, mêmes constats”, Éducation & formations, No. 70.
De la Fuente, A. and A. Ciccone (2003), Human Capital in a Global and Knowledge-Based Economy: Final Report, European Commission, DG Economic Affairs, Brussels.
Feinstein, et al. (2005), “The Effects of Education on Health: Concepts, Evidence and Policy Implications”, paper presented at the OECD/CERI Symposium on the Social Outcomes of Learning, Copenhagen, 23-24 March 2006.
Friedman T. (2005), The World Is Flat – A Brief History of the Twenty-First Century, Farrar, Straus & Giroux, New York.
Garet, M.S. and B. Delaney (1988), “Students’ Courses and Stratification”, Sociology of Education, Vol. 61, pp. 61-77.
Groot, W. and H.M. van den Brink (2004), “The Health Effects of Education: Survey and Meta-Analysis”, SCHOLAR Working Paper 50/04, Department of Economics, University of Amsterdam, Amsterdam.
Grossman, M. and R. Kaestner (1997), “Effects of Education on Health” in J.R. Behrman and N. Stacey (eds.), The Social Benefits of Education, The University of Michigan Press, Ann Arbor, Michigan.
Hammond, C. (2002), “Learning to be Healthy”, Brief No. RCB07, Institute of Education, London.
Jackson, G. (1975), “The Research Evidence on the Effects of Grade Retention”, Review of Educational Research, Vol. 45, pp. 613-635.
Jimerson, S.R. (2001), “Meta-Analysis of Grade Retention Research: Implications for Practice in the 21st century”, School Psychological Review, Vol. 30, No. 3, pp. 420-437.
Kelo, M., U. Teichler and B. Wächter (eds.) (2005), “EURODATA: Student Mobility in European Higher Education”, Verlags and Mediengesellschaft, Bonn, 2005.
Krueger, A.B. and M. Lindhal (2001), “Education and Growth: Why and for Whom?”, Journal of Economic Literature, Vol. 39, No. 4, American Economic Association, Nashville Tennessee, pp. 1101-1136.
Lucas, S.R. (2001), “Effectively Maintained Inequality: Education Transitions, Track Mobility, and Social Background Effects”, American Journal of Sociology, Vol. 106, pp. 1642-1690.
Ministry of Education of China, Department of Planning (2006), “Essential Statistics of Education in China”, Chinese Ministry of Education, Beijing.
The Nuffield Foundation (2004), “Time Trends in Adolescent Well-Being”, 2004 Seminars on Children and Families: Evidence and Implications, The Nuffield Foundation, London.
OECD (Organisation for Economic Co-operation and Development) (2001a), The New Economy: Beyond the Hype, OECD, Paris.
OECD (2001b), Education at Glance: OECD Indicators – 2001 Edition, OECD, Paris.
OECD (2003a), Education at Glance: OECD Indicators – 2003 Edition, OECD, Paris.
OECD (2003b), The Sources of Economic Growth in OECD Countries, OECD, Paris.
OECD (2004a), Learning for Tomorrow’s World – First Results from PISA 2003, OECD, Paris.
OECD (2004b), Problem Solving for Tomorrow’s World – First Measures of Cross-Curricular Competencies from PISA 2003, OECD, Paris.
RefeRences
Education at a Glance © OECD 2006444
OECD (2004c), Education at Glance: OECD Indicators – 2004 Edition, OECD, Paris.
OECD (2004d), Internationalisation and Trade in Higher Education: Opportunities and Challenges, OECD, Paris.
OECD (2005a), Trends in International Migration – 2004 Edition, OECD, Paris.
OECD (2005b) School Factors Related to Quality and Equity, OECD, Paris.
OECD (2005c), PISA 2003 Technical Report, OECD, Paris.
OECD (2005d), Education at Glance: OECD Indicators – 2005 Edition, OECD, Paris.
OECD (2005e), Are Students Ready for a Technology-Rich World? What PISA Studies Tell Us, OECD, Paris.
Ready, D.D., V.L. Lee and K.G. Welner (2004), “Educational Equity and School Structure: School Size, Overcrowding, and Schools-within-Schools”, Teachers College Record, Vol. 10, No. 106, pp. 1989-2014.
Rudd, R.E., B.A. Moeykens and T.C. Colton (1999), “Health and Literacy: A Review of Medical and Public Health Literature”, in J. Comings., B. Garners and C. Smith. (eds.), Annual Review of Adult Learning and Literacy, Jossey-Bass, New York.
Schleicher, A. (2006) “The Economics of Knowledge: Why Education Is Key for Europe’s Success”, Lisbon Council Policy Brief, The Lisbon Council absl, Brussels.
Schleicher, A. and K. Tremblay (2006), “Dragons, Elephants and Tigers: Adjusting to the New Global reality”, in Challenge Europe, European Policy Centre, Brussels.
Sianesi, B. and J. Van Reenan (2003), “The Returns to Education: Macroeconomics”, The Journal of Economic Surveys, Vol. 17, No. 2, Blackwell Publishing Ltd., Oxford, pp. 157-200.
Tremblay, K. (2005) “Academic Mobility and Immigration”, Journal of Studies in International Education, Vol. 9, No. 3, Association for Studies in International Education, Thousands Oaks, pp. 1-34.
United States National Science Board (2003), The Science and Engineering Workforce – Realizing America’s Potential, National Science Foundation, Washington, D.C.
Wösmann, L. (2003), “Specifying Human Capital”, Journal of Economic Surveys, Vol. 17, No. 3, Blackwell Publishing Ltd., Oxford, pp. 239-270.
Zhen G. (2006), “First Results from a Survey on Chinese Students’ Learning Time”, Shanghai Jiao Tong University mimeo.
Education at a Glance © OECD 2006 445
Contributors to this PubliCation
Many people have contributed to the development of this publication. The following lists the names of the country representatives, researchers and experts who have actively taken part in the preparatory work leading
to the publication of Education at a Glance – OECD Indicators 2006. The OECD wishes to thank them all for their valuable efforts.
National Co-ordinators
Mr. Brendan O’REILLY (Australia)Mr. Mark NEMET (Austria)M. Dominique BARTHÉLÉMY (Belgium)Ms. Maddy BOLLEN (Belgium)Ms. Oroslinda Maria GOULART (Brazil)Mr. Atilio PIZARRO (Chile)Mr. Lubomir MARTINEC (Czech Republic)Mr. Ken THOMASSEN (Denmark)Ms. Sylvia KIMMEL (Estonia)Mr. Matti KYRÖ (Finland)M. Claude SAUVAGEOT (France)Ms. Barbara MEYER-WYK (Germany)Ms. Evelyn OBELE (Germany)Mr. Gregory KAFETZOPOULOS (Greece)Ms. Judit KáDáR-FüLÖP (Hungary)Ms. Margrét HARÐARDÓTTIR (Iceland)Mr. Pat MAC SITRIC (Ireland)Mr. Yosef GIDANIAN (Israel)Mr. Antonio Giunta LA SPADA (Italy)
Mr. Kenji SAKUMA (Japan)Ms. Chun-Ran PARK (Korea) M. Jérôme LEVY (Luxembourg)Mr. Rafael FREYRE MARTINEZ (Mexico)Mr. Marcel SMITS VAN WAESBERGHE (Netherlands)Mr. David LAMBIE (New Zealand)Mr. Kjetil MÅSEIDE (Norway)Mr. Jerzy WISNIEWSKI (Poland)Mr. João Trocado MATA (Portugal)Mr. Mark AGRANOVITCH (Russian Federation)Mr. Vladimir POKOJNY (Slovak Republic)Mrs. Helga KOCEVAR (Slovenia)Mrs. Carmen MAESTRO MARTIN (Spain)Mr. Dan ANDERSSON (Sweden)Ms. Dominique Simone RYCHEN (Switzerland)Mr. Ibrahim Z. KARABIYIK (Turkey)Ms. Janice ROSS (United Kingdom)Ms. Valena White PLISKO (United States)
Mr. Brendan O’REILLY (Australia)Mr. Adrian PAWSEY (Australia)Ms. Sabine MARTINSCHITZ (Austria)Mr. Wolfgang PAULI (Austria)Ms. Ann VAN DRIESSCHE (Belgium)Mr. Philippe DIEU (Belgium)Ms. Nathalie JAUNIAUX (Belgium)Mr. Liës FEYEN (Belgium)Mr. Guy STOFFELEN (Belgium)Mr. Raymond VAN DE SIJPE (Belgium)Mr. Johan VERMEIREN (Belgium)Ms. Carmilva FLORES (Brazil)Ms. Vanessa NESPOLI DE OLIVEIRA (Brazil)Ms. Lynn BARR-TELFORD (Canada)Mr. Jean-Claude BOUSqUET (Canada)Mr. Eduardo CORREA (Chile)Mr. Cesar MUñOZ HERNANDEZ (Chile)
Technical Group on Education Statistics and Indicators
Mr. Vladimir HULIK (Czech Republic)Ms. Michaela KLENHOVá (Czech Republic)Mr. Felix KOSCHIN (Czech Republic)Mr. Leo JENSEN (Denmark)Mr. Ken THOMASSEN (Denmark)Ms. Birgitta ANDRÉN (EUROSTAT) Mr. Pascal SCHMIDT (EUROSTAT)Mr. Timo ERTOLA (Finland)Mr. Miikka PAAJAVUORI (Finland)Mr. Mika TUONONEN (Finland)Mr. Matti VAISANEN (Finland)Mr. Jean-Michel DURR (France)Ms. Michèle JACqUOT (France)Ms. Christine RAGOUCY (France)Mr. Heinz-Werner HETMEIER (Germany)Ms. Kirsten OTTO (Germany)Mr. Alexander RENNER (Germany)
Contributors
Education at a Glance © OECD 2006446
Mr. Ingo RUSS (Germany)Ms. Vassilia ANDREADAKI (Greece)Mr. Angelos KARAGIANNIS (Greece)Mr. Konstantinos STOUKAS (Greece)Ms. Judit KOZMA-LUKáCS (Hungary)Mr. László LIMBACHER (Hungary)Ms. Judit LUKáCS (Hungary)Ms. ásta URBANCIC (Iceland)Ms. Mary DUNNE (Ireland)Mr. Muiris O’CONNOR (Ireland)Mr. Yosef GIDANIAN (Israel)Ms. Dalia SPRINZAK (Israel)Ms. Gemma DE SANCTIS (Italy)Ms. Giuliana MATTEOCCI (Italy)Ms. Maria Pia SORVILLO (Italy)Mr. Paolo TURCHETTI (Italy)Ms. Nozomi HARAGUCHI (Japan)Ms. Midori MIYATA (Japan)Mr. Tokuo OGATA (Japan)Mr. Satoshi TAKAHASHI (Japan)Mr. Jérôme LEVY (Luxembourg)Ms. Manon UNSEN (Luxembourg)Mr. David VALLADO (Luxembourg)Ms. Erika VALLE BUTZE (Mexico)Mr. Marcel A.M. SMITS VAN WAESBERGHE (Netherlands)Mr. Dick TAKKENBERG (Netherlands)Ms. Pauline THOOLEN (Netherlands)Mr. Paul GINI (New Zealand)Ms. Marie ARNEBERG (Norway)
Ms. Birgitta BØHN (Norway)Mr. Kjetil DIGRE (Norway)Mr. Geir NYGARD (Norway)Mr. Terje RISBERG (Norway)Ms. Alina BARAN (Poland)Ms. Anna NOWOZYNSKA (Poland)Mr. Jose PAREDES (Portugal)Mr. João PEREIRA DE MATOS (Portugal)Ms. Natalia KOVALEVA (Russian Federation)Mr. Mark AGRANOVITCH (Russian Federation)Ms. Alzbeta FERENCICOVÀ (Slovak Republic)Mr. Vladimir POKJNY (Slovak Republic)Ms. Elena REBROSOVA (Slovak Republic)Ms. Helga KOCEVAR (Slovenia)Ms. Tatjana SKRBEC (Slovenia)Mr. Fernando CELESTINO REY (Spain)Mr. Eduardo DE LA FUENTE (Spain)Mr. Jesus IBANEZ MILLA (Spain)Ms. Karin ARVEMO-NOTSTRAND (Sweden)Mr. Henrik ENGSTROM (Sweden)Ms. Christina SANDSTROM (Sweden)Ms. Katrin HOLENSTEIN (Switzerland)Ms. Nilgün DURAN (Turkey)Ms. Alison KENNEDY (UNESCO)Mr. Steve HEWITT (United Kingdom)Mr. Steve LEMAN (United Kingdom)Ms. Mary Ann FOX (United States)Ms. Catherine FREEMAN (United States)Mr. Thomas SNYDER (United States)
Network A on Educational Outcomes
Lead Country: United StatesNetwork Leader: Mr. Eugene OWENMs. Wendy WHITHAM (Australia)Mrs. Helene BABEL (Austria)Mr. Jürgen HORSCHINEGG (Austria)Mrs. Christiane BLONDIN (Belgium)Mr. Luc VAN DE POELE (Belgium)Ms. Oroslinda Maria GOULART (Brazil)Mr. Don HOIUM (Canada)Ms. Tamara KNIGHTON (Canada)Mr. Jerry MUSSIO (Canada)Mr. Lubomir MARTINEC (Czech Republic)Ms. Pavla ZIELENIECOVA (Czech Republic)Mr. Joern SKOVSGAARD (Denmark)Mr. Aki TORNBERG (Finland)Mr. Thierry ROCHER (France)Ms. Evelyn OBELE (Germany)Ms. Kirsten OTTO (Germany)Mr. Botho PRIEBE (Germany)Mr. Panyotis KAZANTZIS (Greece)Ms. Zsuzsa HAMORI-VACZY (Hungary)Mr. Julius K. BJORNSSON (Iceland)Mr. Gerry SHIEL (Ireland)
Mrs. Anna Maria CAPUTO (Italy)Mr. Ryo WATANABE (Japan)Ms. Mee-Kyeong LEE (Korea) Ms. Iris BLANKE (Luxembourg)Mr. Felipe MARTINEZ RIZO (Mexico)Dr. Jules L. PESCHAR (Netherlands)Dr. Paul VAN OIJEN (Netherlands) Ms. Lynne WHITNEY (New Zealand)Ms. Anne-Berit KAVLI (Norway)Ms. Glória RAMALHO (Portugal)Mr. Vladislav ROSA (Slovak Republic)Ms. Mar GONZALEZ GARCIA (Spain)Mr. Ramon PAJARES BOX (Spain)Ms. Anna BARKLUND (Sweden)Ms. Anita WESTER (Sweden)Mr. Erich RAMSEIER (Switzerland)Mr. Sevki KARACA (Turkey)Mr. Jason TARSH (United Kingdom)Ms. Marit GRANHEIM (United States)Mr. Jay MOSKOWITZ (United States)Ms. Elois SCOTT (United States)Ms. Maria STEPHENS (United States)
Contributors
Education at a Glance © OECD 2006 447
Others contributors to this publication
Mr. Donald HIRSCH (Consultant)Ms. Tracey STRANGE (Editor)Ms. Fung-Kwan TAM (Layout)
Lead country: SwedenNetwork Leader: Mr. Dan ANDERSSONMs. Oon Ying CHIN (Australia)Mr. Brendan O’REILLY (Australia)Mr. Mark NÉMET (Austria)Ms. Ariane BAYE (Belgium)Ms. Isabelle ERAUW (Belgium)Ms. Oroslinda Maria GOULART (Brazil)Mr. Patrice DE BROUCKER (Canada)Ms. Shannon DELBRIDGE (Canada)Ms. Zuzana POLAKOVA (Czech Republic)Mr. Steffen BANG (Denmark)Ms. Irja BLOMqVIST (Finland)Ms. Aila REPO (Finland)Ms. Pascale POULET-COULIBANDO (France)Ms. Christiane KRüGER-HEMMER (Germany)Mr. Nikolaos BILALIS (Greece) Mr. Evangelos INTZIDIS (Greece)Ms. Éva TÓT (Hungary)Ms. Asta URBANCIC (Iceland)Mr. Philip O’CONNELL (Ireland)Mrs. Paola UNGARO (Italy)Ms. Ikuko ARIMATSU (Japan)
Ms. Jihee CHOI (Korea)Mr. Jérôme LEVY (Luxembourg)Mme. Astrid SCHORN (Luxembourg)Mr. Roy TJOA (Netherlands)Mr. Johan VAN DER VALK (Netherlands)Mr. Marcel SMITS VAN WAESBERGHE (Netherlands)Ms. Cheryl REMINGTON (New Zealand)Mr. Erik Dahl (Norway)Ms. Anne Brit UDAHL (Norway)Mr. Terje RISBERG (Norway)Ms. Malgorzata CHOJNICKA (Poland)Mr. Jorge BARATA (Portugal)Ms. Raquel áLVAREZ-ESTEBAN (Spain)Mr. Dan ANDERSSON (Sweden)Ms. Anna JÖNSSON (Sweden)Mr. Kenny PETERSSON (Sweden)Mr. Russell SCHMIEDER (Sweden)Ms. Anna BORKOWSKY (Switzerland)Mr. Ali PANAL (Turkey)Mr. David MCPHEE (United Kingdom)Mr. Stephen LEMAN (United Kingdom)Ms. Lisa HUDSON (United States)Mr. Dan SHERMAN (United States)
Network B on Education and Socio-economic Outcomes
Network C on School Features and Processes
Lead Country: NetherlandsNetwork Leader: Mr. Jaap SCHEERENSMr. Lars STAHRE (Australia)Mr. Christian KRENTHALLER (Austria)Mr. Philippe DELOOZ (Belgium)Ms. Ann VAN DRIESSCHE (Belgium)Mr. Peter VAN PETEGEM (Belgium)Ms. Maria Aparecida CHAGAS FERREIRA (Brazil)Ms. Oroslinda Maria GOULART (Brazil)Ms. Nelly MCEWEN (Canada)Ms. Michaela KLENHOVA (Czech Republic)Mr. Lubomir MARTINEC (Czech Republic)Ms. Pavlina STASTNOVA (Czech Republic)Mr. Jørgen Balling RASMUSSEN (Denmark)Ms. Maria HRABINSKA (European Commission) Mr. Hannu-Pekka LAPPALAINEN (Finland)Mrs. Dominique ALLAIN (France)Mr. Gerd MÖLLER (Germany)Mr. Vassilios CHARISMIADIS (Greece)Ms. Anna IMRE (Hungary)Mr. Pat MAC SITRIC (Ireland)
Mrs. Caterina VEGLIONE (Italy)Ms. Sung Eun KIM (Korea)Mme Astrid SCHORN (Luxembourg)Mr. Jean-Claude FANDEL (Luxembourg)Ms. Erika VALLE BUTZE (Mexico)Ms. Maria HENDRIKS (Netherlands)Mr. Marcel SMITS VAN WAESBERGHE (Netherlands)Mr. Paul GINI (New Zealand)Ms. Bodhild BAASLAND (Norway)Mr. Jerzy CHODNICKI (Poland)Ms. Maria DO CARMO CLIMACO (Portugal)Mr. Helder GUERREIRO (Portugal)Mr. Ignacio áLVAREZ PERALTA (Spain)Ms. Ulla LINDqVIST (Sweden)Mrs. Annika HAGLUND (Sweden)Mr. Eugen STOCKER (Switzerland)Ms. Nilgün DURAN (Turkey)Ms. Alison KENNEDY (UNESCO)Mr. Jason TARSH (United Kingdom)Mr. Joel SHERMAN (United States)Mrs. Kerry GRUBER (United States)

Education at a Glance © OECD 2006 449
Related OeCd PubliCatiOns
Where Immigrant Students Succeed: A Comparative Review of Performance and Engagement in PISA 2003ISBN 92-64-02360-7
Are Students Ready for a Technology-Rich World?: What PISA Studies Tell UsISBN 92-64-03608-3
Learning for Tomorrow’s World – First Results from PISA 2003 (2004)ISBN 92-64-00724-5
Problem Solving for Tomorrow’s World – First Measures of Cross-Curricular Competencies from PISA 2003 (2004)ISBN 92-64-00642-7
From Education to Work: A Difficult Transition for Young Adults with Low Levels of Education (2005)ISBN 92-64-00918-3
Education Policy Analysis 2005 (Forthcoming)ISBN 92-64-02269-4
OECD Handbook for Internationally Comparative Education Statistics: Concepts, Standards, Definitions and Classifications (2004)ISBN 92-64-10410-0
Completing the Foundation for Lifelong Learning: An OECD Survey of Upper Secondary Schools (2004)ISBN 92-64-10372-4
OECD Survey of Upper Secondary Schools: Technical Report (2004)ISBN 92-64-10572-7
Internationalisation and Trade in Higher Education: Opportunities and Challenges (2004)ISBN 96-64-01504-3
Classifying Educational Programmes: Manual for ISCED-97 Implementation in OECD Countries (1999)ISBN 92-64-17037-5
OECD publications can be browsed or purchased at the OECD Online Bookshop (www.oecdbookshop.org).

OECD PUBLICATIONS, 2, rue André-Pascal, 75775 PARIS CEDEX 16
PRINTED IN FRANCE
(96 2006 06 1 P) ISBN 92-64-02531-6 – No. 55217 2006
Education at a GlanceOECD INDICATORS 2006
Ed
uc
atio
n a
t a G
lan
ce
OE
CD
IND
ICA
TO
RS
-:HSTCQE=UWZXV]:
Across OECD countries, governments are seeking policies to make education more effective while searching for additional resources to meet the increasing demand for education.
The 2006 edition of Education at a Glance enables countries to see themselves in the light of other countries’ performance. It provides a rich, comparable and up-to-date array of indicators on the performance of education systems and represents the consensus of professional thinking on how to measure the current state of education internationally.
The indicators look at who participates in education, what is spent on it and how education systems operate and at the results achieved. The latter includes indicators on a wide range of outcomes, from comparisons of student’s performance in key subject areas to the impact of education on earnings and on adults’ chances of employment.
New material in this edition includes:
• Further analysis of results of the 2003 survey of the OECD’s Programme for International Student Assessment (PISA) , including student access to and use of ICT, analysis of the lowest performing students and the effects on students performance of family background and the way classes are organised in schools.
• Trend data on tertiary qualifications, including projections for the year 2014.• Trend data on survival rates in tertiary education. • The impact of demographic trends on education systems, as well as projections on expenditure
for the year 2015.• Trend data on expected years of education.• Instruction time per subject for 9-to-14-year-olds.• A picture of student mobility and the significance of internationalisation of higher education.
The Excel™ spreadsheets used to create the tables and charts in this book are available via the StatLinks printed in this book. The tables, charts and the complete Education Database are freely available via the OECD Education Web site at www.oecd.org/edu/eag2006.
FURTHER READINGEducation Policy Analysis
2006
www.oecd.org
2006
The full text of this book is available on line via these links:http://www.sourceoecd.org/education/9264025316http://www.sourceoecd.org/emergingeconomies/9264025316http://www.sourceoecd.org/transitioneconomies/9264025316
Those with access to all OECD books on line should use this link:http://www.sourceoecd.org/9264025316
SourceOECD is the OECD's online library of books, periodicals and statistical databases. For more information about this award-winning service and free trials ask your librarian, or write to us at:
2006
«Education at a GlanceOECD INDICATORS 2006
ISBN 92-64-02531-6 96 2006 06 1 P