oslo manual 2018 - oecd ilibrary
TRANSCRIPT

The Measurement of Scientific, Technological and Innovation Activities
Oslo Manual 2018GUIDELINES FOR COLLECTING, REPORTING AND USING DATA ON INNOVATION
The Measurement of Scientific, Technological and Innovation Activities
Oslo Manual 2018GUIDELINES FOR COLLECTING, REPORTING AND USING DATA ON INNOVATION4th EDITION
What is innovation and how should it be measured? Understanding the scale of innovation activities, the characteristics of innovative fi rms and the internal and systemic factors that can infl uence innovation is a prerequisite for the pursuit and analysis of policies aimed at fostering innovation. First published in 1992, the Oslo Manual is the international reference guide for collecting and using data on innovation. In this fourth edition, the manual has been updated to take into account a broader range of innovation-related phenomena as well as the experience gained from recent rounds of innovation surveys in OECD countries and partner economies and organisations.
ISBN 978-92-64-30455-092 2018 03 1 P
Consult this publication on line at https://doi.org/10.1787/9789264304604-en.
This work is published on the OECD iLibrary, which gathers all OECD books, periodicals and statistical databases.Visit www.oecd-ilibrary.org for more information.
9HSTCQE*daeffa+
Oslo
Man
ual 2018
Th
e Measu
rement o
f Scientific, Tech
nolo
gical an
d In
novation A
ctivities
4th Edition


The Measurement of Scientific, Technological and InnovationActivities
Oslo Manual2018
GUIDELINES FOR COLLECTING, REPORTING AND USING DATA ON INNOVATION
4TH EDITION
This work is published under the responsibility of the Secretary-General of the OECD. The
opinions expressed and arguments employed herein do not necessarily reflect the official
views of OECD member countries or those of Eurostat or the European Union.
This document, as well as any data and any map included herein, are without prejudice
to the status of or sovereignty over any territory, to the delimitation of international
frontiers and boundaries and to the name of any territory, city or area.
Please cite this publication as:OECD/Eurostat (2018), Oslo Manual 2018: Guidelines for Collecting, Reporting and Using Data on Innovation,4th Edition, The Measurement of Scientific, Technological and Innovation Activities, OECDPublishing, Paris/Eurostat, Luxembourg.https://doi.org/10.1787/9789264304604-en
ISBN 978-92-64-30455-0 (print)ISBN 978-92-64-30460-4 (pdf)
Series: The Measurement of Scientific, Technological and Innovation ActivitiesISSN 2413-2756 (print)ISSN 2413-2764 (online)
European UnionPrintCatalogue number: KS-01-18-852-EN-CISBN 978-92-79-92581-8PDFCatalogue number: KS-01-18-852-EN-NISBN 978-92-79-92578-8
The statistical data for Israel are supplied by and under the responsibility of the relevant Israeli authorities. The use ofsuch data by the OECD is without prejudice to the status of the Golan Heights, East Jerusalem and Israeli settlements inthe West Bank under the terms of international law.
Photo credits: “Prometheus bringing fire to mankind”, fresco mural painting by Rufino Tamayo, 1958. Original work ondisplay at UNESCO, Paris. Photo reproduced with permission from UNESCO and author’s heirs, depicted in full in theAcknowledgements section. © D.R. Rufino Tamayo / Herederos / México / 2018 / Fundación Olga y Rufino Tamayo, A.C.© All rights reserved UNESCO © Photo UNESCO/J.C.Bernath.
Corrigenda to OECD publications may be found on line at: www.oecd.org/publishing/corrigenda.
© OECD, European Union, 2018
You can copy, download or print OECD content for your own use, and you can include excerpts from OECD publications, databases and
multimedia products in your own documents, presentations, blogs, websites and teaching materials, provided that suitable
acknowledgement of OECD as source and copyright owner is given. All requests for public or commercial use and translation rights should
be submitted to [email protected]. Requests for permission to photocopy portions of this material for public or commercial use shall be
addressed directly to the Copyright Clearance Center (CCC) at [email protected] or the Centre français d’exploitation du droit de copie
(CFC) at [email protected].

FOREWORD │ 3
OSLO MANUAL 2018 © OECD/EUROPEAN UNION 2018
Foreword
Addressing the current and emerging economic, social and environmental challenges
requires novel ideas, innovative approaches and greater levels of multilateral co-operation.
Innovation and digitalisation are playing an increasingly important role in virtually all
sectors and in the daily lives of citizens around the world. As such, policy makers are
placing the “innovation imperative” at the centre of their policy agendas.
The design, development and implementation of policies, however, is fraught with
difficulty – and even more so when international co-ordination is required. Innovation has
often been regarded as ‘too fuzzy’ a concept to be measured and accounted for. The OECD
Frascati Manual opened the way for measuring one key dimension of science, technology
and innovation so that, nowadays, investment in research and development – R&D – is
systematically encouraged and monitored around the world. However, policymaking today
is still largely focused on what is easier to measure. There is, therefore, an urgent need to
capture how ideas are developed and how they can become the tools that transform
organisations, local markets, countries, the global economy and the very fabric of society.
In 1991, the city of Oslo witnessed the first agreement within the global community of
practitioners in the OECD Working Party of National Experts on Science and Technology
Indicators on how to conceptualise and measure business innovation. These guidelines
became known as the Oslo Manual, which was published and put to the test with the support
of the European Union. The fast adoption and diffusion of the manual’s proposals, both
within and beyond the OECD and the EU, are a clear indication of the value of this
initiative; in fact, innovation surveys covering more than 80 countries have been carried
out thus far.
Moreover, the OECD and Eurostat have jointly led further revisions of the manual to extend
the scope and increase the robustness of the data collected according to the Oslo guidelines.
These revisions have been based on the experience gained from collecting data on
innovation in OECD member and partner countries.
This fourth edition of the Oslo Manual takes account of major trends such as, the pervasive
role of global value chains; the emergence of new information technologies and how they
influence new business models; the growing importance of knowledge-based capital; as
well as the progress made in understanding innovation processes and their economic
impact. Its guidance seeks to contribute to measuring the process of digital transformation
and thus supports the goals of the OECD’s Going Digital initiative.
The manual is a truly international resource benefitting from inputs by UNESCO, the
World Bank and a number of regional development banks, who, like the OECD, are
strongly committed to developing an evidence base to support investments in innovation
and promote economic and social development. The 2018 edition is relevant for economies
worldwide, regardless of their levels of economic development, and supports the
assessment of the Sustainable Development Goals (SDGs). The manual rises to the
challenges of being globally relevant – as set out by the G20 at its 2016 summit in
4 │ FOREWORD
OSLO MANUAL 2018 © OECD/EUROPEAN UNION 2018
Hangzhou (China); and continuing to improve measurement systems to better capture the
key features of science, technology and innovation – as stated in the Declaration of Science
and Innovation Ministers Meeting in Daejeon (Korea) in 2015.
For the first time, the Oslo Manual provides a common framework for measuring
innovation in a more inclusive manner across the economy, in government, in non-profit
organisations and in households. This provides a path for realising many of the proposals
put forward at the OECD Blue Sky Forum held in Ghent (Belgium) in 2016. For example,
the inclusion of a new chapter in the manual focuses on the use of innovation data for
constructing indicators and conducting analysis and evaluation.
The Oslo Manual has earned a pre-eminent place in the family of continuously evolving
instruments devoted to the definition, collection, analysis and use of data related to science,
technology and innovation. As a statistical manual, it represents a meeting point between
users’ needs for practical concepts, definitions and evidence on innovation, and the expert
consensus on what can be robustly measured. Conceived as an open, voluntary standard,
the Oslo Manual seeks to inspire dialogue, encourage new data collection efforts and
experimentation.
As highlighted by the OECD Innovation Strategy, better measurement of innovation and
its impact on economic growth, sustainability and inclusiveness is key to fulfilling the
promise of better co-ordinated innovation policies in the digital era. The OECD has long
argued for a whole-of-government approach to innovation policy and has stressed the
importance of understanding the complex array of factors that influence innovation and the
way it impacts our societies, anticipating and addressing their unintended outcomes. The
Oslo Manual represents an extremely valuable additional tool for a wide range of
innovation experts and policy practitioners worldwide.
Angel Gurría
OECD Secretary-General
ACKNOWLEDGEMENTS │ 5
OSLO MANUAL 2018 © OECD/EUROPEAN UNION 2018
Acknowledgements
This joint publication of the OECD and Eurostat is the outcome of a collective effort of all
national delegates and representatives from international organisations participating in the
OECD Working Party of National Experts on Science and Technology Indicators (NESTI).
Several people invested considerable time and effort to help steer the revision process on
behalf of the entire NESTI group. The present fourth edition came together thanks to the
leadership and dedication of the members of the Oslo Manual revision steering group
(OMSG). Chaired by the NESTI Chair Svein Olav Nås (Research Council, Norway), the
OMSG was set up by OECD and Eurostat to steer the revision process from inception to
publication. A diverse group of experts comprising Ales Capek (Eurostat), Alessandra
Colecchia (OECD), Tomohiro Ijichi (NISTEP and Seijo University, Japan), John
Jankowski (NSF/NCSES, United States), Carsten Olsson (Eurostat), Christian Rammer
(ZEW, Germany), Monica Salazar (Inter-American Development Bank) and Martin
Schaaper (ITU, formerly UNESCO Institute for Statistics) stepped up to the challenges set
out in the revision’s terms of reference. The OMSG deliberated frequently, using (and
sometimes abusing) the opportunities provided by online remote communication across
different time zones, to provide a collegial and effective interface between the working
party and the drafting team. This allowed the work to progress in between meetings and
fulfil the NESTI vision and agreements.
Anthony Arundel (University of Maastricht and consultant to the OECD secretariat),
Fernando Galindo-Rueda (OECD) and Christian Rammer (ZEW) prepared, on request
from the OMSG, a series of chapter outlines and drafts for discussion and review. These
drafts represented the backbone of the present manual. Anthony Arundel took
responsibility for editing the entire manual, ensuring consistency and the timely delivery
of the manual for discussion and approval by delegates. Vladimir López-Bassols
(consultant to the OECD secretariat) supported the OECD in the final copy and style editing
of the manuscript and the preparation of the glossary of terms. Fred Gault (UNU-MERIT,
TUT-IERI and consultant to the OECD secretariat) provided additional editorial support
and assisted the NESTI Chair in outreach and liaison activities with other international
organisations such as the International Organization for Standardization (ISO).
The revision work undertaken by NESTI was facilitated by the S&T indicators unit in the
Economic Analysis and Statistics (EAS) Division of the OECD Directorate for Science,
Technology and Innovation (STI), led by Fernando Galindo-Rueda with support from
Michela Bello and Daniel Ker. On the part of the Eurostat STI Working Group (STI WG)
Secretariat, Giulio Perani and Gregor Kyi within Unit G4 Innovation and Digitalisation at
Eurostat’s Business and Trade Statistics Directorate played an instrumental role getting the
revision off the ground and defining its final scope. Carsten Olsson, as the Unit G4 head,
co-chaired the OMSG in the initial phase of the project. His successor, Ales Capek,
facilitated the final signature of the co-publication agreement between the OECD and
Eurostat. Formal oversight within the OECD was provided by Alessandra Colecchia as

6 │ ACKNOWLEDGEMENTS
OSLO MANUAL 2018 © OECD/EUROPEAN UNION 2018
Head of the EAS division. STI Director Andrew Wyckoff and Deputy Director Dirk Pilat
provided guidance and comments on the drafts.
This edition would not have been possible without the financial and human resources
provided by the following organisations: the United States’ National Science
Foundation/National Center for Science and Engineering Statistics, the German Federal
Ministry for Research and Education, the Research Council of Norway, Eurostat, and the
European Commission. These organisations supported work directly related to the revision
as well as preparatory, exploratory and methodological work in the years preceding the
revision.
Participants in four revision workshops (Oslo, December 2016; Ghent, September 2016; a
NESTI meeting in Paris, March 2017; and a NESTI meeting in Madrid, December 2017)
provided valuable insights to the discussions and contributed discussion documents and
presentations. Additionally, webinars were carried out in June 2016 and October 2017. The
December 2017 NESTI meeting was kindly hosted by the Spanish Foundation for Science
and Technology (FECYT), during which the manual was agreed to in principle by
delegates.
Workshops organised by the US National Academies of Science and Engineering in
Washington DC (through a grant from NSF/NCSES), ZEW in Mannheim, RICYT in San
José (Costa Rica), and the OECD Blue Sky Forum in Ghent, provided excellent
opportunities to float ideas and proposals with members of the external academic and
policy users community.
We would also like to gratefully acknowledge the input from individual and institutional
submissions to the online stakeholder consultation process and the chairpersons and
delegates of the OECD Committee for Scientific and Technological Policy (CSTP) and
Committee for Statistics and Statistical Policy (CSSP), as well as their national teams, for
the feedback provided up until declassification approval.
This work would not have been possible without the additional input of the NESTI Bureau
and that of several other OECD and Eurostat colleagues, including IT, publications,
communication and administrative support staff. They all contributed to the final printed
and online (http://oe.cd/oslomanual) versions of this Manual.
Special gratitude is owed to the experts who initially conceived this manual and worked on
it for nearly 30 years to enhance its relevance and quality, overcoming several challenges
along the way. It is hoped that they will see this edition as a substantive and worthwhile
“innovation” as it is implemented worldwide and inspires new measurement and analysis.
The NESTI and STI WG communities, in partnership with experts from all over the world,
will strive to make the Oslo Manual guidelines accessible and useful in the coming months
and years.

ACKNOWLEDGEMENTS │ 7
OSLO MANUAL 2018 © OECD/EUROPEAN UNION 2018
Cover image
The cover image of this manual is part of a photographic reproduction of a fresco mural
painting by Mexican artist Rufino Tamayo. He was commissioned in 1957 by the
International Committee of Art Advisors of UNESCO to contribute to the artistic
decoration of Room II upon the completion of the Fontenoy building at UNESCO
Headquarters in Paris. The fresco was executed in situ and completed in 1958.
The subject portrayed, “Prometheus bringing the fire to mankind”, comes from the ancient
Greek mythology and has been recurrent theme in the arts for centuries. The titan
Prometheus disobeys the gods giving the human race the gift of fire and the skill of
metalwork, an action for which both he and humankind are punished, albeit not fatally,
ultimately being freed byanother heroic character, Heracles.
As noted in the UNESCO Works of Art Collection website, “Tamayo’s fresco seems to be
an exaltation of the red colour through its different tones: the carmines and the vermilions
bring the fire to life”.
We would like to express our gratitude to María Eugenia Bermúdez Flores de Ferrer,
representative of the heirs of Rufino Tamayo’s legacy, the “Fundación Olga y Rufino
Tamayo”, and Ms. Tania Fernández de Toledo, Chief of Section at UNESCO, for kindly
allowing us to reproduce this image that so well symbolises the essence of this publication
and the meaning of innovation.
TAMAYO, Rufino (1899-1991)
PROMETHEUS BRINGING FIRE TO MANKIND, 1958
Fresco, signed lower right 'Tamayo 9-58', 500 x 450 cm
http://www.unesco.org/artcollection/

TABLE OF CONTENTS │ 9
OSLO MANUAL 2018 © OECD/EUROPEAN UNION 2018
Table of contents
Foreword ................................................................................................................................................ 3
Acknowledgements ................................................................................................................................ 5
Abbreviations and acronyms .............................................................................................................. 17
Executive summary ............................................................................................................................. 19
What is the Oslo Manual?.................................................................................................................. 19 Why a manual for measuring innovation? ......................................................................................... 19 What is innovation? ........................................................................................................................... 20 Why and how was the manual revised? ............................................................................................. 21 What are the main novelties of this edition? ...................................................................................... 21 How are the guidelines intended to be used? ..................................................................................... 23 Where to find additional relevant resources? ..................................................................................... 23
Part I. Introduction to the measurement of innovation ................................................................... 25
Chapter 1. Introduction to innovation statistics and the Oslo Manual ........................................... 27
1.1. Objectives and background of the Oslo Manual ......................................................................... 28 1.1.1. The origins of the Oslo Manual ............................................................................................ 28 1.1.2. Main objectives of the fourth edition ................................................................................... 29 1.1.3. Scope and approach of the fourth edition ............................................................................. 30 1.1.4. The Oslo Manual and other statistical standards .................................................................. 31
1.2. Structure and contents of the Oslo Manual 2018 ........................................................................ 32 1.2.1. Introduction to the measurement of innovation (Part I) ....................................................... 32 1.2.2. Framework and guidelines for measuring business innovation (Part II) .............................. 32 1.2.3. Methods for collecting, analysing and reporting statistics on business innovation (Part III)36 1.2.4. Cross-cutting issues covered within this manual.................................................................. 37 1.2.5. Digitalisation and innovation ............................................................................................... 37 1.2.6. Globalisation and innovation................................................................................................ 39
1.3. Implementing the guidance in this manual ................................................................................. 39 1.3.1. Nature of the guidance in this manual .................................................................................. 39 1.3.2. Transition and implementation ............................................................................................. 40
References .......................................................................................................................................... 41
Chapter 2. Concepts for measuring innovation ................................................................................ 43
2.1. Introduction ................................................................................................................................. 44 2.2. The concept of innovation .......................................................................................................... 45
2.2.1. Conceptual foundations ........................................................................................................ 45 2.2.2. Knowledge ........................................................................................................................... 46 2.2.3. Novelty with respect to potential uses .................................................................................. 46
10 │ TABLE OF CONTENTS
OSLO MANUAL 2018 © OECD/EUROPEAN UNION 2018
2.2.4. Implementation and actual use ............................................................................................. 47 2.2.5. Value creation ...................................................................................................................... 47
2.3. User needs and relevance of statistical evidence on innovation ................................................. 48 2.3.1. Research academics .............................................................................................................. 48 2.3.2. Business managers ............................................................................................................... 49 2.3.3. Innovation and other public policy makers .......................................................................... 49
2.4. Elements of an innovation measurement framework .................................................................. 50 2.4.1. Scope of innovation measurement: SNA sectors and jurisdictions ...................................... 50 2.4.2. Innovation phenomena for measurement ............................................................................. 53
2.5. General strategies for measuring innovation .............................................................................. 56 2.5.1. Subject- versus object-based approaches ............................................................................. 56 2.5.2. Qualitative and quantitative data .......................................................................................... 57 2.5.3. Sources of innovation data ................................................................................................... 57 2.5.4. Responsibility for primary source data collection ................................................................ 58 2.5.5. Summary of the measurement approach in this manual ....................................................... 59
2.6. Measuring innovation beyond the Business sector ..................................................................... 60 2.6.1. Innovation in the General government sector ...................................................................... 60 2.6.2. Innovation and non-profit institutions .................................................................................. 61 2.6.3. Innovation, households and individuals ............................................................................... 61
References .......................................................................................................................................... 62
Part II. Framework and guidelines for measuring business innovation ........................................ 65
Chapter 3. Concepts and definitions for measuring business innovation ...................................... 67
3.1. Introduction ................................................................................................................................. 68 3.2. Innovation in the Business enterprise sector ............................................................................... 68
3.2.1. Definition of innovation activities and innovation ............................................................... 68 3.2.2. Division of innovation effort and responsibilities ................................................................ 70
3.3. Taxonomies of innovation .......................................................................................................... 70 3.3.1. Innovation types by object: Product and business process innovations ............................... 70 3.3.2. Types of innovation according to novelty and impacts ........................................................ 77
3.4. Changes that are not innovations ................................................................................................ 78 3.5. Innovation and business profiling ............................................................................................... 80
3.5.1. Innovative and innovation-active firms ................................................................................ 80 3.6. Use of innovation definitions in data collection ......................................................................... 81
3.6.1. Use of the term “innovation” in surveys .............................................................................. 81 3.6.2. Innovation profiles ............................................................................................................... 82 3.6.3. Priorities for data collection about innovations .................................................................... 82
References .......................................................................................................................................... 83
Chapter 4. Measuring business innovation activities ....................................................................... 85
4.1. Introduction and main features of innovation activities .............................................................. 86 4.2. Types of activities of relevance to innovation ............................................................................ 87
4.2.1. Research and experimental development activities .............................................................. 87 4.2.2. Engineering, design and other creative work activities ........................................................ 87 4.2.3. Marketing and brand equity activities .................................................................................. 88 4.2.4. Intellectual property related activities .................................................................................. 89 4.2.5. Employee training activities ................................................................................................. 89 4.2.6. Software development and database activities ..................................................................... 89 4.2.7. Activities related to the acquisition or lease of tangible assets ............................................ 90 4.2.8. Innovation management ....................................................................................................... 91
TABLE OF CONTENTS │ 11
OSLO MANUAL 2018 © OECD/EUROPEAN UNION 2018
4.3. Collecting qualitative data on the incidence of innovation activities ......................................... 91 4.3.1. Internal and externally sourced activities ............................................................................. 91 4.3.2. Qualitative data on specific activities related to innovation ................................................. 92
4.4. Collecting expenditure data on innovation activities .................................................................. 93 4.4.1. Conceptual issues in measuring innovation expenditures .................................................... 93 4.4.2. Expenditures for specific innovation activities .................................................................... 94 4.4.3. Expenditures by accounting categories for innovation-active firms .................................... 97 4.4.4. Sources of funds for innovation activities ............................................................................ 98
4.5. Other data on innovation activities ............................................................................................. 99 4.5.1. Collecting data on human resources for innovation activities .............................................. 99 4.5.2. Data on innovation projects .................................................................................................. 99 4.5.3. Follow-on activities ............................................................................................................ 100 4.5.4. Planned innovation activities and expenditures ................................................................. 100
4.6. Summary of recommendations ................................................................................................. 101 References ........................................................................................................................................ 102
Chapter 5. Measuring business capabilities for innovation ........................................................... 103
5.1. Introduction ............................................................................................................................... 104 5.2. General resources of the firm .................................................................................................... 104
5.2.1. Firm size ............................................................................................................................. 105 5.2.2. Business assets ................................................................................................................... 105 5.2.3. Age ..................................................................................................................................... 105 5.2.4. Financing and ownership ................................................................................................... 106
5.3. Management capabilities .......................................................................................................... 106 5.3.1. Business strategy ................................................................................................................ 106 5.3.2. Organisational and managerial capabilities ........................................................................ 108 5.3.3. Characteristics of the business owner and top management .............................................. 109 5.3.4. Innovation management capabilities .................................................................................. 110 5.3.5. Intellectual property management and appropriation ......................................................... 113
5.4. Workforce skills and human resource management ................................................................. 115 5.4.1. Workforce qualifications, occupational structure and competences .................................. 115 5.4.2. Human resource management ............................................................................................ 117
5.5. Technological capabilities ........................................................................................................ 117 5.5.1. Technical expertise ............................................................................................................. 118 5.5.2. Design capabilities ............................................................................................................. 119 5.5.3. Capabilities related to digital technologies and data analytics ........................................... 121
5.6. Summary of recommendations ................................................................................................. 123 References ........................................................................................................................................ 124
Chapter 6. Business innovation and knowledge flows.................................................................... 127
6.1. Introduction ............................................................................................................................... 128 6.2. Knowledge flows and innovation: Key concepts and definitions ............................................. 129
6.2.1. Diffusion of innovation ...................................................................................................... 129 6.2.2. Knowledge flows ................................................................................................................ 129 6.2.3. Open innovation ................................................................................................................. 132
6.3. Collecting data on knowledge flows and their relationship to innovation ................................ 134 6.3.1. General issues ..................................................................................................................... 134 6.3.2. Data on knowledge flows from innovation activities ......................................................... 135 6.3.3. Sources of ideas or information for innovation .................................................................. 139 6.3.4. Interactions with higher education and public research institutions .................................. 140
12 │ TABLE OF CONTENTS
OSLO MANUAL 2018 © OECD/EUROPEAN UNION 2018
6.3.5. IP rights and knowledge flows ........................................................................................... 141 6.3.6. Barriers and undesirable consequences of knowledge flows ............................................. 141
6.4. Summary of recommendations ................................................................................................. 142 References ........................................................................................................................................ 143
Chapter 7. Measuring external factors influencing innovation in firms ...................................... 145
7.1. Introduction ............................................................................................................................... 146 7.2. Main elements of the external environment for business innovation ....................................... 146 7.3. Location of business activities .................................................................................................. 148 7.4. Markets and the environment for business innovation ............................................................. 149
7.4.1. Markets for the firm’s products .......................................................................................... 149 7.4.2. Competition and collaboration in markets ......................................................................... 151 7.4.3. The market for inputs ......................................................................................................... 153 7.4.4. Intermediaries and digital platforms ................................................................................... 155
7.5. The public policy environment for business innovation ........................................................... 156 7.5.1. Regulations ......................................................................................................................... 156 7.5.2. Government support programmes ...................................................................................... 156 7.5.3. Innovation and public infrastructure .................................................................................. 158 7.5.4. Macroeconomic policy environment .................................................................................. 159
7.6. The social and natural environment for innovation .................................................................. 159 7.6.1. The social context for innovation ....................................................................................... 159 7.6.2. The natural environment .................................................................................................... 159
7.7. External factors as drivers and obstacles to business innovation .............................................. 160 7.7.1. External factors as drivers of innovation ............................................................................ 160 7.7.2. External factors as barriers or obstacles to innovation ....................................................... 160
7.8. Summary of recommendations ................................................................................................. 161 References ........................................................................................................................................ 162
Chapter 8. Objectives and outcomes of business innovation ......................................................... 163
8.1. Introduction ............................................................................................................................... 164 8.2. Qualitative measures of business innovation objectives and outcomes .................................... 164
8.2.1. Types of innovation objectives and outcomes.................................................................... 164 8.2.2. Innovation objectives and outcomes in relation to business strategies .............................. 166
8.3. Quantitative measures of innovation outcomes ........................................................................ 168 8.3.1. Quantitative measures for product innovation ................................................................... 168 8.3.2. Quantitative outcome data for business process innovations ............................................. 170
8.4. Issues for measurement ............................................................................................................. 172 8.5. Summary of recommendations ................................................................................................. 172 References ........................................................................................................................................ 173
Part III. Methods for collecting, analysing and reporting statistics on business innovation ...... 175
Chapter 9. Methods for collecting data on business innovation .................................................... 177
9.1. Introduction ............................................................................................................................... 178 9.2. Population and other basic characteristics for a survey ............................................................ 179
9.2.1. Target population ............................................................................................................... 179 9.2.2. Statistical units and reporting units .................................................................................... 180 9.2.3. Data linkage........................................................................................................................ 184 9.2.4. Frequency of data collection .............................................................................................. 185 9.2.5. Observation and reference periods ..................................................................................... 185
9.3. Question and questionnaire design ........................................................................................... 186
TABLE OF CONTENTS │ 13
OSLO MANUAL 2018 © OECD/EUROPEAN UNION 2018
9.3.1. Question design .................................................................................................................. 187 9.3.2. Questionnaire design .......................................................................................................... 188 9.3.3. Short-form questionnaires .................................................................................................. 189 9.3.4. Combining innovation and other business surveys ............................................................ 189 9.3.5. Questionnaire testing .......................................................................................................... 191
9.4. Sampling ................................................................................................................................... 191 9.4.1. The survey frame ................................................................................................................ 191 9.4.2. Census versus sample ......................................................................................................... 192 9.4.3. Longitudinal panel data and cross-sectional surveys ......................................................... 194
9.5. Data collection methods ............................................................................................................ 194 9.5.1. Postal surveys ..................................................................................................................... 194 9.5.2. Online surveys .................................................................................................................... 195 9.5.3. Telephone and face-to-face interviews ............................................................................... 196 9.5.4. Combined survey methods ................................................................................................. 196
9.6. Survey protocol ......................................................................................................................... 196 9.6.1. Respondent identification ................................................................................................... 197 9.6.2. Support for respondents ..................................................................................................... 197 9.6.3. Mandatory and voluntary surveys ...................................................................................... 197 9.6.4. Non-response ...................................................................................................................... 197 9.6.5. Conducting non-response surveys ...................................................................................... 198
9.7. Post-survey data processing ...................................................................................................... 199 9.7.1. Error checks........................................................................................................................ 199 9.7.2. Imputation of missing data ................................................................................................. 200 9.7.3. Calculating weights ............................................................................................................ 201
9.8. Publication and dissemination of results ................................................................................... 201 9.8.1. Metadata and quality reports .............................................................................................. 202 9.8.2. Data access ......................................................................................................................... 202
References ........................................................................................................................................ 202
Chapter 10. The object method for innovation measurement ....................................................... 205
10.1. Introduction ............................................................................................................................. 206 10.2. Including an “object module” in an innovation survey ........................................................... 206
10.2.1. Identifying a focal innovation within surveys .................................................................. 207 10.2.2. Non-innovative firms ....................................................................................................... 208
10.3. Questions on a focal innovation .............................................................................................. 209 10.3.1. Characteristics of the focal, most important innovation ................................................... 209 10.3.2. Innovation activities contributing to the focal innovation ................................................ 209 10.3.3. Business capabilities contributing to the focal innovation ............................................... 210 10.3.4. Knowledge flows contributing to and generated by the focal innovation ........................ 210 10.3.5. External factors influencing the focal innovation ............................................................ 210 10.3.6. Objectives and outcomes of the focal innovation............................................................. 211
10.4. Summary of recommendations ............................................................................................... 211 References ........................................................................................................................................ 212
Chapter 11. Use of innovation data for statistical indicators and analysis .................................. 213
11.1. Introduction ............................................................................................................................. 214 11.2. Data and indicators on business innovation ............................................................................ 214
11.2.1. What are innovation indicators and what are they for? .................................................... 214 11.2.2. Desirable properties of innovation indicators .................................................................. 215 11.2.3. Recommendations and resources for innovation indicators ............................................. 216
14 │ TABLE OF CONTENTS
OSLO MANUAL 2018 © OECD/EUROPEAN UNION 2018
11.3. Methodologies for constructing business innovation indicators ............................................. 217 11.3.1. Aggregation of statistical indicators ................................................................................. 217 11.3.2. Indicator development and presentation for international comparisons ........................... 219 11.3.3. Firm-level innovation rankings ........................................................................................ 221
11.4. A blueprint for indicators on business innovation .................................................................. 222 11.4.1. Choice of innovation indicators ....................................................................................... 222 11.4.2. Breakdown categories, scaling, and typologies ................................................................ 227 11.4.3. Choice of statistical data for innovation indicators .......................................................... 228
11.5. Using data on innovation to analyse innovation performance, policies and their impacts ..... 229 11.5.1. Modelling dependencies and associations ........................................................................ 230 11.5.2. Inference of causal effects in innovation analysis ............................................................ 230 11.5.3. Analysing the impact of public innovation policies ......................................................... 233 11.5.4. Co-ordinated analysis of innovation microdata across countries ..................................... 236
11.6. Conclusions ............................................................................................................................. 237 References ........................................................................................................................................ 237
Glossary of terms ............................................................................................................................... 241
Tables
Table 3.1. Functional categories for identifying the type of business process innovations .................. 73 Table 3.2. Comparing types of innovation in the current and previous Oslo Manual editions ............. 75 Table 3.3. Innovative and innovation-active firms ................................................................................ 81 Table 4.1. Collection of qualitative data on activities relevant to innovation ....................................... 93 Table 4.2. Collecting expenditure data on specific activities of relevance to innovation ..................... 95 Table 4.3. Accounting method for collecting expenditure data on activities for innovation ................ 97 Table 5.1. Types of intellectual property protection for data collection ............................................. 114 Table 6.1. Typology and examples of mechanisms for intentional knowledge flows ......................... 131 Table 6.2. Measuring the contribution of inbound knowledge flows to innovation ............................ 135 Table 6.3. Sources of inbound knowledge flows for innovation ......................................................... 137 Table 6.4. Measuring direct mechanisms for outbound knowledge flows .......................................... 138 Table 6.5. Types of collaboration partners for innovation .................................................................. 138 Table 6.6. Measurement of sources of ideas and information for innovation ..................................... 139 Table 6.7. Measuring channels for knowledge-based interactions between firms and HEIs/PRIs ..... 140 Table 6.8. Potential questions on the use of IP rights for knowledge flows ........................................ 141 Table 6.9. Measuring barriers and unintended outcomes of knowledge interactions.......................... 142 Table 7.1. Business activities by location ........................................................................................... 148 Table 7.2. Competition and product market characteristics that can influence innovation ................. 152 Table 7.3. Types of finance for general and specific innovation activities ......................................... 155 Table 7.4. Possible approaches for classifying government policy instruments in innovation surveys157 Table 7.5. Main types of policy instruments to support innovation .................................................... 158 Table 7.6. Types of public infrastructure of potential relevance to innovation in firms ..................... 158 Table 7.7. Collecting information on characteristics of the firm’s social environment ...................... 159 Table 7.8. Proposal for integrated collection of data on external drivers of innovation ..................... 160 Table 8.1. Innovation objectives and outcomes for measurement, by area of influence ..................... 166 Table 8.2. Measurement of innovation objectives and outcomes for business strategies ................... 167 Table 8.3. Measurement of potential market impacts from business innovation ................................ 168 Table 9.1. Economic activities for inclusion in international comparisons of business innovation .... 183 Table 11.1. Desirable properties of business innovation indicators .................................................... 215 Table 11.2. Descriptive statistics and methods for constructing innovation indicators ...................... 218
TABLE OF CONTENTS │ 15
OSLO MANUAL 2018 © OECD/EUROPEAN UNION 2018
Table 11.3. Thematic areas for business innovation indicators ........................................................... 222 Table 11.4. Indicators of innovation incidence and characteristics ..................................................... 223 Table 11.5. Indicators of knowledge-based capital/innovation activities ............................................ 224 Table 11.6. Indicators of potential or actual innovation capabilities ................................................... 224 Table 11.7. Indicators of knowledge flows and innovation ................................................................ 225 Table 11.8. Indicators of external factors influencing innovation ....................................................... 226 Table 11.9. Indicators of innovation objectives and outcomes ........................................................... 226
Figures
Figure 1.1. General representation of the relationship between chapters in Part II ............................... 33
Figure 7.1. Main elements of the external environment for business innovation ................................ 147
Figure 9.1. From innovation theory to innovation data ....................................................................... 187 Figure 11.1. Logic model used in evaluation literature applied to innovation .................................... 231 Figure 11.2. The innovation policy evaluation problem to identifying causal effects ........................ 234
Boxes
Box 6.1. Uses of the “open” concept in science and innovation ......................................................... 133 Box 11.1. Major resources for international innovation data using Oslo Manual guidelines ............. 217 Box 11.2. Examples of innovation scoreboards and innovation indexes ............................................ 221
lerts


ABBREVIATIONS AND ACRONYMS │ 17
OSLO MANUAL 2018 © OECD/EUROPEAN UNION 2018
Abbreviations and acronyms
AI Artificial intelligence
ANZSIC Australian and New Zealand Standard Industrial Classification
APSC Australian Public Service Commission
CAD Computer-aided design
CAPI Computer-assisted personal interviewing
CATI Computer-assisted telephone interviewing
CDM Crépon, Duguet and Mairesse
CIS Community Innovation Survey (European Commission)
CPC Central Product Classification (United Nations)
EC European Commission
EIS European Innovation Scoreboard
ESS European Statistical System
EU European Union
EUIPO European Union Intellectual Property Office
Eurostat European Commission’s Directorate-General for Statistics
FTE Full-time equivalent
G20 Group of Twenty
GDP Gross domestic product
HEI Higher education institution
ICT Information and communication technology
ILO International Labour Organization
INSEE Institut national de la statistique et des études économiques (France)
IP Intellectual property
IPP Intellectual property product
IPRs Intellectual property rights
ISCED International Standard Classification of Education
ISIC International Standard Industrial Classification of All Economic Activities
ISO International Organization for Standardization

18 │ ABBREVIATIONS AND ACRONYMS
OSLO MANUAL 2018 © OECD/EUROPEAN UNION 2018
IT Information technology
KAU Kind-of-activity unit
KBC Knowledge-based capital
MMD Micro-moments database
MNE Multinational enterprise
NACE Statistical classification of economic activities in the European Community
NAICS North American Industry Classification System
NEPAD New Partnership for Africa’s Development
NESTI Working Party of National Experts on Science and Technology Indicators
NPI Non-profit institution
NPISHs Non-profit institutions serving households
NSO National statistical organisation
NSS National statistical system
NTF New-to-firm
NTM New-to-market
OECD Organisation for Economic Co-operation and Development
OM Oslo Manual
PCT Patent Cooperation Treaty (World Intellectual Property Organization)
PIAAC Programme for the International Assessment of Adult Competencies
PRI Public research institution
RICYT Ibero-American/Inter-American Network for Science and Technology Indicators
R&D Research and experimental development
RHG Response homogeneity group
SIBS Survey of Innovation and Business Strategy (Canada)
SMEs Small and medium-sized enterprises
SNA System of National Accounts (United Nations)
STI Science, technology and innovation
TQM Total Quality Management
TRIPS Trade-Related Aspects of Intellectual Property Rights
UIS UNESCO Institute for Statistics
UN United Nations
UPOV International Union for the Protection of New Varieties of Plants
WIPO World Intellectual Property Organization
WTO World Trade Organization
EXECUTIVE SUMMARY │ 19
OSLO MANUAL 2018 © OECD/EUROPEAN UNION 2018
Executive summary
What is the Oslo Manual?
The Oslo Manual provides guidelines for collecting and interpreting data data on
innovation. It seeks to facilitate international comparability, and provides a platform for
research and experimentation on innovation measurement. Its guidelines are principally
intended to support national statistical offices and other producers of innovation data in
designing, collecting, and publishing measures of innovation to meet a range of research
and policy needs. In addition, the guidelines are also designed to be of direct value to users
of information on innovation.
These guidelines should be viewed as a combination of formal statistical standards, advice
on best practices, as well as proposals for extending the measurement of innovation into
new domains through the use of existing and new tools.
At present, a large number of countries and international organisations recognise the
importance of innovation measurement and have developed capabilities to collect such
data. This manual supports this co-ordinated effort in pursuit of robust, internationally
comparable data, indicators and analysis.
Why a manual for measuring innovation?
Innovation is central to improvements in living standards and can affect individuals,
institutions, entire economic sectors, and countries in multiple ways. Sound measurement
of innovation and the use of innovation data in research can help policy makers to better
understand economic and social changes, assess the contribution (positive or negative) of
innovation to social and economic goals, and monitor and evaluate the effectiveness and
efficiency of their policies.
The purpose of this manual is to guide innovation data collection and reporting efforts
through a common vocabulary, agreed principles and practical conventions. These can
enhance the comparability of statistical outputs and support the progressive development
of a global statistical information infrastructure on innovation that is relevant and useful
for researchers and decision makers alike.
Jointly published by the OECD and Eurostat, the Oslo Manual is a key component of the
series of measurement manuals produced by OECD under the title “The Measurement of
Scientific, Technological and Innovation Activities”. As part of this family of manuals, it
addresses the need to reflect how innovation systems operate beyond a description of the
efforts made to invest in new knowledge (captured in the OECD Frascati Manual on
resources dedicated to R&D), or the numbers and characteristics of patented inventions (as
covered in the OECD Patent Statistics Manual).
20 │ EXECUTIVE SUMMARY
OSLO MANUAL 2018 © OECD/EUROPEAN UNION 2018
The Oslo Manual plays a key role in demonstrating and communicating the
multidimensional and often hidden nature of innovation. However, there are several
outstanding research and policy questions that call for extended and more robust data.
What is innovation?
A key tenet of the Oslo Manual is that innovation can and should be measured. The
requirement for measurability is an essential criterion for selecting the concepts, definitions
and classifications in this manual. This feature sets this manual apart from other documents
that conceptualise and define innovation.
Key components of the concept of innovation include the role of knowledge as a basis for
innovation, novelty and utility, and value creation or preservation as the presumed goal of
innovation. The requirement for implementation differentiates innovation from other
concepts such as invention, as an innovation must be implemented, i.e. put into use or made
available for others to use.
The term ‘innovation’ can signify both an activity and the outcome of the activity. This
manual provides definitions for both. The general definition of an innovation is as follows:
An innovation is a new or improved product or process (or combination thereof)
that differs significantly from the unit’s previous products or processes and that
has been made available to potential users (product) or brought into use by the unit
(process).
This definition uses the generic term “unit” to describe the actor responsible for
innovations. It refers to any institutional unit in any sector, including households and their
individual members.
This definition is further developed and operationalised to provides the basis for the
practical guidelines in this manual for the business sector. Although the concept of
innovation is inherently subjective, its application is rendered fairly objective and
comparable by applying common reference points for novelty and utility, requiring a
significant difference to be appreciated. This facilitates the collection and reporting of
comparable data on innovation and related activities for firms in different countries and
industries and for firms of different sizes and structures, ranging from small single-product
firms to large multinational firms that produce a wide range of goods or services.
Innovation activities include all developmental, financial and commercial
activities undertaken by a firm that are intended to result in an innovation for the
firm.
A business innovation is a new or improved product or business process (or
combination thereof) that differs significantly from the firm's previous products or
business processes and that has been introduced on the market or brought into use
by the firm.
Compared to the previous edition, a major change for the definition of business innovation
in this manual has been the reduction, informed by cognitive testing work, in the
complexity of the previous list-based definition of four types of innovations (product,
process, organisational and marketing), to two main types: product innovations and
business process innovations. The revised definition also reduces the ambiguity of the
requirement for a “significant” change by comparing both new and improved innovations
EXECUTIVE SUMMARY │ 21
OSLO MANUAL 2018 © OECD/EUROPEAN UNION 2018
to the firm’s existing products or business processes. The basic definitions of a product and
business process innovation are as follows:
A product innovation is a new or improved good or service that differs significantly
from the firm’s previous goods or services and that has been introduced on the
market.
A business process innovation is a new or improved business process for one or
more business functions that differs significantly from the firm’s previous business
processes and that has been brought into use by the firm.
Business process innovations concern six different functions of a firm, as identified in the
business management literature. Two functions relate to a firm’s core activity of producing
and delivering products for sale, while the other functions concern supporting operations.
The taxonomy of business functions proposed in this manual maps reasonably well onto
the previous edition’s categories of process, marketing and organisational innovations.
Why and how was the manual revised?
Measurement requires an understanding of what needs to be measured and awareness of
what can be reliably measured. In response to strong policy demand for empirical evidence
on innovation, the Oslo Manual addresses both requirements and supports further
experimentation to improve and extend innovation data. Increasing societal awareness of
innovation-related phenomena has also expanded interest in new targets for measurement.
Yet despite these advances, there are still major gaps in the evidence and questions about
the role of innovation and what policies can do to influence it. One of the main objectives
of this fourth edition of the Oslo Manual is to address some of these gaps and outstanding
questions.
This edition of the Oslo Manual is based on the experience gained from collecting
innovation statistics in both OECD and non-member countries since the early 1990s. It is
a result of the collective work of the Working Party of national Experts on Science and
Technology Indicators (NESTI) and Eurostat’s Community Innovation Survey IS Task
Force, involving more than 120 experts from nearly 45 countries and international
organisations. The revision took place over a three year period and was supported by an
expert consultation at its outset and a number of workshops involving key stakeholders
throughout the revision. The OECD established a liaison with the International
Organization for Standardization’s (ISO) technical committee on Innovation Management
in order to facilitate greater alignment between definitions.
This and previous revisions to the Oslo Manual reflect continual evolution in expert
consensus on what can and should be measured. This evolution is due to ongoing changes
in economic and social factors, the nature of innovation and how it occurs, as well as the
accumulation of measurement experiments and the sharing of experiences among experts.
What are the main novelties of this edition?
This new edition contains a number of major novelties, compared to the previous 2005
edition, to enhance the relevance of the manual as a source of conceptual and practical
guidance for the provision of data, indicators and quantitative analyses on innovation. This
manual:
22 │ EXECUTIVE SUMMARY
OSLO MANUAL 2018 © OECD/EUROPEAN UNION 2018
Provides a conceptual framework and a general definition of innovation that is
applicable to all sectors in the economy (Business, Government, Non-profit
institutions serving households and Households). These are necessary for
developing future guidelines for measuring innovation in sectors other than
business and eventually building up an economy- and society-wide statistical view
of innovation, as recommended in the 2016 OECD Blue Sky Forum.
Updates and streamlines core definitions and taxonomies to facilitate reporting and
interpretation across the entire business sector, including service sector firms
specialised in providing knowledge-based services.
Supports the measurement of investment in intangible assets by making a link
between intangibles (also described as knowledge-based capital) and the generation
of different types of knowledge for innovation, providing explicit measurement
recommendations.
Provides guidance on measuring internal and external factors influencing business
innovation, integrating previous ad hoc guidance on measuring innovation in
developing countries, as well as addressing the need to measure the incidence and
effect of diverse government policies on innovation.
Promotes the collection of a broader set of data relevant to both non-innovative and
innovation-active firms to help analyse the drivers and enablers of innovation.
While the baseline definition of innovation in this manual does not require it to be
a success, recommendations are provided for measuring attributes of the outcomes
of innovation. This aims to facilitate a better understanding of the diverse range of
innovations and their impacts on the firm and the market and the broader social
context in which it operates.
Provides extended methodological guidelines for the entire innovation data
lifecycle, from survey design and testing to data dissemination and curation.
Compared to previous editions of the manual, there is considerably more guidance
on methods for assessing question items and the implications of using different
survey methods. The importance of the length of the observation period is
discussed, highlighting the importance of seeking greater international convergence
in survey practices.
Extends guidance on the linkage of surveys with other sources, such as
administrative records, and proposes complementary methods for obtaining
evidence on a firm’s focal (i.e. most important) innovation. Integrating an object-
based approach can deliver significant improvements in survey data quality.
Supports users of innovation data with a new chapter explaining the use of
statistical data on innovation to construct indicators and for analysis. It presents a
blueprint for the production of statistical indicators of innovation by thematic areas,
drawing on the recommendations in previous chapters. It also describes methods
for analysing innovation data, with a major focus on the analysis of innovation
impacts and the empirical evaluation of innovation policies.
Provides a glossary of key terms for ease of reference and to facilitate translation
efforts to different languages.
In addition, this manual contributes to a better understanding of digitalisation and its links
with innovation by providing guidance on the role of digitised information from both a
EXECUTIVE SUMMARY │ 23
OSLO MANUAL 2018 © OECD/EUROPEAN UNION 2018
product and business process innovation perspective. It also achieves this goal by
recognising data development activities, along with software, as a potential innovation
activity; highlighting data management competences as a key potential innovation
capability for measurement, as well as recommending the measurement of external factors
such as the role of digital platforms in the markets in which the firm operates.
The analysis of globalisation and how it shapes innovation is supported by guidance on
capturing knowledge flows with the rest of the world and the role of multinational
enterprises (MNEs) and mapping the position of a firm’s business processes within value
chains. International coordination is called for when interpreting data on the role of MNEs.
The Oslo Manual’s recommendations for data collection are limited to the Business
enterprise sector (including public – i.e. government controlled – enterprises) and focus
principally on statistical survey methods for representative samples of units within the
business population. However, the recommendations also cover complementary data
sources and collection methods, including administrative sources and big data, pointing to
an integrated use of sources and methods to address user needs.
How are the guidelines intended to be used?
The manual is a statistical resource that contains guidelines for applying concepts,
definitions, classifications, taxonomies and statistical methods for collecting innovation
statistics about the Business sector. The manual makes recommendations and identifies
possible approaches for experimentation. Within the OECD context, the recommendations
are not mandatory, but member countries are nonetheless expected to adopt the
recommendations to the best of their ability. This is required in order to produce
internationally comparable data that can constitute a global public information good on
innovation.
The manual allows for a significant degree of discretion on how different countries or
groups of countries carry out their data collection activities. As measurement results are
sensitive to the choice of survey methods, it is difficult to obtain international comparability
without uniformity in data collection and reporting practices. Although uniformity is not
feasible in an OECD or global setting, greater convergence in methods should be possible
and aimed for. To this end, the OECD works with other international organisations and
networks that support statistical capability development and the sharing of experiences on
collecting innovation data.
Although not designed with this purpose in mind, the manual can provide a reference for
policy or regulatory uses, for instance linking policies to specific innovation activities and
outcomes described in the manual. In addition, the adoption of its concepts and definitions
by innovation managers and practitioners will facilitate data collection.
Where to find additional relevant resources?
As a statistical standard, the Oslo Manual is freely available on line in multiple formats.
Additional online annex material is expected to be developed and evolve to complement
guidance in the manual’s printed edition, following the example of the 2015 edition of the
Frascati Manual. Relevant resources, including links to updated classifications and
statistics on innovation published by the OECD, Eurostat and other international and
national bodies, can be found at http://oe.cd/oslomanual.


PART I. INTRODUCTION TO THE MEASUREMENT OF INNOVATION │ 25
OSLO MANUAL 2018 © OECD/EUROPEAN UNION 2018
Part I. Introduction to the measurement of innovation

CHAPTER 1. INTRODUCTION TO INNOVATION STATISTICS AND THE OSLO MANUAL │ 27
OSLO MANUAL 2018 © OECD/EUROPEAN UNION 2018
Chapter 1. Introduction to innovation statistics and the Oslo Manual
Innovation is central to improvements in living standards and can affect individuals,
institutions, entire economic sectors, and countries in multiple ways. Sound measurement
of innovation and the use of innovation data in research can help policy makers better
understand economic and social changes, assess the contribution of innovation to social
and economic goals, and monitor and evaluate the effectiveness and efficiency of their
policies. Since 1992, the Oslo Manual has been the international standard of reference for
conceptualising and measuring innovation. It has since been revised on three occasions to
account for growing levels of adoption and address evolving user needs. The manual
provides the basis for a common language to discuss innovation, the factors supporting
innovation, and innovation outcomes. This chapter sets out the rationale for measuring
innovation and summarises the objectives pursued by this edition of the manual. The
chapter outlines the contents of the manual and highlights the main definitions and other
major novelties introduced in this edition. The chapter concludes with an overview of the main
implementation challenges amidst a context of digital transformation of our economies and
societies.
28 │ CHAPTER 1. INTRODUCTION TO INNOVATION STATISTICS AND THE OSLO MANUAL
OSLO MANUAL 2018 © OECD/EUROPEAN UNION 2018
1.1. Objectives and background of the Oslo Manual
1.1.1. The origins of the Oslo Manual
1.1. Innovation is central to improvements in living standards and can affect individuals,
institutions, entire economic sectors, and countries in multiple ways. Policy can contribute
directly and indirectly to setting the direction of innovation and shaping how its effects are
distributed. Sound measurement of innovation and the use of innovation data in research
can help policy makers better understand economic and social changes, assess the
contribution (positive or negative) of innovation to social and economic goals, and monitor
and evaluate the effectiveness and efficiency of their policies (OECD, 2010).
1.2. Measurement requires an understanding of what needs to be measured and
awareness of what can be reliably measured. In response to strong policy demand for
empirical evidence on innovation, the Oslo Manual addresses both requirements, and supports
further experimentation to improve and extend innovation data. The manual identifies best
practices for data collection on innovation, facilitates international comparability, and
provides a platform for research on innovation measurement. The manual plays a key role
in communicating that innovation often does not require research and experimental
development (R&D) and that innovation also involves the diffusion of existing technologies
and practices across an economy.
1.3. The first edition of the Oslo Manual was issued in 1992 (OECD, 1992) and covered
innovation in manufacturing industries. “Oslo” in the title of the manual is a reference to
the city where the guidelines were first approved by the OECD Working Party of National
Experts on Science and Technology Indicators (NESTI). Innovation surveys based on the
1992 edition included the European Community Innovation Survey (CIS) and comparable
surveys in Australia and Canada. These surveys showed that it was possible to develop and
collect data on complex and differentiated innovation phenomena.
1.4. The second edition (OECD/Eurostat/EU, 1997) updated the concepts, definitions and
methodology to incorporate accumulated survey experience as well as greater understanding
of the innovation process. This edition included guidelines for measuring innovation in
several service industries in addition to manufacturing. It expanded the guidance for
developing internationally comparable innovation indicators for OECD countries and discussed
analytical and policy problems that could be addressed using innovation data and indicators.
1.5. Both the first and second editions limited innovation to new or significantly
improved “technological” products and processes. This reflected a focus on the technical
development of new products and new production techniques and their diffusion to other
firms. The measurement of “non-technological” innovation, however, was discussed in an
annex to the second edition.
1.6. The third edition (OECD/Eurostat, 2005) built on a large amount of data and
experience gained from the rapid adoption of innovation surveys worldwide, including in
economies at very different levels of economic development. The third edition expanded
the innovation measurement framework: it gave greater emphasis to the role of linkages
with other firms and institutions in the innovation process, recognised the major importance
of innovation in traditionally less R&D-intensive industries, and modified the definitions
of innovation and innovation activities to accommodate innovation in market-based service
industries. The identification of product and process innovation with technological change
was abandoned in order to include service innovations that significantly improved user
experiences without necessarily having a technological component. The definition of
CHAPTER 1. INTRODUCTION TO INNOVATION STATISTICS AND THE OSLO MANUAL │ 29
OSLO MANUAL 2018 © OECD/EUROPEAN UNION 2018
innovation was extended to include two additional and complementary types: organisational
and marketing innovation. The third edition also included an annex on measuring innovation
in developing countries, reflecting widespread interest in this topic.
1.7. The revisions to the Oslo Manual over time reflect continual evolution in expert
consensus on what can and should be measured. This evolution is due to ongoing changes
in economic and social factors, such as the nature of innovation and how it occurs, as well
as the accumulation of measurement experiments and the sharing of experiences among
experts interested in measuring innovation. Increasing societal awareness of innovation-
related phenomena has also expanded interest in new targets for measurement. Yet despite
these advances, there are still major gaps in evidence and questions about the role of
innovation and what policies can do to influence it. One of the main objectives of this fourth
edition of the Oslo Manual is to address some of these gaps and outstanding questions.
1.1.2. Main objectives of the fourth edition
1.8. Published 13 years after the release of the manual’s third edition, this fourth edition
seeks to strengthen its relevance as a source of conceptual and practical guidance for the
provision of data, indicators and quantitative analyses on innovation. The role of the Oslo
Manual as a key guideline for policy analysis and discussion was highlighted in the Group
of Twenty (G20) Innovation Action Plan (G20, 2016) endorsed by G20 Leaders in Hangzhou,
the People’s Republic of China, in September 2016. The summit demonstrated high-level
interest by the governments of the world’s largest economies in good innovation measurement
to assist policy, as well as reaffirming the OECD’s role in supporting this objective.
1.9. The 2016 OECD Blue Sky III Forum (http://oe.cd/blue-sky) stressed the need to
extend the measurement of innovation to the broader economy and society. With this
in mind, NESTI proposed that this fourth edition also become a platform for future
experimentation and guidance by discussing key innovation concepts in a broader sense
and by providing a general definition of innovation, as requested by many stakeholders.
Consequently, despite the Oslo Manual’s focus on measuring innovation in the Business
sector, the fourth edition includes a framework for measuring innovation in all sectors using
a common definition. This explains why the title of the fourth edition does not refer
explicitly to business innovation.
1.10. At the outset of the revision process, participants agreed that the fourth edition of the
Oslo Manual should incorporate the following substantial extensions and improvements:
Include general definitions and concepts of innovation applicable to all four
economic sectors (Business, Government, Non-profits serving households, and
Households). These are necessary for developing future guidelines for measuring
innovation in sectors other than the Business sector.
Ensure that the recommendations are relevant to both developed and developing
countries so that the manual provides effective global guidance.
Ensure consistency with the 2015 edition of the Frascati Manual for measuring
R&D (OECD, 2015) and major statistical frameworks and guidelines, including the
System of National Accounts (SNA) (see EC et al., 2009).
Address the ongoing digitalisation of the economy and society, as identified in the
OECD project “Going Digital” (www.oecd.org/sti/goingdigital.htm). The manual
covers digital perspectives in several chapters and provides guidance on measuring
innovation in digital products, platforms, and data capabilities.
30 │ CHAPTER 1. INTRODUCTION TO INNOVATION STATISTICS AND THE OSLO MANUAL
OSLO MANUAL 2018 © OECD/EUROPEAN UNION 2018
Fully reflect changing models of innovation, including those relating to open
innovation, global value chains and global innovation networks.
Apply the evidence and experience accumulated over the past decade to address
long-standing challenges (subjectivity and international comparability, interpretation
of the novelty and improvement requirements for innovation, quantitative measurement
of innovation inputs and outputs, coverage of non-R&D-based innovation, etc.).
Promote the collection of a broader set of data of relevance to both non-innovative
and innovation-active firms, for instance on investments in knowledge-based
capital (KBC) and on the internal and external conditions in which firms operate
and decide to undertake innovation-relevant practices. This is required for analyses
of the drivers and enablers of innovation.
Provide in-depth discussion of survey methodology, plus the implications of data
collection methodologies on data quality, timeliness, and international comparability.
Discuss how statistical data on innovation can be used to support research,
management, and policy, including indicator development and how to assess the
effectiveness of policies to support innovation.
1.1.3. Scope and approach of the fourth edition
1.11. With the exception of the introductory chapter, this fourth edition of the Oslo
Manual focuses on innovation in the Business enterprise sector, including, in many cases,
government-owned enterprises. The approach of the fourth edition is as follows:
Collect innovation data using statistically representative samples of firms in the
Business sector. Although new data sources are available, such as from the Internet,
many of them do not share the desirable features of representative samples from
the population of interest. Consequently, the manual recommends the use of
representative surveys as the preferred method for data collection. Where feasible,
these can be complemented with additional representative surveys or by linking
surveys to administrative data.
Highlight how responses to survey questions are influenced by survey methods and
questionnaire design. In particular, it is advised not to combine an innovation
survey with an R&D survey.
Primarily collect data using a subject-based approach that captures all of a firm’s
innovation activities. This can be complemented with additional information on the
firm’s most important innovation (or the most important innovation activity, or
change for non-innovative firms), also known as an object-based approach.
1.12. While anchored in accumulated experience, this fourth edition provides ample
discussion and suggestions to support necessary experimentation in the measurement of
business innovation. It also highlights instances where advanced digital tools can be used
for data collection and analysis, both to provide new types of data that can result in
additional insights and to reduce respondent burden in surveys.
1.13. This manual is designed as a freely accessible open standard that provides guidance
on what innovation statistics should be collected, how they should be compiled and how
they can be used. Adherence to the guidelines will improve the uniformity and
comparability of innovation data collected by a large number of organisations. Although
not designed with this purpose in mind, the manual can provide a reference for policy or
CHAPTER 1. INTRODUCTION TO INNOVATION STATISTICS AND THE OSLO MANUAL │ 31
OSLO MANUAL 2018 © OECD/EUROPEAN UNION 2018
regulatory uses, for instance linking policies to specific innovation activities and outcomes
described in the manual. In addition, the adoption of its concepts and definitions by
innovation managers and practitioners would facilitate data collection.
1.1.4. The Oslo Manual and other statistical standards
STI measurement standards
1.14. The OECD produces a series of measurement manuals under the title “The
Measurement of Scientific, Technological and Innovation Activities”. Each manual
presents internationally agreed methodological guidelines and proposals for the collection,
reporting, and use of data and indicators on science, technology and innovation (STI). The
OECD commenced its activities on setting STI statistical standards with the Frascati
Manual, first published in 1963. While relatively recent compared to other manuals, the
Oslo Manual is a central component of the OECD family of statistical guidelines on the
measurement of STI.
1.15. Over time, additional manuals have been added, such as the OECD Patent Statistics
Manual (OECD, 2009a). Manuals in this series are periodically revised to take into account
new challenges and developments. The scope of the series will also continue to expand in
line with developments in the field.
Links to general statistical standards and statistics
1.16. The Oslo Manual makes extensive use of and pursues full alignment with United
Nations’ statistical classifications. These include the SNA 2008 (EC et al., 2009) and the
International Standard Industrial Classification of All Economic Activities (ISIC) (UN, 2008).
1.17. External classifications are regularly updated by the relevant organisations in
charge. The references in this manual to other statistical documents are for the editions at
the time of this manual’s publication (printed edition and electronic file). An updated set
of references is maintained on line as an annex.
1.18. This manual follows the recommendations in the SNA 2008 to treat expenditures
on R&D, as well as on other forms of knowledge, as investments in capital assets, rather
than as an expense. This affects how gross domestic product (GDP) is measured and how
growth accounting exercises interpret the contribution of innovation-related activities to
economic growth.
1.19. While the SNA does not currently recognise many types of innovation activities as
capital formation (other than R&D and software), the development of satellite innovation
accounts is part of the measurement agenda in many countries that is also converging with
an interest in satellite accounts that map the extent of digital economic activities. Further
progress on integrating innovation data in economic statistics will require sustained efforts
to improve the measurement of innovation activities and their costs and benefits to
businesses, as well as documenting the lifespan of innovations in order to contribute to the
measurement of obsolescence and depreciation.
1.20. Furthermore, the SNA is used to define the Business enterprise sector (the primary
scope of this manual, see Chapter 2) and to define other sectors where innovation has been
measured by researchers and statisticians.
32 │ CHAPTER 1. INTRODUCTION TO INNOVATION STATISTICS AND THE OSLO MANUAL
OSLO MANUAL 2018 © OECD/EUROPEAN UNION 2018
Links to other standards
1.21. In parallel with work to produce the fourth edition of the Oslo Manual, the OECD
established a relationship with the International Organization for Standardization’s (ISO)
technical committee on Innovation Management, responsible for developing standards for
the innovation management ISO 50500 series. The exchange between the two expert groups
of the OECD and ISO covered different perspectives on the definitions of innovation and
innovation management, with the OECD requiring definitions suitable for innovation
measurement and the ISO requiring definitions for standardisation. The discussions led
to an alignment of the definitions, taking into account the different objectives of the
Oslo Manual and of the ISO standards.
1.2. Structure and contents of the Oslo Manual 2018
1.22. The 2018 edition of the Oslo Manual comprises three Parts that provide a general
presentation of innovation measurement (Part I), a framework and guidelines for measuring
business innovation (Part II), and practical guidance on methodologies for collecting and
using innovation data (Part III).
1.2.1. Introduction to the measurement of innovation (Part I)
Concepts for measuring innovation (Chapter 2)
1.23. Chapter 2 explains the purpose of the manual and what makes innovation
distinctive from other related phenomena such as invention or R&D. It sets out the basic
concepts of innovation, including in sectors other than the Business enterprise sector.
1.24. The chapter uses internationally accepted statistical frameworks to identify the
boundaries of the Business enterprise sector (the focus of this manual) and other sectors of
an economy. However, actors in other sectors also play a role in the innovation system and
can contribute to innovation in the Business enterprise sector. The chapter identifies
connecting elements that link sectors to allow for future guidance to refer to the same
underlying phenomenon. The requirement for measurability is an essential criterion for
selecting the concepts, definitions and classifications in this manual. This feature sets the
manual apart from other documents that conceptualise and define innovation.
1.25. The chapter concludes with a general definition of innovation that is relevant to all
sectors and discusses the potential measurement of innovation in other sectors of an
economy. The general definition of an innovation for all types of units is as follows:
An innovation is a new or improved product or process (or combination thereof)
that differs significantly from the unit’s previous products or processes and that
has been made available to potential users (product) or brought into use by the
unit (process).
1.26. The general definition uses the generic term “unit” to describe the actor responsible
for innovations. It refers to any institutional unit in any sector, including households and
their individual members. The definition is appropriate for measuring innovation developed
by individuals, a key goal identified at the 2016 Blue Sky Forum.
1.2.2. Framework and guidelines for measuring business innovation (Part II)
1.27. Part II of the Oslo Manual describes the innovation process in firms and the
relationship between firms, their competitive environment, and the innovation system in
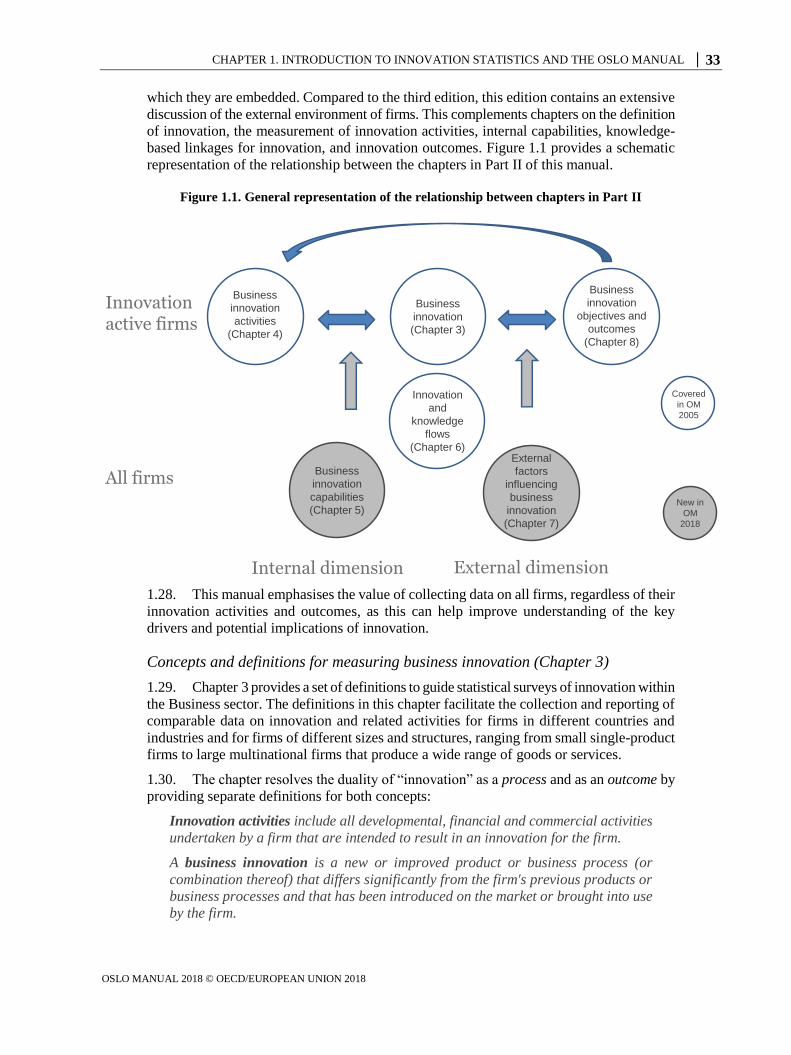
CHAPTER 1. INTRODUCTION TO INNOVATION STATISTICS AND THE OSLO MANUAL │ 33
OSLO MANUAL 2018 © OECD/EUROPEAN UNION 2018
which they are embedded. Compared to the third edition, this edition contains an extensive
discussion of the external environment of firms. This complements chapters on the definition
of innovation, the measurement of innovation activities, internal capabilities, knowledge-
based linkages for innovation, and innovation outcomes. Figure 1.1 provides a schematic
representation of the relationship between the chapters in Part II of this manual.
Figure 1.1. General representation of the relationship between chapters in Part II
1.28. This manual emphasises the value of collecting data on all firms, regardless of their
innovation activities and outcomes, as this can help improve understanding of the key
drivers and potential implications of innovation.
Concepts and definitions for measuring business innovation (Chapter 3)
1.29. Chapter 3 provides a set of definitions to guide statistical surveys of innovation within
the Business sector. The definitions in this chapter facilitate the collection and reporting of
comparable data on innovation and related activities for firms in different countries and
industries and for firms of different sizes and structures, ranging from small single-product
firms to large multinational firms that produce a wide range of goods or services.
1.30. The chapter resolves the duality of “innovation” as a process and as an outcome by
providing separate definitions for both concepts:
Innovation activities include all developmental, financial and commercial activities
undertaken by a firm that are intended to result in an innovation for the firm.
A business innovation is a new or improved product or business process (or
combination thereof) that differs significantly from the firm's previous products or
business processes and that has been introduced on the market or brought into use
by the firm.
Business
innovation
(Chapter 3)
Business
innovation
objectives and
outcomes
(Chapter 8)
Business
innovation
activities
(Chapter 4)
Innovation
and
knowledge
flows
(Chapter 6)
Business
innovation
capabilities
(Chapter 5)
External
factors
influencing
business
innovation
(Chapter 7)
Covered
in OM
2005
New in
OM
2018
Internal dimension External dimension
Innovation active firms
All firms
34 │ CHAPTER 1. INTRODUCTION TO INNOVATION STATISTICS AND THE OSLO MANUAL
OSLO MANUAL 2018 © OECD/EUROPEAN UNION 2018
1.31. Compared to the third edition, a major consideration in revising the definition of
business innovation was the decision, based on cognitive testing work, to reduce the
complexity of the previous list-based definition, comprising four types of innovations
(product, process, organisational and marketing), to two main types: product innovations
and business process innovations. The revised definition also reduces the ambiguity of the
requirement for a “significant” change by comparing both new and improved innovations
to the firm’s existing products or business processes. The chapter provides detailed
explanations of the definition of business innovation and provides guidance on what does
not constitute an innovation. The basic definitions of a product and business process
innovation are as follows:
A product innovation is a new or improved good or service that differs significantly
from the firm’s previous goods or services and that has been introduced on
the market.
A business process innovation is a new or improved business process for one or
more business functions that differs significantly from the firm’s previous business
processes and that has been brought into use by the firm.
1.32. Business process innovations concern six different functions of a firm, as identified
in the business management literature. Two functions relate to a firm’s core activity of
producing and delivering products for sale, while the others concern supporting operations.
The six main business functions have a reasonable match with the third edition’s categories
of process, marketing and organisational innovations.
1.33. The definitions for innovation and innovation activity lead to guidance on how
firms can be characterised:
An innovative firm reports one or more innovations within the observation period.
This applies equally to a firm that is individually or jointly responsible for an innovation.
An innovation-active firm is engaged at some time during the observation period
in one or more activities to develop or implement new or improved products or
business processes for an intended use. Both innovative and non-innovative firms
can be innovation-active during an observation period.
1.34. In common usage the term “innovative” can refer to a potential ability or propensity
to innovate in the future, creativity, a type of product or process, etc. In contrast, the term
“innovative” is only used in this manual for a specific meaning: to identify whether a firm
has an innovation over a given time period. The meaning of this adjective is restricted to a
single purpose to avoid misunderstanding. Adaptations of this manual to different
languages should replicate the precision in definitions. This also applies to innovation
indicators, which should be given labels or headings that do not mislead users.
1.35. A non-innovative firm is innovation-active if it had one or more ongoing,
suspended, abandoned or completed innovation activities that did not result in an innovation
during the observation period. A number of activities, such as an experiment or co-creation
exercise, can be completed without resulting in an innovation within the observation period.
Business innovation activities (Chapter 4)
1.36. Chapter 4 provides a framework for measuring business innovation activities. The
chapter identifies eight types of activities that firms can undertake in pursuit of innovation,
although many of these largely knowledge-based activities can also be carried out for other,
more general purposes:

CHAPTER 1. INTRODUCTION TO INNOVATION STATISTICS AND THE OSLO MANUAL │ 35
OSLO MANUAL 2018 © OECD/EUROPEAN UNION 2018
R&D activities
engineering, design and other creative work activities
marketing and brand equity activities
intellectual property (IP) related activities
employee training activities
software development and database activities
activities relating to the acquisition or lease of tangible assets
innovation management activities.
1.37. The chapter recommends collecting data on whether or not firms conduct each of
these activities and whether they do so in pursuit of innovation. Similarly, data collection
on expenditures for these activities should first determine all expenditures on each activity,
for any purpose, followed by a question, for innovation-active firms only, on expenditures
specifically for innovation. Data for all firms on each activity can provide useful information
on the role of investment in KBC (intangible investment) on the propensity to innovate and
economic performance. It is also useful to determine if activities are conducted in-house or
procured from external sources.
1.38. The chapter proposes that questions on expenditures for innovation should make
a distinction between R&D expenditures, for which records exist in most firms, and
expenditures for other innovation activities. Expenditures can also be collected for personnel
costs and for other major accounting categories. The measurement of expenditures on
innovation activities other than R&D is an ongoing challenge. The chapter proposes several
alternative approaches to innovation activity measurement. Experiments with these
methods should lead to improvements in the accuracy of collected data.
Business innovation capabilities (Chapter 5)
1.39. Chapter 5 is a new chapter that was not included in previous editions of the Oslo
Manual. Business capabilities include the knowledge, competencies and resources that a
firm accumulates over time and draws upon in pursuit of its objectives. Collecting data on
business capabilities is of critical importance for analyses of the effect of innovation on
firm performance and why some firms engage in innovation activities and others do not.
1.40. Numerous business capabilities can potentially support innovation activities, the
development of product or business process innovations, and the economic impact of these
innovations. The chapter provides measurement options for four types of capabilities that
are relevant for research on the innovation performance of all firms:
the resources controlled by a firm
the general management capabilities of a firm
the skills of the workforce and how a firm manages its human resources
the ability to design, develop and adopt technological tools and data resources, with
the latter providing an increasingly important source of information for innovation.
36 │ CHAPTER 1. INTRODUCTION TO INNOVATION STATISTICS AND THE OSLO MANUAL
OSLO MANUAL 2018 © OECD/EUROPEAN UNION 2018
Business innovation and knowledge flows (Chapter 6)
1.41. Chapter 6 focuses on the measurement of inward and outward information and
knowledge flows and linkages between firms and other actors in the innovation system and
extends the third edition’s coverage of these topics. The chapter provides an introduction
to theories of knowledge flows and open innovation that describe innovation in the
Business sector as a distributed process based on managed knowledge flows across
organisational boundaries.
1.42. The chapter builds on previous experience with capturing knowledge flows in
innovation surveys. Mapping knowledge flows and the diffusion of innovations would
benefit from the use of non-survey data sources to identify the linkages between actors,
outputs and outcomes. The chapter recommendations cover data collection on the role of
other firms or organisations in the development and adoption of innovations by a firm
(extending Chapter 3), collaborative activities for innovation, the main sources of ideas and
information for innovation, and the role of IP in knowledge flows. Additional guidance is
provided on measuring the linkages between firms, universities, and public research
organisations and the barriers and challenges for engaging in knowledge exchanges with
external parties.
External factors influencing business innovation (Chapter 7)
1.43. Chapter 7 is new to the fourth edition of the manual and complements Chapters 5
and 6 by promoting the measurement of the firm’s external environment as well as the
associated challenges and opportunities that managers need to consider when making
strategic choices, including for innovation. These factors include customers, competitors
and suppliers; labour markets, legal, regulatory, competitive and economic conditions, and
the supply of technological and other types of knowledge of value to innovation.
1.44. The chapter identifies the main elements of the external environment and provides
priorities for data collection. Markets are a leading contextual factor that is often shaped by
the firm’s own decisions. The chapter also provides guidance on measuring the direct and
indirect effects of public policy on innovation activities, social and environmental factors,
and external factors that can hinder innovation.
Objectives and outcomes of business innovation (Chapter 8)
1.45. Chapter 8 reviews different approaches to measuring innovation objectives and
outcomes. It discusses a number of qualitative measures of the variety of innovation
objectives and outcomes pursued by firms. This is followed by an evaluation of quantitative
measures of innovation outcomes for product and business process innovations. This
chapter also discusses limitations in the measurement of outcomes that are further
developed in Chapter 11.
1.2.3. Methods for collecting, analysing and reporting statistics on business
innovation (Part III)
Methods for collecting data on business innovation (Chapter 9)
1.46. Chapter 9 provides guidance on the methodologies for collecting data on business
innovation. The chapter focuses on the use of surveys, discussing the different steps for
producing data, from setting objectives and priorities with stakeholders to data release and
microdata storage. Compared to previous editions of the manual, there is considerably more
CHAPTER 1. INTRODUCTION TO INNOVATION STATISTICS AND THE OSLO MANUAL │ 37
OSLO MANUAL 2018 © OECD/EUROPEAN UNION 2018
guidance on methods for assessing question items and the implications of using different
survey methods. The importance of the length of the observation period is highlighted
and discussed.
1.47. Survey questions need to be carefully formulated to be correctly understood by
potential respondents. All respondents must interpret questions as intended by the concepts
and definitions in this manual. Many concepts and definitions cannot be used verbatim in
a question, but require careful adaptation. Key terms often need to be adapted to match the
language used by potential respondents in different cultural, regional and national contexts.
In some cases, more than one question item may be needed to obtain data that matches a
definition or a concept (see Chapter 3). The chapter also covers several practical issues that
were included in the third edition’s Annex on “Innovation Surveys in Developing Countries”.
Object-based approaches for measuring and analysing business innovation
(Chapter 10)
1.48. Chapter 10 is a new chapter that discusses the use, in innovation surveys, of the
object approach to innovation – namely collecting data on a single, “focal” innovation (the
object of study). This method can complement data collected through the subject approach,
which covers all of a firm’s innovation activities. The main purpose of the object approach
is to support analytical and research uses, as well as helping data producers assess statistical
quality (e.g. potential over or under-reporting of innovation). Under some conditions, the
object approach can also be used to construct indicators.
Using innovation data: statistical indicators and analysis (Chapter 11)
1.49. Chapter 11 is a new chapter that addresses the use of statistical data to construct
indicators and for multivariate analyses. These are key outputs of data collection that can
describe and shed insights into business innovation phenomena. This final chapter provides
guidance not only to those producing indicators in an official capacity, but also to other
interested users of innovation data, including academics, policy analysts or managers.
Other users could draw on the manual to guide their own data collection, analysis, and
construction of innovation indicators.
1.50. The first half of the chapter discusses the concept of indicators, major available
resources, and methodologies for constructing statistical indicators of innovation, both
from a micro and a macro perspective. It also discusses approaches for summarising
aggregate information on innovation into dashboards, scoreboards and composite indexes.
It presents a blueprint for the production of statistical indicators of innovation by thematic
areas, drawing on the recommendations in previous chapters.
1.51. The second half of the chapter describes methods for analysing innovation data,
with a major focus on the analysis of innovation impacts and the empirical evaluation of
innovation policies. This includes an introduction to the distributed, multi-country analysis
of innovation microdata as featured in OECD (2009b).
1.2.4. Cross-cutting issues covered within this manual
1.2.5. Digitalisation and innovation
1.52. Digitalisation entails the application of digital technologies to a wide range of
existing tasks and enables new tasks to be performed. Digitalisation has the potential to
transform business processes, the economy and society in general. Although this manual
38 │ CHAPTER 1. INTRODUCTION TO INNOVATION STATISTICS AND THE OSLO MANUAL
OSLO MANUAL 2018 © OECD/EUROPEAN UNION 2018
only provides a few concrete examples of digitalisation processes, due to their rapid
obsolescence and replacement, it introduces several new elements that can contribute to a
better understanding of digitalisation, both as an innovation process in its own right and as
a key factor driving innovation. Examples include:
Recognition of the role of information from both a product and business process
innovation perspective (Chapter 3). The definition of product innovation comprises
intellectual products that exhibit features of both goods and services, as is often the
case for digitised information. This is of particular importance for industries that
specialise in developing and selling information content. The definition of business
process innovation adopts a business function typology that separates innovations
within the firm’s information and communication function. Innovation in data-
based business models is also discussed.
Recognition of data development activities, along with software, as a potential
innovation activity (Chapter 4). Data accumulation by companies can entail significant
direct or indirect costs, for example when a firm gives away for free, or at a
discounted price, the use of goods or services that generate a stream of information
of value for advertising existing products. In addition, the information could also
be used to improve business decision processes that result in product or business
process innovations.
Data management competences are highlighted as key potential innovation capabilities
that innovation surveys should capture, directly or indirectly, in order to assess the
factors influencing innovation and related outcomes within firms (Chapter 5). This
chapter provides a basis for analysing the interrelationships between data-based
competences and other competences such as skills, general management and design.
The chapter also promotes the measurement of advanced technology development
and use, in close co-ordination with surveys on information and communication
technology use in firms.
The analysis of knowledge flows related to innovation (Chapter 6) is relevant to
digitalisation, with decentralised collaboration models supported by digitised knowledge.
Digitalisation is also relevant to the discussion on external factors influencing
innovation (Chapter 7), such as the nature of a firm’s markets and the extent to
which a firm uses digital platforms. Consumer and societal perspectives such as
trust are also relevant to digitalisation.
1.53. Digitalisation is also a key driver of measurement opportunities. Digital sources
and tools can be used:
To collect information on innovation outside the Business sector, even though these
digital sources and tools were not originally developed for statistical purposes
(Chapter 2).
In identifier technology in combination with available sources to reduce respondent
burden, such as identifying a most important business partner (supplier or customer)
or innovation collaborator, thus avoiding complex matrix-based questions (Chapter 6).
To obtain statistical data on innovation and business characteristics and to reduce
respondent burden (Chapter 9).
CHAPTER 1. INTRODUCTION TO INNOVATION STATISTICS AND THE OSLO MANUAL │ 39
OSLO MANUAL 2018 © OECD/EUROPEAN UNION 2018
To implement leaner and more secure electronic methods for collecting survey data
from respondents, minimising potential sources of bias and facilitating the collection
of inputs from different divisions within a firm (Chapter 9).
To collect qualitative information from respondents on their most important
innovations or changes (Chapter 10) and apply semantic analysis tools in a semi-
or entirely automated fashion to determine if the description is consistent with the
responses obtained on key items, such as whether innovation has been under- or
over-reported.
To analyse and visualise data on innovation (Chapter 11).
1.2.6. Globalisation and innovation
1.54. This manual provides a number of tools aimed at supporting the analysis of
globalisation and its relationship with innovation. As in the previous edition, the measurement
of knowledge flows aims to make a distinction between domestic flows and those with the
rest of the world (Chapter 6). The importance of identifying the role of multinational
enterprises (MNEs) is for the first time highlighted for measuring innovation capabilities
(Chapter 5), characterising knowledge flows with other parts of the business group
(Chapter 6) as well as describing the position of the firm in the value chain (Chapter 7)
through questions on the location of business functions. Furthermore, the methodological
discussion in Chapter 9. also addresses some of the specificities associated with collecting
data from MNEs.
1.3. Implementing the guidance in this manual
1.3.1. Nature of the guidance in this manual
1.55. The purpose of this manual is to guide innovation data collection and reporting
efforts through a common vocabulary, agreed principles and practical conventions. These
can enhance the comparability of statistical outputs and support the progressive development
of a global statistical information infrastructure on innovation that is relevant and useful
for researchers and decision makers alike.
1.56. The manual is a statistical resource that contains guidelines for applying concepts,
definitions, classifications, taxonomies and statistical methods for collecting innovation
statistics about the Business sector. The manual makes recommendations and identifies
possible approaches for experimentation. Within the OECD context, the recommendations
are not mandatory, but member countries are nonetheless expected to conform to
recommendations to the best of their ability. This is required in order to produce internationally
comparable data that can provide a global public information good on innovation.
1.57. The manual allows for a significant degree of discretion on how different countries
or groups of countries undertake their surveys. As measurement results are sensitive to the
choice of survey methods, it is difficult to obtain international comparability without
uniformity in data collection and reporting practices. Although uniformity is not feasible
in an OECD or global setting, greater convergence in methods should be possible and
aimed for. To this end, the OECD works with other international organisations and
networks that support statistical capability development and the sharing of experiences on
collecting innovation data.
40 │ CHAPTER 1. INTRODUCTION TO INNOVATION STATISTICS AND THE OSLO MANUAL
OSLO MANUAL 2018 © OECD/EUROPEAN UNION 2018
Glossary of terms and online annex material
1.58. Definitions represent one of this manual’s major contributions. As an additional
resource, a glossary is included for the first time in this edition of the Oslo Manual, following
the example of the latest edition of the Frascati Manual (OECD, 2015). The glossary of
terms facilitates translation efforts to different languages as well as reference checks.
1.59. Online annex material is expected to be developed and evolve to complement
guidance in the printed edition of the Oslo Manual, following the example of the latest edition
of the Frascati Manual. Relevant resources, including links to updated classifications, can
be found at http://oe.cd/oslomanual.
1.3.2. Transition and implementation
1.60. The revision of this manual entails a number of changes that require implementation
and adaptation over a transition period for both the producers and users of innovation
statistics. Implementing recommendations for surveys can take time. Throughout a transition
period, the wording used in survey forms, databases and reports needs to be tested and
adapted to the local context in which it is used. Cognitive testing with potential respondents
and consultation with key stakeholders is strongly recommended.
1.61. The continuity with previous innovation data is of great importance and has been
an overarching consideration throughout the fourth edition. Changes in practices have been
introduced that will or might imply breaks or discontinuities in data series. Therefore, it is
important for practitioners to identify possible breaks in series and to work collectively to
build bridges between previous and new data, especially on the incidence of generic types
of innovation for which an approximate correspondence has been established in Chapter 3.
This will facilitate the enhanced maintenance and use of innovation data on a time series basis.
1.62. Burdens on data producers and respondents should also be considered. There is no
expectation that all recommendations for new questions will be introduced at once. The
manual provides suggestions for assigning priority to different questions. Some questions
can also be rotated on a two, four or six-year cycle in order to minimise respondent burden.
Other questions can be included in surveys as experiments to collect evidence on key
knowledge gaps outside the traditional core set of questions.
1.63. Experience shows that unilateral country-level experimentation may fail to yield
the expected results due to a lack of historical information or international benchmarking
opportunities. It is therefore useful to engage in multilateral collaboration efforts across
national statistical organisations and agencies in charge of innovation surveys to co-
ordinate the content and timing of experimental questions. This will contribute to a more
valuable set of statistical resources for users in the years to come.

CHAPTER 1. INTRODUCTION TO INNOVATION STATISTICS AND THE OSLO MANUAL │ 41
OSLO MANUAL 2018 © OECD/EUROPEAN UNION 2018
References
EC et al. (2009), System of National Accounts 2008, United Nations, New York,
https://unstats.un.org/unsd/nationalaccount/docs/sna2008.pdf.
G20 (2016), G20 Blueprint on Innovative Growth,
www.g20chn.com/xwzxEnglish/sum_ann/201609/P020160912341449502867.pdf.
OECD (2015), Frascati Manual 2015: Guidelines for Collecting and Reporting Data on Research and
Experimental Development, The Measurement of Scientific, Technological and Innovation Activities,
OECD Publishing, Paris, http://oe.cd/frascati.
OECD (2010), The OECD Innovation Strategy: Getting a Head Start on Tomorrow, OECD Publishing,
Paris, https://doi.org/10.1787/9789264083479-en.
OECD (2009a), OECD Patent Statistics Manual, OECD Publishing, Paris,
https://doi.org/10.1787/9789264056442-en.
OECD (2009b), Innovation in Firms: A Microeconomic Perspective, OECD Publishing, Paris,
https://doi.org/10.1787/9789264056213-en.
OECD (1992), OECD Proposed Guidelines for Collecting and Interpreting Technological Innovation
Data: Oslo Manual, OECD Publishing, Paris.
OECD/Eurostat (2005), Oslo Manual: Guidelines for Collecting and Interpreting Innovation Data,
3rd Edition, The Measurement of Scientific and Technological Activities, OECD Publishing, Paris,
https://doi.org/10.1787/9789264013100-en.
OECD/Eurostat/EU (1997), Proposed Guidelines for Collecting and Interpreting Technological
Innovation Data: Oslo Manual, OECD Publishing, Paris, https://doi.org/10.1787/9789264192263-en.
UN (2008), International Standard Industrial Classification of All Economic Activities (ISIC),
Revision 4, United Nations, New York,
https://unstats.un.org/unsd/publications/catalogue?selectID=396.

CHAPTER 2. CONCEPTS FOR MEASURING INNOVATION │ 43
OSLO MANUAL 2018 © OECD/EUROPEAN UNION 2018
Chapter 2. Concepts for measuring innovation
This chapter provides the context and key foundations for innovation measurement underpinning
this manual. It describes major perspectives and theories of innovation, user needs for
innovation data, a framework for innovation measurement, and different approaches to
measuring innovation. Although this manual focuses on the measurement of innovation in
the Business enterprise sector, this chapter provides a general definition of innovation that
applies to all sectors and discusses the measurement of innovation in both the Business
enterprise sector and in other sectors.
44 │ CHAPTER 2. CONCEPTS FOR MEASURING INNOVATION
OSLO MANUAL 2018 © OECD/EUROPEAN UNION 2018
2.1. Introduction
2.1. This chapter provides the context for innovation measurement, and outlines its
rationale and possibilities. It describes the concepts that underlie major perspectives and
theories of innovation, user needs for innovation data, the elements of a framework, and
different approaches for innovation measurement. A general definition of innovation that
is suitable for all sectors is developed and presented in the final section of the chapter
2.2. Innovation is more than a new idea or an invention. An innovation requires
implementation, either by being put into active use or by being made available for use by
other parties, firms, individuals or organisations. The economic and social impacts of inventions
and ideas depend on the diffusion and uptake of related innovations. Furthermore, innovation
is a dynamic and pervasive activity that occurs in all sectors of an economy; it is not the
sole prerogative of the Business enterprise sector. Other types of organisations, as well as
individuals, frequently make changes to products or processes and produce, collect, and
distribute new knowledge of relevance to innovation.
2.3. These dynamic and complex activities and relationships represent significant, but not
insurmountable, challenges for measurement. Precise definitions of innovation and innovation
activities are required to measure innovation and its subsequent economic outcomes. This
manual draws upon the academic and management literature, and recent experience with
innovation measurement in multiple countries, to update relevant definitions and measurement
guidelines.
2.4. Data about innovation are relevant to managers and stakeholders of private and
public organisations, academics and policy users. Policy analysts and governments around
the world seek to promote innovation because it is a key driver of productivity, economic
growth and well-being. In addition, policies require an empirically grounded understanding
of how innovation works in order to support economic and social changes that can address
domestic and global challenges. These challenges include changing demographics, the need
for food and housing security, climate change and other environmental issues, and many
other obstacles to well-being.
2.5. Innovation occurs in all of the four broad sectors of an economy, as defined by the
United Nations’ (UN) System of National Accounts (SNA): Business enterprises (referred
to within the SNA as the corporate sector), General government, Households, and Non-
profit institutions serving households (NPISHs) (EC et al., 2009). Although the concepts
discussed in this chapter are broadly applicable to all four sectors, the focus of this edition
of the Oslo Manual (as with previous editions) is the Business enterprise sector and its
linkages within and outside this sector. However, this chapter also provides relevant
information for readers interested in measuring innovation in the other three SNA sectors.
2.6. The structure of this chapter is as follows. Section 2.2 discusses key innovation
concepts that set innovation apart from other related phenomena. This is followed by section 2.3,
which discusses user needs for innovation data; and section 2.4, identifying the subject and
phenomena that characterise the possible scope of innovation measurement. The formulation
of a general measurement framework for innovation is completed by section 2.5, which deals
with general strategies for measuring innovation and sets out the basis for the measurement
choices that this manual applies to the Business enterprise sector. Section 2.6 provides a
general definition of innovation and short descriptions of the context for innovation in the
government, NPISH and Household sectors. No guidelines for measuring innovation outside
of the Business enterprise sector are provided, in the expectation that other guidance,
consistent with this manual, will be developed in the future for other SNA sectors.
CHAPTER 2. CONCEPTS FOR MEASURING INNOVATION │ 45
OSLO MANUAL 2018 © OECD/EUROPEAN UNION 2018
2.2. The concept of innovation
2.2.1. Conceptual foundations
2.7. The conceptual foundations for innovation measurement are primarily derived from
the management and economics disciplines (Smith, 2006). Management perspectives on
innovation cover how innovation can change a firm’s position in the market and how to
generate ideas for innovation. Economic perspectives examine why organisations innovate,
the forces that drive innovation, the factors that hinder it, and the macroeconomic effects
of innovation on an industry, market or economy. Schumpeter’s (1934) theories on how
firms search for new opportunities and competitive advantage over current or potential
competitors are a major influence in this regard. Schumpeter introduced the concept of
“creative destruction” to describe the disruption of existing economic activity by
innovations that create new ways of producing goods or services or entirely new industries.
The economic growth literature has used this paradigm to investigate the drivers of long-
term economic growth.
2.8. Diffusion theory (Rogers, 1962) examines the processes by which innovations are
communicated and adopted over time among the participants in a social system. Evolutionary
theories (Nelson and Winter, 1982) view innovation as a path-dependent process (Dosi,
1982) whereby innovations are developed through interactions between various actors and
then tested on the market. These interactions and market tests determine, to a large extent,
which products are developed and which ones are successful, thereby influencing the future
path of economic development. The work by Simon (1982, 1969) into decision-making and
problem-solving has influenced the literature on innovation and the emergence of design
thinking methods that harness creativity to solve complex problems (Verganti, 2009) for
innovations in both private and public sector organisations.
2.9. Theories of innovation such as Kline and Rosenberg’s (1986) chain-link model and
innovation systems theory (Freeman, 1987; Lundvall, 1992; Nelson [ed.], 1993; OECD,
1997) stress that innovation is not a linear, sequential process, but involves many
interactions and feedbacks in knowledge creation and use. In addition, innovation is based
on a learning process that draws on multiple inputs and requires ongoing problem-solving.
2.10. The systems perspective of innovation calls for multidisciplinary and interdisciplinary
approaches to examine the interdependencies among actors, the uncertainty of outcomes,
as well as the path-dependent and evolutionary features of systems that are complex and
non-linear in their responses to policy intervention. Innovation systems include organisations
from the Business enterprise sector and the three other SNA sectors. Innovation systems
can be delineated by industry, technology, or geography and are often interrelated, with
local systems linked to national and global systems. Measurement usually collects data at
the firm level, with the resulting data then aggregated to provide results at the national or
industry level. Innovation measurement that covers multiple countries is of high potential
value, but requires considerable co-ordination efforts.
2.11. Systems perspectives are used for developing innovation policies to co-ordinate
system transformations that serve broad societal objectives (OECD, 2016). An example of a
system transformation is a regime shift to decarbonise transportation systems (Kemp, Schot
and Hoogma, 1998). This would require co-ordination among producers and consumers to
ensure that each complementary component of a complex network is in place, particularly
when some of the key actors may not exist (such as a dense network of electric vehicle
charging stations). Systemic changes can be the outcome and the channel by which new
46 │ CHAPTER 2. CONCEPTS FOR MEASURING INNOVATION
OSLO MANUAL 2018 © OECD/EUROPEAN UNION 2018
technologies are adopted, for example the application of artificial intelligence across a
broad range of uses.
2.12. An evaluation of innovation theories points to four dimensions of innovation that
can guide measurement: knowledge, novelty, implementation, and value creation. Each is
discussed below.
2.2.2. Knowledge
2.13. Innovations derive from knowledge-based activities that involve the practical
application of existing or newly developed information and knowledge. Information
consists of organised data and can be reproduced and transferred across organisations at
low cost. Knowledge refers to an understanding of information and the ability to use
information for different purposes. Knowledge is obtained through cognitive effort and
consequently new knowledge is difficult to transfer because it requires learning on the part
of the recipient. Both information and knowledge can be sourced or created within or
outside a relevant organisation.
2.14. Research and experimental development (R&D), described in detail in the OECD’s
Frascati Manual (OECD, 2015a), is one of a range of activities that can generate innovations,
or through which useful knowledge for innovation can be acquired (see Chapter 4). Other
methods of gaining potentially useful knowledge include market research, engineering
activities to assess the efficiency of processes, or analysing data from the users of digital
goods or services. Innovation-relevant information can be gathered without a specific
application in mind, for instance to help develop and evaluate options for future actions.
2.15. Knowledge has specific attributes that are relevant to and influence its measurement
(Arrow, 1962). Knowledge is non-rival because its use by one organisation or person does
not diminish the amount potentially available for use by others. The scope for spillovers
that create new knowledge provides a policy motivation for ensuring that knowledge is widely
available. However, the resources required to assimilate and effectively use knowledge can
be rival (for instance if there is a limited supply of skilled and proficient people or other
scarce complementary resources), as well as the ability to realise value from knowledge.
Depending on the context, knowledge can be more or less valuable to a given actor if other
parties hold it or are able to use it.
2.16. A number of practices that are supported by economic and social institutions can
make knowledge an excludable good, including the use of secrecy or other intellectual
property (IP) protection methods. These practices affect the incentives and ability to source
and transform new knowledge into innovations. Technological, market and regulatory
changes can also influence incentives. For example, the growing ability to digitise, organise
and access information at a nil or marginal cost has increased the stock of knowledge that
can be made potentially available, and created advantages from being able to exclude other
users (Cameron and Bazelon, 2013).
2.2.3. Novelty with respect to potential uses
2.17. Knowledge can be used to develop new ideas, models, methods or prototypes that
can form the basis of innovations. These can be sourced externally or developed within an
organisation. The novelty of an innovation is related to its potential uses, as determined by
the characteristics of a product or process compared to alternatives, and by the previous
experiences of its provider and intended users.
CHAPTER 2. CONCEPTS FOR MEASURING INNOVATION │ 47
OSLO MANUAL 2018 © OECD/EUROPEAN UNION 2018
2.18. Some characteristics can be objectively measured, such as energy efficiency, speed,
material strength, fault rates, and other physical attributes, while subjective characteristics
such as user satisfaction, usability, flexibility, responsiveness to changing conditions and
emotional affinity can be more challenging to measure. Novelty can be difficult to ascertain
for subjective characteristics, although the boundary between what can and cannot be
measured has shrunk as organisations develop methods to gauge experiential and emotional
responses. Furthermore, novelty can be intrinsically subjective because users can assign
different priorities to specific attributes, for example one group of users could give higher
priority to the ease of use of a mobile phone, while a second group could prioritise its
technical performance.
2.2.4. Implementation and actual use
2.19. In order for a new idea, model, method or prototype to be considered an innovation,
it needs to be implemented. Implementation requires organisations to make systematic efforts
to ensure that the innovation is accessible to potential users, either for the organisation’s
own processes and procedures, or to external users for its products. The requirement for
implementation is a defining characteristic of innovation that distinguishes it from inventions,
prototypes, new ideas, etc.
2.20. At a minimum, innovations must contain characteristics that were not previously
made available by the relevant organisation to its users. These features may or may not be
new to the economy, society, or a particular market. An innovation can be based on products
and processes that were already in use in other contexts, for instance in other geographical
or product markets. In this case the innovation represents an example of diffusion. Innovation
diffusion can generate substantial economic and social value and is consequently of policy
importance. This manual defines innovation to include diffusion processes (see Chapter 3),
while providing guidelines for identifying different levels of novelty, including new-to-
world innovations.
2.21. Lastly, implementation is not the final step for an innovative organisation. Follow-on
activities to review innovations after their implementation can result in minor improvements
or radically new innovations, e.g. through a fundamental redesign or major improvements.
Some of these follow-on efforts could potentially result in innovations in their own right.
Post-implementation reviews can also lead to the abandonment of innovations.
2.2.5. Value creation
2.22. Viewed as an economic activity, innovation requires resources that could be used
for other purposes. The existence of opportunity costs implies the likely intention to pursue
some form of value creation (or value preservation) by the actors responsible for an innovation
activity. Value is therefore an implicit goal of innovation, but cannot be guaranteed on an
ex ante basis because innovation outcomes are uncertain and heterogeneous.
2.23. Value-related measures are thus important for understanding the impacts of innovation,
although there is no single measure of economic or social value in established statistical
frameworks such as the SNA. Statistical measures of gross value added capture the
production surplus over and above the cost of intermediate inputs (excluding employee
compensation or the cost of meeting financing obligations). Financial measures such as net
worth capture the value of all assets owned by an institutional unit or sector, minus the
value of all outstanding liabilities. These measures can be extended to account for outputs
and assets that escape formal accounting conventions and for which market prices cannot
provide reliable indicators of economic value.
48 │ CHAPTER 2. CONCEPTS FOR MEASURING INNOVATION
OSLO MANUAL 2018 © OECD/EUROPEAN UNION 2018
2.24. Although it is not possible to make broad generalisations about the drivers of
organisational behaviour, decisions to innovate can be presumed, a priori, to have an implicit
motive to directly or indirectly benefit the innovative organisation, community or individual.
In the Business enterprise sector, benefits often involve profitability. In normally functioning
markets, customers have the freedom to decide whether to acquire a new product on the
basis of its price and characteristics. Therefore, the markets for products and finance fulfil
a selection function for innovations by guiding the processes of resource allocation in the
Business enterprise sector. This is replaced by different mechanisms in the other SNA sectors.
2.25. The realisation of the value of an innovation is uncertain and can only be fully
assessed sometime after its implementation. The value of an innovation can also evolve
over time and provide different types of benefits to different stakeholders. Complementary
measures and analytical strategies can be used to trace innovation outcomes after a suitable
length of time. The importance of outcome measures depends on the intended uses of
innovation data. They are particularly necessary for the study of government policy
initiatives to promote innovation that delivers socially desirable outcomes such as inclusion,
sustainability, jobs, or economic growth.
2.3. User needs and relevance of statistical evidence on innovation
2.26. User needs drive the construction of a system for measuring and reporting innovation
and the subsequent production of innovation data, statistics, indicators, and in-depth
analyses of innovation activities. There is widespread interest in understanding what drives
firms, communities and individuals to innovate and the factors that influence their innovation
activities. The relevance of innovation data for understanding innovation processes and
drivers can vary across countries, industries and institutional settings. The usefulness of
innovation data also depends on the ability to connect them with other types of data.
2.27. There are three main current or potential users of innovation data: academics,
managers, and policy makers or policy analysts. The data needs of all three types of users
are similar, with an interest in: (i) obtaining comparable data across industries, regions and
time; (ii) keeping up with changes in the nature of innovation, such as open innovation or
the use of design thinking principles; (iii) enabling analyses of innovation impacts on
innovative organisations, other parties, and regional or national economies; (iv) providing
data on the factors that enable or hinder innovation; and (v) linking innovation data to other
relevant data, such as administrative registers or data on individual users of innovations.
2.3.1. Research academics
2.28. Academics use innovation data to improve society’s understanding of innovation
and its socio-economic effects, and to test the predictions and implications of a broad range
of models on the role of innovation in economic development, organisational change, firm
dynamics and social transformation. Academics have a strong interest in research that
can provide predictive and causal interpretations of innovation outcomes, which requires
longitudinal data on innovation linked to data for variables such as value added, employment,
productivity and user/stakeholder satisfaction. Robust causal inference studies are an
important input to policy development, as they overcome the limitations of cross-sectional
studies that can only identify correlated phenomena.
2.29. Experience gained from using innovation data for research can point to desirable
changes in the measurement framework for collecting innovation data and the types of data
that are required to improve analysis (Gault, 2018). Academic researchers conducted many
CHAPTER 2. CONCEPTS FOR MEASURING INNOVATION │ 49
OSLO MANUAL 2018 © OECD/EUROPEAN UNION 2018
of the initial studies to measure innovation and consequently had a strong influence on the
first edition of the Oslo Manual (Arundel and Smith, 2013). Academics also use the Oslo
Manual guidelines to develop specialised or “one-off” surveys that test new questions for
evaluating theories or hypotheses about innovation and innovation policies. Some of these
approaches or questions have been adapted for general data collection.
2.3.2. Business managers
2.30. Managers can also benefit from statistical evidence on innovation. Although micro-
level innovation data collected on a confidential basis cannot be publicly released, managers
can use aggregated results for their industry to benchmark their organisation’s innovation
activities and outcomes. It is also worth noting that the act of collecting data on innovation
in an organisation can indirectly influence managerial decisions by raising awareness of
potential innovation activities and resources. This could induce search, learning and other
actions leading to innovation among targeted survey respondents (Gault, 2013). The interests
and incentives of innovation managers, as main providers of data on innovation, should be
placed at the centre of data collection efforts in order to ensure high-quality data.
2.3.3. Innovation and other public policy makers
2.31. The core target user of innovation data is the policy community, consisting of
policy analysts and policy makers. An important function of innovation data is to provide
an informed basis for public policy decisions through benchmarking indicators and research
using innovation data. Public policy interest in innovation is extensively reflected in the
literature (OECD, 2015b, 2010a) and is relevant to all industries and SNA sectors (OECD,
2015c). Consequently, coherent policies across multiple government portfolios are required to
marshal the transformational power of innovation in order to achieve key policy objectives.
2.32. The scope for establishing international benchmarking comparisons is of relevance
to this manual’s methodological guidelines, which are intended for use in different economies
and to support mutual economic co-operation and development in a multilateral setting.
However, not all indicators that are useful for benchmarking or analysis within a single
country are suitable for benchmarking across countries, due to linguistic, cultural and
contextual differences.
2.33. In order to determine if a set of data and indicators is well-suited to inform public
policy, the goals of public policy need to be identified to ensure that the measurement
framework matches policy needs. While policy interests influence the types of data that are
needed, policy can also influence the extent and quality of collected data through support
for funding new data collection or data linkage to existing sources.
2.34. The user base for innovation statistics is evolving over time as statistical data on
innovation prove to be more or less relevant for informing decisions, or as new data become
available. Innovation data are relevant to a wide array of policy areas, including general
macroeconomic management, public services and industry, taxation, and environmental
policies. Innovation data can be particularly informative for the study of structural policies
because of the high degree of persistence of many innovation-related behaviours. This
means that some types of innovation data do not need to be collected on a frequent basis,
although the value of timely data will increase in the presence of rapid structural change or
at times of economic or financial crises.
2.35. A potential area for future development from a user perspective is the scope for
improving the relevance of innovation data to other statistical frameworks. For example,
50 │ CHAPTER 2. CONCEPTS FOR MEASURING INNOVATION
OSLO MANUAL 2018 © OECD/EUROPEAN UNION 2018
innovation statistics are of relevance to productivity statistics and the measurement of
output gaps, trade and foreign investment, deflators, and other economic statistics. Greater
recognition of the value of innovation statistics would help integrate innovation measurement
in the broader framework of national statistics, where the precedent of satellite accounts on
R&D (mainstreamed into the core accounts since the SNA 2008) may one day be followed
by innovation satellite accounts.
2.4. Elements of an innovation measurement framework
2.36. An innovation measurement framework covers a defined scope, such as an SNA
sector of interest, a jurisdiction or geographic a rea where data will be collected, a set of
relevant phenomena of interest for understanding innovation, and measurement strategies.
The latter are discussed separately in section 2.5.
2.37. The phenomena of interest must be measurable, which requires instruments that
can reliably capture intended concepts (Griliches, 1986). For example, survey respondents
must be able to understand a question as intended and provide valid responses (meeting
one among various validity criteria). The definitions of innovation in Chapter 3 meet basic
validity requirements as a result of extensive cognitive testing with potential respondents.
This distinguishes them from other definitions in the literature that have not been rigorously
assessed for measurability.
2.38. In addition, valid statistical data must be representative of the target population.
This contrasts with other data collection methods based on case studies or other non-
representative samples, although these methods can provide very useful information for
specific purposes. Further discussion of data quality requirements is provided in Chapters 9
and 11 for business innovation measurement.
2.4.1. Scope of innovation measurement: SNA sectors and jurisdictions
2.39. As much as possible, the scope of measurement should be consistent with general
statistical frameworks. The SNA (EC et al., 2009) provides a globally adopted, generic
framework for measuring the economic activities of production, consumption, and
accumulation and the associated concepts of income and wealth. The SNA framework is
useful for the collection of innovation statistics because it permits the integration of
innovation data with other statistical sources that are consistent with the SNA. Furthermore,
guidance for measuring innovation in all SNA sectors should follow SNA terminology to
ensure consistency.
2.40. The fundamental unit for analysis in the SNA is the institutional unit, which has
legal responsibility for its actions and consequently can own assets, incur liabilities and
engage in the full range of economic transactions. In practice, institutional units can be
controlled by other units, as in the case of a domestic subsidiary of an international
corporation. This can place limits on the autonomy of decision-making.
The jurisdiction for data collection
2.41. This manual adopts the SNA’s jurisdictional perspective as a reference framework
for compiling innovation statistics. The main jurisdiction for data collection on innovation
is a country or economy, but innovation data can also be provided at the level of sub-
divisions such as regions, states, provinces, municipalities, etc. The “rest of the world”
consists of all non-resident organisations that enter into innovation-related relationships or
transactions with resident (domestic) units located in a specific country. For some purposes,
it can be convenient to describe the rest of the world as if it were a sector.
CHAPTER 2. CONCEPTS FOR MEASURING INNOVATION │ 51
OSLO MANUAL 2018 © OECD/EUROPEAN UNION 2018
2.42. The globalisation of economic activities represents a challenge for measuring
jurisdiction-based activities because actors outside the reference country can make
decisions on innovation. For example, a head office located in a different jurisdiction could
be responsible for such decisions, or a domestic innovation could depend on innovation
activities conducted by organisations in other countries. Some of the contributions of non-
resident actors can be captured by collecting data on the linkages between non-resident
organisations and domestic institutional units. As in other statistical areas, collaboration
across different jurisdictions can be necessary to obtain a complete picture of innovation
activities that span national boundaries.
SNA sectors and this manual’s focus on business enterprises
2.43. Institutional units are classified in the SNA into four sectors on the basis of their
principal functions, behaviours and objectives:
The SNA Corporations sector consists of corporations that are principally
engaged in the production of market goods and services. This manual adopts the
convention of referring to this sector as the Business enterprise sector, in line with
the terminology adopted in the OECD’s Frascati Manual (OECD, 2015a).
General government consists of institutional units that, in addition to meeting their
political and regulatory responsibilities, redistribute income and wealth and
produce services and goods for individual or collective consumption, mainly on a
non-market basis. The General government sector also includes non-profit institutions
controlled by the government.
NPISHs are legal entities that are principally engaged in the production of non-
market services for households or the community at large and whose main resource
is from voluntary contributions. If controlled by government, they are part of the
General government sector. If controlled by firms, they are assigned to the Business
enterprise sector.
Households are institutional units consisting of one or more individuals. In the
SNA, individuals must belong to only one household. The principal functions of
households are to supply labour, to undertake final consumption and, as entrepreneurs,
to produce market goods and services.
2.44. An institutional unit can be assigned to only one SNA sector. The total economy
consists of all institutional units resident in the economic territory of a country. As
previously mentioned, the main focus of this manual is the Business enterprise sector,
although innovation data can also be collected for institutional units and individuals
employed in other SNA sectors, as discussed in section 2.6 below.
2.45. The Business enterprise sector includes a type of government-controlled unit
known as public business enterprises.
2.46. The “public sector” is a broader concept than the General government sector, with
the former including all institutions controlled by government, including public business
enterprises. The latter should not be confused with publicly listed (and traded) corporations.
2.47. The borderline between business enterprises and households presents a number of
challenges when dealing with the entrepreneurial activities of households, which consist of
unincorporated enterprises that remain within the Household sector, except under specific
conditions. These can be particularly relevant for the study of innovation and can be also
hard to separate from the Business enterprise sector.
52 │ CHAPTER 2. CONCEPTS FOR MEASURING INNOVATION
OSLO MANUAL 2018 © OECD/EUROPEAN UNION 2018
2.48. Self-employed persons work for themselves, often through establishing an
unincorporated enterprise that is not legally separate from its owner. The self-employed
include the sole or joint owners of unincorporated enterprises in which they work, contributing
family members, and members of producer co-operatives. Examples of unincorporated
enterprises include small farms or communal construction.
2.49. Under some conditions, self-employed and unincorporated enterprises (with or
without employees) can be part of the “informal sector” or the “informal economy”. The
informal sector can play a very significant economic role, not only in low- and middle-
income countries, but also in high-income countries.
2.50. According to the SNA, the following factors can influence inclusion in the informal
sector:
Registration practices, which differ across countries and activity characteristics.
Generally, registered unincorporated enterprises are part of the Business enterprise
sector.
Legal incorporation: units for which a full set of accounts, including a balance
sheet, are available or can be drawn up are part of the Business enterprise sector.
Size in terms of employment or turnover, with very small units more likely to be
included in the informal sector.
Activities such as services for own consumption, which may occasionally be
offered to third parties.
Activities not according to or authorised by law.
Terms of employment at the boundary of service provision, as in the “gig economy”
(individuals working as independent contractors or freelancers instead of as full- or
part-time employees).
2.51. For a wide number of statistical purposes, individuals, rather than the households
to which they belong, can be the more appropriate measurement targets.
2.52. Institutional units with similar principal economic activities are grouped into
industries according to the UN International Standard Industrial Classification of All
Economic Activities Revision 4 (ISIC Rev.4) (see UN, 2008), or compatible regional
classifications (e.g. NACE within Europe, NAICS in North America, and ANZSIC in
Australia and New Zealand).
2.53. Policy interest in measuring innovation often calls for evidence on institutional
units engaged in specific economic activities that do not match with SNA institutional
sectors. In particular, the Frascati Manual (OECD, 2015a) assigns a special “headline
sector” status to units active in providing higher education services, regardless of which
SNA sector they belong to. Similarly, many countries also pay special attention and grant
special status to many research institutes specialising in the provision of R&D services.
Both are called out specifically within this manual’s Chapter 6 in the context of capturing
knowledge-based linkages with business enterprises.
2.54. This manual’s coverage of economic activities in the Business enterprise sector
expanded from manufacturing industries in the first edition, to manufacturing and selected
service industries in the second edition. The current edition provides guidance for all
industries in the Business enterprise sector (see Chapter 9).
CHAPTER 2. CONCEPTS FOR MEASURING INNOVATION │ 53
OSLO MANUAL 2018 © OECD/EUROPEAN UNION 2018
2.4.2. Innovation phenomena for measurement
The object of innovations
2.55. Innovations and innovation activities are the central object of analysis in an
innovation measurement framework. Chapter 3 describes the characteristics of product and
process innovations from the perspective of business enterprises. Products and processes
are generic concepts that are also applicable to the other three SNA sectors.
2.56. The SNA defines a product as a good or service that results from production
activities. Products can be exchanged and used as inputs into the production of other goods
and services, for final consumption, or for investment.
2.57. Goods are objects for which current or potential demand exists and for which
ownership rights can be established. Ownership permits goods (and rights to such goods)
to be transferred from one owner to another through market transactions.
2.58. Services are the result of a production activity that changes the conditions of users
or facilitates the exchange of products, including financial assets. They cannot be traded
separately from their production. By the time their production is completed, they must have
been provided to their users. As indicated in the SNA, changes in the condition of users
include:
Changes in the condition of the user’s goods: the producer works directly on goods
owned by the user by transporting, cleaning, repairing or otherwise transforming
them. Users include other firms, for example a firm can provide materials to another
firm to be transformed into a product that the original firm then sells.
Changes in the physical condition of a person: the producer transports a person or
provides accommodation, medical or surgical treatments, changes the appearance
of their hair, etc.
Changes in the psychological condition of a person: the producer provides education,
information, advice, entertainment, experience or similar services, potentially but not
necessarily in a “face-to-face” manner. These services may be digitally delivered.
2.59. The boundary between a good and a service can be difficult to identify and is
subject to constant change. The provision of goods can shift to service-based models and
vice versa. Furthermore, some products can combine features of both goods and services, for
example, knowledge-capturing products that concern the provision, storage, safekeeping,
communication and dissemination of information that users can copy, share and access
repeatedly have features of both goods and services (see Chapter 3). Digital technologies
have contributed to an increase in the variety of information and knowledge-based products
available, as well as the ways in which production (understood in a general sense) and
consumption takes place in all SNA sectors.
2.60. Production processes (or production activities) are defined in the SNA as all
activities, under the control of an institutional unit, that use inputs of labour, capital, goods
and services to produce outputs of goods and services. These activities are the focus of
innovation analysis.
2.61. The SNA classifies production activities by the types of goods or services produced as
outputs, the types of inputs used or consumed, the techniques or models of production employed,
and how the outputs are used. By including goods and services, the concept of production
is broader than manufacturing. All SNA sectors have distinctive approaches to production.
54 │ CHAPTER 2. CONCEPTS FOR MEASURING INNOVATION
OSLO MANUAL 2018 © OECD/EUROPEAN UNION 2018
2.62. Beyond production, measurement can identify innovations in redistribution, consumption
and other activities. These can be relevant to the study of innovation at the household or
systemic level, as major system transformations require not only production shifts, but also
the development of new consumption habits for recycling, sustainability, etc.
Activities leading to and following from innovations
2.63. Institutional units can undertake a series of actions with the intention to develop or
adopt innovations. This can require dedicated resources and engagement in specific activities,
including policies, processes and procedures.
2.64. Chapter 4 identifies innovation activities that are used by firms to develop innovations.
These activities can be characterised by the knowledge they draw upon and generate, or the
stage in the innovation process when they are used. They include R&D, engineering, design
and other creative activities; marketing and brand equity activities, IP-related activities,
employee training activities, software development and database activities, activities
related to the acquisition or lease of tangible assets, and innovation management activities.
2.65. Engagement in these activities can strengthen organisational or individual capabilities
for innovation, although most of these activities can be conducted without an explicit
innovation objective. For example, R&D, as formally defined, is neither a sufficient nor
necessary condition for either innovation activity or innovation to occur.
2.66. Innovation activities can be organised around explicit innovation projects. ISO 10006
defines a project as a “unique process consisting of a set of co-ordinated and controlled
activities with start and finish dates, undertaken to achieve an objective conforming to
specific requirements, including constraints of time, cost and resources” (ISO, 2017). The
concept of an innovation project, while useful for understanding how innovation takes
place, is unlikely to be applied in the same way across all types of organisations or
institutional units. Some organisations, especially large firms, will have a broad portfolio
of innovation projects at different stages of maturity, while start-ups could devote all of
their resources to a single innovation without viewing it as a project. This limits the
usefulness of innovation projects as a construct for measurement.
Transactions and assets of relevance to innovation
2.67. Innovation data users are interested in the magnitude of efforts devoted to innovation
activities. In-house expenditures on these activities can be difficult for managers to estimate
if the activity is not undertaken within a formal division of the organisation or under
narrowly defined cost codes. In comparison, market purchases of goods or services to
support innovation activities can often be identified from company accounts. Chapter 4
discusses methods for estimating expenditures on developing or acquiring knowledge used
in business innovation activities, including methods for estimating the internal costs of
these activities.
2.68. Innovation activities can produce knowledge-based assets. The SNA defines an
asset as a store of value that represents a benefit or series of benefits accruing to the
economic owner by holding or using the asset over a period of time. Both financial and
non-financial assets are relevant to innovation. Fixed assets are the result of production
activities and are used repeatedly or continuously in production processes for more than
one year. The SNA treatment of knowledge assets (formally defined as intellectual property
products) has evolved over time, with the addition of R&D in 2008. Other types of
knowledge assets that the SNA recognises as generated through production and of

CHAPTER 2. CONCEPTS FOR MEASURING INNOVATION │ 55
OSLO MANUAL 2018 © OECD/EUROPEAN UNION 2018
relevance to innovation include investment in computer software and databases, and
entertainment, literary and artistic items.
2.69. Knowledge assets can be used by their owners in production or sold on the market
if use of the knowledge is restricted through legal or other protection mechanisms. The
ability to exclude users provides an incentive to invest in innovation, as recognised in
theories of innovation and economic growth (Aghion and Howitt, 1992; Romer, 1990).
2.70. Units in all sectors can develop or acquire knowledge assets (Corrado, Jäger and
Jona-Lasinio [eds.], 2016). Because development requires some degree of specialisation,
many units, including firms, acquire knowledge assets of value to innovation without
engaging in their production.
2.71. The study of innovation can extend beyond products and processes. In the SNA,
the production activities and ownership of assets generates income for institutional units.
Units can use their disposable income for the consumption of individual or collective goods
to satisfy household needs or wants. Collective consumption services are provided
simultaneously to all members or groups of the community. Changes in consumption
patterns over time are a potential object of innovation analysis, especially if the focus is on
institutional units with final consumption as a defining attribute, as is the case for the
Government and Household sectors.
Knowledge flows
2.72. Knowledge for use in innovation can be exchanged through market transactions
and through non-market means. Relevant channels include knowledge carried in the minds
of individuals across different organisational boundaries. Individuals can work temporarily
in different organisations without a change in employer, for instance when an employee is
seconded to work in an academic institution as part of a collaboration project. Data on the
types of networks used, linkages between organisations, and the role of different actors in
knowledge creation and diffusion is useful for research on the division of innovation labour
across organisations and the creation of innovation value chains. It is difficult, however, to fully
trace innovation-relevant linkages due to complex feedback loops and because respondents
may not be aware of relevant linkages that extend beyond an immediate partner organisation.
2.73. Innovations can emerge through linkages between actors within or across different
sectors and through a wide range of mechanisms (co-operation, alliances, joint ventures),
or as an interactive process involving open innovation or user-producer interactions
(OECD, 2013). The conceptualisation and measurement of linkages for innovation in the
Business enterprise sector, including the open innovation paradigm, are covered in Chapter 6.
Innovation policies, laws and regulations
2.74. Understanding the effects of innovation policies on the innovation activities of
organisations, especially firms, is of major interest to the policy community. Innovation
policies are intended, as a primary or secondary objective, to influence the extent and nature
of innovation in an economy. The implementation of innovation policies and practices can
be complex and influenced not only by the intention of enabling legislation, but also by
their actual use at different organisational and jurisdictional levels. Innovation policies
require co-ordination and institutional arrangements that extend beyond science and
research ministries to a whole-of-government approach (OECD, 2010a). Typologies of
innovation policies, of value for measuring the use of innovation programs by firms, are in
56 │ CHAPTER 2. CONCEPTS FOR MEASURING INNOVATION
OSLO MANUAL 2018 © OECD/EUROPEAN UNION 2018
continuous development. Chapter 7 discusses methods for assessing the relevance of
different policies and policy instruments for the innovation activities of firms.
Innovation outcomes
2.75. At the level of a society, the ultimate impacts of innovation are the satisfaction of
current or future human needs at either the individual or collective level. For a firm, the
expectation of outcomes such as an increase in market share, sales, or profits acts as an
incentive for innovation. Measuring the extent to which innovation results in social or
private outcomes is difficult, but remains a high priority. Furthermore, innovation does not
necessarily result in desirable outcomes for all parties.
2.76. Productivity, profits, jobs, and social and environmental impacts are examples of
outcomes of interest to users of innovation data. Innovation outcomes can be widely
distributed over time, organisations and individuals. Innovation impacts can be measured
directly (e.g. self-reported impacts), or indirectly through the analysis of data on innovation
activities, data on outputs (such as different types of innovations) and data on internal or
external outcomes (such as profits). Chapter 8 discusses the measurement of outcomes
from innovation in the Business enterprise sector.
2.5. General strategies for measuring innovation
2.77. The choice of which methods to use to measure innovation depends on the quality
of the data collected and its intended use. A measurement strategy for innovation must
address several issues, such as the choice of a subject or object approach, the collection of
qualitative and quantitative data, data sources, and responsibility for data collection.
2.78. The structure of a measurement strategy can vary over time as user needs and the
types of data that can be collected evolve in response to new opportunities or challenges.
In addition, different measurement approaches can complement each other. The value to
users of innovation data can often be improved by combining several approaches to
measurement and by creating opportunities for data linkage and follow-on analysis.
2.5.1. Subject- versus object-based approaches
2.79. In selecting the unit of analysis, a measurement framework can focus on the
phenomena of interest (the object approach) or on the actors that are responsible for the
phenomena (the subject approach). It is also possible to combine both approaches: for
instance a survey questionnaire can include general questions about strategies and innovation
practices (subject), followed by detailed questions focused on a single innovation (object).
2.80. The most common use of the object-based approach is to collect data on specific
innovations, for example innovations reported in trade journals, crowdfunding platforms
or, in a survey context, the most important innovation for a given organisation. Other
options are to collect data on specific innovation projects or innovation-related transactions
or linkages. Object-based approaches can provide a high level of granularity and detail, but
can suffer from self-selection or non-representative samples, as when cases are selected
from trade journals.
2.81. The subject approach is commonly used in innovation surveys to collect data on the
innovation activities, outputs and outcomes of the respondent’s organisation. Subject-based
surveys can benefit from the statistical infrastructure of business registers and other available
information at the firm level, including the industry of activity and the number of employees.
CHAPTER 2. CONCEPTS FOR MEASURING INNOVATION │ 57
OSLO MANUAL 2018 © OECD/EUROPEAN UNION 2018
This permits the drawing of representative samples, analyses at the level of the organisation,
and the presentation of results by industry or by region. Another advantage of subject-based
surveys is that they can collect data on organisations with no innovations or innovation
activities in the reference period, whereas these organisations would not be captured through
object-based approaches based on self-reported innovations or innovation activities.
2.82. Subject- and object-based approaches can converge if it is possible to collect
separate data for every innovation introduced by a firm. This is only likely to be feasible
for small organisations with only one or two innovations within the observation period. The
combined use of subject and object approaches in business innovation surveys is discussed
in Chapter 10.
2.5.2. Qualitative and quantitative data
2.83. Academic and policy users prefer quantitative data for most research purposes.
However, survey respondents find it difficult and demanding to report quantitative, interval
data for innovation activities or outcomes, such as expenditures, personnel, income generated
by innovations, the number and length of collaborations, the number of IP registrations or
applications, etc. In addition, many innovation concepts are difficult to quantify, in part
because the records and management systems of firms do not align with innovation concepts,
or because the concepts only apply to specific contexts.
2.84. Qualitative measures for innovation activities that cannot be collected on an interval
level can be obtained and codified by using questions that ask for nominal or ordinal data,
such as the importance of different information sources or categories for the frequency with
which these sources are accessed. This type of qualitative data can be used in econometric
analysis and to construct indicators.
2.85. There is considerable scope for using unstructured qualitative data to construct
statistics. Examples include self-reported descriptions of an organisation’s most important
innovation, or descriptions of innovation strategies in company or organisational reports.
These can be codified manually or through machine-based algorithms that use natural
language processing techniques. Chapter 9 discusses the collection of qualitative and
quantitative data on innovation.
2.5.3. Sources of innovation data
Census and sample statistical surveys
2.86. Innovation surveys collect data by sending a questionnaire to all firms in a target
population that meet predefined inclusion criteria (a census) or to a random sample of the
target population. As a census is expensive, representative samples of the population are
commonly used. Sample results can be extrapolated to the entire population and differences
between subgroups can be tested using statistical inference techniques. However, non-response
can reduce the reliability and validity of the results if the respondents are not representative
of the entire population and if the size of this effect cannot be accurately measured.
2.87. Surveys are well-suited for eliciting information that is not available from other
sources, provided that respondents have the ability and incentive to report truthfully and
accurately. Surveys of organisations face challenges that are not found in surveys where
an individual is the subject of interest, as in social surveys. In surveys of complex
organisations, designated respondents might be faced with questions they are unable to
answer. For instance, an R&D manager could be unaware of the innovation activities of a
58 │ CHAPTER 2. CONCEPTS FOR MEASURING INNOVATION
OSLO MANUAL 2018 © OECD/EUROPEAN UNION 2018
logistics division or not know the amount spent on the purchase of equipment innovations
for production. Accurate answers may only be possible if different people answer different
sections of the questionnaire. In contrast, this problem is considerably less likely to occur
in small organisations.
Administrative and commercially generated data
2.88. Data created for administrative purposes or in the course of commercial activities
provide a potentially valuable source of information on a range of innovation phenomena.
2.89. Company filings and published reports can provide detailed information on innovation
activities and outcomes, although not always in a structured and comparable fashion.
Administrative data can provide detailed information on specific elements of the innovation
process, such as applications for different types of IP rights (patents, design registrations,
etc.), or on possible outcomes of innovation, such as value added and profits.
2.90. The increasing digitalisation of economic and social activities provides new and
complementary sources of innovation data. Examples include:
Barcode data signalling product launches and product recalls.
Data from electronic platforms where individuals or organisations post proposals
for innovation projects in order to secure funding and feedback (e.g. Kickstarter).
These can provide a measure of user needs and wants.
Media reports for product launches, joint ventures, collaborations, product reviews, etc.
Meta-databases such as the Open Knowledge Foundation’s Open Product Data.
2.91. Internet platforms provide new sources of innovation data derived from diffusion
and feedback processes. This is a promising area of future research, although such data
must be evaluated for quality and representativeness.
2.5.4. Responsibility for primary source data collection
2.92. This manual’s guidelines are designed for organisations with expertise in data
collection (particularly national statistical organisations [NSOs]), but they can also be
useful for other organisations that collect innovation data on a continuous or one-off basis.
Other organisations include government agencies, academic and research organisations,
international organisations, market research organisations and consultancies.
National statistical organisations
2.93. NSOs and comparable agencies have the resources, expertise and jurisdictional
authority to conduct representative innovation surveys. Comparable agencies include research
institutes with delegated data collection responsibilities and quality assurance mechanisms.
Many NSOs and comparable agencies can use legislation to compel respondents to answer
innovation surveys and can link other administrative information to innovation data. The
expertise, independence and reputation of NSOs, plus routines to ensure confidentiality,
increase the trust and confidence of survey respondents, thereby helping secure high
response rates and high-quality data from representative samples. However, NSOs can face
legal or resource constraints that limit the number of questions that can be asked, the ability
to link administrative and innovation data, or the use of in-depth innovation surveys that
focus on specific topics or parts of the relevant population.
CHAPTER 2. CONCEPTS FOR MEASURING INNOVATION │ 59
OSLO MANUAL 2018 © OECD/EUROPEAN UNION 2018
Other organisations
2.94. Academics and research organisations are regular and frequent users of innovation
data collected by NSOs or other comparable agencies. Furthermore, they often self-
organise as consortia to conduct one-off or regular surveys of innovation or related topics.
Examples include inventor surveys (Giuri et al., 2007), the Division of Innovative Labour
survey (Arora, Cohen and Walsh, 2016), and the World Management Survey consortium
(http://worldmanagementsurvey.org).
2.95. Several international organisations have conducted surveys for countries or on
topics that were not covered by national innovation surveys. For example, several
Eurobarometer surveys, funded by the European Commission, provided in-depth coverage
of innovation-related topics such as the effect of public procurement on the innovation
activities of firms. Other organisations that have conducted innovation surveys include the
World Bank and the European Bank for Reconstruction and Development. A major motivation
for international organisations is to obtain microdata on innovation for multiple countries.
2.96. Market research organisations and consultants can also conduct innovation surveys
on behalf of other organisations, including government agencies, foundations, trade bodies,
media companies, etc.
2.5.5. Summary of the measurement approach in this manual
2.97. The Oslo Manual provides guidelines for the statistical measurement of innovation
with the following data collection features:
A target population of business enterprises, which has been progressively extended
from manufacturing industries in the first edition to the entire Business enterprise
sector in this manual. The Oslo Manual’s guidelines are not expressly designed to
measure innovation in other SNA sectors, but research shows that many of the
concepts can be applied to them (Gault, 2018).
A subject approach focused on the innovation activities of a firm. However, this
manual provides recommendations for the collection of data on specific innovation
objects, such as the most important innovation or innovation project (see Chapter 10).
Compatibility with censuses or surveys that are representative of the target
population and linkable to other data sources (see Chapters 9 and 11).
Guidelines designed for use by NSOs or delegated agencies that conduct innovation
surveys under some degree of public authority. As an open standard, the guidelines
can also be used by international organisations, research institutes, academics, and
any other groups with an interest in measuring innovation.
A focus on serving policy user needs through providing guidance for the
construction of indicators and for analysis (see Chapter 11).
2.98. Although not all measurement strategies are sufficiently mature for inclusion in this
manual, the intention is to encourage the development of complementary approaches as
well as research on questions that are not covered in this manual. Further research and
experimentation are necessary to respond to changes in user demand and to improve
existing research practices.
60 │ CHAPTER 2. CONCEPTS FOR MEASURING INNOVATION
OSLO MANUAL 2018 © OECD/EUROPEAN UNION 2018
2.6. Measuring innovation beyond the Business sector
2.99. Innovation activities occur in all four SNA sectors. Consequently there is a need
for a general definition of innovation that is applicable to all institutional units or entities,
while retaining consistency with the definition in Chapter 3 for business enterprises. The
general definition of an innovation for all types of units is as follows:
An innovation is a new or improved product or process (or combination thereof)
that differs significantly from the unit’s previous products or processes and that
has been made available to potential users (product) or brought into use by the
unit (process).
2.100. Processes include policies that provide an overall strategy that drives a unit’s
activities, activities that transform inputs into outputs, and procedures that govern the
detailed steps for activities to transform inputs into outputs.
2.101. Newly established entities such as firms or organisations do not have previous
products or processes for comparison. In this case the comparison group for defining an
innovation is what is available in the relevant market. Therefore, a product or process of a
newly established entity is an innovation if it differs significantly from products available in
the relevant market or processes that are currently in use by other entities in the relevant market.
2.102. Specific innovations can involve the participation of multiple actors across sectoral
boundaries. These units can be linked through various methods, such as funding mechanisms,
hiring of human resources, or informal contacts.
2.6.1. Innovation in the General government sector
2.103. Government units are established by political processes with legislative, judicial or
executive authority and occur at the national, regional and local administrative levels. Public
corporations are part of the Business sector. The key difference between a government unit
and a public corporation is that the former do not charge economically significant prices
for their goods or services. In order to analyse the full engagement of government in
innovation in an economy, it can be useful to collect and report data at the level of the entire
public sector, which includes all general government units and all public corporations.
2.104. The range of goods and services provided by government, and the prices charged,
are based on political and social considerations rather than on profit-maximisation or related
business objectives. This influences the types of product innovations developed by institutional
units within the Government sector and made available to households, non-profits or business
enterprises. Many process innovations in the Government sector draw on or are similar to
innovations in the Business enterprise sector, but public service innovations often pursue
redistributive or consumption-related goals that are unique to government. Common
characteristics of innovation in the Government sector include the frequent use of collaboration,
including with organisations in other SNA sectors, and the co-production of innovations.
2.105. The presence or absence of a market is frequently cited as the major difference
between the Business and Government sectors (Bloch and Bugge, 2013; Gault, 2012;
Lægreid, Roness and Verhoest, 2011). The absence of a market alters both the incentives
for innovation and the methods for measuring innovation outcomes compared to the
business sector. Without data on the cost or price paid for government services, outcome
measurement has relied on subjective, self-reported measures, such as an increase in
efficiency or improved user satisfaction (Bloch and Bugge, 2013). It is also difficult to
provide aggregated economic outcome measures (financial measures of cost savings or
CHAPTER 2. CONCEPTS FOR MEASURING INNOVATION │ 61
OSLO MANUAL 2018 © OECD/EUROPEAN UNION 2018
benefits) or external validity measures for outcomes. High-quality outcome measures are
generally only available for specific innovations. Examples include the cost and benefits of
new treatments or protocols in hospitals or new educational methods in schools.
2.106. The study of innovation within government and the public sector more broadly has
attracted a growing body of empirical research, motivated in part by the increasing demand
for benchmarking the efficiency and quality of public services as well as identifying the
factors that contribute to desirable innovation outputs and outcomes. Many of these studies
have adapted the guidelines in the previous edition of this manual to develop surveys of
innovation in public administration organisations (APSC, 2011; Arundel and Huber, 2013;
Bloch and Bugge, 2013; OECD, 2015c), but more recent surveys have added questions that
are explicitly designed for the Government sector. This shift was driven by the need to
collect data to support public sector innovation policy (Arundel, Bloch and Ferguson,
2016). Other research has used various methodologies to examine innovation in education,
health and social care services (Windrum and Koch [eds.], 2008; Osborne and Brown
[eds.], 2013). The OECD has supported extensive testing of questions on public sector
innovation and interim guidelines for measurement OECD (2015c).
2.6.2. Innovation and non-profit institutions
2.107. Non-profit institutions (NPIs) produce or distribute goods or services, but do not
generate income or profit for the units that control or finance them. NPIs that are not part
of the Government or Business enterprise sectors are classified as NPISHs. They are often
non-governmental social institutions. The assignment of an NPI to the NPISH sector can
change, due to an increase in the role of government or business representatives in decision-
making or funding. NPISHs can also spin out businesses or exert control over business
enterprises in order to serve social objectives.
2.108. Many NPISHs seek to implement “social innovations”, defined by their objectives
to improve the welfare of individuals or communities (Mulgan, Joseph and Norman 2013;
Young Foundation, 2012). The same issues for measuring innovation outcomes in the
General government sector apply to the NPISH sector.
2.6.3. Innovation, households and individuals
2.109. People drive the innovation process at many levels and consequently policies often
encourage individuals and collective groups in all SNA sectors to engage in innovation
(OECD, 2010a). Households, including individuals and unincorporated enterprises, play a
critical role for innovation from both a supply and demand perspective.
2.110. Individuals are the ultimate providers of human and financial resources for production
activities including innovation processes. As employees, individuals contribute directly to
innovations attributed to their employers and can be engaged in reporting innovation data.
Members of one or more households can be involved in innovations for which they are
solely responsible as individuals. This can occur outside of regular employment, or through
their work on a self-employed basis in unincorporated enterprises for which they are the
sole or joint owner.
2.111. Self-employed individuals, in the Household or Business sector, can have
considerable involvement in innovations, although their status can also be highly transient
because a promising idea can quickly lead to incorporation, potentially resulting in a
transition from the Household to the Business sector. Individuals can also benefit from
policy interventions such as direct funding or tax support for innovation that can lead to
incorporation or other forms of registration.
62 │ CHAPTER 2. CONCEPTS FOR MEASURING INNOVATION
OSLO MANUAL 2018 © OECD/EUROPEAN UNION 2018
2.112. Historically, individuals have played a leading role in the development of new ideas
and subsequent solutions. With the rise in research specialisation and the growth of the
industrial corporation, households and individuals came to be viewed as passive consumers
of innovations incorporated in purchased goods and services, rather than developers of
innovations (von Hippel, 2017, 2005; von Hippel, Ogawa and de Jong, 2011). While
individuals lack the organisational support to develop innovations requiring considerable
investment, empirical research indicates that there is a non-negligible proportion of
individuals who develop concepts and ideas into early prototypes or models, which they
either make available to others or pursue further by themselves.
2.113. Technological developments such as the Internet, 3-D printing and crowdfunding
platforms can potentially support the innovation activities of individuals, although
technical and commercial success is likely to result in a transition from the Household to
the Business sector. Individuals can also finance the innovation activities of other members
of the Household sector or start-ups, for instance through crowdfunding platforms. In many
of these cases, individual funders can receive the product before it is widely marketed,
becoming lead users.
2.114. Understanding and managing the impact of innovation on individuals in their roles
as employees (OECD, 2014; OECD, 2010b), asset owners, and consumers is a policy
priority. Measurement could provide policy-relevant data on a range of topics, such as the
effect of innovation on skills obsolescence, the willingness of individuals to trade personal
data for access to free apps and networks, and factors that support trust and empower
consumers to make well-informed purchasing decisions that benefit their interests. Data on
the use of innovations by final consumers is also of value to business managers and policy
makers. Individuals can contribute useful data for the design of new products and
processes, for example behavioural data through their digital online footprint and the use
of connected devices, as well as through feedback and review mechanisms. These examples
point to the value of innovation measurement in the Household sector.
References
Aghion, P. and P. Howitt (1992), “A model of growth through creative destruction”, Econometrica,
Vol. 60/2, pp. 323-351.
APSC (2011), State of the Service Report 2010-11, State of the Service Series, Australian Public Service
Commission (APSC), Commonwealth of Australia, Canberra.
Arora, A., W.M. Cohen and J.P. Walsh (2016), “The acquisition and commercialization of invention in
American manufacturing: Incidence and impact”, Research Policy, Vol. 45/6, pp. 1113-1128.
Arrow, K. (1962), “Economic welfare and the allocation of resources for inventions”, in The Rate and
Direction of Inventive Activity: Economic and Social Factors, Princeton University Press, Princeton.
Arundel, A., C. Bloch and B. Ferguson (2016), “Methodologies for measuring innovation in the public
sector”, conference paper for the OECD Blue Sky Forum 2016, Ghent (Belgium), 19-21 September.
Arundel, A. and D. Huber (2013), “From too little to too much innovation? Issues in measuring
innovation in the public sector”, Structural Change and Economic Dynamics, Vol. 27, pp. 146-159.
Arundel, A. and K. Smith (2013), “History of the Community Innovation Survey”, in Handbook of
Innovation Indicators and Measurement, Edward Elgar, Cheltenham, pp. 60-87.
Bloch, C. and M. Bugge (2013), “Public sector innovation – From theory to measurement”, Structural
Change and Economic Dynamics, Vol. 27, pp. 133-145.

CHAPTER 2. CONCEPTS FOR MEASURING INNOVATION │ 63
OSLO MANUAL 2018 © OECD/EUROPEAN UNION 2018
Cameron, L. and C. Bazelon (2013), “The impact of digitization on business models in copyright-driven
industries: A review of economic issues”, Brattle Group paper for the US National Research Council,
http://sites.nationalacademies.org/cs/groups/pgasite/documents/webpage/pga_063398.pdf.
Corrado, C., K. Jäger and C. Jona-Lasinio (eds.) (2016), SPINTAN Manual: Measuring Intangible
Capital in the Public Sector, www.spintan.net/manual-and-reports/ (accessed 30 July 2018).
Dosi, G. (1982), “Technological paradigms and technological trajectories: A suggested interpretation of
the determinants and directions of technical change”, Research Policy, Vol. 11/3, pp. 147-162.
EC et al. (2009), System of National Accounts 2008, United Nations, New York,
https://unstats.un.org/unsd/nationalaccount/docs/sna2008.pdf.
Freeman, C. (1987), Technology Policy and Economic Performance: Lessons from Japan, Pinter, London.
Gault, F. (2018), “Defining and measuring innovation in all sectors of the economy”, Research Policy,
Vol. 47/3, pp. 617-622, https://doi.org/10.1016/j.respol.2018.01.007.
Gault, F. (2013), “Innovation indicators and measurement: An overview”, in Handbook of Innovation
Indicators and Measurement, Edward Elgar, Cheltenham, pp. 3-37.
Gault, F. (2012), “User innovation and the market”, Science and Public Policy, Vol. 39/1, pp. 118-128.
Giuri, P. et al. (2007), “Inventors and invention processes in Europe: Results from the PatVal-EU
survey”, Research Policy, Vol. 36/8, pp. 1107-1127.
Griliches, Z. (1986), “Productivity, R&D, and basic research at the firm level in the 1970s”, American
Economic Review, Vol. 76/1, pp. 141-154.
ISO (2017), Quality Management: Guidelines for Quality Management in Projects, ISO 10006:2017,
ISO/TC 176/SC 2, International Organization for Standardization (ISO), Geneva,
https://www.iso.org/standard/70376.html.
Kemp, R., J. Schot and R. Hoogma (1998), “Regime shifts to sustainability through processes of niche
formation: The approach of strategic niche management”, Technology Analysis & Strategic
Management, Vol. 10/2, pp. 175-198.
Kline, S. and N. Rosenberg (1986), “An overview of innovation”, in The Positive Sum Strategy:
Harnessing Technology for Economic Growth, National Academies Press, Washington, DC.
Lægreid, P., P. Roness and K. Verhoest (2011), “Explaining the innovative culture and activities of state
agencies”, Organization Studies, Vol. 32/10, pp. 1321-1347.
Lundvall, B.-Å. (ed.) (1992), National Innovation Systems: Towards a Theory of Innovation and
Interactive Learning, Pinter, London.
Mulgan, G., K. Joseph and W. Norman (2013), “Indicators for social innovation”, in Handbook of
Innovation Indicators and Measurement, Edward Elgar, Cheltenham.
National Research Council (1986), The Positive Sum Strategy: Harnessing Technology for Economic
Growth, National Academies Press, Washington DC.
Nelson, R. (ed.) (1993), National Innovation Systems. A Comparative Analysis, Oxford University Press,
New York/Oxford.
Nelson, R. and S. Winter (1982), An Evolutionary Theory of Economic Change, Harvard University
Press, Cambridge, MA.
OECD (2016), “System innovation”, in OECD Science, Technology and Innovation Outlook 2016,
OECD Publishing, Paris, https://doi.org/10.1787/sti_in_outlook-2016-9-en.

64 │ CHAPTER 2. CONCEPTS FOR MEASURING INNOVATION
OSLO MANUAL 2018 © OECD/EUROPEAN UNION 2018
OECD (2015a), Frascati Manual 2015: Guidelines for Collecting and Reporting Data on Research and
Experimental Development, OECD Publishing, Paris, http://oe.cd/frascati.
OECD (2015b), The Innovation Imperative: Contributing to Productivity, Growth and Well-Being,
OECD Publishing, Paris, https://doi.org/10.1787/9789264239814-en.
OECD (2015c), The Innovation Imperative in the Public Sector: Setting an Agenda for Action, OECD
Publishing, Paris, https://doi.org/10.1787/9789264236561-en.
OECD (2014), Measuring Innovation in Education. A New Perspective, OECD Publishing, Paris,
https://doi.org/10.1787/9789264215696-en.
OECD (2013), “Knowledge networks and markets”, OECD Science, Technology and Industry Policy
Papers, No. 7, OECD Publishing, Paris, https://doi.org/10.1787/5k44wzw9q5zv-en.
OECD (2010a), The OECD Innovation Strategy: Getting a Head Start on Tomorrow, OECD Publishing,
Paris, https://doi.org/10.1787/9789264083479-en.
OECD (2010b), Innovative Workplaces: Making Better Use of Skills within Organisations, OECD
Publishing, Paris, https://doi.org/10.1787/9789264095687-en.
OECD (1997), National Innovation Systems, OECD, Paris, https://www.oecd.org/science/inno/2101733.pdf.
Osborne, S. and L. Brown (eds.) (2013), Handbook of Innovation in Public Services, Edward Elgar, Cheltenham.
Rogers, E. (1962), Diffusion of Innovations, Free Press, New York.
Romer, P.M. (1990), “Endogenous technological change,” Journal of Political Economy, Vol. 98/5,
Part2, pp. S71-S102.
Schumpeter, J. (1934), The Theory of Economic Development: An Inquiry into Profits, Capital, Credit,
Interest and the Business Cycle, Harvard University Press, Cambridge, MA.
Simon, H. (1982), Models of Bounded Rationality: Behavioral Economics and Business Organization,
Vol. 2, MIT Press, Cambridge, MA.
Simon, H. (1969), The Sciences of the Artificial, MIT Press, Cambridge, MA.
Smith, K. (2006), “Measuring innovation”, in The Oxford Handbook of Innovation, Oxford University
Press, Oxford.
UN (2008), International Standard Industrial Classification of All Economic Activities (ISIC),
Revision 4, United Nations, New York,
https://unstats.un.org/unsd/publications/catalogue?selectID=396.
Verganti, R. (2009), Design-Driven Innovation: Changing the Rules of Competition by Radically
Innovating What Things Mean, Harvard Business Press, Boston, MA.
von Hippel, E. (2017), Free Innovation, MIT Press, Cambridge, MA.
von Hippel, E. (2005), Democratizing Innovation, MIT Press, Cambridge, MA.
von Hippel, E., S. Ogawa and J.P.J. de Jong (2011), “The age of the consumer-innovator”, MIT Sloan
Management Review, Sloan School of Management, Vol. 53/1, pp. 27-35.
Windrum, P. and P. Koch (eds.) (2008), Innovation in Public Sector Services: Entrepreneurship,
Creativity and Management, Edward Elgar, Cheltenham.
Young Foundation (2012), “Social innovation overview: Part I – Defining social innovation”, a
deliverable of the project “The theoretical, empirical and policy foundations for building social
innovation in Europe” (TEPSIE), European Commission, Brussels, http://youngfoundation.org/wp-
content/uploads/2012/12/TEPSIE.D1.1.Report.DefiningSocialInnovation.Part-1-defining-social-
innovation.pdf.

PART II. FRAMEWORK AND GUIDELINES FOR MEASURING BUSINESS INNOVATION │ 65
OSLO MANUAL 2018 © OECD/EUROPEAN UNION 2018
Part II. Framework and guidelines for measuring business innovation

CHAPTER 3. CONCEPTS AND DEFINITIONS FOR MEASURING BUSINESS INNOVATION │ 67
OSLO MANUAL 2018 © OECD/EUROPEAN UNION 2018
Chapter 3. Concepts and definitions for measuring business innovation
This chapter provides a set of definitions to guide statistical surveys of innovation within
the Business sector, including a taxonomy for different types of innovation. The definitions
within this chapter also help characterise business enterprises in relation to their innovations
and their activities in pursuit of innovation. The aim of this chapter’s definitions and
complementary guidance is to facilitate the collection and reporting of comparable data
on innovation and related activities for firms in different countries and industries and for
firms of different sizes and structures, ranging from small single-product firms to large
multinational firms responsible for a wide range of products (goods or services). The
chapter concludes with recommendations on the use of definitions in surveys.
68 │ CHAPTER 3. CONCEPTS AND DEFINITIONS FOR MEASURING BUSINESS INNOVATION
OSLO MANUAL 2018 © OECD/EUROPEAN UNION 2018
3.1. Introduction
3.1. Based on the concepts presented in Chapter 2, this chapter provides a set of
definitions to guide statistical surveys of innovation within the Business sector. As innovation
is a pervasive, heterogeneous and multi-faceted phenomenon, clear and concise definitions
for innovation and related concepts are required for accurate measurement and interpretation
of business innovation activities and to establish a common standard that serves the needs
of the producers and users of innovation statistics.
3.2. The definitions given in this chapter facilitate the collection and reporting of comparable
data on innovation and related activities for firms in different countries and industries and
for firms of different sizes and structures, ranging from small single-product firms to large
multinational firms that produce a wide range of products, including services.
3.3. Section 3.2 contains the main definitions for measuring innovation in the Business
enterprise sector. Section 3.3 develops various taxonomies of business innovation including
by type, and by novelty and impacts. Changes that are not innovations are described in
section 3.4. Section 3.5 categorises firms according to their innovation status. Section 3.6
concludes with recommendations on the use of definitions in surveys.
3.2. Innovation in the Business enterprise sector
3.2.1. Definition of innovation activities and innovation
3.4. As discussed in Chapter 2, the term “innovation” can be used in different contexts
to refer to either a process or an outcome. To avoid confusion, this manual uses the term
“innovation activities” to refer to the process while the term “innovation” is limited to outcomes.
3.5. The basic definition of (business) innovation activities is as follows:
Innovation activities include all developmental, financial and commercial activities
undertaken by a firm that are intended to result in an innovation for the firm.
3.6. Innovation activities can result in an innovation (defined below), be ongoing,
postponed or abandoned. Follow-on activities as defined in subsection 4.5.3 are generally
outside the scope of innovation activity.
3.7. The organisation of innovation activities varies greatly between firms. Some firms
manage their innovation activities through well-defined innovation projects or programmes
with dedicated budgets, for which an innovation represents an intermediate or final milestone.
Other firms primarily integrate their innovation activities into regular business operations
and work to make continuous improvements to their products and business processes, while
other firms primarily engage in innovation activities on an ad hoc basis. All methods of
organising innovation activities are within the scope of the definitions and recommendations
in this chapter. Additional details on the definition, categorisation and measurement of
innovation activities are provided in Chapter 4.
3.8. This chapter focuses on the concept of innovation and provides summary
definitions for innovation and for different types of innovation. Each definition is followed
by additional details on the interpretation of the definition.
3.9. The basic definition of a business innovation is as follows:
A business innovation is a new or improved product or business process (or combination
thereof) that differs significantly from the firm's previous products or business processes
and that has been introduced on the market or brought into use by the firm.
CHAPTER 3. CONCEPTS AND DEFINITIONS FOR MEASURING BUSINESS INNOVATION │ 69
OSLO MANUAL 2018 © OECD/EUROPEAN UNION 2018
3.10. As introduced in Chapter 2, a product is a good or service (or combination thereof).
Business processes include all core activities by the firm to produce products and all
ancillary or supporting activities.
3.11. A product is introduced when it is made available for use by its intended users. A
business process is introduced when it is brought into actual use in the firm’s operations.
The act of introduction is defined as implementation and is the point in time when a
significantly different product or business process is first made available for use. Firms will
often make further adjustments to an innovation after its implementation (see Chapter 4),
for instance to the characteristics of a new service. Some of these can be sufficiently
different to count as an additional innovation.
3.12. The minimum requirement for an innovation is that the product or business process
must have one or more characteristics that are significantly different from those contained
in the products or business processes previously offered by or used by the firm. These
characteristics must be relevant to the firm or to external users. For example, the firm may
expect the new or improved characteristics of a product (or business process) to increase
utility for users or to enhance its own competitive position in the market. Relevant characteristics
are described below for product innovations and business process innovations.
3.13. An innovation can also result from a series of minor improvements made during
the observation period, provided that the sum of these minor improvements results in a
significant difference in the final product or business process.
3.14. The requirement for significantly different characteristics applies to product and
business process innovations that a firm develops itself and innovations first developed by
other firms, organisations or individuals, with little or no additional modification. Therefore,
the definition of innovation also includes diffusion.
3.15. The adoption of a new or improved product or business process by a firm that is
part of an enterprise group is an innovation, even if the new or improved product or business
process has previously been introduced on the market or brought into use by other firms within
the same enterprise group. For instance, the adoption, by a subsidiary firm, of a new business
process that was developed and brought into use by the parent firm is an innovation for the
subsidiary firm. However, the adoption of a new or improved product or business process that
was already in use in a different section or division of the same firm is not an innovation.
3.16. The concept of a “significant” difference excludes minor changes or enhancements.
However, the boundary between a change that is an innovation and one that is not an
innovation is unavoidably subjective because it is relative to each firm’s context, capabilities
and requirements. For example, an improvement to an online service could represent a
minor change for a large firm in a research and experimental development (R&D)-intensive
industry but be a significant difference for a small firm in a less R&D-intensive industry.
3.17. The definition does not require an innovation to be a commercial, financial or
strategic success at the time of measurement. A product innovation can fail commercially
or a business process innovation may require more time to meet its objectives.
3.18. The definition of an innovation does not require it to have a positive value for
society, or a positive benefit for the firm. In the former case, an innovation can lead to a
significant boost in the financial performance of the firm while providing fewer benefits to
consumers than other offerings from the same firm or its competitors. An innovation can
also result in safety, health or environmental problems. Conversely, an innovation does not
necessarily improve the market position or financial performance of the firm when their
users benefit from it. For example, an innovation can improve the utility for users without
increasing a firm's sales, market share or net earnings.
70 │ CHAPTER 3. CONCEPTS AND DEFINITIONS FOR MEASURING BUSINESS INNOVATION
OSLO MANUAL 2018 © OECD/EUROPEAN UNION 2018
3.2.2. Division of innovation effort and responsibilities
3.19. The division of labour that underpins economic specialisation also applies to
innovation activities, as a majority of firms are unlikely to possess all of the necessary
capabilities and property rights to develop an innovation. Many innovations are based on
purchasing, imitating or modifying products, business process equipment, or business
methods that are already in use by other firms or organisations. Consequently many firms
do not develop all of the concepts, prototypes or designs that underpin their innovations
and multiple firms can derive similar innovations from a single concept or technology. Nor
do firms implement all of the concepts or prototypes they develop, for example when a firm
only licenses an invention to other firms. These relationships and how they result in
different types of innovations are discussed in detail in Chapter 6.
3.20. Innovations that have been developed in full or in part elsewhere, or in partnership
with third parties are not necessarily less valuable; they may only signal a higher degree of
specialisation. Data collection should encourage respondents to report all innovations,
including those that were not primarily developed by their own firm.
3.3. Taxonomies of innovation
3.21. Innovation changes the characteristics of one or more products or business processes
and consequently common usage describes innovation in terms of its purpose or object. For
example, managers may refer to their firm’s service innovations or to a delivery system
innovation. Information on the object of an innovation is useful for assessing the purpose
of the innovation, its general characteristics, its potential impacts on the firm, and the types
of innovation activities that are relevant to its development and implementation.
3.3.1. Innovation types by object: Product and business process innovations
3.22. There are two major types of innovation by object: innovations that change the
firm’s products (product innovations), and innovations that change the firm’s business
processes (business process innovations).
3.23. Product innovations are divided into two main types, while business process
innovations are divided into six broad types (see below). A single innovation can involve
combinations of different types of product and business process innovations. Consequently,
the typology of innovation types by object is not a classification of mutually exclusive
categories. Furthermore, a firm can introduce more than one type of innovation over the
observation period for data collection. It is therefore recommended to collect information
on multiple types of innovations on the assumption that the responses can refer either to
different innovations or to innovations that combine two or more innovation types.
Product innovation
3.24. The term “product” is defined in the System of National Accounts and encompasses
both goods and services. Products are the economic output of production activities. They
can be exchanged and used as inputs in the production of other goods and services, as final
consumption by households or governments, or for investment, as in the case of financial
products (EC et al., 2009).
A product innovation is a new or improved good or service that differs significantly
from the firm’s previous goods or services and that has been introduced on the market.
CHAPTER 3. CONCEPTS AND DEFINITIONS FOR MEASURING BUSINESS INNOVATION │ 71
OSLO MANUAL 2018 © OECD/EUROPEAN UNION 2018
3.25. Product innovations must provide significant improvements to one or more
characteristics or performance specifications. This includes the addition of new functions,
or improvements to existing functions or user utility. Relevant functional characteristics
include quality, technical specifications, reliability, durability, economic efficiency during
use, affordability, convenience, usability, and user friendliness. Product innovations do not
need to improve all functions or performance specifications. An improvement to or addition
of a new function can also be combined with a loss of other functions or a decline in some
performance specifications.
3.26. Relevant characteristics can include financial attributes such as affordability and
financial convenience. Examples of innovations with financial characteristics that provide
benefits to users include dynamic toll pricing to ease traffic congestion, the introduction of
a new product line that uses less expensive materials and is consequently offered at lower
cost, and a service for automatic payment of a taxi ride after the ride has taken place.
3.27. An additional characteristic of both goods and services that can influence usability
or utility is product design. New designs or improved design features can influence the
appearance or “look” of a product and consequently enhance the user’s utility, for instance
through a substantial design change that creates a positive emotional response. However,
minor design changes are unlikely to lead to goods or services that differ significantly from
previous ones (see below).
3.28. A product innovation must be made available to potential users, but this does not
require the innovation to generate sales. Limiting product innovations to those with sales
would exclude product innovations that fail to meet established or expected demand or
where sales require a longer observation period to materialise. In addition, this would
exclude digital products that are offered at no cost to users, with revenue obtained from
advertising, monetising user information, or through other methods.
3.29. Product innovations can use new knowledge or technologies, or be based on new
uses or combinations of existing knowledge or technologies.
Types of products
3.30. Product innovations can involve two generic types of products: goods and services.
These product types have been introduced in Chapter 2 and are defined below drawing on
the System of National Accounts (SNA) (EC et al., 2009).
Goods include tangible objects and some knowledge-capturing products (see
below) over which ownership rights can be established and whose ownership can
be transferred through market transactions.
Services are intangible activities that are produced and consumed simultaneously
and that change the conditions (e.g. physical, psychological, etc.) of users. The
engagement of users through their time, availability, attention, transmission of
information, or effort is often a necessary condition that leads to the co-production
of services by users and the firm. The attributes or experience of a service can
therefore depend on the input of users. Services can also include some knowledge-
capturing products (see below).
3.31. As noted in Chapter 2, the dividing line between goods and services can sometimes
be difficult to establish and some products can have characteristics of both. A company can
sell goods to its customers or rent their use as a service, as is often the case for durable
consumer goods and for assets for business production. Firms can also bundle ancillary
services such as service contracts or insurance with their goods.
72 │ CHAPTER 3. CONCEPTS AND DEFINITIONS FOR MEASURING BUSINESS INNOVATION
OSLO MANUAL 2018 © OECD/EUROPEAN UNION 2018
3.32. Knowledge-capturing products (as identified in the SNA) can have the characteristics
of either a good or service and concern the provision, storage, safekeeping, communication
and dissemination of digital information that users can access repeatedly. These products
can be stored on physical objects and infrastructure, such as electronic media or the Cloud.
An example is when access to digital products such as music, films and books is provided
on demand to consumers for a fee. Knowledge-capturing products are similar to a good if
consumers can share or sell them to others after purchase, but they are similar to a service
if the consumer’s rights are limited by a license that restricts sharing or selling. Digital
technologies, through reducing the cost of copying and exchanging information to a
negligible amount, have contributed to the proliferation of knowledge-capturing products.
3.33. At a minimum, it is recommended to collect data on both goods and services.
Surveys should specifically refer to services to ensure that the questions are relevant to
respondents from service sector firms. Where possible, data should be collected on
knowledge-capturing products, especially those of a digital nature, to support research on
the prevalence of these products and the factors that influence their development.
Business process innovation
3.34. All business functions can be the object of innovation activity. The term business
process includes the core business function of producing goods and services and supporting
functions such as distribution and logistics, marketing, sales and after-sales services;
information and communication technology (ICT) services to the firm, administrative and
management functions, engineering and related technical services to the firm, and product
and business process development. Business processes can be considered as services for
which the firm itself is the customer. Business processes can be delivered in-house or
procured from external sources.
A business process innovation is a new or improved business process for one or
more business functions that differs significantly from the firm’s previous business
processes and that has been brought into use in the firm.
3.35. The relevant characteristics of an improved business function are related to those
for an improved product, in particular services that can be delivered to business customers.
Examples include greater efficacy, resource efficiency, reliability and resilience, affordability,
convenience and usability for those involved in the business process, either external or
internal to the firm.
3.36. Both new and improved business processes can be motivated by goals to implement
business strategies, reduce costs, improve product quality or working conditions, or to meet
regulatory requirements. A business process innovation can involve improvements to one
or more aspects of a single business function or to combinations of different business
functions. They can involve the adoption by the firm of new or improved business services that
are delivered by external contractors, for instance accounting or human resources systems.
3.37. Business process innovations are implemented when they are brought into use by
the firm in its internal or outward-facing operations. The implementation of a business
process innovation can require several steps, from initial development, pilot testing in
a single business function, to implementation across all relevant business functions.
Implementation occurs when the business process is used on an ongoing basis in the firm’s
operations. This can occur shortly after pilot testing.
3.38. Digital technologies and practices are pervasive across business processes. They
are used to codify processes and procedures, add functions to existing processes and enable
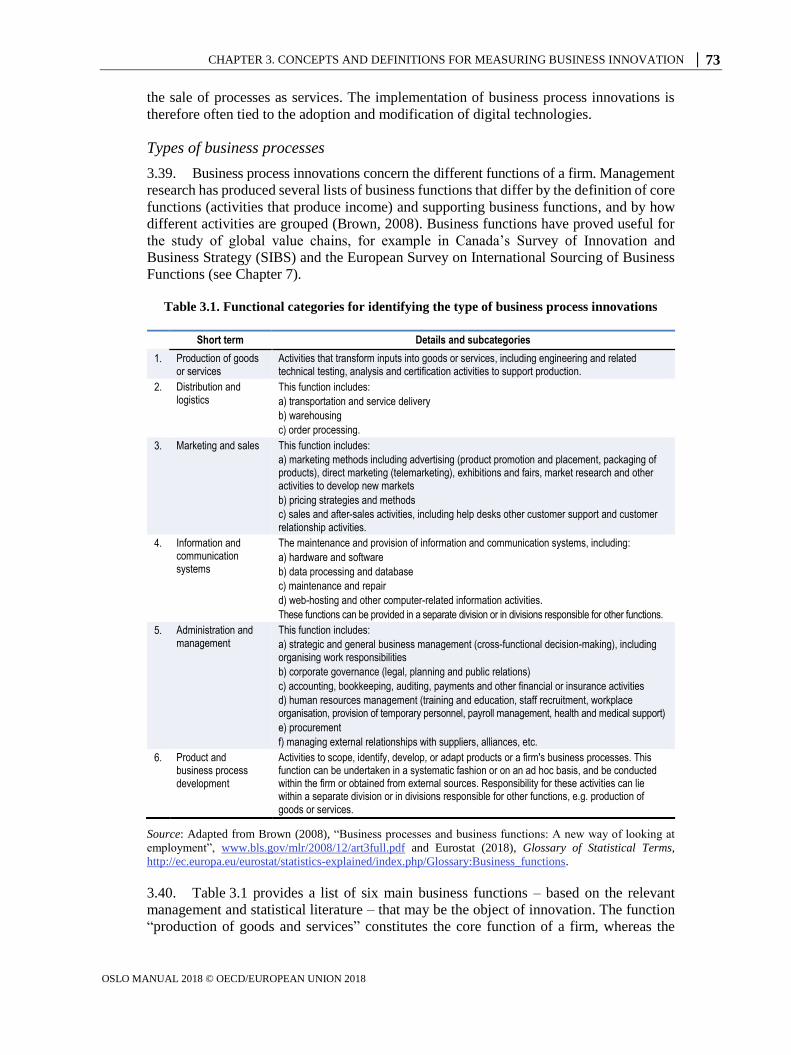
CHAPTER 3. CONCEPTS AND DEFINITIONS FOR MEASURING BUSINESS INNOVATION │ 73
OSLO MANUAL 2018 © OECD/EUROPEAN UNION 2018
the sale of processes as services. The implementation of business process innovations is
therefore often tied to the adoption and modification of digital technologies.
Types of business processes
3.39. Business process innovations concern the different functions of a firm. Management
research has produced several lists of business functions that differ by the definition of core
functions (activities that produce income) and supporting business functions, and by how
different activities are grouped (Brown, 2008). Business functions have proved useful for
the study of global value chains, for example in Canada’s Survey of Innovation and
Business Strategy (SIBS) and the European Survey on International Sourcing of Business
Functions (see Chapter 7).
Table 3.1. Functional categories for identifying the type of business process innovations
Short term Details and subcategories
1. Production of goods or services
Activities that transform inputs into goods or services, including engineering and related technical testing, analysis and certification activities to support production.
2. Distribution and logistics
This function includes:
a) transportation and service delivery
b) warehousing
c) order processing.
3. Marketing and sales This function includes:
a) marketing methods including advertising (product promotion and placement, packaging of products), direct marketing (telemarketing), exhibitions and fairs, market research and other activities to develop new markets
b) pricing strategies and methods
c) sales and after-sales activities, including help desks other customer support and customer relationship activities.
4. Information and communication systems
The maintenance and provision of information and communication systems, including:
a) hardware and software
b) data processing and database
c) maintenance and repair
d) web-hosting and other computer-related information activities.
These functions can be provided in a separate division or in divisions responsible for other functions.
5. Administration and management
This function includes:
a) strategic and general business management (cross-functional decision-making), including organising work responsibilities
b) corporate governance (legal, planning and public relations)
c) accounting, bookkeeping, auditing, payments and other financial or insurance activities
d) human resources management (training and education, staff recruitment, workplace organisation, provision of temporary personnel, payroll management, health and medical support)
e) procurement
f) managing external relationships with suppliers, alliances, etc.
6. Product and business process development
Activities to scope, identify, develop, or adapt products or a firm's business processes. This function can be undertaken in a systematic fashion or on an ad hoc basis, and be conducted within the firm or obtained from external sources. Responsibility for these activities can lie within a separate division or in divisions responsible for other functions, e.g. production of goods or services.
Source: Adapted from Brown (2008), “Business processes and business functions: A new way of looking at
employment”, www.bls.gov/mlr/2008/12/art3full.pdf and Eurostat (2018), Glossary of Statistical Terms,
http://ec.europa.eu/eurostat/statistics-explained/index.php/Glossary:Business_functions.
3.40. Table 3.1 provides a list of six main business functions – based on the relevant
management and statistical literature – that may be the object of innovation. The function
“production of goods and services” constitutes the core function of a firm, whereas the
74 │ CHAPTER 3. CONCEPTS AND DEFINITIONS FOR MEASURING BUSINESS INNOVATION
OSLO MANUAL 2018 © OECD/EUROPEAN UNION 2018
other five functions comprise ancillary activities to support production and bring products
to the market. Firms can develop business process innovations that target one or more
functions. For example, the implementation of an online ordering system could represent
an innovation in to the distribution and logistics business functions. The short descriptions
of each business function, followed by the detailed description, are recommended for use
in data collection. The list is sufficiently brief for use in surveys and provides moderate
comparability with the definitions of process, organisational, and marketing innovations in
the third edition of the Oslo Manual. More detailed applications of this taxonomy can
improve comparability with the results of innovation surveys that followed the third edition
of this manual. The new categories also cover areas that were not identified in the third
edition, such as changes in financing (item 5c) and changes in functions dedicated to
product or process development (item 6).
3.41. The latter captures business process innovations in the business function dedicated
to the development of products and other business processes of the firm. There was no
equivalent type of business process in earlier editions of this manual. Examples of
innovations in this function include the use of new gene editing technologies to develop
either existing or new plant varieties or pharmaceuticals and the application of data mining
analysis to large databases to identify potential market development opportunities. Other
examples for an innovation in this category include the adoption of new methodologies
such as design thinking, co-creation, rapid prototyping or high-throughput screening. An
innovation of this type may just seek to introduce incremental modifications that do not
qualify as innovations – e.g. to be able to cater to different customers’ needs – or may seek
to bring about product or business process innovations. However, there is no guarantee that
such innovations will ultimately materialise.
3.42. For data collection, some functions can be combined into a single item or disaggregated.
For example, functions 1 and 6 could be combined into a single function that includes both
production activities and the development of products and business processes. Functions 3
and 5 could be further disaggregated to facilitate comparison with the definitions of
organisational and marketing innovation in the third edition of the manual (see next section
for details).
Comparison of innovation types with the previous edition of the Oslo Manual
3.43. Table 3.2 compares the types of product and business process innovations used in
this manual with the definitions used in the third edition of the Oslo Manual.
3.44. Two types of marketing innovation that are included in the third edition of the Oslo
Manual (adoption of methods for product placement and product promotion or pricing) are
not listed in the short description of the six business functions in Table 3.1, but these are
included in the detailed descriptions. In addition, this manual assigns innovations involving
the design of products under product innovation, whereas the third edition included these
under marketing innovation. The change is due to the close relationship between design
activities and the development of product characteristics for both goods and services.
However, changes in the design of packaging remain under marketing.
3.45. There is a good match between the fourth edition and the third edition’s definitions
for two types of business process innovations, namely the production of goods and services
and for distribution and logistics. The third edition’s subcategory of ancillary services is
divided in this edition between information and communication systems on the one hand
and administration and management on the other, with the latter including activities that
are listed in the third edition under organisational innovation.
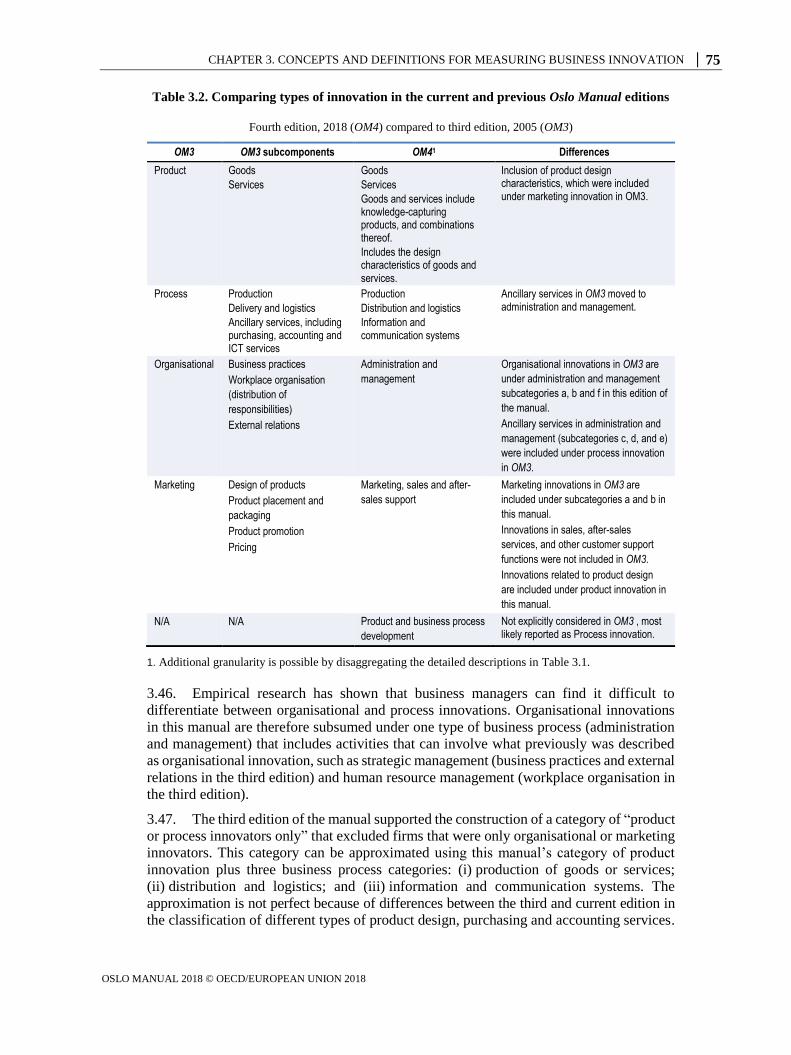
CHAPTER 3. CONCEPTS AND DEFINITIONS FOR MEASURING BUSINESS INNOVATION │ 75
OSLO MANUAL 2018 © OECD/EUROPEAN UNION 2018
Table 3.2. Comparing types of innovation in the current and previous Oslo Manual editions
Fourth edition, 2018 (OM4) compared to third edition, 2005 (OM3)
OM3 OM3 subcomponents OM41 Differences
Product Goods
Services
Goods
Services
Goods and services include knowledge-capturing products, and combinations thereof.
Includes the design characteristics of goods and services.
Inclusion of product design characteristics, which were included under marketing innovation in OM3.
Process Production
Delivery and logistics
Ancillary services, including purchasing, accounting and ICT services
Production
Distribution and logistics
Information and communication systems
Ancillary services in OM3 moved to administration and management.
Organisational Business practices Workplace organisation
(distribution of
responsibilities) External relations
Administration and
management
Organisational innovations in OM3 are
under administration and management
subcategories a, b and f in this edition of
the manual. Ancillary services in administration and
management (subcategories c, d, and e)
were included under process innovation
in OM3. Marketing Design of products
Product placement and
packaging Product promotion Pricing
Marketing, sales and after-
sales support
Marketing innovations in OM3 are
included under subcategories a and b in
this manual. Innovations in sales, after-sales
services, and other customer support
functions were not included in OM3. Innovations related to product design
are included under product innovation in
this manual. N/A N/A Product and business process
development
Not explicitly considered in OM3 , most likely reported as Process innovation.
1. Additional granularity is possible by disaggregating the detailed descriptions in Table 3.1.
3.46. Empirical research has shown that business managers can find it difficult to
differentiate between organisational and process innovations. Organisational innovations
in this manual are therefore subsumed under one type of business process (administration
and management) that includes activities that can involve what previously was described
as organisational innovation, such as strategic management (business practices and external
relations in the third edition) and human resource management (workplace organisation in
the third edition).
3.47. The third edition of the manual supported the construction of a category of “product
or process innovators only” that excluded firms that were only organisational or marketing
innovators. This category can be approximated using this manual’s category of product
innovation plus three business process categories: (i) production of goods or services;
(ii) distribution and logistics; and (iii) information and communication systems. The
approximation is not perfect because of differences between the third and current edition in
the classification of different types of product design, purchasing and accounting services.
76 │ CHAPTER 3. CONCEPTS AND DEFINITIONS FOR MEASURING BUSINESS INNOVATION
OSLO MANUAL 2018 © OECD/EUROPEAN UNION 2018
3.48. Previous innovation surveys that followed the third edition of this manual collected
data on multiple types of innovation. For example, the European Community Innovation
Survey (CIS) collected data on two types of product innovations, three types of process
innovations, four types of organisational innovations and four types of marketing
innovations. This data can be reanalysed to approximate the innovation categories in
Table 3.1, thus minimising the impact of a break in series. However, there are several
exceptions where surveys based on the third edition cannot replicate the categories of this
manual, due to a lack of coverage of several administrative and management functions
(e.g. corporate governance), financing, after-sales services, and the business function of
product and business process development.
Combinations of several innovation types by object
3.49. Many innovations are bundled, presenting characteristics that span more than one
type (O’Brien et al., 2015; Frenz and Lambert, 2012; OECD, 2013). This is due to the
complementarity between different types of innovations. Some possible combinations of
innovation types are as follows:
A business process innovation can significantly improve the quality of a product,
resulting in a joint business process and product innovation.
A product innovation can require a supporting business process innovation. This is
particularly common for service innovations. For example, a new online function
for selling information products is both a business process innovation (requiring
ICT and web development) and a service innovation for potential users. If it creates
a new sales channel for the first time, it can also be a marketing innovation.
Product and business process innovation can be closely intertwined, especially
when the process is not distinguishable from the product. This applies particularly
to services for which production, delivery and consumption occur simultaneously.
Changes by the firm to non-economic outputs of production processes, such as
carbon or NOx emissions from energy generation, are due to innovations in business
processes, but firms can choose to include emission changes in the product
description if there is market demand. In this example, low emission energy can be
a business process innovation and a product innovation.
3.50. The object approach discussed in Chapter 10 can help obtain information on the
incidence of different types of bundled innovations.
Business model innovations
3.51. A business model includes all core business processes such as the production,
logistical, marketing and co-operative arrangements in use as well as the main products
that a firm sells, currently or in the future, to achieve its strategic goals and objectives. A
firm can use a single business model or several business models at the same time, for
instance for different product lines or markets. The innovation management literature notes
that successful business models combine a method for better meeting the needs of users
relative to what competitors can deliver and a profit formula for earning income from
delivering utility to customers (Johnson, Christensen and Kagermann, 2008).
3.52. There is no single, recognised definition of a business model innovation, which can
vary from partial business model innovations that only affect either a firm’s products or
business functions, to comprehensive business model innovations that involve both products
CHAPTER 3. CONCEPTS AND DEFINITIONS FOR MEASURING BUSINESS INNOVATION │ 77
OSLO MANUAL 2018 © OECD/EUROPEAN UNION 2018
and business functions. In many cases it is difficult to distinguish partial business model
innovations from product and business process innovations.
3.53. Comprehensive business model innovations are of greater interest because they can
have substantial effects on supply chains and economic production, transforming markets
and potentially creating new ones. They can influence how a firm creates utility for users
(product innovation) and how products are produced, brought to market, or priced (business
process innovations).
3.54. There are three types of comprehensive business model innovations in existing
firms: (i) a firm extends its business to include completely new types of products and
markets that require new business processes to deliver; (ii) a firm ceases its previous
activities and enters into new types of products and markets that require new business
processes; and (iii) a firm changes the business model for its existing products, for example
it switches to a digital model with new business processes for production and delivery and
the product changes from a tangible good to a knowledge-capturing service.
3.55. It is not recommended to directly collect data on business model innovation as a
distinct, stand-alone category through innovation surveys because of the difficulty in
differentiating partial business model innovations from other types. However, the occurrence
of comprehensive business model innovations could be estimated through analysis (see
Chapter 11) that combines information on the types of innovations introduced by a firm with
other questions on innovation objectives, including a question on the objective of establishing
a new business model (see Chapter 8). Identifying the third type of comprehensive business
model innovation could require dedicated questions on changes to existing products.
3.3.2. Types of innovation according to novelty and impacts
3.56. The basic requirement for an innovation is that it must be significantly different
from the firm’s previous products or business processes. As “significantly different” is
subjective and will vary according to the firm’s capabilities and context, the interpretation
and comparability of innovation statistics can benefit from additional data on the significance
of innovations in terms of their novelty or economic impacts. Some forms of novelty, such
as disruptive or radical innovations, and some types of economic impacts are difficult to
identify within the limited observation period recommended for innovation surveys.
Alternative measures of novelty, “innovativeness” and economic impacts that are suitable
for survey observation periods include:
whether an innovation is new to the firm only, new to the firm’s market, or new to
the world
the firm’s expectation of the potential to transform the market in which it operates
the firm’s expectation of the potential to improve its competitiveness.
3.57. The first and most widely used approach is to determine the novelty of a firm’s
innovations (or at least one of its innovations) in comparison with the state of the art in the
market or industry in which the firm operates. A firm can serve a single market (if it only
offers one type of product) or several markets (if it offers different types of products). A
market can be geographically restricted (if a firm only serves customers in specific regions)
or it can be global. A firm can sell its products directly on local, regional, national or
international markets or through the use of intermediaries. Innovation can also create new
markets, which could allow the innovative firm to benefit from monopoly prices for a
certain period of time.
78 │ CHAPTER 3. CONCEPTS AND DEFINITIONS FOR MEASURING BUSINESS INNOVATION
OSLO MANUAL 2018 © OECD/EUROPEAN UNION 2018
3.58. It is recommended to ask respondents if their firm has one or more product
innovations or business process innovations that are a market novelty (i.e. a first to their
market innovation). The interpretation of market novelty must be combined with information
on the geographical area served by the firm. A local or regional market novelty could be
based on imitating what is already available in other geographical markets, whereas a
world-first innovation will be a market leader.
3.59. Respondents can find it difficult to estimate if they have a world-first product
innovation, unless the innovation is based on one or more patented inventions that
underwent rigorous screening to establish global novelty. A world-first product innovation
implies a qualitatively greater degree of novelty than a new-to-market innovation.
3.60. Firms that first develop innovations are often drivers of follow-on innovation
within an industry. New ideas and knowledge often originate from these firms, but the
economic impact of their innovations will usually depend on the adoption (or imitation) of
their innovations by other firms. Information on the degree of novelty can be used to
identify the developers, adopters and imitators of innovations, to examine patterns of
diffusion, and to identify market leaders and followers.
3.61. The novelty of business process innovations in comparison to what is already in
use by other firms can be difficult for respondents to determine due to the importance of
secrecy and confidentiality for protecting business processes. However, evidence from
cognitive testing suggests that many managers are able to assess the novelty of process
innovations in their market, particularly for their most important business process innovations.
Furthermore, a “don’t know” response can provide valuable information on the extent to
which secrecy is used in specific industries or types of firms.
3.62. The second option on the potential for an innovation to transform (or create) a
market can provide a possible indicator for the incidence of a radical or a disruptive
innovation. Radical innovations are considered to transform the status quo, while a disruptive
innovation takes root in simple applications in a niche market and then diffuses throughout
the market, eventually displacing established competitors (Christensen, 1997). Although
managers may be able to estimate the potential of an innovation to transform a market,
radical and disruptive innovations are likely to be very rare and therefore innovation
surveys may be a poor instrument for their detection. Relevant questions should be limited
to a single, most important innovation (see Chapter 10).
3.63. The third option on the effect of innovations on the firm’s competitiveness can be
assessed for product innovations through the observed change in sales over the observation
period (see Chapter 4) or by asking directly about future expectations of the effect of
innovations on competitiveness (see Chapter 7).
3.4. Changes that are not innovations
3.64. This section discusses changes that are either not an innovation or which can only
be considered an innovation if specific conditions are met. The basic principles are those
introduced earlier in section 3.2, namely that an innovation must have been implemented
and must be significantly different from the firm’s previous products or business processes.
3.65. Routine changes or updates do not by themselves represent product innovations.
This includes software updates that only identify and remove coding errors and seasonal
changes in clothing fashions.
CHAPTER 3. CONCEPTS AND DEFINITIONS FOR MEASURING BUSINESS INNOVATION │ 79
OSLO MANUAL 2018 © OECD/EUROPEAN UNION 2018
3.66. Simple capital replacement or extension is not an innovation. This includes the
purchase of identical models of installed equipment or minor extensions and updates to
existing equipment or software. New equipment or extensions must be new to the firm and
involve a significant improvement in specifications.
3.67. Product introductions that only involve minor aesthetic changes, such as a change
in colour or a minor change in shape, do not meet the requirement for a “significant
difference” and are therefore not product innovations.
3.68. Firms engaged in custom production make single and often complex goods or
services for sale on the market (e.g. computer games, films) or according to customer
orders (e.g. buildings, production plants, logistic systems, machinery, consulting reports).
Unless the one-off item displays significantly different attributes from products that the
firm has previously made, it is not a product innovation. It is not a business process
innovation unless developing the one-off item required the firm to develop and use
significantly different or enhanced capabilities. However, the first use of customised
production can be a business process innovation.
3.69. An advertised concept, prototype or model of a product that does not yet exist
is in general not a product innovation because it does not meet the implementation
requirement, even if customers can pre-order or make advance payments for the concept,
such as a product concept funded by crowdsourcing. The concept can fail or take
considerably longer than expected before it is available for use.
3.70. It may be more difficult to decide whether implementation has taken place in the
case of new knowledge products that have been sold to other parties. While the seller has
brought a new product to the market, the buyer may hold on from using it in their business
processes or taking it to their own markets. Such information may not be known to the
knowledge provider that is the subject of measurement and has to decide on whether to
report an innovation. If the knowledge product meets the novelty and significance requirements
to be considered a product innovation, a knowledge product can be considered to pass the
implementation test if it has been sold in the market by a firm to another party or parties.
3.71. The outputs of creative and professional service firms, such as reports for clients,
books, or films are not by default an innovation for the firms that develop them. For
example, a report by a consulting firm that summarises the results of a design project
without major novelty elements conducted under contract for a client is not a product
innovation for the consulting firm. The report’s role in innovation for the buying firm
depends on whether or not its results are used in the client firm’s innovation activities.
However, the consulting firm could be credited with an innovation if it implemented new
business processes as part of conducting the project for its client, or if the blueprints or
designs that are sold on the market meet the innovation requirements of novelty and
significance. These phenomena are considered in more detail in Chapters 4 and 6.
3.72. Actions by retail, wholesale, transport and storage, and personal service firms to
extend the range of products handled or offered to customers are only an innovation if
the extension requires significant changes by the firm to its business processes. A fruit
importer or wholesaler who adds a new variety of fruit for sale to retailers is not engaged
in innovation unless the extension requires a major change to business processes such as
developing a new supply chain or the purchase of novel refrigerating equipment (e.g. to
permit the delivery of fresh produce that was not previously possible).
3.73. The activities of newly created firms (most of which are service firms) present a
potential source of confusion with respect to the basic definition of an innovation because
80 │ CHAPTER 3. CONCEPTS AND DEFINITIONS FOR MEASURING BUSINESS INNOVATION
OSLO MANUAL 2018 © OECD/EUROPEAN UNION 2018
for a period of time a new firm will have no previous products or business processes for
comparison. In this case, the comparison group is what is available in the relevant market.
A product of a new firm is an innovation if it differs significantly from products available
in its markets. Likewise, a business process of a new firm is a process innovation if it differs
significantly from the business processes used by its competitors. However, respondents
from new firms may view all of their products or business processes as innovations.
Consequently it may be necessary to provide separate results for newly created firms such
as start-ups. In addition, it would be worthwhile for specialised surveys of start-up firms to
experiment with measuring product and business process novelty.
3.74. In the absence of further qualification, mergers or the acquisition of other firms
are not business process innovations in their own right. Mergers and acquisitions can drive
business process innovations, however, if the firm develops or adopts a new business
process as a result of the merger or for the purpose of improving the success of the merger
or acquisition.
3.75. Ceasing to use a business process, ceasing to outsource a business process, or
withdrawing a product from the market are not innovations. However, the first
implementation of business processes to determine when an activity should cease could
meet the requirements for an innovation.
3.76. A change due to externally determined factor prices is unlikely to represent an
innovation. For example, an innovation does not occur when the same model of a mobile phone
is constructed and sold at a lower price simply because the price of a video processor chip falls.
3.77. The formulation of a new corporate or managerial strategy is not an innovation
if it is not implemented. Furthermore, a change in a business process is not an innovation
if it is already in use in an identical form in other divisions of the firm.
3.5. Innovation and business profiling
3.5.1. Innovative and innovation-active firms
3.78. The innovation status of a firm is defined on the basis of its engagement in
innovation activities and its introduction of one or more innovations over the observation
period of a data collection exercise. As discussed in Chapter 9, the recommended observation
period can vary between one and three years.
3.79. During the observation period, any given innovation activity of the firm can:
Result in an innovation. The innovation activity can consequently cease during
the observation period after implementation or it could still be ongoing if it is
undertaken for other innovation projects.
Be ongoing without an innovation. Work can still be in progress and proceeding
according to plan, or delayed due to various reasons, such as technical difficulties
or a shortage of expertise or finance.
Be aborted, discontinued, or put on hold, for instance when activities to develop an
innovation are stopped before implementation.
3.80. These three outcomes apply to the wide array of innovation activities and projects
within a firm. The combination of data on the incidence of innovation and innovation
activity (innovation status) produces four possible categories for the innovative status of a
firm, as shown in Table 3.3.
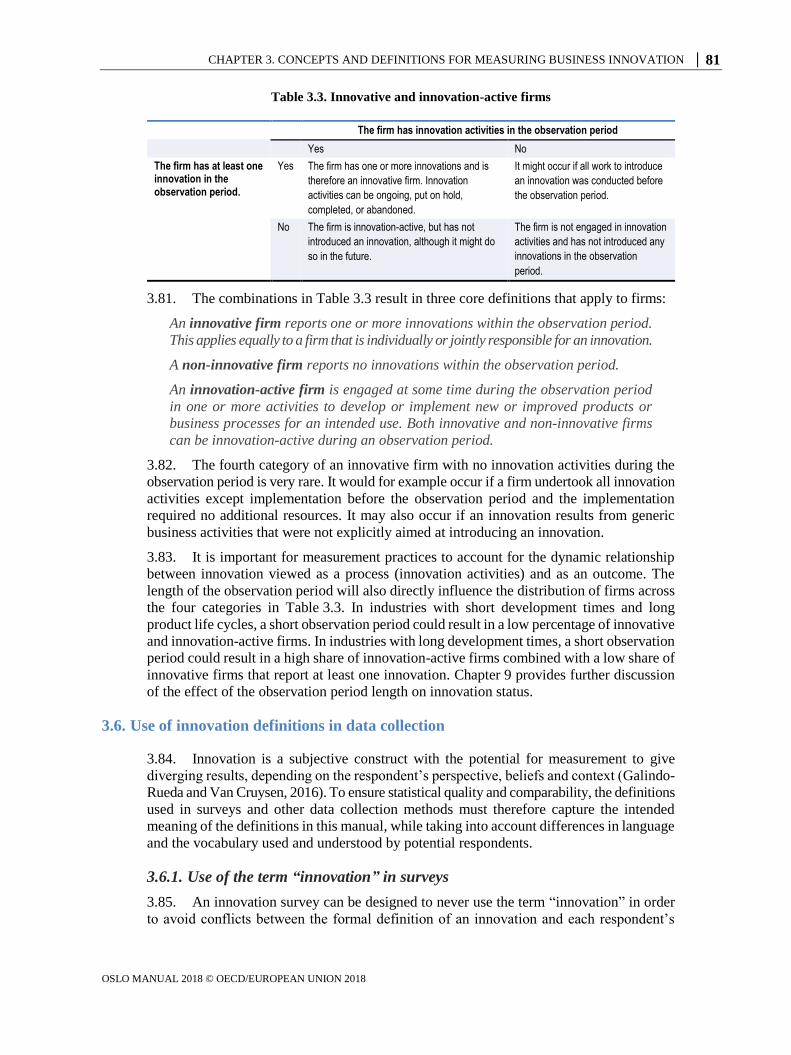
CHAPTER 3. CONCEPTS AND DEFINITIONS FOR MEASURING BUSINESS INNOVATION │ 81
OSLO MANUAL 2018 © OECD/EUROPEAN UNION 2018
Table 3.3. Innovative and innovation-active firms
The firm has innovation activities in the observation period
Yes No The firm has at least one innovation in the observation period.
Yes The firm has one or more innovations and is
therefore an innovative firm. Innovation
activities can be ongoing, put on hold,
completed, or abandoned.
It might occur if all work to introduce
an innovation was conducted before
the observation period.
No The firm is innovation-active, but has not
introduced an innovation, although it might do
so in the future.
The firm is not engaged in innovation
activities and has not introduced any
innovations in the observation
period.
3.81. The combinations in Table 3.3 result in three core definitions that apply to firms:
An innovative firm reports one or more innovations within the observation period.
This applies equally to a firm that is individually or jointly responsible for an innovation.
A non-innovative firm reports no innovations within the observation period.
An innovation-active firm is engaged at some time during the observation period
in one or more activities to develop or implement new or improved products or
business processes for an intended use. Both innovative and non-innovative firms
can be innovation-active during an observation period.
3.82. The fourth category of an innovative firm with no innovation activities during the
observation period is very rare. It would for example occur if a firm undertook all innovation
activities except implementation before the observation period and the implementation
required no additional resources. It may also occur if an innovation results from generic
business activities that were not explicitly aimed at introducing an innovation.
3.83. It is important for measurement practices to account for the dynamic relationship
between innovation viewed as a process (innovation activities) and as an outcome. The
length of the observation period will also directly influence the distribution of firms across
the four categories in Table 3.3. In industries with short development times and long
product life cycles, a short observation period could result in a low percentage of innovative
and innovation-active firms. In industries with long development times, a short observation
period could result in a high share of innovation-active firms combined with a low share of
innovative firms that report at least one innovation. Chapter 9 provides further discussion
of the effect of the observation period length on innovation status.
3.6. Use of innovation definitions in data collection
3.84. Innovation is a subjective construct with the potential for measurement to give
diverging results, depending on the respondent’s perspective, beliefs and context (Galindo-
Rueda and Van Cruysen, 2016). To ensure statistical quality and comparability, the definitions
used in surveys and other data collection methods must therefore capture the intended
meaning of the definitions in this manual, while taking into account differences in language
and the vocabulary used and understood by potential respondents.
3.6.1. Use of the term “innovation” in surveys
3.85. An innovation survey can be designed to never use the term “innovation” in order
to avoid conflicts between the formal definition of an innovation and each respondent’s
82 │ CHAPTER 3. CONCEPTS AND DEFINITIONS FOR MEASURING BUSINESS INNOVATION
OSLO MANUAL 2018 © OECD/EUROPEAN UNION 2018
own understanding. This could result in more objective responses and reduce issues of
comparability across industries or countries. An example is the Australian Business
Characteristics Survey, which replaces the term “innovation” with a description of all types
of innovations. For instance, the 2013 survey (based on the third edition of the Oslo
Manual) asks respondents “where did this business source ideas and information for the
development or introduction of new goods, services, processes or methods?”. This also
illustrates an important disadvantage of avoiding the use of “innovation”: it can require
listing all types of innovations in multiple questions. However, the adoption in this manual
of only two major categories of innovations, products and business processes, will improve
the ability of data collection exercises to avoid the term “innovation” while ensuring some
economy of language.
3.6.2. Innovation profiles
3.86. The minimum definition of an innovative firm is a poor indicator for comparing
innovation across industries, firm size classes or countries because it does not capture
variations in the novelty of innovations or each firm’s capacity to develop innovations.
Information on firms’ innovation status can be combined with other information on
innovation novelty, innovation activities (see Chapter 4), or the division of innovation effort
(see Chapter 5) to produce indicators for the novelty of innovations and the innovation
capability of each firm. These indicators can be aggregated to produce innovation profiles
for firms by industry, firm size category or country. When combined with outcome data
(see Chapter 11), profiles can be used to explore the contribution of innovation to firm
performance and the utility for users of the innovation.
3.6.3. Priorities for data collection about innovations
3.87. It is recommended to collect data on the following topics of relevance to research
on innovation status and innovation profiles (see Chapter 11).
3.88. Data on each main innovation type by object (product and business process) can be
collected through a single question for each type, but it is useful for interpretation to include
additional questions on the two types of product innovations and the six types of business
process innovations. This will result in considerably more detailed information on the
innovations of each firm and permit replication of the generic innovation types (i.e. product
or process innovations) defined in the third edition of this manual.
3.89. The collection of data on innovation characteristics and novelty is recommended in
order to create innovation profiles that classify firms according to the characteristics of their
innovations and innovation efforts. Relevant questions for the construction of profiles include:
The different levels of innovation novelty, as per subsection 3.3.2.
The characteristics of product innovations, including design, as per subsection 3.3.1.
The role of third parties in developing and implementing innovations, as per
subsection 3.2.2 and Chapter 5.
The existence of ongoing or discontinued innovation activities, as per
subsection 3.5.1.
3.90. The concept of novelty is applicable to both product and business process
innovations, but questions on novelty are likely to be easier for managers to answer for
product innovations.
CHAPTER 3. CONCEPTS AND DEFINITIONS FOR MEASURING BUSINESS INNOVATION │ 83
OSLO MANUAL 2018 © OECD/EUROPEAN UNION 2018
References
Brown, S. (2008), “Business processes and business functions: A new way of looking at employment”,
Monthly Labor Review, www.bls.gov/mlr/2008/12/art3full.pdf.
Christensen, C. (1997), The Innovator’s Dilemma: When New Technologies Cause Great Firms to Fail,
Harvard Business School Press, Boston, MA.
EC et al. (2009), System of National Accounts 2008, United Nations, New York,
https://unstats.un.org/unsd/nationalaccount/docs/sna2008.pdf.
Eurostat (2018), Glossary of Statistical Terms, http://ec.europa.eu/eurostat/statistics-
explained/index.php/Glossary:Business_functions (accessed 31 July 2018).
Frenz, M. and R. Lambert (2012), “Mixed modes of innovation: An empiric approach to capturing firms’
innovation behaviour”, OECD Science, Technology and Industry Working Papers, No. 2012/06,
OECD Publishing, Paris, https://doi.org/10.1787/5k8x6l0bp3bp-en.
Galindo-Rueda, F. and A. Van Cruysen (2016), “Testing innovation survey concepts, definitions and
questions: Findings from cognitive interviews with business managers”, OECD, Paris,
http://oe.cd/innocognitive.
Johnson, M., C. Christensen and H. Kagermann (2008), “Reinventing your business model”, Harvard
Business Review, https://hbr.org/product/reinventing-your-business-model/an/R0812C-PDF-ENG.
O’Brien, K. et al. (2015), “New evidence on the frequency, impacts and costs of activities to develop
innovations in Australian businesses: Results from a 2015 pilot study”, report to the Commonwealth,
Department of Industry, Innovation and Science, Australian Innovation Research Centre, Hobart,
www.utas.edu.au/__data/assets/pdf_file/0009/772857/AIRC-Pilot-survey-report-for-
DIS_Dec_2015.pdf.
OECD (2013), “Knowledge networks and markets”, OECD Science, Technology and Industry Policy
Papers, No. 7, OECD Publishing, Paris, https://doi.org/10.1787/5k44wzw9q5zv-en.

CHAPTER 4. MEASURING BUSINESS INNOVATION ACTIVITIES │ 85
OSLO MANUAL 2018 © OECD/EUROPEAN UNION 2018
Chapter 4. Measuring business innovation activities
This chapter deals with the measurement of innovation activities, complementing the
measurement of innovations as outcomes. It identifies eight major types of activities that firms
may undertake in pursuit of innovation, namely research and experimental development;
engineering, design and other creative work; marketing and brand equity activities;
intellectual property; employee training; software development and databases; acquisition
or lease of tangible assets; and innovation management activities. Acknowledging that
these activities may be carried out for purposes other than innovation, this chapter provides
guidelines for identifying the innovation-related content of resources dedicated to these
activities. It also makes proposals for identifying follow-on activities to innovations as well
as planned innovation activities and expenditures shortly after the reference year.
86 │ CHAPTER 4. MEASURING BUSINESS INNOVATION ACTIVITIES
OSLO MANUAL 2018 © OECD/EUROPEAN UNION 2018
4.1. Introduction and main features of innovation activities
4.1. This chapter provides a framework for measuring business innovation activities,
which are defined in Chapter 3 as “all developmental, financial and commercial activities,
undertaken by a firm, that are intended to result in an innovation” carried out during the
observation period for data collection. Therefore, this chapter deals with the measurement
of innovation efforts, complementing the measurement of innovations as outcomes which
were covered in the previous chapter.
4.2. Business innovation activities have the following features:
Firms can perform innovation activities in-house or source goods or services for
innovation activities from external organisations.
Innovation activities may be postponed or abandoned during the observation period
due to multiple reasons.
Innovation activities can create knowledge or information that is not used to
introduce an innovation during the observation period. This includes knowledge
from activities that fail to meet their primary innovation goals.
Firms can use the results of their innovation activities, including innovations, new
knowledge, and new information for their own benefit within the observation period,
they can retain the results for their own use until a later date, or they can transfer,
sell or license the results to other firms or organisations.
4.3. Different innovation activities are typically linked to each other as part of a goal-
oriented process that can require multiple recursive steps before resulting in an innovation.
Innovation activities can be undertaken informally or follow a systematic approach comprising
organised and formal processes to evaluate opportunities for introducing changes, for
example through the use of analysis, creativity and problem-solving methods.
4.4. Many activities of potential relevance to innovation can be conducted for other
purposes that serve to enhance business performance without necessarily being intended
for innovation. Indeed, some firms may not be aware of the innovation potential of their
activities. It is recommended in this chapter to collect data on a range of innovation-relevant
activities, for all types of firms, including non-innovative firms. This recommendation is
in recognition of the value of such data for research into the performance (e.g. productivity)
effects of expenditures that are not directly related to innovation compared to those that are.
In addition, data on expenditures for knowledge-based capital (KBC) (intellectual property
[IP], know-how, skills, etc.) and tangible capital (equipment, buildings, machinery, etc.)
are useful for analysing embodied technological change.
4.5. Qualitative data on business involvement in different activities of potential value to
innovation can provide evidence on the capabilities of all types of firms – whether
innovative or innovation-active (see subsection 3.5.1) –, the specific activities that firms
undertake to develop innovations, and the types of activities that are conducted internally
versus acquired from external sources. This information can be used to create different
profiles of how firms innovate and identify the different types of knowledge and other
assets that are used to develop innovations.
4.6. Innovation activities can be managed as separate “innovation projects” or undertaken
as an ad hoc addition to other business functions. All activities for innovation exhibit some
degree of overlap or close interrelationship and can be conducted sequentially or concurrently
for one or more innovation projects.
CHAPTER 4. MEASURING BUSINESS INNOVATION ACTIVITIES │ 87
OSLO MANUAL 2018 © OECD/EUROPEAN UNION 2018
4.7. This chapter is structured as follows. Section 4.2 of this chapter identifies eight
types of activities that are relevant for innovation. Section 4.3 contains guidance on collecting
qualitative data on the incidence of innovation activities in firms. Two methods for collecting
expenditure data on innovation activities are described in section 4.4. Section 4.5 provides
suggestions for additional data collection on innovation activities. Section 4.6 summarises
the recommendations of this chapter.
4.2. Types of activities of relevance to innovation
4.8. This chapter identifies eight broad types of activities that firms can undertake in
pursuit of innovation:
1. research and experimental development (R&D) activities
2. engineering, design and other creative work activities
3. marketing and brand equity activities
4. IP-related activities
5. employee training activities
6. software development and database activities
7. activities related to the acquisition or lease of tangible assets
8. innovation management activities.
4.9. While these activities may be part of business innovation efforts, they may not be
carried out with that explicit goal. The measurement of these generic activities
complements the characterisation of firms as innovation-active or non-active, as defined
and explained in Chapter 3. This section describes these eight activities and gives guidance
on how to assess whether they constitute innovation activities.
4.2.1. Research and experimental development activities
4.10. Research and experimental development (R&D) comprises creative and systematic
work undertaken in order to increase the stock of knowledge and to devise new applications
of available knowledge. According to the Frascati Manual 2015 definition (OECD, 2015:
§ 2.5 to 2.7), R&D activities must meet five criteria: (i) novel; (ii) creative; (iii) address an
uncertain outcome; (iv) systematic; and (v) transferable and/or reproducible. R&D comprises
basic research, applied research, and experimental development.
4.11. R&D as an innovation activity: by definition, applied research is directed towards
a specific practical aim or objective, while experimental development seeks to produce new
products or processes or to improve existing products or process. Hence, there is an intention
for innovation. Although basic research to enlarge a firm’s knowledge stock may not be
used to pursue specific innovations during the observation period, for practical reasons, all
types of R&D carried out or paid for by business enterprises are considered by definition as
innovation activities of those firms. Sections 4.3 and 4.4 below provide further clarification.
4.2.2. Engineering, design and other creative work activities
4.12. Engineering, design and other creative work cover experimental and creative
activities that may be closely related to R&D, but do not meet all of the five R&D criteria.
These include follow-up or auxiliary activities of R&D, or activities that are performed
independently from R&D.
88 │ CHAPTER 4. MEASURING BUSINESS INNOVATION ACTIVITIES
OSLO MANUAL 2018 © OECD/EUROPEAN UNION 2018
4.13. Engineering involves production and quality control procedures, methods and
standards. Activities include the planning of technical specifications, testing, evaluation,
setup and pre-production for goods, services, processes or systems; installing equipment,
tooling up, testing, trials and user demonstrations; and activities to extract knowledge or
design information from existing products or process equipment (“reverse engineering”).
4.14. For many service firms, design and other creative work constitutes their main
creative activity for innovation. While these activities often result in knowledge, they seldom
meet the functional novelty and uncertainty requirements for R&D, or are conducted on an
ad hoc basis.
4.15. Design includes a wide range of activities to develop a new or modified function,
form or appearance for goods, services or processes, including business processes to be
used by the firm itself. The goal of product design is to improve the attractiveness
(aesthetics) or ease of use (functionality) of goods or services. Process design, which can
be closely linked to engineering, improves the efficiency of processes. Common features
of product design activities include involving potential users in the design process (through
surveys of potential users, ethnographic research, co-creation, or project user groups), pilot
testing on a sample of potential users, and post-implementation studies to identify or solve
problems with a particular design. Product design capabilities and design thinking methods
are discussed in greater detail in Chapter 5.
4.16. Other creative work includes all activities for gaining new knowledge or applying
knowledge in a novel way that do not meet the specific novelty and uncertainty (also
relating to non-obviousness) requirements for R&D. Other creative work includes ideation
(the creative process of generating new ideas), the development of concepts for innovations,
and activities related to organisational change as part of product or business process
innovation activities.
4.17. Engineering, design and other creative work as an innovation activity: most
design and other creative work are innovation activities, with the exception of minor design
changes that do not meet the requirements for an innovation, such as producing an existing
product in a new colour. Identifying the use of design thinking methodologies by firms can
help to differentiate minor design changes from innovation activities. Many engineering
activities are not innovation activities, such as day-to-day production and quality control
procedures for existing processes. Engineering activities for reverse engineering, or to alter
or introduce new production processes, services or delivery methods, may or may not be
an innovation activity, depending on whether these activities are conducted for innovation
or for other reasons.
4.2.3. Marketing and brand equity activities
4.18. Marketing and brand equity activities include market research and market testing,
methods for pricing, product placement and product promotion; product advertising, the
promotion of products at trade fairs or exhibitions and the development of marketing
strategies. They also include advertising for trademarks that are not directly related to a
specific product, such as advertising linked to the firm’s name, as well as public relations
activities that contribute to a firm’s reputation and brand equity. Sales and distribution
activities are not part of marketing and brand equity activities.
4.19. Marketing and brand equity activities as an innovation activity: marketing
activities for existing products are only innovation activities if the marketing practice is
itself an innovation. For many companies only a small fraction of marketing expenditures
CHAPTER 4. MEASURING BUSINESS INNOVATION ACTIVITIES │ 89
OSLO MANUAL 2018 © OECD/EUROPEAN UNION 2018
is likely to be linked to product innovations introduced within the observation period.
Relevant innovation activities include preliminary market research, market tests, launch
advertising, and the development of pricing mechanisms and product placement methods
for product innovations. In some cases, the advantages of a business process innovation
could also be marketed, for instance if the business process innovation has environmental
benefits or improves product quality.
4.2.4. Intellectual property related activities
4.20. IP related activities include the protection or exploitation of knowledge, often
created through R&D, software development, and engineering, design and other creative
work. IP activities include all administrative and legal work to apply for, register, document,
manage, trade, license-out, market and enforce a firm’s own intellectual property rights
(IPRs), all activities to acquire IPRs from other organisations such as through licensing-in
or the outright purchase of IP, and activities to sell IP to third parties. IPRs include patents,
utility patents, industrial designs, trademarks, copyright, integrated circuit designs, plant
breeder’s rights (new plant varieties), geographical indications and confidential information
such as trade secrets (WIPO, 2004).
4.21. IP- related activities as an innovation activity: IP activities for ideas, inventions
and new or improved products or business processes developed during the observation
period are innovation activities. Examples include activities to apply for IP rights for an
innovation or for an invention, licensing-in the right to use an invention or an innovation,
or licensing-out IP for inventions and innovations. All IP activities for inventions made
before the observation period and for products and business processes that existed before
the observation period should be excluded.
4.22. Respondents to data collection exercises may find it difficult to differentiate IP
activities for innovation from IP activities for existing products or business processes,
particularly if IP is managed in a separate division with its own budget and there is a large
IP portfolio under management.
4.2.5. Employee training activities
4.23. Employee training includes all activities that are paid for or subsidised by the firm
to develop knowledge and skills required for the specific trade, occupation or tasks of a
firm’s employees. Employee training includes on-the-job training and job-related education
at training and educational institutions.
4.24. Employee training as an innovation activity: employee training activities for the
use of existing products or business processes, the upgrading of general skills, or language
training are not innovation activities. Examples of training as an innovation activity include
training personnel to use innovations, such as new software logistical systems or new
equipment; and training relevant to the implementation of an innovation, such as instructing
personnel or customers on the features of a product innovation. Employee training that is
required to develop an innovation, such as training for R&D or for design, are respectively
part of R&D activities or part of engineering, design and other creative work.
4.2.6. Software development and database activities
4.25. Software development and database activities include:
The in-house development and purchase of computer software, programme descriptions
and supporting materials for both systems and applications software (including
90 │ CHAPTER 4. MEASURING BUSINESS INNOVATION ACTIVITIES
OSLO MANUAL 2018 © OECD/EUROPEAN UNION 2018
standard software packages, customised software solutions and software embedded
in products or equipment).
The acquisition, in-house development and analysis of computer databases and
other computerised information, including the collection and analysis of data in
proprietary computer databases and data obtained from publicly available reports
or the Internet.
Activities to upgrade or expand the functions of information technology (IT) systems,
including computer programmes and databases. This includes statistical data analysis
and data mining activities.
4.26. Costs associated with the use of and access to computer and other information and
communication technology (ICT) services, such as cloud storage and processing services,
can be part of software development and database activities if incurred with that purpose.
However, computer and IT services to maintain hardware systems are generally not a
software development and database activity.
4.27. Software development and database activities include activities that may be unrelated
to innovation, such as minor upgrades to existing software (either developed in-house or
purchased) and the purchase and analysis of databases for accounting and other routine
business functions.
4.28. Software development and database activities as innovation activity: software
development is an innovation activity when used to develop new or improved business
processes or products, such as computer games, logistical systems, or software to integrate
business processes. Database activities are an innovation activity when used for innovation,
such as analyses of data on the properties of materials or customer preferences.
4.2.7. Activities related to the acquisition or lease of tangible assets
4.29. These activities include the purchase, lease, or acquisition through a takeover of
buildings, machinery, equipment, or the in-house production of such goods for own-use.
Equipment includes items such as instruments, transport equipment and computer hardware
for IT systems. Tangible assets owned by the firm remain in corporate balance sheets for
more than one year. The acquisition of tangible assets is covered within the category of
gross fixed capital formation in national accounts for the relevant asset categories. A firm’s
financial statements will provide information on expenditures for additions to property,
plant and equipment. Balance sheets will reflect the overall value of the stock of assets. In
addition to acquiring or developing on own account such assets, firms may secure their
services by leasing or renting them from external parties. This includes payments for cloud
services to use assets such as servers. Such costs represent an indirect measure of use.
4.30. Acquisition or lease of tangible assets for innovation: the acquisition or lease of
tangible assets can be innovation activities in their own right, such as when a firm purchases
or leases equipment with significantly different characteristics than the existing equipment
that it uses for its business processes. The acquisition of tangible capital goods is generally
not an innovation activity if it is for replacement or capital-widening investments that are
unchanged, or if it consists of only minor changes compared to the firm’s existing stock of
tangible capital.
4.31. The lease or rental of tangible assets is an innovation activity if these assets are
required for product or business process innovations. The measurement of innovation
activity should be robust to business decisions on whether to own outright or rent an asset
CHAPTER 4. MEASURING BUSINESS INNOVATION ACTIVITIES │ 91
OSLO MANUAL 2018 © OECD/EUROPEAN UNION 2018
to be used for innovation. For example, leasing additional building space for a design lab
may be an innovation activity. Likewise, the use of third-party cloud services for
transforming and making operations more efficient may contribute to a business process
innovation or support the delivery of new products to customers.
4.2.8. Innovation management
4.32. Innovation management includes all systematic activities to plan, govern and
control internal and external resources for innovation. This includes how resources for
innovation are allocated, the organisation of responsibilities and decision-making among
employees, the management of collaboration with external partners, the integration of
external inputs into a firm’s innovation activities, and activities to monitor the results of
innovation and to support learning from experience. Innovation management includes
activities for establishing policies, strategies, objectives, processes, structures, roles and
responsibilities to deal with innovation in the firm, as well as mechanisms to assess and
review them. Information on innovation management is relevant to research on the efficiency
of expenditures on innovation activities to generate sales or other innovation outcomes (see
Chapter 5 for further details on innovation management).
4.33. Innovation management practices are relevant to innovation-active firms, although
the degree of formality and the complexity of these practices can differ considerably between
firms. Respondents from firms with only ad hoc innovations based on the acquisition or
lease of tangible assets may not recognise that their firm has innovation management
practices. As innovation management activities are not relevant to non-innovative firms,
it is recommended to collect qualitative data on innovation management practices for
innovation-active firms only. Subsections 4.3.2 and 5.3.4 discuss the type of data that can
be collected on firms’ innovation management activities and capabilities.
4.34. An innovation management practice that is potentially relevant to all firms is
searching external sources for ideas for innovation. Firms that search external sources for
ideas will not be innovation-active if they decide not to develop an idea during the
observation period. It is recommended to collect data on search activities in questions on
knowledge sources for innovation (see subsection 6.3.3) for all types of firms if possible.
4.3. Collecting qualitative data on the incidence of innovation activities
4.35. The guidance in this section concerns the collection of qualitative data on the
incidence of specific activities of potential relevance to innovation within firms, identifying
those that are explicitly conducted in pursuit of innovations.
4.3.1. Internal and externally sourced activities
4.36. Many innovation activities can be conducted in-house, procured from external
organisations, or based on a combination of intramural and extramural activities. Furthermore,
inputs to the innovation process can be obtained from other enterprises or from organisations
outside the Business enterprise sector. Other enterprises include affiliated enterprises linked
by ownership to the respondent firm, either located in the same country or abroad. Firms
that belong to an enterprise group should be instructed to consider other enterprises of their
group as external organisations. Procurement typically includes activities that are contracted-
out for a fee to an external organisation that conducts a series of activities as a service to
the firm that may be pursuing an innovation. There may be other arrangements for sourcing
activities externally (see Chapter 6).
92 │ CHAPTER 4. MEASURING BUSINESS INNOVATION ACTIVITIES
OSLO MANUAL 2018 © OECD/EUROPEAN UNION 2018
4.37. Firms can provide a series of knowledge-based services, such as design, training,
marketing, consulting, software or IP services, to other firms or organisations on a contractual
basis. However, the firms that provide these services are not considered to be innovation-
active (see Chapter 3) unless they conduct innovation activities with the intention to
introduce an innovation themselves. This restriction is necessary from a measurement
perspective because the firm that provides these activities as a service may not know if the
contractor intends to use their services for innovation or not.
4.38. An exception to this restriction is for firms that provide R&D services to other firms
or organisations. By convention, all R&D is an innovation activity and consequently it is
generally not necessary to determine if R&D services are for innovation. Applied research
and experimental development are directed towards producing specific outcomes. Even basic
research may be ultimately aimed towards innovation even though, as defined, it may not
have a specific immediate commercial application or use in mind (OECD, 2015: § 7.47).
4.39. Data on the incidence of activities and expenditures for innovation activities other
than R&D (design, training, software, etc.), that are conducted by external organisations,
should be collected from the firm that procured such services. The firm that purchases these
activities will know if the activities were intended to support its innovation efforts or not.
However, data on extramurally performed R&D can be collected from firms that perform
R&D as a service and from firms that procured R&D. Data from both groups can be of
interest in countries where specialised R&D firms conduct a considerable amount of
R&D for foreign firms. However, when aggregating R&D expenditure data at the national
level, it is important to avoid double counting R&D reported by both the procurer and the
service provider.
4.40. One consequence of the division of labour for innovation (see Chapters 3 and 6) is
that firms providing services that generate knowledge of potential value to the innovation
activities of other firms or organisations can represent an important input to an economy’s
total innovation performance. Consequently, it may be of interest for research on the
division of labour for innovation to collect data on the prevalence of such firms.
4.3.2. Qualitative data on specific activities related to innovation
4.41. It is recommended to collect qualitative data on the performance of activities listed
in section 4.2 above for all types of firms (innovative and non-innovative as defined in
Chapter 3). Questions on innovation management should only be addressed to firms that
report one or more activities for innovation. For all firms, qualitative data should be
collected on:
1. whether each activity was conducted, regardless of its purpose
2. whether each activity (other than R&D) was conducted in pursuit of one or more
innovations.
4.42. It may also be of interest to collect additional data on whether the identified
innovation activities were conducted in-house or procured from external organisations, as
shown in Table 4.1.
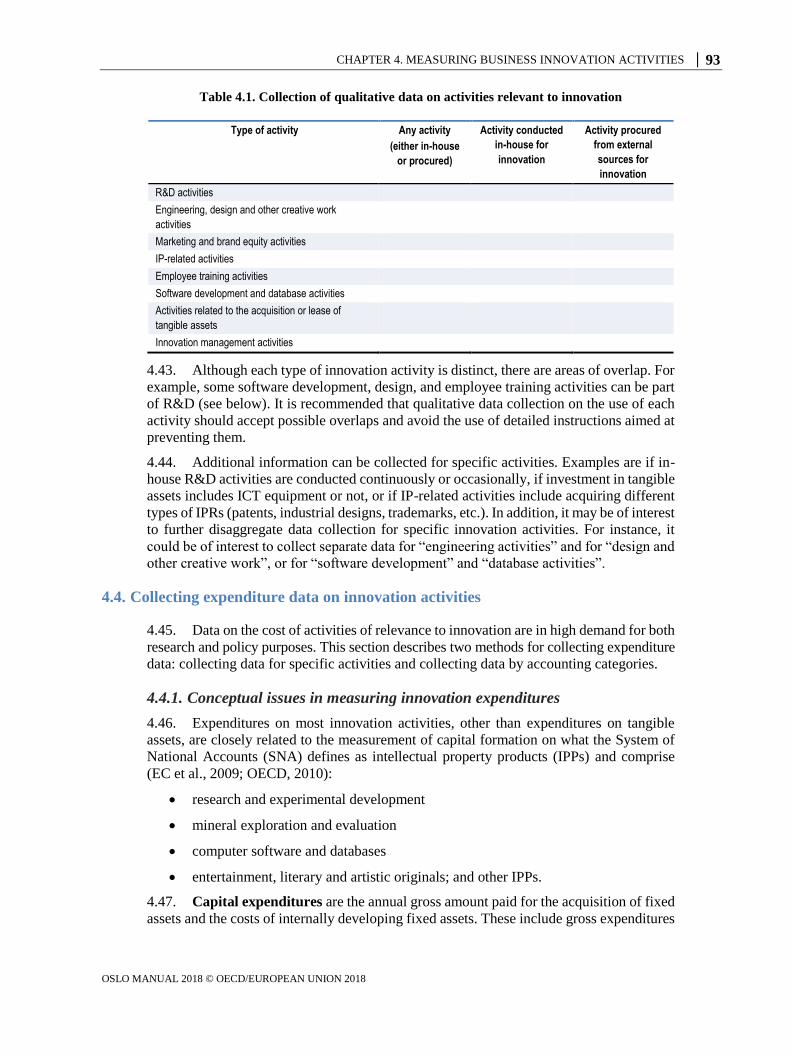
CHAPTER 4. MEASURING BUSINESS INNOVATION ACTIVITIES │ 93
OSLO MANUAL 2018 © OECD/EUROPEAN UNION 2018
Table 4.1. Collection of qualitative data on activities relevant to innovation
Type of activity Any activity
(either in-house
or procured)
Activity conducted
in-house for
innovation
Activity procured
from external
sources for
innovation
R&D activities
Engineering, design and other creative work
activities
Marketing and brand equity activities
IP-related activities
Employee training activities
Software development and database activities
Activities related to the acquisition or lease of
tangible assets
Innovation management activities
4.43. Although each type of innovation activity is distinct, there are areas of overlap. For
example, some software development, design, and employee training activities can be part
of R&D (see below). It is recommended that qualitative data collection on the use of each
activity should accept possible overlaps and avoid the use of detailed instructions aimed at
preventing them.
4.44. Additional information can be collected for specific activities. Examples are if in-
house R&D activities are conducted continuously or occasionally, if investment in tangible
assets includes ICT equipment or not, or if IP-related activities include acquiring different
types of IPRs (patents, industrial designs, trademarks, etc.). In addition, it may be of interest
to further disaggregate data collection for specific innovation activities. For instance, it
could be of interest to collect separate data for “engineering activities” and for “design and
other creative work”, or for “software development” and “database activities”.
4.4. Collecting expenditure data on innovation activities
4.45. Data on the cost of activities of relevance to innovation are in high demand for both
research and policy purposes. This section describes two methods for collecting expenditure
data: collecting data for specific activities and collecting data by accounting categories.
4.4.1. Conceptual issues in measuring innovation expenditures
4.46. Expenditures on most innovation activities, other than expenditures on tangible
assets, are closely related to the measurement of capital formation on what the System of
National Accounts (SNA) defines as intellectual property products (IPPs) and comprise
(EC et al., 2009; OECD, 2010):
research and experimental development
mineral exploration and evaluation
computer software and databases
entertainment, literary and artistic originals; and other IPPs.
4.47. Capital expenditures are the annual gross amount paid for the acquisition of fixed
assets and the costs of internally developing fixed assets. These include gross expenditures
94 │ CHAPTER 4. MEASURING BUSINESS INNOVATION ACTIVITIES
OSLO MANUAL 2018 © OECD/EUROPEAN UNION 2018
on land and buildings, machinery, instruments, transport equipment and other equipment,
as well as IPPs such as computer software and databases, R&D-based assets and other IP
assets. Fixed assets must have a useful life of greater than one year (EC et al., 2009).
Current expenditures include all costs for labour, materials that last for less than one year,
and the costs for leasing fixed assets.
4.48. Other types of knowledge-based assets are still not considered to be within the SNA
production boundary and are therefore excluded from official estimates of capital
formation. The scope of measurement efforts to capture an enlarged category of intangible
or knowledge-based assets (see Corrado, Hulten and Sichel 2006; Awano et al., 2010;
Goodridge, Haskel and Wallis, 2014) is very close to the list of activities in Table 4.1. In
addition to the SNA’s IPPs, the concept of knowledge-based assets also includes efforts to
invest in brand equity, design, and organisational capital (see also subsections 2.4.2 and 5.2.2).
4.49. The measurement of capital formation in IPPs or extended KBC focuses on capturing
additions to the asset stock of the relevant IPP, and therefore excludes activities which are
not expected to deliver benefits for more than one year. Expenditures on activities of
relevance to innovation include capital and current expenditures. On the other hand, not all
capital formation is aimed at innovation.
4.50. Although there are slight differences in the way in which IPP capital formation and
innovation expenditures are accounted for in general and the way in which specific items
are conceptualised, it is useful to compare any figures collected for consistency.
Reference period
4.51. While collecting data for a multi-year observation period is feasible for qualitative
indicators on activities, it is recommended that data collection should focus on the survey
reference year in order to reduce the response burden and thereby improve data quality.
An exception is when the object method is used to collect data on the resources used for an
individual innovation project (see Chapter 10), which could cover several years. In case the
firm’s fiscal year deviates from the reference year, data on expenditures should be requested
for the fiscal year that best matches the reference year.
Challenges
4.52. The quality of data on expenditures on innovation activities can be impaired by
several factors. For example, many types of expenditure by activity are not directly available
from a firm’s accounting systems. A firm may collect data for all training expenditures, but
it might not divide these into general training and training for innovation. Furthermore,
information may be dispersed across different parts of the firm in a manner that it is difficult
for respondents to bring together consistently.
4.4.2. Expenditures for specific innovation activities
4.53. It is recommended to collect total expenditure data for each of seven activities for
all firms, as shown in Table 4.2. Additional data on expenditures for each (innovation)
activity can be collected for innovation-active firms only in order to determine the share of
innovation-related expenditures within each activity. Details on the assignment of innovation
expenditures to each activity are given below. Although there is an eighth type of innovation
activity relating to innovation management (see subsection 4.2.8), it is only recommended
to collect qualitative data on this category (see subsection 4.3.2) and not expenditure data,
hence why it is excluded from Table 4.2.
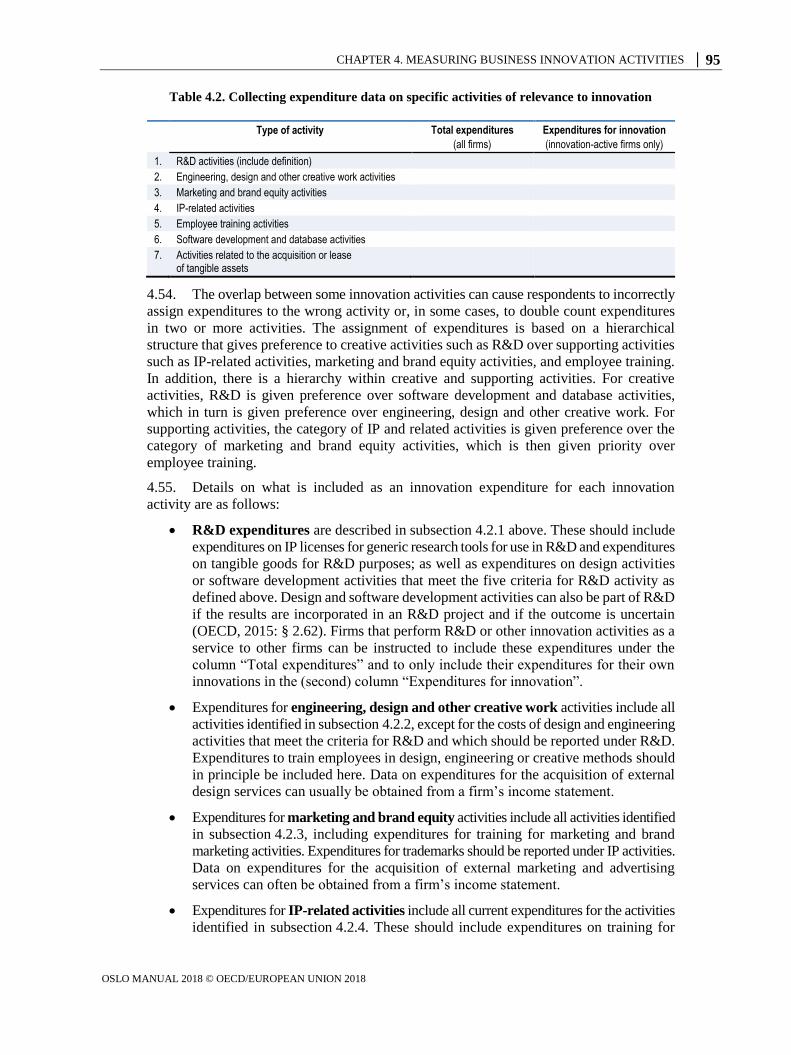
CHAPTER 4. MEASURING BUSINESS INNOVATION ACTIVITIES │ 95
OSLO MANUAL 2018 © OECD/EUROPEAN UNION 2018
Table 4.2. Collecting expenditure data on specific activities of relevance to innovation
Type of activity Total expenditures
(all firms)
Expenditures for innovation
(innovation-active firms only)
1. R&D activities (include definition)
2. Engineering, design and other creative work activities
3. Marketing and brand equity activities
4. IP-related activities
5. Employee training activities
6. Software development and database activities
7. Activities related to the acquisition or lease of tangible assets
4.54. The overlap between some innovation activities can cause respondents to incorrectly
assign expenditures to the wrong activity or, in some cases, to double count expenditures
in two or more activities. The assignment of expenditures is based on a hierarchical
structure that gives preference to creative activities such as R&D over supporting activities
such as IP-related activities, marketing and brand equity activities, and employee training.
In addition, there is a hierarchy within creative and supporting activities. For creative
activities, R&D is given preference over software development and database activities,
which in turn is given preference over engineering, design and other creative work. For
supporting activities, the category of IP and related activities is given preference over the
category of marketing and brand equity activities, which is then given priority over
employee training.
4.55. Details on what is included as an innovation expenditure for each innovation
activity are as follows:
R&D expenditures are described in subsection 4.2.1 above. These should include
expenditures on IP licenses for generic research tools for use in R&D and expenditures
on tangible goods for R&D purposes; as well as expenditures on design activities
or software development activities that meet the five criteria for R&D activity as
defined above. Design and software development activities can also be part of R&D
if the results are incorporated in an R&D project and if the outcome is uncertain
(OECD, 2015: § 2.62). Firms that perform R&D or other innovation activities as a
service to other firms can be instructed to include these expenditures under the
column “Total expenditures” and to only include their expenditures for their own
innovations in the (second) column “Expenditures for innovation”.
Expenditures for engineering, design and other creative work activities include all
activities identified in subsection 4.2.2, except for the costs of design and engineering
activities that meet the criteria for R&D and which should be reported under R&D.
Expenditures to train employees in design, engineering or creative methods should
in principle be included here. Data on expenditures for the acquisition of external
design services can usually be obtained from a firm’s income statement.
Expenditures for marketing and brand equity activities include all activities identified
in subsection 4.2.3, including expenditures for training for marketing and brand
marketing activities. Expenditures for trademarks should be reported under IP activities.
Data on expenditures for the acquisition of external marketing and advertising
services can often be obtained from a firm’s income statement.
Expenditures for IP-related activities include all current expenditures for the activities
identified in subsection 4.2.4. These should include expenditures on training for
96 │ CHAPTER 4. MEASURING BUSINESS INNOVATION ACTIVITIES
OSLO MANUAL 2018 © OECD/EUROPEAN UNION 2018
managing IP and on the acquisition of trademarks for marketing and brand equity
activities. The cost of purchasing external IP for R&D should be reported under
R&D. Data on expenditures for managing IPRs can often be obtained from the cost
of the respective department in the firm (in the case of larger organisations) or by
combining the labour costs of in-house personnel, application and registration costs,
and costs for external services. Data on expenditures for the acquisition of external
IP often can be obtained from balance sheet data (additions to the respective
categories of intangible assets). It is advisable, whenever possible, to break down
this category by different types of IP.
Expenditures for employee training include all direct and indirect costs related to
training for a firm’s employees, as identified in subsection 4.2.5. Direct costs include
fees for external courses, travel and subsistence payments while attending training
courses, teaching materials, labour costs for in-house training of personnel, and
administrative and other costs for in-house training centres. Indirect costs refer to
the labour costs of employees for time spent on training, including time for on-the-
job training. Two activities should be excluded from expenditures on employee
training: (i) expenditures for training customers or other persons not employed by the
firm; and (ii) expenditures for initial vocational training (e.g. training of apprentices).
Data on the direct costs for employee training often can be obtained from a firm’s
human resources department.
Expenditures for software development and database activities include all expenditures
on the activities identified in subsection 4.2.6. Data on software development and
database activities should be available from balance sheet data (additions to capitalised
software and databases), although some additions for non-capitalised costs will need
to be made. There are two exclusions for this activity: expenditures on computer
software that is used to perform R&D should be reported under R&D, and data
collection costs for market research should be reported as part of marketing expenditure.
Expenditures for the acquisition or lease of tangible assets include the costs of all
activities listed in subsection 4.2.7 obtained through purchase or lease, plus the
costs of in-house production of such goods for own-use as a capitalised service, but
excluding capitalised expenditures for R&D. This expenditure category consists of
capital expenditures on the purchase of tangible assets and current expenditures for
leasing tangible assets. Data on capital expenditures can be obtained from a firm’s
balance sheet (additions to property, plant and equipment). Data on leasing costs
can be obtained from a firm’s income statement.
4.56. Respondents may find it difficult to assign the resources for innovation to the
correct activity, even when provided with instructions. For example, respondents in service
sector firms that perform design work but do not have an R&D department could fail to
recognise that some of their design activities may meet the criteria for R&D. This could
result in underestimates or overestimates of the amount of resources given to specific
activities, but it should not substantially affect estimates of total innovation expenditures
4.57. The sum of expenditures for specific innovation activities in Table 4.2 may not
equal a firm’s total innovation expenditure since firms may conduct innovation activities other
than those listed, e.g. activities related to business process innovation in administration and
management. The following section provides an alternative means for collecting data on
total innovation expenditure.
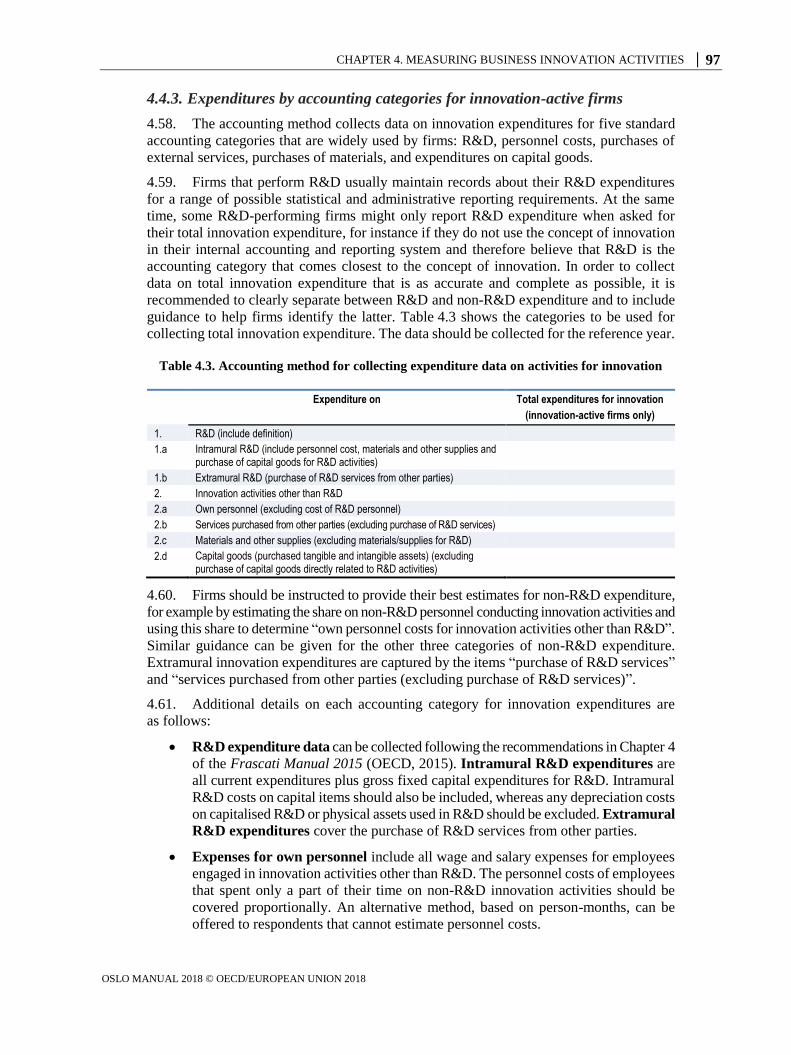
CHAPTER 4. MEASURING BUSINESS INNOVATION ACTIVITIES │ 97
OSLO MANUAL 2018 © OECD/EUROPEAN UNION 2018
4.4.3. Expenditures by accounting categories for innovation-active firms
4.58. The accounting method collects data on innovation expenditures for five standard
accounting categories that are widely used by firms: R&D, personnel costs, purchases of
external services, purchases of materials, and expenditures on capital goods.
4.59. Firms that perform R&D usually maintain records about their R&D expenditures
for a range of possible statistical and administrative reporting requirements. At the same
time, some R&D-performing firms might only report R&D expenditure when asked for
their total innovation expenditure, for instance if they do not use the concept of innovation
in their internal accounting and reporting system and therefore believe that R&D is the
accounting category that comes closest to the concept of innovation. In order to collect
data on total innovation expenditure that is as accurate and complete as possible, it is
recommended to clearly separate between R&D and non-R&D expenditure and to include
guidance to help firms identify the latter. Table 4.3 shows the categories to be used for
collecting total innovation expenditure. The data should be collected for the reference year.
Table 4.3. Accounting method for collecting expenditure data on activities for innovation
Expenditure on Total expenditures for innovation (innovation-active firms only)
1. R&D (include definition)
1.a Intramural R&D (include personnel cost, materials and other supplies and purchase of capital goods for R&D activities)
1.b Extramural R&D (purchase of R&D services from other parties)
2. Innovation activities other than R&D
2.a Own personnel (excluding cost of R&D personnel)
2.b Services purchased from other parties (excluding purchase of R&D services)
2.c Materials and other supplies (excluding materials/supplies for R&D)
2.d Capital goods (purchased tangible and intangible assets) (excluding purchase of capital goods directly related to R&D activities)
4.60. Firms should be instructed to provide their best estimates for non-R&D expenditure,
for example by estimating the share on non-R&D personnel conducting innovation activities and
using this share to determine “own personnel costs for innovation activities other than R&D”.
Similar guidance can be given for the other three categories of non-R&D expenditure.
Extramural innovation expenditures are captured by the items “purchase of R&D services”
and “services purchased from other parties (excluding purchase of R&D services)”.
4.61. Additional details on each accounting category for innovation expenditures are
as follows:
R&D expenditure data can be collected following the recommendations in Chapter 4
of the Frascati Manual 2015 (OECD, 2015). Intramural R&D expenditures are
all current expenditures plus gross fixed capital expenditures for R&D. Intramural
R&D costs on capital items should also be included, whereas any depreciation costs
on capitalised R&D or physical assets used in R&D should be excluded. Extramural
R&D expenditures cover the purchase of R&D services from other parties.
Expenses for own personnel include all wage and salary expenses for employees
engaged in innovation activities other than R&D. The personnel costs of employees
that spent only a part of their time on non-R&D innovation activities should be
covered proportionally. An alternative method, based on person-months, can be
offered to respondents that cannot estimate personnel costs.
98 │ CHAPTER 4. MEASURING BUSINESS INNOVATION ACTIVITIES
OSLO MANUAL 2018 © OECD/EUROPEAN UNION 2018
Expenditures for services purchased from other parties include all expenses for
services that are used in innovation activities and not already part of R&D
(extramural R&D).
Expenditures for materials and other supplies include all expenses for material
inputs that are used in innovation activities and have not been included in R&D.
Capital expenditures include the costs of the acquisition of tangible and intangible
capital goods, such as machinery, equipment, buildings, land, capitalised software
and other externally purchased capital goods. The acquisition of capital goods that
are included in intramural R&D expenditure should be excluded. Capitalised own-
produced assets (e.g. in-house produced capitalised software, capitalised development
costs) that are not for R&D should be included.
4.62. Respondents should be instructed to include both capital and current expenditures
for innovation activities under the relevant headings. No depreciation provisions for tangible
or intangible assets should be included in the current expenditure data to avoid double
counting with related capital expenditures.
4.63. When using the accounting method for collecting innovation expenditure, special
instructions need to be given for firms with R&D expenditure to report only non-R&D expenditure
in the categories 2.a to 2.d listed in Table 4.3 and not to include any R&D expenditure on
personnel, materials, capital goods or purchased R&D services in these categories.
4.4.4. Sources of funds for innovation activities
4.64. Expenditures on innovation activities can be disaggregated by the source of funds.
Collecting data on the funding source is useful for assessing the role of government
investments and financial markets in the innovation process. There are many potential
sources of funding for innovation including:
own funds (retained profits or income from asset disposal)
transfers from affiliated firms (holding, subsidiary or associated companies located
in the domestic country or abroad)
customer orders (including procurement contracts from domestic or foreign governments
or international organisations)
shareholder loans
debt funding from commercial loans (banks, credit cards etc.), overdraft facilities
or suppliers’ credit
loans from governments
loans from international organisations
equity from private equity or venture capital firms, business angels or other individuals
(family and friends)
grants or subsidies from domestic or foreign governments, international organisations,
non-governmental organisations, etc.
bonds and obligations
other sources (e.g. crowdfunding).
CHAPTER 4. MEASURING BUSINESS INNOVATION ACTIVITIES │ 99
OSLO MANUAL 2018 © OECD/EUROPEAN UNION 2018
4.65. Data collection can aggregate the above categories, for instance by creating one
category for all internal sources of finance and a second category for all external sources
of finance. Alternatively, data collection can focus on specific sources, such as funds provided
by governments, or divide external sources into domestic and international sources of funds.
4.66. It may be sufficient for a variety of policy and research issues to collect information
on whether or not each source is used, instead of seeking an estimate of the amount (either
in monetary or percentage terms) contributed by each source.
4.5. Other data on innovation activities
4.5.1. Collecting data on human resources for innovation activities
4.67. For specific innovation activities, managers can find it difficult to estimate expenditures
that are not performed by a separate reporting unit within the firm and which mainly involve
internal labour costs. This can result in poor quality expenditure estimates for innovation
activities that mostly consist of labour costs, such as training; engineering, design and other
creative work; and marketing and brand equity activities.
4.68. For these activities, requesting estimates of the number of person-months (on a full-
time equivalent [FTE] basis) allotted to each activity could improve data quality. Person-
month data on innovation activities should only be collected for activities that mostly
involve labour costs, or in industries where firms are unlikely to be able to provide accurate
expenditure data, such as small firms in service industries. If other data are available on
average hourly wages or monthly salary costs, expenditures could be estimated by combining
person-month estimates with wage and salary data.
4.5.2. Data on innovation projects
4.69. Many innovation-active firms organise their innovation activities as innovation
projects, defined as a set of activities that are organised and managed for a specific purpose
and with their own objectives, resources and expected outcomes (see Chapter 3). Respondents
can be asked if their firm organises some or all of its work to develop innovations into
recognised projects, or they can be asked about a specific innovation project (see Chapter 10).
4.70. Information on innovation projects can complement other qualitative and
quantitative data on innovation activities. Data on the number of projects for innovation
can provide indicators on the variety and diversity of innovation activities. Disaggregated
data on the number of projects for product and for business process innovations can be used
to determine the relationships between innovation goals, firm capabilities, and business
strategies (see Chapter 5).
4.71. Collecting data on a single innovation project can provide detailed information on
innovation investments, using the “object approach” discussed in Chapter 10. Cognitive
testing indicates that respondents find it easier to provide expenditure or FTE data for
innovation activities relating to a single innovation project than for all innovation activities
combined (the “subject approach”).
4.72. For firms that organise their innovation activities on a project basis, it can be
useful to obtain the following information, either for all innovation projects combined or
disaggregated into projects for product and business process innovations:
the number of innovation projects undertaken during the observation period
the number of innovation projects completed during the observation period
100 │ CHAPTER 4. MEASURING BUSINESS INNOVATION ACTIVITIES
OSLO MANUAL 2018 © OECD/EUROPEAN UNION 2018
the number of innovation projects ceased before completion during the observation
period
the number of ongoing innovation projects at the end of the observation period.
4.73. The number of completed, ceased, and ongoing innovation projects should equal
the total number of innovation projects during the observation period. The exact definition
of what constitutes an innovation project should be left to the firm’s actual practice,
allowing the respondents to collect the required information from the firms’ project
management tools or similar sources.
4.74. Information on the number of innovation projects is not primarily intended to
produce an aggregate figure of the total number of projects for a firm or industry, but rather
to derive indicators at the firm level, such as the share of completed projects, the share of
projects stopped before completion, or the share of projects to develop product vs. business
process innovations.
4.5.3. Follow-on activities
4.75. Innovation activities occur before and up to the date of introduction of a product
innovation or implementation of a business process innovation. Firms can also conduct
marketing activities, employee training, demonstrations and other services for users of an
innovation after its implementation, but within the observation period. These follow-on
activities can be critical for the success of an innovation, but they are not included in the
definition of an innovation activity.
4.76. Data collection can obtain qualitative data on three particular follow-on activities:
Follow-on marketing comprises all efforts to promote the sale of a product
innovation in the market, including advertising, sales promotion at trade fairs,
altering distribution channels, etc.
Follow-on training includes all in-house training of employees related to the use
of product or business process innovations during the observation period. It also
includes activities to familiarise potential and current users with a firm’s product or
process innovations, e.g. through demonstration activities or the training of users.
After-sales services include all services provided by an innovative firm to improve
the utility of an innovation for its users. These can include installation, updating
and repair services, guarantee and return schemes (which can reduce uncertainty
for users), and information services (including websites or other forums to facilitate
communication among users).
4.77. Collecting information on follow-on activities can be particularly useful if the
information is collected for specific innovations, as in the object-based approach discussed
in Chapter 10.
4.5.4. Planned innovation activities and expenditures
4.78. Data on a firm’s future plans for innovation activities can provide information about
the possible development of innovation in an economy or industry in the near future. Data
on planned innovation activities can also be useful for producing more timely indicators
that help assess the likely impact of recent changes in the innovation environment of firms,
for instance changes in innovation support programmes or innovation-related regulation.
CHAPTER 4. MEASURING BUSINESS INNOVATION ACTIVITIES │ 101
OSLO MANUAL 2018 © OECD/EUROPEAN UNION 2018
4.79. Given the uncertain nature of innovation, collecting data on planned innovation
activities should refer to the immediate present and the very near future. Information on
planned activities can be collected for the year in which data are being collected (nowcasting),
which is usually the year after the reference year, and for no more than two years after the
reference year.
4.80. If data on planned activities are collected, it is of interest to ask respondents if their
firm plans to conduct any innovation activities in the one or two years after the reference
year on a “yes” or “no” basis and if the total innovation expenditures compared to the
reference year (if any) are expected to increase, stay the same, or decrease. Questions on
planned expenditures should immediately follow questions on innovation expenditures in
the reference year to ensure that the same definitions of innovation expenditures are used.
4.81. Additional questions could query the types of innovations that are planned for the
near future (using the innovation typology in section 3.3) or the types of planned innovation
activities outlined in this chapter.
4.82. Since many firms will not have decided on whether or not to invest in innovation
activities in the near future or how much they will spend, a separate “Don’t know” response
category must be provided. This information can be useful in its own right because it
provides information on the level of uncertainty about future innovation activities and
expenditures.
4.6. Summary of recommendations
4.83. This chapter identifies innovation activities of value to policy and for research.
Recommendations of questions for general data collection are given below. Other types of
data covered in this chapter are suitable for specialised data collection exercises.
4.84. Key questions for general data collection include:
qualitative data on whether or not each of the eight activities were conducted,
identifying in each affirmative case whether the activity was conducted for innovation
(subsection 4.3.2)
whether or not each activity was conducted in-house or procured from external
organisations (subsection 4.3.1)
total expenditures for each of seven activities (subsection 4.4.2)
total innovation expenditures using the accounting method (subsection 4.4.3)
funding sources for innovation (subsection 4.4.4).
4.85. Supplementary questions for general data collection (given space or resources) are:
additional information for specific activities, such as whether R&D activities are
conducted continuously or on an occasional basis (subsection 4.3.2)
innovation expenditures by funding source (subsection 4.4.4)
follow-on activities (subsection 4.5.3)
planned innovation activities and expenditures (subsection 4.5.4).

102 │ CHAPTER 4. MEASURING BUSINESS INNOVATION ACTIVITIES
OSLO MANUAL 2018 © OECD/EUROPEAN UNION 2018
References
Awano, G. et al. (2010), “Measuring investment in intangible assets in the UK: Results from a new
survey”, Economic & Labour Market Review, Vol. 4/7, pp. 66-71.
Corrado, C., C. Hulten, and D. Sichel (2006), “Intangible capital and economic growth”, NBER Working
Papers, No. 11948, National Bureau of Economic Research (NBER), Cambridge, MA,
www.nber.org/papers/w11948.
EC et al. (2009), System of National Accounts 2008, United Nations, New York,
https://unstats.un.org/unsd/nationalaccount/docs/sna2008.pdf.
Goodridge, P., J. Haskel, and G. Wallis (2014), “Estimating UK investment in intangible assets and
intellectual property rights”, No. 2014/36, The Intellectual Property Office, Newport.
OECD (2015), Frascati Manual 2015: Guidelines for Collecting and Reporting Data on Research and
Experimental Development, The Measurement of Scientific, Technological and Innovation Activities,
OECD Publishing, Paris, http://oe.cd/frascati.
OECD (2010), Handbook on Deriving Capital Measures of Intellectual Property Products, OECD
Publishing, Paris, https://doi.org/10.1787/9789264079205-en.
WIPO (2004), “What is intellectual property?”, WIPO Publications, No. 450(E), World Intellectual
Property Organization, Geneva, www.wipo.int/edocs/pubdocs/en/intproperty/450/wipo_pub_450.pdf.
CHAPTER 5. MEASURING BUSINESS CAPABILITIES FOR INNOVATION │ 103
OSLO MANUAL 2018 © OECD/EUROPEAN UNION 2018
Chapter 5. Measuring business capabilities for innovation
Business capabilities include the knowledge, competencies and resources that a firm
accumulates over time and draws upon in the pursuit of its objectives. Collecting data on
business capabilities is of critical importance for the analysis of the drivers and impacts of
innovation (why some firms innovate and others do not), the types of innovation activities
performed by firms, and their impacts. Business capabilities of relevance to innovation
include management capabilities, workforce skills, and technological capabilities. The
discussion of technological capabilities covers technical expertise, design capabilities and
digital competences.
104 │ CHAPTER 5. MEASURING BUSINESS CAPABILITIES FOR INNOVATION
OSLO MANUAL 2018 © OECD/EUROPEAN UNION 2018
5.1. Introduction
5.1. Business capabilities include the knowledge, competencies and resources that a
firm accumulates over time and draws upon in the pursuit of its objectives. The skills and
abilities of a firm's workforce are a particularly critical part of innovation-relevant capabilities.
Collecting data on business capabilities is of critical importance for analyses of the effect
of innovation on firm performance and why some firms seek to innovate and others do not
(see Chapter 11).
5.2. Numerous business capabilities can potentially support innovation activities and the
economic success of innovations. This chapter provides options for measurement for four
types of capabilities that are relevant for research on the innovation performance of firms:
the resources controlled by a firm (section 5.2)
the general management capabilities of a firm, including capabilities related to
managing innovation activities (section 5.3)
the skills of the workforce and how a firm manages its human capital (section 5.4)
the ability to develop and use technological tools and data resources, with the latter
providing an increasingly important source of information for innovation (section 5.5).
5.3. Many of the concepts relating to business capabilities have changed over time as
research improves our understanding of the process of innovation. Further improvements in
understanding will require data collection to adopt new concepts and measurement approaches.
5.4. The discussion in this chapter of internal capabilities with the potential to affect
innovation in firms complements Chapter 7, which addresses the effects of external factors
on innovation. Some of these factors are linked, for instance the skills of a firm's workforce
are constrained by to the availability of skilled employees in the labour market. Chapter 6
covers the activities and capabilities of firms to draw on and use externally produced
knowledge and consequently provides a bridge between this chapter and Chapter 7.
5.5. Both innovation-active and non-innovative firms can develop and use the business
capabilities discussed in this chapter.
5.6. Section 5.2 describes the general resources of the firm which strongly influence its
ability to engage in innovation activities. Section 5.3 examines the firm’s management
capabilities, in particular its competitive strategy and its organisational and managerial
capabilities. Human resources and workforce skills of relevance to innovation are reviewed
in section 5.4, followed by various technological capabilities (including design) in section 5.5.
The chapter’s recommendations for measurement are summarised in section 5.6.
5.2. General resources of the firm
5.7. The resources available to a firm have a strong influence on its ability to pursue its
objectives by engaging in different types of activities, including innovation-related activities.
Relevant resources for the firm include its own workforce, physical and intangible assets
(comprising knowledge-based capital), accumulated experience in conducting business
activities and available financial resources. Access to the resources of affiliated enterprises
for firms that are part of an enterprise group and those of partners and collaborators can be
equally relevant.
CHAPTER 5. MEASURING BUSINESS CAPABILITIES FOR INNOVATION │ 105
OSLO MANUAL 2018 © OECD/EUROPEAN UNION 2018
5.2.1. Firm size
5.8. Firm size is a commonly used predictor of innovation activities and a firms’
propensity to innovate (Cohen and Klepper, 1996). The most common measures of firm
size include the number of employed persons and the volume of turnover (or equivalent
measures in sectors such as financial services for which this is a less relevant measure of
output). Data on both employment and turnover should therefore be collected. Employment
data can be collected in headcounts, but should be based whenever possible on full-time
equivalents (FTE). Another measure of firm size is the value of assets owned, which is
useful for productivity analysis.
5.2.2. Business assets
5.9. In business accounting, total assets consist of tangible fixed assets, intangible fixed
assets, goodwill and current assets (e.g. cash, accounts receivable, inventories). The distinction
between assets that imply liabilities on another party and those that do not helps separate
financial from “real” assets. In the economics literature and throughout this manual (see
also Chapters 2 and 4), the term asset is applied to those resources controlled by the firm
that are expected to continue to be productive for more than a year. Data on assets can be
obtained from financial statements and include the book value of tangible fixed assets (property,
plant, and equipment) and the gross carrying amount of intangible assets (e.g. software,
patents, franchises, trademarks and goodwill). Regulatory licenses to exploit resources
(e.g. wireless spectrum, natural resources, etc.) can also be considered as business assets.
5.2.3. Age
5.10. A firm’s age is another resource indicator because it captures a firm’s overall
accumulated experience over time. Older firms have usually accumulated a larger stock of
knowledge than younger firms on how to implement change and obtain results from
investments. Learning over time can affect both the ability to innovate and innovation
outcomes (Huergo and Jaumandreu, 2004). Conversely, younger firms can be more agile
in implementing change if they are less affected by organisational inertia and have lower
adjustment and sunk costs.
5.11. The measurement of a firm’s age involves several conceptual and practical
challenges such as identifying the relevant date of birth of an enterprise (Eurostat/OECD,
2007). The definition of an enterprise birth does not include entries into the business
population due to mergers, break-ups and other forms of business restructuring. It also
excludes entries resulting solely from a change of activity.
5.12. The age of the firm should be measured whenever possible by the number of years
that a firm (as an organisational unit) has been economically active. This provides a
measure of the length of time that the firm has been effectively accumulating knowledge.
This can differ from the number of years since a firm’s legal establishment, since firms can
adopt a legal form well after having started operations or may not be active for some time
after being set up. In line with the definition used by Eurostat/OECD for business
demographics, it is important for events other than births to be excluded, which can be
difficult in practice if only basic administrative data are available.
5.13. It is therefore recommended to collect data on the year a firm started any type of
business activity, including activities before the year of legal establishment. Information on
how firms are established can also be of value because different methods of establishment
(start-up by an individual, spin-off from a university or firm, family operation, etc.) can
influence innovation activities and strategies.
106 │ CHAPTER 5. MEASURING BUSINESS CAPABILITIES FOR INNOVATION
OSLO MANUAL 2018 © OECD/EUROPEAN UNION 2018
5.2.4. Financing and ownership
5.14. A firm’s internal financial sources are another major driver for innovation. More
profitable firms and firms with a larger share of own capital can find it easier to invest in
activities with uncertain outcomes, such as those relating to innovation. Useful measures
of a firm's internal financial resources include the profit margin (earnings before taxes, or
earnings before interest, taxes, depreciation and amortisation) and the equity ratio. Data on
internal financial sources are also important when interpreting data on a firm’s external
financing and its access to financial markets (see subsection 7.4.3). These can also be
measures of financial outcomes of innovation (see Chapter 8).
5.15. A firm’s ownership status can also affect access to resources. Firms that are part of
an enterprise group could have access to resources that substantially exceed the firm's own
resources. Data can be collected on the following (some of this information can be obtained
from business registers):
if the firm is a stand-alone enterprise or part of an enterprise group
if the firm is part of a multinational group (firms of the enterprise group are located
in different countries) or a national group (all firms of the enterprise group are
located in the same country)
the country of the head office of the firm’s ultimate owner (the firm that has the
controlling stake in the firm)
if the firm is publicly listed on the stock exchange and, if so, information on the
concentration of ownership.
5.16. At a minimum, it is recommended to identify if a firm is a stand-alone firm or part
of an enterprise group, and if the latter, if the enterprise group is a multinational or national
group. In addition, more information on the enterprise group can be collected, e.g. the
country of the group's headquarters and the size of the entire group.
5.3. Management capabilities
5.17. Management capabilities can influence a firm’s ability to undertake innovation
activities, introduce innovations and generate innovation outcomes. While the management
literature has identified a large variety of management practices and capabilities that can
potentially affect innovation performance, this section focuses on two key areas: a firm’s
competitive strategy and the organisational and managerial capabilities used to implement
this strategy.
5.3.1. Business strategy
5.18. A business strategy includes the formulation of goals and the identification of
policies to reach these goals. Strategic goals cover the intended outcomes over the mid-
and long-term (excluding the goal of profitability, which is shared by all firms). Strategic
policies or plans include how a firm creates a competitive advantage or a “unique selling
proposition”. Common strategic choices include:
competing on price or quality
market leadership or followership (proactively shaping the market or reacting to
competition)
CHAPTER 5. MEASURING BUSINESS CAPABILITIES FOR INNOVATION │ 107
OSLO MANUAL 2018 © OECD/EUROPEAN UNION 2018
approach to risk (involvement in high-risk and high-reward activities versus a
preference for low-risk activities)
degree of openness (seeking out new collaboration partners versus establishing
close and stable ties with key partners)
transformation (searching for new business models versus continuous
improvements to the existing business model)
a focus on a single product market versus serving multiple markets simultaneously.
5.19. The geographical distribution of sales activities (e.g. local, national or international
markets) is an important dimension of a firm’s competitive strategy, as is the degree of vertical
integration. Finally, competitive strategies are more likely to influence a firm’s operations,
including innovation activities, if they are formalised and communicated within the firm.
5.20. A firm’s business strategy influences key economic outcomes, such as its growth
(in terms of sales, employment or capital stock), profit margin or return on capital, and
market share. Data on general business competitive strategies, objectives for innovation
and outcomes (see Chapter 8) are of value to research on the relative success of different
strategies with respect to observed performance.
5.21. Data collection can obtain information on the existence of different strategic plans,
how these plans are communicated to employees (for instance if there is a written strategic
plan), and systems to monitor progress towards achieving such plans. In addition, information
on which business functions are covered by a strategic plan (e.g. finance, marketing and
customer relations, logistics) and which activities (e.g. innovation, workforce development,
health and safety, corporate social responsibility) can help identify the linkages between
strategies and innovation.
5.22. One major choice made by firms that will influence innovation activities is whether
to primarily compete on price or quality. Quality-focused firms should be more likely to
develop new-to-market product innovations, whereas price-focused firms should put
greater emphasis on highly efficient processes. To capture these strategic orientations, it is
recommended to collect data on the overall relative importance of cost and quality for a
firm's competitive strategy including:
the extent to which firms focus on the price of their products (cost competitiveness)
the extent to which firms focus on quality features (e.g. functionality, durability,
flexibility of use, etc.).
5.23. Other relevant information includes the importance to firms of focussing on
improving existing products, introducing entirely new products, or aligning products to the
specific requirements of individual customers. Another dimension of quality-related
competitive strategies includes the significance of branding activities to differentiate a
firm’s products from those of its competitors.
5.24. One strategic choice is whether a firm serves a single product market or multiple
markets simultaneously, since a higher level of diversification can drive innovation activity.
Firms that serve multiple markets are more likely to have greater opportunities and needs
for innovations than those that serve a single product market. To capture this type of
diversification, surveys can collect data on the number of product lines in which the firm
is active and the respective revenue shares. This information can be used to construct
diversification or concentration indexes similar to the Herfindahl index. Alternatively,
surveys can ask respondents if their firm targets specific product markets or applications
108 │ CHAPTER 5. MEASURING BUSINESS CAPABILITIES FOR INNOVATION
OSLO MANUAL 2018 © OECD/EUROPEAN UNION 2018
within a product market. For this purpose, the number of different customers served, or the
share of the main three or five customers in total sales, can provide valuable information.
Data collection on a firm’s product strategy should be linked with data on the level of
competition in the firm’s product market (see subsection 7.4.2).
5.25. Because it is possible for firms to adopt different strategies in different markets, the
questions on strategic orientations should either be broken down by market or refer
specifically to all of a firm’s markets.
5.26. The geographical markets targeted by a firm provide additional information on a
firm’s strategy because they relate to the variety of user demands and competitive and
regulatory environments that affect the extent and orientation of innovation activities. A
simple way to collect this information is to ask if a firm sells products in specific
geographical regions. The share of sales to customers located abroad (export share) is
another useful measure. It is recommended to collect data on whether or not a firm serves
markets outside its domestic country, and if so, the share of sales from exports.
5.27. Another dimension of a firm’s competitive strategy is the “make or buy” decision,
particularly for product components (and relevant production and logistic processes) that
are of greatest value to users, and consequently critical to a firm’s market position. The
degree of vertical integration (share of in-house production) can offer clues on the breadth
of a firm’s innovation activities. However, data on the share of purchased materials and
services in gross production are insufficient because they fail to capture vertical integration
for key components. Consequently, survey questions need to collect information from self-
assessments, such as the extent of vertical integration for critical and non-critical components.
This type of data should be linked with data on the role of suppliers in the firm’s production
and innovation activities (see subsection 7.4.3).
5.3.2. Organisational and managerial capabilities
5.28. Organisational and managerial capabilities include all of a firm’s internal abilities,
capacities, and competences that can be used to mobilise, command and exploit resources
in order to meet the firm’s strategic goals. These capabilities typically relate to managing
people; intangible, physical and financial capital; and knowledge. Capabilities concern both
internal processes and external relations. Managerial capabilities are a specific subset of
organisational capabilities that relate to the ability of managers to organise change.
5.29. Change management capabilities are closely related to an organisation’s innovation
capability. They include:
responsiveness (the ability to identify relevant external challenges)
learning (the ability to learn from experience)
alignment (the ability to integrate different processes to achieve strategic goals)
creativity (the ability to generate and use new knowledge and new solutions).
5.30. Surveys can collect data on the relevance of these capabilities for a firm's business
operations, using a Likert scale, or alternatively on the level of managerial abilities for each
of these four capabilities. In both cases, data collection will need to rely on the subjective
assessment of respondents.
5.31. A further concept of relevance to innovation is a firm’s “dynamic managerial
capabilities” which refers to the ability of managers to organise an effective response to
internal and external challenges (see Helfat and Martin, 2015; Helfat et al., 2007). Dynamic
managerial capabilities include three main dimensions:

CHAPTER 5. MEASURING BUSINESS CAPABILITIES FOR INNOVATION │ 109
OSLO MANUAL 2018 © OECD/EUROPEAN UNION 2018
managerial cognition: knowledge structures that influence managers’ biases and
heuristics when, for example, anticipating market changes or understanding the
implications of different choices
managerial social capital: goodwill derived from relationships that managers have
with others and can use to obtain resources and information
managerial human capital: learned skills and knowledge that individuals develop
through their prior experience, training, and education.
5.32. Data collection on dynamic managerial capabilities can rely on items that have been
developed in a series of management studies (see Helfat and Martin [2015] for a review).
5.33. Another organisational capability that is closely related to innovation is the adoption
of Total Quality Management (TQM), part of the ISO 9000 family of standards. It includes
all efforts to install and maintain continuous improvement in a firm’s ability to produce and
deliver high-quality goods or services. Data collection can identify if a firm has ISO certification
for TQM, when this certification was obtained, and if the firm follows other quality
management approaches, such as continuous improvement processes or lean manufacturing.
The former is a management approach to continuously identify potential shortcomings in
an organisation’s processes and develop ways to overcome them. Lean manufacturing
focuses on production activities that create value, while avoiding all other activities.
5.34. Management is responsible for defining performance goals. The use of key
performance indicators across different operational areas indicates how systematically a
firm defines and monitors operational objectives (see Bloom and Van Reenen, 2010).
Surveys can ask respondents about the following methods for tracking performance (e.g.
Australian Bureau of Statistics, 2016):
whether firms have key performance indicators in place
which performance areas and business functions are measured through performance
indicators (e.g. financial, operational, quality, innovation, human resources, environment,
health and safety)
how frequently performance is monitored
if performance results are used to determine the remuneration of managers or
employees, e.g. through a bonus system or promotions
the consequences if performance results are not met.
5.3.3. Characteristics of the business owner and top management
5.35. Organisational and managerial capabilities are usually only relevant to larger
organisations that split operations across different departments or business functions. Many
of these concepts are therefore not relevant to small firms, including firms in the informal
sector, which lack multiple departments or functions. For these firms it can be more
appropriate to collect data on the characteristics of the owner-manager responsible for the
firm’s strategies and activities. In the case of larger and more complex enterprises, especially
those with highly distributed ownership, data collection efforts can combine information
on organisational capabilities and data on the characteristics of top management.
5.36. Relevant data for collection includes the owner or manager’s highest educational
qualification, entrepreneurial experience, and professional career. All three of these
characteristics can influence the owner’s level of human capital and types of expertise. The
110 │ CHAPTER 5. MEASURING BUSINESS CAPABILITIES FOR INNOVATION
OSLO MANUAL 2018 © OECD/EUROPEAN UNION 2018
owners’ entrepreneurial experience and professional career are measures of their managerial
skills obtained through business practice. Relevant data include the years of professional
experience or the number of different firms a person owned before becoming the owner of
the current firm.
5.37. Demographic data on the age, sex or gender identity, place of birth, and
sociocultural background of the owner can also be of value (US Census Bureau, 2018),
although the type of demographic data that can be collected will depend on legislation about
the collection and use of personal data. Data on personal characteristics can be of value for
research on the effects of government policies to support innovation and other business
activities among specific population groups.
5.38. A special form of firm ownership relevant to the analysis of management
capabilities is the family-owned business. A firm is family-owned if members of the same
family hold 50 % or more of the firm’s shares. Family ownership can affect innovation if
family-owned firms have different preferences than other firms for strategic goals such as
profitability and growth, and more importantly the time frame to achieve these goals. In
addition, differences in management experience and risk-taking between family owners
and managers could affect a firm’s innovation activities.
5.39. If data collection can identify family-owned firms, the following additional
variables are relevant to research on the effect of family ownership on strategic goals and
innovation (see Bloom and Van Reenen, 2007):
the number of generations the firm has been family-owned
if the firm is managed only by family members, jointly by family members and
external managers, or only by external managers
the share of managing directors that are family members
if the owners plan to transfer the firm to the next family generation.
5.40. Other characteristics related to ownership that can be relevant to a firm’s capability
to innovate include the legal type of ownership, whether the firm is listed on a stock market,
or whether other firms hold minority shares in it.
5.41. In some countries, it may be possible to link innovation survey data to other sources
of data on the characteristics of business owners.
5.3.4. Innovation management capabilities
5.42. Innovation management covers all activities to initiate, develop, and achieve results
from innovation. The relevant capabilities are closely linked to general organisational and
managerial capabilities and include:
identifying, generating, assessing and pursuing ideas for innovation
organising innovation activities within the firm (i.e. aligning different innovation
activities)
allocating resources to innovation activities
managing innovation activities conducted in collaboration with external partners
integrating external knowledge and other external inputs into a firm’s innovation
activities

CHAPTER 5. MEASURING BUSINESS CAPABILITIES FOR INNOVATION │ 111
OSLO MANUAL 2018 © OECD/EUROPEAN UNION 2018
monitoring the results of innovation activities and learning from experience
exploiting and managing innovations and other knowledge that has been generated
as part of a firm’s innovation activities, including protecting knowledge and
innovation assets.
5.43. A major innovation management capability is to stimulate, collect and evaluate
novel ideas produced within the firm. Data collection can identify the use or importance of
the following methods:
knowledge management systems
idea management platforms
employee suggestion schemes
financial and non-financial incentives (awards, promotion) for employees to propose
innovative ideas
delegating decision-making to innovation project managers and innovation staff
involving employee representatives in innovation decisions
actions to identify, promote and motivate key individuals and groups to drive innovation.
5.44. The organisation of innovation activities within the firm includes the development
or modification of an innovation strategy, the establishment or reorganisation of units
within a firm with a responsibility for innovation (for example a research and experimental
development [R&D] department or a design lab), and human resource practices to encourage
innovation throughout the firm.
5.45. Innovation management requires assigning responsibility for innovation within the
firm. Respondents can be asked if responsibility is assigned to a separate department, to
specific individuals (innovation managers), distributed across multiple business functions,
or combined with general management. Innovation activities can be organised within
clearly defined projects (see subsection 4.5.2) to achieve a particular objective, or organised
as non-structured processes. Firms can use more than one method to assign responsibility
or organise their innovation activities.
5.46. Knowledge management supports internal and external knowledge sources and
flows. Data collection on knowledge management practices within the firm can cover
practices or mechanisms to support three knowledge activities: knowledge capture, the
codification of knowledge (which will assist internal knowledge flows), and activities to
promote knowledge sharing within the firm. Some management practices and mechanisms
can be relevant to more than one of these activities.
5.47. Support for co-operation and mutual learning within the firm is a critical part of
knowledge management because innovation typically involves different functional areas within
a firm and requires communication between different people, groups and departments. Data
can be collected on the use of the following methods to support the internal exchange of
innovation-related knowledge and experience:
innovation circles and team work in innovation projects
stimulating informal contacts between employees
joint development of innovation strategies across functional areas
112 │ CHAPTER 5. MEASURING BUSINESS CAPABILITIES FOR INNOVATION
OSLO MANUAL 2018 © OECD/EUROPEAN UNION 2018
exchanging innovation ideas openly across the firm
mutual support across functional areas to address problems in innovation projects
regular meetings of heads of functional areas to discuss innovation issues
mechanisms for iterative and interactive project development and delivery
temporary involvement in innovation projects of personnel from different
functional areas.
5.48. Knowledge flows with external sources (see Chapter 6) can require supporting systems,
institutions and procedures to enable social relationships and networks for identifying and
collecting knowledge from external sources. Firms need to search and evaluate potential
knowledge partners, sources and their offerings; agree on the terms of knowledge purchases
where necessary, and resolve potential disputes (OECD, 2013). Data collection can obtain
information on the enablers of knowledge flows by identifying the internal practices and
channels used by firms to obtain external knowledge or the use of external service providers
such as knowledge brokers for this purpose.
5.49. Good innovation management must allocate scarce resources as effectively and
efficiently as possible. Management methods to meet this objective include:
organisation of innovation activities into dedicated projects with defined objectives,
a budget, time schedule, and manager
systematic evaluation and prioritisation of innovation ideas
use of quantitative methods to assess likely returns from innovation ideas
choice of methods to allocate resources to innovation activities, e.g. stepwise
depending on progress made (e.g. stage-gate processes) or all-at-once
offering incentives for stopping or revising unsuccessful innovation activities
stopping innovation activities before completion if they do not meet certain objectives.
5.50. The collection of data on the number of innovation projects that have been
successfully completed and those that have been stopped before completion, as proposed
in subsection 4.5.2, can provide additional relevant information on resource allocation to
innovation activities (see Klingebiel and Rammer, 2014).
5.51. Innovation management practices that demonstrate a commitment to innovation
can contribute to the establishment and maintenance of an innovation culture, defined as
the behaviours, values and beliefs with regard to innovation that are shared by a firm’s
personnel. The characteristics of a supportive innovation culture can include open-
mindedness, willingness to change, diversity, collaboration, and learning from failure. Data
can be collected on the following practices for building a supportive culture:
communicating the importance of innovation, including the innovation vision
and strategy
allowing time and resources for innovation activities and providing supporting tools
and methods
recognising innovators and innovation results
training employees on how to engage in innovation
assessing innovation performance using dedicated innovation indicators.

CHAPTER 5. MEASURING BUSINESS CAPABILITIES FOR INNOVATION │ 113
OSLO MANUAL 2018 © OECD/EUROPEAN UNION 2018
5.52. Identifying and evaluating external knowledge (see Chapter 6) is a key element of
innovation management for developing absorptive capacity (Cohen and Levinthal, 1990).
Managers can support the sourcing of external knowledge through:
regular, systematic communication with customers, suppliers and other organisations
along a firm’s value chain to identify opportunities and needs for innovation
regular, systematic screening of the firm’s knowledge environment (e.g. through patent
searches, attending trade fairs, reading trade or scientific journals, or web searches)
entering into alliances, joint ventures or strategic co-operation with other organisations
in order to access external knowledge
support for innovation contests or crowdsourcing to provide ideas for solving
innovation problems.
5.53. The first two methods in the above list are relevant to all firms regardless of their
innovation status.
5.54. Firms can benefit from the results of their innovation activities through innovations
and other methods of exploiting the knowledge assets produced by these activities. These
other methods include:
protecting intellectual assets generated by innovation activities through formal and
informal mechanisms
licensing-out knowledge to external organisations
transferring knowledge to external partners
exploring alternative applications for their knowledge.
5.55. Assessing innovation results and learning from past innovation can help maximise
the returns from innovation activities. Learning and assessment is supported by the development
and use by firms of indicators to monitor and evaluate innovation inputs, outputs and
performance. Activities to document innovation activities or projects, for example in databases,
can enable learning from experience and support future innovation activities or projects.
5.3.5. Intellectual property management and appropriation
5.56. The World Intellectual Property Organization defines intellectual property (IP) as
creations of the mind, comprising inventions; literary and artistic works; and symbols,
names and images used in commerce (WIPO, 2004). The management of IP and associated
IP rights includes strategic decisions for the application and registration processes as well
as the types of IP rights use. Data collection can cover both the use of specific types of IP
and the importance of different types of IP and other strategies for capturing economic
value from innovations (appropriation).
5.57. Table 5.1 provides an overview of different IP rights, what they protect, application
requirements, and the relevant jurisdiction for obtaining a right. The act of application or
registration represents disclosure, initially to the managing authority and subsequently to
the public. As a result, IP registration is an indicator of outbound knowledge flows.
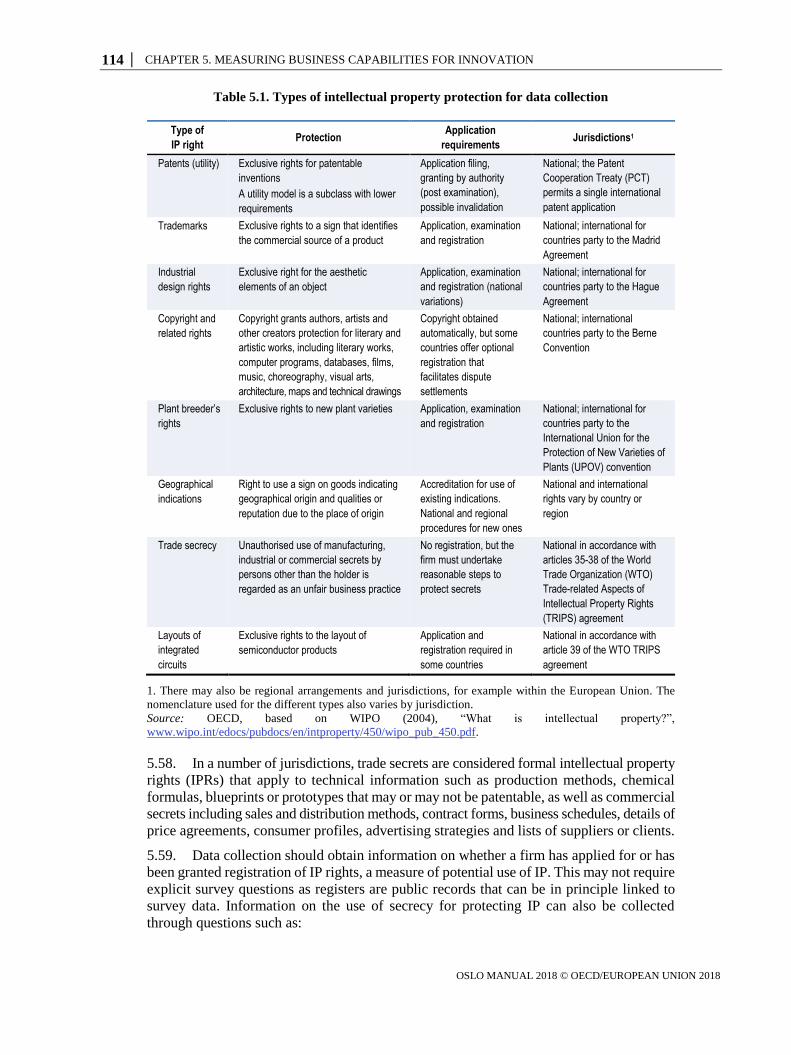
114 │ CHAPTER 5. MEASURING BUSINESS CAPABILITIES FOR INNOVATION
OSLO MANUAL 2018 © OECD/EUROPEAN UNION 2018
Table 5.1. Types of intellectual property protection for data collection
Type of
IP right Protection
Application
requirements Jurisdictions1
Patents (utility) Exclusive rights for patentable
inventions A utility model is a subclass with lower
requirements
Application filing,
granting by authority
(post examination),
possible invalidation
National; the Patent
Cooperation Treaty (PCT)
permits a single international
patent application
Trademarks Exclusive rights to a sign that identifies
the commercial source of a product
Application, examination
and registration
National; international for
countries party to the Madrid
Agreement Industrial
design rights
Exclusive right for the aesthetic
elements of an object
Application, examination
and registration (national
variations)
National; international for
countries party to the Hague
Agreement Copyright and
related rights
Copyright grants authors, artists and
other creators protection for literary and
artistic works, including literary works,
computer programs, databases, films,
music, choreography, visual arts,
architecture, maps and technical drawings
Copyright obtained
automatically, but some
countries offer optional
registration that
facilitates dispute
settlements
National; international
countries party to the Berne
Convention
Plant breeder’s
rights
Exclusive rights to new plant varieties Application, examination
and registration
National; international for
countries party to the
International Union for the
Protection of New Varieties of
Plants (UPOV) convention Geographical
indications
Right to use a sign on goods indicating
geographical origin and qualities or
reputation due to the place of origin
Accreditation for use of
existing indications.
National and regional
procedures for new ones
National and international
rights vary by country or
region
Trade secrecy Unauthorised use of manufacturing,
industrial or commercial secrets by
persons other than the holder is
regarded as an unfair business practice
No registration, but the
firm must undertake
reasonable steps to
protect secrets
National in accordance with
articles 35-38 of the World
Trade Organization (WTO)
Trade-related Aspects of
Intellectual Property Rights
(TRIPS) agreement Layouts of
integrated
circuits
Exclusive rights to the layout of
semiconductor products
Application and
registration required in
some countries
National in accordance with
article 39 of the WTO TRIPS
agreement
1. There may also be regional arrangements and jurisdictions, for example within the European Union. The
nomenclature used for the different types also varies by jurisdiction.
Source: OECD, based on WIPO (2004), “What is intellectual property?”,
www.wipo.int/edocs/pubdocs/en/intproperty/450/wipo_pub_450.pdf.
5.58. In a number of jurisdictions, trade secrets are considered formal intellectual property
rights (IPRs) that apply to technical information such as production methods, chemical
formulas, blueprints or prototypes that may or may not be patentable, as well as commercial
secrets including sales and distribution methods, contract forms, business schedules, details of
price agreements, consumer profiles, advertising strategies and lists of suppliers or clients.
5.59. Data collection should obtain information on whether a firm has applied for or has
been granted registration of IP rights, a measure of potential use of IP. This may not require
explicit survey questions as registers are public records that can be in principle linked to
survey data. Information on the use of secrecy for protecting IP can also be collected
through questions such as:
CHAPTER 5. MEASURING BUSINESS CAPABILITIES FOR INNOVATION │ 115
OSLO MANUAL 2018 © OECD/EUROPEAN UNION 2018
if the firm required any other parties to sign confidentiality agreements
if the firm required any employees to sign non-compete agreements
if the firm has taken other active steps to maintain secrecy.
5.60. Testing shows that questions on IP rights can be sensitive for firms and should
therefore be carefully designed to avoid non-response. Data on the importance of each type
of IP right or strategy can be collected at the same time as data on the use of each type of
IP. As there are multiple reasons for using IP, including for protection against copying, use
in cross-licensing, to sell, etc.; importance should be defined in a way that captures the
importance of each method for appropriating the value of innovations. To place IP in
context, questions on appropriation should also ask about the importance of:
technical complexity of goods or services in preventing imitation by competitors
use of lead time advantages (rapid introduction of product or business processes)
to stay ahead of competitors
establishing and maintaining good relationships with other firms in a value chain.
5.4. Workforce skills and human resource management
5.61. People are the most important resource for innovation as they are the source of
creativity and new ideas. The design, development and implementation of innovations
require a variety of skills and the co-operation of different individuals. Data on the skill
levels of a firm’s workforce and on how a firm organises its human resources (including
how it attracts and retains talent) are therefore critical for understanding innovation activities
and innovation outcomes. Data on workforce skills and human resource management are
also important for analysing the role of labour markets, education, and human resources for
innovation (see subsection 7.4.3).
5.4.1. Workforce qualifications, occupational structure and competences
5.62. A key indicator for workforce skills is the composition of the workforce by levels
of educational attainment. A simple but informative measure is the share of employed persons
with tertiary education. It is recommended to collect this information from all firms, regardless
of their innovation status. Tertiary education should be defined using the respective
International Standard Classification of Education (ISCED) levels (levels 5 to 8 in the
ISCED 2011 classification; see UNESCO/UIS, 2012). In addition, it is useful to obtain the
share of employed persons with tertiary education by field of education and training
according to the ISCED-F 2013 classification (UNESCO/UIS, 2015), with a focus on:
natural sciences, mathematics and statistics
engineering (including manufacturing and construction)
health and medicine
information and communication technology (ICT)
media and design.
5.63. If business records allow, more detailed breakdowns can separate between different
ISCED attainment levels and fields of education and training. Detailed breakdowns are
particularly useful for analysing combinations of skills within a firm and their links
to innovation.
116 │ CHAPTER 5. MEASURING BUSINESS CAPABILITIES FOR INNOVATION
OSLO MANUAL 2018 © OECD/EUROPEAN UNION 2018
5.64. In addition to tertiary education, the workforce composition by occupational status is
another important dimension contributing to innovation capability. Occupations are characterised
by a combination of attributes relating to tasks, work activities, knowledge requirements,
technology and broader skills, and personal abilities and values. For international comparability,
occupational categories should use the International Labour Organization’s (ILO) International
Standard Classification of Occupations (ISCO-08; see ILO, 2012), which includes ten major
occupational groups (although not all groups may be required for data collection). Alternatively,
a national classification system that is comparable to the ILO classification can be used.
5.65. In addition to data on the qualifications and occupational status of the workforce,
the share of the workforce with completed vocational training is another useful indicator.
Indicators of workforce experience and tenure within the firm can also provide relevant
information for research on the incidence and impacts of innovation. Data on workforce
qualifications and occupations can be obtained through surveying managers or, where
possible, through linkage to other sources that contain relevant data.
5.66. The diversity of a firm’s workforce can influence innovation performance. As
innovation activities usually involve communication and interaction among employees,
diversity can both stimulate and hamper the exchange of knowledge (see Østergaard,
Timmermans and Kristinsson, 2011). Relevant dimensions of employee diversity include
age, gender, nationality, and sociocultural background. Collecting detailed data on more
than a few dimensions of employee diversity through innovation surveys is generally
unfeasible. Research on the effect of diversity on innovation often requires linked employer-
employee surveys or the ability to link firm-level data with employee-level data. Collecting
workforce-level information from firms requires business respondents to have access to
detailed information on personnel.
5.67. In addition to formal qualifications, a wide range of skills and competences can
play an important role in innovation. An example of a survey that captures skills among
the adult population is the OECD Programme for the International Assessment of Adult
Competencies (PIAAC). There are different possible models for capturing various facets
of skills. For instance, the O*NET occupational content model (incorporating tasks, skills,
knowledge requirements, and values) identifies the following workforce characteristics of
potential relevance to innovation (O*NET, 2018):
enduring attributes of workforce members that influence performance, such as:
o cognitive abilities, in particular idea generation and reasoning abilities of
the workforce
o adaptability and flexibility towards change.
workforce capacities that facilitate performance of activities that occur across
different jobs such as:
o social skills, to work with people to achieve goals
o complex problem-solving skills, to solve novel, ill-defined problems in complex,
real-world settings
o technical skills, to design, set up, operate, and correct malfunctions involving
machines or technological systems
o systems skills, to understand, monitor, and improve sociotechnical systems
work values and styles, such as those related to entrepreneurialism, teamwork,
creativity and autonomy.
CHAPTER 5. MEASURING BUSINESS CAPABILITIES FOR INNOVATION │ 117
OSLO MANUAL 2018 © OECD/EUROPEAN UNION 2018
5.68. Relevant data on skills and competences include measures of the presence of these
skills in a workforce or the importance of these skills to a firm’s business strategy.
5.4.2. Human resource management
5.69. Human resource management practices can influence the ability of a firm to profit
from the creative potential and skills of its workforce. Many of these practices can benefit
both innovation and other goals. Human resource management practices that can benefit
innovation activities include:
employee recruitment policies that seek creative skills
training and skills development (see subsection 4.2.5)
appraisals and incentives for employee performance in suggesting ideas for innovation
(see subsection 5.3.4 above) or in developing innovations
promotion and career development opportunities.
5.70. Other human resource management policies can indirectly improve innovation
outcomes by increasing employee satisfaction and loyalty, such as flexibility in working
hours and places (flexi time, home office, sabbatical) and social initiatives (family-friendly
policies). Firms can be asked about the presence of these policies and the share of employees
that benefit from these schemes.
5.5. Technological capabilities
5.71. The novelty or improved characteristics of an innovation are often due to the use
of new or modified technology. At the same time, the accumulated innovation activities of
one or more actors can advance knowledge within specific technological domains, creating
new markets and opportunities for innovation. The ability of a firm to take advantage of
these opportunities will depend on its technological capabilities within relevant domains.
5.72. In its broadest sense, “technology” is defined as the state of knowledge on how to
convert resources into outputs (OECD, 2018). This includes the practical use and application
to business processes or products of technical methods, systems, devices, skills and practices.
Technological knowledge can be applied to transform the functional or experiential
characteristics of goods, services and business processes. Technological capabilities include
knowledge about these technologies and how to use them, including the ability to advance
technologies beyond the state of the art. The latter is typically associated with R&D
activities, although it is possible for new techniques to be developed in the absence of
systematic R&D efforts.
5.73. Three types of technological capabilities are of particular interest to potential users
of innovation data: technical expertise, design capabilities, and capabilities for the use of
digital technologies and data analytics.
5.74. Technical expertise consists of a firm’s knowledge of and ability to use technology.
This knowledge is derived from the skills and qualifications of its employees, including its
engineering and technical workforce, accumulated experience in using the technology, the
use of capital goods containing the technology, and control over the relevant IP.
5.75. Design capabilities are difficult to define in a way that is consistently understood
by all types of firms across different countries. For the purposes of this manual, design is
defined (following the Frascati Manual) as an innovation activity “aimed at planning and
118 │ CHAPTER 5. MEASURING BUSINESS CAPABILITIES FOR INNOVATION
OSLO MANUAL 2018 © OECD/EUROPEAN UNION 2018
designing procedures, technical specifications and other user and functional characteristics
for new products and business processes” (OECD, 2015a: § 2.62).
5.76. Capabilities related to digital technologies and data analytics are part of a firm's
technical expertise. These are specifically singled out because of the enabling, general-
purpose nature of digital technologies and data analytics.
5.5.1. Technical expertise
5.77. Surveys can collect generic information on a firm's degree of technical expertise by
asking respondents if their firm engaged in the following activities:
acquiring technology embodied in objects (machinery, equipment, software) from
other firms or organisations
acquiring IP rights that give ownership, exclusion rights or rights to use technical
knowledge (see subsection 6.3.6)
modifying or adapting existing technology to the firm’s specific needs
developing new technology in-house.
5.78. A similar question structure for inbound knowledge flows is used in Table 6.2.
5.79. An alternative method for obtaining generic data on technical expertise is to ask
respondents if their firm conducts in-house R&D, and if so, if R&D is performed continuously
(permanent staff for R&D) or only occasionally (when needed). It is recommended that
surveys collect data on continuous or occasional in-house R&D activities as a basic proxy
indicator of technical expertise (see subsection 4.3.2).
Expertise with emerging and enabling technologies
5.80. There is considerable policy interest in the ability of firms to use or develop
emerging and enabling technologies, particularly those with applications across multiple
industries. In the past, areas of policy interest included the use of biotechnology, advanced
manufacturing methods, nanotechnology and ICTs and applications. More recent areas of
interest are quantum computing, artificial intelligence (AI) and robotics, as well as Internet-
based applications such as cloud services and big data analytics.
5.81. Expertise with emerging technologies can be measured through an open question
or through a checklist of specified technologies.
5.82. In the first method, respondents are given an open question and asked to specify new
technologies that are important for their firm, and describe their level of expertise with each
technology. The results can be compared to an existing list of technologies of interest or used
to construct a data-driven taxonomy. The principal disadvantage of this method is that it
might elicit responses covering many established technologies of limited interest to policy.
5.83. In the second method, respondents are given a predefined checklist of technologies
and asked if they use each one. Questions on use can distinguish between the ability to use
a technology in the firm’s operations and the ability to further develop or modify the
technology. This method has been used in surveys on the use of advanced manufacturing
and services technologies, including surveys on the use of biotechnology, nanotechnology,
and other enabling and emerging technologies such as robotics, photonics, AI and machine
learning (Statistics Canada, 2016). It is also used in dedicated surveys of ICT usage that
focus on the uptake of ICT technologies in business processes (OECD 2015b).
CHAPTER 5. MEASURING BUSINESS CAPABILITIES FOR INNOVATION │ 119
OSLO MANUAL 2018 © OECD/EUROPEAN UNION 2018
5.84. The second method needs to provide:
Completeness by covering all emerging technologies that may be relevant to the
target business population. The optimal list of relevant technologies is likely to
differ between services and manufacturing firms and also within specific service or
manufacturing industries.
Clarity and accuracy such that respondents can recognise the listed technologies
and can accurately identify those used by their firm. This requires a “don’t know”
option because many technologies are likely to be unfamiliar to a high percentage
of respondents.
Relevance to data users, which requires capturing emerging technologies while
excluding technologies that have been widely adopted. This means that a list of
emerging technologies needs to be continually updated.
5.85. The disadvantage of the second method is that many emerging technologies are only
relevant to a limited number of industries and consequently only a very small percentage
of firms are likely to be active in developing or using the technology.
5.86. It is not recommended to include a checklist for the use or development of emerging
technologies in the core section of a general innovation survey because these questions will
take up considerable questionnaire space while obtaining little information for a large
majority of firms. Technology checklists aimed for use in representative business surveys,
for example as ad hoc modules in innovation surveys, should focus on more widely
diffused technologies with a broad range of applications.
5.87. A feasible alternative for online innovation surveys is to target questions on the use
of emerging technologies, or technologies with specialised applications to firms that are
likely to use them. For instance, questions on the use of biotechnology could be sent only
to firms in industries known to use biotechnology, while questions on the use of AI could
be sent only to firms in information technology (IT)-intensive industries.
5.88. Another method of identifying technical expertise in emerging technologies is to
analyse publicly available patent application data, which contain information on the
technological fields of relevance to the invention as well as unstructured information on
the nature of the claims (OECD, 2009). Patent data can be merged with other firm data,
using information in the patent application on the name and address of inventors and
assignees. A limitation with patent data is that it misses firms that only apply existing
technologies to their operations, without engaging in technological development that leads
to a patentable invention. In addition, not all technological development activities result in
patentable inventions and firms do not seek patent protection for all of their inventions.
5.5.2. Design capabilities
5.89. Design capabilities can be subdivided into three categories that are defined both by
their skill sets and purpose:
1. engineering design, including technical specifications, tooling up and prototype
construction
2. product design that determines the shape, colour or pattern of objects, the interface
between software and users, or the user experience of services
3. design thinking, which is a systematic methodology for approaching the design of
a good, service or system.
120 │ CHAPTER 5. MEASURING BUSINESS CAPABILITIES FOR INNOVATION
OSLO MANUAL 2018 © OECD/EUROPEAN UNION 2018
5.90. Engineering design and product design often overlap, but the former can be part of
R&D, while the latter focuses on the user experience and is often conducted within a design
department, design lab, or outsourced to a design consultancy.
5.91. A firm's design capabilities can be measured by identifying personnel with design-
relevant responsibilities (occupations) or skills. These occupations or skills are relevant to
both engineering and product design and are expected to score highly across some of the
following dimensions:
knowledge and skills of design techniques, tools, and principles used in computer-
aided design, technical drawings, the construction of models, and rendering
the practical application of engineering science and technology (e.g. applying
principles, techniques, procedures, and equipment to the design and production of
goods and services)
problem-solving and critical thinking skills that use evidence, logic and reasoning
to identify the strengths and weaknesses of alternative solutions, conclusions or
approaches to problems
ability to come up with novel or creative solutions for a given topic or situation, or
to develop creative ways to solve a problem
skills for evaluating the feasibility of design ideas, based on factors such as customer
usability, appearance, safety, function, serviceability, budget, production costs/methods,
and market characteristics and trends
skills in conferring with customers and with engineering, marketing, production, or
sales personnel.
5.92. Collecting data on the presence of a design department can fail to capture design
capabilities in small firms or service sector firms that do not perform design activities as a
separate, distinct activity, since these firms can combine design activities with other business
functions. Workforce design capabilities can be identified by asking respondents about the
presence and importance of the design-relevant skills listed above. The importance of
formal qualifications and accreditation may vary according to the application area of design
(e.g. within engineering) and practical experience levels.
5.93. Similar to the use of patents to measure technical expertise, publicly available data
on design registrations can be used to identify some design activities. Design rights protect
the shape, colour or pattern of objects. Hence they cover only one aspect of design use in a
firm, with a focus on tangible goods. National as well as international intellectual property
organisations such as the European Union Intellectual Property Office (EUIPO) offer IPRs
for designs. Data on registered designs can be linked to other firm-level data, provided that
the name and address of firms are available for other data sources. Designs can also be
protected by means other than registered design rights, such as copyrights, or patents when
the design incorporates functional performance features.
Design thinking
5.94. Design thinking is a systematic methodology for the design process that uses design
methods to identify needs, define problems, generate ideas, develop prototypes and test
solutions. It can be used for the design of systems, goods, and services (Brown, 2008).
5.95. The use of design thinking often does not meet the novelty and uncertainty
requirements of R&D. However, collecting data on design thinking is of value to policy
CHAPTER 5. MEASURING BUSINESS CAPABILITIES FOR INNOVATION │ 121
OSLO MANUAL 2018 © OECD/EUROPEAN UNION 2018
because the methodology can support the innovation activities of both service and
manufacturing firms, resulting in improvements to competitiveness and economic outcomes.
5.96. Measuring design thinking is difficult because there are several methodologies with
similar aims and because design methods can be used without adopting a systematic design
thinking methodology. Respondents can be asked if their firm uses specific methods that
are commonly used as part of design thinking activities such as:
divergent idea generation or brainstorming
techniques to develop an understanding of the customer experience, particularly
ethnographic field research methods (observing how people use a product in real-
world environments, developing an empathetic understanding of what users want
in a product, etc.)
co-design or co-creation (involvement of potential users in generating design concepts)
prototyping and testing.
5.97. In addition to ethnographic methods for understanding user experiences, firms can
use other methods to obtain information from actual or potential users of goods and
services. This information can initiate or supplement design activities, for instance by
identifying opportunities and problems in relation to new or existing goods or services.
Data collection can ask about the following methods for obtaining information from users:
feedback from sales or marketing personnel
evaluation of user initiated reports of their experiences with a product (social media,
online reviews and comments, etc.)
structured data collection (feedback forms, dedicated user surveys, focus groups).
5.98. Examples of questions on user-engagement capabilities and practices can be found
in the innovation surveys implemented by Statistics Denmark and Statistics Finland
(Kuusisto, Niemi and Gault, 2014).
5.99. The importance of design capabilities to a firm’s business strategy can be identified
through questions that position a firm on a “Design Ladder”, a concept developed by the
Danish Design Centre (Galindo-Rueda and Millot, 2015; Galindo-Rueda and Van Cruysen,
2016). It is recommended to collect this data, using the following four categories:
no design activity at all
design is used to develop the aesthetic form or style of goods and services, but
design activities are not conducted on a systematic basis
design thinking methods are integrated into the product development process
design is a key strategic element of the firm’s business model.
5.100. The use of questions on design capabilities should be preceded by a description of
product design and design thinking (see above) because of national and linguistic differences
in how respondents understand the concept of design.
5.5.3. Capabilities related to digital technologies and data analytics
5.101. Digital technologies comprise electronic tools, systems, devices and resources that
generate, store, process, exchange or use digital data. Digitisation is the conversion of an
122 │ CHAPTER 5. MEASURING BUSINESS CAPABILITIES FOR INNOVATION
OSLO MANUAL 2018 © OECD/EUROPEAN UNION 2018
analogue signal conveying information (e.g. sound, image, printed text) to binary bits.
Digitalisation is the application or increase in use of digital technologies by an organisation,
industry, country, etc., for example transforming existing tasks or enables new ones. This
concept thus refers to how digitisation affect the economy or society.
5.102. Digitalisation provides a wealth of innovation opportunities for firms (OECD,
2017). Capabilities to manage digital technologies, to generate, access, link, process and
analyse data, including the use of AI, and to exploit new ICT-enabled applications can be
crucial for harnessing these innovation opportunities. The digital skills of the workforce
are particularly relevant in this context.
5.103. A starting point for capturing the digital capabilities of firms is to collect data on
the use of different digital technologies, including computer infrastructure (server technologies),
AI, Internet-connected devices, automation, mobile communication technologies, cloud
computing, the use of digital technologies for collaboration, communication and value exchange
(e.g. through social media), and digital technologies for planning and management (e.g. enterprise
resource planning, customer relationship management) or distributed ledgers (blockchain).
5.104. Data collection should also obtain data on a firm's capabilities for using digital
technologies. Measures include the existence of a separate IT department, the size of the
firm’s annual IT budget (both for hardware and software), the prevalence of digital skills
among the workforce (e.g. software programming skills, database skills, computer engineering
skills), the sales generated from e-commerce, and if a firm has an IT strategy or a digital
strategy. It is also worthwhile to obtain data on the importance or centrality of digital
capabilities to a firm’s general strategy and leadership.
5.105. A common feature of digital technologies is their potential to connect various
business activities and business functions, forming an integrated system with structured
data exchanges among different functions and units. Data on the digital integration of
different business functions (production/delivery of services, logistics, marketing/sales,
product development, administration) and digital connections with suppliers and customers
can provide valuable information on the state of digital capabilities and usage in a firm.
5.106. An increasingly critical capability in the digital age is the use of pervasive, large
data sources and tools for business intelligence purposes. Digital technologies allow firms
to generate and store huge amounts of data (often in real time) on a range of business
operations, both within the firm and related to suppliers and users. These data are an
increasingly important source for the development of business strategies, business models,
products and business processes. Measures of these capabilities can be obtained through
questions on the use of data analytic methods and tools, either in-house or through acquiring
data analytics services externally: database management systems, data mining tools, machine
learning, data modelling, predictive analytics, user behaviour analysis, and real time data analysis.
5.107. Digital-based innovations include product or business process innovations that
contain ICTs, as well as innovations that rely to a significant degree on ICTs for their
development or implementation. Qualitative studies find that digital-based innovations are
widespread, with respondents noting their use in a very high share of innovations in all
industries (OECD, 2015b). For this reason, there is little value in identifying innovations
that contain or were developed through the use of digital technologies. Instead, data collection
should obtain information on the digital competences of firms as a key component of their
innovation capabilities.
CHAPTER 5. MEASURING BUSINESS CAPABILITIES FOR INNOVATION │ 123
OSLO MANUAL 2018 © OECD/EUROPEAN UNION 2018
5.108. Digital competence is a multi-faceted construct that captures the ability of a firm to
benefit from digitalisation and address associated challenges. Some relevant dimensions of
digital competence include indicators of:
digital integration within and across different business functions
access to and ability to use data analytics to design, develop, commercialise and
improve products, including data about the users of the firm’s products and their
interactions with such products
access to networks and the use of appropriate solutions and architectures (hardware
and software)
effective management of privacy and cybersecurity risks
adoption of appropriate business models for digital environments, such as e-commerce,
participative platforms, etc.
5.109. These indicators can refer to managerial and general workforce skills, infrastructures
and practices within the firm.
5.110. Digital platforms are a distinguishing feature of the digital age. Platforms integrate
producers and users at various stages of the value chain. They often form an ecosystem in
which new products are developed and sold, and data generated and exchanged. Data on
the participation of firms in digital platforms and the position of firms in these platforms
(whether or not a firm owns the platform or controls who may enter, the information shared
on the platform, etc.) can provide information on the firm’s potential to leverage the
business opportunities of digital technologies. Digital platform activities are also discussed
in subsection 7.4.4.
5.111. Dedicated ICT surveys (OECD, 2015b) are the main instrument for collecting data
on ICT use by firms. The most cost-effective option that also reduces response burden is to
link data on digital capabilities and usage from ICT surveys with data from innovation
surveys. If no dedicated ICT surveys are conducted in a country, or if data linkage is not
possible, innovation surveys can opt to directly collect data on the use of digital technologies.
The challenge is to identify a relevant list of current and emerging technologies, while
excluding technologies that are used by almost all firms at the time of the survey (see
subsection 5.5.1).
5.6. Summary of recommendations
5.112. This chapter covers a large number of business capabilities of relevance to
innovation. Recommended data collection for general innovation surveys are divided into
key and supplementary indicators. Key indicators should be collected whenever possible,
while supplementary ones should only be collected if relevant to data users and if resources
permit. Of note, some of these indicators are either available in administrative sources (such
as IP registers) or collected in ICT or other surveys, and may be obtained through data
linkage at the level of the firm. Data on other capabilities discussed in this chapter could
be collected through ad hoc modules in innovation surveys, specialised surveys, pilot
studies, or using experimental methods from unconventional sources.
5.113. Key indicators for general data collection include:
number of employed persons (full-time equivalents) (subsection 5.2.1)
total turnover (subsection 5.2.1)
124 │ CHAPTER 5. MEASURING BUSINESS CAPABILITIES FOR INNOVATION
OSLO MANUAL 2018 © OECD/EUROPEAN UNION 2018
firm age by year the firm began business activities (subsection 5.2.3)
firm ownership status (stand-alone, part of a national group, part of a multinational
group) (subsection 5.2.4)
geographical distribution of sales (local, national, international markets) (subsection 5.3.1)
export share of sales (subsection 5.3.1)
importance of cost versus quality for the firm’s competitive strategy (subsection 5.3.1)
share of employed persons with a tertiary education (subsection 5.4.1)
level of design capability (subsection 5.5.2).
5.114. Supplementary indicators for general data collection (given space or resources):
family-owned firm status (subsection 5.2.4)
number of product lines (subsection 5.3.1)
innovation management: responsibility for innovation within the firm (subsection 5.3.4)
innovation management: methods to support internal knowledge exchange
(subsection 5.3.4)
number of employed persons by major field of education (subsection 5.4.2)
technical expertise in emerging technologies (subsection 5.5.1)
digital competences (may be collected through dedicated ICT surveys) (subsection 5.5.3).
References
Australian Bureau of Statistics (2016), “Business Characteristics Survey Management Capabilities
Module 2015-16”, Australian Bureau of Statistics, Canberra.
Bloom, N. and J. Van Reenen (2010), “Why do management practices differ across firms and
countries?”, Journal of Economic Perspectives, Vol. 24/1, pp. 203-224.
Bloom, N. and J. Van Reenen (2007), “Measuring and explaining management practices across
countries”, The Quarterly Journal of Economics, Vol. 122/4, pp. 1351-1408.
Brown, T. (2008), “Design thinking”, Harvard Business Review, June, pp. 84-92,
https://hbr.org/2008/06/design-thinking.
Cohen, W.M. and S. Klepper (1996), “Firm size and the nature of innovation within industries: The case
of process and product R&D”, The Review of Economics and Statistics, Vol. 78/2, The MIT Press,
pp. 232-243.
Cohen, W.M. and D.A. Levinthal, (1990), “Absorptive capacity: A new perspective on learning and
innovation”, Administrative Science Quarterly, Vol. 35/1, pp. 128-152.
Eurostat/OECD (2007), Eurostat-OECD Manual on Business Demography Statistics, OECD, Paris,
www.oecd.org/sdd/39974460.pdf.
Galindo-Rueda, F. and V. Millot (2015), “Measuring design and its role in innovation”, OECD Science,
Technology and Industry Working Papers, No. 2015/01, OECD Publishing, Paris,
https://doi.org/10.1787/5js7p6lj6zq6-en.
CHAPTER 5. MEASURING BUSINESS CAPABILITIES FOR INNOVATION │ 125
OSLO MANUAL 2018 © OECD/EUROPEAN UNION 2018
Galindo-Rueda, F. and A. Van Cruysen (2016), “Testing innovation survey concepts, definitions and
questions: Findings from cognitive interviews with business managers”, OECD Science, Technology
and Innovation Technical Papers, OECD Publishing, Paris, http://oe.cd/innocognitive.
Helfat, C.E. and J.A. Martin (2015), “Dynamic managerial capabilities: Review and assessment of
managerial impact on strategic change”, Journal of Management, Vol. 41/5, pp. 1281-1312.
Helfat, C.E. et al. (2007), Dynamic Capabilities: Understanding Strategic Change in Organizations,
Blackwell Publishing, Oxford.
Huergo, E. and J. Jaumandreu (2004), “Firms’ age, process innovation and productivity growth”,
International Journal of Industrial Organization, Vol. 22/4, pp. 541-559.
ILO (2012), International Standard Classification of Occupations: ISCO-08, International Labour
Organization, Geneva, www.ilo.org/public/english/bureau/stat/isco/index.htm.
Klingebiel, R. and C. Rammer (2014), “Resource allocation strategy for innovation portfolio
management”, Strategic Management Journal, Vol. 35/2, pp. 246-268.
Kuusisto, J., M. Niemi and F. Gault (2014), “User innovators and their influence on innovation activities
of firms in Finland”, UNU-MERIT Working Papers, No. 2014-003, United Nations University -
Maastricht Economic and Social Research Institute on Innovation and Technology (MERIT),
Maastricht, www.merit.unu.edu/publications/wppdf/2014/wp2014-003.pdf.
OECD (2018), OECD Glossary of Statistical Terms, OECD, Paris,
https://stats.oecd.org/glossary/detail.asp?ID=2692 (accessed on 2 August 2018).
OECD (2017), OECD Digital Economy Outlook 2017, OECD Publishing, Paris,
https://doi.org/10.1787/9789264276284-en.
OECD (2015a), Frascati Manual 2015: Guidelines for Collecting and Reporting Data on Research and
Experimental Development, The Measurement of Scientific, Technological and Innovation Activities,
OECD Publishing, Paris, http://oe.cd/frascati.
OECD (2015b), The OECD Model Survey on ICT Usage by Businesses: 2nd Revision, Working Party on
Measurement and Analysis of the Digital Economy, OECD, Paris, www.oecd.org/sti/ieconomy/ICT-
Model-Survey-Usage-Businesses.pdf.
OECD (2013), “Knowledge networks and markets”, OECD Science, Technology and Industry Policy
Papers, No. 7, OECD Publishing, Paris, https://doi.org/10.1787/5k44wzw9q5zv-en.
OECD (2009), OECD Patent Statistics Manual, OECD Publishing, Paris,
https://doi.org/10.1787/9789264056442-en.
O*NET (2018), The O*NET® Content Model, https://www.onetcenter.org/content.html (accessed on
2 August 2018).
Østergaard, C., B. Timmermans and K. Kristinsson (2011), “Does a different view create something
new? The effect of employee diversity on innovation”, Research Policy, Vol. 40/3, pp. 500-509.
Statistics Canada (2016), Survey of Advanced Technology, Statistics Canada,
www.statcan.gc.ca/eng/survey/business/4223.
UNESCO/UIS (2015), International Standard Classification of Education: Fields of Education and
Training 2013 (ISCED-F 2013), UNESCO/UNESCO Institute for Statistics, Montreal,
http://unesdoc.unesco.org/images/0023/002350/235049e.pdf.

126 │ CHAPTER 5. MEASURING BUSINESS CAPABILITIES FOR INNOVATION
OSLO MANUAL 2018 © OECD/EUROPEAN UNION 2018
UNESCO/UIS (2012), International Standard Classification of Education: ISCED 2011, UNESCO/UNESCO
Institute for Statistics, Montreal, http://uis.unesco.org/sites/default/files/documents/international-
standard-classification-of-education-isced-2011-en.pdf.
US Census Bureau (2018), Survey of Business Owners (SBO),
www.census.gov/econ/overview/mu0200.html (accessed on 2 August 2018).
WIPO (2004), “What is intellectual property?”, WIPO Publications, No. 450(E), World Intellectual
Property Organization, Geneva, www.wipo.int/edocs/pubdocs/en/intproperty/450/wipo_pub_450.pdf.
CHAPTER 6. BUSINESS INNOVATION AND KNOWLEDGE FLOWS │ 127
OSLO MANUAL 2018 © OECD/EUROPEAN UNION 2018
Chapter 6. Business innovation and knowledge flows
Knowledge is one of the most strategically significant resources for firms. How it is
accessed and deployed is particularly important for firms engaged in innovation activities.
This chapter focuses on the measurement of knowledge flows and exchanges between firms
and other actors in the innovation system. It describes the conceptual framework underpinning
knowledge exchange, diffusion and open innovation. This framework is used as the basis
for recommendations on how to measure inbound and outbound knowledge flows, internal
and external sources of knowledge for innovation, innovation collaboration partners, as
well as enablers and barriers to knowledge flows. Specific recommendations are provided
on capturing knowledge-based linkages between firms and higher education and public
research institutions.
128 │ CHAPTER 6. BUSINESS INNOVATION AND KNOWLEDGE FLOWS
OSLO MANUAL 2018 © OECD/EUROPEAN UNION 2018
6.1. Introduction
6.1. Knowledge is one of the most strategically significant resources for firms. How it
is accessed and deployed is particularly important for firms directly or indirectly engaged
in innovation activities (see subsection 2.2.2). Knowledge flows encompass the deliberate
and accidental transmission of knowledge. Knowledge exchange (sometimes referred to in
a narrower context as knowledge transfer) is the deliberate transmission of knowledge from
one entity to another (OECD, 2013).
6.2. Interest in knowledge flows stems from the observation that knowledge is generated,
distributed and used by multiple actors of an innovation system, such as firms, universities,
public research institutions (PRIs), customers as users of product innovations, and individuals.
Firms draw on external sources of knowledge for their innovation activities (Chesbrough.
2003; Dahlander and Gann, 2010). Information can also be exchanged, but it is not useful
unless it is understood and turned into knowledge.
6.3. Firms can source knowledge within their organisational boundaries, as well as from
outside including from their key customers, investors, known experts, and other groups that
are potential new sources of knowledge (Enkel, 2010).
6.4. The factors that support knowledge flows and the formation of knowledge networks
have changed due to new technology and business models. Digital information and
communication technologies have substantially reduced the cost of copying, storing and
distributing data and information, enabling pecuniary and non-pecuniary models for sourcing
and exploiting knowledge. New methods and platforms for obtaining knowledge and other
innovation inputs from diverse sources have emerged, such as crowdsourcing ideas and
solutions to problems (e.g. through inducements such as prizes, awards, tournaments,
hackathons – collaborative events where experts meet to develop specialised software
solutions – etc.), crowdfunding, and the use of digital online platforms to obtain user
comments and suggestions on goods and services. Intellectual property (IP) rights can be used
to create knowledge markets that support knowledge flows while ensuring that knowledge
creators can appropriate the benefits from their investments in developing new knowledge.
6.5. The measurement of knowledge flows between firms and other actors of the
innovation system can contribute to a better understanding of their relative importance in
the division of labour underpinning innovation activities (see subsection 3.2.2), differences
in knowledge networks by industry, how these networks change over time, the effect of
knowledge flows on innovation outcomes, and the methods that firms use to manage their
knowledge capabilities. Data on knowledge flows can assist both policy analysts and
business managers in identifying the opportunities and constraints affecting such flows,
and the factors enabling firms to absorb external knowledge.
6.6. This chapter focuses on the measurement of knowledge flows and related exchanges
between firms and other actors in the innovation system, as described in Chapter 2. Section 6.2
provides a conceptual framework and rationale for the measurement of knowledge flows
and open innovation. The framework views innovation in the Business sector as a highly
distributed process based on managed knowledge flows across organisational boundaries.
6.7. Section 6.3 proposes specific approaches for measuring knowledge flows in innovation
surveys. In addition to surveys, mapping knowledge flows and the diffusion of innovations
often requires the use of other data to identify the linkages between actors, outputs and
outcomes. The proposals for data collection cover the role of other firms or organisations
in the development and adoption of innovations by a firm (see Chapter 3), the external
CHAPTER 6. BUSINESS INNOVATION AND KNOWLEDGE FLOWS │ 129
OSLO MANUAL 2018 © OECD/EUROPEAN UNION 2018
orientation of a firm’s business innovation activities (see Chapter 4), collaborative activities
for innovation, the main sources of ideas and information for innovation, and the measurement
of IP-based registration activities and transactions. Additional guidance is provided on how
to measure the links between firms and higher education and PRIs, as well as on measures
of the barriers and challenges for engaging in knowledge flows with external parties.
Section 6.4 provides a brief summary of recommendations.
6.2. Knowledge flows and innovation: Key concepts and definitions
6.2.1. Diffusion of innovation
6.8. The concept of innovation diffusion encompasses both the process by which ideas
underpinning product and business process innovations spread (innovation knowledge
diffusion), and the adoption of such products, or business processes by other firms (innovation
output diffusion). The adoption of a product or a business process can result in an
innovation by the adopting firm if the products or business processes differ significantly
from those previously offered by the firm (as defined in Chapter 3). In some cases, adoption
can entirely replace or render obsolete previously used products and business processes.
6.9. Both the process and the outcomes of innovation diffusion are of policy and
research interest because diffusion amplifies the economic and social impacts of ideas and
technology, especially when there are synergies and complementarities in their use. Innovation
diffusion can also create knowledge flows that lead to further innovations, for instance
when learning from using an adopted business process results in significant improvements
(Rosenberg, 1982; Hall, 2005). The expected speed and nature of innovation diffusion also
shape the incentives to innovate.
6.10. Based on concepts presented earlier in this manual, firms are active in innovation
diffusion when they:
Adopt products or business processes with no or very little additional modification,
as long as the adopted product or business process differs significantly from what
the firm previously offered or used. These innovations are only new to the firm.
Draw upon the ideas, experiences, products or business processes of other firms or
actors to develop a product or business process that differs from what was originally
offered or used by the source firm.
Enable other parties to make use of their innovations or relevant knowledge, for
example, by providing another firm with IP rights or the tacit knowledge required
to use the innovation or knowledge in a practical application.
6.2.2. Knowledge flows
6.11. All firms are engaged in knowledge interactions with other actors. A knowledge
network consists of the knowledge-based interactions or linkages shared by a group of
firms and possibly other actors. It includes knowledge elements, repositories and agents
that search for, transmit and create knowledge. These are interconnected by relationships
that enable, shape or constrain the acquisition, transfer and creation of knowledge (Phelps,
Heidl and Wadhwa, 2012). Knowledge networks contain two main components: the type
of knowledge and the actors that receive, supply or exchange knowledge.
130 │ CHAPTER 6. BUSINESS INNOVATION AND KNOWLEDGE FLOWS
OSLO MANUAL 2018 © OECD/EUROPEAN UNION 2018
Type of knowledge
6.12. Knowledge can be “captured” by or embodied into “objects” such as databases,
software routines, patents, publications, public presentations and know-how. Knowledge
can be classified by the following criteria:
The extent to which knowledge is codified or tacit and therefore the ease with which
it can be transferred to other parties and rendered directly usable (Polanyi, 1958;
von Hippel, 1988). This has implications for rivalry in the use of knowledge. When
codified and inexpensive to copy, the amount of knowledge available for use does
not diminish with the intensity of use by other firms or individuals. Codified
knowledge can be transferred through articles, books, formulas, models, materials,
databases, and IP rights such as patents. In contrast, tacit knowledge may only be
available in the minds of people who use it (Breschi and Lissoni, 2001). This
applies if the holder of the knowledge does not codify it or make it available through
presentations or verbal discussions.
Excludability, i.e. the ability to prevent other parties from using knowledge. Partial
excludability is a characteristic of tacit knowledge and knowledge that requires
considerable expertise to understand. Excludability in the application of knowledge
can be created through the assignment and enforcement of IP rights, but also by
other means such as secrecy, agreements or social norms.
The extent to which knowledge already exists or has a prospective nature, i.e. whether
knowledge is yet to be developed. Agreements to jointly produce new knowledge,
for example through collaboration, will typically entail a pledge for active participation
in the production of new knowledge and the exchange of existing knowledge
required to achieve that goal.
6.13. Different types of knowledge can be complementary, creating a motivation for
knowledge flows and in some cases for pooling the IP rights to complementary knowledge.
Actors engaged in knowledge flows
6.14. All organisations, agents or individuals can be involved in knowledge flows. The various
entities and individuals with whom a firm interacts can be classified using several criteria:
The economic activity (e.g. industry) of the actors in knowledge flows since the type
of knowledge exchanged, competitive pressures to obtain or create new knowledge,
and excludability all vary by industry.
The institutional affiliation of the actor (see section 5.2). For instance if the actor is
a PRI, a stand-alone firm, a firm that is part of a domestic or a multinational group.
Institutional affiliation influences the ownership and control over knowledge and
its uses, the predominant sources of funding for creating knowledge, and the
sources of knowledge available to the actor.
Supplier or user of knowledge: actors can use, supply, or search for knowledge, or
act as both suppliers and users of knowledge.
Capability attributes: these determine the absorptive capacity of individuals and
organisations to apply knowledge obtained from other entities, including entities
that are affiliated with the firm via ownership and independent entities such as
universities or other firms (see section 5.3).
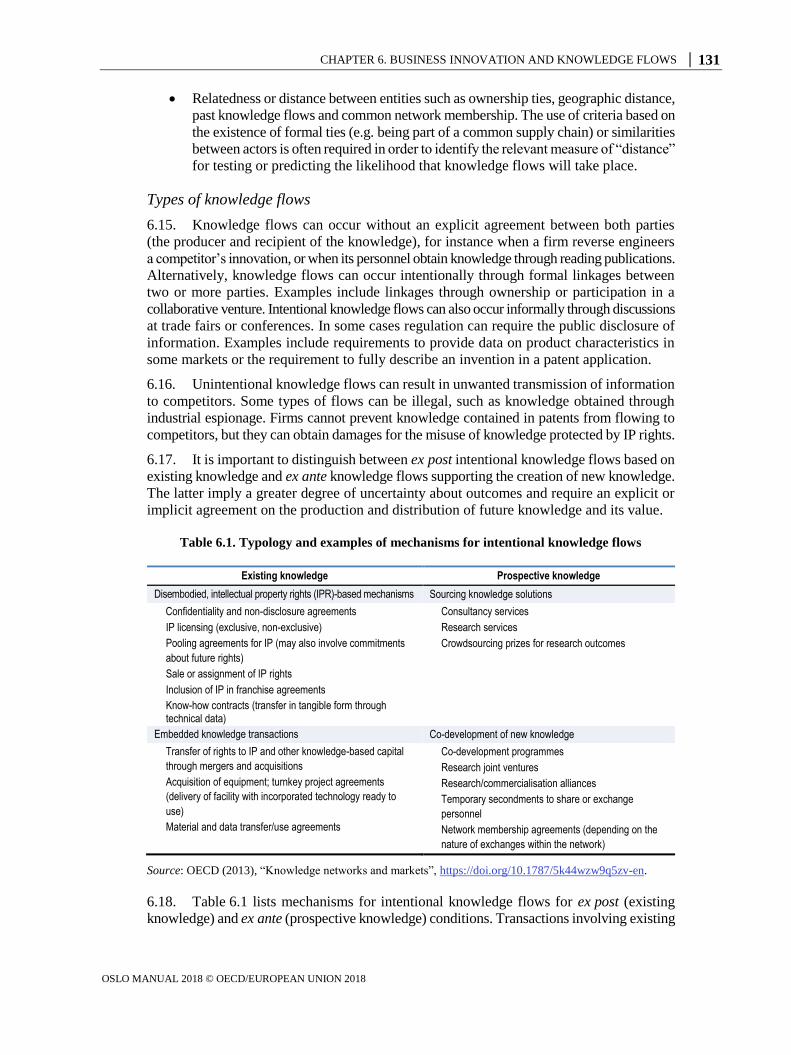
CHAPTER 6. BUSINESS INNOVATION AND KNOWLEDGE FLOWS │ 131
OSLO MANUAL 2018 © OECD/EUROPEAN UNION 2018
Relatedness or distance between entities such as ownership ties, geographic distance,
past knowledge flows and common network membership. The use of criteria based on
the existence of formal ties (e.g. being part of a common supply chain) or similarities
between actors is often required in order to identify the relevant measure of “distance”
for testing or predicting the likelihood that knowledge flows will take place.
Types of knowledge flows
6.15. Knowledge flows can occur without an explicit agreement between both parties
(the producer and recipient of the knowledge), for instance when a firm reverse engineers
a competitor’s innovation, or when its personnel obtain knowledge through reading publications.
Alternatively, knowledge flows can occur intentionally through formal linkages between
two or more parties. Examples include linkages through ownership or participation in a
collaborative venture. Intentional knowledge flows can also occur informally through discussions
at trade fairs or conferences. In some cases regulation can require the public disclosure of
information. Examples include requirements to provide data on product characteristics in
some markets or the requirement to fully describe an invention in a patent application.
6.16. Unintentional knowledge flows can result in unwanted transmission of information
to competitors. Some types of flows can be illegal, such as knowledge obtained through
industrial espionage. Firms cannot prevent knowledge contained in patents from flowing to
competitors, but they can obtain damages for the misuse of knowledge protected by IP rights.
6.17. It is important to distinguish between ex post intentional knowledge flows based on
existing knowledge and ex ante knowledge flows supporting the creation of new knowledge.
The latter imply a greater degree of uncertainty about outcomes and require an explicit or
implicit agreement on the production and distribution of future knowledge and its value.
Table 6.1. Typology and examples of mechanisms for intentional knowledge flows
Existing knowledge Prospective knowledge
Disembodied, intellectual property rights (IPR)-based mechanisms Sourcing knowledge solutions Confidentiality and non-disclosure agreements
IP licensing (exclusive, non-exclusive)
Pooling agreements for IP (may also involve commitments
about future rights)
Sale or assignment of IP rights
Inclusion of IP in franchise agreements
Know-how contracts (transfer in tangible form through technical data)
Consultancy services
Research services
Crowdsourcing prizes for research outcomes
Embedded knowledge transactions Co-development of new knowledge Transfer of rights to IP and other knowledge-based capital
through mergers and acquisitions
Acquisition of equipment; turnkey project agreements
(delivery of facility with incorporated technology ready to
use)
Material and data transfer/use agreements
Co-development programmes
Research joint ventures
Research/commercialisation alliances
Temporary secondments to share or exchange
personnel
Network membership agreements (depending on the
nature of exchanges within the network)
Source: OECD (2013), “Knowledge networks and markets”, https://doi.org/10.1787/5k44wzw9q5zv-en.
6.18. Table 6.1 lists mechanisms for intentional knowledge flows for ex post (existing
knowledge) and ex ante (prospective knowledge) conditions. Transactions involving existing
132 │ CHAPTER 6. BUSINESS INNOVATION AND KNOWLEDGE FLOWS
OSLO MANUAL 2018 © OECD/EUROPEAN UNION 2018
knowledge are divided into disembodied, IP rights-based mechanisms and those where
knowledge is embedded in transactions concerning other goods and services. The latter
includes the transfer of knowledge through the acquisition of other firms or capital equipment.
Transactions for the creation of prospective knowledge can also be divided into agreements
where a firm contracts a supplier to provide customised knowledge, and agreements where
both parties contribute to the joint development of a knowledge product.
6.19. An agreement to provide knowledge to another actor can be based on different
forms of compensation, such as deferred financial compensation, provision of other services
in return, exchange for other forms of knowledge, or co-ownership of IP rights. Actors can
also seek nonmonetary rewards, such as an improved reputation, or they may be able to
bundle “free” knowledge with other proprietary services. Knowledge can also be provided
with no expectation of compensation, as when knowledge is made freely available, or when
knowledge is shared among affiliated firms.
6.2.3. Open innovation
6.20. The importance of inbound and outbound knowledge flows for improving the
efficiency of innovation activities of firms has been recognised for many decades (Kline
and Rosenberg, 1986; Teece, 1986) and discussed in previous editions of this manual.
Questions on inbound and outbound flows of technical knowledge were included in the
first European Community Innovation Survey (CIS) in 1992/93. The concept of open
innovation (Chesbrough, 2003) stresses the advantages to firms of “the use of purposive
inflows and outflows of knowledge to accelerate internal innovation, and expand the
markets for external use of innovation, respectively”. The “open innovation” paradigm has
increased awareness of the distributed nature of knowledge production and usage across
actors and the importance of accessing knowledge from specialised networks and markets
(Arora, Fosfuri and Gambardella, 2001).
6.21. Although the term “open” lends itself to several different interpretations in the
science and innovation context (see Box 6.1), open innovation is a useful umbrella concept
for generalising existing and prospective forms of knowledge flows across the boundaries
of innovation-active firms.
6.22. The open innovation perspective defines inbound and outbound knowledge as follows:
Inbound (or inward) knowledge flows occur when a firm acquires and absorbs
externally sourced knowledge in its innovation activities. This encompasses knowledge
acquisition and sourcing activities, some of which are described in Chapter 4.
Outbound (or outward) knowledge exchanges occur when a firm intentionally enables
other firms or organisations to use, combine, or further develop its knowledge or
ideas for their own innovation activities. An example is when a firm licenses its
technology, patents or prototypes to another firm.
6.23. Companies that combine outbound and inbound knowledge flows have been
described as “ambidextrous” (Cosh and Zhang, 2011). These companies engage in coupled
or joint processes that can involve the search for new sources of knowledge and the
recombination of knowledge from inside and outside the company. Innovation collaboration
is an example of a coupled process where all partners participate in both inbound and
outbound knowledge flows. Data on the use of inbound and outbound knowledge flows can
be used to identify the position of firms in innovation networks.
CHAPTER 6. BUSINESS INNOVATION AND KNOWLEDGE FLOWS │ 133
OSLO MANUAL 2018 © OECD/EUROPEAN UNION 2018
6.24. Outbound open innovation activities have seldom been measured, especially within
the domain of official statistics. Outbound strategies are used by firms that earn revenues
by selling or licensing their knowledge or inventions to other firms and by knowledge
service firms that provide research and experimental development (R&D) or related services
under contract to third parties. A firm can also follow an outbound strategy whereby it gives
other firms or customers the right to use its innovations at no cost. This can benefit the firm
if its innovation is used in a standard that increases the firm’s market or if the adoption of
its innovations by others creates market dominance that can be used to sell other services.
Box 6.1. Uses of the “open” concept in science and innovation
Open innovation denotes the flow of innovation-relevant knowledge across the boundaries
of individual organisations. This includes proprietary-based business models that use
licensing, collaborations, joint ventures, etc. to produce and share knowledge. This notion
of “openness” does not necessarily imply that knowledge is free of charge (i.e. “gratis”)
or exempt from use restrictions (i.e. “libre”). Pricing and use restrictions are often key
conditions for access to knowledge.
The term “open source” is often applied to innovations that are jointly developed by
different contributors. Although open source outputs such as software code can be included
in products that are sold, royalty fees are seldom paid to contributors and there are usually
no significant restrictions on how these outputs are used. Follow-on additions to open
source outputs may also need to be provided on an “open source” basis.
“Open science” describes a movement to promote greater transparency in scientific
methodology and data, the availability and reusability of data, tools and materials by
researchers; and the availability to researchers and the general public of research results
(particularly when publicly funded).
“Open access” typically describes the ability to access content (e.g. documents) or data
on line, free of charge and with minimal copyright and licensing restrictions. This term
is also applied to the business models of firms that secure revenue through bundling services
with information that is provided on a free and unconstrained basis. An alternative access
model is when firms charge for posting information on an open access site, as with open
access journals.
A key implication for survey practitioners of these different uses of the notion of “open”
is the need to avoid the unqualified use of this term in survey questions. Instead, the main
attributes of interest should be fully described.
Sources: OECD (2013), “Knowledge networks and markets”, https://doi.org/10.1787/5k44wzw9q5zv-en;
OECD (2015a), “Making open science a reality”, https://doi.org/10.1787/5jrs2f963zs1-en.
Co-operation, collaboration and co-innovation
6.25. Although these three concepts are often used interchangeably, they can have different
meanings. For the purposes of this manual, they are defined as follows:
6.26. Co-operation occurs when two or more participants agree to take responsibility for
a task or series of tasks and information is shared between the parties to facilitate the
agreement. An innovation-active firm co-operates with another firm if it procures ideas or
inputs from the other firm by providing it with a detailed specification of its needs.
134 │ CHAPTER 6. BUSINESS INNOVATION AND KNOWLEDGE FLOWS
OSLO MANUAL 2018 © OECD/EUROPEAN UNION 2018
6.27. Collaboration requires co-ordinated activity across different parties to address a
jointly defined problem, with all partners contributing. Collaboration requires the explicit
definition of common objectives and it may include agreement over the distribution of
inputs, risks and potential benefits. Collaboration can create new knowledge, but it does
not need to result in an innovation. Each partner in a collaboration agreement can use the
resulting knowledge for different purposes.
6.28. Co-innovation, or “coupled open innovation”, occurs when collaboration between
two or more partners results in an innovation (Chesbrough and Bogers, 2014). An important
implication for innovation measurement is that summing the number of innovations
reported by firms in a population could result in an overestimate, with the size of the
overestimate dependent on the prevalence of co-innovation.
6.29. Alliances, consortia, joint ventures and other forms of partnerships are all mechanisms
for knowledge flows that can be used in innovation activities, although each of these can be
used for other purposes. In alliances and consortia firms participate with other organisations
in a common activity or pool their resources to achieve a common goal. Participants retain
their separate legal status, with the consortium's control over each participant generally
limited to activities involving the joint endeavour, particularly the division of profits. A
consortium is formed by contract, which delineates the rights and obligations of each
member. Joint ventures arise when two or more companies invest funds (equity) into
creating a third, jointly owned company, into which they may also transfer access to some
of their own resources, such as IP.
6.3. Collecting data on knowledge flows and their relationship to innovation
6.30. Knowledge management is the co-ordination of all activities by an organisation to
direct, control, capture, use, and share knowledge within and outside its boundaries. The
management of internal and external knowledge flows is discussed in Chapter 5.
6.3.1. General issues
6.31. The complexity of knowledge flows creates practical challenges for measurement.
Firms can establish knowledge-based linkages with multiple actors in different locations
and seek different types of knowledge objects at different phases in the innovation and
diffusion process. They can enter into a variety of knowledge exchange agreements. In
addition, changes to the boundaries of the firm through mergers, acquisitions and disposals
can affect the structure of internal and external knowledge flows. Such complexity can also
reduce the ability of the subject-based approach to innovation measurement to provide
sufficient detail to trace changes in knowledge sources over time. Research in this area
could benefit from the object-based approach discussed in Chapter 10.
6.32. Some of the limitations of survey data on knowledge flows can be addressed by
linking survey data to other sources, such as data on the co-invention or co-ownership of
intellectual assets and co-publications. Administrative transaction data linking buyers and
sellers can also be used to map some types of knowledge-based interactions.
6.33. The recommendations in this section cover the measurement of internal knowledge
flows (within an enterprise and with affiliated firms linked through ownership) and external
knowledge flows with unaffiliated firms or organisations. Knowledge flows among the
affiliates of multinational enterprises is a special case of high research and policy interest
that requires specific attention.
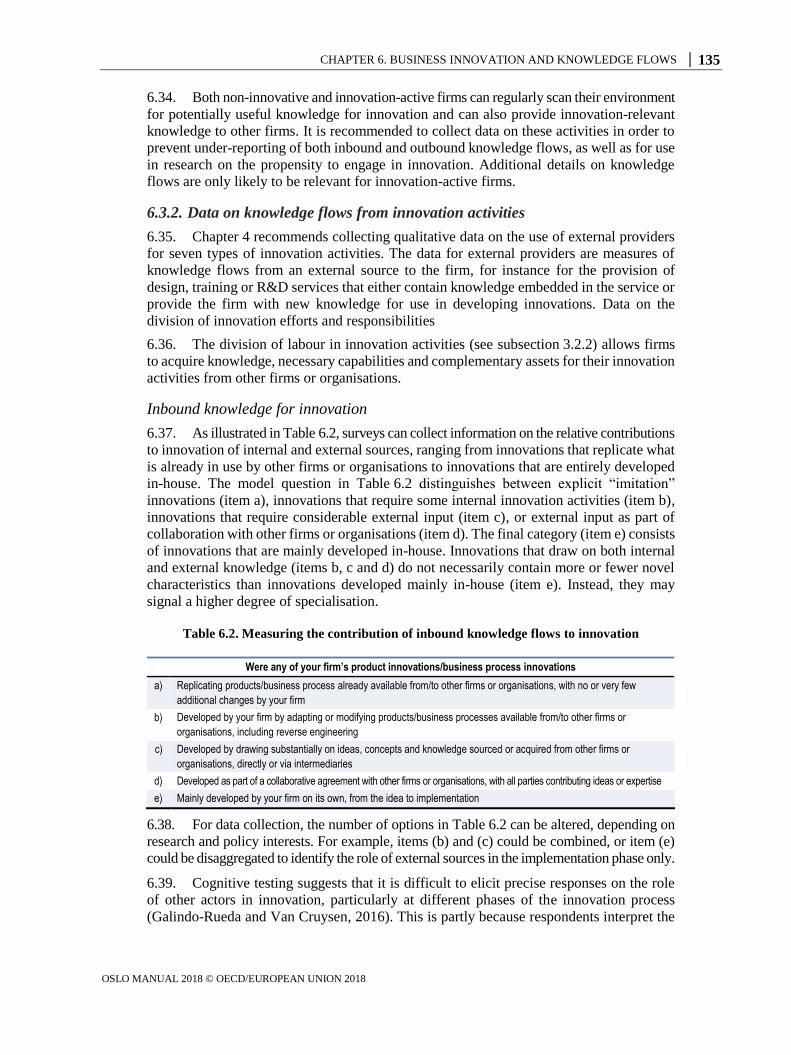
CHAPTER 6. BUSINESS INNOVATION AND KNOWLEDGE FLOWS │ 135
OSLO MANUAL 2018 © OECD/EUROPEAN UNION 2018
6.34. Both non-innovative and innovation-active firms can regularly scan their environment
for potentially useful knowledge for innovation and can also provide innovation-relevant
knowledge to other firms. It is recommended to collect data on these activities in order to
prevent under-reporting of both inbound and outbound knowledge flows, as well as for use
in research on the propensity to engage in innovation. Additional details on knowledge
flows are only likely to be relevant for innovation-active firms.
6.3.2. Data on knowledge flows from innovation activities
6.35. Chapter 4 recommends collecting qualitative data on the use of external providers
for seven types of innovation activities. The data for external providers are measures of
knowledge flows from an external source to the firm, for instance for the provision of
design, training or R&D services that either contain knowledge embedded in the service or
provide the firm with new knowledge for use in developing innovations. Data on the
division of innovation efforts and responsibilities
6.36. The division of labour in innovation activities (see subsection 3.2.2) allows firms
to acquire knowledge, necessary capabilities and complementary assets for their innovation
activities from other firms or organisations.
Inbound knowledge for innovation
6.37. As illustrated in Table 6.2, surveys can collect information on the relative contributions
to innovation of internal and external sources, ranging from innovations that replicate what
is already in use by other firms or organisations to innovations that are entirely developed
in-house. The model question in Table 6.2 distinguishes between explicit “imitation”
innovations (item a), innovations that require some internal innovation activities (item b),
innovations that require considerable external input (item c), or external input as part of
collaboration with other firms or organisations (item d). The final category (item e) consists
of innovations that are mainly developed in-house. Innovations that draw on both internal
and external knowledge (items b, c and d) do not necessarily contain more or fewer novel
characteristics than innovations developed mainly in-house (item e). Instead, they may
signal a higher degree of specialisation.
Table 6.2. Measuring the contribution of inbound knowledge flows to innovation
Were any of your firm’s product innovations/business process innovations
a) Replicating products/business process already available from/to other firms or organisations, with no or very few
additional changes by your firm b) Developed by your firm by adapting or modifying products/business processes available from/to other firms or
organisations, including reverse engineering c) Developed by drawing substantially on ideas, concepts and knowledge sourced or acquired from other firms or
organisations, directly or via intermediaries d) Developed as part of a collaborative agreement with other firms or organisations, with all parties contributing ideas or expertise e) Mainly developed by your firm on its own, from the idea to implementation
6.38. For data collection, the number of options in Table 6.2 can be altered, depending on
research and policy interests. For example, items (b) and (c) could be combined, or item (e)
could be disaggregated to identify the role of external sources in the implementation phase only.
6.39. Cognitive testing suggests that it is difficult to elicit precise responses on the role
of other actors in innovation, particularly at different phases of the innovation process
(Galindo-Rueda and Van Cruysen, 2016). This is partly because respondents interpret the
136 │ CHAPTER 6. BUSINESS INNOVATION AND KNOWLEDGE FLOWS
OSLO MANUAL 2018 © OECD/EUROPEAN UNION 2018
concept of “developing innovations” as applying to the entire innovation process, including
implementation. This differs from an R&D-based interpretation of development as applying
only to the development of ideas, concepts or designs, as with the definition of “experimental
development” in the OECD’s Frascati Manual 2015 (OECD, 2015b) – see also the section
on R&D in Chapter 4. To avoid differences in interpretation, questions on the role of
internal and external sources should specify which items include development and
implementation activities.
6.40. The options presented in Table 6.2 differentiate among a rich variety of inbound
knowledge sourcing strategies. They enable research to identify, for example, if service
innovations are more or less likely to require external inputs than goods innovations, and
differences in knowledge sourcing strategies between business process innovations and
product innovations.
6.41. Since a firm can have multiple product or business process innovations, questions
on inbound knowledge flows should permit respondents to select more than one option in
Table 6.2. It is also possible to ask respondents to identify the most commonly used option
listed in the table. Alternatively, the object-based approach described in Chapter 10 can be
used to identify the method used for the firm’s most economically valuable innovation.
6.42. Data collected on inbound knowledge flows can be used to qualify other data on
whether or not the respondent’s firm has new-to-firm (NTF) or new-to-market (NTM)
innovations. Innovations that meet the criteria for items (b) or (c) are more likely to be
NTM innovations, while those that meet the criteria for option (a) are more likely to be
NTF innovations. However, innovations that meet the criteria for item (a) can also be NTM
innovations, for instance if the firm’s market is a local region. It is recommended to collect
data on a firm’s market (see subsection 5.3.1) in addition to the data in Table 6.2, in order
to identify how NTM innovations are developed.
6.43. Respondents might understate the role of other firms or organisations in their firm’s
innovations, particularly when the original concept is acquired externally, but the development
work took place in-house. To reduce such under-reporting, item (e) on innovations that are
mainly developed in-house should be placed after the other options.
Sources of inbound knowledge
6.44. It is recommended to collect data on the different sources of inbound knowledge
and the geographic location of the source. The institutional classification in the Frascati
Manual 2015 (OECD, 2015b: Chapter 3) is recommended for innovation data for international
comparison purposes, as shown in Table 6.3.
6.45. As depicted in Table 6.3, the headline Frascati institutional sectors can be broken
down according to policy and research needs.
It is advisable to separate between affiliated and non-affiliated business sources
of knowledge.
It is also important to separate between households and their members acting on
that capacity, and other private non-profit organisations.
Research institutes, defined on the basis of their main economic activity, constitute
a group of high policy interest. Research institutes can be found in all Frascati
sectors (see subsection 2.4.1). Measurement recommendations can be found below
in subsection 6.3.4.
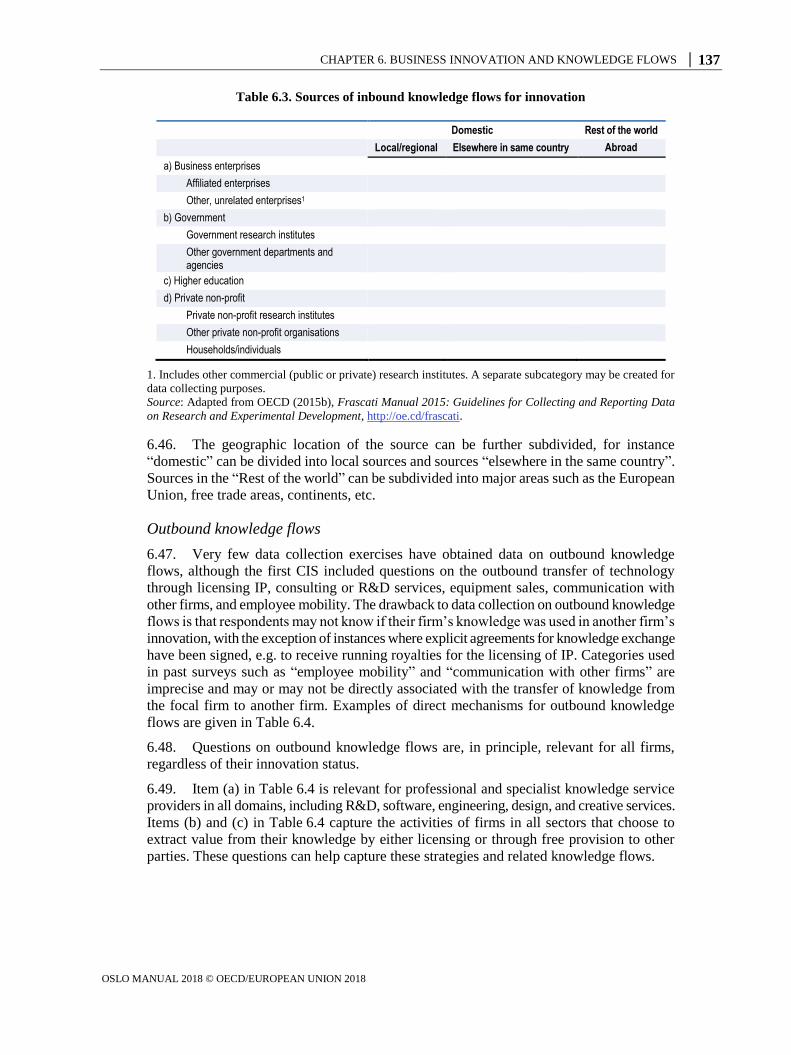
CHAPTER 6. BUSINESS INNOVATION AND KNOWLEDGE FLOWS │ 137
OSLO MANUAL 2018 © OECD/EUROPEAN UNION 2018
Table 6.3. Sources of inbound knowledge flows for innovation
Domestic Rest of the world
Local/regional Elsewhere in same country Abroad
a) Business enterprises
Affiliated enterprises Other, unrelated enterprises1
b) Government Government research institutes
Other government departments and agencies
c) Higher education d) Private non-profit
Private non-profit research institutes
Other private non-profit organisations
Households/individuals
1. Includes other commercial (public or private) research institutes. A separate subcategory may be created for
data collecting purposes.
Source: Adapted from OECD (2015b), Frascati Manual 2015: Guidelines for Collecting and Reporting Data
on Research and Experimental Development, http://oe.cd/frascati.
6.46. The geographic location of the source can be further subdivided, for instance
“domestic” can be divided into local sources and sources “elsewhere in the same country”.
Sources in the “Rest of the world” can be subdivided into major areas such as the European
Union, free trade areas, continents, etc.
Outbound knowledge flows
6.47. Very few data collection exercises have obtained data on outbound knowledge
flows, although the first CIS included questions on the outbound transfer of technology
through licensing IP, consulting or R&D services, equipment sales, communication with
other firms, and employee mobility. The drawback to data collection on outbound knowledge
flows is that respondents may not know if their firm’s knowledge was used in another firm’s
innovation, with the exception of instances where explicit agreements for knowledge exchange
have been signed, e.g. to receive running royalties for the licensing of IP. Categories used
in past surveys such as “employee mobility” and “communication with other firms” are
imprecise and may or may not be directly associated with the transfer of knowledge from
the focal firm to another firm. Examples of direct mechanisms for outbound knowledge
flows are given in Table 6.4.
6.48. Questions on outbound knowledge flows are, in principle, relevant for all firms,
regardless of their innovation status.
6.49. Item (a) in Table 6.4 is relevant for professional and specialist knowledge service
providers in all domains, including R&D, software, engineering, design, and creative services.
Items (b) and (c) in Table 6.4 capture the activities of firms in all sectors that choose to
extract value from their knowledge by either licensing or through free provision to other
parties. These questions can help capture these strategies and related knowledge flows.
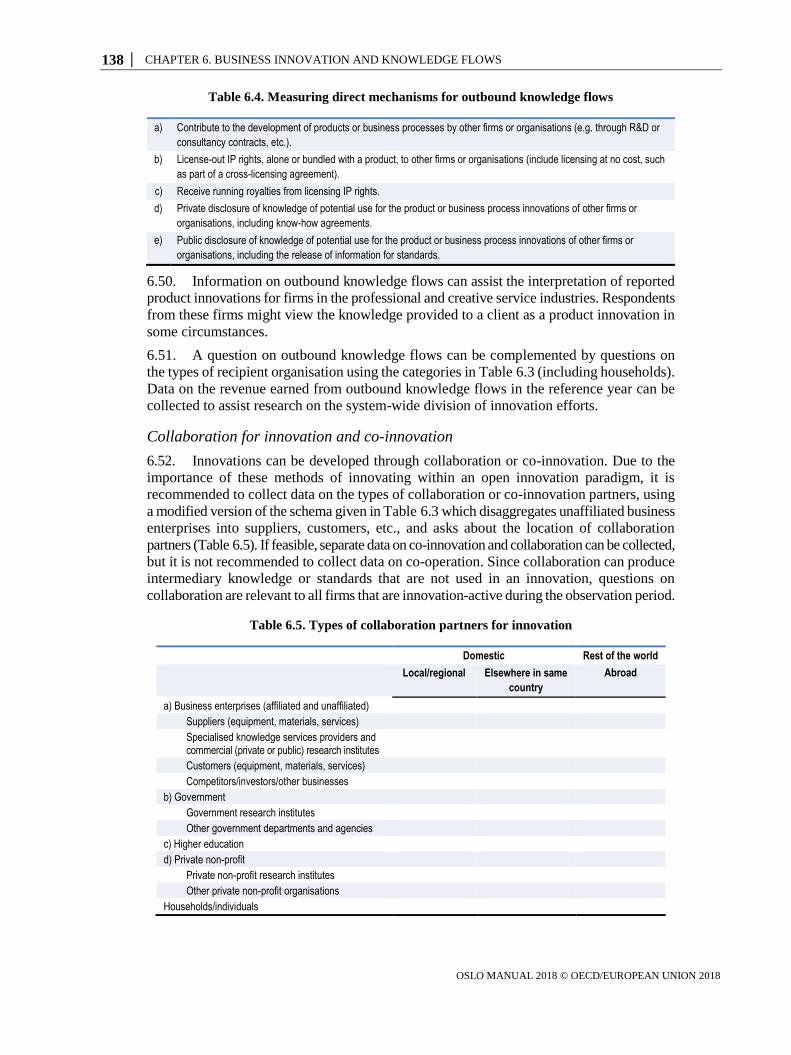
138 │ CHAPTER 6. BUSINESS INNOVATION AND KNOWLEDGE FLOWS
OSLO MANUAL 2018 © OECD/EUROPEAN UNION 2018
Table 6.4. Measuring direct mechanisms for outbound knowledge flows
a) Contribute to the development of products or business processes by other firms or organisations (e.g. through R&D or
consultancy contracts, etc.). b) License-out IP rights, alone or bundled with a product, to other firms or organisations (include licensing at no cost, such
as part of a cross-licensing agreement). c) Receive running royalties from licensing IP rights. d) Private disclosure of knowledge of potential use for the product or business process innovations of other firms or
organisations, including know-how agreements. e) Public disclosure of knowledge of potential use for the product or business process innovations of other firms or
organisations, including the release of information for standards.
6.50. Information on outbound knowledge flows can assist the interpretation of reported
product innovations for firms in the professional and creative service industries. Respondents
from these firms might view the knowledge provided to a client as a product innovation in
some circumstances.
6.51. A question on outbound knowledge flows can be complemented by questions on
the types of recipient organisation using the categories in Table 6.3 (including households).
Data on the revenue earned from outbound knowledge flows in the reference year can be
collected to assist research on the system-wide division of innovation efforts.
Collaboration for innovation and co-innovation
6.52. Innovations can be developed through collaboration or co-innovation. Due to the
importance of these methods of innovating within an open innovation paradigm, it is
recommended to collect data on the types of collaboration or co-innovation partners, using
a modified version of the schema given in Table 6.3 which disaggregates unaffiliated business
enterprises into suppliers, customers, etc., and asks about the location of collaboration
partners (Table 6.5). If feasible, separate data on co-innovation and collaboration can be collected,
but it is not recommended to collect data on co-operation. Since collaboration can produce
intermediary knowledge or standards that are not used in an innovation, questions on
collaboration are relevant to all firms that are innovation-active during the observation period.
Table 6.5. Types of collaboration partners for innovation
Domestic Rest of the world Local/regional Elsewhere in same
country
Abroad
a) Business enterprises (affiliated and unaffiliated)
Suppliers (equipment, materials, services)
Specialised knowledge services providers and commercial (private or public) research institutes
Customers (equipment, materials, services)
Competitors/investors/other businesses
b) Government
Government research institutes
Other government departments and agencies
c) Higher education
d) Private non-profit
Private non-profit research institutes
Other private non-profit organisations
Households/individuals
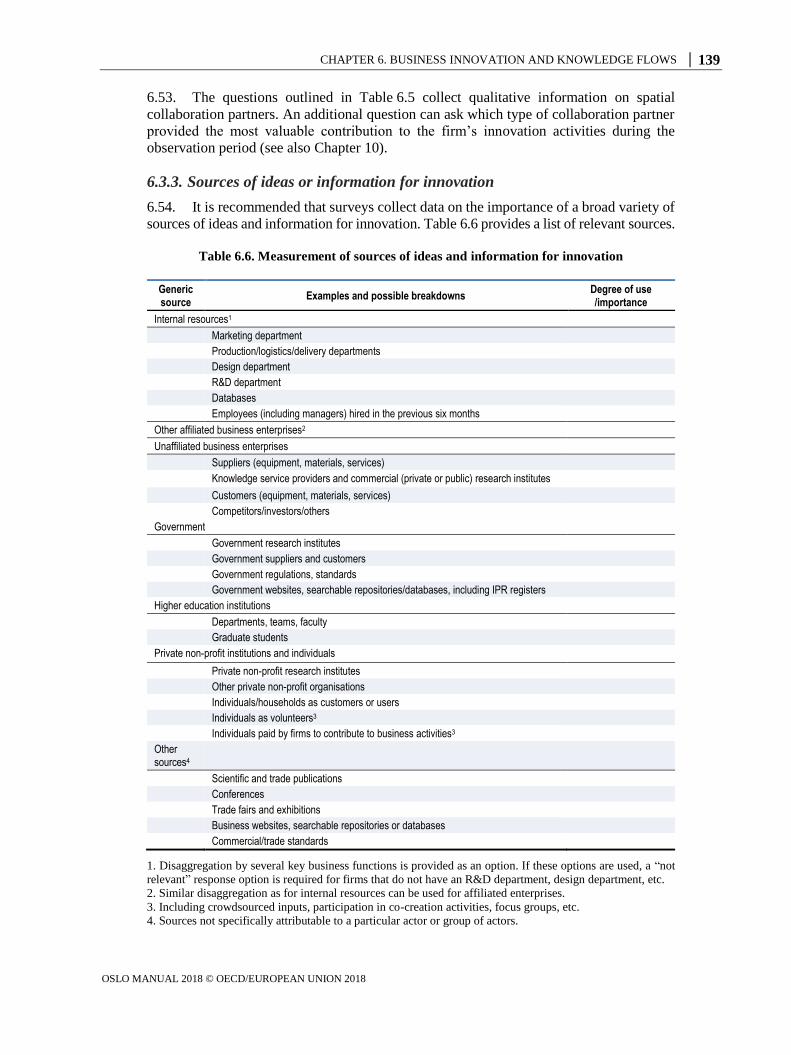
CHAPTER 6. BUSINESS INNOVATION AND KNOWLEDGE FLOWS │ 139
OSLO MANUAL 2018 © OECD/EUROPEAN UNION 2018
6.53. The questions outlined in Table 6.5 collect qualitative information on spatial
collaboration partners. An additional question can ask which type of collaboration partner
provided the most valuable contribution to the firm’s innovation activities during the
observation period (see also Chapter 10).
6.3.3. Sources of ideas or information for innovation
6.54. It is recommended that surveys collect data on the importance of a broad variety of
sources of ideas and information for innovation. Table 6.6 provides a list of relevant sources.
Table 6.6. Measurement of sources of ideas and information for innovation
Generic source
Examples and possible breakdowns Degree of use /importance
Internal resources1 Marketing department
Production/logistics/delivery departments
Design department
R&D department
Databases
Employees (including managers) hired in the previous six months
Other affiliated business enterprises2
Unaffiliated business enterprises
Suppliers (equipment, materials, services)
Knowledge service providers and commercial (private or public) research institutes
Customers (equipment, materials, services)
Competitors/investors/others
Government
Government research institutes
Government suppliers and customers
Government regulations, standards
Government websites, searchable repositories/databases, including IPR registers
Higher education institutions
Departments, teams, faculty
Graduate students
Private non-profit institutions and individuals
Private non-profit research institutes
Other private non-profit organisations
Individuals/households as customers or users
Individuals as volunteers3
Individuals paid by firms to contribute to business activities3
Other sources4
Scientific and trade publications
Conferences
Trade fairs and exhibitions
Business websites, searchable repositories or databases
Commercial/trade standards
1. Disaggregation by several key business functions is provided as an option. If these options are used, a “not
relevant” response option is required for firms that do not have an R&D department, design department, etc.
2. Similar disaggregation as for internal resources can be used for affiliated enterprises.
3. Including crowdsourced inputs, participation in co-creation activities, focus groups, etc.
4. Sources not specifically attributable to a particular actor or group of actors.
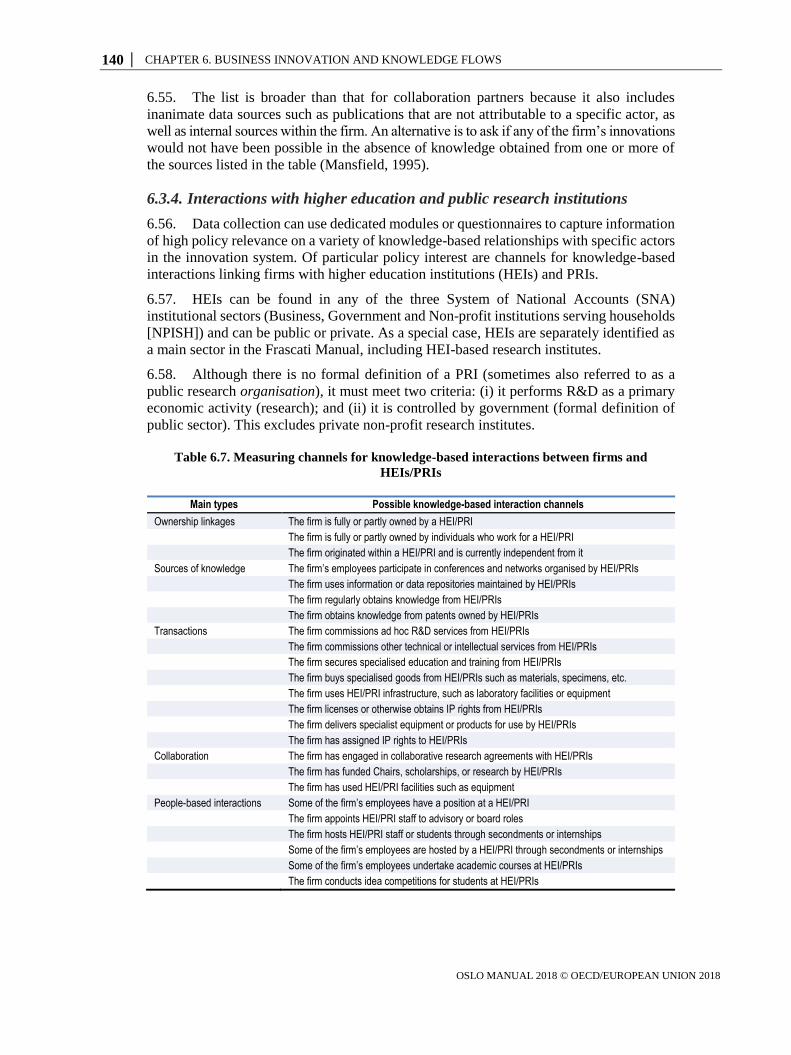
140 │ CHAPTER 6. BUSINESS INNOVATION AND KNOWLEDGE FLOWS
OSLO MANUAL 2018 © OECD/EUROPEAN UNION 2018
6.55. The list is broader than that for collaboration partners because it also includes
inanimate data sources such as publications that are not attributable to a specific actor, as
well as internal sources within the firm. An alternative is to ask if any of the firm’s innovations
would not have been possible in the absence of knowledge obtained from one or more of
the sources listed in the table (Mansfield, 1995).
6.3.4. Interactions with higher education and public research institutions
6.56. Data collection can use dedicated modules or questionnaires to capture information
of high policy relevance on a variety of knowledge-based relationships with specific actors
in the innovation system. Of particular policy interest are channels for knowledge-based
interactions linking firms with higher education institutions (HEIs) and PRIs.
6.57. HEIs can be found in any of the three System of National Accounts (SNA)
institutional sectors (Business, Government and Non-profit institutions serving households
[NPISH]) and can be public or private. As a special case, HEIs are separately identified as
a main sector in the Frascati Manual, including HEI-based research institutes.
6.58. Although there is no formal definition of a PRI (sometimes also referred to as a
public research organisation), it must meet two criteria: (i) it performs R&D as a primary
economic activity (research); and (ii) it is controlled by government (formal definition of
public sector). This excludes private non-profit research institutes.
Table 6.7. Measuring channels for knowledge-based interactions between firms and
HEIs/PRIs
Main types Possible knowledge-based interaction channels Ownership linkages The firm is fully or partly owned by a HEI/PRI
The firm is fully or partly owned by individuals who work for a HEI/PRI The firm originated within a HEI/PRI and is currently independent from it
Sources of knowledge The firm’s employees participate in conferences and networks organised by HEI/PRIs The firm uses information or data repositories maintained by HEI/PRIs The firm regularly obtains knowledge from HEI/PRIs The firm obtains knowledge from patents owned by HEI/PRIs
Transactions The firm commissions ad hoc R&D services from HEI/PRIs The firm commissions other technical or intellectual services from HEI/PRIs The firm secures specialised education and training from HEI/PRIs The firm buys specialised goods from HEI/PRIs such as materials, specimens, etc. The firm uses HEI/PRI infrastructure, such as laboratory facilities or equipment The firm licenses or otherwise obtains IP rights from HEI/PRIs The firm delivers specialist equipment or products for use by HEI/PRIs The firm has assigned IP rights to HEI/PRIs
Collaboration The firm has engaged in collaborative research agreements with HEI/PRIs The firm has funded Chairs, scholarships, or research by HEI/PRIs The firm has used HEI/PRI facilities such as equipment
People-based interactions Some of the firm’s employees have a position at a HEI/PRI The firm appoints HEI/PRI staff to advisory or board roles The firm hosts HEI/PRI staff or students through secondments or internships Some of the firm’s employees are hosted by a HEI/PRI through secondments or internships Some of the firm’s employees undertake academic courses at HEI/PRIs The firm conducts idea competitions for students at HEI/PRIs
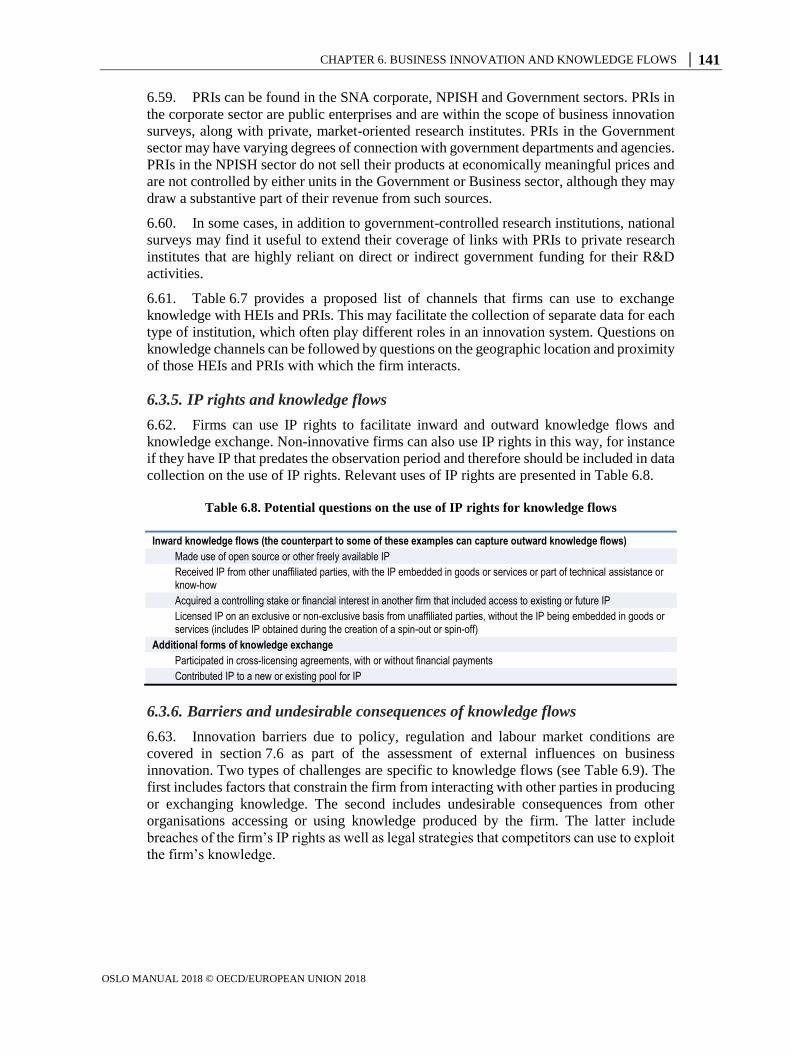
CHAPTER 6. BUSINESS INNOVATION AND KNOWLEDGE FLOWS │ 141
OSLO MANUAL 2018 © OECD/EUROPEAN UNION 2018
6.59. PRIs can be found in the SNA corporate, NPISH and Government sectors. PRIs in
the corporate sector are public enterprises and are within the scope of business innovation
surveys, along with private, market-oriented research institutes. PRIs in the Government
sector may have varying degrees of connection with government departments and agencies.
PRIs in the NPISH sector do not sell their products at economically meaningful prices and
are not controlled by either units in the Government or Business sector, although they may
draw a substantive part of their revenue from such sources.
6.60. In some cases, in addition to government-controlled research institutions, national
surveys may find it useful to extend their coverage of links with PRIs to private research
institutes that are highly reliant on direct or indirect government funding for their R&D
activities.
6.61. Table 6.7 provides a proposed list of channels that firms can use to exchange
knowledge with HEIs and PRIs. This may facilitate the collection of separate data for each
type of institution, which often play different roles in an innovation system. Questions on
knowledge channels can be followed by questions on the geographic location and proximity
of those HEIs and PRIs with which the firm interacts.
6.3.5. IP rights and knowledge flows
6.62. Firms can use IP rights to facilitate inward and outward knowledge flows and
knowledge exchange. Non-innovative firms can also use IP rights in this way, for instance
if they have IP that predates the observation period and therefore should be included in data
collection on the use of IP rights. Relevant uses of IP rights are presented in Table 6.8.
Table 6.8. Potential questions on the use of IP rights for knowledge flows
Inward knowledge flows (the counterpart to some of these examples can capture outward knowledge flows)
Made use of open source or other freely available IP
Received IP from other unaffiliated parties, with the IP embedded in goods or services or part of technical assistance or know-how
Acquired a controlling stake or financial interest in another firm that included access to existing or future IP
Licensed IP on an exclusive or non-exclusive basis from unaffiliated parties, without the IP being embedded in goods or services (includes IP obtained during the creation of a spin-out or spin-off)
Additional forms of knowledge exchange
Participated in cross-licensing agreements, with or without financial payments
Contributed IP to a new or existing pool for IP
6.3.6. Barriers and undesirable consequences of knowledge flows
6.63. Innovation barriers due to policy, regulation and labour market conditions are
covered in section 7.6 as part of the assessment of external influences on business
innovation. Two types of challenges are specific to knowledge flows (see Table 6.9). The
first includes factors that constrain the firm from interacting with other parties in producing
or exchanging knowledge. The second includes undesirable consequences from other
organisations accessing or using knowledge produced by the firm. The latter include
breaches of the firm’s IP rights as well as legal strategies that competitors can use to exploit
the firm’s knowledge.
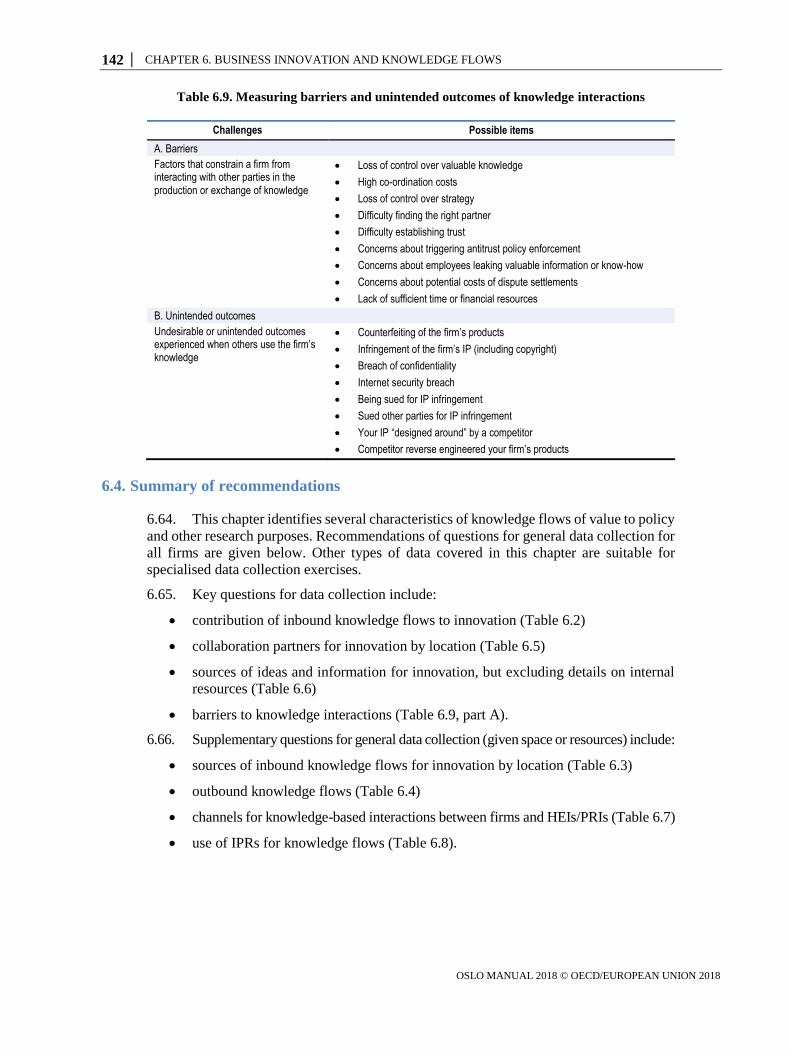
142 │ CHAPTER 6. BUSINESS INNOVATION AND KNOWLEDGE FLOWS
OSLO MANUAL 2018 © OECD/EUROPEAN UNION 2018
Table 6.9. Measuring barriers and unintended outcomes of knowledge interactions
Challenges Possible items
A. Barriers
Factors that constrain a firm from interacting with other parties in the production or exchange of knowledge
Loss of control over valuable knowledge
High co-ordination costs
Loss of control over strategy
Difficulty finding the right partner
Difficulty establishing trust
Concerns about triggering antitrust policy enforcement
Concerns about employees leaking valuable information or know-how
Concerns about potential costs of dispute settlements
Lack of sufficient time or financial resources B. Unintended outcomes
Undesirable or unintended outcomes experienced when others use the firm’s knowledge
Counterfeiting of the firm’s products
Infringement of the firm’s IP (including copyright)
Breach of confidentiality
Internet security breach
Being sued for IP infringement
Sued other parties for IP infringement
Your IP “designed around” by a competitor
Competitor reverse engineered your firm’s products
6.4. Summary of recommendations
6.64. This chapter identifies several characteristics of knowledge flows of value to policy
and other research purposes. Recommendations of questions for general data collection for
all firms are given below. Other types of data covered in this chapter are suitable for
specialised data collection exercises.
6.65. Key questions for data collection include:
contribution of inbound knowledge flows to innovation (Table 6.2)
collaboration partners for innovation by location (Table 6.5)
sources of ideas and information for innovation, but excluding details on internal
resources (Table 6.6)
barriers to knowledge interactions (Table 6.9, part A).
6.66. Supplementary questions for general data collection (given space or resources) include:
sources of inbound knowledge flows for innovation by location (Table 6.3)
outbound knowledge flows (Table 6.4)
channels for knowledge-based interactions between firms and HEIs/PRIs (Table 6.7)
use of IPRs for knowledge flows (Table 6.8).

CHAPTER 6. BUSINESS INNOVATION AND KNOWLEDGE FLOWS │ 143
OSLO MANUAL 2018 © OECD/EUROPEAN UNION 2018
References
Arora, A., A. Fosfuri and A. Gambardella (2001), “Specialized technology suppliers, international
spillovers and investment: Evidence from the chemical industry”, Journal of Development
Economics, Vol. 65/1, pp. 31-54.
Breschi, S. and F. Lissoni (2001), “Knowledge spillovers and local innovation systems: A critical
survey”, Industrial and Corporate Change, Vol. 10/4, Oxford University Press, pp. 975-1005.
Chesbrough, H. (2003), Open Innovation: The New Imperative for Creating and Profiting from
Technology, Harvard Business School Press, Boston.
Chesbrough, H. and M. Bogers (2014), “Explicating open innovation: Clarifying an emerging paradigm
for understanding innovation”, in New Frontiers in Open Innovation, Oxford University Press,
Oxford.
Cosh, A. and J.J. Zhang (2011), “Open innovation choices – What is British Enterprise doing?”, UK
Innovation Research Centre, Imperial College and University of Cambridge.
Dahlander, L. and D. Gann (2010), “How open is open innovation?”, Research Policy, Vol. 39/6,
pp. 699-709.
Enkel, E. (2010), “Attributes required for profiting from open innovation in networks”, International
Journal of Technology Management, Vol. 52(3/4), pp. 344-371.
Galindo-Rueda, F. and A. Van Cruysen (2016), “Testing innovation survey concepts, definitions and
questions: Findings from cognitive interviews with business managers”, OECD, Paris,
http://oe.cd/innocognitive.
Hall, B. (2005), “Innovation and diffusion”, in The Oxford Handbook of Innovation, Oxford University
Press, Oxford.
Kline, S. and N. Rosenberg (1986), “An overview of innovation”, in The Positive Sum Strategy:
Harnessing Technology for Economic Growth, National Academies Press, Washington, DC.
Mansfield, E. (1995), “Academic research underlying industrial innovations: Sources, characteristics,
and financing”, The Review of Economics and Statistics, Vol. 77/1, pp. 55-65.
OECD (2015a), “Making open science a reality”, OECD Science, Technology and Industry Policy
Papers, No. 25, OECD Publishing, Paris, https://doi.org/10.1787/5jrs2f963zs1-en.
OECD (2015b), Frascati Manual 2015: Guidelines for Collecting and Reporting Data on Research and
Experimental Development, The Measurement of Scientific, Technological and Innovation Activities,
OECD Publishing, Paris, http://oe.cd/frascati.
OECD (2013), “Knowledge networks and markets”, OECD Science, Technology and Industry Policy
Papers, No. 7, OECD Publishing, Paris, https://doi.org/10.1787/5k44wzw9q5zv-en.
Phelps, C., R. Heidl and A. Wadhwa (2012), “Knowledge, networks, and knowledge networks: A review
and research agenda”, Journal of Management, Vol. 38/4, pp. 1115-1166.
Polanyi, M. (1958), Personal Knowledge: Towards a Post-Critical Philosophy, Routledge, London.
Rosenberg, N. (1982), Inside the Black Box: Technology and Economics, Cambridge University Press,
Cambridge.
Teece, D. (1986), “Profiting from technological innovation: Implications for integration, collaboration,
licensing, and public policy”, Research Policy, Vol. 15/6, pp. 285-305.
von Hippel, E. (1988), The Sources of Innovation, Oxford University Press, New York.

CHAPTER 7. MEASURING EXTERNAL FACTORS INFLUENCING INNOVATION IN FIRMS │ 145
OSLO MANUAL 2018 © OECD/EUROPEAN UNION 2018
Chapter 7. Measuring external factors influencing innovation in firms
Understanding the context in which firms operate is essential for collecting and interpreting
data on business innovation. The systems view of innovation stresses the importance of
external factors that can influence a firm’s incentives to innovate, the types of innovation
activities that it undertakes, and its innovation capabilities and outcomes. External factors
can also be the object of a business strategy, public policy or concerted social action by
public interest groups. This chapter discusses the characteristics of the firm’s external
environment that can influence innovation and the associated challenges and opportunities
that managers need to consider when making strategic choices, including for innovation.
These factors include the activities of customers, competitors and suppliers; labour market,
legal, regulatory, competitive and economic conditions; and the supply of technological
and other types of knowledge of value to innovation.
146 │ CHAPTER 7. MEASURING EXTERNAL FACTORS INFLUENCING INNOVATION IN FIRMS
OSLO MANUAL 2018 © OECD/EUROPEAN UNION 2018
7.1. Introduction
7.1. The systems view of innovation stresses the importance of the external environment
by conceptualising the innovation activities of firms as embedded in political, social,
organisational and economic systems (Lundvall [ed.], 1992; Nelson [ed.], 1993; Edquist,
2005; Granstrand, Patel and Pavitt, 1997). These external factors can influence a firm’s
incentives to innovate and its innovation activities, capabilities and outcomes. External
factors can also be the object of a business strategy, public policy or concerted social action
by public interest groups.
7.2. Building on the innovation literature and previous measurement experiences, this
chapter identifies the main elements of interest in the external environment and priorities
for data collection. These include external environmental or contextual factors that are
often closely intertwined with the firm’s internal drivers, strategies and behaviours. A
firm’s environmental context is partly the outcome of management choices, such as a
decision to enter a given market. Consequently, research on outcomes, such as business
performance, requires data on a firm’s internal capabilities and strategies (see Chapter 5)
as well as on external factors.
7.3. External influences on the innovation activities of firms can be measured directly
or indirectly. Indirect measurement obtains information on the influence of external factors
on the firm without referring specifically to innovation. In this case, the effects of external
factors on innovation are identified after data collection, for example through econometric
analysis. The advantage of indirect measurement is that data can be collected for all types
of firms, regardless of their innovation status. In contrast, direct measurement methods ask
respondents to self-assess the relevance and impact of an external factor on a specific
dimension of innovation. These questions require limited additional analysis. However,
direct questions can introduce cognitive biases, or insufficient time could have passed to
allow the respondent to evaluate the effects of an external factor on the firm’s innovation
activities or outcomes.
7.4. As highlighted in Chapter 2, contextual information on the framework conditions
for business innovation can be collected from multiple sources. In some instances, reliable
quantitative and qualitative information can be obtained from experts or from administrative
sources such as budgetary and legislative records. The number of external factors of
potential relevance to innovation is large enough to warrant dedicated data collection on
the business environment. This chapter contains proposals for obtaining data (either by
linking existing information or collecting new information) on the external environment of
firms that can help explain the incidence of innovation and its outcomes.
7.2. Main elements of the external environment for business innovation
7.5. A firm’s external environment includes factors that are beyond the immediate
control of management. These factors create challenges and opportunities that managers
need to consider when making strategic choices. Such factors include the activities of
customers, competitors and suppliers; the labour market; legal, regulatory, competitive and
economic conditions; and the supply of technological and other types of knowledge of
value to innovation. The internal environment of a firm is ostensibly under the control of
management and refers to the firm’s business model, production and innovation capabilities,
as well as financial and human resources (see Chapter 5).

CHAPTER 7. MEASURING EXTERNAL FACTORS INFLUENCING INNOVATION IN FIRMS │ 147
OSLO MANUAL 2018 © OECD/EUROPEAN UNION 2018
Figure 7.1. Main elements of the external environment for business innovation
7.6. Figure 7.1 provides an overview of the external factors that can influence business
innovation. There are five main elements: spatial and locational factors, markets, knowledge
flows and networks, public policy, and society and the natural environment. Four of these
elements are discussed below, while knowledge flows and networks are covered in Chapter 6.
7.7. Spatial and locational factors define the firm’s jurisdictional location and its
proximity to product and labour markets (see section 7.4). These factors can influence costs
and awareness of consumer demand (Krugman, 1991). When detailed data on policy,
taxation, public infrastructure, society and other factors that vary by location are unavailable,
a firm’s location at the regional or national level can act as a proxy for these factors.
7.8. Markets are leading contextual factors (see Chapter 2) that are also shaped by the
firm’s own decisions. Relevant information for data collection (see section 7.4) includes
the characteristics of suppliers that provide inputs of goods and services to the firm, the
structure of demand in the firm’s current and potential markets, the markets for finance and
labour, as well as data on the extent of competition in product markets and standards.
Information on intermediaries and platforms is of growing importance because of the
reorganisation of several markets around online platforms (see subsection 7.4.4).
7.9. Public policy can influence business activities in direct and indirect ways. The
regulatory and enforcement framework influences how firms can appropriate the outcomes
of their innovation efforts (see Chapter 5) and the multiple relationships and transactions
that firms engage in, while the tax system affects the cost of business activities. Governments
can also use the tax system and other policies to target support to firms, including support
for innovation. Other aspects of the public sector that can influence firms include the
delivery of infrastructure services and the management of macroeconomic policy, which
External business environment
Spatial and locational factors
Markets
Ouputs
Customers and users
Competition
Co-ordination and standards
Inputs and resources
Suppliers
Humanresources
Finance
Intermediaries and digital platforms
Knowledge flows and networks
Public policy
Regulation and tax system
Government support
Public infrastructure
Macroeconomic policies
Society and the natural environment
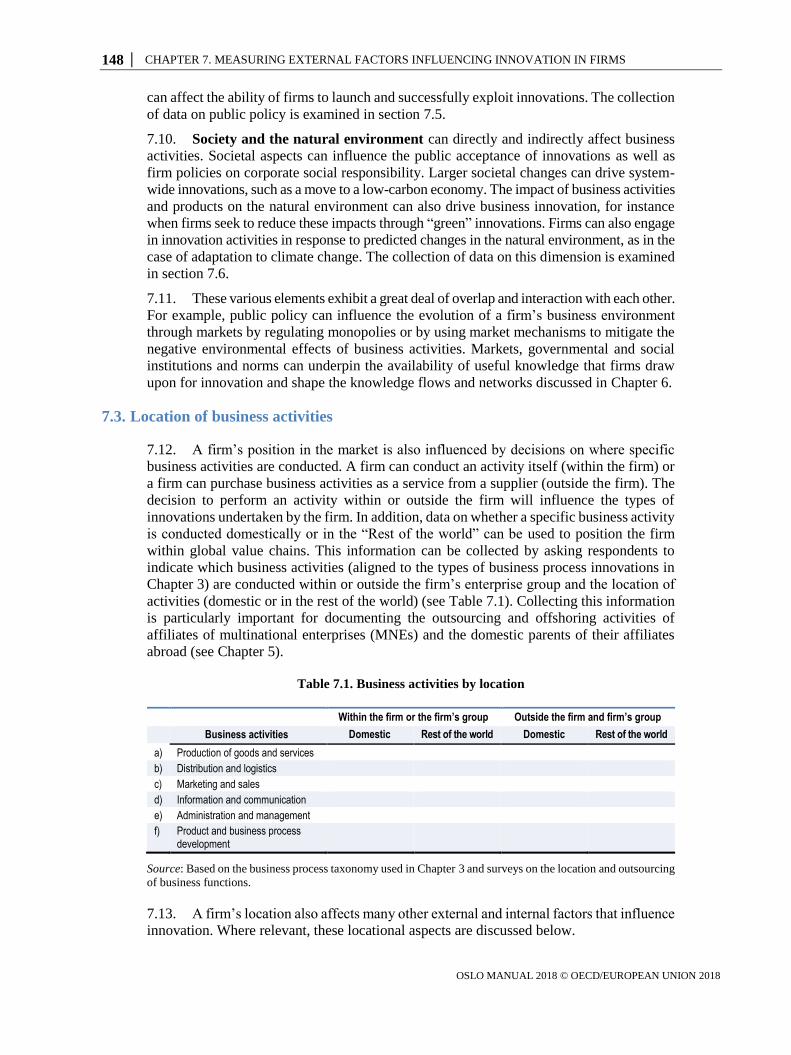
148 │ CHAPTER 7. MEASURING EXTERNAL FACTORS INFLUENCING INNOVATION IN FIRMS
OSLO MANUAL 2018 © OECD/EUROPEAN UNION 2018
can affect the ability of firms to launch and successfully exploit innovations. The collection
of data on public policy is examined in section 7.5.
7.10. Society and the natural environment can directly and indirectly affect business
activities. Societal aspects can influence the public acceptance of innovations as well as
firm policies on corporate social responsibility. Larger societal changes can drive system-
wide innovations, such as a move to a low-carbon economy. The impact of business activities
and products on the natural environment can also drive business innovation, for instance
when firms seek to reduce these impacts through “green” innovations. Firms can also engage
in innovation activities in response to predicted changes in the natural environment, as in the
case of adaptation to climate change. The collection of data on this dimension is examined
in section 7.6.
7.11. These various elements exhibit a great deal of overlap and interaction with each other.
For example, public policy can influence the evolution of a firm’s business environment
through markets by regulating monopolies or by using market mechanisms to mitigate the
negative environmental effects of business activities. Markets, governmental and social
institutions and norms can underpin the availability of useful knowledge that firms draw
upon for innovation and shape the knowledge flows and networks discussed in Chapter 6.
7.3. Location of business activities
7.12. A firm’s position in the market is also influenced by decisions on where specific
business activities are conducted. A firm can conduct an activity itself (within the firm) or
a firm can purchase business activities as a service from a supplier (outside the firm). The
decision to perform an activity within or outside the firm will influence the types of
innovations undertaken by the firm. In addition, data on whether a specific business activity
is conducted domestically or in the “Rest of the world” can be used to position the firm
within global value chains. This information can be collected by asking respondents to
indicate which business activities (aligned to the types of business process innovations in
Chapter 3) are conducted within or outside the firm’s enterprise group and the location of
activities (domestic or in the rest of the world) (see Table 7.1). Collecting this information
is particularly important for documenting the outsourcing and offshoring activities of
affiliates of multinational enterprises (MNEs) and the domestic parents of their affiliates
abroad (see Chapter 5).
Table 7.1. Business activities by location
Within the firm or the firm’s group Outside the firm and firm’s group
Business activities Domestic Rest of the world Domestic Rest of the world
a) Production of goods and services
b) Distribution and logistics
c) Marketing and sales
d) Information and communication
e) Administration and management
f) Product and business process development
Source: Based on the business process taxonomy used in Chapter 3 and surveys on the location and outsourcing
of business functions.
7.13. A firm’s location also affects many other external and internal factors that influence
innovation. Where relevant, these locational aspects are discussed below.
CHAPTER 7. MEASURING EXTERNAL FACTORS INFLUENCING INNOVATION IN FIRMS │ 149
OSLO MANUAL 2018 © OECD/EUROPEAN UNION 2018
7.4. Markets and the environment for business innovation
7.14. Markets provide the medium in which firms exchange goods and services to fulfil
their objectives. This section identifies market-mediated influences on innovation and describes
options for measurement.
7.4.1. Markets for the firm’s products
Industry and products
7.15. Competition and technological opportunities vary by product market and can
directly influence decisions on innovation activities and investments. The firm’s product
market can be identified using the United Nations’ Central Product Classification (CPC)
system, which is the main global reference for all goods and services and provides a
framework for the international comparison of statistics on goods and services. The CPC
classifies products by their physical properties, other intrinsic characteristics, and industrial
origin into one CPC class. Alternatively, firms can be classified by their main economic
activity or industry, based on the types of products produced and the methods of production
in use (see Chapter 9).
Main product market
7.16. Data on the classification of a firm’s products or industry are rarely sufficient for
identifying the effects of market conditions on the activities of firms, hence the need for
supplementary data, for example on a firm’s main market.
7.17. A firm’s main market (by product or industry) can influence its market power, the
level of competition that it faces, and potential barriers to entry. Relevant questions on the main
market include the amount of sales, the number of competitors, and the presence or absence
of MNEs in a firm’s main market. Further discussion of competition is provided below.
Geographical markets
7.18. Data on the geographical coverage of a firm’s markets are useful for interpreting
information on whether the firm has “new-to-market” innovations (see Chapter 3) and the
location of competitors and the variety of user demand (see Chapter 5). In addition, users
of innovation data may be interested in data on firms that were “born global” by serving
foreign or digital markets from their inception.
Types of customers
7.19. Firms can sell products to three main types of customers: governments (business-to-
government [B2G]), other businesses (business-to-business [B2B]), and individual consumers
(business-to-consumer [B2C]). A firm can sell products to more than one type of customer
at a given time.
7.20. Identifying B2G-active firms is relevant for research on the role of government in
innovation. It is of interest to collect data on whether firms entered into new agreements to
sell products to governments and to identify agreements by the level of government
(national, regional or local). For B2B-active firms, data collection should differentiate
between sales to independent firms and sales to firms that are affiliated through ownership.
150 │ CHAPTER 7. MEASURING EXTERNAL FACTORS INFLUENCING INNOVATION IN FIRMS
OSLO MANUAL 2018 © OECD/EUROPEAN UNION 2018
Main customer
7.21. Due to survey response burden, it is not possible to collect data on the characteristics
of all of a firm’s customers. One option is to focus on the firm’s main customer, which
could be a business, a government or private non-profit organisation, or an individual
consumer. Data on the identities of main customers that are businesses or government
organisations are of value to research on competition and networks. However, respondents
might be reluctant to provide this information due to concerns over confidentiality. Some
of this information could be available from other sources such as annual reports. Of note,
the collection and processing of data on named sources requires careful governance,
resources and data handling capabilities on the part of agencies or organisations running
innovation surveys. If the name and other details for a firm’s main customer cannot be
obtained, an alternative is to ask if a firm has a dominant customer (e.g. accounting for 10%
or more of total sales), the sales share of its three largest customers, and the industry of the
firm’s dominant or three largest customers.
Influence of customers on innovation
7.22. Customer and user demand for products from businesses, governments and
individuals are major drivers of all types of innovation, not only product. Firms can use
several methods or channels to identify customer demand for new or improved products
(or business processes), including:
Surveys or focus groups of customers, including surveys or discussions with those
who attended product demonstrations.
Development or co-creation with customers of concepts and ideas for new or
improved products or business processes (see subsection 5.5.2).
User innovation, whereby consumers or end-users modify a firm’s products, with
or without the firm’s consent (von Hippel, 2005, 1988), or when users develop
entirely new products. These modifications or new products can then be adopted
and sold by firms.
Computer or sensor data generated through the use of products.
7.23. Firms can use these channels to collect the following types of information from
their customers or users:
detailed specification requirements, for instance when a business customer provides
technical and other specifications for new business processes, software, services, etc.
information about the price that customers are willing to pay for new or improved
product characteristics
evaluations of the quality or reliability of the firm’s business processes, such as
service delivery
other data that may be used to improve the firm’s products or business processes, such
as behavioural and performance data on the interaction between users and products.
7.24. These questions are relevant for all firms, regardless of their innovation status (see
Chapter 3). Interpretation can be improved by collecting data on the firm’s main type of customer
(business/government/consumers), or by collecting data on customer engagement for each of
the three main customer types. The methods used to obtain valuable information from customers,
and the intensity with which these methods are used, are likely to vary by type of customer.
CHAPTER 7. MEASURING EXTERNAL FACTORS INFLUENCING INNOVATION IN FIRMS │ 151
OSLO MANUAL 2018 © OECD/EUROPEAN UNION 2018
7.25. An evaluation of the role of customers in innovation can also benefit from information
on how (or if) the firm used data from customers in its innovation activities. Data collection
can ask respondents about the use of specific actions to meet customer requirements, such
as cost reductions, improvements in product quality, reduced lead times, enhanced after-
sales functions, greater risk-sharing (i.e. consignment-based payments), extended business
hours, etc.
7.26. Evidence on the influence of government demand on innovation activities can be
obtained through questions that distinguish between participation in government procurement
agreements that:
formally required an innovation to meet the procurement specifications
did not formally require innovation, but where innovation was needed to meet
the specifications
neither required nor needed innovation to fulfil the contract specifications.
7.27. Although most research on procurement and innovation focuses on contractual
agreements with governments, the same structure can be used to collect data about
procurement requirements from businesses or other entities to which the firm provides
goods or services (Appelt and Galindo-Rueda, 2016).
7.4.2. Competition and collaboration in markets
Competition
7.28. Competition is a defining characteristic of markets and can have a substantial
influence on innovation. Information on market competition can be obtained indirectly
from data on the geographical location of the firm’s markets, from the types of customers
served by a firm (see above), or directly from questions on the extent or type of competition
faced by firms.
7.29. Key indicators of competition in product markets include the number of competitors,
the relative size of competitors (larger or smaller than the respondent firm), or qualitative
measures of the intensity of competition in the firm’s market. Surveys can include questions on
the characteristics or identity of a firm’s main competitor, for example whether it is an MNE.
7.30. Innovation surveys can capture information on the entry of new competitors into
the firm’s market and expectations about future sources of competitive pressures, including
new entrants with disruptive business models or firms with competing innovations. Competitive
pressure from the unregulated or informal sector can be an important driver of innovation
activities in some industries, countries and regions. Firms can also be asked to rate the
current or expected competitive pressure from different types of firms or organisations.
7.31. Innovation surveys can query whether any of a firm’s products or business processes
has been rendered fully or partially obsolete as a result of a competitor’s innovations.
Information on obsolescence would provide evidence on the process of creative destruction,
a major tenet of the innovation and growth literature.
7.32. The response of firms to competitive pressures and the role of innovation in this
response are of interest to innovation research. Possible responses include the innovation
objectives discussed in Chapter 8, and other actions such as changes to prices, adjustments
to personnel, disinvestment, mergers and acquisitions, etc.
152 │ CHAPTER 7. MEASURING EXTERNAL FACTORS INFLUENCING INNOVATION IN FIRMS
OSLO MANUAL 2018 © OECD/EUROPEAN UNION 2018
7.33. Situations of monopsony (a market situation in which there is a single buyer) can
affect a firm’s operations, profitability and ability to enter new markets or redesign its
business processes. From a firm’s perspective, this can apply to both the demand for its
products (number of potential buyers) and its suppliers (if the firm is the sole buyer for a
certain type of input).
7.34. Data collection can capture features of the market for business inputs by querying
the extent of competition in the firm’s main markets for inputs, the existence of alternative
sources of essential goods or services, the adoption of strategies to reduce supplier dependence,
and the establishment of strategic partnerships or risk-sharing agreements with suppliers.
7.35. Intense competition, along with a high rate of technological change and high
demand for innovation in a firm’s market, can result in short product life cycles. Under
these conditions, firms must update their products frequently, resulting in a high rate of
product innovation and consequently a high share of total sales from product innovations
(see subsection 8.3.1).
7.36. Data collection can identify the importance of competition and product market
conditions in driving innovation. A list of relevant factors is provided in Table 7.2.
Respondents can be asked about the importance of each factor or the respondent’s level of
agreement with each item.
Table 7.2. Competition and product market characteristics that can influence innovation
Proposed items for inclusion in questions on competition
Basic measures
Number of competitors1
Characteristics of main competitor – e.g. whether an MNE, a digital platform2
Qualitative measures of potential competition intensity
Your firm’s goods/services need to be quickly upgraded to remain relevant.
Technological developments in your firm’s main markets are difficult to predict.
Your firm’s goods/services are easily substituted by your competitors’ offerings.
The entry of new competitors is a major threat to your firm’s market position.
The actions of your competitors are difficult to predict.
Your firm faces strong competition in its markets.
Price increases in your markets tend to lead to an immediate loss of clients.
Customers in your markets find it difficult to assess the quality of products before purchasing them.
1. In the case of firms operating in more than one product market, it may be necessary to focus on the most
important market.
2. Competitors with digital business models are also relevant (see subsection 7.4.4).
Source: Based on questions on competition used in various innovation surveys.
Co-ordination and standards in markets
7.37. In market environments, co-ordination through collaboration or standards plays an
important role as an enabler and instrument of business strategy and activity.
7.38. Section 6.3 describes how to collect data on collaboration practices for innovation.
This information can be complemented by data on collaborative arrangements that do not
necessarily involve innovation, such as alliances, joint ventures, public-private partnerships,
supplier-customer networks, consortia and other collaborative initiatives with other businesses
and trade associations.
CHAPTER 7. MEASURING EXTERNAL FACTORS INFLUENCING INNOVATION IN FIRMS │ 153
OSLO MANUAL 2018 © OECD/EUROPEAN UNION 2018
7.39. Standards play an important co-ordination role in many markets and can influence
the characteristics of product and business process innovations. Standards are often defined
by consensus and approved by a recognised body that provides, for common and repeated
use, rules or guidelines for the characteristics of products, processes and organisations (Blind,
2004). A firm that has accreditation for specific standards can offer potential customers a
guarantee that its products and processes are fully compliant (Frenz and Lambert, 2014).
7.40. Surveys can evaluate the role of standards in a firm’s markets and for its innovation
activities through questions on the importance to the firm of the following actions involving:
accreditation for important industry or market standards (a priority list of standards
can be provided to firms active in specific industries)
ability to demonstrate that product or business process innovations meet relevant
industry or market standards
active engagement in the formulation of relevant industry standards
ownership of – or access to – intellectual property (IP) rights that are essential for
the use of industry standards, i.e. when an unlicensed party cannot comply with a
standard without infringing IP rights.
7.41. Standards can be important sources of knowledge and therefore can be included in
the list of information sources for innovation (see Table 6.6) or innovation objectives.
Compliance with standards can also be an innovation objective (see Table 8.1).
7.42. Widespread policy and research interest in the transformation of innovation systems
(see subsection 2.2.1) could also warrant the inclusion of questions on the importance of
complementary innovations introduced by other actors in the system. For instance, the
widespread adoption of an innovation can depend on complementary innovations occurring
in other industries or in supporting infrastructure.
7.4.3. The market for inputs
7.43. In addition to customers as a source of ideas for innovation, firms can obtain other inputs
for their innovation activities from their suppliers, the labour market, and financial markets.
Suppliers
7.44. Firms can obtain inputs from firms or organisations that supply goods (equipment,
materials, software, components etc.), services (consulting, business services, etc.) or IP rights.
7.45. Data collection is unlikely to be able to identify all of a firm’s suppliers of goods,
services or IP rights. One option is to collect data for specific types of suppliers, such as
suppliers of equipment or business services, or for the most important supplier of goods or
services. Relevant information on a firm’s most important supplier includes its main
economic activity, location, multinational status, and if it is linked by ownership to the
respondent’s firm. The identity of the supplier can also be requested to support data linking
and network analysis, but this approach faces the same challenges of confidentiality and
response burden as for questions on the firm’s main customer. An alternative is to collect
data on the share of materials, equipment, etc. obtained from the firm’s three most important
suppliers. Further details can be requested on the nature of supplier-based relationships,
for instance if they involve collaboration, co-investment and risk-sharing, or franchising
agreements. This may also include a question on criteria used to select suppliers (technical
capabilities, prestige, prices, accreditation, geographic proximity, etc.).
154 │ CHAPTER 7. MEASURING EXTERNAL FACTORS INFLUENCING INNOVATION IN FIRMS
OSLO MANUAL 2018 © OECD/EUROPEAN UNION 2018
7.46. Surveys consistently identify suppliers as important sources of information and
collaboration partners for innovation (see Chapter 6). Further insight on the role played by
suppliers in innovation can be acquired through questions on the engagement of suppliers
in each of the activities listed in Table 7.1, with some adaptation for the context of different
supplier relationships. The influence of suppliers on innovation can also be assessed
through questions on whether procurement contracts with suppliers required innovation to
meet contract specifications.
Human resources and the labour market
7.47. Guidance on the measurement of human resources used by the firm and contributing
to its internal capabilities is provided in Chapter 5. Such internal capability is closely
related to the labour market in which the firm operates. Firms search for individuals and
hire their services on the labour market. Some of these individuals are responsible for
building and maintaining the internal competencies of the firm, including the competencies
required for innovation. The market for skilled and highly qualified labour warrants attention
because of the close links between human capital and innovation capabilities (Cohen and
Levinthal, 1990; Jones and Grimshaw, 2012). The efficiency and characteristics of the labour
market can have a wide range of implications for the firm’s strategy and performance.
Labour market transactions between firms and individuals are also subject to regulatory
oversight (see section 7.5 below) and social norms that can be difficult to disentangle from
other market characteristics.
7.48. Two labour market characteristics that are relevant to skilled workers, or workers
involved in innovation, are the geographical scope of the labour market and the employment
history of new hires. The geographical scope concerns where a firm sources its employees
from: locally, regionally, nationally, or internationally. Data collection on this topic can
identify the need to attract workers from increasingly distant locations and is relevant to
research on domestic and international migration. The employment history concerns the
primary source of a firm’s new hires, which is relevant to research on knowledge flows.
Individuals can be hired directly as they leave the education system, for instance new
graduates with a master’s or doctoral degree, from a period of inactivity or unemployment,
or from previous employment. The latter can be disaggregated into hiring primarily from
competitors, from other firms (such as suppliers), or from government.
7.49. Data on labour market conditions can be collected for the entire workforce and for
highly skilled or qualified personnel involved in innovation. It is important to specify if a
question refers to all employees, or only to employees involved in innovation activities.
Markets for finance
7.50. Financial markets play a central role in allocating resources to innovation and other
activities (Kerr, Nanda and Rhodes-Kropf, 2014). They shape the innovation investment
efforts of firms and their actual sources of funds (see Chapter 4).
7.51. A basic distinction when considering markets for finance is between equity (provided
in exchange for a share in ownership of the firm) and debt (generating an obligation to
repay the amount borrowed). Table 7.3 provides a summary list with different types of
internal and external sources of finance. Respondents may find it difficult to map sources
of finance to specific activities that may or may not involve innovation, such as business
investment, mergers and acquisitions, payment of liabilities, or shareholder buyouts. An
alternative is to collect information on the overall financing of the firm. Questions can be
framed in terms of past behaviour during the observation period or in terms of future plans.

CHAPTER 7. MEASURING EXTERNAL FACTORS INFLUENCING INNOVATION IN FIRMS │ 155
OSLO MANUAL 2018 © OECD/EUROPEAN UNION 2018
In addition, respondents may be asked about the availability and affordability of different
sources of finance. Evidence on the use of intangible assets as collateral can be of high
relevance to research on the financing of innovation.
Table 7.3. Types of finance for general and specific innovation activities
Source Type of finance Examples
Internal
Through retained profits or asset disposal
Transfers and loans from affiliated firms or owners
External Equity Ordinary/common stock
Venture capital or private equity
Business angel
Debt Bonds and obligations, convertible debt
Bank loans, overdraft facilities
Trade credit, factoring, leasing, advance orders
Credit cards
Loans from family and friends
Loans from government or government-backed credit institutions
Mixed Subordinated loans/bonds, mezzanine finance, convertible bonds, preferred stock
Financial transfers Grants and subsidies
Private donations and philanthropy
7.4.4. Intermediaries and digital platforms
7.52. Markets can include intermediaries that encourage and support transactions between
different types of customers, creating supplier-customer relationships. Network effects can
create interchangeable roles for suppliers and customers that alter market dynamics and
relations. An example is when networks allow media firms, content providers, and advertisers
to act as both suppliers and users of content. Intermediaries such as knowledge brokers or
knowledge transfer offices at universities and research institutes connect potential users of
knowledge with knowledge producers. Data can be collected on the use of knowledge
brokers and IP rights to mediate knowledge transfer (see subsection 6.3.5).
7.53. Digitalisation has contributed to the emergence of technology-based virtual market
platforms that capture, transmit and monetise data over the Internet through competitive and
collaborative transactions between different users, buyers, or suppliers (see subsection 5.5.3).
These virtual market platforms provide a space for established and new firms to develop and
sell complementary technologies, products or services (Evans and Gawer, 2016). Consequently,
these platforms provide fertile ground for the development and diffusion of innovations.
7.54. Data collection on digital platforms is primarily conducted in information and
communication technology surveys. However, innovation surveys could include basic
questions on whether or not the firm provides, uses or competes on digital platforms, and
if goods or services are digitally ordered or delivered. Data collection can ask respondents
whether their firm:
provides digital platform services, or has a digital platform business model
uses the services of digital platform providers
competes with (or is exposed to competition from) providers of digital platform
services (see Table 7.2)
competes with (or is exposed to competition from) users of digital platform services.
156 │ CHAPTER 7. MEASURING EXTERNAL FACTORS INFLUENCING INNOVATION IN FIRMS
OSLO MANUAL 2018 © OECD/EUROPEAN UNION 2018
7.5. The public policy environment for business innovation
7.5.1. Regulations
7.55. Regulation refers to the implementation of rules by public authorities and governmental
bodies to influence market activity and the behaviour of private actors in the economy
(OECD, 1997). A wide variety of regulations can affect the innovation activities of firms,
industries and economies (Blind, 2013), including regulations on product markets, trade
and tariffs, financial affairs, corporate governance, accounting and bankruptcy, IP rights,
health and safety, employment and the labour market, immigration, environment, and
energy. In order to be of use for research, data on regulations must be obtained for specific
markets or purposes. For example, product market regulations can be disaggregated into
regulations to ensure the health or safety of users, energy efficiency, recycling after use,
etc. Data collection can determine if each regulatory area acted as a barrier to change,
required innovation for compliance, or was not relevant to the firm. If a firm made changes
in response to a regulation, the firm can be asked if the changes required investment in
innovation to comply with the regulation.
7.56. Alternatively, surveys can collect information on the types of regulations that create
the highest compliance costs and which regulations have the largest effect on decisions to
develop product or business process innovations or enter new markets. The jurisdiction of
regulations (local, regional, national, supranational) is also of research interest.
7.5.2. Government support programmes
7.57. Government support programmes represent direct or indirect transfers of resources
to firms. Support can be of a financial nature or may be provided in kind. This support may
come directly from government authorities or indirectly, for example when consumers are
subsidised to purchase specific products. Firms can benefit from public support that targets
business activities (for instance expenditures on research and experimental development
[R&D] or the acquisition of new machinery) or the outcomes of business activities (for
instance revenue streams arising from past innovation activities or reduced pollutant emission
levels). Innovation-related activities and outcomes are common targets of government
support. National and international regulations oversee the conditions under which support
can be provided to firms, thus generating specific demand for evidence on the extent and
impact of different forms and levels of government support for innovation.
7.58. Data collection can obtain information on whether a firm received direct financial
support from public authorities and, if possible, the level of government that provided the
support. Research into the effect of government financial support for innovation requires
data on the nature and amount of government support by innovative, innovation-active and
non-innovative firms. This includes identifying the component of government support that
is specifically aimed at promoting innovation. Chapter 4 guidance on the sources of finance
for innovation is helpful in this respect.
7.59. Both survey and administrative data sources on government support can be usefully
combined to analyse the effects of public support policies. Administrative data on participation
in government support programmes can be linked to innovation survey respondents, preferably
using common business identification numbers if available in both databases. In addition
to reducing response burden, this can provide more granular and accurate quantitative
information for research on the individual and combined impacts of government programmes
to support innovation. However, when administrative data are used, it is important to achieve
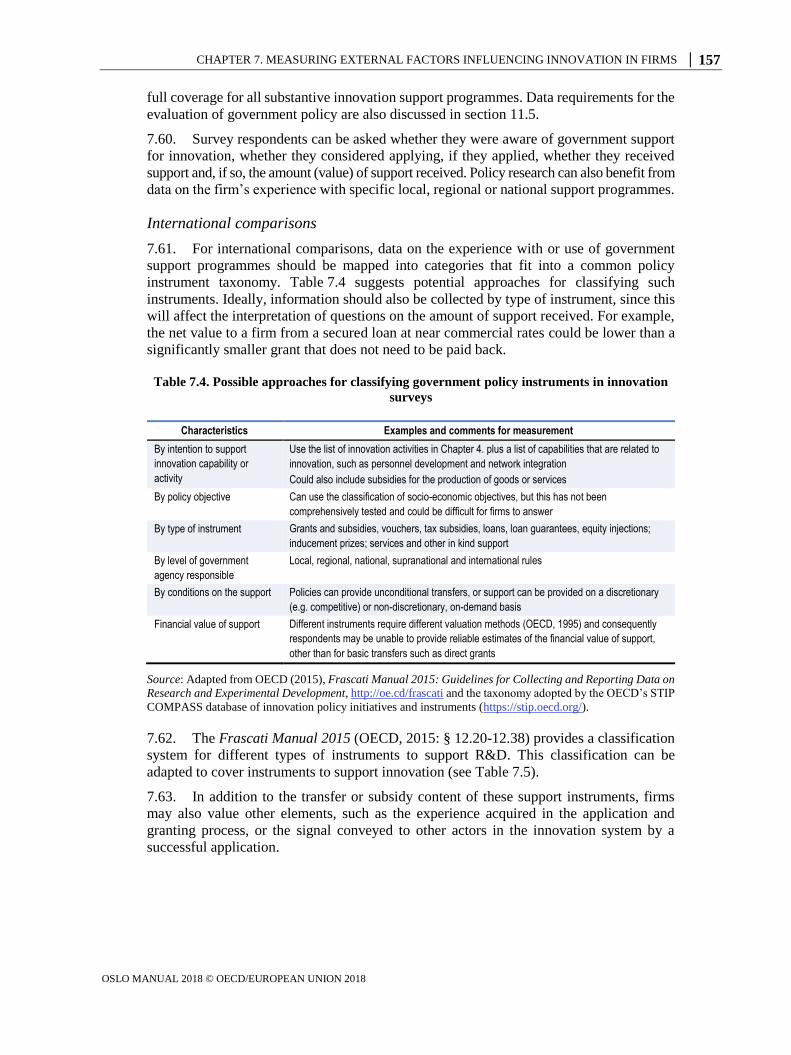
CHAPTER 7. MEASURING EXTERNAL FACTORS INFLUENCING INNOVATION IN FIRMS │ 157
OSLO MANUAL 2018 © OECD/EUROPEAN UNION 2018
full coverage for all substantive innovation support programmes. Data requirements for the
evaluation of government policy are also discussed in section 11.5.
7.60. Survey respondents can be asked whether they were aware of government support
for innovation, whether they considered applying, if they applied, whether they received
support and, if so, the amount (value) of support received. Policy research can also benefit from
data on the firm’s experience with specific local, regional or national support programmes.
International comparisons
7.61. For international comparisons, data on the experience with or use of government
support programmes should be mapped into categories that fit into a common policy
instrument taxonomy. Table 7.4 suggests potential approaches for classifying such
instruments. Ideally, information should also be collected by type of instrument, since this
will affect the interpretation of questions on the amount of support received. For example,
the net value to a firm from a secured loan at near commercial rates could be lower than a
significantly smaller grant that does not need to be paid back.
Table 7.4. Possible approaches for classifying government policy instruments in innovation
surveys
Characteristics Examples and comments for measurement
By intention to support
innovation capability or
activity
Use the list of innovation activities in Chapter 4. plus a list of capabilities that are related to
innovation, such as personnel development and network integration
Could also include subsidies for the production of goods or services By policy objective Can use the classification of socio-economic objectives, but this has not been
comprehensively tested and could be difficult for firms to answer By type of instrument Grants and subsidies, vouchers, tax subsidies, loans, loan guarantees, equity injections;
inducement prizes; services and other in kind support By level of government
agency responsible
Local, regional, national, supranational and international rules
By conditions on the support Policies can provide unconditional transfers, or support can be provided on a discretionary
(e.g. competitive) or non-discretionary, on-demand basis Financial value of support Different instruments require different valuation methods (OECD, 1995) and consequently
respondents may be unable to provide reliable estimates of the financial value of support,
other than for basic transfers such as direct grants
Source: Adapted from OECD (2015), Frascati Manual 2015: Guidelines for Collecting and Reporting Data on
Research and Experimental Development, http://oe.cd/frascati and the taxonomy adopted by the OECD’s STIP
COMPASS database of innovation policy initiatives and instruments (https://stip.oecd.org/).
7.62. The Frascati Manual 2015 (OECD, 2015: § 12.20-12.38) provides a classification
system for different types of instruments to support R&D. This classification can be
adapted to cover instruments to support innovation (see Table 7.5).
7.63. In addition to the transfer or subsidy content of these support instruments, firms
may also value other elements, such as the experience acquired in the application and
granting process, or the signal conveyed to other actors in the innovation system by a
successful application.
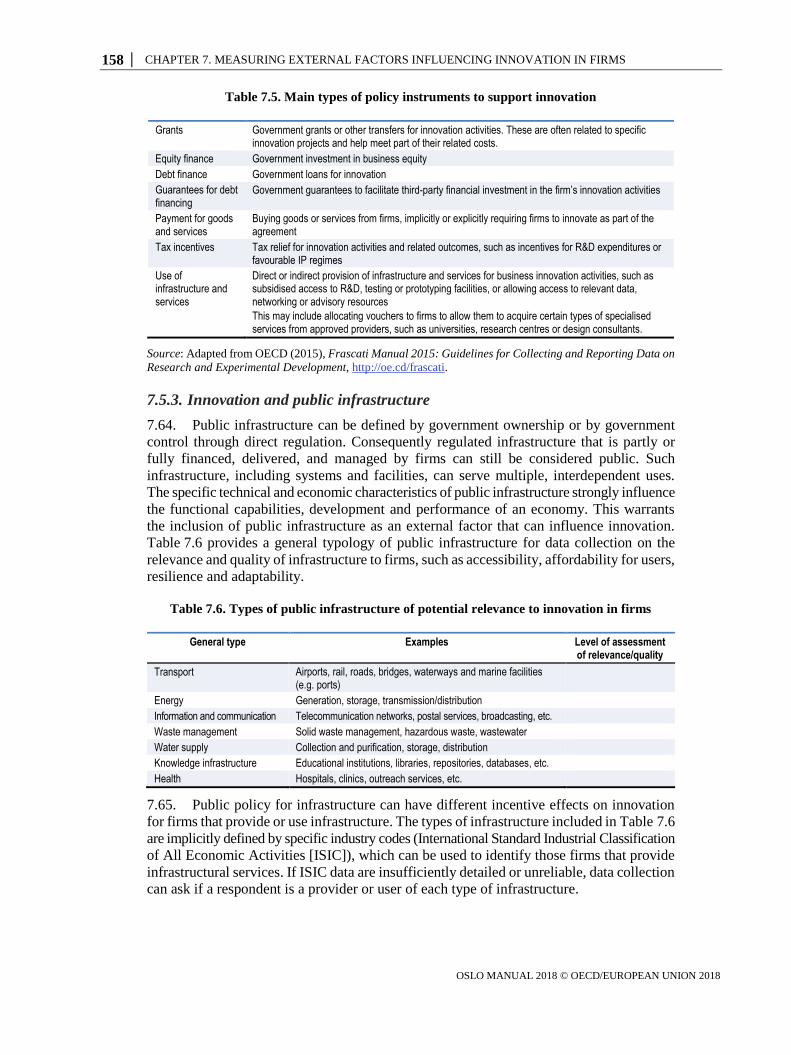
158 │ CHAPTER 7. MEASURING EXTERNAL FACTORS INFLUENCING INNOVATION IN FIRMS
OSLO MANUAL 2018 © OECD/EUROPEAN UNION 2018
Table 7.5. Main types of policy instruments to support innovation
Grants Government grants or other transfers for innovation activities. These are often related to specific innovation projects and help meet part of their related costs.
Equity finance Government investment in business equity
Debt finance Government loans for innovation
Guarantees for debt financing
Government guarantees to facilitate third-party financial investment in the firm’s innovation activities
Payment for goods and services
Buying goods or services from firms, implicitly or explicitly requiring firms to innovate as part of the agreement
Tax incentives Tax relief for innovation activities and related outcomes, such as incentives for R&D expenditures or favourable IP regimes
Use of infrastructure and services
Direct or indirect provision of infrastructure and services for business innovation activities, such as subsidised access to R&D, testing or prototyping facilities, or allowing access to relevant data, networking or advisory resources
This may include allocating vouchers to firms to allow them to acquire certain types of specialised services from approved providers, such as universities, research centres or design consultants.
Source: Adapted from OECD (2015), Frascati Manual 2015: Guidelines for Collecting and Reporting Data on
Research and Experimental Development, http://oe.cd/frascati.
7.5.3. Innovation and public infrastructure
7.64. Public infrastructure can be defined by government ownership or by government
control through direct regulation. Consequently regulated infrastructure that is partly or
fully financed, delivered, and managed by firms can still be considered public. Such
infrastructure, including systems and facilities, can serve multiple, interdependent uses.
The specific technical and economic characteristics of public infrastructure strongly influence
the functional capabilities, development and performance of an economy. This warrants
the inclusion of public infrastructure as an external factor that can influence innovation.
Table 7.6 provides a general typology of public infrastructure for data collection on the
relevance and quality of infrastructure to firms, such as accessibility, affordability for users,
resilience and adaptability.
Table 7.6. Types of public infrastructure of potential relevance to innovation in firms
General type Examples Level of assessment of relevance/quality
Transport Airports, rail, roads, bridges, waterways and marine facilities (e.g. ports)
Energy Generation, storage, transmission/distribution
Information and communication Telecommunication networks, postal services, broadcasting, etc.
Waste management Solid waste management, hazardous waste, wastewater
Water supply Collection and purification, storage, distribution
Knowledge infrastructure Educational institutions, libraries, repositories, databases, etc.
Health Hospitals, clinics, outreach services, etc.
7.65. Public policy for infrastructure can have different incentive effects on innovation
for firms that provide or use infrastructure. The types of infrastructure included in Table 7.6
are implicitly defined by specific industry codes (International Standard Industrial Classification
of All Economic Activities [ISIC]), which can be used to identify those firms that provide
infrastructural services. If ISIC data are insufficiently detailed or unreliable, data collection
can ask if a respondent is a provider or user of each type of infrastructure.
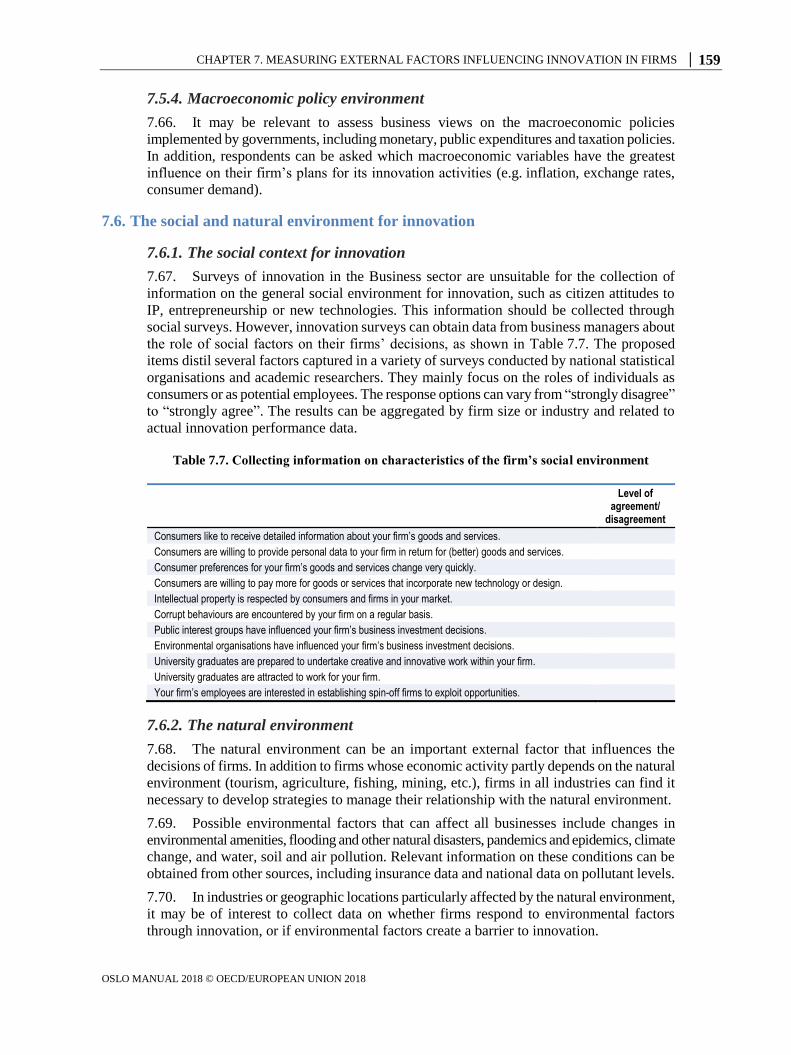
CHAPTER 7. MEASURING EXTERNAL FACTORS INFLUENCING INNOVATION IN FIRMS │ 159
OSLO MANUAL 2018 © OECD/EUROPEAN UNION 2018
7.5.4. Macroeconomic policy environment
7.66. It may be relevant to assess business views on the macroeconomic policies
implemented by governments, including monetary, public expenditures and taxation policies.
In addition, respondents can be asked which macroeconomic variables have the greatest
influence on their firm’s plans for its innovation activities (e.g. inflation, exchange rates,
consumer demand).
7.6. The social and natural environment for innovation
7.6.1. The social context for innovation
7.67. Surveys of innovation in the Business sector are unsuitable for the collection of
information on the general social environment for innovation, such as citizen attitudes to
IP, entrepreneurship or new technologies. This information should be collected through
social surveys. However, innovation surveys can obtain data from business managers about
the role of social factors on their firms’ decisions, as shown in Table 7.7. The proposed
items distil several factors captured in a variety of surveys conducted by national statistical
organisations and academic researchers. They mainly focus on the roles of individuals as
consumers or as potential employees. The response options can vary from “strongly disagree”
to “strongly agree”. The results can be aggregated by firm size or industry and related to
actual innovation performance data.
Table 7.7. Collecting information on characteristics of the firm’s social environment
Level of agreement/
disagreement
Consumers like to receive detailed information about your firm’s goods and services.
Consumers are willing to provide personal data to your firm in return for (better) goods and services.
Consumer preferences for your firm’s goods and services change very quickly.
Consumers are willing to pay more for goods or services that incorporate new technology or design.
Intellectual property is respected by consumers and firms in your market.
Corrupt behaviours are encountered by your firm on a regular basis.
Public interest groups have influenced your firm’s business investment decisions.
Environmental organisations have influenced your firm’s business investment decisions.
University graduates are prepared to undertake creative and innovative work within your firm.
University graduates are attracted to work for your firm.
Your firm’s employees are interested in establishing spin-off firms to exploit opportunities.
7.6.2. The natural environment
7.68. The natural environment can be an important external factor that influences the
decisions of firms. In addition to firms whose economic activity partly depends on the natural
environment (tourism, agriculture, fishing, mining, etc.), firms in all industries can find it
necessary to develop strategies to manage their relationship with the natural environment.
7.69. Possible environmental factors that can affect all businesses include changes in
environmental amenities, flooding and other natural disasters, pandemics and epidemics, climate
change, and water, soil and air pollution. Relevant information on these conditions can be
obtained from other sources, including insurance data and national data on pollutant levels.
7.70. In industries or geographic locations particularly affected by the natural environment,
it may be of interest to collect data on whether firms respond to environmental factors
through innovation, or if environmental factors create a barrier to innovation.
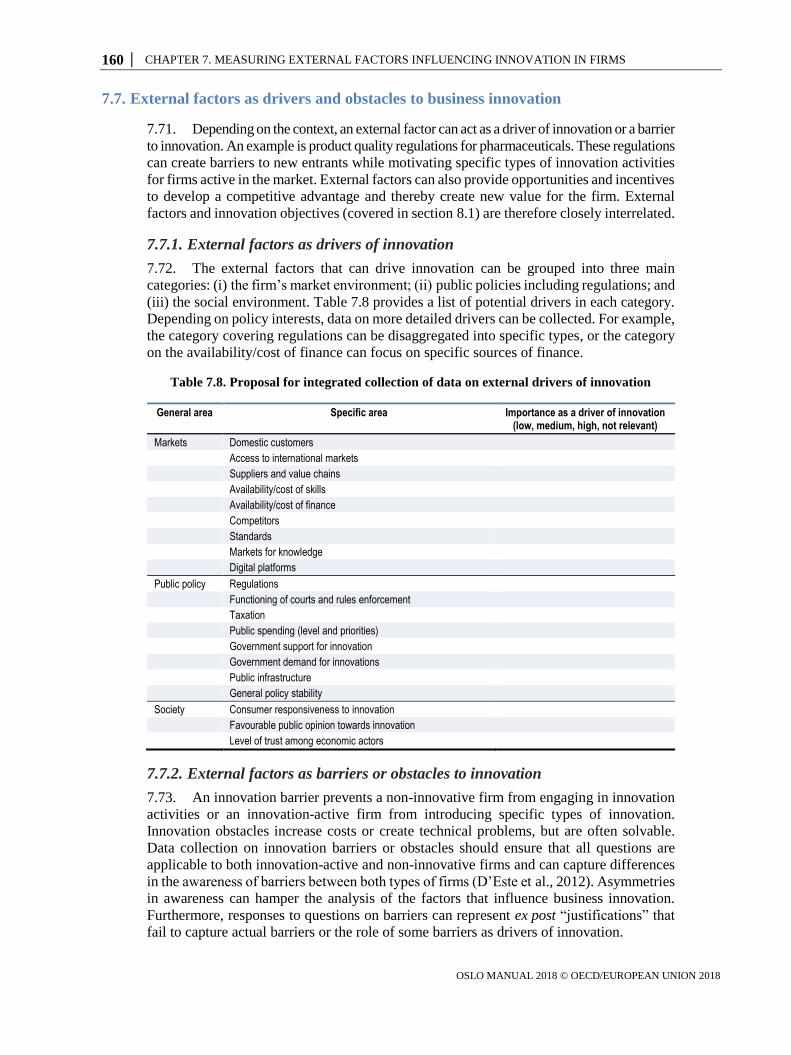
160 │ CHAPTER 7. MEASURING EXTERNAL FACTORS INFLUENCING INNOVATION IN FIRMS
OSLO MANUAL 2018 © OECD/EUROPEAN UNION 2018
7.7. External factors as drivers and obstacles to business innovation
7.71. Depending on the context, an external factor can act as a driver of innovation or a barrier
to innovation. An example is product quality regulations for pharmaceuticals. These regulations
can create barriers to new entrants while motivating specific types of innovation activities
for firms active in the market. External factors can also provide opportunities and incentives
to develop a competitive advantage and thereby create new value for the firm. External
factors and innovation objectives (covered in section 8.1) are therefore closely interrelated.
7.7.1. External factors as drivers of innovation
7.72. The external factors that can drive innovation can be grouped into three main
categories: (i) the firm’s market environment; (ii) public policies including regulations; and
(iii) the social environment. Table 7.8 provides a list of potential drivers in each category.
Depending on policy interests, data on more detailed drivers can be collected. For example,
the category covering regulations can be disaggregated into specific types, or the category
on the availability/cost of finance can focus on specific sources of finance.
Table 7.8. Proposal for integrated collection of data on external drivers of innovation
General area Specific area Importance as a driver of innovation (low, medium, high, not relevant)
Markets Domestic customers
Access to international markets
Suppliers and value chains
Availability/cost of skills
Availability/cost of finance
Competitors
Standards
Markets for knowledge
Digital platforms
Public policy Regulations
Functioning of courts and rules enforcement
Taxation
Public spending (level and priorities)
Government support for innovation
Government demand for innovations
Public infrastructure
General policy stability
Society Consumer responsiveness to innovation
Favourable public opinion towards innovation
Level of trust among economic actors
7.7.2. External factors as barriers or obstacles to innovation
7.73. An innovation barrier prevents a non-innovative firm from engaging in innovation
activities or an innovation-active firm from introducing specific types of innovation.
Innovation obstacles increase costs or create technical problems, but are often solvable.
Data collection on innovation barriers or obstacles should ensure that all questions are
applicable to both innovation-active and non-innovative firms and can capture differences
in the awareness of barriers between both types of firms (D’Este et al., 2012). Asymmetries
in awareness can hamper the analysis of the factors that influence business innovation.
Furthermore, responses to questions on barriers can represent ex post “justifications” that
fail to capture actual barriers or the role of some barriers as drivers of innovation.
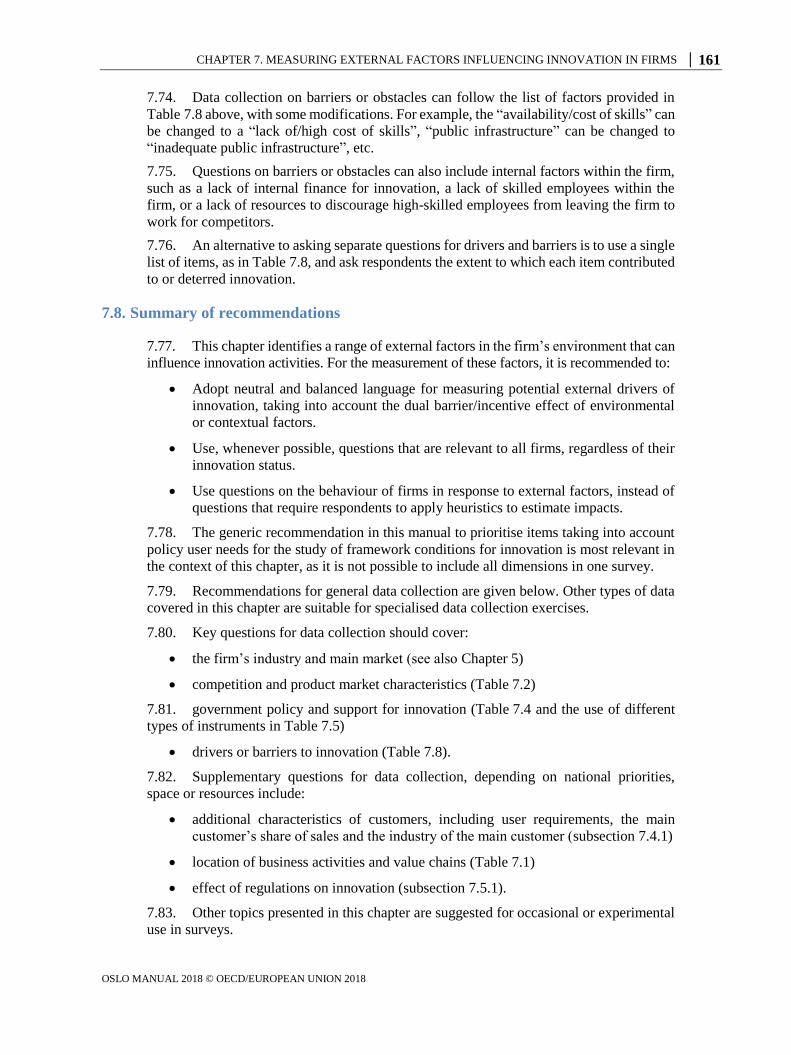
CHAPTER 7. MEASURING EXTERNAL FACTORS INFLUENCING INNOVATION IN FIRMS │ 161
OSLO MANUAL 2018 © OECD/EUROPEAN UNION 2018
7.74. Data collection on barriers or obstacles can follow the list of factors provided in
Table 7.8 above, with some modifications. For example, the “availability/cost of skills” can
be changed to a “lack of/high cost of skills”, “public infrastructure” can be changed to
“inadequate public infrastructure”, etc.
7.75. Questions on barriers or obstacles can also include internal factors within the firm,
such as a lack of internal finance for innovation, a lack of skilled employees within the
firm, or a lack of resources to discourage high-skilled employees from leaving the firm to
work for competitors.
7.76. An alternative to asking separate questions for drivers and barriers is to use a single
list of items, as in Table 7.8, and ask respondents the extent to which each item contributed
to or deterred innovation.
7.8. Summary of recommendations
7.77. This chapter identifies a range of external factors in the firm’s environment that can
influence innovation activities. For the measurement of these factors, it is recommended to:
Adopt neutral and balanced language for measuring potential external drivers of
innovation, taking into account the dual barrier/incentive effect of environmental
or contextual factors.
Use, whenever possible, questions that are relevant to all firms, regardless of their
innovation status.
Use questions on the behaviour of firms in response to external factors, instead of
questions that require respondents to apply heuristics to estimate impacts.
7.78. The generic recommendation in this manual to prioritise items taking into account
policy user needs for the study of framework conditions for innovation is most relevant in
the context of this chapter, as it is not possible to include all dimensions in one survey.
7.79. Recommendations for general data collection are given below. Other types of data
covered in this chapter are suitable for specialised data collection exercises.
7.80. Key questions for data collection should cover:
the firm’s industry and main market (see also Chapter 5)
competition and product market characteristics (Table 7.2)
7.81. government policy and support for innovation (Table 7.4 and the use of different
types of instruments in Table 7.5)
drivers or barriers to innovation (Table 7.8).
7.82. Supplementary questions for data collection, depending on national priorities,
space or resources include:
additional characteristics of customers, including user requirements, the main
customer’s share of sales and the industry of the main customer (subsection 7.4.1)
location of business activities and value chains (Table 7.1)
effect of regulations on innovation (subsection 7.5.1).
7.83. Other topics presented in this chapter are suggested for occasional or experimental
use in surveys.

162 │ CHAPTER 7. MEASURING EXTERNAL FACTORS INFLUENCING INNOVATION IN FIRMS
OSLO MANUAL 2018 © OECD/EUROPEAN UNION 2018
References
Appelt, S. and F. Galindo-Rueda (2016), “Measuring the link between public procurement and
innovation”, OECD Science, Technology and Industry Working Papers, No. 2016/03, OECD
Publishing, Paris, https://doi.org/10.1787/5jlvc7sl1w7h-en.
Blind, K. (2013), “The impact of standardization and standards on innovation”, Nesta Working Papers,
No. 13/15, Nesta, London, www.nesta.org.uk/report/the-impact-of-standardization-and-standards-on-
innovation/.
Blind, K. (2004), The Economics of Standards: Theory, Evidence, Policy, Edward Elgar Publishing,
Cheltenham.
Cohen, W.M. and D.A. Levinthal, (1990), “Absorptive capacity: A new perspective on learning and
innovation”, Administrative Science Quarterly, Vol. 35/1, pp. 128-152.
D’Este, P. et al. (2012), “What hampers innovation? Revealed barriers versus deterring barriers”,
Research Policy, Vol. 41/2, pp. 482-488.
Edquist, C. (2005), “Systems of innovation: Perspectives and challenges”, in The Oxford Handbook of
Innovation, Oxford University Press, Oxford, pp. 181-208.
Evans, P.C. and A. Gawer (2016), “The rise of the platform enterprise: A global survey”, The Emerging
Platform Economy Series, No. 1, The Center of Global Enterprise.
Frenz, M. and R. Lambert (2014), “The economics of accreditation”, NCSLI Measure, Vol. 9/2, pp. 42-
50, https://doi.org/10.1080/19315775.2014.11721682.
Granstrand, O., P. Patel and K. Pavitt (1997), “Multi-technology corporations: why they have
‘distributed’ rather than ‘distinctive core’ competences”, California Management Review, Vol. 39/4,
pp. 8-25.
Jones, B. and D. Grimshaw (2012), “The effects of policies for training and skills on improving
innovation capabilities in firms”, Nesta Working Papers, No. 12/08, Nesta, London.
Kerr, W.R., R. Nanda and M. Rhodes-Kropf (2014), “Entrepreneurship as experimentation”, Journal of
Economic Perspectives, Vol. 28/3, pp. 25-48.
Krugman, P. (1991), Geography and Trade, MIT Press, Cambridge, MA.
Lundvall, B.-Å. (ed.) (1992), National Innovation Systems: Towards a Theory of Innovation and
Interactive Learning, Pinter, London.
Nelson, R. (ed.) (1993), National Innovation Systems. A Comparative Analysis, Oxford University Press,
New York/Oxford.
OECD (2015), Frascati Manual 2015: Guidelines for Collecting and Reporting Data on Research and
Experimental Development, The Measurement of Scientific, Technological and Innovation Activities,
OECD Publishing, Paris, http://oe.cd/frascati.
OECD (1997), The OECD Report on Regulatory Reform: Synthesis Report, OECD Publishing, Paris,
https://doi.org/10.1787/9789264189751-en.
OECD (1995), Industrial Subsidies: A Reporting Manual, OECD Publishing, Paris.
von Hippel, E. (2005), Democratizing Innovation, MIT Press, Cambridge, MA.
von Hippel, E. (1988), The Sources of Innovation, Oxford University Press, New York.
CHAPTER 8. OBJECTIVES AND OUTCOMES OF BUSINESS INNOVATION │ 163
OSLO MANUAL 2018 © OECD/EUROPEAN UNION 2018
Chapter 8. Objectives and outcomes of business innovation
This chapter discusses different approaches to measuring business innovation objectives
and outcomes, extending the measurement of innovation characteristics introduced in
Chapter 3. It discusses several qualitative measures of the variety of innovation objectives
and outcomes pursued by firms. This is complemented by an evaluation of quantitative
measures of innovation outcomes for both product and business process innovations. An
overview of the challenges to measuring innovation outcomes is presented before providing
a final set of recommendations.

164 │ CHAPTER 8. OBJECTIVES AND OUTCOMES OF BUSINESS INNOVATION
OSLO MANUAL 2018 © OECD/EUROPEAN UNION 2018
8.1. Introduction
8.1. The planning and development stage for an innovation includes the identification
of a set of one or more objectives that the innovation is expected to achieve. The objectives
can refer to the characteristics of the innovation itself, such as its specifications, or its market
and economic objectives. The outcomes of an innovation can be captured by a similar list
of items as the objectives, but consist of the innovation’s realised effects. These can also
include unexpected effects that were not identified among the firm’s initial objectives.
8.2. A firm’s economic objectives for its innovations can include the generation of
profits, an increase in sales or brand awareness from product innovation, and cost savings
or productivity improvements from business process innovation (Crépon, Duguet and
Mairesse, 1998). Other objectives include changes to the firm’s capabilities, markets, or
the types of customers that buy its products, and the establishment of new external linkages.
8.3. Innovation outcomes include the extent to which a firm’s objectives are met and
the broader effects of innovation on other organisations, the economy, society, and the
environment. The broader effects may or may not have been identified by a firm as
innovation objectives. They include different types of spillovers and externalities that can
change the structure of competition in markets and stimulate or hamper the innovation
activities of other organisations. Broader effects of innovation can also contribute to or
hinder societal goals such as improvements to employment, health and environmental
conditions, or help solve or influence other societal challenges.
8.4. Common objectives for many firms are to increase overall profits and growth in
terms of sales or market share. Research on the effects of innovation on such outcomes should
ideally use administrative data and identify the effect of innovation through econometric
analysis (see Chapter 11). However, it is also of value for research to collect data on outcomes
that are limited to innovations, such as the sales share or profit margin of innovations.
8.5. This chapter presents different approaches to measuring innovation objectives and
outcomes. Section 8.2 discusses qualitative measures of the variety of innovation objectives
and outcomes pursued by firms. Section 8.3 includes an evaluation of quantitative measures
of innovation outcomes for product and business process innovations. An overview of the
challenges for measuring innovation outcomes is presented in section 8.4, before providing
a final set of recommendations.
8.2. Qualitative measures of business innovation objectives and outcomes
8.2.1. Types of innovation objectives and outcomes
8.6. Innovation objectives consist of a firm’s identifiable goals that reflect its motives
and underlying strategies with respect to its innovation efforts (see subsection 5.3.1)
Collecting data on innovation objectives is useful for research on the factors that drive a
firm’s decision to engage in innovation activities, such as the intensity of competition or
the opportunities for entering new markets, and how the firm responds to these drivers,
such as improvements to the efficiency of the firm’s operations or enhancements to its
innovation capabilities. Data on objectives can also provide insights into the planned
characteristics of innovations, for instance if a firm’s objective is to substantially change
its business processes or to only make minor adjustments. In addition, data on innovation
objectives can be used to construct innovation profiles (see subsection 3.6.2) or other
systems for classifying innovative firms.
CHAPTER 8. OBJECTIVES AND OUTCOMES OF BUSINESS INNOVATION │ 165
OSLO MANUAL 2018 © OECD/EUROPEAN UNION 2018
8.7. Innovation outcomes are the observed effects of innovations. In a survey context,
outcome data are based on the perceptions of respondents in innovative firms. Firms may
or may not succeed in achieving their innovation objectives, or innovations can entail
additional effects that were not part of the firm’s original objectives.
8.8. Many innovation objectives and outcomes can be captured by the same list of items.
Table 8.1 lists common objectives that can become outcomes if realised, grouped by areas
of influence: markets, production and delivery, firm organisation, and environment and
society. Objectives are always intentional, but outcomes can be unintended.
8.9. Objectives and outcomes that influence markets mainly concern product innovations,
although some business process innovations can also play an indirect role, such as those
that improve the quality or marketing of services thus enhancing the visibility or reputation
of these services. The objectives listed under “markets for the firm’s products” capture
whether or not the firm planned to change its product portfolio (increase its range of goods
or services), enter new markets, target existing markets (increase or maintain market share),
or change customer perceptions of the firm’s products (increase its reputation or visibility).
Firms may also need to comply with market regulations, for instance by meeting product
emissions or recycling standards.
8.10. Objectives and outcomes for production and delivery concern the cost and quality
of a firm’s operations. They are mainly related to business process innovation, although
some product innovations can contribute. An example is a change in the materials used for
a product that reduces the material costs per unit of output.
8.11. The objectives and outcomes that influence the firm’s business organisation capture
the effects of business process innovations on a firm’s capabilities. Some of these effects
can improve the firm’s capabilities for absorbing, processing and analysing knowledge.
Others influence the ability of the firm to adapt to changes or improve working conditions
as well as ensuring the continued existence of the firm itself.
8.12. Outcomes that affect an economy, society or the environment are influenced by
innovation objectives that target externalities, such as reducing environmental impacts or
improving health and safety. Other items refer to the contribution of innovations to wider
societal goals such as social inclusion, public security or gender equality. Both product and
business process innovations undertaken to comply with standards or regulations can
contribute to environmental and societal goals.
8.13. At a minimum, it is recommended to collect data on either the objectives or the
outcomes of innovations. As some objectives and outcomes are common, data collection
should use an ordinal scale of their importance to the firm. Data on outcomes can only be
collected for innovations, while for objectives, data collection should encompass all
completed, ongoing, postponed or abandoned innovation activities.
8.14. If data are collected for both innovation objectives and innovation outcomes, then
it is recommended to limit both sets of questions to innovations to ensure comparability
between objectives and outcomes, and exclude those innovation activities that are ongoing,
postponed or ceased.
8.15. A single question can be used to collect data on both objectives and outcomes. In
this case, it is recommended to use an importance scale for the objectives. The response
options for the outcomes should include whether or not the objective was achieved, if the
outcome occurred without a corresponding objective (i.e. it was unintended), and if it is
“too early to tell”.
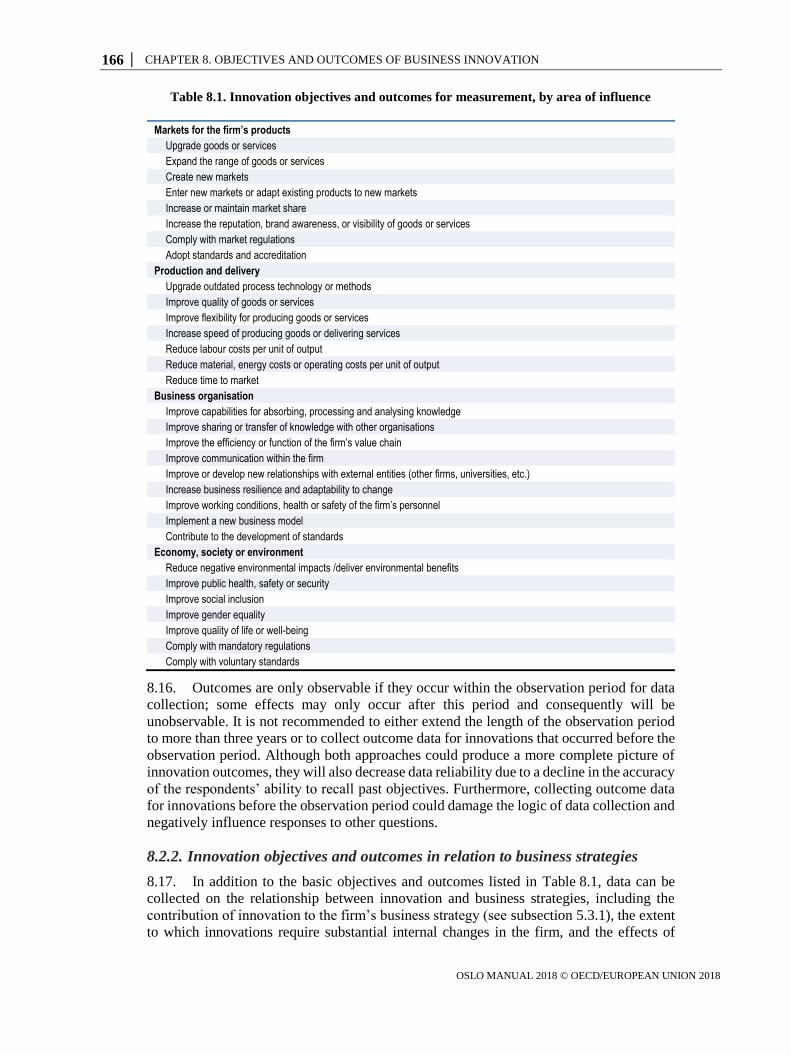
166 │ CHAPTER 8. OBJECTIVES AND OUTCOMES OF BUSINESS INNOVATION
OSLO MANUAL 2018 © OECD/EUROPEAN UNION 2018
Table 8.1. Innovation objectives and outcomes for measurement, by area of influence
Markets for the firm’s products
Upgrade goods or services
Expand the range of goods or services
Create new markets
Enter new markets or adapt existing products to new markets
Increase or maintain market share
Increase the reputation, brand awareness, or visibility of goods or services
Comply with market regulations
Adopt standards and accreditation
Production and delivery
Upgrade outdated process technology or methods
Improve quality of goods or services
Improve flexibility for producing goods or services
Increase speed of producing goods or delivering services
Reduce labour costs per unit of output
Reduce material, energy costs or operating costs per unit of output
Reduce time to market
Business organisation
Improve capabilities for absorbing, processing and analysing knowledge
Improve sharing or transfer of knowledge with other organisations
Improve the efficiency or function of the firm’s value chain
Improve communication within the firm
Improve or develop new relationships with external entities (other firms, universities, etc.)
Increase business resilience and adaptability to change
Improve working conditions, health or safety of the firm’s personnel
Implement a new business model
Contribute to the development of standards
Economy, society or environment
Reduce negative environmental impacts /deliver environmental benefits
Improve public health, safety or security
Improve social inclusion
Improve gender equality
Improve quality of life or well-being
Comply with mandatory regulations
Comply with voluntary standards
8.16. Outcomes are only observable if they occur within the observation period for data
collection; some effects may only occur after this period and consequently will be
unobservable. It is not recommended to either extend the length of the observation period
to more than three years or to collect outcome data for innovations that occurred before the
observation period. Although both approaches could produce a more complete picture of
innovation outcomes, they will also decrease data reliability due to a decline in the accuracy
of the respondents’ ability to recall past objectives. Furthermore, collecting outcome data
for innovations before the observation period could damage the logic of data collection and
negatively influence responses to other questions.
8.2.2. Innovation objectives and outcomes in relation to business strategies
8.17. In addition to the basic objectives and outcomes listed in Table 8.1, data can be
collected on the relationship between innovation and business strategies, including the
contribution of innovation to the firm’s business strategy (see subsection 5.3.1), the extent
to which innovations require substantial internal changes in the firm, and the effects of
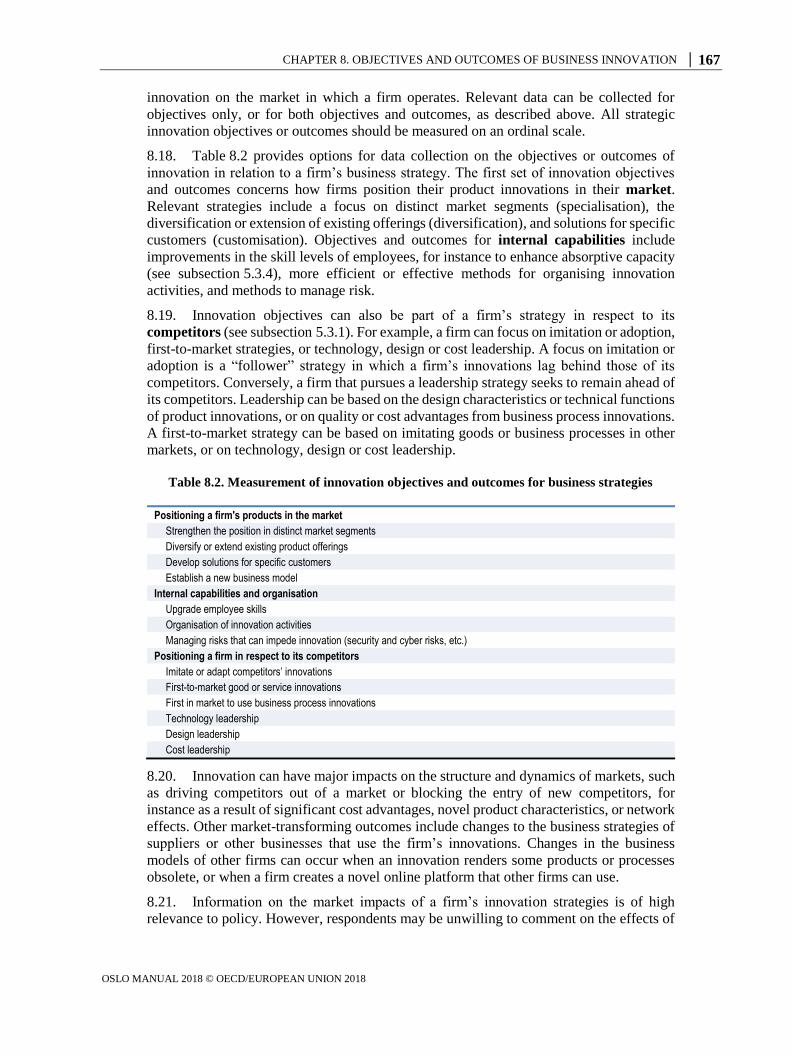
CHAPTER 8. OBJECTIVES AND OUTCOMES OF BUSINESS INNOVATION │ 167
OSLO MANUAL 2018 © OECD/EUROPEAN UNION 2018
innovation on the market in which a firm operates. Relevant data can be collected for
objectives only, or for both objectives and outcomes, as described above. All strategic
innovation objectives or outcomes should be measured on an ordinal scale.
8.18. Table 8.2 provides options for data collection on the objectives or outcomes of
innovation in relation to a firm’s business strategy. The first set of innovation objectives
and outcomes concerns how firms position their product innovations in their market.
Relevant strategies include a focus on distinct market segments (specialisation), the
diversification or extension of existing offerings (diversification), and solutions for specific
customers (customisation). Objectives and outcomes for internal capabilities include
improvements in the skill levels of employees, for instance to enhance absorptive capacity
(see subsection 5.3.4), more efficient or effective methods for organising innovation
activities, and methods to manage risk.
8.19. Innovation objectives can also be part of a firm’s strategy in respect to its
competitors (see subsection 5.3.1). For example, a firm can focus on imitation or adoption,
first-to-market strategies, or technology, design or cost leadership. A focus on imitation or
adoption is a “follower” strategy in which a firm’s innovations lag behind those of its
competitors. Conversely, a firm that pursues a leadership strategy seeks to remain ahead of
its competitors. Leadership can be based on the design characteristics or technical functions
of product innovations, or on quality or cost advantages from business process innovations.
A first-to-market strategy can be based on imitating goods or business processes in other
markets, or on technology, design or cost leadership.
Table 8.2. Measurement of innovation objectives and outcomes for business strategies
Positioning a firm's products in the market
Strengthen the position in distinct market segments
Diversify or extend existing product offerings
Develop solutions for specific customers
Establish a new business model
Internal capabilities and organisation
Upgrade employee skills
Organisation of innovation activities
Managing risks that can impede innovation (security and cyber risks, etc.)
Positioning a firm in respect to its competitors
Imitate or adapt competitors’ innovations
First-to-market good or service innovations
First in market to use business process innovations
Technology leadership
Design leadership
Cost leadership
8.20. Innovation can have major impacts on the structure and dynamics of markets, such
as driving competitors out of a market or blocking the entry of new competitors, for
instance as a result of significant cost advantages, novel product characteristics, or network
effects. Other market-transforming outcomes include changes to the business strategies of
suppliers or other businesses that use the firm’s innovations. Changes in the business
models of other firms can occur when an innovation renders some products or processes
obsolete, or when a firm creates a novel online platform that other firms can use.
8.21. Information on the market impacts of a firm’s innovation strategies is of high
relevance to policy. However, respondents may be unwilling to comment on the effects of
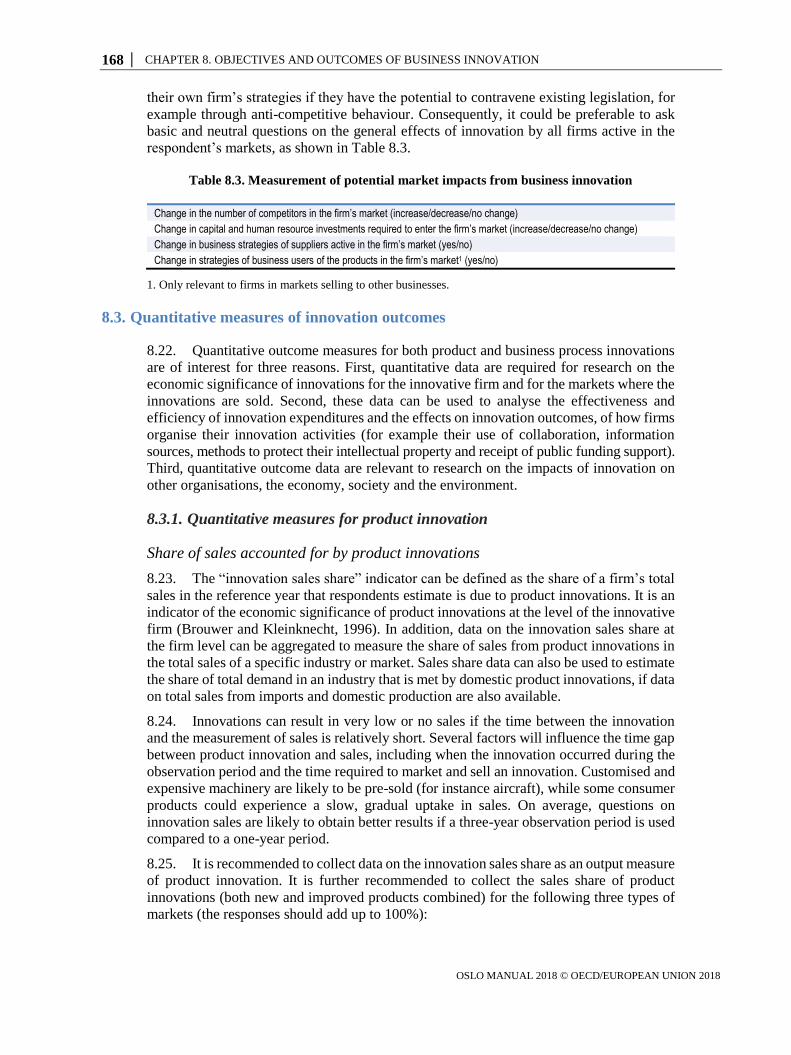
168 │ CHAPTER 8. OBJECTIVES AND OUTCOMES OF BUSINESS INNOVATION
OSLO MANUAL 2018 © OECD/EUROPEAN UNION 2018
their own firm’s strategies if they have the potential to contravene existing legislation, for
example through anti-competitive behaviour. Consequently, it could be preferable to ask
basic and neutral questions on the general effects of innovation by all firms active in the
respondent’s markets, as shown in Table 8.3.
Table 8.3. Measurement of potential market impacts from business innovation
Change in the number of competitors in the firm’s market (increase/decrease/no change)
Change in capital and human resource investments required to enter the firm’s market (increase/decrease/no change)
Change in business strategies of suppliers active in the firm’s market (yes/no)
Change in strategies of business users of the products in the firm’s market1 (yes/no)
1. Only relevant to firms in markets selling to other businesses.
8.3. Quantitative measures of innovation outcomes
8.22. Quantitative outcome measures for both product and business process innovations
are of interest for three reasons. First, quantitative data are required for research on the
economic significance of innovations for the innovative firm and for the markets where the
innovations are sold. Second, these data can be used to analyse the effectiveness and
efficiency of innovation expenditures and the effects on innovation outcomes, of how firms
organise their innovation activities (for example their use of collaboration, information
sources, methods to protect their intellectual property and receipt of public funding support).
Third, quantitative outcome data are relevant to research on the impacts of innovation on
other organisations, the economy, society and the environment.
8.3.1. Quantitative measures for product innovation
Share of sales accounted for by product innovations
8.23. The “innovation sales share” indicator can be defined as the share of a firm’s total
sales in the reference year that respondents estimate is due to product innovations. It is an
indicator of the economic significance of product innovations at the level of the innovative
firm (Brouwer and Kleinknecht, 1996). In addition, data on the innovation sales share at
the firm level can be aggregated to measure the share of sales from product innovations in
the total sales of a specific industry or market. Sales share data can also be used to estimate
the share of total demand in an industry that is met by domestic product innovations, if data
on total sales from imports and domestic production are also available.
8.24. Innovations can result in very low or no sales if the time between the innovation
and the measurement of sales is relatively short. Several factors will influence the time gap
between product innovation and sales, including when the innovation occurred during the
observation period and the time required to market and sell an innovation. Customised and
expensive machinery are likely to be pre-sold (for instance aircraft), while some consumer
products could experience a slow, gradual uptake in sales. On average, questions on
innovation sales are likely to obtain better results if a three-year observation period is used
compared to a one-year period.
8.25. It is recommended to collect data on the innovation sales share as an output measure
of product innovation. It is further recommended to collect the sales share of product
innovations (both new and improved products combined) for the following three types of
markets (the responses should add up to 100%):
CHAPTER 8. OBJECTIVES AND OUTCOMES OF BUSINESS INNOVATION │ 169
OSLO MANUAL 2018 © OECD/EUROPEAN UNION 2018
product innovations introduced during the observation period that were new to the
firm’s market
product innovations introduced during the observation period that were only new
to the firm
products that were unchanged or only marginally modified during the
observation period.
8.26. Under some conditions it may be possible to disaggregate the innovation sales share
by type of product innovation (goods or services), or by the location of sales (domestic or
foreign markets). However, disaggregation by type of innovation will be difficult for firms
that combine goods and services into a single product, such as when capital equipment
manufacturers combine equipment sales with a service maintenance contract.
8.27. A useful disaggregation for research and policy is by the level of novelty, as in the
example given above. Other methods of disaggregating by novelty include:
sales from new products or improved products
sales from world-first, market-first, or only first to the firm innovations (see
subsection 3.3.2)
sales from innovations that are not available from any of the firm’s competitors,
or from innovations that are identical or very similar to products already offered
by competitors.
8.28. Respondents may find it difficult to provide an exact figure for the innovation sales
share. An alternative is to provide response categories such as “0%,” “more than 0% to less
than 5%”, “5% to less than 10%”, etc. The response categories need to be narrowly defined
to provide useful data.
8.29. Information on the innovation sales share by type of market is useful for differentiating
between the diffusion of product innovations that were previously available in the firm’s
markets and product innovations that are market novelties. In addition, accurate interpretation
of the share of sales from market novelties requires data on the geographic market where
these products were sold. The degree of novelty is likely to differ if the product innovation
is only new to a local market compared to a national or international market. Respondents
can be asked if any of their new-to-market product innovations were new to their local,
regional or national markets, or were a “world-first” product innovation (see subsection 3.3.2).
It is also of value for research on capabilities and profiles (see subsection 3.6.2) to collect
data on the innovation sales share of “world-first” product innovations.
8.30. The innovation sales share is affected by the speed of change in technology and
demand in a firm’s market, with high rates of change resulting in short product life cycles.
These and other external factors that can lead to short product life cycles are discussed in
subsection 7.4.2.
Other quantitative measures of product innovation
8.31. A quantitative output indicator for product innovation is the number of product
innovations during the observation period. This needs to be measured cautiously because
respondents can find it difficult to estimate innovation counts, particularly for large firms
with multiple innovations, highly complex products containing several sub-systems, or
multiple products that can be subject to substantial or minor variations. To address these
issues, data collection for innovation counts should use predefined categories (e.g. 0, 1, 2,
170 │ CHAPTER 8. OBJECTIVES AND OUTCOMES OF BUSINESS INNOVATION
OSLO MANUAL 2018 © OECD/EUROPEAN UNION 2018
3-5, 6-10, 11-20, more than 20) and instruct respondents not to consider minor variations
of the same product as different product innovations.
8.32. Count data on the number of product innovations is useful for interpreting data on
the objectives and outcomes of innovation. For instance, the variety of innovation objectives
is likely to be positively correlated with the number and diversity of product innovations.
Indicators on the share of innovation projects that are completed during the observation
period can also be calculated from count data for the number of innovation projects (see
subsection 4.5.2).
8.33. Data on the economic significance or market success of product innovations can be
collected by asking respondents for their firm’s general performance expectations (in terms
of an increase in sales or profits), and the share of product innovations that met these
expectations. Questions on performance expectations and outcomes for a change in sales or
profits can use predefined response categories (e.g. “0%”, “more than 0% to less than 25%”,
“25% to less than 50%”, “50% to less than 75%”, “75% to less than 100%”, “100%”).
8.34. Other quantitative outcome indicators for product innovation include the profit
margin of product innovations and the market share of the firm’s product innovations out
of all sales in the market for similar products (including the sales of products sold by
competitors). Both indicators provide a better measure of the economic and market success of
product innovations than the innovation sales share. The profit margin (degree of markup) is
a measure of economic success that is positively correlated with the competitive advantage
of the firm’s product innovations over other products offered in the same market. Similarly,
a high market share indicates that a product innovation is able to outcompete offerings by
other firms in the market. In contrast, a high innovation sales share for product innovations can
still result in lower economic advantages to the firm, for instance when a firm ceases to sell
older products or if a firm sells high volumes of a product innovation at low profit margins.
8.35. Respondents can find it more difficult to provide data on the profit margin or market
share of product innovations than for the innovation sales share, particularly if the firm has
a large number of product innovations with varying profit margins and market shares that
need to be averaged. In addition, respondents can regard data on the profit margin and
market share as highly sensitive. Data collection can reduce the response burden by asking
for relative measures, such as the difference between the average profit margin for product
innovations and the average profit margin for other products. Another option is to only
collect data on the profit margin and market share for the firm’s most important product
innovation (see Chapter 10).
8.3.2. Quantitative outcome data for business process innovations
8.36. In comparison with product innovations, respondents can face greater difficulty in
providing estimates of quantitative outcomes for business process innovations. Data on the
savings from business process innovations are often not collected by firms. Furthermore,
business process innovation can relate to very different areas of operations, requiring different
indicators for each type of business process (Davenport, 1993). An alternative is to collect
quantitative data on the firm’s most important business process innovation (see Chapter 10).
8.37. A relevant indicator for some types of business process innovations is the percentage
of a firm’s personnel who were directly affected by these innovations during the observation
period. This indicator is of value for measuring the influence of business process innovations
across an organisation. It does not, however, provide any information on whether business process
innovations were successful or if they had any positive or negative effects on operations.
CHAPTER 8. OBJECTIVES AND OUTCOMES OF BUSINESS INNOVATION │ 171
OSLO MANUAL 2018 © OECD/EUROPEAN UNION 2018
8.38. A second indicator is the change in sales that can be attributed to business process
innovation. This measure can be driven by efficiency-enhancing business process innovations
that reduce costs or that enhance product quality. Respondents can be asked if business
process innovations led – directly or indirectly – to an increase in sales, and, if so, the size
of the increase using a predefined scale. Useful categories are: “0%”, “more than 0% to
less than 1%”, “1% to less than 2%”, “2% to less than 5%”, “5% to less than 10%”, and
“10% or more”. This indicator is conceptually similar to the innovation sales share indicator
for product innovations.
8.39. Both of these quantitative outcome indicators for business process innovation are
likely to be very difficult for respondents from large firms to estimate, or for specific types
of business process innovations that are not directly used in production activities, such as
in administration and management. The indicators are more suitable for small and medium-
sized firms, or for a question that focuses on business process innovations that are directly
linked to products. An example is the share of sales affected by business process innovations
in production, delivery and logistics.
8.40. Many business process innovations aim to improve the efficiency of a firm’s
operations, though it is usually difficult to map individual innovations to specific outcomes.
Efficiency-enhancing innovations should, directly or indirectly, result in lower costs
compared to the situation before their use or compared to business process innovations that
did not improve efficiency. In order to quantify the cost reduction resulting from business
process innovations, respondents can be asked if such innovations led – directly or indirectly –
to a reduction in operating costs, and, if so, the size of the reduction (Piening and Salge,
2015). Questions on cost reduction should refer to costs per unit of output or per operation,
in order to exclude scale-related cost changes from an increase or decrease in production
or operations. To reduce response burden, predefined response categories should be used.
Experience with this approach in surveys indicates that the response categories should be
weighted to small differences, such as “0%”, “more than 0% to less than 2%”, “2% to less
than 5%”, “5% to less than 10%”, “10% to less than 20%”, and “20% or more”.
8.41. Other business process innovations aim to improve the quality characteristics of
processes, such as flexibility, adaptability, speed, precision, accuracy or customer-friendliness
(relevant to many business processes for delivering services). In some cases, quality-enhancing
business process innovations can increase unit costs, but these additional costs can be
matched or exceeded by an increase in the value of the resulting output.
8.42. Quantitative indicators on quality-enhancing business process innovations have
been developed as part of quality management (Powell, 1995). These cover improvements
in the timeliness of business processes due to innovations (lead time, processing time, on-
time delivery) and improvements in the quality of outputs from business process innovations
(customer satisfaction rate, defect rate, accuracy rate, reworking rate, scrap rate).
Quantitative indicators for many of these outcomes require individualised scales built into
each question, for instance the share of products delivered on time, the share of customers
that were satisfied with the process, the share of scrap in total production volume, or the
share of products that had to be reworked. Other indicators include improvements to
process complexity (the number of steps) and employee satisfaction. Some of these quality
indicators are designed for manufacturing processes that produce distinct units of output
and are less relevant for business process innovations in continuous manufacturing
industries such as chemicals, or in service industries. Other indicators can be applied to all
industries, such as the customer satisfaction rate (share of customers that are usually
satisfied with the good or service), the accuracy rate (share of operations that produce the
172 │ CHAPTER 8. OBJECTIVES AND OUTCOMES OF BUSINESS INNOVATION
OSLO MANUAL 2018 © OECD/EUROPEAN UNION 2018
intended process result) or the employee satisfaction rate. Many of these indicators are
difficult to apply or less relevant (e.g. the scrap rate) to firms in service industries.
8.4. Issues for measurement
8.43. The choice of a subject or object method for data collection will have a substantial
effect on the information obtained for innovation objectives and outcomes. The subject
approach requires asking firms about the objectives or outcomes of all innovations (or
innovation activities) during the observation period. If the objectives or outcomes differ
among innovations (or innovation activities), it will be difficult for respondents to derive
an average level of importance for each objective or outcome. Conversely, the object approach
(see Chapter 10), with a focus on a single innovation, will reduce the response burden and
increase the accuracy of the data for specific objectives and outcomes, but at the expense
of data for a broader range of objectives.
8.44. The inclusion of questions on outcomes in data collection assumes that respondents
are able to assess the consequences of their firm’s innovations. For some outcomes, such as
a change in sales, this assumption could be valid, whereas respondents could find it difficult
to assess other outcomes, such as a reduction in environmental impacts outside the firm.
8.45. Questions that ask respondents about the performance effects of their firm’s innovations
could be subject to biases in favour of positive effects, which can be more visible to
respondents than the secondary effects of an innovation. For example, a product innovation
could result in the hiring of new employees to develop, produce and market the innovation,
but also cause a fall in the demand for other products of the same firm as customers shift
to the new or improved product, resulting in the layoff of employees involved in the
production and marketing of these other products. Respondents are more likely to recall the
positive increase in employment due to the innovation than the negative employment
effects from the innovation replacing other product lines. In addition, respondents may find
it difficult to assess positive or negative indirect effects, for instance when an innovation
reduces the sales of old products with a better safety record than the new product.
8.46. Some of the above issues can be addressed through the use of econometric methods
that estimate innovation outcomes while controlling for the effects of possible biases (see
subsection 11.5.2). Econometric methods have been developed for analysing productivity
performance, employment outcomes, profitability, and measures of competitiveness. These
analyses benefit from data on innovation outcomes as described in this chapter, such as sales
from product innovations or the effect of business process innovations on sales or costs.
8.5. Summary of recommendations
8.47. Recommendations for general data collection are given below. Supplementary data
are suitable for specialised data collection exercises.
8.48. Key recommendations for data collection include:
8.49. innovation objectives and outcomes by area of influence (Table 8.1)
innovation objectives and outcomes for business strategies (Table 8.2)
innovation sales share in total business sales.
8.50. At the time of publication, there is a serious lack of quantitative outcome data for
business process innovation, which significantly hinders understanding of the role of business
CHAPTER 8. OBJECTIVES AND OUTCOMES OF BUSINESS INNOVATION │ 173
OSLO MANUAL 2018 © OECD/EUROPEAN UNION 2018
process innovation in economic growth. Consequently, a key recommendation is to
experiment with one or more of the proposed indicators discussed in subsection 8.3.2 above.
8.51. Supplementary recommendations (given space or resources) include:
counts of product innovations
major impacts of innovations for markets (Table 8.3).
References
Brouwer, E. and A. Kleinknecht (1996), “Determinants of innovation: A microeconometric analysis of
three alternative innovation output indicators”, in Determinants of Innovation: The Message from
New Indicators, Palgrave Macmillan, London, pp. 99-124.
Crépon, B., E. Duguet and J. Mairesse (1998), “Research, innovation and productivity: An econometric
analysis at the firm level”, Economics of Innovation and New Technology, Vol. 7/2, pp. 115-158.
Davenport, T.H. (1993), Process Innovation: Reengineering Work Through Information Technology,
Harvard Business School Press, Boston.
Piening, E.P. and T.O Salge (2015), “Understanding the antecedents, contingencies, and performance
implications of process innovation: A dynamic capabilities perspective”, Journal of Product
Innovation Management, Vol. 32/1, pp. 80-97.
Powell, T.C. (1995), “Total quality management as competitive advantage: A review and empirical
study”, Strategic Management Journal, Vol. 16/1, pp. 15-37.


PART III. METHODS FOR STATISTICS ON BUSINESS INNOVATION │ 175
OSLO MANUAL 2018 © OECD/EUROPEAN UNION 2018
Part III. Methods for collecting, analysing and reporting statistics on business
innovation

CHAPTER 9. METHODS FOR COLLECTING DATA ON BUSINESS INNOVATION │ 177
OSLO MANUAL 2018 © OECD/EUROPEAN UNION 2018
Chapter 9. Methods for collecting data on business innovation
This chapter provides guidance on methodologies for collecting data on business innovation,
based on the concepts and definitions introduced in previous chapters. The guidance is aimed
at producers of statistical data on innovation as well as advanced users who need to
understand how innovation data are produced. While acknowledging other potential sources,
this chapter focuses on the use of business innovation surveys to collect data on different
dimensions of innovation-related activities and outcomes within the firm, along with other
contextual information. The guidance within this chapter covers the full life cycle of data
collection, including setting the objectives and scope of business innovation surveys; identifying
the target population; questionnaire design; sampling procedures; data collection methods
and survey protocols; post-survey data processing, and dissemination of statistical outputs.
178 │ CHAPTER 9. METHODS FOR COLLECTING DATA ON BUSINESS INNOVATION
OSLO MANUAL 2018 © OECD/EUROPEAN UNION 2018
9.1. Introduction
9.1. This chapter provides guidance on methodologies for collecting data on business
innovation. As noted in Chapter 2, methodological guidance for the collection of data on
innovation is an essential part of the measurement framework for innovation. Data on
innovation can be obtained through object-based methods such as new product announcements
on line or in trade journals (Kleinknecht, Reijnen and Smits, 1993), and from expert assessments
of innovations (Harris, 1988). Other sources of innovation data include annual corporate
reports, websites, social surveys of employee educational achievement, reports to regional,
national and supranational organisations that fund research and experimental development
(R&D) or innovation, reports to organisations that give out innovation prizes, university
knowledge transfer offices that collect data on contract research funded by firms and the
licensing of university intellectual property, business registers, administrative sources, and
surveys of entrepreneurship, R&D and information and communication technology (ICT)
use. Many of these existing and potential future sources may have “big data” attributes,
namely they are too large or complex to be handled by conventional tools and techniques.
9.2. Although useful for different purposes, these data sources all have limitations.
Many do not provide representative coverage of innovation at either the industry or national
level because the data are based on self-selection: only firms that choose to make a product
announcement, apply for R&D funding, or license knowledge from universities are
included. Information from business registers and social, entrepreneurship, and R&D
surveys is often incomplete, covering only one facet of innovation. Corporate annual
reports and websites are inconsistent in their coverage of innovation activities, although
web-scraping techniques can automate searches for innovation activities on documents
posted on line and may be an increasingly valuable source of innovation data in the future.
Two additional limitations are that none of these sources provide consistent, comparable
data on the full range of innovation strategies and activities undertaken by all firms, as
discussed in Chapters 3 to 8, and many of these sources cannot be accurately linked to other
sources. Currently, the only source for a complete set of consistent and linkable data is a
dedicated innovation survey based on a business register.
9.3. The goal of a business innovation survey is to obtain high-quality data on innovation
within firms from authoritative respondents such as the chief executive officer or senior
managers. A variety of factors influence the attainment of this goal, including coverage of
the target population, the frequency of data collection, question and questionnaire design
and testing, the construction of the survey sample frame, the methods used to implement
the survey (including the identification of an appropriate respondent within the surveyed
unit) and post-survey data processing. All of these topics are relevant to national statistical
organisations (NSOs) and to international organisations and researchers with an interest in
collecting data on innovation activities through surveys and analysing them.
9.4. Business innovation surveys that are conducted by NSOs within the framework of
national business statistics must follow national practices in questionnaire and survey
design. The recommendations in this chapter cover best practices that should be attainable
by most NSOs. Surveys implemented outside of official statistical frameworks, such as by
international organisations or academics, will benefit from following the recommendations
in this chapter (OECD, 2015a). However, resource and legal restrictions can make it
difficult for organisations to implement all best practices.
9.5. The decision on the types of data to collect in a survey should be taken in
consultation with data users, including policy analysts, business managers and consultants,
CHAPTER 9. METHODS FOR COLLECTING DATA ON BUSINESS INNOVATION │ 179
OSLO MANUAL 2018 © OECD/EUROPEAN UNION 2018
academics, and others. The main users of surveys conducted by NSOs are policy makers and
policy analysts and consequently the choice of questions should be made after consultations
with those government departments and agencies responsible for innovation and business
development. Surveys developed by academics could also benefit from consultations with
governments or businesses.
9.6. The purpose(s) of data collection, for instance to construct national or regional
indicators or for use in research, will largely influence survey methodology choices. The
sample can be smaller if only indicators at the national level are required, whereas a larger
sample is necessary if users require data on sub-populations, longitudinal panel data, or
data on rare innovation phenomena. In addition, the purpose of the survey will have a strong
influence on the types of questions to be included in the survey questionnaire.
9.7. This manual contains more suggestions for questions on innovation than can be
included in a single survey. Chapters 3 to 8 and Chapter 10 recommend key questions for
collection on a regular basis and supplementary questions for inclusion on an occasional
basis within innovation survey questionnaires. Occasional questions based on the supplementary
recommendations or on other sections of the manual can be included in one-off modules
that focus on specific topics or in separate, specialised surveys. The recommendations in
this chapter are relevant to full innovation surveys, specialised surveys, and to innovation
modules included in other surveys.
9.8. This chapter provides more details on best practice survey methods than previous
editions of this manual. Many readers from NSOs will be familiar with these practices and
do not require detailed guidance on a range of issues. However, this edition is designed to
serve NSOs and other producers and users of innovation data globally. Readers from some
of these organisations may therefore find the details in this chapter of value to their work.
In addition to this chapter, other sources of generic guidelines for business surveys include
Willeboordse (ed.) (1997) and Snijkers et al. (eds.) (2013). Complementary material to this
manual’s online edition will provide relevant links to current and recent survey practices and
examples of experiments with new methods for data collection (http://oe.cd/oslomanual).
9.9. The chapter is structured as follows: Section 9.2 covers the target population and
other basic characteristics of relevance to innovation surveys. Questionnaire and question
design are discussed in section 9.3. A number of survey methodology issues are discussed
in the subsequent sections including sampling (section 9.4), data collection methods
(section 9.5), survey protocol (section 9.6) and post-survey processing (section 9.7). The
chapter concludes with a brief review of issues regarding the publication and dissemination
of results from innovation surveys (section 9.8).
9.2. Population and other basic characteristics for a survey
9.2.1. Target population
9.10. The Business enterprise sector, defined in Chapter 2 and OECD (2015b), is the
target for surveys of business innovation. It comprises:
All resident corporations, including legally incorporated enterprises, regardless of
the residence of their shareholders. This includes quasi-corporations, i.e. units
capable of generating a profit or other financial gain for their owners, recognised
by law as separate legal entities from their owners, and set up for the purpose of
engaging in market production at prices that are economically significant. They
include both financial and non-financial corporations.
180 │ CHAPTER 9. METHODS FOR COLLECTING DATA ON BUSINESS INNOVATION
OSLO MANUAL 2018 © OECD/EUROPEAN UNION 2018
The unincorporated branches of non-resident enterprises deemed to be resident and
part of this sector because they are engaged in production on the economic territory
on a long-term basis.
All resident non-profit institutions that are market producers of goods or services
or serve businesses. This includes independent research institutes, clinics, and other
institutions whose main activity is the production of goods and services for sale at
prices designed to recover their full economic costs. It also includes entities controlled
by business associations and financed by contributions and subscriptions.
9.11. The Business enterprise sector includes both private enterprises (either publicly
listed and traded, or not) and government-controlled enterprises (referred to as “public
enterprises” or “public corporations”). For public enterprises, the borderline between the
Business enterprise and Government sectors is defined by the extent to which the unit
operates on a market basis. If a unit’s principal activity is the production of goods or
services at economically significant prices it is considered to be a business enterprise.
9.12. Consistent with the definition in the System of National Accounts (SNA) (EC et
al., 2009), the residence of each unit is the economic territory with which it has the strongest
connection and in which it engages for one year or more in economic activities. An
economic territory can be any geographic area or jurisdiction for which statistics are
required, for instance a country, state or province, or region. Businesses are expected to
have a centre of economic interest in the country in which they are legally constituted and
registered. They can be resident in different countries than their shareholders and subsidiary
firms may be resident in different countries than their parent organisations.
9.13. The main characteristics of the target population that need to be considered for
constructing a sample or census are the type of statistical unit, the unit’s industry of main
activity, the unit’s size, and the geographical location of the unit.
9.2.2. Statistical units and reporting units
9.14. Firms organise their innovation activities at various levels in order to meet their
objectives. Strategic decisions concerning the financing and direction of innovation efforts
are often taken at the enterprise level. However, these decisions can also be taken at the
enterprise group level, regardless of national boundaries. It is also possible for managers
below the level of the enterprise (i.e. establishment or kind-of-activity unit [KAU]) to take
day-to-day decisions of relevance to innovation.
9.15. These decisions can cut across national borders, especially in the case of
multinational enterprises (MNEs). This can make it difficult to identify and survey those
responsible for decision-making, particularly when NSOs or other data collection agencies
only have the authority to collect information from domestic units.
Statistical unit
9.16. A statistical unit is an entity about which information is sought and for which
statistics are ultimately compiled; in other words, it is the institutional unit of interest for
the intended purpose of collecting innovation statistics. A statistical unit can be an observation
unit for which information is received and statistics are compiled, or an analytical unit
which is created by splitting or combining observation units with the help of estimations or
imputations in order to supply more detailed or homogeneous data than would otherwise
be possible (UN, 2007; OECD, 2015b).
CHAPTER 9. METHODS FOR COLLECTING DATA ON BUSINESS INNOVATION │ 181
OSLO MANUAL 2018 © OECD/EUROPEAN UNION 2018
9.17. The need to delineate statistical units arises in the case of large and complex
economic entities that are active in different industry classes, or have units located in
different geographical areas. There are several types of statistical units according to their
ownership, control linkages, homogeneity of economic activity, and their location, namely
enterprise groups, enterprises, establishments (a unit in a single location with a single
productive activity), and KAUs (part of a unit that engages in only one kind of productive
activity) (see OECD [2015b: Box 3.1] for more details). The choice of the statistical unit
and the methodology used to collect data are strongly influenced by the purpose of
innovation statistics, the existence of records of innovation activity within the unit, and the
ability of respondents to provide the information of interest.
9.18. The statistical unit in business surveys is generally the enterprise, defined in the
SNA as the smallest combination of legal units with “autonomy in respect of financial and
investment decision-making, as well as authority and responsibility for allocating resources
for the production of goods and services” (EC et al., 2009; OECD, 2015b: Box 3.1).
9.19. Descriptive identification variables should be obtained for all statistical units in the
target population for a business innovation survey. These variables are usually available
from statistical business registers and include, for each statistical unit, an identification
code, the geographic location, the kind of economic activity undertaken, and the unit size.
Additional information on the economic or legal organisation of a statistical unit, as well
as its ownership and public or private status, can help to make the survey process more
effective and efficient.
Reporting units
9.20. The reporting unit (i.e. the “level” within the business from which the required
data are collected) will vary from country to country (and potentially within a country),
depending on institutional structures, the legal framework for data collection, traditions,
national priorities, survey resources and ad hoc agreements with the business enterprises
surveyed. As such, the reporting unit may differ from the required statistical unit. It may
be necessary to combine, split, or complement (using interpolation or estimation) the
information provided by reporting units to align with the desired statistical unit.
9.21. Corporations can be made up of multiple establishments and enterprises, but for
many small and medium-sized enterprises (SMEs) the establishment and the enterprise are
usually identical. For enterprises with heterogeneous economic activities, it may be necessary
for regional policy interests to collect data for KAUs, or for establishments. However,
sampling establishments or KAUs requires careful attention to prevent double counting
during data aggregation.
9.22. When information is only available at higher levels of aggregation such as the
enterprise group, NSOs may need to engage with these units to obtain disaggregated data,
for instance by requesting information by jurisdiction and economic activity. This will
allow better interoperability with other economic statistics.
9.23. The enterprise group can play a prominent role as a reporting unit if questionnaires
are completed or responses approved by a central administrative office. In the case of
holding companies, a number of different approaches can be used, for example, asking the
holding company to report on the innovation activities of enterprises in specific industries,
or forwarding the questionnaire, or relevant sections, to other parts of the company.
9.24. Although policy interests or practical considerations may require innovation data
at the level of establishments, KAUs, and enterprise groups, it is recommended, wherever
182 │ CHAPTER 9. METHODS FOR COLLECTING DATA ON BUSINESS INNOVATION
OSLO MANUAL 2018 © OECD/EUROPEAN UNION 2018
possible, to collect data at the enterprise level to permit international comparisons. When
this is not possible, careful attention is required when collecting and reporting data on
innovation activities and expenditures, as well as linkage-related information, that may not
be additive at different levels of aggregation, especially in the case of MNEs. Furthermore,
innovation activities can be part of complex global value chains that involve dispersed
suppliers and production processes for goods and services, often located in different
countries. Therefore, it is important to correctly identify whenever possible statistical units
active in global value chains (see Chapter 7) in order to improve compatibility with other
data sources (such as foreign investment and trade surveys).
Main economic activity
9.25. Enterprises should be classified according to their main economic activity using the
most recent edition of the United Nation’s (UN) International Standard Industrial Classification
(ISIC Rev.4) (see UN, 2008) or equivalent regional/national classifications. ISIC supports
international comparability by classifying industries into economic activities by section,
division, group and class, though in most cases the target population can be defined using
the section and division levels. The recommendations given below use the sections and
divisions as defined in ISIC Rev.4. These should be updated with future revisions of ISIC.
9.26. When there is significant uncertainty about the true economic activity of firms (for
instance if this information is not available from a business register, refers to non-official
classifications or is likely to be out of date) innovation surveys can include a question on
the main product lines produced by each firm and, if possible, questions on the relative
importance of different types of product lines (for instance the contribution of different
product categories to turnover). This information is required to assign an economic activity
to the enterprise, both for stratification, sampling and analytical purposes.
9.27. As noted in Chapters 1 and 2, this manual recommends the collection of innovation
data for businesses in most ISIC-defined industries, with some qualifying exceptions
discussed below. Key considerations when defining the recommended scope of business
innovation surveys by economic activity, especially for international comparison purposes,
are the prevalence of non-business actors in an industry, the presence of specific measurement
challenges such as unstable business registers, and previous international experience measuring
innovation within an industry.
9.28. Table 9.1 provides the broad structure of industries by ISIC Rev.4 at the section
and division level and identifies economic activities that are recommended for international
comparisons, supplementary economic activities that may be worth including for national
purposes, and economic activities that are not currently recommended for surveys of
innovation in the Business sector.
9.29. The recommended economic activities for national data collection and for
international comparisons include ISIC Rev.4 sections B to M inclusive with the exception
of section I (Accommodation and food service activities). In these areas there is substantive
national and international comparative experience with data collection.
9.30. Supplementary economic activities that are worth collecting, but are still largely
untested from an international comparison perspective, include ISIC Rev.4 sections A
(Agriculture, forestry and fishing), I (Accommodation and food services activities), N
(Administrative and support activities), and divisions 95-96 of section S (Repair activities,
other personal service activities). For these industries, the international standardisation of
business registers is still incomplete (particularly for agriculture) and current experience is
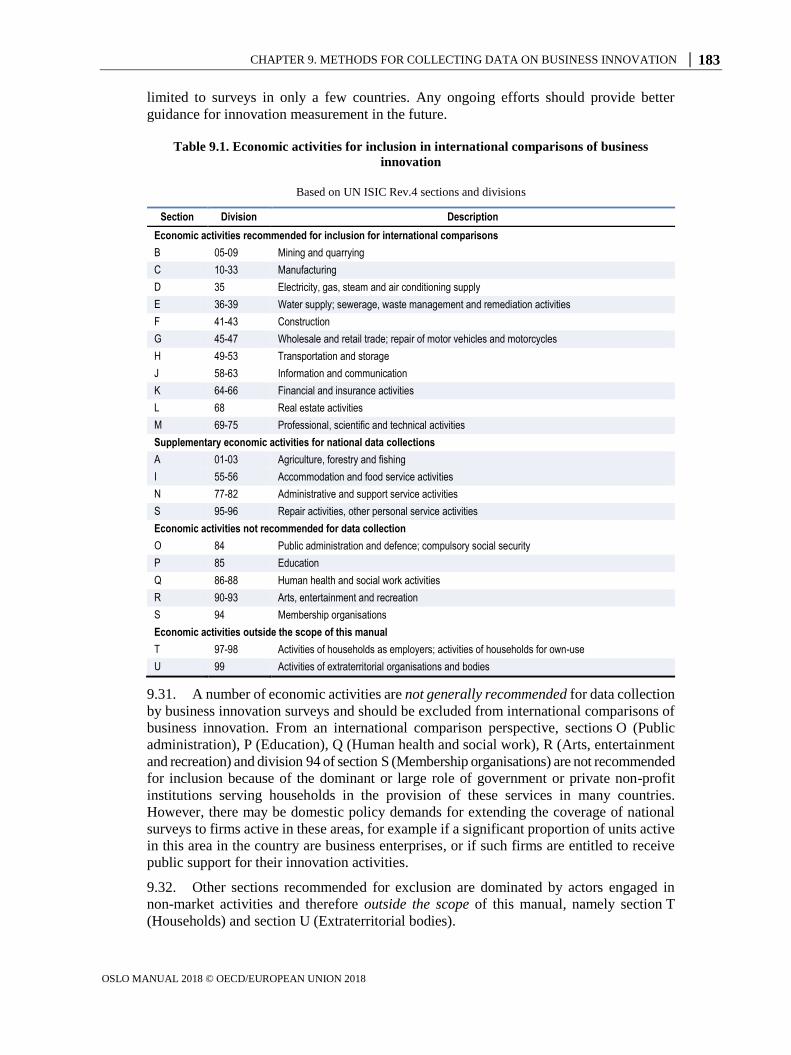
CHAPTER 9. METHODS FOR COLLECTING DATA ON BUSINESS INNOVATION │ 183
OSLO MANUAL 2018 © OECD/EUROPEAN UNION 2018
limited to surveys in only a few countries. Any ongoing efforts should provide better
guidance for innovation measurement in the future.
Table 9.1. Economic activities for inclusion in international comparisons of business
innovation
Based on UN ISIC Rev.4 sections and divisions
Section Division Description
Economic activities recommended for inclusion for international comparisons B 05-09 Mining and quarrying C 10-33 Manufacturing D 35 Electricity, gas, steam and air conditioning supply E 36-39 Water supply; sewerage, waste management and remediation activities F 41-43 Construction G 45-47 Wholesale and retail trade; repair of motor vehicles and motorcycles H 49-53 Transportation and storage J 58-63 Information and communication K 64-66 Financial and insurance activities L 68 Real estate activities M 69-75 Professional, scientific and technical activities Supplementary economic activities for national data collections
A 01-03 Agriculture, forestry and fishing I 55-56 Accommodation and food service activities N 77-82 Administrative and support service activities S 95-96 Repair activities, other personal service activities Economic activities not recommended for data collection O 84 Public administration and defence; compulsory social security P 85 Education Q 86-88 Human health and social work activities R 90-93 Arts, entertainment and recreation S 94 Membership organisations Economic activities outside the scope of this manual
T 97-98 Activities of households as employers; activities of households for own-use U 99 Activities of extraterritorial organisations and bodies
9.31. A number of economic activities are not generally recommended for data collection
by business innovation surveys and should be excluded from international comparisons of
business innovation. From an international comparison perspective, sections O (Public
administration), P (Education), Q (Human health and social work), R (Arts, entertainment
and recreation) and division 94 of section S (Membership organisations) are not recommended
for inclusion because of the dominant or large role of government or private non-profit
institutions serving households in the provision of these services in many countries.
However, there may be domestic policy demands for extending the coverage of national
surveys to firms active in these areas, for example if a significant proportion of units active
in this area in the country are business enterprises, or if such firms are entitled to receive
public support for their innovation activities.
9.32. Other sections recommended for exclusion are dominated by actors engaged in
non-market activities and therefore outside the scope of this manual, namely section T
(Households) and section U (Extraterritorial bodies).
184 │ CHAPTER 9. METHODS FOR COLLECTING DATA ON BUSINESS INNOVATION
OSLO MANUAL 2018 © OECD/EUROPEAN UNION 2018
Unit size
9.33. Although innovation activity is generally more extensive and more frequently
reported by larger firms, units of all sizes have the potential to be innovation-active and
should be part of the scope of business innovation surveys. However, smaller business
units, particularly those with higher degree of informality (e.g. not incorporated as companies,
exempt from or not declaring some taxes, etc.), are more likely to be missing from statistical
business registers. The relative importance of such units can be higher in countries in earlier
stages of development. Comparing data for countries with different types of registers for
small firms and with varying degrees of output being generated in the informal economy
can therefore present challenges. An additional challenge, noted in Chapter 3, stems from
adequately interpreting innovation data for recently created firms, for which a substantial
number of activities can be deemed to be new to the firm.
9.34. Therefore, for international comparisons, it is recommended to limit the scope of
the target population to comprise all statistical business units with ten or more persons
employed and to use average headcounts for size categories. Depending on user interest
and resources, surveys can also include units with fewer than ten persons employed,
particularly in high technology and knowledge-intensive service industries. This group is
likely to include start-ups and spin-offs of considerable policy interest (see Chapter 3).
9.2.3. Data linkage
9.35. An official business register is often used by NSOs to identify the sample for the
innovation survey and for the R&D, ICT, and general business statistics surveys. This
creates opportunities for linking the innovation survey with other surveys in order to obtain
interval data on several variables of interest, such as on R&D, ICT, employment, turnover,
exports or investments. Over the years, an increasing number of NSOs have used data
linkage to partially eliminate the need to collect some types of data in the innovation survey,
although data linkage is only possible when the surveys to be linked use the same statistical
units, which for NSOs is usually the enterprise.
9.36. Data linkage can reduce respondent burden, resulting in higher response rates, and
improve the quality of interval data that are obtained from mandatory R&D and business
surveys. However, questions must be replicated in an innovation survey when respondents need
a reference point for related questions, either to jog their memory or to provide a reference
for calculating subcategories or shares. For example, questions on innovation expenditures
should include a question on R&D expenditures for reference, and questions on the number
(or share) of employees with different levels of educational attainment should follow a question
on the total number of employees. Once the survey is completed, the innovation survey
values for R&D, employment, or other variables can be replaced for some analyses by values
from the R&D and business surveys, if analysis indicates that this will improve accuracy.
9.37. Another option created by the ability to combine administrative and survey data is
to pre-fill online innovation questionnaires with data obtained from other sources on
turnover, employment, R&D expenditures, patent applications, etc. These can provide
immediate reference points for respondents and reduce response burden. A disadvantage is
that pre-filled data could be out of date, although older data could still be useful for pre-
filling data for the first year of the observation period. Respondents should also be given
an option to correct errors in pre-filled data.
9.38. Linkage to structural business statistics data on economic variables after a suitable
time lag (one or more years after the innovation survey) is useful for research to infer causal
CHAPTER 9. METHODS FOR COLLECTING DATA ON BUSINESS INNOVATION │ 185
OSLO MANUAL 2018 © OECD/EUROPEAN UNION 2018
relationships between innovation activities and outcomes. Relevant outcomes include changes
in productivity, employment, exports and revenue.
9.39. Selected innovation questions may be added occasionally to other surveys to assist
in improving, updating and maintaining the innovation survey frame.
9.2.4. Frequency of data collection
9.40. The frequency of innovation surveys depends on practical considerations and user
needs at the international, national and regional level. Considerations such as cost, the slow
rate of change in many variables, the effect of frequent surveys on response burden, and
problems due to overlapping observation periods between consecutive surveys influence the
recommended frequency for innovation surveys. The importance of innovation for economic
growth and well-being creates a policy demand for more frequent and up-to-date data
collected on an annual basis, particularly for innovation activities that can change quickly.
Annual panel surveys can also facilitate analysis of the lag structure between innovation
inputs and outputs, or the effects of innovation on economic performance (see Chapter 11).
9.41. It is recommended to conduct innovation surveys every one to three years. For a
frequency of two or three years, a shorter survey that only collects key innovation variables
can be conducted in alternating years, resources permitting. However, caution is required
when comparing the results of short and long surveys because responses can be affected by
survey length (see section 9.3 below). Information on innovation can also be obtained from the
Internet or other sources in years without an innovation survey. Options for using alternative
sources of innovation data in non-survey years have yet to be investigated in detail.
9.2.5. Observation and reference periods
9.42. To ensure comparability among respondents, surveys must specify an observation
period for questions on innovation. The observation period is the length of time covered by
a majority of questions in a survey. In order to minimise recall bias, it is recommended that
the observation period should not exceed three years. The reference period is the final
year of the overall survey observation period and is used as the effective observation period
for collecting interval level data items, such as expenditures or the number of employed
persons. The reference and observation periods are identical in surveys that use a one-year
observation period.
9.43. The length of the observation period qualifies the definition of innovation and
therefore the share of units that are reported as innovative (see Chapter 3). For example,
the choice of an observation period can affect comparisons between groups of units
(e.g. industries) that produce goods or services with varying life cycles (industries with
short product life cycles are more likely to introduce product innovations more frequently).
This has implications for interpretability and raises the need for adequate standardisation
across national surveys (see Chapter 11).
9.44. In some instances, interpretation issues favour a longer observation period. For
example, if an innovation project runs over several years, a short observation period might
result in assigning different innovation activities and outputs to different years, such as the
use of co-operation, the receipt of public funding, and sales from new products. This could
hamper some relevant analyses on innovation patterns and impacts.
9.45. Data quality concerns favour a shorter observation period in order to reduce recall
errors. This applies for instance when respondents forget to report an event, or from
telescoping errors when respondents falsely remember events that happened before the
observation period as occurring during that period.
186 │ CHAPTER 9. METHODS FOR COLLECTING DATA ON BUSINESS INNOVATION
OSLO MANUAL 2018 © OECD/EUROPEAN UNION 2018
9.46. The quality advantages of short observation periods and the potential interpretation
advantages of longer observation periods may be combined through the construction of a
longitudinal panel linking firms in consecutive cross-sectional innovation surveys (see
subsection 9.4.3 below). For example, if the underlying data have a one-year observation
period, the innovation status of firms over a two- (three-) year period can be effectively
calculated from data for firms with observations over two (or three) consecutive annual
observation periods. Additional assumptions and efforts would be required to deal with
instances where repeated observations are not available for all firms in the sample, for
example due to attrition, or the use of sampling methods to reduce the burden on some
types of respondents (e.g. SMEs). A strong argument in favour of a longitudinal panel
survey design is that it enhances the range of possible analyses of causal relationships
between innovation activities and outcomes (see subsection 9.4.3 below).
9.47. Observation periods that are longer than the frequency of data collection can affect
comparisons of results from consecutive surveys. In such cases, it can be difficult to
determine if changes in results over time are mainly due to innovation activities in the non-
overlapping period or if they are influenced by activities in the period of overlap with the
previous survey. Spurious serial correlation could therefore be introduced as a result.
9.48. At the time of publication of this manual, the observation period used by countries
varies between one and three years. This reduces international comparability for key
indicators such as the incidence of innovation and the rate of collaboration with other
actors. Although there is currently no consensus on what should be the optimal length of
the generic observation period (other than a three-year maximum limit), convergence towards
a common observation period would considerably improve international comparability. It is
therefore recommended to conduct, through concerted efforts, additional experimentation
on the effects of different lengths for the observation period and the use of panel data to
address interpretation issues. The results of these experiments would assist efforts to reach
international agreement on the most appropriate length for the observation period.
9.3. Question and questionnaire design
9.49. Chapters 3 to 8 of this manual identify different concepts and characteristics of
business innovation for measurement. These need to be operationalised in the form of
questions that create useful data for empirical analysis, as indicated in Figure 9.1.
9.50. The operationalisation of theoretical concepts can result in a number of possible
errors that can be minimised through careful question and questionnaire design. This
manual does not provide full examples of survey questions because the phrasing of final
questions is likely to differ depending on contextual conditions that vary across and within
countries. Instead, the following sections provide guidelines for best practice in the design
of questions and the layout of the questionnaire. Good question design and questionnaire
layout can improve data quality, increase response rates, and improve comparability across
different survey methods (see subsection 9.5.4 below).
9.51. The design of individual questions and questionnaire layout are influenced by the
ability to obtain data from other sources (which makes some questions unnecessary), and
by the choice of survey method (see section 9.5 below). For example, grid or matrix
questions are difficult and time-consuming when heard, as in telephone surveys, but are
easily understood when presented visually, as in online and mailed questionnaire surveys.
These differences in survey methods need to be taken into consideration when multiple
methods are used.
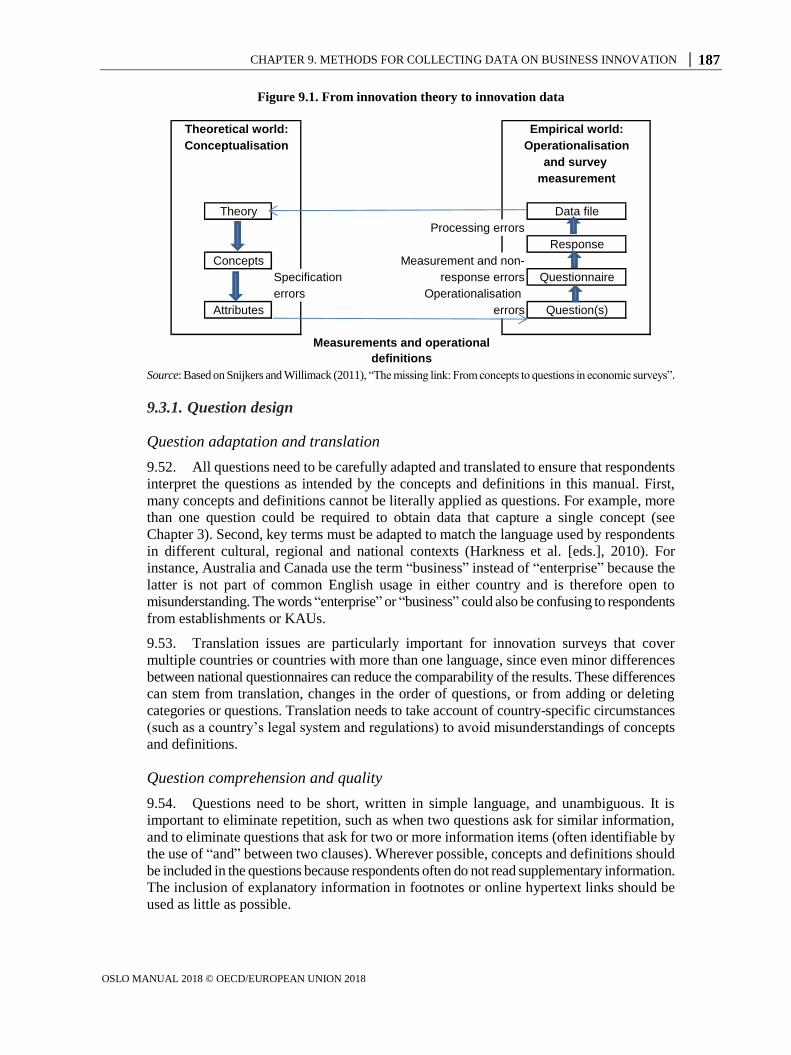
CHAPTER 9. METHODS FOR COLLECTING DATA ON BUSINESS INNOVATION │ 187
OSLO MANUAL 2018 © OECD/EUROPEAN UNION 2018
Figure 9.1. From innovation theory to innovation data
Source: Based on Snijkers and Willimack (2011), “The missing link: From concepts to questions in economic surveys”.
9.3.1. Question design
Question adaptation and translation
9.52. All questions need to be carefully adapted and translated to ensure that respondents
interpret the questions as intended by the concepts and definitions in this manual. First,
many concepts and definitions cannot be literally applied as questions. For example, more
than one question could be required to obtain data that capture a single concept (see
Chapter 3). Second, key terms must be adapted to match the language used by respondents
in different cultural, regional and national contexts (Harkness et al. [eds.], 2010). For
instance, Australia and Canada use the term “business” instead of “enterprise” because the
latter is not part of common English usage in either country and is therefore open to
misunderstanding. The words “enterprise” or “business” could also be confusing to respondents
from establishments or KAUs.
9.53. Translation issues are particularly important for innovation surveys that cover
multiple countries or countries with more than one language, since even minor differences
between national questionnaires can reduce the comparability of the results. These differences
can stem from translation, changes in the order of questions, or from adding or deleting
categories or questions. Translation needs to take account of country-specific circumstances
(such as a country’s legal system and regulations) to avoid misunderstandings of concepts
and definitions.
Question comprehension and quality
9.54. Questions need to be short, written in simple language, and unambiguous. It is
important to eliminate repetition, such as when two questions ask for similar information,
and to eliminate questions that ask for two or more information items (often identifiable by
the use of “and” between two clauses). Wherever possible, concepts and definitions should
be included in the questions because respondents often do not read supplementary information.
The inclusion of explanatory information in footnotes or online hypertext links should be
used as little as possible.
Theory Data file
Response
Concepts
Specification Questionnaire
errors
Attributes Question(s)
measurement
Measurements and operational
definitions
Theoretical world:
Conceptualisation
Empirical world:
Operationalisation
and survey
Processing errors
response errors
Operationalisation
errors
Measurement and non-
188 │ CHAPTER 9. METHODS FOR COLLECTING DATA ON BUSINESS INNOVATION
OSLO MANUAL 2018 © OECD/EUROPEAN UNION 2018
9.55. Data quality can be improved by reducing respondent fatigue and by maintaining a
motivation to provide good answers. Both fatigue and motivation are influenced by question
length, but motivation can be improved by questions that are relevant and interesting to the
respondent. The latter is particularly important for respondents from non-innovative units,
who need to find the questionnaire relevant and of interest, otherwise, they are less likely
to respond. Therefore, all questions should ideally be relevant to all units in all industries
(Tourangeau, Rips and Rasinski, 2000).
9.56. “Satisficing” refers to respondent behaviours to reduce the time and effort required
to complete an online or printed questionnaire. These include abandoning the survey before it
is completed (premature termination), skipping questions, non-differentiation (when respondents
give the identical response category to all sub-questions in a question, for example
answering “slightly important” to all sub-questions in a grid question), and speeding
through the questionnaire (Barge and Gelbach, 2012; Downes-Le Guin et al., 2012). The
main strategies for minimising satisficing are to ensure that the questions are of interest to
all respondents and to minimise the length of the questionnaire. Non-differentiation can be
reduced by limiting the number of sub-questions in a grid to no more than seven (Couper
et al., 2013). Grid questions with more than seven sub-questions can be split into several
subgroups. For instance, a grid question with ten sub-questions could be organised around
one theme with six sub-questions, and a second theme with four.
Nominal and ordinal response categories
9.57. Qualitative questions can use nominal response categories (“yes or no”) or ordinal
ones such as an importance or frequency scale. Nominal response categories are simple and
reliable, but provide only limited information; while ordinal response categories may
introduce a degree of subjectivity. Both types of questions may require a “don’t know” or
“not applicable” response category.
9.3.2. Questionnaire design
9.58. The questionnaire should be as short as possible, logically structured, and have
clear instructions. In voluntary surveys, unit response rates (the percentage of the sample
that completes the questionnaire) decline with questionnaire length. The quality of responses
can also decline for questions placed towards the end of a long questionnaire (Galesic and
Bosnjak, 2009). Survey implementation factors that affect unit response rates are discussed
in section 9.6 below.
9.59. Respondent comprehension and willingness to respond can be affected by the
questionnaire layout, with best practices being similar between printed and online questionnaires.
Skip routines or branching instructions on printed questionnaires need to be clearly visible.
The layout needs to incorporate national preferences for font sizes and the amount of blank
space on a page. Instructions should be repeated wherever applicable to improve the
likelihood that respondents follow them.
Filters
9.60. Filters and skip instructions direct respondents to different parts of a questionnaire,
depending on their answers to the filter questions. Filters can be helpful for reducing
response burden, particularly in complex questionnaires. Conversely, filters can encourage
satisficing behaviour whereby respondents answer “no” to a filter question to avoid
completing additional questions.
CHAPTER 9. METHODS FOR COLLECTING DATA ON BUSINESS INNOVATION │ 189
OSLO MANUAL 2018 © OECD/EUROPEAN UNION 2018
9.61. The need for filters and skip instructions can be minimised, for instance by
designing questions that can be answered by all units, regardless of their innovation status.
This can provide additional information of value to policy and to data analysis. However,
filters are necessary in some situations, such as when a series of questions are only relevant
to respondents that report one or more product innovations.
9.62. The online format permits automatic skips as a result of a filter, raising concerns
that respondents who reply to an online questionnaire could provide different results from
those replying to a printed version which allows them to see skipped questions and change
their mind if they decide that those skipped questions are relevant. When both online and
printed questionnaires are used, the online version can use “greying” for skipped questions
so that the questions are visible to respondents. This could improve comparability with the
printed version. If paradata – i.e. the data about the process by which surveys are filled in
– are collected in an online survey (see section 9.5 below), each respondent’s path through
the questionnaire can be evaluated to determine if greying has any effect on behaviour, for
instance if respondents backtrack to change an earlier response.
Question order
9.63. A respondent’s understanding of a question can be influenced by information
obtained from questions placed earlier in the questionnaire. Adding or deleting a question
can therefore influence subsequent answers and reduce comparability with previous surveys
or with surveys conducted in other jurisdictions.
9.64. Questions on activities that are relevant to all units regardless of their innovation
status should be placed before questions on innovation and exclude references to innovation.
This applies to potential questions on business capabilities (see Chapter 5).
9.65. Wherever possible, questions should be arranged by theme so that questions on a
similar topic are grouped together. For instance, questions on knowledge sourcing activities
and collaboration for innovation should be co-located. Questions on the contribution of
external actors to a specific type of innovation (product or business process) need to be
located in the section relating to that type of innovation.
9.3.3. Short-form questionnaires
9.66. For many small units and units in sectors with little innovation activity, the response
burden for a full innovation questionnaire can be high relative to their innovation activity,
thereby reducing response rates. In such cases, shorter survey questionnaires that focus on
a set of core questions could be useful. Short-form questionnaires can also be used to survey
units that have not reported innovation activity in previous innovation surveys. However,
empirical research for Belgium (Hoskens et al., 2016) and various developing countries
(Cirera and Muzi, 2016) finds significant differences in the share of innovative firms among
respondents to short and long questionnaires, with higher rates of innovative firms found
for short questionnaires. These results suggest that comparisons of data on innovation from
short-form and long-form questionnaires may reflect design factors that should be carefully
taken into account.
9.3.4. Combining innovation and other business surveys
9.67. Several NSOs have combined their innovation surveys with other business surveys,
in particular with R&D surveys, due to the conceptual and empirical proximity between
R&D and innovation. In principle, various types of business surveys can be integrated with
190 │ CHAPTER 9. METHODS FOR COLLECTING DATA ON BUSINESS INNOVATION
OSLO MANUAL 2018 © OECD/EUROPEAN UNION 2018
innovation surveys, for instance by combining questions on innovation with questions on
business characteristics, ICT or knowledge management practices.
9.68. There are several advantages of combining surveys including:
A combined survey can reduce the response burden for reporting units as long as
the combined survey is shorter in length and less difficult than separate surveys due
to avoiding repeated questions.
A combined survey permits analyses of the relationship between innovation and
other activities within the responding unit, for instance ICT use. This is advantageous
if separate surveys cannot be linked or if the innovation survey and other surveys
use different samples.
A combined survey can reduce the printing and postage costs for questionnaires
provided by mail and the follow-up costs for all types of surveys.
9.69. On the other hand, there are also disadvantages from combining surveys such as:
Both the unit and item response rates can decline if the combined questionnaire is
much longer than the length of the separate survey questionnaires. This is most
likely to be a problem for voluntary surveys.
If the topics are sufficiently distinct and relate to different functional areas within
the business, several persons within an organisation, especially large ones, may
need to be contacted in order to answer all questions.
Combining an innovation and an R&D survey can result in errors in the
interpretation of questions on innovation and R&D. Some respondents from units
that do not perform R&D could incorrectly assume that innovation requires R&D,
or that they are only being invited to report innovations based on R&D. This can
lower the observed incidence of innovation, as reported in some countries that have
experimented with combined R&D and innovation surveys (the observed incidence
of R&D is not affected) (e.g. Wilhelmsen, 2012). In addition, some respondents
could erroneously report innovation expenditures as R&D expenditures.
The sampling frames for the innovation survey and other business surveys can
differ. In the case of combining innovation and R&D surveys, the sample for
innovation can include industries (and small units) that are not usually included in
R&D surveys.
9.70. Based on the above considerations, the guidelines for combining an innovation
survey with one or more other business surveys are as follows:
A combined R&D and innovation survey needs to reduce the risk of conceptual
confusion by non-R&D-performing units by using two distinct sections and by
placing the innovation section first.
Separate sections need to be used when combining innovation questions with other
types of questions, such as on ICT or business characteristics. Questions that are
relevant to all units should be placed before questions on innovation.
A combined R&D and innovation survey can further reduce conceptual problems by
ensuring that the R&D section is only sent to units that are likely to perform R&D.
To avoid a decline in response rates, the length of a combined survey should be comparable
to the summed length of the separate surveys, particularly for voluntary surveys.

CHAPTER 9. METHODS FOR COLLECTING DATA ON BUSINESS INNOVATION │ 191
OSLO MANUAL 2018 © OECD/EUROPEAN UNION 2018
Care should be taken in comparisons of innovation results from combined surveys
with the results from separate innovation surveys. Full details on the survey method
should also be reported, including steps to reduce conceptual confusion.
9.71. Therefore, as a general rule, this manual recommends not combining R&D and
innovation surveys because of the drawbacks mentioned earlier, for instance by suggesting
to some respondents that innovation requires R&D. Although untested, it seems at this
point that there could be fewer problems with combining an innovation survey with other
types of surveys, such as surveys on business strategy or business characteristics.
9.3.5. Questionnaire testing
9.72. Innovation surveys undergo regular updates to adapt to known challenges and
address emerging user needs. It is strongly recommended to subject all new questions and
questionnaire layout features to cognitive testing in face-to-face interviews with respondents
drawn from the survey target population.
9.73. Cognitive testing, developed by psychologists and survey researchers, collects
verbal information on survey responses. It is used to evaluate the ability of a question (or
group of questions) to measure constructs as intended by the researcher and if respondents
can provide reasonably accurate responses. The evidence collected through cognitive
interviews is used to improve questions before sending the survey questionnaire to the full
sample (Galindo-Rueda and Van Cruysen, 2016). Cognitive testing is not required for
questions and layout features that have previously undergone testing, unless they were
tested in a different language or country. Descriptions of the cognitive testing method are
provided by Willis (2015, 2005).
9.74. Respondents do not need to be selected randomly for cognitive testing, but a
minimum of two respondents should be drawn from each possible combination of the
following three subgroups of the target population: non-innovative and innovative units,
service and manufacturing units, and units from two size classes: small/medium (10 to 249
employees) and large (250+ employees). This results in 16 respondents in total. Two (or
more) rounds of cognitive testing may be required, with the second round testing revisions
to questions made after the first round of testing.
9.75. In addition to cognitive testing, a pilot survey of a randomly drawn sample from the
target population is recommended when substantial changes are made to a questionnaire,
such as the addition of a large number of new questions, or new questions combined with
a major revision to the layout of the questionnaire. Pilot surveys can help optimise the flow
of the questions in the questionnaire and provide useful information on item non-response
rates, logical inconsistencies, and the variance of specific variables, which is useful for
deciding on sample sizes (see also subsection 9.4.2 below).
9.4. Sampling
9.4.1. The survey frame
9.76. The units in a survey sample or census are drawn from the frame population. When
preparing a survey, the intended target population (for instance all enterprises with ten or more
employed persons) and the frame population should be as close as possible. In practice, the
frame population can differ from the target population. The frame population (such as a
business register) could include units that no longer exist or no longer belong to the target
population, and miss units that belong to the target population due to delays in updating the
register. The latter can fail to identify small firms with rapid employment growth.
192 │ CHAPTER 9. METHODS FOR COLLECTING DATA ON BUSINESS INNOVATION
OSLO MANUAL 2018 © OECD/EUROPEAN UNION 2018
9.77. The frame population should be based on the reference year of the innovation
survey. Changes to units during the reference period can affect the frame population,
including changes in industrial classifications (ISIC codes), new units created during the
period, mergers, splits of units, and units that ceased activities during the reference year.
9.78. NSOs generally draw on an up-to-date official business register, established for
statistical purposes, to construct the sample frame. Other organisations interested in conducting
innovation surveys may not have access to this business register. The alternative is to use
privately maintained business registers, but these are often less up to date than the official
business register and can therefore contain errors in the assigned ISIC industry and number
of employed persons. The representativeness of private registers can also be reduced if the
data depend on firms responding to a questionnaire, or if the register does not collect data
for some industries. When an official business register is not used to construct the sampling
frame, survey questionnaires should always include questions to verify the size and sector
of the responding unit. Units that do not meet the requirements for the sample should be
excluded during data editing.
9.4.2. Census versus sample
9.79. While a census will generate more precise data than a sample, it is generally neither
possible nor desirable to sample the entire target population, and a well-designed sample is
often more efficient than a census for data collection. Samples should always use probability
sampling (with known probabilities) to select the units to be surveyed.
9.80. A census may be needed due to legal requirements or when the frame population
in a sampling stratum is small. In small countries or in specific sectors, adequate sampling
can produce sample sizes for some strata that are close in size to the frame population. In
this case using a census for the strata will provide better results at little additional cost. A
census can also be used for strata of high policy relevance, such as for large units responsible
for a large majority of a country’s R&D expenditures or for priority industries. A common
approach is to sample SMEs and use a census for large firms.
Stratified sampling
9.81. A simple random sample (one sampling fraction for all sampled units of a target
population) is an inefficient method of estimating the value of a variable within a desired
confidence level for all strata because a large sample will be necessary to provide sufficient
sampling power for strata with only a few units or where variables of interest are less
prevalent. It is therefore more efficient to use different sampling fractions for strata that are
determined by unit size and economic activity.
9.82. The optimal sample size for stratified sample surveys depends on the desired level
of precision in the estimates and the extent to which individual variables will be combined
in tabulated results. The sample size should also be adjusted to reflect the expected survey
non-response rate, the expected misclassification rate for units, and other deficiencies in
the survey frame used for sampling.
9.83. The target sample size can be calculated using a target precision or confidence level
and data on the number of units, the size of the units and the variability of the main variables
of interest for the stratum. The variance of each variable can be estimated from previous
surveys or, for new variables, from the results of a pilot survey. In general, the necessary
sample fraction will decrease with the number of units in the population, increase with the
size of the units and the variability of the population value, and increase with the expected
non-response rate.
CHAPTER 9. METHODS FOR COLLECTING DATA ON BUSINESS INNOVATION │ 193
OSLO MANUAL 2018 © OECD/EUROPEAN UNION 2018
9.84. It is recommended to use higher sampling fractions for heterogeneous strata (high
variability in variables of interest) and for smaller ones. The sampling fractions should be
100% in strata with only a few units, for instance when there are only a few large units in
an industry or region. The size of the units could also be taken into consideration by using
the probability proportional to size (pps) sampling approach, which reduces the sampling
fractions in strata with smaller units. Alternatively, the units in each stratum can be sorted
by size or turnover and sampled systematically. Different sampling methods can be used
for different strata.
9.85. Stratification of the population should produce strata that are as homogeneous as
possible in terms of innovation activities. Given that the innovation activities of units differ
substantially by industry and unit size, it is recommended to use principal economic activity
and size to construct strata. In addition, stratification by region can be required to meet
policy needs. The potential need for age-based strata should also be explored.
9.86. The recommended size strata by persons employed are as follows:
small units: 10 to 49
medium units: 50 to 249
large units: 250+.
9.87. Depending on national characteristics, strata for units with less than 10, and 500 or
more persons employed can also be constructed, but international comparability requires
the ability to accurately replicate the above three size strata.
9.88. The stratification of units by main economic activity should be based on the most
recent ISIC or nationally equivalent industrial classifications. The optimal classification level
(section, division, group or class) largely depends on national circumstances that influence the
degree of precision required for reporting. For example, an economy specialised in wood
production would benefit from a separate stratum for this activity (division 16 of section
C, ISIC Rev.4), whereas a country where policy is targeting tourism for growth might
create separate strata for division 55 (Accommodation) of section I, for division 56 (Food
services) of section I, and for section R (Arts, entertainment and recreation). Sampling strata
should not be over-aggregated because this reduces homogeneity within each stratum.
Domains (sub-populations of high interest)
9.89. Subsets of the target population can be of special interest to data users, or users may
need detailed information at industry or regional levels. These subsets are called domains
(or sub-populations). To get representative results, each domain must be a subset of the
sampling strata. The most frequent approach is to use a high sampling fraction to produce
reliable results for the domains. Additionally, establishing domains can allow for the co-
ordination of different business surveys, as well as for comparisons over time between units
with similar characteristics. Potential sub-populations for consideration include industry
groupings, size classes, the region where the unit is located (state, province, local government
area, municipality, metropolitan area etc.), R&D-performing units, and enterprise age.
Stratification by age can be useful for research on young, innovative enterprises.
9.90. Relevant preliminary data on domains can be acquired outside of representative
surveys run by NSOs, for instance by academics, consultancies or other organisations using
surveys or other methods described in the introduction. Academic surveys of start-ups or
other domains can produce good results or useful experiments in data collection, as long as
they follow good practice research methods.
194 │ CHAPTER 9. METHODS FOR COLLECTING DATA ON BUSINESS INNOVATION
OSLO MANUAL 2018 © OECD/EUROPEAN UNION 2018
9.4.3. Longitudinal panel data and cross-sectional surveys
9.91. As previously noted, innovation surveys are commonly based on repeated cross-
sections, where a new random sample is drawn from a given population for each innovation
survey. Cross-sectional innovation surveys can be designed in the form of a longitudinal
panel that samples a subset of units over two or more iterations of the survey, using a core
set of identical questions. Non-core questions can differ over consecutive surveys.
9.92. Longitudinal panel data allow research on changes in innovation activities at the
microeconomic level over time and facilitate research aimed at inferring causal relationships
between innovation activities and economic outcomes, such as the share of sales due to
innovation (see Chapter 8), by incorporating the time lag between innovation and its outcomes.
9.93. A number of procedures should be carefully followed when constructing a panel survey:
Panel units should be integrated within the full-scale cross-sectional survey in order
to reduce response burden, maintain an acceptable level of consistency between the
results from the two surveys, and collect good quality cross-sectional data for
constructing indicators. A panel does not replace the need for a cross-sectional survey.
Analysis should ensure that the inclusion of results from the panel does not bias or
otherwise distort the results of the main cross-sectional survey.
Panel samples need to be updated on a regular basis to adjust for new entries as
well as panel mortality (closure of units, units moving out of the target population)
and respondent fatigue. Sample updating should follow the same stratification
procedure as the original panel sample.
9.5. Data collection methods
9.94. Four main methods can be used to conduct surveys: online, postal, computer-
assisted telephone interviewing (CATI), and computer-assisted personal interviewing (CAPI
or face-to-face interviewing). Online and postal surveys rely on the respondent reading the
questionnaire, with a visual interface that is influenced by the questionnaire layout. CATI
and face-to-face surveys are aural, with the questions read out to the respondent, although
a face-to-face interviewer can provide printed questions to a respondent if needed.
9.95. The last decade has seen a shift from postal to online surveys in many countries.
Most countries that use an online format as their primary survey method also provide a
printed questionnaire as an alternative, offered either as a downloadable file (via a link in
an e-mail or on the survey site) or via the post.
9.96. The choice of which survey method to use depends on costs and potential differences
in response rates and data quality. Recent experimental research has found few significant
differences in either the quality of responses or in response rates, between printed and
online surveys (Saunders, 2012). However, this research has mostly focused on households
and has rarely evaluated surveys of business managers. Research on different survey
methods, particularly in comparison to online formats, is almost entirely based on surveys
of university students or participants in commercial web panels. It would therefore be
helpful to have more research on the effects of different methods for business surveys.
9.5.1. Postal surveys
9.97. For postal surveys, a printed questionnaire is mailed to respondents along with a
self-addressed postage paid envelope which they can use to return the survey. A best
CHAPTER 9. METHODS FOR COLLECTING DATA ON BUSINESS INNOVATION │ 195
OSLO MANUAL 2018 © OECD/EUROPEAN UNION 2018
practice protocol consists of posting a cover letter and a printed copy of the questionnaire
to the respondent, followed by two or three mailed follow-up reminders to non-respondents
and telephone reminders if needed.
9.98. Postal surveys make it easy for respondents to quickly view the entire questionnaire
to assess its length, question topics, and its relevance. If necessary, a printed questionnaire
can be easily shared among more than one respondent, for instance if a separate person
from accounting is required to complete the section on innovation expenditures (see section
9.6 below on multiple respondents). A printed questionnaire with filter questions requires
that respondents carefully follow instructions on which question to answer next.
9.5.2. Online surveys
9.99. The best practice protocol for an online survey is to provide an introductory letter
by post that explains the purpose of the survey, followed by an e-mail with a clickable link
to the survey. Access should require a secure identifier and password and use up-to-date
security methods. Follow-up consists of two or three e-mailed or posted reminders to non-
respondents, plus telephone reminders if needed.
9.100. Online questionnaires can be shared, if necessary, among several respondents if the
initial respondent provides the username and password to others (see section 9.6).
9.101. Online surveys have several advantages over postal surveys in terms of data quality
and costs:
The software can notify respondents through a pop-up box if a question is not
completed or contains an error, for instance if a value exceeds the expected maximum
or if percentages exceed 100%. With a postal survey, respondents need to be contacted
by telephone to correct errors, which may not occur until several weeks after the
respondent completed the questionnaire. Due to the cost of follow-up, missing values
in a postal survey are often corrected post-survey through imputation.
Pop-up text boxes, placed adjacent to the relevant question, can be used to add
additional information, although respondents rarely use this feature.
Respondents cannot see all questions in an online survey and consequently are less
likely than respondents to a printed questionnaire to use a “no” response option
to avoid answering follow-on questions. An online survey can therefore reduce
false negatives.
Survey costs are reduced compared to other survey methods because there is less
need to contact respondents to correct some types of errors, data are automatically
entered into a data file, data editing requirements are lower than in other methods,
and there are reduced mailing and printing costs.
9.102. The main disadvantage of an online survey compared to other survey methods is
that some respondents may be unable to or refuse to complete an online form. In this case
an alternative survey method is required (see subsection 9.5.4 below). The online system
may also need to be designed so that different persons within a unit can reply to different
sections of the survey.
Collecting paradata in online surveys
9.103. Online survey software offers the ability to collect paradata on keystrokes and
mouse clicks (for instance to determine if help menus have been accessed) and response

196 │ CHAPTER 9. METHODS FOR COLLECTING DATA ON BUSINESS INNOVATION
OSLO MANUAL 2018 © OECD/EUROPEAN UNION 2018
time data, such as the time required to respond to specific questions, sections, or to the
entire survey (Olson and Parkhurst, 2013). Paradata can be analysed to identify best
practices that minimise undesirable respondent behaviour such as premature termination or
satisficing, questions that are difficult for respondents to understand (for instance if
question response times are considerably longer than the average for a question of similar
type), and if late respondents are more likely than early ones to speed through a
questionnaire, thereby reducing data quality (Belfo and Sousa, 2011; Fan and Yan, 2010;
Revilla and Ochoa, 2015).
9.104. It is recommended to collect paradata when using online surveys in order to
identify issues with question design and questionnaire layout.
9.5.3. Telephone and face-to-face interviews
9.105. Telephone and face-to-face surveys use computer-assisted data capture systems.
Both methods require questions to be heard, which can require changes to question formats
compared to visual survey methods. Interviewers must be trained in interview techniques
and how to answer questions from the respondent, so that the respondent’s answers are not
biased through interactions with the interviewer. For both formats, filters are automatic and
the respondent does not hear skipped questions, although interviewers can probe for
additional information to ensure that a “no” or “yes” response is accurate.
9.106. The CATI method has a speed advantage compared to other methods, with results
obtainable in a few weeks. Both CATI and CAPI can reduce errors and missing values, as
with online surveys. Their main disadvantage, compared to an online survey, is higher costs
due to the need for trained interviewers. Secondly, compared to both online and postal
surveys, CATI and CAPI methods are unsuited for collecting quantitative data that require
the respondent to search records for the answer.
9.107. The main reason for using the CAPI format is to obtain high response rates. This
can occur in cultures where face-to-face interviews are necessary to show respect to the
respondent and in areas where online or postal surveys are unreliable.
9.5.4. Combined survey methods
9.108. The use of more than one survey method can significantly increase response rates
(Millar and Dillman, 2011). Where possible, surveys should combine complementary
survey methods that are either visual (printed or on line) or aural (CATI or face-to-face)
because of differences by survey methods in how respondents reply to questions. Telephone
surveys can also elicit higher scores than online or mailed surveys on socially desirable
questions (Zhang et al., 2017). As innovation is considered socially desirable, this could
result in higher rates of innovation reported to CATI surveys compared to printed or online
surveys. Possible survey method effects should be assessed when compiling indicators and
comparing results across countries that use different survey methods.
9.6. Survey protocol
9.109. The survey protocol consists of all activities to implement the questionnaire,
including contacting respondents, obtaining completed questionnaires, and following up
with non-respondents. The protocol should be decided in advance and designed to ensure
that all respondents have an equal chance of replying to the questionnaire, since the goal is
to maximise the response rate. Nonetheless, the optimum survey protocol is likely to vary
by country.
CHAPTER 9. METHODS FOR COLLECTING DATA ON BUSINESS INNOVATION │ 197
OSLO MANUAL 2018 © OECD/EUROPEAN UNION 2018
9.6.1. Respondent identification
9.110. Choosing a suitable respondent (or department within a large firm) is particularly
important in innovation surveys because the questions are specialised and can be answered
by only a few people, who are rarely the same as the person who completes other statistical
questionnaires. In small units, managing directors are often good respondents. As much as
possible, knowledgeable respondents should be selected to minimise the physical or virtual
“travel” of a questionnaire to multiple people within a firm. Travel increases the probability
that the questionnaire is lost, misplaced or that no one takes responsibility for its completion.
In large units where no single individual is likely to be able to respond to all questions,
some travel will be inevitable. However, a single, identified contact person or department
should be responsible for co-ordinating questionnaire completion.
9.6.2. Support for respondents
9.111. Innovation surveys contain terms and questions that some respondents may not
fully understand. Survey managers need to train personnel to answer potential questions
and provide them with a list of basic definitions and explanations of questions.
9.6.3. Mandatory and voluntary surveys
9.112. Completion of innovation surveys can be either voluntary or mandatory, with
varying degrees of enforcement. Higher non-response rates are expected for voluntary
surveys and are likely to increase with questionnaire length. Sampling fractions can be
increased to account for expected non-response rates, but this will not solve potential bias
due to differences in the characteristics of non-respondent and respondent units that are
correlated with survey questions. Reducing bias requires maximising response rates and
representativeness (see below).
9.113. Whether a survey is voluntary or mandatory can also affect results. For example,
the calculated share of innovative firms in a voluntary survey will be biased upwards if
managers from non-innovative firms are less likely to respond than the managers of
innovative firms (Wilhelmsen, 2012).
9.6.4. Non-response
9.114. Unit non-response occurs when a sampled unit does not reply at all. This can occur
if the surveying institute cannot reach the reporting unit or if the reporting unit refuses to
answer. Item non-response refers to the response rate to a specific question and is equal to
the percentage of missing answers among the responding units. Item non-response rates are
frequently higher for quantitative questions than for questions using nominal or ordinal
response categories.
9.115. Unit and item non-response are only minor issues if missing responses are randomly
distributed over all units sampled and over all questions. When unit non-responses are
random, statistical power can be maintained by increasing the sampling fraction. When
item non-responses are random, simple weighting methods can be used to estimate the
population value of a variable. However, both types of non-response can be subject to bias.
For example, managers from non-innovative units could be less likely to reply because they
find the questionnaire of little relevance, resulting in an overestimate of the share of innovative
units in the population. Or, managers of innovative units could be less likely to reply due
to time constraints.
198 │ CHAPTER 9. METHODS FOR COLLECTING DATA ON BUSINESS INNOVATION
OSLO MANUAL 2018 © OECD/EUROPEAN UNION 2018
Improving response rates
9.116. Achieving high response rates, particularly in voluntary surveys, can be supported
by good question and questionnaire design (see section 9.3) as well as good survey
protocols. Two aspects of the survey protocol can have a large positive effect on response rates:
(i) good follow-up with multiple reminders to non-respondents; and (ii) the personalisation
of all contacts, such as using the respondent’s name and changing the wording of reminder
e-mails. Personalisation includes sending a first contact letter by post, which can significantly
increase response rates in comparison to a first contact via e-mail (Dykema et al., 2013).
Clearly communicating the purpose and use of the survey data is critical for generating
trust and participation. Participation can be further enhanced if managers anticipate direct
benefits for their business from providing truthful and carefully thought-out answers.
Managing low unit response rates
9.117. There are no clear boundaries for high, moderate and low unit response rates. The
rule of thumb is that high response rates exceed 70% or 80%, moderate response rates are
between 50% and 70% or 80%, and low response rates are below 50%.
9.118. Unless the response rate is very high (above 95%), differences between respondents
and non-respondents should be compared using stratification variables such as unit size or
industry. If the response rate is high and there are no significant differences by stratification
variables, population weighting can be calculated on the basis of the units that replied. This
procedure assumes that the innovation behaviour of responding and non-responding units
conditional on these characteristics is identical. Challenges can arise when behaviour is
very heterogeneous within strata (e.g. between large and very large firms).
9.119. If the response rate is moderate or low, it is recommended to conduct a non-
response survey (see subsection 9.6.5 below).
9.120. If the unit response rate is very low (below 20%), a non-response survey may be
insufficient for correcting for potential bias, unless it is of very high quality and covers a
large share of non-responding units. The data can be analysed to determine if response rates
are acceptable in some strata and to conduct a non-response survey for those strata. Otherwise,
the results should not be used to estimate the characteristics of the target population because
of the high possibility of biased results. It is possible to use the data to investigate patterns in
how variables are correlated, as long as the results are not generalised to the target population.
9.6.5. Conducting non-response surveys
9.121. Many NSOs have their own regulations for when a non-response survey is
necessary. Otherwise, a non-response survey is recommended when the unit non-response
rate in a stratum exceeds 30%. The non-response survey should sample a minimum of 10%
of non-respondents (more for small surveys or for strata with a low population count).
9.122. The objective of the non-response survey is to identify significant differences between
responding and non-responding units in innovation activities. To improve future surveys,
it is possible to obtain information on why non-respondent units did not answer. In the ideal
case, the unit response rate for the non-response survey is sufficiently high and replies are
sufficiently reliable to be useful for adjusting population weightings. However, survey method
effects in the non-response survey (different survey methods or questionnaires compared
to the main survey) should also be considered when adjusting population weights.
CHAPTER 9. METHODS FOR COLLECTING DATA ON BUSINESS INNOVATION │ 199
OSLO MANUAL 2018 © OECD/EUROPEAN UNION 2018
9.123. The non-response survey questionnaire must be short (no more than one printed
page) and take no more than two to three minutes to complete. The key questions should
replicate, word for word, “yes or no” questions in the main survey on innovation outputs
(product innovations and business process innovations) and for some of the innovation
activities (for instance R&D, engineering, design and other creative work activities, etc.).
If not available from other sources, the non-response survey needs to include questions on
the unit’s economic activity and size.
9.124. Non-response surveys are usually conducted by CATI, which provides the
advantage of speed and can obtain high response rates for a short questionnaire, as long as
all firms in the sample have a working contact telephone number. The disadvantage of a
CATI survey as a follow-up to a postal or online survey is that short telephone surveys in
some countries could be more likely than the original survey to elicit positive responses for
questions on innovation activities and outputs. The experience in this regard has been
mixed, with different countries obtaining different results. More experimental research on
the comparability of business survey methods is recommended.
9.7. Post-survey data processing
9.125. Data processing involves checks for errors, imputation of missing values and the
calculation of weighting coefficients.
9.7.1. Error checks
9.126. As noted in subsections 9.5.2 and 9.5.3 above, the use of online, CATI and CAPI
survey methods can automatically identify potential errors and request a correction from
respondents. All of the following types of error checks are required for printed questionnaires,
but only the check for out of scope units might be required for an online survey. When
errors are identified, the respondent or reporting unit should be contacted as soon as
possible to request a correction.
Out of scope units
9.127. Responses can be obtained from out of scope units that do not belong to the target
population, such as a unit that is below the minimum number of persons employed, a unit
that is not owned by a business, or a unit in an excluded ISIC category. Responses from
these units must be excluded from further analysis.
Data validation checks
9.128. These procedures test whether answers are permissible. For example, a permissible
value for a percentage is between 0 and 100.
9.129. An additional check for data quality should be applied to ratio and interval level
data, particularly for innovation expenditures. Current best practice is to compare interval
level data against other available sources (for instance for R&D expenditures and for
expenditures on capital equipment). In addition, estimates of the innovation sales share and
other interval level data should be checked for outliers or other unexpected values. These
methods are particularly important for large units that account for a high share of total
reported R&D and innovation expenditures.
200 │ CHAPTER 9. METHODS FOR COLLECTING DATA ON BUSINESS INNOVATION
OSLO MANUAL 2018 © OECD/EUROPEAN UNION 2018
Relational checks
9.130. These evaluate the relationship between two variables and can identify hard and
soft errors. Hard errors occur when a relationship must be wrong, for instance if percentages
do not sum to 100% or if the number of reported persons employed with a tertiary education
exceeds the total reported number of persons employed. Other relational checks identify
soft errors where a response could be wrong. For instance, a unit with ten persons employed
could report EUR 10 million of innovation expenditures. This is possible, but unlikely.
Routing error checks
9.131. These checks test whether all questions that should have been answered have been
answered, i.e. respondents from innovation-active units answered all questions on
innovation expenditures. An error indicates that the respondent did not understand or
follow the filtering instructions.
9.7.2. Imputation of missing data
9.132. Another type of error is when a respondent fails to answer a question, for instance
several sub-questions in a grid question are left blank, either intentionally or accidentally.
Respondents can also refuse to answer a question if they find that none of the response
categories are appropriate or if they don’t know the answer and a “don’t know” option is
not provided. Online survey software can force the respondent to reply, but this is not
recommended for voluntary surveys because it may cause the respondent to abandon
the questionnaire.
9.133. To reduce costs and response burden, missing values can in some cases be imputed
through the use of additional information, instead of re-contacting the respondent. The use
of additional information should provide a more accurate estimate of missing values than
simply using the mean observed value in a stratum. Imputed values should always be
flagged to prevent their possible use as dependent values in multivariate analyses to avoid
biased coefficients.
9.134. Cold-deck imputation techniques estimate missing values using data in other
statistical surveys (including previous surveys) or from other related sources. For instance,
data on the number of employees with a tertiary education could be available in a separate
survey for similar types of units.
9.135. Hot-deck imputation uses other data from the innovation survey to impute some
missing values. The choice of which hot-deck method to use depends on the measurement
level for the variable. Interval level data can be imputed either by using the mean value of
the variable in the responding unit’s stratum, or by using regression to predict the value of
the interval level variable. In the latter case, the results need to be checked to identify non-
credible estimated values, such as negative values.
9.136. Nearest-neighbour techniques can be used to impute missing nominal and ordinal
level values. This technique uses data from clean records (a donor case with a record not
violating any error check), in order to replace the missing value with the value in the donor
record. The donors are chosen on the basis of similar stratification variables and for
maximum comparability on related variables. For example, the donor for a missing ordinal
variable on collaboration partners should be as similar as possible for related variables on
information sources.
CHAPTER 9. METHODS FOR COLLECTING DATA ON BUSINESS INNOVATION │ 201
OSLO MANUAL 2018 © OECD/EUROPEAN UNION 2018
9.7.3. Calculating weights
9.137. The results of sample surveys need to be weighted to provide estimates that are
representative of the target population. There are various methods for weighting sampling
results. The simplest is weighting by the reciprocal (inverse) of the sampling fractions of
the stratum for each sampled unit, corrected by the unit non-response for each stratum,
which gives the realised sample. For instance, if the sampling fraction is 10/100, but 10%
of the sampled units did not respond, the corrected sampling fraction is 9/100. This procedure
assumes that the distribution of innovation activities among responding and non-responding
units is identical. This assumption can be tested through a non-response analysis, and even
if the assumption is wrong, the bias introduced can be disregarded if the fraction of non-
responding units is fairly small.
9.138. Not all sample surveys use stratification – a census by definition is not stratified.
For a non-stratified survey, weighting should use the reciprocal of the overall sampling
fraction, adjusted for the reciprocal of the total response rate. For a census, strata can be
constructed post-survey to identify non-response rates in strata defined by firm size, sector,
region etc. Census weighting variables can be constructed from the reciprocal of the strata
response rates.
9.139. The final weighting factors should be further corrected if a non-response survey
identifies statistically significant differences between the original survey respondents and
the respondents to the non-response survey, for instance if a lower percentage of non-
innovative units replied to the full survey compared to the non-respondent survey. One
approach is to divide each stratum into a number of response homogeneity groups (RHGs)
with (assumed) equal response probabilities within groups. RHGs can be determined using
the results of the non-response survey. A second approach is to use auxiliary information
at the estimation stage for reducing the non-response bias or two-phase sampling estimation
methods. In the latter case, the sample is split by the phenomenon for which a likely non-
response bias has been investigated (e.g. innovative versus non-innovative firms) and weighting
factors are calculated separately for each group. In a second step, weighting factors are
adjusted by a non-response correction factor that represents the bias between responding
and non-responding firms with respect to the investigated phenomenon.
9.140. The weights can be further refined by calibration if the frame population includes
some quantitative or qualitative information on all units, such as number of employees,
turnover, legal status or region. The calibration ensures that the weighted sample sums to
the total population or distribution for the frame variables and can increase precision and
reduce bias. Effective calibration software, in particular CLAN from Statistics Sweden,
CALMAR from the French National Statistical Insitute (INSEE) in France, and G-Est from
Statistics Canada, are available for use by other countries. Many of the software packages
used for calculating weights can also calculate measures of sampling variability.
9.8. Publication and dissemination of results
9.141. Innovation surveys are used to produce tables of innovation statistics and indicators
and in econometric analyses of a variety of topics concerning innovation. The production
of statistics and indicators requires using population weights to produce representative
results for the target population. Most innovation surveys use a probability sample for many
strata. Surveys can create two types of errors for indicators: random errors due to the
random process used to select the units, and systematic errors containing all non-random
errors (bias). The probability of random errors should be provided with the results by
202 │ CHAPTER 9. METHODS FOR COLLECTING DATA ON BUSINESS INNOVATION
OSLO MANUAL 2018 © OECD/EUROPEAN UNION 2018
including the confidence intervals, standard errors and coefficients of variation where
applicable. Confidence limits span the true but unknown values in the survey population
with a given probability. If possible, data quality reports should also provide an evaluation
of non-random errors.
9.8.1. Metadata and quality reports
9.142. The presentation of statistics and indicators should contain metadata, including
information on the procedure used to collect data, sampling methods, procedures for
dealing with non-response, and quality indicators. This will allow users to better interpret
the data and judge its quality. International organisations should continue to provide
detailed information about the common and idiosyncratic methodologies adopted by countries
covered in their databases and reports.
9.8.2. Data access
9.143. Descriptive data can be provided through press releases, tables, databases and
reports. Econometric analysis of innovation survey data is of considerable value to policy
development (see section 11.5), but this is not the main task of NSOs. In-house econometric
analyses by NSOs can be supplemented at low cost by providing researchers with access
to innovation survey microdata. This requires maintaining confidentiality, either through the
provision of a safe centre for data access by external academics or through the construction
of anonymised data sets.
References
Barge, S. and H. Gehlbach (2012), “Using the theory of satisficing to evaluate the quality of survey
data”, Research in Higher Education, Vol. 53/2, pp. 182-200.
Belfo, F.P. and R.D. Sousa (2011), “A web survey implementation framework: evidence-based design
practices”, conference paper for the 6th Mediterranean Conference on Information Systems,
MCIS 2011, Limassol, 3-5 September, http://aisel.aisnet.org/mcis2011/43/.
Cirera, X. and S. Muzi (2016), “Measuring firm-level innovation using short questionnaires: Evidence
from an experiment”, Policy Research Working Papers, No. 7696, World Bank Group.
Couper, M.P. et al. (2013), “The design of grids in web surveys”, Social Science Computer Review,
Vol. 31/3, pp. 322-345.
Downes-Le Guin, T. et al. (2012), “Myths and realities of respondent engagement in online surveys”,
International Journal of Market Research, Vol. 54/5, pp. 613-633.
Dykema, J. et al. (2013), “Effects of e-mailed versus mailed invitations and incentives on response rates,
data quality, and costs in a web survey of university faculty”, Social Science Computer Review,
Vol. 31/3, pp. 359-370.
EC et al. (2009), System of National Accounts 2008, United Nations, New York,
https://unstats.un.org/unsd/nationalaccount/docs/sna2008.pdf.
Fan, W. and Z. Yan (2010), “Factors affecting response rates of a web survey: A systematic review”,
Computers in Human Behavior, Vol. 26/2, pp. 132-139.
Galesic, M. and M. Bosnjak (2009), “Effects of questionnaire length on participation and indicators of
response quality in a web survey”, Public Opinion Quarterly, Vol. 73/2, pp. 349-360.
CHAPTER 9. METHODS FOR COLLECTING DATA ON BUSINESS INNOVATION │ 203
OSLO MANUAL 2018 © OECD/EUROPEAN UNION 2018
Galindo-Rueda, F. and A. Van Cruysen (2016), “Testing innovation survey concepts, definitions and
questions: Findings from cognitive interviews with business managers”, OECD Science, Technology
and Innovation Technical Papers, OECD Publishing, Paris, http://oe.cd/innocognitive.
Harkness, J.A. et al. (eds.) (2010), Survey Methods in Multicultural, Multinational, and Multiregional
Contexts, Wiley Series in Survey Methodology, John Wiley & Sons, Hoboken.
Harris, R.I.D. (1988), “Technological change and regional development in the UK: Evidence from the
SPRU database on innovations”, Regional Studies, Vol. 22/5, pp. 361-374.
Hoskens, M. et al. (2016), “State of the art insights in capturing, measuring and reporting firm-level
innovation indicators”, paper for the OECD Blue Sky 2016 Forum, www.oecd.org/sti/069%20-
%20Measuring%20innovation_ECOOM%20August%202016.pdf.
Kleinknecht, A., J.O.N. Reijnen and W. Smits (1993), “Collecting literature-based innovation output
indicators: The experience in the Netherlands”, in New Concepts in Innovation Output Measurement,
Palgrave Macmillan, London, pp. 42-84.
Millar, M.M. and D.A. Dillman (2011), “Improving response to web and mixed-mode surveys”, Public
Opinion Quarterly, Vol. 75/2, pp. 249-269, https://doi.org/10.1093/poq/nfr003.
OECD (2015a), Recommendation of the OECD Council on Good Statistical Practice, OECD, Paris,
www.oecd.org/statistics/good-practice-toolkit/Brochure-Good-Stat-Practices.pdf.
OECD (2015b), Frascati Manual 2015: Guidelines for Collecting and Reporting Data on Research and
Experimental Development, The Measurement of Scientific, Technological and Innovation Activities,
OECD Publishing, Paris, http://oe.cd/frascati.
Olson, K, and B. Parkhurst (2013), “Collecting paradata for measurement error evaluations”, in
Improving Surveys with Paradata: Analytic Uses of Process Information, John Wiley & Sons,
Hoboken, pp. 43-72.
Revilla, M. and C. Ochoa (2015), “What are the links in a web survey among response time, quality and
auto-evaluation of the efforts done?”, Social Science Computer Review, Vol. 33/1, pp. 97-114,
https://doi.org/10.1177/0894439314531214.
Saunders, M.N.K. (2012), “Web versus mail: The influence of survey distribution mode on employees’
response”, Field Methods, Vol. 24/1, pp. 56-73.
Snijkers, G. and D.K. Willimack (2011), “The missing link: From concepts to questions in economic
surveys”, paper presented at the 2nd European Establishment Statistics Workshop (EESW11),
Neuchâtel, Switzerland, Sept. 12-14.
Snijkers, G. et al. (eds.) (2013), Designing and Conducting Business Surveys, Wiley Series in Survey
Methodology, John Wiley & Sons, Hoboken.
Tourangeau, R., L.J. Rips and K. Rasinski (2000), The Psychology of Survey Response, Cambridge
University Press, Cambridge.
UN (2008), International Standard Industrial Classification of All Economic Activities (ISIC),
Revision 4, United Nations, New York,
https://unstats.un.org/unsd/publications/catalogue?selectID=396.
UN (2007), Statistical Units, United Nations, New York,
http://unstats.un.org/unsd/isdts/docs/StatisticalUnits.pdf.
204 │ CHAPTER 9. METHODS FOR COLLECTING DATA ON BUSINESS INNOVATION
OSLO MANUAL 2018 © OECD/EUROPEAN UNION 2018
Wilhelmsen, L. (2012), “A question of context: Assessing the impact of a separate innovation survey and
of response rate on the measurement of innovation activity in Norway”, Documents, No. 51/2012, Statistics
Norway, Oslo, www.ssb.no/a/english/publikasjoner/pdf/doc_201251_en/doc_201251_en.pdf.
Willeboordse, A. (ed.) (1997), Handbook on Design and Implementation of Business Surveys, Eurostat,
Luxembourg, http://ec.europa.eu/eurostat/ramon/statmanuals/files/Handbook%20on%20surveys.pdf.
Willis, G.B. (2015), Analysis of the Cognitive Interview in Questionnaire Design, Oxford University
Press, Oxford.
Willis, G.B. (2005), Cognitive Interviewing: A Tool for Improving Questionnaire Design, SAGE
Publications.
Zhang, X.C. et al. (2017), “Survey method matters: Online/offline questionnaires and face-to-face or
telephone interviews differ”, Computers in Human Behavior, Vol. 71, pp. 172-180.
CHAPTER 10. THE OBJECT METHOD FOR INNOVATION MEASUREMENT │ 205
OSLO MANUAL 2018 © OECD/EUROPEAN UNION 2018
Chapter 10. The object method for innovation measurement
This chapter provides guidance on collecting data on innovation from an object-based
perspective. The object-based method collects data on a single, focal, most important
innovation, facilitating information retrieval about enablers, features and outcomes of
business innovations. Although the method can also be applied to unconventional data
sources, this chapter describes how to implement the object approach within subject-based
innovation surveys that cover the full range of innovation activities and innovations of the
firm. Because focal innovations are not representative of the business as a whole, the main
purpose of the object approach is to collect data for analytical and research purposes. The
method can also be used to assess whether innovation is over- or under-reported by
business respondents.
206 │ CHAPTER 10. THE OBJECT METHOD FOR INNOVATION MEASUREMENT
OSLO MANUAL 2018 © OECD/EUROPEAN UNION 2018
10.1. Introduction
10.1. The object approach to innovation measurement collects data on a single, “focal”
innovation (the object of the study), in contrast to the subject approach, which focuses on
the firm and collects data on all its innovation activities (the subject) (see Chapter 2). The
main purpose of the object approach is not to produce aggregate innovation statistics but to
collect data for analytical and research purposes. The method can also provide useful
information for quality assurance purposes on how respondents interpret questions on
innovation and whether they over-, under- or misreport innovation.
10.2. The object method can identify focal innovations through expert evaluations, or through
announcements of innovations in trade publications (Kleinknecht and Reijnen, 1993; Santarelli
and Piergiovanni, 1996; Townsend, 1981) or online sources (company websites, reports,
investor announcements, etc.). An alternative method of using the object method is to incorporate
the object approach within a subject-based innovation survey. In addition to questions on all
of the firm’s innovation activities, a module of questions can focus on a single innovation.
DeBresson and Murray (1984) were the first to use a version of this method as part of an
innovation survey in Canada. More recently, this approach has been used in business enterprise
surveys, for instance by Statistics Canada and the Japanese Statistical Office, academic
researchers in Australia (O’Brien et al., 2015, 2014) and the United States (Arora, Cohen and
Walsh, 2016), and in surveys of innovation in the Government sector (Arundel et al., 2016).
10.3. The inclusion of the object method within a subject-based innovation survey has
several advantages over the use of experts or announcements to identify focal innovations.
First, it can obtain information on a focal innovation for a representative sample of all
innovative firms, whereas other methods will be prone to self-selection biases. Second, it
can collect data on all types of innovations. Using experts or announcements to identify
innovations will produce a bias towards successful product innovations. Third, it can collect
information on innovations that are new to the firm only, or not sufficiently novel to be
reported on line or in trade journals. It is therefore recommended, where cost-effective, to
collect data on a focal innovation through representative surveys.
10.2. Including an “object module” in an innovation survey
10.4. In the survey context, there are several advantages of collecting data on a focal
innovation in addition to data on all of the innovation activities of a firm. First, the inclusion
of an object method module in an innovation survey can support the use of in-depth,
quantitative and interval level questions that are too difficult for respondents to answer for
all their innovations combined, for instance questions that require respondents to calculate
the average importance of a variable across multiple innovations or innovation activities.
Potentially difficult questions include expenditures on different innovation activities and
the use of specific technical capabilities. Other difficult questions are those that require
respondents to construct an “average” representation across the entire firm, such as
questions on the importance of different knowledge sources, obstacles and outcomes.
10.5. Second, the use of questions on a single focal innovation ensures that the set of data
collected refer to the same innovation. This is primarily an advantage for analyses on the
relationships between innovation inputs, activities and outcomes, as in the research by
Arora, Cohen and Walsh (2016) on the economic value of alternative knowledge sources
for innovation. It can also assist other types of research, such as an evaluation of how
respondents understand innovation survey questions (Arundel, O’Brien and Torugsa, 2013),
and research into blended innovations that span both product and business processes (Bloch
and Bugge, 2016), including changes to business models.
CHAPTER 10. THE OBJECT METHOD FOR INNOVATION MEASUREMENT │ 207
OSLO MANUAL 2018 © OECD/EUROPEAN UNION 2018
10.6. Nonetheless, it is not recommended to only include object-based questions in an
innovation survey, or to allot a significant percentage of survey questions to an object
module. Many research and policy questions cannot be addressed through questions on a
focal innovation. These include questions that are relevant to the firm as a whole, such as
questions on the firm’s internal capabilities and strategies (see Chapter 5) and external
environment (see Chapter 7), as well as questions that are used to create aggregate indicators
for all innovation activities, such as data on innovation expenditures (see Chapter 4) or the
innovation sales share (see Chapter 8).
10.7. The object method is seldom useful for constructing simple statistics and indicators at
the national or industry level because the answers do not fully reflect the overall innovation
inputs, outputs and outcomes of an economy or industry. Furthermore, the focal innovation
is unlikely to be representative of all of the responding firm’s own innovations or innovation
activities. Data for a firm’s most important innovation should therefore not be used to produce
indicators that require data for all of a firm’s innovations, such as total expenditures for
specific innovation activities, the importance of different types of knowledge sources for
innovation, or the frequency of collaboration with different types of partners.
10.8. Many of the guidelines in this manual for collecting data on innovation at the subject
level can be directly applied to collecting data at the object level. There are no additional
methodological limitations to including an object-based module in a subject-based
innovation survey.
10.2.1. Identifying a focal innovation within surveys
10.9. An object module must include an initial prompt that asks respondents from
innovative firms to think of a single innovation and limit all subsequent questions in the
module to this innovation. Respondents from firms that are innovation-active, but with no
innovations in the observation period, can be also asked to think about a single innovation
project. As a device to ensure that the responses are focused on the innovation, it is helpful
to ask the respondent, in an open question, to provide a short description of the innovation.
10.10. It is recommended to ask respondents to select a focal innovation that was
introduced or implemented during the observation period. This ensures that other data from
an innovation survey on the general capabilities or strategies of the firm are relevant to the
focal innovation and that data on the focal innovation can be linked to outcome data from
other surveys with a known time lag interval. It also reduces recall biases for innovations
that occurred before the observation period (see Chapter 9). However, respondents should
be permitted in their responses to include activities, where relevant, that occurred before
the start of the observation period, such as collaboration with specific types of partners or
the receipt of government subsidies for the innovation.
10.11. The questionnaire should also provide guidance for the choice of a focal innovation
(or innovation project) to improve comparability between respondents. Possible options include:
the most important innovation with respect to its actual or expected contributions
to the firm’s economic performance
the innovation with the highest share of total innovation expenditures invested in
its development
the product innovation with the greatest actual or expected contribution to sales
the business process innovation with the greatest actual or expected contribution to
reducing costs
the most recent innovation.
208 │ CHAPTER 10. THE OBJECT METHOD FOR INNOVATION MEASUREMENT
OSLO MANUAL 2018 © OECD/EUROPEAN UNION 2018
10.12. The first option has several advantages. The question is usually well understood by
respondents and the innovation is memorable, which ensures that respondents can answer
questions about it. In addition, the most important innovation is relevant to many areas of
research, such as on the factors that lead to success. Leaving the first option open to all
types of innovations can collect useful data on the types of innovations that firms find
important. It can also identify innovation inputs that are likely to be of high value to a firm.
For instance, a respondent could give a moderate importance ranking to universities as a
source of knowledge for all innovation activities, but the use of this source for its most
important innovation would indicate that the value of knowledge from universities could
vary by the type of innovation.
10.13. The second option requires respondents to have a good knowledge of the development
cost for different innovations. The third and fourth options are a variant of the first option,
but limited to either product or business process innovations and therefore will not be
relevant to firms that did not introduce an innovation of that type. The fifth option is useful
for research that requires a random selection of all types of innovations.
10.14. Unless there are good research reasons for using a different option, the first option
is recommended because it is better understood by respondents and is relevant to all firms.
Furthermore, the first option is useful for research into the types of innovations with the
largest expected economic benefits to the firm. These results can be used to construct aggregate
indicators by industry, firm size, or other firm characteristic on the types of innovations
(i.e. product or business process innovations) that respondents find of greatest economic
value to their firm.
10.15. Cognitive testing shows that respondents are able to identify their most important
innovation as defined by its actual or expected contribution to the firm’s economic performance.
For small and medium-sized enterprises (SMEs), there is usually one innovation that stands
out from all others. Respondents from firms with many different innovations (often, but
not always large firms) can find it difficult to identify a single innovation that stands out in
comparison with the rest, but this does not affect their ability to select a single innovation
and answer subsequent questions about it. Respondents from firms with many innovations
are still likely to find it easier to answer questions on a focal innovation than to summarise
results for multiple innovations.
10.16. If resources permit, written information in an open-ended description of the most
important innovation can be coded and analysed to assess how respondents interpret
questions on the types of innovation and the novelty of the innovation (Arundel, O’Brien
and Torugsa, 2013; Cirera and Muzi, 2016; EBRD, 2014). This requires written information
to be coded by experts, but text mining software tools can significantly reduce coding
costs. Textual data on novelty can also be used to estimate if respondents understood the
questionnaire definition of an innovation (Bloch and Bugge, 2016).
10.2.2. Non-innovative firms
10.17. Firms with no innovations or innovation activities cannot be asked about a focal
innovation or a focal innovation project. However, it can be useful to ask respondents from non-
innovative firms to describe their most important change to products or business processes
during the observation period. This information can be analysed to determine whether respondents
correctly report innovations and can distinguish them from changes that are not innovations
(Arundel O’ Brien and Torugsa, 2013). Combined with information on the novelty of reported
innovations, the object approach can help identify potential biases towards under- or over-
reporting innovations of different types by firm characteristics such as size or industry.
CHAPTER 10. THE OBJECT METHOD FOR INNOVATION MEASUREMENT │ 209
OSLO MANUAL 2018 © OECD/EUROPEAN UNION 2018
10.3. Questions on a focal innovation
10.18. Subject-based innovation surveys that include an object-based module should place
such module after all other innovation questions in order to ensure that respondents do not
confuse questions about all innovation activities with questions limited to a focal innovation.
10.3.1. Characteristics of the focal, most important innovation
10.19. It is recommended to include a list of innovation types (two types of product
innovations and six types of business process innovations) and ask respondents to identify
all innovation types that are part of their focal innovation (see Chapter 3). This can provide
data on the prevalence of “bundled” innovations that have the characteristics of more than one
innovation type (for instance both a service innovation and a business process innovation
for product delivery) and which types of innovations are most important to firms.
10.20. It is recommended to collect information on the comparative importance for the
responding firm of the focal innovation. Useful measures include the share of total innovation
costs spent on the focal innovation and the contribution of the focal innovation to a firm’s
performance outcomes (e.g. sales or profits) (see subsection 10.3.2 below). Outcome questions
will not be relevant to respondents reporting on an innovation project.
10.21. Respondents can be asked several questions on the novelty of their focal innovation,
including if it is new to their market or only new to their firm, if it is part of a new business
model, or if it is a radical or disruptive innovation (see subsection 3.3.2). However, data
collection on radical, disruptive and related types of innovations will require experimentation
to determine if these concepts can be properly measured in an innovation survey.
10.3.2. Innovation activities contributing to the focal innovation
10.22. Cognitive testing shows that respondents find it easier to provide interval level
expenditure data (either in currency units or in person-months) for a single innovation than
for all innovations combined (see Chapter 4). Consequently, it may be possible to obtain
expenditure data for the entire period that the focal innovation was under development,
instead of only for the reference year.
10.23. A question on expenditures for a single innovation can be particularly appropriate
for SMEs or service sector firms that do not organise their innovation activities into clearly
defined projects with a separate accounting budget.
10.24. It may be possible to obtain the following data for the focal innovation:
the total time, in calendar months, from the initial idea for the focal innovation, to
its introduction or implementation
the year of introduction for a product innovation or the year of implementation for
a business process innovation
total expenditures in currency units or person-months on the focal innovation
total external expenditures by type of activity on the focal innovation (research and
experimental development, training, design, engineering, and other creative work
activities, etc.)
the use of and expenditures on follow-on activities after the introduction of a
product innovation onto the market. This can include marketing, training, and after-
sales services (see subsection 4.5.3).
210 │ CHAPTER 10. THE OBJECT METHOD FOR INNOVATION MEASUREMENT
OSLO MANUAL 2018 © OECD/EUROPEAN UNION 2018
10.25. Some of these questions could ask for data on activities before the observation
period, such as the question on calendar months or total expenditures, but this is only likely
to be relevant for major innovations.
10.3.3. Business capabilities contributing to the focal innovation
10.26. Business capabilities related to management or workforce skills are a characteristic
of the firm (see Chapter 5) and generally not limited to a focal innovation. However,
intellectual property (IP) strategies and technological capabilities can vary significantly
among different types of innovations.
10.27. Depending on research interests, it can be worthwhile to ask about the use of
different IP protection methods for the focal innovation, for instance whether a patent,
design, trademark, or other IP right application was made for the focal innovation or if it is
covered by copyright or trade secrecy. In addition, respondents can be asked if they
licensed-in technology for their focal innovation or if the focal innovation was licensed-out
(Arora, Cohen and Walsh, 2016).
10.28. Questions on technical capabilities are appropriate for an object module that can
link capabilities to specific types of innovations. Relevant capabilities include design
capabilities (engineering design, product design, and design thinking), digital capabilities,
and digital platforms (see section 5.5).
10.3.4. Knowledge flows contributing to and generated by the focal innovation
10.29. The types of internal and external knowledge sources of value to innovation
activities can differ between those used to identify an idea for an innovation, to develop
and test an idea, including problem-solving; and to implement business process innovations
or introduce a product innovation onto the market (see section 6.1). Differences in the use
or importance of knowledge sources at different stages of the innovation process can be too
complex for a respondent to track for all innovations, but it may be possible to include
questions on such topics for a single focal innovation. An option is to ask for the knowledge
sources of the original idea for the innovation, and the knowledge sources used to develop
the innovation. These questions can list both internal and external sources (see Table 6.6).
10.30. It is also of interest to collect data on the contribution of external actors to the
development of the focal innovation, such as whether the innovation replicates products or
business processes already available on the market, was developed as part of a collaborative
agreement with other organisations, or was mainly developed by the firm on its own (see
Table 6.2). Further information on collaboration with different types of partners for the
focal innovation can also be of value.
10.3.5. External factors influencing the focal innovation
10.31. The effect of some external factors can vary by the type of innovation
(see Chapter 7). External factors of interest include the type of customer and customer
engagement in a focal product innovation, the use of government support policies and other
external drivers for the focal innovation.
10.32. Questions on innovation obstacles can be applied to the most important innovation
or to a focal ongoing or abandoned innovation project or an innovation that did not meet
expectations. This information can be used to differentiate between the factors that impede
the implementation of an innovation, result in unsatisfactory outcomes, or result in an
innovation project being cancelled or put on hold.
CHAPTER 10. THE OBJECT METHOD FOR INNOVATION MEASUREMENT │ 211
OSLO MANUAL 2018 © OECD/EUROPEAN UNION 2018
10.3.6. Objectives and outcomes of the focal innovation
10.33. Innovation objectives and outcomes can vary substantially by the type of innovation
and therefore it can be useful to collect this information for a focal innovation. Table 8.1
provides a list of common innovation objectives and outcomes, such as increasing customer
satisfaction or reducing environmental impacts that can be measured on a nominal or
ordinal scale. Data collection for quantitative outcomes is particularly suitable for a focal
innovation because respondents should find it easier, compared to all innovations
combined, to provide data on the innovation sales share in the reference year, the market
share or profit margin for a focal product innovation, or the cost savings for a focal business
process innovation.
10.34. Data on all types of outcomes can also be collected by asking respondents if a
specific outcome of the focal innovation was above, at the same level, or below the outcome
level typically obtained by the firm for other innovations of the same type. For instance,
respondents can be asked about the relative outcome of a focal product innovation on sales
compared to the firm’s other product innovations.
10.35. The factors that influence outcomes can be investigated if data on inputs and
innovation activities are also collected for the focal innovation.
10.4. Summary of recommendations
10.36. The decision to include an object-based module in an innovation survey depends
on the needs of users, particularly policy analysts and researchers, and if there are sufficient
available resources to conduct analyses of the object data, for instance on the effect of
inputs and strategies on outcomes. An object module is not recommended if use of the
relevant data is limited to constructing aggregate indicators. Recommended questions for
an object-based module are given below. Other types of data covered in this chapter are
suitable for specialised data collection exercises.
10.37. Key items for data collection using an object-based module include:
define the focal innovation as the most important innovation with respect to its
expected contribution to the firm’s economic performance (subsection 10.2.1); or
the most important change for non-innovative firms (subsection 10.2.2), providing
an open-ended description if possible
the type of innovation (subsection 10.3.1)
a measure of the novelty of the innovation (subsection 10.3.1) and the sources of
knowledge contributing to the innovation
the year in which the innovation was introduced on the market or implemented in the
firm’s business processes (subsection 10.3.2). This will be implicit if the observation
period is one year
the time span between the beginning of the relevant innovation project or activities
and implementation (subsection 10.3.2)
a measure of the efforts made towards the innovation by the firm, such as the
total expenditure (in currency units or person-months) on the focal innovation
(subsection 10.3.2)

212 │ CHAPTER 10. THE OBJECT METHOD FOR INNOVATION MEASUREMENT
OSLO MANUAL 2018 © OECD/EUROPEAN UNION 2018
the contribution of internal and external actors to the development of the focal
innovation, in order to identify potential success factors (subsection 10.3.4)
an outcome measure such as the innovation sales share for a focal product innovation
or cost savings from a focal business process innovation (subsection 10.3.6).
10.38. Supplementary topics for data collection using an object-based module include:
use of IP rights for the focal innovation (subsection 10.3.3)
obstacles to innovation (subsection 10.3.5)
use of government support policies (subsection 10.3.5).
References
Arora, A., W.M. Cohen and J.P. Walsh (2016), “The acquisition and commercialization of invention in
American manufacturing: Incidence and impact”, Research Policy, Vol. 45/6, pp. 1113-1128.
Arundel, A. et al. (2016), “Management and service innovations in Australian and New Zealand
universities: Preliminary report of descriptive results”, Australian Innovation Research Centre
(University of Tasmania) and LH Martin Institute (University of Melbourne).
Arundel, A., K. O’Brien and A. Torugsa (2013), “How firm managers understand innovation:
Implications for the design of innovation surveys” in Handbook of Innovation Indicators and
Measurement, Edward Elgar, Cheltenham, pp. 88-108.
Bloch, C. and M. Bugge (2016), “Between bricolage and breakthroughs – Framing the many faces of
public sector innovation”, Public Money & Management, Vol. 36/4, pp. 281-288.
Cirera, X. and S. Muzi (2016), “Measuring firm-level innovation using short questionnaires: Evidence
from an experiment”, Policy Research Working Papers, No. 7696, World Bank Group.
DeBresson, C. and B. Murray (1984), “Innovation in Canada – A retrospective survey: 1945-1978”,
Cooperative Research Unit on Science and Technology (CRUST), New Westminster.
EBRD (2014), Transition Report 2014: Innovation in Transition, European Bank for Reconstruction and
Development, London.
Kleinknecht, A. and J.O.N. Reijnen (1993), “Towards literature-based innovation output indicators”,
Structural Change and Economic Dynamics, Vol. 4/1, pp. 199-207.
O’Brien, K. et al. (2015), “New evidence on the frequency, impacts and costs of activities to develop
innovations in Australian businesses: Results from a 2015 pilot study”, report to the Commonwealth,
Department of Industry, Innovation and Science, Australian Innovation Research Centre (University
of Tasmania), Hobart, www.utas.edu.au/__data/assets/pdf_file/0009/772857/AIRC-Pilot-survey-
report-for-DIS_Dec_2015.pdf.
O’Brien K, et al. (2014), “Lessons from high capability innovators: Results from the 2013 Tasmanian
Innovation Census”, Australian Innovation Research Centre (University of Tasmania), Hobart.
Santarelli, E. and R. Piergiovanni (1996), “Analyzing literature-based innovation output indicators: The
Italian experience”, Research Policy, Vol. 25/5, pp. 689-711.
Townsend, J. (1981), “Science innovation in Britain since 1945”, SPRU Occasional Paper Series,
No. 16, Science Policy Research Unit (SPRU), University of Sussex, Brighton.
CHAPTER 11. USE OF INNOVATION DATA FOR STATISTICAL INDICATORS AND ANALYSIS │ 213
OSLO MANUAL 2018 © OECD/EUROPEAN UNION 2018
Chapter 11. Use of innovation data for statistical indicators and analysis
This chapter provides guidance on the use of innovation data for constructing indicators
as well as statistical and econometric analysis. The chapter provides a blueprint for the
production of innovation indicators by thematic areas, drawing on the recommendations
in previous chapters. Although targeted to official organisations and other users of
innovation data, such as policy analysts and academics, the guidance in this chapter
also seeks to promote better understanding among innovation data producers about
how their data are or might be used. The chapter provides suggestions for future
experimentation and the use of innovation data in policy analysis and evaluation. The
ultimate objective is to ensure that innovation data, indicators and analysis provide
useful information for decision makers in government and industry while ensuring that
trust and confidentiality are preserved.
214 │ CHAPTER 11. USE OF INNOVATION DATA FOR STATISTICAL INDICATORS AND ANALYSIS
OSLO MANUAL 2018 © OECD/EUROPEAN UNION 2018
11.1. Introduction
11.1. Innovation data can be used to construct indicators and for multivariate analysis of
innovation behaviour and performance. Innovation indicators provide statistical information
on innovation activities, innovations, the circumstances under which innovations emerge,
and the consequences of innovations for innovative firms and for the economy. These
indicators are useful for exploratory analysis of innovation activities, for tracking innovation
performance over time and for comparing the innovation performance of countries, regions,
and industries. Multivariate analysis can identify the significance of different factors that
drive innovation decisions, outputs and outcomes. Indicators are more accessible to the
general public and to many policy makers than multivariate analysis and are often used in
media coverage of innovation issues. This can influence public and policy discussions on
innovation and create demand for additional information.
11.2. This chapter provides guidance on the production, use, and limitations of innovation
indicators, both for official organisations and for other users of innovation data, such as
policy analysts and academics who wish to better understand innovation indicators or
produce new indicators themselves. The discussion of multivariate analyses is relevant to
researchers with access to microdata on innovation and to policy analysts. The chapter also
includes suggestions for future experimentation. The ultimate objective is to ensure that
innovation data, indicators and analysis provide useful information for decision makers in
both government and industry, as discussed in Chapters 1 and 2.
11.3. Most of the discussion in this chapter focuses on data collected through innovation
surveys (see Chapter 9). However, the guidelines and suggestions for indicators and
analysis also apply to data obtained from other sources. For some topics, data from other
sources can substantially improve analysis, such as for research on the effects of innovation
activities on outcomes (see Chapter 8) or the effect of the firm’s external environment on
innovation (see Chapters 6 and 7).
11.4. Section 11.2 below introduces the concepts of statistical data and indicators relating
to business innovation, and discusses desirable properties and the main data resources available.
Section 11.3 covers methodologies for constructing innovation indicators and aggregating
them using dashboards, scoreboards and composite indexes. Section 11.4 presents a blueprint
for the production of innovation indicators by thematic areas, drawing on the recommendations
in previous chapters. Section 11.5 covers multivariate analyses of innovation data, with a
focus on the analysis of innovation outcomes and policy evaluation.
11.2. Data and indicators on business innovation
11.2.1. What are innovation indicators and what are they for?
11.5. An innovation indicator is a statistical summary measure of an innovation phenomenon
(activity, output, expenditure, etc.) observed in a population or a sample thereof for a specified
time or place. Indicators are usually corrected (or standardised) to permit comparisons
across units that differ in size or other characteristics. For example, an aggregate indicator
for national innovation expenditures as a percentage of gross domestic product (GDP)
corrects for the size of different economies (Eurostat, 2014; UNECE, 2000).
11.6. Official statistics are produced by organisations that are part of a national statistical
system (NSS) or by international organisations. An NSS produces official statistics for
government. These statistics are usually compiled within a legal framework and in accordance
with basic principles that ensure minimum professional standards, independence and objectivity.
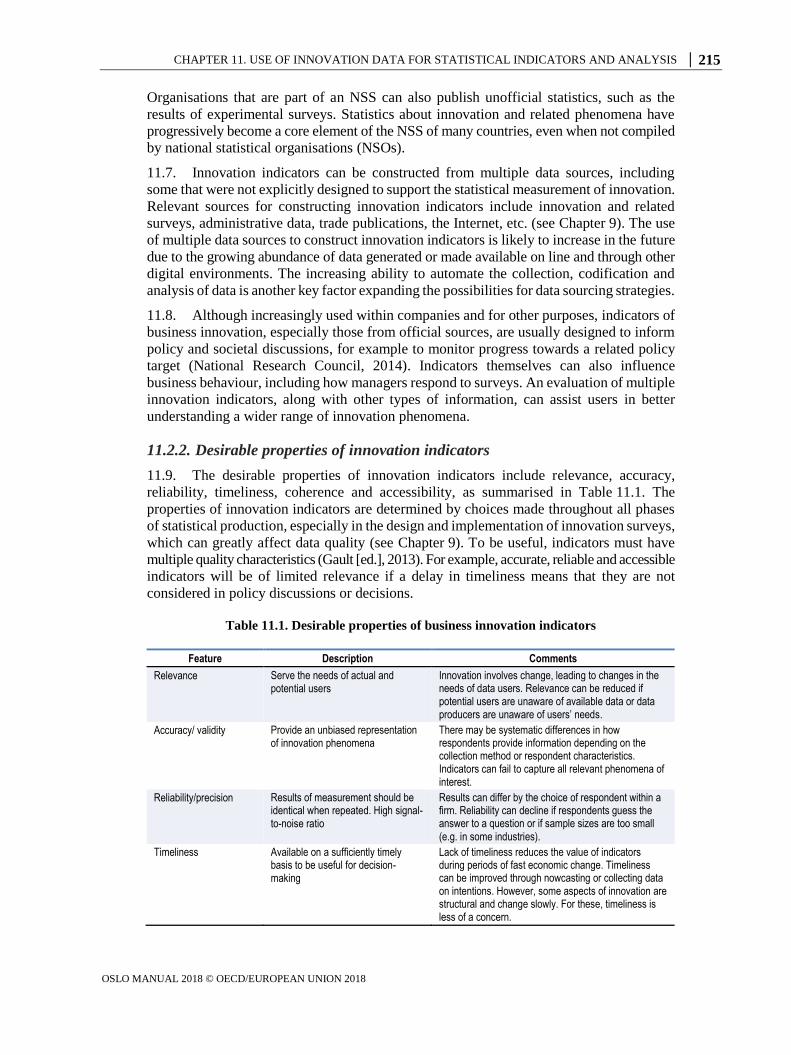
CHAPTER 11. USE OF INNOVATION DATA FOR STATISTICAL INDICATORS AND ANALYSIS │ 215
OSLO MANUAL 2018 © OECD/EUROPEAN UNION 2018
Organisations that are part of an NSS can also publish unofficial statistics, such as the
results of experimental surveys. Statistics about innovation and related phenomena have
progressively become a core element of the NSS of many countries, even when not compiled
by national statistical organisations (NSOs).
11.7. Innovation indicators can be constructed from multiple data sources, including
some that were not explicitly designed to support the statistical measurement of innovation.
Relevant sources for constructing innovation indicators include innovation and related
surveys, administrative data, trade publications, the Internet, etc. (see Chapter 9). The use
of multiple data sources to construct innovation indicators is likely to increase in the future
due to the growing abundance of data generated or made available on line and through other
digital environments. The increasing ability to automate the collection, codification and
analysis of data is another key factor expanding the possibilities for data sourcing strategies.
11.8. Although increasingly used within companies and for other purposes, indicators of
business innovation, especially those from official sources, are usually designed to inform
policy and societal discussions, for example to monitor progress towards a related policy
target (National Research Council, 2014). Indicators themselves can also influence
business behaviour, including how managers respond to surveys. An evaluation of multiple
innovation indicators, along with other types of information, can assist users in better
understanding a wider range of innovation phenomena.
11.2.2. Desirable properties of innovation indicators
11.9. The desirable properties of innovation indicators include relevance, accuracy,
reliability, timeliness, coherence and accessibility, as summarised in Table 11.1. The
properties of innovation indicators are determined by choices made throughout all phases
of statistical production, especially in the design and implementation of innovation surveys,
which can greatly affect data quality (see Chapter 9). To be useful, indicators must have
multiple quality characteristics (Gault [ed.], 2013). For example, accurate, reliable and accessible
indicators will be of limited relevance if a delay in timeliness means that they are not
considered in policy discussions or decisions.
Table 11.1. Desirable properties of business innovation indicators
Feature Description Comments
Relevance Serve the needs of actual and potential users
Innovation involves change, leading to changes in the needs of data users. Relevance can be reduced if potential users are unaware of available data or data producers are unaware of users’ needs.
Accuracy/ validity Provide an unbiased representation of innovation phenomena
There may be systematic differences in how respondents provide information depending on the collection method or respondent characteristics. Indicators can fail to capture all relevant phenomena of interest.
Reliability/precision Results of measurement should be identical when repeated. High signal-to-noise ratio
Results can differ by the choice of respondent within a firm. Reliability can decline if respondents guess the answer to a question or if sample sizes are too small (e.g. in some industries).
Timeliness Available on a sufficiently timely basis to be useful for decision-making
Lack of timeliness reduces the value of indicators during periods of fast economic change. Timeliness can be improved through nowcasting or collecting data on intentions. However, some aspects of innovation are structural and change slowly. For these, timeliness is less of a concern.
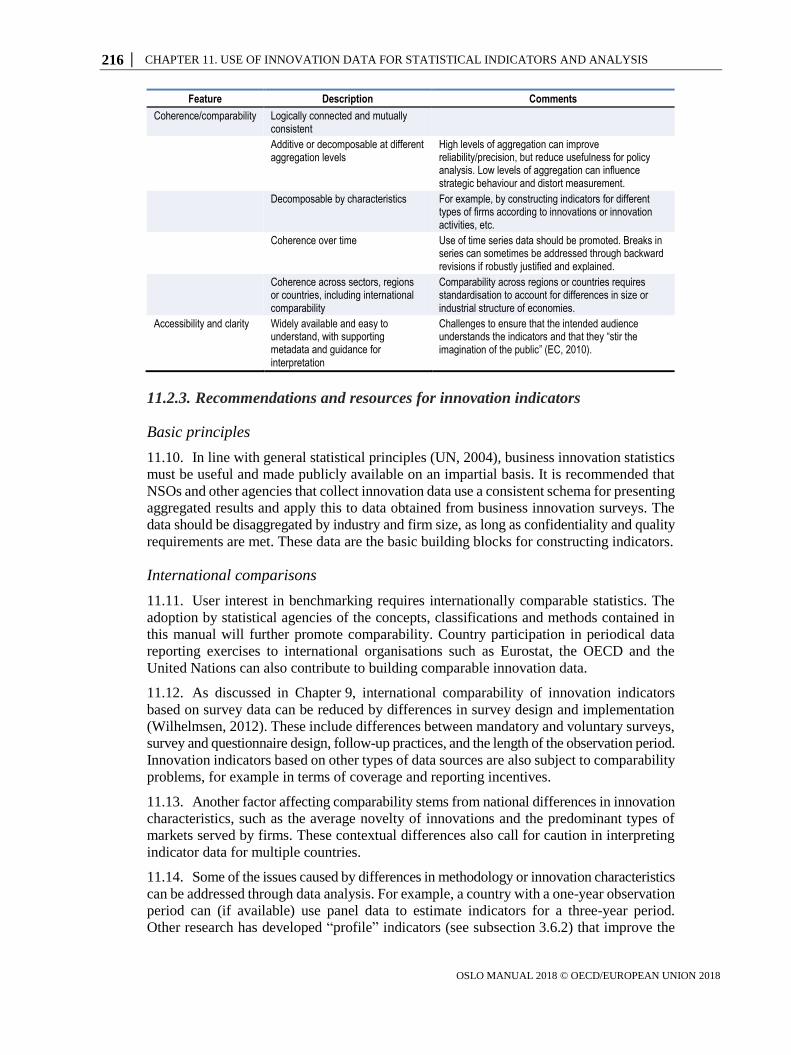
216 │ CHAPTER 11. USE OF INNOVATION DATA FOR STATISTICAL INDICATORS AND ANALYSIS
OSLO MANUAL 2018 © OECD/EUROPEAN UNION 2018
Feature Description Comments
Coherence/comparability Logically connected and mutually consistent
Additive or decomposable at different aggregation levels
High levels of aggregation can improve reliability/precision, but reduce usefulness for policy analysis. Low levels of aggregation can influence strategic behaviour and distort measurement.
Decomposable by characteristics For example, by constructing indicators for different types of firms according to innovations or innovation activities, etc.
Coherence over time Use of time series data should be promoted. Breaks in series can sometimes be addressed through backward revisions if robustly justified and explained.
Coherence across sectors, regions or countries, including international comparability
Comparability across regions or countries requires standardisation to account for differences in size or industrial structure of economies.
Accessibility and clarity Widely available and easy to understand, with supporting metadata and guidance for interpretation
Challenges to ensure that the intended audience understands the indicators and that they “stir the imagination of the public” (EC, 2010).
11.2.3. Recommendations and resources for innovation indicators
Basic principles
11.10. In line with general statistical principles (UN, 2004), business innovation statistics
must be useful and made publicly available on an impartial basis. It is recommended that
NSOs and other agencies that collect innovation data use a consistent schema for presenting
aggregated results and apply this to data obtained from business innovation surveys. The
data should be disaggregated by industry and firm size, as long as confidentiality and quality
requirements are met. These data are the basic building blocks for constructing indicators.
International comparisons
11.11. User interest in benchmarking requires internationally comparable statistics. The
adoption by statistical agencies of the concepts, classifications and methods contained in
this manual will further promote comparability. Country participation in periodical data
reporting exercises to international organisations such as Eurostat, the OECD and the
United Nations can also contribute to building comparable innovation data.
11.12. As discussed in Chapter 9, international comparability of innovation indicators
based on survey data can be reduced by differences in survey design and implementation
(Wilhelmsen, 2012). These include differences between mandatory and voluntary surveys,
survey and questionnaire design, follow-up practices, and the length of the observation period.
Innovation indicators based on other types of data sources are also subject to comparability
problems, for example in terms of coverage and reporting incentives.
11.13. Another factor affecting comparability stems from national differences in innovation
characteristics, such as the average novelty of innovations and the predominant types of
markets served by firms. These contextual differences also call for caution in interpreting
indicator data for multiple countries.
11.14. Some of the issues caused by differences in methodology or innovation characteristics
can be addressed through data analysis. For example, a country with a one-year observation
period can (if available) use panel data to estimate indicators for a three-year period.
Other research has developed “profile” indicators (see subsection 3.6.2) that improve the
CHAPTER 11. USE OF INNOVATION DATA FOR STATISTICAL INDICATORS AND ANALYSIS │ 217
OSLO MANUAL 2018 © OECD/EUROPEAN UNION 2018
comparability of national differences in the novelty of innovations and markets on headline
indicators such as the share of innovative firms (Arundel and Hollanders, 2005).
11.15. Where possible and relevant, it is recommended to develop methods for improving the
international comparability of indicators, in particular for widely used headline indicators.
International resources
11.16. Box 11.1 lists three sources of internationally comparable indicators on innovation
that follow, in whole or in part, Oslo Manual guidelines and are available at the time of
publishing this manual.
Box 11.1. Major resources for international innovation data using Oslo Manual guidelines
Eurostat Community Innovation Survey (CIS) indicator database
Innovation indicators from the CIS for selected member states of the European Statistical System
(ESS): http://ec.europa.eu/eurostat/web/science-technology-innovation/data/database.
Ibero-American/Inter-American Network of Science and Technology Indicators (RICYT)
Innovation indicators for manufacturing and service industries for selected Ibero-American countries:
www.ricyt.org/indicadores.
OECD Innovation Statistics Database
Innovation indicators for selected industries for OECD member countries and partner economies,
including countries featured in the OECD Science, Technology and Industry Scoreboard:
http://oe.cd/inno-stats.
UNESCO Institute for Statistics (UIS) Innovation Data
Global database of innovation statistics focused on manufacturing industries:
http://uis.unesco.org/en/topic/innovation-data.
The NEPAD (New Partnership for Africa’s Development) for the African Union is also active in
promoting the use of comparable indicators in Africa. Online links to this manual will provide
up-to-date links to international and national sources of statistical data and indicators on innovation.
11.3. Methodologies for constructing business innovation indicators
11.3.1. Aggregation of statistical indicators
11.17. Table 11.2 summarises different types of descriptive statistics and methods used to
construct indicators. Relevant statistics include measures of central tendency, dispersion,
association, and dimension reduction techniques.
Micro and macro indicators
11.18. Indicators can be constructed from various sources at any level of aggregation equal
to or higher than the statistical unit for which data are collected. For survey and many types
of administrative data, confidentiality restrictions often require indicators to be based on a
sufficient level of aggregation so that users of those indicators cannot identify values for
individual units. Indicators can also be constructed from previously aggregated data.
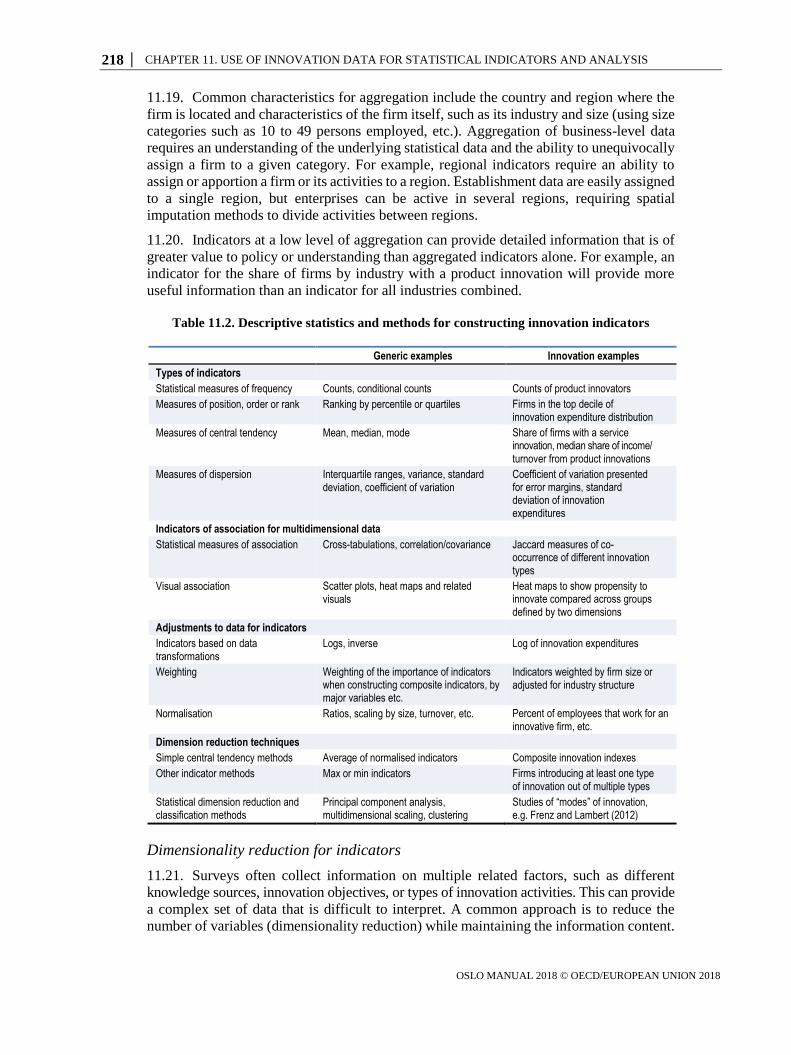
218 │ CHAPTER 11. USE OF INNOVATION DATA FOR STATISTICAL INDICATORS AND ANALYSIS
OSLO MANUAL 2018 © OECD/EUROPEAN UNION 2018
11.19. Common characteristics for aggregation include the country and region where the
firm is located and characteristics of the firm itself, such as its industry and size (using size
categories such as 10 to 49 persons employed, etc.). Aggregation of business-level data
requires an understanding of the underlying statistical data and the ability to unequivocally
assign a firm to a given category. For example, regional indicators require an ability to
assign or apportion a firm or its activities to a region. Establishment data are easily assigned
to a single region, but enterprises can be active in several regions, requiring spatial
imputation methods to divide activities between regions.
11.20. Indicators at a low level of aggregation can provide detailed information that is of
greater value to policy or understanding than aggregated indicators alone. For example, an
indicator for the share of firms by industry with a product innovation will provide more
useful information than an indicator for all industries combined.
Table 11.2. Descriptive statistics and methods for constructing innovation indicators
Generic examples Innovation examples
Types of indicators
Statistical measures of frequency Counts, conditional counts Counts of product innovators
Measures of position, order or rank Ranking by percentile or quartiles Firms in the top decile of innovation expenditure distribution
Measures of central tendency Mean, median, mode Share of firms with a service innovation, median share of income/ turnover from product innovations
Measures of dispersion Interquartile ranges, variance, standard deviation, coefficient of variation
Coefficient of variation presented for error margins, standard deviation of innovation expenditures
Indicators of association for multidimensional data
Statistical measures of association Cross-tabulations, correlation/covariance Jaccard measures of co-occurrence of different innovation types
Visual association Scatter plots, heat maps and related visuals
Heat maps to show propensity to innovate compared across groups defined by two dimensions
Adjustments to data for indicators
Indicators based on data transformations
Logs, inverse Log of innovation expenditures
Weighting Weighting of the importance of indicators when constructing composite indicators, by major variables etc.
Indicators weighted by firm size or adjusted for industry structure
Normalisation Ratios, scaling by size, turnover, etc. Percent of employees that work for an innovative firm, etc.
Dimension reduction techniques
Simple central tendency methods Average of normalised indicators Composite innovation indexes
Other indicator methods Max or min indicators Firms introducing at least one type of innovation out of multiple types
Statistical dimension reduction and classification methods
Principal component analysis, multidimensional scaling, clustering
Studies of “modes” of innovation, e.g. Frenz and Lambert (2012)
Dimensionality reduction for indicators
11.21. Surveys often collect information on multiple related factors, such as different
knowledge sources, innovation objectives, or types of innovation activities. This can provide
a complex set of data that is difficult to interpret. A common approach is to reduce the
number of variables (dimensionality reduction) while maintaining the information content.
CHAPTER 11. USE OF INNOVATION DATA FOR STATISTICAL INDICATORS AND ANALYSIS │ 219
OSLO MANUAL 2018 © OECD/EUROPEAN UNION 2018
Several statistical procedures ranging from simple addition to factor analysis can be used
for this purpose.
11.22. Many indicators are calculated as averages, sums, or maximum values across a
range of variables (see Table 11.2). These methods are useful for summarising related nominal,
ordinal, or categorical variables that are commonly found in innovation surveys. For example,
a firm that reports at least one type of innovation out of a list of eight innovation types (two
products and six business processes) is defined as an innovative firm. This derived variable
can be used to construct an aggregate indicator for the average share of innovative firms by
industry. This is an example of an indicator where only one positive value out of multiple
variables is required for the indicator to be positive. The opposite is an indicator that is only
positive when a firm gives a positive response to all relevant variables.
11.23. Composite indicators are another method for reducing dimensionality. They combine
multiple indicators into a single index based on an underlying conceptual model (OECD/JRC,
2008). Composite indicators can combine indicators for the same dimension (for instance
total expenditures on different types of innovation activities), or indicators measured along
multiple dimensions (for example indicators of framework conditions, innovation investments,
innovation activities, and innovation impacts).
11.24. The number of dimensions can also be reduced through statistical methods such as
cluster analysis and principal component analysis. Several studies have applied these
techniques to microdata to identify typologies of innovation behaviour and to assess the
extent to which different types of behaviour can predict innovation outcomes (de Jong and
Marsili, 2006; Frenz and Lambert, 2012; OECD, 2013).
11.3.2. Indicator development and presentation for international comparisons
11.25. The selection of innovation indicators reflects a prioritisation of different types of
information about innovation. The ability to construct indicators from microdata creates
greater opportunities for indicator construction, but this is rarely an option for experts or
organisations without access to microdata. The alternative is to construct indicators from
aggregated data, usually at the country, sector, or regional level.
11.26. Reports that use multiple innovation indicators for international comparisons tend
to share a number of common features (Arundel and Hollanders, 2008; Hollanders and
Janz, 2013) such as:
The selection of specific innovation indicators at a country, sector, or regional level
is usually guided by innovation systems theory.
The selection is also partly guided by conceptual and face validity considerations,
although this is constrained by data availability.
Indicators are presented by thematic area, with themes grouped within a hierarchical
structure, such as innovation inputs, capabilities, and outputs.
Varying levels of contextual and qualitative information for policy making are
provided, as well as methodological information.
11.27. NSS organisations and most international organisations tend to address user requests
for international comparisons through reports or dashboards based on official statistics,
often drawing attention to headline indicators. The advantage of reports and dashboards is
that they provide a fairly objective and detailed overview of the available information. However,
due to the large amount of data presented, it can be difficult to identify the key issues.
220 │ CHAPTER 11. USE OF INNOVATION DATA FOR STATISTICAL INDICATORS AND ANALYSIS
OSLO MANUAL 2018 © OECD/EUROPEAN UNION 2018
Composite innovation indexes, presented in scoreboards that rank the performance of countries
or regions, were developed to address the limitations of dashboards. They are mostly produced
by consultants, research institutes, think tanks and policy institutions that lack access to
microdata, with the composite indexes constructed by aggregating existing indicators.
11.28. Compared to simple indicators used in dashboards, the construction of composite
innovation indexes requires two additional steps:
The normalisation of multiple indicators, measured on different scales (nominal,
counts, percentages, expenditures, etc.), into a single scale. Normalisation can be
based on standard deviations, the min-max method, or other options.
The aggregation of normalised indicators into one or more composite indexes. The
aggregation can give an identical weight to all normalised indicators or use different
weights. The weighting determines the relative contribution of each indicator to the
composite index.
11.29. Composite indexes provide a number of advantages as well as challenges over
simple indicators (OECD/JRC, 2008). The main advantages are a reduction in the number of
indicators and simplicity, both of which are desirable attributes that facilitate communication
with a wider user base (i.e. policy makers, media, and citizens). The disadvantages of
composite indexes are as follows:
With few exceptions, the theoretical basis for a composite index is limited. This
can result in problematic combinations of indicators, such as indicators for inputs
and outputs.
Only the aggregate covariance structure of underlying indicators can be used to
build the composite index, if used at all.
The relative importance or weighting of different indicators is often dependent on
the subjective views of those constructing the composite index. Factors that are
minor contributors to innovation can be given as much weight as major ones.
Aside from basic normalisation, structural differences between countries are seldom
taken into account when calculating composite performance indexes.
Aggregation results in a loss of detail, which can hide potential weaknesses and
increase the difficulty in identifying remedial action.
11.30. Due to these disadvantages, composite indicators need to be accompanied by
guidance on how to interpret them. Otherwise, they can mislead readers into supporting
simple solutions to complex policy issues.
11.31. The various innovation dashboards, scoreboards and composite indexes that are
currently available change frequently. Box 11.2 provides examples that have been published
on a regular basis.
11.32. The combination of a lack of innovation data for many countries, plus concerns
over the comparability of innovation survey data, has meant that many innovation rankings
rely on widely available indicators that capture only a fraction of innovation activities, such
as R&D expenditures or IP rights registrations, at the expense of other relevant dimensions.
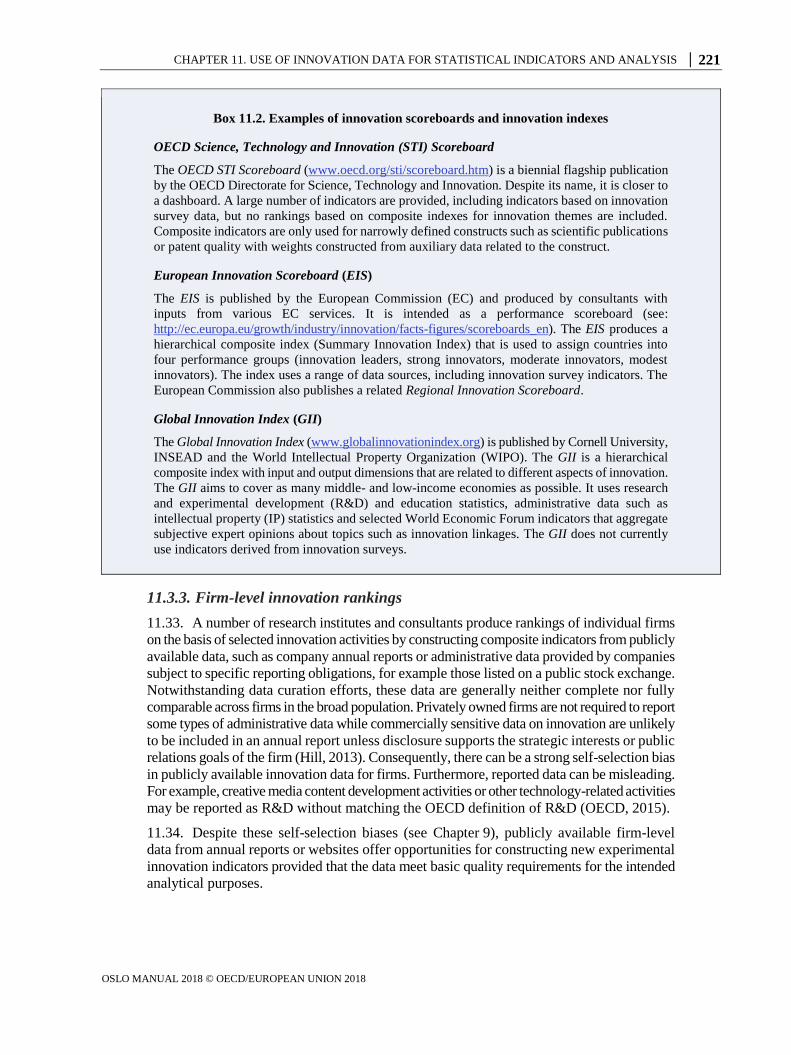
CHAPTER 11. USE OF INNOVATION DATA FOR STATISTICAL INDICATORS AND ANALYSIS │ 221
OSLO MANUAL 2018 © OECD/EUROPEAN UNION 2018
Box 11.2. Examples of innovation scoreboards and innovation indexes
OECD Science, Technology and Innovation (STI) Scoreboard
The OECD STI Scoreboard (www.oecd.org/sti/scoreboard.htm) is a biennial flagship publication
by the OECD Directorate for Science, Technology and Innovation. Despite its name, it is closer to
a dashboard. A large number of indicators are provided, including indicators based on innovation
survey data, but no rankings based on composite indexes for innovation themes are included.
Composite indicators are only used for narrowly defined constructs such as scientific publications
or patent quality with weights constructed from auxiliary data related to the construct.
European Innovation Scoreboard (EIS)
The EIS is published by the European Commission (EC) and produced by consultants with
inputs from various EC services. It is intended as a performance scoreboard (see:
http://ec.europa.eu/growth/industry/innovation/facts-figures/scoreboards_en). The EIS produces a
hierarchical composite index (Summary Innovation Index) that is used to assign countries into
four performance groups (innovation leaders, strong innovators, moderate innovators, modest
innovators). The index uses a range of data sources, including innovation survey indicators. The
European Commission also publishes a related Regional Innovation Scoreboard.
Global Innovation Index (GII)
The Global Innovation Index (www.globalinnovationindex.org) is published by Cornell University,
INSEAD and the World Intellectual Property Organization (WIPO). The GII is a hierarchical
composite index with input and output dimensions that are related to different aspects of innovation.
The GII aims to cover as many middle- and low-income economies as possible. It uses research
and experimental development (R&D) and education statistics, administrative data such as
intellectual property (IP) statistics and selected World Economic Forum indicators that aggregate
subjective expert opinions about topics such as innovation linkages. The GII does not currently
use indicators derived from innovation surveys.
11.3.3. Firm-level innovation rankings
11.33. A number of research institutes and consultants produce rankings of individual firms
on the basis of selected innovation activities by constructing composite indicators from publicly
available data, such as company annual reports or administrative data provided by companies
subject to specific reporting obligations, for example those listed on a public stock exchange.
Notwithstanding data curation efforts, these data are generally neither complete nor fully
comparable across firms in the broad population. Privately owned firms are not required to report
some types of administrative data while commercially sensitive data on innovation are unlikely
to be included in an annual report unless disclosure supports the strategic interests or public
relations goals of the firm (Hill, 2013). Consequently, there can be a strong self-selection bias
in publicly available innovation data for firms. Furthermore, reported data can be misleading.
For example, creative media content development activities or other technology-related activities
may be reported as R&D without matching the OECD definition of R&D (OECD, 2015).
11.34. Despite these self-selection biases (see Chapter 9), publicly available firm-level
data from annual reports or websites offer opportunities for constructing new experimental
innovation indicators provided that the data meet basic quality requirements for the intended
analytical purposes.
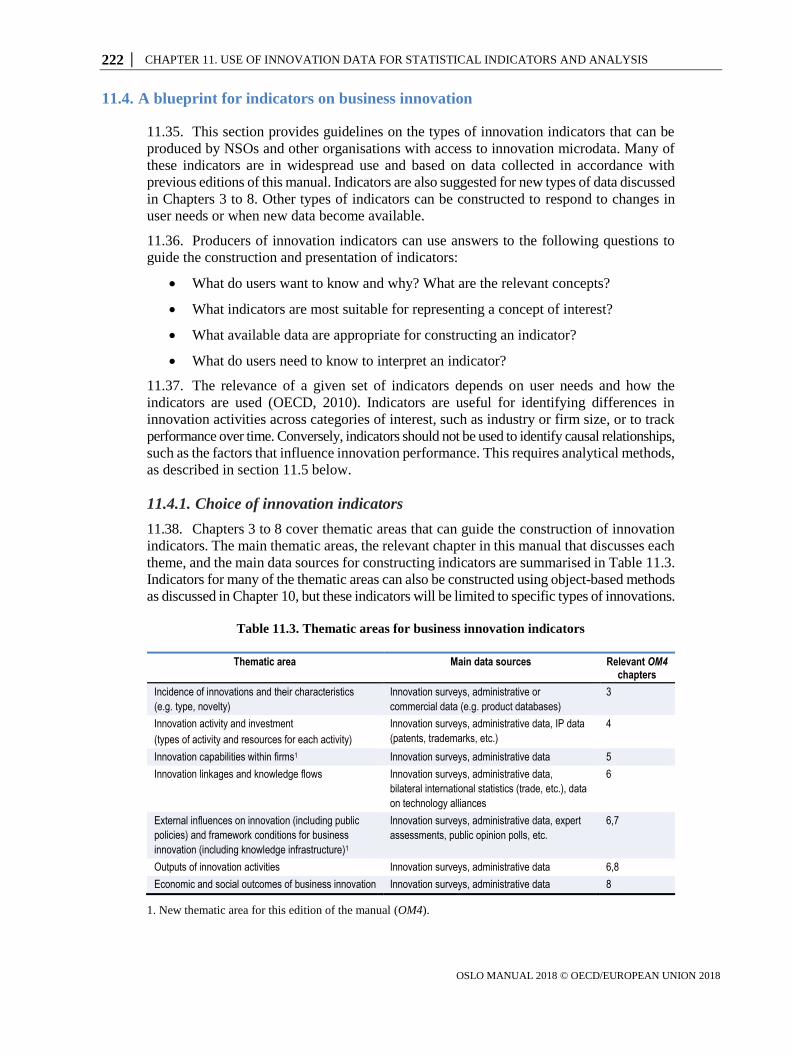
222 │ CHAPTER 11. USE OF INNOVATION DATA FOR STATISTICAL INDICATORS AND ANALYSIS
OSLO MANUAL 2018 © OECD/EUROPEAN UNION 2018
11.4. A blueprint for indicators on business innovation
11.35. This section provides guidelines on the types of innovation indicators that can be
produced by NSOs and other organisations with access to innovation microdata. Many of
these indicators are in widespread use and based on data collected in accordance with
previous editions of this manual. Indicators are also suggested for new types of data discussed
in Chapters 3 to 8. Other types of indicators can be constructed to respond to changes in
user needs or when new data become available.
11.36. Producers of innovation indicators can use answers to the following questions to
guide the construction and presentation of indicators:
What do users want to know and why? What are the relevant concepts?
What indicators are most suitable for representing a concept of interest?
What available data are appropriate for constructing an indicator?
What do users need to know to interpret an indicator?
11.37. The relevance of a given set of indicators depends on user needs and how the
indicators are used (OECD, 2010). Indicators are useful for identifying differences in
innovation activities across categories of interest, such as industry or firm size, or to track
performance over time. Conversely, indicators should not be used to identify causal relationships,
such as the factors that influence innovation performance. This requires analytical methods,
as described in section 11.5 below.
11.4.1. Choice of innovation indicators
11.38. Chapters 3 to 8 cover thematic areas that can guide the construction of innovation
indicators. The main thematic areas, the relevant chapter in this manual that discusses each
theme, and the main data sources for constructing indicators are summarised in Table 11.3.
Indicators for many of the thematic areas can also be constructed using object-based methods
as discussed in Chapter 10, but these indicators will be limited to specific types of innovations.
Table 11.3. Thematic areas for business innovation indicators
Thematic area Main data sources Relevant OM4 chapters
Incidence of innovations and their characteristics
(e.g. type, novelty)
Innovation surveys, administrative or
commercial data (e.g. product databases)
3
Innovation activity and investment
(types of activity and resources for each activity)
Innovation surveys, administrative data, IP data
(patents, trademarks, etc.)
4
Innovation capabilities within firms1 Innovation surveys, administrative data 5
Innovation linkages and knowledge flows Innovation surveys, administrative data,
bilateral international statistics (trade, etc.), data
on technology alliances
6
External influences on innovation (including public
policies) and framework conditions for business
innovation (including knowledge infrastructure)1
Innovation surveys, administrative data, expert
assessments, public opinion polls, etc.
6,7
Outputs of innovation activities Innovation surveys, administrative data 6,8 Economic and social outcomes of business innovation Innovation surveys, administrative data 8
1. New thematic area for this edition of the manual (OM4).
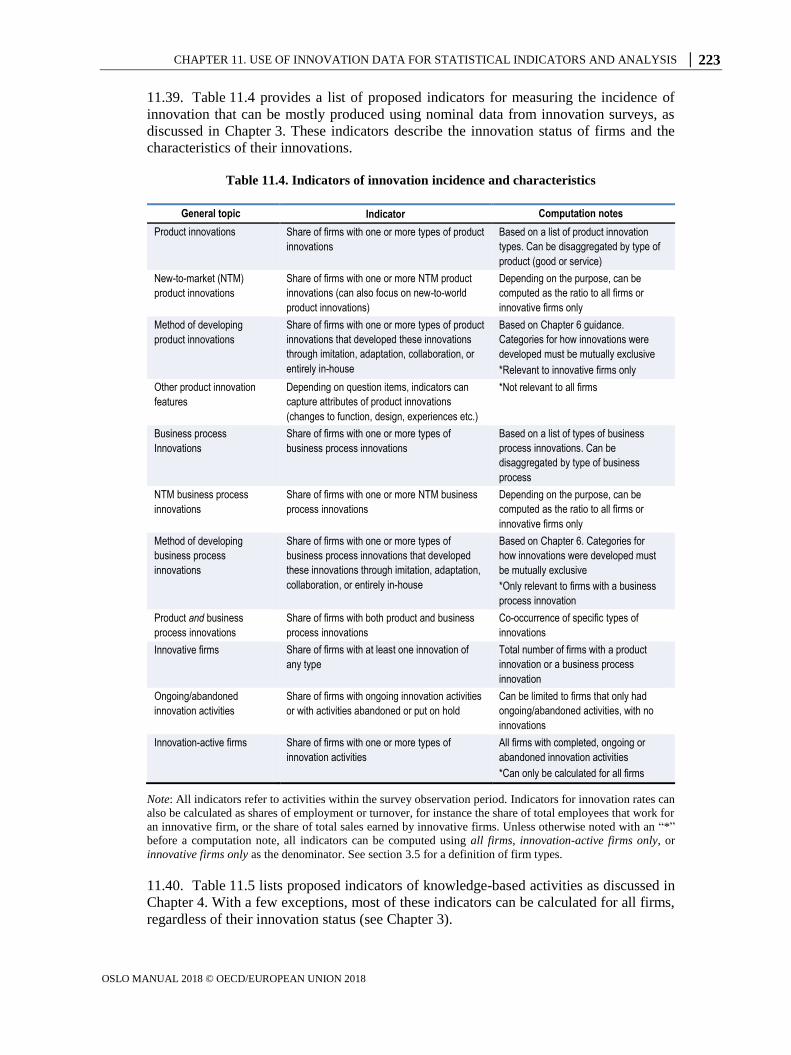
CHAPTER 11. USE OF INNOVATION DATA FOR STATISTICAL INDICATORS AND ANALYSIS │ 223
OSLO MANUAL 2018 © OECD/EUROPEAN UNION 2018
11.39. Table 11.4 provides a list of proposed indicators for measuring the incidence of
innovation that can be mostly produced using nominal data from innovation surveys, as
discussed in Chapter 3. These indicators describe the innovation status of firms and the
characteristics of their innovations.
Table 11.4. Indicators of innovation incidence and characteristics
General topic Indicator Computation notes
Product innovations Share of firms with one or more types of product
innovations
Based on a list of product innovation
types. Can be disaggregated by type of
product (good or service) New-to-market (NTM)
product innovations
Share of firms with one or more NTM product
innovations (can also focus on new-to-world
product innovations)
Depending on the purpose, can be
computed as the ratio to all firms or
innovative firms only Method of developing
product innovations
Share of firms with one or more types of product
innovations that developed these innovations
through imitation, adaptation, collaboration, or
entirely in-house
Based on Chapter 6 guidance.
Categories for how innovations were
developed must be mutually exclusive *Relevant to innovative firms only
Other product innovation
features
Depending on question items, indicators can
capture attributes of product innovations
(changes to function, design, experiences etc.)
*Not relevant to all firms
Business process
Innovations
Share of firms with one or more types of
business process innovations
Based on a list of types of business
process innovations. Can be
disaggregated by type of business
process NTM business process
innovations
Share of firms with one or more NTM business
process innovations
Depending on the purpose, can be
computed as the ratio to all firms or
innovative firms only Method of developing
business process
innovations
Share of firms with one or more types of
business process innovations that developed
these innovations through imitation, adaptation,
collaboration, or entirely in-house
Based on Chapter 6. Categories for
how innovations were developed must
be mutually exclusive *Only relevant to firms with a business
process innovation Product and business
process innovations
Share of firms with both product and business
process innovations
Co-occurrence of specific types of
innovations Innovative firms Share of firms with at least one innovation of
any type
Total number of firms with a product
innovation or a business process
innovation Ongoing/abandoned
innovation activities
Share of firms with ongoing innovation activities
or with activities abandoned or put on hold
Can be limited to firms that only had
ongoing/abandoned activities, with no
innovations Innovation-active firms Share of firms with one or more types of
innovation activities
All firms with completed, ongoing or
abandoned innovation activities *Can only be calculated for all firms
Note: All indicators refer to activities within the survey observation period. Indicators for innovation rates can
also be calculated as shares of employment or turnover, for instance the share of total employees that work for
an innovative firm, or the share of total sales earned by innovative firms. Unless otherwise noted with an “*”
before a computation note, all indicators can be computed using all firms, innovation-active firms only, or
innovative firms only as the denominator. See section 3.5 for a definition of firm types.
11.40. Table 11.5 lists proposed indicators of knowledge-based activities as discussed in
Chapter 4. With a few exceptions, most of these indicators can be calculated for all firms,
regardless of their innovation status (see Chapter 3).
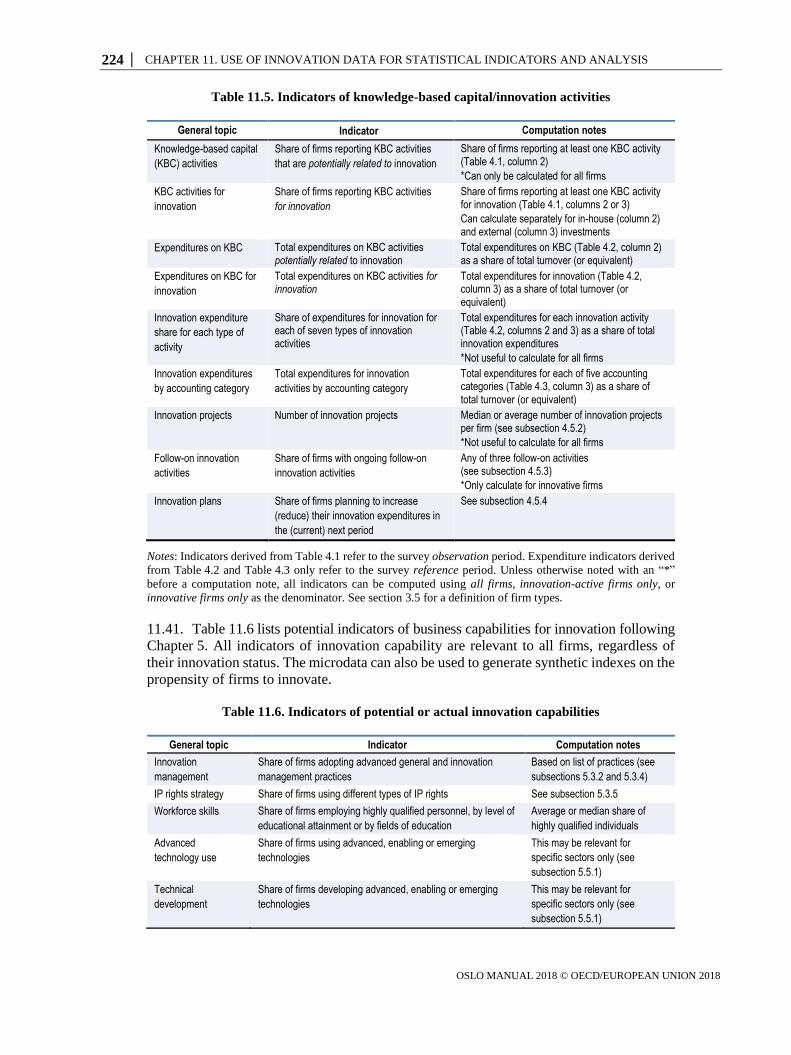
224 │ CHAPTER 11. USE OF INNOVATION DATA FOR STATISTICAL INDICATORS AND ANALYSIS
OSLO MANUAL 2018 © OECD/EUROPEAN UNION 2018
Table 11.5. Indicators of knowledge-based capital/innovation activities
General topic Indicator Computation notes
Knowledge-based capital
(KBC) activities
Share of firms reporting KBC activities
that are potentially related to innovation
Share of firms reporting at least one KBC activity (Table 4.1, column 2)
*Can only be calculated for all firms
KBC activities for
innovation
Share of firms reporting KBC activities
for innovation
Share of firms reporting at least one KBC activity for innovation (Table 4.1, columns 2 or 3)
Can calculate separately for in-house (column 2) and external (column 3) investments
Expenditures on KBC Total expenditures on KBC activities potentially related to innovation
Total expenditures on KBC (Table 4.2, column 2) as a share of total turnover (or equivalent)
Expenditures on KBC for
innovation
Total expenditures on KBC activities for innovation
Total expenditures for innovation (Table 4.2, column 3) as a share of total turnover (or equivalent)
Innovation expenditure
share for each type of
activity
Share of expenditures for innovation for each of seven types of innovation activities
Total expenditures for each innovation activity (Table 4.2, columns 2 and 3) as a share of total innovation expenditures
*Not useful to calculate for all firms
Innovation expenditures
by accounting category
Total expenditures for innovation
activities by accounting category
Total expenditures for each of five accounting categories (Table 4.3, column 3) as a share of total turnover (or equivalent)
Innovation projects Number of innovation projects Median or average number of innovation projects per firm (see subsection 4.5.2)
*Not useful to calculate for all firms
Follow-on innovation
activities
Share of firms with ongoing follow-on
innovation activities
Any of three follow-on activities (see subsection 4.5.3)
*Only calculate for innovative firms
Innovation plans Share of firms planning to increase
(reduce) their innovation expenditures in
the (current) next period
See subsection 4.5.4
Notes: Indicators derived from Table 4.1 refer to the survey observation period. Expenditure indicators derived
from Table 4.2 and Table 4.3 only refer to the survey reference period. Unless otherwise noted with an “*”
before a computation note, all indicators can be computed using all firms, innovation-active firms only, or
innovative firms only as the denominator. See section 3.5 for a definition of firm types.
11.41. Table 11.6 lists potential indicators of business capabilities for innovation following
Chapter 5. All indicators of innovation capability are relevant to all firms, regardless of
their innovation status. The microdata can also be used to generate synthetic indexes on the
propensity of firms to innovate.
Table 11.6. Indicators of potential or actual innovation capabilities
General topic Indicator Computation notes
Innovation
management
Share of firms adopting advanced general and innovation
management practices
Based on list of practices (see
subsections 5.3.2 and 5.3.4) IP rights strategy Share of firms using different types of IP rights See subsection 5.3.5 Workforce skills Share of firms employing highly qualified personnel, by level of
educational attainment or by fields of education
Average or median share of
highly qualified individuals Advanced
technology use
Share of firms using advanced, enabling or emerging
technologies
This may be relevant for
specific sectors only (see
subsection 5.5.1) Technical
development
Share of firms developing advanced, enabling or emerging
technologies
This may be relevant for
specific sectors only (see
subsection 5.5.1)
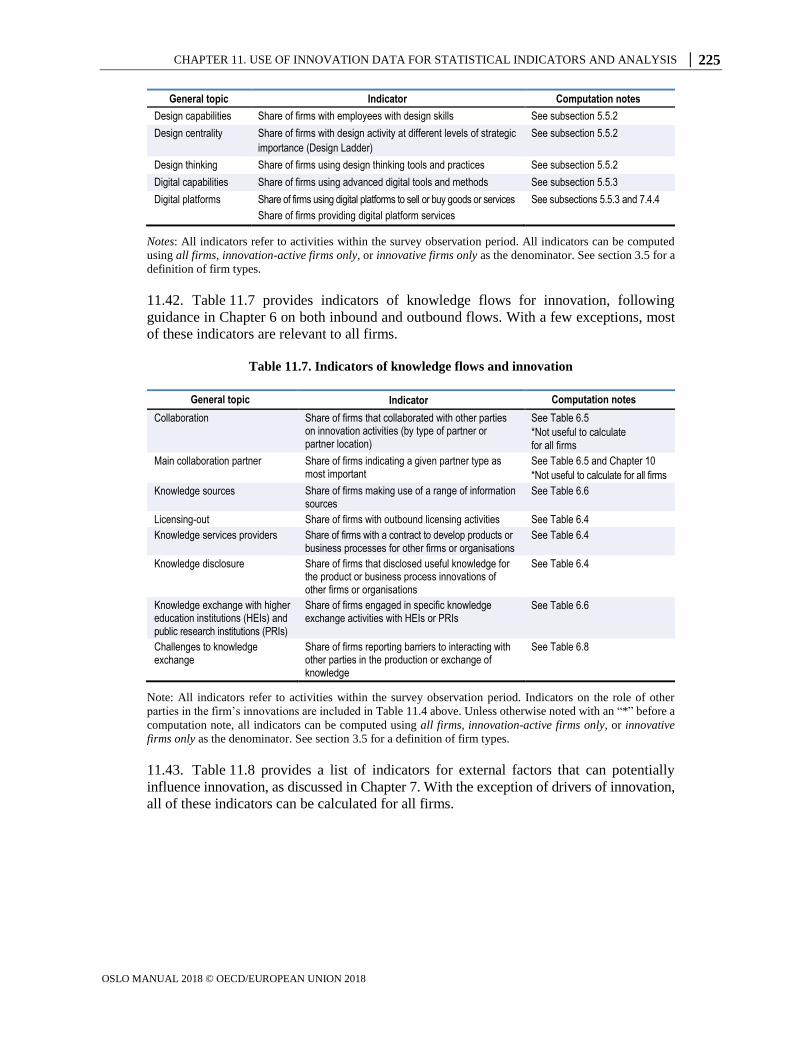
CHAPTER 11. USE OF INNOVATION DATA FOR STATISTICAL INDICATORS AND ANALYSIS │ 225
OSLO MANUAL 2018 © OECD/EUROPEAN UNION 2018
General topic Indicator Computation notes
Design capabilities Share of firms with employees with design skills See subsection 5.5.2 Design centrality Share of firms with design activity at different levels of strategic
importance (Design Ladder)
See subsection 5.5.2
Design thinking Share of firms using design thinking tools and practices See subsection 5.5.2 Digital capabilities Share of firms using advanced digital tools and methods See subsection 5.5.3 Digital platforms Share of firms using digital platforms to sell or buy goods or services
Share of firms providing digital platform services
See subsections 5.5.3 and 7.4.4
Notes: All indicators refer to activities within the survey observation period. All indicators can be computed
using all firms, innovation-active firms only, or innovative firms only as the denominator. See section 3.5 for a
definition of firm types.
11.42. Table 11.7 provides indicators of knowledge flows for innovation, following
guidance in Chapter 6 on both inbound and outbound flows. With a few exceptions, most
of these indicators are relevant to all firms.
Table 11.7. Indicators of knowledge flows and innovation
General topic Indicator Computation notes
Collaboration Share of firms that collaborated with other parties on innovation activities (by type of partner or partner location)
See Table 6.5
*Not useful to calculate for all firms
Main collaboration partner Share of firms indicating a given partner type as most important
See Table 6.5 and Chapter 10
*Not useful to calculate for all firms
Knowledge sources Share of firms making use of a range of information sources
See Table 6.6
Licensing-out Share of firms with outbound licensing activities See Table 6.4
Knowledge services providers Share of firms with a contract to develop products or business processes for other firms or organisations
See Table 6.4
Knowledge disclosure Share of firms that disclosed useful knowledge for the product or business process innovations of other firms or organisations
See Table 6.4
Knowledge exchange with higher education institutions (HEIs) and public research institutions (PRIs)
Share of firms engaged in specific knowledge exchange activities with HEIs or PRIs
See Table 6.6
Challenges to knowledge exchange
Share of firms reporting barriers to interacting with other parties in the production or exchange of knowledge
See Table 6.8
Note: All indicators refer to activities within the survey observation period. Indicators on the role of other
parties in the firm’s innovations are included in Table 11.4 above. Unless otherwise noted with an “*” before a
computation note, all indicators can be computed using all firms, innovation-active firms only, or innovative
firms only as the denominator. See section 3.5 for a definition of firm types.
11.43. Table 11.8 provides a list of indicators for external factors that can potentially
influence innovation, as discussed in Chapter 7. With the exception of drivers of innovation,
all of these indicators can be calculated for all firms.
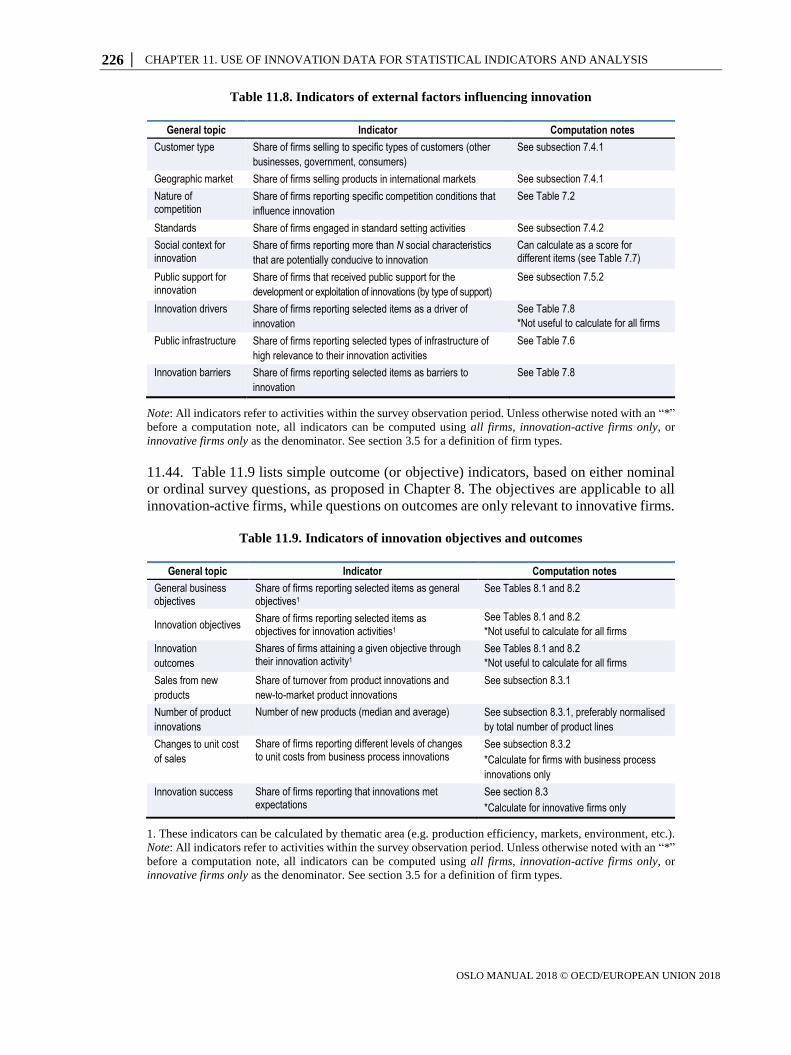
226 │ CHAPTER 11. USE OF INNOVATION DATA FOR STATISTICAL INDICATORS AND ANALYSIS
OSLO MANUAL 2018 © OECD/EUROPEAN UNION 2018
Table 11.8. Indicators of external factors influencing innovation
General topic Indicator Computation notes
Customer type Share of firms selling to specific types of customers (other
businesses, government, consumers)
See subsection 7.4.1
Geographic market Share of firms selling products in international markets See subsection 7.4.1
Nature of competition
Share of firms reporting specific competition conditions that
influence innovation
See Table 7.2
Standards Share of firms engaged in standard setting activities See subsection 7.4.2
Social context for innovation
Share of firms reporting more than N social characteristics
that are potentially conducive to innovation
Can calculate as a score for different items (see Table 7.7)
Public support for innovation
Share of firms that received public support for the
development or exploitation of innovations (by type of support)
See subsection 7.5.2
Innovation drivers Share of firms reporting selected items as a driver of
innovation
See Table 7.8
*Not useful to calculate for all firms
Public infrastructure Share of firms reporting selected types of infrastructure of
high relevance to their innovation activities
See Table 7.6
Innovation barriers Share of firms reporting selected items as barriers to
innovation
See Table 7.8
Note: All indicators refer to activities within the survey observation period. Unless otherwise noted with an “*”
before a computation note, all indicators can be computed using all firms, innovation-active firms only, or
innovative firms only as the denominator. See section 3.5 for a definition of firm types.
11.44. Table 11.9 lists simple outcome (or objective) indicators, based on either nominal
or ordinal survey questions, as proposed in Chapter 8. The objectives are applicable to all
innovation-active firms, while questions on outcomes are only relevant to innovative firms.
Table 11.9. Indicators of innovation objectives and outcomes
General topic Indicator Computation notes
General business objectives
Share of firms reporting selected items as general objectives1
See Tables 8.1 and 8.2
Innovation objectives Share of firms reporting selected items as objectives for innovation activities1
See Tables 8.1 and 8.2
*Not useful to calculate for all firms Innovation
outcomes
Shares of firms attaining a given objective through their innovation activity1
See Tables 8.1 and 8.2
*Not useful to calculate for all firms
Sales from new
products
Share of turnover from product innovations and
new-to-market product innovations
See subsection 8.3.1
Number of product
innovations
Number of new products (median and average) See subsection 8.3.1, preferably normalised
by total number of product lines Changes to unit cost
of sales
Share of firms reporting different levels of changes to unit costs from business process innovations
See subsection 8.3.2
*Calculate for firms with business process
innovations only Innovation success Share of firms reporting that innovations met
expectations See section 8.3
*Calculate for innovative firms only
1. These indicators can be calculated by thematic area (e.g. production efficiency, markets, environment, etc.).
Note: All indicators refer to activities within the survey observation period. Unless otherwise noted with an “*”
before a computation note, all indicators can be computed using all firms, innovation-active firms only, or
innovative firms only as the denominator. See section 3.5 for a definition of firm types.
CHAPTER 11. USE OF INNOVATION DATA FOR STATISTICAL INDICATORS AND ANALYSIS │ 227
OSLO MANUAL 2018 © OECD/EUROPEAN UNION 2018
11.4.2. Breakdown categories, scaling, and typologies
11.45. Depending on user requirements, indicators can be provided for several breakdown
characteristics. Data on each characteristic can be collected through a survey or by linking
a survey to other sources such as business registers and administrative data, in line with
guidance provided in Chapter 9. Breakdown characteristics of interest include:
Enterprise size by the number of persons employed, or other size measures such as
sales or assets.
Industry of main economic activity, in line with international standard classifications
(see Chapter 9). Combinations of two- to three-digit International Standard Industrial
Classification (ISIC) classes can provide results for policy-relevant groups of firms
(e.g. firms in information and communication technology industries).
Administrative region.
Group affiliation and ownership, for instance if an enterprise is independent, part
of a domestic enterprise group, or part of a multinational enterprise. Breakdowns for
multinationals are of value to research on the globalisation of innovation activities.
Age, measured as the time elapsed since the creation of the enterprise. A breakdown by
age will help differentiate between older and more recently established firms. This is
of interest to research on business dynamism and entrepreneurship (see Chapter 5).
R&D status, if the firm performs R&D in-house, funds R&D performed by other
units, or is not engaged in any R&D activities (see Chapter 4). The innovation
activities of firms vary considerably depending on their R&D status.
11.46. The level of aggregation for these different dimensions will depend on what the
data represent, how they are collected and their intended uses. Stratification decisions in
the data collection (see Chapter 9) will determine the maximum level that can be reported.
11.47. To avoid scale effects, many innovation input, output, intensity and expenditure variables
can be standardised by a measure of the size of each firm, such as total expenditures, total
investment, total sales, or the total number of employed persons.
11.48. A frequently used indicator of innovation input intensity is total innovation
expenditures as a percentage of total turnover (sales). Alternative input intensity measures
include the innovation expenditure per worker (Crespi and Zuñiga, 2010) and the share of
human resources (in headcounts) dedicated to innovation relative to the total workforce.
11.49. For output indicators, the share of total sales revenue from product innovations is
frequently used. In principle, this type of indicator should also be provided for specific
industries because of different rates of product obsolescence. Data by industry can be used
to identify industries with low product innovation rates and low innovation efficiency
relative to their investments in innovation.
11.50. Standardised indicators for the number of IP rights registrations, or measures of
scientific output (invention disclosures, publications, etc.) should also be presented by industry,
since the relevance of these activities varies considerably. Indicators based on IP rights
such as patented inventions can be interpreted as measures of knowledge appropriation
strategies (see Chapter 5). Their use depends on factors such as the industry and the type
of protectable knowledge (OECD, 2009a). Measures of scientific outputs of the Business
enterprise sector such as publications are mostly relevant to science-based industries
(OECD and SCImago Research Group, 2016). Furthermore, depending on a firm’s industry
228 │ CHAPTER 11. USE OF INNOVATION DATA FOR STATISTICAL INDICATORS AND ANALYSIS
OSLO MANUAL 2018 © OECD/EUROPEAN UNION 2018
and strategy, there may be large gaps between a firm’s scientific and technological outputs
and what it decides to disclose.
11.51. Indicators of innovation intensity (summing all innovation expenditures and dividing
by total expenditures) can be calculated at the level of industry, region, and country.
Intensity indicators avoid the need to standardise by measures of firm size.
Typologies of innovative/innovation-active firms
11.52. A major drawback of many of the indicators provided above is that they do not
provide a measure of the intensity of efforts to attain product or business process innovations.
The ability to identify firms by different levels of effort or innovation capabilities can be
of great value for innovation policy analysis and design (Bloch and López-Bassols, 2009).
This can be achieved by combining selected nominal indicators with innovation activity
measures (see Table 11.5) and possibly innovation outcome measures (see Table 11.9).
Several studies have combined multiple indicators to create complex indicators for
different “profiles”, “modes” or taxonomies of firms, according to their innovation efforts
(see Tether, 2001; Arundel and Hollanders, 2005; Frenz and Lambert, 2012).
11.53. Key priorities for constructing indicators of innovation effort or capability include
incorporating data on the degree of novelty of innovations (for whom the innovation is
new), the extent to which the business has drawn on its own resources to develop the
concepts used in the innovation, and the economic significance for the firm of its
innovations and innovation efforts.
11.4.3. Choice of statistical data for innovation indicators
11.54. The choice of data for constructing innovation indicators is necessarily determined
by the purpose of the indicator and data quality requirements.
Official versus non-official sources
11.55. Where possible, indicator construction should use data from official sources that
comply with basic quality requirements. This includes both survey and administrative data.
For both types of data, it is important to determine if all relevant types of firms are included,
if records cover all relevant data, and if record keeping is consistent across different
jurisdictions (if comparisons are intended). For indicators that are constructed on a regular
basis, information should also be available on any breaks in series, so that corrections can
be made (where possible) to maintain comparability over time.
11.56. The same criteria apply to commercial data or data from other sources such as one-
off academic studies. Commercial data sources often do not provide full details for the
sample selection method or survey response rates. A lack of sufficient methodological
information regarding commercial and other sources of data, as well as licensing fees for
data access, have traditionally posed restrictions on their use by NSS organisations. The
use of commercial data by NSS organisations can also create problems if the data provider
stands to obtain a commercial advantage over its competitors.
Suitability of innovation survey data for constructing statistical indicators
11.57. Survey data are self-reported by the respondent. Some potential users of innovation
data object to innovation surveys because they believe that self-reports result in subjective
results. This criticism confuses self-reporting with subjectivity. Survey respondents are capable
of providing an objective response to many factual questions, such as whether their firm
CHAPTER 11. USE OF INNOVATION DATA FOR STATISTICAL INDICATORS AND ANALYSIS │ 229
OSLO MANUAL 2018 © OECD/EUROPEAN UNION 2018
implemented a business process innovation or collaborated with a university. These are
similar to factual questions from household surveys that are used to determine unemployment
rates. Subjective assessments are rarely problematic if they refer to factual behaviours.
11.58. A valid concern for users of innovation data is the variable nature of innovation.
Because innovation is defined from the perspective of the firm, there are enormous differences
between different innovations, which means that a simple indicator such as the share of
innovative firms within a country has a very low discriminatory value. The solution is not
to reject innovation indicators, but to construct indicators that can discriminate between
firms of different levels of capability or innovation investments, and to provide these
indicators by different breakdown categories, such as for different industries or firm size
classes. Profiles, as described above, can significantly improve the discriminatory and
explanatory value of indicators.
11.59. Another common concern is poor discriminatory power for many nominal or
ordinal variables versus continuous variables. Data for the latter are often unattainable
because respondents are unable to provide accurate answers. Under these conditions, it is
recommended to identify which non-continuous variables are relevant to constructs of
interest and to use information from multiple variables to estimate the construct.
Change versus current capabilities
11.60. The main indicators on the incidence of innovation (see Table 11.4) capture
activities that derive from or induce change in a firm. However, a firm is not necessarily
more innovative than another over the long term if the former has introduced an innovation
in a given period and the latter has not. The latter could have introduced the same innovation
several years before and have similar current capabilities for innovation. Indicators of
capability, such as knowledge capital stocks within the firm, can be constructed using
administrative sources or survey data that capture a firm’s level of readiness or competence
in a given domain (see Table 11.6). Evidence on the most important innovations (see
Chapter 10) can also be useful for measuring current capabilities.
11.5. Using data on innovation to analyse innovation performance, policies and
their impacts
11.61. Policy and business decisions can benefit from a thorough understanding of the
factors that affect the performance of an innovation system. Innovation indicators provide
useful information on the current state of the system, including bottlenecks, deficiencies
and weaknesses, and can help track changes over time. However, this is insufficient:
decision makers also need to know how conditions in one part of the system influence other
parts, and how the system works to create outcomes of interest, including the effects of
policy interventions.
11.62. This section examines how innovation data can be used to evaluate the links between
innovation, capability-building activities, and outcomes of interest (Mairesse and Mohnen,
2010). Relevant research has extensively covered productivity (Hall, 2011; Harrison et al., 2014),
management (Bloom and Van Reenen, 2007), employment effects (Griffith et al., 2006),
knowledge sourcing (Laursen and Salter, 2006), profitability (Geroski, Machin and Van
Reenen, 1993), market share and market value (Blundell, Griffith and Van Reenen, 1999),
competition (Aghion et al., 2005), and policy impacts (Czarnitzki, Hanel and Rosa, 2011).
230 │ CHAPTER 11. USE OF INNOVATION DATA FOR STATISTICAL INDICATORS AND ANALYSIS
OSLO MANUAL 2018 © OECD/EUROPEAN UNION 2018
11.5.1. Modelling dependencies and associations
11.63. Associations between the components of an innovation system can be identified
through descriptive and exploratory analysis. Multivariate regression provides a useful tool
for exploring the covariation of two variables, for example innovation outputs and inputs,
conditional on other characteristics such as firm size, age and industry of main economic
activity. Regression is a commonly used tool of innovation analysts and its outputs a
recurrent feature in research papers on innovation.
11.64. The appropriate multivariate technique depends on the type of data, particularly for
dependent variables. Innovation surveys produce mostly nominal or ordinal variables with
only a few continuous variables. Ordered regression models are appropriate for ordinal
dependent variables on the degree of novelty or the level of complexity in the use of a
technology or business practice (Galindo-Rueda and Millot, 2015). Multinomial choice
models are relevant when managers can choose between three or more exclusive states, for
example between different knowledge sources or collaboration partners.
11.65. Machine learning techniques also open new areas of analysis having to do with
classification, pattern identification and regression. Their use in innovation statistics is
likely to increase over time.
11.5.2. Inference of causal effects in innovation analysis
11.66. Statistical association between two variables (for instance an input to innovation
and a performance output) does not imply causation without additional evidence, such as a
plausible time gap between an input and an output, replication in several studies, and the
ability to control for all confounding variables. Unless these conditions are met (which is
rare in exploratory analyses), a study should not assume causality.
11.67. Research on policy interventions must also manage self-selection and plausible
counterfactuals: what would have happened in the absence of a policy intervention? The
effects of a policy intervention should ideally be identified using experimental methods
such as randomised trials, but the scope for experimentation in innovation policy, although
increasing in recent years (Nesta, 2016), is still limited. Consequently, alternative methods
are frequently used.
Impact analysis and evaluation terminology
11.68. The innovation literature commonly distinguishes between different stages of an
innovation process, beginning with inputs (resources for an activity), activities, outputs
(what is generated by activities), and outcomes (the effects of outputs). In a policy context,
a logic model provides a simplified, linear relationship between resources, activities,
outputs and outcomes. Figure 11.1 presents a generic logic model for the innovation process.
Refinements to the model include multiple feedback loops.
11.69. Outputs include specific types of innovations, while outcomes are the effect of
innovation on firm performance (sales, profits, market share etc.), or the effect of innovation
on conditions external to the firm (environment, market structure, etc.). Impacts refer to the
difference between potential outcomes under observed and unobserved counterfactual
treatments. An example of a counterfactual outcome would be the sales of the firm if the
resources expended for innovation had been used for a different purpose, for instance an
intensive marketing campaign. In the absence of experimental data, impacts cannot be
directly observed and must be inferred through other means.
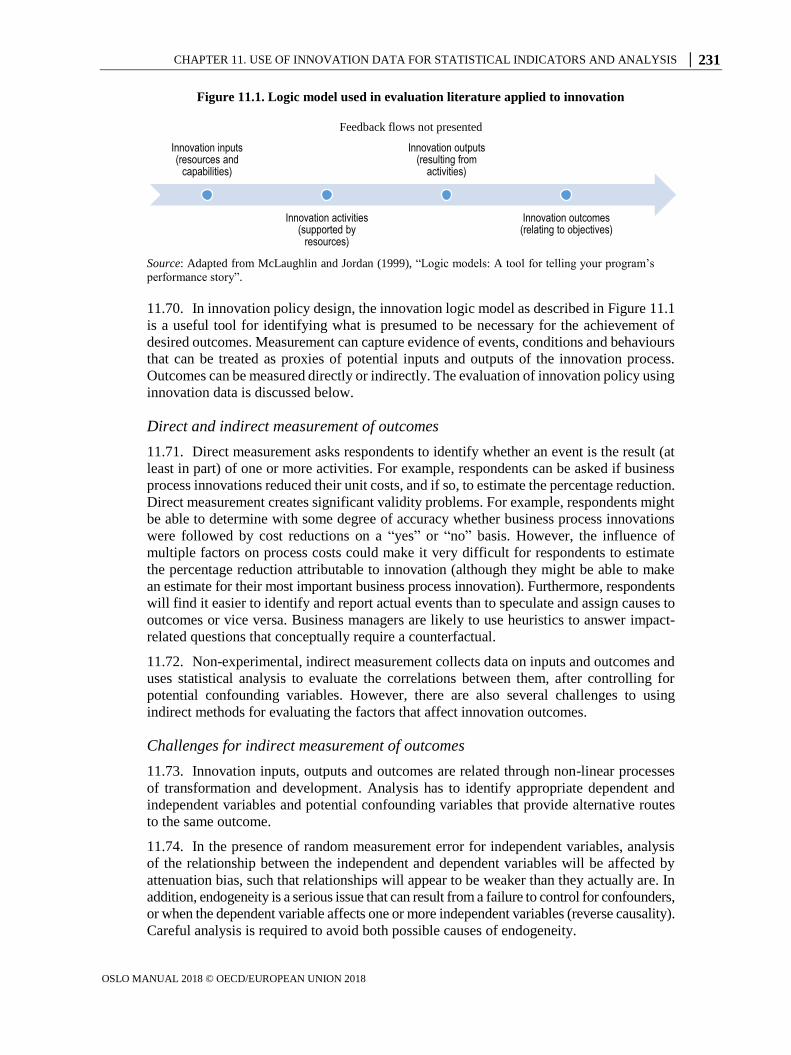
CHAPTER 11. USE OF INNOVATION DATA FOR STATISTICAL INDICATORS AND ANALYSIS │ 231
OSLO MANUAL 2018 © OECD/EUROPEAN UNION 2018
Figure 11.1. Logic model used in evaluation literature applied to innovation
Feedback flows not presented
Source: Adapted from McLaughlin and Jordan (1999), “Logic models: A tool for telling your program’s
performance story”.
11.70. In innovation policy design, the innovation logic model as described in Figure 11.1
is a useful tool for identifying what is presumed to be necessary for the achievement of
desired outcomes. Measurement can capture evidence of events, conditions and behaviours
that can be treated as proxies of potential inputs and outputs of the innovation process.
Outcomes can be measured directly or indirectly. The evaluation of innovation policy using
innovation data is discussed below.
Direct and indirect measurement of outcomes
11.71. Direct measurement asks respondents to identify whether an event is the result (at
least in part) of one or more activities. For example, respondents can be asked if business
process innovations reduced their unit costs, and if so, to estimate the percentage reduction.
Direct measurement creates significant validity problems. For example, respondents might
be able to determine with some degree of accuracy whether business process innovations
were followed by cost reductions on a “yes” or “no” basis. However, the influence of
multiple factors on process costs could make it very difficult for respondents to estimate
the percentage reduction attributable to innovation (although they might be able to make
an estimate for their most important business process innovation). Furthermore, respondents
will find it easier to identify and report actual events than to speculate and assign causes to
outcomes or vice versa. Business managers are likely to use heuristics to answer impact-
related questions that conceptually require a counterfactual.
11.72. Non-experimental, indirect measurement collects data on inputs and outcomes and
uses statistical analysis to evaluate the correlations between them, after controlling for
potential confounding variables. However, there are also several challenges to using
indirect methods for evaluating the factors that affect innovation outcomes.
Challenges for indirect measurement of outcomes
11.73. Innovation inputs, outputs and outcomes are related through non-linear processes
of transformation and development. Analysis has to identify appropriate dependent and
independent variables and potential confounding variables that provide alternative routes
to the same outcome.
11.74. In the presence of random measurement error for independent variables, analysis
of the relationship between the independent and dependent variables will be affected by
attenuation bias, such that relationships will appear to be weaker than they actually are. In
addition, endogeneity is a serious issue that can result from a failure to control for confounders,
or when the dependent variable affects one or more independent variables (reverse causality).
Careful analysis is required to avoid both possible causes of endogeneity.
Innovation inputs (resources and
capabilities)
Innovation activities (supported by
resources)
Innovation outputs (resulting from
activities)
Innovation outcomes (relating to objectives)
232 │ CHAPTER 11. USE OF INNOVATION DATA FOR STATISTICAL INDICATORS AND ANALYSIS
OSLO MANUAL 2018 © OECD/EUROPEAN UNION 2018
11.75. Other conditions can increase the difficulty of identifying causality. In research on
knowledge flows, linkages across actors and the importance of both intended and unintended
knowledge diffusion can create challenges for identifying the effect of specific knowledge
sources on outcomes. Important channels could exist for which there are no data. As noted
in Chapter 6, the analysis of knowledge flows would benefit from social network graphs of
the business enterprise to help identify the most relevant channels. A statistical implication
of highly connected innovation systems is that the observed values are not independently
distributed: competition and collaboration generate outcome dependences across firms that
affect estimation outcomes.
11.76. Furthermore, dynamic effects require time series data and an appropriate model of
evolving relationships in an innovation system, for example between inputs in a given
period (t) and outputs in later periods (t+1). In some industries, economic results are only
obtained after several years of investment in innovation. Dynamic analysis could also
require data on changes in the actors in an innovation system, for instance through mergers
and acquisitions. Business deaths can create a strong selection effect, with only surviving
businesses available for analysis.
Matching estimators
11.77. Complementing regression analysis, matching is a method that can be used for
estimating the average effect of business innovation decisions as well as policy interventions
(see subsection 11.5.3 below). Matching imposes no functional form specifications on the
data but assumes that there is a set of observed characteristics such that outcomes are
independent of the treatment conditional on those characteristics (Todd, 2010). Under this
assumption, the impact of innovation activity on an outcome of interest can be estimated
from comparing the performance of innovators with a weighted average of the performance of
non-innovators. The weights need to replicate the observable characteristics of the innovators
in the sample. Under some conditions, the weights can be estimated from predicted innovation
probabilities using discrete analysis (matching based on innovation propensity scores).
11.78. In many cases, there can be systematic differences between the outcomes of treated
and untreated groups, even after conditioning on observables, which could lead to a violation
of the identification conditions required for matching. Independence assumptions can be
more valid for changes in the variable of interest over time. When longitudinal data are
available, the “difference in differences” method can be used. An example is an analysis of
productivity growth that compares firms that introduced innovations in the reference period
with those that did not. Further bias reduction can be attained by using information on past
innovation and economic performance.
11.79. Matching estimators and related regression analysis are particularly useful for the
analysis of reduced-form causal relationship models. Reduced-form models have fewer
requirements than structural models, but are less informative in articulating the mechanisms
that underpin the relationship between different variables.
Structural analysis of innovation data: The CDM model
11.80. The model, developed by Crépon, Duguet and Mairesse (1998) (hence the name
CDM), builds on Griliches’ (1990) path diagram of the knowledge production function and
is widely used in empirical research on innovation and productivity (Lööf, Mairesse and
Mohnen, 2016). The CDM framework is suitable for cross-sectional innovation survey data
obtained by following this manual’s recommendations, including data not necessarily
collected for indicator production purposes. It provides a structural model that explains
CHAPTER 11. USE OF INNOVATION DATA FOR STATISTICAL INDICATORS AND ANALYSIS │ 233
OSLO MANUAL 2018 © OECD/EUROPEAN UNION 2018
productivity by innovation output and corrects for the selectivity and endogeneity inherent
in survey data. It includes the following sub-models (Criscuolo, 2009):
1. Propensity among all firms to undertake innovation: This key step requires good
quality information on all firms. This requirement provides a motivation for
collecting data from all firms, regardless of their innovation status, as recommended
in Chapters 4 and 5.
2. Intensity of innovation effort among innovation-active firms: The model recognises
that there is an underlying degree of innovation effort for each firm that is only
observed among those that undertake innovation activities. Therefore, the model
controls for the selective nature of the sample.
3. Scale of innovation output: This is observed only for innovative firms. This model
uses the predicted level of innovation effort identified in model 2 and a control for
the self-selected nature of the sample.
4. Relationship between labour productivity and innovation effort: This is estimated
by incorporating information about the drivers of the innovation outcome variable
(using its predicted value) and the selective nature of the sample.
11.81. Policy variables can be included in a CDM model, provided they display sufficient
variability in the sample and satisfy the independence assumptions (including no self-
selection bias) required for identification.
11.82. The CDM framework has been further developed to work with repeated cross-
sectional and panel data, increasing the value of consistent longitudinal data at the micro
level. Data and modelling methods require additional development before CDM and CDM-
related frameworks can fully address several questions of interest, such as the competing
roles of R&D versus non-R&D types of innovation activity, or the relative importance or
complementarity of innovation activities versus generic competence and capability development
activities. Improvements in data quality for variables on non-R&D activities and capabilities
would facilitate the use of extended CDM models.
11.5.3. Analysing the impact of public innovation policies
11.83. Understanding the impact of public innovation policies is one of the main user
interests for innovation statistics and analysis. This section draws attention to some of the
basic procedures and requirements that analysts and practitioners need to consider.
The policy evaluation problem
11.84. Figure 11.2 illustrates the missing counterfactual data problem in identifying the
causal impacts of policies. This is done by means of an example where the policy “treatment”
is support for innovation activities, for instance a grant to support the development and
launch of a new product. Some firms receive support whereas others do not. The true impact
of support is likely to vary across firms. The evaluation problem is one of missing information.
The researcher cannot observe, for supported firms, what would have been their performance
had they not been supported. The same applies to non-supported firms. The light grey boxes
in the figure represent what is not directly observable through measurement. The arrows
indicate comparisons and how they relate to measuring impacts.
11.85. The main challenge in constructing valid counterfactuals is that the potential effect
of policy support is likely to be related to choices made in assigning support to some firms
and not to others. For example, some programme managers may have incentives to select
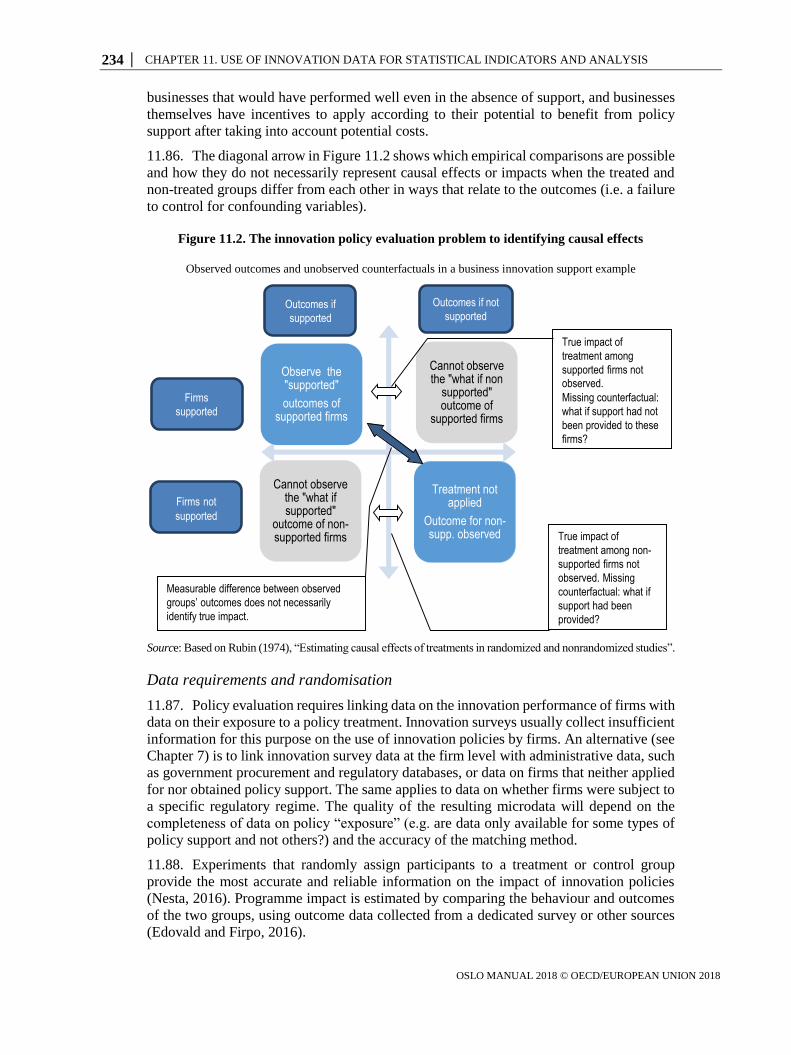
234 │ CHAPTER 11. USE OF INNOVATION DATA FOR STATISTICAL INDICATORS AND ANALYSIS
OSLO MANUAL 2018 © OECD/EUROPEAN UNION 2018
businesses that would have performed well even in the absence of support, and businesses
themselves have incentives to apply according to their potential to benefit from policy
support after taking into account potential costs.
11.86. The diagonal arrow in Figure 11.2 shows which empirical comparisons are possible
and how they do not necessarily represent causal effects or impacts when the treated and
non-treated groups differ from each other in ways that relate to the outcomes (i.e. a failure
to control for confounding variables).
Figure 11.2. The innovation policy evaluation problem to identifying causal effects
Observed outcomes and unobserved counterfactuals in a business innovation support example
Source: Based on Rubin (1974), “Estimating causal effects of treatments in randomized and nonrandomized studies”.
Data requirements and randomisation
11.87. Policy evaluation requires linking data on the innovation performance of firms with
data on their exposure to a policy treatment. Innovation surveys usually collect insufficient
information for this purpose on the use of innovation policies by firms. An alternative (see
Chapter 7) is to link innovation survey data at the firm level with administrative data, such
as government procurement and regulatory databases, or data on firms that neither applied
for nor obtained policy support. The same applies to data on whether firms were subject to
a specific regulatory regime. The quality of the resulting microdata will depend on the
completeness of data on policy “exposure” (e.g. are data only available for some types of
policy support and not others?) and the accuracy of the matching method.
11.88. Experiments that randomly assign participants to a treatment or control group
provide the most accurate and reliable information on the impact of innovation policies
(Nesta, 2016). Programme impact is estimated by comparing the behaviour and outcomes
of the two groups, using outcome data collected from a dedicated survey or other sources
(Edovald and Firpo, 2016).
Observe the "supported"
outcomes of supported firms
Cannot observe the "what if non
supported" outcome of
supported firms
Cannot observe the "what if supported"
outcome of non-supported firms
Treatment not applied
Outcome for non-supp. observed
Measurable difference between observed
groups’ outcomes does not necessarily
identify true impact.
True impact of
treatment among
supported firms not
observed.
Missing counterfactual:
what if support had not
been provided to these
firms?
True impact of
treatment among non-
supported firms not
observed. Missing
counterfactual: what if
support had been
provided?
Firms
supported
Firms not
supported
Outcomes if
supported
Outcomes if not
supported
CHAPTER 11. USE OF INNOVATION DATA FOR STATISTICAL INDICATORS AND ANALYSIS │ 235
OSLO MANUAL 2018 © OECD/EUROPEAN UNION 2018
11.89. Randomisation eliminates selection bias, so that both groups are comparable and
any differences between them are the result of the intervention. Randomised trials are
sometimes viewed as politically unfeasible because potential beneficiaries are excluded
from treatment, at least temporarily. However, randomisation can often be justified on the
basis of its potential for policy learning when uncertainty is largest. Furthermore, a selection
procedure is required in the presence of budgetary resource limitations that prevent all firms
from benefiting from innovation support.
Policy evaluation without randomisation
11.90. In ex ante or ex post non-randomisation evaluation exercises, it is important to
account for the possibility that observed correlations between policy treatment and innovation
performance could be due to confounding by unobserved factors that influence both. This
can be a serious issue for evaluations of discretionary policies where firms must apply for
support. This requires a double selection process whereby the firm self-selects to submit an
application, and programme administrators then make a decision on whether to fund the
applicant. This second selection can be influenced by policy criteria to support applicants
with the highest probability of success, which could create a bias in favour of previously
successful applicants. Both types of selection create a challenge for accurately identifying
the additionality of public support for innovation. To address selection issues, it is necessary
to gather information on the potential eligibility of business enterprises that apply for and do
not receive funding, apply for and receive funding, and for a control group of non-applicants.
11.91. Comprehensive data on the policy of interest and how it has been implemented are
also useful for evaluation. This includes information on the assessment rating for each
application, which can be used to evaluate the effect of variations in application quality on
outcomes. Changes in eligibility requirements over time and across firms provide a potentially
useful source of exogenous variation.
11.92. The available microdata for policy use is often limited to firms that participated in
government programmes. In this case it is necessary to construct a control group of non-
applicants using other data sources. Innovation survey data can also help identify counterfactuals.
Administrative data can be used to identify firms that apply for and ultimately benefit from
different types of government programmes to support innovation and other activities (see
subsection 7.5.2). The regression, matching and structural estimation methods discussed
above can all be applied in this policy analysis and evaluation context.
Procedures
11.93. With few exceptions, NSOs rarely have a mandate to conduct policy evaluations.
However, it is widely accepted that their infrastructures can greatly facilitate such work in
conditions that do not contravene the confidentiality obligations to businesses reporting
data for statistical purposes. Evaluations are usually left to academics, researchers or
consultants with experience in causal analysis as well as the independence to make critical
comments on public policy issues. This requires providing researchers with access to microdata
under sufficiently secure conditions (see subsection 9.8.2). There have been considerable
advances to minimise the burden associated with secure access to microdata for analysis.
Of note, international organisations such as the Inter-American Development Bank have
contributed to comparative analysis by requiring the development of adequate and accessible
microdata as a condition of funding for an innovation (or related) survey.
11.94. Government agencies that commission policy evaluations using innovation and
other related survey data require basic capabilities in evaluation methodologies in order to
236 │ CHAPTER 11. USE OF INNOVATION DATA FOR STATISTICAL INDICATORS AND ANALYSIS
OSLO MANUAL 2018 © OECD/EUROPEAN UNION 2018
scrutinise and assess the methodologies used by contractors or researchers and to interpret
and communicate the results. Replicability is an important requirement for ensuring quality,
and the programming code used for statistical analysis should thus be included as one of the
evaluation’s deliverables. Linked databases that are created for publicly funded evaluation
studies should also be safely stored and made available to other researchers after a
reasonable time lapse, as long as they do not include confidential data.
11.5.4. Co-ordinated analysis of innovation microdata across countries
11.95. When non-discretionary policies are implemented at the national level, it can be
very difficult to identify appropriate control groups. For example, all firms within a country
are subject to identical competition regulations. A solution is to use innovation data from
across countries with different policy environments.
11.96. The main constraint for cross-country policy evaluation is access to microdata for
all the countries included in the analysis. Microdata access is essential for accounting for a
large number of business and contextual features and for testing counterfactuals. Microdata
can be combined with data at the macro level to control for differences by country.
Analysis with pooled microdata
11.97. The optimal solution is to include microdata from multiple countries in a single
database. This minimises differences in data manipulation and provides researchers with
access to the full sample. This is a requirement for the estimation of multi-level models
with combined micro- and country-level effects. An example is a model that analyses
innovation performance as a function of business characteristics and national policies.
11.98. The construction of a single database for microdata from multiple countries is
constrained by regulations governing data collection and access. National legislation to
protect confidentiality can bar non-nationals from accessing data or the use of data abroad.
However, legally compliant solutions have been found when there is consensus on the
importance of co-ordinated international analysis. An example is the European Commission’s
legislative arrangements to provide access to approved researchers to the CIS microdata at
Eurostat’s Safe Centre for agreed research projects. This resource for pooled data from
different countries has made a substantial contribution to international comparative
analysis, although at present it is not possible to link the Safe Centre CIS data to other data.
Distributed, multi-country microdata analysis
11.99. When microdata cannot be remotely accessed or combined in a single database for
confidentiality or other reasons, other methods can be used by focussing on the non-confidential
outputs. The distributed approach to microdata analysis involves, in first instance, the
design and implementation of a common data analysis programming code by individuals
with access to their national microdata. The code is designed to return non-confidential
outputs such as descriptive indicators or coefficients from multivariate analyses that are as
similar as possible across countries. The data can then be compared and further analysed
by the collective of individuals involved in the project or by authorised third parties.
11.100. The use of distributed methods for the analysis of innovation began as researcher-
led initiatives involving a limited group of countries (Griffith et al., 2006). Since then, the
distributed approach has been increasingly adopted for comparative analysis by international
organisations such as the OECD (OECD, 2009b). In addition, national teams can produce
estimates of parameters for use in further comparative analysis (Criscuolo, 2009), adopting
tools similar to those used in quantitative meta-analysis.

CHAPTER 11. USE OF INNOVATION DATA FOR STATISTICAL INDICATORS AND ANALYSIS │ 237
OSLO MANUAL 2018 © OECD/EUROPEAN UNION 2018
11.101. One possible application of a distributed approach to microdata analysis is the
construction of a multi-country micro-moments database (MMD) that includes a set of
statistical indicators, drawn from national microdata, and captures attributes of the joint
distribution of variables within each country. The database comprises a number M of m-
moments corresponding to different multivariate statistics, where the moments have been
estimated within each country for each combination of business group g (e.g. size and
industry) and for each period t. The pooled MMD database for the group of participating
countries enables not only tabulations of indicators but also meso- and macro-level analysis
to which additional policy and other variables can be added. The ability to build a MMD
depends on the comparability of the underlying data and the use of identical protocols to
construct the national MMD components (Bartelsman, Hagsten and Polder, 2017).
11.6. Conclusions
11.102. This chapter has reviewed a number of issues relating to the use of innovation data for
constructing indicators as well as in statistical and econometric analysis. The recommendations
in this chapter are aimed not only at those producing indicators in an official capacity, but
also at other interested users of innovation data. The chapter seeks to guide the work of
those involved in the design, production and use of innovation indicators. It also contributes
to address a broader range of user evidence needs that cannot be met by indicators alone.
The chapter has thus described methods for analysing innovation data, with a focus on
assessing the impacts of innovation and the empirical evaluation of government innovation
policies. It is intended to guide existing data collection and analysis, as well as to encourage
future experimentation which will enhance the quality, visibility, and usefulness of data
and indicators derived from innovation surveys, a key objective of this manual.
References
Aghion, P. et al. (2005), “Competition and innovation: An inverted-U relationship”, The Quarterly
Journal of Economics, Vol. 120/2, pp. 701-728.
Arundel, A. and H. Hollanders (2008), “Innovation scoreboards: Indicators and policy use” in Innovation
Policy in Europe: Measurement and Strategy, Edward Elgar, Cheltenham, pp. 29-52.
Arundel, A. and H. Hollanders (2005), “EXIS: An Exploratory Approach to Innovation Scoreboards”,
European Trend Chart on Innovation, DG Enterprise, European Commission, Brussels,
http://digitalarchive.maastrichtuniversity.nl/fedora/get/guid:25cbd28f-efcf-4850-a43c-
ab25393fcca7/ASSET1 (accessed on 9 August 2018).
Bartelsman, E.J., E. Hagsten and M. Polder (2017), “Micro Moments Database for cross-country analysis
of ICT, innovation, and economic outcomes”, Tinbergen Institute Discussion Papers, No. 2017-
003/VI, http://dx.doi.org/10.2139/ssrn.2898860.
Bloch, C. and V. López-Bassols (2009), “Innovation indicators”, in Innovation in Firms: A
Microeconomic Perspective, OECD Publishing, Paris, https://doi.org/10.1787/9789264056213-en.
Bloom, N. and J. Van Reenen (2007), “Measuring and explaining management practices across
countries”, The Quarterly Journal of Economics, Vol. 122/4, pp. 1351-1408.
Blundell, R., R. Griffith and J. Van Reenen (1999), “Market share, market value and innovation in a
panel of British manufacturing firms”, The Review of Economic Studies, Vol. 66/3, pp. 529-554.
Crépon, B., E. Duguet and J. Mairesse (1998), “Research, innovation and productivity: An econometric
analysis at the firm level”, Economics of Innovation and New Technology, Vol. 7/2, pp. 115-158.
238 │ CHAPTER 11. USE OF INNOVATION DATA FOR STATISTICAL INDICATORS AND ANALYSIS
OSLO MANUAL 2018 © OECD/EUROPEAN UNION 2018
Crespi, G. and P. Zuñiga (2010), “Innovation and productivity: Evidence from six Latin American countries”,
IDB Working Papers, No. IDB-WP-218, Inter-American Development Bank, Washington DC.
Criscuolo, C. (2009), “Innovation and productivity: Estimating the core model across 18 countries”, in
Innovation in Firms: A Microeconomic Perspective, OECD Publishing, Paris,
https://doi.org/10.1787/9789264056213-en.
Czarnitzki, D., P. Hanel and J.M. Rosa (2011), “Evaluating the impact of R&D tax credits on innovation:
A microeconometric study on Canadian firms”, Research Policy, Vol. 40/2, pp. 217-229.
de Jong, J.P.J. and O. Marsili (2006), “The fruit flies of innovations: A taxonomy of innovative small
firms”, Research Policy, Vol.35/2, pp. 213-229.
EC (2010), Elements for the Setting-up of Headline Indicators for Innovation in Support of the Europe
2020 Strategy, Report of the High Level Panel on the Measurement of Innovation, DG Research and
Innovation, European Commission, Brussels.
Edovald, T. and T. Firpo (2016), “Running randomised controlled trials in innovation, entrepreneurship
and growth: An introductory guide”, Innovation Growth Lab, Nesta, London,
https://media.nesta.org.uk/documents/a_guide_to_rcts_-_igl_09aKzWa.pdf (accessed on 9 August 2018).
Eurostat (2014), Glossary of Statistical Terms, http://ec.europa.eu/eurostat/statistics-
explained/index.php/Glossary:Statistical_indicator (accessed on 9 August 2018).
Frenz, M. and R. Lambert (2012), “Mixed modes of innovation: An empiric approach to capturing firms’
innovation behaviour”, OECD Science, Technology and Industry Working Papers, No. 2012/06,
OECD Publishing, Paris, https://doi.org/10.1787/5k8x6l0bp3bp-en.
Galindo-Rueda, F. and V. Millot (2015), “Measuring design and its role in innovation”, OECD Science,
Technology and Industry Working Papers, No. 2015/01, OECD Publishing, Paris,
https://doi.org/10.1787/5js7p6lj6zq6-en.
Gault, F. (ed.) (2013), Handbook of Innovation Indicators and Measurement, Edward Elgar, Cheltenham.
Geroski, P., S. Machin and J. Van Reenen (1993), “The profitability of innovating firms”, The RAND
Journal of Economics, Vol. 24/2, pp. 198-211.
Griffith, R. et al. (2006), “Innovation and productivity across four European countries”, Oxford Review
of Economic Policy, Vol. 22/4, pp. 483-498.
Griliches, Z. (1990), “Patent statistics as economic indicators: A survey”, Journal of Economic
Literature, Vol. 28/4, pp. 1661-1707.
Hall, B.H. (2011), “Innovation and productivity”, NBER Working Papers, No. 17178, National Bureau of
Economic Research (NBER), Cambridge, MA, www.nber.org/papers/w17178.
Harrison, R. et al. (2014), “Does innovation stimulate employment? A firm-level analysis using
comparable micro-data from four European countries”, International Journal of Industrial
Organization, Vol. 35, pp. 29-43.
Hill, C.T. (2013), “US innovation strategy and policy: An indicators perspective”, in Handbook of
Innovation Indicators and Measurement, Edward Elgar, Cheltenham, pp. 333-346.
Hollanders, H. and N. Janz (2013), “Scoreboards and indicator reports”, in Handbook of Innovation
Indicators and Measurement, Edward Elgar, Cheltenham, pp. 279-297.
Laursen, K, and A. Salter (2006), “Open for innovation: the role of openness in explaining innovation
performance among UK manufacturing firms”, Strategic Management Journal, Vol. 27/2, pp. 131-150.
Lööf, H., J. Mairesse and P. Mohnen (2016), “CDM 20 years after”, CESIS Electronic Working Papers,
No. 442, Centre of Excellence for Science and Innovation Studies (CESIS), KTH Royal Institute of
Technology, Stockholm, https://static.sys.kth.se/itm/wp/cesis/cesiswp442.pdf.

CHAPTER 11. USE OF INNOVATION DATA FOR STATISTICAL INDICATORS AND ANALYSIS │ 239
OSLO MANUAL 2018 © OECD/EUROPEAN UNION 2018
Mairesse, J. and P. Mohnen (2010), “Using innovation surveys for econometric analysis”, in Handbook
of the Economics of Innovation, Vol. 2, Elsevier.
McLaughlin, J.A. and G.B. Jordan (1999), “Logic models: A tool for telling your program’s performance
story”, Evaluation and Program Planning, Vol. 22/1, pp. 65-72.
National Research Council (2014), Capturing Change in Science, Technology, and Innovation: Improving
Indicators to Inform Policy, National Academies Press, Washington, DC, https://doi.org/10.17226/18606.
Nesta (2016), “Experimental innovation and growth policy: Why do we need it?”, Innovation Growth Lab,
Nesta, London,
https://media.nesta.org.uk/documents/experimental_innovation_and_growth_policy_why_do_we_nee
d_it.pdf (accessed on 9 August 2018).
OECD (2015), Frascati Manual 2015: Guidelines for Collecting and Reporting Data on Research and
Experimental Development, The Measurement of Scientific, Technological and Innovation Activities,
OECD Publishing, Paris, http://oe.cd/frascati.
OECD (2013), “Knowledge networks and markets”, OECD Science, Technology and Industry Policy
Papers, No. 7, OECD Publishing, Paris, https://doi.org/10.1787/5k44wzw9q5zv-en.
OECD (2010), Measuring Innovation: A New Perspective, OECD Publishing, Paris,
https://doi.org/10.1787/9789264059474-en.
OECD (2009a), OECD Patent Statistics Manual, OECD Publishing, Paris,
https://doi.org/10.1787/9789264056442-en.
OECD (2009b), Innovation in Firms: A Microeconomic Perspective, OECD Publishing, Paris,
https://doi.org/10.1787/9789264056213-en.
OECD/JRC (2008), Handbook on Constructing Composite Indicators - Methodology and User Guide,
OECD Publishing, Paris, www.oecd.org/sdd/42495745.pdf.
OECD and SCImago Research Group (CSIC) (2016), Compendium of Bibliometric Science Indicators,
OECD, Paris, www.oecd.org/sti/inno/Bibliometrics-Compendium.pdf.
Rubin, D.B. (1974), “Estimating causal effects of treatments in randomized and nonrandomized studies”,
Journal of Educational Psychology, Vol. 66/5, pp. 688-701.
Tether, B. (2001), “Identifying innovation, innovators, and innovation behaviours: A critical assessment
of the Community Innovation Survey (CIS)”, CRIC Discussion Papers, No. 48, Centre for Research
on Innovation and Competition, University of Manchester, Manchester.
Todd, P.E. (2010), “Matching estimators”, in Microeconometrics, The New Palgrave Economics
Collection, Palgrave Macmillan, London, pp. 108-121.
UN (2004), Implementation of the Fundamental Principles of Official Statistics; Report of the Secretary-
General, E/CN.3/2004/21, UN Statistical Commission, New York,
https://unstats.un.org/unsd/statcom/doc04/2004-21e.pdf.
UNECE (2000), “Terminology on statistical metadata”, Statistical Standards and Studies, No. 53,
Conference of European Statisticians, UN Statistical Commission and UN Economic Commission for
Europe, Geneva, www.unece.org/fileadmin/DAM/stats/publications/53metadaterminology.pdf.
Wilhelmsen, L. (2012), “A question of context: Assessing the impact of a separate innovation survey and
of response rate on the measurement of innovation activity in Norway”, Documents, No. 51/2012, Statistics
Norway, Oslo, www.ssb.no/a/english/publikasjoner/pdf/doc_201251_en/doc_201251_en.pdf.

GLOSSARY OF TERMS │ 241
OSLO MANUAL 2018 © OECD/EUROPEAN UNION 2018
Glossary of terms
Activities relating to the acquisition or lease of tangible assets
This includes the purchase, lease, or acquisition through a takeover of buildings, machinery, equipment, or the in-house production of such goods for own-use. The acquisition or lease of tangible assets can be innovation activities in their own right, such as when a firm purchases equipment with significantly different characteristics than the existing equipment that it uses for its business processes. The acquisition of tangible capital goods is generally not an innovation activity if it is for replacement or capital-widening investments that are unchanged, or with only minor changes compared to the firm’s existing stock of tangible capital. The lease or rental of tangible assets is an innovation activity if these assets are required for the development of product or business process innovations.
Administrative data Administrative data is the set of units and data derived from an administrative source such as business registers or tax files.
Affiliated firm Affiliated firms include holding, subsidiary or associated companies located in the domestic country or abroad. See also Enterprise group.
Artificial intelligence (AI) Artificial intelligence (AI) describes the activity and outcome of developing computer systems that mimic human thought processes, reasoning and behaviour.
Asset An asset is a store of value that represents a benefit or series of benefits accruing to the economic owner by holding or using the asset over a period of time. Both financial and non-financial assets are relevant to innovation. Fixed assets are the result of production activities and are used repeatedly or continuously in production processes for more than one year.
Big data Data that are too large or complex to be handled by conventional data processing tools and techniques.
Brand equity activities See Marketing and brand equity activities.
Business capabilities Business capabilities include the knowledge, competencies and resources that a firm accumulates over time and draws upon in the pursuit of its objectives. The skills and abilities of a firm's workforce are a particularly critical part of innovation-relevant business capabilities.
Business enterprise sector The Business enterprise sector comprises:
• All resident corporations, including legally incorporated enterprises, regardless of the residence of their shareholders. This includes quasi-corporations, i.e. units capable of generating a profit or other financial gain for their owners, recognised by law as separate legal entities from their owners, and set up for the purpose of engaging in market production at prices that are economically significant.
• The unincorporated branches of non-resident enterprises deemed to be resident and part of this sector because they are engaged in production on the economic territory on a long-term basis.
• All resident non-profit institutions that are market producers of goods or services or serve businesses.
242 │ GLOSSARY OF TERMS
OSLO MANUAL 2018 © OECD/EUROPEAN UNION 2018
Business innovation A business innovation is a new or improved product or business process (or combination thereof) that differs significantly from the firm's previous products or business processes and that has been introduced on the market or brought into use by the firm.
Business innovation activities
See Innovation activities (business).
Business model innovation Business model innovation relates to changes in a firm’s core business processes as well as in the main products that it sells, currently or in the future.
Business process innovation
A business process innovation is a new or improved business process for one or more business functions that differs significantly from the firm’s previous business processes and that has been brought into use by the firm. The characteristics of an improved business function include greater efficacy, resource efficiency, reliability and resilience, affordability, and convenience and usability for those involved in the business process, either external or internal to the firm. Business process innovations are implemented when they are brought into use by the firm in its internal or outward-facing operations. Business process innovations include the following functional categories:
• production of goods and services
• distribution and logistics
• marketing and sales
• information and communication systems
• administration and management
• product and business process development.
Business strategy A business strategy includes the formulation of goals and the identification of policies to reach these goals. Strategic goals cover the intended outcomes over the mid- and long-term (excluding the goal of profitability, which is shared by all firms). Strategic policies or plans include how a firm creates a competitive advantage or a “unique selling proposition”.
Capital expenditures Capital expenditures are the annual gross amount paid for the acquisition of fixed assets and the costs of internally developing fixed assets. These include gross expenditures on land and buildings, machinery, instruments, transport equipment and other equipment, as well as intellectual property products. See also Current expenditures.
CDM model The CDM model (based on the initials of the three authors’ names, Crépon, Duguet and Mairesse) is an econometric model widely used in empirical research on innovation and productivity. The CDM framework provides a structural model that explains productivity by innovation output and corrects for the selectivity and endogeneity inherent in survey data.
Cloud computing Cloud systems and applications are digital storage and computing resources remotely available on-demand via the Internet.
Cognitive testing Cognitive testing is a methodology developed by psychologists and survey researchers which collects verbal information on survey responses. It is used to evaluate the ability of a question (or group of questions) to measure constructs as intended by the researcher and if respondents can provide reasonably accurate responses.
Co-innovation Co-innovation, or “coupled open innovation”, occurs when collaboration between two or more partners results in an innovation.
GLOSSARY OF TERMS │ 243
OSLO MANUAL 2018 © OECD/EUROPEAN UNION 2018
Collaboration Collaboration requires co-ordinated activity across different parties to address a jointly defined problem, with all partners contributing. Collaboration requires the explicit definition of common objectives and it may include agreement over the distribution of inputs, risks and potential benefits. Collaboration can create new knowledge, but it does not need to result in an innovation. See also Co-operation.
Community Innovation Survey (CIS)
The Community Innovation Survey (CIS) is a harmonised survey of innovation in enterprises co-ordinated by Eurostat and currently carried out every two years in EU member states and several European Statistical System (ESS) member countries.
Composite indicator A composite indicator compiles multiple indicators into a single index based on an underlying conceptual model in a manner which reflects the dimensions or structure of the phenomena being measured. See also Indicator.
Computer-assisted personal interviewing (CAPI)
Computer-assisted personal interviewing (CAPI) is a method of data collection in which an interviewer uses a computer to display questions and accept responses during a face-to-face interview.
Computer-assisted telephone interviewing (CATI)
Computer-assisted telephone interviewing (CATI) is a method of data collection by telephone with questions displayed on a computer and responses entered directly into a computer.
Co-operation Co-operation occurs when two or more participants agree to take responsibility for a task or series of tasks and information is shared between the parties to facilitate the agreement. See also Collaboration.
Corporations The System of National Accounts (SNA) Corporations sector consists of corporations that are principally engaged in the production of market goods and services. This manual adopts the convention of referring to this sector as the Business enterprise sector, in line with the terminology adopted in the OECD’s Frascati Manual.
Counterfactual In impact evaluation, the counterfactual refers to what would have happened to potential beneficiaries in the absence of an intervention. Impacts can thus be estimated as the difference between potential outcomes under observed and unobserved counterfactual treatments. An example is estimating the causal impacts of a policy “treatment” to support innovation activities. The researcher cannot directly observe the counterfactuals: for supported firms, what would have been their performance if they had not been supported, and similarly with non-supported firms.
Cross-sectional survey A cross-sectional survey collects data to make inferences about a population of interest (or subset) at a specific point in time.
Current expenditures Current expenditures include all costs for labour, materials, services and other inputs to the production process that are consumed within less than one year, and the costs for leasing fixed assets. See also Capital expenditures.
Design Design is defined as an innovation activity aimed at planning and designing procedures, technical specifications and other user and functional characteristics for new products and business processes. Design includes a wide range of activities to develop a new or modified function, form or appearance for goods, services or processes, including business processes to be used by the firm itself. Most design (and other creative work) activities are innovation activities, with the exception of minor design changes that do not meet the requirements for an innovation, such as producing an existing product in a new colour. Design capabilities include the following: (i) engineering design; (ii) product design; and (iii) design thinking.
244 │ GLOSSARY OF TERMS
OSLO MANUAL 2018 © OECD/EUROPEAN UNION 2018
Design Ladder The Design Ladder is a tool developed by the Danish Design Centre for illustrating and rating a company's use of design. The Design Ladder is based on the hypothesis that there is a positive link between higher earnings, placing a greater emphasis on design methods in the early stages of development and giving design a more strategic position in the company’s overall business strategy. The four steps are: (i) non-design; (ii) design as form-giving; (iii) design as process; and (iv) design as strategy.
Design thinking Design thinking is a systematic methodology for the design process that uses design methods to identify needs, define problems, generate ideas, develop prototypes and test solutions. It can be used for the design of systems, goods, and services. Collecting data on design thinking is of value to policy because the methodology can support the innovation activities of both service and manufacturing firms, resulting in improvements to competitiveness and economic outcomes.
Diffusion (innovation) Innovation diffusion encompasses both the process by which ideas underpinning product and business process innovations spread (innovation knowledge diffusion), and the adoption of such products, or business processes by other firms (innovation output diffusion).
Digital-based innovations Digital-based innovations include product or business process innovations that contain ICTs, as well as innovations that rely to a significant degree on information and communication technologies (ICTs) for their development or implementation.
Digital platforms Digital platforms are information and communication technology-enabled mechanisms that connect and integrate producers and users in online environments. They often form an ecosystem in which goods and services are requested, developed and sold, and data generated and exchanged.
Digitalisation Digitalisation is the application or increase in use of digital technologies by an organisation, industry, country, etc. It refers to how digitisation affects the economy or society. See also Digitisation.
Digitisation Digitisation is the conversion of an analogue signal conveying information (e.g. sound, image, printed text) to binary bits. See also Digitalisation.
Dynamic managerial capabilities
Dynamic managerial capabilities refer to the ability of managers to organise an effective response to internal and external challenges Dynamic managerial capabilities include the following three main dimensions: (i) managerial cognition; (ii) managerial social capital; and (iii) managerial human capital.
Employee training activities Employee training includes all activities that are paid for or subsidised by the firm to develop knowledge and skills required for the specific trade, occupation or vocation of a firm’s employees. Employee training includes on-the-job training and job-related education at training and educational institutions. Examples of training as an innovation activity include training personnel to use innovations, such as new software logistical systems or new equipment; and training relevant to the implementation of an innovation, such as instructing marketing personnel or customers on the features of a product innovation.
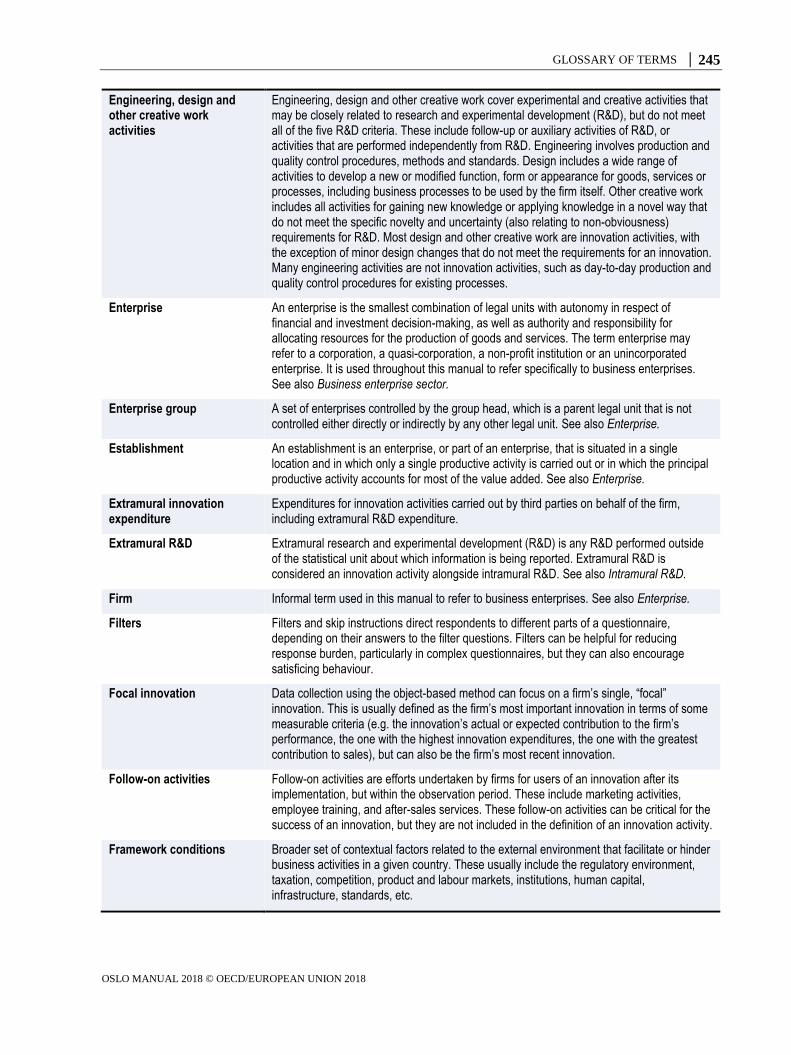
GLOSSARY OF TERMS │ 245
OSLO MANUAL 2018 © OECD/EUROPEAN UNION 2018
Engineering, design and other creative work activities
Engineering, design and other creative work cover experimental and creative activities that may be closely related to research and experimental development (R&D), but do not meet all of the five R&D criteria. These include follow-up or auxiliary activities of R&D, or activities that are performed independently from R&D. Engineering involves production and quality control procedures, methods and standards. Design includes a wide range of activities to develop a new or modified function, form or appearance for goods, services or processes, including business processes to be used by the firm itself. Other creative work includes all activities for gaining new knowledge or applying knowledge in a novel way that do not meet the specific novelty and uncertainty (also relating to non-obviousness) requirements for R&D. Most design and other creative work are innovation activities, with the exception of minor design changes that do not meet the requirements for an innovation. Many engineering activities are not innovation activities, such as day-to-day production and quality control procedures for existing processes.
Enterprise An enterprise is the smallest combination of legal units with autonomy in respect of financial and investment decision-making, as well as authority and responsibility for allocating resources for the production of goods and services. The term enterprise may refer to a corporation, a quasi-corporation, a non-profit institution or an unincorporated enterprise. It is used throughout this manual to refer specifically to business enterprises. See also Business enterprise sector.
Enterprise group A set of enterprises controlled by the group head, which is a parent legal unit that is not controlled either directly or indirectly by any other legal unit. See also Enterprise.
Establishment An establishment is an enterprise, or part of an enterprise, that is situated in a single location and in which only a single productive activity is carried out or in which the principal productive activity accounts for most of the value added. See also Enterprise.
Extramural innovation expenditure
Expenditures for innovation activities carried out by third parties on behalf of the firm, including extramural R&D expenditure.
Extramural R&D Extramural research and experimental development (R&D) is any R&D performed outside of the statistical unit about which information is being reported. Extramural R&D is considered an innovation activity alongside intramural R&D. See also Intramural R&D.
Firm Informal term used in this manual to refer to business enterprises. See also Enterprise.
Filters Filters and skip instructions direct respondents to different parts of a questionnaire, depending on their answers to the filter questions. Filters can be helpful for reducing response burden, particularly in complex questionnaires, but they can also encourage satisficing behaviour.
Focal innovation Data collection using the object-based method can focus on a firm’s single, “focal” innovation. This is usually defined as the firm’s most important innovation in terms of some measurable criteria (e.g. the innovation’s actual or expected contribution to the firm’s performance, the one with the highest innovation expenditures, the one with the greatest contribution to sales), but can also be the firm’s most recent innovation.
Follow-on activities Follow-on activities are efforts undertaken by firms for users of an innovation after its implementation, but within the observation period. These include marketing activities, employee training, and after-sales services. These follow-on activities can be critical for the success of an innovation, but they are not included in the definition of an innovation activity.
Framework conditions Broader set of contextual factors related to the external environment that facilitate or hinder business activities in a given country. These usually include the regulatory environment, taxation, competition, product and labour markets, institutions, human capital, infrastructure, standards, etc.
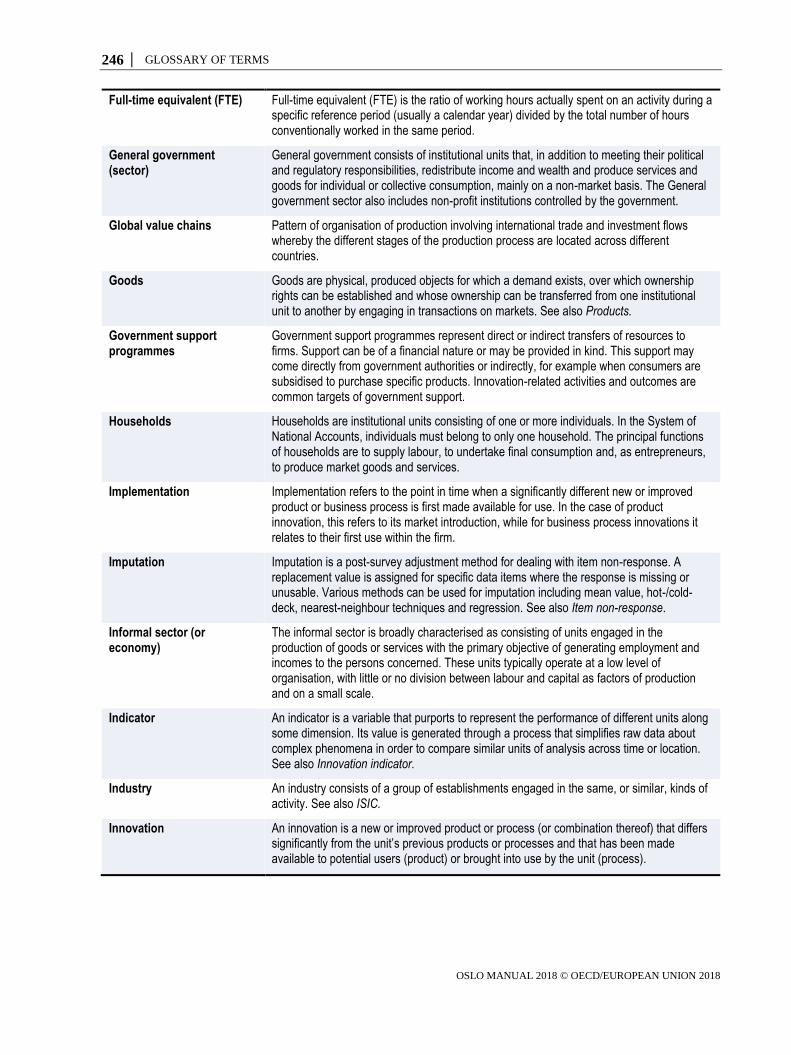
246 │ GLOSSARY OF TERMS
OSLO MANUAL 2018 © OECD/EUROPEAN UNION 2018
Full-time equivalent (FTE) Full-time equivalent (FTE) is the ratio of working hours actually spent on an activity during a specific reference period (usually a calendar year) divided by the total number of hours conventionally worked in the same period.
General government (sector)
General government consists of institutional units that, in addition to meeting their political and regulatory responsibilities, redistribute income and wealth and produce services and goods for individual or collective consumption, mainly on a non-market basis. The General government sector also includes non-profit institutions controlled by the government.
Global value chains Pattern of organisation of production involving international trade and investment flows whereby the different stages of the production process are located across different countries.
Goods Goods are physical, produced objects for which a demand exists, over which ownership rights can be established and whose ownership can be transferred from one institutional unit to another by engaging in transactions on markets. See also Products.
Government support programmes
Government support programmes represent direct or indirect transfers of resources to firms. Support can be of a financial nature or may be provided in kind. This support may come directly from government authorities or indirectly, for example when consumers are subsidised to purchase specific products. Innovation-related activities and outcomes are common targets of government support.
Households Households are institutional units consisting of one or more individuals. In the System of National Accounts, individuals must belong to only one household. The principal functions of households are to supply labour, to undertake final consumption and, as entrepreneurs, to produce market goods and services.
Implementation Implementation refers to the point in time when a significantly different new or improved product or business process is first made available for use. In the case of product innovation, this refers to its market introduction, while for business process innovations it relates to their first use within the firm.
Imputation Imputation is a post-survey adjustment method for dealing with item non-response. A replacement value is assigned for specific data items where the response is missing or unusable. Various methods can be used for imputation including mean value, hot-/cold-deck, nearest-neighbour techniques and regression. See also Item non-response.
Informal sector (or economy)
The informal sector is broadly characterised as consisting of units engaged in the production of goods or services with the primary objective of generating employment and incomes to the persons concerned. These units typically operate at a low level of organisation, with little or no division between labour and capital as factors of production and on a small scale.
Indicator An indicator is a variable that purports to represent the performance of different units along some dimension. Its value is generated through a process that simplifies raw data about complex phenomena in order to compare similar units of analysis across time or location. See also Innovation indicator.
Industry An industry consists of a group of establishments engaged in the same, or similar, kinds of activity. See also ISIC.
Innovation An innovation is a new or improved product or process (or combination thereof) that differs significantly from the unit’s previous products or processes and that has been made available to potential users (product) or brought into use by the unit (process).
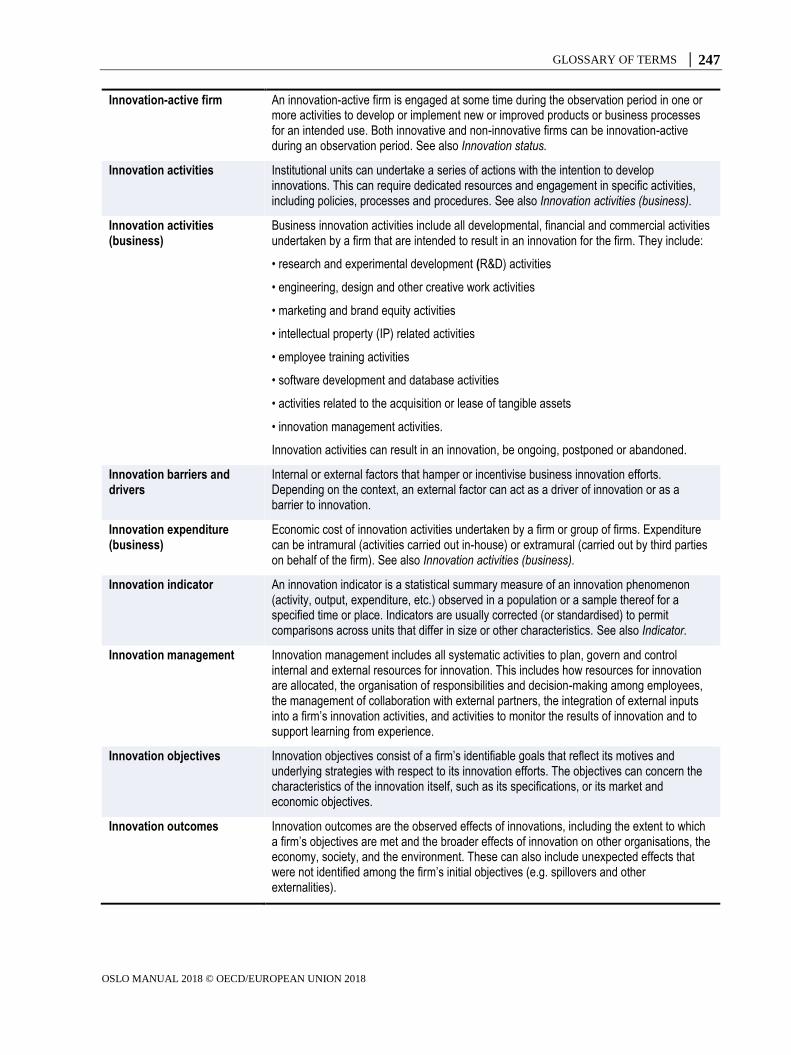
GLOSSARY OF TERMS │ 247
OSLO MANUAL 2018 © OECD/EUROPEAN UNION 2018
Innovation-active firm An innovation-active firm is engaged at some time during the observation period in one or more activities to develop or implement new or improved products or business processes for an intended use. Both innovative and non-innovative firms can be innovation-active during an observation period. See also Innovation status.
Innovation activities Institutional units can undertake a series of actions with the intention to develop innovations. This can require dedicated resources and engagement in specific activities, including policies, processes and procedures. See also Innovation activities (business).
Innovation activities (business)
Business innovation activities include all developmental, financial and commercial activities undertaken by a firm that are intended to result in an innovation for the firm. They include:
• research and experimental development (R&D) activities
• engineering, design and other creative work activities
• marketing and brand equity activities
• intellectual property (IP) related activities
• employee training activities
• software development and database activities
• activities related to the acquisition or lease of tangible assets
• innovation management activities.
Innovation activities can result in an innovation, be ongoing, postponed or abandoned.
Innovation barriers and drivers
Internal or external factors that hamper or incentivise business innovation efforts. Depending on the context, an external factor can act as a driver of innovation or as a barrier to innovation.
Innovation expenditure (business)
Economic cost of innovation activities undertaken by a firm or group of firms. Expenditure can be intramural (activities carried out in-house) or extramural (carried out by third parties on behalf of the firm). See also Innovation activities (business).
Innovation indicator An innovation indicator is a statistical summary measure of an innovation phenomenon (activity, output, expenditure, etc.) observed in a population or a sample thereof for a specified time or place. Indicators are usually corrected (or standardised) to permit comparisons across units that differ in size or other characteristics. See also Indicator.
Innovation management Innovation management includes all systematic activities to plan, govern and control internal and external resources for innovation. This includes how resources for innovation are allocated, the organisation of responsibilities and decision-making among employees, the management of collaboration with external partners, the integration of external inputs into a firm’s innovation activities, and activities to monitor the results of innovation and to support learning from experience.
Innovation objectives Innovation objectives consist of a firm’s identifiable goals that reflect its motives and underlying strategies with respect to its innovation efforts. The objectives can concern the characteristics of the innovation itself, such as its specifications, or its market and economic objectives.
Innovation outcomes Innovation outcomes are the observed effects of innovations, including the extent to which a firm’s objectives are met and the broader effects of innovation on other organisations, the economy, society, and the environment. These can also include unexpected effects that were not identified among the firm’s initial objectives (e.g. spillovers and other externalities).
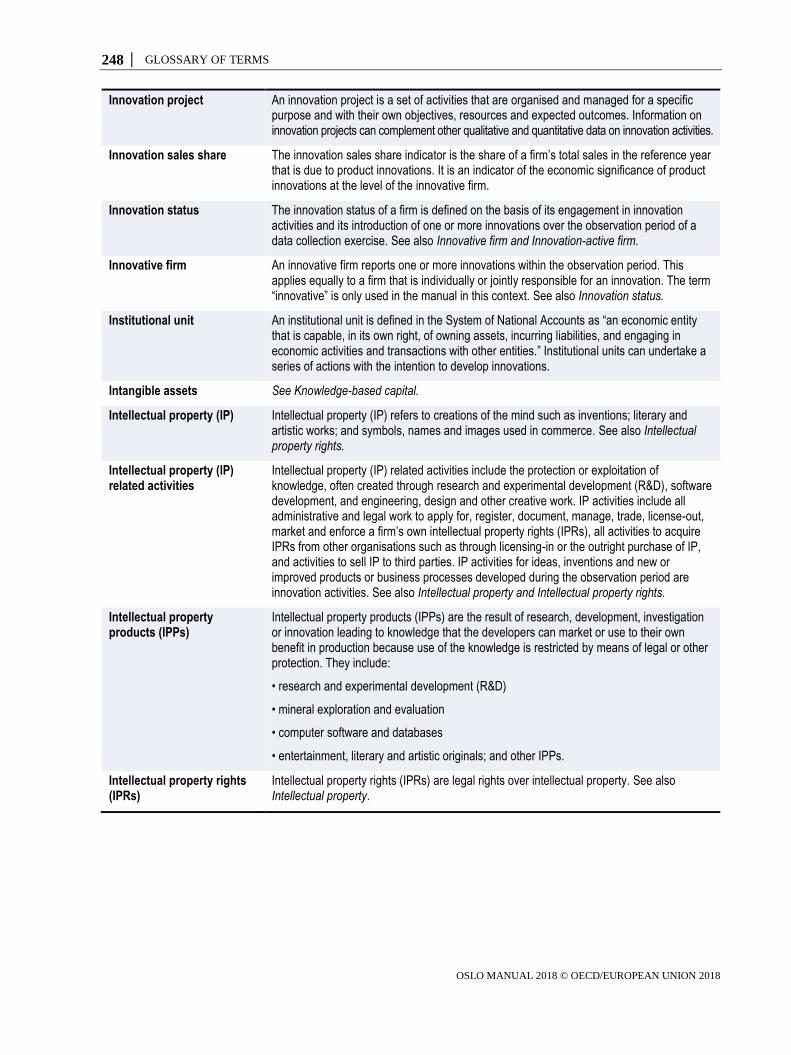
248 │ GLOSSARY OF TERMS
OSLO MANUAL 2018 © OECD/EUROPEAN UNION 2018
Innovation project An innovation project is a set of activities that are organised and managed for a specific purpose and with their own objectives, resources and expected outcomes. Information on innovation projects can complement other qualitative and quantitative data on innovation activities.
Innovation sales share The innovation sales share indicator is the share of a firm’s total sales in the reference year that is due to product innovations. It is an indicator of the economic significance of product innovations at the level of the innovative firm.
Innovation status The innovation status of a firm is defined on the basis of its engagement in innovation activities and its introduction of one or more innovations over the observation period of a data collection exercise. See also Innovative firm and Innovation-active firm.
Innovative firm An innovative firm reports one or more innovations within the observation period. This applies equally to a firm that is individually or jointly responsible for an innovation. The term “innovative” is only used in the manual in this context. See also Innovation status.
Institutional unit An institutional unit is defined in the System of National Accounts as “an economic entity that is capable, in its own right, of owning assets, incurring liabilities, and engaging in economic activities and transactions with other entities.” Institutional units can undertake a series of actions with the intention to develop innovations.
Intangible assets See Knowledge-based capital.
Intellectual property (IP) Intellectual property (IP) refers to creations of the mind such as inventions; literary and artistic works; and symbols, names and images used in commerce. See also Intellectual property rights.
Intellectual property (IP) related activities
Intellectual property (IP) related activities include the protection or exploitation of knowledge, often created through research and experimental development (R&D), software development, and engineering, design and other creative work. IP activities include all administrative and legal work to apply for, register, document, manage, trade, license-out, market and enforce a firm’s own intellectual property rights (IPRs), all activities to acquire IPRs from other organisations such as through licensing-in or the outright purchase of IP, and activities to sell IP to third parties. IP activities for ideas, inventions and new or improved products or business processes developed during the observation period are innovation activities. See also Intellectual property and Intellectual property rights.
Intellectual property products (IPPs)
Intellectual property products (IPPs) are the result of research, development, investigation or innovation leading to knowledge that the developers can market or use to their own benefit in production because use of the knowledge is restricted by means of legal or other protection. They include:
• research and experimental development (R&D)
• mineral exploration and evaluation
• computer software and databases
• entertainment, literary and artistic originals; and other IPPs.
Intellectual property rights (IPRs)
Intellectual property rights (IPRs) are legal rights over intellectual property. See also Intellectual property.
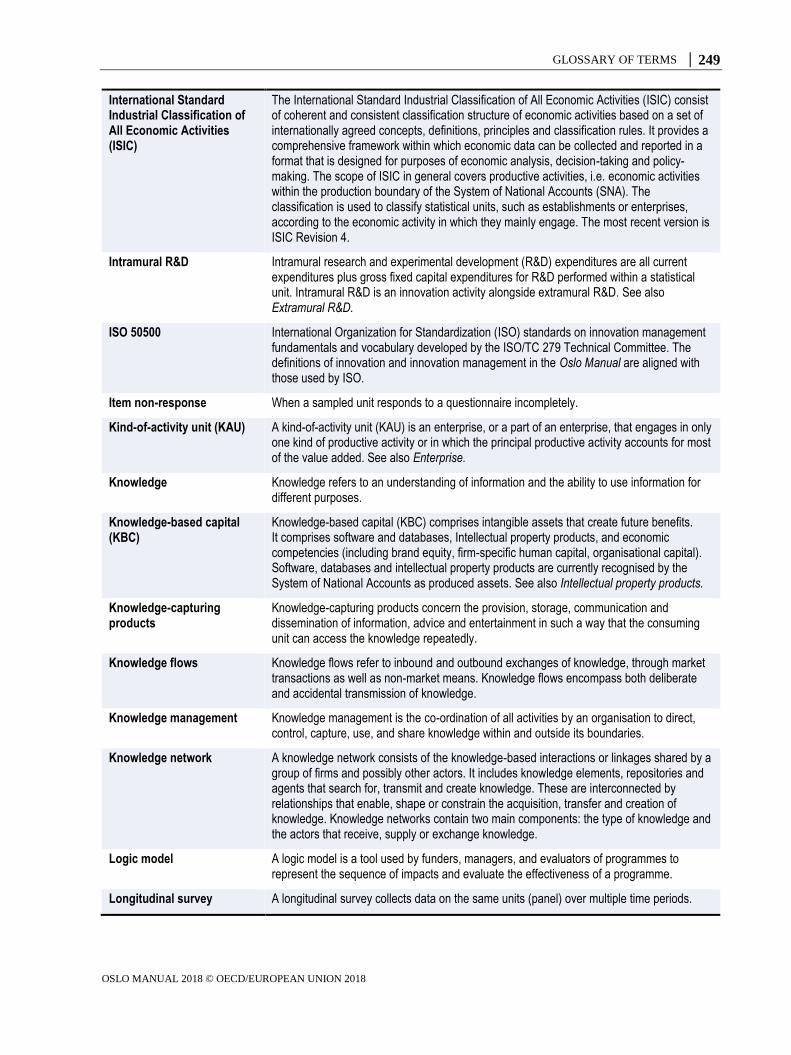
GLOSSARY OF TERMS │ 249
OSLO MANUAL 2018 © OECD/EUROPEAN UNION 2018
International Standard Industrial Classification of All Economic Activities (ISIC)
The International Standard Industrial Classification of All Economic Activities (ISIC) consist of coherent and consistent classification structure of economic activities based on a set of internationally agreed concepts, definitions, principles and classification rules. It provides a comprehensive framework within which economic data can be collected and reported in a format that is designed for purposes of economic analysis, decision-taking and policy-making. The scope of ISIC in general covers productive activities, i.e. economic activities within the production boundary of the System of National Accounts (SNA). The classification is used to classify statistical units, such as establishments or enterprises, according to the economic activity in which they mainly engage. The most recent version is ISIC Revision 4.
Intramural R&D Intramural research and experimental development (R&D) expenditures are all current expenditures plus gross fixed capital expenditures for R&D performed within a statistical unit. Intramural R&D is an innovation activity alongside extramural R&D. See also Extramural R&D.
ISO 50500 International Organization for Standardization (ISO) standards on innovation management fundamentals and vocabulary developed by the ISO/TC 279 Technical Committee. The definitions of innovation and innovation management in the Oslo Manual are aligned with those used by ISO.
Item non-response When a sampled unit responds to a questionnaire incompletely.
Kind-of-activity unit (KAU) A kind-of-activity unit (KAU) is an enterprise, or a part of an enterprise, that engages in only one kind of productive activity or in which the principal productive activity accounts for most of the value added. See also Enterprise.
Knowledge Knowledge refers to an understanding of information and the ability to use information for different purposes.
Knowledge-based capital (KBC)
Knowledge-based capital (KBC) comprises intangible assets that create future benefits. It comprises software and databases, Intellectual property products, and economic competencies (including brand equity, firm-specific human capital, organisational capital). Software, databases and intellectual property products are currently recognised by the System of National Accounts as produced assets. See also Intellectual property products.
Knowledge-capturing products
Knowledge-capturing products concern the provision, storage, communication and dissemination of information, advice and entertainment in such a way that the consuming unit can access the knowledge repeatedly.
Knowledge flows Knowledge flows refer to inbound and outbound exchanges of knowledge, through market transactions as well as non-market means. Knowledge flows encompass both deliberate and accidental transmission of knowledge.
Knowledge management Knowledge management is the co-ordination of all activities by an organisation to direct, control, capture, use, and share knowledge within and outside its boundaries.
Knowledge network A knowledge network consists of the knowledge-based interactions or linkages shared by a group of firms and possibly other actors. It includes knowledge elements, repositories and agents that search for, transmit and create knowledge. These are interconnected by relationships that enable, shape or constrain the acquisition, transfer and creation of knowledge. Knowledge networks contain two main components: the type of knowledge and the actors that receive, supply or exchange knowledge.
Logic model A logic model is a tool used by funders, managers, and evaluators of programmes to represent the sequence of impacts and evaluate the effectiveness of a programme.
Longitudinal survey A longitudinal survey collects data on the same units (panel) over multiple time periods.
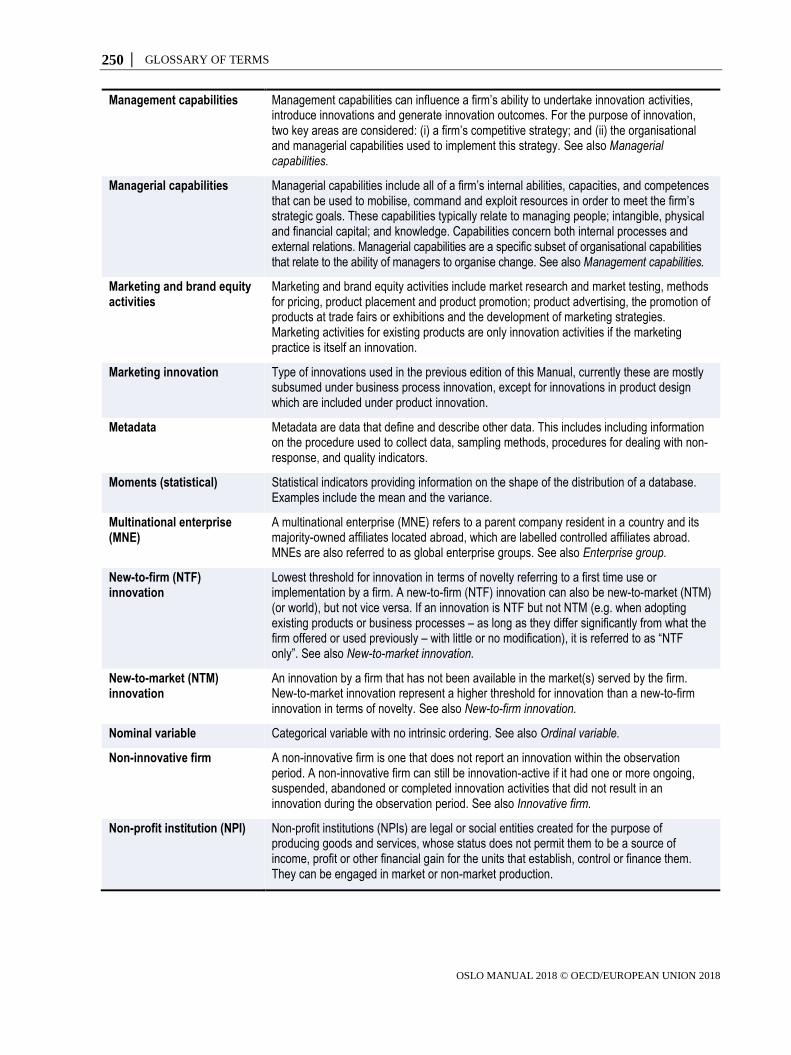
250 │ GLOSSARY OF TERMS
OSLO MANUAL 2018 © OECD/EUROPEAN UNION 2018
Management capabilities Management capabilities can influence a firm’s ability to undertake innovation activities, introduce innovations and generate innovation outcomes. For the purpose of innovation, two key areas are considered: (i) a firm’s competitive strategy; and (ii) the organisational and managerial capabilities used to implement this strategy. See also Managerial capabilities.
Managerial capabilities Managerial capabilities include all of a firm’s internal abilities, capacities, and competences that can be used to mobilise, command and exploit resources in order to meet the firm’s strategic goals. These capabilities typically relate to managing people; intangible, physical and financial capital; and knowledge. Capabilities concern both internal processes and external relations. Managerial capabilities are a specific subset of organisational capabilities that relate to the ability of managers to organise change. See also Management capabilities.
Marketing and brand equity activities
Marketing and brand equity activities include market research and market testing, methods for pricing, product placement and product promotion; product advertising, the promotion of products at trade fairs or exhibitions and the development of marketing strategies. Marketing activities for existing products are only innovation activities if the marketing practice is itself an innovation.
Marketing innovation Type of innovations used in the previous edition of this Manual, currently these are mostly subsumed under business process innovation, except for innovations in product design which are included under product innovation.
Metadata Metadata are data that define and describe other data. This includes including information on the procedure used to collect data, sampling methods, procedures for dealing with non-response, and quality indicators.
Moments (statistical) Statistical indicators providing information on the shape of the distribution of a database. Examples include the mean and the variance.
Multinational enterprise (MNE)
A multinational enterprise (MNE) refers to a parent company resident in a country and its majority-owned affiliates located abroad, which are labelled controlled affiliates abroad. MNEs are also referred to as global enterprise groups. See also Enterprise group.
New-to-firm (NTF) innovation
Lowest threshold for innovation in terms of novelty referring to a first time use or implementation by a firm. A new-to-firm (NTF) innovation can also be new-to-market (NTM) (or world), but not vice versa. If an innovation is NTF but not NTM (e.g. when adopting existing products or business processes – as long as they differ significantly from what the firm offered or used previously – with little or no modification), it is referred to as “NTF only”. See also New-to-market innovation.
New-to-market (NTM) innovation
An innovation by a firm that has not been available in the market(s) served by the firm. New-to-market innovation represent a higher threshold for innovation than a new-to-firm innovation in terms of novelty. See also New-to-firm innovation.
Nominal variable Categorical variable with no intrinsic ordering. See also Ordinal variable.
Non-innovative firm A non-innovative firm is one that does not report an innovation within the observation period. A non-innovative firm can still be innovation-active if it had one or more ongoing, suspended, abandoned or completed innovation activities that did not result in an innovation during the observation period. See also Innovative firm.
Non-profit institution (NPI) Non-profit institutions (NPIs) are legal or social entities created for the purpose of producing goods and services, whose status does not permit them to be a source of income, profit or other financial gain for the units that establish, control or finance them. They can be engaged in market or non-market production.
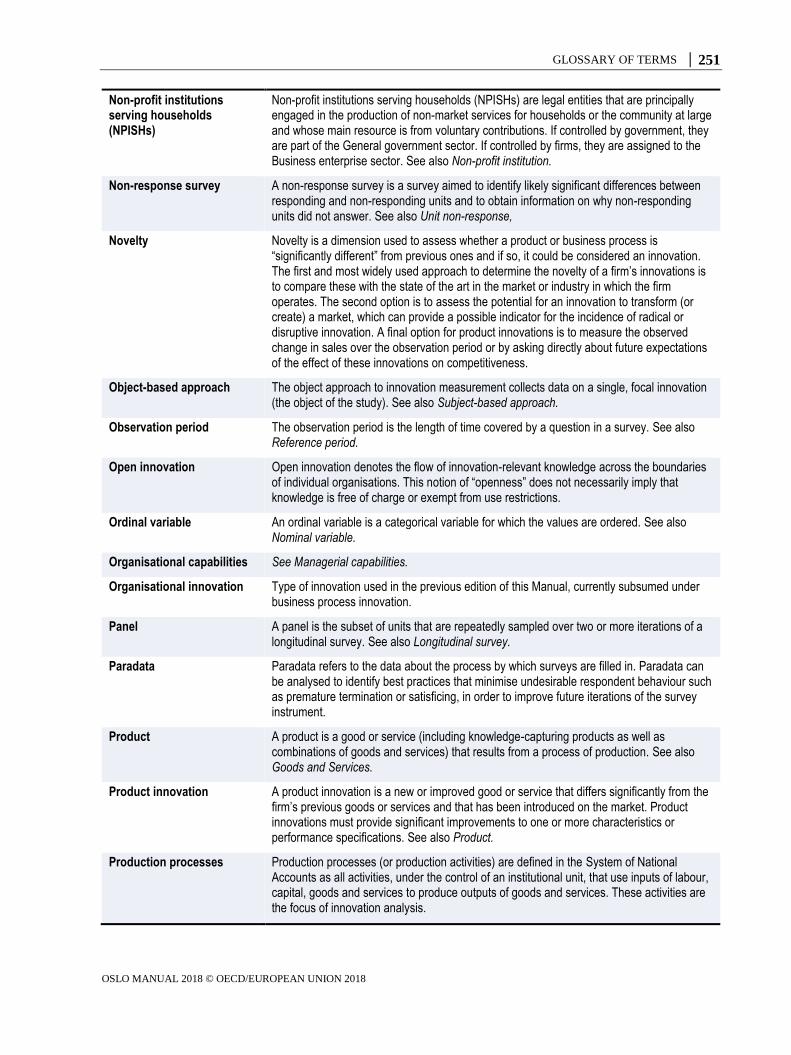
GLOSSARY OF TERMS │ 251
OSLO MANUAL 2018 © OECD/EUROPEAN UNION 2018
Non-profit institutions serving households (NPISHs)
Non-profit institutions serving households (NPISHs) are legal entities that are principally engaged in the production of non-market services for households or the community at large and whose main resource is from voluntary contributions. If controlled by government, they are part of the General government sector. If controlled by firms, they are assigned to the Business enterprise sector. See also Non-profit institution.
Non-response survey A non-response survey is a survey aimed to identify likely significant differences between responding and non-responding units and to obtain information on why non-responding units did not answer. See also Unit non-response,
Novelty Novelty is a dimension used to assess whether a product or business process is “significantly different” from previous ones and if so, it could be considered an innovation. The first and most widely used approach to determine the novelty of a firm’s innovations is to compare these with the state of the art in the market or industry in which the firm operates. The second option is to assess the potential for an innovation to transform (or create) a market, which can provide a possible indicator for the incidence of radical or disruptive innovation. A final option for product innovations is to measure the observed change in sales over the observation period or by asking directly about future expectations of the effect of these innovations on competitiveness.
Object-based approach The object approach to innovation measurement collects data on a single, focal innovation (the object of the study). See also Subject-based approach.
Observation period The observation period is the length of time covered by a question in a survey. See also Reference period.
Open innovation Open innovation denotes the flow of innovation-relevant knowledge across the boundaries of individual organisations. This notion of “openness” does not necessarily imply that knowledge is free of charge or exempt from use restrictions.
Ordinal variable An ordinal variable is a categorical variable for which the values are ordered. See also Nominal variable.
Organisational capabilities See Managerial capabilities.
Organisational innovation Type of innovation used in the previous edition of this Manual, currently subsumed under business process innovation.
Panel A panel is the subset of units that are repeatedly sampled over two or more iterations of a longitudinal survey. See also Longitudinal survey.
Paradata Paradata refers to the data about the process by which surveys are filled in. Paradata can be analysed to identify best practices that minimise undesirable respondent behaviour such as premature termination or satisficing, in order to improve future iterations of the survey instrument.
Product A product is a good or service (including knowledge-capturing products as well as combinations of goods and services) that results from a process of production. See also Goods and Services.
Product innovation A product innovation is a new or improved good or service that differs significantly from the firm’s previous goods or services and that has been introduced on the market. Product innovations must provide significant improvements to one or more characteristics or performance specifications. See also Product.
Production processes Production processes (or production activities) are defined in the System of National Accounts as all activities, under the control of an institutional unit, that use inputs of labour, capital, goods and services to produce outputs of goods and services. These activities are the focus of innovation analysis.
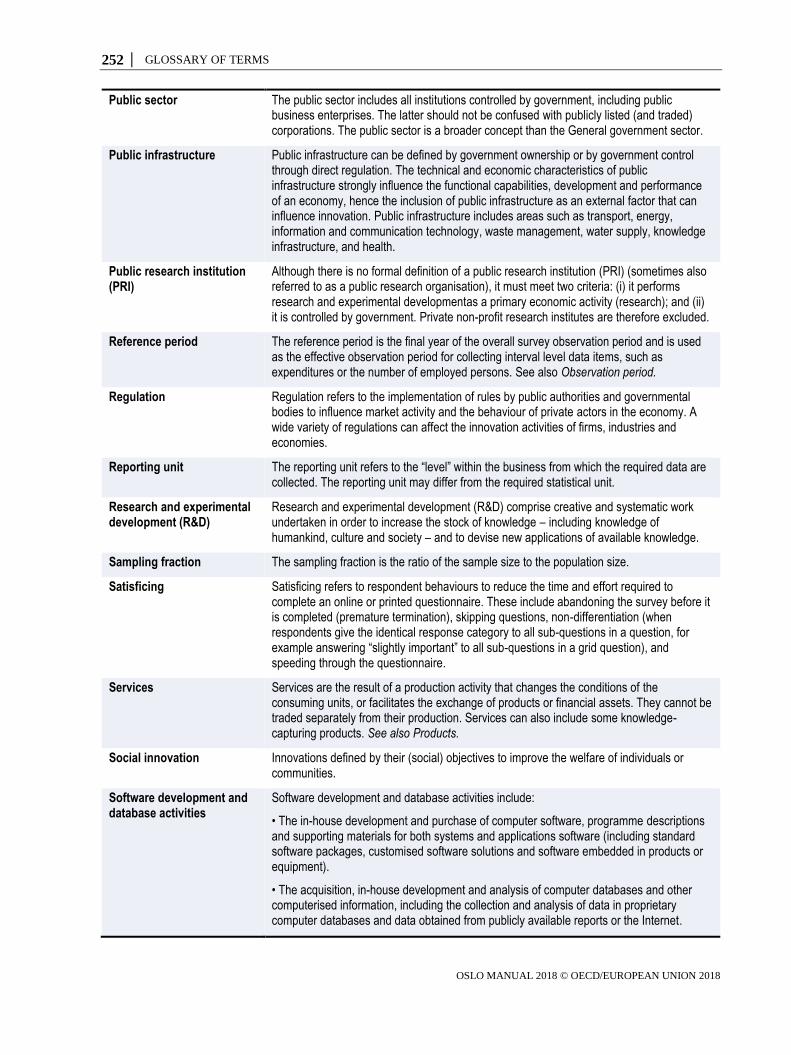
252 │ GLOSSARY OF TERMS
OSLO MANUAL 2018 © OECD/EUROPEAN UNION 2018
Public sector The public sector includes all institutions controlled by government, including public business enterprises. The latter should not be confused with publicly listed (and traded) corporations. The public sector is a broader concept than the General government sector.
Public infrastructure Public infrastructure can be defined by government ownership or by government control through direct regulation. The technical and economic characteristics of public infrastructure strongly influence the functional capabilities, development and performance of an economy, hence the inclusion of public infrastructure as an external factor that can influence innovation. Public infrastructure includes areas such as transport, energy, information and communication technology, waste management, water supply, knowledge infrastructure, and health.
Public research institution (PRI)
Although there is no formal definition of a public research institution (PRI) (sometimes also referred to as a public research organisation), it must meet two criteria: (i) it performs research and experimental developmentas a primary economic activity (research); and (ii) it is controlled by government. Private non-profit research institutes are therefore excluded.
Reference period The reference period is the final year of the overall survey observation period and is used as the effective observation period for collecting interval level data items, such as expenditures or the number of employed persons. See also Observation period.
Regulation Regulation refers to the implementation of rules by public authorities and governmental bodies to influence market activity and the behaviour of private actors in the economy. A wide variety of regulations can affect the innovation activities of firms, industries and economies.
Reporting unit The reporting unit refers to the “level” within the business from which the required data are collected. The reporting unit may differ from the required statistical unit.
Research and experimental development (R&D)
Research and experimental development (R&D) comprise creative and systematic work undertaken in order to increase the stock of knowledge – including knowledge of humankind, culture and society – and to devise new applications of available knowledge.
Sampling fraction The sampling fraction is the ratio of the sample size to the population size.
Satisficing Satisficing refers to respondent behaviours to reduce the time and effort required to complete an online or printed questionnaire. These include abandoning the survey before it is completed (premature termination), skipping questions, non-differentiation (when respondents give the identical response category to all sub-questions in a question, for example answering “slightly important” to all sub-questions in a grid question), and speeding through the questionnaire.
Services Services are the result of a production activity that changes the conditions of the consuming units, or facilitates the exchange of products or financial assets. They cannot be traded separately from their production. Services can also include some knowledge-capturing products. See also Products.
Social innovation Innovations defined by their (social) objectives to improve the welfare of individuals or communities.
Software development and database activities
Software development and database activities include:
• The in-house development and purchase of computer software, programme descriptions and supporting materials for both systems and applications software (including standard software packages, customised software solutions and software embedded in products or equipment).
• The acquisition, in-house development and analysis of computer databases and other computerised information, including the collection and analysis of data in proprietary computer databases and data obtained from publicly available reports or the Internet.
GLOSSARY OF TERMS │ 253
OSLO MANUAL 2018 © OECD/EUROPEAN UNION 2018
• Activities to upgrade or expand the functions of information technology systems, including computer programmes and databases. This includes statistical data analysis and data mining activities.
Software development is an innovation activity when used to develop new or improved business processes or products, such as computer games, logistical systems, or software to integrate business processes. Database activities are an innovation activity when used for innovation, such as analyses of data on the properties of materials or customer preferences.
Standards Document, established by consensus and approved by a recognized body, that provides, for common and repeated use, rules, guidelines or characteristics for activities or their results, aimed at the achievement of the optimum degree of order in a given context.
Statistical unit A statistical unit is an entity about which information is sought and for which statistics are ultimately compiled; in other words, it is the institutional unit of interest for the intended purpose of collecting innovation statistics. A statistical unit can be an observation unit for which information is received and statistics are compiled, or an analytical unit which is created by splitting or combining observation units with the help of estimations or imputations in order to supply more detailed or homogeneous data than would otherwise be possible.
Stratified sample A stratified sample is a sample selected from a population which has been divided into separate groups (“strata”) to control the representation of key sub-populations. Separate samples are drawn from each stratum and the target sample size for each will depend on precision criteria, as well as on the number of units, the size of the units and the variability of the main variables of interest within each stratum.
Subject-based approach The subject approach focuses on the firm (the subject) and collects data on all its innovation activities. See also Object-based approach.
Success of innovations Success of innovations refer to economic returns generated by the commercialisation or the internal use of innovations. The definition of business innovation does not require an innovation to be a commercial, financial or strategic success at the time of measurement. A product innovation can fail commercially or a business process innovation may require more time to meet its objectives.
Suppliers Suppliers are firms or organisations that supply goods (equipment, materials, software, components etc.) or services (consulting, business services, etc.) to other firms or organisations. This includes providers of knowledge-capturing products such as intellectual property rights.
Survey frame The frame population is the set of target population members that has a chance to be selected into the survey sample.
System of National Accounts (SNA)
The System of National Accounts (SNA) is a statistical framework that provides a comprehensive, consistent and flexible set of macroeconomic accounts for policymaking, analysis and research purposes. The most recent version is the 2008 SNA.
Tangible assets See Activities related to the acquisition or lease of tangible assets.
Technological capabilities Technological capabilities include knowledge about technologies and how to use them, including the ability to advance technologies beyond the state of the art. Technological capabilities include (i) technical expertise; (ii) design capabilities; and (iii) capabilities for the use of digital technologies and data analytics. See also Technology.
254 │ GLOSSARY OF TERMS
OSLO MANUAL 2018 © OECD/EUROPEAN UNION 2018
Technical expertise Technical expertise consists of a firm’s knowledge of and ability to use technology. This knowledge is derived from the skills and qualifications of its employees, including its engineering and technical workforce, accumulated experience in using the technology, the use of capital goods containing the technology, and control over the relevant intellectual property. See also Technology.
Technology Technology refers to the state of knowledge on how to convert resources into outputs. This includes the practical use and application to business processes or products of technical methods, systems, devices, skills and practices.
Training See Employee training activities.
Unit non-response When a sampled unit that is contacted does not respond to a survey.
User innovation User innovation refers to activities whereby consumers or end-users modify a firm’s products, with or without the firm’s consent, or when users develop entirely new products.
Value creation The existence of opportunity costs implies the likely intention to pursue some form of value creation (or value preservation) by the actors responsible for an innovation activity. Value is therefore an implicit goal of innovation, but cannot be guaranteed on an ex ante basis. The realisation of the value of an innovation is uncertain and can only be fully assessed sometime after its implementation. The value of an innovation can also evolve over time and provide different types of benefits to different stakeholders.

OECD PUBLISHING, 2, rue André-Pascal, 75775 PARIS CEDEX 16
(92 2018 03 1 P) ISBN 978-92-64-30455-0 – 2018

The Measurement of Scientific, Technological and Innovation Activities
Oslo Manual 2018GUIDELINES FOR COLLECTING, REPORTING AND USING DATA ON INNOVATION
The Measurement of Scientific, Technological and Innovation Activities
Oslo Manual 2018GUIDELINES FOR COLLECTING, REPORTING AND USING DATA ON INNOVATION4th EDITION
What is innovation and how should it be measured? Understanding the scale of innovation activities, the characteristics of innovative fi rms and the internal and systemic factors that can infl uence innovation is a prerequisite for the pursuit and analysis of policies aimed at fostering innovation. First published in 1992, the Oslo Manual is the international reference guide for collecting and using data on innovation. In this fourth edition, the manual has been updated to take into account a broader range of innovation-related phenomena as well as the experience gained from recent rounds of innovation surveys in OECD countries and partner economies and organisations.
ISBN 978-92-64-30455-092 2018 03 1 P
Consult this publication on line at https://doi.org/10.1787/9789264304604-en.
This work is published on the OECD iLibrary, which gathers all OECD books, periodicals and statistical databases.Visit www.oecd-ilibrary.org for more information.
9HSTCQE*daeffa+
Oslo
Man
ual 2018
Th
e Measu
rement o
f Scientific, Tech
nolo
gical an
d In
novation A
ctivities
4th Edition