temporal isotopic variations of dissolved silicon in a pristine boreal river
TRANSCRIPT

Chemical Geology 271 (2010) 142–152
Contents lists available at ScienceDirect
Chemical Geology
j ourna l homepage: www.e lsev ie r.com/ locate /chemgeo
Temporal isotopic variations of dissolved silicon in a pristine boreal river
Emma Engström a,b,⁎, Ilia Rodushkin a,b, Johan Ingri a, Douglas C. Baxter b, Frauke Ecke a,c,Heléne Österlund a,b, Björn Öhlander a
a Division of Applied Geology, Luleå University of Technology, S-971 87 Luleå, Swedenb ALS Laboratory Group, ALS Scandinavia AB, Aurorum 10, S-977 75 Luleå, Swedenc Department of Aquatic Sciences and Assessment, Swedish University of Agricultural Sciences, Box 7050, S-750 07 Uppsala, Sweden
⁎ Corresponding author. ALS Laboratory Group, ALS Sca75 Luleå, Sweden. Tel.: +46 920 289976; fax: +46 920 2
E-mail addresses: [email protected], e(E. Engström).
0009-2541/$ – see front matter © 2010 Elsevier B.V. Adoi:10.1016/j.chemgeo.2010.01.005
a b s t r a c t
a r t i c l e i n f oArticle history:Received 9 April 2009Received in revised form 11 November 2009Accepted 7 January 2010
Editor: B. Bourdon
Keywords:Silicon isotopic compositionDissolved SiBiogenic silicaSubarctic river systemBiogeochemical Si cycleMC-ICPMS
It has previously been concluded that the stable Si isotopes are fractionated during geochemical andbiogeochemical elemental transfers, such as weathering and precipitation of clays and biogenic Si, which hasopened up the possibility of using Si as a tracer in natural terrestrial ecosystems. Furthermore, quantificationof the biogenic impact on the biogeochemical Si cycle has attracted significant scientific interest sincebiological control has been suggested. Previous observations of seasonal variations in the dissolved Siisotopic pattern further imply that high-frequency riverine sampling during main hydrological events mightprovide important information about natural processes governing the fluvial biogeochemical Si cycle.Therefore, temporal variations in the isotopic composition of riverine dissolved Si were investigated for theKalix River, Northern Sweden, the largest pristine river system in Europe, based on high-frequency samplingduring a period of 25 weeks from early April to early October 2006. Temporal variations spanning 0.4‰ forδ29Si and 0.8‰ for δ30Si of dissolved Si in the Kalix River were observed during the period, suggesting thatthe riverine dissolved Si input to the oceans cannot be considered to have a constant Si isotopic compositionon a short time scale.The results implicate biogeochemical Si-cycling via formation and dissolution of biogenic silica as processessignificantly affecting the dissolved Si transport in boreal systems during April to early October. The Sibudget in the river system appeared to be controlled by relative Si enrichment during high discharge eventsand relative Si depletions in the subarctic mountainous and lake dominated areas. The Si enrichments anddepletions were accompanied by decreasing and increasing riverine δ29Si and δ30Si, respectively. Theseisotope variations can be explained by release of plant derived silica, depleted in heavier Si isotopes, duringthe spring snowmelt. Further, increased volumetric contribution from the headwater and losses of dissolvedSi due to biogenic silica formation by diatoms in the subarctic lakes at a later period are expected to beresponsible for the preferential losses of lighter isotopes, as further verified by land cover analysis.
ndinavia AB, Aurorum 10, [email protected]
ll rights reserved.
© 2010 Elsevier B.V. All rights reserved.
1. Introduction
It is well recognized that oceanic and atmospheric CO2 concentra-tions, on a long time scale, are influenced by weathering of primarysilicate minerals (Berner et al., 1983). This links the global Si- and C-cycles, through weathering of silicate minerals as well as biominer-alization (i.e. biogenic formation of amorphous silica) (Berner, 1997;Ittekkot et al., 2000), and calls for better knowledge of the processescontrolling riverine dissolved Si input from primary and secondarysources.
The Earth's crust is composed of approximately 29% Si by mass,making it the second most abundant element after O (Sommer et al.,
2006), which results in a large number of secondary Si pools, e.g. soils,marine- and freshwaters, groundwater, soil solution and vegetation,reflecting the importance of Si in geochemical and biogeochemicalprocesses.
Large quantities of silicic acid, derived ultimately from weatheringof continental primary silicate minerals, are cycled by terrestrialvegetation through uptake of Si present in the soil solution, pre-concentration and finally precipitation of hydrated amorphous silica(called phytoliths) (Alexandre et al., 1997; Farmer et al., 2005; Derryet al., 2005). After plant death or during autumn litter fall in borealforests, the silica is returned to the soil profile. Dissolved silica fromthe soil solution is transported via streams to rivers which supply theworld's oceans, with approximately 80% of the total input of Si fromprimary and secondary weathering products on continents (Trégueret al., 1995). The presence of dissolved Si is crucial for freshwater- andmarine ecosystems, due to its role as nutrient for siliceousphytoplankton. However, the effect of the terrestrial biogeochemical

143E. Engström et al. / Chemical Geology 271 (2010) 142–152
Si cycle, including internal cycling by vegetation and diatoms(Sommer et al., 2006; Gérard et al., 2008), on the global (and riverine)Si cycle remains unclear.
Since it has been concluded that elemental transfer can beassociated with isotopic fractionation (De La Rocha et al., 1997;Ziegler et al., 2005a; Opfergelt et al., 2006a), the Si isotope systemoffers potential for better understanding of processes governing Sifate in terrestrial andmarine systems. Also documented differences inthe Si isotopic composition of secondary silica pools and the principalmineral sources (Basile-Doelsch, 2006 and references cited therein)may be useful in tracing of Si sources. However, despite this largescientific potential, our knowledge of isotope effects in the biogeo-chemical cycle of Si is still rather limited as a result of difficulties inseparating biogenic and mineral secondary sources, as well asanalytical problems outlined below.
The dearth of studies presenting riverine Si isotopic compositions(De La Rocha et al., 2000; Ding et al., 2004; Georg et al., 2006) is aconsequence of the analytical difficulties in acquiring accurate dataand the hazardous nature of conventional sample preparationmethods (De La Rocha et al., 1996). Nevertheless the available data
Fig. 1. Kalix and Torne River catchments with localities of the discharge monitoring stations
for river water have demonstrated an enrichment of the heavierisotopes in comparison to primary minerals (De La Rocha et al., 2000;Ding et al., 2004; Georg et al., 2006), potentially as a result ofpreferential incorporation of 28Si in secondary minerals (Ziegler et al.,2005a), vegetation (Opfergelt et al., 2006a) and diatoms (De La Rochaet al., 1997). Georg et al. (2006) reported seasonal variations in excessof 0.6‰ for δ30Si, demonstrating that the riverine dissolved load of Sihas variable isotopic composition. Seasonal variations in dissolved Siisotopic composition, combined with hydrological parameters, maybe used for studying geochemical and biogeochemical processes govern-ing the riverine Si concentration and isotopic composition by monitoringtemporal patterns of riverine δ29Si and δ30Si (Georg et al., 2006).
Recently we have reported on the Si isotopic composition ofrepresentative biomass components in a boreal forest in NorthernSweden (Engström et al., 2008). The surprisingly homogenous Siisotopic composition of the eight most prolific species in the borealforest allows biogenic Si information to be used when estimatingrelative contributions from biogenic and mineral Si in river water.
To evaluate temporal variations in the dissolved Si isotopiccomposition of subarctic river waters, the largest unregulated water
(Stations 1–6), the sampling point (Station 6; Kamlunge) and sub-catchment areas I–VI.

144 E. Engström et al. / Chemical Geology 271 (2010) 142–152
system in Europe, the Kalix River in Northern Sweden, was sampled athigh frequency during the major hydrological event in the boreal zone,namely the melt water discharge in spring. Multi-elemental analysisand discharge normalization using Mg (Ingri et al., 2005) allowedestimation of seasonal patterns of relative enrichment or depletion ofdissolved Si. Division of the catchment area and quantification ofvolumetric contributions from the resultant river segments allowedidentification of areas significantly affecting the riverine Si budget, aswell as its isotopic composition. Additionally, to verify our results landcover analysis was performed.
2. Sampling and methodology
2.1. Study area
The boreal, subarctic and oligotrophic Kalix and Torne rivers arethe last major unregulated water systems in Europe, originating inthe approximately 400 Ma old Caledonianmountains. The Kalix Rivercatchment is situated in Northern Sweden between ∼N66°9′–N67°28′ and E19°54′–23°23′ and the location of the water samplingpoint (Station 6) is shown in Fig. 1. The rivers are connected by abifurcation, the Tärendö River, throughwhich an average 59% (2006)of the water from the Torne River catchment area is drained. Thecontribution from Tärendö River during 2006 to Kalix River isgreatest (∼75%) during base flow and reaches a minimum (∼50%) inearly June (snowmelt period). The Kalix River catchment area is18,130 km2 and the Torne River catchment above the bifurcation(Tärendö River) is 10,028 km2. The Kalix River catchment area ispositioned in the subarctic (boreal) climate zone (Peel et al., 2007),and in excess of 90% of the area is located above the Arctic Circle.Quaternary deposits in the area consist primarily of till, showingwelldeveloped podzol profiles (Fromm, 1965).
The bedrock in the various areas exhibits significant differences. Inthe headwater region, in the Caledonian mountain range (Fig. 1), thedominant rock types are mica schist, quartzite and metamorphic maficrocks (Gee and Zachrisson, 1979). Around Lake Torneträsk, outcrops ofdolomite and limestone are found (Kulling, 1964). Above the inflow ofthe Kaitum River to the Kalix River, approximately 1.9 Ga old rocks arefound, with alternating acid, intermediate and volcanic rock. Granites ofsimilar age as the volcanic rocks dominate in the forest areas closer tothe coastline, below the Kaitum inflow.
2.2. Quantification of area-specific water contributions and land covertypes in the catchment
For the purpose of quantifying the time-specific water contributionfrom different areas, the catchments were divided into six areas (I–VI)
Table 1Presentation of area-specific percentage land cover.
Land cover types Area I Area II Area III Area IV
Lakes (%) 5.7 14.9 5.9 5.5Boreal forests (%) 50.1 24.7 25.8 22.5Cultivated (%) 0.2 0.0 0.0 0.0Open land (%) 0.7 0.3 0.4 0.2Mountainous (%) 22.2 56.0 62.0 62.4Glaciers (%) 0.3 0.7 1.8 0.7Mires (%) 17.1 3.3 3.7 7.7Forest covered mires (%) 3.6 0.1 0.4 1.1
(−) Indicates negative correlation; (+) positive correlation.( ) Time-specific variation in the percentage water contribution from the specified LCT is b
a The regressions were performed using re-calculated δ29Si-values.b Presentation of the resulting R2 from linear regression of the enrichment/depletion of dc Presentation of the resulting R2 from linear regression of δ29Si (‰) and land cover type
(Fig. 1) based on the geographic positions of the Swedish MetrologicalandHydrological Institute (SMHI) dischargemonitoring stations shownin Fig. 1.
The discharge monitoring stations represented the outflow pointsof the created sub-catchments. Catchment areas for Kalix and Tornerivers were provided by SMHI. In the ArcGIS software (EnvironmentalSystems Research Institute, 2006) the catchments were divided intosub-catchments draining to the discharge monitoring stations using adigital elevation model in the watershed tool. The resulting sub-catchments were adjusted and verified with flow direction vectorsderived from a topographic map on streams. The sub-catchmentspecific relative area of eight land cover types (Table 1) was extractedfrom the Swedish Road Map provided by the Swedish National LandSurvey.
The area-specific relative water contribution was calculated byquantifying the discharge increase between two adjacent dischargemonitoring stations. A water transport time has been added to themodel, estimated using the time of concentration approach (Shaw,1983), to quantify the water contributions from different areas at oursampling point. The transport time is estimated using the averageslope and length of the river segment according to the followingrelationship:
Tc = 0:00025⋅ LffiffiffiS
p� �0:8
ð1Þ
where L and S represent the length of the river segment and theaverage slope, respectively (Shaw, 1983). The relative water con-tributions at the sampling station, corrected for the transport time, arepresented in Table 2. Calculations of the temporal percentage watercontribution from a specified land cover type were performed bymultiplying the time-specific percentage water contributions fromareas I–VI, with the corresponding percentages of the specified landcover type. Then, by summing the resulting area-specific percentage,the temporal percentage from a specific land cover was quantified(data not shown).
2.3. Sampling
The sampling point (Station 6 in Fig. 1) on the Kalix River, Kamlungerapids, was ice covered until May, whereby the first ice-free samplewastakenMay 1st, 2006. Samples were collected at aminimum of 4 m fromland. The sampling equipment was completely metal-free, and thecollectionvesselwasacid-washedand rinsedwithMilli-Qbetweeneachsampling occasion.
Water samples were filtered through 0.22 μm nitrocellulosefilters with 142 mm diameter (Millipore) in a clean laboratory
Area V Area VI Linear regression Linear regression
Si enr./depl. (%) δ30Si (‰)a
LCTb LCTc
5.4 3.1 R2=0.76 (−) R2=0.62 (+)60.6 66.3 R2=0.75 (+) R2=0.58 (−)0.1 0.4 (R2=0.70 (+)) (R2=0.63 (−))1.1 1.4 (R2=0.79 (+)) (R2=0.60 (+))2.5 0.5 R2=0.73 (−) R2=0.55 (+)0.0 0.0 (R2=0.59 (−)) (R2=0.43 (+))
23.5 21.5 R2=0.72 (+) R2=0.53 (−)6.8 6.8 R2=0.76 (+) R2=0.56 (−)
1%.
issolved Si (%) and land cover type (LCT) (%).(LCT) (%).

Table 2Summary of temporal physical and chemical parameters, as well as calculated water contributions from areas I–VI.
Sampling date2006
Temp.(°C)
pH(1)
Specific conductivity(μS/cm−1)
DOC(mg l−1)
Discharge a
(m3/s−1)Water contr.Area I(%)
Water contr.Area II(%)
Water contr.Area III(%)
Water contr.Area IV(%)
Water contr.Area V(%)
Water contr.Area VI(%)
April 4th 0.00 7.07 54.7 3.0 56.0 11.0 26.7 9.1 6.1 21.0 26.1April 9th 0.00 7.07 55.0 2.4 57.2 13.4 24.9 8.9 6.0 23.5 23.3April 17th 0.00 7.10 56.9 3.1 60.0 17.4 23.0 8.4 5.7 35.6 9.8April 24th 0.00 7.00 55.8 2.5 78.0 27.1 13.2 5.2 3.6 50.9 0.0May 1st 0.30 6.68 47.7 3.9 280.4 36.1 4.2 2.4 1.2 30.1 26.1May 4th 0.24 6.48 31.8 6.8 675.3 27.3 1.9 2.5 0.6 18.1 49.6May 7th 1.08 6.42 25.4 6.6 1 111.0 25.1 1.2 4.0 0.6 16.1 53.0May 10th 4.14 6.39 21.1 11.6 1 403.3 25.0 1.1 8.4 1.3 15.8 48.4May 14th 6.07 6.57 21.9 18.2 1 208.7 28.0 2.0 10.4 5.8 11.3 42.6May 18th 5.33 6.65 23.7 10.9 856.7 27.7 3.9 10.5 7.3 13.7 36.8May 22nd 7.68 6.75 25.3 5.5 562.0 26.7 6.6 9.4 6.5 15.1 35.7May 25th 9.32 6.8 26.7 5.0 533.3 24.9 7.2 13.7 5.9 13.3 35.0May 28th 9.47 6.94 26.7 4.9 981.9 23.5 4.7 16.7 5.5 12.0 37.5June 4th 10.34 6.77 24.7 4.8 777.4 28.9 9.4 13.8 9.7 9.8 28.4June 10th 12.66 6.94 28.8 4.6 490.1 26.5 17.2 12.7 8.4 11.1 24.1June 19th 17.18 7.04 30.8 3.6 388.7 25.7 25.2 22.5 14.8 1.5 10.3June 27th 14.94 7.18 34.8 3.2 571.6 29.3 21.4 19.3 13.5 3.2 13.3July 7th 19.00 – 33.1 2.8 381.9 27.7 29.9 12.4 9.4 7.3 13.4July 24th 17.70 7.21 33.9 2.5 311.7 27.0 32.5 14.1 10.1 6.1 10.2August 9th 19.93 7.29 37.4 2.1 176.4 27.2 37.8 12.0 10.7 6.7 5.6August 21st 18.76 7.26 39.1 2.2 159.8 29.3 33.3 12.8 12.7 8.3 3.4September 5th – – 36.0 1.9 160.1 28.1 26.9 11.2 12.4 9.7 11.6September 21st 11.64 6.7 35.0 2.0 211.6 27.0 18.8 18.5 16.7 9.0 9.9October 8th 5.01 7.3 35.7 2.0 253.8 31.2 18.3 13.2 10.4 10.5 16.5
a Discharge data supplied by the Swedish Metrological and Hydrological Institute (SMHI).
145E. Engström et al. / Chemical Geology 271 (2010) 142–152
(Class 10 000) within 12 h of collection. The samples were stored inacid-washed polyethylene bottles at 4–8 °C prior to isotopic andmulti-elemental analyses.
2.4. Instrumentation
The single-collector, double-focusing, inductively coupled plasma-sector field mass spectrometry (ICP-SFMS) instrument used in thisstudy for the determination of elemental concentrations was anElement2 (Thermo Fisher Scientific, Bremen, Germany). The intro-duction system consisted of a double-pass Scott type water cooledspray chamber, low-flow PFA microconcentric nebulizer (ElementalScientific Inc., Omaha, NE) and a peristaltic pump operating at a flowrate of 0.2–0.3 ml min−1. Elemental analyses were performed inmedium and high-resolutionmodes. Further operating conditions andmeasurement parameters are detailed elsewhere (Rodushkin et al.,2000; Stenberg et al., 2004; Engström et al., 2008).
The Si isotopic compositions were determined by multi-collectorinductively coupled plasma-sector field mass spectrometry (MC-ICP-MS) using a Neptune (Thermo Fischer Scientific) in high-resolutionmode (Weyer and Schwieters, 2003). A platinum guard electrode(CD-system activated) and Ni skimmer X-cone served to maximizethe sensitivity. Instrumental operating conditions and measurementparameters are detailed in Engström et al. (2008). Additionalinformation about the Si isotopic analyses by MC-ICP-MS is given inSection 2.7.
2.5. Determination of chemical and physical characteristics
A Hydrolab MS5, with a Surveyor 4 display unit (Hach Environ-mental, Loveland, CO, USA), was used tomonitor specific conductivity,temperature and pH on every sampling occasion. Since the specificconductivity constantly was less than 60 μS/cm, the MS5 had to beequipped with a low ionic strength reference. The concentration ofdissolved organic carbon, DOC, was determined at Umeå MarineSciences Centre, Norrbyn, Sweden using a Shimadzu TOC-5000 hightemperature catalytic oxidation instrument with non-dispersiveinfra-red detection.
The determination of major, minor and trace elements wasperformed by ICP-SFMS using external calibration combined withinternal standardization. The samples were prepared by 10-folddilution and internal standard (In) was added to a final concentrationof 2.5 μg l−1. All samples and standards were matrix matched to aHNO3 concentration of 0.3 M. Both filtered and unfiltered sampleswere analyzed.
2.6. Chemical purification prior to Si isotope analyses
The silicon purification procedure, based on strong-base anion-exchange chromatography, is thoroughly detailed elsewhere(Engström et al., 2006). Briefly, the samples were matrix matchedto 5.6 mM HF (sp) prior to sample loading. The amount of resin wasincreased to 1.0 g due to the requirement for increased samplevolume. Approximately 130 ml water sample was loaded on thecolumn, corresponding to 140–580 μg Si depending on the Siconcentration. Silicon was eluted in a 0.16 M HNO3 (sp) and 5.6 mMHF (sp) matrix using a fraction volume of 10 ml after 5 ml had passedthrough the column. The resulting Si concentration in the purifiedfraction was approximately 33 mg l−1. The average recovery duringthe Si purification was 99%. The collected fraction was additionallyanalyzed using ICP-SFMS to verify the absence of matrix- andinterfering elements.
2.7. Silicon isotopic analyses using MC-ICP-MS
Spectral interferences (see Engström et al., 2006) on 28Si, 29Si and30Si can result in significant problems with measurement accuracy forthe isotope ratios 29Si/28Si and 30Si/28Si if not quantitatively resolved.The intensity of the spectral interferences consisting of oxides andhydrides can be significantly reduced using a desolvating nebulizersystem as employed by Cardinal et al. (2003). Using a conventionalintroduction system a mass resolution in excess of 3500 (according tothe conventional definition, i.e. m/Δm) is required for quantitativeresolution of isobaric interferences. The molecules 14N16O+ (requiredresolution of 1240) on 30Si and 28Si1H+ (3510) on 29Si constitute themost challenging interferences due to their magnitude and low mass

146 E. Engström et al. / Chemical Geology 271 (2010) 142–152
difference (0.0083 amu), respectively. The pseudo-high resolutioncapability of the Neptune MC-ICP-MS used during this study allowsinterference-freemeasurement of 28Si, 29Si and 30Si. However, the limitedwidth of the interference-free plateau requires high mass calibrationstability during the isotope analyses. Even though the high-resolutioncapability of theNeptune allows interference-freemeasurements of the Siisotopes (Engström et al., 2006), the condition of the high-resolution slitduring the period ofmeasurement is of the utmost importance. From ourexperience, performance of the slit starts to deteriorate after approxi-mately 60–80 h of measurements. As a result, complete elimination oftailing from the abundant 14N16O+ interference on 30Si may not alwayshavebeenachieved. Therefore, during the interpretationof the results, re-calculated δ30Si (δ30Si=δ29Si·1.964; Young et al., 2005), from the moreaccurate δ29Si were utilized. Measured δ30Si are reported in Table 3 alongwith δ29Si for comparative purposes.
Dilution and spiking of the samples, working- and isotopicstandards were additionally diluted to a silicon concentration of2.5 mg l−1 before spiking themeasurement solution to 2.5 mg l−1 Mgand matrix matching to 0.08 M HNO3. Typical sensitivity for 28Siduring the measurement sessions averaged 8 V per mg l−1.
The resulting Si isotope abundance ratios 29Si/28Si and 30Si/28Si areexpressed according to the conventional δ-notation in units per milusing NBS28 as the standard, i.e.
δxSi =ðxSi=28SiÞsample
ðxSi=28SiÞNBS28−1
" #⋅1000‰ ð2Þ
where x corresponds to 29 or 30, and the experimental ratios havebeen corrected for mass bias according to an exponential model usingMg as internal standard (Baxter et al., 2006).
Outliers were eliminated at the integration, cycle and block levelsusing the 2σ criterion in the Neptune software. All Si fractions havebeen analyzed in duplicate. The instrumental long-term reproduc-ibility, expressed as twice the standard deviation for the reference
Table 3Temporal elemental concentrationsa, as well as Si isotopic composition, expressed as δ2
concentrations is expressed as 1σ. For δ29Si and δ30Si, the uncertainty is expressed as 2σ astandard deviation falls below the external reproducibility of the standardc, this parameter
Sampling date2006
Si(1σ)(μg l−1)
Ca(1σ)(μg l−1)
Na(1σ)(μg l−1)
K(1σ)(μg l−1)
Al(1σ)(μg l−1)
April 4th 4536 (108) 6651 (247) 2350 (123) 822 (6) 6.34 (0.April 9th 4504 (5) 6508 (323) 2413 (69) 842 (7) 5.94 (0.April 17th 4335 (20) 6622 (121) 2376 (102) 822 (37) 5.74 (0.April 24th 4208 (32) 6526 (95) 2396 (68) 837 (14) 6.24 (0.May 1st 3782 (72) 5555 (47) 2045 (138) 833 (23) 13.8 (0.May 4th 3144 (65) 3520 (63) 1488 (56) 721 (30) 27.7 (0.May 7th 2457 (19) 2869 (66) 1118 (32) 679 (32) 29.2 (0.May 10th 2095 (21) 2254 (57) 958 (53) 667 (41) 27.2 (1.May 14th 2089 (18) 2375 (256) 932 (54) 625 (13) 29.3 (1.May 18th 2187 (27) 2810 (34) 1055 (35) 563 (36) 26.8 (0.May 22nd 2196 (139) 2900 (58) 1090 (32) 546 (45) 22.5 (0.May 25th 2246 (52) 2965 (69) 1116 (40) 567 (12) 19.9 (1.May 28th 2284 (81) 3053 (88) 1090 (114) 545 (12) 20.5 (1.June 4th 1946 (8) 2884 (9) 1091 (12) 443 (6) 22.7 (0.June 10th 1894 (46) 3235 (20) 1204 (63) 503 (3) 15.7 (0.June 19th 1825 (11) 3406 (43) 1233 (43) 516 (11) 10.8 (0.June 27th 1667 (16) 3594 (136) 1269 (22) 511 (4) 8.07 (0.July 7th 1594 (56) 3872 (60) 1256 (12) 492 (6) 6.87 (0.July 24th 1535 (17) 4148 (60) 1249 (24) 476 (14) 4.67 (0.August 9th 1294 (19) 4402 (35) 1270 (30) 511 (11) 1.43 (0.August 21st 1167 (15) 4620 (34) 1308 (24) 543 (6) 2.18 (0.September 5th 1036 (11) 4452 (267) 1334 (57) 552 (17) 0.64 (0.September 21st 1381 (15) 4206 (138) 1280 (12) 552 (9) 2.56 (0.October 8th 1710 (27) 3960 (69) 1274 (25) 558 (7) 3.91 (0.
aData have not been corrected for wet depositional input (Ingri, 1996; Ingri et al., 2005).dMeasured δ30Si are reported for comparative reasons, re-calculated δ30Si from measuredregression of the experimental δ29Si and δ30Si yielded a mass dependent fractionation line
material NBS28 (n=6) measured on three different days was 0.06‰for δ29Si and 0.18‰ for δ30Si.
3. Results and discussion
3.1. Temporal variations in the discharge and percentage water contributionfrom different areas
Temporal variations in the water discharge of three representativestations (Fig. 1) are shown in Fig. 2. The clear separation of the relativewater contributions from each area (Table 2) is an effect of differencesin hydrological characteristics, location and relative distribution ofland cover types (Table 1). In general, the snow in forest and miredominated area VI melts in early May, whereas the prolonged meltperiod in area IV occurs inMay and June (some years only in June) andarea II in early July. Area II is to a large extent covered by theoligotrophic Lake Torneträsk (area 330 km2) (Lindkvist and Daniels-son, 1987), resulting in a delayed main water discharge due to winterice-cover and prolonged water residence time. Lake Torneträsk is thesixth largest lake in Sweden and the second deepest (maximum andaverage depths 168 and 51.8 m, respectively) (Lindkvist andDanielsson, 1987). Normal break-up of ice in Torneträsk occurs June13th (average from 1872–2005) although in 2006, the lake was ice-free on June 1st. Area IV also encloses a large mountainous lake, LakePaittasjärvi (Fig. 1). During the spring snowmelt in early May thewater contribution from area VI, mainly (N85%) covered by forest andmires, exceeds 50%, while the contributions from area II approach 40%in late July and early August.
3.2. Major element chemistry
The specific conductivity and pH values (Table 2) exhibitsignificant decreases during early May. This period corresponds tothe snowmelt event in the boreal forest and mire dominated area IV(Figs. 1 and 2), which is reflected in the increased DOC values.
9Si and δ30Si, of the Kalix River. The uncertainty for the reported major elementalnd represents the instrumental standard deviationb. In cases where the instrumentalis reported in accordance with the policy outlined by Goldstein et al. (2003).
P(1σ)(μg l−1)
Mg(1σ)(μg l−1)
δ29Si(2σ)(‰)
δ30Sid
(2σ)(‰)
43) 2.26 (0.04) 1599 (76) 0.58 (0.06) c (0.03) b 1.10 (0.18) c (0.06) b
21) 2.25 (0.06) 1609 (36) 0.55 (0.06) c (0.01) b 0.98 (0.18) c (0.06) b
09) 1.6 (0.21) 1565 (26) 0.50 (0.06) c (0.01) b 0.93 (0.18) c (0.01) b
15) 2.19 (0.14) 1548 (17) 0.52 (0.06) c (0.04) b 1.04 (0.18) c (0.07) b
2) 2.11 (0.11) 1323 (67) 0.52 (0.06) c (0.02) b 1.15 (0.18) c (0.06) b
47) 2.64 (0.3) 968 (13) 0.43 (0.06) c (0.03) b 0.73 (0.18) c (0.12) b
83) 2.88 (0.23) 689 (20) 0.39 (0.06) c (0.03) b 0.79 (0.18) c (0.05) b
38) 2.76 (0.53) 583 (31) 0.34 (0.07) b 0.71 (0.18) c (0.12) b
96) 4.05 (0.45) 547 (53) 0.42 (0.06) c (0.03) b 0.73 (0.18) c (0.02) b
51) 2.93 (0.35) 674 (8) 0.40 (0.06) b 0.73 (0.18) c (0.10) b
92) 1.84 (0.06) 673 (23) 0.40 (0.06) c (0.02) b 0.77 (0.18) c (0.01) b
45) 2.26 (0.17) 698 (14) 0.50 (0.10) b 0.98 (0.18) c (0.15) b
54) 1.72 (0.08) 652 (42) 0.50 (0.06) c (0.02) b 0.96 (0.18) c (0.07) b
25) 1.41 (0.02) 662 (6) 0.44 (0.06) c (0.03) b 0.74 (0.18) c (0.11) b
43) 1.34 (0.05) 719 (16) 0.47 (0.06) c (0.02) b 0.86 (0.18) b
18) 1.95 (0.21) 775 (8) 0.60 (0.08) b 0.99 (0.18) c (0.04) b
29) 1.71 (0.1) 798 (13) 0.55 (0.10) b 1.00 (0.18) b
12) 1.38 (0.1) 850 (3) 0.49 (0.10) b 1.01 (0.25) b
07) 1.6 (0.14) 922 (6) 0.70 (0.06) c (0.04) b 1.30 (0.18) c (0.08) b
06) 0.62 (0.03) 937 (33) 0.54 (0.06) c (0.02) b 1.18 (0.18) c (0.06) b
11) 0.8 (0.07) 999 (8) 0.73 (0.06) b 1.51 (0.18) c (0.17) b
03) 0.66 (0) 988 (77) 0.80 (0.06) c (0.04) b 1.41 (0.18) c (0.06) b
08) 1.15 (0.17) 941 (12) 0.65 (0.06) c (0.02) b 1.33 (0.18) c (0.14) b
05) 1.09 (0.04) 903 (13) 0.67 (0.06) c (0.04) b 1.45 (0.18) c (0.06) b
δ29Si are used during the interpretation of the results (see also Section 2.7). Linearof y=1.96x−0.02 (R2=0.89).
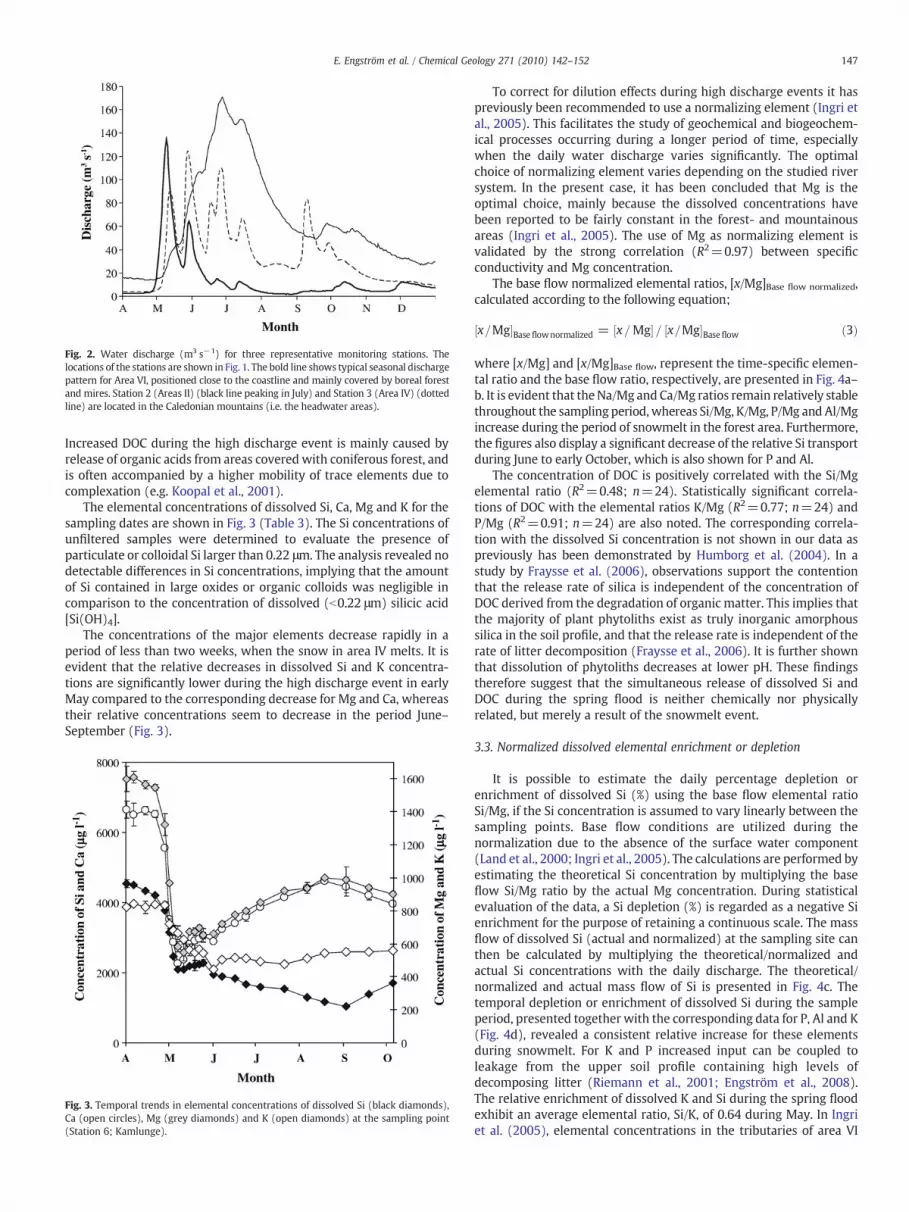
Fig. 2. Water discharge (m3 s−1) for three representative monitoring stations. Thelocations of the stations are shown in Fig. 1. The bold line shows typical seasonal dischargepattern for Area VI, positioned close to the coastline and mainly covered by boreal forestand mires. Station 2 (Areas II) (black line peaking in July) and Station 3 (Area IV) (dottedline) are located in the Caledonian mountains (i.e. the headwater areas).
147E. Engström et al. / Chemical Geology 271 (2010) 142–152
Increased DOC during the high discharge event is mainly caused byrelease of organic acids from areas covered with coniferous forest, andis often accompanied by a higher mobility of trace elements due tocomplexation (e.g. Koopal et al., 2001).
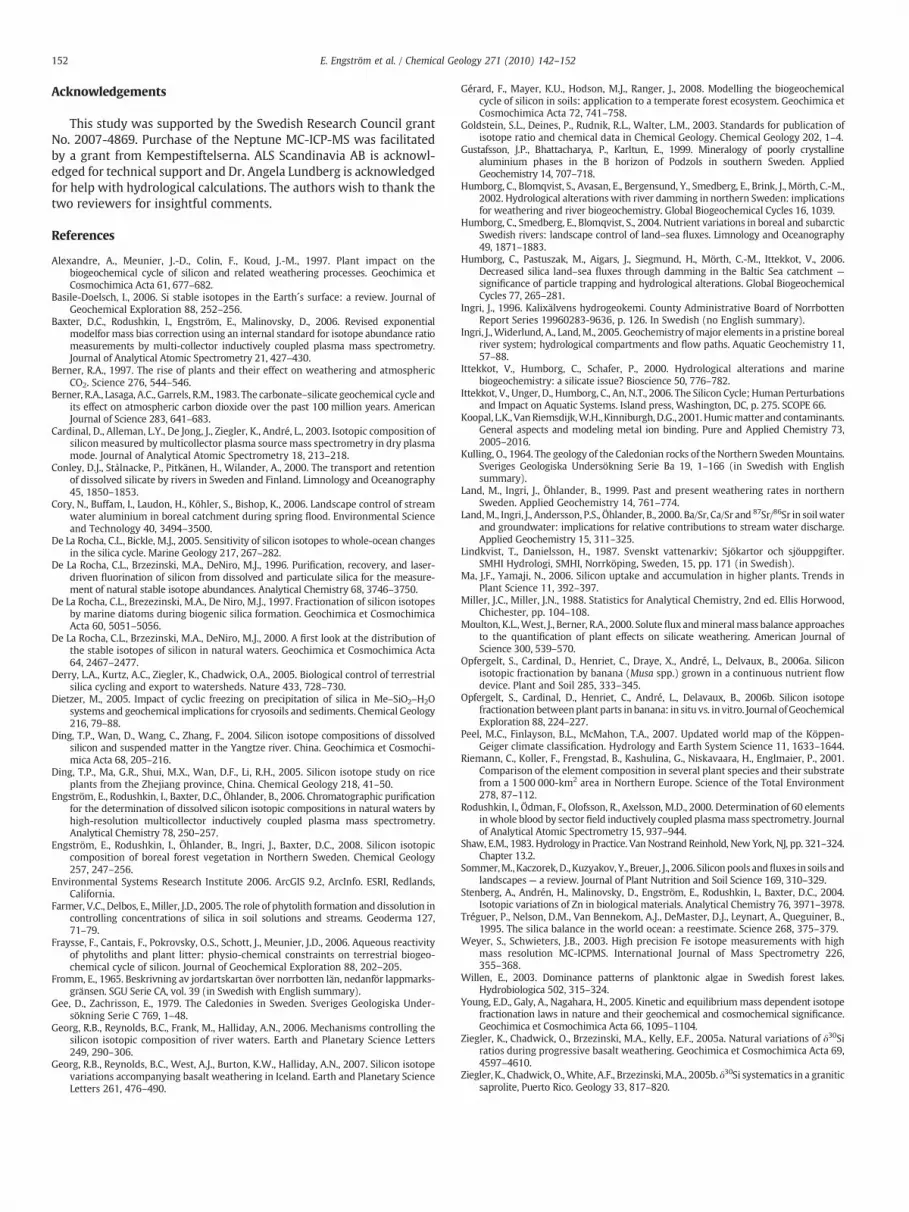
The elemental concentrations of dissolved Si, Ca, Mg and K for thesampling dates are shown in Fig. 3 (Table 3). The Si concentrations ofunfiltered samples were determined to evaluate the presence ofparticulate or colloidal Si larger than 0.22 μm. The analysis revealed nodetectable differences in Si concentrations, implying that the amountof Si contained in large oxides or organic colloids was negligible incomparison to the concentration of dissolved (b0.22 μm) silicic acid[Si(OH)4].
The concentrations of the major elements decrease rapidly in aperiod of less than two weeks, when the snow in area IV melts. It isevident that the relative decreases in dissolved Si and K concentra-tions are significantly lower during the high discharge event in earlyMay compared to the corresponding decrease for Mg and Ca, whereastheir relative concentrations seem to decrease in the period June–September (Fig. 3).
Fig. 3. Temporal trends in elemental concentrations of dissolved Si (black diamonds),Ca (open circles), Mg (grey diamonds) and K (open diamonds) at the sampling point(Station 6; Kamlunge).
To correct for dilution effects during high discharge events it haspreviously been recommended to use a normalizing element (Ingri etal., 2005). This facilitates the study of geochemical and biogeochem-ical processes occurring during a longer period of time, especiallywhen the daily water discharge varies significantly. The optimalchoice of normalizing element varies depending on the studied riversystem. In the present case, it has been concluded that Mg is theoptimal choice, mainly because the dissolved concentrations havebeen reported to be fairly constant in the forest- and mountainousareas (Ingri et al., 2005). The use of Mg as normalizing element isvalidated by the strong correlation (R2=0.97) between specificconductivity and Mg concentration.
The base flow normalized elemental ratios, [x/Mg]Base flow normalized,calculated according to the following equation;
½x=Mg�Base flownormalized = ½x=Mg�= ½x=Mg�Base flow ð3Þ
where [x/Mg] and [x/Mg]Base flow, represent the time-specific elemen-tal ratio and the base flow ratio, respectively, are presented in Fig. 4a–b. It is evident that theNa/Mg and Ca/Mg ratios remain relatively stablethroughout the sampling period,whereas Si/Mg, K/Mg, P/Mg and Al/Mgincrease during the period of snowmelt in the forest area. Furthermore,the figures also display a significant decrease of the relative Si transportduring June to early October, which is also shown for P and Al.
The concentration of DOC is positively correlated with the Si/Mgelemental ratio (R2=0.48; n=24). Statistically significant correla-tions of DOC with the elemental ratios K/Mg (R2=0.77; n=24) andP/Mg (R2=0.91; n=24) are also noted. The corresponding correla-tion with the dissolved Si concentration is not shown in our data aspreviously has been demonstrated by Humborg et al. (2004). In astudy by Fraysse et al. (2006), observations support the contentionthat the release rate of silica is independent of the concentration ofDOC derived from the degradation of organic matter. This implies thatthe majority of plant phytoliths exist as truly inorganic amorphoussilica in the soil profile, and that the release rate is independent of therate of litter decomposition (Fraysse et al., 2006). It is further shownthat dissolution of phytoliths decreases at lower pH. These findingstherefore suggest that the simultaneous release of dissolved Si andDOC during the spring flood is neither chemically nor physicallyrelated, but merely a result of the snowmelt event.
3.3. Normalized dissolved elemental enrichment or depletion
It is possible to estimate the daily percentage depletion orenrichment of dissolved Si (%) using the base flow elemental ratioSi/Mg, if the Si concentration is assumed to vary linearly between thesampling points. Base flow conditions are utilized during thenormalization due to the absence of the surface water component(Land et al., 2000; Ingri et al., 2005). The calculations are performed byestimating the theoretical Si concentration by multiplying the baseflow Si/Mg ratio by the actual Mg concentration. During statisticalevaluation of the data, a Si depletion (%) is regarded as a negative Sienrichment for the purpose of retaining a continuous scale. The massflow of dissolved Si (actual and normalized) at the sampling site canthen be calculated by multiplying the theoretical/normalized andactual Si concentrations with the daily discharge. The theoretical/normalized and actual mass flow of Si is presented in Fig. 4c. Thetemporal depletion or enrichment of dissolved Si during the sampleperiod, presented together with the corresponding data for P, Al and K(Fig. 4d), revealed a consistent relative increase for these elementsduring snowmelt. For K and P increased input can be coupled toleakage from the upper soil profile containing high levels ofdecomposing litter (Riemann et al., 2001; Engström et al., 2008).The relative enrichment of dissolved K and Si during the spring floodexhibit an average elemental ratio, Si/K, of 0.64 during May. In Ingriet al. (2005), elemental concentrations in the tributaries of area VI

Fig. 4. (a) Base flow normalized elemental ratios Si/Mg (black horizontal lines), Ca/Mg (grey diamonds) and K/Mg (open diamonds) and (b) Al/Mg (open diamonds), P/Mg (blackhorizontal lines) and Na/Mg (grey diamonds). The error bars correspond to 1σ (propagated instrumental uncertainty). (c) Actual (black line) and Mg-normalized Si transport inkg day−1 (dotted line) during the period April to early October and (d) the temporal Mg-normalized relative elemental depletions or enrichments of dissolved Si (black horizontallines) (primary axis), K (open diamonds) (primary axis), P (black line) (secondary axis) and Al (grey diamonds) (secondary axis).
148 E. Engström et al. / Chemical Geology 271 (2010) 142–152
show similar ratios, confirming a Si contribution during the snowmeltevent originates from the boreal forests and mires of area IV, close tothe coastline. A significant Si depletion is shown from early June toOctober, implying that the input of Si relative to Mg is decreased. Aland P also show relative depletions during August and September.
The relative enrichment of dissolved Si is negatively correlatedwith the water contributions from area II (R2=0.72), as well as areaIV (R2=0.56), (both dominated by mountains and lakes) indicatingthat these areas exhibit depletion of dissolved Si during the periodfrom June to early October (results of the linear regressions are shownin Table 4). A negative correlation, visually apparent but notstatistically significant at the P=0.1 level (R2=0.29), for thedissolved concentration of Si and the percentage area covered bylakes and reservoirs has been reported previously (Ittekkot et al.,2006). Furthermore, the contribution from area VI exhibits a positivecorrelation (R2=0.66) with the depletion/enrichment of dissolved Si,indicating that water from this region carries a higher Si load. Areas Iand III do not exhibit significant correlations with the relativedepletion/enrichment of dissolved Si (Table 4). From the overall
results, it appears as if the riverine Si budget is mainly controlled bydecreased input or relative losses of dissolved Si in the two lake andmountainous dominated areas (II and IV), and a relative enrichmentof dissolved Si originating from the forest and mire dominated area(VI and V) during the spring snowmelt. The elemental depletions orenrichments of P, K and Al also show significant negative correlationswith the mountainous lake area II (R2=0.50, 0.61 and 0.69, respectively;n=13) and positive correlationswith the boreal forest area VI (R2=0.55,0.67 and 0.75, respectively; n=13), indicative of a contribution of theseelements from forest areas during spring snowmelt.
3.4. Silicon isotopic composition
The results of the Si isotopic composition analysis, expressed asδ29Si and δ30Si, are presented in Table 3 and Fig. 5. The river waterexhibited positive values of δ29Si and δ30Si throughout the samplingperiod (δ29Si and δ30Si averages of (0.53±0.12)‰ and (1.11±0.27)‰, respectively), consistent with previously reported Si isotopiccompositions for natural surface waters (De La Rocha et al., 2000;

Table 4Summary of the results from linear regression analyses of the relative water contributionsversus the enrichment or depletion of dissolved Si and Si isotopic composition.
April–October(n=24)
April–May(n=13)
Late May–August(n=11)
Relative dissolved Si enrichment or depletion (%)Area I Not significant⁎ Not significant⁎ Not significant⁎
Area II R2=0.72 (−) R2=0.58 (−) R2=0.92 (−)Area III Not significant⁎ Not significant⁎ Not significant⁎
Area IV R2=0.56 (−) Not significant⁎ R2=0.41 (−)Area V Not significant⁎ R2=0.57 (−) Not significant⁎
Area VI R2=0.66 (+) R2=0.69 (+) R2=0.87 (+)
δ30Si (‰)a
Area I Not significant⁎ Not significant⁎ Not significant⁎
Area II R2=0.57 (+) R2=0.63 (+) R2=0.58 (+)Area III Not significant⁎ Not significant⁎ Not significant⁎
Area IV R2=0.43 (+) Not significant⁎ R2=0.40 (+)Area V Not significant⁎ Not significant⁎ Not significant⁎
Area VI R2=0.60 (−) R2=0.62 (−) R2=0.63 (−)
Relative dissolved Si enrichment or depletion (%) versus δ30Sia (‰)R2=0.68 (−) – –
(−) Indicates negative correlation; (+) positive correlation.a The regressions were performed using re-calculated δ29Si-values (see also Section 2.7).⁎ Not significant at the 95% confidence level (i.e.R2b0.20 (n=24);R2b0.40 and0.35 for
n=11 and 13) (Miller and Miller, 1988).
Fig. 5. (a) Si isotopic composition expressed as δ30Si (‰) and (b) relative watercontributions for the forestdominatedareaVI (opendiamonds) andmountainous and lakedominated areas II and IV (grey diamonds), as well as the daily water discharge as % ofmaximum (crosses) at the sampling point (Station 6; Kamlunge). From the figure it isvisually evident that an increased contribution from the mountainous lake areas isassociated with an increased δ30Si, while the opposite effect is observed when the watercontribution from the forest area increases.
Fig. 6. Linear regression of the relative enrichment or depletion of dissolved Si versusδ30Si, indicating that a relative depletion is associated with an increased δ30Si, while theopposite is true for a relative Si enrichment.
149E. Engström et al. / Chemical Geology 271 (2010) 142–152
Ding et al., 2004; Basile-Doelsch, 2006; Georg et al., 2006, 2007).Furthermore, the dissolved Si isotopic composition varied significant-ly on a weekly basis during periods with large discharge variations(Fig. 5a and b). These results therefore suggest that daily samplingmight be required during periods with large discharge variations inorder to detect the maximum δ29Si, δ30Si amplitude. The maximumranges of measured δ29Si and δ30Si during the sampling period werein excess of 0.4 and 0.8‰, respectively. In Fig. 5b it is evident that anincreased water contribution from the forest dominated area VI isaccompanied by a decreased δ30Si, while the opposite is true for anincreased water contribution from mountainous and lake dominatedareas.
Including all sampling points, there is no statistically significantcorrelation between the dissolved Si concentration and δ30Si (datanot shown), which has been proposed by De La Rocha et al. (2000) tobe an indication of Si released by weathering. However, due to thesignificance of snowmelt dilutions, this relation may be inapplicableas a weathering indicator in the present system. Theoreticalconstraints of a statistically significant relationship between δ30Siand Si(OH)4, indicative of a system where the level of secondarymineral formation controls the dissolved Si isotopic composition (DeLa Rocha et al., 2000), are constant weathering rate and the absence ofdilution of the weathering derived Si component. Since theseconstraints are not fulfilled in the studied system, this relationshipcould not be utilized for interpretative purposes in the present study.
The isotopic composition of dissolved Si is significantly correlated(R2=0.68; n=24; Fig. 6) with the percentage depletion or enrich-ment of Si, indicating that dissolved Si depletion in the system isassociated with enrichment of the heavier Si isotopes.
As depletion and enrichment of Si were negatively correlated withthe mountainous and lake dominated areas II and IV, and positivelyassociated with the forest and mire dominated area VI (Section 3.3;Table 4), corresponding statistical evaluations were performed forδ30Si versus the water contributions from the sub-catchments (theresults are shown in Table 4). Generally, it was found that anincreased discharge from area VI is accompanied by a decreased δ30Sivalue, while an enhanced contribution from the mountainous andsubarctic lake dominated areas II and IV results in isotopically heavierriverine dissolved Si. Simple linear regression over the total samplingperiod (n=24), reveals a strong overall correlation between δ30Si and
areas II, IV and VI. It is noted that linear regression of δ30Si versus thewater contributions from areas I–VI resulted in significant correlationswith the same areas (II, IV and VI) as the corresponding regressions for

150 E. Engström et al. / Chemical Geology 271 (2010) 142–152
dissolved Si depletion or enrichment. In the following sections thesampling period is divided in three shorter time segments, and morethorough discussions are given.
3.4.1. Silicon isotopic variations during April to early JuneDuring April a constant base flow δ29Si (2σ) or δ30Si (2σ) averaging
(0.56±0.05)‰ and (1.04±0.08)‰, respectively, is observed, whichexceedspreviously reported Si isotopic compositions observedbyGeorget al. (2006) for the corresponding sampling period.
During a period of two weeks (from base flow to early May), δ30Sidecreases bymore than 0.4‰, coincidingwith the dischargemaximum,i.e. the snowmelt event in the boreal forest area VI (Fig. 5a and b). Withreference to Fig. 4c, the total transported amount of Si increases from∼25ton day−1 (corresponding to baseflow transport) to amaximumof∼260ton day−1, and thus approximately 60% of the total Si load duringMay to October is transported during the period from late April to earlyJune (a period of approximately 7 of 25 weeks).
Temporal fluctuations in the Si isotopic composition of the dissolvedphase may reflect shifts in controlling processes, e.g. weathering orbiological uptake of dissolved Si from soil solution or riverine water, orrelative variations in the Si contribution from different, isotopically-distinct sources. Due to the rapid transition from base flow δ30Si to theperiod minimum, it is not likely that variations in biological uptake orweathering rate are responsible for the decreased δ30Si duringsnowmelt.
The formation of clays or precipitation of secondary minerals hasbeen considered to be one of the main processes controlling the Siamount in, as well as Si isotopic composition of soil solution (De LaRocha et al., 2000; De La Rocha and Bickle, 2005; Ziegler et al., 2005a),and it has been suggested that it can be detected by a correlationbetween an increased δ30Si and the Al/Si elemental ratio (Georg et al.,2006). Clear correlation (R2=0.70; n=24) is also evident in our data(linear regression not shown). However, our data also revealed anincreased relative concentration of Al (using Mg normalization tocorrect for the dilution bymelt water) during the high discharge eventin May (Fig. 4). The Al/Mg elemental ratio is strongly correlated withDOC, suggesting a simultaneous leaching during the snowmelt event.In a study by Cory et al. (2006), it is concluded that organiccomplexation of Al controls the dissolved Al concentration in borealstreams, implying that the increased relative Al concentration resultsfrom complexation with organic acids increasing the mobility duringsnowmelt.
The increased concentration of organic acids in the soil solutionmight potentially affect the ratio between dissolved Si and the Siincorporated in clay minerals or adsorbed to solid surfaces, due to theincreased mobility of Al during snowmelt. This might be one of themechanisms explaining the decrease in δ29Si during snowmelt in theforest areas. Furthermore, the Al/Si elemental ratio shows a strongcorrelation (R2=0.69; n=24) with the contribution from area VI,indicating that Al-leaching from the forest area is responsible for theincreased relative concentration of Al in riverine water during thespring flood.
To evaluate the potential effect of reduced secondary mineralformation, the molar ratio between the Si and Al contributions duringspring flood was calculated, resulting in an average value of ∼18.Therefore, the maximum percentage of Si contributed by congruentweathering (i.e. no secondary minerals are formed during theweathering process) is approximately 2.9% of the total Si flow (orapproximately 17.6% of the Si contribution relative to Mg normaliza-tion) during snowmelt in the forest. The calculation is performed bycomputing the theoretical, Mg-normalized Al-contribution duringspring flood, and thereafter multiplying by a representative Si/Al ratiofrom a range of secondary mineral phases in a Swedish podzol profile(e.g. imogolite, allophone, illite, vermiculite) of 0.2–3.0 (Gustafssonet al., 1999). The resulting value represents the Si contributionsupplied by a decreased level of secondary mineral formation. If the
drop in dissolved Si isotopic composition during snowmelt is a result ofvariations in secondary mineral formation, the fractionation level (i.e.difference in δ29Si and δ30Si between product and source) during claymineral formation would not exceed −8.0 and −15.4‰ for δ29Si andδ30Si, respectively, assuming kinetic fractionation. Considering previ-ously reported fractionation levels of between −1.5‰ and −1.1‰ forδ30Si (De La Rocha et al., 2000; Georg et al., 2007), the slow weatheringkinetics (Land et al., 1999), and the fact that the calculations are basedon complete inhibition of clay mineral formation, this mechanismappears to be highly unlikely in the present system.
Spring snowmelt results in an increased leaching of the upper soilprofile during May–June (Land et al., 2000), which previously hasbeen concluded in Section 3.3 and is further verified by increased DOC(Table 2). In fact, quantification of the contribution from soil water(b2.5 m depth) to stream water revealed a N90% contribution fromsoil water during May (Land et al., 2000). It is further noted that theonly regional contribution that reveals a negative correlation with theδ30Si value during the period of snowmelt, significant at the 99%confidence level, is area VI (R2=0.69; n=13). This implies that thelighter Si originates from the upper section of the soil profile in theforest area, having two main sources of dissolved silicic acid in soilsolution. The first source (component 1) is Si released by incongruentand congruent weathering of primary minerals and the second(component 2) is Si released by dissolution of biogenic amorphoussilica (plant phytoliths) present in the upper horizon of the soilprofile. Leaching of pore water with relatively light Si from the uppersoil section is in favourable agreement with the results reported byZiegler et al. (2005a,b). However, in contrast to one study by Ziegleret al. (2005b), concluding that local streams were mainly fed withdeep groundwater, the study by Land et al. (2000) shows that theannual contribution from deep groundwater in the studied catchmentdoes not exceed 15% even during base flow conditions.
The δ30Si value of component 2 can be estimated if δ30Si of the baseflow, the fractions of Si derived from base flow and the snowmelt eventand the contribution during the snowmelt event derived fromweathering and from component 2, are known. Assuming that δ30Si ofcomponent 1, derived from variations in secondary mineral formation,varies from −2.5‰ to 0.0‰ (Basile-Doelsch, 2006) results in a Siisotopic composition of component 2 corresponding to δ30Si of 0.61‰ to0.28‰. With reference to previous results from Si isotopic analyses ofplantmaterial fromNorthern Sweden, ranging from δ30Si of−0.31‰ to0.22‰ (Engström et al., 2008), and possible local variations (Ding et al.,2005), it seems to be highly likely that component 2 has a biogenicorigin.
Furthermore, if it is assumed that the possible effect of variationsin secondarymineral formation is negligible, we end upwith a systemconsisting of only a base flow and a biogenic component. Applyingsimilar isotope mass balance constraints to this system, the resultingisotopic composition of the second component equals 0.25‰, which isin close agreement with the measured Si isotopic composition ofvegetation from the boreal forest (Engström et al., 2008).
3.4.2. Silicon isotopic variations during June, July and AugustThe negative correlation between the enrichment of dissolved Si
and water contributions from areas II and IV (mountainous lakedominated areas) during the sampling period suggests that thesesources contain low relative concentrations of dissolved Si (Table 4).The concentration of dissolved Si also decreases relative to that of K,Ca and Na (Fig. 4). Consequently, an increased water contributionfrom these areas is associated with a decreased relative Si input. It haspreviously been concluded that the concentration of dissolved Siincreases with forest and mire coverage in boreal and subarctic rivercatchments (Humborg et al., 2004), implying that the total outputfrom mountainous areas generally is lower, which is consistent withour data. It is, however, unclear whether the decreased normalized Si

151E. Engström et al. / Chemical Geology 271 (2010) 142–152
concentration is a result of a decreased Si input or Si loss occurring inthese areas, or potentially a combination of both processes.
A decreased relative input from the mountainous areas couldpotentially be explained by differences in weathering intensity incomparison to the vegetated areas (further strengthened by relative Aldepletion in these areas). Sparse vegetation cover in the mountainousareas reduces the concentration of organic acids, potentially decreasingthe mobility of the weathering products and the weathering rate. Anincreasedweathering rate in vegetated areas has beenwell documented(e.g. Moulton et al., 2000). As a consequence, the importance ofincorporation of Si in secondary minerals might be higher in theheadwater areas. Since 28Si is preferentially incorporated in secondarymineral phases, an increased level of secondary mineral formationwould result in an increased δ30Si in the dissolved phase.
An alternative or supplementary explanatory factor might be thatloss of dissolved Si occurs due to seasonal uptake by diatoms, i.e.formationof biogenic silica. A cleardecrease in the Si/Mgelemental ratioin Lake Torneträsk has been detected previously (Ingri et al., 2005),indicativeof a significant consumptionof dissolved Si bydiatoms in LakeTorneträsk. An estimated 35% loss (Ingri, 1996) is, however, consider-ably lower than the calculated Si depletion of ∼60%, which is a result oflower base flow Si/Mg elemental ratio in the outflow from LakeTorneträsk (Ingri, 1996; Ingri et al., 2005). The greater dissolved Sidepletion might also be a result of biogenic silica formation by benthicdiatoms and vegetation during water transport.
Published dominance patterns of Bacillariophycae (diatoms) in LakeAbiskojaure (Willen, 2003), situated in area II, show that the date of theminimum Si/Mg ratio in Lake Torneträsk coincides in time with themaximum biomass of diatoms, which supports the previous suggestionof Si loss due to biogenic uptake.
Large-scale utilization of dissolved Si by diatoms (Bacillariophycae)is associated with an enrichment of heavier isotopes in the remainingdissolved Si (De La Rocha et al., 1997), since preferential uptake of 28Sioccurs. In our system, a significant positive correlation between δ29Siand δ30Si in areas II and IV is evident (Table 4), demonstrating that thedissolved Si depletion is accompanied by an enrichment of the heavierisotopes. From the linear regression slope (data not shown), it is alsoevident that δ30Si increases more rapidly with increasing watercontribution from area IV, which is expected as a result of the largerdissolved Si depletion in comparison to area II.
An additional possible explanation to the increased δ30Si might beconsumption of dissolved Si by terrestrial or aquatic vegetation (Dinget al., 2005; Ma and Yamaji, 2006; Opfergelt et al., 2006a,b).
3.4.3. Silicon isotopic variations during September and early OctoberThe decreased δ30Si is associated with increased discharge and
relative water contribution from the forest area VI, due to heavyautumn rain in the coastal region (Fig. 5). The relative loss of Sidecreases from −63% to −33% (Fig. 4d) during September andOctober, indicating a large contribution from the forest andmire areasduring autumn rain.With reference to the above, the rapid decrease inδ30Si again appears to be a result of leaching of Si from the upper soilprofile in the forest areas.
3.5. Land cover analysis
Inorder toverify ourprevioushypothesesof dissolvedSidepletion inmountainous and lake dominated areas and Si enrichment in forest andmire dominated areas, associated with a depletion and enrichment of28Si, respectively, land cover analysis combined with linear regressionwas performed. The aim of the analysis was to reveal land cover typessignificantly correlated with the enrichment, depletion and isotopiccomposition of dissolved Si. Results of our linear regression analyses ofthe land cover types and dissolved δ30Si or Si depletion/ enrichment arepresented in Table 1 (the underlying calculations are detailed inSection 2.2). In accordance with our previous hypothesis, a dissolved Si
enrichment is associated with an increased contribution from forested,cultivated and mire areas, whereas an increased contribution frommountainous, glacier and lake areas (also shown by Conley et al., 2000)is associated with a relative Si depletion. Furthermore, the analysis alsorevealed a positive correlation between the Si isotopic composition andthe percentage of lake and mountainous cover, which verifies ourprevious conclusion of a relative depletion of 28Si associated with anincreased water contribution from mountainous lake areas. Also inagreementwith our previous assertions, δ29Siwas negatively correlatedwith forest and mire areas.
4. Conclusions
It has previously been considered that the biogeochemical cycle ofSi is of minor importance in the studied region in comparison to thegeochemical cycle, by not considering Si uptake by diatoms and large-scale leaching of biogenic silica from forest dominated areas(Humborg et al., 2002, 2004, 2006). Instead, increased leaching ofdissolved Si from vegetated areas was assumed to predominantly bean effect of increased weathering (Humborg et al., 2004). However,the results of the present study implicate formation and dissolution ofbiogenic silica as processes significantly affecting the geochemistry ofthe investigated river system during the sampling period. The riverinedissolved Si budget appears to be controlled by relative enrichmentsfrom the boreal forest areas and depletions originating in themountainous and subarctic lake areas. The depletion is most likely acombined effect of a decreased input from the headwater areas andlosses of dissolved Si via uptake of Si by diatoms, and is associatedwith an increased δ29Si and δ30Si. An increased water contributionfrom the forest and mire area was instead associated with an elevatedrelative concentration of 28Si, suggesting release of isotopically-lightplant derived Si mainly during the spring snowmelt. These findingsimply that water sources in the subarctic mountainous and lakedominated areas contain dissolved Si exhibiting relative enrichmentof the heavier Si isotopes, whereas isotopically-lighter Si is drainedfrom the forest areas. Land cover analysis confirmed these conclu-sions, verifying that dissolved Si supplied by the forested and mireareas is enriched in 28Si, whereas the mountainous and lake areascontribute with isotopically heavier Si. It should, however, be kept inmind that even though this study suggests that biological cycling of Sihas the potential of significantly affecting the geochemical Si cycle,weathering of Si-containing primaryminerals is the ultimate source ofSi.
Tovalidate the resultsof this study it is recommended thatadditionalanalyses of soil solution, soil and subarctic lake water, mountainousstreamwater, as well as diatoms, are performed. Extended sampling ofmountainous lake water and diatoms would permit potential Si lossesdue to seasonal uptake of dissolved Si(OH)4 by freshwater diatoms to beinvestigated. Furthermore, the determination of chlorophyll a wouldallow seasonal patterns in primary production to be monitored,potentially facilitating the interpretation with respect to the biogeo-chemistry of the system. It must be noted that abiotic and bioticprocesses occurring during the water transport have been neglected inthis study. In order to accurately evaluate the system, these processesmust also be investigated. Potential conversion of dissolved Si toamorphous Si upon freezing (Dietzer, 2005) has not been consideredhere because, even if occurring, the effect would be geographicallyinvariant and thus not affect the interpretation.
The major Si fraction (60% in 7 of 25 weeks) is transported duringthe event of snowmelt. Hence, the biogeochemical cycle, via thedissolution of plant derived Si, significantly affects the Si budget, aswell as the Si isotopic composition, in boreal pristine river systems.With reference to the calculations supporting the contention thatdissolved Si enrichment during the spring flood is a result of leachingof forest derived Si, it can be hypothesized that a large fraction of theSi input to the Baltic Sea has a biogenic origin.
152 E. Engström et al. / Chemical Geology 271 (2010) 142–152
Acknowledgements
This study was supported by the Swedish Research Council grantNo. 2007-4869. Purchase of the Neptune MC-ICP-MS was facilitatedby a grant from Kempestiftelserna. ALS Scandinavia AB is acknowl-edged for technical support and Dr. Angela Lundberg is acknowledgedfor help with hydrological calculations. The authors wish to thank thetwo reviewers for insightful comments.
References
Alexandre, A., Meunier, J.-D., Colin, F., Koud, J.-M., 1997. Plant impact on thebiogeochemical cycle of silicon and related weathering processes. Geochimica etCosmochimica Acta 61, 677–682.
Basile-Doelsch, I., 2006. Si stable isotopes in the Earth´s surface: a review. Journal ofGeochemical Exploration 88, 252–256.
Baxter, D.C., Rodushkin, I., Engström, E., Malinovsky, D., 2006. Revised exponentialmodelfor mass bias correction using an internal standard for isotope abundance ratiomeasurements by multi-collector inductively coupled plasma mass spectrometry.Journal of Analytical Atomic Spectrometry 21, 427–430.
Berner, R.A., 1997. The rise of plants and their effect on weathering and atmosphericCO2. Science 276, 544–546.
Berner, R.A., Lasaga, A.C., Garrels, R.M., 1983. The carbonate–silicate geochemical cycle andits effect on atmospheric carbon dioxide over the past 100 million years. AmericanJournal of Science 283, 641–683.
Cardinal, D., Alleman, L.Y., De Jong, J., Ziegler, K., André, L., 2003. Isotopic composition ofsilicon measured bymulticollector plasma source mass spectrometry in dry plasmamode. Journal of Analytical Atomic Spectrometry 18, 213–218.
Conley, D.J., Stålnacke, P., Pitkänen, H., Wilander, A., 2000. The transport and retentionof dissolved silicate by rivers in Sweden and Finland. Limnology and Oceanography45, 1850–1853.
Cory, N., Buffam, I., Laudon, H., Köhler, S., Bishop, K., 2006. Landscape control of streamwater aluminium in boreal catchment during spring flood. Environmental Scienceand Technology 40, 3494–3500.
De La Rocha, C.L., Bickle, M.J., 2005. Sensitivity of silicon isotopes to whole-ocean changesin the silica cycle. Marine Geology 217, 267–282.
De La Rocha, C.L., Brzezinski, M.A., DeNiro, M.J., 1996. Purification, recovery, and laser-driven fluorination of silicon from dissolved and particulate silica for the measure-ment of natural stable isotope abundances. Analytical Chemistry 68, 3746–3750.
De La Rocha, C.L., Brezezinski, M.A., De Niro, M.J., 1997. Fractionation of silicon isotopesby marine diatoms during biogenic silica formation. Geochimica et CosmochimicaActa 60, 5051–5056.
De La Rocha, C.L., Brzezinski, M.A., DeNiro, M.J., 2000. A first look at the distribution ofthe stable isotopes of silicon in natural waters. Geochimica et Cosmochimica Acta64, 2467–2477.
Derry, L.A., Kurtz, A.C., Ziegler, K., Chadwick, O.A., 2005. Biological control of terrestrialsilica cycling and export to watersheds. Nature 433, 728–730.
Dietzer, M., 2005. Impact of cyclic freezing on precipitation of silica in Me–SiO2–H2Osystems and geochemical implications for cryosoils and sediments. Chemical Geology216, 79–88.
Ding, T.P., Wan, D., Wang, C., Zhang, F., 2004. Silicon isotope compositions of dissolvedsilicon and suspended matter in the Yangtze river. China. Geochimica et Cosmochi-mica Acta 68, 205–216.
Ding, T.P., Ma, G.R., Shui, M.X., Wan, D.F., Li, R.H., 2005. Silicon isotope study on riceplants from the Zhejiang province, China. Chemical Geology 218, 41–50.
Engström, E., Rodushkin, I., Baxter, D.C., Öhlander, B., 2006. Chromatographic purificationfor the determination of dissolved silicon isotopic compositions in natural waters byhigh-resolution multicollector inductively coupled plasma mass spectrometry.Analytical Chemistry 78, 250–257.
Engström, E., Rodushkin, I., Öhlander, B., Ingri, J., Baxter, D.C., 2008. Silicon isotopiccomposition of boreal forest vegetation in Northern Sweden. Chemical Geology257, 247–256.
Environmental Systems Research Institute 2006. ArcGIS 9.2, ArcInfo. ESRI, Redlands,California.
Farmer, V.C., Delbos, E., Miller, J.D., 2005. The role of phytolith formation and dissolution incontrolling concentrations of silica in soil solutions and streams. Geoderma 127,71–79.
Fraysse, F., Cantais, F., Pokrovsky, O.S., Schott, J., Meunier, J.D., 2006. Aqueous reactivityof phytoliths and plant litter: physio-chemical constraints on terrestrial biogeo-chemical cycle of silicon. Journal of Geochemical Exploration 88, 202–205.
Fromm, E., 1965. Beskrivning av jordartskartan över norrbotten län, nedanför lappmarks-gränsen. SGU Serie CA, vol. 39 (in Swedish with English summary).
Gee, D., Zachrisson, E., 1979. The Caledonies in Sweden. Sveriges Geologiska Under-sökning Serie C 769, 1–48.
Georg, R.B., Reynolds, B.C., Frank, M., Halliday, A.N., 2006. Mechanisms controlling thesilicon isotopic composition of river waters. Earth and Planetary Science Letters249, 290–306.
Georg, R.B., Reynolds, B.C., West, A.J., Burton, K.W., Halliday, A.N., 2007. Silicon isotopevariations accompanying basalt weathering in Iceland. Earth and Planetary ScienceLetters 261, 476–490.
Gérard, F., Mayer, K.U., Hodson, M.J., Ranger, J., 2008. Modelling the biogeochemicalcycle of silicon in soils: application to a temperate forest ecosystem. Geochimica etCosmochimica Acta 72, 741–758.
Goldstein, S.L., Deines, P., Rudnik, R.L., Walter, L.M., 2003. Standards for publication ofisotope ratio and chemical data in Chemical Geology. Chemical Geology 202, 1–4.
Gustafsson, J.P., Bhattacharya, P., Karltun, E., 1999. Mineralogy of poorly crystallinealuminium phases in the B horizon of Podzols in southern Sweden. AppliedGeochemistry 14, 707–718.
Humborg, C., Blomqvist, S., Avasan, E., Bergensund, Y., Smedberg, E., Brink, J., Mörth, C.-M.,2002. Hydrological alterations with river damming in northern Sweden: implicationsfor weathering and river biogeochemistry. Global Biogeochemical Cycles 16, 1039.
Humborg, C., Smedberg, E., Blomqvist, S., 2004. Nutrient variations in boreal and subarcticSwedish rivers: landscape control of land–sea fluxes. Limnology and Oceanography49, 1871–1883.
Humborg, C., Pastuszak, M., Aigars, J., Siegmund, H., Mörth, C.-M., Ittekkot, V., 2006.Decreased silica land–sea fluxes through damming in the Baltic Sea catchment —significance of particle trapping and hydrological alterations. Global BiogeochemicalCycles 77, 265–281.
Ingri, J., 1996. Kalixälvens hydrogeokemi. County Administrative Board of NorrbottenReport Series 19960283-9636, p. 126. In Swedish (no English summary).
Ingri, J.,Widerlund, A., Land,M., 2005. Geochemistry ofmajor elements in a pristine borealriver system; hydrological compartments and flow paths. Aquatic Geochemistry 11,57–88.
Ittekkot, V., Humborg, C., Schafer, P., 2000. Hydrological alterations and marinebiogeochemistry: a silicate issue? Bioscience 50, 776–782.
Ittekkot, V., Unger, D., Humborg, C., An, N.T., 2006. The Silicon Cycle; Human Perturbationsand Impact on Aquatic Systems. Island press, Washington, DC, p. 275. SCOPE 66.
Koopal, L.K., VanRiemsdijk,W.H., Kinniburgh,D.G., 2001.Humicmatter andcontaminants.General aspects and modeling metal ion binding. Pure and Applied Chemistry 73,2005–2016.
Kulling, O., 1964. The geology of the Caledonian rocks of theNorthern SwedenMountains.Sveriges Geologiska Undersökning Serie Ba 19, 1–166 (in Swedish with Englishsummary).
Land, M., Ingri, J., Öhlander, B., 1999. Past and present weathering rates in northernSweden. Applied Geochemistry 14, 761–774.
Land,M., Ingri, J., Andersson, P.S., Öhlander, B., 2000. Ba/Sr, Ca/Sr and 87Sr/86Sr in soilwaterand groundwater: implications for relative contributions to stream water discharge.Applied Geochemistry 15, 311–325.
Lindkvist, T., Danielsson, H., 1987. Svenskt vattenarkiv; Sjökartor och sjöuppgifter.SMHI Hydrologi, SMHI, Norrköping, Sweden, 15, pp. 171 (in Swedish).
Ma, J.F., Yamaji, N., 2006. Silicon uptake and accumulation in higher plants. Trends inPlant Science 11, 392–397.
Miller, J.C., Miller, J.N., 1988. Statistics for Analytical Chemistry, 2nd ed. Ellis Horwood,Chichester, pp. 104–108.
Moulton, K.L.,West, J., Berner, R.A., 2000. Solutefluxandmineralmass balance approachesto the quantification of plant effects on silicate weathering. American Journal ofScience 300, 539–570.
Opfergelt, S., Cardinal, D., Henriet, C., Draye, X., André, L., Delvaux, B., 2006a. Siliconisotopic fractionation by banana (Musa spp.) grown in a continuous nutrient flowdevice. Plant and Soil 285, 333–345.
Opfergelt, S., Cardinal, D., Henriet, C., André, L., Delavaux, B., 2006b. Silicon isotopefractionationbetweenplant parts inbanana: in situ vs. in vitro. Journal ofGeochemicalExploration 88, 224–227.
Peel, M.C., Finlayson, B.L., McMahon, T.A., 2007. Updated world map of the Köppen-Geiger climate classification. Hydrology and Earth System Science 11, 1633–1644.
Riemann, C., Koller, F., Frengstad, B., Kashulina, G., Niskavaara, H., Englmaier, P., 2001.Comparison of the element composition in several plant species and their substratefrom a 1500 000-km2 area in Northern Europe. Science of the Total Environment278, 87–112.
Rodushkin, I., Ödman, F., Olofsson, R., Axelsson, M.D., 2000. Determination of 60 elementsinwhole blood by sector field inductively coupled plasmamass spectrometry. Journalof Analytical Atomic Spectrometry 15, 937–944.
Shaw, E.M., 1983. Hydrology in Practice. Van Nostrand Reinhold, NewYork, NJ, pp. 321–324.Chapter 13.2.
Sommer,M., Kaczorek,D., Kuzyakov, Y., Breuer, J., 2006. Siliconpools andfluxes in soils andlandscapes— a review. Journal of Plant Nutrition and Soil Science 169, 310–329.
Stenberg, A., Andrén, H., Malinovsky, D., Engström, E., Rodushkin, I., Baxter, D.C., 2004.Isotopic variations of Zn in biological materials. Analytical Chemistry 76, 3971–3978.
Tréguer, P., Nelson, D.M., Van Bennekom, A.J., DeMaster, D.J., Leynart, A., Queguiner, B.,1995. The silica balance in the world ocean: a reestimate. Science 268, 375–379.
Weyer, S., Schwieters, J.B., 2003. High precision Fe isotope measurements with highmass resolution MC-ICPMS. International Journal of Mass Spectrometry 226,355–368.
Willen, E., 2003. Dominance patterns of planktonic algae in Swedish forest lakes.Hydrobiologica 502, 315–324.
Young, E.D., Galy, A., Nagahara, H., 2005. Kinetic and equilibriummass dependent isotopefractionation laws in nature and their geochemical and cosmochemical significance.Geochimica et Cosmochimica Acta 66, 1095–1104.
Ziegler, K., Chadwick, O., Brzezinski, M.A., Kelly, E.F., 2005a. Natural variations of δ30Siratios during progressive basalt weathering. Geochimica et Cosmochimica Acta 69,4597–4610.
Ziegler, K., Chadwick, O.,White, A.F., Brzezinski,M.A., 2005b. δ30Si systematics in a graniticsaprolite, Puerto Rico. Geology 33, 817–820.