temporal and spatial variation of shore-fast ice in the kara sea
TRANSCRIPT

ARTICLE IN PRESS
0278-4343/$ - se
doi:10.1016/j.cs
�Correspondi75-05-01.
E-mail addre
Continental Shelf Research 24 (2004) 1717–1736
www.elsevier.com/locate/csr
Temporal and spatial variation of shore-fast icein the Kara Sea
Dmitry V. Divinea,�, Reinert Korsnesb, Alexander P. Makshtasc
aNorwegian Polar Institute, Polar Environmental Centre, N-9296 Tromso, NorwaybNorwegian Defense Research Establishment, Division for electronics, Postboks 25, NO-2027Kjeller, Norway
cInternational Arctic Research Center, University of Alaska Fairbanks, 930 Koyukuk Drive, PO Box 757340 Fairbanks,
AK 99775-7335, USA
Received 19 February 2003; received in revised form 15 April 2004; accepted 14 May 2004
Available online 23 August 2004
Abstract
The present study of temporal and spatial variations of shore-fast ice in the Kara Sea includes utilization of aircraft
observations by the Arctic and Antarctic Research Institute (AARI) from 1953 to 1990, and surface brightness
temperature from SSM/I from 1987 to 2001. Analyses of a time series of spatially distributed SSM/I brightness
temperatures provide estimates of the shore-fast ice extent. The present work shows spatial distributions of frequencies
of shore-fast ice coverage in the Kara Sea for each month, and it gives a time series of its area. The fast ice extent in
early spring typically reaches a stable configuration, which falls into one of two different categories (modes) with
significantly different area. The smaller of these two modes tends to appear with increased frequency since 1980. This
gives, for this period, a negative trend in fast ice area during spring. There is a correlation above 0.5 between the average
winter temperature and maximum ice thickness anomalies and fast ice area. Analysis of surface wind data and sea level
pressure indicates that wind during winter controls much of the shore-fast ice development. Specially strong westerly
and southwesterly winds tend to give a smaller fast ice extent than otherwise. Variations in river discharge tend only to
have an observable effect on the ice at the river mouths.
r 2004 Elsevier Ltd. All rights reserved.
Keywords: Fast ice; Ice breakup; Atmospheric forcing; Kara Sea; SSM/I
e front matter r 2004 Elsevier Ltd. All rights reserve
r.2004.05.010
ng author. Tel.: +47-77-75-05-58; fax: +47-77-
ss: [email protected] (D.V. Divine).
1. Introduction
One of the most pronounced features of sea icecover in the Siberian shelf seas is the large zones ofmotionless ice during winter. Such zones appearfrom the Chukchi Sea to the western part of theKara Sea as strips of 10–15 km width along the
d.

ARTICLE IN PRESS
D.V. Divine et al. / Continental Shelf Research 24 (2004) 1717–17361718
shore line (Timokhov, 1994). Islands in the easternKara, Laptev and East-Siberian Seas prevents theice from moving. The extent of fast ice cantherefore reach hundreds of kilometers in thisregion (Zubov, 1945).Knowledge and modeling of the formation and
destruction of shore fast ice have several applica-tions. Fast ice affects navigation. Grounded iceridges (stamukhi), forming at the border of fastice, restrict offshore exploration. Narrow, recur-rent belts of open water and new ice, induced byoff-shore winds, separate the edge of the fast icefrom drifting ice. The relatively warm water,exposed to the cold air, loses significant amountsof heat that induces the new ice formation anddeep water production. This turns such areas intoice and deep water factories, important on regionalas well as local scale (Dethleff et al., 1998;Reimnitz et al., 1994; Martin and Cavalieri,1989; Chapman, 1999). Several authors believethat the regions of fast ice and adjacent quasi-stationary polynyas are significant for uptake ofparticulate materials and contaminants into sea icefrom sea water (Reimnitz et al., 1992, 1995; Eickenet al., 1995). These materials tend to melt out ofthe ice in the Greenland and Barents Sea and mayin this way enter the food web there (Weeks, 1994;Pfirman et al., 1995, 1997a, b; Rigor and Colony,1997; Pavlov and Stanovoy, 2001; Korsnes et al.,2002).Shore-fast ice in the Kara Sea consists predo-
minantly of ice formed in autumn. It starts to formin October–December as a narrow strip up to 1 kmwidth near the shoreline after the quick cooling ofshallow coastal waters. Borodachev (1998) andVolkov et al. (2002) identified two main types offast ice development in the Kara Sea after initialfreezing. The first type of fast ice formation,prevailing in the western part of the Kara Sea, isdue to formation of ice floes of different types andthickness during periods with on-shore winds. Thesecond type is related to formation of stamukhiand surrounding new ice on shallow banks andnear islands in the eastern part of the Kara Sea.The total area of fast ice in the Kara Sea tends
to increase during January to March, except forperiods of partial break-ups. It reaches a stablemaximum in April–May. By this time fast ice
typically extends to the 10m bathymetry line in thewestern part of the Kara Sea. In the eastern part itcan extend to the 20–30m and even 100mbathymetry line near the Archipelago SevernayaZemlya.The break-up of fast ice in the Kara Sea usually
starts in May-June, outside the line of stamukhiand in the vicinity of the Ob and Yenisei riversmouths. The more stable part in the eastern KaraSea breaks up in July and the first 20 days ofAugust. Small areas of fast ice may remain in thenorthern straits of the Archipelago SevernayaZemlya until the end of August or even to thebeginning of the next winter season.The main goal of this paper is to describe the
temporal and spatial variation of fast ice in theKara Sea, mainly in its northeastern part, between1953 and 2001, and to examine the dependence offast ice extent on interannual variations ofmeteorological and hydrological conditions. Thisstudy is based on analysis of Russian ice recon-naissance charts reformatted by the U.S. NationalSnow and Ice Data Center (NSIDC), and of SSM/I surface brightness temperature data.The paper is organized as follows: in Section 2
we describe the data set used, in Section 3 wepresent the results of data analysis on fast iceextent and its sensitivity to changes in meteorolo-gical and hydrological forcing, and discussion andconclusions follow in Section 4.
2. Data sets
2.1. Russian sea ice charts
Between 1953 and 1990, the Arctic and Antarc-tic Research Institute (AARI) regularly observedice conditions in the Siberian shelf seas. Theseobservations included information about shore-fast ice. Observations from aircraft surveys,satellite radar and passive microwave sensors,infrared and other radar surveys from aircraft,coastal radar installations, buoy-mounted instru-mentation and automatic drifting ice stations, aswell as observations from ships and coastalmeteorological stations, were all manually assimi-lated into ice maps.

ARTICLE IN PRESS
D.V. Divine et al. / Continental Shelf Research 24 (2004) 1717–1736 1719
The most common methods of observation wereaircraft surveys and visible and infrared imagesfrom Russian ‘‘Meteor’’ and ‘‘Okean’’ satellites andNOAA AVHRR imagery. Since marine navigationwas the main application of the ice service, the bestdata coverage was for the navigation period fromJune to September, with three surveys each month.The rest of the year was covered by one observa-tional survey in each month since 1969, except1980–1990, when three aircraft surveys each monthwere executed year-around.We utilize information about fast ice in the Kara
Sea from the resulting data-set: ‘‘AARI 10-Day
Arctic Ocean EASE-Grid Sea Ice Observations’’,available via the EOSDIS NSIDC DistributedActive Archive Center (NSIDC DAAC), Univer-sity of Colorado (Fetterer and Troisi, 1997). Thisreformatted data set comprises about 70 percent ofthe original observations. It includes a set ofregularly spaced grid points with information ontotal sea ice concentration, multi- and first-year iceconcentration, new ice concentration, and pre-sence of fast ice. We will refer to this data set as the
AARI data set. The grid spacing in AARI data set
(12.5 km) and the map projection and griddingconform to other NSIDC data sets, such as theSSM/I and TOVS data, which simplifies theanalysis.We also use newly available records of anoma-
lies of fast ice thickness (Polyakov et al., 2003) toexamine the response of fast ice extent to thethickness of ice. The observations were carried outat meteorological polar stations by means ofdrilling. The annual maximum ice thickness,typically reached in May, is analyzed. These dataare available for two locations in the northeasternKara Sea: Dikson Island and Sterlegova Cape (seeFig. 1) and span the period 1936 to 2000.
2.2. SSM/I brightness temperature data
We use DMSP SSM/I daily polar griddedbrightness temperatures from NSIDC DAAC forestimation of the shore fast ice extent. The analysiswas made for the period July 9, 1987 to December31, 2001. This data set partly overlaps and extendsthe time-series of fast ice extent available fromRussian sea ice charts.
These data have been generated from the SpecialSensor Microwave/Imager (SSM/I) mounted onthe Defense Meteorological Satellite Program(DMSP) F8, F11 and F13 platforms (Maslanikand Stroeve, 1990, updated 2003). The SSM/I is aseven channel, four frequency, linearly polarized,passive microwave radiometric system. The instru-ment measures antenna temperatures subsequentlyconverted to surface radiances at 19.3, 22.2, 37.0and 85.5GHz with a resolution of 0:1 �C. Thespatial resolution of SSM/I is 25 km, except for thetwo 85.5GHz channels with vertical and horizon-tal polarization. These two channels providespatial resolution of 12.5 km.In the present work we use the horizontally
polarized 85.5GHz channel (referred to as 85H),because it provides better discrimination of icefrom open water in comparison to the 85.5GHzvertically polarized channel. This is due to greaterdifference between open water and first-year iceradiances in this channel with horizontal polariza-tion, as is also observed for bands with lowerfrequencies (Svendsen et al., 1987; Cavalieri et al.,1984; Swift et al., 1985). The SSM/I time series isalmost continuous except for 1991, when 85.5GHzdata were unavailable due to degradation of themicrowave sensor.For estimation of fast ice extent with SSM/I
radiances we use a method developed by Divine(2003). The method is capable of identifying large(above 50 km width) areas of shore fast ice duringevents of formation of polynyas along its outerborder. It is based on analysis of the spatialdistribution of the correlation coefficients betweenthe time-series of surface brightness temperaturesin neighboring points of the grid. A goodperformance of the method was proven for thenorth-eastern Kara Sea and the Laptev Sea. Theconsistency between AARI and SSM/I data will bediscussed in Section 3.2.
2.3. Meteorological data
Regular meteorological observations have beenmade at many coastal stations throughout theRussian Arctic since the beginning of the 20thcentury. The main source of meteorological datafor this work is the Arctic Meteorology and

ARTICLE IN PRESS
Fig. 1. Topography of the Kara Sea. The locations of meteorological stations referred to in the paper are numbered: 1.Dikson Island;
2.Izvestiy ZIK Island; 3.Sterlegova Cape; 4.Isachenko Island; 5.Pravdy Island; 6.Russkiy Island; 7.Geyberga Island; 8.Krasnophlotskie
Island; 9.Golomyannyy Cape; 10.Uedineniya Island. The dotted lines mark three parts of the study area: the northeastern Kara Sea;
the Ob and Yenisei estuaries; the western Kara Sea. Two extreme extents of fast ice in the Kara Sea in April are shown: the extent in
1979 (dashed line) was especially large, while in 1985 (solid line) it was especially small.
D.V. Divine et al. / Continental Shelf Research 24 (2004) 1717–17361720
Climate Atlas (Fetterer and Radionov, 2000). Thisatlas provides monthly means of surface airtemperature, sea level pressure, relative humidityand cloudiness from meteorological observationsat 65 Russian and 24 Western arctic coastal andisland stations for 1953–1990. The stations refer-enced in this paper are shown in Fig. 1.Weekly means of snow depth and monthly
totals of precipitation for Dikson Island, Golo-
myannyy Cape and Uedineniya Island were takenfrom the Former Soviet Union (FSU) Hydrologi-cal Snow Surveys (Krenke, 1998, updated 2003)and the FSU Monthly Precipitation Archive(Groisman et al., 1998). Accumulated thawingdegree days for May–July (base 0 �C) and wind-time integrals (see Section 3.4 for explanation)were calculated with data from observations at theDikson Island meteorological station, prepared in

ARTICLE IN PRESS
D.V. Divine et al. / Continental Shelf Research 24 (2004) 1717–1736 1721
framework of the ‘‘Transport and fate of contami-
nants in the northern seas’’ program hosted by theNorwegian Polar Institute. These observations areavailable for 6-hour intervals for 1953–1965 andfor 3-h intervals for 1965–1990. We also use themonthly Ob and Yenisei river runoff records for1950–1987 from the Russian rivers data set(Martin and Munoz, 1995).
3. Results
3.1. Accuracy of the fast ice area estimations
In our analysis we consider the Kara Sea as awhole, its northeastern part, western part, and theOb and Yenisei estuaries (Fig. 1). The north-eastern Kara Sea is located to the northeast of the‘‘line’’ connecting Dikson Island and ZhelaniyaCape (the northern tip of Novaya Zemlya). Thewestern Kara Sea is defined here as an area locatedto the west of the ‘‘line’’ connecting the northerntips of Yamal Peninsula and Novaya Zemlya. TheOb and Yenisei estuaries occupy the area betweenthe western and north-eastern Kara Sea, as theydefined in the present work. The ‘‘line’’ connectingthe points 72.58E� 71.85N� and 80.71E� 72.45N�
defines the southern boundary of the estuaries.Our study is focused on fast ice forming along theshelf coast of the Kara Sea and the ArchipelagoSevernaya Zemlya; fast ice of Franz Josef Landand the Novaya Zemlya islands is excluded fromconsideration. We found that the variations of fastice area in the northeastern part of the Kara Sea,according to AARI data, is a good proxy for thetotal fast ice area in the Kara Sea duringDecember to June. For this period, the ratio ofmonthly average fast ice area in the northeasternpart of the Kara Sea to the total monthly averagearea of fast ice is 0:7� 0:1, with the correlationcoefficient between the total and northeastern fastice areas equal to 0:96. This is important becausecombined analysis of AARI and SSM/I data setcould be carried out for the northeastern Kara Seaonly, due to the restrictions of the method ofidentification of fast ice from SSM/I surfacebrightness temperatures (Divine, 2003).
The accuracy of determination of the bound-aries between different types of sea ice with AARIice maps lies between 2 and 10 km (Fetterer andTroisi, 1997). But we use the gridded data set, sothe actual boundaries of fast ice should be some-where within the spacing between given grid points(or pixel). Hence the relative error for a given areaof the fast ice is less than
dS ¼Nb
2N; ð1Þ
where Nb and N are the number of pixels on theborder of fast ice and total number of pixels in thefast ice area, respectively. From Eq. (1), the upperbound of the relative error increases with de-creased fast ice extent. Analysis shows that theerror in estimating the fast ice area in the north-eastern Kara Sea in March–May is around 7.5%.The error approaches 12% for the whole Kara Seain the same months. Such increase is explained bythe fact that the width of the fast ice zone in thewestern Kara Sea is comparable to the pixel size.Hence the exclusion of this area from considera-tion increases the accuracy of results. The lastpoint is important because the accuracy ofassessment the SSM/I data gives even highererrors than for the AARI data set. The mainsources of uncertainty in identification of the fastice edge with SSM/I data are geolocation error andspatial averaging along the edge of fast ice.According to Maslanik and Stroeve (1990, up-dated 2003) the location accuracy lies within�8 km both along and across the scan. The fastice mapping algorithm uses a cluster of 3� 3 pixelsand introduces the uncertainty of about 1 pixel,caused by blurring along the fast ice border. Hencethe uncertainty of the fast ice border positiondetermination is roughly �1 pixel. This is twicethat of the AARI data set. The error in estimatingfast ice area in the northeastern Kara Sea fromSSM/I surface brightness temperatures in March–-May is therefore about 15%.
3.2. Variability of fast ice extent
Table 1 shows monthly mean area of fast ice inthe selected regions of the Kara Sea for periodscovered by the AARI data. The data coverage is

ARTICLE IN PRESS
Table 1
Monthly average fast ice extent (in 1000 km2) and its standard deviation in the whole Kara Sea, its northeastern part, the Ob and
Yenisei estuaries and the western Kara Sea
Month Years studied Whole Kara Sea N–E part Estuaries W part
Jan 1979–1990 95.6725.9 69.3727.9 21.5710.0 4.873.2Feb 1967–1990 121.9728.1 90.1729.2 25.875.8 6.073.0Mar 1954–1990 144.5720.9 109.3720.1 28.474.3 6.773.0Apr 1954–1990 150.2726.3 111.7721.6 30.977.0 7.673.4May 1953–1990 156.0725.4 114.8722.0 32.377.0 8.974.2Jun 1953–1990 136.5730.5 102.3727.3 27.376.8 6.974.1Jul 1953–1990 65.1750.8 57.5736.3 6.477.1 1.271.4Aug 1953–1990 5.577.9 5.577.9 0.0 0.0
Sep 1953–1990 0.670.8 0.670.8 0.0 0.0
Oct 1967–1990 4.576.7 4.375.2 0.270.3 0.0
Nov 1980–1990 34.1715.6 24.276.9 8.276.1 1.771.0Dec 1970–1990 65.0731.1 49.0728.2 13.078.7 3.072.3
D.V. Divine et al. / Continental Shelf Research 24 (2004) 1717–17361722
sparse for November through February. It is seenthat the fast ice in the study area is mainlyconcentrated in the northeastern Kara Sea where itcomprises about 73% of the total fast ice areaduring the spring. Fast ice in the estuaries and thewestern Kara Sea comprise about 21% and 6% ofthe total extent, respectively.Fig. 2 shows seasonal variability of the multi-
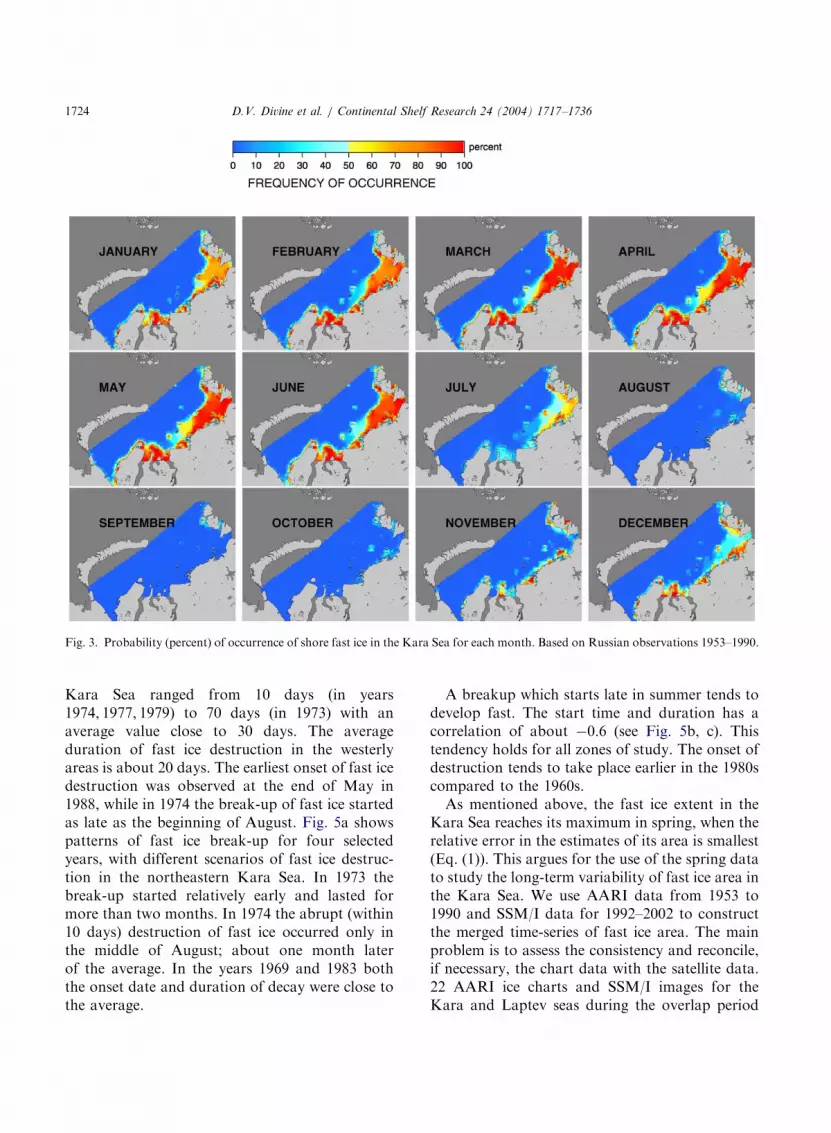
year 10-day average fast ice area in the sameregions together with monthly average total Oband Yenisei discharge. Note that all values arenormalized on their respective maximums, whichare equal to 115,000 km2 (N–E Kara Sea),9,400 km2 (W Kara Sea), 34,000 km2 (estuaries)and 117,000m3=s (river runoff).Fig. 3 shows the frequency of occurrence Pðz;mÞ
of shore fast ice during 1953–1990 according to theAARI data set.
Pðz;mÞ is given for each grid point z and monthm as
Pðz;mÞ ¼Nfiðz;mÞ
N totðz;mÞ; ð2Þ
where
Nfiðz;mÞ ¼X
y
pðz;m; yÞNfiðz;m; yÞ; ð3Þ
N totðz;mÞ ¼X
y
pðz;m; yÞN totðz;m; yÞ ð4Þ
are the number of observations with fast ice andthe total number of valid observations at z of themonth m, respectively, weighted according to thenumber of valid observations in the currentmonth. The weight pðz;m; yÞ is equal to 1, 1
2or 1
3
if one, two or three valid observations in themonth m of the year y are available in the gridpoint z. The use of weights gives a balancedrepresentation throughout time since the numberof observations in a particular month variedduring the period of observations.Fig. 3 and Table 1 show that fast ice starts to
form during November, mainly in shallow waters.It reaches its maximum area in April or May. Theposition of the fast ice border exhibits smallvariations during winter in the western region ofthe Kara Sea (the Baydaradskaya Bay, YamalPeninsula, Ob and Yenisei outlets). Here ittypically extends less than 25 km from the shore.In the northeastern region, however, fast ice extentincreases significantly during December–March.Note that the area of highest variability of fast iceextent is located in the northeastern Kara Sea, tothe west of the Isachenko Island-Sterlegova Capetransect.A prominent feature of fast ice spatial distribu-
tion in the Kara Sea is a bimodality of therelative frequency of fast ice area in spring(Borodachev et al., 2000). Results of our estimatespresented in Fig. 4 support this suggestion. There

ARTICLE IN PRESS
0.25
0.5
0.75
1
0 30 60 90 120 150 180 210 240 270 300 330 360
norm
alis
ed fa
st ic
e ar
ea
Day of year
north-eastern Kara SeaOb and Enisey estuaries
western Kara Seariver runoff
Fig. 2. Mean annual variations of average fast ice area in the north-eastern Kara Sea, western Kara Sea and the Ob and Yenisei
estuaries. Monthly average Ob and Yenisei runoff is also shown.
D.V. Divine et al. / Continental Shelf Research 24 (2004) 1717–1736 1723
are two evident local maxima with areas90,000–110,000 km2 and 120,000–140,000 km2.The span between modes exceeds two standarddeviations and the modes cover about 80% of allobservations. Divine (2003) verified a significantmaximum at 98,000 km2 and at 125,000 km2 usingthe SiZer technique (Chaudhuri and Marron,1999). There therefore seem to exist two regimesof shore fast ice formation in the northeasternKara Sea. Dmitrenko (personal communication)found a similar feature in the Eastern Siberian Sea.The area of fast ice exceeded 130,000 km2 in the
northeastern part of the Kara Sea in April–May ofthe years 1959, 1964, 1967, 1969, 1971, 1974, 1979,1980 and 1981. During these years, the fast iceborder was located along the line between theSverdrup, Izvestiy, Kirova and Voronina islands,and the Archipelago Severnaya Zemlya. Inyears with minimal fast ice extent, with areasequal to or less than 90,000 km2 in April–May1961, 1962, 1976, 1985 and 1988, the border in thenorth-eastern Kara Sea was located close to shorebetween Dikson Island and the Nordsheld archi-pelago, extending seaward between the Nordsheldand Severnaya Zemlya archipelagos. Fig. 1 illus-trates an example of two extreme fast ice extents in
April of 1979 and 1985. Divine et al. (2003) show adetailed investigation of the regimes of fast ice forthese two particular years.Zonal extent of the Kara Sea as well as the
mainly eastward direction of propagation ofcyclones determine the wave of fast ice break-uppropagation from the west to the east. Shore-fastice starts to break-up first in the western Kara Seain the beginning of June and the breakupcontinues eastward over the next two months.The break-up in the estuaries of the Ob andYenisei begins on average 10 days after it starts inthe western Kara Sea. Further to the east, in thenortheastern Kara Sea, the average lag is about 20days relative to the western part of the sea (Fig. 2).The date of onset and duration of break-up in
the northeastern Kara Sea varies significantly. Asthe date of onset we accept the day when shore-fast in its stable spring configuration was lastobserved. Conventionally, the break-up is com-pleted if the area of fast ice is below 30,000 km2,i.e. only the patches of fast ice along the mainlandand Severnaya Zemlya are left. We analyzed theperiod 1967–1990, which has the best data cover-age in late spring and summer. In 24 years studied,the duration of break-up in the northeastern
ARTICLE IN PRESS
Fig. 3. Probability (percent) of occurrence of shore fast ice in the Kara Sea for each month. Based on Russian observations 1953–1990.
D.V. Divine et al. / Continental Shelf Research 24 (2004) 1717–17361724
Kara Sea ranged from 10 days (in years1974, 1977, 1979) to 70 days (in 1973) with anaverage value close to 30 days. The averageduration of fast ice destruction in the westerlyareas is about 20 days. The earliest onset of fast icedestruction was observed at the end of May in1988, while in 1974 the break-up of fast ice startedas late as the beginning of August. Fig. 5a showspatterns of fast ice break-up for four selectedyears, with different scenarios of fast ice destruc-tion in the northeastern Kara Sea. In 1973 thebreak-up started relatively early and lasted formore than two months. In 1974 the abrupt (within10 days) destruction of fast ice occurred only inthe middle of August; about one month laterof the average. In the years 1969 and 1983 boththe onset date and duration of decay were close tothe average.
A breakup which starts late in summer tends todevelop fast. The start time and duration has acorrelation of about �0:6 (see Fig. 5b, c). Thistendency holds for all zones of study. The onset ofdestruction tends to take place earlier in the 1980scompared to the 1960s.As mentioned above, the fast ice extent in the
Kara Sea reaches its maximum in spring, when therelative error in the estimates of its area is smallest(Eq. (1)). This argues for the use of the spring datato study the long-term variability of fast ice area inthe Kara Sea. We use AARI data from 1953 to1990 and SSM/I data for 1992–2002 to constructthe merged time-series of fast ice area. The mainproblem is to assess the consistency and reconcile,if necessary, the chart data with the satellite data.22 AARI ice charts and SSM/I images for theKara and Laptev seas during the overlap period

ARTICLE IN PRESS
Fig. 4. Histograms of fast ice area in March, April and May.
0
40000
80000
120000
160000
150 160 170 180 190 200 210 220 230 240
fast
ice
area
, km
2
Day of year
1969197319741983
120
140
160
180
200
220
240
1965 1970 1975 1980 1985 1990 1995
day
of y
ear
year
start of break-up
0
20
40
60
80
1965 1970 1975 1980 1985 1990 1995
days
year
duration of break-up
(a)
(b)
(c)
Fig. 5. Temporal patterns of fast ice break-up in the north-
eastern Kara Sea in 1969, 1973, 1974, 1983 (a). Interannual
variability of the onset date (b) and duration (c) of fast ice
break-up in the same area.
D.V. Divine et al. / Continental Shelf Research 24 (2004) 1717–1736 1725
(1988–1990) show reasonably good agreement forthe location of the border of fast ice (about 1-2pixels) and its area. The estimates of area (of fastice) from these two data sources have a correlationof about 0.98 (Divine, 2003) within this overlapperiod.Further assessment of data consistency was
performed by means of visual comparison ofSSM/I data with new AARI ice charts for themost recent 4 years of the study period. Theseweekly ice charts are publicly available electro-nically in the form of GIF images at the AARIweb-site.1 These data are based on infraredsatellite images and spaceborne radar data. Thisis the common method for observations for thelast ten years of the AARI data set. We found
1www.aari.nw.ru.
again a good consistency between fast ice bordersfor 36 out of 40 observations available forcomparison. The final time-series of fast ice areais 48-years long. The years with missing dataduring all three spring months are 1972 and 1995.There are missing data for one or two months forseveral years.Fig. 6 shows the temporal variability of monthly
mean fast ice area in spring. A linear regressionanalysis here provides identification of trends. Thefigure shows trends for the AARI data set alone aswell as for the combined AARI and SSM/I datasets. We computed the standard deviation of theslope of each regression line and estimated thesignificance of the slope using an F -test with 1 andn-2 degrees of freedom (Draper and Smith, 1998).The value of n is the length of the respective time-series in years. By significance we mean theconfidence level (%) with which the null hypoth-esis of zero slope is rejected.

ARTICLE IN PRESS
Fig. 6. Mean area of fast ice in the northeastern Kara Sea
during spring. The dashed line and the solid line are linear fits
for the period 1953–1990 (AARI data only is used) and for the
period 1953–2001 (estimates from AARI and SSM/I data),
respectively. A 5-year running average (thick solid lines) is also
superimposed on each figure.
D.V. Divine et al. / Continental Shelf Research 24 (2004) 1717–17361726
A 5-years running average highlights the inter-annual variability of fast ice area. Table 2summarizes this trend analysis.
Both AARI and AARI+SSM/I time-seriesshow evidence of negative trends of fast ice areaduring spring (Fig. 6). Table 2 shows that values oftrends in March and April are similar for the twotime-series, but the slopes of the trends areessentially (ca. twice as much) different for May.This discrepancy is due to particularly low, about40,000 km2, fast ice extent in May 1993. A detailedinvestigation of cyclone activity during April andMay 1993 reveals 4 cyclones which traversed thestudy area and, in principle, might initiate thebreak-up of fast ice. This situation is similar tothat observed in April 1985 (Divine et al., 2003).Caution must be exercised here, though, since theperformance of the fast ice mapping algorithmmay be erroneous in this case. Exclusion of thispoint from the time-series decreases the slope ofthe trend to �360 km2 year�1; a value close to thatestimated with only the AARI data. Both data setsindicate decreases of average fast ice area in1990–2000 relative to 1950–1960 of approximately11%, 24% and 25% in March, April and May,respectively. The statistical significance of thetrends reaches values close to 95% in April andMay for the merged time-series of data. The slopesof fast ice area vs. time for these months is about 2standard deviations above zero.
3.3. The relation of fast ice extent to winter surface
air temperature, precipitation and snow depth
The interannual variabilities of the September–April average air temperature, total precipitationand snow depth at three sites located in thestudy area are shown in Fig. 7. Total precipita-tion and snow depth data were obtained fromweekly means. Note that available precipita-tion data spans a period of about 70 years versus23 years for snow depth data. Table 3 showsmean values of the same parameters and respectiveresults of linear trend analysis. No evidence ofsignificant changes in average temperature orsnow depth are found at any locations. Totalprecipitation, corrected following Groisman et al.(1991), exhibits a significant positive trend atDikson and Uedineniya islands. The trend is mostpronounced for Dikson Island, where average

ARTICLE IN PRESS
Table 2
Time-series of fast ice area in the northeastern Kara Sea during spring. The slope of the least square line and the standard deviation
(km2 year�1) for AARI data and combined time-series of AARI and SSM/I data with respective significance (%) of slope from F -test
are given
Month AARI data, km2 year�1 Sign. (%) AARI+SSM/I data, km2 year�1 Sign. (%)
Mar �170�330 38 �220�220 68
Apr �440�390 73 �470�250 93
May �300�360 59 �500�260 94
(a) (b) (c)
Fig. 7. Interannual variation in average surface air temperature, precipitation totals and mean snow depth during September–April for
(a) Dikson Island, (b) Golomyannyy Cape, (c) Uedineniya Island. The solid line is the result of linear regression analysis.
Table 3
Mean winter temperature (MWT, �C), precipitation totals (MPT, cm) and snow depth (MSD, cm) during September–April and
respective slopes of the least square linear fits � standard deviation. The significance of trends (%) according to F -test is shown in
parenthesis
Station Dikson Island Golomyannyy Cape Uedineniya Island
MWT �17:86 (1951–90) �21:37 (1955–90) �18:75 (1952–90)
Trend, �Cy�1 0.005�0.025 (17) �0:021�0.027 (56) �0:040�0.027 (87)
MPT 131.0 (1917–92) 61.8 (1932–92) 72.0 (1936–92)
Trend, cmy�1 2.0�0.4 (99) 0.3�0.2 (90) 0.8�0.3 (99)
MSD 12.2 (1967–90) 19.0 (1967–90) 6.9 (1967–90)
Trend, cmy�1 0.06�0.1 (35) 0.8�0.3 (99) �0:1�0.1 (60)
D.V. Divine et al. / Continental Shelf Research 24 (2004) 1717–1736 1727

ARTICLE IN PRESS
Table 5
Correlation coefficients of mean winter surface air temperature
(September–April) and fast ice area for each month during the
following May–August (based on the AARI data set for
1953–1990).
Station May June July August
Dikson Island �0.57* �0.32 �0.44* �0.14
Isachenko Island �0.51* �0.27 �0.57* �0.24
Sterlegova Cape �0.58* �0.28 �0.41* �0.12
Izvestiy ZIK Island �0.60* �0.37 �0.52* �0.22
Pravdy Island �0.59* �0.32 �0.49* �0.15
Russkiy Island �0.56* �0.35 �0.56* �0.19
Geyberga Island �0.45* �0.20 �0.48* �0.16
Krasnophlotskie Islands �0.57* �0.47* �0.57* �0.23
Golomyannyy Cape �0.47* �0.25 �0.54* �0.23
Uedineniya Island �0.53* �0.28 �0.53* �0.21
Significant correlations are marked by *ðp ¼ 0:05Þ.
D.V. Divine et al. / Continental Shelf Research 24 (2004) 1717–17361728
winter cumulative precipitation in 1970–1992 was100% higher than in 1917–1950.Table 4 shows correlation coefficients (r) be-
tween mean air temperature, snow depth and totalprecipitation for three spatially distributed me-teorological stations in the Kara Sea. We esti-mated the significance of the correlations using astandard Student’s t-test with a 95% ðp ¼ 0:05Þconfidence level. The mean temperatures arehighly correlated over the whole region. Sevenother stations located in the study area showsimilar results. Correlation coefficients betweenmean temperature time series are between 0.8–0.9.Interannual variations in mean monthly airtemperature are even more correlated than seaso-nal means. Correlation coefficients in this caseapproach 0.95–0.99. The total precipitation valuesshow weaker, but still significant, correlation witha value of r about 0.5. Mean snow depth datashow significant correlation of about 0.5 betweenDikson and Uedineniya islands only. The fact thatthe correlation coefficient for mean snow depth isless than for total precipitation could be explainedby strong influence of the site topography on snowcover. Brown and Cote (1992) and Jacobs (1989)obtained similar results for the Canadian Arctic.Jacobs (1989) concluded that precipitation rateand snow depth data contain such high levels ofspatial variability and/or measurement errors thatthese data cannot be reliably interpolated evenover mesoscale distance. The significant correla-tion for total precipitation among three siteslocated in different parts of the study area allowsus to assume that the increase in precipitationrate, shown in Fig. 7, took place over the wholestudy area.
Table 4
Spatial correlation of mean winter temperature (MWT), precipitation t
the Kara Sea
Golomyannyy Cape
MWT PT
Dikson Island 0.67* 0.52*
Golomyannyy Cape — —
*Correlations significant at 95% level.
Tables 5 and 6 show statistical relations betweenfast ice area and meteorological parameters. Table5 shows that winter average air temperature hassignificant negative correlation with fast ice areafor the following May and July for all stations (cf.Fig. 1).Especially large fast ice extents tend to form
during cold winters. In May all correlationcoefficients are significant and have a negativesign, close to �0:55. Table 7 shows correlationsbetween fast ice area during spring/summer andwinter mean surface air temperatures (Septem-ber–April) at meteorological stations. Fast iceextent is most sensitive to anomalies of the surfaceair temperature in September, March and April.The spatial behavior of monthly correlationcoefficients exhibits an increase of correlation forlocations where the variability of fast ice extent is
otal (PT) and mean snow depth(MSD) among three locations in
Uedineniya Island
MSD MWT PT MSD
0.34 0.82* 0.56* 0.47*
— 0.90* 0.42 0.17

ARTICLE IN PRESS
D.V. Divine et al. / Continental Shelf Research 24 (2004) 1717–1736 1729
higher, i.e. in the area restricted by the Dikson-Isachenko- Izvestiy-Russkiy islands transects (seeFigs. 1 and 3). We must note that variations of themean air temperature can be as due to large-scaleprocesses (advection) as well as due to local,air–sea surface interaction processes, dependingpartly on spatial and thickness distributions of fastice, i.e. variations determined by fast ice itself.The correlation between surface air temperature
and fast ice area is significantly lower in Junecompare to May and July. As discussed below, itcould be because wind especially affects fast ice inJune initiating the break-up of its least stablezones. Another possible reason could be related tothe increase in river discharge, which is normallyat its maximum in June (see Fig. 2).Table 6 shows a weak negative correlation
between fast ice extent and total precipitationand mean snow depth on Dikson and Uedineniyaislands. Data obtained on the Golomyanniy Cape
Table 6
Correlation coefficient of precipitation totals (PT) and mean
snow depth (MSD) during September–April and average fast
ice area in May (1953–1990).
Station PT MSD
Dikson Island �0.32 �0.02
Golomyannyy Cape �0.67* �0.47*
Uedineniya Island �0.38 �0.06
*Correlations significant at 95% level
Table 7
Correlation coefficients ðrÞ of average surface air temperature in differ
the following May (1953–1990)
Station Sep Oct Nov
Dikson Island �0.55* �0.22 �0.16
Isachenko Island �0.36 �0.29 �0.20
Sterlegova Cape �0.45* �0.26 �0.22
Izvestiy ZIK Island �0.55* �0.31 �0.25
Pravdy Island �0.43* �0.40* �0.28
Russkiy Island �0.40* �0.37 �0.27
Geyberga Island �0.28 �0.40* �0.25
Krasnophlotskie Islands �0.31 �0.46* �0.36
Golomyannyy Cape �0.32 �0.38 �0.25
Uedineniya Island �0.51* �0.15 �0.30
Significant correlations are marked by *ðp ¼ 0:05Þ.
show a significant negative correlation both fortotal precipitation and snow depth. Relatively highvalues of the correlation coefficients obtained forthe total precipitation on the Golomyanniy Capeshould be interpreted with caution because it isbased on poor data coverage (9 points). In total,the negative sign of the correlation coefficientsobtained for all stations suggests the effect of theinsulating role of snow cover on sea ice formation(Zubov, 1945; Brown and Cote, 1992).
3.4. Correlation between wind and fast ice area
Wind affects fast ice formation and destruction.In the following analysis we assume that theobservations of wind speed and direction mea-sured at 10m height at Dikson Island arerepresentative for wind directly affecting the fastice in the northeastern Kara Sea. The fact that aconsiderable part of the fast ice variability is due toexpansion and retreat of its border in the areabetween Dikson Island and Sterlegova Capesupports this assumption. We examined windfrom 9 separate 40� sectors during each fall-winterseason. For each sector s we calculated the wind-time integral IðsÞ, defined as
IðsÞ ¼
Z t2
t1
jvðtÞjX sða; tÞdt; ð5Þ
where jvðtÞj is the magnitude of the wind velocity,½t1::t2 is the time interval of integration, andX sða; tÞ is a Boolean function of the wind direction
ent months of the fall-winter season with average fast ice area in
Dec Jan Feb Mar Apr
�0.36 �0.04 �0.05 �0.45* �0.41*
�0.25 �0.11 �0.12 �0.39* �0.34
�0.35 �0.15 �0.09 �0.38 �0.29
�0.36 �0.13 �0.05 �0.46* �0.42*
�0.31 �0.33 �0.10 �0.32 �0.24
�0.34 �0.19 �0.19 �0.32 �0.37
�0.30 �0.22 �0.21 �0.17 �0.16
�0.27 �0.19 �0.13 �0.25 �0.30
�0.21 �0.20 �0.10 �0.20 �0.35
�0.26 �0.14 �0.06 �0.37 �0.37

ARTICLE IN PRESS
D.V. Divine et al. / Continental Shelf Research 24 (2004) 1717–17361730
and sector s
X sða; tÞ ¼1 if a 2 s;
0 if aes:
�
The time integral allows estimation of the influenceof wind speed and direction on fast ice formationand destruction. Fig. 8 shows results of calcula-tions for each sector with a period of integrationfrom September through April of every fall-winterseason and wind speeds above 1m s�1. As can beseen, the wind-time integral in sector 200� 240exhibits a significant positive trend, indicating anintensification of zonal west–east flow over theKara Sea. During the same time, wind-timeintegrals for northeastern and southeastern direc-tions show significant negative trends.Table 8 shows the correlation coefficients of
average fast ice area in April and May with thewind integral. Here we calculate wind time integralsfor all measured wind speeds of a given directionand for wind speeds above 10m s�1. This is toinvestigate the sensitivity of the fast ice area to allwinds in a given sector and to the strongest winds.
(a) (b)
Fig. 8. Interannual variability of time integrals (September through A
corresponding linear fit is superimposed on each figure. Asterisk in
confidence level.
Several authors (Tarbeev, 1960; Lepparanta,1981; Skokov, 1985; Batskikh et al., 1987; Yulin,1997) have reported that the extent of fast iceduring the winter is sensitive to wind direction.They suggest that the fast ice area increases whenthere is prevailing on-shore wind. Our results,presented in Table 8, do not confirm this hypoth-esis for the Kara Sea, at least on a monthly timescale. Table 8 shows significant correlation ofwinter western and southwestern winds with adecrease of shore fast ice area, indicated bycorrelations of �0:45� 0:55. Note that Vize(1944), based on scarce data, reported similarresults. So, when the westerly and southwesterlywinds prevail along the coast, the fast ice area inthe northeastern Kara Sea tends to decrease. Wealso calculate the correlation between the monthlywind-time integrals for sectors 200–240� and240–280� for each month beginning from Septem-ber and the fast ice area in the following May.Again, as in the case with surface air temperatures,we found that air mass transport in September andMarch is most important for subsequent fast iceextent in May.
(c)
pril) of wind with velocities above 1m s�1 at Dikson Island. The
the upper right corner marks the trends significant at 95%

ARTICLE IN PRESS
Table 8
Correlation coefficients of mean fast ice area for April and May and time integral of wind speeds for 9 sectors of width 40� and two
ranges of wind velocities
Wind speed Wind direction (degree clockwise from North)
(m s�1) 0–40 40–80 80–120 120–160 160–200 200–240 240–280 280–320 320–360
April
X1 �0.23 0.37 �0.12 0.27 �0.04 �0.41* �0.57* �0.05 0.03
X10 �0.32 0.15 �0.21 0.22 �0.12 �0.37 �0.50* 0.03 �0.07
May
X1 �0.22 0.32 0.02 0.27 �0.06 �0.45* �0.56* �0.19 �0.21
X10 �0.31 0.14 �0.17 0.20 �0.15 �0.46* �0.54* �0.14 �0.28
Significant correlations are marked by *ðp ¼ 0:05Þ.
D.V. Divine et al. / Continental Shelf Research 24 (2004) 1717–1736 1731
We calculated the correlation between the meanwinter surface air temperature and wind fromdifferent directions during the cold season. Theanalysis shows that winds from directions 0–80�
(northerlies and northeasterlies) are associatedwith a decrease of the surface temperature, whilethe winds for directions 160–280� (southerlies towesterly), with an increase of the surface airtemperature, respectively. These relationships areevidently due to advection of cold air from theArctic Ocean and Siberia in the first case andadvection of heat with westerly wind from theNordic Seas in the latter. The correlations varywith month and take on the values of ca. �0:40 to�0:60 for northerlies and northeasterlies and0:40� 0:65 for southerlies and westerly. Therelationship changes during the summer. Windsfrom the east or south–east in June–Augustbrings warm air masses from Siberia while theevents of cold are generally associated with thenortherlies. The effect of advection of heat ismost pronounced in July. We obtained for thismonth the correlation of 0:59 for wind directions80–160� (easterlies and south-easterlies). Theadvection of cold is, in turn, characterized by acorrelation coefficient of �0:62 for wind directions320–360� (northerlies). Note that July is amonth when most of the fast ice in the Kara Seabreaks up.
We define the rate of fast ice destruction as theslope of the least square linear fit to the time-seriesof fast ice area during June 10 to August 10. Fig. 2demonstrates that the decrease of fast ice area inthe northeastern Kara Sea during these sixty dayscould, on average, be reasonably approximated bystraight line on average. We calculated wind-timeintegrals for June–July for 4 sectors and itscorrelation with the rate of fast ice destruction.The results presented in Table 9 show that on-shore winds from the northwest tend to restrainthe process of fast ice destruction in summer. Thisis characterized by the correlation coefficientabout 0:55. Note that this effect decreases forstronger winds from the same sector, perhaps dueto destruction by waves from open water to thenorth of fast ice area.
3.5. Correlation between the extent and thickness of
fast ice
Ice thickness is the one of the principal factorsdetermining the strength of ice cover. It affects theresistance of fast ice to mechanical stresses,duration of ice decay and the date of fast icebreak-up in summer (Bilello, 1980; Crocker andWadhams, 1989; Flato and Brown, 1996).Although the local observations are not necessa-rily representative of the areal average, there is

ARTICLE IN PRESS
Table 9
Correlation coefficients between the rate of fast ice destruction
in summer (see text for definition) and time integral of wind
speeds for 4 sectors and 3 ranges of wind velocities in June–July
Wind speed Wind direction (degree clockwise from North)
(m s�1) 0–90 90–180 180–270 270–360
X1 �0.32 �0.01 �0.05 0.55*
X5 �0.33 �0.01 �0.12 0.53*
X10 �0.34 0.04 �0.25 0.45*
Significant correlations are marked by *ðp ¼ 0:05Þ.
Table 10
Correlation coefficients between average fast ice extent in
April–July and ice thickness. The last column shows the
correlation between the mean air temperature (during Septem-
ber–April) and ice thickness at the respective location
Station Apr May Jun Jul air T
Dikson Island 0.60* 0.60* 0.47* 0.38* �0.68*
Sterlegova Cape 0.54* 0.40* 0.36* 0.46* �0.58*
Significant correlations are marked by *ðp ¼ 0:05Þ.
D.V. Divine et al. / Continental Shelf Research 24 (2004) 1717–17361732
some evidence of a similar spatial pattern in icethickness over much of the Kara Sea (Volkov et al.,2002). Table 10 shows the relation of fast ice extentin spring and summer to the anomalies of icethickness at Dikson Island and Sterlegova Cape.As can bee seen, the correlation coefficients are
generally greater for Dikson Island and tend todecrease with time for both locations. Note againthe higher value of correlation for the site locatedcloser to the area which undergoes higher varia-bility of fast ice extent.Since the measurements of fast ice thickness
have been carried out mainly on level ice in thevicinity of the polar stations, the thickness of icepredominantly reflects the thermodynamic influ-ence on ice growth. This is demonstrated by thecorrelation coefficients �0:68 and �0:58 betweenthe average winter temperature and ice thickness(last column in Table 10).We do not find any significant relation of the ice
thickness anomalies to cumulative precipitationduring winter. This somewhat contradicts theresults of Brown and Cote (1992) and Flato andBrown (1996). Furthermore, correlations betweenthe onset date of fast ice break-up, the rate of itsdestruction in summer and the maximum icethickness are also close to zero. A discussion ofthese findings is given below.
4. Discussion
Three important factors for fast ice formationare distinguished. All these factors, as shownabove, are interconnected. The influence of meanwinter surface temperature, wind and maximum
ice thickness anomaly on fast ice extent in springare characterized by correlations of about �0:55,�0:50 and 0:68, respectively. The surface winddata analysis and average sea level pressure mapsshow that interannual variation of fast ice extent isrelated to direction of air mass transport. Prevail-ing westerly and southwesterly winds in winter areassociated with factors that impede fast iceexpansion.We performed multiple regression analysis of
winter wind-time integrals from different direc-tions, mean winter air temperature, maximumice thickness anomaly and fast ice area inMay. Correlation coefficients close to �0:68 wereobtained for wind directions 200–240� and240–280�. The resulting regression equations forfast ice area are
S ¼ � 5:3� 102T � 2:2� 10�3I200 ��240 �
þ 4:9� 104H þ 119600� 17600 ð6Þ
and
S ¼ � 4:9� 102T � 8:6� 10�4I240 ��280 �
þ 5:5� 104H þ 110300� 17800; ð7Þ
where S, T, I,H denote fast ice area in May, meanwinter air temperature, winter wind-time integraland maximum ice thickness anomaly at DiksonIsland. We can conclude that surface level airtemperature, ice thickness and surface windexplain about 45% of fast ice variance.Analysis of the correlation coefficients for
specific months showed that surface wind andtemperature variations in September and March–April are especially important for fast ice devel-opment in the following late spring. Moreover, the

ARTICLE IN PRESS
D.V. Divine et al. / Continental Shelf Research 24 (2004) 1717–1736 1733
variability of fast ice area increases where thesurface level air temperature undergoes highervariations. This demonstrates the importance ofthe local forcing. Note that the surface level airtemperature is determined not only by advectionin the atmosphere but also by the thermodynamicinteraction with the underlying surface. In parti-cular during September the surface level airtemperature is affected by several factors, like thesea surface temperature or sea ice concentration(Teytelbaum, 1972; Shpaikher and Fedorova,1969). These factors in turn are related to theamount of heat stored in the water column duringsummer. Furthermore, the westerly air masstransport in the early fall bringing relatively warmair and water masses into the northeastern KaraSea, restrains the heat losses due to radiationcooling and shifts the date of the onset of stable iceformation. One can expect the correspondingresponse of sea ice thickness in following springand hence in the strength of fast ice cover.Strong negative anomalies of the surface air
temperature in the early spring may be favorablefor freezing of drifting ice floes as well as forrecovery of fast ice integrity after partial break-upevents. We may suppose these effects are morepronounced if accompanied by relatively calmweather conditions. In that case one may expectquick fast ice expansion seawards. Such eventswith rapid fast ice growth (increase in area up to50% within 10–20 days) took place in March 1978,1979 and 1981, and April 1984. During theseperiods, the surface air temperature at DiksonIsland was below monthly average temperaturesby up to 6�C. We suggest it may be one of themechanisms responsible for the anomalous expan-sion of fast ice in the northeastern Kara Sea duringwinter. Analysis of surface level pressure charts(not shown) also reveals that during the years withrapid fast ice growth, winds from the secondquarter had been prevailing in the northeasternKara Sea. Additionally, in 1979 and 1984 thesoutheasterly flow encompassed the entire KaraSea. We may speculate that it promoted favorableconditions for the opening and maintaining of thepolynya for an extended time. New ice growth onthe edge of fast ice could play the role of anothereffective mechanism of fast ice expansion. Such
phenomena have been observed in the Laptev SeaDethleff et al., 1998; Reimnitz et al., 1994), wherethe fast ice edge consisted of thin (o70 cm) youngice. On the other hand, enhanced zonal westerlyflow brings relatively warm air masses of NorthAtlantic origin into the northeastern Kara Sea andincreases the shear and compression stressesbetween the shore-fast and drift ice. The increasedvalue of the wind-time integral for these directionsmay also indicate the increased frequency andstrength of Atlantic Arctic cyclones. These cy-clones, as shown in (Divine et al., 2003), maysignificantly influence fast ice development duringthe winter by inducing partial break-ups.We suggest the following explanation to the
sensitivity of the rate of fast ice destruction inJune–August to the westerly and northerly winds.As was shown, northerly winds in summer areassociated with advection of cold air. This processis most pronounced in July when a substantial partof the fast ice usually breaks up. The winds fromthese directions also induce on-shore ice drift andreduce the area of leads in the ice cover (inparticular, they close the polynya that borders thefast ice). Since the open water areas absorb over90% of incoming solar radiation in spring andsummer (Smith et al., 1990), these winds hinder theaccumulation of heat in the upper water layer andconstrain lateral and bottom ablation of ice. Thedecrease of the correlation coefficient with increaseof wind speed points out the increasing role ofdynamical processes in the mechanical break-up offast ice, possibly due to surface waves on the openparts of the sea.Visual inspection of the SLP over the Kara Sea
during the summer break-up allowed identificationof three characteristic patterns (not shown): a highpressure system over the Kara Sea; a low pressuresystem over the Taymyr Peninsula or northwesternSiberia and a pattern which is close to the climaticmean. The SLP gradient across the northeasternKara Sea can be high as 8 mb on average for thefirst two patterns, while in the latter case it isabout 2–4 mb—slightly above the climate meanfor the summer period. The first two patternsaccompanied 17 of the 24 cases consideredand, in particular, all three cases with a quick(within 10 days) destruction of fast ice. We

ARTICLE IN PRESS
D.V. Divine et al. / Continental Shelf Research 24 (2004) 1717–17361734
speculate therefore that wind action plays a keyrole in the final break-up of fast ice in summer.The lack of correlation between the maximum icethickness anomalies, accumulated thawing degreedays in May–July, and the onset date of fast icebreak-up also indirectly support this suggestion.However, the air temperature during summer andthickness of ice at the onset of ice melting doinfluence the ice concentration in summer to earlyautumn. Other disruptive factors that are hard toquantify should also be mentioned, such as thenumber and distribution of cracks in the ice cover,which can produce erratic patterns at specific sites:for example, Vilkitsky Strait (Karelin, 1945).Few other hypothetical mechanisms have been
proposed to explain of interannual variability offast ice extent in the Arctic. There are variations ofriver runoff (Dmitrenko et al., 1998) and varia-bility of snow precipitation. Analysis of fast iceextent and the Ob and Yenisei cumulativedischarge in the previous summer showed noevidence of impact of river runoff to variationsof fast ice extent the following April and May. Thecorrelation between these two parameters is closeto zero. Also no evidence of the influence of riverdischarge variations on the rate of fast icedestruction was found. We suppose, however, thatriver discharge is important near the river estu-aries. The AARI data (see Fig. 2) show that theonset of fast ice break-up in the regions of the Oband Yenisei estuaries precedes the start of fast icebreak-up in the northeastern part of the Kara Seaon average by 10 days. The increase in river run-off causes sea level to increase, affects currents andstratification, which may induce, for example,generation of internal waves and forcing fromthe water to the ice. Relatively warm riverdischarge also supplies a significant amount ofsensible heat to the bottom of the sea ice andleading to the melt. The lag of about 10 days onaverage between the onset of fast ice break-up inthe estuaries and the adjacent areas in the north-eastern Kara Sea agrees reasonably with theresults of Searcy et al. (1996) for Mackenzie RiverDelta.Recent work on fast ice in the Canadian Arctic
showed that variation in snow depth is the mainfactor for interannual ice thickness variability
(Brown and Cote, 1992; Flato and Brown, 1996).Our work, however, shows that this is not a casefor the Kara Sea. Moreover, the well-pronouncedcorrelations of �0:68 and �0:58 characterize theresponse of ice thickness to the air temperature attwo sites on the fast ice. These values exceedsubstantially those obtained by Brown and Cote(1992); Flato and Brown (1996). This fact illus-trates the difficulty of extrapolating results ob-tained for the Canadian Arctic to the northeasternKara Sea. We believe that this discrepancy iscaused by hydrometeorological conditions, whichin the Kara Sea and the Canadian Arctic aresubstantially different. We examined the values ofthe coefficient of variation (COV), defined as theratio of the standard deviation to the mean, forsnow depth and accumulated freezing degree-daytotals (FDD) at Dikson Island. COV values forsnow depth and FDD have the same order ofmagnitude for the Kara Sea, whereas the value ofCOV for snow depth in the Canadian Arctic is oneorder of magnitude greater than those for FDD.This suggests a leading role for snow cover in icethickness variability in the latter area. In contrast,equal COV for snow depth and FDD determinethe greater response of fast ice thickness to thevariations of surface air temperature in the KaraSea.Another important mechanism that, according
to Volkov et al. (2002), could influence icethickness and fast ice extent, is an advection ofheat by currents during autumn and winter fromthe western Kara Sea and the Barents Sea. Sincethe hydrographic data for the study area are notpublicly available at the moment, this subject isleft beyond the scope of this work.We found that relative frequency of fast ice
extent has a bimodal distribution (Fig. 4). At thesame time Fig. 6 shows that the mode withdecreased fast ice area has occurred predominantlysince 1980. This determines the negative trend offast area in spring during the whole period ofinvestigation. The studies of Rogers and Loon(1995) and Walsh et al. (1996), as well as ourFig. 8, show that strong changes of atmosphericcirculation in the Central Arctic, related to thedecrease in average sea level pressure, tookplace during this period. We speculate that the
ARTICLE IN PRESS
D.V. Divine et al. / Continental Shelf Research 24 (2004) 1717–1736 1735
strengthening of the western zonal flow briningmild Atlantic air to the interior of the Kara Seahas forced the decrease of fast ice area andstimulated the early breakup of fast ice in the1980s–1990s.
Acknowledgements
The Norwegian Research Council supportedthis work via the project number 128087/730. TheInternational Arctic Research Center, UAF partlysupported participation of A. Makshtas in theframework of the Frontier Research System forGlobal Change. The authors also thank J.Kohlerand C.Dick (NPI) for improvement of the manu-script, V. Pavlov (NPI) for helpful discussion andS.Divina for preparing Fig. 1, and two reviewersfor their constructive comments.
References
Batskikh, Y., Borodachev, V., Potapov, V., 1987. Estimation of
the influence of meteorological factors on the safety of cargo
work on fast ice. Problemy Arctiki i Antarctiki 63, 102–107
(in Russian).
Bilello, M., 1980. Decay patterns of fast sea ice in Canada and
Alaska. In: Sea Ice Processes and Models: Proceedings of the
Arctic Ice Dynamic Joint Experiment Seattle, pp. 313–326.
Borodachev, V., 1998. Ice in the Kara Sea. Gidrometeoizdat,
St.-Petersburg (in Russian).
Borodachev, V., Gudkovich, Z., Klyachkin, S., Smolyanitsky,
V., 2000. Fast ice conditions in the Kara Sea and possible
reasons of interannual changes of fast ice area. Transport
and fate of contaminants in the northern seas. AARI Final
Report, Norwegian Polar Institute.
Brown, R.D., Cote, P., 1992. Interannual variability of landfast
ice thickness in the Canadian High Arctic, 1950–89. Arctic
45 (3), 273–284.
Cavalieri, D., Gloersen, P., Campbell, W., 1984. Determination
of sea ice parameters with the NIMBUS 7 SSMR. Journal
of Geophysical Research 89 (D4), 5355–5369.
Chapman, D., 1999. Dense water formation beneath a time-
dependent coastal Polynya. Journal of Physical Oceano-
graphy 29, 807–820.
Chaudhuri, P., Marron, J., 1999. SiZer for exploration of
structures in curves. Journal of the American Statistical
Association 94, 807–823.
Crocker, G., Wadhams, P., 1989. Breakup of Antarctic fast ice.
Cold Regions Science and Technology 17, 61–76.
Dethleff, D., Loewe, P., Kleine, E., 1998. The Laptev sea flaw
lead—detailed investigation on ice formation and export
during 1991/1992 winter season. Cold Regions Science and
Technology 27, 225–243.
Divine, D., 2003. Peculiarities of shore-fast ice formation and
destruction in the Kara Sea. Ph.D. Thesis, University of
Bergen, Bergen, Norway.
Divine, D., Korsnes, R., Makshtas, A., 2003. Variability and
climate sensitivity of fast ice extent in the north-eastern
Kara Sea. Polar Research 22 (1), 27–34.
Dmitrenko, I., Golovin, P., Gribanov, V., Kassens, H.,
Holeman, J., 1998. Influence of the summer river runoff
on ice formation in the Kara and Laptev seas. In: Ice in the
Surface Waters. Rotterdam, pp. 251–257.
Draper, N., Smith, H., 1998. Applied Regression Analysis.
Wiley, New York.
Eicken, H., Viehoff, T., Martin, T., Kolatschek, J., Alexandrov,
V., Reimnitz, E., 1995. Studies of clean and sediment-laden
ice in the Laptev Sea. Reports on Polar Research 176,
62–70.
Fetterer, F., Radionov, V. (Eds.), 2000. Arctic Climatology
Project. Environmental Working Group Arctic Meteorol-
ogy and Climate Atlas. National Snow and Ice Data Center,
Boulder, CO, CD-ROM.
Fetterer, F., Troisi, V., 1997. AARI 10-Day Arctic Ocean
EASE-Grid Sea-Ice Observations. National Snow and Ice
Data Center, Boulder, CO, Digital Media.
Flato, G., Brown, R., 1996. Variability and climate sensitivity
of landfast Arctic sea ice. Journal of Geophysical Research
101 (C10), 25767–25777.
Groisman, P., Koknaeva, V., Belokrylova, T., Karl, T., 1991.
Overcoming biases of precipitation measurement: a history
of the USSR experience. Bulletin American Meteorological
Society 72 (11), 1725–1733.
Groisman, P., Koknaeva, V., Belokrylova, T., Sanina, A., 1998.
Former Soviet Union monthly precipitation archive,
1891–1993. National Snow and Ice Data Center, Boulder,
CO, Digital Media.
Jacobs, J.D., 1989. Spatial representativeness of climatic data
from Baffin Island, N.W.T., with implications for muskoxen
and caribou distribution. Arctic 42 (1), 50–56.
Karelin, D., 1945. The influence of hydrometeorological
conditions on the ice state in the Laptev Sea. Izd.
Glavsevmorputi, Moscow-Leningrad (in Russian).
Korsnes, R., Pavlova, O., Godtliebsen, F., 2002. Assessment of
potential transport of pollutants into the Barents Sea via sea
ice—an observational approach. Marine Pollution Bulletin
44, 861–869.
Krenke, A., 1998, updated 2003. Former Soviet Union
Hydrological Snow Surveys. National Snow and Ice Data
Center/World Data Center for Glaciology, Boulder, CO,
Digital Media.
Lepparanta, M., 1981. On the structure and mechanics of pack
ice in the Bothninan Bay. Finnland Marial Research 248,
3–86.
Martin, S., Cavalieri, D., 1989. Contributions of the Siberian
shelf polynyas to the Arctic Ocean intermediate and
deep water. Journal of Geophysical Research 94 (C9),
12725–12738.

ARTICLE IN PRESS
D.V. Divine et al. / Continental Shelf Research 24 (2004) 1717–17361736
Martin, S., Munoz, E., 1995. Russian rivers data set. National
Snow and Ice Data Center, Boulder, CO, Digital Media.
Maslanik, J., Stroeve, J., 1990, updated 2003. DMSP SSM/I
Daily Polar Gridded Brightness Temperatures. National
Snow and Ice Data Center, Boulder, CO, CD-ROM.
Pavlov, V., Stanovoy, V., 2001. The problem of transfer of
radionuclide pollution by sea ice. Marine Pollution Bulletin
42 (4), 319–323.
Pfirman, S., Kogler, J., Anselme, I., 1995. Coastal environments
of the western Kara and eastern Barents Seas. Deep-Sea
Research 42 (6), 1391–1412.
Pfirman, S., Colony, R., Nurnberg, D., Eicken, H., Rigor, I.,
1997a. Reconstructing the origin and trajectory of drifting
Arctic sea ice. Journal of Geophysical Research 102 (C6),
12575–12586.
Pfirman, S., Kogler, J., Rigor, I., 1997b. Potential for rapid
transport of contaminants from the Kara Sea. The Science
of the Total Environment 202, 111–122.
Polyakov, I., Alekseev, G., Bekryaev, R., Bhatt, U., Colony, R.,
Johnson, M., Karklin, V., Walsh, D., Yulin, A., 2003.
Long-term ice variability in arctic marginal seas. Journal of
Climate 16, 2078–2085.
Reimnitz, E., Marincovich, J., McCormick, M., Briggs, W.,
1992. Suspension freezing of bottom sediment and biota in
the Northwest Passage and implications for Arctic Ocean
sedimentation. Canandian Journal of Earth Sciences 29,
693–703.
Reimnitz, E., Dethleff, D., Nurnberg, D., 1994. Contrasts in
Arctic shelf sea-ice regimes and some implications: Beaufort
Sea versus Laptev Sea. Marine Geology 119, 215–225.
Reimnitz, E., Kassens, H., Eicken, H., 1995. Sediment
transport by Laptev Sea ice. Reports on Polar Research
176, 71–77.
Rigor, I., Colony, R., 1997. Sea ice production in the Laptev
Sea. The Science of the Total Environment 202, 89–110.
Rogers, J., Loon, v.H., 1995. Atlantic Arctic cyclones and the
mild Siberian winters of the 1980s. Geophysical Research
Letters 22, 799–802.
Searcy, C., Kenneson, D., Stringer, W., 1996. A river-coastal
sea ice interaction model: Mackenzie River Delta. Journal
of Geophysical Research 101 (C4), 8885–8894.
Shpaikher, A., Fedorova, Z., 1969. Water temperature fluctua-
tions in the Kara Sea over recent decades. Problems of
Arctic and Antarctic 33.
Skokov, R., 1985. To the forecast of fast ice break-up.
Proceedings of Hydrometeorology Research Center of the
USSR 270, pp. 52–57 (in Russian).
Smith, S.D., Muench, R., Pease, C., 1990. Polynyas and leads:
an overview of physical processes and environment. Journal
of Geophysical Research 95 (C6), 9461–9479.
Svendsen, E., Matzler, C., Grenfell, T., 1987. A model for
retrieving total sea ice concentration from a spaceborn dual-
polarized passive microwave instrument operating near
90GHz. International Journal of Remote Sensing 8 (10),
1479–1487.
Swift, C., Fedor, L.S., Ramseier, R., 1985. An algorithm to
measure sea ice concentration with microwave radiometers.
Journal of Geophysical Research 90 (C1), 1087–1099.
Tarbeev, Y.V., 1960. Role of wind in the processes of fast ice
destruction. Proceedings of Oceanography commission
RAS 7. pp. 116–126 (in Russian).
Teytelbaum, K., 1972. Dependence of the temperature of the air
over the Kara Sea upon ice coverage and atmospheric
processes in the spring–summer period. Trudy AANII 346.
Timokhov, L., 1994. Regional characteristics of the Laptev and
the East Siberian seas: climate, topography, ice phases,
thermohaline regime, circulation. Reports on Polar Re-
search 144, 15–31.
Vize, V., 1944. The background of longterm ice forecast for the
Arctic seas. Trudy AANII 190 (in Russian).
Volkov, V., Johannessen, O., Borodachev, V., Voinov, G.,
Pettersson, L., Bobylev, L., Kouraev, A., 2002. Polar Seas
Oceanography. An Integrated Case Study of the Kara Sea.
Springer, London.
Walsh, J., Chapman, W., Shy, T., 1996. Recent decrease of sea
level pressure in the central Arctic Journal of Climate 9,
480–486.
Weeks, W., 1994. Possible roles of sea ice in the transport of
hazardous material. Arctic Research US 8, 34–52.
Yulin, A., 1997. Contingency of extreme fast ice formation and
summer ice conditions in the East Siberian Sea. Trudy
AANII 437, 115–123 (in Russian).
Zubov, N., 1945. Arctic ice Izd. Glavsevmorputi, Moscow
(translated by U.S. Navy Oceanographic Office, Springfield,
1963).