temperature and moisture conditions for life in the extreme arid region of the atacama desert: four...
TRANSCRIPT
ASTROBIOLOGYVolume 3, Number 2, 2003© Mary Ann Liebert, Inc.
Research Paper
Temperature and Moisture Conditions for Life in theExtreme Arid Region of the Atacama Desert: Four Years
of Observations Including the El Niño of 1997–1998
CHRISTOPHER P. MCKAY,1 E. IMRE FRIEDMANN,1 BENITO GÓMEZ-SILVA,2
LUIS CÁCERES-VILLANUEVA,2 DALE T. ANDERSEN,3
and RAGNHILD LANDHEIM3
ABSTRACT
The Atacama along the Pacific Coast of Chile and Peru is one of the driest and possibly old-est deserts in the world. It represents an extreme habitat for life on Earth and is an analog forlife in dry conditions on Mars. We report on four years (September 1994–October 1998) of cli-mate and moisture data from the extreme arid region of the Atacama. Our data are focusedon understanding moisture sources and their role in creating suitable environments for pho-tosynthetic microorganisms in the desert surface. The average air temperature was 16.5°C and16.6°C in 1995 and 1996, respectively. The maximum air temperature recorded was 37.9°C, andthe minimum was 25.7°C. Annual average sunlight was 336 and 335 W m22 in 1995 and 1996,respectively. Winds averaged a few meters per second, with strong föhn winds coming fromthe west exceeding 12 m s21. During our 4 years of observation there was only one signifi-cant rain event of 2.3 mm, which occurred near midnight local time. We suggest that this eventwas a rainout of a heavy fog. It is of interest that the strong El Niño of 1997–1998 broughtheavy rainfall to the deserts of Peru, but did not bring significant rain to the central Atacamain Chile. Dew occurred at our station frequently following high nighttime relative humidity,but is not a significant source of moisture in the soil or under stones. Groundwater also doesnot contribute to surface moisture. Only the one rain event of 2.3 mm resulted in liquid wa-ter in the soil and beneath stones for a total of only 65–85 h over 4 years. The paucity of liq-uid water under stones is consistent with the apparent absence of hypolithic (under-stone)cyanobacteria, the only known primary producers in such extreme deserts. Key Words: Ata-cama Desert—Extreme environments—Mars—Hypolithic cyanobacteria. Astrobiology 3,393–406.
393
1Space Science Division and 3NASA Ames and SETI Institute, NASA Ames Research Center, Moffett Field, Cali-fornia.
2Departmento de Biomédico and Instituto del Desierto, Universidad de Antofagasta, Antofagasta, Chile.
INTRODUCTION
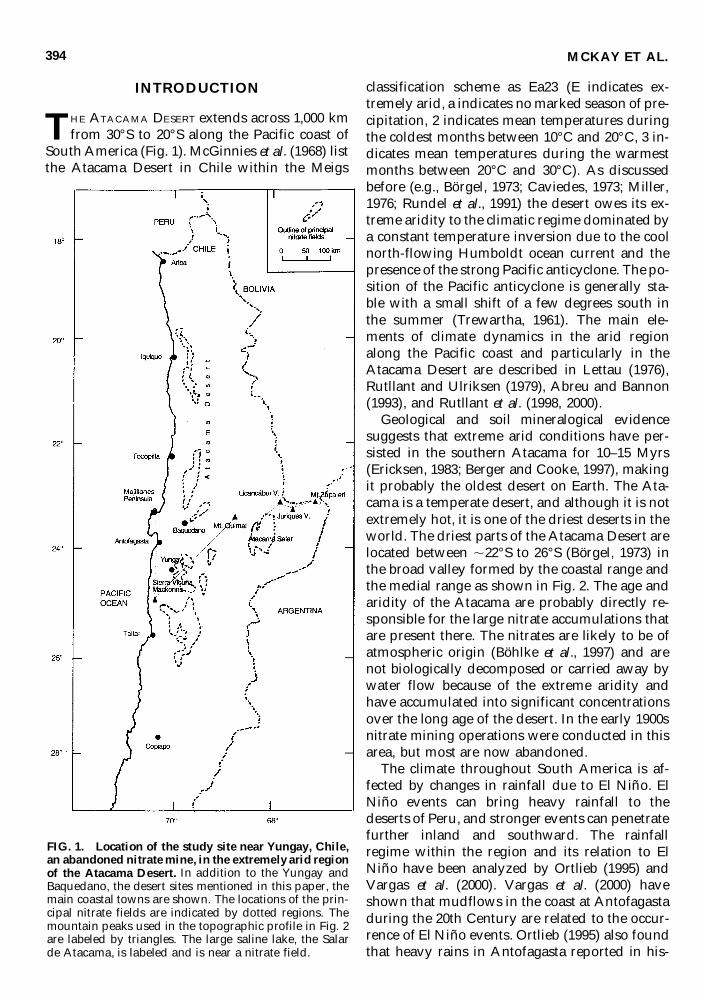
THE ATACAMA DESERT extends across 1,000 kmfrom 30°S to 20°S along the Pacific coast of
South America (Fig. 1). McGinnies et al. (1968) listthe Atacama Desert in Chile within the Meigs
classification scheme as Ea23 (E indicates ex-tremely arid, a indicates no marked season of pre-cipitation, 2 indicates mean temperatures duringthe coldest months between 10°C and 20°C, 3 in-dicates mean temperatures during the warmestmonths between 20°C and 30°C). As discussedbefore (e.g., Börgel, 1973; Caviedes, 1973; Miller,1976; Rundel et al., 1991) the desert owes its ex-treme aridity to the climatic regime dominated bya constant temperature inversion due to the coolnorth-flowing Humboldt ocean current and thepresence of the strong Pacific anticyclone. The po-sition of the Pacific anticyclone is generally sta-ble with a small shift of a few degrees south inthe summer (Trewartha, 1961). The main ele-ments of climate dynamics in the arid regionalong the Pacific coast and particularly in the Atacama Desert are described in Lettau (1976),Rutllant and Ulriksen (1979), Abreu and Bannon(1993), and Rutllant et al. (1998, 2000).
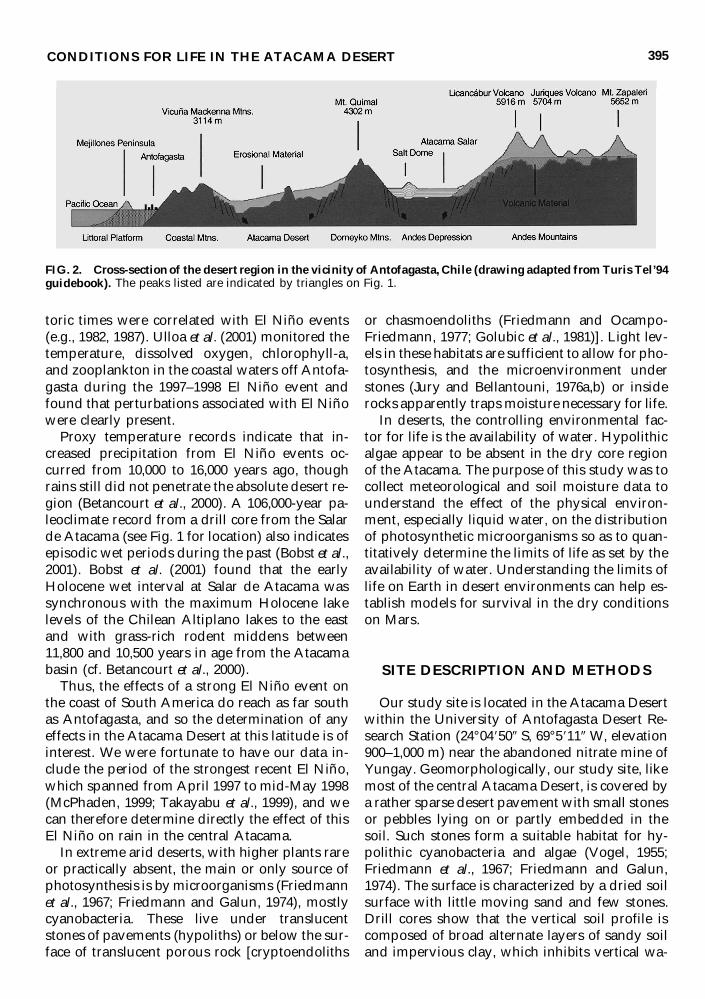
Geological and soil mineralogical evidencesuggests that extreme arid conditions have per-sisted in the southern Atacama for 10–15 Myrs(Ericksen, 1983; Berger and Cooke, 1997), makingit probably the oldest desert on Earth. The Ata-cama is a temperate desert, and although it is notextremely hot, it is one of the driest deserts in theworld. The driest parts of the Atacama Desert arelocated between ,22°S to 26°S (Börgel, 1973) inthe broad valley formed by the coastal range andthe medial range as shown in Fig. 2. The age andaridity of the Atacama are probably directly re-sponsible for the large nitrate accumulations thatare present there. The nitrates are likely to be ofatmospheric origin (Böhlke et al., 1997) and arenot biologically decomposed or carried away bywater flow because of the extreme aridity andhave accumulated into significant concentrationsover the long age of the desert. In the early 1900snitrate mining operations were conducted in thisarea, but most are now abandoned.
The climate throughout South America is af-fected by changes in rainfall due to El Niño. ElNiño events can bring heavy rainfall to thedeserts of Peru, and stronger events can penetratefurther inland and southward. The rainfallregime within the region and its relation to ElNiño have been analyzed by Ortlieb (1995) andVargas et al. (2000). Vargas et al. (2000) haveshown that mudflows in the coast at Antofagastaduring the 20th Century are related to the occur-rence of El Niño events. Ortlieb (1995) also foundthat heavy rains in Antofagasta reported in his-
MCKAY ET AL.394
FIG. 1. Location of the study site near Yungay, Chile,an abandoned nitrate mine, in the extremely arid regionof the Atacama Desert. In addition to the Yungay andBaquedano, the desert sites mentioned in this paper, themain coastal towns are shown. The locations of the prin-cipal nitrate fields are indicated by dotted regions. Themountain peaks used in the topographic profile in Fig. 2are labeled by triangles. The large saline lake, the Salarde Atacama, is labeled and is near a nitrate field.
toric times were correlated with El Niño events(e.g., 1982, 1987). Ulloa et al. (2001) monitored thetemperature, dissolved oxygen, chlorophyll-a,and zooplankton in the coastal waters off Antofa-gasta during the 1997–1998 El Niño event andfound that perturbations associated with El Niñowere clearly present.
Proxy temperature records indicate that in-creased precipitation from El Niño events oc-curred from 10,000 to 16,000 years ago, thoughrains still did not penetrate the absolute desert re-gion (Betancourt et al., 2000). A 106,000-year pa-leoclimate record from a drill core from the Salarde Atacama (see Fig. 1 for location) also indicatesepisodic wet periods during the past (Bobst et al.,2001). Bobst et al. (2001) found that the earlyHolocene wet interval at Salar de Atacama wassynchronous with the maximum Holocene lakelevels of the Chilean Altiplano lakes to the eastand with grass-rich rodent middens between11,800 and 10,500 years in age from the Atacamabasin (cf. Betancourt et al., 2000).
Thus, the effects of a strong El Niño event onthe coast of South America do reach as far southas Antofagasta, and so the determination of anyeffects in the Atacama Desert at this latitude is ofinterest. We were fortunate to have our data in-clude the period of the strongest recent El Niño,which spanned from April 1997 to mid-May 1998(McPhaden, 1999; Takayabu et al., 1999), and wecan therefore determine directly the effect of thisEl Niño on rain in the central Atacama.
In extreme arid deserts, with higher plants rareor practically absent, the main or only source ofphotosynthesis is by microorganisms (Friedmannet al., 1967; Friedmann and Galun, 1974), mostlycyanobacteria. These live under translucentstones of pavements (hypoliths) or below the sur-face of translucent porous rock [cryptoendoliths
or chasmoendoliths (Friedmann and Ocampo-Friedmann, 1977; Golubic et al., 1981)]. Light lev-els in these habitats are sufficient to allow for pho-tosynthesis, and the microenvironment understones (Jury and Bellantouni, 1976a,b) or insiderocks apparently traps moisture necessary for life.
In deserts, the controlling environmental fac-tor for life is the availability of water. Hypolithicalgae appear to be absent in the dry core regionof the Atacama. The purpose of this study was tocollect meteorological and soil moisture data tounderstand the effect of the physical environ-ment, especially liquid water, on the distributionof photosynthetic microorganisms so as to quan-titatively determine the limits of life as set by theavailability of water. Understanding the limits oflife on Earth in desert environments can help es-tablish models for survival in the dry conditionson Mars.
SITE DESCRIPTION AND METHODS
Our study site is located in the Atacama Desertwithin the University of Antofagasta Desert Re-search Station (24°049500 S, 69°59110 W, elevation900–1,000 m) near the abandoned nitrate mine ofYungay. Geomorphologically, our study site, likemost of the central Atacama Desert, is covered bya rather sparse desert pavement with small stonesor pebbles lying on or partly embedded in thesoil. Such stones form a suitable habitat for hy-polithic cyanobacteria and algae (Vogel, 1955;Friedmann et al., 1967; Friedmann and Galun,1974). The surface is characterized by a dried soilsurface with little moving sand and few stones.Drill cores show that the vertical soil profile iscomposed of broad alternate layers of sandy soiland impervious clay, which inhibits vertical wa-
CONDITIONS FOR LIFE IN THE ATACAMA DESERT 395
FIG. 2. Cross-section of the desert region in the vicinity of Antofagasta, Chile (drawing adapted from Turis Tel’94guidebook). The peaks listed are indicated by triangles on Fig. 1.
ter diffusion. There is virtually no vegetation ex-cept at rare sites where the water table reachesthe surface. Throughout the region the watertable is typically at $25 m depth. Figure 1 showsthe location of the study site, and Fig. 2 shows arepresentative cross section of the topography ofthe region. There are no permanent human set-tlements in the central desert near Yungay.
The meteorological station was based on aCampbell 103 data logger operated by solar-recharged batteries. The system records air tem-perature and relative humidity (RH) at 2 m abovethe surface using a Campbell 207 probe in a ven-tilated radiation shield. The error in the temper-ature measurement is 6 0.2°C. The error in thehumidity measurement is ,10%. However, animportant caveat is that the Campbell 207 RHsensor has high errors for RH values below 15%—usually tending to systematically overestimatevalues. A 05013 RM Young Wind Monitor (windspeed and direction) was mounted at approxi-mately a 2.5 m height. A Texas Electronics TE525tipping bucket rain gauge was placed 20 cmabove the ground about a meter from the station.Our onsite calibration after 3 years in the fieldshowed good operation and an accuracy of bet-ter than 6%. Nearby, mounted to the top surfaceof a small stone, a Campbell 237 leaf wetness in-strument was used as a dew indicator. The dewsensor recorded a signal from 0 to 1 that is de-pendent on the amount of moisture present onthe sensor surface. There is no quantitative cali-bration for this unit, but its proper operation wasconfirmed after 3 years in the field. A LiCor Li200pyranometer recorded solar flux. The Li200 isbased on a silicon detector sensitive to light ofwavelengths from 0.4 to 1.1 mm. It was calibratedagainst an Eppley precision pyranometer, and theerror in the averaged light measurement was,10%.
At ground level, one RH chip (PCRC-11, Phys-Chem Scientific Corp.) was placed beneath asmall (6 cm in diameter) quartzite stone of thedesert pavement; another was placed in the soilsurface a few centimeters away. The sensors ex-tend to ,2 cm below the surface. Another unitwas placed at 10 cm depth in the soil. The PCRC-11 is the same sensor element used in the Camp-bell 207 probe. In the extreme dry soils of the At-acama Desert, RH sensors are a practical way tomonitor soil moisture. The temperature of the un-derside of the quartzite stone was measured us-ing a copper-constantan thermocouple. Conduc-
tivity probes to measure soil moisture were alsoplaced under the stone, as well as under anotherquartzite stone similar in size located a few cen-timeters away. The soil conductivity probe isbased on the voltage drop across two bare wires,5 mm apart, referenced to a 2.2 kV (kohm) resis-tor utilizing a 2.5-V alternating current excitation.
All sensors were sampled once every 3 min,and the average of 10 measurements was writtento final memory every 30 min, corresponding to48 recordings each day. For wind direction the in-stantaneous direction at the time of output wasrecorded, not the average.
The station was emplaced on September 24,1994, and operated until it was removed on Oc-tober 16, 1998. No useful data on wind directionwere obtained before November 31, 1995. Be-cause of loss of the solar power panel the stationdid not operate from September 2, 1997, to Octo-ber 15, 1997. In total, 1,438 complete days of datawere recorded and 46 complete months. The com-plete dataset, as well as monthly averages, areavailable from the authors electronically.
RESULTS
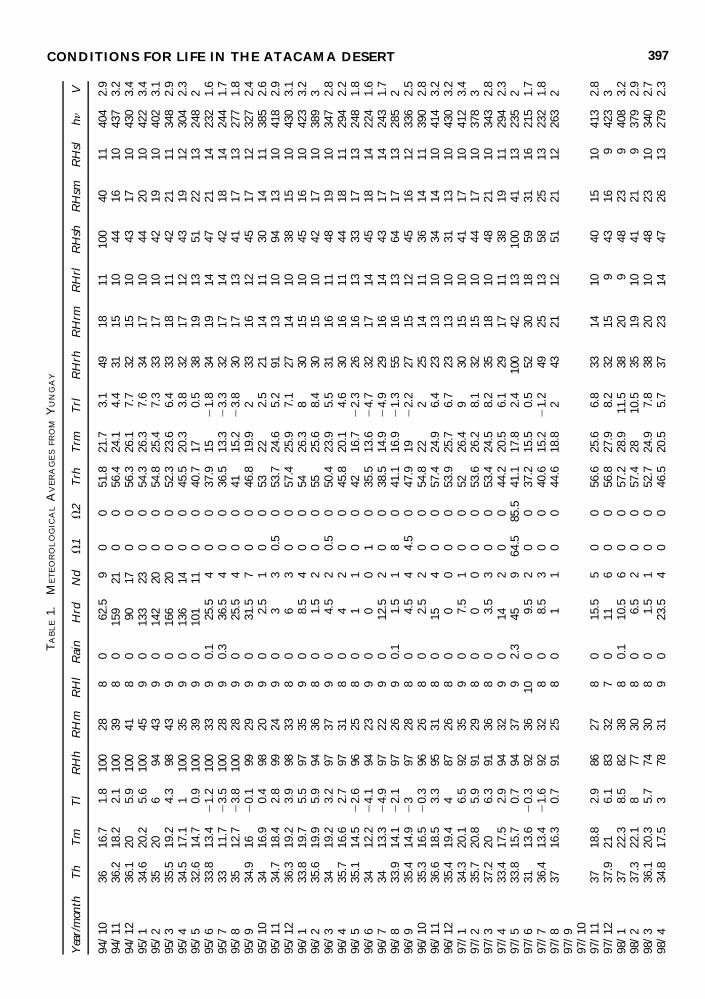
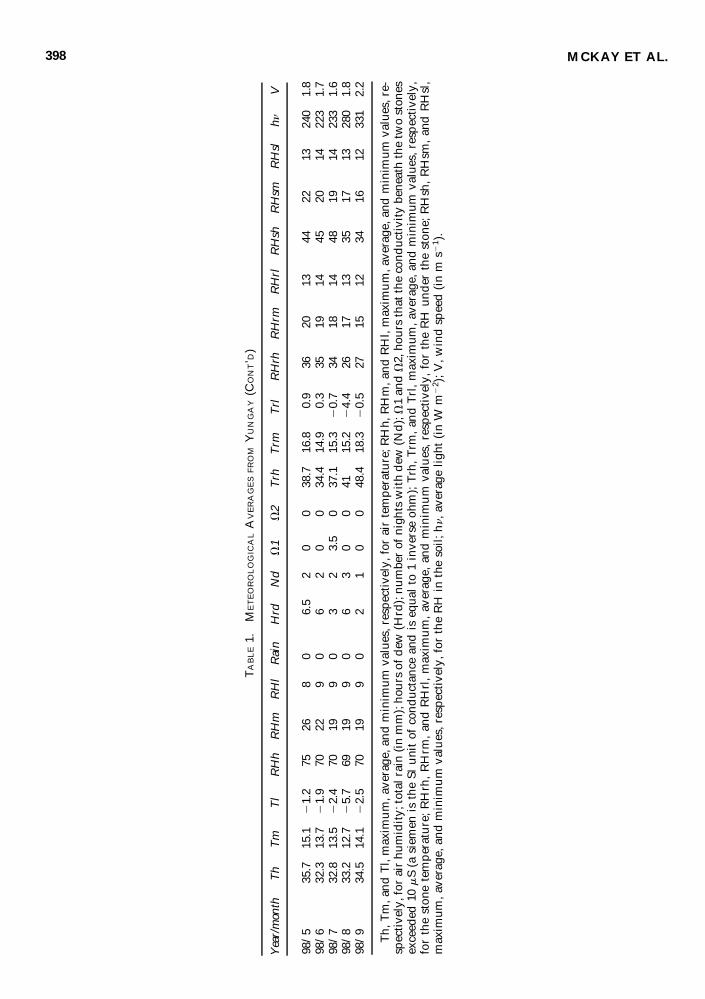
Monthly summaries of the key meteorologicaldata are listed in Table 1. The list includes themaximum, average, and minimum values for theair temperature and air humidity. Also listed istotal rain; hours of dew; number of nights withdew; hours that the conductivity beneath the twostones exceeded 10 mS (a siemen is the SI unit ofconductance and is equal to 1 inverse ohm); max-imum, average, and minimum values for thestone temperature; maximum, average, and min-imum values for the RH under the stone and inthe soil; average light; and wind speed.
Temperature
The temperature regime in the Atacama Desertis not extremely hot, nor are extremes of coldreached (e.g., compared with Death Valley whereair temperatures exceed 50°C for many days inthe summer). The maximum air temperaturerecorded over the 4-year period was 37.9°C, andthe minimum was 25.7°C. Figure 3 shows dailymaximum, average, and minimum temperaturefor each day in 1996. Typically, daytime maxi-mum temperatures reach 32°C. There is more sea-sonal variation in the minimum with summer
MCKAY ET AL.396
CONDITIONS FOR LIFE IN THE ATACAMA DESERT 397TABLE1.
METEOROLOGIC
ALA
VERAGES
FROM
YUNGAY
Year/month
Th
Tm
Tl
RHh
RHm
RHl
Rain
Hrd
Nd
V1
V2
Trh
Trm
Trl
RHrh
RHrm
RHrl
RHsh
RHsm
RHsl
hnV
94/10
3616
.71.8
100
288
062
.59
00
51.8
21.7
3.1
4918
1110
040
1140
42.9
94/11
36.2
18.2
2.1
100
398
015
921
00
56.4
24.1
4.4
3115
1044
1610
437
3.2
94/12
36.1
205.9
100
418
090
170
056
.326
.17.7
3215
1043
1710
430
3.4
95/1
34.6
20.2
5.6
100
459
013
323
00
54.3
26.3
7.6
3417
1044
2010
422
3.4
95/2
3520
694
439
014
220
00
54.8
25.4
7.3
3317
1042
1910
402
3.1
95/3
35.5
19.2
4.3
9843
90
166
200
052
.323
.66.4
3318
1142
2111
348
2.9
95/4
34.5
17.1
110
035
90
136
140
045
.520
.33.8
3217
1243
1912
304
2.3
95/5
32.6
14.7
0.9
100
399
010
111
00
40.7
170.5
3819
1351
2213
248
295
/6
33.8
13.4
21.2
100
339
0.1
25.5
40
037
.915
21.8
3419
1447
2114
232
1.6
95/7
3311
.723.5
100
289
0.3
36.5
40
036
.513
.323.3
3217
1442
1814
244
1.7
95/8
3512
.723.8
100
289
025
.54
00
4115
.223.8
3017
1341
1713
277
1.8
95/9
34.9
1620.1
9929
90
31.5
70
046
.819
.92
3316
1245
1712
327
2.4
95/10
3416
.90.4
9820
90
2.5
10
053
222.5
2114
1130
1411
385
2.6
95/11
34.7
18.4
2.8
9924
90
33
0.5
053
.724
.65.2
9113
1094
1310
418
2.9
95/12
36.3
19.2
3.9
9833
80
63
00
57.4
25.9
7.1
2714
1038
1510
430
3.1
96/1
33.8
19.7
5.5
9735
90
8.5
40
054
26.3
830
1510
4516
1042
33.2
96/2
35.6
19.9
5.9
9436
80
1.5
20
055
25.6
8.4
3015
1042
1710
389
396
/3
3419
.23.2
9737
90
4.5
20.5
050
.423
.95.5
3116
1148
1910
347
2.8
96/4
35.7
16.6
2.7
9731
80
42
00
45.8
20.1
4.6
3016
1144
1811
294
2.2
96/5
35.1
14.5
22.6
9625
80
11
00
4216
.722.3
2616
1333
1713
248
1.8
96/6
3412
.224.1
9423
90
00
10
35.5
13.6
24.7
3217
1445
1814
224
1.6
96/7
3413
.324.9
9722
90
12.5
20
038
.514
.924.9
2916
1443
1714
243
1.7
96/8
33.9
14.1
22.1
9726
90.1
1.5
18
041
.116
.921.3
5516
1364
1713
285
296
/9
35.4
14.9
23
9728
80
4.5
44.5
047
.919
22.2
2715
1245
1612
336
2.5
96/10
35.3
16.5
20.3
9626
80
2.5
20
054
.822
225
1411
3614
1139
02.8
96/11
36.6
18.5
3.3
9531
80
154
00
57.4
24.9
6.4
2313
1034
1410
414
3.2
96/12
35.4
19.4
487
268
00
00
053
.925
.76.7
2313
1031
1310
430
3.2
97/1
34.3
20.1
6.5
9235
90
7.5
10
052
26.4
930
1510
4117
1041
23.4
97/2
35.7
20.8
5.9
9129
80
00
00
53.6
26.2
8.1
3215
1044
1710
378
397
/3
37.2
206.3
9136
80
3.5
30
053
.424
.58.2
3518
1048
2110
343
2.8
97/4
33.4
17.5
2.9
9432
90
142
00
44.2
20.5
6.1
2917
1138
1911
294
2.3
97/5
33.8
15.7
0.7
9437
92.3
459
64.5
85.5
41.1
17.8
2.4
100
4213
100
4113
235
297
/6
3113
.620.3
9236
100
9.5
20
037
.215
.50.5
5230
1859
3116
215
1.7
97/7
36.4
13.4
21.6
9232
80
8.5
30
040
.615
.221.2
4925
1358
2513
232
1.8
97/8
3716
.30.7
9125
80
11
00
44.6
18.8
243
2112
5121
1226
32
97/9
97/10
97/11
3718
.82.9
8627
80
15.5
50
056
.625
.66.8
3314
1040
1510
413
2.8
97/12
37.9
216.1
8332
70
116
00
56.8
27.9
8.2
3215
943
169
423
398
/1
3722
.38.5
8238
80.1
10.5
60
057
.228
.911
.538
209
4823
940
83.2
98/2
37.3
22.1
877
308
06.5
20
057
.428
10.5
3519
1041
219
379
2.9
98/3
36.1
20.3
5.7
7430
80
1.5
10
052
.724
.97.8
3820
1048
2310
340
2.7
98/4
34.8
17.5
378
319
023
.54
00
46.5
20.5
5.7
3723
1447
2613
279
2.3
MCKAY ET AL.398
TABLE1.
METEOROLOGIC
ALA
VERAGES
FROM
YUNGAY(C
ONT’D)
Year/month
Th
Tm
Tl
RHh
RHm
RHl
Rain
Hrd
Nd
V1
V2
Trh
Trm
Trl
RHrh
RHrm
RHrl
RHsh
RHsm
RHsl
hnV
98/5
35.7
15.1
21.2
7526
80
6.5
20
038
.716
.80.9
3620
1344
2213
240
1.8
98/6
32.3
13.7
21.9
7022
90
62
00
34.4
14.9
0.3
3519
1445
2014
223
1.7
98/7
32.8
13.5
22.4
7019
90
32
3.5
037
.115
.320.7
3418
1448
1914
233
1.6
98/8
33.2
12.7
25.7
6919
90
63
00
4115
.224.4
2617
1335
1713
280
1.8
98/9
34.5
14.1
22.5
7019
90
21
00
48.4
18.3
20.5
2715
1234
1612
331
2.2
Th, Tm, a
nd Tl, max
imum, a
verage
, and
minim
um value
s, respe
ctively, for air tem
perature; R
Hh, RHm, a
nd RHl, max
imum, a
verage
, and
minim
um value
s, re-
spective
ly, for air hum
idity; to
tal rain (in mm); ho
urs of d
ew (Hrd
); nu
mbe
r of nights with dew
(Nd);
V1 an
d V
2, hou
rs th
at th
e co
nduc
tivity ben
eath th
e tw
o ston
esexceed
ed 10
mS (a siemen
is the SI unit of con
duc
tanc
e an
d is eq
ual to 1 inv
erse ohm
); Trh, T
rm, a
nd Trl, m
axim
um, a
verage
, and
minim
um value
s, respective
ly,
for the ston
e temperature; R
Hrh, RHrm
, an
d R
Hrl, max
imum, av
erag
e, and
minim
um values, resp
ective
ly, for the RH und
er the
stone
; RHsh
, RHsm
, an
d R
Hsl,
max
imum
, ave
rage
, and
minim
um values, respe
ctively, for the
RH in the soil; h
n, a
verage
light (in W
m22 ); V
, wind speed (in m
s21 ).
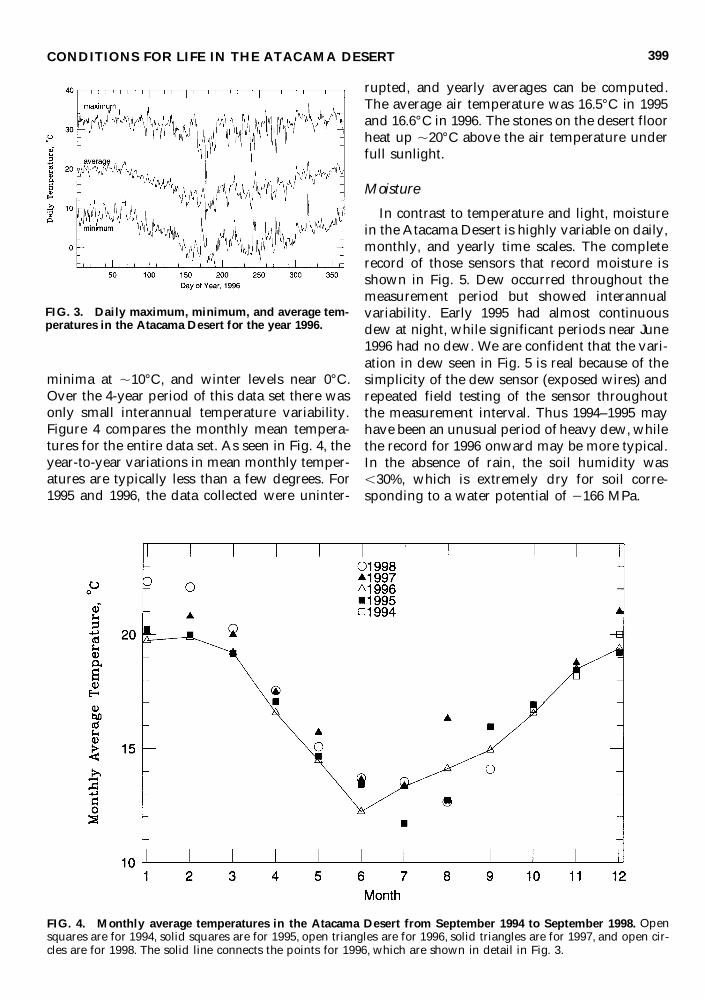
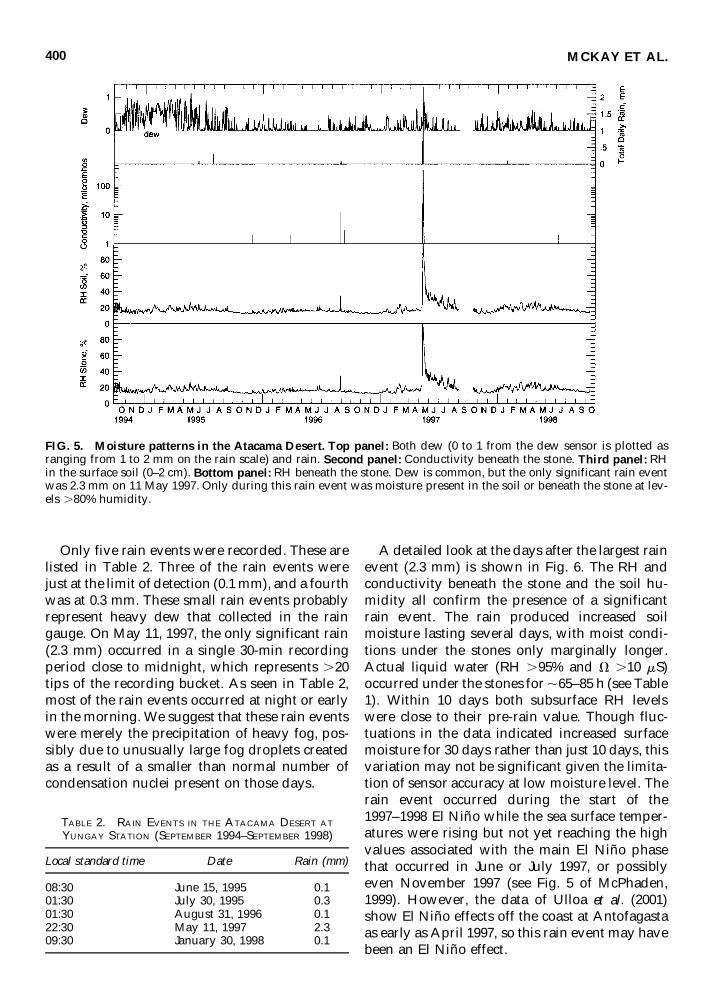
minima at ,10°C, and winter levels near 0°C.Over the 4-year period of this data set there wasonly small interannual temperature variability.Figure 4 compares the monthly mean tempera-tures for the entire data set. As seen in Fig. 4, theyear-to-year variations in mean monthly temper-atures are typically less than a few degrees. For1995 and 1996, the data collected were uninter-
rupted, and yearly averages can be computed.The average air temperature was 16.5°C in 1995and 16.6°C in 1996. The stones on the desert floorheat up ,20°C above the air temperature underfull sunlight.
Moisture
In contrast to temperature and light, moisturein the Atacama Desert is highly variable on daily,monthly, and yearly time scales. The completerecord of those sensors that record moisture isshown in Fig. 5. Dew occurred throughout themeasurement period but showed interannualvariability. Early 1995 had almost continuousdew at night, while significant periods near June1996 had no dew. We are confident that the vari-ation in dew seen in Fig. 5 is real because of thesimplicity of the dew sensor (exposed wires) andrepeated field testing of the sensor throughoutthe measurement interval. Thus 1994–1995 mayhave been an unusual period of heavy dew, whilethe record for 1996 onward may be more typical.In the absence of rain, the soil humidity was,30%, which is extremely dry for soil corre-sponding to a water potential of 2166 MPa.
CONDITIONS FOR LIFE IN THE ATACAMA DESERT 399
FIG. 3. Daily maximum, minimum, and average tem-peratures in the Atacama Desert for the year 1996.
FIG. 4. Monthly average temperatures in the Atacama Desert from September 1994 to September 1998. Opensquares are for 1994, solid squares are for 1995, open triangles are for 1996, solid triangles are for 1997, and open cir-cles are for 1998. The solid line connects the points for 1996, which are shown in detail in Fig. 3.
Only five rain events were recorded. These arelisted in Table 2. Three of the rain events werejust at the limit of detection (0.1 mm), and a fourthwas at 0.3 mm. These small rain events probablyrepresent heavy dew that collected in the raingauge. On May 11, 1997, the only significant rain(2.3 mm) occurred in a single 30-min recordingperiod close to midnight, which represents .20tips of the recording bucket. As seen in Table 2,most of the rain events occurred at night or earlyin the morning. We suggest that these rain eventswere merely the precipitation of heavy fog, pos-sibly due to unusually large fog droplets createdas a result of a smaller than normal number ofcondensation nuclei present on those days.
A detailed look at the days after the largest rainevent (2.3 mm) is shown in Fig. 6. The RH andconductivity beneath the stone and the soil hu-midity all confirm the presence of a significantrain event. The rain produced increased soilmoisture lasting several days, with moist condi-tions under the stones only marginally longer.Actual liquid water (RH .95% and V .10 mS)occurred under the stones for ,65–85 h (see Table1). Within 10 days both subsurface RH levelswere close to their pre-rain value. Though fluc-tuations in the data indicated increased surfacemoisture for 30 days rather than just 10 days, thisvariation may not be significant given the limita-tion of sensor accuracy at low moisture level. Therain event occurred during the start of the1997–1998 El Niño while the sea surface temper-atures were rising but not yet reaching the highvalues associated with the main El Niño phasethat occurred in June or July 1997, or possiblyeven November 1997 (see Fig. 5 of McPhaden,1999). However, the data of Ulloa et al. (2001)show El Niño effects off the coast at Antofagastaas early as April 1997, so this rain event may havebeen an El Niño effect.
MCKAY ET AL.400
TABLE 2. RAIN EVENTS IN THE ATACAMA DESERT AT
YUNGAY STATION (SEPTEMBER 1994–SEPTEMBER 1998)
Local standard time Date Rain (mm)
08:30 June 15, 1995 0.101:30 July 30, 1995 0.301:30 August 31, 1996 0.122:30 May 11, 1997 2.309:30 January 30, 1998 0.1
FIG. 5. Moisture patterns in the Atacama Desert. Top panel: Both dew (0 to 1 from the dew sensor is plotted asranging from 1 to 2 mm on the rain scale) and rain. Second panel: Conductivity beneath the stone. Third panel: RHin the surface soil (0–2 cm). Bottom panel: RH beneath the stone. Dew is common, but the only significant rain eventwas 2.3 mm on 11 May 1997. Only during this rain event was moisture present in the soil or beneath the stone at lev-els .80% humidity.
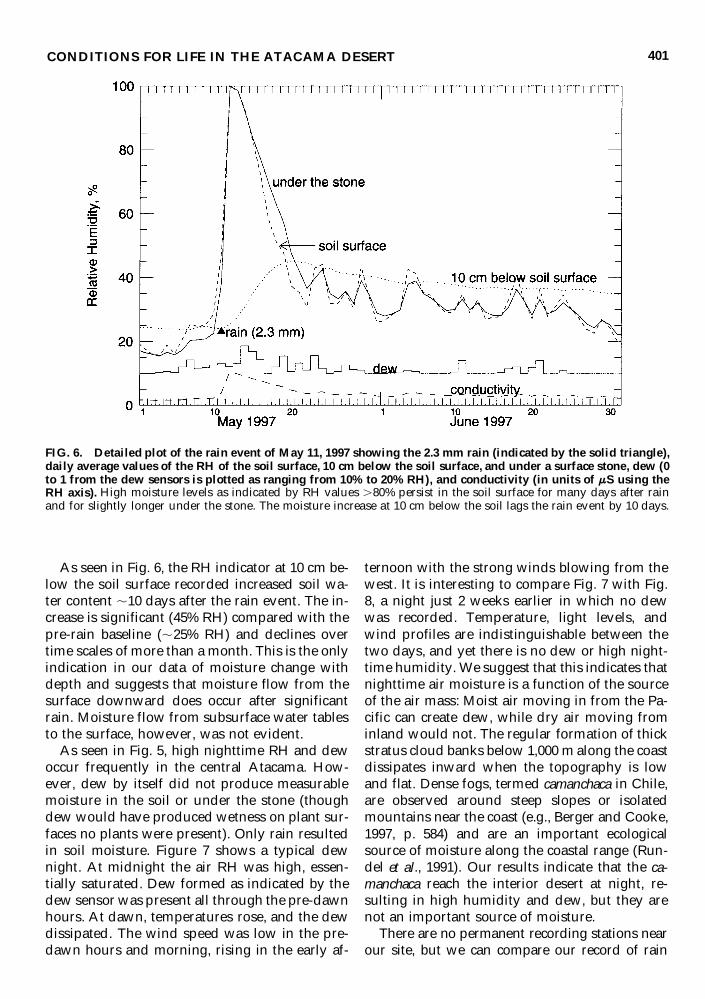
As seen in Fig. 6, the RH indicator at 10 cm be-low the soil surface recorded increased soil wa-ter content ,10 days after the rain event. The in-crease is significant (45% RH) compared with thepre-rain baseline (,25% RH) and declines overtime scales of more than a month. This is the onlyindication in our data of moisture change withdepth and suggests that moisture flow from thesurface downward does occur after significantrain. Moisture flow from subsurface water tablesto the surface, however, was not evident.
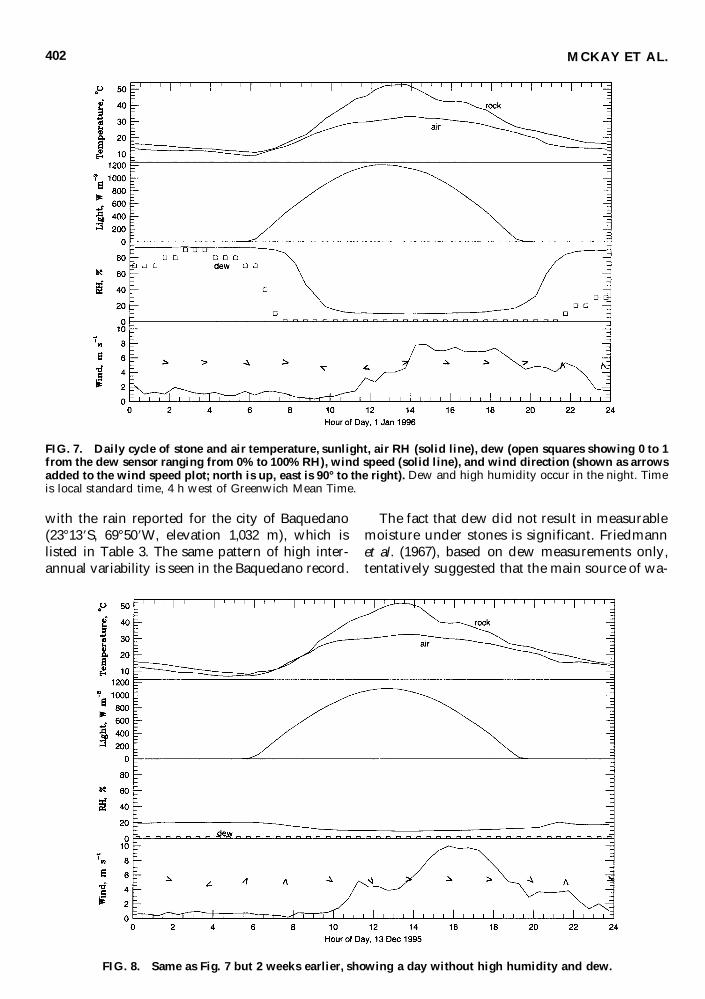
As seen in Fig. 5, high nighttime RH and dewoccur frequently in the central Atacama. How-ever, dew by itself did not produce measurablemoisture in the soil or under the stone (thoughdew would have produced wetness on plant sur-faces no plants were present). Only rain resultedin soil moisture. Figure 7 shows a typical dewnight. At midnight the air RH was high, essen-tially saturated. Dew formed as indicated by thedew sensor was present all through the pre-dawnhours. At dawn, temperatures rose, and the dewdissipated. The wind speed was low in the pre-dawn hours and morning, rising in the early af-
ternoon with the strong winds blowing from thewest. It is interesting to compare Fig. 7 with Fig.8, a night just 2 weeks earlier in which no dewwas recorded. Temperature, light levels, andwind profiles are indistinguishable between thetwo days, and yet there is no dew or high night-time humidity. We suggest that this indicates thatnighttime air moisture is a function of the sourceof the air mass: Moist air moving in from the Pa-cific can create dew, while dry air moving frominland would not. The regular formation of thickstratus cloud banks below 1,000 m along the coastdissipates inward when the topography is lowand flat. Dense fogs, termed camanchaca in Chile,are observed around steep slopes or isolatedmountains near the coast (e.g., Berger and Cooke,1997, p. 584) and are an important ecologicalsource of moisture along the coastal range (Run-del et al., 1991). Our results indicate that the ca-manchaca reach the interior desert at night, re-sulting in high humidity and dew, but they arenot an important source of moisture.
There are no permanent recording stations nearour site, but we can compare our record of rain
CONDITIONS FOR LIFE IN THE ATACAMA DESERT 401
FIG. 6. Detailed plot of the rain event of May 11, 1997 showing the 2.3 mm rain (indicated by the solid triangle),daily average values of the RH of the soil surface, 10 cm below the soil surface, and under a surface stone, dew (0to 1 from the dew sensors is plotted as ranging from 10% to 20% RH), and conductivity (in units of mS using theRH axis). High moisture levels as indicated by RH values .80% persist in the soil surface for many days after rainand for slightly longer under the stone. The moisture increase at 10 cm below the soil lags the rain event by 10 days.
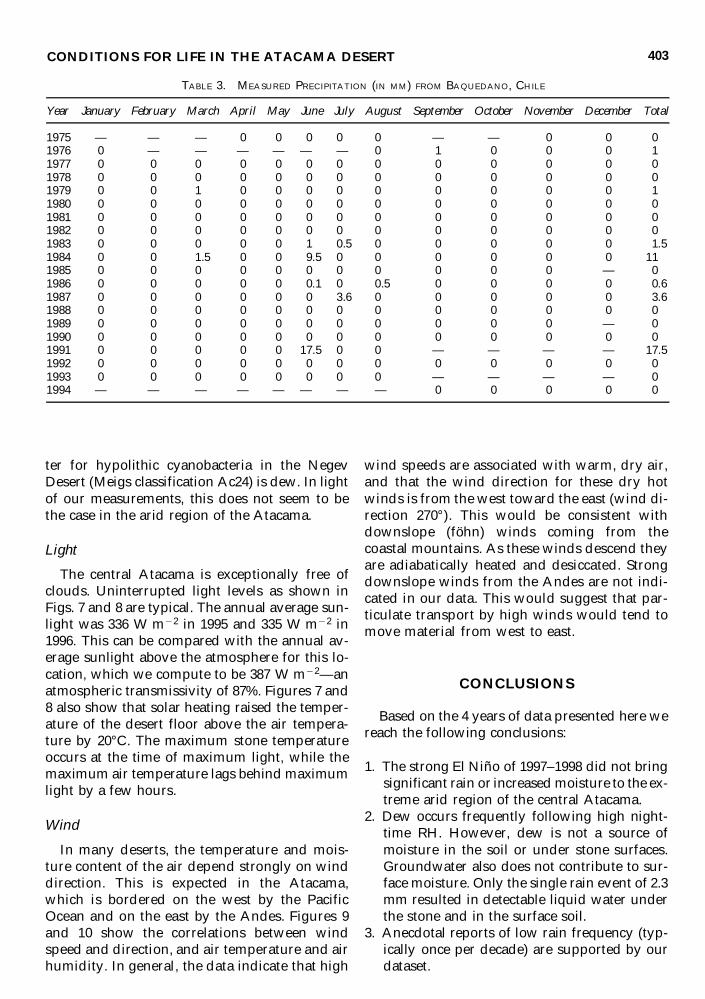
with the rain reported for the city of Baquedano(23°139S, 69°509W, elevation 1,032 m), which islisted in Table 3. The same pattern of high inter-annual variability is seen in the Baquedano record.
The fact that dew did not result in measurablemoisture under stones is significant. Friedmannet al. (1967), based on dew measurements only,tentatively suggested that the main source of wa-
MCKAY ET AL.402
FIG. 7. Daily cycle of stone and air temperature, sunlight, air RH (solid line), dew (open squares showing 0 to 1from the dew sensor ranging from 0% to 100% RH), wind speed (solid line), and wind direction (shown as arrowsadded to the wind speed plot; north is up, east is 90° to the right). Dew and high humidity occur in the night. Timeis local standard time, 4 h west of Greenwich Mean Time.
FIG. 8. Same as Fig. 7 but 2 weeks earlier, showing a day without high humidity and dew.
ter for hypolithic cyanobacteria in the NegevDesert (Meigs classification Ac24) is dew. In lightof our measurements, this does not seem to bethe case in the arid region of the Atacama.
Light
The central Atacama is exceptionally free ofclouds. Uninterrupted light levels as shown inFigs. 7 and 8 are typical. The annual average sun-light was 336 W m22 in 1995 and 335 W m22 in1996. This can be compared with the annual av-erage sunlight above the atmosphere for this lo-cation, which we compute to be 387 W m22—anatmospheric transmissivity of 87%. Figures 7 and8 also show that solar heating raised the temper-ature of the desert floor above the air tempera-ture by 20°C. The maximum stone temperatureoccurs at the time of maximum light, while themaximum air temperature lags behind maximumlight by a few hours.
Wind
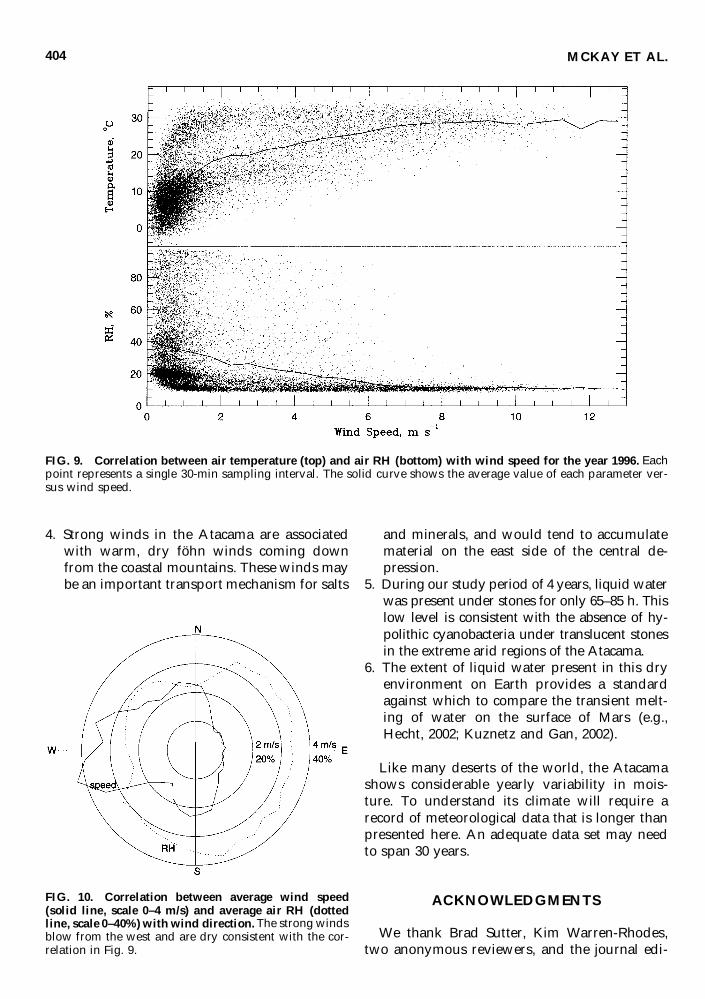
In many deserts, the temperature and mois-ture content of the air depend strongly on winddirection. This is expected in the Atacama,which is bordered on the west by the PacificOcean and on the east by the Andes. Figures 9and 10 show the correlations between windspeed and direction, and air temperature and airhumidity. In general, the data indicate that high
wind speeds are associated with warm, dry air,and that the wind direction for these dry hotwinds is from the west toward the east (wind di-rection 270°). This would be consistent withdownslope (föhn) winds coming from thecoastal mountains. As these winds descend theyare adiabatically heated and desiccated. Strongdownslope winds from the Andes are not indi-cated in our data. This would suggest that par-ticulate transport by high winds would tend tomove material from west to east.
CONCLUSIONS
Based on the 4 years of data presented here wereach the following conclusions:
1. The strong El Niño of 1997–1998 did not bringsignificant rain or increased moisture to the ex-treme arid region of the central Atacama.
2. Dew occurs frequently following high night-time RH. However, dew is not a source ofmoisture in the soil or under stone surfaces.Groundwater also does not contribute to sur-face moisture. Only the single rain event of 2.3mm resulted in detectable liquid water underthe stone and in the surface soil.
3. Anecdotal reports of low rain frequency (typ-ically once per decade) are supported by ourdataset.
CONDITIONS FOR LIFE IN THE ATACAMA DESERT 403
TABLE 3. MEASURED PRECIPITATION (IN MM) FROM BAQUEDANO, CHILE
Year January February March April May June July August September October November December Total
1975 — — — 0 0 0 0 0 — — 0 0 01976 0 — — — — — — 0 1 0 0 0 11977 0 0 0 0 0 0 0 0 0 0 0 0 01978 0 0 0 0 0 0 0 0 0 0 0 0 01979 0 0 1 0 0 0 0 0 0 0 0 0 11980 0 0 0 0 0 0 0 0 0 0 0 0 01981 0 0 0 0 0 0 0 0 0 0 0 0 01982 0 0 0 0 0 0 0 0 0 0 0 0 01983 0 0 0 0 0 1 0.5 0 0 0 0 0 1.51984 0 0 1.5 0 0 9.5 0 0 0 0 0 0 111985 0 0 0 0 0 0 0 0 0 0 0 — 01986 0 0 0 0 0 0.1 0 0.5 0 0 0 0 0.61987 0 0 0 0 0 0 3.6 0 0 0 0 0 3.61988 0 0 0 0 0 0 0 0 0 0 0 0 01989 0 0 0 0 0 0 0 0 0 0 0 — 01990 0 0 0 0 0 0 0 0 0 0 0 0 01991 0 0 0 0 0 17.5 0 0 — — — — 17.51992 0 0 0 0 0 0 0 0 0 0 0 0 01993 0 0 0 0 0 0 0 0 — — — — 01994 — — — — — — — — 0 0 0 0 0
4. Strong winds in the Atacama are associatedwith warm, dry föhn winds coming downfrom the coastal mountains. These winds maybe an important transport mechanism for salts
and minerals, and would tend to accumulatematerial on the east side of the central de-pression.
5. During our study period of 4 years, liquid waterwas present under stones for only 65–85 h. Thislow level is consistent with the absence of hy-polithic cyanobacteria under translucent stonesin the extreme arid regions of the Atacama.
6. The extent of liquid water present in this dryenvironment on Earth provides a standardagainst which to compare the transient melt-ing of water on the surface of Mars (e.g.,Hecht, 2002; Kuznetz and Gan, 2002).
Like many deserts of the world, the Atacamashows considerable yearly variability in mois-ture. To understand its climate will require arecord of meteorological data that is longer thanpresented here. An adequate data set may needto span 30 years.
ACKNOWLEDGMENTS
We thank Brad Sutter, Kim Warren-Rhodes,two anonymous reviewers, and the journal edi-
MCKAY ET AL.404
FIG. 9. Correlation between air temperature (top) and air RH (bottom) with wind speed for the year 1996. Eachpoint represents a single 30-min sampling interval. The solid curve shows the average value of each parameter ver-sus wind speed.
FIG. 10. Correlation between average wind speed(solid line, scale 0–4 m/s) and average air RH (dottedline, scale 0–40%) with wind direction.The strong windsblow from the west and are dry consistent with the cor-relation in Fig. 9.
tor for helpful reviews and comments and SteveWarren for the suggestion that the rain event wasa precipitation of a heavy fog. This work was sup-ported by subventions from the NASA Exobiol-ogy program.
ABBREVIATION
RH, relative humidity.
REFERENCES
Abreu, M.L. and Bannon, P. (1993) Dynamics of the SouthAmerican coastal desert. J. Atmos. Sci. 50, 2952–2964.
Berger, I.A. and Cooke, R.U. (1997) The origin and dis-tribution of salts on alluvial fans in the Atacama Desert,Northern Chile. Earth Surface Processes Landforms 22,581–600.
Betancourt, J.L., Latorre, C., Rech, J.A., Quade, J., and Ry-lander, K.A. (2000) A 22,000–year record of monsoonalprecipitation from northern Chile’s Atacama Desert.Science 289, 1542–1546.
Bobst, A.L., Lowenstein, T.K., Jordan, T.E., Godfrey,L.V., Ku, T.-L., and Luo, S. (2001) A 106ka paleocli-mate record from drill core of the Salar de Atacama,northern Chile. Paleogeogr. Paleoclimatol. Paleoecol. 173,21–42.
Böhlke, J.K., Ericksen, G.E., and Revesz, K. (1997) Stableisotopic evidence for an atmospheric origin of desertnitrate deposits in northern Chile and southern Cali-fornia, USA. Chem. Geol. 136, 135–152.
Börgel, R.O. (1973) The coastal desert of Chile. In CoastalDeserts, Their Natural and Human Environments, editedby D.H. Amiran and A.W. Wilson, University of Ari-zona Press, Tucson, pp. 111–114.
Caviedes, C.L. (1973) A climatic profile of the northChilean desert at latitude 20 south. In Coastal Deserts,Their Natural and Human Environments, edited by D.H.Amiran and A.W. Wilson, University of Arizona Press,Tucson, pp. 115–121.
Ericksen, G.E. (1983) The Chilean nitrate deposits. Am. Sci.71, 366–374.
Friedmann, E.I. and Galun, M. (1974) Desert algae,lichens, and fungi. In Desert Biology, edited by G.W.Brown, Academic Press, San Diego, pp. 165–212.
Friedmann, E.I. and Ocampo-Friedmann, R. (1977) En-dolithic microorganisms in extreme dry environments:analysis of a lithobiotic habitat. In Current Perspectivesin Microbial Ecology, edited by M.J. Klug and C.A.Reddy, American Society for Microbiology, Washing-ton, DC, pp. 177–185.
Friedmann, E.I., Lipkin, Y., and Ocampo-Paus, R. (1967)Desert algae of the Negev (Israel). Phycologia 6, 185–200.
Golubic, S., Friedmann, I., and Schneider, J. (1981) Thelithobiotic ecological niche, with special reference to mi-croorganisms. J. Sediment. Petrol. 51, 475–478.
Hecht, M.H. (2002) Metastability of liquid water on Mars.Icarus 156, 373–386.
Jury, W.A. and Bellantuoni, B. (1976a) Heat and watermovement under surface rocks in a field soil: I. Ther-mal effects. Soil Sci. Soc. Am. J. 40, 505–509.
Jury, W.A. and Bellantuoni, B. (1976b) Heat and watermovement under surface rocks in a field soil: II. Mois-ture effects. Soil Sci. Soc. Am. J. 40, 509–513.
Kuznetz, L.H. and Gan, D.C. (2002) On the existence andstability of liquid water on the surface of Mars today.Astrobiology 2, 183–195.
Lettau, H. (1976) Dynamics and energetic factors whichcause and limit aridity along South America’s Pacificcoast. In World Survey of Climatology, Vol. 12: Climate ofCentral and South America, edited by W. Schwerdfeger,Elsevier, Amsterdam, pp. 188–192.
McGinnies, W.G., Goldman, B.J., and Paylore, P. (1968)Deserts of the World, University of Arizona Press, Tucson.
McPhaden, M.J. (1999) Genesis and evolution of the1997–98 El Niño. Science 283, 950–954.
Miller, A. (1976) The climate of Chile. In World Survey ofClimatology, Vol. 12: Climate of Central and South Amer-ica, edited by W. Schwerdfeger, Elsevier, Amsterdam,pp. 113–145.
Ortlieb, L. (1995) El Niño events and the occurrence ofrainfall episodes in the Atacama Desert: the record dur-ing the last two centuries [in Spanish]. Bull. Inst. Fran-cais Etudes Andines 24, 519–537.
Rundel, P.W., Dillon, M.O., Palma, B., Hooney, H.A., Gul-mon, S.L., and Ehleringer, J.R. (1991) The phytogeog-raphy and ecology of the coastal Atacama and Peru-vian deserts. Aliso 13(1), 1–49.
Rutllant, J. and Ulriksen, P. (1979) Boundary layer dy-namics of the extremely arid northern part of Chile: theAntofagasta Field Experiment. Boundary Layer Meteor.17, 41–55.
Rutllant, J., Fuenzalida, H., Torres R., and Figueroa, D.(1998) Ocean-atmosphere-land interaction in theAntofagasta Region (Chile, 23 S): the DICLIMA fieldexperiment [in Spanish]. Rev. Chilena Historia Natural71, 405–427.
Rutllant, J., Fuenzalida, H., Aceituno, P., Montecinos, A.,Sanchez, R., Salinas, H., Inzunza, J., and Zuleta, R.(2000) Coastal climate dynamics of the Antofagasta re-gion (Chile, 23 S): the 1997–1998 DICLIMA experiment.In 6th International Conference on Southern HemisphereMeteorology and Oceanography, Santiago, 3–7 April 2000,American Meteorological Society, Boston, pp. 268–269.
Takayabu, Y.N., Iguchi, T., Kachi, M., Shibata, A., andKanzawa, H. (1999) Abrupt termination of the 1997–98El Niño in response to a Madden-Julian oscillation. Na-ture 402, 279–282.
Trewartha, G.T. (1961) The Earth’s Problem Climates, Uni-versity of Wisconsin Press, Madison.
Ulloa, O., Escribano, R., Hormazabal, S., Quiñones, R.A.,González, R.R., and Ramos, M. (2001) Evolution and bi-ological effects of the 1997–98 El Niño in the upwellingecosystems off northern Chile. Geophys. Res. Lett. 28,1591–1594.
CONDITIONS FOR LIFE IN THE ATACAMA DESERT 405

Vargas, G., Ortlieb, L., and Rutllant, J. (2000) Historicmudflows in Antofagasta, Chile, and their relationshipto the El Niño/Southern Oscillation events [in Span-ish]. Rev. Geol. Chile 27, 157–176.
Vogel, S. (1955) “Fensterpflanzen” in der südafrikansis-chen Wüste, eine ökologische Schilderung. Beitr. Biol.Pfl. 31, 45–135.
Address reprint requests to:Dr. Christopher P. McKay
Space Science DivisionNASA Ames Research Center
Moffett Field, CA 94035
E-mail: [email protected]
MCKAY ET AL.406