tailoring raney-catalysts for the selective hydrogenation of butyronitrile to n-butylamine
TRANSCRIPT
Journal of Catalysis 245 (2007) 237–248
www.elsevier.com/locate/jcat
Tailoring Raney-catalysts for the selective hydrogenation of butyronitrileto n-butylamine
Adam Chojecki, Maritza Veprek-Heijman, Thomas E. Müller ∗, Peter Schärringer, Stan Veprek,Johannes A. Lercher
Technische Universität München, Department Chemie, Lichtenbergstraße 4, 85747 Garching, Germany
Received 17 July 2006; revised 5 October 2006; accepted 6 October 2006
Abstract
The influence of LiOH promotion on Co-based Raney-catalysts for the selective hydrogenation of butyronitrile to n-butylamine was explored.Doping with LiOH led to an increase in the fraction of metallic surface area and reduced concentration of Lewis acid sites resulting from aluminaparticles decorating the metal surface. Two factors were found to be crucial to achieving high selectivity to primary amines. These factors includea low adsorption constant of n-butylamine relative to butyronitrile (because adsorbed butylamine is necessary for byproduct formation) and a lowconcentration of Lewis acid sites catalyzing condensation reactions.© 2006 Elsevier Inc. All rights reserved.
Keywords: Nitrile; Amine; Hydrogenation; Selectivity; Raney-catalyst; Cobalt; Nickel; Lithium hydroxide; Surface modification; Lewis acid site; Adsorptionconstant; Polarization effect; Condensation reaction
1. Introduction
The reduction of nitriles to primary amines is a large-scale commercial process route [1]. One of the most impor-tant applications is the conversion of 1,4-dicyanobutane to 1,6-diaminohexane, which is used in the production of nylon-6,6[2,3]. It is known that the hydrogenation of C≡N groups pro-ceeds stepwise through reactive intermediates [4,5]. Conse-quently, condensation reactions may occur and mixtures of am-monia and primary, secondary, and tertiary amines are generallyobtained. The factors that influence the product distribution aremanifold and originate from catalyst composition (e.g., choiceof metal and support, presence of promoters) and reaction con-ditions [6]. High selectivities to primary amines were reportedfor Co, Ni, and Ru catalysts [7]. In contrast, nitriles can be re-duced to secondary and tertiary amines using Rh, Pd, and Ptcatalysts [8]. In the industrial process, a high selectivity to pri-mary amines is achieved by working at high hydrogen pressures(up to 600 bar) and with ammonia as solvent [9]. Skeletal metal
* Corresponding author.E-mail address: [email protected] (T.E. Müller).
0021-9517/$ – see front matter © 2006 Elsevier Inc. All rights reserved.doi:10.1016/j.jcat.2006.10.012
catalysts based on Ni and Co provide the lowest cost per unitmass of active catalyst and are widely used [10]. Their selec-tivity can be enhanced by modification with small amounts ofalkali metal hydroxides [11–13]. The reduction of nitriles withRaney-Ni has been studied repeatedly [14–16], whereas fewerreports have been published on Raney-Co [17–20]. For Raney-Ni, the effect of bases on selectivity also has been investigated[21,22].
The rational development of next generation catalysts withhigh specifity to primary amines requires deeper insights intothe processes that govern selectivity. Consequently, the presentstudy was aimed at establishing for the first time correlationsbetween the surface properties of unmodified and LiOH-dopedRaney-Co catalyst, the sorption characteristics for hydrogenas well as nitrile and amine, and the catalytic activity in thereduction of nitriles. The hydrogenation of butyronitrile to n-butylamine was explored as a model reaction for the reduc-tion of nitriles over Raney catalysts (Scheme 1). Several tech-niques for the characterization of Raney catalysts were used,focusing on surface properties. Special emphasis was placedon understanding the beneficial effect of LiOH modificationon the intrinsic activity and selectivity of Raney-Co. As ref-

238 A. Chojecki et al. / Journal of Catalysis 245 (2007) 237–248
Scheme 1.
erence materials, commercial catalysts with low selectivity butrelatively high activity (Raney-Ni), high selectivity and low ac-tivity (Raney-Co), and both high selectivity and high activity(Ni–Cr-promoted Raney-Co) were chosen. For those materials,the characterization was aimed at establishing boundary condi-tions for designing catalysts for the selective hydrogenation ofnitriles to primary amines.
2. Experimental
2.1. Catalyst preparation and materials
The catalysts Raney-Ni (#2800, lot #7716, mean grain di-ameter 45.6 µm), Raney-Co (#2700, lot #7865, mean grain di-ameter 30.1 µm), and Ni–Cr-promoted Raney-Co (#2724, lot#7733, mean grain diameter 28.5 µm) were obtained as anaqueous suspension from W.R. Grace & Co, GRACE Davi-son Chemical Division (see Table 1 for chemical composition).Catalysts used for characterization and hydrogenation exper-iments underwent the following pretreatment. The catalystswere washed with deionized water until pH 7 was reached, tak-ing care that the catalyst was sufficiently covered with liquid toprevent contact with atmospheric oxygen. After drying in a flowof argon (4 h at 328 K, followed by 1 h at 378 K), the catalystswere handled and stored under inert atmosphere throughout allother preparation and characterization steps. For doping withLiOH, a thoroughly washed 143-g sample of Raney-Co wassuspended in an aqueous solution of LiOH (3.25 g in 100 cm3
of deionized water). The water was removed in partial vacuum(<4 mbar), and the sample was dried (10 h at 323 K). Theconcentration of Li+ was 0.5 wt% Li as determined by atomicabsorption spectrometry (UNICAM 939 AA-Spectrometer).
All other chemicals used in this study were obtained fromcommercial suppliers and used as received (butyronitrile,�99% GC-assay, Fluka; mono-, di-, and tri-n-butylamine,>99% GC-assay, Aldrich; n-octane and n-undecane, �99 GC-assay, Aldrich; and H2, Ar, NH3, 99.999, 99.999, and 99.98
Table 1Chemical composition of the catalysts used in this study (data of catalyst man-ufacturer)
Catalyst Element
Co[wt%]
Ni[wt%]
Cr[wt%]
Al[wt%]
Raney-Ni <0.5 92.8 – 6.77Raney-Co 97.5 <0.5 <0.5 1.85Ni–Cr-promoted Raney-Co 91.3 2.8 2.2 3.50
vol%, respectively). All solvents and reactants were degassedin partial vacuum.
2.2. Catalysis
The hydrogenation of butyronitrile was carried out in a high-pressure 160 cm3 semibatch reactor at constant hydrogen pres-sure. Oxygen was removed from the autoclave through severalcycles of pressurizing and depressurizing with argon. The au-toclave was then charged under a flow of argon with 50 cm3 ofreaction mixture, composed of butyronitrile (2.18 cm3, 0.025mol, corresponding to 0.5 mol dm−3), octane (47.6 cm3), andcatalyst (0.2 g), with n-undecane (0.2 g) added as an internalstandard for GC chromatography. The mixture was stirred at1500 rpm and equilibrated at the reaction temperature (373 K)for 45–60 min. The reaction was started by rapidly pressuriz-ing the autoclave with hydrogen to 15, 30, or 45 bar. During theexperiment, samples of the liquid phase were taken for off-lineGC analysis with an HP 5890 gas chromatograph equipped witha cross-linked 5% diphenyl–95% dimethylpolysiloxane column(Rtx-5 Amine, 30 m, Restek GmbH). The reaction rate was cal-culated from the decrease in butyronitrile concentration in thelinear range between 20 and 80% conversion. A test on masstransfer limitations showed that the reaction rate did not dependon the stirring speed in the range of 1000–1850 rpm.
2.3. Catalyst characterization
N2-physisorption and H2-chemisorption measurements werecarried out on a Sorptomatic 1990 instrument (ThermoFinni-gan). For N2-physisorption, the catalyst samples (0.4–1.0 g)were outgassed for 1 h under high vacuum at a prespecifiedtemperature (298–633 K). The measurements were carried outat 77 K using N2 as a probe molecule. BET area and pore vol-ume were calculated from the isotherm. The micropore volumewas calculated from a Horvath–Kawazoe plot in the pressurerange of p/p◦ = 0–0.2. For hydrogen chemisorption, the cata-lysts were outgassed for 1 h at 383 K. Isotherms were recordedat 298 K, with equilibration for 2–180 min for each pressurestep. Equilibration was continued until the pressure deviationwas <0.27 mbar within of a 2-min period. Isotherms weremeasured twice on the same sample. Between the two mea-surements, the sample was evacuated to 10−3 mbar for 1 h.The second isotherm (physisorbed H2) was subtracted fromthe first isotherm (chemisorbed and physisorbed H2). To de-termine the amount of chemisorbed hydrogen, the linear part ofthe isotherm at p > 3 Pa was extrapolated to zero. The fraction

A. Chojecki et al. / Journal of Catalysis 245 (2007) 237–248 239
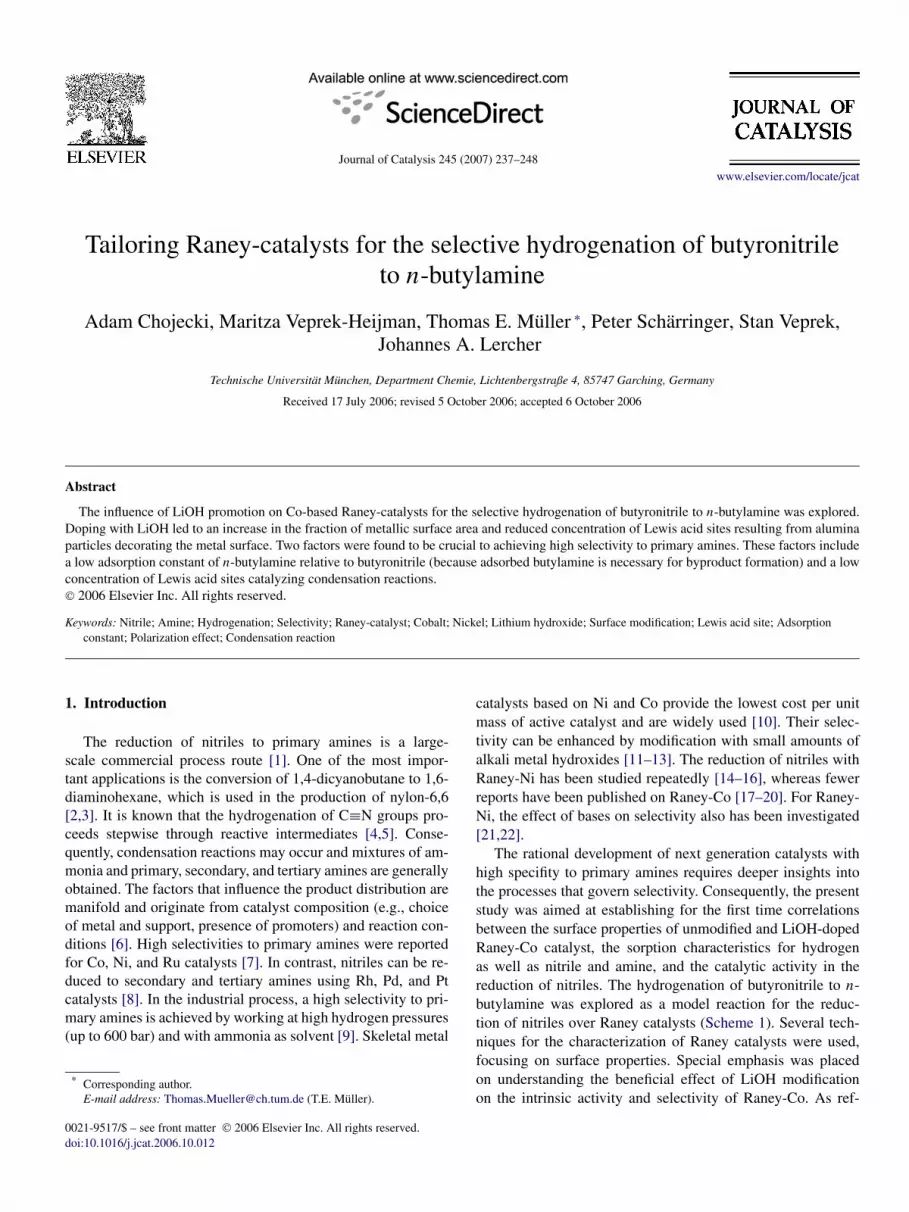
Fig. 1. (a) Concentration profile for the hydrogenation of butyronitrile over Raney-Ni at 373 K, p = 30 bar, c0 (butyronitrile) = 0.50 mol dm−3 (", butyronitrile;2, n-butylamine; Q, di-n-butylamine; F, N -butylidene-butylamine; +, tri-n-butylamine). (b) Integral hydrogen uptake.
of accessible metal atoms was calculated assuming that one hy-drogen atom was adsorbed per nickel or cobalt atom.
Temperature-programmed desorption (TPD) measurementswere carried out in a custom-built vacuum setup. The catalyst(50 mg) was outgassed for 8 h at 378 K. The temperature wasthen raised at a rate of 10 K min−1 to 973 K, and the des-orbing molecules were analyzed by mass spectrometry. Themasses m/z+ = 2 and 18 were used for monitoring desorptionof hydrogen and water, respectively. To determine the desorp-tion maxima, the MS traces were fitted with Gaussian curvesusing Grams/AI (Thermo Galactic, version 7.02). For TPD ofammonia, the sample (100 mg) was heated in high vacuumat 5 K min−1 to 473 K, outgassed for 5 min, and cooled to423 K. Then the sample was equilibrated for 1 h with ammonia(pNH3 = 1 ± 0.3 mbar), outgassed for 3 h, and finally heatedat a rate of 10 K min−1. Ammonia desorption was followed byMS using m/z+ = 15.
For X-ray photoelectron spectroscopy (XPS) measurements,care was taken to avoid contact of the catalyst samples with at-mospheric oxygen. In a glove box, the dried catalyst was placedon adhesive conducting tape. The sample was transferred underArgon to a Leybold LH 10 surface analysis system and ana-lyzed without further pretreatment. For each sample, a surveyspectrum was collected. The detailed spectra were excited withAlKα (1486.6 eV, 0.83 nm) and recorded in �E = constantmode. Selected spectral regions were repetitively scanned, andthe signals were averaged to improve the signal-to-noise ratio.To compensate for charge effects, the C 1s signal at 285 eV wasused as a reference [23], and the binding energy scale was cor-rected. Data were fitted (solid lines in Fig. 7) to account for thedifferent species on the catalyst surface. Spectral resolution anderror in the peak position was approximately 0.5 eV.
The adsorption constants were calculated from breakthroughcurves, which were obtained in a custom-built setup. A chro-matographic column was packed under argon with the driedcatalyst (2.5 g). The void spaces below and above the cat-alyst were filled with glass beads. Using a bypass, all lineswere flushed with argon before the experiments. The columnwas equilibrated at room temperature with thoroughly degassed
n-pentane. A solution of the adsorbate (n-butylamine or buty-ronitrile) and internal standard (octane) in n-pentane (both 12.5mmol dm−3) was passed over the catalyst at constant rate (2.2–2.3 cm3 min−1). The effluent was sampled every 0.2 min untilsteady state was obtained at the exit of the column. The compo-sition of the eluent was evaluated by gas chromatography. Theconcentration of the adsorbate in the feed was then increasedstepwise to 12.5, 25, 50, 75, and 100 mmol dm−3. For com-petitive sorption, an equimolar solution of n-butylamine andbutyronitrile (50 mmol dm−3) was passed over the catalyst.
3. Results
3.1. Catalytic activity in the reduction of butyronitrile andselectivity to n-butylamine
Activity and selectivity of four different Raney catalysts(Raney-Ni, Raney-Co, Ni–Cr-promoted Raney-Co, and LiOH-modified Raney-Co) were tested for the hydrogenation of bu-tyronitrile. A typical concentration profile for Raney-Ni isshown in Fig. 1a. After a short induction time (2 min), thehydrogenation of butyronitrile proceeded at a rate of 0.97 ×10⁻⁴ molbutyronitrile (gcat. s)−1. The butyronitrile concentrationdecreased almost linearly with time. In parallel, the integralhydrogen consumption increased linearly (Fig. 1b). Only athigh conversions (>80%), the rate of reaction decreased. Themain product was n-butylamine, which was formed with 66%selectivity. Di-n-butylamine and traces of tri-n-butylaminewere formed as byproducts; N -butylidene-butylamine was ob-served as a reaction intermediate (maximum concentration,20 × 10−3 mol dm−3). Its concentration began to decrease assoon as >70% of butyronitrile had been converted. At the endof the experiment, no N -butylidene-butylamine was found. Theconcentrations of n-butylamine and N -butylidene-butylaminebegan to increase immediately after the start of the reaction,indicating that both are primary reaction products. In contrast,di-n-butylamine and tri-n-butylamine were formed with a timedelay, suggesting that they are secondary reaction products.
A typical concentration profile for the hydrogenation of bu-tyronitrile over Raney-Co is related to the integral hydrogen
240 A. Chojecki et al. / Journal of Catalysis 245 (2007) 237–248
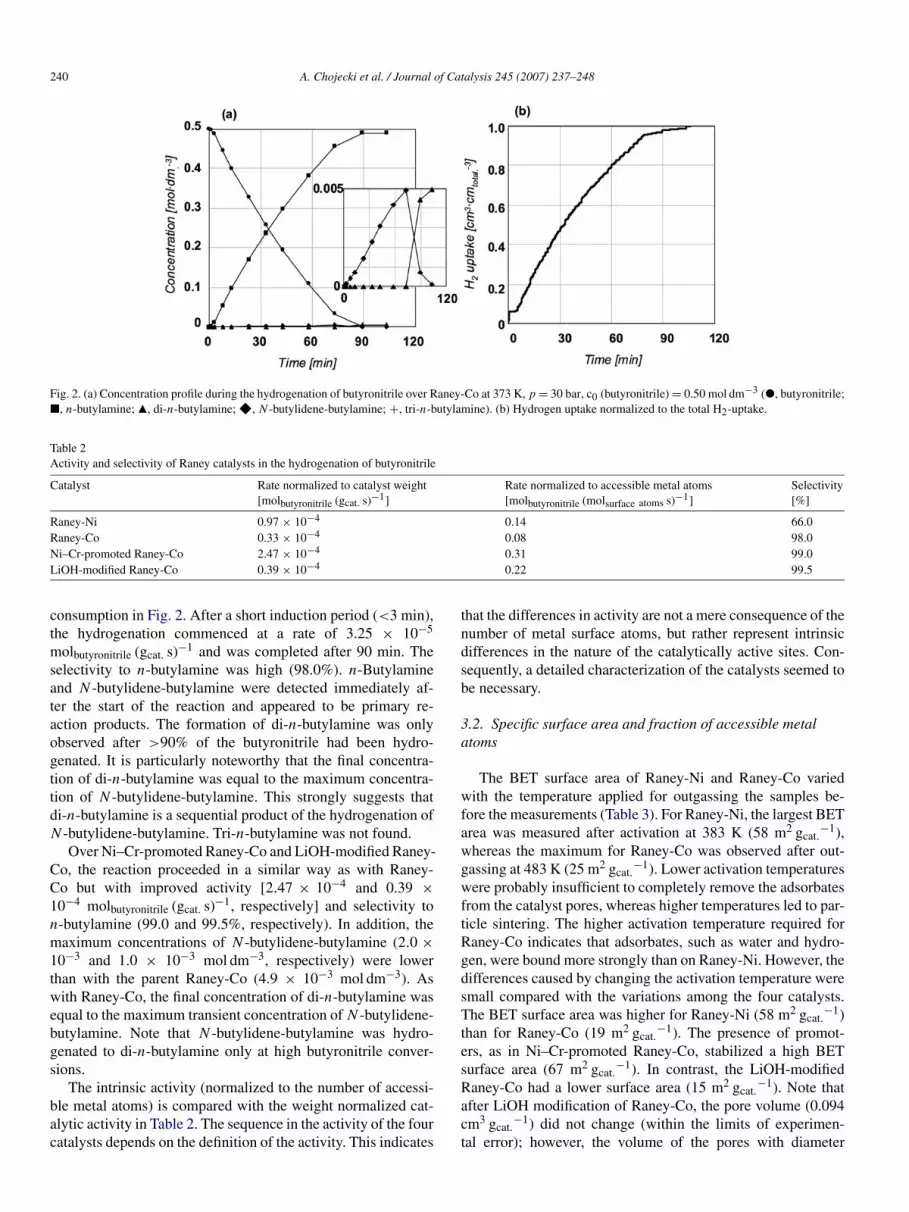
Fig. 2. (a) Concentration profile during the hydrogenation of butyronitrile over Raney-Co at 373 K, p = 30 bar, c0 (butyronitrile) = 0.50 mol dm−3 (", butyronitrile;2, n-butylamine; Q, di-n-butylamine; F, N -butylidene-butylamine; +, tri-n-butylamine). (b) Hydrogen uptake normalized to the total H2-uptake.
Table 2Activity and selectivity of Raney catalysts in the hydrogenation of butyronitrile
Catalyst Rate normalized to catalyst weight[molbutyronitrile (gcat. s)−1]
Rate normalized to accessible metal atoms[molbutyronitrile (molsurface atoms s)−1]
Selectivity[%]
Raney-Ni 0.97 × 10⁻⁴ 0.14 66.0Raney-Co 0.33 × 10⁻⁴ 0.08 98.0Ni–Cr-promoted Raney-Co 2.47 × 10⁻⁴ 0.31 99.0LiOH-modified Raney-Co 0.39 × 10⁻⁴ 0.22 99.5
consumption in Fig. 2. After a short induction period (<3 min),the hydrogenation commenced at a rate of 3.25 × 10⁻⁵
molbutyronitrile (gcat. s)−1 and was completed after 90 min. Theselectivity to n-butylamine was high (98.0%). n-Butylamineand N -butylidene-butylamine were detected immediately af-ter the start of the reaction and appeared to be primary re-action products. The formation of di-n-butylamine was onlyobserved after >90% of the butyronitrile had been hydro-genated. It is particularly noteworthy that the final concentra-tion of di-n-butylamine was equal to the maximum concentra-tion of N -butylidene-butylamine. This strongly suggests thatdi-n-butylamine is a sequential product of the hydrogenation ofN -butylidene-butylamine. Tri-n-butylamine was not found.
Over Ni–Cr-promoted Raney-Co and LiOH-modified Raney-Co, the reaction proceeded in a similar way as with Raney-Co but with improved activity [2.47 × 10⁻⁴ and 0.39 ×10⁻⁴ molbutyronitrile (gcat. s)−1, respectively] and selectivity ton-butylamine (99.0 and 99.5%, respectively). In addition, themaximum concentrations of N -butylidene-butylamine (2.0 ×10⁻³ and 1.0 × 10⁻³ mol dm−3, respectively) were lowerthan with the parent Raney-Co (4.9 × 10⁻³ mol dm−3). Aswith Raney-Co, the final concentration of di-n-butylamine wasequal to the maximum transient concentration of N -butylidene-butylamine. Note that N -butylidene-butylamine was hydro-genated to di-n-butylamine only at high butyronitrile conver-sions.
The intrinsic activity (normalized to the number of accessi-ble metal atoms) is compared with the weight normalized cat-alytic activity in Table 2. The sequence in the activity of the fourcatalysts depends on the definition of the activity. This indicates
that the differences in activity are not a mere consequence of thenumber of metal surface atoms, but rather represent intrinsicdifferences in the nature of the catalytically active sites. Con-sequently, a detailed characterization of the catalysts seemed tobe necessary.
3.2. Specific surface area and fraction of accessible metalatoms
The BET surface area of Raney-Ni and Raney-Co variedwith the temperature applied for outgassing the samples be-fore the measurements (Table 3). For Raney-Ni, the largest BETarea was measured after activation at 383 K (58 m2 gcat.
−1),whereas the maximum for Raney-Co was observed after out-gassing at 483 K (25 m2 gcat.
−1). Lower activation temperatureswere probably insufficient to completely remove the adsorbatesfrom the catalyst pores, whereas higher temperatures led to par-ticle sintering. The higher activation temperature required forRaney-Co indicates that adsorbates, such as water and hydro-gen, were bound more strongly than on Raney-Ni. However, thedifferences caused by changing the activation temperature weresmall compared with the variations among the four catalysts.The BET surface area was higher for Raney-Ni (58 m2 gcat.
−1)than for Raney-Co (19 m2 gcat.
−1). The presence of promot-ers, as in Ni–Cr-promoted Raney-Co, stabilized a high BETsurface area (67 m2 gcat.
−1). In contrast, the LiOH-modifiedRaney-Co had a lower surface area (15 m2 gcat.
−1). Note thatafter LiOH modification of Raney-Co, the pore volume (0.094cm3 gcat.
−1) did not change (within the limits of experimen-tal error); however, the volume of the pores with diameter

A. Chojecki et al. / Journal of Catalysis 245 (2007) 237–248 241
�1.0 nm decreased from 0.008 to 0.006 cm3 gcat.−1. This sug-
gests that LiOH resided mostly in the small pores, which con-tribute little to the void volume but significantly to the surfacearea.
The fraction of surface metal atoms was determined by hy-drogen chemisorption (Fig. 3, Table 4). For the four catalysts,the same trend was observed as that based on the BET surfacearea; however, the metal surface area was roughly two timeslower than the specific surface area. This demonstrates that onlya part of the surface was accessible nickel or cobalt. Most likely,aluminum not removed during preparation [21,24,25], Al2O3,and other oxides led to a higher specific surface area and cov-ered part of the catalytically active metal surface.
Fig. 3. Hydrogen adsorption isotherms recorded at 298 K (F, Ni–Cr-promotedRaney-Co; Q, Raney-Ni; 2, Raney-Co; 1, LiOH-modified Raney-Co).
Table 3BET surface area measured after outgassing the catalyst samples for 1 h at thetemperature stated
Tactivation[K]
Raney-Ni[m2 gcat.
−1]Raney-Co[m2 gcat.
−1]Ni–Cr-promotedRaney-Co[m2 gcat.
−1]
LiOH-modifiedRaney-Co[m2 gcat.
−1]
298 55.4 19.2 67.5 14.8383 57.7 19.3 66.8 14.8483 52.2 24.6 61.7 –533 – 24.1 – –583 47.9 23.7 – –633 45.7 19.5 – –
3.3. Residual water and hydrogen on the catalyst surface
The concentration of residual molecules remaining on thecatalyst surface after outgassing was determined by TPD(Figs. 4 and 5 [26]). Raney-Ni exhibited a relatively narrowtemperature range for desorption of water and hydrogen (400–530 K). The narrow distribution of desorption states may berelated to a uniform surface structure with a low concentra-tion of defects. In this respect, Martin et al. demonstrated, bymeasuring the saturation magnetization of Raney-Ni in an elec-tromagnetic field, that the hydrogen that evolves during TPDcannot be the result of a reaction between water and metallicaluminum [27]. Thus, hydrogen evolution can originate onlyfrom hydrogen that remained adsorbed on the material after thepreparation procedure. Note that this process involves dissolu-tion of aluminum in an aqueous base under the evolution ofhydrogen.
For the parent and Ni–Cr-promoted Raney-Co, the TPDtraces of both residual water and hydrogen showed a broad tem-perature range for desorption (400–730 K). For hydrogen, therather difficult deconvolution of the data allows only a quali-
Fig. 4. TPD traces of residual water (2) for the Raney-catalysts studied andcontribution of single sites (solid lines).
Table 4Number of Ni or Co surface atoms and metal surface area as determined by H2-chemisorption at 298 K. For comparison, the results from N2-physisorption areincluded
Catalyst Accessible metal atoms[mmol gcat.
−1]Dispersion[%]
Metal surface area*
[m2 gcat.−1]
BET surface area[m2 gcat.
−1]Pore volume[cm3 gcat.
−1]
Raney-Ni 0.69 4.06 27.0 55.4 –Raney-Co 0.40 2.35 15.7 19.2 0.094Ni–Cr-promotedRaney-Co
0.80 4.72 31.3 67.5 –
LiOH-modifiedRaney-Co
0.18 1.06 7.1 14.8 0.095
* Calculated based on a stoichiometry of 1 H atom per metal atom and a transversal section of 6.5 Å2 for Ni and Co.

242 A. Chojecki et al. / Journal of Catalysis 245 (2007) 237–248
tative discussion of the data. Note that metal sintering occursat higher temperatures but is a relatively slow process. Becausethe BET area at 633 K was decreased by only about 20% rel-ative to the maximum BET area (Raney-Ni and Raney-Co; seeTable 4), we assume that the TPD measurements reflect the truestate of the catalyst. In general, the desorption maxima for waterand hydrogen occurred at roughly the same temperature, but thelow-temperature peaks for water were much more pronouncedthan those for hydrogen.
Fig. 5. TPD traces of residual hydrogen (2) for the Raney-catalysts used in thisstudy and contribution of single sites (solid lines).
For LiOH-modified Raney-Co, analysis of the TPD dataagain did not exhibit a satisfying deconvolution. However, thehighest rate of water desorption occurred at 436 K and de-creased slowly at higher temperatures. In contrast, for the parentRaney-Co, the first desorption maximum occurred at 460 K.In this respect, it is known [28] that lithium hydroxide reactsreadily with aluminum hydroxide to LiAl2(OH)7 × 2H2O [29],which dehydrates at low temperatures (�473 K). Thus, the des-orption maximum at 436 K is probably related to reaction oflithium hydroxide. A second low-intensity desorption featureat 619 K can be similarly explained by dehydration of LiOHoccurring in vacuum at 623 K. The desorption peak at 619 Kcorrelates well with a maximum hydrogen desorption at 625 K.The desorption trace of hydrogen showed two major desorp-tion peaks at 551 and 625 K. The first hydrogen desorptionmaximum at 551 K is probably due to desorption of residualhydrogen from the metal surface, as for the other two Raney-Cocatalysts. The second, more intense peak at 625 K is probablythe result of a secondary reaction between aluminum and LiOH,
2LiOH −→ Li2O + H2, (1)
2Al + LiOH + 6H2O −→ LiAl2(OH)7 + 3H2, (2)
2Al + 13LiOH −→ LiAl2(OH)7 + 6Li2O + 3H2. (3)
3.3.1. TPD of ammoniaThe acid–base properties of Raney-Ni and Raney-Co were
explored through TPD of ammonia. Note that acid sites cat-alyze side reactions during the hydrogenation of nitriles [30].The desorption traces of ammonia were generally broad andshowed two pronounced maxima (Fig. 6). It is particularly note-worthy that for Raney-Ni, maximum H2 desorption was asso-
Fig. 6. TPD traces of NH3 (2), N2 (+) and H2 (×) for Raney-catalysts after adsorption of NH3 at 423 K.

A. Chojecki et al. / Journal of Catalysis 245 (2007) 237–248 243
ciated with the low-temperature desorption peak of ammoniaat 560 K, whereas maximum N2 desorption was related to thehigh-temperature peak in NH3 desorption at 713 K. For Raney-Co, maxima in N2 and H2 desorption occurred in parallel withthe first desorption peak of NH3 (595 K), whereas a secondmaximum at 709 K was observed only for NH3 desorption. ForNi–Cr-promoted Raney-Co, the desorption maxima were at 559and 704 K. An additional contribution with very low intensitywas detected at 633 K.
The significant differences between cobalt and nickel canbe explained by considering the relative stability of cobalt andnickel nitrides [31,32]. Baiker et al. found that reaction of am-monia with nickel at temperatures above 395 K led to the for-mation of nickel nitride Ni3N and molecular hydrogen [33].Nickel nitride is stable up to 683 K but decomposes to metallicnickel and nitrogen at higher temperatures. When ammonia isadsorbed at 423 K, it partially dissociates on the Ni surface tosurface hydrogen atoms and nitrenes [34]. The latter species re-act with nickel to form nickel nitride. As the catalyst is heated,surface-bound hydrogen and ammonia desorb first. At highertemperatures, Ni3N decomposes, resulting in the maximum rateof nitrogen evolution at 713 K. Part of the nitrogen reacts withresidual H2 and leads to a second maximum in NH3 desorption.
In contrast, Co3N is less stable and decomposes when heatedto 549 K [32]. Consequently, cobalt nitride is hardly formedduring the adsorption of ammonia. On heating, dissociated sur-face species recombine to either ammonia or molecular hy-drogen and nitrogen. Thus, the second maximum observed forRaney-Co at 709 K cannot be associated with metallic cobaltbut instead is attributed to ammonia molecularly bound toAl3+ Lewis acid sites [22]. Because of the high stability, theLewis adduct H3N:→Al3+ decomposes only at high tempera-tures [35].
Compared with the parent Raney-Co, the first maximum inthe ammonia trace for Ni–Cr-promoted Raney-Co was shiftedto lower temperatures (559 K), indicating weaker binding ofammonia. It was associated with nitrogen and hydrogen des-orption.
For the LiOH-modified Raney-Co, the NH3 desorption traceshowed a maximum at 523 K with a broad shoulder centeredat 596 K. Similar to the parent Raney-Co, the peak at 596 K istentatively attributed to NH3 desorption from metallic cobalt.This assignment is supported by the parallel H2 desorption. Itis noteworthy that hardly any nitrogen desorbed from the sam-ple, and we speculate that surface bound nitrenes reacted withLiOH. The low-temperature peak in the NH3 desorption traceat 523 K is most likely molecular ammonia, which is weaklycoordinated to LiOH clusters. The high-temperature peak at709 K (Raney-Co) associated with Lewis acid sites of aluminawas not observed, strongly suggesting that LiOH blocks thesesites.
3.4. Characterization by XPS
The nature of different phases at the catalyst surface wasevaluated by XPS (see Fig. 7). Note that the inelastic meanfree path (IMPF) of the electrons for Ni and Co was ∼1.25 and
Fig. 7. XPS spectra for Raney-catalysts and contribution of single states.
1.2 nm, respectively; thus, the surface was probed to roughlythis depth. Peaks that were not sufficiently separated in decon-volution are shown in the diagrams but not considered furtherin this discussion.
For Raney-Ni, peaks at 857.0, 853.5, and 851.1 eV were ob-served in the Ni 2p3/2 region. The peaks at 857.0 and 853.5 eVcorrespond to Ni2+ cations, probably NiAl2O4 (857.1 eV [36])and NiO (853.5 eV [36]), respectively. In the literature, Ni2O3
[37], Ni(OH)2, and NiAl2O4 [21] have also been reported at thesurface of Raney-Ni catalysts; however, the peak at 853.5 eVcould also be attributed to Al3Ni alloy (853.6 eV [38]). Metal-

244 A. Chojecki et al. / Journal of Catalysis 245 (2007) 237–248
lic nickel (Ni0) was observed at 851.1 eV, lower than reportedpreviously (852.1 eV [36]).
The XPS spectra of cobalt samples exhibited two maxima at782.0 and ∼779.0 eV in the Co 2p3/2 region. The peak at 779.0was almost completely superposed by other peaks, and decon-volution might not afford the exact peak position. The spectraof Raney-Co and LiOH-modified Raney-Co showed an addi-tional peak between 777.1 and 777.5 eV. The two peaks couldnot be clearly distinguished in the spectrum of Ni–Cr-promotedRaney-Co. Note that after LiOH treatment of Raney-Co, the in-tensity of the peak at 777.5 eV increased relative to the otherpeaks in the spectrum. The highest binding energy at 782.0 eVis probably related to oxidized cobalt in a strongly ionic lig-and field. Co/Al mixed oxide is speculated to cause this peak.The photoelectron contribution at 777.1 eV shows that metalliccobalt Co0 was present at the outermost surface [36]. The rela-tive contribution of metallic cobalt increased significantly afterLiOH modification of the surface. In this respect, it is knownthat Al2O3 can be removed from the surface of Raney-Ni bytreatment with bases, such as NaOH [21].
The 3p3/2 region was also analyzed; the IMPF was ∼0.37–0.40 for nickel and 0.36–0.40 nm for cobalt. Note that, com-pared with the Co and Ni 2p3/2 region, the XPS spectrum in the3p3/2 region bears more information about the catalyst compo-sition on the surface.
The spectrum of Raney-Ni showed a peak at 73.8 eV, an in-tense peak at 66.0 eV, and a small contribution between thosetwo peaks. Spectra of all three cobalt samples featured a peakat 73.5 eV. In addition, a broad peak between 70 and 55 eV wasobserved, with a maximum at roughly 61 and 60 eV. The XPSspectra of Raney-Co also included a shoulder at approximately57 eV.
The peak at 73.5–73.9 eV is readily attributed to alumina(Al 2p3/2 emission line): α-Al2O3 (73.8 eV [39]), γ -Al2O3(73.5 eV [36]), or Al(OH)3 (73.6 eV [39]). (Note that this wasthe only state of aluminum in the cobalt samples.) In contrast,a contribution of metallic aluminum (72.3 eV [36]) was ob-served in the XPS spectrum of Raney-Ni at 72.3 eV. In thisrespect, it has been reported that Raney-Ni contains surface alu-minum [22]. In the Co 3p3/2 region, both oxidized and metalliccobalt was found (61.3–61.7 and 59.2–60.0 eV, respectively),although the peak positions could not be clearly separated. Thecontribution of metallic cobalt increased after LiOH modifi-cation; Ni–Cr-promoted Raney-Co had the least intense metalcontribution among the cobalt samples. This is in line withobservations from the Co 2p3/2 region of the XPS spectra.The peak leading to the shoulder at 57 eV for Raney-Co in-dicates the presence of iron on the surface (Fe 3p line, FeOOH56.3 eV [40]). Because XPS is much more sensitive for ironthan for lithium, the Li 1s contribution in the XPS spectrumof the LiOH-modified Raney-Co (e.g., Li2O 55.6 eV [41]) isdifficult to evaluate. In contrast, iron was not observed for Ni–Cr-promoted Raney-Co. The XPS spectrum of Raney-Ni in theNi 3p3/2 region shows mainly metallic nickel at 66.0 (66.3 eV[42]).
The elemental surface composition was estimated based onthe main contributions of the XPS spectra (Table 5). Note that
Table 5Estimation of the elemental surface composition of Raney-Ni, Raney-Co, Ni–Cr-promoted Raney-Co, and LiOH-modified Raney-Co by analysis of the XPSdata
Element Orbital Raney-Ni[%]
Raney-Co[%]
Ni–Cr-promotedRaney-Co[%]
LiOH-modifiedRaney-Coa
[%]
Ob 1s 74.9 71.1 76.8 68.1–46.6–35.5Co 3p 0 19.0 17.9 21.2–14.5–11.1Ni 3p 11.4 – – –Al 2p 13.7 4.1 5.3 3.0–2.1–1.6Fe 3p 0 5.7 0 7.7–2.6–0Li 1s 0 0 0 0–34.1–51.9
a Difficulties to separate Fe 3p and Li 1s lines led to ambiguities in the esti-mation of the iron and lithium content in LiOH modified Raney-Co. The threevalues shown were calculated assuming (i) 100% Fe, (ii) equal contribution ofFe and Li, and (iii) 100% Li, respectively. For the discussion, the values fromassumption (ii) were considered most likely.
b The values exceed the real oxygen concentration on the surface as somecarbon oxide contamination was unavoidable, which could not be distinguishedfrom the metal oxide signal.
XPS mostly probes the outer surface of the catalyst particles.In the discussion of XPS data that follows, we assume thatthe composition of the inner and outer surfaces were compa-rable for the different catalysts. Raney-Co had little aluminumon the surface (4.1%), although these amounts were higher forNi–Cr-promoted Raney-Co and Raney-Ni (5.3 and 13.7%, re-spectively). The amount of elemental cobalt or nickel on thesurface was in the reverse order: 19.0% for Raney-Co, 17.9%for Ni–Cr-promoted Raney-Co, and 11.4% for Ni–Cr-promotedRaney-Ni. The corresponding ratios of elemental cobalt ornickel to aluminum were 4.6, 3.4, and 0.8, respectively. LiOHdoping of Raney-Co led to an increase in the elemental ra-tio of cobalt to aluminum (6.9). As explained in the footnoteto Table 5, determining the elemental surface composition ofLiOH-modified Raney-Co was difficult because the contribu-tion of iron and lithium could not be distinguished. Thus, thisdiscussion is restricted to the ratios of the elements oxygen,cobalt, and aluminum.
3.5. Adsorption of butyronitrile and n-butylamine from theliquid phase
Adsorption isotherms were recorded to characterize the(competitive) sorption properties of the catalysts. Isotherms de-rived from breakthrough curves [43] are shown in Fig. 8 (seeTable 6 for adsorption capacities). The amount of n-butylamineadsorbed on the parent Raney-Co catalyst at saturation wassignificantly higher than the amount of adsorbed butyronitrile(7.39 × 10⁻² and 5.37 × 10⁻² mmol g−1
cat., respectively). AfterLiOH modification, the amount of n-butylamine decreased to4.25 × 10−2 mmol gcat.
−1 at saturation. Similarly, the adsorp-tion capacity for butyronitrile was reduced after LiOH doping(4.06 × 10⁻² mmol gcat.
−1). Note that the intrinsic amount ofadsorbents increased considerably on LiOH doping. Further,the adsorption capacity for butyronitrile increased relative to theadsorption capacity for n-butylamine after LiOH modificationof the Raney-Co catalyst (ratios of 0.72 and 0.96, respectively).

A. Chojecki et al. / Journal of Catalysis 245 (2007) 237–248 245
Table 6Amount of n-butylamine and butyronitrile adsorbed on Raney-Co and adsorption constants derived from break-through curves
Catalyst n-Butylamine amount adsorbed Butyronitrile amount adsorbed
[mmol gcat.−1] [mol molCo,surface
−1] [mmol gcat.−1] [mol molCo,surface
−1]
Raney-Co 7.39 × 10⁻² 0.185 5.37 × 10⁻² 0.134LiOH-modified Raney-Co 4.25 × 10⁻² 0.236 4.06 × 10⁻² 0.226
Fig. 8. Adsorption isotherms for adsorption of n-butylamine (2, 1) and buty-ronitrile (Q, P) on parent (filled symbols) and LiOH-doped Raney-Co (opensymbols) at 293 K. Solid lines represent a fit of the data according to the Lang-muir equation.
Fig. 9. Breakthrough curve for the co-adsorption of butyronitrile (2) andn-butylamine (Q) on Raney-Co at 293 K. Octane (!) was used as internal refer-ence for determining the residence time distribution in the adsorption column.
To confirm the relative adsorption strength of n-butylamineand butyronitrile, competitive adsorption measurements wereconducted on parent and LiOH-modified Raney-Co (Fig. 9).After the breakthrough of a nonadsorbing reference, butyroni-trile appeared first in the eluent. The concentration of butyroni-trile quickly rose above the feed concentration, passed througha maximum, and reached steady state at the same time asthe breakthrough of n-butylamine occurred. This indicates thatboth molecules adsorb on the same sites and that the steady-state surface coverage was higher for n-butylamine than forbutyronitrile (0.053 and 0.003 mmol gcat.
−1, respectively, at0.05 mol dm−3 adsorbent concentration). After LiOH doping,the molar ratio of n-butylamine and butyronitrile adsorbed on
the catalyst surface at steady state decreased significantly (from17.7 to 3.4).
4. Discussion
4.1. Reaction mechanism and role of surface intermediates inbyproduct formation
A general mechanism for the formation of byproducts dur-ing the hydrogenation of nitriles was first proposed by vonBraun in 1923 [44]. According to this model, the hydrogenationof butyronitrile proceeds via butan-1-imine, which is furtherhydrogenated to the primary butylamine. Secondary and ter-tiary amines are formed by desorption of the imine-intermediatefrom the catalyst surface, which subsequently reacts in solutionwith n-butylamine or di-n-butylamine (Fig. 10). Elimination ofammonia yields N -butylidene-butylamine and N -but-1-enyl-dibutylamine as condensation products. Subsequent hydrogena-tion provides di-n-butylamine and tri-n-butylamine.
The postulated intermediate butan-1-imine was not found inthe reaction mixture. However, the transient concentration ofbutan-1-imine will be very low if it is consumed much fasterthan it is formed. Closer inspection of the time–concentrationdiagram showed that the formal condensation product of butan-1-imine and n-butylamine, N -butylidene-butylamine, was aprimary kinetic reaction product. This strongly suggests thatbutan-1-imine or other intermediates taking part in the first stepof byproduct formation did not desorb into the liquid phase,as was also suggested by a previous study [45]. The model alsopredicts the formation of N -but-1-enyl-dibutylamine as the pre-cursor for tri-n-butylamine. Huang and Sachtler [45] detectedN -but-1-enyl-dibutylamine in the liquid-phase over PdNi/NaY,although in a very low concentration. However in this study, weobserved no N -but-1-enyl-dibutylamine and, only in case of theRaney-Ni catalyst, traces of tri-n-butylamine.
Thus, the side product N -butylidene-butylamine most likelyresults from a bimolecular condensation reaction occurring onthe catalyst surface. Similar to the metal-catalyzed dispropor-tionation of amines [46], the reaction is thought to proceedby condensation of unsaturated intermediates [47]. It was sug-gested that for nickel, carbenes and nitrenes can be formedas surface intermediates (see Fig. 11), with nitrenes being thepreferred species [48]. In the initial step of the condensationreaction, a nitrogen nucleophile attacks an unsaturated carbonatom, such as the carbon atom of a carbene or a π -coordinatednitrile. This step of the condensation process is probably acid-catalyzed [30,49]. Note that nitrenes are much less susceptibleto nucleophilic attack, because the carbon atom is fully sat-urated [47]. These surface processes depend on the catalyst

246 A. Chojecki et al. / Journal of Catalysis 245 (2007) 237–248
Fig. 10. Von Braun mechanism explaining the formation of higher amines during the reduction of butyronitrile with molecular hydrogen.
Fig. 11. Surface reactions suggested for the hydrogenation of butyronitrile.
properties and thus need to be addressed in the discussion ondifferences in selectivity and activity observed for the four typesof catalysts.
4.2. Accessible metal atoms, oxidation state of the surfaceatoms, and the presence of Lewis acid sites
N2-physisorption and H2-chemisorption provided similartrends in the four catalysts even though different sites wereprobed. The catalyst with the highest BET surface area (Ni–Cr-promoted Raney-Co) had the highest concentration of ac-cessible metal atoms. Thus, with an increasing BET area, itwas possible to reach a better dispersion of the catalytically ac-tive metal. However, XPS measurements showed that the metalsurface was in large part (>70%) covered with multioxide de-posits, which do not contribute to the number of accessiblemetal atoms. XPS data also demonstrated that the aluminumcontent on the surface followed the trend in the bulk.
Accordingly, nickel in Raney-Ni was covered by aluminumoxide to a much larger extent than cobalt in Ni–Cr-promotedRaney-Co and Raney-Co. For Raney-Ni, Raney-Co, and Ni–Cr-promoted Raney-Co, the surface aluminum content was higherthan in the bulk, indicating enrichment of aluminum in the sur-face near region. In TPD of NH3, a high-temperature peak at
704–713 K was observed for those three catalysts and associ-ated with ammonia desorbing from Al3+ Lewis acid sites. Itappears likely that the Al3+ Lewis acid sites are associated withaluminum oxide on the catalyst surface. The nature of this sur-face oxide is strongly influenced by modification of the catalystwith LiOH. The TPD of NH3 indicates that LiOH modificationled to blocking of the sites associated with strong Lewis acidity,and we speculate that LiAl2(OH)7 was formed.
Consequently, one possible reason for the enhanced selectiv-ity after LiOH addition is the reduced concentration of Lewisacid sites, which are known to catalyze condensation reactions[30]. A large part of the oxide deposit was removed duringLiOH modification, and the fraction of the clean metal surfaceincreased, as indicated by XPS.
The elemental ratio of the catalytically active metal to alu-mina and metal oxide was much lower for Raney-Ni, which isa possible explanation for the low selectivity to primary amine.Modification of Raney-Co with LiOH led to a decrease in thenumber of accessible metal atoms. However, the elemental ra-tio of cobalt to alumina was increased, indicating that on theone hand, surface alumina was removed or blocked, whereason the other hand, LiOH covered part of the previously acces-sible metal atoms. By taking into account that the pore volumeremained constant while the BET area was reduced, it can be
A. Chojecki et al. / Journal of Catalysis 245 (2007) 237–248 247
concluded that the decrease in accessible metal atoms was dueto blocking of micropores, which contribute little to the porevolume.
4.3. The role of hydrogen in the reaction mechanism
Assuming a simple Langmuir–Hinshelwood model and sur-face reaction of the first hydrogen atom with adsorbed nitrileas the rate-determining step, the rate can be expressed as r =kθH θbutyronitrile. Little dependence of the reaction rate on nitrileconcentration was observed for all catalysts up to about 80%conversion. This observation is in line with previous liquid-phase hydrogenation reactions, for which zero order in nitrilewas reported [50,51]. This suggests that the sites were fullysaturated with nitrile during most of the reaction. Under the as-sumption of a Langmuir–Hinshelwood model, this observationleads to two possible scenarios concerning the co-adsorption ofhydrogen and n-butyronitrile. The simpler of these scenarios isthat hydrogen and nitrile adsorb on different sites. Alternatively,hydrogen and nitrile might compete for the same sites, but ni-trile is adsorbed much more strongly. For nickel, more than onemetal atom is required for adsorption of one acetonitrile mole-cule (up to 4) [48]. The resulting space between two nitrilemolecules might be available for hydrogen adsorption. Thus,the scenario of different adsorption sites appears more likely.The hydrogen atoms can adsorb in different binding modes(e.g., on top, bridging, in hollow sites) that have different re-activities. In this respect, it has been reported that for nickelsurfaces, on top bound hydrogen is less strongly adsorbed thanhydrogen on bridge and hollow sites and thus is notably morereactive [48,52].
4.4. Effect of the sorption mode on activity and selectivity
The activation of the C≡N group depends on the sorptionmode (see Fig. 11) and the strength of the interaction betweennitrile and the metal surface. The nitrile group is able to bindwith the C≡N bond normal to the surface plane (the preferredmode on cobalt, weak activation) or tilted, with the nitrile σ -and π -orbitals interacting with the surface (the preferred modeon nickel, strong activation) [53,54]. A metallacycle can also beformed, but this is not considered in the discussion here.
To gain insight into the influence of Li+ on the adsorp-tion of butyronitrile and n-butylamine, the adsorption of bothmolecules from the liquid phase was explored (Figs. 8 and 9).The findings were in line with the results from XPS andH2-chemisorption measurements. Less butyronitrile and buty-lamine was adsorbed after LiOH doping (with respect to cata-lyst weight), reflecting an overall reduction in the number ofaccessible cobalt atoms. It is remarkable that in both cases,the coverage was <0.25 mol molCo,surface
−1. In this respect,theoretical results suggest that acetonitrile adsorbs on nickelpreferentially parallel to the surface in a 4-fold or even 5-foldmode [48,55]. Taking into account that, due to the presence ofoxidic species and alumina on the surface, not all elementalcobalt atoms are in groups of adequate size, the low cover-age can be explained. The “steric” constraint around the ad-
sorption sites might be reduced after LiOH doping, account-ing for the higher adsorption capacity. The ratio of adsorbedbutyronitrile (n-butylamine) to cobalt atoms on the surface de-creased from 1:7.5 (1:5.4) to 1:4.4 (1:4.2) after LiOH modifica-tion.
The higher surface concentration of reactants is a possiblereason for the higher activity observed after LiOH doping. Theco-adsorption experiment on Raney-Co (Fig. 9) also showedthat butyronitrile was partially displaced by n-butylamine, sug-gesting that both competed for the same sites. The rate re-mained constant up to relatively high conversion (80%). Thus,we tend to attribute the higher activity after LiOH doping to thelower amount of butylamine relative to butyronitrile adsorbingon the catalyst surface, leading to a higher surface concentrationof butyronitrile for the LiOH-modified samples. With respect toselectivity, note that, due to the lower surface concentration ofn-butylamine, the integral rate of condensation reactions, whichinvolve amines, is reduced.
5. Conclusion
To gain insight into the critical properties affecting the selec-tivity and catalytic activity of Raney catalysts in the hydrogena-tion of nitriles, LiOH-modified Raney-Co and three commercialRaney catalysts (Raney-Ni, Raney-Co, and Ni–Cr-promotedRaney-Co) were tested and thoroughly characterized. Amongthe commercial catalysts, Ni–Cr-promoted Raney-Co showedthe highest activity and selectivity to n-butylamine.
LiOH modification of Raney-Co led to enhanced intrinsicactivity (second highest) and the highest selectivity of the cat-alysts tested. This beneficial effect of LiOH was linked to themodified nature of the catalyst surface. Most likely, islands oflithium aluminate and lithium hydroxide were formed on thecatalyst surface, leading to a higher ratio of metallic cobalt tooxidic cobalt and alumina and resulting in (i) a reduced num-ber of Al3+ Lewis acid sites, which are claimed to catalyze sidereactions; (ii) a higher sorption capacity per metal atom for bu-tyronitrile and butylamine; and (iii) a higher ratio of adsorbedbutyronitrile relative to butylamine.
Therefore, the activity is increased due to an increased sur-face concentration of butyronitrile and reduced product inhi-bition by butylamine. In terms of selectivity, a lower adsorp-tion constant of butylamine compared with that of butyroni-trile is beneficial, because adsorbed butylamine is necessary forbyproduct formation.
Acknowledgments
The authors thank Air Products & Chemicals Inc. for theirgenerous financial support, and Jeno Bodis for many stimulat-ing discussions.
References
[1] M.G. Turcotte, T.A. Johnson, in: J.I. Kroschwitz (Ed.), Kirk-Othmer En-cyclopedia of Chemical Technology, vol. 2, fourth ed., Wiley, New York,1992, pp. 369–386.

248 A. Chojecki et al. / Journal of Catalysis 245 (2007) 237–248
[2] M. Serra, P. Salagre, Y. Cesteros, F. Medina, J.E. Sueiras, J. Catal. 209(2002) 202.
[3] S. Alini, A. Bottino, G. Capannelli, R. Carbone, A. Comite, G. Vitulli,J. Mol. Catal. A Chem. 206 (2003) 363.
[4] A.G.M. Barrett, in: B.M. Trost (Ed.), Comprehensive Organic Synthesis,vol. 8, Reduction, Pergamon, Oxford, 1991, pp. 251–257.
[5] J. Barrault, Y. Pouilloux, Catal. Today 37 (1997) 137.[6] P. Baumeister, M. Studer, F. Roessler, in: G. Ertl, H. Knözinger, J. Weit-
kamp (Eds.), Handbook of Heterogeneous Catalysis, vol. 5, Wiley–VCH,Weinheim, 1997, pp. 2186–2195.
[7] F. Medina, P. Salagre, J.E. Sueiras, J. Mol. Catal. 81 (1993) 363.[8] P.N. Rylander, Catalytic Hydrogenation over Platinum Metals, Academic
Press, New York/London, 1967, pp. 203–226.[9] P. Schärringer, T.E. Müller, W. Kaltner, J.A. Lercher, Ind. Eng. Chem.
Res. 44 (2005) 9770.[10] M.S. Wainwright, in: G. Ertl, H. Knözinger, J. Weitkamp (Eds.), Prepara-
tion of Solid Catalysts, Wiley–VCH, Weinheim, 1999, pp. 28–43.[11] G. Cordier, P. Fouilloux, N. Laurain, J.F. Spindler, US Patent No.
5,777,166, 1998, to Rhone-Poulene Chimie.[12] T. A. Johnson, US Patent No. 5,869,653, 1999, to Air Products and Chem-
icals, Inc.[13] A.F. Elsasser, US Patent No. 5,874,625, 1999, to Henkel Corporation.[14] W. Huber, J. Am. Chem. Soc. 66 (1944) 876.[15] P. Tinapp, Chem. Ber. Rec. 102 (1969) 2770.[16] C. Mathieu, E. Dietrich, H. Delmas, J. Jenck, Chem. Eng. Sci. 47 (1992)
2289.[17] W. Reeve, J. Christian, J. Am. Chem. Soc. 78 (1956) 860.[18] A.J. Chadwell Jr., H.A. Smith, J. Phys. Chem. 60 (1956) 1339.[19] J.P. Orchard, A.D. Tomsett, M.S. Wainwright, D.J. Young, J. Catal. 84
(1983) 189.[20] S. Nishimura, M. Kawashuma, S. Inoue, S. Takeoka, M. Shimizu, Y. Tak-
agai, Appl. Catal. 76 (1991) 19.[21] F. Hochard-Poncet, P. Delichere, B. Moraweck, J. Jobic, A. Renouprez,
J. Chem. Soc. Faraday Trans. 91 (1995) 2891.[22] S.N. Thomas-Pryor, T.A. Manz, Z. Liu, T.A. Koch, S.K. Sengupta, W.N.
Delgass, Catalysis of Organic Reactions, in: F. Herkes (Ed.), ChemicalIndustries Series, vol. 75, Dekker, New York, 1998, p. 195.
[23] G. Moretti, in: G. Ertl, H. Knözinger, J. Weitkamp (Eds.), Handbook ofHeterogeneous Catalysis, vol. 2, VCH–Wiley, Weinheim, 1997, pp. 632–641.
[24] J.R. Anderson, Structure of Metallic Catalysts, Academic Press, London,1975, p. 228.
[25] A.B. Fasman, in: F. Herkes (Ed.), Catalysis of Organic Reactions, in:Chemical Industries Series, vol. 75, Dekker, New York, 1998, pp. 151–168.
[26] J.L. Falconer, J.A. Schwarz, Catal. Rev. Sci. Eng. 25 (1983) 141.[27] G.A. Martin, P. Fouilloux, J. Catal. 38 (1975) 231.
[28] M. Nayak, T.R.N. Kutty, V. Jayaraman, G. Periaswamy, J. Mater. Chem. 7(1997) 2131.
[29] J.P. Thiel, C.K. Chiang, K.R. Poeppelmeier, Chem. Mater. 5 (1993)297.
[30] M.J.F.M. Verhaak, A.J. van Dillen, J.W. Geus, Catal. Lett. 26 (1994) 37.[31] M.J.F.M. Verhaak, A.J. van Dillen, J.W. Geus, Appl. Catal. A 105 (1993)
251.[32] Gmelins Handbuch der Anorganischen Chemie, System-Nr. 58: Kobalt,
Ergänzungsband, Teil A, Verlag Chemie, Weinheim, 1961, p. 511.[33] A. Baiker, M. Maciejewski, J. Chem. Soc. Faraday Trans. 1 80 (1984)
2331.[34] A. Borgna, R. Frety, M. Primet, M. Guenin, Appl. Catal. 76 (1991) 233,
and references therein.[35] Y. Okamoto, J. Cryst. Growth 191 (1998) 405.[36] C.D. Wagner, W.M. Riggs, L.E. Davis, J.F. Moulder, in: G.E. Muilen-
berg (Ed.), Handbook of X-Ray Photoelectron Spectroscopy, first ed.,Perkin–Elmer Corporation (Physical Electronics Division), Eden Prairie,MN, 1979.
[37] T. Yoshino, T. Abe, I. Nakabayashi, J. Catal. 118 (1989) 436.[38] D. Briggs, M.P. Seah (Eds.), Practical Surface Analysis, vol. 1, second
ed., Wiley, New York, 1993.[39] T.L. Barr, J. Vac. Sci. Technol. A 9 (1991) 1793.[40] D. Brion, Appl. Surf. Sci. 5 (1980) 133.[41] J.P. Contour, A. Salesse, M. Froment, M. Garreau, J. Thevenin, D. Warin,
J. Microsc. Spectrosc. Electron. 4 (1979) 483.[42] N.S. McIntyre, M.G. Cook, Anal. Chem. 47 (1975) 2208.[43] A. Dabrowski, M. Jaroniec, Adv. Colloid Interface Sci. 31 (1990) 155.[44] J. von Braun, G. Blessing, F. Zobel, Ber. 56B (1923) 1988.[45] Y. Huang, W.M.H. Sachtler, Appl. Catal. A 182 (1999) 365.[46] A. Ozaki, Isotopic Studies of Heterogeneous Catalysis, Kodansha Ltd./
Academic Press, Tokyo/London, 1977, 140–141.[47] B. Coq, D. Tichit, S. Ribet, J. Catal. 189 (2000) 117.[48] B. Bigot, F. Delbecq, A. Millet, V.-H. Peuch, J. Catal. 159 (1996) 383.[49] P. Sykes, A Guidebook to Mechanism in Organic Chemistry, sixth ed.,
Longman, London/Singapore, 1986.[50] H. Li, Y. Wu, H. Luo, M. Wang, Y. Xu, J. Catal. 214 (2003) 15.[51] B.W. Hoffer, P.H.J. Schoenmakers, P.R.M. Mooijman, G.M. Hamminga,
R.J. Berger, A.D. van Langeveld, J.A. Moulijn, Chem. Eng. Sci. 59(2004) 259.
[52] F. Hochard, H. Jobic, J. Massardier, A. Renouprez, J. Mol. Catal. A 95(1995) 165.
[53] F.J.G. Alonso, M.G. Sanz, V. Riera, Organometallics 11 (1992) 801.[54] A. Chojecki, H. Jobic, A. Jentys, T.E. Müller, J.A. Lercher, Catal.
Lett. 97 (3–4) (2004) 155.[55] B. Bigot, F. Delbecq, V.-H. Peuch, Langmuir 11 (1995) 3828.