hydrogenation of acetylenes over supported metal catalysts
TRANSCRIPT
HYDROGENATION OF ACETYLENES
OVER SUPPORTED METAL CATALYSTS
A Thesis Presented to
the University o f G lasgow
fo r the D egree o f
D octor o f Philosophy
by
David Rankin Kennedy
November 1997
© David R. Kennedy (1997)
ProQuest Number: 13818594
All rights reserved
INFORMATION TO ALL USERS The quality of this reproduction is dependent upon the quality of the copy submitted.
In the unlikely event that the author did not send a com p le te manuscript and there are missing pages, these will be noted. Also, if material had to be removed,
a note will indicate the deletion.
uestProQuest 13818594
Published by ProQuest LLC(2018). Copyright of the Dissertation is held by the Author.
All rights reserved.This work is protected against unauthorized copying under Title 17, United States C ode
Microform Edition © ProQuest LLC.
ProQuest LLC.789 East Eisenhower Parkway
P.O. Box 1346 Ann Arbor, Ml 48106- 1346

afiSKuruwffijjr
To
Rose and Katie
SUMMARY
The hydrogenation reactions of propyne, 2-butyne and phenylacetylene
have been studied using a series of silica- and alumina-supported palladium
and platinum catalysts, each containing a nominal metal loading of 1%. All
catalysts have been the subject of numerous characterisation techniques
including temperature programmed reduction, selective chemisorption, UV-Vis
diffuse reflectance spectroscopy, thermal gravimetric analysis, BET
measurements, atomic absorption spectroscopy and transmission electron
microscopy.
The reaction of hydrogen and propyne was performed in a pulse-flow
microcatalytic reactor using reaction mixtures of varying hydrogen
concentration; (1:1 :: C3H4 : H2) and (1:3 :: C3H4 : H2). All propyne
hydrogenation reactions were performed at ambient temperature.
Using low concentrations of hydrogen, both Pd/Si02 and Pt/Y-Al20 3
were completely selective for the formation of propene; Pd/y-Al20 3 and
Pt/Si02 exhibiting lower selectivities. This behaviour is believed to be the
result of a particle size effect, with the former catalysts containing large metal
particles which act less electrophilically towards the acetylenic bond of the
reactant, and thus permit desorption of the olefin before complete saturation
occurs. With higher coverages of hydrogen, the formation of the alkane was
favoured over all catalysts, with an “induction period” being observed before
the production of propene was evident. This behaviour has been attributed to
the initial dissociative adsorption of propyne to produce surface
hydrocarbonaceous overlayers and alkane precursors simultaneously. The
associative adsorption of propyne on this hydrocarbonaceous overlayer, with
the latter acting as a hydrogen transfer medium, is proposed as the route to
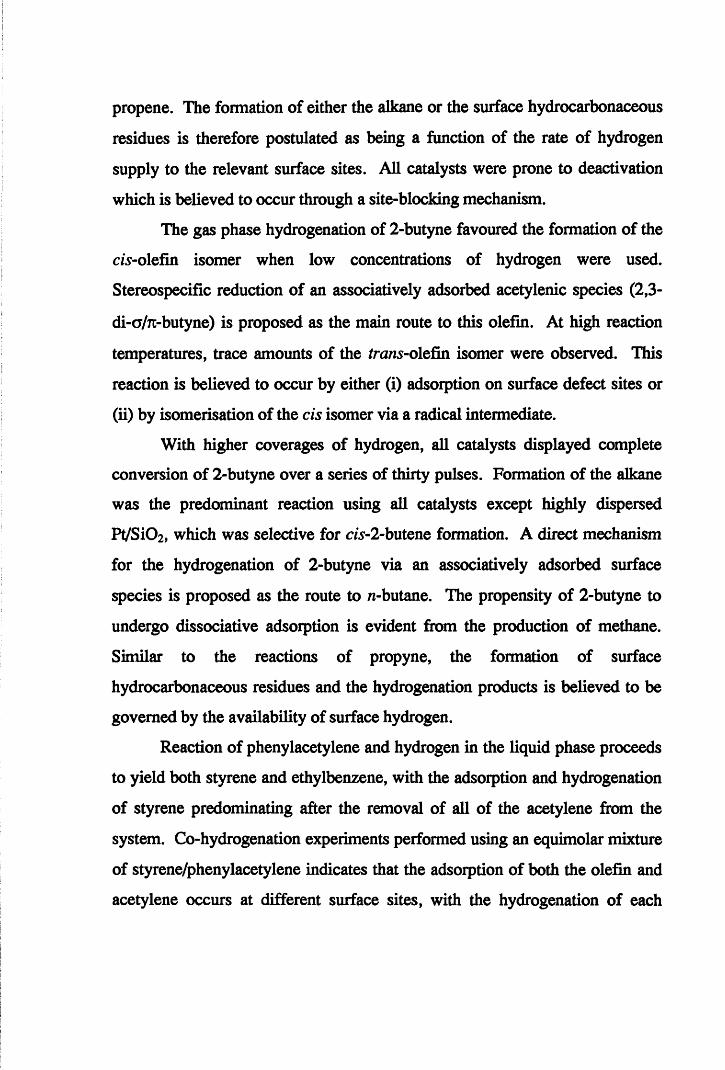
propene. The formation of either the alkane or the surface hydrocarbonaceous
residues is therefore postulated as being a function of the rate of hydrogen
supply to the relevant surface sites. All catalysts were prone to deactivation
which is believed to occur through a site-blocking mechanism.
The gas phase hydrogenation of 2-butyne favoured the formation of the
ds-olefin isomer when low concentrations of hydrogen were used.
Stereospecific reduction of an associatively adsorbed acetylenic species (2,3-
di-a/71-butyne) is proposed as the main route to this olefin. At high reaction
temperatures, trace amounts of the trans-olefin isomer were observed. This
reaction is believed to occur by either (i) adsorption on surface defect sites or
(ii) by isomerisation of the cis isomer via a radical intermediate.
With higher coverages of hydrogen, all catalysts displayed complete
conversion of 2-butyne over a series of thirty pulses. Formation of the alkane
was the predominant reaction using all catalysts except highly dispersed
Pt/Si02, which was selective for cw-2-butene formation. A direct mechanism
for the hydrogenation of 2-butyne via an associatively adsorbed surface
species is proposed as the route to n-butane. The propensity of 2-butyne to
undergo dissociative adsorption is evident from the production of methane.
Similar to the reactions of propyne, the formation of surface
hydrocarbonaceous residues and the hydrogenation products is believed to be
governed by the availability of surface hydrogen.
Reaction of phenylacetylene and hydrogen in the liquid phase proceeds
to yield both styrene and ethylbenzene, with the adsorption and hydrogenation
of styrene predominating after the removal of all of the acetylene from the
system. Co-hydrogenation experiments performed using an equimolar mixture
of styrene/phenylacetylene indicates that the adsorption of both the olefin and
acetylene occurs at different surface sites, with the hydrogenation of each
adsorbate occurring independently of the other. It is believed that olefin
chemisorption in the presence of the acetylene has the effect of reducing the
amount of available hydrogen for phenylacetylene hydrogenation.
The hydrogenation of phenylacetylene in the gas phase produces only
ethylbenzene, the formation of which is proposed to occur via (i) a di-7t-
adsorbed species analogous to that involved in propyne hydrogenation to
propene or (ii) from dissociative adsorption to yield a surface alkylidyne.
In conclusion, we can state that the surface hydrogen concentration
plays a crucial role in determining the selectivity and activity of the catalysts
during the hydrogenation reactions. In the presence of high coverages of
hydrogen, all catalysts favoured the production of the alkane, except highly
dispersed Pt/Si02 in 2-butyne hydrogenation. The observed deactivation
phenomenon during propyne hydrogenation has been attributed to the possible
formation of surface oligomers which reduce the number of exposed active
sites. Since the reactions between 2-butyne and excess hydrogen exhibited no
signs of catalyst deactivation, it is proposed that the formation of surface
oligomers from this acetylene would be less probable due to the steric effects
experienced by the substituent methyl groups. Therefore, the likelihood of
extensive oligomerisation and hence, deactivation occurring is reduced.
ACKNOWLEDGEMENTS
Grateful acknowledgement is made to both Prof. G. Webb and Dr S.D.
Jackson for their guidance throughout the course of this project. It has proved
an invaluable and informative experience.
I am indebted to my dear wife, Rose (previously Rose - the catalysis
technician) for all her assistance and good humour during my time in the
Catalysis Research Group (and at home).
Thanks are also due to the numerous members of the Chemistry
Departments academic and technical staff, with particular thanks to Dr. John
Cole for helping me with many of my analytical queries, and also Dr. R.J.
Cross for pointing me in the direction of some excellent homogeneous systems
for further reading.
I am grateful to Dr. Dave Lennon for the many interesting conversations
we shared over the last couple of years (many were over my head), and for
suggesting the application of infra-red spectroscopy to this project. I must also
thank John McNamara for his help in performing the DRIFTS study, and for
carrying out the Transmission Infra-Red work (it got you away from TETRIS).
Last but not least, I would like to express my thanks to the occupants of
the Inorganic Research laboratories (most are to be found in the office). There
have been many through the last three years, most of whom have now flown
the nest; you know who you are - Cheers.
CONTENTS
PAGE
SUMMARY
ACKNOWLEDGEMENTS
CONTENTS
Chapter One INTRODUCTION
1.1 Physisorption 1
1.2 Chemisorption 2
1.3 Thermodynamic Aspects of Adsorption 4
1.4 Hydrogen Adsorption on Metals 5
1.4.1 Hydrogen Adsorption on Platinum 6
1.4.2 Hydrogen Adsorption on Palladium 9
1.5 Hydrocarbon Adsorption at Surfaces
1.5.1 Adsorption of Olefins 11
1.5.2 Adsorption of Acetylenes 14
1.6 Hydrogenation of Acetylenic Hydrocarbons 16
1.6.1 Catalyst Selectivity 17
1.6.2 Hydrogenation Mechanisms 19
1.7 Carbonaceous Overlayers 23
1.7.1 Effects of Carbonaceous Overlayers
on Catalyst Behaviour
Chapter Two OBJECTIVES OF STUDY 26
Chapter Three EXPERIMENTAL PAGE
3.1 Introduction 28
3.2 Catalyst Preparation
3.2.1 Metal Precursors and Supports
3.2.2 Preparation
3.3 Catalyst Characterisation 29
3.3.1 Temperature Programmed Reduction (TPR)
3.3.2 Chemisorption 30
3.3.3 UV/Vis Diffuse Reflectance Spectroscopy (UVDRS) 33
3.3.4 Transmission Electron Microscopy (TEM) 34
3.3.5 Thermogravimetric Analysis (TGA)
3.3.6 Atomic Absoiption Spectroscopy (AAS) 35
3.3.7 Surface Area Measurements (BET)
3.4 Catalyst Activation 36
3.5 Pulse-Flow Microcatalytic Reactor System 37
3.5.1 Sample Loop
3.5.2 Sample Loop Volume Determination 38
3.5.3 Gas Supply
3.5.4 Materials
3.6 Pulse-Flow Experimental Procedure 40
3.6.1 Hydrogenation Reactions
3.6.2 Gas Phase Analysis System
3.7 Liquid Phase Hydrogenation Apparatus 41
3.7.1 Palladium Catalysed Reactions
PAGE
Chapter Three EXPERIMENTAL (cont)
3.8
3.9
Chapter Four RESULTS
Section One Catalyst Characterisation
4.1.1 Temperature Programmed Reduction (TPR) 45
4.1.2 Chemisorption
4.1.3 UV-Vis Diffuse Reflectance Spectroscopy (UVDRS) 46
4.1.3(a) Platinum Catalysts
4.1.3(b) Palladium Catalysts 47
4.1.4 Transmission Electron Microscopy (TEM) 48
4.1.5 Thermogravimetric Analysis (TGA) 49
4.1.6 Atomic Absorption Spectroscopy (AAS)
4.1.7 Surface Area Measurements (BET) 50
4.1.8 Sample Loop Volume Results 51
3.7.2 Platinum Catalysed Reactions 42
3.7.3 Liquid Phase Analysis Equipment
Infra-Red Spectroscopy
3.8.1 Diffuse Reflectance Infra-Red Spectroscopy
3.8.2 Transmission Infra-Red Spectroscopy 43
Continuous Flow Hydrogenations 44
4.2 Hydrogenation Results 52
Chapter Four RESULTS (cont) PAGE
4.3 Carbon Mass Balance 53
Section Two Propyne Hydrogenation
4.4.1 Propyne Hydrogenation over Pd/silica 54
4.4.2 Propyne Hydrogenation over Pd/alumina 61
4.4.3 Propyne Hydrogenation over Pt/silica 68
4.4.4 Propyne Hydrogenation over Pt/alumina 75
Section Three 2-Butyne Hydrogenation
4.4.5 2-Butyne Hydrogenation over Pd/silica 82
4.4.6 2-Butyne Hydrogenation over Pd/alumina 94
4.4.7 2-Butyne Hydrogenation over Pt/silica 103
4.4.8 2-Butyne Hydrogenation over Pt/alumina 112
Section Four
4.4.9 Infra-Red Spectroscopy Results for
2-Butyne/Hydrogen Chemisorption on
Silica-Supported Palladium 121
Section Five Liquid Phase Hydrogenations
4.5.1 Phenylacetylene and Styrene Hydrogenation
over Pd/silica 123
4.5.2 Phenylacetylene and Styrene Hydrogenation
over Pd/alumina 124
Chapter Four RESULTS (cont) PAGE
Section Six
Chapter Five
5.1
4.5.3 Phenylacetylene and Styrene Hydrogenation
over Pt/silica
4.5.4 Phenylacetylene and Styrene Hydrogenation
over Pt/alumina 125
Continuous Flow Hydrogenations
4.6 Gas Phase Hydrogenation of
Phenylacetylene and Styrene 137
DISCUSSION
Introduction 147
5.1.1 Preface
5.1.2 The Interaction of Propyne with Metal Surfaces 148
5.1.3 The Reaction of Propyne with Hydrogen
over Supported-Palladium 151
5.1.4 The Reaction of Propyne with Hydrogen
over Supported-Platinum 154
5.1.5 Mechanism for Propyne Hydrogenation to Propene 159
5.1.6 Propyne Hydrogenation - Conclusions 161
5.1.6.1 Equimolar Ratio of Propyne and Hydrogen
5.1.6.2 Excess Hydrogen Reactions 162
5.1.6.3 Physical Nature of Catalysts -Effect on
Product Selectivities 163
5.2.1 The Interaction of 2-Butyne with Metal Surfaces 164
Chapter Five
5.2.2
5.2.3
5.2.4
5.2.5
5.3.1
5.3.2
5.3.3
5.3.4
5.3.5
5.3.6
5.3.7
DISCUSSION (cont)
The Reaction of 2-Butyne with Hydrogen
over Supported-Palladium
The Reaction of 2-Butyne with Hydrogen
over Supported-Platinum
Infra-Red Study of 2-Butyne Adsorption
on Pd/Si02 under Hydrogenation Conditions
Carbonaceous Residue Formation on
Palladium and Platinum
Phenylacetylene and Styrene
Hydrogenation - Preface
The Liquid Phase Hydrogenation of
Phenylacetylene and Styrene over
Supported-Palladium
The Liquid Phase Hydrogenation of
Phenylacetylene and Styrene over
Supported-Platinum
The Gas Phase Hydrogenation of Phenylacetylene
and Styrene over Supported-Palladium
The Gas Phase Hydrogenation of Phenylacetylene
and Styrene over Supported-Platinum
Mechanism for Phenylacetylene Hydrogenation
to Ethylbenzene
Gas Phase Hydrogenation of Phenylacetylene
and Styrene - Conclusions
PAGE
165
174
180
183
188
189
194
195
198
199
Chapter Five DISCUSSION (cont)
5.4 Overall Conclusions - Effect of Substitution -
Geometric or Electronic?
PAGE
201
REFERENCES
Chapter One
INTRODUCTION
1
1. Introduction
In heterogeneous catalysis, the initial, and most important step of any
surface reaction is the adsorption of the reactant(s).
Adsorption is a process in which molecules of a particular material become
attached or concentrated at an interface, with an interface describing the area
between two distinct phases. Typical examples of interfaces are gas-solid,
liquid-solid and gas-liquid, to name but a few. Adsorption is normally
classified into two areas, namely chemisorption and physisorption.
1.1 Physisorption (Physical Adsorption)
Physical adsorption or van der Waals adsorption involves weak and
associative bonds between reactant and substrate. This adsorption is
accompanied by only small heat changes which are often of the same order of
magnitude as the heat of liquefaction of the adsorbing gas. Unlike
chemisorption, the physical adsorption of a molecule at an interface is not
directly associated with any distinct surface atom, and may indeed occupy an
area independent of the nature of the adsorbate. Physisorption is also prone to
multi-layer adsorption, since the forces involved between the adsorbate and
adsorbent are similar in magnitude to those involved between molecules in a
liquid. A typical example of physisorption is oxygen adsorption on titania,
which involves a binding energy of approximately 5kJ mol"1, not markedly
different from the latent heat of condensation of oxygen (6.80kJ mol"1).
Typical applications of physical adsorption include the determination of
catalyst surface areas and pore structure characteristics through low
temperature nitrogen adsorption; the temperature at which this adsorption
occurs being close to the boiling point of the adsorbate. Such procedures
2
allow correlations to be drawn between catalyst structure and behaviour, under
reaction conditions.
1.2 Chemisorption (Chemical Adsorption)
In chemical adsorption the adsorbate molecules are held at the surface
by valence forces similar to those present between atoms in a molecule. This
phenomenon can be observed between an adsorbing gas at a metal surface,
where the metal possesses unoccupied orbitals, providing sites for co
ordination. The chemical bonds formed are much stronger than those formed
during physical adsorption, and the heats involved are similar to those
liberated during chemical reactions. Considering the energy changes observed
in chemisorption processes, the reactivities of molecules may be altered upon
surface adsorption, and may even be greatly enhanced. This is indeed the case
when chemisorption is accompanied by dissociation of the adsorbate.
An example of this would be the adsorption of hydrogen on tungsten, where
the (H-H) bonds are broken, with the resulting dissociated hydrogen atoms
being more reactive than the free hydrogen molecules.
Clearly, for the purposes of catalytic reactions, chemisorption of at
least one of the reactants is a prerequisite to further reaction, and a number of
special features of chemisorption are detailed below;
i) surface coverage never exceeds a monolayer of adsorbate
ii) chemisorption processes may often have appreciable activation energies
iii) considerable variation in the adsorptive capacities of various surface
sites observed
iv) chemisorption can occur over a wide range of temperatures
3
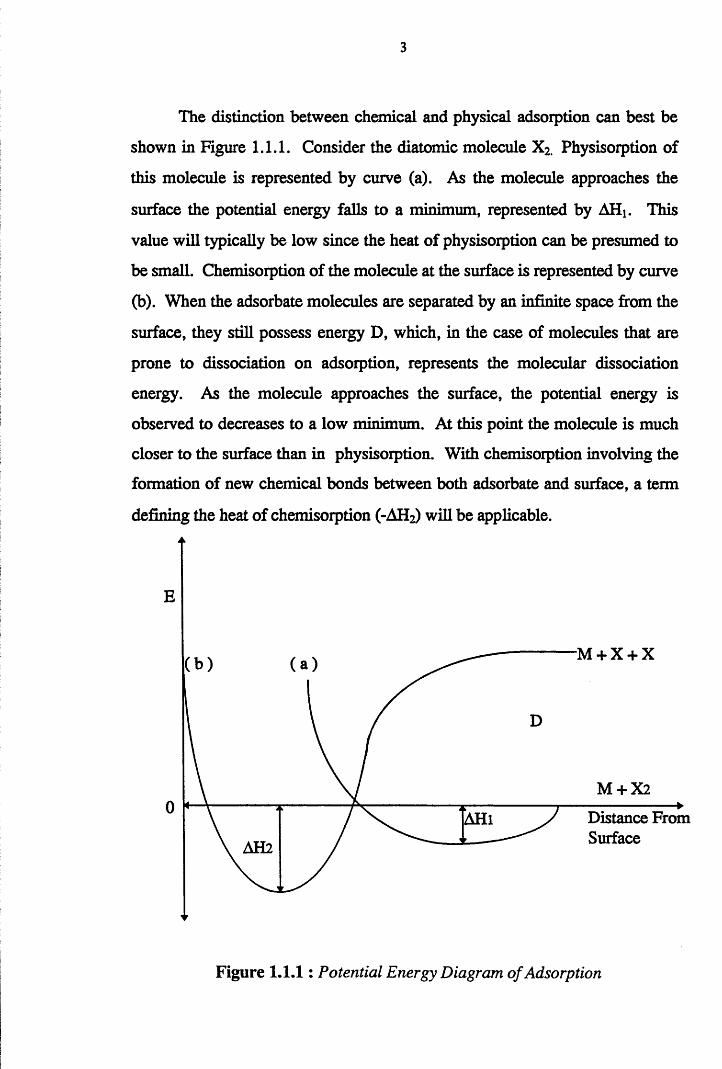
The distinction between chemical and physical adsorption can best be
shown in Figure 1.1.1. Consider the diatomic molecule X2. Physisorption of
this molecule is represented by curve (a). As the molecule approaches the
surface the potential energy falls to a minimum, represented by AHi. This
value will typically be low since the heat of physisorption can be presumed to
be small. Chemisorption of the molecule at the surface is represented by curve
(b). When the adsorbate molecules are separated by an infinite space from the
surface, they still possess energy D, which, in the case of molecules that are
prone to dissociation on adsorption, represents the molecular dissociation
energy. As the molecule approaches the surface, the potential energy is
observed to decreases to a low minimum. At this point the molecule is much
closer to the surface than in physisorption. With chemisorption involving the
formation of new chemical bonds between both adsorbate and surface, a term
defining the heat of chemisorption (-AH2) will be applicable.
E
M + X + X
M + X20 Distance From
SurfaceAHl
Affi
Figure 1.1.1: Potential Energy Diagram of Adsorption
4
1.3 Thermodynamic Aspects of Adsorption
For an adsorption process to be thermodynamically feasible, the Gibbs
free energy change (AG) must be a negative quantity, specified by the equation
shown below:
AG = AH - TAS Equation 1
Since the adsorption of any molecule at a surface is invariably an
exothermic process, the enthalpy change (AH) for the process will be negative.
Also, since the adsorption step converts a free molecule into a surface bound
entity, there is an accompanying loss in entropy; therefore, the change in free
entropy of the system (AS) will also be negative. Therefore, since adsorption
is a spontaneous process, proceeding with the decrease of the free energy of
the system, it would follow that surface adsorption was itself an exothermic
reaction.
The largest contribution to the observance of this exothermic behaviour
will be the enthalpy change in the system. This factor will be governed by the
relative strengths of the chemical bonds involved, and hence, will be
dependent upon the nature of both the adsorbate and the adsorbent.
Less influential will be the change in the entropy of the system, since
AS values might not be expected to vary markedly on altering the identity of
either the adsorbate or adsorbent once chemisorption had occurred.
5
1.4 Hydrogen Adsorption on Metals
For the purposes of hydrogenation reactions over metal catalysts,
maximum catalytic activity is associated with rapid, but not too strong,
chemisorption of the adsorbates. The most active metals for such reactions are
the group VTH metals. For example, the strength of reactant adsorption over
group VB and VIB metals is too great, while that observed over group IB
metals is either too weak or non-existent. Therefore, for the purposes of this
study, the application of supported palladium and platinum catalysts was
examined.
Fundamental aspects of hydrogen chemisoiption on the noble metals
have been well reviewed1,2, with particular reference given to the strength and
electronic nature of the (M-H) bonds and the location and configuration of
adsorbed hydrogen. Some of the key points regarding the adsorption of
hydrogen on metals are detailed below :
i) The adsorption of hydrogen on metals involves four processes
a) initial physical adsorption of molecular hydrogen
b) formation of hydrogen atoms via molecular hydrogen dissociation
c) hydrogen atom migration into bulk and surface layers
d) possible formation of surface and/or bulk hydrides
ii) bonds between hydrogen and metal are generally covalent type bonds
iii) hydrogen atoms will preferentially bond to high co-ordination sites -
usually three or four fold hollow sites on metal surface.
iv) hydrogen generally chemisorbs dissociatively on catalytic metals with
heats of adsorption of approximately 60 to ^OkJmol'1. These heats of
adsorption are not usually influenced by carriers or surface structure.
6
1.4.1 Hydrogen Adsorption on Platinum
A face centred cubic metal, platinum is one of the most versatile metals
used in heterogeneous catalysis. The highest density, lowest free energy
surfaces are the (111) and (100) crystal faces respectively. However, for the
purposes of hydrogen adsorption and activation, the existence of atomic steps
on the surface are essential in dissociating the hydrogen molecules. At these
atomic steps, hydrogen readily dissociates through a low activation energy
route, with the surface retaining a large concentration of the adsorbed
hydrogen atoms.
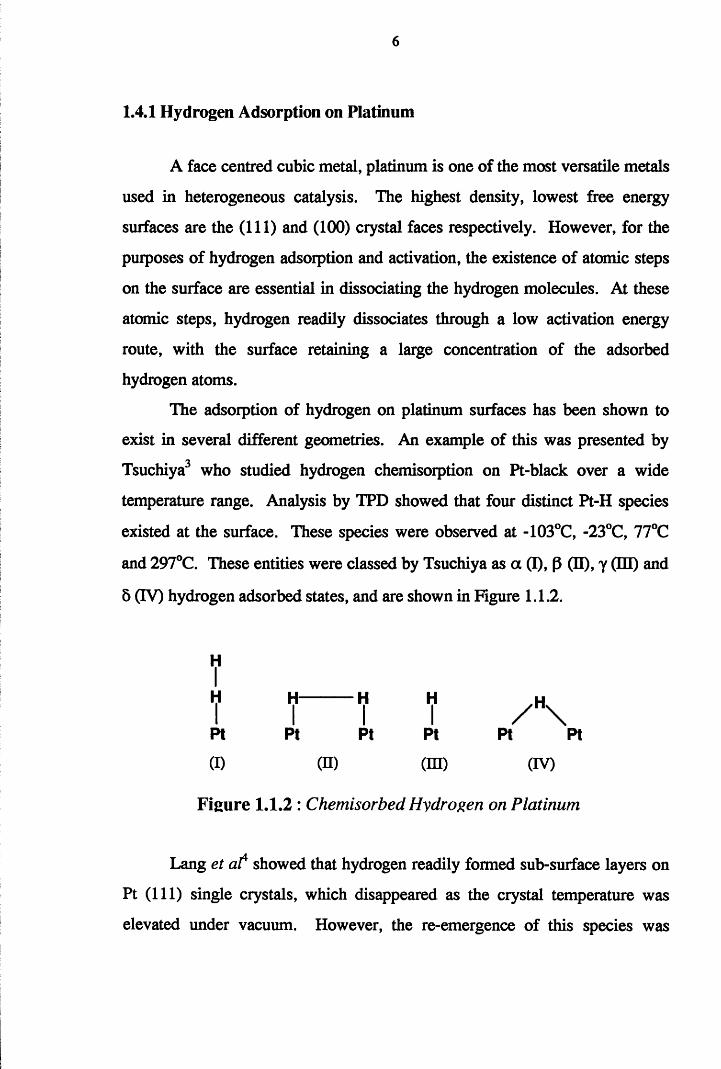
The adsorption of hydrogen on platinum surfaces has been shown to
exist in several different geometries. An example of this was presented by
Tsuchiya3 who studied hydrogen chemisoiption on Pt-black over a wide
temperature range. Analysis by TPD showed that four distinct Pt-H species
existed at the surface. These species were observed at -103°C, -23°C, 77°C
and 297°C. These entities were classed by Tsuchiya as a (I), P (II), y (HI) and
5 (IV) hydrogen adsorbed states, and are shown in Figure 1.1.2.
H
H H H H
Pt
(I)
Pt
(n)
Pt Pt Pt Pt
(m) (iv)
Figure 1.1.2 : Chemisorbed Hydrogen on Platinum
Lang et a t showed that hydrogen readily formed sub-surface layers on
Pt (111) single crystals, which disappeared as the crystal temperature was
elevated under vacuum. However, the re-emergence of this species was
7
observed upon treating the surface with oxygen; a cycle that was reproduced
successfully several times.
The kinetics of hydrogen adsorption on platinum single crystals has
been the subject of numerous reviews2,5. TPD studies on Pt/H systems reveal
the existence of atomic hydrogen states of low binding energies at platinum
surfaces, which are readily desorbed at temperatures of 200-300K. This
therefore means that a fraction of the hydrogen adsorbed is held “reversibly”
at ambient temperature. This statement should not however be taken literally.
In practical terms the rate of desorption of hydrogen at room temperature is
essentially negligible. However, at 300K, the Pi state of hydrogen, which is
formed at high coverages is reversibly adsorbed on platinum surfaces, while
the P2 state, which predominates at low surface coverages is mostly
irreversible, since its rates of desorption are very small at these temperatures.
These observations have important implications in regard to the use of
hydrogen chemisoiption for measuring monolayer capacities.
The ability of platinum to chemisorb hydrogen is also dependent upon
the reduction temperature. On difficult to reduce support materials, the
capacity of platinum for hydrogen adsorption is significantly reduced, a
phenomenon which can be reversed by oxygen treatment, and subsequent
reduction at lower temperatures.
The observation of decreasing hydrogen adsorption following reduction
at high temperatures has also been studied over an alumina-supported platinum
catalyst by Den Otter et a f. A reduction in the Pt/H ratio was observed after
reduction at temperatures of 500°C or greater. Den Otter suggested that this
observed behaviour was the result of alloy formation between metal and
support, assuming that the A1 sites did not contribute to the uptake of
hydrogen, and the adsorption over Pt is both dissociative and bridged between
two distinct metal sites. This behaviour was observed for both low and highly
8
dispersed catalysts, and is, therefore, not a strong function of platinum
dispersion.
Application of hydrogen chemisorption methods to the study of
EUROPT-1 was performed by Wells et al7. The exact stoichiometry of
hydrogen to platinum over this silica-supported platinum catalyst was
unknown, although normally it is assumed to be 1:1. EXAFS experiments
performed by Joyner and Meehan8 showed that by altering the catalyst
temperature under vacuum, to simulate the evacuation process, the nature of
the surface bonding was dramatically altered. An associated change in the
platinum particle character occurred, with a new feature characteristic of (Pt-
O) now observed. Therefore, hydrogen chemisorption on this catalyst would
proceed initially by hydrogenolysis of the (Pt-O) bond, as shown.
(1) 2 (Si-O-Pt) + H2 =» 2 (Si-OH) + (-Pt-Pt-)
(2) (Si-O-Pt) + H2 => (Si-OH) + (-H-R-)
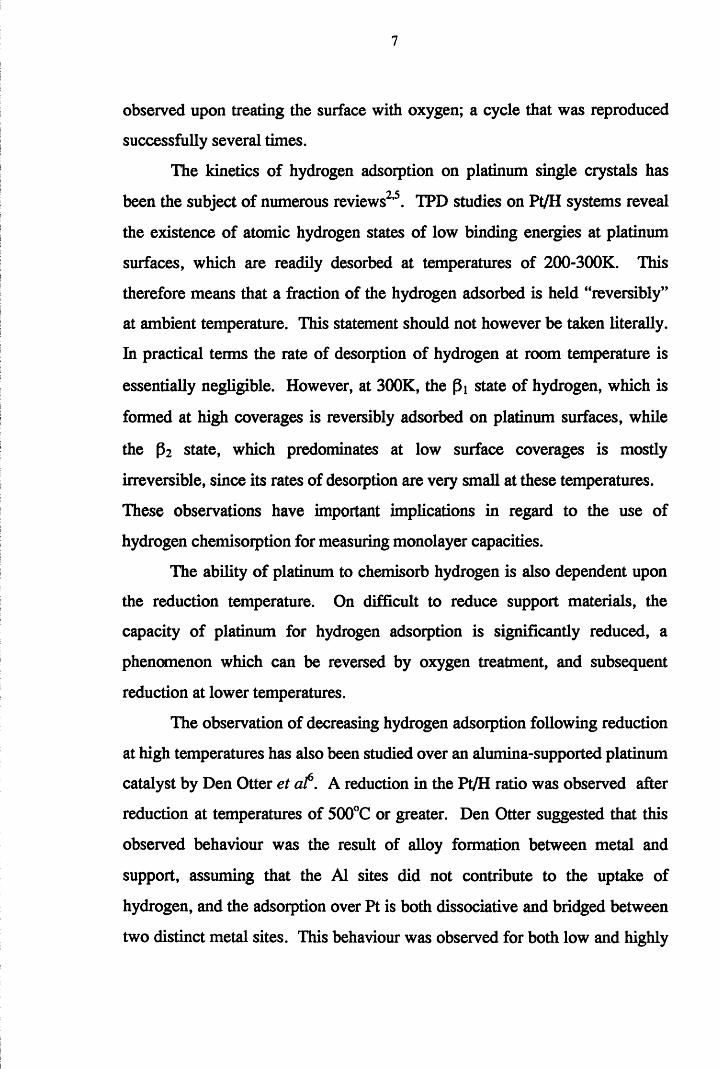
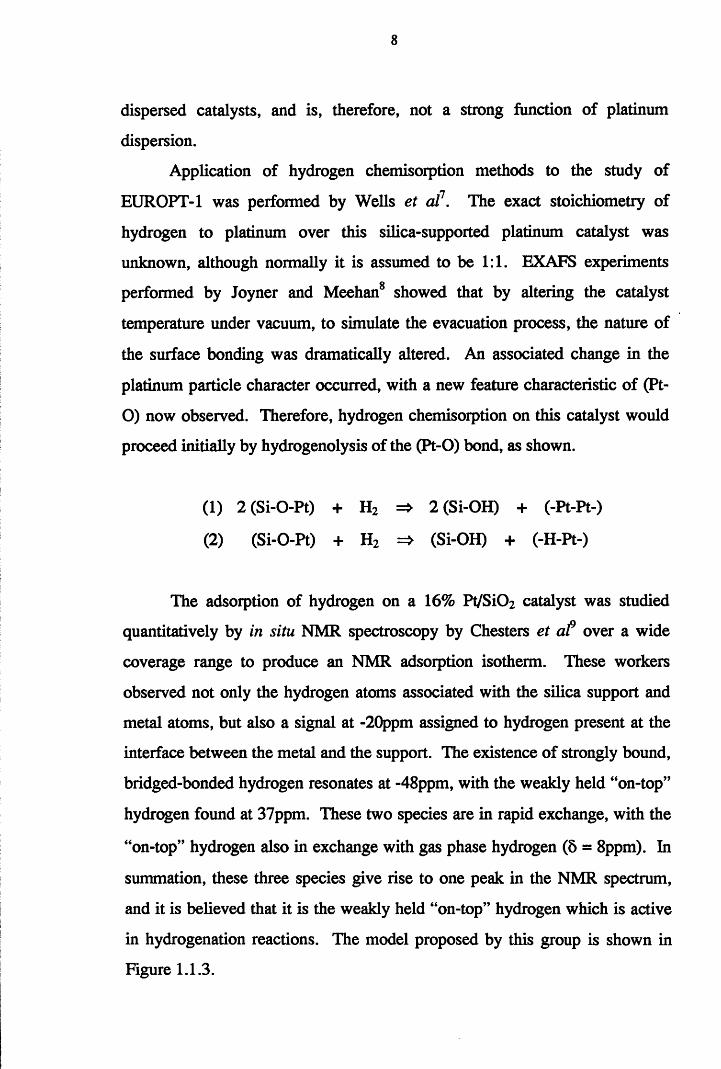
The adsorption of hydrogen on a 16% Pt/Si02 catalyst was studied
quantitatively by in situ NMR spectroscopy by Chesters et a f over a wide
coverage range to produce an NMR adsorption isotherm. These workers
observed not only the hydrogen atoms associated with the silica support and
metal atoms, but also a signal at -20ppm assigned to hydrogen present at the
interface between the metal and the support. The existence of strongly bound,
bridged-bonded hydrogen resonates at -48ppm, with the weakly held “on-top”
hydrogen found at 37ppm. These two species are in rapid exchange, with the
“on-top” hydrogen also in exchange with gas phase hydrogen (5 = 8ppm). In
summation, these three species give rise to one peak in the NMR spectrum,
and it is believed that it is the weakly held “on-top” hydrogen which is active
in hydrogenation reactions. The model proposed by this group is shown in
Figure 1.1.3.
9
O Si
Figure 1.1.3 : Hydrogen on Pt!silica
1.4.2 Hydrogen Adsorption on Palladium
Palladium crystallises in a cubic close packed lattice similar to platinum
but, unlike platinum, behaves very differently when exposed to hydrogen.
One property palladium exhibits is its ability to absorb hydrogen up to a point
represented by the stoichiometry Pd2H10. At higher temperatures, the metal
becomes permeable to hydrogen, a property which is employed in the
separation of hydrogen from other gases.
The heats of adsorption of palladium and platinum were calculated to
be 63± 4kJmol1 and 56±12kJmol'1 respectively for hydrogen chemisorption on
unsupported powders11,12,13. These values compare well with the calculated
heats of adsorption for Pd (111) and Pt (111) estimated to be approximately
TltlOkJmol'1 and 42±5kJmol'1. Therefore, it would appear that the heat of
hydrogen adsorption on palladium and platinum is independent of both
crystallite size and support, over a wide range.
10
The above results, for hydrogen adsorption on palladium, were
corroborated by Guerrero14 using both low and highly dispersed 0.5%
Pd/alumina catalysts. The observed change in heats of adsorption was
attributed to changes in the electronic properties of small palladium
crystallites. Results published by Chou and Vannice12 showed observable
increases in the heats of hydrogen adsorption on particles of less than 3nm in
size.
The ability of palladium to dissolve hydrogen atoms into the metal bulk
results in the formation of Pd-H phases which have different hydrogen
concentrations. Two types of Pd-H phases predominate and are classed as the
p-Pd-H and a-Pd-H systems. The former of these two is believed to exist and
predominate at room temperature. The stability of this phase is believed to
diminish at elevated temperatures in favour of the a-Pd-H phase. The
transition between the two phases is not believed to be dependent on metal
particle size, although evidence for the existence of the p-Pd-H phase on very
small particles is sparse.
When palladium is found in its bulk metallic form it is still subject to
surface and bulk rearrangement processes in the presence of hydrogen15,
suggesting that the metal particles are morphologically unstable under such
conditions.
Static and MAS NMR spectroscopy studies on hydrogen and deuterium
phases present in Pd/SiC>2 catalysts presented by Benesi et al16, were
performed over a series of metal particle sizes. Resolution of peaks attributed
to gas phase D2, p-phase deuteride, mobile, weakly chemisorbed deuterium on
palladium, and less mobile OD groups associated with the silica support
surface were detailed. Boudart and Hwang17 showed that the pressure
required for hydride formation increases with decreasing crystallite size, and
11
Aben18 has reported a drop in total hydrogen uptake in the P-Pd-hydride phase
with decreasing particle size.
1.5 Hydrocarbon Adsorption at Surfaces
1.5.1 Adsorption of Olefins
The hydrogenation of olefins at catalytic surfaces is undoubtedly the
result of the initial chemisorption of the hydrocarbon. Clearly, the nature of
this adsorbed olefinic species will have a significant effect on both the activity
and selectivity of the catalyst during the course of the reaction. Therefore, it is
necessary to detail some of the work performed in this area, with a view to
explaining the nature and role of the adsorbed olefin complex.
There are two predominating types of adsorbed olefin species classed as :
i) di-cr-olefin species
ii) di-Tt-olefin species
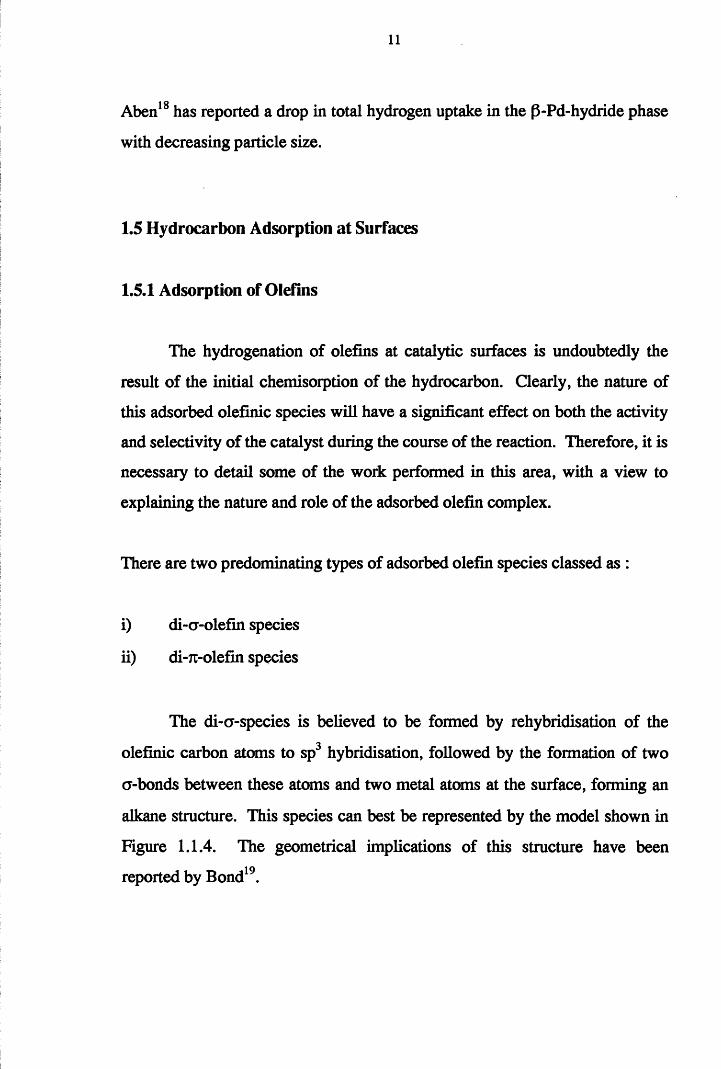
The di-a-species is believed to be formed by rehybridisation of the
olefinic carbon atoms to sp3 hybridisation, followed by the formation of two
CT-bonds between these atoms and two metal atoms at the surface, forming an
alkane structure. This species can best be represented by the model shown in
Figure 1.1.4. The geometrical implications of this structure have been
reported by Bond19.
12
RnHC=CHRm 2 0 RnCH CHRm
Figure 1.1.4 : o-Bonded Olefin State
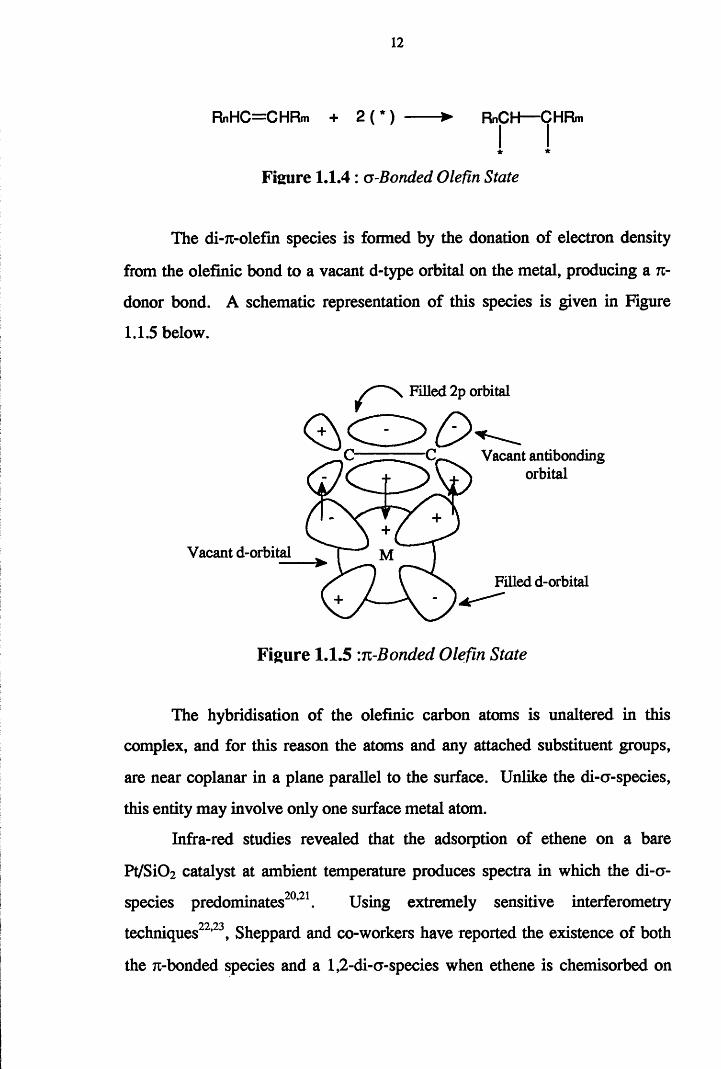
The di-rc-olefin species is formed by the donation of electron density
from the olefinic bond to a vacant d-type orbital on the metal, producing a 71-
donor bond. A schematic representation of this species is given in Figure
1.1.5 below.
Filled 2p orbital
Vacant antibonding orbital
Vacant d-orbital
Filled d-orbital
Figure 1.1.5 :n-Bonded Olefin State
The hybridisation of the olefinic carbon atoms is unaltered in this
complex, and for this reason the atoms and any attached substituent groups,
are near coplanar in a plane parallel to the surface. Unlike the di-a-species,
this entity may involve only one surface metal atom.
Infra-red studies revealed that the adsorption of ethene on a bare
Pt/Si02 catalyst at ambient temperature produces spectra in which the d i-o0 (\ *71species predominates ’ . Using extremely sensitive interferometry
techniques22,23, Sheppard and co-workers have reported the existence of both
the 7t-bonded species and a 1,2-di-a-species when ethene is chemisorbed on
13
hydrogen precovered Pd/SiC>2 and Pt/SiC>2 catalysts. However, the observance20 21of dissociatively adsorbed olefin complexes has also been reported ’ . Both
the 7i-bonded and di-a-species were observed from magnetic studies of ethene
chemisorption on a Ni/SiC>2 catalyst at 0°C. However, at elevated
temperatures molecular dissociation occurred, resulting in self-hydrogenation
producing ethane. This can be explained by either the reaction of chemisorbed
ethene with hydrogen atoms released by the dissociation of an associatively
adsorbed ethene molecule, or by disproportionation of two associatively
adsorbed ethene molecules. The existence of dissociatively adsorbed ethene
on Pd/SiC>2 has been reported by Little et al24.
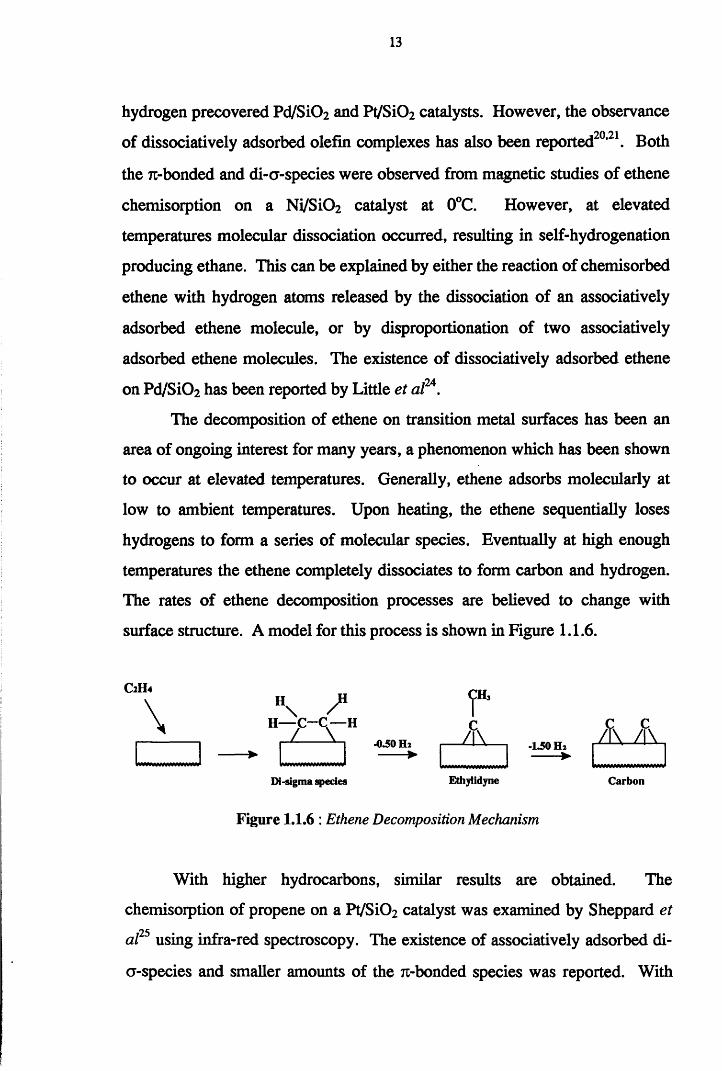
The decomposition of ethene on transition metal surfaces has been an
area of ongoing interest for many years, a phenomenon which has been shown
to occur at elevated temperatures. Generally, ethene adsorbs molecularly at
low to ambient temperatures. Upon heating, the ethene sequentially loses
hydrogens to foim a series of molecular species. Eventually at high enough
temperatures the ethene completely dissociates to form carbon and hydrogen.
The rates of ethene decomposition processes are believed to change with
surface structure. A model for this process is shown in Figure 1.1.6.
C 2 H 4
\ \ / » H— c - c —-H
Di-sigma species
-0.50 Hz ►
<j:H3
A .
Ethylidyne
-1.50 Hz ►
AACarbon
Figure 1.1.6 : Ethene Decomposition Mechanism
With higher hydrocarbons, similar results are obtained. The
chemisorption of propene on a Pt/Si02 catalyst was examined by Sheppard et25al using infra-red spectroscopy. The existence of associatively adsorbed di-
a-species and smaller amounts of the 71-bonded species was reported. With
14
the chemisorbed propene, heating under vacuum above 130°C lead to the
dissociation of the initially adsorbed species to yield ethylidyne, which could
only be produceithrough (C-C) bond scission.
The C-3 counterpart of ethylidyne called propylidyne is itself well
documented25,26’27. Sheppard and co-workers26 reported RAIRS results
consistent with the formation of propylidyne, a di-a-species and traces of the
it-bonded species on Pt/SiC>2. The presence of the latter two complexes was
accounted for by the adsorption of propene on crystal planes other than the
(1 1 1 ) face.
In the case of C-4 hydrocarbons, the observance of the saturated
butylidyne species o n a P t ( l l l ) surface, was observed by Sheppard . This
species however, was only observed from the direct chemisorption of 1-
butene, with both 2 -butene isomers producing a tx-adsorbed complex at
temperatures in excess of 250K.
1.5.2. Adsorption of Acetylenes
Similar to olefin hydrogenation, the initial step in the hydrogenation of
an acetylenic hydrocarbon is its chemisorption at the surface. There are
essentially two forms adopted by the acetylene upon surface chemisorption,
which are termed:
i) di-a-species
ii) di-7t-species
The first of these two is formed by the initial rupture of the acetylenic
bond to produce two a-bonds between the unsaturated carbon atoms and two
distinct surface metal atoms. This structure was first observed by Little24 for
15
ethyne adsorption on palladium, nickel and copper supported on silica glass,
and by Sheppard et al29 over silica-supported platinum and nickel catalysts.
This species was not removable by evacuation, but formed a new saturated
molecule when exposed to hydrogen. The geometry of this associatively
adsorbed state has been investigated30’31, and the optimum metal-metal
distances required are available on the commonly exposed crystal planes.
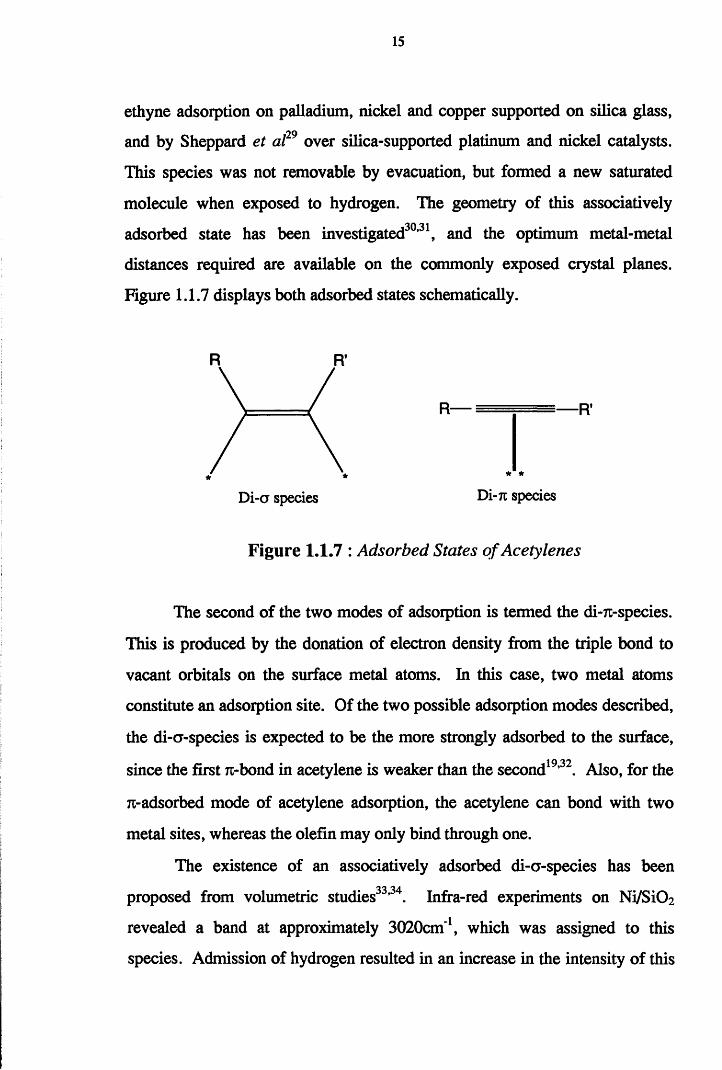
Figure 1.1.7 displays both adsorbed states schematically.
Di-a species
-FT
Di-7r species
Figure 1.1.7 : Adsorbed States o f Acetylenes
The second of the two modes of adsorption is termed the di-7t-species.
This is produced by the donation of electron density from the triple bond to
vacant orbitals on the surface metal atoms. In this case, two metal atoms
constitute an adsorption site. Of the two possible adsorption modes described,
the di-a-species is expected to be the more strongly adsorbed to the surface,
since the first n-bond in acetylene is weaker than the second19,32. Also, for the
Ti-adsorbed mode of acetylene adsorption, the acetylene can bond with two
metal sites, whereas the olefin may only bind through one.
The existence of an associatively adsorbed di-a-species has been
proposed from volumetric studies33,34. Infra-red experiments on Ni/Si0 2
revealed a band at approximately 3020cm'1, which was assigned to this
species. Admission of hydrogen resulted in an increase in the intensity of this
16
band, which was attributed to surface alkyl groups of average form, H3C-(
CH2)n, where n = 3 on nickel, and n > 4 on platinum.
The effects of hydrogen on the IR spectra of adsorbed acetylenes
combined with mechanistic studies of ethyne hydrogenation reactions has led
to the conclusion that the acetylenic species active in hydrogenation reactions
are associatively bound to the surface. It was assumed that these species could
be adequately represented as the di-o-bonded olefin. Hence, it was proposed
that the (1 1 1 ) faces would be inactive for acetylene adsorption due to
geometrical requirements in that adsorption mode. However, LEED35
experiments performed on platinum single crystals showed that ethyne readily
adsorbs on the (111) planes. Following work published by Rooney et a/36’37’38,
it has generally been assumed that the active adsorbed form of ethyne in
hydrogenation reactions is the 7t-adsorbed complex, formed between the 71-
bond and two metal atoms.
1.6 Hydrogenation of Acetylenic Hydrocarbons
The hydrogenation of acetylenes is a critical reaction in the
petrochemical industry39. Some basic chemical processes require large
quantities of olefins of reagent grade purity with a very low concentration of
acetylene impurity. This aim is normally met by the application of supported
metal catalysts, typically low loaded Pd/Al2C>3 which selectively reduce the
acetylene impurity to the desired olefin. However, even with the best
catalysts40,41, the hydrogenation of acetylenes rarely reaches the low levels
required without the accompanied formation of the alkane. Therefore, an
acetylene will generally hydrogenate to yield both the olefin and alkane, and
the system may show a preference for either product depending on the catalyst
and operating conditions employed. This situation is made somewhat more
17
complicated when the acetylene contains four or more carbon atoms. In these
circumstances, partial hydrogenation of the acetylene can yield a number of
isomeric olefins as well as the alkane. The extent to which the acetylene
hydrogenates to the olefin as opposed to the alkane is termed the selectivity,
and is determined in part by the adsorption characteristics of both the olefin
and acetylene.
1.6.1 Catalyst Selectivity
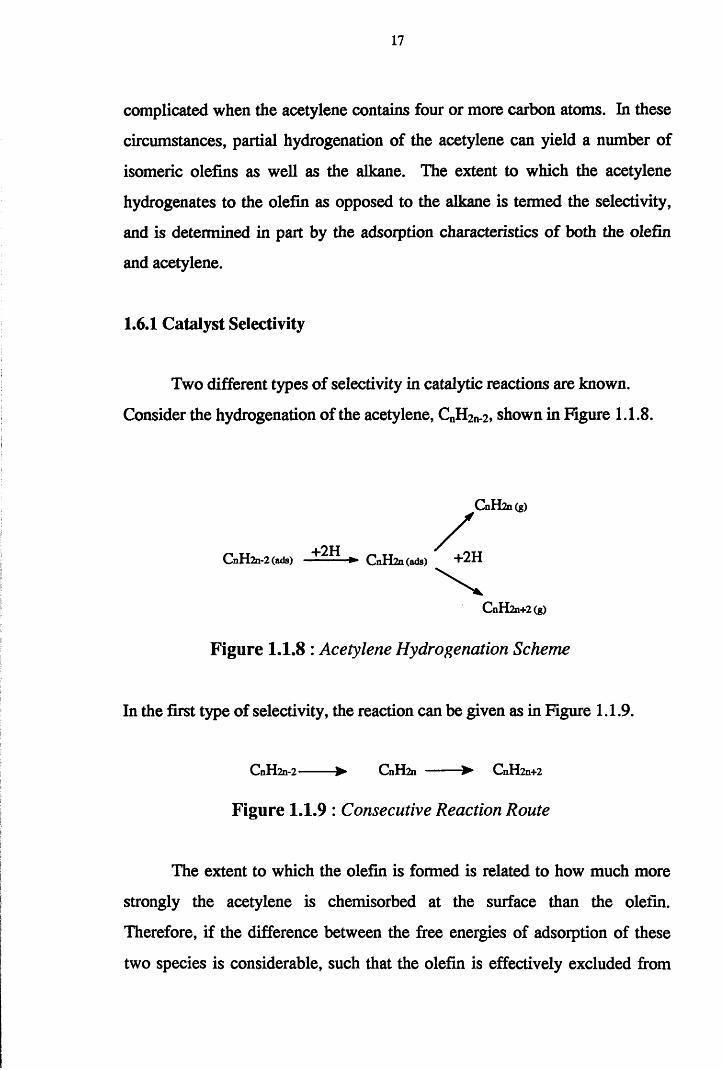
Two different types of selectivity in catalytic reactions are known.
Consider the hydrogenation of the acetylene, CnH2n-2, shown in Figure 1 .1 .8 .
In the first type of selectivity, the reaction can be given as in Figure 1.1.9.
The extent to which the olefin is formed is related to how much more
strongly the acetylene is chemisorbed at the surface than the olefin.
Therefore, if the difference between the free energies of adsorption of these
two species is considerable, such that the olefin is effectively excluded from
CnH2n-2 (ads) CnH2n(ads)
C nH 2n(g)
CnH2n+2(g)
Figure 1.1.8 : Acetylene Hydrogenation Scheme
C nH 2n-2 ► C nH 2n ----------► CnH2n+2
Figure 1.1.9 : Consecutive Reaction Route
18
the surface, then the formation of the alkane from the olefin will not occur.
This phenomenon is called the thermodynamic factor.
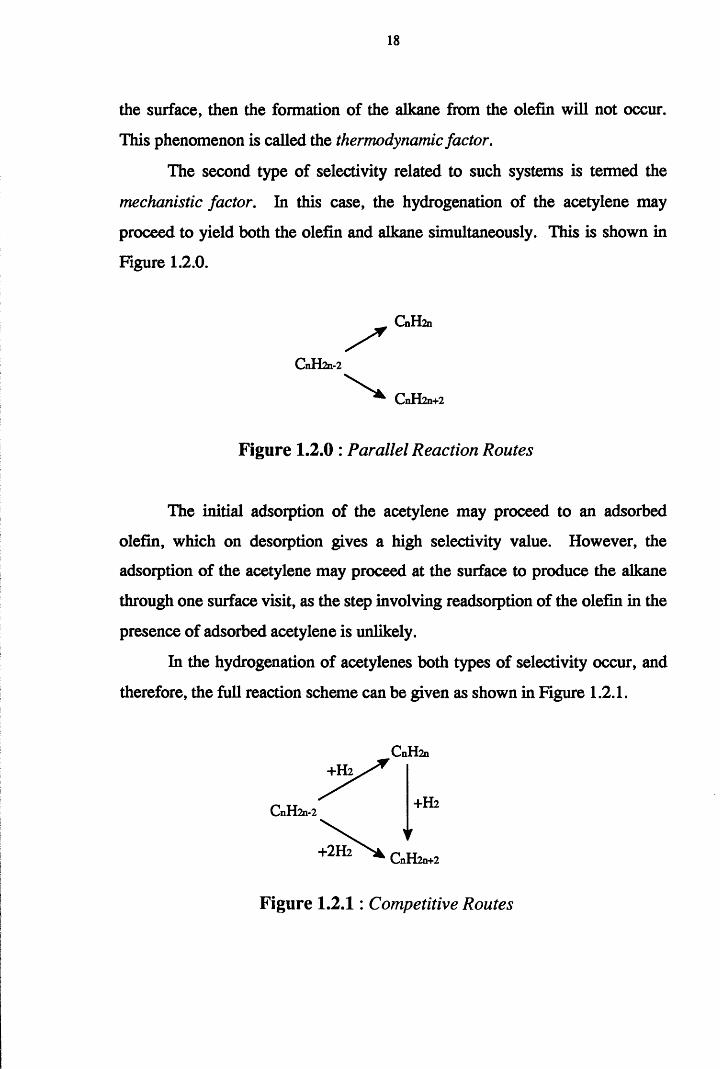
The second type of selectivity related to such systems is termed the
mechanistic factor. In this case, the hydrogenation of the acetylene may
proceed to yield both the olefin and alkane simultaneously. This is shown in
Figure 1.2.0.
C nH 2n
C nH2n-2
CnH2n+2
Figure 1.2.0 : Parallel Reaction Routes
The initial adsorption of the acetylene may proceed to an adsorbed
olefin, which on desorption gives a high selectivity value. However, the
adsorption of the acetylene may proceed at the surface to produce the alkane
through one surface visit, as the step involving readsorption of the olefin in the
presence of adsorbed acetylene is unlikely.
In the hydrogenation of acetylenes both types of selectivity occur, and
therefore, the full reaction scheme can be given as shown in Figure 1.2.1.
C nH 2n
Figure 1.2.1: Competitive Routes
19
1.6.2 Hydrogenation Mechanisms
l4C-tracer studies performed by Webb and Al-Ammar42 on the
hydrogenation of ethyne over silica-supported palladium, platinum and iridium
in the presence of 14C-ethene, showed that with each catalyst, the amount of
alkane formed directly from ethene was small. They discovered that the major
route to ethane formation was from ethyne hydrogenation, and that ethene did
not adsorb on the ethyne hydrogenation sites. This mechanistic study
suggested that the hydrogenation of ethyne and ethene occurred on different
types of surface site.
Ethyne hydrogenation has been well documented43,44,45,46,47,48 over the
years, with less work on the hydrogenation of substituted acetylenes being
reported For the purposes of this section of the introduction the
hydrogenation of acetylenes containing three or more carbon atoms will be
considered.
The study of propyne hydrogenation reactions over metal catalysts has
been little discussed, with the majority of the work published in this area
relating to static reaction experiments49. Mann and Khulbe50 studied the
hydrogenation of propyne over both pumice-supported and unsupported
platinum and iridium catalysts. Over a range of reactant ratios and
temperatures the order of reaction with respect to hydrogen and propyne was
determined. Over unsupported iridium these workers found that the order of
reaction in propyne was zero or slightly negative and dependent on
temperature. For hydrogen the reaction order was found to be positive. This
suggests that propyne is more strongly chemisorbed at the surface than
hydrogen. Therefore, the surface coverage for propyne would be very high,
while that of hydrogen would be low in comparison. Similar results were
obtained by Bond and Wells51 using PCI/AI2O3 in the hydrogenation of ethyne.
20
More recent work on propyne hydrogenation has been published by Jackson
and Kelly52. Using a Pt/Si(>2 catalyst, the reactions were performed in a pulse-
flow system using various reactant ratios and temperatures. The order of
reaction with respect to propyne was found to change with reaction4q
temperature and, similar to the results of Bond and Sheridan , they
concluded that the propyne is indeed strongly adsorbed at the surface. The
effect of reactant ratio was also determined in this study. At high temperatures
an increase in the hydrogen concentration was found to favour the formation
of propane over propene suggesting that the activation energy for propane
formation was higher than that of propene.
Jackson and Casey53 reported the results of propyne hydrogenation
reactions performed in both a static and pulse-flow system, and full
characterisation of the intermediates was achieved by in-situ infra-red
spectroscopy. The pulse-flow reactions displayed significant quantities of
carbon being deposited over the catalyst surface resulting in the attainment of
a steady-state regime. This behaviour undoubtedly relates to the build up of
hydrocarbonaceous overlayers on the surface54. On all supported palladium
catalysts examined by this group, the selectivity toward propene formation
was found to be 100%. Clearly the reaction which predominates is the
conversion of propyne to propene. Characterisation of the reaction
intermediates was performed by in-situ IR spectroscopy. Similar to work
published earlier by Jackson et al27 on highly dispersed VdfLv02, this
technique allowed the elucidation of all adsorbed surface intermediates
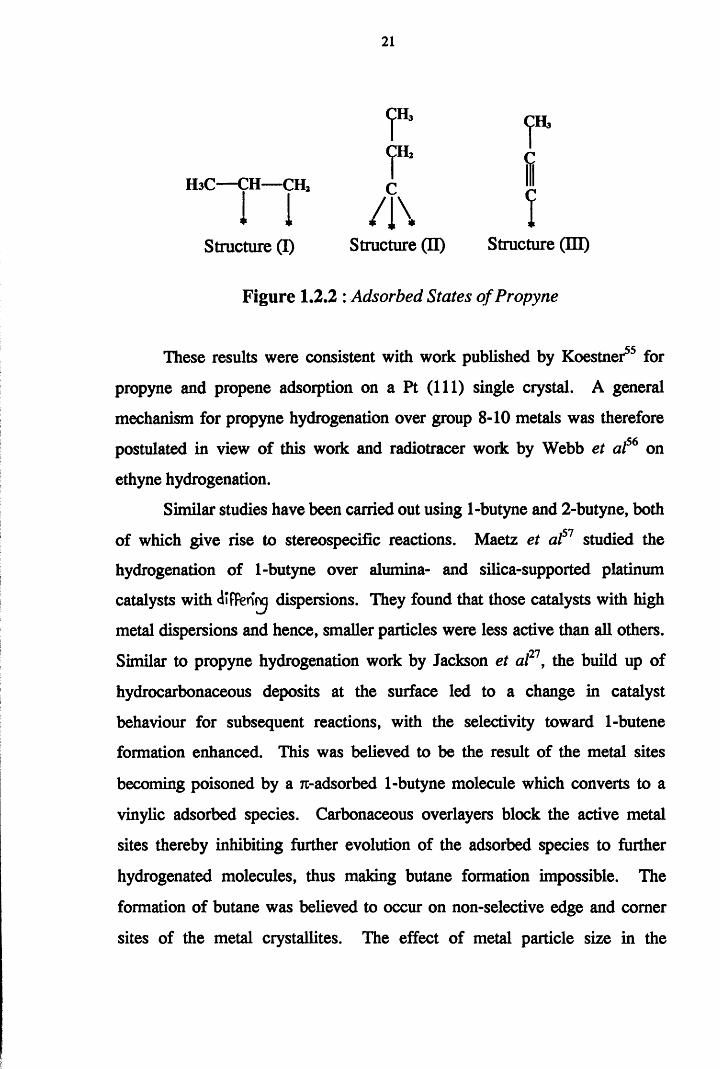
involved in the reaction. The spectra obtained were found to contain bands
similar to those observed by Shahid and Sheppard25 for propene
chemisorption. Bands attributed to a di-a-bonded propene species (I) and the
propylidyne molecule (II) were obtained, as was a a-bonded propyne species
(IE), as shown in Figure 1.2.2.
21
^ CH,
V * ?HsC— CH— CH, c I
1 1 /1\ IStructure (I) Structure (II) Structure (HI)
Figure 1.2.2 : Adsorbed States o f Propyne
These results were consistent with work published by Koestner55 for
propyne and propene adsorption on a Pt (111) single crystal. A general
mechanism for propyne hydrogenation over group 8 - 1 0 metals was therefore
postulated in view of this work and radiotracer work by Webb et al56 on
ethyne hydrogenation.
Similar studies have been carried out using 1-butyne and 2-butyne, bothcn
of which give rise to stereospecific reactions. Maetz et al studied the
hydrogenation of 1-butyne over alumina- and silica-supported platinum
catalysts with JifBenjvj dispersions. They found that those catalysts with high
metal dispersions and hence, smaller particles were less active than all others.
Similar to propyne hydrogenation work by Jackson et aF1, the build up of
hydrocarbonaceous deposits at the surface led to a change in catalyst
behaviour for subsequent reactions, with the selectivity toward 1-butene
formation enhanced. This was believed to be the result of the metal sites
becoming poisoned by a Tt-adsorbed 1-butyne molecule which converts to a
vinylic adsorbed species. Carbonaceous overlayers block the active metal
sites thereby inhibiting further evolution of the adsorbed species to further
hydrogenated molecules, thus making butane formation impossible. The
formation of butane was believed to occur on non-selective edge and comer
sites of the metal crystallites. The effect of metal particle size in the
22
hydrogenation of 1 -butyne over platinum and rhodium catalysts has also been
discussed by Boitiaux et al5S.
In the hydrogenation reactions of disubstituted acetylenes, the
formation of the cis isomer of the olefin is favoured using supported palladium
and copper catalysts. Burwell and Hamilton59 examined the hydrogenation of
2-butyne in a flow system using a low loaded Pd/Al20 3 catalyst. In the
presence of the acetylene, only trace amounts of butane and trans-2 -butene
were observed with the major product being c/s-2-butene. Similar to propyne
and ethyne hydrogenation, on the removal of the acetylene from the system,
the c/s-olefin underwent both isomerisation to trans-2 -butene and
hydrogenation to butane. The stereoselective nature of these reactions was
best shown in the work of Meyer and Burwell60 employing deuterium as a
tracer. Approximately 99% of the product was found to be cw-2-butene-2,3,-
d2, provided unconverted 2-butyne was present. NMR spectroscopy showed
that two deuterium atoms were present on the second and third carbon atoms
only. 2 -butyne itself did not undergo exchange, but did reduce the rate of
hydrogen exchange by a factor of forty.
Using alumina-supported osmium and ruthenium catalysts, Webb and
Wells61 reported the formation of all three butenes in the hydrogenation of 2-
butyne using a static reaction system. This work showed that although the
activity of osmium and ruthenium for 2 -butyne hydrogenation was similar to
that of the face centred cubic metals, the stereoselective behaviour of
palladium, platinum and nickel could not be mimicked. It has been shown that
the highest selectivity of all transition metals is to be found in the first row
metals with lower selectivities obtained on descending the groups.
23
1.7 Carbonaceous Overlayers
It is generally accepted that the hydrogenation of unsaturated
hydrocarbons at catalytic surfaces is accompanied by the deposition of surface
carbonaceous overlayers62. The discovery of this phenomenon is not a new
one, with Beeck et al63 reporting the formation of surface carbonaceous
residues in a study into the interaction of ethene with evaporated metal films.
Similar conclusions were reported by Dus64 from ethene hydrogenation
experiments performed over evaporated palladium films. He claimed that two
adsorbed ethene layers where present at the surface; the first layer produced
by dissociative adsorption of ethene and the second by associative adsorption
of the olefin. It was on this second carbonaceous overlayer that the
hydrogenation step occurred. Using supported metal catalysts, Al-Ammar and
Webb65,66,67 provided 14C-radiotracer evidence for the existence of such
overlayers in ethene and ethyne adsorption studies. At ambient temperature,
the adsorption of 14C-ethene and 14C-ethyne was found to occur in two distinct
stages. In the first stage, the species were dissociatively adsorbed at the
surface, and self-hydrogenation occuijed to produce ethane. At higher
pressures, a secondary adsorption region was evident, and those species which
undergo hydrogenation do so on this surface overlayer. Similar conclusions
were presented by Kesmodel et al36 for the hydrogenation of ethyne on a
platinum (1 1 1 ) surface, where the hydrogenation step was found to proceed on
a secondary adsorbed carbonaceous layer.
1.7.1 Effects of Carbonaceous Overlayers on Catalyst Behaviour
on o t aqSheppard et al ' reported the ability of carbonaceous overlayers to
reversibly store hydrogen, using infra-red spectroscopy. This group found that
when a hydrocarbon precovered surface was exposed to hydrogen, the band
24
intensities in the (C-H) region increased, whilst subsequent evacuation of the
surface resulted in a loss in band intensity in this region. The hydrogen
storage capacity of carbonaceous overlayers was also reported by Somoijai
and Zaera69 using platinum single crystals. This work showed that the
presence of active carbonaceous residues containing CH or CH2 fragments
were capable of storing approximately ten times as much hydrogen as a clean
metal surface.
Jackson and Kelly52 noted the selectivity enhancing properties of such
deposits in the hydrogenation of propyne over Pt/Si02. Using reactant ratios
of dfPferinj hydrogen concentration, it was discovered that the selectivity of the
catalyst toward propene formation was enhanced when the carbonaceous
residues were found in a hydrogenated form. When dehydrogenated, these
residues no longer acted as hydrogen transfer species.
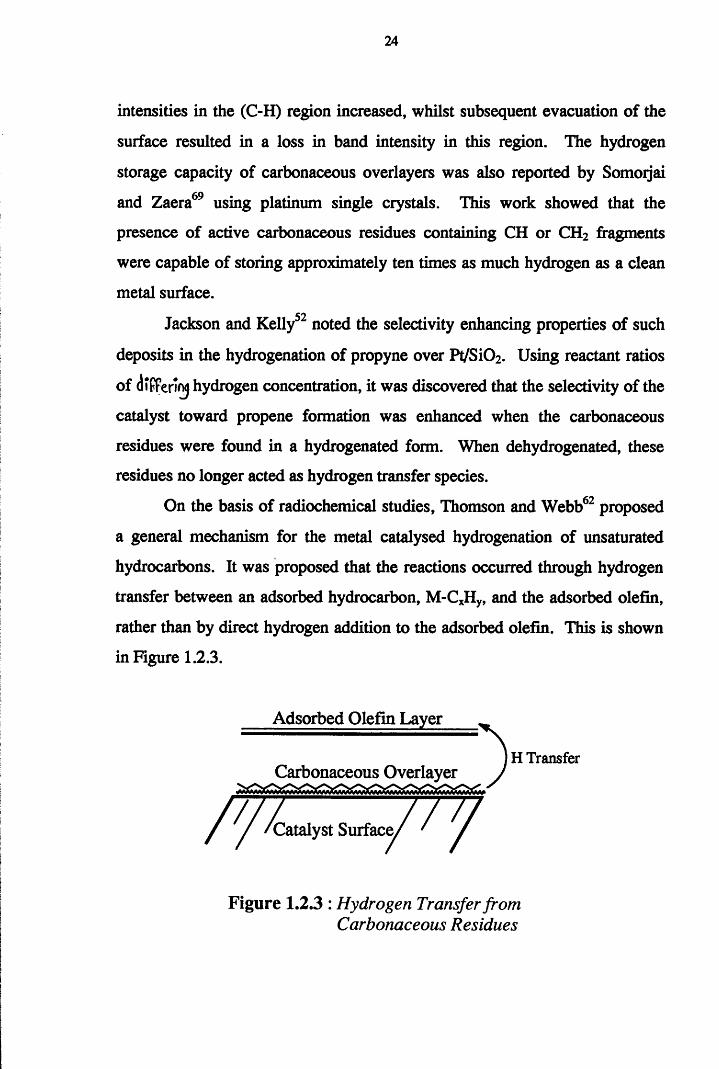
On the basis of radiochemical studies, Thomson and Webb62 proposed
a general mechanism for the metal catalysed hydrogenation of unsaturated
hydrocarbons. It was proposed that the reactions occurred through hydrogen
transfer between an adsorbed hydrocarbon, M-CxHy, and the adsorbed olefin,
rather than by direct hydrogen addition to the adsorbed olefin. This is shown
in Figure 1.2.3.
Adsorbed Olefin Layer
H TransferCarbonaceous Overlayer
“ “ 7 -------------------------------------------Catalyst Surface
Figure 1.2.3 : Hydrogen Transfer from Carbonaceous Residues
25
A second detrimental feature of carbonaceous overlayer formation is catalyst
deactivation43,44. Salmeron and Somorjai70 found that extensive carbon
deposition was predominantly found on flat surfaces that are well populated; a
phenomenon also observed with larger particles. Therefore, reactions that
occur preferentially at these surfaces are then suppressed by the deposition of
carbon which diminishes the number of exposed atom clusters. This has the
effect of lowering the activity of the catalyst for further reaction, since the
number of active sites have been reduced.
Generally, catalyst regeneration can be achieved by treating the catalyst
with oxygen at high temperatures, effectively burning off the carbon as the
oxygenated product. However, the removal of carbon is irreversible when the
carbonaceous overlayers become graphitic71.
Chapter Two
OBJECTIVES OF STUDY
26
The principle aim of this project was to examine the hydrogenation
reactions of a number of mono- and di-substituted acetylenic hydrocarbons over
supported palladium and platinum catalysts. For the purposes of this study, three
acetylenes have been examined; propyne, 2-butyne and phenylacetylene. Four
supported metal catalysts (Pd/Si02, Pd/y*Al20 3 , Pt/Si02, Pt/Y-Al2C>3) have been
tested for activity and selectivity in these hydrogenation reactions.
The hydrogenation reactions of propyne have been performed in the gas
phase at ambient temperature. The effect of hydrogen concentration was
examined by using two different acetylene to hydrogen ratios; an equimolar ratio
(1 :1 : : C3H4 : H2), and a three fold excess of hydrogen (1 :3: : C3H4 : H2).
Hydrogenation of the di-substituted acetylene 2-butyne, was performed
over a range of temperatures using gas mixtures of the same ratio as in the
propyne hydrogenation reactions.
Phenylacetylene hydrogenation was initially performed as a liquid phase
study, with reactions carried out in a stirred autoclave. Similar reactions were
also performed for styrene and a co-hydrogenation mixture of styrene and
phenylacetylene. These reactions were also examined in a gas phase continuous
flow system.
It was hoped that the above reactions would yield valuable information into such
surface processes, with a view to :
(a) determining the effects of the adsorbed acetylene structure on
(i) the selectivity and hence, the mechanism of the reaction, with particular
reference to the nature and involvement of the adsorbed acetylenic species.
27
(ii) the ease of formation and nature of permanently retained
hydrocarbonaceous surface residues, and the influence of such species on
catalyst selectivity and activity.
(b) determining possible correlations between the various effects noted in (a)
and the structure of the supported metal catalyst.
Chapter Three
EXPERIM ENTAL
28
Experimental
3.1 Introduction
Three of the four catalysts used in this study were prepared at Glasgow
using a wet impregnation method of preparation. The Pt/silica catalyst, also
prepared by wet impregnation, was supplied by ICI Katalco.
Catalyst characterisation performed on all four samples included
chemisorption measurements, temperature programmed reduction (TPR),
thermal gravimetric analysis (TGA), transmission electron microscopy (TEM),
atomic absorption spectroscopy (AAS), surface area determination (BET) and
UV/Visible diffuse reflectance spectroscopy (UVDRS). The results of these
characterisation procedures are given in the results chapter (Section 4.1).
3.2 CATALYST PREPARATION
3.2.1 Metal Precursors and Supports
Supported catalysts were prepared from hexachloroplatinic acid,
H2PtCl6 (Johnson Matthey Chemicals Ltd, minimum Pt assay 40%) and
anhydrous palladium (II) chloride (Fluka Chemicals Ltd, minimum Pd assay
60%). The supports used were silica (M5 Cab-O-Sil) and y-alumina (Degussa
Aluminium Oxid C).
3.2.2 Preparation
The platinum catalysts were prepared by dissolving hexachloroplatinic
acid in 725ml of deionised water in a round bottomed flask. The required
support material was then added and the solution stirred for approximately two
hours forming a gel-like suspension. A further 375mls of water was added to
29
complete dissolution of the salt. This procedure was continued until all the
support material had been introduced, with the total volume of water required
being 2.01. The flask was then attached to a Buchi rotary evaporator and the
water slowly removed by maintaining the flasks contents at 80°C under a
nitrogen atmosphere. This was continued until all the water had evaporated
off producing a free-flowing powder.
In the case of the palladium catalysts a similar procedure was adopted.
However, since PdCk has limited solubility in water, concentrated HC1 was
added dropwise to the flasks containing the aqueous salt solutions until
dissolution had occurred. At this stage, catalyst preparation followed the route
given above. All catalysts were then dried for 12 hours at 100°C.
3 3 CATALYST CHARACTERISATION
33.1. Temperature Programmed Reduction (TPR)
Reduction is a necessary step in the preparation of a metallic catalyst.
If this is not done correctly the catalyst may sinter or may not reach its
optimum state of reduction. The reduction of the metal precursor, MCI2 by
hydrogen is described by the equation
MC12 + nH2 => M + 2nHCl Equation 2
Therefore, when the temperature of a catalyst precursor is increased
linearly in a stream of reducing gas, typically H2/N2, hydrogen will be
consumed as a function of the temperature/reactivity relationship of the
precursor species. This technique is termed temperature programmed
reduction (TPR). TPR is a highly useful technique, providing quick
30
characterisation, and most important, critical information on the temperature
needed for the complete reduction of the catalyst.
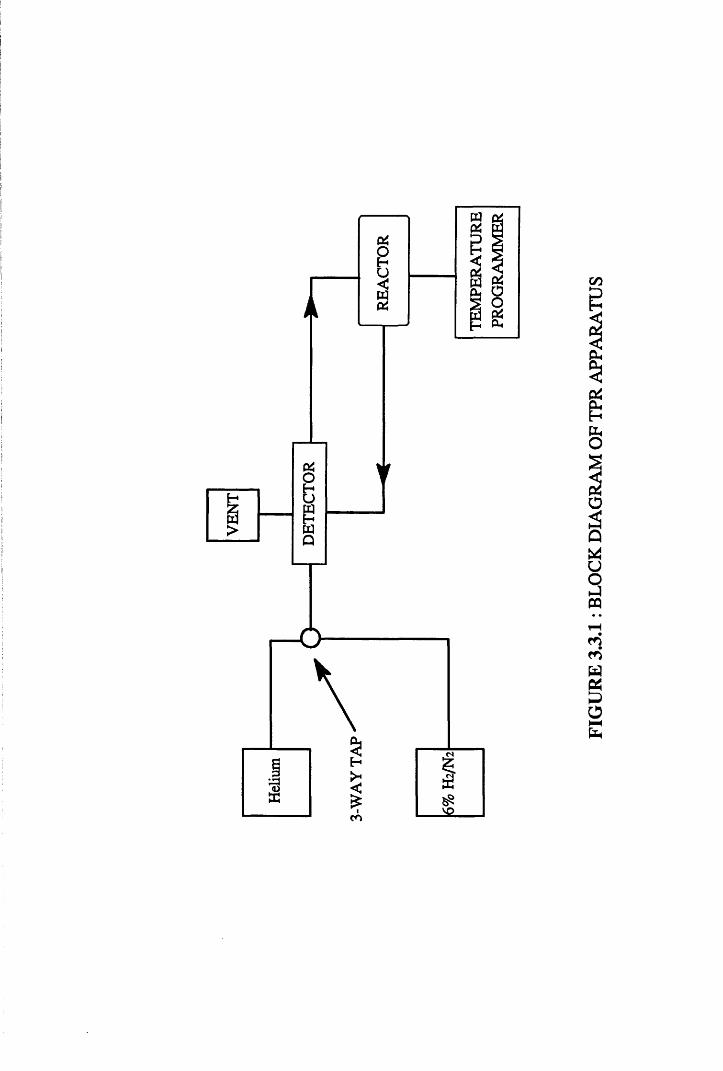
The experiments were performed in the system given in Figure 3.3.1.
The temperature of the catalyst sample was increased linearly using an electric
furnace attached to a Eurotherm temperature programmer. The reduction
procedure initially involved placing 0.20g of catalyst into the reactor and
purging the system with helium, until the chart recorder displayed a steady
baseline.
The reducing gas mixture used was 6% H2/N2, which was passed
through an oxygen trap, 5% Pd/W0 3 , and dried by passing through a Linde 5A
molecular sieve trap. The extent of metal precursor reduction was monitored
using a thermal conductivity detector (TCD), which operates by detecting
changes in the composition of the effluent gas, as hydrogen is consumed. The
removal of reduction products was achieved by incorporating a cold trap,
consisting of acetone and dry ice, to protect the TCD filaments from possible
corrosion.
The flow of reducing gas was set at 45ml min'1 and the sample
temperature raised by 5° min"1. The consumption of hydrogen was monitored
by the TCD and the reduction of distinct surface species producing a peak on
the chart recorder at a specific temperature. This procedure was adopted for
all four catalysts, providing information on the number of species present and,
more importantly, the minimum temperature at which complete reduction
occurs for each catalyst before use in the hydrogenation reactions.
3.3.2 Chemisorption
To achieve a greater understanding of any supported metal catalyst r t is
important to have a knowledge of the catalyst surface. For the purpose of
Heliu
m
CO
FIG
URE
3.
3.1:
BLO
CK
DIAG
RAM
OF
TP
R A
PPA
RA
TUS
31
further reaction chemistry it was deemed necessary to determine the fraction
of the total number of metal atoms which were exposed at the surface. This
was achieved by the adsorption of carbon monoxide and oxygen in separate
experiments. Since the modes of adsorption of both of these gases is simple
over palladium and platinum, the number of surface metal atoms could readily
be obtained. This allows the determination of the catalyst dispersion, w ere
^ No. Surface Metal Atoms „ ,% Dispersion = —— — ————------ ——-----— Equation 3Total No. Metal Atoms Per Sample
When a known volume of an adsorbate gas is pulsed over a freshly
reduced catalyst, a quantity of that gas will be chemisorbed at the surface,
forming a fraction of a monolayer. Continued pulsing will result in more gas
being adsorbed until a monolayer has been achieved, at which time no more
gas will react at the surface, with flow chemisorption only determining the
amount of material permanently retained at the adsorption temperature. This
model suggests that there is little or no contribution from the support to the
observed chemisorption process, hence, a direct stoichiometry between the
number of exposed metal atoms and adsorbed gas molecules can be applied.
Carbon monoxide and oxygen adsorption experiments were performed
on all catalysts as a means of determining the degree of metal atom dispersion
over the support materials, and also to determine the average metal crystallite
sizes.
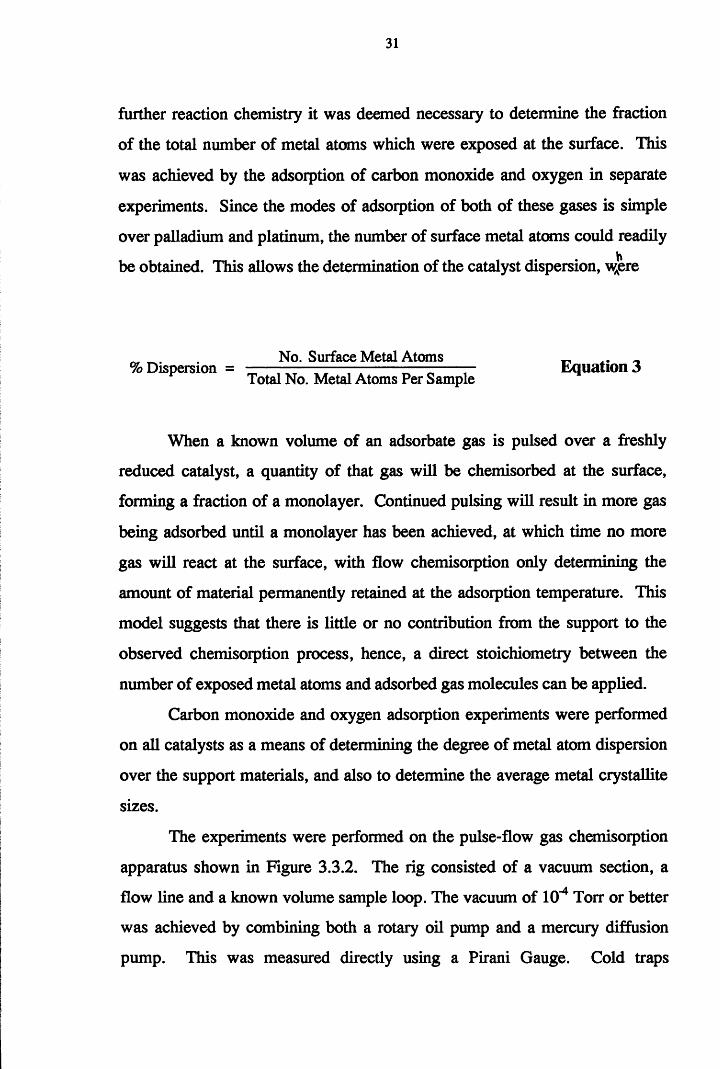
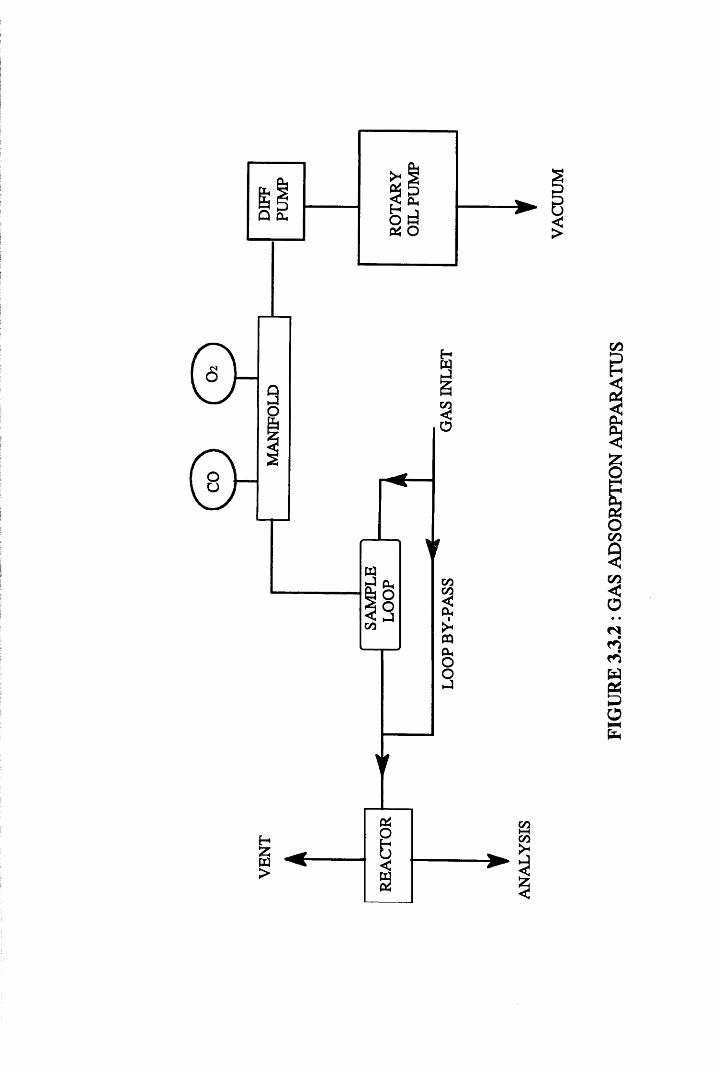
The experiments were performed on the pulse-flow gas chemisorption
apparatus shown in Figure 3.3.2. The rig consisted of a vacuum section, a
flow line and a known volume sample loop. The vacuum of 10"4 Torr or better
was achieved by combining both a rotary oil pump and a mercury diffusion
pump. This was measured directly using a Pirani Gauge. Cold traps
<N
CO
COCO
CO
COHHCO
FIG
URE
33
.2
: GAS
A
DSO
RPTI
ON
A
PPA
RA
TUS
32
containing liquid nitrogen were used to remove the possibility of mercury
vapour poisoning the catalysts, and to protect the oil pump from condensable
gases.
The adsorbate gases were stored in bulbs attached to the line via a
manifold. By isolating the manifold from the vacuum section, the adsorbate
gas could be admitted into the known volume loop and the pressure measured
by a mercury manometer. This known amount of gas (4.70cm3, lOmmHg)
was then injected into a helium carrier gas flow and over the reduced catalyst.
A TCD placed in the gas flow allowed direct monitoring of any changes in the
gas composition.
For the purposes of these chemisorption experiments approximately
0.10g of catalyst was reduced in situ in a flow of 6% H2/N2 at the required
elevated temperature. When catalyst activation was complete, the reducing
gas mixture was changed to helium and the sample allowed to cool to ambient
temperature. Both gas flows were purified before reaching the catalyst, by
passage over a deoxygenating catalyst, 5% Pd/WC>3, and subsequently dried
by passing through a molecular sieve trap.
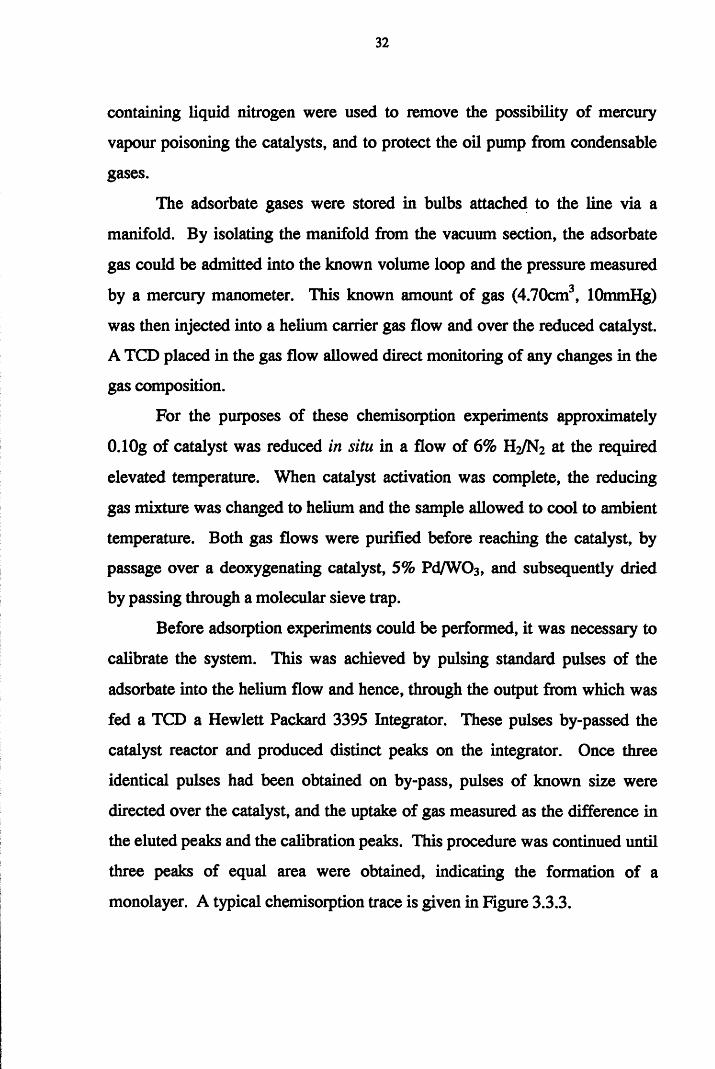
Before adsorption experiments could be performed, it was necessary to
calibrate the system. This was achieved by pulsing standard pulses of the
adsorbate into the helium flow and hence, through the output from which was
fed a TCD a Hewlett Packard 3395 Integrator. These pulses by-passed the
catalyst reactor and produced distinct peaks on the integrator. Once three
identical pulses had been obtained on by-pass, pulses of known size were
directed over the catalyst, and the uptake of gas measured as the difference in
the eluted peaks and the calibration peaks. This procedure was continued until
three peaks of equal area were obtained, indicating the formation of a
monolayer. A typical chemisorption trace is given in Figure 3.3.3.
33
Area Indicates Monolayer Formation
Adsorbate Pulses
Figure 33 .3 : Typical Chemisorption Trace
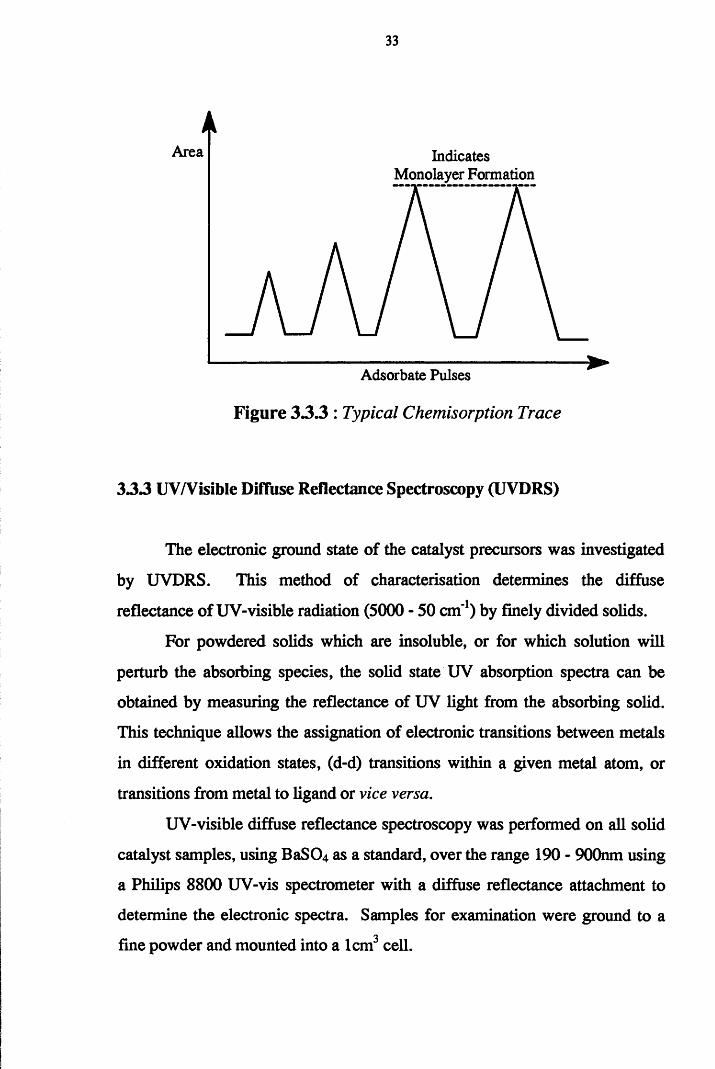
3 3 3 UV/Visible Diffuse Reflectance Spectroscopy (UVDRS)
The electronic ground state of the catalyst precursors was investigated
by UVDRS. This method of characterisation determines the diffuse
reflectance of UV-visible radiation (5000 - 50 cm'1) by finely divided solids.
For powdered solids which are insoluble, or for which solution will
perturb the absorbing species, the solid state UV absorption spectra can be
obtained by measuring the reflectance of UV light from the absorbing solid.
This technique allows the assignation of electronic transitions between metals
in different oxidation states, (d-d) transitions within a given metal atom, or
transitions from metal to ligand or vice versa.
UV-visible diffuse reflectance spectroscopy was performed on all solid
catalyst samples, using BaSC>4 as a standard, over the range 190 - 900nm using
a Philips 8800 UV-vis spectrometer with a diffuse reflectance attachment to
determine the electronic spectra. Samples for examination were ground to a
fine powder and mounted into a 1cm3 cell.
34
33.4 Transmission Electron Microscopy (TEM)
For studying supported catalysts, TEM is a commonly applied form of
electron microscopy. Generally, the detection of the supported metal particles
is possible provided that there is sufficient contrast between metal and support
material. However, this may impede the application of TEM on highly
dispersed supported oxide catalysts.
This technique was applied to correlate particle size measurements with
those determined from the chemisorption experiments.
Samples were prepared by grinding approximately 0.1 Og of catalyst
into a fine powder, which was then suspended in distilled water and
ultrasonically dispersed for 15 minutes. A drop of the fine suspension was
then placed on a 300 square mesh Cu carbon coated grid. This was then put in
an oven overnight to dry at 40°C. The impregnated grid was placed in the
microscope and measurements made using a Philips 1200 electron microscope.
33.5 Thermogravimetric Analysis (TGA)
This technique was applied to all catalyst samples using a Du Pont 951
Thermogravimetric analyser. This procedure involves monitoring the mass of
the sample against temperature, whilst the temperature is ramped in a reducing
gas atmosphere.
The TGA curve obtained expresses the dependence of the weight
change on temperature, thus yielding information on the sample composition,
thermal stability and the products formed during heating.
Samples of approximately 5mg were placed inside a furnace and
subjected to a flow of 6% H2/N2 at 60ml m in1, whilst the temperature was
raised by 5° min'1. The subsequent loss of sample weight was recorded by a
thermobalance and plotted as a function of temperature.
35
Iii
33.6 Atomic Absorption Spectroscopy (AAS)
AAS is an analytical method for the determination of elements in small
quantities and is based on the absorption of radiation by free atoms.
An absorption spectrum is obtained when the atoms are irradiated with
radiation of the appropriate wavelength. Quantitative results can only be
obtained by comparison of the catalyst solutions with reference solutions. The
calibration graph is established by plotting the absorbance readings for a series
of standards against the concentration.
The calibration method used is an interpolation method, which means
that all catalyst solutions must lie between the lowest and highest readings of
all the standard solutions.
Actual metal loadings in each of the catalysts were obtained using a
Perkin Elmer Ml 100 spectrometer, with both palladium and platinum samples
being irradiated with the appropriate radiation wavelength : Pd (247.6nm), Pt
(265.9nm).
In order to obtain a calibration curve, 10 to 60ppm platinum standard
solutions and 1 to 10 ppm palladium standard solutions, all in 5% HN0 3 , were
prepared and their absorbances determined. These absorbances were plotted
against concentration, and the actual metal loadings for each of the four
catalysts calculated.
33.7 Surface Area Measurements (BET)
The volume of gas adsorbed per unit mass of solid depends on the
equilibrium pressure P, the absolute temperature T, and the nature of the gas
and solid. The pressure is usually expressed in terms of P/Ps, the relative
pressure, where Ps is the saturation vapour pressure of the adsorbing gas. At a
constant adsorption temperature, a series of measurements plotted as
36
Volume o f gas adsorbed / unit mass solid versus P / P5
yields a graph called an adsorption isotherm.
Surface area determination involves admitting an adsorbing gas to a
sample of known weight, which has been previously dried, weighed and
removed of any adsorbed gases and atmospheric vapours by subjecting it to
elevated temperature and evacuation procedures. The adsorbate, which for the
puiposes of BET measurements is nitrogen, is admitted to the sample in
incremental amounts. Some of the gas will be physisorbed by the sample at
low temperatures, usually that of liquid nitrogen. The adsorption temperature
of this process is critical, and is typically near the boiling point of the
adsorbing gas. This procedure is repeated until no more adsorbate gas is taken s
up by the catalyst sample.
BET surface areas (N2, 77K) were performed by Coulter Scientific
Instruments using a Coulter SA 3100 surface area instrument.
3.4 CATALYST ACTIVATION
Catalyst activation was achieved by loading the catalyst sample into the
U-tube flow reactor, which contained a silica sinter to support the sample
against the downward flow of gas. The reducing gas mixture, 6% H2/N2, was
set at 30ml min'1, and the temperature of the catalyst bed increased by 5° min"1
using a Eurotherm temperature programmer. The samples were heated to a
predetermined temperature which would ensure complete reduction of the
precursors to the active metal; palladium samples (200°C, 2hrs) and platinum
samples (300°C, 2hrs). After this step was complete, the samples were flushed
with pure hydrogen gas for approximately 0.50hrs, after which time they were
flushed with helium at the reduction temperature for 0.50hrs, before being set
to the reaction temperature.
37
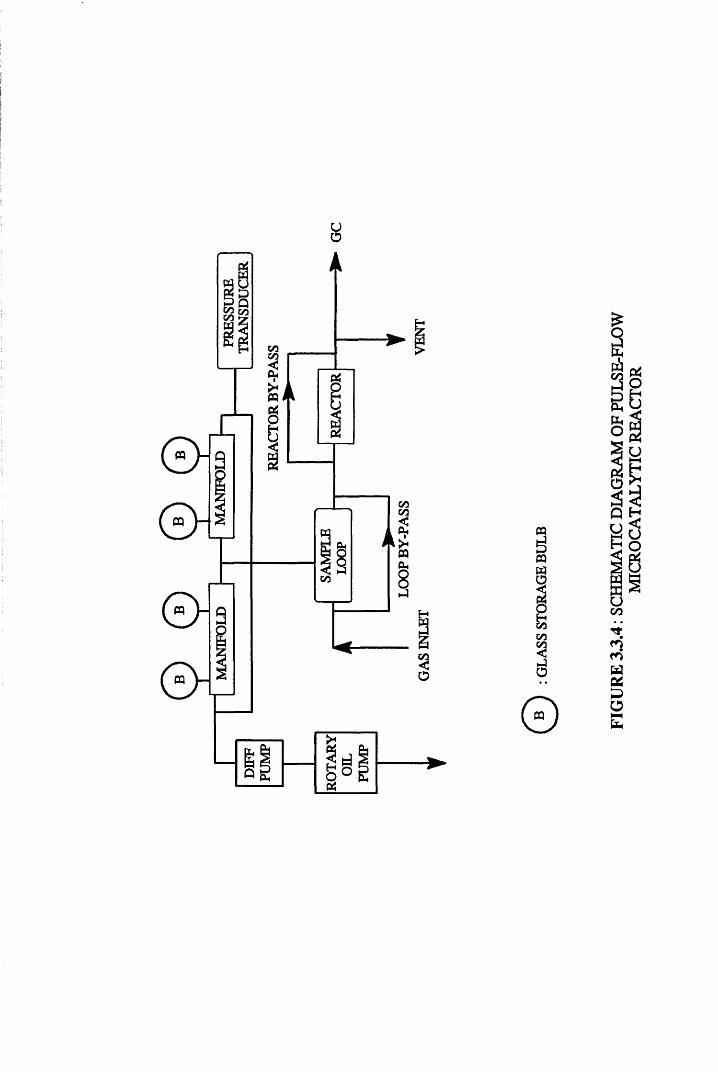
3.5 Pulse-Flow Microcatalytic Reactor System
A conventional high vacuum system, shown in Figure 3.3.4, was used
for hydrogenation reactions in the gas phase. This system incorporated both a
high vacuum section and a pulse flow section. Both sections were joined(v=5-83cftt3)
through a sample loop of known volume, through which gas mixtures could be
isolated and hence, injected into a helium carrier stream, and over the catalyst.
Similar to the chemisorption apparatus, the vacuum within the system
was achieved by combining both a rotary oil pump and a mercury diffusion
pump, allowing the system to be evacuated to pressures of 10*4 Torr or better.
The vacuum line incorporated four glass bulbs for the storage of
hydrogen and reactant hydrocarbons. Reaction mixtures of the required
compositions were pre-mixed and stored before use.
The pressure of gas within the line could be monitored at all times
using a pressure transducer (Edwards Medium Vacuum control unit 251).
3.5.1 Sample Loop
For the hydrogenation reactions of propyne, the sample loop used
consisted of three spring loaded glass taps, all of which could be lubricated
using Apiezon N tap grease. However, for the purposes of further
hydrogenation experiments on 2-butyne, this grease was found to be
unsuitable, in that the gas readily dissolved in the vacuum grease. To avoid
this problem, it was deemed necessary to adapt the loop to incorporate only
Youngs vacuum taps.
FIGU
RE
3.3.
4: S
CHEM
ATIC
DI
AGRA
M
OF
PULS
E-FL
OW
M
ICRO
CATA
LYTI
C RE
ACT
OR
38
3.5.2 Sample Loop Volume Determination
This was achieved by the use of several known volume bulbs. A
standard volume flask was attached to the line, and filled with helium of a
known pressure. The line was then evacuated, and the contents of the bulb
allowed to expand within the system. The pressure obtained was measured
using a pressure transducer. This procedure was carried out several times with
both the loop open and closed. The difference between both sets of values
allows Vioop to be determined. This procedure was repeated with several bulbs
until three reproducible Vioop values were obtained.
3.53 Gas Supply
The gas supply for the vacuum flow system consisted of helium,
hydrogen and 6 % H2/N2. All were supplied by B.O.C (99% purity), and were
purified using the deoxygenating and drying traps described in section 3.3.1.
3.5.4 Materials
Propvne
Cylinder propyne (BDH Chemicals Ltd, minimum purity 96%) was
purified through two bulb to bulb distillations before use.
2-Butvne
Cylinder 2-butyne (CK Gas Products, minimum assay 96%) was
purified as described for propyne, above.
39
Propane and Propene
Both, supplied by BOC (minimum assay 99%), were found to contain
no impurities detectable by gas chromatography, and were merely degassed
before use.
Butane and 2-Butene Isomers
Butane (BOC Ltd, minimum assay 99%) was found to contain no
impurities detectable by gas chromatography, and similar to the above, was
degassed before use. The 2-butene isomers were degassed before use.
Phenvlacetvlene
Supplied by Aldrich Ltd (minimum purity 98%), this was frozen,
pumped and thawed several times before use in the gas phase, to remove
dissolved gases. Degassing was completeiby bubbling hydrogen through the
liquid (25ml min'1) for one hour before use.
Stvrene
Supplied by Aldrich Ltd (minimum purity 99%), this was frozen at
liquid nitrogen temperatures, pumped and thawed before use in the gas phase.
Similar to phenylacetylene, hydrogen was also bubbled through the
hydrocarbon before use.
Ethvlbenzene
Supplied by Hopkins and Williams Ltd (minimum purity 98%), this
was purified using a similar method to that used for styrene and
phenylacetylene.
40
3.6 PULSE-FLOW EXPERIMENTAL PROCEDURE
3.6.1 Hydrogenation Reactions
A mixture of hydrocarbon and hydrogen was prepared by admitting a
known pressure of hydrocarbon into a mixing bulb and condensing it in a cold
finger. Hydrogen gas was then admitted to the bulb until the desired ratio of
hydrocarbon to hydrogen was obtained. The mixture was then allowed to
warm to ambient temperature over several hours before use.
Hydrogenation reactions were performed by admitting a known
pressure of the reaction mixture into the sample loop. Once isolated, this
mixture could be injected into the helium carrier gas flow and hence, over the
catalyst bed. Product analysis was achieved by gas chromatography.
3.6.2 Gas Phase Analysis System
Analysis of reaction products was performed by gas chromatography,
using a Shimadzu GC-14A chromatograph fitted with a TCD. An on-line
computer terminal (Labnet) and Chromjet integrator allowed direct analysis of
the chromatographic data.
Analysis of the propyne hydrogenation products was achieved using a
stainless steel column (2.2m x 0.125inch, packed with Poropak QS 50-80
mesh).
2 -Butyne hydrogenation products were also seperated using a stainless
steel column (12ft x 0.125 inch, Carbowax 1500 on Carbopack C 80-100
mesh).
A stainless steel column was also employed for the separation of
phenylacetylene hydrogenation products; (12ft x 0.125 inch; Carbowax 20M
on Chromosorb W-NAW 60-80 mesh).
41
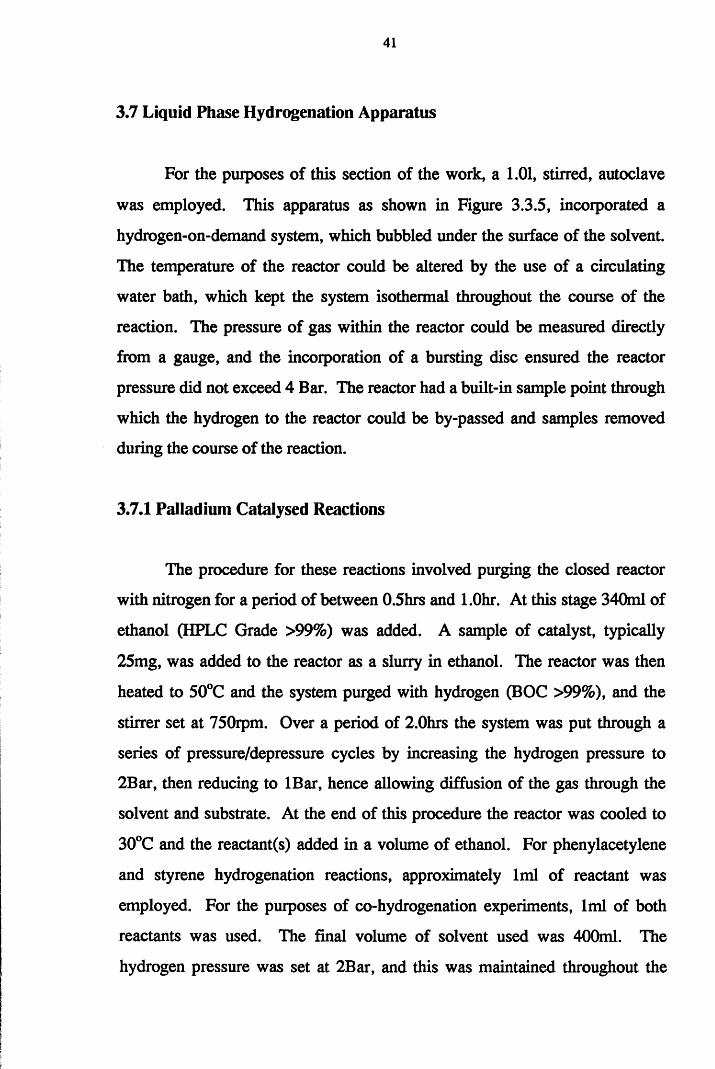
3.7 Liquid Phase Hydrogenation Apparatus
For the purposes of this section of the work, a 1.01, stirred, autoclave
was employed. This apparatus as shown in Figure 3.3.5, incorporated a
hydrogen-on-demand system, which bubbled under the surface of the solvent.
The temperature of the reactor could be altered by the use of a circulating
water bath, which kept the system isothermal throughout the course of the
reaction. The pressure of gas within the reactor could be measured directly
from a gauge, and the incorporation of a bursting disc ensured the reactor
pressure did not exceed 4 Bar. The reactor had a built-in sample point through
which the hydrogen to the reactor could be by-passed and samples removed
during the course of the reaction.
3.7.1 Palladium Catalysed Reactions
The procedure for these reactions involved purging the closed reactor
with nitrogen for a period of between 0.5hrs and l.Ohr. At this stage 340ml of
ethanol (HPLC Grade >99%) was added. A sample of catalyst, typically
25mg, was added to the reactor as a slurry in ethanol. The reactor was then
heated to 50°C and the system purged with hydrogen (BOC >99%), and the
stirrer set at 750rpm. Over a period of 2.0hrs the system was put through a
series of pressure/depressure cycles by increasing the hydrogen pressure to
2Bar, then reducing to IBar, hence allowing diffusion of the gas through the
solvent and substrate. At the end of this procedure the reactor was cooled to
30°C and the reactant(s) added in a volume of ethanol. For phenylacetylene
and styrene hydrogenation reactions, approximately 1ml of reactant was
employed. For the purposes of co-hydrogenation experiments, 1ml of both
reactants was used. The final volume of solvent used was 400ml. The
hydrogen pressure was set at 2Bar, and this was maintained throughout the
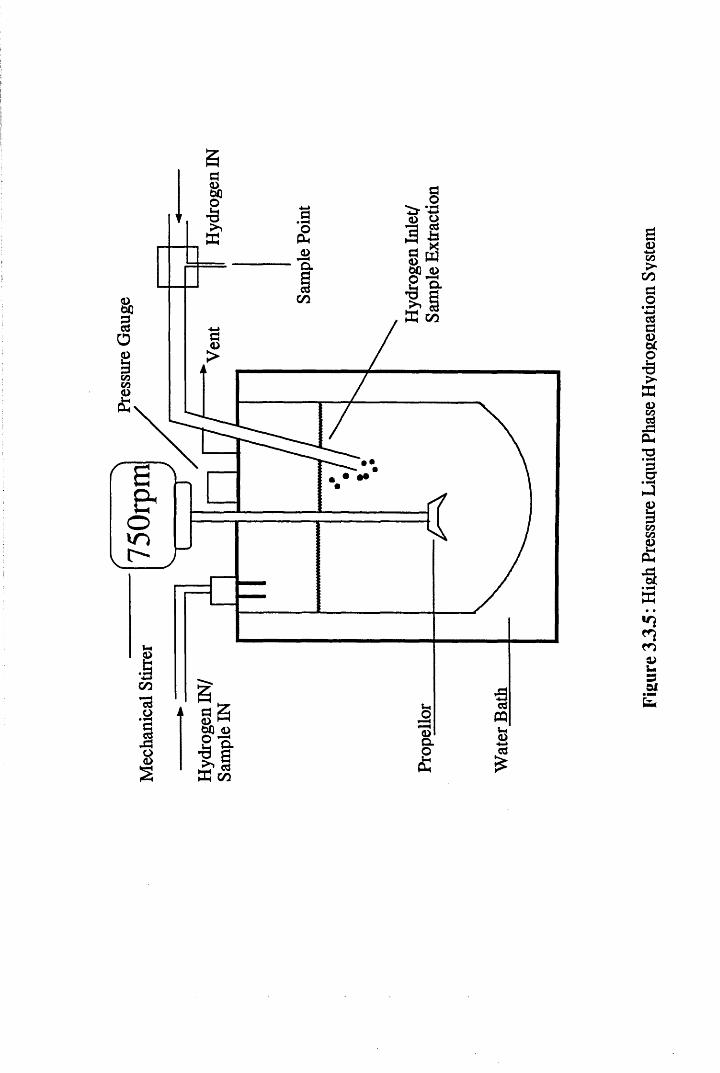
IiIi
iIi s
Q. bQ <D2 Q.
CO
Om
CO
^ CS CO
Figu
re
3.3.
5: H
igh
Pres
sure
Li
quid
Ph
ase
Hyd
roge
natio
n Sy
stem
42
course of the experiment. Samples for GC analysis were removed every
5mins for the first 45mins, and finally after one hour of reaction.
3.7.2 Platinum Catalysed Reactions
Due to the higher temperatures required for activation of the above
catalysts, the reductions were performed under flowing conditions, as in pulse-
flow reactions. The catalysts were then transferred into the reactor in a small
volume of degassed solvent. At this stage, the experimental procedure was as
in the palladium cases, above.
3.73 Liquid Phase Analysis System
Analysis of the liquid phase hydrogenation products was achieved
using a Chrompack 9001 GC fitted with a flame ionisation detector (FED).
Separation was achieved using a Carbowax 20M column as detailed in section
3.6.2.
3.8 Infra-Red Spectroscopy
This section details the procedure used for the characterisation of
surface structures present in the hydrogenation of 2 -butyne over silica-
supported palladium, using an equimolar ratio of 2 -butyne and hydrogen.
3.8.1 Diffuse Reflectance Infra Red Spectroscopy (DRIFTS)
DRIFTS spectra were obtained at 4cm"1 resolution using a Nicolet
Magna 550 FTTR spectrometer. The DRIFTS environmental cell was installed
onto an optical bench and a sample of catalyst loaded into an elevated holder.
43
The cell was connected to a low pressure (1CT4 - 10‘5 Torr) vacuum line, and
was water cooled, to reduce the effects of heat transfer when operating the cell
at elevated temperatures. The spectrometer was equipped with a purging
facility, which allowed the optical bench to be operated under flowing
nitrogen, to reduce the concentration of atmospheric moisture in the spectra
taken.
The reducing gas mixture, 6 % H2/N2, was then passed over the catalyst
via the vacuum line. Standard activation procedures were followed (Section
3.4) before cooling the sample to ambient temperature in flowing helium.
The reactant gas mixture (1:1 :: C4H6 : H2) was introduced to the
catalyst via a known volume sample loop, with the pressure of gas (80 Torr)
recorded by a Baratron capacitance manometer.
A background spectrum was acquired after the activation procedure.
Spectra were then obtained immediately after adsorbate pulsing, and are
presented as background subtracted spectra, referenced to the clean catalyst.
3.8.2 Transmission Infra Red Spectroscopy
The above experiments were performed using the same instrument as detailed
in Section 3.8.1 above. The in situ infra red cell used in these experiments
contained a catalyst wafer holder. Two KBr windows, sealed in stainless steel
rings, were connected to both ends of the cell, with a heating element
connected to an external thermocouple, allowing the catalyst to be activated in
situ. This cell was connected to a low pressure vacuum line which allowed
the system to be pumped or subjected to injected gases. Samples for
examination (typically, 50mg catalyst; 150mg KBr) were pressed into wafer
thin discs and mounted on the sample holder.
Activation of the catalyst samples was achieved by heating the cell to
200°C and charging the cell with a pressure of hydrogen (200 Torr). This was
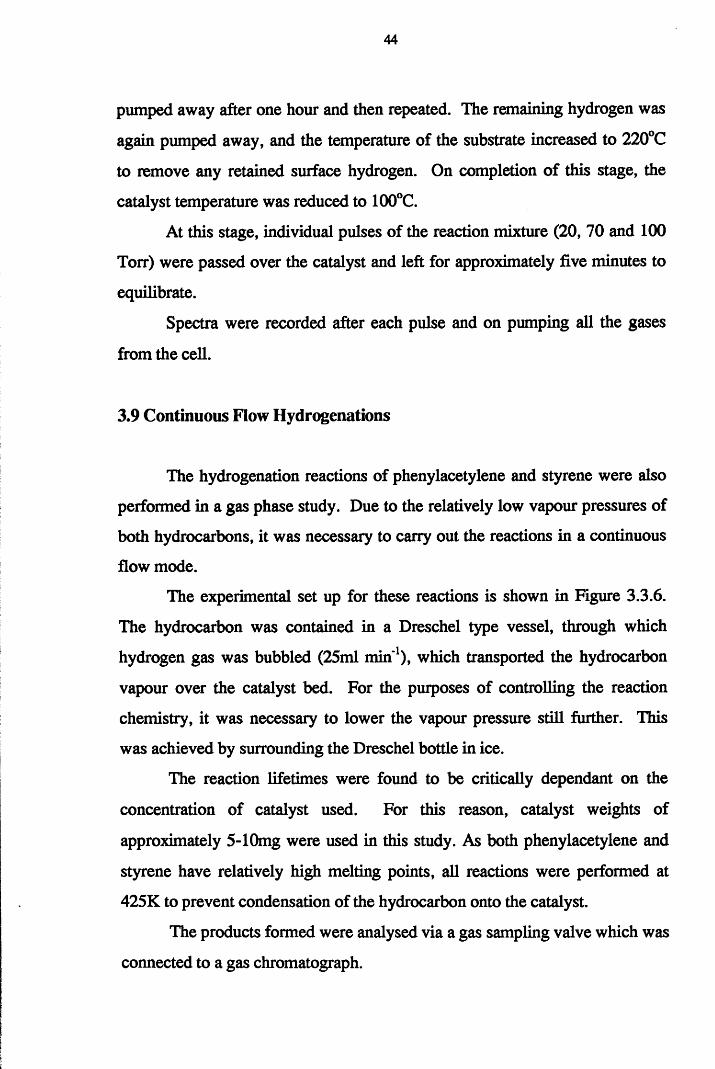
44
pumped away after one hour and then repeated. The remaining hydrogen was
again pumped away, and the temperature of the substrate increased to 220°C
to remove any retained surface hydrogen. On completion of this stage, the
catalyst temperature was reduced to 100°C.
At this stage, individual pulses of the reaction mixture (20, 70 and 100
Torr) were passed over the catalyst and left for approximately five minutes to
equilibrate.
Spectra were recorded after each pulse and on pumping all the gases
from the cell.
3.9 Continuous Flow Hydrogenations
The hydrogenation reactions of phenylacetylene and styrene were also
performed in a gas phase study. Due to the relatively low vapour pressures of
both hydrocarbons, it was necessary to carry out the reactions in a continuous
flow mode.
The experimental set up for these reactions is shown in Figure 3.3.6.
The hydrocarbon was contained in a Dreschel type vessel, through which
hydrogen gas was bubbled (25ml min'1), which transported the hydrocarbon
vapour over the catalyst bed. For the purposes of controlling the reaction
chemistry, it was necessary to lower the vapour pressure still further. This
was achieved by surrounding the Dreschel bottle in ice.
The reaction lifetimes were found to be critically dependant on the
concentration of catalyst used. For this reason, catalyst weights of
approximately 5-10mg were used in this study. As both phenylacetylene and
styrene have relatively high melting points, all reactions were performed at
425K to prevent condensation of the hydrocarbon onto the catalyst.
The products formed were analysed via a gas sampling valve which was
connected to a gas chromatograph.
CO
COCO
COCO
COCO FIG
URE
3.3.6
: CO
NTI
NU
OU
S FL
OW
HY
DRO
GEN
ATIO
N A
PPA
RA
TU
S
Chapter Four
RESULTS
Section One
Catalyst Characterisation
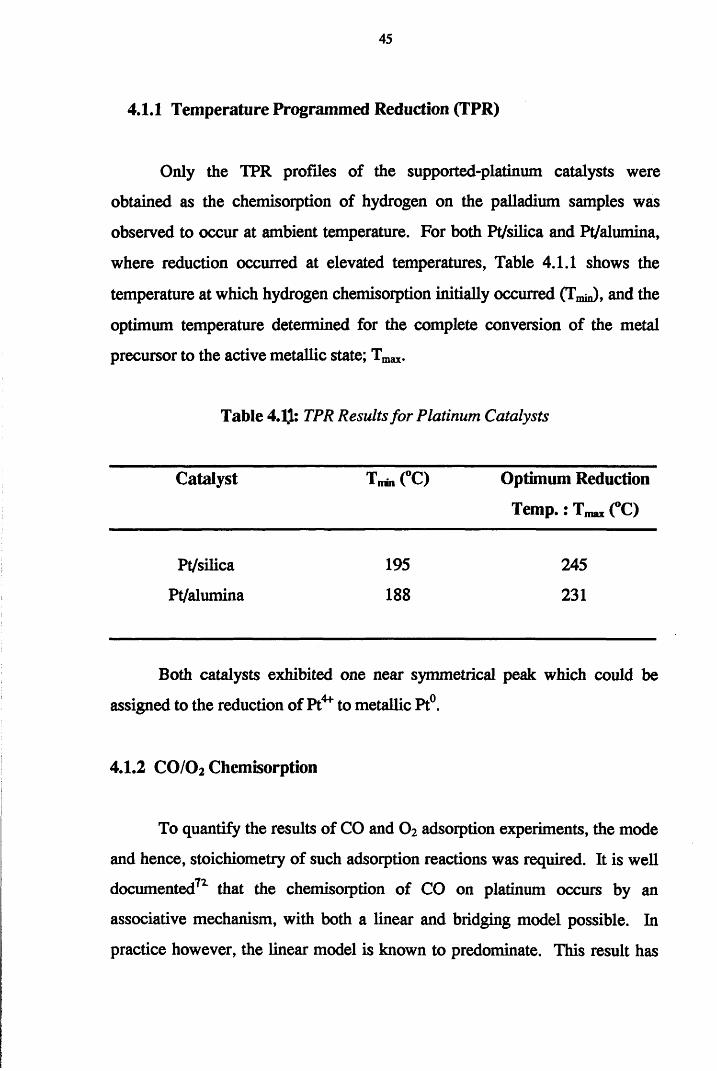
45
4.1.1 Temperature Programmed Reduction (TPR)
Only the TPR profiles of the supported-platinum catalysts were
obtained as the chemisorption of hydrogen on the palladium samples was
observed to occur at ambient temperature. For both Pt/silica and Pt/alumina,
where reduction occurred at elevated temperatures, Table 4.1.1 shows the
temperature at which hydrogen chemisorption initially occurred (Tmm), and the
optimum temperature determined for the complete conversion of the metal
precursor to the active metallic state; Tmax.
Table 4.1J: TPR Results for Platinum Catalysts
Catalyst T™ CO Optimum Reduction
Tem p.: (°C)
Pt/silica 195 245
Pt/alumina 188 231
Both catalysts exhibited one near symmetrical peak which could be
assigned to the reduction of Pt4* to metallic Pt°.
4.1.2 C 0 /0 2 Chemisorption
To quantify the results of CO and O2 adsorption experiments, the mode
and hence, stoichiometry of such adsorption reactions was required. It is well
documented77" that the chemisorption of CO on platinum occurs by an
associative mechanism, with both a linear and bridging model possible. In
practice however, the linear model is known to predominate. This result has
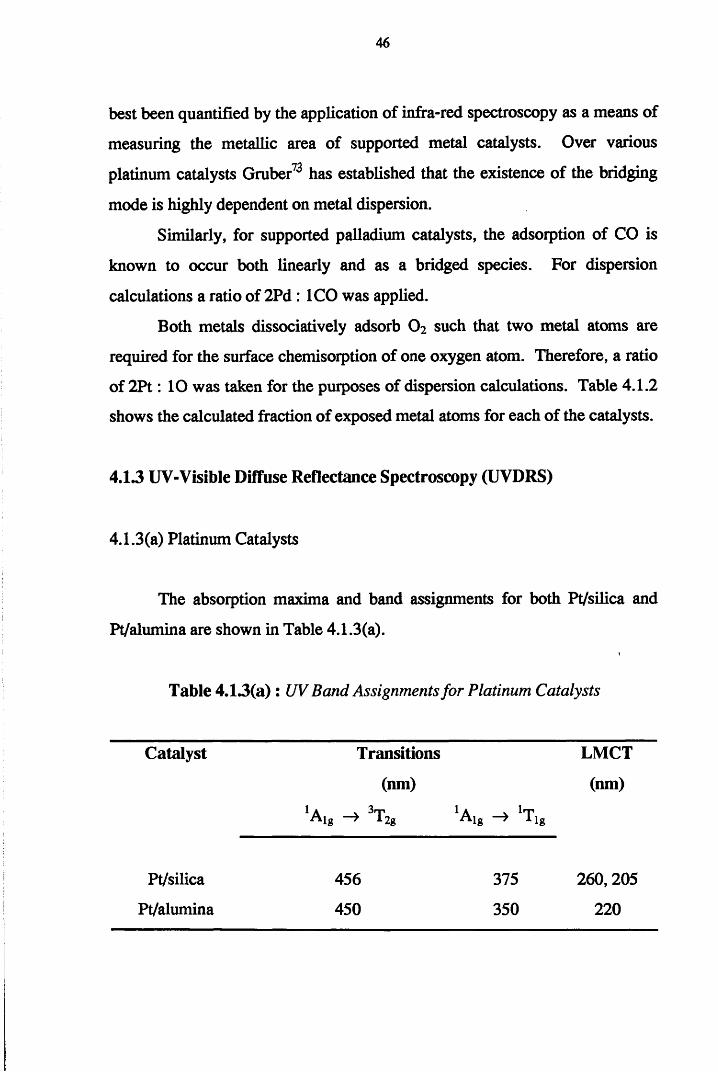
46
best been quantified by the application of infra-red spectroscopy as a means of
measuring the metallic area of supported metal catalysts. Over various
platinum catalysts Gruber7 has established that the existence of the bridging
mode is highly dependent on metal dispersion.
Similarly, for supported palladium catalysts, the adsorption of CO is
known to occur both linearly and as a bridged species. For dispersion
calculations a ratio of 2Pd: ICO was applied.
Both metals dissociatively adsorb O2 such that two metal atoms are
required for the surface chemisorption of one oxygen atom. Therefore, a ratio
of 2 P t: 10 was taken for the purposes of dispersion calculations. Table 4.1.2
shows the calculated fraction of exposed metal atoms for each of the catalysts.
4.1.3 UV-Visible Diffuse Reflectance Spectroscopy (UVDRS)
4.1.3(a) Platinum Catalysts
The absorption maxima and band assignments for both Pt/silica and
Pt/alumina are shown in Table 4.1.3(a).
Table 4.13(a) : UV Band Assignments for Platinum Catalysts
Catalyst Transitions LMCT
(nm) (nm)
*Aig -» 3T2g ^ ig -> !Tig
Pt/silica 456 375 260,205
Pt/alumina 450 350 220
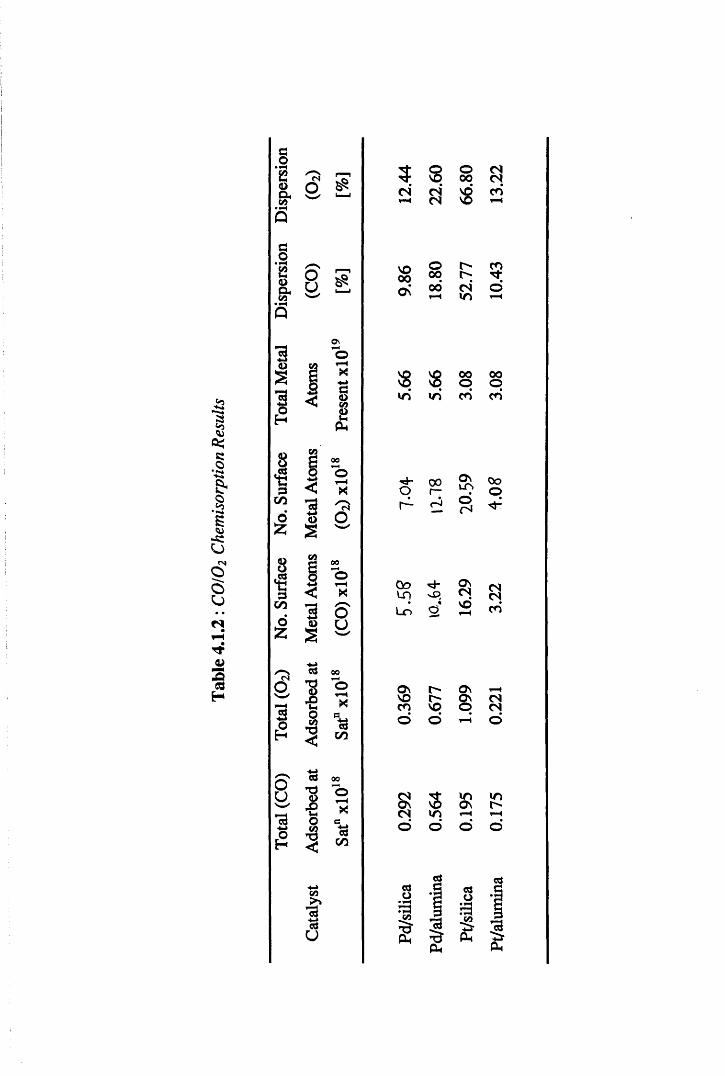
303*RO
e -s
S■RUfN
o
ou
fN
—2a
H
co3 2 8. o & w
§£ o& y,CO w
3<L>S
I
cho3£
ou
£
I
orHx<<->a<DCO8Ah
8CO
00
<+3 OhJ X
CO3a>o ' O
55 sCO
'w '
8 a 00
e g ©< X
CO 3 /-Voo © u55 2
H-»
>>«✓
03 00
UhOCO
5
X
“cGCO
cG oo T? ©I0
1
co>»13c3
U
xet3co
5 2c n c n t- h c n
VO00O n
Or1
oo
0oLO '■£> L o 2
03O
O (N 00 CN
CO8
o CO00 i> N"00 CN ©
m
8 8 . .in in cd cd00 00 o o
On #o
2 cn
O n ONVO ON CNCO VO © CNd o o
s 8 mO n
i n
CN i n t- H
o o o o
o■ fHrzco
H ? 1* If s
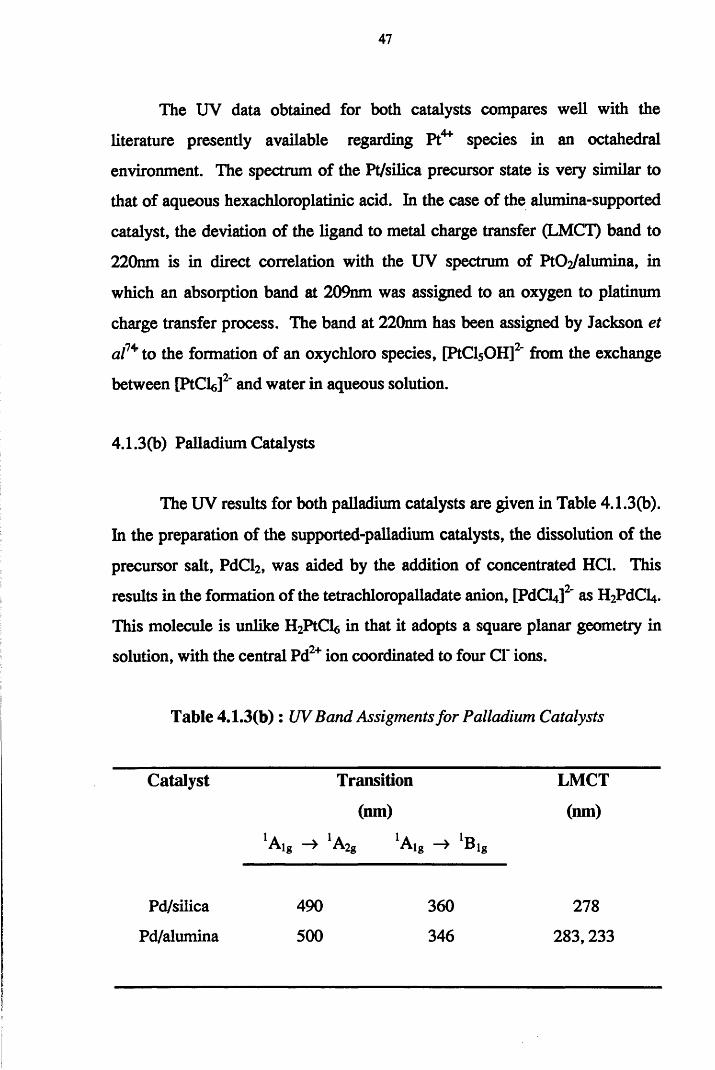
47
The UV data obtained for both catalysts compares well with the
literature presently available regarding Pt4+ species in an octahedral
environment. The spectrum of the Pt/silica precursor state is very similar to
that of aqueous hexachloroplatinic acid. In the case of the alumina-supported
catalyst, the deviation of the ligand to metal charge transfer (LMCT) band to
220nm is in direct correlation with the UV spectrum of PtCValumina, in
which an absorption band at 209nm was assigned to an oxygen to platinum
charge transfer process. The band at 220nm has been assigned by Jackson et
al1* to the formation of an oxychloro species, [PtCl5OH]2' from the exchange
between [PtCy2" and water in aqueous solution.
4.1.3(b) Palladium Catalysts
The UV results for both palladium catalysts are given in Table 4.1.3(b).
In the preparation of the supported-palladium catalysts, the dissolution of the
precursor salt, PdCl2, was aided by the addition of concentrated HC1. This
results in the formation of the tetrachloropalladate anion, [PdCL*]2 as H2PdCl4 .
This molecule is unlike H2PtCl6 in that it adopts a square planar geometry in
solution, with the central Pd2+ ion coordinated to four Cl' ions.
Table 4.1.3(b) : UV Band Assigments for Palladium Catalysts
Catalyst Transition LMCT
(nm) (nm)
*Aig -> *A2g xAig -» lBig
Pd/silica 490 360 278
Pd/alumina 500 346 283,233
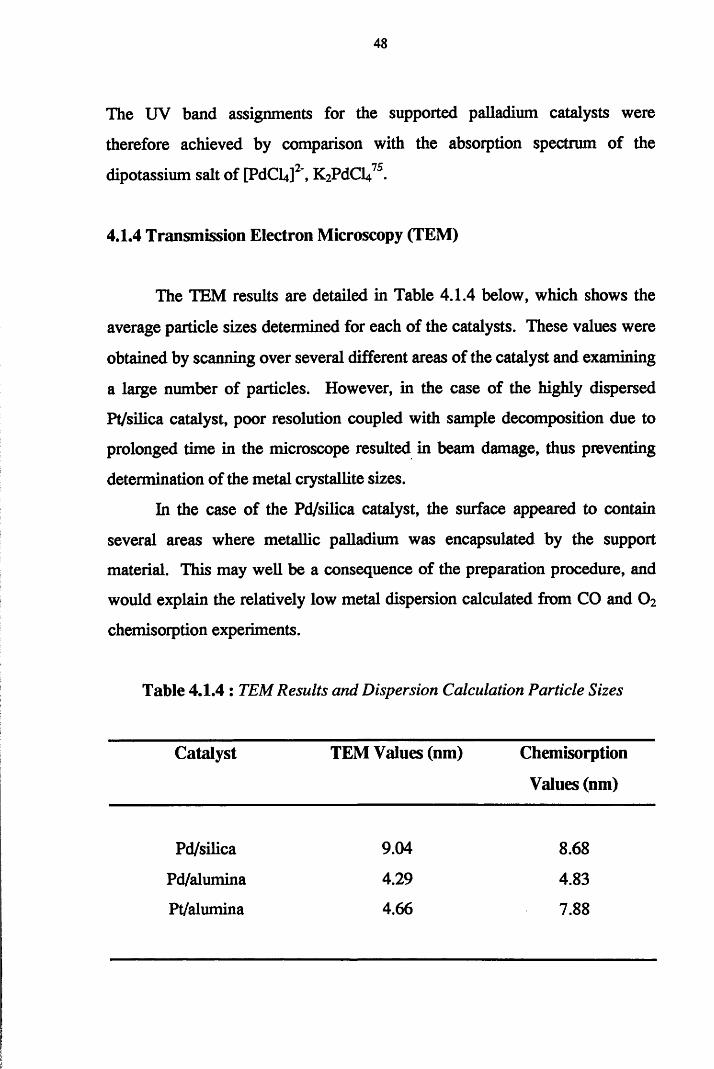
48
The UV band assignments for the supported palladium catalysts were
therefore achieved by comparison with the absorption spectrum of the
dipotassium salt of [PdCLJ2, I^PdCU75-
4.1.4 Transmission Electron Microscopy (TEM)
The TEM results are detailed in Table 4.1.4 below, which shows the
average particle sizes determined for each of the catalysts. These values were
obtained by scanning over several different areas of the catalyst and examining
a large number of particles. However, in the case of the highly dispersed
Pt/silica catalyst, poor resolution coupled with sample decomposition due to
prolonged time in the microscope resulted in beam damage, thus preventing
determination of the metal crystallite sizes.
In the case of the Pd/silica catalyst, the surface appeared to contain
several areas where metallic palladium was encapsulated by the support
material. This may well be a consequence of the preparation procedure, and
would explain the relatively low metal dispersion calculated from CO and O2
chemisorption experiments.
Table 4.1.4 : TEM Results and Dispersion Calculation Particle Sizes
Catalyst TEM Values (nm) Chemisorption
Values (nm)
Pd/silica
Pd/alumina
Pt/alumina
9.04 8.68
4.29 4.83
4.66 7.88
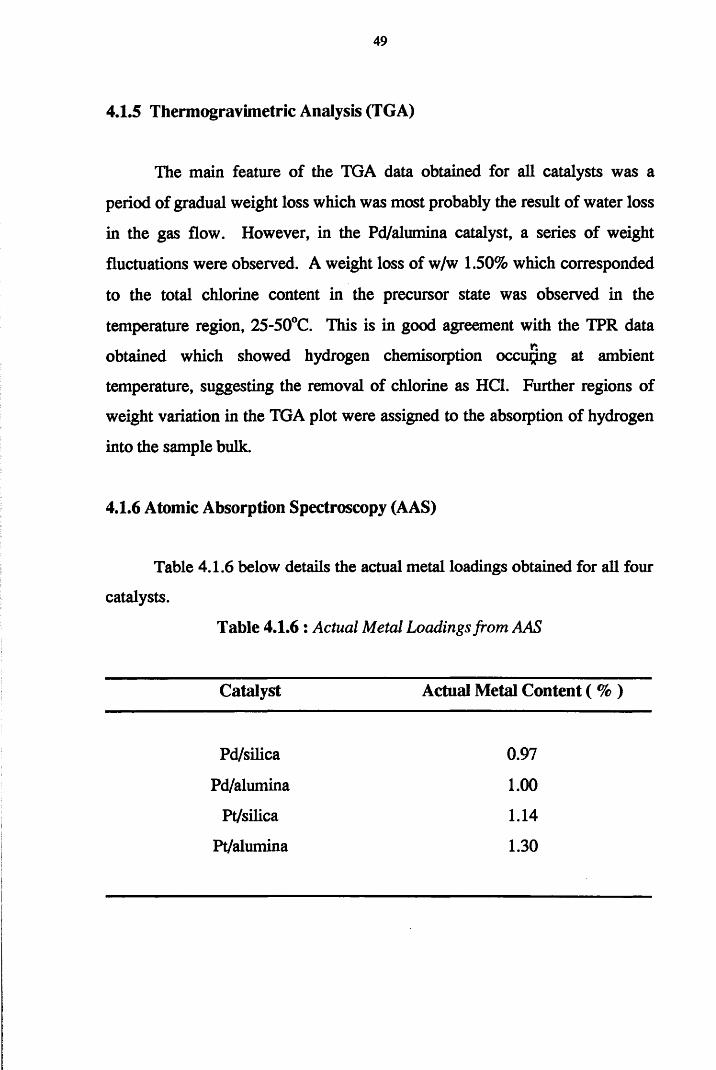
49
4.1.5 Thermogravimetric Analysis (TGA)
The main feature of the TGA data obtained for all catalysts was a
period of gradual weight loss which was most probably the result of water loss
in the gas flow. However, in the Pd/alumina catalyst, a series of weight
fluctuations were observed. A weight loss of w/w 1.50% which corresponded
to the total chlorine content in the precursor state was observed in the
temperature region, 25-50°C. This is in good agreement with the TPR data
obtained which showed hydrogen chemisorption occu^ng at ambient
temperature, suggesting the removal of chlorine as HC1. Further regions of
weight variation in the TGA plot were assigned to the absorption of hydrogen
into the sample bulk.
4.1.6 Atomic Absorption Spectroscopy (AAS)
Table 4.1.6 below details the actual metal loadings obtained for all four
catalysts.
Table 4.1.6 : Actual Metal Loadings from AAS
Catalyst Actual Metal Content ( % )
Pd/silica
Pd/alumina
Pt/silica
Pt/alumina
0.97
1.00
1.14
1.30
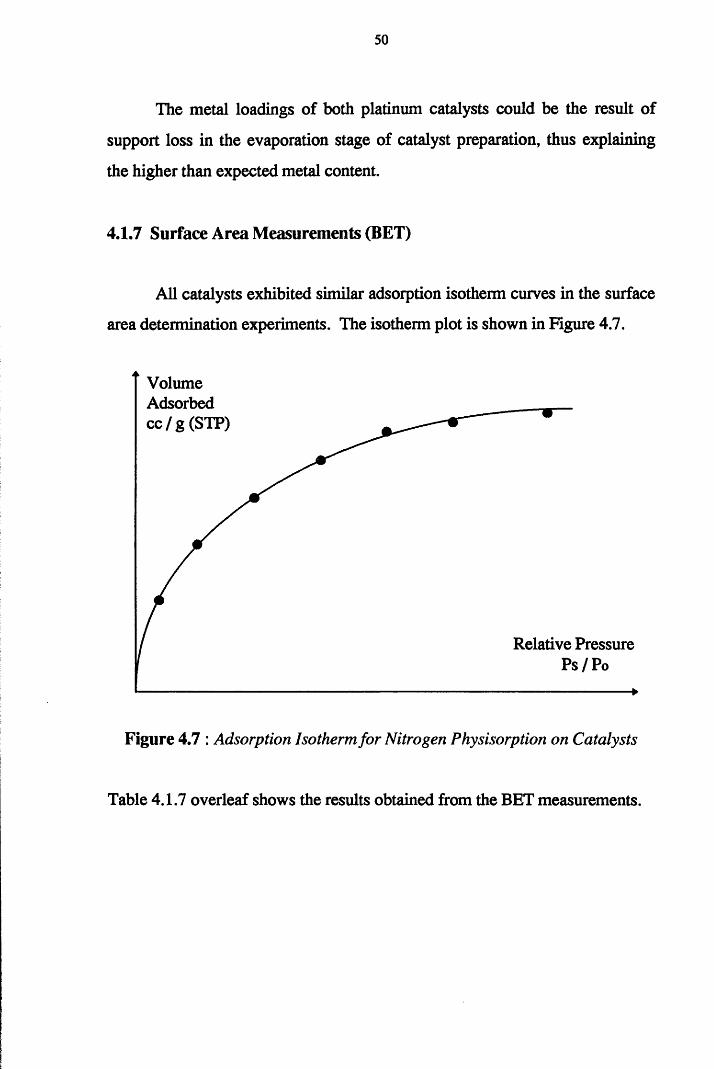
50
The metal loadings of both platinum catalysts could be the result of
support loss in the evaporation stage of catalyst preparation, thus explaining
the higher than expected metal content.
4.1.7 Surface Area Measurements (BET)
All catalysts exhibited similar adsorption isotherm curves in the surface
area determination experiments. The isotherm plot is shown in Figure 4.7.
Volume Adsorbed cc / g (STP)
Relative Pressure Ps/Po
Figure 4.7 : Adsorption Isotherm for Nitrogen Physisorption on Catalysts
Table 4.1.7 overleaf shows the results obtained from the BET measurements.
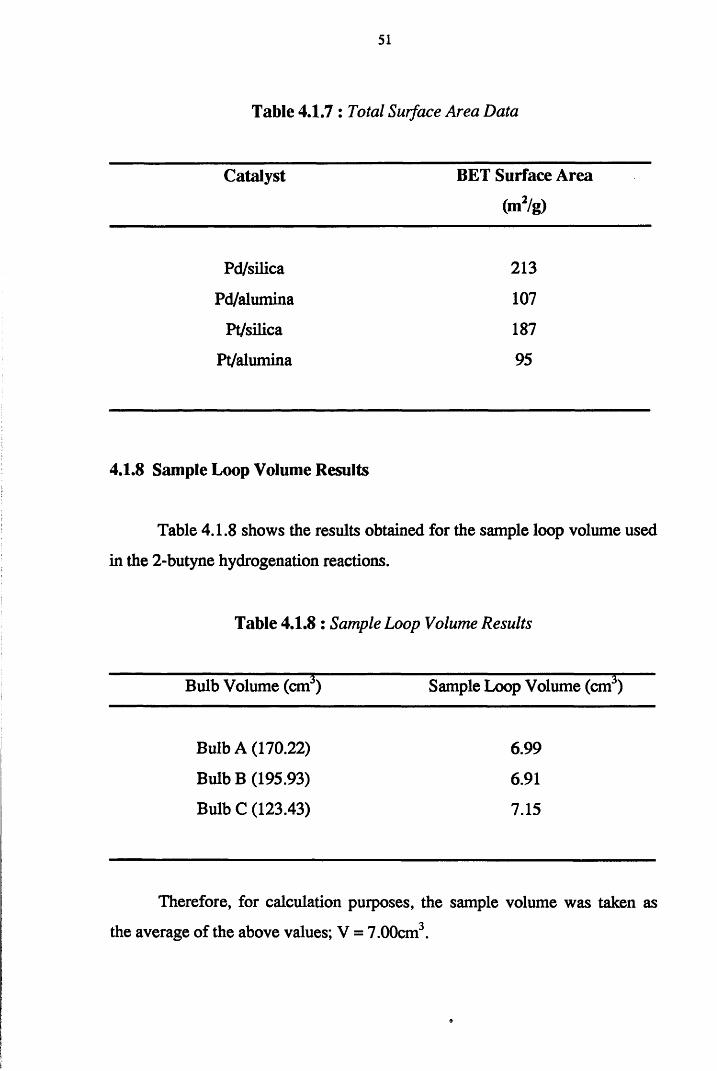
51
Table 4.1.7 : Total Surface Area Data
Catalyst BET Surface Area
(m2/g)
Pd/silica 213
Pd/alumina 107
Pt/silica 187
Pt/alumina 95
4.1.8 Sample Loop Volume Results
Table 4.1.8 shows the results obtained for the sample loop volume used
in the 2-butyne hydrogenation reactions.
Table 4.1.8 : Sample Loop Volume Results
Bulb Volume (cm3) Sample Loop Volume (cm3)
Bulb A (170.22) 6.99
Bulb B (195.93) 6.91
Bulb C (123.43) 7.15
Therefore, for calculation purposes, the sample volume was taken as
the average of the above values; V = 7.00cm3.
9
52
4.2 Hydrogenation Results
This section details the results obtained in the hydrogenation reactions
of propyne and 2-butyne using the pulse-flow microcatalytic reactor system.
The determination of product distributions, reaction selectivities and
conversions were obtained from quantitative GC calibration for the products
observed. Calibration for the reactants and products was achieved by passing
known pressures of gas over the GC. This procedure allowed a relationship to
be drawn between the number of molecules of gas and the area response of the
chromatograph detector. Carbon balance data was achieved by relating the
amount of carbon injected over the catalyst in each pulse, with the amount of
eluted products and reactant. The difference between these two values
(Acarbon), yielded information as to whether carbon was retained by the
catalyst (Acarbon value positive) or carbon was removed from the catalyst
(Acarbon value negative).
Standard procedure for the hydrogenation reactions involved passing a
mixture of hydrogen and the acetylene over a freshly reduced catalyst sample,
typically of weight, 0.20g. For the purposes of these reactions, the
concentration of hydrogen in the reaction mixtures was varied. Reactions
were performed using either a three fold excess of hydrogen, or an equimolar
acetylene/hydrogen mixture.
The following section details the hydrogenation reactions of propyne
performed at ambient temperature. The equation applied for the determination
of catalyst selectivity toward olefin formation is shown in Equation 4.
Conversion calculations were determined as the difference in the amount of
acetylene, before and after pulsing. This is shown in Equation 5.
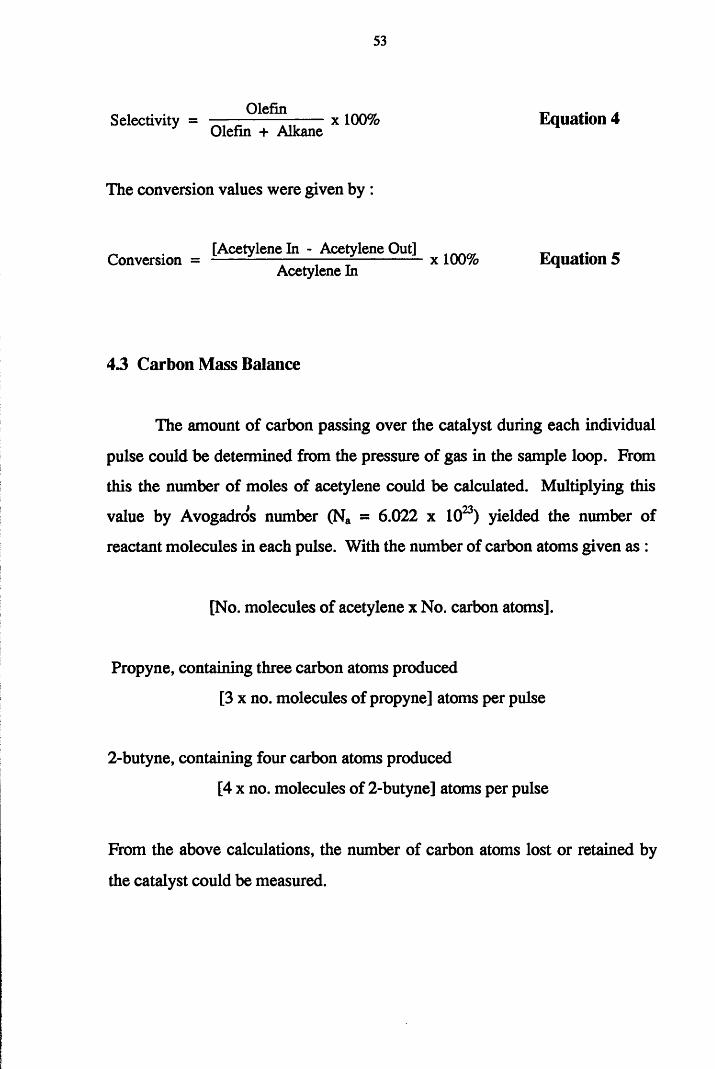
53
Selectivity = ^ „ ° lefi?„ x 100% Equation 4Olefin + Alkane
The conversion values were given by :
_ [Acetylene In - Acetylene Out] _Conversion = ------------ x 100% Equation 5Acetylene In
43 Carbon Mass Balance
The amount of carbon passing over the catalyst during each individual
pulse could be determined from the pressure of gas in the sample loop. From
this the number of moles of acetylene could be calculated. Multiplying this
value by Avogadros number (Na = 6.022 x 10²³) yielded the number of
reactant molecules in each pulse. With the number of carbon atoms given as :
[No. molecules of acetylene x No. carbon atoms].
Propyne, containing three carbon atoms produced
[3 x no. molecules of propyne] atoms per pulse
2-butyne, containing four carbon atoms produced
[4 x no. molecules of 2-butyne] atoms per pulse
From the above calculations, the number of carbon atoms lost or retained by
the catalyst could be measured.
Section Two
PROPYNE HYDROGENATION
54
4.4.1 The Hydrogenation of Propyne over Silica-Supported Palladium
The hydrogenation of propyne over silica-supported palladium using an
equimolar reactant mixture exhibited complete selectivity toward propene
production, as shown in Table 5.1.1. The amount of propene produced over a
series of ten pulses was constant, with the corresponding yield of propyne found
to increase with increasing number of pulses, until a steady state was reached.
The amount of carbon retained by the catalyst was observed to decrease with
increasing number of pulses.
Changing the composition of hydrogen in the reaction mixture (1:3 :: C3H4
: H2), produced both propane and propene. However, it was not until the second
pulse that the olefin was produced (Table 5.1.3). The yield of propene was found
to increase to a seemingly steady-state (quasi-steady state), before increasing still
further until a limiting value was reached. Similar to the equimolar reaction, the
conversion of propyne, although initially high, decreased with increasing number
of pulses. In these reactions the activity of the catalyst decreased at a much
slower rate, with the final conversion of propyne greater than that observed in the
equimolar reactions. The deposition of carbon was found to decrease with
increasing number of pulses, until the twentieth pulse, from which point, carbon
was removed from the surface (Figure 5.1.5).
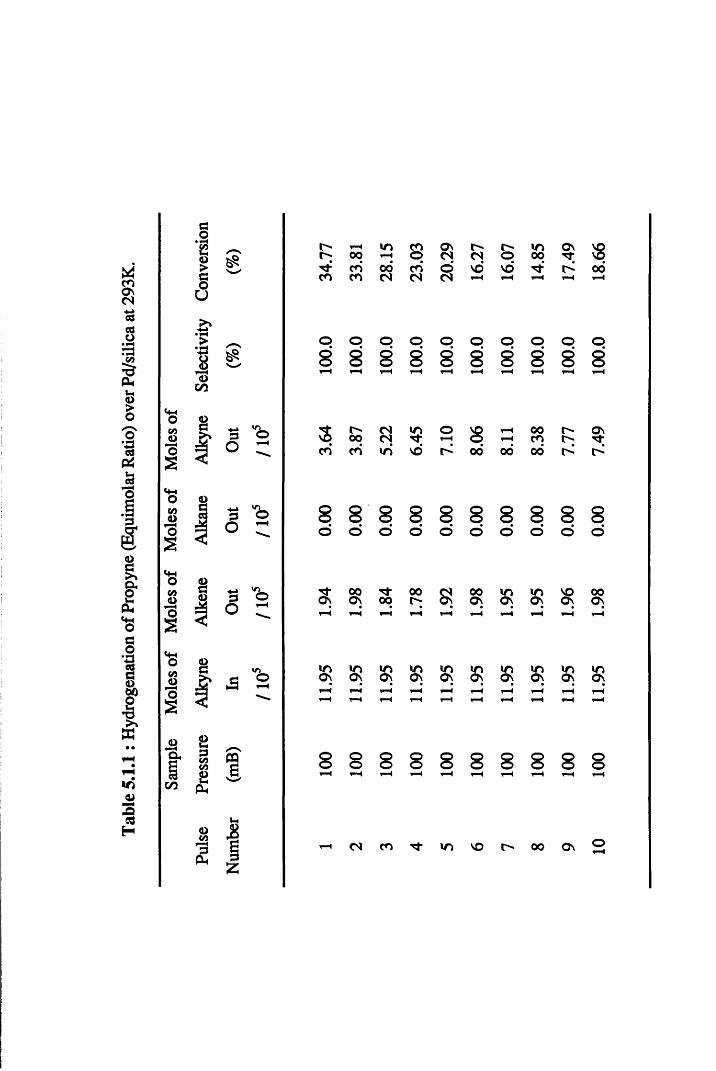
Tabl
e 5.
1.1:
Hyd
roge
natio
n of
Prop
yne
(Equ
imol
ar R
atio)
ove
r Pd
/silic
a at
293K
.
co• He>CoU
CO
CO0> 3O
GOU
oGO4> 'o
<D
CO
fi5COO(-4Ph
CQS.
* I 2 1
1%p
rH00
m CO©
O nCS
t -c s o
in° 9
OnT f $
T fCO
COCO
00c s
CO(N
oCN
NOrH
NOrH rH rH
00rH
o o o o O © o o © o
8 8H 8i-H 8rH 8rH 8rH 8H 8rH 8rH 8rH
so00
<NCN
mt j-
orH 8rH^H
00cn
r^-p
ONH -
CO CO in NO 00* 00 00 l>
8 8 8 8 8 8 8 8 8 8© o o o o o o o o o
3 s00O n 00
00p s ?
00ON JCp JCp
NOp
00p
t-H ^H rH rH rH rH rH rH t-H
O nJOO n
J£O n )Qp J£p &p &pinp )Qp in
p1-HrH
i—» T—t
rHrH
rHrH
^HrH
^HrH
rHrH
rH^H
rHrH
rHrH
8H 8i—t 8H 100 8rH 8rH
ooHoorH 8rH
oorH
i-H CN CO in NO 00 ON oH
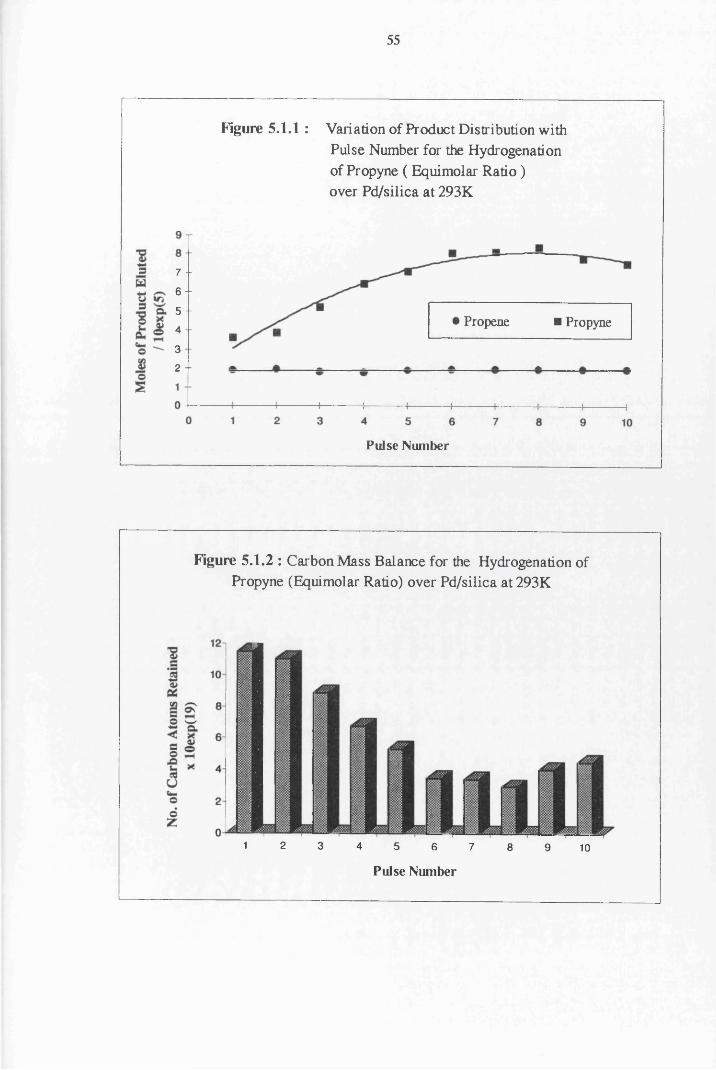
55
Figure 5.1.1 : Variation of Product Distribution withPulse Number for the Hydrogenation of Propyne ( Equimolar Ratio) over Pd/silica at 293K
7 -
6 -
5 -• Propene ■ Propyne
4 -
32 -
Pulse Number
Figure 5.1.2 : Carbon Mass Balance for the Hydrogenation of Propyne (Equimolar Ratio) over Pd/silica at 293K
1 2 3 4 5 6 7 8 9 10
Pulse Number
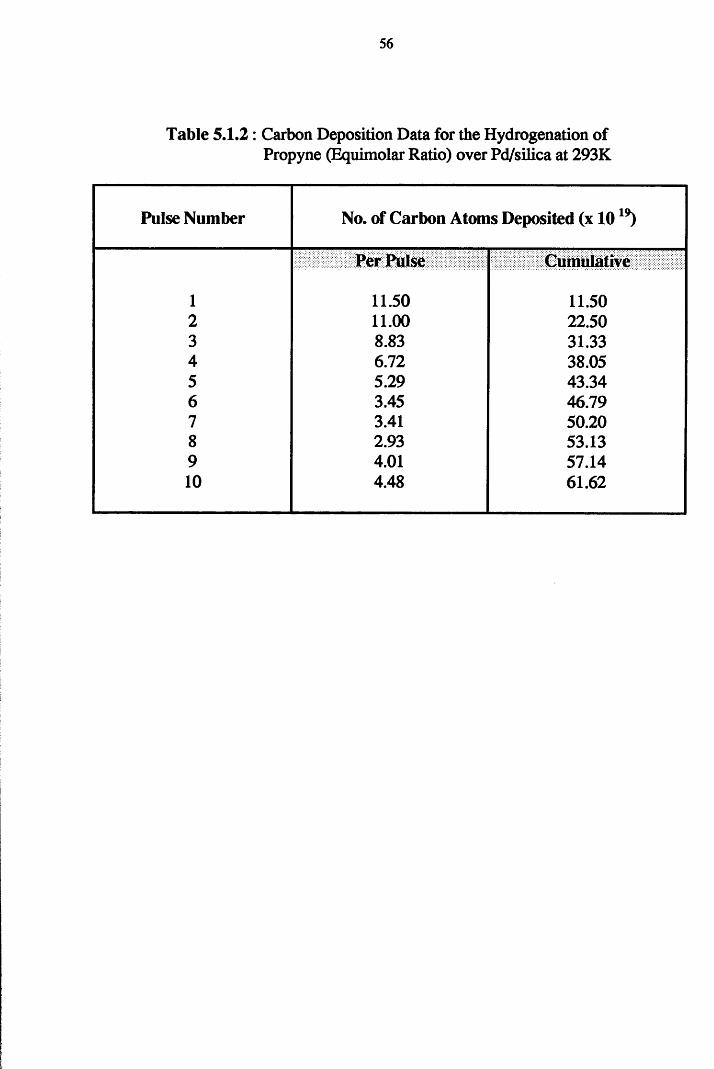
56
Table 5.1.2 : Carbon Deposition Data for the Hydrogenation of Propyne (Equimolar Ratio) over Pd/silica at 293K
Pulse Number No. of Carbon Atoms Deposited (x 1019)
Per Pulse Cumulative
1 11.50 11.502 11.00 22.503 8.83 31.334 6.72 38.055 5.29 43.346 3.45 46.797 3.41 50.208 2.93 53.139 4.01 57.1410 4.48 61.62
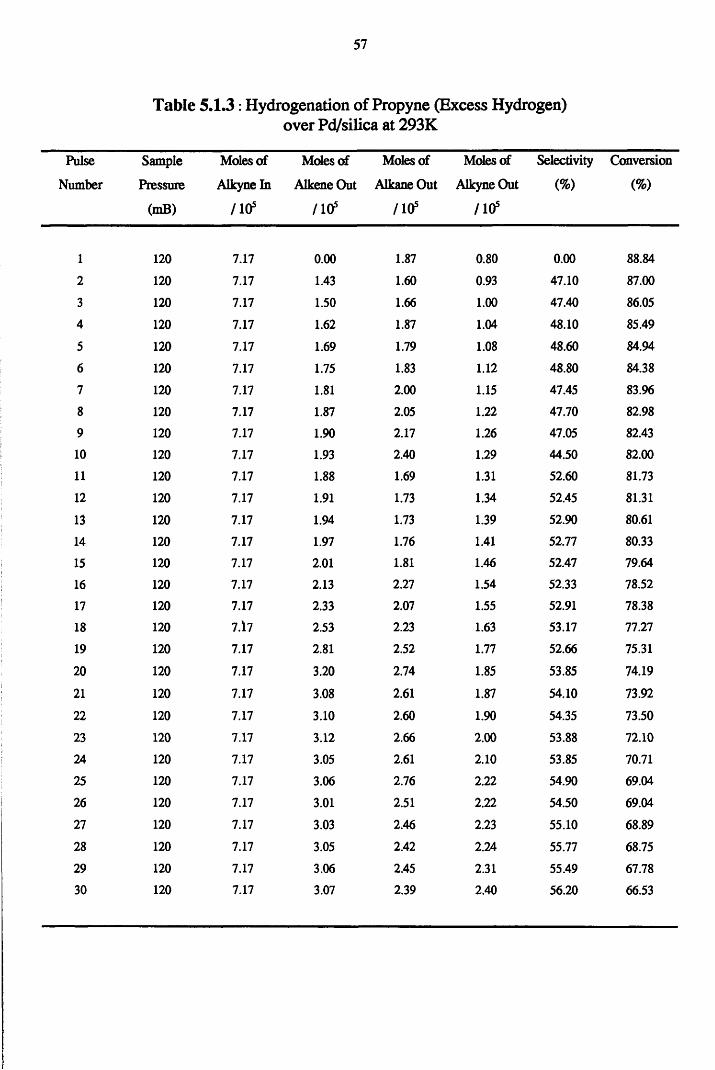
57
Table 5.1.3: Hydrogenation of Propyne (Excess Hydrogen) over Pd/silica at 293K
Pulse Sample Moles of Moles of Moles of Moles of Selectivity Conversion
Number Pressure Alkyne In Alkene Out Alkane Out Alkyne Out (%) (%)
(mB) / 10s / 105 / 10s /10s
1 1202 1203 1204 1205 1206 1207 1208 1209 12010 12011 12012 12013 12014 12015 12016 12017 12018 12019 12020 12021 12022 12023 12024 12025 12026 12027 12028 12029 12030 120
7.17 0.007.17 1.437.17 1.507.17 1.627.17 1.697.17 1.757.17 1.817.17 1.877.17 1.907.17 1.937.17 1.887.17 1.917.17 1.947.17 1.977.17 2.017.17 2.137.17 2.337.17 2.537.17 2.817.17 3.207.17 3.087.17 3.107.17 3.127.17 3.057.17 3.067.17 3.017.17 3.037.17 3.057.17 3.067.17 3.07
1.87 0.801.60 0.931.66 1.001.87 1.041.79 1.081.83 1.122.00 1.152.05 1.222.17 1.262.40 1.291.69 1.311.73 1.341.73 1.391.76 1.411.81 1.462.27 1.542.07 1.552.23 1.632.52 1.772.74 1.852.61 1.872.60 1.902.66 2.002.61 2.102.76 2.222.51 2.222.46 2.232.42 2.242.45 2.312.39 2.40
0.00 88.8447.10 87.0047.40 86.0548.10 85.4948.60 84.9448.80 84.3847.45 83.9647.70 82.9847.05 82.4344.50 82.0052.60 81.7352.45 81.3152.90 80.6152.77 80.3352.47 79.6452.33 78.5252.91 78.3853.17 77.2752.66 75.3153.85 74.1954.10 73.9254.35 73.5053.88 72.1053.85 70.7154.90 69.0454.50 69.0455.10 68.8955.77 68.7555.49 67.7856.20 66.53
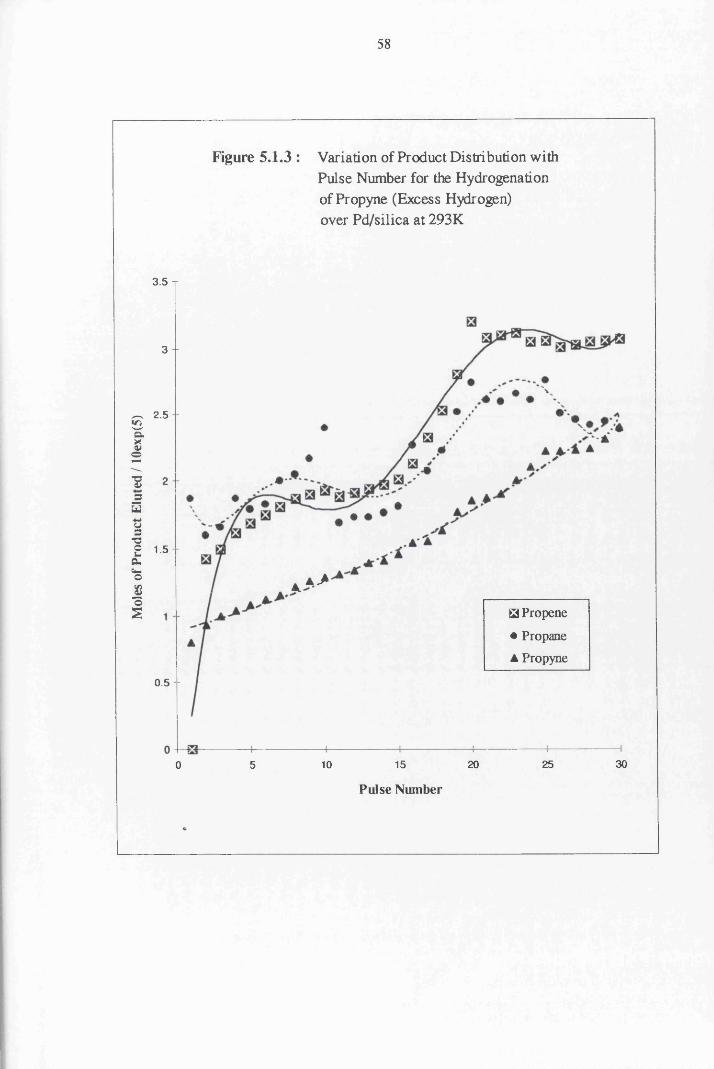
Mole
s of
Prod
uct
Elut
ed
/ 10e
xp(5
)
58
Figure 5.1.3 : Variation of Product Distribution withPulse Number for the Hydrogenation of Propyne (Excess Hydrogen) over Pd/silica at 293K
3. 5 T
3 -
2. 5 -
2
1.5 -
A >A. “
GS Propene
• Propane A Propyne
0. 5 -
302515 205 100Pulse Number
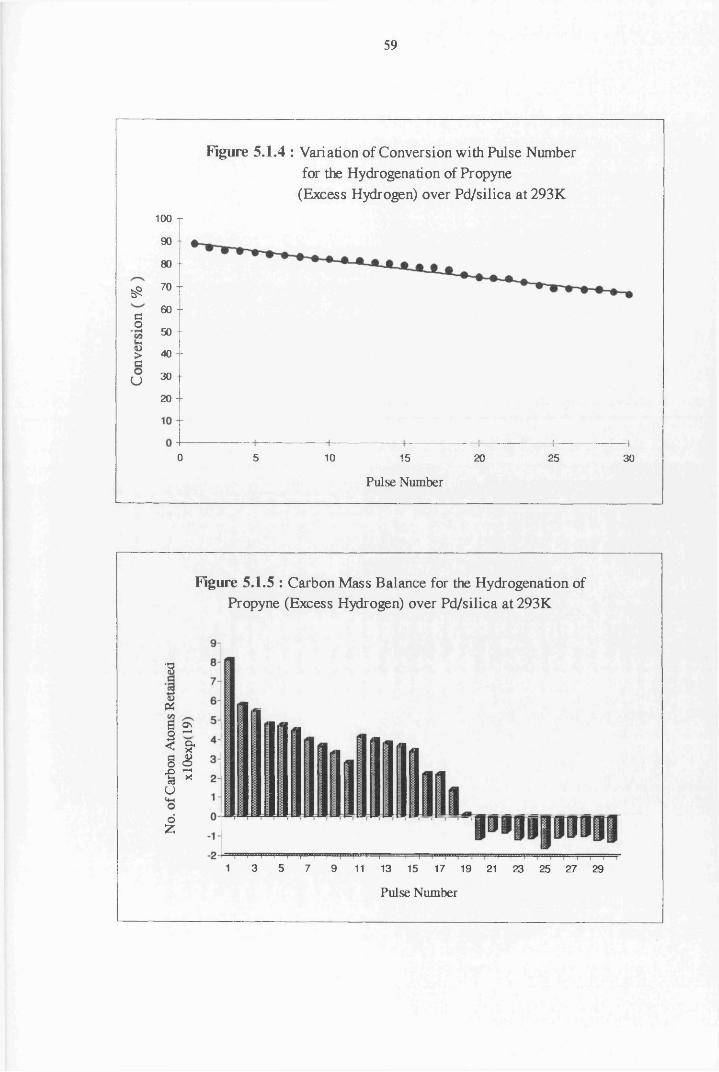
59
Figure 5.1.4 : Variation of Conversion with Pulse Number for the Hydrogenation of Propyne
(Excess Hydrogen) over Pd/silica at 293K100 T
90 -
80 -
£ 70” 60 ~Co50 -
<5> 40 - Cu 30 -
20 -
0 5 10 15 20 25 30
Pulse Number
Figure 5.1.5 : Carbon Mass Balance for the Hydrogenation of Propyne (Excess Hydrogen) over Pd/silica at 293K
■s<DPia on o r \% %§ 8 x> ^% * U
o£11'1 I I i '■ -I I I I I I I i i I I | | |
3 5 7 9 11 13 15 17 19 21 23 25 27 29
Pulse Number
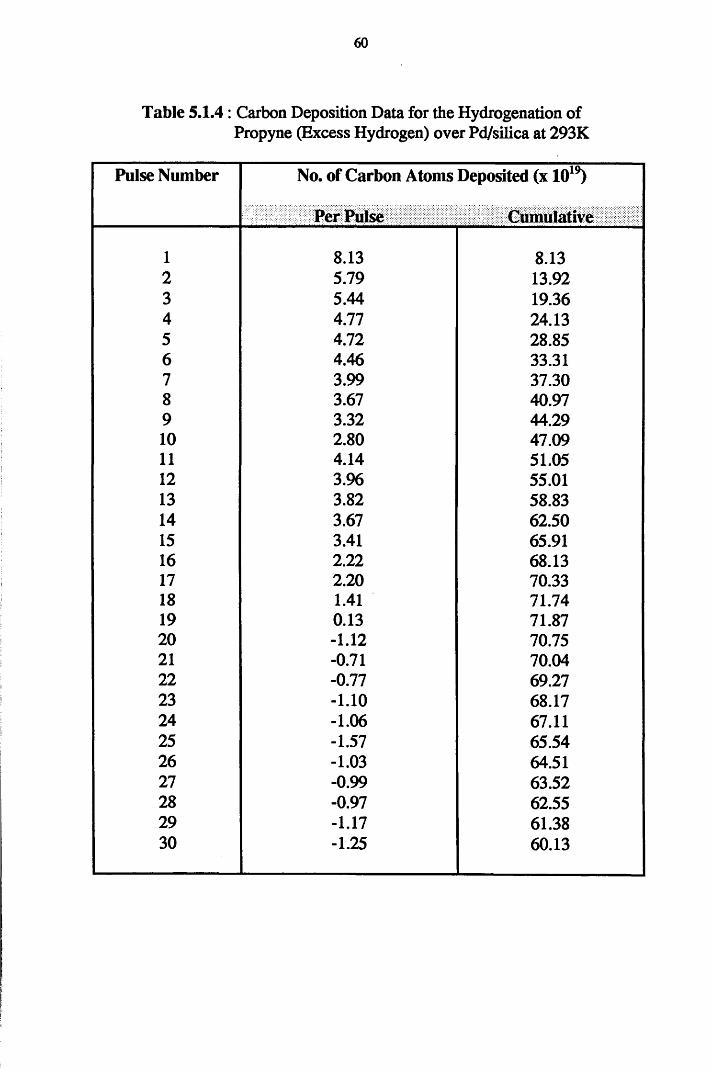
60
Table 5.1.4: Carbon Deposition Data for the Hydrogenation ofPropyne (Excess Hydrogen) over Pd/silica at 293K
Pulse Number No. of Carbon Atoms Deposited (x 1019)
Per Pulse Cumulative
1 8.13 8.132 5.79 13.923 5.44 19.364 4.77 24.135 4.72 28.856 4.46 33.317 3.99 37.308 3.67 40.979 3.32 44.2910 2.80 47.0911 4.14 51.0512 3.96 55.0113 3.82 58.8314 3.67 62.5015 3.41 65.9116 2.22 68.1317 2.20 70.3318 1.41 71.7419 0.13 71.8720 -1.12 70.7521 -0.71 70.0422 -0.77 69.2723 -1.10 68.1724 -1.06 67.1125 -1.57 65.5426 -1.03 64.5127 -0.99 63.5228 -0.97 62.5529 -1.17 61.3830 -1.25 60.13
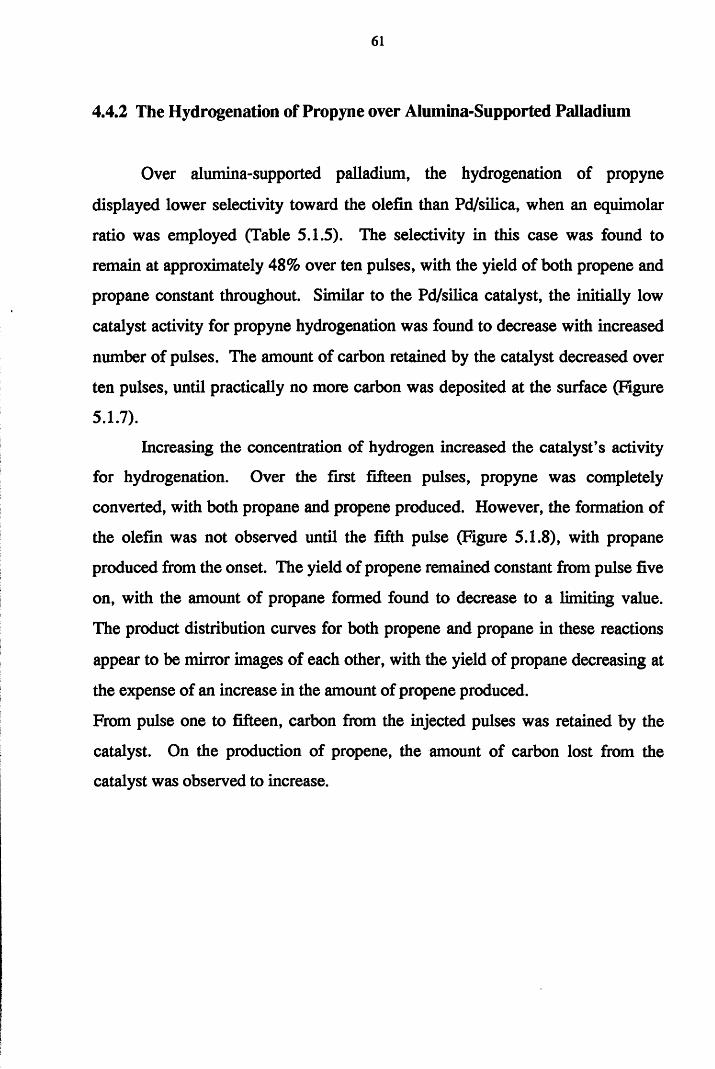
61
4.4.2 The Hydrogenation of Propyne over Alumina-Supported Palladium
Over alumina-supported palladium, the hydrogenation of propyne
displayed lower selectivity toward the olefin than Pd/silica, when an equimolar
ratio was employed (Table 5.1.5). The selectivity in this case was found to
remain at approximately 48% over ten pulses, with the yield of both propene and
propane constant throughout. Similar to the Pd/silica catalyst, the initially low
catalyst activity for propyne hydrogenation was found to decrease with increased
number of pulses. The amount of carbon retained by the catalyst decreased over
ten pulses, until practically no more carbon was deposited at the surface (Figure
5.1.7).
Increasing the concentration of hydrogen increased the catalyst’s activity
for hydrogenation. Over the first fifteen pulses, propyne was completely
converted, with both propane and propene produced. However, the formation of
the olefin was not observed until the fifth pulse (Figure 5.1.8), with propane
produced from the onset. The yield of propene remained constant from pulse five
on, with the amount of propane formed found to decrease to a limiting value.
The product distribution curves for both propene and propane in these reactions
appear to be mirror images of each other, with the yield of propane decreasing at
the expense of an increase in the amount of propene produced.
From pulse one to fifteen, carbon from the injected pulses was retained by the
catalyst. On the production of propene, the amount of carbon lost from the
catalyst was observed to increase.
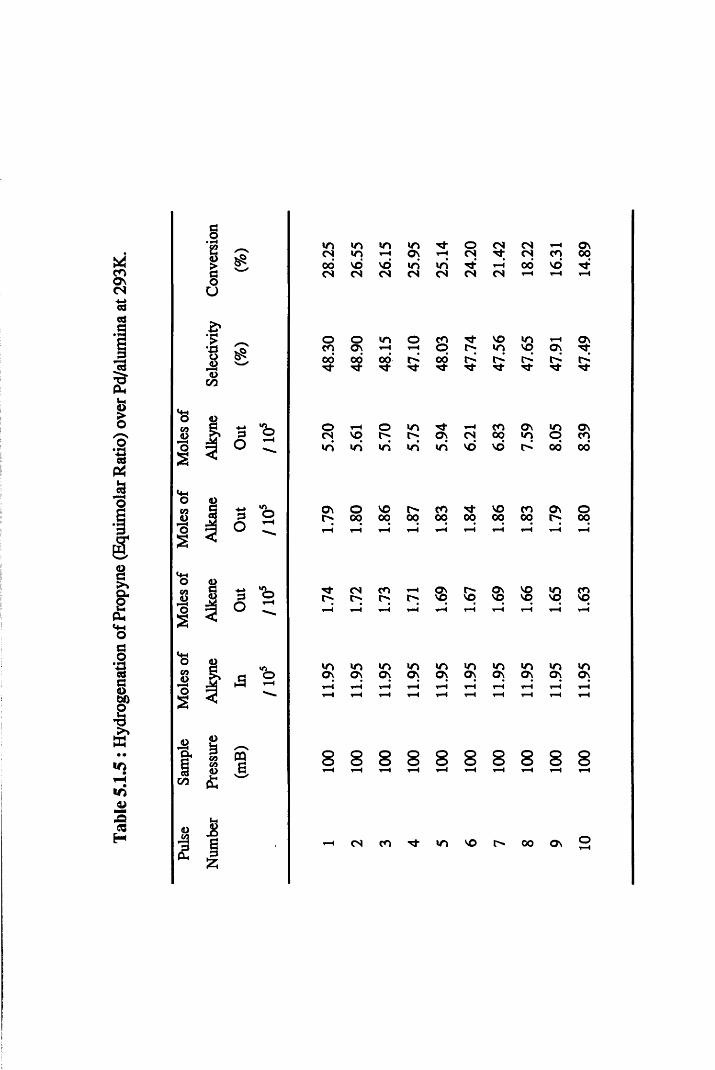
Tabl
e 5.1
.5 : H
ydro
gena
tion
of Pr
opyn
e (E
quim
olar
Rati
o) o
ver
Pd/al
umin
a at
293K
.
§qaoU
V3CO
£
mO
co
<D13GOCO<D
OQa
U;O £J3 C
incs inin inrH
mON rHoCN CN CNCN t*HCO
00CN noCN vdCN inCN inCN CN t-HCN 00 vdH
o o m O CO tj- NO m t-H
CO O n rH ^H o in vq O n00* °9 00 00 r *
rt- Tt H" Tj-
o i—H O m Tj- t-H CO O n *£)CN VO t"* O n CN 00 in O
iri in in in iri vd vd t> 00
O n o NO CO NO CO O n00 00 00 00 00 00 00
t-H ^H t-H r“H H t-H H r-H t-H
CN CO tH O n r^ On NO inl> VO vq NO NO q
t“H tH H tH rH t-H t-H t-H
*n in *0 in m in m m inO n ON ON O n O n O n ON O n O nT-H t-H t-H t-H t-H t-H t-H t-H t-HH t-H rH H t-H H t-H t-H t-H
8 8 8 8 8 8 8 8 8H t-H t-H iH rH t-H t-H t-H t-H
H CN CO in vo 00 O n
11.95
1.6
3 1.8
0 8.3
9 47
.49
14.89
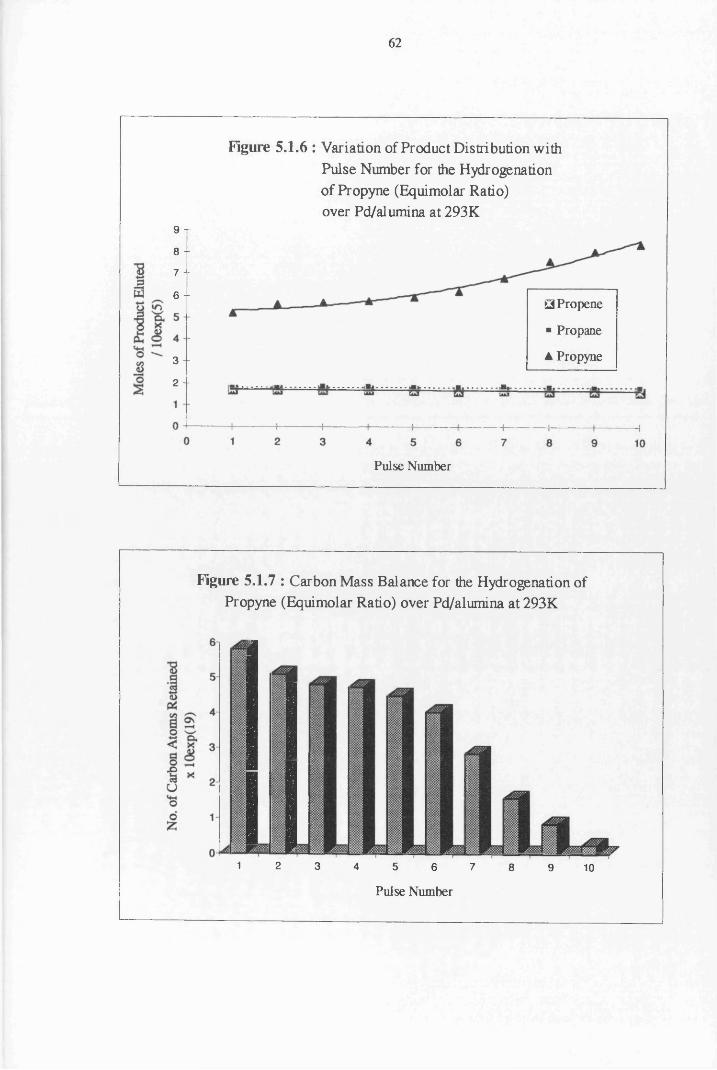
62
Figure 5.1.6 : Variation of Product Distribution with Pulse Number for the Hydrogenation of Propyne (Equimolar Ratio) over Pd/alumina at 293K
9 T8 -
7 --
6 -
S3 Propene
■ Propane
A Propyne3 -
2 -
Pulse Number
Figure 5.1.7 : Carbon Mass Balance for the Hydrogenation of Propyne (Equimolar Ratio) over Pd/alumina at 293K
1 2 3 4 5 6 7 8 9 10
Pulse Number
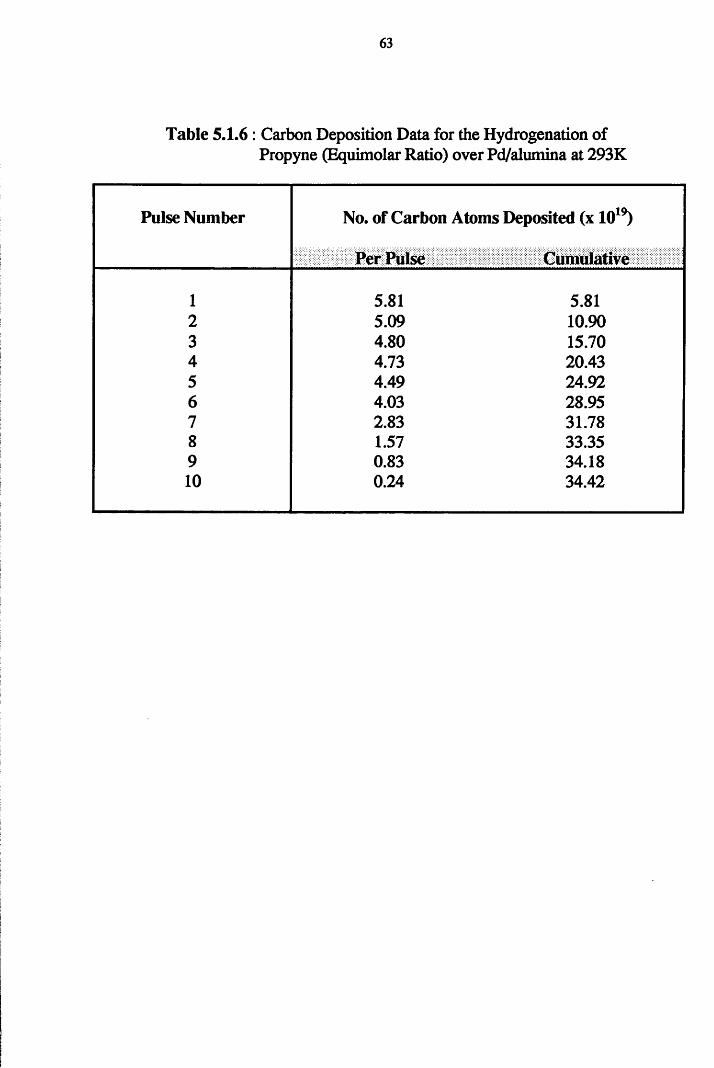
63
Table 5.1.6: Carbon Deposition Data for the Hydrogenation ofPropyne (Equimolar Ratio) over Pd/alumina at 293K
Pulse Number No. of Carbon Atoms Deposited (x 1019)
Per Pulse Cumulative
1 5.81 5.812 5.09 10.903 4.80 15.704 4.73 20.435 4.49 24.926 4.03 28.957 2.83 31.788 1.57 33.359 0.83 34.1810 0.24 34.42
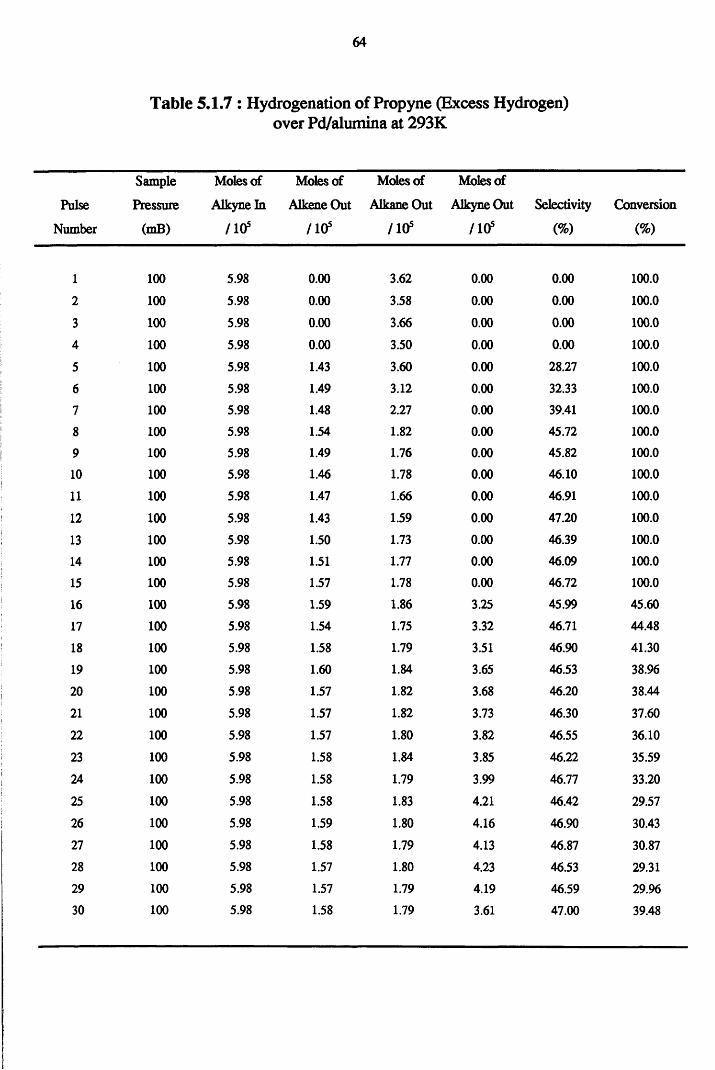
64
Table 5.1.7 : Hydrogenation of Propyne (Excess Hydrogen) over Pd/alumina at 293K
Sample Moles of Moles of Moles of Moles of
Pulse Pressure Alkyne In Alkene Out Alkane Out Alkyne Out Selectivity Conversion
Number (mB) / 10s /10s /10s /10s (%) (%)
1 1002 1003 1004 1005 1006 1007 1008 1009 10010 10011 10012 10013 10014 10015 10016 10017 10018 10019 10020 10021 10022 10023 10024 10025 10026 10027 10028 10029 10030 100
5.98 0.005.98 0.005.98 0.005.98 0.005.98 1.435.98 1.495.98 1.485.98 1.545.98 1.495.98 1.465.98 1.475.98 1.435.98 1.505.98 1.515.98 1.575.98 1.595.98 1.545.98 1.585.98 1.605.98 1.575.98 1.575.98 1.575.98 1.585.98 1.585.98 1.585.98 1.595.98 1.585.98 1.575.98 1.575.98 1.58
3.62 0.003.58 0.003.66 0.003.50 0.003.60 0.003.12 0.002.27 0.001.82 0.001.76 0.001.78 0.001.66 0.001.59 0.001.73 0.001.77 0.001.78 0.001.86 3.251.75 3.321.79 3.511.84 3.651.82 3.681.82 3.731.80 3.821.84 3.851.79 3.991.83 4.211.80 4.161.79 4.131.80 4.231.79 4.191.79 3.61
0.00 100.00.00 100.00.00 100.00.00 100.028.27 100.032.33 100.039.41 100.045.72 100.045.82 100.046.10 100.046.91 100.047.20 100.046.39 100.046.09 100.046.72 100.045.99 45.6046.71 44.4846.90 41.3046.53 38.9646.20 38.4446.30 37.6046.55 36.1046.22 35.5946.77 33.2046.42 29.5746.90 30.4346.87 30.8746.53 29.3146.59 29.9647.00 39.48
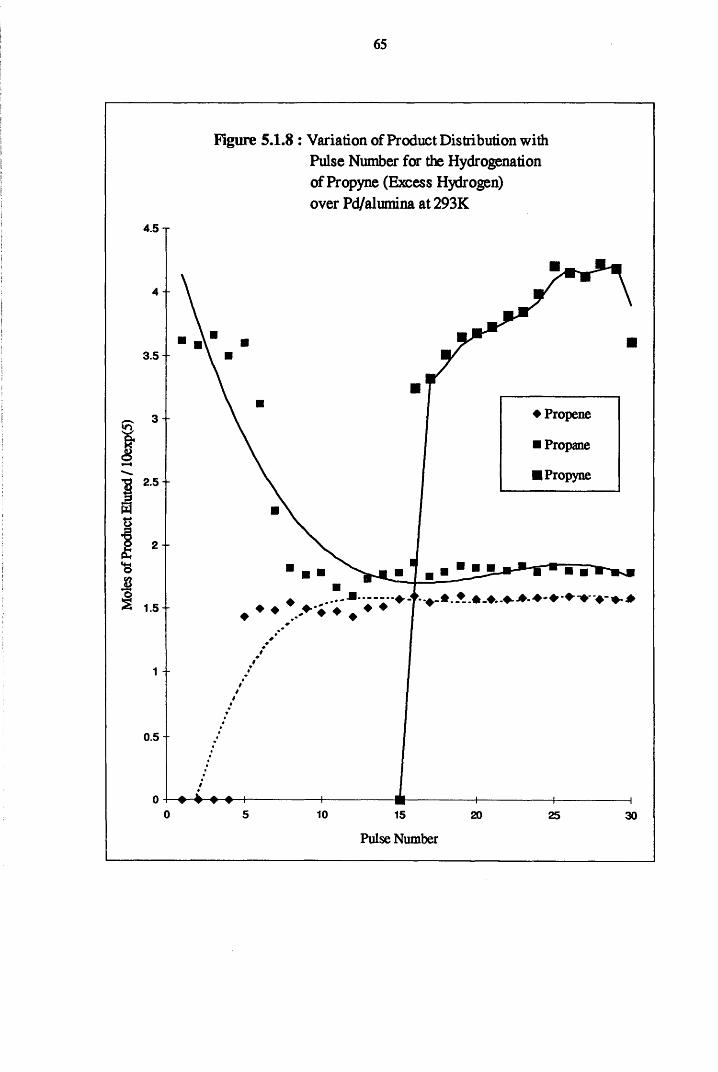
65
Figure 5.1.8 : Variation of Product Distribution with Pulse Number for the Hydrogenation of Propyne (Excess Hydrogen) over Pd/alumina at 293K
4.5 T
4 -
3 . 5 -
♦ Propene3■ Propane
■ Propyne
o2 - -
*8&I 1 .5 -
0.5
0 5 10 15 20 25 30
Pulse Number
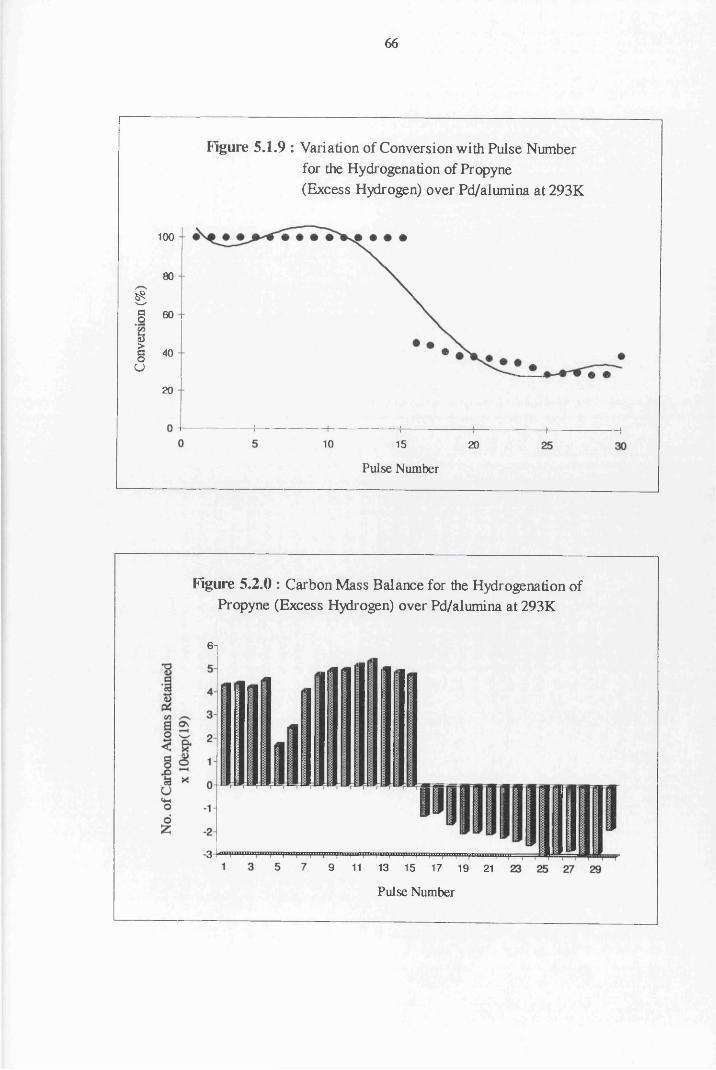
66
Figure 5.1.9 : Variation of Conversion with Pulse Number for the Hydrogenation of Propyne (Excess Hydrogen) over Pd/alumina at 293K
100
80
gg 60
sI <oU
20
10 15 20
Pulse Number
Figure 5.2.0 : Carbon Mass Balance for the Hydrogenation of Propyne (Excess Hydrogen) over Pd/alumina at 293K
6-i
J ^ i n y n r ^ m . i M ry i i i i i i i i i ^ i i i i f i i i i ^ i i i i U i i i i ^ i i i i ! i i i i u , i , , n rxl|1i , , „ i , , , f , , | , M, , , , ,
9 11 13 15 17 19 21
Pulse Number
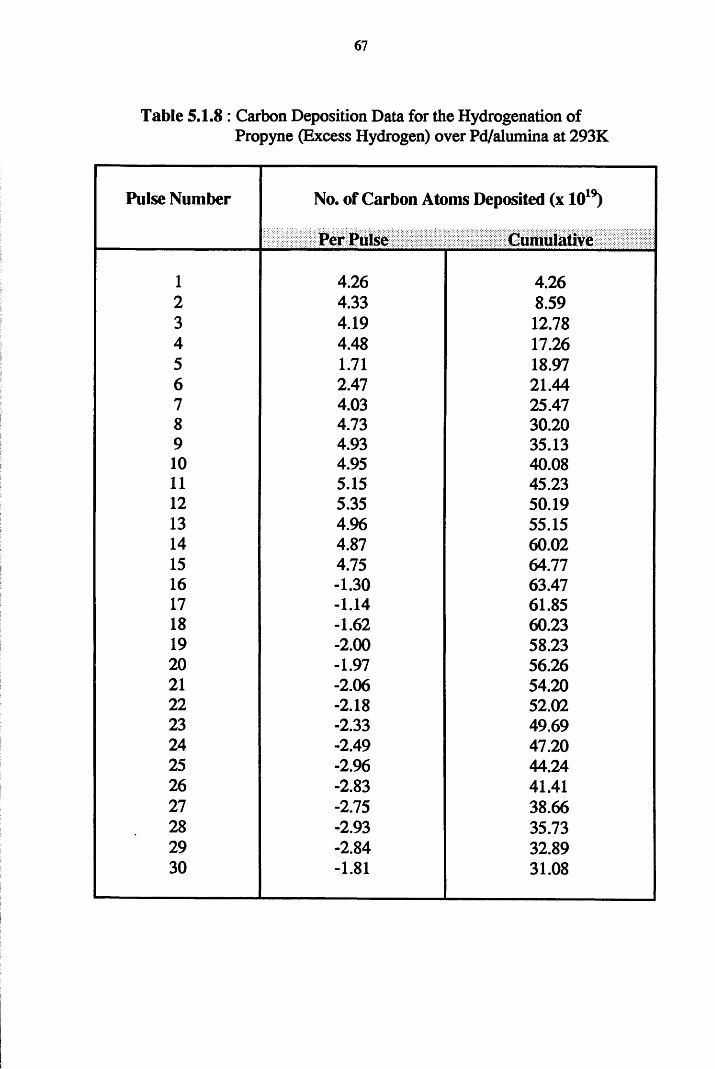
67
Table 5.1.8 : Carbon Deposition Data for the Hydrogenation ofPropyne (Excess Hydrogen) over Pd/alumina at 293K
Pulse Number No. of Carbon Atoms Deposited (x 1019)
Per Pulse Cumulative
1 4.26 4.262 4.33 8.593 4.19 12.784 4.48 17.265 1.71 18.976 2.47 21.447 4.03 25.478 4.73 30.209 4.93 35.1310 4.95 40.0811 5.15 45.2312 5.35 50.1913 4.96 55.1514 4.87 60.0215 4.75 64.7716 -1.30 63.4717 -1.14 61.8518 -1.62 60.2319 -2.00 58.2320 -1.97 56.2621 -2.06 54.2022 -2.18 52.0223 -2.33 49.6924 -2.49 47.2025 -2.96 44.2426 -2.83 41.4127 -2.75 38.6628 -2.93 35.7329 -2.84 32.8930 -1.81 31.08
68
4.43 The Hydrogenation of Propyne over Silica-Supported Platinum
The hydrogenation of propyne (1:1 :: CaH*:^) over silica-supported
platinum, produced both propane and propene with very low conversions of
propyne. In the first pulse (Table 5.1.9), the only hydrogenation product was
propane, with approximately 75% of the initial propyne content of the pulse
unreacted. From pulse two onward, the yield of propane decreased, with the
amount of propene formed remaining constant over ten pulses. The activity of
the catalyst dropped sharply from pulse one to pulse two (25% to 6%), and
continued to decrease until there was effectiviely no hydrogenation occurring at
the surface.
The amount of carbon retained by the catalyst was large in the first pulse.
The retention of carbon at the surface was observed to decrease sharply in pulse
two, and decreased further over the remaining eight pulses (Figure 5.2.2).
The hydrogenation of propyne (1:3 :: CsKU:^) over Pt/silica displayed
relatively high conversions of propyne which decreased with an increase in the
number of pulses, until a steady state was achieved (Table 5.2.1). However, the
marked difference in this system compared to the others, was in the product
distributions observed in the reaction. Over the first sixteen pulses the only
observed products were unreacted propyne and propane. From pulse seventeen to
thirty, propene was also produced (Figure 5.2.3). This propene production was
accompanied by a decrease in the yield of propane, with the amount of propyne
eluted increasing to a limiting value. The initially high amounts of retained
carbon decreased in pulse seventeen onward, with effectively no carbon being
retained at the catalyst surface.
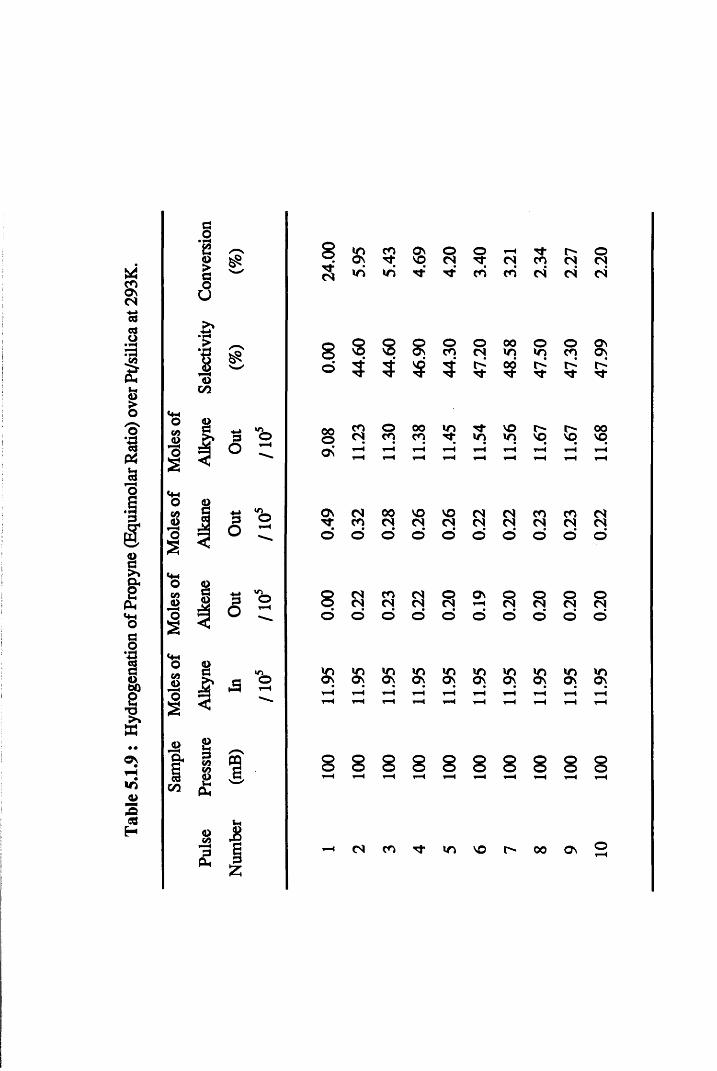
Tabl
e 5.1
.9 :
Hyd
roge
natio
n of
Prop
yne
(Equ
imol
ar R
atio)
ove
r Pt
/silic
a at
293K
.
GO•?heo>§U
I*
<DGO
OUJ<Uos
co.2os
coOOs
4*Oh
GO
§<9
** •cuG Oo r
Go
§coCO
2a,
* 1* 55
8S
WOON
COH;
ONvq
oCN
OTf CNH-CO CN
oCN
WO wo n- CO CO CN CN CN
o 00 o oCN WO wo CO00 t>''1* Tf
ooo
ON CN 00 vo voTf CO CN CN CNo o o o o
8o
cn co wo VO 00 on
8!
CO o 00 wo VO r - 00CN CO CO wo wo vq vq vqH H t-H T-H H t-H1—H H i-H l-H t-H t-H t-H
CN CN CO CO CNCN CN CN CN CNo o o o o
CN o On o o o oCN CN r-H CN CN CN CNo o o o o o d
vn W) wo wo wo wo wo wo WO woOn On On on On ON ON On On ont-H i-H *-H t-H T"H t-H t-H ^H
r—H ▼-H t-H r-H v-H ^H t-H ^H
8 8 8 8 8 8 8 8 8 8
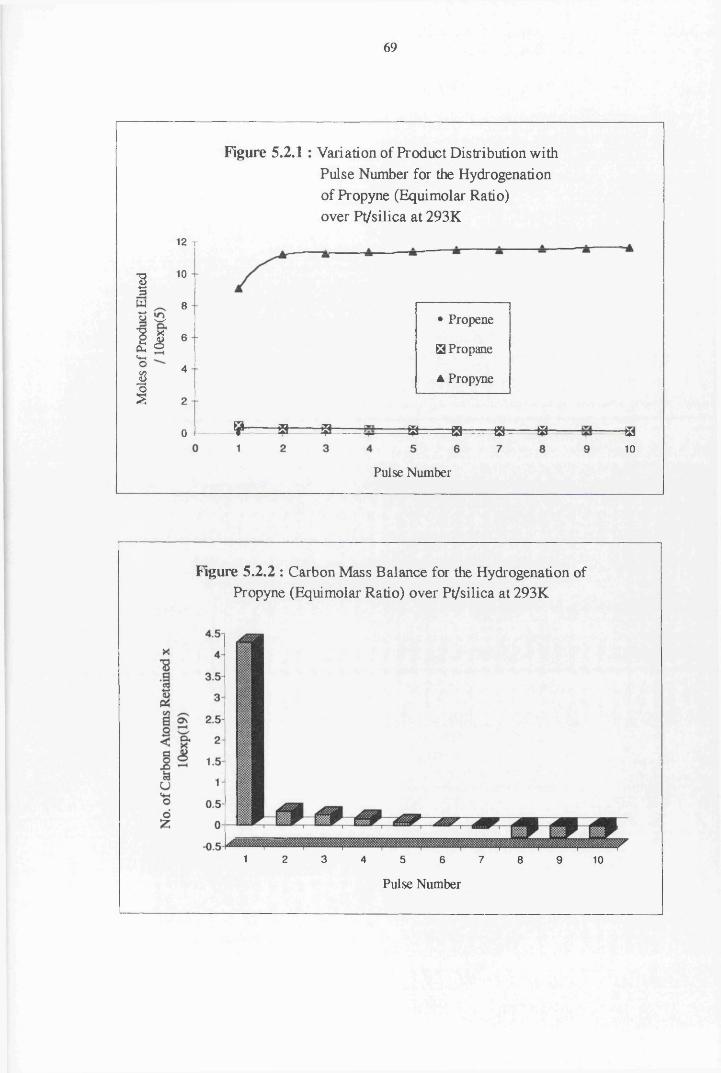
69
13w*-»o w•js s#*
1fS£
Vho£1
12 T
10
8 -
6 ~
4
2
0
Figure 5.2.1: Variation of Product Distribution with Pulse Number for the Hydrogenation of Propyne (Equimolar Ratio) over Pt/silica at 293K
s t a a
• Propene
23 Propane
A Propyne
12- -g§- ig - * -a10
Pulse Number
Figure 5.2.2 : Carbon Mass Balance for the Hydrogenation of Propyne (Equimolar Ratio) over Pt/silica at 293K
1 2 3 4 5 6 7 8 9 10
Pulse Number
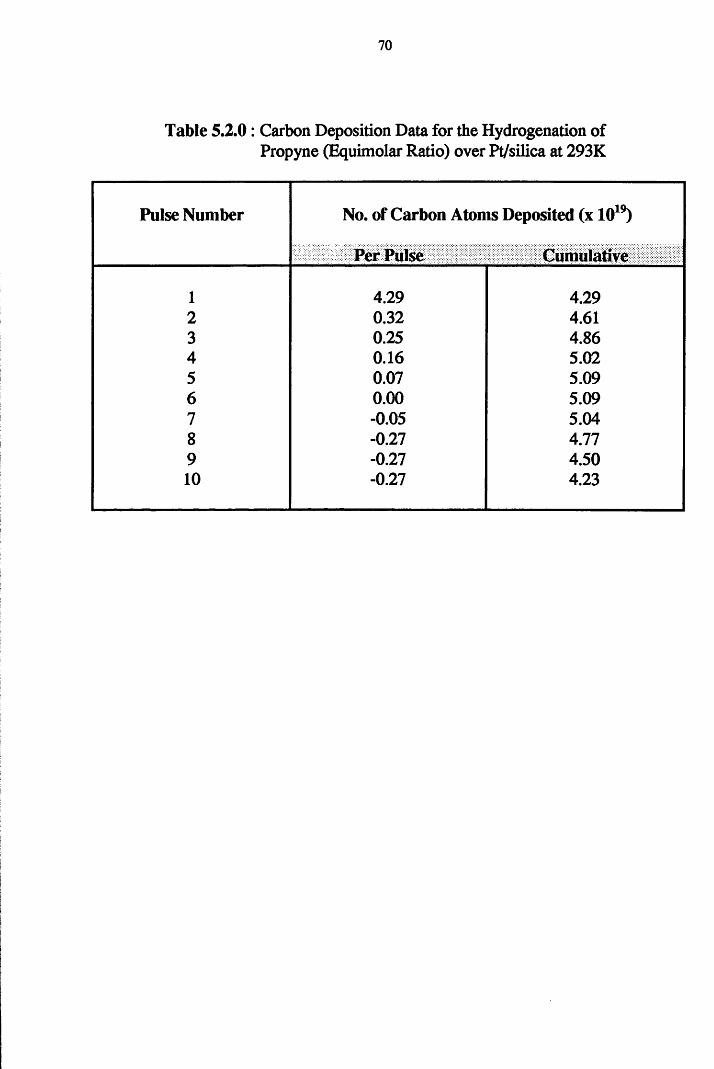
70
Table 5.2.0: Carbon Deposition Data for the Hydrogenation ofPropyne (Equimolar Ratio) over Pt/silica at 293K
Pulse Number No. of Carbon Atoms Deposited (x 1019)
Per Pulse Cumulative
1 4.29 4.292 0.32 4.613 0.25 4.864 0.16 5.025 0.07 5.096 0.00 5.097 -0.05 5.048 -0.27 4.779 -0.27 4.5010 -0.27 4.23
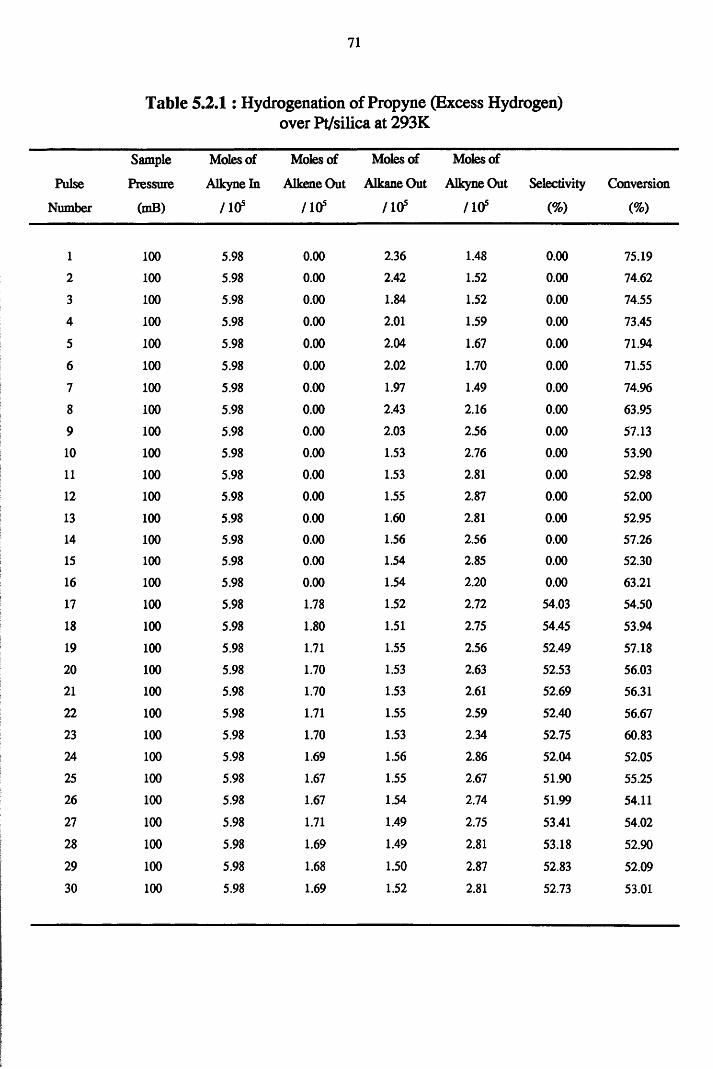
71
Table 5.2.1: Hydrogenation of Propyne (Excess Hydrogen) over Pt/silica at 293K
Sample Moles of Moles of Moles of Moles of
Pulse Pressure Alkyne In Alkene Out Alkane Out Alkyne Out Selectivity Conversion
Number (mB) /10s /10s /10s /10s (%) (%)
1 1002 1003 1004 1005 1006 1007 1008 1009 10010 10011 10012 10013 10014 10015 10016 10017 10018 10019 10020 10021 10022 10023 10024 10025 10026 10027 10028 10029 10030 100
5.98 0.005.98 0.005.98 0.005.98 0.005.98 0.005.98 0.005.98 0.005.98 0.005.98 0.005.98 0.005.98 0.005.98 0.005.98 0.005.98 0.005.98 0.005.98 0.005.98 1.785.98 1.805.98 1.715.98 1.705.98 1.705.98 1.715.98 1.705.98 1.695.98 1.675.98 1.675.98 1.715.98 1.695.98 1.685.98 1.69
2.36 1.482.42 1.521.84 1.522.01 1.592.04 1.672.02 1.701.97 1.492.43 2.162.03 2.561.53 2.761.53 2.811.55 2.871.60 2.811.56 2.561.54 2.851.54 2.201.52 2.721.51 2.751.55 2.561.53 2.631.53 2.611.55 2.591.53 2.341.56 2.861.55 2.671.54 2.741.49 2.751.49 2.811.50 2.871.52 2.81
0.00 75.190.00 74.620.00 74.550.00 73.450.00 71.940.00 71.550.00 74.960.00 63.950.00 57.130.00 53.900.00 52.980.00 52.000.00 52.950.00 57.260.00 52.300.00 63.2154.03 54.5054.45 53.9452.49 57.1852.53 56.0352.69 56.3152.40 56.6752.75 60.8352.04 52.0551.90 55.2551.99 54.1153.41 54.0253.18 52.9052.83 52.0952.73 53.01
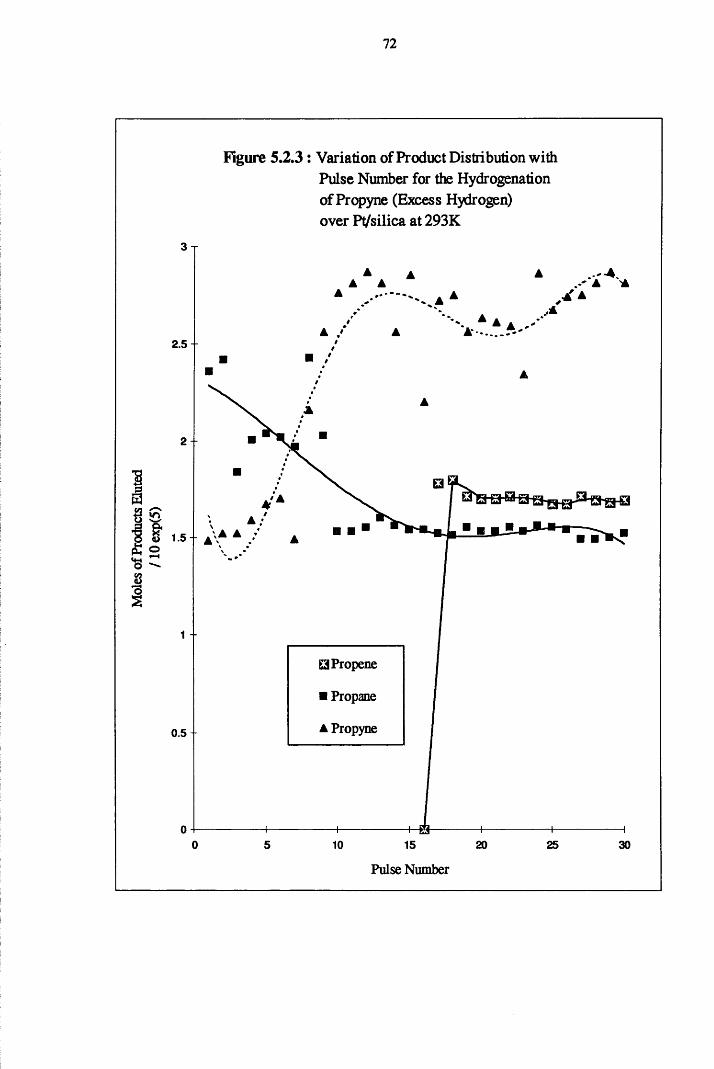
72
Figure 5.2.3: Variation of Product Distribution with Pulse Number for the Hydrogenation of Propyne (Excess Hydrogen) over Pt/silica at 293K
£
2.5
2 --
/-N&£<uo
JL *A A
■ Propane
▲ Propyne0.5
o 5 10 15 20 25 30
Pulse Number
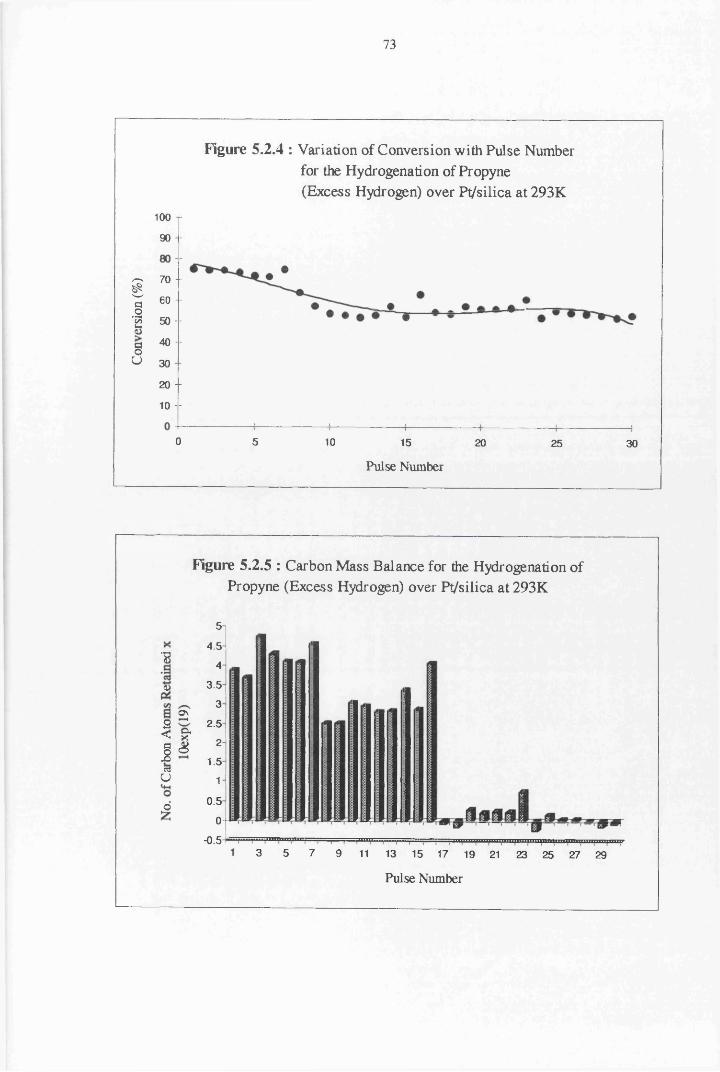
73
Figure 5.2.4 : Variation of Conversion with Pulse Number for the Hydrogenation of Propyne (Excess Hydrogen) over Pt/silica at 293K
100 T90 -
s 7 0 -
I 80--•a 50 -- fca 40 --o
u 30 -
20 -
10 - -
0 5 10 15 20 25 30
Pulse Number
Figure 5.2.5 : Carbon Mass Balance for the Hydrogenation of Propyne (Excess Hydrogen) over Pt/silica at 293K
■8<D
S<Ic3u
ONHax8
o
5
4. 5
43. 5
32. 5
21. 5
10. 5
0-0.5 .... >1111111111111)11111 imiimiiiiimiinTtnnfimimiiiiiiiim/
3 5 7 9 11 13 15 17 19 21 23 25 27 29
Pulse Number
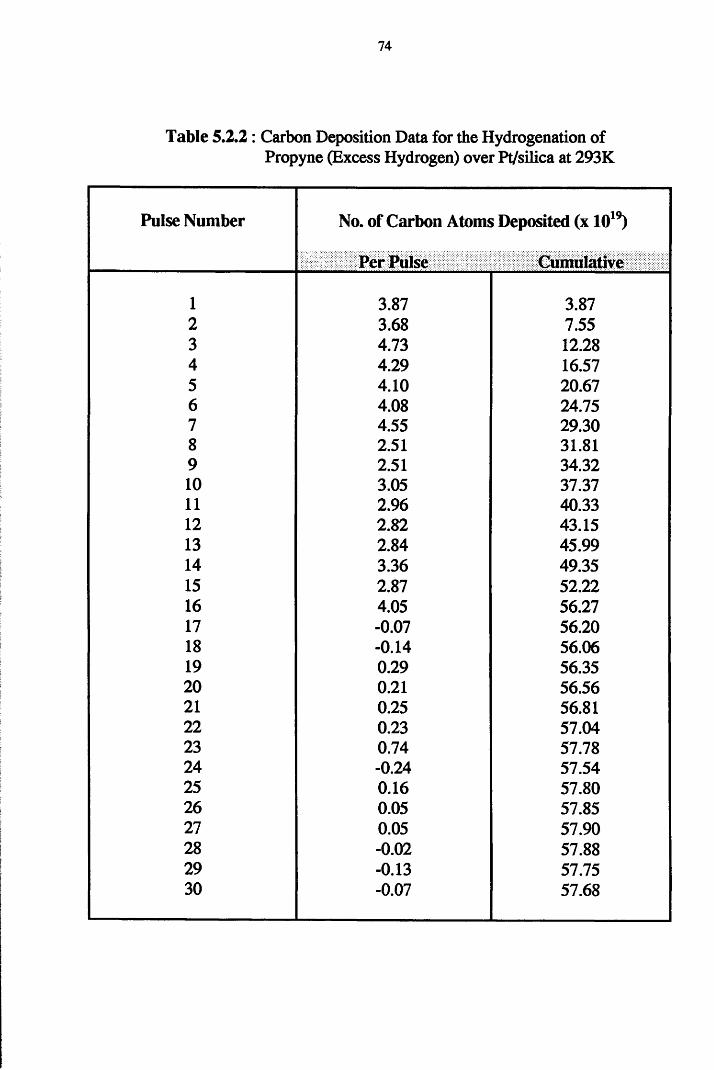
74
Table 5.2.2: Carbon Deposition Data for the Hydrogenation ofPropyne (Excess Hydrogen) over Pt/silica at 293K
Pulse Number No. of Carbon Atoms Deposited (x 1019)
Per Pulse Cumulative
1 3.87 3.872 3.68 7.553 4.73 12.284 4.29 16.575 4.10 20.676 4.08 24.757 4.55 29.308 2.51 31.819 2.51 34.3210 3.05 37.3711 2.96 40.3312 2.82 43.1513 2.84 45.9914 3.36 49.3515 2.87 52.2216 4.05 56.2717 -0.07 56.2018 -0.14 56.0619 0.29 56.3520 0.21 56.5621 0.25 56.8122 0.23 57.0423 0.74 57.7824 -0.24 57.5425 0.16 57.8026 0.05 57.8527 0.05 57.9028 -0.02 57.8829 -0.13 57.7530 -0.07 57.68
75
4.4.4 The Hydrogenation of Propyne over Alumina-Supported Platinum
Similar to silica-supported palladium, the hydrogenation of propyne using
an equimolar reactant ratio produced propene, over Pt/alumina. However, the
activity of this catalyst for hydrogenation was low, even in the first pulse, and
was observed to decrease still further with an increased number of pulses. In
pulse one, approximately 66% of the reactant propyne remained unreacted,
compared to pulse ten in which over 80% of the freshly injected propyne was
unconverted. The yield of propene was unaltered over ten pulses with the
corresponding retention of carbon at the surface found to drop significantly over
the first eight pulses. From pulse nine and ten, in Figure 5.2.7, it can be seen that
the catalyst loses carbon to the system.
Increasing the concentration of hydrogen in the reaction mixture, produced
both propene and propane over Pt/alumina. As with all other catalyst, there was
an induction period before propene was produced, as can be seen in Figure 5.2.8.
Over this catalyst, the hydrogenation of propyne produced only propane over the
first five pulses (Table 5.2.5). An increase in the number of pulses resulted in
propene formation. The yield of propane was found to oscillate over the course
of the experiments, while that of propene increased to an apparently steady value.
The retention of carbon on the catalyst was found to decrease with an increasing
number of pulses.
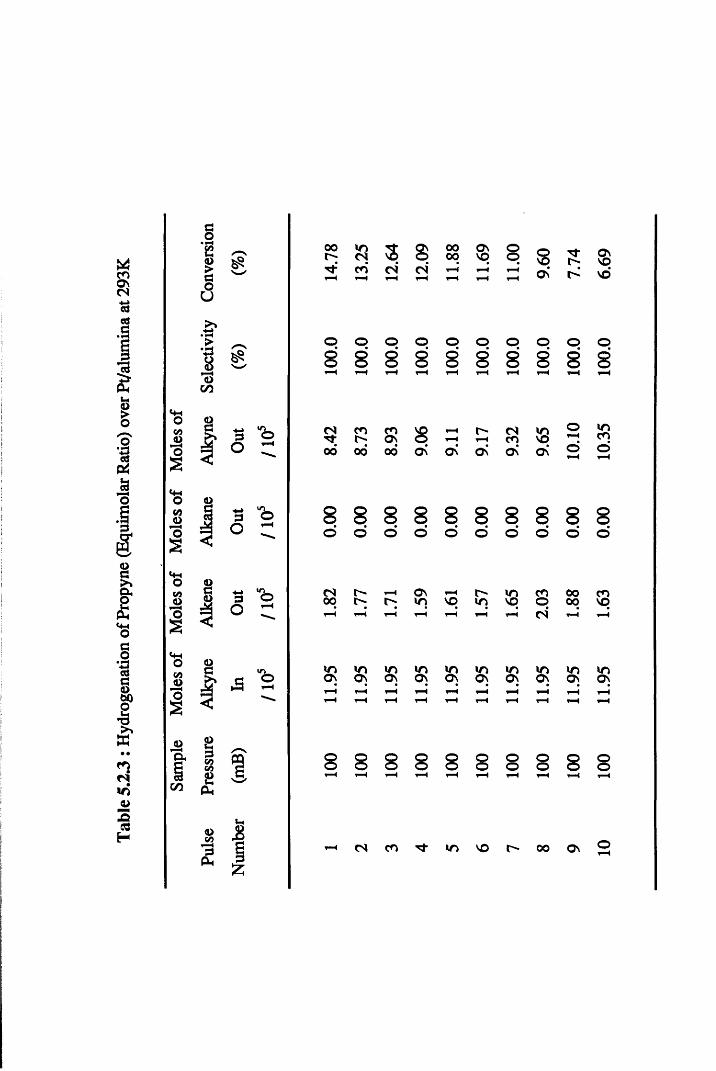
Tabl
e 5.2
.3 : H
ydro
gena
tion
of Pr
opyn
e (E
quim
olar
Rati
o) o
ver
Pt/al
umin
a at
293K
aoe4>>aoU
IC/5
vmOCO<Do2<4Hoco<DO2
co d> * <o2
GO
O2
Oh
C/5
<DCC>
2§GO
2PL,
<Dco3
Ph
a o o r
|
z
t ^ c ^ ' q p o o v q p g J J ^ cn cn cn C\
o o o o o o o o o 8 8 8 8 8 8 8 8 8
c N c n c n ' O ^ H t ^ c N i n ST t r - o s O ’—i » - i c n v o ^ . o o o d o o o \ 0 \ o \ a i o \ 5
8 8 8 8 8 8 8 8 80 0 0 0 0 0 0 0 0
cn O n r- in cn 0000 in vq in vq p 00
tH T—i CN t-H
in in in in in in in in in ino ON ON ON ON ON ON O n p pi-H
l-H T—< ▼-Hl—H v-H i-H r—H r-H
8 8 8 0O 8 88 OO 8H ▼-H t-H ▼“H iH
CM cn in VO 00 O n
oo
11.95
1.6
3 0.0
0 10
.35
100.0
6.
69
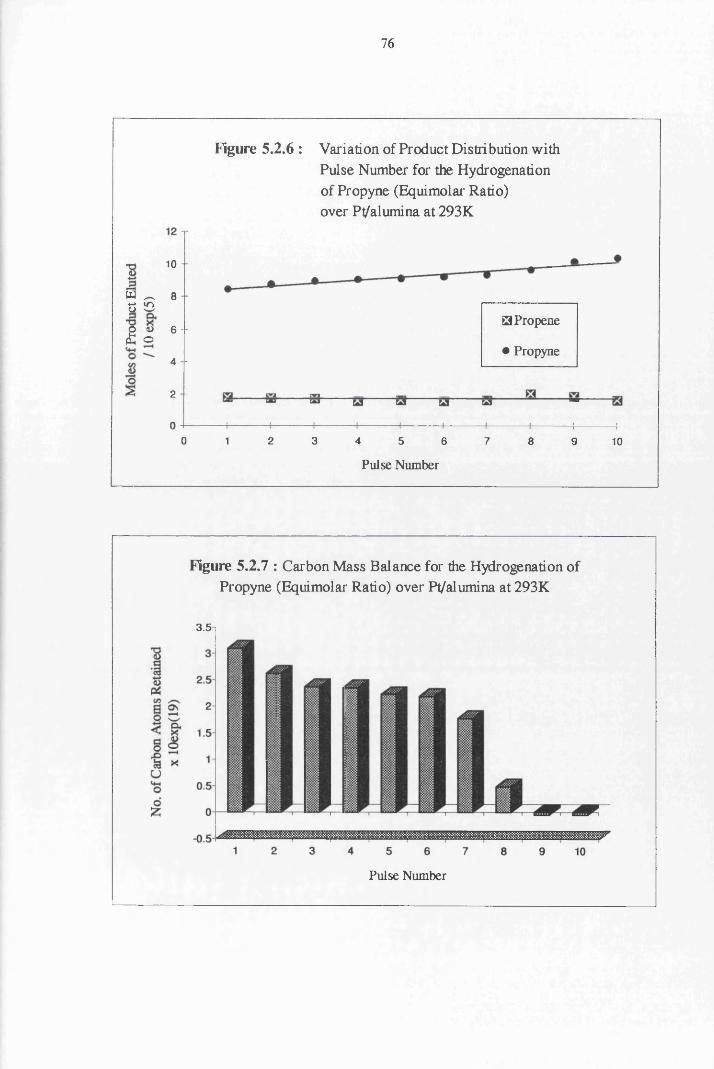
76
Figure 5.2.6 : Variation of Product Distribution withPulse Number for the Hydrogenation of Propyne (Equimolar Ratio) over Pl/alumina at 293K
10 -
W ^ 8 -3 ^O <u 6 --£ o
□ Propene
• Propyne4 -
2 -
o 2 31 4 5 6 7 8 9 10
Pulse Number
Figure 5.2.7 : Carbon Mass Balance for the Hydrogenation of Propyne (Equimolar Ratio) over Pt/alumina at 293K
3.5n
Pulse Number
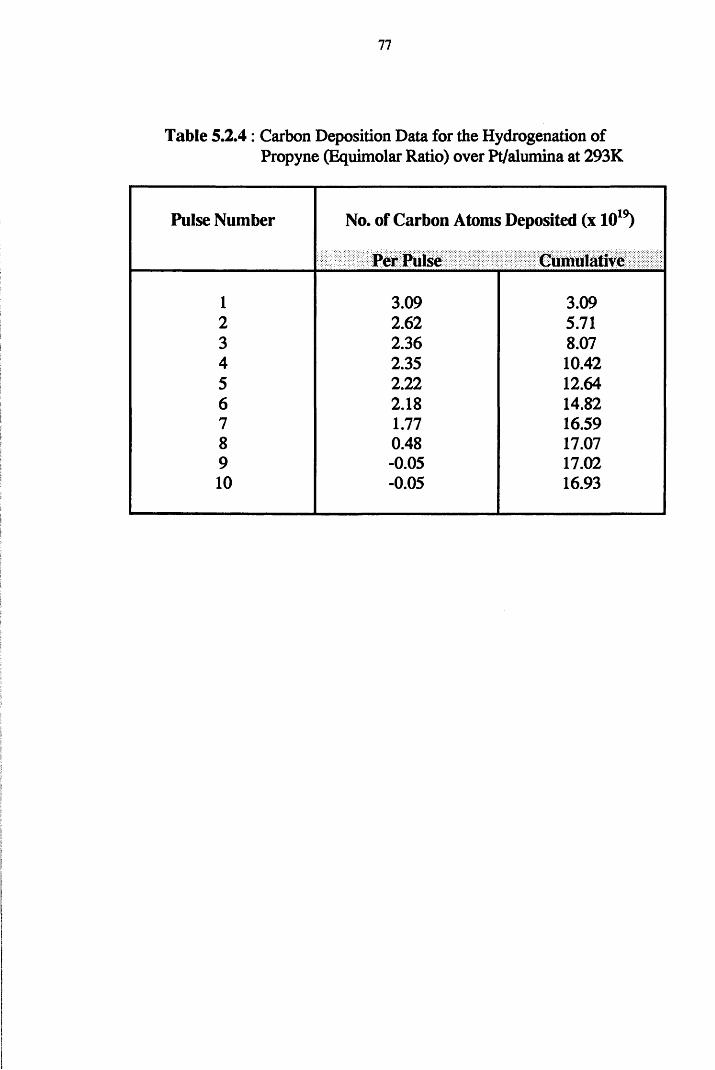
77
Table 5.2.4 : Carbon Deposition Data for the Hydrogenation ofPropyne (Equimolar Ratio) over Pt/alumina at 293K
Pulse Number No. of Carbon Atoms Deposited (x 1019)
Per Pulse Cumulative
1 3.09 3.092 2.62 5.713 2.36 8.074 2.35 10.425 2.22 12.646 2.18 14.827 1.77 16.598 0.48 17.079 -0.05 17.0210 -0.05 16.93
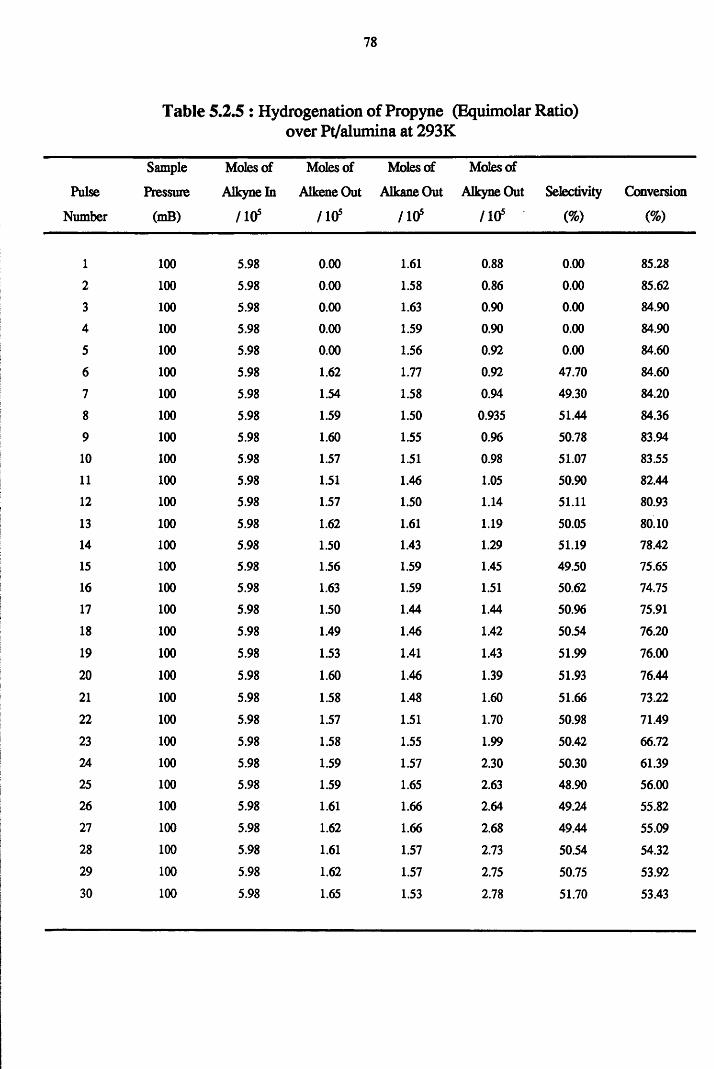
78
Table 5.2.5 : Hydrogenation of Propyne (Equimolar Ratio) over Pt/alumina at 293K
Sample Moles of Moles of Moles of Moles of
Pulse Pressure Alkyne In Alkene Out Alkane Out Alkyne Out Selectivity Conversion
Number (mB) / 10s / 10s /10s / 105 (%) (%)
1 1002 1003 1004 1005 1006 1007 1008 1009 10010 10011 10012 10013 10014 10015 10016 10017 10018 10019 10020 10021 10022 10023 10024 10025 10026 10027 10028 10029 10030 100
5.98 0.005.98 0.005.98 0.005.98 0.005.98 0.005.98 1.625.98 1.545.98 1.595.98 1.605.98 1.575.98 1.515.98 1.575.98 1.625.98 1.505.98 1.565.98 1.635.98 1.505.98 1.495.98 1.535.98 1.605.98 1.585.98 1.575.98 1.585.98 1.595.98 1.595.98 1.615.98 1.625.98 1.615.98 1.625.98 1.65
1.61 0.881.58 0.861.63 0.901.59 0.901.56 0.921.77 0.921.58 0.941.50 0.9351.55 0.961.51 0.981.46 1.051.50 1.141.61 1.191.43 1.291.59 1.451.59 1.511.44 1.441.46 1.421.41 1.431.46 1.391.48 1.601.51 1.701.55 1.991.57 2.301.65 2.631.66 2.641.66 2.681.57 2.731.57 2.751.53 2.78
0.00 85.280.00 85.620.00 84.900.00 84.900.00 84.6047.70 84.6049.30 84.2051.44 84.3650.78 83.9451.07 83.5550.90 82.4451.11 80.9350.05 80.1051.19 78.4249.50 75.6550.62 74.7550.96 75.9150.54 76.2051.99 76.0051.93 76.4451.66 73.2250.98 71.4950.42 66.7250.30 61.3948.90 56.0049.24 55.8249.44 55.0950.54 54.3250.75 53.9251.70 53.43
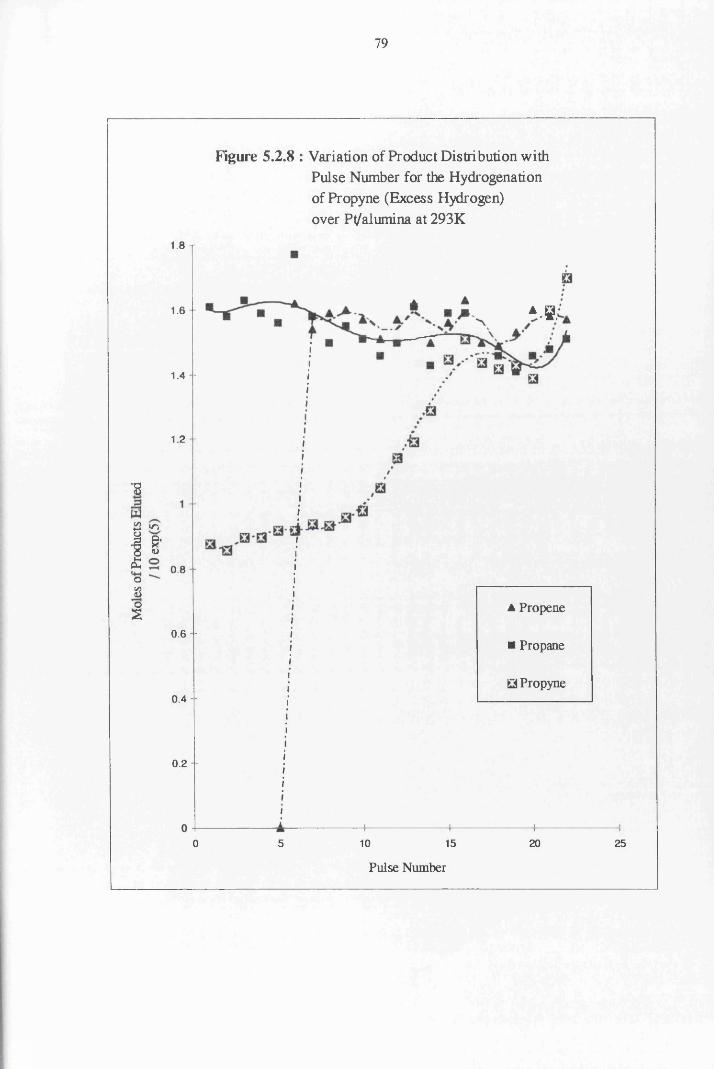
79
Figure 5.2.8 : Variation of Product Distribution with Pulse Number for the Hydrogenation of Propyne (Excess Hydrogen) over Pt/alumina at 293K
*8
aI
I0s1
1.8 T
Vfi1.6 -
1.4 -
1.2 -
*0g*4)
0.8 -
A Propene
0.6 -
■ Propane
E2 Propyne0.4 -
0.2 -
5 10 15 20 250
Pulse Number
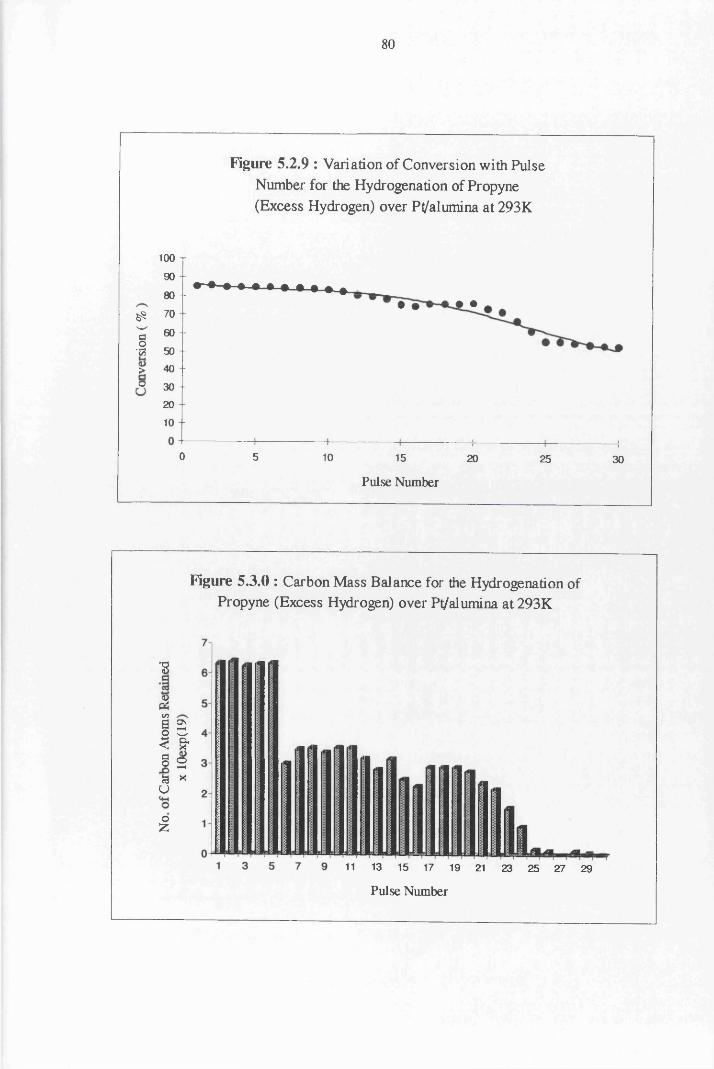
80
Figure 5.2.9 : Variation of Conversion with Pulse Number for the Hydrogenation of Propyne (Excess Hydrogen) over Pt/alumina at 293K
100 T
90 -
80 -- • •• •^ 7 0 -
I 60'■a so -> 40 -
° 3 0 -
20 -
10 -
0 5 10 15 20 25 30
Pulse Number
Figure 5.3.0 : Carbon Mass Balance for the Hydrogenation of Propyne (Excess Hydrogen) over Pt/alumina at 293K
•8
sC/5IS I &§ 2 & XV
o£
11 13 15 17 19 21 23 25 27 29
Pulse Number
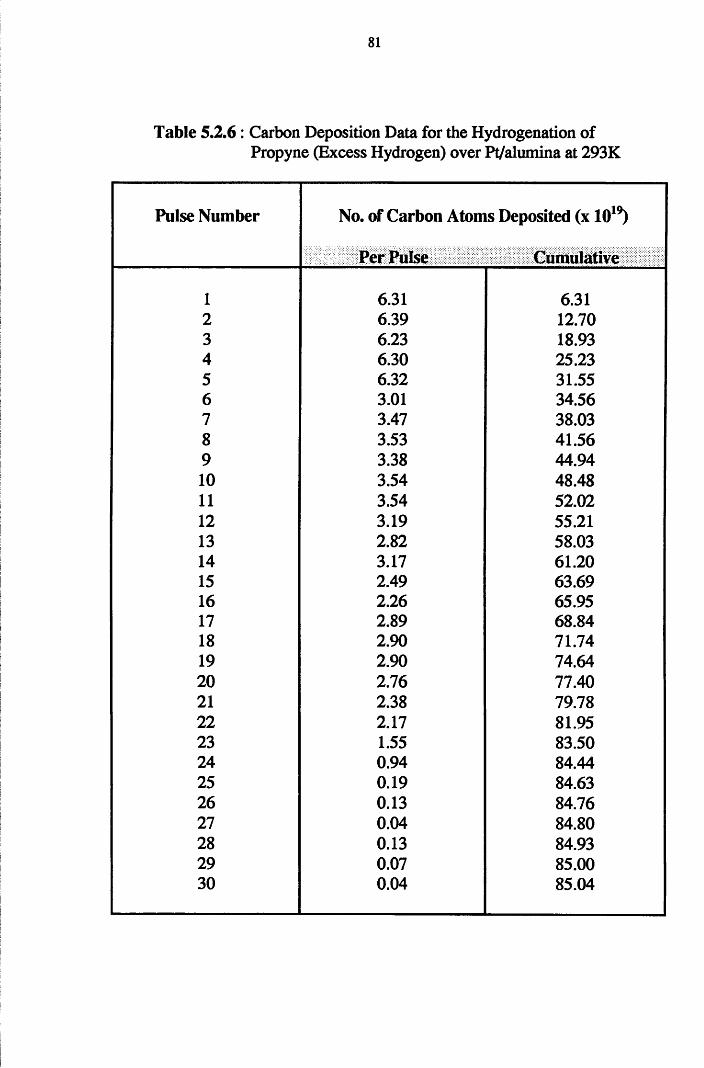
81
Table 5.2.6 : Carbon Deposition Data for the Hydrogenation ofPropyne (Excess Hydrogen) over Pt/alumina at 293K
Pulse Number No. of Carbon Atoms Deposited (x 1019)
Per Pulse
1 6.31 6.312 6.39 12.703 6.23 18.934 6.30 25.235 6.32 31.556 3.01 34.567 3.47 38.038 3.53 41.569 3.38 44.9410 3.54 48.4811 3.54 52.0212 3.19 55.2113 2.82 58.0314 3.17 61.2015 2.49 63.6916 2.26 65.9517 2.89 68.8418 2.90 71.7419 2.90 74.6420 2.76 77.4021 2.38 79.7822 2.17 81.9523 1.55 83.5024 0.94 84.4425 0.19 84.6326 0.13 84.7627 0.04 84.8028 0.13 84.9329 0.07 85.0030 0.04 85.04
Section Three
2-BUTYNE HYDROGENATION
82
4.4.5 The Hydrogenation of 2-Butyne over Silica-Supported Palladium
The hydrogenation of 2-butyne over silica-supported palladium has been
investigated using two different reactant ratios, and various reaction temperatures.
Using an equimolar reactant ratio, the hydrogenation of 2-butyne over
Pd/silica at 465K produced both the cis and trans-olefin isomers. The yield of cis
isomer was far greater than the trans isomer, but was observed to decrease with
increasing number of pulses, before increasing again to its initial value. The
trans isomer in this reaction was produced in trace amounts, and was relatively
constant over a series of ten pulses (Table 5.2.7). The activity of the catalyst for
2-butyne hydrogenation was initially complete (100%), but decreased before
increasing again. The amount of carbon retained in each pulse decreased
(negative in pulse 3), and fluctuated from pulse four to ten (Figure 5.3.2).
The hydrogenation of 2-butyne with excess hydrogen (1:3 :: C ^ : ^ ) over
Pd/silica, at the same reaction temperature, gave complete removal of the
acetylene over thirty pulses. This high acetylene conversion was accompanied by
continual carbon deposition, which did not dimininsh the catalysts efficiency for
2-butyne hydrogenation. The only observed hydrogenation products were n-
butane and methane, the latter product formed by hydrogenolysis of the adsorbed
acetylene. The yield of methane was relatively constant throughout a series of
thirty pulses (Figure 5.3.4), with the yield of n-butane found to increase with an
increase in the number of pulses.
2-Butyne hydrogenation over the above catalyst at 373K (equimolar
reactant ratio) produced c/s-2-butene as the sole hydrogenation product. The
conversion of 2-butyne was constant at 100% over the first two pulses. This
activity decreased with increasing number of pulses, but as with the reaction
performed at 465K, the conversion of acetylene increased in the later pulses. The
83
yield of c/s-2-butene was relatively constant over the ten pulses (Figure 5.3.6).
Carbon mass balance data shows that the amount of carbon retained by the
catalyst in each pulse decreases before increasing again. The yield of 2-butyne
and the amount of carbon retained at the surface seem to be mirror images of
each other, such that as one increased the other decreased.
Increasing the hydrogen concentration, produced only n-butane over
Pd/silica at 373K. Similar to the reactions performed at 465K, the conversion of
the acetylene was complete over a series of thirty pulses and was accompanied by
a fluctuating yield of the alkane. The carbon mass balance data shows that the
amount of carbon held at the surface fluctuated from pulse to pulse (Figure
5.4.0).
When an equimolar ratio of 2-butyne and hydrogen was injected over
silica-supported palladium at 330K, there was no hydrogenation observed.
Indeed, the only reaction was the partial loss of acetylene to the catalyst surface,
which can be attributed to a poisoning process. There seems to be no relation
between the amount of acetylene pulsed over the catalyst and the amount of
carbon retained (Table 5.3.1).
At room temperature, the hydrogenation of 2-butyne, using an equimolar
reactant ratio over the above catalyst produced c/s-2-butene, with complete
conversion of the acetylene over the first nine pulses. In pulse ten, the activity of
the catalyst decreased such that approximately 33% of the injected 2-butyne
remained unreacted. The yield of the olefin was found to decrease with increased
number of pulses, with the amount of carbon held at the catalyst surface
increasing from pulse one to nine (Figure 5.4.1), before decreasing in pulse ten.
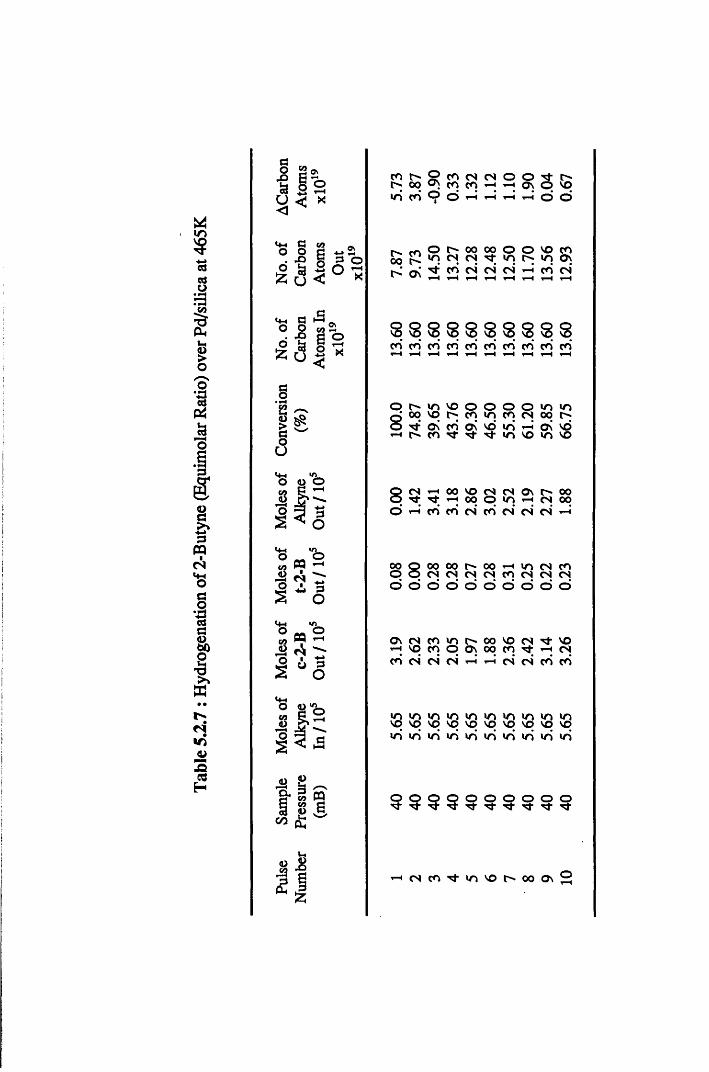
in5?03O• pHra
IPh*-«<D>O'o'•apie3
4— 4o
<Da
PQ■cnMhoa0a§1ffi • •
t s
inJU3C3H
aO gosS 2 ° 0 < X
<4-4 C CO° 2 S. x> S .£ S j O Z y <
I
ON■ HP O
rHx
<4—4 C ►So o w2 . -O c o£ & ! -£ O Si X
^ ** 4—
« p?'S ^ ^s “ 6<+h •«° PQ 5GO P
3 ^ ^0 i lO <D
Os
43o.
| S* £
m £
<D &*3 e
5 PQ</> rj<l> A
cn o CO CN CN o or>* oo Os CO CO fH pH ON•o CO Oi o P-( H pH
r-*. o f" 00 00 o o00
\ ’ I V"> CN CN in i>[s! as CO CN* CN* CN* pH
Vi iH ^H pH pH pH pH
8 8 8 8 8 8 8 8CO CO* CO* CO* CO CO* CO* CO*4—4 pH rH r—4 4—H pH
o wo VO o o o o© oo VO CO »n cn CN© ^ t ON CO O n vd in tH
CO H- H- in VO
© CN rH 00 VO CN CN O nO ''t T f tH 00 O in H
o pH CO* CO* CN* CO* CN* CN*
§ 8 o o
00 00 t-" 00 4— 1 inCN CN CN CN CO CNo o d d d o
O n CN CO in 00 VO CNpH p CO o ON 00 COCO CN* CN* CN* pH pH CN* CN
inp inp mp inp inp inp inp inpin in in in in iri in in
o o o''t -<t o o o o o oTf "t "t’ t Tl-
HcscnTj-invoh-ooON
5.65
3.14
0.22
2.27
59.85
13
.60
13.56
0.
045.6
5 3.2
6 0.2
3 1.8
8 66
.75
13.60
12
.93
0.67
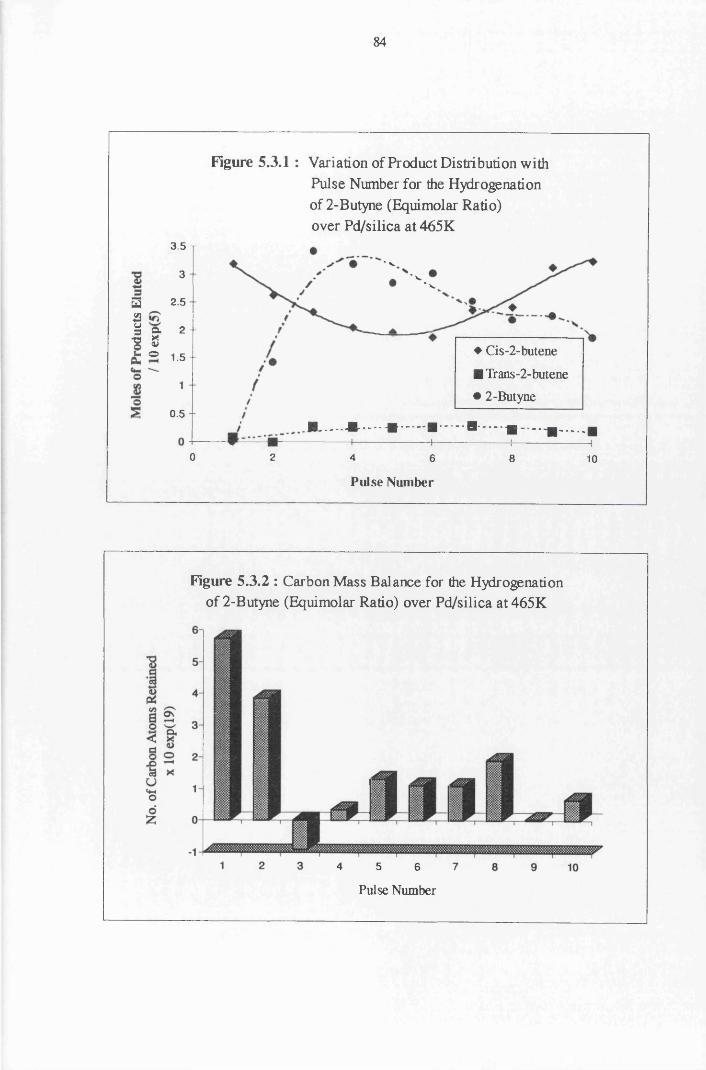
84
Figure 5.3.1 : Variation of Product Distribution with Pulse Number for the Hydrogenation of 2-Butyne (Equimolar Ratio) over Pd/silica at 465K
3.5 T* V
3 - * v' V3 2-5j2u ~s a 2 --a *s «
1.5 - ♦ Cis-2-butene
■ Trans-2-butene
• 2-Butyne
©
0.5 -
0 2 4 6 8 10
Pulse Number
Figure 5.3.2 : Carbon Mass Balance for the Hydrogenation of 2-Butyne (Equimolar Ratio) over Pd/silica at 465K
4 5 6
Pulse Number
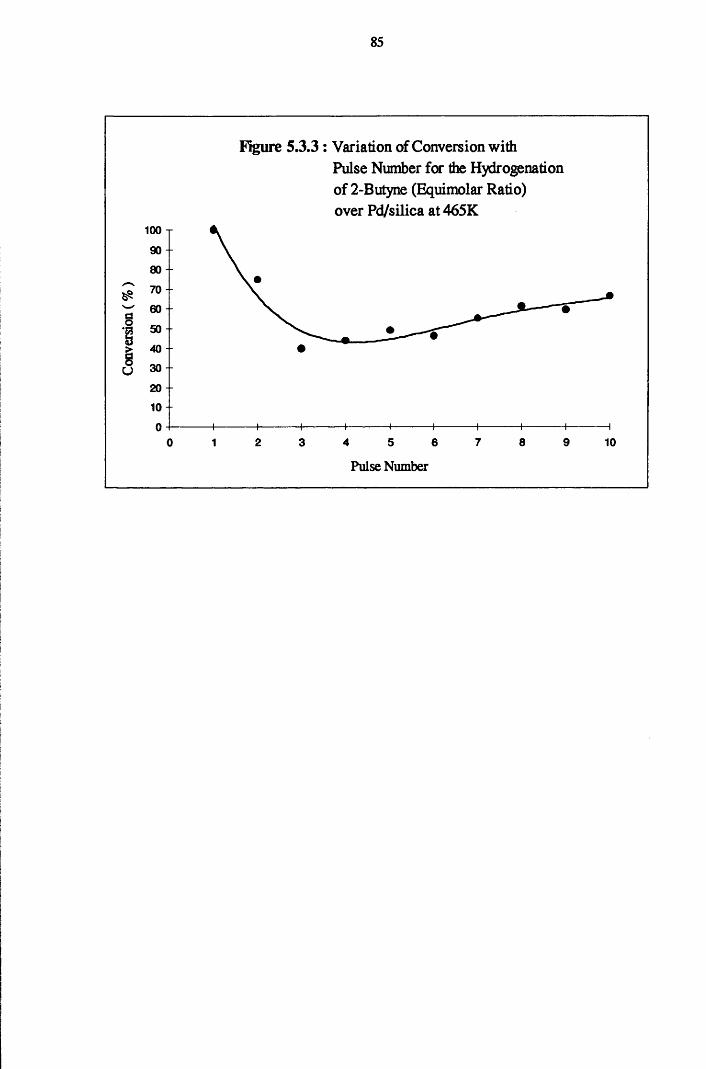
85
Figure 5.3.3: Variation of Conversion withPulse Number for the Hydrogenation of 2-Butyne (Equimolar Ratio) over Pd/silica at 465K
100 T90 --
80
^ 70 '60 -
8 50 -
> 408O 30
20 -
10
5 7 8 90 2 3 4 6 101
Pulse Number
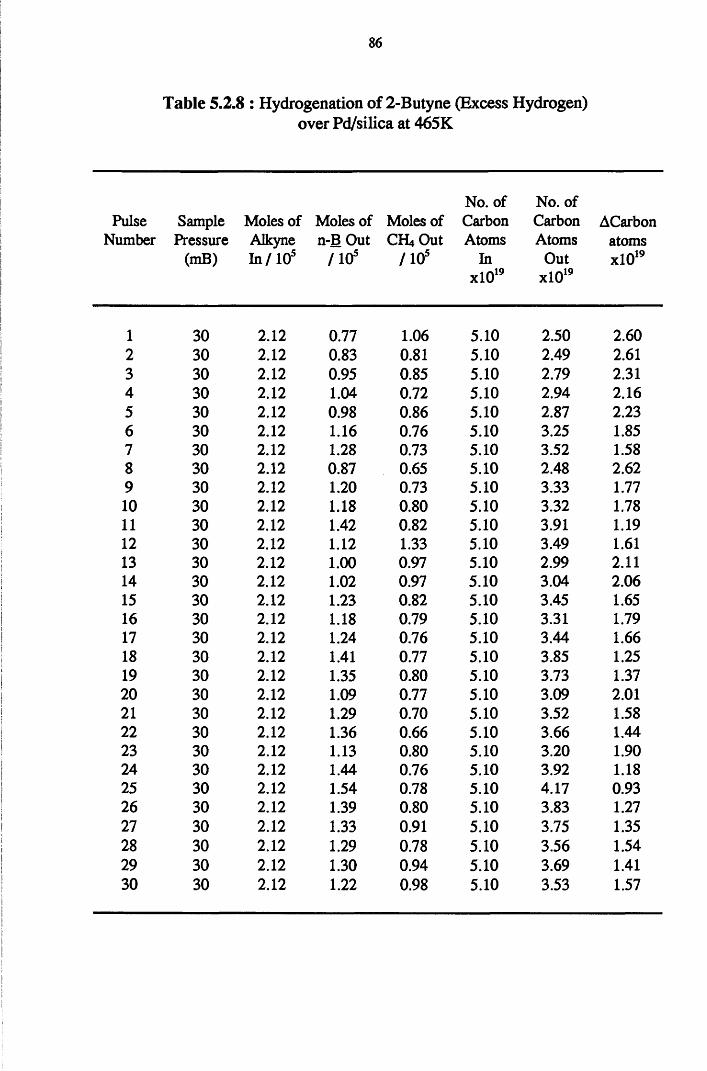
86
Table 5.2.8 : Hydrogenation of 2-Butyne (Excess Hydrogen)over Pd/silica at 465K
No. of No. ofPulse Sample Moles of Moles of Moles of Carbon Carbon ACarbon
Number Pressure Alkyne n-B Out CH4 Out Atoms Atoms atoms(mB) In /10s / 10s / 10s In Out xlO19
xlO19 xlO19
1 30 2.12 0.77 1.06 5.10 2.50 2.602 30 2.12 0.83 0.81 5.10 2.49 2.613 30 2.12 0.95 0.85 5.10 2.79 2.314 30 2.12 1.04 0.72 5.10 2.94 2.165 30 2.12 0.98 0.86 5.10 2.87 2.236 30 2.12 1.16 0.76 5.10 3.25 1.857 30 2.12 1.28 0.73 5.10 3.52 1.588 30 2.12 0.87 0.65 5.10 2.48 2.629 30 2.12 1.20 0.73 5.10 3.33 1.7710 30 2.12 1.18 0.80 5.10 3.32 1.7811 30 2.12 1.42 0.82 5.10 3.91 1.1912 30 2.12 1.12 1.33 5.10 3.49 1.6113 30 2.12 1.00 0.97 5.10 2.99 2.1114 30 2.12 1.02 0.97 5.10 3.04 2.0615 30 2.12 1.23 0.82 5.10 3.45 1.6516 30 2.12 1.18 0.79 5.10 3.31 1.7917 30 2.12 1.24 0.76 5.10 3.44 1.6618 30 2.12 1.41 0.77 5.10 3.85 1.2519 30 2.12 1.35 0.80 5.10 3.73 1.3720 30 2.12 1.09 0.77 5.10 3.09 2.0121 30 2.12 1.29 0.70 5.10 3.52 1.5822 30 2.12 1.36 0.66 5.10 3.66 1.4423 30 2.12 1.13 0.80 5.10 3.20 1.9024 30 2.12 1.44 0.76 5.10 3.92 1.1825 30 2.12 1.54 0.78 5.10 4.17 0.9326 30 2.12 1.39 0.80 5.10 3.83 1.2727 30 2.12 1.33 0.91 5.10 3.75 1.3528 30 2.12 1.29 0.78 5.10 3.56 1.5429 30 2.12 1.30 0.94 5.10 3.69 1.4130 30 2.12 1.22 0.98 5.10 3.53 1.57
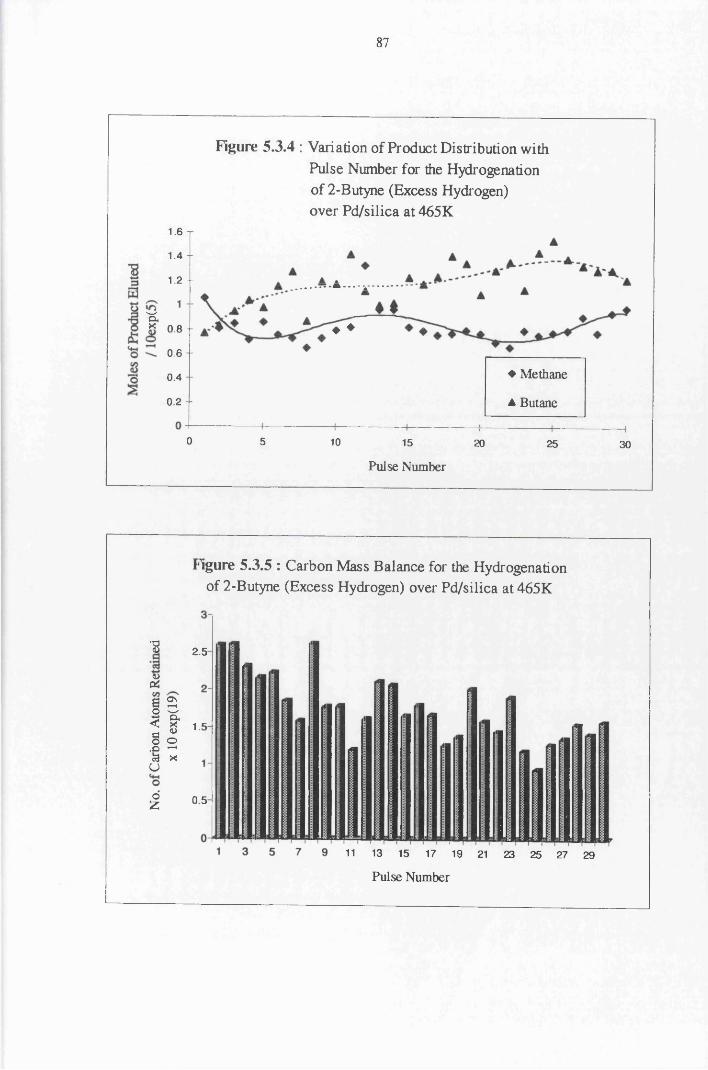
87
Figure 5.3.4 : Variation of Product Distribution with Pulse Number for the Hydrogenation of 2-Butyne (Excess Hydrogen) over Pd/silica at 465K
1.6 T
1.4 -
1.2 -
wa,* 0.8 - ♦ ♦
0.6 -
♦ Methane0.4
A Butane0.2 -
o 5 10 15 20 25 30
Pulse Number
Figure 5.3.5 : Carbon Mass Balance for the Hydrogenation of 2-Butyne (Excess Hydrogen) over Pd/silica at 465K
•8 2.5
<DPia 23 ^< xa u o o•e ^e3 x UoZ
1.5
0.5
I11 13 15 17 19 21 23 25 27 29
Pulse Number
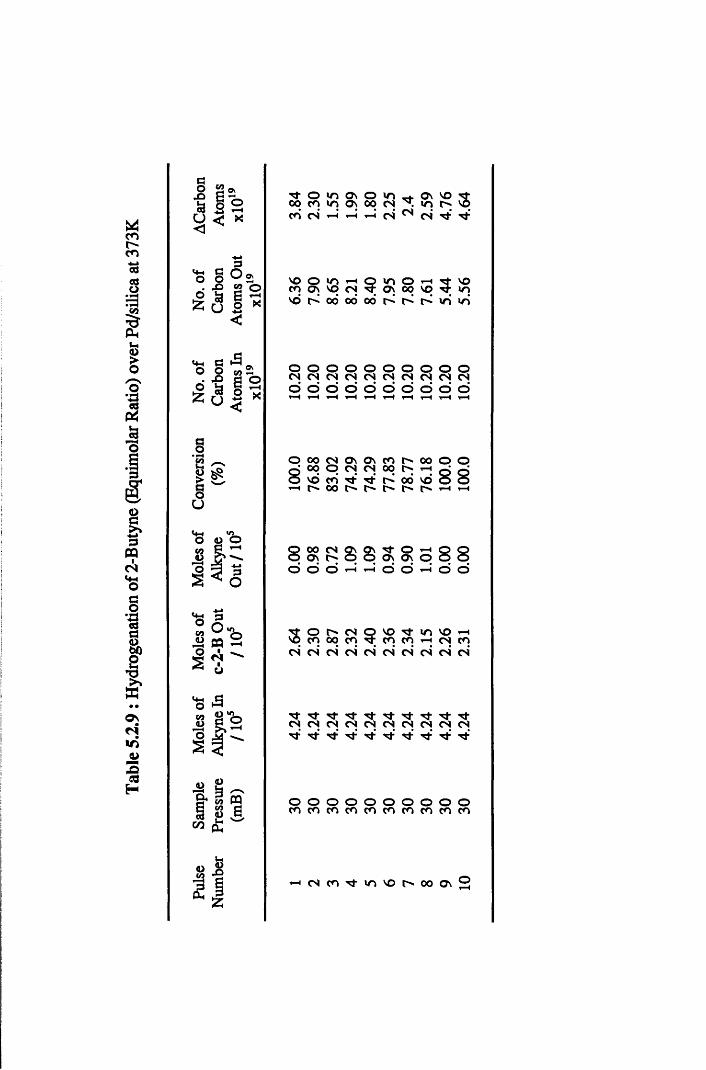
Tabl
e 5.2
.9 : H
ydro
gena
tion
of 2-
Buty
ne
(Equ
imol
ar R
atio)
ove
r Pd
/silic
a at
373K
co.oo3U<
CODOs
o\otH
X
_ P <4-. C O ~o o ^ 2 . x> £2 O£ & G - £ u 2 <
x
«+-. C *3 o o m2o jj § 2
g 2 ^ g *g w u
p0tt1<n■o
■H- o in ov o «nv4> Ov VO00 cn in ov 00 CN N i n tx.cn CN rH rH rH CN CN CN
VOcn
oOv
i nvq
rHCN ? i n
Ovooo
rHvq
vd 00 00 00 r ^
T f VO•'I in uS
o o o o o o o o o oC N C N C N C N C N C N C N C N C N C No o o o o o o o o o
oo CN Ov Ov cn tx. oo0 0 o CN CN 00 tx. rHvd cn Tf" ex! 00 vd
00 f x fx. ex. r x r x
8 00 CN ON C"
d o ©
o o 88
8 0 \ ^ O h Q Q . © Ov Ov © O p
rH rH Q O Q O
o r x CN o VO m VO rHcn oo cn cn cn rH CN cnCN CN CN CN CN CN CN CN CN
CNTTCN
H -CN CN CN CN
r fCN CN CN CN
H -’ H - NT
O O O O O O O O O Ococncococncncowcnfo
’-HCNcnTrinvor^ooovP
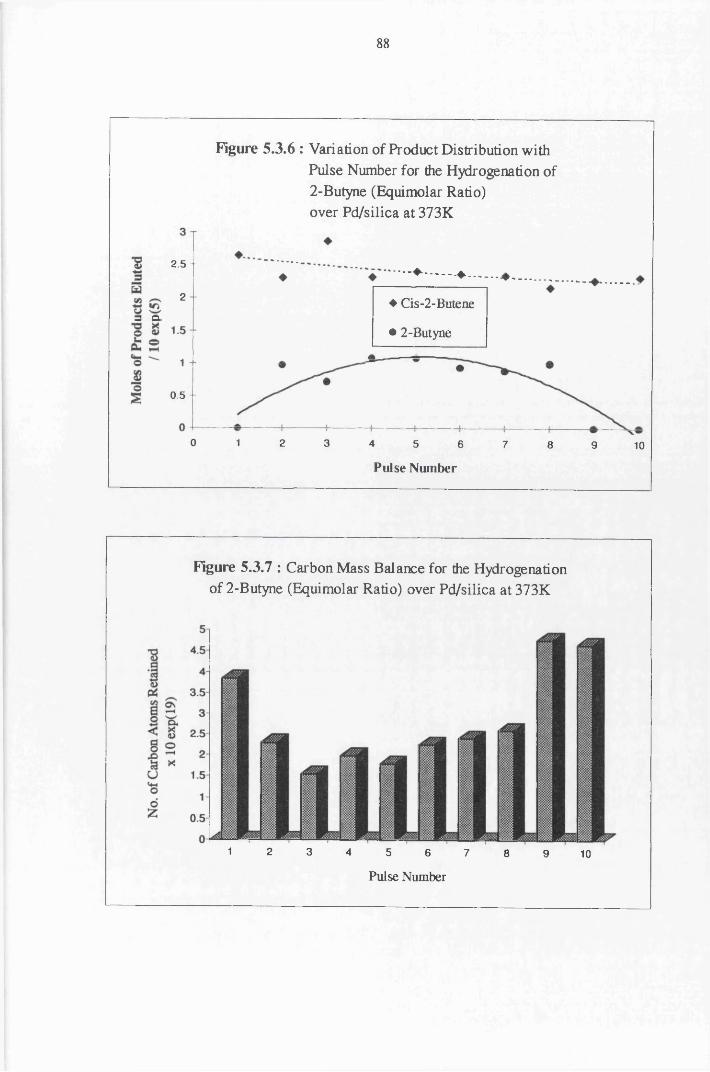
88
Figure 5.3.6 : Variation of Product Distribution with Pulse Number for the Hydrogenation of 2-Butyne (Equimolar Ratio) over Pd/silica at 373K
2.5 -—♦ .......♦
2 ♦ Cis-2-Butene3 a.
• 2-Butyne
0.5 -
o 1 2 3 4 5 6 7 8 9 10Pulse Number
Figure 5.3.7 : Carbon Mass Balance for the Hydrogenation of 2-Butyne (Equimolar Ratio) over Pd/silica at 373K
1 2 3 4 5 6 7 8 9 10
Pulse Number
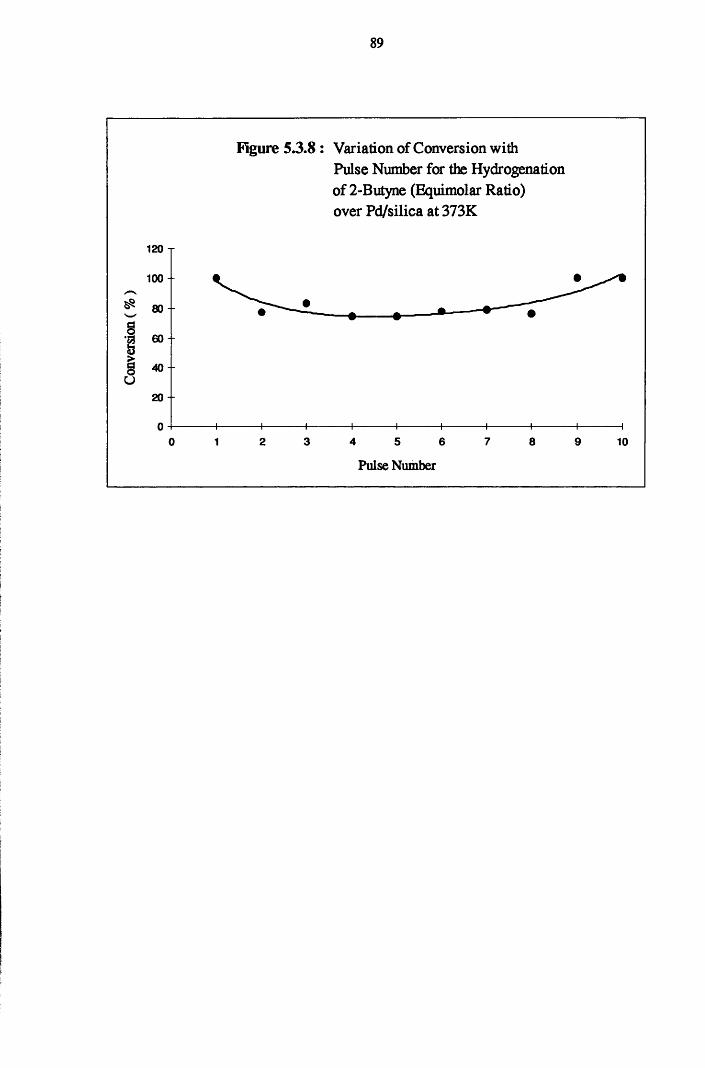
89
Figure 5.3.8 : Variation of Conversion withPulse Number for the Hydrogenation of 2-Butyne (Equimolar Ratio) over Pd/silica at 373K
120 T
100 -
£ 80
§ 60
| 4 0 -u
20 -
3 4 5 6 7 8 90 1 2 10Pulse Number
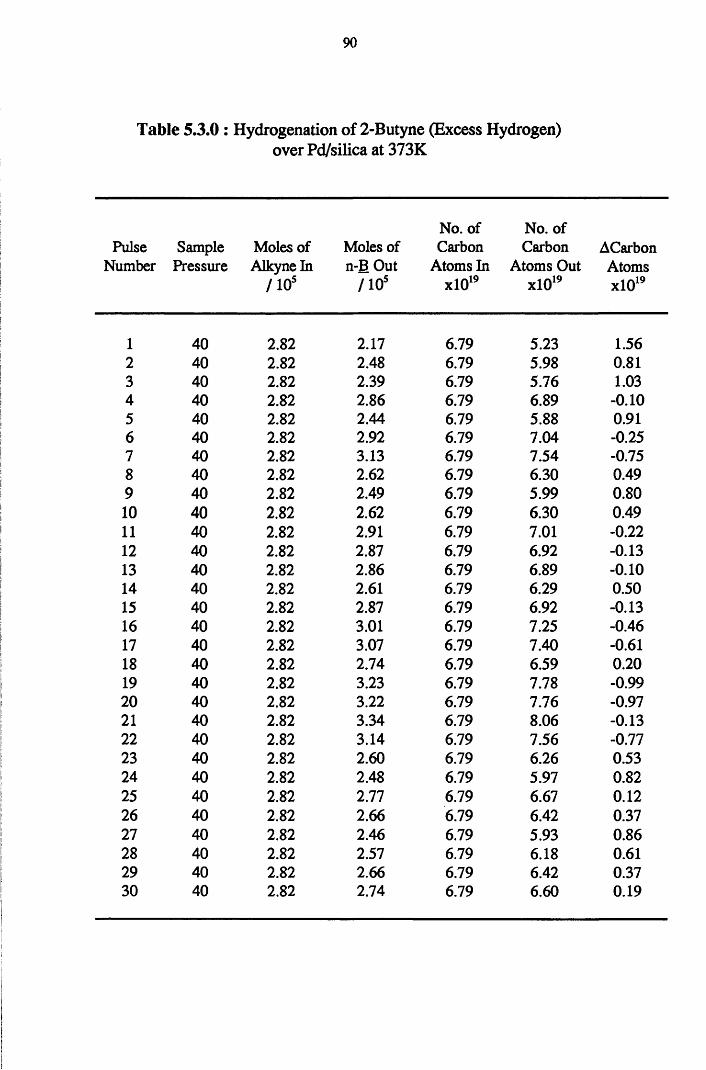
90
Table 5.3.0 : Hydrogenation of 2-Butyne (Excess Hydrogen)over Pd/silica at 373K
No. of No. ofPulse Sample Moles of Moles of Carbon Carbon ACarbon
Number Pressure Alkyne In n-B Out Atoms In Atoms Out Atoms/ 105 / 10s xlO19 xlO19 xlO19
1 40 2.82 2.17 6.79 5.23 1.562 40 2.82 2.48 6.79 5.98 0.813 40 2.82 2.39 6.79 5.76 1.034 40 2.82 2.86 6.79 6.89 -0.105 40 2.82 2.44 6.79 5.88 0.916 40 2.82 2.92 6.79 7.04 -0.257 40 2.82 3.13 6.79 7.54 -0.758 40 2.82 2.62 6.79 6.30 0.499 40 2.82 2.49 6.79 5.99 0.8010 40 2.82 2.62 6.79 6.30 0.4911 40 2.82 2.91 6.79 7.01 -0.2212 40 2.82 2.87 6.79 6.92 -0.1313 40 2.82 2.86 6.79 6.89 -0.1014 40 2.82 2.61 6.79 6.29 0.5015 40 2.82 2.87 6.79 6.92 -0.1316 40 2.82 3.01 6.79 7.25 -0.4617 40 2.82 3.07 6.79 7.40 -0.6118 40 2.82 2.74 6.79 6.59 0.2019 40 2.82 3.23 6.79 7.78 -0.9920 40 2.82 3.22 6.79 7.76 -0.9721 40 2.82 3.34 6.79 8.06 -0.1322 40 2.82 3.14 6.79 7.56 -0.7723 40 2.82 2.60 6.79 6.26 0.5324 40 2.82 2.48 6.79 5.97 0.8225 40 2.82 2.77 6.79 6.67 0.1226 40 2.82 2.66 6.79 6.42 0.3727 40 2.82 2.46 6.79 5.93 0.8628 40 2.82 2.57 6.79 6.18 0.6129 40 2.82 2.66 6.79 6.42 0.3730 40 2.82 2.74 6.79 6.60 0.19
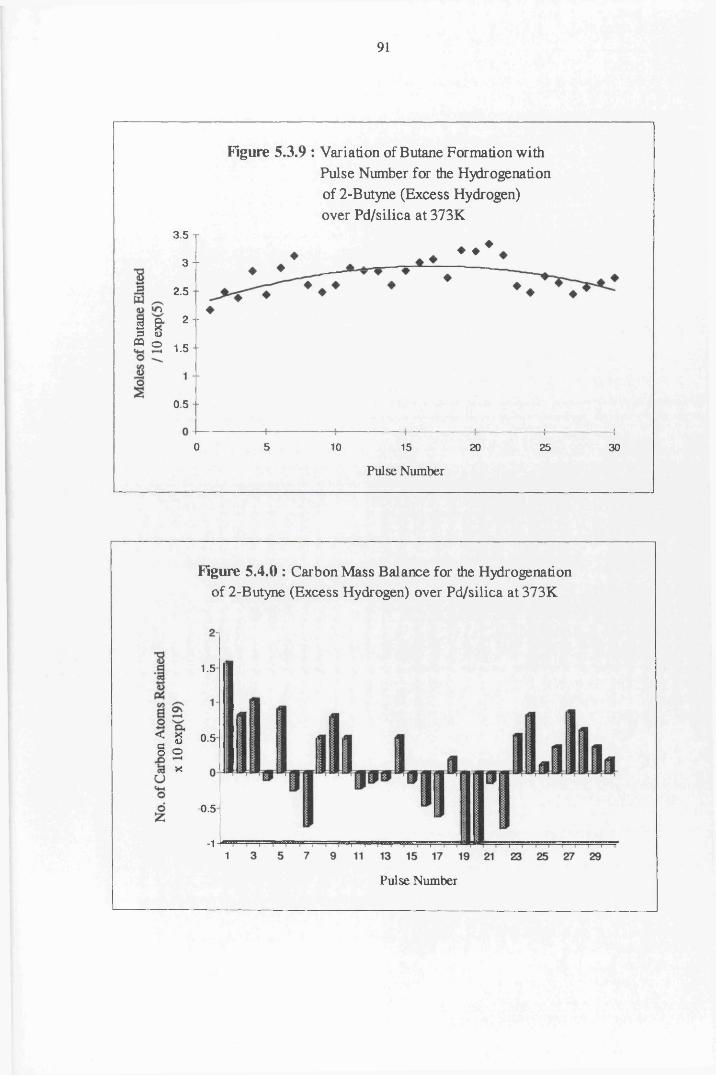
91
Figure 5.3.9 : Variation of Butane Formation with Pulse Number for the Hydrogenation of 2-Butyne (Excess Hydrogen) over Pd/silica at 373K
3. 5 T♦ ♦
3 -
2. 5 -
3 & 2 '3 <U“ ° 15-« 1 .0
0. 5 -
0 5 10 15 2520 30
Pulse Number
Figure 5.4.0 : Carbon Mass Balance for the Hydrogenation of 2-Butyne (Excess Hydrogen) over Pd/silica at 373K
1. 5
< g 0. 5 § ©
X
-0.5
.1>=1
Pulse Number
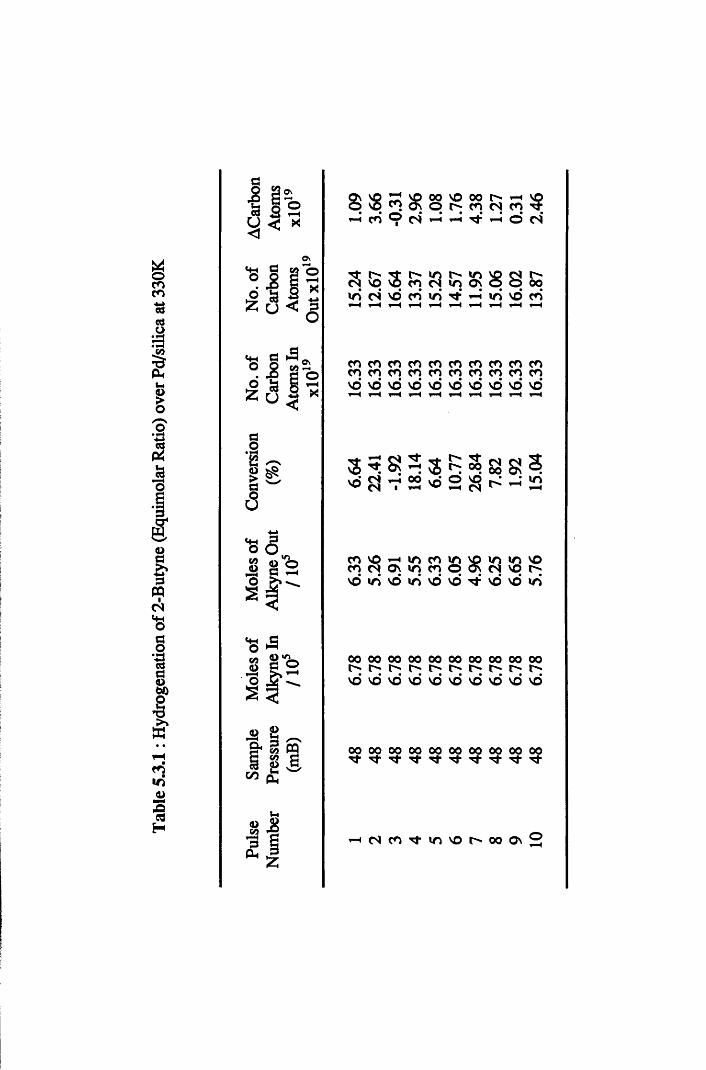
Tabl
e 5.
3.1:
Hyd
roge
natio
n of
2-Bu
tyne
(E
quim
olar
Rati
o) o
ver
Pd/si
lica
at 33
0K
>coU
«4H C *5S Iis a | *
ao
u<oCO -2^ 5PL, 3
oCO00 VO 00 t"» vpo p co c* co *3;H H H O CS
in(N r-in p s 8 ooin Tt i-H inH vd CO1-H
c5 vq 3> in <N vd co m
c o c o c o c o c o c o c o c o c o c oc o c o c o c o c o c o c o c o c o c ov d v d v d v d t d v d v d v d v d i d
voi-HTt s? Tf
s t"* Tf00cs(N 1 00r-H vd o vdcs m
CO vo m CO m m m voCO (N ON in CO o ON CN vovd in vd in vd vd vd vd in
00 00 00 00 00 00 00 00 00 00r^ r- r- r- r-vd vd vd vd VO vd vd vd vd vd
00 00 00 00 00 00 00 00 00 00
-HCScoTttnvor->oooN
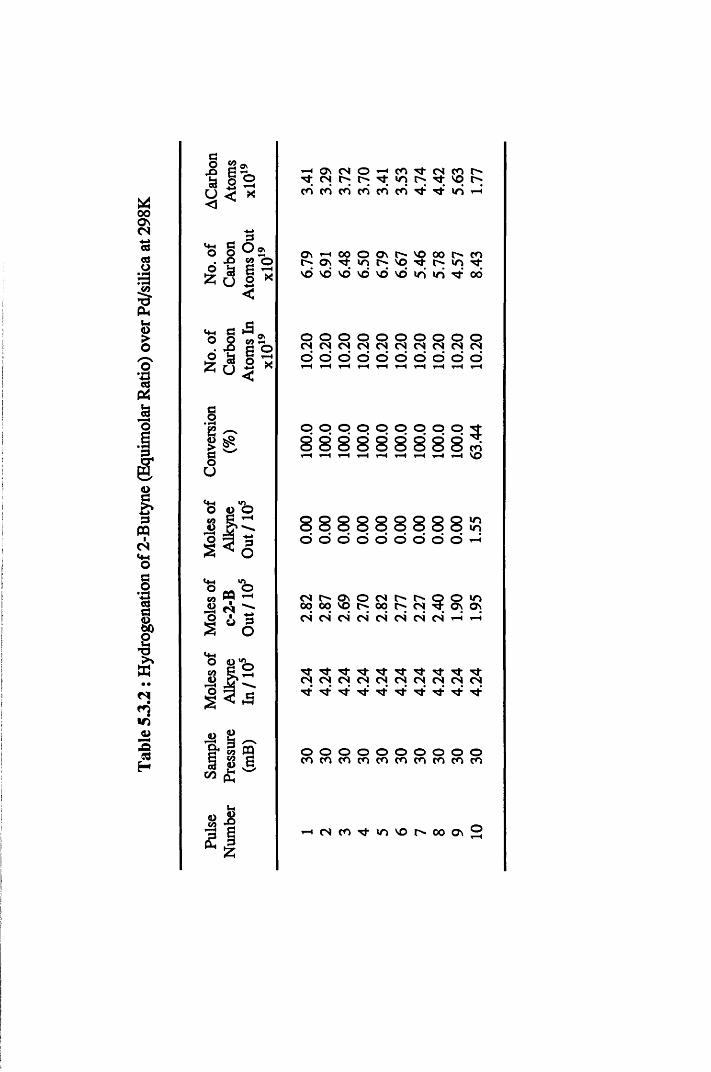
Tabl
e 53
.2 : H
ydro
gena
tion
of 2-
Buty
ne
(Equ
imol
ar R
atio)
ove
r Pd
/silic
a at
298K
GO gc*t i s *
_ g<+H GO ovO O. 2 oO ^ g<
e
gu
X
<+H G ^O O 0)2 . X) G o5 * § x
S « 2•§*? ^ I u o
iH3
O nCN
CN O3
CO«n
CN3
co CO CO CO CO CO
co t >vo t>vo
ON 00 o ON VO 0 0 COas VO r>* VO 3 »o TfVO vd vd vd vd VO vo vo 00
o o o o o o o o O oCNCNCNCNCNCNCNCNCNCNo o
iHorH
otH
o' orH
o o ov*H
o
0 0 0 0 0 0 0 0 0 38 8 8 8 8 8 8 8 8 3H tH ?H S)
8 8 8 8 8 8 8 8 8 8d d d d d d d d d —<
CN00 f"00 OnVOO CN00 O CNS OOnvoOnCNCNCNCNCNCNCNCNiH t-H
CNCNCNCNCNCNCNCNCNCN
o o o o o o o o o o(ocococotncncncnmco
HtNCO^inVOMX)^
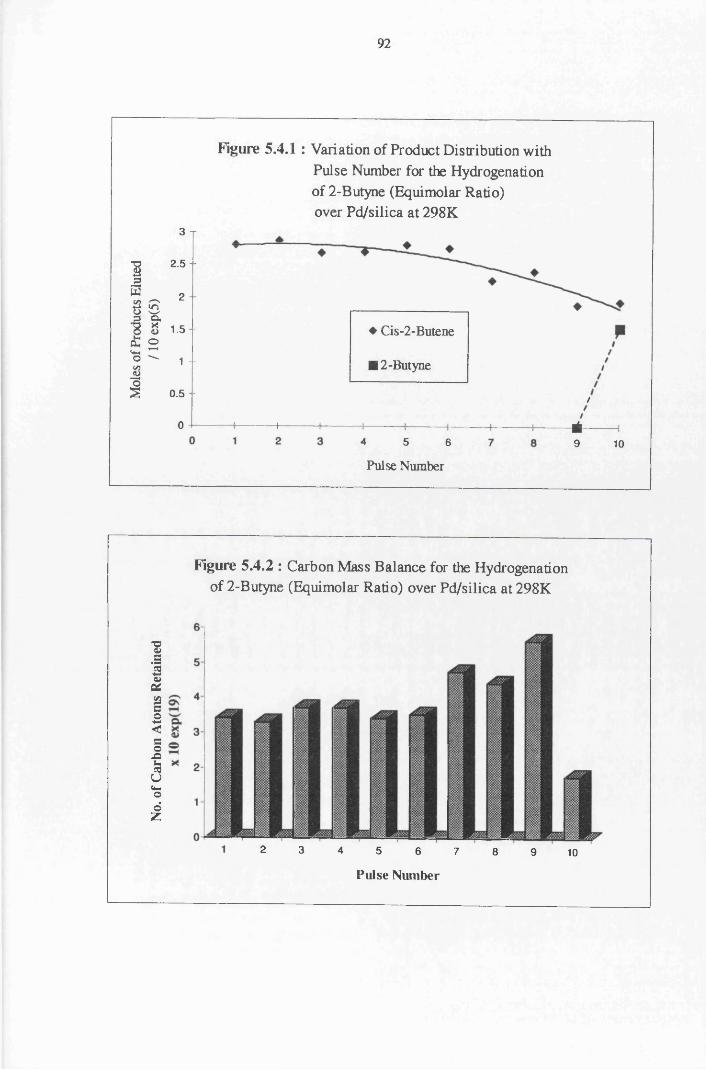
Mol
es o
f Pr
oduc
ts El
uted
No
. of
Carb
on
Atom
s Re
tain
ed
/10
exp(
5)
92
3 T2 . 5 -
2
1.5 -
1 --
0.5 --
0
Figure 5.4.1: Variation of Product Distribution with Pulse Number for the Hydrogenation of 2-Butyne (Equimolar Ratio) over Pd/silica at 298K
-------h
♦ Cis-2-Butene
■ 2-Butyne
/
i 5 6
Pulse Number
*9 10
Figure 5.4.2 : Carbon Mass Balance for the Hydrogenation of 2-Butyne (Equimolar Ratio) over Pd/silica at 298K
2 3 4 5 6 7 8 9 10
Pulse Number
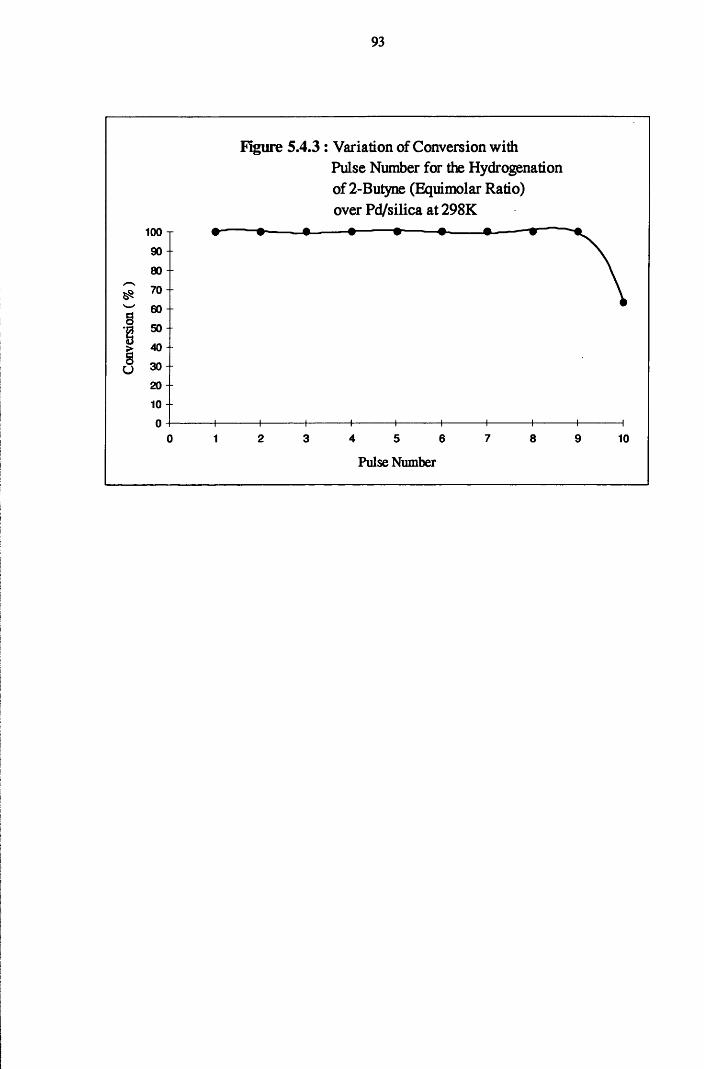
93
Figure 5.4.3 : Variation of Conversion withPulse Number for the Hydrogenation of 2-Butyne (Equimolar Ratio) over Pd/silica at 298K
100 T90
80
§ 50 -
> 40° Tn (J 30
2010 -
2 3 4 5 6 7 8 9 100 1Pulse Number
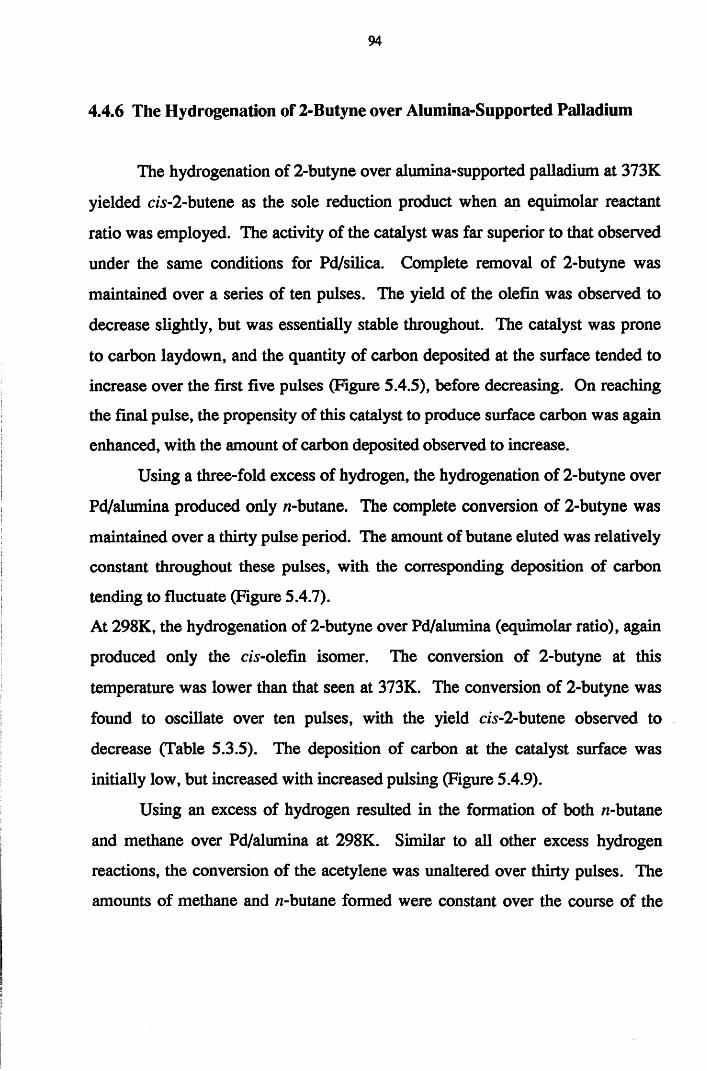
94
4.4.6 The Hydrogenation of 2-Butyne over Alumina-Supported Palladium
The hydrogenation of 2-butyne over alumina-supported palladium at 373K
yielded c/s-2-butene as the sole reduction product when an equimolar reactant
ratio was employed. The activity of the catalyst was far superior to that observed
under the same conditions for Pd/silica. Complete removal of 2-butyne was
maintained over a series of ten pulses. The yield of the olefin was observed to
decrease slightly, but was essentially stable throughout. The catalyst was prone
to carbon laydown, and the quantity of carbon deposited at the surface tended to
increase over the first five pulses (Figure 5.4.5), before decreasing. On reaching
the final pulse, the propensity of this catalyst to produce surface carbon was again
enhanced, with the amount of carbon deposited observed to increase.
Using a three-fold excess of hydrogen, the hydrogenation of 2-butyne over
Pd/alumina produced only n-butane. The complete conversion of 2-butyne was
maintained over a thirty pulse period. The amount of butane eluted was relatively
constant throughout these pulses, with the corresponding deposition of carbon
tending to fluctuate (Figure 5.4.7).
At 298K, the hydrogenation of 2-butyne over Pd/alumina (equimolar ratio), again
produced only the c/s-olefin isomer. The conversion of 2-butyne at this
temperature was lower than that seen at 373K. The conversion of 2-butyne was
found to oscillate over ten pulses, with the yield ds-2-butene observed to
decrease (Table 5.3.5). The deposition of carbon at the catalyst surface was
initially low, but increased with increased pulsing (Figure 5.4.9).
Using an excess of hydrogen resulted in the formation of both n-butane
and methane over Pd/alumina at 298K. Similar to all other excess hydrogen
reactions, the conversion of the acetylene was unaltered over thirty pulses. The
amounts of methane and n-butane formed were constant over the course of the
95
experiments, with butane constituting approximately 80% of the eluted gas
mixture. This catalyst showed no indication of losing surface carbon, with
carbon being retained in each individual pulse.
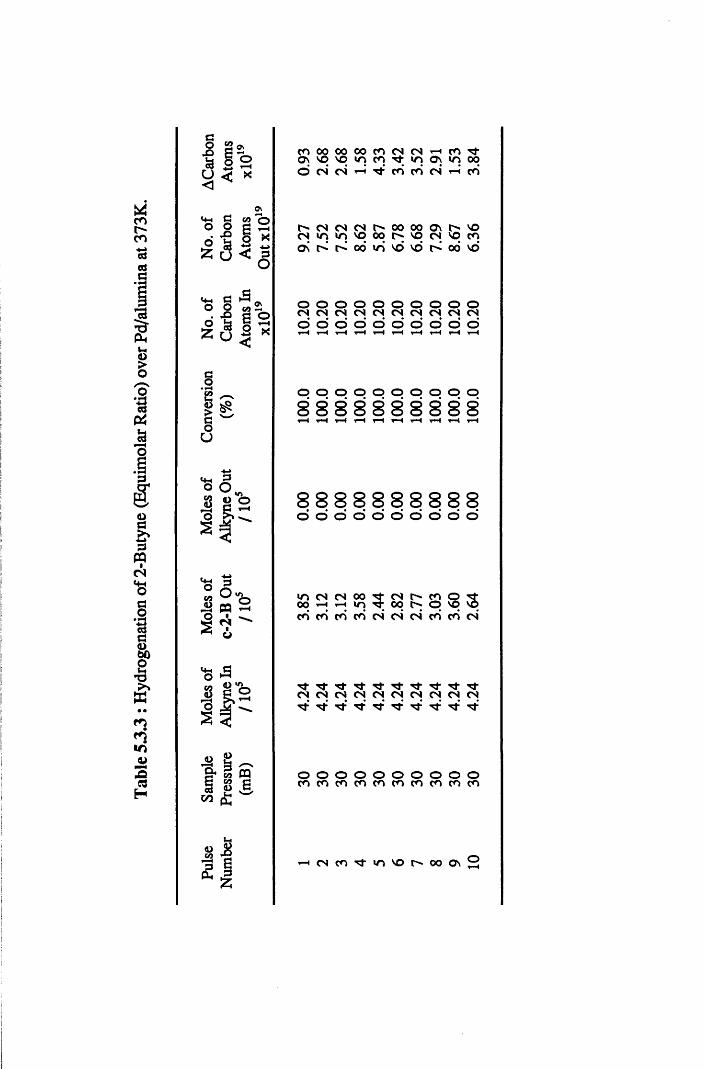
Tabl
e 53
.3 : H
ydro
gena
tion
of 2-
Buty
ne
(Equ
imol
ar R
atio)
ove
r Pd
/alum
ina
at 37
3K.
■§ I sx
<4-1 a
a»<DI
09
’o2
® 2 S o S j S l Z o < (§
<+H Co o w 2. . o a O
5 % i *
o ,u o
pOPQIn■
<o ga /-s& 5 CQH Ui c2a 0 5VI £
i-4<D jg
COa\ 00VO00vq 00in COCOCNCN«o i-HONCOin 00O CNCN COCOCN CO
CN CN CN 0 00 00 ON CN voin in vq 00 vo CN vq CO
00 in vd vd 00 vdCNC\
O O O O O O O O O OC N C N < N < N C N C N C N C N < N C NO d O O d o O O d O
O O O O O O O O O O 8 8 8 8 8 8 8 8 8 8
8 8 8 8 8 8 8 8 8 8O O O O O O O O O O
> O C N C N O O '< t C N t s ( O Q ^ 00 ’H 'H lT) OO C; O 'O 'Oco cd co cd cn cn cn cd cd cn
CNTfCNTfCNCNCNCNCNTt-CNCNCNTj- Tt
O O O O O O O O O OC O C O C O C O C O C O C O C O C O C O
^HCNCOTflOVOr^OOON
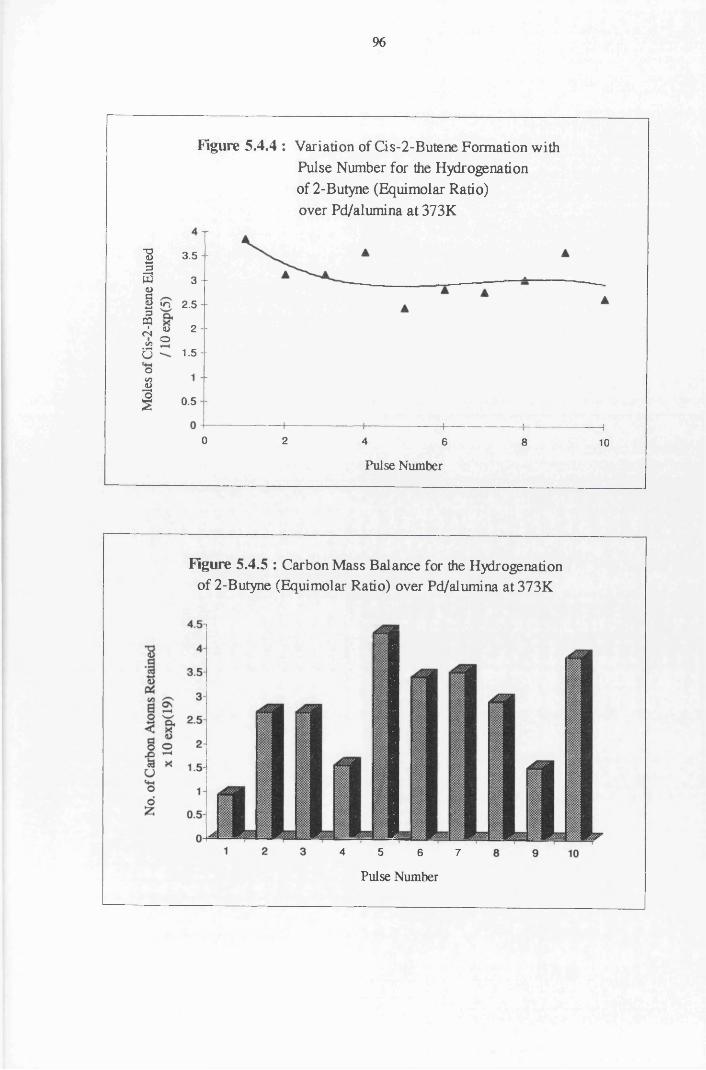
96
Figure 5.4.4 : Variation of Cis-2-Butene Formation with Pulse Number for the Hydrogenation of 2-Butyne (Equimolar Ratio) over Pd/alumina at 373K
13au§3PQI
CNon0oS3S
3.5 -
3 -
»o 2.5 -
<u 2 -o
1.5 -
0.5
0 2 4 6 8 10Pulse Number
Figure 5.4.5 : Carbon Mass Balance for the Hydrogenation of 2-Butyne (Equimolar Ratio) over Pd/alumina at 373K
4 5 6 7
Pulse Number
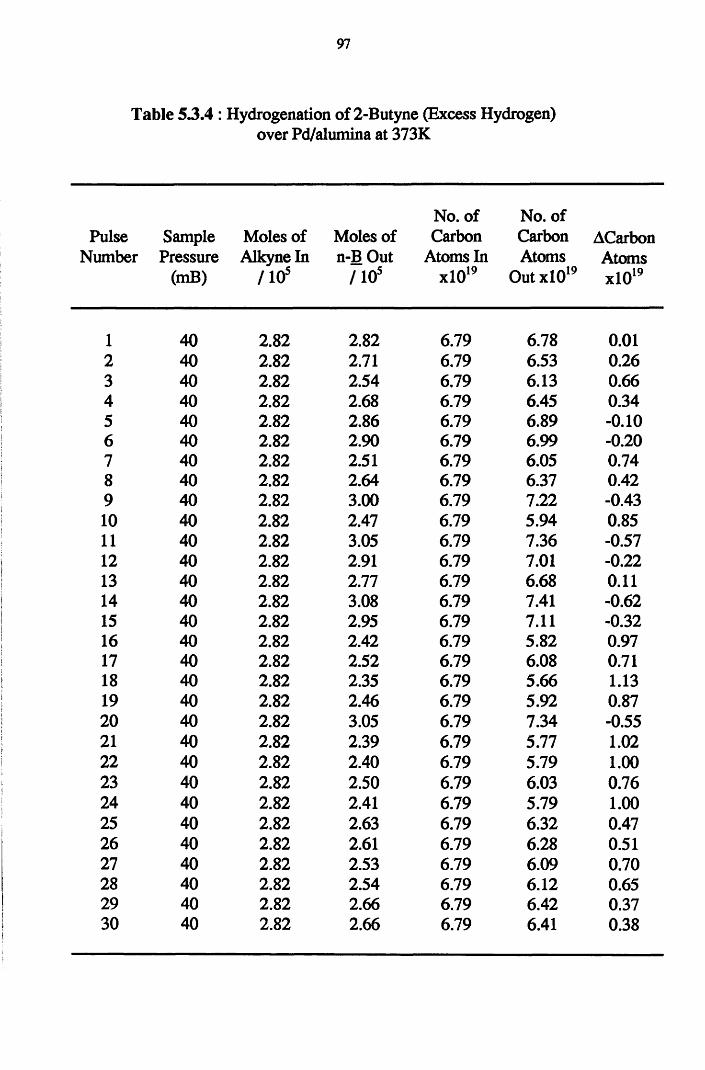
97
Table 53.4 : Hydrogenation of 2-Butyne (Excess Hydrogen)over Pd/alumina at 373K
No. of No. ofPulse Sample Moles of Moles of Carbon Carbon ACarbon
Number Pressure Alkyne In n-B Out Atoms In Atoms Atoms(mB) /1 0 s / 105 xlO19 Out xlO19 xlO19
1 40 2.82 2.82 6.79 6.78 0.012 40 2.82 2.71 6.79 6.53 0.263 40 2.82 2.54 6.79 6.13 0.664 40 2.82 2.68 6.79 6.45 0.345 40 2.82 2.86 6.79 6.89 -0.106 40 2.82 2.90 6.79 6.99 -0.207 40 2.82 2.51 6.79 6.05 0.748 40 2.82 2.64 6.79 6.37 0.429 40 2.82 3.00 6.79 7.22 -0.4310 40 2.82 2.47 6.79 5.94 0.8511 40 2.82 3.05 6.79 7.36 -0.5712 40 2.82 2.91 6.79 7.01 -0.2213 40 2.82 2.77 6.79 6.68 0.1114 40 2.82 3.08 6.79 7.41 -0.6215 40 2.82 2.95 6.79 7.11 -0.3216 40 2.82 2.42 6.79 5.82 0.9717 40 2.82 2.52 6.79 6.08 0.7118 40 2.82 2.35 6.79 5.66 1.1319 40 2.82 2.46 6.79 5.92 0.8720 40 2.82 3.05 6.79 7.34 -0.5521 40 2.82 2.39 6.79 5.77 1.0222 40 2.82 2.40 6.79 5.79 1.0023 40 2.82 2.50 6.79 6.03 0.7624 40 2.82 2.41 6.79 5.79 1.0025 40 2.82 2.63 6.79 6.32 0.4726 40 2.82 2.61 6.79 6.28 0.5127 40 2.82 2.53 6.79 6.09 0.7028 40 2.82 2.54 6.79 6.12 0.6529 40 2.82 2.66 6.79 6.42 0.3730 40 2.82 2.66 6.79 6.41 0.38
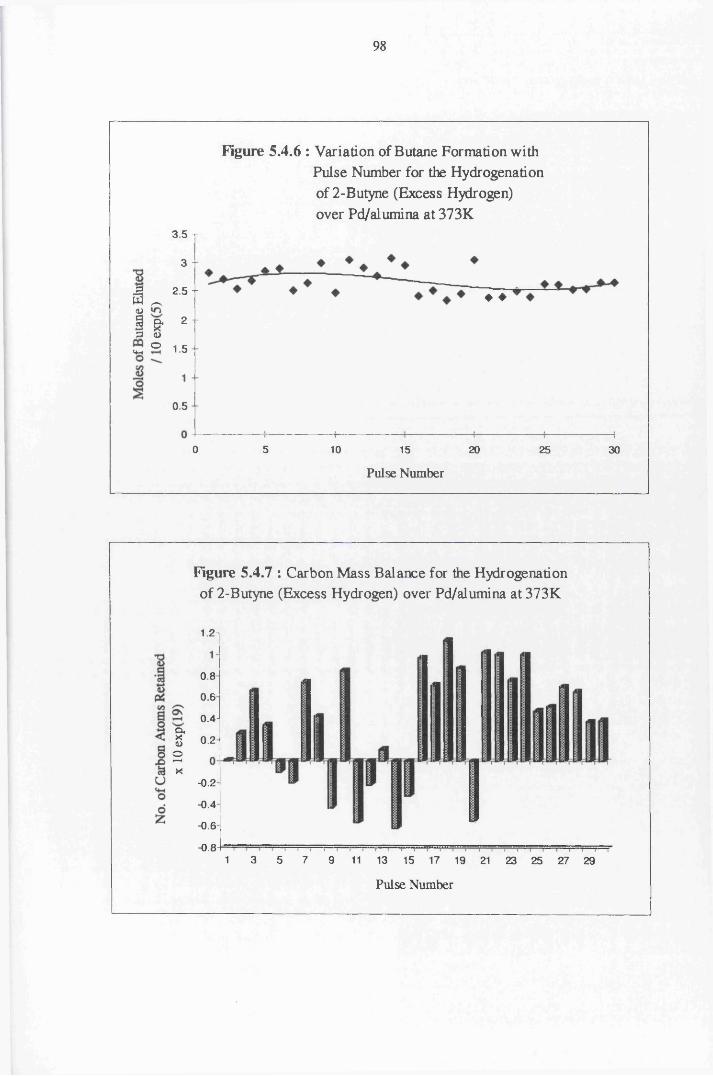
98
Figure 5.4.6 : Variation of Butane Formation with Pulse Number for the Hydrogenation of 2-Butyne (Excess Hydrogen) over Pd/alumina at 373K
3.5 T
3 -
M 2.5 -W ^<DI & 2”P V
o 1 c U-i 1- 3
♦ ♦
0.5
50 10 15 20 25 30
Pulse Number
Figure 5.4.7 : Carbon Mass Balance for the Hydrogenation of 2-Butyne (Excess Hydrogen) over Pd/alumina at 373K
1 .2 -i
0.8
0.6
0.4-Q,X<UO
r -H
0.2
x-0.2
-0.4
-0.6
-0.841 3 5 7 9 11 13 15 17 19 21 23 25 27 29
Pulse Number
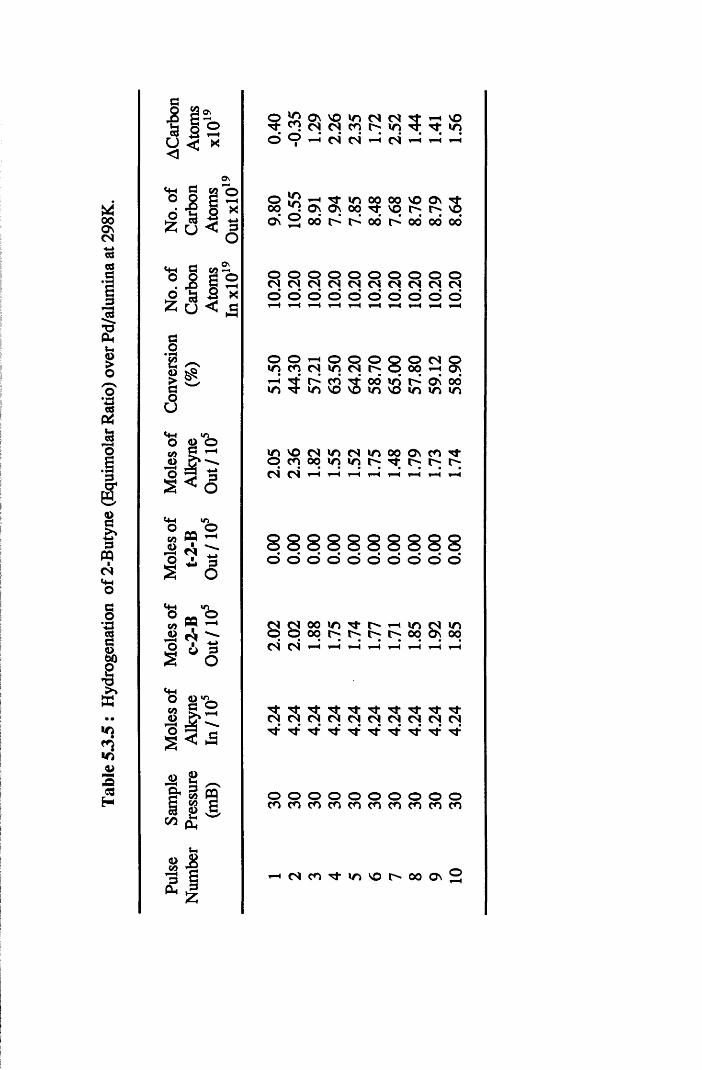
Tabl
e 53
.5 :
Hyd
roge
natio
n of
2-Bu
tyne
(E
quim
olar
Rati
o) o
ver
Pd/al
umin
a at
298K
.G
Iu<
a<
oX
‘S j § 2 4 a J n
G CO-° . S §2o ia 2 Xz u < 5GO
S ^ § w o U
° „ ° M W H■8 ^ -S o
0 „ o w ff HJ3 ^1 6 o*+H° g 'feI t -| < f l
- irv G H co s 2 a>
<U!
CO
© jSco
1%
incn CMIN. CMin 5 voinCM CM
o H 00 ^ ON2 oo
Tf in 00 00 VOp 00 vq ININ IN 00* IN 0000 00 00
o O o o o o o o o oCMCMCMCMCMCMCMCMCMCMd O4 O O ©t-Ho o dr*Ho o
o o o o oin cn CMin CMINm 5 m cnvo £ 00m
O CM Q 00 1-H ONO n o o ’
i n v o c M m c M i n o o O N c n T fq c ^ o o t n i o r ^ ^ h ; ^ ^CM CM t““l *"H t-H t-H i-H t-H rH
8 8 8 8 8 8 8 8 8 8O O O O O O O O O O
8 cm oo m t j - t - ^O OO r - t - ; C-; t - ;
CM CM H t-H t-H t-H t-H t-H t>H tH
m00 s 00
rf rf tTCMCMCMCMCMCMCMCMCMCMrj- Tf- Tf
O O O O O O O O O Ocncncncncncncncncncn
^HCMcnTj-mvor^ooosS
S'Ii
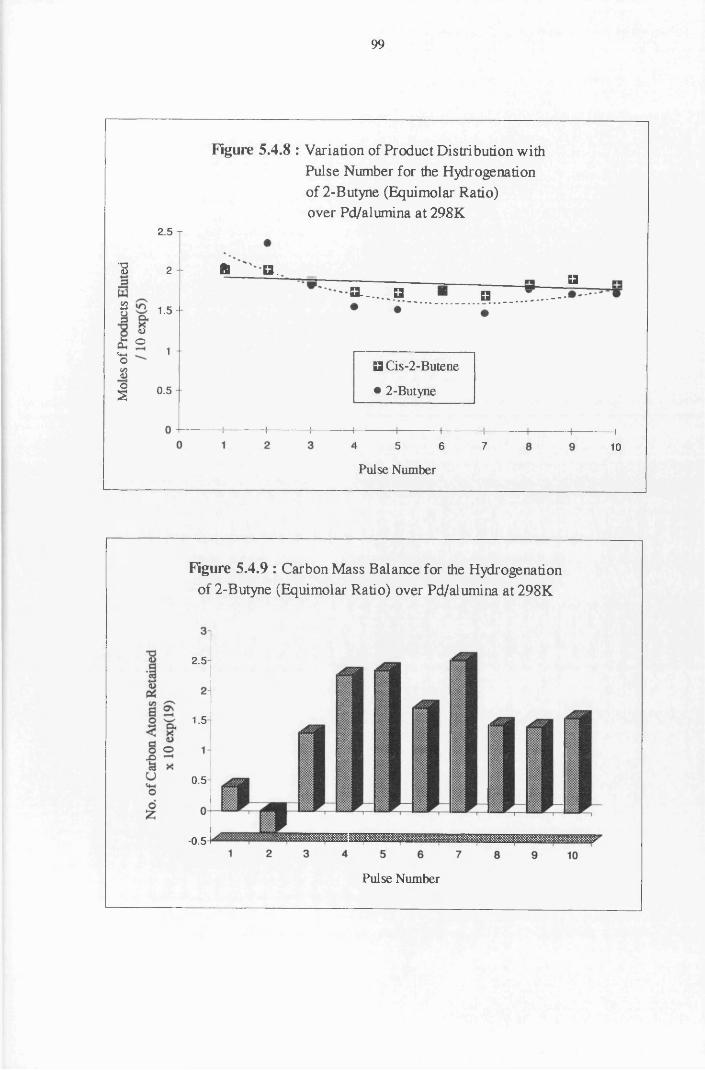
99
2 5 T
■8 2
2o0J
1 .5-
£v-.o
O1 -
8o
s0.5 -
Figure 5.4.8 : Variation of Product Distribution with Pulse Number for the Hydrogenation of 2-Butyne (Equimolar Ratio) over Pd/alumina at 298K
ft B .
B. a B
B Cis-2-Butene
• 2-Butyne
1 5 6 7
Pulse Number
B
H10
Figure 5.4.9 : Carbon Mass Balance for the Hydrogenation of 2-Butyne (Equimolar Ratio) over Pd/alumina at 298K
2.5
1.5
0.5
-0.5
Pulse Number

100
Figure 5.5.0 : Variation of Conversion withPulse Number for the Hydrogenation of 2-Butyne (Equimolar Ratio) over Pd/alumina at 298K
100 T90 -
80 --
70" w 608 50
> 40
J 30-
20 -10 -
0 2 3 5 6 71 4 8 9 10Pulse Number
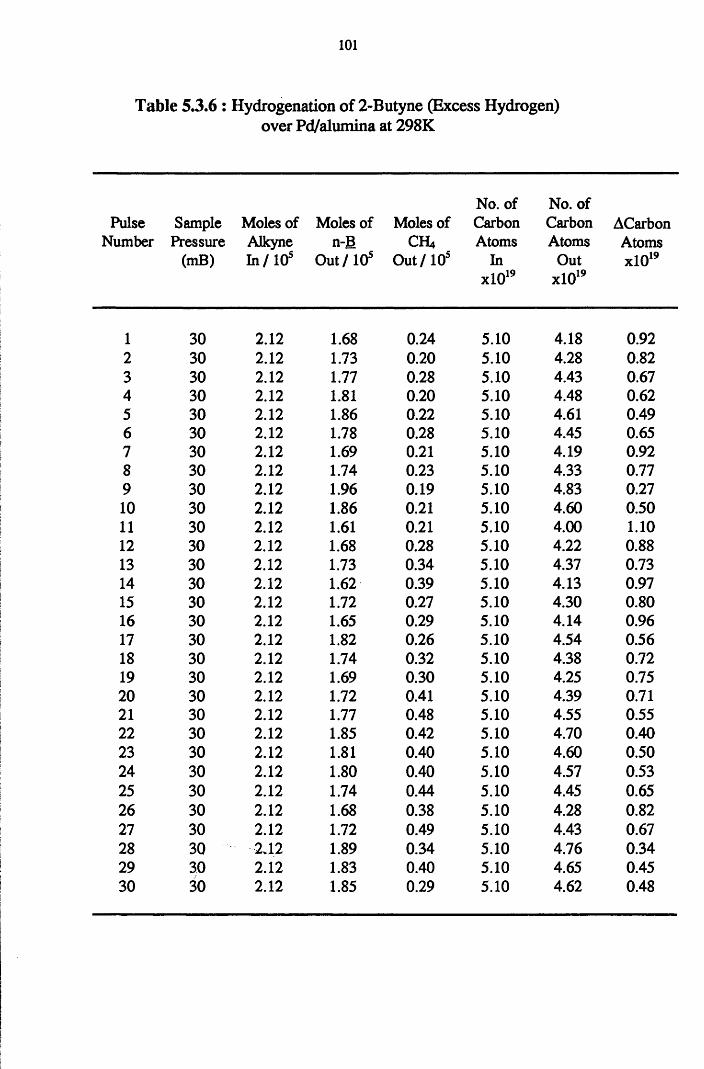
101
Table 5.3.6 : Hydrogenation of 2-Butyne (Excess Hydrogen)over Pd/alumina at 298K
No. of No. ofPulse Sample Moles of Moles of Moles of Carbon Carbon ACarbon
Number Pressure Alkyne n-B CH4 Atoms Atoms Atoms(mB) In/105 Out/10s o u t / 1 0 5 In
xlO19
OutxlO19
xlO19
1 30 2 .1 2 1 .6 8 0.24 5.10 4.18 0.922 30 2 .1 2 1.73 0 .2 0 5.10 4.28 0.823 30 2 .1 2 1.77 0.28 5.10 4.43 0.674 30 2 .1 2 1.81 0 .2 0 5.10 4.48 0.625 30 2 .1 2 1 .8 6 0 .2 2 5.10 4.61 0.496 30 2 .1 2 1.78 0.28 5.10 4.45 0.657 30 2 .1 2 1.69 0 .2 1 5.10 4.19 0.928 30 2 .1 2 1.74 0.23 5.10 4.33 0.779 30 2 .1 2 1.96 0.19 5.10 4.83 0.271 0 30 2 .1 2 1 .8 6 0 .2 1 5.10 4.60 0.5011 30 2 .1 2 1.61 0 .2 1 5.10 4.00 1 .1 012 30 2 .1 2 1 .6 8 0.28 5.10 4.22 0 .8 8
13 30 2 .1 2 1.73 0.34 5.10 4.37 0.7314 30 2 .1 2 1.62 0.39 5.10 4.13 0.9715 30 2 .1 2 1.72 0.27 5.10 4.30 0.8016 30 2 .1 2 1.65 0.29 5.10 4.14 0.9617 30 2 .1 2 1.82 0.26 5.10 4.54 0.5618 30 2 .1 2 1.74 0.32 5.10 4.38 0.7219 30 2 .1 2 1.69 0.30 5.10 4.25 0.752 0 30 2 .1 2 1.72 0.41 5.10 4.39 0.712 1 30 2 .1 2 1.77 0.48 5.10 4.55 0.552 2 30 2 .1 2 1.85 0.42 5.10 4.70 0.4023 30 2 .1 2 1.81 0.40 5.10 4.60 0.5024 30 2 .1 2 1.80 0.40 5.10 4.57 0.5325 30 2 .1 2 1.74 0.44 5.10 4.45 0.6526 30 2 .1 2 1 .6 8 0.38 5.10 4.28 0.8227 30 2 .1 2 1.72 0.49 5.10 4.43 0.6728 30 2 J 2 1.89 0.34 5.10 4.76 0.3429 30 2 .1 2 1.83 0.40 5.10 4.65 0.4530 30 2 .1 2 1.85 0.29 5.10 4.62 0.48
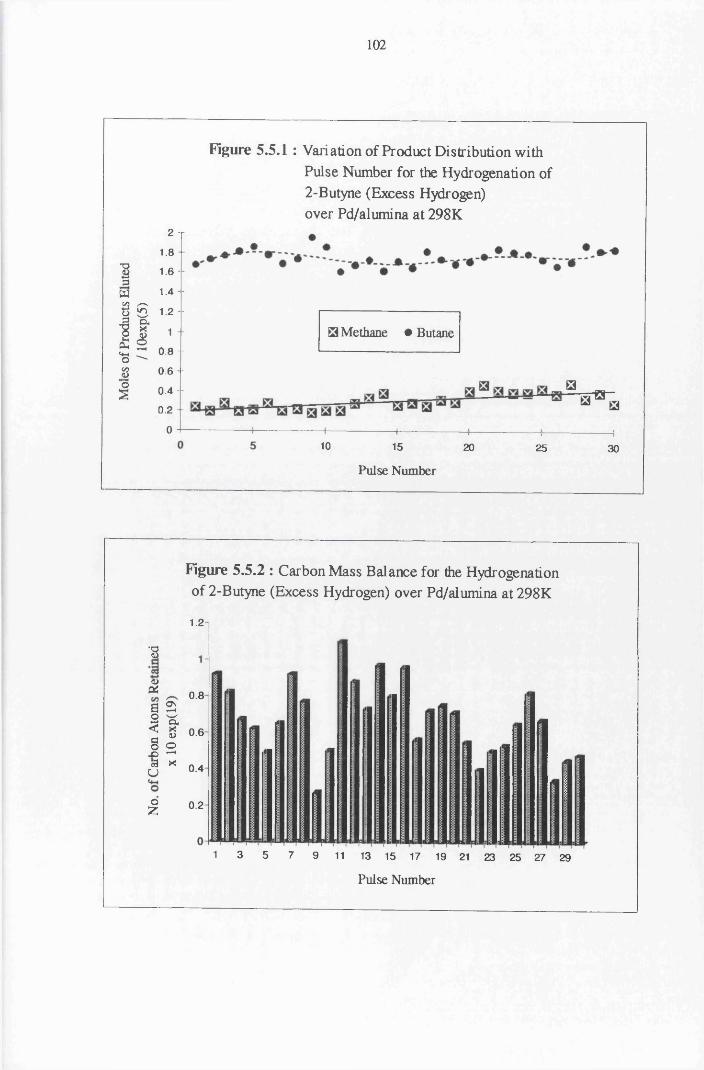
102
2 -r
1.8 -
1 1.6 -
w 1.4 --
§ £ 1.2 --J2. o.V, xI s <+-( ^ o ^
1 -
0 .8 --
£ 0 .6 -o
s 0.4 --
0.2 + 0
Figure 5.5.1 : Variation of Product Distribution with Pulse Number for the Hydrogenation of 2-Butyne (Excess Hydrogen) over Pd/alumina at 298K
S3 Methane • Butane
□S3«■a
10 1-------
15
Pulse Number20 25 30
Figure 5.5.2 : Carbon Mass Balance for the Hydrogenation of 2-Butyne (Excess Hydrogen) over Pd/alumina at 298K
*8<uc*
I I i 8o OX3 —'e3 X Uo£
1.2
0.8
0.6
0.4
0.2
1 3 5 7 9 11 13 15 17 19 21 23 25 27 29
Pulse Number
^
103
4.4.7 The Hydrogenation of 2-Butyne over Silica-Supported Platinum
Over highly dispersed silica-supported platinum, the hydrogenation of 2-
butyne (1:1 :: C ^ : ^ ) at 465K, produced both olefin isomers. The amount of
trans-2-butene detected was small, with the yield of cw-2-butene observed to
decrease with increasing number of pulses, until a limiting value was reached
(Figure 5.5.3). The conversion of 2-butyne was maintained at 100% over the first
three pulses before decreasing to approximately 60%. The amount of carbon lost
to the surface increased and then decreased, until carbon was being removed from
the surface (Ctotai positive).
Using excess hydrogen, the hydrogenation of 2-butyne over Pt/silica at
465K, produced c/s-2-butene as the major product, with 100% conversion of the
acetylene maintained over thirty pulses. Over the first two pulses the trans
isomer was also detected, but only in trace amounts (Table 5.3.8). The yield of
c/s-2-butene was observed to increase (unsteadily) to a limiting value, with the
catalyst observed to retain and lose carbon (Ctotai positive).
At 373K, the reaction between 2-butyne and hydrogen (equimolar ratio)
over Pt/silica produced c/s-2-butene. The conversion of 2-butyne was found to
decrease sharply after six pulses, from 100% to approximately 27% (Table 5.3.6).
The amount of olefin produced decreased with increased number of pulses, with
the laydown of surface carbon decreasing from pulse five onward, until negative
(Ctotai positive).
Using excess hydrogen, the reaction produced only ds-2-butene. The
yield of the olefin was observed to fluctuate from pulse to pulse, with the
resulting product curve showing behaviour indicative of an oscillating system.
This oscillatory behaviour was also seen in the carbon mass balance data (Figure
5.6.3).
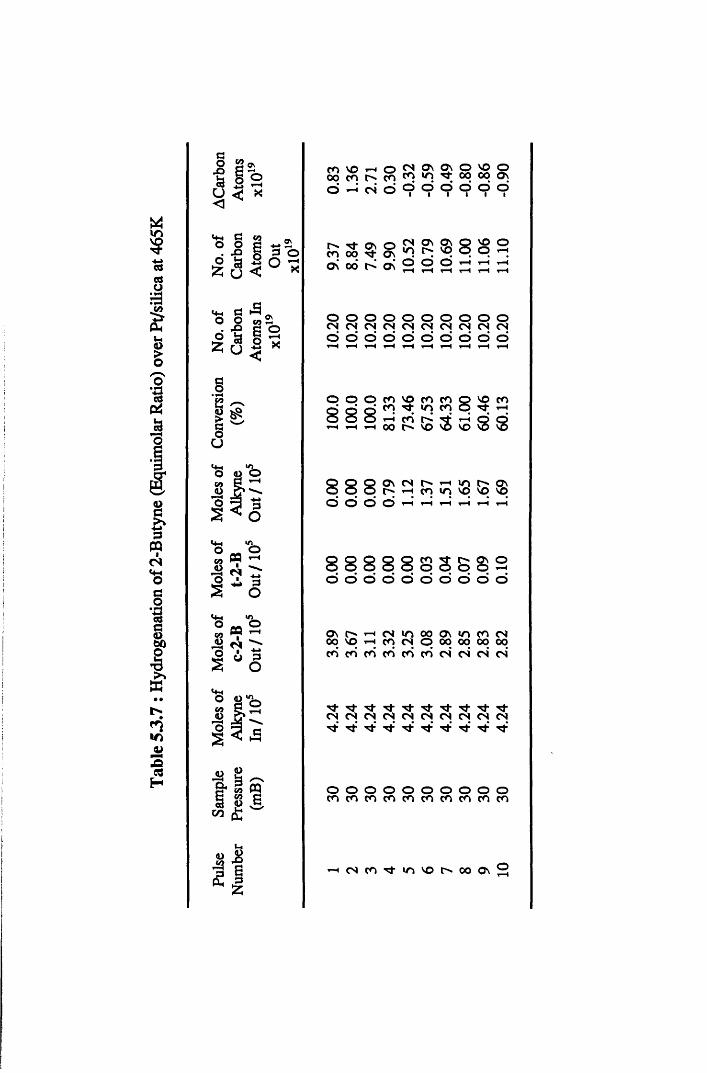
Tabl
e 53
.7 : H
ydro
gena
tion
of 2-
Buty
ne
(Equ
imol
ar R
atio)
ove
r Pt
/silic
a at
465K
o " at I so < X
C co _ O O e ^ 2
. X> S P o
55 U < *
<+H C ^ 0\ o o43 C O
§ -
° m °l " 93 * 5
oGO4>3s
pa
CO vo rH O00 CO COd t-H CN 0
CN O n O n 0 VO 0CO «o 00 00 O nd d d 0 0 O
'<fr O n OCO OO ONO n 00 O n
CN O n O n IT) t''> NOo d d
vo oO y—I
O O O O O O O O O OC N C N C N C N C N C N C N C N C N C N 0 0 0 0 0 0 0 0 0 0
O O O CO vo
8 8 8 2 3rH t-H rH 00 C''*
COi n
COCO 8 vo CO
S 3 rHvo s 8
O n CNt-H
t"-CO
H10
10vq vq
O nvq
O rH rH rH t-H rH rH
8 8 8 8 8 S 3 S 8 S0 0 0 0 0 0 0 0 0 0
t-H O n r * t-H CN «n 00 ON in CO CN00 vq t-H CO CN p 00 00 00 00
P CO CO CO CO CO CO CN CN CN CN
CN CN CN CN CN CN CN CN CN CN■tf
O O O O O O O O O Oc o c o c o c o c o c o c o c o c o c o
’HCNCO' t inVOtsOOON
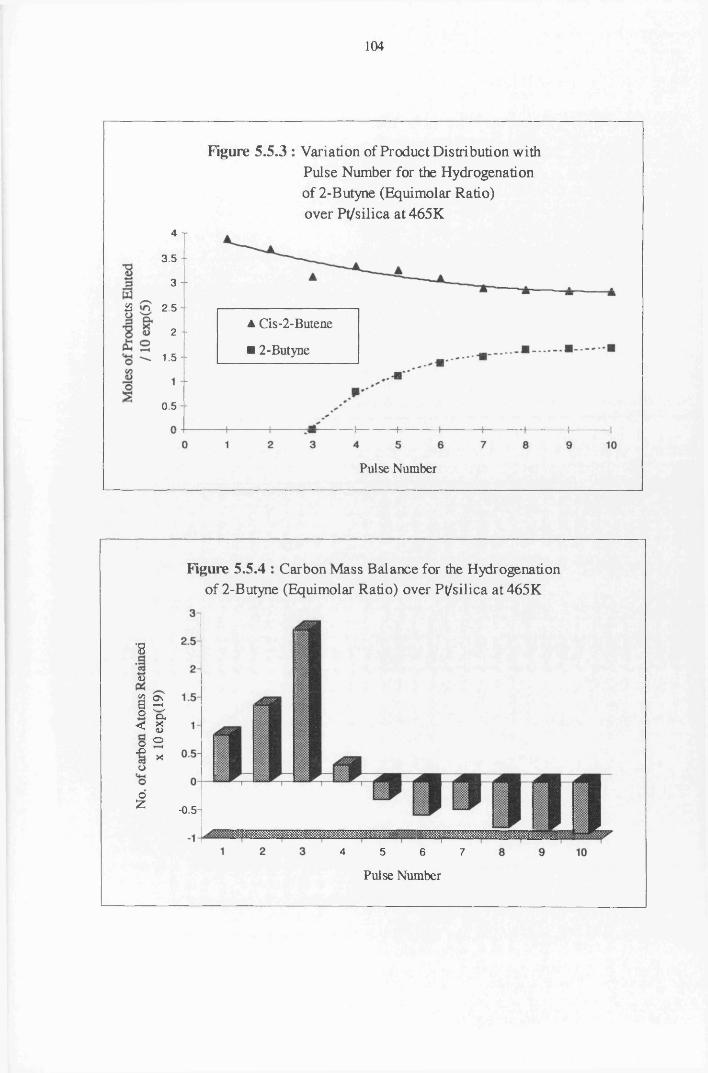
104
Figure 5.5.3 : Variation of Product Distribution with Pulse Number for the Hydrogenation of 2-Butyne (Equimolar Ratio) over Pt/silica at 465K
4 T3.5 -
3
2 2.5 -A Cis-2-Butene2 -■ 2-Butyne1.5 -
0.5 -
Pulse Number
Figure 5.5.4 : Carbon Mass Balance for the Hydrogenation of 2-Butyne (Equimolar Ratio) over Pt/silica at 465K
■8d>% ONS rio<oX)oo£
Cu,soHX
-0.5
4 5 6 7
Pulse Number
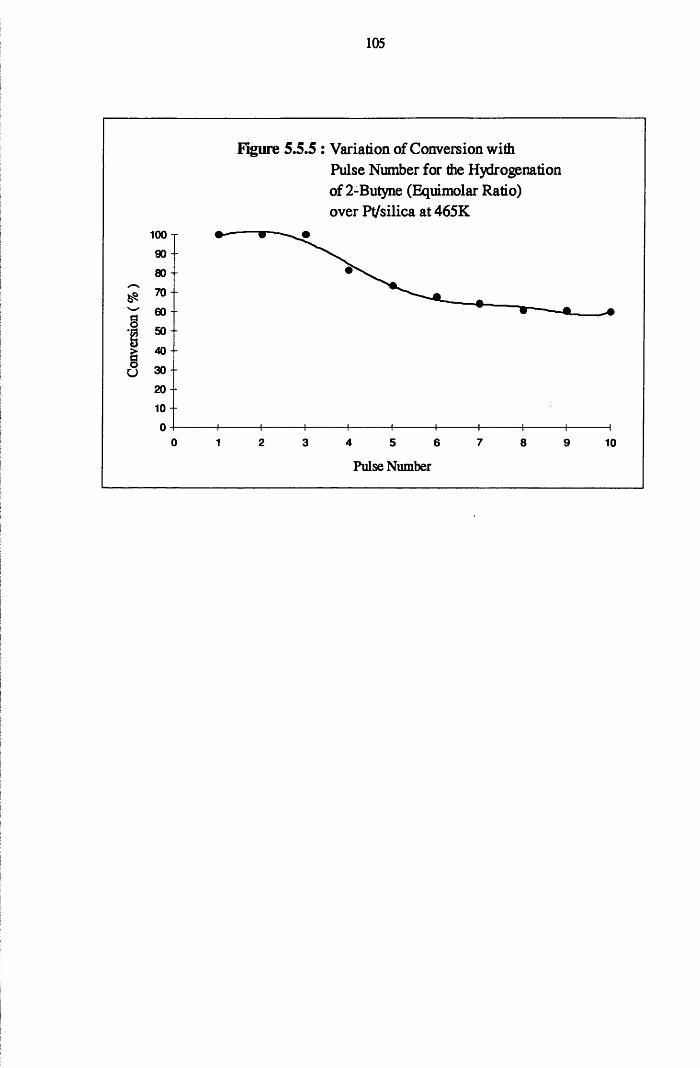
105
Figure 5.5.5 : Variation of Conversion withPulse Number for the Hydrogenation of 2-Butyne (Equimolar Ratio) over Pt/silica at 465K
100 T90 -
80 -
8 50 -
> 40sd 30
20 -
10 -
0 1 2 3 4 5 6 7 8 9 10Pulse Number
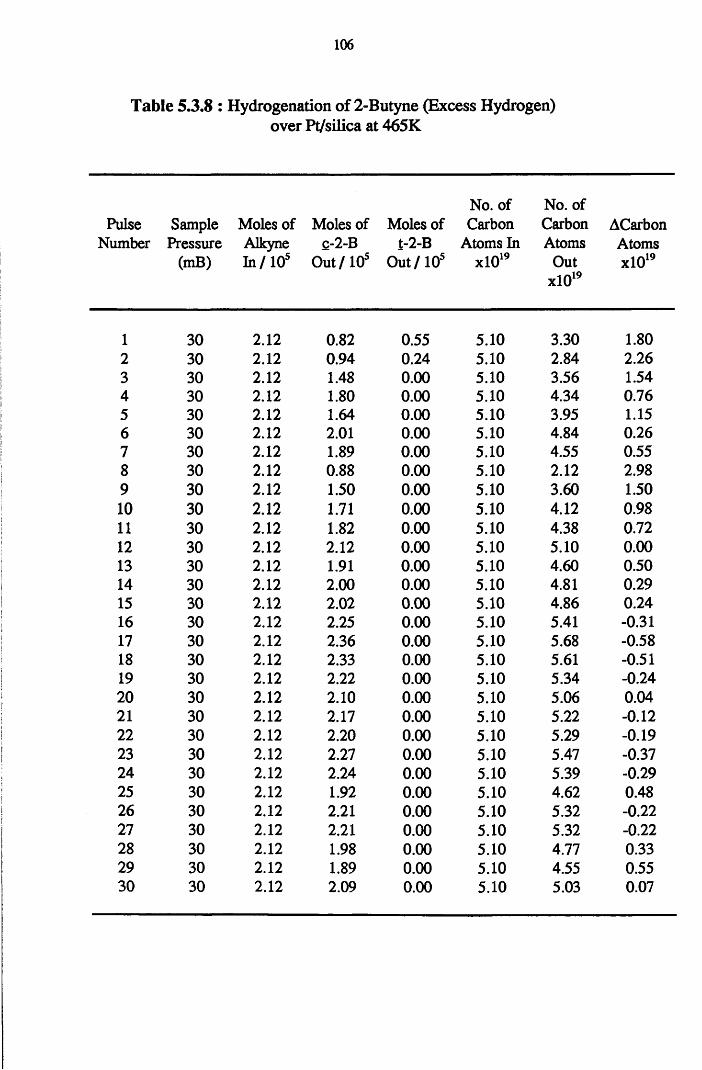
106
Table 5.3.8 : Hydrogenation of 2-Butyne (Excess Hydrogen)over Pt/silica at 465K
PulseNumber
SamplePressure
(mB)
Moles of Alkyne
Moles of c-2-B
Moles of t-2-B
In / 10 Out / 10 Out / 10
No. of Carbon
Atoms In xlO19
No. of Carbon Atoms
Out xlO19
ACarbonAtomsxlO19
1 30 2.12 0.82 0.55 5.10 3.30 1.802 30 2.12 0.94 0.24 5.10 2.84 2.263 30 2.12 1.48 0.00 5.10 3.56 1.544 30 2.12 1.80 0.00 5.10 4.34 0.765 30 2.12 1.64 0.00 5.10 3.95 1.156 30 2.12 2.01 0.00 5.10 4.84 0.267 30 2.12 1.89 0.00 5.10 4.55 0.558 30 2.12 0.88 0.00 5.10 2.12 2.989 30 2.12 1.50 0.00 5.10 3.60 1.5010 30 2.12 1.71 0.00 5.10 4.12 0.9811 30 2.12 1.82 0.00 5.10 4.38 0.7212 30 2.12 2.12 0.00 5.10 5.10 0.0013 30 2.12 1.91 0.00 5.10 4.60 0.5014 30 2.12 2.00 0.00 5.10 4.81 0.2915 30 2.12 2.02 0.00 5.10 4.86 0.2416 30 2.12 2.25 0.00 5.10 5.41 -0.3117 30 2.12 2.36 0.00 5.10 5.68 -0.5818 30 2.12 2.33 0.00 5.10 5.61 -0.5119 30 2.12 2.22 0.00 5.10 5.34 -0.2420 30 2.12 2.10 0.00 5.10 5.06 0.0421 30 2.12 2.17 0.00 5.10 5.22 -0.1222 30 2.12 2.20 0.00 5.10 5.29 -0.1923 30 2.12 2.27 0.00 5.10 5.47 -0.3724 30 2.12 2.24 0.00 5.10 5.39 -0.2925 30 2.12 1.92 0.00 5.10 4.62 0.4826 30 2.12 2.21 0.00 5.10 5.32 -0.2227 30 2.12 2.21 0.00 5.10 5.32 -0.2228 30 2.12 1.98 0.00 5.10 4.77 0.3329 30 2.12 1.89 0.00 5.10 4.55 0.5530 30 2.12 2.09 0.00 5.10 5.03 0.07
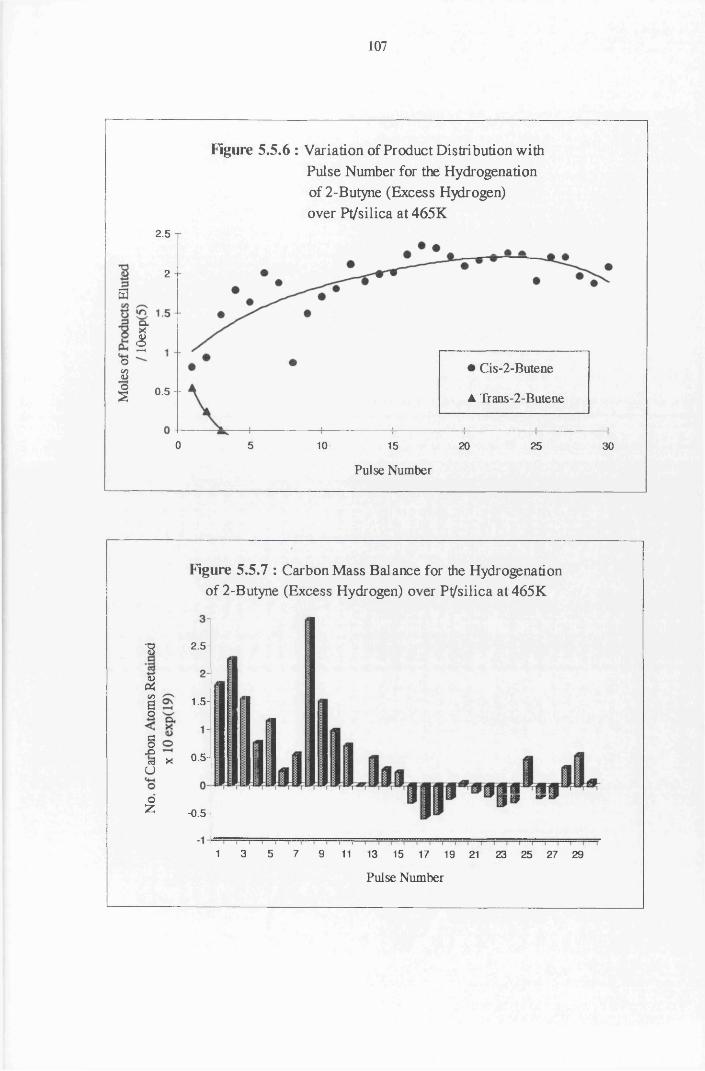
107
a
oSos
Figure 5.5.6 : Variation of Product Distribution with Pulse Number for the Hydrogenation of 2-Butyne (Excess Hydrogen) over Pt/silica at 465K
2.5 T
2
'o,X
<st-H
• Cis-2-Butene
0.5 -A Trans-2-Butene
o 5 10 15 20 25 30
Pulse Number
Figure 5.5.7 : Carbon Mass Balance for the Hydrogenation of 2-Butyne (Excess Hydrogen) over Pt/silica at 465K
•8a>04(/)ao
8x>c3uo£
2.5-
1.5-
0.5-X
-0.5-
3 5 7 9 11 13 15 17 19 21 23 25 27 291
Pulse Number
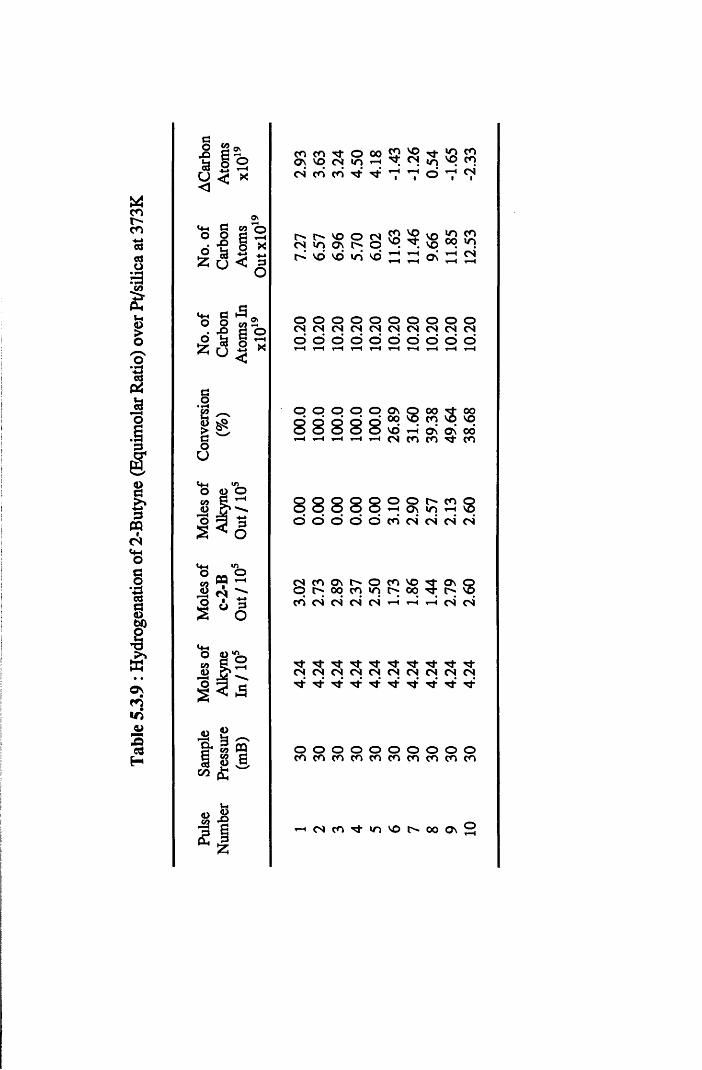
Tabl
e 5.3
.9 : H
ydro
gena
tion
of 2-
Buty
ne
(Equ
imol
ar R
atio)
ove
r Pt
/silic
a at
373K
1 1 *a 1 2U < K
o\Mh G m "o ° O g H5 a J 5S u < a
<4-1 C ►S° 2 w 2d | | S S 5 < 3 | x
8e<UsoU
>nO
PQ rH1CN| 4-»CJ
o
2*nO
i T"^
►5
CO«uO2
•Si S ^ & 3 «S s aCO £ w
V-jo 2 43 •§
CO CO O 00ON vq CN •O r-HCN CO CO
r- VO o CN COvq
vovt" VOCN «o ON o N VOvo vd uS vd rH
i-HrH ON
oo in *-h CN
O O O O O O O O O OC N C N C N C N C N C N C N C N C N C NO O O O O O O O O O
ON00 s 0 0
CO 3 00vq
vd T—1 ON O n 00*CN CO CO ' t CO
O O O O O8 8 8 8 8 5
8 Q Q Q Q ° O c ^ c o q ^ q q q H O j i o H ®O o o d O CO CN CN CN CN
CN CO O n o CO vo 5 O n
8O 00 cq «q 00 ( >cd CN CN CN CN rH r-H rH CN CN
CN CN CNT fCN CN
N -CN CN
T fCN
' tCN CN
N t ' t 'St NT ' t ' t
O O O O O O O O O Oc o c o c o c o c o c o c o c o c o c o
'H (N ( 0 ^ i n 'O h « o o a \ 2
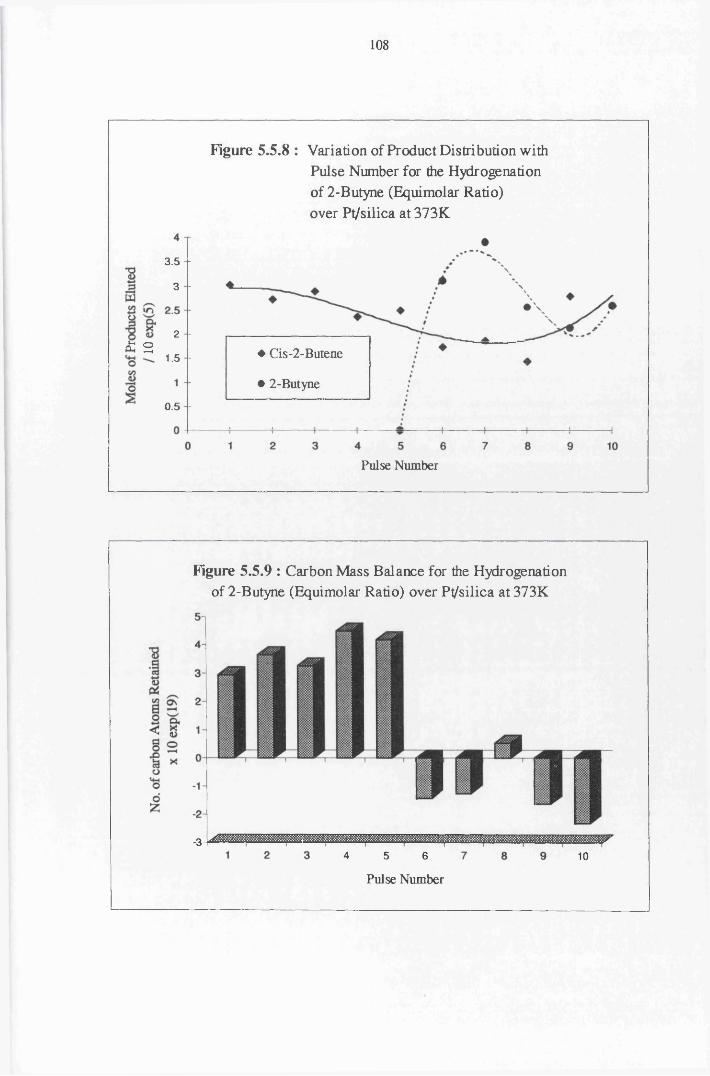
108
Figure 5.5.8 : Variation of Product Distribution with Pulse Number for the Hydrogenation of 2-Butyne (Equimolar Ratio) over Pt/silica at 373K
3.5 -
3 -
2 -
£ 2 ♦ Cis-2-Butene1.5 -
• 2-Butyne0.5 -
Pulse Number
Figure 5.5.9 : Carbon Mass Balance for the Hydrogenation of 2-Butyne (Equimolar Ratio) over Pt/silica at 373K
-3i4 5 6
Pulse Number
10
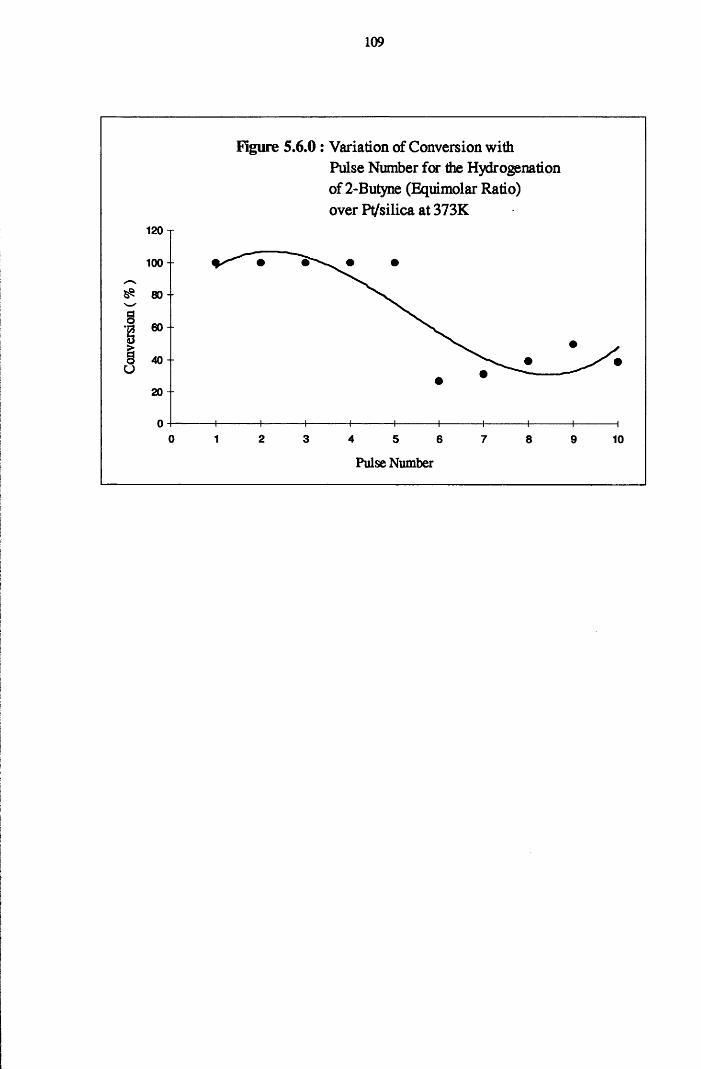
109
Figure 5.6.0 : Variation of Conversion withPulse Number for the Hydrogenation of 2-Butyne (Equimolar Ratio) over Pt/silica at 373K
120 X
100 - -
^ so -8 60 -
>8 40 --
20 -
20 1 3 4 5 6 7 8 9 10
Pulse Number
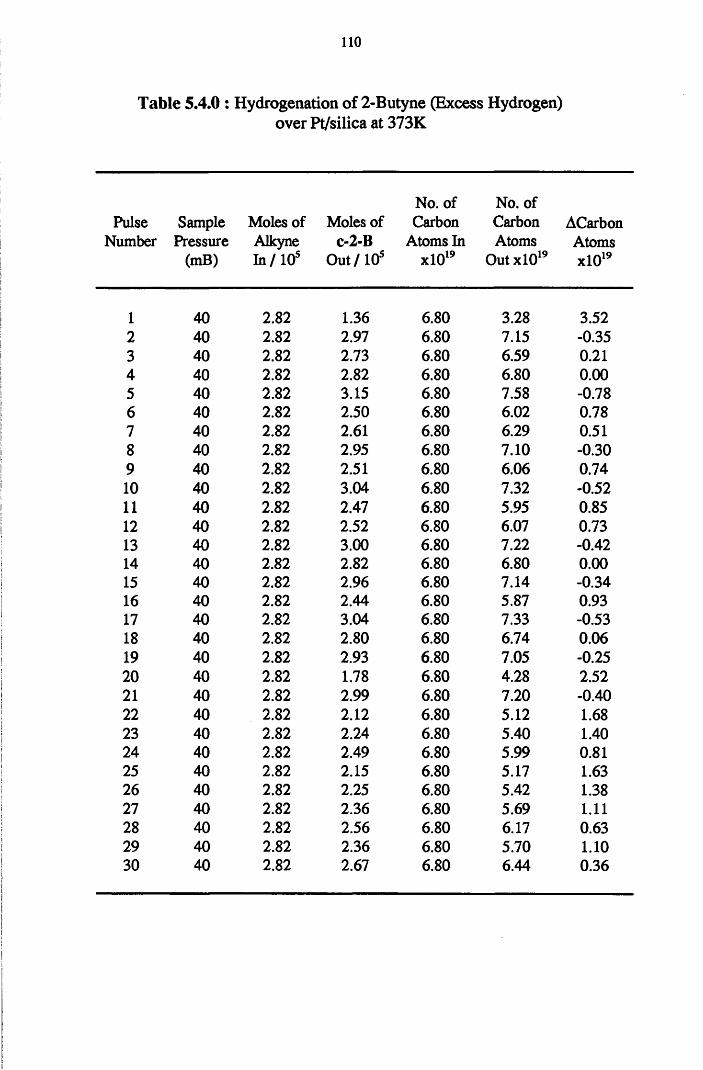
110
Table 5.4.0 : Hydrogenation of 2-Butyne (Excess Hydrogen)over Pt/silica at 373K
No. of No. ofPulse Sample Moles of Moles of Carbon Carbon ACarbon
Number Pressure Alkyne c-2-B Atoms In Atoms Atoms (mB) In/105 Out /105 xlO19 OutxlO19 xlO19
1 40 2.82 1.36 6.80 3.28 3.522 40 2.82 2.97 6.80 7.15 -0.353 40 2.82 2.73 6.80 6.59 0.214 40 2.82 2.82 6.80 6.80 0.005 40 2.82 3.15 6.80 7.58 -0.786 40 2.82 2.50 6.80 6.02 0.787 40 2.82 2.61 6.80 6.29 0.518 40 2.82 2.95 6.80 7.10 -0.309 40 2.82 2.51 6.80 6.06 0.7410 40 2.82 3.04 6.80 7.32 -0.5211 40 2.82 2.47 6.80 5.95 0.8512 40 2.82 2.52 6.80 6.07 0.7313 40 2.82 3.00 6.80 7.22 -0.4214 40 2.82 2.82 6.80 6.80 0.0015 40 2.82 2.96 6.80 7.14 -0.3416 40 2.82 2.44 6.80 5.87 0.9317 40 2.82 3.04 6.80 7.33 -0.5318 40 2.82 2.80 6.80 6.74 0.0619 40 2.82 2.93 6.80 7.05 -0.2520 40 2.82 1.78 6.80 4.28 2.5221 40 2.82 2.99 6.80 7.20 -0.4022 40 2.82 2.12 6.80 5.12 1.6823 40 2.82 2.24 6.80 5.40 1.4024 40 2.82 2.49 6.80 5.99 0.8125 40 2.82 2.15 6.80 5.17 1.6326 40 2.82 2.25 6.80 5.42 1.3827 40 2.82 2.36 6.80 5.69 1.1128 40 2.82 2.56 6.80 6.17 0.6329 40 2.82 2.36 6.80 5.70 1.1030 40 2.82 2.67 6.80 6.44 0.36
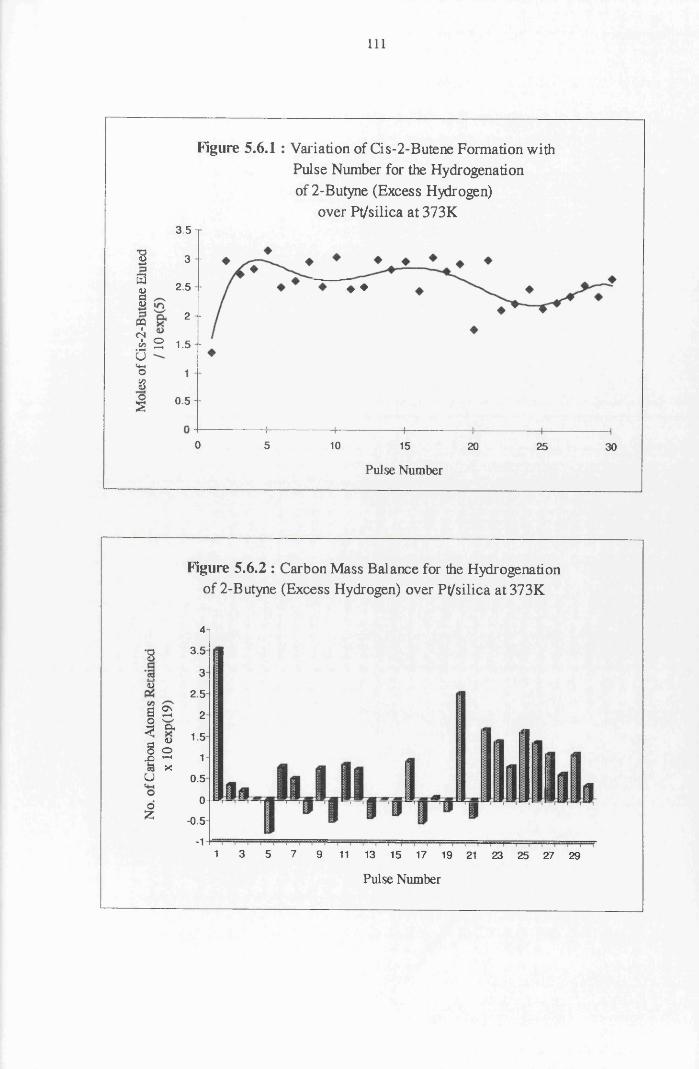
I l l
Figure 5.6.1 : Variation of Cis-2-Butene Formation with Pulse Number for the Hydrogenation of 2-Butyne (Excess Hydrogen)
over Pt/silica at 373K
ia<usPQICNic/5• Hu4-1oSos
3.5 T
3 -
2.5 - ♦ ♦
2 -
2 1.5 -
0.5 -
0 5 10 15 20 25 30
Pulse Number
Figure 5.6.2 : Carbon Mass Balance for the Hydrogenation of 2-Butyne (Excess Hydrogen) over Pt/silica at373K
•855
a 23 *a w o o•6 ^ xUo£
43.5
32.5
21.5
10.5
0-0.5
-11 3 5 7 9 11 13 15 17 19 21 23 25 27 29
Pulse Number
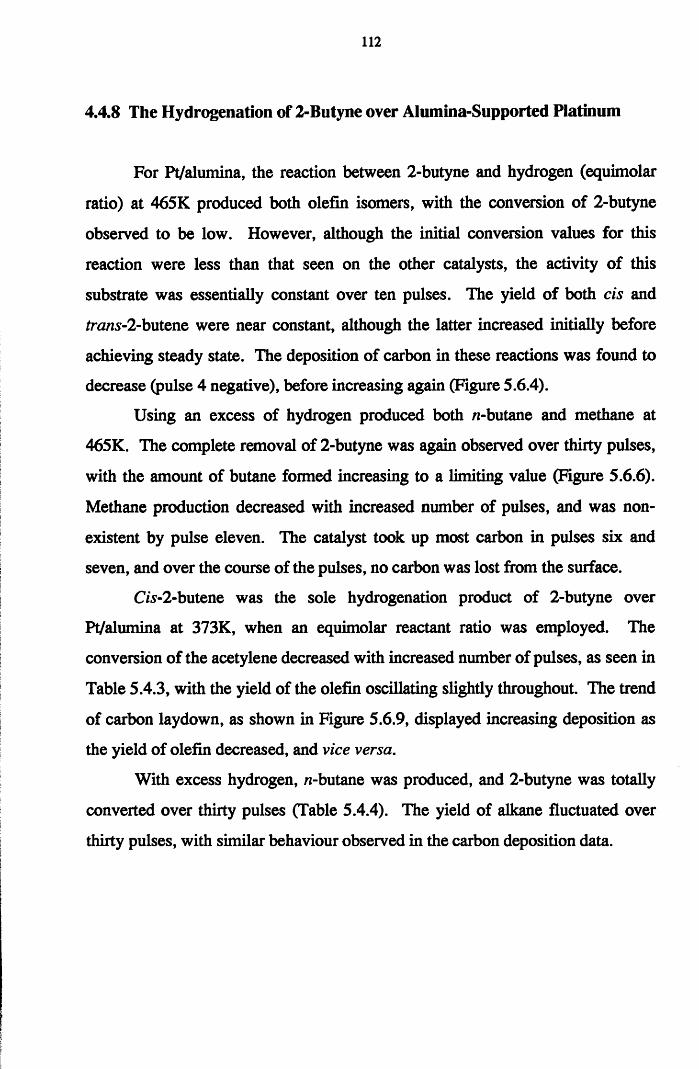
112
4.4.8 The Hydrogenation of 2-Butyne over Alumina-Supported Platinum
For Pt/alumina, the reaction between 2-butyne and hydrogen (equimolar
ratio) at 465K produced both olefin isomers, with the conversion of 2-butyne
observed to be low. However, although the initial conversion values for this
reaction were less than that seen on the other catalysts, the activity of this
substrate was essentially constant over ten pulses. The yield of both cis and
trans-2-butene were near constant, although the latter increased initially before
achieving steady state. The deposition of carbon in these reactions was found to
decrease (pulse 4 negative), before increasing again (Figure 5.6.4).
Using an excess of hydrogen produced both /i-butane and methane at
465K. The complete removal of 2-butyne was again observed over thirty pulses,
with the amount of butane formed increasing to a limiting value (Figure 5.6.6).
Methane production decreased with increased number of pulses, and was non
existent by pulse eleven. The catalyst took up most carbon in pulses six and
seven, and over the course of the pulses, no carbon was lost from the surface.
C/s-2-butene was the sole hydrogenation product of 2-butyne over
Pt/alumina at 373K, when an equimolar reactant ratio was employed. The
conversion of the acetylene decreased with increased number of pulses, as seen in
Table 5.4.3, with the yield of the olefin oscillating slightly throughout. The trend
of carbon laydown, as shown in Figure 5.6.9, displayed increasing deposition as
the yield of olefin decreased, and vice versa.
With excess hydrogen, n-butane was produced, and 2-butyne was totally
converted over thirty pulses (Table 5.4.4). The yield of alkane fluctuated over
thirty pulses, with similar behaviour observed in the carbon deposition data.
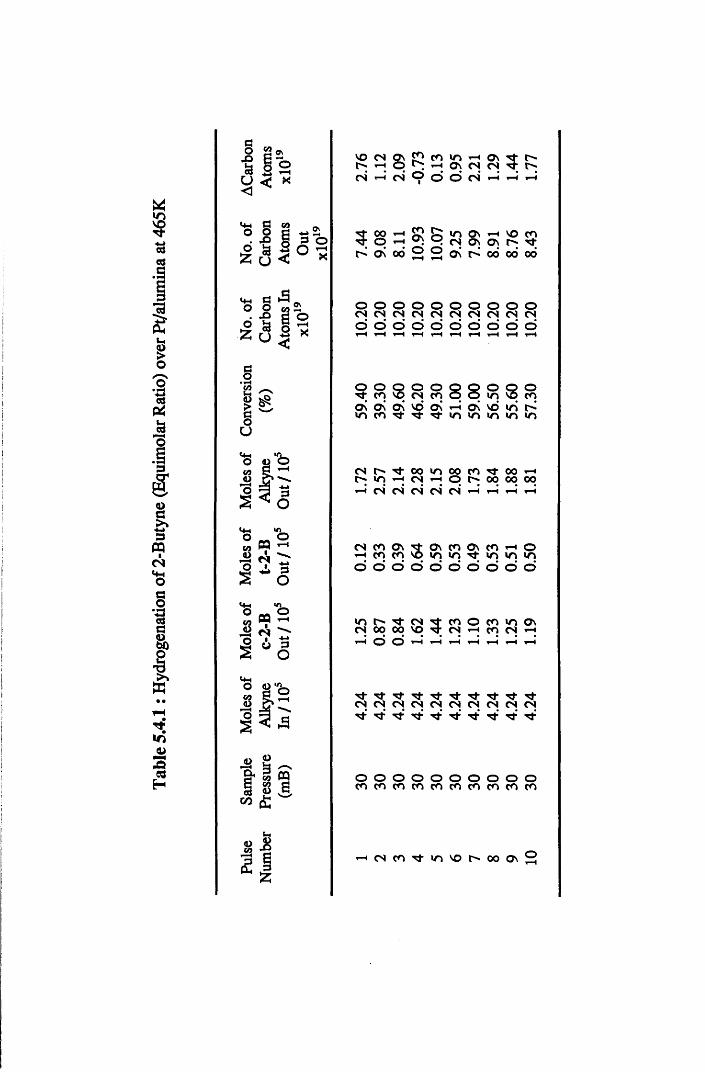
Tabl
e 5.
4.1:
Hyd
roge
natio
n of
2-Bu
tyne
(E
quim
olar
Rati
o) o
ver
Pt/al
umin
a at
465K
o
■§ I sU < KVO CN s
CO CO IT) rH O n 5t"; iH r-H O n CN CNCN 1-H cn ©
1 © o CN T“H ^H ^H
M-h G co _o o g *jS5 . x i g p o
Z CJ < *00 ^ a s O HOn oo
8 in ON r H VO COCN O n O n i > T j-
O n 0 0 0 0 0 0
t+-t G ^o o m 2• X) g O5 & i *Z 0 3 x
o o o o o o o o o oC N C N C N C N C N C N C N C N C N C N0 0 0 0 0 0 0 0 0 0
o o s O oCO CNCOOnOnOnvd Onin CO h-
8 8 ° SO Q O in vq co*-i oi vd in in in <n «n
u oCN
i nT ffH
0 0CN
u-»rHooo
COOO
00oo
t-HOO
t-H CN CN CN CN CN H tH iH r-H
CNCOOns OnCOOnCOH oi-HCOCO in in in in ino o d o o o d d o o
»nCN
r -00 OO
CNvq 5
COCN
ot—H
COCO
i nCN
O n
t-H o o t-H r-H t-H ^H T“H l-H
H -CN
t J-CN CN
T fCN CN CN CN CN CN CN
H - H -* H"
o o o o o o o o o oc o c o c o c o c o c o c o c o c o c o
^(NC^'tlONOt^OOON
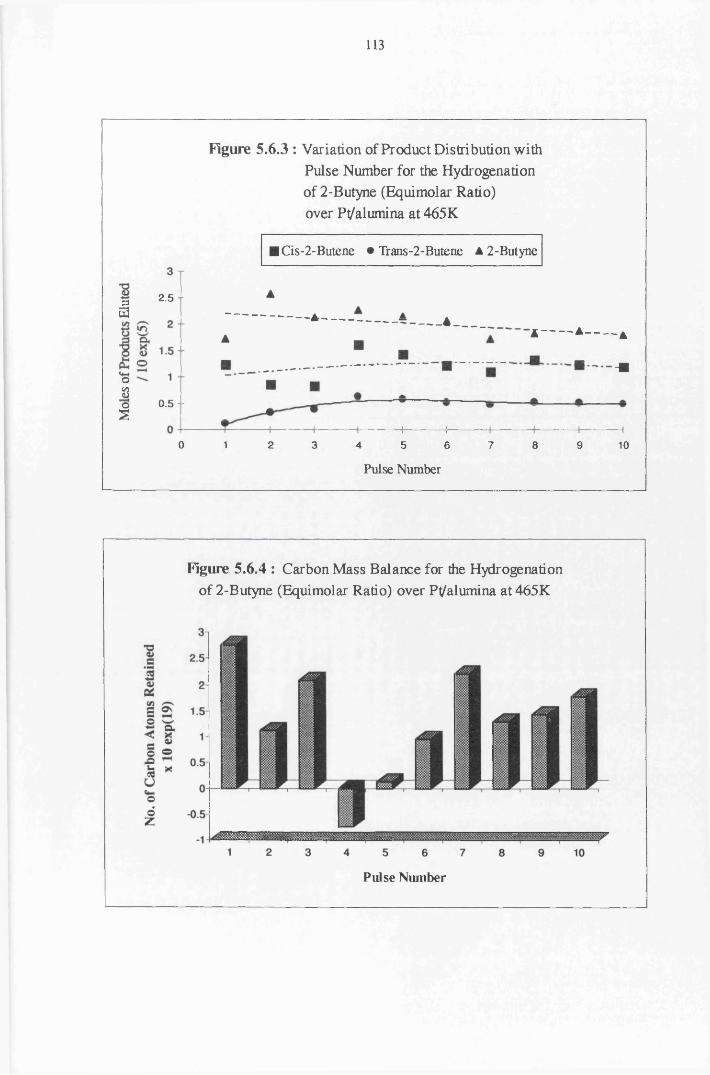
113
saa
o3oS
Figure 5.6.3 : Variation of Product Distribution with Pulse Number for the Hydrogenation of 2-Butyne (Equimolar Ratio) over Pt/alumina at 465K
■ Cis-2-Butene • Trans-2-Butene A 2-Butyne
2.5 -
— A---------- .4___A 4 A
-■
0.5 -
0 1 2 3 5 6 8 94 7 10
Pulse Number
Figure 5.6.4 : Carbon Mass Balance for the Hydrogenation of 2-Butyne (Equimolar Ratio) over Pt/alumina at 465K
Pulse Number
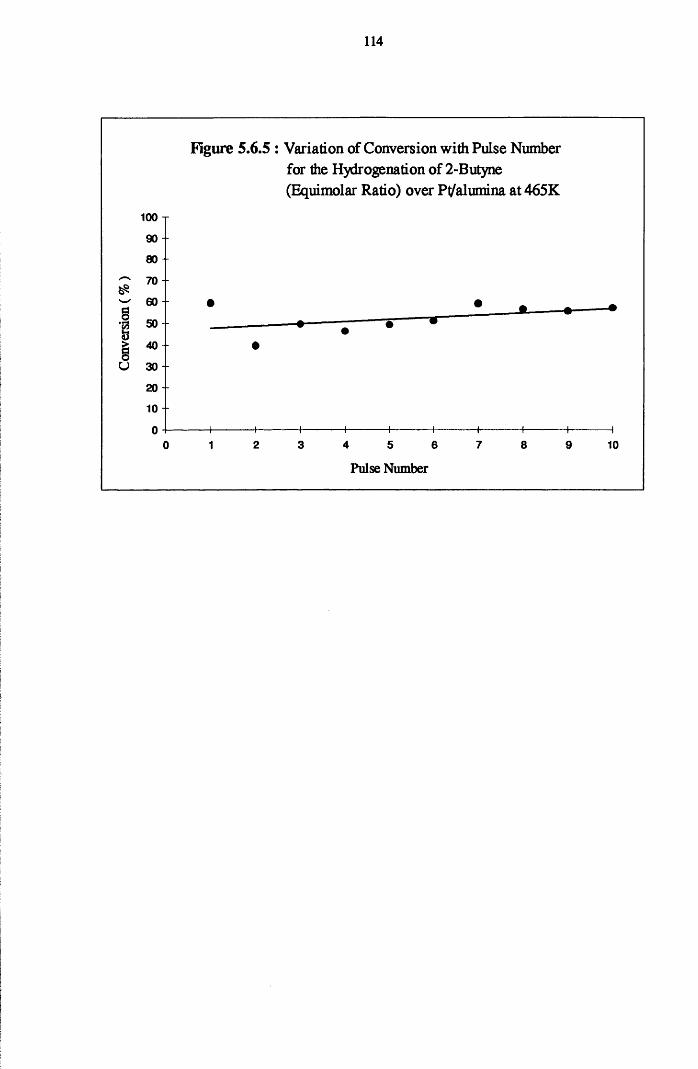
114
Figure 5.6.5 : Variation of Conversion with Pulse Number for the Hydrogenation of 2-Butyne (Equimolar Ratio) over Pt/alumina at 465K
100 T90 --
80 -
~ 70 --
60 -8 50 -
> 40g
U 30 -
20 ~
10 - -
2 3 4 5 6 7 8 90 1 10
Pulse Number
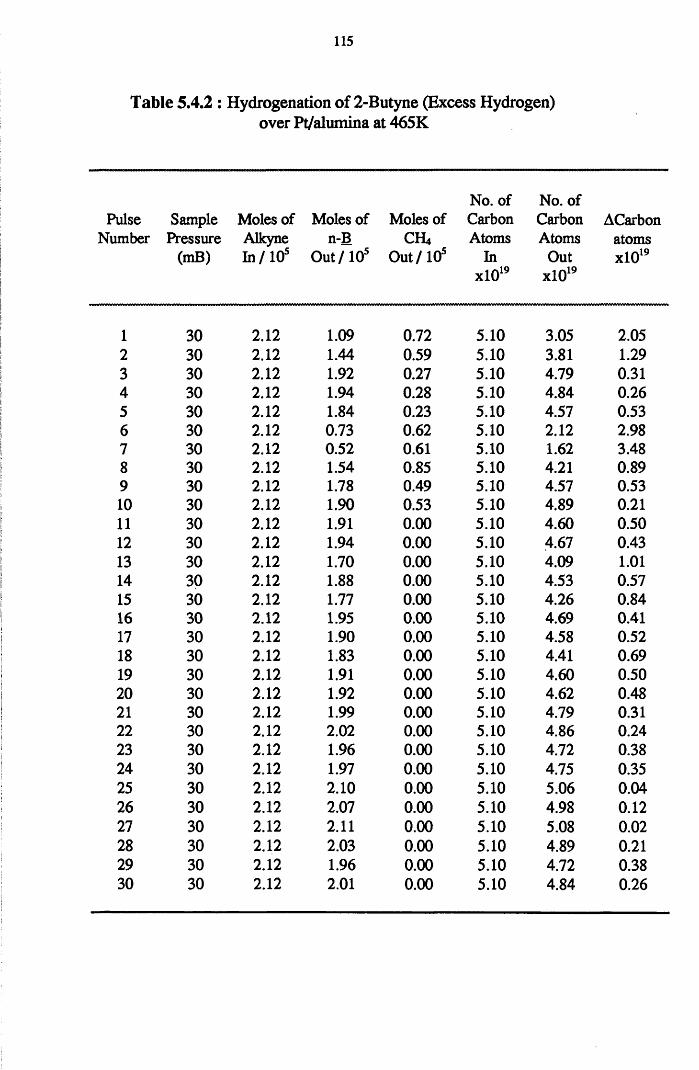
115
Table 5.4.2 : Hydrogenation of 2-Butyne (Excess Hydrogen)over Pt/alumina at 465K
No. of No. ofPulse Sample Moles of Moles of Moles of Carbon Carbon ACarbon
Number Pressure Alkyne n-B CH4 Atoms Atoms atoms(mB) In/105 Out /105 Out/105 In Out xlO19
xlO19 xlO19
1 30 2 .1 2 1.09 0.72 5.10 3.05 2.052 30 2 .1 2 1.44 0.59 5.10 3.81 1.293 30 2 .1 2 1.92 0.27 5.10 4.79 0.314 30 2 .1 2 1.94 0.28 5.10 4.84 0.265 30 2 .1 2 1.84 0.23 5.10 4.57 0.536 30 2 .1 2 0.73 0.62 5.10 2 .1 2 2.987 30 2 .1 2 0.52 0.61 5.10 1.62 3.488 30 2 .1 2 1.54 0.85 5.10 4.21 0.899 30 2 .1 2 1.78 0.49 5.10 4.57 0.5310 30 2 .1 2 1.90 0.53 5.10 4.89 0 .2 1
11 30 2 .1 2 1.91 0 .0 0 5.10 4.60 0.5012 30 2 .1 2 1.94 0 .0 0 5.10 4.67 0.4313 30 2 .1 2 1.70 0 .0 0 5.10 4.09 1 .0 1
14 30 2 .1 2 1 .8 8 0 .0 0 5.10 4.53 0.5715 30 2 .1 2 1.77 0 .0 0 5.10 4.26 0.8416 30 2 .1 2 1.95 0 .0 0 5.10 4.69 0.4117 30 2 .1 2 1.90 0 .0 0 5.10 4.58 0.5218 30 2 .1 2 1.83 0 .0 0 5.10 4.41 0.6919 30 2 .1 2 1.91 0 .0 0 5.10 4.60 0.502 0 30 2 .1 2 1.92 0 .0 0 5.10 4.62 0.482 1 30 2 .1 2 1.99 0 .0 0 5.10 4.79 0.312 2 30 2 .1 2 2 .0 2 0 .0 0 5.10 4.86 0.2423 30 2 .1 2 1.96 0 .0 0 5.10 4.72 0.3824 30 2 .1 2 1.97 0 .0 0 5.10 4.75 0.3525 30 2 .1 2 2 .1 0 0 .0 0 5.10 5.06 0.0426 30 2 .1 2 2.07 0 .0 0 5.10 4.98 0 .1 2
27 30 2 .1 2 2 .1 1 0 .0 0 5.10 5.08 0 .0 2
28 30 2 .1 2 2.03 0 .0 0 5.10 4.89 0 .2 1
29 30 2 .1 2 1.96 0 .0 0 5.10 4.72 0.3830 30 2 .1 2 2 .0 1 0 .0 0 5.10 4.84 0.26
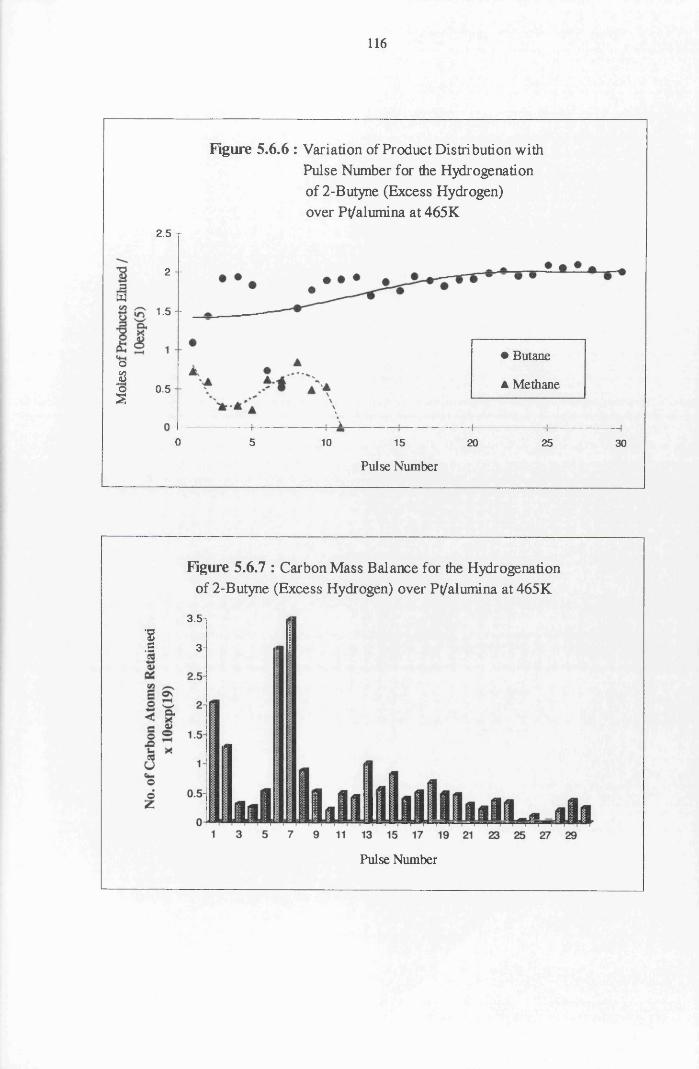
116
Figure 5.6.6 : Variation of Product Distribution with Pulse Number for the Hydrogenation of 2-Butyne (Excess Hydrogen) over Pt/alumina at 465K
3w
o8~os
2.5 T
2 -
1.5 -
• Butane
A Methane0.5
0 5 10 15 20 25 30
Pulse Number
Figure 5.6.7 : Carbon Mass Balance for the Hydrogenation of 2-Butyne (Excess Hydrogen) over Pt/alumina at 465K
3.5-1■S I,2 3- 1
Pulse Number
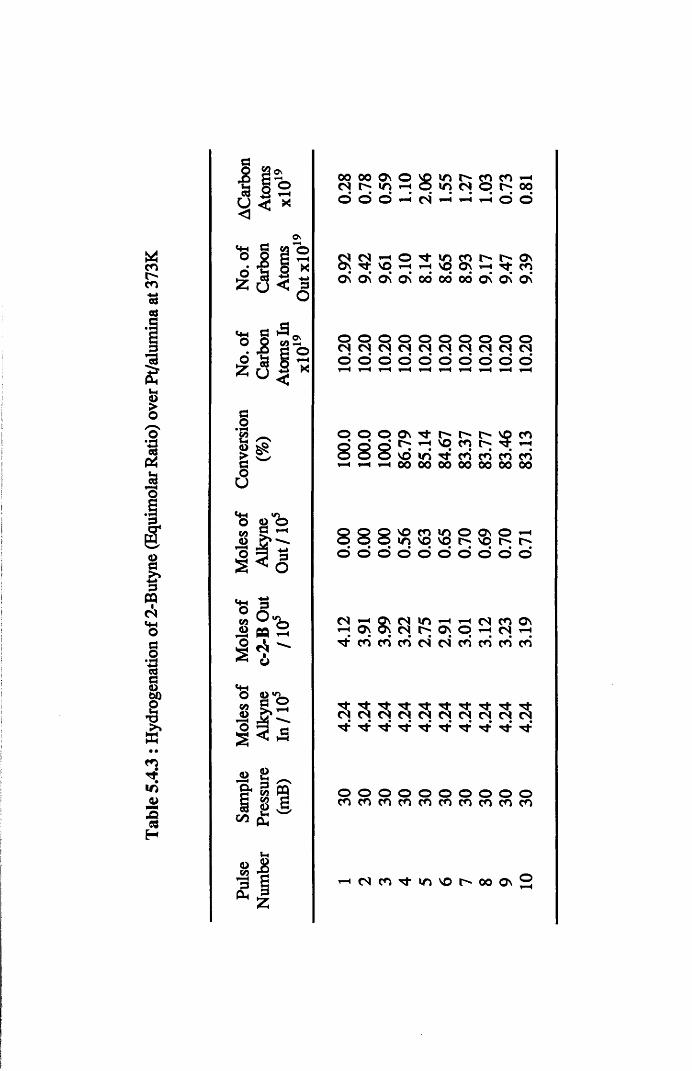
Tabl
e 5.4
.3 : H
ydro
gena
tion
of 2-
Buty
ne
(Equ
imol
ar R
atio)
ove
r Pt
/alum
ina
at 37
3KaI § 3 s a O
X
On
’©•8 84 a | n
ao
g $
a
<D
0 0 0 0 Os o8
m cn c n t- H
c n i > c n o 0 0o o o c n T—H t- H t- H o o
S t- H o i n c n r-» OsT f VO p o s c nOs Os Os 0 0 0 0 0 0 Os Os Os
O o o o o o o o o oCNCNCNCNCNCNCNCNCNCNo o o d o*
tHo d
fHO o o
o o o8 8 8 S
OS T f r - VO c np c n r t - fH
VO i n T t c n c n c n c n0 0 0 0 0 0 0 0 0 0 0 0 0 0
o o ov o c n in o OSin v o VO r * v od o o o d
o© o
CNr", OvCNin’-H*-HCNcnOs ON ON CS ON O ’- J CS
T t c n c n c n c n c n c n c n c n c n
r j -CN 3 CN CN
T tCN 3
T fCN CN
r TCN S.Tf-
o o o o o o o o o oc n c n c n c n c n c n c n c n c n c n
^ ( S c n T j - m v O h o o o v S
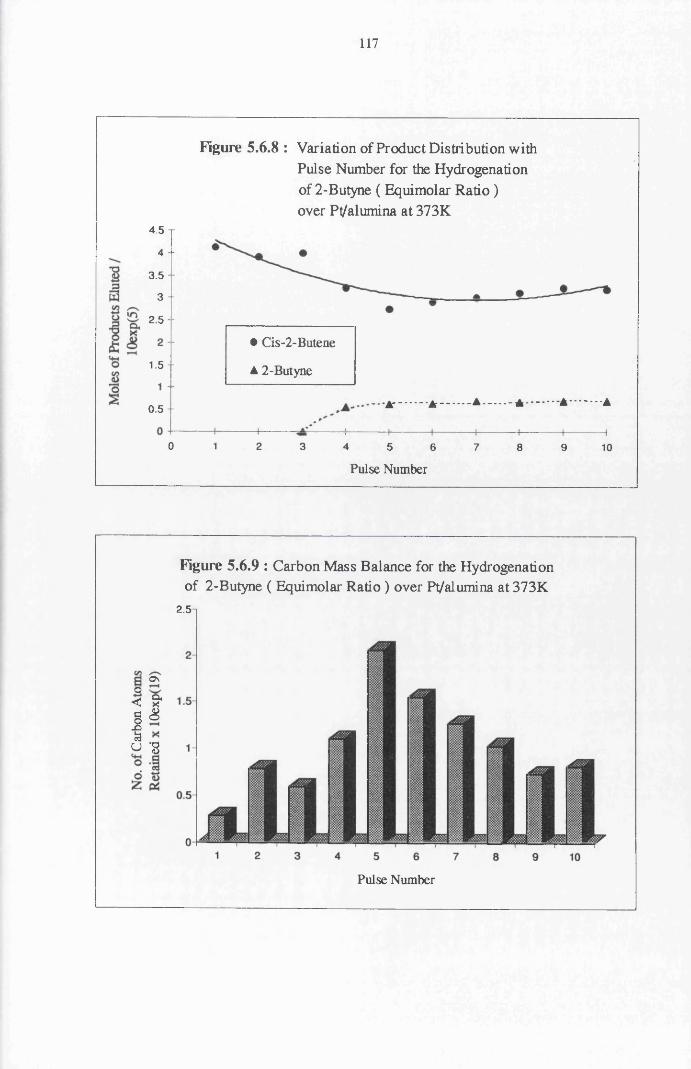
117
Figure 5.6.8 : Variation of Product Distribution with Pulse Number for the Hydrogenation of 2-Butyne ( Equimolar Ratio) over Pt/alumina at 373K
4.5 T
4 -
3.5
3 -
2.5 -
• Cis-2-Butene1.5 - A 2-Butyne
- -A- A A - A A A0.5 -
0 1 2 3 54 6 7 8 9 10
Pulse Number
o\0 <1 5 -g
Figure 5.6.9 : Carbon Mass Balance for the Hydrogenation of 2-Butyne ( Equimolar Ratio ) over Pt/alumina at 373K
2.5
GX8
Pulse Number
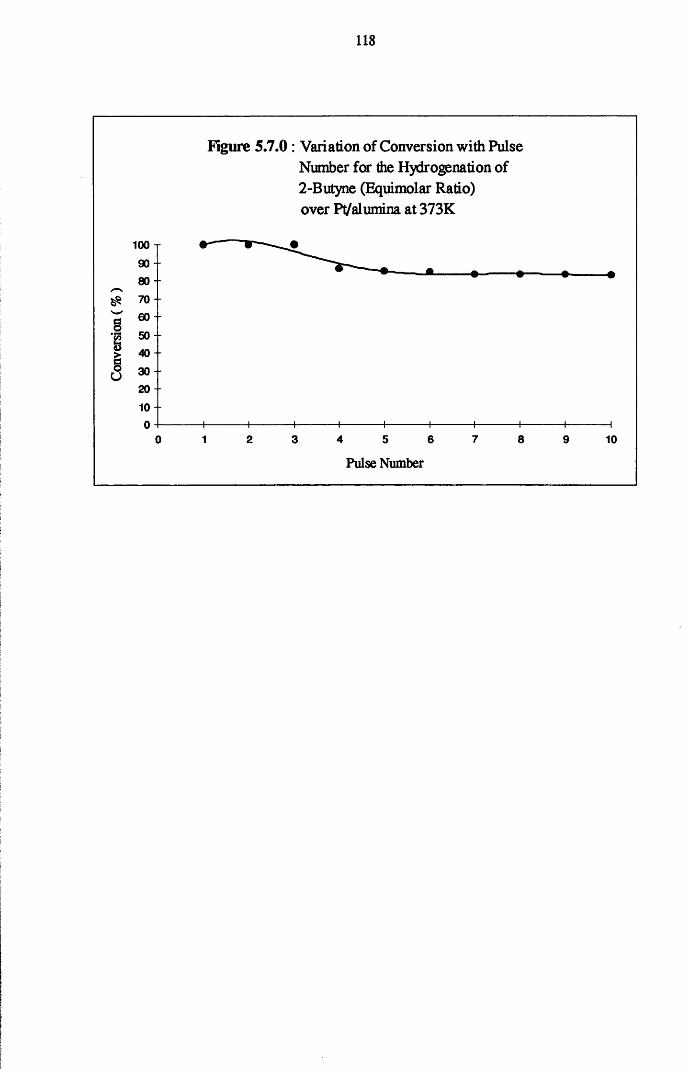
118
Figure 5.7.0 : Variation of Conversion with Pulse Number for the Hydrogenation of 2-Butyne (Equimolar Ratio) over Pt/alumina at 373K
100 T90 - 80 -
5 to-o' 60 • i 50 - > 40
^ 3 0 -20 -
10 -
4 5 6 7 80 1 2 3 9 10
Pulse Number
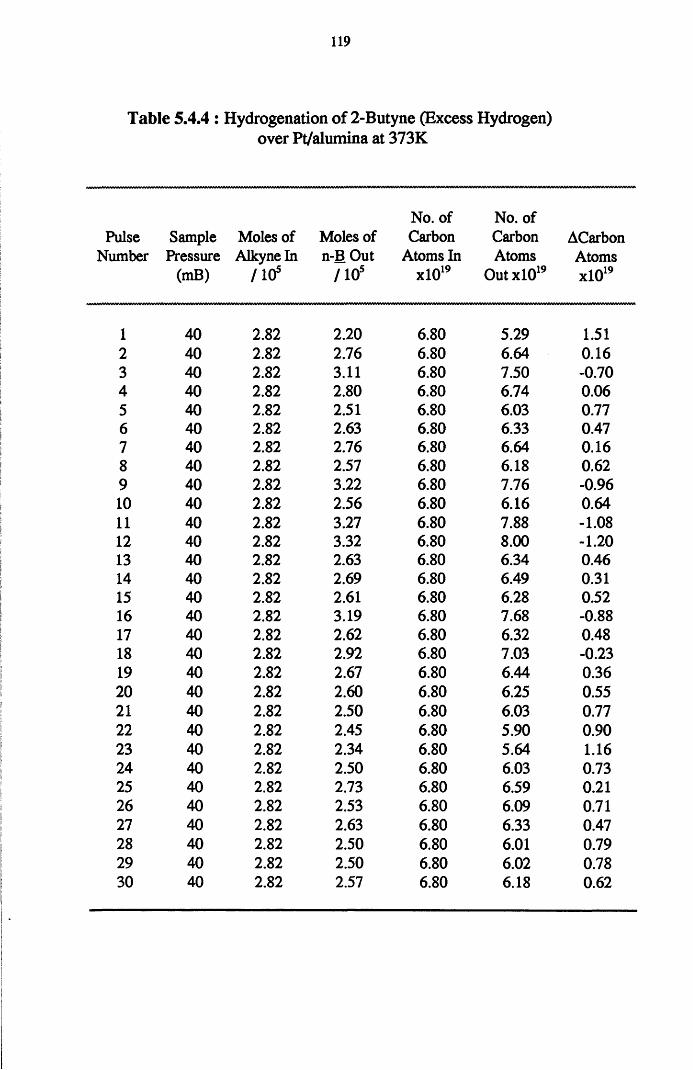
119
Table 5.4.4 : Hydrogenation of 2-Butyne (Excess Hydrogen)over Pt/alumina at 373K
No. of No. ofPulse Sample Moles of Moles of Carbon Carbon ACarbon
Number Pressure Alkyneln n-BOut Atoms In Atoms Atoms(mB) / 10s / 10s xlO19 OutxlO19 xlO19
1 40 2.82 2.20 6.80 5.29 1.512 40 2.82 2.76 6.80 6.64 0.163 40 2.82 3.11 6.80 7.50 -0.704 40 2.82 2.80 6.80 6.74 0.065 40 2.82 2.51 6.80 6.03 0.776 40 2.82 2.63 6.80 6.33 0.477 40 2.82 2.76 6.80 6.64 0.168 40 2.82 2.57 6.80 6.18 0.629 40 2.82 3.22 6.80 7.76 -0.9610 40 2.82 2.56 6.80 6.16 0.6411 40 2.82 3.27 6.80 7.88 -1.0812 40 2.82 3.32 6.80 8.00 -1.2013 40 2.82 2.63 6.80 6.34 0.4614 40 2.82 2.69 6.80 6.49 0.3115 40 2.82 2.61 6.80 6.28 0.5216 40 2.82 3.19 6.80 7.68 -0.8817 40 2.82 2.62 6.80 6.32 0.4818 40 2.82 2.92 6.80 7.03 -0.2319 40 2.82 2.67 6.80 6.44 0.3620 40 2.82 2.60 6.80 6.25 0.5521 40 2.82 2.50 6.80 6.03 0.7722 40 2.82 2.45 6.80 5.90 0.9023 40 2.82 2.34 6.80 5.64 1.1624 40 2.82 2.50 6.80 6.03 0.7325 40 2.82 2.73 6.80 6.59 0.2126 40 2.82 2.53 6.80 6.09 0.7127 40 2.82 2.63 6.80 6.33 0.4728 40 2.82 2.50 6.80 6.01 0.7929 40 2.82 2.50 6.80 6.02 0.7830 40 2.82 2.57 6.80 6.18 0.62
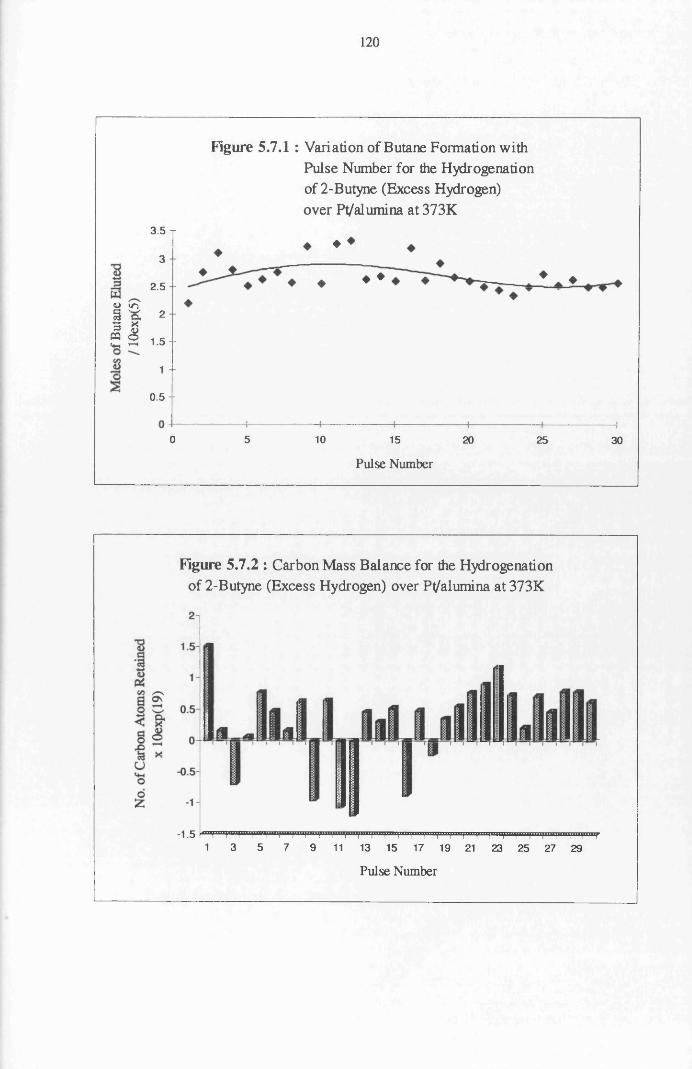
120
Figure 5.7.1: Variation of Butane Formation with Pulse Number for the Hydrogenation of 2-Butyne (Excess Hydrogen) over Pt/alumina at 373K
3.5 T♦ ♦
3
♦ ♦2.5
52 »n3 'a. 2B S£ S i s -
0.5 -
0 5 10 15 20 25 30
Pulse Number
Figure 5.7.2 : Carbon Mass Balance for the Hydrogenation of 2-Butyne (Excess Hydrogen) over Pl/alumina at 373K
-1.5 >°,pmT,,,|f»||viiiifiiiiPiiiiMiii>iiiiviiivi“?Mivillltllin“iiii“Mi“iiii“iifii“fiiiifiii,viiiiiii|y|iiiiii,iifiuif““i“,iiiiiiiii,,mr1 3 5 7 9 11 13 15 17 19 21 23 25 27 29
Pulse Number
Section Four
INFRA-RED SPECTROSCOPY RESULTS
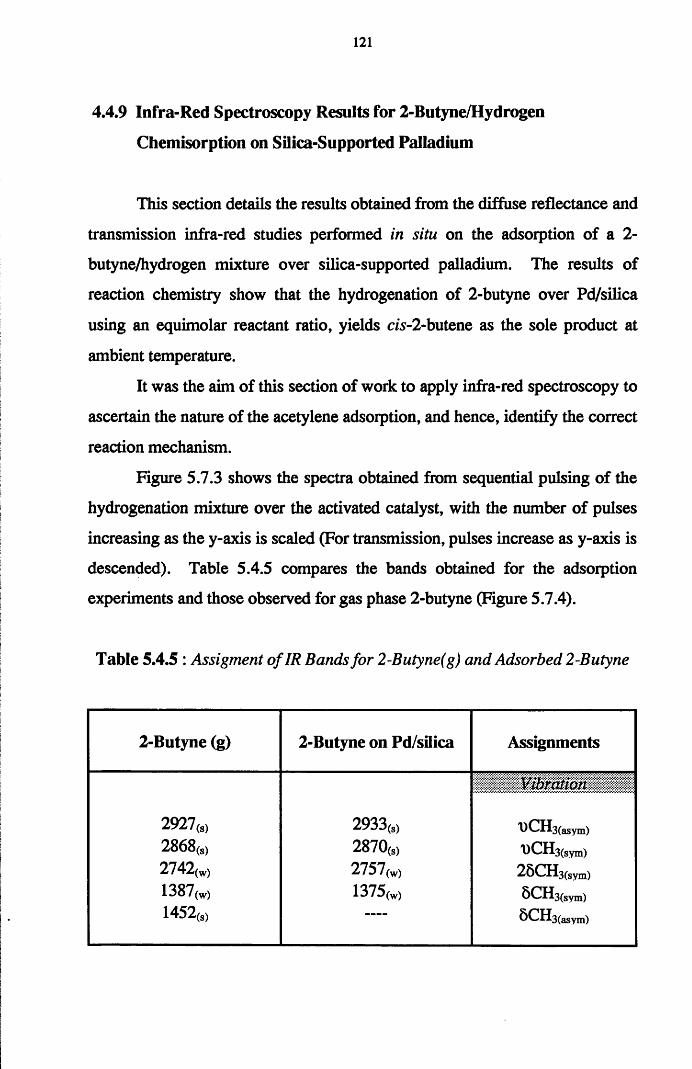
121
4.4.9 Infra-Red Spectroscopy Results for 2-Butyne/Hydrogen
Chemisorption on Silica-Supported Palladium
This section details the results obtained from the diffuse reflectance and
transmission infra-red studies performed in situ on the adsorption of a 2-
butyne/hydrogen mixture over silica-supported palladium. The results of
reaction chemistry show that the hydrogenation of 2-butyne over Pd/silica
using an equimolar reactant ratio, yields c/s-2-butene as the sole product at
ambient temperature.
It was the aim of this section of work to apply infra-red spectroscopy to
ascertain the nature of the acetylene adsorption, and hence, identify the correct
reaction mechanism.
Figure 5.7.3 shows the spectra obtained from sequential pulsing of the
hydrogenation mixture over the activated catalyst, with the number of pulses
increasing as the y-axis is scaled (For transmission, pulses increase as y-axis is
descended). Table 5.4.5 compares the bands obtained for the adsorption
experiments and those observed for gas phase 2-butyne (Figure 5.7.4).
Table 5.4.5 : Assigment ofIR Bands for 2-Butyne(g) and Adsorbed 2-Butyne
2-Butyne (g) 2-Butyne on Pd/silica Assignments
Vibration
2927(S) 2933(g) <l)CH3(agym)2868(S) 2870(g) ^CH3(gym)2742(W) 2757(w) 25CH3(gym)1387(W) 1375(W) ^CH3(gym)1452(g) bCH3(agym)
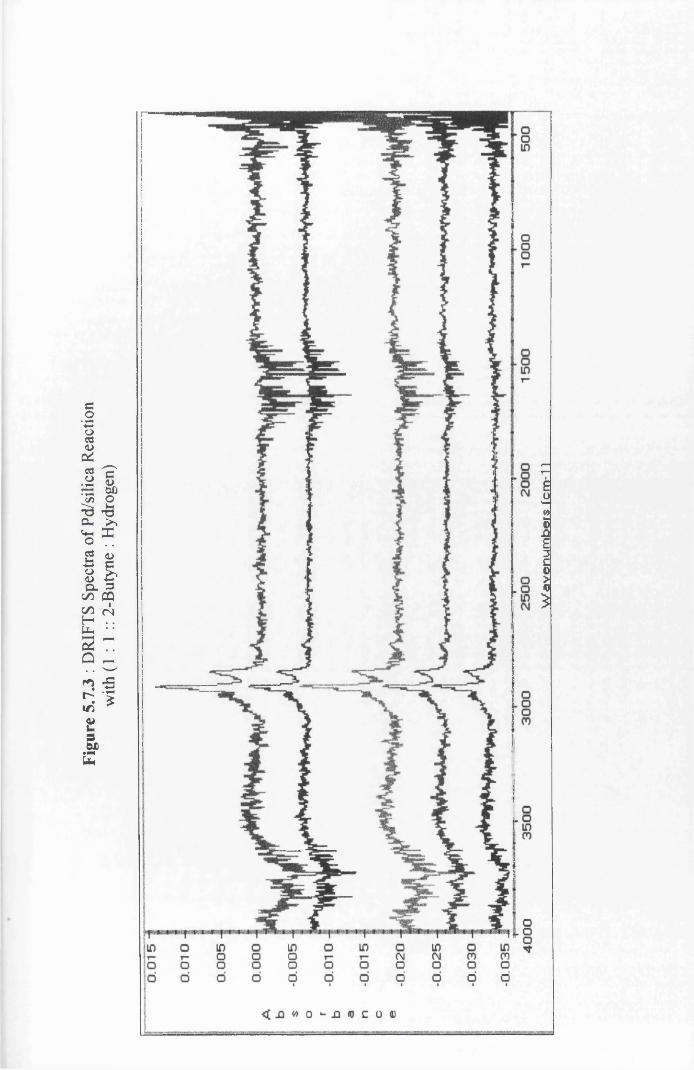
Figu
re
5.7.3
: DRI
FTS
Spec
tra
of Pd
/silic
a R
eact
ion
with
(1:1
:: 2
-But
yne
: Hyd
roge
n)
Wav
enum
bers
fc
m-1
1
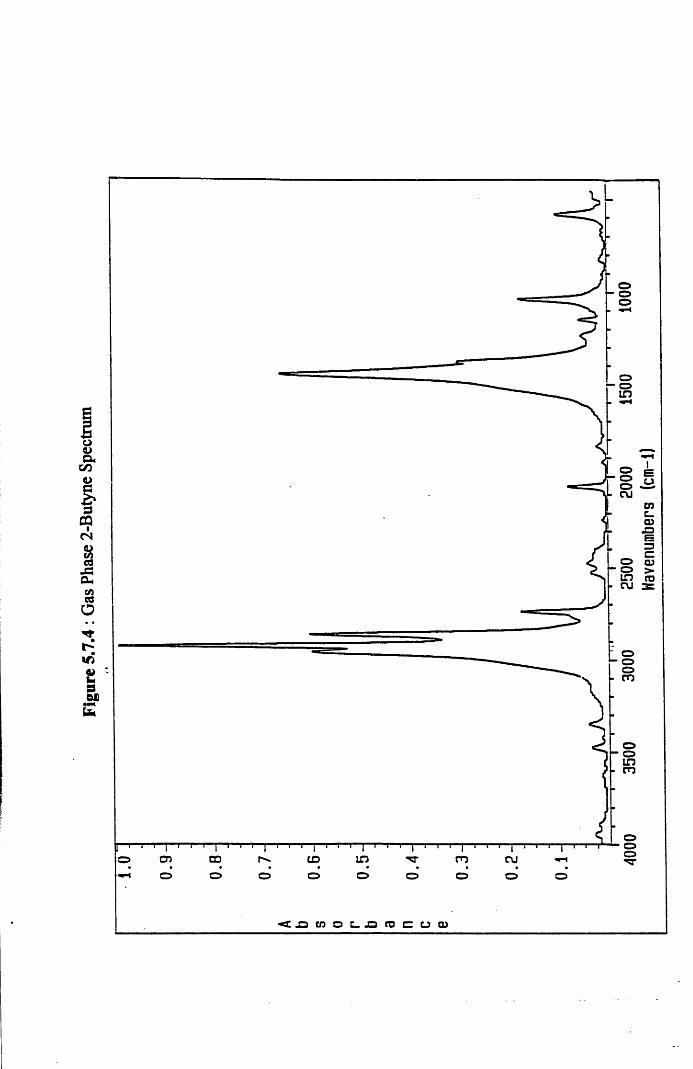
Figu
re
5.7.
4: G
as Ph
ase
2-Bu
tyne
Sp
ectru
m
CT5 CO CO in m nj
U O)
4000
35
00
3000
25
00
2000
15
00
1000
Hav
enum
bers
(c
m-1
)
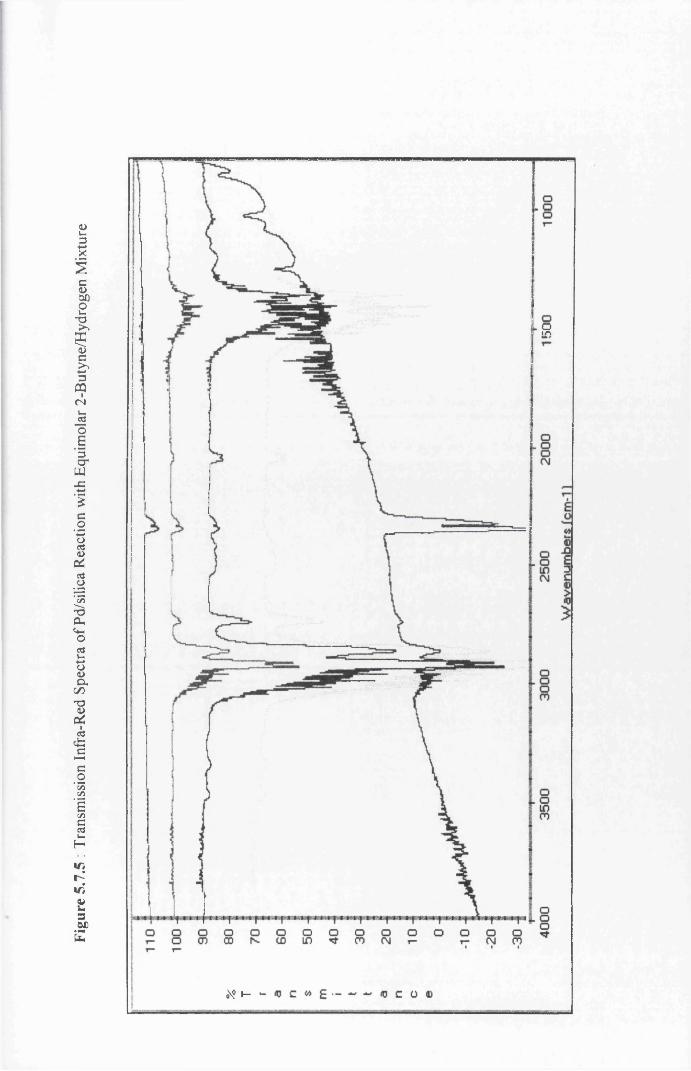
Figu
re
5.7.5
: Tra
nsm
issio
n In
fra-R
ed
Spec
tra
of Pd
/silic
a Re
actio
n wi
th Eq
uim
olar
2-B
utyn
e/H
ydro
gen
Mix
ture
oin
•\° *-
122
On subjecting the catalyst to a series of five pulses, the symmetric CH3 bands
were observed to decrease in intensity when left in flowing helium for 0.20hrs.
Attempts to adsorbed CO onto the used catalyst produced a spectrum which
was consistent with the presence of gas phase CO.
The results of the transmission infra-red experiments are shown in
Figure 5.7.5. These bands are similar to those found in the DRIFTS study, in
that they are indicative of molecularly adsorbed species. Similar to the
DRIFTS experiments, it was found that the intensity of these bands decreased
when the catalyst’ chamber was evacuated over a period of 0.20hrs.
Section Five
LIQUID PHASE HYDROGENATION
123
4.5.1 The Hydrogenation of Phenylacetylene
and Styrene over Palladium/silica
The liquid phase hydrogenation of phenylacetylene over Pd/silica
produced both styrene and ethylbenzene, with the removal of the acetylene from
the system complete after approximately twenty-five minutes of reaction. At this
stage the yield of styrene decreased, suggesting that the hydrogenation of styrene
to ethylbenzene predominated. As can be seen in Figure 5.7.6, the rate of styrene
formation in the early stages of reaction is approximately double that of
ethylbenzene.
The hydrogenation of styrene over Pd/silica yielded ethylbenzene.
However, unlike the phenylacetylene reaction, the complete removal of the
reactant was not observed, as displayed in Figure 5.8.4. The kinetics of this
reaction obeyed a simple first order mechanism, with the rate of reaction
determined.
When a co-hydrogenation reaction between phenylacetylene and styrene
was performed, complete consumption of the acetylene occurred inside twenty
minutes of reaction. In the presence of the acetylene, both styrene and
ethylbenzene were produced, as shown in Figure 5.9.2. Similar to the
hydrogenation of phenylacetylene, the adsorption and hydrogenation of styrene
only predominated on removal of phenylacetylene from the system.
124
4.5.2 The Hydrogenation of Phenylacetylene
and Styrene over Palladium/alumina
Phenylacetylene hydrogenation over alumina-supported palladium yielded both
ethylbenzene and styrene. However, the rate of phenylacetylene consumption
was less than that observed over Pd/silica. On removal of the acetylene, the
hydrogenation of the olefin proceeded to produce ethylbenzene, which explains
the decrease in styrene yield after forty-five minutes of reaction (Figure 5.7.8).
Styrene hydrogenation over the above catalyst again yielded ethylbenzene.
Over Pd/alumina, the complete removal of the olefin was observed after
approximately forty-five minutes of reaction (Figure 5.8.6). Therefore,
comparing both Pd/silica and Pd/alumina, indicates that the latter is slightly more
active for styrene hydrogenation. Similar to Pd/silica, the hydrogenation of
styrene followed first order kinetics, with the corresponding rate coefficient
determined.
The hydrogenation of an equimolar mixture of phenylacetylene and
styrene proceeded with the initial formation of both ethylbenzene and styrene
(Figure 5.93). Removal of the acetylene resulted in the hydrogenation of styrene
to ethylbenzene predominating.
4.53 The Hydrogenation of Phenylacetylene
and Styrene over Platinum/silica
Over Pt/silica, the rate of phenylacetylene hydrogenation was very slow.
Even after one hour of reaction, the reaction liquor consisted of approximately
30% phenylacetylene. Both the olefin and alkane were produced from the onset,
125
with the rate of olefin production far greater than that of the alkane (Figure
5.8.0).
Styrene hydrogenation catalysed by Pt/silica, exhibited very low
conversion to the alkane. After one hour of reaction, the reaction mixture
consisted of approximately 90% styrene and 10% ethylbenzene. As with the
supported-palladium catalysed reactions of styrene, the first order rate coefficient
was determined (Table 5.4.7).
Co-hydrogenation of phenylacetylene/styrene over Pt/silica again
displayed very low catalyst activity for phenylacetylene hydrogenation. Over the
course of the analysis, the composition of phenylacetylene and styrene were
observed to slightly decrease and increase, respectively (Figure 5.9.4).
4.5.4 The Hydrogenation of Phenylacetylene
and Styrene over Platinum/alumina
As shown in Figure 5.8.2, phenylacetylene hydrogenation over Pt/alumina
exhibited low conversion of the acetylene with increasing reaction time. On
reaching one hour of reaction, the amount of reactant in the final reaction liquor
was approximately 50%. Similar to Pt/silica, the rate of olefin production was far
greater than that of the alkane.
Styrene hydrogenation over Pt/alumina was almost identical to that
observed using Pt/silica, with very low conversion of olefin to alkane over a one
hour period, as shown in Figure 5.9.0.
Using a co-hydrogenation mixture, there was a slight increase in the
amount of styrene and ethylbenzene in the system. The accompanying loss of
phenylacetylene was very small over a one hour period.
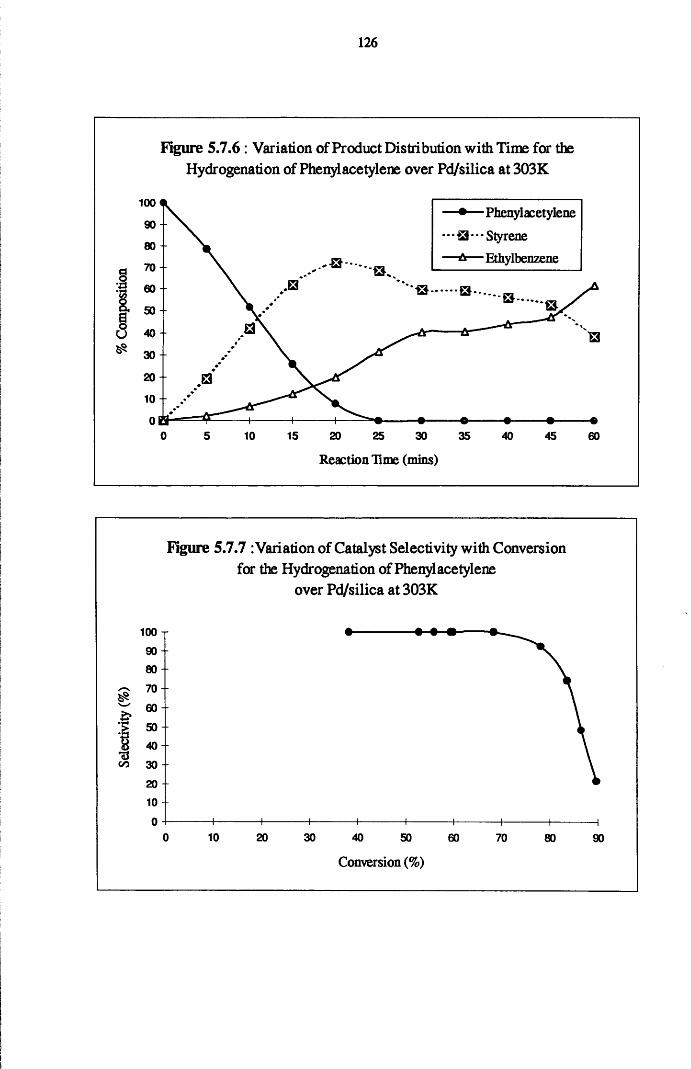
126
Figure 5.7.6 : Variation of Product Distribution with Time for the Hydrogenation of Phenylacetylene over Pd/silica at 303K
I
iu
— • — Phenylacetylene
■••a---StyreneEthylbenzene
Reaction Time (mins)
Figure 5.7.7 : Variation of Catalyst Selectivity with Conversion for the Hydrogenation of Phenyl acetylene
over Pd/silica at 303K
100 -r
90 -80 -
X- V 70 --'W ' 60 --&> 50
O 40 -13CO 30 --
2010 -
0 -10 20 30 40 50
Conversion (%)
GO 70 80 90
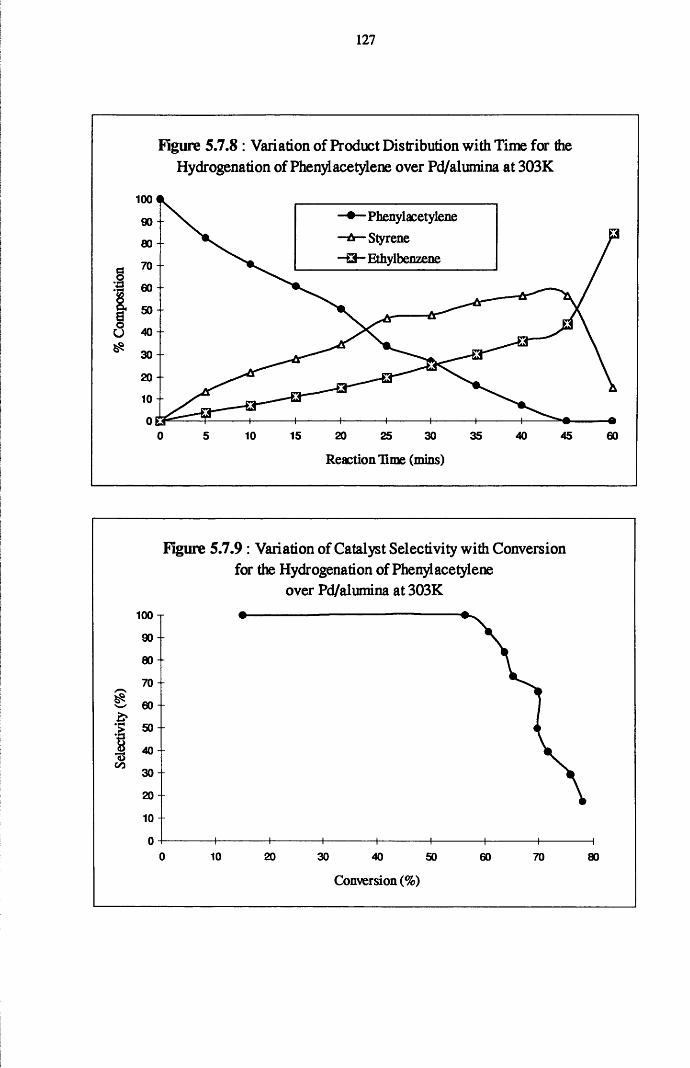
127
Figure 5.7.8 : Variation of Product Distribution with Time for the Hydrogenation of Phenylacetylene over Pd/alumina at 303K
100— Phenylacetylene -A —Styrene -S3- Ethylbenzene
90 -eo --
I-■s 60 --
20 - -
10 - ■
200 5 10 15 25 30 35 40 45 60Reaction lime (mins)
Figure 5.7.9 : Variation of Catalyst Selectivity with Conversion for the Hydrogenation of Phenylacetylene
over Pd/alumina at 303K
><D
GO
100 J
90 - 80 70 - 60 -- 50 - 4030 + 20
10
010
— I—
20 30 40 50
Conversion (%)
60 70 80
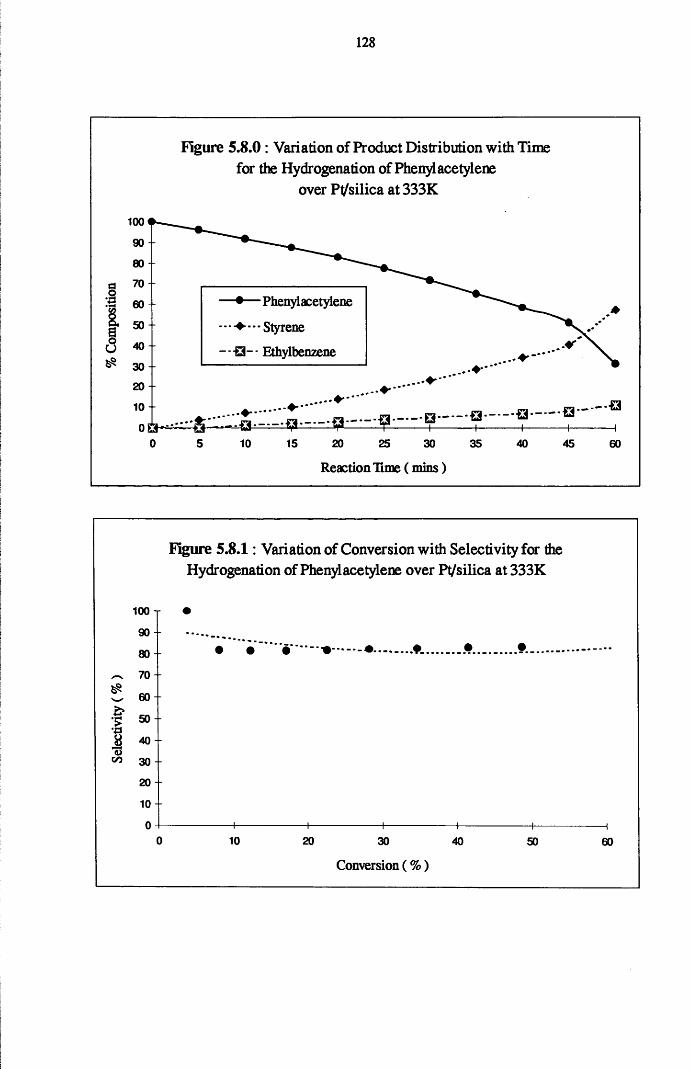
128
Figure 5.8.0 : Variation of Product Distribution with Time for the Hydrogenation of Phenylacetylene
over Pt/silica at 333K
-•— Phenylacetylene
♦•••Styrene
-E2-- Ethylbenzene
0 5 10 15 2 0 2 5 3 0 3 5 4 0 4 5 6 0
Reaction lime ( mins)
Figure 5.8.1: Variation of Conversion with Selectivity for the Hydrogenation of Phenylacetylene over Pt/silica at 333K
100 -r
90 --
80
70 -
60
I “ t8 40co 30
20 -
10 - -
0 H------------ 1------------ 1------------ h0 10 20 30 40 SO GO
Conversion (% )
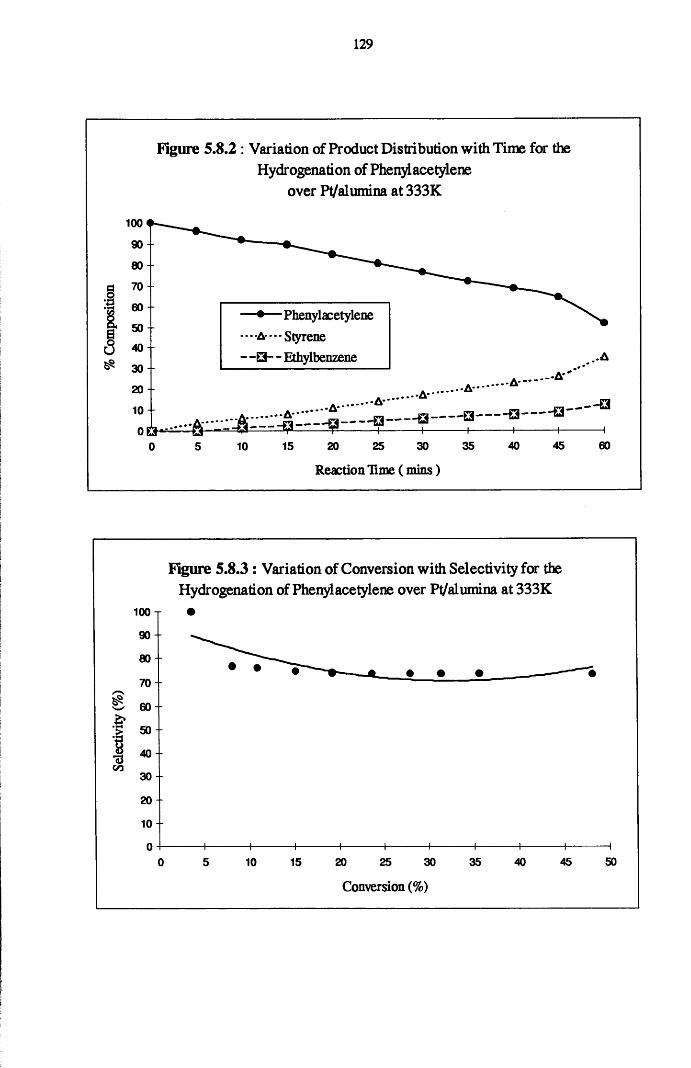
129
Figure 5.8.2 : Variation of Product Distribution with Time for the Hydrogenation of Phenyl acetylene
over Pt/alumina at 333K
— Phenylacetylene
•A----Styrene S3— Ethylbenzene
0 5 10 15 20 25 30 35 40 45 60
Reaction Time ( mins)
Figure 5.8.3: Variation of Conversion with Selectivity for the Hydrogenation of Phenylacetylene over Pt/alumina at 333K
100 T
90
80 -
70 -
g 6 0 -
SB
'S 4 0 -•a 40CO
30 --
20 -
10 - -
5035 40 455 10 15 20 25 300
Conversion (%)
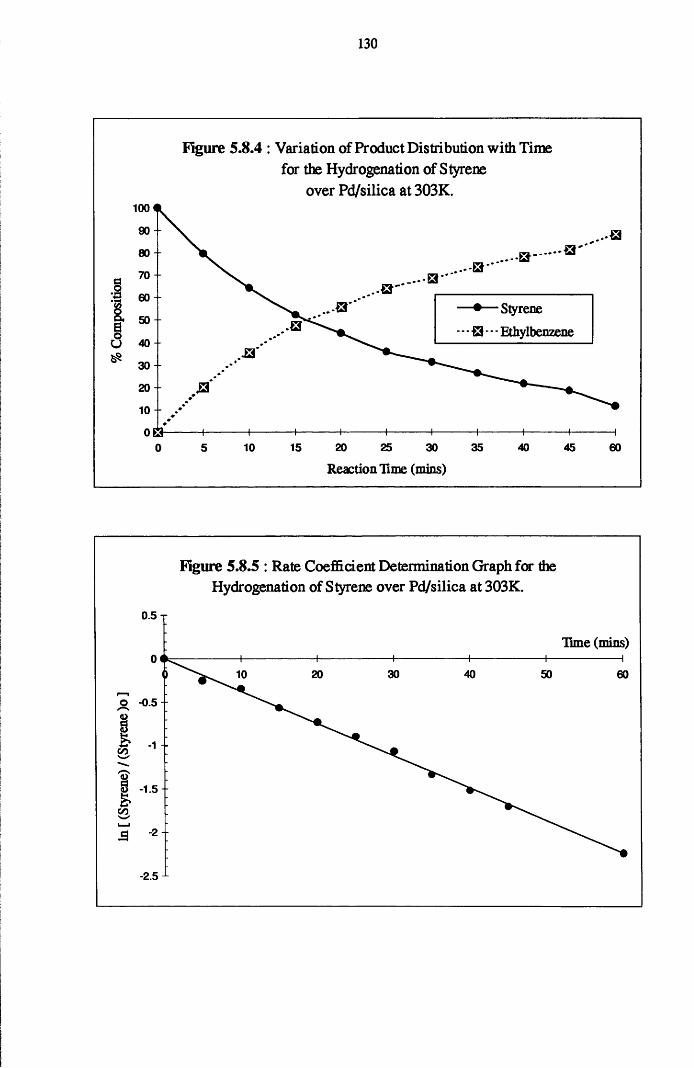
130
Figure 5.8.4 : Variation of Product Distribution with Time for the Hydrogenation of Styrene
over Pd/silica at 303K.100
90
80 --
I " ":s 60 - I S 0 - -
Iu 40
30
— • — Styrene
- * - Q - - - Ethylbenzene
20 --10 - -
0H0 20 25 30 3510 15 40 45 605
Reaction Time (mins)
Figure 5.8.5 : Rate Coefficient Determination Graph for the Hydrogenation of Styrene over Pd/silica at 303K.
0.5 T
Time (mins)
-0.5--
-1 - •CO
-1.5--
co
-2 - -
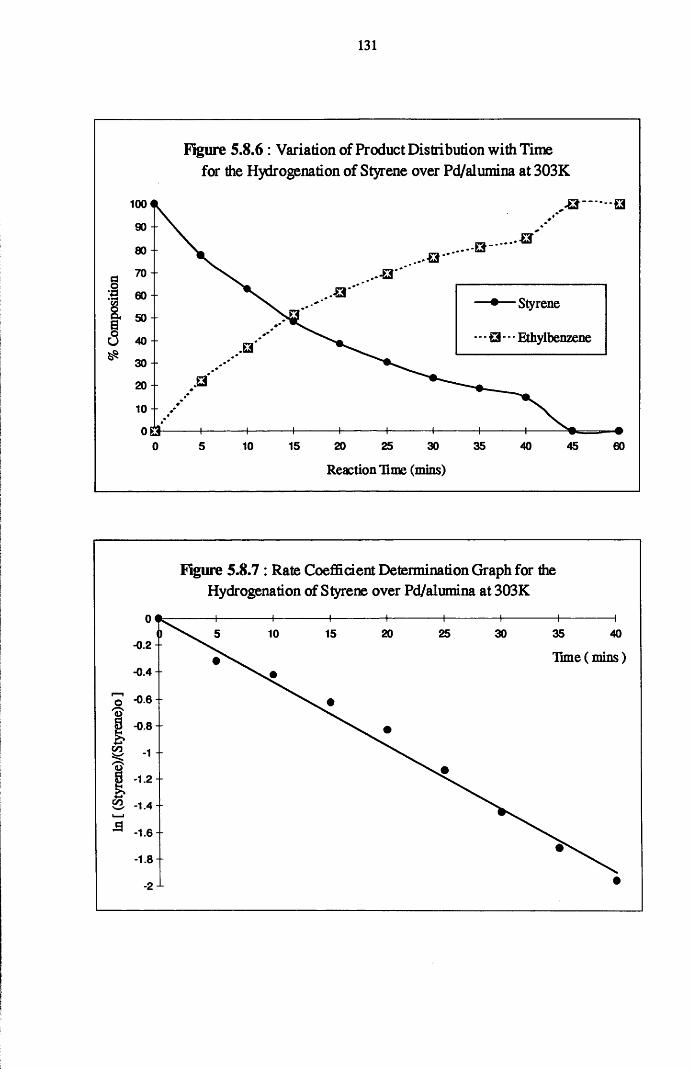
131
Figure 5.8.6 : Variation of Product Distribution with Time for the Hydrogenation of Styrene over Pd/alunrina at 303K
100
90 --
80 -
70 --
60 -- -•— Styrene
I -U 40
30
- - - £3 - - - Ethylbenzene
20 - -
10 - -
o ao 2515 20 30 35 40 45 605 10
Reaction Time (mins)
Figure 5.8.7 : Rate Coefficient Determination Graph for the Hydrogenation of Styrene over Pd/alumina at 303K
- 0.2 -
Time (mins)-0.4
-0.6 -
-0.8-co -1"
- 1.2 -
& -1.4
-1.6--1.8-
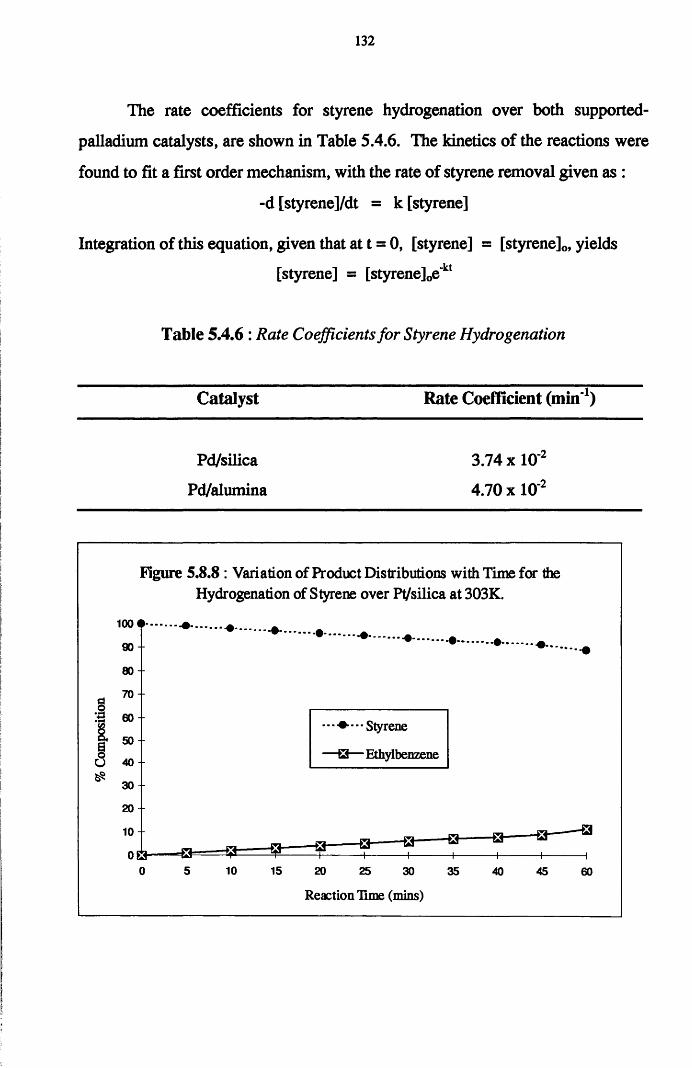
132
The rate coefficients for styrene hydrogenation over both supported-
paUadium catalysts, are shown in Table 5.4.6. The kinetics of the reactions were
found to fit a first order mechanism, with the rate of styrene removal given as :
-d [styrene]/dt = k [styrene]
Integration of this equation, given that at t = 0, [styrene] = [styrene]c, yields
[styrene] = [styrene]0e‘kt
Table 5.4.6 : Rate Coefficients for Styrene Hydrogenation
Catalyst Rate Coefficient (min'1)
Pd/silica 3.74 xlO '2
Pd/alumina 4.70 x 10'2
Figure 5.8.8 : Variation of Product Distributions with Time for the Hydrogenation of Styrene over Pt/silica at 303K.
0 5 10 15 20 25 30 35 40 45 60
Reaction Time (mins)
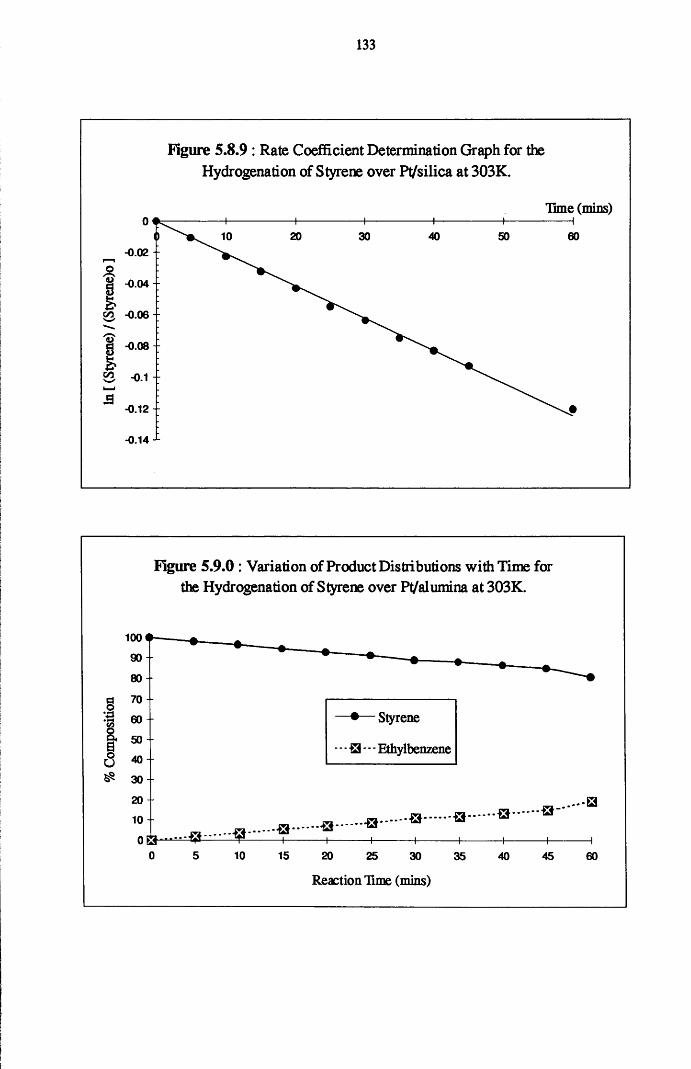
133
Figure 5.8.9 : Rate Coefficient Determination Graph for the Hydrogenation of Styrene over Pt/silica at 303K.
Time (mins)
- 0.02 - -
-0.04 -
c/3 -0.06 -
-0 .08-
$2 -01
-0.12 - -
-0.14 ±
Flgure 5.9.0 : Variation of Product Distributions with Time for the Hydrogenation of Styrene over Pt/alumina at 303K.
100
90 -
80
70 -1 • — Styrene60 -- VI| 5 0 -
<3 4 0 -
a& 30
- - -Q - - - Ethylbenzene
20 --10 --
o 5 10 15 20 25 30 35 40 45 60
Reaction Time (mins)
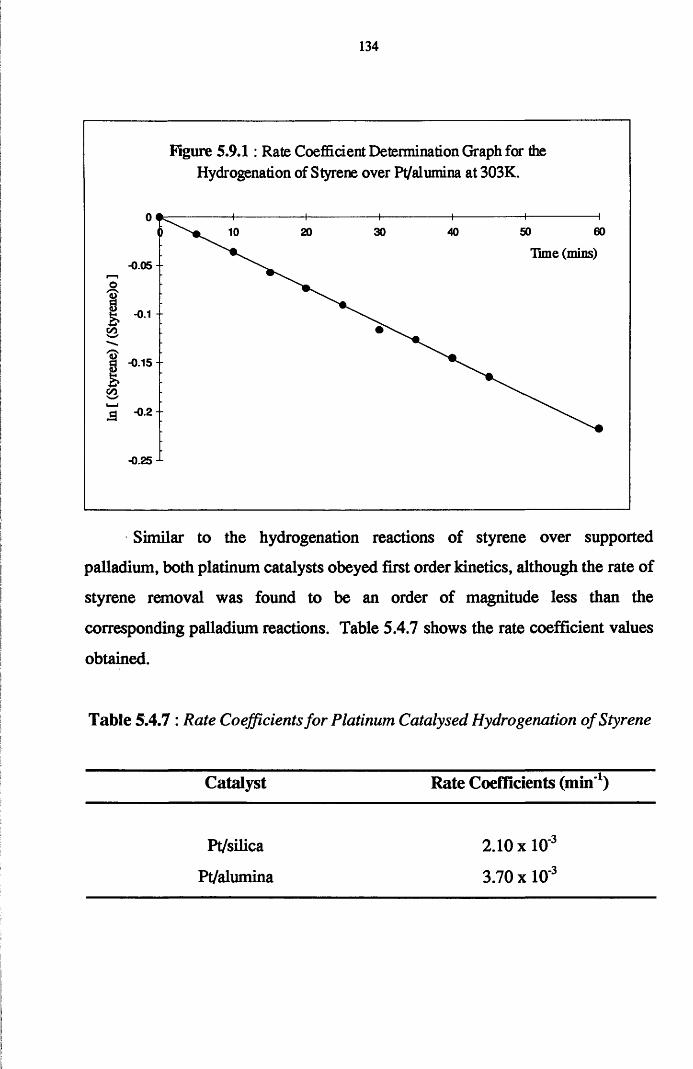
134
Figure 5.9.1: Rate Coefficient Determination Graph for the Hydrogenation of Styrene over Pt/alumina at 303K.
Time (mins)-0.05 --
o
-0.1
9Ia -02';
-0.25
Similar to the hydrogenation reactions of styrene over supported
palladium, both platinum catalysts obeyed first order kinetics, although the rate of
styrene removal was found to be an order of magnitude less than the
corresponding palladium reactions. Table 5.4.7 shows the rate coefficient values
obtained.
Table 5.4.7 : Rate Coefficients for Platinum Catalysed Hydrogenation o f Styrene
Catalyst Rate Coefficients (min'1)
Pt/silica 2.10 xlO-3
Pt/alumina 3.70 x 10'3
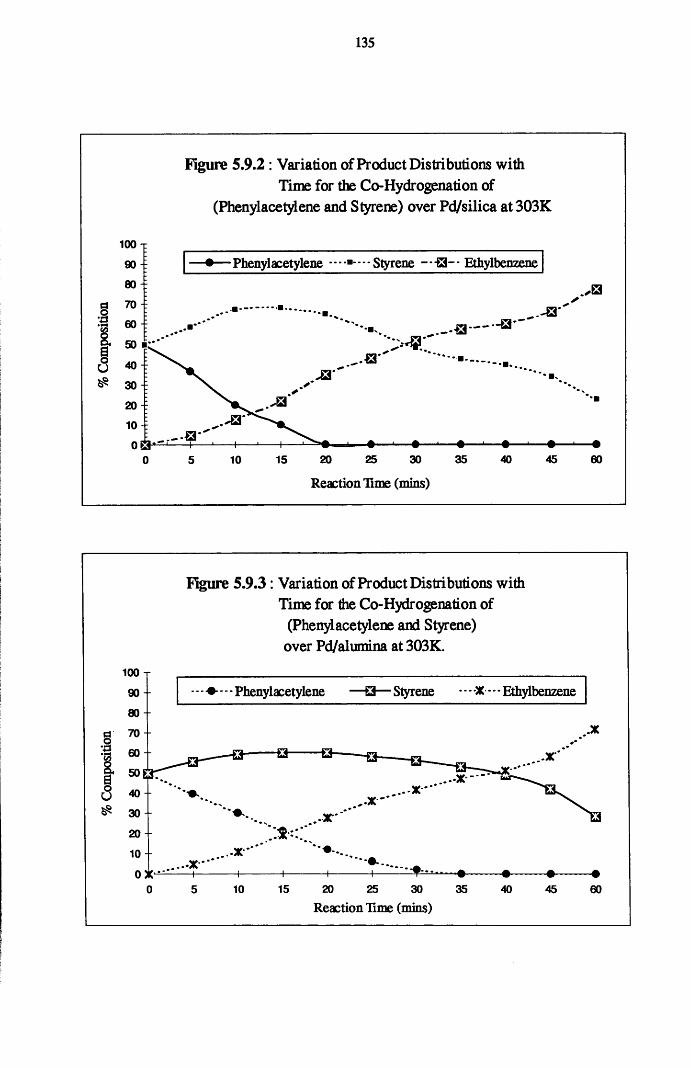
135
Figure 5.9.2 : Variation of Product Distributions with Time for the Co-Hydrogenation of
(Phenylacetylene and Styrene) over Pd/silica at 303K
a•SIa&
100 T
90 I
80
70 1 60 |
50
40 -E
30 !
20 -E
10o a
-•— Phenylacetylene --------- Styrene - ■ -S3- • Ethylbenzene
.✓B
^ "> *
B
15 20 25 30 35 40
Reaction Time (mins)
45 GO
Figure 5.9.3: Variation of Product Distributions with Time for the Co-Hydrogenation of
(Phenylacetylene and Styrene) over Pd/alumina at 303K.
100 T
- - - Phenylacetylene — □ — Styrene -X - - - Ethylbenzene
.x-Q B-
..X'"
15 20 25 30 35
Reaction Time (mins)40 45 GO
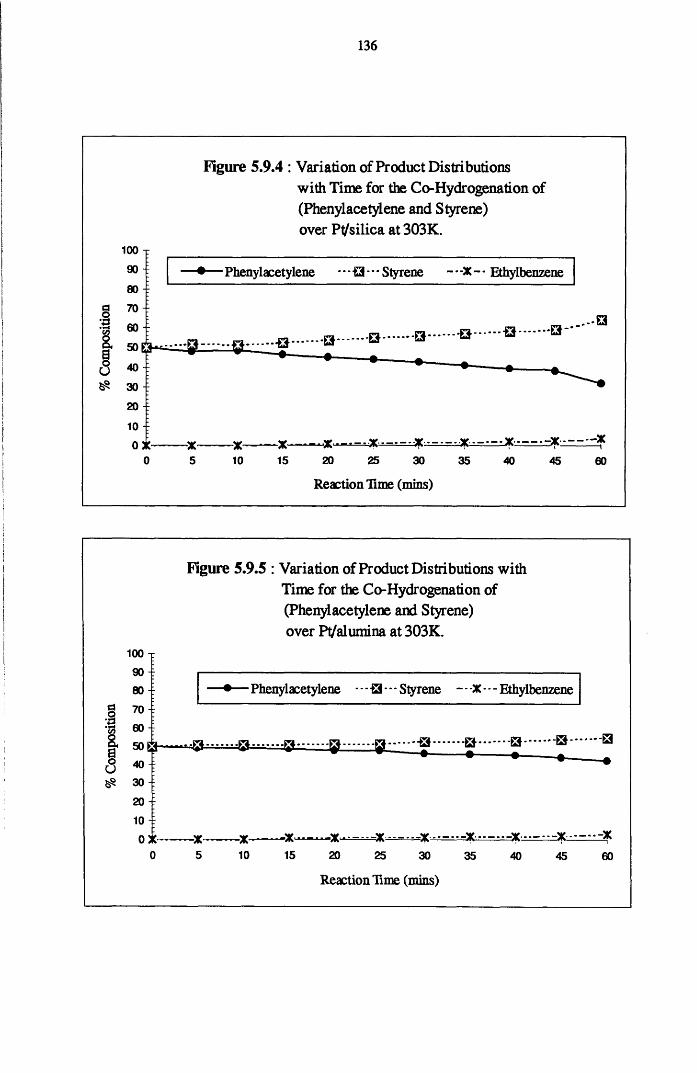
136
Figure 5.9.4 : Variation of Product Distributionswith Time for the Co-Hydrogenation of (Phenylacetylene and Styrene) over Pt/silica at 303K.
-•— Phenylacetylene Styrene - • -X - - Ethylbenzene
a•8iIU
-B a a b a b-
20 25 30
Reaction lime (mins)
.Q
II
Figure 5.9.5 : Variation of Product Distributions with Time for the Co-Hydrogenation of (Phenylacetylene and Styrene) over Pt/alumina at 303K.
100
9080
7060504030
20100
■ Phenylacetylene - a - - - Styrene - - -X - - - Ethylbenzene
n— .......g p -a a Q ***-• Q
-X-5
=X10 15 20 25 30
Reaction Time (mins)
35 40 45
X--160
Section Six
CONTINUOUS FLOW HYDROGENATION
137
4.6 Continuous Flow Hydrogenation Reactions
The hydrogenation of phenylacetylene in the continuous flow mode
produced only ethylbenzene. Over silica-supported palladium, the conversion of
the acetylene was found to increase with increasing time on-line. Increasing the
weight of catalyst resulted in the attainment of a steady state (with respect to
catalyst activity and product(s) yield) from the onset of the reaction.
Alumina-supported palladium produced constant amounts of ethylbenzene
and unreacted phenylacetylene over the course of the reaction. On increasing the
weight of catalyst, ethylbenzene formation could be followed as a function of
time. This continued until a constant yield of the alkane was achieved.
Both platinum catalysts displayed near constant product distributions in
the hydrogenation of phenylacetylene. However, when alumina-supported
platinum was used, the conversion of phenylacetylene was observed to decrease
with increasing reaction.
Styrene hydrogenation produced ethylbenzene over both supported-
palladium and platinum. However, the hydrogenation activity of palladium was
found to be low, with low concentrations of ethylbenzene produced. In contrast,
the hydrogenation of styrene over supported-platinum resulted in the rapid
formation of ethylbenzene, with complete conversion of the olefin over a one
hour period.
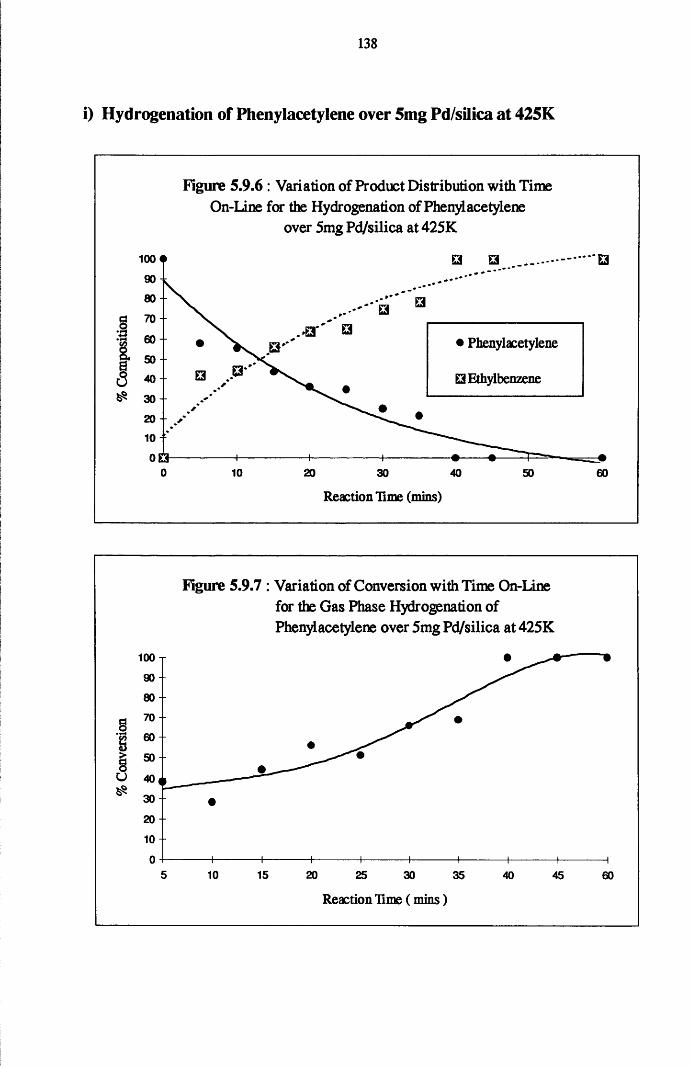
138
i) Hydrogenation of Phenylacetylene over 5mg Pd/silica at 425K
Figure 5.9.6: Variation of Product Distribution with Time On-Line for the Hydrogenation of Phenylacetylene
over 5mg Pd/silica at 425K
100 •
80
d 70-I • PhenylacetyleneII 50U 405$ 30
□ Ethylbenzene
2010 30 40 so 60
Reaction lime (mins)
Figure 5.9.7 : Variation of Conversion with Time On-Line for the Gas Phase Hydrogenation of Phenylacetylene over 5mg Pd/silica at 425K
100 T
90
80 --
•H
§
20 --10
5 10 15 20 25 30 35 4540 60
Reaction lime ( mins)
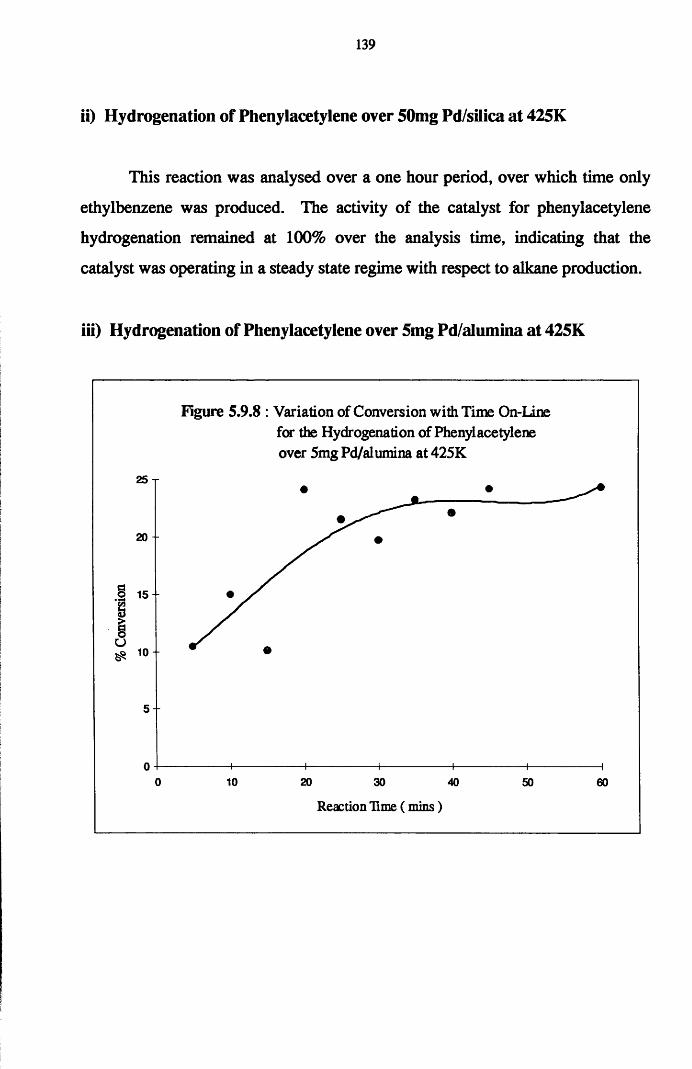
139
ii) Hydrogenation of Phenylacetylene over 50mg Pd/silica at 425K
This reaction was analysed over a one hour period, over which time only
ethylbenzene was produced. The activity of the catalyst for phenylacetylene
hydrogenation remained at 100% over the analysis time, indicating that the
catalyst was operating in a steady state regime with respect to alkane production.
iii) Hydrogenation of Phenylacetylene over 5mg Pd/alumina at 425K
25 T
20 -
I 15 f
i* 10 +
Figure 5.9.8 : Variation of Conversion with Time On-Line for the Hydrogenation of Phenylacetylene over 5mg Pd/alumina at 425K
5 -
-i------------ 1------------ 1—20 30 40
Reaction Time ( mins)
10 50 60
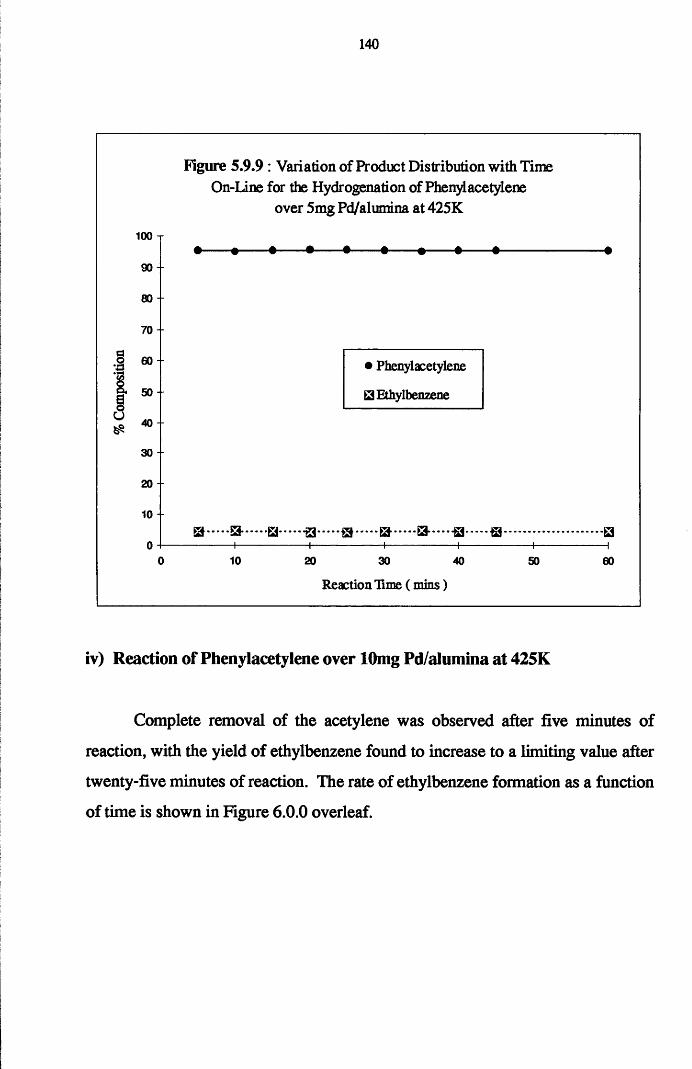
140
I
§U
100
90 +
80
70 -
eo
50
40 -
30 --
20
10 +
0
Figure 5.9.9 : Variation of Product Distribution with Time On-Line for the Hydrogenation of Phenylacetylene
over 5mg Pd/alumina at 425K
B-
• Phenylacetylene
□ Ethylbenzene
a - a -83 q b a — —a a ...............
10 20 30 40
Reaction lime ( mins)
so-a—i60
iv) Reaction of Phenylacetylene over lOmg Pd/alumina at 425K
Complete removal of the acetylene was observed after five minutes of
reaction, with the yield of ethylbenzene found to increase to a limiting value after
twenty-five minutes of reaction. The rate of ethylbenzene formation as a function
of time is shown in Figure 6.0.0 overleaf.
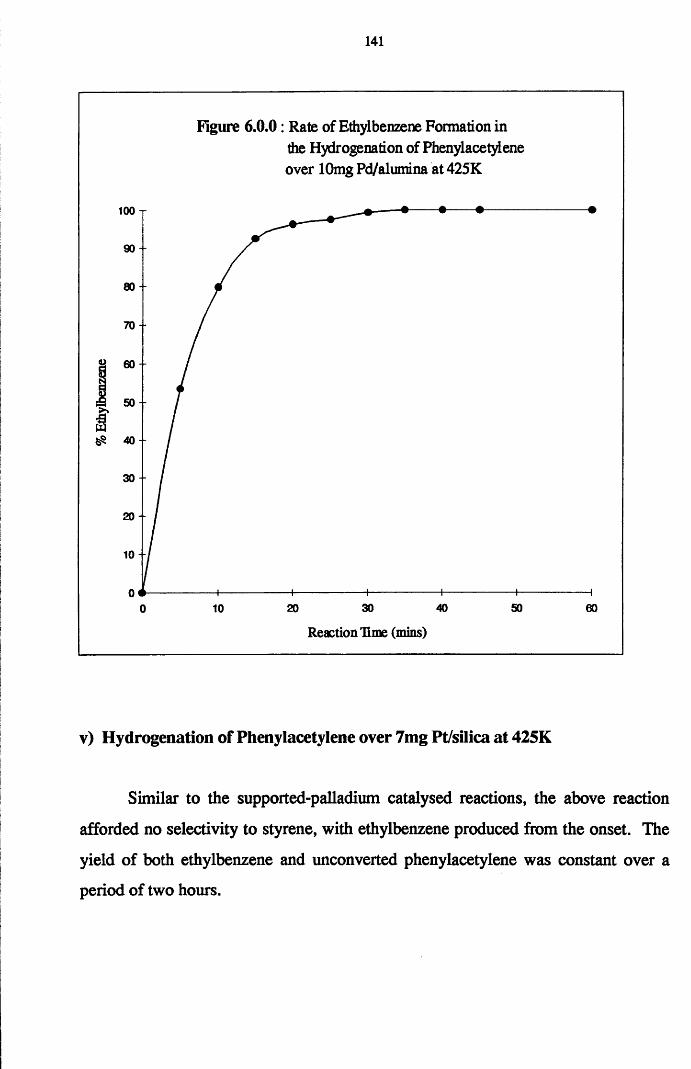
141
Figure 6.0.0: Rate of Ethylbenzene Formation inthe Hydrogenation of Phenylacetylene over lOmg Pd/alumina at 425K
100 T
90 --
s o - -
70 --
eo -
50 --
30 --
20 - -
10 - -
30 40 5020 60100Reaction Time (mins)
v) Hydrogenation of Phenylacetylene over 7mg Pt/silica at 425K
Similar to the supported-palladium catalysed reactions, the above reaction
afforded no selectivity to styrene, with ethylbenzene produced from the onset. The
yield of both ethylbenzene and unconverted phenylacetylene was constant over a
period of two hours.
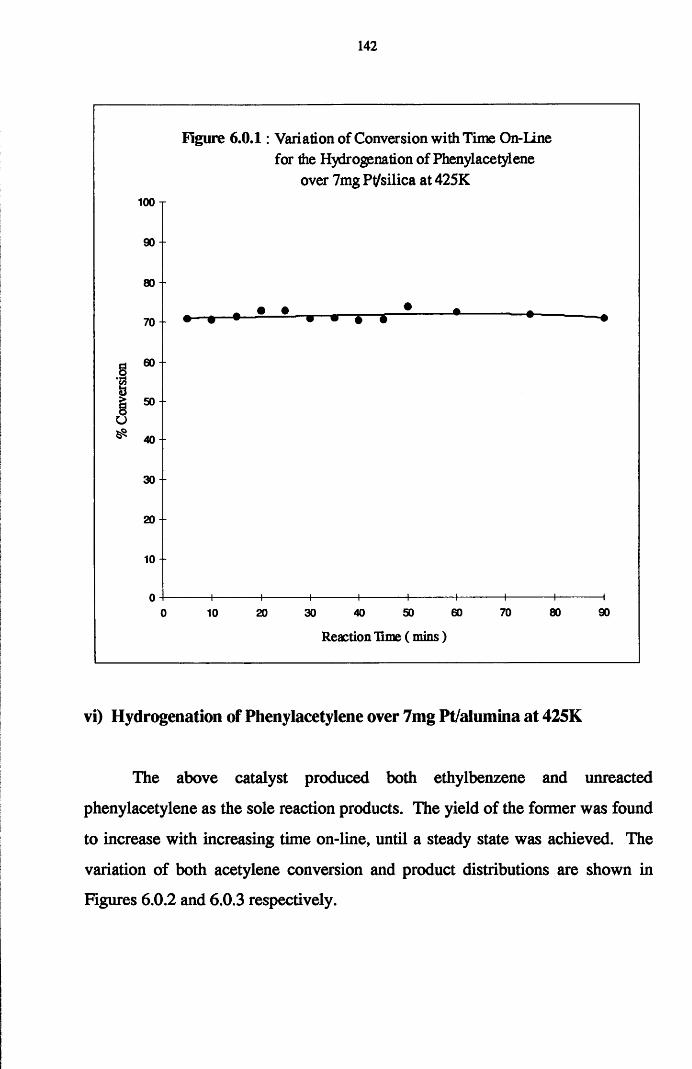
142
Figure 6.0.1: Variation of Conversion with Time On-Line for the Hydrogenation of Phenylacetylene
over 7mg Pt/silica at 425K100 T
90
ao --
60 -8• H8
508U
30 -
20 -
10 -
70 80 9050 600 10 20 30 40
Reaction Time ( mins)
vi) Hydrogenation of Phenylacetylene over 7mg Pt/alumina at 425K
The above catalyst produced both ethylbenzene and unreacted
phenylacetylene as the sole reaction products. The yield of the former was found
to increase with increasing time on-line, until a steady state was achieved. The
variation of both acetylene conversion and product distributions are shown in
Figures 6.0.2 and 6.0.3 respectively.
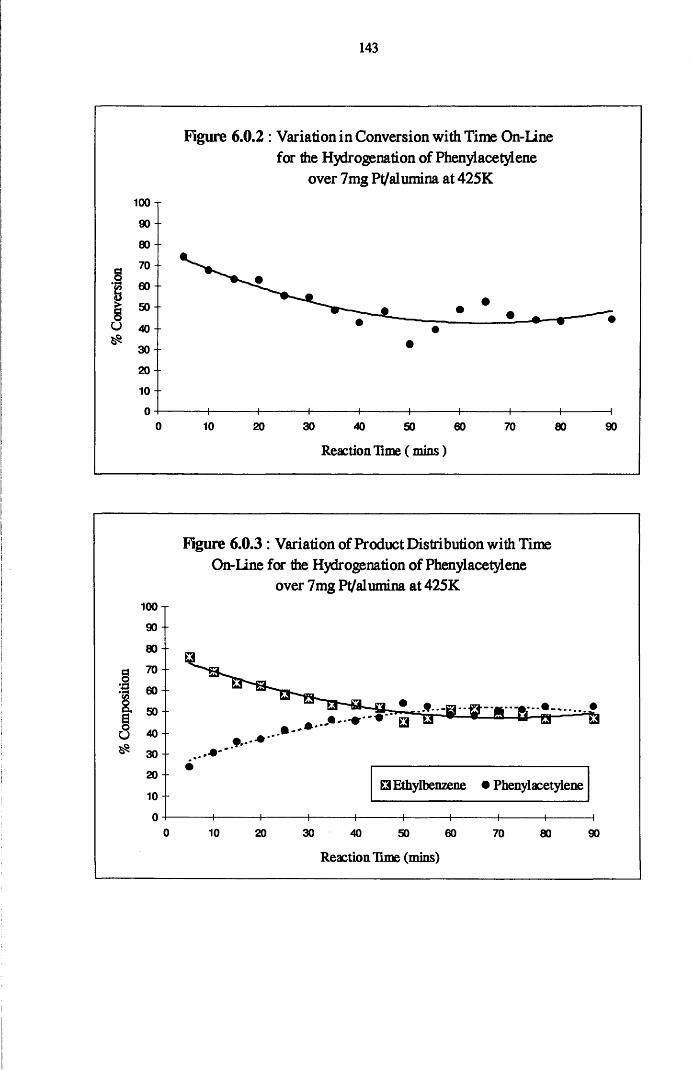
143
Figure 6.0.2 : Variation in Conversion with Time On-line for the Hydrogenation of Phenylacetylene
over 7mg Pt/alumina at 425K100 T
90 -
80 -
708$ 60
>; 508U 40-
30 -
20
10 -
0 10 30 40 5020 60 70 80 90
Reaction Time ( mins)
1
I
100
90
80
70
60
50
40
30
20
10
0
Figure 6.0.3 : Variation of Product Distribution with Time On-Line for the Hydrogenation of Phenylacetylene
over 7mg Pt/alumina at 425K
E3 Ethylbenzene •Phenylacetylene
_i--------1--------1--------1--------1--------1--------1------- 1—10 20 30 40 50 60 70 80 90
Reaction Time (mins)
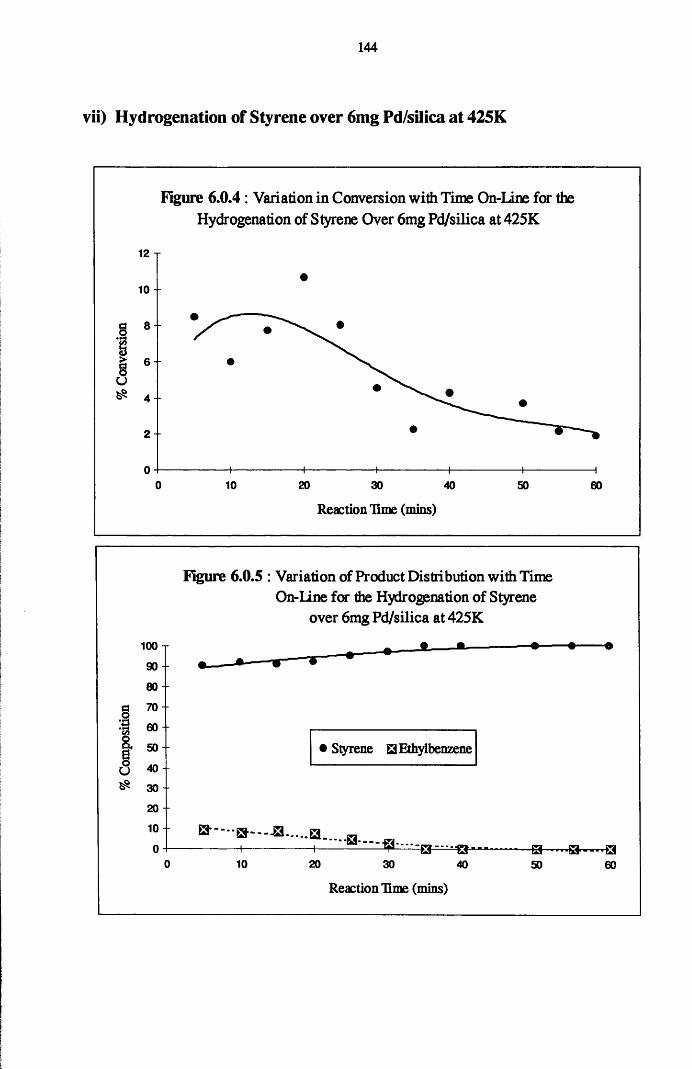
144
vii) Hydrogenation of Styrene over 6mg Pd/silica at 425K
Figure 6.0.4 : Variation in Conversion with Time On-Line for the Hydrogenation of Styrene Over 6mg Pd/silica at 425K
12 T
10 - -
.ig§eu^ 4 -
2 --
0 20 3010 40 50 60
Reaction lime (mins)
100
90
80
70
60
50
40
30
20
10
0
Figure 6.0.5 : Variation of Product Distribution with Time On-Line for the Hydrogenation of Styrene
over 6mg Pd/silica at 425K
• Styrene Q Ethylbenzene
& ■ — ga--— a . . .
10 20 30 40
Reaction lime (mins)
50 60
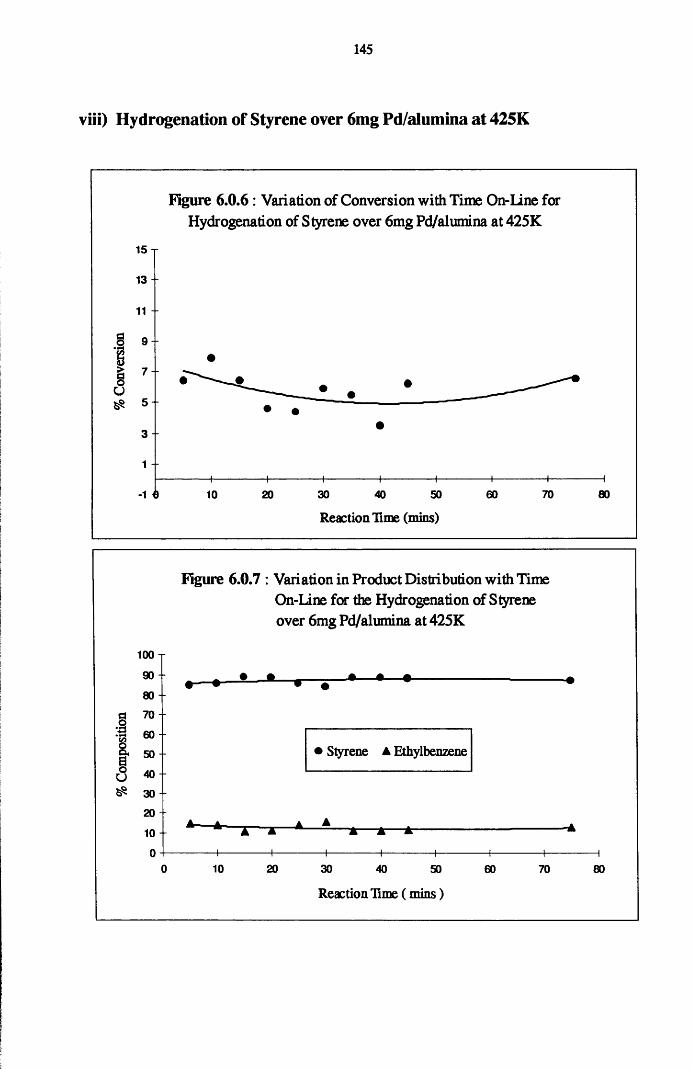
145
viii) Hydrogenation of Styrene over 6mg Pd/alumina at 425K
Figure 6.0.6: Variation of Conversion with Time On-Line for Hydrogenation of Styrene over 6mg Pd/alumina at 425K
15 T
13 --
11 --
8g
9 -
I 7 "U^ 5 --
3 --
Reaction Time (mins)
Figure 6.0.7 : Variation in Product Distribution with Time On-Line for the Hydrogenation of Styrene over 6mg Pd/alumina at 425K
100
90 +
80
70 -
60 -
50 -
40 --
30 -
20
10 +
0
• • -• *-
Styrene ▲ Ethylbenzene
4 A z—*—A— “—*— *—Jfc-
4010 20 30 40 50 60
Reaction Time ( mins)
70 80
146
ix) Hydrogenation of Styrene over 7mg Pt/silica at 425K
The reaction between hydrogen and styrene over the above substrate
produced ethylbenzene from five minutes onward. Similar to the hydrogenation
of phenylacetylene, the yield of the alkane remained unaltered over a period of
one hour, and was accompanied by complete conversion of the olefin.
x) Hydrogenation of Styrene over 7mg Pt/alumina at 425K
Styrene hydrogenation produced a constant yield of the alkane with
complete removal of the olefin maintained throughout the analysis time.
Chapter Five
DISCUSSION
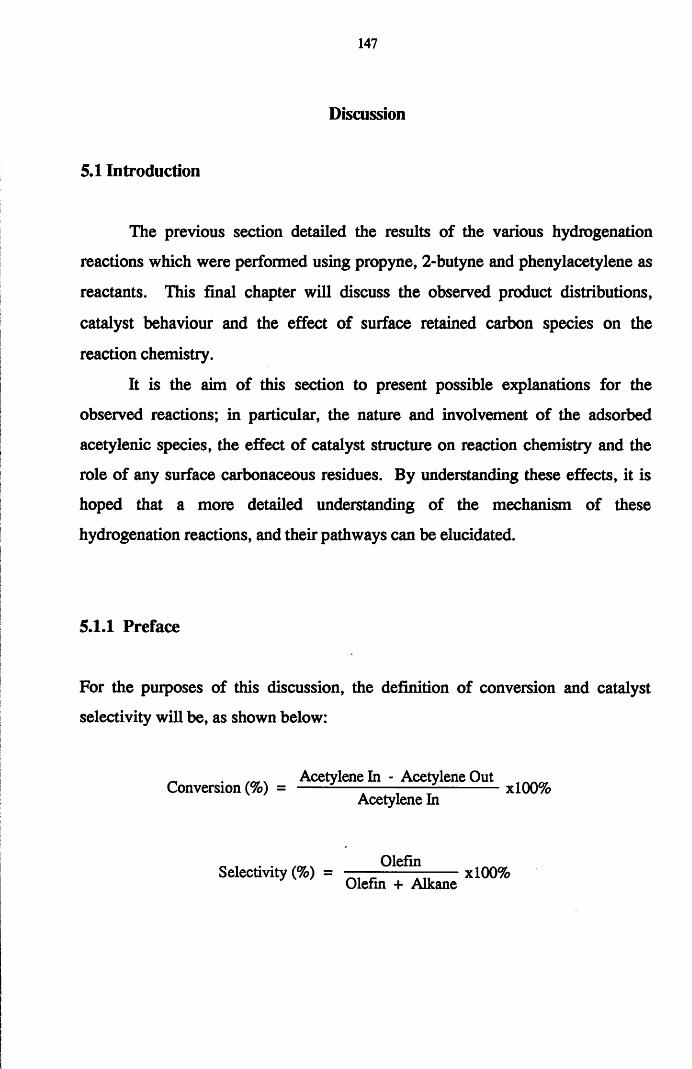
147
Discussion
5.1 Introduction
The previous section detailed the results of the various hydrogenation
reactions which were performed using propyne, 2-butyne and phenylacetylene as
reactants. This final chapter will discuss the observed product distributions,
catalyst behaviour and the effect of surface retained carbon species on the
reaction chemistry.
It is the aim of this section to present possible explanations for the
observed reactions; in particular, the nature and involvement of the adsorbed
acetylenic species, the effect of catalyst structure on reaction chemistry and the
role of any surface carbonaceous residues. By understanding these effects, it is
hoped that a more detailed understanding of the mechanism of these
hydrogenation reactions, and their pathways can be elucidated.
5.1.1 Preface
For the purposes of this discussion, the definition of conversion and catalyst
selectivity will be, as shown below:
_ . Acetylene In - Acetylene OutConversion (%) = ----- ------ xl00%Acetylene In
OlefinSelectivity (%) = — —------—------ xl00%Olefin + Alkane
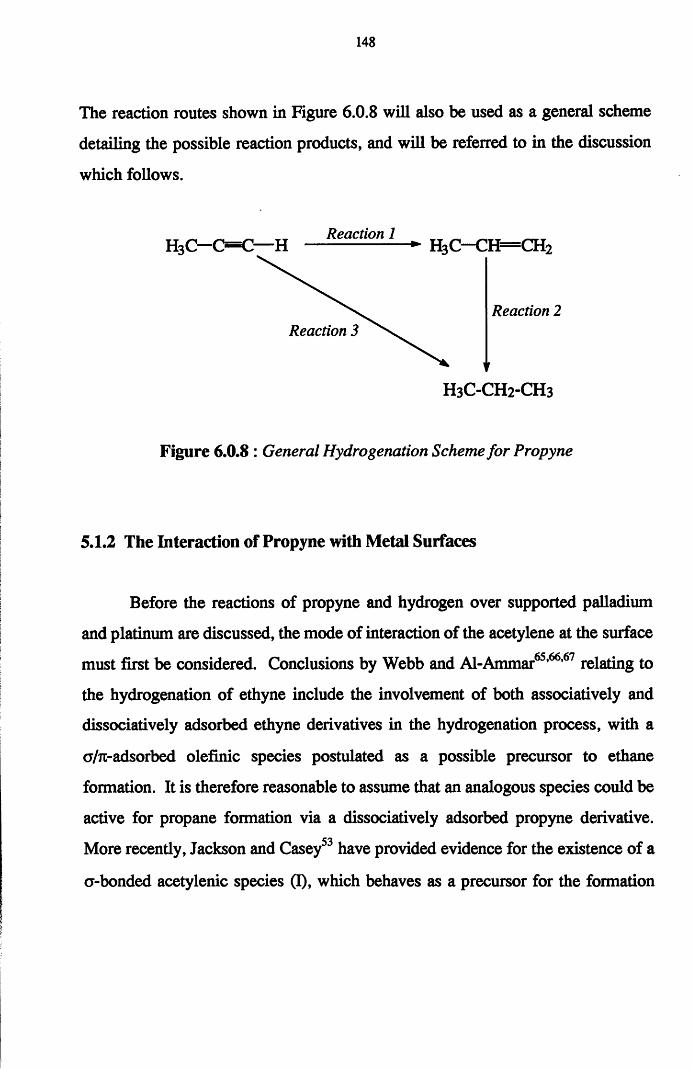
148
The reaction routes shown in Figure 6.0.8 will also be used as a general scheme
detailing the possible reaction products, and will be referred to in the discussion
which follows.
h 3c - o =c — HReaction 1
Reaction 3
- h3c- ch= ch2
Reaction 2
H3C-CH2-CH3
Figure 6.0.8 : General Hydrogenation Scheme for Propyne
5.1.2 The Interaction of Propyne with Metal Surfaces
Before the reactions of propyne and hydrogen over supported palladium
and platinum are discussed, the mode of interaction of the acetylene at the surface
must first be considered. Conclusions by Webb and Al-Ammar65,66,67 relating to
the hydrogenation of ethyne include the involvement of both associatively and
dissociatively adsorbed ethyne derivatives in the hydrogenation process, with a
o/ji-adsorbed olefinic species postulated as a possible precursor to ethane
formation. It is therefore reasonable to assume that an analogous species could be
active for propane formation via a dissociatively adsorbed propyne derivative.
More recently, Jackson and Casey have provided evidence for the existence of a
a-bonded acetylenic species (I), which behaves as a precursor for the formation
149
of the corresponding alkylidyne, propylidyne27 (II), which may be coordinated
through three distinct metal atoms, as shown in Figure 6.0.9.
H3Tff★
(D
H3C11CH3
Propane (g) +H <fH2
A(n)
H3C
+H
+H
H3C CH-
★ * ★ *'7 k
Figure 6.0.9 : A Possible Route to the Formation o f Propane
via Dissociative Adsorption o f Propyne
The propylidyne species may also be an important precursor to further
surface hydrocarbonaceous overlayers, which could be produced from (i)
dehydrogenation of this alkylidyne or (ii) cleavage of one or more of the (C-Q
bonds. Therefore, in view of this it is reasonable to assume that both the alkane
precursor and the hydrocarbonaceous residues will co-exist at the surface.
Therefore we can propose that the formation of either the alkane or surface
hydrocarbonaceous overlayers will be dependent on the rate of hydrogen supply
to the alkane or overlayer precursor sites. Those reactions where the alkane
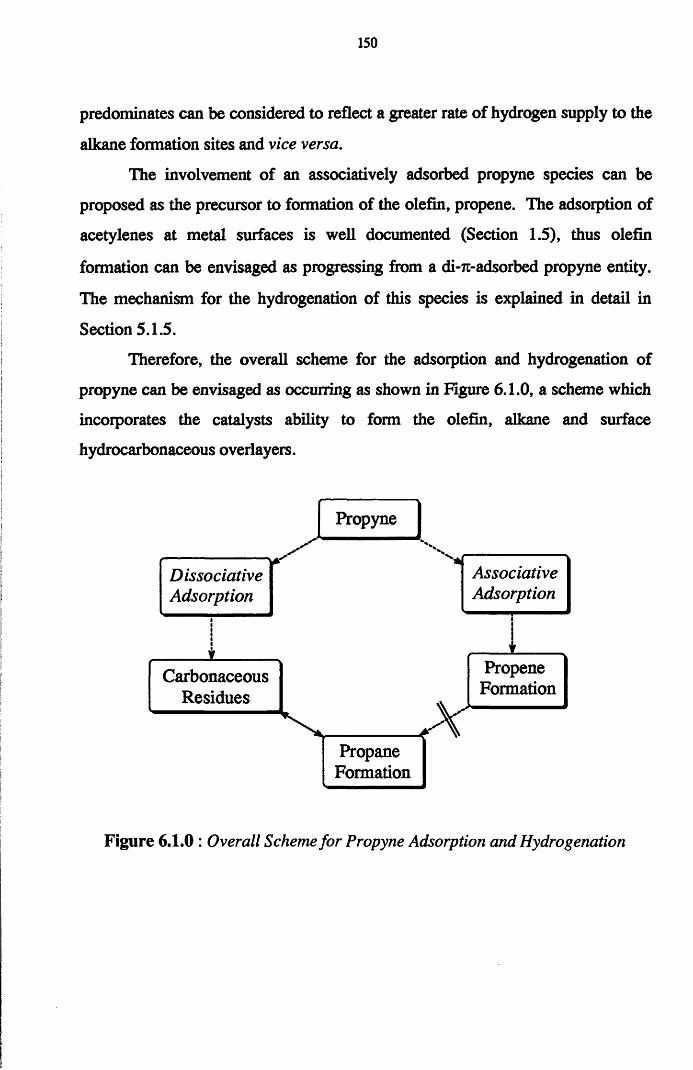
150
predominates can be considered to reflect a greater rate of hydrogen supply to the
alkane formation sites and vice versa.
The involvement of an associatively adsorbed propyne species can be
proposed as the precursor to formation of the olefin, propene. The adsorption of
acetylenes at metal surfaces is well documented (Section 1.5), thus olefin
formation can be envisaged as progressing from a di-Tt-adsorbed propyne entity.
The mechanism for the hydrogenation of this species is explained in detail in
Section 5.1.5.
Therefore, the overall scheme for the adsorption and hydrogenation of
propyne can be envisaged as occurring as shown in Figure 6.1.0, a scheme which
incorporates the catalysts ability to form the olefin, alkane and surface
hydrocarbonaceous overlayers.
Propyne
AssociativeAdsorption
DissociativeAdsorption
PropeneFormation
CarbonaceousResidues
PropaneFormation
Figure 6.1.0 : Overall Scheme for Propyne Adsorption and Hydrogenation
151
5.1.3 The Reaction of Propyne with Hydrogen over Supported Palladium
When propyne was hydrogenated using an equimolar reactant mixture, the
silica-supported palladium catalyst displayed complete selectivity toward the
formation of propene (Table 5.1.1). However, over a series of ten pulses, the
turnover of propyne to propene was found to decrease with increasing number of
pulses (Figure 5.1.1). This decrease in catalyst activity is termed deactivation,
and was accompanied by a decrease in the amount of carbon retained by the
catalyst (11.5 xlO19 atoms [pulse 1] -» 4.48 xlO19 atoms [pulse 10]: Octal = 11.5
xlO19 atoms [pulse 1], 61.62 xlO19 atoms [pulse 10]). The loss of activity is
attributed to the ability of surface carbonaceous residues to diminish the number
of active metal clusters, thus inhibiting the initial adsorption of the propyne
molecule. The initially low conversion values for this reaction tends to suggest
that either the surface contains relatively few sites for propyne adsorption, or the
availability of surface hydrogen is limited ( 6 h low). This latter conclusion would
result in the desorption of propyne before hydrogenation had occurred.
Comparing the high selectivity and low conversion values suggests that either (i)
only sites for the hydrogenation of propyne to propene are available, and the
existence of surface sites for propane formation, if any, are blocked by the
retained carbon, or (ii) that the surface hydrogen coverage is too low to meet the
demands of propane formation. Since the amount of propene produced was
relatively constant throughout the ten pulses, the decreasing conversion and
carbon retention suggests that the surface carbon residues, which give rise to
catalyst deactivation, originate from propyne.
When the pressure of hydrogen in the reactant mixture was increased (3-
fold excess), the conversion of propyne was initially much greater than in the
equimolar experiments (Table 5.1.3). However, similar to the equimolar
152
reactions, this conversion was observed to decrease over a series of thirty pulses.
The hydrogenation of propyne under these conditions gave rise to both propene
and propane. The amount of propane detected over the course of the thirty pulses
was found to oscillate (Figure 5.1.3), while propene was only observed from
pulse two onward. Similar to the result of Jackson and Kelly52, it is believed that
the formation of the olefin is a consequence of hydrocarbonaceous overlayers
acting as hydrogen transfer species62, and furnishing the propyne molecule with
activated hydrogen atoms. The deposition of carbon, determined quantitatively,
was observed to decrease (8.13 xlO19 atoms [pulse 1]), until a point at which
carbon was being removed from the surface (-1.25 xlO19 atoms [pulse 30]). The
yield of propene was observed to pass through two cycles before reaching an
apparent steady state value. This can be related to the rate of hydrogen supply to
the sites of associatively adsorbed propyne, such that when the yield of propene
was low the rate of hydrogen supply could be considered to be low also. When
the amount of propene increased with pulsing, the availabilty of hydrogen was
greater at the surface.
The oscillations in the propane composition from pulse to pulse are
indicative of the concentration of hydrogen in the hydrocarbonaceous residues
varying. The existence of an equilibrium between the precursor states for
propane and hydrocarbonaceous residue formation, would result in the amount of
product formed varying with pulsing, with the rate of hydrogen supply to the
relevant sites dictating the predominant reaction.
Using alumina-supported palladium, the reaction of propyne and hydrogen
(1:1 ratio) afforded both propene and propane (Table 5.1.5). This relatively low
selectivity for a palladium catalyst was accompanied by low conversions of
propyne (<. 28%). Similiar to the silica-supported palladium catalyst, this
153
reaction also gave rise to significant amounts of retained carbon which was
deemed responsible for the drop in catalyst activity for hydrogenation.
The low turnover of propyne, even in pulse one, is in contrast with the
expected chemisorption strength of an acetylene at a metal surface. Generally,
the heats of adsorption for such processes are high, but the deposition of carbon
in the first reaction pulse may be responsible for perturbing the electronic nature
of the 'modified’ metal surface. It is the existence of this carbon containing
surface which gives rise to the desorption of unreacted propyne. Clearly, the
production of both propane and propene indicates that sites for the formation of
both hydrocarbons are available at the surface. Coupling this with the relatively
low conversions of propyne, leads to the conclusion that since both products are
only formed in small amounts, the formation of propane can be considered to
occur by hydrogenation of surface hydrocarbonaceous overlayers. Under these
circumstances we can state that the consecutive reaction pathway, where propane
is produced via one surface visit from dissociatively adsorbed propyne is likely.
The selective hydrogenation of propyne to propene will occur from the adsorption
of an associatively adsorbed propyne species on the hydrogen covered overlayers.
Using an excess of hydrogen in the reactant mixture resulted in complete
removal of propyne from the gas eluent stream over a period of sixteen pulses
(Table 5.1.7). This high turnover was found to decrease by approximately 55%
in pulse seventeen. As with all the previous reactions, this loss of catalyst
activity is a function of the poisoning abilities of surface carbonaceous residues.
Unlike the silica-supported palladium catalyst, the formation of propene was not
evident until after the fifth pulse. This catalyst selectivity increased from zero to
approximately 46%, and remained constant at this value over the remaining
pulses.
154
With the amount of propene formed remaining relatively constant, the
reaction pathway for propene formation from propyne hydrogenation can be
considered to be unaffected by the deposition of carbon at the surface. However,
the composition of propane produced was found to vary with pulsing, and the
overall trend seems to be one of poisoning of the propane formation sites
(decreases by 1.83 xlO'5 moles over 30 pulses). From Figure 6.0.8, we can state
that:
(i) propene production will be the result of the hydrogenation of an
associatively adsorbed acetylenic species (Reaction 1)
(ii) formation of propane (from hydrogenation of dissociatively
adsorbed propyne) will be susceptible to poisoning through carbon
deposition (Reaction 3)
With the yield of propene effectively unaltered throughout, propane
production must occur from direct hydrogenation of the acetylene, with the yield
of the alkane therefore decreasing at lower propyne conversions.
5.1.4 The Reaction of Propyne with Hydrogen over Supported Platinum
The hydrogenation of propyne over highly dispersed silica-supported
platinum, using an equimolar reactant mixture, produced both propene and
propane (Table 5.1.9). The conversion of propyne, although initially low, was
found to decrease further over ten pulses. The yield of the olefin and alkane was
also small, with the amount of alkane produced decreasing to a limiting value
(0.49 xlO'5 moles —» 0.22 xlO'5 moles over 10 pulses). In the case of the olefin,
155
the amount detected increased from zero in pulse one to a constant amount (0.20
xlO'5 moles [pulse 6]), suggesting the attainment of a steady state regime.
The conversion of propyne over this catalyst decreased to near zero after
ten pulses. Under these circumstances, where all the propyne passed over the
catalyst is unreacted, it seems reasonable to propose that both propene and
propane detected at this stage of the reaction must be the product of carbonaceous
residue hydrogenation. This is in good agreement with the carbon mass balance
data which shows that carbon was removed from the surface in the later pulses.
The initially low conversion of propyne could be the result of one or both
of two factors. First, the accompanying carbon laydown may act as a poison for
subsequent reactions. Second, the catalyst surface, which contains a large
fraction of exposed metal atoms, may have insufficient adsorption sites of the
required geometric and/or electronic arrangement for propyne chemisorption.
The metal particles which have an average diameter of l-2nm will behave more
electrophilically, such that the electron rich acetylenic bond will be chemisorbed
more strongly at the surface, thus contributing to the laydown of surface carbon.
This would effectively poison the active sites for further propyne adsorption.
Coupled with the low concentration of hydrogen atoms at these sites, the
carbonaceous residues would become carbidic and deactivate the catalyst.
The selectivity of this reaction shows that the hydrogenation of propyne to
yield both propene and propane is still feasible. Since only propane is detected in
pulse one, the direct hydrogenation of propyne to produce propane is important.
This is most probably a reflection of a primary adsorption period where only
dissociative adsorption of propyne occurs directly on the metal to yield the
alkane. The production of propene from pulse two onwards suggests that the
enhancement of the catalyst selectivity is again a consequence of the
hydrocarbonaceous residues acting as hydrogen suppliers for the hydrogenation
156
of associatively adsorbed propyne species. Since the amount of propene
produced is relatively small (and constant) throughout, we can assume that the
concentration of propene sites is unaltered by carbon deposition.
In the case of the alkane, an increase in the number of pulses is
accompanied by a decreasing propane yield, indicating that the opposite is true
for these sites, and that propane formation sites on this surface are susceptible to
poisoning; at least until a steady concentration of sites has been attained.
Therefore, in relation to the general reaction route described in Figure 6.0.8, we
can state that the initial stages of the reaction are (i) the dissociative adsorption of
propyne to form surface hydrocarbonaceous residues and (ii) the hydrogenation
of adsorbed propyne to produce propane. When the number of pulses increased,
the amount of propane eluted decreased, indicating the propensity of these sites to
undergo poisoning through carbon build-up. An induction period precedes the
formation of propene, the production of which will be the result of hydrogen
supply to a di-n-propyne entity from the carbonaceous overlayers.
Increasing the hydrogen content of the reactant mixture (3-fold excess) has
a marked effect on both catalyst activity and selectivity. The conversion of
propyne under these conditions was initially greater than in the equimolar
reactions (Table 5.2.1), which clearly shows that the adsorbed propyne in the
former reactions was starved of hydrogen. In the early stages of these reactions
the formation of propane occurred exclusively. This reaction predominated until
the seventeenth pulse, at which point propene was simultaneously formed.
Therefore, it is clear that in order for the hydrogenation of propyne and
desorption of adsorbed propene to commence, the accumulation of surface
hydrocarbonaceous residues must have progressed in parallel with propane
formation.
157
The amount of propane eluted throughout these reactions was observed to
decrease, while the yield of propene increased from zero to a steady value (Figure
5.2.3). Therefore, with regard to the available reaction pathways we can state
that those sites which govern propane formation by direct hydrogenation of a
dissociatively adsorbed propyne species predominated during the initial sixteen
pulses. However, since the amount of propane formed decreased with increasing
number of pulses, we can state that these sites are susceptible to deactivation.
The large induction period before the detection of propene may be the result of
the reluctance of smaller metal particles to form carbonaceous residues76, which
act as hydrogenation species when hydrogen rich52.
From the carbon mass balance data, it is evident that the amount of carbon
retained by the catalyst is increasing as a function of decreasing propyne
hydrogenation. Therefore, it is reasonable to assume that both the retained
associatively and dissociatively adsorbed surface species must originate from the
olefin and alkane precursors.
Propyne hydrogenation over alumina-supported platinum employing a 1:1
mixture displayed complete selectivity toward the production of propene, with
low conversion of propyne (Table 5.2.3). As with all other reactions, the
turnover of propyne decreased with increasing number of pulses, and was
accompanied by significant carbon deposition. The high catalyst selectivity
points to (i) the effective exclusion of the olefin from the surface, such that no
competition for sites occurs or (ii) the low surface hydrogen coverage favouring
olefin formation. The hydrogenation of propyne to yield propene will proceed on
a carbon covered surface, and the lack of propane suggests that any sites for
dissociative adsorption and hydrogenation of propyne are inactive due to the low
concentration of hydrogen at the surface.
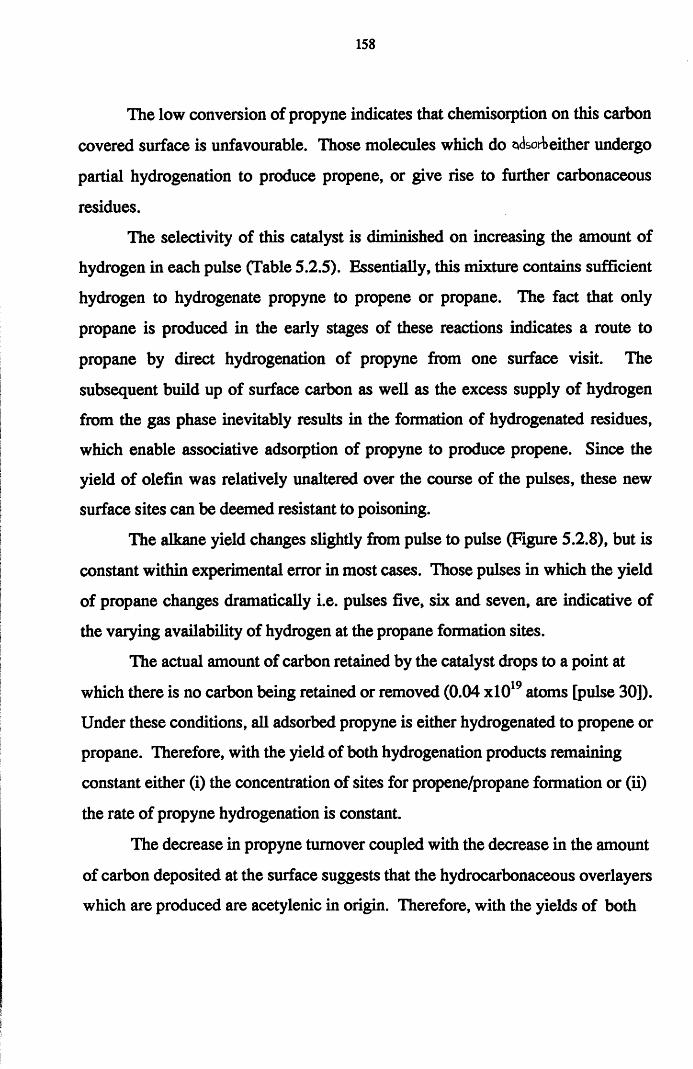
158
The low conversion of propyne indicates that chemisorption on this carbon
covered surface is unfavourable. Those molecules which do adsorb either undergo
partial hydrogenation to produce propene, or give rise to further carbonaceous
residues.
The selectivity of this catalyst is diminished on increasing the amount of
hydrogen in each pulse (Table 5.2.5). Essentially, this mixture contains sufficient
hydrogen to hydrogenate propyne to propene or propane. The fact that only
propane is produced in the early stages of these reactions indicates a route to
propane by direct hydrogenation of propyne from one surface visit. The
subsequent build up of surface carbon as well as the excess supply of hydrogen
from the gas phase inevitably results in the formation of hydrogenated residues,
which enable associative adsorption of propyne to produce propene. Since the
yield of olefin was relatively unaltered over the course of the pulses, these new
surface sites can be deemed resistant to poisoning.
The alkane yield changes slightly from pulse to pulse (Figure 5.2.8), but is
constant within experimental error in most cases. Those pulses in which the yield
of propane changes dramatically i.e. pulses Eve, six and seven, are indicative of
the varying availability of hydrogen at the propane formation sites.
The actual amount of carbon retained by the catalyst drops to a point at
which there is no carbon being retained or removed (0.04 xlO19 atoms [pulse 30]).
Under these conditions, all adsorbed propyne is either hydrogenated to propene or
propane. Therefore, with the yield of both hydrogenation products remaining
constant either (i) the concentration of sites for propene/propane formation or (ii)
the rate of propyne hydrogenation is constant.
The decrease in propyne turnover coupled with the decrease in the amount
of carbon deposited at the surface suggests that the hydrocarbonaceous overlayers
which are produced are acetylenic in origin. Therefore, with the yields of both
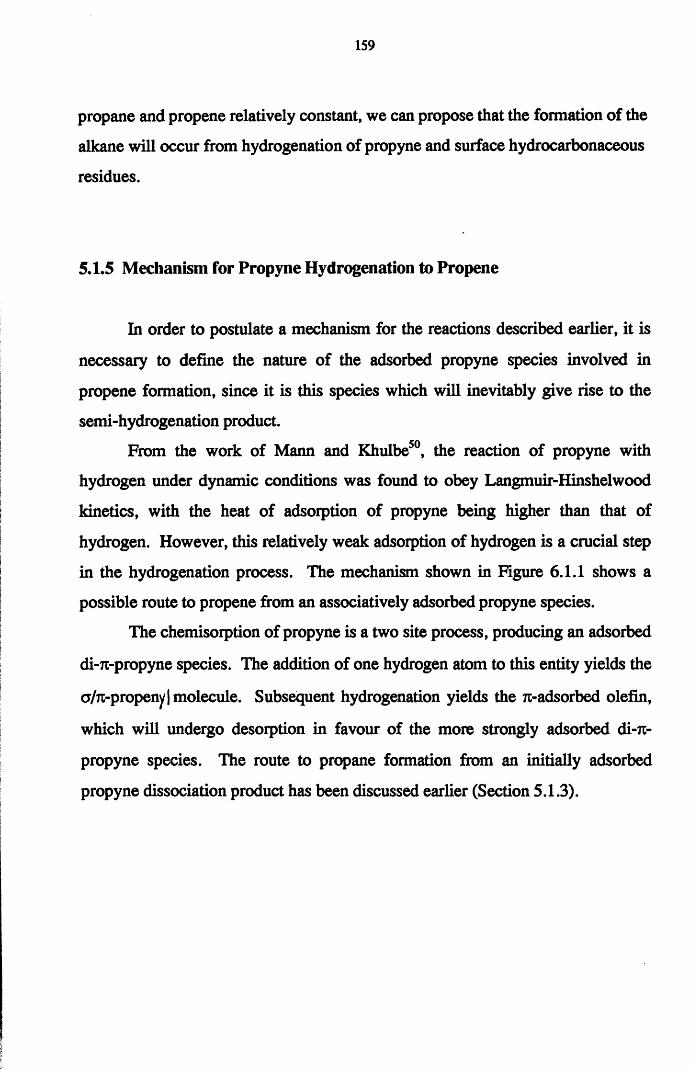
159
propane and propene relatively constant, we can propose that the formation of the
alkane will occur from hydrogenation of propyne and surface hydrocarbonaceous
residues.
5.1.5 Mechanism for Propyne Hydrogenation to Propene
In order to postulate a mechanism for the reactions described earlier, it is
necessary to define the nature of the adsorbed propyne species involved in
propene formation, since it is this species which will inevitably give rise to the
semi-hydrogenation product.
From the work of Mann and Khulbe50, the reaction of propyne with
hydrogen under dynamic conditions was found to obey Langmuir-Hinshelwood
kinetics, with the heat of adsorption of propyne being higher than that of
hydrogen. However, this relatively weak adsorption of hydrogen is a crucial step
in the hydrogenation process. The mechanism shown in Figure 6.1.1 shows a
possible route to propene from an associatively adsorbed propyne species.
The chemisorption of propyne is a two site process, producing an adsorbed
di-7t-propyne species. The addition of one hydrogen atom to this entity yields the
a/tt-propeny | molecule. Subsequent hydrogenation yields the Ti-adsorbed olefin,
which will undergo desorption in favour of the more strongly adsorbed di-7t-
propyne species. The route to propane formation from an initially adsorbed
propyne dissociation product has been discussed earlier (Section 5.1.3).
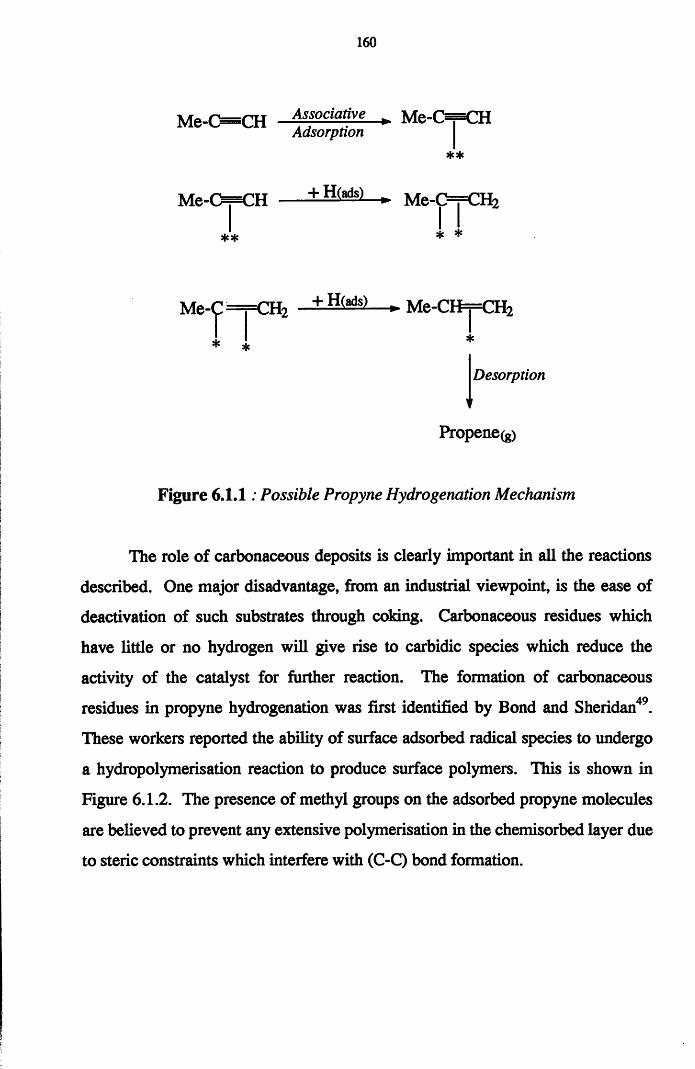
160
M e-C=CH Associative ► M e-0=C H Adsorption
**
M e-O jC H ----+ H(«ds) ► Me-D=j=CH2
Me-C=j=CH2 + H W — Me-CH=pCH2
* i *Desorption
v
Propene(g)
Figure 6.1.1: Possible Propyne Hydrogenation Mechanism
The role of carbonaceous deposits is clearly important in all the reactions
described. One major disadvantage, from an industrial viewpoint, is the ease of
deactivation of such substrates through coking. Carbonaceous residues which
have little or no hydrogen will give rise to carbidic species which reduce the
activity of the catalyst for further reaction. The formation of carbonaceous
residues in propyne hydrogenation was first identified by Bond and Sheridan49.
These workers reported the ability of surface adsorbed radical species to undergo
a hydropolymerisation reaction to produce surface polymers. This is shown in
Figure 6.1.2. The presence of methyl groups on the adsorbed propyne molecules
are believed to prevent any extensive polymerisation in the chemisorbed layer due
to steric constraints which interfere with (C-C) bond formation.
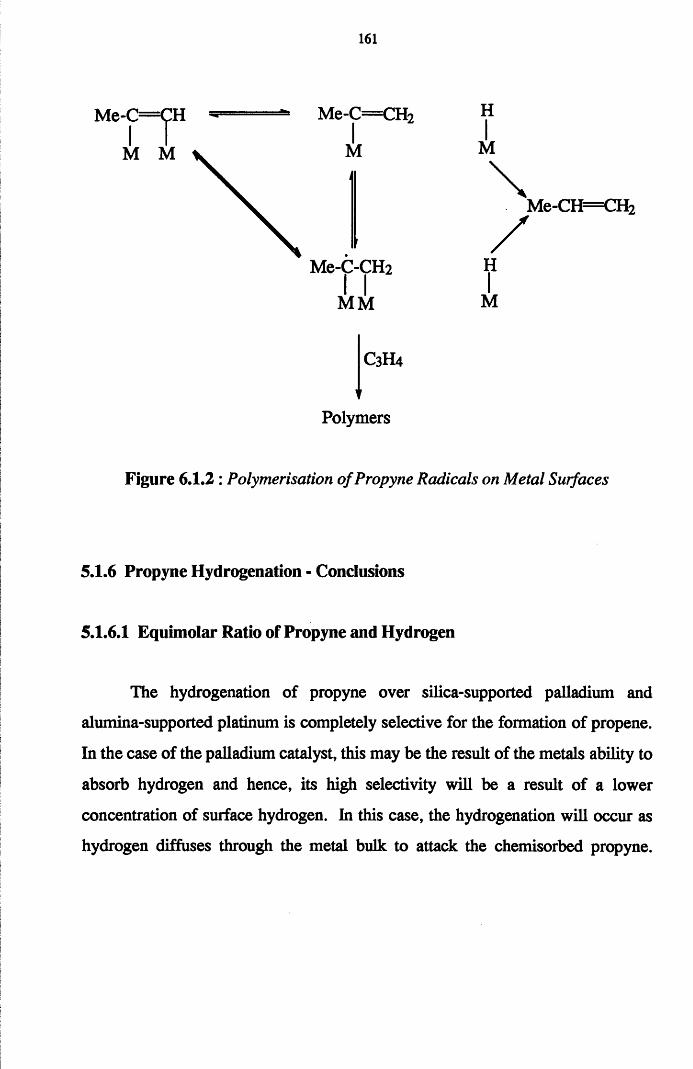
161
HI
M
\M e-CH =CH 2
/HI
M M M
C3H4
r
Polymers
Figure 6.1.2 : Polymerisation of Propyne Radicals on Metal Surfaces
Me-G
M M
Me-C-CH2
5.1.6 Propyne Hydrogenation - Conclusions
5.1.6.1 Equimolar Ratio of Propyne and Hydrogen
The hydrogenation of propyne over silica-supported palladium and
alumina-supported platinum is completely selective for the formation of propene.
In the case of the palladium catalyst, this may be the result of the metals ability to
absorb hydrogen and hence, its high selectivity will be a result of a lower
concentration of surface hydrogen. In this case, the hydrogenation will occur as
hydrogen diffuses through the metal bulk to attack the chemisorbed propyne.
162
Bond77 suggests that this dissolved hydrogen has the ability to alter the electronic
nature of the metal and its propensity to attract the Ti-electrons of the olefin.
For alumina-supported platinum, the above argument cannot be applied so
readily. In this case it seems that the formation of propene is either (i) a
consequence of propyne excluding propene from the surface [AHaCCsRO »
AHa(C3H6)] or that (ii) the rate of hydrogen supply to dissociatively adsorbed
propyne sites is limited.
Both alumina-supported palladium and silica-supported platinum exhibit
low selectivities for propene formation. The existence of both propene and
propane suggests that both catalysts contain similar concentrations of sites for
associative and dissociative propyne adsorption. For highly dispersed platinum,
the electrophilicity of the metal particles may be enhanced toward the acetylenic
bonds. Therefore, the residence time of the acetylene will be increased, allowing
propane production to occur.
Over alumina-supported palladium, the formation of both propene and
propane indicates that this surface also has sites for propyne hydrogenation to
propene and/or propane. The metal also has the ability to occlude large quantities
of hydrogen, which may play an active role in furnishing the adsorbed propyne
molecules with hydrogen atoms. The formation of both propene and propane will
occur on carbon covered surfaces which does not alter the yield of either product.
5.1.6.2 Excess Hydrogen Reactions
All catalysts were prone to deactivation through carbon deposition. The
promoting ability of hydrocarbonaceous residues was more pronounced in these
reactions, most notably in the case of silica-supported platinum. The large
induction period before the detection of propene using this substrate may well be
the result of the smaller metal particles being more reluctant to form surface
carbonaceous residues, which act to supply hydrogen to associatively adsorbed
di-rc-propyne species. Salmeron and Somoijai71 reported the preferential
deposition of carbon on flat catalytic planes that are well populated with large
particles. Therefore, small metal particles, which contain fewer flat faces will be
less sensitive to self poisoning through carbon deposition. The low selectivities
in these reactions is a product of the greater availability of hydrogen at the
surface, a condition which will favour propane production.
5.1.6.3 Physical Nature of Catalysts - Effect on Product Selectivities
In order to fully characterise the hydrogenation reactions of propyne over
supported palladium and platinum catalysts, it is necessary to consider the nature
of the catalytic surface. The first factor which may be taken into account is the
role of the support material in the observed reactions. Clearly the support has an
influential role in the reaction chemistry, with both Pd/silica and Pt/alumina
exhibiting complete selectivity toward the olefin. However, since these differing
supports have identical products, we can assume that the hydrogen atoms
associated with each support are not important in relation to the hydrogenation
reactions. However, where the support may be important is in the catalyst
preparation stages. Both Pd/silica and Pt/alumina have comparable particle sizes
(~10 nm from TEM/chemisorption), while Pt/silica and Pd/alumina have smaller
particle diameters; 1-2 nm and 5nm respectively. Therefore, the hydrogenation of
164
propyne over supported palladium and platinum may be governed by the relative
metal particle sizes.
This may be summarised in terms of the electrophilicity of smaller metal
particles toward electron rich bonds. With both Pd/alumina and Pt/silica
exhibiting low selectivities to the olefin, we can propose that this is merely a
result of the metal particles ability to retain the acetylene at the surface, with the
increase in retention time favouring saturation of the acetylene, to yield the
alkane. Those catalysts which are completely selective toward propene (and have
larger metal particles) will be less electrophilic, and hence, more likely to allow
desorption of the olefin before saturation occurs.
5.2.1 The Interaction of 2-Butyne with Metal Surfaces
The results of the 2-butyne hydrogenation reactions, detailed in the
previous chapter, show that with low concentrations of surface hydrogen, 2-
butyne hydrogenation favoured production of the cw-olefin isomer. At high
reaction temperatures, the formation of trace amounts of trans-2-butene was also
evident.
At high coverages of hydrogen, the major reaction over almost all catalysts
Was the hydrogenation of 2-butyne to w-butane. Unlike the C-3 hydrogenation
reactions, the conversion of the acetylene (detailed in Section 5.1.2) was
complete, such that all 2-butyne passed over the catalyst was either converted to
the alkane or was retained in the form of surface hydrocarbonaceous residues.
The existence of methane in several of the “excess hydrogen” reactions
suggests that the dissociative adsorption of 2-butyne on bare metal sites is
feasible, as shown in Figure 6.1.3. Therefore, we can conclude that similar to
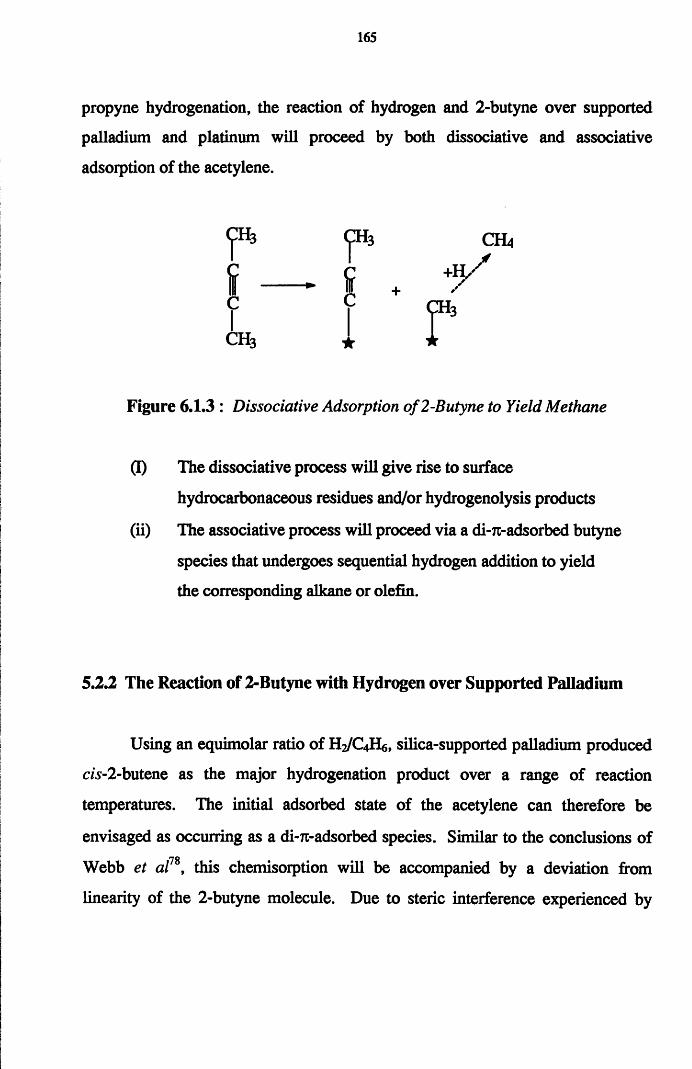
165
propyne hydrogenation, the reaction of hydrogen and 2 -butyne over supported
palladium and platinum will proceed by both dissociative and associative
adsorption of the acetylene.
Figure 6.1.3 : Dissociative Adsorption of2-Butyne to Yield Methane
(I) The dissociative process will give rise to surface
hydrocarbonaceous residues and/or hydrogenolysis products
(ii) The associative process will proceed via a di-rc-adsorbed butyne
species that undergoes sequential hydrogen addition to yield
the corresponding alkane or olefin.
5.2.2 The Reaction of 2-Butyne with Hydrogen over Supported Palladium
Using an equimolar ratio of H2/C4H6 , silica-supported palladium produced
c/s-2 -butene as the major hydrogenation product over a range of reaction
temperatures. The initial adsorbed state of the acetylene can therefore be
envisaged as occurring as a di-71-adsorbed species. Similar to the conclusions of
Webb et aln , this chemisorption will be accompanied by a deviation from
linearity of the 2-butyne molecule. Due to steric interference experienced by
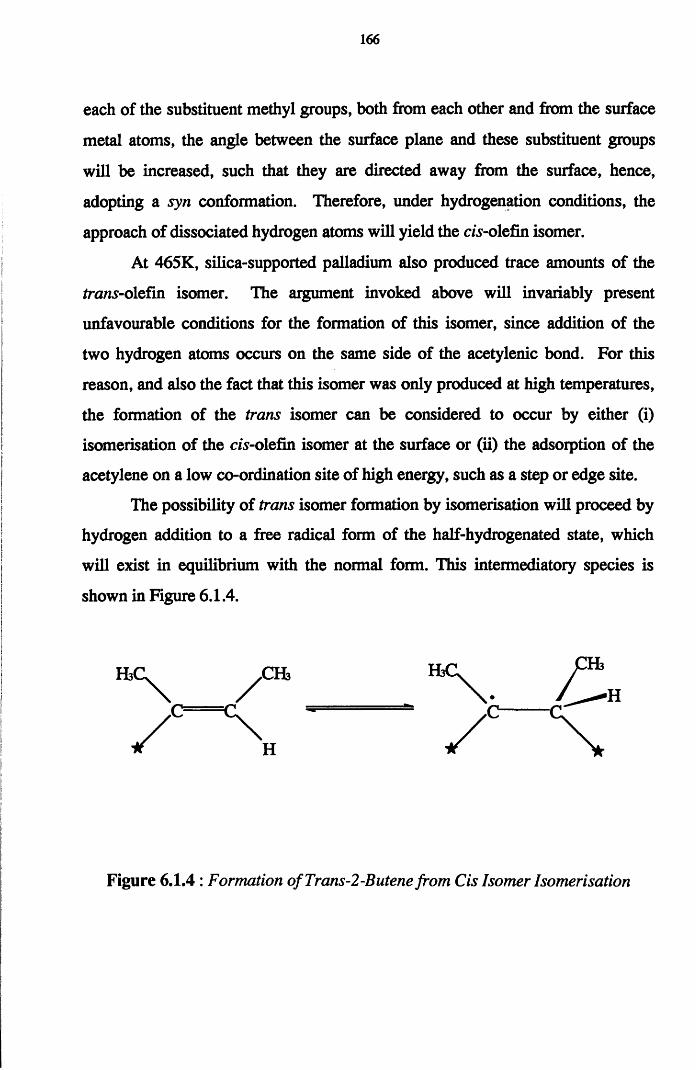
166
each of the substituent methyl groups, both from each other and from the surface
metal atoms, the angle between the surface plane and these substituent groups
will be increased, such that they are directed away from the surface, hence,
adopting a syn conformation. Therefore, under hydrogenation conditions, the
approach of dissociated hydrogen atoms will yield the czs'-olefm isomer.
At 465K, silica-supported palladium also produced trace amounts of the
trans-olefin isomer. The argument invoked above will invariably present
unfavourable conditions for the formation of this isomer, since addition of the
two hydrogen atoms occurs on the same side of the acetylenic bond. For this
reason, and also the fact that this isomer was only produced at high temperatures,
the formation of the trans isomer can be considered to occur by either (i)
isomerisation of the cis-olefin isomer at the surface or (ii) the adsorption of the
acetylene on a low co-ordination site of high energy, such as a step or edge site.
The possibility of trans isomer formation by isomerisation will proceed by
hydrogen addition to a free radical form of the half-hydrogenated state, which
will exist in equilibrium with the normal form. This intermediatory species is
shown in Figure 6.1.4.
Figure 6.1.4 : Formation ofTrans-2-Butene from Cis Isomer Isomerisation
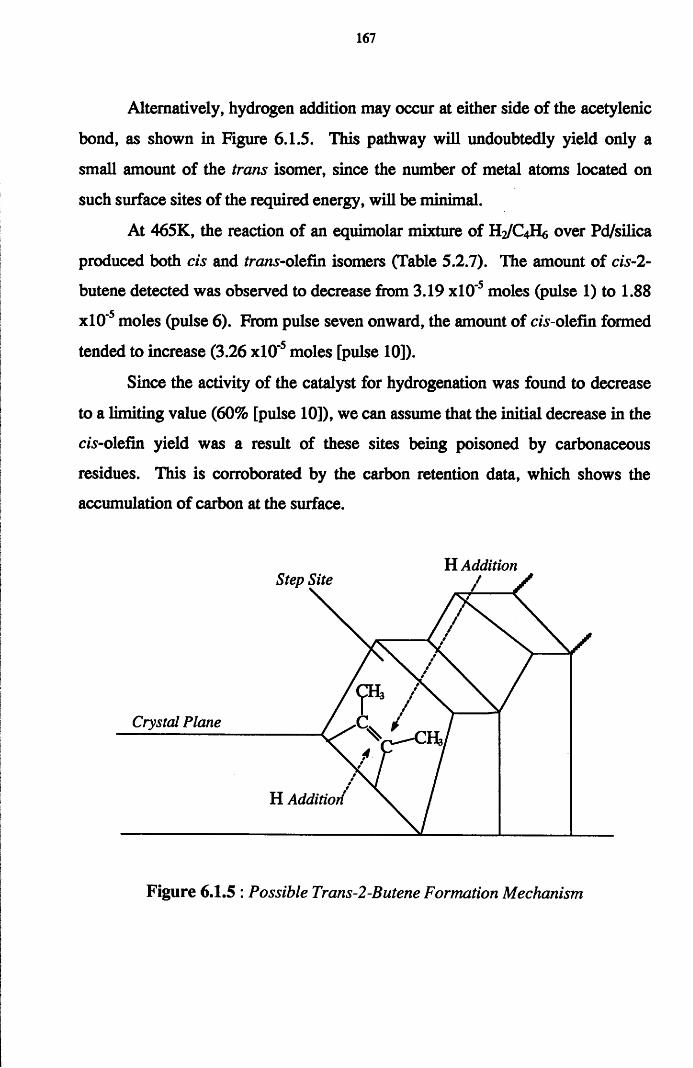
167
Alternatively, hydrogen addition may occur at either side of the acetylenic
bond, as shown in Figure 6.1.5. This pathway will undoubtedly yield only a
small amount of the trans isomer, since the number of metal atoms located on
such surface sites of the required energy, will be minimal.
At 465K, the reaction of an equimolar mixture of H2/C4H6 over Pd/silica
produced both cis and trans-olefin isomers (Table 5.2.7). The amount of cis-2-
butene detected was observed to decrease from 3.19 xlO'5 moles (pulse 1) to 1.88
xlO’5 moles (pulse 6 ). From pulse seven onward, the amount of c/s-olefin formed
tended to increase (3.26 xlO'5 moles [pulse 10]).
Since the activity of the catalyst for hydrogenation was found to decrease
to a limiting value (60% [pulse 1 0 ]), we can assume that the initial decrease in the
c/s-olefin yield was a result of these sites being poisoned by carbonaceous
residues. This is corroborated by the carbon retention data, which shows the
accumulation of carbon at the surface.
H AdditionStep Site
Crystal Plane
H Addition
Figure 6.1.5 : Possible Trans-2-Butene Formation Mechanism
168
From pulse seven onward, where the c/s-olefin yield increased, the degree
of carbon laydown tended to decrease. Therefore, since the conversion of 2-
butyne was constant, we can attribute the decrease in carbon deposition to a slow
supply of hydrogen to the dissociatively adsorbed 2 -butyne sites which produce
hydrocarbonaceous residues.
The reaction of an equimolar mixture of over Pd/silica at 373K
again showed signs of catalyst deactivation (Table 5.2.9). However, at this
temperature, the amount of detected ds-2 -butene was unaltered over ten pulses.
The conversion of 2-butyne decreased before finally increasing in the lat er
pulses, at which point all the acetylene was converted. The retention of carbon
by the catalyst also fluctuated, with the amount retained at the surface decreasing
(3.84 xlO19 atoms —» 2.4 xlO19 atoms over eight pulses) then increasing (4.76
xlO19 atoms [pulse 9]). The hydrogenation of 2-butyne to produce c/s-2-butene
occurs in parallel with this carbon deposition, with (i) hydrogenation of the
associatively adsorbed acetylene and (ii) hydrogenation of the surface retained
carbonaceous residues determined by the availability of hydrogen. Therefore, the
initial decrease in the catalysts activity for 2 -butyne conversion can be attributed
to a greater rate of formation of carbonaceous residues at the surface, thus
reducing the number of c/s-2-butene formation sites. The increase in the amount
of c/s-2 -butene produced in pulses nine and ten, although small, may be due to a
greater rate of hydrogenation of the di-Ti-adsorbed butyne species as opposed to
the carbonaceous residues. This may be a reflection of the greater propensity of
the surface for non-dissociative adsorption of the 2 -butyne molecule, a
phenomenon which could be related to a surface with a reduced number of bare
metal sites.
At 330K, the reaction of an equimolar mixture of H2/C4H6 over Pd/silica
produced no hydrogenation products. These pulse reactions showed no trend in
169
the conversion of 2-butyne with increased pulsing. The lack of hydrogenation
activity at this intermediate temperature suggests :
(i) At ambient temperature the hydrogenation of 2-butyne to yield cis-
2 -butene proceeds via an associatively adsorbed acetylenic
species
(ii) At high temperatures the hydrogenation of 2-butyne to form cis-2-
butene proceeds with an associatively adsorbed species adsorbed on
a surface carbonaceous overlayer (formed from initial dissociative
adsorption of the acetylene), with the latter acting as a hydrogen
transfer medium
(iii) Therefore, at 330K, we can propose that both low and high
temperature reaction pathways are subject to poisoning through
carbon deposition
At ambient temperature (298K), the reaction of equimolar H2/C4H6 over
the above catalyst displayed complete conversion of the acetylene over nine
pulses (Table 5.3.2). The effect of carbon deposition is apparent in pulse ten, at
which point 2-butyne conversion decreased by approximately 30%, with the
decreasing yield of cw-2 -butene also attributable to the poisoning properties of
such surface carbonaceous overlayers.
The reaction of 2-butyne with excess hydrogen at 465K over Pd/silica,
produced both n-butane and methane, with all acetylene passed over the catalyst
converted to either product(s) or carbonaceous residues over thirty pulses (Table
5.2.8). The elution of both hydrogenation products was accompanied by
continual carbon deposition which decreased (2.60 xlO19 atoms [pulsel] -> 1.57
xlO19 atoms [pulse 30]) with increased pulsing. Taking each hydrogenation
170
product separately, let us first consider the mechanism for n-butane formation.
One possible mechanism for the hydrogenation of 2-butyne to produce the
corresponding alkane, will proceed with the acetylene adsorbed as shown in
Figure 6.1.6. The addition of adsorbed hydrogen to this species will give rise to a
surface bound olefin, which itself will undergo reduction, to yield the alkane.
Therefore, the hydrogenation of 2-butyne over silica-supported palladium in
excess hydrogen can be postulated to proceed by a Langmuir-Hinshelwood
mechanism, with the sequential addition of adsorbed hydrogen atoms to the
unsaturated hydrocarbon.
Over Pd/silica the extent of methane production was quite marked at
465K, and was found to remain relatively constant over thirty pulses. Therefore,
since the formation of both n-butane and methane was coupled with continued
carbon laydown, we can conclude that there where bare metal sites at the surface
which permitted hydrogenolysis. The hydrogenation reaction shown below can
be envisaged as occurring on either an exposed or carbon covered surface.^7Similar conclusions were reported by Maetz and Touroude , for the
hydrogenation of 1-butyne over palladium and platinum catalysts. In this study
the existence of compact overlayers existing on high co-ordination sites proved
incapable of dissociating molecular hydrogen, while the low co-ordination sites
(top, edge and comer atoms) were available for the hydrogenation reactions.
It may therefore be concluded that the increased surface hydrogen
coverage favours the formation of the saturated product. The complete activity of
this catalyst for 2-butyne conversion coupled with substantial carbonaceous
overlayer formation, indicates that the hydrogenation of 2-butyne to n-butane and
methane is a consequence of the catalysts ability to chemisorb the acetylene as
either an associative or dissociative entity. The fact that no carbon was removed
from the surface suggests however, that the supply of hydrogen to the
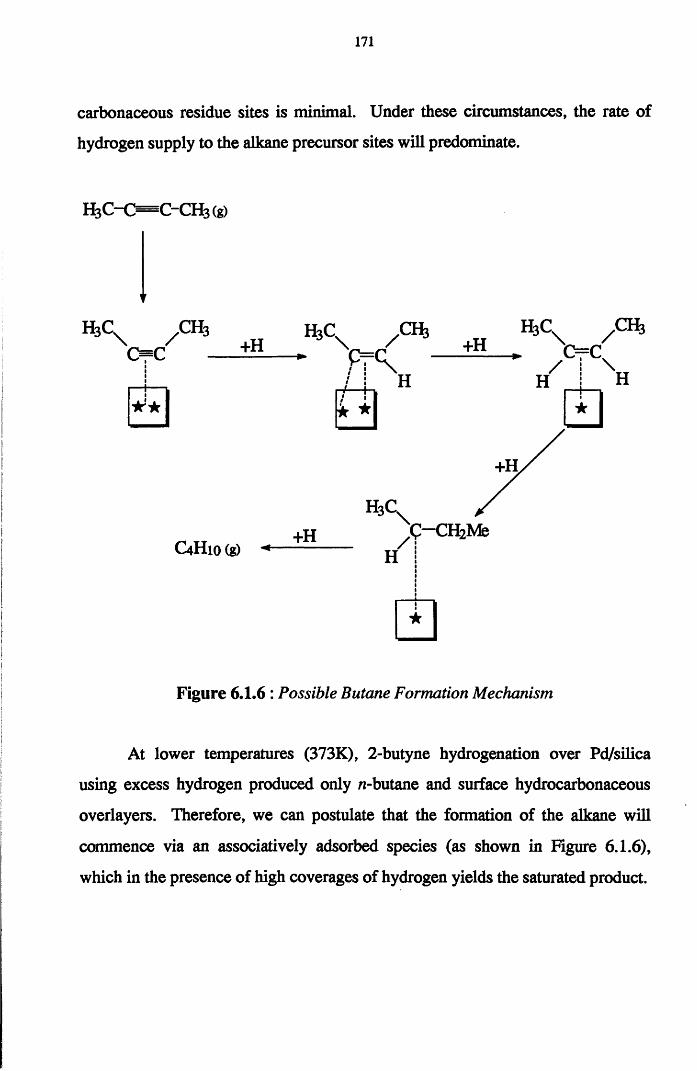
171
carbonaceous residue sites is minimal. Under these circumstances, the rate of
hydrogen supply to the alkane precursor sites will predominate.
H3C-0 -C-CH3(g)
h3cn x ch 3 o=c +H
C4H10 (g)
+HH3C / c h 3
c==c
nH
/ \
a H
h 3c.\
+H
+HH
/C-CH2Me
aFigure 6.1.6 : Possible Butane Formation Mechanism
At lower temperatures (373K), 2-butyne hydrogenation over Pd/silica
using excess hydrogen produced only n-butane and surface hydrocarbonaceous
overlayers. Therefore, we can postulate that the formation of the alkane will
commence via an associatively adsorbed species (as shown in Figure 6.1.6),
which in the presence of high coverages of hydrogen yields the saturated product.
172
In these reactions, the degree of carbon laydown was less (Table 5.3.0),
and indeed, in several pulses, carbon was removed from the surface. Clearly the
residues formed at this temperature are prone to hydrogenation, which could
explain the slight oscillations in the n-butane yield, with both the alkane and
carbonaceous residues competing for hydrogen supply.
Over alumina-supported palladium, the reaction of an equimolar reactant
mixture produced only c/s-2-butene at 373K. In these reactions, all 2-butyne
passed over the catalyst was converted to the olefin and surface carbonaceous
residues. This conversion of 2-butyne was maintained over a series of ten pulses
(Table 5.3.3). The ability of the substrate to produce carbonaceous residues
fluctuated with increasing reaction. The fact that the amount of olefin formed
decreased, suggests that either the concentration of surface sites for olefin
production were reduced, or that the rate of hydrogen supply to these sites was
low.
At 298K, hydrogenation of 2-butyne using an equimolar reactant mixture
produced only c/s-2-butene and unconverted acetylene (Table 5.3.5). Pd/alumina
was found to operate within a steady state regime with respect to 2 -butyne
conversion, with the amount of c/s-2 -butene formed tending to decrease with
increasing number of pulses. At this temperature, the amount of retained carbon
was observed to increase suggesting an increase in the rate of dissociative
adsorption of the acetylene. Therefore, since the decreasing yield of the cis-
olefin isomer is accompanied by increased carbonaceous overlayer formation, we
can propose that as the reaction progresses, the rate of hydrogen supply to the
olefin formation sites (associatively adsorbed 2-butyne) is reduced. This can be
attributed to the low availabilty of dissociated hydrogen atoms at the catalyst
surface. From the carbon mass balance (Figure 5.4.9) it can be seen that in pulse
173
two the removal of surface carbonaceous residues occurs. This may well be a
result of an increase in the supply of hydrogen to those sites which initiate
dissociative adsoiption. One possibility is that in pulse one, dissociative
adsorption of 2-butyne occurs to yield a dehydrogenation product, such as C4H5
(shown in Figure 6.1.7). This species could then undergo hydrogenation in pulse
two and desorb as 2-butyne, thus explaining the negative Acarbon value. Another
possible explanation for this observation is that the acetylene is adsorbed at a
surface site which is inactive for hydrogenation, and is desorbed in a later pulse.
Using excess hydrogen, the hydrogenation of 2-butyne over Pd/alumina
produced only w-butane and surface carbonaceous residues at 373K (Table 5.3.4).
The yield of the alkane varied with pulsing, although conversion of the acetylene
was maintained at 100% over thirty pulses. The production of surface
carbonaceous overlayers oscillated from pulse one to twenty, with subsequent
pulses being retained by the catalyst (Figure 5.4.7). Again the fluctuations in the
extent of alkane and carbonaceous overlayer formation suggests that some type of
competition for hydrogen between the associative and dissociative acetylene
states exists. The ability of previously retained overlayers to undergo
hydrogenation (reflected in negative Acarbon values) may be an indication of the
type of species formed when 2 -butyne is dissociatively adsorbed on the surface.
Clearly the decrease in the amount of carbon retained by the catalyst, coupled
with the increasing n-butane yield suggests that the initial state of the surface
residue is that of a dehydrogenation product. This species would undergo
hydrogenation to produce the alkane. From pulse twenty-one onwards, where
there is effectively no hydrogenation of the residues, it is the hydrogenation of
associatively adsorbed 2-butyne which predominates. This suggests that bare
metal sites must be available at the surface in order to dissociate molecular
hydrogen and activate the resultant hydrogen atoms.
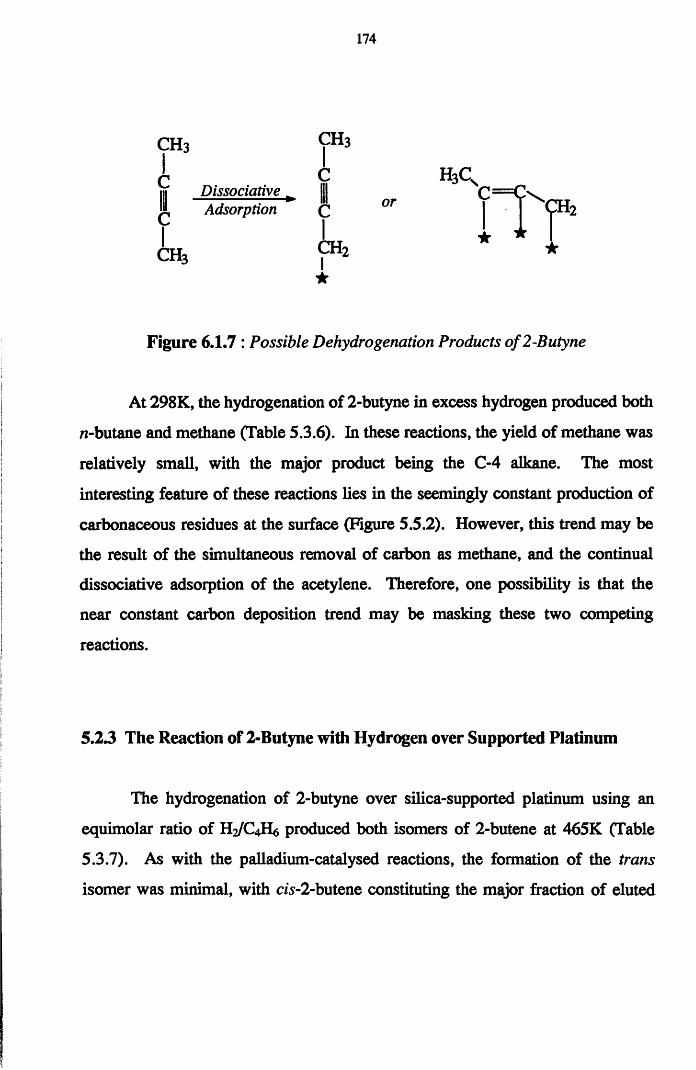
174
c h 3 CHj
CH3
C
CII Dissociative M |||
Adsorption Q
C
c h 2
1 or
I★
Figure 6.1.7 : Possible Dehydrogenation Products of2-Butyne
At 298K, the hydrogenation of 2-butyne in excess hydrogen produced both
n-butane and methane (Table 5.3.6). In these reactions, the yield of methane was
relatively small, with the major product being the C-4 alkane. The most
interesting feature of these reactions lies in the seemingly constant production of
carbonaceous residues at the surface (Figure 5.5.2). However, this trend may be
the result of the simultaneous removal of carbon as methane, and the continual
dissociative adsorption of the acetylene. Therefore, one possibility is that the
near constant carbon deposition trend may be masking these two competing
reactions.
5.23 The Reaction of 2-Butyne with Hydrogen over Supported Platinum
The hydrogenation of 2-butyne over silica-supported platinum using an
equimolar ratio of H2/C4H6 produced both isomers of 2-butene at 465K (Table
5.3.7). As with the palladium-catalysed reactions, the formation of the trans
isomer was minimal, with c/s-2 -butene constituting the major fraction of eluted
175
products. With increased number of pulses, the yield of this cis isomer and the
conversion of 2-butyne were observed to decrease. Both phenomena can be
attributed to a poisoning process, whereby the surface sites for both olefin
production and butyne conversion (to carbonaceous residues) are reduced in
number. The amount of carbon retained by this catalyst was found to increase
from pulse one (0.83 xlO19 atoms) to three (2.71 xlO19 atoms), at which point all
subsequent pulses removed surface carbon species. Therefore, we can state that
the initial increase in carbonaceous residue formation is responsible for the
decrease in the cis-olefin yield. The ensuing decrease in retained carbon, coupled
with the deactivation of the substrate indicates that the carbonaceous residues
formed originate from the adsorbed acetylene. Indeed, the trend in both the
carbon deposition data and the amount of eluted acetylene suggests that this
carbonaceous species is a 2-butyne derivative which is removeable from the
surface by hydrogenation.
When excess hydrogen was used in the reaction mixture, Pt/silica
produced both isomers of 2-butene (Table 5.3.8), and the conversion of the
acetylene was maintained at 100% over thirty pulses. The amount of trans-2-
butene detected was again small (0.55 xlO’5 moles —» 0.24 xlO'5 moles) and
decreased to zero after three pulses. The yield of the cis isomer was found to
increase with increasing number of pulses (Figure 5.5.6). Similar to the other 2-
butyne hydrogenation reactions performed with high coverages of hydrogen, it
seems that the nature of the adsorbed acetylenic species is sensitive to the surface
hydrogen concentration. However, since the existence of a higher concentration
of hydrogen atoms does not produce the saturated hydrocarbon, we must consider
the likely reasons for this high catalyst selectivity.
First, in considering the active surface sites, we must consider the effect of
the high metal dispersion on possible reaction pathways. The existence of a large
176
number of exposed metal atoms at the surface of this catalyst, suggests that there
is a greater possibility of metal atoms being located in low co-ordination sites.
Clearly the adsorption of 2-butyne at such sites would be statistically less likely
than adsorption on the more densely packed crystal planes, and so the residence
time of the acetylene at the surface would be decreased. In these circumstances,
the desorption of the partially hydrogenated product would occur before complete
saturation. However, in view of the high turnover of 2-butyne, we can assume
that such sites are minimal compared to the number of exposed metal atoms on
the common crystal planes, such as the (111) and (100) faces.
A second possibility lies in the mode of 2-butyne adsoiption at the surface.
Since no alkane was observed we can conclude that the adsoiption of 2-butyne on
Pt/silica will proceed as either an associative or dissociative adsorbed entity.
Hydrogenation of the former will proceed as detailed earlier (Section 5.2.2). In
the case of the dissociatvely adsorbed acetylene we can propose that this species
must retain the overall integrity of the reactant hydrocarbon such that
hydrogenation will not affect the overall stereochemistry of the molecule. ThisX
route to c/s-2-butene will become more feasible if the inital dissociative
adsorption of 2-butyne occurs via (C-H) bond scission, as opposed to (C-C) bond
breaking. Since (C-C) bond scission is an initial requirement for the formation of
surface carbon, an increase in the amount of carbon deposited at the surface
would be evidence for this reaction. However, since the carbon mass balance
data indicates that almost all pulses remove carbon (deposited in initial pulses), it
seems that the (C-H) bond breaking model is more likely.
In conclusion we can state that either (i) the hydrogenation occurs on
crystal defect sites or (ii) the products are governed by the adsorption of the
acetylene as either an associative or dissociative species.
177
At 373K, the reaction of an equimolar H2/C4H6 mixture over Pt/silica was
also 100% selective for the production of the c/$-olefin isomer (Table 5.3.9). The
amount of olefin formed was observed to change (Figure 5.5.8), with the general
trend indicating a decrease in the amount of eluted olefin with increased number
of pulses. However, in pulses nine and ten, the olefin yield was found to increase
again. The activity of the catalyst for 2-butyne conversion also decreased with
increasing reaction, with the amount of unreacted 2 -butyne increasing sharply in
pulse five. From this we can conclude that the formation of surface carbonaceous
overlayers is important in the deactivation process. The increase in the olefin
yield in pulses nine and ten must also be related to the deposition of carbon. From
pulse six, the retention of carbon is either negative in value (-1.43 xlO19 atoms) or
slightly positive (0.54 x 10¹⁹ atoms). Pulses nine and ten show significant carbon
loss from the catalyst surface, suggesting that these species are, as detailed earlier
(excess hydrogen; 465K), susceptible to hydrogenation and constitute a fraction
of the detected c/s-2 -butene product.
At 373K, the hydrogenation of 2-butyne in excess hydrogen over Pt/silica
produced only cw-2-butene (Table 5.4.0). However, there appeared to be
oscillations in both the olefin yield and the extent of carbon retention at the
surface. This behaviour may be directly related to the availability of hydrogen at
the surface. With a high concentration of surface hydrogen it is reasonable to
assume that the fluctuations in both the carbonaceous residue formation and the
olefin yield are the result of a competition for hydrogen. Such a process will be
governed by the rate of hydrogenation of the relevant adsorbed species. Since the
catalyst maintains 1 0 0 % conversion of the acetylene in each pulse, with only
carbon remaining, we can conclude that the adsorption of 2 -butyne in each
successive pulse will be altered, since the availability of suitable adsorption sites
will be changed by this carbon laydown. This carbon may well have the ability to
178
perturb the electronic nature (as well as geometric arrangement) of the acetylene,
such that the availability of hydrogen at the olefin formation sites changes.
Hydrogenation of 2-butyne over alumina-supported platinum at 465K,
produced both olefin isomers, when an equimolar ratio of H2/C4H6 was employed
(Table 5.4.1). The yield of c/s-2-butene decreased over ten pulses (1.19 xlO'5
moles [pulse 1 0 ]) with the corresponding trans isomer yield observed to increase
to a limiting value (0.50 x 10‘5 moles [pulse 10]). The retention of carbon by the
catalyst decreased to a negative minimum (-0.73 x 1 0 19 atoms [pulse 4]; Ctotai :5.24 xlO19 atoms [pulse 4]), before increasing in subsequent pulses. The
fluctuations in the carbon retention values suggests that these residues are
themselves prone to hydrogenation. Therefore, we can conclude that the decrease
in retained carbon is indicative of a greater availability of hydrogen, with the
subsequent increase in surface retention reflecting either (i) an increase in the rate
of dissociative acetylene adsorption or (ii) the lack or slow supply of hydrogen to
these sites.
Using an excess of hydrogen, Pt/alumina produced both n-butane and
methane at 465K (Table 5.4.2). As with all other reactions performed in excess
hydrogen, 1 0 0 % conversion of the acetylene was maintained over thirty pulses.
The yield of n-butane increased (1.09 x 10"5 moles —» 2.01 x 10'5 moles over 30
pulses) until a steady state was achieved with respect to alkane production.
Methane production was observed to fluctuate over the first ten pulses before
decreasing to zero in pulse eleven. This behaviour can be attributed to the
accessibility of bare metal sites at the surface. In order for (C-C) bond breaking
to occur, the initial requirement is the adsorption of 2 -butyne at a bare metal
site(s) which initiate dissociative adsorption (see Section 5.2.1). If these sites are
blocked by carbonaceous residues then this bond cleaving process will be limited.
Indeed, the extent of the metals influence on the acetylene will decrease as a
function of increased acetylene distance from the surface. The relatively low
quantities of carbon retained by the catalyst in these reactions may well be
reflecting (i) the ease of hydrogenation of such residues or (ii) a decrease in the
number of exposed metal sites for (C-C) bond scission.
Over Pt/alumina, the reaction of an equimolar ratio of H2/C4H6 at 373K
produced only c/s-2-butene and unconverted 2-butyne (Table 5.4.3). The initially
high catalyst activity for acetylene conversion (1 0 0 %) was observed to decrease
with increasing number of pulses (8 6 % [pulse 4]), indicating deactivation through
carbon laydown. The c/s-olefin yield decreased initially before reaching a
limiting value. Carbon retention increased with decreasing olefin yield and vice
versa, suggesting that the number of active hydrogenation sites was reduced
through carbon deposition, resulting in the attainment of a steady concentration of
olefin formation sites.
At 373K, the reaction of 2-butyne with excess hydrogen produced n-
butane, with 100% conversion of the acetylene (Table 5.4.4). The amount of
alkane detected oscillated from pulse to pulse, with similar behaviour observed in
the carbon retention data. Similar to the other reactions where oscillatory
behaviour was observed, we can attribute this to the supply of hydrogen to the
acetylene adsorption sites. With the surface effectively changing with each pulse,
the supply of hydrogen atoms to the unsaturated hydrocarbon will vary, such that
either the associatively adsorbed states (alkane precursor) or the dissociatively
adsorbed states (carbonaceous residue precursor) will predominate.
180
5.2.4 Infra-Red Study of 2-Butyne Adsorption on Silica-Supported
Palladium under Hydrogenation Conditions.
The infra-red spectrum of 2-butyne (Figure 5.7.4) shows significant
intensity in the (C-H) stretching region (2927 and 2868 cm'1) which is
characteristic of the methyl substituents of the hydrocarbon. Two intense (C-H)
deformation modes are observed at 1452 cm' 1 and 1387 cm'1, with the latter found
as a shoulder on the more intense 1452 cm"1 band. An overtone of the 1387 cm' 1
band is also observed at 2742 cm'1.
Adsorption of 2-butyne on silica-supported palladium results in a slight
shift in the frequencies of the gas IR bands, as shown in Table 5.4.8. This is
indicative of weak adsorption of the acetylene at the surface. Similar to the
spectrum of 2-butyne, this spectrum exhibits similar bands in the (C-H) stretching
region which is evidence for the retention of the integrity of the methyl groups
upon adsorption. The high frequency region contains a band at 2757 cm"1 which
can be attributed to the overtone of the symmetric deformation mode of the
methyl groups. Evidence for the assignment of this band was corroborated by
the existence of the corresponding fundamental vibration, found at 1375 cm'1.
However, our ability to observe the asymmetric CH3 deformation mode was
hindered by the poor signal to noise ratio in this region due to moisture detection.
Band identification in this region is further complicated, due to the silica support
contributing to the absorption of infra-red radiation, hence, weakening any
existing signal(s).
The inherent weakness of this asymmetric deformation band was verified
by Chesters etal in a publication on the results of a transmission infra-red study
for c/s-2 -butene adsorption on Pt/SiC>2. Although present, and quoted at 1450 cm'
\ this band had a small peak height compared to its symmetric counterpart, and
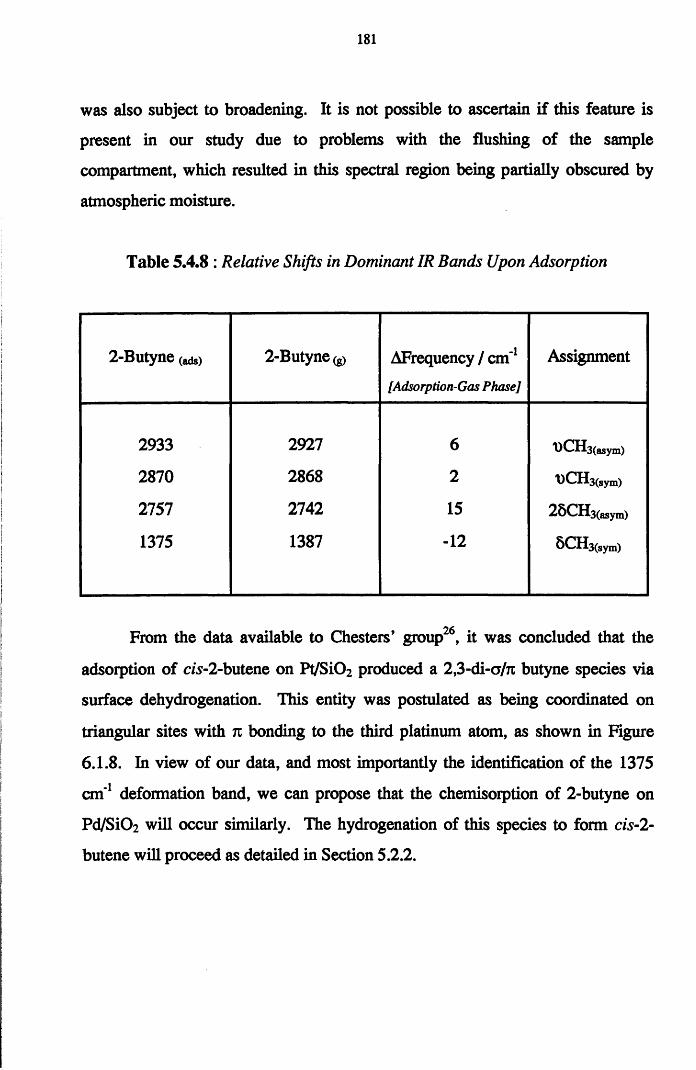
181
was also subject to broadening. It is not possible to ascertain if this feature is
present in our study due to problems with the flushing of the sample
compartment, which resulted in this spectral region being partially obscured by
atmospheric moisture.
Table 5.4.8 : Relative Shifts in Dominant IR Bands Upon Adsorption
2-Butyne (ads) 2-Butyne (g> AFrequency / cm'1[Adsorption-Gas Phase]
Assignment
2933 2927 6 CH3(asym)
2870 2868 2 DCHs^ym)
2757 2742 15 25CH3(asym)
1375 1387 -12 SCH^syin)
From the data available to Chesters’ group26, it was concluded that the
adsorption of c/s-2-butene on Pt/Si02 produced a 2,3-di-a/Tt butyne species via
surface dehydrogenation. This entity was postulated as being coordinated on
triangular sites with n bonding to the third platinum atom, as shown in Figure
6.1.8. In view of our data, and most importantly the identification of the 1375
cm'1 deformation band, we can propose that the chemisorption of 2-butyne on
Pd/SiC>2 will occur similarly. The hydrogenation of this species to form cis-2-
butene will proceed as detailed in Section 5.2.2.
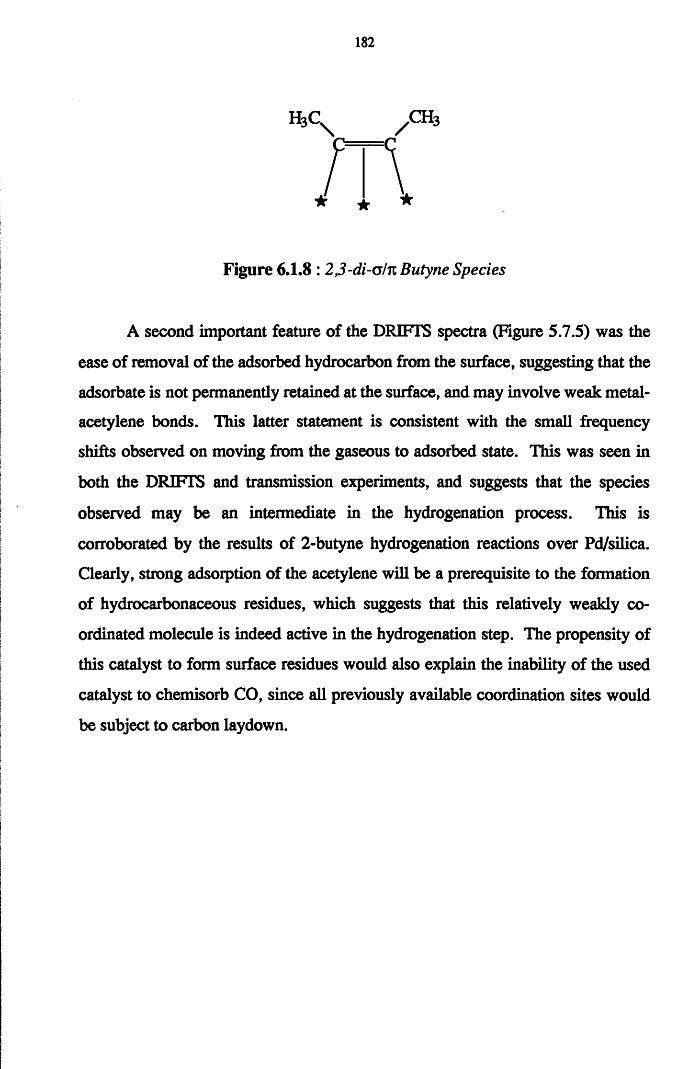
182
h 3c x ,c h 3
* ★ *! \
Figure 6.1.8 : 2,3-di-o/n Butyne Species
A second important feature of the DRIFTS spectra (Figure 5.7.5) was the
ease of removal of the adsorbed hydrocarbon from the surface, suggesting that the
adsorbate is not permanently retained at the surface, and may involve weak metal-
acetylene bonds. This latter statement is consistent with the small frequency
shifts observed on moving from the gaseous to adsorbed state. This was seen in
both the DRIFTS and transmission experiments, and suggests that the species
observed may be an intermediate in the hydrogenation process. This is
corroborated by the results of 2-butyne hydrogenation reactions over Pd/silica.
Clearly, strong adsorption of the acetylene will be a prerequisite to the formation
of hydrocarbonaceous residues, which suggests that this relatively weakly co
ordinated molecule is indeed active in the hydrogenation step. The propensity of
this catalyst to form surface residues would also explain the inability of the used
catalyst to chemisorb CO, since all previously available coordination sites would
be subject to carbon laydown.
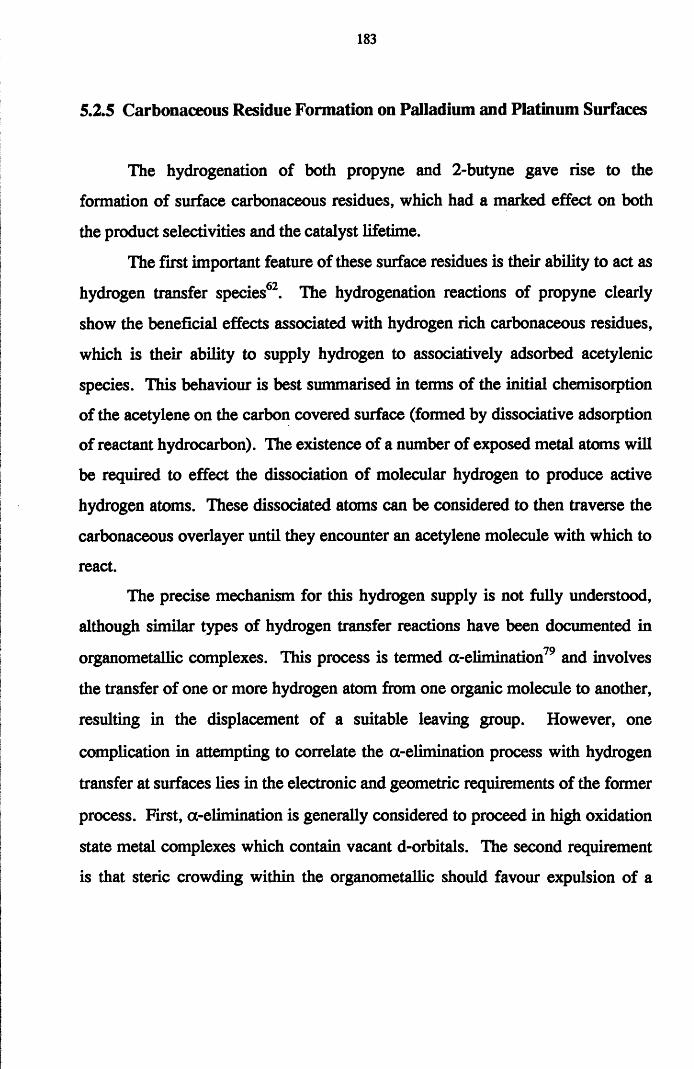
183
5.2.5 Carbonaceous Residue Formation on Palladium and Platinum Surfaces
The hydrogenation of both propyne and 2-butyne gave rise to the
formation of surface carbonaceous residues, which had a marked effect on both
the product selectivities and the catalyst lifetime.
The first important feature of these surface residues is their ability to act as
hydrogen transfer species62. The hydrogenation reactions of propyne clearly
show the beneficial effects associated with hydrogen rich carbonaceous residues,
which is their ability to supply hydrogen to associatively adsorbed acetylenic
species. This behaviour is best summarised in terms of the initial chemisoiption
of the acetylene on the carbon covered surface (formed by dissociative adsoiption
of reactant hydrocarbon). The existence of a number of exposed metal atoms will
be required to effect the dissociation of molecular hydrogen to produce active
hydrogen atoms. These dissociated atoms can be considered to then traverse the
carbonaceous overlayer until they encounter an acetylene molecule with which to
react.
The precise mechanism for this hydrogen supply is not fully understood,
although similar types of hydrogen transfer reactions have been documented in
organometallic complexes. This process is termed a-elimination79 and involves
the transfer of one or more hydrogen atom from one organic molecule to another,
resulting in the displacement of a suitable leaving group. However, one
complication in attempting to correlate the a-elimination process with hydrogen
transfer at surfaces lies in the electronic and geometric requirements of the former
process. First, a-elimination is generally considered to proceed in high oxidation
state metal complexes which contain vacant d-orbitals. The second requirement
is that steric crowding within the organometallic should favour expulsion of a
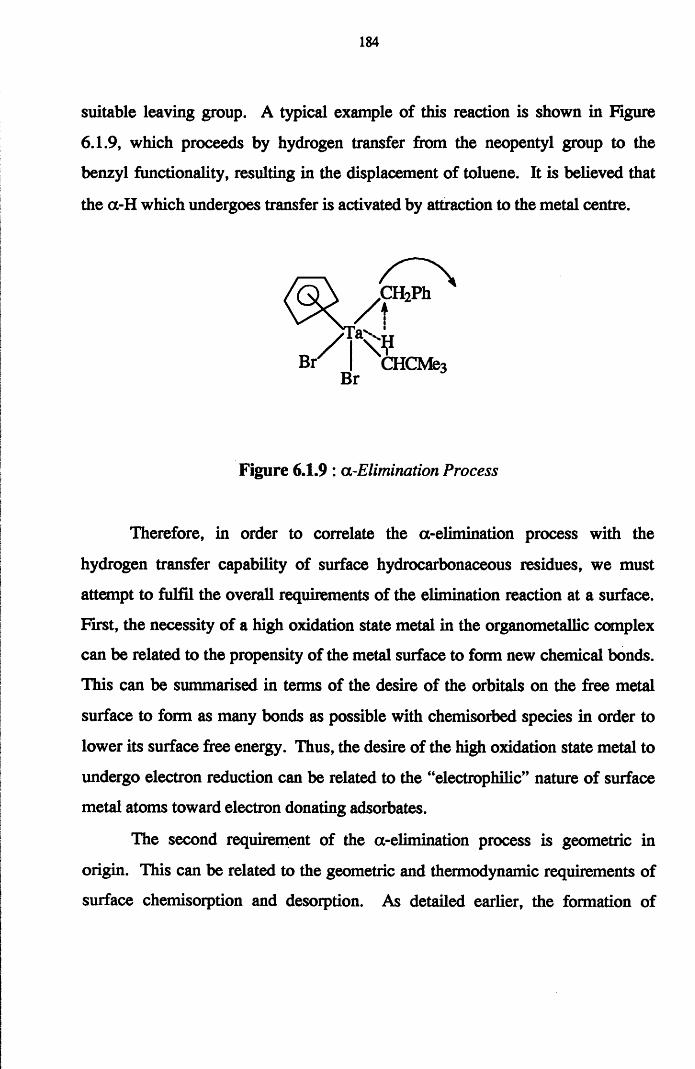
184
suitable leaving group. A typical example of this reaction is shown in Figure
6.1.9, which proceeds by hydrogen transfer from the neopentyl group to the
benzyl functionality, resulting in the displacement of toluene. It is believed that
the a-H which undergoes transfer is activated by attraction to the metal centre.
Therefore, in order to correlate the a-elimination process with the
hydrogen transfer capability of surface hydrocarbonaceous residues, we must
attempt to fulfil the overall requirements of the elimination reaction at a surface.
First, the necessity of a high oxidation state metal in the organometallic complex
can be related to the propensity of the metal surface to form new chemical bonds.
This can be summarised in terms of the desire of the orbitals on the free metal
surface to form as many bonds as possible with chemisorbed species in order to
lower its surface free energy. Thus, the desire of the high oxidation state metal to
undergo electron reduction can be related to the “electrophilic” nature of surface
metal atoms toward electron donating adsorbates.
The second requirement of the a-elimination process is geometric in
origin. This can be related to the geometric and thermodynamic requirements of
surface chemisorption and desorption. As detailed earlier, the formation of
CHCMe3Br
Figure 6.1.9 : a -Elimination Process
185
carbonaceous residues at a catalytic surface results in a reduction in the number
of exposed metal atoms. In the hydrogenation reactions of propyne and 2-butyne,
the quantity of carbon retained at the surface was large. One possibility is that
the retained carbonaceous species are located on the support material80. The
second scenario may involve the location of surface carbonaceous species, which
are acetylenic in origin, near the active metal sites, which undergo a surface
polymerisation reaction49 to produce oligomeric species. Another factor which
must be taken into consideration is the thermodynamic stabilities of the various
adsorbed species at the surface. When considering the possibility of “leaving
groups’* we must take into account the relative heats of adsoiption of the reactant
and product hydrocarbons. Clearly, the hydrogenation of the acetylenic precursor
to produce the product olefin or alkane (via hydrocarbonaceous overlayers) will
favour the desorption of either the alkane or the olefin over the acetylene. Under
these circumstances, the product hydrocarbons can be considered to act as better
leaving groups than the acetylene. Therefore, taking all of these factors into
consideration, the catalyst surface may be considered to mirror the organometallic
complex, with the possibility of hydrogen transfer from hydrocarbonaceous
residues proceeding by the a-elimination process not infeasible.
The second, detrimental feature of surface carbonaceous residue formation
is tbs role in the deactivation process. Carbon deposited at the surface can
partially or wholly obscure the metal sites so as to prevent the chemisorption of
either or both reactants. Therefore, in the case of partial poisoning of the metal
sites, the build up of surface carbon can be considered to alter product
selectivities, whilst complete poisoning is generally thought of as involving a
diffusion inhibition mechanism, such as pore blocking.
In propyne hydrogenation, the continual formation of surface
carbonaceous residues resulted in a reduced turnover of the acetylene with
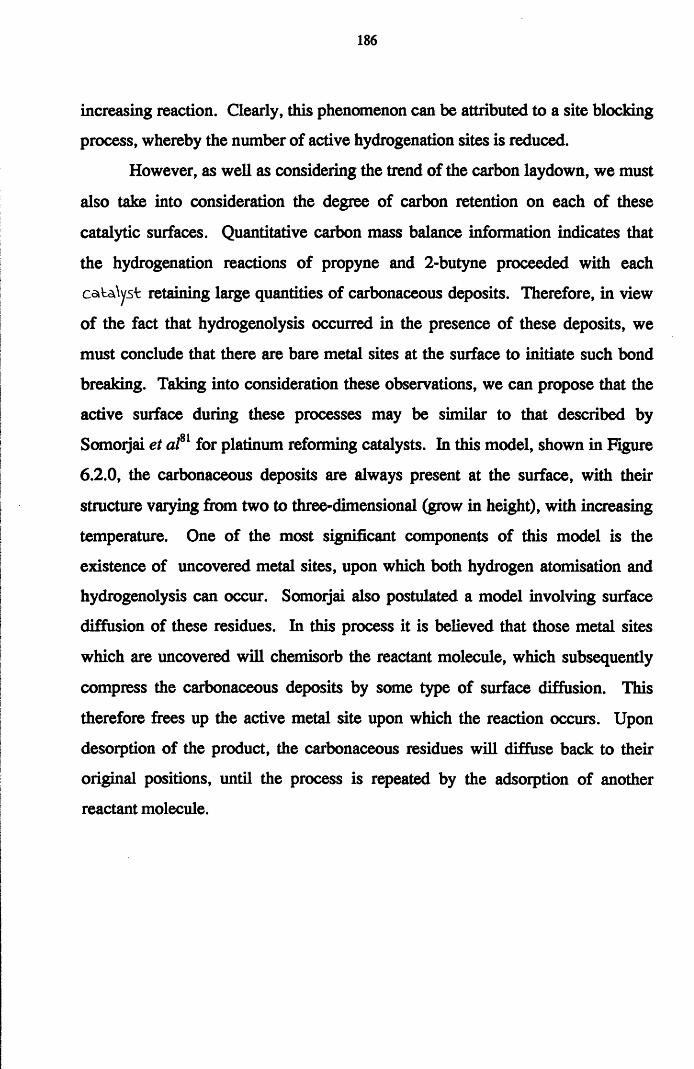
186
increasing reaction. Clearly, this phenomenon can be attributed to a site blocking
process, whereby the number of active hydrogenation sites is reduced.
However, as well as considering the trend of the carbon laydown, we must
also take into consideration the degree of carbon retention on each of these
catalytic surfaces. Quantitative carbon mass balance information indicates that
the hydrogenation reactions of propyne and 2-butyne proceeded with each
cataAyst retaining large quantities of carbonaceous deposits. Therefore, in view
of the fact that hydrogenolysis occurred in the presence of these deposits, we
must conclude that there are bare metal sites at the surface to initiate such bond
breaking. Taking into consideration these observations, we can propose that the
active surface during these processes may be similar to that described by
Somoijai et a/81 for platinum reforming catalysts. In this model, shown in Figure
6.2.0, the carbonaceous deposits are always present at the surface, with their
structure varying from two to three-dimensional (grow in height), with increasing
temperature. One of the most significant components of this model is the
existence of uncovered metal sites, upon which both hydrogen atomisation and
hydrogenolysis can occur. Somoijai also postulated a model involving surface
diffusion of these residues. In this process it is believed that those metal sites
which are uncovered will chemisorb the reactant molecule, which subsequently
compress the carbonaceous deposits by some type of surface diffusion. This
therefore frees up the active metal site upon which the reaction occurs. Upon
desorption of the product, the carbonaceous residues will diffuse back to their
original positions, until the process is repeated by the adsorption of another
reactant molecule.
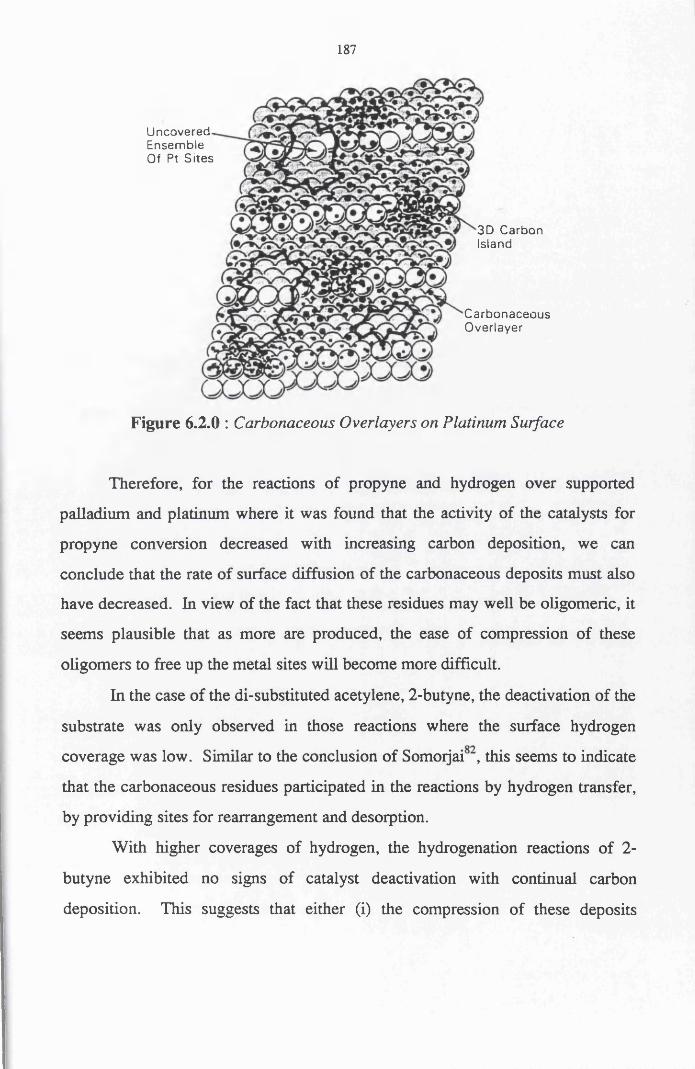
187
U ncovered . Ensem ble Of Pt S ites
3D Carbon Island
C arb onaceou sOverlayer
Figure 6.2.0 : Carbonaceous Overlayers on Platinum Surface
Therefore, for the reactions of propyne and hydrogen over supported
palladium and platinum where it was found that the activity of the catalysts for
propyne conversion decreased with increasing carbon deposition, we can
conclude that the rate of surface diffusion of the carbonaceous deposits must also
have decreased. In view of the fact that these residues may well be oligomeric, it
seems plausible that as more are produced, the ease of compression of these
oligomers to free up the metal sites will become more difficult.
In the case of the di-substituted acetylene, 2-butyne, the deactivation of the
substrate was only observed in those reactions where the surface hydrogen
coverage was low. Similar to the conclusion of Somoijai , this seems to indicate
that the carbonaceous residues participated in the reactions by hydrogen transfer,
by providing sites for rearrangement and desorption.
With higher coverages of hydrogen, the hydrogenation reactions of 2-
butyne exhibited no signs of catalyst deactivation with continual carbon
deposition. This suggests that either (i) the compression of these deposits
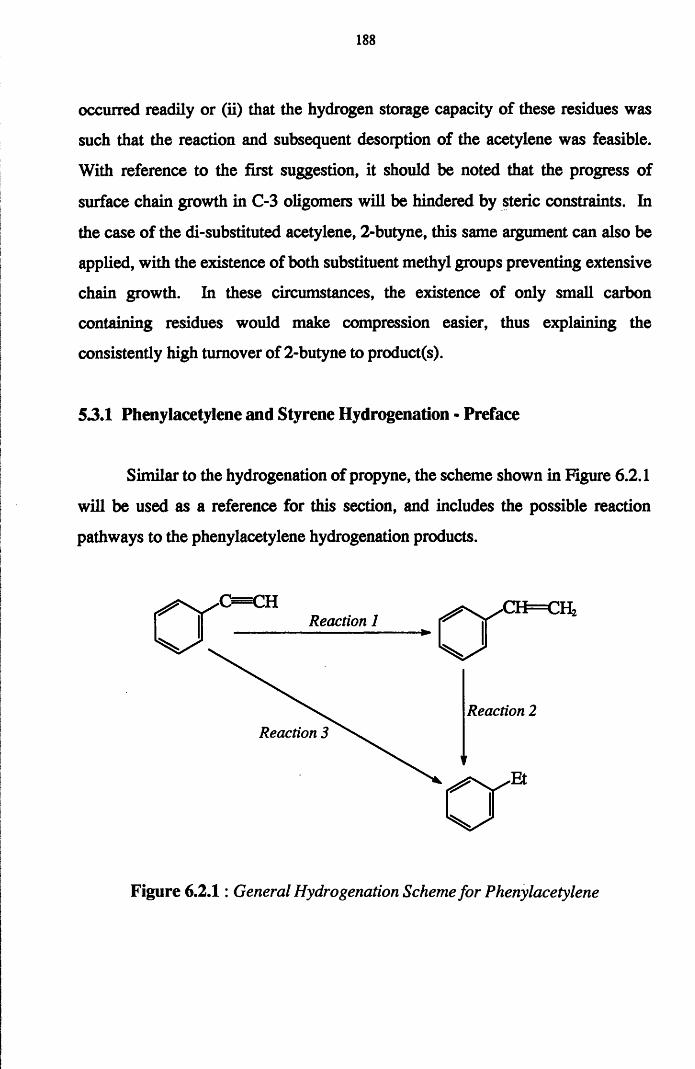
188
occurred readily or (ii) that the hydrogen storage capacity of these residues was
such that the reaction and subsequent desorption of the acetylene was feasible.
With reference to the first suggestion, it should be noted that the progress of
surface chain growth in C-3 oligomers will be hindered by steric constraints. In
the case of the di-substituted acetylene, 2-butyne, this same argument can also be
applied, with the existence of both substituent methyl groups preventing extensive
chain growth. In these circumstances, the existence of only small carbon
containing residues would make compression easier, thus explaining the
consistently high turnover of 2-butyne to product(s).
5.3.1 Phenylacetylene and Styrene Hydrogenation - Preface
Similar to the hydrogenation of propyne, the scheme shown in Figure 6.2.1
will be used as a reference for this section, and includes the possible reaction
pathways to the phenylacetylene hydrogenation products.
Reaction 1
Reaction 2Reaction 3
Figure 6.2.1: General Hydrogenation Scheme for Phenylacetylene
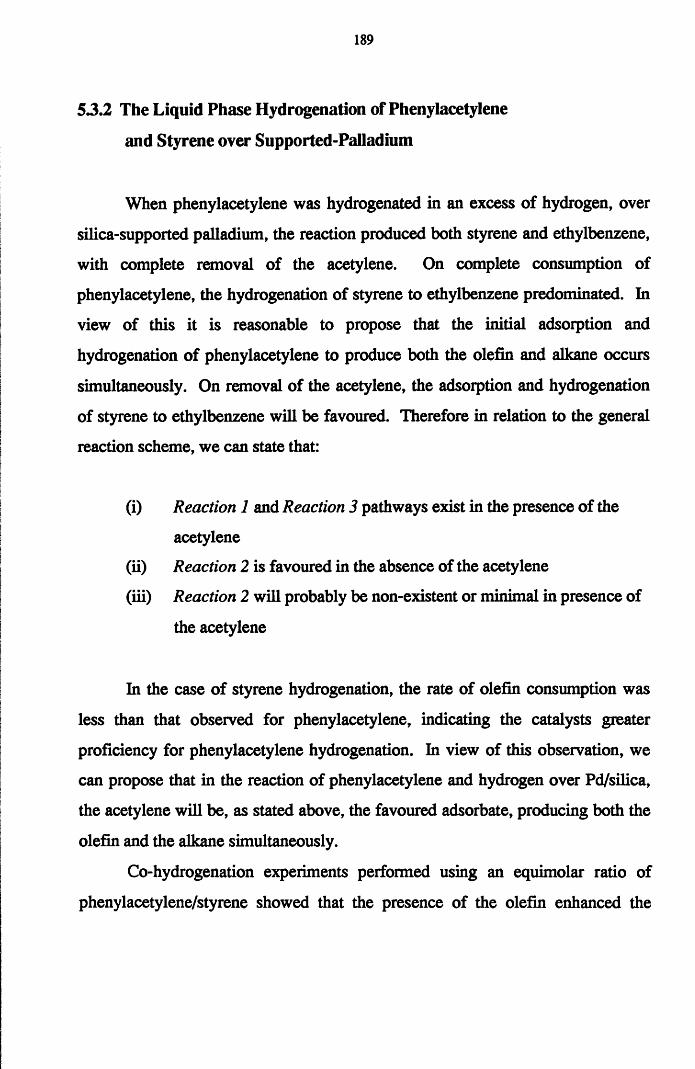
189
53.2 The Liquid Phase Hydrogenation of Phenylacetylene
and Styrene over Supported-Palladium
When phenylacetylene was hydrogenated in an excess of hydrogen, over
silica-supported palladium, the reaction produced both styrene and ethylbenzene,
with complete removal of the acetylene. On complete consumption of
phenylacetylene, the hydrogenation of styrene to ethylbenzene predominated. In
view of this it is reasonable to propose that the initial adsoiption and
hydrogenation of phenylacetylene to produce both the olefin and alkane occurs
simultaneously. On removal of the acetylene, the adsorption and hydrogenation
of styrene to ethylbenzene will be favoured. Therefore in relation to the general
reaction scheme, we can state that:
(i) Reaction 1 and Reaction 3 pathways exist in the presence of the
acetylene
(ii) Reaction 2 is favoured in the absence of the acetylene
(iii) Reaction 2 will probably be non-existent or minimal in presence of
the acetylene
In the case of styrene hydrogenation, the rate of olefin consumption was
less than that observed for phenylacetylene, indicating the catalysts greater
proficiency for phenylacetylene hydrogenation. In view of this observation, we
can propose that in the reaction of phenylacetylene and hydrogen over Pd/silica,
the acetylene will be, as stated above, the favoured adsorbate, producing both the
olefin and the alkane simultaneously.
Co-hydrogenation experiments performed using an equimolar ratio of
phenylacetylene/styrene showed that the presence of the olefin enhanced the
190
catalytic hydrogenation of phenylacetylene. In the early stages of the reaction,
the hydrogenation of phenylacetylene/styrene produced both styrene and
ethylbenzene. Similar to phenylacetylene hydrogenation, it was only on the
removal of all of the acetylene from the system that the adsorption of styrene and
its subsequent hydrogenation to ethylbenzene occurred to an appreciable extent.
As expected, the hydrogenation of styrene obeyed a simple first order
mechanism. In the hydrogenation of phenylacetylene, the existence of two
hydrogenation products coupled with the available pathways for the reactions,
made the kinetics more complicated. Therefore, to obtain information regarding
the competitive adsorption of the reactants, it was necessary to examine the
product distribution curves for each reaction.
Co-adsorption experiments performed by Jackson and Shaw83 on
phenylacetylene/styrene over Pd/carbon produced results indicative of equal
adsorption of the olefin and the acetylene. This conclusion was reached since the
rate of phenylacetylene consumption (from phenylacetylene hydrogenation only)
was observed to halve when an equal amount of styrene was added to the reactant
mixture. Therefore, since the rate of phenylacetylene removal was slightly
greater in the presence of styrene, we can propose that, although evident, the
competition for surface sites between the acetylene and the olefin was minimal.
Therefore, with reference to the hydrogenation of phenylacetylene and styrene,
the following conclusions can be drawn :
i) Phenylacetylene hydrogenation produced both styrene and ethylbenzene,
with the rate of styrene formation greater than that of ethylbenzene
ii) Styrene hydrogenation showed that silica-supported palladium was
more efficient for hydrogenation of the acetylene than the olefin
191
iii) In the co-hydrogenation experiments, the presence of styrene accelerated
the removal of phenylacetylene. Under these circumstances, the styrene
molecule can be considered to act as a promoter for the hydrogenation of
phenylacetylene.
The rate of styrene formation was lower on changing from
phenylacetylene to the co-hydrogenation mixture, with the corresponding rate of
ethylbenzene formation found to have increased. Therefore, with reference to
scheme 6.2.1, we can propose that, in the presence of styrene:
(i) Reaction 1 is less favourable
(ii) The rate of Reaction 3 is increased cf. phenylacetylene
hydrogenation
(iii) Reaction 2 is favoured in the absence of the acetylene
Since the addition of styrene to a phenylacetylene hydrogenation mixture
results in an increase in the rate of ethylbenzene production, we can propose the
following:
(i) Phenylacetylene and styrene adsorbed at different surface sites
(ii) Hydrogenation of styrene (although minimal) occurs independently
of phenylacetylene hydrogenation, thus explaining the increased
amount of ethylbenzene formed during the reaction
Similar to the conclusions of Al-Ammar et a/84, the co-adsorption of both
the olefin and the acetylene in these reactions can be considered to have an effect
on the amount of available hydrogen at the surface. Therefore, with the rate of
192
phenylacetylene hydrogenation to styrene observed to have decreased, we can
propose that co-adsorption of the olefin has acted to reduce the supply of
hydrogen to the olefin formation sites.
Over alumina-supported palladium, the hydrogenation of phenylacetylene
produced both styrene and ethylbenzene. However, the rate of acetylene
consumption was markedly reduced compared to that observed in the Pd/silica
reaction. Similar to Pd/silica, the loss of phenylacetylene was accompanied by an
increase in ethylbenzene formation, formed by hydrogenation of styrene. In the
initial stages of the reaction, when phenylacetylene is present, the rate of styrene
formation was found to be greater than that of ethylbenzene, thus indicating the
propensity of the system to favour Reaction 1.
The hydrogenation of styrene exhibited similar changes in product
distributions as were found using Pd/silica. However, over Pd/alumina the
hydrogenation of styrene to ethylbenzene reached completion moie rapidly,
suggesting that this substrate was slightly more active for styrene hydrogenation
than Pd/silica. These results are in good agreement with the work of Carturan85
who reported the tendency of palladium catalysts with low dispersions to favour
alkane formation. Wells86 however, suggested that the formation of the active p-
Pd-hydride phase occurred more readily on larger metal particles. He states that
it is the hydride phase which retains the olefin at the surface long enough for it to
react to yield the alkane. Of the two palladium catalysts used in this study, the
opposite was found to be true, with Pd/alumina (dispersion 22% c.f. Pd/silica
10%) found to be slightly more active for styrene hydrogenation than the silica-
supported catalyst.
The co-hydrogenation experiment over alumina-supported palladium
proceeded to yield both the olefin and the alkane simultaneously. Therefore, we
193
can state that the hydrogenation of the acetylene to form the olefin can occur in
the presence of the olefin itself. The rate of ethylbenzene production was found
to be slightly greater than that observed in the acetylene hydrogenation
experiments. Therefore, since the enhancement in alkane production is coupled
with an increase in the yield of styrene, we can propose that either:
(i) The formation of ethylbenzene occurs via phenylacetylene and/or
styrene hydrogenation,
with a compensation effect required, such that
(ii) All olefin removed as the alkane would be replenished by
acetylene hydrogenation (rate Reaction i > rate Reaction 2), thus,
maintaining the increasing olefin yield.
With reference to the co-adsorption experiments performed using silica-
supported palladium, the hydrogenation of phenylacetylene/styrene over
Pd/alumina can be considered to follow the same mechanism. Therefore, in
conclusion, when an equal quantity of phenylacetylene/styrene is hydrogenated
over Pd/alumina, both hydrocarbons will be chemisorbed and hydrogenated
independently of each other, with the hydrogenation of styrene to ethylbenzene
constituting a small fraction of the increased ethylbenzene yield.
194
5 3 3 The Liquid Phase Hydrogenation of Phenylacetylene
and Styrene over Supported-Platinum
In contrast to the reactions of supported-palladium, the hydrogenation of
phenylacetylene over silica-supported platinum exhibited relatively low activity.
The reaction produced both styrene and ethylbenzene, with the yield of alkane
reaching a maximum of only 10%, and the rate of phenylacetylene consumption
far less than in the palladium-catalysed reactions. However, over Pt/silica the
rate of styrene formation was approximately double that found for ethylbenzene,
suggesting that Reaction 1 was favoured over this catalyst.
In the reaction between styrene and hydrogen over silica-supported
platinum, conversion of the olefin was virtually non-existent, with the maximum
yield of ethylbenzene reaching only 10%. The difference in reaction conditions
(compared to the phenylacetylene hydrogenation reactions) may well have
contributed to this result, since both the reaction temperature and catalyst weight
were lowered.
The reaction of hydrogen and an equimolar phenylacetylene/styrene
mixture over the above catalyst again displayed low activity. Similar to the
supported-palladium catalysts, both styrene and ethylbenzene were produced,
although the quantities observed were much smaller with the platinum catalysts.
Alumina-supported platinum produced both styrene and ethylbenzene
during the hydrogenation of phenylacetylene. However, the rate of
phenylacetylene consumption was again less than in the palladium experiments.
The rate of ethylbenzene formation was similar in magnitude to that observed
over palladium. The major difference between both supported-platinum catalysts
was in the rate of styrene hydrogenation. Over Pt/silica this rate was
approximately 1.5 times greater, with the final reaction liquor consisting of 65%
195
styrene (Pt/alumina : 40% styrene), thus, indicating that the highly dispersed
Pt/silica catalyst is more proficient for the adsoiption and hydrogenation of the
olefin than the alumina-supported catalyst. This observation may be reflecting a
greater turnover frequency of the olefin on the silica-supported catalyst, or merely
the ability of the smaller metal particles to attract the olefinic bond to the surface
for reaction.
For the co-hydrogenation experiment, the amount of styrene remained
relatively constant, with the phenylacetylene concentration observed to decrease
with increasing reaction. This would imply that the formation of ethylbenzene
from direct hydrogenation of phenylacetylene was feasible {Reaction 3). This
statement is supported by the increased amount of ethylbenzene produced. The
presence of styrene in equal concentration to the acetylene reduces the rate of
both phenylacetylene loss and ethylbenzene formation.
Clearly, supported-platinum catalysts are not as efficient as supported-
palladium for the hydrogenation of either phenylacetylene or styrene in the liquid
phase. By comparing the rate coefficients for both palladium and platinum in the
hydrogenation of styrene, it can be seen that those rates determined for the
platinum-catalysed reactions are inherently smaller. This may in part be a result
of the susceptibility of platinum catalysts to re-oxidise when exposed to low
concentrations of oxygen from the atmosphere.
53.4 The Gas Phase Hydrogenation of Phenylacetylene
and Styrene over Supported-Palladium
The hydrogenation of phenylacetylene over silica-supported palladium
showed no selectivity toward the formation of styrene, producing only
196
ethylbenzene. The amount of ethylbenzene produced was found to increase with
increasing time on-line, until a steady state was attained. This lack of catalyst
selectivity may be attributed to two factors. First, the use of hydrogen gas as the
flow gas in the system undoubtedly favoured the formation of the alkane.
Second, the use of a relatively high reaction temperature would favour
phenylacetylene desorption. These conditions would favour the relatively weak
adsorption of the acetylene in an atmosphere of reducing gas which would almost
certainly yield the alkane.
Increasing the weight of catalyst resulted in a more rapid attainment of
steady state behaviour with respect to the rate of ethybenzene formation, with the
hydrogenation of phenylacetylene over 50mg of Pd/silica giving complete
conversion of the acetylene and a constant yield of alkane.
In shaip contrast to phenylacetylene hydrogenation, the reaction of
hydrogen and styrene over silica-supported palladium resulted in a decrease in the
conversion of styrene with increased time on-line. The initial distribution of
products in this reaction were found to change from [90% styrene, 10%
ethylbenzene] to 100% styrene over a one hour period. This decrease in catalyst
activity may be reflecting the deactivation of the substrate, perhaps through
carbon deposition.
Similar to the hydrogenation of phenylacetylene over Pd/silica, alumina-
supported palladium yielded no styrene during phenylacetylene hydrogenation.
The conversion of phenylacetylene was observed to increase until a steady state
was reached. The distribution of products did not change over the course of the
analysis. Therefore, for the same weight of catalyst, the turnover of
phenylacetylene to ethylbenzene over Pd/alumina was much lower than that
observed using Pd/silica. Doubling the weight of catalyst resulted in complete
197
conversion of the acetylene, with the yield of alkane found to increase until a
steady state, with respect to alkane production was achieved.
Styrene hydrogenation over the above catalyst showed no indications of
catalyst deactivation, with low conversions of styrene maintained throughout the
course of the analysis. The yield of both unconverted styrene and ethylbenzene
was constant also.
Therefore, in view of the above results, we can state that Pd/silica is more
active than Pd/alumina for phenylacetylene hydrogenation in the gas phase. This
may in part be a result of a particle size effect, since the mean particle diameters
of the palladium crystallites in Pd/silica are approximately double that found in
Pd/alumina. Another possibility which cannot be overlooked is the role of
“spillover” hydrogen (from metal to support) on the reaction chemistry. It is well
documented that silica supports have the ability to undergo rapid exchange
between spiltover hydrogen and the silanol groups associated with the support .
Therefore, the differences in the activities of both Pd/silica and Pd/alumina may
be a reflection of the active role of “spillover” hydrogen in phenylacetylene
hydrogenation.
The results of the gas phase hydrogenation of styrene showed that both
palladium catalysts were relatively inefficient for hydrogenation. The possible
deactivation trend in the case of Pd/silica may be due to the ease of carbon
residue formation on large metal particles. The low conversions over both
catalysts can be attributed to a weak interaction between the adsorbate and
catalyst, with the thermodynamics of styrene chemisorption, although favourable,
less so than those of phenylacetylene. That coupled with the reaction conditions
(high temperature, neat hydrogen flow) will result in the removal of any weakly
chemisorbed styrene molecules from the surface.
198
In view of the styrene results, the reaction between phenylacetylene and
hydrogen over supported palladium in the gas phase can be envisaged as
occurring via Reaction 3 (Figure 6.2.1).
5.3.5 The Gas Phase Hydrogenation of Phenylacetylene and Styrene
over Supported-Platinum
The hydrogenation of phenylacetylene over silica-supported platinum
produced ethylbenzene as the sole product. The yield of both ethylbenzene and
unreacted phenylacetylene remained constant, with the conversion of
phenylacetylene maintained at 70%. However, in the hydrogenation of styrene
the conversion of the olefin was maintained at 100%.
Alumina-supported platinum catalysed the hydrogenation of
phenylacetylene to form ethylbenzene. The activity of the catalyst decreased
with increasing reaction, until a steady state was reached. Over the course of the
reaction the yield of alkane decreased. The hydrogenation of styrene, catalysed
by Pt/alumina, gave complete removal of the olefin, with the amount of
ethylbenzene produced unaltered over the course of the analysis.
53.6 Mechanism for Phenylacetylene Hydrogenation to Ethylbenzene
The hydrogenation of the mono-substituted acetylene, phenylacetylene, to
yield ethylbenzene may be postulated to proceed via either:
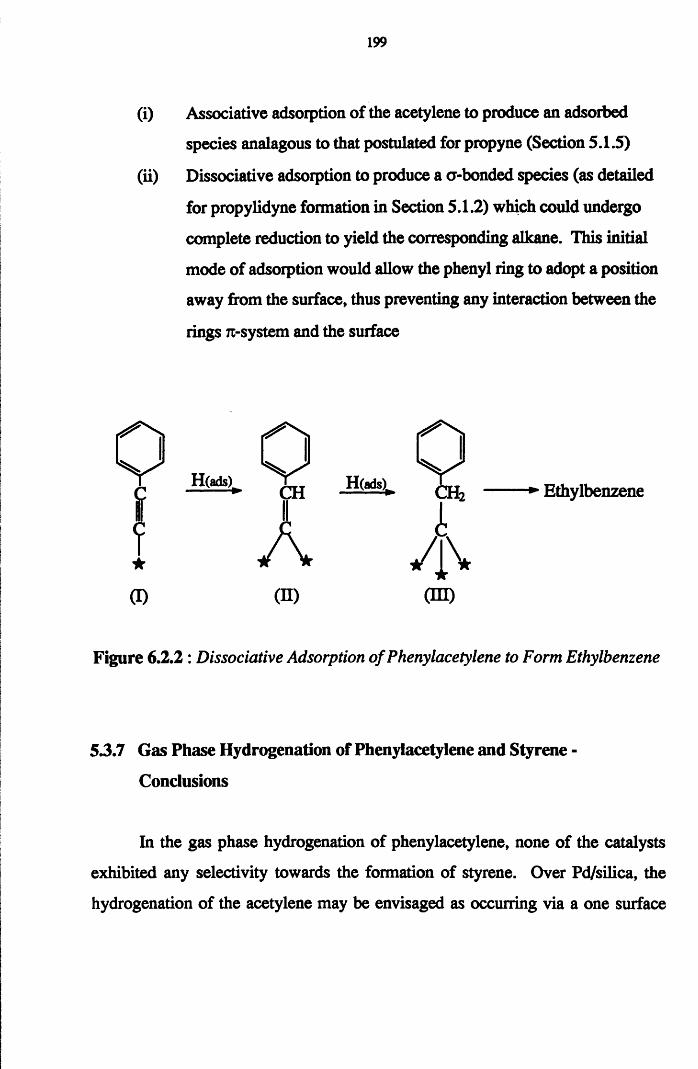
199
(i) Associative adsorption of the acetylene to produce an adsorbed
species analagous to that postulated for propyne (Section 5.1.5)
(ii) Dissociative adsorption to produce a a-bonded species (as detailed
for propylidyne formation in Section 5.1.2) which could undergo
complete reduction to yield the corresponding alkane. This initial
mode of adsorption would allow the phenyl ring to adopt a position
away from the surface, thus preventing any interaction between the
rings 7i-system and the surface
CH .QCads) q j 2 ------- ► Ethylbenzene
l A 4v(D (D) m
Figure 6.2.2 : Dissociative Adsorption of Phenylacetylene to Form Ethylbenzene
53.7 Gas Phase Hydrogenation of Phenylacetylene and Styrene -
Conclusions
In the gas phase hydrogenation of phenylacetylene, none of the catalysts
exhibited any selectivity towards the formation of styrene. Over Pd/silica, the
hydrogenation of the acetylene may be envisaged as occurring via a one surface
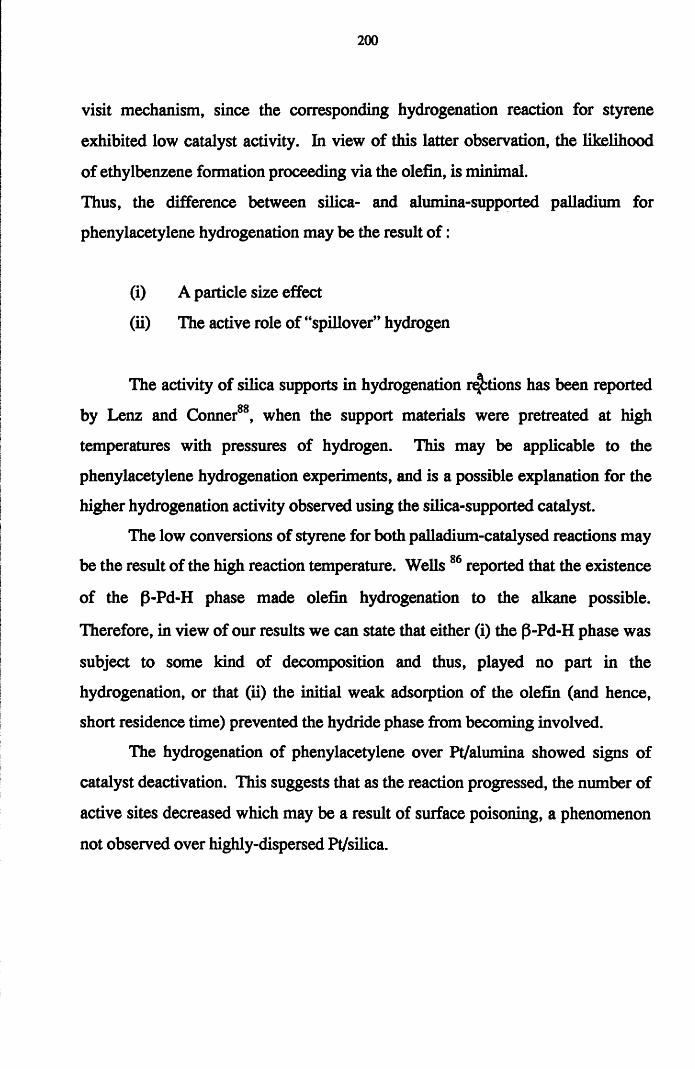
200
visit mechanism, since the corresponding hydrogenation reaction for styrene
exhibited low catalyst activity. In view of this latter observation, the likelihood
of ethylbenzene formation proceeding via the olefin, is minimal.
Thus, the difference between silica- and alumina-supported palladium for
phenylacetylene hydrogenation may be the result o f :
(i) A particle size effect
(ii) The active role of “spillover” hydrogen
The activity of silica supports in hydrogenation rations has been reported
by Lenz and Conner88, when the support materials were pretreated at high
temperatures with pressures of hydrogen. This may be applicable to the
phenylacetylene hydrogenation experiments, and is a possible explanation for the
higher hydrogenation activity observed using the silica-supported catalyst.
The low conversions of styrene for both palladium-catalysed reactions may
be the result of the high reaction temperature. Wells 86 reported that the existence
of the (3-Pd-H phase made olefin hydrogenation to the alkane possible.
Therefore, in view of our results we can state that either (i) the p-Pd-H phase was
subject to some kind of decomposition and thus, played no part in the
hydrogenation, or that (ii) the initial weak adsorption of the olefin (and hence,
short residence time) prevented the hydride phase from becoming involved.
The hydrogenation of phenylacetylene over Pt/alumina showed signs of
catalyst deactivation. This suggests that as the reaction progressed, the number of
active sites decreased which may be a result of surface poisoning, a phenomenon
not observed over highly-dispersed Pt/silica.
201
5.4 Overall Conclusions - Effect of Substitution - Geometric or Electronic?
In order to conclude this section of work it is necessary to consider the
effect of substitution on the mode and strength of the acetylenes adsorption at the
active surface. Therefore, to correlate the results detailed earlier with this
substitution, it is imperative that the nature of the triple bond is fully understood
as the various substituent groups are replaced.
The hydrogenation reactions of propyne and 2-butyne show that the
methyl mono- and di-substituted acetylenes are more prone to hydrocarbonaceous
overlayer formation than the phenyl-substituted acetylene, and hence, exhibit a
greater degree of deactivation. The precise nature of these surface retained
species is not known, although radiotracer experiments reported by Webb eta l89.90on ethene adsorption provided an informative insight into such surface
residues. This study showed evidence for the retention of hydrocarbonaceous
species from the formation of multiply bonded hydrogen-deficient surface
residues, as shown in Figure 6.2.3.
Figure 6.2.3 : Precursors to Hydrocarbonaceous Overlayers
from the Dissociative Adsorption o f Ethene
202
In the case of ethyne itself, the degree of surface retention is far greater
than that observed for ethene, and may well be reflecting the ability of the
acetylene to undergo surface polymerisation91. Therefore, in view of the results
obtained in this study, the involvement of a geometric factor must be considered.
In order for both propyne and 2-butyne to produce surface
hydrocarbonaceous species, the acetylenic molecules must first undergo chemical
adsorption at the surface, such that species analogous to those in Fig 6.2.3 can
form. The formation of any hydrocarbonaceous overlayer precursor will occur
only if the adsorption strength of the acetylene is great enough to permit
appreciable retention before the reaction and subsequent desorption of the
product. Therefore, in the case of phenylacetylene adsorption, the substituent
phenyl ring will orientate itself away from the active surface effectively relieving
any steric hindrance experienced by the phenyl ring from the surface metal atoms.
In the case of the methyl substituted acetylenes, the involvement of a geometric
factor will be less complicated, thus, easing the route to hydrocarbonaceous
overlayer formation.
The second parameter which must be considered in relation to the ease of
hydrocarbonaceous overlayer formation is electronic in origin. It is well
documented that acetylenic hydrocarbons exhibit an unpredictably high degree of
shielding, which can be attributed to the circulation of electrons at the carbon
atoms. However, this shielding, although present in substituted acetylenes, varies
with the substituent group. Table 5.4.9 shows the 13C nmr chemical shifts for the
acetylenic carbon atoms of various acetylenes. It is obvious that the replacement
of one hydrogen atom in propyne with a methyl group results in an increase in the
chemical shift of the substituted carbon atom. This change is indicative of the
deshielding of the acetylenic carbon, and can be related to the inductive effect
associated with the methyl group. Essentially, this substituent has the ability to
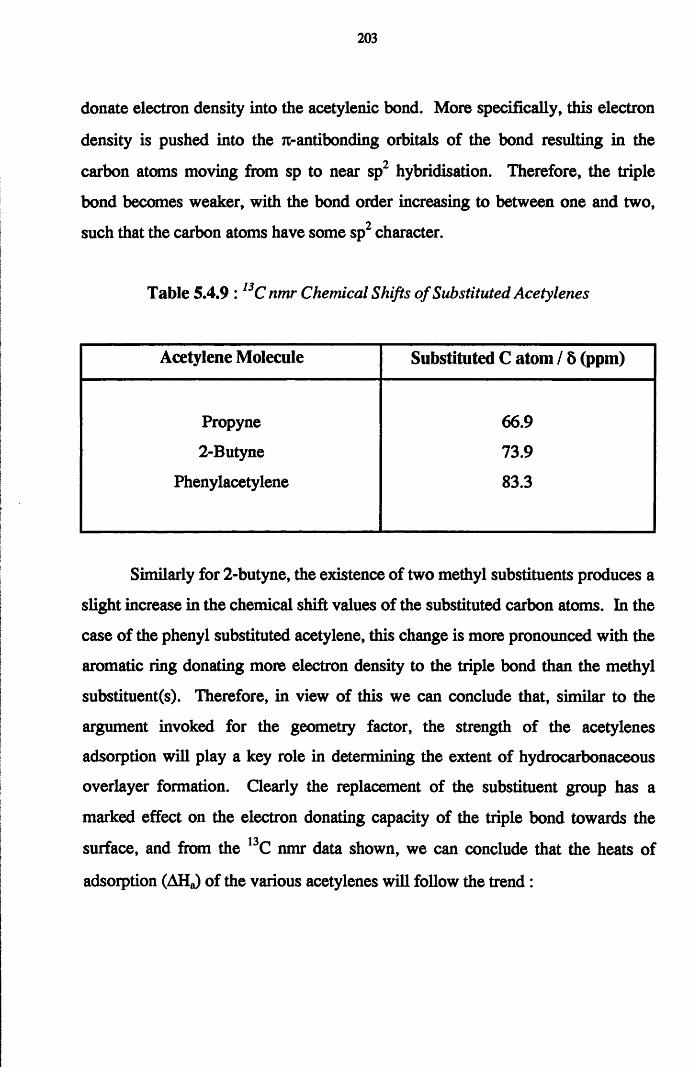
203
donate electron density into the acetylenic bond. More specifically, this electron
density is pushed into the tt-antibonding orbitals of the bond resulting in the
carbon atoms moving from sp to near sp2 hybridisation. Therefore, the triple
bond becomes weaker, with the bond order increasing to between one and two,
such that the carbon atoms have some sp2 character.
Table 5.4.9 : 13C nmr Chemical Shifts o f Substituted Acetylenes
Acetylene Molecule Substituted C atom / 5 (ppm)
Propyne 66.9
2-Butyne 73.9
Phenylacetylene 83.3
Similarly for 2-butyne, the existence of two methyl substituents produces a
slight increase in the chemical shift values of the substituted carbon atoms. In the
case of the phenyl substituted acetylene, this change is more pronounced with the
aromatic ring donating more electron density to the triple bond than the methyl
substituent(s). Therefore, in view of this we can conclude that, similar to the
argument invoked for the geometry factor, the strength of the acetylenes
adsorption will play a key role in determining the extent of hydrocarbonaceous
overlayer formation. Clearly the replacement of the substituent group has a
marked effect on the electron donating capacity of the triple bond towards the
surface, and from the 13C nmr data shown, we can conclude that the heats of
adsorption (AHJ of the various acetylenes will follow the trend:
Phenylacetylene < 2-Butyne < Propyne
Therefore, the likelihood of hydrocarbonaceous overlayer formation
occurring in the hydrogenation of phenylacetylene will be less than that of either
propyne or 2-butyne, as was observed in this study. In conclusion, we can state
that the role of the substituent group is crucial to the chemistry of the acetylene
and its propensity to yield surface hydrocarbonaceous overlayers.
References
1. Z. Knor, in “Catalysis, Science and Technology”, eds. J.R. Anderson and
H. Boudart, Springer-Verlag, Berlin, (1982) Vol. 3, p231.
2. K.R. Christmann, in “Hydrogen Effects in Catalysis”, eds. Z. Paal and
P.G. Menon, Marcel Dekker, NY, (1988) Chapter 1, p3.
3. S.Tsuchiya, Y. Amenomiya and R.J. Cvetanovic, J. Catal., 9, (1970), 245.
4. B. Lang, R.W. Joyner and G.A. Somoijai, Surf. Science, 30, (1972), 454.
5. M.A. Morris, M. Bowker and D.A. King, in “Simple Processes at the Gas-
Solid Interface”, Comprehensive Chemical Kinetics Series, eds. C.H.
Bamford, C.F.H. Tipper and R.G. Compton, Elsevier, (1984) Chapter 1,
Vol. 19.
6. G.J. Den Otter and F.M. Dautzenberg, J. Catal., 53, (1978), 116-125.
7. A. Frennet and P.B. Wells, Appl. Catal., 18, (1985), 243-257.
8. R.W. Joyner and P. Meehan, Vacuum, 33, (1983), 691.
9. M.A. Chesters, K.J. Packer, DJLennon and H.E. Viner, J. Chem. Soc.
Farad. Trans., 91(14), (1995), 2191-2201.
10. P.M. Maitlis, “The Organic Chemistry of Palladium”, Metal Complexes,
(1971), Academic Press, NY Vol.l.
11. B. Sen and M.A. Vannice, J. Catal., 101, (1986), 517.
12. P. Chou and M.A. Vannice, J. Catal., 104, (1987), 1.
13. B. Sen and M.A. Vannice, J. Catal., 130, (1991), 9.
14. A. Guerrero, M. Reading, Y. Grillet. J. Rouguerol, J.P. Boitiaux and J.
Cosyns, Z. Phys. D-Atoms, Molecules and Clusters, 12, (1989), 583.
15. J.G. Ulan, W.F. Maier and D.A. Smith, J. Org. Chem., 52, (1987), 3132-
3142.
16. A.A. Chen, A.J. Benesi and M.A. Vannice, J. Catal., 119, (1989), 14-32.
17. M. Boudart and H.S. Hwang, J. Catal., 39, (1975), 44.
18. P.C. Aben, J. Catal., 10, (1968), 224.
19. G.C. Bond, “Catalysis by Metals”, Academic Press, NY (1962).
20. B.A. Morrow and N. Sheppard, J. Phys. Chem., 70, (1966), 2406.
21. B.A. Morrow and N. Sheppard, Proc. Roy. Soc., A311, (1969), 391.
22. J.D. Prentice, A. Lesuinas and N. Sheppard, J. Chem. Soc., Chem. Comm.,
(1976), 76.
23. N. Sheppard, D.H. Clenery, D.H. Lesuinas, J.D. Prentice, H.A. Pearse and
M. Primet, in “Proc. 12th Eur. Congr. Mol. Spectroscop.”, eds. M.
Grossmann, S.G. Ellcomoss and J. Rimgessen, Elsevier, Amsterdam
(1976), p.345.
24. L.H. Little, in “Infra-Red Spectra of Adsorbed Species”, Academic Press,
London (1966), p. 111.
25. N. Sheppard and G. Shahid, Spectrochemica Acta, Vol. 46A, no. 6,
(1990), 999-1010.
26. M.A. Chesters, C. De La Cruz, P. Gardner, E.M. McCash, P. Pudney, G.
Shahid and N. Sheppard, J. Chem. Soc. Farad. Trans., 86(15), (1990),
2757-2763.
27. S.D. Jackson, N.J. Casey and I.J. Huntington, Catalyst Deactivation, 88,
(1994), 313-318.
28. N.R. Avery and N. Sheppard, Surf. Science, 169, (1986), L367-L373.
29. N. Sheppard and J.N. Ward, J. Catal., 15, (1969), 50.
30. J. Sheridan, J. Chem. Soc., 301, (1945), 133.
31. E.F.G. Herrington, Trans. Farad. Soc., 37, (1941), 361.
32. G.C. Bond, Catalysis, 3, (1954), 109, references therein.
33. D.W. McKee, J. Am. Chem. Soc., 84, (1962), 1109.
34. G.I. Jenkins and E.K. Rideal, J. Chem. Soc., (1955), 2490.
35. L.L. Kesmodel, P.C. Stair, R.C. Baetzold and G.A. Somoijai, Phys. Rev.
Letters, 36, (1976), 1316.
36. J.J. Rooney, F.G. Gault and C.Kemball, J. Catal., 1, (1962), 255.
37. J.J. Rooney, J. Catal., 2, (1963), 53.
38. J.J. Rooney and G. Webb, J. Catal., 3, (1964), 488.
39. M. Derrien, in “Catalytic Hydrogenation”, ed. L. Cerveny, Elsevier,
Amsterdam, (1986) p.613.
40. H. Lindlar and R. Dubuis, Org. Synthesis, 46, (1966), 89.
41. S. Siegel, Adv. Catal., 16, (1966), 160.
42. A.S. Al-Ammar and G. Webb, J. Chem. Soc. Faraday (I), 75, (1979),
1900.
43. S. Asplund. C. Fomell, A. Holmgren and S. Irandoust, Cat. Today, 24,
(1995), 181-187.
44. S. Asplund, J. Catal., 158, (1996), 267-278.
45. J.U. Reid, S.J. Thomson and G. Webb, J. Catal., 30, (1973), 378-386.
46. J.U. Reid, S.J. Thomson and G. Webb, J. Catal., 30, (1973), 372-377.
47. C.M. Pradier, M. Mazina, Y. Berthier and J. Oudar, J. Mol. Catal., 89,
(1994), 211-220.
48. J.M. Moses, A.H. Weiss, K. Matusek and L. Guczi, J. Catal., 86, (1984),
417-426.
49. G.C. Bond and J. Sheridan, Trans. Farad. Soc., 48, (1952), 651.
50. R.S. Mann and K.C. Khulbe, J. Phys. Chem., 73, (1969), 2104.
51. G.C. Bond and P.B. Wells, J. Catal., 4, (1965), 211.
52. S.D. Jackson and G. Kelly, J. Mol. Catal., 87, (1994), 275-286.
53. S.D. Jackson and N.J. Casey, J. Chem. Soc. Farad. Trans., 91(18), (1995),
3269-3274.
54. G. Webb, S J . Thomson and N.C. Kuhnen, J. Chem. Soc. Farad. Trans.
(I), 79, (1983), 2195.
55. R.J. Koestner, J.C. Frost, P.C. Stair, M.A. Van Hore, Surf. Science, 116,
(1982), 85.
56. G. Webb, in “Comprehensive Chemical Kinetics”, ed. C.H. Bamford and
C.E. Tipper, Elsevier, Amsterdam, (1978), Vol.20, p .l.
57. Ph. Maetz and R. Touroude, J. Mol. Catal., 91, (1994), 259-275.
58. J.P. Boutiaux, J. Cosyns and E. Robert, Appl. Catal., 35, (1987), 193-209.
59. W.M. Hamilton and R.L. Burwell, Proc. 2nd Intern. Congr. Catal., Paris,
(1960), p.987; (1961), technip, Paris.
60. E.F. Meyer and R.L. Burwell, J. Am. Chem. Soc., 85, (1963), 2877.
61. G. Webb and P.B. Wells, Trans. Farad. Soc., Vol.61, (1965), 1232.
62. G. Webb and S.J. Thomson, J. Chem. Soc. Chem. Comm., (1976), 526.
63. O. Beeck, Discuss. Farad. Soc., 8, (1950), 118.
64. R. Dus, Surf. Science, 50, (1975), 241.
65. A.S. Al-Ammar, S.J. Thomson and G. Webb, J. Chem. Soc. Chem.
Comm., (1977), 323.
66. A.S. Al-Ammar and G. Webb, J. Chem. Soc. Farad. Trans.(I), 74, (1978),
195.
67. A.S. Al-Ammar and G. Webb, J. Chem. Soc. Farad. Trans.ffl, 74, (1978),
657.
68. N. Sheppard, Discuss. Farad. Soc., 41, (1966), 177.
69. G.A. Somoijai and F. Zaera, J. Phys. Chem., 86, (1982), 3070.
70. G.A. Somoijai and D.W. Blakely, Nature, 258, (1975), 580
71. M. Salmeron and G.A. Somoijai, J. Phys. Chem., 86, (1982), 341.
72. M. Primet, M. El Azhar, R. Frety and M. Guenin, Appl. Catal., 59, (1990),
153-163.
73. H.L. Gruber, J. Phys. Chem., 66, (1962), 48.
74. S.D. Jackson, J. Willis, G.D. McLellan, M.B.T. Keegan, R.B. Moyes, S.
Simpson, G. Webb, P.B. Wells and R. Whyman, J. Catal., 139, (1993),
191-206
75. P.R. Hartley, “The Chemistry of Palladium and Platinum”, Applied
Science Publishers Ltd., (1973), Ch.9, p.244-245
76. G.C. Bond and V. Ponec, “Catalysis by Metals and Alloys”, Studies in
Surf. Science and Catalysis, Elsevier, (1995), Vol.95, C h .ll, p.497-498.
77. G.C. Bond and V. Ponec, in “Catalysis by Metals and Alloys”, Studies in
Surf. Science and Catalysis, Elsevier, (1995),Vol.95, C h .ll, p.496
78. G. Webb, Ph.D Thesis, University of Hull, (1963)
79. R.J. Cross, in “The Chemistry of the Metal-Carbon Bond”, Vol.2, (1985),
Ed. F.R. Hartley and S. Patai, Wiley and Sons Ltd
80. R.A. Carbrol and A. Oberlin, J. Catal., 89, (1984), 256
81. G.A. Somoijai, S.M. Davis and F. Zaera, J. Catal., 77, (1982), 439-459
82. G.A. Somoijai, “Introduction to Surface Science and Catalysis”, Wiley-
Interscience Publication, (1994), Ch.7, p.507
83. S.D. Jackson and L.A. Shaw, Appl. Catal., (A)-General, Vol. 134, no .l,
(1996), p.91-99
84. A.S. Al-Ammar, Ph.D Thesis, University of Glasgow, (1977)
85. G. Carturan, G. Facchin, G. Cocco, S. Enzo and G. Navazio, J. Catal., 76,
(1982), 405-417
86. P.B. Wells, J. Catal., 52, (1978), 498
87. J.F. Cevallos Candau and W.C. Conner, J. Catal., 106, (1987), 378-385
88. D.H. Lenz and W.C. Conner, J. Catal., 112, (1988), 116-125
89. G. Webb, G. Taylor and S.J. Thomson, J. Catal., 12, (1968), 150
90. G. Webb, G. Taylor and S.J. Thomson, J. Catal., 12, (1968), 191
91. L.H. Little, N. Sheppard and DJ.C. Yates, Proc. Roy. Soc. (1960), A249,
242