catalysts - mpg.pure
TRANSCRIPT
catalysts
Article
Analysis and Model-Based Description of the TotalProcess of Periodic Deactivation and Regeneration ofa VOx Catalyst for Selective Dehydrogenationof Propane
Andreas Brune 1,2,*, Andreas Seidel-Morgenstern 1 and Christof Hamel 1,2,*1 Institute of Process Engineering, Otto von Guericke University Magdeburg, Universitätsplatz 2,
39106 Magdeburg, Germany; [email protected] Process Engineering, Anhalt University of Applied Sciences, Bernburger Straße 55, 06354 Köthen, Germany* Correspondence: [email protected] (A.B.); [email protected] (C.H.)
Received: 26 October 2020; Accepted: 22 November 2020; Published: 25 November 2020 �����������������
Abstract: This study intends to provide insights into various aspects related to the reaction kineticsof the VOx catalyzed propane dehydrogenation including main and side reactions and, in particular,catalyst deactivation and regeneration, which can be hardly found in combination in current literature.To kinetically describe the complex reaction network, a reduced model was fitted to lab scaleexperiments performed in a fixed bed reactor. Additionally, thermogravimetric analysis (TGA) wasapplied to investigate the coking behavior of the catalyst under defined conditions consideringpropane and propene as precursors for coke formation. Propene was identified to be the main cokeprecursor, which agrees with results of experiments using a segmented fixed bed reactor (FBR).A mechanistic multilayer-monolayer coke growth model was developed to mathematically describethe catalyst coking. Samples from long-term deactivation experiments in an FBR were used forregeneration experiments with oxygen to gasify the coke deposits in a TGA. A power law approachwas able to describe the regeneration behavior well. Finally, the results of periodic experimentsconsisting of several deactivation and regeneration cycles verified the long-term stability of thecatalyst and confirmed the validity of the derived and parametrized kinetic models for deactivationand regeneration, which will allow model-based process development and optimization.
Keywords: deactivation; coking; regeneration; propane dehydrogenation; VOx catalyst; periodicoperation; kinetic modeling; reaction kinetics
1. Introduction
Light olefins are some of the most important building blocks in the chemical industry [1].Most of the light olefins are currently produced by highly optimized steam cracking processes.Since feedstocks are shifting progressively toward light alkanes, on-purpose technologies for theproduction of propene and other short chain alkenes have drawn more and more attention and are stillconsidered in research [2–5]. Dehydrogenation of propane is a well-known alternative productionroute for producing propene that was already commercialized [6]. Besides being energy intensive,the catalysts used in these processes are known to suffer from rapid coking, which requires periodicregeneration. Furthermore, the endothermic thermal dehydrogenation reaction itself is limited by achemical equilibrium.
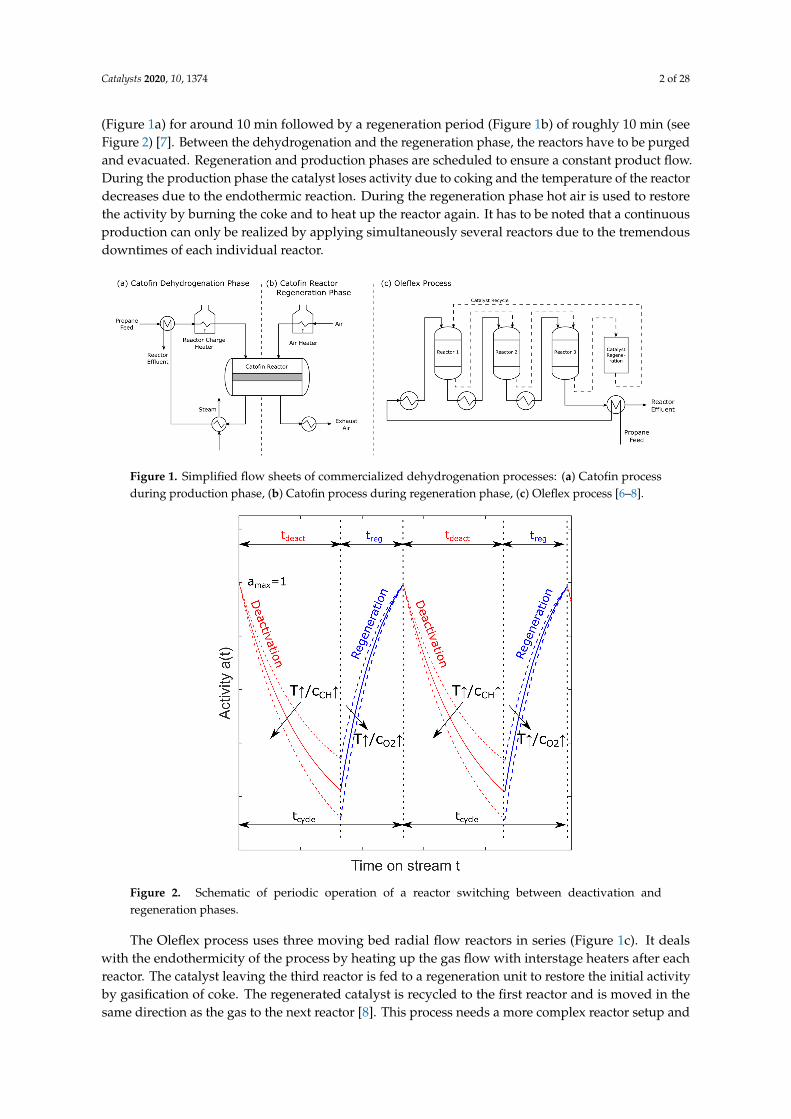
Examples illustrating how industry faces these drawbacks are found with the Catofin and Oleflexprocesses, among others (Figure 1). In the Catofin process, several adiabatic fixed bed reactors are usedin parallel to ensure a semi-continuous production of propene. Each reactor is used for dehydrogenation
Catalysts 2020, 10, 1374; doi:10.3390/catal10121374 www.mdpi.com/journal/catalysts
Catalysts 2020, 10, 1374 2 of 28
(Figure 1a) for around 10 min followed by a regeneration period (Figure 1b) of roughly 10 min (seeFigure 2) [7]. Between the dehydrogenation and the regeneration phase, the reactors have to be purgedand evacuated. Regeneration and production phases are scheduled to ensure a constant product flow.During the production phase the catalyst loses activity due to coking and the temperature of the reactordecreases due to the endothermic reaction. During the regeneration phase hot air is used to restorethe activity by burning the coke and to heat up the reactor again. It has to be noted that a continuousproduction can only be realized by applying simultaneously several reactors due to the tremendousdowntimes of each individual reactor.
1
1
2
Figure 1. Simplified flow sheets of commercialized dehydrogenation processes: (a) Catofin processduring production phase, (b) Catofin process during regeneration phase, (c) Oleflex process [6–8].
1
1
2
Figure 2. Schematic of periodic operation of a reactor switching between deactivation andregeneration phases.
The Oleflex process uses three moving bed radial flow reactors in series (Figure 1c). It dealswith the endothermicity of the process by heating up the gas flow with interstage heaters after eachreactor. The catalyst leaving the third reactor is fed to a regeneration unit to restore the initial activityby gasification of coke. The regenerated catalyst is recycled to the first reactor and is moved in thesame direction as the gas to the next reactor [8]. This process needs a more complex reactor setup and
Catalysts 2020, 10, 1374 3 of 28
places high demands on the catalyst which has to be mechanically stable to be used in a moving bedreactor. Besides that it is not possible to remove coke built up on the reactor surfaces or the devices inthe reactor during operation [6].
Thus, process intensification is needed to overcome some disadvantages of the established plantdesigns and can lead to a more sustainable and energy effective overall process [9]. Numerousresearch activities in the field of process intensification are related to membrane reactors [10,11].Membrane reactors can provide distribution or extraction of intermediates, reactants, or products toassure a more advantages concentration and temperature regime than conventional reactor designs [12].Porous and dense membranes are subject of current research [13,14].
Different membrane reactors were already used for the dehydrogenation of short chainalkanes [15–22]. Coking of the catalyst used in membrane reactors as well as coking of the membranesthemselves was repeatedly reported [11,19–21,23]. Various reactor setups and strategies able to preventcoking or regenerate the coked catalyst were also suggested [15,23]. A new innovative approach can bethe application of periodic regeneration in a membrane reactor in distributor configuration couplingthermal and oxidative dehydrogenation in one apparatus [15]. This concept avoids downtimes due tothe operando regeneration of the catalyst as in established processes discussed above. Coupling of theexothermic oxidative dehydrogenation and the endothermic thermal dehydrogenation can lead to anautothermic operation and improves energy efficiency.
To be able to evaluate the possibilities of periodic regeneration of the catalyst a profound knowledgeof the reaction network is needed. This includes parallel and side reactions as well as deactivation andregeneration of the catalyst which occurs simultaneously. A combined study of all relevant effects witha systematic model discrimination is rarely found in the literature.
In this contribution the reaction network of the dehydrogenation of propane on a vanadium oxide(VOx) catalyst is investigated and modeled. The main and side reactions are studied in a lab scalefixed bed reactor and the kinetics are described by a power law approach. The coking behavior andregeneration of the catalyst are studied in a setup for thermogravimetric analysis (TGA), equipped withmass flow controllers (MFCs) for dosing of propane, propene, O2 and N2. For describing the coking ofthe catalyst, different multilayer-monolayer coke growth models (MMCGM) with different reactionorders are further developed and tested. It is shown that it is possible to describe the regenerationkinetics by a reduced model. Deactivation and regeneration kinetics as well as long-term stability ofthe catalyst are validated by periodic experiments including deactivation and regeneration phasesin several subsequent cycles as illustrated in Figure 2 and occurring in commercialized industrialprocesses as discussed above.
2. Results and Discussion
This chapter presents the results of the kinetic analysis of the reaction network first (Section 2.1).After that the findings of kinetic modeling and parametrization of the catalyst coking are explained anddiscussed (Section 2.2), followed by an analysis of the regeneration kinetics (Section 2.3). Afterwardsthe deactivation and the regeneration models are validated by periodic experiments (Section 2.4).
2.1. Kinetic Investigation of the Reaction Network
For all experiments in this study a VOx catalyst was used [15–18]. Kinetic experiments wereconducted in a lab scale tubular fixed bed quartz glass reactor, which is described in detail in theMaterials and Methods section of this contribution. Isothermal conditions and plug flow were assumed.
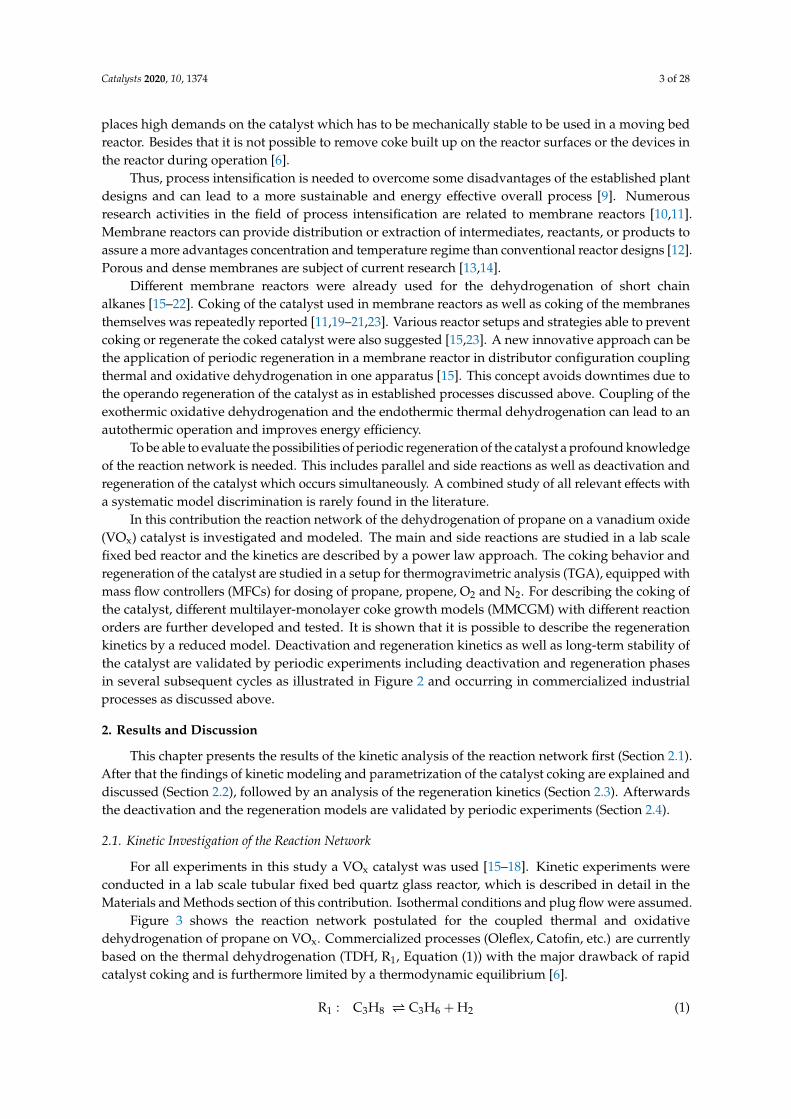
Figure 3 shows the reaction network postulated for the coupled thermal and oxidativedehydrogenation of propane on VOx. Commercialized processes (Oleflex, Catofin, etc.) are currentlybased on the thermal dehydrogenation (TDH, R1, Equation (1)) with the major drawback of rapidcatalyst coking and is furthermore limited by a thermodynamic equilibrium [6].
R1 : C3H8 C3H6 + H2 (1)
Catalysts 2020, 10, 1374 4 of 28
2
3
4
Figure 3. Reaction network of the dehydrogenation of propane on a VOx catalyst.
A promising alternative is the oxidative dehydrogenation (ODH, R2, Equation (2)).
R2 : C3H8 + 0.5 O2 → C3H6 + H2O (2)
The oxygen needed for the ODH largely prevents coking but decreases the selectivity due tounwanted consecutive reactions namely series and total oxidation of the desired product propene (R3,R4). Reaction R5 describes the water–gas shift reaction, which has shown to be beneficial for overcomingthe chemical equilibrium of the TDH by consuming the hydrogen produced in the TDH [15].
For a mathematical description of the reaction network a power law approach was used andextended (Equations (3)–(7))
r1 = k1 · pa1C3H8
(3)
r2 = k2 · pa2C3H8
· pb2O2
(4)
r3 = k3 · pa3C3H6
· pb3O2
(5)
r4 = k4 · pa4C3H6
· pb4O2
(6)
r5 = k5 · pH2· pCO2
·
1−pH2O · pCO
1KWGS
· pH2· pCO2
(7)
pi represents the partial pressure of component i, ai is the reaction order with respect to propaneand propene and bi is the reaction order of oxygen. KWGS represents the equilibrium constant of thewater–gas shift reaction (Equation (8)) [24]:
KWGS = 1.767× 10⁻²· exp
(4400T
)(8)
The temperature dependency of this model was described by a reparametrized Arrhenius approach(Equations (9)–(11), Tre f = 450 ◦C)
A j = ln(k0, j
)−
EA, j
R Tre f(9)
B j =EA, j
R Tre f(10)
k j = exp[A j + B j
(T − Tre f
T
)](11)
Catalysts 2020, 10, 1374 5 of 28
This approach minimizes the correlation between the activation energy EA and the collision factork of the standard Arrhenius equation (Equation (12)) [25].
k j = k0, j exp[EA, j
R T
](12)
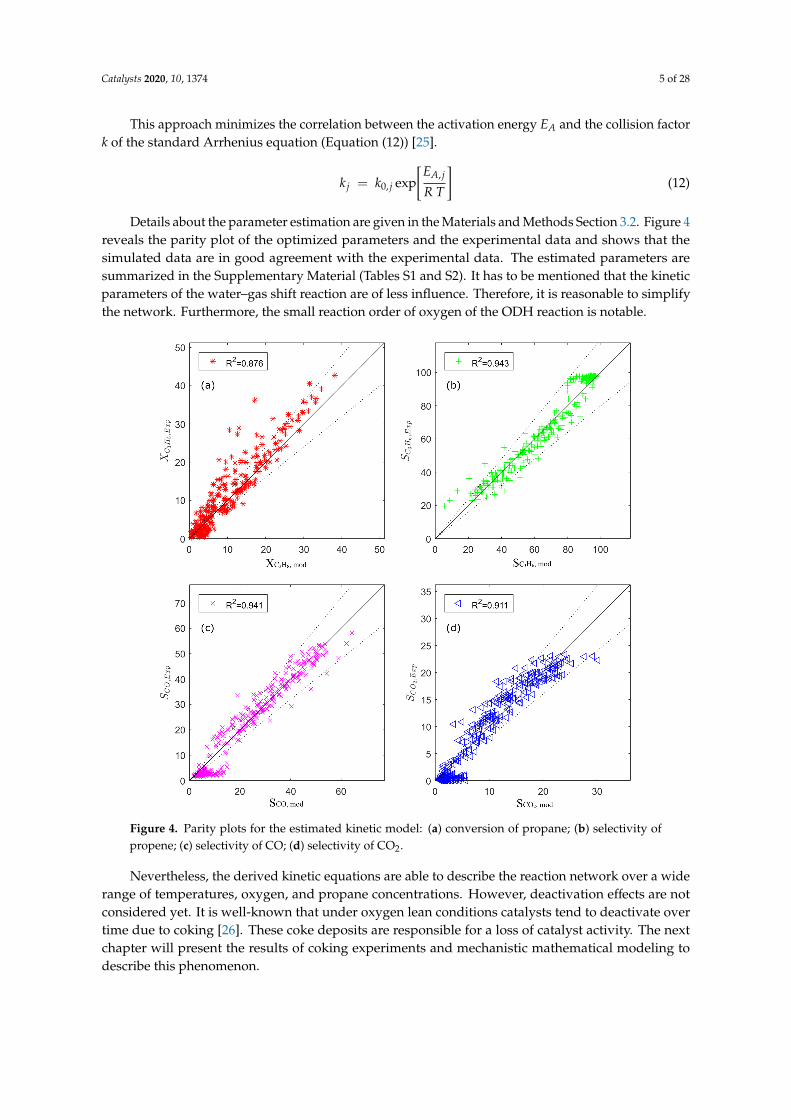
Details about the parameter estimation are given in the Materials and Methods Section 3.2. Figure 4reveals the parity plot of the optimized parameters and the experimental data and shows that thesimulated data are in good agreement with the experimental data. The estimated parameters aresummarized in the Supplementary Material (Tables S1 and S2). It has to be mentioned that the kineticparameters of the water–gas shift reaction are of less influence. Therefore, it is reasonable to simplifythe network. Furthermore, the small reaction order of oxygen of the ODH reaction is notable.
2
3
4
Figure 4. Parity plots for the estimated kinetic model: (a) conversion of propane; (b) selectivity ofpropene; (c) selectivity of CO; (d) selectivity of CO2.
Nevertheless, the derived kinetic equations are able to describe the reaction network over a widerange of temperatures, oxygen, and propane concentrations. However, deactivation effects are notconsidered yet. It is well-known that under oxygen lean conditions catalysts tend to deactivate overtime due to coking [26]. These coke deposits are responsible for a loss of catalyst activity. The nextchapter will present the results of coking experiments and mechanistic mathematical modeling todescribe this phenomenon.
Catalysts 2020, 10, 1374 6 of 28
2.2. Catalyst Deactivation
Coking experiments were conducted in a TGA setup (see Materials and Methods Section 3.3) thatallows deactivating the catalyst at constant temperature in a defined gas atmosphere adjusted by MFCs.The TGA is coupled with a Micro GC for a fast online analysis of gas compositions. Propene andpropane were used as coking precursors. Preliminary experiments showed that experiments withtemperatures between 575 ◦C and 650 ◦C offer a reasonable deactivation behavior at simultaneouslyhigh reactor performance. The temperature was varied in steps of 25 K within these limits betweenthe experiments. The mass change and catalyst temperature were recorded by the TGA during theexperiments. All studied deactivation experiments are summarized in Table 11 (see Materials andMethods Section 3.3).
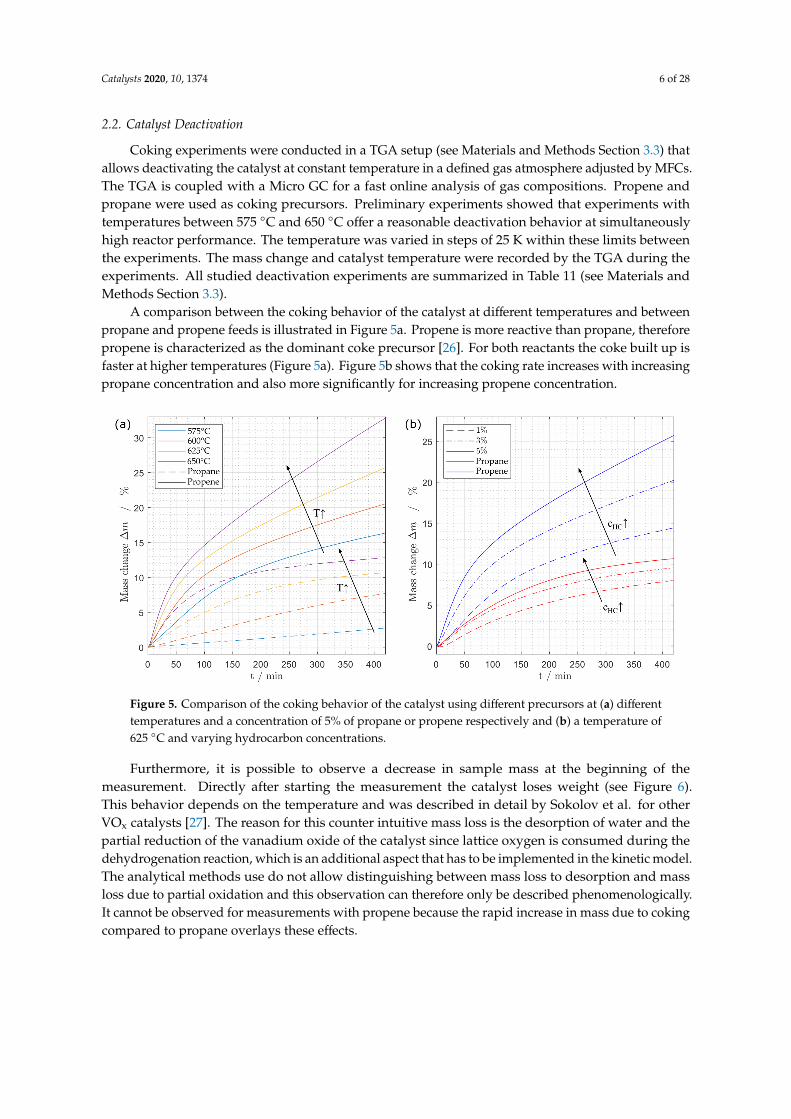
A comparison between the coking behavior of the catalyst at different temperatures and betweenpropane and propene feeds is illustrated in Figure 5a. Propene is more reactive than propane, thereforepropene is characterized as the dominant coke precursor [26]. For both reactants the coke built up isfaster at higher temperatures (Figure 5a). Figure 5b shows that the coking rate increases with increasingpropane concentration and also more significantly for increasing propene concentration.
3
5
6
Figure 5. Comparison of the coking behavior of the catalyst using different precursors at (a) differenttemperatures and a concentration of 5% of propane or propene respectively and (b) a temperature of625 ◦C and varying hydrocarbon concentrations.
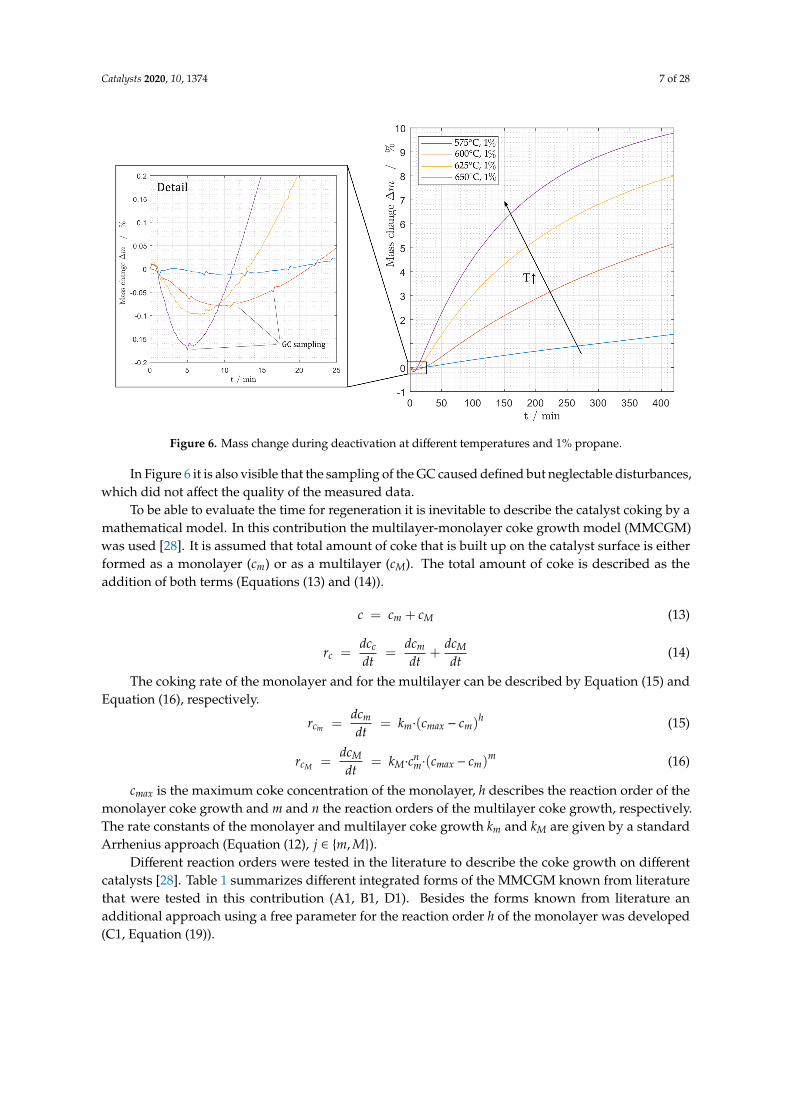
Furthermore, it is possible to observe a decrease in sample mass at the beginning of themeasurement. Directly after starting the measurement the catalyst loses weight (see Figure 6).This behavior depends on the temperature and was described in detail by Sokolov et al. for otherVOx catalysts [27]. The reason for this counter intuitive mass loss is the desorption of water and thepartial reduction of the vanadium oxide of the catalyst since lattice oxygen is consumed during thedehydrogenation reaction, which is an additional aspect that has to be implemented in the kinetic model.The analytical methods use do not allow distinguishing between mass loss to desorption and massloss due to partial oxidation and this observation can therefore only be described phenomenologically.It cannot be observed for measurements with propene because the rapid increase in mass due to cokingcompared to propane overlays these effects.
Catalysts 2020, 10, 1374 7 of 28
3
5
6
Figure 6. Mass change during deactivation at different temperatures and 1% propane.
In Figure 6 it is also visible that the sampling of the GC caused defined but neglectable disturbances,which did not affect the quality of the measured data.
To be able to evaluate the time for regeneration it is inevitable to describe the catalyst coking by amathematical model. In this contribution the multilayer-monolayer coke growth model (MMCGM)was used [28]. It is assumed that total amount of coke that is built up on the catalyst surface is eitherformed as a monolayer (cm) or as a multilayer (cM). The total amount of coke is described as theaddition of both terms (Equations (13) and (14)).
c = cm + cM (13)
rc =dcc
dt=
dcm
dt+
dcM
dt(14)
The coking rate of the monolayer and for the multilayer can be described by Equation (15) andEquation (16), respectively.
rcm =dcm
dt= km·(cmax − cm)
h (15)
rcM =dcM
dt= kM·cn
m·(cmax − cm)m (16)
cmax is the maximum coke concentration of the monolayer, h describes the reaction order of themonolayer coke growth and m and n the reaction orders of the multilayer coke growth, respectively.The rate constants of the monolayer and multilayer coke growth km and kM are given by a standardArrhenius approach (Equation (12), j ∈ {m, M}).
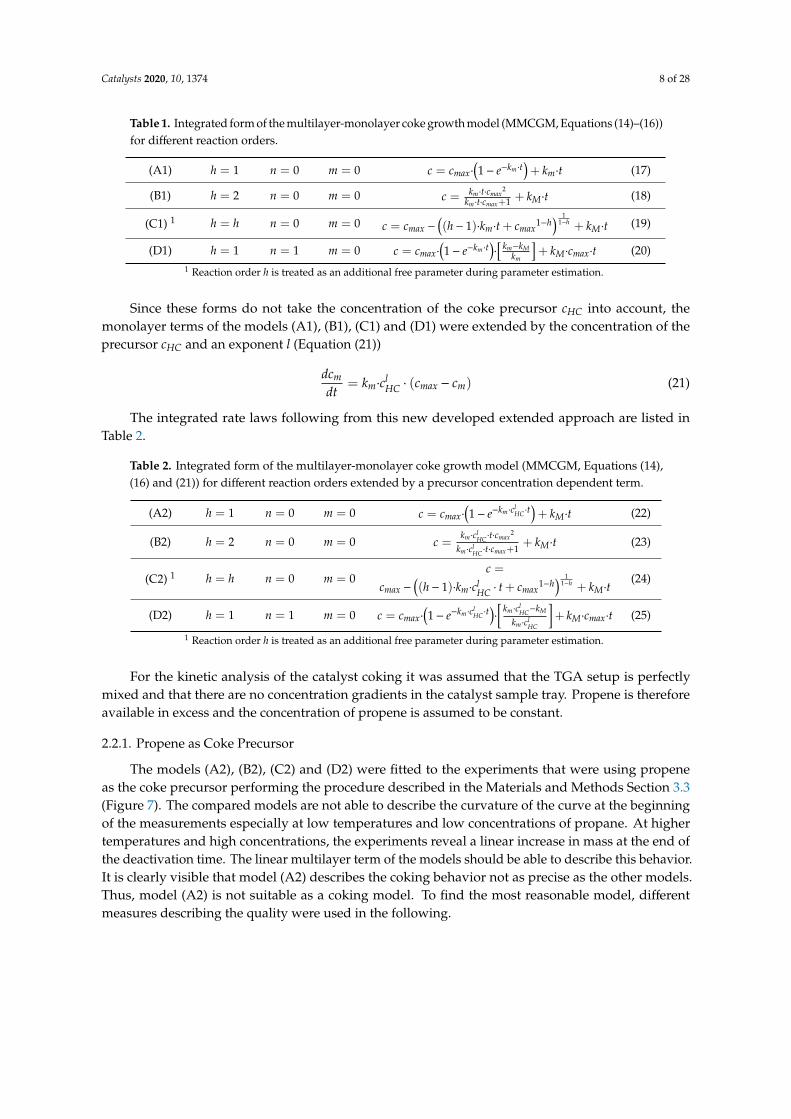
Different reaction orders were tested in the literature to describe the coke growth on differentcatalysts [28]. Table 1 summarizes different integrated forms of the MMCGM known from literaturethat were tested in this contribution (A1, B1, D1). Besides the forms known from literature anadditional approach using a free parameter for the reaction order h of the monolayer was developed(C1, Equation (19)).
Catalysts 2020, 10, 1374 8 of 28
Table 1. Integrated form of the multilayer-monolayer coke growth model (MMCGM, Equations (14)–(16))for different reaction orders.
(A1) h = 1 n = 0 m = 0 c = cmax·(1− e−km·t
)+ km·t (17)
(B1) h = 2 n = 0 m = 0 c = km·t·cmax2
km·t·cmax+1 + kM·t (18)
(C1) 1 h = h n = 0 m = 0 c = cmax −((h− 1)·km·t + cmax
1−h) 1
1−h + kM·t (19)
(D1) h = 1 n = 1 m = 0 c = cmax·(1− e−km·t
)·
[km−kM
km
]+ kM·cmax·t (20)
1 Reaction order h is treated as an additional free parameter during parameter estimation.
Since these forms do not take the concentration of the coke precursor cHC into account, themonolayer terms of the models (A1), (B1), (C1) and (D1) were extended by the concentration of theprecursor cHC and an exponent l (Equation (21))
dcm
dt= km·cl
HC · (cmax − cm) (21)
The integrated rate laws following from this new developed extended approach are listed inTable 2.
Table 2. Integrated form of the multilayer-monolayer coke growth model (MMCGM, Equations (14),(16) and (21)) for different reaction orders extended by a precursor concentration dependent term.
(A2) h = 1 n = 0 m = 0 c = cmax·(1− e−km·cl
HC·t)+ kM·t (22)
(B2) h = 2 n = 0 m = 0 c =km·cl
HC·t·cmax2
km·clHC·t·cmax+1
+ kM·t (23)
(C2) 1 h = h n = 0 m = 0c =
cmax −((h− 1)·km·cl
HC · t + cmax1−h
) 11−h + kM·t
(24)
(D2) h = 1 n = 1 m = 0 c = cmax·(1− e−km·cl
HC·t)·
[km·cl
HC−kM
km·clHC
]+ kM·cmax·t (25)
1 Reaction order h is treated as an additional free parameter during parameter estimation.
For the kinetic analysis of the catalyst coking it was assumed that the TGA setup is perfectlymixed and that there are no concentration gradients in the catalyst sample tray. Propene is thereforeavailable in excess and the concentration of propene is assumed to be constant.
2.2.1. Propene as Coke Precursor
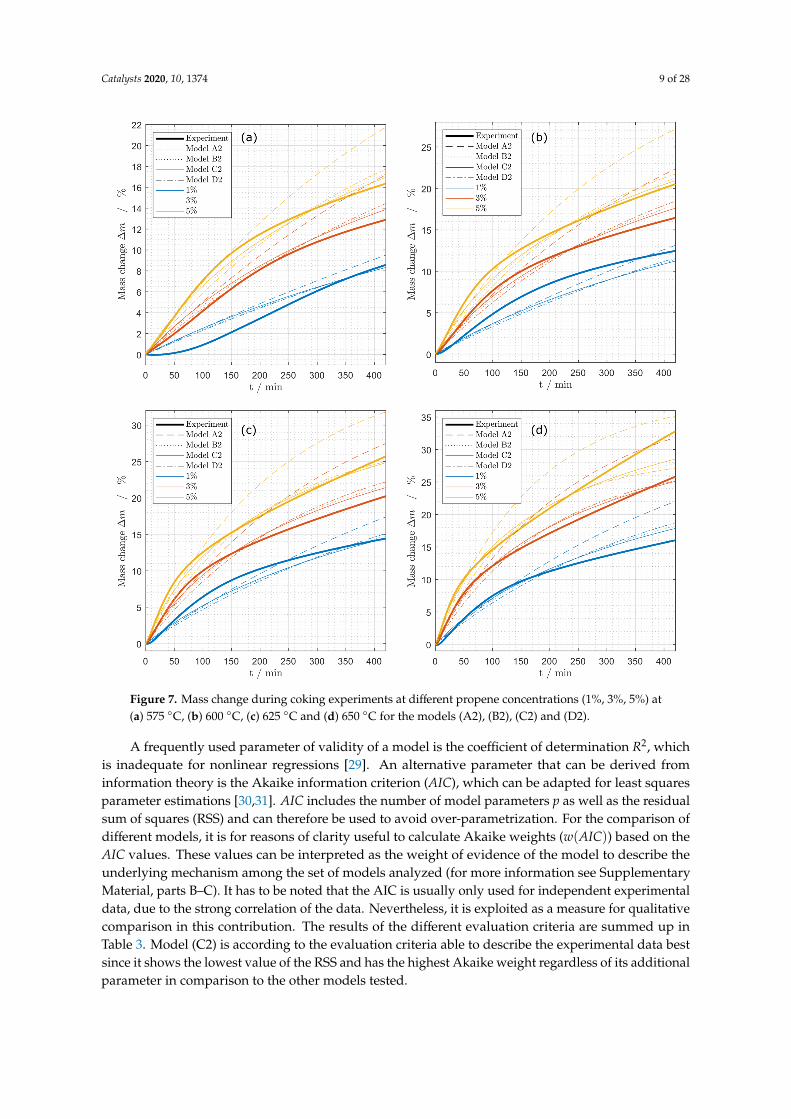
The models (A2), (B2), (C2) and (D2) were fitted to the experiments that were using propeneas the coke precursor performing the procedure described in the Materials and Methods Section 3.3(Figure 7). The compared models are not able to describe the curvature of the curve at the beginningof the measurements especially at low temperatures and low concentrations of propane. At highertemperatures and high concentrations, the experiments reveal a linear increase in mass at the end ofthe deactivation time. The linear multilayer term of the models should be able to describe this behavior.It is clearly visible that model (A2) describes the coking behavior not as precise as the other models.Thus, model (A2) is not suitable as a coking model. To find the most reasonable model, differentmeasures describing the quality were used in the following.
Catalysts 2020, 10, 1374 9 of 28
4
7
Figure 7. Mass change during coking experiments at different propene concentrations (1%, 3%, 5%) at(a) 575 ◦C, (b) 600 ◦C, (c) 625 ◦C and (d) 650 ◦C for the models (A2), (B2), (C2) and (D2).
A frequently used parameter of validity of a model is the coefficient of determination R2, whichis inadequate for nonlinear regressions [29]. An alternative parameter that can be derived frominformation theory is the Akaike information criterion (AIC), which can be adapted for least squaresparameter estimations [30,31]. AIC includes the number of model parameters p as well as the residualsum of squares (RSS) and can therefore be used to avoid over-parametrization. For the comparison ofdifferent models, it is for reasons of clarity useful to calculate Akaike weights (w(AIC)) based on theAIC values. These values can be interpreted as the weight of evidence of the model to describe theunderlying mechanism among the set of models analyzed (for more information see SupplementaryMaterial, parts B–C). It has to be noted that the AIC is usually only used for independent experimentaldata, due to the strong correlation of the data. Nevertheless, it is exploited as a measure for qualitativecomparison in this contribution. The results of the different evaluation criteria are summed up inTable 3. Model (C2) is according to the evaluation criteria able to describe the experimental data bestsince it shows the lowest value of the RSS and has the highest Akaike weight regardless of its additionalparameter in comparison to the other models tested.
Catalysts 2020, 10, 1374 10 of 28
Table 3. Information criteria and comparison of the models (A2), (B2), (C2) and (D2) for deactivationexperiments using propene.
- A2 B2 C2 D2
RSSopt 31,483 22,259 17,241 31,483p 6 6 7 6
AIC 66,209.7 59,220.4 54,072.2 66,209.7w(AIC) 0.00% 0.00% 100.00% 0.00%
Based on model (C2) different modifications, extensions as well as reductions were tested toachieve a better agreement with the measured data. To study the influence of the multilayer term onthe overall mass change, a model consisting only of the monolayer term (model (C3)) was examined.
(C3) : c = cmax −((h− 1)·km·cl
HC · t + cmax1−h
) 11−h (26)
To be able to describe the mass loss due to desorption at the beginning of the measurements themodels (C2) and (C3) were extended by a desorption term (Equations (27) and (28)) [27]. The adsorptionterm is not depending on temperature, meaning that kdes is a constant value for all measurements.A temperature depended desorption term was also tested in preliminary parameter estimations butdid not offer any advantages.
(C4) : c = cmax −((h− 1)·km·cl
HC · t + cmax1−h
) 11−h + kM·t− c0·
(1− e−kdes·t
)(27)
(C5) : c = cmax −((h− 1)·km·cl
HC · t + cmax1−h
) 11−h− c0·
(1− e−kdes·t
)(28)
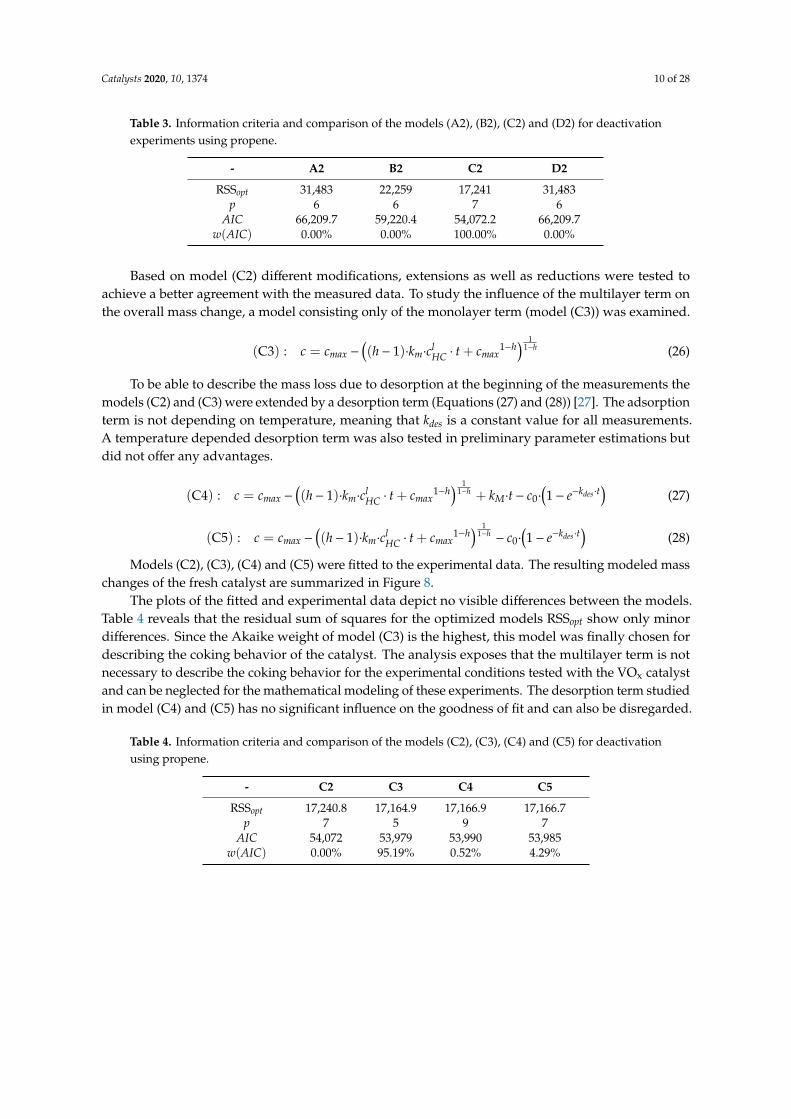
Models (C2), (C3), (C4) and (C5) were fitted to the experimental data. The resulting modeled masschanges of the fresh catalyst are summarized in Figure 8.
The plots of the fitted and experimental data depict no visible differences between the models.Table 4 reveals that the residual sum of squares for the optimized models RSSopt show only minordifferences. Since the Akaike weight of model (C3) is the highest, this model was finally chosen fordescribing the coking behavior of the catalyst. The analysis exposes that the multilayer term is notnecessary to describe the coking behavior for the experimental conditions tested with the VOx catalystand can be neglected for the mathematical modeling of these experiments. The desorption term studiedin model (C4) and (C5) has no significant influence on the goodness of fit and can also be disregarded.
Table 4. Information criteria and comparison of the models (C2), (C3), (C4) and (C5) for deactivationusing propene.
- C2 C3 C4 C5
RSSopt 17,240.8 17,164.9 17,166.9 17,166.7p 7 5 9 7
AIC 54,072 53,979 53,990 53,985w(AIC) 0.00% 95.19% 0.52% 4.29%
Catalysts 2020, 10, 1374 11 of 28
5
8
Figure 8. Mass change during coking experiments at different propene concentrations (1%, 3%, 5%) at(a) 575 ◦C, (b) 600 ◦C, (c) 625 ◦C and (d) 650 ◦C for the models (C2), (C3), (C4) and (C5).
Consequently, the reduced model consisting only of a monolayer term (model (C3)) is sufficient todescribe the mass changes in the experiments. It has to be stressed that the prediction quality of thismodel decreases for low concentrations and low temperatures.
The optimized parameters of the selected model are shown in Table 5. For the estimation ofconfidence intervals (CI) a more suitable bootstrapping algorithm [32–34] was used (see SupplementaryMaterial, parts B–C).
Table 5. Optimized parameters of model C3 to describe the coking behavior of the VOx catalyst.
Parameter Opt. Value Confidence Intervals Unit
cmax 87.060 −0.45% +0.82% %(
kgcokekgcat
× 100)
l 0.700 −0.30% +0.30% -k0 9.52× 10⁷ −33.21% +11.26%
(kgcokekg−1
cat min−1)1−h
EA 106, 397 −0.13% +0.12% J mol−1
h 6.401 −0.38% +1.27% -
2.2.2. Propane as Coke Precursor
Besides describing the deactivation based on propene in the feed, a kinetic analysis of theexperiments using propane was also executed. The parameter estimation was performed in the same
Catalysts 2020, 10, 1374 12 of 28
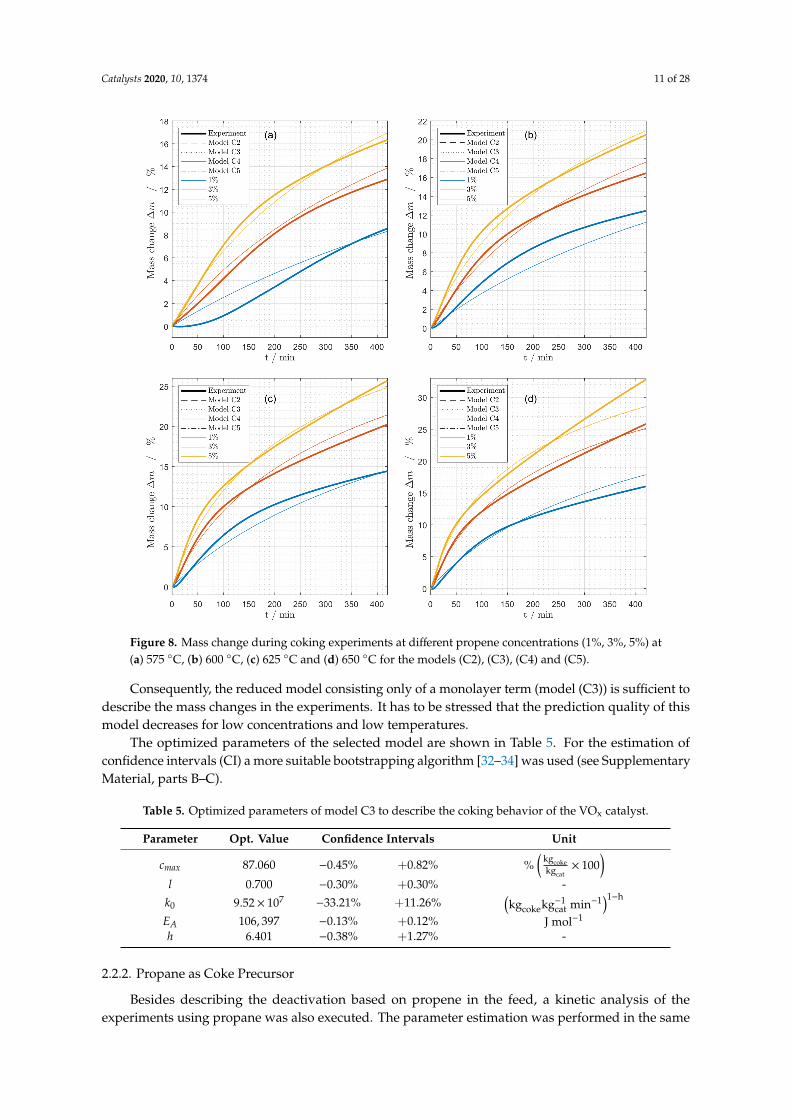
way as discussed for propene. A comparison between the unmodified MMCGM models (A2), (B2),(C2), and (D2) is shown in Figure 9.
6
9
Figure 9. Mass change during coking experiments at different propane concentrations (1%, 3%, 5%) at(a) 575 ◦C, (b) 600 ◦C, (c) 625 ◦C and (d) 650 ◦C for the models (A2), (B2), (C2) and (D2) as used forcoking from propene (Table 2).
By comparing the information criteria listed in Table 6, it becomes clear that model (C2) describesthe deactivation best.
Table 6. Information criteria and comparison of the models (A2), (B2), (C2) and (D2) for the deactivationof VOx catalyst with propane.
- A2 B2 C2 D2
RSSopt 4889.5 5078.9 4783.5 4889.4p 6 6 7 6
AIC 28,665 29,431 28,225 28,664w(AIC) 0.00% 0.00% 100.00% 0.00%
Catalysts 2020, 10, 1374 13 of 28
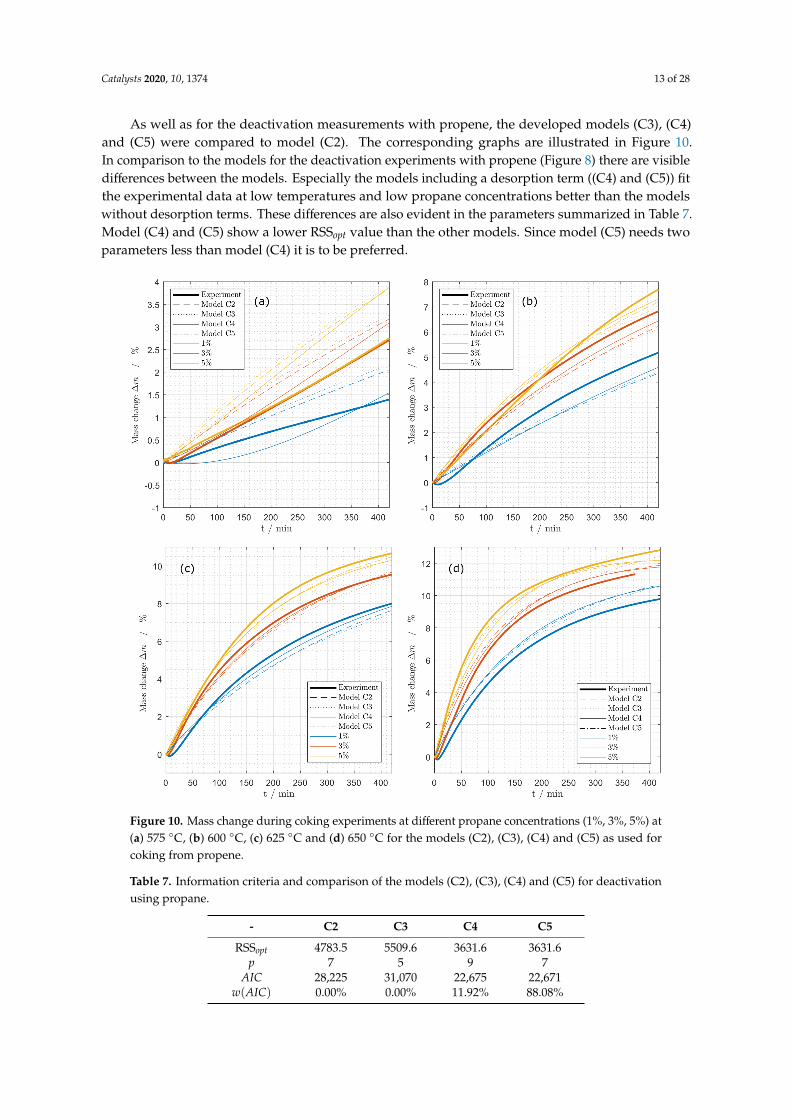
As well as for the deactivation measurements with propene, the developed models (C3), (C4)and (C5) were compared to model (C2). The corresponding graphs are illustrated in Figure 10.In comparison to the models for the deactivation experiments with propene (Figure 8) there are visibledifferences between the models. Especially the models including a desorption term ((C4) and (C5)) fitthe experimental data at low temperatures and low propane concentrations better than the modelswithout desorption terms. These differences are also evident in the parameters summarized in Table 7.Model (C4) and (C5) show a lower RSSopt value than the other models. Since model (C5) needs twoparameters less than model (C4) it is to be preferred.
7
10
Figure 10. Mass change during coking experiments at different propane concentrations (1%, 3%, 5%) at(a) 575 ◦C, (b) 600 ◦C, (c) 625 ◦C and (d) 650 ◦C for the models (C2), (C3), (C4) and (C5) as used forcoking from propene.
Table 7. Information criteria and comparison of the models (C2), (C3), (C4) and (C5) for deactivationusing propane.
- C2 C3 C4 C5
RSSopt 4783.5 5509.6 3631.6 3631.6p 7 5 9 7
AIC 28,225 31,070 22,675 22,671w(AIC) 0.00% 0.00% 11.92% 88.08%
Catalysts 2020, 10, 1374 14 of 28
Table 8 shows the optimal parameters of the model and the corresponding confidence intervals,estimated by a bootstrapping procedure (Supplementary Material, parts B–C).
Table 8. Optimized parameters of model C5 to describe the coking behavior of the VOx catalystusing propene.
Parameter Opt. Value Confidence Intervals Unit
cmax 17.695 −1.54% +1.35% %(
kgcokekgcat
× 100)
l 0.275 −2.05% +1.55% -k0 9.59× 10⁵ −29.71% +33.72%
(kgcokekg−1
cat min−1)1−h
EA 139, 022 −1.92% +1.35% J mol−1
h 1.106 −2.79% +1.47% -kdes 3.22× 10⁻³ −2.24% +4.09% min−1
c0 5.994 −4.47% +5.17% %(
kgcokekgcat
× 100)
Model (C5) does also not include a multilayer term. The difference between model (C3), whichwas chosen for the deactivations using propene and model (C5) is the missing desorption term in model(C3). The desorption does not play a significant role in describing the deactivation using propene dueto the fast coking which dominates in the experiments. It has to be noted that these results are validfor the deactivation times realized in this study. Especially for propane a linear mass change at theend of the measurements for high temperatures can be observed, which leads to the conclusion that alinear multilayer term is suitable to describe the coking behavior for longer deactivation times [28,35].This is an indicator that the systematic model reduction disregards a multilayer term that would bereasonable from a mechanistic point of view. A different experimental basis may lead to another modeldescribing the coking of the catalyst.
In this section, a simple mathematical model was developed and validated to describe the cokingbehavior of the VOx catalyst under a wide range of deactivation conditions. The models describe themass change of the catalyst in good agreement with experimental data in a temperature range relevantfor industrial processes. Keeping the total industrial production cycle in mind (see Figure 1), still adescription of the regeneration of the catalyst is necessary. A mathematical model for the regenerationof the catalyst with oxygen is developed in the next section.
2.3. Catalyst Regeneration
For subsequent regeneration of the deactivated catalyst burn off of the coke is used. Differentgases can be used for catalyst regeneration. The reactivity of these gases and therefore the gasificationrates vary by orders of magnitudes [26]. Many processes, as introduced in Figure 1, use oxygen forregeneration of coked catalysts which has the advantage of the availability in air and reasonablegasification rates at moderate temperatures. In this contribution oxygen diluted in nitrogen was usedfor gasification.
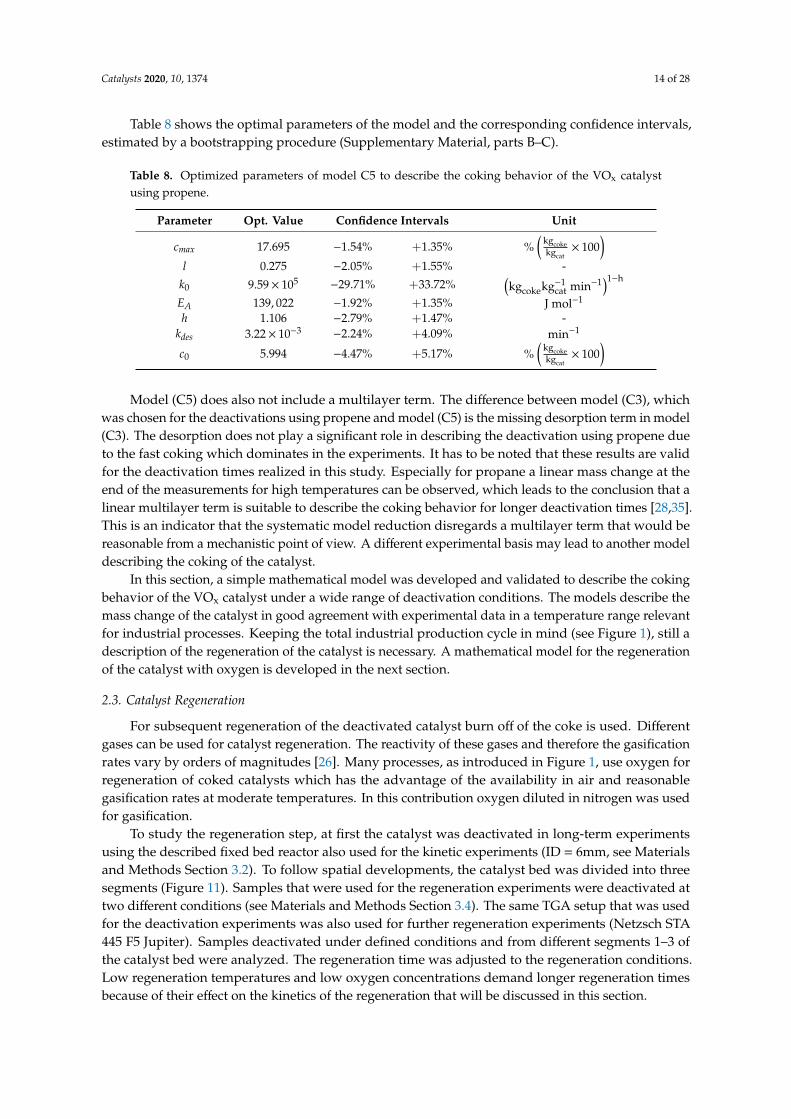
To study the regeneration step, at first the catalyst was deactivated in long-term experimentsusing the described fixed bed reactor also used for the kinetic experiments (ID = 6mm, see Materialsand Methods Section 3.2). To follow spatial developments, the catalyst bed was divided into threesegments (Figure 11). Samples that were used for the regeneration experiments were deactivated attwo different conditions (see Materials and Methods Section 3.4). The same TGA setup that was usedfor the deactivation experiments was also used for further regeneration experiments (Netzsch STA445 F5 Jupiter). Samples deactivated under defined conditions and from different segments 1–3 ofthe catalyst bed were analyzed. The regeneration time was adjusted to the regeneration conditions.Low regeneration temperatures and low oxygen concentrations demand longer regeneration timesbecause of their effect on the kinetics of the regeneration that will be discussed in this section.
Catalysts 2020, 10, 1374 15 of 28
8
11
12
Figure 11. Regeneration behavior for samples from different catalyst segments in the lab scale fixedbed reactor at (A) constant oxygen concentration and (B) constant temperature and varied oxygenconcentration for catalyst deactivated at deactivation condition 1.
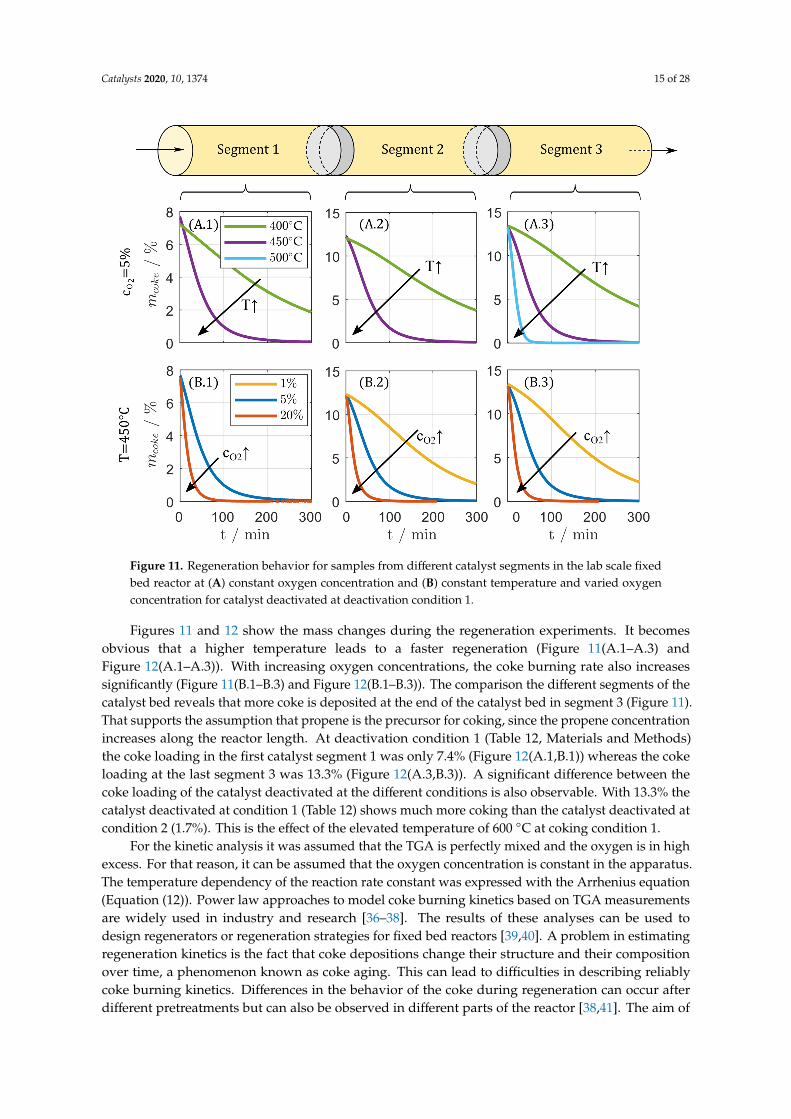
Figures 11 and 12 show the mass changes during the regeneration experiments. It becomesobvious that a higher temperature leads to a faster regeneration (Figure 11(A.1–A.3) andFigure 12(A.1–A.3)). With increasing oxygen concentrations, the coke burning rate also increasessignificantly (Figure 11(B.1–B.3) and Figure 12(B.1–B.3)). The comparison the different segments of thecatalyst bed reveals that more coke is deposited at the end of the catalyst bed in segment 3 (Figure 11).That supports the assumption that propene is the precursor for coking, since the propene concentrationincreases along the reactor length. At deactivation condition 1 (Table 12, Materials and Methods)the coke loading in the first catalyst segment 1 was only 7.4% (Figure 12(A.1,B.1)) whereas the cokeloading at the last segment 3 was 13.3% (Figure 12(A.3,B.3)). A significant difference between thecoke loading of the catalyst deactivated at the different conditions is also observable. With 13.3% thecatalyst deactivated at condition 1 (Table 12) shows much more coking than the catalyst deactivated atcondition 2 (1.7%). This is the effect of the elevated temperature of 600 ◦C at coking condition 1.
For the kinetic analysis it was assumed that the TGA is perfectly mixed and the oxygen is in highexcess. For that reason, it can be assumed that the oxygen concentration is constant in the apparatus.The temperature dependency of the reaction rate constant was expressed with the Arrhenius equation(Equation (12)). Power law approaches to model coke burning kinetics based on TGA measurementsare widely used in industry and research [36–38]. The results of these analyses can be used todesign regenerators or regeneration strategies for fixed bed reactors [39,40]. A problem in estimatingregeneration kinetics is the fact that coke depositions change their structure and their compositionover time, a phenomenon known as coke aging. This can lead to difficulties in describing reliablycoke burning kinetics. Differences in the behavior of the coke during regeneration can occur afterdifferent pretreatments but can also be observed in different parts of the reactor [38,41]. The aim of
Catalysts 2020, 10, 1374 16 of 28
this section is to develop a simplified kinetic model of the complex coke burning kinetics and to checkwhether these difficulties occur in the considered reaction system. To describe the complex kinetics ofthe regeneration the following power law approach was applied:
r =dmcoke
dt= kreg·mαcoke·x
βO2
(29)
8
11
12
Figure 12. Regeneration behavior for samples from catalyst bed segment 3 in the lab scale fixedbed reactor at (A) constant oxygen concentration and (B) constant temperature and varied oxygenconcentration for catalyst deactivated at deactivation condition 2.
The coke content mcoke is given in % (mass of coke per mass of fresh catalyst), in analogy to thedeactivation experiments to make it possible to combine deactivation and regeneration models. xO2
denotes the volume fraction of oxygen. It was crucial to make sure that samples selected from differentsegments of the reactor bed as well as samples of different coking experiments are part of the data setof this analysis. An overview of all experiments in the data set is given in the Materials and Methodssection (Table 13).
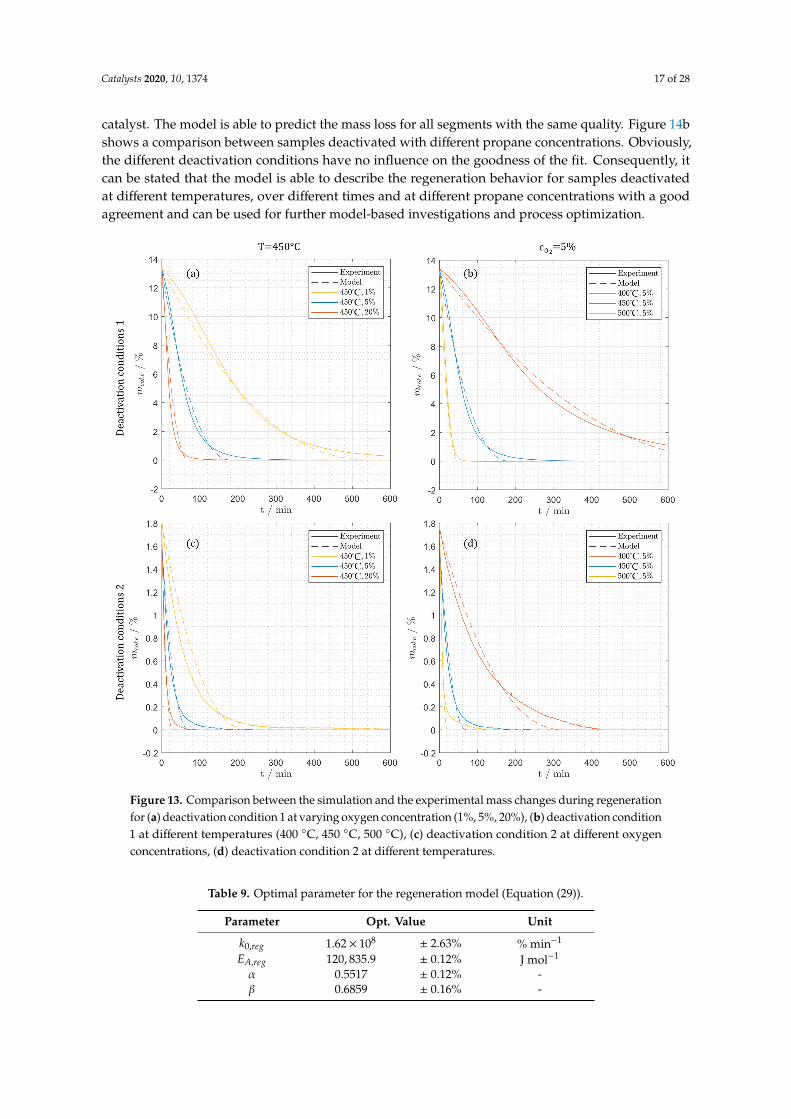
The optimized parameters of the power law kinetics (Equation (29)) are listed in Table 9.The activation energy of 120 kJ mol−1 and the preexponential factor of 1.62 × 10⁸ % min−1 are inthe range of activation energies reported for dehydrogenation catalysts [42]. This is especially notablebecause the model in this contribution is not strictly mechanistic and can be seen as a simplification thatlumps together the regeneration kinetics of different coke species that are supposed to be deposited atthe different parts of the catalyst (support, active sites, etc.) Figure 13 illustrates experimental andsimulated values of mass loss during the regeneration for catalyst deactivated at both deactivationconditions and regenerated at different conditions. The simulated mass loss during the regeneration isin good agreement with the experimental data for all experimental conditions covered. The simulatedvalues reach a fully regenerated state earlier than the experimental values. Both deactivation conditionsare fitted with a good precision. Figure 14a compares the regeneration for different segments of the
Catalysts 2020, 10, 1374 17 of 28
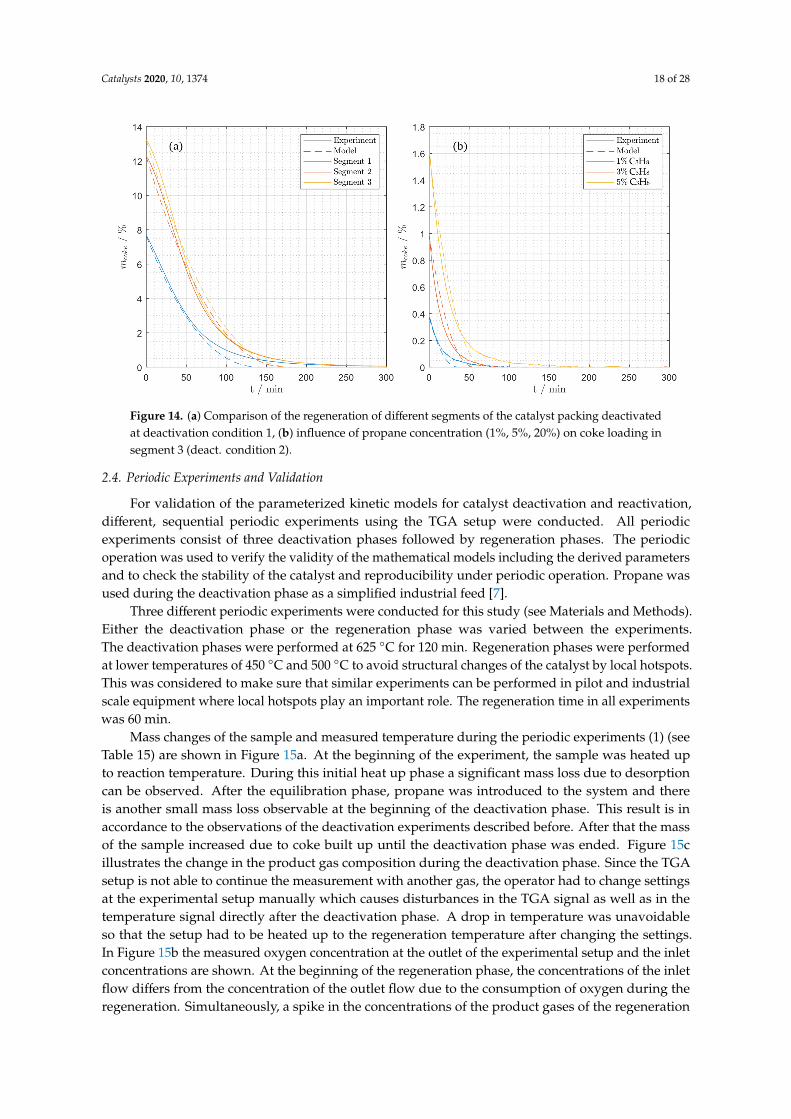
catalyst. The model is able to predict the mass loss for all segments with the same quality. Figure 14bshows a comparison between samples deactivated with different propane concentrations. Obviously,the different deactivation conditions have no influence on the goodness of the fit. Consequently, itcan be stated that the model is able to describe the regeneration behavior for samples deactivatedat different temperatures, over different times and at different propane concentrations with a goodagreement and can be used for further model-based investigations and process optimization.
9
13
14
Figure 13. Comparison between the simulation and the experimental mass changes during regenerationfor (a) deactivation condition 1 at varying oxygen concentration (1%, 5%, 20%), (b) deactivation condition1 at different temperatures (400 ◦C, 450 ◦C, 500 ◦C), (c) deactivation condition 2 at different oxygenconcentrations, (d) deactivation condition 2 at different temperatures.
Table 9. Optimal parameter for the regeneration model (Equation (29)).
Parameter Opt. Value Unit
k0,reg 1.62× 10⁸ ± 2.63% % min−1
EA,reg 120, 835.9 ± 0.12% J mol−1
α 0.5517 ± 0.12% -β 0.6859 ± 0.16% -
Catalysts 2020, 10, 1374 18 of 28
9
13
14
Figure 14. (a) Comparison of the regeneration of different segments of the catalyst packing deactivatedat deactivation condition 1, (b) influence of propane concentration (1%, 5%, 20%) on coke loading insegment 3 (deact. condition 2).
2.4. Periodic Experiments and Validation
For validation of the parameterized kinetic models for catalyst deactivation and reactivation,different, sequential periodic experiments using the TGA setup were conducted. All periodicexperiments consist of three deactivation phases followed by regeneration phases. The periodicoperation was used to verify the validity of the mathematical models including the derived parametersand to check the stability of the catalyst and reproducibility under periodic operation. Propane wasused during the deactivation phase as a simplified industrial feed [7].
Three different periodic experiments were conducted for this study (see Materials and Methods).Either the deactivation phase or the regeneration phase was varied between the experiments.The deactivation phases were performed at 625 ◦C for 120 min. Regeneration phases were performedat lower temperatures of 450 ◦C and 500 ◦C to avoid structural changes of the catalyst by local hotspots.This was considered to make sure that similar experiments can be performed in pilot and industrialscale equipment where local hotspots play an important role. The regeneration time in all experimentswas 60 min.
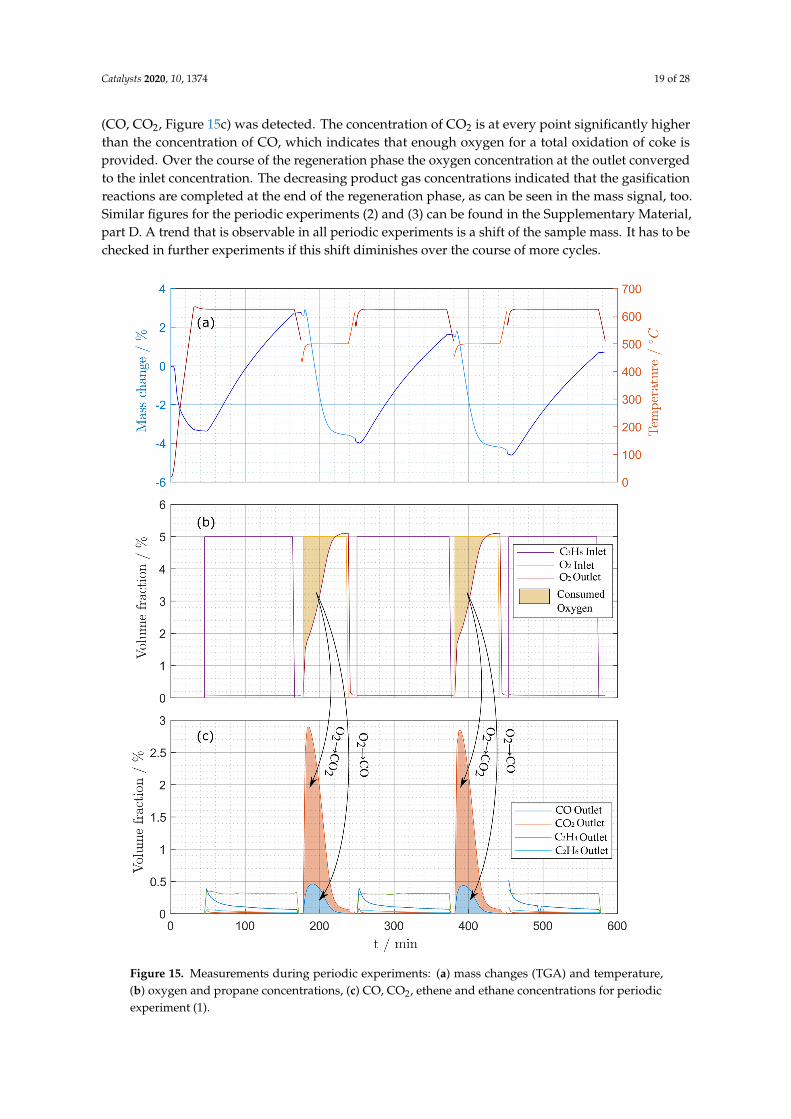
Mass changes of the sample and measured temperature during the periodic experiments (1) (seeTable 15) are shown in Figure 15a. At the beginning of the experiment, the sample was heated upto reaction temperature. During this initial heat up phase a significant mass loss due to desorptioncan be observed. After the equilibration phase, propane was introduced to the system and thereis another small mass loss observable at the beginning of the deactivation phase. This result is inaccordance to the observations of the deactivation experiments described before. After that the massof the sample increased due to coke built up until the deactivation phase was ended. Figure 15cillustrates the change in the product gas composition during the deactivation phase. Since the TGAsetup is not able to continue the measurement with another gas, the operator had to change settingsat the experimental setup manually which causes disturbances in the TGA signal as well as in thetemperature signal directly after the deactivation phase. A drop in temperature was unavoidableso that the setup had to be heated up to the regeneration temperature after changing the settings.In Figure 15b the measured oxygen concentration at the outlet of the experimental setup and the inletconcentrations are shown. At the beginning of the regeneration phase, the concentrations of the inletflow differs from the concentration of the outlet flow due to the consumption of oxygen during theregeneration. Simultaneously, a spike in the concentrations of the product gases of the regeneration
Catalysts 2020, 10, 1374 19 of 28
(CO, CO2, Figure 15c) was detected. The concentration of CO2 is at every point significantly higherthan the concentration of CO, which indicates that enough oxygen for a total oxidation of coke isprovided. Over the course of the regeneration phase the oxygen concentration at the outlet convergedto the inlet concentration. The decreasing product gas concentrations indicated that the gasificationreactions are completed at the end of the regeneration phase, as can be seen in the mass signal, too.Similar figures for the periodic experiments (2) and (3) can be found in the Supplementary Material,part D. A trend that is observable in all periodic experiments is a shift of the sample mass. It has to bechecked in further experiments if this shift diminishes over the course of more cycles.
10
15
Figure 15. Measurements during periodic experiments: (a) mass changes (TGA) and temperature,(b) oxygen and propane concentrations, (c) CO, CO2, ethene and ethane concentrations for periodicexperiment (1).
Catalysts 2020, 10, 1374 20 of 28
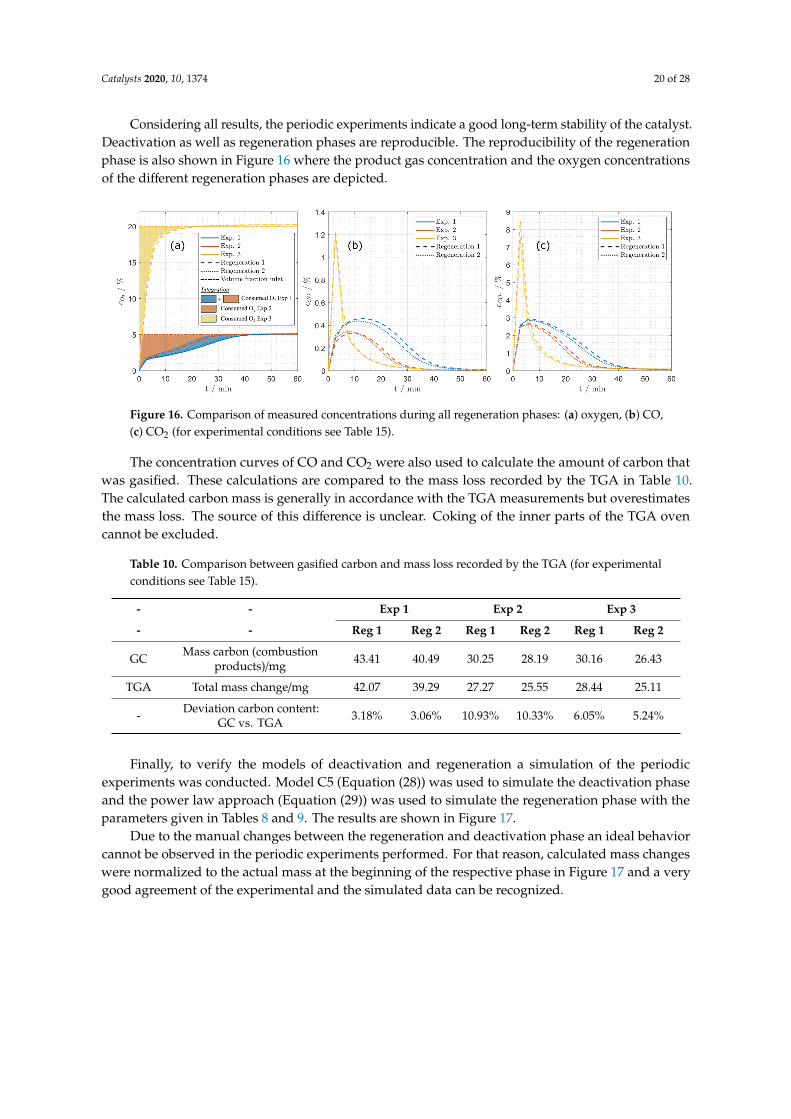
Considering all results, the periodic experiments indicate a good long-term stability of the catalyst.Deactivation as well as regeneration phases are reproducible. The reproducibility of the regenerationphase is also shown in Figure 16 where the product gas concentration and the oxygen concentrationsof the different regeneration phases are depicted.
11
16
Figure 16. Comparison of measured concentrations during all regeneration phases: (a) oxygen, (b) CO,(c) CO2 (for experimental conditions see Table 15).
The concentration curves of CO and CO2 were also used to calculate the amount of carbon thatwas gasified. These calculations are compared to the mass loss recorded by the TGA in Table 10.The calculated carbon mass is generally in accordance with the TGA measurements but overestimatesthe mass loss. The source of this difference is unclear. Coking of the inner parts of the TGA ovencannot be excluded.
Table 10. Comparison between gasified carbon and mass loss recorded by the TGA (for experimentalconditions see Table 15).
- - Exp 1 Exp 2 Exp 3
- - Reg 1 Reg 2 Reg 1 Reg 2 Reg 1 Reg 2
GC Mass carbon (combustionproducts)/mg 43.41 40.49 30.25 28.19 30.16 26.43
TGA Total mass change/mg 42.07 39.29 27.27 25.55 28.44 25.11
- Deviation carbon content:GC vs. TGA 3.18% 3.06% 10.93% 10.33% 6.05% 5.24%
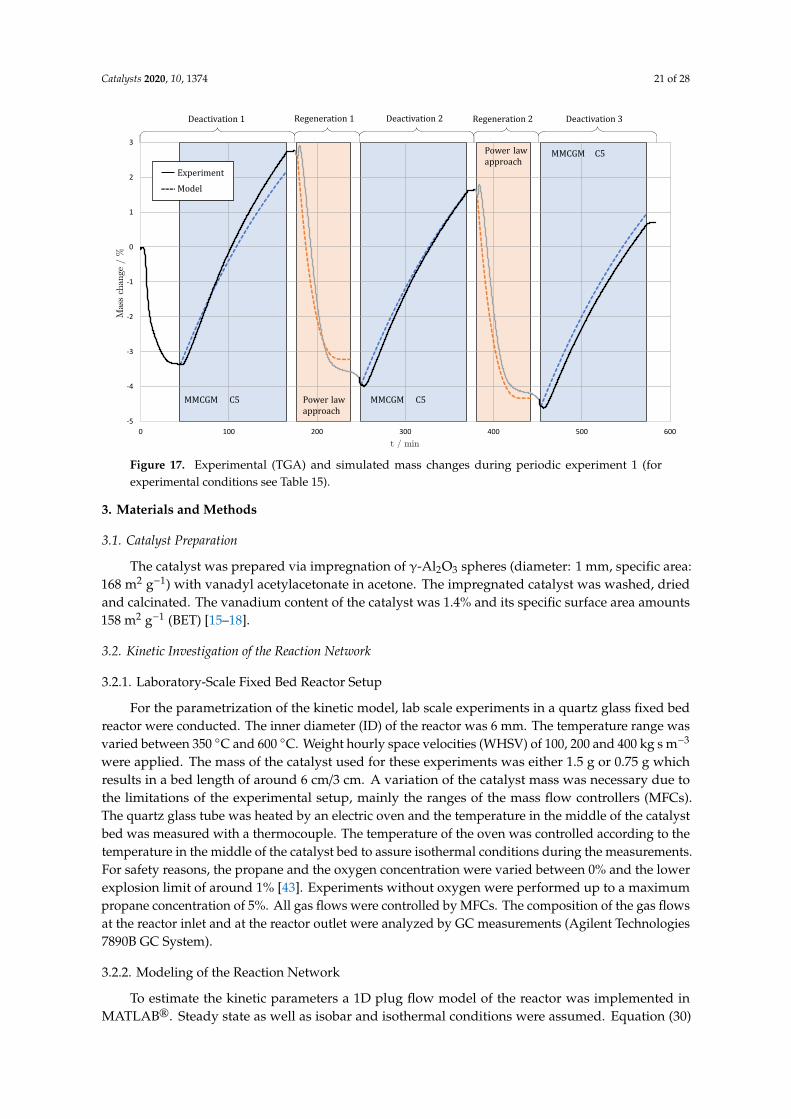
Finally, to verify the models of deactivation and regeneration a simulation of the periodicexperiments was conducted. Model C5 (Equation (28)) was used to simulate the deactivation phaseand the power law approach (Equation (29)) was used to simulate the regeneration phase with theparameters given in Tables 8 and 9. The results are shown in Figure 17.
Due to the manual changes between the regeneration and deactivation phase an ideal behaviorcannot be observed in the periodic experiments performed. For that reason, calculated mass changeswere normalized to the actual mass at the beginning of the respective phase in Figure 17 and a verygood agreement of the experimental and the simulated data can be recognized.
Catalysts 2020, 10, 1374 21 of 28
-5
-4
-3
-2
-1
0
1
2
3
0 100 200 300 400 500 600
Experiment
Model
MMCGM C5 Power law approach
MMCGM C5
MMCGM C5Power law approach
Deactivation 1 Deactivation 2 Deactivation 3Regeneration 2Regeneration 1
Figure 17. Experimental (TGA) and simulated mass changes during periodic experiment 1 (forexperimental conditions see Table 15).
3. Materials and Methods
3.1. Catalyst Preparation
The catalyst was prepared via impregnation of γ-Al2O3 spheres (diameter: 1 mm, specific area:168 m2 g−1) with vanadyl acetylacetonate in acetone. The impregnated catalyst was washed, driedand calcinated. The vanadium content of the catalyst was 1.4% and its specific surface area amounts158 m2 g−1 (BET) [15–18].
3.2. Kinetic Investigation of the Reaction Network
3.2.1. Laboratory-Scale Fixed Bed Reactor Setup
For the parametrization of the kinetic model, lab scale experiments in a quartz glass fixed bedreactor were conducted. The inner diameter (ID) of the reactor was 6 mm. The temperature range wasvaried between 350 ◦C and 600 ◦C. Weight hourly space velocities (WHSV) of 100, 200 and 400 kg s m−3
were applied. The mass of the catalyst used for these experiments was either 1.5 g or 0.75 g whichresults in a bed length of around 6 cm/3 cm. A variation of the catalyst mass was necessary due tothe limitations of the experimental setup, mainly the ranges of the mass flow controllers (MFCs).The quartz glass tube was heated by an electric oven and the temperature in the middle of the catalystbed was measured with a thermocouple. The temperature of the oven was controlled according to thetemperature in the middle of the catalyst bed to assure isothermal conditions during the measurements.For safety reasons, the propane and the oxygen concentration were varied between 0% and the lowerexplosion limit of around 1% [43]. Experiments without oxygen were performed up to a maximumpropane concentration of 5%. All gas flows were controlled by MFCs. The composition of the gas flowsat the reactor inlet and at the reactor outlet were analyzed by GC measurements (Agilent Technologies7890B GC System).
3.2.2. Modeling of the Reaction Network
To estimate the kinetic parameters a 1D plug flow model of the reactor was implemented inMATLAB®. Steady state as well as isobar and isothermal conditions were assumed. Equation (30)
Catalysts 2020, 10, 1374 22 of 28
shows the mass balance of component i using the molar flux.ni. M describes the total amount of
reactions, mcat the mass of the catalyst and z the axial length, where Z represents the length ofthe reactor.
d.ni
dz=
mcat
Z·
M∑j=1
νi,j·rj,m (30)
The lsqnonlin function of MATLAB® was used for optimizing the kinetic parameters Γkin byminimizing the objective function (Equation (31)), where Nexp is the absolute number of all conductedexperiments (Nexp = 269) and K are the experimentally (exp) or simulative (sim) investigated propaneconversion XC3H8 (Equation (32)), propene selectivity SC3H6 , CO2 selectivity SCO2 and CO selectivitySCO (Equation (33)). Γkin denotes the set kinetic parameters of the reaction network.
Objective Function : OFkin = minΓ
RSS =
Nexp,kin∑l=1
[Kexp
l −Ksiml (Γkin)
]2(31)
Conversion : XC3H8 =
.nin
C3H8−
.nC3H8(z = Z).nin
C3H8
(32)
Selectivity : Si =
.ni(z = Z) −
.nin
i.nin
C3H8−
.nC3H8(z = Z)
, i ∈ {C3H6, CO2, CO} (33)
3.3. Catalyst Deactivation
3.3.1. Experimental Setup and Procedure
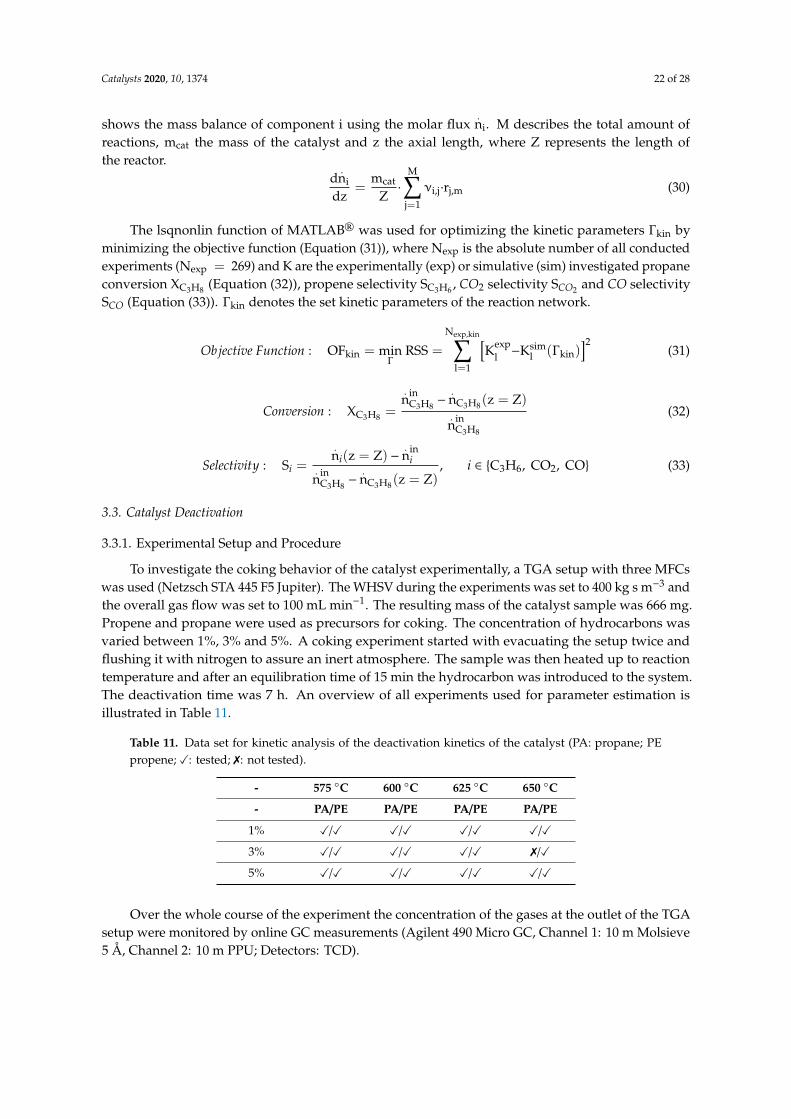
To investigate the coking behavior of the catalyst experimentally, a TGA setup with three MFCswas used (Netzsch STA 445 F5 Jupiter). The WHSV during the experiments was set to 400 kg s m−3 andthe overall gas flow was set to 100 mL min−1. The resulting mass of the catalyst sample was 666 mg.Propene and propane were used as precursors for coking. The concentration of hydrocarbons wasvaried between 1%, 3% and 5%. A coking experiment started with evacuating the setup twice andflushing it with nitrogen to assure an inert atmosphere. The sample was then heated up to reactiontemperature and after an equilibration time of 15 min the hydrocarbon was introduced to the system.The deactivation time was 7 h. An overview of all experiments used for parameter estimation isillustrated in Table 11.
Table 11. Data set for kinetic analysis of the deactivation kinetics of the catalyst (PA: propane; PEpropene; X: tested; 7: not tested).
- 575 ◦C 600 ◦C 625 ◦C 650 ◦C
- PA/PE PA/PE PA/PE PA/PE
1% X/X X/X X/X X/X
3% X/X X/X X/X 7/X
5% X/X X/X X/X X/X
Over the whole course of the experiment the concentration of the gases at the outlet of the TGAsetup were monitored by online GC measurements (Agilent 490 Micro GC, Channel 1: 10 m Molsieve5 Å, Channel 2: 10 m PPU; Detectors: TCD).
Catalysts 2020, 10, 1374 23 of 28
3.3.2. Analysis of Deactivation Experiments
The kinetic parameters of the deactivation models Γdeact were used to fit the experimental data.For estimating the parameters based on the experimental results the lsqnonlin solver of MATLAB®
was used to minimize the objective function (Equation (34)).
OFdeact = minΓ
RSS =
Nexp,deact∑l=1
[cexp
coke,l−csimcoke,l(Γdeact)
]2(34)
3.4. Catalyst Regeneration
3.4.1. Experimental Setup and Procedure
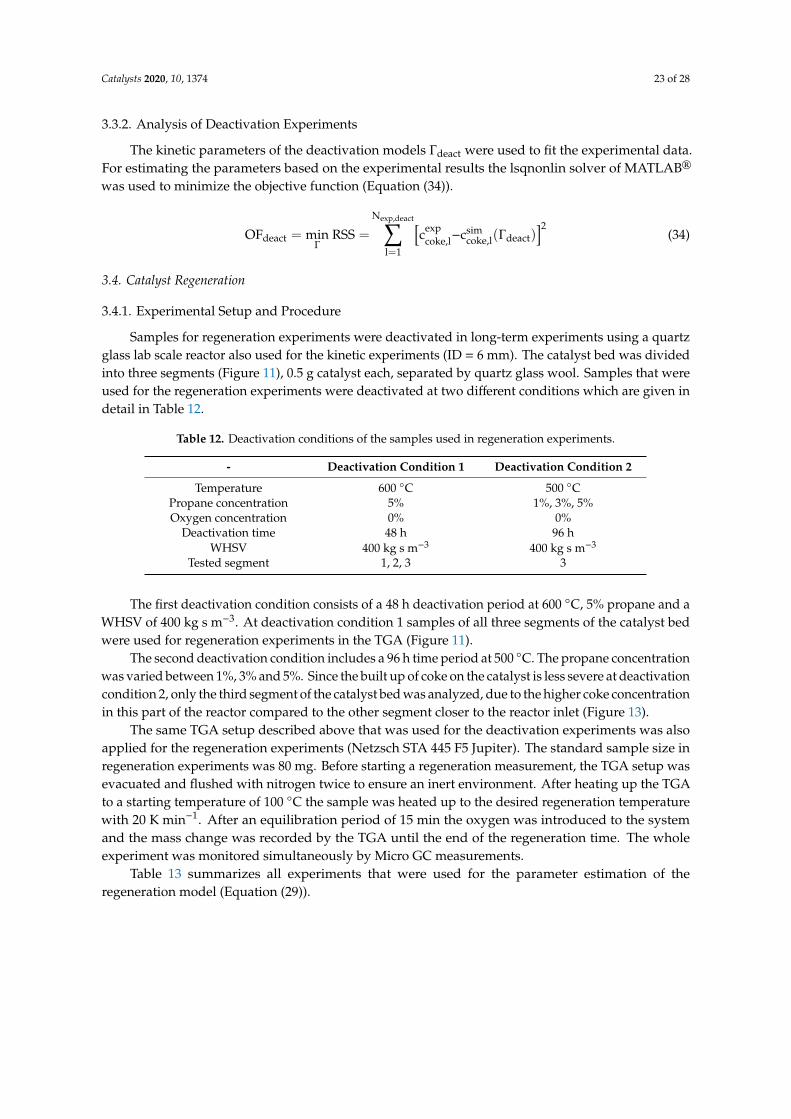
Samples for regeneration experiments were deactivated in long-term experiments using a quartzglass lab scale reactor also used for the kinetic experiments (ID = 6 mm). The catalyst bed was dividedinto three segments (Figure 11), 0.5 g catalyst each, separated by quartz glass wool. Samples that wereused for the regeneration experiments were deactivated at two different conditions which are given indetail in Table 12.
Table 12. Deactivation conditions of the samples used in regeneration experiments.
- Deactivation Condition 1 Deactivation Condition 2
Temperature 600 ◦C 500 ◦CPropane concentration 5% 1%, 3%, 5%Oxygen concentration 0% 0%
Deactivation time 48 h 96 hWHSV 400 kg s m−3 400 kg s m−3
Tested segment 1, 2, 3 3
The first deactivation condition consists of a 48 h deactivation period at 600 ◦C, 5% propane and aWHSV of 400 kg s m−3. At deactivation condition 1 samples of all three segments of the catalyst bedwere used for regeneration experiments in the TGA (Figure 11).
The second deactivation condition includes a 96 h time period at 500 ◦C. The propane concentrationwas varied between 1%, 3% and 5%. Since the built up of coke on the catalyst is less severe at deactivationcondition 2, only the third segment of the catalyst bed was analyzed, due to the higher coke concentrationin this part of the reactor compared to the other segment closer to the reactor inlet (Figure 13).
The same TGA setup described above that was used for the deactivation experiments was alsoapplied for the regeneration experiments (Netzsch STA 445 F5 Jupiter). The standard sample size inregeneration experiments was 80 mg. Before starting a regeneration measurement, the TGA setup wasevacuated and flushed with nitrogen twice to ensure an inert environment. After heating up the TGAto a starting temperature of 100 ◦C the sample was heated up to the desired regeneration temperaturewith 20 K min−1. After an equilibration period of 15 min the oxygen was introduced to the systemand the mass change was recorded by the TGA until the end of the regeneration time. The wholeexperiment was monitored simultaneously by Micro GC measurements.
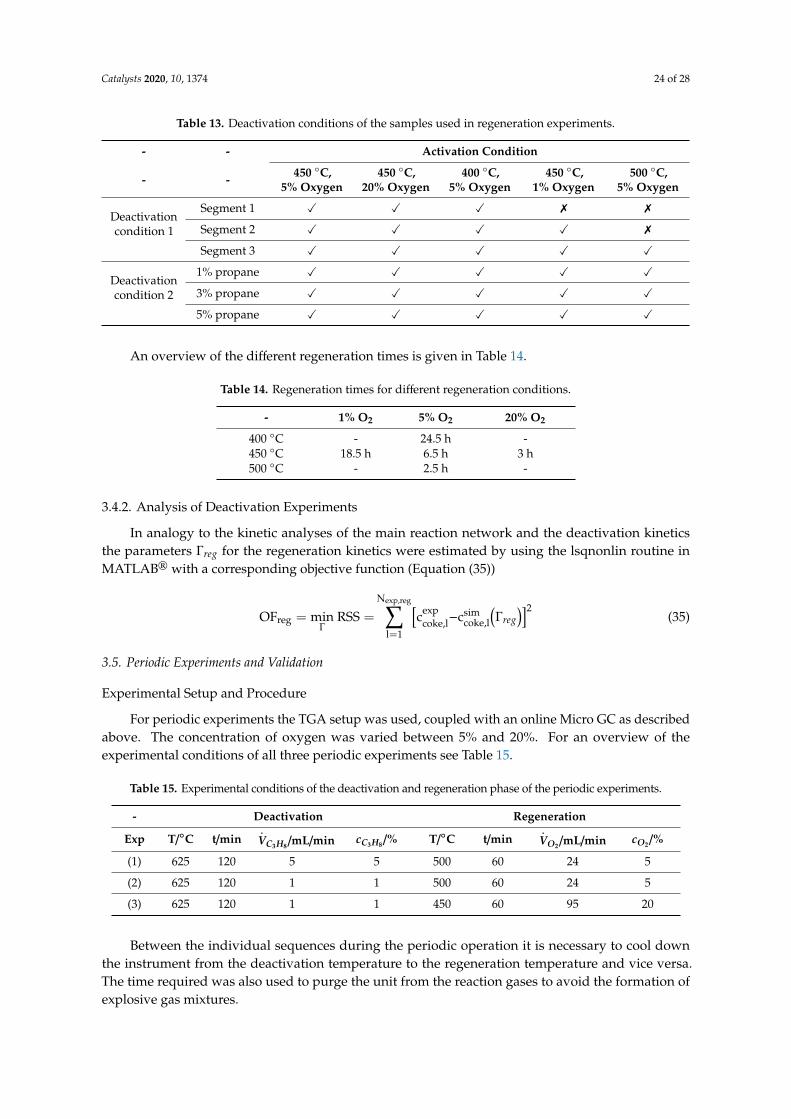
Table 13 summarizes all experiments that were used for the parameter estimation of theregeneration model (Equation (29)).
Catalysts 2020, 10, 1374 24 of 28
Table 13. Deactivation conditions of the samples used in regeneration experiments.
- - Activation Condition
- - 450 ◦C,5% Oxygen
450 ◦C,20% Oxygen
400 ◦C,5% Oxygen
450 ◦C,1% Oxygen
500 ◦C,5% Oxygen
Deactivationcondition 1
Segment 1 X X X 7 7
Segment 2 X X X X 7
Segment 3 X X X X X
Deactivationcondition 2
1% propane X X X X X
3% propane X X X X X
5% propane X X X X X
An overview of the different regeneration times is given in Table 14.
Table 14. Regeneration times for different regeneration conditions.
- 1% O2 5% O2 20% O2
400 ◦C - 24.5 h -450 ◦C 18.5 h 6.5 h 3 h500 ◦C - 2.5 h -
3.4.2. Analysis of Deactivation Experiments
In analogy to the kinetic analyses of the main reaction network and the deactivation kineticsthe parameters Γreg for the regeneration kinetics were estimated by using the lsqnonlin routine inMATLAB® with a corresponding objective function (Equation (35))
OFreg = minΓ
RSS =
Nexp,reg∑l=1
[cexp
coke,l−csimcoke,l
(Γreg
)]2(35)
3.5. Periodic Experiments and Validation
Experimental Setup and Procedure
For periodic experiments the TGA setup was used, coupled with an online Micro GC as describedabove. The concentration of oxygen was varied between 5% and 20%. For an overview of theexperimental conditions of all three periodic experiments see Table 15.
Table 15. Experimental conditions of the deactivation and regeneration phase of the periodic experiments.
- Deactivation Regeneration
Exp T/◦C t/min.VC3H8 /mL/min cC3H8 /% T/◦C t/min
.VO2 /mL/min cO2 /%
(1) 625 120 5 5 500 60 24 5
(2) 625 120 1 1 500 60 24 5
(3) 625 120 1 1 450 60 95 20
Between the individual sequences during the periodic operation it is necessary to cool downthe instrument from the deactivation temperature to the regeneration temperature and vice versa.The time required was also used to purge the unit from the reaction gases to avoid the formation ofexplosive gas mixtures.
Catalysts 2020, 10, 1374 25 of 28
The deactivation sequences started with evacuating and flushing the TGA twice with nitrogen.The sample was then heated up to the deactivation temperature with a heating rate of 20 K min−1.After 15 min of equilibration the coking was started by introducing the intended amount of propane tothe gas flow. After 120 min the gas composition was changed to nitrogen only and the instrumentcooled down to 500 ◦C or 450 ◦C with a cooling rate of 12.5 K min−1. The cooling procedure takes10 min or 14 min, respectively. In preliminary experiments it was checked that a 10 min time span forcooling is also sufficient to flush out propane to be able to safely introduce oxygen without operatingwithin the explosion limits.
The regeneration sequence started by introducing the selected oxygen concentration to the systemat a temperature of 500 ◦C or 450 ◦C, respectively. After 60min the gas composition was changed tonitrogen and the setup was heated up to 625 ◦C with 12.5 K min−1 to reach deactivation temperatureand to reject all oxygen from the system. Throughout the experiments, the composition of the gases atthe outlet of the TGA were monitored using Micro GC. Mass and temperatures changes were recordedby the TGA system itself. For an overview of the periodic experiments see Figure 15 and Figures S2and S3.
4. Conclusions and Outlook
The aim of this contribution was the experimental and model-based investigation of thedeactivation and regeneration of a VOx catalyst during the thermal and oxidative dehydrogenationof propane in order to understand and optimize established processes and to develop new reactorconcepts, respectively.
The kinetic models developed in this contribution are all able to describe the complex behavior ofthe VOx catalyst with good agreement. An empirical power law model was able to describe the kineticnetwork and kinetics of propane dehydrogenation (ODH + TDH) in a wide range of experimentalconditions. Propene was identified as the main precursor for coke formation. Coking kinetics werequantified to be able to describe the coke growth during long-term production cycles caused by TDH.This kinetics were modeled using multilayer-monolayer coke growth models of different complexity.Approaches from literature were extended by to describe the influence of the precursor concentrations.A systematic model discrimination was applied to find a suitable model. Gasification of the cokedeposits was described by a power law approach. It was shown that the corresponding model isable to describe the regeneration behavior regardless of the position of the coke in the reactor and thecoking conditions.
On the basis of the derived and parametrized models it is possible to carry out detailed transientsimulations of conventional fixed bed reactors with locally different coke built up related to the localpropene concentrations. The subsequent regeneration of the coke distributed across the reactor lengthcan also be simulated. The results show that also the consumption of oxygen is this process canbe described.
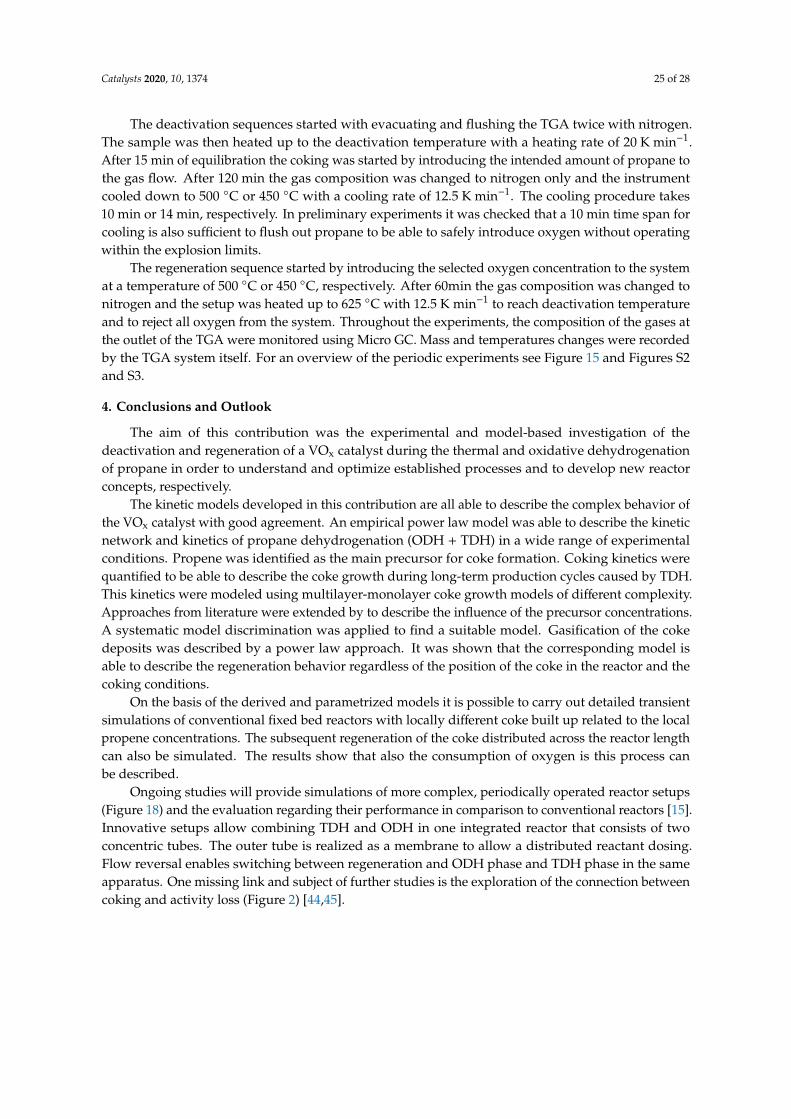
Ongoing studies will provide simulations of more complex, periodically operated reactor setups(Figure 18) and the evaluation regarding their performance in comparison to conventional reactors [15].Innovative setups allow combining TDH and ODH in one integrated reactor that consists of twoconcentric tubes. The outer tube is realized as a membrane to allow a distributed reactant dosing.Flow reversal enables switching between regeneration and ODH phase and TDH phase in the sameapparatus. One missing link and subject of further studies is the exploration of the connection betweencoking and activity loss (Figure 2) [44,45].
Catalysts 2020, 10, 1374 26 of 28
Figure 18. Integrated membrane reactor concept for periodic operation of the reactor includingoperando regeneration by flow reversal.
In summary, a comprehensive mathematical model covering all aspects of relevance regardingthe catalyst performance was established in this contribution. This model allows a detailed non-steadystate reactor simulation as basis for optimization of established reactors and for designing new reactorconcepts (Figure 18).
Supplementary Materials: The following are available online at http://www.mdpi.com/2073-4344/10/12/1374/s1,Table S1: Optimized kinetic parameters for the reaction network of the dehydrogenation of propane, Table S2:Preexponential factors and activation energies for the reaction network of the dehydrogenation of propane derivedfrom the optimized parameters (Table S1), Table S3: Optimized parameters of model C5 to describe the cokingbehavior of the VOx catalyst using propene, Figure S1: Histograms of the distribution of the parameters of thebootstrapping process of model (C5) of the deactivation of the VOx catalyst with propene, Figure S2. Measurementsduring periodic experiments: (a) mass changes (TGA) and temperature, (b) oxygen concentration and propaneconcentration, (c) CO, CO2, ethene and ethane concentration for periodic experiment (2), Figure S3. Measurementsduring periodic experiments: (a) mass changes (TGA) and temperature, (b) oxygen concentration and propaneconcentration, (c) CO, CO2, ethene and ethane concentration for periodic experiment (3).
Author Contributions: Conceptualization, C.H.; Methodology, A.B. and C.H.; Software, A.B.; Validation,A.B.; Formal Analysis, A.B.; Investigation, A.B.; Resources, C.H.; Writing—Original Draft Preparation, A.B.;Writing—Review & Editing, C.H. and A.S.-M.; Visualization, A.B.; Supervision, C.H.; Project Administration, C.H.and A.S.-M.; Funding Acquisition, C.H. and A.S.-M. All authors have read and agreed to the published version ofthe manuscript.
Funding: The financial support of the German Science Foundation (projects: “Kontrolle und Intensivierungvon Reaktionen durch Einsatz zyklisch betriebener Distributoren” (SE 568/23-1/HA 6762/2-1) and SFB/TRR 63:“InPROMPT—Integrated Chemical Processes in Multi-Phase Fluid Systems”) is gratefully acknowledged.
Acknowledgments: The authors thank Jutta Wilke for the technical assistance at the FBR experiments and AnneBaier and Renate Zinke for the technical assistance at the TGA experiments.
Conflicts of Interest: The authors declare no conflict of interest.
References
1. Amghizar, I.; Vandewalle, L.A.; van Geem, K.M.; Marin, G.B. New Trends in Olefin Production. Engineering2017, 3, 171–178. [CrossRef]
2. Nakaya, Y.; Hirayama, J.; Yamazoe, S.; Shimizu, K.-I.; Furukawa, S. Single-atom Pt in intermetallics as anultrastable and selective catalyst for propane dehydrogenation. Nat. Commun. 2020, 11, 2838. [CrossRef][PubMed]
3. Kotanjac, Ž.S.; van Sint Annaland, M.; Kuipers, J.A.M. Demonstration of a packed bed membrane reactor forthe oxidative dehydrogenation of propane. Chem. Eng. Sci. 2010, 65, 6029–6035. [CrossRef]
4. Matveyeva, A.N.; Wärnå, J.; Pakhomov, N.A.; Murzin, D.Y. Kinetic modeling of isobutane dehydrogenationover Ga2O3/Al2O3 catalyst. Chem. Eng. J. 2020, 381, 122741. [CrossRef]
5. Matveyeva, A.N.; Zaitseva, N.A.; Mäki-Arvela, P.; Aho, A.; Bachina, A.K.; Fedorov, S.P.; Murzin, D.Y.;Pakhomov, N.A. Fluidized-Bed Isobutane Dehydrogenation over Alumina-Supported Ga2O3 andGa2O3–Cr2O3 Catalysts. Ind. Eng. Chem. Res. 2018, 57, 927–938. [CrossRef]
6. Eisele, P.; Killpack, R. Propene. In Ullmann’s Encyclopedia of Industrial Chemistry; Wiley: Chichester, UK, 2010;p. 101. ISBN 3527306730.
7. Won, W.; Lee, K.S.; Lee, S.; Jung, C. Repetitive Control and Online Optimization of Catofin Propane Process.IFAC Proc. Vol. 2009, 42, 273–278. [CrossRef]
Catalysts 2020, 10, 1374 27 of 28
8. Farsi, M.; Jahanmiri, A.; Rahimpour, M.R. Steady state modeling and simulation of the Oleflex processfor isobutane dehydrogenation considering reaction network. Asia-Pac. J. Chem. Eng. 2013, 8, 862–869.[CrossRef]
9. Keil, F.J. Process intensification. Rev. Chem. Eng. 2018, 34, 135–200. [CrossRef]10. Gallucci, F.; Antonio Medrano, J.; Roses, L.; Brunetti, A.; Barbieri, G.; Viviente, J. Process Intensification via
Membrane Reactors, the DEMCAMER Project. Processes 2016, 4, 16. [CrossRef]11. Rieck Genannt Best, F.; Mundstock, A.; Dräger, G.; Rusch, P.; Bigall, N.C.; Richter, H.; Caro, J.
Methanol-to-Olefins in a Membrane Reactor with in situ Steam Removal—The Decisive Role of Coking.ChemCatChem 2020, 12, 273–280. [CrossRef]
12. Caro, J. Basic Aspects of Membrane Reactors. In Comprehensive Membrane Science and Engineering; Drioli, E., Ed.;Elsevier: Amsterdam, The Netherlands, 2010; pp. 1–24. ISBN 9780080932507.
13. Cruellas, A.; Ververs, W.; van Annaland, M.S.; Gallucci, F. Experimental Investigation of the OxidativeCoupling of Methane in a Porous Membrane Reactor: Relevance of Back-Permeation. Membranes 2020, 10,152. [CrossRef] [PubMed]
14. Cruellas, A.; Heezius, J.; Spallina, V.; van Sint Annaland, M.; Medrano, J.A.; Gallucci, F. Oxidative Couplingof Methane in Membrane Reactors; A Techno-Economic Assessment. Processes 2020, 8, 274. [CrossRef]
15. Brune, A.; Wolff, T.; Seidel-Morgenstern, A.; Hamel, C. Analysis of Membrane Reactors for IntegratedCoupling of Oxidative and Thermal Dehydrogenation of Propane. Chem. Ing. Tech. 2019, 56, 251. [CrossRef]
16. Hamel, C.; Tóta, Á.; Klose, F.; Tsotsas, E.; Seidel-Morgenstern, A. Analysis of single and multi-stage membranereactors for the oxidation of short-chain alkanes—Simulation study and pilot scale experiments. Chem. Eng.Res. Des. 2008, 86, 753–764. [CrossRef]
17. Hamel, C.; Wolff, T.; Subramaniam, P.; Seidel-Morgenstern, A. Multicomponent Dosing in MembraneReactors Including Recycling—Concept and Demonstration for the Oxidative Dehydrogenation of Propane.Ind. Eng. Chem. Res. 2011, 50, 12895–12903. [CrossRef]
18. Klose, F. Selective oxidation of ethane over a VOx/γ-Al2O3 catalyst—Investigation of the reaction network.Appl. Catal. A 2004, 260, 101–110. [CrossRef]
19. Sheintuch, M.; Nekhamkina, O. Architecture alternatives for propane dehydrogenation in a membranereactor. Chem. Eng. J. 2018, 347, 900–912. [CrossRef]
20. Peters, T.A.; Liron, O.; Tschentscher, R.; Sheintuch, M.; Bredesen, R. Investigation of Pd-based membranes inpropane dehydrogenation (PDH) processes. Chem. Eng. J. 2016, 305, 191–200. [CrossRef]
21. Schäfer, R.; Noack, M.; Kölsch, P.; Stöhr, M.; Caro, J. Comparison of different catalysts in themembrane-supported dehydrogenation of propane. Catal. Today 2003, 82, 15–23. [CrossRef]
22. Shelepova, E.V.; Vedyagin, A.A. Intensification of the dehydrogenation process of different hydrocarbons ina catalytic membrane reactor. Chem. Eng. Process. Process. Intensif. 2020, 155, 108072. [CrossRef]
23. Fouty, N.J.; Carrasco, J.C.; Lima, F.V. Modeling and Design Optimization of Multifunctional MembraneReactors for Direct Methane Aromatization. Membranes 2017, 7, 48. [CrossRef] [PubMed]
24. Hou, K.; Hughes, R. The kinetics of methane steam reforming over a Ni/α-Al2O catalyst. Chem. Eng. J. 2001,82, 311–328. [CrossRef]
25. Schwaab, M.; Pinto, J.C. Optimum reference temperature for reparameterization of the Arrhenius equation.Part 1: Problems involving one kinetic constant. Chem. Eng. Sci. 2007, 62, 2750–2764. [CrossRef]
26. Argyle, M.; Bartholomew, C. Heterogeneous Catalyst Deactivation and Regeneration: A Review. Catalysts2015, 5, 145–269. [CrossRef]
27. Sokolov, S.; Bychkov, V.Y.; Stoyanova, M.; Rodemerck, U.; Bentrup, U.; Linke, D.; Tyulenin, Y.P.; Korchak, V.N.;Kondratenko, E.V. Effect of VOx Species and Support on Coke Formation and Catalyst Stability inNonoxidative Propane Dehydrogenation. ChemCatChem 2015, 7, 1691–1700. [CrossRef]
28. Gascón, J.; Téllez, C.; Herguido, J.; Menéndez, M. Propane dehydrogenation over a Cr2O3/Al2O3 catalyst:Transient kinetic modeling of propene and coke formation. Appl. Catal. A 2003, 248, 105–116. [CrossRef]
29. Spiess, A.-N.; Neumeyer, N. An evaluation of R2 as an inadequate measure for nonlinear models inpharmacological and biochemical research: A Monte Carlo approach. BMC Pharmacol. 2010, 10, 6. [CrossRef]
30. Burnham, K.P.; Anderson, D.R. Model Selection and Multimodel Inference; Springer: New York, NY, USA, 2004.31. Akaike, H. A Bayesian analysis of the minimum AIC procedure. Ann. Inst. Stat. Math. 1978, 30, 9–14.
[CrossRef]
Catalysts 2020, 10, 1374 28 of 28
32. Carpenter, J.; Bithell, J. Bootstrap confidence intervals: When, which, what? A practical guide for medicalstatisticians. Statist. Med. 2000, 19, 1141–1164. [CrossRef]
33. Gentle, J.E. Computational Statistics; Springer: Berlin/Heidelberg, Germany, 2009.34. Chernick, M.R. Bootstrap Methods: A Guide for Practitioners and Researchers, 2nd ed.; Wiley-Interscience:
Hoboken, NJ, USA, 2008; ISBN 9780471756217.35. Lobera, M.P.; Téllez, C.; Herguido, J.; Menéndez, M. Transient kinetic modelling of propane dehydrogenation
over a Pt–Sn–K/Al2O3 catalyst. Appl. Catal. A 2008, 349, 156–164. [CrossRef]36. Aguayo, A.T.; Gayubo, A.G.; Atutxa, A.; Olazar, M.; Bilbao, J. Regeneration of a catalyst based on a SAPO-34
used in the transformation of methanol into olefins. J. Chem. Technol. Biotechnol. 1999, 74, 1082–1088.[CrossRef]
37. Kern, C.; Jess, A. Regeneration of coked catalysts—Modelling and verification of coke burn-off in singleparticles and fixed bed reactors. Chem. Eng. Sci. 2005, 60, 4249–4264. [CrossRef]
38. Sørensen, M.D.P. The establishment of a coke-burn kinetic model for zeolite catalysts. Chem. Eng. Sci. 2017,168, 465–479. [CrossRef]
39. Kelling, R.; Kolios, G.; Tellaeche, C.; Wegerle, U.; Zahn, V.M.; Seidel-Morgenstern, A. Development of acontrol concept for catalyst regeneration by coke combustion. Chem. Eng. Sci. 2012, 83, 138–148. [CrossRef]
40. Jiang, B.; Zhou, B.; Jiang, Y.; Feng, X.; Liao, Z.; Huang, Z.; Wang, J.; Yang, Y. Kinetic and regenerator modelingof the coke combustion in the moving bed MTP process. Chem. Eng. Res. Des. 2017, 122, 52–62. [CrossRef]
41. Royo, C.; Perdices, J.M.; Monzón, A.; Santamaría, J. Regeneration of Fixed-Bed Catalytic Reactors Deactivatedby Coke: Influence of Operating Conditions and of Different Pretreatments of the Coke Deposits. Ind. Eng.Chem. Res. 1996, 35, 1813–1823. [CrossRef]
42. Luo, S.; He, S.; Li, X.; Li, J.; Bi, W.; Sun, C. Combustion kinetics of the coke on deactivated dehydrogenationcatalysts. Fuel Process. Technol. 2015, 129, 156–161. [CrossRef]
43. Steen, H. Handbuch des Explosionsschutzes; Wiley-VCH: Weinheim, Germany, 2009; ISBN 3527624996.44. Lin, C.C.; Park, S.W.; Hatcher, W.J. Zeolite catalyst deactivation by coking. Ind. Eng. Chem. Proc. Des. Dev.
1983, 22, 609–614. [CrossRef]45. Dumez, F.J.; Froment, G.F. Dehydrogenation of 1-Butene into Butadiene. Kinetics, Catalyst Coking, and
Reactor Design. Ind. Eng. Chem. Proc. Des. Dev. 1976, 15, 291–301. [CrossRef]
Publisher’s Note: MDPI stays neutral with regard to jurisdictional claims in published maps and institutionalaffiliations.
© 2020 by the authors. Licensee MDPI, Basel, Switzerland. This article is an open accessarticle distributed under the terms and conditions of the Creative Commons Attribution(CC BY) license (http://creativecommons.org/licenses/by/4.0/).