systems integration in maintenance engineering
TRANSCRIPT
Systems Integration in
Maintenance Engineering
Andrew Starr, Andrew Ball
Maintenance Engineering Research Group
Manchester School of Engineering
University of Manchester
Abstract
Integration in maintenance engineering systems provides a potential solution to some
complex and conflicting problems. Decision making is often achieved with uncertainty
and unknowns, while measuring against conflicting performance criteria. Maintenance
decisions are made in the context of business priorities.
Integration must consider the bi-directional flow of data and information into the decision
making and planning process at all levels. This reaches from business systems right down
to sensor level. Integration automates the organisation and operation of systems, data
collection and actuation, information storage and decision making. Critically, integrated
systems display the evidence of thorough top-down system design, which incorporates
the elements above, and closes the loop from the minutiae of data collection to strategic
decision making.
This paper introduces the systems associated with maintenance and draws comparisons
with adjacent disciplines such as control. A globalised model is proposed, and methods
for selecting and adapting technologies for the model are discussed. Examples of
industrial implementation are shown at several levels within the model.
Key words: Maintenance Engineering, Integration, Condition Monitoring, Control,
Communications
1. Introduction
Integration is a holistic approach: it sets objectives for a system as a whole, hence
specifications. The systems approach determines inputs and outputs, and in this context
maintenance engineering aims to optimise outputs such as reliability, availability, and
cost, using inputs such as expertise, information, and resources, both human and physical.
In the traditional maintenance department, the systems in place organise resources against
scheduled and unscheduled tasks in many different ways, all of which are effective in
their own way:
simple communications, by word of mouth or on paper;
time based planning on cards or wall charts;
computerised inventory, spares and job planning.
These methods have limitations in speed, automation and optimisation. Integration can
only be achieved in the former cases by detailed manual transfer of data from one system
to another, whether inside the maintenance department, e.g. decisions emanating from
condition monitoring, or outside, e.g. transfer of costing information to a financial
system. In all cases localised information storage and processing methods make it
difficult to link across to wider systems.
The enlightened organisation recognises maintenance as a prerequisite to production or
service provision. Since the effectiveness of corporate objectives is seen as dependent
upon maintenance, a different approach is taken to organisation and integration. Planning
commences with integration as a starting point instead of trying to paste together
disparate entities. This approach quickly identifies duplication and dissonance, and
enables the parts of an organisation to work to the same objectives. The technological
advances can realise their full potential only in this framework.
It is estimated that the penetration of condition monitoring (CM) is only 10–20% of its
potential. This represents a loss of up to £1.6 bn in the UK alone [1]. One of the limiting

factors is the existing level of systems integration. This can be addressed by the holistic
approach and the adoption of new technology, e.g.:
open, global electronic information systems;
adaptive, shared communications media;
smart sensors;
adaptive, flexible decision-making algorithms.
True integrated systems require top-down system design, which is able effectively to
incorporate the elements above. The integrated system closes the loop from the minutiae
of data collection to strategic decision making.
1.1 Levels of Integration
Integration theory combines the application of holistics and global performance criteria.
The concept of asset management optimises labour, tools, equipment, materials, and
information by integrating financial, human resources, and purchasing functions, as well
as production, materials requirements planning, and enterprise resources planning
systems [2]. The manufacturing systems community regards maintenance as a critical
part of life cycle support, and facilitates this with software tools for design,
implementation, run-time and change processes [3]. The integration of operations and
maintenance is becoming widespread and is promoted by the use of Reliability Centred
Maintenance (RCM) and Total Productive Maintenance (TPM) philosophies [4].
The information systems solutions are being driven by Enterprise Asset Management
(EAM) in manufacturing, e.g. at Nippon Steel [5]. The integration of EAM and
computerised maintenance management systems (CMMS) aims to prolong and enhance
equipment and tool life, and reduce maintenance costs.
1.2 The technology of integration
Several enabling technologies have penetrated the maintenance sector. Hand held
personal computers and bar code readers, coupled with the integration of work processes
and systems, have enabled a cultural change [6]. Intelligent instruments merge control
and maintenance, allowing field tasks to be performed from the control room [7]. In
complex systems such as gas turbines, the monitoring of health, cost, performance and
remnant life is achieved with the integration of advanced diagnostics and models of
structure and performance [8].
Multimedia resources have been adopted for maintenance, diagnostics and training [9].
Maintenance and process information are linked on the factory floor [10]. Fieldbus
systems and virtual devices have been exploited for remote monitoring, maintenance and
control, allowing a distributed systems infrastructure [11].
1.3 Applications of integration in maintenance
Integration in maintenance systems is of vital important in many industrial sectors:
Electricity distribution: integration of control, quality, scheduling and maintenance
over a SCADA in high and medium voltage networks [12]; remote on–line
monitoring of electricity substations [13];
Manufacturing: integration of data collection and statistical process control with cell
control, diagnostics and planned maintenance in semiconductor manufacture [14];
integration of maintenance modules and diagnostics in flexible manufacturing
systems [15];
Power generation: integration of operations, engineering, and maintenance by
providing data and software applications in a common environment [16];
Military applications: very high levels of integration in weapons support, integrating
display, modular instrumentation, information bank and diagnostics [17]; Helicopter
Usage Monitoring Systems (HUMS) are well advanced [18];
Rail: US operator Conrail integrates wayside monitoring devices with maintenance
systems to detect faults in freight cars and reduce manual inspection requirements
[19].
In terms of technology, thermography has been integrated with lubricant analysis, wear
debris and contaminant analysis, and performance monitoring, to tackle the problem of
“machine wear” in a holistic sense [20,21]. For example, integration of process
information with expert system vibration analysis and wear debris analysis improves the
accuracy of fault detection in rotating machinery fault detection in air conditioning plant
[22].
1.4 Consolidating the integration strategy
The review above shows that the islands of integration, mainly found at a technological
level, are beginning to be merged. While the technologies enable some quantum leaps to
be made, the vision must be formed at the top level. The strategic approach focuses the
effort and raises the importance of maintenance.
This paper examines the structure and detail of some of those enabling technologies, and
identifies what systems exist to achieve integration in maintenance. The structure and
methodology which supports integration is described, and a globalised model is
proposed. Examples are given of implementations of the levels of integration.
2. Systems in maintenance engineering
Maintenance forms only part of a production or service operation. To form a picture of
the systems, it is necessary to take a global view, as is done in top down design for
systems. Here the specification of the system meets the required business objectives, and
the operations and maintenance must fit with them. At the top level we find business
oriented systems. Maintenance management sits below the business systems, and in a
traditional organisation sits alongside production. In an integrated business, maintenance
is part of the production organisation. Condition monitoring and control systems
necessarily fit below plant operations and maintenance management.
2.1 Business systems
All manufacturing and service operations use their resources with the prime aim either of
making money, or of providing an excellent service. Typical business systems manage
transactions involving some or all of buying, processing, adding value, selling, and
employment, and information pertaining to these. Almost all operations require physical
assets, to perform the processing and/or to house the activity. The physical assets are
essential to the business, so the life cycle of those assets, and the cost associated with
them, is fundamental to the success of the business.
Before we even consider a maintenance plan, several important decisions have usually
been made:
the purpose of the business associated with the assets;
the risk associated with investing in the assets;
the required output of the assets and hence pay back.
Even in less enlightened businesses, the information regarding acquisition of assets,
production output, purchase of spare parts, and emoluments to the maintenance trade
force resides in the business systems. Maintenance has a direct effect on the ability of the
resources to be effective, and hence at least part of its management is always found in
high level business systems.
In integrated business systems where maintenance is freely regarded as a prerequisite to
production (e.g. by adopting the TPM philosophy) a good deal more of the activity of
maintenance management finds itself at the top level in the hierarchy.
2.2 Maintenance management
Maintenance is the process of restoring an asset to full working order, or ideally,
preventing it ever from leaving full working order, provided that it is economical to do
so. Maintenance policy can be formed from the generic strategies of on-failure
maintenance, time or usage based planned preventive maintenance (PPM), and condition
based maintenance, and may incorporate hybrid planning based on asset operating
windows. Repetitive failures may be designed out.
Typical maintenance systems plan maintenance around the following structures, which
are commonly computerised.
Plant inventory/asset register - an identification scheme is essential
to the system.

Job catalogue - time based PPM tasks are stored as a "tool kit" which
is applied to the plant;
Work planning - scheduling jobs and matching required skills to
resources;
Stores - catalogue of spare parts in stock, ordering information - over
10,000 items is common;
Report generation - important for day-to-day running tasks and
performance summaries;
Plant history - feedback information is very important; unless
recorded at the time of the incident, accurate information is forgotten.
It is particularly useful to be able to compare the history of a group of
similar machines.
2.3 Condition monitoring
Condition based maintenance (CBM) bases actions on the degradation of a parameter
indicative of machine health. Regular PPM repair or replacement tasks are substituted by
inspection and measurement. Condition monitoring (CM) is the assessment of plant
health. The use of CBM shifts the focus away from maintaining plant to sustaining the
ability of the plant to produce.
CBM provides the following benefits:
Advanced warning of failure is given, so that repairs can be planned out of production
time;
Inconvenient breakdowns and expensive consequential damage are minimised;
The failure rate is reduced, thus improving plant availability and reliability;
A reduced spares inventory can be carried;
Unnecessary work is avoided.
The CM parameter may be a performance indicator, or a diagnostic measurement which
gives early warning of deterioration, e.g. vibration, thermal emissions, or oil analysis.
Additional information is available from control and monitoring systems which offer
performance data from existing sensors or extra sensors, chosen to detect machine
condition or process performance.
The success of a CM application depends as much on its financial performance as its
technical performance. It is expected that a CM technique is sensitive enough to give
adequate warning time before failure, and to have a clear change over the normal effects
of noise on the data (through variation in measurement or performance). Additionally the
costs of set up and operation should be exceeded by the savings in maintenance and
indirect benefits.
Typical state of the art systems include on line measurement, and several different
measurement techniques. Advanced systems also improve cost effectiveness with
portable instrumentation. Examples include:
Power stations monitor vibration, thermal emissions and lubricants using on– and
off–line techniques. Steam turbines, for example, contain large masses rotating at
high speed. If a turbine blade is shed, the unbalanced forces are considerable. The
machines are monitored for vibration with hard wired accelerometers and
displacement transducers which are continuously monitored. Excessive vibration can
trigger immediate shutdown to prevent catastrophic damage.
Paper machines have been monitored with hard wired accelerometers and shock pulse
transducers, but it may be more cost effective to use portable instrumentation. The
instrument is used with either portable or permanently mounted transducers. The data
is transferred to a host computer at the end of the data collection tour.
Electrical distribution, both high and low voltage, can be monitored on–line with
thermal imaging. Many users hire a service rather than own the equipment, but retain
ownership of the data. The data is used to diagnose potential faults and to schedule
remedial action at a convenient time.
2.4 Plant Control
Control exercises regulation, verification or constraint, and determines the course of
action. As a parallel to maintenance, which sustains the ability of the plant to produce, the
focus of control systems is to ensure production to the specified quantity and quality
while meeting constraints.
Modern control systems tackle the disparate aspects of sequencing, where steps are made
through state space, and of analogue control. Typical example applications are found in
automation:
The tool changer of a machining centre passes through approximately 20 discrete
steps to exchange a tool, some of which depend on completion of a previous step and
inputs from sensors;
The temperature of a soldering vessel is required to be kept within a tight band, by
continuous variation of the heater current, in response to reductions in temperature
caused by dynamic changes such as work load and ambient conditions.
State of the art automated systems are able to communicate performance information to a
supervisory system and to respond to requests for changes as required by systems higher
in the hierarchical structure. Controllers interface with many forms of input and output, in
modular fashion, and with many types of sensor as input. Considerable local processing
capacity is provided, allowing distributed systems to act robustly and autonomously, and
to realise complex control algorithms which are dependant on high speed data processing.
The indicators of good performance in a control system are associated with its ability to
keep within a tight tolerance band in relation to the set point, and its ability accurately to
track changes in the input with a minimum delay.
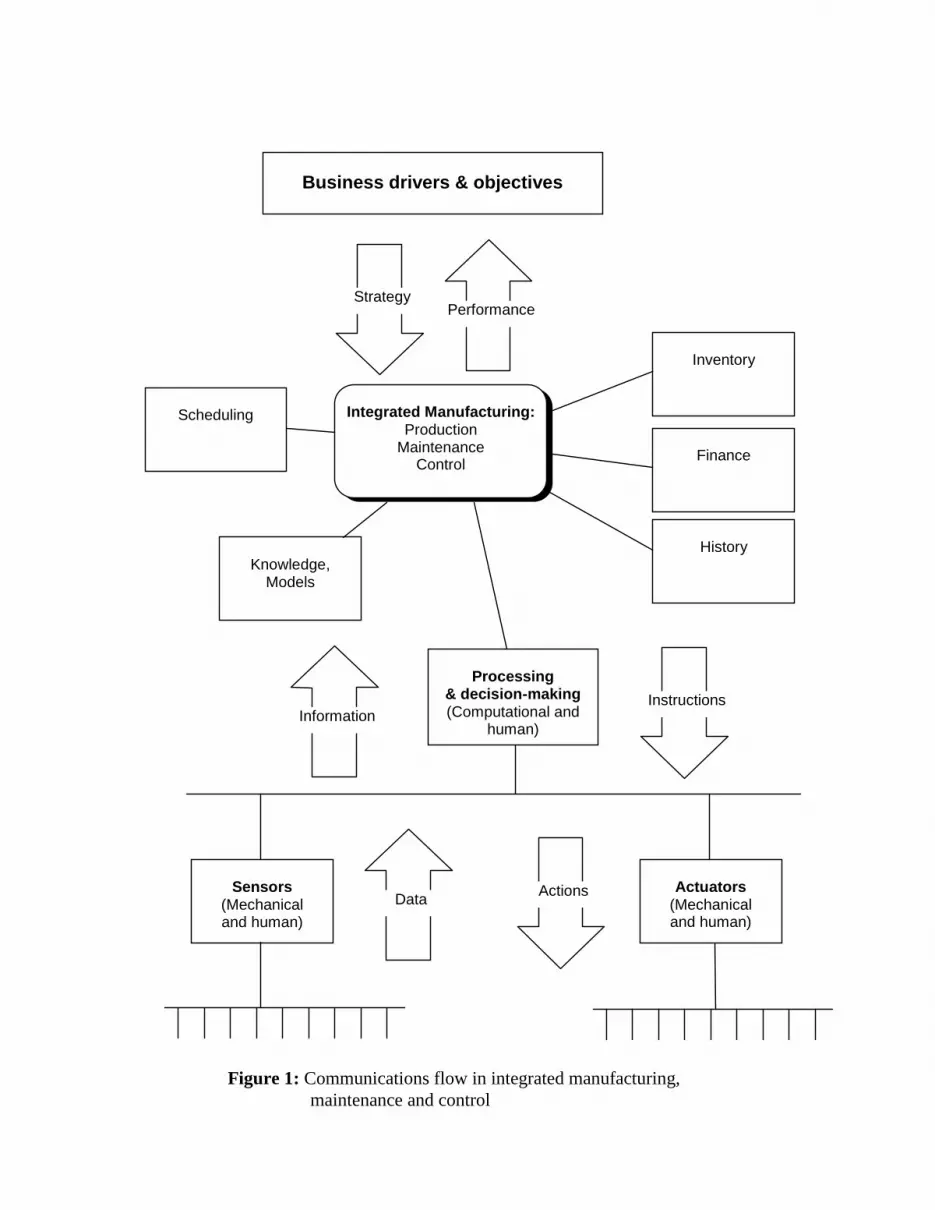
2.5 Systems comparison
Maintenance and control systems share many similarities at macroscopic and microscopic
level, as illustrated on figure 1:
their hierarchical structures, which pass messages and requests down to the plant, and
return signals and information to higher levels of supervision;
the technologies of communication and measurement, e.g. data acquisition, signal
processing including trending and abnormality detection, data storage, and
subsequent data mining.
Some fundamental differences exist, of course. In CM applications the result of
monitoring is planned actions. A relatively loose feed back loop exists, usually with
human intervention. The time scales allow hours, days, or preferably months of lead time.
Short term guaranteed delivery of messages is rarely required. The actions are proactive,
intending to avoid an unplanned failure.
In control, on the other hand, the time scales are “real time” i.e. of a short time constant
down to fractions of a second. Many signals need guaranteed delivery times. There is less
emphasis on system history unless the system is model based. The focus is on production,
hence different sub-business objectives exist. Automatic actions require a tight control
loop but its nature is reactive to external conditions.
3. Integration: conceptualisation and exploitation of enabling
technologies
Considerable steps forward are being made in systems integration in maintenance and
control as a consequence of conceptual and technological advances. Concepts are drawn
from complementary areas of manufacturing and IT. New technologies are providing off–
the–shelf solutions to problems for which, historically, the control and CM communities
have reluctantly developed bespoke solutions at great expense. Hard–wired data
collection, for example, has been a source of chagrin to the industry.
Massive leaps in low cost computer processing power and memory enable powerful
numerical algorithms to be performed, in some cases using mathematics which has
existed for many years but impossible to realise outside research laboratories. Fast
communications allow high bandwidth signals to be transferred at high sampling rates
and to tighten the performance of control loops. Local processing can turn data into
information, decimating the data rate. Smart sensors take this a step further, moving the
decision making algorithm down to the sensor, and only communicating with the wider
system when necessary. Standards, whether official or de facto, offer working solutions
such that the control and CM specialists can concentrate on their own fields rather than
reinventing the wheel.
3.1 Integration overview
Integration is the unification of the parts into a coherent whole. In maintenance the
motivation for integration is the wish to reduce the number of separate systems, to
increase automation and to reduce manning. In integrated systems the overall architecture
is important, because the traditional boundaries are blurred or removed entirely. The
communications process during design and implementation is most important, because it
ensures that the people concerned are brought “on board” – there is a danger of
alienation, which creates its own barriers and conflicts.
The success of integration in systems can be measured by a number of performance
criteria:
Avoidance of duplication: shared information, reduced effort;
Greater robustness and reliability;
Tighter loops in the broad sense of control: less effort for the same gain or more
output for the same input;
A “total” approach improves many human/management issues.
The emergent generation of factory automation systems comprises five key components:
field devices (sensors);
final control elements (actuators);
process control units;
condition monitoring systems;
management support systems.
The existing distinction between control and maintenance systems is disappearing.
Intelligent field devices will replace existing analogue sensors. These feature two-way
digital communication in addition to a degree of local intelligence, permitting them to
make decisions and to perform signal processing tasks. The information obtained from
the field devices is used by the process control unit as the basis for closed-loop control.
The condition monitoring system will perform its conventional tasks (e.g. data trending,
abnormality detection) but it may also utilise process control system data as an additional
source of condition-indicating information.
3.2 Current advances
The pressures upon manufacturing industry to reduce production costs and to improve
operational efficiencies have never been greater. The improvement of performance is
essential to ensure survival. The magnitudes of these pressures seem inexorably linked to
the rate of technological advancement.
Recent years have seen the proliferation of sophisticated automatic control, condition
monitoring and manufacturing systems. The cost of the microelectronic components
continues to fall, and digital electronics is now permeating the sensors, actuators,
transmitters, and drivers of industrial control equipment.
These items, which were previously seen as discrete entities, are being linked by digital
networks to permit communication between in-the-field devices (digital sensors and
actuators) and the higher-level components (such as PLCs) of the automation system.
Currently there exists a diversity of proprietary standards governing the rules for
communication between the devices, and as a consequence the resulting networks are
often incompatible, meaning that individual users find themselves forced into sourcing
automation equipment from a single supplier.
The need for an open, rigorously defined, non-proprietary communications protocol has
led to the formation of industrial “clubs” which aim to standardise the rules of

communication so that devices from many vendors may be plugged directly into a factory
floor network without extensive configuration.
These technological advances would be of little interest to a maintenance engineer if they
did not offer exciting potential for access to, and sharing of, condition-indicating data.
They bring with them the realistic possibility that signals from a wide range of existing
control system sensors (like thermocouples, pressure transducers and proximity probes)
may be combined with those from devices specifically installed for CM purposes (such as
accelerometers). This multivariate data can then be fused to improve condition indicating
information and consequently to enhance maintenance management decision making.
There are three factors which are currently advancing integration:
standardisation – the modularization of hardware and software, and de facto
commonality;
human issues – the technology of system design and realisation is becoming more
widely accepted and skills are being developed;
cost – the reduction in acquisition and upgrade cost associated with a widely
applicable and accepted technology.
3.3 Structure, design methods and tools
In many areas of manufacturing management structured methods are used to define
problems and plan solutions [23]. For example, in computerised information systems,
structured methods for design use modelling, definition and analysis techniques, such as
SSADM (Structured Systems and Design Methodology) or IDEF (ICAM (Integrated
Computer Aided Manufacturing) Definition). The following characteristics are common
[24]:
A project is structured into small, well defined activities; the sequence and interaction
of the activities is specified.
A diagrammatic or other modelling technique defines the structure.
The approach in software design is a similar discipline and identifies data flow as a
logical tool for understanding and working with a system of any complexity [25].
Structured methods in Manufacturing Systems extend further than the original concepts
of information systems design, and are penetrating many areas of selection and design
processes. In maintenance, formalised methods are being created which are partly
embodied in reliability centred maintenance (RCM) [26]. These procedures aid the
decisions in selection and design of a condition based maintenance programme by using a
consistent scheme which:
defines the known information in a criticality analysis and a maintenance audit, i.e.
defines the problem;
selects plant, and performs a further analysis using failure data or heuristic failure
analysis, before matching techniques to failure mode, i.e. selects a solution;
enforces review processes to evaluate effectiveness at all levels.
In control it is common to use a block diagram representation prior to modelling, and this
is also useful for reliability block diagrams [27]. In holistic approaches, however, the
control and monitoring community can gain considerably by taking a wider approach, as
exemplified by the use of the Boyd control loop in data fusion architectures [28]. The
structure loops through the stages of observation, orientation, decision and action
(OODA). In monitoring and control terms, these align as shown in figure 2. While the
OODA loop was conceived for military control, it has found enthusiastic followers in
business strategy and encapsulates many desirable features for integrated system design.
3.4 Emerging standards
3.4.1 Fieldbus
The construction of a distributed control and monitoring system is enabled by an
accepted set of communications rules or protocol, e.g. Fieldbus. It is the basis for an
advanced networking system used to interconnect field devices such as sensors, actuators,
and transducers to higher level systems such as PLCs for control or microcomputers for
monitoring purposes. Unlike computer network protocols (e.g. Ethernet) Fieldbuses are
optimised for the exchange of relatively short data messages containing control or status
information. They can guarantee delivery of messages on a periodic basis or within a
limited time. Fieldbuses transmit digital signals along a twisted pair cable, and are
replacing the traditional 4-20mA analogue network system. The advantages include:
digital signals are more robust in the presence of noise;
cabling costs are substantially reduced because all devices are linked up on the same
cable;
modularity, allowing reconfiguration and upgrading;
novel interaction between devices.
Fieldbus enables two-way communication with information no longer being addressed to
specific areas of the network but being available to all nodes. This allows full advantage
to be taken of existing information, empowering intelligent field devices and leading
towards distributed control.
A true Fieldbus has the ability to pass information across contractual boundaries, not just
within automation systems, but both down into the plant equipment and up into the
factory–wide management information system (MIS). The demand for information is
subject to change and has to be extracted without disturbing the real-time control. It is
therefore necessary that the Fieldbus not only prevents disturbance of time-critical traffic
by messages, but that the unexpected traffic can be handled with no change to the original
application software.
This is where the “producer-consumer” model of communications is of key importance.
This allows any node on the network to consume the data that is already passing without
any disturbance to the network traffic. So, for example, it is simple to add a SCADA
system or gateway to “piggy back” on a PLC/remote I/O network without changing the
PLC programme or disturbing the control. It is only possible to have open “hooks” with
networks using a producer-consumer model. For those using master-slave
communications it is necessary to work through the master or add additional
communications traffic.
There are three major international Fieldbus clubs, each of which started in a different
country and is supported by different major suppliers:
Foundation Fieldbus (USA: the major DCS manufacturers)
Profibus (Germany: Siemens)
WorldFIP (France: Alstom, Cegelec, Groupe Schneider/Telemecanique)
An International Fieldbus, IEC 61158, has been under development for many years. It is
a layered communications protocol with three layers: Physical, Data link and
Applications. The physical layer (cable, connectors, electrical signalling) has been a
standard for over 5 years. The data link and applications layer have been approved and
are likely to come into use in the next 5 to 10 years.
There are many other proprietary protocols which claim to be a Fieldbus. There is also a
European Standard, EN50170, issued by CENELEC, which includes WorldFIP, Profibus
and P-Net as three solutions for general purpose field communications. The Fieldbus
standardisation process has recognised the need to support background messages for
configuration, diagnostics and condition monitoring. This is reflected strongly in the IEC
Standard and in WorldFIP.
3.4.2 Other emergent standards
Whilst Fieldbus is creating a sea change in control architectures, several emergent
standards are influencing the use of data at higher level in maintenance and control.
Among these, MIMOSA, STEP and OPC have significant impact.
The Machinery Information Management Open Systems Alliance (MIMOSA) advocates
open exchange of equipment condition related information between condition
assessment, process control and maintenance information systems through published and
consensus conventions. This will gain its greatest value by combining condition
information from multiple sources for collective evaluation, reaching accurate
determinations of current condition and remaining life and communicating results in a
useful, understandable form at a managerial level [29].
The Standard for the Exchange of Product Model Data (STEP) is the familiar name for
ISO 10303 [30]. STEP is developed by the working committee for ISO TC184 SC4,
Industrial-Automation Systems and Integration, Industrial Data. STEP is the result of
many years development in product data management (PDM), which offers huge
advantages for the manufacturing sector, and hence has many parallels with maintenance
and control.
Object linking and embedding (OLE) for process control (OPC) is an emerging software
standard designed to provide business applications with easy and common access to
industrial plant floor data [31]. Traditionally, each software or application developer was
required to write a custom interface, or server/driver, to exchange data with hardware
field devices. OPC eliminates this requirement by defining a common interface that
permits this work to be done once, and then easily reused by management and control
applications. OPC has significant influence on the workings of Fieldbus protocols and on
the MIMOSA standards.
3.5 Integration benefits
The enhanced processing and decision making capabilities offered by an integrated
maintenance and control system using a distributed architecture bring three powerful
benefits to maintenance and monitoring systems:
increased processing power;
distributed processing, which localises intelligence near to (or within) the
sensor;
shared information between sensors and the conceptually high level system
components.
There are many opportunities to apply these capabilities, some of which are discussed
below.
3.5.1 Data fusion and multivariate trending
Data fusion is the process of combining data and knowledge from different sources with
the aim of maximising the useful information content, for improved reliability or
discriminant capability, whilst minimising the quantity of data ultimately retained [32].
The sensor and signal processing communities have been using fusion to synthesise the
results of two or more sensors for some years. This simple step recognises the limitations
of a single sensor but exploits the capability of another similar or dissimilar sensor to
calibrate, add dimensionality or simply to increase statistical significance or robustness to
cope with sensor uncertainty. In many such applications the fusion process is necessary to
gain sufficient detail in the required domain.
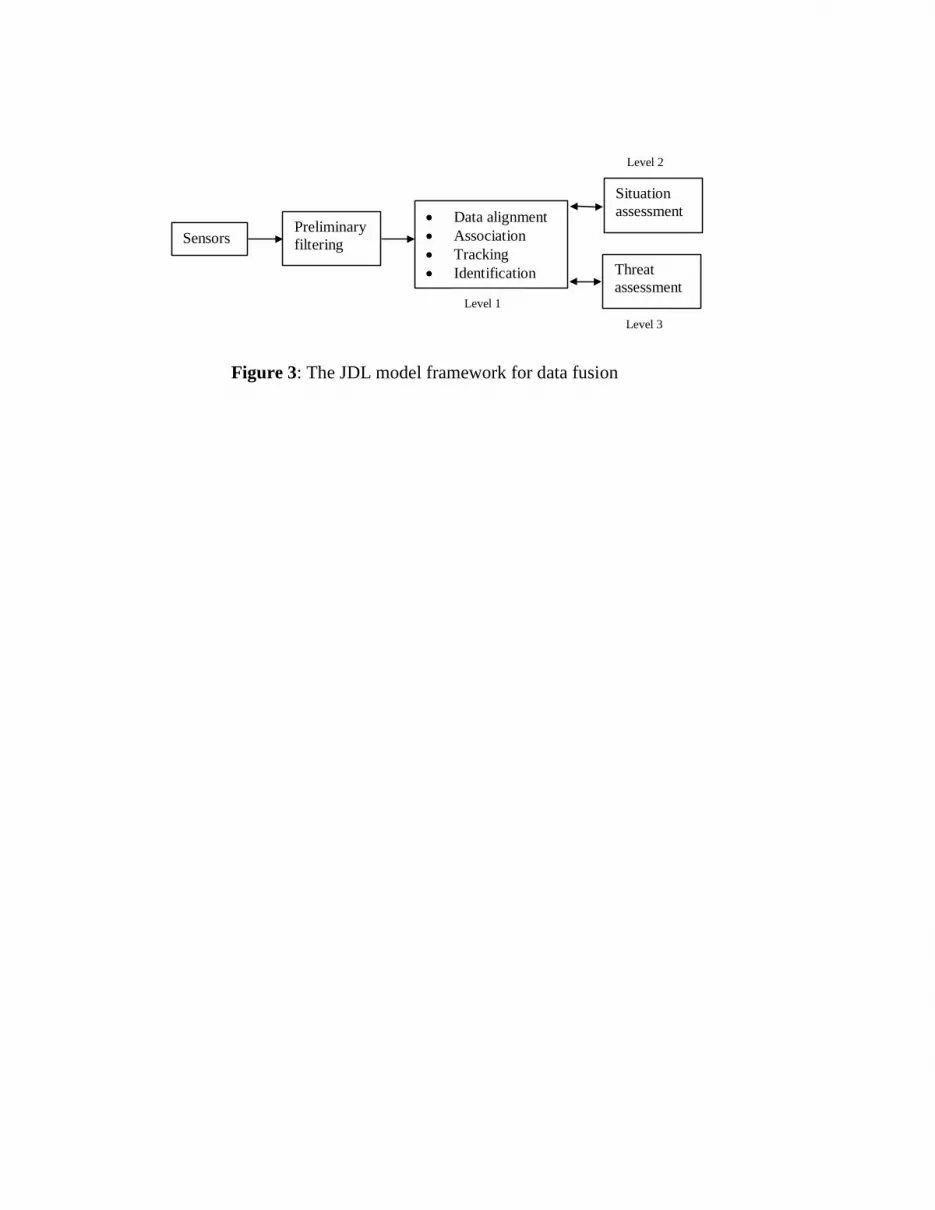
Higher levels of data fusion deal with problems of feature extraction, correlation, and
decision making. A common structure can be identified, which can be compared to the
Boyd loop, and is embodied in the Joint Directors of Laboratories (JDL) model as shown
in figure 3 [33]. In real problems, it is not always necessary to apply all the stages:
Pre-processing, i.e. reduction of the quantity of data whilst retaining useful
information and improving its quality, with minimal loss of detail. The pre-processing
may include feature extraction and sensor validation. Some of the techniques used
include dimension reduction, gating for association, thresholding, Fourier transform,
averaging, and image processing.
Data alignment, where the techniques must fuse the results of multiple independent
sensors, or possibly features already extracted in pre-processing. These include
association metrics, batch and sequential estimation processes, grouping techniques,
and model-based methods.
Post-processing, combining the mathematical data with knowledge, and decision
making. Techniques could be classified as knowledge-based, cognitive-based,
heuristic, and statistical.
Classical condition monitoring systems treat monitored parameters individually by
trending processed results from single sensors (single values or spectral arrays) and
relying upon the maintenance engineer to interpret them in combination. The intelligent
sensor can take many transducer readings and share this information with other sensors.
The combined data can be fused to produce a multi-dimensional representation whose
trends and variations provide much more powerful condition indicating information. For
example, in the case of rolling element bearing damage, rises in bearing frequencies may
be accompanied by impact excited resonance and a lagged rise in housing temperature,
measured by an accelerometer and a thermometer respectively. By mathematical
manipulation these three data forms from the two sensors can be fused to produce a
powerful multivariate indicator.
3.5.2 Smart Sensors
A smart sensor, or intelligent field device, has several elements which make it superior to
a conventional sensor. It may contain some or all of the following parts, which
traditionally have been part of a wider system. “Smart” does not imply miniature, but
many of the functions described can be included on a single printed circuit board, or
where mass production allows, on a single chip.
Sampling: traditionally controlled by the host, the on–board algorithm of a smart
sensor can dictate when and how the signal is sampled.
Processing and memory: the computing power to perform signal processing has
traditionally been expensive, leading to high bandwidth data acquisition systems and
centralised processing. The high bandwidth cabling is now one of the most expensive
items to buy and install. Local processing can reduce data transmission and speed up
response. Complex signal processing can be performed on raw data without
transmission across a data network. Data can be stored until transmission is instructed
or requested remotely.
Communications interfaces: integrated 4–20mA interfaces are commonplace, but the
smart sensor can also include and control a wireless transceiver, modem, Ethernet
adapter, Fieldbus node or internet host. Bi–directional communication is necessary to
allow the host to send instructions, and for the sensor to return status information or
data.
Decision making: the on board algorithm can control any function, e.g. whether or not
to transmit data, and how much.
Calibration: local measurement of conditions can be used for correction and
compensation prior to data transmission.
Redundancy: multiple sensing elements can be incorporated in a single smart sensor,
to increase dimensionality or to validate the measurement. This can account for drift
or rogue readings at the point of measurement.
3.5.3 Robustness
Hard-wired condition monitoring systems are susceptible to sensor failure and damage to
cabling. Automation systems are frequently and unnecessarily shut down due to
erroneous information received from sensors. Within a Fieldbus based system it is
possible to incorporate sensor validation mechanisms. Such mechanisms exploit the
redundancy between nearby sensors and permit validation of sensor output and data
reconstruction in the event of a device failure.
The use of intelligent devices permits prioritisation of the information that they are
generating, or its storage until the transient overload has passed. This avoids the inherent
drawback of conventional serial process control and monitoring systems.
3.5.4 Model-based fault diagnosis
Model based fault diagnosis uses a mathematical model of the plant as the basis for
decision making. The model may be updated on-line by using information from sensors
and the control system. Changes in the plant model may then be related to variations in
the condition of the plant. The influence of sporadic sensor noise is greatly reduced
because the model is tolerant to transient variation. Model based fault diagnosis is a
powerful aid to condition monitoring. In industrial applications model updating has been
used in control but rarely for CM.
3.5.5 Scalability
The design framework must be flexible and adaptable. Modular designs can evolve. The
ability to reconfigure hardware and software components is important. For example it
may be necessary to add a CM module to an existing automation system. A distributed
architecture not only allows the future addition of more processing power, but permits
optimisation of the individual processors according to the specialist tasks that each must
perform.
3.5.6 Future proofing
Distributed systems are open to evolutionary change. The automation system
manufacturers benefit from a steady demand for more advanced components, while
adherence to standards allows them to focus design activity.
Often, instrumentation is replaced because its accompanying software has less
functionality than newer products, or because of changes in the processing to be
performed on the sensor data. Re-programmable sensors allow remote software updates
to field devices, enabling the incorporation of new processing techniques and advances in
maintenance technology. This can be achieved with minimum disruption to system
operation and no changes to system hardware.
4. Exemplars
The best examples of integrated systems to date comprise the elements which suit
particular applications. Each integrated system is different, and hence develops and
exploits differing aspects. The examples below demonstrate integration at several levels:
Management systems;
Decision–level fusion;
Condition monitoring over a Fieldbus network;
Advanced signal processing algorithms for feature extraction on a smart sensor.
4.1 Integration of management information systems
Many management information systems (MIS‟s) are encountered in maintenance
management. In building services maintenance at a major London Bank, the Facilities
Management System (FMS) is perhaps the top level in MIS [34]. A typical FMS, in
common with the typical MIS in many other sectors, includes modules for:
resources: plant and spares inventory, personnel, skills, tools;
suppliers and customers, cost estimating, purchasing and billing;
planning and scheduling, activities, installations;
reporting and graphical output;
historical analysis and forecasting.
The FMS is commonly installed on one or more workstations accessing databases over a
technical network. As an MIS it is not intended to gather information directly from
hardware, nor to transmit instructions to it. The FMS can be considered complementary to
the maintenance management system (CMMS) and building energy management system
(BEMS). The FMS deals with the management functions, the CMMS deals with monitoring
and maintenance actions, while the BEMS deals with the control issues. There are, however,
areas of overlap and information exchange:
all systems require a plant inventory structure for identification;
the BEMS can generate valuable utilisation and costing information for the FMS;
the FMS may contain scheduling information which will be used to program the BEMS;
the CMMS can collect jobs from the FMS and data from the BEMS, and transmit
costing information to the FMS.
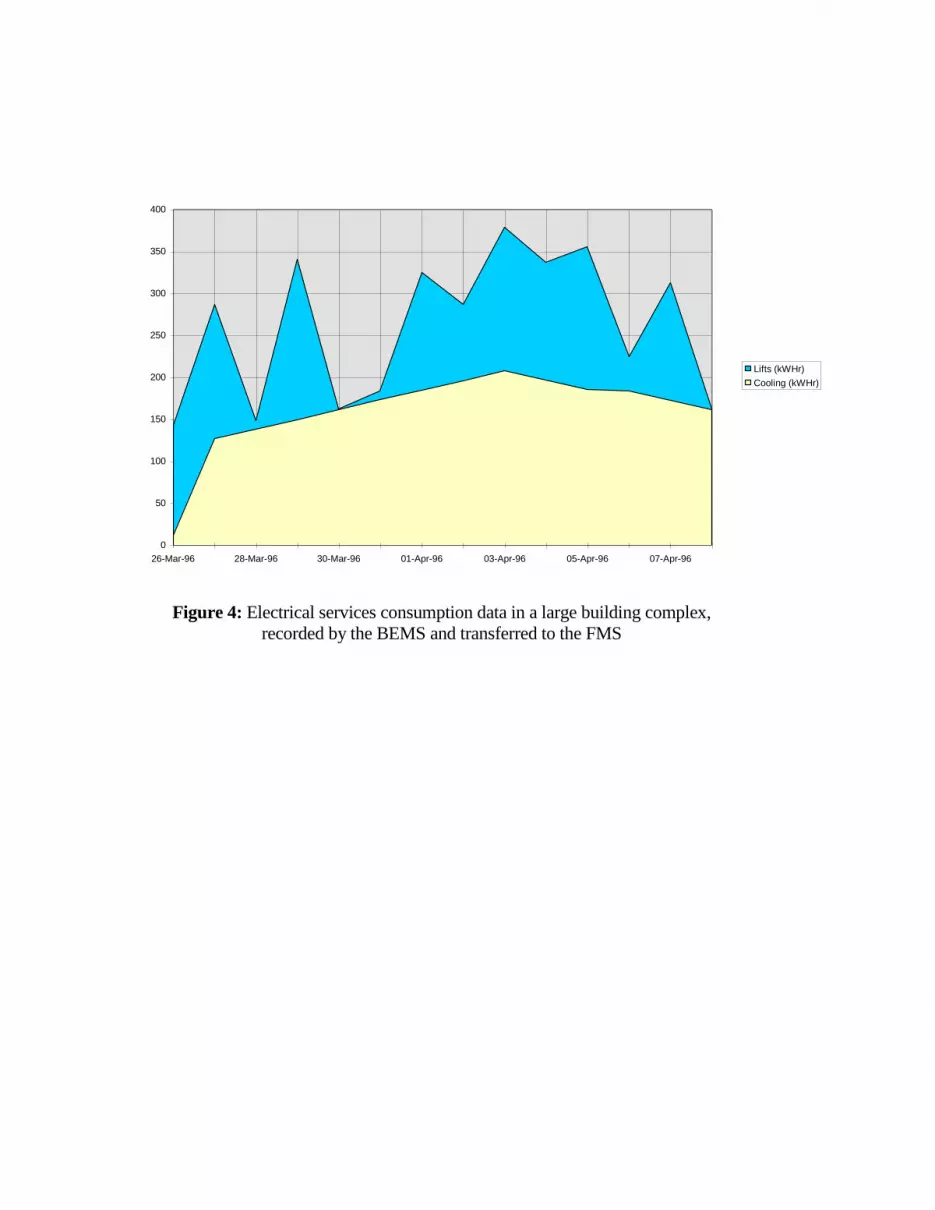
As an example of the information which the BEMS can pass to the FMS, figure 4 shows a
sample of the services consumption data in a large building complex. The BEMS was
programmed to summarise consumption of electricity, gas and water on a daily basis. The
information was passed through a spreadsheet, which allowed live updating through DDE,
as well as bespoke analysis and charting. This information was in turn used for billing the
building users.

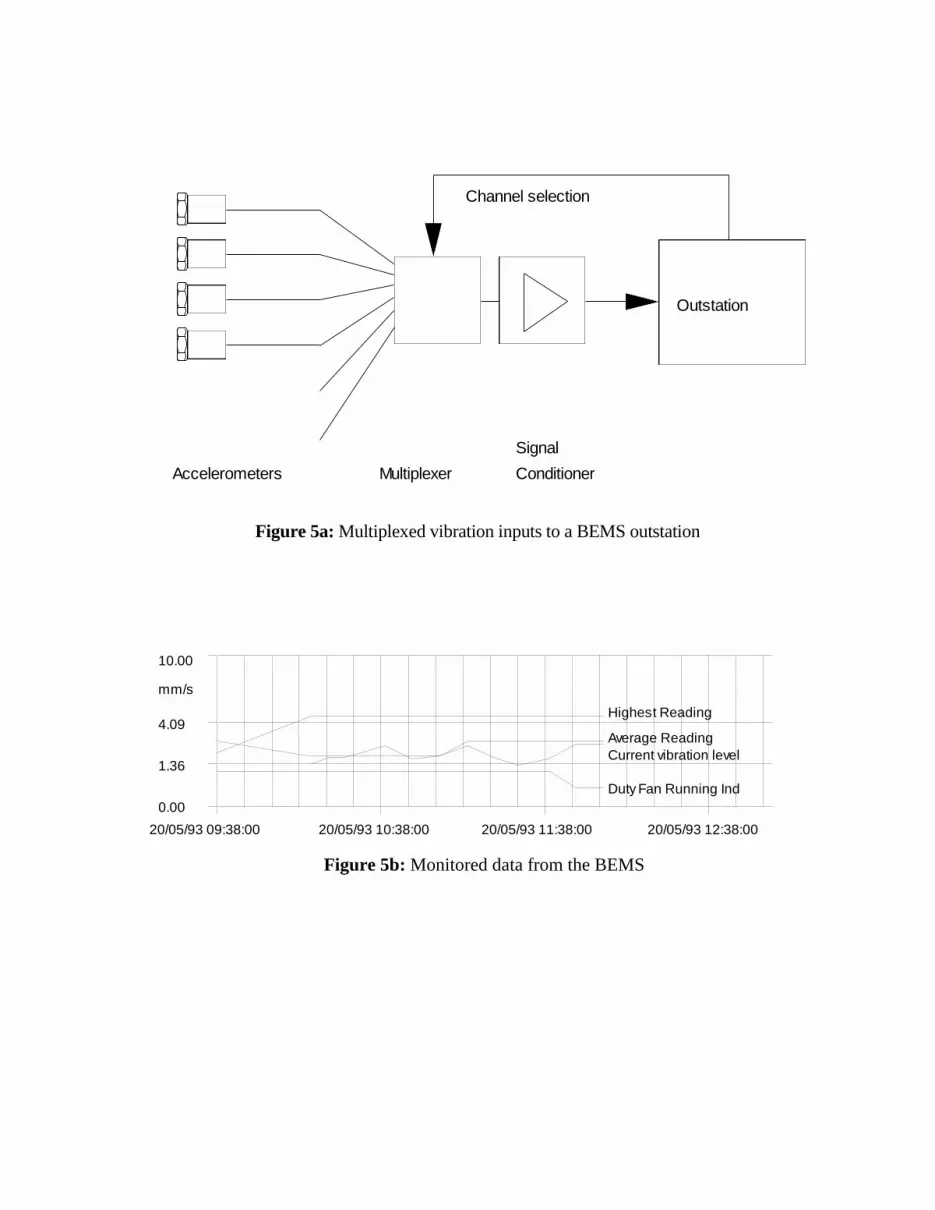
The BEMS usually handles data from building systems such as electrical power,
transportation and heating, ventilation and air conditioning (HVAC). At another building a
BEMS outstation was fitted with a smart interface to allow high–bandwidth vibration
signals to be sampled. Figure 5a illustrates the schematic for interfacing vibration data
collection to the BEMS and figure 5b shows a typical report.
4.2 Knowledge based decision fusion
In complex systems we make decisions based on measured parameters, but we relate
those to knowledge about the way the systems operates. In manufacturing systems, for
example, operational faults account for about 70% of failures. Rapid diagnosis is critical
for improving the availability and productivity of the manufacturing system.
Diagnosis of complex systems is challenging because there are many different faults, and
training is likely to be forgotten before it can be applied. Hierarchical diagnosis models,
based on fault tree analysis, logical control and sequential control can be built around the
operation of the Programmable Logical Controller (PLC). With these models working
together, the operational faults of a manufacturing system can be diagnosed completely.
The models have been successfully applied to a PLC controlled flexible manufacturing
system and have achieved good results [35].
The model combines knowledge about the intended operating procedure with measured
inputs from the normal automation sensors. The stage of the programme indicates the
broad area of the fault, and the status of the measured inputs localises the solution further.
In the example shown in figure 6, a system fault in a flexible manufacturing system
(FMS) is traced:
In the functional tree, we first establish that the FMS has failed because of a machine
tool (F11); the tree further establishes that this is a PFZ1500 milling machine (F21);
this has failed during the machining process (F33).
According to the principles of operation of the machining process (P11), the highest
probability lies in a spindle failure (P21: 0.4) and that, in this case, the most likely
fault is the spindle motor (P32: 0.45).

The rule tree analyses the potential faults in the spindle motor and their cost weighted
risk. Here several potential faults are compared, and the most likely ones are
investigated: a fault could exist in the mechanical drive system (R211) or in the
control circuit (R212). A first likely fault is a high temperature cut out (R312) caused
by a blunt tool (R421). Other likely faults are investigated in order of probability until
the fault is found.
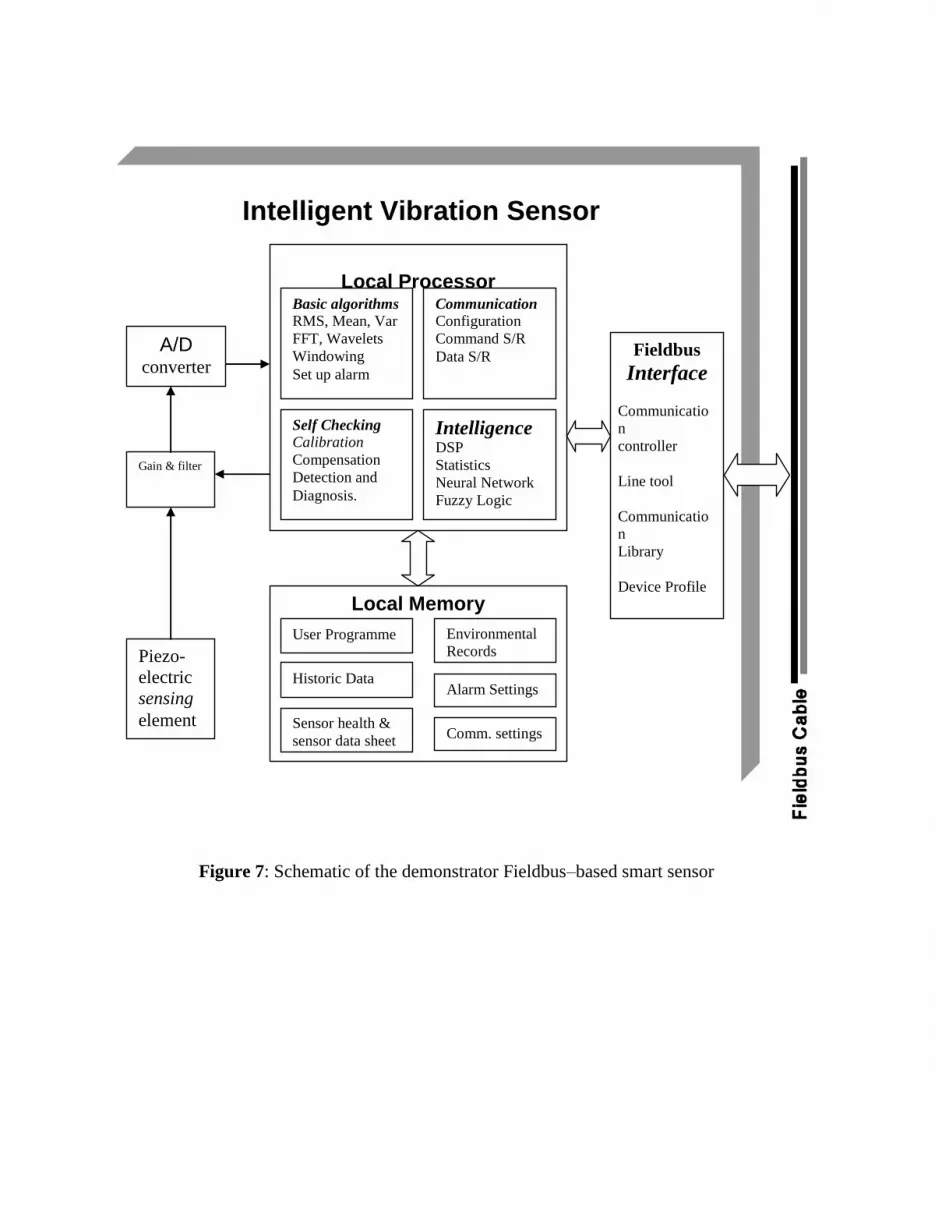
4.3 Condition monitoring over Fieldbus with intelligent sensors
A Fieldbus network was constructed at the University of Manchester to demonstrate the
use of smart sensors in condition monitoring. A PC was programmed to act as a
combined bus arbitrator and CM controller, and another as a remote node and intelligent
sensor. 50% of the Fieldbus bandwidth was deliberately occupied by the continuous
transmission of simulated time critical control variables. On the Fieldbus between the two
PC‟s a field tap was provided to permit a third PC to access the Fieldbus and transmit the
data to an Ethernet link to an Internet server. The server provided world-wide real-time
access to the condition monitoring of an induction motor in the Manchester laboratories
and the functioning of the intelligent sensor as the motor‟s condition was changed on
line. Figure 7 shows a schematic of the demonstrator system, and figure 8 shows the web
page output.
The function of the CM controller was to implement the monitoring strategy. In
overview, this involved requesting information from the intelligent sensor, interpreting
this information, and issuing messages as necessary for consumption by the management
information systems that would in reality be present on the same network. Specifically,
the monitoring strategy was defined as follows:
routinely request a condition status (i.e. a green, amber or red traffic light) from
the intelligent sensor;
if status is green, record status and time stamp, then wait 60 seconds until next
status indicator is required;
if status is amber, record status and time stamp, then request and record data
summary, then reduce subsequent monitoring interval to 15 seconds;
if status is red, record status and time stamp, then request and record full data
transmission, then reduce subsequent monitoring interval to 15 seconds and issue
a warning message onto the network for consumption by the management
information systems.
There are numerous ways in which this monitoring strategy could be changed or refined.
The system demonstrated „on-request‟ communication of condition monitoring
information over a Fieldbus network which was being used for the simultaneous
transmission of time-critical data. In terms of the intelligent sensor, the prototype
included simple signal processing:
sensing, filtering and amplification of vibration acceleration data;
sampling and digitisation;
calculation of RMS level and frequency spectrum (FFT);
comparison of processed output with thresholds;
determination of the current status;
on request from the condition monitoring controller, transmission of the status,
time stamp, data summary or full FFT as necessary.
4.4 Advanced signal processing algorithms in an intelligent sensor
Analytical techniques can accentuate condition monitoring information by manipulating
the data from measurements. In rotating and reciprocating machines it is common to use
software or hardware to convert a time series of vibration data into the frequency domain.
This has limitations in non–stationary signals because transient events are lost in the
averaging. Time-frequency representations permit the simultaneous representation of a
signal's time, frequency and amplitude on a per cycle or per revolution basis. [36]
Time-frequency methods are particularly useful in CM because many common machine
faults give rise to transient vibration or electrical symptoms which are superimposed
upon a continuous periodic waveform. The transients themselves may occur from
impacting, stiffness variation around a cycle, or asymmetric magnetic effects. With the
ability to interpret the output of advanced signal processing techniques such as these,
comes the ability to incorporate them within a stand-alone microprocessor system such as
a smart sensor.
The example shown in figure 9 demonstrates the characterisation of a diesel fuel injector.
Its characteristics are hard to identify in the noisy environment of the engine when using
the time domain or frequency domain alone. In the time–frequency plot, however, it is
possible to detect the timing events, including the opening and closing of the injector
needle, the onset and duration of combustion, and the peak acceleration level, which is
well correlated with the maximum pressure in the cylinder. The time–frequency plot has
sufficiently high resolution to identify faults in injection and timing.
5. Conclusions
5.1 Integration in maintenance engineering
Systems integration in maintenance exists on many levels, from the business system right
through to the sensor. Many new technologies are providing rapid routes to advances in
integration and allowing the realisation of existing and novel integration theory. A
fundamental aim of maintenance activity is to deliver a required level of service from
plant at the lowest lifecycle cost. Cost effective advancement in maintenance technology
will be achieved by making better use of the data that is already held on a plant, rather
than by measuring more variables.
5.2 Standards
The use of international and cross–industrial de facto standards is important to the ability
of the manifold information systems found in maintenance engineering to communicate,
and also to the effectiveness of off–the–shelf hardware and software. The adoption of
standard information exchange protocols allows the system builder to concentrate on
maintenance related issues rather than being diverted into IT and data acquisition
problems.
5.3 Enabling technologies
Next generation automation systems will be more open, integrated and robust than their
predecessors. With a communications backbone provided by internationally agreed
protocols, information will be shared between the control, maintenance and process
management systems which will allow improved plant utilisation through more effective
control and better informed decision making. Fieldbuses are now being widely used for
control and instrumentation, and have shown potential for use for condition monitoring.
5.4 Advanced processing
Distributed processing is considerably enhancing the capacity to integrate and evolve
advanced algorithms, which are tending to run close to the source of the data rather than
in a centralised system. The low cost, speed and memory capacity of distributed
processing, down to sensor level, now allows the use of algorithms such as the time–
frequency transforms which have up to now been restricted to high speed devices in the
laboratory.
5.5 Architecture
The most significant influence on the success of integration is the overall vision. While
the detail of every step must be in place, and each part contributes to the whole, the
formation of a strategic picture of maintenance as part of the business is required to make
sense of the purpose of integration down to sensor level. The architecture will be the
embodiment of a holistic approach.
5.6 Future directions
Examples of the levels of integration have been shown which demonstrate performance
benefits, both on a technical and business level. Considerable work remains to be done to
realise fully integrated systems over all the potential levels, but a major effort will be in
convincing users that their commitment to new standards and protocols is worthwhile.
Change will be evolutionary: users own many “legacy” systems, and suppliers have a
commitment to existing products which do not yet take advantage of all of the potential
benefits. Sustained collaboration and standardisation will be essential.
6. Acknowledgements
The authors would like to thank the following bodies for their support and collaboration:
Ford of Europe
WM Engineering Ltd
Engineering and Physical Science Research Council (EPSRC)
WorldFIP
7 References
[1] Kennedy, I, 1998, Holistic Machine Condition Monitoring, Seminar – Advances in
Maintenance Engineering, University of Manchester
[2] Dilger KA, 1997, Asset management, maintenance redefined, Manufacturing
Systems, Vol.15, No.7, pp.122-124, 126-128, ISSN 0748-948X
[3] Singh V, Weston RH, 1996, Life cycle support of manufacturing systems based on
an integration of tools, International Journal of Production Research, Vol.34, No.1,
pp.1-17, ISSN: 0020-7543
[4] Marquez RB, Burgess J, 1998, Introduction of reliability centered maintenance in a
copper smelter, Proceedings of the 1998 TMS Annual Meeting, San Antonio, TX,
pp.197-203, (Conf. code 48105)
[5] Weil M, 1998, Raising the bar for maintenance applications, Manufacturing
Systems, Vol.16, No.11, p.5, ISSN: 0748-948X
[6] McElhaney D, Aelmore J, Braun G, 1997, Use of hand held bar code readers and
personal computers to improve plant maintenance, Proceedings of the 1997 76th
Annual Convention of the Gas Processors Association, San Antonio, TX, USA, Mar
10-12 1997, (Conf. code 46983), ISSN 0096-8870
[7] Chemane LA, Nunes AF Jr, Hancke GP, 1997, Industrial information infrastructure
and intelligent instrumentation - the options, Proceedings of the 1997 IEEE
International Symposium on Industrial Electronics, Vol.1, pp.44-48, (Conf. code
48073)
[8] Roemer MJ, Atkinson B, 1997, Real-time health monitoring and diagnostics for gas
turbine engines, Proceedings of the, 1997 International Gas Turbine & Aeroengine,
Congress & Exposition, Orlando, FL, American Society of Mechanical Engineers
ISSN: 0402-1215 (Conf. code 47341)
[9] Crowder RM, Hall W, Heath I, Bernard R, Gaskell D, 1996, Hypermedia
maintenance information system, Computing & Control Engineering Journal, Vol.7,
No.3, pp.121-128, ISSN 0956-3385
[10] Crowder RM, Hall W, Heath I, Wills G, 1999, Integration of manufacturing
information using open hypermedia, Computers in Industry, Vol.38, No.1, pp. 31-
42, ISSN 0166-3615
[11] Lumpp T, Gruhler G, Kuechlin W, 1998, Virtual Java Devices integration of
Fieldbus based systems in the Internet, Proceedings of the 1998 24th Annual
Conference of the IEEE Industrial Electronics Society, IECON. Part 1 (of 4),
Aachen, Ger, Aug 31-Sep 4 1998, (Conf. code 49499), Vol.1, pp. 176-181
[12] Grosmangin F, 1997, Diagnosis of the location of defects accessible from an MV
network control system (SCADA), Proceedings of the 14th International Conference
and Exhibition on Electricity Distribution, CIRED. Part 1/4 (of 7), Birmingham,
UK, Jun 2-5 1997, (Conf. code 47479), IEE Conference Publication, 1997, No.438
pt 1/4, pp.4.28.1- 4.28.3 ISSN: 0537-9989
[13] Chan WL, So ATP, Lai LL, 1999, Internet based transmission substation
monitoring, IEEE Transactions on Power Systems, Feb 1999, Vol.14, No.1, pp. 293-
298, ISSN: 0885-8950
[14] Clayton M, Durham J, Felker S, Fortner G, Martinez J, Shelton S, 1997,
Manufacturing integration of data collection and statistical process control systems,
Proceedings of the 1997 IEEE 6th International Conference on Emerging
Technologies & Factory Automation, ETFA, (Conf. code 47152), Los Angeles, CA,
pp.505-507, IEEE, Piscataway, NJ, USA
[15] LopezDeLacalle LN, Zulueta G, Burgos A, Sarachaga I, Fernandez H, 1997,
Integracion del mantenimiento en la filosofia de control de sistemas automatizados
(Integration of maintenance in the philosophy of automized system control)
Informacion Tecnologica, Vol.8, No.1, pp.17-22, ISSN: 0716-8756
[16] Wood RT, Mullens JA, Naser JA, 1997, Plant-window system: a flexible,
expandable computing environment for the integration of nuclear power plant

activities, Proceedings of the 1997 5th International Conference on Nuclear
Engineering, ICONE, p.263, ASME (Conf. code, 46894)
[17] Bosco CD, Su LP, Girolamo H, Darty M, 1996, Maintenance and Repair Support
System (MARSS), Proceedings of the AUTOTESTCON'96 Conference, Dayton,
OH, (Conf. code 45491), pp.336-343, ISSN: 0734-7510
[18] Legge PJ, 1996, Health and Usage Monitoring System (HUMS) in retrofit and ab
initio helicopter applications, Proceedings of the 1996 52nd Annual Forum. Part 2
(of 3), (Conf. code 45377), American Helicopter Society, Vol.2, pp.1407-1417,
Alexandria, VA, USA, ISSN: 0733-4249
[19] Steets PG, Tse YH, 1998, Conrail's integrated automated wayside inspection,
Proceedings of the IEEE/ASME Joint Railroad Conference, Philadelphia, PA,
pp.113-125, IEEE, (Conf. code 48527)
[20] Evans JP, Jarc TJ, Wurzbach RN, 1995, Increasing predictive program effectiveness
by integrating thermography and lubricant analysis, Proceedings of Thermosense
XVII: An International Conference on Thermal Sensing and Imaging Diagnostic
Applications, Orlando, FL, SPIE - The International Society for Optical
Engineering, Vol.2473, pp.82-90, ISSN: 0277-786X, 0-81-941826-9, (Conf. code
22196)
[21] Ball PG, 1998, Machine wear analysis - a rational approach to methods integration
for maximum benefits, Lubrication Engineering, Vol.54, No.3, pp.18-22, ISSN:
0024-7154
[22] Martin DK, VanDyke J, 1997, Integrating vibration, motor current, and wear particle
analysis with machine operating state for on-line machinery prognostics/diagnostics
systems (MPROS), Proceedings of the 1997 ASME International Mechanical
Engineering Congress and Exposition, Dallas, TX, American Society of Mechanical
Engineers, Tribology Division, Vol.7, pp.61-67, (Conf. code 47756)
[23] Report of EPSRC Workshop on Structured Methods and Tools in Information
Systems Specification and Design, November 1995, Department of Industrial
Studies, University of Liverpool
[24] Goodland, M., Slater, C., 1992, SSADM Version 4 - A Practical Approach,
McGraw Hill
[25] Yourdon, E., Constantine, L.L., 1979, Structured Design, Prentice Hall
[26] Moubray, J., 1997, Reliability centred maintenance (2 ed.) Butterworth
Heinemann ISBN 0-7506-3358-1
[27] BSI, 1986, BS5760 British standard - Reliability of constructed or manufactured
products, systems, equipments or components
[28] Boyd, J R, The Essence of Winning and Losing, http://www.belisarius.com/
[29] MIMOSA, http://www.mimosa.org/
[30] ISO 10303 - Industrial automation systems and integration - Product data
representation and exchange, http://www.nist.gov/sc4/
[31] OPC Foundation, http://www.opcfoundation.org/
[32] Starr A, Desforges M, 1998, Strategies in data fusion - sorting through the tool box,
Proceedings of Eurofusion 98 – DERA Malvern, UK
[33] Starr A G, Esteban J, Desforges M, 1999, Strategies in Data Fusion - A Condition
Monitoring Approach, Proc. 12th International Congress on Condition Monitoring
and Diagnostic Engineering Management (COMADEM 99), Sunderland, UK
[34] Starr, A, Wynne, R, Kennedy, I, 1993, Condition monitoring of building services - a
case study in a high technology building, Proc. 5th International Congress on
Condition Monitoring and Diagnostic Engineering Management (COMADEM 93),
Bristol, UK
[35] Hu W, Starr A G, Leung A Y T, Two diagnostic models for PLC controlled flexible
manufacturing systems, International Journal of Machine Tools & Manufacture, Vol
39 Iss 12 pp1979-1991, ISSN 0890-6955
[36] Gu F, Ball A D, Rao K K, 1996, Diesel injector dynamic modelling and estimation
of injection parameters from impact response – Part 2: prediction of injection
parameters from monitored vibration, Proc. I. Mech. E. Part D: Journal of
Automobile Engineering, v210 pp303–312
Figure Captions
Figure 1: Communications flow in integrated manufacturing, maintenance and
control
Figure 2: The Boyd control loop adapted to monitoring and control
(with acknowledgements to O’Brien and Bedworth)
Figure 3: The JDL model framework for data fusion
Figure 4: Electrical services consumption data in a large building complex, recorded
by the BEMS and transferred to the FMS
Figure 5a: Multiplexed vibration inputs to a BEMS outstation
Figure 5b: Monitored data from the BEMS
Figure 6: A diagnostic reasoning procedure for a machine tool [35]
Figure 7: Schematic of the demonstrator Fieldbus-based smart sensor
Figure 8: Web page output from the demonstrator smart sensor
Figure 9: Characterisation of a diesel fuel injector from vibration and cylinder
pressure, displayed in time-frequency plots
Engine FSD425 operating at 59.7Nm and 2043 rev./min.
Abbreviations
BEMS Building energy management system
CAM Computer aided manufacturing
CBM Condition based maintenance
CENELEC European committee for electrotechnical standardization
CM Condition monitoring
CMMS Computerised maintenance management system
DCS Distributed control system
DDE Dynamic data exchange
EAM Enterprise asset management
EN Euro Norm
FFT Fast Fourier transform
FMS Flexible manufacturing system or Facilities management system
HUMS Helicopter usage and monitoring system
HVAC Heating, ventilation and air conditioning
ICAM Integrated CAM
IDEF ICAM definition
IEC International Electrotechnical Commission
ISO International Organization for Standardization (ISO)
IT Information technology
JDL Joint directors of laboratories (US military)
LAN Local area network
MIMOSA Machinery information management open systems alliance
MIS Management information system
OLE Object linking and embedding
OODA Observe, orientate, decide, act
OPC OLE for process control
PC Personal computer
PLC Programmable logic controller
PPM Time base planned preventive maintenance system
RCM Reliability centred maintenance

SCADA Supervisory control and data acquisition
SSADM Structured systems analysis and design method
STEP Standard for the exchange of product model data
TPM Total productive maintenance
TQM Total quality management
Business drivers & objectives
Processing
& decision-making (Computational and
human)
History
Knowledge, Models
Scheduling
Inventory
Finance
Integrated Manufacturing:
Production Maintenance
Control
Sensors
(Mechanical and human)
Actuators
(Mechanical and human)
Information Instructions
Data Actions
Strategy Performance
Figure 1: Communications flow in integrated manufacturing,
maintenance and control
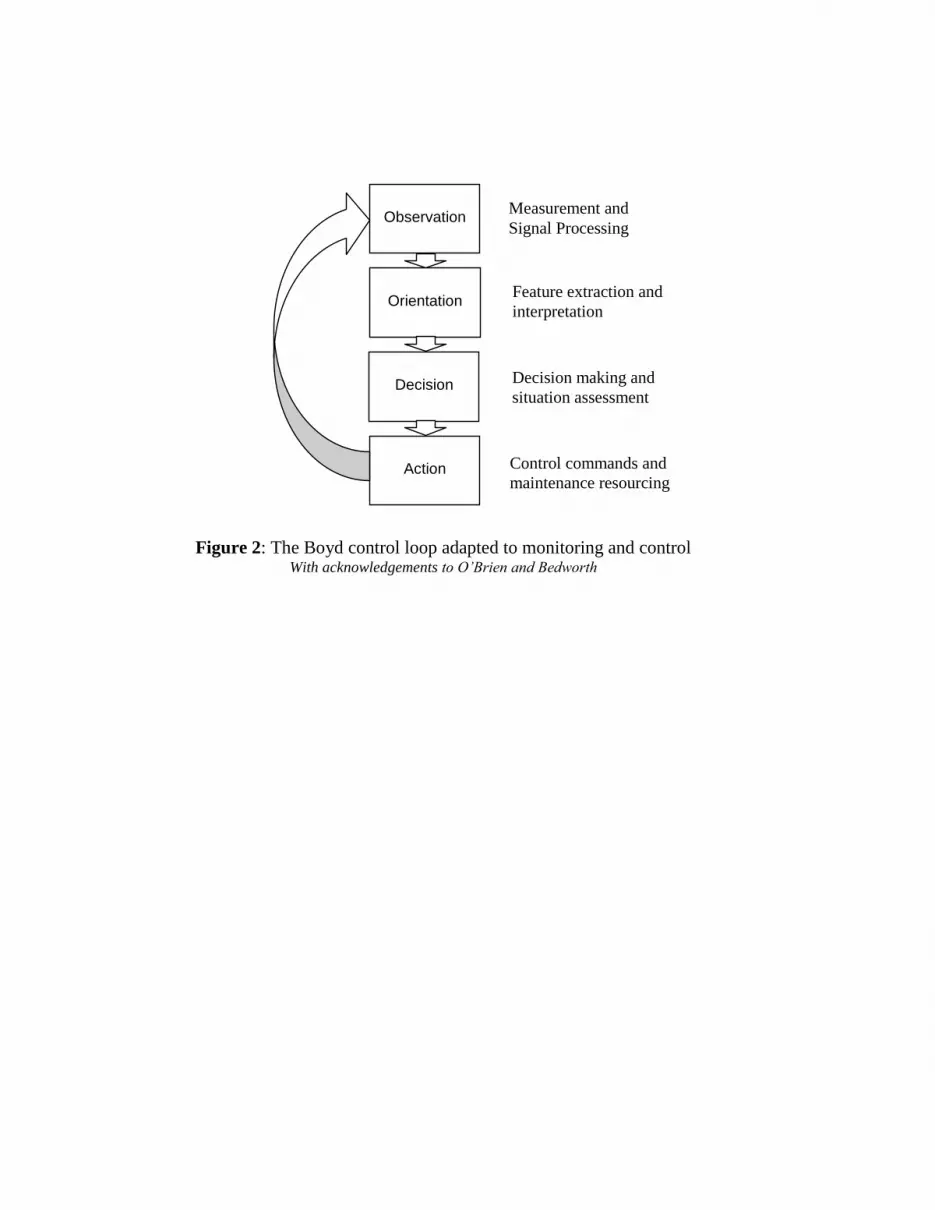
Figure 2: The Boyd control loop adapted to monitoring and control With acknowledgements to O’Brien and Bedworth
Observation
Orientation
Action
Decision
Measurement and
Signal Processing
Feature extraction and
interpretation
Decision making and
situation assessment
Control commands and
maintenance resourcing
SensorsPreliminary
filtering
Data alignment
Association
Tracking
Identification
Situation
assessment
Threat
assessmentLevel 1
Level 2
Level 3
Figure 3: The JDL model framework for data fusion
0
50
100
150
200
250
300
350
400
26-Mar-96 28-Mar-96 30-Mar-96 01-Apr-96 03-Apr-96 05-Apr-96 07-Apr-96
Lifts (kWHr)
Cooling (kWHr)
Figure 4: Electrical services consumption data in a large building complex,
recorded by the BEMS and transferred to the FMS
Accelerometers
Outstation
Multiplexer
Signal
Conditioner
Channel selection
Figure 5a: Multiplexed vibration inputs to a BEMS outstation
10.00
4.09
1.36
0.00
20/05/93 09:38:00 20/05/93 10:38:00 20/05/93 11:38:00 20/05/93 12:38:00
Highest Reading
Average Reading
Duty Fan Running Ind
Current vibration level
mm/s
Figure 5b: Monitored data from the BEMS
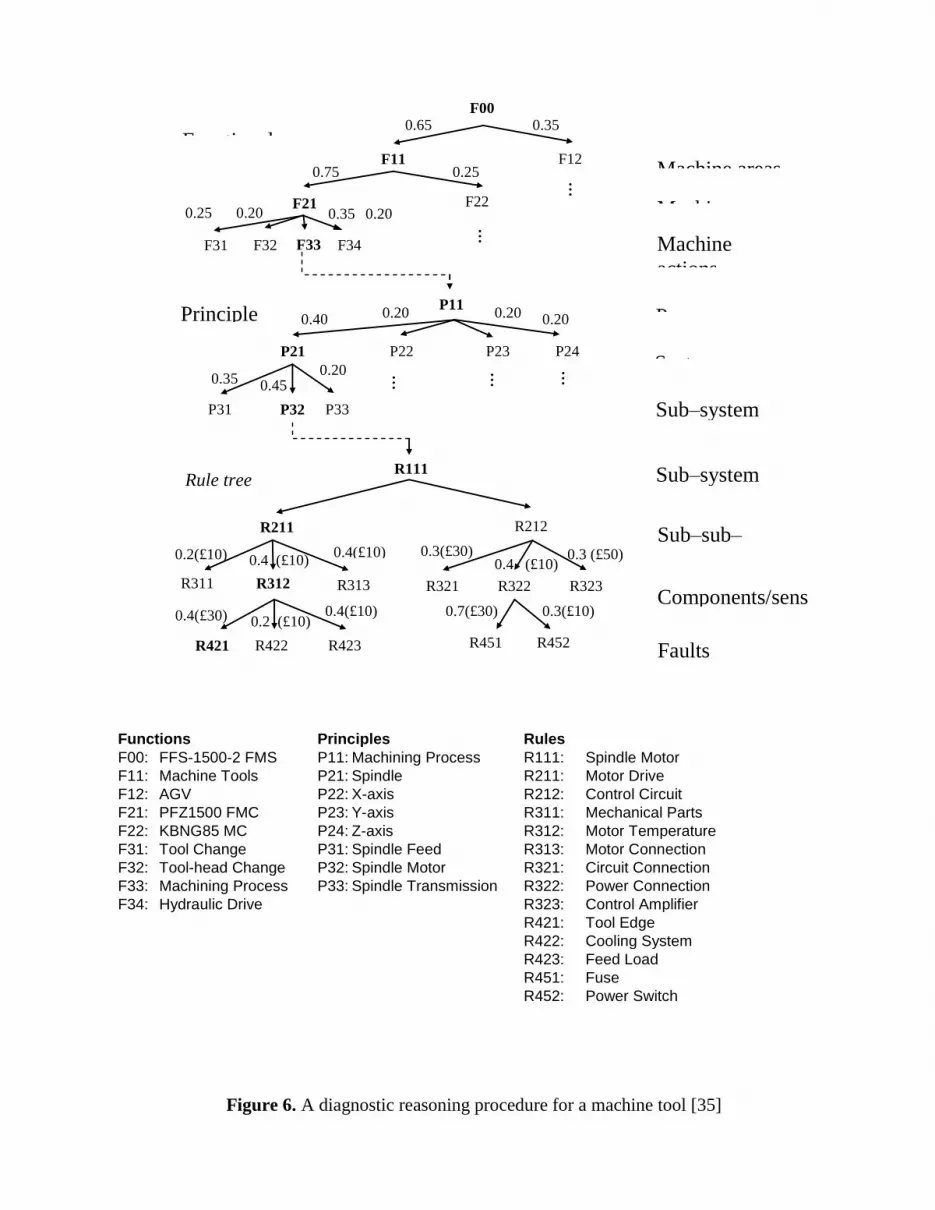
Figure 6. A diagnostic reasoning procedure for a machine tool [35]
R311 R312 R313 R321 R322 R323
R422 R421 R423 R451 R452
R211 R212
R111
P33 P32 P31
P21 P22
F00
F11 F12
F21 F22
F31 F32 F33 F34
…
P11
P23 P24
…
…
…
…
0.65 0.35
0.75 0.25
0.25 0.20 0.35 0.20
0.40 0.20 0.20 0.20
0.35 0.45 0.20
0.2(£10) 0.4 (£10) 0.4(£10) 0.3(£30)
0.4 (£10) 0.3 (£50)
0.4(£30) 0.4(£10) 0.2 (£10)
0.7(£30) 0.3(£10)
Functional
tree
Principle
tree
Rule tree
Functions Principles Rules
F00: FFS-1500-2 FMS P11: Machining Process R111: Spindle Motor
F11: Machine Tools P21: Spindle R211: Motor Drive
F12: AGV P22: X-axis R212: Control Circuit
F21: PFZ1500 FMC P23: Y-axis R311: Mechanical Parts
F22: KBNG85 MC P24: Z-axis R312: Motor Temperature
F31: Tool Change P31: Spindle Feed R313: Motor Connection
F32: Tool-head Change P32: Spindle Motor R321: Circuit Connection
F33: Machining Process P33: Spindle Transmission R322: Power Connection
F34: Hydraulic Drive R323: Control Amplifier
R421: Tool Edge
R422: Cooling System
R423: Feed Load
R451: Fuse
R452: Power Switch
Machine areas
Machines
Machine
actions
Process
System
Sub–system
Sub–system
Sub–sub–
system
Components/sens
ors
Faults
A/D converter
Gain & filter
Piezo-
electric
sensing
element
Local Processor Basic algorithms
RMS, Mean, Var
FFT, Wavelets
Windowing
Set up alarm
Communication
Configuration
Command S/R
Data S/R
Self Checking Calibration
Compensation
Detection and
Diagnosis.
Intelligence DSP
Statistics
Neural Network
Fuzzy Logic
Local Memory
User Programme
Historic Data
Sensor health &
sensor data sheet
Environmental
Records
Alarm Settings
Comm. settings
Fieldbus
Interface
Communicatio
n
controller
Line tool
Communicatio
n
Library
Device Profile
Memory.
Intelligent Vibration Sensor
Figure 7: Schematic of the demonstrator Fieldbus–based smart sensor
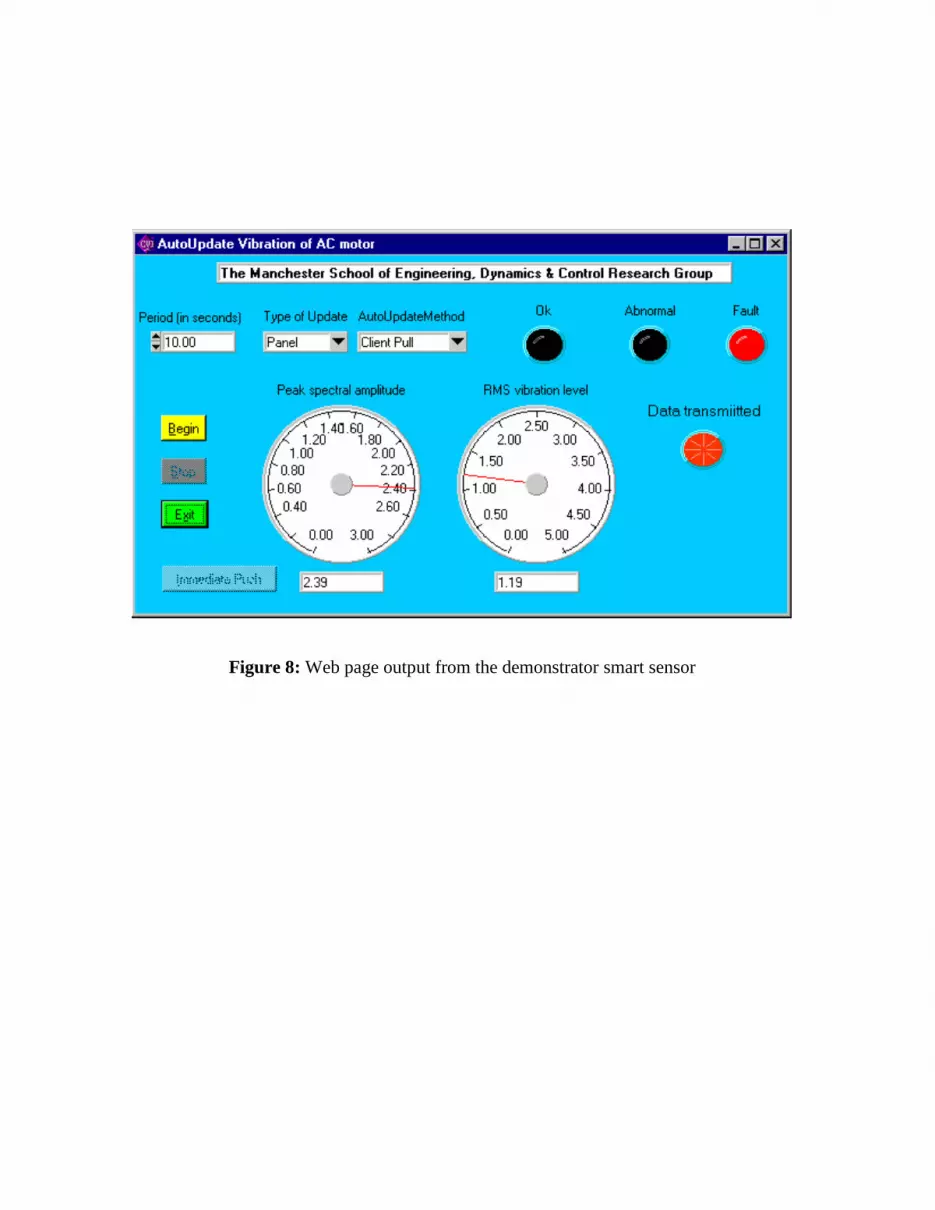
Figure 8: Web page output from the demonstrator smart sensor
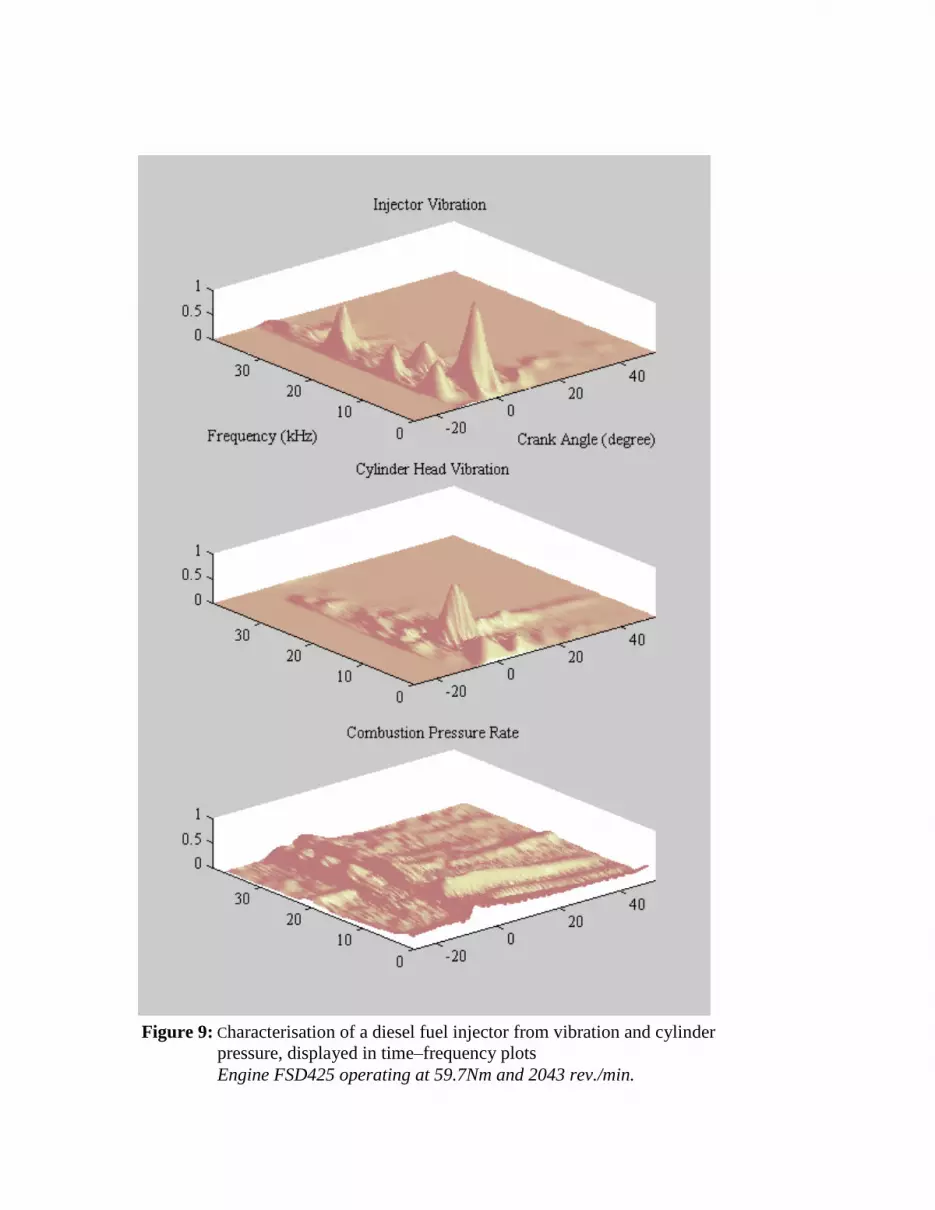
Figure 9: Characterisation of a diesel fuel injector from vibration and cylinder
pressure, displayed in time–frequency plots
Engine FSD425 operating at 59.7Nm and 2043 rev./min.