system dynamics and lean approach: development of a
TRANSCRIPT
applied sciences
Article
System Dynamics and Lean Approach: Developmentof a Technological Solution in a Regional ProductPackaging Company
Ernesto A. Lagarda-Leyva
�����������������
Citation: Lagarda-Leyva, E.A.
System Dynamics and Lean
Approach: Development of a
Technological Solution in a Regional
Product Packaging Company. Appl.
Sci. 2021, 11, 7938. https://
doi.org/10.3390/app11177938
Academic Editors: Jorge
Luis García-Alcaraz and
Cuauhtémoc Sánchez Ramírez
Received: 28 July 2021
Accepted: 24 August 2021
Published: 27 August 2021
Publisher’s Note: MDPI stays neutral
with regard to jurisdictional claims in
published maps and institutional affil-
iations.
Copyright: © 2021 by the author.
Licensee MDPI, Basel, Switzerland.
This article is an open access article
distributed under the terms and
conditions of the Creative Commons
Attribution (CC BY) license (https://
creativecommons.org/licenses/by/
4.0/).
Industrial Engineering Department at Sonora Institute of Technology, Cd. Obregón, Sonora 85000, Mexico;[email protected]
Abstract: This study was performed in a regional product marketing company located in CiudadObregón, Sonora, México, where a problem was detected in empirical decision-making due to theirrecent incorporation into the market. Thus, the objective of this study is the shelf-product productionlink, where the interest is in knowing the behavior of the main variables that influence the system.System dynamics methodology follows six steps: (1) Map the process under study with the valuestream map (VSM); (2) Create a causal diagram; (3) Elaborate the Forrester diagram and equations;(4) Validate the current model; (5) Simulate scenarios; (6) Create the graphical user interface. Themain results were the design of the scenarios starting from a robust system dynamics model, threescenarios, and the graphical interface. For this purpose, Stella Architect Software was used as it hasspecial attributes to create a graphical user interface. Furthermore, all the elements of the VSM wereadded under the Lean Startup approach. Significantly, the inadequate management of the materialswas detected, which is why the recommendation was to separate the packaging of dry and coldproducts to care for food innocuousness and the cold chain. Likewise, processing time decreased,reducing material transfer, which was detected by applying a future VSM based on the Lean Startupmethodology. The technological solution in this study is a contribution based on social sciencesand mathematics (nonlinear equations) using dynamics simulation to observe the complexity ofsystem behavior.
Keywords: system dynamics; value stream map; scenarios; simulation; logistics; supply chain
1. Introduction
The economic sectors are constituted of a series of diverse organizations, which arethe basis of the economy. With reference to the 2019 version of the Global CompetitivenessReport of the World Economic Forum (WEF), the economies with more potential are ledby the United States of America jointly with Singapore, Germany, Switzerland, and Japan,while in the other extreme, Haiti, Yemen, and Chad are the less competitive economies.This report is not necessarily only associated with greater income competitiveness but alsowith outstanding economic results, including life satisfaction [1]. México was positionedin 48th place according to this report, positioning it second place in Latin America belowChile [2].
Acknowledging the extraordinary events that occurred in 2020, and the unified globaleffort required to confront the health crisis and its socioeconomic consequences, the WEFsuspended spreading the Global Competitiveness Index rankings. Nevertheless, the 2021edition will retake the comparative assessment, providing a renewed framework to directfuture economic growth.
In México, the activities that have shown greater growth are those of the tertiary sector.The economic activities in the commercial and service sectors showed an annual increaseof 3.6% in July 2019. This sector positively influenced the total economic activity in México,
Appl. Sci. 2021, 11, 7938. https://doi.org/10.3390/app11177938 https://www.mdpi.com/journal/applsci
Appl. Sci. 2021, 11, 7938 2 of 19
which increased by 2.8% in July 2019. Within the tertiary sector, commercial activity was insecond place in economic expansion, which grew by 5.2% in the annual comparison [3].
According to data of the Ministry of Agriculture, Livestock, Hydraulic Resources,Fishing and Aquaculture [4], of the total exports, 73% were to the United States of Americaand Canada, the main commercial partners of México.
Sonora—the northwestern state in México bordering Arizona, USA—is first-place inthe worldwide export of pecan nuts, third in crystal wheat and asparagus, and seventhin zucchini. At the national level, the state is the leader in the production of zucchini,watermelon, potato, wheat, grapes, and asparagus, and second place in pecan nuts.
In comparison with the rest of the country, the state stands out for producing all thefood in the basic food basket. Additionally, in recent years, important growth has beenobserved in this sector, and sources of employment have strengthened [5].
According to the information gathered by ProMéxico (Federal Government Organisa-tion that coordinates strategies to strengthen the international economy), the main productthat the State of Sonora negotiates is electrical manufacturing, with 19.7% of the total exportvalue. Livestock and agriculture products are positioned in second place in the list with9.8%, and the metal-mechanic industry is in third place with 8.8% of the total export value.Likewise, the main countries that received products from Sonora were the United Statesreceiving 90.1% of the total export, followed by Japan with 3%, and in third place wasBelgium with 0.9% [6].
Export and import growth are due, in great measure, to the Treaty (T-MEC) betweenMéxico, the United States (USMCA), and Canada (CUSMA), which allows dealing (buying-selling) between participating countries by eliminating customs tariffs. Knowing thatthe United States is the greatest destination to receive products from México, business isreciprocal, since the US is the main issuer of liquified petroleum (LP), natural gas, gasoline,poultry, apples, pears, clothing, shoes, and more (Proyecto Puente, 2018). One of themain regions in the southern part of the state of Sonora that produces wheat is Valle delYaqui, located in Ciudad Obregón, where the Ministry of Agriculture, Livestock, HydraulicResources, Fisheries, and Aquaculture (SAGARPA) [4] will be located, with the purpose ofboosting farmland and breeding grounds and making good use of resources [7].
1.1. Problematic Situation
The focus of study in this research is centered on dry, long shelf-life products used inthe packaging process of a marketing company in the southern part of Sonora, México.
The organization where this study is performed is from the business subsector locatedin the tertiary sector because buying–selling activities are performed for greater or lesserproducts of the basic food basket, specifically shelf products (dry) such as oil, instant coffee,tuna fish, wheat cereal, rice, beans, and pasta (macaroni, spaghetti, and noodles). The focusof the study is in the area of product packaging (production) given that the activity ofplacing individual products is in containers that group together merchandise in a package.The trajectory of these articles performed by the enterprise is as follows: they go into palletsin packages for wholesale or retail (depending on the type of demand) and are taken to awarehouse. Figure 1 represents the process to obtain the packages of the basic food basket.
When an order arrives at the organization, product picking (recollection) is performedin the warehouse, and it is placed in crates used in production to form the packages. Onceready they are passed on to be sheltered in the conservation area. If the order is wholesale,the products are taken directly to the warehouse. When the required packages are complete,they are inspected and transferred to the corresponding transport according to the demand.
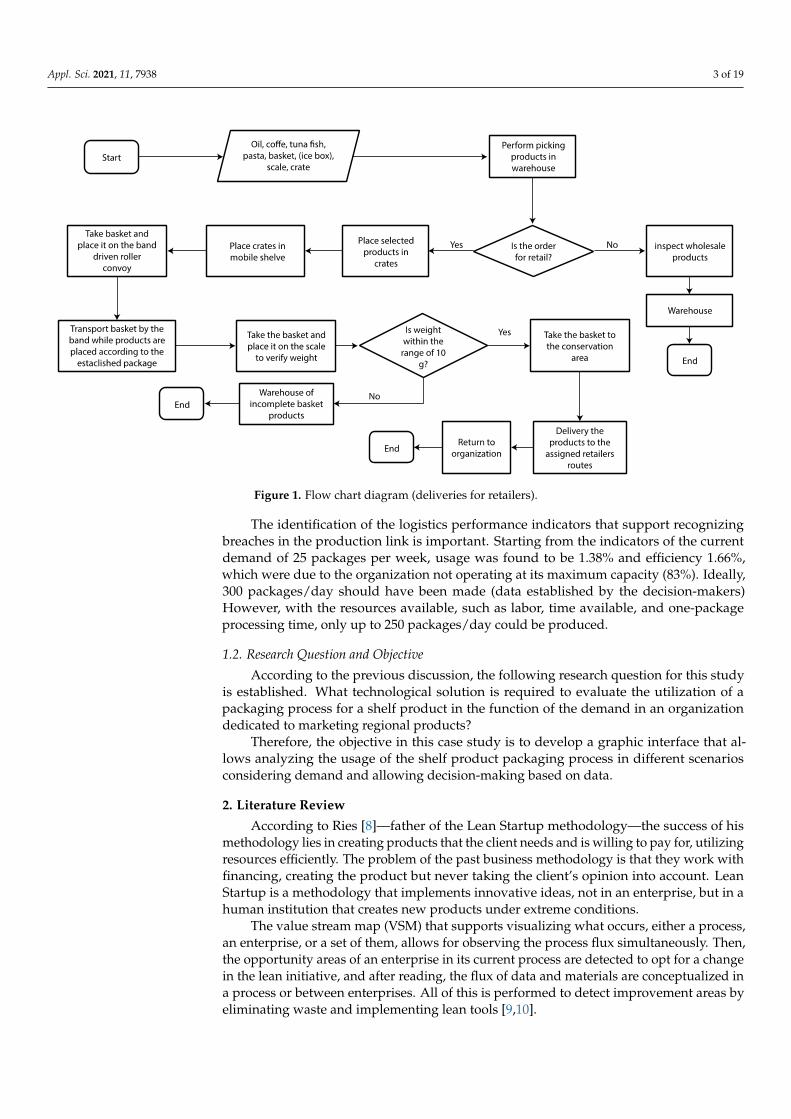
Appl. Sci. 2021, 11, 7938 3 of 19Appl. Sci. 2021, 11, x FOR PEER REVIEW 3 of 20
Figure 1. Flow chart diagram (deliveries for retailers).
When an order arrives at the organization, product picking (recollection) is per-formed in the warehouse, and it is placed in crates used in production to form the pack-ages. Once ready they are passed on to be sheltered in the conservation area. If the order is wholesale, the products are taken directly to the warehouse. When the required pack-ages are complete, they are inspected and transferred to the corresponding transport ac-cording to the demand.
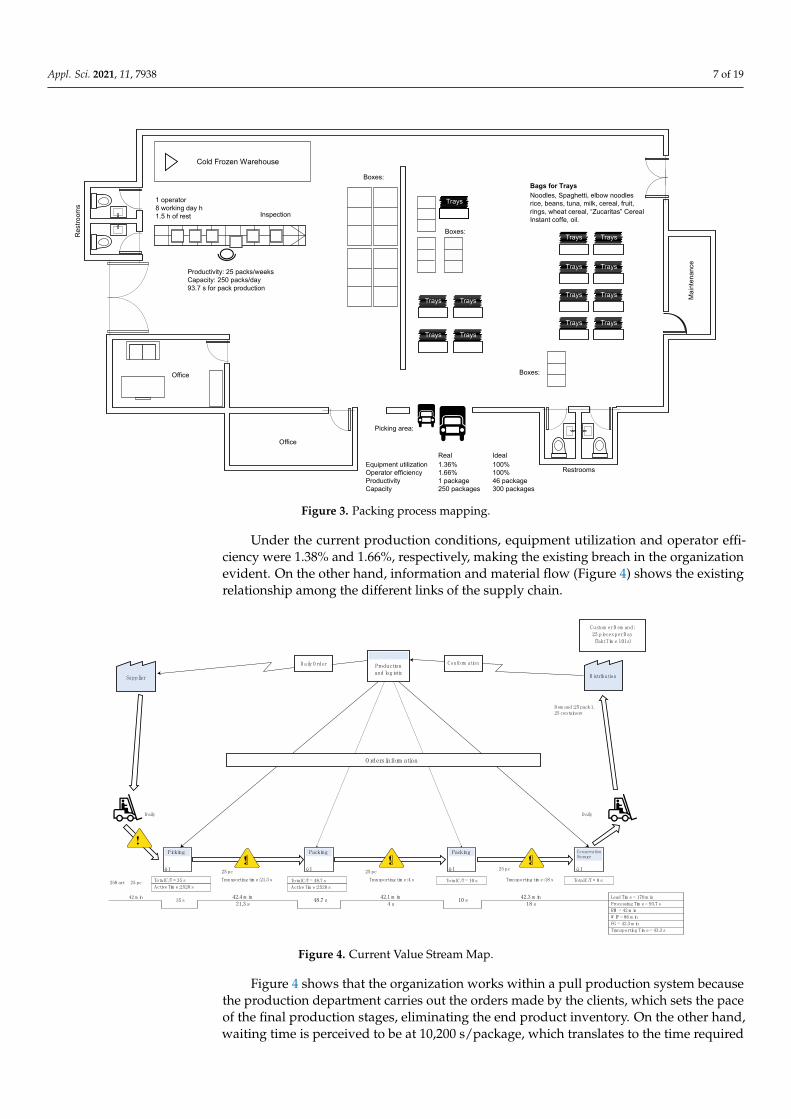
The identification of the logistics performance indicators that support recognizing breaches in the production link is important. Starting from the indicators of the current demand of 25 packages per week, usage was found to be 1.38% and efficiency 1.66%, which were due to the organization not operating at its maximum capacity (83%). Ideally, 300 packages/day should have been made (data established by the decision-makers) How-ever, with the resources available, such as labor, time available, and one-package pro-cessing time, only up to 250 packages/day could be produced.
1.2. Research Question and Objective According to the previous discussion, the following research question for this study
is established. What technological solution is required to evaluate the utilization of a pack-aging process for a shelf product in the function of the demand in an organization dedi-cated to marketing regional products?
Therefore, the objective in this case study is to develop a graphic interface that allows analyzing the usage of the shelf product packaging process in different scenarios consid-ering demand and allowing decision-making based on data.
2. Literature Review According to Ries [8]—father of the Lean Startup methodology—the success of his
methodology lies in creating products that the client needs and is willing to pay for, uti-lizing resources efficiently. The problem of the past business methodology is that they
Figure 1. Flow chart diagram (deliveries for retailers).
The identification of the logistics performance indicators that support recognizingbreaches in the production link is important. Starting from the indicators of the currentdemand of 25 packages per week, usage was found to be 1.38% and efficiency 1.66%,which were due to the organization not operating at its maximum capacity (83%). Ideally,300 packages/day should have been made (data established by the decision-makers)However, with the resources available, such as labor, time available, and one-packageprocessing time, only up to 250 packages/day could be produced.
1.2. Research Question and Objective
According to the previous discussion, the following research question for this studyis established. What technological solution is required to evaluate the utilization of apackaging process for a shelf product in the function of the demand in an organizationdedicated to marketing regional products?
Therefore, the objective in this case study is to develop a graphic interface that al-lows analyzing the usage of the shelf product packaging process in different scenariosconsidering demand and allowing decision-making based on data.
2. Literature Review
According to Ries [8]—father of the Lean Startup methodology—the success of hismethodology lies in creating products that the client needs and is willing to pay for, utilizingresources efficiently. The problem of the past business methodology is that they work withfinancing, creating the product but never taking the client’s opinion into account. LeanStartup is a methodology that implements innovative ideas, not in an enterprise, but in ahuman institution that creates new products under extreme conditions.
The value stream map (VSM) that supports visualizing what occurs, either a process,an enterprise, or a set of them, allows for observing the process flux simultaneously. Then,the opportunity areas of an enterprise in its current process are detected to opt for a changein the lean initiative, and after reading, the flux of data and materials are conceptualized ina process or between enterprises. All of this is performed to detect improvement areas byeliminating waste and implementing lean tools [9,10].

Appl. Sci. 2021, 11, 7938 4 of 19
The main idea of these methodologies is to conceptualize and parametrize a systeminitially. A time horizon is set up in which performance can be assessed in the supply chainwhere different policies and decisions to observe future scenarios can be considered. Inthis sense, the system dynamics methodology allows for clarity in the VSM and simulatingdynamic events in the function of variables and parameters that are related to knowingtheir behavior on time [11,12].
System dynamics are in charge of studying system data feedback and the means bywhich models are used for setting up and approaching problems, which are made with thepurpose of showing the organization structure and observing how such variables interactin the success of the enterprise [13]. From another point of view, different authors [14–17]have explained system dynamics as the behavior of a system adopting the methodologycreated [13] where a language is used to simulate and model complex problems.
On the one hand, García [16] mentioned that system dynamics, according to For-rester [14], is the methodology that allows for understanding change and making use ofequations to study complex phenomena. On the other hand, Senge [18] defines a systemas a totality, whose components gather because they affect reciprocally along time andwork with a common purpose—the word originally meant “causing a union”. Throughcompiling different concepts, a system is a set of processes that work jointly for a commongoal, which may be observed and analyzed by simulation.
Simulation is a process by which a mathematical model of a real aspect is established—all this by means of a computer [14]. On their part, Mantufar et al. [19] considered sim-ulation a tool used to respond to questions about an uncertain future, sharing the ideathat if the problem can be imagined, then it can be simulated. A scenario represents thecreation of a set of actions that gives, as a result, a history to test business plans or projects,thus, supporting strategic decision-makers facing uncertainties that may happen [20,21].Similarly, Vergara et al. [22] agreed in their work, that a scenario is the description of apotential or possible future, including the detail of how to reach it and explore the effect ofseveral events jointly.
The following empirical studies related to business process management (BPM) havebeen considered from a perspective that allows for observing the enterprise as an organiza-tion that analyzes the current state and identifies areas of performance improvement tocreate a more efficient and effective organization. The company takes a step back and looksat all of these processes as a whole and individually.
One of the most important and recent contributions is that of AlMulhim [23], whoexplored the impact of digital transformation to evaluate business performance with thesupport of intelligent technologies. The main findings, starting from the application of460 participants from 150 small and medium enterprises, demonstrated the importance ofrelating digital transformation and business performance.
The HORSE Project—where BPM was applied—investigated several of the new tech-nologies to find novel ways to improve flexibility. The purpose was to develop a systemintegrating these new technologies to support efficient and flexible manufacturing basedon the application and extension of BPM to manage dynamic manufacturing processes [24].
On the other hand, Kremert et al. [25] used a modeling process for intelligent enter-prises starting from understanding strategic topics to observe future behavior and trends.Their main findings show that the Business Process Model and Notation (BPMN), UnifiedModeling Language (UML), and Petri Net are the most relevant languages for smart man-ufacturing. The authors highlighted the need for developing new languages capable ofrepresenting the dynamics, interoperability, and multiple technologies to be considered.
A study developed in Germany by Kowalkiewicz et al. [26] was based on BPM,where a particular process was modeled in a business to measure its dependence on theinflexibility of the traditional chart models, which has been considered as the main sourceof process rigidity.
One of the studies related to operational performance (OP) and the use of LeanManagement (LM) techniques for the development of small and medium enterprises is
Appl. Sci. 2021, 11, 7938 5 of 19
that set out by Abdallah and Aljuaid [27], who applied and analyzed 268 surveys; amongtheir main findings were that the association of lean manufacturing techniques have apositive effect in operational performance. However, the effect of technical LM on bothtypes of innovation was not significant. In addition, process and management innovationspositively mediated the social LM–OP relationship.
Empirical studies have been developed with system dynamics related to the casestudy. For example, Perez and Parra [28] improved an assemblage line of front car seats.They considered modification in quantity and distribution of human talent and operationsusing a simulation model that represented and identified two improvement strategies. Thefirst one, with almost null investment, increased line productivity by 12% and reduced theidle time by 44%. The second one, called “integration of work centers”, broke productionparadigms and allowed for obtaining still greater benefits [28].
From another perspective, Cardiel, Baeza, and Lizarraga [29] analyzed the complexityassociated with the production systems to improve process yield through the Six Sigmaphilosophy, using a dynamic model; the results showed an improvement in process yieldby increasing the Sigma level that allowed for validating the proposed approach.
The work of Amezquitas and Chamorro [30] simulated the behavior of the mainagribusiness productive chains that belong to the Department of Bolivar. The authorsfound different scenarios that were set out to determine the sensitivity and how thesechanges affected the productivity, employment, and usefulness of the actors. When 10% ofincreases and decreases showed in the participation percentages of the hectares harvested,all the actors experienced similar variations, either profits and/or losses.
Indeed, an informatics model conducted by Soto et al. [31] allowed for simulating theeffect of Knowledge Management on the corn production industry. The result achievedwas due to the application of Knowledge Management production that increased throughsystem stability. Another recommendation is to perform the same study with the samemethodology but applied to other agribusiness environments.
Several works have focused—as is this research—on the study of the agri-food supplychain, such as Herrera and Orjuela [32], who identified the implementation dynamics oftraceability technologies in the fruit chain. As a result, the conclusion of the implementationeffect of traceability technology in the fruit supply chain was reached, as well as the rela-tionship with investment capacity and product quality. Toro and Becerra [33] analyzed thecotton agri-chain in Colombia using system dynamics to identify potential improvementsat the logistics and decision-making levels, considering growth and variables, such asthe harvested area and the production of the cotton sector. Analysis and diagnosis of thecotton sector and scenarios started from different variables to create a model that generatedimprovement in these variables.
Indore et al. [34] estimated the future demand of construction materials in Colombiaand the necessary minerals to produce them using system dynamics and material fluxanalysis. The results indicated that 176.9 Mt of crushed aggregate, river sand, gray cement,dead rock, and fired ceramics were required, without considering secondary materialsupply from 2014 to 2017. For cement and concrete production, 15.4 Mt of limestone, 14.9of gravel, 14.1 of gypsum, 13.3, 9.7, and 9.3 of clay, iron minerals, and sand, respectively,were also required.
3. Materials and Methods
The materials used to execute the project included the following software: VensimPLE®, (Version 8.2.1, Ventana System Inc., Harvard, MA, USA, 2019) for causal loopsdiagrams; Stella Architect®, 2020 (Version 1.9.1, Isee Systems Inc., Lebanon, NH, USA,2019) for flow and stock models, simulation, and graphical interfaces. This software waschosen because it included the module for designing graphical interfaces and could alsorun them online, which is not expensive for the final user.

Appl. Sci. 2021, 11, 7938 6 of 19
Excel® (Microsoft, Redmond, WA, USA, 2018) was used to process data and infor-mation that did not need additional modules for specific statistics considerations; basicarithmetical functions were included in formulas.
Visio® (version 15.0.4623.100, Microsoft, Redmond, WA, USA, 2013) was used for flowdiagrams and íGrafx® (version 17.8.1.816.3586, Tualatin, OR, USA, 2021) for VSM, which isone of the most popular software programs for creating Value Stream Maps.
The method was followed in six steps according to Lagarda-Leyva [11]: (1) Mappingthe process being studied by means of a value stream map (VSM); (2) Creating a causal dia-gram; (3) Elaborating the stock and levels diagram, as well as the equations; (4) Validatingthe current model; (5) Simulating scenarios; (6) Creating the graphic interface. See Figure 2.
Appl. Sci. 2021, 11, x FOR PEER REVIEW 6 of 20
3. Materials and Methods The materials used to execute the project included the following software: Vensim
PLE®, (Version 8.2.1, Ventana System Inc., Harvard, MA, USA, 2019) for causal loops dia-grams; Stella Architect®, 2020 (Version 1.9.1, Isee Systems Inc., Lebanon, NH, USA, 2019) for flow and stock models, simulation, and graphical interfaces. This software was chosen because it included the module for designing graphical interfaces and could also run them online, which is not expensive for the final user.
Excel® (Microsoft, Redmond, WA, USA, 2018) was used to process data and infor-mation that did not need additional modules for specific statistics considerations; basic arithmetical functions were included in formulas.
Visio® (version 15.0.4623.100, Microsoft, Redmond, WA, USA, 2013) was used for flow diagrams and íGrafx® (version 17.8.1.816.3586, Tualatin, OR, USA, 2021) for VSM, which is one of the most popular software programs for creating Value Stream Maps.
The method was followed in six steps according to Lagarda-Leyva [11]: (1) Mapping the process being studied by means of a value stream map (VSM); (2) Creating a causal diagram; (3) Elaborating the stock and levels diagram, as well as the equations; (4) Vali-dating the current model; (5) Simulating scenarios; (6) Creating the graphic interface. See Figure 2.
Figure 2. System dynamics methodology.
As a suggestion for stage 5 of the method, open source software (OSS) could be con-sidered since Stella Architect (Version 1.9.1, Isee Systems Inc., Lebanon, NH, USA, 2019) software has an elevated cost in the market and could be a limit in implementing the so-lution. The only option the company has for its use is one month with the limitation that the graphical interphase cannot be stored. Thus, simulators that integrate the graphical interface of the OSS type could be explored, one of which is Simul8 (Student version, Simul8 Corporation, Boston, MA, USA, 2021).
Simul8 is a very popular simulation software that enables organizations to make rapid and confident decisions. It is highly intuitive, affordable, and fast software with ad-vanced features. It can be accessed online, using a desktop, or through a network license. Moreover, it can model processes of any scale and complexity. Precisely, it is an all-in-one solution that is extremely easy to use, flexible, and powerful.
4. Results 4.1. Mapping the Process under Study by a Value Stream Map
The packaging process of the basic basket dry products was characterized. Figure 3 exemplifies the production area beside the warehouse and conservation areas that partic-ipate in the process. It also shows data related to the current capacity of the band, which
Figure 2. System dynamics methodology.
As a suggestion for stage 5 of the method, open source software (OSS) could beconsidered since Stella Architect (Version 1.9.1, Isee Systems Inc., Lebanon, NH, USA,2019) software has an elevated cost in the market and could be a limit in implementing thesolution. The only option the company has for its use is one month with the limitation thatthe graphical interphase cannot be stored. Thus, simulators that integrate the graphicalinterface of the OSS type could be explored, one of which is Simul8 (Student version,Simul8 Corporation, Boston, MA, USA, 2021).
Simul8 is a very popular simulation software that enables organizations to make rapidand confident decisions. It is highly intuitive, affordable, and fast software with advancedfeatures. It can be accessed online, using a desktop, or through a network license. Moreover,it can model processes of any scale and complexity. Precisely, it is an all-in-one solutionthat is extremely easy to use, flexible, and powerful.
4. Results4.1. Mapping the Process under Study by a Value Stream Map
The packaging process of the basic basket dry products was characterized. Figure 3exemplifies the production area beside the warehouse and conservation areas that par-ticipate in the process. It also shows data related to the current capacity of the band,which at the moment of the study was 250 packages/day. However, only an average of25 packages/week is demanded, which is operated by only one employee, who workseight h/day, with a production capacity of one package in 93.7 s.
Appl. Sci. 2021, 11, 7938 7 of 19
Appl. Sci. 2021, 11, x FOR PEER REVIEW 7 of 20
at the moment of the study was 250 packages/day. However, only an average of 25 pack-ages/week is demanded, which is operated by only one employee, who works eight h/day, with a production capacity of one package in 93.7 s.
Figure 3. Packing process mapping.
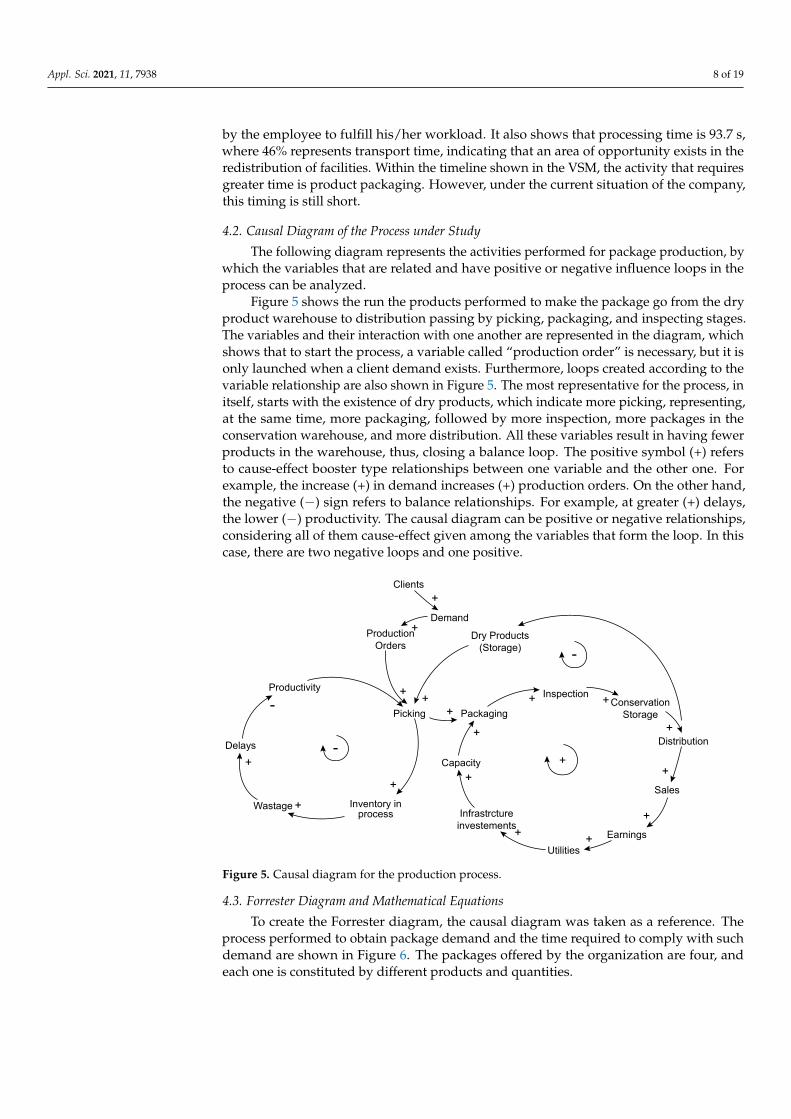
Under the current production conditions, equipment utilization and operator effi-ciency were 1.38% and 1.66%, respectively, making the existing breach in the organization evident. On the other hand, information and material flow (Figure 4) shows the existing relationship among the different links of the supply chain.
Figure 4 shows that the organization works within a pull production system because the production department carries out the orders made by the clients, which sets the pace of the final production stages, eliminating the end product inventory. On the other hand, waiting time is perceived to be at 10,200 s/package, which translates to the time required by the employee to fulfill his/her workload. It also shows that processing time is 93.7 s, where 46% represents transport time, indicating that an area of opportunity exists in the redistribution of facilities. Within the timeline shown in the VSM, the activity that requires greater time is product packaging. However, under the current situation of the company, this timing is still short.
Cold Frozen Warehouse
1 operator8 working day h1.5 h of rest Inspection
Productivity: 25 packs/weeksCapacity: 250 packs/day93.7 s for pack production
Boxes:
Boxes:
TraysTrays
Trays Trays
Trays Trays
Trays Trays
Trays Trays
Trays Trays
Trays Trays
Boxes:Office
Office
Picking area:
Real Ideal1.36%1.66%1 package250 packages
100%100%46 package300 packages
Equipment utilizationOperator efficiencyProductivityCapacity
Mai
nten
ance
Restrooms
Res
troom
s
Bags for TraysNoodles, Spaghetti, elbow noodlesrice, beans, tuna, milk, cereal, fruit,rings, wheat cereal, “Zucaritas” CerealInstant coffe, oil.
Figure 3. Packing process mapping.
Under the current production conditions, equipment utilization and operator effi-ciency were 1.38% and 1.66%, respectively, making the existing breach in the organizationevident. On the other hand, information and material flow (Figure 4) shows the existingrelationship among the different links of the supply chain.
Appl. Sci. 2021, 11, x FOR PEER REVIEW 8 of 20
Figure 4. Current Value Stream Map.
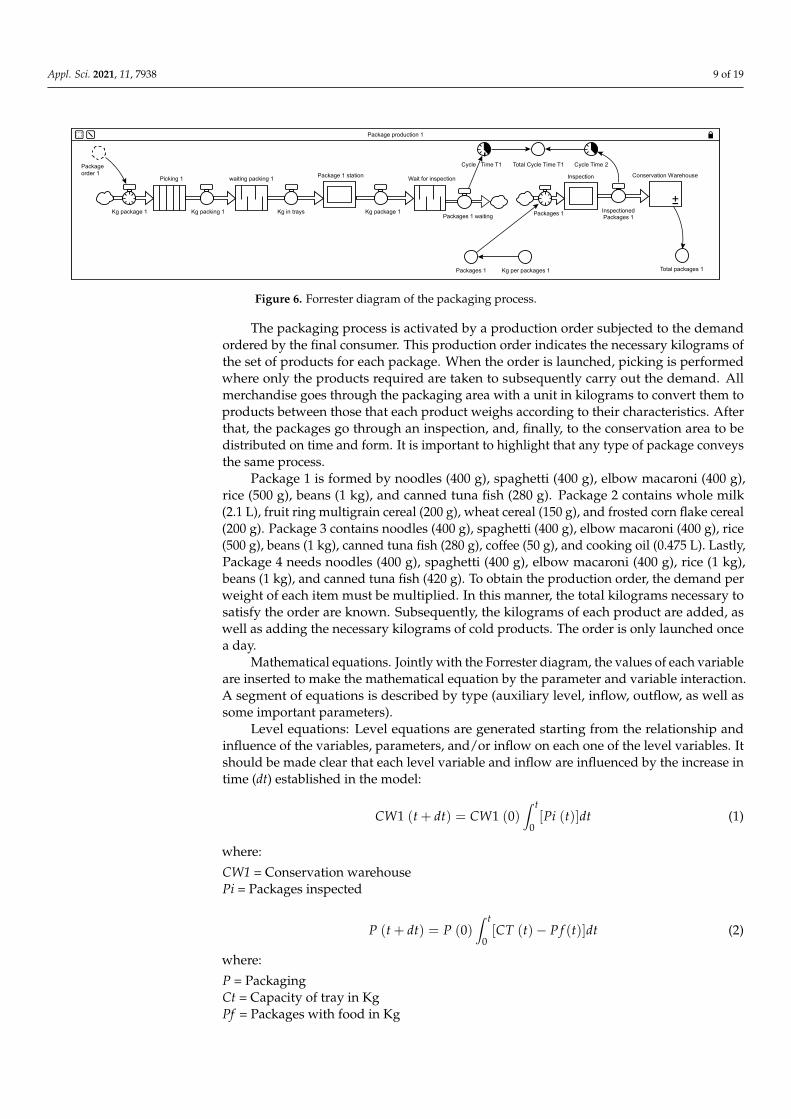
4.2. Causal Diagram of the Process under Study The following diagram represents the activities performed for package production,
by which the variables that are related and have positive or negative influence loops in the process can be analyzed.
Figure 5 shows the run the products performed to make the package go from the dry product warehouse to distribution passing by picking, packaging, and inspecting stages. The variables and their interaction with one another are represented in the diagram, which shows that to start the process, a variable called “production order” is necessary, but it is only launched when a client demand exists. Furthermore, loops created according to the variable relationship are also shown in Figure 5. The most representative for the process, in itself, starts with the existence of dry products, which indicate more picking, representing, at the same time, more packaging, followed by more inspection, more pack-ages in the conservation warehouse, and more distribution. All these variables result in having fewer products in the warehouse, thus, closing a balance loop. The positive symbol (+) refers to cause-effect booster type relationships between one variable and the other one. For example, the increase (+) in demand increases (+) production orders. On the other hand, the negative (−) sign refers to balance relationships. For example, at greater (+) de-lays, the lower (−) productivity. The causal diagram can be positive or negative relation-ships, considering all of them cause-effect given among the variables that form the loop. In this case, there are two negative loops and one positive.
Transporting tim e: 21.3 s
42.4 m in21.3 s
25 pc
35 s 48.7 s
Total C/T = 35 s
Active Tim e: 2520 s
Total C/T = 48.7 s
Active Tim e: 2520 s
Packing
1! !
42.1 m in4 s
Transporting tim e: 4 s
25 pc
10 s
Total C/T = 10 s
Packing
1!
!
42 m in
250 art 25 pc
Picking
1
O rders Inform ation
25 pc
42.3 m in18 s
ConservationStorage
1
Transporting tim e: 18 s
Productionand logistic
Conform ationD aily O rder
Total C/T = 0 s
D aily
D em and: 25 pack 1.25 containers
D aily
Supplier D istribution
Custom er D em and:25 pieces per D ay(Takt Tim e 101s)
Lead Tim e = 170 m in
Processing Tim e = 93.7 s
RM = 42 m in
W IP = 86 m in
FG = 42.3 m in
Transporting Tim e = 43.3 s
Figure 4. Current Value Stream Map.
Figure 4 shows that the organization works within a pull production system becausethe production department carries out the orders made by the clients, which sets the paceof the final production stages, eliminating the end product inventory. On the other hand,waiting time is perceived to be at 10,200 s/package, which translates to the time required
Appl. Sci. 2021, 11, 7938 8 of 19
by the employee to fulfill his/her workload. It also shows that processing time is 93.7 s,where 46% represents transport time, indicating that an area of opportunity exists in theredistribution of facilities. Within the timeline shown in the VSM, the activity that requiresgreater time is product packaging. However, under the current situation of the company,this timing is still short.
4.2. Causal Diagram of the Process under Study
The following diagram represents the activities performed for package production, bywhich the variables that are related and have positive or negative influence loops in theprocess can be analyzed.
Figure 5 shows the run the products performed to make the package go from the dryproduct warehouse to distribution passing by picking, packaging, and inspecting stages.The variables and their interaction with one another are represented in the diagram, whichshows that to start the process, a variable called “production order” is necessary, but it isonly launched when a client demand exists. Furthermore, loops created according to thevariable relationship are also shown in Figure 5. The most representative for the process, initself, starts with the existence of dry products, which indicate more picking, representing,at the same time, more packaging, followed by more inspection, more packages in theconservation warehouse, and more distribution. All these variables result in having fewerproducts in the warehouse, thus, closing a balance loop. The positive symbol (+) refersto cause-effect booster type relationships between one variable and the other one. Forexample, the increase (+) in demand increases (+) production orders. On the other hand,the negative (−) sign refers to balance relationships. For example, at greater (+) delays,the lower (−) productivity. The causal diagram can be positive or negative relationships,considering all of them cause-effect given among the variables that form the loop. In thiscase, there are two negative loops and one positive.
Appl. Sci. 2021, 11, x FOR PEER REVIEW 9 of 20
Figure 5. Causal diagram for the production process.
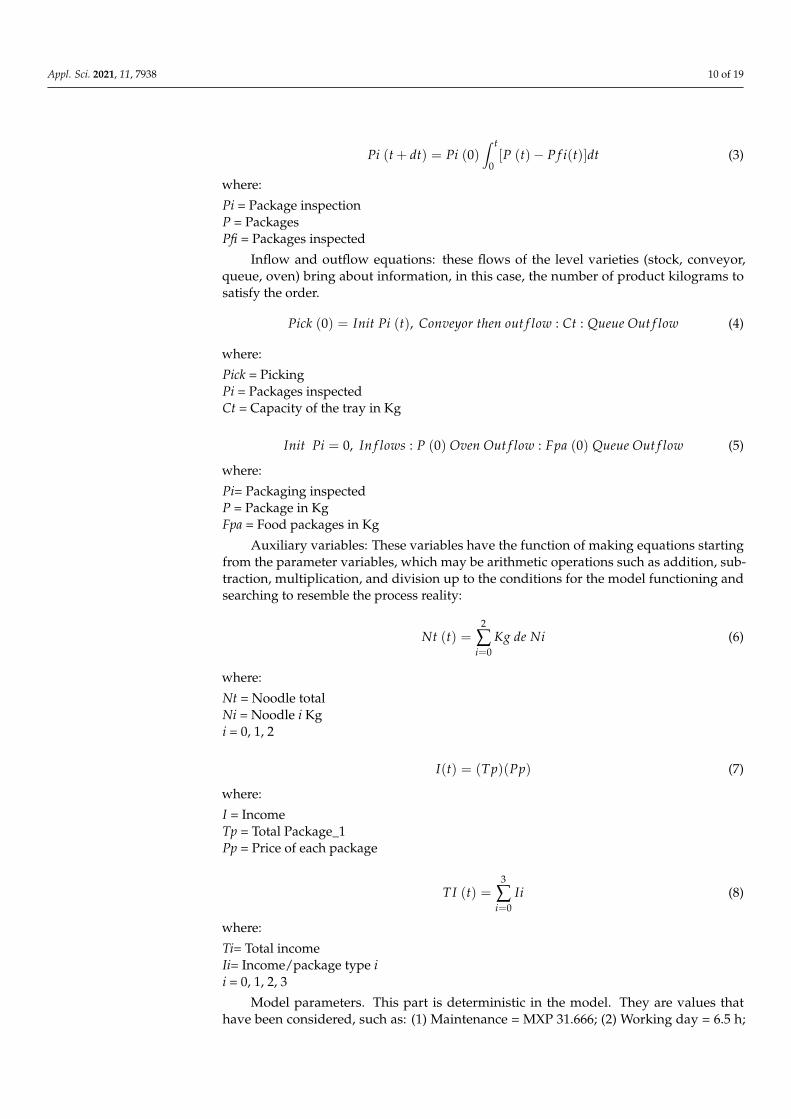
4.3. Forrester Diagram and Mathematical Equations To create the Forrester diagram, the causal diagram was taken as a reference. The
process performed to obtain package demand and the time required to comply with such demand are shown in Figure 6. The packages offered by the organization are four, and each one is constituted by different products and quantities.
Figure 6. Forrester diagram of the packaging process.
The packaging process is activated by a production order subjected to the demand ordered by the final consumer. This production order indicates the necessary kilograms of the set of products for each package. When the order is launched, picking is performed where only the products required are taken to subsequently carry out the demand. All merchandise goes through the packaging area with a unit in kilograms to convert them to products between those that each product weighs according to their characteristics. After that, the packages go through an inspection, and, finally, to the conservation area to be distributed on time and form. It is important to highlight that any type of package conveys the same process.
Package 1 is formed by noodles (400 g), spaghetti (400 g), elbow macaroni (400 g), rice (500 g), beans (1 kg), and canned tuna fish (280 g). Package 2 contains whole milk (2.1 L), fruit ring multigrain cereal (200 g), wheat cereal (150 g), and frosted corn flake cereal (200 g). Package 3 contains noodles (400 g), spaghetti (400 g), elbow macaroni (400 g), rice (500 g), beans (1 kg), canned tuna fish (280 g), coffee (50 g), and cooking oil (0.475 L). Lastly, Package 4 needs noodles (400 g), spaghetti (400 g), elbow macaroni (400 g), rice (1
Productivity
Picking
Delays
Wastage Inventory inprocess
Clients
ProductionOrders
Demand
Dry Products(Storage)
Packaging
Capacity
InspectionConservation
Storage
Sales
Earnings
Distribution
Utilities
Infrastrctureinvestements
+
+ +
+
+++
+
+
+ +
+
++
+
++
-
-+
-
Package order 1
Kg package 1 Kg packing 1
Picking 1 waiting packing 1
Kg in trays
Package 1 station Wait for inspection
Kg package 1
Cycle Time T1 Total Cycle Time T1
Packages 1 Kg per packages 1 Total packages 1
Inspection
Cycle Time 2
Packages 1 waiting Packages 1 InspectionedPackages 1
Conservation Warehouse
Package production 1
+
Figure 5. Causal diagram for the production process.
4.3. Forrester Diagram and Mathematical Equations
To create the Forrester diagram, the causal diagram was taken as a reference. Theprocess performed to obtain package demand and the time required to comply with suchdemand are shown in Figure 6. The packages offered by the organization are four, andeach one is constituted by different products and quantities.
Appl. Sci. 2021, 11, 7938 9 of 19
Appl. Sci. 2021, 11, x FOR PEER REVIEW 9 of 20
Figure 5. Causal diagram for the production process.
4.3. Forrester Diagram and Mathematical Equations To create the Forrester diagram, the causal diagram was taken as a reference. The
process performed to obtain package demand and the time required to comply with such demand are shown in Figure 6. The packages offered by the organization are four, and each one is constituted by different products and quantities.
Figure 6. Forrester diagram of the packaging process.
The packaging process is activated by a production order subjected to the demand ordered by the final consumer. This production order indicates the necessary kilograms of the set of products for each package. When the order is launched, picking is performed where only the products required are taken to subsequently carry out the demand. All merchandise goes through the packaging area with a unit in kilograms to convert them to products between those that each product weighs according to their characteristics. After that, the packages go through an inspection, and, finally, to the conservation area to be distributed on time and form. It is important to highlight that any type of package conveys the same process.
Package 1 is formed by noodles (400 g), spaghetti (400 g), elbow macaroni (400 g), rice (500 g), beans (1 kg), and canned tuna fish (280 g). Package 2 contains whole milk (2.1 L), fruit ring multigrain cereal (200 g), wheat cereal (150 g), and frosted corn flake cereal (200 g). Package 3 contains noodles (400 g), spaghetti (400 g), elbow macaroni (400 g), rice (500 g), beans (1 kg), canned tuna fish (280 g), coffee (50 g), and cooking oil (0.475 L). Lastly, Package 4 needs noodles (400 g), spaghetti (400 g), elbow macaroni (400 g), rice (1
Productivity
Picking
Delays
Wastage Inventory inprocess
Clients
ProductionOrders
Demand
Dry Products(Storage)
Packaging
Capacity
InspectionConservation
Storage
Sales
Earnings
Distribution
Utilities
Infrastrctureinvestements
+
+ +
+
+++
+
+
+ +
+
++
+
++
-
-+
-
Package order 1
Kg package 1 Kg packing 1
Picking 1 waiting packing 1
Kg in trays
Package 1 station Wait for inspection
Kg package 1
Cycle Time T1 Total Cycle Time T1
Packages 1 Kg per packages 1 Total packages 1
Inspection
Cycle Time 2
Packages 1 waiting Packages 1 InspectionedPackages 1
Conservation Warehouse
Package production 1
+
Figure 6. Forrester diagram of the packaging process.
The packaging process is activated by a production order subjected to the demandordered by the final consumer. This production order indicates the necessary kilograms ofthe set of products for each package. When the order is launched, picking is performedwhere only the products required are taken to subsequently carry out the demand. Allmerchandise goes through the packaging area with a unit in kilograms to convert them toproducts between those that each product weighs according to their characteristics. Afterthat, the packages go through an inspection, and, finally, to the conservation area to bedistributed on time and form. It is important to highlight that any type of package conveysthe same process.
Package 1 is formed by noodles (400 g), spaghetti (400 g), elbow macaroni (400 g),rice (500 g), beans (1 kg), and canned tuna fish (280 g). Package 2 contains whole milk(2.1 L), fruit ring multigrain cereal (200 g), wheat cereal (150 g), and frosted corn flake cereal(200 g). Package 3 contains noodles (400 g), spaghetti (400 g), elbow macaroni (400 g), rice(500 g), beans (1 kg), canned tuna fish (280 g), coffee (50 g), and cooking oil (0.475 L). Lastly,Package 4 needs noodles (400 g), spaghetti (400 g), elbow macaroni (400 g), rice (1 kg),beans (1 kg), and canned tuna fish (420 g). To obtain the production order, the demand perweight of each item must be multiplied. In this manner, the total kilograms necessary tosatisfy the order are known. Subsequently, the kilograms of each product are added, aswell as adding the necessary kilograms of cold products. The order is only launched oncea day.
Mathematical equations. Jointly with the Forrester diagram, the values of each variableare inserted to make the mathematical equation by the parameter and variable interaction.A segment of equations is described by type (auxiliary level, inflow, outflow, as well assome important parameters).
Level equations: Level equations are generated starting from the relationship andinfluence of the variables, parameters, and/or inflow on each one of the level variables. Itshould be made clear that each level variable and inflow are influenced by the increase intime (dt) established in the model:
CW1 (t + dt) = CW1 (0)∫ t
0[Pi (t)]dt (1)
where:
CW1 = Conservation warehousePi = Packages inspected
P (t + dt) = P (0)∫ t
0[CT (t)− P f (t)]dt (2)
where:
P = PackagingCt = Capacity of tray in KgPf = Packages with food in Kg
Appl. Sci. 2021, 11, 7938 10 of 19
Pi (t + dt) = Pi (0)∫ t
0[P (t)− P f i(t)]dt (3)
where:
Pi = Package inspectionP = PackagesPfi = Packages inspected
Inflow and outflow equations: these flows of the level varieties (stock, conveyor,queue, oven) bring about information, in this case, the number of product kilograms tosatisfy the order.
Pick (0) = Init Pi (t), Conveyor then out f low : Ct : Queue Out f low (4)
where:
Pick = PickingPi = Packages inspectedCt = Capacity of the tray in Kg
Init Pi = 0, In f lows : P (0) Oven Out f low : Fpa (0) Queue Out f low (5)
where:
Pi= Packaging inspectedP = Package in KgFpa = Food packages in Kg
Auxiliary variables: These variables have the function of making equations startingfrom the parameter variables, which may be arithmetic operations such as addition, sub-traction, multiplication, and division up to the conditions for the model functioning andsearching to resemble the process reality:
Nt (t) =2
∑i=0
Kg de Ni (6)
where:
Nt = Noodle totalNi = Noodle i Kgi = 0, 1, 2
I(t) = (Tp)(Pp) (7)
where:
I = IncomeTp = Total Package_1Pp = Price of each package
TI (t) =3
∑i=0
Ii (8)
where:
Ti= Total incomeIi= Income/package type ii = 0, 1, 2, 3
Model parameters. This part is deterministic in the model. They are values thathave been considered, such as: (1) Maintenance = MXP 31.666; (2) Working day = 6.5 h;
Appl. Sci. 2021, 11, 7938 11 of 19
(3) Electricity (light) = MXP 79.7157; (4) Sale price of Package_1 = MXP 212.52; (5) Coldproduct = 1.7 kg (the prices are in Mexican pesos (MXP)).
4.4. Validation of the Current Model
Three model validation forms were performed. First, an extreme condition test wasconsidered where demand of zero packages and model run were obtained; no action wasperformed in any operation to obtain packages. The simulation of placing zero packages asdemand is shown in the charts within the processes without activity, which shows that itcomplies with the test of extreme conditions [35].
The second test consisted of units where the program Stella Architect Lab® (ISEESystems, Lebanon, NH, USA) verifies that the model has zero errors in the units generatedby the equations. The consistency of the units in the current dry production model refersto the equation units that have an agreement since the dimension of each one of the termsshows mathematical equality in all the algebraic expressions.
As a final test, the graphic interface of the model functioning is shown descriptivelyand clearly to the user for a better understanding of the parties interested. This testhighlights that the simulated process is similar to the real process in structure and function.
4.5. Scenario Simulation
Values of the critical variables of the model are set, representing the conditions inwhich the organization may run into and, thus, know the behavior of the variables involvedin the process.
Normal scenario: To carry out the simulation, the real variable values of the currentprocess were set, and the process was run with consumer demand of 25 packages/day. Thesimulated production and model yielded 25 packages in the conservation warehouse forType 1; the local production had a cycle time of 0.65 h. For package types 2 and 3, zeropackages were obtained in the conservation warehouse, when currently these types ofpackages had not been ordered.
Pessimistic scenario: This scenario takes place when no consumer demand has beenplaced, that is, none of the packages were ordered, so no production order exists.
Optimistic scenario: On the one hand, to simulate the optimistic scenario, the VSM toolwas used. Starting from the current VSM previously performed, a future was formulated,in which by the Lean Startup methodology the future of the company was visualized,taking as a basis all the Lean Manufacturing techniques. In the VSM outline under thecurrent situation, a significant part of the process time was observed consumed by rawmatter transport from the warehouse to the production area. After detecting this problem,the decision was taken to implement a supermarket close to the production area, whichwould contain the raw matter for a whole day and decrease the distances run by thematerial managers.
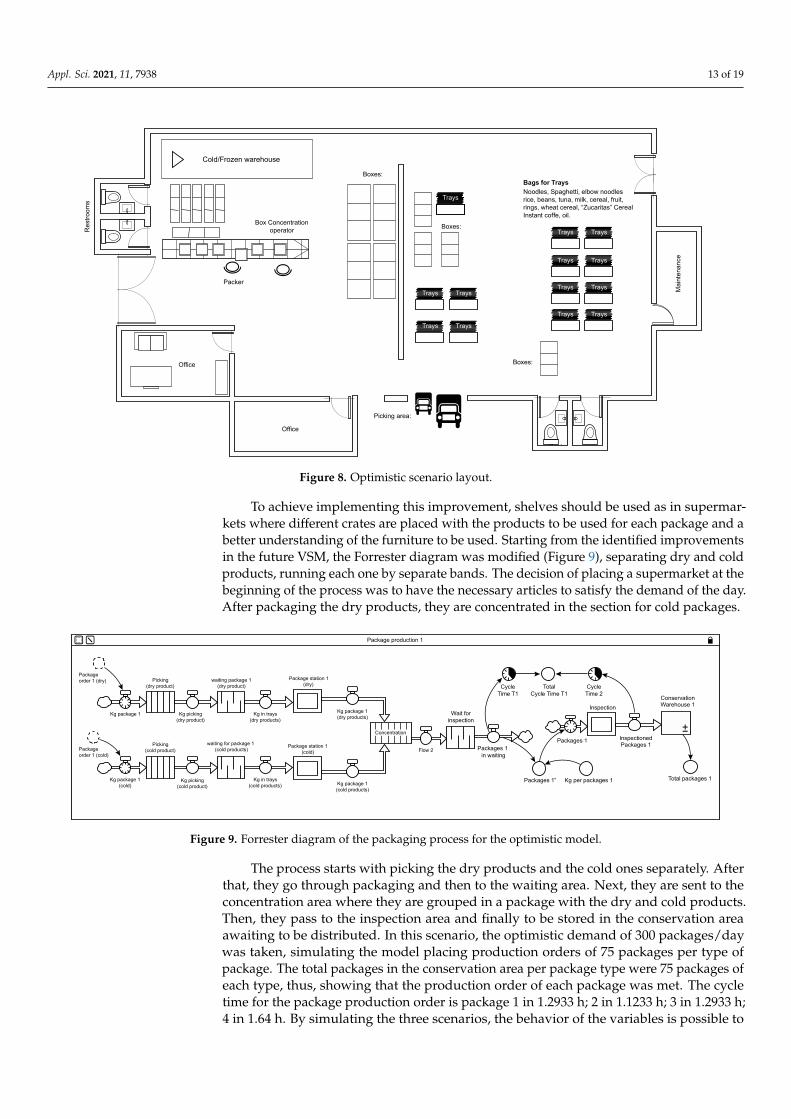
On the other hand, the decision was taken to separate dry and cold products, takingcare of food innocuousness and the cold chain. This decision initiated the creation of aconcentration area, whose function would be to gather the portions of the dry and coldproducts that form the final package. To avoid a bottleneck in the production lines, asupermarket of final products was established, where the operator would place a portionof dry products while waiting for the cold ones to concentrate them in the same package. Itshould be mentioned that during the creation of the new scenario, cold product packagingproduction was considered out of reach in the current project, but its inventory wasconsidered, as shown in Figure 7.

Appl. Sci. 2021, 11, 7938 12 of 19
Appl. Sci. 2021, 11, x FOR PEER REVIEW 12 of 20
Optimistic scenario: On the one hand, to simulate the optimistic scenario, the VSM tool was used. Starting from the current VSM previously performed, a future was formu-lated, in which by the Lean Startup methodology the future of the company was visual-ized, taking as a basis all the Lean Manufacturing techniques. In the VSM outline under the current situation, a significant part of the process time was observed consumed by raw matter transport from the warehouse to the production area. After detecting this problem, the decision was taken to implement a supermarket close to the production area, which would contain the raw matter for a whole day and decrease the distances run by the ma-terial managers.
On the other hand, the decision was taken to separate dry and cold products, taking care of food innocuousness and the cold chain. This decision initiated the creation of a concentration area, whose function would be to gather the portions of the dry and cold products that form the final package. To avoid a bottleneck in the production lines, a su-permarket of final products was established, where the operator would place a portion of dry products while waiting for the cold ones to concentrate them in the same package. It should be mentioned that during the creation of the new scenario, cold product packaging production was considered out of reach in the current project, but its inventory was con-sidered, as shown in Figure 7.
Figure 7. Optimistic VSM scenario.
Figure 7 shows that to achieve the functioning of supermarkets, Kanban cards were used, either production, withdrawal, or withdrawal per lot cards. For better control of Kanban cards, a Heijunka box should be used, which functions by means of a pitch that refers to the time in which each Kanban card should be moved to use them efficiently. The movement of Kanban cards starts in the conservation area process where the employee in this area takes a withdrawal card from the Heijunka box, takes the quantity established by the card from the supermarket, and works with it. Once the supermarket is discharged, the production operator proceeds to take the production cards and performs what is re-quired on the card, filling out again the supermarket from the concentration area. Once the packer uses all the raw matter by means of production cards, he/she performs picking from the supermarket the raw matter as indicated on the card.
Figure 7. Optimistic VSM scenario.
Figure 7 shows that to achieve the functioning of supermarkets, Kanban cards wereused, either production, withdrawal, or withdrawal per lot cards. For better control ofKanban cards, a Heijunka box should be used, which functions by means of a pitch thatrefers to the time in which each Kanban card should be moved to use them efficiently. Themovement of Kanban cards starts in the conservation area process where the employee inthis area takes a withdrawal card from the Heijunka box, takes the quantity established bythe card from the supermarket, and works with it. Once the supermarket is discharged, theproduction operator proceeds to take the production cards and performs what is requiredon the card, filling out again the supermarket from the concentration area. Once the packeruses all the raw matter by means of production cards, he/she performs picking from thesupermarket the raw matter as indicated on the card.
To supply the supermarket with the raw matter, a Kanban card lot type is used,indicating that the supply is only once for the raw matter used for the whole day. This cardis sent to the production and logistics area where they send the raw matter requirements tothe supply link for the warehouse, closing, in this manner, the cycle of using Kanban cards.
One of the main improvements of the process is found in the processing times thatdecreased by 38.42%, achieving being able to establish them in 57.7 s. This result was dueto the change of picking activity by implementing the raw matter supermarket. Anotheractivity that benefitted was the packaging, with the reduction of 8 s in their work, whichwas achieved by using Kanban cards since they generate more organized work. Theconcentration area is an addition to the process, but because it is an activity of littlelabor load, it is not considered as critical variable. Another element that is favored istransportation time since it decreases by following a suggestion with the plant distribution.To carry out this scenario, a slight change in the company facilities is required as shown inFigure 8.
Appl. Sci. 2021, 11, 7938 13 of 19
Appl. Sci. 2021, 11, x FOR PEER REVIEW 13 of 20
To supply the supermarket with the raw matter, a Kanban card lot type is used, in-dicating that the supply is only once for the raw matter used for the whole day. This card is sent to the production and logistics area where they send the raw matter requirements to the supply link for the warehouse, closing, in this manner, the cycle of using Kanban cards.
One of the main improvements of the process is found in the processing times that decreased by 38.42%, achieving being able to establish them in 57.7 s. This result was due to the change of picking activity by implementing the raw matter supermarket. Another activity that benefitted was the packaging, with the reduction of 8 s in their work, which was achieved by using Kanban cards since they generate more organized work. The con-centration area is an addition to the process, but because it is an activity of little labor load, it is not considered as critical variable. Another element that is favored is transportation time since it decreases by following a suggestion with the plant distribution. To carry out this scenario, a slight change in the company facilities is required as shown in Figure 8.
Figure 8. Optimistic scenario layout.
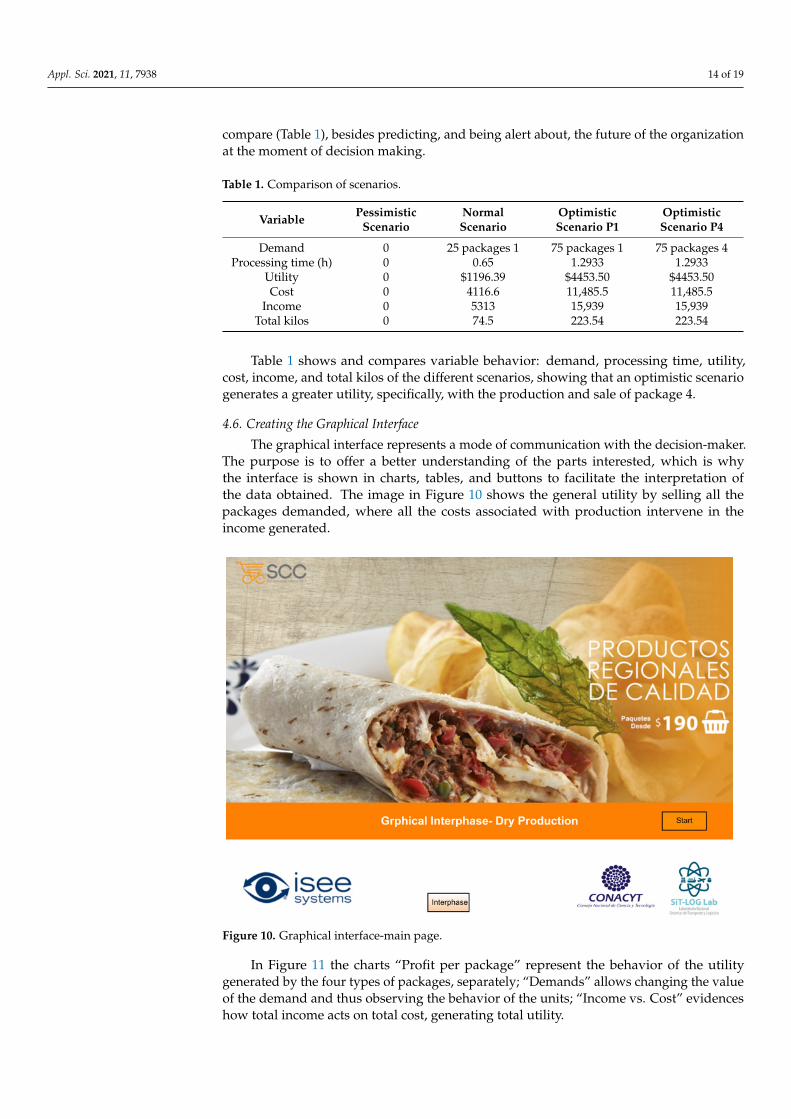
To achieve implementing this improvement, shelves should be used as in supermar-kets where different crates are placed with the products to be used for each package and a better understanding of the furniture to be used. Starting from the identified improve-ments in the future VSM, the Forrester diagram was modified (Figure 9), separating dry and cold products, running each one by separate bands. The decision of placing a super-market at the beginning of the process was to have the necessary articles to satisfy the demand of the day. After packaging the dry products, they are concentrated in the section for cold packages.
Restrooms
Cold/Frozen warehouse
Box Concentrationoperator Boxes:
Boxes:
TraysTrays
Trays Trays
Trays Trays
Trays Trays
Trays Trays
Trays Trays
Trays Trays
Boxes:Office
Office
Picking area:
Mai
nten
ance
Res
troom
s
Bags for TraysNoodles, Spaghetti, elbow noodlesrice, beans, tuna, milk, cereal, fruit,rings, wheat cereal, “Zucaritas” CerealInstant coffe, oil.
Packer
Figure 8. Optimistic scenario layout.
To achieve implementing this improvement, shelves should be used as in supermar-kets where different crates are placed with the products to be used for each package and abetter understanding of the furniture to be used. Starting from the identified improvementsin the future VSM, the Forrester diagram was modified (Figure 9), separating dry and coldproducts, running each one by separate bands. The decision of placing a supermarket at thebeginning of the process was to have the necessary articles to satisfy the demand of the day.After packaging the dry products, they are concentrated in the section for cold packages.
Appl. Sci. 2021, 11, x FOR PEER REVIEW 14 of 20
Figure 9. Forrester diagram of the packaging process for the optimistic model.
The process starts with picking the dry products and the cold ones separately. After that, they go through packaging and then to the waiting area. Next, they are sent to the concentration area where they are grouped in a package with the dry and cold products. Then, they pass to the inspection area and finally to be stored in the conservation area awaiting to be distributed. In this scenario, the optimistic demand of 300 packages/day was taken, simulating the model placing production orders of 75 packages per type of package. The total packages in the conservation area per package type were 75 packages of each type, thus, showing that the production order of each package was met. The cycle time for the package production order is package 1 in 1.2933 h; 2 in 1.1233 h; 3 in 1.2933 h; 4 in 1.64 h. By simulating the three scenarios, the behavior of the variables is possible to compare (Table 1), besides predicting, and being alert about, the future of the organization at the moment of decision making.
Table 1. Comparison of scenarios.
Variable Pessimistic Scenario
Normal Sce-nario
Optimistic Scenario P1
Optimistic Scenario P4
Demand 0 25 packages 1 75 packages 1 75 packages 4 Processing time (h) 0 0.65 1.2933 1.2933
Utility 0 $1196.39 $4453.50 $4453.50 Cost 0 4116.6 11,485.5 11,485.5
Income 0 5313 15,939 15,939 Total kilos 0 74.5 223.54 223.54
Table 1 shows and compares variable behavior: demand, processing time, utility, cost, income, and total kilos of the different scenarios, showing that an optimistic scenario generates a greater utility, specifically, with the production and sale of package 4.
4.6. Creating the Graphical Interface The graphical interface represents a mode of communication with the decision-
maker. The purpose is to offer a better understanding of the parts interested, which is why the interface is shown in charts, tables, and buttons to facilitate the interpretation of the data obtained. The image in Figure 10 shows the general utility by selling all the packages demanded, where all the costs associated with production intervene in the income gener-ated.
Packageorder 1 (dry)
Kg package 1 Kg picking(dry product)
Picking(dry product)
waiting package 1(dry product)
Kg in trays(dry products)
Package station 1(dry)
Kg package 1(dry products)
Concentration
Kg package 1(cold)
Kg picking(cold product)
Kg in trays(cold products) Kg package 1
(cold products)
Packageorder 1 (cold)
Picking(cold product)
waiting for package 1 (cold products)
Package station 1(cold) Flow 2
Wait forinspection
Packages 1 in waiting
Packages 1 InspectionedPackages 1
CycleTime T1
TotalCycle Time T1
CycleTime 2
InspectionConservationWarehouse 1
Total packages 1Kg per packages 1Packages 1”
+
Package production 1
Figure 9. Forrester diagram of the packaging process for the optimistic model.
The process starts with picking the dry products and the cold ones separately. Afterthat, they go through packaging and then to the waiting area. Next, they are sent to theconcentration area where they are grouped in a package with the dry and cold products.Then, they pass to the inspection area and finally to be stored in the conservation areaawaiting to be distributed. In this scenario, the optimistic demand of 300 packages/daywas taken, simulating the model placing production orders of 75 packages per type ofpackage. The total packages in the conservation area per package type were 75 packages ofeach type, thus, showing that the production order of each package was met. The cycletime for the package production order is package 1 in 1.2933 h; 2 in 1.1233 h; 3 in 1.2933 h;4 in 1.64 h. By simulating the three scenarios, the behavior of the variables is possible to
Appl. Sci. 2021, 11, 7938 14 of 19
compare (Table 1), besides predicting, and being alert about, the future of the organizationat the moment of decision making.
Table 1. Comparison of scenarios.
Variable PessimisticScenario
NormalScenario
OptimisticScenario P1
OptimisticScenario P4
Demand 0 25 packages 1 75 packages 1 75 packages 4Processing time (h) 0 0.65 1.2933 1.2933
Utility 0 $1196.39 $4453.50 $4453.50Cost 0 4116.6 11,485.5 11,485.5
Income 0 5313 15,939 15,939Total kilos 0 74.5 223.54 223.54
Table 1 shows and compares variable behavior: demand, processing time, utility,cost, income, and total kilos of the different scenarios, showing that an optimistic scenariogenerates a greater utility, specifically, with the production and sale of package 4.
4.6. Creating the Graphical Interface
The graphical interface represents a mode of communication with the decision-maker.The purpose is to offer a better understanding of the parts interested, which is whythe interface is shown in charts, tables, and buttons to facilitate the interpretation ofthe data obtained. The image in Figure 10 shows the general utility by selling all thepackages demanded, where all the costs associated with production intervene in theincome generated.
Appl. Sci. 2021, 11, x FOR PEER REVIEW 15 of 20
Figure 10. Graphical interface-main page.
In Figure 11 the charts “Profit per package” represent the behavior of the utility gen-erated by the four types of packages, separately; “Demands” allows changing the value of the demand and thus observing the behavior of the units; “Income vs. Cost” evidences how total income acts on total cost, generating total utility.
Figure 11. Graphical interface incomes.
Figure 10. Graphical interface-main page.
In Figure 11 the charts “Profit per package” represent the behavior of the utilitygenerated by the four types of packages, separately; “Demands” allows changing the valueof the demand and thus observing the behavior of the units; “Income vs. Cost” evidenceshow total income acts on total cost, generating total utility.

Appl. Sci. 2021, 11, 7938 15 of 19
Appl. Sci. 2021, 11, x FOR PEER REVIEW 15 of 20
Figure 10. Graphical interface-main page.
In Figure 11 the charts “Profit per package” represent the behavior of the utility gen-erated by the four types of packages, separately; “Demands” allows changing the value of the demand and thus observing the behavior of the units; “Income vs. Cost” evidences how total income acts on total cost, generating total utility.
Figure 11. Graphical interface incomes. Figure 11. Graphical interface incomes.
The pie chart symbolizes the production cost, such as labor, maintenance, electricity,and raw matter. Additionally, the tabs “Costs” and “Raw Materials Costs” allow formodifying the costs associated with production.
The optimistic scenario created another model, which generated a second interfacethat facilitates understanding the behavior of this new scenario. The screens in this interfaceare similar to those of the current model, changing only the behavior of the charts andvariable values. Because of the separation of dry and cold production, two screens werealso added, one showing the VSM future where the best proposals are shown, and theother one with the proposed layout.
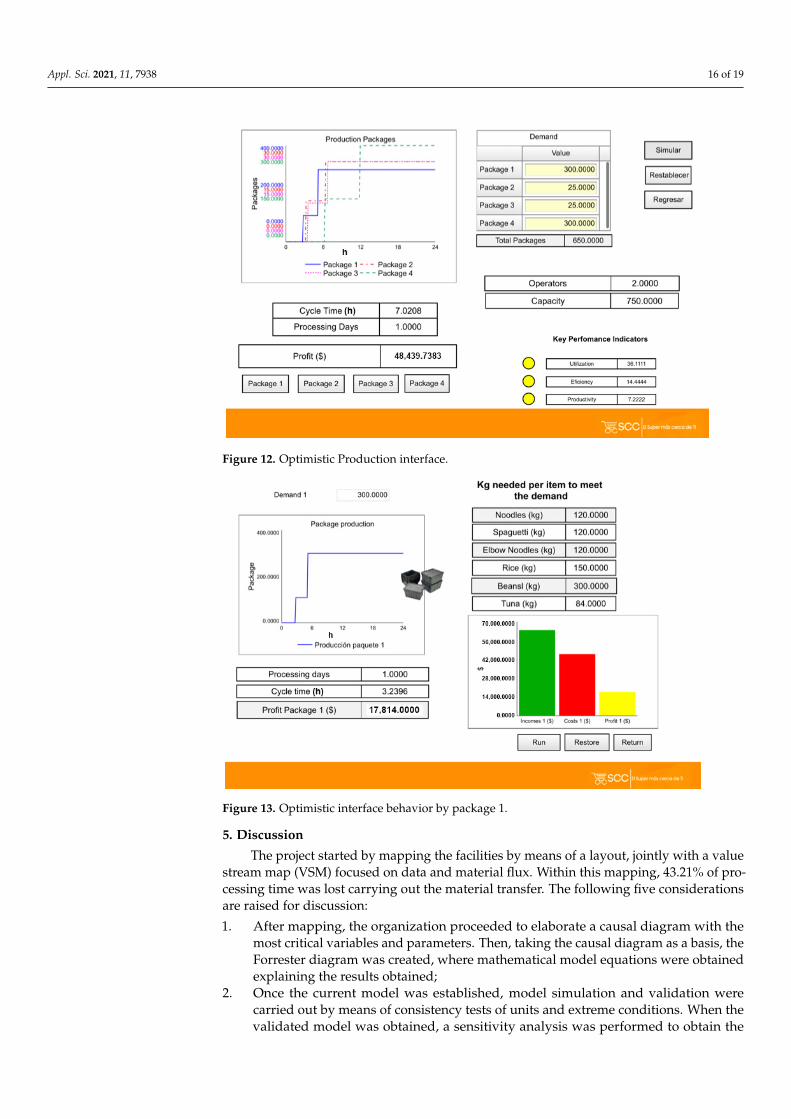
The optimistic production behavior scheme (Figure 12) is shown in the chart “Pro-duced Packages” simulating the demand and packaging process behavior. In the “Demand”chart, the number of packages is placed to satisfy the production order.
The relevant information is cycle time and number of days required to satisfy thedemand of each package type, number of required operators, and utility generated with thepackages sold. Likewise, the process indicators reveal performance, which compared to thereal situation, shows that, with the optimistic scenario, the indicators express better results.
Additionally, by means of this interface, the productive behavior of each type ofpackage can be observed, as shown in Figure 13.
The chart “Demand 1” allows for modifying the total value of the packages to beproduced. The production behavior of the packages in demand can be observed in thechart and with it, know the cycle time and necessary day to satisfy the order. Likewise,income behavior and costs that generate package sale utility can be analyzed. Data foundin this screen is equivalent for package types 2, 3, and 4.
Appl. Sci. 2021, 11, 7938 16 of 19
Appl. Sci. 2021, 11, x FOR PEER REVIEW 16 of 20
The pie chart symbolizes the production cost, such as labor, maintenance, electricity, and raw matter. Additionally, the tabs “Costs” and “Raw Materials Costs” allow for mod-ifying the costs associated with production.
The optimistic scenario created another model, which generated a second interface that facilitates understanding the behavior of this new scenario. The screens in this inter-face are similar to those of the current model, changing only the behavior of the charts and variable values. Because of the separation of dry and cold production, two screens were also added, one showing the VSM future where the best proposals are shown, and the other one with the proposed layout.
The optimistic production behavior scheme (Figure 12) is shown in the chart “Pro-duced Packages” simulating the demand and packaging process behavior. In the “De-mand” chart, the number of packages is placed to satisfy the production order.
The relevant information is cycle time and number of days required to satisfy the demand of each package type, number of required operators, and utility generated with the packages sold. Likewise, the process indicators reveal performance, which compared to the real situation, shows that, with the optimistic scenario, the indicators express better results.
Figure 12. Optimistic Production interface.
Additionally, by means of this interface, the productive behavior of each type of package can be observed, as shown in Figure 13.
Figure 12. Optimistic Production interface.
Appl. Sci. 2021, 11, x FOR PEER REVIEW 17 of 20
Figure 13. Optimistic interface behavior by package 1.
The chart “Demand 1” allows for modifying the total value of the packages to be produced. The production behavior of the packages in demand can be observed in the chart and with it, know the cycle time and necessary day to satisfy the order. Likewise, income behavior and costs that generate package sale utility can be analyzed. Data found in this screen is equivalent for package types 2, 3, and 4.
5. Discussion The project started by mapping the facilities by means of a layout, jointly with a value
stream map (VSM) focused on data and material flux. Within this mapping, 43.21% of processing time was lost carrying out the material transfer. The following five considera-tions are raised for discussion: 1. After mapping, the organization proceeded to elaborate a causal diagram with the
most critical variables and parameters. Then, taking the causal diagram as a basis, the Forrester diagram was created, where mathematical model equations were ob-tained explaining the results obtained;
2. Once the current model was established, model simulation and validation were car-ried out by means of consistency tests of units and extreme conditions. When the validated model was obtained, a sensitivity analysis was performed to obtain the op-timistic and pessimistic models. It is worth mentioning that the pessimistic scenario appears to be the current situation that the company is going through because of the advanced situation of its business;
3. To obtain the optimistic scenario, the VSM was taken as a basis following the Lean Startup methodology that allows for idealizing the road for the company develop-ment placing as a priority the client needs. Thus, the company is obliged to change its way of supplying the production process, since it showed a loss of time in transfer, an activity that does add value to the final product;
4. To elaborate the new optimistic model, the products had to be divided into dry, fresh, and frozen in each package with the purpose of taking care of the cold chain and innocuousness;
5. All findings, including the experience of modeling with system dynamics methodol-ogy and knowledge about the exogenous and endogenous variables of the complex system are related to contributions [36–40].
Figure 13. Optimistic interface behavior by package 1.
5. Discussion
The project started by mapping the facilities by means of a layout, jointly with a valuestream map (VSM) focused on data and material flux. Within this mapping, 43.21% of pro-cessing time was lost carrying out the material transfer. The following five considerationsare raised for discussion:
1. After mapping, the organization proceeded to elaborate a causal diagram with themost critical variables and parameters. Then, taking the causal diagram as a basis, theForrester diagram was created, where mathematical model equations were obtainedexplaining the results obtained;
2. Once the current model was established, model simulation and validation werecarried out by means of consistency tests of units and extreme conditions. When thevalidated model was obtained, a sensitivity analysis was performed to obtain the

Appl. Sci. 2021, 11, 7938 17 of 19
optimistic and pessimistic models. It is worth mentioning that the pessimistic scenarioappears to be the current situation that the company is going through because of theadvanced situation of its business;
3. To obtain the optimistic scenario, the VSM was taken as a basis following the LeanStartup methodology that allows for idealizing the road for the company developmentplacing as a priority the client needs. Thus, the company is obliged to change its wayof supplying the production process, since it showed a loss of time in transfer, anactivity that does add value to the final product;
4. To elaborate the new optimistic model, the products had to be divided into dry,fresh, and frozen in each package with the purpose of taking care of the cold chainand innocuousness;
5. All findings, including the experience of modeling with system dynamics methodol-ogy and knowledge about the exogenous and endogenous variables of the complexsystem are related to contributions [36–40].
According to Richardson et al. [41], the development of a graphical user interfaceusing Stella® Architect (Version 1.9.1, Isee Systems Inc., Lebanon, NH, USA, 2021) is anavailable option for organizations. However, two important facts should be considered:(1) a person with knowledge of the use of the software and the basic concepts of systemdynamics methodology is required for future modifications of the model, based on newconstraints, variables, or parameters; (2) the price of the software and of investing inlicenses, which have a significant cost in the market, should be considered.
Another interesting reference is the methodology applied by Di Nardo et al. [42], whoredefined and reorganized the supply chain stock management from a logistic 4.0 environ-mental perspective to guarantee high levels of customer availability and reliability in anIndustry 4.0 smart environment.
Future Work. The future work to be developed will be implementing the model torespond to real and future demand. Based on the capacity of the company, it should requirecontinuous improvement processes. Another solution may be based on the physical Inter-net to keep products packed. In the Physical Internet approach, the goods are encapsulatedin modular dimensions, reusable or recyclable, and smart containers [43].
6. Conclusions
The completion of this project met the objective of developing a graphical user inter-face that would allow for analyzing the packaging process of shelf products in differentscenarios, considering the demand and decision-making based on quantitative data. Thus,the purpose of solving the problem detected was achieved by finding the technological so-lution and observing the use of the packaging process in the function of the demand. Withthese detected actions, the company under study was able to understand how the mostcritical variables of the production link behave and close the gap in the lack of informationfor decision-making, which is based on empirical data, improving the development of thecompany, and from the perspective of previous empirical studies reviewed in this research.It is important to evaluate the purchase of Stella Architect Software.
Therefore, the scientific contribution of this study, from the perspective of the dynamicsystems theory, is based on the use of mathematics, systemic thought, and general systemtheory. The purpose is to model, mathematically, and in cause–effect relationships, complexproductive systems of non-linear behavior through dynamic simulation that allows forhaving information on future scenarios for decision-making based on endogenous andexogenous data and variables.
Funding: The author is grateful to the Instituto Tecnológico de Sonora (ITSON) for financing supportthrough the project PROFAPI 2021. Grant number: DFP300320569.
Institutional Review Board Statement: The study did not involve humans or animals.
Data Availability Statement: The study did not report any data.
Appl. Sci. 2021, 11, 7938 18 of 19
Acknowledgments: The author E.A.L.-L., is grateful to The National Science and Technology Councilof México (CONACYT) through the Instituto Tecnológico de Sonora (ITSON), National Laboratoryin Transportation and Logistic-ITSON; special thanks to the Company Sistema Comercial Cerradofor opening their facilities and provide primary data.
Conflicts of Interest: The author declares no conflict of interest. The funders had no role in the designof the study; in the collection, analyses, or interpretation of data; in the writing of the manuscript, orin the decision to publish the results.
References1. Foro Económico Mundial. Available online: http://www3.weforum.org/docs/WEF_TheGlobalCompetitivenessReport2019.pdf
(accessed on 16 October 2019).2. Forbes. Available online: https://www.forbes.com.mx/industria-4-0-oportunidades-y-retos-en-mexico/ (accessed on 11 May 2019).3. García, A.K. (25 de Septiembre de 2018). Indicador Global de Actividad Económica: Comercio y Servicios, los Motores de Crecimiento
de la Actividad Económica en México. Available online: https://www.eleconomista.com.mx/economia/Comercio-y-servicios-los-motores-de-crecimiento-de-la-actividad-economica-en-Mexico-20180925-0055.html (accessed on 25 September 2018).
4. SAGARPA. 2020. Available online: http://www.sagarpa.mx/quienesomos/introduccion/Paginas/default.aspx(accessed on 15 February 2021).
5. Miranda, M. Uniradio Noticias. Available online: https://www.uniradionoticias.com/noticias/reportajesespeciales/438658/exportaciones-ponen-en-el-mapa-mundial-a-sonora.htm (accessed on 25 September 2016).
6. Fimbres, A. 20 minutos Editora SL, (9 de septiembre de 2017). Notimex. Sonora Exporta Bienes Manufacturados y productosagricolas. Available online: https://www.20minutos.com.mx/noticia/267511/0/sonora-exporta-bienes-manufacturados-y-productos-agricolas/ (accessed on 14 September 2017).
7. Ayala, E. Ayala, E. (15 de Agosto de 2018). Transición 2018. Reducción en Importaciones de Granos Beneficiaría a Estados Produc-tores. Available online: https://www.eleconomista.com.mx/estados/Reduccion-en-importaciones-de-granos-beneficiaria-a-estados-productores--20180815-0004.html (accessed on 14 August 2018).
8. Ries, E. El Método Lean Startup; Grupo Planeta: Barcelona, Spain, 2012.9. Jones, D.; Womack, J. Lean Thinking: Cómo Utilizar el Pensamiento Lean para Eliminar los Despilfarros y Crear Valor en la Empresa;
Grupo Planeta: Barcelona, Spain, 2018.10. Cabrera, R. TPS Americanizado: Manual de Manufactura Esbelta. 2014. Available online: https://play.google.com/store/books/
details/TPS_Americanizado_Manual_de_Manufactura_Esbelta?id=gvwRAwAAQBAJ&hl=es (accessed on 4 March 2021).11. Lagarda-Leyva, E.A. Introducción a la Dinámica de Sistemas, Casos y Ejercicios de Aplicación en el Sector Agroalimentario; Pearson:
London, UK, 2019.12. Lagarda-Leyva, E.A.; Bueno-Solano, A.; Vea-Valdez, H.P.; Machado, D.O. Dynamic Model and Graphical User Interface: A
Solution for the Distribution Process of Regional Products. Appl. Sci. 2020, 10, 4481. [CrossRef]13. Forrester, J. Dinámica Industrial (Segunda Edición); El Ateneo: Buenos Aires, Argentina, 1981.14. Aracil, J. Publicaciones de Ingeniería de sistemas: Dinámica de Sistemas; Isdefe: Madrid, Spain, 1995. Available online: https:
//www.academia.utp.ac.pa/sites/default/files/docente/51/dinsist-dinamica_sistemas.pdf (accessed on 2 November 2019).15. Aracil, J.; Gordillo, F. Dinámica de Sistemas; Alianza Editorial; Universidad Textor: Madrid, Spain, 1995.16. García, E.; Reyes, H.G.; Cárdenas, L. Simulación y Análisis de Sistemas con ProModel; Pearson Educación: London, UK, 2006.17. García, J.M. Teoría y Ejercicios Prácticos de Dinámica de Sistemas: Dinámica de Sistemas (Cuarta Edición); Spain. 2018.
Available online: https://www.amazon.com.mx/Teor%C3%ADa-Ejercicios-Prácticos-Dinámica-Sistemas/dp/1718137931#customerReviews (accessed on 28 November 2019).
18. Senge, P. La Quinta Disciplina. (Segunda Edición); Granica: Buenos Aires, Argentina, 2005.19. Mantufar, M.; Flores, H.; Hein, H.; López, J.; Martínez, O.; Santori, G. Investigación de Operaciones; Grupo Editorial: Mexico, 2018.
Available online: https://editorialpatria.com.mx/pdffiles/9786074386967.pdf (accessed on 23 August 2021).20. Sterman, J. Business Dynamics: Systems Thinking and Modeling for a Complex World; McGraw Hill: New York, NY, USA, 2000.21. Postma, T.; Liebl, F. How to improve scenario analysis as a strategic management tool? Technol. Forecast. Soc. Chang. 2005,
72, 161–173. [CrossRef]22. Vergara, J.; Fontalvo, T.; Maza, F. La planeación por escenarios: Revisión de conceptos y propuestas metodológicas. Prospectiva
2010, 8, 21–29.23. AlMulhim, A.F. Smart supply chain and firm performance: The role of digital technologies. Bus. Process Manag. J. 2021,
27, 1353–1372. [CrossRef]24. Erasmus, J.; Vanderfeesten, I.; Traganos, K.; Keulen, R.; Grefen, P. The HORSE Project: The Application of Business Process
Management for Flexibility in Smart Manufacturing. Appl. Sci. 2020, 10, 4145. [CrossRef]25. Sott, M.K.; Furstenau, L.B.; Kipper, L.M.; Reckziegel Rodrigues, Y.P.; López-Robles, J.R.; Giraldo, F.D.; Cobo, M.J. Process
modeling for smart factories: Using science mapping to understand the strategic themes, main challenges and future trends.Bus. Process Manag. J. 2021, 27, 1391–1417. [CrossRef]
Appl. Sci. 2021, 11, 7938 19 of 19
26. Kowalkiewicz, M.; Lu, R.; Bäuerle, S.; Krümpelmann, M.; Lippe, S. Weak Dependencies in Business Process Models. In BusinessInformation Systems. BIS 2008. Lecture Notes in Business Information Processing; Abramowicz, W., Fensel, D., Eds.; Springer:Berlin/Heidelberg, Germany, 2008; Volume 7. [CrossRef]
27. Abdallah, A.B.; Alkhaldi, R.Z.; Aljuaid, M.M. Impact of social and technical lean management on operational performance inmanufacturing SMEs: The roles of process and management innovations. Bus. Process Manag. J. 2021, 27, 1418–1444. [CrossRef]
28. Pérez, J.; Parra, C. Mejoramiento de una línea de ensamble de asientos delanteros autopartistas usando simulación dinámica desistemas. Rev. Técnica Fac. Ing. Univ. Zulia 2010, 33, 11–20.
29. Cardiel, J.; Baeza, R.; Lizarraga, R. Desarrollo de un modelo de dinámica de sistemas basado en la metodología Six Sigma.Ing. Investig. 2017, 80–90. [CrossRef]
30. Amézquita, J.; Chamorro, K. Dinámica de sistemas aplicado en el análisis de cadenas productivas agroindustriales en eldepartamento de Bolívar. Sist. Telemática 2013, 11, 27–37. [CrossRef]
31. Soto, M.; Rodríguez, C.; Gil, M.; Morris, A. La dinámica de sistemas en la simulación del efecto de la gestión del conocimientosobre la cadena de suministro de la agroindustria del maíz. Rev. Técnica Fac. Ing. Univ. Zulia 2013, 36, 80–90.
32. Herrera, M.; Orjuela, J. Perspectiva de trazabilidad en la cadena de suministros de frutas: Un enfoque desde la dinámica desistemas. Ingeniería 2014, 19, 63–84.
33. Toro, R.; Becerra, M. Análisis Logístico Agrocadena de Algodón. Ing. Ind. 2017, 16, 289–304. [CrossRef]34. Ríos, J.; Olaya, Y.; Rivera, G. Proyección de la demanda de materiales de construcción en Colombia por medio de análisis de
flujos de materiales y dinámica de sistemas. Ing. Investig. 2017, 16, 75–95.35. Rodríguez, L.; Lopéz, M. Aplicación de Técnicas de Validación de un Modelo de Simulación de Dinámica de Sistemas: Caso de
Estudio. Rev. Latinoam. Ing. Softw. 2016, 187–196. [CrossRef]36. Schwartz, P. The Art of The Long View: “Planning for the Future in an Uncertain World”; Currency Doubleday: New York, NY,
USA, 1996.37. Sameer, K.; Anvar, A. System dynamics analysis of food supply chains—Case study with non-perishable products. Simul. Model.
Pract. Theory 2011, 19, 2151–2168.38. de Leon, H.J.; Kopainsky, B. Do you bend or break? System dynamics in resilience planning for food security. Syst. Dyn. Rev.
2019, 35, 287–309. [CrossRef]39. Iakovou, E.; Bochtis, D.; Vlachos, D.; Aidonis, D. Risk Management for Agrifood Supply Chain. In Supply Chain Management for
Sustainable Food Networks; John Wiley & Sons, Ltd.: Hoboken, NJ, USA, 2016.40. Laimon, M.; Mai, T.; Goh, S.; Yusaf, T. Energy Sector Development: System Dynamics Analysis. Appl. Sci. 2020, 10, 134. [CrossRef]41. Richardson, G.; Pugh, A., III. Introduction to System Dynamics Modeling with Dynamo. J. Oper. Res. Soc. 1997, 48, 1146.
[CrossRef]42. Di Nardo, M.; Clericuzio, M.; Murino, T.; Sepe, C. An Economic Order Quantity Stochastic Dynamic Optimization Model in a
Logistic 4.0 Environment. Sustainability 2020, 12, 4075. [CrossRef]43. Sallez, Y.; Montreuil, B.; Ballot, E. On the Activeness of Physical Internet Containers. In Service Orientation in Holonic and
Multi-Agent Manufacturing; Springer: Cham, Switzerland, 2015; pp. 259–269. [CrossRef]