synergy journal of management - sardar patel university
TRANSCRIPT
G. H. Patel Postgraduate Institute of Business Management
SARDAR PATEL UNIVERSITY
NAAC Re-accredited with Grade 'A' (CGPA:3.25) (23-1-2017 to 22-1-2022)
Vallabh Vidyanagar - 388 120
Gujarat, India
Synergy Journal of Management
ISSN Number : 0973922X
Source : UNIV
Subject : Economics, Econometrics and Finance (all),
Social Sciences (all)
Publisher : Sardar Patel University
Country of Publication : India
Broad Subject Category : Social Science
All manuscripts should be sent to The Editor, Synergy-Journal of Management, MBA
Programme, Sardar Patel University, Vallabh Vidyanagar-388 120, Gujarat. Manuscripts
can also be submitted through e-mail: [email protected]
Foreword
The Post Graduate Department of Business Management (MBA
Programme) is a constituent department of Sardar Patel University
(NAAC Accredited Grade A with 3.25 CGPA) is offering management
programme since 1989. It is one of the leading management institutes
in Gujarat state.
The University Grants Commission, New Delhi, in recognition of the
quality of research in the department had elevated its status for award
of special assistance under DRS - II for "Consumer Research in Rural
Areas", which it completed successfully in March 2016. The department
has also received SAP DRS III (2016 to 2021) for undertaking research
on "Transformation of Rural Economy" for five years. The department
has also received a project on "Knowledge, Attitude and Perception of
Voters in Gujarat from Election Commission of India. All through its
journey of providing management education, it has exemplary record in
terms of quality education and placements.
The department has been contributing to research activities continuously.
All the faculty members are actively involved in research publications.
It also organises national level seminar every year on varied topics
relevant to current scenario to promote research in Management. All
the ten faculty members are recognized Ph.D. Guides. More than 100
students have successfully completed their Ph.D. degree from department
and fifty are pursuing their doctoral research.
This research journal provides a platform for regular interaction and
exchange of views, opinions and research findings among peer groups.
I am sure that this issue of "Synergy", Journal of Management, Sardar
Patel University, provides for a great deal of information sharing among
teachers and research scholars belonging to the discipline.
I congratulate the editors for bringing out yet another volume of Synergy
and appreciate the efforts undertaken by them.
Date : 15th March, 2019 Dr. Shirish Kulkarni
Sardar Patel University Vice-Chancellor
Vallabh Vidyanagar
Editorial
Economic liberalization and globalization has significantly affected the
Indian economy. Business organizations find themselves into more
competitive environment as they grow. More number of variables are
added continously and affect these organizations. In this process such
organizations are trying to find ways to be more effective and profitable.
This makes a perfect case for undertaking quality research in various
areas to improve decision making and make organizations competitive.
The present issue of 'Synergy' Volume 20, No 2, consists of research
papers on varied topics related to management. This volume of Synergy
focuses on some of the current research undertaken by researchers on
topics relevant to the managers. The present issue covers research
papers on issues across functional areas of Management including
General Management, Rural Marketing, Consumer Behaviour, Brand
Management, Finance, Human Resources, etc.
In all 18 blind peer reviewed papers have been included focusing on
topics such as consumer decision making, economic nationalism, CRSs
compliance, brand tribalism, ergonomics, achievement motivation, brand
identity, digital revolution, transforming India initiative, spirituality, multi
commodity exchange, social media, cluster branding, etc.
On behalf of our editorial team, we sincerely thank all the contributors
and look forward to their continued support in sharing of facts, opinions
and views in the form of research papers in forthcoming issues as well.
We humbly invite your views and suggestions to strengthen our efforts
in making further improvements.
(Dr. Yogesh C. Joshi)
Director
12-20
67-76
59-66
9.
8.
52-587.
47-516.
36-465.
29-354.
21-283.
Contents
2.
1-11
Job Related Factors Affecting Achievement Motivationof Employees in Information Technology, Hospitality andTelecom Sectors in GujaratVilas Kulkarni
Study on Perception Towards Fast Food ConsumptionGautamkumar Parmar and Raju M. Rathod
Effect of Social Networking Sites on Life of Engineering Studentsin GujaratDivyang Purohit, Mitesh Jayswal and Priya Panchal
A Study on Identifying Work Related Musculoskeletal Injuries andAssociated Ergonomic Risk Factors among Different Workers:Systematic Literature ReviewK. S. Prasad and Akanxa J Dhamale
Effect of Gender and Family Income on Brand Tribalism withSpecial Emphasis on Mobile Phone Users in AhmedabadHarish Sharma
An Analysis of Mandated CSRs Compliance in SelectedPower Sector Companies in IndiaHimanshu Nagarale
An Empirical Study of Expectations Model ofEconomic Nationalism Among Millennials In South GujaratRiddhish Joshi and Yogesh C. Joshi
Applications of Blockchain Technology In Banking :A Conceptual ApproachTejal Shah and P. K. Priyan
A Study on the Impact of Social Media on Consumer DecisionMaking Process in Anand and Vallabh VidyanagarDarshna Dave and Komal Shukla
1.
Editorial
Foreword
18. Consumer Buying Behaviour and Market Size of Milk in Surat City Aashaka Thakkar and Parth Chauhan
132-137
124-131
114-123
108-113
101-107
94-100
87-93
83-86
10. A Study of Customers Perception Toward Apparels in Online Shopping 77-82 Frince Chemmanoor
17. Cluster Branding: Issues and Challenges Bhamra Manmeet Harjit and Kaushal Kishore
16. Analysis of Agricultural Commodities at Multi Commodity Exchange in India Kamini Shah and Priyanka Kansara
15. Transcending from A Healthy Life to A Holistic Living - Role of Spirituality Ravi Gor and Bhavesh Kinkhabwala
14. A Study on Contemporary Issues and Challenges in Front of Transforming India Initiative Ashish Joshi and Nilang Veyda
13. Challenges of Digital Revolution in Indian Banking Sector Mukesh Pal and Brijesh Patel
12. Idea to Implementation: Adoption of Solar Roof Top Plant (SRTP) - Offered by Gujarat Energy Development Agency (GEDA) - by Owners of Apartment Houses: A Case of "Satyam Apartment" in Surat. Mahendra Kumar Soni
11. Brand Identity : An Important Element of Branding Ruta Shringarpure
Priyanka Kansara and Kamini Shah
Bhavesh Khinkhabwala and Ravi Gor
1
* Professor, G. H. Patel Post Graduate Institute of Business Management, (MBA department), Sardar Patel University, VallabhVidyanagar, Anand.
** Asstt. Professor, Anand Commerce College, Sardar Patel University, Vallabh Vidyanagar, Anand.
A Study on The Impact of Social Media on Consumer Decision Making Process inAnand and Vallabh Vidyanagar
Dashana R. Dave* and Komal Shukla**
Abstract
Purpose: A research paper on "The Impact of Social Media on Consumer Decision Making Process in Anand andVallabh Vidyanagar" is undertaken with the main objective of determining the impact of social media on consumers'decision-making process.
Research Design/ Methodology/ Approach: For this study, the descriptive research design has been used. Primarydata has been collected from 150 respondents through questionnaire by survey method using convenience samplingmethod.
Findings: Out of 150 respondents, 147 are using social media in Anand and Vallabh Vidyanagar. The social mediausage has been increased and mass media usage has been decreasing gradually. Majority of the users (80%) prefer topurchase products from social media sites. The findings of the study can be used by marketers and media planners foreffective marketing results.
Research limitations/Implications: The geographical scope of the study is Anand and Vallabh Vidyanagar. Throughthis model, the study is going to focus on consumers' selection process before purchase, how social media affects thepurchase stages in consumer decision making process and to identify the differences between social media marketingand mass media marketing.
Originality/ Value: The analysis has been done by applying various statistical tools in SPSS. The intellectual contentof this paper is the product of the original work and that all the assistance received in preparing this paper and sourceshave been acknowledged. This paper is prepared for academic purpose.
Key words: Consumer Behaviour, Consumer Decision Making Process, Social Media.
Type of Paper: Research Paper.
Introduction
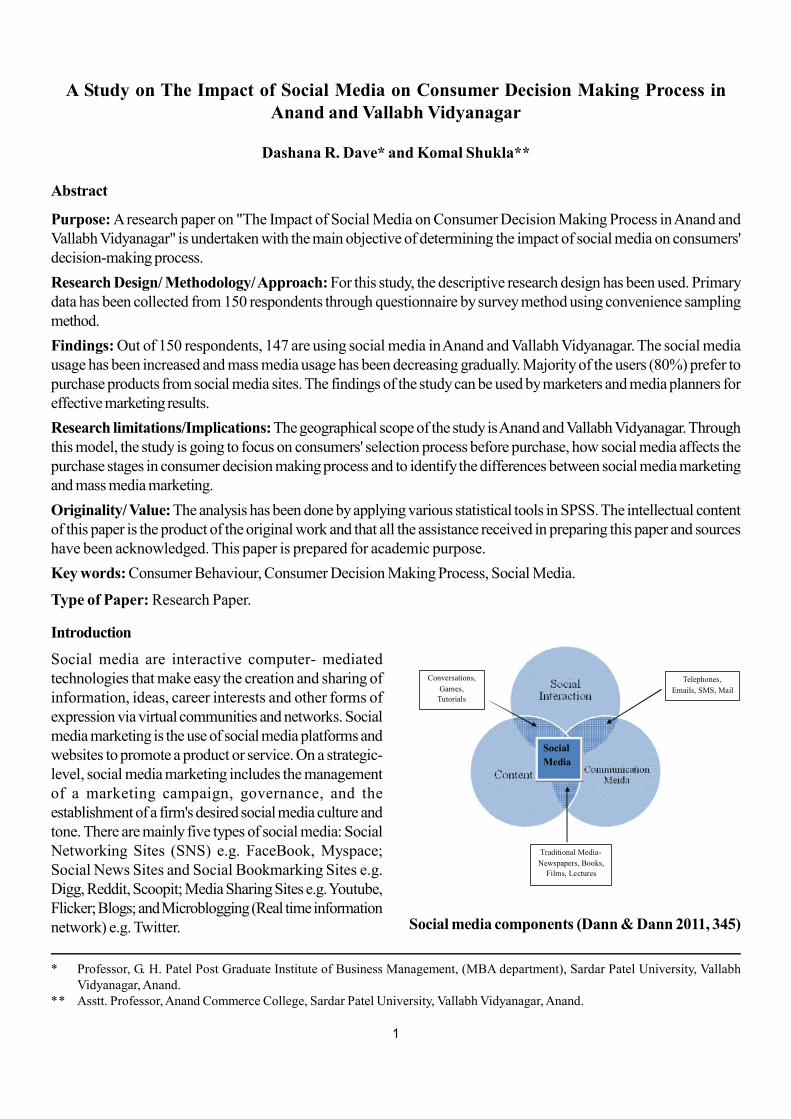
Social media are interactive computer- mediatedtechnologies that make easy the creation and sharing ofinformation, ideas, career interests and other forms ofexpression via virtual communities and networks. Socialmedia marketing is the use of social media platforms andwebsites to promote a product or service. On a strategic-level, social media marketing includes the managementof a marketing campaign, governance, and theestablishment of a firm's desired social media culture andtone. There are mainly five types of social media: SocialNetworking Sites (SNS) e.g. FaceBook, Myspace;Social News Sites and Social Bookmarking Sites e.g.Digg, Reddit, Scoopit; Media Sharing Sites e.g. Youtube,Flicker; Blogs; and Microblogging (Real time informationnetwork) e.g. Twitter. Social media components (Dann & Dann 2011, 345)
Social
Media
Conversations,
Games,
Tutorials
Telephones,
Emails, SMS, Mail
Traditional Media-
Newspapers, Books,
Films, Lectures
2
The social media are more and more powerful andchanging the way the consumers behave, and how theymake the decision to buy. "Social media" is being used torefer to online communication channels, while the term"traditional mass media" will refer to conventionalcommunication media like TV, radio, newspapers, etc.The consumer decision making process consists of fivestages: Need/problem recognition, information search,alternative evaluation, purchase decision and post-purchase behaviour. (Journal of Knowledge Management,Economics and Information Technology: The impact ofsocial media on consumer behavior - Case studyKosovo).
Weinberg (2009) places of interest that the geographicalwalls which divide individuals are fragmented and newonline communities are emerging and growing by socialmedia. The social media includes a wide range of onlineword-of-mouth forums and information sharing formatsincluding blogs, micro blogging sites, company sponsoreddiscussion boards, chat rooms, customer-to-customeremail, consumer product or service rating emails, creativityworks-sharing and social networking sites (Mangold andFaulds, 2009 Impact Of Social Media On Consumer'sDecision Making Process Among The Youth In Nairobi-United States International University-Africa).
The study on The Impact of Social Media on ConsumerDecision Making Process may be significant to variousstakeholders. It mainly affects to the following:
1. Scholars and Academicians
Researchers can use this study to facilitate further researchon other sectors especially those that are related to socialmedia platforms. The study provides baseline data thatassists people to carry out similar studies among otherorganizations where the business environment is similar.
2. Companies and Organizations
The study assists online retailers to increase their profitsby utilizing their sales opportunities. It also helps onlineretailers through social media to adapt to the changingconsumer tastes and preferences to avoid heavy losseswhen stocks pile up.
3. Youth
Since most youth interact with social media in makingdecision relating to purchases of their choice, the findingsof this study can be used to help the youth populationestablish the factors that impact on their choices basedon the different stages of buyer decisions.
4. Online Consumers
Often, online shoppers are not aware of the factors thatimpact their decisions. The research provides measuresrequired to ensure that consumers purchase qualityproducts that suit their needs.
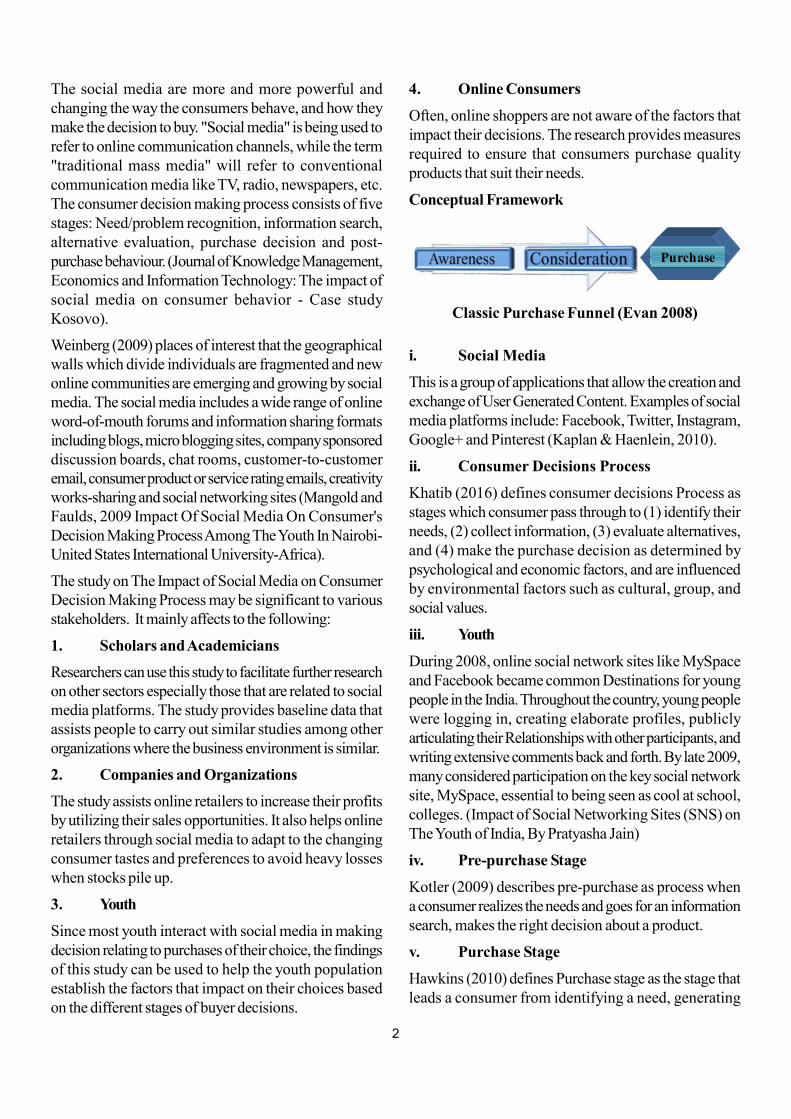
Conceptual Framework
i. Social Media
This is a group of applications that allow the creation andexchange of User Generated Content. Examples of socialmedia platforms include: Facebook, Twitter, Instagram,Google+ and Pinterest (Kaplan & Haenlein, 2010).
ii. Consumer Decisions Process
Khatib (2016) defines consumer decisions Process asstages which consumer pass through to (1) identify theirneeds, (2) collect information, (3) evaluate alternatives,and (4) make the purchase decision as determined bypsychological and economic factors, and are influencedby environmental factors such as cultural, group, andsocial values.
iii. Youth
During 2008, online social network sites like MySpaceand Facebook became common Destinations for youngpeople in the India. Throughout the country, young peoplewere logging in, creating elaborate profiles, publiclyarticulating their Relationships with other participants, andwriting extensive comments back and forth. By late 2009,many considered participation on the key social networksite, MySpace, essential to being seen as cool at school,colleges. (Impact of Social Networking Sites (SNS) onThe Youth of India, By Pratyasha Jain)
iv. Pre-purchase Stage
Kotler (2009) describes pre-purchase as process whena consumer realizes the needs and goes for an informationsearch, makes the right decision about a product.
v. Purchase Stage
Hawkins (2010) defines Purchase stage as the stage thatleads a consumer from identifying a need, generating
Classic Purchase Funnel (Evan 2008)
Purchase
3
options, and choosing a specific product and brand. Themore major the purchase decision, the more effort istypically put into the process.
vi. Post-purchase Decision
Kotler (2009) defines post-purchase decision as the finalstage in the consumer decision process when the customerassesses whether he is satisfied or dissatisfied with apurchase.
Review of Literature
Researchers have explored the consumer behavior andattitude toward social media sites and implications formarketers. A Study on the Impact of Social Media onConsumer Decision Making Process has been interpreteddifferently by different researchers.
Boyd and Nielsen (2006)
The top ten social networking sites developed with thepassage of time, and its number of users increased from46.8 million to 68.8 million. The rating reveals theimportant information about how new generation interactswith each other. (Hensel and Deis Abhinav: NationalMonthly Refereed Journal of Research in Commerce &Management 2010) are of view that marketers shouldconsider positively the use of social media to influencethe consumer behaviour.
Blythe (2008)
Study of consumer behaviour has shifted from why peoplepurchase to consumption behaviour. Furthermore of theimportant aspects of consumer behaviour is marketsegmentation, because consumers within the segment aremore or less similar in terms of product's needs,consumer's physical and social environments have hugeinfluences on consumers' purchase decision and can makea big difference in their desire and motives for productpurchase. The buyers' decisions are affected by numerousstimuli from their environment, the commercialenvironment consists of the marketing activities of variousfirms by which they attempt to communicate the buyers(Schiffman & Kanuk, 2005).
Chung and Austria (2010)
In this paper author has made an attempt to conduct astudy to determine the factors related with social mediagratification and attitude toward social media marketingmessages. The results of the study show that attitudetoward social media marketing messages are stronglyrelated to social media usage gratifications such as
interaction and information, but not entertainmentgratification.
Diffley and Kearns (2011)
The study has shown focused groups of different agegroups for their perception about social networking sites.They suggest that companies must seek to integrateadvertisements and engage consumers rather thandisturbing on their privacy or irritate customers.
Hampton et al. (2011)
An average Internet user has 669 social ties; Facebookhas more than 600 million daily active users, with over1.5 million business pages (Facebook 2013), and 30billion pieces of content shared on a monthly basis(McKinsey 2011). Approximately 500 million Tweetssent per day, at about 600 Tweets per second (Tweeter2012). LinkedIn has more than 225 million professionalsworldwide, including all Fortune 500 companies(LinkedIn 2013). The global average time spent perperson on social networking sites is 6.9 hours per month(Delaney and Salminen 2012).
Gros (2012)
With regards to consumer perception, the author hasobserved that consumers might associate low price withlow quality and also perceives that social media and brandreputation has power on purchasing decision than priceof the product. The post-purchase period consists ofproduct ownership and usage which provide contexts ofsatisfaction appraisal, seller-directed complaints, wordof mouth transmissions and repurchase planning (Wang,2012), In the post-purchase period, consumer word-of-mouth trans-missions provide informal communicationswhich are directed at other consumers about theownership, usage and experiences of goods and services.Yin, (2009) laments that the consumer behaviour mayeasily change time by time and social media has createda new way of consumer behaviour pattern by providingsocial interactive tools to share their product-relatedopinions in buying decision process and the influence ofdigital interactivity on buyers' intentions. Lee (2013)remarks that youth influence on consumers' decisions andtheir buying intentions may be strong and be influencedby opinion leaders who offer informal advice andinformation about a specific product or brand.
Rant (2014)
The author is trying to convince that perception is theprocess through which an individual select, organizes and
4
interprets the information. Selecting, organizing andinterpreting information in a way to produce a meaningfulexperience of the world is called perception. Rant (2014)also observes that the type of information or stimuli to anindividual is more sensitive and depends on each and everyperson. And in relation to perceived risks, According toCampbell & Goodstein, (2001) after the consumption,the consumer experiences certain levels of satisfaction ordissatisfaction, and evaluates the wisdom of the choicemade in selecting the alternative.
Chen (2014)
In this paper the author accounts that in post purchasestage; consumers evaluate the outcome of their purchasedecision, as it can influence their future purchase patterns.And that consumers use Social Media to talk about theirown good or bad experiences and thus share feedbackand opinions with peers. He elaborates that social mediahas become easier for consumers to spread the wordquickly to hundreds of people and influence their purchasedecision-making processes by offering the possibility toconsumers to share their good or bad experiences withtheir peers.
Duffett (2017)
According to this study, the purchase goal is a plannedbehaviour for a consumer prepared to buy certain product.There is a relationship between brand image and purchaseintention. Social media is a major factor to increase brandimage on consumer, for that reason some companies usedifferent kind of social media stimuli to motivate purchaseintention. Consumers who are satisfied with the productcan have a positive attitude towards the brand. It wasnoted that perception of quality considers subjectivenotation which is consumer evaluation of the product andjudgment that based on some attributes, that qualityperception determines consumer proneness to buy aprivate brand.
Kosavinta (2017)
The author concluded that consumer is more likely tomake repeat purchase only if they derive an acceptableminimum level of satisfaction from the last purchases,hence satisfied consumers are more likely to share theirexperiences with others, generate positive effect towardspurchase intention for example social media which canclearly show how dissatisfied consumers complain orswitch brands.
Research Gap
A gap is something that remains to be done or learned inan area of research. It is a gap in the knowledge of theresearchers in the field of research of the study. From theliterature review, it is noted that the key questions are tofind out the purchase process, selection of information,and consumer behaviour during purchase. However, theinformation search identified that difference between socialand mass media marketing were not found out by theresearchers.
Therefore, the goals of this study are: identifyingconsumers' purchase process; information search beforepurchase, finding out the social media influences onconsumer decision making process and finding out thedifferences between social media and mass mediamarketing.
Objectives of Study
1. To study how consumers attend, process and selectthe information before a purchase.
2. To find out how social media influences the pre-purchase stage and the post purchase stage inconsumer decision making process.
3. To identify the differences between marketing onsocial media and through mass media.
Research Methodology
Research Design is a framework or blue print forconducting the marketing research project. It specifiesdetails of the procedures necessary for obtaining theinformation needed to structure and solve marketingresearch problems.
For the given study, Descriptive research is used todescribe characteristics of a population. Descriptiveresearch is a study designed to depict the participants inan accurate way. More simply put, descriptive researchis all about describing people who take part in the study.The present investigations will be descriptive in naturewith survey being used as the major research approach.There are three ways a researcher can go about doing adescriptive research project, and they are: observationalmethods, case-study methods and survey methods. Thesurvey method by personally interviewing respondentswith duly tested structured questionnaire is beingimplemented for this study in Anand and VallabhVidyanagar.
5
Sampling: The actual user of specific service will constitutethe sample of the study. Approximately, 150 respondentswere chosen conveniently for survey. Enough care wastaken to make the sample proportionate andrepresentative.
Data collection: After reviewing the existing literature onthe subject and interactions with experts and academicians,a self-developed measure was used to collect data fromthe respondents. The respondent was the actual user ofspecific product representing the population in Indiancontext with respect to social and demographicdimensions. Primary data was collected through structuredquestionnaire by personally interviewing respondents andSecondary data was also collected through Internet,related books, Newspapers, Journals, Magazines,Newspapers, and Articles etc. The collected data was
analysed with suitable statistical analysis using appropriateparametric and non-parametric methods of hypothesistesting as and when required.
Variables of the study
Dependent Variables - Consumer decisionmaking process
Independent Variables - Social Media, Needrecognition, Information search, Pre- purchase stage,Post- purchase stage
Data Analysis and Interpretation
The collected data were coded, tabulated and analysedwith help of computer software. The statistical toolsemployed for present studies are frequencies, percentage,and mean.
Frequency Percentage
Gender Male 90 60
Female 60 40
Age
Below 20 75 50
21 to 30 55 37
31 to 40 11 7
41 to 50 4 3
Above 50 5 3
Occupation
Public 10 7
Private 10 7
Business 10 7
Profession 15 10
Student 80 53
Housewife 20 13
Others 5 3
Annual Income
Below 2.5L 100 67
>2.5L to <5L 10 7
>5L to <10L 30 20
>10L 10 7
Place of Residence VVN 90 60
Anand 60 40
Total 150 100.00
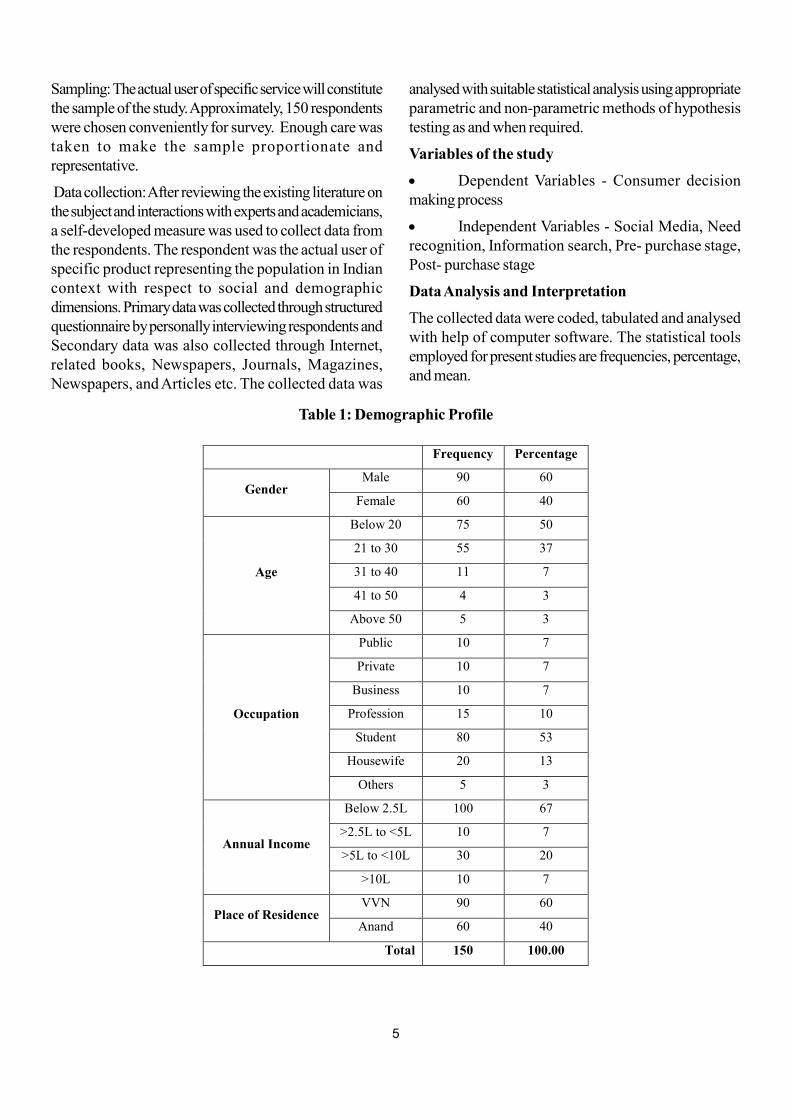
Table 1: Demographic Profile
6
Interpretation:
From the above Table 1, it can be said that as per thedata collected, out of 150 respondents 90 were malesand 60 were females. It can be observed that 50% arebelow the age of 20, 37% are between 21 to 30 years.7% are between 31 to 40 are 11, between 41 to 50 are4 and above 50 years are 5; 10 belonged to public sector,10 belonged to private sector as well, 10 are havingown business, 15 belonged to different professions likemedical, charter accountant, musicians and others, it has
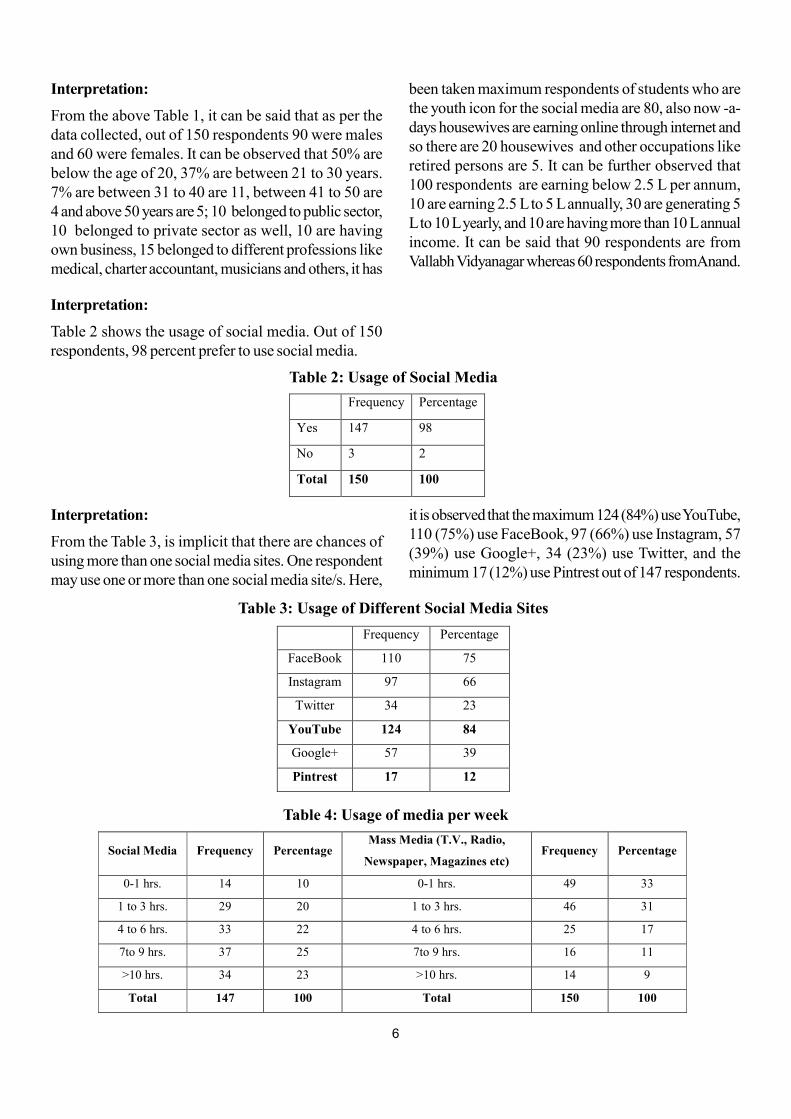
Table 2: Usage of Social Media
Frequency Percentage
Yes 147 98
No 3 2
Total 150 100
Table 3: Usage of Different Social Media Sites
Frequency Percentage
FaceBook 110 75
Instagram 97 66
Twitter 34 23
YouTube 124 84
Google+ 57 39
Pintrest 17 12
been taken maximum respondents of students who arethe youth icon for the social media are 80, also now -a-days housewives are earning online through internet andso there are 20 housewives and other occupations likeretired persons are 5. It can be further observed that100 respondents are earning below 2.5 L per annum,10 are earning 2.5 L to 5 L annually, 30 are generating 5L to 10 L yearly, and 10 are having more than 10 L annualincome. It can be said that 90 respondents are fromVallabh Vidyanagar whereas 60 respondents fromAnand.
Interpretation:
Table 2 shows the usage of social media. Out of 150respondents, 98 percent prefer to use social media.
Interpretation:
From the Table 3, is implicit that there are chances ofusing more than one social media sites. One respondentmay use one or more than one social media site/s. Here,
it is observed that the maximum 124 (84%) use YouTube,110 (75%) use FaceBook, 97 (66%) use Instagram, 57(39%) use Google+, 34 (23%) use Twitter, and theminimum 17 (12%) use Pintrest out of 147 respondents.
Social Media Frequency Percentage Mass Media (T.V., Radio,
Newspaper, Magazines etc) Frequency Percentage
0-1 hrs. 14 10 0-1 hrs. 49 33
1 to 3 hrs. 29 20 1 to 3 hrs. 46 31
4 to 6 hrs. 33 22 4 to 6 hrs. 25 17
7to 9 hrs. 37 25 7to 9 hrs. 16 11
>10 hrs. 34 23 >10 hrs. 14 9
Total 147 100 Total 150 100
Table 4: Usage of media per week
7
Interpretation:
The above table 4 describes the per week usage of socialmedia and mass media. 25% users use the social mediamore per week where as only 9% users use the massmedia more. Here, it can be said that the social mediausage has increased and mass media usage has been
decreasing gradually. People these days, post theirproduct promotion on social media and consumerspurchase it from social media only. T.V news channelsand radio jockeys are available on social media that'swhy people prefer social media more. This will give us ahighlight of the actual usage differences between socialmedia and mass media.
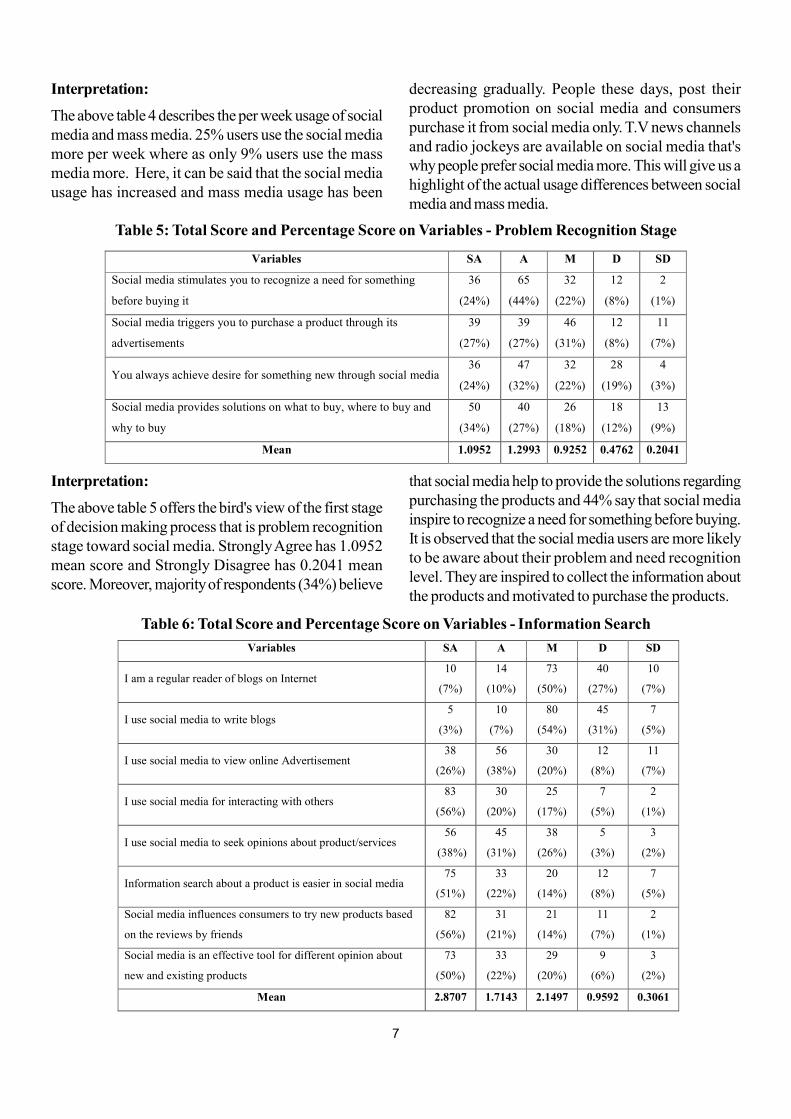
Interpretation:
The above table 5 offers the bird's view of the first stageof decision making process that is problem recognitionstage toward social media. Strongly Agree has 1.0952mean score and Strongly Disagree has 0.2041 meanscore. Moreover, majority of respondents (34%) believe
Table 5: Total Score and Percentage Score on Variables - Problem Recognition Stage
Variables SA A M D SD
Social media stimulates you to recognize a need for something
before buying it
36
(24%)
65
(44%)
32
(22%)
12
(8%)
2
(1%)
Social media triggers you to purchase a product through its
advertisements
39
(27%)
39
(27%)
46
(31%)
12
(8%)
11
(7%)
You always achieve desire for something new through social media 36
(24%)
47
(32%)
32
(22%)
28
(19%)
4
(3%)
Social media provides solutions on what to buy, where to buy and
why to buy
50
(34%)
40
(27%)
26
(18%)
18
(12%)
13
(9%)
Mean 1.0952 1.2993 0.9252 0.4762 0.2041
that social media help to provide the solutions regardingpurchasing the products and 44% say that social mediainspire to recognize a need for something before buying.It is observed that the social media users are more likelyto be aware about their problem and need recognitionlevel. They are inspired to collect the information aboutthe products and motivated to purchase the products.
Table 6: Total Score and Percentage Score on Variables - Information Search
Variables SA A M D SD
I am a regular reader of blogs on Internet 10
(7%)
14
(10%)
73
(50%)
40
(27%)
10
(7%)
I use social media to write blogs 5
(3%)
10
(7%)
80
(54%)
45
(31%)
7
(5%)
I use social media to view online Advertisement 38
(26%)
56
(38%)
30
(20%)
12
(8%)
11
(7%)
I use social media for interacting with others 83
(56%)
30
(20%)
25
(17%)
7
(5%)
2
(1%)
I use social media to seek opinions about product/services 56
(38%)
45
(31%)
38
(26%)
5
(3%)
3
(2%)
Information search about a product is easier in social media 75
(51%)
33
(22%)
20
(14%)
12
(8%)
7
(5%)
Social media influences consumers to try new products based
on the reviews by friends
82
(56%)
31
(21%)
21
(14%)
11
(7%)
2
(1%)
Social media is an effective tool for different opinion about
new and existing products
73
(50%)
33
(22%)
29
(20%)
9
(6%)
3
(2%)
Mean 2.8707 1.7143 2.1497 0.9592 0.3061
8
Interpretation:
From the above Table 6, it can be understood that thereare different statements asked to the respondents. Eachimpact has its own percentage of analysis. These are theeffects of Information Search during consumer decisionmaking. Strongly Agree has 2.8707 mean score andStrongly Disagree has 0.3061 mean score. Majority 56%users believe that Social media influences consumers to
try new products based on the reviews by friends. Fromthe above interpretations, it is observed that the socialmedia users are more likely aware about their problemand need recognition level. They are inspired to collectthe information about the products and motivated topurchase the products. Users do not prefer to write orread a blog through internet sites but they are more likelyto read them on social media sites. They prefer socialmedia more than mass media.
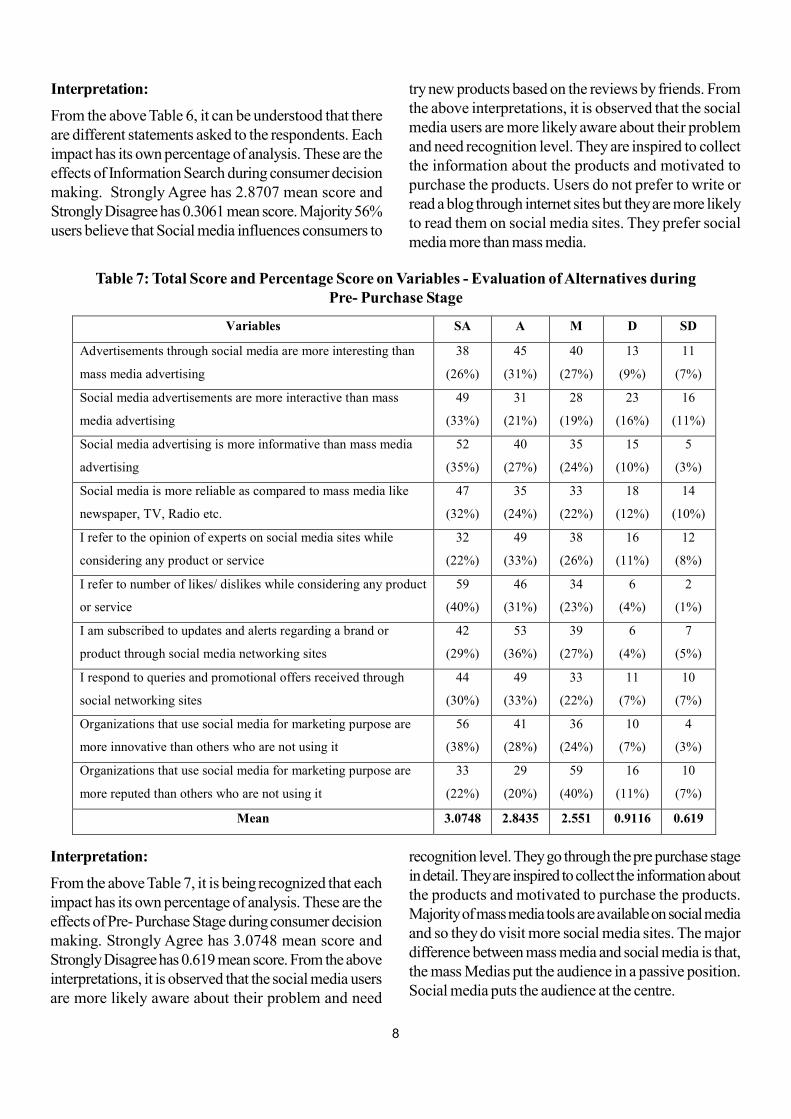
Interpretation:
From the above Table 7, it is being recognized that eachimpact has its own percentage of analysis. These are theeffects of Pre- Purchase Stage during consumer decisionmaking. Strongly Agree has 3.0748 mean score andStrongly Disagree has 0.619 mean score. From the aboveinterpretations, it is observed that the social media usersare more likely aware about their problem and need
Table 7: Total Score and Percentage Score on Variables - Evaluation of Alternatives duringPre- Purchase Stage
Variables SA A M D SD
Advertisements through social media are more interesting than
mass media advertising
38
(26%)
45
(31%)
40
(27%)
13
(9%)
11
(7%)
Social media advertisements are more interactive than mass
media advertising
49
(33%)
31
(21%)
28
(19%)
23
(16%)
16
(11%)
Social media advertising is more informative than mass media
advertising
52
(35%)
40
(27%)
35
(24%)
15
(10%)
5
(3%)
Social media is more reliable as compared to mass media like
newspaper, TV, Radio etc.
47
(32%)
35
(24%)
33
(22%)
18
(12%)
14
(10%)
I refer to the opinion of experts on social media sites while
considering any product or service
32
(22%)
49
(33%)
38
(26%)
16
(11%)
12
(8%)
I refer to number of likes/ dislikes while considering any product
or service
59
(40%)
46
(31%)
34
(23%)
6
(4%)
2
(1%)
I am subscribed to updates and alerts regarding a brand or
product through social media networking sites
42
(29%)
53
(36%)
39
(27%)
6
(4%)
7
(5%)
I respond to queries and promotional offers received through
social networking sites
44
(30%)
49
(33%)
33
(22%)
11
(7%)
10
(7%)
Organizations that use social media for marketing purpose are
more innovative than others who are not using it
56
(38%)
41
(28%)
36
(24%)
10
(7%)
4
(3%)
Organizations that use social media for marketing purpose are
more reputed than others who are not using it
33
(22%)
29
(20%)
59
(40%)
16
(11%)
10
(7%)
Mean 3.0748 2.8435 2.551 0.9116 0.619
recognition level. They go through the pre purchase stagein detail. They are inspired to collect the information aboutthe products and motivated to purchase the products.Majority of mass media tools are available on social mediaand so they do visit more social media sites. The majordifference between mass media and social media is that,the mass Medias put the audience in a passive position.Social media puts the audience at the centre.
9
Interpretation:
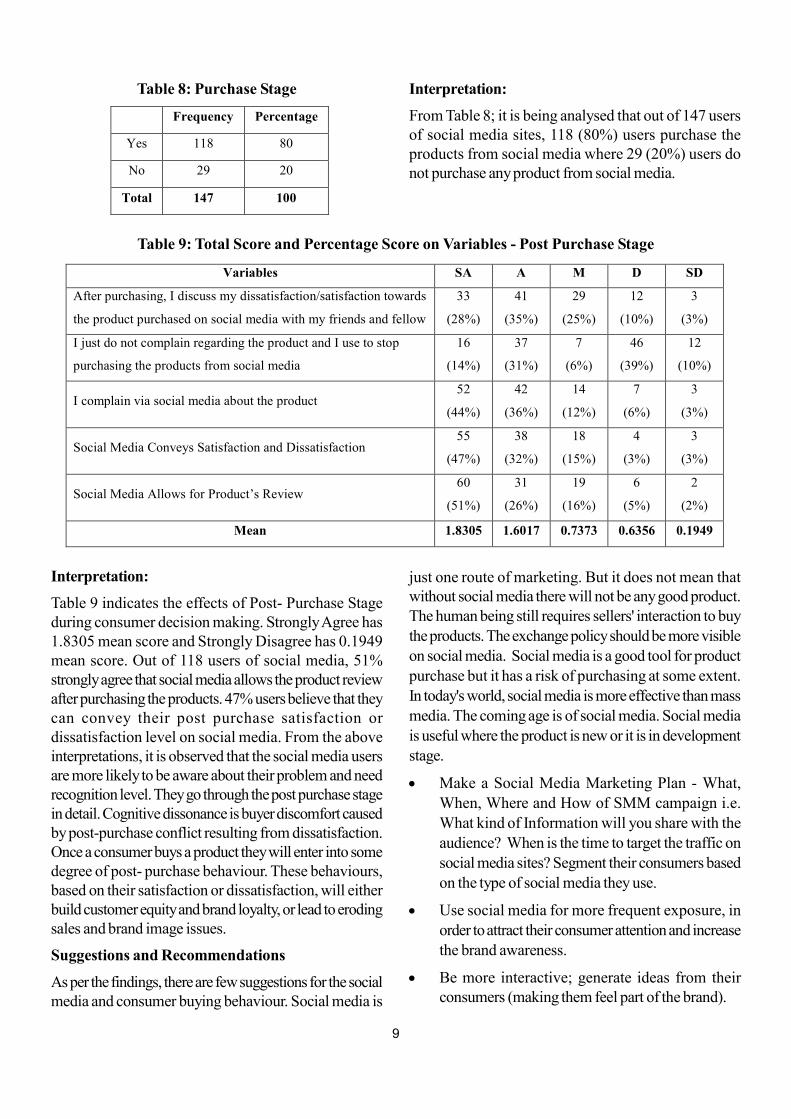
From Table 8; it is being analysed that out of 147 usersof social media sites, 118 (80%) users purchase theproducts from social media where 29 (20%) users donot purchase any product from social media.
Table 8: Purchase Stage
Frequency Percentage
Yes 118 80
No 29 20
Total 147 100
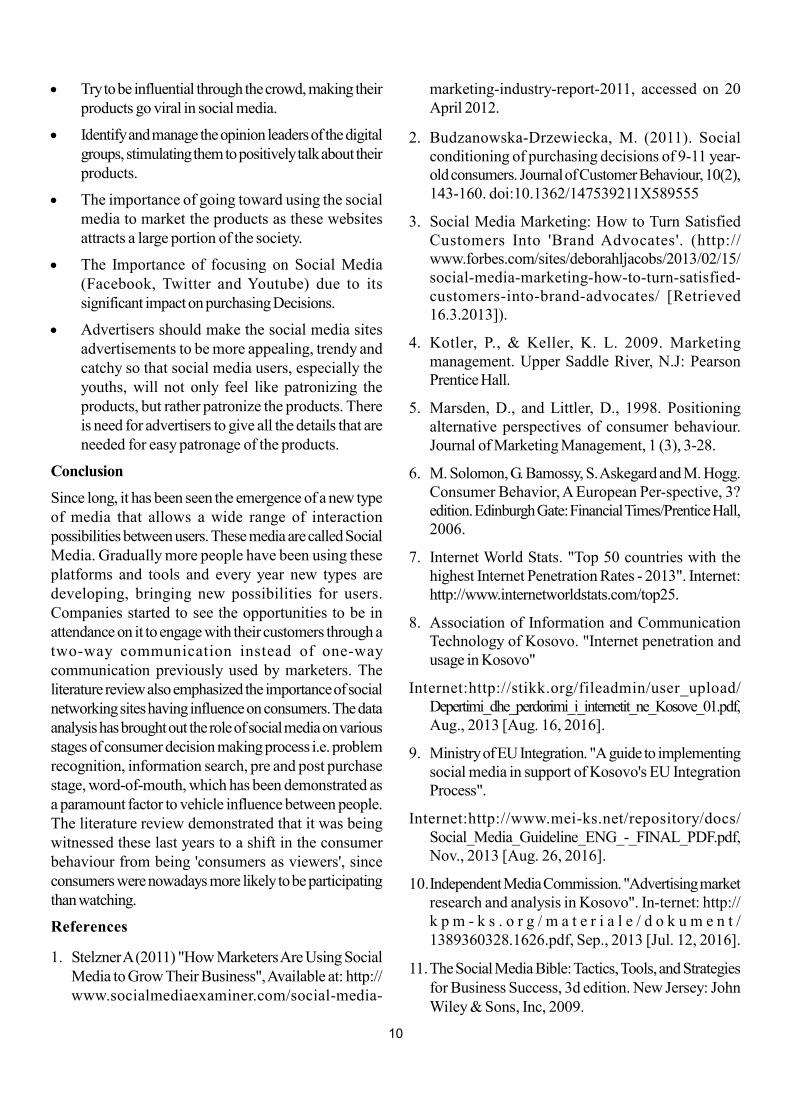
Interpretation:
Table 9 indicates the effects of Post- Purchase Stageduring consumer decision making. Strongly Agree has1.8305 mean score and Strongly Disagree has 0.1949mean score. Out of 118 users of social media, 51%strongly agree that social media allows the product reviewafter purchasing the products. 47% users believe that theycan convey their post purchase satisfaction ordissatisfaction level on social media. From the aboveinterpretations, it is observed that the social media usersare more likely to be aware about their problem and needrecognition level. They go through the post purchase stagein detail. Cognitive dissonance is buyer discomfort causedby post-purchase conflict resulting from dissatisfaction.Once a consumer buys a product they will enter into somedegree of post- purchase behaviour. These behaviours,based on their satisfaction or dissatisfaction, will eitherbuild customer equity and brand loyalty, or lead to erodingsales and brand image issues.
Suggestions and Recommendations
As per the findings, there are few suggestions for the socialmedia and consumer buying behaviour. Social media is
Table 9: Total Score and Percentage Score on Variables - Post Purchase Stage
Variables SA A M D SD
After purchasing, I discuss my dissatisfaction/satisfaction towards
the product purchased on social media with my friends and fellow
33
(28%)
41
(35%)
29
(25%)
12
(10%)
3
(3%)
I just do not complain regarding the product and I use to stop
purchasing the products from social media
16
(14%)
37
(31%)
7
(6%)
46
(39%)
12
(10%)
I complain via social media about the product 52
(44%)
42
(36%)
14
(12%)
7
(6%)
3
(3%)
Social Media Conveys Satisfaction and Dissatisfaction 55
(47%)
38
(32%)
18
(15%)
4
(3%)
3
(3%)
Social Media Allows for Product’s Review 60
(51%)
31
(26%)
19
(16%)
6
(5%)
2
(2%)
Mean 1.8305 1.6017 0.7373 0.6356 0.1949
just one route of marketing. But it does not mean thatwithout social media there will not be any good product.The human being still requires sellers' interaction to buythe products. The exchange policy should be more visibleon social media. Social media is a good tool for productpurchase but it has a risk of purchasing at some extent.In today's world, social media is more effective than massmedia. The coming age is of social media. Social mediais useful where the product is new or it is in developmentstage.
Make a Social Media Marketing Plan - What,When, Where and How of SMM campaign i.e.What kind of Information will you share with theaudience? When is the time to target the traffic onsocial media sites? Segment their consumers basedon the type of social media they use.
Use social media for more frequent exposure, inorder to attract their consumer attention and increasethe brand awareness.
Be more interactive; generate ideas from theirconsumers (making them feel part of the brand).
10
Try to be influential through the crowd, making theirproducts go viral in social media.
Identify and manage the opinion leaders of the digitalgroups, stimulating them to positively talk about theirproducts.
The importance of going toward using the socialmedia to market the products as these websitesattracts a large portion of the society.
The Importance of focusing on Social Media(Facebook, Twitter and Youtube) due to itssignificant impact on purchasing Decisions.
Advertisers should make the social media sitesadvertisements to be more appealing, trendy andcatchy so that social media users, especially theyouths, will not only feel like patronizing theproducts, but rather patronize the products. Thereis need for advertisers to give all the details that areneeded for easy patronage of the products.
Conclusion
Since long, it has been seen the emergence of a new typeof media that allows a wide range of interactionpossibilities between users. These media are called SocialMedia. Gradually more people have been using theseplatforms and tools and every year new types aredeveloping, bringing new possibilities for users.Companies started to see the opportunities to be inattendance on it to engage with their customers through atwo-way communication instead of one-waycommunication previously used by marketers. Theliterature review also emphasized the importance of socialnetworking sites having influence on consumers. The dataanalysis has brought out the role of social media on variousstages of consumer decision making process i.e. problemrecognition, information search, pre and post purchasestage, word-of-mouth, which has been demonstrated asa paramount factor to vehicle influence between people.The literature review demonstrated that it was beingwitnessed these last years to a shift in the consumerbehaviour from being 'consumers as viewers', sinceconsumers were nowadays more likely to be participatingthan watching.
References
1. Stelzner A (2011) "How Marketers Are Using SocialMedia to Grow Their Business", Available at: http://www.socialmediaexaminer.com/social-media-
marketing-industry-report-2011, accessed on 20April 2012.
2. Budzanowska-Drzewiecka, M. (2011). Socialconditioning of purchasing decisions of 9-11 year-old consumers. Journal of Customer Behaviour, 10(2),143-160. doi:10.1362/147539211X589555
3. Social Media Marketing: How to Turn SatisfiedCustomers Into 'Brand Advocates'. (http://www.forbes.com/sites/deborahljacobs/2013/02/15/social-media-marketing-how-to-turn-satisfied-customers-into-brand-advocates/ [Retrieved16.3.2013]).
4. Kotler, P., & Keller, K. L. 2009. Marketingmanagement. Upper Saddle River, N.J: PearsonPrentice Hall.
5. Marsden, D., and Littler, D., 1998. Positioningalternative perspectives of consumer behaviour.Journal of Marketing Management, 1 (3), 3-28.
6. M. Solomon, G. Bamossy, S. Askegard and M. Hogg.Consumer Behavior, A European Per-spective, 3?edition. Edinburgh Gate: Financial Times/Prentice Hall,2006.
7. Internet World Stats. "Top 50 countries with thehighest Internet Penetration Rates - 2013". Internet:http://www.internetworldstats.com/top25.
8. Association of Information and CommunicationTechnology of Kosovo. "Internet penetration andusage in Kosovo"
Internet:http://stikk.org/fileadmin/user_upload/Depertimi_dhe_perdorimi_i_internetit_ne_Kosove_01.pdf,Aug., 2013 [Aug. 16, 2016].
9. Ministry of EU Integration. "A guide to implementingsocial media in support of Kosovo's EU IntegrationProcess".
Internet:http://www.mei-ks.net/repository/docs/Social_Media_Guideline_ENG_-_FINAL_PDF.pdf,Nov., 2013 [Aug. 26, 2016].
10.Independent Media Commission. "Advertising marketresearch and analysis in Kosovo". In-ternet: http://k p m - k s . o r g / m a t e r i a l e / d o k u m e n t /1389360328.1626.pdf, Sep., 2013 [Jul. 12, 2016].
11.The Social Media Bible: Tactics, Tools, and Strategiesfor Business Success, 3d edition. New Jersey: JohnWiley & Sons, Inc, 2009.
11
12.The Social Media Marketing Book. Sebastopol 1005Gravenstein Highway North: O'Reilly Media, Inc,
2010.
13.E. Helsper, W. Richter, and E.T. Meyer. (2010 April)
"Consumption (incl. media and enter-tainment)"
Oxford Internet Institute.
O n l i n e : h t t p s : / / w w w. g o o g l e . c o m / u r l ?
sa=t&rct=j&q=&esrc=s&source=web&cd=1&v
e d = 0 a h U K E w i 6 6 N P P 1 N f PA h U C 1 h o K
HZ8gD5AQFggoMAA &url=http%3A%2F%2
Fec.europa.eu%2Finformation_society%
2Fnewsroom%2Fcf%2Fdocument.cfm%3
Fact ion%3Ddisp lay%26doc_id%3D673
&usg=AFQjCNF2oey3ek0bOUtLIoxnKDTE8S9l
EA&bvm=bv.135475266,d.b Gg&cad =rja[Jul. 29,
2016].
14.European Parliament. "Consumer behavior in a digital
envrnment". Internet: http://www.europarl.europa.eu/
RegData/etudes/etudes/join/2011/464441/IPOL-
IMCO_ET (2011)464441_EN.pdf, Aug., 2011
[Aug. 25, 2016].
15.The New Influencers, A Marketer's Guide to the New
Social Media. California: Quill Driver Books, Linden
Publishing, Inc, 2007, pp. 67.
16.J. Surowiecki. The Wisdom of Crowds. New Yourk:
Anchor Books, Random House Inc, 2005, pp. xiv.
17.Forbes, L.P., & Vespoli, E.M. (2013). Do social
media influence consumer buying behavior? An
investigation of recommendations and purchases.
Journal of Business & Economics Research, 11(2),
107-111.
18.Heinonen, K. (2011). Consumer activity in social
media: Managerial approaches to consumers' social
media behavior. Journal of Consumer Behavior, 10(6),
356-364. doi:10.1002/cb.376
19.Kang, M., & Schuett, M. (2013). Determinants of
sharing travel experiences in social media. Jounal of
travel & Tourism Marketing, 93-107, doi:10.1080/
10548408.2013.751237
20.Lehmann, B.A., Ruiter, R.C., & Kok, G. (2013). Aqualitative study of the coverage of influenza
vaccination on Dutch news sites and social media
websites. BMC Public Health, 13(1), 1-13.
doi:10.1186/1471-2458-13-547
21.Ostrow, A. (2010). It's Official: Facebook Passes
500 Million User. Retrieved from http://
mashable.com/2010/07/21facebook-500-million-2
22.Simpler III, M.F. (2012). The unjust "Web" we
weave: The evolutiom of social media and its
psychological impact on juror impartiality and fair trials.
Law & Psychology Review, 36, 275-296. Taining,
Y. (2012) The decision behavior of facebook users.
Journal of Computer Information Systems, 52(3), 50-
59.
23.The effects of social media marketing on online
consumer behavior. International Journal of Business
& Management, 8(14), 66- 9. Vinerean, S., Cetina,
I., & Tichindelean, M. (2013).
24.Ward, S. (1974). Consumer socialization. Journal of
Consumer Research, 1(2), 1-14. Retrieved from http:/
/dx.doi.org/10.1086/208584
25.Belch, G., & Belch, M. (2003). Advertising and
promotion: an integrated marketing communication
perspective. Berkshire: McGraw-Hill.
26.Bernoff, J. &. (2008). Harnessing the power of the
oh-so-social web. MIT Sloan Management Review,
49(3), 36-42.
27.Blumberg, B., Cooper. D. R. & Schindler. P. S.
(2014). Business Research Methods. New York, NY:
McGraw-Hill Higher Education. C
28.Chu, S. C., & Kim, Y. (2011). Determinants of
consumer engagement in electronic word-of-mouth
(eWOM) in social networking sites. International
journal of Advertising, 30(1), 47-75.
29.Blythe, J. (2008). Consumer behaviour. Cengage
Learning EMEA.
30.Duffett, R. G. (2017). Influence of social media
marketing communications on young consumers'
attitude. Young Consumers, 18(1).
12
1. Introduction
Blockchain, mostly known as the backbone technologybehind Bitcoin, is one of the emerging technologiescurrently in the market attracting lot of attentions fromenterprises, start-ups and media. Blockchain has thepotential to transform multiple industries and makeprocesses more democratic, secure, transparent, andefficient. With high volumes of data getting generated everyday owing to digitization of records, it becomes importantfor every organization to effectively manage the securitythreats and achieve significant cost efficiencies. This iswhere Blockchain, with its promises of decentralized
* Assistant Professor, Faculty of Management Studies, Parul University, Vadodara** Post Graduate Student, Faculty of Management Studies, Parul University, Vadodara*** Professor, G. H. Patel Post Graduate Institute of Business Management, (MBA department) Sardar Patel University, Vallabh
Vidyanagar, Anand
Applications of Blockchain Technology In Banking : A Conceptual Approach
Tejal Shah* Shailak Jani** and P K Priyan ***
Abstract
Purpose
A new disruptive force of digital technology is changing the business models and increasingly becoming a crucial factoraround the world. One of the most discussed and supposedly ingenious innovations is the distributed database referredto as blockchain. However, the technology and its road of development still have a lot of common unknowns forpractitioners and researchers alike, especially regarding the question, how the technology could modify or be includedinto the existing landscape of digital services, processes and infrastructures. The purpose of this paper is to introducethe technology, its core concepts and components and to assess the value of Blockchain technology in banking sectoras a solution to creating and preserving reliable digital records, presenting some of the limitations, risks and opportunitiesof the approach.
Design/methodology/approach
The use cases for blockchain have been developed and blockchain fit assessment have also been performed for threetransactions- consortium banking, payment and KYC transaction
Findings
The results of the analysis suggest that Blockchain technology can be used to address issues associated with informationintegrity in the present and near term, assuming proper security architecture and infrastructure management controls.
Research limitations/implications
We limited to only three banking transactions;however, use cases for more transactions can be developed.
Originality/value
Our framework is of high theoretical and practical value as it provides researchers and practitioners a common basisfor communication and means for guided analysis of blockchain applicability.
Keywords
Applications of Blockchain, Blockchain, Benefits from Blockchain, Decentralized consensus, Features of Blockchain,Use cases, Smart contracts, Trusted Computing, Banking.
Paper type: Conceptual
ownership, immutability and cryptographic security ofdata, is catching the attention of the C-suite executives.Multiple use cases are also getting explored acrossindustries as everyone has started realising the disruptivepotential of this technology. Financial players are the firstmovers to capitalize on this technology even though it isstill in a nascent stage. Many companies, from a plethoraof nonfinancial services industries like telecom CyberSecurity, Governance, Energy Management, Retail, Realestate are on its way to establish the potential Blockchainuse cases.
13
2. Literature Review
In recent times, many researchershave been carried outin the field of Blockchain Technology. The studies wereaimed at in exploring the scope of this new BlockchainTechnology, as well as, its applications. Following arethe literatures reviewed for the purpose of the study.
Johansen(2017) did a comprehensive review on theBlockchain, as a Technological Enabler for Innovation, itwas found that Blockchain technology has certain featuresthat is well applied within the financial industry, but stilllacks to find the appropriate use of large scale Blockchainusage within modern society. Research also pointstowards the technological features as becoming driversfor disruption and innovation for the technology. It wasalso found that one of the main issues of Blockchaintechnology is scalability.
Crowdfunding is a critical utility particularly for smallmarket enterprises as the new venture amidst a pervasivethreat of employment crisis and insecurity. Traditionalcrowdfunding has been thwarted by concerns ofmalpractices such as money laundering, informationasymmetry, and fraud that prompts legislative restrictionson the fundraising activities.
Gebert (2017) carried out research on the Applicationof Blockchain Technology In Crowdfunding, it was foundthat the blockchain technology is a tool that providesimmense hope for a revival of crowdfunding across theworld. The blockchain technology provides a distributedpublic ledger that enhances transparency such thatparticipants can conduct affairs without concerns ofimposition over the internet.
Krause (2017) found that, the blockchain technology isstill in an early stage and has to prove itself in practice.The time horizon for the technology's availability for broaduse in financial services is estimated to be 5-10 years. Itwas further found that the technology could removetrusted third parties, decrease costs and ultimatelyincrease profits for various players within the industry.
White & Brown (2016) focused on creating a value-based society & researched on theFuture Applicationsof Blockchain, it was found that the defining characteristicof a blockchain is that it is a trustworthy open ledger ofwork or transactions that are independently verified bymultiple agents. Independent verification imbues theblockchain with a degree of robustness that enables itscontents to be trusted.
Seebacher and Schüritz (2017) found that the Blockchaintechnology addresses many important aspects, such asfacilitating co-creation of value, ensuring availability ofinformation and offering mechanisms of coordination. Italso creates a trusted environment through its transparentnature, making information publicly available thought outits entire network, while also assuring the integrity andimmutability of data. Decentralization allows for theprotection of privacy, through pseudonymization, andcreates a reliable and versatile setting.
Trautman(2017) investigated the role of disruptiveBlockchain technology in the future of Financial Services,it was found that laws and regulations could beprogrammed into the blockchain itself, so that they areenforced automatically. In other situations, the ledger canact as legal evidence for accessing (or storing) data, sinceit is (Computationally) tamper-proof.
Aggrawal(2017) investigated the scope of BlockchainTechnology for Financial Inclusion. It was found thatBlockchain can play significant role in the FinancialInclusion process. It further found that Financial Inclusionusing block chain for internal and cross border paymentscan lower costs, shorten settlement time, and providebetter user experience. Besides it suggested that regulatorsshould engage, intervene at early stage and shape theinnovation.
Guo and Liang (2016) while examining Chinese Bankingsector & the use of BlockchainTechnology, found thatBlockchains could revolutionize the underlying technologyof the payment clearing and credit information systems inbanks, thus upgrading and transforming them. It alsofurther identified some challenges like regulation, efficiency,and securitythat has sparked extensive debate in theprocess of each new financial innovation, to enhance theefficiency of the banking industry.
3. What is Blockchain
A Blockchain is a digital, immutable, distributed ledgerthat chronologically records transactions in near real time.The prerequisite for each subsequent transaction to beadded to the ledger is the respective consensus of thenetwork participants (called nodes), thereby creating acontinuous mechanism of control regarding manipulation,errors, and data quality. It creates a digital ledger oftransactions and thereby allowing to share it among adistributed network of computers and it also maintains acontinuously-growing list of records called generally called"blocks" which are secured from tampering and revision.
14
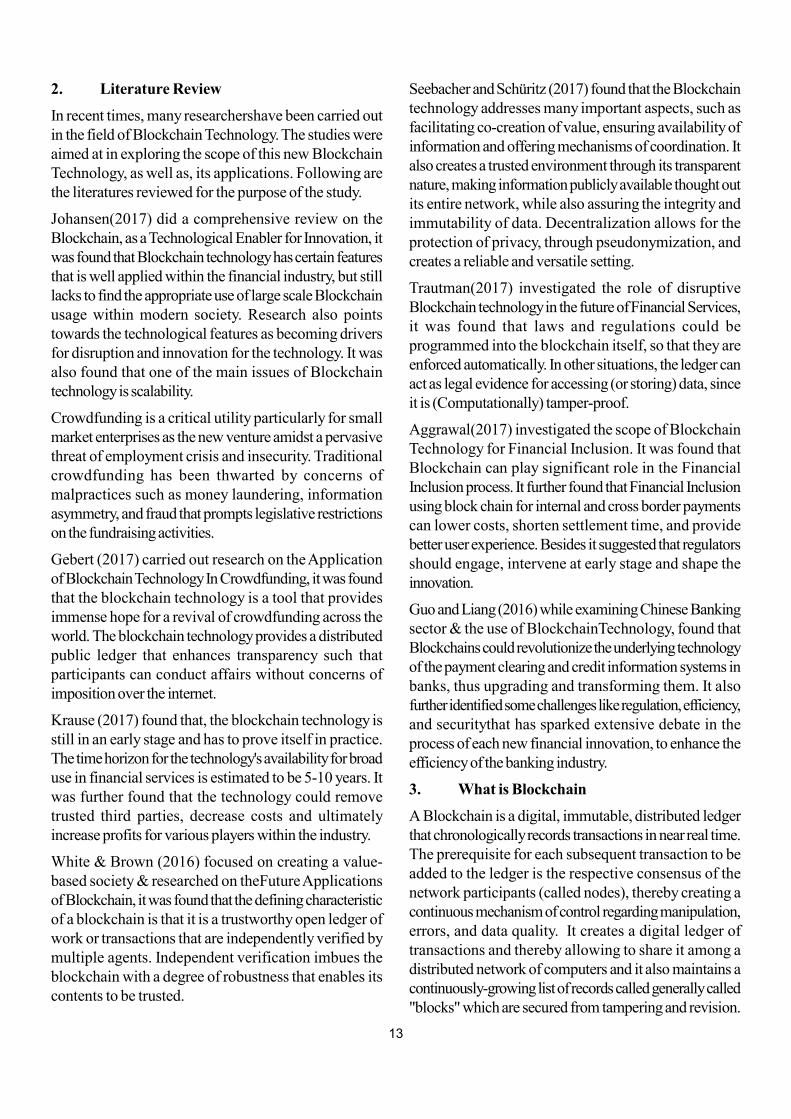
A blockchain implementation comprises of two kinds ofrecords: blocks and transactions. In each block containsa timestamp and a link to a previous block is providedby the secure hash algorithm. The prime advantage isthat it uses cryptography which allows different users tomodify the transactions on a secured network each oneaccessing their node of data. If majority of nodes agreethat the transaction performed looks valid, identifyinginformation which matches the blockchain's history andthus a new block is added to the chain. The two types ofblockchain are public and private. Ledgers are public if:
1. Anyone can write data, without permission granted byanother authority.
2. Anyone can read data, without permission granted byanother authority
In Private Blockchain network the participants are knownand trusted and there is a level of confidentiality. Forexample, in a conglomerate, many of the mechanismsaren't needed or they are replaced with legal bindingcontracts making everyone whoever has signed thecontract to abide to these rules
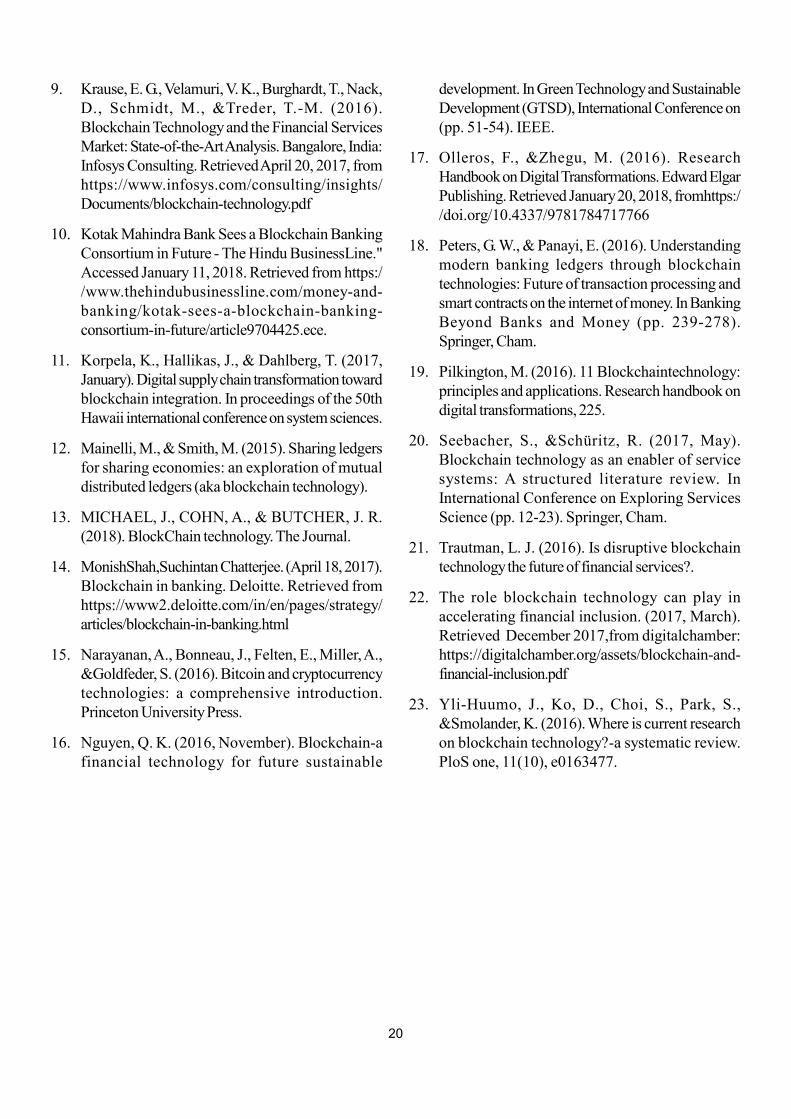
The blockchain architecture consists of a few fundamentalconcepts like decentralization, digital signature, mining anddata integrity.
(i) Decentralization:Rather than one central authorityoverpowering others in the ecosystem, blockchainexplicitly distributes control amongst all peers in thetransactionchain.
(ii) Digital signature:Blockchain enables an exchangeof transactional value using public keysby the mechanismof a unique digital sign i.e. code for decryption known toeveryone on the network and private keys known onlyto the owner to createownership.
(iii) Mining:In a distributed system every user minesand digs deep into the data which is then evaluatedaccording to the cryptographic rules and it alsoacknowledges miners for confirmation and verificationof thetransactions.
(iv) Data integrity:Complex algorithms and agreementamong users ensures that transaction data, once agreedupon, cannot be tampered with and thus remainsunaffected.
Figure 1: Blockchain Architecture
Source: Anatomy of a typical Blockchain Transaction,SachsInsights
4. Benefits From Blockchain
Blockchain, as discussed in the above section by virtueof its design and architecture, offers some inherent benefitswhich the industry has been looking for quite some timenow.
4.1 Near real time:Blockchain enables the near real-time settlement of recorded transactions, removingfriction, and reducing risk
4.2 No intermediary:Blockchain technology is basedon cryptographic proof instead of trust, allowing any twoparties to transact directly with each other without theneed for a trusted third party.
4.3 Distributed ledger: The peer-to-peer distributednetwork records a public history of transactions. Theblockchain is distributed and highly available.
4.4 Irreversibility & Immutability: The blockchaincontains a certain and verifiable record of every singletransaction ever made. This prevents past blocks from
15
being altered and in turn stops double spending, fraud,abuse, and manipulation of transactions.
4.5 Smart Contracts: Stored procedures executedin a Blockchain to process pre-defined business stepsand execute a commercially/legally enforceable transactionwithout involvement of an intermediary.
5. Blockchain Fit Assessment Framework
Banks across the country have successfully initiatedcollaboration with specialized firms (Fintech) and/orconsulting firms to build proof-of-concepts and explorevarious potential use-cases, which explains howBlockchain can address and resolve few pain points inthe currentstate process.
5.1 Major issues those banks face today
The Indian banking industry today is faced with issuessuch as rising costs of operations, increasing susceptibilityto fraudulent attacks on centralized servers and challengesin ensuring transparency. All this, primarily because mostof the banking transactions - from opening customeraccounts to making global payments - may requireintensive manual processing and documentation, involvecostly intermediaries and is timeconsuming as thesetransactions need to be validated by various participants
at various point in time causing the delay thereby resultingin almost lack of fraudproof real time solution.
5.2 What are banks looking for?
Banks are continuously exploring new ways to performtransactions quicker for an enhanced customer service,while ensuring cost efficiency in its operations and assuringtransparency to customers and regulators.
For this, Blockchain potentially provides a solution forbanks as it inherently helps eliminate intermediaries,maintain immutable log of transactions and also facilitatesreal-time execution of transactions. This could potentiallyreduce the TAT for banking transaction, reducing costsof manual work, and leading to enhanced customerservice and satisfaction.
5.3 The Blockchain Fit Assessment Framework
Based on the above discussion of what are the currentpain points of Banking Industry and benefits ofblockchain, a Blockchain Assessment Framework isdeveloped to evaluate whether a particular process oruse-case is the right fit for a Blockchain based solution.For a process or a use-case to classify as Blockchain-fit,majority of the questions provided in the framework needto be answered in the affirmative.
6. Use-cases or Processes Where BlockchainCan Play A Key Role
Presented below are some specific use cases, where we
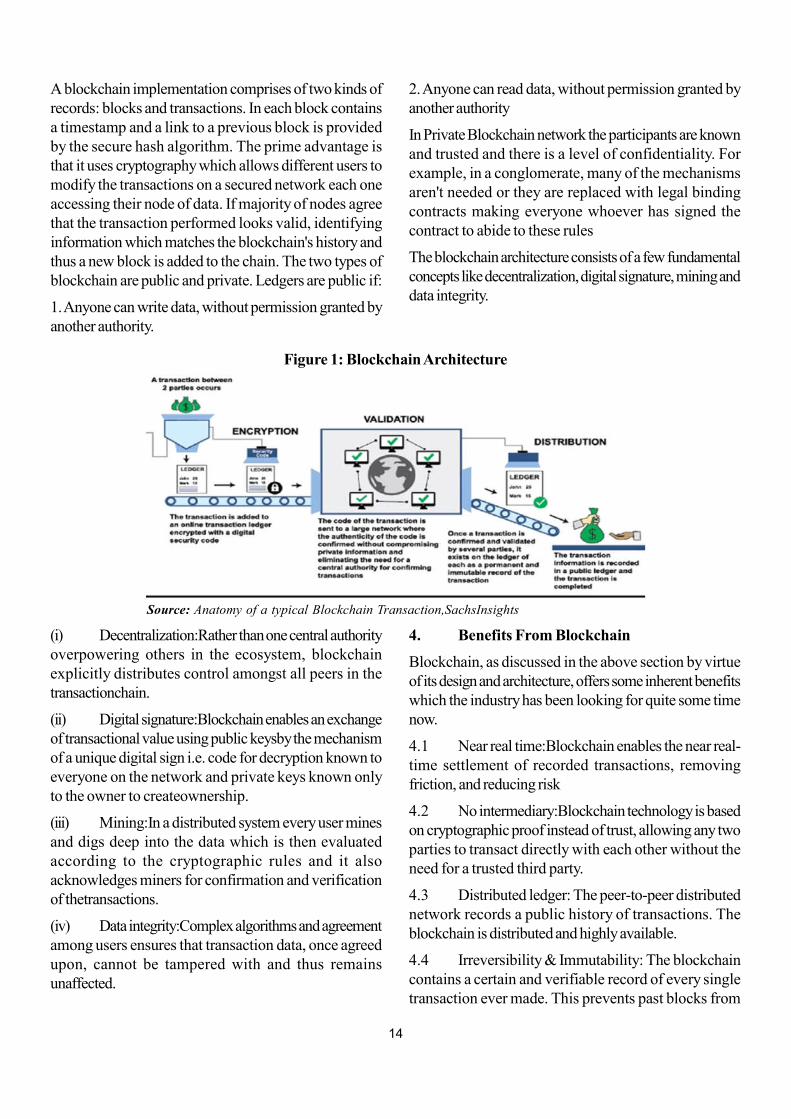
Table 1: The Blockchain Fit Assessment Framework
Factor Assessment Framework Impact of Blockchain Fit Intermediary • High fees for intermediary?
• Latency due to processing through intermediary? • Does the intermediary exist due to lack of trust?
Blockchain's distributed ledger technology facilitates disintermediation, thereby reducing costs and lowering latency.
Transparency • Are multiple participants involved? • Does increase in transparency into the transaction help the participants
The hash/ pointers of the records written on the Blockchain are immutable and irreversible, not allowing modifications and eliminating risk of fraud.
Information Storage
• Is the same information being stored in multiple locations? • Is data consistency an issue?
Blockchain's distributed ledger and consensus mechanism allows data consistency across multiple participants.
Manual Processing
• Does the process involve manual operations? • Is the cost of Reconciliation high?
Blockchain maintains automated audit trail of transactions, thereby reducing manual processing for data validations and reconciliations.
Trust • Is there trust among participants? • Do multiple participants have the right to modify transactions? • Is there a risk of fraudulent transactions?
Smart contracts allow codification of business rules, validations and reconciliation, thereby reducing manual processing.
Documentation
• Is the documentation paper-based? • Is there a large number of documents / reports required to be generated?
Smart contracts allow business validations and automated reconciliation for straight through processing.
Time Sensitivity
• Will the transactions benefit from being real-time or synchronous?
Blockchain enables the near real-time settlement of recorded transactions, reducing risk and providing an enhanced customer experience.
believe that Blockchain can play a key role for helpingIndian banks and financial institutions realize significantbenefits.
16
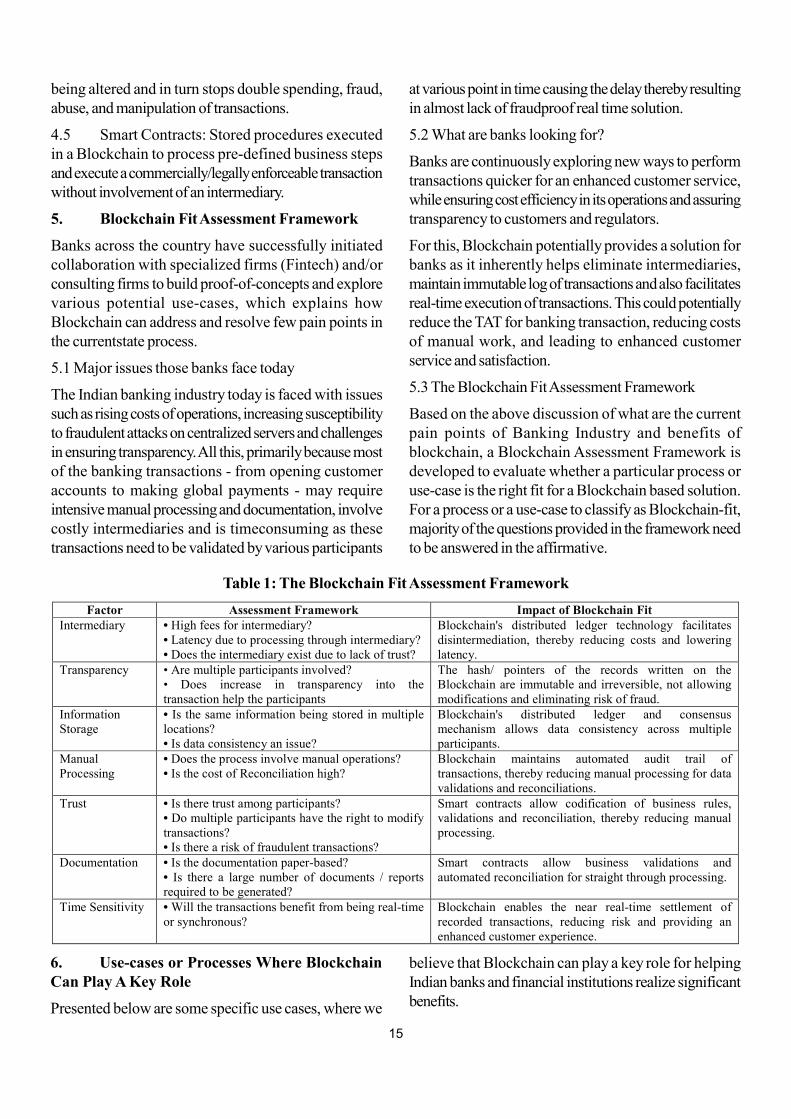
6.1 Consortium Banking
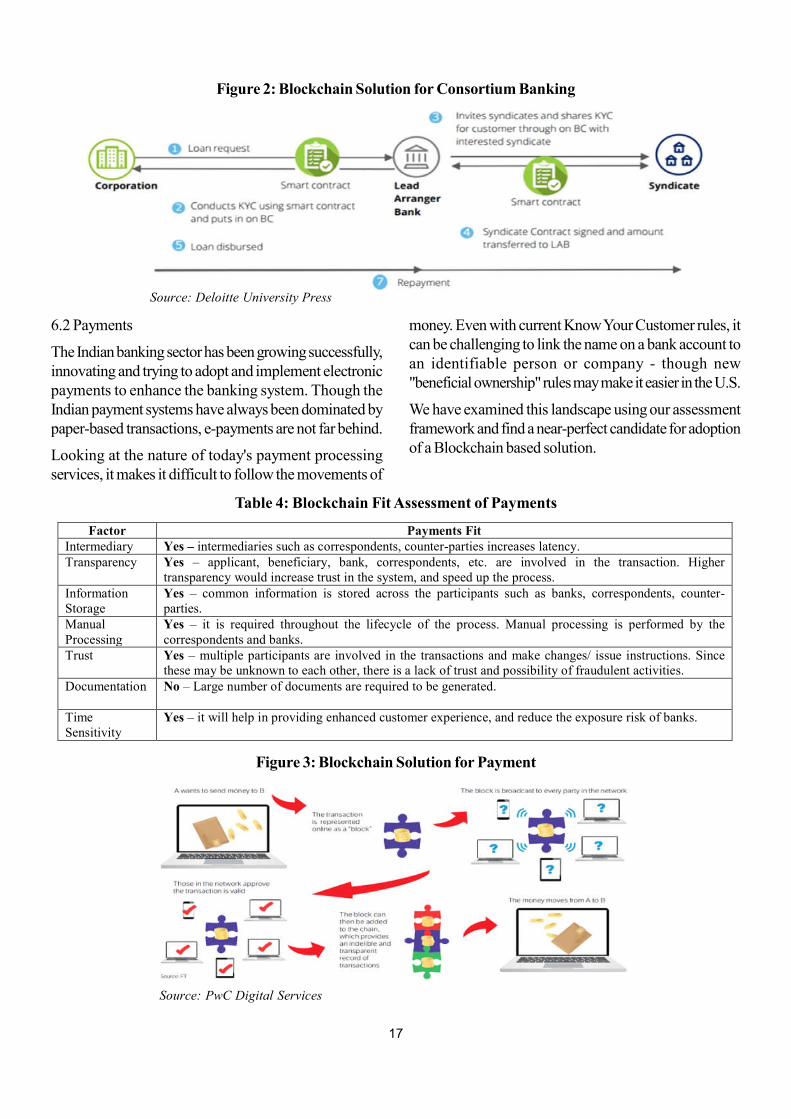
Corporations undertake multiple large projects such asdevelopment of roads, train systems, airports, factories,new business centres, etc., which requires large-scalefinancing. Procuring these large funds necessitate theinstitutions to come together to form consortium anddiversify the financial risk among its members. Suchparticipation in lending will enable a bank to limit thecommitment in respect of any one party.
Various regulatory prescriptions regarding conduct ofconsortium / multiple banking / syndicate arrangementswere withdrawn by Reserve Bank of India in October1996 with a view to introducing flexibility in the credit
delivery system and to facilitate smooth flow of credit.However, Central Vigilance Commission, Governmentof India, in the light of frauds involving consortium /multiple banking arrangements which have taken placerecently, has expressed concerns on the working ofConsortium Lending and Multiple Banking Arrangementsin the banking system. The Commission has attributedthe incidence of frauds mainly to the lack of effectivesharing of information about the credit history and theconduct of the account of the borrowers among variousbanks.
We have examined this landscape using our assessmentframework and find a near-perfect candidate for adoptionof a Blockchain based solution.
Table 2 : Blockchain Fit Assessment of Consortium Banking
Table 3: Current pain points of consortium banking and solution provided by Blockchain
Factor Consortium Banking Fit Intermediary Yes – agents & intermediaries are appointed at high fees to manage and administer the process. Transparency Yes – consortium members seek transparency customer's rating, loan administering, etc. while customers
seek transparency in underwriting. Information Storage
Yes – customer information has to be gathered from multiple sources for underwriting. Each member also stores a copy of the customer details
Manual Processing
Yes – the entire lifecycle is very paper intensive with customer details, negotiated terms and conditions among members, etc
Trust Yes – multiple participants are involved in the transactions including agents, customers, consortium members, etc. who may not be well known to each other, causing a lack of trust.
Documentation
Yes – There are multiple documentations required at consortium formation, as well as payment with a lot of validations for bills, items of purchase, etc. This is not due to regulatory reporting requirement.
Time Sensitivity
Yes – the turnaround time can be reduced and risk lowered if payment settlements become real time.
Current Pain Points How Blockchain Can Help Time-consuming process: Selection of members based on financial soundness and industry expertise, evaluation of borrower’s financial background and then negotiation of term and conditions is a tedious and time consuming process for the Lead Arranger.
Faster syndicate formation: Automated selection criteria for syndicate formation in programmable smart contracts.
Intermediary Fees: Agents and intermediaries have to be appointed at high fees to manage and administer the process
Technology integration: Automated due diligence and analysis of information for loan underwriting through Blockchain, reducing TAT.
Manual Processing: The technology systems are obsolete and processes are manual and paper intensive, taking a long time as well as increasing the cost of operations.
Digitization of documents: Agreements, contracts, terms and condition documents, etc. are digitized on the BlockChain and validations and checks are automated.
Duplication of effort: The lack of technology integration for due diligence and underwriting causes referencing of different applications and sources during the process. Document duplication also leads to risk of fraud.
Document immutability: Immutability feature of the Blockchain eliminates need for multiple copies of the same documents being held.
Delayed settlement cycles: Delayed settlement cycles for payments lock up capital and increase default risk.
Reduced settlement periods:Blockchain can facilitate near real-time loan funding and payment settlements with activities executed via smart contracts.
17
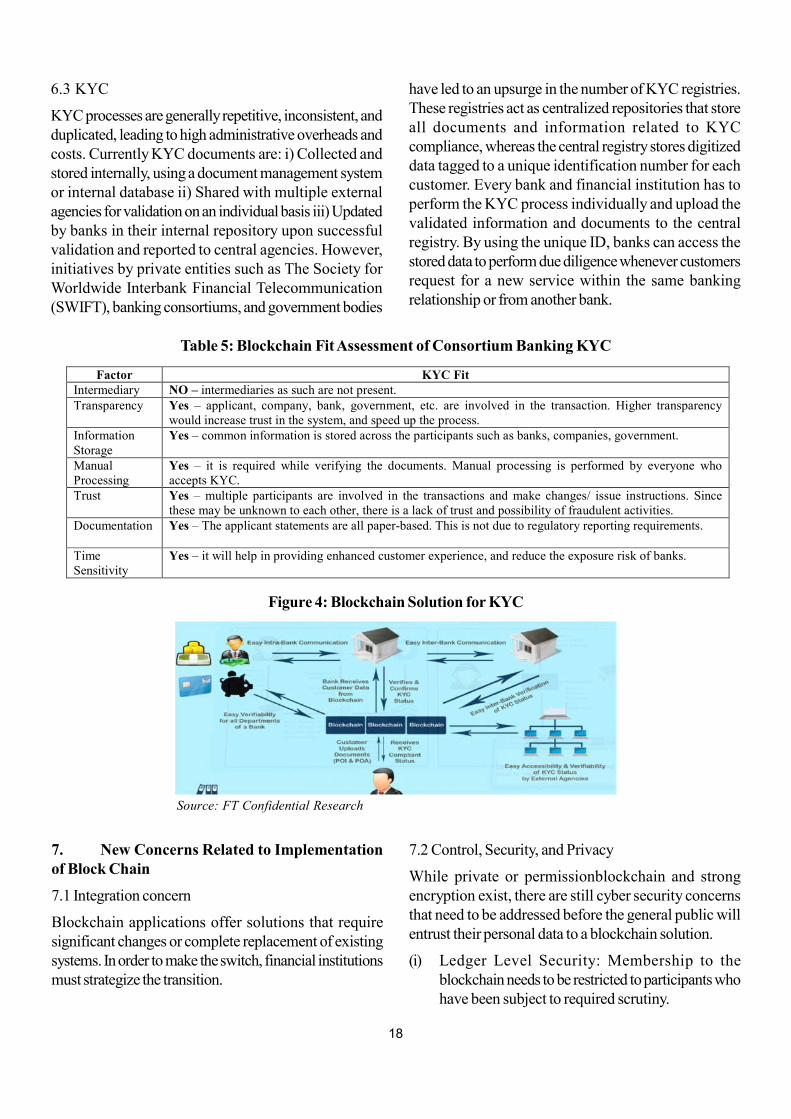
6.2 Payments
The Indian banking sector has been growing successfully,innovating and trying to adopt and implement electronicpayments to enhance the banking system. Though theIndian payment systems have always been dominated bypaper-based transactions, e-payments are not far behind.
Looking at the nature of today's payment processingservices, it makes it difficult to follow the movements of
Figure 2: Blockchain Solution for Consortium Banking
Source: Deloitte University Press
money. Even with current Know Your Customer rules, itcan be challenging to link the name on a bank account toan identifiable person or company - though new"beneficial ownership" rules may make it easier in the U.S.
We have examined this landscape using our assessmentframework and find a near-perfect candidate for adoptionof a Blockchain based solution.
Table 4: Blockchain Fit Assessment of Payments
Factor Payments Fit Intermediary Yes – intermediaries such as correspondents, counter-parties increases latency. Transparency Yes – applicant, beneficiary, bank, correspondents, etc. are involved in the transaction. Higher
transparency would increase trust in the system, and speed up the process. Information Storage
Yes – common information is stored across the participants such as banks, correspondents, counter-parties.
Manual Processing
Yes – it is required throughout the lifecycle of the process. Manual processing is performed by the correspondents and banks.
Trust Yes – multiple participants are involved in the transactions and make changes/ issue instructions. Since these may be unknown to each other, there is a lack of trust and possibility of fraudulent activities.
Documentation
No – Large number of documents are required to be generated.
Time Sensitivity
Yes – it will help in providing enhanced customer experience, and reduce the exposure risk of banks.
Figure 3: Blockchain Solution for Payment
Source: PwC Digital Services
18
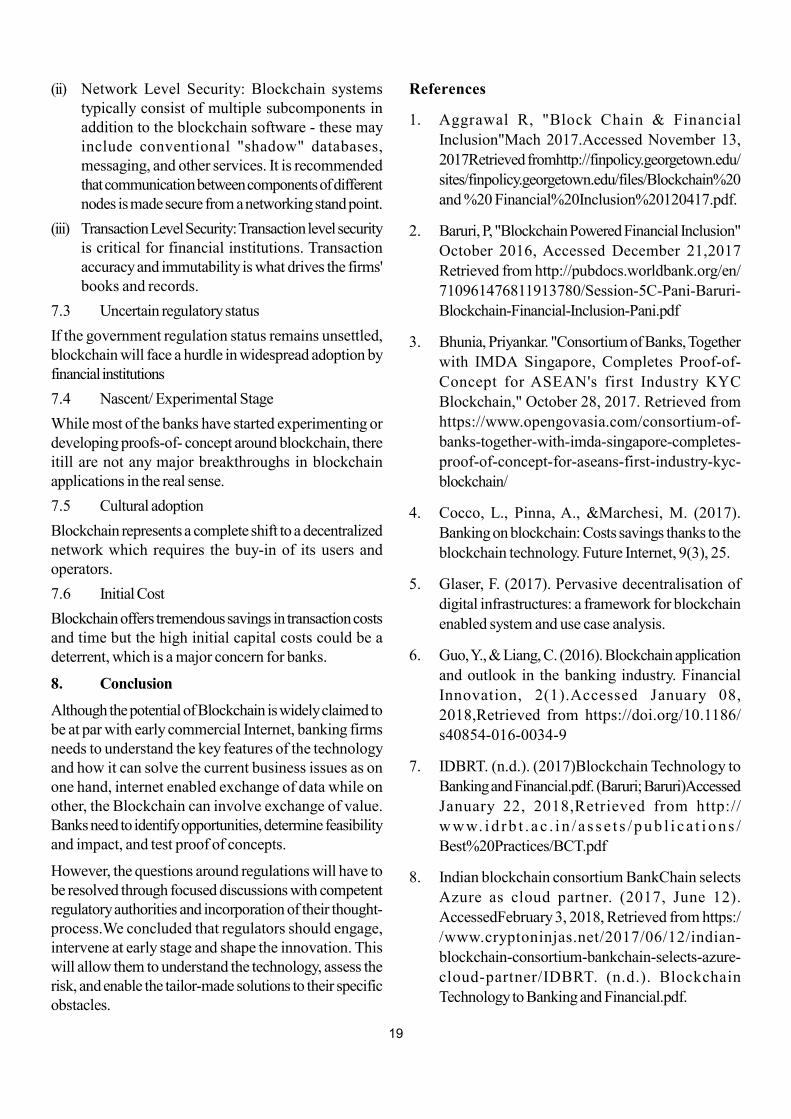
6.3 KYC
KYC processes are generally repetitive, inconsistent, andduplicated, leading to high administrative overheads andcosts. Currently KYC documents are: i) Collected andstored internally, using a document management systemor internal database ii) Shared with multiple externalagencies for validation on an individual basis iii) Updatedby banks in their internal repository upon successfulvalidation and reported to central agencies. However,initiatives by private entities such as The Society forWorldwide Interbank Financial Telecommunication(SWIFT), banking consortiums, and government bodies
have led to an upsurge in the number of KYC registries.These registries act as centralized repositories that storeall documents and information related to KYCcompliance, whereas the central registry stores digitizeddata tagged to a unique identification number for eachcustomer. Every bank and financial institution has toperform the KYC process individually and upload thevalidated information and documents to the centralregistry. By using the unique ID, banks can access thestored data to perform due diligence whenever customersrequest for a new service within the same bankingrelationship or from another bank.
7. New Concerns Related to Implementationof Block Chain
7.1 Integration concern
Blockchain applications offer solutions that requiresignificant changes or complete replacement of existingsystems. In order to make the switch, financial institutionsmust strategize the transition.
Factor KYC Fit Intermediary NO – intermediaries as such are not present. Transparency Yes – applicant, company, bank, government, etc. are involved in the transaction. Higher transparency
would increase trust in the system, and speed up the process. Information Storage
Yes – common information is stored across the participants such as banks, companies, government.
Manual Processing
Yes – it is required while verifying the documents. Manual processing is performed by everyone who accepts KYC.
Trust Yes – multiple participants are involved in the transactions and make changes/ issue instructions. Since these may be unknown to each other, there is a lack of trust and possibility of fraudulent activities.
Documentation
Yes – The applicant statements are all paper-based. This is not due to regulatory reporting requirements.
Time Sensitivity
Yes – it will help in providing enhanced customer experience, and reduce the exposure risk of banks.
Table 5: Blockchain Fit Assessment of Consortium Banking KYC
Figure 4: Blockchain Solution for KYC
Source: FT Confidential Research
7.2 Control, Security, and Privacy
While private or permissionblockchain and strongencryption exist, there are still cyber security concernsthat need to be addressed before the general public willentrust their personal data to a blockchain solution.
(i) Ledger Level Security: Membership to theblockchain needs to be restricted to participants whohave been subject to required scrutiny.
19
(ii) Network Level Security: Blockchain systemstypically consist of multiple subcomponents inaddition to the blockchain software - these mayinclude conventional "shadow" databases,messaging, and other services. It is recommendedthat communication between components of differentnodes is made secure from a networking stand point.
(iii) Transaction Level Security: Transaction level securityis critical for financial institutions. Transactionaccuracy and immutability is what drives the firms'books and records.
7.3 Uncertain regulatory status
If the government regulation status remains unsettled,blockchain will face a hurdle in widespread adoption byfinancial institutions
7.4 Nascent/ Experimental Stage
While most of the banks have started experimenting ordeveloping proofs-of- concept around blockchain, thereitill are not any major breakthroughs in blockchainapplications in the real sense.
7.5 Cultural adoption
Blockchain represents a complete shift to a decentralizednetwork which requires the buy-in of its users andoperators.
7.6 Initial Cost
Blockchain offers tremendous savings in transaction costsand time but the high initial capital costs could be adeterrent, which is a major concern for banks.
8. Conclusion
Although the potential of Blockchain is widely claimed tobe at par with early commercial Internet, banking firmsneeds to understand the key features of the technologyand how it can solve the current business issues as onone hand, internet enabled exchange of data while onother, the Blockchain can involve exchange of value.Banks need to identify opportunities, determine feasibilityand impact, and test proof of concepts.
However, the questions around regulations will have tobe resolved through focused discussions with competentregulatory authorities and incorporation of their thought-process.We concluded that regulators should engage,intervene at early stage and shape the innovation. Thiswill allow them to understand the technology, assess therisk, and enable the tailor-made solutions to their specificobstacles.
References
1. Aggrawal R, "Block Chain & FinancialInclusion"Mach 2017.Accessed November 13,2017Retrieved fromhttp://finpolicy.georgetown.edu/sites/finpolicy.georgetown.edu/files/Blockchain%20and %20 Financial%20Inclusion%20120417.pdf.
2. Baruri, P, "Blockchain Powered Financial Inclusion"October 2016, Accessed December 21,2017Retrieved from http://pubdocs.worldbank.org/en/710961476811913780/Session-5C-Pani-Baruri-Blockchain-Financial-Inclusion-Pani.pdf
3. Bhunia, Priyankar. "Consortium of Banks, Togetherwith IMDA Singapore, Completes Proof-of-Concept for ASEAN's first Industry KYCBlockchain," October 28, 2017. Retrieved fromhttps://www.opengovasia.com/consortium-of-banks-together-with-imda-singapore-completes-proof-of-concept-for-aseans-first-industry-kyc-blockchain/
4. Cocco, L., Pinna, A., &Marchesi, M. (2017).Banking on blockchain: Costs savings thanks to theblockchain technology. Future Internet, 9(3), 25.
5. Glaser, F. (2017). Pervasive decentralisation ofdigital infrastructures: a framework for blockchainenabled system and use case analysis.
6. Guo, Y., & Liang, C. (2016). Blockchain application
and outlook in the banking industry. FinancialInnovation, 2(1).Accessed January 08,2018,Retrieved from https://doi.org/10.1186/s40854-016-0034-9
7. IDBRT. (n.d.). (2017)Blockchain Technology toBanking and Financial.pdf. (Baruri; Baruri)AccessedJanuary 22, 2018,Retrieved from http://w ww. i d r b t . a c . i n / a s s e t s /p u b l i c a t i o ns /Best%20Practices/BCT.pdf
8. Indian blockchain consortium BankChain selectsAzure as cloud partner. (2017, June 12).AccessedFebruary 3, 2018, Retrieved from https://www.cryptoninjas.net/2017/06/12/indian-blockchain-consortium-bankchain-selects-azure-cloud-partner/IDBRT. (n.d.). BlockchainTechnology to Banking and Financial.pdf.
20
9. Krause, E. G., Velamuri, V. K., Burghardt, T., Nack,D., Schmidt, M., &Treder, T.-M. (2016).Blockchain Technology and the Financial ServicesMarket: State-of-the-Art Analysis. Bangalore, India:Infosys Consulting. Retrieved April 20, 2017, fromhttps://www.infosys.com/consulting/insights/Documents/blockchain-technology.pdf
10. Kotak Mahindra Bank Sees a Blockchain BankingConsortium in Future - The Hindu BusinessLine."Accessed January 11, 2018. Retrieved from https://www.thehindubusinessline.com/money-and-banking/kotak-sees-a-blockchain-banking-consortium-in-future/article9704425.ece.
11. Korpela, K., Hallikas, J., & Dahlberg, T. (2017,January). Digital supply chain transformation towardblockchain integration. In proceedings of the 50thHawaii international conference on system sciences.
12. Mainelli, M., & Smith, M. (2015). Sharing ledgersfor sharing economies: an exploration of mutualdistributed ledgers (aka blockchain technology).
13. MICHAEL, J., COHN, A., & BUTCHER, J. R.(2018). BlockChain technology. The Journal.
14. MonishShah,Suchintan Chatterjee. (April 18, 2017).Blockchain in banking. Deloitte. Retrieved fromhttps://www2.deloitte.com/in/en/pages/strategy/articles/blockchain-in-banking.html
15. Narayanan, A., Bonneau, J., Felten, E., Miller, A.,&Goldfeder, S. (2016). Bitcoin and cryptocurrencytechnologies: a comprehensive introduction.Princeton University Press.
16. Nguyen, Q. K. (2016, November). Blockchain-afinancial technology for future sustainable
development. In Green Technology and SustainableDevelopment (GTSD), International Conference on(pp. 51-54). IEEE.
17. Olleros, F., &Zhegu, M. (2016). ResearchHandbook on Digital Transformations. Edward ElgarPublishing. Retrieved January 20, 2018, fromhttps://doi.org/10.4337/9781784717766
18. Peters, G. W., & Panayi, E. (2016). Understandingmodern banking ledgers through blockchaintechnologies: Future of transaction processing andsmart contracts on the internet of money. In BankingBeyond Banks and Money (pp. 239-278).Springer, Cham.
19. Pilkington, M. (2016). 11 Blockchaintechnology:principles and applications. Research handbook ondigital transformations, 225.
20. Seebacher, S., &Schüritz, R. (2017, May).Blockchain technology as an enabler of servicesystems: A structured literature review. InInternational Conference on Exploring ServicesScience (pp. 12-23). Springer, Cham.
21. Trautman, L. J. (2016). Is disruptive blockchaintechnology the future of financial services?.
22. The role blockchain technology can play inaccelerating financial inclusion. (2017, March).Retrieved December 2017,from digitalchamber:https://digitalchamber.org/assets/blockchain-and-financial-inclusion.pdf
23. Yli-Huumo, J., Ko, D., Choi, S., Park, S.,&Smolander, K. (2016). Where is current researchon blockchain technology?-a systematic review.PloS one, 11(10), e0163477.
21
1. Introduction
Economic nationalism has been and will continue to bean argumentative subject. While it is certainly not amodern philosophy, its appearances in today'sinternational economy have been constant and critical.
According to Heilperin (1960), it is difficult to discernthe precise meaning of economic nationalism but the termwas widely used during interwar years in 20th century.Liberal economists often use this term to define the policiesthey don't like. As per the view of Kofman (1990),economic nationalism is everything that did not fit in withthe liberal explanation of economy and development. Atbest economic nationalism is an open-ended word, usedby its antagonists, more that by its protagonists (Hadgson,1933).
According Helleiner and Pickel (2005), economicnationalism denotes to policies directed by the idea ofshielding the domestic economy from perils including butnot limited to the consequences of free trade. Such policies
* Research Scholar, G.H. Patel P. G. Institute of Business Management, Sardar Patel University, VallabhVidyanagar and AssistantProfessor, S.R. Luthra Institute of Management, Surat
** Dean, Faculty of Management, Director and Professor, G.H. Patel P.G. Institute of Business Management, Sardar Patel University,VallabhVidyanagar
An Empirical Study of Expectations Model of Economic Nationalism AmongMillennials in South Gujarat
Riddhish N. Joshi* and Yogesh C. Joshi**
Abstract
Purpose - The purpose of this paper is to examine the influence of various dimensions of economic nationalism onbehavioural intention of millennials.
Design/methodology/approach - Primary research using structured questionnaire was directed in South Gujaratamongst millennial age group consumers to investigate the expectations model of economic nationalism and theirbehavioural intention.
Findings - The result of the study finds that behavioural intention of millennials to avoid and discourage foreignproducts is largely affected by their expectations with respect to Indian firms and general public.
Research implications - The study enhances the understanding about the expectations of people with respect toIndian government, Indian firms and general public about their role to restrain the magnitudes of foreign operations inhost countries.
Originality/value - The research provides practicing marketers as well as international researchers a deeperunderstanding about the relationship between dimensions of expectations model of economic nationalism and behaviouralintention among millennials.
Keywords - Economic nationalism, economics, consumer behaviour, globalization
Paper type - Research Paper
include tariffs and other constraints on free trade that arerepellent to neoliberals yet might be in the interest ofeconomic development. It can be understood as a set ofattitudes or set of themes rather than a coherent anddisciplined form of economic or political philosophy(Gilpin, 1987).
Economic nationalism is really a complex set ofrelationships between nation and economy that can indeedinclude neoliberalism in its various forms and provide notjust theory but empirical descriptions to exhibit theirargument (Winters, 2006). Although economic nationalismhas been around for some time, elucidations vary and itis often confused with the similar yet distinct concepts ofnationalism, patriotism, ethnocentrism and consumerethnocentrism (Akhter, 2007).
The trend toward economic nationalism has also beenpowered by greater global income inequality, growingreliance on individual merchandises for governmentrevenues, too many countries hitching their economicprosperities to China, and a growing inclination for oil-
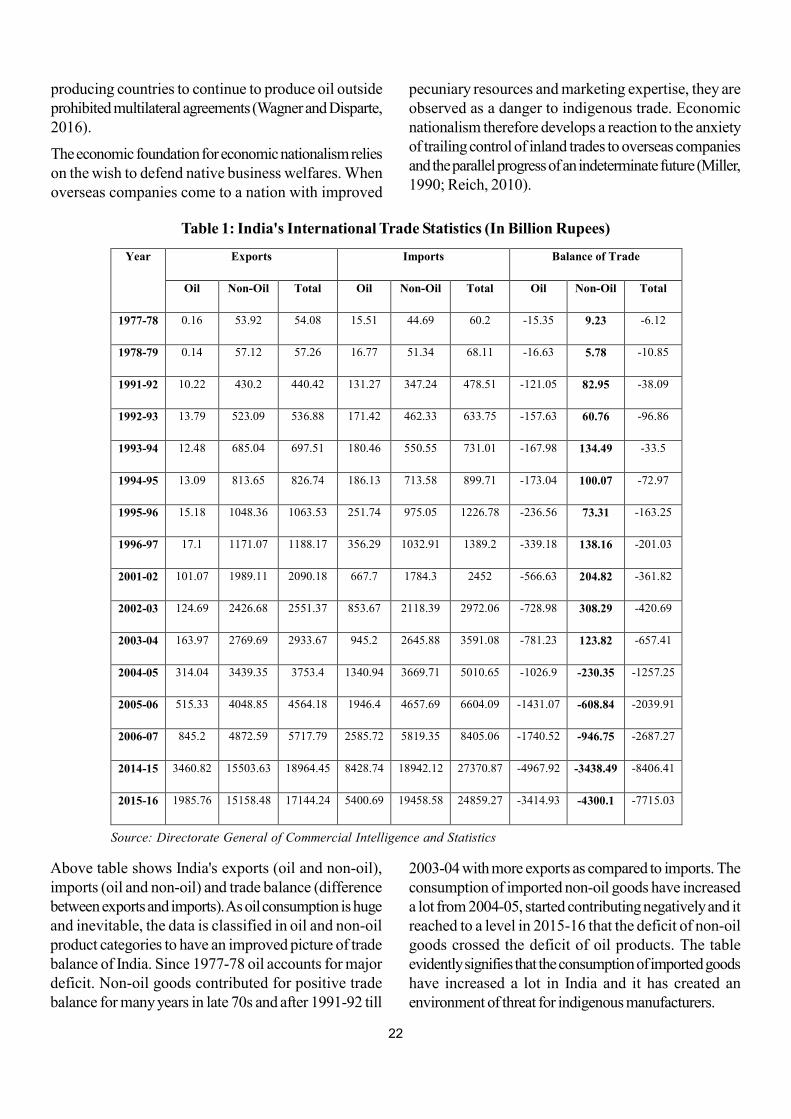
22
producing countries to continue to produce oil outsideprohibited multilateral agreements (Wagner and Disparte,2016).
The economic foundation for economic nationalism relieson the wish to defend native business welfares. Whenoverseas companies come to a nation with improved
Table 1: India's International Trade Statistics (In Billion Rupees)
Year
Exports Imports Balance of Trade
Oil Non-Oil Total Oil Non-Oil Total Oil Non-Oil Total
1977-78 0.16 53.92 54.08 15.51 44.69 60.2 -15.35 9.23 -6.12
1978-79 0.14 57.12 57.26 16.77 51.34 68.11 -16.63 5.78 -10.85
1991-92 10.22 430.2 440.42 131.27 347.24 478.51 -121.05 82.95 -38.09
1992-93 13.79 523.09 536.88 171.42 462.33 633.75 -157.63 60.76 -96.86
1993-94 12.48 685.04 697.51 180.46 550.55 731.01 -167.98 134.49 -33.5
1994-95 13.09 813.65 826.74 186.13 713.58 899.71 -173.04 100.07 -72.97
1995-96 15.18 1048.36 1063.53 251.74 975.05 1226.78 -236.56 73.31 -163.25
1996-97 17.1 1171.07 1188.17 356.29 1032.91 1389.2 -339.18 138.16 -201.03
2001-02 101.07 1989.11 2090.18 667.7 1784.3 2452 -566.63 204.82 -361.82
2002-03 124.69 2426.68 2551.37 853.67 2118.39 2972.06 -728.98 308.29 -420.69
2003-04 163.97 2769.69 2933.67 945.2 2645.88 3591.08 -781.23 123.82 -657.41
2004-05 314.04 3439.35 3753.4 1340.94 3669.71 5010.65 -1026.9 -230.35 -1257.25
2005-06 515.33 4048.85 4564.18 1946.4 4657.69 6604.09 -1431.07 -608.84 -2039.91
2006-07 845.2 4872.59 5717.79 2585.72 5819.35 8405.06 -1740.52 -946.75 -2687.27
2014-15 3460.82 15503.63 18964.45 8428.74 18942.12 27370.87 -4967.92 -3438.49 -8406.41
2015-16 1985.76 15158.48 17144.24 5400.69 19458.58 24859.27 -3414.93 -4300.1 -7715.03
pecuniary resources and marketing expertise, they areobserved as a danger to indigenous trade. Economicnationalism therefore develops a reaction to the anxietyof trailing control of inland trades to overseas companiesand the parallel progress of an indeterminate future (Miller,1990; Reich, 2010).
Above table shows India's exports (oil and non-oil),imports (oil and non-oil) and trade balance (differencebetween exports and imports). As oil consumption is hugeand inevitable, the data is classified in oil and non-oilproduct categories to have an improved picture of tradebalance of India. Since 1977-78 oil accounts for majordeficit. Non-oil goods contributed for positive tradebalance for many years in late 70s and after 1991-92 till
Source: Directorate General of Commercial Intelligence and Statistics
2003-04 with more exports as compared to imports. Theconsumption of imported non-oil goods have increaseda lot from 2004-05, started contributing negatively and itreached to a level in 2015-16 that the deficit of non-oilgoods crossed the deficit of oil products. The tableevidently signifies that the consumption of imported goodshave increased a lot in India and it has created anenvironment of threat for indigenous manufacturers.
23
International business, international marketing, politicalscience and literature repeatedly discuss and presentnumerous thoughts which seem very much linked to theconcept of economic nationalism like nationalism,patriotism, ethnocentrism, and consumer ethnocentrismbut are abstractly dissimilar.Unlike other four concepts,economic nationalism pursues to protect domesticpossessions, businesses, and folks from the control ofoverseas organisations, who are considered members ofthe out-group (Akhter, 2007).
2. Literature Review
Review of literature is veryimportant to criticallysummarize the present knowledge in the area underexploration. It also aids to establishmerits and flaws ofearlier work, lead to categorise them in the contemporaryresearch and also support to eliminate probabledeficiencies. It also conveys perspective and contributesin detecting the gap. The present review scrutinizednumerous literature in the viewpoint of the current researcharea.
The notion of economic nationalism recommends thatproduction, exchange, consumption and accumulation canreinforce the national communal and that national powercan be and used for such devotions (Crane, 1998).Economic nationalist politics abandon one of the vitalconcepts of economics--that of gains from trade: the ideathat, when people trade willingly, they are both betteroff--they interchange things they worth for things theyvalue even more (Wrong, 1998).
The flaws of economic nationalism are greater or lesserthan those of its two rivals, economic liberalism andeconomic socialism. Indeed, all three leave open questionsand provoke us with difficult predicaments (Levi-Faur,1997).
It is deceptive to apprehend this phase of globalisationand economic liberalisation as inevitablyindicating thedownfall of economic nationalism. Economic nationalismdoes not stance any challenge to economic liberalism,furthermore, the intensifying approval of liberal economicpolicies in the contemporary phase should not be muddledwith the supremacy of economic liberalism (Helleiner,2002). New Statesman (2009) stated that the worldcannot return to the world of closed economies. Thepowers of globalisation, directed by state-of-the-arttechnologies such as the internet and the entertainmentindustry, are alluring and irreversible. The way forwardmust be for governments, working in concert, to attempt
to soften the effects of globalisation, to regulate marketsmore efficiently, while keeping them free and open. Thealternative, aretreat into protectionism and economicnationalism, would only make the present-day crunch evenshoddier.
The blatant choice we face is either a common assuranceto internationalism or a return to economic nationalismled by industrial policy. At present, the second seems tobe the more prospective (Leipziger, 2010). Canada's bigbusinesses favoured globalization to nationalism. Theywanted a world where they could sell their holdings towhichever consumer from whatever country offered theutmost price. And they wanted reciprocal rights to investCanadian money overseas (Walcom, 2007).
The idea of a single services market bridging all its memberstates was one of the establishing ideas of the EuropeanUnion and Economic nationalism will not shapetomorrow's Europe. The Commission will exercise itsauthorities if companies abuse their dominant positionson the marketplace (The Associated, 2006). In arighteousseries, globalisation both moulded and bankedon healthy economic development and in line with thesame individual countries surrendered national interest aspay backs. Reversal of the trend to global integrationand rise of new nationalism, including more closedeconomies with restricted trade or capital flows, ismotivated by numerous reasons and in turn economicnationalism is a threat to global prosperity (Satyajit, 2013).
The apparent conviction of economic nationalism is thatmounting international business may threaten the survivaland expansion of few indigenous companies and hurt thedomestic economic well-being (Han, 1988). Economicnationalism thus not only stimulates behaviours inlivelihood of national businesses, organisations, and goods,but also amplifies the division between indigenous andoverseas companies. (Slater, 1998).
Based on literature review, it can be summarised thateconomic nationalism is always observed in incongruousmanner by several economists and researchers. Manyresearchers sight it negatively and contemplate it as threatto global economic health while many pose a conflictingview and ponder it as boosting a domestic economy. Bothschool of thoughts present their supporting arguments also.
3. Research Methodology
The expectations model of economic nationalism wasdeveloped by Akhter (2007) based on the foundation
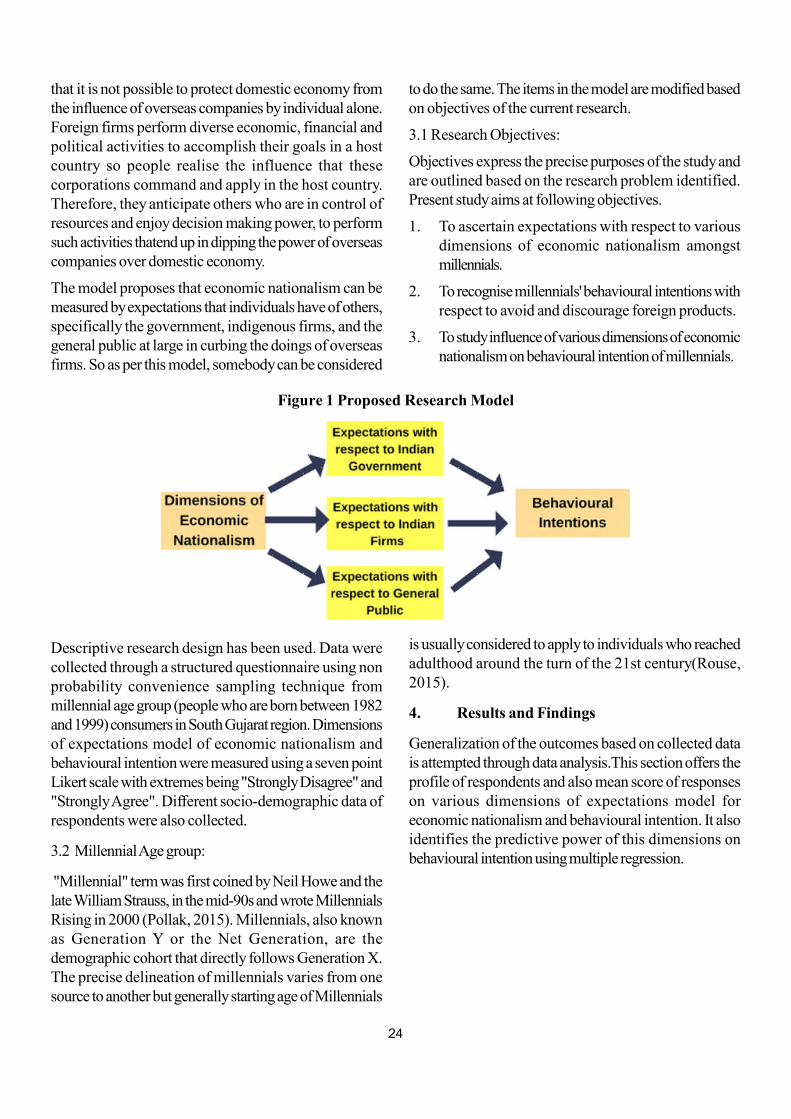
24
that it is not possible to protect domestic economy fromthe influence of overseas companies by individual alone.Foreign firms perform diverse economic, financial andpolitical activities to accomplish their goals in a hostcountry so people realise the influence that thesecorporations command and apply in the host country.Therefore, they anticipate others who are in control ofresources and enjoy decision making power, to performsuch activities thatend up in dipping the power of overseascompanies over domestic economy.
The model proposes that economic nationalism can bemeasured by expectations that individuals have of others,specifically the government, indigenous firms, and thegeneral public at large in curbing the doings of overseasfirms. So as per this model, somebody can be considered
to do the same. The items in the model are modified basedon objectives of the current research.
3.1 Research Objectives:
Objectives express the precise purposes of the study andare outlined based on the research problem identified.Present study aims at following objectives.
1. To ascertain expectations with respect to variousdimensions of economic nationalism amongstmillennials.
2. To recognise millennials' behavioural intentions withrespect to avoid and discourage foreign products.
3. To study influence of various dimensions of economicnationalism on behavioural intention of millennials.
Descriptive research design has been used. Data werecollected through a structured questionnaire using nonprobability convenience sampling technique frommillennial age group (people who are born between 1982and 1999) consumers in South Gujarat region. Dimensionsof expectations model of economic nationalism andbehavioural intention were measured using a seven pointLikert scale with extremes being "Strongly Disagree" and"Strongly Agree". Different socio-demographic data ofrespondents were also collected.
3.2 Millennial Age group:
"Millennial" term was first coined by Neil Howe and thelate William Strauss, in the mid-90s and wrote MillennialsRising in 2000 (Pollak, 2015). Millennials, also knownas Generation Y or the Net Generation, are thedemographic cohort that directly follows Generation X.The precise delineation of millennials varies from onesource to another but generally starting age of Millennials
Figure 1 Proposed Research Model
is usually considered to apply to individuals who reachedadulthood around the turn of the 21st century(Rouse,2015).
4. Results and Findings
Generalization of the outcomes based on collected datais attempted through data analysis.This section offers theprofile of respondents and also mean score of responseson various dimensions of expectations model foreconomic nationalism and behavioural intention. It alsoidentifies the predictive power of this dimensions onbehavioural intention using multiple regression.
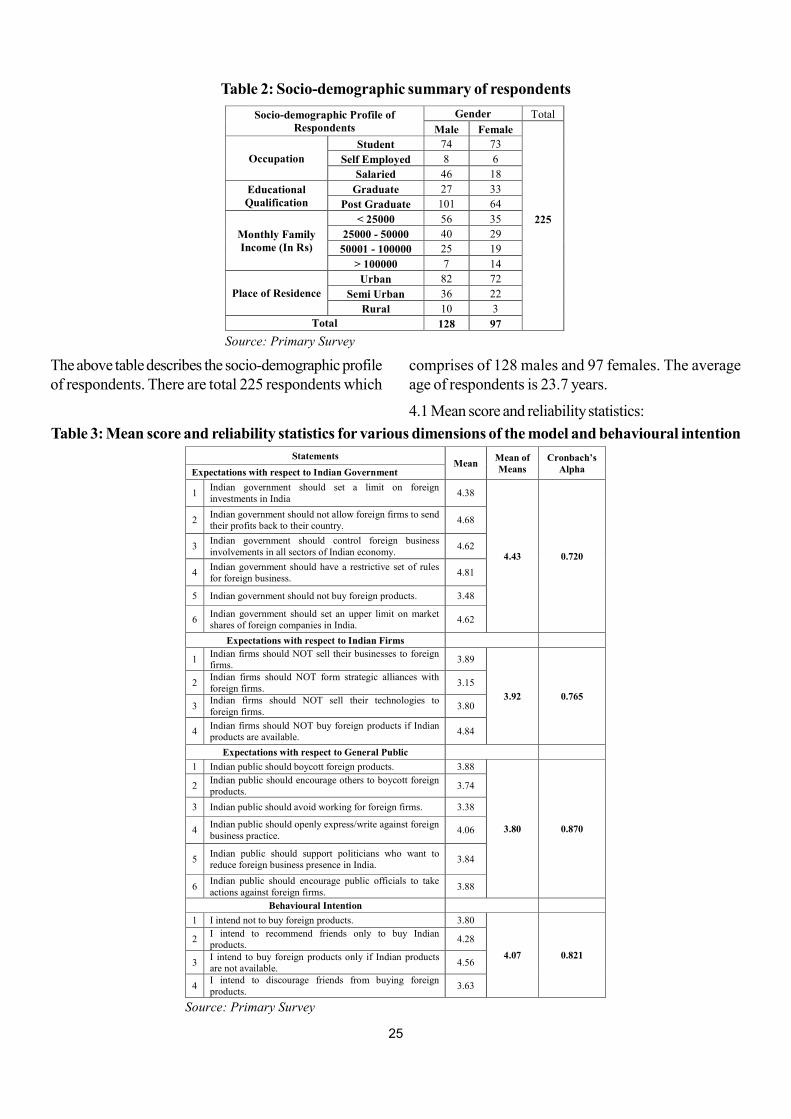
25
Table 2: Socio-demographic summary of respondents
Socio-demographic Profile of Respondents
Gender Total
Male Female
225
Occupation
Student 74 73
Self Employed 8 6
Salaried 46 18
Educational Qualification
Graduate 27 33
Post Graduate 101 64
Monthly Family Income (In Rs)
< 25000 56 35
25000 - 50000 40 29
50001 - 100000 25 19
> 100000 7 14
Place of Residence
Urban 82 72
Semi Urban 36 22
Rural 10 3
Total 128 97
Source: Primary Survey
The above table describes the socio-demographic profileof respondents. There are total 225 respondents which
comprises of 128 males and 97 females. The averageage of respondents is 23.7 years.
4.1 Mean score and reliability statistics:
Table 3: Mean score and reliability statistics for various dimensions of the model and behavioural intention
Statements Mean
Mean of Means
Cronbach’s Alpha Expectations with respect to Indian Government
1 Indian government should set a limit on foreign investments in India
4.38
4.43 0.720
2 Indian government should not allow foreign firms to send their profits back to their country.
4.68
3 Indian government should control foreign business involvements in all sectors of Indian economy.
4.62
4 Indian government should have a restrictive set of rules for foreign business.
4.81
5 Indian government should not buy foreign products. 3.48
6 Indian government should set an upper limit on market shares of foreign companies in India.
4.62
Expectations with respect to Indian Firms
1 Indian firms should NOT sell their businesses to foreign firms.
3.89
3.92 0.765
2 Indian firms should NOT form strategic alliances with foreign firms.
3.15
3 Indian firms should NOT sell their technologies to foreign firms.
3.80
4 Indian firms should NOT buy foreign products if Indian products are available.
4.84
Expectations with respect to General Public
1 Indian public should boycott foreign products. 3.88
3.80 0.870
2 Indian public should encourage others to boycott foreign products.
3.74
3 Indian public should avoid working for foreign firms. 3.38
4 Indian public should openly express/write against foreign business practice.
4.06
5 Indian public should support politicians who want to reduce foreign business presence in India.
3.84
6 Indian public should encourage public officials to take actions against foreign firms.
3.88
Behavioural Intention
1 I intend not to buy foreign products. 3.80
4.07 0.821
2 I intend to recommend friends only to buy Indian products.
4.28
3 I intend to buy foreign products only if Indian products are not available.
4.56
4 I intend to discourage friends from buying foreign products.
3.63
Source: Primary Survey
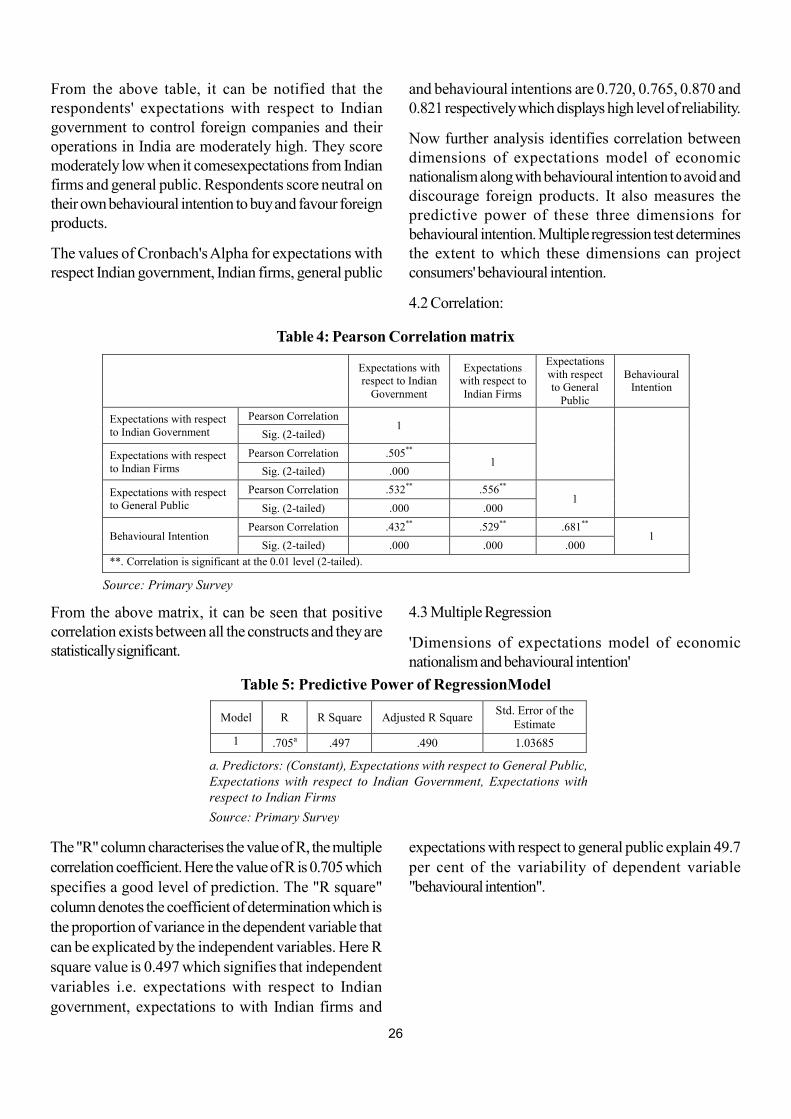
26
From the above table, it can be notified that therespondents' expectations with respect to Indiangovernment to control foreign companies and theiroperations in India are moderately high. They scoremoderately low when it comesexpectations from Indianfirms and general public. Respondents score neutral ontheir own behavioural intention to buy and favour foreignproducts.
The values of Cronbach's Alpha for expectations withrespect Indian government, Indian firms, general public
and behavioural intentions are 0.720, 0.765, 0.870 and0.821 respectively which displays high level of reliability.
Now further analysis identifies correlation betweendimensions of expectations model of economicnationalism along with behavioural intention to avoid anddiscourage foreign products. It also measures thepredictive power of these three dimensions forbehavioural intention. Multiple regression test determinesthe extent to which these dimensions can projectconsumers' behavioural intention.
4.2 Correlation:
From the above matrix, it can be seen that positivecorrelation exists between all the constructs and they arestatistically significant.
Table 4: Pearson Correlation matrix
Expectations with respect to Indian
Government
Expectations with respect to Indian Firms
Expectations with respect to General
Public
Behavioural Intention
Expectations with respect to Indian Government
Pearson Correlation 1
Sig. (2-tailed)
Expectations with respect to Indian Firms
Pearson Correlation .505** 1
Sig. (2-tailed) .000
Expectations with respect to General Public
Pearson Correlation .532** .556** 1
Sig. (2-tailed) .000 .000
Behavioural Intention Pearson Correlation .432** .529** .681**
1 Sig. (2-tailed) .000 .000 .000
**. Correlation is significant at the 0.01 level (2-tailed).
Source: Primary Survey
4.3 Multiple Regression
'Dimensions of expectations model of economicnationalism and behavioural intention'
Model R R Square Adjusted R Square Std. Error of the
Estimate
1 .705a .497 .490 1.03685
Table 5: Predictive Power of RegressionModel
The "R" column characterises the value of R, the multiplecorrelation coefficient. Here the value of R is 0.705 whichspecifies a good level of prediction. The "R square"column denotes the coefficient of determination which isthe proportion of variance in the dependent variable thatcan be explicated by the independent variables. Here Rsquare value is 0.497 which signifies that independentvariables i.e. expectations with respect to Indiangovernment, expectations to with Indian firms and
a. Predictors: (Constant), Expectations with respect to General Public,Expectations with respect to Indian Government, Expectations withrespect to Indian Firms
Source: Primary Survey
expectations with respect to general public explain 49.7per cent of the variability of dependent variable"behavioural intention".
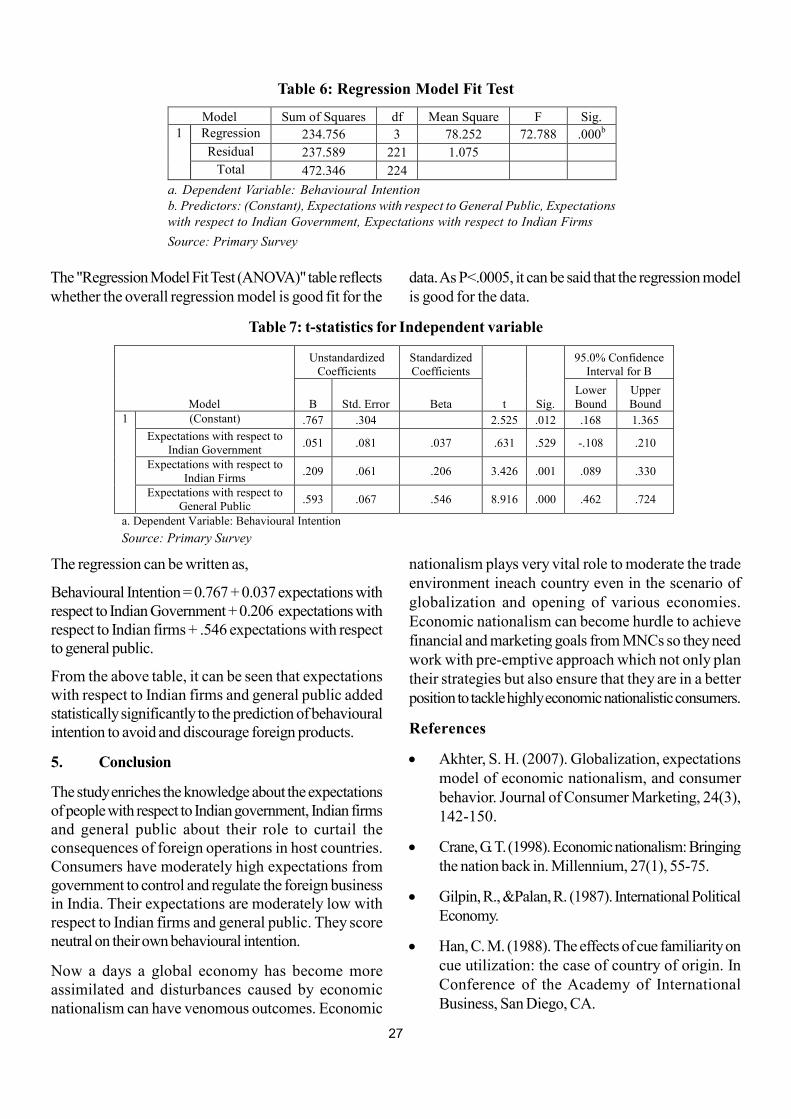
27
Table 6: Regression Model Fit Test
Model Sum of Squares df Mean Square F Sig. 1 Regression 234.756 3 78.252 72.788 .000b
Residual 237.589 221 1.075
Total 472.346 224
a. Dependent Variable: Behavioural Intentionb. Predictors: (Constant), Expectations with respect to General Public, Expectationswith respect to Indian Government, Expectations with respect to Indian Firms
Source: Primary Survey
The "Regression Model Fit Test (ANOVA)" table reflectswhether the overall regression model is good fit for the
data. As P<.0005, it can be said that the regression modelis good for the data.
The regression can be written as,
Behavioural Intention = 0.767 + 0.037 expectations withrespect to Indian Government + 0.206 expectations withrespect to Indian firms + .546 expectations with respectto general public.
From the above table, it can be seen that expectationswith respect to Indian firms and general public addedstatistically significantly to the prediction of behaviouralintention to avoid and discourage foreign products.
5. Conclusion
The study enriches the knowledge about the expectationsof people with respect to Indian government, Indian firmsand general public about their role to curtail theconsequences of foreign operations in host countries.Consumers have moderately high expectations fromgovernment to control and regulate the foreign businessin India. Their expectations are moderately low withrespect to Indian firms and general public. They scoreneutral on their own behavioural intention.
Now a days a global economy has become moreassimilated and disturbances caused by economicnationalism can have venomous outcomes. Economic
Table 7: t-statistics for Independent variable
Model
Unstandardized Coefficients
Standardized Coefficients
t Sig.
95.0% Confidence Interval for B
B Std. Error Beta Lower Bound
Upper Bound
1 (Constant) .767 .304 2.525 .012 .168 1.365
Expectations with respect to Indian Government
.051 .081 .037 .631 .529 -.108 .210
Expectations with respect to Indian Firms
.209 .061 .206 3.426 .001 .089 .330
Expectations with respect to General Public
.593 .067 .546 8.916 .000 .462 .724
a. Dependent Variable: Behavioural Intention
Source: Primary Survey
nationalism plays very vital role to moderate the tradeenvironment ineach country even in the scenario ofglobalization and opening of various economies.Economic nationalism can become hurdle to achievefinancial and marketing goals from MNCs so they needwork with pre-emptive approach which not only plantheir strategies but also ensure that they are in a betterposition to tackle highly economic nationalistic consumers.
References
Akhter, S. H. (2007). Globalization, expectationsmodel of economic nationalism, and consumerbehavior. Journal of Consumer Marketing, 24(3),142-150.
Crane, G. T. (1998). Economic nationalism: Bringingthe nation back in. Millennium, 27(1), 55-75.
Gilpin, R., &Palan, R. (1987). International PoliticalEconomy.
Han, C. M. (1988). The effects of cue familiarity oncue utilization: the case of country of origin. InConference of the Academy of InternationalBusiness, San Diego, CA.
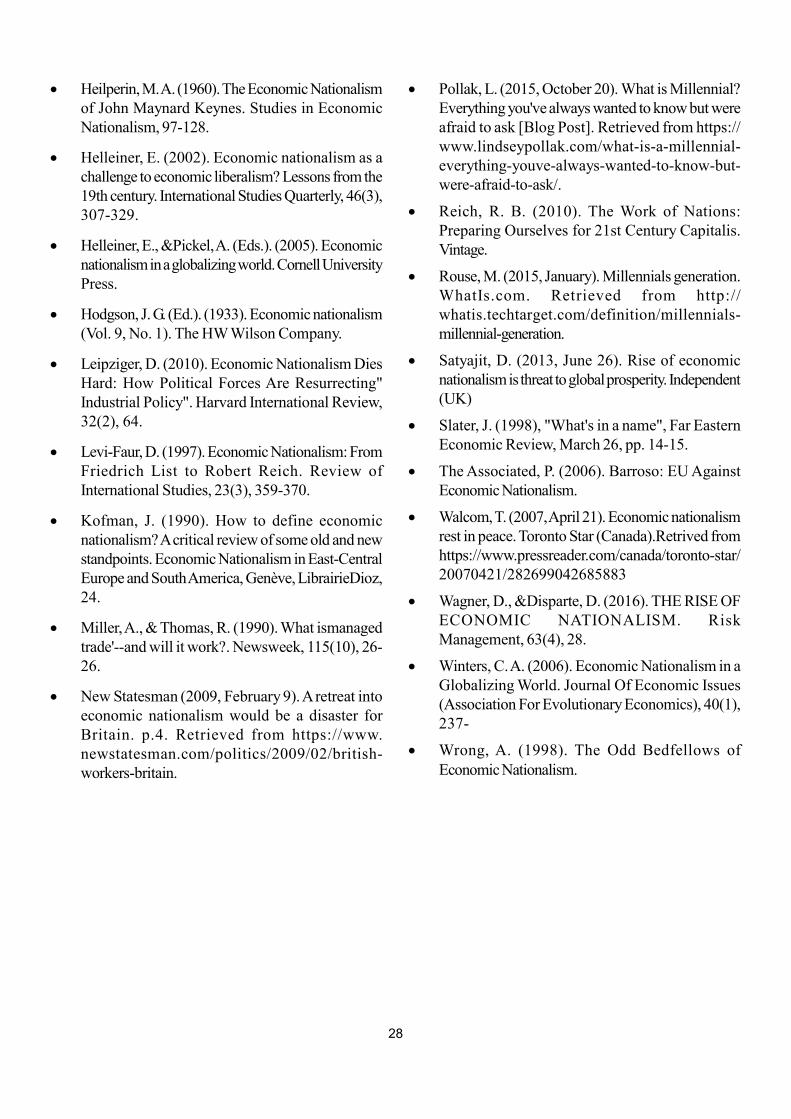
28
Heilperin, M. A. (1960). The Economic Nationalismof John Maynard Keynes. Studies in EconomicNationalism, 97-128.
Helleiner, E. (2002). Economic nationalism as achallenge to economic liberalism? Lessons from the19th century. International Studies Quarterly, 46(3),307-329.
Helleiner, E., &Pickel, A. (Eds.). (2005). Economicnationalism in a globalizing world. Cornell UniversityPress.
Hodgson, J. G. (Ed.). (1933). Economic nationalism(Vol. 9, No. 1). The HW Wilson Company.
Leipziger, D. (2010). Economic Nationalism DiesHard: How Political Forces Are Resurrecting"Industrial Policy". Harvard International Review,32(2), 64.
Levi-Faur, D. (1997). Economic Nationalism: FromFriedrich List to Robert Reich. Review ofInternational Studies, 23(3), 359-370.
Kofman, J. (1990). How to define economicnationalism? A critical review of some old and newstandpoints. Economic Nationalism in East-CentralEurope and South America, Genève, LibrairieDioz,24.
Miller, A., & Thomas, R. (1990). What ismanagedtrade'--and will it work?. Newsweek, 115(10), 26-26.
New Statesman (2009, February 9). A retreat intoeconomic nationalism would be a disaster forBritain. p.4. Retrieved from https://www.newstatesman.com/politics/2009/02/british-workers-britain.
Pollak, L. (2015, October 20). What is Millennial?Everything you've always wanted to know but wereafraid to ask [Blog Post]. Retrieved from https://www.lindseypollak.com/what-is-a-millennial-everything-youve-always-wanted-to-know-but-were-afraid-to-ask/.
Reich, R. B. (2010). The Work of Nations:Preparing Ourselves for 21st Century Capitalis.Vintage.
Rouse, M. (2015, January). Millennials generation.WhatIs.com. Retrieved from http://whatis.techtarget.com/definition/millennials-millennial-generation.
Satyajit, D. (2013, June 26). Rise of economicnationalism is threat to global prosperity. Independent(UK)
Slater, J. (1998), "What's in a name", Far EasternEconomic Review, March 26, pp. 14-15.
The Associated, P. (2006). Barroso: EU AgainstEconomic Nationalism.
Walcom, T. (2007, April 21). Economic nationalismrest in peace. Toronto Star (Canada).Retrived fromhttps://www.pressreader.com/canada/toronto-star/20070421/282699042685883
Wagner, D., &Disparte, D. (2016). THE RISE OFECONOMIC NATIONALISM. RiskManagement, 63(4), 28.
Winters, C. A. (2006). Economic Nationalism in aGlobalizing World. Journal Of Economic Issues(Association For Evolutionary Economics), 40(1),237-
Wrong, A. (1998). The Odd Bedfellows ofEconomic Nationalism.
29
1 Preface
Profitable companies make important contribution tosociety by the way of job creation and providing financefor the general welfare of the population. The mainobjective of the companies is to create value and generatefinancial results within the legislative framework of thesociety in which they operate. But, companies notsupposed to work for profit only. As companies areworking and operating within a society, they have animpact on social development where they operate.Therefore, they must have responsibility that extendsbeyond value creation and profitability. Perhaps, answerto company's responsibility towards society is CorporateSocial Responsibility (CSR).
CSR is way of conducting business now-a-days, ascorporate entities/business entities are under mandatorycompliance of contribution of at least 2 percent of lastthree years' average profit towards society in which theyoperate. Before August,2013 there was no suchmandatory compliance for corporate entity/business entity.CSR is basically the responsibility of companies towards
* Faculty Member, Department of Accounting and Financial Management, Faculty of Commerce, The Maharaja Sayajirao Universityof Baroda, Vadodara
An Analysis of Mandated CSRs Compliance in Selected Power Sector Companies inIndia
Himanshu Nagarale*
Abstract
Abstract Purpose - The purpose of this paper is to analyse whether the corporate organisations working in India arereally making contribution for general welfare of society or actual fact is something different.
Design/methodology/approach - Purposive sampling technique is used for the selection of listed sample companiesfrom a recognised stock exchange of India. For the purpose of the study, top 10 listed companies are selected out ofthe total 31 listed companies available on Bombay Stock Exchange. Selection of listed companies is based on marketcapitalization criteria.
Findings - In concludes that sample selected companies for study purpose wants to follow the legal requirement notonly in words but also in true spirit of lawmakers who were behind formulating such act or rules, as maximum numbersof companies are contributing more than 2 percentage of net worth for CSR expenditure. This shows companies areactually taking seriously the CSR expenditure and accepted Corporate Social Responsibility as an effective tool forsocietal development.
Originality/value - The Originality of this research lies in identifying the actual contribution made be companiesengaged in power sector companies in India with that of statutory requirement as per Companies Act.
Keywords - CSR in India and it's applicability, Power sector Companies, CSR spending, Co's Act 2013
Paper type: Research paper
people, society and the environment that are affected bytheir activities.
India has fifth largest power generation capacity in theWorld. The country ranks third globally in terms ofElectricity production. Electricity production in Indiareached 902.9 Billion Units (BU) during April-December2017. As per the 13th Five Year Plan, India is targeting atotal of 100 GW of power capacity addition by 2022.(IB E F, 2018) Power sector is heavy capital-intensivesector which provide benefits in long run and this becomesa reason for selection of power sector companies forconducting this research study.
2 Literature Review
Sharma (2013)in her study "the Role of Corporate SocialResponsibility in Organisation" tried to generateawareness and to understand meaning, significance,dimensional aspects of CSR and how to manage it.Shehad made efforts to study three dimensional aspects ofCSR which includes economic aspects, social aspectsand environmental aspects. She concluded that CSR is
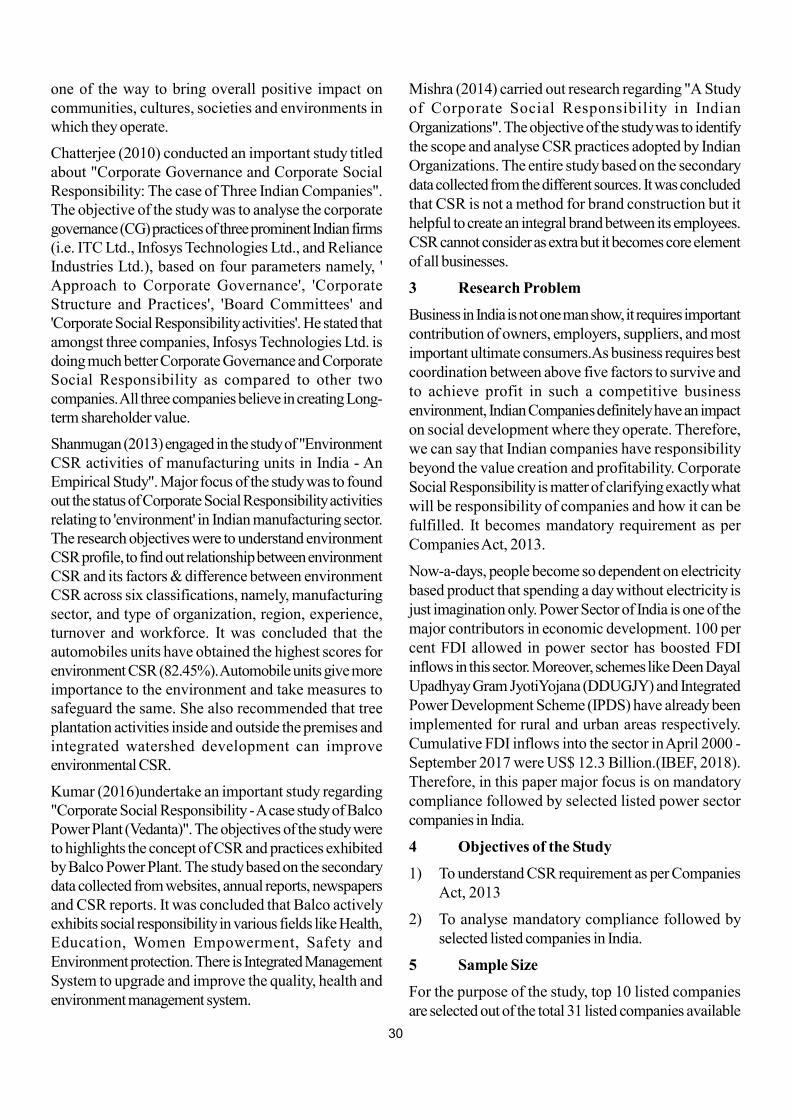
30
one of the way to bring overall positive impact oncommunities, cultures, societies and environments inwhich they operate.
Chatterjee (2010) conducted an important study titledabout "Corporate Governance and Corporate SocialResponsibility: The case of Three Indian Companies".The objective of the study was to analyse the corporategovernance (CG) practices of three prominent Indian firms(i.e. ITC Ltd., Infosys Technologies Ltd., and RelianceIndustries Ltd.), based on four parameters namely, 'Approach to Corporate Governance', 'CorporateStructure and Practices', 'Board Committees' and'Corporate Social Responsibility activities'. He stated thatamongst three companies, Infosys Technologies Ltd. isdoing much better Corporate Governance and CorporateSocial Responsibility as compared to other twocompanies. All three companies believe in creating Long-term shareholder value.
Shanmugan (2013) engaged in the study of "EnvironmentCSR activities of manufacturing units in India - AnEmpirical Study". Major focus of the study was to foundout the status of Corporate Social Responsibility activitiesrelating to 'environment' in Indian manufacturing sector.The research objectives were to understand environmentCSR profile, to find out relationship between environmentCSR and its factors & difference between environmentCSR across six classifications, namely, manufacturingsector, and type of organization, region, experience,turnover and workforce. It was concluded that theautomobiles units have obtained the highest scores forenvironment CSR (82.45%). Automobile units give moreimportance to the environment and take measures tosafeguard the same. She also recommended that treeplantation activities inside and outside the premises andintegrated watershed development can improveenvironmental CSR.
Kumar (2016)undertake an important study regarding"Corporate Social Responsibility - A case study of BalcoPower Plant (Vedanta)". The objectives of the study wereto highlights the concept of CSR and practices exhibitedby Balco Power Plant. The study based on the secondarydata collected from websites, annual reports, newspapersand CSR reports. It was concluded that Balco activelyexhibits social responsibility in various fields like Health,Education, Women Empowerment, Safety andEnvironment protection. There is Integrated ManagementSystem to upgrade and improve the quality, health andenvironment management system.
Mishra (2014) carried out research regarding "A Studyof Corporate Social Responsibility in IndianOrganizations". The objective of the study was to identifythe scope and analyse CSR practices adopted by IndianOrganizations. The entire study based on the secondarydata collected from the different sources. It was concludedthat CSR is not a method for brand construction but ithelpful to create an integral brand between its employees.CSR cannot consider as extra but it becomes core elementof all businesses.
3 Research Problem
Business in India is not one man show, it requires importantcontribution of owners, employers, suppliers, and mostimportant ultimate consumers.As business requires bestcoordination between above five factors to survive andto achieve profit in such a competitive businessenvironment, Indian Companies definitely have an impacton social development where they operate. Therefore,we can say that Indian companies have responsibilitybeyond the value creation and profitability. CorporateSocial Responsibility is matter of clarifying exactly whatwill be responsibility of companies and how it can befulfilled. It becomes mandatory requirement as perCompanies Act, 2013.
Now-a-days, people become so dependent on electricitybased product that spending a day without electricity isjust imagination only. Power Sector of India is one of themajor contributors in economic development. 100 percent FDI allowed in power sector has boosted FDIinflows in this sector. Moreover, schemes like Deen DayalUpadhyay Gram JyotiYojana (DDUGJY) and IntegratedPower Development Scheme (IPDS) have already beenimplemented for rural and urban areas respectively.Cumulative FDI inflows into the sector in April 2000 -September 2017 were US$ 12.3 Billion.(IBEF, 2018).Therefore, in this paper major focus is on mandatorycompliance followed by selected listed power sectorcompanies in India.
4 Objectives of the Study
1) To understand CSR requirement as per CompaniesAct, 2013
2) To analyse mandatory compliance followed byselected listed companies in India.
5 Sample Size
For the purpose of the study, top 10 listed companiesare selected out of the total 31 listed companies available
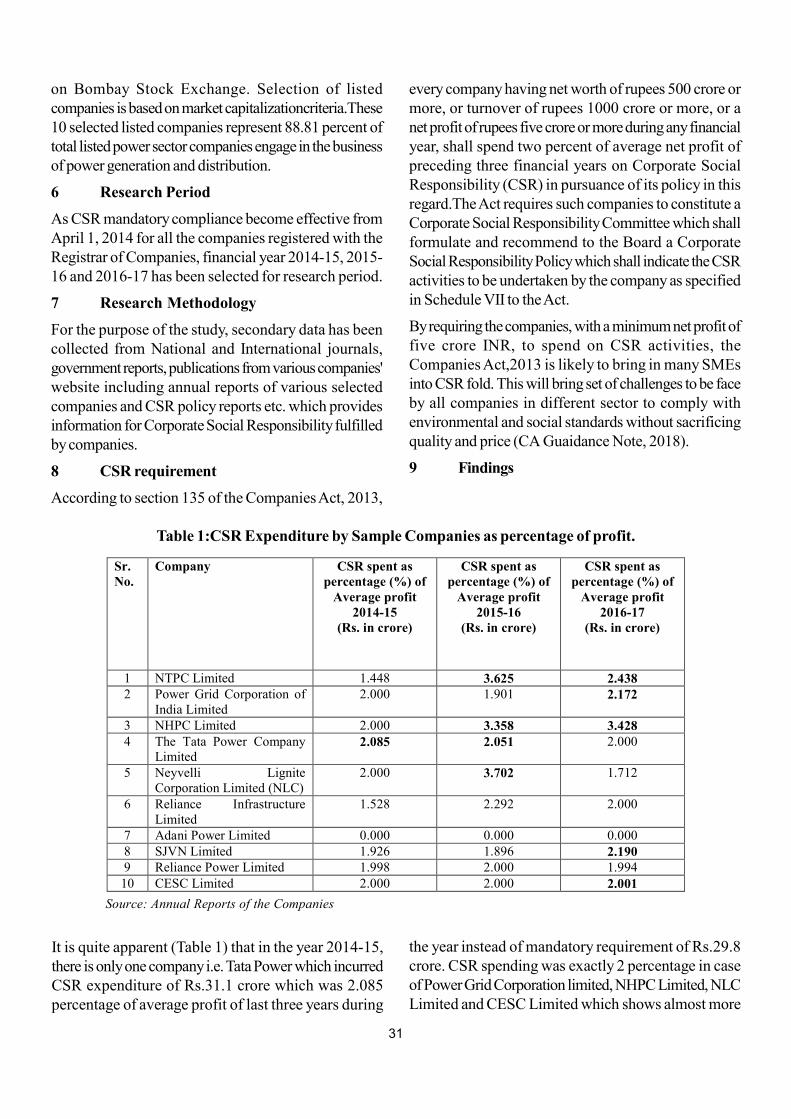
31
on Bombay Stock Exchange. Selection of listedcompanies is based on market capitalizationcriteria.These10 selected listed companies represent 88.81 percent oftotal listed power sector companies engage in the businessof power generation and distribution.
6 Research Period
As CSR mandatory compliance become effective fromApril 1, 2014 for all the companies registered with theRegistrar of Companies, financial year 2014-15, 2015-16 and 2016-17 has been selected for research period.
7 Research Methodology
For the purpose of the study, secondary data has beencollected from National and International journals,government reports, publications from various companies'website including annual reports of various selectedcompanies and CSR policy reports etc. which providesinformation for Corporate Social Responsibility fulfilledby companies.
8 CSR requirement
According to section 135 of the Companies Act, 2013,
every company having net worth of rupees 500 crore ormore, or turnover of rupees 1000 crore or more, or anet profit of rupees five crore or more during any financialyear, shall spend two percent of average net profit ofpreceding three financial years on Corporate SocialResponsibility (CSR) in pursuance of its policy in thisregard.The Act requires such companies to constitute aCorporate Social Responsibility Committee which shallformulate and recommend to the Board a CorporateSocial Responsibility Policy which shall indicate the CSRactivities to be undertaken by the company as specifiedin Schedule VII to the Act.
By requiring the companies, with a minimum net profit offive crore INR, to spend on CSR activities, theCompanies Act,2013 is likely to bring in many SMEsinto CSR fold. This will bring set of challenges to be faceby all companies in different sector to comply withenvironmental and social standards without sacrificingquality and price (CA Guaidance Note, 2018).
9 Findings
Table 1:CSR Expenditure by Sample Companies as percentage of profit.
Sr. No.
Company CSR spent as percentage (%) of
Average profit 2014-15
(Rs. in crore)
CSR spent as percentage (%) of
Average profit 2015-16
(Rs. in crore)
CSR spent as percentage (%) of
Average profit 2016-17
(Rs. in crore)
1 NTPC Limited 1.448 3.625 2.438 2 Power Grid Corporation of
India Limited 2.000 1.901 2.172
3 NHPC Limited 2.000 3.358 3.428 4 The Tata Power Company
Limited 2.085 2.051 2.000
5 Neyvelli Lignite Corporation Limited (NLC)
2.000 3.702 1.712
6 Reliance Infrastructure Limited
1.528 2.292 2.000
7 Adani Power Limited 0.000 0.000 0.000 8 SJVN Limited 1.926 1.896 2.190 9 Reliance Power Limited 1.998 2.000 1.994 10 CESC Limited 2.000 2.000 2.001
Source: Annual Reports of the Companies
It is quite apparent (Table 1) that in the year 2014-15,there is only one company i.e. Tata Power which incurredCSR expenditure of Rs.31.1 crore which was 2.085percentage of average profit of last three years during
the year instead of mandatory requirement of Rs.29.8crore. CSR spending was exactly 2 percentage in caseof Power Grid Corporation limited, NHPC Limited, NLCLimited and CESC Limited which shows almost more
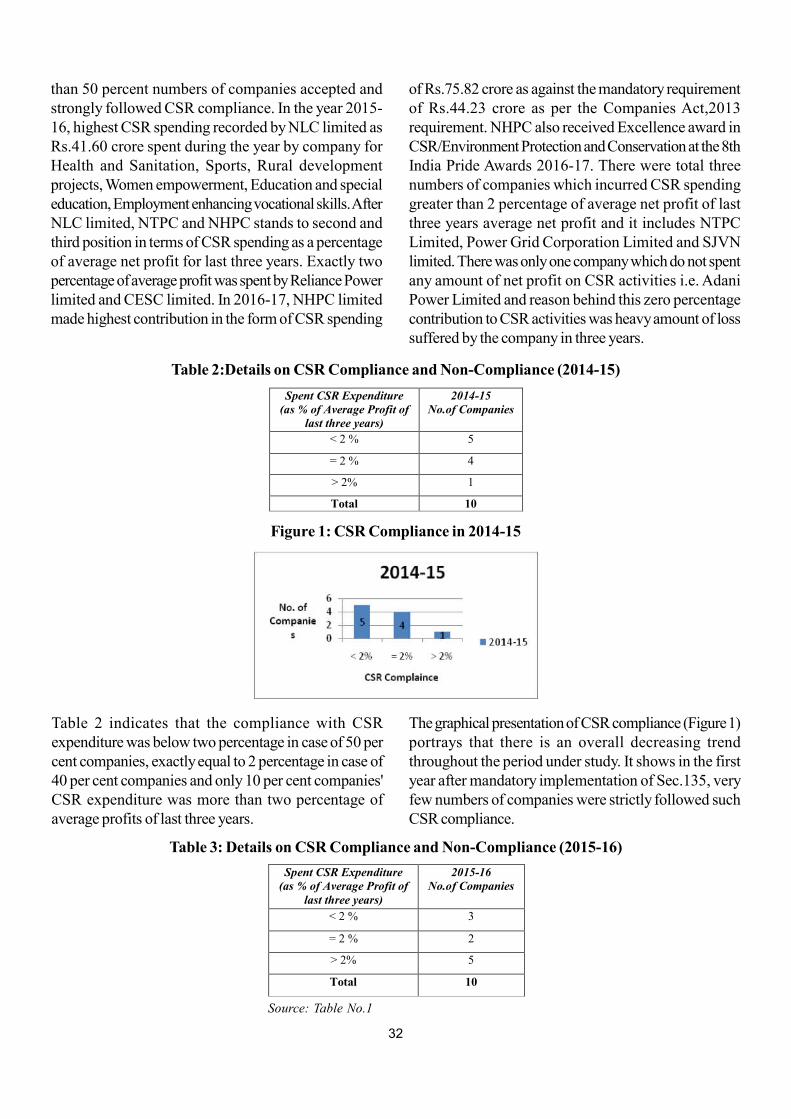
32
than 50 percent numbers of companies accepted andstrongly followed CSR compliance. In the year 2015-16, highest CSR spending recorded by NLC limited asRs.41.60 crore spent during the year by company forHealth and Sanitation, Sports, Rural developmentprojects, Women empowerment, Education and specialeducation, Employment enhancing vocational skills. AfterNLC limited, NTPC and NHPC stands to second andthird position in terms of CSR spending as a percentageof average net profit for last three years. Exactly twopercentage of average profit was spent by Reliance Powerlimited and CESC limited. In 2016-17, NHPC limitedmade highest contribution in the form of CSR spending
of Rs.75.82 crore as against the mandatory requirementof Rs.44.23 crore as per the Companies Act,2013requirement. NHPC also received Excellence award inCSR/Environment Protection and Conservation at the 8thIndia Pride Awards 2016-17. There were total threenumbers of companies which incurred CSR spendinggreater than 2 percentage of average net profit of lastthree years average net profit and it includes NTPCLimited, Power Grid Corporation Limited and SJVNlimited. There was only one company which do not spentany amount of net profit on CSR activities i.e. AdaniPower Limited and reason behind this zero percentagecontribution to CSR activities was heavy amount of losssuffered by the company in three years.
Table 2 indicates that the compliance with CSRexpenditure was below two percentage in case of 50 percent companies, exactly equal to 2 percentage in case of40 per cent companies and only 10 per cent companies'CSR expenditure was more than two percentage ofaverage profits of last three years.
Table 2:Details on CSR Compliance and Non-Compliance (2014-15)
Spent CSR Expenditure (as % of Average Profit of
last three years)
2014-15 No.of Companies
< 2 % 5
= 2 % 4
> 2% 1
Total 10
Figure 1: CSR Compliance in 2014-15
The graphical presentation of CSR compliance (Figure1)portrays that there is an overall decreasing trendthroughout the period under study. It shows in the firstyear after mandatory implementation of Sec.135, veryfew numbers of companies were strictly followed suchCSR compliance.
Table 3: Details on CSR Compliance and Non-Compliance (2015-16)
Spent CSR Expenditure (as % of Average Profit of
last three years)
2015-16 No.of Companies
< 2 % 3
= 2 % 2
> 2% 5
Total 10
Source: Table No.1
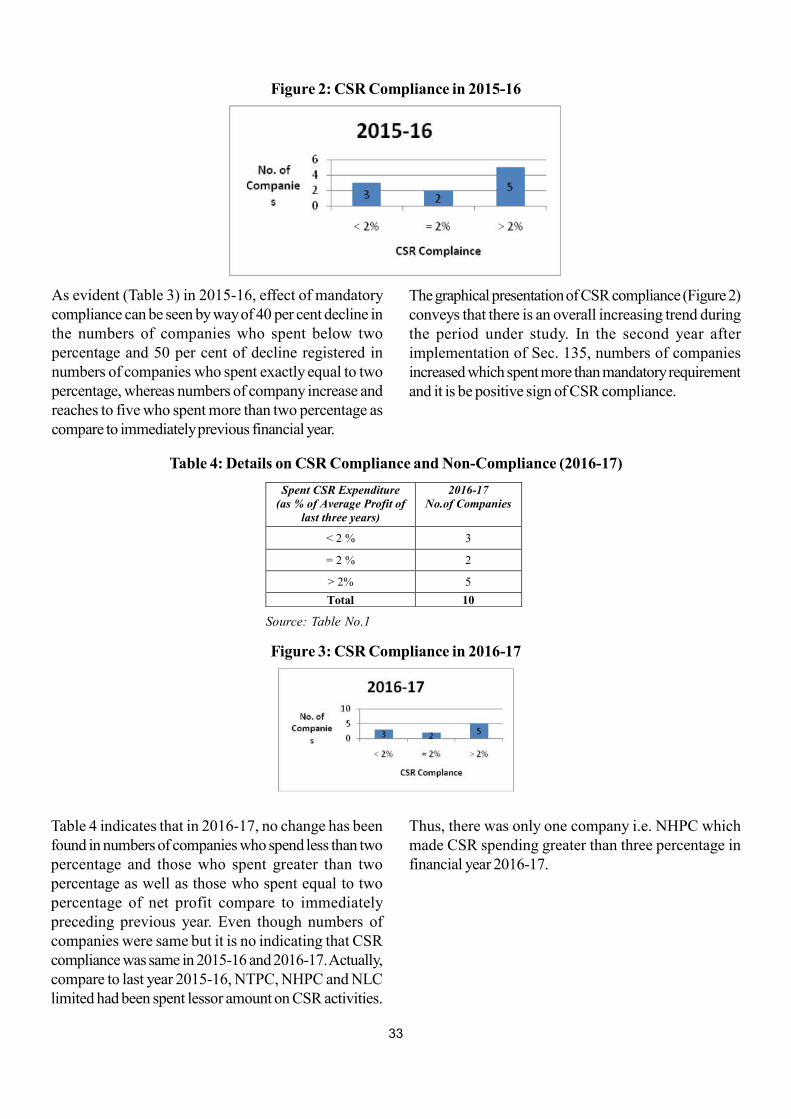
33
As evident (Table 3) in 2015-16, effect of mandatorycompliance can be seen by way of 40 per cent decline inthe numbers of companies who spent below twopercentage and 50 per cent of decline registered innumbers of companies who spent exactly equal to twopercentage, whereas numbers of company increase andreaches to five who spent more than two percentage ascompare to immediately previous financial year.
Figure 2: CSR Compliance in 2015-16
The graphical presentation of CSR compliance (Figure 2)conveys that there is an overall increasing trend duringthe period under study. In the second year afterimplementation of Sec. 135, numbers of companiesincreased which spent more than mandatory requirementand it is be positive sign of CSR compliance.
Table 4 indicates that in 2016-17, no change has beenfound in numbers of companies who spend less than twopercentage and those who spent greater than twopercentage as well as those who spent equal to twopercentage of net profit compare to immediatelypreceding previous year. Even though numbers ofcompanies were same but it is no indicating that CSRcompliance was same in 2015-16 and 2016-17. Actually,compare to last year 2015-16, NTPC, NHPC and NLClimited had been spent lessor amount on CSR activities.
Table 4: Details on CSR Compliance and Non-Compliance (2016-17)
Spent CSR Expenditure (as % of Average Profit of
last three years)
2016-17 No.of Companies
< 2 % 3
= 2 % 2
> 2% 5
Total 10
Source: Table No.1
Figure 3: CSR Compliance in 2016-17
Thus, there was only one company i.e. NHPC whichmade CSR spending greater than three percentage infinancial year 2016-17.
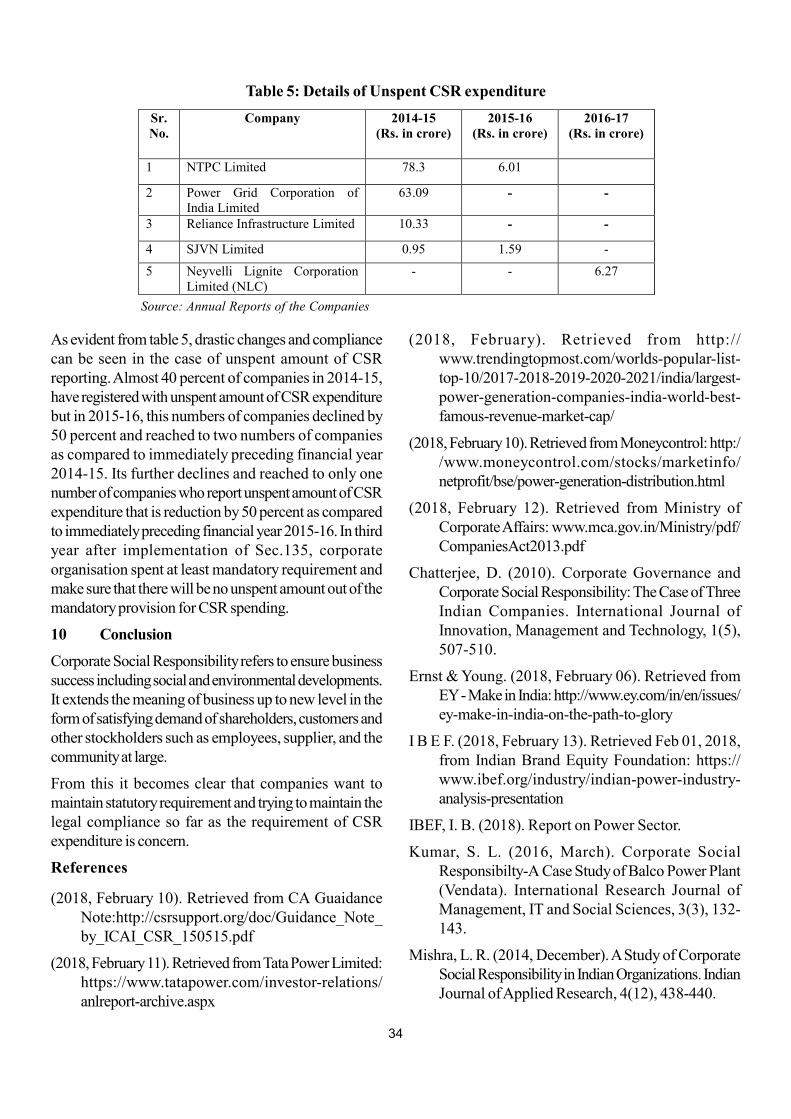
34
Table 5: Details of Unspent CSR expenditure
Sr. No.
Company 2014-15 (Rs. in crore)
2015-16 (Rs. in crore)
2016-17 (Rs. in crore)
1 NTPC Limited 78.3 6.01
2 Power Grid Corporation of India Limited
63.09 - -
3 Reliance Infrastructure Limited 10.33 - -
4 SJVN Limited 0.95 1.59 -
5 Neyvelli Lignite Corporation Limited (NLC)
- - 6.27
Source: Annual Reports of the Companies
As evident from table 5, drastic changes and compliancecan be seen in the case of unspent amount of CSRreporting. Almost 40 percent of companies in 2014-15,have registered with unspent amount of CSR expenditurebut in 2015-16, this numbers of companies declined by50 percent and reached to two numbers of companiesas compared to immediately preceding financial year2014-15. Its further declines and reached to only onenumber of companies who report unspent amount of CSRexpenditure that is reduction by 50 percent as comparedto immediately preceding financial year 2015-16. In thirdyear after implementation of Sec.135, corporateorganisation spent at least mandatory requirement andmake sure that there will be no unspent amount out of themandatory provision for CSR spending.
10 Conclusion
Corporate Social Responsibility refers to ensure businesssuccess including social and environmental developments.It extends the meaning of business up to new level in theform of satisfying demand of shareholders, customers andother stockholders such as employees, supplier, and thecommunity at large.
From this it becomes clear that companies want tomaintain statutory requirement and trying to maintain thelegal compliance so far as the requirement of CSRexpenditure is concern.
References
(2018, February 10). Retrieved from CA GuaidanceNote:http://csrsupport.org/doc/Guidance_Note_by_ICAI_CSR_150515.pdf
(2018, February 11). Retrieved from Tata Power Limited:https://www.tatapower.com/investor-relations/anlreport-archive.aspx
(2018, February). Retrieved from http://www.trendingtopmost.com/worlds-popular-list-top-10/2017-2018-2019-2020-2021/india/largest-power-generation-companies-india-world-best-famous-revenue-market-cap/
(2018, February 10). Retrieved from Moneycontrol: http://www.moneycontrol.com/stocks/marketinfo/netprofit/bse/power-generation-distribution.html
(2018, February 12). Retrieved from Ministry ofCorporate Affairs: www.mca.gov.in/Ministry/pdf/CompaniesAct2013.pdf
Chatterjee, D. (2010). Corporate Governance andCorporate Social Responsibility: The Case of ThreeIndian Companies. International Journal ofInnovation, Management and Technology, 1(5),507-510.
Ernst & Young. (2018, February 06). Retrieved fromEY - Make in India: http://www.ey.com/in/en/issues/ey-make-in-india-on-the-path-to-glory
I B E F. (2018, February 13). Retrieved Feb 01, 2018,from Indian Brand Equity Foundation: https://www.ibef.org/industry/indian-power-industry-analysis-presentation
IBEF, I. B. (2018). Report on Power Sector.
Kumar, S. L. (2016, March). Corporate SocialResponsibilty-A Case Study of Balco Power Plant(Vendata). International Research Journal ofManagement, IT and Social Sciences, 3(3), 132-143.
Mishra, L. R. (2014, December). A Study of CorporateSocial Responsibility in Indian Organizations. IndianJournal of Applied Research, 4(12), 438-440.
35
National Hydro Power Coproration Limited. (2018,February 10). Retrieved from NHPC Limited:nhpcindia.com/newwebsite/NHPC-annual-reports.htm
National Thermal Power Corporation Limited. (2018,February 05). Retrieved from NTPC Limited:www.ntpc.co.in/
Neyveli Lignite Corporation Limited. (2018, February05). Retrieved from NLC India Ltd: nlcindia.in/index.php?file_name=investor_02
Power Grid Corporation of India. (2018, February 12).Retrieved from Power Grid:www.powergridindia.com/_layouts/PowerGrid/User/ContentPage.aspx?PId=186
PricewaterhouseCoopers . (2018, February 11).Retrieved from PwC: https://www.pwc.in/assets/pdfs/publications/2013/handbook-on-corporate-social-responsibility-in-india.pdf
Shanmugam, K. (2013). Environment CSR initiatives ofmanufacturing units in India An empirical study.African Journal of Business Management, 7(16),1560-1570.
Sharma, Y. (2013, Sep-Oct). Role of Corporate SocialResponsibility in Organization. IOSR Journal ofBusiness and Management, 13(4), 01-08.
36
1. Introduction
A consumer tribe is a gathering of individuals associatedby comparable utilization of qualities and uses goods andservices to make a community & are heterogeneous. Theycan't be the result of demographic division or any sort ofpresent day society parameters (Cova and Cova, 2002).
'Brand Tribalism' a concept introduced by Cova and Covain 2002 designating a community of individuals formedon the base of emotional attachment to a particular brand,product or service, it focus on the strong linkage amongstthe group members.
* Sr. Section Engineer (W. Rly) and Research Student of B.K. School of Business Management, Gujarat University, Ahmedabad
Effect of Gender and Family Income on Brand Tribalism with Special Emphasis onMobile Phone Users in Ahmedabad
Harish J. Sharma*
Abstract
Purpose
Purpose of this paper is to evaluate impact of Gender and Family Income i.e. demographic variables on Brandtribalism, specifically for Mobile phone users in Ahmedabad city of Gujarat, India as 'Brand tribalism', which is somesort of financial, physical, emotional bondage that brings the brand seller and buyer together and consumers-buyers solinked can't be the result of demographic division or any sort of present day society parameters and hence presumedthat these variables may not affect such strongly bonded seller & buyer.
Methodology/approach
This is a combination of single cross sectional, descriptive research. Primary data was collected through questionnaireof closed ended type having multiple choice and likert questions from 260 respondents. Data collected was interpretedfor basic descriptive analysis, reliability test, factor analysis and hypothesis testing.
Findings
Findings derived from this study includes that male and female are equally emotionally attached to a particular brand,product or service. Secondly opinion of group having family income of '8 lacs & above' differs indicating that this groupis having strong financial, physical, emotional bondage with particular brand, product, service than other income groups.
Research limitations/implications
Samples collection is confined to Ahmedabad city only and thus is not representative of entire population of India.Also only gender and family income have been considered however many other demographic variables are availablethat can be considered. Types of research methods adopted are also limitations as well.
Originality/Value
Although research frame work is confined to two demographic variables and one city of India only however thisresearch is original and data is interpreted for specific purpose only. Limitations of this study may be transferable toconduct further research considering other cities, different demographic variables and with other statistical tools insame area of 'Mobile phone user' or in other area of interest.
Key words: Consumer Research, Brand tribalism, Consumer tribe.
Paper Type: Research paper
'Mobile Phones' are rapidly becoming media for wirelesscommunication as well as for "click and mortar" modelof business.The point of this research is to comprehendinfluence of Gender and Family Income on Brandtribalism.
2. Literature review
Consumer tribe is new concept in social theory and havemade a significant impact on marketing (Cova & Cova,2002; Cova & Salle, 2008; Gronroos, 2006; Kozinets,1999; Penaloza & Venkatesh, 2006). This differs fromhistorical tribes by having a new social order, wherein
37
status within a tribe is achieved by different and specificvalues & are grouped around something emotional ratherthan rational (Cova & Cova, 2002).
Social influences are the most important influence on anindividual's consumption decisions (Bagozzi, 2000).Involvement with a tribe is an expression of self-identity,so the consumer tribe shares not only moral values oropinions, but also consumption and preferences. Thisprovides opportunity for marketers to access a group ofconsumers that actually connect with each other and shareconsumption preferences. In a recent study among smartphone users, Taute and Sierra (2014) discovered apositive relationship between tribalism and loyalty.
Lifestyle has a great impact on consumer behaviour andbrand preferences. Very often, consumers tend to choosebrands that are considered "appropriate" for their self-image. Accordingly, companies will try to position theirbrands in order to fit into consumers' lifestyle. In additionto expressing their identity through the everyday choicesthey make, consumers will often seek new ways in whichthey can express their personal identity. As a result,consumers can use brands as a relevant mean of self-expression. Brands can be used as valid medium forshowing status signaling in everyday circumstances(Catalin & Andreea, 2014).
Researchers measure construct of tribal brands in differentways. Cova and Cova (2002) emphasize 'linking value,social interaction of the communal type etc.' Otherresearchers, such as Moutinho et al. (2007), use a factorstructure, such as 'Brand liking, sponsor favorability etc.'Veloutsou & Moutinho (2007) measures brand tribalismin five dimensions namely 'Degree of fit with the individualconsumer life style, Passion in Life, Reference groupacceptance, Social visibility of brand, Collective memory'.These dimensions are divided in 18 questions (subdimensions) as under,
1. Degree of fit with the individual consumer life style
a. This brand is right for me
b. Using this brand does something good for me
c. This brand fits my image
d. This brand is related to the way I perceive life
2. Passion in Life
a. This brand makes a contribution in life
b. There is something about this brand that goes beyondits tangible characteristics
c. This brand is almost become part of my life.
3. Reference group acceptance
a. I would buy this brand because I am sure that myfriends approve of it
b. I am very loyal to this brand because my friendsalso use it
c. My friends buy this brand and I buy it too justbecause I want to be like them
d. I achieve a sense of belonging by buying the samebrand my friends buy
e. I often discuss with friends about this brand
4. Social visibility of brand
a. Wherever I go, this brand is present
b. I know of many people who own/use this brand
c. I know that people feel good about this brand
5. Collective memory
a. When my friends buy this product they consider thispurchase
b. When my friends buy this product they choose thisbrand
c. My friend refers this brand to his relative also.
Measurement of brand tribalism as per Veloutsou &Moutinho (2007) is considered in this study.
Mobile phones are rapidly becoming the communicationdevice in people's lives. Application delivery channels likeApple's AppStore, Google's Play store are transformingmobile phones into App Phones, capable of downloadinga myriad of applications in an instant. Importantly, today'ssmart phones are having powerful sensors, like anaccelerometer, gyroscope, GPS etc., and are usable toindividual, group, and community. Nowadays mobilephones are changing many sectors of economy, includingbusiness, healthcare, social networks and transportationetc. (Nicholas Lane et al.(2010). Since activities likeMobile phone purchasing, downloading application on itand applications' use is not confined to any boundaryhence in this study Mobile phone is chosen.
3. Research Methodology
This chapter includes Scope of Study, Researchobjectives, Hypothesis formulation, Research Design,Methods of Data collection, Sample Size.
3.1 Scope of the Study
The findings of this study will be helpful to improve the
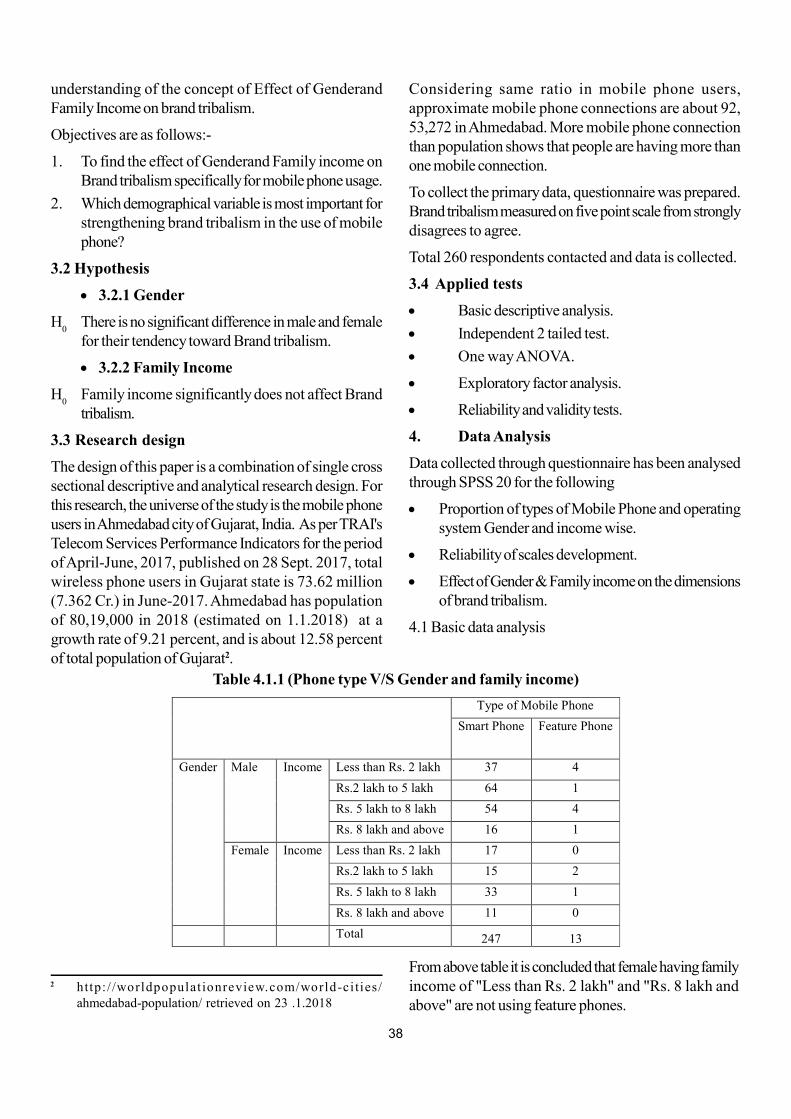
38
understanding of the concept of Effect of GenderandFamily Income on brand tribalism.
Objectives are as follows:-
1. To find the effect of Genderand Family income onBrand tribalism specifically for mobile phone usage.
2. Which demographical variable is most important forstrengthening brand tribalism in the use of mobilephone?
3.2 Hypothesis
3.2.1 Gender
H0
There is no significant difference in male and femalefor their tendency toward Brand tribalism.
3.2.2 Family Income
H0
Family income significantly does not affect Brandtribalism.
3.3 Research design
The design of this paper is a combination of single crosssectional descriptive and analytical research design. Forthis research, the universe of the study is the mobile phoneusers in Ahmedabad city of Gujarat, India. As per TRAI'sTelecom Services Performance Indicators for the periodof April-June, 2017, published on 28 Sept. 2017, totalwireless phone users in Gujarat state is 73.62 million(7.362 Cr.) in June-2017. Ahmedabad has populationof 80,19,000 in 2018 (estimated on 1.1.2018) at agrowth rate of 9.21 percent, and is about 12.58 percentof total population of Gujarat2.
2 http: / /worldpopulat ionreview.com/world-ci ties/ahmedabad-population/ retrieved on 23 .1.2018
Considering same ratio in mobile phone users,approximate mobile phone connections are about 92,53,272 in Ahmedabad. More mobile phone connectionthan population shows that people are having more thanone mobile connection.
To collect the primary data, questionnaire was prepared.Brand tribalism measured on five point scale from stronglydisagrees to agree.
Total 260 respondents contacted and data is collected.
3.4 Applied tests
Basic descriptive analysis.
Independent 2 tailed test.
One way ANOVA.
Exploratory factor analysis.
Reliability and validity tests.
4. Data Analysis
Data collected through questionnaire has been analysedthrough SPSS 20 for the following
Proportion of types of Mobile Phone and operatingsystem Gender and income wise.
Reliability of scales development.
Effect of Gender & Family income on the dimensionsof brand tribalism.
4.1 Basic data analysis
Type of Mobile Phone
Smart Phone Feature Phone
Gender Male Income Less than Rs. 2 lakh 37 4
Rs.2 lakh to 5 lakh 64 1
Rs. 5 lakh to 8 lakh 54 4
Rs. 8 lakh and above 16 1
Female Income Less than Rs. 2 lakh 17 0
Rs.2 lakh to 5 lakh 15 2
Rs. 5 lakh to 8 lakh 33 1
Rs. 8 lakh and above 11 0
Total 247 13
Table 4.1.1 (Phone type V/S Gender and family income)
From above table it is concluded that female having familyincome of "Less than Rs. 2 lakh" and "Rs. 8 lakh andabove" are not using feature phones.
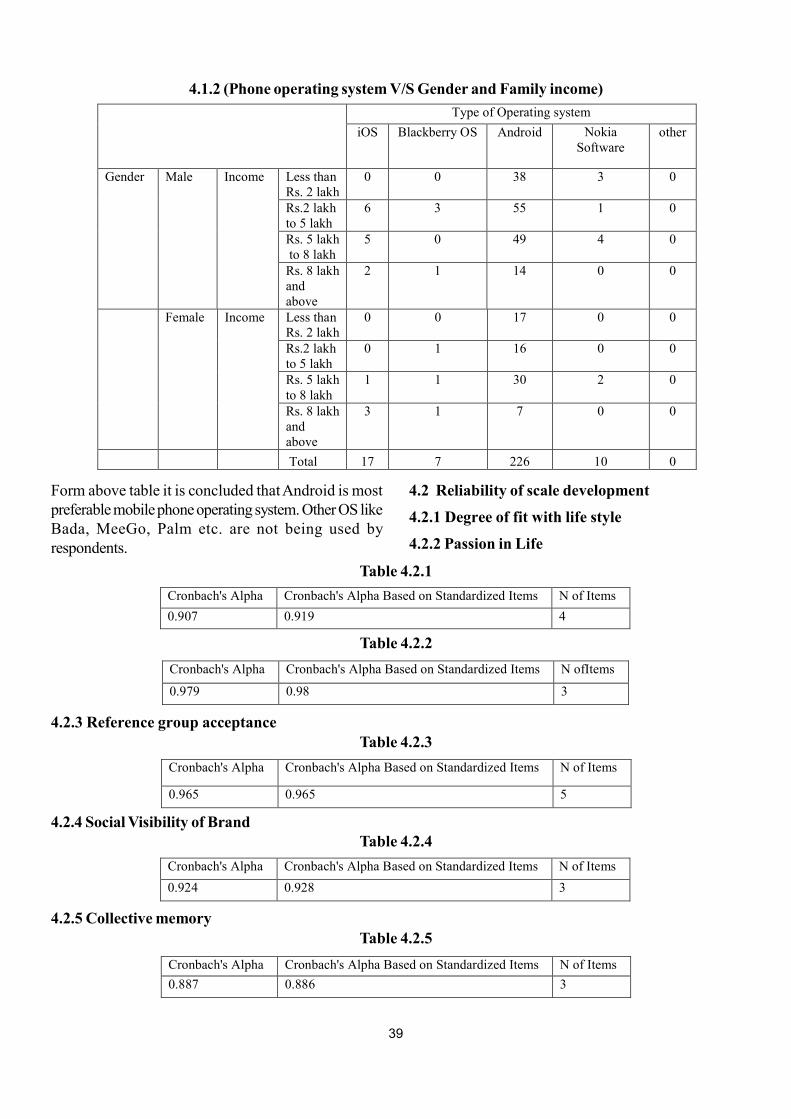
39
Form above table it is concluded that Android is mostpreferable mobile phone operating system. Other OS likeBada, MeeGo, Palm etc. are not being used byrespondents.
4.1.2 (Phone operating system V/S Gender and Family income)
Type of Operating system
iOS Blackberry OS Android Nokia Software
other
Gender Male Income Less than Rs. 2 lakh
0 0 38 3 0
Rs.2 lakh to 5 lakh
6 3 55 1 0
Rs. 5 lakh to 8 lakh
5 0 49 4 0
Rs. 8 lakh and above
2 1 14 0 0
Female Income Less than Rs. 2 lakh
0 0 17 0 0
Rs.2 lakh to 5 lakh
0 1 16 0 0
Rs. 5 lakh to 8 lakh
1 1 30 2 0
Rs. 8 lakh and above
3 1 7 0 0
Total 17 7 226 10 0
4.2 Reliability of scale development
4.2.1 Degree of fit with life style
4.2.2 Passion in Life
Table 4.2.1
4.2.3 Reference group acceptance
Cronbach's Alpha Cronbach's Alpha Based on Standardized Items N of Items
0.907 0.919 4
Table 4.2.2
Cronbach's Alpha Cronbach's Alpha Based on Standardized Items N ofItems
0.979 0.98 3
4.2.4 Social Visibility of Brand
Table 4.2.3
Cronbach's Alpha Cronbach's Alpha Based on Standardized Items N of Items
0.965 0.965 5
4.2.5 Collective memory
Table 4.2.4
Cronbach's Alpha Cronbach's Alpha Based on Standardized Items N of Items
0.924 0.928 3
Table 4.2.5
Cronbach's Alpha Cronbach's Alpha Based on Standardized Items N of Items
0.887 0.886 3
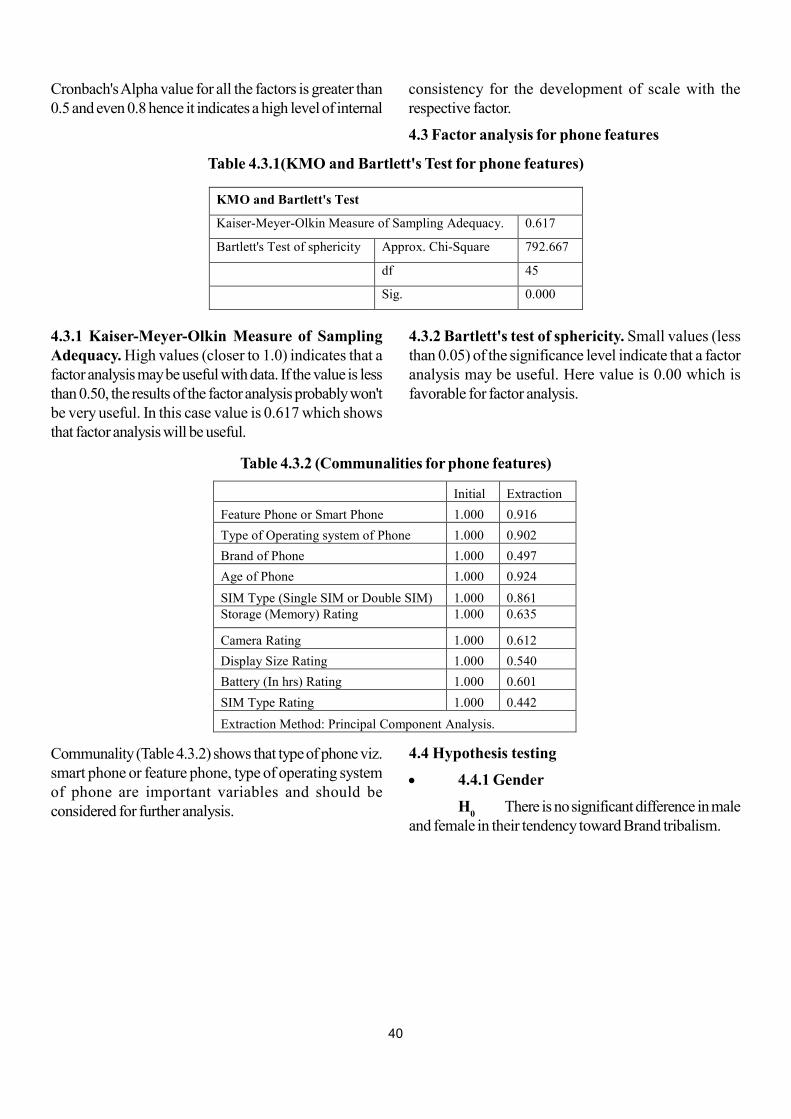
40
Cronbach's Alpha value for all the factors is greater than0.5 and even 0.8 hence it indicates a high level of internal
consistency for the development of scale with therespective factor.
4.3 Factor analysis for phone features
Table 4.3.1(KMO and Bartlett's Test for phone features)
KMO and Bartlett's Test
Kaiser-Meyer-Olkin Measure of Sampling Adequacy. 0.617
Bartlett's Test of sphericity Approx. Chi-Square 792.667
df 45
Sig. 0.000
4.3.1 Kaiser-Meyer-Olkin Measure of SamplingAdequacy. High values (closer to 1.0) indicates that afactor analysis may be useful with data. If the value is lessthan 0.50, the results of the factor analysis probably won'tbe very useful. In this case value is 0.617 which showsthat factor analysis will be useful.
4.3.2 Bartlett's test of sphericity. Small values (lessthan 0.05) of the significance level indicate that a factoranalysis may be useful. Here value is 0.00 which isfavorable for factor analysis.
Communality (Table 4.3.2) shows that type of phone viz.smart phone or feature phone, type of operating systemof phone are important variables and should beconsidered for further analysis.
Table 4.3.2 (Communalities for phone features)
Initial Extraction
Feature Phone or Smart Phone 1.000 0.916
Type of Operating system of Phone 1.000 0.902
Brand of Phone 1.000 0.497
Age of Phone 1.000 0.924
SIM Type (Single SIM or Double SIM) 1.000 0.861 Storage (Memory) Rating 1.000 0.635
Camera Rating 1.000 0.612
Display Size Rating 1.000 0.540
Battery (In hrs) Rating 1.000 0.601
SIM Type Rating 1.000 0.442
Extraction Method: Principal Component Analysis.
4.4 Hypothesis testing
4.4.1 Gender
H0
There is no significant difference in maleand female in their tendency toward Brand tribalism.
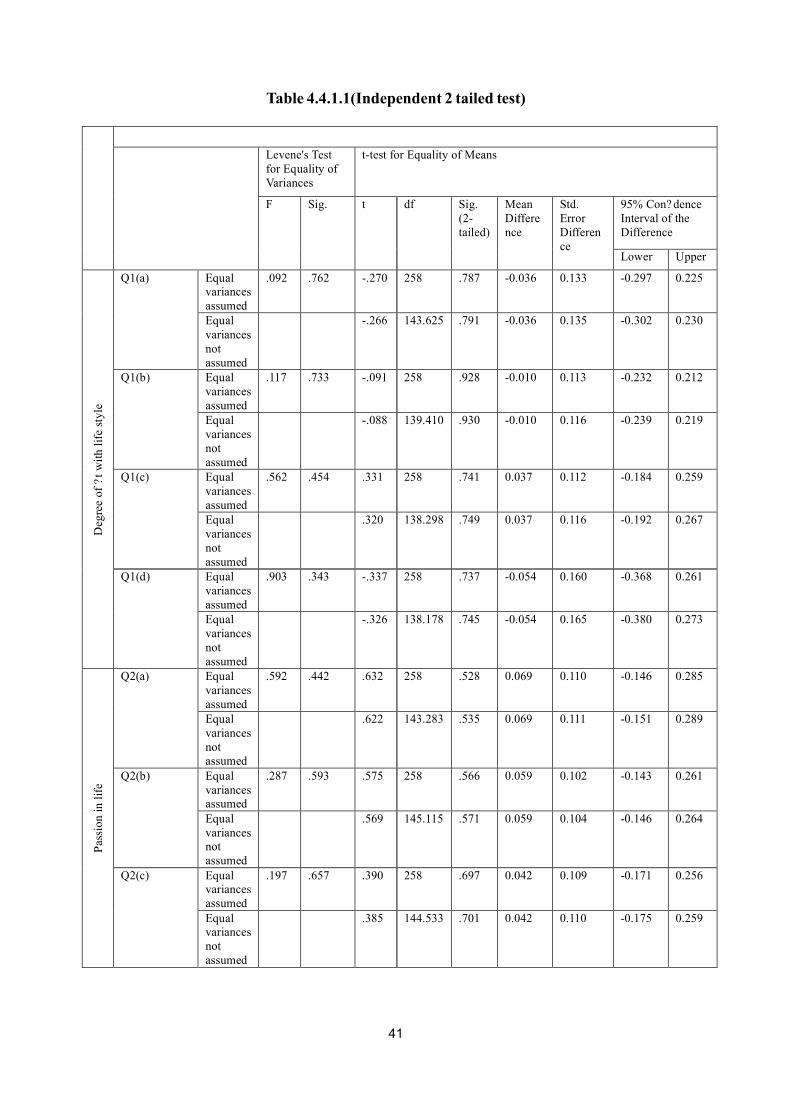
41
Levene's Test for Equality of Variances
t-test for Equality of Means
F Sig. t df Sig. (2-tailed)
Mean Difference
Std. Error Difference
95% Con? dence Interval of the Difference
Lower Upper
Deg
ree
of
?t
wit
h l
ife
style
Q1(a) Equal variances assumed
.092 .762 -.270 258 .787 -0.036 0.133 -0.297 0.225
Equal variances not assumed
-.266 143.625 .791 -0.036 0.135 -0.302 0.230
Q1(b) Equal variances assumed
.117 .733 -.091 258 .928 -0.010 0.113 -0.232 0.212
Equal variances not assumed
-.088 139.410 .930 -0.010 0.116 -0.239 0.219
Q1(c) Equal variances assumed
.562 .454 .331 258 .741 0.037 0.112 -0.184 0.259
Equal variances not assumed
.320 138.298 .749 0.037 0.116 -0.192 0.267
Q1(d) Equal variances assumed
.903 .343 -.337 258 .737 -0.054 0.160 -0.368 0.261
Equal variances not assumed
-.326 138.178 .745 -0.054 0.165 -0.380 0.273
Pas
sion i
n l
ife
Q2(a) Equal variances assumed
.592 .442 .632 258 .528 0.069 0.110 -0.146 0.285
Equal variances not assumed
.622 143.283 .535 0.069 0.111 -0.151 0.289
Q2(b) Equal variances assumed
.287 .593 .575 258 .566 0.059 0.102 -0.143 0.261
Equal variances not assumed
.569 145.115 .571 0.059 0.104 -0.146 0.264
Q2(c) Equal variances assumed
.197 .657 .390 258 .697 0.042 0.109 -0.171 0.256
Equal variances not assumed
.385 144.533 .701 0.042 0.110 -0.175 0.259
Table 4.4.1.1(Independent 2 tailed test)
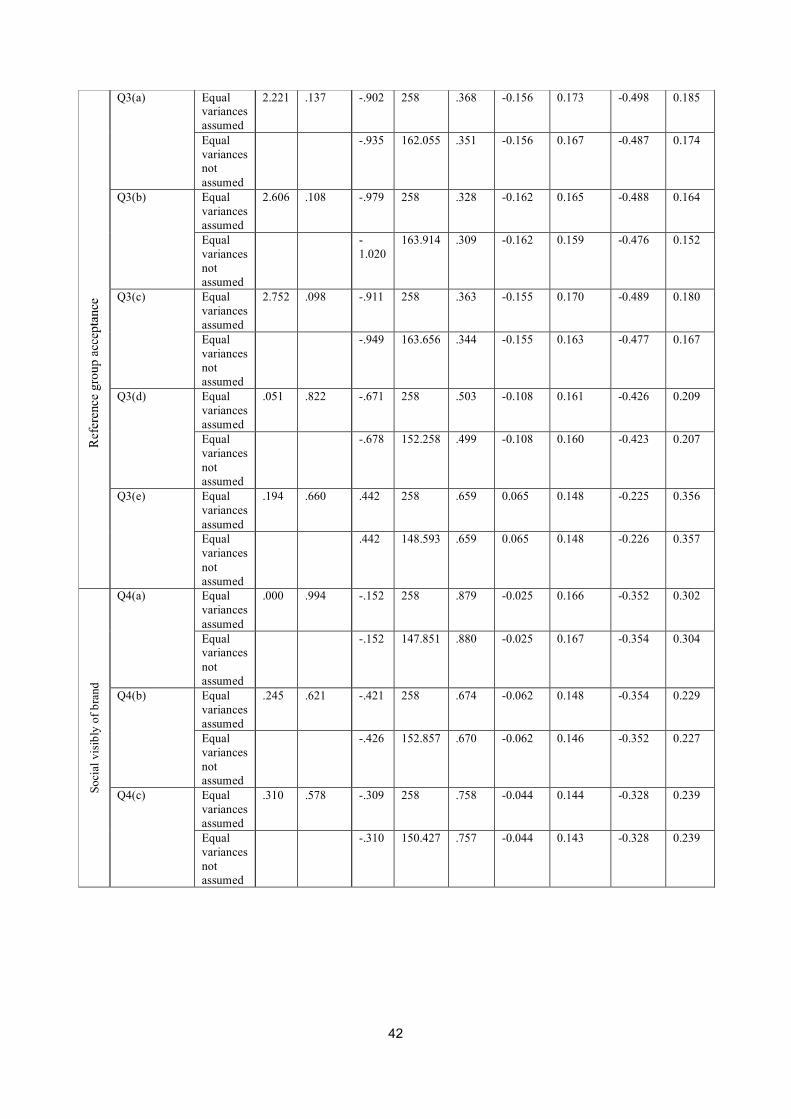
42
Q3(a) Equal variances assumed
2.221 .137 -.902 258 .368 -0.156 0.173 -0.498 0.185
Equal variances not assumed
-.935 162.055 .351 -0.156 0.167 -0.487 0.174
Q3(b) Equal variances assumed
2.606 .108 -.979 258 .328 -0.162 0.165 -0.488 0.164
Equal variances not assumed
-1.020
163.914 .309 -0.162 0.159 -0.476 0.152
Q3(c) Equal variances assumed
2.752 .098 -.911 258 .363 -0.155 0.170 -0.489 0.180
Equal variances not assumed
-.949 163.656 .344 -0.155 0.163 -0.477 0.167
Q3(d) Equal variances assumed
.051 .822 -.671 258 .503 -0.108 0.161 -0.426 0.209
Equal variances not assumed
-.678 152.258 .499 -0.108 0.160 -0.423 0.207
Q3(e) Equal variances assumed
.194 .660 .442 258 .659 0.065 0.148 -0.225 0.356
Equal variances not assumed
.442 148.593 .659 0.065 0.148 -0.226 0.357
So
cial
vis
ibly
of
bra
nd
Q4(a) Equal variances assumed
.000 .994 -.152 258 .879 -0.025 0.166 -0.352 0.302
Equal variances not assumed
-.152 147.851 .880 -0.025 0.167 -0.354 0.304
Q4(b) Equal variances assumed
.245 .621 -.421 258 .674 -0.062 0.148 -0.354 0.229
Equal variances not assumed
-.426 152.857 .670 -0.062 0.146 -0.352 0.227
Q4(c) Equal variances assumed
.310 .578 -.309 258 .758 -0.044 0.144 -0.328 0.239
Equal variances not assumed
-.310 150.427 .757 -0.044 0.143 -0.328 0.239
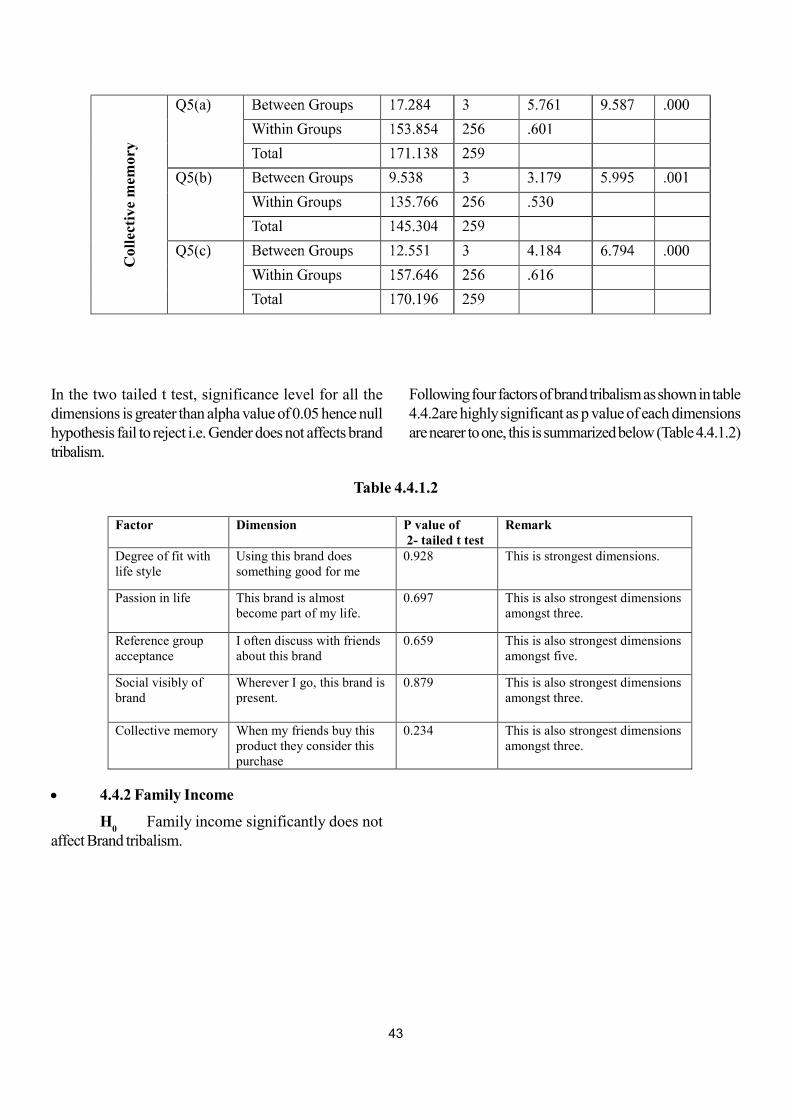
43
In the two tailed t test, significance level for all thedimensions is greater than alpha value of 0.05 hence nullhypothesis fail to reject i.e. Gender does not affects brandtribalism.
Following four factors of brand tribalism as shown in table4.4.2are highly significant as p value of each dimensionsare nearer to one, this is summarized below (Table 4.4.1.2)
4.4.2 Family Income
H0
Family income significantly does notaffect Brand tribalism.
Factor Dimension P value of 2- tailed t test
Remark
Degree of fit with life style
Using this brand does something good for me
0.928 This is strongest dimensions.
Passion in life This brand is almost become part of my life.
0.697 This is also strongest dimensions amongst three.
Reference group acceptance
I often discuss with friends about this brand
0.659 This is also strongest dimensions amongst five.
Social visibly of brand
Wherever I go, this brand is present.
0.879 This is also strongest dimensions amongst three.
Collective memory When my friends buy this product they consider this purchase
0.234 This is also strongest dimensions amongst three.
Table 4.4.1.2
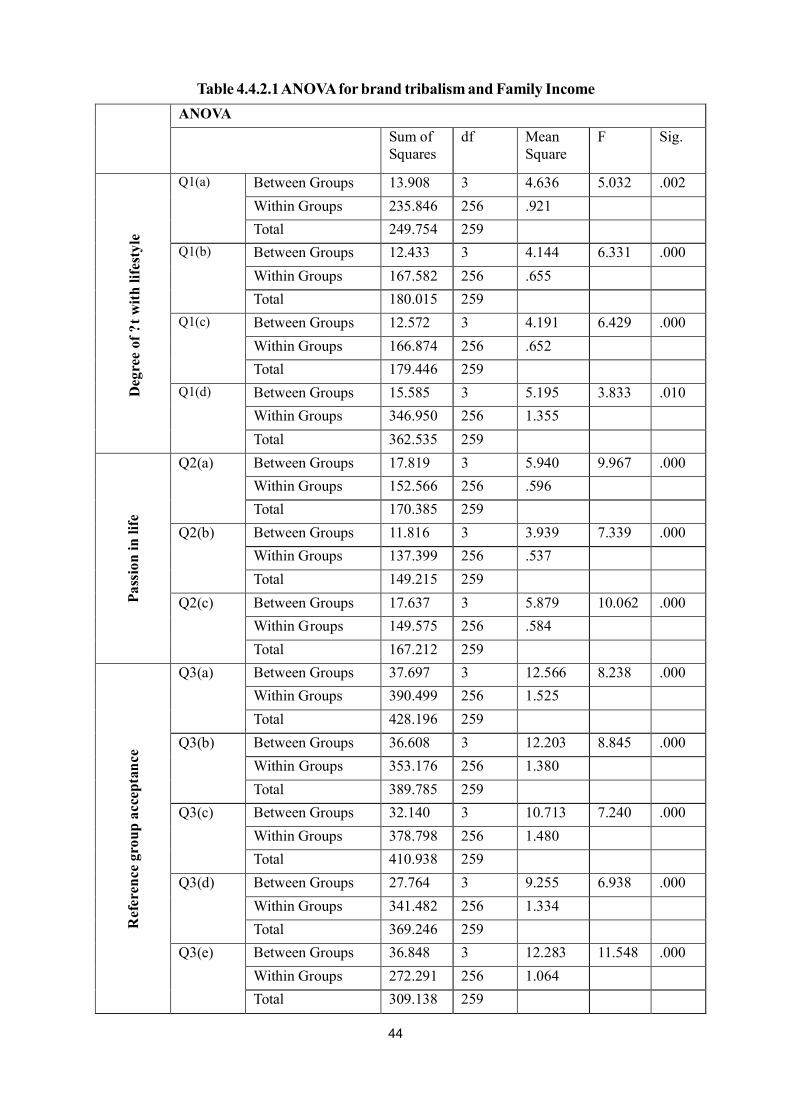
44
Table 4.4.2.1 ANOVA for brand tribalism and Family Income
ANOVA
Sum of Squares
df Mean Square
F Sig.
Deg
ree
of ?
t w
ith
lif
esty
le
Q1(a)
Between Groups 13.908 3 4.636 5.032 .002
Within Groups 235.846 256 .921
Total 249.754 259
Q1(b)
Between Groups 12.433 3 4.144 6.331 .000
Within Groups 167.582 256 .655
Total 180.015 259
Q1(c) Between Groups 12.572 3 4.191 6.429 .000
Within Groups 166.874 256 .652
Total 179.446 259
Q1(d) Between Groups 15.585 3 5.195 3.833 .010
Within Groups 346.950 256 1.355
Total 362.535 259
Pa
ssio
n i
n l
ife
Q2(a) Between Groups 17.819 3 5.940 9.967 .000
Within Groups 152.566 256 .596
Total 170.385 259
Q2(b) Between Groups 11.816 3 3.939 7.339 .000
Within Groups 137.399 256 .537
Total 149.215 259
Q2(c) Between Groups 17.637 3 5.879 10.062 .000
Within Groups 149.575 256 .584
Total 167.212 259
Ref
eren
ce g
rou
p a
ccep
tan
ce
Q3(a) Between Groups 37.697 3 12.566 8.238 .000
Within Groups 390.499 256 1.525
Total 428.196 259
Q3(b) Between Groups 36.608 3 12.203 8.845 .000
Within Groups 353.176 256 1.380
Total 389.785 259
Q3(c) Between Groups 32.140 3 10.713 7.240 .000
Within Groups 378.798 256 1.480
Total 410.938 259
Q3(d) Between Groups 27.764 3 9.255 6.938 .000
Within Groups 341.482 256 1.334
Total 369.246 259
Q3(e) Between Groups 36.848 3 12.283 11.548 .000
Within Groups 272.291 256 1.064
Total 309.138 259
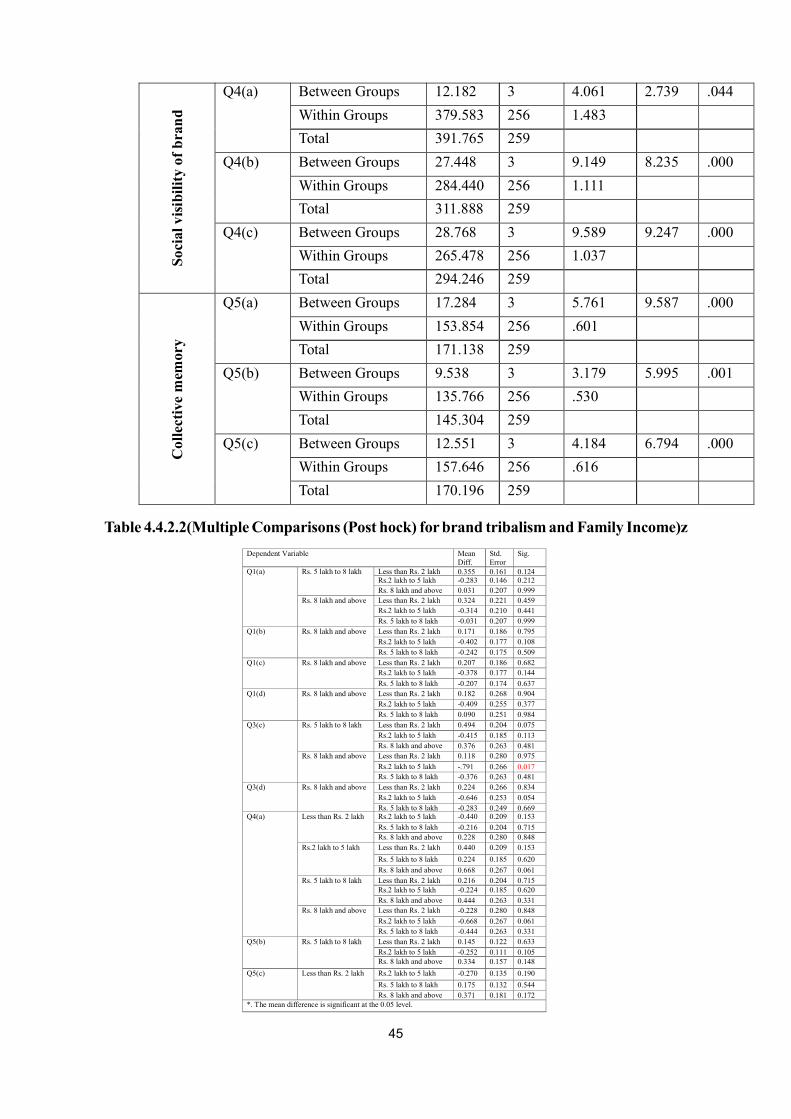
45
So
cial
vis
ibil
ity
of
bra
nd
Q4(a) Between Groups 12.182 3 4.061 2.739 .044
Within Groups 379.583 256 1.483
Total 391.765 259
Q4(b) Between Groups 27.448 3 9.149 8.235 .000
Within Groups 284.440 256 1.111
Total 311.888 259
Q4(c) Between Groups 28.768 3 9.589 9.247 .000
Within Groups 265.478 256 1.037
Total 294.246 259
Co
llec
tive
mem
ory
Q5(a) Between Groups 17.284 3 5.761 9.587 .000
Within Groups 153.854 256 .601
Total 171.138 259
Q5(b) Between Groups 9.538 3 3.179 5.995 .001
Within Groups 135.766 256 .530
Total 145.304 259
Q5(c) Between Groups 12.551 3 4.184 6.794 .000
Within Groups 157.646 256 .616
Total 170.196 259
Table 4.4.2.2(Multiple Comparisons (Post hock) for brand tribalism and Family Income)z
Dependent Variable Mean Diff.
Std. Error
Sig.
Q1(a) Rs. 5 lakh to 8 lakh Less than Rs. 2 lakh 0.355 0.161 0.124
Rs.2 lakh to 5 lakh -0.283 0.146 0.212
Rs. 8 lakh and above 0.031 0.207 0.999
Rs. 8 lakh and above Less than Rs. 2 lakh 0.324 0.221 0.459
Rs.2 lakh to 5 lakh -0.314 0.210 0.441
Rs. 5 lakh to 8 lakh -0.031 0.207 0.999
Q1(b) Rs. 8 lakh and above Less than Rs. 2 lakh 0.171 0.186 0.795
Rs.2 lakh to 5 lakh -0.402 0.177 0.108
Rs. 5 lakh to 8 lakh -0.242 0.175 0.509
Q1(c) Rs. 8 lakh and above Less than Rs. 2 lakh 0.207 0.186 0.682
Rs.2 lakh to 5 lakh -0.378 0.177 0.144
Rs. 5 lakh to 8 lakh -0.207 0.174 0.637
Q1(d) Rs. 8 lakh and above Less than Rs. 2 lakh 0.182 0.268 0.904
Rs.2 lakh to 5 lakh -0.409 0.255 0.377
Rs. 5 lakh to 8 lakh 0.090 0.251 0.984
Q3(c) Rs. 5 lakh to 8 lakh Less than Rs. 2 lakh 0.494 0.204 0.075
Rs.2 lakh to 5 lakh -0.415 0.185 0.113
Rs. 8 lakh and above 0.376 0.263 0.481
Rs. 8 lakh and above Less than Rs. 2 lakh 0.118 0.280 0.975
Rs.2 lakh to 5 lakh -.791 0.266 0.017
Rs. 5 lakh to 8 lakh -0.376 0.263 0.481
Q3(d) Rs. 8 lakh and above Less than Rs. 2 lakh 0.224 0.266 0.834
Rs.2 lakh to 5 lakh -0.646 0.253 0.054
Rs. 5 lakh to 8 lakh -0.283 0.249 0.669 Q4(a) Less than Rs. 2 lakh Rs.2 lakh to 5 lakh -0.440 0.209 0.153
Rs. 5 lakh to 8 lakh -0.216 0.204 0.715
Rs. 8 lakh and above 0.228 0.280 0.848
Rs.2 lakh to 5 lakh Less than Rs. 2 lakh 0.440 0.209 0.153
Rs. 5 lakh to 8 lakh 0.224 0.185 0.620
Rs. 8 lakh and above 0.668 0.267 0.061
Rs. 5 lakh to 8 lakh Less than Rs. 2 lakh 0.216 0.204 0.715 Rs.2 lakh to 5 lakh -0.224 0.185 0.620
Rs. 8 lakh and above 0.444 0.263 0.331
Rs. 8 lakh and above Less than Rs. 2 lakh -0.228 0.280 0.848
Rs.2 lakh to 5 lakh -0.668 0.267 0.061
Rs. 5 lakh to 8 lakh -0.444 0.263 0.331
Q5(b) Rs. 5 lakh to 8 lakh Less than Rs. 2 lakh 0.145 0.122 0.633
Rs.2 lakh to 5 lakh -0.252 0.111 0.105 Rs. 8 lakh and above 0.334 0.157 0.148
Q5(c) Less than Rs. 2 lakh Rs.2 lakh to 5 lakh -0.270 0.135 0.190
Rs. 5 lakh to 8 lakh 0.175 0.132 0.544
Rs. 8 lakh and above 0.371 0.181 0.172 *. The mean difference is significant at the 0.05 level.
46
As per above table, p value for each dimension is lessthan alpha value i.e. 0.05 however as per table for posthock analysis, it is seen that 9 sub-dimensions out of 18are having p value greater than 0.05 hence family incomeaffects brand tribalism for those sub-dimensions and forselected income group hence this is the "Null Until ProvenAlternative"
Discussions and Conclusions
Through this conceptual paper it is revealed that
a. Gender does not affect brand tribalism in case ofmobile phone users in Ahmedabad city. We canconclude that both male & female are equallyemotionally attached to a particular brand, productor service.
b. Hypothesis "Family income significantly does notaffect Brand tribalism" is not proven hence it is "Nulluntil Proven Alternative". P value for within the groupfor some income group is less than alpha value of0.05 hence to some extent it is concluded that allincome group significantly does not affect Brandtribalism. However the opinion of persons havingfamily income '8 lakh & above' is significantly differthan those of person having family income of '2 lakhto 5 lakh' in the dimension of 'Reference groupacceptance' and in sub-dimension of 'My friends buythis brand and I buy it too just because I want to belike them'.
c. 'Family income' rather than 'Gender' is moreimportant variable for strengthening brand tribalismin the use of mobile phone.
5. Limitations of study and future scope
The study has used samples from Ahmedabad city onlyand thus is not representative of entire population of India.Also only Gender & Family income have been consideredbut there are more other demographic variable. Limitedfield work and types of research methods adopted arealso limitations as well. Mobile phone industries and itsservice provider industries are extremely volatile marketconcept hence result may vary due to passage of time.
Future research can be conducted beyond the abovelimitation.
References
1. Bagozzi Richard P. (2000), "On the concept ofintentional social action in consumer behavior",Journal of Consumer Research, Vol-27, Issue 3,p388-96
2. Catalin &Andreea, (2014), "Brands as a Mean ofConsumer Self-expression and Desired PersonalLifestyle", Social and behaviour science, Vol-109,p 103-107
3. Cova Bernard and Cova Veronique (2002), "Tribalmarketing: The tribalisation of society and its impacton conduct of marketing, European Journal ofMarketing, Vol. 36 Issue 5, p595 - 620
4. Cova Bernard and Salle Robert. (2008), "Theindustrial/consumer marketing dichotomy revisited",Journal of Business & Industrial Marketing, Vol-23, Issue- 1, p3-11.
5. Gronroos Christian (2006), "On definingmarketing:Finding a new roadmap for marketing",Sage journals, Vol-6, Issue 4, p395-417
6. Kozinets Robert V. (1999), "E-tribalized marketing-The strategic implications of virtual communities ofconsumption", European management journal,Vol-17, Issue 3, p252-264
7. Nicholas Lane D. , Emiliano Miluzzo, Hong Lu,Daniel Peebles, Tanzeem Choudhury, and AndrewT. Campbell, (Sept 2010), IEEE CommunicationsMagazine ,p140-150
8. Moutinho L, Dionísio P, Leal C. Surf tribal behaviour:a sports marketing application. Mark Intell Plann2007;25(7):668-90.
9. Penalozalisa and Alladi Venkatesh (2006), "Furtherevolving the new dominant logic of marketing-Fromservices to the social construction of markets" Sagejournal, Vol-6, Issue 3, p299-316
10. Taute Harry A. and Jeremy Sierra (2014), "Brandtribalism: An anthropological perspective", Journalof Product & Branding Management, Vol-23,Issue 1, p2-15
11. Veloutsou Cleopatra and Luiz Moutinho (2009),"Brand relationship through brand relationship andbrand tribalism", Journal of business research, Vol-62, Issue 3, p314-322
47
Introduction
Ergonomics is the study of human abilities andcharacteristics which affect the design of equipment,systems and job and its aims to improve efficiency, safetyand wellbeing. (Choobineh, Musculoskeletal problemsin Iranian hand-woven carpet industry:Guidelines forworkstation design, 2007). The formal definition ofErgonomics coined by United Kingdom in 1950, is studyof human characteristics for appropriate design of theliving and work environment (Forza, 2000)Now a dayson one side ergonomics is not properly implemented at
* Associate Professor, G.H. Patel Postgraduate Institute of Business Management, Sardar Patel University, VallabhVidynanagar, Anand** Research Scholar (Management), G.H. Patel Postgraduate Institute of Business Management Sardar Patel University, Vallabh Vidynanagar,
Anand & Teaching assistant at K S School of Business management, Gujarat University, Ahmedabad
A Study on Identifying Work Related Musculoskeletal Injuries and AssociatedErgonomic Risk Factors Among Different Workers: Systematic Literature Review
K S Prasad* and Akanxa J Dhamale**
Abstract
Objective
The purpose of this paper is to highlight and identify work-related musculoskeletal injuries and associated ergonomicrisk factors among different workers.
Methodology/approach
Comprehensive literature search was done and subsequently publications identified were studied thoroughly. Availableinformation has been segregated and narrated systematically for easy understanding by readers.
Findings
Musculoskeletal disorders injuries majorly damages the muscles, joints, tendons, ligaments, nerves, bones and localizedblood circulation system in human body. This study found a high prevalence of musculoskeletal injuries in workerssuch as trigger finger, carpal tunnel syndrome, and muscle fatigue, restricted movement of limbs, strain / sprain and lossof muscles strength. There exist severe musculoskeletal pain in the body regions such as shoulder, elbow, wrist, upperback, lower back, arms, lower limbs, forearm, elbow, lumbar region, hips, thighs, knees, ankles, feet and hands.Musculoskeletal injuries occur due poor ergonomic design and ergonomic risk factors. This paper provide summarizedinformation to readers about the associated ergonomic risk factors such as awkward postures ,force, repetition,static postures, vibration, improper workstation environment and extreme temperature.
Research limitations
Being a review paper, the present paper is purely academic in nature.
Originality/Value
This paper systematically reviews literature on the topic of ergonomic risk factors and its related musculoskeletalinjuries prevailing among different workers. The paper concludes that with reducing ergonomic risk factors in theworkplace can have positive impact on reducing musculoskeletal injuries in the workplace.
Key words: Musculoskeletal injuries, Ergonomics, Ergonomic risk factor, Pain, Symptom
Paper type : Literature review
the workplace and on other side there is high stress ofwork load which result in the prevalence of work relatedmusculoskeletal injuries among workers in industrialsectors. Musculoskeletal disorders injuries majorlydamages the muscles, joints, tendons, ligaments, nerves,bones and localized blood circulation system in humanbody. (Nunes, 2009) Musculoskeletal injuries occur dueto ergonomics risk factors such as long hours of staticwork, awkward posture, repetitive movements, ill-designed workstation (Choobineh, Musculoskeletalproblems in Iranian hand-woven carpet industry
48
Guidelines for workstation design, 2007).
Objective of the paper
The purpose of this study is to identify work-relatedmusculoskeletal injuries among different workers andergonomics risk factors prevailing with their profession.
Research Methodology
Literature review
This research paper summarizes more than 17 researchpaper on work-related musculoskeletal injuries andassociated ergonomic risk factors among differentworkers.
(Aghilinejad, 2016) The study was conducted amongassembly workers in semiconductor industry in Tehranprovince. The paper concluded that semi conductorassembly workers have to assemble electronic circuitswhich require high precision while in static postures forlong duration. So they have to bent head and necksforward to provide optimum visual conditions. Due toawkward working posture the risk of musculoskeletaldisorder increases in neck, back, shoulder and arms. Thesymptom of musculoskeletal disorder involves musclesfeeling tired and achy and progress to a disease in whichrestricted movement of limbs or loss of muscles strengthand power can be observed.
Research (Ramdass, 2013) revealed that sewing machineoperator in apparel manufacturing experienced significantjob related musculoskeletal pain specifically in upperbacks, shoulders/wrists, and necks. Reason behind suchillness was poor postures of sewing operator which wasdue to visual demands of the work, the improperworkstation design, repetitive manual activity andinadequate seating. It has been observed that insufficientlighting of the work area required the operators to lean intowards their work area resulting in a hunched posture.The workstation design was such that the workers hadto adapt to it rather than having the workstation designed
Type of data Secondary
Research Design
Descriptive
No of literature review 17
Paper type Literature review
Source EBSCO's databases
for the worker. Seating arrangements lacked adjustablebackrests and improper height. Worktables did not allowenough surface area for workers to rest their upper limbs,and workstation height led to awkward postures. Besidesthis there were accident occurred in cutting room andsewing section.
(Choi, 2012) Construction workers mostly sufferedcommon types of injury such as sprain/strain, back injury,fractures, burns, cuts, carpal Tunnel Syndrome,contusions and eye injuries. Options in the source of injury/illness section included overexertion, motion/position, slip/trip, tools/machinery, chemicals, manual handling of tools,equipment, materials, sharp edges and struck by. Otherrelevant issues included time spent on lifting/carrying perday, distances traveled while handling loads, weight ofthe loads carried, and method of carrying the commonloads. Excessive hand and arm vibrations were anotherconcern for the construction contractors. This is becausethere tends to be extensive usage of power tools on adaily basis. The workers ranked highest rate of injuries inthe body parts such as back and hand/fingers followedby shoulders, knees, foot/ankle, head/neck, and eyes.
(Aghilinejad, 2015) The prevalence of neck and shouldercomplaints was observed and assessed in the trialparticipants with questionnaire of Nordic Musculoskeletalamong automobile workers of a factory.
(Akter, 2015)The study has identified a high prevalenceof musculoskeletal symptoms in upper and lower backbody regions among metal workers in Dhaka,Bangladesh. Since the risk factor present were such aslifting or pulling heavy loads, repetitive movement,awkward and twisting movements bending or extendedreaching for objects reaching above shoulder level ormaintaining the same postural position for an extendedperiod of time more than one hour, presence of vibration,scattered tools in the working environment; insufficientlight and ventilation.
(Nogueira, 2012) Aircraft maintenance workers has toperform manual material handling tasks which require theuse of force to carry, lift or lower objects with the hands.The Nordic musculoskeletal Questionnaire data show thatthe complaints are mainly concentrated on lower back,neck, upper back and ankle/foot. On the other hand, thephysical examination has shown clinical diagnosis ofshoulder disorders.
(Nogueira, 2012) Aircraft maintenance workers has toperform manual material handling tasks which require the
49
use of force to carry, lift or lower objects with the hands.The Nordic musculoskeletal Questionnaire data show thatthe complaints were mainly concentrated on lower back,neck, upper back and ankle/foot. The physicalexamination has shown diagnosis of shoulder disorderson the other side.
(Motamedzade, 2011) Manual television and radioassembly workers in a TV manufacturing industry havesigns and symptoms of the upper extremities present inshoulder, wrist, forearm and elbow.
(Purani, 2016)Salespersons in department stores are atan increased risk of developing musculoskeletalsymptoms. Their jobs involve prolonged forward standing,twisting the body, manual handling tasks such as lifting,carrying, pushing, pulling and working in static posturefor longer periods during work have been identified asrisk factors for musculoskeletal symptoms of the lowerback pain.
(Cristancho, 2012) Mostly female cashiers from adepartment store have a musculoskeletal injuries declaringpain mainly in the neck, lower back, right wrist andshoulders. Problems faced by cashiers were such aspostural overload, repetitive work, manual load handling,mental fatigue, environmental discomfort, variable workschedules, extended working days and absence ofbreaks.
(Escalona, 2012) A transport company worker hasmusculoskeletal disorders in the upper extremities,shoulder and neck. The risk factors associated with themusculoskeletal disorders were as follows: the repetitivemotion of flexion and extension of the wrist, shoulderelevation, lifting above height of the shoulders, andextension of elbow, neck flexion and stress due to thework requirements. The root cause was due to theorganization long working hours, short rest, workoverload, mental demand, and high responsibility andhaving to work under strict supervision by a video camera.
(Rodrigues, 2012) The boiler activities workers are facedwith danger due to the great risk of explosions anddamages in cases of failure during the operation in boilers.The study concluded that the activity causes pains indifferent parts of the body with pain/discomfort in the leftshoulder, right elbow, wrists, neck, lower and upper back, hips, thighs, knees , ankles and feet due to excessiveloading of weight and exposure to heat that cause musclefatigue and cause diseases like cancer. The work offeeding the boiler requires a great physical effort because
it is necessary to lift logs of wood of different sizes andweights. It was observed that the operator carries outactivities with improperly posture causing pain especiallyin the lumbar region.
(Sett, 2012) The hacklers working in jute mill have severepain in the neck, shoulder, elbow, wrist and upper backand the intensity are much higher than the workers ofother departments. The reason behind this is that they liftand carry heavy load, they perform repetitive task andthey remain in awkward postures most of their workingtime. Apart from their work, they carry out the work industy environment of jute fibers and under poorlyventilated, ill illuminated factory sheds. In the summerseasons this environmental heat stress is even worse.
(Pullopdissakul, 2013) The prevalence of clinicallydiagnosed upper extremities musculoskeletal disordersfound in electronic assembly workers was radial styloidtenosynovitis, trigger finger, carpal tunnel syndrome. Theergonomic factors associated with upper extremitiesmusculoskeletal disorders included awkward posture,high force exertion and contact stress.
(Mukhopadhyay, 2015) Old bicycle repairing workerswere in the high risk category such as the workersrequired good amount of physical effort to dismantle theparts, repetitive movements of the upper and forearmcoupled with grip force in cleaning, static muscular loadon the forearm and upper arm muscles in spray painting,forceful and repetitive activities of the upper arm and theforearm accompanied by deviated wrist postures inassembling the parts.
(Mukhopadhyay, 2010) Stone carving workers involvedin the process of three different sections such as roughcut, fine cut and polishing. This whole process requiresmaximum effort and for this a hammer, different types ofchisels as well as an electric cuter are used. The workersare exposed to stone dust which is continuous for eighthours of their normal working duration. The workersassume awkward postures with limbs deviated fromneutral for long periods of time. Polishing is done manuallywith brush which involves repetitive movements of thehand in deviated postures. At the end of the day, neck,shoulder and lower back were the body parts maximumaffected and it often prevented them from doing anyhousehold activities.
(Choobineh, Musculoskeletal problems in Iranian handwoven carpet industry, Guidelines for workstation design,2007) Carpet weaving workers has one of the most
50
tedious jobs especially in loom type requiring long hoursof static work, awkward posture, repetitive movementsand ill-designed weaving workstation. It is a high riskoccupation for developing musculoskeletal disorders. Inmost of the cases that weavers sat on the ground or apiece of wood strip in cross-legged or folded kneesposition which showed awkward postures and resultedin neck and trunk deviated from neutral posture Theresults of the study demonstrated that the most commonlyaffected regions among the weavers were shoulders,lower back, wrists/hands, upper back, neck and knees.
(Thinius, 2014) Female parlor operatives in dairy farmsreported more musculoskeletal discomfort compared tothe male parlor operatives workers. The work placeanalysis revealed that women regularly worked aboveshoulder level and had to tort and bend more often thanmen because of the gender specific anthropometrics andthe workplace design. Most affected body region amongfemales was the lower back followed by neck andshoulder region. A possible explanation for the high rateof low back pain might be the necessity to bend forwardto place a hand centric beneath the udder.
Findings of literature review
The research paper presents a systematic literature reviewof prevalence work related musculoskeletal disordersamong different workers.
Musculoskeletal injuries
There exists distribution of musculoskeletal disorder painin different organs of the body regions such as neck,shoulder, elbow, wrist, upper back lower back, arm,lower limbs, forearm, lumbar region, hips, thigh, knee,ankles, feet and hands.
This study found a high prevalence of musculoskeletalinjuries such as trigger finger, carpal Tunnel syndrome,Achy, restricted movement of limbs, strain /sprain, lossof muscles strength and muscle fatigue.
Ergonomic risk factors
Awkward postures refer to the positions of body thatdeviates from appropriate positions while doing the activityof the task in working area. Awkward postures includesprolonged forward standing , twisting the body , extendedreaching for objects above shoulder level , poor postures,required the operators to lean in towards their work arearesulting in a hunched posture , awkward posture withlimbs deviated from neutral for long periods of time,extension of elbow and neck flexion
High force refers to excessive physical effort requiredto perform a task. (Pullopdissakul, 2013). So high forceincludes manual handling tasks such as lifting, carrying,pushing, and pulling heavy loads, high force exertion, timespent on lifting/carrying, distances traveled while handlingloads, weight of the loads carried, the use of force tocarry, lift or lower objects with the hands, maximum effortrequired for using hammer/ different types of chisels /electric cutter and physical effort to dismantle the parts.
Repetition refers perform the same motion repeatedlyor frequently over duration of work time (Pullopdissakul,2013). So repetition includes repetitive movements ofthe hand in deviated postures, repetitive movements ofthe upper and forearm coupled with grip force, forcefulrepetitive activities of the upper arm and the forearmaccompanied by deviated wrist postures. Static posturesincludes static postures for long duration, maintaining thesame postural position for an extended period of time,visual demands of the work, static muscular load on theforearm and upper arm muscles.
Vibration includes presence of vibration during the workactivity.
Improper working environment all the aspects includesscattered tools in the working environment , insufficientlight of the work area ,improper ventilation ,the improperworkstation design , inadequate seating , environmentaldiscomfort ,variable work schedules , absence of breaks, mental fatigue , stress due to the work requirements ,high responsibility and having to work under strictsupervision, long working hours, short rest , workoverload and overexertion.
Extreme Temperature includes exposure to heat facedby worker in working area.
Conclusion
Thus on the basis of above data it can be concluded thatlot of research has been done on identifyingmusculoskeletal injuries and associated ergonomic riskfactors prevailing among different workers. There is strongneed for implementation of ergonomics at workplace sothe ergonomic risk factors as well as work relatedmusculoskeletal injuries can be reduced to great extentamong the different workers. Providing proper suitablework environment as per the requirement of the workerswill increase the productivity, efficiency and safety of theworker in workplace. There is scope for further researchon identifying ergonomic risk factors among different
51
workers working in different sectors. If the ergonomicrisk factors of work related musculoskeletal injuries areidentified then accordingly ergonomic designed can beplanned as per the requirement of workers.
Research limitations - Being a review paper, the presentpaper is purely academic in nature.
References
Aghilinejad, M. A. (2016). An ergonomic intervention toreduce musculoskeletal discomfort amongsemiconductor assembly workers. Works , 54 (2),445-450.
Aghilinejad, M. K.-M.-A. (2015). The role of ergonomictraining interventions on decreasing neck andshoulders pain among workers of an Iranianautomobile factory: a randomized trial study.Medical Journal of the Islamic Republic of Iran(MJIRI) , 29, 190.
Akter, S. M. (2015). Prevalence of musculoskeletalsymptoms and associated factors: A cross-sectionalstudy of metal workers in Bangladesh. 50 (3), 363-370.
Choi, S. D. (2012). A study of trade-specific occupationalergonomics considerations in the U.S. constructionindustry. Work , 42 (2), 215-222.
Choobineh, A. H. (2007). Musculoskeletal problems inIranian hand woven carpet industry, Guidelines forworkstation design. Applied ergonomics, 38 (5),617-624.
Choobineh, A. H. (2007). Musculoskeletal problems inIranian hand-woven carpet industry Guidelines forworkstation design. Applied Ergonomicsines , 38(5), 617-624.
Corlett, E. N. (1984). Evaluation of human work Apratical ergonomics methodology. British Library.
Cristancho, M. L. (2012). Participatory ergonomicsamong female cashiers from a department store.Work , 41, 2499-2505.
Escalona, E. H. (2012). Ergonomic evaluation in a valuestransportation company in Venezuela . works , 41,710-713.
Forza, C. (2000). Time compression in production anddistribution within the textile-apparel chain.Integrated manufacturing. MCB University press,11 (2), 138-146.
Motamedzade, M. M. (2011). Ergonomics intervention
in an Iranian television manufacturing industry. Work,
38 (3), 257-263.
Mukhopadhyay, P. &. (2010). Evaluating ergonomic risk
factors in non-regulated stone carving units of Jaipur.
works , 35 (1), 87-99.
Mukhopadhyay, P. J. (2015). Ergonomic risk factors in
bicycle repairing units at Jabalpur. works , 51 (2),
245-254.
Nogueira, H. C. (2012). Musculoskeletal disorders and
psychosocial risk factors among workers of the
aircraft maintenance industry. Work , 41, 4801-
4807.
Nunes, I. L. (2009). FAST ERGO_X-a tool for
ergonomic auditing and work-related
musculoskeletal disorders prevention. Work , 34
(2), 133-148.
Pullopdissakul, S. E. (2013). Upper extremities
musculoskeletal disorders: Prevalence and
associated ergonomic factors in an electronic
assembly factory. International Journal of
Occupational Medicine and Environmental Health ,
26 (5), 751-761.
Purani, R. S. (2016). Prevalence of low back pain in
salespersons and its association with ergonomic risk
factors in Ahmedabad, Gujarat: A cross-sectional
survey. Medical Journal Of Dr. D.Y. Patil University,
9 (3), 331-335.
Ramdass, K. (2013). The Implementation of Ergonomics
as a Sustainable Competitive Advantage.
Proceedings of PICMET '13: Technology
Management for Emerging Technologies., (p. 1669).
Rodrigues, V. A. (2012). Assessment of physical
workload in boiler operations. Works , 41, 406-
413.
Sett, M. &. (2012). Study on work load and work-related
musculoskeletal disorders amongst male jute mill
workers of West Bengal, India. work , 42 (2), 289-
297.
Thinius, M. &. (2014). Ergonomic workplace evaluation
and epidemiology of musculoskeletal discomfort on
German dairy farms. Work , 49 (1), 25-32.
52
I. Introduction
Social media is basically the interplay and verbal exchangebetween humans for sharing and receiving information. Itis a web based tool. Man being a human animal, there isconstantly a need for socializing and networking. Theworld has been modified swiftly with the aid of theevolution of technology; this has resulted in the use oftechnological know-how as the first-class medium toexplore the broad location of knowledge. The evolutionof internet science has led to its use as the satisfactorymedium for communication. Whereby, two-thirds of theworld's internet population visit social networking orrunning a blog site, hence serving as a verbal exchangeand connection tool. Social networking sites (SNSs) areonline communities of internet users who prefer to speakwith different users about areas of mutual interest, whetheror not from a personal, business or tutorial standpoint
* Training and Placement Officer, Charotar University of Science and Technology (CHARUSAT), Changa, Gujarat** Professor, G. H. Patel PG Institute of Business Management, Vallabh Vidyanagar, Gujarat
Effect of Social Networking Sites on Life of Engineering Students in Gujarat
Divyang Purohit* and Mitesh Jayswal**
Abstract
Purpose: The purpose of this paper is to understand the effect of social networking sites on Life of engineeringstudents in Gujarat.
Design/methodology/approach: Data collected from 479 undergraduate engineering students from Chandubhai S.Patel Institute of Technology (CSPIT), Changa, Gujarat using 14 point structured close ended questionnaire. The linkof the questionnaire was sent through the form created on Google drive with the aid of electronic mail to the respondents.Bar charts and tabulation method using spreadsheet were performed for data analysis.
Findings: Results indicate that 99.8 per cent students had smartphone out of which 94.2 per cent had internet facilityand 96.45 per cent used social networking sites in which 87.3 per cent spent more than an hour on SNS. 44.23 percent males and 50 per cent females agreed that SNS were important for them. 47.17 males and 47.22 per centfemales believed that SNS had somewhat effect on face to face communication.
Research limitations/implications: Findings of this paper cannot be generalized as it involves students from onlyone engineering college of Gujarat. A survey involving students from different strata across Gujarat would enablescholars to capture more insight into the effects of social networking sites on life of engineering students.
Practical implications:Study reveals that even though most of the engineers had smartphones having internet connectionstill there were students who did not have any social media account. Most of the engineers believed that SNSs isimportant. Most of the engineers believed that SNSs had affected their social life. Most of the engineers used SNSsto keep in touch with their family and friends during study and to find new information for their study.
Originality/value: Many studies have been conducted to identify the effect of SNS on students of different disciplineexcluding engineering. This study tries to find the effect of SNS on engineering students.
Keywords: Effect of Social sites, Engineering students, Internet, Social Networking sites, SNS.
Paper type: Research paper
(Helou et al., 2012). Young guys and girls now exchangeideas, feelings, personal information, images and videosat a simply superb speed on social networking sites.However, every day many college students are spendinginfinite hours immersed in social media, such as WhatsApp,Facebook, LinkedIn, Twitter. At first look, this can alsoappear like a waste of time; on the other hand, it alsohelps students to increase essential know-how and socialskills, and be lively citizens who create and share content(Jha et al., 2016). At present, whether social media isfavorable or unfavorable, many college students makeuse of these websites on a daily basis.
II. Literature Review
Social media cannot be understood except first defining'Web 2.0': a term that describes a new way in which endusers use the World Wide Web, a place where content is
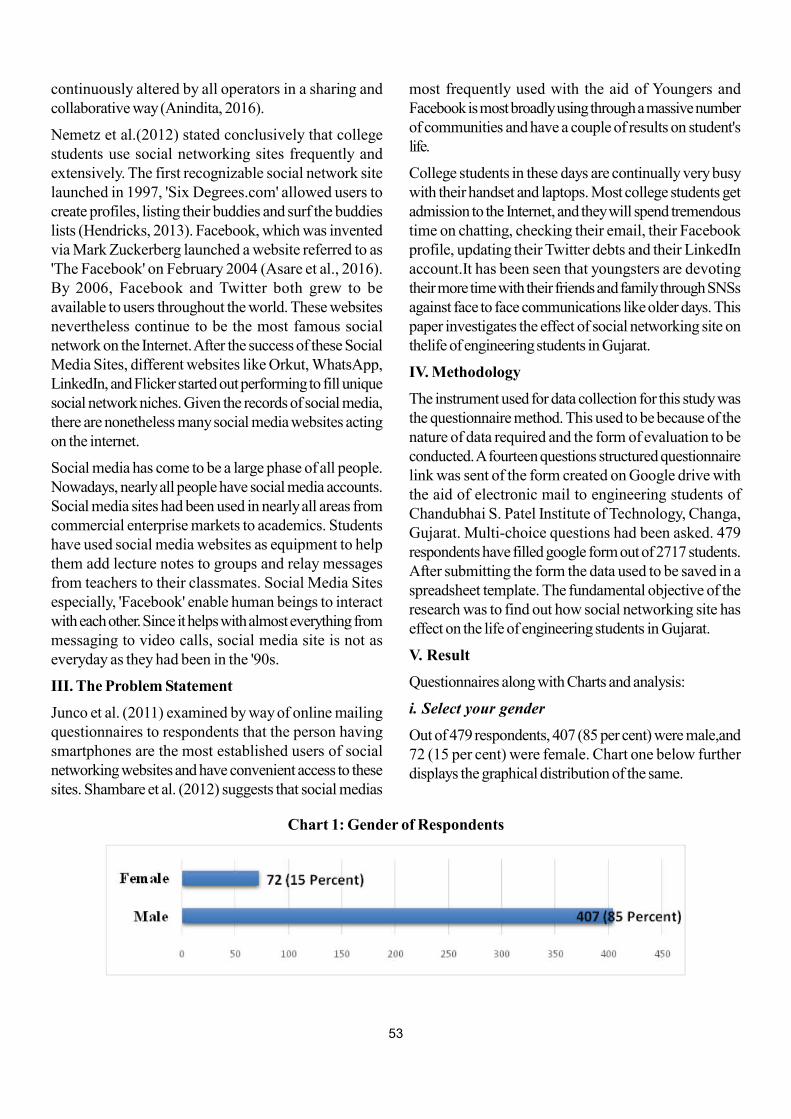
53
continuously altered by all operators in a sharing andcollaborative way (Anindita, 2016).
Nemetz et al.(2012) stated conclusively that collegestudents use social networking sites frequently andextensively. The first recognizable social network sitelaunched in 1997, 'Six Degrees.com' allowed users tocreate profiles, listing their buddies and surf the buddieslists (Hendricks, 2013). Facebook, which was inventedvia Mark Zuckerberg launched a website referred to as'The Facebook' on February 2004 (Asare et al., 2016).By 2006, Facebook and Twitter both grew to beavailable to users throughout the world. These websitesnevertheless continue to be the most famous socialnetwork on the Internet. After the success of these SocialMedia Sites, different websites like Orkut, WhatsApp,LinkedIn, and Flicker started out performing to fill uniquesocial network niches. Given the records of social media,there are nonetheless many social media websites actingon the internet.
Social media has come to be a large phase of all people.Nowadays, nearly all people have social media accounts.Social media sites had been used in nearly all areas fromcommercial enterprise markets to academics. Studentshave used social media websites as equipment to helpthem add lecture notes to groups and relay messagesfrom teachers to their classmates. Social Media Sitesespecially, 'Facebook' enable human beings to interactwith each other. Since it helps with almost everything frommessaging to video calls, social media site is not aseveryday as they had been in the '90s.
III. The Problem Statement
Junco et al. (2011) examined by way of online mailingquestionnaires to respondents that the person havingsmartphones are the most established users of socialnetworking websites and have convenient access to thesesites. Shambare et al. (2012) suggests that social medias
most frequently used with the aid of Youngers andFacebook is most broadly using through a massive numberof communities and have a couple of results on student'slife.
College students in these days are continually very busywith their handset and laptops. Most college students getadmission to the Internet, and they will spend tremendoustime on chatting, checking their email, their Facebookprofile, updating their Twitter debts and their LinkedInaccount.It has been seen that youngsters are devotingtheir more time with their friends and family through SNSsagainst face to face communications like older days. Thispaper investigates the effect of social networking site onthelife of engineering students in Gujarat.
IV. Methodology
The instrument used for data collection for this study wasthe questionnaire method. This used to be because of thenature of data required and the form of evaluation to beconducted. A fourteen questions structured questionnairelink was sent of the form created on Google drive withthe aid of electronic mail to engineering students ofChandubhai S. Patel Institute of Technology, Changa,Gujarat. Multi-choice questions had been asked. 479respondents have filled google form out of 2717 students.After submitting the form the data used to be saved in aspreadsheet template. The fundamental objective of theresearch was to find out how social networking site haseffect on the life of engineering students in Gujarat.
V. Result
Questionnaires along with Charts and analysis:
i. Select your gender
Out of 479 respondents, 407 (85 per cent) were male,and72 (15 per cent) were female. Chart one below furtherdisplays the graphical distribution of the same.
Chart 1: Gender of Respondents
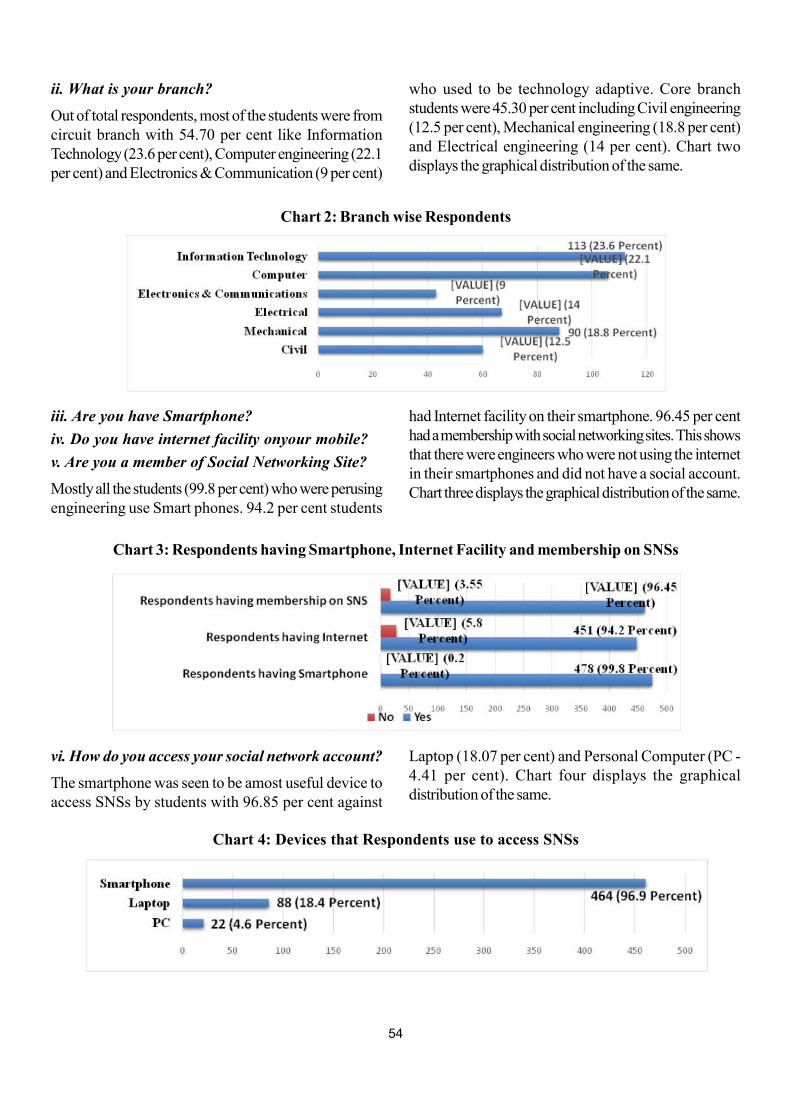
54
ii. What is your branch?
Out of total respondents, most of the students were fromcircuit branch with 54.70 per cent like InformationTechnology (23.6 per cent), Computer engineering (22.1per cent) and Electronics & Communication (9 per cent)
who used to be technology adaptive. Core branchstudents were 45.30 per cent including Civil engineering(12.5 per cent), Mechanical engineering (18.8 per cent)and Electrical engineering (14 per cent). Chart twodisplays the graphical distribution of the same.
iii. Are you have Smartphone?
iv. Do you have internet facility onyour mobile?
v. Are you a member of Social Networking Site?
Mostly all the students (99.8 per cent) who were perusingengineering use Smart phones. 94.2 per cent students
Chart 2: Branch wise Respondents
had Internet facility on their smartphone. 96.45 per centhad a membership with social networking sites. This showsthat there were engineers who were not using the internetin their smartphones and did not have a social account.Chart three displays the graphical distribution of the same.
vi. How do you access your social network account?
The smartphone was seen to be amost useful device toaccess SNSs by students with 96.85 per cent against
Chart 3: Respondents having Smartphone, Internet Facility and membership on SNSs
Laptop (18.07 per cent) and Personal Computer (PC -4.41 per cent). Chart four displays the graphicaldistribution of the same.
Chart 4: Devices that Respondents use to access SNSs
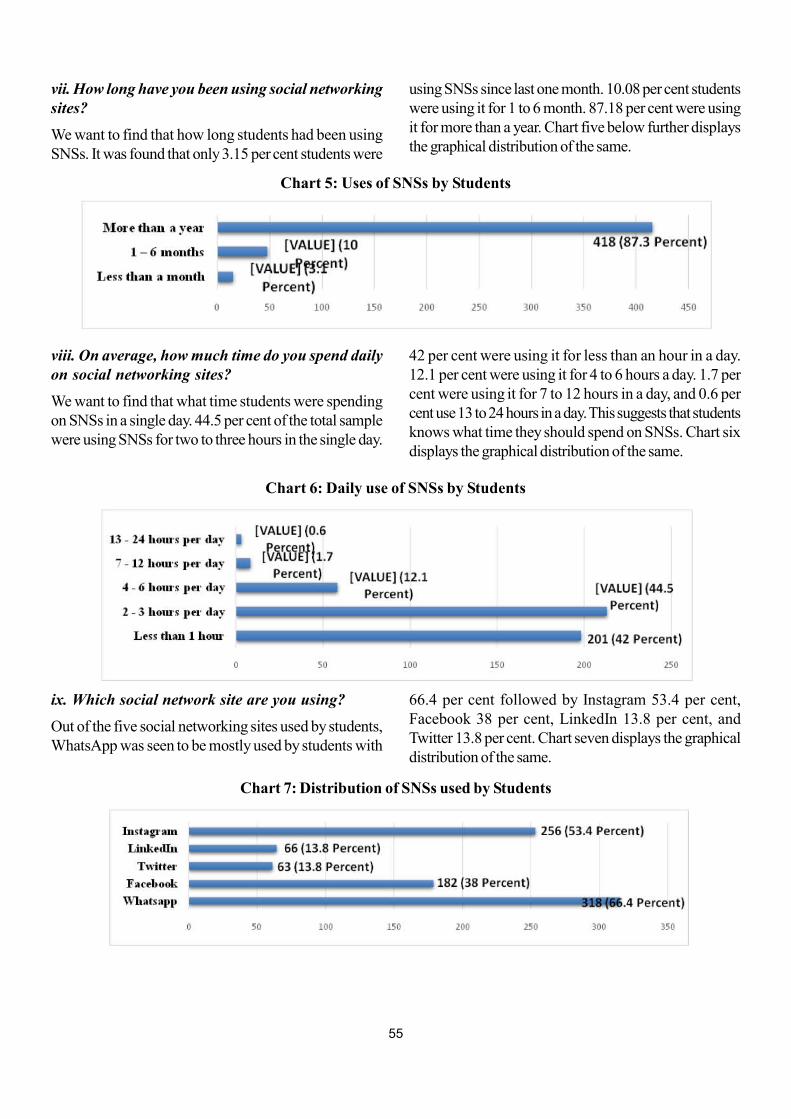
55
vii. How long have you been using social networkingsites?
We want to find that how long students had been usingSNSs. It was found that only 3.15 per cent students were
using SNSs since last one month. 10.08 per cent studentswere using it for 1 to 6 month. 87.18 per cent were usingit for more than a year. Chart five below further displaysthe graphical distribution of the same.
viii. On average, how much time do you spend dailyon social networking sites?
We want to find that what time students were spendingon SNSs in a single day. 44.5 per cent of the total samplewere using SNSs for two to three hours in the single day.
Chart 5: Uses of SNSs by Students
42 per cent were using it for less than an hour in a day.12.1 per cent were using it for 4 to 6 hours a day. 1.7 percent were using it for 7 to 12 hours in a day, and 0.6 percent use 13 to 24 hours in a day. This suggests that studentsknows what time they should spend on SNSs. Chart sixdisplays the graphical distribution of the same.
ix. Which social network site are you using?
Out of the five social networking sites used by students,WhatsApp was seen to be mostly used by students with
Chart 6: Daily use of SNSs by Students
66.4 per cent followed by Instagram 53.4 per cent,Facebook 38 per cent, LinkedIn 13.8 per cent, andTwitter 13.8 per cent. Chart seven displays the graphicaldistribution of the same.
Chart 7: Distribution of SNSs used by Students
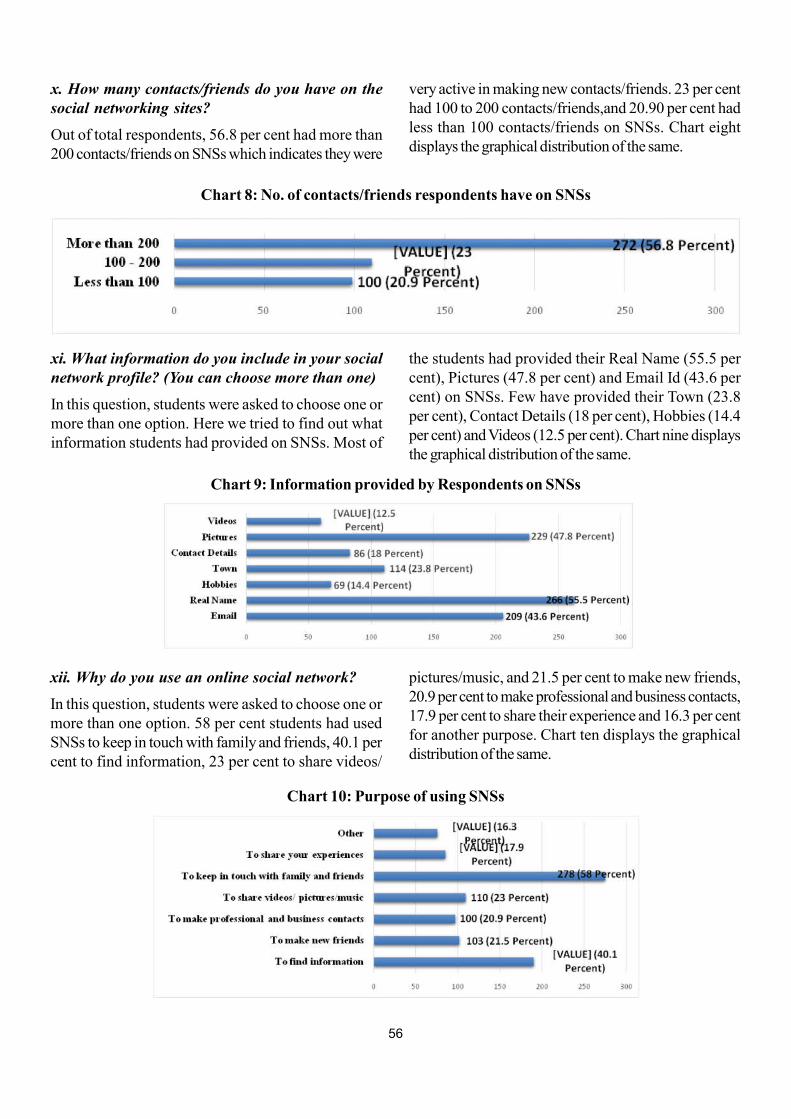
56
x. How many contacts/friends do you have on thesocial networking sites?
Out of total respondents, 56.8 per cent had more than200 contacts/friends on SNSs which indicates they were
very active in making new contacts/friends. 23 per centhad 100 to 200 contacts/friends,and 20.90 per cent hadless than 100 contacts/friends on SNSs. Chart eightdisplays the graphical distribution of the same.
xi. What information do you include in your socialnetwork profile? (You can choose more than one)
In this question, students were asked to choose one ormore than one option. Here we tried to find out whatinformation students had provided on SNSs. Most of
Chart 8: No. of contacts/friends respondents have on SNSs
the students had provided their Real Name (55.5 percent), Pictures (47.8 per cent) and Email Id (43.6 percent) on SNSs. Few have provided their Town (23.8per cent), Contact Details (18 per cent), Hobbies (14.4per cent) and Videos (12.5 per cent). Chart nine displaysthe graphical distribution of the same.
xii. Why do you use an online social network?
In this question, students were asked to choose one ormore than one option. 58 per cent students had usedSNSs to keep in touch with family and friends, 40.1 percent to find information, 23 per cent to share videos/
Chart 9: Information provided by Respondents on SNSs
pictures/music, and 21.5 per cent to make new friends,20.9 per cent to make professional and business contacts,17.9 per cent to share their experience and 16.3 per centfor another purpose. Chart ten displays the graphicaldistribution of the same.
Chart 10: Purpose of using SNSs
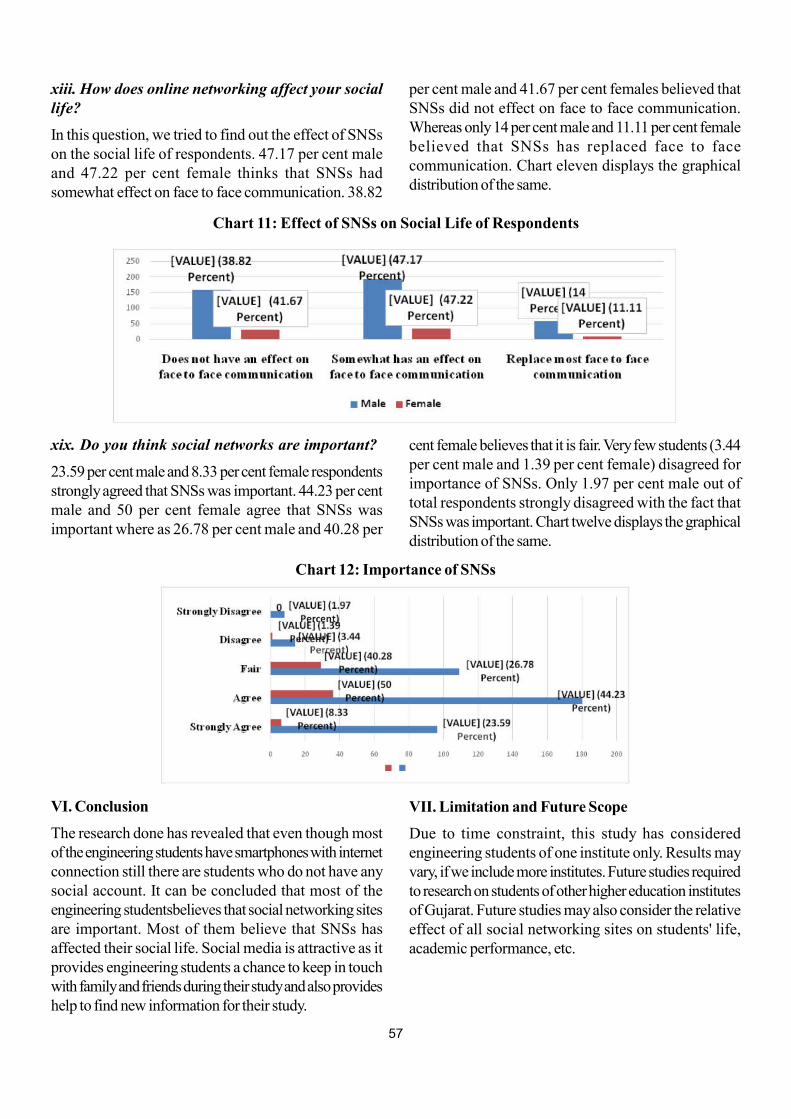
57
xiii. How does online networking affect your sociallife?
In this question, we tried to find out the effect of SNSson the social life of respondents. 47.17 per cent maleand 47.22 per cent female thinks that SNSs hadsomewhat effect on face to face communication. 38.82
per cent male and 41.67 per cent females believed thatSNSs did not effect on face to face communication.Whereas only 14 per cent male and 11.11 per cent femalebelieved that SNSs has replaced face to facecommunication. Chart eleven displays the graphicaldistribution of the same.
xix. Do you think social networks are important?
23.59 per cent male and 8.33 per cent female respondentsstrongly agreed that SNSs was important. 44.23 per centmale and 50 per cent female agree that SNSs wasimportant where as 26.78 per cent male and 40.28 per
Chart 11: Effect of SNSs on Social Life of Respondents
cent female believes that it is fair. Very few students (3.44per cent male and 1.39 per cent female) disagreed forimportance of SNSs. Only 1.97 per cent male out oftotal respondents strongly disagreed with the fact thatSNSs was important. Chart twelve displays the graphicaldistribution of the same.
VI. Conclusion
The research done has revealed that even though mostof the engineering students have smartphones with internetconnection still there are students who do not have anysocial account. It can be concluded that most of theengineering studentsbelieves that social networking sitesare important. Most of them believe that SNSs hasaffected their social life. Social media is attractive as itprovides engineering students a chance to keep in touchwith family and friends during their study and also provideshelp to find new information for their study.
Chart 12: Importance of SNSs
VII. Limitation and Future Scope
Due to time constraint, this study has consideredengineering students of one institute only. Results mayvary, if we include more institutes. Future studies requiredto research on students of other higher education institutesof Gujarat. Future studies may also consider the relativeeffect of all social networking sites on students' life,academic performance, etc.
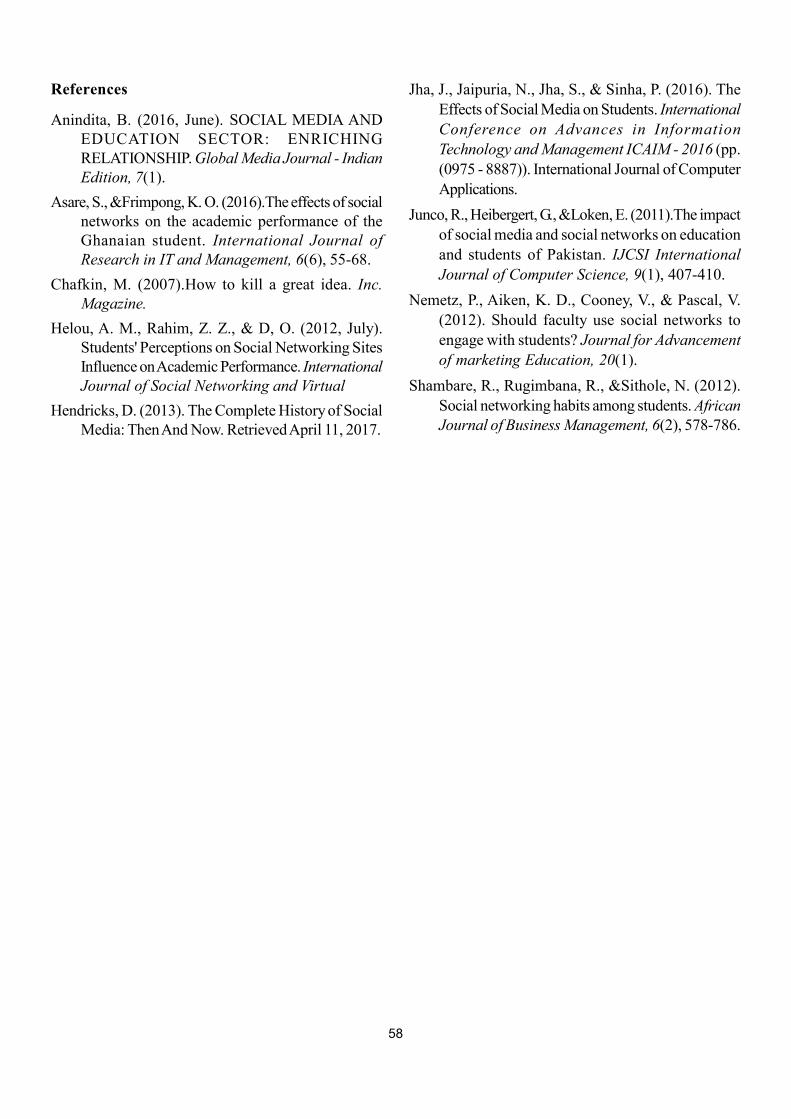
58
References
Anindita, B. (2016, June). SOCIAL MEDIA ANDEDUCATION SECTOR: ENRICHINGRELATIONSHIP. Global Media Journal - IndianEdition, 7(1).
Asare, S., &Frimpong, K. O. (2016).The effects of socialnetworks on the academic performance of theGhanaian student. International Journal ofResearch in IT and Management, 6(6), 55-68.
Chafkin, M. (2007).How to kill a great idea. Inc.Magazine.
Helou, A. M., Rahim, Z. Z., & D, O. (2012, July).Students' Perceptions on Social Networking SitesInfluence on Academic Performance. InternationalJournal of Social Networking and Virtual
Hendricks, D. (2013). The Complete History of SocialMedia: Then And Now. Retrieved April 11, 2017.
Jha, J., Jaipuria, N., Jha, S., & Sinha, P. (2016). TheEffects of Social Media on Students. InternationalConference on Advances in InformationTechnology and Management ICAIM - 2016 (pp.(0975 - 8887)). International Journal of ComputerApplications.
Junco, R., Heibergert, G., &Loken, E. (2011).The impactof social media and social networks on educationand students of Pakistan. IJCSI InternationalJournal of Computer Science, 9(1), 407-410.
Nemetz, P., Aiken, K. D., Cooney, V., & Pascal, V.(2012). Should faculty use social networks toengage with students? Journal for Advancementof marketing Education, 20(1).
Shambare, R., Rugimbana, R., &Sithole, N. (2012).Social networking habits among students. AfricanJournal of Business Management, 6(2), 578-786.
59
Introduction
Food is an important for life. Indian households spendtwo-third of what they earn on food. The Indian foodand grocery market is the world's sixth largest, with retailcontributing 70 per cent of the sales. India has a substantialfood-loving consumer base leading to a significant marketsize for F&B sales. Food and grocery retail constitute60-65 per cent of the total retail market in India - 15-20per cent of organised retail and about 70 per cent ofunorganised retail industry. (KPMG, 2015)
Fast food is convenience foods obtained in self-serviceor take-away eateries with minimal waiting and are usuallycharacterized as energy dense, low in micronutrients andfibre, high in simple sugars and salt, generally larger inportion size than conventional home cooked or restaurantfoods and highly palatable (Lewis. et al., 2005). Risingnumber of nuclear families, exposure to western cuisineand global media, growing number of working women -have had a substantial impact on the eating out trends
* Assistant Professor, ASPEE Agribusiness Management Institute, Navsari Agriculture University, Navsari** Professor, G.H. Patel P.G. Institute of Business Management, VallabhVidyanagar, Anand
Study on Perception Towards Fast Food Consumption
Gautam Parmar* and Raju M Rathod**
Abstract
Background: Food is basic need for life but now it has gone beyond fuelling bodies and satisfying taste buds. India'sfood market size which is at around Rs 23 trillion in 2014 is set to reach around Rs 42 trillion by 2020. India is in aphase of rapid economic and demographic transition. With increase in income, changing lifestyle, urbanization andchanges in the demographic profile, the transformation in the food consumption pattern also found in India. The fastfood considered as served ready to eat. Foods sold in a restaurant or store which are rapidly prepared and quicklyserved Indian foods like in a packaged form for take away. Increase in fast food players, marketing strategies,urbanization, nuclear families, woman working, long working hours, youth leads to increase in fast food consumption.
Purpose: The present study aims to understand the consumers' perception towards fast food consumption.
Research/Design/Methodology: The convenience sampling technique was used for the present study. To achieveobjectives, 120 respondents were surveyed. The exploratory factor analysis was also carried out to know the factorsaffecting perception towards fast food consumption.
Findings: Majority of respondents preferred to eat fast food anytime and from nearby place. The exploratory factoranalysis yielded four factors namely "Concern for Value", "Concern for Taste and Health", "Concern for Review &Reference" and "Concern Convenience" influencing fast food consumption.
Implications: The study will be helpful to fast food players in designing the marketing strategies.
Keywords: Fast Food, Health, Perception towards fast food.
Paper Type: Research Paper
and growth of the fast food industry. (M.Mondurailingam,2015). Fast food refers to food that can be served readyto eat. Foods sold in a restaurant or store which are rapidlyprepared and quickly served Indian foods like in apackaged form for take away (Kaushik, Narang, &Parakh, 2011). Fast foods are taking popularity bynuclear families because working parents have less timefor meal preparation by themselves (Das, 2015). Fastfood is the world's fastest growing food type and it isquick, reasonably priced and readily available alternativesto home cooked food. (Goyal and Singh, 2007). Fastfood is a food prepared and served quickly at a fast foodrestaurant or a shop. Fast foods are characterized asquick, easily accessible and cheap alternatives to home-cooked meals, according to the National Institutes ofHealth (NIH). Fast food is a mass-produced food that isprepared and served very quickly. The food is typicallyless nutritionally valuable compared to other foods anddishes. Perceived factors contributing to the growingpopularity of fast food includes urbanization, long working
60
hours, growing interest in exotic food, advertising,availability of commercial buildings and rise in income.(Horsu et.al, 2015)
Need of the study
The India is growing rapidly in various sectors that resultinto increase in income, changing lifestyle, urbanizationand changes in the demographic profile, the transformationin the food consumption pattern also found in India. Thefast food is the category of food which is rapidly acceptedby the Indians especially youth. The various national andmultinational companies are investing in food sector. Theperception and behaviour towards these developing areasis need of hour for the fast food market players, the presentstudy try to investigate the perception towards fast foodconsumption. The study will give valuable insights tomarket players in designing the marketing strategies.
Methodology
The present research aims to study the perception towardsfast food consumption. To achieve the objectivestructured questionnaire was used which containsdemographic details of respondents and researchquestions. The questionnaire was containing 14 statementsdesigned to investigate perception towards fast foodconsumption. The perception of respondents wasmeasure on a five-point Likert-type rating scale (stronglyagree to strongly disagree). The researcher have developthe scale by reviewing literature on fast food consumption.To assess for internal consistency, Cronbach's alphareliability coefficient was calculated for the 14 statements.A cronbach's Alpha value obtained was 0.711, whichindicating the response scale had a good and acceptableinternal consistency. The sampling frame are the fast foodconsuming respondents of Gujarat state. The samplingunit for the study is an individual consuming fast food.The convenience sampling method was employed for thepresent study. The online survey platform was used tocollect data for the present study, the questionnaire wasbuild up online and sent to the various respondents inGujarat state. Total 120 respondents' data were obtainedwith the help of online survey. The descriptive statisticsand exploratory factor analysis are used to analyze thecollected data.
Data Analysis
The table 1 depicts the demographic profile ofrespondents. Total 120 respondents were surveyed andout of that 69.2 percent were male where as 30.8 percent
were female. The average age of respondents were found22.72 years. The majority of respondents (63.3 percent)studied up to post graduate level where as 35 percentstudied up to graduation level. Majority of respondentswere students followed by service class. The 93.3 percentrespondents were unmarried.
The researchers have classified fast food into four broadcategories namely dry snacks including chocolate, fastfood meals, fried foods and soft drinks. The table 2 showsresponses (in percentage) for frequencies of consumptionof fast food. It is observed that in case of dry snacks 50percent respondents consume either every day or twicea week. The 33.40 percent respondents prefer to havefast food meal once in a week, while 26.70 percentrespondents prefer to have fast food meal twice in a week,in case of fried foods same scenario observed. The 29.20percent respondents prefer to have soft drink rarelyfollowed by 27.50 percent twice in a week.
The respondents were asked to give response onpreferred timing for fast food, the results are depicts intable 3. As shown in table 49.2 percent responses like toeat it at any time a day. In case of preferred place for fastfood eating the 54.2 percent respondents like to eat atnearby place followed by quick service restaurants.
Full-service restaurants and Quick Service Restaurants(QSRs) together account for a majority of 73 per cent ofIndia's food service industry. (KPMG, 2016). QuickService Restaurants (QSR) and casual dining are the twomost popular formats that form 45% and 32% of theoverall market respectively. The overall market for QSRis estimated to be around INR 92,000Croreand isestimated to grow at an annual rate of 16%, FICCI report,2015.
Reliability test Alpha
The respondents were asked to respond on 5 point Likertscale for 14 statements for the perception towards fastfood consumption. To check reliability of the scale, asshown in table no 4cronbach's Alpha was calculated andit was found 0.711 for 14 items. The reliability test Alphawas developed by Lee Cronbach in 1951 to provide ameasure of the internal consistency of a test or scale; it isexpressed as a number between 0 and 1. (Tavakol et al.2011). As a rule of thumb the value greater than 0.7 isgood and acceptable. For the present study Cronbach'sAlpha Based on Standardized Items obtained 0.711. Sothe data are reliable for further analysis.
61
Factor Analysis
Factor analysis attempts to identify underlying variables,or factors, that explain the pattern of correlations withina set of observed variables. Factor analysis is often usedin data reduction to identify a small number of factorsthat explain most of the variance observed in a muchlarger number of manifest variables. Factor analysis isone of the multivariate analytical techniques. Factoranalysis is a generic name denoting a class of proceduresprimarily used for data reduction and summarization. Thisfactor conveys all essential information about the originalvariables.
To do the factor analysis there are about 6 to 7 methodsavailable, out of which, two methods are generally used:(1) Principal Component Analysis, and (2) CommonFactor Analysis. An appropriate method is to be selectedfor the analysis. From these two methods, 'PrincipalComponent Analysis method' is selected to carry outFactor Analysis, as is usually done by different analysts.
Factor Analysis needs to appropriate for the data. Tocheck that two tests have been conducted. (1) Bartlett'stest of sphericity and (2) Kaiser-Meyer-Olkin (KMO)measures of sampling adequacy. Bartlett's test of sphericityis used to test the null hypothesis that variables areuncorrelated in the population. The second is an index toexamine the appropriateness of factor analysis. Generally,the values of 'KMO measure of sampling adequacy', fallsin-between 0.5 to 1.0, which indicate factor analysis isappropriate. Values below 0.5 indicate inappropriatenessof the analysis. The value of Kaiser-Meyer-OlkinMeasure of Sampling Adequacy test is accepted greaterthan 0.6. (Malhotra,2007) For the present study theKaiser-Meyer-Olkin Measure of Sampling Adequacyvalue obtained is 0.674. (Table 5)
Factor analysis was carried out on all the responses to14 attributes for fast food perception using 'PrincipalComponents Analysis' method. The results showed theapproximate Chi-Square value of 247.017at 91 degreeof freedom under the Bartlett's Test of Sphericity, whichis significant at the 0.05 levels. The null hypothesis (thatthe variables are uncorrelated in the population, or thecorrelation matrix is an identity matrix) is, therefore,rejected. The alternate hypothesis that the variables inthe population are correlated is accepted. The Kaiser-Meyer-Olkin Measure of Sampling Adequacy was0.674, which is sufficiently large. Thus, factor analysismay be considered appropriate for analyzing the data.
Further analysis, therefore was carried out. In the finalresults (as shown in table 6), total four factors out of 14have eigen values more than 1.00. As per the approachbased on Eigen values, only factors with eigen valuesgreater than 1.00 are to be retained. Hence, total fourfactors are to be considered in this data. The results alsoshow that these four factors account for 51.528percentof the total variance.
An important output from factor analysis is the factormatrix, also called the factor pattern matrix. The factormatrix contains the coefficients used to express thestandardized variables in terms of the factors. Thesecoefficients, factor loadings, represent the correlationbetween the factors and the variables. A coefficient witha large absolute variable indicates that the factor and thevariable are closely related. Hence, to facilitateinterpretation of factors, it is necessary to identify thevariables that have large loadings on the same factor. Itwas decided to consider factor loading of 0.350 as a cutoff point for a statement to be associated with a factor.When 'factor matrix' of the above four factors was referredto, and a cut off value of loading of 0.3 was considered;four attributes were associated with factor '1', fiveattributes with factor 2 , three attributes with factor 3 andtwo attributes with factor 4.
Although, the initial or un-rotated factor matrix indicatesthe relationship between the factors and individualvariables, it seldom results in factors that can beinterpreted; because the factors are correlated with manyvariables. The factor matrix, therefore, is transformed intoa simpler one through rotation. It is easier to interpret thisrotated factor matrix. Again, many methods are availablefor rotation. Most commonly used method for rotation isthe 'varimax' procedure. Other three popular methodsare 'direct oblimin' and 'quartimax' and 'Promax'. Here'varimax' used to get the factor matrix and factor loadings.(Table 7)
Factor Number 1:
The first factor can be named as concern for value due tohigh loading factors to the statements associated to thebenefits and convenience which explained 14.369% oftotal variance having factor loading for the statements areranging from 0.741 to 0.532.
These statements are extracted from the Questionnaireand reproduced below:
A. Fast food are value for money
62
B. Fast food are cheaper food source
C. Fast food is today's trend
D. Fast food suits to me
The four attributes stated above reflect "concern for value"for perception towards fast food consumption.
Factor Number 2:
The second factor can be named as Concern for Tasteand Health due to high loading factors to the statementsassociated to the benefits and convenience whichexplained 13.734% of total variance having factor loadingfor the statements are ranging from 0.713 to 0.342.
These statements are extracted from the Questionnaireand reproduced below:
E. Fast food are delicious
F. Fast food gives me good feeling
G. My friends prefer to have Fast foods
H. Fast food have adverse impact on health
I. Fast food saves the time
The four attributes stated above reflect "Concern for Tasteand Health" for perception towards fast foodconsumption.
Factor Number 3:
The third factor can be named as Concern for Review &Reference due to high loading factors to the statementsassociated to the benefits and convenience whichexplained 12.339% of total variance having factor loadingfor the statements are ranging from 0.784 to 0.493.
These statements are extracted from the Questionnaireand reproduced below:
J. Fast food always found at my home
K. I usually choose fast food by TV ads.
L. I usually choose fast food by neighbours.
The three attributes stated above reflect "Concern forReview & Reference" for perception towards fast foodconsumption.
Factor Number 4 :
The fourth factor can be named as Concern Conveniencedue to high loading factors to the statements associatedto the benefits and convenience which explained11.085% of total variance having factor loading for thestatements are ranging from 0.779 to 0.739.
These statements are extracted from the Questionnaireand reproduced below:
M. Fast foods are easily available
N. Fast foods help when I have short time.
The two attributes stated above reflect "ConcernConvenience" for perception towards fast foodconsumption.
Result and Discussion
The factor analysis yielded four factors which explain51.528 % of total variance. This depicts in the table 8.The results of study in line with the findings of (Horsuet.al, 2015) "consumers, who currently patronize fast food,do so for the reasons that they perceive them to beconvenient, time saving, delicious, good for a change andfun as well as preference of the environment" and also inline with findings of (Aloia et.al, 2013) "that participantfrom both low-income and high-income neighbourhoodsvisited fast food restaurants for the same reasons asconvenience, price, social enjoyment and quality meals".The study also supports findings of (Ismail, 2016) "themain reason for fast food consumption among universitygirls in study was found to be convenience" and also thefindings of (Onurluba? & Yilmaz, 2013) "the Fast foodconsumption reasons are "Product-Quality-Pricerelation", "Correctitude of Location", Product andService", and "Scarcity of Time". The finding of (Bipasha& Goon, 2014) "the important factors for the preferenceof fast food include good taste, easy accessibility,increased convenience, and pocket friendly in nature",also support the findings of present study. The finding ofthe study also in line with findings of (Narayan & Prabhu,2015) "Time, taste, cleanliness, hygiene and money arethe main factors which have influenced students to optfor having fast food items. Quick services and a convenientlocation are also amongst the reasons for the preferencefor fast food amongst the students".
Conclusion and Implication
The fast food is becoming popular nowadays. The presentstudy was carried out to understand consumers'perception toward fast food consumption. To achievethis objectives the exploratory factor analysis was carriedout on primary data which ultimately help to explore fourdimensions of consumers' perception towards fast foodnamely "Concern for Value", "Concern for Taste andHealth", "Concern for Review & Reference" and"Concern Convenience" influencing fast food consumption.
63
The study also found that consumes would like toconsumer fast food in their daily diet. The outcomes ofthe study help the market players to formulate rightmarketing strategy pertaining to targeting and positioningof their products. The study may also help to design thepromotional strategies based on the factors found.
Future Research
The future research can be carried out on consumerbehaviour towards fast food consumption. The study canalso be done on college students especially staying inhostel. Impact of socio-demographic profile on fast foodconsumption can also be studied to understand the insightsof behaviour towards fast food consumption.
References
1. Aloia, C. R., Gasevic, D., Yusuf, S., Teo, K.,Chockalingam, A., Patro, B. K., Lear, S. A. (2013).Differences in perceptions and fast food eatingbehaviours between Indians living in high- and low-income neighbourhoods of Chandigarh, India.Nutrition Journal, 12(1). doi:10.1186/1475-2891-12-4
2. Bipasha, M. S., & Goon, S. (2014). Fast foodpreferences and food habits among students ofprivate universities in Bangladesh. South East AsiaJournal of Public Health, 3(1):61-64. doi:10.3329/seajph.v3i1.17713
3. Das, J. C. (2015). Fast Food Consumption inChildren: A Review. Medical & Clinical Reviews ,Vol. 1 No. 1: 1 pp.1-4.
4. FICCI, G. T. (2015). Unlocking the potential in thefood and beverage services sector. New Delhi: GrantThornton India LLP,.
5. Goyal, A., & Singh, N. (2007). Consumerperception about fast food in India: An exploratorystudy. British Food Journal, 109(2), 182-195.doi:10.1108/00070700710725536
6. Horsu E N, Y. S. (2015). Consumer Perception andPreference of Fast Food: A Study of Tertiary
Students in Ghana. Science Journal of Business andManagement , Vol 3(1): pp. 43-49. doi: 10.11648/j.sjbm.20150301.13
7. Ismail, I. (2016). Trend of Fast Food Consumption
among University Girls in Karachi, Pakistan.
International Journal Of Endorsing Health Science
Research (Ijehsr), 4(1), 32-38. doi:10.29052/
ijehsr.v4.i1.2016.32-38
8. Kaushik, J. S., Narang, M., & Parakh, A. (2011).
Fast food consumption in children. Indian Pediatrics,
48(2), 97-101. doi:10.1007/s13312-011-0035-8
9. KPMG. (2016). India's food service industry:
Growth recipe. KPMG.
10. Lewis, L. B., Sloane, D. C., Nascimento, L. M.,
Diamant, A. L., Guinyard, J. J., Yancey, A. K., &
Flynn, G. (2005). African Americans' Access to
Healthy Food Options in South Los Angeles
Restaurants. American Journal of Public Health,
95(4), 668-673. doi:10.2105/ajph.2004.050260
11. Mohsen Tavakol, R. D. (2011). Making sense of
Cronbach's alpha. International Journal of Medical
Education. , 2 pp. 53-55.
12. Mondurailingam. M, J. V. (2015). Comparative
Study On Customer Satisfaction Towards KFC and
Mcdonalds, Chennai. ZENITH International Journal
of Multidisciplinary Research , Vol.5 (6),pp-50-62.
13. Narayan, B., & Prabhu, M. (2015). Examining f
ast - food consumption behaviour of students in
Manipal University, India. African Journal of
Hospitality, Tourism and Leisure, 4(2), 1-10.
14. Onurluba, E., & Yilmaz, N. (2013). Fast food
consumption habits of university students. Journal
of Food Agriculture and Environment, 11(3), 12-
14.
https://www.livestrong.com/article/49366-definition-fast-
foods/ - retrieved on 12 October, 2017
https://en.wikipedia.org/wiki/Fast_food - retrieved on 12
October, 2017
//economictimes.indiatimes.com/articleshow/
45890613.cms?utm_source=contentofinterest
&utm_medium=text&utm_campaign=cppst -
retrieved on 12 October, 2017
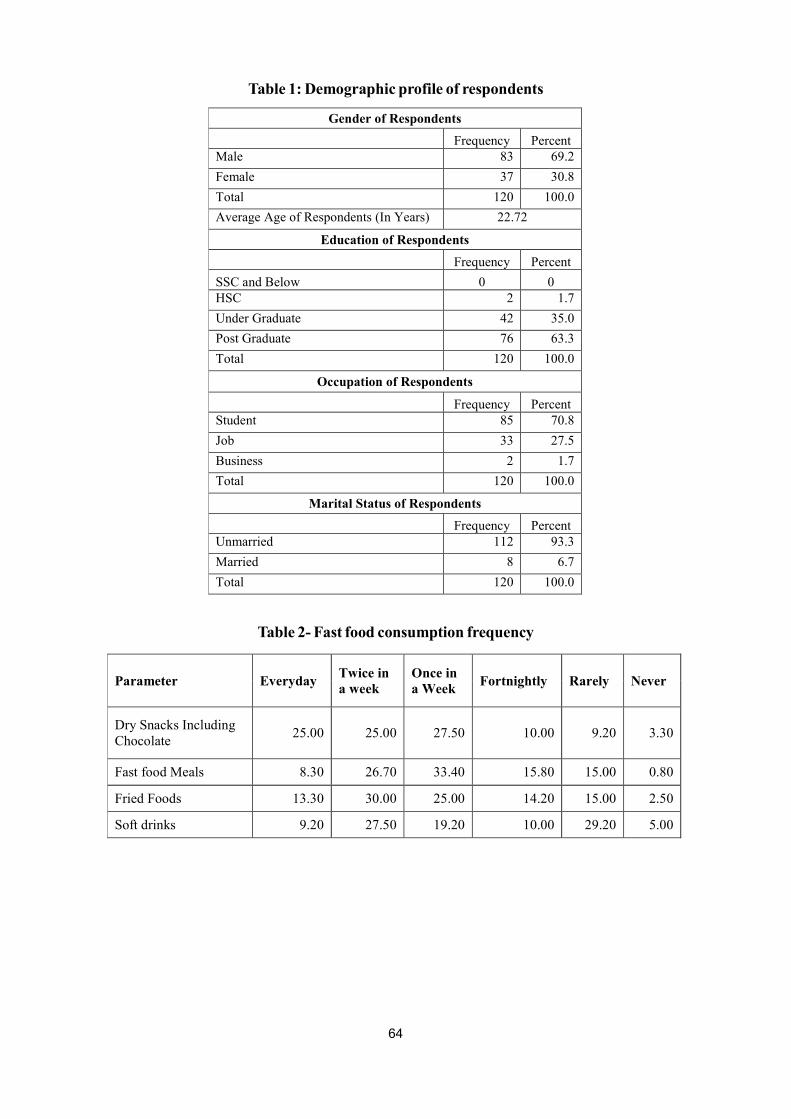
64
Table 1: Demographic profile of respondents
Gender of Respondents
Frequency Percent Male 83 69.2
Female 37 30.8
Total 120 100.0
Average Age of Respondents (In Years) 22.72
Education of Respondents
Frequency Percent
SSC and Below 0 0 HSC 2 1.7
Under Graduate 42 35.0
Post Graduate 76 63.3
Total 120 100.0
Occupation of Respondents
Frequency Percent Student 85 70.8
Job 33 27.5
Business 2 1.7
Total 120 100.0
Marital Status of Respondents
Frequency Percent Unmarried 112 93.3
Married 8 6.7
Total 120 100.0
Table 2- Fast food consumption frequency
Parameter Everyday Twice in a week
Once in a Week
Fortnightly Rarely Never
Dry Snacks Including Chocolate
25.00 25.00 27.50 10.00 9.20 3.30
Fast food Meals 8.30 26.70 33.40 15.80 15.00 0.80
Fried Foods 13.30 30.00 25.00 14.20 15.00 2.50
Soft drinks 9.20 27.50 19.20 10.00 29.20 5.00
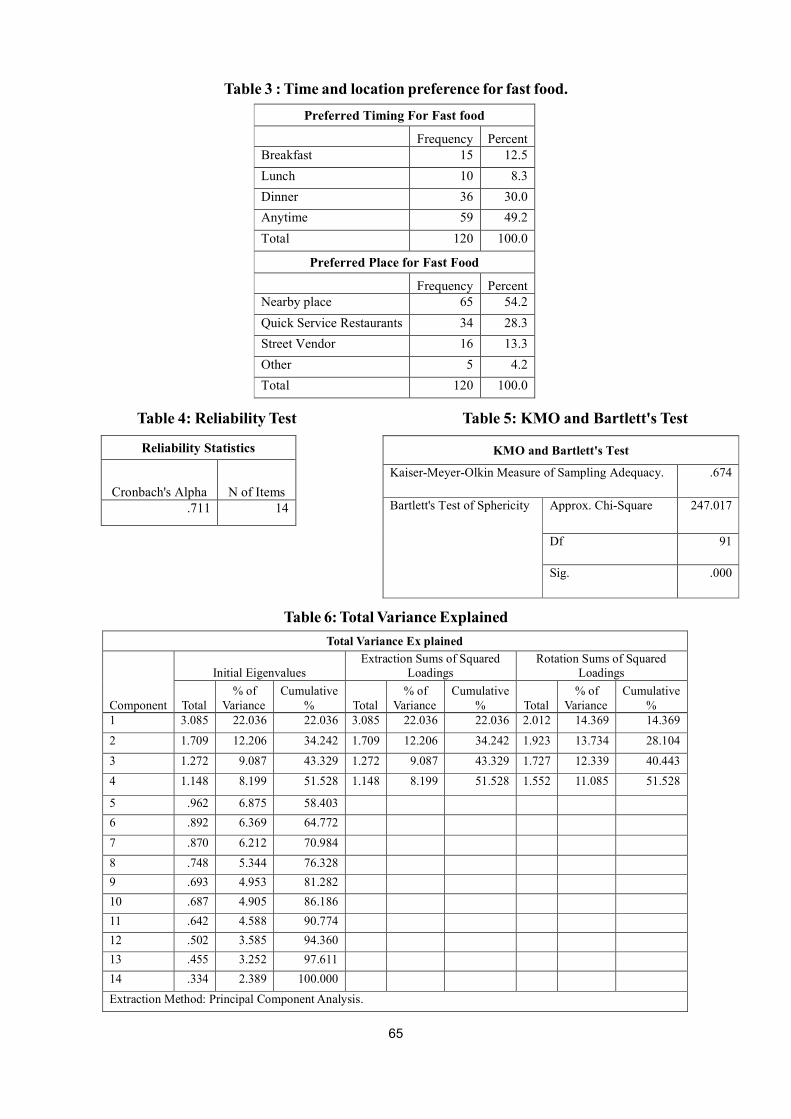
65
Table 3 : Time and location preference for fast food.
Preferred Timing For Fast food
Frequency Percent Breakfast 15 12.5
Lunch 10 8.3
Dinner 36 30.0
Anytime 59 49.2
Total 120 100.0
Preferred Place for Fast Food
Frequency Percent Nearby place 65 54.2
Quick Service Restaurants 34 28.3
Street Vendor 16 13.3
Other 5 4.2
Total 120 100.0
Table 4: Reliability Test
Reliability Statistics
Cronbach's Alpha N of Items .711 14
Table 5: KMO and Bartlett's Test
KMO and Bartlett's Test
Kaiser-Meyer-Olkin Measure of Sampling Adequacy. .674
Bartlett's Test of Sphericity Approx. Chi-Square 247.017
Df 91
Sig. .000
Table 6: Total Variance Explained
Total Variance Ex plained
Component
Initial Eigenvalues Extraction Sums of Squared
Loadings Rotation Sums of Squared
Loadings
Total % of
Variance Cumulative
% Total % of
Variance Cumulative
% Total % of
Variance Cumulative
% 1 3.085 22.036 22.036 3.085 22.036 22.036 2.012 14.369 14.369
2 1.709 12.206 34.242 1.709 12.206 34.242 1.923 13.734 28.104
3 1.272 9.087 43.329 1.272 9.087 43.329 1.727 12.339 40.443
4 1.148 8.199 51.528 1.148 8.199 51.528 1.552 11.085 51.528
5 .962 6.875 58.403
6 .892 6.369 64.772
7 .870 6.212 70.984
8 .748 5.344 76.328
9 .693 4.953 81.282
10 .687 4.905 86.186
11 .642 4.588 90.774
12 .502 3.585 94.360
13 .455 3.252 97.611
14 .334 2.389 100.000
Extraction Method: Principal Component Analysis.
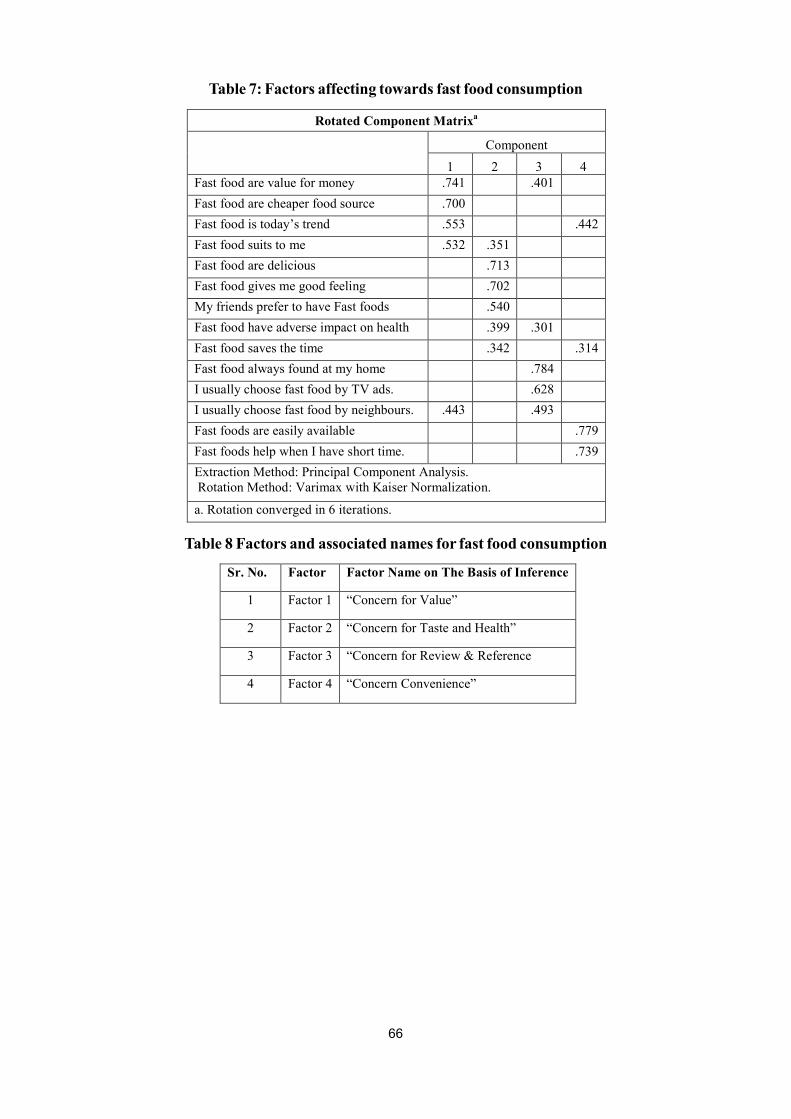
66
Table 7: Factors affecting towards fast food consumption
Rotated Component Matrixa
Component
1 2 3 4 Fast food are value for money .741 .401
Fast food are cheaper food source .700
Fast food is today’s trend .553 .442
Fast food suits to me .532 .351
Fast food are delicious .713
Fast food gives me good feeling .702
My friends prefer to have Fast foods .540
Fast food have adverse impact on health .399 .301
Fast food saves the time .342 .314
Fast food always found at my home .784
I usually choose fast food by TV ads. .628
I usually choose fast food by neighbours. .443 .493
Fast foods are easily available .779
Fast foods help when I have short time. .739
Extraction Method: Principal Component Analysis. Rotation Method: Varimax with Kaiser Normalization.
a. Rotation converged in 6 iterations.
Table 8 Factors and associated names for fast food consumption
Sr. No. Factor Factor Name on The Basis of Inference
1 Factor 1 “Concern for Value”
2 Factor 2 “Concern for Taste and Health”
3 Factor 3 “Concern for Review & Reference
4 Factor 4 “Concern Convenience”
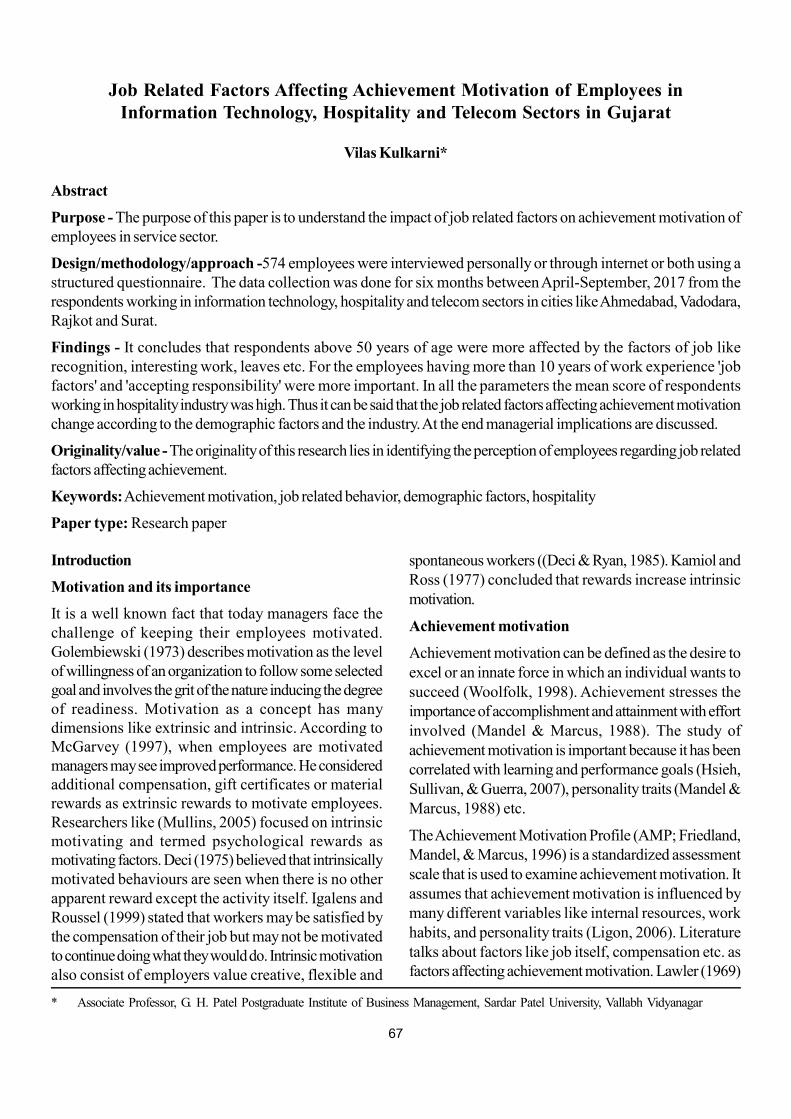
67
Introduction
Motivation and its importance
It is a well known fact that today managers face thechallenge of keeping their employees motivated.Golembiewski (1973) describes motivation as the levelof willingness of an organization to follow some selectedgoal and involves the grit of the nature inducing the degreeof readiness. Motivation as a concept has manydimensions like extrinsic and intrinsic. According toMcGarvey (1997), when employees are motivatedmanagers may see improved performance. He consideredadditional compensation, gift certificates or materialrewards as extrinsic rewards to motivate employees.Researchers like (Mullins, 2005) focused on intrinsicmotivating and termed psychological rewards asmotivating factors. Deci (1975) believed that intrinsicallymotivated behaviours are seen when there is no otherapparent reward except the activity itself. Igalens andRoussel (1999) stated that workers may be satisfied bythe compensation of their job but may not be motivatedto continue doing what they would do. Intrinsic motivationalso consist of employers value creative, flexible and
* Associate Professor, G. H. Patel Postgraduate Institute of Business Management, Sardar Patel University, Vallabh Vidyanagar
Job Related Factors Affecting Achievement Motivation of Employees inInformation Technology, Hospitality and Telecom Sectors in Gujarat
Vilas Kulkarni*
Abstract
Purpose - The purpose of this paper is to understand the impact of job related factors on achievement motivation ofemployees in service sector.
Design/methodology/approach -574 employees were interviewed personally or through internet or both using astructured questionnaire. The data collection was done for six months between April-September, 2017 from therespondents working in information technology, hospitality and telecom sectors in cities like Ahmedabad, Vadodara,Rajkot and Surat.
Findings - It concludes that respondents above 50 years of age were more affected by the factors of job likerecognition, interesting work, leaves etc. For the employees having more than 10 years of work experience 'jobfactors' and 'accepting responsibility' were more important. In all the parameters the mean score of respondentsworking in hospitality industry was high. Thus it can be said that the job related factors affecting achievement motivationchange according to the demographic factors and the industry. At the end managerial implications are discussed.
Originality/value - The originality of this research lies in identifying the perception of employees regarding job relatedfactors affecting achievement.
Keywords: Achievement motivation, job related behavior, demographic factors, hospitality
Paper type: Research paper
spontaneous workers ((Deci & Ryan, 1985). Kamiol andRoss (1977) concluded that rewards increase intrinsicmotivation.
Achievement motivation
Achievement motivation can be defined as the desire toexcel or an innate force in which an individual wants tosucceed (Woolfolk, 1998). Achievement stresses theimportance of accomplishment and attainment with effortinvolved (Mandel & Marcus, 1988). The study ofachievement motivation is important because it has beencorrelated with learning and performance goals (Hsieh,Sullivan, & Guerra, 2007), personality traits (Mandel &Marcus, 1988) etc.
The Achievement Motivation Profile (AMP; Friedland,Mandel, & Marcus, 1996) is a standardized assessmentscale that is used to examine achievement motivation. Itassumes that achievement motivation is influenced bymany different variables like internal resources, workhabits, and personality traits (Ligon, 2006). Literaturetalks about factors like job itself, compensation etc. asfactors affecting achievement motivation. Lawler (1969)
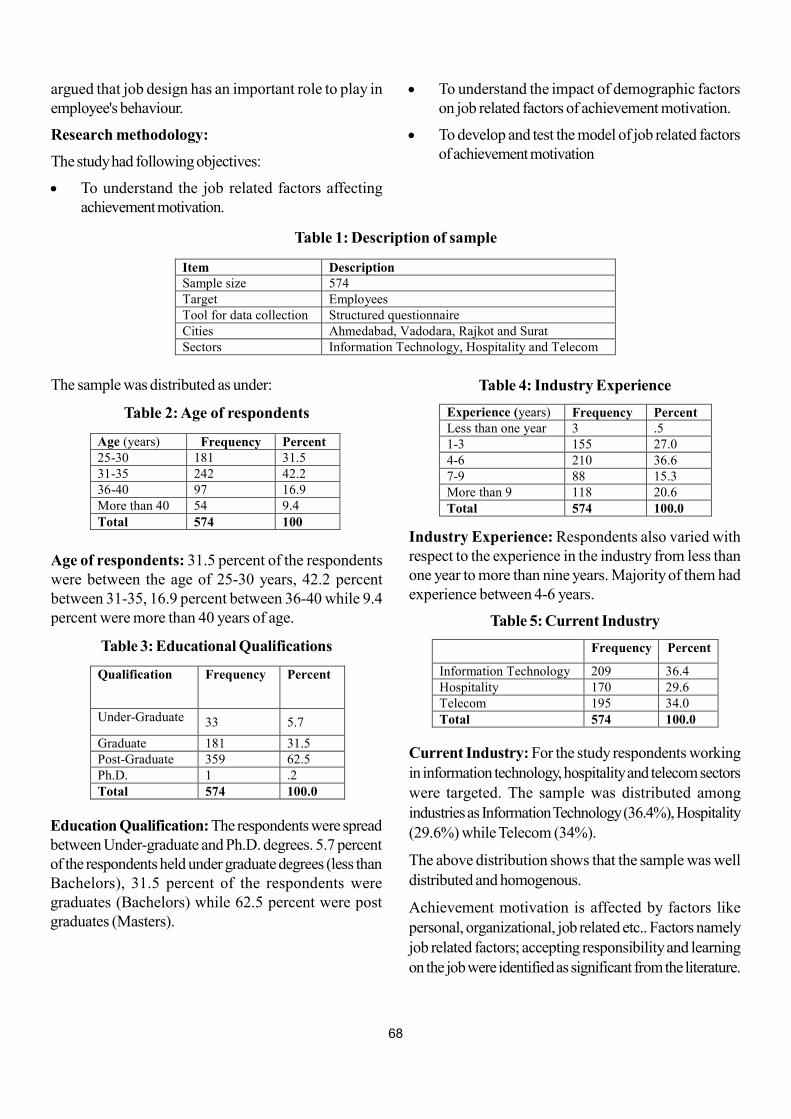
68
argued that job design has an important role to play inemployee's behaviour.
Research methodology:
The study had following objectives:
To understand the job related factors affectingachievement motivation.
Table 1: Description of sample
To understand the impact of demographic factorson job related factors of achievement motivation.
To develop and test the model of job related factorsof achievement motivation
The sample was distributed as under:
Item Description Sample size 574 Target Employees Tool for data collection Structured questionnaire Cities Ahmedabad, Vadodara, Rajkot and Surat Sectors Information Technology, Hospitality and Telecom
Age of respondents: 31.5 percent of the respondentswere between the age of 25-30 years, 42.2 percentbetween 31-35, 16.9 percent between 36-40 while 9.4percent were more than 40 years of age.
Table 2: Age of respondents
Age (years) Frequency Percent 25-30 181 31.5 31-35 242 42.2 36-40 97 16.9 More than 40 54 9.4 Total 574 100
Education Qualification: The respondents were spreadbetween Under-graduate and Ph.D. degrees. 5.7 percentof the respondents held under graduate degrees (less thanBachelors), 31.5 percent of the respondents weregraduates (Bachelors) while 62.5 percent were postgraduates (Masters).
Table 3: Educational Qualifications
Qualification Frequency Percent
Under-Graduate 33 5.7
Graduate 181 31.5 Post-Graduate 359 62.5 Ph.D. 1 .2 Total 574 100.0
Industry Experience: Respondents also varied withrespect to the experience in the industry from less thanone year to more than nine years. Majority of them hadexperience between 4-6 years.
Table 4: Industry Experience
Experience (years) Frequency Percent Less than one year 3 .5 1-3 155 27.0 4-6 210 36.6 7-9 88 15.3 More than 9 118 20.6 Total 574 100.0
Current Industry: For the study respondents workingin information technology, hospitality and telecom sectorswere targeted. The sample was distributed amongindustries as Information Technology (36.4%), Hospitality(29.6%) while Telecom (34%).
The above distribution shows that the sample was welldistributed and homogenous.
Achievement motivation is affected by factors likepersonal, organizational, job related etc.. Factors namelyjob related factors; accepting responsibility and learningon the job were identified as significant from the literature.
Table 5: Current Industry
Frequency Percent
Information Technology 209 36.4 Hospitality 170 29.6 Telecom 195 34.0 Total 574 100.0
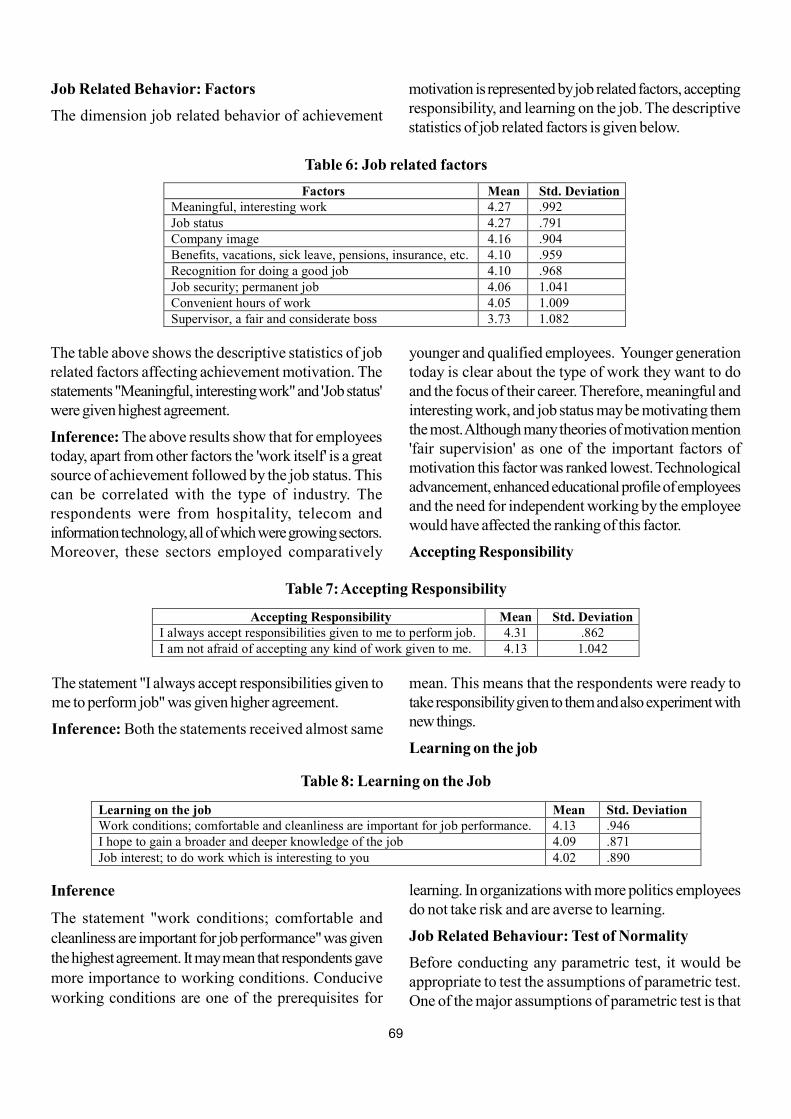
69
Job Related Behavior: Factors
The dimension job related behavior of achievement
motivation is represented by job related factors, acceptingresponsibility, and learning on the job. The descriptivestatistics of job related factors is given below.
The table above shows the descriptive statistics of jobrelated factors affecting achievement motivation. Thestatements "Meaningful, interesting work" and 'Job status'were given highest agreement.
Inference: The above results show that for employeestoday, apart from other factors the 'work itself' is a greatsource of achievement followed by the job status. Thiscan be correlated with the type of industry. Therespondents were from hospitality, telecom andinformation technology, all of which were growing sectors.Moreover, these sectors employed comparatively
Table 6: Job related factors
Factors Mean Std. Deviation Meaningful, interesting work 4.27 .992 Job status 4.27 .791 Company image 4.16 .904 Benefits, vacations, sick leave, pensions, insurance, etc. 4.10 .959 Recognition for doing a good job 4.10 .968 Job security; permanent job 4.06 1.041 Convenient hours of work 4.05 1.009 Supervisor, a fair and considerate boss 3.73 1.082
younger and qualified employees. Younger generationtoday is clear about the type of work they want to doand the focus of their career. Therefore, meaningful andinteresting work, and job status may be motivating themthe most. Although many theories of motivation mention'fair supervision' as one of the important factors ofmotivation this factor was ranked lowest. Technologicaladvancement, enhanced educational profile of employeesand the need for independent working by the employeewould have affected the ranking of this factor.
Accepting Responsibility
The statement "I always accept responsibilities given tome to perform job" was given higher agreement.
Inference: Both the statements received almost same
Table 7: Accepting Responsibility
Accepting Responsibility Mean Std. Deviation I always accept responsibilities given to me to perform job. 4.31 .862 I am not afraid of accepting any kind of work given to me. 4.13 1.042
mean. This means that the respondents were ready totake responsibility given to them and also experiment withnew things.
Learning on the job
Inference
The statement "work conditions; comfortable andcleanliness are important for job performance" was giventhe highest agreement. It may mean that respondents gavemore importance to working conditions. Conduciveworking conditions are one of the prerequisites for
Table 8: Learning on the Job
Learning on the job Mean Std. Deviation Work conditions; comfortable and cleanliness are important for job performance. 4.13 .946 I hope to gain a broader and deeper knowledge of the job 4.09 .871 Job interest; to do work which is interesting to you 4.02 .890
learning. In organizations with more politics employeesdo not take risk and are averse to learning.
Job Related Behaviour: Test of Normality
Before conducting any parametric test, it would beappropriate to test the assumptions of parametric test.One of the major assumptions of parametric test is that
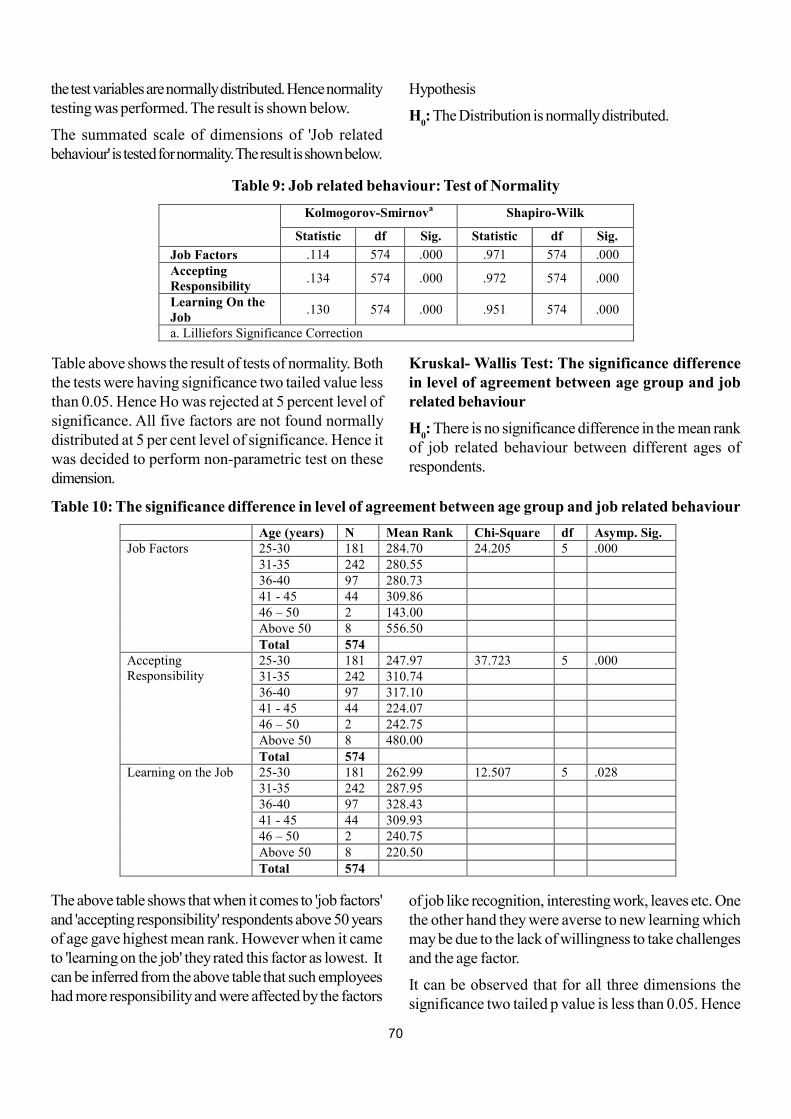
70
the test variables are normally distributed. Hence normalitytesting was performed. The result is shown below.
The summated scale of dimensions of 'Job relatedbehaviour' is tested for normality. The result is shown below.
Hypothesis
H0: The Distribution is normally distributed.
Table above shows the result of tests of normality. Boththe tests were having significance two tailed value lessthan 0.05. Hence Ho was rejected at 5 percent level ofsignificance. All five factors are not found normallydistributed at 5 per cent level of significance. Hence itwas decided to perform non-parametric test on thesedimension.
Table 9: Job related behaviour: Test of Normality
Kolmogorov-Smirnova Shapiro-Wilk
Statistic df Sig. Statistic df Sig.
Job Factors .114 574 .000 .971 574 .000 Accepting Responsibility
.134 574 .000 .972 574 .000
Learning On the Job
.130 574 .000 .951 574 .000
a. Lilliefors Significance Correction
Kruskal- Wallis Test: The significance differencein level of agreement between age group and jobrelated behaviour
H0: There is no significance difference in the mean rank
of job related behaviour between different ages ofrespondents.
The above table shows that when it comes to 'job factors'and 'accepting responsibility' respondents above 50 yearsof age gave highest mean rank. However when it cameto 'learning on the job' they rated this factor as lowest. Itcan be inferred from the above table that such employeeshad more responsibility and were affected by the factors
Table 10: The significance difference in level of agreement between age group and job related behaviour
Age (years) N Mean Rank Chi-Square df Asymp. Sig. Job Factors 25-30 181 284.70 24.205 5 .000
31-35 242 280.55 36-40 97 280.73 41 - 45 44 309.86 46 – 50 2 143.00 Above 50 8 556.50 Total 574
Accepting Responsibility
25-30 181 247.97 37.723 5 .000 31-35 242 310.74 36-40 97 317.10 41 - 45 44 224.07 46 – 50 2 242.75 Above 50 8 480.00 Total 574
Learning on the Job 25-30 181 262.99 12.507 5 .028 31-35 242 287.95 36-40 97 328.43 41 - 45 44 309.93 46 – 50 2 240.75 Above 50 8 220.50 Total 574
of job like recognition, interesting work, leaves etc. Onethe other hand they were averse to new learning whichmay be due to the lack of willingness to take challengesand the age factor.
It can be observed that for all three dimensions thesignificance two tailed p value is less than 0.05. Hence
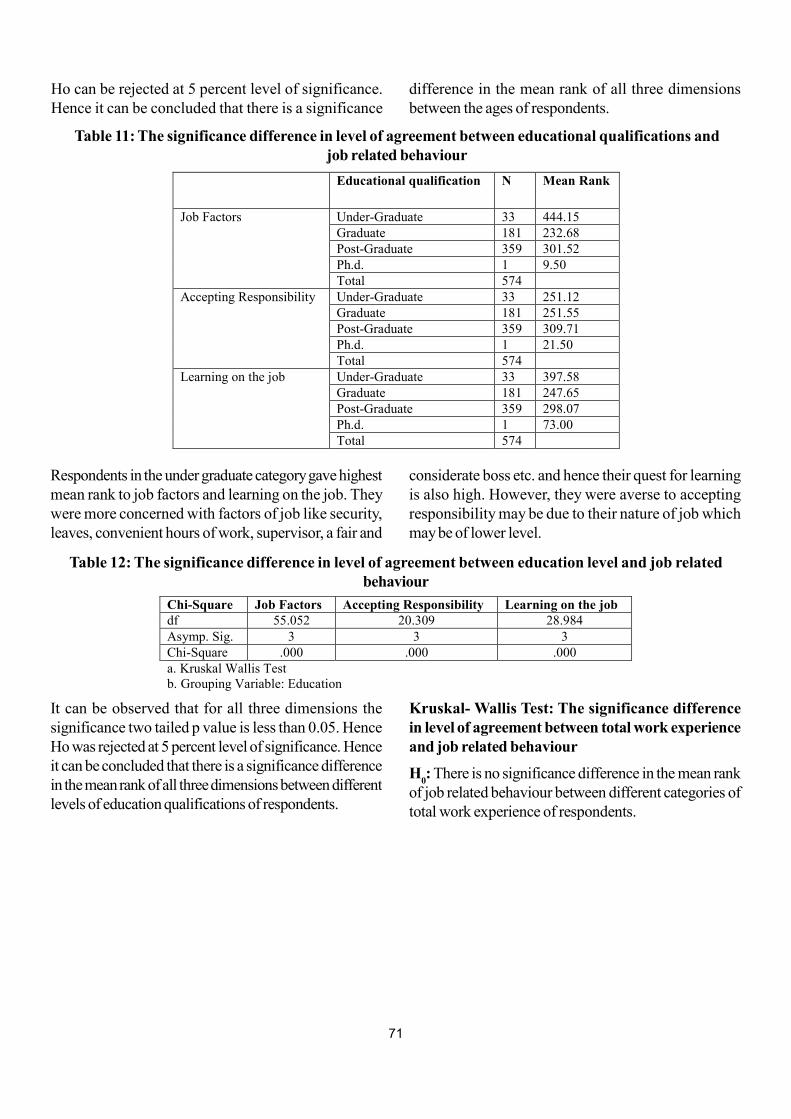
71
Ho can be rejected at 5 percent level of significance.Hence it can be concluded that there is a significance
difference in the mean rank of all three dimensionsbetween the ages of respondents.
Respondents in the under graduate category gave highestmean rank to job factors and learning on the job. Theywere more concerned with factors of job like security,leaves, convenient hours of work, supervisor, a fair and
Table 11: The significance difference in level of agreement between educational qualifications andjob related behaviour
Educational qualification N Mean Rank
Job Factors Under-Graduate 33 444.15 Graduate 181 232.68 Post-Graduate 359 301.52 Ph.d. 1 9.50 Total 574
Accepting Responsibility Under-Graduate 33 251.12 Graduate 181 251.55 Post-Graduate 359 309.71 Ph.d. 1 21.50 Total 574
Learning on the job Under-Graduate 33 397.58 Graduate 181 247.65 Post-Graduate 359 298.07 Ph.d. 1 73.00 Total 574
considerate boss etc. and hence their quest for learningis also high. However, they were averse to acceptingresponsibility may be due to their nature of job whichmay be of lower level.
Table 12: The significance difference in level of agreement between education level and job relatedbehaviour
Chi-Square Job Factors Accepting Responsibility Learning on the job df 55.052 20.309 28.984 Asymp. Sig. 3 3 3 Chi-Square .000 .000 .000 a. Kruskal Wallis Test b. Grouping Variable: Education
It can be observed that for all three dimensions thesignificance two tailed p value is less than 0.05. HenceHo was rejected at 5 percent level of significance. Henceit can be concluded that there is a significance differencein the mean rank of all three dimensions between differentlevels of education qualifications of respondents.
Kruskal- Wallis Test: The significance differencein level of agreement between total work experienceand job related behaviour
H0: There is no significance difference in the mean rank
of job related behaviour between different categories oftotal work experience of respondents.
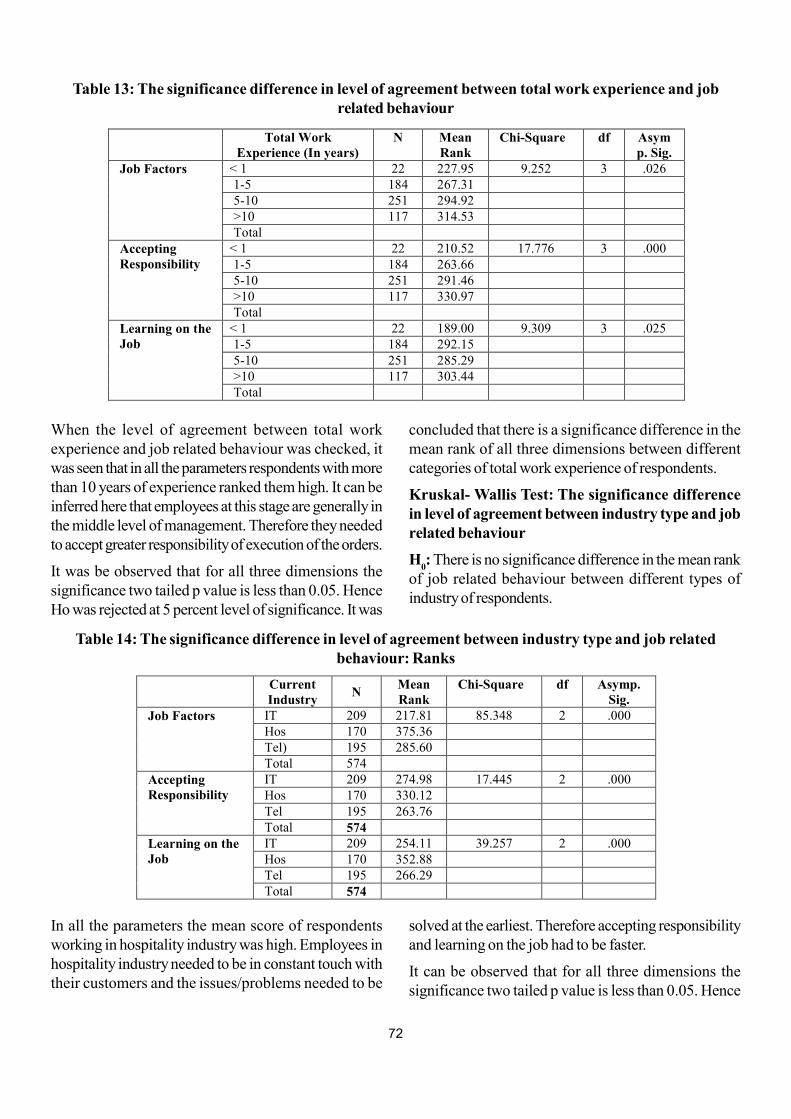
72
Table 13: The significance difference in level of agreement between total work experience and jobrelated behaviour
Total Work Experience (In years)
N Mean Rank
Chi-Square df Asymp. Sig.
Job Factors < 1 22 227.95 9.252 3 .026 1-5 184 267.31 5-10 251 294.92 >10 117 314.53 Total
Accepting Responsibility
< 1 22 210.52 17.776 3 .000 1-5 184 263.66 5-10 251 291.46 >10 117 330.97 Total
Learning on the Job
< 1 22 189.00 9.309 3 .025 1-5 184 292.15 5-10 251 285.29 >10 117 303.44 Total
When the level of agreement between total workexperience and job related behaviour was checked, itwas seen that in all the parameters respondents with morethan 10 years of experience ranked them high. It can beinferred here that employees at this stage are generally inthe middle level of management. Therefore they neededto accept greater responsibility of execution of the orders.
It was be observed that for all three dimensions thesignificance two tailed p value is less than 0.05. HenceHo was rejected at 5 percent level of significance. It was
concluded that there is a significance difference in themean rank of all three dimensions between differentcategories of total work experience of respondents.
Kruskal- Wallis Test: The significance differencein level of agreement between industry type and jobrelated behaviour
H0: There is no significance difference in the mean rank
of job related behaviour between different types ofindustry of respondents.
In all the parameters the mean score of respondentsworking in hospitality industry was high. Employees inhospitality industry needed to be in constant touch withtheir customers and the issues/problems needed to be
Table 14: The significance difference in level of agreement between industry type and job relatedbehaviour: Ranks
Current Industry
N Mean Rank
Chi-Square df Asymp. Sig.
Job Factors IT 209 217.81 85.348 2 .000 Hos 170 375.36 Tel) 195 285.60 Total 574
Accepting Responsibility
IT 209 274.98 17.445 2 .000 Hos 170 330.12 Tel 195 263.76 Total 574
Learning on the Job
IT 209 254.11 39.257 2 .000 Hos 170 352.88 Tel 195 266.29 Total 574
solved at the earliest. Therefore accepting responsibilityand learning on the job had to be faster.
It can be observed that for all three dimensions thesignificance two tailed p value is less than 0.05. Hence
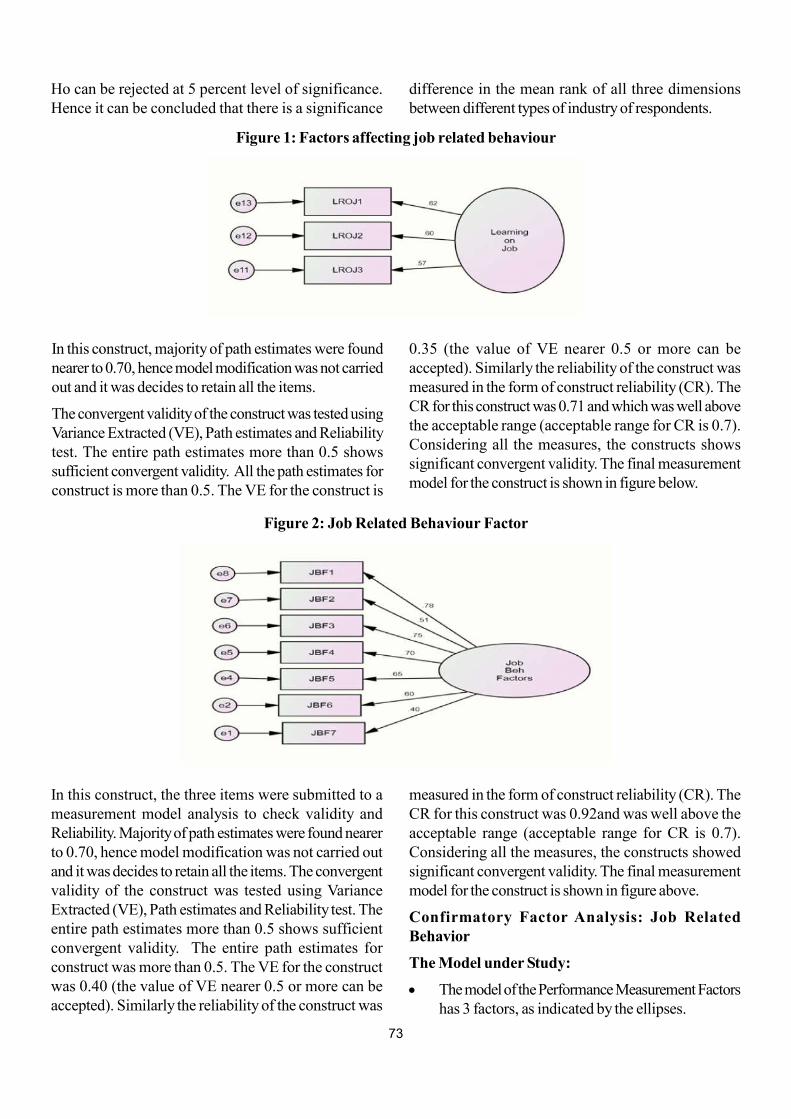
73
Ho can be rejected at 5 percent level of significance.Hence it can be concluded that there is a significance
difference in the mean rank of all three dimensionsbetween different types of industry of respondents.
Figure 1: Factors affecting job related behaviour
In this construct, majority of path estimates were foundnearer to 0.70, hence model modification was not carriedout and it was decides to retain all the items.
The convergent validity of the construct was tested usingVariance Extracted (VE), Path estimates and Reliabilitytest. The entire path estimates more than 0.5 showssufficient convergent validity. All the path estimates forconstruct is more than 0.5. The VE for the construct is
0.35 (the value of VE nearer 0.5 or more can beaccepted). Similarly the reliability of the construct wasmeasured in the form of construct reliability (CR). TheCR for this construct was 0.71 and which was well abovethe acceptable range (acceptable range for CR is 0.7).Considering all the measures, the constructs showssignificant convergent validity. The final measurementmodel for the construct is shown in figure below.
In this construct, the three items were submitted to ameasurement model analysis to check validity andReliability. Majority of path estimates were found nearerto 0.70, hence model modification was not carried outand it was decides to retain all the items. The convergentvalidity of the construct was tested using VarianceExtracted (VE), Path estimates and Reliability test. Theentire path estimates more than 0.5 shows sufficientconvergent validity. The entire path estimates forconstruct was more than 0.5. The VE for the constructwas 0.40 (the value of VE nearer 0.5 or more can beaccepted). Similarly the reliability of the construct was
Figure 2: Job Related Behaviour Factor
measured in the form of construct reliability (CR). TheCR for this construct was 0.92and was well above theacceptable range (acceptable range for CR is 0.7).Considering all the measures, the constructs showedsignificant convergent validity. The final measurementmodel for the construct is shown in figure above.
Confirmatory Factor Analysis: Job RelatedBehavior
The Model under Study:
The model of the Performance Measurement Factorshas 3 factors, as indicated by the ellipses.
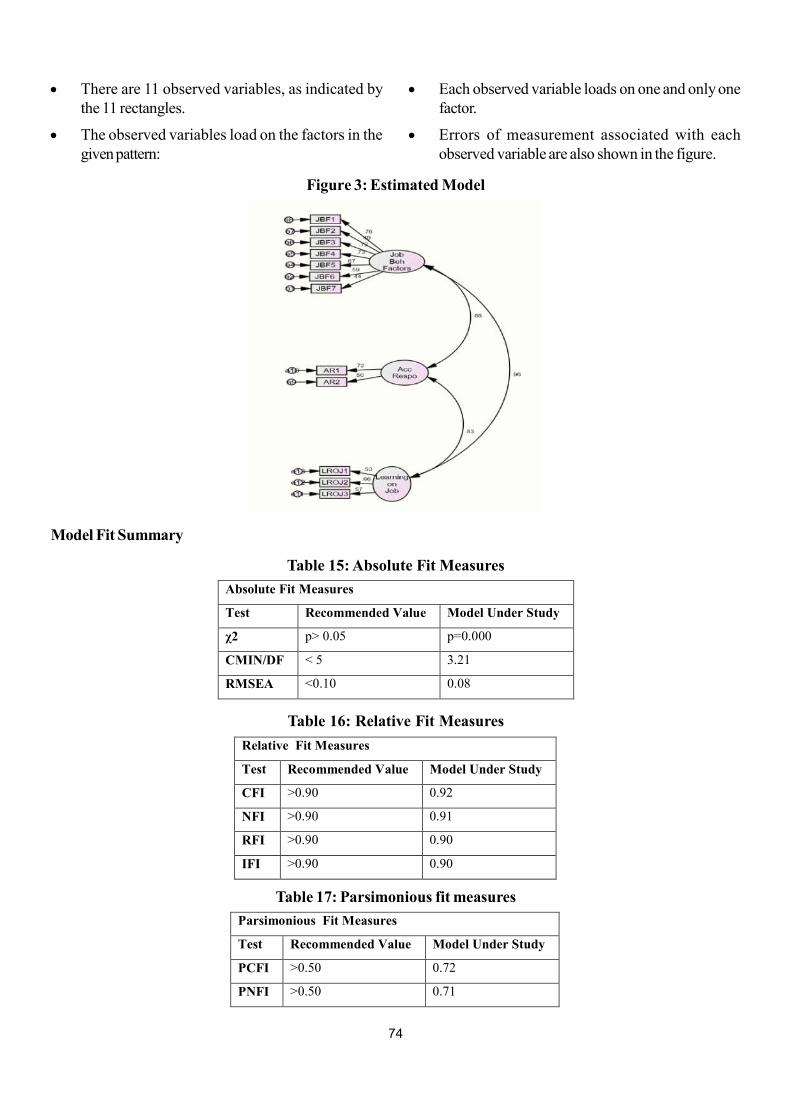
74
There are 11 observed variables, as indicated bythe 11 rectangles.
The observed variables load on the factors in thegiven pattern:
Each observed variable loads on one and only onefactor.
Errors of measurement associated with eachobserved variable are also shown in the figure.
Figure 3: Estimated Model
Model Fit Summary
Table 15: Absolute Fit Measures
Absolute Fit Measures
Test Recommended Value Model Under Study
χ2 p> 0.05 p=0.000
CMIN/DF < 5 3.21
RMSEA <0.10 0.08
Table 16: Relative Fit Measures
Relative Fit Measures
Test Recommended Value Model Under Study
CFI >0.90 0.92
NFI >0.90 0.91
RFI >0.90 0.90
IFI >0.90 0.90
Table 17: Parsimonious fit measures
Parsimonious Fit Measures
Test Recommended Value Model Under Study
PCFI >0.50 0.72
PNFI >0.50 0.71
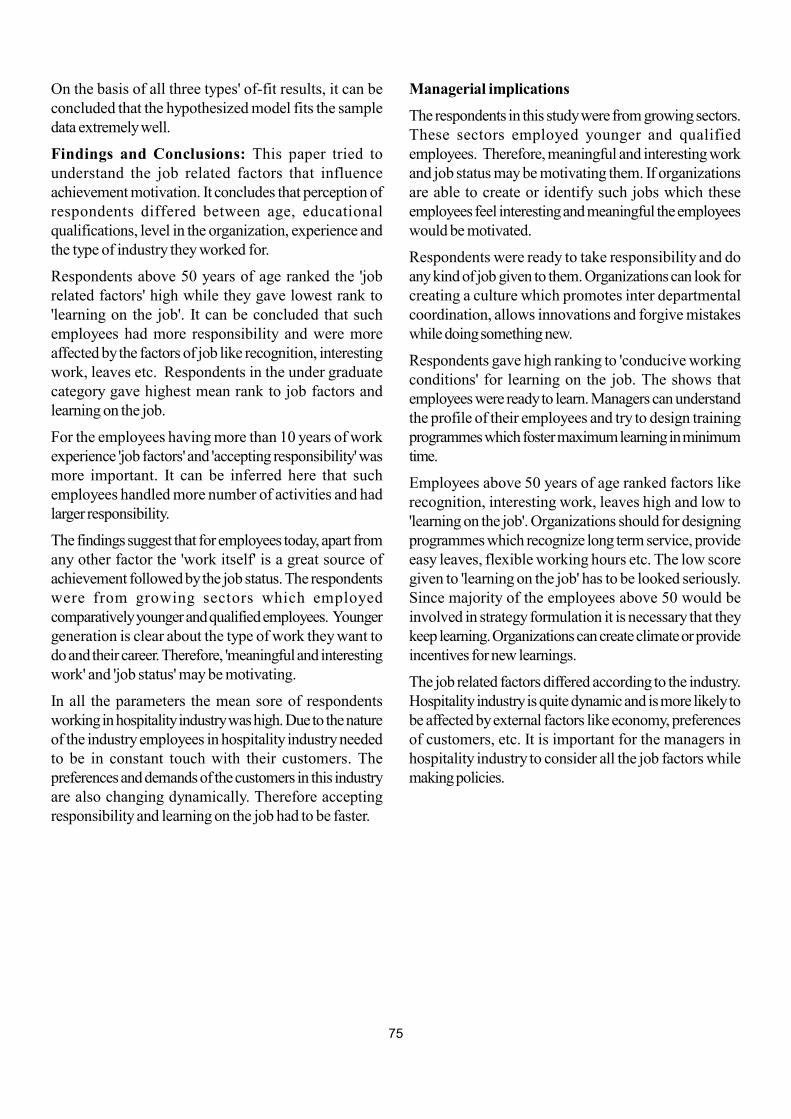
75
On the basis of all three types' of-fit results, it can beconcluded that the hypothesized model fits the sampledata extremely well.
Findings and Conclusions: This paper tried tounderstand the job related factors that influenceachievement motivation. It concludes that perception ofrespondents differed between age, educationalqualifications, level in the organization, experience andthe type of industry they worked for.
Respondents above 50 years of age ranked the 'jobrelated factors' high while they gave lowest rank to'learning on the job'. It can be concluded that suchemployees had more responsibility and were moreaffected by the factors of job like recognition, interestingwork, leaves etc. Respondents in the under graduatecategory gave highest mean rank to job factors andlearning on the job.
For the employees having more than 10 years of workexperience 'job factors' and 'accepting responsibility' wasmore important. It can be inferred here that suchemployees handled more number of activities and hadlarger responsibility.
The findings suggest that for employees today, apart fromany other factor the 'work itself' is a great source ofachievement followed by the job status. The respondentswere from growing sectors which employedcomparatively younger and qualified employees. Youngergeneration is clear about the type of work they want todo and their career. Therefore, 'meaningful and interestingwork' and 'job status' may be motivating.
In all the parameters the mean sore of respondentsworking in hospitality industry was high. Due to the natureof the industry employees in hospitality industry neededto be in constant touch with their customers. Thepreferences and demands of the customers in this industryare also changing dynamically. Therefore acceptingresponsibility and learning on the job had to be faster.
Managerial implications
The respondents in this study were from growing sectors.These sectors employed younger and qualifiedemployees. Therefore, meaningful and interesting workand job status may be motivating them. If organizationsare able to create or identify such jobs which theseemployees feel interesting and meaningful the employeeswould be motivated.
Respondents were ready to take responsibility and doany kind of job given to them. Organizations can look forcreating a culture which promotes inter departmentalcoordination, allows innovations and forgive mistakeswhile doing something new.
Respondents gave high ranking to 'conducive workingconditions' for learning on the job. The shows thatemployees were ready to learn. Managers can understandthe profile of their employees and try to design trainingprogrammes which foster maximum learning in minimumtime.
Employees above 50 years of age ranked factors likerecognition, interesting work, leaves high and low to'learning on the job'. Organizations should for designingprogrammes which recognize long term service, provideeasy leaves, flexible working hours etc. The low scoregiven to 'learning on the job' has to be looked seriously.Since majority of the employees above 50 would beinvolved in strategy formulation it is necessary that theykeep learning. Organizations can create climate or provideincentives for new learnings.
The job related factors differed according to the industry.Hospitality industry is quite dynamic and is more likely tobe affected by external factors like economy, preferencesof customers, etc. It is important for the managers inhospitality industry to consider all the job factors whilemaking policies.
76
Scale: Job Related Behavior
References
Chakraborty Subhayan (2016); India's Services Sectorgrew 10% a year in 2015-16: CII Report;
http://www.business-standard.com/article/economy-policy/india-s-services-sector-grew-10-a-year-in-2015-16-cii-report-116042001082_1.html(Accessed on 17.2.2017).
Deci, E. L. (1975). Intrinsic motivation. New York, NY,US.
Deci, E., & Ryan, R. M. (1985). Intrinsic motivation andself-determination in human behavior. SpringerScience & Business Media.
Golembiewski, R. T. (1973). Motivation. In Carl Heyel(Ed.), the Encyclopedia of Management 2nd. NewYork: Van Nostrand Reinhold.
Igalens, J., and Roussel, P. (1999). A study of theRelationships between Compensation Package,Work Motivation and Job Satisfaction. Journal ofOrganizational Behaviour, 20 (7), 1003-1025.
Lawler, E. E. (2003). Treat people right!: Howorganizations and individuals can propel each otherinto a virtuous spiral of success. San Francisco, CA:Jossey-Bass.
Ligon, N. Y. (2006). Assessing the achievementmotivation across grades and gender.
Dissertation Abstracts International Section A: Humanitiesand Social Sciences, 67(6-A), p.2052.
Mandel, H. P., & Marcus, S. I. (1988). The psychologyof underachievement: Differential diagnosis anddifferential treatment (Vol. 127). John Wiley & Sons.
Mandel, H. P., Friedland, J. G., & Marcus, S. I. (1996).Achievement Motivation Profile. Los Angeles:Western Psychological Services, Journal ofPsychoeducational Assessment , Vol 17, Issue 1,pp. 90 - 94.
Mcgarvey, R. (1997). Inspiration points: unmotivatedemployees could cost you your business.Entrepreneur Magazine.
Mullins LJ (2005). Management and OrganizationalBehavior. Prentice hall. UK 7th Ed. 88(431):1052-1058.
Hsieh, P., Sullivan, J. R., & Guerra, N. S. (2007). Acloser look at college students: Self-efficacy and goalorientation. Journal of Advanced Academics, 18(3),454-476.
Woolfolk, A. E. (1998). Educational Psychology.Needham Heights, MA: Allyn & Bacon
No. Particular 1
(Strongly agree)
2 (Disagree)
3 (Neutral)
4 (Agree)
5 (Strongly
Agree)
Factors
1 Recognition for doing a good job –JBF1
2 Job security; permanent job –JBF2
3 Job status –JBF3
4 Meaningful, interesting work –JBF4
5 Bene?ts, vacations, sick leave, pensions, insurance, etc. –JBF5
6 Convenient hours of work –JBF6
7 Company image –JBF7
8 Supervisor, a fair and considerate boss –JBF8
Accepting responsibility
9 I always accept responsibilities given to me to perform job. –AR1
10 I am not afraid of accepting any kind of work given to me. –AR2
Learning on the job
11 I hope to gain a broader and deeper knowledge of the job –LROJ1
12 Job interest; to do work which is interesting to you –LROJ2
13 Work conditions; comfortable and cleanliness are important for job performance. –LROJ3
77
Introduction
Online fashion is emerging as the fastest growing categoryin India's booming e-commerce market, backed by strongtechnology as well as marketing dexterity. It is growingat such a fast rate that experts believe by 2020, India isexpected to generate $100 billion online retail revenueout of which $35 billion will come from fashion e-commerce. In other words, online apparel sales are set
to grow four times in the next 5 years to contributesignificantly to the burgeoning e-commerce growth.
Experts believe, while apparel has always been one ofthe most popular segments in retail, there was muchscepticism about the growth of online clothing, as Indianshopaholics who love the touch, feel and fits of theirfavourite piece of garment, may dissuade from buying.However, miraculously Indian Online apparel sites havemanaged to break this barrier.
By 2018, India is set to witness 500 million internet userswhereas 280 million Smartphone users could be the keydrivers for e-commerce portals, as a recent ForesterConsumer Research observes that there will be 26-30percent increase in apparel, footwear, baby-care andskincare products in the coming months.
* Assistant Professor, Center for Management Studies, Dharmsinh Desai University, Nadiad
A Study of Customers' Perception toward Apparels in Online Shopping
Frince Thomas Chemmanoor*
Abstract
Purpose:To study on-line shopping experience from customers.
Design/methodology/approach:The paper is constructed on the basis of descriptive research.A sample size was 90respondents who filled the questionnaire.The sampling approach used was convenience sampling.
Findings:The study found that customers are attracted by discounts, good offers & low priced products. Customerspreferred CoD (cash on delivery) because they faced difficulties in on-line payment. As a result, some effectivemeasures need to take for improving payment related issues. Customers should be given with some additional discountfor making immediate on-line payment.
Research Limitation and Implication: The present study is restricted to population of Gujarat.The study is limitedto few shopping websites.
Originality and Value: A study is of primary and secondary approach. This study is confined only to online users.This study is conducted to analyse the current trends of online shopping in apparel segment. Further, it investigatesexperiences and preferences of the respondents in online shopping
Keywords/Paper type: Online shopping, Apparels and Customer Perception
Type of Paper: Research paper
A survey conducted by Baggout also revealed that clothesand footwear are the two most popular categories inFashion and apparel is one of the three most sold onlineproduct category today.
Digital marketing is yet another area these fashion sitesare investing in to lure customers. From retailing giantAmazon to domestic players such as Snapdeal, Jabongand Myntra, every player in this category is spendinggenerously on print and social media and other forms ofdigital marketing as part of their sales strategies.
Needless to say, with better brands, deals and discounts,price category and return policy, the future looks brightfor online clothing, especially, the rise in Indian womenshoppers coupled by the huge demand for trendy clotheswill continue to fuel this segment.
Online shopping is commonly known as internetshopping or e-shopping. Online shopping is donewhen the consumers purchase products on-line.Through online shopping, consumers shop forrequired products without physically visiting thestore. Nowadays, the consumers have becomemore shopping conscious and surf the internet on adaily basis and buy products even across the globe.Development in technology and an increase in the
78
usage of internet in recent times have led to a drastic,
increase in the practice of online shopping. The
greater the accessibility of internet to the general
population, higher is the number of people shopping
online.
At present, online shopping is becoming a well-
accepted way to purchase a wide range of products
and services. Internet shopping is becoming
extremely popular because online shoppers have an
option of shopping at any time of the day sitting at
their home or offices. Consumers buy products from
various apparel websites and depict a specific kind
of behaviour which is related to various demographic
factors, such as, age, gender, income group, marital
status, occupation, etc. It is believed that shopping
online is superior and more intelligent way of
spending money. It offers a huge collection of
products and allows consumers to get the products
as per their needs. Shopping online offers lower
prices as compared to the traditional shopping
method. Shopping websites provide various kinds
of discounts on the original price of the product. It
offers gift coupons, vouchers and promotional offers
which attracts the consumer to buy products in
discounted price.
There are many benefits of online shopping websites
which includes; description of the products,
information related to sizes and colour of the
garments, price of the products and various other
details like customer reviews and ratings. The
greatest feature of online shopping is that the websites
are open 24 hours a day and consumers are free to
shop at their convenience. Most of the items available
for online shopping are on huge discount and low
prices along with free shipping on the maximum
range of products. The online shopping websites and
number of consumers shopping online have increased
exponentially in the past few years. It is important
to study consumers' behaviour towards online
shopping as it clearly reflects their intentions. It helps
in developing better marketing strategies to convert
off-line buyers into online shoppers. It gives an idea
about the kind of products that a consumer is
interested in buying and the circumstances under
which they prefer buying online.
General Factorsthatinfluence online shoppingbehaviour:
Though there are several factors that influence consumersto shop online, some of these factors have been discussedbelow:
Convenience: Online shopping is very convenientwhen compared to offline shopping. Instead of goingout to a physical store away from the house andlooking for the Introduction required products,online shopping can be done just sitting at home.There are a variety of products available for aparticular category and the products can becompared from different brands before making thefinal buying decision. There is a convenience in termsof the payment methods as a variety of paymentoptions are available including cash on delivery, netbanking and online wallets etc. During festive seasonsthe stores are heavily crowded which makes it verydifficult to make the right choice. The consumerscan instead look for the products online without anyhassle.
Previous online experience: Previous onlineshopping experiences play a major role in theconsumer behaviour towards online shopping. Bothgood and bad experiences of shopping have aneffect on consumers' behaviour.
Pricing policy: Online retailers have an advantageof not having to pay for store bills, electricity andother physical resources which gives them anadvantage to place their products at a lower pricethan physical stores. Consumers generally preferlower prices for products with good quality and aresatisfied spending lesser amount for buying anyproduct. Hence, purchasing and sales of a productare equally affected by the price of product. Theconsumers are attracted towards online shoppingdue to lower prices offered by online stores ascompared to offline stores.
Online trust: Trust on an online website related toits products and services generally depends onconsumers' perception which therefore is directlyrelated to frequency in shopping online. More thetrust a consumer has on website better is thefrequency of Introduction shopping from thatwebsite. Consumer's trust on a website is amplifiedwhen the delivered product is the same or is betterthan as displayed on the website and vice versa.
79
Variety: The variety of products that a website offerto the consumers while online shopping is hard tomatch by offline stores. Offline shoppers usually haveto visit different stores for searching the productswhereas online shopping provides a wide varietyon a single website.
Discreet shopping: Shopping online is discreetand the products delivered are well packed to avoiduncomfortable scenarios. Female consumers do notfeel comfortable while purchasing some productslike lingerie from offline stores. Thus, online shoppinggives an option to purchase their items without feelingembarrassed or uncomfortable.
Special offers: There are various discountcoupons, special offers, coupon codes, free shippingand gift cards provided by online websites from timeto time which can help reduce the original cart valueof the products. These offers and deals encouragethe consumers to get a better deal and influencesthe consumer behaviour as the consumers are drawnto shop more on lower prices.
Website design/Features: The way a website isdisplayed affects the behaviour of consumer majorlyas the first impression of an online website is relatedto how the website looks. The theme of the websiteincluding layout and options available for navigationare included in website design. The easier it is tolocate information related to a product; more arechances that the consumers will buy from thatwebsite. Shergill & Chen (2005) stated that "Websitedesign, website reliability/fulfilment, websitecustomer service and website security/privacy arethe most attractive features that influence theperception of the consumer of online buying".
Payment options: Various types of paymentoptions are available for the consumers like cash ondelivery, net banking, online wallets, payment viaeasy equated monthly instalment (EMI), credit cardsand debit cards etc. Some of these features are notavailable with online stores, which give the customeranother advantage to get attracted towards onlineshopping.
Wish list: Online shopping websites provide theconsumers with an option of wish list in which theconsumers can save the products they like for later.Using this feature the consumer does not have to
look for the products they like again and again andcan easily navigate to the saved products with a singleclick.
Send gifts: Online shopping offers the alternativeof getting the product delivered at any place ordelivery address and gives the option to gift wrapthe product at a very less additional cost. Theconsumers can get the product gift wrapped anddelivered at a special occasion to a specific addresswithout any hassle. Also, changing the deliveryaddress for a particular order does not have anyadditional cost attached to it.
Comparison of prices: It is relatively easier forthe consumers to compare the prices from differentbrands and websites before making the final buyingdecision. The consumers do not have to visit differentphysical stores to check the range of productsavailable rather they can view the product and itsfeatures on the same website. They also have anoption to compare prices for the same product ondifferent websites and can buy the product theydesire at a better price.
Literature review
According to Lee, Jung, Park and Kun (2005), exploresthe dynamics of online service personalization in the onlineapparel retailing context, with regard to customers' actualonline shopping activities, this study empirically presentthe dynamics of online service personalization in thecontext of online apparel retailing. Also, the results showthat customer online shopping experiences may impacton their online service personalization attitudes. Jones,Christie and Kim (2009) stated that the study examinesthe influence of retail brand trust, off-line patronage,clothing involvement, and website quality on online apparelshopping intention for young female US consumers. Retailbrand trust, off-line patronage, clothing involvement andtwo factors of website quality were found to significantlyinfluence online apparel shopping intention. According toAgrawal, Sandhir, Gupta, and Gaurav (2010) underlinethat online shopping is most common these days in thedeveloped world especially in the USA. Though rapidlyrising, online shopping in the developing countriesparticularly in India is yet to become strong and diversified.The theme hasn't been researched strongly either. Authorsclaimed that men and women differ in fashion consciousshopping but, they do not differ in the impulsive, quality,brand or price aspects related to online shopping
80
(Workman and Cho, 2012). Openness to online shoppingwas noticed among students with more positive attributesby Xu and Paulins (2005).According to Goldsmith andFynn (2004) that adventurous buyer and regular cataloguebuyers were more inclined towards online apparelpurchase. Brand familiarity and previous experience withonline shopping was found to be an important factor forclothing purchase done online. The author states that theperceived attributes of online shopping consisted of fourfactors: transaction/cost, incentive, site design andinteractivity influenced shopping behavior greatly. Existingstudies point out that there are several factors influencingthe online purchase intention like trust, risk, and internetexperience, shopping orientation, online shoppingexperience, shopping motivation, cultural values and socialinfluence (Kim, 2004). According to Sarkar (2011), asuccessful online marketing must focus on increasing thehedonic value of the sites and offer stricter security to theindividuals using their card for payment. Customerpurchase intentions increased with web design, reliability/security, responsiveness and overall service quality of theonline portals. Shoppers feel greater risk for buyingapparel products online due to inability to fully examinethe product online and the substantial variation in thecharacteristics of apparel delivered.
Study Objective:
To study On-line shopping experience from Customers.
Methodology:
Marketing Researchis the process of collecting andanalyzing and ultimately arrives at certain conclusion.Research comprises of defining and redefining problems,formulating hypothesis, or suggesting solutions, collecting,organizing, and evaluating data, making deductions andreaching conclusions.
The main aim of the research is to find out the truth whichis hidden and which has not been discovered as yet.Market analysis has become an integral tool of businesspolicies these days. Research, thus replaces intuitivebusiness decisions by more logical and scientific decisions.
Research methodology is a way to systematically solvethe research problem. It may be understood as a scienceof studying how research is done scientifically. In it I studyvarious steps that are adopted by a researcher in studyingresearch problem along with the logic behind them. Theresearcher should not only know how to develop certainindices or tests, how to calculate chi-square etc.
Research Process:
Defining the problem and research objectives
Develop the research plan
Collect the information
Analyze the information
Present the findings
Make the decision
Research Design:
In fact, a major difference between exploratory anddescriptive research is that descriptive research ischaracterized by the prior formulation of specifichypotheses. The paper is constructed on the basis ofDescriptive research. Thus, the information needed isclearly defined. As a result, descriptive research ispreplanned and structured. It is typically based on largerepresentative samples. A formal research design specifiesthe methods for selecting the sources of information andfor collecting data from those sources. A descriptive designrequires a clear specification of the who, what, when,where, why and way (the six Ws) of the research.
Sample size:
A sample size was of 90 respondents.
Sampling approach:
The sampling approach used was convenience sampling.The questionnaire was constructed and filled through on-line and off-line. According to Patton (2003), "Strategicallyselect as case that is pertinent to the object of the studyand that will allow the subject to be investigated fully".Sampling strategies like information rich, convenience andcriterion are usually applied in the selection of case.
Data collection:
The data has collected in the form of Primary Source(structured Questionnaire) and from Secondary Sources.Secondary sources via through different websites,newspapers, magazines, journals.
Scope of the Study:
This study is confined only to online users. This study hasbeen conducted to analyze the current trends of onlineshopping in apparel segment. Further, it investigates
81
experiences and preferences of the respondents in onlineshopping.
Relationship between dependent variable andIndependent variables:
Dependent Variable:
Online Shopping Behaviour of Customers
Independent Variables:
Price
Brand
Offer/Discount
Colour/Style
Delivery
Return Policy
Payment Procedure
Trust
Analysis and Findings:
90% of the respondents rated that Price is veryimportant parameter in on-line shopping.
70% of the respondents rated the Delivery is veryimportant parameter in on-line shopping.
80% of the respondents rated the Return policy isvery important parameter in on-line shopping.
90% of the respondents rated the Payment procedureis very important parameter in on-line shopping.
100% of the respondents rated the Trust is veryimportant parameter in on-line shopping.
50% of the respondents rated the Discount/Offer isvery important parameter in on-line shopping.
80% of the respondents rated the Style/Color is veryimportant parameter in on-line shopping especiallyfor Clothes.
40% of the respondents rated the Brand is veryimportant parameter in on-line shopping.
Conclusions:
From the secondary data and in-depth study revealsthat there is good scope of selling apparels throughonline mode provided it comes with better serviceslike return policy.
The study found that customers are attracted bydiscounts, good offers and low priced products.
Customers preferred CoD (cash on delivery)because they have faced difficulties in on-linepayment. As a result, some effective measures needto take for improving payment related issues.Customers should give with some additional discountfor making immediate on-line payment.
Limitations of the study:
Following are some limitation of the study:
1. The present study is restricted to population of Gujarat.
2. The study is limited to few shopping websites.
References
Lee, E. J., & Park, J. K. (2009). Online servicepersonalization for apparel shopping. Journal ofRetailing and Consumer Services, 16(2), 83-91.
Jones, C., & Kim, S. (2010). Influences of retailbrand trust, off?line patronage, clothing involvementand website quality on online apparel shoppingintention. International Journal of Consumer Studies,34(6), 627-637.
Agrawal, Sandhir M, Gupta V and Gaurav (2017)."Emerging Profile of Online Apparel Shoppers inIndia", Journal of IJRCM, 7(04).
Workman, J. E., & Cho, S. (2012). Gender, fashionconsumer groups, and shopping orientation. Familyand Consumer Sciences Research Journal, 40(3),267-283.
Young Kim, E., & Kim, Y. K. (2004). Predictingonline purchase intentions for clothing products.European journal of Marketing, 38(7), 883-897.
Ling Z. Md. J. G. H (2012) "Factors influencingconsumer's attitudes towards e-commerce purchasethrough online shopping", International Journal ofHumanities and Social Science, 2 (4): 223.
Goldsmith, R. E., & Goldsmith, E. B. (2002). Buyingapparel over the Internet. Journal of Product &Brand Management, 11(2), 89-102.
Goldsmith, R. E., & Flynn, L. R. (2004).Psychological and behavioral drivers of onlineclothing purchase. Journal of Fashion Marketing andManagement: An International Journal, 8(1), 84-95.
Cowart, K. O., & Goldsmith, R. E. (2007). Theinfluence of consumer decision?making styles ononline apparel consumption by college students.
82
International Journal of Consumer Studies, 31(6),639-647.
C R Kothari (1996) "Research Methodology", NewDelhi, WishawaPrakaashan
Sarkar, A. (2011). Impact of utilitarian and hedonicshopping values on individual's perceived benefitsand risks in online shopping. Internationalmanagement review, 7(1), 58-65.
Aaker, D.A. (1996), Building Strong Brands, FreePress, New York.
Biplab S Bose (1998) Handbook of MarketingManagement, Himalaya publishing House
Carl, W. J. (2006). What's all the buzz about?Everyday communication and the relational basis ofword-of-mouth and buzz marketing practices.Management Communication Quarterly, 19(4),601-634.
David J Luck and Ronald S Rubin (1997) MarketingResearch, Prentice-Hall of India Private Limited,New Delhi.
Monippally MM and Pawar BS (2010) AcademicWriting, New Delhi, Sage Publication
Naresh K Malhotra (2004) Marketing ResearchAn Applied Orientation, New Delhi PearsonEducation.
Philip Kotler (2005) Marketing Management, NewDelhi, Pearson Education.
Porter, M. E., & Strategy, C. (1980). Techniquesfor analyzing industries and competitors. CompetitiveStrategy. New York: Free.
RajendraNargundkar and Tapan K Panda (2005)Marketing strategies for emerging markets, Excelbooks.
Scherf, K. (2006). Digital lifestyles: 2006 outlook.Dallas, Texas: Parks Associates.
Schiffman, L. G., &Kanuk, L. L. (2000). Consumerbehavior, 7th. NY: Prentice Hall, 15-36.
Sekaran U (2010) Research Methods for Business,New Delhi, Wiley India Edition.
Zeithaml, V., BERRY, L., PARASURAMAN, A.,PARASURAMAN, A., & BERRY, L. (1996).BITNER. MJ Services Marketing.
A Study on Changing Trends in OnlineShoppingofIndian...www.allresearchjournal.com/archives/2015/vol1issue9/PartD/1-9-4.pdf.Retrieved April 04, 2017.
http://www.magscholar.com/joomla/images/docs/ajbr/ajbrv1n2/Online%20Shopper%20Behavior%20Influences.pdf. Retrieved February 07, 2017
83
1. Introduction
The American Marketing Association defines a brand asfollows: " A brand is a name , term, sign, symbol, or design,or a combination of them, intended to identify the goodsor services of one seller or group of sellers and todifferentiate them from those of competitors." In essence,a brand identifies a seller or maker. A brand is essentiallya seller's promise to deliver a specific set of features,benefits and services consistently to the buyers. The bestconvey the warranty of quality. But a brand is even morecomplex symbol. It can convey up to six levels of meaningsuch as attributes, benefits, values, culture, personalityand user. A strong brand should have a rich, clear brandidentity-a set of association the brands strategist seeksto create or maintain. A brand identity is aspirational andmay imply that the image needs to be changed oraugmented."(Aaker, 2000).
2. Review of Literature
Dissanayake and Amarasuriya (2015) studied that BrandIdentity plays a very important role in developing brands.The authors studied that Apple I-phone and Samsung
* Faculty Member, The Maharaja Sayajirao University of Baroda
Brand Identity: An Important Element of Branding
Ruta Shringarpure*
Abstract
Purpose: Branding is a very important concept. Brand Identity has become a important element in the brand equity.The purpose of this research paper is that associating the product with a strong brand identity is a key factor incompetitive advantage and leads to a great financial rewards.
Design/ Methodology/ Approach:The research paper is totally based on literature review of secondary data fromvarious sources such as books, journals, magazines and newspapers in addition to visit various websites. The earlierresearchers study in the area of branding has led to the conceptualization of this research paper.
Findings: This research paper draws attention on brand, brand identity, influence and importance of brand identity inbranding. Aaker's brand identity model has been chosen to form the framework of this paper because it provides toolsand theories to guide the process of creating a comprehensive and versatile brand identity.
Originality/Value: The paper uses the literature of secondary data to illustrate the importance of a strong brandidentity which helps the audience differentiate you from the competitors and can positively influence their purchasingdecisions, directly impacting your profitability. A common buzzword heard throughout the industry today is branding.It is generally known that the decisional process regarding to choose or not to choose a brand is determined byanecdotal evidence. Having a great product without a strong identification is not enough. If a potential customer canrelate to previous experience with the identity of a brand, he surely developed a brand image and is more likely toprefer that specific brand.
Key Words: Brand, Brand Identity, Branding and Brand Equity.
Paper Type: Literature Review
Smart phones have created a global brands as an identityin the market. Brand Identity can be also created throughits unique design, features. Apple has created its own selfimage. Moreover, smart phones are doing the role ofcomputers. There is a need to create a branding strategiesregarding the products. Strong and favorite unique brandassociations has to be created in the market. Galaxy inSamsung phone has created a unique edge. It has raisedits value through brand personality.
Shabir (2014) had studied Brand Awareness in RuralArea: A case study of Fast Moving Goods in PulwanaDistrict of Jammu and Kashmir State. The purpose ofthe study was to examine the brand awareness in ruralareas and to study the interest of consumers in brandedproducts of fast moving consumer goods (FMCG). Theobjective of the study was to understand the buyingperception of the rural consumer towards FMCGProducts. For this, the objectives of the research workwere to study the perception of the rural consumertowards FMCG products. To examine the brandpreference and awareness of rural consumer towardsFMCG products and to study the impact of media on
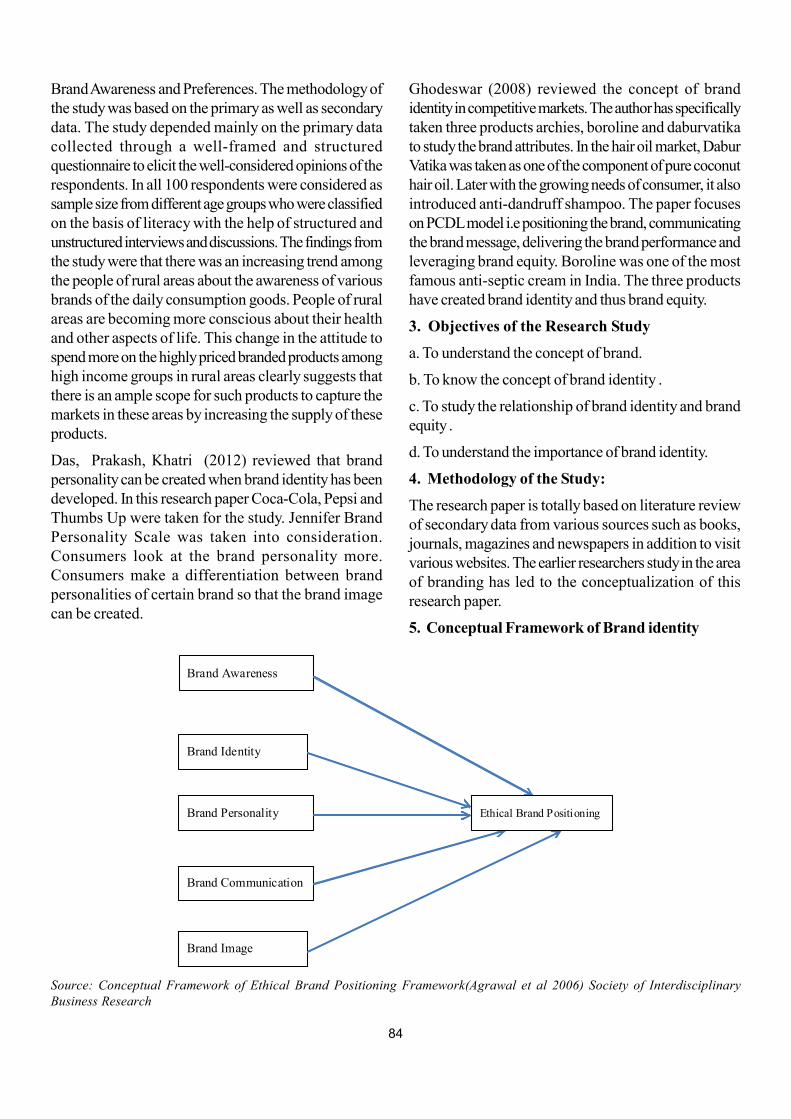
84
Brand Awareness and Preferences. The methodology ofthe study was based on the primary as well as secondarydata. The study depended mainly on the primary datacollected through a well-framed and structuredquestionnaire to elicit the well-considered opinions of therespondents. In all 100 respondents were considered assample size from different age groups who were classifiedon the basis of literacy with the help of structured andunstructured interviews and discussions. The findings fromthe study were that there was an increasing trend amongthe people of rural areas about the awareness of variousbrands of the daily consumption goods. People of ruralareas are becoming more conscious about their healthand other aspects of life. This change in the attitude tospend more on the highly priced branded products amonghigh income groups in rural areas clearly suggests thatthere is an ample scope for such products to capture themarkets in these areas by increasing the supply of theseproducts.
Das, Prakash, Khatri (2012) reviewed that brandpersonality can be created when brand identity has beendeveloped. In this research paper Coca-Cola, Pepsi andThumbs Up were taken for the study. Jennifer BrandPersonality Scale was taken into consideration.Consumers look at the brand personality more.Consumers make a differentiation between brandpersonalities of certain brand so that the brand imagecan be created.
Ghodeswar (2008) reviewed the concept of brandidentity in competitive markets. The author has specificallytaken three products archies, boroline and daburvatikato study the brand attributes. In the hair oil market, DaburVatika was taken as one of the component of pure coconuthair oil. Later with the growing needs of consumer, it alsointroduced anti-dandruff shampoo. The paper focuseson PCDL model i.e positioning the brand, communicatingthe brand message, delivering the brand performance andleveraging brand equity. Boroline was one of the mostfamous anti-septic cream in India. The three productshave created brand identity and thus brand equity.
3. Objectives of the Research Study
a. To understand the concept of brand.
b. To know the concept of brand identity .
c. To study the relationship of brand identity and brandequity .
d. To understand the importance of brand identity.
4. Methodology of the Study:
The research paper is totally based on literature reviewof secondary data from various sources such as books,journals, magazines and newspapers in addition to visitvarious websites. The earlier researchers study in the areaof branding has led to the conceptualization of thisresearch paper.
5. Conceptual Framework of Brand identity
Source: Conceptual Framework of Ethical Brand Positioning Framework(Agrawal et al 2006) Society of InterdisciplinaryBusiness Research
Brand Awareness
Brand Identity
Brand Personality
Brand Communication
Brand Image
Ethical Brand Positioning
85
Brand identity is often understood only as a set of colorsand shapes, but it is obvious that the term is much broader,because brand identity also makes the image of thecorporation and forms an image of the regular consumerof its production. Brand identity is closely connected withadvertising, because the designers advertise the brand,its logo and present a certain image of a lifestyle which issuitable for the consumer of the production made by thebrand. There are many types of brand identity, and aseverybody knows the process of the development ofbrand identity is very long. Years ago designers preferredcreating detailed colorful theme identities, which remindedsmall pictures, but today the preferences are completelydifferent, because everybody strives to minimalism in thedesign.
Brand identity is based on a thorough understanding ofthe firm's customers, competitors, and businessenvironment. The brand identity needs to reflect thebusiness strategy and the firm's willingness to invest inthe programs needed for the brand to live up to its promiseto customers (Aaker and Joachimsthaler, 2000). Strongbrands enjoy customer loyalty, the potential to chargepremium prices, and considerable brand power tosupport new product and service launches. Companiesneed to have thorough understanding of customer beliefs,behaviors, product or service attributes, and competitors.
Benefits of Brand Identity
1. Personality: A brand identity is the visualrepresentation of the values and "personality" of yourbrand. Identity design essentially sets the tone of yourbrand, and it can be used to evoke specific feelings inyour audience. Your brand identity should be designedto communicate your company's overall message andpromote your business goals.
2. Consistency: Developing a brand identity allows youto create a consistent message across all marketingmaterials. Each piece should have the same basic stylesand design elements, creating a cohesive brandingpackage.
3. Differentiation: A brand identity helps you todifferentiate your business from the competition andappropriately position your brand. Developing aprofessional, creative identity design can help you to standout to potential customers in your market.
4. Awareness: Creating a brand identity package ensuresthat your brand is at the forefront of all your marketing
materials, which helps to increase brand awareness. Themore places your brand is featured, the more contact itwill make with consumers, and the more memorable itwill be.
5. Loyalty: An effective brand identity can help to buildcustomer loyalty and trust in a brand, since it allowscustomers to make a connection between a product andthe company.
7. Conclusion
Developing a strong brand identity for your business isan extremely important factor in its success. Effectivebranding can help build your reputation, make you standout from your competition and project your values toattract your ideal client. Your brand is your businessidentity-the image you wish to portray to the world-andis one of your company's most valuable assests. Yourbrand communicates your business personality and shapesyour client's perceptions of who you are. Your brandshould project the expectations and promises you extendto your customer's in terms of quality service, reliabilityand trustworthiness and create trust and loyalty from thosewho do business with you.
A strong brand identity helps the audience differentiateyou from your competitors and can positively influencetheir purchasing decisions, directly impacting yourprofitability.
References
Dissanayake, D. R., &Amarasuriya, T. (2015). Roleof brand identity in developing global brands: Aliterature based review on case comparison betweenApple iPhone vs Samsung smartphone brands.
Majeed, S. (2014). Brand Awareness in Rural Area:A Case Study of Fast Moving Consumer Goods inPulwama District of J&K State. Age, 50(50), 50.
Das, J. K., Prakash, O., &Khattri, V. (2012). Brandpersonality mapping: A study on colas. Asian Journalof Management Research, 3(1), 193-200.
Ghodeswar, B. M. (2008). Building brand identityin competitive markets: a conceptual model. Journalof product & brand management, 17(1), 4-12.
Keller, K.L and Kotler, P (2006), MarketingManagement , 12thedition, New Delhi : PrenticeHall of India Private Ltd
Retrieved on 21st Feb 2018, https://masterful-marketing.com/benefits of a strong brand identity.

86
Retrieved on 21st Feb 2018,https:/ blog.tbhcreative.com/2011/10/brand identity-why itsimportant. html
Retrieved on 21st Feb 2018,https:/useful researchpapers.com/ research proposal on brand identity.
Retrieved on 21st Feb 2018, https:// www.indiatrade.com
87
INTRODUCTION
Renewable energy resources are those which can bereplenished after their use or which are unlimited in theiravailability i.e. inexhaustible in nature within reasonablylong period. e.g. Sun (solar energy), Water (hydro electricenergy), Air (wind energy), Biomass (alternative fuels),Hydrogen, Inner earth layers (geothermal energy) etc.
Awareness refers to public or common knowledge orunderstanding about a social, scientific, or political issue.
* Assistant Prof. in Management, Prof. V. B. Shah Institute of Management, Amroli, Surat
Idea to Implementation: Adoption of Solar Roof Top Plant (SRTP) Offered byGujarat Energy Development Agency (GEDA) by Owners of Apartment Houses:
A Case of "Satyam Apartment" in Surat.
Mahendrakumar Vrajlal Soni*Abstract
Purpose: This case study aims to explore (1) how the residents of Satyam Apartment, Surat; arrived at consensus toadopt SRTP; (2) documentation necessary for SRTP installation; (3) problems faced during and after installation ofSRTP and (4) performance of SRTP.
Research Methodology/Approach :
Type of research: Exploratory.
Information/data collection method: Personally contacting "Channel Partners" authorised by GEDA;personally visitingSatyam Apartment; and interviewing key decision makers [Kiritbhai Shah,the secretary and Kamaleshbhai Patel, aflat holder (Engineer)] for documents related to meetings, resolutions, electricity bills, SMC bills etc.
Findings
Continuous efforts by key-decision-makers- Secretary, President and active members - are necessary to get informationof SRTP, scheme of GEDA to install SRTP, to convene the meetings to make members aware, to discuss the benefitsand pass resolution for installation.
Documentation and application procedure are simple.
Major problems: Delays in installation, inspection and net metering by contractors and GEDA/DGVCL authorities;and inverter setting (occasionally).
Power generation: Daily average 3.2 to 5 (annually 1450) units per KW installed capacity
Research Limitations/Implications
Other apartments may not adopt SRTP due to lack of awareness, efforts & active support of decision makers &members.
Originality/Value
This paper sets an example how apartments (accommodating 30% of urban population) can utilise their rooftop spaceto generate solar power and contribute to achieve Government of India is target of 100,000 MW grid connected solarpower by 2022.
Key Words: Renewable Energy Sources, Awareness, SRTP
Paper type: Case Study
Energy is basic input for all economic activities andsustainable development. Population growth and risinglevels of industrialisation & urbanisation have createdneed for energy at exponential rate. However, the energysupply has not increased at the same rate, resulting indemand-supply gap.
Traditional sources of energy such as fossil fuels havethree drawbacks: exhaustible nature; pollution causingadverse effects on health & environment and insufficientdistribution net-work to all regions of nation.
88
Therefore, energy conservation by avoiding wastage, byimproved technology and use of renewable energysources like solar energy can offer good solutions to easeenergy crisis. So, Governments of most of the worldcountries are involved in developing renewable energysources. Government of India and State Governmentshave taken extensive steps to develop renewable energysources including solar energy.
Grid connected photovoltaic Solar Roof Top Plant(SRTP) to produce electricity provides best synergy toproduce electricity for household/institutional/industrialconsumption.
Renewable Energy Benefits
Renewable energy sources offer viable option to addressthe energy security concerns of a country in the followingways.
Renewable energy is almost inexhaustible and canlast for many future generations.
Renewable energy technologies are ideally suitedto distributed applications, and they have substantialpotential to provide a reliable and secure energysupply as an alternative to grid extension or as asupplement to grid-provided power.
Grid connected solar rooftop system has followingadditional technical benefits.
* Utilization of available vacant roof space;
* Low gestation period;
* Lower transmission and distribution losses;
* Improvement in the tail-end grid voltages andreduction of system congestion;
* Loss mitigation by utilization of distributionnetwork as a source of storage through netmetering;
* Long term energy and ecological security byreduction in carbon emission;
* Abatement of about 60 million tonnes of CO2per year over its life cycle;
* Better Management of daytime peak loads byDISCOM/ utility;
* Meeting of the renewable purchase obligations(RPOs) of obligated entities which are targetedat 8% of electricity consumption;
* Minimal technical losses as power consumptionand generation are co located.
Renewable energy technologies are clean sourcesof energy that have a much lower environmentalimpact than conventional energy technologies.
Moreover; manufacturing, supply and distributionof renewable energy products, plants & systemsresults in growth of economy, employmentgeneration, savings in foreign exchange reserve etc.
Thus, greater reliance on renewable energy sourcesoffers enormous economic, social, & environmentalbenefits.
Solar energy is the energy obtained from sun rays. It canbe used for direct heating with help of solar water heaters,solar cookers or solar reactors. Heat is produced byconverging sun rays with the help of concave reflectorsor convex lenses.
Indirectly it is used to produce electricity with the help ofsolar panels (photovoltaic panels) which are made upof semiconductor materials like silicon-boron chips andwhich capture photons & convert them into electricalenergy (D.C.). With development of new photosensitivematerials, generation can be increased and the cost ofsolar plant is reduced. Governments of many countriesof world adopt solar power generation and providesubsidies for the same. Modern technology can be usedto promote a wide range of applications to support greenenvironment.
Government of India, State Governments and LocalGovernments like Municipal Corporations have takenintensive steps to develop solar electricity. Ministry ofNew and Renewable Energy (MNRE), Jawaharlal NehruNational Solar Mission (JNNSM), Renewable EnergyCorporation of India (RECI), State Nodal Agencies (e.g.Gujarat Energy Development Agency - GEDA) havetaken measures as following.
Government Initiativesto develop Solar Energy
Provision of renewable purchase obligation (RPO)for solar power in the National Tariff Policy.
Grant of subsidy on off-grid applications and GBIfacility for bundled power and Viability Gap Funding(VGF) for grid-connected solar power projectsthrough various interventions announced from timeto time.
Financial subsidy of 30% of project / bench markcost for rooftop solar projects (RTS) in residential/institutional/social sectors.
89
Incentives-cum-Awards for RTS in Government/PSU sector.
Pursuing notification of Gross/Net metering policiesin all states / UT.
Development of Online Portal for RTS developmentprogrammes.
Development of Online Portals for registration ofpartners, approval of proposals and projectmonitoring.
Empanelment of agencies / channel partners forinstallation of RTS systems.
Training of 50,000 Surya Mitra and staffs ofDiscoms/State Nodal Agencies.
Nationwide program for training of officials ofUtilities, Nodal Agencies, Regulatory Commissionsand Banks as also entrepreneurs.
Provision of concessional credit to projectdevelopers through multilateral support.Setting upultra-mega solar power projects and solar parks, 1MW solar parks on the banks of canals, and solarpower driven agricultural pump sets for energizing1 lakh pumps
Concessional import duty/excise duty exemption forsetting up of solar power plants, accelerateddepreciation and tax holiday etc.
Surat as a "Solar City"
Surat city has been declared as a "Solar City" videMNRE's approval letter no. 5/47/2010?11/ST,Dated: 13/04/2011.
100 KW SPV based Grid connected Power Plantwas establishedat Science Centreon January 18,2013. It has average 1304 units of electricitygeneration per KW per year.
Aggregate 750 kWp SPV based Grid connectedPower Plants were established at SMC Main OfficeBuilding, Katargam Water Works and other 12 siteson March 26, 2014. It has average 1360 units ofelectricity generation per KW per year.
SRTP
The Solar Roof Top Plant offered by GEDA is theexcellent system of generation of DC electricity throughsolar photovoltaic panels, converting it into AC powerby Invertors and supplying to the point of use through
grid lines so that unused power goes to the grid andrecorded as "Export" of power. In absence of solar power,the power is extracted from supply grid. This eliminatesthe need to store power in batteries. Thus, initial installationcost reduces and further maintenance cost is almost nil.Government of Gujarat also provides subsidy of Rs.10000/- per KW capacity (maximum Rs. 20000/-) inaddition to Government of India subsidy of 30% of totalprice, which is fixed at Rs. 69000/- per KW (Revisedprice as per revised scheme on 25/092018 is Rs. 48300/- per KW. The net payment for first 2 KW capacity isRs. 23810/- per KW and then Rs. 33810/- per KW. Itis quite attractive offer as about 4 units of electricity isgenerated per day per KW installed capacity. Theinvestment is recovered in about 30 months.
NEED FOR RESEARCH
The target of Government of India is to install & produce100,000 MW electricity through grid connected solargeneration by the year 2022. GEDA, the Nodal Agencyof Government of Gujarat, has launched the scheme ofSRTP since April 1, 2016; to install the plant in 100,000houses up to March 31, 2017. However, the totalinstallations were less than 4000 only during this period.Then the scheme was extended till 31/03/2018. The totalinstallations during two years from 01/04/2016 to 31/03/2018 were about 37000 only. Thus, it requiresintensive efforts to find out the reasons of poor responseand the ways to come out of them.
REVIEW OF LITERATURE
Some selected literature review articles are brieflyincluded here, due to limitations of space, as following.
Sweeney et al. (2013) of University of WesternAustralia, Australia; in their article "Energy savingbehaviours: Development of a practice-based model"obtained the views of consumers & identified energysaving motivators, barriers & supports and developed aPractice Based Energy-Cultures Framework (PBECF).
Mancha et al. (2015) of Technology, Operations andInformation Management Division, Babson College, USAand Carol Y. Yoder of department of Psychology, TrinityUniversity, USA (2015) studied the cultural antecedentsof green behavioural intent by using an environmentaltheory of planned behaviour in their research paper"Cultural antecedents of green behavioural intent: anenvironmental theory of planned behaviour".
90
Kenzie & Mohr (2000) presented Community BasedSocial Marketing to promote sustainable behaviour.
The authors suggest making psychological knowledgerelevant and accessible to the designers of programs anda process for developing & delivering environmentalprograms based on psychological expertise. They notethat most of programs are information intensive i.e. bymedia advertising and distribution of printed materials.
The program designers assume that (1) by enhancing theknowledge of an issue like global warming andencouraging to develop the supportive attitude, thebehaviour will change and (2) The behaviour is stronglyinfluenced by economic motives and public is rational &will act by economic self interest. So the programs highlightthe economic advantages of engaging in specific activities.
However, such programs have been failures, as observedby the authors in researches by others i.e. awarenessincreases, attitude becomes positive, but the behaviourdoes not change because it is affected by manypsychological and social factors.
Johe and Bhullar (2016) of University of New England,Australia examined the roles of self identity, attitudes,perceived behavioural control and norms in organicconsumerism in their article "To buy or not to buy: Theroles of self-identity, attitudes, perceived behaviouralcontrol and norms in organic consumerism".
George et. al (1995) have devised "ECOSCALE: Ascale for the measurement of environmentally responsibleconsumers" and defined Consumer EnvironmentalResponsibility" as "a state in which a person expressesan intention to take action directed toward remediationof environmental problems, acting not as an individualconsumer with his/her own economic interests, but througha citizen consumer concept of societal-environmental wellbeing. Further, this action will be characterized byawareness of environmental problems, knowledge ofremedial alternatives best suited for alleviation of theproblem, skill in pursuing his/her own chosen action, andpossession of a genuine desire to act after having weighedhis/her own locus of control and determining that theseactions can be meaningful in alleviation of the problem".
Shu Yang of Energy Research Institute, State Grid, Chinaand Dingtao Zao of School of Management, Universityof Science and Technology of China, China explored theeffects of subsidy incentives and family incomes onpurchase attitudes and intentionsof individuals towards
the purchase of EERE (Energy-Efficient and RenewableEnergy) equipments in their article "Do subsidies workbetter in low-income than in high-income families? Surveyon domestic energy-efficient and renewable energyequipment purchase in China".
Justin Paul &Ashwin Modi of Graduate School ofBusiness Administration, University of Pureto Rico, USAand Jayesh Patel of V. M. Patel Institute of Management,Ganpat University, Kherva, Gujarat, India (2016) usedTheory of Planned Behaviour (TPB), extended form ofTPB and theory of Reasoned Action (TRA) to predictIndian consumers' green product purchase intention intheir article "Predicting green product consumption usingtheory of planned behaviour and reasoned action".
The New Ecological Paradigm Scale is a survey basedmeasurement tool devised by the US environmentalsociologist Dunlap et al. (2000) and colleagues. Itmeasures environmental concern of groups of people byusing a survey instrument constructed of fifteen statements.Respondents are asked to indicate their agreement ordisagreement with each statement. Then, responses toall statements are used to construct various statisticalmeasures of environmental concern. The scale isconsidered as a measure of environmental world view /paradigm i.e. framework of thought.
The paper by Wright (2007), "Reconsidering publicattitudes and public acceptance of renewable energytechnologies: a critical review" summarises existing socialresearch on public understanding of, and attitudes towardsrenewable energy technologies, and provides a novelclassification of personal, psychological and contextualfactors explaining public acceptance.
Munjur et. al., (2013) of Department of EnergyTechnology, Aalto University, Finland UNESCOCommission, Finland measured the social acceptancerenewable energy technologies (RETs) in their researchpaper "Researching social acceptability of renewableenergy technologies in Finland".
Nada (2014) of Institute of Urban & regional planningfor post graduate studies, Baghdad University, Iraqdescribes various types of renewable energy in her paper"Renewable Energy Types" along with drawbacks of nonrenewable sources, need for renewable energy sourcesand benefits of renewable energy sources.
Schreier and Wilhelm (2008) of Vienna University ofEconomics and Business Administration (WU), Australia
91
searched for antecedents and consequences of being alead user and described and differentiated lead users fromordinary users in their article "Extending lead user theory:Antecedents and consequences of consumers' leaduserness".
Lead users are defined as those who are ahead of animportant market trend and who experience high benefitsfrom innovations.
OBJECTIVES OF STUDY
1. To find out how the residents arrived at consensusto adopt SRTP.
2. To find out the documents involved for installationof SRTP.
3. To find out the problems faced during the process.
4. To find the performance of SRTP after installation.
RESEARCH METHODOLOGY
Information regarding above objectives was collected bypersonally contacting and interviewing the key decisionmakers - the secretary and a flat holder of StyamApartment, Opposite Navayug College, Rander Road,Surat.
The source of information used by the respondents wastheir file records related to SRTP.
Information / Data in Chronological Order
The information about an apartment where SRTP has beeninstalled was obtained from the authorised channel partnerof GEDA, who had installed SRTP in my college. Then Icontacted the secretary of the apartment by introducingmyself as a teacher in college, pursuing PhD researchfrom the Department of Business and IndustrialManagement, Veer Narmad South Gujarat University,Surat. It is summarised as following.
Origin
The idea to install SRTP was origin of Mr. KamaleshbhaiPatel who is a flat holder of Satyam Apartment. He isCivil Engineer and serving in a private constructioncompany. Then he talked to Mr. Kiritbhai J. Shah,Secertary of the Apartment.
Steps
Both Kamaleshbhai and Kiritbhai gathered theinformation about the SRTP, scheme of GEDA, theauthorised contractors i.e. channel partners, detailsof subsidy etc.
Two meetings were conducted in the month ofDecember, 2016; to make the flat holders aware ofSRTP.
On 20/01/2017, a resolution was passed in themeeting to install SRTP (6KW capacity) and applythrough Surat Municipal Corporation websiteregistration. It was also resolved that in addition ofavailable fund with the society, Rs. 6000/- permember will be collected and it was agreed bymembers on the same day.
Online applicationwas filedon 16/03/2017withSMC.
As the application was put on GEDA website bySMC, offers from various contractors startedcoming. So, they negotiated and verified the priceand terms and conditions. One of the channel partneragreed to install at the prescribed price by GEDA.He also agreed to mount solar panels on elevatedstructured frame work. By the end of April, 2017,all these activities were completed.
Meanwhile, it was noticed that GEDA allowed toinstall unlimited capacity of SRTP since 01/04/2017.So, it was thought to apply for 10 KW capacity soas to reduce electricity bill to almost nil. (earlier, itwas about 10000/- per month.)
A meeting of members was held on 09/05/2017 andit was resolved to apply for 10.5 KW capacity andcollect Rs. 12000/- per member instead of 6000/-month.
Application to GEDA was filed through the channelpartner on 18/05/2017.
Then the contractor completed installation, inspectionand net meter connection by DGVCL. Theconnection was accomplished by 19/11/2017 i.e.after 6 months.
Documents needed in installation
Copies of "House Tax bill" paid to SMC, Electricitybill last paid to DGVCL and the Copy of resolutionmade at meetings of apartment members arerequired at the time of application to GEDA.
Inspection report after installation of SRTP to besubmitted to DGVCL for net meter connection. It isarranged by channel partner by following theDGVCL authorities.
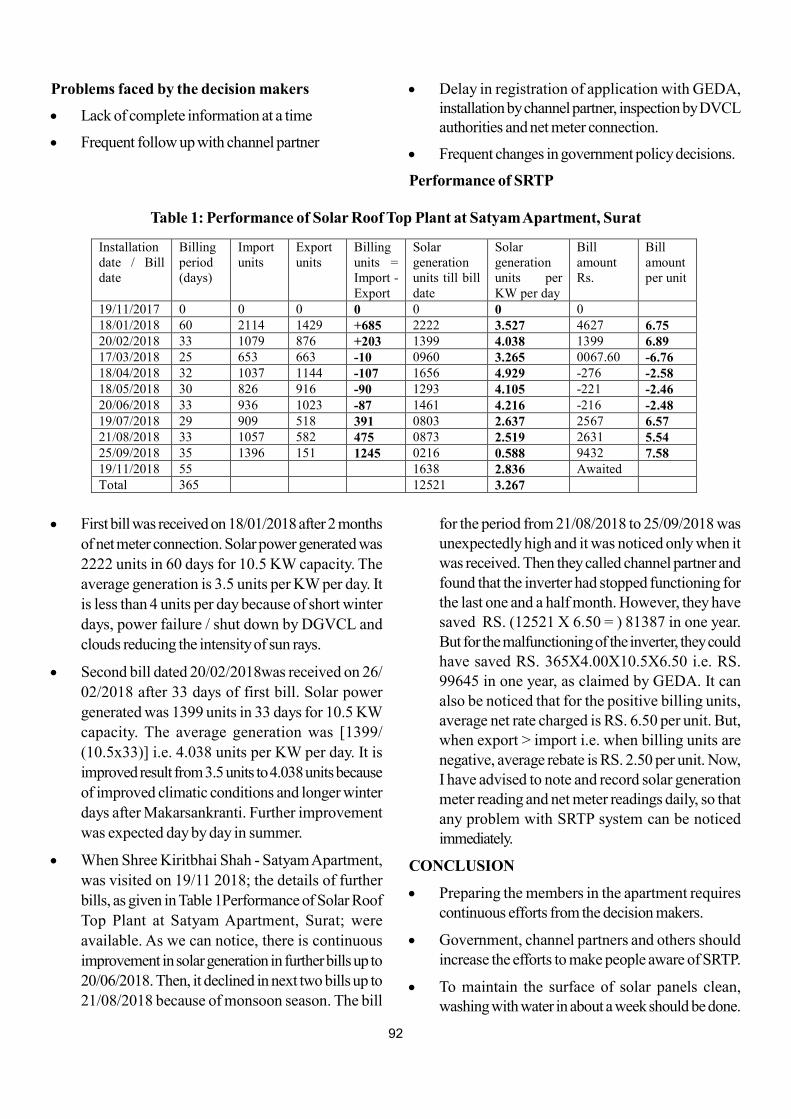
92
Problems faced by the decision makers
Lack of complete information at a time
Frequent follow up with channel partner
Installation date / Bill date
Billing period (days)
Import units
Export units
Billing units = Import - Export
Solar generation units till bill date
Solar generation units per KW per day
Bill amount Rs.
Bill amount per unit
19/11/2017 0 0 0 0 0 0 0 18/01/2018 60 2114 1429 +685 2222 3.527 4627 6.75 20/02/2018 33 1079 876 +203 1399 4.038 1399 6.89 17/03/2018 25 653 663 -10 0960 3.265 0067.60 -6.76 18/04/2018 32 1037 1144 -107 1656 4.929 -276 -2.58 18/05/2018 30 826 916 -90 1293 4.105 -221 -2.46 20/06/2018 33 936 1023 -87 1461 4.216 -216 -2.48 19/07/2018 29 909 518 391 0803 2.637 2567 6.57 21/08/2018 33 1057 582 475 0873 2.519 2631 5.54 25/09/2018 35 1396 151 1245 0216 0.588 9432 7.58 19/11/2018 55 1638 2.836 Awaited Total 365 12521 3.267
Delay in registration of application with GEDA,installation by channel partner, inspection by DVCLauthorities and net meter connection.
Frequent changes in government policy decisions.
Performance of SRTP
First bill was received on 18/01/2018 after 2 months
of net meter connection. Solar power generated was
2222 units in 60 days for 10.5 KW capacity. Theaverage generation is 3.5 units per KW per day. It
is less than 4 units per day because of short winter
days, power failure / shut down by DGVCL and
clouds reducing the intensity of sun rays.
Second bill dated 20/02/2018was received on 26/
02/2018 after 33 days of first bill. Solar power
generated was 1399 units in 33 days for 10.5 KWcapacity. The average generation was [1399/
(10.5x33)] i.e. 4.038 units per KW per day. It is
improved result from 3.5 units to 4.038 units because
of improved climatic conditions and longer winter
days after Makarsankranti. Further improvement
was expected day by day in summer.
When Shree Kiritbhai Shah - Satyam Apartment,
was visited on 19/11 2018; the details of further
bills, as given in Table 1Performance of Solar Roof
Top Plant at Satyam Apartment, Surat; were
available. As we can notice, there is continuous
improvement in solar generation in further bills up to20/06/2018. Then, it declined in next two bills up to21/08/2018 because of monsoon season. The bill
Table 1: Performance of Solar Roof Top Plant at Satyam Apartment, Surat
for the period from 21/08/2018 to 25/09/2018 wasunexpectedly high and it was noticed only when itwas received. Then they called channel partner andfound that the inverter had stopped functioning forthe last one and a half month. However, they havesaved RS. (12521 X 6.50 = ) 81387 in one year.But for the malfunctioning of the inverter, they couldhave saved RS. 365X4.00X10.5X6.50 i.e. RS.99645 in one year, as claimed by GEDA. It canalso be noticed that for the positive billing units,average net rate charged is RS. 6.50 per unit. But,when export > import i.e. when billing units arenegative, average rebate is RS. 2.50 per unit. Now,I have advised to note and record solar generationmeter reading and net meter readings daily, so thatany problem with SRTP system can be noticedimmediately.
CONCLUSION
Preparing the members in the apartment requirescontinuous efforts from the decision makers.
Government, channel partners and others shouldincrease the efforts to make people aware of SRTP.
To maintain the surface of solar panels clean,washing with water in about a week should be done.
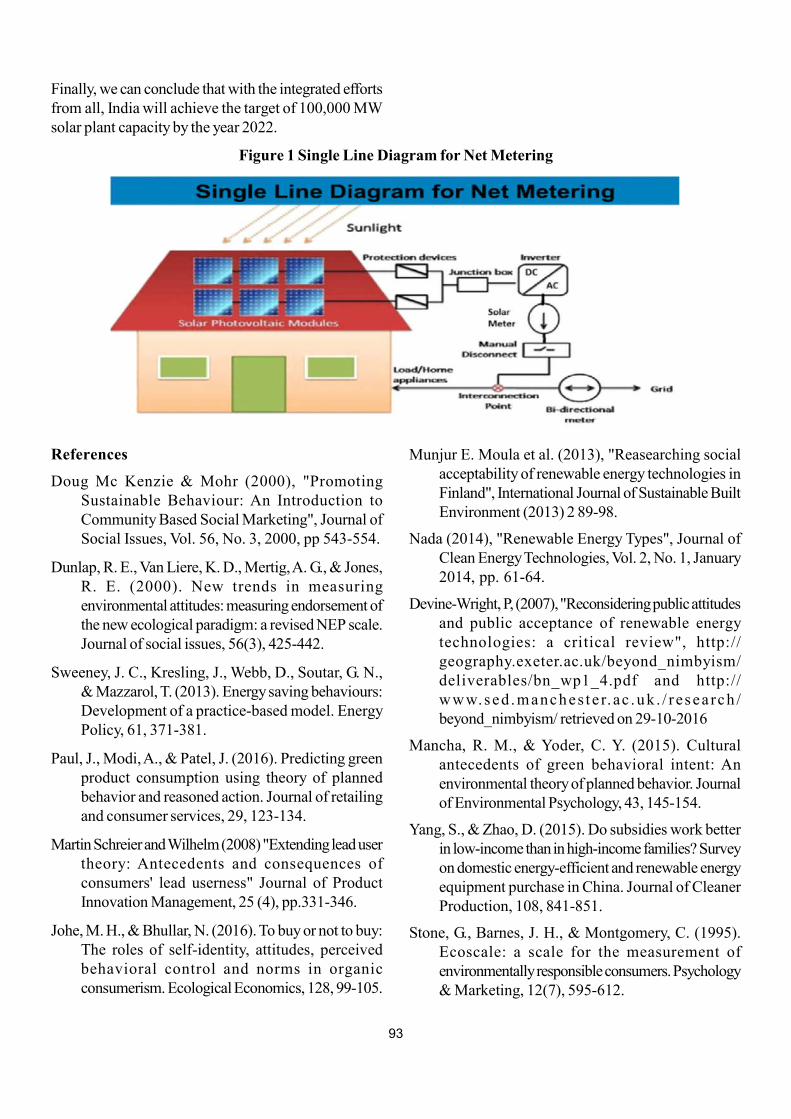
93
Finally, we can conclude that with the integrated effortsfrom all, India will achieve the target of 100,000 MWsolar plant capacity by the year 2022.
References
Doug Mc Kenzie & Mohr (2000), "PromotingSustainable Behaviour: An Introduction toCommunity Based Social Marketing", Journal ofSocial Issues, Vol. 56, No. 3, 2000, pp 543-554.
Dunlap, R. E., Van Liere, K. D., Mertig, A. G., & Jones,R. E. (2000). New trends in measuringenvironmental attitudes: measuring endorsement ofthe new ecological paradigm: a revised NEP scale.Journal of social issues, 56(3), 425-442.
Sweeney, J. C., Kresling, J., Webb, D., Soutar, G. N.,& Mazzarol, T. (2013). Energy saving behaviours:Development of a practice-based model. EnergyPolicy, 61, 371-381.
Paul, J., Modi, A., & Patel, J. (2016). Predicting greenproduct consumption using theory of plannedbehavior and reasoned action. Journal of retailingand consumer services, 29, 123-134.
Martin Schreier and Wilhelm (2008) "Extending lead usertheory: Antecedents and consequences ofconsumers' lead userness" Journal of ProductInnovation Management, 25 (4), pp.331-346.
Johe, M. H., & Bhullar, N. (2016). To buy or not to buy:The roles of self-identity, attitudes, perceivedbehavioral control and norms in organicconsumerism. Ecological Economics, 128, 99-105.
Figure 1 Single Line Diagram for Net Metering
Munjur E. Moula et al. (2013), "Reasearching socialacceptability of renewable energy technologies inFinland", International Journal of Sustainable BuiltEnvironment (2013) 2 89-98.
Nada (2014), "Renewable Energy Types", Journal ofClean Energy Technologies, Vol. 2, No. 1, January2014, pp. 61-64.
Devine-Wright, P, (2007), "Reconsidering public attitudesand public acceptance of renewable energytechnologies: a critical review", http://geography.exeter.ac.uk/beyond_nimbyism/deliverables/bn_wp1_4.pdf and http://www.sed .manches t e r. ac .uk . / r esea rch /beyond_nimbyism/ retrieved on 29-10-2016
Mancha, R. M., & Yoder, C. Y. (2015). Culturalantecedents of green behavioral intent: Anenvironmental theory of planned behavior. Journalof Environmental Psychology, 43, 145-154.
Yang, S., & Zhao, D. (2015). Do subsidies work betterin low-income than in high-income families? Surveyon domestic energy-efficient and renewable energyequipment purchase in China. Journal of CleanerProduction, 108, 841-851.
Stone, G., Barnes, J. H., & Montgomery, C. (1995).Ecoscale: a scale for the measurement ofenvironmentally responsible consumers. Psychology& Marketing, 12(7), 595-612.
94
Introduction
In order to improve the customer service experience,book keeping and speedy delivery of services, need forcomputerization has been felt in banking sector. In 1988,Reserve Bank of India has set up a committee headedby former RBI governor Dr. Raghuram Rajan oncomputerization in banks. Banks have started using
* Research Scholar, Sardar Patel University, Vallabh Vidyanagar.** Research Associate, Sardar Patel University, Vallabh Vidyanagar
Challenges of Digital Revolution in Indian Banking Sector
Mukesh Pal* and Brijesh M. Patel**
Abstract
Purpose
The purpose of this paper is to highlight the latest technology innovation ecosystem developed that changed thetraditional way of banking in India in order to facilitate banking services to outreach the end users in a cost effectivemanner. Business Analytics and Artificial Intelligence (AI) has a potential to bring a paradigm shift in Indian bankingsector. Robotics, enabled by AI, is expected to be the future game changer in the banking industries. Many privatebanks have already deployed Robots for customer service, investment advisory and credit-approval process toimprove the services and be cost effective in the long run. Digital Banking will be the most preferred form of bankingin the coming years and how it will change the competitive edge dynamics among the Banks in India. The paper alsohighlights the changes taking place in banking competition dynamics due to technological innovation and the role ofbanks either to compete with FinTech companies or to collaborate with them and enhance their efficiency in nearfuture. It also show case the benefits of using technology platforms in banking to reduce the marginal cost of transactionresulting into improved profitability of banks.
Design/methodology/approach
Latest technological products and services offered by banks and digital revolution started since 90's in Indian bankingsector has been compiled with the help of secondary data from various government, non government reports, journals,magazines, newspapers, websites and other publications.
Findings
Innovative technological platforms have played a significant role to transform the way of doing banking in India. It alsoarticulate the future dimensions for banks to remain cost effective and enable to offer specialized services to thecustomers based on their likes/dislikes and preferences. The banking sector has undergone for major transformationand role of technology plays vital role in routine banking transaction and will replace the human manpower.
Research limitations/implications
As an introductory paper, this lays the foundation for further study on the role of technology in banking sector and itsimplications for banks as well as Indian economy.
Originality/value
This paper showcases all the technological innovation platforms used by Indian banks putting together and the challengesfaced by them in order to remain competitive in coming years. This special issue gives valuable insight on change incompetitive dynamics and transformed the way of doing banking in modern era.
Keywords: Indian Banking Sector, Banking Technology, Digital Banking, Financial Inclusion
Paper Type: Conceptual
computerization initially by with standalone PCs and laterdivert to Local Area Network (LAN) connectivity. Astechnologies evolved, there were new IT eco system hasbeen developed. Core banking system (CBS) isconsidered to be important milestone for banks as it haschanged the dimension of traditional banking andempower the banks to offer enhance products and
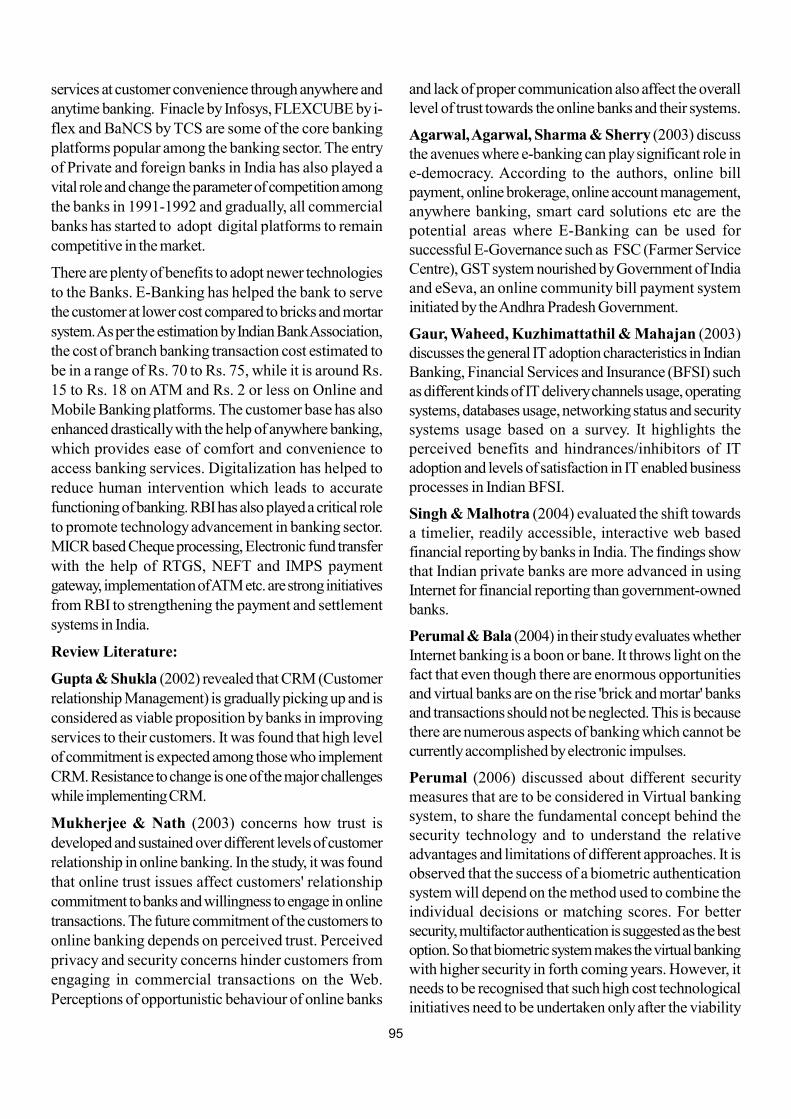
95
services at customer convenience through anywhere andanytime banking. Finacle by Infosys, FLEXCUBE by i-flex and BaNCS by TCS are some of the core bankingplatforms popular among the banking sector. The entryof Private and foreign banks in India has also played avital role and change the parameter of competition amongthe banks in 1991-1992 and gradually, all commercialbanks has started to adopt digital platforms to remaincompetitive in the market.
There are plenty of benefits to adopt newer technologiesto the Banks. E-Banking has helped the bank to servethe customer at lower cost compared to bricks and mortarsystem. As per the estimation by Indian Bank Association,the cost of branch banking transaction cost estimated tobe in a range of Rs. 70 to Rs. 75, while it is around Rs.15 to Rs. 18 on ATM and Rs. 2 or less on Online andMobile Banking platforms. The customer base has alsoenhanced drastically with the help of anywhere banking,which provides ease of comfort and convenience toaccess banking services. Digitalization has helped toreduce human intervention which leads to accuratefunctioning of banking. RBI has also played a critical roleto promote technology advancement in banking sector.MICR based Cheque processing, Electronic fund transferwith the help of RTGS, NEFT and IMPS paymentgateway, implementation of ATM etc. are strong initiativesfrom RBI to strengthening the payment and settlementsystems in India.
Review Literature:
Gupta & Shukla (2002) revealed that CRM (Customerrelationship Management) is gradually picking up and isconsidered as viable proposition by banks in improvingservices to their customers. It was found that high levelof commitment is expected among those who implementCRM. Resistance to change is one of the major challengeswhile implementing CRM.
Mukherjee & Nath (2003) concerns how trust isdeveloped and sustained over different levels of customerrelationship in online banking. In the study, it was foundthat online trust issues affect customers' relationshipcommitment to banks and willingness to engage in onlinetransactions. The future commitment of the customers toonline banking depends on perceived trust. Perceivedprivacy and security concerns hinder customers fromengaging in commercial transactions on the Web.Perceptions of opportunistic behaviour of online banks
and lack of proper communication also affect the overalllevel of trust towards the online banks and their systems.
Agarwal, Agarwal, Sharma & Sherry (2003) discussthe avenues where e-banking can play significant role ine-democracy. According to the authors, online billpayment, online brokerage, online account management,anywhere banking, smart card solutions etc are thepotential areas where E-Banking can be used forsuccessful E-Governance such as FSC (Farmer ServiceCentre), GST system nourished by Government of Indiaand eSeva, an online community bill payment systeminitiated by the Andhra Pradesh Government.
Gaur, Waheed, Kuzhimattathil & Mahajan (2003)discusses the general IT adoption characteristics in IndianBanking, Financial Services and Insurance (BFSI) suchas different kinds of IT delivery channels usage, operatingsystems, databases usage, networking status and securitysystems usage based on a survey. It highlights theperceived benefits and hindrances/inhibitors of ITadoption and levels of satisfaction in IT enabled businessprocesses in Indian BFSI.
Singh & Malhotra (2004) evaluated the shift towardsa timelier, readily accessible, interactive web basedfinancial reporting by banks in India. The findings showthat Indian private banks are more advanced in usingInternet for financial reporting than government-ownedbanks.
Perumal & Bala (2004) in their study evaluates whetherInternet banking is a boon or bane. It throws light on thefact that even though there are enormous opportunitiesand virtual banks are on the rise 'brick and mortar' banksand transactions should not be neglected. This is becausethere are numerous aspects of banking which cannot becurrently accomplished by electronic impulses.
Perumal (2006) discussed about different securitymeasures that are to be considered in Virtual bankingsystem, to share the fundamental concept behind thesecurity technology and to understand the relativeadvantages and limitations of different approaches. It isobserved that the success of a biometric authenticationsystem will depend on the method used to combine theindividual decisions or matching scores. For bettersecurity, multifactor authentication is suggested as the bestoption. So that biometric system makes the virtual bankingwith higher security in forth coming years. However, itneeds to be recognised that such high cost technologicalinitiatives need to be undertaken only after the viability
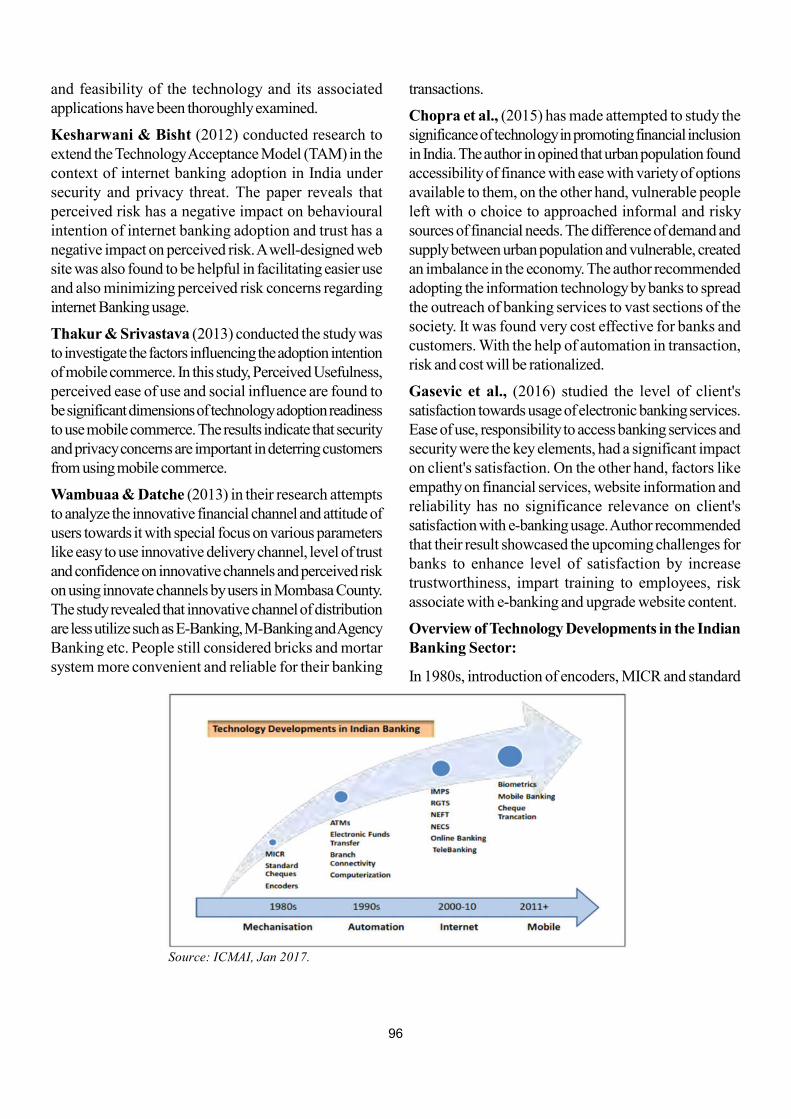
96
and feasibility of the technology and its associatedapplications have been thoroughly examined.
Kesharwani & Bisht (2012) conducted research toextend the Technology Acceptance Model (TAM) in thecontext of internet banking adoption in India undersecurity and privacy threat. The paper reveals thatperceived risk has a negative impact on behaviouralintention of internet banking adoption and trust has anegative impact on perceived risk. A well-designed website was also found to be helpful in facilitating easier useand also minimizing perceived risk concerns regardinginternet Banking usage.
Thakur & Srivastava (2013) conducted the study wasto investigate the factors influencing the adoption intentionof mobile commerce. In this study, Perceived Usefulness,perceived ease of use and social influence are found tobe significant dimensions of technology adoption readinessto use mobile commerce. The results indicate that securityand privacy concerns are important in deterring customersfrom using mobile commerce.
Wambuaa & Datche (2013) in their research attemptsto analyze the innovative financial channel and attitude ofusers towards it with special focus on various parameterslike easy to use innovative delivery channel, level of trustand confidence on innovative channels and perceived riskon using innovate channels by users in Mombasa County.The study revealed that innovative channel of distributionare less utilize such as E-Banking, M-Banking and AgencyBanking etc. People still considered bricks and mortarsystem more convenient and reliable for their banking
transactions.
Chopra et al., (2015) has made attempted to study thesignificance of technology in promoting financial inclusionin India. The author in opined that urban population foundaccessibility of finance with ease with variety of optionsavailable to them, on the other hand, vulnerable peopleleft with o choice to approached informal and riskysources of financial needs. The difference of demand andsupply between urban population and vulnerable, createdan imbalance in the economy. The author recommendedadopting the information technology by banks to spreadthe outreach of banking services to vast sections of thesociety. It was found very cost effective for banks andcustomers. With the help of automation in transaction,risk and cost will be rationalized.
Gasevic et al., (2016) studied the level of client'ssatisfaction towards usage of electronic banking services.Ease of use, responsibility to access banking services andsecurity were the key elements, had a significant impacton client's satisfaction. On the other hand, factors likeempathy on financial services, website information andreliability has no significance relevance on client'ssatisfaction with e-banking usage. Author recommendedthat their result showcased the upcoming challenges forbanks to enhance level of satisfaction by increasetrustworthiness, impart training to employees, riskassociate with e-banking and upgrade website content.
Overview of Technology Developments in the IndianBanking Sector:
In 1980s, introduction of encoders, MICR and standard
Source: ICMAI, Jan 2017.
97
cheque processing in banking system eliminated manualway of processing cheques and bank drafts etc. Duringthe period of 1990s, massive efforts put towardscomputerization of Indian banking sector. All brancheswere computerized which resulted in high productivityand enhance bank's capability to expand their productand services to customers. Due to computerization,connectivity among the branches of the bank facilitatedcross branch transactions, which considered to be thefirst step towards anywhere banking, Core bankingsolutions enabled the banks to process seamlesstransactions of various product and services of bankwithin the various departments. That helps to robust theoverall efficiency of banking operations and productivityof bank staffs. This decade also witnessed theimplementation of ATM (Automated Teller Machine)facility in Indian Banking sector that has changed the wayof doing banking .Now customer able to access cashtransactions and other non-financial services 24x7 withthe help of ATM. The entrant of new private sector banksplayed a significant role in induction of new technology inbanking sector. These banks came with advancedtechnology of the time to attract the customers from oldbanks into their side. This compelled the existing banksto focus towards adopting new technology to becompetitive. The birth of internet has changed all facetsof banking sector in year 2000s.Banks had adapted theinternet to give all new banking experience to customers.
Customers were no more compulsory to visit thebranches for many transactions; they can do the same attheir convenient with the help of Internet based bankingplatforms. Introduction of RTGS (Real Time GrossSettlement), NEFT (National Electronic Fund Transfer)and ECS (Electronic Fund Transfer) facilitated speedyfund transfer irrespective of the branch, bank and location.Cross location funds transfer who took days to transferthe fund earlier, was transformed to be completed inminutes. In last few years, seen a tremendousdevelopment of technology on mobile platforms. Mobilebanking is a new banking platform that gives access tobank services on mobile device. It adds a feeling of wowto the customer banking experience just by touch of theirsmart phones.
Current Status in the Digital Space
The Government of India's endeavor to promote digitaltransactions and move towards cashless economy. Theintroduction of Unified Payment Interfaces (UPI), BharatInterface of Money (BHIM) by National PaymentsCorporation of India (NPCI) are important steps forinnovative payment system domain in India. UPI is enableto make the instant payment across the different bank'saccounts without sharing bank account details with thehelp of virtual address.
Payment Systems in India
According to RBI report in 2016-17, there are nearly
Source: Banking on Technology, Perspectives on the Indian banking Industry
2.23 Lakh ATMs and 25 Lakh Point of Sales machine inIndia. The usage of prepaid payment instruments (PPIs)such as mobile prepaid instruments, gift cards, forex travelcard and mobile wallet have jumped drastically from Rs.105 billion and Rs.82 billion respectively in 2014-15 toRs.277 billion and Rs. 532 billion respectively in 2016-17.
Future of Banking in Dynamic World
The convergence of telecommunication, media andcomputing will change the way of doing banking. In theera of digital world, everything is being connected,information is flowing through networks with greaterintensity. Markets are disappearing and are beingsubstituted by networks of information with the customerat the heart. Digital revolution acting as a secular shift in
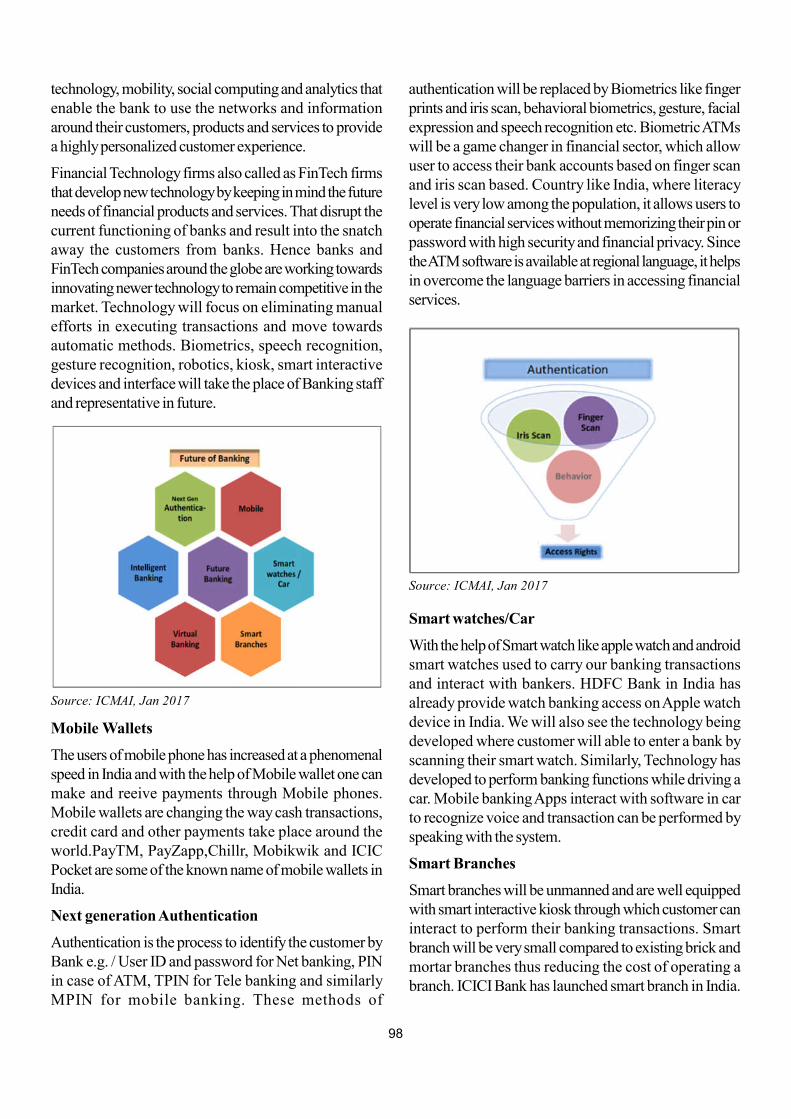
98
technology, mobility, social computing and analytics thatenable the bank to use the networks and informationaround their customers, products and services to providea highly personalized customer experience.
Financial Technology firms also called as FinTech firmsthat develop new technology by keeping in mind the futureneeds of financial products and services. That disrupt thecurrent functioning of banks and result into the snatchaway the customers from banks. Hence banks andFinTech companies around the globe are working towardsinnovating newer technology to remain competitive in themarket. Technology will focus on eliminating manualefforts in executing transactions and move towardsautomatic methods. Biometrics, speech recognition,gesture recognition, robotics, kiosk, smart interactivedevices and interface will take the place of Banking staffand representative in future.
Mobile Wallets
The users of mobile phone has increased at a phenomenalspeed in India and with the help of Mobile wallet one canmake and reeive payments through Mobile phones.Mobile wallets are changing the way cash transactions,credit card and other payments take place around theworld.PayTM, PayZapp,Chillr, Mobikwik and ICICPocket are some of the known name of mobile wallets inIndia.
Next generation Authentication
Authentication is the process to identify the customer byBank e.g. / User ID and password for Net banking, PINin case of ATM, TPIN for Tele banking and similarlyMPIN for mobile banking. These methods of
Source: ICMAI, Jan 2017
authentication will be replaced by Biometrics like fingerprints and iris scan, behavioral biometrics, gesture, facialexpression and speech recognition etc. Biometric ATMswill be a game changer in financial sector, which allowuser to access their bank accounts based on finger scanand iris scan based. Country like India, where literacylevel is very low among the population, it allows users tooperate financial services without memorizing their pin orpassword with high security and financial privacy. Sincethe ATM software is available at regional language, it helpsin overcome the language barriers in accessing financialservices.
Smart watches/Car
With the help of Smart watch like apple watch and androidsmart watches used to carry our banking transactionsand interact with bankers. HDFC Bank in India hasalready provide watch banking access on Apple watchdevice in India. We will also see the technology beingdeveloped where customer will able to enter a bank byscanning their smart watch. Similarly, Technology hasdeveloped to perform banking functions while driving acar. Mobile banking Apps interact with software in carto recognize voice and transaction can be performed byspeaking with the system.
Smart Branches
Smart branches will be unmanned and are well equippedwith smart interactive kiosk through which customer caninteract to perform their banking transactions. Smartbranch will be very small compared to existing brick andmortar branches thus reducing the cost of operating abranch. ICICI Bank has launched smart branch in India.
Source: ICMAI, Jan 2017
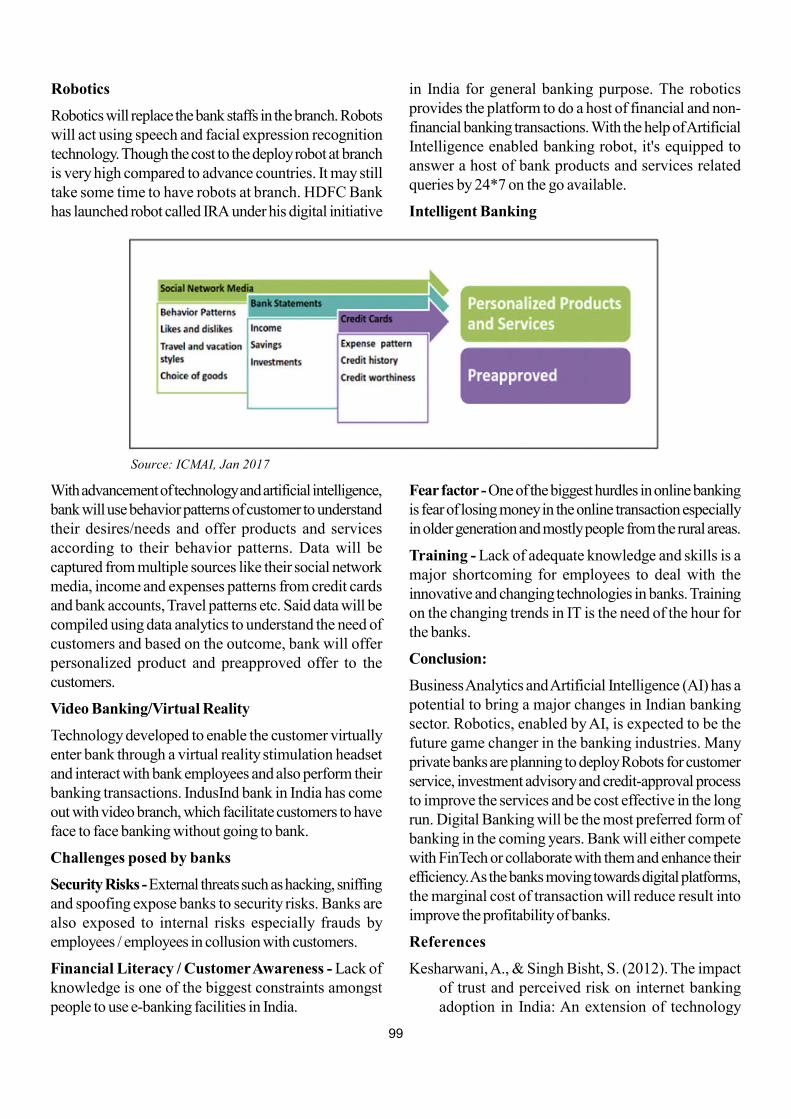
99
Robotics
Robotics will replace the bank staffs in the branch. Robotswill act using speech and facial expression recognitiontechnology. Though the cost to the deploy robot at branchis very high compared to advance countries. It may stilltake some time to have robots at branch. HDFC Bankhas launched robot called IRA under his digital initiative
in India for general banking purpose. The roboticsprovides the platform to do a host of financial and non-financial banking transactions. With the help of ArtificialIntelligence enabled banking robot, it's equipped toanswer a host of bank products and services relatedqueries by 24*7 on the go available.
Intelligent Banking
With advancement of technology and artificial intelligence,bank will use behavior patterns of customer to understandtheir desires/needs and offer products and servicesaccording to their behavior patterns. Data will becaptured from multiple sources like their social networkmedia, income and expenses patterns from credit cardsand bank accounts, Travel patterns etc. Said data will becompiled using data analytics to understand the need ofcustomers and based on the outcome, bank will offerpersonalized product and preapproved offer to thecustomers.
Video Banking/Virtual Reality
Technology developed to enable the customer virtuallyenter bank through a virtual reality stimulation headsetand interact with bank employees and also perform theirbanking transactions. IndusInd bank in India has comeout with video branch, which facilitate customers to haveface to face banking without going to bank.
Challenges posed by banks
Security Risks - External threats such as hacking, sniffingand spoofing expose banks to security risks. Banks arealso exposed to internal risks especially frauds byemployees / employees in collusion with customers.
Financial Literacy / Customer Awareness - Lack ofknowledge is one of the biggest constraints amongstpeople to use e-banking facilities in India.
Source: ICMAI, Jan 2017
Fear factor - One of the biggest hurdles in online bankingis fear of losing money in the online transaction especiallyin older generation and mostly people from the rural areas.
Training - Lack of adequate knowledge and skills is amajor shortcoming for employees to deal with theinnovative and changing technologies in banks. Trainingon the changing trends in IT is the need of the hour forthe banks.
Conclusion:
Business Analytics and Artificial Intelligence (AI) has apotential to bring a major changes in Indian bankingsector. Robotics, enabled by AI, is expected to be thefuture game changer in the banking industries. Manyprivate banks are planning to deploy Robots for customerservice, investment advisory and credit-approval processto improve the services and be cost effective in the longrun. Digital Banking will be the most preferred form ofbanking in the coming years. Bank will either competewith FinTech or collaborate with them and enhance theirefficiency. As the banks moving towards digital platforms,the marginal cost of transaction will reduce result intoimprove the profitability of banks.
References
Kesharwani, A., & Singh Bisht, S. (2012). The impactof trust and perceived risk on internet bankingadoption in India: An extension of technology
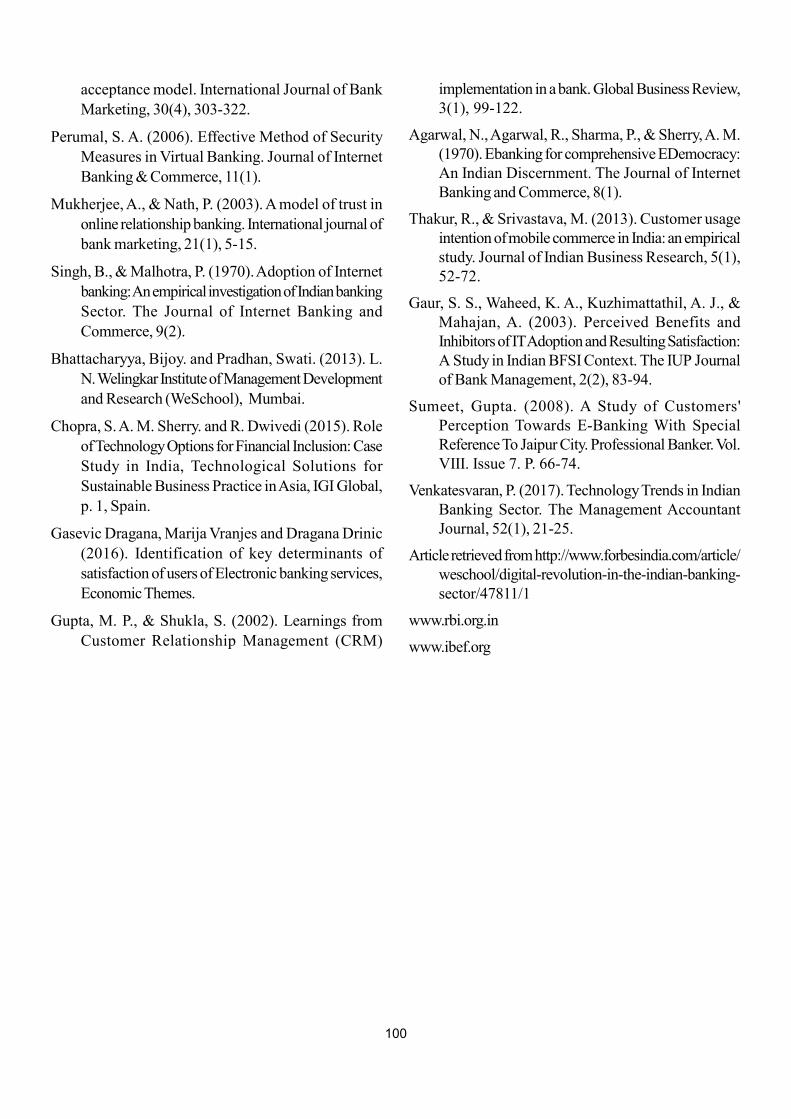
100
acceptance model. International Journal of BankMarketing, 30(4), 303-322.
Perumal, S. A. (2006). Effective Method of SecurityMeasures in Virtual Banking. Journal of InternetBanking & Commerce, 11(1).
Mukherjee, A., & Nath, P. (2003). A model of trust inonline relationship banking. International journal ofbank marketing, 21(1), 5-15.
Singh, B., & Malhotra, P. (1970). Adoption of Internetbanking: An empirical investigation of Indian bankingSector. The Journal of Internet Banking andCommerce, 9(2).
Bhattacharyya, Bijoy. and Pradhan, Swati. (2013). L.N. Welingkar Institute of Management Developmentand Research (WeSchool), Mumbai.
Chopra, S. A. M. Sherry. and R. Dwivedi (2015). Roleof Technology Options for Financial Inclusion: CaseStudy in India, Technological Solutions forSustainable Business Practice in Asia, IGI Global,p. 1, Spain.
Gasevic Dragana, Marija Vranjes and Dragana Drinic(2016). Identification of key determinants ofsatisfaction of users of Electronic banking services,Economic Themes.
Gupta, M. P., & Shukla, S. (2002). Learnings fromCustomer Relationship Management (CRM)
implementation in a bank. Global Business Review,3(1), 99-122.
Agarwal, N., Agarwal, R., Sharma, P., & Sherry, A. M.(1970). Ebanking for comprehensive EDemocracy:An Indian Discernment. The Journal of InternetBanking and Commerce, 8(1).
Thakur, R., & Srivastava, M. (2013). Customer usageintention of mobile commerce in India: an empiricalstudy. Journal of Indian Business Research, 5(1),52-72.
Gaur, S. S., Waheed, K. A., Kuzhimattathil, A. J., &Mahajan, A. (2003). Perceived Benefits andInhibitors of IT Adoption and Resulting Satisfaction:A Study in Indian BFSI Context. The IUP Journalof Bank Management, 2(2), 83-94.
Sumeet, Gupta. (2008). A Study of Customers'Perception Towards E-Banking With SpecialReference To Jaipur City. Professional Banker. Vol.VIII. Issue 7. P. 66-74.
Venkatesvaran, P. (2017). Technology Trends in IndianBanking Sector. The Management AccountantJournal, 52(1), 21-25.
Article retrieved from http://www.forbesindia.com/article/weschool/digital-revolution-in-the-indian-banking-sector/47811/1
www.rbi.org.in
www.ibef.org
101
1. INTRODUCTION
India is considered as one of the fast growing economiesof the world and has shown signs of growth in manysectors. However, there are major challenges in front ofcountry like unemployment, poverty, Population Growth,Pollution, Education, Sanitation, Health etc. To translatethe economic growth into broad based sustainabledevelopment it is necessary to take into considerationthese challenges and to develop long term strategies tocounter them. Union Government's ambitious move of
* Associate Professor, SLS, PDPU, Gandhinagar** Research Scholar of Ph.D. Program, Indus University, Ahmedabad
A Study on Contemporary Issues and Challenges in Front ofTransforming India Initiative
Ashish Joshi* and Nilang Vayeda**Abstract
Purpose
India's sustainable economic growth is an outcome of persistent economic reforms taking place in the country over thelast two decades. During last three years India has seen major Socio-Economic reforms in form of Make in India,Start up India, Skill India, Swatch Bharat Abhiyan, Digital India, Smart Cities, Demonetisation, Goods and ServicesTax (GST) etc. These reforms aim at generating high levels of economic growth, and new developmental opportunities.As a part of transforming India initiative there are several issues and challenges in achieving the goal of sustainablesocio-economic progress in the country. The present study aims to assess the issues and challenges which are likely tohinder the process of Transforming India Initiatives.
Design/Methodology/Approach
The major question raised in the paper is: Whether Transforming India Initiatives can convert issues and challengesinto opportunities? The research methodology used in the paper depends on the secondary data collection referring tovarious newspaper articles, reports, Government & Non Government websites etc.
Findings
This paper will help to develop an insight about the key issues and challenges faced in Transforming India initiatives.Therefore it is a way forward for the modern India to reduce the excessive pressure of unemployment in the countryby creating new job opportunities for the Indian Youth. New initiatives in form of economic reforms can strengthen oureconomy. Ease of doing business may create new opportunities (India jumped to 77th position from 142nd position inease of doing business) for MNCs to look forward towards India as an ocean of opportunities and to explore newerbusiness opportunities. This can lead to generate new employment prospects for the growing Indian youth.
Originality/value
The study is focused on various initiatives taken by Central Government to transform and keep India on a sustainabledevelopment path which can provide ample employment opportunities to its rapidly growing young population (around906 Million working age population) and provide them quality life. It mainly focuses on the issues and challenges thathinder the process of transforming India initiatives.
Keywords: Transforming India Initiatives, Make in India, Poverty, Unemployment, Population, Education, Corruption& Black Money, Socio-Economic Reforms
Paper Type: Conceptual
Transforming India Initiatives led by Make in India, Start
up India, Skill India, Swatch Bharat Abhiyan, Digital India,
Smart Cities, Demonetisation, Goods and Services Tax
(GST) etc. aims at creating New India Incorporation.
However the success of these initiatives will be seen in
the long run.
2. OBJECTIVE
The objective of this paper is to analyze the issues andchallenges before Transforming India Initiatives in the
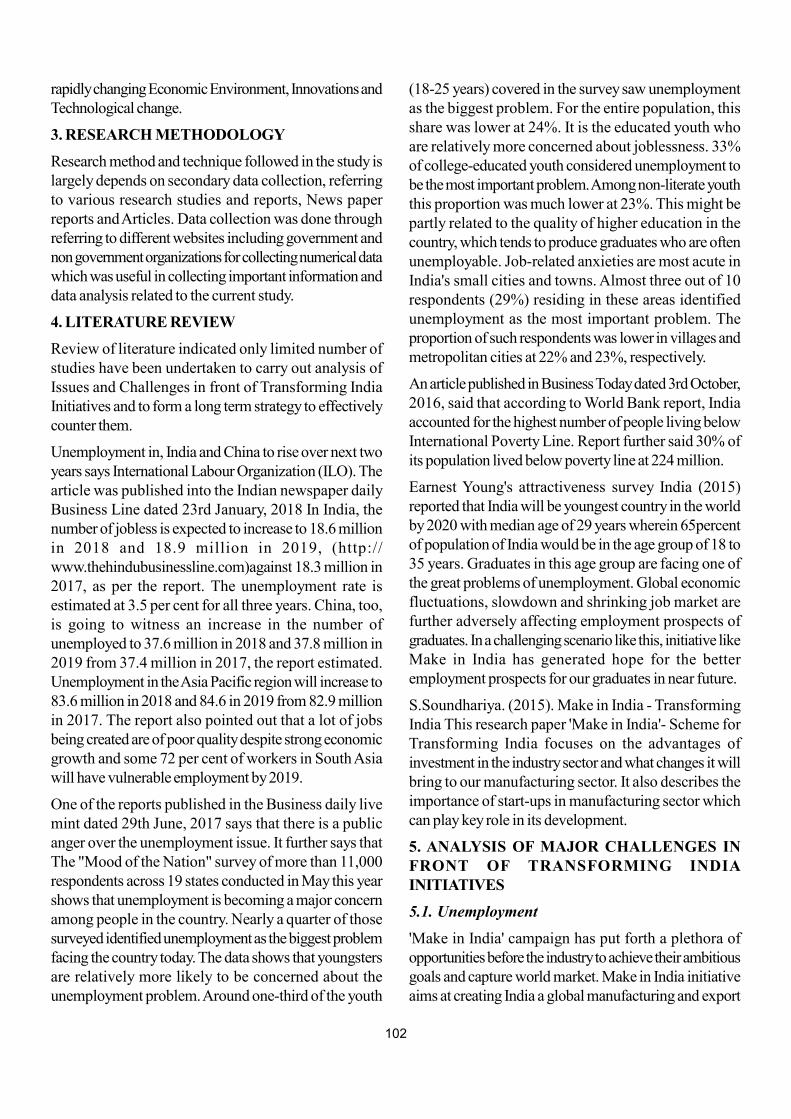
102
rapidly changing Economic Environment, Innovations andTechnological change.
3. RESEARCH METHODOLOGY
Research method and technique followed in the study islargely depends on secondary data collection, referringto various research studies and reports, News paperreports and Articles. Data collection was done throughreferring to different websites including government andnon government organizations for collecting numerical datawhich was useful in collecting important information anddata analysis related to the current study.
4. LITERATURE REVIEW
Review of literature indicated only limited number ofstudies have been undertaken to carry out analysis ofIssues and Challenges in front of Transforming IndiaInitiatives and to form a long term strategy to effectivelycounter them.
Unemployment in, India and China to rise over next twoyears says International Labour Organization (ILO). Thearticle was published into the Indian newspaper dailyBusiness Line dated 23rd January, 2018 In India, thenumber of jobless is expected to increase to 18.6 millionin 2018 and 18.9 million in 2019, (http://www.thehindubusinessline.com)against 18.3 million in2017, as per the report. The unemployment rate isestimated at 3.5 per cent for all three years. China, too,is going to witness an increase in the number ofunemployed to 37.6 million in 2018 and 37.8 million in2019 from 37.4 million in 2017, the report estimated.Unemployment in the Asia Pacific region will increase to83.6 million in 2018 and 84.6 in 2019 from 82.9 millionin 2017. The report also pointed out that a lot of jobsbeing created are of poor quality despite strong economicgrowth and some 72 per cent of workers in South Asiawill have vulnerable employment by 2019.
One of the reports published in the Business daily livemint dated 29th June, 2017 says that there is a publicanger over the unemployment issue. It further says thatThe "Mood of the Nation" survey of more than 11,000respondents across 19 states conducted in May this yearshows that unemployment is becoming a major concernamong people in the country. Nearly a quarter of thosesurveyed identified unemployment as the biggest problemfacing the country today. The data shows that youngstersare relatively more likely to be concerned about theunemployment problem. Around one-third of the youth
(18-25 years) covered in the survey saw unemploymentas the biggest problem. For the entire population, thisshare was lower at 24%. It is the educated youth whoare relatively more concerned about joblessness. 33%of college-educated youth considered unemployment tobe the most important problem. Among non-literate youththis proportion was much lower at 23%. This might bepartly related to the quality of higher education in thecountry, which tends to produce graduates who are oftenunemployable. Job-related anxieties are most acute inIndia's small cities and towns. Almost three out of 10respondents (29%) residing in these areas identifiedunemployment as the most important problem. Theproportion of such respondents was lower in villages andmetropolitan cities at 22% and 23%, respectively.
An article published in Business Today dated 3rd October,2016, said that according to World Bank report, Indiaaccounted for the highest number of people living belowInternational Poverty Line. Report further said 30% ofits population lived below poverty line at 224 million.
Earnest Young's attractiveness survey India (2015)reported that India will be youngest country in the worldby 2020 with median age of 29 years wherein 65percentof population of India would be in the age group of 18 to35 years. Graduates in this age group are facing one ofthe great problems of unemployment. Global economicfluctuations, slowdown and shrinking job market arefurther adversely affecting employment prospects ofgraduates. In a challenging scenario like this, initiative likeMake in India has generated hope for the betteremployment prospects for our graduates in near future.
S.Soundhariya. (2015). Make in India - TransformingIndia This research paper 'Make in India'- Scheme forTransforming India focuses on the advantages ofinvestment in the industry sector and what changes it willbring to our manufacturing sector. It also describes theimportance of start-ups in manufacturing sector whichcan play key role in its development.
5. ANALYSIS OF MAJOR CHALLENGES INFRONT OF TRANSFORMING INDIAINITIATIVES
5.1. Unemployment
'Make in India' campaign has put forth a plethora ofopportunities before the industry to achieve their ambitiousgoals and capture world market. Make in India initiativeaims at creating India a global manufacturing and export
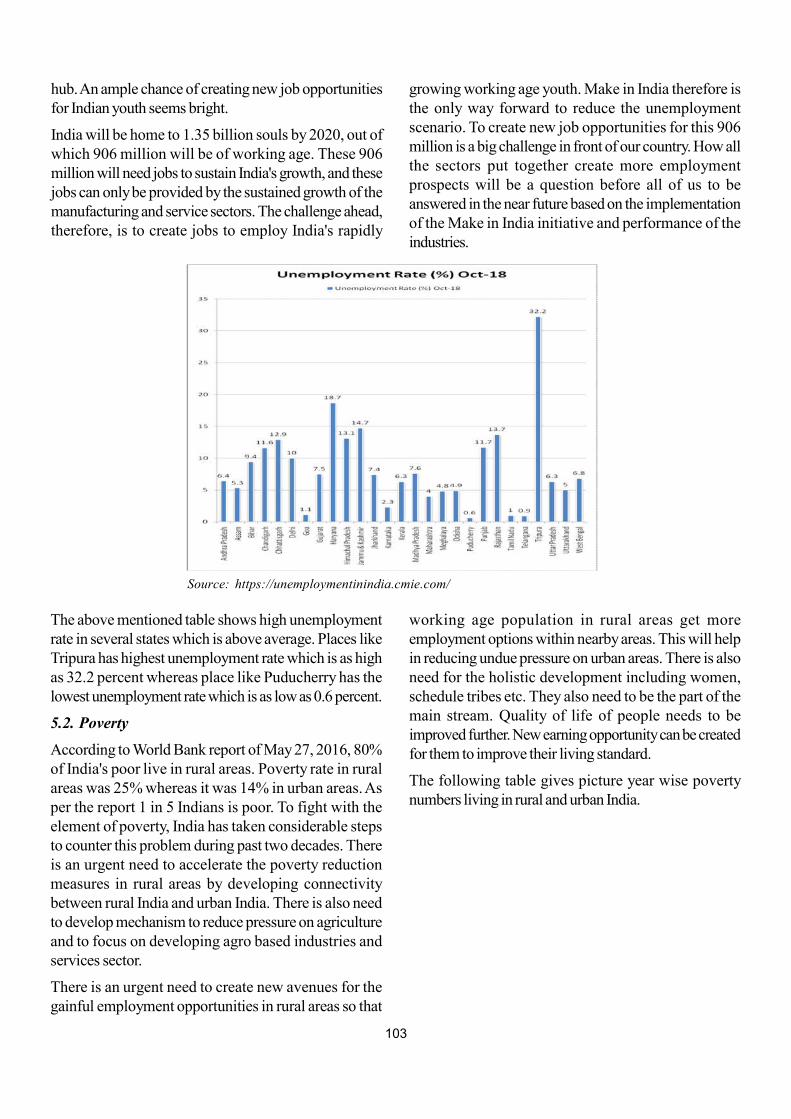
103
hub. An ample chance of creating new job opportunitiesfor Indian youth seems bright.
India will be home to 1.35 billion souls by 2020, out ofwhich 906 million will be of working age. These 906million will need jobs to sustain India's growth, and thesejobs can only be provided by the sustained growth of themanufacturing and service sectors. The challenge ahead,therefore, is to create jobs to employ India's rapidly
growing working age youth. Make in India therefore isthe only way forward to reduce the unemploymentscenario. To create new job opportunities for this 906million is a big challenge in front of our country. How allthe sectors put together create more employmentprospects will be a question before all of us to beanswered in the near future based on the implementationof the Make in India initiative and performance of theindustries.
The above mentioned table shows high unemploymentrate in several states which is above average. Places likeTripura has highest unemployment rate which is as highas 32.2 percent whereas place like Puducherry has thelowest unemployment rate which is as low as 0.6 percent.
5.2. Poverty
According to World Bank report of May 27, 2016, 80%of India's poor live in rural areas. Poverty rate in ruralareas was 25% whereas it was 14% in urban areas. Asper the report 1 in 5 Indians is poor. To fight with theelement of poverty, India has taken considerable stepsto counter this problem during past two decades. Thereis an urgent need to accelerate the poverty reductionmeasures in rural areas by developing connectivitybetween rural India and urban India. There is also needto develop mechanism to reduce pressure on agricultureand to focus on developing agro based industries andservices sector.
There is an urgent need to create new avenues for thegainful employment opportunities in rural areas so that
Source: https://unemploymentinindia.cmie.com/
working age population in rural areas get moreemployment options within nearby areas. This will helpin reducing undue pressure on urban areas. There is alsoneed for the holistic development including women,schedule tribes etc. They also need to be the part of themain stream. Quality of life of people needs to beimproved further. New earning opportunity can be createdfor them to improve their living standard.
The following table gives picture year wise povertynumbers living in rural and urban India.
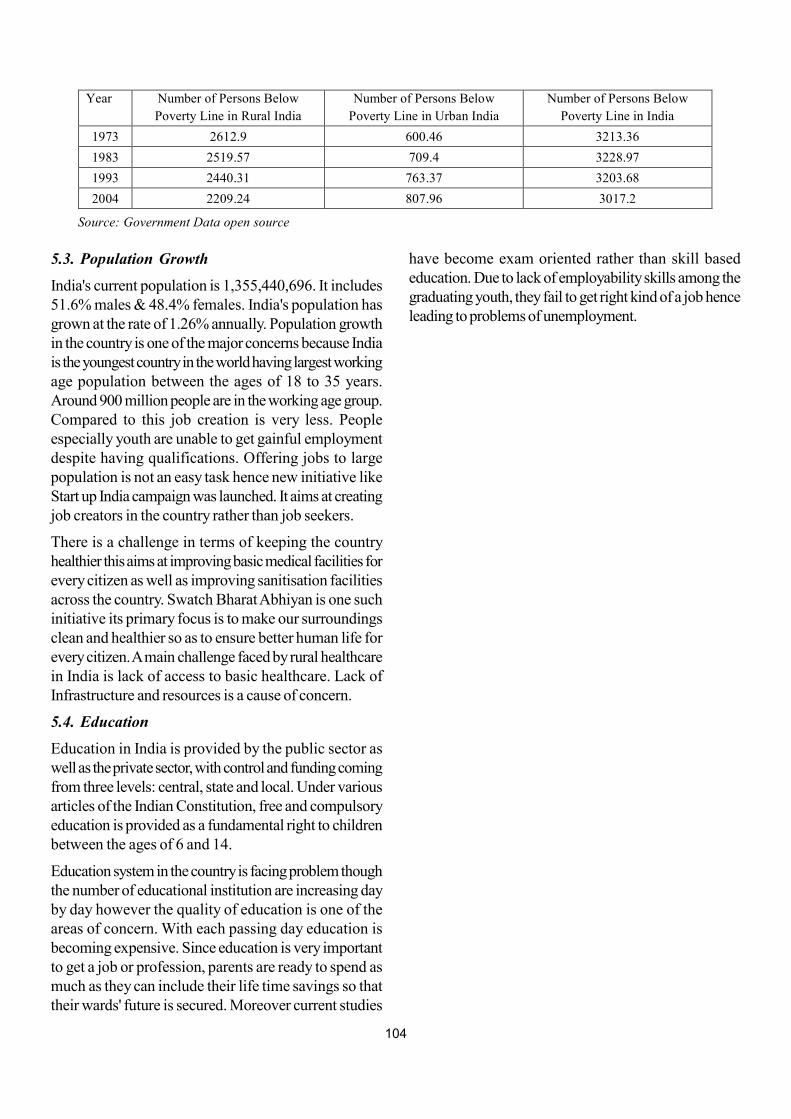
104
5.3. Population Growth
India's current population is 1,355,440,696. It includes51.6% males & 48.4% females. India's population hasgrown at the rate of 1.26% annually. Population growthin the country is one of the major concerns because Indiais the youngest country in the world having largest workingage population between the ages of 18 to 35 years.Around 900 million people are in the working age group.Compared to this job creation is very less. Peopleespecially youth are unable to get gainful employmentdespite having qualifications. Offering jobs to largepopulation is not an easy task hence new initiative likeStart up India campaign was launched. It aims at creatingjob creators in the country rather than job seekers.
There is a challenge in terms of keeping the countryhealthier this aims at improving basic medical facilities forevery citizen as well as improving sanitisation facilitiesacross the country. Swatch Bharat Abhiyan is one suchinitiative its primary focus is to make our surroundingsclean and healthier so as to ensure better human life forevery citizen. A main challenge faced by rural healthcarein India is lack of access to basic healthcare. Lack ofInfrastructure and resources is a cause of concern.
5.4. Education
Education in India is provided by the public sector aswell as the private sector, with control and funding comingfrom three levels: central, state and local. Under variousarticles of the Indian Constitution, free and compulsoryeducation is provided as a fundamental right to childrenbetween the ages of 6 and 14.
Education system in the country is facing problem thoughthe number of educational institution are increasing dayby day however the quality of education is one of theareas of concern. With each passing day education isbecoming expensive. Since education is very importantto get a job or profession, parents are ready to spend asmuch as they can include their life time savings so thattheir wards' future is secured. Moreover current studies
Year Number of Persons Below
Poverty Line in Rural India
Number of Persons Below
Poverty Line in Urban India
Number of Persons Below
Poverty Line in India
1973 2612.9 600.46 3213.36
1983 2519.57 709.4 3228.97
1993 2440.31 763.37 3203.68
2004 2209.24 807.96 3017.2
Source: Government Data open source
have become exam oriented rather than skill basededucation. Due to lack of employability skills among thegraduating youth, they fail to get right kind of a job henceleading to problems of unemployment.
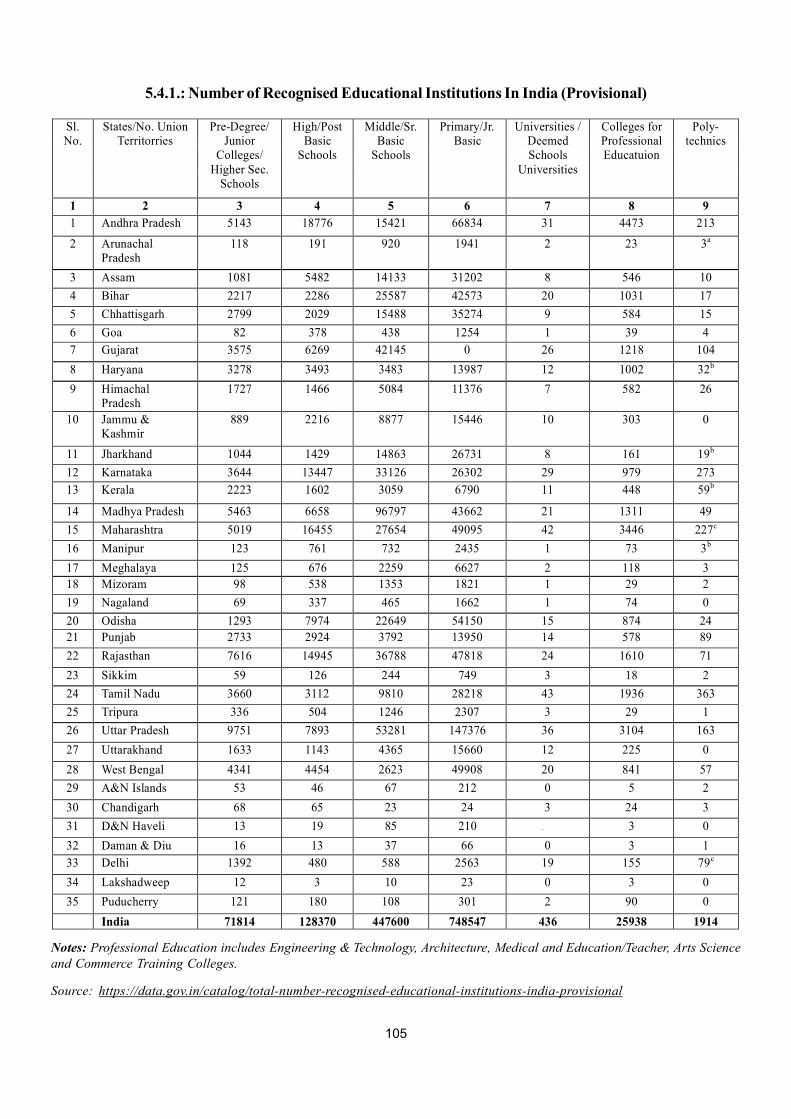
105
5.4.1.: Number of Recognised Educational Institutions In India (Provisional)
Sl. No.
States/No. Union Territorries
Pre-Degree/ Junior
Colleges/ Higher Sec.
Schools
High/Post Basic
Schools
Middle/Sr. Basic
Schools
Primary/Jr. Basic
Universities / Deemed Schools
Universities
Colleges for Professional Educatuion
Poly-technics
1 2 3 4 5 6 7 8 9
1 Andhra Pradesh 5143 18776 15421 66834 31 4473 213
2 Arunachal Pradesh
118 191 920 1941 2 23 3a
3 Assam 1081 5482 14133 31202 8 546 10
4 Bihar 2217 2286 25587 42573 20 1031 17
5 Chhattisgarh 2799 2029 15488 35274 9 584 15
6 Goa 82 378 438 1254 1 39 4
7 Gujarat 3575 6269 42145 0 26 1218 104
8 Haryana 3278 3493 3483 13987 12 1002 32b
9 Himachal Pradesh
1727 1466 5084 11376 7 582 26
10 Jammu & Kashmir
889 2216 8877 15446 10 303 0
11 Jharkhand 1044 1429 14863 26731 8 161 19b
12 Karnataka 3644 13447 33126 26302 29 979 273
13 Kerala 2223 1602 3059 6790 11 448 59b
14 Madhya Pradesh 5463 6658 96797 43662 21 1311 49
15 Maharashtra 5019 16455 27654 49095 42 3446 227c
16 Manipur 123 761 732 2435 1 73 3b
17 Meghalaya 125 676 2259 6627 2 118 3
18 Mizoram 98 538 1353 1821 1 29 2
19 Nagaland 69 337 465 1662 1 74 0
20 Odisha 1293 7974 22649 54150 15 874 24
21 Punjab 2733 2924 3792 13950 14 578 89
22 Rajasthan 7616 14945 36788 47818 24 1610 71
23 Sikkim 59 126 244 749 3 18 2
24 Tamil Nadu 3660 3112 9810 28218 43 1936 363
25 Tripura 336 504 1246 2307 3 29 1
26 Uttar Pradesh 9751 7893 53281 147376 36 3104 163
27 Uttarakhand 1633 1143 4365 15660 12 225 0
28 West Bengal 4341 4454 2623 49908 20 841 57
29 A&N Islands 53 46 67 212 0 5 2
30 Chandigarh 68 65 23 24 3 24 3
31 D&N Haveli 13 19 85 210 — 3 0
32 Daman & Diu 16 13 37 66 0 3 1
33 Delhi 1392 480 588 2563 19 155 79c
34 Lakshadweep 12 3 10 23 0 3 0
35 Puducherry 121 180 108 301 2 90 0
India 71814 128370 447600 748547 436 25938 1914
Notes: Professional Education includes Engineering & Technology, Architecture, Medical and Education/Teacher, Arts Scienceand Commerce Training Colleges.
Source: https://data.gov.in/catalog/total-number-recognised-educational-institutions-india-provisional
106
According to World Bank report on skilling India dated23rd June, 2017, India is the world's fastest growingeconomy, expected to grow at 7.2 percent in 2017-18,and at 7.7 percent by 2019-20. The government ofIndia has ambitious plans to transform India into acompetitive, high-growth, high productivity middle-income country. The economy is now diversifying frombeing largely agro-based to a manufacturing and service-based economy. These ambitious plans to transform theIndian economy are highly dependent on the availabilityof jobs and the quality of the labour force. This hasresulted in an increased demand for skilled labour overthe past few years. More than 12 million youth between15 and 29 years of age are expected to enter India'slabour force every year for the next two decades. Thegovernment's recent skill gap analysis concludes that by2022, other 109 million or so skilled workers will beneeded in the 24 keys sectors of the economy. At present,however, school leavers have few opportunities to acquirejob specific skills; only 2.3 percent of India's workforcehas received some formal skills training.
According to report of The Wire dated 11th May, 2017,a government appointed panel has found that the firstiteration of the government's flagship skilling scheme -the Pradhan Mantri Kaushal Vikas Yojana (PMKVY) -spent over Rs 1,500 crore in skilling over 18 lakh peoplebut failed to achieve key objectives such as high rates ofjob placement.
The report further said that, "SSCs entire focus seems tohave been on implementation of the PMKVY withoutregard to whether it will really meet the exact skill needsof the sectoral industry or turn out skilled manpower ofglobal standards or persons that would get placed afterthe training," says the report. More damningly, the Prasadcommittee goes on to suggest that the flagship governmentskilling programme was carried out to ensure the financialstability of the various sector skill councils and in theprocess monetarily benefiting the private vocationaleducation sector. "The entire effort seems to make theSSCs financially strong by way of different mechanismsbut in the process, there was a compromise on qualityand basic objectives of their creation at every stage," thereport, which was submitted to the government lastDecember but only recently made available for publiccomments, states.
5.5. Corruption & Black Money
Demonetisation was one of the major reforms towards
fight against Corruption and Black Money. According toCNBC report dated 7th September, 2017, The ReserveBank of India said in its annual report on Aug. 30 that 99percent, or around 15.28 trillion rupees ($238.7 billion),of the demonetized 500- and 1,000-rupee notes weredeposited or exchanged for new currency. This maderevolution by opening gateway for the digital Indiainitiative. Demonetisation brought revolutionary changein the banking system, and financial transactions. MobileBanking, Online Payment Methods have become morepopular and easy to operate through mobile phones.Gradually Indian economy is becoming cashless and hasmoved towards plastic money. Due to new innovationsand technological advancement, this period may beconsidered as a digital revolution era.
The success of Digital India Initiative depends upon theinternet connectivity and speed in the country. One of thereports says that India has the lowest internet speed andconnectivity compared to the other countries of the world.India had 86.77 million 4G subscribers in 2016, the lateststatistics released by telecom regular TRAI on July 3,2017 indicates
6. CONCLUSION
India stays in village. Initially majority of the populationwas dependent on agriculture. However over the yearsneed for industrialization was felt hard to give balancedgrowth to the country and to increase employmentprospects of our rising population and to reduce theburden of agriculture sector. Transforming India initiativestherefore is the way forward for the modern India toreduce the unemployment scenario in the country bycreating new job opportunities.
Despite of new initiatives there are few sectors which aresuffering with the effect of global economic slowdown.Sectors affected are Textiles, Leather, Metals,Automobiles, Gems & Jewellery, Transport & IT / BPO.Due to this, process of employment generation into thesesectors remained slow. The performance of these sectorswill be significant in the mass employment generationprocess.
Reduction of jobs due to effect of downsizing by manyindustries is also one of the causes of low employmentgeneration. Today companies are more capital intensiverather than labour intensive. Due to this reason capitalintensive industries require low manpower compared tolabour intensive industries. Many industries have startedreducing their staff especially some of the MNC
107
companies exited from Indian market due to toughcompetition by domestic companies.
High levels of automation in the industries have reducedtheir manpower requirements. Production processes arefully automated in many industries. Usages of robots inmanufacturing, is common now. Product designs,Production, planning, etc. are based on computers. Moreusage of Internet of Things (IOT), 3D Printing, ComputerAided Design and Manufacturing further reduced thehuman capital requirements of the industries. Now theyrequire quality manpower with industry specific skills.
All the above mentioned factors have correlation witheach other as high population growth requires highrequirement for employment if the sectors not generatingenough jobs or employment opportunities then this maylead to increase in poverty. Poverty effects the education.Lack of education causes unemployment as well asincrease in the economic and social offences likecorruption and black money.
References
1. Pti. (2016, October 03). India has highest numberof people living below poverty line: World Bank.Retrieved January 01, 2018, from https://www.businesstoday.in/current/economy-politics/india-has-highest-number-of-people-living-below-poverty-line-world- ank/story/238085.html(Business Today, 2016)
2. Indias Poverty Profile - World Bank. (2016, May27). Retrieved January 01, 2018, from
3. Countrymeters.info. (2016, May 27). IndiaPopulation. Retrieved January 01, 2018, from https://countrymeters.info/en/India
4. India. (2015, December 03). Retrieved January 01,2018, from http://www.who.int/countries/ind/en/
5. Lee, Yen Nee. "India Tried to Get the 'Black Money'out of Its Banking System - It Ended up Doing theOpposite." CNBC, CNBC, 7 Sept. 2017,www.cnbc.com/2017/09/07/demonetization-r es e rv e- b an k -o f - i nd i a - su gge s t s - t h a t -demonetisation-allowed-black-money-to-enter-banking-system.html.
6. Rangeet.ghosh. "Total Number of RecognisedEducational Institutions in India (Provisional)."Data.gov.in, 14 June 2013, data.gov.in/catalog/total-number-recognised-educational-institutions-india-provisional.
7. "How Modi's Flagship Skill India Project StumbledHard in Its First Year." The Wire, The Wire,thewire.in/economy/modi-skill-india-stumbled.
8. http://www.telecomlead.com/telecom-statistics/india-86-77-million-4g-subscribers-2016-trai- 77616,2017
108
I. Background
From childhood we all have been remembering a famousquote "health is wealth". With a passage of time the verygenesis of said proverb need to be given a fresh thought.Ever Changing world pose upon a new dynamic thriftinto a new outlook and the phrase "health care" shouldbe shifted to "human care". Health is one of the mostimportant aspects of the entire wellbeing of a livingcreature. Human being is at the apex level of the livingcreature and thereby possesses the foundationencompassing not only health but, many other factors.Such many other factors are mental health, psychological
* Doctoral Student - Ph.D in Management, B.K. School of Business Management, Gujarat University** Associate Professor, Department of Mathematics, Gujarat University, Ahmedabad
Transcending From a Healthy Life to a Holistic Living - Role of Spirituality
Bhavesh A. Kinkhabwala* and Ravi Gor**
Abstract
Purpose
Ever Changing world pose upon a new dynamic thrift into a new outlook and the phrase "health care" should be shiftedto "human care". Health is one of the most important aspects of the entire wellbeing of a living creature. Life is not asingle block but, built up by so many components and also do not survive in isolation so, one component affect theother one and if one component is not functioning properly or having effective functioning then certainly it will havenegative or positive impact on other and thereby the overall wellbeing is determined with a genesis of level of functioningof different components. In view of above, a comprehensive approach towards the life and wellbeing is a need for anhour and therefore, a holistic approach for human care is the necessity.
Design/methodology/approach
Involves multi disciplinary study and mainly library and qualitative research.
Findings
More and more efforts should be towards development of Spiritual Quotient (SQ).
Spirituality is an essential component of a holistic approach to life, its finds expression in creativity and all art forms andis the bit that adheres together our conscious intellect and our intelligent action. Spirituality sustains us from withinwhen all else fails; spirituality allows us to dream, aspire and raise ourselves up
Research limitations
In this paper primary research is not carried out due to constrain of having sufficient base for the statistical tools andanalysis. Future research has scope for judicious application of the statistical tools and analysis thereof for coming outquantifiable and measured outcome when bridging between the spirituality and healthy as well as holistic living
Originality/value
This research study is useful for developing an approach for the human care and having a comprehensive approachtowards the life and wellbeing.
Keywords: health and human care, spirituality,
Paper Type
Article / Conceptual paper
comfort, healthy environment, emotional balance,emotional support, inner peace, mental peace and so on.Life is not a single block but, built up by so manycomponents and also do not survive in isolation so, onecomponent affect the other one and if one component isnot functioning properly or having effective functioningthen certainly it will have negative or positive impact onother and thereby the overall wellbeing is determined witha genesis of level of functioning of different components.
In view of above, a comprehensive approach towardsthe life and wellbeing is a need for an hour and therefore,a holistic approach for a human care is the necessity.
109
II. What is Health ?
Health is not a state of absence of disease at physicallevel but, it is state of overall wellbeing both at physicaland mental, psychological and also at emotional level.Health is a level of equilibrium between outer and innerworld comprising positive and blissful well being and livinga productive and meaningful life with a sense of selfrespect, self satisfaction. In 1948, however, theConstitution of the World Health Organization definedhealth as "a state of complete physical, mental, and socialwell-being and not merely the absence of disease andinfirmity." This definition affirms that health is a positive,multidimensional state that involves three major domains:physical health, psychological health and social health(Straub, 2002).
III. What is holistic life style ?
Human life is having two aspects, (1) that connected withthe physical body - called materialism and (2) that relatingto the inner self (the soul) - known as spirituality.
Materialism stands for preferences for acquiring andpossessing material things and comforts and having a lifein which pleasures associated with the body are givenpriority above all.
Spirituality means having connected with the self and thesoul and having a life in which actions are decided andperformed with an object of the welfare of the soul.Priority is given to the soul compared to the body. So,way of life is "simple living, high thinking".
This implies, a man who is focussed with Spirituality needsto practice a prudent restraint or self control over theoutward senses and stay happy and satisfied with what ispossessed. In the event that, for instance, the consumptionof food is kept reasonable, it has the twofold advantageof life span and security from illnesses. Then again theutilization of a lot of sugar, salt and fat can prompt todiabetes, hypertension and arteriosclerosis separately.Observing an excessive amount of TV or a too muchexposure to PCs harms the visual perception. Youthstoday listen to noisy popular music, which seriouslyinfluences their listening to capacity. Overindulgence insexual exercises diminishes the vitality of a person.
Individuals who rehearse and regular practice restrictionand self controlnever encounter money crisis, keep up asound body and solid personality. They are calledindividuals of character; they receive respect and regardfrom the general public, the society.
A study of the lives of great personalities (who givenpriority to the soul as their true guide in life) with ordinarygeneral public (who strived for the bodily pleasures)reveals that real bliss, joy, satisfaction and happiness liein taking soul at the priority. In spite of the fact that it isnecessary and also important to take care of the bodyfor survival, the lesson being highlighted here is that oneshould evolve from the lower physiological need to thehigher level needs of the soul. Paying importance andprioritizing bodily and outward senses requirements leadsto frustration.On the other hand, following the soulprincipally and also meeting the minimum needs andrequirement of the body leads to the state of eternal blissand permanent happiness. It is this happiness individualsare after today yet at times prevail with regards todiscovering it.
IV. What is a holistic living ?
As mentioned above, life when taken is piecemeal that isto say one of the components of making life gives animpression of "wholeness" but, that is not the correctinterpretation of perceiving the life. During secondaryschool days a very famous story was taught wherein sevenblind people touches an elephant from different parts ofthe body and defines an elephant by saying an elephant islike a pillar by those who touched the legs, further sayingthat an elephant is like a thin rope who touched the endtail but, such a partial view, grasp, understanding andperceiving a thing or matter is really very dangerous as itis an old proverb having a meaning that half knowledge ismore dangerous than the ignorance. In the same way atag of Success / failure, happy / unhappy etc. cannot beattached to anyone by just looking in isolation - health(physical, mental), work (employment / business), bankbalance, lifestyle, relationships in society etc. there arisesthe difference between wholeness vis-à-vis holiness.Looking to all the segment of a person's life viz. health(physical, mental), work (employment / business),balanced lifestyle, relationships in all sectors of society,it's all about living a wholesome with bliss and keeping abalance between body, mind and spirit.
V. Route of Human Care
It is true that individual cells have a finite life span, andwhen they die off they are replaced with new cells. AsThe New York Public Library's Science Desk Reference(Stonesong Press, 1995) notes, "There are between 50and 75 trillion cells in the body.... Each type of cell has itsown life span" (www.livescience.com)
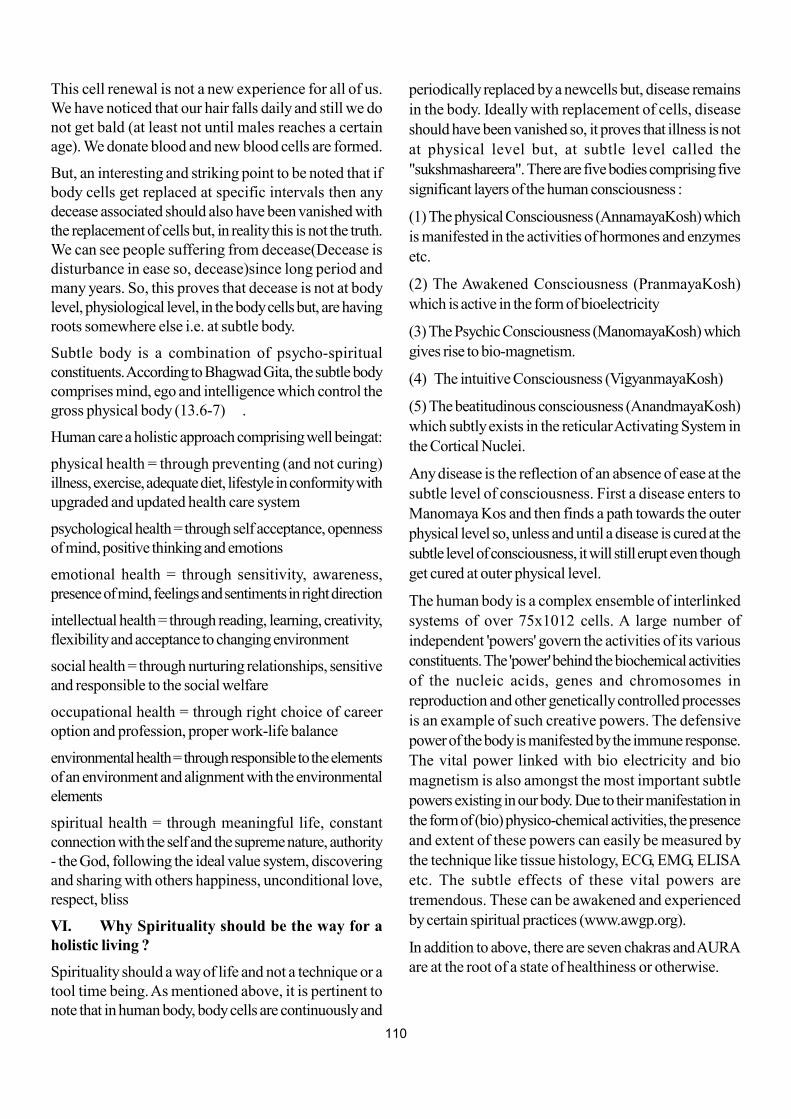
110
This cell renewal is not a new experience for all of us.We have noticed that our hair falls daily and still we donot get bald (at least not until males reaches a certainage). We donate blood and new blood cells are formed.
But, an interesting and striking point to be noted that ifbody cells get replaced at specific intervals then anydecease associated should also have been vanished withthe replacement of cells but, in reality this is not the truth.We can see people suffering from decease(Decease isdisturbance in ease so, decease)since long period andmany years. So, this proves that decease is not at bodylevel, physiological level, in the body cells but, are havingroots somewhere else i.e. at subtle body.
Subtle body is a combination of psycho-spiritualconstituents. According to Bhagwad Gita, the subtle bodycomprises mind, ego and intelligence which control thegross physical body (13.6-7) .
Human care a holistic approach comprising well beingat:
physical health = through preventing (and not curing)illness, exercise, adequate diet, lifestyle in conformity withupgraded and updated health care system
psychological health = through self acceptance, opennessof mind, positive thinking and emotions
emotional health = through sensitivity, awareness,presence of mind, feelings and sentiments in right direction
intellectual health = through reading, learning, creativity,flexibility and acceptance to changing environment
social health = through nurturing relationships, sensitiveand responsible to the social welfare
occupational health = through right choice of careeroption and profession, proper work-life balance
environmental health = through responsible to the elementsof an environment and alignment with the environmentalelements
spiritual health = through meaningful life, constantconnection with the self and the supreme nature, authority- the God, following the ideal value system, discoveringand sharing with others happiness, unconditional love,respect, bliss
VI. Why Spirituality should be the way for aholistic living ?
Spirituality should a way of life and not a technique or atool time being. As mentioned above, it is pertinent tonote that in human body, body cells are continuously and
periodically replaced by a newcells but, disease remainsin the body. Ideally with replacement of cells, diseaseshould have been vanished so, it proves that illness is notat physical level but, at subtle level called the"sukshmashareera". There are five bodies comprising fivesignificant layers of the human consciousness :
(1) The physical Consciousness (AnnamayaKosh) whichis manifested in the activities of hormones and enzymesetc.
(2) The Awakened Consciousness (PranmayaKosh)which is active in the form of bioelectricity
(3) The Psychic Consciousness (ManomayaKosh) whichgives rise to bio-magnetism.
(4) The intuitive Consciousness (VigyanmayaKosh)
(5) The beatitudinous consciousness (AnandmayaKosh)which subtly exists in the reticular Activating System inthe Cortical Nuclei.
Any disease is the reflection of an absence of ease at thesubtle level of consciousness. First a disease enters toManomaya Kos and then finds a path towards the outerphysical level so, unless and until a disease is cured at thesubtle level of consciousness, it will still erupt even thoughget cured at outer physical level.
The human body is a complex ensemble of interlinkedsystems of over 75x1012 cells. A large number ofindependent 'powers' govern the activities of its variousconstituents. The 'power' behind the biochemical activitiesof the nucleic acids, genes and chromosomes inreproduction and other genetically controlled processesis an example of such creative powers. The defensivepower of the body is manifested by the immune response.The vital power linked with bio electricity and biomagnetism is also amongst the most important subtlepowers existing in our body. Due to their manifestation inthe form of (bio) physico-chemical activities, the presenceand extent of these powers can easily be measured bythe technique like tissue histology, ECG, EMG, ELISAetc. The subtle effects of these vital powers aretremendous. These can be awakened and experiencedby certain spiritual practices (www.awgp.org).
In addition to above, there are seven chakras and AURAare at the root of a state of healthiness or otherwise.
111
VII. Nuances engraving Spirituality
The word "Spirituality" comes from the Latin term"Spiritus", which means "breath". In its true senseSpirituality is highly individualistic and certainly applies ata personal level. Many have tried to institutionalize forthe foundation of Spirituality and that is welcomed so asto channelize the group energy but, at its route Spiritualityis an individual persona and multidimensional nuances ofSpirituality caters to the individuals depending upon theindividual capacity and level of consciousness. Therefore,many times it seems difficult to describe, explain andconvince the foundation of spirituality.
1) Mr. P. Rajagopalachari (2002) says : "spiritualityis the natural expression of once own inner Self. Spiritualityis the science of divine human perfection up to the highestlimit of divinization"
2) Kelemen and Peltonen (2005), opined :"Spirituality is a positive emotion that serves to bringtogether the rational and the embodied aspects of humanlife while at the same time reaching to make a connectionwith a larger universe. To make this a guideline for humanexistence at work, it is, however, necessary to understandit as an art, requiring regular exercise and constant workingon one's self and one's relation to the world"
3) This student / author believe that : "Spirituality isthe God's gift to the mankind given by way of an inherentvirtue and quality that deals with introspection,magnification, refinement and purification of total physic,psychological and intellectual levels through managing theself and further nurturing intrinsic values and tendenciestowards the supreme level of consciousness for attainingself actualization through the route of the balanced lifebetween materialistic world and the inner world andgenerating value addition at both the personal level andfor the mankind in general ".
Based upon the personal experience, characteristics ofbeing Spiritual at individual level are the feel of : wisdom,emotions, awareness, completeness, living in the present,presence of mind, willpower, sacredness, sensitive,sensible, inner peace, inner love, joy and happiness, faithin oneself and to the God, unconditional love, acceptance,drive of excellence, balanced life, importance of the ethics,values and virtues in life, quest for the truth etc.
VIII. What encompasses Spirituality for theholistic living ?
Religion and Spirituality are two different connotations.Religion can be part of the Spirituality. "Spirituality is the
God's gift to the mankind given by way of an inherentvirtue and quality that deals with introspection,magnification, refinement and purification of total physic,psychological and intellectual levels through managing theself and further nurturing intrinsic values and tendenciestowards the supreme level of consciousness for attainingself actualisation through the route of the balanced lifebetween materialistic world and the inner world andgenerating value addition at both the personal level andfor the mankind in general ".
Spiritual practices may include meditation, mindfulness,prayer, the contemplation of sacred texts, ethicaldevelopment and the use of psychoactive substances.Love and/or compassion are often described as themainstay of spiritual development (Dalai Lama, 1999).
Waaijman discerns four forms of spiritual practices:
- Somatic practices, especially deprivation anddiminishment. Deprivation aims to purify the body.Diminishment concerns the repulsement of ego-oriented impulses. Examples include fasting andpoverty.
- Psychological practices, for example meditation.
- Social practices. Examples include the practice ofobedience and communal ownership, reforming ego-orientedness into other-orientedness.
- Spiritual. All practices aim at purifying ego-centeredness, and direct the abilities at the divinereality. (Waaijman, 2000).
Based upon the personal experiences, the student / authorbelieves Spirituality can be developed through :
1) Thorough study of Vedas, Upanishads, ancient holyscriptures. Further rethinking and grasping theessence of such readings and implementation thereof.
2) Yoga, Pranayam techniques are quite useful forphysical as well as mental health.
3) Gayatri Mantra is having a very powerful effect onthe five bodies and 24 places in the human body.See below picture depicting the effect of GayatriMantra (www.awgp.org).
4) Healing is yet another tool for curing the illness atphysical, mental and emotional level. Healing meansto set right, restore to spiritual wholeness, health orsoundness cure.
112
"Shivyog" has proved the effective scientific tool forthe healthy life.
The doctors who are combining Shiv Yog with theirregular treatment are finding that:
- They are able to make better diagnosis
- The patients are more comfortable and receptive tothem and respond well to the treatment they prescribe
- The recovery rate of the patients has improved
- Their own energy levels are very high
- They themselves now enjoy much better state ofhealth
- They enjoy better reputation as their efficiency andquality of treatment is much better now.(http://shivyog.com/research/)
5) Prayer, Meditation is widely known for the livingholistic life. Einstein has rightly explained with a smallformula E = MC2. From above formula, a spiritualinference can be drawn that energy is formed fromvibration and vibration is formed from thought whichis an outcome of emotions and that energy leads tomaterialization.
So, it would be :- Emotion --> Thought -->Vibration--> Energy --> Materialization.
6) Giving unconditional love, respect to all, doingphilanthropic activities with a view to "something togive back to the society" definitely helps to grow inmanifold.
IX. What next ?
Spirituality should be a way of life and not a technique ora tool time being. More and more efforts should betowards development of Spiritual Quotient (SQ). Focusshould be on interweaving Spirituality as a natural part oflife addressing the interiors of human life through regularpractice.
Spirituality is an essential component of a holistic approachto life, its finds expression in creativity and all art formsand is the bit that adheres together our conscious intellectand our intelligent action. Spirituality sustains us fromwithin when all else fails; spirituality allows us to dream,aspire and raise ourselves up (http://www.speakingtree.in/allslides/what-is-iq-eq-sq).
X. Conclusion
The world has tried enough to take decisions and tacklinghealth issues on the basis of different streams of medicalsciences but, a deeper insight is required with a flare ofspiritual dimension. Perhaps this is the only way left totake a try and which can be a source of hope for a healthierand sustainable living. We have to decide "what kind ofhealth status required for the future?" and answer shallunderlie to quest for the self awareness and subsequentlyproviding guidelines to the next generations. Spiritualityis somewhat less explored domain in the field of medicalscience so, a great scope to explore and reap the fruits.Spirituality is the gift of the God and is interwoven withthe inner self however, need to be uncovered with theconstant and continuous practice.
It's a very popular saying that - Journey being at homeand also a very famous story of Zen master who realizesat the last stage of life that instead of changing the word,society it would be rather worth that I should first changemyself - these two aptly answers the intricacy and issuesbeing faced by an individual, the society, nation.
References
1) Straub R.O. (2002), Health Psychology, New York,Worth Publishers
2) http://shivyog.com/medicalmiracles/ (Source : http://shivyog.com/medicalmiracles/ retrieved on 14thDecember, 2017)
3) http://shivyog.com/research/ (Source : http://shivyog.com/research/ retrieved on 14th December,2017)
113
4) http://www.awgp.org/spiritual_wisdom/gayatri/activation_of_internal_power_centres_by_gayatri_sadhan(Source: http://www.awgp.org/spiritual_wisdom/gayatri/activation_of_internal_power_centres_by_gayatri_sadhanretrieved on 14th December, 2017)
5) Shriram Sharma Acharya, "Astonishing Powers ofBiophysical & Subtle energies of the human body",Shri VedmataGayatri Trust, 2012
6) http://www.speakingtree.in/allslides/what-is-iq-eq-sq (Source : http://www.speakingtree.in/allslides/what-is-iq-eq-sq retrieved on 14th December,2017)
7) Rajagopalachari P. : Spider's Web , July 2002,Published by SRCM Chennai
8) Kelemen, M., &Peltonen, T. (2005). Spirituality: AWay to an Alternative Subjectivity?. OrganizationManagement Journal, 2(1), 52-63.
9) Dalai Lama, Ethics for the New Millennium, NY:Riverhead Books, 1999
10) Waaijman, Kees (2000), Spiritualiteit. Vormen,grondslagen, methoden, Kampen/Gent: Kok/Carmelitana (retrieved through the source : https://e n . w i k i p e d i a . o r g / w i k i /Spirituality#CITEREFWaaijman2000 on20thDecember, 2017)
11) http://www.livescience.com/33179-does-human-body-replace-cells-seven-years.html (Source : http://www.livescience.com/33179-does-human-body-replace-cells-seven-years.html retrieved on 21stDecember, 2017)
12) http://www.awgp.org/spiritual_wisdom/s c i e n t i f i c _ s p i r i t u l a l i t y /five_important_levels_of_the_human_consciousness(Source : http://www.awgp.org/spiritual_wisdom/s c i e n t i f i c _ s p i r i t u l a l i t y /five_important_levels_of_the_human_consciousnessretrieved on 22nd December, 2017)
114
Introduction
Payment are made using variety of mode which are knowna payment instrument like cash , checks etc. so Digitalpayment is a method of making payment through digitalmodes.
Digital payment is a way of payment which is madethrough digital modes. In digital payments, payer andpayee both use digital modes to send and receive money.It is also called electronic payment. No hard cash isinvolved in the digital payments. All the transactions indigital payments are completed online. It is an instant andconvenient way to make payments. The following arethe different types of digital payments.
* Assistant Professor, Smt. J. B. Patel College of Commerce Studies & Research, Anand - 388 001, Gujarat, India** Associate Professor, Dept. of Business Studies, Sardar Patel University, Vallabh Vidyanagar-388 120, Gujarat, India*Corresponding Author
Analysis of Agricultural Commodities at Multi Commodity Exchange in India
Parul Dipsinh Zala* and Kamini Shah**
Abstract
Purpose
After demonetization people are eager to use various digital payment modes because now a day's different modes ofpayment are available. In other words we can say that e-payment is a method in which a person can make onlinepayments for his purchase of goods and services without physical transfer of cash irrespective of time and locationusing various modes of digital payment. The aim of present study is to analyze the awareness of university students fordigital payment system and how they perceive new payment method.
Design/methodology/approach
Inferential statistical research design is used for the present study.
Social Implications
India is expected to have significant share of youth in total population by 2020. So present study can help for assistingvarious government schemes, programme related to digital payment.
Findings
And it was found people are aware and there is no significant difference in their perception on the bases of variousdemographic factors like income, age, profession. It was found that most of the students are using banking cards andpaytm. They consider digital payment system is better than traditional method of payment. So it is clear that studentsare aware about digital payment and there is great future ahead for this method of payment.
Research limitations
The study is restricted to 115 university students only and data has been collected through questionnaire which maysuffer from the subjectivity biases of respondent.
Keywords: Digital Payment, Students, Digital Wallet, Online Payment, Payment System
Paper Type
The paper is empirical in nature.
Evolution of payment system
Since 1960s digital payment system has been in operationsand day to day there is a great improvement in this system.As the present digital modes of payment have been passthrough barter system, commodity money metallic money,paper money, bank money and virtual money. Years agothere was no money. In barter system people exchangegoods for goods without any valuation whereas the mainadvantage of plastic money is that there is no need tocarry cash to make transactions
Electronic payment system is a mode of payments overan electronic network such as the internet. In other wordswe can say that e-payment is a method in which a person
Priyanka Kansara
115
can make online payments for his purchase of goods andservices without physical transfer of cash and cheque,irrespective of time and location.
Since many years the use of technology in variouscommercial activities increased to the emergence ofvarious new supporting services in the marketplace. Andas we know, payment is an integral part of commercialactivities, digital payment system is an integral part of e-commerce.
The use of electronic distribution networks are paymentsystems activate a further practice in commercial sectorsince 1960s and especially for transfer of big amounts ofmoney. Digital/Electronic payment system's concept hasbeen affected by these changes.
Generally the term electronic payment means any paymentto businesses, bank or public services from citizens orbusinesses, which are executed through atelecommunications or electronic networks using moderntechnology. From the above definition it is obvious that,the electronic payments that will be the object of presentresult, are the payment that are executed by the payerhimself , whether the latter is a consumer or a business,without the intervention of the another natural person.
One more concept of digital payment is popular and thatis the payment is made from distance, without the physicalpresence of the payer and naturally it does not includecash.
In other words an electronic payment system is a systemof financial exchange between buyer and seller in theonline environment that is facilitated by digital financialinstruments.
So from the above it is clear that digital payment is a wayof payment which is made through digital modes. In digitalpayment both the parties i.e. payer and payee use digitalmodes to make payment and to receive their dues.Electronic payment is also known as digital payment. Nowa days digital payments are considered as one of themost easy instant and convenient method because thissystem save time as person pay digitally, he won't needto withdraw cash from account and can save him fromlong queues of ATMs and banks. It does not save timeonly but little bit money as well.
For development of national payment system of anycountry's central bank play main role in any country. InIndia reserve bank play main role. In India RBI of India
as Central Bank of a country playing crusial role and hastaken different initiatives for a sound, safe, efficient andsecure system. In India payment systems are regulatedby Payment and Settlement Systems Act, (PSS Act). ThePSS Act was legislated in December 2007 for introducingand upgradation of safe payment system in country. Centralbank has taken different initiative. The dominant featuresof large geographic spread of the Country and the vastnetwork of branches of the Indian banking system requirethe logistic of collection of delivery of paper instruments.
Digital Payment in Gujarat
Since the prime minister has announced to transform Indiainto cashless economy, Gujarat has also joined in this.Various training and awareness programmes have beenorganized to train the people about cashless system. Themain aim of such programme was to promote digitalpayment and aware people that how it can change society.Such training programmes include training to youth,communities and training to anganwadi workers, Ashaworkers.
After demonetization cashless transactions are verypopular. There are various platforms for digital transactionswhich are as follow.
NFC or MST transmission waves platform soundbased payments platform
Sound based payments platform
Mobile Money Identifier
UPI App based payments platform
QR code based payments system
USSD code payments system
Aadhar enabled payment system
Net banking payments platform
Digital Wallet payment System
Magnetic stripped cards.
To promote digital transaction some of the famous templesin Gujarat accept donation through
e-wallet and ATMs . For this purpose they introducedswipe machines as well. The trust has also started toaccept e-payment for the "Prasad".
1. Review of Literature
Extensive research related to digital payment has beencarried out from various perspectives. The review of
116
research studies at national and international has beenpresented in two categories viz.
(a) Studies outside India.
(b) Studies in India.
(a) Studies outside India
Chaudhari et. al. (2014) in their research paper, "A Studyon Awareness of E-banking Services in college Studentsof BhusawalCity" Most of the students have their savingaccount in nationalized bank. They are aware aboutdifferent e-banking services. Students trust & used netbanking. ATM service is popular among students. It isalso found that there is need to create awareness aboutdigital security.
Gandhi et. al.(2014) in their research article,"Pre andPost Behavioral Study of Students regarding e-commerceand Cyber Security" In the field of e-commerce studentshad idea about purchase and sale only. Students don'thave credit/debit card as they are not financiallyindependent. Students are quite confident after gettingknowledge of e-commerce. They are also ready to spreadawareness among friends, parents and others.
Kher et. al. (2018) in their research article, "A study ofAwareness among Youth About Digital India Initiatives".The study shows that from total respondents 81.25%female and 92.21% male were aware about the digitalpayment initiative.
Kalyani (2016) in his research paper "An EmpiricalStudy about the Awareness ofPaperless E-CurrencyTransaction like E-Wallet using ICT in the Youth of India"As with changing environment it is better and advisableto accept and adopt change. As the digital paymentsystem is one of the advancement of modern financialsystem. Mobile wallet is popular among customers onlyfor some specific services like paying bills, rechargingetc. It is observed that awareness of mobile wallet andits practical usability is quite low.
Singh et. al. (2017) in their paper "Study of ConsumerPerception of Digital Payment Mode" There was nosignificant difference was perceived by the respondentson the bases of gender, age, profession and annual income.Adoption of digital payment was influenced by educationlevel. It was also found that the area where educationlevel is high in such area acceptance of digital pyment ismuch higher.
(b) Studies outside India
Warwick et.al (2000) in his study, "Credit Card
Consumer: College Students to sign in as customers. It is
for their promotion activity. The study look after the credit
card activity of students of Midwestern campus, the study
reveals that majority of the students were not interested
and don't have knowledge. They were using credit card
but don't have detailed knowledge. There was a question
on university and business schools that -Are they
preparing their students to become knowledgeable
customer?
Al-Amer, 2006 in their research work on, "Young
Generation Attitude and Awareness Towards the
implementation of Smart Card in Bahrain: an exploratory
Study" As smart cards are one of the advancement and
innovation of information and communication technology.
For the present study data was collected from students
of university of Bahrian through questionnaire. The study
examines the impact of government for awareness
program for usage and features of the smart cards.
Raihan et.al.(2013)"A Risk perception Analysis on the
use of Electronic Payment System by Young Adults"
Nation's competitiveness can be increased by use of e-
payment system as it is beneficial both to customer and
service providers. The Customer satisfaction is depends
on how risk is perceived by them.
Davies (2017) in his research work, "To study university
Student's Perception towards their cashless financial
transaction" The cashless method is used by young people
as they are more aware of technology. It was also clear
that all participants compare methods of payment to
determine time consumed by each. The study shows
positive perception towards cashless financial transaction.
The perception of university students was quite different
from other generation people.
Research Gap:
Most of the studies were on particular mode of payment
like digital wallet, pay-tm and credit card but for overall
digital payment awareness studies have not been
attempted by any researchers in India. No particular
studies have been conducted particular for students for
digital payment awareness and perception. Most of the
studies are carried out of India.
117
3. Research Methodology:
3.1 Identification of the research problem:
Youth being enthusiastic, vibrant, innovative and dynamicin nature is the most important section of the population.Youth shows strong passion, motivation and will powerwhich also make them the most valuable human resourcefor fostering economic, cultural and political developmentof a nation. India has world's second largest population.As per one survey population of India in the year 2018 isestimated 1.35352 Billion. India is expected to have34.33% share of youth in total population by 2020.
It is need of the hour to welcome digital payments in anera of technology revolution. Indian government has greatfocus on digital India and making the country cashlesseconomy. It is therefore relevant to pay attention towardsawareness and perception of people about digitalpayments. The primary research question for this studyhas been identified as follow:
"Awareness and perception about digital payment amonguniversity students"
3.2 Objectives of the study
1. To study awareness about digital payment amonguniversity students.
2. To know whether students using digital paymentservice or not.
3. To study the sources of information about digitalpayment.
4. To understand how students perceive digital paymentservice
5. To understand various risk and challenges faced bystudents while using digital payment.
3.3 Research Design:
This research applies the inferential statistical researchdesign.
3.4 Data collection
The data for the present study was collected from primaryand secondary sources. Secondary data was collectedfrom websites, newspaper, journals, magazines etc.Primary data was collected through structurequestionnaire. Questionnaire was distributed amongstudents.
3.5 Sample Size & Technique:
The sample size consisted of115 student respondents.
Convenience sampling technique was used for a periodof one month August.
3.6 Hypotheses of the study:
The following hypotheses have been examined:
1. There is no significant awareness about digitalpayment among students.
2. There is no significant difference in the awarenessamong P.G. and U.G. students.
3. There is no significant difference in the perceptionof male and female students.
4. There is no significant impact of age on theirperception.
5. There is no impact of family income on theirperception about security while using digitalpayment.
6. There is no impact of residential area on theirawareness for digital payment information.
3.7 Data Analysis and Interpretation:
The collected data from the different sources wereanalyzed using appropriate statistical techniques like t-test, chi-square test, Anova test, Excel and SPSS etc.Frequency analysis has been done to analyze theawareness of respondents about digital payment. Foranalyzing perception of respondents on the basis of theirage and family income, chi-square test and for analyzingtheir perception on the basis of income and education,Anova test has been used.
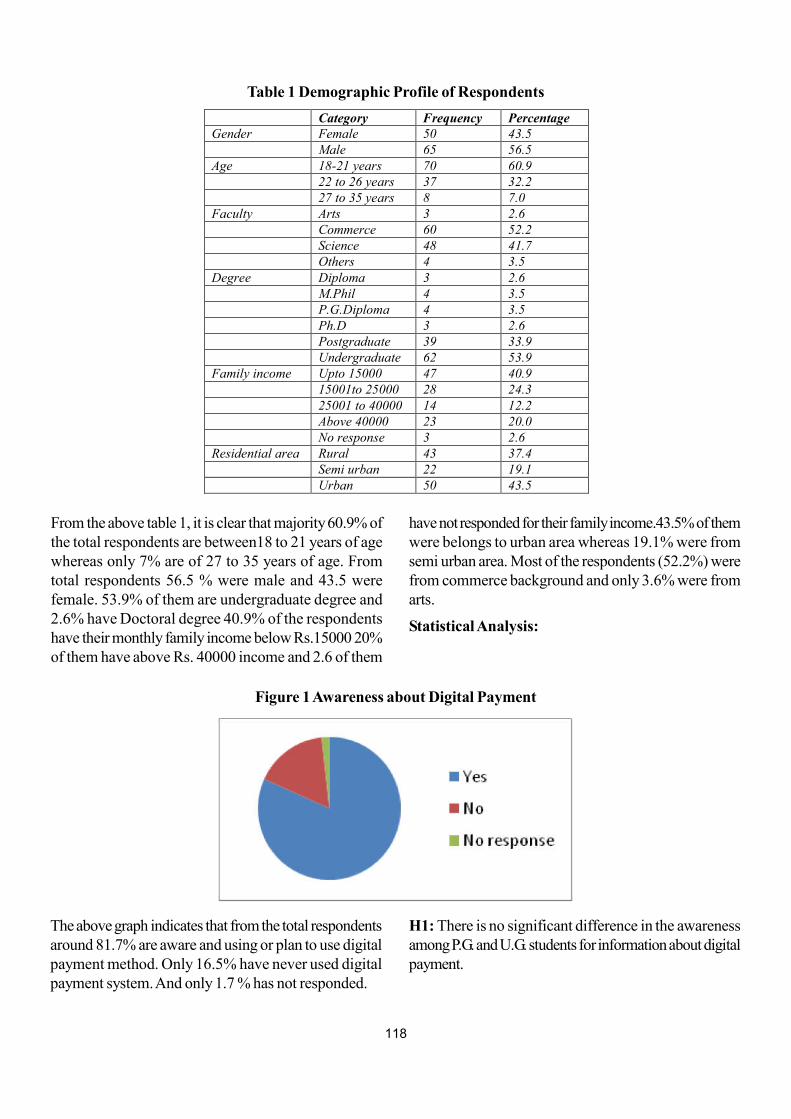
118
From the above table 1, it is clear that majority 60.9% ofthe total respondents are between18 to 21 years of agewhereas only 7% are of 27 to 35 years of age. Fromtotal respondents 56.5 % were male and 43.5 werefemale. 53.9% of them are undergraduate degree and2.6% have Doctoral degree 40.9% of the respondentshave their monthly family income below Rs.15000 20%of them have above Rs. 40000 income and 2.6 of them
Table 1 Demographic Profile of Respondents
Category Frequency Percentage Gender Female 50 43.5 Male 65 56.5 Age 18-21 years 70 60.9 22 to 26 years 37 32.2 27 to 35 years 8 7.0 Faculty Arts 3 2.6 Commerce 60 52.2 Science 48 41.7 Others 4 3.5 Degree Diploma 3 2.6 M.Phil 4 3.5 P.G.Diploma 4 3.5 Ph.D 3 2.6 Postgraduate 39 33.9 Undergraduate 62 53.9 Family income Upto 15000 47 40.9 15001to 25000 28 24.3 25001 to 40000 14 12.2 Above 40000 23 20.0 No response 3 2.6 Residential area Rural 43 37.4 Semi urban 22 19.1 Urban 50 43.5
have not responded for their family income.43.5% of themwere belongs to urban area whereas 19.1% were fromsemi urban area. Most of the respondents (52.2%) werefrom commerce background and only 3.6% were fromarts.
Statistical Analysis:
The above graph indicates that from the total respondentsaround 81.7% are aware and using or plan to use digitalpayment method. Only 16.5% have never used digitalpayment system. And only 1.7 % has not responded.
Figure 1 Awareness about Digital Payment
H1: There is no significant difference in the awarenessamong P.G. and U.G. students for information about digitalpayment.
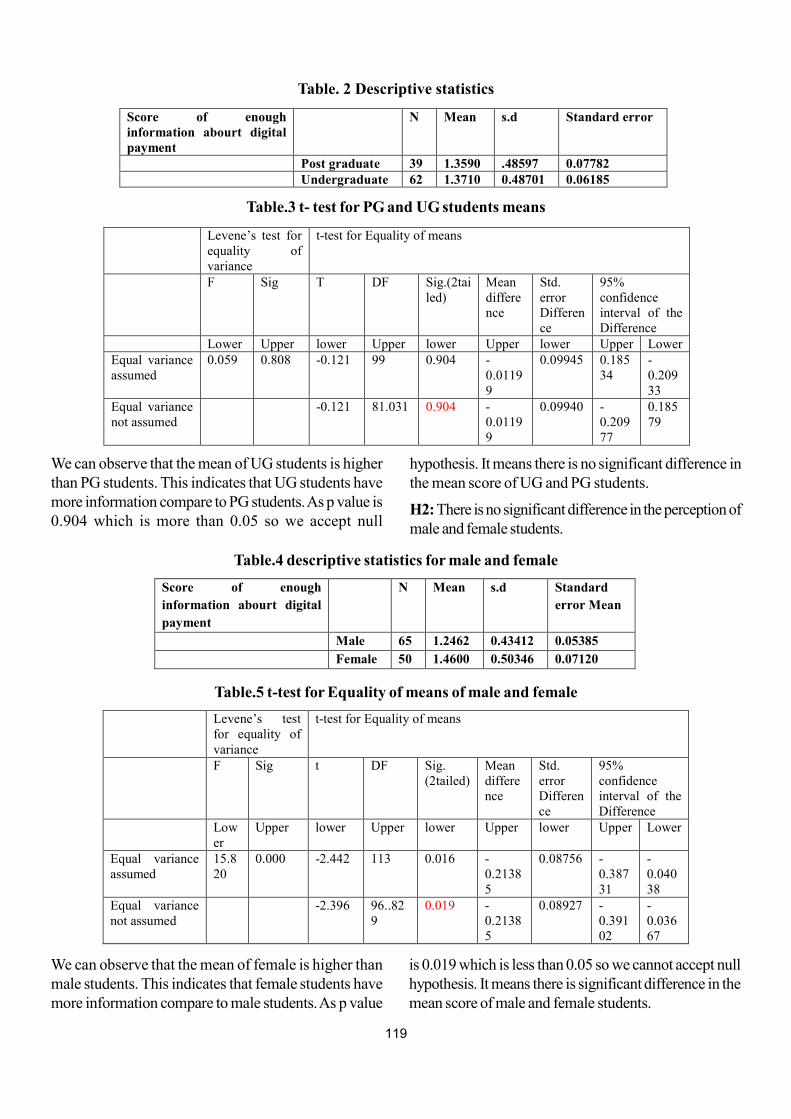
119
We can observe that the mean of UG students is higherthan PG students. This indicates that UG students havemore information compare to PG students. As p value is0.904 which is more than 0.05 so we accept null
Table. 2 Descriptive statistics
Score of enough information abourt digital payment
N Mean s.d Standard error
Post graduate 39 1.3590 .48597 0.07782 Undergraduate 62 1.3710 0.48701 0.06185
Table.3 t- test for PG and UG students means
Levene’s test for equality of variance
t-test for Equality of means
F Sig T DF Sig.(2tailed)
Mean difference
Std. error Difference
95% confidence interval of the Difference
Lower Upper lower Upper lower Upper lower Upper Lower Equal variance assumed
0.059 0.808 -0.121 99 0.904 -0.01199
0.09945 0.18534
-0.20933
Equal variance not assumed
-0.121 81.031 0.904 -0.01199
0.09940 -0.20977
0.18579
hypothesis. It means there is no significant difference inthe mean score of UG and PG students.
H2: There is no significant difference in the perception ofmale and female students.
Table.4 descriptive statistics for male and female
Score of enough
information abourt digital
payment
N Mean s.d Standard
error Mean
Male 65 1.2462 0.43412 0.05385
Female 50 1.4600 0.50346 0.07120
Table.5 t-test for Equality of means of male and female
Levene’s test for equality of variance
t-test for Equality of means
F Sig t DF Sig. (2tailed)
Mean difference
Std. error Difference
95% confidence interval of the Difference
Lower
Upper lower Upper lower Upper lower Upper Lower
Equal variance assumed
15.820
0.000 -2.442 113 0.016 -0.21385
0.08756 -0.38731
-0.04038
Equal variance not assumed
-2.396 96..829
0.019 -0.21385
0.08927 -0.39102
-0.03667
We can observe that the mean of female is higher thanmale students. This indicates that female students havemore information compare to male students. As p value
is 0.019 which is less than 0.05 so we cannot accept nullhypothesis. It means there is significant difference in themean score of male and female students.
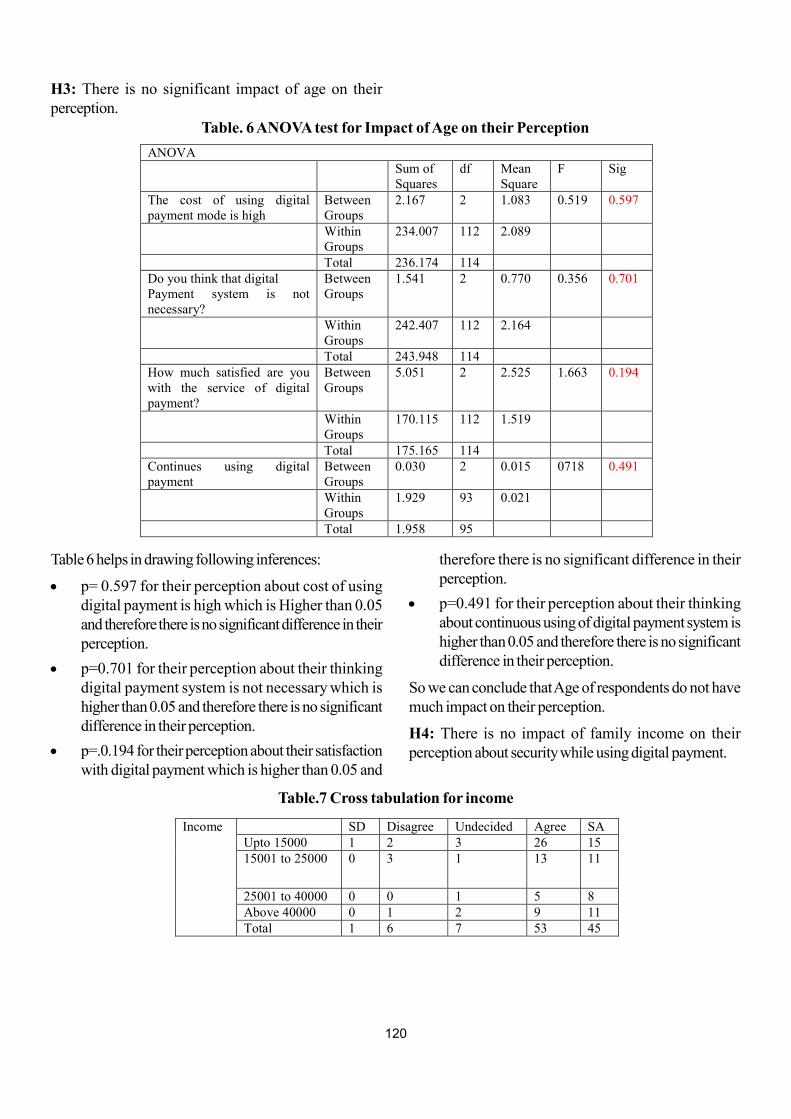
120
H3: There is no significant impact of age on theirperception.
Table 6 helps in drawing following inferences:
p= 0.597 for their perception about cost of usingdigital payment is high which is Higher than 0.05and therefore there is no significant difference in theirperception.
p=0.701 for their perception about their thinkingdigital payment system is not necessary which ishigher than 0.05 and therefore there is no significantdifference in their perception.
p=.0.194 for their perception about their satisfactionwith digital payment which is higher than 0.05 and
Table. 6 ANOVA test for Impact of Age on their Perception
ANOVA Sum of
Squares df Mean
Square F Sig
The cost of using digital payment mode is high
Between Groups
2.167 2 1.083 0.519 0.597
Within Groups
234.007 112 2.089
Total 236.174 114 Do you think that digital Payment system is not necessary?
Between Groups
1.541 2 0.770 0.356 0.701
Within Groups
242.407 112 2.164
Total 243.948 114 How much satisfied are you with the service of digital payment?
Between Groups
5.051 2 2.525 1.663 0.194
Within Groups
170.115 112 1.519
Total 175.165 114 Continues using digital payment
Between Groups
0.030 2 0.015 0718 0.491
Within Groups
1.929 93 0.021
Total 1.958 95
therefore there is no significant difference in theirperception.
p=0.491 for their perception about their thinkingabout continuous using of digital payment system ishigher than 0.05 and therefore there is no significantdifference in their perception.
So we can conclude that Age of respondents do not havemuch impact on their perception.
H4: There is no impact of family income on theirperception about security while using digital payment.
Table.7 Cross tabulation for income
Income SD Disagree Undecided Agree SA Upto 15000 1 2 3 26 15 15001 to 25000 0 3 1 13 11
25001 to 40000 0 0 1 5 8 Above 40000 0 1 2 9 11 Total 1 6 7 53 45
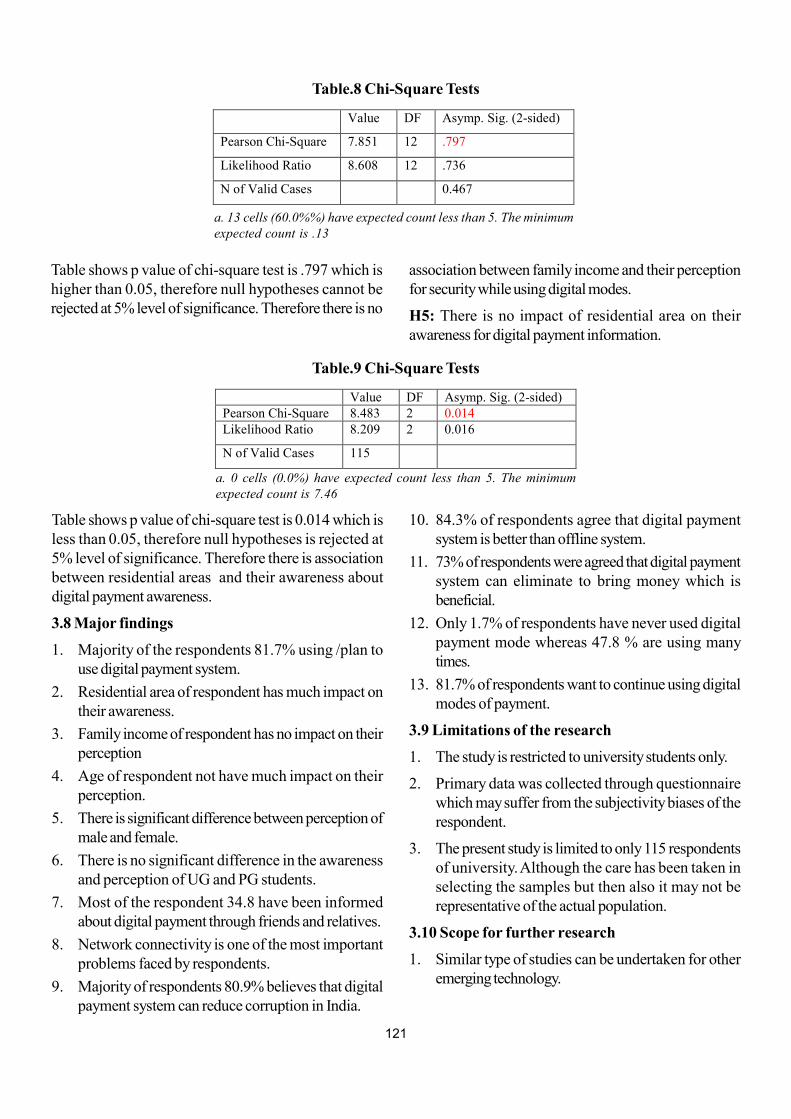
121
Table shows p value of chi-square test is .797 which ishigher than 0.05, therefore null hypotheses cannot berejected at 5% level of significance. Therefore there is no
Table.8 Chi-Square Tests
Value DF Asymp. Sig. (2-sided)
Pearson Chi-Square 7.851 12 .797
Likelihood Ratio 8.608 12 .736
N of Valid Cases 0.467
a. 13 cells (60.0%%) have expected count less than 5. The minimumexpected count is .13
association between family income and their perceptionfor security while using digital modes.
H5: There is no impact of residential area on theirawareness for digital payment information.
Table shows p value of chi-square test is 0.014 which isless than 0.05, therefore null hypotheses is rejected at5% level of significance. Therefore there is associationbetween residential areas and their awareness aboutdigital payment awareness.
3.8 Major findings
1. Majority of the respondents 81.7% using /plan touse digital payment system.
2. Residential area of respondent has much impact ontheir awareness.
3. Family income of respondent has no impact on theirperception
4. Age of respondent not have much impact on theirperception.
5. There is significant difference between perception ofmale and female.
6. There is no significant difference in the awarenessand perception of UG and PG students.
7. Most of the respondent 34.8 have been informedabout digital payment through friends and relatives.
8. Network connectivity is one of the most importantproblems faced by respondents.
9. Majority of respondents 80.9% believes that digitalpayment system can reduce corruption in India.
Table.9 Chi-Square Tests
Value DF Asymp. Sig. (2-sided) Pearson Chi-Square 8.483 2 0.014 Likelihood Ratio 8.209 2 0.016
N of Valid Cases 115
a. 0 cells (0.0%) have expected count less than 5. The minimumexpected count is 7.46
10. 84.3% of respondents agree that digital paymentsystem is better than offline system.
11. 73% of respondents were agreed that digital paymentsystem can eliminate to bring money which isbeneficial.
12. Only 1.7% of respondents have never used digitalpayment mode whereas 47.8 % are using manytimes.
13. 81.7% of respondents want to continue using digitalmodes of payment.
3.9 Limitations of the research
1. The study is restricted to university students only.
2. Primary data was collected through questionnairewhich may suffer from the subjectivity biases of therespondent.
3. The present study is limited to only 115 respondentsof university. Although the care has been taken inselecting the samples but then also it may not berepresentative of the actual population.
3.10 Scope for further research
1. Similar type of studies can be undertaken for otheremerging technology.
122
2. The study can be expanded to cover the state wiseimplementation and awareness among respondent ondigital payment.
3. Similar study for other stakeholder viz., schoolstudents, millennial, rural population senior citizensetc. would be interesting to carry out.
Conclusion
The study reveals that the students are highly aware aboutdigital payment. As most of the respondents considerdigital payment system easy, convenient and time savingas it is available 24*7. It will definitely help students of allfaculties and all age from different residential area. It willalso help. Digital payment will help for betterment ofstudents.
References
Al-Alawi, A. I., & Al-Amer, M. A. (2006). Younggeneration attitudes and awareness towards theimplementation of smart card in Bahrain: anexploratory study. Journal of Computer Science,2(5), 441-446.
Chaudhari, A., Patil, M., &Sonawane, M. (2014).A Study on Awareness of E-Banking Services inCollege Students of Bhusawal City. InternationalJournal of Innovative Research and Development,3(1).
Davies, A. E. (2017). To Study UniversityStudents'perceptions Towards Their CashlessFinancial Transactions (Doctoral dissertation,Cardiff Metropolitan University).
Desai, H. V. (2014). Pre and post behavioral studyof students regarding e-commerce and cybersecurity, Journal of Global Research in ComputerScience, 3(2), 30-32.
Kalyani, P. (2016). An Empirical Study about theAwareness of Paperless E-Currency Transactionlike E-Wallet Using ICT in the Youth of India. Journalof Management Engineering and InformationTechnology, 3(3), 18-41.
Ab Hamid, N. R., & Cheng, A. Y. (2020). A riskperception analysis on the use of electronic paymentsystems by young adult. order, 6(8.4), 6-7.
Singh, S., & Rana, R. (2017). Study of ConsumerPerception of Digital Payment Mode.Journal ofInternet Banking and Commerce, 22(3), 1-14.
Warwick, J., & Mansfield, P. (2000). Credit cardconsumers: College students' knowledge andattitude. Journal of Consumer Marketing, 17(7),617-626.
Websites:
h t t p s : / / w w w . g o o g l e . c o . i n /search?q=1.+https%3a%2f%2fwww.payumoney.co m & a m p ; r l z = 1 c 1 r n r a _ e n u s 5 0 5 u s 5 0 5&oq=1.+https%3 a%20%2fwww. payumoney.com&aqs=chrome..69i57.2402j0j8 &sourceid= chrome&ie =utf-8 (2018, July 15)
https://www.google.co.in/search?q = 2.+ www. google.co.in&rlz=1c1rnra_enus505us505&oq=2.+www.google.co.in&aqs=chrome..69i57.1187j0j8&sourceid=chrome&ie=utf-8 (2018, July 21)
https://www.google.co.in/search?q=3.+http% 3a%2f%2fwww.narendramodi.in%2f&rlz=1c1rnra_enus505us505& amp;oq=3.+http%3a%2f%2fwww.narendramodi.in%2f&aqs=chrome.. 69i57.8796j0j9&sourceid=chrome&ie=utf-8 (2018,July 28)
https://www.google.co.in/search?q=4.+http %3a%2f %2fiosrjournals.org%2f &a mp;rlz=1c1rnra_enus 505us505&oq=4.+http%3a%2f%2fiosrjournals.org%2f&aqs=chrome..69i57.4995j0j9&sourceid=chrome&ie=utf-8 (2018, July 30)
https://www.google.co.in/search?q =5. +http% 3a%2f%2feconom ictimes.com&rlz=1c1rnra_enus 5 0 5 u s 5 0 5 &a m p ; o q = 5 . + h t t p % 3 a % 2 f % 2 feconomictimes.com & aqs= chrome..69i57.4192j0j9&sourceid=chrome&ie=utf-8(2018,August 1)
h t t p s : / / w w w . g o o g l e . c o . i n /search?q=6.+http%3a%2f%2fww w.kaavpulications.org&rlz=1c1rnra_enus505us505&oq=6.+htt p%3a%2f%2fwww.kaavpu lications.org&aqs=ch rome..69i57.3796j0j9&sourceid=chrome& amp;ie= utf-8 (2018, August 9)
h t t p s : / / w w w . g o o g l e . c o . i n /search?q=7.+http%3a%2f%2fwww.business-standard.com&rlz=1c1rnra_enus505us505&oq=7.+http%3a%2f%2fwww.business-standard.
123
com&aqs=chrome..69i57.3986j0j9&sourceid=chrome&ie=utf-8 (2018, August, 9)
https://www.google.co.in/search?q=8.+http%3a%2f %2fwww.forbes.com&rlz=1c1rnra_enus505us505&oq=8.+http%3a%2f%2fwww.forbes.com&aqs=chrome..69i57.11838j0j9&sourceid=chrome&ie=utf-8 (2018, August 9)
h t t p s : / / w w w. g o o g l e . c o . i n / s e a r c h ? q = 9 . +http%3a%2f%2f+ www.allresearch journal.com&rlz=1c1rnra_enus19505us 505&oq=9. +http%3a%2f%2f+www.allres earch journal.com& amp;aqs=chrome..69i57.4363j0j9& sourceid=chrome&ie=utf-8 (2018, August 10)
https://www.google.co.in/search?q=10.+http%3a%2f%2f+www.irmbrjournal.com&rlz=1c1rnra_ e n u s 5 0 5 u s 5 0 5 & a m p ; o q = 1 0 . + h t t p % 3 a %2f%2f+www.irmbrjournal.com&aqs= chrome..69i57.5115j0j9&sourceid= chrome & ie=utf-8 (2018, August 16)
h t t p s : / / w w w . g o o g l e . c o . i n /s e a r c h ? q = 1 1 . + h t t p % 3 a % 2 f % 2 f w w w. i jera.com&rlz=1c1rnra_enu s505us505&oq=11.+http%3a%2f%2fwww.ijera.com&aqs=chrome..69i57.4001j0j9&sourceid= chrome&ie=ut f-8 (2018, August 16)
124
Overview:
Porter (1990) has defined that clusters and nationalcompetitiveness have become key concerns ofgovernment and business.Rosenfeld (2005) in a studysuggested that clusters have become a pot of gold foreconomic development.In many developed nations,especially the European nations, cluster has been playingan essential role in the overall development which is notonly business oriented but for all the other aspects liketourism as well. In these nations, not only the big renownedMultinationals Corporations (MNC) companies but alsoSmall and Medium Enterprises (SME) have gained fromcluster initiatives through recognition and investments. Asthese companies work together like a community for theoverall benefits in the long run, thus it is being saidthat,clustersco-operate, instead of just competing withone another. Such arrangements not only give themfinancial gains, but also helps them for better productivityand human resource skill enhancement.
In this competitive world, globalization has become acommon phenomenon where nations around the globeare competing for better funding, which might be advanced
* Ph.D. Scholar, School of Petroleum Management (SPM), Pandit Deendayal Petroleum University (PDPU), Gandhinagar, Gujarat** Assistant Professor, School of Petroleum Management (SPM), Pandit Deendayal Petroleum University (PDPU), Gandhinagar, Gujarat
Cluster Branding: Issues and Challenges
Bhamra Manmeet Harjit* and Kaushal Kishore**
Abstract
Purpose: This paper has worked on to define the role of clusters and its significant role in the development of aneconomy. This paper also made an attempt to understand the issues and challenges evolve around clusters and howbranding can help them to survive.
Design/methodology/approach: With the help of several secondary data sources, authors tried to understand thelinkages between clusters and branding in general.
Findings: Cluster branding in developing economy has its own importance. Cluster initiatives are organized efforts toincrease growth and competitiveness of different clusters within a region. Cluster supports the economy in acceleratingthe industrialization, introducing and developinginnovations, creating employment and attracting FDI etc. Althoughclusters offer several benefitsto the economy and firms but sustainability and scalability of such clusters requiresomemeaningful insights from academia and policy makers.
Research limitations / Implications: In this study, the major limitation was the data collection, as it was donethrough secondary sources only, which added to further challenge. The secondary data analysis and study had itslimitations on coverage of Indian clusters. The branding of clusters in India is still evolving andsoon researchers willhave more information to access.
Keywords: Clusters, Cluster initiatives in Gujarat, Cluster Branding, Cluster's stakeholders
Paper Type: Conceptual
through cluster initiatives. Thus, in order to achieve allthese gains, it becomes essential for all the clusters tobetter themselves differently in the eyes of the world toget better recognition and identity.Ivan Boesso (2012)studied that "Globalization has dramatically increased theneed for specialization and excellence for clusters to fosterand accelerate".
The major challenge is that, the clusters categorically don'tknow what they really stand for in the initial stages oftheir development, which leads to poor visibility and lackof identification in the eyes of the world (potentialinvestors).The absence of clarity, poor investments andlow degree of commitment of members and stakeholdersare the prime reasons of failure of clusters.
Branding is known for its impact on stakeholders in theform of identity, competitiveness and survival.Considering the issues and challenges with clusters, roleof cluster branding has emerged.
Research Methodology:
This study was conducted as an attempt to understandthe perspective of the clusters, cluster branding and
125
various challenges and procedures involved in clusterbranding as a concept. Data collection for the study waspurely through secondary sources as the study on clusterbranding is still evolving in India. The data collected forthe study was through several studies done in the past,including academic literature and practitioners orientedreports in the field, which were thoroughly reviewed.Several websites of the companies, consulting firms andgovernment's agencies were referred as part of study.
Literature Review:
Rosenfeld (2005) has defined that almost any geographicalgrouping of similar or complementary companies, can bedescribed as a cluster. Porter (1990)has introduced theconcept of a business cluster in 1990, as "a geographicalconcentration of interconnected businesses, suppliers, andassociated institutions in a particular field". Rosenfeld(2005) has confirmed that definition of clusters by Porterhas remained almost the same except in 2005, where he(Porter) re-defined cluster, "as a geographic concentrationof interconnected companies, specialised suppliers,service providers and firms in related industries andassociated institutions in a particular field that competebut also cooperate". Sarkar (2014)has suggested that"the targeting of industrial development programmes atspecific industry clusters generally will provide greatereconomic development benefits than those associated withmore unfocused industrialization".
Solvell, Lindqvist, & Ketels (2003)examinedmanyclusters, however, face branding and image relatedchallenges. Koszarek (2013) has suggested that in today'scompetitive environment, it is important for clusters todifferentiate themselves with the strategic focus on thedevelopment of branding and marketing strategies.
Several studies on branding has emphasized on that howbranding is important for a cluster's development andoverall success. It becomes essential for clusters tounderstand the importance and then formulate a properbranding strategy, will help to attract investments and skills.The branding strategies will also maintain the interest ofthe internal existing members and would help in long termsurvival of the cluster as a brand.
In a globalised scenario, it becomes essential for a clusterto know their own importance, identification and to knowwhat they really stand for and what they want to achieveeventually from this cluster setting. Answering suchquestions ensure that these clusters will formulate brandingstrategies in order to make the cluster a success in thecompetitive world.
To support the industries and clusters, government of Indiaand state governments have taken many initiatives as asafeguard for such emerging companies in particulargeographical areas. The state government of Gujaratunderstands the importance of cluster development andtried to support them through policy intervention.Government of Gujarat (2016) stated that, "Thedevelopment of small and medium enterprises has takenplace in the form of different industrial clusters. Thereare, in all 83 industrial clusters for different industry groupshave been identified in the state, developed at a numberof different locations. The approach of cluster-baseddevelopment has helped in improving costcompetitiveness of the industries by way of creatingcommon facilities, developing market centres and brandnames, promotion of skill".
The State Government has also further taken initiativesto extend support for further solidification these clustersthrough involvements such as, technology up-gradation,quality improvement, setting up of common facility centres,skill development facilities, etc. with the active assistanceof R&D institutions, as well as industry associations(Anneuxure-2).
Pathak (2015) in an article informed that "GujaratMaritime Board, Government of Gujarat, (2016) in anarticle informed that, the regulator of private-sector portsand marine activities in the state, plans to set up a maritimecluster by 2017 on the lines of the ones that exist inLondon, Rotterdam, Hong Kong and New York. Theseclusters house maritime-related service providers suchas ship owners, shipping agents, ship chandlers, andshipping finance and insurance firms and maritimeeducation institutes.
The maritime cluster has potential to become a hub forthe entire country but not only for the state of Gujarat.Thisgeographic concentration of interconnected maritimecompanieswill not only compete with each other, but willalso cooperate to support rapidly growing shippingindustry of the nation.
Solanki (2009) referred that the government of India,under the development for handloom has sanctioned atotal of 419 handloom clusters, among which 9 handloomclusters are based out in Gujarat. In the year 2008-2009these clusters were sanctioned and were allotted toGujarat state handloom and Handicraft Corporation.Cities like Gandhinagar, Junagarh, Amreli, Porbandar,Vadgam, Bhuj and Ahmedabad are being sanctioned
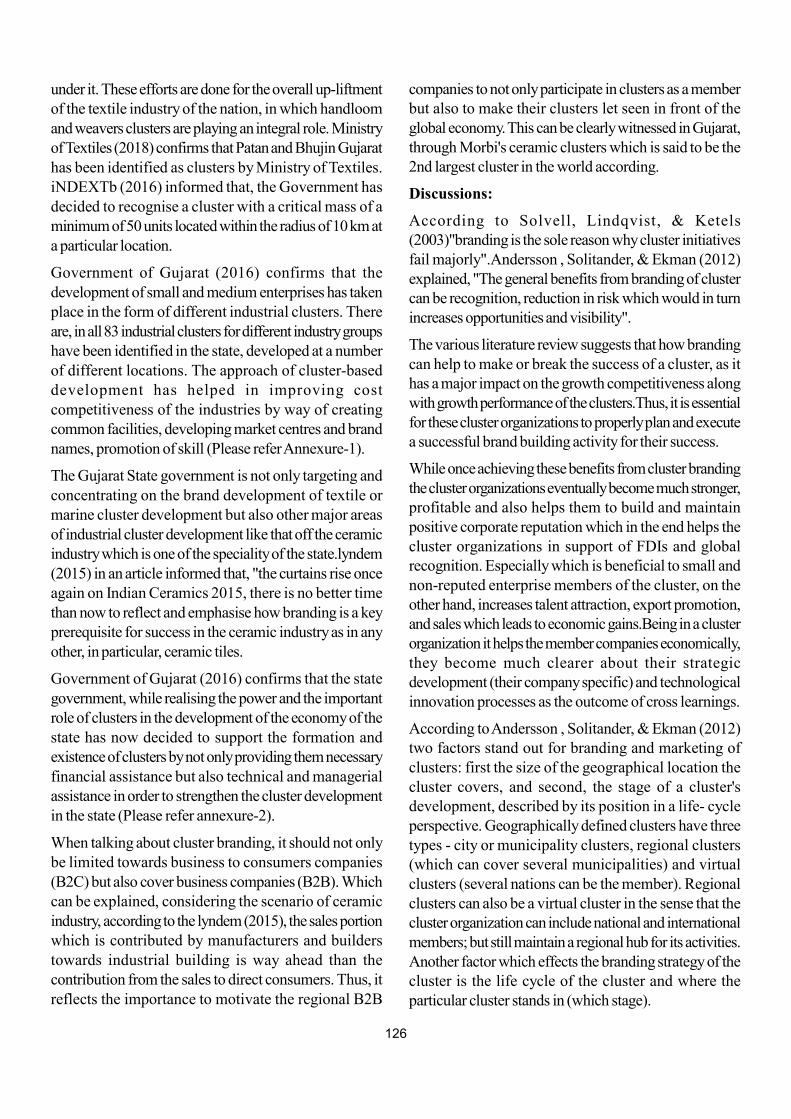
126
under it. These efforts are done for the overall up-liftmentof the textile industry of the nation, in which handloomand weavers clusters are playing an integral role. Ministryof Textiles (2018) confirms that Patan and Bhujin Gujarathas been identified as clusters by Ministry of Textiles.iNDEXTb (2016) informed that, the Government hasdecided to recognise a cluster with a critical mass of aminimum of 50 units located within the radius of 10 km ata particular location.
Government of Gujarat (2016) confirms that thedevelopment of small and medium enterprises has takenplace in the form of different industrial clusters. Thereare, in all 83 industrial clusters for different industry groupshave been identified in the state, developed at a numberof different locations. The approach of cluster-baseddevelopment has helped in improving costcompetitiveness of the industries by way of creatingcommon facilities, developing market centres and brandnames, promotion of skill (Please refer Annexure-1).
The Gujarat State government is not only targeting andconcentrating on the brand development of textile ormarine cluster development but also other major areasof industrial cluster development like that off the ceramicindustry which is one of the speciality of the state.lyndem(2015) in an article informed that, "the curtains rise onceagain on Indian Ceramics 2015, there is no better timethan now to reflect and emphasise how branding is a keyprerequisite for success in the ceramic industry as in anyother, in particular, ceramic tiles.
Government of Gujarat (2016) confirms that the stategovernment, while realising the power and the importantrole of clusters in the development of the economy of thestate has now decided to support the formation andexistence of clusters by not only providing them necessaryfinancial assistance but also technical and managerialassistance in order to strengthen the cluster developmentin the state (Please refer annexure-2).
When talking about cluster branding, it should not onlybe limited towards business to consumers companies(B2C) but also cover business companies (B2B). Whichcan be explained, considering the scenario of ceramicindustry, according to the lyndem (2015), the sales portionwhich is contributed by manufacturers and builderstowards industrial building is way ahead than thecontribution from the sales to direct consumers. Thus, itreflects the importance to motivate the regional B2B
companies to not only participate in clusters as a memberbut also to make their clusters let seen in front of theglobal economy. This can be clearly witnessed in Gujarat,through Morbi's ceramic clusters which is said to be the2nd largest cluster in the world according.
Discussions:
According to Solvell, Lindqvist, & Ketels(2003)"branding is the sole reason why cluster initiativesfail majorly".Andersson , Solitander, & Ekman (2012)explained, "The general benefits from branding of clustercan be recognition, reduction in risk which would in turnincreases opportunities and visibility".
The various literature review suggests that how brandingcan help to make or break the success of a cluster, as ithas a major impact on the growth competitiveness alongwith growth performance of the clusters.Thus, it is essentialfor these cluster organizations to properly plan and executea successful brand building activity for their success.
While once achieving these benefits from cluster brandingthe cluster organizations eventually become much stronger,profitable and also helps them to build and maintainpositive corporate reputation which in the end helps thecluster organizations in support of FDIs and globalrecognition. Especially which is beneficial to small andnon-reputed enterprise members of the cluster, on theother hand, increases talent attraction, export promotion,and sales which leads to economic gains.Being in a clusterorganization it helps the member companies economically,they become much clearer about their strategicdevelopment (their company specific) and technologicalinnovation processes as the outcome of cross learnings.
According to Andersson , Solitander, & Ekman (2012)two factors stand out for branding and marketing ofclusters: first the size of the geographical location thecluster covers, and second, the stage of a cluster'sdevelopment, described by its position in a life- cycleperspective. Geographically defined clusters have threetypes - city or municipality clusters, regional clusters(which can cover several municipalities) and virtualclusters (several nations can be the member). Regionalclusters can also be a virtual cluster in the sense that thecluster organization can include national and internationalmembers; but still maintain a regional hub for its activities.Another factor which effects the branding strategy of thecluster is the life cycle of the cluster and where theparticular cluster stands in (which stage).
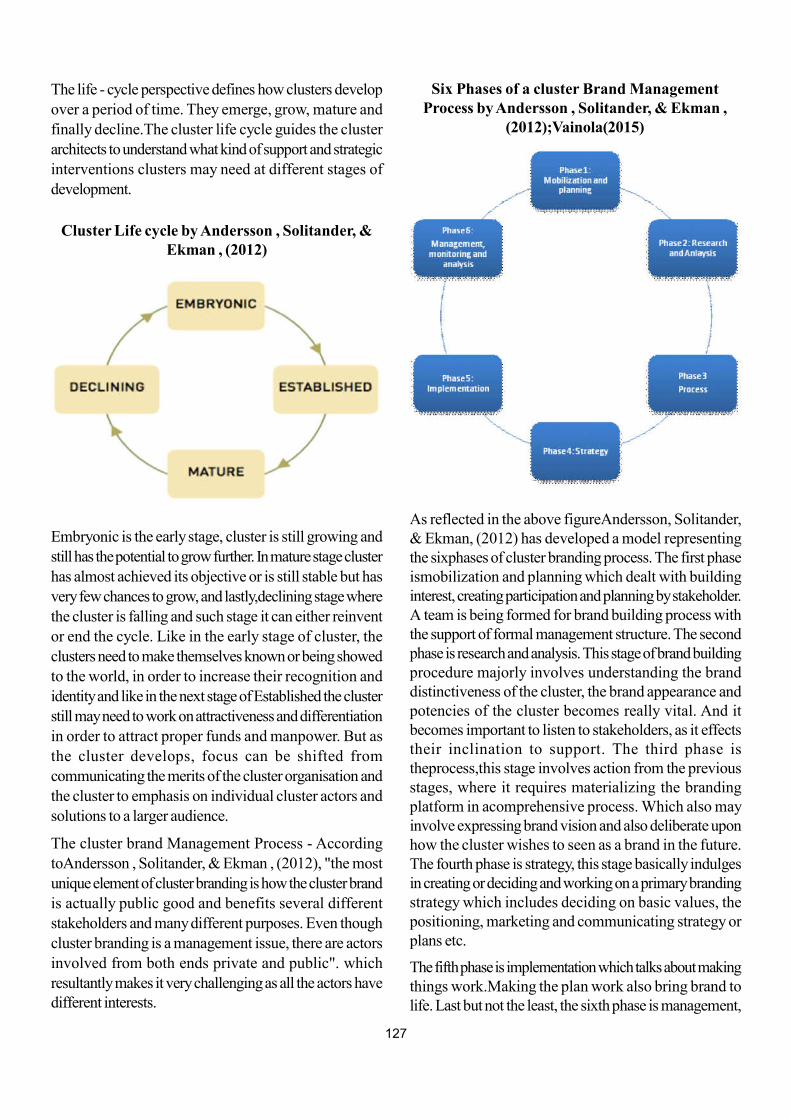
127
The life - cycle perspective defines how clusters developover a period of time. They emerge, grow, mature andfinally decline.The cluster life cycle guides the clusterarchitects to understand what kind of support and strategicinterventions clusters may need at different stages ofdevelopment.
Embryonic is the early stage, cluster is still growing andstill has the potential to grow further. In mature stage clusterhas almost achieved its objective or is still stable but hasvery few chances to grow, and lastly,declining stage wherethe cluster is falling and such stage it can either reinventor end the cycle. Like in the early stage of cluster, theclusters need to make themselves known or being showedto the world, in order to increase their recognition andidentity and like in the next stage of Established the clusterstill may need to work on attractiveness and differentiationin order to attract proper funds and manpower. But asthe cluster develops, focus can be shifted fromcommunicating the merits of the cluster organisation andthe cluster to emphasis on individual cluster actors andsolutions to a larger audience.
The cluster brand Management Process - AccordingtoAndersson , Solitander, & Ekman , (2012), "the mostunique element of cluster branding is how the cluster brandis actually public good and benefits several differentstakeholders and many different purposes. Even thoughcluster branding is a management issue, there are actorsinvolved from both ends private and public". whichresultantly makes it very challenging as all the actors havedifferent interests.
Cluster Life cycle by Andersson , Solitander, &Ekman , (2012)
As reflected in the above figureAndersson, Solitander,& Ekman, (2012) has developed a model representingthe sixphases of cluster branding process. The first phaseismobilization and planning which dealt with buildinginterest, creating participation and planning by stakeholder.A team is being formed for brand building process withthe support of formal management structure. The secondphase is research and analysis. This stage of brand buildingprocedure majorly involves understanding the branddistinctiveness of the cluster, the brand appearance andpotencies of the cluster becomes really vital. And itbecomes important to listen to stakeholders, as it effectstheir inclination to support. The third phase istheprocess,this stage involves action from the previousstages, where it requires materializing the brandingplatform in acomprehensive process. Which also mayinvolve expressing brand vision and also deliberate uponhow the cluster wishes to seen as a brand in the future.The fourth phase is strategy, this stage basically indulgesin creating or deciding and working on a primary brandingstrategy which includes deciding on basic values, thepositioning, marketing and communicating strategy orplans etc.
The fifth phase is implementation which talks about makingthings work.Making the plan work also bring brand tolife. Last but not the least, the sixth phase is management,
Six Phases of a cluster Brand ManagementProcess by Andersson , Solitander, & Ekman ,
(2012);Vainola(2015)
128
monitoring and evaluation. During this phase, theevaluation of the previous phase is done, ensuring thatthe process runs smoothly, branding promises areachieved and modification is done. Sometime clusterbrand audit can take place measuring and evaluating howthe branding strategy implementation and managementhas progressed and functioned
When talking about the success of a cluster organization,the cluster manager plays an important role. The managerof the cluster is not only expected to be knowledgeableregarding the specific area where the cluster operatesbut also, he should have that overall personality whicheventually plays a vital role in the contribution of thesuccess of cluster organization. The cluster managershould have proper networking skills and connectionswhich have a significant function. Additionally, clustermanager does involve branding and selling of what thecluster intends to do, considering both tangibility andintangibility aspects pragmatically. Vainola (2015), "thecluster manager has a significant role both in clusterbranding and also in the overall success of the cluster".
Cluster Branding has its own limitations and challenges.When it comes to the cluster initiatives SME's are theones which are greatly benefitted but compare to largecompanies. Big companies sometimes think that theirbrand is being diluted as SMEs contribution andrecognition is most of the time is question mark. Due towhich cluster members showing lack of commitment andfinally disrupt the speed of cluster branding.
To make cluster initiatives and branding effective, thestakeholders like media, potential members or investors,financial institutions, policy makers and also the customerscan be engaged in various ways. And for that the clustermanager and the cluster as whole have to chooseappropriate communication tools in order to convey thecluster's message to such stakeholders and targetmasses.Andersson , Solitander, & Ekman (2012);Vainola(2015) in their study suggested that unlike products andcorporate branding, geographical branding or brandingfor a cluster is under the control of one single centralauthority, making co-ordination challenging.
Conclusion:
It seems clear that the branding and marketing of clusterhas many challenges. And in order to motivate effortstowards the effective branding and marketing of clusters,a set of actions needs to be undertaken. And definitelyfrom the all the studies it clearly reflects that making the
cluster more visible can work in the success of clusterbrand management. And with this the cluster clearly needsto show their USPs or competitive advantage in order tobecome a successful cluster initiative, thus it isrecommended that the cluster branding initiative shouldhave a clear set of processes.Involvement of clustermembers is essential in order to secure their commitmentto the cluster as a brand. Effective branding andcommunication requires different tools and channels,different marketing activities like trade fairs or basicallymaking one's cluster visible at the respective markets,the cluster should use a mix of both traditional and non-traditional channels tools. The cluster managers shouldseriously think about the PR activities that can well supportthe overall reputation of the cluster as well as drive certainspecific issues.
Cluster initiatives have to be supported at a regional levelwith the full involvement of the local authorities in orderto succeed in the pursuit of branding and marketing ofthe cluster as a brand. Cluster branding should beconsistent with the image of the region and it should bepart of territorial marketing strategy. SME based clustersin Gujarat which have huge potential with the support ofpolicy at the regional and national levels both which isbeing given by the Government. A cluster's strategicmarketing and branding capacity is significantly improvedby public source and co-funding.Clusters when in theinitial stage of development should not only pay attentionon the marketing and branding aspects, but also shouldkeep a holistic concentration on the other factors.
Limitations:
This study was attempted to understand cluster and clusterbranding through based on several studies done in Indiaand abroad. Any geographical grouping of firms whichbelong to similar field is known as a cluster. The findingon clusters suggested that branding can support suchclusters in many ways for which a different level of studywas expected.
In this study, the major limitation was the data collection,as it was done through secondary sources only, whichadded to further challenge. The secondary data analysisand study had its limitations on coverage of Indian clusters.The branding of clusters in India is still evolving and soonresearchers will have more information to access.
The future scope for the study has a huge potential, asthe study can be carried out with an Indian context, keepingin mind that the sector of cluster and cluster branding is
129
still in the introductory stage. The data collection can bemore primary data oriented, where the major insights can
come from current cluster managers, cluster membersand policy makers.
Annexure-1: Some important industrial clusters identified in Gujarat
(Government of Gujarat, 2016)
Sr. No. Type of Cluster Location
1 Brass Parts Jamnagar
2 Castings & Forgings Ahmedabad, Bhavnagar, Jamnagar, Rajkot, Vadodara, Anand
3 Ceramics Morbi, Thangadh, Himatnagar, Ahmedabad
4 Chalk Industry Porbandar
5 Common Salt Anjar, Gandhidham, Dasada
6 Dyestuff Ahmedabad
7 Data Processing Ahmedabad, Surat
8 Diamond Processing Ahmedabad, Surat
9 Fabrication Ahmedabad, Vadodara
10 Fish Processing Veraval
11 Machine Tools Rajkot
12 Oil Engines Rajkot
13 Power driven Pumps Ahmedabad, Mehsana
14 Re-rolling Mills Bhavnagar
15 Textiles Ahmedabad, Dholka, Surat
16 Textiles-Ginning Ahmedabad, Manavadar
17 Textiles-Printing Jetpur
18 Textiles-Khadi Wadhvan
19 Textiles-Finishing Bhuj
20 Textiles-Synthetic Surat , Mangrol
21 Jari-Printing Surat
22 Textiles-Powerloom Ahmedabad, Surat
23 Readymade Garments Ahmedabad
24 Textile Stores Ahmedabad, Surat , Wadhvan
25 Utensils Ahmedabad, Vadodara
26 Wood based Nadiad
27 Book Publishing Ahmedabad
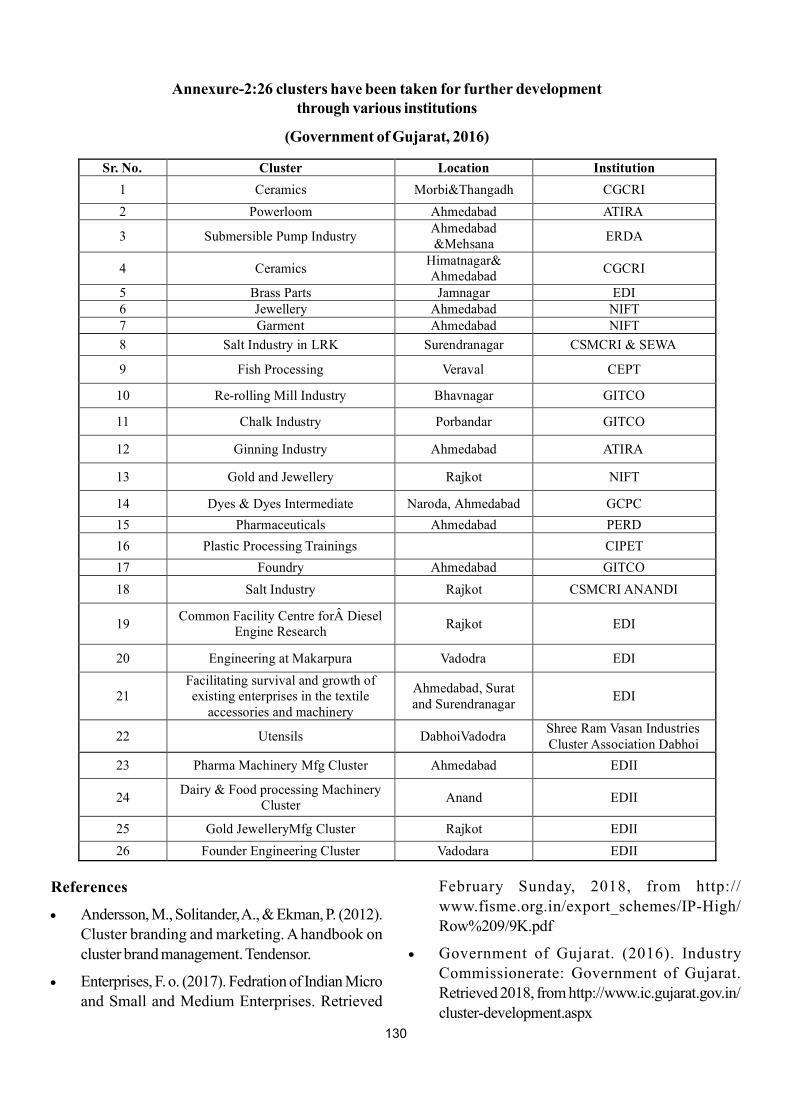
130
Annexure-2:26 clusters have been taken for further developmentthrough various institutions
(Government of Gujarat, 2016)
Sr. No. Cluster Location Institution
1 Ceramics Morbi&Thangadh CGCRI
2 Powerloom Ahmedabad ATIRA
3 Submersible Pump Industry Ahmedabad &Mehsana
ERDA
4 Ceramics Himatnagar& Ahmedabad
CGCRI
5 Brass Parts Jamnagar EDI 6 Jewellery Ahmedabad NIFT 7 Garment Ahmedabad NIFT
8 Salt Industry in LRK Surendranagar CSMCRI & SEWA
9 Fish Processing Veraval CEPT
10 Re-rolling Mill Industry Bhavnagar GITCO
11 Chalk Industry Porbandar GITCO
12 Ginning Industry Ahmedabad ATIRA
13 Gold and Jewellery Rajkot NIFT
14 Dyes & Dyes Intermediate Naroda, Ahmedabad GCPC
15 Pharmaceuticals Ahmedabad PERD
16 Plastic Processing Trainings
CIPET
17 Foundry Ahmedabad GITCO
18 Salt Industry Rajkot CSMCRI ANANDI
19 Common Facility Centre for Diesel
Engine Research Rajkot EDI
20 Engineering at Makarpura Vadodra EDI
21 Facilitating survival and growth of existing enterprises in the textile
accessories and machinery
Ahmedabad, Surat and Surendranagar
EDI
22 Utensils DabhoiVadodra Shree Ram Vasan Industries Cluster Association Dabhoi
23 Pharma Machinery Mfg Cluster Ahmedabad EDII
24 Dairy & Food processing Machinery
Cluster Anand EDII
25 Gold JewelleryMfg Cluster Rajkot EDII
26 Founder Engineering Cluster Vadodara EDII
References
Andersson, M., Solitander, A., & Ekman, P. (2012).Cluster branding and marketing. A handbook oncluster brand management. Tendensor.
Enterprises, F. o. (2017). Fedration of Indian Microand Small and Medium Enterprises. Retrieved
February Sunday, 2018, from http://www.fisme.org.in/export_schemes/IP-High/Row%209/9K.pdf
Government of Gujarat. (2016). IndustryCommissionerate: Government of Gujarat.Retrieved 2018, from http://www.ic.gujarat.gov.in/cluster-development.aspx
131
Ivan Boesso, M. S. (2012). Supporting ClusterMarketing and Branding. Europe.
iNDEXTb. (2016). globalgujarat.com. RetrievedFebruary 08, 2018, from http://www.globalgujarat.com/images/engineering-auto-details.pdf
Koszarek, M. (2013). Challenges of branding andmarketing of clusters. ZeszytyNaukoweSzko?yG?ównej GospodarstwaWiejskiego w Warszawie.PolitykiEuropejskie, Finansei Marketing, (10 [59]).
lyndem, A. S. (2015). The Economic Times.Retrieved February Sunday, 2018, from https://blogs.economictimes.indiatimes.com/et-commentary/branding-in-the-indian-ceramic-tiles-industry/
Marcus Andersson, A. S. (2012). Cluster Brandingand Marketing . In Tendensor (Ed.), Cluster Brandingand Marketing (pp. 12-13). Stockholm: Tendensor.
Ministry of Textiles. (2018). Office of theDevelopment Commisioner (Handlooms), Ministryof Textiles,Government of India. RetrievedFebruary 18, 2018, from http://handlooms.nic.in/Default.aspx?ReturnUrl=%2f
Porter, M. (1990). Competitive Advantage ofNations IN Montgomery, AC and Porter, M.(1991)Strategy-Seeking and Securing Competitive
Advantage. Boston. Harvard Business Review, 135-170.
Pathak, M. (2015, August 10). Why Gujarat needsMaritime Clusters. Retrieved January 18, 2018, fromh t t p : / / w w w. l i v e m i n t . c o m / P o l i t i c s /ZPoRUidoHASecL6dAv4USI/Why-Gujarat-needs-a-maritime-cluster.html
Rosenfeld, S. (2005). Industry clusters: businesschoice, policy outcome, or branding strategy. Journalof New Business Ideas and Trends, 3(2), 4-13.
Sarkar, A. (2014). Eco - Industrial Clsuters:Pathways for evolving New Buisness Models forEco - Innovation and Green growth. Productivity ,54(4), 421 - 441.
Sölvell, Ö.,Lindqvist, G., &Ketels, C. (2003). Thecluster initiative greenbook (p. 11). Stockholm: IvoryTower.
Solanki, N. O. (2009). fiber2fashion. Retrieved2018, from fiber2fashion: https://www.fibre2fashion.com/industry-article/5106/implementation-of-handloom-cluster-and-role-of-wsc
Vainola, L. -E. (2015). Cluster Brand as acompetative Advantage - Airport cluster finland.Aalto : Aalto university school of Buisness .
132
Introduction:
In India, Dairy sector plays an important role, when welook at the socio-economic development. It providesfood, which is nutritional and cheap at the same time.The dairy sector has helped the Indian Economy to bebetter in all possible ways. The development in this sectorhas provided ample amount of opportunities. This hasalso helped in increasing the employment and decreasingthe poverty rates. On the whole, this progress has madeIndia, the leading producer of milk.
The dairy sector in India is operated by Co-operativeSocieties and Milk Unions. The National DairyDevelopment Board is the primer institution of DairyIndustry. Coming to Gujarat, there are 17 district unions,which manufactures the dairy products for Gujarat Co-operative Milk Marketing Federation Limited, whichmarkets these products in the name of Amul.
The survey undertaken here is of Surat city. Surat is oneof the major cities of Gujarat, famous for its diamondsand textile industries. Surties are popular worldwide fortheir eating habits and love for food. Be it of any type-traditional, fast food or the staple one!
* Students of MBA Programme (2017-2019), G H Patel Post Graduate Institute of Business Management, Sardar Patel University, V.V.Nagar
Consumer Buying Behaviour and Market Size of Milk in Surat City
Aashaka Thakkar* and Parth Chauhan*
Abstract
Purpose: The main aim of this research was to study the buying behaviour of households regarding milk. The marketsize and per capita consumption of milk is also derived from this study. It also showcases various reasons for changingconsumption patterns of households.
Design/Methodology: As a result of literature review, a structured questionnaire was designed. The survey wasconducted in different areas of Surat. The interviewer-administered method was selected to survey 1003 respondents.
Findings: Results shows that the branded packaged milk has more market share in Surat city compared to allavailable forms. The total market size of milk was calculated to be 15.75 lakh liter. And per capita consumption turnedout to be 0.308 ml. The other results showcases the reasons behind such behaviour.
Research Limitations: The research work is limited to the type of survey. Due to time constraints ConvinenceSampling technique was used. Moreover, at times when the Female of the households were not available, the Malesor available adult was interviewed.
Originality / value: The study focuses on the buying behaviour and perception for both the packaged and loose milk.Moreover, the influences, changing patterns and rising demand was also studied during the work.
Keywords: Milk, Consumption pattern, Market size.
Paper Type: Research Paper
If we only look at the milk, Surat daily consumes lakhs ofliter of milk. Along with milk, several other milk productsare also consumed on daily basis.
The general purpose of this study is to discover theconsumption behaviour of the households and calculatethe market size of milk in Surat City. Also, the variousfactors affecting the consumption of liquid milk are studiedand observed. The study covers almost all possible areasof Surat city.
Literature Review:
Kumar (2014) had undertaken a study to depict thepatters in consumption of milk and milk products. Thisstudy also forecasts the possible demand and supply ofmilk in India by 2026-27. It was surveyed on the basisof the primary data collected by National Sample Surveyorganization. The survey shows that there is a drift in theconsumption pattern of milk and milk products. It alsodepicts that the increasing demands for the same will putIndia under pressure to maintain the existing growth inmilk production.
Chawla (2011) concluded that the consumption of milk isincreasing at more than double the rate, while the increase
133
in production takes place at a slower rate of three percent. This will eventually create an unbalanced demandand supply of the commodity. Also, the exports of itemssuch as skimmed milk powder and butter oil may increase,as India will step into the international markets. At the sametime, there is an increased demand of products like cheeseand tabled butter because of the changing lifestyle andimpacts of western style of fast foods. The modern retailoutlets promote such commodities. As a result, this willincrease the opportunities for many products to enter intoa huge market.
Kassahun Melesse and Fekadu Beyene in their researchstudy on "Consumption pattern of milk and milk products"derived some interesting findings. From their study theyfound out that there prevails a female dominancy when itcomes to the food budgeting. The increasing householdincome is the reason for the increasing consumption ofmilk and vis-à-vis is also true.
Research Design and Data collection:
The methods and procedures used for gathering theinformation needed for the research study, in known asresearch design. The design used for this project isdescriptive research design.
A scientific method which involves observing anddescribing the behavior of a subject without influencing itin any way is known as Descriptive Research Design.When the information is to be obtained in the true formfrom the source, this particular method is used.
For the survey purpose, a structured questionnaire wasdesigned and employed to collect data from thehouseholds. The questionnaire was intervieweradministered. The sample size of the survey was 1003households. The entire Surat city was divided into 5 zonesand households from all these zones were selected usingconvenience sampling technique. The sources of datawere both primary and secondary. Secondary data wascollected from company's website, records, census,published literatures and journals. The females of thehouseholds were interviewed for the collection of primarydata. Below listed are the areas from where the sampleswere collected.
Research Objective:
The objective of the research is:
1. To study the Socio-Economic profile of thehouseholds consuming milk and milk products.
2. To study the consumption behavior and purchasepattern of Milk in households.
3. To estimate per capita consumption and total marketsize of packaged milk in Surat city.
4. To estimate the actual proportion of the milkconsumed for drinking in Surat city.
5. To estimate the change in consumption pattern ofhouseholds of Surat in different festivals.
Data Analysis:
Methods of data analysis such as Cross-tabular method,averages, and percentages were used to analyze data inSPSS. Chi-square analysis was used to analyze factorsaffecting consumption behavior.
Market size was calculated using this formula:
First of all the average family size was calculated fromthe collected data. Dividing the total quantity of milkconsumed per household by the total number of familymembers gives the per capita consumption of thehouseholds.
To find out the total market size, this per capitaconsumption was multiplied to the total population of Suratcity. This depicts the total Milk market of Surat. To furtherderive the market size of packaged milk, the total marketsize can be multiplied to the market share of packagedmilk.
Data Analysis and Interpretation
For estimation of per capita consumption of packagedmilk in city of Surat.
Size of family (in average) = Number of family membersin total(of respondant) / Number of responses in total= 4435/100= 4.4 members per family
Consumption of milk in total = quantity of milk purchasedin average (yesterday & today)= 1335.575 liter
Consumption per household:= 1335.575/1003= 1.3315 litre per household.
Consumption per capita = consumption per household /average size of family= 1.3315/4.4= 0.308 litre
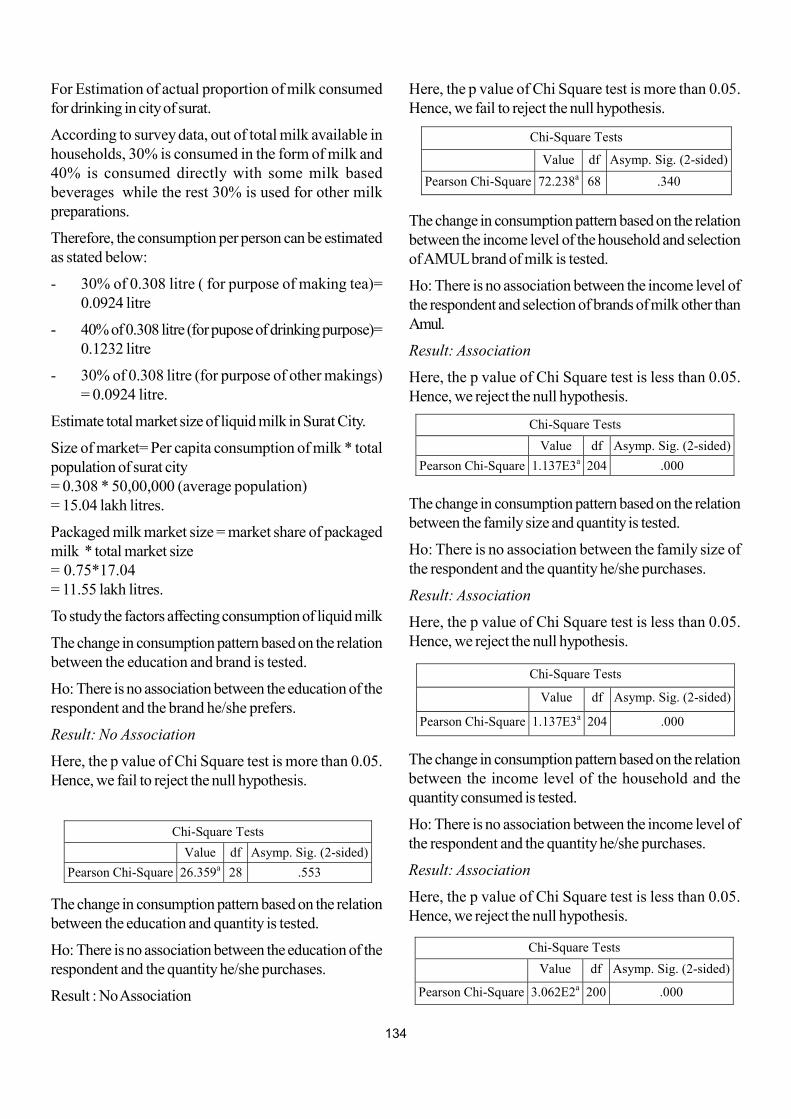
134
For Estimation of actual proportion of milk consumedfor drinking in city of surat.
According to survey data, out of total milk available inhouseholds, 30% is consumed in the form of milk and40% is consumed directly with some milk basedbeverages while the rest 30% is used for other milkpreparations.
Therefore, the consumption per person can be estimatedas stated below:
- 30% of 0.308 litre ( for purpose of making tea)=0.0924 litre
- 40% of 0.308 litre (for pupose of drinking purpose)=0.1232 litre
- 30% of 0.308 litre (for purpose of other makings)= 0.0924 litre.
Estimate total market size of liquid milk in Surat City.
Size of market= Per capita consumption of milk * totalpopulation of surat city= 0.308 * 50,00,000 (average population)= 15.04 lakh litres.
Packaged milk market size = market share of packagedmilk * total market size= 0.75*17.04= 11.55 lakh litres.
To study the factors affecting consumption of liquid milk
The change in consumption pattern based on the relationbetween the education and brand is tested.
Ho: There is no association between the education of therespondent and the brand he/she prefers.
Result: No Association
Here, the p value of Chi Square test is more than 0.05.Hence, we fail to reject the null hypothesis.
Chi-Square Tests
Value df Asymp. Sig. (2-sided)
Pearson Chi-Square 26.359a 28 .553
The change in consumption pattern based on the relationbetween the education and quantity is tested.
Ho: There is no association between the education of therespondent and the quantity he/she purchases.
Result : No Association
Here, the p value of Chi Square test is more than 0.05.Hence, we fail to reject the null hypothesis.
The change in consumption pattern based on the relationbetween the income level of the household and selectionof AMUL brand of milk is tested.
Ho: There is no association between the income level ofthe respondent and selection of brands of milk other thanAmul.
Result: Association
Here, the p value of Chi Square test is less than 0.05.Hence, we reject the null hypothesis.
Chi-Square Tests
Value df Asymp. Sig. (2-sided)
Pearson Chi-Square 72.238a 68 .340
Chi-Square Tests
Value df Asymp. Sig. (2-sided)
Pearson Chi-Square 1.137E3a 204 .000
The change in consumption pattern based on the relationbetween the family size and quantity is tested.
Ho: There is no association between the family size ofthe respondent and the quantity he/she purchases.
Result: Association
Here, the p value of Chi Square test is less than 0.05.Hence, we reject the null hypothesis.
The change in consumption pattern based on the relationbetween the income level of the household and thequantity consumed is tested.
Ho: There is no association between the income level ofthe respondent and the quantity he/she purchases.
Result: Association
Here, the p value of Chi Square test is less than 0.05.Hence, we reject the null hypothesis.
Chi-Square Tests
Value df Asymp. Sig. (2-sided)
Pearson Chi-Square 1.137E3a 204 .000
Chi-Square Tests
Value df Asymp. Sig. (2-sided)
Pearson Chi-Square 3.062E2a 200 .000
135
To estimate the change in consumption pattern ofhouseholds of Surat in different festivals.
In the survey, the consumption pattern of festivals wasalso studied. There are number of households whoseconsumption pattern changes during each festival.Through the statistical analysis we have derived theadditional demand of milk during different festivals. Theyare as follows:
Makarsankranti: Demand of milk increases by 423litre during this festival.
Diwali: Respondents are consuming extra quantityof milk during this festival making the demand of 985litre per 1000 households.
Rakshabandhan: Increased demand of 775 litre ofmilk per 1000 households is observed.
Shraadh: An increased demand is of 546 litre isobserved from the survey of 1000 houses.
Eid: Out of the 1000 respondents interviewed, only58 respondents were using extra milk in the festivalof Eid making the demand of 100 litre
Janmasthami: 416 litres of extra milk is demandedduring tis festival based on this survey.
Randhanchatt: This makes the additional demand of260 litre on this day.
Chandi Padwa: Increase of only 136 litre of milk isseen during this festival.
Shravan: Demand observed during this month is of328 litres of milk.
Sharad Purnima: The demand increases by 352 litreof milk at this time.
Besta Varas: There is an increase in demand of about328 litre during this time of the year.
Others: Only 7 respondents have added otheroccasions when their consumption is increased. Thisdemand is of 14 litre.
FINDINGS:
Objective 1: SOCIO ECONOMIC PROFILE
76% of the respondents were Female and rest 24%were Male.
Most of the respondents were educated up toGraduation level.
It was found that out of total respondents, 68%belonged in 3 to 5 family size, 12% belonged to more
than 5 member's family size, 17% belonged to 2family size, and 3% belonged to individual dwelling.
Out of total respondents, 40% of the respondentswere engaged in private job, 28% respondents werein government job, 19% respondents were self-employed and 13% respondents had their ownbusiness.
41% of respondents belonged to income groupranging 250000 to 500000 annually, whereas 4%minority belonged to less than 250000 annual incomegroup.
Objective 2: CONSUMPTION BEHAVIOR OFHOUSEHOLDS IN SURAT CITY RELATED TOPACKAGED MILK.
98.3% of the households are regular users of milk.1.1% are occasional users. These are mostlybachelors or students who have different food habits.
Out of 1003 respondents, 74.4 % of householdsprefer to use 'Branded Packed' milk, followed by16.2% of unbranded loose milk.
In 46.1% of households, the females' makes thepurchase, in 24.8% on households there is a facilityof home delivery, at 17.5% of households the son/daughter makes the purchase.
36.5% are early risers, who makes the purchasebetween 5:30 to 7:30 AM and 32.2% of householdsmakes the purchase between 7:30 to 8:30 AM.Almost 31.3% of the households prefer to purchasemilk in the second half of the day.
Amul brand here has a market of 79.4% as a directpreference. This is the first choice of majority of thehouseholds of Surat city. Followed by a fragment of11.1% of customers of Vijay dairy or Choriyasi.
44.3% of the households are using Whole milk, thatis Amul Gold. 30.4% are using standard milk, whichis Amul Sakti. 8.4% of households prefer TonedMilk, which is Amul Taaza. There is a segment of8.1 % who consumes Amul Cow milk.
40.4% of households are making purchase from theProvision Stores in the nearby areas. Followed by19.7%, those are making purchase form the milkbooths. We have class of 12.4% of households thatprefer home delivery system. A small segment of16.6% uses the grocer shop for the purchase of milk.Rests have varied options available according to theirconvenience.
136
Objective 3: PER CAPITA CONSUMPTION
It was estimated that the per capita consumption ofliquid milk in Surat City is 0.308 litres daily. Per capitaconsumption was arrived at by dividing average perhousehold consumption with average family sizewhich was estimated to be 4.4.
The proportion wise usage of milk for differentpurposes that in all makes a total of 0.308 litre thatis, roughly 300 ml. Here, we can conclude that asingle time tea drinker would be consuming only 90ml of milk, a person who drinks milk once in a daywould be consuming roughly 120 ml of milk and rest90 ml of the per capita milk available is used formaking of different milk products like Dahi, Buttermilk, etc.
Objective 4: TOTAL MARKET SIZE
It was revealed that total potential for liquid milk inSurat city is estimated to be 15.04 lakh litres andpotential of packaged liquid milk was estimated tobe 11.55. lakh litres.
Objective 5: FACTORS AFFECTINGCONSUMPTION OF LIQUID MILK
It was revealed that majority of respondentsconsidered availability of milk as the major factorfollowed by consistency and price. These factors playan important role in decision making of consumers.
There was no significant impact of education onquantity consumed per household, whereas there wasa significant impact of annual income, family size, age,type of family, and occupation on quantity consumed.
Senior women (Mother-in-law, Mother, GrandMother) (97%) influenced decision making relatedto milk and milk products in most of the households.
46 % of respondents were spending in range of Rs35 to 40 per litre of milk, 43% of them were spendingless than Rs 35 per litre of milk, followed by 11%spending more than 40 Rs per litre.
Limitations
Sampling Method used was Non ProbabilityConvenience due to time constraint.
At several places housewives were not available andhence males became our available respondents.
Conclusion:
It was concluded that the market potential ofpackaged liquid milk in Surat city is very highamounting to 15.04 lakh litres. Also, the consumptionbehavior of Surat city shows that most of the peopleare buying packaged milk and buffalo milk in quantityof 1.5 to 3.5 litres making it 74.4% and only 25.6%people opting for loose milk.
Further, it was concluded that there was noassociation between the education and the quantityof milk consumed, whereas there was an associationbetween annual income, family size, age, type offamily, occupation on quantity consumed.
The reason of buying loose milk was found out to beits quality and nutritional value as perceived byrespondents.
Factors affecting the buying behavior of people aremainly availability, followed by consistency and price.Further, it can be concluded that a large and widemarket is already in the hands of Packaged Milksuppliers i.e Amul Milkas people opting for loosemilk is a smaller segment.
Even though, theycan still increase theirmarket sharegiven that it takes appropriate strategies to capturemarket and win confidence of people for packagedmilk. Overall there is a positive environment for thepacked milkwhich should be utilized by capturing andincreasing market size through proper understandingof consumer buying behavior and factors affecting it.
References
Anonymous. "AMUL BOOK"- Achievements andawards details. Gujarat Co-operative MilkMarketing Federation.
Anonymous. (2017) "Annual Report of GCMMF(2011-2012)". Retrieved from http://www1.ximb.ac.in/users/fac/visiting/vfac.nsf/23e5e39594c064ee852564ae004fa010/7e07e576262b8e5b6525757400226be2/$FILE/GCMMF%20Case%20ACRJ%20version.pdf
Kumar, A., Joshi, P. K., Kumar, P., &Parappurathu,S. (2014). Trends in the consumption of milk andmilk products in India: implications for self-sufficiencyin milk production. Food security, 6(5), 719-726.
Mehta, K. P. (2016). Market potential andconsumption behavior of packaged milk in surat city

137
(Doctoral dissertation, Aspee Agribusiness Mgt.Ins., NAU, Navsari).
Melesse, K., &Beyene, F. (2009). Consumptionpattern of milk and milk products in Ada'aworeda,East Shoa Zone, central Ethiopia. LivestockResearch for Rural Development, 21(4), 1-11.
Shah, B. (2017). A Study on Drivers ofOrganizational Structure and Design as Tool toEnhance Organizational Effectiveness: A Case Studyof AMUL. Int J Innov Res Multidiscip Field, 3(4),55-59p.
Websites:
http://sumul.com/index.html retrieved on: 10/01/2019
http://www.censusindia.gov.in/2011census/dchb/2425_PART_B_DCHB_SURAT.pdf retrieved on:10/01/2019
http://www.amul.com/files/pdf/GCMMF-turnover.pdfretrieved on: 10/01/2019