synergies between renewable energy and flexibility ... - mdpi
TRANSCRIPT

energies
Article
Synergies between Renewable Energy and FlexibilityInvestments: A Case of a Medium-Sized Industry
Natapon Wanapinit * and Jessica Thomsen
�����������������
Citation: Wanapinit, N.; Thomsen, J.
Synergies between Renewable Energy
and Flexibility Investments: A Case
of a Medium-Sized Industry. Energies
2021, 14, 7753. https://doi.org/
10.3390/en14227753
Academic Editor: Ali Mehrizi-Sani
Received: 14 October 2021
Accepted: 15 November 2021
Published: 18 November 2021
Publisher’s Note: MDPI stays neutral
with regard to jurisdictional claims in
published maps and institutional affil-
iations.
Copyright: © 2021 by the authors.
Licensee MDPI, Basel, Switzerland.
This article is an open access article
distributed under the terms and
conditions of the Creative Commons
Attribution (CC BY) license (https://
creativecommons.org/licenses/by/
4.0/).
Fraunhofer Institute for Solar Energy Systems ISE, Heidenhofstrasse 2, 79110 Freiburg, Germany;[email protected]* Correspondence: [email protected]; Tel.: +49-761-458-85221
Abstract: Climate and energy policies are tools used to steer the development of a sustainableeconomy supplied by equally sustainable energy systems. End-users should plan their investmentsaccounting for future policies, such as incentives for system-oriented consumption, emission pricesand hydrogen economy, to ensure long-term competitiveness. In this work, the utilization of variablerenewable energy and flexibility potentials in a case study of an aggregate industry is investigated.An energy concept considering PV and battery expansion, flexible production, fuel cell electrictrucks (FCEV) and hydrogen production is proposed, and analysed under expected techno-economicconditions and policies of 2030 using an energy system optimization model. Under this concept, totalcosts and emissions are reduced by 14% and 70%, respectively, compared to the business-as-usualsystem. The main benefit of PV investment is the lowered electricity procurement. Flexibility fromschedulable manufacturing and hydrogen production increases not only the self-consumption ofPV generation from 51% to 80% but also the optimal PV capacity by 41%. Despite the expectedcost reduction and efficiency improvement, FCEV is still not competitive to diesel trucks due tohigher investment and fuel prices, i.e., its adoption increases the costs by 8%. However, this isresolved when hydrogen can be produced from own surplus electricity generation. Our findingsreveal synergistic effects between different potentials and the importance of enabling local businessmodels, e.g., regional hydrogen production and storage services. The SWOT analysis of the proposedconcept shows that the pursuit of sustainability via new technologies entails new opportunities andrisks. Lastly, end-users and policymakers are advised to plan their investments and supports towardsintegration of multiple application, consumption sectors and infrastructure.
Keywords: optimization; investment; renewable energy; demand-side management; hydrogen economy
1. Introduction
Energy system decarbonization requires massive and rapid investments in both re-newable energy (RE) and flexibility technologies [1]. Essential emission reduction measuresinclude utilization of biomass, wind and solar energy, electrifying heat generation andtransport, and replacing fossil fuels with renewable hydrogen in selected applications [1].Flexibility—the ability to react to changes in demand and supply—accommodates effectivevariable RE integration, and arises from various processes, e.g., energy storage, demand-side management and sector-coupling technologies [2]. Ideally, needs from the privatesector based on market conditions without public supports should drive these investments.
Studies on optimal investments at a national level which consider a variety of po-tentials, e.g., [3–5], found that both RE and complementing flexibility investments arenecessary for cost-effective and sustainable decarbonization efforts. Studies at an end-userlevel are sparse and often focus of selected technologies or applications. For example: [6]studied optimal sizes battery in households with PV. An optimal planning of a microgridcampus with PV and battery was evaluated in [7]. In [8], a self-sufficient energy supplyconcept based on local bio-waste and flexible combined heat-and-power plants was anal-ysed. Ref. [9] studied the flexibility potential for reserve energy provision and electricity
Energies 2021, 14, 7753. https://doi.org/10.3390/en14227753 https://www.mdpi.com/journal/energies
Energies 2021, 14, 7753 2 of 24
cost reduction in a pulp-and-paper industry. Similarly, potentials in steel production andchemical plants are studied in [10,11], respectively. Ref. [12] found that the potential toreduce primary energy and CO2 emissions of a plastic processing industry is best usedwhen consumption, generation, distribution and storage are intelligently linked. Thissuggests that synergies between these potentials also exist in various end-users, and thatend-users should investigate them together.
Policymakers introduce energy and climate policies to steer end-users’ investmentstrategies towards common welfare [13,14]; for example, introducing CO2 prices for trans-port and heating fuels encourage electrification and the utilization of renewable fuels [15].Commercial end-users should plan their long-term investment strategies carefully to staycompetitive under prospective policies, i.e., to invest in new technologies at the right time,while adapting their production and energy supply towards carbon neutrality [16]. Aspolicies are constantly changing, so do the optimal strategies and the synergetic effectsof RE and flexibility. Furthermore, these synergies are likely different for each end-usergroup, as operating characteristics of end-users influence their investment strategies [17].Thus, regular evaluations of investment strategies for each end-user group are crucial, bothfor policymakers and investors.
In this work, an energy supply concept for a medium-sized aggregate industry, agravel plant, is proposed and evaluated. The plant is characterized by high demand forelectricity and transport fuel, high RE potentials from its large vicinity and operational flex-ibility from semi-automated production and material storage. Aggregate industries supplyconstruction materials, which are essential elements not only for the urbanization of devel-oping economies but also for the global growth of climate-resilient infrastructure [18,19].This work will answer two questions: (1) How do different investment strategies affect totalcosts and scope 1 and 2 CO2 emissions of the plant in 2030? Scope 1 includes emissions directlyfrom sources owned by the company. Scope 2 considers emissions related to purchased elec-tricity [20]. (2) What are the advantages and disadvantages of the least-cost strategy formedium-sized industries? A techno-economic optimization model for distributed energysystems is used to analyse the plant and to answer the first question; the second question isanswered by performing the SWOT analysis on the optimal investment strategy from themodelling results.
The contributions of this work are: The joint consideration of various investmentoptions—namely PV, wind turbines, battery storage, demand-side management, fuelcell electric trucks and hydrogen production from electricity surplus—under a novelbusiness model reveals their interaction. The combination of model-based and qualitativeanalyses provides deeper insights for operators and decision-makers. Its contribution tothe knowledge on investment strategies towards sustainable productions for medium-sizedindustries enables more inclusive energy system transition and decarbonization.
The paper is structured as follows: Section 2 introduces the expected regulatoryframework in the future. Section 3 presents the methodology. The case study is describedin Section 4. Results are presented in Section 5, and are discussed in Section 6. Lastly,Section 7 concludes the paper.
2. Background on Prospective Policies
Energy and climate policies can affect investment strategies of industrial end-users [16].For example, under low feed-in tariffs of variable renewable energy, investments may beintended for self-consumption. To plan a cost-effective strategy towards carbon neutrality,end-users must consider prospective policies while exploiting their renewable energy andflexibility potentials. In this section, four policies deemed influential for this planning arepresented, namely, decreasing supports for renewable energy in Section 2.1, incentives forflexible consumption in Section 2.2, CO2 emission pricing in Section 2.3 and the promotionof renewable hydrogen in Section 2.4.

Energies 2021, 14, 7753 3 of 24
2.1. Reduction in Renewable Energy Supports
Technological development drives down costs of variable renewable energy (VRE)generation to the point that VRE is already competitive with conventional power plants insome regions of the world [21]; as results, average prices of VRE auctions are decreasing [22].In Germany, PV feed-in tariffs have been strongly reduced in recent years [23]; and levelizedcosts of wind and solar generation can compete with costs of combined-cycle gas turbinesin 2030 [24].
As the development progresses, and VRE is expanded at an unprecedented pace, newchallenges includes how to effectively integrate VRE into systems [25]. On the premise thatVRE should recover costs via markets just like conventional generation, support schemescould interfere with market mechanisms and distort market prices from generation costs. Inthis regard, supports should be kept low, and feed-in premiums are preferred over feed-intariffs [26]. Due to its similar generation profile, market values of VRE decrease as morecapacities are integrated, i.e., cannibalization effect [27]. This could lead to reducing feasibilityof VRE investments in coming decades. Since the reducing supports and uncertainty inmarket-based revenues, end-users looking to invest in their VRE potentials arguably shouldfocus on self-consumption.
2.2. Price-Based Incentives for Flexibility Utilization
Flexibility potentials can be utilized explicitly via markets or implicitly via the re-action to time-varying tariffs [28]. The latter is of interest for this work. Tariff design iscomplex, and requires consideration of different principles, namely system sustainability,e.g., complete cost recovery, economic efficiency, e.g., cost-causality, and customer protection,e.g., transparency and simplicity. Principles may act against one another—e.g., a flatprice is simple, but not cost-causal –, and must be prioritized [29]. Tariffs consist of threecomponents, namely procurement, grid fees and taxes-and-levies [30].
Each agent in liberalized electricity markets can incentivize behaviours beneficial totheir responsibility by introducing time-varying prices. Grid operators may charge higherfees during periods of congestion to deter consumption, and to reduce grid expansion inthe long term [31]. For energy providers, procurement rates reflecting market prices canencourage consumption during periods with low marginal generation costs, which reducessupply costs [32].
While the ratio of capital and operational expenditures of electricity grids may vary fromcountry-to-country, these expenditures generally involve large initial investments, which shall berecovered gradually over assets’ lifetimes (30–40 years) via grid fees [33,34]. The cost structureof grid fees is conventionally based on a peak power charge and a fixed volumetric charge.As end-users evolve from a price-insensitive consumer to a flexible prosumer, this structuremay not be adequate to ensure a complete cost recovery [35]. To ensure sufficient revenuesfor grid operators and to provide incentives for grid-friendly consumption, the structureshould comprise of a fixed charge and a time-varying volumetric charge [35,36].
2.3. Prices of CO2 Emissions
Different political instruments to curb emissions by internalizing environmental costsexist, e.g., cap-and-trade or carbon tax. Their implementation scopes and prices vary fromnation to nation [37]. Low carbon technologies required for the long-term sustainabledevelopment may not be invested if the prices are too low [38]. For comparison, clearingprices in the EU emission trading system fluctuated between 15–32 e/ton in 2020 [39].The regulated price during the introduction phase of German emission trading system is55 e/ton in 2025 [40]. Abatement costs of direct air capture without utilizing waste heatin 2020 are 222 e/ton [41]. Even though the future prices are uncertain, it is generallyprojected that prices will rise over time, cf. [15,42,43].
Energies 2021, 14, 7753 4 of 24
2.4. Renewable Hydrogen Economy
Renewable hydrogen—hydrogen produced from renewable energy—is a candidateenergy carrier for many difficult-to-decarbonize applications, e.g., long-haul transport orhigh temperature heat generation [44]. As key technologies, e.g., electrolyzer and fuel cell,are still not cost-competitive, their research and investment require public supports witha clear target [45]. In the EU sustainability vision, the share of hydrogen in total energydemand is expected to increase from less than 2% to 14% in 2050; and 40 GW productioncapacity should be regionally available by 2030 [45].
Both hydrogen fuel cell electric vehicles (FCEV) and battery electric vehicles (BEV)are essential to decarbonize land-based transport [46]. While both use electrical drivetrains, their performances and costs vary. BEV is more efficient than FCEV; whereas, FCEVpurchase costs are cheaper than BEV [47]. FCEV can drive further and transport morepayload due to the higher energy density of hydrogen; thus, it is suited for commercialvehicles, trucks and buses [46].
3. Methodology
The model for the quantitative analysis is explained in Section 3.1. The SWOT frame-work is presented in Section 3.2.
3.1. Energy System Model
The techno-economic optimization model for local energy systems DISTRICT [48,49], isused to determine the optimal operation and investment strategies. Systems are representedin a regionalized and time-resolved manner, which is suitable for analyzing renewableenergy and flexibility potentials. They are assumed to be price-takers. Feasible solutionsadhere to operational constraints, e.g., energy balance, efficiency and transport capacitiesand targets, e.g., renewable energy generation. The model solves for solutions with thelowest total costs, which include costs related to investment, operation, energy importand emissions.
The utilization of end-user flexibility must consider manifold process characteristics,e.g., working hours, input/output delivery, production- targets, sequences and efficiency.A generic process model developed in [50] describes flexible processes in details, and iscoupled to DISTRICT for modelling flexible production. The coupling is done by includingprocess power consumption in the energy balance equations, and operation costs in totalcosts. That is, both technical and economical aspects are linked. Thus, solutions considerall potentials and constraints.
The coupled model is a mixed-integer linear program. The case study is optimizedover one year in a 15-min time interval. Figure 1 shows inputs and outputs of the modelrelevant to this case study. In Appendix A, the model is further elaborated. Interestedreaders are referred to [48–50] for the full description.
Parameters:
Technology costs andoperating characteris-tics, VRE generationprofiles, electricitytariff, energy prices,emission factors andemission price
Plant attributes:
Production targets,working hours, oper-ating characteristics ofproduction processes,transport demandand technology ex-pansion potentials
Outputs:
Costs for each com-ponent, optimal in-vestment volumes,optimal productionschedule, total emis-sions, energy importand export and en-ergy production
Figure 1. Simplified framework of the model.

Energies 2021, 14, 7753 5 of 24
3.2. SWOT Analysis
Businesses must timely react to external and internal conditions to stay competitive.These conditions can be evaluated by the SWOT analysis. Strengths are advantageousinternal conditions of the business; whereas weaknesses are disadvantageous. Externalfactors are opportunities and threats [51]. Figure 2 presents the framework with examples.
Exte
rnal
Inte
rnal
Helpful Harmful
Opportunitiese.g. growing demand for
sustainable products
Threatse.g. stricter policies
on VRE land use
Strengthse.g. special right tobuild wind parks
Weaknessese.g. long transport
distance to consumers
Figure 2. SWOT Framework.
With this analysis, actors can plan the launch of new initiatives, weight pros andcons of different strategies or review ongoing projects [52]. Good strategies shall relyon strengths, mitigate weaknesses, capitalize on opportunities and defend threats [51].Note that the analysis has its limitations, such as, subjectivity of results or the lack ofprioritization. In this work, the SWOT of the least-cost strategy is analysed in addition tothe model-based analysis.
4. Case Study
The case study is a gravel plant, an energy intensive medium-sized industry, inGermany. Its operation and technical measures are described in Section 4.1. An energyconcept is explained in Section 4.2. In Sections 4.3 and 4.4, scenarios and related parametersare presented.
4.1. Description of the Plant
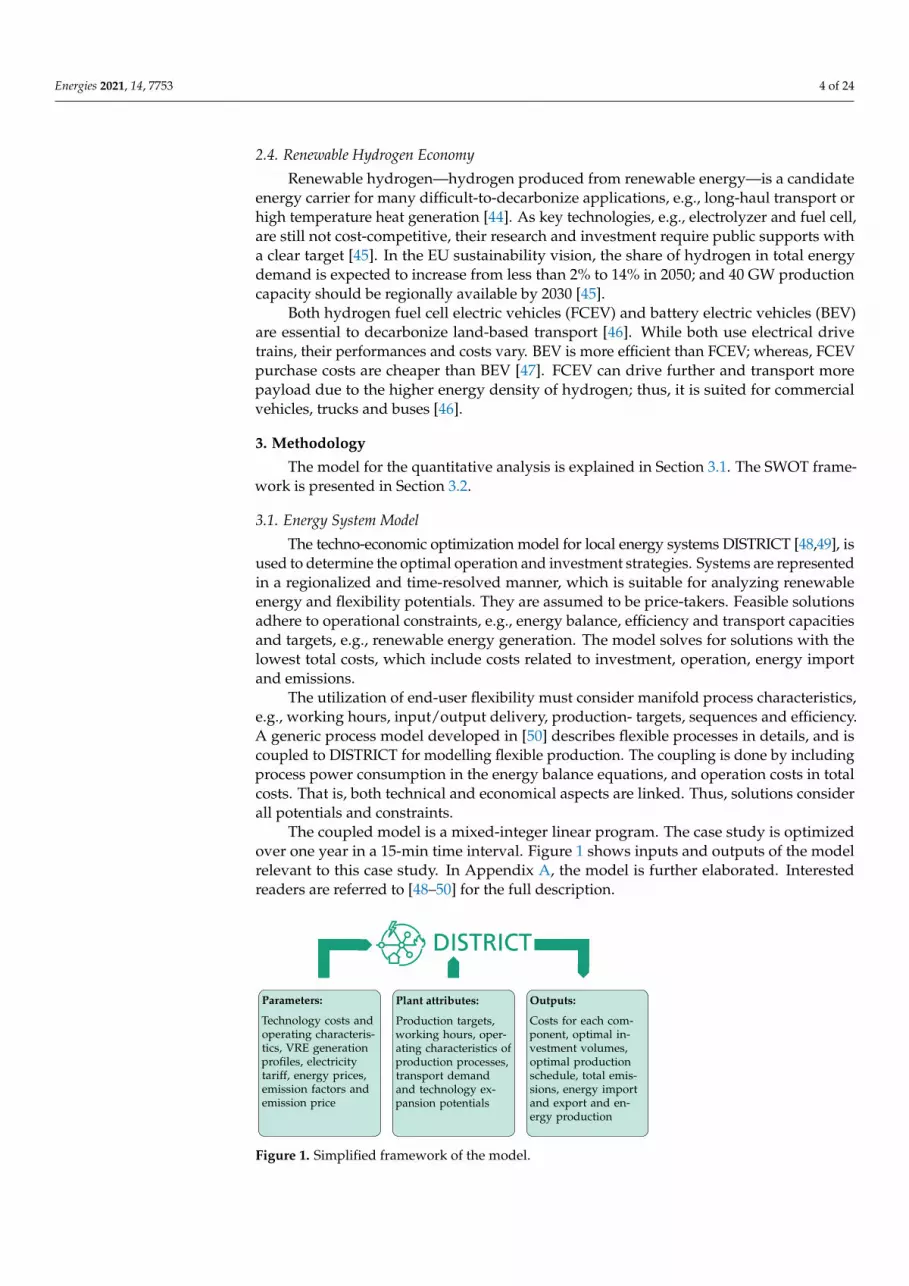
The plant produces gravel with different sizes, that is delivered to customers viadiesel trucks. Figure 3 shows the internal processes of the plant. The production beginswith backhoes extracting raw material from an on-site artificial lake. A conveyor systemtransports material through out the production line. In the pre-sieving, raw material iscleaned, sorted and stored by sizes. Large gravel is broken down by stone crushers beforethe final sieving, where it is again cleaned and sorted. Finally, processed gravel are storedbefore delivery. Water pumps supply high-pressured water jet for cleaning. Auxiliaryprocesses include product transport and energy demand for office buildings.
In status quo: No distributed energy resource is installed. The plant is automaticallycontrolled by a production management system according to planned output while keepingthe peak power under a limit. Operation planning does neither consider energy prices norlocal generation. It operates 1 to 2 shifts on weekdays, which is unlike the round-the-clockoperation of large industries. In the reference year 2019, the plant demands 3.7 GWh p.a.electricity for the production and 2.2 GWh diesel for the transport fleet. On the transportdemand, the fleet travels on average 2700 km per day, 248 days a year. Transformersconnecting the plant to the medium voltage grid have a cumulative capacity of 1700 kW,and set a limit on the power feed-in and withdrawal. Next to the plant is a 47 ha. gravellake (German: Baggersee).
Energies 2021, 14, 7753 6 of 24
Floatingbackhoe
Raw gravelstock
Pre-siever
Gravelsilos
Stonecrushers
Finalsiever
Waterpumps
Storagespace
Transportfleet
Officebuildings
Dist. energyresources
Pro
duct
ion
Auxiliary processes
Transformers MV gridpowert
Figure 3. Internal processes of the gravel plant; brown boxes represent material storage; brownarrows represent product flows, and blue for water.
Together with the plant operators, three technical measures are identified.
Installation of energy technologies 8.3 MWp floating PV and 2 MWh battery storageare deemed feasible. PV can produce electricity on-site, and battery can increase theself-consumption. Due to low heating demand, a combined heat-and-power plantis excluded.Investment in a production-energy management system (PEMS) Due to embeddedstorage and long lead time between order and delivery, the production is flexible,i.e., it can be shifted within the same day or between adjacent days. A modern PEMSis required to utilize this potential, e.g., to react to time-varying prices.Adoption of a low-emission transport fleet Hydrogen fuel cell electric trucks (FCEV)can replace diesel trucks for product transport. FCEV can deliver high payload over along distance. Note that refueling stations should be available across the region in thefuture. Battery electric vehicles are not suitable because of limited travel distance andhigh tare weight.
This case study belongs to an aggregate industry sector. The sector produces varietiesof products including sand, gravel and crushed rock, which are used as raw materialsfor construction. In Europe, the sector has over 15,000 SMEs, operates in 26,000 sites andemploys over 200,000 people [53]. Overall, the sector demands electricity for mechanicalprocesses and fuels largely for product transport, e.g., 67% primary energy consumptionof a construction waste recycling plant are for the production operation, and 32% are fortransportation [54]. This is similar to the energy demand of the case study.
4.2. Energy Concept
The case study has high electricity and transport fuel demand and high PV andflexibility potentials. The plant can reduce its energy import and CO2 emissions, and benefitfrom flexibility incentives. It is assumed that hydrogen production and storage capacities,distributed across Europe [45], can be rented by industrial end-users. Figure 4 presents theproposed energy concept. The concept focuses on four actors: the end-user, local hydrogenproducer, local community and national energy system. Their interactions are:
1. Distributed energy resources supply internal processes with on-site electricity gener-ation. Flexibility increases self-consumption, and allows responses to time-varyingelectricity prices. The production-energy management system monitors and controlsall processes.
2. Electricity is imported for on-site utilization or for hydrogen production. The importis subject to procurement costs, grid fees and taxes-and-levies.
3. On-site electricity generation is fed-in, and simultaneously withdrawn for hydrogenproduction. Grid fees are applied.

Energies 2021, 14, 7753 7 of 24
4. Hydrogen is produced with the electricity from (2) and (3), and stored at the pro-duction facility waiting to be tanked or (optional) transported to the end-user via ahydrogen grid. End-users may use the facility up to the rented capacities, and mustpay levelized operation and investment costs. Note that idle capacities can still beused by the facility or other end-users.
5. (optional) End-users and local communities can trade surplus energy with each other.
It is assumed that end-users do not plan for electricity sale, as the goal is to be self-sufficient. Except for reacting to time-varying prices, end-users do not directly interactwith grid operators or energy providers.
Figure 4. Proposed energy concept; solid lines represent considered interactions; dashed linesrepresent additional interactions.
4.3. Scenarios
A scenario is a framework, i.e., parameters and possible decisions, under which totalcosts will be minimized. Scenario names are written in typewritter font. Five scenariosare defined based on the proposed concept, and form the principle scenario set. Eachscenario is built on the previous.
Business as usual BAU The plant has no energy technologies, and is inflexible. That is,the production follows the historical plan regardless of electricity prices. The transportfleet consists of diesel trucks.Technology expansion TECH The company can invest in PV and battery.Flexible production FLEX A production-energy management system is installed; thus,the production is flexible.Decarbonized transport TRAN Diesel trucks are replaced by fuel cell electric trucks,which are filled by purchased hydrogen.Local synegies SYN Hydrogen can be produced from surplus generation.
Three supplementary scenario sets are investigated to understand the effects of thepeak power charge, type of renewable energy and decision year. In GFS, a grid fee structurehas a fixed annual access charge accounts for 50%, a time-varying volumetric charge 25%and a peak power charge of 25%. Benefits of wind energy potential instead of solar energyare studied in WEP. In Y25, parameters for 2025 are assumed. Lastly, a sensitivity analysis isperformed on the cost-optimal scenario to understand the effects of parameter uncertainties.
4.4. Parameters
Sources and assumptions for parameters used for the calculations are presented asfollows and also in tables in Appendix B.
4.4.1. Electricity Prices and Emission Factors
In 2019, an average procurement rate based on EPEX prices [55] and historicalconsumption amounts to 4.30 cte/kWh. Grid fees interpolated from data in [56] are
Energies 2021, 14, 7753 8 of 24
5.65 cte/kWh. Taxes-and-levies comprise of EEG-Levy 6.41 cte/kWh and other taxes2.55 cte/kWh [57]. Thus, the effective price for the case study totals to 18.90 cte/kWh.
The price projection for future years assumes that total price and other taxes remainthe same. After 2022, EEG-Levy is assumed to linearly reduce to zero in 20 years. In the pastfive years, grid fees increase by 0.072 cte/kWh p.a. This is assumed to continue. The pro-curement price is the adjusting component so that the total prices equal to 18.90 cte/kWh.Table A1 shows the projected electricity prices. [58] projected electricity prices with thesame trend. On the grid fee structure, a fixed access charge contributes to 75% of grid fees,and the rest is a volumetric charge. The latter and electricity procurement are time-varyingfollowing the EPEX price profile.
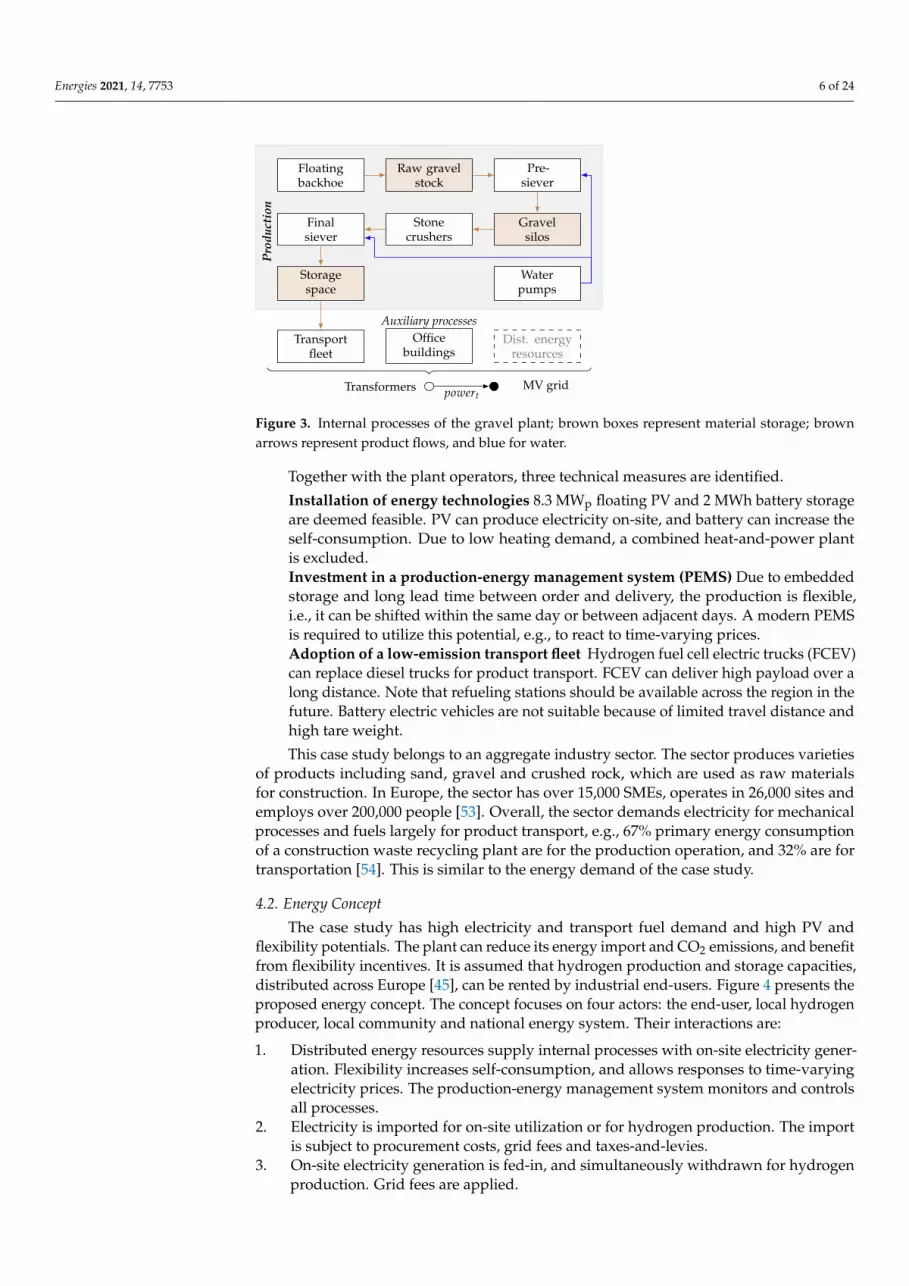
A German emission factor profile for 2019 is processed from generation profiles [59]and emission factors [60] specific to power plant types. An average factor is 401 g/kWh [60].German emission factor is assumed to reduce by 12.0 g/kWh p.a. This rate is derived fromdata in [42]. The projected average factor in 2030 is 269 g/kWh; the corresponding profileis processed by offsetting the profile for 2019.
Figure 5 plots the volumetric price and emission profiles in 2030. Winter prices arehigher than summer due to the higher demand. PV generation lowers both price andemission factor at midday; this is especially notable in summer.
Figure 5. Average volumetric electricity prices and emission factor in summer and winter.
4.4.2. Energy Technologies
Investment costs for PV park and wind turbines (WT) in 2030 are 718, 550 and1366 e/kWp [61]. Costs for floating PV is approximately 18% higher than PV parkdue to the floating platform [62]. Correspondingly, floating PV price is assumed to be660 e/kWp. On-site PV and WT generation profiles are extracted from [63] based onmethods in [64,65]. The full load hours of PV generation are 1250 h p.a., and 1800 h forWT. Battery prices strongly vary by system sizes. A 150 kWh lithium-battery system costsaround 1000 e/kWh [66] in 2019. For the projection, the cost reduction from [67] is applied,which results in the price 550 e/kWh in 2030. Table A2 provides more detail.
4.4.3. Fuel Import and Emission Price
In 2030, diesel price without emission costs is assumed to be 10.89 ct/kWh [68,69].Diesel specific emission factor is 266 g/kWh [70]. Price of renewable hydrogen producedin Germany is 20 ct/kWh [71]. Table A3 shows hydrogen price components. Its emissionfactor is neglected.
Future emission prices are uncertain. [15] estimate German emission price in 2030in the range of 80–96 e/ton; whereas, [42] expects a price of 140 e/ton. In this work,emissions are priced at 100 e/ton.

Energies 2021, 14, 7753 9 of 24
4.4.4. Hydrogen Production
According to [71], renewable hydrogen production in 2030 has an average efficiencyof 71%, and a price of 20 cte/kWh. Related costs are electricity costs, investment andoperation costs of equipment, and transport and distribution costs. To produce hydrogenfrom own electricity, end-users pay the related costs minus the electricity costs to the localhydrogen producer. These costs amount to 7.5 cte/kWh, and represent levelized costsof production, storage and distribution services. Grid fees of 1.0 cte/kWh also apply forelectricity fed-in for the hydrogen production.
In this work, the rented capacities are predetermined based on historical transportdemand. The sizing criteria is the 90th percentile of daily travel is 4074 km, which corre-sponds to 8.5 MWh-H2 demand based on the efficiency of fuel cell electric trucks in [58]. Atminimum, a 355 kW-H2 electrolyser running non-stop is needed to supply this demand. Itis assumed that the plant rents 3 × 355 kW production and 2 × 8.5 MWh storage capacities.
For the transport fleet, Table A4 provides parameters on different trucks accordingto [58].
5. Results
Results are presented in three parts: an overview in Section 5.1, flexibility utilization inSection 5.2, and hydrogen production in Section 5.3. In Section 5.4, results of supplementaryscenario sets are analysed. The sensitivity analysis is presented in Section 5.5.
5.1. Overview on Costs, Emissions and Energy Technology
Costs by component for each principle scenario are shown in Figure 6. Table 1 presentsPV capacities, generation utilization, energy imports and total emissions.
Figure 6. Costs by component of the principle scenarios.
Table 1. Optimal PV capacities and generation utilization (self-consumption, export and curtail), energy imports andemissions of the principle scenario set.
Scenarios Installed Capacity Generation Utilization (%) Import (GWh) Emissions(MWp) Consume Export Curtail Elec. Fuel (ktons)
BAU - - - - 3.64 1.58 1.43TECH 2.58 51.0 47.5 1.5 1.99 1.58 1.04FLEX 2.89 54.1 43.4 2.5 1.67 1.58 0.90TRAN 2.87 54.3 43.3 2.4 1.68 1.39 0.48SYN 3.63 80.3 14.0 5.7 1.64 0.22 0.44
In summary, BAU has the highest costs and emissions. All measures reduce energyimports and emissions. PV and flexible production reduce costs. The switch to hydrogenfuel cell trucks (FCEV) increase costs unless hydrogen can be produced from own electricity.

Energies 2021, 14, 7753 10 of 24
SYN has the lowest costs and emissions, 14.0% and 69.6% lower than BAU, respectively.Battery is not invested. In the following, results by scenario are described.
In BAU, the plant imports all of its energy demand, 3.64 GWh electricity and 1.58 GWhdiesel p.a. This is associated with procurement costs of 687 ke and emissions of 1.01 ktonsfor electricity; and 173 ke and 0.42 ktons for diesel. Emission costs are 143 ke.
In TECH, 2.58 MWp PV is installed, which can generate 3.23 GWh electricity p.a.However, only 51.0% of the generation are consumed by the plant; 47.5% are exported, and1.5% are curtailed due to the transformer limit. On-site generation significantly reduceselectricity import and emissions. In comparison to BAU in Figure 6, reduced electricity andemission costs outweigh the additional energy technology costs.
In FLEX, flexible production has two benefits: First, PV potentials are better utilized,i.e., higher optimal capacity and higher self-consumption rate. Second, electricity costs arelower as consumption during periods with high prices is avoided.
In TRAN, the switch to FCEV increases the transport fleet costs and fuel procurementcosts, but results in lower emissions. However, the reduced emission costs do not com-pensate for the increase; thus, total costs are higher in comparison to FLEX. Due to highervehicle-to-wheel efficiency of FCEV, fuel import also decreases.
In SYN, the option to produce own hydrogen increases PV value. This results in thehighest PV installation (3.63 MWp) and self-consumption rate (80.3%), higher than themaximum on-site utilization (71.4%) (As the plant operates five days a week, 5
7 of PVgeneration can theoretically be used.) The hydrogen import and fuel costs significantlyreduce. The latter outweighs the higher energy technology costs and additional hydrogenproduction costs.
5.2. Utilization of Production Flexibility
From FLEX onward, production is intelligently scheduled; thus, electricity demandis flexible. As the electrical operation in TRAN is identical to FLEX, it is excluded fromthe analysis.
Figure 7 plots average electricity demand, PV generation and electricity prices. InBAU, demand is high in the morning, and is lower in the afternoon. This is the historicalinflexible production, in which the plant simply operates until storage is full or productionquota is met. In FLEX, the intelligently-planned demand is shifted to midday to increase theself-consumption and to procure electricity during periods with low prices. Furthermore,the demand during early morning and evening, i.e., when prices are high, is reduced. Thedemand in SYN and FLEX are similar, which suggests hydrogen production and flexibleproduction are disjointed. Note that demand cannot be shifted to night time or weekends,which leads to the weekend surplus.
Figure 7. Average on-site electricity demand, PV generation and electricity prices of exemplaryweekdays and weekend.
Energies 2021, 14, 7753 11 of 24
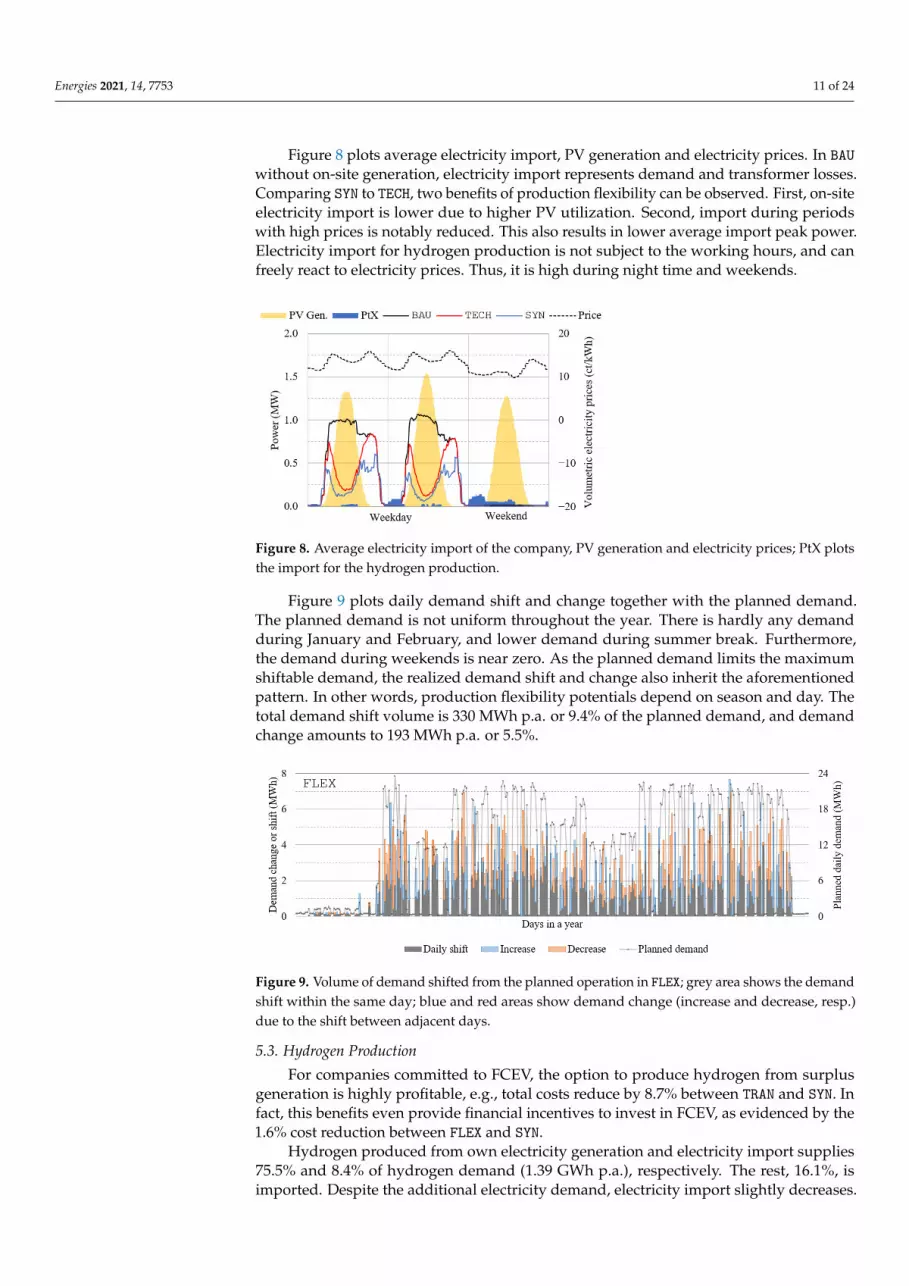
Figure 8 plots average electricity import, PV generation and electricity prices. In BAUwithout on-site generation, electricity import represents demand and transformer losses.Comparing SYN to TECH, two benefits of production flexibility can be observed. First, on-siteelectricity import is lower due to higher PV utilization. Second, import during periodswith high prices is notably reduced. This also results in lower average import peak power.Electricity import for hydrogen production is not subject to the working hours, and canfreely react to electricity prices. Thus, it is high during night time and weekends.
Figure 8. Average electricity import of the company, PV generation and electricity prices; PtX plotsthe import for the hydrogen production.
Figure 9 plots daily demand shift and change together with the planned demand.The planned demand is not uniform throughout the year. There is hardly any demandduring January and February, and lower demand during summer break. Furthermore,the demand during weekends is near zero. As the planned demand limits the maximumshiftable demand, the realized demand shift and change also inherit the aforementionedpattern. In other words, production flexibility potentials depend on season and day. Thetotal demand shift volume is 330 MWh p.a. or 9.4% of the planned demand, and demandchange amounts to 193 MWh p.a. or 5.5%.
Figure 9. Volume of demand shifted from the planned operation in FLEX; grey area shows the demandshift within the same day; blue and red areas show demand change (increase and decrease, resp.)due to the shift between adjacent days.
5.3. Hydrogen Production
For companies committed to FCEV, the option to produce hydrogen from surplusgeneration is highly profitable, e.g., total costs reduce by 8.7% between TRAN and SYN. Infact, this benefits even provide financial incentives to invest in FCEV, as evidenced by the1.6% cost reduction between FLEX and SYN.
Hydrogen produced from own electricity generation and electricity import supplies75.5% and 8.4% of hydrogen demand (1.39 GWh p.a.), respectively. The rest, 16.1%, isimported. Despite the additional electricity demand, electricity import slightly decreases.

Energies 2021, 14, 7753 12 of 24
This is because the additional PV generation is used not only for the hydrogen productionbut also for on-site consumption. Figure 10 plots daily hydrogen demand, supply andaverage electricity prices. Hydrogen demand, an indicator for transport demand, is lowduring winter, as construction activities and with it the product demand are low. Onthe supply side: the hydrogen production from electricity import is sporadic, and occursduring days with low electricity prices. Hydrogen import is needed during late autumnand early winter, because PV generation is limited, and own production from electricityimport is more expensive. Owing to the hydrogen storage, hydrogen can be produced fromsurplus PV generation during weekends, generation which would otherwise be exportedor curtailed. The plant utilizes electrolysers for 1096 full load hours or a 12.5%. On average,hydrogen storage is filled to 5.52 MWh or 32.4%. Note that actual utilization is higher, asidle capacities can be used by others.
Figure 10. Daily hydrogen demand, supply and average electricity prices.
5.4. Supplementary Scenarios
In this section, results of supplementary sets, see Table A5 in Appendix C, are com-pared to the principle results, see Figure 6 and Table 1.
Grid Fee Structure with Peak Power Charge (GFS)
The peak power charge incentivizes the flexibility utilization for peak power reduc-tion. Consequently, peak power in FLEX is 1154 kW lower than 1633 kW in the princi-ple results. This also reduces the peak power costs by 17.1 ke p.a. and total costs by12.5 ke p.a. Reduced grid fees imply lower grid operators’ revenues, which may preventfull recovery of grid investment. The optimal PV capacity slightly increases so too does theself-consumption, because on-site generation can reduce peak residual load. The strategicreduction of peak feed-in leads to a higher curtailment rate and a lower self-consumptionrate in SYN. Overall, investment and costs in GFS are similar to the principle results. The dif-ferences mainly lie on the operation, which can be adapted by a modern production-energymanagement system.
Location with Only Wind Energy Potentials (WEP)
Only in SYN, a 2.3 MW wind turbine (WT) is installed. Battery is not installed. Withouton-site generation, TECH and BAU are identical, and production flexibility in FLEX is usedonly in response to time-varying electricity prices and emission factors. The latter leadsto the cost reduction of 23 ke p.a. (1.6%), and 68 tons p.a. (4.8%) emission reduction.Without the benefits of on-site generation, TRAN has the highest costs due to the increasefrom the FCEV switch. In SYN, WT generation mitigates the cost increase, as it reducesenergy imports and emissions; however, SYN is not the least cost scenario, but rather FLEX.
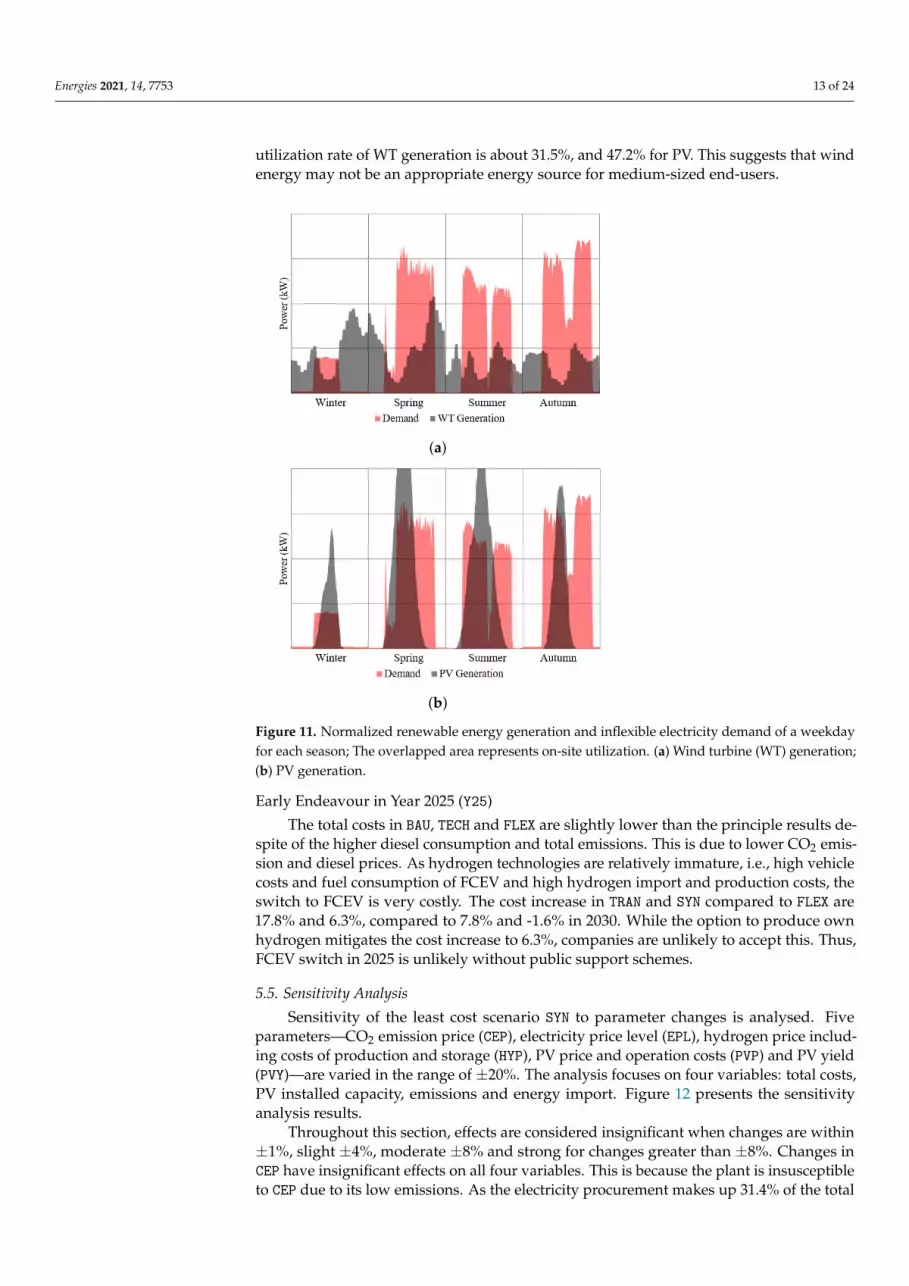
Figure 11 plots normalized PV-, WT generation and demand, i.e., profiles are scaledto a 1 MWh annual energy so that they are comparable. WT generation is high in winter,spring and often at night, see Figure 11a; whereas, PV generation is more seasonally anddiurnally aligns with the demand, see Figure 11b. Analysing these profiles shows that the
Energies 2021, 14, 7753 13 of 24
utilization rate of WT generation is about 31.5%, and 47.2% for PV. This suggests that windenergy may not be an appropriate energy source for medium-sized end-users.
(a)
(b)
Figure 11. Normalized renewable energy generation and inflexible electricity demand of a weekdayfor each season; The overlapped area represents on-site utilization. (a) Wind turbine (WT) generation;(b) PV generation.
Early Endeavour in Year 2025 (Y25)
The total costs in BAU, TECH and FLEX are slightly lower than the principle results de-spite of the higher diesel consumption and total emissions. This is due to lower CO2 emis-sion and diesel prices. As hydrogen technologies are relatively immature, i.e., high vehiclecosts and fuel consumption of FCEV and high hydrogen import and production costs, theswitch to FCEV is very costly. The cost increase in TRAN and SYN compared to FLEX are17.8% and 6.3%, compared to 7.8% and -1.6% in 2030. While the option to produce ownhydrogen mitigates the cost increase to 6.3%, companies are unlikely to accept this. Thus,FCEV switch in 2025 is unlikely without public support schemes.
5.5. Sensitivity Analysis
Sensitivity of the least cost scenario SYN to parameter changes is analysed. Fiveparameters—CO2 emission price (CEP), electricity price level (EPL), hydrogen price includ-ing costs of production and storage (HYP), PV price and operation costs (PVP) and PV yield(PVY)—are varied in the range of ±20%. The analysis focuses on four variables: total costs,PV installed capacity, emissions and energy import. Figure 12 presents the sensitivityanalysis results.
Throughout this section, effects are considered insignificant when changes are within±1%, slight ±4%, moderate ±8% and strong for changes greater than ±8%. Changes inCEP have insignificant effects on all four variables. This is because the plant is insusceptibleto CEP due to its low emissions. As the electricity procurement makes up 31.4% of the total
Energies 2021, 14, 7753 14 of 24
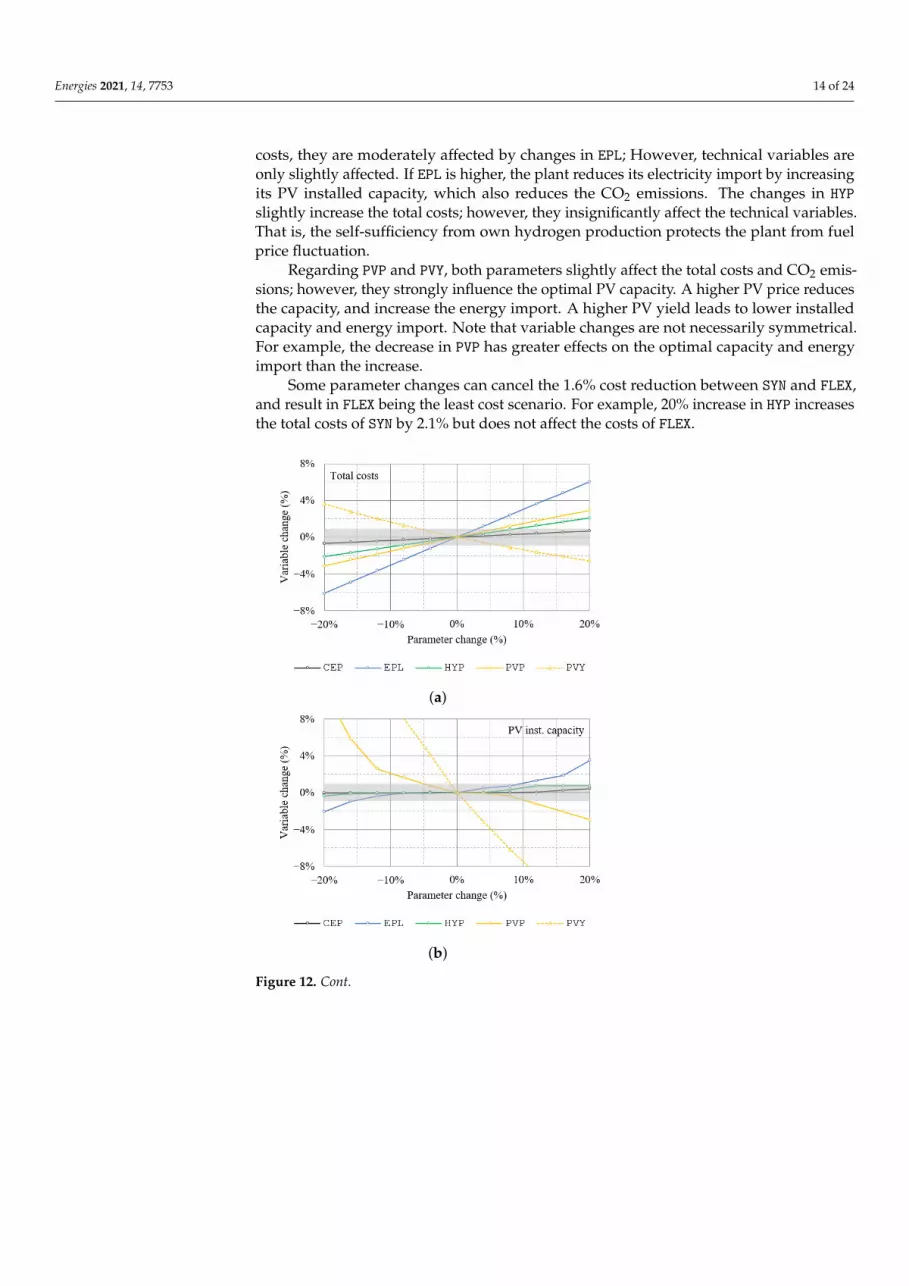
costs, they are moderately affected by changes in EPL; However, technical variables areonly slightly affected. If EPL is higher, the plant reduces its electricity import by increasingits PV installed capacity, which also reduces the CO2 emissions. The changes in HYPslightly increase the total costs; however, they insignificantly affect the technical variables.That is, the self-sufficiency from own hydrogen production protects the plant from fuelprice fluctuation.
Regarding PVP and PVY, both parameters slightly affect the total costs and CO2 emis-sions; however, they strongly influence the optimal PV capacity. A higher PV price reducesthe capacity, and increase the energy import. A higher PV yield leads to lower installedcapacity and energy import. Note that variable changes are not necessarily symmetrical.For example, the decrease in PVP has greater effects on the optimal capacity and energyimport than the increase.
Some parameter changes can cancel the 1.6% cost reduction between SYN and FLEX,and result in FLEX being the least cost scenario. For example, 20% increase in HYP increasesthe total costs of SYN by 2.1% but does not affect the costs of FLEX.
(a)
(b)
Figure 12. Cont.

Energies 2021, 14, 7753 15 of 24
(c)
(d)
Figure 12. Effects of parameter changes to respective variables; Grey areas indicate a ±1% in-significant region; CO2 emission price (CEP), electricity price (EPL), hydrogen price (HYP), PV prices(PVP) and PV yield (PVY). (a) Total costs; (b) Optimal PV installed capacity; (c) Total CO2 emissions;(d) Energy import.
6. Discussion
Potential implications of the proposed energy concept to end-users and the energytransition are discussed in Sections 6.1 and 6.2, respectively.
6.1. Advantages and Disadvantages to End-Users
The model-based analysis suggests that end-users should invest in PV, productionflexibility and fuel cell electric trucks (FCEV) if hydrogen can be produced from ownelectricity generation. This strategy, i.e., the proposed energy concept, results in a least-costleast-emission energy system. The following presents the SWOT analysis of the concept.
Strengths
By supplying electricity demand from on-site renewable generation instead of import,end-users utilize its low-cost generation, and avoid paying grid fees, taxes-and-levies andother administrative charges. Lower energy import also means less susceptibility to energyor emission price fluctuation. Benefits of a production-energy management system, apartfrom increasing self-consumption and shifting demand to periods with low prices, alsoinclude reducing price risks, increasing efficiency and preemptively detecting potentialproblems. Lastly, the adoption of low-emission technologies can improve the company’simage as technologically advanced and sustainable, which can improve its reputation tothe local community, customers and investors.

Energies 2021, 14, 7753 16 of 24
Opportunities
As public concerns over climate change grow, sustainability will be important forlong term competitiveness. The company, already in the low-emission stage, can appeal itsproducts to environmentally-conscious customers, or further offset its remaining emissionsto be emission-neutral. Sales of unused generation can bring in additional revenues. Thealready-invested PV generation and PEMS also reduce the barriers for the utilization ofpower-to-heat technologies and participation in demand response programs.
Weaknesses
Initially, training for employees to operate new technologies involves additional costsand time. Installing PV in publicly-accessible area may involve permit acquisition andpotential vandalism. Frequent operation changes can lead to higher maintenance costsdue to extra wear-and-tear. To use own hydrogen, trucks may only be allowed to tank atdesignated stations, which could limit the day-to-day operation. As energy technologies,FCEV and production processes have high capital costs, simultaneous investments canlead to low financial liquidity of the firm.
Threats
The operation of FCEV may be difficult if filling stations and/or production facilitiesare not widely-available, e.g., due to slow transition towards the hydrogen economy.Furthermore, the regulations related to hydrogen production and storage business modelsare unclear; the feasibility of own hydrogen production can be reduced if taxes-and-leviesare applied. Lastly, as the system relies largely on PV generation, it is susceptible to risksfrom fluctuating yield.
Although the model-based analysis indicates the profitability of the proposed energyconcept, the SWOT analysis reveals new weaknesses and threats. The company should beaware of these disadvantages and try to mitigate them. For example, to avoid the threatfrom fluctuating PV yield, the company can deliberately oversize their PV systems or setup energy procurement contracts with favorable terms for uncertain consumption.
6.2. Implication to Energy Transition
The path towards climate-neutral energy systems has four phases: the developmentof renewable energy generation technologies, the integration of variable renewable energy(VRE), e.g., via direct electricity use or energy storage, the utilization of synthetic fuels andthe final displacement of fossil fuels [25]. The three measures considered in this work, seeSection 4.1, correspond to the first three phases.
The decarbonization of energy systems requires massive volumes of VRE investment,which must predominantly come from the private sector [72]. VRE investment has beengrowing in past decades given public supports and falling costs. As VRE values onsaturated markets and subsidies are decreasing [22,27], the future investment is arguablyto focus on self-consumption. Our results show that end-user flexibility leads not only tothe higher self-consumption rate but also installed capacities. This suggests that financialor regulatory supports for flexibility investment and utilization can indirectly foster privateinvestments in VRE.
In this work, flexible production is deployed to increase PV utilization, react to time-varying prices and reduce peak power. While flexibility potential can also provide reserveenergy or interruptible load services [73], technical requirements can restrict the partici-pation of small- and medium-sized end-users. For example in Germany, the minimumbid size of manual frequency restoration reserve, i.e., tertiary reserve, is one MW with afour-hours stand-by period [74]. Although pooling is allowed, it may not be an effectivemean. Alternatively, regional markets can open up marketing opportunities for thesepotentials. In the project WindNODE, a market concept aimed to coordinate flexibilitypotentials to mitigate grid congestion is proposed and tested. In this concept, a minimum
Energies 2021, 14, 7753 17 of 24
bid is 100 kW in size and 15 minutes in duration [75]. Potential revenues and benefits toenergy systems from future markets should be investigated further.
Despite its higher efficiency and lower emissions, the switch to fuel cell electric trucks(FCEV) increases the costs due to high vehicle and fuel prices; this is observed in both2025 and also 2030 albeit to a lesser extent. The use of synthetic fuels in transport wouldlikely need a higher emission price, subsidies for vehicle investments or fuel procurement.Furthermore, the feasibility of FCEV in the long term can be improved by extensivesupports in fuel cell research, which would reduce price and increase efficiency.
The switch to FCEV could be economical when hydrogen can be produced fromown electricity generation. This is mainly because the company has significant electricitysurplus which would otherwise be curtailed or exported at marginal prices. Despite havingto pay for grid fees and production and storage costs, own hydrogen production is cheaperthan hydrogen import to the point that this combination is more economic than the use ofdiesel trucks. Arguably, end-users not blessed with on-site VRE potentials could benefitfrom these benefits as well by directly purchasing surplus electricity from external sources,e.g., local communities as shown in Figure 4 or own off-site VRE investments. Both casesare similar from the perspective of the national climate goal, namely, VRE and FCEV areinvested by private sectors and renewable hydrogen is produced inland. This shows thatnovel business models can promote investments in sustainable technologies by linkinggeneration and demand from different sectors and various agents in the systems.
In this work, a time-resolved optimization model is used to plan the investments andoperation of a company. Noteworthy cautions of this application are: Various data—e.g.,operation profiles of the company or techno-economics parameters of an energy system ortechnologies—are required in detail; however, information may not be easily accessibleor available in all cases. As the investigation scope involves flexibility and its responseto time-varying electricity prices, these efforts are deemed necessary. The optimizationassumes a perfect foresight on parameters. This certainly does not reflect the reality wherepolitics and markets constantly change. The sensitivity analysis partially addresses therobustness of results to parameter changes. In the future, more extensive models, such asstochastic programs, can also account the decisive uncertainties.
7. Conclusions
An energy concept for an industrial end-user with renewable energy and flexibilitypotentials—PV plant, battery storage, flexible production, FCEV and hydrogen production—isanalysed. Different investment strategies are investigated. PV is a highly profitable in-vestment as it reduces electricity import and emission costs. Flexible production reducescosts by shifting the production to periods with low electricity prices and increasing theutilization of PV generation. The switch from diesel to hydrogen for product transportis not economical due to higher fuel and vehicle costs, unless hydrogen can be producedfrom own surplus electricity generation. The synergistic benefits of both potentials lead tothe least-cost least-emission system.
End-users are advised to consider both potentials in the planning process to ensure thata strategy is optimal in the long term. The cost optimal investment strategy entails new risksand opportunities from the changing energy politics and the adoption of new technologies.For example, heavy reliance on PV generation implies susceptibility to uncertain PVyield. Carbon-neutral industrial end-users can appeal its products to environmentally-conscious customers.
The pathway towards sustainable energy systems requires not only supports for theR&D or the adoption of new technologies but also new incentives—e.g, time-varyingelectricity prices for flexibility or CO2 prices for decarbonization—and enabling businessmodels. Case in point, the switch to FCEV is promoted by the higher fossil fuel prices andby own hydrogen production via a regional hydrogen facility. Early regulatory adjustments,e.g., tax exemptions for own hydrogen production, can accelerate the adoption in easily-achievable cases. Next generation energy policies should couple supports for flexibility

Energies 2021, 14, 7753 18 of 24
and renewable energy expansion to transition towards integrated energy systems withcoordination of multiple applications, sectors and infrastructures.
On the limitations of this work: as policies are constantly changing, the absolute resultsare subject to uncertainties of the future development. Each end-user group has uniquepotentials and requirements. It stands to reason that synergies between both potentialsexist in all users; nevertheless, studies similar to this for other end-users are advised togauge the effects and to gain insights into optimal investment behaviours. Energy efficiencymeasures should also be considered.
Author Contributions: Conceptualization, N.W.; methodology, N.W. and J.T.; software, N.W.; vali-dation, N.W.; formal analysis, N.W.; investigation, N.W.; data curation, N.W.; writing—original draft,N.W. and J.T.; writing—review & editing, N.W. and J.T.; visualization, N.W.; supervision, J.T.; projectadministration, J.T.; and funding acquisition, N.W. and J.T. All authors have read and agreed to thepublished version of the manuscript.
Funding: This work is a part of the main author’s doctoral dissertation supported by the GermanFederal Environmental Foundation, and was carried out under the project FlexGeber sponsored bythe German Ministry of Economics and Energy under the grant 03EGB0001A.
Institutional Review Board Statement: Not applicable.
Informed Consent Statement: Not applicable.
Data Availability Statement: The data acquired and/or generated for the study are not publiclyavailable due to privacy concerns, but may be available on reasonable request.
Conflicts of Interest: The authors declare no conflict of interest.
Abbreviationst time stepstec technologyre renewable energy technology, ∈ tecsto energy storage technology, ∈ tecec energy carrierp processs statepFuel fuel prices in e/kWhpEmis emission price in e/tonemisFactor emission factors in ton/kWhpH2Prod Hydrogen production price in e/kWhpFix tariff: fix charge in epPeak tariff: peak charge in e/kWpVol tariff: volumetric charge in e/kWh∆t time step lengthgenRE RE generation profileη Process efficiencyaux Auxiliary consumptionoutput∗ Planned outputVariablesinvC annualized investment costs in eoptC annual operating costs in eimp energy import in kWelecC electricity costs in eH2Prod hydrogen production in kWcons energy consumption in kWcap installed capacity in kWcur curtailment in kW
Energies 2021, 14, 7753 19 of 24
exp energy export in kWdch storage discharge in kWch storage charge in kWTC total costs in ex Operation level of a processz Indication of an active stateoutput Realized outputinput Realized input
Appendix A
In this appendix, fundamental functions of the model in Section 3.1 are further clarified.Symbols are listed in the abbreviations. Subscripts refer to indices. Parameters are writtenin gray.
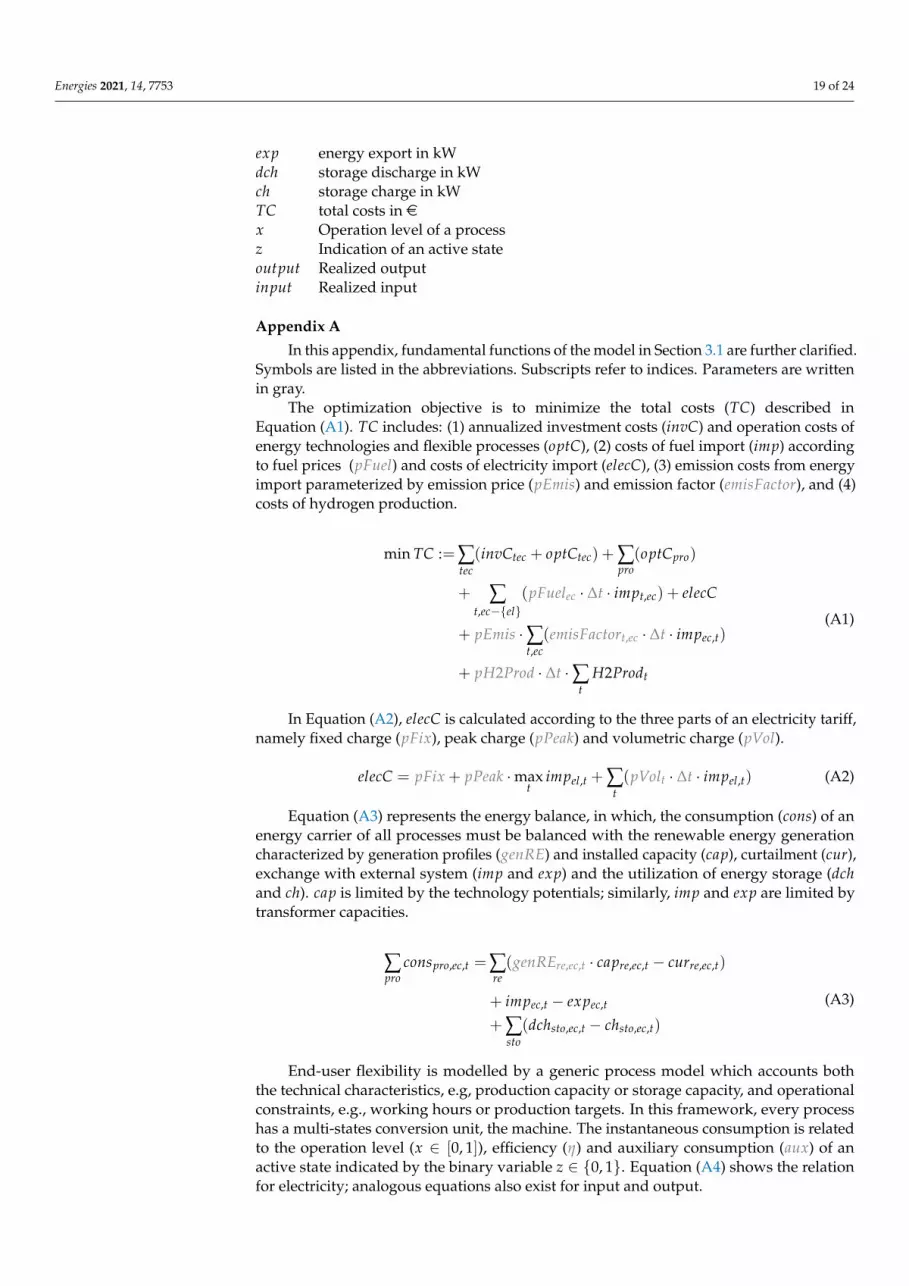
The optimization objective is to minimize the total costs (TC) described inEquation (A1). TC includes: (1) annualized investment costs (invC) and operation costs ofenergy technologies and flexible processes (optC), (2) costs of fuel import (imp) accordingto fuel prices (pFuel) and costs of electricity import (elecC), (3) emission costs from energyimport parameterized by emission price (pEmis) and emission factor (emisFactor), and (4)costs of hydrogen production.
min TC :=∑tec(invCtec + optCtec) + ∑
pro(optCpro)
+ ∑t,ec−{el}
(pFuelec · ∆t · impt,ec) + elecC
+ pEmis ·∑t,ec
(emisFactort,ec · ∆t · impec,t)
+ pH2Prod · ∆t ·∑t
H2Prodt
(A1)
In Equation (A2), elecC is calculated according to the three parts of an electricity tariff,namely fixed charge (pFix), peak charge (pPeak) and volumetric charge (pVol).
elecC = pFix + pPeak ·maxt
impel,t + ∑t(pVolt · ∆t · impel,t) (A2)
Equation (A3) represents the energy balance, in which, the consumption (cons) of anenergy carrier of all processes must be balanced with the renewable energy generationcharacterized by generation profiles (genRE) and installed capacity (cap), curtailment (cur),exchange with external system (imp and exp) and the utilization of energy storage (dchand ch). cap is limited by the technology potentials; similarly, imp and exp are limited bytransformer capacities.
∑pro
conspro,ec,t =∑re(genREre,ec,t · capre,ec,t − curre,ec,t)
+ impec,t − expec,t
+ ∑sto(dchsto,ec,t − chsto,ec,t)
(A3)
End-user flexibility is modelled by a generic process model which accounts boththe technical characteristics, e.g, production capacity or storage capacity, and operationalconstraints, e.g., working hours or production targets. In this framework, every processhas a multi-states conversion unit, the machine. The instantaneous consumption is relatedto the operation level (x ∈ [0, 1]), efficiency (η) and auxiliary consumption (aux) of anactive state indicated by the binary variable z ∈ {0, 1}. Equation (A4) shows the relationfor electricity; analogous equations also exist for input and output.

Energies 2021, 14, 7753 20 of 24
consp,el,t = ∑s(ηp,s · xp,s,t + auxp,s · zp,s,t) (A4)
In Equation (A5), the realized output (output) is related to the planned output (output∗)and deviation options, namely output increase or decrease (OID) and output shift withinthe same day or between adjacent days (OSW and OSB).
outputp,t = output∗p,t + OIDp,t + OSWp,t + OSBp,t (A5)
Input and output of dependent processes are linked via a constraint: outputp1,t =inputp2,t|p1, p2 ∈ p.
A procedure to model the floating backhoe process is as follows: From the site visit, itis noted that the process has two operating states: on and off. Working hours, the maximumcapacity and the operation range in the on state are defined from the historical load profileand statements from plant operators. It is then established that the process can be operatedfrom 06:00–22:00 and at loading capacity from 75% to 100%. Power consumption at themaximum loading capacity is 110 kW. Based on these characteristics, the planned operationis the operating profile which is best fit to the historical load profile. The procedure isrepeated for all processes.
Appendix B
Table A1 shows electricity prices. Table A2 presents costs of energy technologies.Table A3 shows costs of renewable hydrogen by components. And Table A4 shows costsand efficiency of different trucks.
Table A1. Electricity prices by components.
Parameters 2019 2025 2030
Procurement 4.30 4.83 7.31Grid fees 5.65 6.08 6.44EEG Levy 6.41 5.44 3.84Other taxes 2.55 2.55 2.55
Total 18.90 18.90 18.90
Table A2. Costs and lifetime of energy technologies.
Technology Parameter 2020 2025 2030
Rooftop PV Investment (e/kWp) 976 847 718OPEX (% CAPEX p.a.) 2 2 2Lifetime 26 27 27
Floating PV Investment (e/kWp) 778 719 660OPEX (% CAPEX p.a.) 2 2 2Lifetime 26 27 27
Wind turbine Investment (e/kWp) 1493 1430 1366OPEX (% CAPEX p.a.) 3 3 3Lifetime 24 25 25
Battery Investment (e/kWh) 870 650 550OPEX (% CAPEX p.a.) 1 1 1Lifetime 10 12 15
Energies 2021, 14, 7753 21 of 24
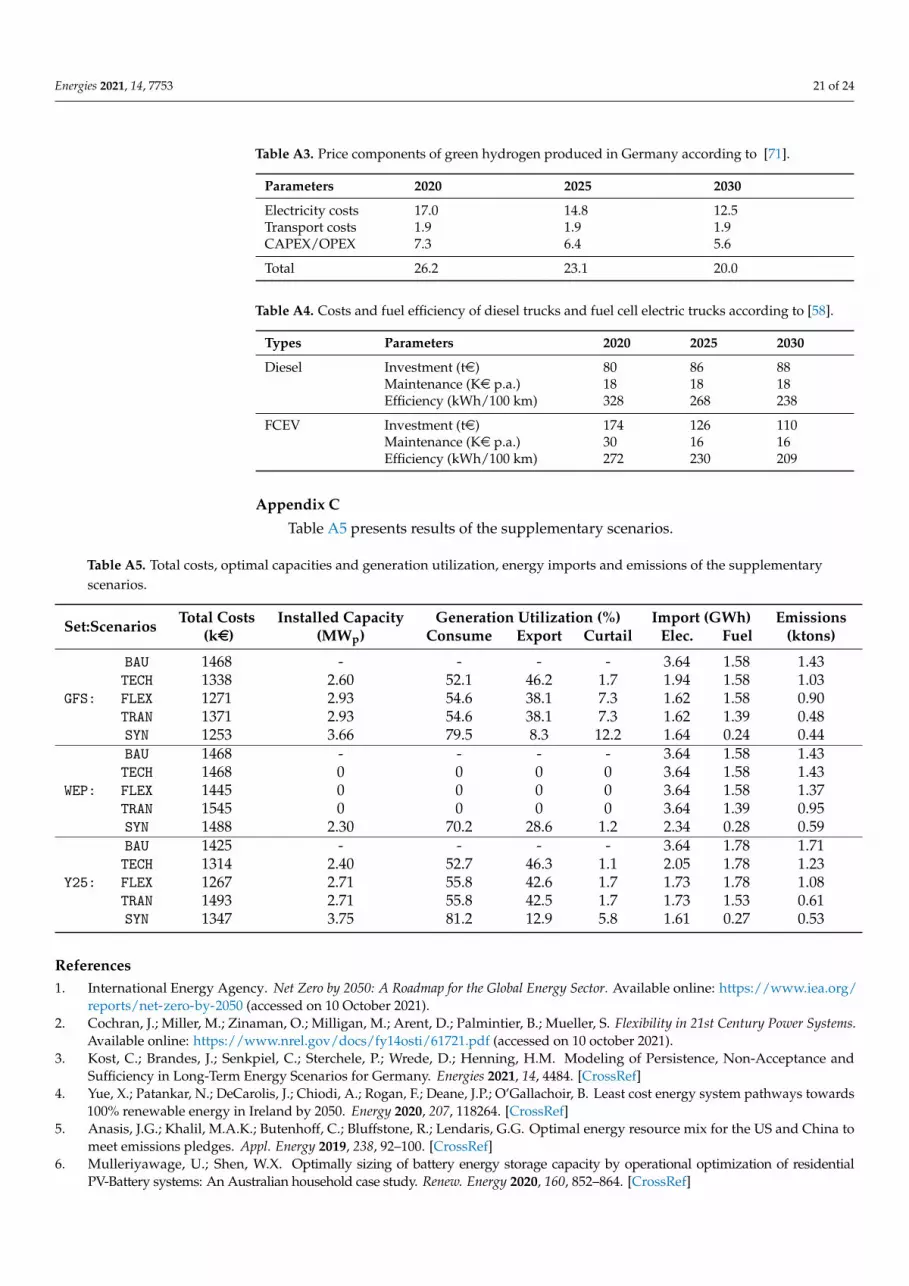
Table A3. Price components of green hydrogen produced in Germany according to [71].
Parameters 2020 2025 2030
Electricity costs 17.0 14.8 12.5Transport costs 1.9 1.9 1.9CAPEX/OPEX 7.3 6.4 5.6
Total 26.2 23.1 20.0
Table A4. Costs and fuel efficiency of diesel trucks and fuel cell electric trucks according to [58].
Types Parameters 2020 2025 2030
Diesel Investment (te) 80 86 88Maintenance (Ke p.a.) 18 18 18Efficiency (kWh/100 km) 328 268 238
FCEV Investment (te) 174 126 110Maintenance (Ke p.a.) 30 16 16Efficiency (kWh/100 km) 272 230 209
Appendix C
Table A5 presents results of the supplementary scenarios.
Table A5. Total costs, optimal capacities and generation utilization, energy imports and emissions of the supplementaryscenarios.
Set:Scenarios Total Costs Installed Capacity Generation Utilization (%) Import (GWh) Emissions(ke) (MWp) Consume Export Curtail Elec. Fuel (ktons)
BAU 1468 - - - - 3.64 1.58 1.43TECH 1338 2.60 52.1 46.2 1.7 1.94 1.58 1.03
GFS: FLEX 1271 2.93 54.6 38.1 7.3 1.62 1.58 0.90TRAN 1371 2.93 54.6 38.1 7.3 1.62 1.39 0.48SYN 1253 3.66 79.5 8.3 12.2 1.64 0.24 0.44BAU 1468 - - - - 3.64 1.58 1.43TECH 1468 0 0 0 0 3.64 1.58 1.43
WEP: FLEX 1445 0 0 0 0 3.64 1.58 1.37TRAN 1545 0 0 0 0 3.64 1.39 0.95SYN 1488 2.30 70.2 28.6 1.2 2.34 0.28 0.59BAU 1425 - - - - 3.64 1.78 1.71TECH 1314 2.40 52.7 46.3 1.1 2.05 1.78 1.23
Y25: FLEX 1267 2.71 55.8 42.6 1.7 1.73 1.78 1.08TRAN 1493 2.71 55.8 42.5 1.7 1.73 1.53 0.61SYN 1347 3.75 81.2 12.9 5.8 1.61 0.27 0.53
References1. International Energy Agency. Net Zero by 2050: A Roadmap for the Global Energy Sector. Available online: https://www.iea.org/
reports/net-zero-by-2050 (accessed on 10 October 2021).2. Cochran, J.; Miller, M.; Zinaman, O.; Milligan, M.; Arent, D.; Palmintier, B.; Mueller, S. Flexibility in 21st Century Power Systems.
Available online: https://www.nrel.gov/docs/fy14osti/61721.pdf (accessed on 10 october 2021).3. Kost, C.; Brandes, J.; Senkpiel, C.; Sterchele, P.; Wrede, D.; Henning, H.M. Modeling of Persistence, Non-Acceptance and
Sufficiency in Long-Term Energy Scenarios for Germany. Energies 2021, 14, 4484. [CrossRef]4. Yue, X.; Patankar, N.; DeCarolis, J.; Chiodi, A.; Rogan, F.; Deane, J.P.; O’Gallachoir, B. Least cost energy system pathways towards
100% renewable energy in Ireland by 2050. Energy 2020, 207, 118264. [CrossRef]5. Anasis, J.G.; Khalil, M.A.K.; Butenhoff, C.; Bluffstone, R.; Lendaris, G.G. Optimal energy resource mix for the US and China to
meet emissions pledges. Appl. Energy 2019, 238, 92–100. [CrossRef]6. Mulleriyawage, U.; Shen, W.X. Optimally sizing of battery energy storage capacity by operational optimization of residential
PV-Battery systems: An Australian household case study. Renew. Energy 2020, 160, 852–864. [CrossRef]

Energies 2021, 14, 7753 22 of 24
7. Husein, M.; Chung, I.Y. Optimal design and financial feasibility of a university campus microgrid considering renewable energyincentives. Appl. Energy 2018, 225, 273–289. [CrossRef]
8. Petersen, J.P. Energy concepts for self-supplying communities based on local and renewable energy sources: A case study fromnorthern Germany. Sustain. Cities Soc. 2016, 26, 1–8. [CrossRef]
9. Helin, K.; Käki, A.; Zakeri, B.; Lahdelma, R.; Syri, S. Economic potential of industrial demand side management in pulp andpaper industry. Energy 2017, 141, 1681–1694. [CrossRef]
10. Ramin, D.; Spinelli, S.; Brusaferri, A. Demand-side management via optimal production scheduling in power-intensive industries:The case of metal casting process. Appl. Energy 2018, 225, 622–636. [CrossRef]
11. Xenos, D.P.; Mohd Noor, I.; Matloubi, M.; Cicciotti, M.; Haugen, T.; Thornhill, N.F. Demand-side management and optimaloperation of industrial electricity consumers: An example of an energy-intensive chemical plant. Appl. Energy 2016, 182, 418–433.[CrossRef]
12. Dunkelberg, H.; Wagner, J.; Hannen, C.; Schlüter, B.A.; Phan, L.; Hesselbach, J.; Lin, C.X. Optimization of the energy supply inthe plastics industry to reduce the primary energy demand. J. Clean. Prod. 2018, 192, 790–800. [CrossRef]
13. Hong, L.; Zhou, N.; Fridley, D.; Raczkowski, C. Assessment of China’s renewable energy contribution during the 12th Five YearPlan. Energy Policy 2013, 62, 1533–1543. [CrossRef]
14. European Commission. Report on the Functioning of the European Carbon Market: COM(2020) 740 Final. Available online:https://eur-lex.europa.eu/legal-content/EN/TXT/?uri=CELEX%3A52020DC0740 (accessed on 5 October 2021).
15. Hennes, O.; Jeddi, S.; Madlener, R.; Schmitz, H.; Wagner, J.; Wolff, S.; Zinke, J. Auswirkungen von CO2-Preisen auf den Gebäude-,Verkehrs- und Energiesektor. Z. FÜR Energiewirtschaft 2021, 45, 91–107. [CrossRef]
16. Obrist, M.D.; Kannan, R.; Schmidt, T.J.; Kober, T. Decarbonization pathways of the Swiss cement industry towards net zeroemissions. J. Clean. Prod. 2021, 288, 125413. [CrossRef]
17. Wesseling, J.H.; Lechtenböhmer, S.; Åhman, M.; Nilsson, L.J.; Worrell, E.; Coenen, L. The transition of energy intensive processingindustries towards deep decarbonization: Characteristics and implications for future research. Renew. Sustain. Energy Rev. 2017,79, 1303–1313. [CrossRef]
18. Bai, X.; Dawson, R.J.; Ürge-Vorsatz, D.; Delgado, G.C.; Salisu Barau, A.; Dhakal, S.; Dodman, D.; Leonardsen, L.; Masson-Delmotte, V.;Roberts, D.C.; et al. Six research priorities for cities and climate change. Nature 2018, 555, 23–25. [CrossRef] [PubMed]
19. Mullan, M.; Danielson, L.; Lasfargues, B.; Morgado, N.C.; Perry, E. Climate-Resilient Infrastructure: Policy Perspectives OECDEnvironment Policy Paper. Available online: https://www.oecd.org/environment/cc/policy-perspectives-climate-resilient-infrastructure.pdf (accessed on 1 October 2021).
20. World Business Council for Sustainable Development, World Resources Institute. The Greenhouse Gas Protocol: A CorporateAccounting and Reporting Standard; World Business Council for Sustainable Development and World Resources Institute: Geneva,Switzerland; Washington, DC, USA, 2004.
21. Gielen, D.; Boshell, F.; Saygin, D.; Bazilian, M.D.; Wagner, N.; Gorini, R. The role of renewable energy in the global energytransformation. Energy Strategy Rev. 2019, 24, 38–50. [CrossRef]
22. International Renewable Energy Agency. Renewable Energy Auctions: Analysing; 2016. Available online: https://www.irena.org/publications/2017/Jun/Renewable-Energy-Auctions-Analysing-2016 (accessed on 23 September 2021).
23. Wirth, H. Recent Facts about Photovoltaics in Germany. Available online: https://www.ise.fraunhofer.de/en/publications/studies/recent-facts-about-pv-in-germany.html (accessed on 15 September 2021).
24. Kost, C.; Shammugam, S.; Fluri, V.; Peper, D.; Davoodi Memar, A.; Schlegl, T. Levelized Cost of Electricity Renewable EnergyTechnologies. Available online: https://www.ise.fraunhofer.de/content/dam/ise/en/documents/publications/studies/EN2021_Fraunhofer-ISE_LCOE_Renewable_Energy_Technologies.pdf (accessed on 15 August 2021).
25. Leopoldina, A.; Union der Deutschen Akademien der Wissenschaften. Coupling the Different Energy Sectors—Options for theNext Phase of the Energy Transition. Available online: https://www.akademienunion.de/publikation/coupling-the-different-energy-sectors-options-for-the-next-phase-of-the-energy-transition (accessed on 20 October 2021).
26. Winkler, J.; Gaio, A.; Pfluger, B.; Ragwitz, M. Impact of renewables on electricity markets—Do support schemes matter? EnergyPolicy 2016, 93, 157–167. [CrossRef]
27. Pape, C. The impact of intraday markets on the market value of flexibility—Decomposing effects on profile and the imbalancecosts. Energy Econ. 2018, 76, 186–201. [CrossRef]
28. Smart Energy Demand Coalition. Explicit and Implicit Demand-Side Flexibility: Complementary Approaches for an EfficientEnergy System. Available online: https://www.smarten.eu/wp-content/uploads/2016/09/SEDC-Position-paper-Explicit-and-Implicit-DR-September-2016.pdf (accessed on 17 September 2021).
29. Picciariello, A.; Reneses, J.; Frias, P.; Söder, L. Distributed generation and distribution pricing: Why do we need new tariff designmethodologies? Electr. Power Syst. Res. 2015, 119, 370–376. [CrossRef]
30. Eid, C.; Koliou, E.; Valles, M.; Reneses, J.; Hakvoort, R. Time-based pricing and electricity demand response: Existing barriersand next steps. Util. Policy 2016, 40, 15–25. [CrossRef]
31. REF-E; Mercados; Indra. Study on Tariff Design for Distribution Systems: Final Report Prepared for Directorate-General forEnergy of the European Commission. Available online: https://ec.europa.eu/energy/sites/ener/files/documents/20150313%20Tariff%20report%20fina_revREF-E.PDF (accessed on 3 October 2021).

Energies 2021, 14, 7753 23 of 24
32. Finn, P.; Fitzpatrick, C. Demand side management of industrial electricity consumption: Promoting the use of renewable energythrough real-time pricing. Appl. Energy 2014, 113, 11–21. [CrossRef]
33. Ofgem. International Review of Cost Recovery Issues. Available online: https://www.ofgem.gov.uk/sites/default/files/docs/2017/03/cepa_tnei_international_review_of_cost_recovery_issues_final_report.pdf (accessed on 24 April 2021).
34. Hesamzadeh, M.; Rosellón, J.; Vogelsang, I. Transmission Network Investment in Liberalized Power Markets; Lecture notes in energy;Springer: Cham, Switzerland, 2020; Volume 79.
35. Borenstein, S. The economics of fixed cost recovery by utilities. Electr. J. 2016, 29, 5–12. [CrossRef]36. Fritz, W.; Willemsen, S.; Linke, C.; Klobasa, M. Optionen zur Weiterentwicklung der Netzentgeltsystematik für Eine Sichere,
Umweltgerechte und Kosten Effiziente Energiewende. Available online: http://publica.fraunhofer.de/dokumente/N-555070.html (accessed on 14 August 2021).
37. Narassimhan, E.; Gallagher, K.S.; Koester, S.; Rivera Alejo, J. Carbon Pricing in Practice: A Review of the Evidence. Availableonline: https://sites.tufts.edu/cierp/files/2017/11/Carbon-Pricing-In-Practice-A-Review-of-the-Evidence.pdf (accessed on21 September 2021).
38. Brink, C.; Vollebergh, H.R.; van der Werf, E. Carbon pricing in the EU: Evaluation of different EU ETS reform options. EnergyPolicy 2016, 97, 603–617. [CrossRef]
39. European Commission. Report on the Functioning of the European Carbon Market in 2020: COM(2021) 962 Final. Availableonline: https://eur-lex.europa.eu/legal-content/EN/TXT/?uri=CELEX%3A52021DC0962&qid=1635437877783 (accessed on3 October 2021).
40. Umweltbundesamt. Nationales Emissionshandelssystem: Hintergrundpapier. Available online: https://www.dehst.de/SharedDocs/downloads/DE/nehs/nehs-hintergrundpapier.pdf?_blob=publicationFile&v=3 (accessed on 3 October 2021).
41. Fasihi, M.; Efimova, O.; Breyer, C. Techno-economic assessment of CO2 direct air capture plants. J. Clean. Prod. 2019, 224, 957–980.[CrossRef]
42. Prognos. Energiewirtschaftliche Projektionen und Folgeabschätzungen 2030/2050: Dokumentation von Referenzszenario undSzenario mit Klimaschutzprogramm 2030. Available online: https://www.prognos.com/de/projekt/energiewirtschaftliche-projektionen-20302050 (accessed on 10 October 2021).
43. Hänsel, M.C.; Drupp, M.A.; Johansson, D.J.A.; Nesje, F.; Azar, C.; Freeman, M.C.; Groom, B.; Sterner, T. Climate economicssupport for the UN climate targets. Nat. Clim. Chang. 2020, 10, 781–789. [CrossRef]
44. International Energy Agency. The Future of Hydrogen: Seizing Today’s Opportunities: Report Prepared by the IEA fro the G20, Japan.Available online: https://www.iea.org/reports/the-future-of-hydrogen (accessed on 29 July 2021).
45. European Commission. A Hydrogen Strategy for a Climate-Neutral EUROPE: COM(2020) 301 Final. Available online: https://ec.europa.eu/energy/sites/ener/files/hydrogen_strategy.pdf (accessed on 23 August 2021).
46. Fuel Cells and Hydrogen Joint Undertaking. Hydrogen Roadmap Europe: A Sustainable Pathway for the European Energy Tran-sition. Available online: https://www.fch.europa.eu/publications/hydrogen-roadmap-europe-sustainable-pathway-european-energy-transition (accessed on 18 September 2021).
47. Unterlohner, F. Comparison of Hydrogen and Battery Electric Trucks: Methodology and Underlying Assumptions. Availableonline: https://www.transportenvironment.org/wp-content/uploads/2021/07/2020_06_TE_comparison_hydrogen_battery_electric_trucks_methodology.pdf (accessed on 28 July 2021).
48. Thomsen, J. Enhancing operation of decentralized energy systems by a regional economic optimization model DISTRICT. EnergySyst. 2018, 9, 669–707. [CrossRef]
49. Saad Hussein, N. A method for evaluating building retrofit effects on a decentral energy system by a sector coupling operationand expansion model. Energy Syst. 2018, 9, 605–645. [CrossRef]
50. Wanapinit, N.; Thomsen, J.; Kost, C.; Weidlich, A. An MILP model for evaluating the optimal operation and flexibility potentialof end-users. Appl. Energy 2021, 282, 116183. [CrossRef]
51. Dess, G.G.; McNamara, G.; Eisner, A.B. Strategic Management: Text and Cases, 9th ed.; McGraw-Hill Education: New York, NY,USA, 2019.
52. United Nations Children’s Fund. SWOT and PESTEL: Understanding Your External and Internal Context for Better Planningand Decision-Making. Available online: https://www.academia.edu/30818727/SWOT_AND_PESTEL_Understanding_your_external_and_internal_context_for_better_planning_and_decision_making_WHAT_ARE_SWOT_AND_PESTEL (accessed on14 September 2021).
53. European Aggregates Association. Annual Review of European Aggregates Association: A Sustainable Industry for a SustainableEurope. Available online: https://uepg.eu/mediatheque/media/UEPG-AR20192020_V13_(03082020)_spreads.pdf (accessed on29 September 2021).
54. Coelho, A.; de Brito, J. Environmental analysis of a construction and demolition waste recycling plant in Portugal–Part I: Energyconsumption and CO2 emissions. Waste Manag. 2013, 33, 1258–1267. [CrossRef] [PubMed]
55. EPEX Spot. EEX Prices. Available online: https://www.epexspot.com/en (accessed on 10 October 2021).56. Wissenschaftliche Dienste des Deutschen Bundestages. Fragen zur Entwicklung der Netzentgelte im Stromsektor. Available
online: https://www.bundestag.de/resource/blob/689786/9b84cafbe64abf68170c87763ca2b5ea/WD-5-012-20-pdf-data.pdf(accessed on 5 October 2021).
Energies 2021, 14, 7753 24 of 24
57. Bundesverband der Energie- und Wasserwirtschaft. BDEW-Strompreisanalyse Juli 2019: Haushalte und Industrie. Avail-able online: https://cupdf.com/document/bdew-strompreisanalyse-juli-2019-bdew-bundesverband-der-energie-und-wasserwirtschaft.html (accessed on 26 August 2021).
58. Kühnel, S.; Hacker, F.; Görz, W. Oberleitungs-Lkw im Kontext weiterer Antriebs- und Energieversorgungsoptionen fürden Straßengüterfernverkehr: Ein Technologie- und Wirtschaftlichkeitsvergleich.Available online: https://www.oeko.de/publikationen/p-details/oberleitungs-lkw-im-kontext-weiterer-antriebs-und-energieversorgungsoptionen-fuer-den-strassengueterfe (accessed on 9 September 2021).
59. Fraunhofer ISE. Energy-Charts: The Site for Interactive Graphics Displaying Energy Production and Spot Market Prices, 2020.Available online: https://energy-charts.info/?l=en&c=DE (accessed on 4 October 2021).
60. Icha, P.; Lauf, T.; Kuhs, G. Entwicklung der Spezifischen Kohlendioxid-Emissionen des Deutschen Strommix in den Jahren1990–2019. Available online: https://www.umweltbundesamt.de/publikationen/entwicklung-der-spezifischen-kohlendioxid-6(accessed on 13 September 2021).
61. Fraunhofer ISE. Wege zu Einem Klimaneutralen Energiesystem: Die Deutsche Energiewende im Kontext Gesellschaftlicher Verhal-tensweisen. Available online: https://www.ise.fraunhofer.de/de/veroeffentlichungen/studien/wege-zu-einem-klimaneutralen-energiesystem.html (accessed on 12 October 2021).
62. World Bank Group; ESMAP; SERIS. Where Sun Meets Water: Floating Solar Market Report. Available online: https://openknowledge.worldbank.org/handle/10986/31880 (accessed on 10 September 2021).
63. Pfenninger, S.; Staffell, I. Renewables.ninja; 2020. Available online: https://www.renewables.ninja/about (accessed on 10 October2021).
64. Pfenninger, S.; Staffell, I. Long-term patterns of European PV output using 30 years of validated hourly reanalysis and satellitedata. Energy 2016, 114, 1251–1265. [CrossRef]
65. Staffell, I.; Pfenninger, S. Using bias-corrected reanalysis to simulate current and future wind power output. Energy 2016,114, 1224–1239. [CrossRef]
66. Figgener, J.; Haberschusz, D.; Kairies, K.P.; Wessels, O.; Zurmühlen, S.; Sauer, D.U. Speichermonitoring Baden-Württemberg: Jahresbericht 2019. Available online: https://www.speichermonitoring-bw.de/wp-content/uploads/2019/08/Speichermonitoring_BW_Jahresbericht_2019_ISEA_RWTH_Aachen.pdf (accessed on 17 September 2021).
67. Cole, W.; Frazier, A.W. Cost Projections for Utility-Scale Battery Storage. Available online: https://www.nrel.gov/docs/fy19osti/73222.pdf (accessed on 28 September 2021).
68. Prognos; Fraunhofer UMSICHT; DBFZ. Status und Perspektiven flüssiger Energieträger in der Energiewende. Avail-able online: https://www.umsicht-suro.fraunhofer.de/content/dam/umsicht-suro/de/images/pressemitteilungen/2018/EndberichtPrognos/Prognos-Endbericht_Fluessige_Energietraeger_Web-final.pdf (accessed on 25 July 2021).
69. Bundesverband Güterkraftverkehr Logistik und Entsorgung. Dieselpreis-Information (Großverbraucher). Available online:https://www.bgl-ev.de/images/downloads/dieselpreisinformation.pdf (accessed on 17 September 2021).
70. Umweltbundesamt. CO2-Emissionsfaktoren für fossile Brennstoffe. Available online: https://www.umweltbundesamt.de/sites/default/files/medien/1968/publikationen/co2-emissionsfaktoren_fur_fossile_brennstoffe_korrektur.pdf (accessed on 23 August2021).
71. Kreidelmeyer, S.; Dambeck, H.; Kirchner, A.; Wünsch, M. Kosten und Transformationspfade für strombasierte Energieträger:Endbericht zum Projekt Transformationspfade und regulatorischer Rahmen für synthetische Brennstoffe. Available on-line: https://www.bmwi.de/Redaktion/DE/Downloads/Studien/transformationspfade-fuer-strombasierte-energietraeger.pdf?__blob=publicationFile (accessed on 7 October 2021).
72. Wuester, H.; Jungmin Lee, J.; Lumijarvi, A. Unlocking Renewable Energy Investment: The Role of Risk Mitigation and StructuredFinance. Available online: https://www.irena.org/-/media/Files/IRENA/Agency/Publication/2016/IRENA_Risk_Mitigation_and_Structured_Finance_2016.pdf (accessed on 5 October 2021).
73. Richstein, J.C.; Hosseinioun, S.S. Industrial demand response: How network tariffs and regulation (do not) impact flexibilityprovision in electricity markets and reserves. Appl. Energy 2020, 278, 115431. [CrossRef]
74. Poplavskaya, K.; de Vries, L. Distributed energy resources and the organized balancing market: A symbiosis yet? Case of threeEuropean balancing markets. Energy Policy 2019, 126, 264–276. [CrossRef]
75. WindNODE. Flexibility, Markets and Regulation: Insights from the WindNODE Reality Lab. Available online: https://www.windnode.de/fileadmin/Daten/Downloads/FMR_eng.pdf (accessed on 6 October 2021).