leveraging growth synergies in a multi-unit business through
TRANSCRIPT

Pepperdine University Pepperdine University
Pepperdine Digital Commons Pepperdine Digital Commons
Theses and Dissertations
2015
Leveraging growth synergies in a multi-unit business through the Leveraging growth synergies in a multi-unit business through the
application of a multidimensional organizational design application of a multidimensional organizational design
augmented by lateral intergrative mechanisms: a augmented by lateral intergrative mechanisms: a
phenomenological case study phenomenological case study
Joel Bigley
Follow this and additional works at: https://digitalcommons.pepperdine.edu/etd
Recommended Citation Recommended Citation Bigley, Joel, "Leveraging growth synergies in a multi-unit business through the application of a multidimensional organizational design augmented by lateral intergrative mechanisms: a phenomenological case study" (2015). Theses and Dissertations. 639. https://digitalcommons.pepperdine.edu/etd/639
This Dissertation is brought to you for free and open access by Pepperdine Digital Commons. It has been accepted for inclusion in Theses and Dissertations by an authorized administrator of Pepperdine Digital Commons. For more information, please contact [email protected], [email protected], [email protected].

Pepperdine University
Graduate School of Education and Psychology
LEVERAGING GROWTH SYNERGIES IN A MULTI-UNIT BUSINESS THROUGH
THE APPLICATION OF A MULTIDIMENSIONAL ORGANIZATIONAL DESIGN
AUGMENTED BY LATERAL INTEGRATIVE MECHANISMS:
A PHENOMENOLOGICAL CASE STUDY
A dissertation submitted in partial satisfaction
of the requirements for the degree of
Doctor of Education
by
Joel Bigley
September, 2015
Kent Rhodes, Ph.D. – Dissertation Chairperson

This dissertation, written by
Joel Bigley
under the guidance of a Faculty Committee and approved by its members, has been submitted to
and accepted by the Graduate Faculty in partial fulfillment of the requirements for the degree of
DOCTOR OF EDUCATION
Doctoral Committee:
Kent Rhodes, Ph.D., Chairperson
Doug Leigh, Ph., D., Committee Member
James Rocco DellaNeve, Ph., D., Committee Member

© Copyright by Joel Bigley (2015)
All Rights Reserved
TABLE OF CONTENTS
Page
LIST OF TABLES ........................................................................................................................ IX
LIST OF FIGURES ...................................................................................................................... XI
ACKNOWLEDGEMENTS ....................................................................................................... XVI
VITA ......................................................................................................................................... XVII
Chapter 1. Introduction ................................................................................................................... 1
Background of Problem .............................................................................................................. 4 Purpose of the Study ................................................................................................................. 15 Importance of the Study ............................................................................................................ 16
Research Questions ................................................................................................................... 17 Limitations of the Study ........................................................................................................... 23
Summary of Chapter 1 .............................................................................................................. 25
Chapter 2. Literature Review ........................................................................................................ 27
Synergies ................................................................................................................................... 28
Organizational design. ...........................................................................................................29
Growth synergies. ..................................................................................................................30
Operative Synergies. ..............................................................................................................30 Relatedness. ...........................................................................................................................31
Resources. ..............................................................................................................................31 Market synergies. ...................................................................................................................32 Financial synergies. ...............................................................................................................33
Corporate synergies. ..............................................................................................................34 Profitability. ...........................................................................................................................36 Sustainable growth. ................................................................................................................36
Multi-unit synergy. ................................................................................................................38 Interdependencies. .................................................................................................................39 Conglomerate surplus. ...........................................................................................................41 Competitive advantage. .........................................................................................................42
Sustained advantage. ..............................................................................................................43 Dis-Synergies. ........................................................................................................................44
Diversification .......................................................................................................................... 46
Multidimensional Organizational Design ................................................................................. 53 Lateral Integrative Mechanisms ................................................................................................ 67 Designed Relationship with the Corporate Center ................................................................... 77
V
Leadership in a MOS ................................................................................................................ 92
Contribution to Theory and Management Practice ................................................................... 98 Summary of Chapter 2 .............................................................................................................. 98
Chapter 3. Empirical Approach .................................................................................................. 100
Qualitative Research Design ................................................................................................... 101 Case Study Selection .............................................................................................................. 116 Research Approach ................................................................................................................. 119
Phase 1. ................................................................................................................................120 Phase 2. ................................................................................................................................120 Phase 3. ................................................................................................................................120
Data Collection and Recording ............................................................................................... 121
Participants .............................................................................................................................. 123 Instrumentation ....................................................................................................................... 125
Data Process and Analysis ...................................................................................................... 126 Precipitating Event .................................................................................................................. 130
Quality of the Research ........................................................................................................... 131 Summary of Chapter 3 ............................................................................................................ 135
Chapter 4. Data and Analysis...................................................................................................... 137
Data Collection Schema .......................................................................................................... 139 Purpose .................................................................................................................................... 140 Coding ..................................................................................................................................... 141
Analytical Dimensions ............................................................................................................ 144
Data Domains ......................................................................................................................... 145 Directional strategy. .............................................................................................................145 Optimized scope. .................................................................................................................146
Selective focus. ....................................................................................................................146 Strategy method. ..................................................................................................................147
Endogenous Data .................................................................................................................... 148 Roles. ...................................................................................................................................150
Horizontal themes. .......................................................................................................... 151 ERP system. .................................................................................................................... 153 Capacity management. .................................................................................................... 157
Cost mitigation. ........................................................................................................... 159 Standardization. .......................................................................................................... 161
Communication. .......................................................................................................... 163 Revenue growth. ......................................................................................................... 166
Operational performance. ........................................................................................... 168 Leadership. .................................................................................................................. 171 Summary of horizontal themes. .................................................................................. 173
Vertical dimension. ......................................................................................................... 173 Alignment. .................................................................................................................. 179 Performance. ............................................................................................................... 183
VI
Collaboration. ............................................................................................................. 189
Awareness. .................................................................................................................. 194 Leadership. .................................................................................................................. 201 Growth. ....................................................................................................................... 217
Communication. .......................................................................................................... 221 Continuous improvement. ........................................................................................... 223
Diagonal functions .......................................................................................................... 226 Support diagonal. ........................................................................................................ 227 Client diagonal ............................................................................................................ 234
Products and services. ..........................................................................................................241 Synergistic experience. ........................................................................................................242
Positive synergistic experiences. .................................................................................... 243 Planning. ..................................................................................................................... 244
Communication. .......................................................................................................... 247 Behavior. ..................................................................................................................... 249
Execution. ................................................................................................................... 251 Positive experience summary. .................................................................................... 257
Negative synergistic experiences. ................................................................................... 257 Planning. ..................................................................................................................... 258 Behavior. ..................................................................................................................... 261
Communication. .......................................................................................................... 263 Awareness. .................................................................................................................. 264
Leadership. .................................................................................................................. 267 Negative experience summary. ................................................................................... 269
Self-interest. .........................................................................................................................269
Autonomy. ...................................................................................................................... 271
Administration. ............................................................................................................... 272 Culture............................................................................................................................. 272 Outcomes. ....................................................................................................................... 274
Algorithm. ....................................................................................................................... 275 Collaboration in a MOS .......................................................................................................278
Financial observations .........................................................................................................282 Allocations. ..................................................................................................................... 282
Cost. ................................................................................................................................ 287 Revenue........................................................................................................................... 292 Comparison. .................................................................................................................... 296
LIMs. ....................................................................................................................................300 Formal work-structures. .................................................................................................. 301
Shared systems ................................................................................................................ 304 Cultural mechanisms. ...................................................................................................... 307
Drift mitigation ....................................................................................................................310 Focused action. ....................................................................................................................315
MOS action ..................................................................................................................... 317 Finance action ................................................................................................................. 321 LIM action. ..................................................................................................................... 323 Corporate action. ............................................................................................................. 330
VII
Organizational aspects. ................................................................................................... 335
Strategy and execution. ................................................................................................... 336 Summary of endogenous data. .............................................................................................338
Exogenous Data ...................................................................................................................... 338
Megatrend impact ................................................................................................................339 Corporate center. ..................................................................................................................347
Organizational inertia...................................................................................................... 347 Information. .................................................................................................................... 349 Support. ........................................................................................................................... 350
Alignment as an influence. ..................................................................................................354 Drivers............................................................................................................................. 355 Development. .................................................................................................................. 355 1MC. ............................................................................................................................... 357
Scaling the MOS. .................................................................................................................406 Growth. ................................................................................................................................423
Client wheel. ................................................................................................................... 423 Addressable market. ........................................................................................................ 425
LOB wheel. ..................................................................................................................... 425 Sector wheel. ................................................................................................................... 426 Client interaction. ............................................................................................................ 427
Market penetration. ..............................................................................................................431 Capability. ....................................................................................................................... 432
Cost. ................................................................................................................................ 434 Infrastructure ................................................................................................................... 435 Products........................................................................................................................... 436
System ............................................................................................................................. 438
Technical. ........................................................................................................................ 441 Summary of exogenous data. ...............................................................................................446
Summary of Chapter 4 ............................................................................................................ 447
Chapter 5. Conclusions ............................................................................................................... 450
Overview ................................................................................................................................. 450
Conclusions ............................................................................................................................. 455 Propositions and Findings ....................................................................................................... 456
RQ1. .....................................................................................................................................458 Profitability synergy........................................................................................................ 459 Diagonal support. ............................................................................................................ 461
Diagonal client. ............................................................................................................... 462 1MC. ............................................................................................................................... 467
RQ2. .....................................................................................................................................508 RQ3. .....................................................................................................................................526 RQ4. .....................................................................................................................................529 RQ5. .....................................................................................................................................538 ORQ. ....................................................................................................................................546
Implications of the Study ........................................................................................................ 558
VIII
Theory. .................................................................................................................................558
Research. ..............................................................................................................................566 Practice. ................................................................................................................................571
Summary of Chapter 5 ............................................................................................................ 573
REFERENCES ........................................................................................................................... 576
APPENDIX A: GPS IRB Approval Letter ................................................................................. 618
APPENDIX B: List of Definitions ............................................................................................. 620
APPENDIX C: List of Abbreviations ......................................................................................... 626
IX
LIST OF TABLES
Page
Table 1. Horizontal Role Attributes by Category ....................................................................... 152
Table 2. Participant Mapping by Location Structure .................................................................. 178
Table 3. Vertical Leader Theme Categories ............................................................................... 179
Table 4. Alignment Themes ........................................................................................................ 180
Table 5. Performance Themes ................................................................................................... 184
Table 6. Collaboration Themes .................................................................................................. 191
Table 7. Awareness Themes ...................................................................................................... 196
Table 8. Proactive Leadership Themes ...................................................................................... 204
Table 9. Execution Leadership Themes ..................................................................................... 212
Table 10. Growth Themes .......................................................................................................... 219
Table 11. Communication Themes ............................................................................................ 222
Table 12. Continuous Improvement Themes ............................................................................. 224
Table 13. Positive Change Management Themes ...................................................................... 243
Table 14. Negative Change Management Themes .................................................................... 257
Table 15. Collaboration Comments ........................................................................................... 281
Table 16. Financial Observations Themes ................................................................................. 282
Table 17. Allocation Themes ..................................................................................................... 284
Table 18. Cost Themes .............................................................................................................. 288
Table 19. Organization Cost Themes......................................................................................... 290
Table 20. Revenue Themes ........................................................................................................ 293
Table 21. Comparison Themes .................................................................................................. 296
X
Page
Table 22. LIMs: Formal Work Structures.................................................................................. 303
Table 23. LIMs: Shared Systems ............................................................................................... 305
Table 24. LIMs: Cultural Mechanisms ...................................................................................... 308
Table 25. Drift Mitigation Themes ............................................................................................ 312
Table 26. Focused Action by Category...................................................................................... 317
Table 27. Megatrends and Consequences: Market Observations ............................................... 340
Table 28. 1MC Themes.............................................................................................................. 362
Table 29. Meeting Types ........................................................................................................... 428
Table 30. Meeting Topics .......................................................................................................... 430
Table 31. Proposition - Research Question Mapping ................................................................ 453
Table 32. Strength Mapping to Theme Category....................................................................... 454
XI
LIST OF FIGURES
Page
Figure 1. Topic overview . .............................................................................................................. 4
Figure 2. Management levels at MediaCorp ................................................................................... 6
Figure 3. The multidimensional organizational structure . ............................................................. 8
Figure 4. Cumulative life-cycle landscape ................................................................................... 14
Figure 5. Research question topic overview map ......................................................................... 19
Figure 6. Realized synergy advantage .......................................................................................... 29
Figure 7. The multi-unit organization prior to growth synergy .................................................... 41
Figure 8. Growth synergy opportunities prioritized at the nodes ................................................ 43
Figure 9. Life-cycle curve of a product or service. ....................................................................... 49
Figure 10. Strategic complementarity ........................................................................................... 52
Figure 11. MOS scalability ......................................................................................................... 58
Figure 12. Lateral integrative mechanisms .................................................................................. 69
Figure 13. Single case study framework for profitability ........................................................... 112
Figure 14. Transition timeline .................................................................................................... 118
Figure 15. Coding scheme sample for data analysis . ................................................................. 128
Figure 16. Linking propositions to research questions . ............................................................. 141
Figure 17. Coding flow chart ..................................................................................................... 143
Figure 18. Data domains ............................................................................................................ 145
Figure 19. ERP: Consistent usage theme map ............................................................................ 156
Figure 20. Capacity utilization theme map ................................................................................. 158
Figure 21. Cost mapping and management theme map .. ........................................................... 160
XII
Page
Figure 22. Standardization theme map ....................................................................................... 162
Figure 23. Communication theme map ....................................................................................... 165
Figure 24. Revenue theme map .................................................................................................. 167
Figure 25. Operational performance theme map. ....................................................................... 170
Figure 26. Leadership theme map ............................................................................................... 172
Figure 27. MOS: Three embedded models . ............................................................................... 177
Figure 28. Alignment theme map. .............................................................................................. 182
Figure 29. Performance theme map ............................................................................................ 188
Figure 30. Collaboration theme map .......................................................................................... 193
Figure 31. Awareness theme map. .............................................................................................. 200
Figure 32. Proactive leadership theme map ................................................................................ 209
Figure 33. Execution leadership theme map ............................................................................... 216
Figure 34. Location growth theme map ...................................................................................... 220
Figure 35. Communication theme map ....................................................................................... 223
Figure 36. Continuous improvement theme map. ....................................................................... 225
Figure 37. Diagonal support: Infrastructure................................................................................ 229
Figure 38. Diagonal support: System.......................................................................................... 231
Figure 39. Diagonal support: Development ................................................................................ 233
Figure 40. Maintaining current client ......................................................................................... 236
Figure 41. Growing current client ............................................................................................... 238
Figure 42. Growing new client. .................................................................................................. 240
Figure 43. Positive change: Planning theme map ....................................................................... 246
XIII
Page
Figure 44. Positive change: Communication theme map ........................................................... 248
Figure 45. Positive change: Behavior theme map ...................................................................... 250
Figure 46. Positive change: Execution theme map ..................................................................... 255
Figure 47. Negative change: Planning theme map. .................................................................... 260
Figure 48. Negative change: Behavior theme map ..................................................................... 262
Figure 49. Negative change: Communication theme map .......................................................... 263
Figure 50. Negative change: Awareness theme map .................................................................. 266
Figure 51. Negative change: Leadership theme map .................................................................. 268
Figure 52. Exploiting self-interest for profitability. .................................................................... 277
Figure 53. Allocation theme map ................................................................................................ 286
Figure 54. Cost theme map ......................................................................................................... 291
Figure 55. Revenue theme map. ................................................................................................. 295
Figure 56. Comparison theme map ............................................................................................. 299
Figure 57. Entropy mitigation theme map. ................................................................................. 314
Figure 58. Focused action: MOS ................................................................................................ 319
Figure 59. Focused action: MOS synergy................................................................................... 320
Figure 60. Focused action: MOS support ................................................................................... 321
Figure 61. Focused action: Finance theme map.......................................................................... 323
Figure 62. Focused action: LIMs ................................................................................................ 326
Figure 63. Focused action: LIM knowledge. .............................................................................. 328
Figure 64. Focused action: LIM’s system................................................................................... 330
Figure 65. Focused action: Corporate theme map ...................................................................... 332
XIV
Page
Figure 66. Focused action ........................................................................................................... 335
Figure 67. Megatrend theme map ............................................................................................... 346
Figure 68. Corporate: Organizational inertia .............................................................................. 349
Figure 69. Corporate: Information .............................................................................................. 350
Figure 70. Corporate: Support initiatives.................................................................................... 352
Figure 71. Exogenous scalability of a MOS ............................................................................... 407
Figure 72. Assessing MOS scaling map diagram ....................................................................... 412
Figure 73. Defining MOS scaling map diagram ......................................................................... 414
Figure 74. Executing MOS scaling map diagram ....................................................................... 421
Figure 75. Client wheel ............................................................................................................... 424
Figure 76. Addressable market expansion .................................................................................. 425
Figure 77. LOB wheel................................................................................................................. 426
Figure 78. Sector wheel .............................................................................................................. 427
Figure 79. Meeting type theme map ........................................................................................... 429
Figure 80. Market silo penetration in the MOS .......................................................................... 432
Figure 81. Market penetrator: Capability.................................................................................... 434
Figure 82. Market penetrators: Products ..................................................................................... 438
Figure 83. Market penetrator: System ........................................................................................ 441
Figure 84. Sector strategies ......................................................................................................... 443
Figure 85. Sector growth synergy mapping and execution ......................................................... 444
Figure 86. Synergy optimization................................................................................................. 445

XV
DEDICATION
I dedicate my dissertation work to my family and many friends who have supported me
throughout this process. Special gratitude goes out to my loving wife, Ingrid, who endured,
listened, and offered words of encouragement. I will always appreciate all she does to support
me.
I dedicate this work and give special thanks to the many people who work hard to make
our company successful. They represent the best of what makes our global economy work. Their
support was invaluable. I would like to especially call out the co-researchers on this project who
are a critical part of the company and its success. It is their ability to execute with excellence that
makes our brand what it is.

XVI
ACKNOWLEDGEMENTS
My time at Pepperdine has been intellectually challenging and enriching. I would like to
thank the people who accompanied me on this journey, the members of the West LA Cohort and
the professors who influenced us.
I would like to thank my chairperson, Professor Kent Rhodes who has guided me
throughout this process and helped me in my academic and personal development. He has shared
with me his extensive experience in corporate organizational development and strategy. His
constructive guidance through a positive and encouraging communication style has helped me
complete this dissertation.
I would also like to thank my co-chairs, Professor Leigh and Professor DellaNeve. Their
advice and encouragement was invaluable. Their advice on the final draft and constant support
was critical to the completion of this paper and the case study discussed.
The participants in the study were extremely helpful in providing the empirical data.
Their insightful wisdom and collaboration, regarding the effective realization of growth
synergies, made this dissertation possible.
Finally and most importantly, I thank my wife and children for being patient with me
during my studies and this work. They encouraged me to complete what I had set out to do. I
dedicate this dissertation to them.
XVII
VITA
Deluxe Entertainment Services Group, Inc.:
SVP, WW Operations and Business Execution 11/09 - Present
VP, WW Operations and Business Execution 1/08 - 11/09
VP, Global Business Execution 6/07 - 1/08
Senior Director, WW Quality Assurance and Security 11/06 - 6/07
Worldwide Director of Quality (Division 2) 11/05 - 11/06
Worldwide Director of Quality (Division 1) 1/00 - 11/05
Director, Packaging Operations 10/96 - 1/00
Precision Packaging, Inc.:
General Manager 1/93 - 10/96
Other Employment:
Plant Engineer for Production and Distribution 6/91 - 12/92
R&D Intern, Project Engineer/Manager (for various companies) 6/87 - 6/91
EDUCATIONAL EXPERIENCE
D. Ed. Organizational Leadership, Pepperdine University May, 2015
Malibu, CA
MS Operations Management, University of Arkansas May, 2000
Little Rock, AR
BS Mechanical Engineering, John Brown University May, 1992
Siloam Springs, AR
BS Electrical Engineering, John Brown University Dec., 1992
Siloam Springs, AR
Aeronautical Engineering, Embry-Riddle Aeronautical University 1984 - 1985
Daytona Beach, FL (70 credit hours Aeronautical Engineering)
AS Engineering Technology, John Brown University May, 1983
Siloam Springs, AR
PROFESSIONAL EDUCATION & CERTIFICATIONS
Leadership Program - Center for Creative Leadership
Certified Zenger-Miller Trainer/Facilitator - Achieve Global
Certified Quality Manager – American Society for Quality (ASQ)
Certified Quality Auditor - ASQ
Certified Reliability Engineer - ASQ
Certified Six Sigma Black Belt - ASQ and Six Sigma Academy
Certified Software Quality Engineer - ASQ
Certified Master Black Belt - Six Sigma Partners
XVIII
ABSTRACT
The realization of growth synergies across products and services in a global multi-unit firm is a
topic of discovery that has substantial implications for the profitability of multi-national
corporations. A driver for the realization of this incompletely tapped potential is the influence of
organizational design. The scholar comprehensively examines a singular case study in which a
multidimensional organizational design is used to exploit growth synergies in a global multi-unit
firm. For many firms, collaboration is connected to synergy realization, which is critical to
growth in saturated and emerging markets. Cross-business unit strategy research has been largely
focused on diversification rather than on synergies. Additionally, the literature addresses synergy
realization in very turbulent or static markets; however, in this case, the scholar illustrates how a
multi-unit firm in a moderately dynamic market attempted to exploit growth synergy
opportunities through (a) focused action, (b) the application of an organizational design that
exploits decentralized collaboration, (c) lateral support mechanisms that preserve business unit
(BU) self-interest, (d) a designed relationship with the corporate center, and (e) a singular
context with clients. The intent of these actions is to enhance profitability theory by analyzing
rapid evolutionary change in an integrated global value chain. This study attempts to show
whether or not a multi-unit firm made of business units that are related diversifiers can be
combined, or recombined, to exploit complementary resources. Furthermore, this study advances
emerging research on the exploitation of multidimensional organizational design, its dynamic
capabilities, co-evolutionary organization-wide change leadership, and cross-unit innovation.
1
Chapter 1. Introduction
Corporate advantage, the profitable exploitation of a business opportunity, from cross-
unit synergies in a multi-business firm is a high priority for increasing corporate profitability
(Ansoff, 1965; Martin, 2002; Martin & Eisenhardt, 2001; Porter, 1985). Recent international
surveys have shown that over 70% of international firms are benefitting from the exploitation of
synergies between their business units (Mueller-Stewens & Knoll, 2006). For many firms this is
critical for growth in both saturated and emerging markets. Portfolio diversification, by
extending the range of services or products offered, has typically been the focus of strategic
management research for firm profitability in turbulent markets. Consequently, research has
generally excluded cross-business unit synergies (Li & Greenwood, 2004). Considering that
experts say that there will be as much change in the next 10 years as was seen in the last
hundred, the urgency for realizing synergistic growth only increases (Rose, 1990). Perhaps this is
understated. Some information is available about synergies in static and radically dynamic
markets; however, little is known about synergies across business units in moderately dynamic
markets. In this context moderately dynamic is characterized by the scholar as three times the
minimum volume swing during seasonality, a multi-year product life-cycle potential, intermittent
volume surges to three times normal, and up to three times product complexity shifting. This
research is relevant as many businesses fall into this category. Furthermore, recent studies have
begun to suggest that product or service opportunities, referred to as sustainable competitive
advantages, are experiencing shorter life-cycles (D’Aveni, Dagnino, & Smith, 2010). For the
opportunities to resemble sustained corporate advantage the temporary advantages need to be
concatenated together (Wiggins & Ruefli, 2005). Available research does not provide insight into

2
the achievement of this sustained profitable corporate growth in moderately dynamic markets
through cross-unit synergies (Goold & Campbell, 1998), thereby setting the stage for this study.
This dissertation is divided into five chapters. In the first chapter, the scholar introduces
growth synergies and their realization in a multidimensional organizational design that leverages
lateral integrative mechanisms endogenously and firm one-ness exogenously in a moderately
dynamic market. In this study the scholar will discuss the realization of growth synergies for the
purpose of corporate advantage through several key ideas that are intended to influence
management theory. Here, the background of the problem along with the research questions will
be presented. Chapter 2 elaborates on the critical topics of the dissertation through an in-depth
review of the literature on growth synergies within a context. This review will point to gaps that
validate the research questions. Chapter 3 describes the method and research design. This chapter
explains why an empirical approach is being taken based on phenomenology as a method rather
than a tradition. The case study is the design based in tradition. The single case study design was
chosen as it enabled the scholar to explore the topic in depth. Chapter 4 will reveal the data and
findings of the case study. Detailed descriptions of exploratory work regarding leadership roles,
synergistic experiences, financial observations, and focused actions are described. This
discussion presents themes that emerged from the data collected at the case study research site.
Through the empirical evidence the reader may draw conclusions relative to the scholar’s
interpretation of the data. Chapter 5 will discuss and summarize the scholar’s conclusions and
recommendations from the study by answering the research questions. Ultimately, the scholar
aims to create a mid-range theory about sustainable growth synergy realization in multi-unit
firms. The scholar will examine whether or not a multi-unit firm with an aligned focus and an
organizational design that promotes self-directed decentralized collaboration, while preserving
3
self-interest, can promote sustained realization of growth synergies. Through a discussion of the
theoretical and practical contributions of the results of this empirical study, this chapter provides
a summary of the research. Finally, the limitations of this research are presented and suggestions
are made for future study.
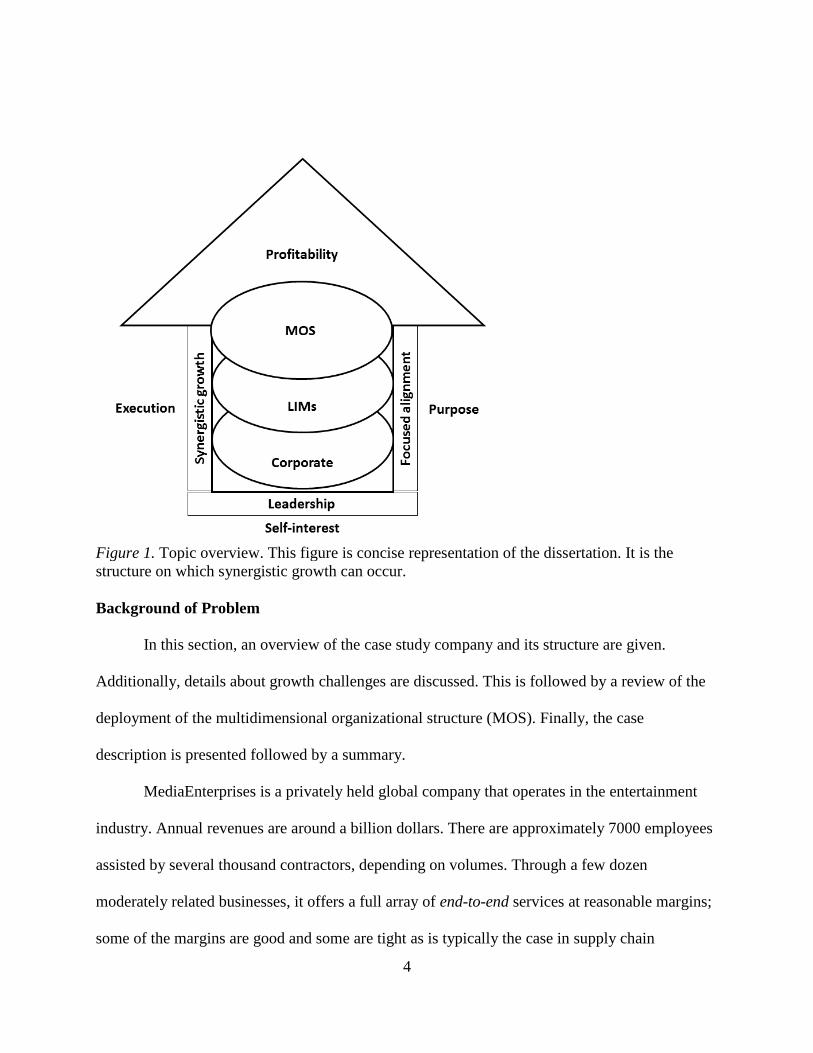
The topic overview is presented graphically in Figure 1. The upward arrow indicates
symbolically an increase in profitability. This is supported by the multidimensional
organizational design, lateral integrative mechanisms (LIMs), and a designed relationship with
corporate. The organization experiences purpose through alignment. All of this is achieved with
the execution of focused tasks that are related to growth synergies. Leadership supports the effort
through motivation and inspiration.
4
Figure 1. Topic overview. This figure is concise representation of the dissertation. It is the
structure on which synergistic growth can occur.
Background of Problem
In this section, an overview of the case study company and its structure are given.
Additionally, details about growth challenges are discussed. This is followed by a review of the
deployment of the multidimensional organizational structure (MOS). Finally, the case
description is presented followed by a summary.
MediaEnterprises is a privately held global company that operates in the entertainment
industry. Annual revenues are around a billion dollars. There are approximately 7000 employees
assisted by several thousand contractors, depending on volumes. Through a few dozen
moderately related businesses, it offers a full array of end-to-end services at reasonable margins;
some of the margins are good and some are tight as is typically the case in supply chain
5
scenarios. These products and services share, to some extent, common customers, workflows,
infrastructure elements, and technologies in a global value chain. MediaCorp, a division of
MediaEnterprises, has traditionally produced most of the profits for MediaEnterprises; however,
the trend is downward due to the approaching end of a product’s life-cycle in a moderately
dynamic market. MediaCorp largely enjoys financial performance autonomy. Even so, the
dynamic marketplace made it imperative that MediaCorp respond to the tension around the need
for growth.
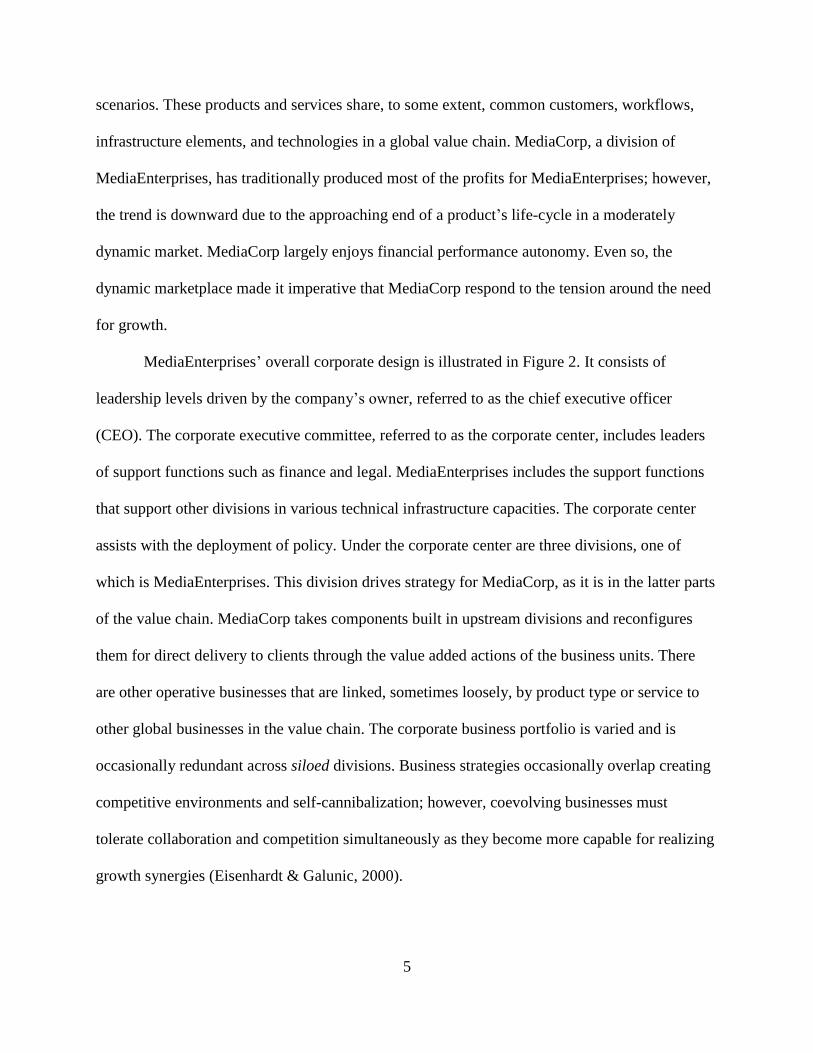
MediaEnterprises’ overall corporate design is illustrated in Figure 2. It consists of
leadership levels driven by the company’s owner, referred to as the chief executive officer
(CEO). The corporate executive committee, referred to as the corporate center, includes leaders
of support functions such as finance and legal. MediaEnterprises includes the support functions
that support other divisions in various technical infrastructure capacities. The corporate center
assists with the deployment of policy. Under the corporate center are three divisions, one of
which is MediaEnterprises. This division drives strategy for MediaCorp, as it is in the latter parts
of the value chain. MediaCorp takes components built in upstream divisions and reconfigures
them for direct delivery to clients through the value added actions of the business units. There
are other operative businesses that are linked, sometimes loosely, by product type or service to
other global businesses in the value chain. The corporate business portfolio is varied and is
occasionally redundant across siloed divisions. Business strategies occasionally overlap creating
competitive environments and self-cannibalization; however, coevolving businesses must
tolerate collaboration and competition simultaneously as they become more capable for realizing
growth synergies (Eisenhardt & Galunic, 2000).
6
Figure 2. Management levels at MediaCorp. This figure illustrates the structure of the company
and the relationship between the owners and the business units.
Each division operates with a high level of autonomy and is responsible for earnings. The
corporate center and the corporate owner level executives have no operative responsibilities;
however, they perform business reviews and impose target agreements while seeking to
understand operational performance. Each physical location has entrepreneurial responsibility for
their markets. Each division has, to some extent, research and development, production, and
sales capabilities and is partly responsible for the strategic management, holistically, of their sub-
divisions. Regional businesses differ in size, competency, product or service offering, sector
involvement, and scope of client base. The structure generally matches other businesses due to
workflow similarities within products or services; however, the task and client scope influences
overall structure and size. These businesses are financially bound by a yearly budgeting process
which produces performance target agreements at the business level.
MediaCorp has more than a dozen profit and loss business units (P&Ls) and, for purposes
of this dissertation, this is the lowest strategic planning unit and the focus of this single case
study. MediaCorp has a global supply chain that includes more than a dozen locations in as many
7
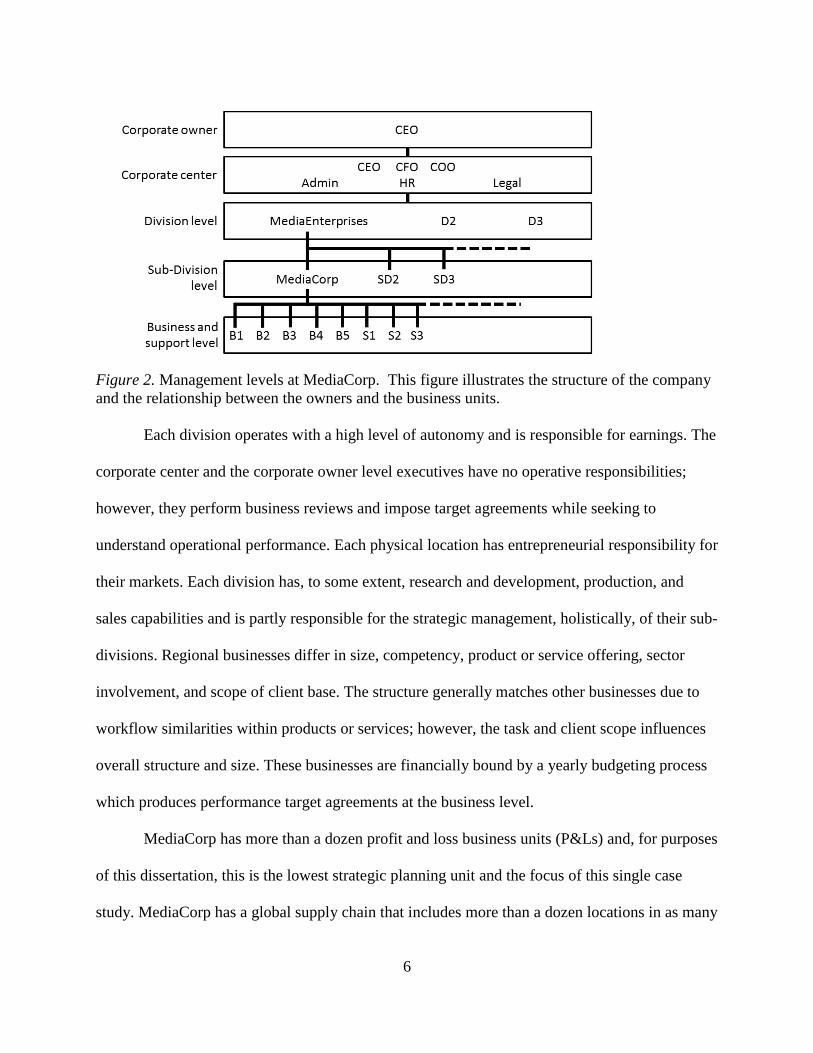
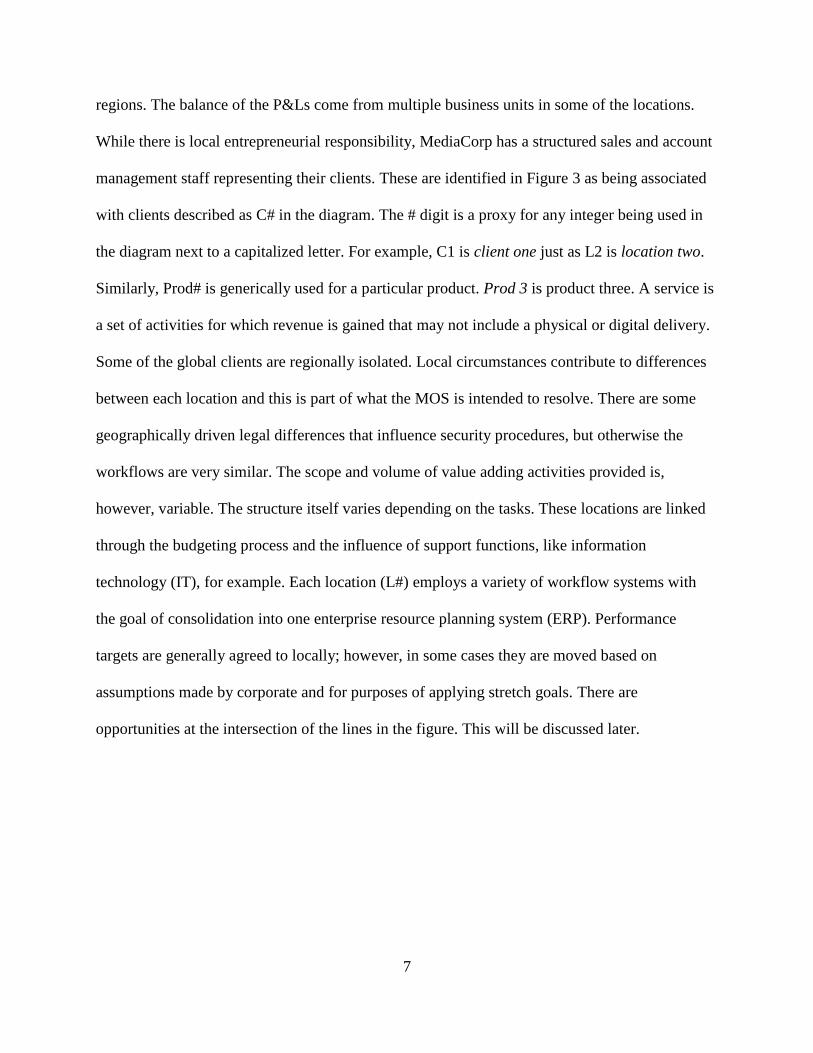
regions. The balance of the P&Ls come from multiple business units in some of the locations.
While there is local entrepreneurial responsibility, MediaCorp has a structured sales and account
management staff representing their clients. These are identified in Figure 3 as being associated
with clients described as C# in the diagram. The # digit is a proxy for any integer being used in
the diagram next to a capitalized letter. For example, C1 is client one just as L2 is location two.
Similarly, Prod# is generically used for a particular product. Prod 3 is product three. A service is
a set of activities for which revenue is gained that may not include a physical or digital delivery.
Some of the global clients are regionally isolated. Local circumstances contribute to differences
between each location and this is part of what the MOS is intended to resolve. There are some
geographically driven legal differences that influence security procedures, but otherwise the
workflows are very similar. The scope and volume of value adding activities provided is,
however, variable. The structure itself varies depending on the tasks. These locations are linked
through the budgeting process and the influence of support functions, like information
technology (IT), for example. Each location (L#) employs a variety of workflow systems with
the goal of consolidation into one enterprise resource planning system (ERP). Performance
targets are generally agreed to locally; however, in some cases they are moved based on
assumptions made by corporate and for purposes of applying stretch goals. There are
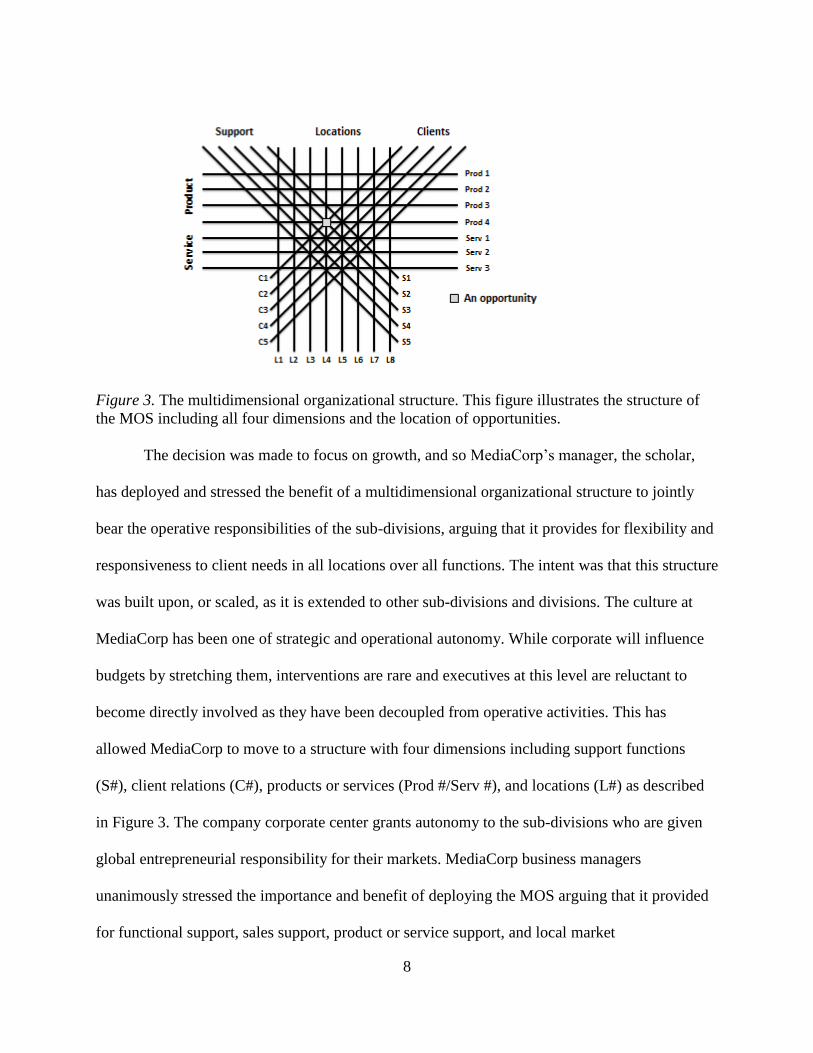
opportunities at the intersection of the lines in the figure. This will be discussed later.
8
Figure 3. The multidimensional organizational structure. This figure illustrates the structure of
the MOS including all four dimensions and the location of opportunities.
The decision was made to focus on growth, and so MediaCorp’s manager, the scholar,
has deployed and stressed the benefit of a multidimensional organizational structure to jointly
bear the operative responsibilities of the sub-divisions, arguing that it provides for flexibility and
responsiveness to client needs in all locations over all functions. The intent was that this structure
was built upon, or scaled, as it is extended to other sub-divisions and divisions. The culture at
MediaCorp has been one of strategic and operational autonomy. While corporate will influence
budgets by stretching them, interventions are rare and executives at this level are reluctant to
become directly involved as they have been decoupled from operative activities. This has
allowed MediaCorp to move to a structure with four dimensions including support functions
(S#), client relations (C#), products or services (Prod #/Serv #), and locations (L#) as described
in Figure 3. The company corporate center grants autonomy to the sub-divisions who are given
global entrepreneurial responsibility for their markets. MediaCorp business managers
unanimously stressed the importance and benefit of deploying the MOS arguing that it provided
for functional support, sales support, product or service support, and local market
9
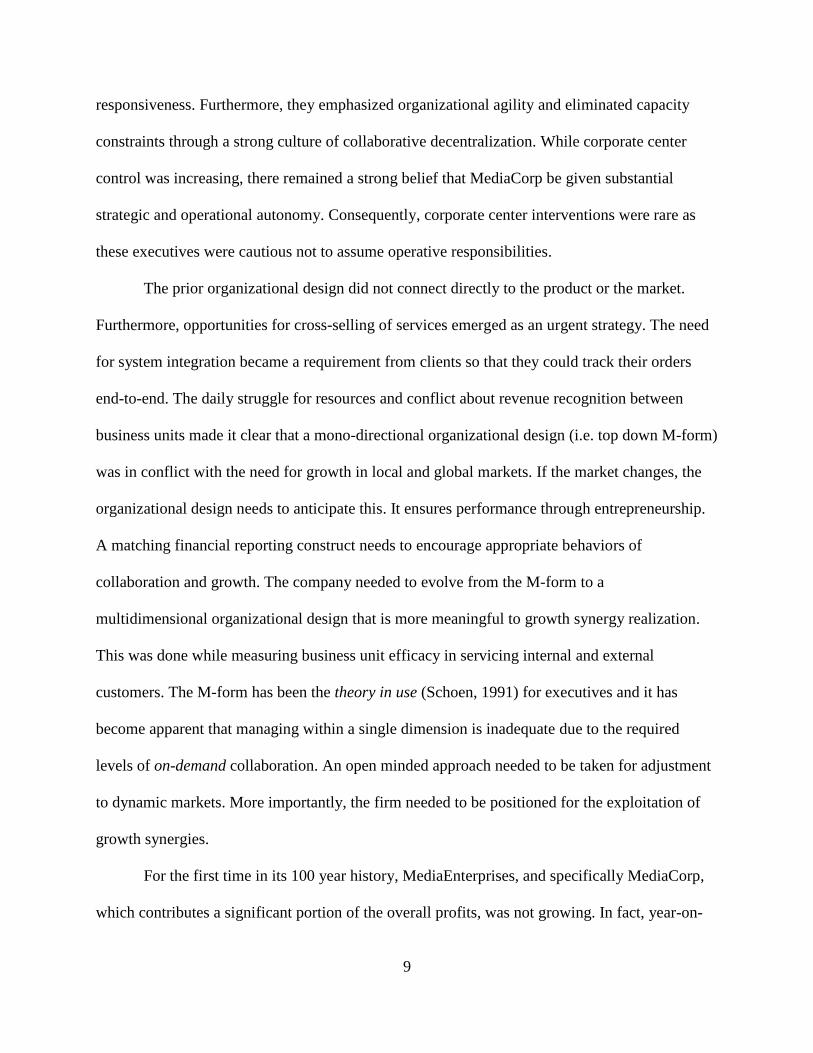
responsiveness. Furthermore, they emphasized organizational agility and eliminated capacity
constraints through a strong culture of collaborative decentralization. While corporate center
control was increasing, there remained a strong belief that MediaCorp be given substantial
strategic and operational autonomy. Consequently, corporate center interventions were rare as
these executives were cautious not to assume operative responsibilities.
The prior organizational design did not connect directly to the product or the market.
Furthermore, opportunities for cross-selling of services emerged as an urgent strategy. The need
for system integration became a requirement from clients so that they could track their orders
end-to-end. The daily struggle for resources and conflict about revenue recognition between
business units made it clear that a mono-directional organizational design (i.e. top down M-form)
was in conflict with the need for growth in local and global markets. If the market changes, the
organizational design needs to anticipate this. It ensures performance through entrepreneurship.
A matching financial reporting construct needs to encourage appropriate behaviors of
collaboration and growth. The company needed to evolve from the M-form to a
multidimensional organizational design that is more meaningful to growth synergy realization.
This was done while measuring business unit efficacy in servicing internal and external
customers. The M-form has been the theory in use (Schoen, 1991) for executives and it has
become apparent that managing within a single dimension is inadequate due to the required
levels of on-demand collaboration. An open minded approach needed to be taken for adjustment
to dynamic markets. More importantly, the firm needed to be positioned for the exploitation of
growth synergies.
For the first time in its 100 year history, MediaEnterprises, and specifically MediaCorp,
which contributes a significant portion of the overall profits, was not growing. In fact, year-on-
10
year profits were approximately half in 2014 what they were the previous year. This caused
anxiety within the leadership of MediaEnterprises and the corporate enter. Continuous and
intense competition was endangering profitability and the outlook was not optimistic as its
primary products reached their highest points in their respective life-cycles. Other issues
exacerbated the problem. Some orders were taken with pricing that was outside of contracted
guidelines. The time to complete orders was reduced dramatically, pushing up overtime costs. A
shift in administrative tasks from the in-house client staff to MediaCorp helped the client to
reduce their costs while shifting the burden to MediaCorp. Overall revenue per product for the
primary business line had fallen by about 40% over the last 12 months, due to the reduction in
product variants. The count, and cost, of implanted personnel (staff located in the client’s facility
but paid for by MediaCorp) had not changed in line with revenue trends. Services that were
offered for free with older more profitable pricing were continued despite the declining revenue
trend. Payment terms were extended to clients to meet short term goals that influenced the P&L
in the form of discounts. Unexpectedly, additional rebates were exploited by clients. Clients also
decided to cancel extra features that enhanced MediaCorp’s profitability. This reduced product
differentiation in the marketplace and encouraged commoditization of existing and new products.
The client’s process of supplying fit-for-use parts improved reducing overage opportunities
previously enjoyed. Finally, with the reduction in the number of variations of each product, the
ability to redundantly exploit product configurations and operational activities was reduced. All
of MediaCorp’s businesses were operating in highly competitive markets with a small set of
competitors vying for work from a small set of customers. The resultant captive vendor
environment enabled the clients to exact discounts with impunity as they played one vendor off
the other, or just dictated prices. Vendors that had one-off work at low volumes did not have the
11
financial resources to invest in new technologies as product life cycles came and went. This
narrowed the field and accelerated consolidation in the industry. The surviving vendors had to
achieve high volumes in order to sustain financial profits. In some cases sole supplier contracts
were awarded to vendors, like MediaEnterprises, but with substantial pricing compression. This
was further promoted by a sales effort to capture bulk orders with limited margin. Otherwise,
client culture was to have a number of vendors as risk mitigation measure. Clients were forced,
however, to move towards a sole supplier to achieve ongoing technology investments, as the
vendors were disappearing from the starved vendor pool.
Within the MOS, each client (C#) had a representative responsible for performance from
a P&L perspective. The overall revenue and profit margin per client was made available, and
was scrutinized. Additionally, these metrics were available by service and location. Some of
MediaCorp’s markets were becoming saturated. The only reprieve would come from new
formats; however, these opportunities were limited due to reduced format life-cycles and
fragmented user adoption, which in turn limited the opportunity for profitability. Regardless,
these opportunities required substantial R&D and capital investment. Clients became dependent
on MediaCorp’s capital resources, leveraging them for new revenue opportunities; however,
there was uncertainty around growth potential and some formats declined after volatile launches.
While staying on the leading edge of new developments and with the encouraging prospect and
hope associated with new formats, MediaCorp overcommitted resources to the maturing of these
products. Some were cancelled by clients or adopted slowly by consumers. In general, product
fragmentation in the marketplace led to a lack of consensus in the industry, confusing early
adopters. Forecasted potential revenue loss based on client intentions added to corporate
anxieties. A dyadic conflict existed between representing potential revenues to appease the
12
corporate and the reality of historical format successes that should have been expressed more
conservatively.
Clients complained about a lack of coordination between businesses and across products
contributing to service dissatisfaction. Other vendors, and the clients themselves, had a more
integrated approach than MediaCorp. To make matters worse, there were price wars between
MediaEnterprises business units out of desperation to capture revenue. To clients it was just as
difficult to take their work to three disparate vendors as it was to work with three silos within
MediaEnterprises. This exacerbated recent initiatives to promote the benefits of bundling or
purchasing end-to-end services. The One initiatives of competitors enabled them to gain
competitive advantage from a more integrated, cross-unit approach. The inability to capture large
projects, the unwillingness of clients to allow MediaEnterprises to consume a large percentage of
their budgeted spend, and not using the full potential of the sales force kept MediaEnterprises
from realizing potential profitable growth.
Markets that MediaCorp supplied quickly became saturated with product and thus,
profitable growth was at risk. Vertical growth opportunities were limited by decisions that clients
made about their product offerings. MediaCorp then decided to pursue one-off bulk work and
expand its client base in other sectors. This was, however, unfamiliar territory and it was difficult
to win new work without endangering profitability. An analysis of market needs against
MediaCorp capabilities revealed a number of opportunities. Gaining entry into these markets
resulted in pricing concessions. This work consumed capacity while producing minimal
contribution margin. In fact, the overall financial performance trended poorly as a result. New
sector nuances with regard to compliance and culture added complexity, created conflict, and
stretched resources. Furthermore, an analysis was done of untapped market segments within the

13
control of existing clients. These were vigorously pursued, as the ability to network using
existing contacts was potentially fruitful. Unfortunately, with penetration comes pricing
concessions in order to gain entry (Porter, 1985). While this increased revenues, it put stress on
profitability and the organization struggled to meet the demands of the complex undulating
landscape as described in Figure 4.
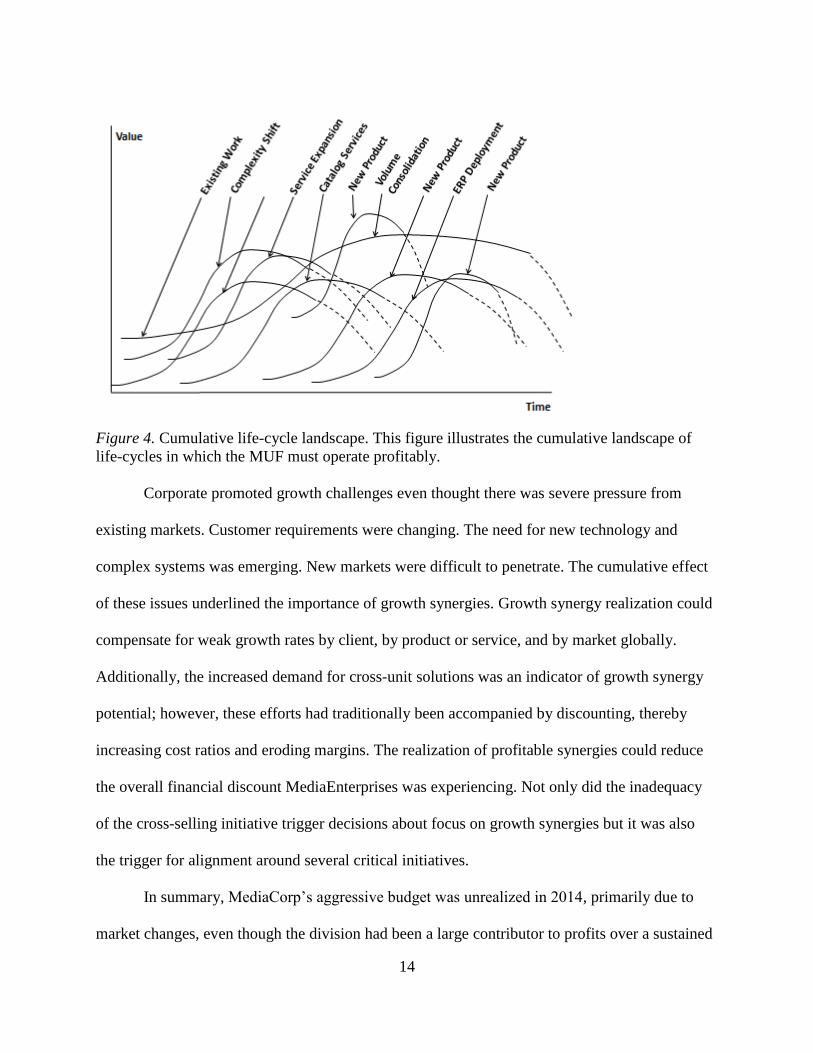
The landscape is made up of many life-cycles in play at MediaCorp at any given time.
The value of each life-cycle curve depends on many variables including complexity, size, and the
effort needed to make each product or perform the service. For example, existing work may be of
a lower volume, but then with seasonality the volume increases. Overall value can be enhanced
with an increase in complexity or from new product launches. Even fees from an ERP
deployment can create revenue. A leader would need to successfully navigate the cumulative
effect of these undulations. In the case of MediaCorp, this landscape was unpredictable for the
most part. Multiple industry trends are involved; however, what a vendor experiences within
those trends is difficult to predict. Even clients were unable to predict what they required, as they
are manipulated by the same megatrends. As a result, forecasting information from the clients
was largely inaccurate.
14
Figure 4. Cumulative life-cycle landscape. This figure illustrates the cumulative landscape of
life-cycles in which the MUF must operate profitably.
Corporate promoted growth challenges even thought there was severe pressure from
existing markets. Customer requirements were changing. The need for new technology and
complex systems was emerging. New markets were difficult to penetrate. The cumulative effect
of these issues underlined the importance of growth synergies. Growth synergy realization could
compensate for weak growth rates by client, by product or service, and by market globally.
Additionally, the increased demand for cross-unit solutions was an indicator of growth synergy
potential; however, these efforts had traditionally been accompanied by discounting, thereby
increasing cost ratios and eroding margins. The realization of profitable synergies could reduce
the overall financial discount MediaEnterprises was experiencing. Not only did the inadequacy
of the cross-selling initiative trigger decisions about focus on growth synergies but it was also
the trigger for alignment around several critical initiatives.
In summary, MediaCorp’s aggressive budget was unrealized in 2014, primarily due to
market changes, even though the division had been a large contributor to profits over a sustained
15
period of time. This loss, along with other shortfalls in other divisions, altered the corporate
mindset to focus on growth synergies. The tension, combined with an entrepreneurial culture,
challenged the organization to recalibrate. It was compelled to deal with emerging market trends
and the inertia in its traditional structure. Some of the financial issues promoted desperation in
the units. To experience profits, they used disruptive tactics and client stealing. Internal
competition became unhealthy. The opportunity for a more effective method to realize growth
synergies became apparent. The leader of MediaCorp deployed the MOS to enable the
organization to exploit growth opportunities in a dynamic market. Some specific strategies in
MediaCorp included horizontal synergy realization across locations. Additionally, clients were
expecting a one-ness within MediaEnterprises that had not been achieved due to corporate silos.
The enterprise was challenged by growth stagnation, price erosion, changing client needs, a
technology vacuum, emerging product types, and the ending of existing product life-cycles.
Clients imposed production oriented market share limitations that were difficult to overcome in
an environment of survival-oriented competition.
Purpose of the Study
The purpose of this study is to establish a perspective based on empirical research on
cross-business synergies that leads to growth in a multi-unit global business. The focus of the
study is on concepts that include a multidimensional organizational structure and a one-ness
strategy. The scholar intends to increase understanding around the following issues:
Various types of growth oriented synergies can be leveraged by a multi-unit firm (MUFs)
that has leveraged a multidimensional organizational design (MOS).

16
A multi-unit business can achieve profitable growth through effective collaboration-
based mechanisms strategically inserted across dimensions in a multidimensional
structure.
Corporate can perform a selective and supportive role that contributes to MOS
capabilities in the addressable market.
Lateral control mechanisms can influence the achievement of synergistic growth.
The scholar intends to shift the thinking of corporate strategy to being more growth oriented
and less exclusively cost-reduction oriented. When this occurs, overall corporate value will
increase through the exploitation of growth opportunities across businesses and between
dimensions in a multidimensional organization. This study addresses the research questions
posed by the scholar. In answering these research questions the scholar aims to close the gaps in
theory and create understanding through an exploratory empirical case study. This study draws
on theoretical and empirical insights to inform management theory on cross-unit synergies for
the practical purpose of improving corporate performance.
Importance of the Study
A critical result of this dissertation, or the expected deliverable, is a taxonomy of cross-
business synergy realization mechanisms as well as empirically based theoretical insights. These
will be represented as propositions that emerge from empirical data regarding the sustainable
realization of growth synergies in a particular business context. The context is an uncommon and
novel organizational topology as applied to a cross-unit firm. Within this taxonomy, categories
of cross-businesses synergy sources and their relationship for sustained corporate advantage are
discussed. Additionally, constructs enhancing lateral collaboration are described. The leadership
of these structures is critical to their influence of goal achievement, and so the roles of leaders in
17
an effective multidimensional organizational structure that leverages lateral control mechanisms
will be described. Ultimately, this dissertation will provide contributions to mid-ranged theory of
sustainable growth synergy realization through the successful deployment of several
organizational constructs endogenous (ex. relationship with quality control) and exogenous (ex.
relationship with corporate finance) to a multi-unit firm (MUF).
This study aims to augment existing theories that relate to organizational strategy. The
primary contribution of this dissertation is new empirical insights about the effects of a multi-
dimensional organizational design augmented by lateral integrative mechanisms on growth
synergy realization. These results will therefore be relevant to the achievement of sustained
profitability and competitive advantage by focusing a MUF on business unit relatedness and
strategic complementarity. A co-evolutionary perspective of change is discussed for the purpose
of promoting sustainable, as opposed to temporary, corporate advantage. The singular case study
approach will reveal and support empirical exploration through data review and analysis, and
exploitation, through focused action. Furthermore, this research attempts to contribute to
practical management theory as it relates to identifying opportunities for ongoing corporate value
generation. This study challenges radical downsizing where there is market uncertainty as a
default strategic solution for profitability and encourages, rather, co-evolutionary adaptation
through an organizational design that promotes profitable growth.
Research Questions
Research questions focus the research and help reduce ambiguity within the study. This is
especially relevant to phenomenological case studies (Punch, 1998). A scholar can be quickly
overwhelmed by the data if the research questions are not specifically defined and framed within
a suitable scope (Eisenhardt, 1989; Yin, 1994). Punch (1998) suggests two strategies for
18
developing research questions. The research questions can be formed from existing research
before the actual study or the questions can be formed inductively during the study. The scholar
will employ an approach that includes the forming of the questions in an interview protocol that
leads to follow up questions, as part of the approved protocol, for purposes of creating additional
clarity where needed. The specific detail of the research questions were iteratively influenced
through literature research and through a review of preexisting company data. The questions are
graphically displayed in Figure 5, the topic overview diagram.
Figure 5, like Figure 1, shows the overall themes in this case study. The research
questions (RQ#) are mapped to each element of the diagram. The overall research question
(ORQ) is in the top of the arrow. This is a general question that relates to profitability from
which the others are specifically developed. The first research question relates to the influence of
the MOS on profitability. The second research question relates to the influence of exploiting
growth synergies for realizing profitability. The third question seeks to understand the
relationship between corporate and profitability achievement by supporting the MOS design. The
fourth question relates to the influence of LIMs on profitability. The last question relates to the
influence of alignment on profitability.
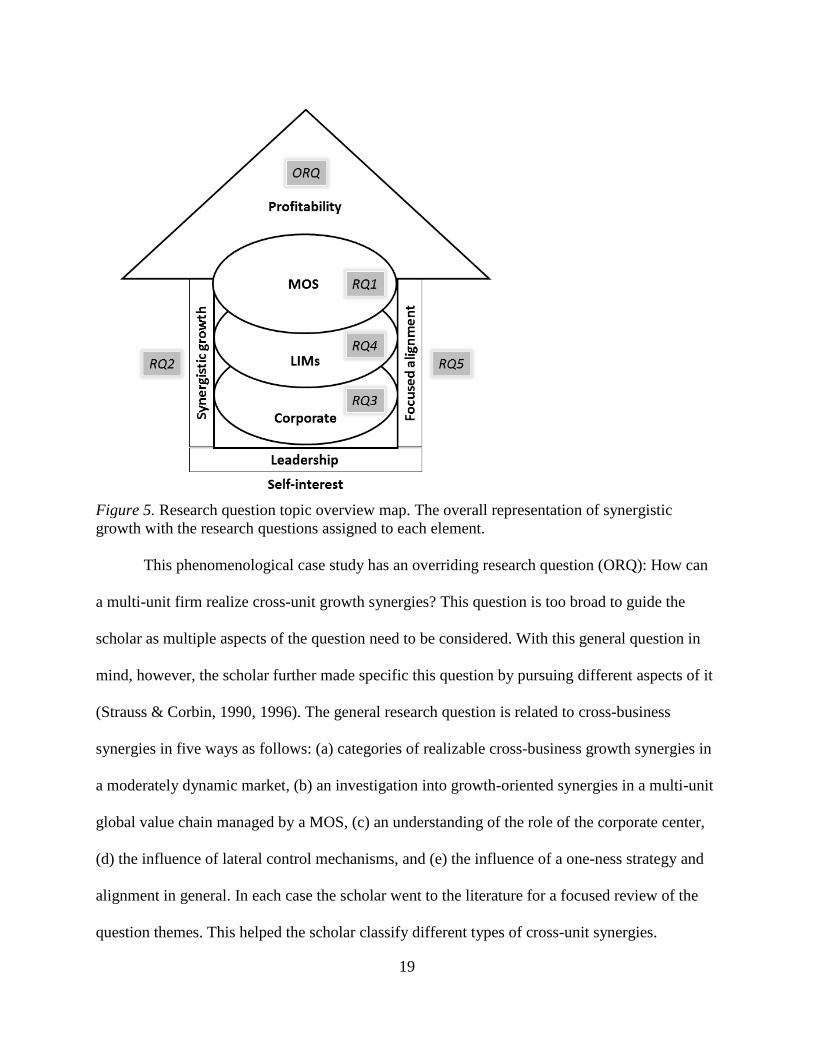
19
Figure 5. Research question topic overview map. The overall representation of synergistic
growth with the research questions assigned to each element.
This phenomenological case study has an overriding research question (ORQ): How can
a multi-unit firm realize cross-unit growth synergies? This question is too broad to guide the
scholar as multiple aspects of the question need to be considered. With this general question in
mind, however, the scholar further made specific this question by pursuing different aspects of it
(Strauss & Corbin, 1990, 1996). The general research question is related to cross-business
synergies in five ways as follows: (a) categories of realizable cross-business growth synergies in
a moderately dynamic market, (b) an investigation into growth-oriented synergies in a multi-unit
global value chain managed by a MOS, (c) an understanding of the role of the corporate center,
(d) the influence of lateral control mechanisms, and (e) the influence of a one-ness strategy and
alignment in general. In each case the scholar went to the literature for a focused review of the
question themes. This helped the scholar classify different types of cross-unit synergies.
20
Ansoff (1965) and Porter (1985) published their seminal works five and three decades
ago, respectively. Since that time there has been little additional typological information
provided by scholars regarding cross-business multidimensional growth oriented synergies that
are grounded in theory. This led the scholar to attempt to close this gap by identifying a topology
for cross-business synergies in a global supply chain organized in a multidimensional
organizational design. This then led the scholar to the first research question (RQ1): What types
of growth synergies, if any, can a multi-unit business, multidimensional organizational structure
realize? There is very little information in the literature about the unique combination of a MOS
in a multi-unit firm. The scholar aims to answer this research question by providing further
insights into the integration of this organizational design into a multi-unit firm. This data will be
provided through an interview process of participants involved in the transition to this design.
The associated success factors and challenges are revealed in this single case study.
This dissertation focuses on how multi-unit businesses in a multidimensional structure
can capture corporate value through the sustainable realization of growth synergies. While the
first research question identifies the relationship between organizational structure and the
realization of cross-unit synergies, the second investigates growth synergies through focused and
selected action. With the exception of Martin (2002), research is too empirically immature to
provide adequate insight into synergy realization. Consequently, the second research question
(RQ2) that this study explores is: How do multi-unit firms with a multidimensional
organizational structure continuously realize the benefits of growth synergies, if at all? The
scholar aims to answer this question by developing an empirically substantiated theory of
sustained growth synergy realization in a multi-unit business. This data will be collected from
stakeholders (owners of P&Ls) in the business units through an interview process. This study
21
attempts to increase scholarly thinking beyond the efficiency-oriented view of corporate strategy,
where corporate value is achieved though cost reductions and capacity balancing, to a growth-
based view of corporate strategy that exploits growth synergies across businesses. This leads to
the next research question.
The design of the corporate center is critical to the performance of the structure under its
influence. This dissertation attempts to close the gap in the literature regarding the influence of
the corporate center on continuous and sustained growth synergies (Palich, Cardinal, & Miller,
2000; Rumelt, 1974; Wrigley, 1970). The role of the corporate center and how this role, through
the support of strategic action, integrates effectively into a MOS with a varied client base and
product line is complex and needs to be understood. Hence the scholar poses the third research
question (RQ3): What is the role, if any, of the corporate center in the context of this case study?
The scholar aims to answer this question by providing further insights and by increasing
scholarly understanding around the relationship between the corporate center and the MOS;
specifically with regard to how it influences continuous growth synergy realization. This data
will be collected from stakeholders who benefit, and are influenced by, their relationship with
corporate functions. To further refine the organizational discussion the fourth research question
is posed.
Lateral integrative mechanisms (LIMs) are critical for the success of a MOS. LIMs help
connect the multidimensional organizational structure dimensions and influence how they
interface with the corporate center. They are complex, situational, and dynamic. This study
attempts to provide research information about the nature of LIMs, how they are constructed, and
how they influence growth synergy realization by connecting relevant networks and enabling the
exploitation of knowledge, the most strategic resource in an organization (McEvily &
22
Chakravarthy, 2002). Hence, the fourth research question (RQ4) that this study explores is: How
can lateral integrative mechanisms influence, if at all, growth synergies in a MOS? The scholar
aims to answer this question by providing further insights into the nature of this needed structure
and how it works in the context of a MOS. There is little information in the literature about LIMs
and so this singular case study contributes to scholarly thinking about LIMs and organizational
theory in general. This data will be collected from stakeholders in the MOS, from LIM leaders,
and from LIM members. When the organizational discussion is completed, the next emphasis
will be on the alignment of the organization as posed by the final research question.
An organizational topology designed around an aligning norm, in this case one-ness,
enables agile behavior optimizing the organization’s success potential in a moderately dynamic
environment. This relates to an organization’s ability to focus its experience, skills, information,
and routines on growth synergies collectively (Almeida & Grant, 1998; Grant, 1991, 1996;
Santos & Eisenhardt, 2005; Winter, 1987). This alignment may be described simply as a mindset
that guides decisions. There is a general lack of literature that describes these types of emerging
initiatives. The scholar aims to overcome cognitive inertia (Huff, Huff, & Thomas, 1992) by
increasing knowledge around the execution of achieving one-ness in a MUF. Consequently, the
scholar explores the fifth research question (RQ5): To what extent, if any, does a one-ness
strategy align a MUF to influence growth synergy? The scholar aims to answer this question by
providing further insights into an alignment strategy through a single case study with the
understanding that some of the observations and experiences can be beneficial to others. The
scholar intends to capture this data by collecting relevant information from participants in the
One Media Corp (1MC) initiative. Managerial theory may be influenced as MediaCorp’s
experience is studied within this context.
23
Limitations of the Study
The scholar is attempting to develop generalizable theoretical findings based on the
empirical results of the study. Even so, this dissertation will encounter several limitations
concerning theory and empirical study. The limitations are as follows:
1. There will be some weaknesses regarding the generalizability of the findings. The
single case study approach will be based on approximately 20 in-depth interviews. Given that the
phenomenon under investigation is novel and complex, this methodological choice seems
reasonable. The research method mandates that in-depth observation is required for collecting
and analyzing the resultant holistic data (Eisenhardt, 1989; Miles & Huberman, 1994; Siggelkow
2007; Yin, 1994). The choice of a phenomenological case study using a qualitative approach is
affirmed; however, the generalizability of results is not exact due to the context of the case. The
context is defined as a moderately dynamic environment, a large size organization with a multi-
national organizational structure, and a business with a relatively low degree of relatedness
within a vertically integrated value chain. Other firm-specific factors, such as company history,
may influence the exactness of the generalizations. The scholar understands that comparative
case studies within similar contexts would help better ground evolving theories.
2. A single case study approach does not make it possible to determine the significance
and weighting of drivers for the realization of sustainable growth synergies. Drivers may occur
in unique situations relevant to the single case study; however, they may not be relevant in
general. Consequently, their general relevance may not be understood. This includes the relative
importance of strategic actions and organizational design factors. While the scholar may be able
to uncover key success factors, he may not be able to reliably and accurately determine their
significance apart from outcomes present in the single case study. Further comparative results
24
may be obtained from a multiple case study that has the potential to produce quantitative results;
however, this approach would have made the study unmanageable due to the enhanced scope.
This limitation may point to the need for quantitative follow-up studies.
3. The research will be limited by subjective interpretations of the data. This will lead to
various theoretical constructs from qualitative information provided by participants. Subjective
biases are reduced through the review of the coding process (Yin, 1994), using key informants
for validating results (Mayring, 1996), and by following data analysis (Strauss & Corbin, 1990,
1996). Even so, this research still has associated risk due to potential subjective and invalid
interpretations of quotations.
4. Several meaningful metrics, from preexisting company data, will be used to assess the
extent to which growth synergies were successfully realized. Metrics such as average changes in
interview ratings, job descriptions, qualitative assessments validating performance, and financial
results over a time span of 10 months (from 1/24/2014 – 10/30/2014) could be among the
preexisting data that will be used. While this is a short period for the assessment of sustained
growth synergies, the scholar feels that this is adequate given the speed of the change driven by
the transition from an M-form design to a MOS. Additionally, this data will be augmented and
potentially validated by interview data that will be collected over approximately 60 days and
which will relate to the experiences of the stakeholders who went through the transition. In the
event that a longer period of time would have been used for the investigation, other important
success factors may have emerged. Unfortunately, a longer-term observation period is beyond
the time scope allotted to this study and this additional data would likely have produced little
additional value.
25
5. While this research design is holistic and multi-faceted, there were some limitations
with regard to theory building. The nature of phenomena under investigation is complex as it
includes strategic focused action, organizational design, and corporate management. As a result,
the development of a complete and fulsome theory is constrained (Miles & Huberman, 1994).
Given that reality based phenomena tends to be complicated, it follows that this study can only
offer a mid-range theory of continuous growth synergy realization while developing thought-
provoking and new perspectives that may inspire creative theorizing in the future.
6. Finally, the selection of variables may be incomplete. While the analysis is focused on
MUF factors of growth synergy realization, like strategy and organizational design, other factors
like leadership efficacy, human resource inspiration, and the embedding of human networks were
generally neglected. These factors at the initiative level and personal level may impact successful
cross-business unit collaboration (Martin, 2002; Martin & Eisenhardt, 2010) and, consequently,
on the sustainable realization of growth synergies. As a result, the scholar suggests that further
research is required for developing a more holistic theory on realizing sustainable growth
synergies.
Summary of Chapter 1
In the first chapter, the scholar created a platform for the study. The purpose of the study
is to create understanding around how a MUF can realize growth synergies through the
deployment of a MOS augmented by LIMs and a designed relationship with the corporate center.
The outline of the paper was presented along with the purpose and critical results of the study.
The background of the single case study was revealed through a discussion of the company’s
structure, the multi-dimensional organizational design, and the general state of the company.
This state was the compelling reason for changing the company’s current pursuit of growth

26
synergies. Existing efforts to expand the company’s portfolio proved inadequate for the
profitability challenge. The research questions were posed, revealed, and discussed. The scholar
indicated how the questions would be answered in this dissertation. Finally, the limitations of the
study were noted. Cross-unit synergies are not just a compelling theoretical idea, but they are
real as exposed in this empirical study, thus, reiterating the research objectives.
27
Chapter 2. Literature Review
In this chapter the scholar will provide a summary of the relevant information that
management literature exposes within the scope of this phenomenological case study. As it is a
single case study, the information will be relatively high level and broad and should not be
considered to be exhaustive. As a result, this leaves opportunity for further inquiry. The scholar
is studying a unique combination of organizational factors as applied to a global multi-unit firm
for the purpose of achieving growth related synergies. This is the essence of the narrow scope of
the study. While referencing the literature, the scholar points to the gaps that ultimately are
intended to inform the research questions.
The literature review for the study begins with a discussion on synergy as reflected in the
literature. As described, growth synergies in a MUF are a sub-set of operative synergies;
consequently, the literature review in this case is focused on research that relates to growth
synergies in a multi-unit firm managed by a multidimensional structure and which is supported
by secondary work structures. Following Igor Ansoff’s (1965) introduction of the idea of
synergy as a part of strategic management, scholars have only considered it indirectly as it
pertains to diversification. The scholar goes on to describe diversification, as it is a common
incomplete strategy that firms use for realizing or sustaining growth. The literature suggests three
types of diversification based on the deliverables that come from operational units with common
attributes (Barney, 2007; Rumelt, 1974). The scholar continues to discuss organizational
structure including multi-dimensional organizational structure, lateral integrative mechanisms,
and corporate design. Within any design, leadership is needed to exploit profitable opportunity,
which is referred to as corporate advantage (D’Aveni et al., 2010). This is then discussed. In each
section the scholar describes critical aspects of each discussion area for the purpose of
28
identifying general gaps in the literature that suggest the need for this empirical study and the
associated research questions.
Synergies
The importance of exploiting synergies in multi-unit firms has been emphasized by
researchers for decades as part of the decision-making process regarding mergers and
acquisitions (Larsson & Finkelstein, 1999) and for cross-business collaboration in multi-business
firms (Ansoff, 1965; Martin, 2002; Porter, 1985). The etymological roots of the word synergy are
in the Greek word synergia, or together work (Boyd & Headen, 1978, Synergy, n.d.). The term is
refined further by Fuller (1975) in three ways; (a) where combined action is favored over the
sum of individual actions, (b) where the behavior of whole systems is unpredictable in relation to
the behavior of each part, and (c) where the cooperative behavior of two or more stimuli results
in a different or greater response than the sum of the individual stimuli. Ansoff (1965) is credited
with bringing this concept of combined action into strategic management. He describes the effect
of synergy as the effect of a whole being greater than the sum of its individual parts while
understanding that there is a cost associated with combining the parts (Sourabh, n.d.). Martin
and Eisenhardt (2001) further define cross-business synergies as “the value that is created and
captured, over time, by the sum of the businesses relative to what it would be separately” (p. 3).
Other scholars express the value added by synergies between dimensions in a business structure.
A substantial contributor is cross-business unit collaboration. Most research suggests that the
differences between firm performances are attributable to industry or business level effects
(Rumelt, 1991); however, more recent studies have suggested substantial corporate effects
(Bowman & Helfat, 2001; Roquebert, Phillips & Westfall, 1996). Furthermore, a recent study by
Anand and Byzalov (2007) suggests that cross-business synergies do exist.
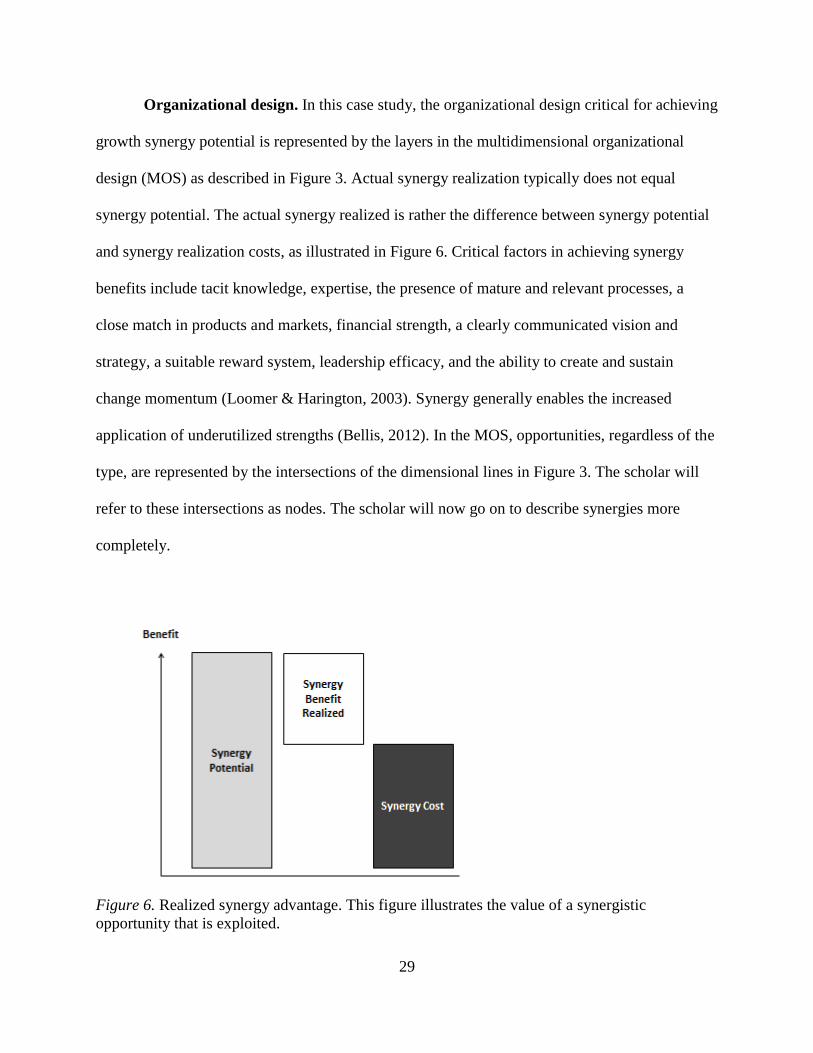
29
Organizational design. In this case study, the organizational design critical for achieving
growth synergy potential is represented by the layers in the multidimensional organizational
design (MOS) as described in Figure 3. Actual synergy realization typically does not equal
synergy potential. The actual synergy realized is rather the difference between synergy potential
and synergy realization costs, as illustrated in Figure 6. Critical factors in achieving synergy
benefits include tacit knowledge, expertise, the presence of mature and relevant processes, a
close match in products and markets, financial strength, a clearly communicated vision and
strategy, a suitable reward system, leadership efficacy, and the ability to create and sustain
change momentum (Loomer & Harington, 2003). Synergy generally enables the increased
application of underutilized strengths (Bellis, 2012). In the MOS, opportunities, regardless of the
type, are represented by the intersections of the dimensional lines in Figure 3. The scholar will
refer to these intersections as nodes. The scholar will now go on to describe synergies more
completely.
Figure 6. Realized synergy advantage. This figure illustrates the value of a synergistic
opportunity that is exploited.
30
Growth synergies. While the first research question identifies the relationship between
organizational structure and the realization of cross-unit synergies, the second investigates
growth synergies through focused and selected action. The exploitation of growth synergies can
lead to profitability, pricing power in the marketplace, the ability to leverage strengths, and
scalability with minimal cost. Growth synergy has been neglected in the literature. Operative
synergies, prevalent in the literature, represent sustained performance advantages of multi-
business firms that leverage operative resources across businesses that exhibit relatedness.
According to Mueller-Stewens and Knoll (2006) they are prioritized on corporate agendas.
Unfortunately, growth synergies are typically explored through the lens of product and service
diversification. Empirical studies typically use operative synergies for describing the impact of
relatedness, as described by the presence of similar activities and shared resources at various
points of the value chain (Davis & Thomas, 1993). Relatedness may also exist between business
units of diversified firms (Amit & Livnat, 1988; Berger & Ofek, 1995; Christensen &
Montgomery, 1981; Grant & Jammine, 1988; Lang & Stulz, 1994; Ramanujam & Varadarajan,
1989; Rumelt, 1982; Simmonds, 1990). In order to further contrast operative synergies from
growth synergies, operative synergies are now discussed more fully.
Operative synergies. Managers of multi-unit businesses desperately search for synergies
within their businesses. Recent studies suggest that they exist (Goold & Campbell, 1998);
however, scholars have not yet established a research perspective for cross-business synergies in
a multi-dimensional context. The exploitation of operative synergies can lead to profitable
corporate growth. This type of synergy has, to some extent, been generally neglected in the
literature. Operative synergies represent sustained performance advantages of multi-unit firms
31
which leverage operative resources across businesses that exhibit relatedness (Martin &
Eisenhardt, 2001).
Relatedness. Empirical studies typically use operative synergies for describing the
impact of relatedness as described by the presence of similar activities and shared resources at
various points of the value chain (Davis & Thomas, 1993). Relatedness may also exist between
business units within diversified firms (Amit & Livnat, 1988; Berger & Ofek, 1995; Christensen
& Montgomery, 1981; Grant & Jammine, 1988; Lang & Stulz, 1994; Ramanujam &
Varadarajan, 1989; Rumelt, 1982; Simmonds, 1990). Relatedness is sometimes referred to in the
context of economies of scope (Bailey & Friedlander, 1982; Panzar & Willig, 1981). While
economies of scope refer to economics around increased production of multiple products,
economies of scale are related to cost economics associated with increasing the output of a single
product. Scope economies often occur together with scale economies and so are often included in
firm expansion discussions (Cappron, 1999; Collins & Montgomery, 2005). Operative resources
that may be related are tangible and intangible resources necessary for ongoing operations that
may include product knowledge, product components, and production facilities that represent
production capacity. By contrast, while operative synergies benefit cost-related profitability,
growth synergies substantially benefit profitability, as they occur when unique, rare, and
complementary resources are combined strategically.
Resources. Functional synergies contribute to corporate advantage when resources are
better utilized because they are difficult to find. In this way the organization is exploiting the
agency and transaction advantages of the firm (Jackson, 2009). A super-additive benefit occurs
from a cost efficiency perspective if it is significantly less costly to combine two or more highly
sought after resource combinations into one organization than it would be to use them separately
32
(Panzar & Willig, 1981). These profitability benefits are experienced when non-imitable
resources are shared to stimulate growth when an opportunity presents itself. This benefit occurs
while exploiting the economic impact of underutilized resources across multiple units. While
physical production has been the focus of efficiency synergies (Panzar & Willig, 1981), growth
synergies may also occur in non-production activities like research and development (R&D)
(Davis & Thomas, 1993; Wiessmeier, Axel, & Christoph, 2012) and may include intangible
resources like best practices and brand image (Milgrom & Roberts, 1995; Montgomery &
Wernerfelt, 1988; Prahalad & Hamel, 1990; Szulanski, 1993).
Market synergies. Conglomerate power, also known as market power synergies, are
profitability-based advantages of MUFs that are exploited by leveraging relatedness across
businesses and market power resources (Dutta, Dutta, & Das, 2011; Martin & Eisenhardt, 2001).
Market power resources include all sources the firm uses for reducing competition and
increasing prices. This synergy is achieved by several means, including mutual forbearance,
complementary products, reciprocal buying and selling, bundling, and predatory pricing
(Almeida & Grant, 1998; Bernheim & Whinston, 1990; Karnani & Wernerfelt, 1985). Predatory
pricing is when a firm drives competitors out of the market by selling at below market rates and
conceding profits in one or more business for enabling another business to gain revenue or
market share. Short term losses for long term gain are deemed tolerable. It may also deter new
competitors from entering the market. Bundling is selling the products together to extend the
monopoly power of one business into another related business. Bundling may also be considered
as a form of predatory pricing. Reciprocal buying and selling happens when a potential customer
is a supplier to another business. The firm establishes an advantageous buying and selling
relationship to gain revenue in a supply chain. Mutual forbearance and collusion are similar. This

33
beneficial economic situation occurs when MUFs keep prices high through regular contact with
multi-market competitors. For example, a product may be ceded to a competitor with the
understanding that a concession is made for another product. Or, a predatory pricing scenario for
a product may be enacted by a market leader in a competitor’s market when the leader
encourages a competitor to retreat from a market they recently penetrated that is dominated by
the leader. Multi-unit businesses with substantial market share are at an advantage, as single-unit
firms are not able to exploit these opportunities for corporate advantage. Market power synergies
can contribute to corporate advantage; however, anti-trust laws and other factors may restrict
opportunity exploitation (Devos, Kadapakkam & Krishnamurthy, 2009).
Financial synergies. Performance advantages gained by leveraging financial resources
across strong long-cycle international businesses in a multi-unit firm are financial synergies
(Chatterjee, 1986). The firm’s capacity for managing risk and its means for financing are
considered to be financial resources. Financial synergies are achieved by establishing an internal
capital market, reducing corporate risk, creating tax advantage, and the benefits of financial
economies of scale, including financial flexibility and autonomy. Stakeholders in this context
may be more willing to increase financial decision-making autonomy, invest in the business,
explore transaction cost-efficiency advantages, and reduce debt-financing costs. (Martin &
Eisenhardt, 2001). Corporate risk is reduced by building a portfolio that improves cash flow.
Stakeholders are more inclined to invest their efforts in the firm if the risk is perceived to be
relatively low (Andersen, 2008; Calvello, 2013; John, Litov, & Yeung, 2008). An internal capital
market produces a number of benefits including increased financial agility, lower financing
costs, and more efficient, quality capital allocations due to fewer restrictions. External sources of
capital do not benefit from the information available to internal managers and they may not be
34
inclined to make capital available (Obel & vander Weide, 1979). Further financial benefit for the
diversified multi-unit business comes from reducing tax liabilities by offsetting profits in one
business, or by using the losses from another. Additionally, a reduction in fixed transaction costs
and fees may be experienced due to financial economies of scale (Dyer & Singh, 1998; Xiaokai,
1994).
Corporate synergies. Performance advantages in a MUF are achieved when corporate
management capabilities are leveraged across business units. The idea is that corporate leaders
increase performance through managerial advice, thereby improving the profitability of the
individual business unit in the firm. While these capabilities and the resultant positive impact
may not be as frequent as desired, they are realizable with the right leadership. Bowman and
Helfat (2001) hypothesize that corporate leaders generally create value in a MUF by establishing
the scope of the firm, specifying corporate and business goals, generating an organizational
climate, implementing corporate control mechanisms, establishing a suitable organizational
structure, and correctly allocating core competencies as applicable. Hill and Jones (2007) refer to
general organizational capabilities that, when transferred to corporate, increase corporate
oversight efficacy. An increase in entrepreneurship, organizational design layout, and strategic
capabilities are to be expected. To the extent that corporate managers are not isolated or unaware
of business unit issues, they should be able to diagnose the real source of performance problems
in underperforming business units and take appropriate actions for remediation. Additionally,
corporate should be able to develop leaders, conduct strategic planning, provide financial
control, provide international management, and promote decentralized decision making that
reconciles with centralized control (Bass, 1981; Bell & Kozlowski, 2002; Grant 2005).
According to Goold, Campbell, and Alexander (1994) corporate management resources may
35
assume a parent role that could include deciding on acquisitions, businesses support issues, and
alliances with other companies. The corporate parent, depending on its ability to influence and
the degree to which it is centralized, also defines the organization design, defines the budget
process and capital investment process, determines the relationship between the business units
and the corporate center, and sets the tone for corporate values and culture (Martin & Eisenhardt,
2001).
Corporate management synergies differ from operative synergies. They both are value
based; however, corporate management synergies are mainly concerned with the value in the
relationships between the corporate center and individual business units. In contrast, operative
synergies focus primarily on the attributes of the connection between businesses. Corporate
synergies tend to be focused on the value-relationship between skills in the corporate center and
the functional and strategic fit between business units. Operative synergies tend to be focused on
opportunities with similarity and complementarity along the value chain (Pankratz, 1991). While
these synergies are different, they are complementary and aim to extract value from resources.
Corporate synergies are likely to increase with strategic relatedness between the business units
and the overall corporate portfolio. When businesses face common challenges they can benefit
from meaningful corporate advice. This is referred to as dominant logic (Prahalad & Bettis,
1986). Managerial relatedness is evident in similar size, similar time spans of capital investment,
similar requirements of management skills, similar life-cycle stages in the industry, similar
competitive positions within markets, and similar time horizons for targets (Grant, 2005). In
some cases, corporate may have expertise in a needed skill. For example, they may provide
guidance in strategic planning. They may also provide guidance related to appropriate
36
organizational structure design, assuming they are able to effectively connect beneficial design
and market need.
Profitability. Studies on operative synergies typically only capture benefits of economies
of scope, by sharing similar or slack resources across businesses (Shaver, 2006; Panzar & Willig,
1981; Tanriverdi & Venkatraman, 2005; Williamson, 1975). Relationships among business units
need not be limited to economies of scope but also must lead to value-enhanced revenue, or
corporate growth (Davis & Thomas, 1993; Mueller-Stewens & Knoll, 2006; Tanriverdi &
Venkatraman, 2005) referred to as positive spillovers (Shaver, 2006). This type of corporate
growth associated with the combination and transfer of complementary resources is limited as
efficiency gains are not necessarily realized through sharing alone (Eisenhardt & Martin, 2000;
Tanriverdi & Venkatraman, 2005). These value-enhancing opportunities, or profitable growth
advantages, are created by combining complementary operative resources across businesses.
Sustainable growth. Corporate initiatives are dedicated to growth synergy opportunities;
however, the sustainable realization of growth synergies has received little attention in literature,
despite often being identified as a goal for managers (Amit & Livnat, 1988; Bettis, 1981;
Eisenhardt & Galunic, 2000; Martin, 2002; Palich et al., 2000; Ramanujam & Varadarajan,
1989), thereby ultimately leading to unrealized value (Goold & Campbell, 1998). Specifically,
research on diversification concerned with operative synergies explores the strategic rationale of
related diversification (Davis & Thomas, 1993; Tanriverdi & Venkatraman, 2005), but does not
reveal anything about realization. It assumes that cross-business synergies are observed in
organizational constructs and that they are easily realizable when in fact they are complex and
difficult to achieve. With the exception of Martin (2002), research is too empirically immature to
37
provide adequate insight into growth synergy realization from resource combination, or the
unique and timely combination of the elements of the synergies previously discussed.
Synergy realization costs include both direct and indirect costs. Direct costs could include the
cost of coordination and control, while indirect costs may relate to the need for a compromise or
an adaptation (Campbell & Goold, 2000). Coordination costs may be visible in costs associated
with collaborative linkages between business units (Porter, 1985). This could include
management time, the cost of a designated liaison, the cost of an embedded team, the cost of
integrating sales forces, human resource related costs, marketing costs, moving costs, culture
assimilation costs, costs of standardization, the cost of outsourcing, or costs associated with the
installation and maintenance of enterprise resource planning (ERP) systems (Loomer &
Harington, 2003; Zhou, 2011). Business level managers may spend a significant amount of their
disposable time meeting and negotiating with other business managers for coordinating
activities, problem-solving, and making decisions. Resources for exploiting opportunities may
not be easy to share due to specialization, for example (Teece, 1980). Corporate costs may
increase for the same reasons if escalation is needed (Hill, Hitt, & Hoskisson, 1992; Michel &
Hambrick, 1992). Furthermore, corporate-level behavior may be unproductive due to self-
interest. For example, disruptive technologies that self-cannibalize, or inequitable intercompany
pricing, may be deliberate in the business in order to prop up a favored unit or help penetrate a
new market. Corporate managers may not be capable of resolving conflict as they are not fully
aware of the situation and do not have the needed operational skills for understanding the impact
of a decision. They typically do not have to deal with collateral damage wherever it may occur.
This may lead to less than optimal decisions, frustrating and alienating business unit managers
(Goold & Campbell, 1998; Goold & Luchs, 1993; Michel & Hambrick, 1992; Vancil, 1980).
38
Business unit managers may also be frustrated by imposed decisions and the requirement to
resource share (Beer, 1964; Fleishman & Harris, 1962; Gupta & Govindarajan, 1986;
Tannenbaum, 1962,) or redeploy (Cappron, 1999). This overall organizational inertia introduces
waste that results in additional cost and smaller profits.
Multi-unit synergy. Cross-business or cross-unit synergies were introduced by Igor
Ansoff in 1965 largely in the context of alliances (Das & Teng, 2000; Harrison, Hitt, Hoskisson,
& Ireland, 2001), mergers and acquisitions (Larsson & Finkelstein, 1999), and for multi-unit
firms (Ansoff, 1965; Martin & Eisenhardt, 2001; Martin, 2002; Porter, 1985). Synergy in this
dissertation is focused on a multi-unit firm (MUF) with a multidimensional organizational
structure (MOS). The term unit, shown as L# in Figure 3, has the context of a business entity
with a leader in a geographic location, generally, with profit and loss financial measurements.
The business unit operates autonomously performing value chain activities. As business units
provide products or services to clients that are shared, their performance is measured by a profit
and loss statement and a budget. In this case study, the scholar is using a MUF that has a self-
contained global value chain (Palmisano, 2006). Cross-unit synergies are the value that business
units co-create together relative to what the value would have been separately (Martin &
Eisenhardt, 2001; Wiessmeier, Axel & Christoph, 2012). As this definition focuses on value it
applies to both cost reduction and revenue enhancement. It is further noted that these benefits are
constrained by time to be growth synergy opportunities. While cross-unit synergies describe the
value added by the corporate level, they also explain the value that is associated with
collaboration between dimensions in a MOS. Value is defined specifically as the net present
value of the MUF including all of its business units.
39
Interdependencies. As synergies are recognized and realized, interdependencies between
business units are strengthened (Porter, 1985; Prahalad & Doz, 1987; Zhou, 2011). Depending
on leadership behaviors, these interdependencies can lead to the obfuscation of relevant facts,
and to role ambiguity. This makes it more difficult to measure the synergistic potential. The
effort needed to evaluate the businesses requires higher controlling costs, as overhead needs to
manage multiple equilibria through critical decision making about joint design, joint scheduling,
mutual adjustments, setting transfer pricing, and designing reward systems that encourage
cooperation (Arrow, 1974; Becker & Murphy, 1992; Marshak & Radner, 1972). The burden on
information systems and the volume of initial and ongoing decisions made, leads to a higher
probability of decision errors (Levinthal, 1997; Sutherland, 1980). Knowledge sharing depends
on the combinability of knowledge bases and active collaboration (Argyres, 1996; Henderson &
Cockburn, 1994). This non-exhaustive resource across workflows and products carries the risk of
contamination (Greenwood, Li, Prakash, & Deephouse, 2005).
Effort is needed to manage the ripple effect of beneficial and non-beneficial decisions
(Zhou, 2011). As more inputs are shared between the integrated businesses and as more
relationships need to be adjusted, the sensitivity to the ripple effect increases (Zhou, 2011).
Furthermore, the potential for the asymmetrical distribution of benefits is frustrating. It stalls
decision making and diminishes entrepreneurial energy. Synergy is instead better served by
simplification to reduce waste, the liberation of workers to make creative decisions, and a
healthy work experience (Rose, 1990). Moreover, interdependency may also drive the need for
compromise, resulting in a less favorable outcome for one of the involved parties. The imposed
compromise may result in an interdependency that diminishes the value of a product, enacts self-
cannibalization, or diminishes the value of a customer (Goold & Campbell, 2002). Compromise
40
may also reduce a business unit’s ability to be flexible (Eisenhardt & Galunic, 2000; Porter,
1985; Prahalad & Doz, 1998). Rigidity may become evident in slower adaptation to change in a
dynamic market, resulting in the inability to innovate due to internal competition (Birkinshaw &
Lingblat, 2001; Gulati, 1995; Peters & Waterman, 1988; Prahalad & Doz, 1987) and
inefficiencies in organizational design (Sloan, 1986). Furthermore, continued strategy innovation
is necessary in disruptive and high-velocity environments where structure and norms are unstable
or erratic (Christensen, 1997; D’Aveni, 1994; Hamel, 2000; Markides, 1999). As a result, a
typical multi-unit organization looks like Figure 7.
Figure 7 illustrates how an organization can be fragmented, broken, and incomplete.
Referencing, by way of comparison, the complete structure from Figure 3, Figure 7 shows the
opportunity for lines to be complete across all of the locations, clients, and diagonal functions.
For example, there are products and services that have not been developed that could be sold in a
variety of markets. This would be represented by an incomplete product line. There are also
clients that MediaCorp does not have that they could if they had the right product offerings.
There are market locations that MediaCorp should be leveraging. There are support functions
that are not available at all locations. Growth synergy realization would make the lattice in
Figure 7 more complete and robust such that it would evolve towards Figure 3.
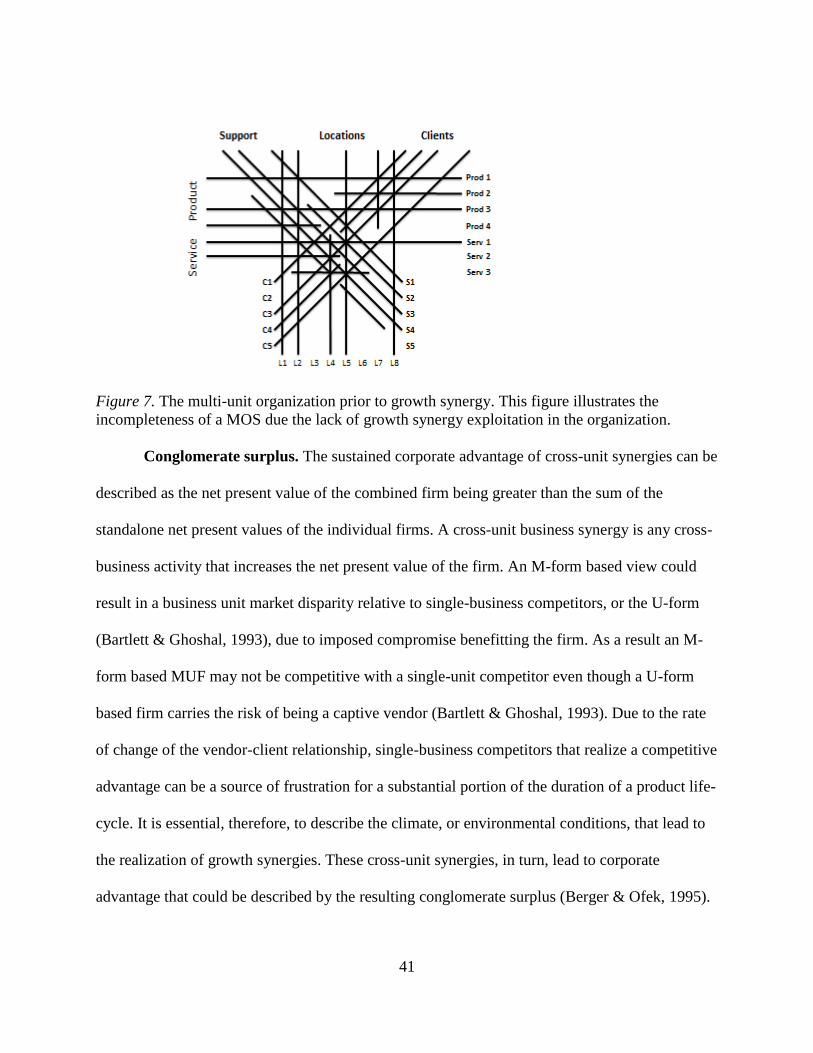
41
Figure 7. The multi-unit organization prior to growth synergy. This figure illustrates the
incompleteness of a MOS due the lack of growth synergy exploitation in the organization.
Conglomerate surplus. The sustained corporate advantage of cross-unit synergies can be
described as the net present value of the combined firm being greater than the sum of the
standalone net present values of the individual firms. A cross-unit business synergy is any cross-
business activity that increases the net present value of the firm. An M-form based view could
result in a business unit market disparity relative to single-business competitors, or the U-form
(Bartlett & Ghoshal, 1993), due to imposed compromise benefitting the firm. As a result an M-
form based MUF may not be competitive with a single-unit competitor even though a U-form
based firm carries the risk of being a captive vendor (Bartlett & Ghoshal, 1993). Due to the rate
of change of the vendor-client relationship, single-business competitors that realize a competitive
advantage can be a source of frustration for a substantial portion of the duration of a product life-
cycle. It is essential, therefore, to describe the climate, or environmental conditions, that lead to
the realization of growth synergies. These cross-unit synergies, in turn, lead to corporate
advantage that could be described by the resulting conglomerate surplus (Berger & Ofek, 1995).
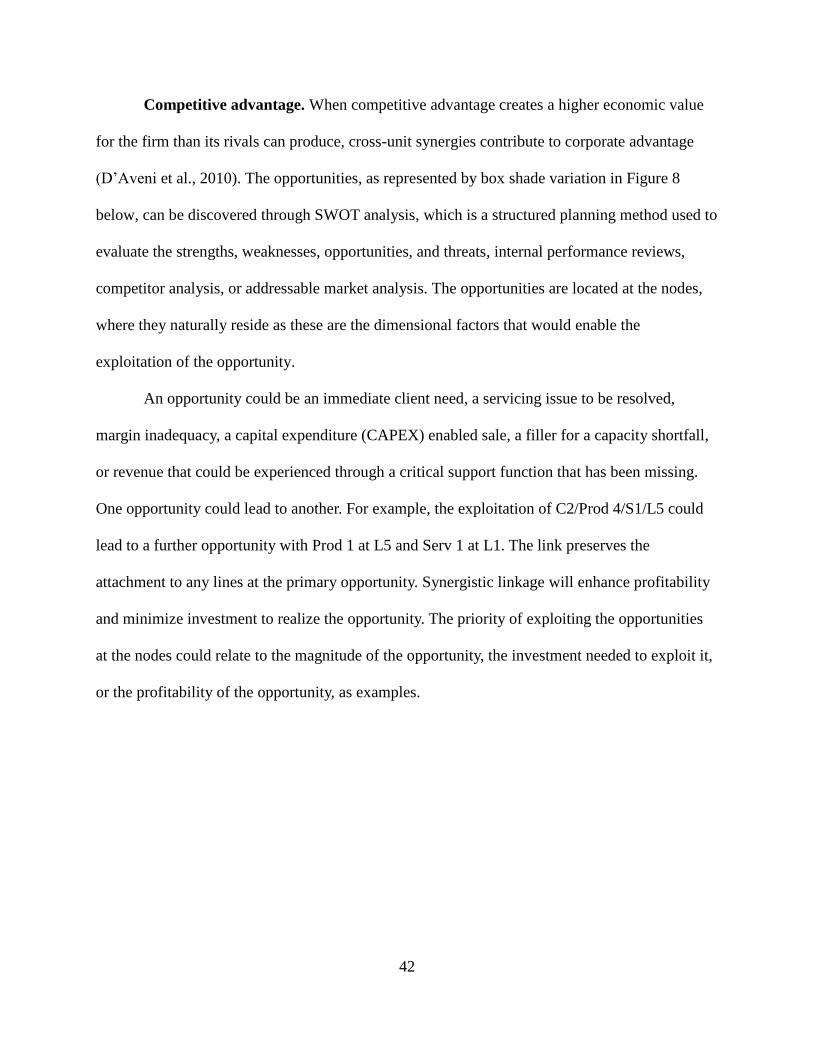
42
Competitive advantage. When competitive advantage creates a higher economic value
for the firm than its rivals can produce, cross-unit synergies contribute to corporate advantage
(D’Aveni et al., 2010). The opportunities, as represented by box shade variation in Figure 8
below, can be discovered through SWOT analysis, which is a structured planning method used to
evaluate the strengths, weaknesses, opportunities, and threats, internal performance reviews,
competitor analysis, or addressable market analysis. The opportunities are located at the nodes,
where they naturally reside as these are the dimensional factors that would enable the
exploitation of the opportunity.
An opportunity could be an immediate client need, a servicing issue to be resolved,
margin inadequacy, a capital expenditure (CAPEX) enabled sale, a filler for a capacity shortfall,
or revenue that could be experienced through a critical support function that has been missing.
One opportunity could lead to another. For example, the exploitation of C2/Prod 4/S1/L5 could
lead to a further opportunity with Prod 1 at L5 and Serv 1 at L1. The link preserves the
attachment to any lines at the primary opportunity. Synergistic linkage will enhance profitability
and minimize investment to realize the opportunity. The priority of exploiting the opportunities
at the nodes could relate to the magnitude of the opportunity, the investment needed to exploit it,
or the profitability of the opportunity, as examples.
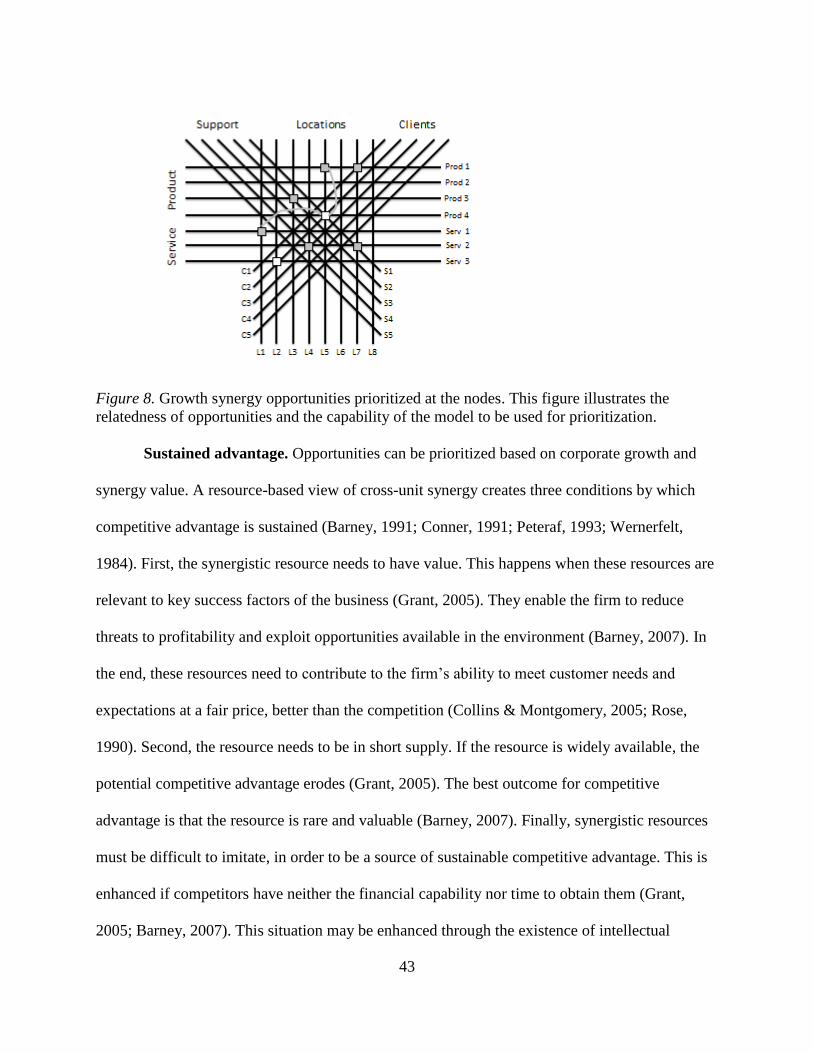
43
Figure 8. Growth synergy opportunities prioritized at the nodes. This figure illustrates the
relatedness of opportunities and the capability of the model to be used for prioritization.
Sustained advantage. Opportunities can be prioritized based on corporate growth and
synergy value. A resource-based view of cross-unit synergy creates three conditions by which
competitive advantage is sustained (Barney, 1991; Conner, 1991; Peteraf, 1993; Wernerfelt,
1984). First, the synergistic resource needs to have value. This happens when these resources are
relevant to key success factors of the business (Grant, 2005). They enable the firm to reduce
threats to profitability and exploit opportunities available in the environment (Barney, 2007). In
the end, these resources need to contribute to the firm’s ability to meet customer needs and
expectations at a fair price, better than the competition (Collins & Montgomery, 2005; Rose,
1990). Second, the resource needs to be in short supply. If the resource is widely available, the
potential competitive advantage erodes (Grant, 2005). The best outcome for competitive
advantage is that the resource is rare and valuable (Barney, 2007). Finally, synergistic resources
must be difficult to imitate, in order to be a source of sustainable competitive advantage. This is
enhanced if competitors have neither the financial capability nor time to obtain them (Grant,
2005; Barney, 2007). This situation may be enhanced through the existence of intellectual
44
property protection, historical conditions, timing disadvantages, the inability of the competitor to
assemble the needed resources, and the existence of socially complex phenomena that cannot be
sufficiently influenced (Barney, 2007). To optimize growth synergy choices, firms need to
balance the potential value with the associated coordination costs. This must be accomplished
with a view towards complexity, consideration for the overall coordination capacity constraints,
and an understanding of the opportunity itself so that it can be optimally applied horizontally as
well as vertically. Furthermore, the application needs to be accomplished with consideration for
the impact of synergy realization on specialization, which may result in a loss of competitive
advantage. Organizational capability like managerial expertise, knowledge creation, and
adaptation to offset limitations, also need to be taken into consideration (Capron, Dussuage, &
Michell, 1998; Hill et al., 1992; Nelson & Winter, 1982). All things considered, firms need to
understand and optimize coordination costs that arise from managing complex interdependencies
between business units (Zhou, 2011).
Dis-Synergies. Negative spill-overs or contagion that may spread from one unit to
another through integration or collaboration, thereby reducing overall value, may also be referred
to as dis-synergies. There is persuasive support in the literature that synergies and dis-synergies
exist (Bloch, 2008; Falk, Schepers, Hammerschmidt, & Bauer, 2007). As explained earlier,
synergy is a micro-level phenomenon that is typically defined as savings arising from economies
of scale or scope that can be exploited. Conversely, dis-synergies occur when related
diversification strategies result in internal transaction costs that outweigh realized economies of
scope (Besanko, Dranove, & Shanley, 2000; Jones & Hill, 1988; Martin & Eisenhardt, 2001). In
some situations, resources do not have synergy potential, or they are not realized, or are not
realizable (Gruca, Nath, & Mehra, 1997). Synergy realization should be measured in terms of
45
outcomes such as revenue enhancement or creation, rather than just cost mitigation (Martin &
Eisenhardt, 2001). Dis-synergies occur when an integrated entity does not have the potential for
realizing better performance than the two entities would if operating independently. This
contagion effect from unit consolidation or collaboration may come from, but not be limited to,
the allocation of work to two entities with slack capacity, deploying systems or talent to an entity
that does not need it, and cross-selling or bundling to increase consumer acceptance and sales.
Brand value can be tarnished by product or service liability, an inability to fulfill orders due to
volatility or congestion, increased costs to meet spike demands from unexpected success,
capacity issues that drive poor execution or divert attention, and the inability of resources to use
existing systems (Berger, Hanweck, & Humphrey, 1987; Gruca et al., 1997). In addition,
resources may not be critical for the value chain, sufficiently flexible or substitutable, and may
have a fixed capacity. Flexibility, on the other hand, comes with constraints such as; a large
acquisition cost, coordination costs may be excessive, they may force miss-alignment, culture, or
value shifting to accommodate, and the resource may not by unique to the firm (Barney, 1986;
Berger et al., 1987; Deller, Chicoine, & Walzer, 1988; Ghemawat, 1988; Hill & Hosskisson,
1994; Prahalad & Hamel, 1990). Additionally, research on operative synergy strategy does not
provide insights into the actual value of the realization of these synergies, even though there are
persuasive arguments and evidence for their existence (Shaver, 2006).
In summary, the scholar has briefly introduced and defined synergy types, a substantial
empirical component of this study. The scholar defined cross-business unit synergies using an
outcome-based definition. It is the sum of the time-based value of business units together as
compared to the outcome separately. Synergy total potential value is the difference between the
cumulative synergy potential across business units minus the synergy realization expense.
46
Similarly, realized synergy value is the total value of realized synergy minus the realization cost.
Realization cost can include controlling cost, coordination costs, and cost associated with
compromise or inflexibility. Additionally, if cross-business unit synergies are either a source of
competitive advantage or if they contribute to the firm’s ability to realize synergies, they
contribute to corporate advantage. In this section corporate advantage is linked to the four
distinct types of cross-business unit synergies, all of which the scholar will attempt to leverage
within this study for profitable growth. Operative synergies are not limited to relatedness
between production functions. They may also exist as resources in other value chain activities.
The type of resources, and similarities between common key success factors across business
units, relates directly to their exploited value potential. This value is enhanced through
complementarities between resources and activities. Most commonly, operative synergies are
thought of as leading to cost reductions exclusively. The scholar, on the other hand, intends that
synergies are thought of in the context of leading to revenue enhancements. Complementary
resource relationships between business units may be required for achieving operating synergies.
This is only possible if organizational costs do not outweigh synergistic benefits. Finally,
operative synergies may become dis-synergies, or negative synergies, over time in the event that
the market changes, invalid assumptions are enacted, or through technology shifts.
Diversification
Research by Mueller-Stewens and Knoll (2006) suggests that operative synergies are
prioritized on corporate agendas. Unfortunately, they are typically explored through the lens of
diversification and acquired through acquisition (Salter & Weinhold, 1978). Related
diversification is described by the deliverables that come from operational units with similar
characteristics (Barney, 2007; Rumelt, 1974). These common attributes define relatedness
47
between business units. Most studies have looked at relatedness and commonality over the
business value chain for determining opportunities for operative synergies (Rumelt, 1974; Zhou,
2011). Rumelt (1974), building on the work of Wrigley (1970), looks at relatedness by assessing
MUFs through the lens of common skills, resources, markets, and purpose. Rumelt (1974) shows
in his study how diversifiers that were related substantially outperformed diversifiers that were
unrelated, thereby suggesting that operative synergies yield benefits that are greater than other
types of cross-business unit synergies. Even so, all types of relatedness may not be synergistic
(Davis & Thomas, 1993). For example, resources that were once related may become unrelated
and even dis-synergistic over time. Relatedness attributes may vary over time and become
neutral or even negative as they may be influenced by exogenous product or service life-cycles,
or megatrends, which influence market life-cycles. As examples, market or technology shifting
may influence synergistic relationships between business units in a MUF, making resource
interdependencies irrelevant (Davis & Thomas, 1993; Markides & Williamson, 1994).
Furthermore, relatedness may be an imperfect substitute for synergy. Direct estimates of synergy
benefit provide unambiguous relevant data about growth opportunity in an organization (Davis &
Thomas, 1993). Further to this, relatedness, as described by similarities in production-oriented
functions, excludes potential relevant similarities and complementarities in other non-production
functions. While often ignored, these may potentially influence growth synergies. These include
endogenous and exogenous contributors, including the exploitation of strategic assets that are not
adequately covered in the literature as it relates to growth synergy realization.
Research has shown that there is an inverse U-shape to the curve that plots diversification
against performance. When diversification is limited, it is not optimal and it limits the
opportunity to put available resources to beneficial use (Lubatkin & Chatterjee, 1994). Also to be
48
considered, as the level of diversification increases, there is a point of diminishing returns (Zhou,
2011). This is where an additional investment in organizational costs does not produce
meaningful benefits. An example could be adding customers that do not contribute to
profitability. From this point on, diversification destroys rather than produces value. Moderately
diversified firms are not limited in this way, but rather create operative synergies from slack
resources, thus, increasing their performance. Palich et al. (2000) confirm this relationship.
Diversification-performance literature suggests that corporate managers should focus on
realizing operative synergies within the group of core related businesses (Amit & Livnat, 1988;
Berry, 1974; Dubofsky & Varadarajan, 1987; Jacquemin & Berry, 1979; Michel & Shaked,
1984; Montgomery, 1982; Palepu, 1985; Reed & Luffman, 1986). As corporate leaders pursue
related diversification, they should populate their portfolios with common strategic assets and
complementary resource bases, such as customer knowledge, product knowledge, and
managerial knowledge. Operative synergies should be considered with these resources over
multiple points in the value chain. These points may be linked. Regular assessment by corporate
leaders should establish the value provided by these linkages, review the rationale behind the
portfolio structure, manage interdependencies that result in coordination costs, and monitor
business for emerging linkages (Zhou, 2011). While the literature describes efficiency synergies,
it does not provide much information on joint growth synergies across business units.
To explain further, similarities in the production function are not limited to relatedness as
an attribute; scholars have also started to look at the resources that support performance-
enhancing diversification. Markides and Williamson (1994) argue that the similarity between
valuable resources, like strategic assets, should be considered for the benefit of diversification.
These related assets, which are imperfectly tradable, imperfectly substitutable, and imperfectly
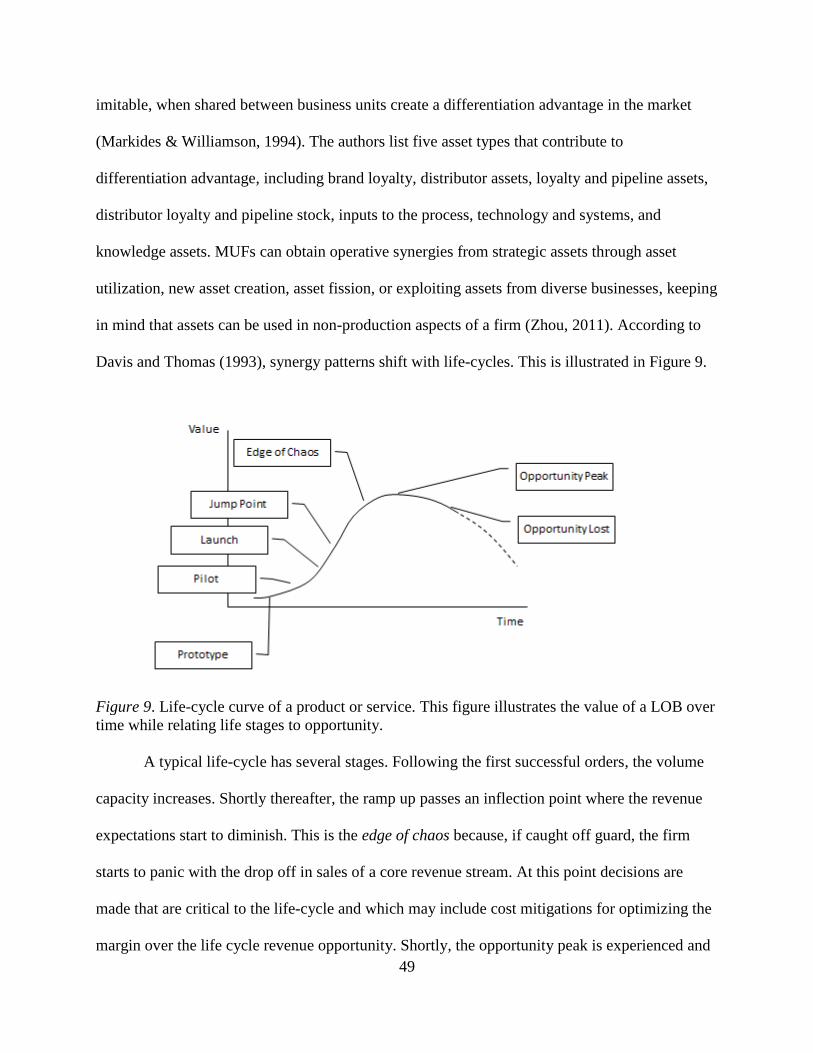
49
imitable, when shared between business units create a differentiation advantage in the market
(Markides & Williamson, 1994). The authors list five asset types that contribute to
differentiation advantage, including brand loyalty, distributor assets, loyalty and pipeline assets,
distributor loyalty and pipeline stock, inputs to the process, technology and systems, and
knowledge assets. MUFs can obtain operative synergies from strategic assets through asset
utilization, new asset creation, asset fission, or exploiting assets from diverse businesses, keeping
in mind that assets can be used in non-production aspects of a firm (Zhou, 2011). According to
Davis and Thomas (1993), synergy patterns shift with life-cycles. This is illustrated in Figure 9.
Figure 9. Life-cycle curve of a product or service. This figure illustrates the value of a LOB over
time while relating life stages to opportunity.
A typical life-cycle has several stages. Following the first successful orders, the volume
capacity increases. Shortly thereafter, the ramp up passes an inflection point where the revenue
expectations start to diminish. This is the edge of chaos because, if caught off guard, the firm
starts to panic with the drop off in sales of a core revenue stream. At this point decisions are
made that are critical to the life-cycle and which may include cost mitigations for optimizing the
margin over the life cycle revenue opportunity. Shortly, the opportunity peak is experienced and
50
now the firm has to understand the decline and make decisions to optimize the tail of the curve.
The firm may be able to extend the tail by adding value to the product or service, repackaging it
for another sector, or by bundling it with something else that has value. Once the opportunity is
lost, it is wise to reallocate resources. Due to the nature of life-cycles, a related resource can
become unrelated and even dis-synergistic over time as markets evolve, collide, split, and/or
become extinct (Martin & Eisenhardt, 2001). Furthermore, operative synergistic relationships
between businesses can change over time. Consequently, limiting synergistic discussions to
resource synergy opportunities leads to less than optimal results.
Resources can be thought of as being complementary if the sum of their individual
resource cost is less than their value when linked together (Milgrom & Roberts, 1995).
Consequently, the benefit from resource interdependency is referred to as super-additive.
Complementary resources are interdependent and mutually supportive but not identical. For
example, Tanriverdi and Venkatraman (2005) explain that complementary knowledge resources
could be exploited across businesses for influencing market expansion and influencing corporate
performance. Others have come to the same conclusion (Farjoun, 1998; Larsson & Finkelstein,
1999); however, knowledge resources should not be considered to be purely dyadic between two
entities, but may be triadic, or more realistically systemic (Marsden & Franklin, 1993) as
described below.
Selective focus is important to the realization of synergistic growth, as it is aligned with
the objective to achieve profitable results. Selective focus is achieved by allocating energy
strategically to achieve the best results. Available resources can be better utilized through
prioritization, plan, and purpose clarity. The effectiveness of these resources can be measured by
looking at value creation. The ability to execute through selective focus is augmented by an
51
appropriate strategic method, a scope that is optimized, and an organization that is directionally
exploitable and scalable. The strategic method includes aspects that penetrate boundaries. These
may include, as an example, a technology that could break through the walls of a siloed
organization, thus, making available the revenue that was previously unrealized. Other
techniques can be leveraged; for example, existing resource redeployment can achieve improved
profitability as these resources are already capable to perform the synergistic task. Additionally,
the benefits of a system can be leveraged to encourage a client to pay more, as the ability to track
orders may be considered to be a value-add. The directional strategy relates to the MOS and its
scalability. For example, and referring to Figure 7, the complete directional extension of a line in
the MOS results in increased synergy exploitation opportunities. Similar skills and resources can
be exploited to maximize profits. The structure can also scale and be leveraged across divisional
lines. For example, a synergistic activity at MediaCorp can be exploited by another division
without incurring proportional additional resource or infrastructure costs. Lastly, the scope needs
to be optimized. Out-of-scope strategies drain energy with little return. A focused strategy must
include a scope of work that is in alignment with market trends and which is locally available to
exploit. Additionally, the part of the opportunity that is profitable should not be burdened with
other aspects that are not. These opportunities should be monitored through metrics to ensure
transparency and facilitate timely decision making. The guidance of an appropriate strategic
method, in an optimized scope, leveraging the directional capability of a MOS will help to
ensure that only the most profitable opportunities are selected for focused attention. This
relationship between the three key strategic themes on selective focus is illustrated in Figure 10.
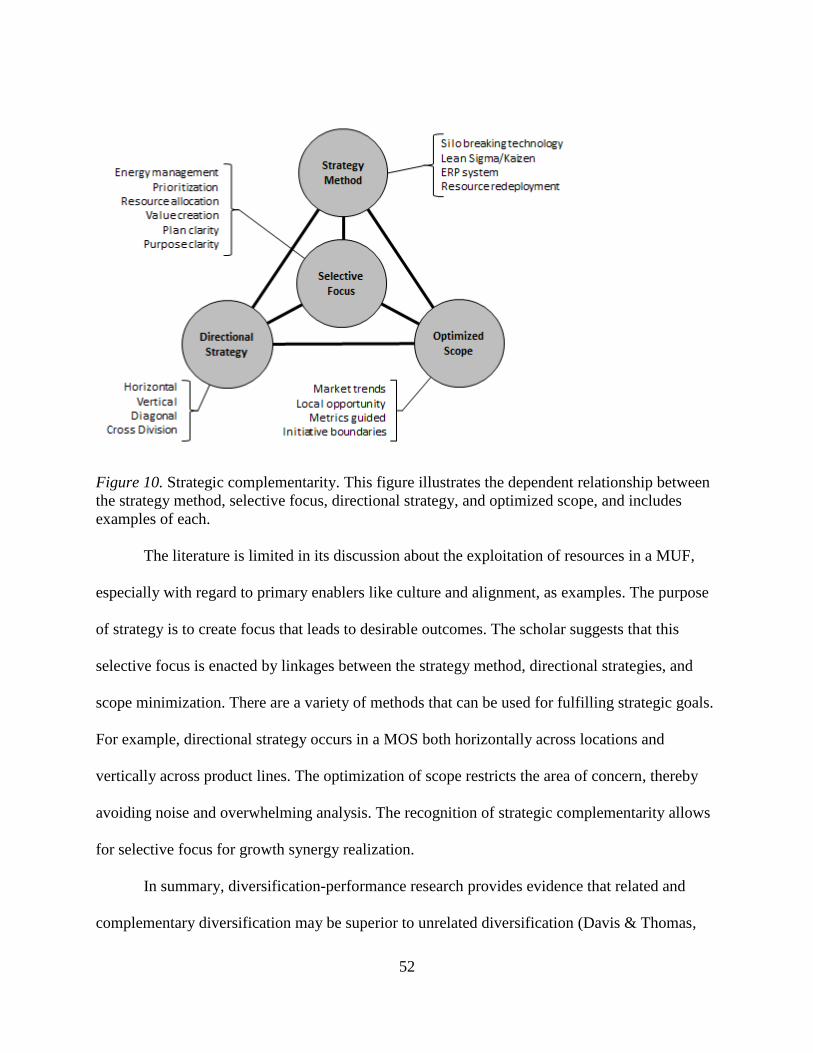
52
Figure 10. Strategic complementarity. This figure illustrates the dependent relationship between
the strategy method, selective focus, directional strategy, and optimized scope, and includes
examples of each.
The literature is limited in its discussion about the exploitation of resources in a MUF,
especially with regard to primary enablers like culture and alignment, as examples. The purpose
of strategy is to create focus that leads to desirable outcomes. The scholar suggests that this
selective focus is enacted by linkages between the strategy method, directional strategies, and
scope minimization. There are a variety of methods that can be used for fulfilling strategic goals.
For example, directional strategy occurs in a MOS both horizontally across locations and
vertically across product lines. The optimization of scope restricts the area of concern, thereby
avoiding noise and overwhelming analysis. The recognition of strategic complementarity allows
for selective focus for growth synergy realization.
In summary, diversification-performance research provides evidence that related and
complementary diversification may be superior to unrelated diversification (Davis & Thomas,
53
1993; Palich et al., 2000; St. John & Harrison, 1999). It would be expected that a MUF could
gain more from operative synergy than from other types of synergy; however, there is more to
this discussion, including limiting aspects such as organizational rigidity and complexity (Kaplan
& Henderson, 2005). The concept of relatedness typically ignores growth synergies by excluding
potentially beneficial complementarities in other value chain functions. Generally, literature
excludes information on the sustainable realization of growth synergies in a MUF in favor of
diversification-performance.
Multidimensional Organizational Design
A critical result that will emerge from the empirical data is theory about the realization of
sustainable growth synergies in a multi-unit firm with a multidimensional organizational
structure, as described originally in Figure 3. In this section the scholar will discuss two related
themes for sustainable growth synergy realization, including a selective focus on opportunities
and an organization design based on decentralized collaboration. Without self-interest there is
minimal motivation. A deeper theme of guided and balanced self-interest aligns these principles
contributing to a culture of entrepreneurship and healthy growth.
While there is substantial information on the U-form, more on the M-form organizational
designs, and some in the literature about matrix designs, there is little information about
multidimensional organizational designs. Extremely limited information is available, as only a
few studies have been accomplished that explore the implementation of these designs to exploit
synergies across business units along multiple dimensions (Strikwerda & Stoelhorst, 2009).
Some firms studied were organized along the lines of key accounts, professional services,
support functions, or facility management (Strikwerda & Stoelhorst, 2009). Managers were
responsible for profits, market position, and customer retention, but they controlled very few
54
resources. Often, resources are controlled by facility managers who are responsible for the
bottom line. This creates tension between sales, as they develop new market opportunities, and
facility managers, who are accountable for the efficient utilization of resources (Galbraith, 2009;
Goold & Campbell, 2003; Ruigok et al., 2000). Risk-averse behavior of resource managers must
be confronted by market opportunities identified by account managers. Concurrently, market
managers cannot be overly optimistic in their judgments about market opportunities (Galbraith,
2009; Goold & Campbell, 2003; Ruigok et al., 2000). It is therefore essential that a MOS
simultaneously reports performance on two or more dimensions. Managers need to be held
accountable for their dimension as it contributes to overall firm performance and the execution of
growth synergies. Unique challenges for implementation are present in a globally integrated
enterprise with globally integrated support functions such as MediaCorp.
The scholar believes that the organizational design of a firm is what leads to success or
failure with regard to the realization of growth opportunity. The most successful form of a MUF
is the M-form, named by Williamson (1975), in which activities are organized into separate
business units (Roberts, 2004; Williamson, 1985). Resources are delegated to managers charged
with creating economic value for the firm. These resources are controlled within business
structures that are measured for financial performance. The boundaries of the units are reinforced
by financial systems. To illustrate, organizational design has been influenced by corporate
agendas driven by synergistic savings evident in the form of corporate account management,
shared service centers, and matrix organizations. Consequently, most businesses now depend on
some resources that are controlled by other units (Strikwerda & Stoelhorst, 2009). In this section,
the scholar will briefly discuss organizational theory as it relates to a MOS, as depicted in Figure
3, and specifically refer to the most frequently occurring M-form for purposes of comparison.
55
This research attempts to contribute to organizational theory by exploring an innovative
multidimensional organizational design with the advantage of collaborative opportunity
exploitation in a dynamic market. In the case of MediaCorp, the design includes dimensions that
relate to products and services, geographic locations, support functions, and clients. Each
dimension is not flat, as a layer might imply, but rather is intrinsically variable. For example,
products within this dimension are different in complexity, volume, capacity consumption,
quality rigor, seasonality, and sensitivity to penalty or liability. Within the support functions
there is variability in team expertise and the nature of the support, as examples. Support could be
present in the form of ERP enhancements or module creation, or storage, and the availability of
workflow assets. There is variability in the client dimension with regard to size, rate structure,
administrative load, hunter vs. harvester activity, and the meaningfulness of relationships.
Geographic locations vary in culture, size, and mix of products used in local markets, further
strengthening the idea of a dimension rather than a layer (Armstrong & Cole, 2002). This
multidimensional organizational design is applied to a multi-unit business that includes a global
value chain. The MUF must be competitively agile in its dynamic market while managing
through an otherwise complex organizational construct. The scholar proposes a minimalist role
of the corporate center with the addition of secondary work structures, or collaboration
platforms, that exploit capabilities across business units (Wiessmeier et al., 2012). These lateral
integrative mechanisms, discussed later, reduce costs that would otherwise be overhead in a
traditional M-form structure.
The M-form has come into question with regard to its relevancy in modern MUFs
(Bartlett & Ghoshal, 1993; Berggren, 1996; Ruigok et al., 2000). Even Alfred Chandler (1962),
the economic historian from Harvard who documented the emergence of multidimensional
56
organizations in the first half of the 20th century, suggests that structure must follow strategy to
avoid inefficient results. In the 1970s there was interest in organizing MUFs along several
dimensions in a number of publications that were concerned with the dynamic markets in which
multi-national corporations operated (Ackoff, 1977; Bartlett, 1982; Coggin, 1974; Prahalad,
1980; Prahalad & Doz, 1979). The M-form design drives high employee costs, internal battles
over resources, the lack of standardization, the lack of collaboration, and the loss of market
opportunities contributing to tension about synergy exploitation (Strikwerda & Stoelhorst, 2009).
This tension needs to be resolved, at least partially, through an organization design that involves
multiple dimensions without exacerbating issues around resources and market opportunities.
Furthermore, the structure needs to drive clarity and accountability which is an inherent
weakness in matrix structures due to the disparate interests of multiple bosses (Galbraith, 2009).
Further organizational design evolution is needed for moving MUFs from a resource-centric
industrial economy, focused on exploiting tangible physical resources, to a customer-centric,
service-oriented economy that is focused on exploiting intangible knowledge-based resources
(Davis & Thomas, 1993; Grant, 1996; Markides & Williamson, 1994).
MediaCorp’s manager has deployed and stressed the benefit of a MOS to jointly bear the
operative responsibilities of the sub-divisions, arguing that it provides for flexibility and
responsiveness to client needs in all locations over all functions. The intent is that this structure
is built upon as it is extended to other sub-divisions and divisions. This is reflected in Figure 11
and further explained below. The culture at MediaCorp has been one of strategic and operational
autonomy. While corporate influences budgets by stretching them, interventions are rare and
executives at this level are reluctant to become directly involved as they have been decoupled
from operative activities. This has allowed MediaCorp to move to a structure with the four
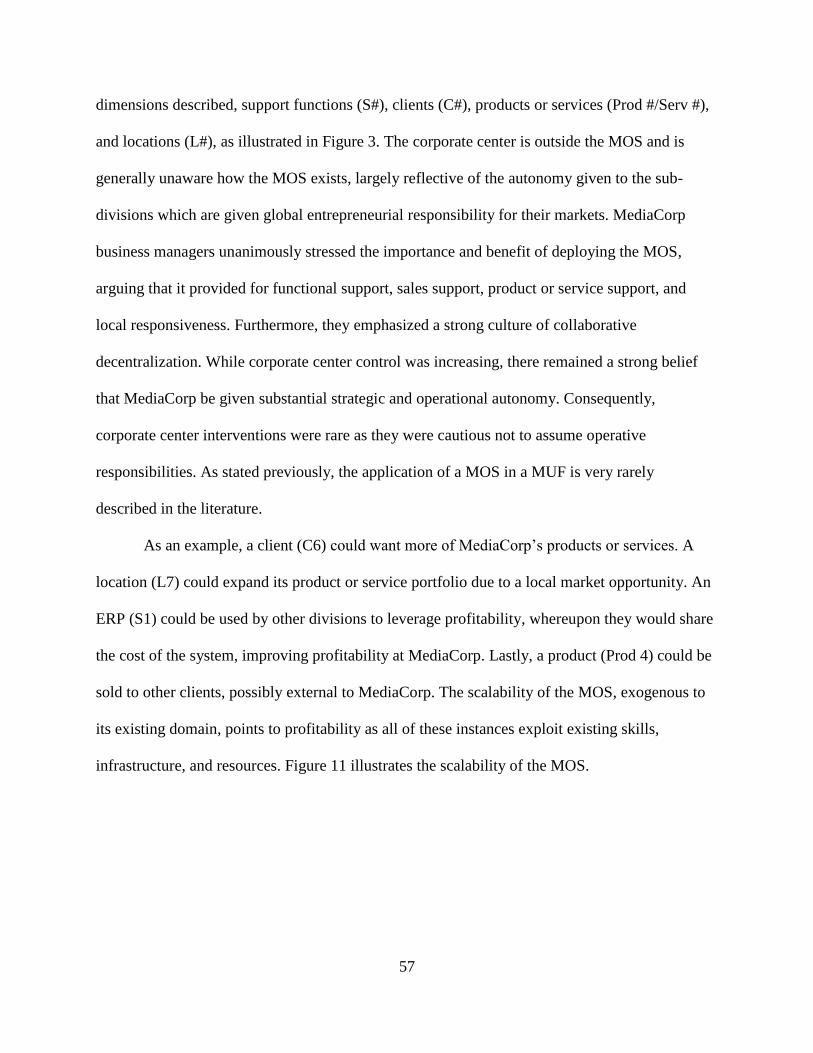
57
dimensions described, support functions (S#), clients (C#), products or services (Prod #/Serv #),
and locations (L#), as illustrated in Figure 3. The corporate center is outside the MOS and is
generally unaware how the MOS exists, largely reflective of the autonomy given to the sub-
divisions which are given global entrepreneurial responsibility for their markets. MediaCorp
business managers unanimously stressed the importance and benefit of deploying the MOS,
arguing that it provided for functional support, sales support, product or service support, and
local responsiveness. Furthermore, they emphasized a strong culture of collaborative
decentralization. While corporate center control was increasing, there remained a strong belief
that MediaCorp be given substantial strategic and operational autonomy. Consequently,
corporate center interventions were rare as they were cautious not to assume operative
responsibilities. As stated previously, the application of a MOS in a MUF is very rarely
described in the literature.
As an example, a client (C6) could want more of MediaCorp’s products or services. A
location (L7) could expand its product or service portfolio due to a local market opportunity. An
ERP (S1) could be used by other divisions to leverage profitability, whereupon they would share
the cost of the system, improving profitability at MediaCorp. Lastly, a product (Prod 4) could be
sold to other clients, possibly external to MediaCorp. The scalability of the MOS, exogenous to
its existing domain, points to profitability as all of these instances exploit existing skills,
infrastructure, and resources. Figure 11 illustrates the scalability of the MOS.
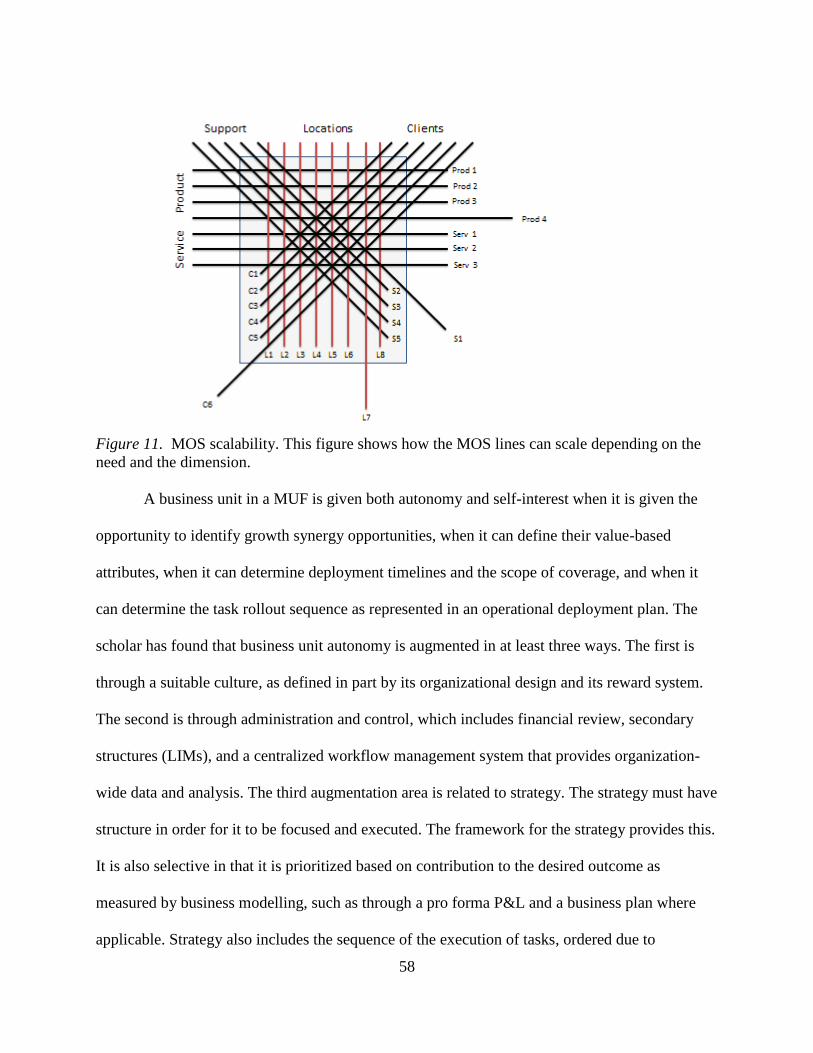
58
Figure 11. MOS scalability. This figure shows how the MOS lines can scale depending on the
need and the dimension.
A business unit in a MUF is given both autonomy and self-interest when it is given the
opportunity to identify growth synergy opportunities, when it can define their value-based
attributes, when it can determine deployment timelines and the scope of coverage, and when it
can determine the task rollout sequence as represented in an operational deployment plan. The
scholar has found that business unit autonomy is augmented in at least three ways. The first is
through a suitable culture, as defined in part by its organizational design and its reward system.
The second is through administration and control, which includes financial review, secondary
structures (LIMs), and a centralized workflow management system that provides organization-
wide data and analysis. The third augmentation area is related to strategy. The strategy must have
structure in order for it to be focused and executed. The framework for the strategy provides this.
It is also selective in that it is prioritized based on contribution to the desired outcome as
measured by business modelling, such as through a pro forma P&L and a business plan where
applicable. Strategy also includes the sequence of the execution of tasks, ordered due to
59
environmental conditions and dependency. Outcomes of exploiting self-interest include
profitability in the form of social impact, organizational efficacy, team efficacy, and personal
leadership efficacy (Lovas & Ghoshal, 2000).
The most common form of multidimensional design is a matrix. Other designs with more
dimensions are viewed as novel with very little coverage in the literature. The scholar now
briefly discusses the matrix design and the design differences when more than two dimensions
are used. Additionally, consideration is given to the inadequacies of a matrix design so that
similar pitfalls are not experienced in a multi-dimensional approach (Galbraith, 1977, 2009). The
matrix design should be thought of as a two-dimensional construct that typically is separated
geographically, for the operation, and non-geographically, for support functions. Other construct
variations exist. Some inadequacies with a two dimensional design include unclear
responsibilities, a lack of accountability, political battles over resources, a risk-averse behavioral
pattern, and loss of market share due to a lack of focus (Galbraith, 1971; “Life in a matrix,”
1980; Strikwerda & Stoelhorst, 2009). On the other hand, business units are not completely self-
contained as they depend, to some extent, on external resources for achieving their objectives
(Barney, 1991; Bower, 1986; Gupta & Govindarajan, 1986). While the M-form still dominates
thought processes, the actual tendency is for firms to move away from the underlying logic of the
M-form to realize growth synergies (Strikwerda & Stoelhorst, 2009). While mental anchoring on
the M-form can render a MUF obsolete, or make a transition difficult, an effective
multidimensional structure can enhance a MUFs growth synergy exploitation capability and
preserve location managers’ status, power, autonomy, and self-interest.
In this dissertation a multidimensional organization design that has been deployed should
not be confused with a matrix design. They are different in several critical ways. In a matrix
60
organization, the node where the two dimensions meet represents the employee who reports to
two bosses, with individual objectives or agendas. Reporting structures may be in a conflicted
dysfunctional relationship with each other. In the multidimensional model for MediaCorp, the
node is put forward as a profitability enhancing opportunity, or growth synergy opportunity,
where representatives from each dimension can meet and align the entrepreneurial energy around
discovered opportunities. In this design, managers are stakeholders in the exploitation of
discovered opportunities. The leader in each dimension reports in to the same person, allowing
for alignment through a singular agenda. Furthermore, this is reinforced through the
organizational design and a reward system based on collaboration. Another difference between
the two structures is in the planning and control processes. While the profitability of the client
oriented P&L is dominant, the P&Ls for products, the support functions, and for locations are
also important as they contribute significantly to profitability. Profitability or cost is, therefore,
measured and monitored in each of the four dimensions through dimension-specific P&Ls.
A final difference between the structures relates to the influence of management
information systems (MIS) in a MUF. The MIS reports performance in each of the dimensions at
all levels of the organization. This eliminates information asymmetries and transfer pricing, as
examples, thereby turning the MUF into a truly integrated dyadic relationship between a
customer-centric focus and operational synergy realization. In many matrix organizations the
emphasis is on authority and power (Galbraith 1971, 1973; Goold & Campbell, 2003; Ruigok et
al., 2000). The management in multidimensional firms focuses on the firm’s joint customer-
centric goals by leveraging MIS or ERP supplied business intelligence which point to
opportunity rather than the disparate and conflicted agendas of two bosses who may be
misaligned and unequally capable (Strikwerda & Stoelhorst, 2009).
61
A critical success driver in a MOS is an integrated management information system
(Pankratz, 1991), assuming that it keeps current with firm adaptations to market dynamics and
corporate advantage life-cycles (D’Aveni et al., 2010). An MIS is a lateral integration
mechanism because it makes critical information and intelligence available to leaders in all of the
dimensions of a MOS, thereby enabling action and mitigation. The MUF must evolve from
unique local business systems geared to local needs to a networked social construct that drives
transparency throughout the MUF across all dimensions (Hirschheim & Klein, 1994). A single
set of common data definitions is necessary so that every transaction can be captured with
suitable data density. This data can then be exploited along multiple dimensions, including
reporting and analytics, across business units in a worldwide value chain. The information it
contains is simultaneously available, providing for real-time sharing, change management,
workflow adaptation, capacity manipulation, and production tracking. Additionally, for business
intelligence it is also necessary that the MIS include a CRM (customer relationship management)
capability so that account managers can mine the database for order information and leads. This
enhances the MUF’s ability to maximize market share by exploiting customer spend budgets
within applicable product categories across customers. It also fosters cooperation between
managers, as performance accountability is shared across dimensions.
The multidimensional structure deployed in MediaCorp, that is being evaluated in this
dissertation, includes the client as the primary profit center (Galbraith, 2005), the products and
services as the secondary dimension, the locations as the third dimension, and the performance of
support services as a fourth and final dimension. The MIS makes it possible for all stakeholders
to obtain the same information in real-time, eliminating information asymmetries between and
across dimensions. Cases are also used across and within all dimensions for monetizing
62
opportunities made visible through business intelligence provided by the MIS or ERP and CRM
systems. The goal of all efforts is profits through the exploitation of growth synergies.
The dimensions in a multidimensional organizational design are important to the market.
Business should be conducted with customers in the way that they prefer so that there is
sustainable value in the relationship (Galbraith, 2005). The MOS deployed at MediaCorp
included a primary dimension that related to client management (C#). A P&L was provided to
each account manager with regard to the client’s overall global financial performance. This P&L
was support function, location, and product agnostic. It allowed the managers to understand the
profitability of working with all clients as well as each individual client. It also allowed for an
understanding of profitability from the client, as it related to product type and the location where
the work is done. The customer-centric nature of multidimensional firms is enhanced by treating
clients as profit centers (Galbraith, 2005) and by listening to them for the purpose of discovering
service opportunities (Wiessmeier et al., 2012). Economic gain is created by pursuing unique
location-specific market strategies, by integrating product and service offerings for maximizing
customer profitability (Amit & Livnat, 1988; Armour & Teece, 1978), and by making the
relationship sticky through optimized complexity and interdependency.
MediaCorp operates in an industry that is networked. Consequently the center of
innovation has shifted from the company to the network in which it operates. The network
flourishes when it exists in a state of deep collaboration, cross-pollination, and concurrent
engineering. This network develops value-based solutions in parallel exceeding time to market
requirements (Grossman, 2005). Additionally, growth synergies can be achieved through alumni
relationships within the industry-wide network. This network is a LIM. The exploitation of
available market knowledge then becomes more critical than creating personal knowledge.
63
Knowledge can be easily obtained from the network if it is not locally available. Organizational
constructs must align with this environmental constraint and facilitate the exploitation of
network-based knowledge resources (Drucker, 1992; Goold & Campbell, 2003). Collaborative
knowledge workers are increasingly valuable due to their collective influence on profitability
opportunities in a multidimensional firm (Bartlett & Ghoshal, 1993; Prahalad & Hamel, 1990),
and especially in a firm with a structure that requires collaborative arrangements (Contractor &
Ra, 2002; Inkpen, 1997). MediaCorp desires that knowledge workers are attracted to their firm,
as they see that it is an opportunity to increase their personal market potential within the industry
network (Drucker, 1992; Florida, 2004; Rosen, 2004). Managing the chaos found in these
networks is the current opportunity for competitive advantage in a MUF. A brief discussion
about network efficacy and chaos theory follows.
There are attributes of the network that can relate to chaos theory as it has been used as a
metaphor for explaining social and organizational phenomenon (Bright & Pryor, 2005; Crandall,
Parnell, & Spillan, 2010; Fredrick, 1998; Hudson, 2000; Lissack, 1999). A non-linear dynamic
framework is needed as a lens for understanding complex interactions. Emerging complexity-
based theories related to strategic management seek to find order in patterns that may be related
to cause and effect (Burnes, 2004; Dervitsiotis, 2004; Edgar & Nisbet, 1996). Signal or warning
detection can be inhibited by underestimating the issues or their impact, hubris, or the inability to
connect the dots (Barton, 2004). While it is impossible to anticipate every potential issue, chaos
occurs when phenomena that appear to be unrelated actually follow an unknown or hidden
related pattern. These are referred to as attractors. Chaotic systems have two characteristics; they
have a sensitive dependence on initial conditions and they have unpredictability in the long run
even when there is some predictive accuracy in the short run (Crandall et al., 2010). Due to
64
sensitivity in the network, a slight change in the initial conditions can lead to a substantially
different, and potentially unwanted, outcome in the system. Outcomes could include bifurcations
or oscillations between two possible values in alternating time periods (Gleick, 1987). For
example, MediaCorp sees cyclical trends in the market due to seasonality. Layered bifurcations,
such as seasonality and product launch trends for example, obfuscate the correlation between
variables resulting in outcomes that are complex. These outcomes appear to be random even
though undulating attractors exist as illustrated in Figure 4. Chaos theory therefore offers some
insight into these systems (Smith, 2002). For example, the transformational changes and ongoing
challenges faced by MediaCorp depend on the ability of a system to predict change need, the
ability to self-organize, and the ability to morph into a new form without intervention from
forces exogenous to the system (Loye & Eisler, 1987). The robustness of the new form evolved
during the transition. Recognizing that chaos is a system of events in flux and change (Kiel,
1995), bifurcations can change the system suddenly causing it to behave unpredictably (Edgar &
Nisbet, 1996). This drives the need for predictive change and organizational agility in a
moderately dynamic market.
Consideration should be given to the fact that negative attractors, due to non-linearity,
can accumulate as a potential crisis progresses unmitigated. Consequently, the concomitant
intensification of negativity results in a momentum that is increasingly difficult to control.
Planned interventions may have little effect because stakeholders stop participating, or
disengage, thereby widening the gap between the current state and desired equilibrium. Positive
feedback in the system, or amplification, may bring the network to a tipping point, resulting in
organizational capability disintegration (Crandall et al., 2010). To avoid this, the multiple
contributing factors that influence risk in the system need to be recognized. Listening to negative
65
feedback in the system can lead to a mitigating influence (Mitroff, 2001). An exception is when
this tipping point is needed to trigger a decision or enact an action. Positive feedback
mechanisms can, however, slip past outdated or ineffective negative feedback mechanisms
undetected (Reason, 1997). It is preferable to enact proactive and effective negative feedback
mechanisms to influence chaos in the network and promote more predictive outcomes. When this
is not possible, crises can be leveraged to break down, change, and remove encrusted routines
and silos (Bertrand & Lajtha, 2002), replacing them with better more capable and agile systems
(Sellnow, Seeger, & Ulmer, 2002).
In summary, this section briefly discussed a multidimensional organizational design as
described in Figure 3. Typically resources that are needed across business units are controlled by
individual units. The MOS provides opportunities to explore the advantage of autonomous
collaboration and problem solving at the intersecting nodes. To accomplish this, an
understanding of the interaction between variables that describe each dimension should be
understood. Lateral integrative mechanisms that can be used to regulate and accelerate
interaction between dimensions in a dynamic market were introduced. They also provided agility
in a complex multi-national organization that can only be realistically represented as a network
or a system. Ultimately, emerging megatrends suggest that the traditional M-form is inadequate
for the efficient realization of growth synergies. The realization of operative synergies requires
cooperative designs that include the centralization of authority, financial controls, corporate-level
incentives, clear accountability, and the use of strong integrative mechanisms. To be sure, the
efficacy of the organizational design is dependent on leadership capabilities. While current
strategy-structure research suggests organizational designs for operational synergies, it does not
make suggestions for dependencies, like this, for growth synergy realization. Contemporary
66
economic conditions increasingly call for the creation and exploitation of synergies (Ansari,
Schouten, & Verwaal, 2006; Chatterjee, 1986; Kinnunen, 2010). This dissertation provides an
evaluation of the accomplishment of MediaCorp’s goals through the use of a MOS that leverages
integrative mechanisms. The scholar believes that the use of this organizational construct creates
a competitive advantage, as it facilitates the creation of synergies across units to serve
increasingly dynamic, technology-dependent, and fragmenting markets. The design is also
suitable for the economic logic around a knowledge-based society, or knowledge economy
(Powell & Snellman, 2004). Knowledge-driven production requires that firms are able to
integrate distributed and tacit information through knowledge management. This is another
example of LIMs. The complexity present in environments and products makes it clear that no
one person holds all the knowledge needed to satisfy client needs; promoting therefore, a
collaborative leadership structure. The MOS facilitates the teamwork and self-directed problem
solving capability needed to successfully create and exploit profit-generating knowledge. It
enables the simultaneous optimization and exploitation of market opportunities, while efficiently
consuming resources. Moreover, many markets are no longer one-dimensional, but rather require
value chain capabilities as well as the capabilities of the other dimensions. Product customization
and differentiation drives the fragmentation of products and services that are sold through
multiple distribution channels. Preferences change quickly and frequently. Furthermore, client
insecurity drives the need for multiple vendors for redundancy, making the requirement for
competitive value increasingly salient. MUFs, therefore, must have the capability to adjust to
transient client and consumer behavior, or whim.
67
Lateral Integrative Mechanisms
Lateral integrative mechanisms (LIMs) are critical to this study. In this section the
scholar will relate LIMs to knowledge transfer in a MOS, describe LIM attributes, discuss LIM
drivers in a MOS network, discuss integrative mechanisms, look at roles within LIMs, and
describe the temporary nature of these dynamic situational structures. Situational adaptation is
highly complex and changeable (Miles, Snow, Meyer, & Coleman, 1978). Lateral mechanisms,
sometimes nebulously referred to as secondary structures or collaborative structures in the
literature contribute to growth synergy realization in a MUF with a MOS. They include work
structures that allow for critical contributors across the various aspects of the multidimensional
structure to assemble, collaborate, create policy, and to problem solve. This construct promotes
stability, helps an organization achieve its purpose, and enables a MUF to exploit market
opportunities that cross business unit boundaries. They are applied as needed and the
organization may be required to continuously modify and refine these dynamic mechanisms.
This may include the description of roles and relationships, managerial controls, and
accountability for each product or service life-cycle (Miles et al., 1978). While the organization
is an integrated and dynamic whole, it includes interrelationships between strategies, structures,
and processes (Miles & Snow, 1978). An agile organizational topology enables adaptive
behavior which optimizes effective alignment of the organization with its dynamic environment
through the deployment of experience, skills, information, and routines (Almeida & Grant, 1998,
Grant, 1991, 1996; Santos & Eisenhardt, 2005; Winter, 1987). With this in mind, the scholar
now introduces more formally lateral integrative mechanisms (LIMs) by discussing how they
encourage organizational alignment by facilitating knowledge transfer throughout the network of
the MOS.
68
LIMs are further described visually in Figure 12. Exploited knowledge at the point of use
is a critical driver for growth. Exploiting shared knowledge in a MOS enables synergistic growth
through system, organizational, technological, and other LIM types. The grey shaded areas show
connections that LIMs facilitate to support profitability. As an example a LIM may be an
organizational structure that links several products together as they utilize similar resources. An
example could be a team that inspects components that are used in several different products. A
quality LIM would exist in the form of a quality requirement that is similar across multiple
locations. This would be intuitive in that it would promote the consistent specification
compliance of a singular product regardless of where it is made. A system LIM may provide
order tracking for all products across all locations. This information could be made known to
clients. Other support functions could leverage this information as well for planning to promote
the efficient use of resources. For example, shipping capacity could be determined using system
information as described. Lastly, a technology LIM could include a tool that is used across
multiple locations. An example would be a measurement system that is under centralized control
for maintenance or calibration purposes.
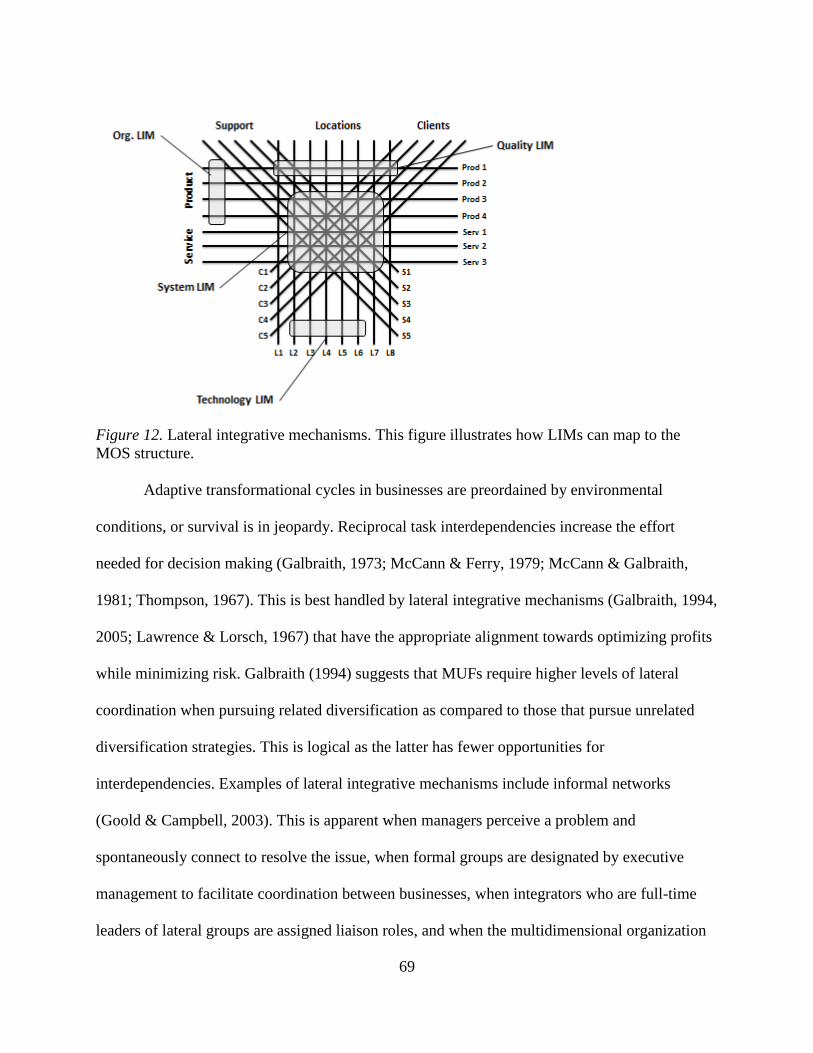
69
Figure 12. Lateral integrative mechanisms. This figure illustrates how LIMs can map to the
MOS structure.
Adaptive transformational cycles in businesses are preordained by environmental
conditions, or survival is in jeopardy. Reciprocal task interdependencies increase the effort
needed for decision making (Galbraith, 1973; McCann & Ferry, 1979; McCann & Galbraith,
1981; Thompson, 1967). This is best handled by lateral integrative mechanisms (Galbraith, 1994,
2005; Lawrence & Lorsch, 1967) that have the appropriate alignment towards optimizing profits
while minimizing risk. Galbraith (1994) suggests that MUFs require higher levels of lateral
coordination when pursuing related diversification as compared to those that pursue unrelated
diversification strategies. This is logical as the latter has fewer opportunities for
interdependencies. Examples of lateral integrative mechanisms include informal networks
(Goold & Campbell, 2003). This is apparent when managers perceive a problem and
spontaneously connect to resolve the issue, when formal groups are designated by executive
management to facilitate coordination between businesses, when integrators who are full-time
leaders of lateral groups are assigned liaison roles, and when the multidimensional organization
70
demonstrates equal authority in all relevant dimensions driven by a growth opportunity. These
stakeholder roles are especially relevant to growth synergy during organizational integrations.
As business units are integrated they mature and become influential by adopting
beneficial attributes such as participation, influence, coordination, collaboration, and capability
in an increasingly complex interdependent production environment (Gupta & Govindarajan,
2000; O’Donnell, 2000). LIMs are needed to span across otherwise confining structures.
Contextually embedded knowledge is typically difficult to discover, locate, or leverage.
Examples of mechanisms to extract relevant knowledge may include boundary spanning
functions, liaisons, and an assortment of team structures informing the organization about
opportunities and complementing existing structures (Ancona & Caldwell, 1992; Ebadi &
Utterback, 1984; Galbraith, 1973; Gersick, 1988; Tushman, 1977; Tushman & Scanlan, 1981).
The scholar considers knowledge flow, whether codified or non-codified, to not be one way, or
even two-way, but rather nodal, or systemic (Gupta & Govindarajan, 2000); hence the concept of
a network. Even though the bandwidth of the network can be increased, absorptive capacity,
while expandable, should be taken into consideration as a constraint. The objective is to have
relevant knowledge manufactured, if needed, and flow to the right locations autonomously, at the
right time, to help MUFs realize growth synergies at the point of opportunity.
Several mechanisms of inter-unit integration have received substantial attention as ways
to facilitate the coordination of information flow in dispersed MUF structures (Bartlett &
Ghoshal, 1989; Ghoshal and Bartlett, 1994; Gupta & Govindarajan, 2000; Nohria & Ghoshal,
1977). Existing cumbersome organizational configurations must be overcome, or compensated
for, by choosing appropriate collaborative mechanisms, especially in complex organizations.
Galbraith (1973) put forward three forms including liaison roles, temporary teams, and
71
permanent teams; however, several other types will be exposed in this dissertation by the scholar.
These lateral integrative mechanisms have been shown to impact knowledge transfer and
processing capacity (Gupta & Govindarajan, 1994, 2000). The scholar has decided not to let
these constructs limit the creation of unique lateral mechanisms in the context of this case study.
Actual LIMs discovered and deployed in the MOS at MediaCorp will be described further in
Chapter 4, including a discussion about their impact on growth synergy realization and data
regarding the co-researchers experience with them.
The operational system allows for the exploitation of entrepreneurial opportunities often
that are concomitant with market and technology changes. Concurrently, administrative
opportunity, through structure and process, is critical for the reduction of uncertainty within the
organizational network. LIMs focus on problem solving to facilitate sustained evolution and
innovation. They avoid embedding or inappropriate routinizing that would contribute to inertia
(Miles et al., 1978). Strategy is an opportunity to avoid risk, restore equilibrium, standardize,
routinize, streamline, mechanize, and promote consistency. Reactive adaptation should be
considered as strategic failure or strategy void, incurring cumulative risk that is not sustainable.
Strategy, on the other hand, may promote a limited set of products directed at a narrow market
segment enhancing penetration, it may enhance the efficiency of serving a stable market domain,
it may enable the exploitation of new products and market opportunities, and it may enact the
harvesting of revenue from core traditional products and customers (Miles et al., 1978). LIMs are
intrinsic to strategy as they may contain organic structure formations that include, but are not be
limited to, cost control specialists that use monitoring techniques and improvement
methodologies to improve profitability, decentralized control mechanisms, intensified planning
and scheduling capabilities to optimize capacity utilization, enhanced functional structures
72
including a division of labor in a centralized control structure, administrative systems that reveal
intelligence and enable effective decision making, environmental scanning to identify internal
and external opportunities, and the deployment of communication mechanisms in all dimensions
that inform each dimension optimally (Burns & Stalker, 1961).
LIMs have attributes that contribute to their success or failure within their respective
environments (Denison, Hart, & Kahn, 1996). In the event that goals and values in the business
units are not congruent with the goals of corporate, knowledge transfer is inhibited (Ghoshal &
Bartlett, 1990). Consequently, LIMs may be effective for the exploitation of the collective
knowledge and help manage the relationship between the unit and the corporate center. Given
that a MUF is a network of business units differentiated by roles, resources, and environment
(Nohria & Ghoshal, 1997), it is important to consider that this network of units is simultaneously
present in each of its contexts. Business units gain significance and can draw from their local
contexts by contributing knowledge and competence to the shared network (Almeida & Phene,
2004; Andersson, Forsgren, & Holm, 2002; Davis & Meyer, 2004; Frost, 2001; Manolopoulos,
Papanastassiou, & Pearce, 2005). Harvesting this knowledge from disparate sources on-demand
reduces the dependency on centralized sources in the MUF and better ensures relevancy to local
contexts (Frost 2001) that may be evident in the limited variety of forms of LIMs illustrated in
Figure 11. For example, the time needed for integration completion is often overstated and the
effort needed to merge cultures is typically understated (Loomer & Harington, 2003). The
challenge initially centers on access to this disparate knowledge so that transfer and integration
can occur (Rugman & Verbeke, 2004; Zander & Solvell, 2000). The purpose of the efficient
transfer of knowledge is to accelerate the innovation process, encourage the replication of
73
capabilities, and to exploit the combination of knowledge assets (Hansen & Lovas, 2004;
Subramaniam & Venkatarman, 2001; Winter & Szulanski, 2002; Zander & Solvell, 2000).
MUF leaders are concerned with the creation and implementation of LIMs to induce
nodes in the network to share and create connectedness for mutual ongoing benefit (Eisenhardt &
Galunic, 2000). For example, business unit and products or services leaders (dimensions in the
MOS) collaborate in frequent fact-focused and pragmatic group meetings where shared interests,
competitor moves, customer feedback, and technology developments are discussed. This
structured activity is a LIM that may be named as a periodic activity. Business units need to be
viewed as entities with bargaining power and influence in addressable markets where
entrepreneurship can be exploited for growth synergy realization (Birkinshaw, 1997; Birkinshaw
& Hood, 1998; Cantwell & Mudambi, 2005; Forsgren & Pedersen, 2000). This profitability
enhancement can be achieved through opportunity discovery and trust-based collaboration
(Eisenhardt & Galunic, 2000) across distributed teams that may be virtual and dynamic (Bell &
Kozlowski, 2002). Companywide control structures may not be complementary with local
environments which have substantial influence over business unit activities (Andersson &
Forsgren, 1996; Nohria & Ghoshal, 1994). The recognition of each business unit’s unique
situation and the subsequent adaptation of control systems create the capability to share within
the network (Nohria & Ghoshal, 1994). This strengthens the networks ability to realize growth
synergies.
Knowledge has come to be known as the most strategic resource in an organization
(McEvily & Chakravarthy, 2002). This is especially critical in multi-national enterprises with
interdependent business units that move work between locations. In this case various influencing
factors come into play; including, but not limited to, operational structure, lateral integrative
74
mechanisms (LIMs), and control mechanisms. The firm’s ability to exploit knowledge related
resources effectively is a fundamental aspect of the firms competitive positioning and attributes
value to the knowledge. Consequently, knowledge management, for the purpose of efficient
exploitation, has been widely researched (Doz, Santos, & Williamson, 2001; Gupta &
Govindarajan, 2000; Zander & Kogut, 1995); however, this exploitation needs to be considered
in change management schemes related to the exploitation of growth synergies. From this
research, an emerging topic has been the relationship between organizational features and the
efficient flow of exploitable knowledge (Björkman, Barner-Rasmussen, & Li, 2004; Harzing &
Noorderhaven, 2006; Schlegelmilch & Chini, 2003). Despite the difficulties, it is important for
this case study that an understanding is created around the efficient transfer of knowledge for
growth synergy realization. Organizational factors substantially correlate to knowledge creation,
availability, and exploitation. The traditional M-form design does not support the degree of
decentralized decision making required to sustain profitability in diversified organizations (Miles
et al., 1978). The organizational design must remove rather than promote constraints that block
stakeholders from contributing meaningfully to the organization’s purpose (Miles et al., 1978).
This may include both information flow and ongoing education (Rose, 1990). Hansen (1999)
found that project teams quickly searched for useful information in other subunits where there
were weak knowledge links. He also found that weak inter-unit ties enhance transfer speed of
tacit knowledge as compared to strong ties. When complex knowledge is transferred to both
stable and dynamic areas of an operation, strong ties are needed. Bresman, Birkinshaw, and
Nobel (1999) found that tacit knowledge is best transferred through intense communication
characterized by substantial personal interaction. This is especially the case in international
acquisitions involving knowledge transfer (Bass, 1981). Gupta and Govindarajan (2000) suggest
75
that this intense communication be facilitated in multidimensional organizations through the use
of lateral integrative structures like liaison personnel, task forces, or permanent teams with these
tasks being performed in addition to regular duties. This structural perspective is extended by
Hansen (2002) who found that project teams obtain information faster from relevant sources
when there are shorter network paths between units that possess related knowledge.
Consequently, they tend to complete projects faster. Additionally, he showed that problems
could be mitigated when direct relations are established. This specifically related to the transfer
of non-codified knowledge. If the information is not codified it could be harmful, as the
enhanced maintenance costs are continued. While Dyer and Singh (1998) emphasize the link
between information sharing and alliance success, Tsai (2002) further explores knowledge
sharing coordination and found that a formal hierarchical structure, in the form of centralization,
had a substantial negative effect on knowledge sharing. He also discovered that when
interactions are social, informal lateral relations had a substantial positive effect on business
units when they compete with each other in the same markets. Conversely, this is not the case
when they compete for internal resources.
Boundary spanning personnel and information gatekeepers create an organizational
environment that is conducive to information exchange (Tushman & Katz, 1980; Tushman &
Scanlan, 1981). Liaison mechanisms enhance inter-unit knowledge exchange by identifying
relevant and potentially beneficial elements of knowledge to consolidate in the MUF. The
gatekeeper makes this information available to all units, while keeping it organized, version
controlled, and accurate. Research has shown that there is a relationship between communication
and its frequency on knowledge transfer (Bresman et al., 1999; Ghoshal & Bartlett, 1988). Team
structures enact mechanisms of interaction, creating social capital driven by trust, a shared
76
vision, similar practices, shared identities, and epistemic cultures (Brown & Duguid, 1991, 2001;
Knorr-Cetina, 1999; Tsai & Ghoshal, 1998). These communities of practice (COPs), also viewed
as LIMs if oriented across dimensional lines or extended beyond the MOS, create technical
language, shared semantics, and help integrate knowledge into the organization through
knowledge sharing (Grant, 1996; Shaver, 2006). Teams are typically formally recognized, have
legitimate power, a sense of mission, have access to financial and human resource information,
have enhanced knowledge in the subject matter, and have substantial experience (Takeuchi &
Nonaka, 1996). Temporary team structures may have a subset of these resources. Teams may be
limited in size and construct and may exclude needed expertise (Grant, 1996) because it is on-
demand, or available as needed. This means that Furthermore, permanent team members may
not keep up with relevant information migrations if they are decoupled from their work areas.
They may also be caught in an embedded routinized culture, due to experience or other factors,
which may encourage rigidity and dampen needed innovation in a dynamic marketplace. The
roles of LIMs should therefore be considered as both temporary and dynamic.
Hedlund (1994) suggests with his N-form that temporary teams be drawn from pools that
experience these dynamics rather than be a permanent structure across dynamic pools. This
keeps the team synchronized with clients, product life-cycles, and the marketplace. Process
owners who are unwilling to share for the benefit of the common good would benefit from and
be encouraged by an incentive system that rewards the right behavior and an organization design
that encourages connectedness. Roth and O’Donnell (1996) found that an appropriate incentive
structure adapted to the situation, temporary or permanent, had a positive impact on information
sharing.
77
In summary, the transfer of knowledge across the organizational network must be
opportunistic and timely to be meaningful. Timely availability and consumption of meaningful
knowledge is critical for organizational agility, enabling the exploitation of growth synergies.
LIMs are designed to build bridges between business units and between dimensions in the MOS
while connecting the MOS to the corporate center for the purpose of mutual benefit. LIMs
promote organizational cultural attributes conducive to growth synergy realization. They span
boundaries that otherwise would contribute to organizational inertia and entropy. Furthermore,
they may be situationally adaptive, conceptually permanent, and dynamically temporary.
Designed Relationship with the Corporate Center
There is considerable research around the design of the corporate enter in MUFs (Collins
& Montgomery, 2005; Collis, Young, & Goold, 2007; Goold & Campbell, 1987, 1998, 2002;
Goold et al.,1994; Foss, 1997; Markides, 2002; Whittington, 2002). There is, however, little or
no information about how the corporate design can be optimized for the success of a MOS in a
multi-unit firm augmented by LIMs. Typically the corporate center is made up of hierarchies of
support function managers and staff outside of the operations oriented functions in a MUF
(Collis et al., 2007; Foss, 1997; Goold et al., 1994). When Eisenhardt and Martin (2000) refer to
dynamic capabilities they referred to the corporate process whereby MUFs align their
organizations through resource recombination or redeployment to realize synergies and corporate
value. Sustained corporate value is critical to growth synergies. The literature suggests four
corporate-level processes of resource recombination; cross-unit resource transfer, knowledge
sharing, coevolution, patching, and cross-business synergy initiatives. Cross-business knowledge
and resource transfer relates to the movement of resources across businesses within an existing
organization (Leibold, Probst, & Gibbert, 2002; Martin, 2002; Probst, Raub, & Romhardt,
78
(2000). Patching refers to the manipulation of the form of a business unit so that it can adapt to a
dynamic market (Eisenhardt & Brown, 1999). Coevolution refers to the manipulation of the links
between units to exploit synergy opportunities. Cross unit synergies refers to temporary
collaboration between business units to exploit growth opportunities. In this section, the scholar
will discuss these aspects of corporate design through the lens of organizational design.
Specifically, the concepts of the corporate ecosystem, corporate advantage and bias, and finally
the impact of merger and acquisition (M&A) theory on organizational design will be discussed.
The scholar will then review concepts around organizational design research, corporate center
strategy, organizational design within the businesses, and the role of diversifiers, structures, and
corporate parenting in the context of a MOS applied in a MUF for the purpose of synergistic
growth.
Corporate may be able to assist a business unit to formulate a vision, mission, and long-
term corporate strategy, including plans and budgets (Goold & Campbell, 1987). They may be
able to assist with a business model and identify other corporate value-adding opportunities
ensuring that they are then aligned with corporate strategy. Corporate may have access to trend
analysis and be aware of the impact of megatrends. They may also allocate capital for goal
realization and assign priority to these goals (Chandler, 1991). Corporate may be able to provide
for financial controls whereby various business units are encouraged to achieve financial targets
(Chandler, 1991). In the strategic planning mode, corporate may be able to help with the
development process and with performance monitoring from a structural perspective; however,
the dimensional leaders in a MOS typically know substantially more meaningful information
about local markets. Consequently, a shared purpose and cross-business collaboration must be
encouraged (Chandler, 1991; Hill et al., 1992). Corporate may be more sensitive to linkages
79
between businesses and encourage unforeseen opportunities for collaboration, thereby enabling
the realization of growth synergies across businesses. Essentially then, corporate governs an
ecosystem that may include temporary growth synergy discovery, incubation, innovation, and
realization through execution enablement. Corporate managers can also coach, nurture, and
transform their leadership structure to benefit from cross-unit collaboration (Wiessmeier et al.,
2012). While corporate managers create and maintain the business ecosystem, they also ideally
align the business portfolio, enforce strong financial controls, create a meaningful reward
system, and build a strong team of business unit leaders as a way to create value in the MUF.
If corporate capabilities are actually rare, valuable to the market, and difficult to imitate,
then they are synergistic and additive with regard to corporate advantage. The genesis of
competitive advantage is linked to the possession of innovations that improve performance, such
as management structures, processes, or practices. This is sometimes referred to as an operating
system (Birkinshaw, Hamel, & Mol, 2008). The sustainability of corporate advantage depends on
how difficult it is to imitate corporate management capabilities. Typically these capabilities are
exposed through systems, strategies, and structures. Additionally, the relationship between the
firm’s competitive advantage and the capability of the corporate center may be ambiguous.
Capabilities may be interconnected or hard to understand. Even if they are understood, they may
be difficult to imitate or implement due to the requirement to make associated and dependent
changes in the management system (Porter, 1996). Performance is reduced further when complex
systems are incompletely matured and implemented. This may influence risk during
implementation (Milgrom & Roberts, 1995; Rivkin, 2000). Furthermore, implementations
become more difficult when the links between biases, evolved routines, and interpersonal
relationships and the capabilities of the corporate center are socially complex (Nelson & Winter,
80
1982). Conversely, corporate management is effective when a business unit can benefit from
enhanced strategic agility, significant innovation capacity, performance continuous
improvement, and effective leadership efficacy all of which point to corporate value. There is
substantial evidence in literature for the existence of operative synergies with cost sub-additives
being the dominant theme (Markides & Williamson, 1994; Montgomery & Singh, 1984, Palepu,
1985); however, revenue super-additives in MUFs through the exploitation of operative
synergies are present in recent diversification oriented research (Farjoun, 1998; Tanriverdi &
Venkatraman, 2005). Competitive advantage based on interconnected assets that are difficult to
imitate is essential for growth synergy outcomes (Dierickx & Cool, 1989). The combination of
complementary resources rather than similar resources tends to be the basis for these synergies
(Tanriverdi & Venkatraman, 2005). The weakness of the literature in this area substantiates the
need for new research around growth synergy realization in multi-unit firms and further research
around the designed relationship between the corporate center and a multidimensional
organizational structure to facilitate consistent and continuous corporate advantage.
Critical to corporate design is the success of knowledge and resource transfer. According
to Zander and Kogut (1995) it is attributed to three factors; the characteristics of the transferred
knowledge, the sender-recipient relationship, and the organization setup, all of which are assets.
Zander and Kogut also found that, while the complexity of knowledge has a negative influence
on transfer speed, the observability of knowledge and the degree of codification has a positive
influence. As an example, subject matter experts (SMEs) function as LIMs by introducing
knowledge effectively. Similarly, Gupta and Govindarajan (2000) found that inflows of tacit
knowledge positively correlated with absorptive capacity. Tsai (2002) indicates that absorptive
capacity is critical to innovation and performance. Szulanski (1996) confirms that the lack of
81
absorptive capacity and causal ambiguity are barriers to knowledge transfer. Neilsen (2005) also
confirms that absorptive capacity and trust have a moderating effect on a knowledge exchange
system. Trust and mutual support between members relates directly to an organizational climate
that promotes synergy generation (Alchian & Demsetz, 1972; Ansari et al., 2006; Covey, 2006;
Tsai & Ghoshal, 1998). Furthermore, Cummings and Teng (2003) found that transfer success is
linked to lower knowledge embedding, knowledge distance, source-recipient norm gap, and the
increased ability to articulate the knowledge. Synergistic growth realization is dependent on the
free flow of valuable information across locations, products or services, client, and support
functions, as well as across corporate organizational lines. The corporate center is an enabler for
knowledge asset exploitation across business-unit participants in a MUF.
Business units in a dynamic market use patching to take advantage of shifting operative
synergies. This would include recombining, adding, splitting, transferring, or exiting all or parts
of a business unit (Eisenhardt & Brown, 1999). Patching is characterized by a sequence of
evolutionary changes that are optimally frequent based on absorptive capacity and optimally
minimized to ensure control (Galunic & Eisenhardt, 1996, 2001). According to Eisenhardt and
Brown (1999), patching companies have unique features including the view that frequent
restructuring is normal and that structure as temporary. Patched business units are optimally
constructed to be small enough to be nimble, but large enough to be efficient and responsive to
customers (Rose 1990). A fast patching process is enhanced by business designs that are
modular, discrete, focused, aligned, and somewhat autonomous. Typically there is a high level of
internal competition in companies that engage in patching (Eisenhardt & Brown, 1999). They
compete for the right to work-specific markets or customers. Resource movement is enhanced by
cross-business controls. For example, parity in compensation makes it easier to move employees
82
between businesses as it avoids wage normalization complications. Finally, timely patching plan
execution is informed by sophisticated reporting and business intelligence systems (Eisenhardt &
Brown, 1999).
Patching suggests that high-velocity environments in a MUF require frequent structural
changes, or recalibrations, in order to realize operative synergies. These changes are accelerated
by simple structures with high levels of competition, autonomous entrepreneurialism, and a loose
coupling that earns the right to serve a specific market (Birkinshaw & Lingblat, 2001). Corporate
managers are therefore encouraged to be supportive and keep organizational structures
competitive, nimble, modular, and simple. Additionally, the corporate structure needs to
constantly realign and recalibrate itself to market and emerging synergy-based opportunities,
through the execution of frequent and incremental evolutionary changes while minimizing its
cost burden on revenue producing business units.
While appealing, patching does suffer from several limitations as a synergistic growth
tool in dynamic markets. The concept of patching does not differentiate between growth and
efficiency synergies and so is theoretically immature (Eisenhardt & Brown, 1999). Patched
modular businesses may capture emerging market opportunities through shared production
(efficiency synergies) or through shared critical components to create integrated solutions
(growth synergies; Eisenhardt & Brown, 1999; Eisenhardt & Galunic, 2000; Martin &
Eisenhardt, 2001). While efficiency synergies are typically emphasized in the literature, growth
synergy opportunities are not. Additionally, patching appears to prefer corporate restructuring in
highly dynamic markets rather than the sustainable realization of cross-unit growth synergies in
moderately dynamic markets.
83
Coevolution is the process of manipulating the collaborative links, or a shifting web of
relationships, to take advantage of both operative and growth synergies among business units
(Eisenhardt & Galunic, 2000). Coevolution is a complex adaptive system that employs
successive changes among unique but interdependent entities. This is achieved through the
balance of tension between opportunity exploitation and organizational links that enable
adaptation. For example, a product manager may consolidate the products or services of several
business units to create a new unique product that improves competitive interdependence.
Coevolving leaders improve information flow so that business unit leaders can see opportunities,
they re-patch closely aligned businesses together into larger business segments, and they
rejuvenate ineffective businesses that are being avoided (Eisenhardt & Galunic, 2000). Over time
new linkages are created or terminated depending on demand. Fewer targeted connections and
decentralized intelligence negatively influences the agility of the network (Eisenhardt & Galunic,
2000).
Positive collaboration in coevolving business units may include joint product
development activities, the exchange of product knowledge, joint purchasing, and shared staff.
Business unit linkages change continuously in response to tension and efficiency requirements,
and to take advantage of market opportunities. Coevolving companies portray distinct features
such as business-unit driven collaboration and execution as well as the associated limited role of
the corporate center. In fact, corporate strategy is in the hands of the business unit managers with
managerial incentives focused on business unit performance rather than corporate performance.
Managers in coevolving business units value business systems, frequent data focused workout
sessions, defined boundaries and roles, shared intuition, exogenous metrics about market
shifting, and reward systems that favor self-interest through collaboration (Eisenhardt & Galunic,
84
2000). In this context competition between business units is seen as a driver for innovation such
as, for example, alternative technologies, business models, distribution channels, and the time
and cost it would take for competitors to develop or acquire similar capabilities across related
products and services (Martin & Eisenhardt, 2001). The scholar suggests that growth synergies
are realized when opportunities are identified, when there is a portfolio of prioritized tasks to
pursue, and when the associated changes are implemented. These three areas are categorized into
four parallel paths with dependencies which include decentralization, financial controls,
integrative mechanisms, and reward systems. Capability is increased with embedded knowledge
in an organization and an effective common organizational design enables its transfer while
inhibiting competitor imitation (Mahoney & Pandian, 1992; Markides & Williamson, 1996;
Peteraf, 1993). Size matters as business units need to be small enough to adapt, but big enough to
combat intense competition and manage capacity demands through economies of scope (scaling)
and rapid-learning (knowledge acquisition; Grant, et. al., 2002; Schulz, 2001). In moderately
dynamic markets, well-functioning business systems are needed to support frequent decision
making sessions that are data-driven. This also suggests that the decision to form cross-unit
linkages should be decentralized to the business units and that collaboration should be guided by
informed self-interest (Eisenhardt & Galunic, 2000). Business level incentives then drive
efficient synergy realization. Coevolution as a meta-concept is also theoretically immature and is
too abstract to be consistently meaningful in realizing growth synergies, and so must be
situationally applied.
Martin (2002) refers to cross-unit synergies in dynamic markets as temporary
collaborations that capture corporate value. He also found that cross-unit synergies with the
highest value tend to come from the business units themselves rather than from the corporate
85
center. These initiatives do not necessarily rely on corporate planning but rather are based on
local experimentation. They may also include substantial involvement between business unit
heads and may be driven by decision making between teams. The agreement on the
implementation typically will involve a significant amount of intense debate resulting in a high
level of agreement. Martin (2002) suggests that high-performing cross-business synergy
initiatives may include substantial realignment or the redeployment of resources, modularity
through the use of a dedicated team, and loose coupling through the use of a few simple
coordination mechanisms to handle interdependencies with external entities. Martin (2002) also
recommends that the corporate center have a very small part in synergy realization. Instead, they
should be more focused on developing the team of business unit managers that are able to
promote, and engage in, a suitable multi-business unit decision-making process. The business
units would be better served if corporate managers would deploy similar, but relevant,
management systems and value-added human resource best practices across business units.
Additionally, they could establish and support the formation of collaborative and effective
organizational designs. These designs would need to have an optimal level of centralization,
corporate-level incentives, non-financial controls, and support the deployment of lateral
integrative mechanisms. They would need to avoid over-involvement and synergy biases. A
weakness of Martin’s study is that he focuses on temporary, rather than consistent, sustainable
collaboration (Martin, 2002). Furthermore, he does not differentiate between efficiency and
growth synergies, inferring that his recommendations are marginal with regard to growth
synergy realization (Martin, 2002). For example, he states that business units come up with
product or service solutions but discounts the collaborative involvement of customers in the
decision making process. Additionally, he does not address organizational arrangements for
86
synergy realization such as incentives, controls, culture, and integrative mechanisms (Martin,
2002).
While the role of the corporate center in synergy realization is relevant to the discussion,
a negative effect could come from synergy bias. This occurs when the corporate center
underestimates the effort of implementation or overestimates potential synergies. This tendency
may be enhanced in a desperate or emotionally-charged environment. Four synergy biases were
identified by Goold and Campbell (1998) including; (a) wishful thinking (synergy bias) for
purposes of self-promotion, (b) assumptions of involvement need (parenting bias) resulting in
reluctant collaboration regardless of opportunity, (c) the assumption that corporate has the skills
to intervene effectively (skill bias) even though they are not aware of local markets, and finally
(d) a perception of opportunity (upside bias) that is emotional rather than rational, thereby
overlooking negative side effects such as strategic thinking ambiguity at the business level,
unaligned incentive systems, employee dissatisfaction, and reduced agility. These biases lead to
overestimates of the benefits of collaboration and underestimates of the costs to achieve the
opportunity (Eisenhardt & Galunic, 2000). Furthermore, if corporate leaders take the lead in
discovery and synergy realization activities they often do not understand the nuances of the
business unit. Conversely, junior managers may lack an overall strategic perspective.
Consequently, Goold and Campbell (1998) suggest that when clear parenting opportunities are
discovered, it is the role of corporate to intervene selectively and analyze operative synergies
carefully. These opportunities may include the following; businesses typically do not have the
overview advantage that corporate has (perception opportunities), businesses may not accurately
calculate the benefits and costs of the synergy (evaluation opportunities), unsuitable
measurement or interpersonal relations (motivation opportunities), and a lack of resources or
87
skills to implement synergy opportunities (implementation opportunity). It may be possible to
conclude then that the successful economic exploitation of operative synergies may be dependent
on the corporate center’s ability to identify and appropriately act on parenting opportunities.
M&A potentially relates to the realization of growth synergies; however, it is outside the
scope of this dissertation and the context is different. Nonetheless, there are lessons in M&A
literature, which is plentiful, that are somewhat transferrable. For example, research on M&A
has explored the effectiveness of various organizational constructs, including the corporate
center-business unit relationship on post-acquisition performance or related acquisitions, as they
derive their value from operative synergies (Datta, 1991; Kinnunen, 2010). These studies also
reveal information on growth synergy realization. This research has also described the
relationship between post-acquisition performance and top management style similarity (Buono
& Bowditch, 1989; Chatterjee, Lubatkin, Schweiger, & Weber, 1992; Datta, 1991; Diven, 1984;
Marks, 1982; Walter, 1985). The emphasis on structure and authority, the decision-making
approach, control preferences, communication patterns, and the attitude towards risk taking are
management style factors (Khandwalla, 1977; Datta, 1991). Larsson and Finkelstein (1999)
discovered that similarity between management styles and human resource practices influence
operative synergy desirable outcomes. Furthermore, the post-merger performance between
merging firms is substantially impacted by the compatibility between core values and cultures
(Buono & Bowditch, 1989; Cartwright & Cooper, 1992; Chatterjee et al., 1992; Forstmann,
1998; Greenwood, Hinings, Brown, 1994; Nahavandi & Malokzadeh, 1988; Sales & Mirvis,
1984; Walter, 1985). Conversely, Vermeulen and Berkema (2001) found the negative influence
that cultural diversity and distance have on realizing benefits from acquisitions. This was also
confirmed in other earlier studies (Buono & Bowditch, 1989; Sales & Mirvis, 1984; Walter,
88
1985). An appropriate level of coordination and interaction between merging organizations is
also required for desirable outcomes, according to other studies (Buono & Bowditch, 1989;
Chatterjee et al., 1992; Datta, 1991; Haspeslagh & Jemison, 1991; Marks, 1982; Walter, 1985).
Literature on M&A also suggests that organizational design may influence outcomes.
Some of these ideas are applicable to a MUF that is aggressively pursuing growth synergy
through organizational or functional integrations. The default organizational design is the M-
form as conceptualized in Chandler’s (1962) work. This has been validated by various studies
(Armour & Teece, 1978). Regardless of their diversification strategy, most diversified firms have
adopted this form (Fligstein, 2001; Pedersen & Thomsen, 1997; Villalonga, 2004); however, this
may be exemplified in unique arrangements with important design nuances (Allen, 1978; Hill &
Hoskisson, 1987). According to Wrigley (1970) there are differences that are structural between
unrelated and related diversifiers. For example, Rumelt (1974) shows that while a high level of
autonomy is given to unrelated diversifiers, highly-related diversifiers typically have centralized
decision-making structures. These ideas are further explained by Hill et al. (1992) who suggest
that performance levels are higher when the fit between control systems, organizational structure,
and diversification strategy is high. These principles are generally applicable to M&A
integrations and MUF efforts to realize growth synergies.
Organization design research may provide some insights into the realization of
operational synergies, as it assumes that diversification and performance are influenced by
organizational design arrangements (Hill, 1994). As exploited operative synergies result in above
average economic performance of related diversifiers (Palich et al., 2000; Rumelt, 1974;
Wrigley, 1970), organizational designs that moderate this relationship should be designs that
contribute to the realization of operative synergies. How corporate managers of MUFs shape and
89
guide decisions across businesses is partially explained by organizational research (Bower,
1970), which explores elements such as organizational culture and structure, control systems,
human resource management, and strategic planning (Collins & Montgomery, 2005).
Corporate may be able to provide advice on leadership style, management systems, and
structure. Leadership style may include the selection, training, and retention of key talent
(Collins & Montgomery, 2005; Markides, 2002, Markides & Williamson, 1994, 1996;
Whittington, 2002). It may include the provision of succession planning and the appointment of
key business leaders from external sources or internal leadership pools. Corporate may establish
performance enhancing values and cultural norms. Leadership style needs to be aligned with
corporate strategy. They may also provide direction for change management when it is enacted.
Corporate may be helpful in providing management systems for strategic planning, financial
planning, corporate controls, reward systems, and innovation cycle management (Markides,
2002; Markides & Williamson, 1996); however, management systems should be aligned with
corporate and business strategy. Lastly, corporate can provide assistance with regard to the
overall structure of the MUF (Galunic & Eisenhardt, 2001; Hill & Hosskisson, 1994).
Scholars suggest that the status of diversifiers drives organizational strategy. If the
diversifiers are unrelated, for example, research recommends the implementation of competitive
organizational arrangements. If the diversifiers are related, the organization should implement
organizational arrangements that stress cooperation between businesses to improve performance
(Amit & Livnat, 1988; Argyres, 1996; Bettis, 1981; Davis & Thomas, 1993; Hill et al., 1992; Li
& Greenwood, 2004; Simmonds, 1990; Wrigley, 1970). MediaEnterprises is a related diversifier,
as it provides products and services that leverage similar infrastructure components and have
similar workflow steps. A cooperative arrangement may be characterized by greater reliance on
90
subjective non-financial controls (e.g. the ability to innovate and the degree to which
independent divisions cooperate), objective non-financial controls (e.g. labor productivity,
capacity utilization, market share, and growth), greater centralization if it is beneficial, the use of
integrative mechanisms, and group level incentives (Hill et al., 1992). Additionally, St. John and
Harrison (1999) found that cooperative administrative mechanisms such as joint planning
processes, task forces, and corporate-level incentives help MUFs perform with higher efficiency,
thereby adding value to the corporate center.
Raynor (2000a) suggests that M-form structures differ in three dimensions including (a)
the extent to which a division contains the functional ability to execute its market strategies, (b)
the extent to which divisions deal with each other through interdivisional relationships like cross-
divisional networks, secondary work structures (Goold & Campbell, 2003), and corporate
managers, and lastly, (c) the extent to which divisional decision-making autonomy is in place on
strategic and operational issues. Reciprocal interdependencies between divisions require resource
sharing. This leads to the realization of benefits from related diversification (Thompson, 1967).
The M-form has been criticized following a focus on the added value of the corporate
parent to its business units (Goold & Campbell, 1987; Porter, 1987). In the event that the
corporate parent adds to the ability of a business unit to create economic value such that the
value of the firm is greater than the value of its individual units (break-up value), then this
construct is appropriate (Fligstein, 1985). This, however, is typically not the case, and so
questions have been raised by scholars about more effective designs that exploit synergies across
business units. Goold and Campbell (1998) suggest that there are four parenting opportunities for
the corporate center including; (a) making businesses aware of synergy opportunities, (b) helping
businesses assess the value of synergy realization, (c) motivation opportunities including reward
91
systems and collaboration, and (d) providing resources and skills for strategy implementation.
Specifically, corporate can help with cross-unit structural designs. With a focus on resources, a
typical solution has been shared service centers. This is an example of a common resource
solution that exploits resources in production, delivery, and a variety of support functions
(Collins & Montgomery, 2005; Forsgren & Pedersen, 2000; Galunic & Eisenhardt, 2001).
Unfortunately, exploiting economies of scale or scope may at some point have diminishing
returns (Sirower & Harrigan, 1997). The M-form assumes that the firm’s customers only need to
deal with one business unit and that this business unit can effectively control all the resources
needed to serve its market. By contrast, the MOS reduces the independence of business units by
more effectively exploiting resources in a capacity that is network based.
In summary, the role of corporate in multidimensional organizations is critical to making
a MUF successful. Corporate added value lies in creating the conditions that make it possible for
the MUF to overcome mental barriers that are legacy in the M-form. Additionally, business unit
managers need to give up deeply engrained ideas about organization design (Drucker, 1992). The
interdependency of dimensional areas is ingrained in the MOS. Some of the related key elements
of a MOS are management information systems, planning processes, and reward schemes. The
systems and processes that support a MOS eliminate information asymmetries and allow
employees to collaborate and focus on creating economic value for clients. While the MOS is a
relatively novel application of organizational design, the structure brings efficiencies to the MUF
through a collaborative culture over a defined scope and with the aid of an optimized designed
relationship with corporate.
92
Leadership in a MOS
In this section the scholar will briefly discuss the inadequacy of the previously discussed
M-form organization, followed by the significance of roles in a MOS. The horizontal and vertical
roles are distinguished next, followed by leadership in corporate roles. The scholar believes, and
will provide evidence in Chapter 4, that the MOS is ideal for growth synergy exploitation. With
this in mind, leadership, a vast topic, is critical to profitability. Existing leadership is influenced
by the history of the organization. A transformational organizational design, such as the MOS,
has freed leaders from embedded paradigms to adopt behaviors and traits that result in profitable
endeavors.
In the typical M-form organization, top-level managers formulate strategy to set direction
and then manipulate resources to fulfill objectives. Mid-level managers then assume the role of
administrative controllers and are in the middle between control from above and implementation
of strategic tasks below (Bartlett & Ghoshal, 1997). The message of empowerment has spread
through organizations as they realize the limitations of this construct, especially in an
environment where behaviors and relationships have not changed. While MUF-type
organizations need top leaders, there is the tendency for them to drift into familiar and traditional
roles with the assumption that boundaries are still present and that all leaders are similar. A study
by Bartlett and Ghoshal (1997) showed that leaders within the complex, networked dimensions
of a MOS are different, unique, and environmentally situational. In fact, the transition to an
organization of empowerment must be enforced through a structure that anchors new behaviors
and relationships (Bartlett & Ghoshal, 1997). This is the intent of the MOS organizational
framework as it provides objective alignment around growth synergy realization, and as it
redefines roles and norms. For example, a norm that has been a cultural pillar at MediaCorp is
93
entrepreneurialism. Cultivating an existing norm is easier than embedding a new one. Leadership
behaviors and the organizational design liberate this embedded capability to enhance operating
profitability. The network in a MOS is exploited through LIMs that enhance communication
channels, increase the frequency of their use, and accelerate the value-based ethical decision-
making process that entrepreneurial leaders stand behind (Jayaraman & Min, 1993). The MOS
also allows for the system-wide exploitation of expertise on-demand. As this approach is holistic,
responsibility and innovation are brought to the coal-face encouraging participation and
inclusion in an evolutionary change process. This creates a strong relational link between the
employee and the organization (Joensson, 2008). Nested roles are homogenized through
decentralization and linkage in the framework. Any node in the network can influence another. It
is the responsibility of leaders to create or discover leaders that are tenacious and thrive in an
environment conducive to growth synergy realization (Bartlett & Ghoshal, 1997).
To experience growth synergy realization at MediaCorp, the leadership roles had to be
recalibrated at all levels. For example, the role of operating manager at a location had to become
optimally and aggressively entrepreneurial. The value-add of this role comes from driving
business performance, focusing on productivity, meaningful innovation, and growth in local
territories. This leader attracts talent and customers in local markets. They also assist and share
in the network. The value-add of this role came from bringing the large company advantage to
the local geographic unit. This is accomplished by dispersing knowledge, skills, and best
practices across units. The role of a senior-level manager had to become substantially supportive
through coaching and advocacy. Top-level managers had to become institutional leaders. The
value-add of this position comes from embedding a sense of direction and commitment. This
comes from challenging embedded assumptions, institutionalizing an appropriate set of norms,
94
and from setting an overarching ambitious purpose. Leaders liberate their people to pursue
entrepreneurial opportunities in a growth-oriented culture that fosters commitment along with a
strong emotional attachment to the organization. They are also connected to the purpose of the
organization (Phelps, Rogg, Downey, & Knight, 1994). This is enhanced by a belief and
acceptance of the organization’s goals and values, a willingness to exert effort on behalf of the
organization, and a strong desire to maintain membership in the organization (Mowday, Steers,
& Porter, 1979). As a result, other offers for employment are not attractive. Specific drivers of
commitment from today’s workers may include contract terms, emotional attachment to the
industry, entrepreneurial involvement, the nature of the work, job challenges, role clarity,
confirmed expectations, reward systems, skills training, and succession planning. Leaders
enable invested and committed stakeholders to exploit growth opportunities through advocacy
for resource fluidity and the enablement of timely execution (Doz & Kosonen, 2008). They must
see untapped potential in resources available to them while assisting with the coordination of
disparate but relevant sources of support. This support-based management is augmented by
applicable organizational development for operator-level entrepreneurs so that they (a) become a
critical source of support and guidance for front-line entrepreneurs; (b) link resources and
competencies; (c) assist with the development, documentation, and defense of plans; and (d)
resolve the many tensions and conflicts that are a part of realizing growth synergies (Bartlett &
Ghoshal, 1997).
Horizontal leaders represent the products (Prod #) and services (Serv #) dimension of the
MOS. They identify best practices, coordinate R&D, and apply performance management
through cross-unit linkages. They create and manage communication channels and decision
forums to capture differences of opinion and interests turning them into exploitable
95
opportunities. Where applicable they connect vertically between product and service workflows
to leverage infrastructure or other workflow-based resources as applicable. Concurrently, they
absorb demands in a capacity construct that is cross-geographic.
Leadership at a distance, a substantial aspect of this role, was originally identified by
Bogardus (1927); however, distance is not only physical, but social. The perception of distance
relates to interaction frequency, for example, but also can be measured by status, rank, authority,
social standing, and power (Antonakis & Atwater, 2002). Napier and Ferris (1993) describe
distance between leaders and those who are influenced, as psychological (demographic, power,
similarity, values), structural (physical, organizational), and functional (closeness, quality of
working relationship). Similarly, Howell and Hall-Merenda (1999) found that LMX (leader-
member exchange theory) positively affects follower performance but that distance is not a
dependency. Other scholars have also found that the supervisory relationship is not distance
related by rather more related to job satisfaction levels (Ramos-Sanchez et al., 2002) or
situationally dependent on goal commitment (Klein & Kim, 1998). Furthermore, physical
distance, or leadership in a distributed context, has been shown to influence the commitment
employees have to the organization (Podsakoff, MacKenzie, & Feller, 1993). Horizontal leaders,
therefore, have the unique challenge to keep location leaders from becoming overwhelmed by
demand, capability needs, ambiguity, complexity, cultural inconsistencies, conflicting
messaging, isolation, and potential conflicts. The networked horizontal organization allows
location leaders to focus on harvesting as much profit from local markets through shared
technology, information systems, and entrepreneurial tasks (Avolio & Kahai, 2003; Bartlett &
Ghoshal, 1997).
96
In the construct of the MOS, vertical leaders are geographic, or location based leaders
(L#). These leaders are charged with running the location facility efficiently, with the support of
the horizontal line of business (LOB) oriented leaders, while harvesting as much profit from
local markets as possible. They discover, create, and pursue growth opportunities. Employee
commitment to their employer was much stronger in the past. Now they are more mobile, they
can pursue their dreams, and they have to balance multiple dimensions in their own lives (Phelps
et al., 1994). Location leaders have to be able to attract skilled resources locally. They also
manage continuous performance improvement at their location. The attributes of vertical leaders
would include, but not be limited to, creative, intuitive, persuasive, engaging, competitive,
resilient, and persistent. They have detailed operating knowledge of the businesses’ competitive
capabilities as well as their customers’ expectations and needs. Vertical leaders focus their
energy on opportunities and are able to recognize potential, make commitments for delivery,
motivate local labor to meet expectations, and focus organizational energy around demanding
objectives (Bartlett & Ghoshal, 1997).
In the MOS, the diagonal leaders are designated as leaders within the support functions
(S#) from top left to bottom right and similarly within client relationship based functions from
right to left (C#). Support functions could include, but not be limited to, IT support, human
resources (HR), finance, R&D, system support, etc. Client relationships are allocated by client,
sector, or client cluster or sector assignment. These assignments are based on volume of work,
product type, leader tenure, complexity of the product, market trends, market saturation, and
other relevant factors. A client and support function line can meet on a node where a location
could experience a product that requires technical assistance for the product launch. While
97
diagonal leaders do not touch the product, they do make sure that the product comes into the
workflow and leaves it on time through the influence of their support.
Corporate leaders have historically been focused on strategy, structure, and systems
rather than purpose, process, and people (Bartlett & Ghoshal, 1997). The primary responsibility
of top corporate leaders is to make sure that organizations are working effectively together to
realize growth synergies (Doz & Kosonen, 2008). While management systems are critical to the
operation, they may isolate corporate leaders from the organization by encouraging them to think
of employees as factors of production rather than factors of growth critical to the rapid
deployment of strategic initiatives (Doz & Kosonen, 2008). Leaders in the MOS should be
thought of as agents of strategic agility (Doz & Kosonen, 2008). Top corporate leaders need to
be optimally in touch with MOS leaders so that they can focus MOS leaders on influencing
growth through a work environment that fosters entrepreneurial initiative and innovation, rather
than just monitoring collective inputs and compliant implementation. Respect for the individuals
and their ideas that can grow the organization profitably come through trust, support, and
listening while questioning and challenging mindsets. Influential entrepreneurs want change in
an environment that achieved equilibrium quickly and that is marked by sustainable economic
growth, and a positive impact on society (Bartlett & Ghoshal, 1997). They want a sense of
purpose and are proud, and motivated by belonging to an organization that is living out its
purpose through its top leadership (Bartlett & Ghoshal, 1997). Frequent communication
encourages participation which contributes to higher job satisfaction, lower levels of conflict,
while strengthening commitment (Cummings & Teng, 2003; Semmer et al., 2015). Top
corporate leaders create an entrepreneurial environment conducive to growth synergy realization
that is sensitive to market trends more through inspirational influence than positional authority
98
(Doz & Kosonen, 2008). Leadership roles in the MOS are critical to the success of the
organization. As this structure is somewhat novel, all leaders must be open minded, capable, and
flexible to enable growth synergy realization within this construct.
Contribution to Theory and Management Practice
The scholar intends to create insight into the attributes of the corporate effect, by
clarifying and deriving empirically strategic success factors for sustainable profitability
(Bowman & Helfat, 2001). This study also aims to contribute to theories of managerial practice,
organization, and strategy. Additionally, the study provides a topology of corporate resources
that may influence the achievement of sustained corporate advantage. The scholar attempts to
contribute to corporate strategy theory by exploring the value-producing effect of combining
complementary resources that are energized by growth opportunities. The role of a corporate
center that creates value by combining resources is further clarified (Hill, 1994; Markides, 2002;
Rumelt, Schendel, & Teece, 1994). The study will confirm the importance of similarities and
complementarities within and between resource pools (Davis & Thomas, 1993; Tanriverdi &
Venkatraman, 2005). Furthermore, this research will provide an empirical example of dynamic
capabilities through organization design. Finally, this research will provide insights into
corporate strategy oriented around interactions between business units. This contrasts with
literature that primarily discusses the creation of strategy between businesses and corporate or
within businesses (Burgelman, 1983a; Floyd & Woolridge, 2000).
Summary of Chapter 2
In this chapter the scholar presented an overview of key ideas covered in the dissertation
and the associated literature references, if any. While there is generally limited information about
the key themes discussed, there is little or no information available with regard to the
99
combination being studied; growth synergy realization in a MUF organized in a MOS augmented
by LIMs and a designed relationship with the corporate center. The tendency in the literature is
to discuss the strategy for growth through diversification. Insufficient consideration is given in
the literature to relatedness between units in a MUF and the relevancy of timing associated with
dynamic product life-cycles to sustained corporate advantage. Synergies were then discussed in
the context of growth opportunity exploitation in a chaotic environment. Behaviors in the MUF
are substantially influenced by organizational design. In this case, the MOS, along with LIMs,
provide the network management needed to realize growth synergies. Alignment around mega-
strategies helps with focus and self-interest management. Critical aspects of a collaborative
organization, such as coevolution, patching, resource redeployment, and knowledge flow aided
by an MIS that informs decision making, were discussed. Finally, leadership in the MOS and in
the corporate center was presented. These themes are uncommon or nonexistent in the literature
due to the unique combination that is being studied in this dissertation.
100
Chapter 3. Empirical Approach
The purpose of this study is to establish a perspective based on empirical research on
cross-business synergies that lead to growth in a multi-unit global business. This chapter begins
by providing an overview of the empirical approach. It goes on to discuss the research design
and its rationale. The chapter then reviews the methods from site selection and data collection to
data analysis that relate to answering the research questions that have been posed. The research
describes the data collection methods, identifies the subjects, describes the data collection tools,
and discusses the data analysis methods that will be used. Finally, the scholar describes steps
taken to ensure trustworthiness of the study, epoché, and ethical considerations.
By answering the research questions, the scholar intends to develop a theory of
continuous growth synergy realization in multi-unit firms (MUFs) with a multidimensional
organizational design (MOS) and therefore, to some extent, close a void in this area of inquiry.
The methodological basis determines which research approach the scholar uses to generate
insights (Guba, 1990; Guba & Lincoln, 1994; Lamnek, 1995; Morgan & Smircich, 1980). A
detailed view of the phenomenon will be employed to aid future research in this area. The
scholar is attempting to study the nature of the social world through a post-positivistic lens using
a phenomenological case study as the best fit for the research method. While the ontological
position of the scholar attempts to reveal the essence of reality (Guba & Lincoln, 1994), the
epistemological position understands the need for limits and validity by stating the assumptions
made, the knowledge basis, and how it is obtained (Guba & Lincoln, 1994; Hirschheim & Klein,
1992). The scholar’s positioning is post-positivistic because reality is assumed to exist, but is
only imperfectly comprehensible due to human cognitive limitations and because of the
fundamental complexity of natural phenomena (Guba & Lincoln, 1994).
101
Qualitative Research Design
To satisfy research questions and objectives, the research design reveals the concrete
steps and actions that the scholar will follow (Yin, 1994). The overall strategy for obtaining
sound scientific insights is the purpose of the research method. The scholar will use a qualitative
method to investigate growth synergies. The qualitative research method is guided by several
factors: (a) the nature of the research questions, (b) the exploratory nature of the study, (c) the
need for a detailed view of the phenomenon, and (d) a need to accommodate the study of
individuals in their natural setting (Creswell, 1998). A qualitative design is ideal when the
scholar does not know the range of variables to examine (Creswell, 1998, 2014; Miles & Snow,
1994). Creswell (1998) defines qualitative research as follows:
Qualitative research is an inquiry process of understanding based on distinct
methodological traditions of inquiry that explore a social or human problem. The scholar
builds a complex, holistic picture, analyzes words, reports detailed views of informants,
and conducts the study in a natural setting. (p. 15)
The nature of this study fits the scholar’s post-positivist assumptions about the nature of
reality that guides the creation of theory through an iterative process around collecting and
analyzing data (Denzin & Lincoln, 1994; Glaser & Strauss, 1967). Theory that is grounded in
data is inductively developed from that data. An active, data driven dialog, between theory and
practice leads to the exploration of practical relevant theories (Suddaby, 2006). Research theory
makes it clear that scholars have cognitive limitations; however, the goal of this study is to use
the data collected to derive general assumptions and principles (Strauss & Corbin, 1990, 1996).
Specifically, the scholar chose this research methodology because it enables the scholar to draw
out generalizations and build theory, discover patterns and frameworks, and deduce hypotheses

102
with regard to growth synergy realization. It is suited for the explorative generation of new
insights making theory around growth synergies more consistent with nature. It also helps gain
more practical insights through a data driven context rich analysis (Pettigrew, 1990; Siggelkow,
& Rivkin, 2006; Yin, 1994). Therefore, this post-positivistic stance is well suited as a guide for
this study. The practitioners that will be interviewed in the study are stakeholders, not just
suppliers of data, who are competent and invested in the outcome of growth synergy realization.
They are able to provide direct information needed for theory building that is generally unbiased.
Strauss and Corbin (1996) suggest that scholars may enter the scope of research with a-priori
theoretical assumptions or relationships. The scholar will follow this more moderate approach
and will not discard preliminary assumptions gleaned from the literature; however, these
assumptions are subject to consistency with new insights that emerge from the data. The scholar
is, therefore, sensitive to new insights and inspiration from the study (Eisenhardt, 1989;
Suddaby, 2006).
The scholar accepts that findings in this study may be temporarily valid because the
nature of discovery is continuous. Consequently, a post-positivistic perspective allows the
scholar to make generalizations to the existing theory and contribute to new theory while
recognizing the existence of limited mental models (Myers, 1997). Post-positivism best reflects
the beliefs of scholars with limited cognitive capability; however, the scholar believes that the
endless creation, validation, and refinement of theories enable continuous improvement in the
comprehension of reality.
Phenomenological research, founded by German philosopher Edmund Husserl, uses the
analysis of substantial statements made by data sources, or interviewees (Richards & Morse,
2013). This research method is an engaging mode of inquiry that, according to van Manen
103
(1990), documents an individual’s perceptions of presence in the world at the moment when
things, truths, or values are constituted. It also includes reflections on concepts of time, space,
body, and relations. People are connected to their world and phenomenological study aims to
create understanding around experiences about things, people, events, and situations (Richards &
Morse, 2013). Perceptions present us with evidence of this connection by focusing on sense-
making around lived experiences (Richards & Morse, 2013). Consequently, this study is
approached as a type of phenomenological case study based on the following: (a) the scholar’s
belief that an understanding of a phenomenon is best achieved through lived experience; (b) the
scholar’s desire to explore sense-making at a deeper level than has been presented to date; and
(c) the understanding that lived experience is irreducible as it cannot be reduced or derived from
the third-person perspective (Lutz & Thompson, 2003; Thompson, 2007; Varela & Shear, 1999a;
Varela, Thompson, Roach, 1993).
A phenomenological case study approach, following Lincoln and Guba’s (1985)
naturalistic inquiry, is used within an organizational setting to bound the study, by time and
location, and to move forward a “naturalistic basis for generalization” (p. 120). Yin (1981A,
1994) suggests that case studies are used for exploratory purposes when how or why questions
are posed, when the scholar does not have complete control over events, and when the focus of
research is on a “contemporary phenomenon within some real-life context” (Yin, 1994, p. 1).
Merriam (2001) posits that a case study approach can be selected as a means to reveal knowledge
about a phenomenon that may be missed by standard statistical approaches, that may occur
infrequently, and that is nonobvious or counterintuitive. The study is framed by an organizational
event (bracketing) that the participants in the case study were all exposed to at the same time,

104
including the scholar. By bracketing reality, the true meaning of the phenomenon under study
can be pursued.
Phenomenology can be broadly thought of as “providing a disciplined characterization of
the phenomenal invariants of lived experience in all of its multifarious forms” (Lutz &
Thompson, 2003, p. 32). Phenomenal invariants are categorical features of experience that are
describable across and within the lived experience (Lutz & Thompson, 2003). Disciplined
characterization is a phenomenological mapping of experience that uses first-person methods for
increasing an individual’s sensitivity to his or her own lived experience (Depraz, Varela, &
Vermersch, 2003; Lutz & Thompson, 2003, Varela & Sheer, 1999a, 1999b). Moustakas (1994)
characterizes phenomenology as the first method of knowledge because it begins with things
themselves. This event was used as a precipitating event that perturbed or punctuated the
experience of the participants and, thus, created conditions for sense-making processes to
emerge. The precipitating event formed the basis of the phenomenological interview phase of the
study.
All research is driven by certain methodological assumptions that have their origins in the
philosophical underpinnings of a research approach. In the case of qualitative research, these
basic assumptions are related to the nature of reality; the relationship of the scholar to what is
being researched, the role of values in the study, and the process of research (Creswell, 1998,
2014). According to Strasser (1969), Lincoln and Guba (1985), and Creswell (1998, 2014), the
assumptions that guide qualitative research are that (a) reality is subjective and multiple; (a)
systematic procedures recognize both co-construction of reality and the scholar as the instrument
of data collection; (c) the inquiry is oriented to inductive and generative analysis; and, most
importantly, (d) evaluative procedures are used to judge the value of the research. While many

105
scholars of methodology contrast the naturalistic assumptions (qualitative) with conventional or
positive assumptions (quantitative), Creswell (2014) did not believe this was necessary, as
“qualitative research is legitimate in its own right and does not need to be compared to achieve
respectability” (pp. 75-76). While qualitative research has its own set of assumptions, so a set of
assumptions guides how phenomenological research should be conducted. Moustakas (1994)
offers specific guidelines for phenomenological research:
1. Phenomenology focuses on the appearance of things, a return to things just as they are
given, removed from everyday routines and biases, from what we are told is true in
nature;
2. Phenomenology is concerned with wholeness, with examining entities from many sides,
angles, and perspectives until a unified vision of the essences of a phenomenon or
experience is achieved;
3. Phenomenology seeks meanings from appearances and arrives at essences through
intuition and reflection on conscious acts of experience, leading to ideas, concepts,
judgments, and understanding;
4. Phenomenology is committed to descriptions of experience, not explanations or analysis.
Descriptions that retain, as close as possible, the original texture of things, their
phenomenal qualities and material properties;
5. Phenomenology is rooted in questions that give a direction and focus to meaning, and in
themes that sustain an inquiry, awaken further interest and concern, and account for our
passionate involvement with whatever is being experienced;
6. Subject and object are integrated – what I see is interwoven with how I see it, with whom
I see it, and with who I am;

106
7. Intersubjective reality is part of the phenomenological process;
8. The data of experience, my own thinking, intuiting, reflecting, and judging are regarded
as primary evidence of scientific investigation;
9. The research question must be carefully constructed in order that the primary words
appear immediately, capture my attention, and guide and direct me in the
phenomenological process of seeing, reflecting, and knowing. (pp. 58-59)
A phenomenological approach is well suited to this study, as the research design engaged the
interpretation that emerged from participants’ observations of their experiences of awareness
within their own sense-making process.
Moustakas (1994) refers to these observations as essence descriptions. They are helpful
in sense-making, as they are the lived experiences described by participants (Giorgi, 2009;
Moustakas, 1994), or stakeholders in this case. They are grounded in reality, as they are
reflections on actual field data (Creswell, 2014). This study is consistent with the
phenomenological perspective of Allard-Poesi (2005) and Petitmengin (2006), which is as
follows: (a) the study of sense-making is an active and subjective sense-making process in itself,
(b) participative action research is a means to fully engage in sense-making with others (vs. on or
against others), (c) in order to study cognition it is essential to take into account its subjective
dimension as it is lived from the inside (Varela et al., 1993), and (d) an interview method is
necessary that enables an individual to become aware of his or her subjective experience and
describe it with great precision. The interpretive nature of sense-making is such that it places the
scholar in the role of making sense of the associated phenomena (Allard-Poesi, 2005 ;Weick,
1995). Phenomenology, a first-person-oriented research method (Moustakas, 1994), is the most
likely methodological lens through which to study the role of individual awareness in sense-
107
making. Phenomenology is the reflective study of the essence of consciousness as experienced
from the first-person point of view (Moustakas, 1994). The scholar was deeply immersed in the
activities in MediaCorp, so that the essential features could be extracted from it “to obtain a
picture of the experience” (Creswell, 1998, p. 52). Van Manen (1990) differentiates
phenomenological study from other types of study by explaining that it uniquely tries to gain
insight into the description of the way the world is experienced. This experience will be captured
from participants who are also stakeholders. To gain insight into the descriptions of their
experiences, the scholar will capture idiomatic phrases, obtain experiential descriptions, and will
observe and reflect further as needed. Expressions believed to be irrelevant will be removed.
Groups of expressions that seem to be related to a core of common elements will be clustered
and labeled. As the scholar has experienced many large-scale change experiences, he is already
at a starting point for interpreting and making sense of the participants’ attempts to interpret their
world and so is in an optimal position to enhance completion and clarity through follow-up
questioning and interpretation.
The research process is structured to be goal-oriented, purposeful, and systematic. The
complexity and dynamic nature of the investigated phenomenon, however, will make it
impossible to be inflexible during the course of the research process. The research process is
therefore iterative and agile. The research questions, methods, and field study method coevolve.
This approach is described by Pettigrew (1990) as planned opportunism and is prevalent in
qualitative studies that cover complex phenomena. Following Eisenhardt’s (1989, Eisenhardt &
Graebner, 2007) suggestions, the scholar will enact a process for building theory from a case
study. In addition, to ensure both agility and the openness required by qualitative research, the
108
scholar will iteratively cycle between data collection and analysis (Strauss & Corbin, 1996). To
illustrate, the research will consist of both an exploratory phase and a deep dive phase.
The objective of the exploratory phase will be to establish the scope of the field of study
and then provide an initial explanation for the phenomenon. As cross-business synergies have
been identified as a valuable area for investigation, the guided empirical work will be executed to
assess the potential for the realization of the expected value of synergy realization. The scholar
will harvest qualitative data from participants’ experiences through an interview protocol and
leverage preexisting data used to drive the organizational transformation. While preexisting data
is being reviewed and the first exploratory investigations are being executed, the scholar will
deepen his understanding of the academic literature on the subject. This will be accomplished by
screening strategic, financial, and economic literature that relate to MUF management.
The preexisting research provided sufficient information on cross-business growth
synergies such that the scholar believed that a dissertation on the topic could make a theoretical
and practical contribution. An academic literature review suggested, in a limited way, that an
increasing number of MUFs are starting to make strategic decisions in this area; however, these
actions are neither described nor explained sufficiently as the frequency of occurrence is very
small. The scholar had confidence in the topic but it is too broad and unstructured. Consequently,
it was decided to add an element related to a more modern organizational design as a coherent
organizational topology that required collaboration, another critical emerging trend. This unique
application of collaboration would lead intrinsically to more focused and rapid discovery due to
the vested interest of participants. The opportunity in these growth synergies would then be
exploited through collaborative activities. This informed the first research question which
109
explores how MUFs can realize corporate value through different types of cross-business unit
synergies.
As discussed, the four types of cross-business synergies are general management
synergies, market power synergies, financial synergies, and operative synergies. By exploring
these prior to formal data collection the scholar will be able to focus the investigation. With this
structure in mind, the scholar will also be able to review in detail initial explorative data that
includes structured meetings, preexisting data, and economic literature. This made it clear that
while MediaCorp managers were more interested in entrepreneurial growth through synergistic
collaboration, the literature was more interested in cost reduction through synergies driven by
economies of scope. This attitude was also pervasive at corporate. Additionally, theory did not
provide insights regarding this phenomenon even though practitioners were seeking advice. As a
result, and to enhance the existing body of knowledge, the scholar, following research on
operative synergies in the literature and for further investigation, will use the discoveries from
the initial research of preexisting data and related literature to support a general research question
relating to growth synergies. The five subsequent research sub-questions followed.
The managers at MediaCorp are fundamentally entrepreneurial and are wired for growth.
They were motivated to further investigate sustainable growth synergy opportunities at
MediaCorp. The objective of the second phase of the research is to do a deep-dive to determine
how MUFs can continuously realize growth strategies. The case company, MediaCorp, will be
studied for growth synergy realization through an iterative process. Data in this phase will be
collected and analyzed for the purpose of deriving constructs and hypothesis.
The scholar has chosen the case study research approach as a method of investigation.
This selection is necessary because of the limited information available on growth synergy
110
realization in a multi-unit, multidimensional organizational design. Miles and Huberman (1994)
describe a case study as a phenomenon that occurs in a bounded context. This case study is
situated in the context of a real-world practice, occurring in the moment, in an organizational
setting (Bamberger, 2008). When exploring complex phenomena where immature theoretical
insights exist, case studies are an established research approach (Brown & Eisenhardt, 1997;
Ghoshal & Bartlett, 1994; Lovas & Ghoshal, 2000). The methodology accounts for the holistic
role of the scholar as both participant and observer within the study (Miles & Huberman, 1994;
Moustakas, 1994, Petitmengin, 2006). The scholar is challenged to recognize the complexity and
context of this case study while exploring the phenomena holistically (Eisenhardt, 1989; Punch,
1998; Siggelkow, 2007; Yin, 1981, 1994). While quantitative studies expand and generalize
theories through analytical and statistical generalization (Yin, 1994), the phenomenological case
study approach is more inductive and explorative in character. Following Maturana (1978),
Strasser (1969), and Varela et al. (1993), the study employs a constitutive ontology, wherein
constitution is the process of providing an ever clearer meaning (Strasser, 1969). Maturana’s
(1978; Maturana & Varela, 1987) constitutive biological perspective holds that living systems
cannot refer to an external, independent reality. This unique perspective reflects an epistemology
in which individuals pull in reality. They do not construct it, nor does it exist independently of
them. Thus, it is possible to extrapolate from Maturana’s (1975, 1978; Maturana & Varela, 1987)
constitutive perspective that sense-making occurs in individuals moment-to-moment, either as a
change triggered by interactions or perturbations coming from the environment and/or through
an individual’s own internal processes. The individual level of analysis is also consistent with the
epistemological and ontological perspectives of this case study.
111
When developing theories that are close to managerial practice, case study research is
recommended (Merton, 1968). In this case the external triggers were related to environmental
dynamics that included growth stagnation, product-requirements shifting, and financial pressures
due to assumptions made in the budget that occurred during the previous year. Organizational
outcome enablers included the MOS design, appropriate norms, alignment through the 1MC
initiative, and an organization-wide ERP system. The external pressure and organizational
enablers forced the organization to implement sector-based sales initiatives, a variety of sales
strategies, and prioritize the portfolio of clients based on value to the MUF. These tasks led to
the preexisting data used for the transformation and the realization of growth synergies as
illustrated in Figure 13. Desirable results were obtained with the combined influence of the
organizational design, selective focus, alignment, and systems influenced by environmental
dynamics. These dynamics include growth stagnation, product requirements, and financial
pressures. The MOS was able to achieve desired results by exploiting synergistic neighboring
sectors, exploiting the existing addressable market with current clients, and enabling market
penetrators to achieve growth.
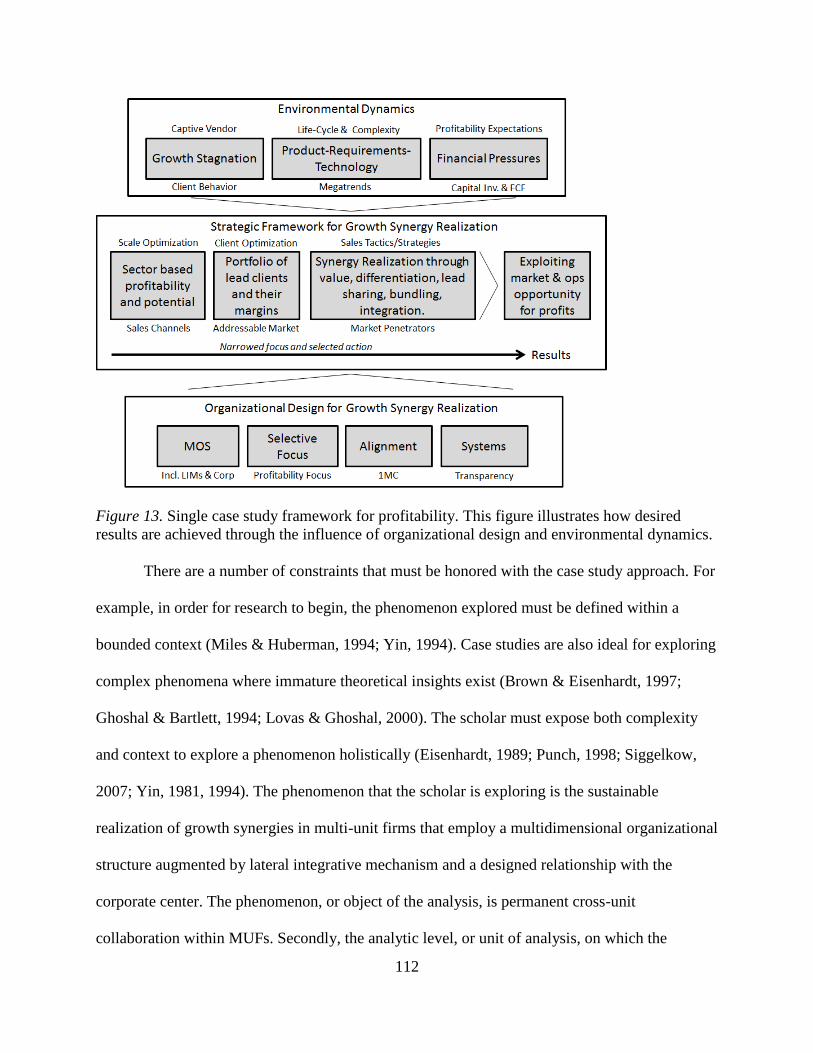
112
Figure 13. Single case study framework for profitability. This figure illustrates how desired
results are achieved through the influence of organizational design and environmental dynamics.
There are a number of constraints that must be honored with the case study approach. For
example, in order for research to begin, the phenomenon explored must be defined within a
bounded context (Miles & Huberman, 1994; Yin, 1994). Case studies are also ideal for exploring
complex phenomena where immature theoretical insights exist (Brown & Eisenhardt, 1997;
Ghoshal & Bartlett, 1994; Lovas & Ghoshal, 2000). The scholar must expose both complexity
and context to explore a phenomenon holistically (Eisenhardt, 1989; Punch, 1998; Siggelkow,
2007; Yin, 1981, 1994). The phenomenon that the scholar is exploring is the sustainable
realization of growth synergies in multi-unit firms that employ a multidimensional organizational
structure augmented by lateral integrative mechanism and a designed relationship with the
corporate center. The phenomenon, or object of the analysis, is permanent cross-unit
collaboration within MUFs. Secondly, the analytic level, or unit of analysis, on which the
113
phenomenon is explored must be clarified to avoid a boil the ocean scenario (Yin, 1994). The
scholars unit of analysis is the strategy and the organizational design that leads to sustainable
desired outcomes. This exploration is done on multiple levels including the business level,
corporate level, and a level that includes secondary constructs, or LIMs. This enables a
dependable process for inductive theory building (Yin, 1981, 1994).
The focus of this phenomenological study is on the perceptions and meanings constituted
by the scholar. Therefore, it is necessary to conduct the study in a naturalistic setting (Lincoln &
Guba, 1985), or in situ. The number of cases within the study scope and the duration of the event
being studied had to be established. In this study the case is singular, a central site is used for the
precipitating event, and the duration of the transition was over a 10-month period. Single case
studies create focus and are preferable for uncovering complex and unexplored phenomena
(Siggelkow, 2007; Stake, 1994; Yin, 1994). A single case study also allows for a holistic and
focused investigation within the area of interest (Yin, 1994). The study will leverage preexisting
transformation based data and data from in-depth phenomenological interviews over a 90-day
period as previously described. By contrast, multiple cases within a study would have required
theoretical replication to provide more generalizable findings (Yin, 1994). For this study, a single
case study approach will be taken using a medium-sized multi-disciplined global conglomerate.
The participants were involved in sense-making while finding and creating structure in a
complex evolving situation (Weick, 1995). The scholar will investigate the unit of analysis
(strategy and organization design) for the object of the analysis (permanent cross-business
collaboration) that led to the outcome of the analysis (sustainable realization of growth
synergies) at a MUF in a moderately dynamic market.
114
The reasoning behind the approach is fourfold. First, a single case study approach is
appropriate for the investigation of a complex phenomenon (Siggelkow, 2007; Stake, 1994; Yin,
1994). The sustainable realization of growth synergies based on complementary resources
(Tanriverdi & Venkatraman, 2005) requires organizational designs that are complex (Stieglitz &
Heine, 2007). When there is a multi-level organizational design, a holistic study is called for,
especially if the scholar has to explore the related phenomenon in its full complexity, in depth,
over time (Pettigrew, 1990, 1997; Siggelkow, 2007; Yin, 1994). Secondly, a single case study
approach in a MUF with a multidimensional structure is relevant in this case, as prior research
has not investigated growth synergy-based profitability in this context. As a result, there is no
theory to guide the investigation. Without guidance the exploration of multiple cases could result
in superficial and meaningless results due to the effort required and the availability of resources
(Yin, 1994). Furthermore, Yin (1994) suggests that a single case approach is relevant in a critical
case scenario. Thirdly, a single case approach is suitable when there is the need for rich
descriptions. The activity of leaders in various aspects of this organizational construct and their
specific outcomes supply valuable situational context and organizational design knowledge to
this highly abstract research area. These descriptions through the comprehensibility and utility of
this research is then significantly increased (Siggelkow, 2007; Weick, 2007). Lastly, this is a
unique research opportunity. The opportunity to do a holistic investigation of the transition to a
sustainable realization of growth synergies within a MUF, organized as a MOS, is a unique
situation. The ability to observe and analyze a phenomenon that has been inaccessible to
previous scientific investigation on its own, justifies this approach (Siggelkow, 2007; Yin, 1994).
Furthermore, the single case study approach chosen by the scholar fits with the post-positivistic
position because of its inductive and explorative attributes.
115
Punch (1998) indicates that the specification of the research question is an important part
of the research design because it focuses the research and so reduces complexity. The data can
become overwhelming without a focus (Eisenhardt, 1989; Yin, 1994). Punch (1998) also
suggests that a research question can be derived deductively from existing research before the
actual study or it can be generated inductively during the empirical study. The scholar decided to
follow an approach that combines these strategies. The specification of the research questions is
through an iterative process that cycled between deduction from the literature, the review of
preexisting data, and induction from the empirical study.
A preliminary overall research question (ORQ) was derived from the literature review:
ORQ: How can a multi-unit firm realize cross-unit growth synergies? Some exploratory research
indicated that while the topic is relevant it is too broad. Operative synergies were present in the
literature however growth synergies by leveraging complementarities were not. Five more
specific and meaningful research questions were then determined. A more focused review of the
literature suggested that there is a need for a contribution to theory as it relates to these five areas
in the context of this case study, hence the additional sub-questions:
RQ1: What types of growth synergies, if any, can a multi-unit business,
multidimensional organizational structure realize?
RQ2: How do multi-unit firms with a multidimensional organizational structure
continuously realize the benefits of growth synergies?
RQ3: What is the role, if any, of the corporate center in the context of this case
study?
RQ4: How can lateral integrative mechanisms influence, if at all, growth
synergies in a MOS?
116
RQ5: To what extent, if any, does a one-ness strategy align a MUF to influence
growth synergy?
Case Study Selection
The selection of an adequate case is one of the most important aspects of case study
design. The scholar chose MediaCorp, a globally diversified firm with a number of businesses
oriented in a global supply chain. These businesses also connect with businesses external to the
division in the form of inputs and outputs. The case selection was influenced by the scholar’s
ability to obtain observations and derive insights into the sustainable realization of growth
synergies in MUFs. This manifested itself in four ways: (a) a dedicated focus on the sustainable
realization of growth synergies, (b) the ability to measure success, (c) moderate environmental
dynamism, and (d) accessibility. MediaCorp already had a strong cultural component that is
entrepreneurial. Consequently, there is already an embedded desire for growth synergy
realization. The company is dedicated to growth synergies as a critical and immediate strategy.
MediaCorp is also advanced in its desire to attempt novel means to achieve their goals. This
included organization design, redesign, rapid evolution, and recalibration against new objectives.
A high tolerance for action enabled the change needed to achieve the deployment of the MOS.
This further enabled the observation of its impact. Furthermore, there were some early successes
that could be exploited. As the investigation continued it became more evident that MediaCorp
had achieved significant market share in most of its moderately dynamic markets. The ability to
gain holistic access at all levels of the firm, including corporate strategy and the ability to change
the organization design, made this research opportunity compelling.
The single case study of MediaCorp (MC) will include experiential observations based on
a transition that happened over a period of time (1/24/2014 – 10/30/2014); as illustrated in Figure
117
14. The transition began shortly after the company announced its intentions to be a single
supplier of end-to-end products and services. This is an emerging market trend with mutual
benefits and challenges between vendor and client. This initiative had a purpose to align the firm
for the sustainable realization of growth synergies. Ongoing observations of the organization
during this alignment allowed the scholar to identify components of strategy and organization
design (units of analysis) that relate to permanent cross-business collaboration (object of
analysis). The scholar would then be able to assess whether strategies and designs would be
successful by measuring profitable cross-business growth at multiple points in time. These
measurements primarily were based on objective performance data such as the increase in cross-
business growth and profit, the increase in the number of cross-business projects, and the
profitability of cross-business projects. This information would be complemented with subjective
evaluations by managers on multiple levels. The timeline of the transition is simply described in
Figure 14 with the identification of critical elements and the sequence of their occurrence.
This single case study intends to examine the experiences of participants in a
transformation, or precipitating event, over a time period as illustrated in Figure 14. The event
was precipitated by significant growth stagnation. This was followed by alignment around the
goal of achieving improved profitability. Alignment was achieved through the deployment of a
MOS augmented by LIMs, a designed relationship with corporate, and a one-ness initiative. With
this execution came the resulting benefits of realizing growth leveraging synergies. The
participants will be interviewed to capture data about their experiences from this transition.
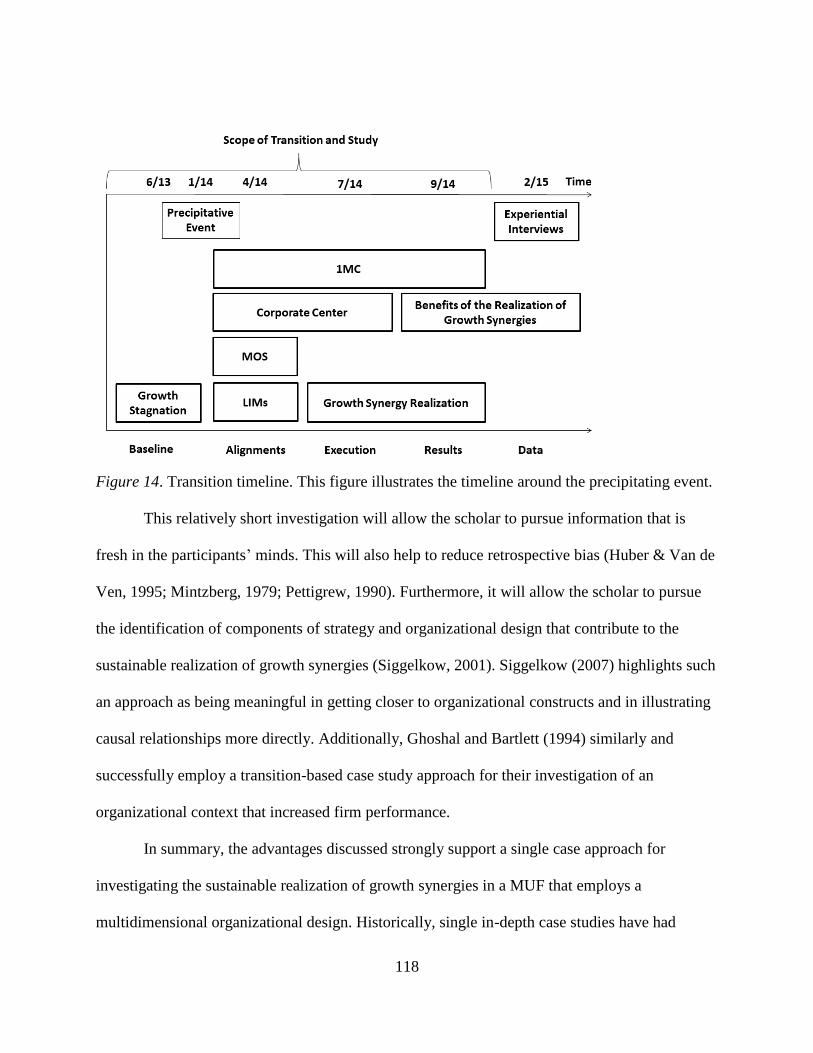
118
Figure 14. Transition timeline. This figure illustrates the timeline around the precipitating event.
This relatively short investigation will allow the scholar to pursue information that is
fresh in the participants’ minds. This will also help to reduce retrospective bias (Huber & Van de
Ven, 1995; Mintzberg, 1979; Pettigrew, 1990). Furthermore, it will allow the scholar to pursue
the identification of components of strategy and organizational design that contribute to the
sustainable realization of growth synergies (Siggelkow, 2001). Siggelkow (2007) highlights such
an approach as being meaningful in getting closer to organizational constructs and in illustrating
causal relationships more directly. Additionally, Ghoshal and Bartlett (1994) similarly and
successfully employ a transition-based case study approach for their investigation of an
organizational context that increased firm performance.
In summary, the advantages discussed strongly support a single case approach for
investigating the sustainable realization of growth synergies in a MUF that employs a
multidimensional organizational design. Historically, single in-depth case studies have had
119
significant impact in the field of strategic management (Bower, 1970; Burgelman, 1994; Ghoshal
& Bartlett, 1994; Lovas & Ghoshal, 2000; Mintzberg & McHugh, 1985). The approach is further
affirmed by the appeal for academics in strategic management to conduct more qualitative small
sample studies. For example, Markides and Williamson (1996) conclude that the issue of
strategy and structural fit in MUFs are too complex for large-scale statistical analysis. They
recommend, consistent with this research, a small-sample single-case study of limited numbers
and limited duration to accelerate learning. In this case, approximately 20 participants will be
interviewed over a 3-month period. These participants will be commenting on their experience
during the transformation. The transformation occurred over a 10-month period. Whittington
(2002) argues that corporate strategy and organizational design should be understood through
study internal to the organization. Mintzberg (1979) stresses the importance of rich descriptions
from in-depth single case studies that explain the relationships evident in data used for theory
building. Porter (1991) is convinced that the very nature of strategy requires case-based research.
Finally, Siggelkow (2007) emphasizes the power of single cases to influence theory.
Research Approach
The scholar aims to structure the research process to be as systematic and goal-oriented
as possible. Consideration is taken regarding the complexity of the investigated phenomenon in
that a strict plan may be difficult to follow. This mandated the need for agility in the planning
during exploration activities. The research process is therefore iterative and flexible including the
exploitation of preexisting data. The research questions and field scope coevolved with the
discovery of the research opportunity. This approach is referred to by Pettigrew (1990) as
planned opportunism and is common in qualitative studies of complex phenomena. The research
process followed Eisenhardt’s (1989, 2007) suggestion for building theory from case studies
120
(Strauss & Corbin, 1990, 1996). The flexibility and openness demanded by qualitative research
is ensured by having the ability to frequently switch between data collection and analysis
(Strauss & Corbin, 1996). The research cycle includes exploration, deep-dive, review, and
refinement when an opportunity presented itself. This is then followed by focused action
planning and execution in phases as follows.
Phase 1. The objective of the exploratory phase was to scope the field of study and
investigate for purposes of registering meaningful observations, detailing opportunities, and
determining focused action. Once a fruitful opportunity was discovered, it was then possible to
mine the data for opportunity clarification through deeper investigation. Financial reports,
workflow diagrams, quality performance information, specifications, and other documents were
used for reference and as evidence. Minutes from operational meetings were also considered to
be part of preexisting data. This data will be referred to indirectly and for purposes of coding to
determine themes that emerge from the data.
Phase 2. By October of 2014, sufficient transformational evidence (preexisting data) was
collected to conclude and confirm the investigation of cross-business synergies. This was
accomplished with the intention of making a theoretical and practical contribution towards
growth synergy realization. These insights enabled the scholar to formulate the empirical
research questions and move to the next phase.
Phase 3. An in-depth investigation of how MUFs can continuously realize growth
synergies is to be conducted by reviewing the experiences of participants in the enacted change.
Growth synergy realization is studied in this way during the beginning of 2015 in an iterative
process, during which time data will be collected and analyzed to derive constructs and
121
hypotheses. The emergent themes will be validated against preexisting data and is presented in
Chapter 4.
In summary, the sequence of data collection is as follows:
Phase 1. Transformational data (preexisting).
Phase 2. Research questions are determined based on preexisting and need for
new data.
Phase 3. Formal interviews are conducted about experiences with the
transformation.
Data Collection and Recording
The phenomenological case study approach allows for a wide range of data sources
(Eisenhardt 1989; Yin 1994). In the case of holistic case studies, such as this one, methodology
scholars specifically suggest the combination of multiple methods of data collection (Eisenhardt,
1989, 2007; Stake, 1995; Yin, 1994). Once the MOS was in place, key stakeholders were able to
assume their roles and begin with the plan to realize growth synergies. Data was collected,
regarding the transformation time period allowing for the refinement of the data collection
process. This also improved the quality and fulsomeness of the data. The purpose of collecting
and analyzing this information was so that sense-making could occur and be documented for
subsequent communication to the scholarly community. The data collected through in-depth
phenomenological interviews will be validated against and supported by preexisting data as
described.
The scholar will enter into conversations with no presuppositions regarding evidence of
participants’ connection with their experiences. Iterative conversations will occur as needed
following the initial interview to clarify and optimize the interview data. An ad hoc interviewing
122
style will be used to stimulate and gain emerging relevant information even though an interview
guide will be followed. The notes from the interviews will be used as a basis for reflection to
validate the participants’ data collection efforts as applicable. The scholar also will reflect on the
experiences that others had (heuristic phenomenology), the way that knowledge is created
(transcendental phenomenology), the reciprocal relationship between the observer and the
phenomenon (existential phenomenology), and the process of writing, rewriting, and thematic
analysis as the scholar describes and interprets the essence of meaning of lived experience
(hermeneutical phenomenology; Richards & Morse, 2013). There will be approximately 20
participants (who they are) in the single case study, involved through in-depth conversations and
interviews. The scholar uses the five steps recommended by Giorgi (1997) including: collecting
verbal data, reading and reflecting on the data, breaking the data into parts, organizing and
expressing the data with discipline, and synthesizing and summarizing the data. The scholar will
also attempt to develop themes and create meaning through the application of codes that linked
data to ideas. Furthermore, phenomenological reflections will be added to further describe the
scholar’s and participants’ experiences from the scholar’s point of view that may include
feelings, meaning, and emotions. Some of this information may come from journal notations
from the scholar informed by preexisting data or general observations.
A unique strength of the case study approach is its ability to deal with a wide variety of
data sources (Eisenhardt, 1989; Yin, 1994). For holistic case studies, scholars specifically
suggest the combination of multiple methods of data collection (Eisenhardt, 1989; Eisenhardt &
Graebner, 2007; Stake, 1995; Yin, 1994). Data triangulation is therefore enabled in this study by
allowing for an increase in the quality of data in three ways. First, it allows for a holistic
perspective on the unit of analysis, as data can be obtained through various methodological
123
techniques. Second, scientific artifacts as misunderstandings that lead to incorrect interpretation
can be identified and corrected (Eisenhardt, 1989; Lamnek, 1995). Thirdly, it enhances validity
through multiple measurements of the same phenomenon (Eisenhardt, 1989). The data collection
methodology that will be used in this study leverages triangulation through a holistic approach to
data collection, by using peer review to challenge the insights of the collectors, and by allowing
other participant stakeholders to opine on their views.
The scholar will conduct interviews at the case company site as tracked by an interview
tracker. The interviews will be chosen iteratively (Miles & Huberman, 1994) and cumulatively
(Straus & Corbin, 1996) based on sampling availability. The objective is to obtain rich data on
the growth synergy initiative. Employees will be questioned on multiple levels to capture the full
breadth of the initiative and to triangulate observations (Yin, 1989, 1994). This may lead to slight
modifications to the interview protocol and influence the follow-up questions. The interviews
will be conducted within multiple levels including corporate, within secondary work structures,
within support functions, and within the production organization. Continuous follow-up
interviews will be conducted to capture new information, identify emerging phenomenon, and to
ensure clarity and fulsomeness to the extent the scholar thinks is necessary.
Participants
The scholar will use purposeful and purposive (Lincoln & Guba, 1985) sampling to select
information rich participants who can provide the greatest insight to the research question (Miles
& Huberman, 1994). Four criteria will be used to select participants: (a) Ability, willingness, and
comfort in participating in the study; (b) Interest in the phenomenon being studied (individual
awareness, and present moment aspects of sense-making); (c) Employment by the same
organization at the same time; (d) Have a functional role concerning the precipitating event.
124
Creswell (1998) recommends “long interviews with up to ten people” (pp. 65, 113) for a
phenomenological study. Interviews allow the scholar to capture situational reality and the
personal experience of stakeholders through communication and interaction (Langley, 1999;
Punch, 1998). Consequently, this study uses interviews as the main exchange method for data
collection. The selection of interviewees is driven by their relevant importance to continuous
growth realization (Denzin & Lincoln, 1994) further strengthening the ability to collect relevant
information within the embedded research approach. During the course of the investigation,
additional interviewees may be identified on the basis of their ability to provide relevant data and
the need for more data. In some cases additional candidates may be recommended through
referrals by interviewees. In other cases the additional candidates may become obvious based on
the progression of thought or due to a shortage of participants as a result of unwillingness to
participate. Additional interviewee searches will be stopped once a perceived data saturation
point is achieved or further references to increase the scope of candidates have ceased.
The scholar followed the provisions of the Pepperdine Institutional Review Board (IRB)
as determined by 45 CFR 46 (code of federal regulation) on the protection of human subjects in
studies. This includes the communication to participants, the duration of the study, foreseeable
risks or benefits, the confidentiality of records, that there will be no compensation, that they can
volunteer with no penalty of withdrawal, the number of participants, that the scope is related to
behavioral observations, the lack of subject identification or traceability, the protection of
personal financial, reputation, or employability damage, and that they are contributing to
generalizable knowledge. Additionally, the interviewees will agree to sign the legally effective
informed consent form. They will be recruited through a conversation whereupon the request is
made known to them. They will then be asked to sign a Research Information and Consent Form.
125
The scholar will meet individually with each interviewee. Consistent with Moustakas’ (1994)
perspective the scholar and the participants in a phenomenological study are involved in an
integrated subject-object relationship. Consequently, the participants in this study will be
considered to be co-scholars.
Instrumentation
Data will be collected using one-on-one, in-depth, semi-structured interviews with follow
up dialog to augment the collected the data. The interviews will be semi-structured positioned
between an entirely free narration and strongly structured questioning provided by an interview
protocol. The scholar will adjust his questions to focus the discussion in the interviews on the
relevant issue. Knowledge acquired in previous interviews will be used to inform subsequent
lines of questioning, as applicable, in the interest of collecting a fulsome set of information. As
the interviewees are easily accessible, although not physically so, frequent communication for
the purpose of data collection is possible verbally or through written form. To ensure
consistency, the interview guide will be used to structure the questions. It was developed based
on Witzel’s (2000a, 2000b) recommendations for problem-centered interviews. The interview
guide includes topics such as the personal background of the interviewee, the history of the
function of the interviewee, the strategic alignment of growth synergies, the alignment of
organizational design elements, the role of the corporate center and alternate work structures, and
the success as represented by key success factor measurements. Most of the interviews will be
done within one of the company’s sites, one-on-one, and will last up to 2 hours on average.
Almost all of the interviews will be summarized and stored within 48 hours of the data receipt or
the interview completion.

126
A second method of data acquisition is through direct observation. The scholar has spent
a substantial amount of time on-site and is personally in contact with the activities and operations
of the firm. The scholar led the transition and has been able to constantly reflect on and revisit
the meaning of what was occurring (Stake, 1995). This provided the scholar with several
opportunities for direct observation, widely appreciated in the literature as a worthwhile source
of data for case studies (Denzin & Lincoln, 1994; Yin, 1994) through the provision of context
rich information and impressions, in addition to the spoken word (Foddy, 1993; Lovas &
Ghoshal, 2000; Pettigrew, 1990). Direct observation and existing historical data will also be used
to validate interviewee statements providing the opportunity for further directed discovery
(Foddy, 1993). The scholar had no agenda other than growth synergy realization through the use
of a MOS augmented by LIMs. In the event that these organizational structures prove to be
inadequate based on determined metrics, then this will be documented as the basis for the study.
The data then will allow for refinement in the organization to ensure growth synergy realization.
Data Process and Analysis
The overall objective of the data analysis is the development of a mid-range theory
around continuous growth synergy realization. Mid-range theories include concepts that are close
to managerial practice (Merton, 1968). They are ideal for practitioners as they are less abstract,
more focused, and have a more practical orientation (Merton, 1968). Conclusions about the mid-
range theory of continuous growth synergy realization are derived from data. While guidance for
quantitative data is mature, guidance for qualitative data continues to emerge (Eisenhardt, 1989).
Additionally, the analytical process used in this study is like those used by Ghoshal and Bartlett
(1994) in studies that are similar. This includes the provision that the data collection period
overlaps with the data analysis period which supports flexible and open theory building
127
(Eisenhardt, 1989; Strauss & Corbin, 1990, 1996) and helps to focus data collection (Witzel,
2000a, 2000b). To be specific, the interview data will be used for triangulation. Regarding
analysis, the scholar will use techniques such as abstracting and comparing (Miles & Huberman,
1994; Punch, 1998; Strauss & Corbin, 1990, 1996; Yin, 1994). The ability to create groupings of
items leads to higher order concepts (Punch, 1998) that finally lead to constructs and/or
propositions grounded in theory.
Each stakeholder participant will receive an initial overview of the complex reality of this
study including information on the objectives, key elements, organizational design, and roles and
responsibilities. The co-scholars were heavily involved in the transition initiated by the
precipitating event. During this time they discovered opportunity and constructed plans that
related to synergies. These synergy opportunities related to the four dimensions within the
multidimensional design; sales, product, support, and geographic location. Each co-scholar,
therefore, is able to provide a lens through which data around growth synergies can be collected.
Each co-scholar is able to provide a vivid account of the underlying dynamics, themes, and
qualities of the experience within the dimension that they occupy. The interview data will be
collected from these co-scholars and then reduced through the application of methods of open
and axial coding and clustering (Creswell, 1998; Strauss & Corbin, 1990, 1996) in four iterative
steps; the identification of core categories, the inferring of overarching sub-categories, the
inferring of overarching constructs, the inferring of core items, and finally the integration of
categories. The data will then be interpreted. Moustakas (1994) views data analysis as the
process of clustering data into themes; organizing them further into coherent textual descriptions
of the phenomenon. The scholar has provided an illustration of a potential breakdown of the
coding system used to identify emergent patterns and themes in the data that would reflect the
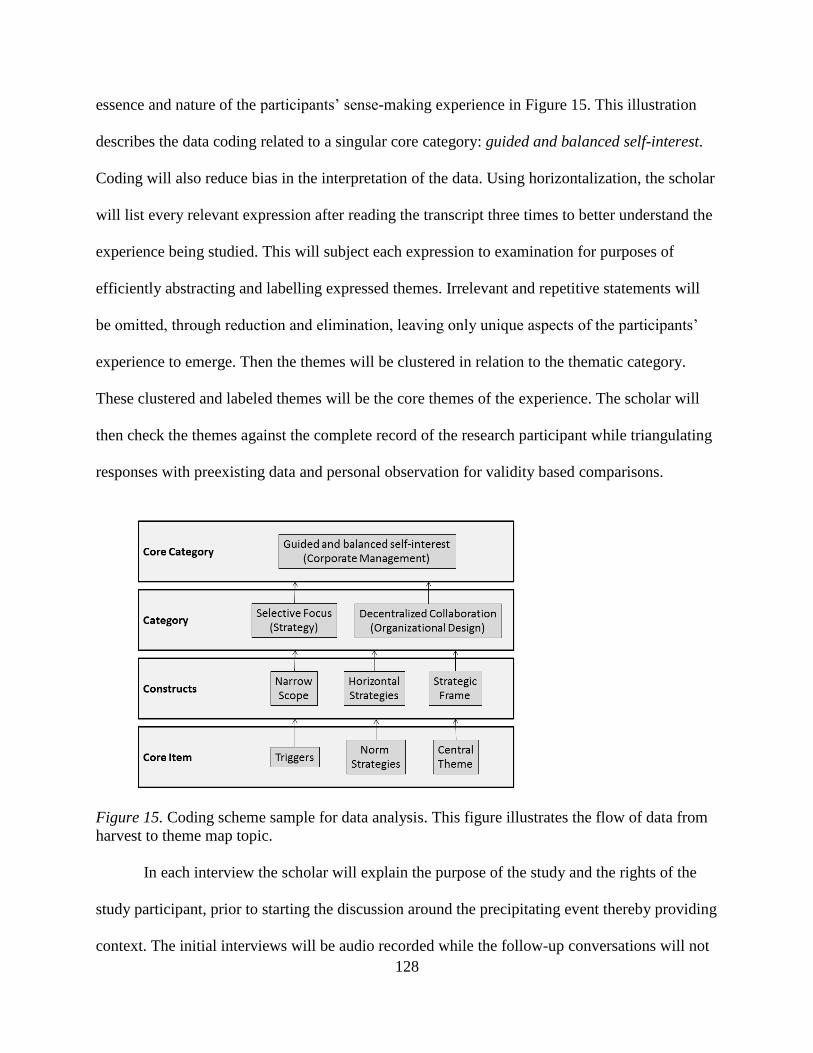
128
essence and nature of the participants’ sense-making experience in Figure 15. This illustration
describes the data coding related to a singular core category: guided and balanced self-interest.
Coding will also reduce bias in the interpretation of the data. Using horizontalization, the scholar
will list every relevant expression after reading the transcript three times to better understand the
experience being studied. This will subject each expression to examination for purposes of
efficiently abstracting and labelling expressed themes. Irrelevant and repetitive statements will
be omitted, through reduction and elimination, leaving only unique aspects of the participants’
experience to emerge. Then the themes will be clustered in relation to the thematic category.
These clustered and labeled themes will be the core themes of the experience. The scholar will
then check the themes against the complete record of the research participant while triangulating
responses with preexisting data and personal observation for validity based comparisons.
Figure 15. Coding scheme sample for data analysis. This figure illustrates the flow of data from
harvest to theme map topic.
In each interview the scholar will explain the purpose of the study and the rights of the
study participant, prior to starting the discussion around the precipitating event thereby providing
context. The initial interviews will be audio recorded while the follow-up conversations will not
129
be as they will occur ad hoc and iteratively until the data saturation is appropriate. Several
neutral questions will be asked initially to put the participant at ease. To add structure to the
interview sessions and to move the process along, the scholar will use open-ended questions,
while remaining open to follow-up probes for clarification, to deepen meaning, or to continue
along an emerging path of interest relevant to the study.
Dialog will be the primary instrument of the communication during the interviews. As
described by Isaacs (1999), dialog is shared inquiry, “a flow of meaning” (p. 19), intended to
create understanding around a topic of interest. During the course of dialog, the participants will
describe how they experienced sense-making and awareness by reflecting on their experience.
The dialog process will generate rich, detailed descriptions of experiential sense-making around
the precipitating event. This process is supported by selected aspects of Petitmengin’s (2006)
protocol (i.e., question development, interview process, tone of inquiry, and stabilizing
attention), using semi-structured questions augmented by deeper probing questions. During the
interview, the scholar will take notes to capture key words, phrases, or gestures and to record
observations gathered from co-scholars’ responses to questions. At the conclusion of the
interview the co-scholars will be asked if they have any questions and they will be thanked for
their participation. They will also be told that they can review the interview transcript and make
edits as needed.
The following tools will be used for data analysis and validation: analytic tables, case
illustrations, comparison with existing literature, discussion with managers, discussion with
support function managers, and the comparison of results with other cases found in the literature.
When theoretical saturation is achieved and elaboration has occurred on all constructs and
categories, the analysis will be concluded (Glaser & Strauss, 1967; Strauss & Corbin, 1990). The
130
individual categories will then be integrated into an overarching core category and a
comprehensive case study report on the sustainable realization of growth synergies at
MediaCorp. The data records will only be used for the intended purpose of completing this
study. They will be stored on a thumb drive and kept in the scholar’s home office. All hard and
electronic copies of data will be destroyed within a year of the conclusion of the study. The
scholar seeks to access the personal experience of each participant by developing a trusted
relationship, by being respectful, committed, and professional throughout the study.
In summary, the data collection and analysis is based on Moustakas’ (1994) revised Van
Kaam method of analysis. It will start with purposive sampling within the single case study site.
Recorded interviews, with follow-up discussions to ensure accuracy and completeness, will
create raw data from textural-structural descriptions. These will be analyzed. Following the
analysis of the data, it will be subject to horizontalization, reduction, and elimination. Emerging
patterns in the data will then be recognized. These will then be clustered and validated. Textural
and structural descriptions will then be defined. A composite of the descriptions will be
assembled in the form of a table or a mapping diagram. Finally, findings will be documented and
discussed.
Precipitating Event
MediaCorp transitioned from a traditional M-form organizational structure to a
multidimensional organizational structure (MOS) in the interest of realizing growth synergies.
This affected the performance of the global value chain created by MediaEnterprises generally
and MediaCorp specifically. The MOS was augmented and stabilized through the addition of
lateral integrative mechanisms (LIMs). Concurrently a designed relationship with corporate was
applied to the overall design. This organizational event is the object of the study. The event
131
selected had gravitas with the participants, as their employment future relied on its success. The
impact of the event was not well known in advance of the action as the structure is novel. The
precipitating event followed the realization that a structural change could enhance profitability of
MediaEnterprises. This organization is operating in an extremely competitive and complex
environment and, as such, client satisfaction is critical to gaining and maintaining market share.
The need to make a substantial change was recognized by the leadership of the enterprise and is
the subject of the study.
Quality of the Research
In qualitative research, “validity does not carry the same connotations as it does in
quantitative research” (Creswell, 2014, p. 195). Qualitative research does not use statistical
numbers to support findings or significance levels to indicate whether or not findings are
meaningful (Worthen, 2002). Instead, Creswell (2014) describes validity in qualitative research
as being “used to suggest determining whether the findings are accurate from the standpoint of
the scholar, the participant, and the readers of an account” (pp. 195-196). In this case, language
and meaning are the data. Creswell (2014), in parallel with Lincoln and Guba’s (1985) approach,
offers qualitative scholars eight possible strategies for checking the accuracy of findings;
triangulation, member-checking, rich descriptions, clarification of bias, the use of negative or
discrepant information, prolonged time in the field, peer debriefing, and the use of an external
auditor. The scholar will selectively use these strategies to ensure data validity with a focus on
triangulation, peer debriefing, and member checking. Findings from qualitative research are
especially vulnerable to bias, incompleteness, and blurred perceptions of reality by the scholar.
As a result, it is important that the quality of the research is assessed on generic criteria enabling
comparability with other research designs (Lamnek, 1995). The quality criteria applicable to this
132
research design and the tactics for quality assurance have been taken into consideration.
Literature on methodology suggests four additional measures for assessing the validity and
reliability of case-based research (Cook & Campbell, 1976; Larsson, 1993; Scandura &
Williams, 2000; Stake, 1994). The first measure is construct validity, which measures the degree
to which a study investigates what it claims to investigate. The second is internal validity, which
refers to the degree to which findings correctly map to the phenomenon in question. The third is
external validity, which describes the extent to which findings can be reproduced in another
setting. The fourth is reliability, which is the degree to which the study is free of random errors.
The specific measures the scholar will take to ensure that the research is of a high quality are
explained below.
Construct validity refers to the extent to which a research procedure leads to an accurate
observation of reality. It refers to the appropriate and accurate measurement of key constructs.
To ensure the validity of the constructs, the scholar will employ four techniques that have been
suggested as relevant for case study research (Denzin & Lincoln, 1994; Eisenhardt, 1989, 2007;
Mayring, 1996; Stake, 1994; Yin, 1994). The first is the use of multiple sources of evidence,
including triangulation with sources of preexisting data. The scholar will use different methods
of data collection by interviewing people with differing personal perspectives and different levels
of observation. The scholar also has had prolonged engagement in the field and will assist with
appropriate questions, follow-up questions, establishing context, and providing for data
interpretation (Bamberger, 2008) to build trust with participants and minimize distortions. The
use of first-person experience by the scholar is also validated by Varela and Shear (1999a,
1999b). Effort will be expended in order to obtain complete data, to enable triangulation, and to
minimize the perception of bias (Stake, 1994; Yin, 1994). A second technique is a-priori
133
specification of key constructs. As Strauss and Corbin (1990, 1996) suggest, the scholar will use
existing theory to highlight general constructs like cross-unit synergies and growth synergies.
This will help to focus the study and improve the findings. Thirdly, a closed chain of evidence
will be evident, linking the data to the constructs. Through case descriptions, interview citations,
and clearly referenced interviews, a closed chain of evidence will allow an external observer to
follow the link between the research questions and the study conclusions (Yin, 1994). This will
increase construct validity. The last technique will be applied through the review of results with
key informants (Mayring, 1996). This is analogous to Creswell’s (2014) peer debriefing and
member discussion provisions. Peers and members will be used to corroborate and confirm the
data. Factual accuracy will be validated by a wider participation in data review. Discussions
around the adequacy, meaningfulness, and relevance of constructs will occur between managers
of business units and support functions. The constructs will also be improved through the testing
and validation of initial results in subsequent interviews and through peer reviews. Additionally,
key informants will be asked as a means for further triangulation to review the case study (Yin,
1994).
Endogenous validity refers to the validity of established causal relationships (Lamnek,
1995; Yin, 1994) or internal logic of the research (Punch, 1998). This will be achieved by
establishing a clear thematic focus that guides the case selection, abstracting and comparing,
conducting peer reviews of causal relationships, and open and comprehensive explanation
building. A thematic focus will be evident in a clear definition of an overarching research theme
(cross-unit synergies), a narrowing research focus (operative synergies), and a specific research
question (the sustainable realization of growth synergies) along with a compatible case selection
in which the constructs of interest can be discovered. Continuous abstracting and comparing

134
(Strauss & Corbin, 1990, 1996) occurs as the scholar continuously compares data sets to build
higher order constructs, preliminary results to emerging data to confirm or refine results, and
observes causal patterns within the existing literature. This will improve the validity of causal
relations (Yin, 1994). Peer reviews of causal relationships will be discussed with research
colleagues for the purpose of capturing and testing additional perspectives based on experience
in the field. Additionally, it will enable the validation of internal consistency and theoretical
relevance of the scholar’s arguments. The final technique for internal validity will be through
open and comprehensible building of explanations and causal relationships. The results will be
documented in such a way that the reader could reconstruct the causal relationship (Mayring,
1996). Openly, the scholar will indicate initial ideas, deducted assumptions, and potential
inconsistencies.
Exogenous validity refers to the generalizability of research results critical for robust
theory development (Sutton & Straw, 1995; Weick, 1995) and depends on the research approach
(Yin, 1994). Single case study empirical findings are difficult to generalize. Yin (1994)
emphasizes that case studies do not allow for statistical generalization. More specifically, it is
difficult to make inferences about a population based on empirical data collected in a sample.
While issues of generalizability from case studies are severe (Denzin, 1989; Yin, 1994), single-
case studies are recognized to be substantial from an evolutionary perspective (Stake, 1995).
Single case studies can also provide new ideas and new thinking paradigms. They can help
modify existing theories by exposing gaps and helping to fill them. There are several facts about
this study that will support the scholar’s conclusions that it will be at least somewhat
generalizable. Several of the constructs can be confirmed as being present in existing literature,
indicating general theoretical relevance of the research (Eisenhardt, 1989). The findings will be
135
confirmed through consultation with the co-scholars, who are operationally capable with varied
experience in the industry, suggesting the potential transferability of the claims. Finally, the
findings will be somewhat generalizable due to the continuous comparison of similarities and
differences within case items across different levels of analysis.
Reliability refers to the possibility that scholars can replicate the research activity and
produce the same findings (Eisenhardt, 1989; Yin, 1994). A challenge for this replication is the
attribute of qualitative research, in that it is bound to the context in which it is conducted
(Lamnek, 1995), including time. Reliability in qualitative studies is best served by presenting
sufficient information so that the reader can draw his/her own conclusions (Yin, 1994). The
scholar attempts to ensure reliability through the explicit disclosure of the research design,
including a detailed description of the research process, case selection criteria, interview guide,
and methods for collecting and analyzing empirical data. Furthermore, empirical raw data will be
made available to allow the reader to draw their own conclusions.
Summary of Chapter 3
In this chapter the scholar presented the strategy for collecting data for purposes of
achieving growth synergies. This will be the result of the exploratory empirical work described,
including practitioner interviews, documenting data analysis, and a survey of critical leaders. The
overall empirical approach was described and justified. The post-positivist research position was
established and a case study was presented as the research design. A post-positivistic lens was
chosen to enable the holistic study of a single phenomenological case study. The phenomenon to
be studied is the growth synergy realization in a multi-unit firm managed by a multidimensional
organizational structure augmented by lateral integrative mechanisms. The research method is
applicable due to the interpretive and explorative character allowing for the creation of a mid-
136
range theory of continuous growth synergy realization. The single case study, while relatively
short in duration, allows for the investigation of complex phenomena of continuous growth
synergy realization. The research approach and the data collection strategy were described
including the use of preexisting data, formatting the research questions, and the data that will
originate from formal interviews. “The scholar has an obligation to respect the rights, needs,
values, and desires of the informant(s)” (Creswell, 2014, p. 201) and so the use of a consent form
was discussed as well as informing participants about the purpose of the study. The description
of the participants and the instrumentation was followed by information on the data processing
methodology. It was explained that a global MUF, MediaCorp, was chosen for the in-depth study
due to the unique opportunity to observe the successful alignment of a firm to its growth
synergies. This observation allows for the inference of constructs and propositions regarding
growth synergy realization. Finally, the strategy for ensuring the quality and validity of the study
was discussed along with the methodological assumptions.
137
Chapter 4. Data and Analysis
The purpose of this qualitative phenomenological research study, using Moustakas’
(1994) modified van Kaam method, was to explore the real-time experiences of stakeholders, or
co-researchers, as they lived and influenced events occurring around them. Awareness is a
transient experience (Freeman, 2000) that may involve exerting influence, letting go, and
redirecting energy and attention (Depraz et al., 2003). It also involves being present physically
and mentally in daily life (Varela et al., 1993). Stakeholders have to anticipate events, make
sense of existing environments, and exert influence over future trends. Weick (1995b) suggests
that sense-making is a retrospective cognitive process that explains unanticipated events. He also
suggests that events in a socially-created world both support and constrain action. Weick,
Sutcliffe, and Obstfeld (2005) later suggest that individuals form both assumptions and
conscious anticipations of future events. By examining sense-making and the development of
mental models through actual lived, shared experiences, this study captures the subjective
processes that have been largely ignored in the context of the connection between organizational
design and growth synergy in a multi-unit firm. Using the experience of stakeholders, the
researcher presents a conceptualization of how individual participants in this study made sense of
their lived experience. This was an ongoing process for participants as they refined their
understanding of lived experiences and established new equilibriums. As suggested by Weick et
al. (2005), participants developed individual action plans to address outcomes (prospection) and
exhibited a self-directed capacity to create action plans (action orientation). Real-life sense-
making processes include awareness, selective and focused responses, need for information,
collaboration, and action planning.
138
This chapter presents the empirical part of this dissertation through the thoughts,
perceptions, and lived experiences of 20 participants who took part in this phenomenological
case study. These participants went through the precipitating event that led to the subsequent
organizational transformation of MediaCorp. The purpose of this study was to explore a single
case study of a multi-unit firm by examining how a multidimensional organizational design
augmented by lateral integrative mechanisms and a designed relationship with the corporate
center contributed to the realization of growth synergies. The constructs that emerged from the
data identify key elements and organizational designs that contribute to continuous synergistic
growth. This chapter presents the strategy, results, analysis, and findings of this study divided
into three sections. The first section discusses what the researcher is referring to as endogenous
data. This is data that relates to issues internal to the MOS. The second section discusses aspects
of the research that are exogenous to the MOS and its design. These are ways that the MOS is
affected by external influences and ways that the MOS can influence external to itself. Lastly,
data are presented with regard to the ability of a MOS to influence other parts of the company by
scaling. A robust and effective structure aligned for growth, such as the MOS, needs to be
exploited to enhance profitability. Furthermore, data are presented with regard to how the MOS
structure can influence alignment within MediaEnterprises and how it can extend its influence
through the execution of focused strategy.
Each section includes individual textual descriptions as well as composite descriptions
concisely oriented and illustrated in a theme map structure. Moustakas (1994) suggested that the
integration of textual and structural descriptions into a composite description, such as relational
table, is a path for understanding the essence of an experience. The composite description is an
intuitive and reflective integrative description of the meanings and essences of a phenomenon, of
139
which the entire group of individuals is making sense. The co-researchers create meaning
through their awareness of the environment, reflection on their experiences, consultation with
others, focused response to an enquiry, and iterative refinement to these enquiries. The textual
descriptions are quotes with references to the data collected. A data references could be in the
form of (RH123), which would, in this case be, Role Horizontal data item 123. The quotes are
modified with brackets in some cases for the purpose of increasing clarity. Otherwise, verbatim
text is included from the participant interviews.
Data Collection Schema
A data collection tracker was used to guide the overall data collection process. This kept
the researcher on track, ensured completeness, and was adaptable as needed. The sequence of
data collection events facilitated the necessary build-up of relevant knowledge and enabled
iterative sense-making. The data collection schema supported the collection of information in the
three context areas previously described. Each data collection event was directed by an interview
guide used by the researcher and stakeholders as a protocol to enhance the efficiency of data
collection while minimizing noise. Noise is superfluous information that would obfuscate reality
embedded in the raw data. It was eliminated. Data was collected from both preexisting data and
through interviews with co-researchers. The sources of the data in the section below are mapped
as follows:
Endogenous Data
o Roles
Horizontal themes - Interview and preexisting data
Vertical dimension - Interview and preexisting data
Support diagonal - Interview and preexisting data
140
Client diagonal - Interview and preexisting data
Products and services - Existing catalog
o Synergistic experiences - Interview
o Self-interest - Policy deployment event
o Collaboration in the MOS - Interview
o Financial observations - Interview
o LIMs - List of existing
o Drift mitigation - Interview
o Focused action - Action trackers
Exogenous Data
o Megatrend impact - Budget commentary
o Corporate center - Interview
o One Media Corp (1MC) - Existing program
Scaling the MOS - Interview
o Growth - Customer data
o Market penetration - Interview
Purpose
The purpose of the data collection and subsequent findings was to inform the research
questions. Each research question is mapped to the associated data protocol element as described
through categories including endogenous, exogenous, and alignment for growth. The interview
question schema progresses from left to right in Figure 16. In order for the data collection
activity to be valid, it had to correlate directly to the research questions. The data, per the data
plan, maps to the research questions as illustrated. The significance of the correlation is indicated
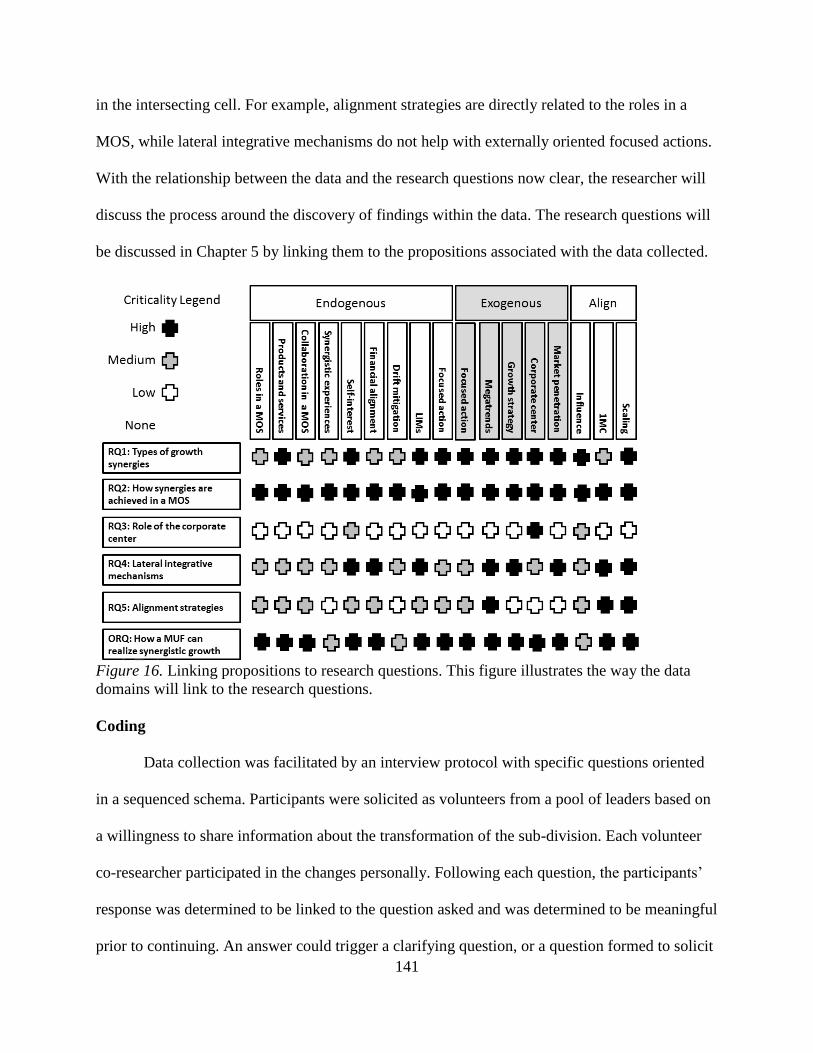
141
in the intersecting cell. For example, alignment strategies are directly related to the roles in a
MOS, while lateral integrative mechanisms do not help with externally oriented focused actions.
With the relationship between the data and the research questions now clear, the researcher will
discuss the process around the discovery of findings within the data. The research questions will
be discussed in Chapter 5 by linking them to the propositions associated with the data collected.
Figure 16. Linking propositions to research questions. This figure illustrates the way the data
domains will link to the research questions.
Coding
Data collection was facilitated by an interview protocol with specific questions oriented
in a sequenced schema. Participants were solicited as volunteers from a pool of leaders based on
a willingness to share information about the transformation of the sub-division. Each volunteer
co-researcher participated in the changes personally. Following each question, the participants’
response was determined to be linked to the question asked and was determined to be meaningful
prior to continuing. An answer could trigger a clarifying question, or a question formed to solicit
142
a more fulsome answer, if needed. The additional information modified the answer and once
again was determined to be fulsome or not. The data was added then to the data sheet and coded.
Sub-code themes were also determined and grouped by code and sub-code. The data was
surveyed by the researcher, who, due to personal experience, was able to apply an analysis of
good (ANOG). Slight modifications were made as needed to reduce the noise in the data and
ensure completeness and clarity. This was accomplished by consolidating like data points and
simplifying others by stripping out noise and redundancy in the answers. The data was then re-
sorted and generalized through categorizing. A pivot-table was used to extract themes in the
wording. The raw data was then posted in a table. In some cases most of the themes were unique
in which case a table was not used. From this data, dependencies, relationship, and the sequence
of events were determined and organized into a theme relationship map. In some cases the data
collected appeared as though the participant was confused about the question. In these cases the
researcher followed up with the participant and then added the newly acquired information to the
raw data previously collected. The coding flow chart is illustrated in Figure 17.
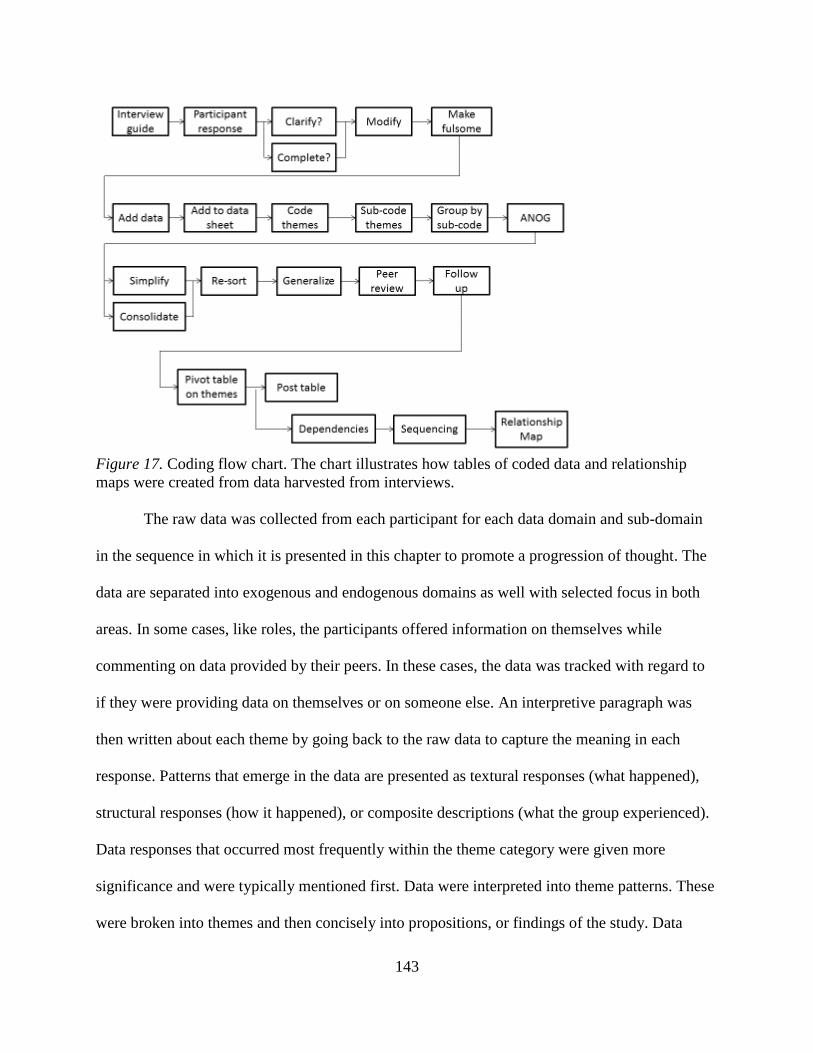
143
Figure 17. Coding flow chart. The chart illustrates how tables of coded data and relationship
maps were created from data harvested from interviews.
The raw data was collected from each participant for each data domain and sub-domain
in the sequence in which it is presented in this chapter to promote a progression of thought. The
data are separated into exogenous and endogenous domains as well with selected focus in both
areas. In some cases, like roles, the participants offered information on themselves while
commenting on data provided by their peers. In these cases, the data was tracked with regard to
if they were providing data on themselves or on someone else. An interpretive paragraph was
then written about each theme by going back to the raw data to capture the meaning in each
response. Patterns that emerge in the data are presented as textural responses (what happened),
structural responses (how it happened), or composite descriptions (what the group experienced).
Data responses that occurred most frequently within the theme category were given more
significance and were typically mentioned first. Data were interpreted into theme patterns. These
were broken into themes and then concisely into propositions, or findings of the study. Data
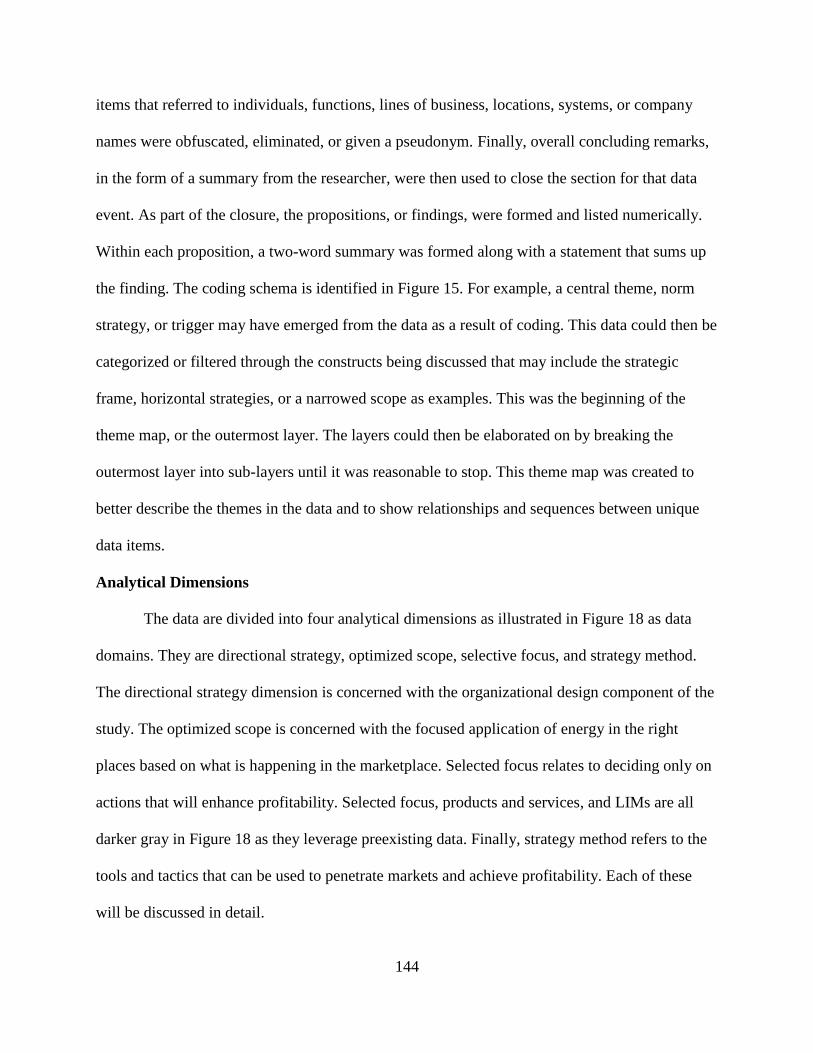
144
items that referred to individuals, functions, lines of business, locations, systems, or company
names were obfuscated, eliminated, or given a pseudonym. Finally, overall concluding remarks,
in the form of a summary from the researcher, were then used to close the section for that data
event. As part of the closure, the propositions, or findings, were formed and listed numerically.
Within each proposition, a two-word summary was formed along with a statement that sums up
the finding. The coding schema is identified in Figure 15. For example, a central theme, norm
strategy, or trigger may have emerged from the data as a result of coding. This data could then be
categorized or filtered through the constructs being discussed that may include the strategic
frame, horizontal strategies, or a narrowed scope as examples. This was the beginning of the
theme map, or the outermost layer. The layers could then be elaborated on by breaking the
outermost layer into sub-layers until it was reasonable to stop. This theme map was created to
better describe the themes in the data and to show relationships and sequences between unique
data items.
Analytical Dimensions
The data are divided into four analytical dimensions as illustrated in Figure 18 as data
domains. They are directional strategy, optimized scope, selective focus, and strategy method.
The directional strategy dimension is concerned with the organizational design component of the
study. The optimized scope is concerned with the focused application of energy in the right
places based on what is happening in the marketplace. Selected focus relates to deciding only on
actions that will enhance profitability. Selected focus, products and services, and LIMs are all
darker gray in Figure 18 as they leverage preexisting data. Finally, strategy method refers to the
tools and tactics that can be used to penetrate markets and achieve profitability. Each of these
will be discussed in detail.
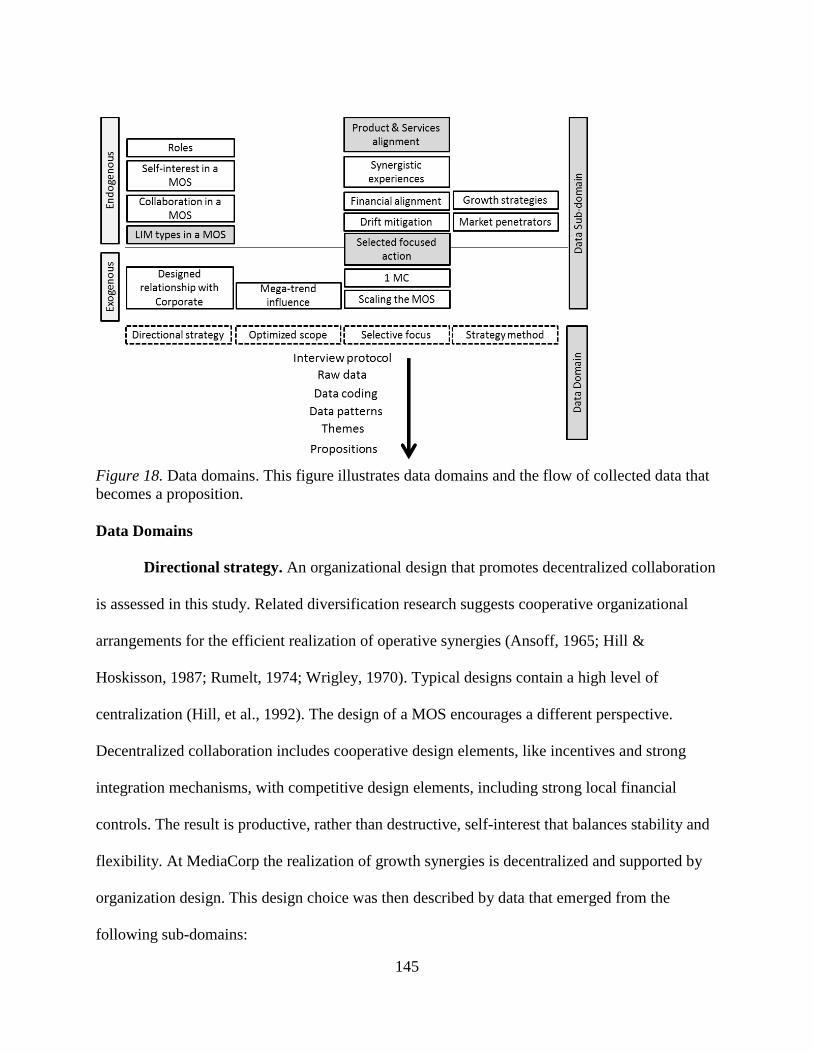
145
Figure 18. Data domains. This figure illustrates data domains and the flow of collected data that
becomes a proposition.
Data Domains
Directional strategy. An organizational design that promotes decentralized collaboration
is assessed in this study. Related diversification research suggests cooperative organizational
arrangements for the efficient realization of operative synergies (Ansoff, 1965; Hill &
Hoskisson, 1987; Rumelt, 1974; Wrigley, 1970). Typical designs contain a high level of
centralization (Hill, et al., 1992). The design of a MOS encourages a different perspective.
Decentralized collaboration includes cooperative design elements, like incentives and strong
integration mechanisms, with competitive design elements, including strong local financial
controls. The result is productive, rather than destructive, self-interest that balances stability and
flexibility. At MediaCorp the realization of growth synergies is decentralized and supported by
organization design. This design choice was then described by data that emerged from the
following sub-domains:
146
Roles (horizontal, vertical, support, and client): the dimensions of a MOS.
Self-interest in a MOS: the reward for leadership success.
Collaboration in a MOS: effort optimization through synergy.
LIM types and effectiveness in a MOS: support structure to enhance collaborative
capability.
The designed relationship with corporate: the interface with external support
functions.
Optimized scope. The achievement of profitable growth comes from pinpointing and
exploiting synergistic opportunity (Campbell & Goold, 2000; Goold & Campbell, 1998). Clear
objectives focus attention (Daft & Weick, 1984; Ocasio, 1997), while reducing ambiguity
(Weick, 1995) and complexity (Collins & Porras, 1994). A strategy for growth is augmented by a
culture of entrepreneurialism and a bias for action, or action tendency, which summons the
needed energy to exploit a discovered opportunity. Energy may come from emotions that help
people manage fundamental tasks (Lazarus, 2001). While complex team structures are highly
dependent on each other for success (Stringer, 2006), a robust organizational design is a design
that can thrive in a moderately dynamic market. Information from markets may cause an
emotional response that creates a tendency for action (Mouilso et al., 2007). Data was collected
from stakeholders regarding market-influencing forces creating the following data category:
Megatrend influence: external market trends forcing adaptation.
Selective focus. Each stakeholder is sensitized to opportunity and therefore channels
attention and concentrated resources towards the opportunities with the highest realizable profit
potential (Goold & Campbell, 1998; Campbell & Goold, 2000). With this attitude, the best
opportunities are sought out and brought forward. Obvious triggers for action become apparent
147
and are expected. The evidence from this study suggests that these can be exploited to pursue
sustainable corporate advantage. The data in this section will convey strategies for growth that
relate to the following areas:
Products and services alignment: operative and sales channel clarity.
Synergistic experiences (positive and negative): change management experiences.
Financial alignment in a MOS: financial clarity to ensure performance
measurement.
Drift mitigation: operative entropy remedies preventing profitability losses.
Selected and focused actions: focused tasks to influence profitability.
1MC – alignment: a one-ness that enables small and large-scale sales strategies.
Scaling the MOS: opportunities to expand the structure leveraging synergies.
Strategy method. Growth strategies may include optimization across business domains.
This requires an understanding of valuable sectors with common cross-business market
segments. Overlapping segments present synergistic opportunities. For example, some clients
may be negative contributors to profits. These clients should have the chance to grow, take on
more services, and agree to price increases, or be removed from the client list. These actions lead
to a focused scope with the effect of making it more possible to obtain a more precise and
realistic picture of the most likely profitable synergies. MediaCorp’s strategy focuses on
continuous growth synergy realization within a few selected areas for the purpose of channeling
attention towards the most influential opportunities while avoiding managerial perception bias. A
restricted exploration scope may lead to better discoveries and the continuous realization of
corporate advantage. Collaboration and implementation energy is also focused with an optimal
148
list of initiatives, otherwise projects are stalled or funding dissipates. The strategic method used
could be broken into two parts as follows:
Growth strategies: actions intended to increase revenue and profitability.
Market penetrators: actions intended to break through silos that otherwise prevent
growth.
MediaCorp desires to bring a unique portfolio of products and services to its clients to
solve their problems. The result is sustained corporate advantage. Market penetration strategies
emerged in the data. The need for improved profitability was triggered by intense competition in
saturated markets, price erosion from critical clients, changing customer requirements, and
discounts associated with significant sales initiatives in order to create a unique value
proposition. A strategic frame improves the selection of growth synergy initiatives while
avoiding illusive opportunities that have little value potential. Clear objectives focus attention
(Daft & Weick, 1984; Ocasio, 1997) and reduce ambiguity (Weick, 1995). Furthermore, focused
attention can reduce complexity and create collaborative energy (Collins & Porras, 1994).
Endogenous Data
This section discusses data internal to the MOS. Previous research pertaining to growth
from related diversification recommends that organizational designs include cooperative
constructs (Ansoff, 1965; Hill & Hoskisson, 1987; Hill, et al., 1992; Rumelt, 1974; Wrigley,
1970). These studies stress the need to limit business unit self-interest through centralized
decision making at the corporate center. The results of this study suggest a different view. The
data suggests that the MOS is an organizational design that stimulates, rather than restricts,
business unit self-interest. It liberates entrepreneurialism embedded in existing employees. The
MOS is based on a design of decentralized collaboration that balances stability and flexibility for
149
continuous and efficient growth synergy realization. Furthermore, the study reveals integrative
mechanisms that further enhanced the capability of the MOS to influence profitability.
As previously discussed, the endogenous data collection is focused on nine areas. The
first focus area relates to roles in the MOS. Clarity of roles is critical for accountability and in
this study it helped with the focus on selected actions. This data includes self-evaluation as well
as input from colleagues and peers for all of the four dimensions in the MOS structure. The
researcher then turned to products and services for purposes of creating clear operational scope
and sales channels to avoid overlap-related redundancy, channel encroachment, and potential
self-cannibalization. The efficient use of available energy better enhanced the possibility for
desirable outcomes to be realized. The third area of endogenous data focus is on synergy driven
change management. Critical leaders were asked about their experiences with synergistic change.
This included positive and negative experiences. It was beneficial for leaders to capture and
share historical experiences that went well, along with experiences that did not go well, so that
these lessons could be reviewed and exploited during future change initiatives. Next, the concept
of self-interest is then explored. Without self-interest it is difficult to encourage the right
behaviors within entrepreneurial-minded business leaders. In the event that behaviors are driven
by policy, they become autonomous and require little effort to enforce. If the influence of policy
is ignored, organizational inertia becomes a significant force in the entrepreneurial environment.
The goodwill of great employees will only go so far and then self-interest, or even survival,
becomes the primary motivator in decision making. The fifth area of discovery was collaboration
in a MOS. The MOS itself is dependent on this; consequently, it is explored in depth in this
chapter. The stakeholders explored financial reports to discover anomalies that would require
financial alignment. If financial systems are not aligned, such that cost follows revenue, the
150
measurement of profitability cannot be accurate. Additionally, financial trends, key financial
ratios, and P&L integrity were examined to ensure alignment between cost and revenue. The
profitability of locations across all clients and products, products across all locations and clients,
and clients across all products and locations were examined. The allocations of cost centers, or
support functions, were also examined. The seventh focus area is lateral integrative mechanisms.
Data regarding LIM structures and their effectiveness was collected from stakeholders during the
interview process. The variety and influence of the LIMs was significant. They had to match the
unique situation in which they resided. The eighth focus area was drift mitigation. The horizontal
dimensional leaders had to make sure that their operations did not drift away from gains once
they were achieved. This may also be referred to as organizational entropy (Levins, 1968).
Information regarding actions taken to prevent this is discussed. This is especially true during
growth cycles, as gains can be a distraction and drifting can erase the benefit of new growth.
Finally, the ninth area of discussion is selected and focused action. This area represents the
themes and areas associated with the execution of growth opportunity. The data reveals areas of
execution that relate to the implementation of the MOS, LIMs, and the designed relationship
between the MOS and the corporate center. It also includes data regarding the alignment of
financial reporting so that there is performance clarity. Patterns in the action trackers were also
instructional with regard to selected focused action.
Roles. The roles of leaders in the MOS, in this scenario, were determined through the
understanding of a vision, the ability to self-reflect on leadership attributes, and the selection of
actions in focused areas of impact. Each stakeholder determined that certain leadership attributes
would be needed in order for a leader in a MOS to be successful, including efficient
collaboration. MOS leaders related collaboration to a variety of job responsibilities.
151
“[We needed to] work closely with facility leaders worldwide, to improve business
metrics and operational data (lowering costs, increasing throughput, higher quality, etc.)
on [the] product line by transforming the way we perform various [LOB] services.”
(RH1)
“[We] work in tandem a lot with large orders or launches...” (RH129)
“Coordination and influence of ERP development will be more effective and efficient if
we stay aligned with our priorities.” (RH131)
“[We will] encourage partnerships between business units, to better utilize existing
capacity.” (RH191)
Data was also collected from other stakeholders at a similar level. The scope of the role
data includes P&L leaders in all four dimensions of the MOS, including (a) horizontal leaders,
(b) vertical leaders, (c) support leaders, and (d) client-facing leaders as depicted in the MOS
model in Figure 3. First, data was collected from thorough interviews regarding the roles of the
horizontal (products and services) leaders, as illustrated in Table 1.
Horizontal themes. Horizontal leaders were defined as leaders with responsibility for
any aspect of a product or service category through direct contact with an asset or a deliverable
(Van Wart & Kapucu, 2011). The functions within this scope were all production areas, asset
handling, configuration enhancement, and invoicing. Table 1 illustrates the critical themes in the
coded data collected from participants who provided 17 themes and 267 rich data descriptions
with regard to their role and the roles of their peers. This data explains what the participant
leaders learned as a result of the transition to a MOS about what they would need to focus on in
order to successfully execute their responsibilities as an effective leader. Following the table, a
description of the role is discussed based on the raw data in order of frequency of occurrence. To
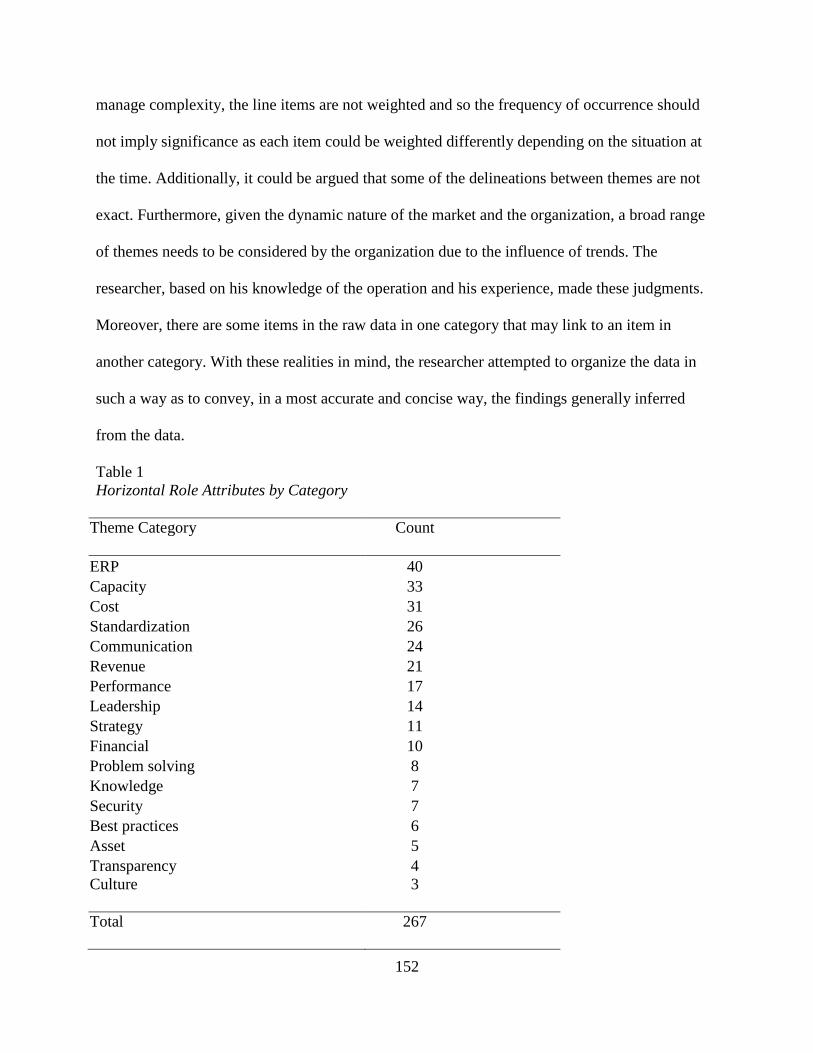
152
manage complexity, the line items are not weighted and so the frequency of occurrence should
not imply significance as each item could be weighted differently depending on the situation at
the time. Additionally, it could be argued that some of the delineations between themes are not
exact. Furthermore, given the dynamic nature of the market and the organization, a broad range
of themes needs to be considered by the organization due to the influence of trends. The
researcher, based on his knowledge of the operation and his experience, made these judgments.
Moreover, there are some items in the raw data in one category that may link to an item in
another category. With these realities in mind, the researcher attempted to organize the data in
such a way as to convey, in a most accurate and concise way, the findings generally inferred
from the data.
Table 1
Horizontal Role Attributes by Category
Theme Category
Count
ERP 40
Capacity 33
Cost 31
Standardization 26
Communication 24
Revenue 21
Performance 17
Leadership 14
Strategy 11
Financial 10
Problem solving 8
Knowledge 7
Security 7
Best practices 6
Asset 5
Transparency 4
Culture
3
Total
267
153
ERP system. Williamson (1975) suggests that corporate management needs to control the
opportunism of business level managers who would otherwise neglect their contribution to cross-
business issues and shared resources. The transparency of an organization-wide business system
enables a decentralized approach. It is then no surprise that the data suggests that MOS leaders
can contribute to profitability. They need to be accountable for results. This accountability is
augmented and encouraged by the transparency provided by an ERP system. Consequently, the
first category in the horizontal theme data table relates to the ERP system. It is no surprise that
leaders in a MOS who influence multiple facilities in different areas of the world value an ERP
system that enables them to see what is happening at all locations simultaneously. Without a
system, change management becomes very difficult. The raw data suggests that the overall
concern is the ability to use the system consistently. This is critical such that data are entered
correctly with the consequent benefit of the exploitation of that data. The raw data suggests that
MOS leaders have six areas of concern: (a) that existing departments are using the system
correctly, (b) that new modules become available for critical workflows that exist or may be
deployed, (c) that other departments in the supply chain are brought into the system, (d) that
other disparate systems are supported or integrated, (e) that development efforts are optimized,
and (f) that tools are developed as appropriate and timely. Further detail in the data suggests that
for (a) existing departments may need training before they use the system. Leadership’s
commitment to the system is also necessary for the transition.
“[We need to] partner with local teams to coordinate deployments and enhancements of
[the] ERP for [product] pipeline services.” (RH25)
I will be joined at the hip on security / chain of custody issues. This area is getting more
significant all the time and we need to make sure the worldwide (WW) facilities are
154
unified in terms of compliance and process. We also need to work together on making
the ERP [LOB] management functions so they properly track assets for all our facilities.
(RH144)
Additional data for (b) suggests that there is the need for several specific modules within
functional areas that were called out by the stakeholders, in this case billing and ingest. With
these new modules there is connectivity between functions within a business unit that results in
data entry efficiency, supply chain visibility, and the ability to extract business intelligence from
the data.
“[MOS leaders need to] be a hub to communicate with each facility and prioritize
internal/ external client enhancement request. When [a] global enhancement is being
deployed, communicate with the each facility beforehand to incorporate requests from
individual facilities.” (RH52)
Additional data for (c) suggests that there are other businesses that could be brought into the
system that have not yet been introduced. This would create connectivity with other parts of the
supply chain, enhancing data visibility and trends.
“[MOS leaders need to] assist in rolling [the ERP] out to our other locations.” (RH57)
Additional data for (d) suggests that there is the need, prior to their integration, for the support of
other existing systems. This is necessary for business continuity and data exploitation. Further
efficiencies are gained by repurposing existing synergistic modules in new areas. Where systems
already exist, the code can be imported and leveraged, eliminating development efforts.
“[The] coordination and influence of ERP development will be more effective and
efficient if we stay aligned with our priorities.” (RH131)
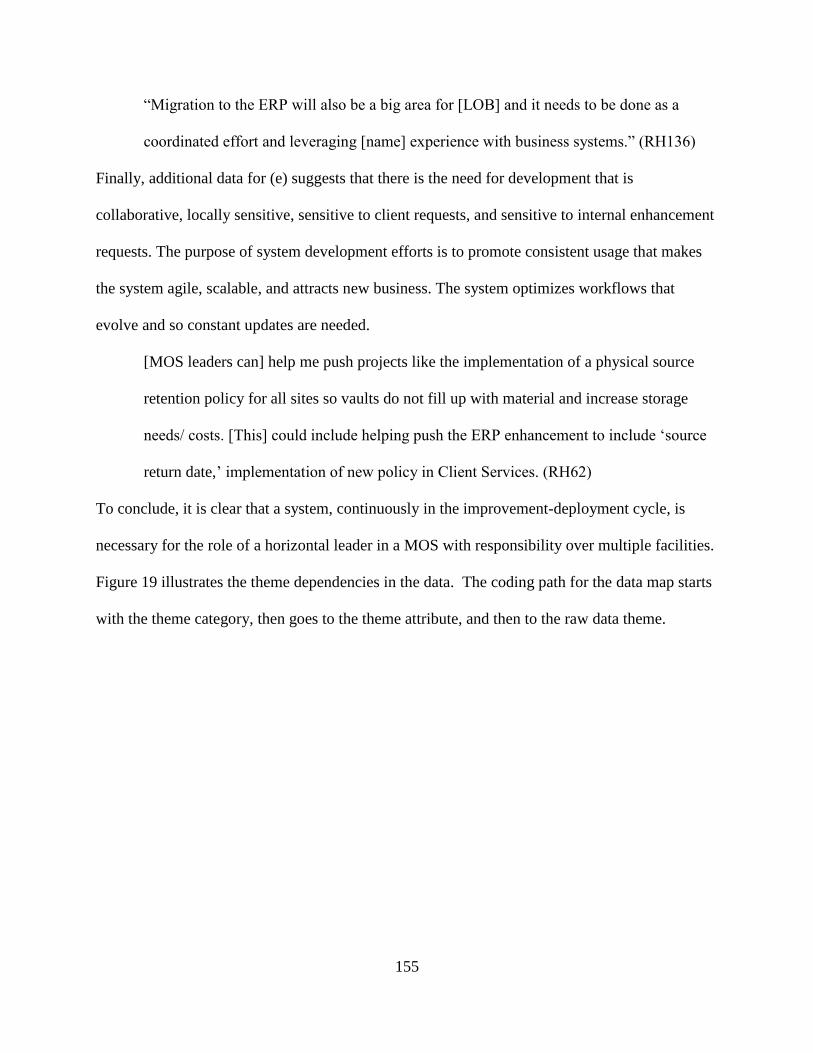
155
“Migration to the ERP will also be a big area for [LOB] and it needs to be done as a
coordinated effort and leveraging [name] experience with business systems.” (RH136)
Finally, additional data for (e) suggests that there is the need for development that is
collaborative, locally sensitive, sensitive to client requests, and sensitive to internal enhancement
requests. The purpose of system development efforts is to promote consistent usage that makes
the system agile, scalable, and attracts new business. The system optimizes workflows that
evolve and so constant updates are needed.
[MOS leaders can] help me push projects like the implementation of a physical source
retention policy for all sites so vaults do not fill up with material and increase storage
needs/ costs. [This] could include helping push the ERP enhancement to include ‘source
return date,’ implementation of new policy in Client Services. (RH62)
To conclude, it is clear that a system, continuously in the improvement-deployment cycle, is
necessary for the role of a horizontal leader in a MOS with responsibility over multiple facilities.
Figure 19 illustrates the theme dependencies in the data. The coding path for the data map starts
with the theme category, then goes to the theme attribute, and then to the raw data theme.
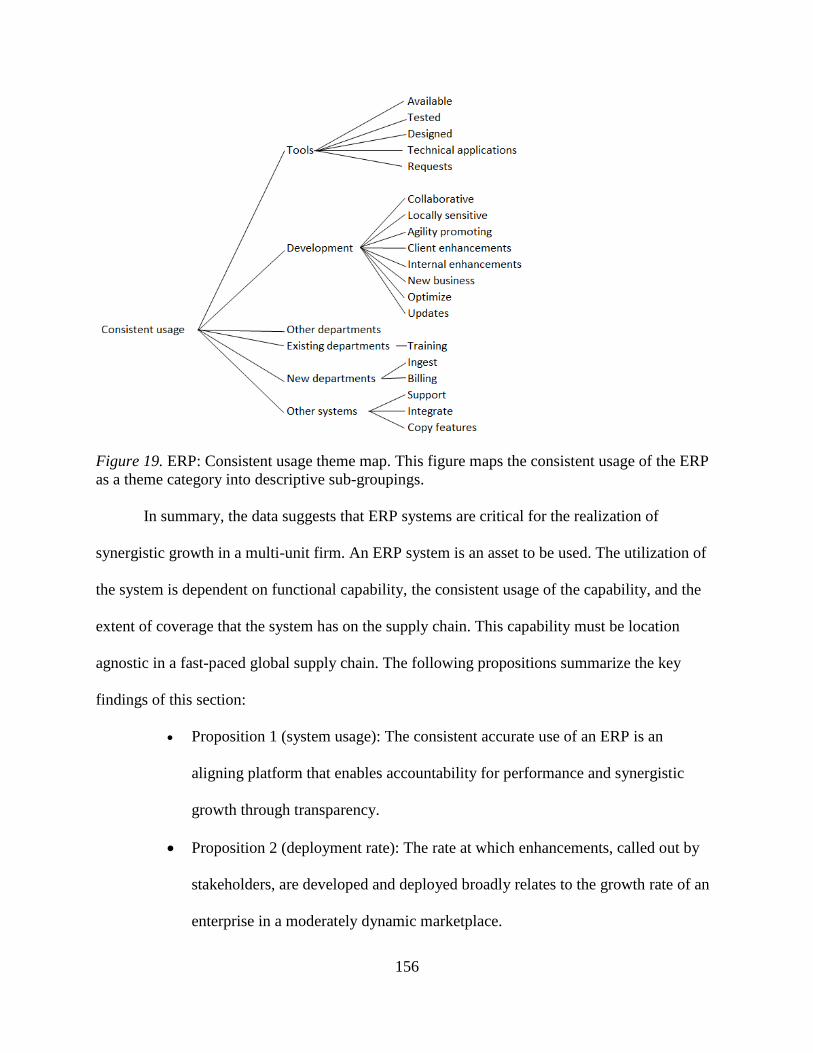
156
Figure 19. ERP: Consistent usage theme map. This figure maps the consistent usage of the ERP
as a theme category into descriptive sub-groupings.
In summary, the data suggests that ERP systems are critical for the realization of
synergistic growth in a multi-unit firm. An ERP system is an asset to be used. The utilization of
the system is dependent on functional capability, the consistent usage of the capability, and the
extent of coverage that the system has on the supply chain. This capability must be location
agnostic in a fast-paced global supply chain. The following propositions summarize the key
findings of this section:
Proposition 1 (system usage): The consistent accurate use of an ERP is an
aligning platform that enables accountability for performance and synergistic
growth through transparency.
Proposition 2 (deployment rate): The rate at which enhancements, called out by
stakeholders, are developed and deployed broadly relates to the growth rate of an
enterprise in a moderately dynamic marketplace.
157
Proposition 3 (system consolidation): The transparencies of relevant data are
enabled by the consolidation of disparate systems that hold valuable data
otherwise not easily made available.
Capacity management. Horizontal leaders in a MOS indicated, by way of the second
most frequently cited category, that management of capacity is critical to their role. The need for
coordination of capacity on a global scale is critical to the success of business units that are
constrained by resources being allocated to a business with extreme swings in capacity demand
as illustrated in Figure 20. This business phenomenon relates to profitability as local markets
often offer up revenue opportunities that are beyond the capacity of the local facility, either by
volume or type, which may be followed by times of very low volume. A significant concern of
the businesses is the ability to sell any product to any market size using the strength of the MOS.
The raw data suggests that the overriding concern here relates to the ability to utilize capacity on-
demand in accordance with the work load.
“[MOS leaders] enable MediaCorp…facilities WW to leverage one another as a
‘globalized’ capacity to enable load balancing, service flexibility, [and the] capture of
‘limitless’ customer demand.” (RH98)
The desirable attributes of capacity availability are (a) scalability, (b) local availability, (c)
strategic planning, and (d) the appropriate allocation of capacity. Capacity management is
directly linked to meeting client expectations and profitability. Additional data for (a) includes
the ability to give the impression to clients, and location leaders, that the production network has
infinite capacity. This encourages a willingness to take on bulk orders. This has become a market
trend. The MOS leaders also need to encourage locations to scale back capacity when the
demand shrinks. This may depend on the ability to move work from location to location.
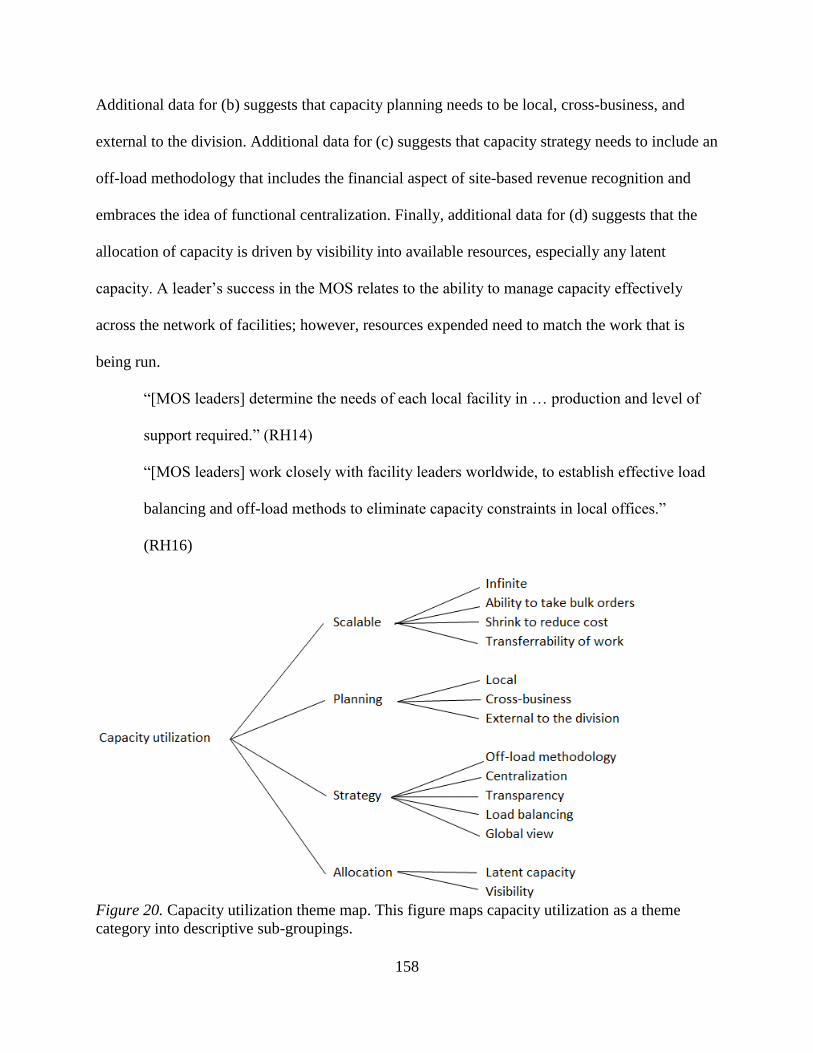
158
Additional data for (b) suggests that capacity planning needs to be local, cross-business, and
external to the division. Additional data for (c) suggests that capacity strategy needs to include an
off-load methodology that includes the financial aspect of site-based revenue recognition and
embraces the idea of functional centralization. Finally, additional data for (d) suggests that the
allocation of capacity is driven by visibility into available resources, especially any latent
capacity. A leader’s success in the MOS relates to the ability to manage capacity effectively
across the network of facilities; however, resources expended need to match the work that is
being run.
“[MOS leaders] determine the needs of each local facility in … production and level of
support required.” (RH14)
“[MOS leaders] work closely with facility leaders worldwide, to establish effective load
balancing and off-load methods to eliminate capacity constraints in local offices.”
(RH16)
Figure 20. Capacity utilization theme map. This figure maps capacity utilization as a theme
category into descriptive sub-groupings.
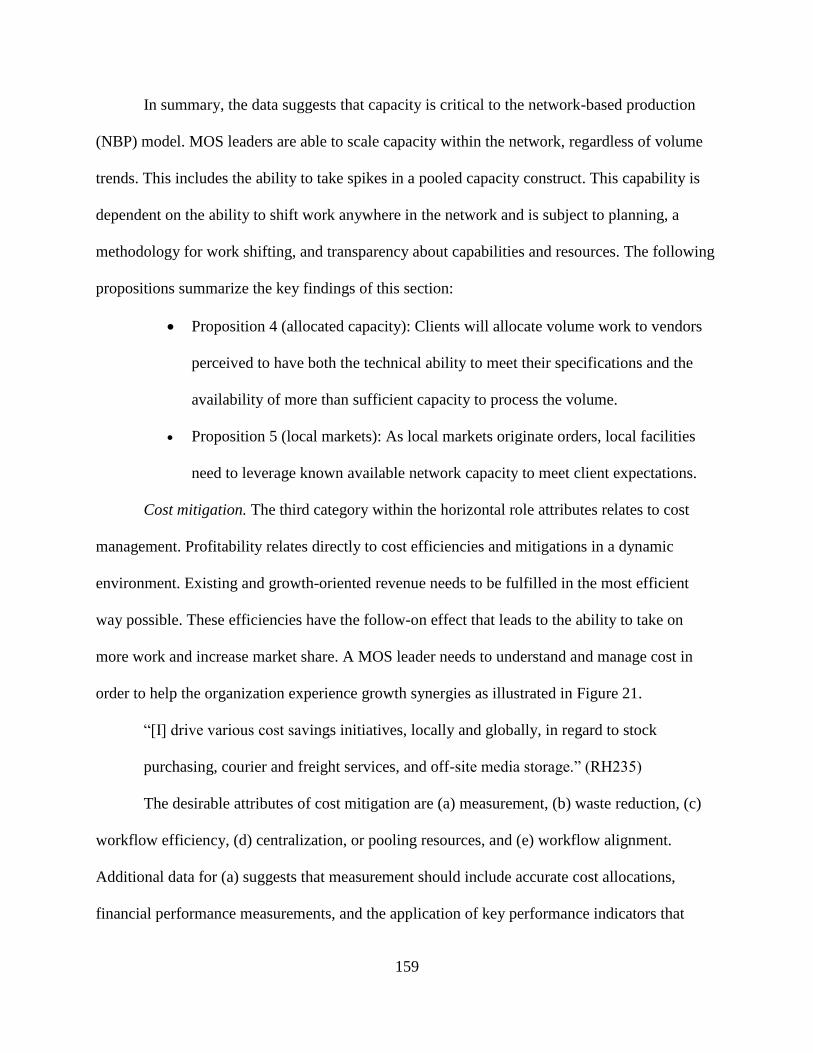
159
In summary, the data suggests that capacity is critical to the network-based production
(NBP) model. MOS leaders are able to scale capacity within the network, regardless of volume
trends. This includes the ability to take spikes in a pooled capacity construct. This capability is
dependent on the ability to shift work anywhere in the network and is subject to planning, a
methodology for work shifting, and transparency about capabilities and resources. The following
propositions summarize the key findings of this section:
Proposition 4 (allocated capacity): Clients will allocate volume work to vendors
perceived to have both the technical ability to meet their specifications and the
availability of more than sufficient capacity to process the volume.
Proposition 5 (local markets): As local markets originate orders, local facilities
need to leverage known available network capacity to meet client expectations.
Cost mitigation. The third category within the horizontal role attributes relates to cost
management. Profitability relates directly to cost efficiencies and mitigations in a dynamic
environment. Existing and growth-oriented revenue needs to be fulfilled in the most efficient
way possible. These efficiencies have the follow-on effect that leads to the ability to take on
more work and increase market share. A MOS leader needs to understand and manage cost in
order to help the organization experience growth synergies as illustrated in Figure 21.
“[I] drive various cost savings initiatives, locally and globally, in regard to stock
purchasing, courier and freight services, and off-site media storage.” (RH235)
The desirable attributes of cost mitigation are (a) measurement, (b) waste reduction, (c)
workflow efficiency, (d) centralization, or pooling resources, and (e) workflow alignment.
Additional data for (a) suggests that measurement should include accurate cost allocations,
financial performance measurements, and the application of key performance indicators that
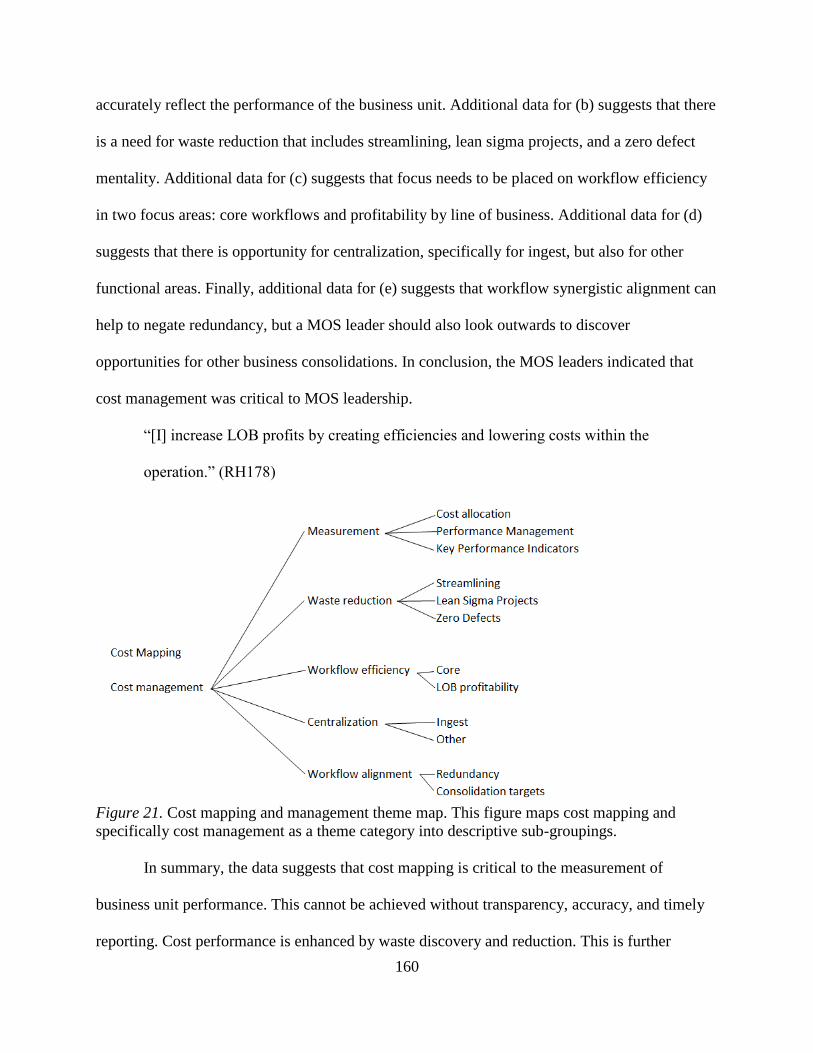
160
accurately reflect the performance of the business unit. Additional data for (b) suggests that there
is a need for waste reduction that includes streamlining, lean sigma projects, and a zero defect
mentality. Additional data for (c) suggests that focus needs to be placed on workflow efficiency
in two focus areas: core workflows and profitability by line of business. Additional data for (d)
suggests that there is opportunity for centralization, specifically for ingest, but also for other
functional areas. Finally, additional data for (e) suggests that workflow synergistic alignment can
help to negate redundancy, but a MOS leader should also look outwards to discover
opportunities for other business consolidations. In conclusion, the MOS leaders indicated that
cost management was critical to MOS leadership.
“[I] increase LOB profits by creating efficiencies and lowering costs within the
operation.” (RH178)
Figure 21. Cost mapping and management theme map. This figure maps cost mapping and
specifically cost management as a theme category into descriptive sub-groupings.
In summary, the data suggests that cost mapping is critical to the measurement of
business unit performance. This cannot be achieved without transparency, accuracy, and timely
reporting. Cost performance is enhanced by waste discovery and reduction. This is further
161
enhanced by opportunities for alignment that provide for compatibility within workflows. Core
workflows experience most of the volume and should be given significant cost-performance
attention. The following propositions summarize the key findings of this section:
Proposition 6 (cost measurement): Accurate cost measurement for each LOB
creates awareness of workflow profitability variation that may lead to targeted
cost mitigations.
Proposition 7 (workflow design): Workflow synergistic alignment and capacity
pooling, where there is demand variability, improve utilization and increase
profitability.
Standardization. The fourth category relates to activities concerning unity and consensus.
The MOS leaders brought up standardization as it ensured performance through the reduction of
complexity. In a chaotic environment, the enhancement of predictability is desirable for financial
and capacity forecasting accuracy.
“[I will] establish [location] as a center of excellence for… workflows through bi-
directional visibility, process alignment, and procedural standardization.” (RH74)
The beneficial attributes of capacity availability are (a) unification, (b) workflows, (c)
scalability, (d) data efficacy, and (e) predictability. Additional data for (a) suggests that,
unification enables the capability to update a system, to audit a system, to take a system to
another facility, and to describe the system with common semantics. Additional data for (b)
suggests that standardization as illustrated in Figure 22 is made possible in workflows through
the deployment of work instructions and procedures that guide the activities in the operation.
Standardization is also possible with inputs and outputs that have meaningful specifications that
are universally known. Additional data for (c) suggests that scalability is important for, and a
162
constraint for, growth. Additional data for (d) suggests that standardization enables the use of
metrics. Without metrics, an operation cannot assess its performance status. Additional data for
(e) suggests that predictability is a benefit of standardization that enables accurate and profit
bearing pricing, the creation of tools, and consistency.
“[I will] partner with local leaders to drive unification, standardization, centralization,
and operational efficiencies across key WW locations.” (RH264)
Figure 22. Standardization theme map. This figure maps standardization as a theme category
into descriptive sub-groupings.
In summary, the data suggests that creating commonality and compatibility between
workflows in all locations is desirable. Standardization, guided by documentation, can achieve
scalability. Performance predictability is encouraged by tools, automation, and performance
monitoring. Unification of practice and semantic unity enable both monitoring and the discovery
of enhancements. The following propositions summarize the key findings of this section:
163
Proposition 8 (chaos reduction): Standardization is a complexity reduction
technique that enhances scalability, capability, predictability, updatability, and
transportability in a chaotic environment.
Proposition 9 (best practice): Standardizing on best practice includes both
deploying a common language needed for more accurate profitability
measurement and creating a platform for efficient organizational evolution.
Communication. The fifth category of interest within the horizontal roles of a MOS
relates to communication. While communication is often cited as a reason for issues, its
significance is typically underestimated. Unbelievable communication may create cognitive
dissonance and frustration. Dissonance could occur when logic, opinions, and environmental
knowledge are inconsistent (Festinger, Riecken, & Schachter, 2008). MOS leaders need to
exchange information that would result in dissonance reduction. Furthermore, there is an optimal
level of communication that, when exceeded, is ignored. When minimized, it creates an
information vacuum that breeds insecurity and frustration. A MOS leader needs to understand
the optimal way to communicate, recognizing that execution is situational.
“[I] establish cohesion and strategy of inter-facility operations, and unify best practices
among … WW … facilities through free-flowing communication.” (RH95)
“[I] establish lines of communication between [support functions] encouraging
cooperation and streamlining intercompany transactions.” (RH193)
The data suggests that the desirable attributes of communication relate to (a) plans, (b)
transparency, and (c) the method used. Additional data for (a) suggests that communication plans
need to include a deployed escalation plan, a single point of contact, periodic communication,
and a flow of information. There is also an optimal level of transparency that should be achieved
164
through the communication strategy. MOS leaders required that there was the ability to be
transparent about policies and capabilities. They wanted a common terminology to enhance
communication efficacy. Additional data for (b) suggests that, like (a) above, communication
needs to be routed to a business unit, across business units, to a client, or to a vendor. While
routing is important, transparency provides information about policies, capabilities, and includes
terminology that is understandable both internally and external to the business unit. Additional
data for (c) suggests that the method chosen is relevant. MOS leaders need to be able to hold a
presence and communicate clearly one-on-one and in a video conference event, as applicable.
The importance of one-on-one communication should not be underestimated. The ability to read
and react to body language may be critical to both maintaining attention and guiding thought
patterns. The rate at which an organization or individual is influenced may depend significantly
on face-time. To be successful in achieving growth synergies a MOS leader needs to be an
effective communicator both internal and external to their assigned organization as illustrated in
Figure 23.
“[I] work closely with facility leaders worldwide, to develop and implement
organizational communication plans for effective communication between all key
[operational] groups in WW [LOB] operations.” (RH269)
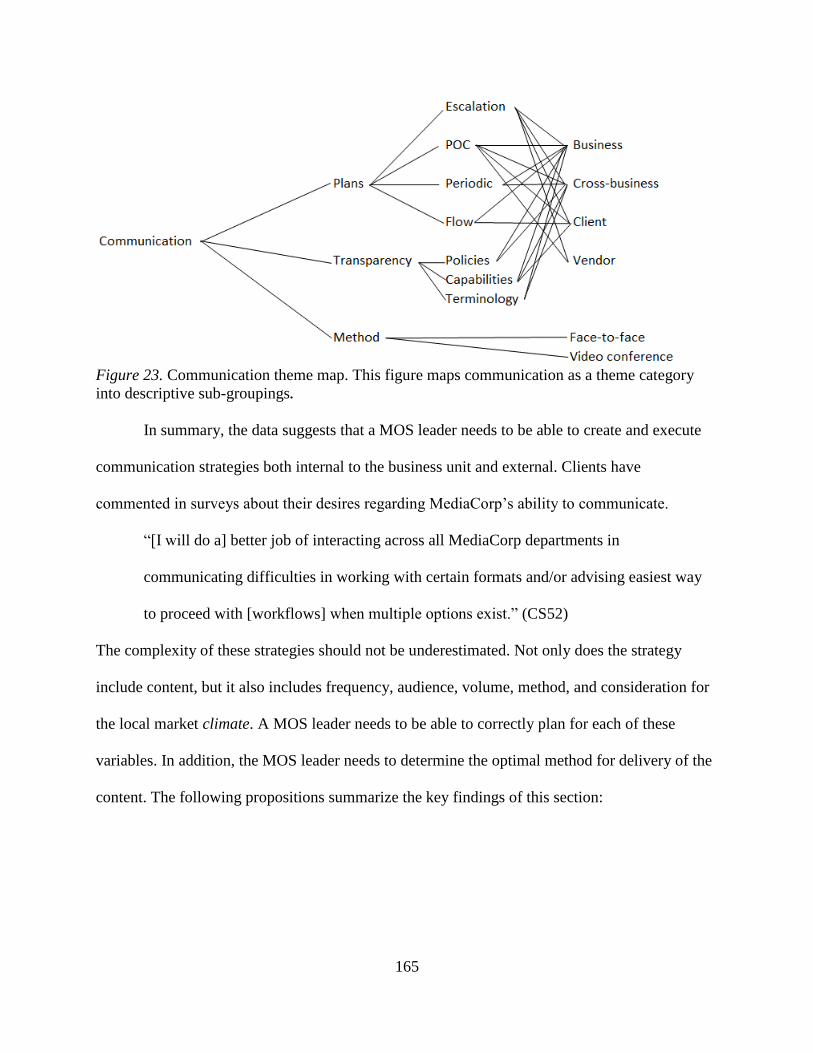
165
Figure 23. Communication theme map. This figure maps communication as a theme category
into descriptive sub-groupings.
In summary, the data suggests that a MOS leader needs to be able to create and execute
communication strategies both internal to the business unit and external. Clients have
commented in surveys about their desires regarding MediaCorp’s ability to communicate.
“[I will do a] better job of interacting across all MediaCorp departments in
communicating difficulties in working with certain formats and/or advising easiest way
to proceed with [workflows] when multiple options exist.” (CS52)
The complexity of these strategies should not be underestimated. Not only does the strategy
include content, but it also includes frequency, audience, volume, method, and consideration for
the local market climate. A MOS leader needs to be able to correctly plan for each of these
variables. In addition, the MOS leader needs to determine the optimal method for delivery of the
content. The following propositions summarize the key findings of this section:
166
Proposition 10 (structured communication): Communication is situationally
routed and structured to include escalation paths, optimal timing, and a focused
scope.
Proposition 11 (communication strategy): Communication should be optimally
frequent, transparent, correctly routed, and timely executed to reduce ambiguity
driven waste.
Revenue growth. The sixth category relates to revenue, specifically as it relates to
profitable growth. Growth synergies, when experienced, will improve financial performance
depending on the revenue opportunity. With cost controls, this will turn into an enhanced
contribution margin. To ensure profitability, revenue must be pursued with a margin in mind. A
MOS leader needs to be able to stimulate revenue locally and globally.
“[I will] partner with both inter-divisional and extra-divisional resources … to capitalize
on synergistic opportunities and coordination of business strategy to motivate revenue
capturing opportunities along the … supply chain.” (RH102)
The desirable attributes of capacity revenue growth potential relate to (a) adjacent markets, (b) a
growth strategy, (c) portfolio diversification, and (d) profitability enhancement activities.
Additional data for (a) suggests that it could be possible to transform existing products, services,
and infrastructure so as to enable the penetration of adjacent markets with products that are
synergistic to the existing portfolio, infrastructure, and workflows. Additional data for (b)
suggests that growth should be considered in the context of local markets, across geographic
boundaries, with the goal to increase market share, and in regards to new business opportunities.
Additional data for (c) suggests that diversification should be pursued with two interests in mind:
expanding the product and service offering and creating next-generation products to stay ahead
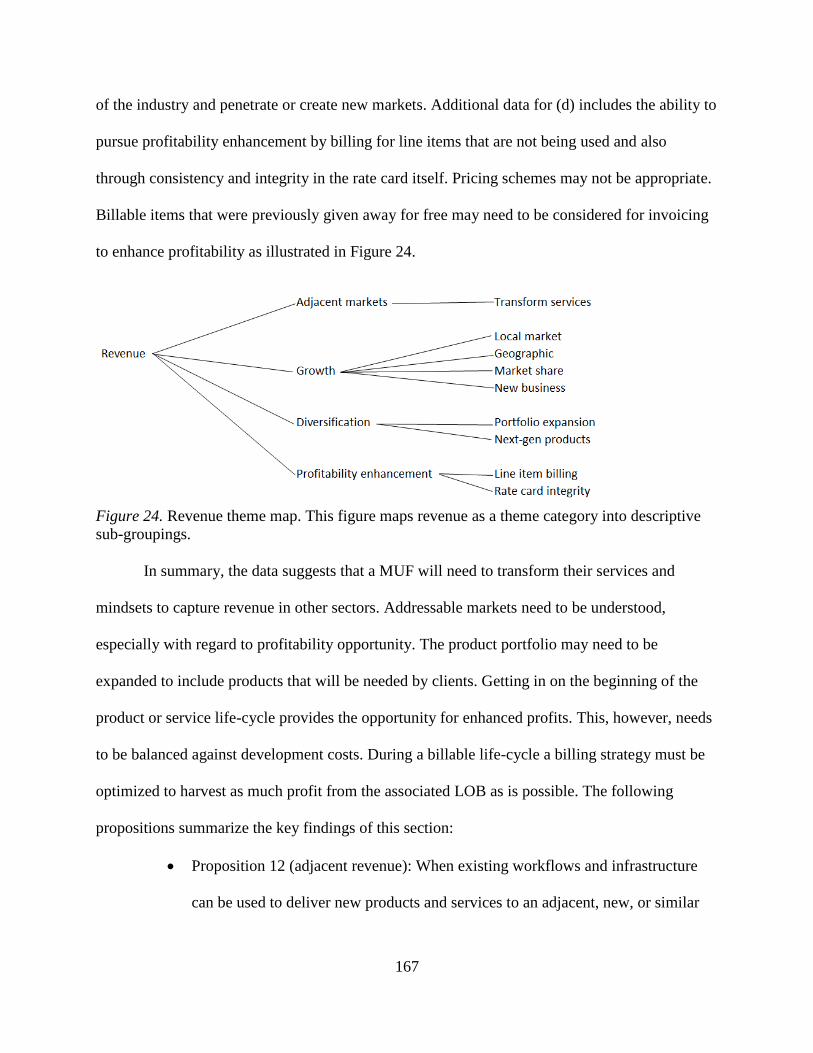
167
of the industry and penetrate or create new markets. Additional data for (d) includes the ability to
pursue profitability enhancement by billing for line items that are not being used and also
through consistency and integrity in the rate card itself. Pricing schemes may not be appropriate.
Billable items that were previously given away for free may need to be considered for invoicing
to enhance profitability as illustrated in Figure 24.
Figure 24. Revenue theme map. This figure maps revenue as a theme category into descriptive
sub-groupings.
In summary, the data suggests that a MUF will need to transform their services and
mindsets to capture revenue in other sectors. Addressable markets need to be understood,
especially with regard to profitability opportunity. The product portfolio may need to be
expanded to include products that will be needed by clients. Getting in on the beginning of the
product or service life-cycle provides the opportunity for enhanced profits. This, however, needs
to be balanced against development costs. During a billable life-cycle a billing strategy must be
optimized to harvest as much profit from the associated LOB as is possible. The following
propositions summarize the key findings of this section:
Proposition 12 (adjacent revenue): When existing workflows and infrastructure
can be used to deliver new products and services to an adjacent, new, or similar
168
market in a different geography, there may be an opportunity for synergistic
profitability.
Proposition 13 (structured pricing): Pricing structures applied after the jump-off
point in the life-cycle of a product or service may need to be reviewed to include
line items that previously were discounted or given away as loss leaders.
Operational performance. This section combines six sections that fall under operational
performance. The data suggests that the MOS leader must understand operational performance to
be an effective contributor to company growth.
“[I] work closely with facility leaders worldwide, to improve business metrics and
operational data (lowering costs, increasing throughput, higher quality, etc.) on … [LOB]
by transforming the way we perform various … services.” (RH1)
“[I] provide global operations support to local office leaders for the expansion of …
services, with a focus on scalability and reliability.” (RH22)
According to the MOS leaders, the desirable attributes of operational performance are (a)
security, (b) transparency, (c) problem solving, (d) financial aspects, (e) best practices, and (f)
asset management. Additional data for (a) suggests that security is directly related to compliance
with controls already in place. Even so, the business unit is continually taking advantage of the
opportunity to enhance controls proactively in light of the dynamic threat-scape. Additional data
for (b) suggests that transparency is bi-directional; the role of listener and speaker may alternate.
This information exchange includes requirements or specifications, a performance scorecard that
reflects quality and reliability, and the deployment and exposure of effective productivity
metrics. Additional data for (c) suggests that problem solving is critical to revenue growth and
includes resolving new workflow deployment issues, corrective actions when errors are made,
169
the ability to discover opportunities, the ability to innovate, and the introduction of value-added
products that solve customer problems. This is important to clients’ perception of MediaCorp’s
abilities, as reflected in a client survey response.
“…the gap has now been plugged and was dealt with swiftly and professionally.” (CS34)
Additional data for (d) includes financial aspects of business unit performance, including fair and
acceptable revenue allocations, billing velocity that does not tie up cash, and standard financial
reporting through a worldwide P&L that is timely and meaningful. Additional data for (e)
suggests that best practices are important to capture, create, model, and propagate horizontally
across locations. MOS leaders help unify operations around excellence, produce skills, and lead
continuous process improvement. The data specifically suggests an appropriate methodology,
lean sigma, as an example. Additional data for (f) suggests that assets are important to clients and
must be tracked while they are in the custody of MediaCorp. Additionally they have to be purged
or immediately returned once they have been used. Otherwise, they are a security risk and a
burden to the vault. Best practices apply to a variety of operational functions, all of which are the
responsibility of horizontal leaders who push policy across locations to improve operational
performance as illustrated in Figure 25.
“[I] partner with local leaders to drive unification, standardization, centralization and
operational efficiencies across key WW … locations.” (RH7)
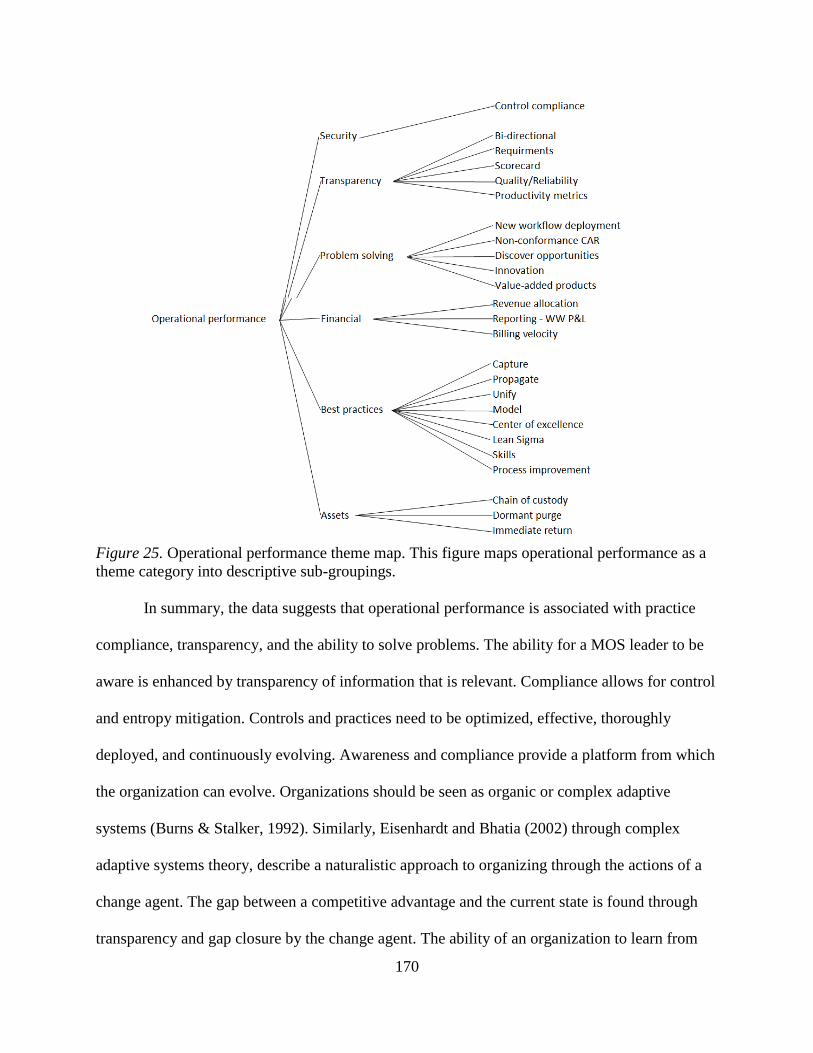
170
Figure 25. Operational performance theme map. This figure maps operational performance as a
theme category into descriptive sub-groupings.
In summary, the data suggests that operational performance is associated with practice
compliance, transparency, and the ability to solve problems. The ability for a MOS leader to be
aware is enhanced by transparency of information that is relevant. Compliance allows for control
and entropy mitigation. Controls and practices need to be optimized, effective, thoroughly
deployed, and continuously evolving. Awareness and compliance provide a platform from which
the organization can evolve. Organizations should be seen as organic or complex adaptive
systems (Burns & Stalker, 1992). Similarly, Eisenhardt and Bhatia (2002) through complex
adaptive systems theory, describe a naturalistic approach to organizing through the actions of a
change agent. The gap between a competitive advantage and the current state is found through
transparency and gap closure by the change agent. The ability of an organization to learn from
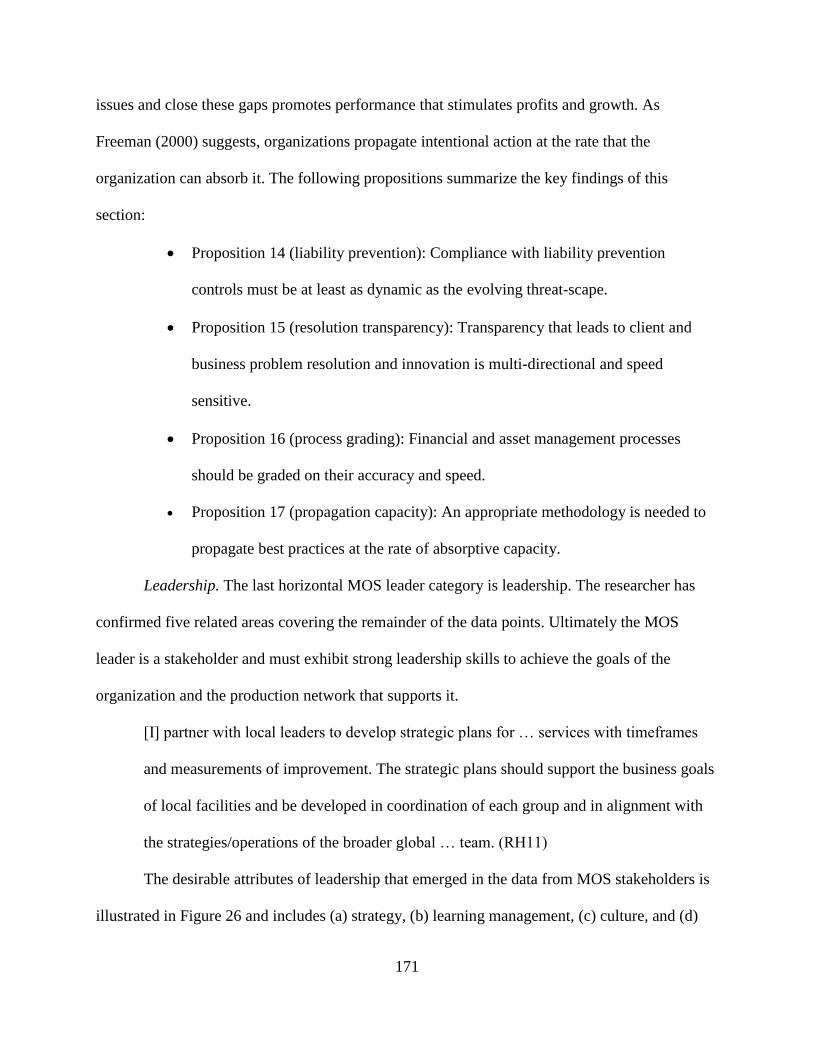
171
issues and close these gaps promotes performance that stimulates profits and growth. As
Freeman (2000) suggests, organizations propagate intentional action at the rate that the
organization can absorb it. The following propositions summarize the key findings of this
section:
Proposition 14 (liability prevention): Compliance with liability prevention
controls must be at least as dynamic as the evolving threat-scape.
Proposition 15 (resolution transparency): Transparency that leads to client and
business problem resolution and innovation is multi-directional and speed
sensitive.
Proposition 16 (process grading): Financial and asset management processes
should be graded on their accuracy and speed.
Proposition 17 (propagation capacity): An appropriate methodology is needed to
propagate best practices at the rate of absorptive capacity.
Leadership. The last horizontal MOS leader category is leadership. The researcher has
confirmed five related areas covering the remainder of the data points. Ultimately the MOS
leader is a stakeholder and must exhibit strong leadership skills to achieve the goals of the
organization and the production network that supports it.
[I] partner with local leaders to develop strategic plans for … services with timeframes
and measurements of improvement. The strategic plans should support the business goals
of local facilities and be developed in coordination of each group and in alignment with
the strategies/operations of the broader global … team. (RH11)
The desirable attributes of leadership that emerged in the data from MOS stakeholders is
illustrated in Figure 26 and includes (a) strategy, (b) learning management, (c) culture, and (d)
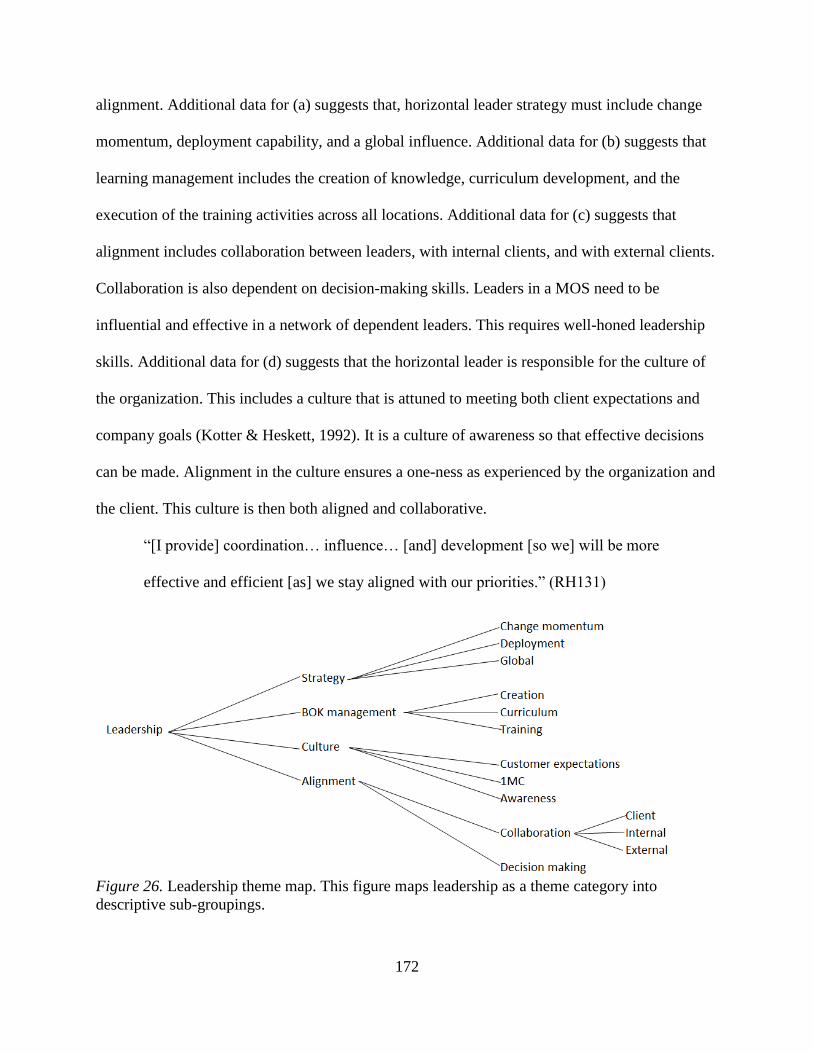
172
alignment. Additional data for (a) suggests that, horizontal leader strategy must include change
momentum, deployment capability, and a global influence. Additional data for (b) suggests that
learning management includes the creation of knowledge, curriculum development, and the
execution of the training activities across all locations. Additional data for (c) suggests that
alignment includes collaboration between leaders, with internal clients, and with external clients.
Collaboration is also dependent on decision-making skills. Leaders in a MOS need to be
influential and effective in a network of dependent leaders. This requires well-honed leadership
skills. Additional data for (d) suggests that the horizontal leader is responsible for the culture of
the organization. This includes a culture that is attuned to meeting both client expectations and
company goals (Kotter & Heskett, 1992). It is a culture of awareness so that effective decisions
can be made. Alignment in the culture ensures a one-ness as experienced by the organization and
the client. This culture is then both aligned and collaborative.
“[I provide] coordination… influence… [and] development [so we] will be more
effective and efficient [as] we stay aligned with our priorities.” (RH131)
Figure 26. Leadership theme map. This figure maps leadership as a theme category into
descriptive sub-groupings.
173
In summary, the data suggests that leadership is a strong component for MOS leadership
success. Horizontal leaders have indicated from the data that they need to manage their business
unit culture, exploit a managed body of knowledge, have alignment within their staff, and
execute an effective strategy. The strategy that is deployed, along with the managed culture, need
to be aligned with the values and norms of the MUF as a whole. Alignment facilitates speed with
regard to decision making. Decision robustness and timing are enhanced through a culture of
collaboration. The following propositions summarize the key findings of this section:
Proposition 18 (strategy momentum): The strategy for a global deployment must
include consideration for change management momentum and the organization’s
capability to effectively deploy.
Proposition 19 (augmented awareness): Leadership efficacy is dependent on
environmental awareness augmented by a culture of purpose-driven learning.
Summary of horizontal themes. This section exposed data collected from horizontal
leaders about attributes needed to be successful in a MOS. It is clear from the data that horizontal
leaders are primarily concerned with the consistent usage of a business system for transparency,
effective capacity utilization, cost mapping and management, standardization, an effective
communication strategy, a revenue growth strategy, and leadership that results in effective
operational performance. The evidence from this study suggests that horizontal leaders who
effectively influence the horizontal dimension in a MOS are critical to growth synergies in a
multi-unit global enterprise in a moderately dynamic market. Horizontalization through effective,
focused strategy also leads to improved profitability.
Vertical dimension. The role of location leaders is critical to the effective application of a
MOS. These leaders influence and control the vertical dimension in the MOS model. Northouse
174
(2013) suggests that “Leadership is a process whereby an individual influences a group of
individuals to achieve a common goal” (p. 5). There is variety in each dimension and the vertical
dimension is no exception. These leaders and locations are divided into three categories:
storefront, semi-storefront, and off-load. Storefront basically means that the operational part of a
high-cost location (ex. New York, Tokyo, or London) is extracted and a dependency is created
for operational services with other locations that have a lower cost. The storefront location then,
ideally, has only two main functions: outward facing coordination with clients and coordination
with other locations within the production network where operational capacity is leveraged. This
establishes a presence in high-cost locations where customers typically have offices and a
capability to produce within an optimal cost structure. To be clear, the objective of the storefront
model is not about cost reduction, but rather about growth and profitability. The idea is to exploit
the addressable market in the high-cost location. Absent the deployment of the model, the
capacity is limited by what the location team can process. With the deployment of the network
production plan, the capacity can be exceeded as the location can tap into the capacity of the
network. This influences the profitability of the location because labor is on-demand when
needed and so is only a cost when needed. This virtually eliminates carrying costs. Additionally,
the labor that is used is cheaper, as it is from a low cost center, and so it creates a margin. The
location leader, not limited by the capacity of the location team, is now able to aggressively
pursue the addressable market. The leader is able to augment his outward facing staff to help
with the project management of the increased volume by pulling people from the back to fill
these needed positions in the front. This works well because they are already known, they
perform well, they know the product, and the recruiting effort for the high-cost location is
eliminated. This model typically allows for a 50% to 70% reduction in total labor cost at the

175
location and allows for lower pricing models with as good or better margins. The location is then
able to aggressively pursue clients where pricing is a barrier to entry. The client wants to see the
person who runs the operation. In this case, most of the operation is run virtually from the high-
cost location. This model invigorates the sales effort.
The execution of the model is challenged by confidence that needs to be built between
the off-load location and the sending location. Corporate bias might infer that this is simple and
thus, results may be required quickly. It is more of an evolution with a high degree of complexity
that must be pursued over time, but at an optimal pace. The off-load location needs to understand
the client’s unique requirements from each sending location. There are nuances that the off-load
site will not understand as they are not on-site and client facing. There are also known and
defined nuances, even between clients at the same location, increasing execution complexity.
The stakes are high, as failure results in the client redirecting work to another vendor. This is
resolved by having key people come from the off-load facility to the high-cost storefront location
so that they can know the local team, acquire the culture, feel the heat from the client, and create
internal and external client relationships. These people typically function well as location
representatives back in the off-load site. They are a single point of contact and help with the
implementation of requirements. Once the off-load team has established confidence, then the
storefront location becomes dependent and the work can be moved gradually with the associated
benefit to profitability. Once the team at the storefront is minimized, it is easier to move them,
allowing for real-estate consolidation and reduced facility cost. From there it becomes a capacity
scheduling and utilization exercise across all storefront locations. Capability, compatibility,
expertise, and collaborative ability come into play.
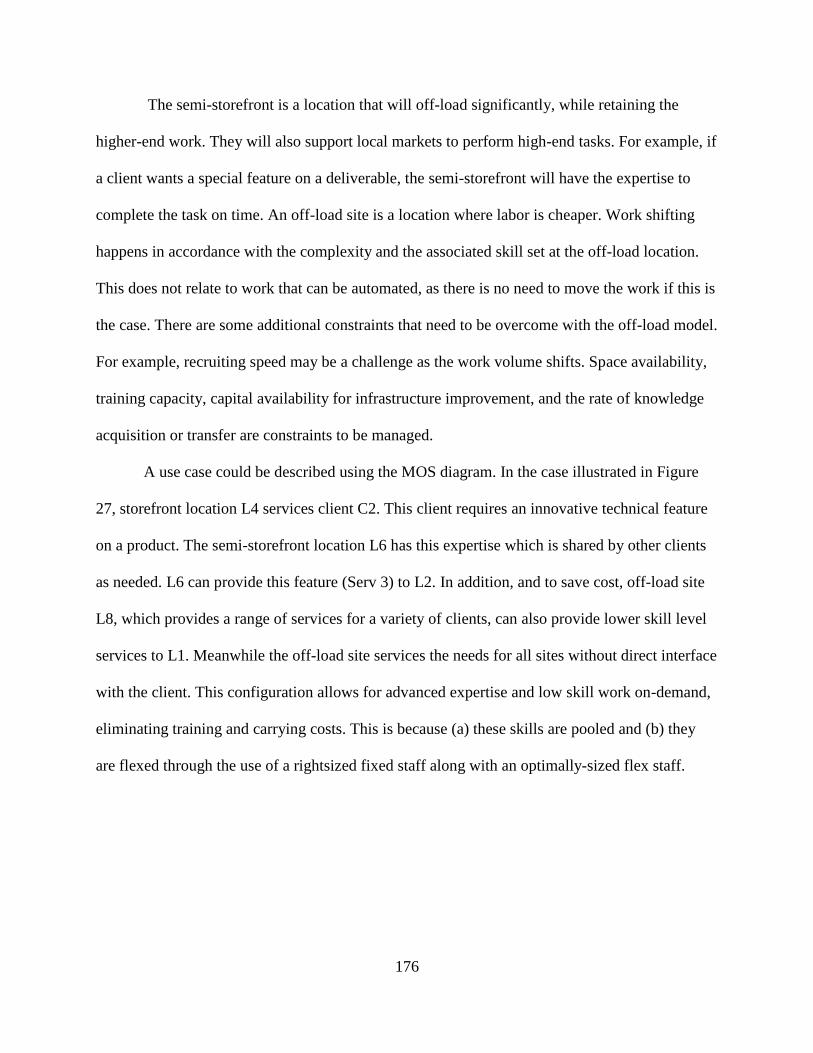
176
The semi-storefront is a location that will off-load significantly, while retaining the
higher-end work. They will also support local markets to perform high-end tasks. For example, if
a client wants a special feature on a deliverable, the semi-storefront will have the expertise to
complete the task on time. An off-load site is a location where labor is cheaper. Work shifting
happens in accordance with the complexity and the associated skill set at the off-load location.
This does not relate to work that can be automated, as there is no need to move the work if this is
the case. There are some additional constraints that need to be overcome with the off-load model.
For example, recruiting speed may be a challenge as the work volume shifts. Space availability,
training capacity, capital availability for infrastructure improvement, and the rate of knowledge
acquisition or transfer are constraints to be managed.
A use case could be described using the MOS diagram. In the case illustrated in Figure
27, storefront location L4 services client C2. This client requires an innovative technical feature
on a product. The semi-storefront location L6 has this expertise which is shared by other clients
as needed. L6 can provide this feature (Serv 3) to L2. In addition, and to save cost, off-load site
L8, which provides a range of services for a variety of clients, can also provide lower skill level
services to L1. Meanwhile the off-load site services the needs for all sites without direct interface
with the client. This configuration allows for advanced expertise and low skill work on-demand,
eliminating training and carrying costs. This is because (a) these skills are pooled and (b) they
are flexed through the use of a rightsized fixed staff along with an optimally-sized flex staff.
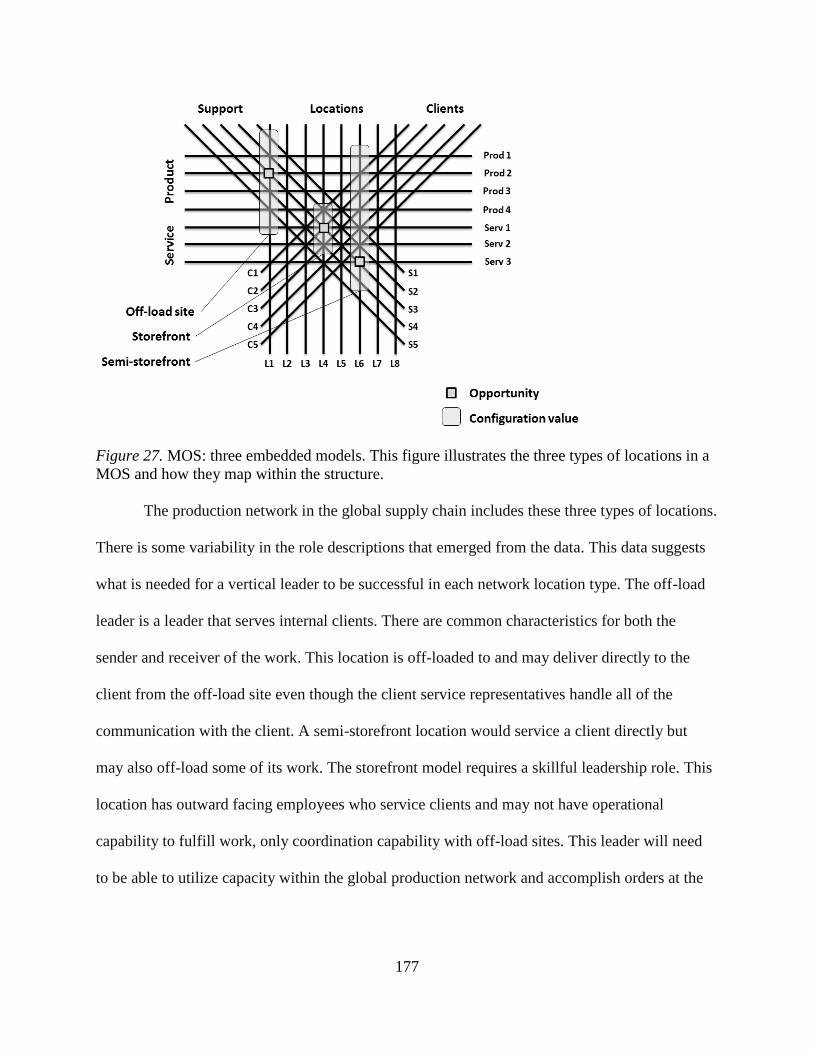
177
Figure 27. MOS: three embedded models. This figure illustrates the three types of locations in a
MOS and how they map within the structure.
The production network in the global supply chain includes these three types of locations.
There is some variability in the role descriptions that emerged from the data. This data suggests
what is needed for a vertical leader to be successful in each network location type. The off-load
leader is a leader that serves internal clients. There are common characteristics for both the
sender and receiver of the work. This location is off-loaded to and may deliver directly to the
client from the off-load site even though the client service representatives handle all of the
communication with the client. A semi-storefront location would service a client directly but
may also off-load some of its work. The storefront model requires a skillful leadership role. This
location has outward facing employees who service clients and may not have operational
capability to fulfill work, only coordination capability with off-load sites. This leader will need
to be able to utilize capacity within the global production network and accomplish orders at the
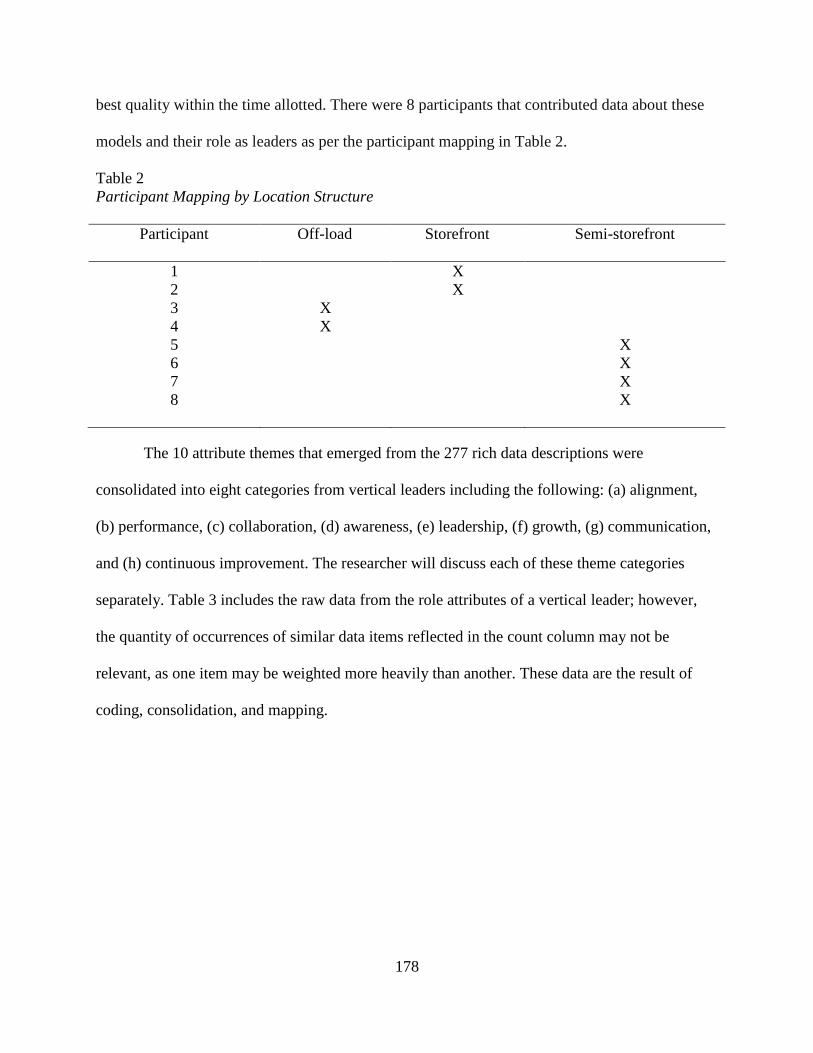
178
best quality within the time allotted. There were 8 participants that contributed data about these
models and their role as leaders as per the participant mapping in Table 2.
Table 2
Participant Mapping by Location Structure
Participant
Off-load Storefront Semi-storefront
1 X
2 X
3 X
4 X
5 X
6 X
7 X
8 X
The 10 attribute themes that emerged from the 277 rich data descriptions were
consolidated into eight categories from vertical leaders including the following: (a) alignment,
(b) performance, (c) collaboration, (d) awareness, (e) leadership, (f) growth, (g) communication,
and (h) continuous improvement. The researcher will discuss each of these theme categories
separately. Table 3 includes the raw data from the role attributes of a vertical leader; however,
the quantity of occurrences of similar data items reflected in the count column may not be
relevant, as one item may be weighted more heavily than another. These data are the result of
coding, consolidation, and mapping.
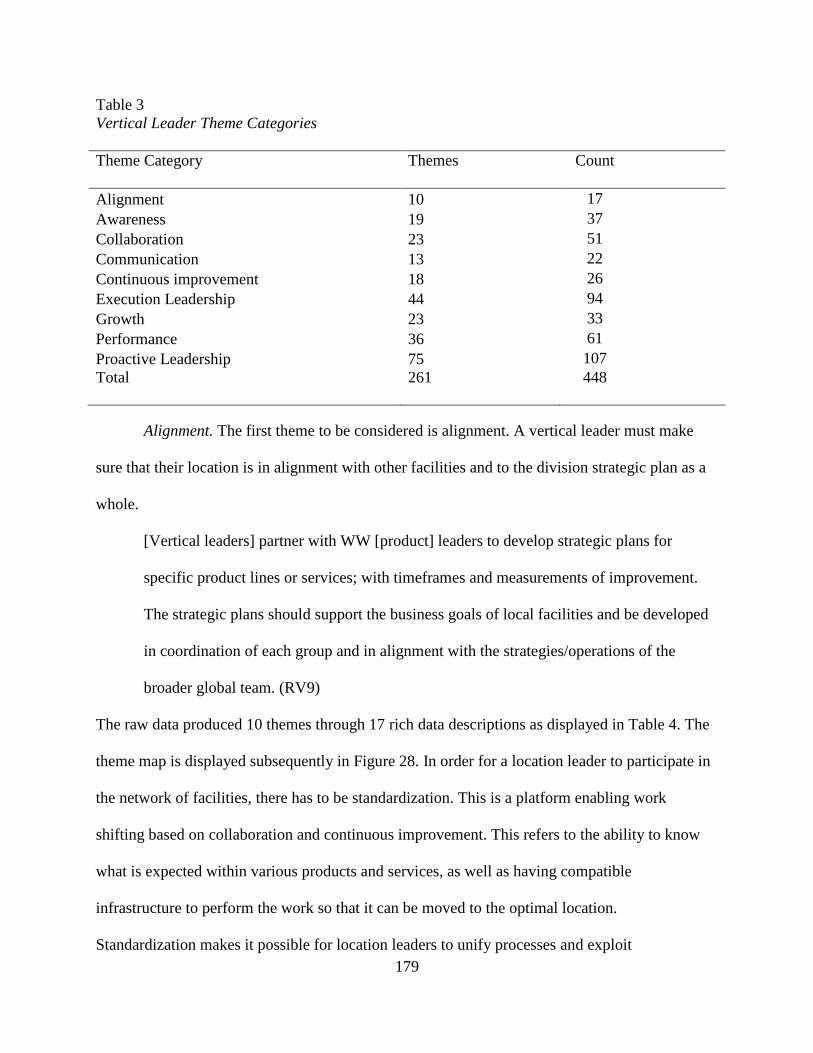
179
Table 3
Vertical Leader Theme Categories
Theme Category
Themes
Count
Alignment 10 17
Awareness 19 37
Collaboration 23 51
Communication 13 22
Continuous improvement 18 26
Execution Leadership 44 94
Growth 23 33
Performance 36 61
Proactive Leadership 75 107
Total
261
448
Alignment. The first theme to be considered is alignment. A vertical leader must make
sure that their location is in alignment with other facilities and to the division strategic plan as a
whole.
[Vertical leaders] partner with WW [product] leaders to develop strategic plans for
specific product lines or services; with timeframes and measurements of improvement.
The strategic plans should support the business goals of local facilities and be developed
in coordination of each group and in alignment with the strategies/operations of the
broader global team. (RV9)
The raw data produced 10 themes through 17 rich data descriptions as displayed in Table 4. The
theme map is displayed subsequently in Figure 28. In order for a location leader to participate in
the network of facilities, there has to be standardization. This is a platform enabling work
shifting based on collaboration and continuous improvement. This refers to the ability to know
what is expected within various products and services, as well as having compatible
infrastructure to perform the work so that it can be moved to the optimal location.
Standardization makes it possible for location leaders to unify processes and exploit
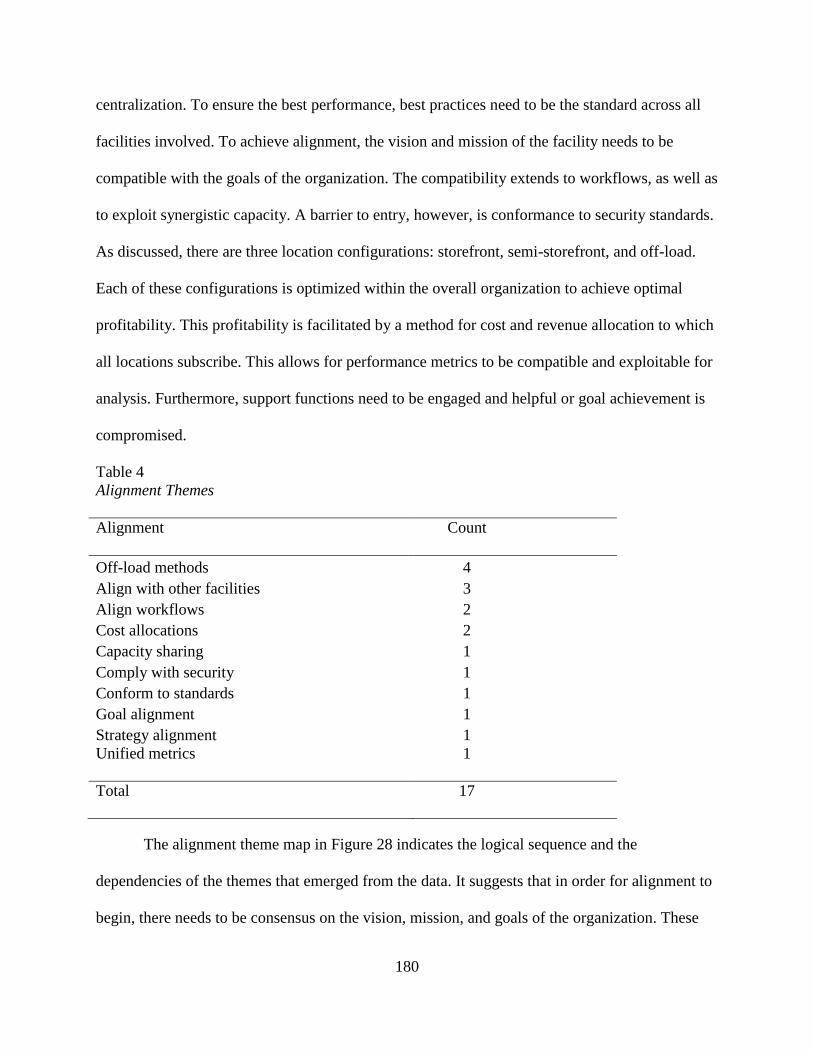
180
centralization. To ensure the best performance, best practices need to be the standard across all
facilities involved. To achieve alignment, the vision and mission of the facility needs to be
compatible with the goals of the organization. The compatibility extends to workflows, as well as
to exploit synergistic capacity. A barrier to entry, however, is conformance to security standards.
As discussed, there are three location configurations: storefront, semi-storefront, and off-load.
Each of these configurations is optimized within the overall organization to achieve optimal
profitability. This profitability is facilitated by a method for cost and revenue allocation to which
all locations subscribe. This allows for performance metrics to be compatible and exploitable for
analysis. Furthermore, support functions need to be engaged and helpful or goal achievement is
compromised.
Table 4
Alignment Themes
Alignment
Count
Off-load methods 4
Align with other facilities 3
Align workflows 2
Cost allocations 2
Capacity sharing 1
Comply with security 1
Conform to standards 1
Goal alignment 1
Strategy alignment 1
Unified metrics
1
Total
17
The alignment theme map in Figure 28 indicates the logical sequence and the
dependencies of the themes that emerged from the data. It suggests that in order for alignment to
begin, there needs to be consensus on the vision, mission, and goals of the organization. These
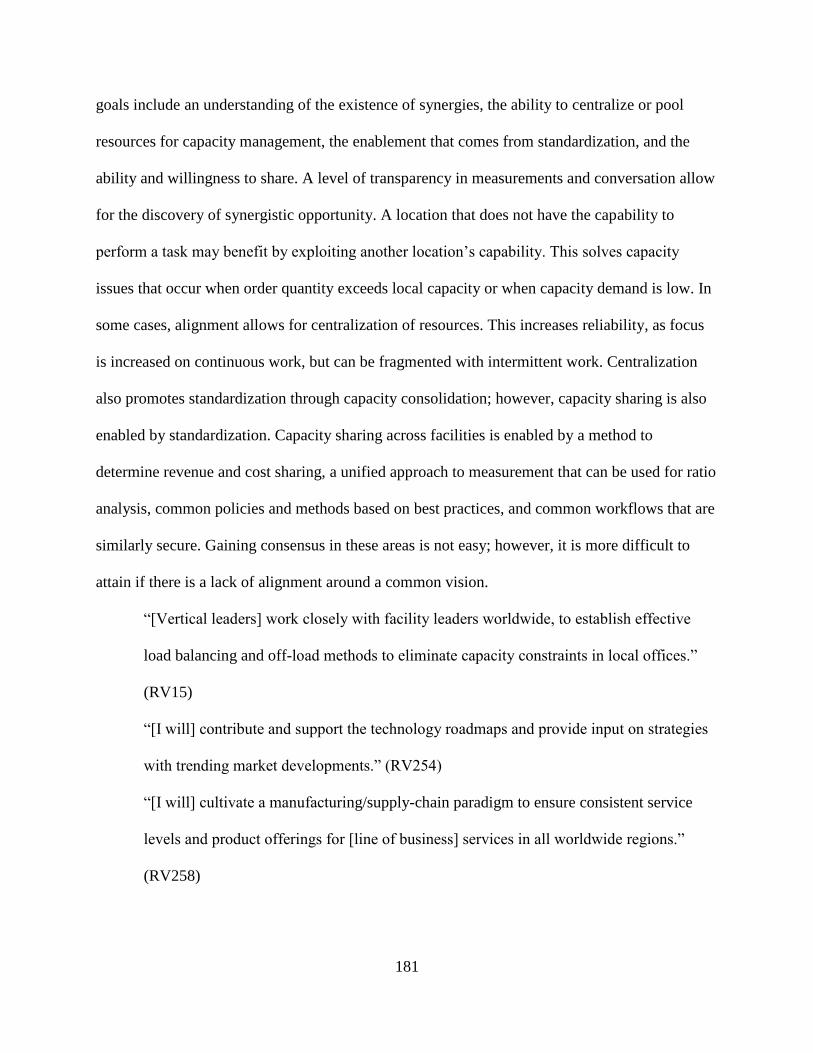
181
goals include an understanding of the existence of synergies, the ability to centralize or pool
resources for capacity management, the enablement that comes from standardization, and the
ability and willingness to share. A level of transparency in measurements and conversation allow
for the discovery of synergistic opportunity. A location that does not have the capability to
perform a task may benefit by exploiting another location’s capability. This solves capacity
issues that occur when order quantity exceeds local capacity or when capacity demand is low. In
some cases, alignment allows for centralization of resources. This increases reliability, as focus
is increased on continuous work, but can be fragmented with intermittent work. Centralization
also promotes standardization through capacity consolidation; however, capacity sharing is also
enabled by standardization. Capacity sharing across facilities is enabled by a method to
determine revenue and cost sharing, a unified approach to measurement that can be used for ratio
analysis, common policies and methods based on best practices, and common workflows that are
similarly secure. Gaining consensus in these areas is not easy; however, it is more difficult to
attain if there is a lack of alignment around a common vision.
“[Vertical leaders] work closely with facility leaders worldwide, to establish effective
load balancing and off-load methods to eliminate capacity constraints in local offices.”
(RV15)
“[I will] contribute and support the technology roadmaps and provide input on strategies
with trending market developments.” (RV254)
“[I will] cultivate a manufacturing/supply-chain paradigm to ensure consistent service
levels and product offerings for [line of business] services in all worldwide regions.”
(RV258)
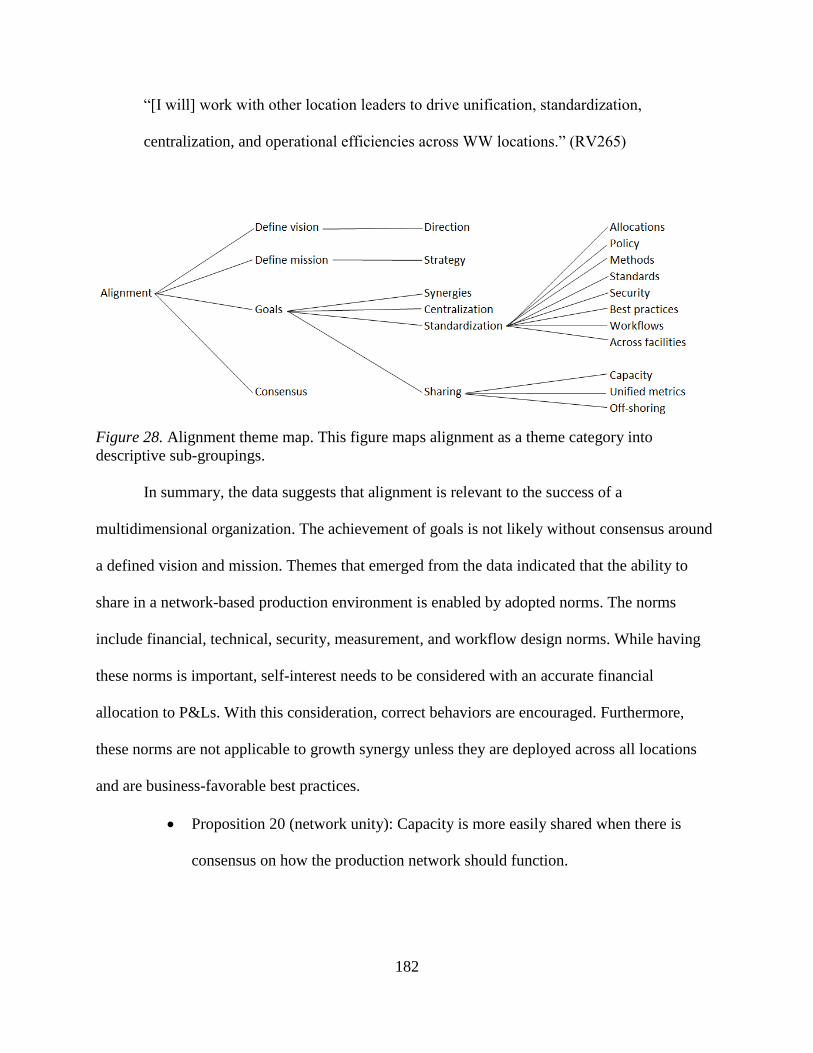
182
“[I will] work with other location leaders to drive unification, standardization,
centralization, and operational efficiencies across WW locations.” (RV265)
Figure 28. Alignment theme map. This figure maps alignment as a theme category into
descriptive sub-groupings.
In summary, the data suggests that alignment is relevant to the success of a
multidimensional organization. The achievement of goals is not likely without consensus around
a defined vision and mission. Themes that emerged from the data indicated that the ability to
share in a network-based production environment is enabled by adopted norms. The norms
include financial, technical, security, measurement, and workflow design norms. While having
these norms is important, self-interest needs to be considered with an accurate financial
allocation to P&Ls. With this consideration, correct behaviors are encouraged. Furthermore,
these norms are not applicable to growth synergy unless they are deployed across all locations
and are business-favorable best practices.
Proposition 20 (network unity): Capacity is more easily shared when there is
consensus on how the production network should function.
183
Proposition 21 (geographic diversity): Alignment enhances profitability through
the exploitation of geographically diverse but synergistic workflows based on best
practice.
Proposition 22 (mission-vision): Measurable goals must to be directionally
aligned with the firm’s mission and vision.
Performance. The table of emergent data for performance indicates that vertical leaders
are driven by efficiency and growth; however, due to financial pressures, the most frequent
comment related to the ability to move work where capacity was available. Of course, this is not
of interest unless the performance levels are suitable. All locations needed to embrace
performance excellence in order for them to be considered for the shifting of work. The result of
the shifting also allows locations to accept orders of a size that exceeded their capacity. This
practice would then reflect positively on their P&Ls.
“[I] enlist the operational leads in assisting with cost reduction and efficiency
improvement.” (RV146)
Vertical leaders see efficiency and cost reduction as an ongoing and critical activity. Before
performance can be improved, the existing situation, through operational data, must be
understood.
“[I will] develop a relationship with finance to make sure [we] are reviewing and
understanding the numbers.” (RV152)
While performance improvements are being achieved, there can be no impact to business
continuity or client satisfaction. If quality performance is compromised, then expectations to
achieve increased market share are at risk. Operational excellence is supported by an
infrastructure and human resource that performs with consistent excellence regardless of the
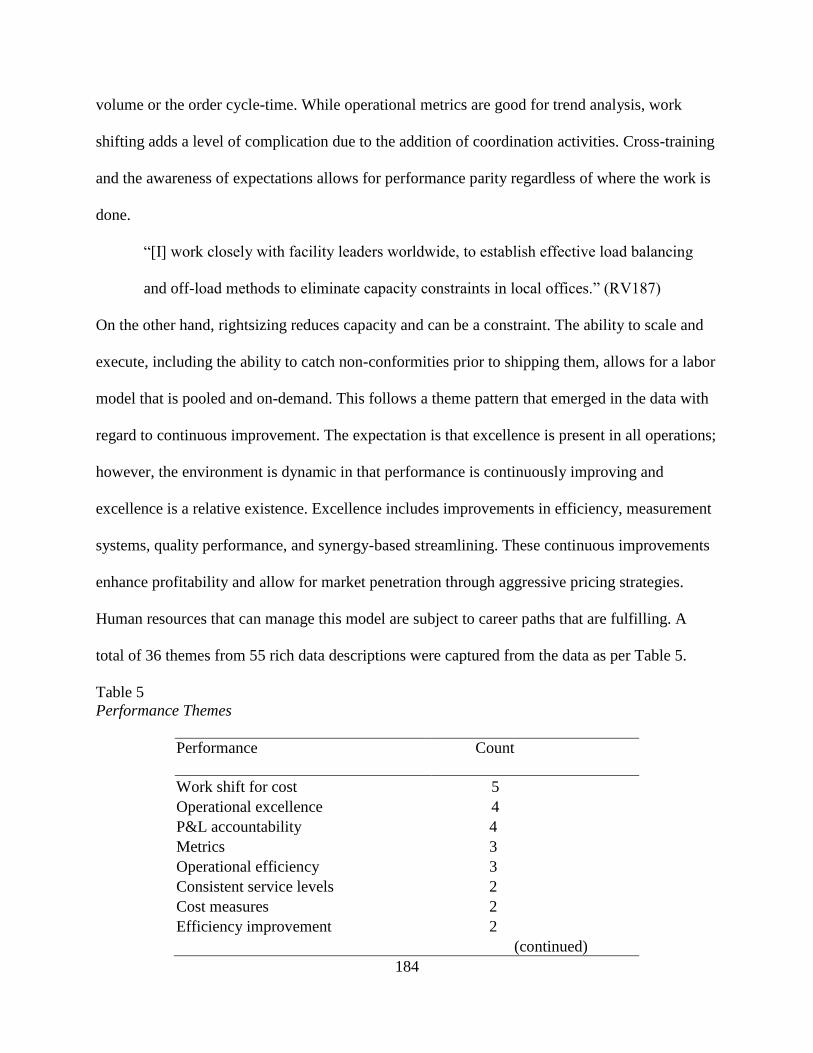
184
volume or the order cycle-time. While operational metrics are good for trend analysis, work
shifting adds a level of complication due to the addition of coordination activities. Cross-training
and the awareness of expectations allows for performance parity regardless of where the work is
done.
“[I] work closely with facility leaders worldwide, to establish effective load balancing
and off-load methods to eliminate capacity constraints in local offices.” (RV187)
On the other hand, rightsizing reduces capacity and can be a constraint. The ability to scale and
execute, including the ability to catch non-conformities prior to shipping them, allows for a labor
model that is pooled and on-demand. This follows a theme pattern that emerged in the data with
regard to continuous improvement. The expectation is that excellence is present in all operations;
however, the environment is dynamic in that performance is continuously improving and
excellence is a relative existence. Excellence includes improvements in efficiency, measurement
systems, quality performance, and synergy-based streamlining. These continuous improvements
enhance profitability and allow for market penetration through aggressive pricing strategies.
Human resources that can manage this model are subject to career paths that are fulfilling. A
total of 36 themes from 55 rich data descriptions were captured from the data as per Table 5.
Table 5
Performance Themes
Performance
Count
Work shift for cost 5
Operational excellence 4
P&L accountability 4
Metrics 3
Operational efficiency 3
Consistent service levels 2
Cost measures 2
Efficiency improvement 2
(continued)
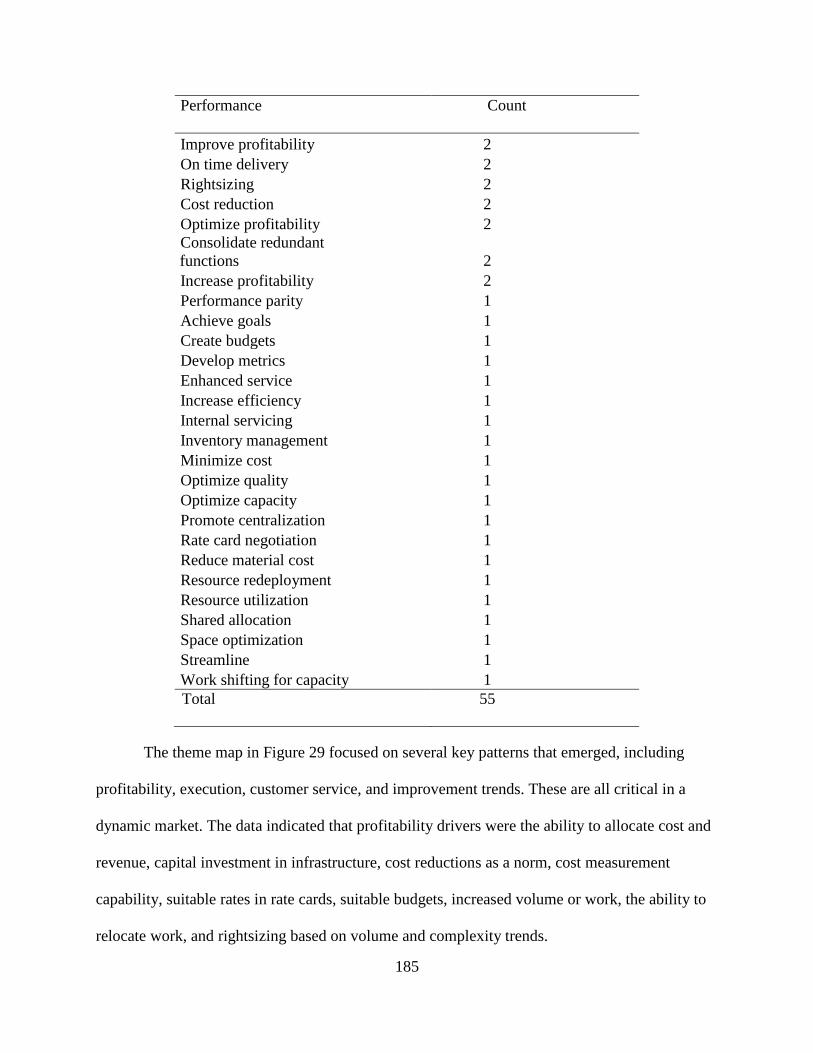
185
Performance
Count
Improve profitability 2
On time delivery 2
Rightsizing 2
Cost reduction 2
Optimize profitability 2
Consolidate redundant
functions 2
Increase profitability 2
Performance parity 1
Achieve goals 1
Create budgets 1
Develop metrics 1
Enhanced service 1
Increase efficiency 1
Internal servicing 1
Inventory management 1
Minimize cost 1
Optimize quality 1
Optimize capacity 1
Promote centralization 1
Rate card negotiation 1
Reduce material cost 1
Resource redeployment 1
Resource utilization 1
Shared allocation 1
Space optimization 1
Streamline 1
Work shifting for capacity 1
Total Total
55
The theme map in Figure 29 focused on several key patterns that emerged, including
profitability, execution, customer service, and improvement trends. These are all critical in a
dynamic market. The data indicated that profitability drivers were the ability to allocate cost and
revenue, capital investment in infrastructure, cost reductions as a norm, cost measurement
capability, suitable rates in rate cards, suitable budgets, increased volume or work, the ability to
relocate work, and rightsizing based on volume and complexity trends.
186
“[I am] responsible for [location] P&L; to improve profitability of all product lines,
[while] leveraging global resources.” (RV23)
Success, with regard to profitability, can be seen in P&Ls, the achievement of goals, meeting
client expectations, a consistent and robust product, the optimization of location capability and
capacity, and minimized material costs. Performance and profitability are also related to the
ability of the organization to execute.
“[I will] ensure [location] facility is a [regional] center of operational excellence for
MediaCorp.” (RV49)
This theme pattern emerged in the data as being driven by a number of factors (or capabilities):
the capability to cross-train for enhanced human resource capability, effective performance
monitoring for awareness, risk mitigation, the will to pursue excellence, meaningful operational
metrics, the ability to detect errors before they ship, seamless work shifting, a centralization
paradigm, and the ability to redeploy resources effortlessly. Location leaders believe that with
execution driven by these capabilities, measurable performance comes as it relates to quality,
asset security, efficiency, on-time delivery, measurable excellence, inventory integrity, and
location capacity, resource, and space utilization. Vertical co-researchers also suggested that
customer satisfaction is a key theme with regard to performance. Customer satisfaction is
ensured through the following attributes: consistency in service levels, the conformance of
product to industry and customer standards, the tendency for increased market share, and the
ability to enhance products to solve customer problems. There are internal and external
customers in a supply chain. Excellent performance presents the best opportunity to satisfy both,
regardless of where the work is done.
187
“[I will] implement a manufacturing/supply-chain philosophy to ensure consistent service
levels and release dates to customers.”(RV110)
A performance culture should also lead to the ability for workers and leaders to advance. If
employees experience success, it should bring them personal success. This could be in the form
of a career path through succession planning. With this hope, there is potential for a reduction in
churn rate. A reduction in turnover cost positively influences profitability. The last aspect of
performance relates to the expectation of continuous improvement in performance. This pattern
was supported by themes that included continuous improvement in profitability, efficiency
performance, quality and reliability improvement, the ability to synergistically exploit existing
workflows, and streamlining.
“[I will] continually analyze cost structure to enable rightsizing costs, staff, and material
expenses and to keep costs in line with [an] evolving business model.” (RV313)
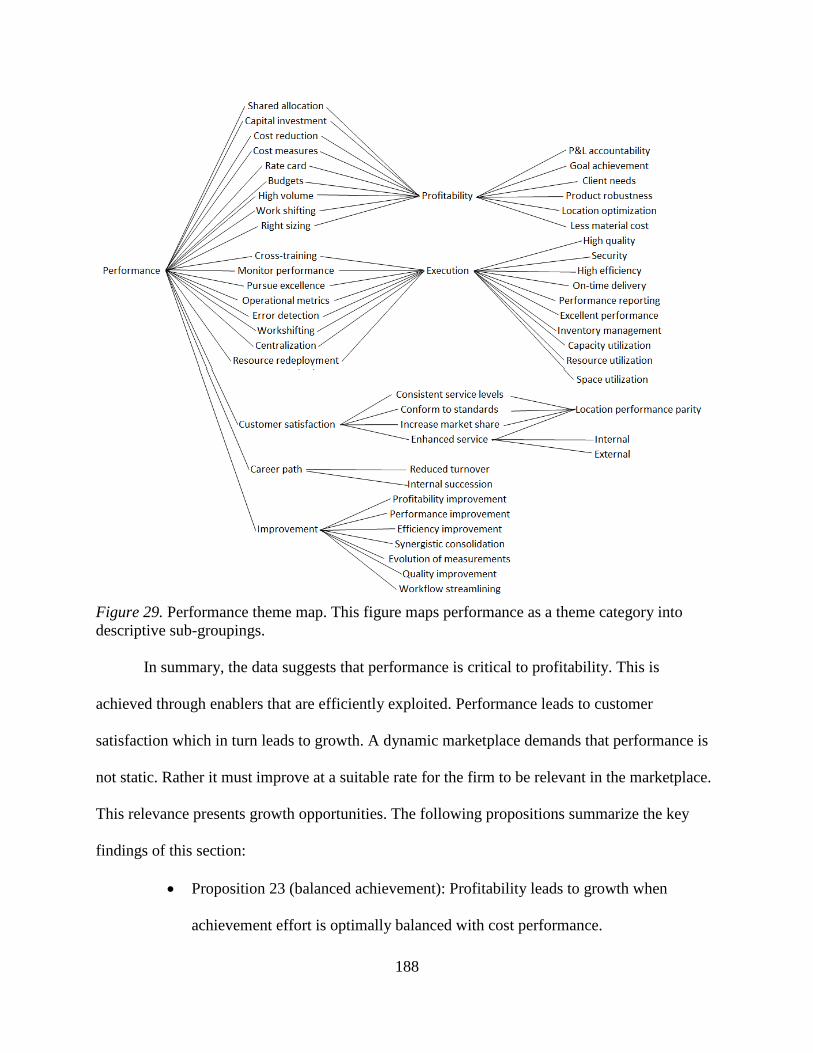
188
Figure 29. Performance theme map. This figure maps performance as a theme category into
descriptive sub-groupings.
In summary, the data suggests that performance is critical to profitability. This is
achieved through enablers that are efficiently exploited. Performance leads to customer
satisfaction which in turn leads to growth. A dynamic marketplace demands that performance is
not static. Rather it must improve at a suitable rate for the firm to be relevant in the marketplace.
This relevance presents growth opportunities. The following propositions summarize the key
findings of this section:
Proposition 23 (balanced achievement): Profitability leads to growth when
achievement effort is optimally balanced with cost performance.
189
Proposition 24 (workflow execution): Workflow performance excellence can lead
to increased market share when execution results are consistent with customer
expectations.
Proposition 25 (profitability enablers): Profitability enablers must be effectively
executed and timely to achieve desirable outcomes.
Proposition 26 (customer satisfaction): Consistent performance reliability that
conforms to evolving client expectations creates opportunities to increase market
share.
Proposition 27 (network capacity): Profitability is enabled by network production
capacity that is seamlessly guided by a propensity for excellence parity.
Proposition 28 (performance workers): High performance workers want to
achieve success in an operation that is measured, monitored, and knowledge rich.
Collaboration. Vertical leaders need to engage with other vertical leaders in the network-
based production environment to make sense of the activities around the precipitating event.
Leaders need to reach out to each other to make sense of lived experiences through participative
sense-making (Fuchs & De Jaegher, 2009). Participants in this study have worked together over
a significant period of time. Consequently, meaningful patterns of interaction have evolved. A
shared history helped participants to gauge the thoughts and reactions of their colleagues.
Collegial interaction helped participants create meaning through self-organized social
encounters, combined histories, and expectation alignment. Table 6 presents the 23 themes that
emerged from 51 rich data descriptions and which indicated that collaboration is critical to the
success of vertical leaders.
190
“[I will] work with sales to develop and pursue opportunities for … servicing in
[location] and support worldwide product servicing efforts.” (RV245)
The capacity in the network of locations cannot otherwise be leveraged for local production
needs which may exceed local capabilities. When demand is lower than available capacity, these
locations can engage in load balancing to avoid carrying costs and to avoid brain drain from their
own organization.
“[I will] work closely with facility leaders worldwide, to establish effective load
balancing and off-load methods to eliminate capacity constraints in local offices.”
(RV15)
Collaboration is also needed to evolve the organization. This relates to the sharing of knowledge
that is centered on capabilities. Technical or methods development could benefit other locations.
For example, a unique requirement at one location may become a requirement at another.
Through information sharing all locations can contribute to technology maturity and system
enhancement. Each vertical leader should also reach out to solicit assistance from support
functions. Feedback to off-load locations on their performance enables global learning and
capability parity in all locations. This enables work shifting to exploit unused capacity and lower
the cost of capacity.
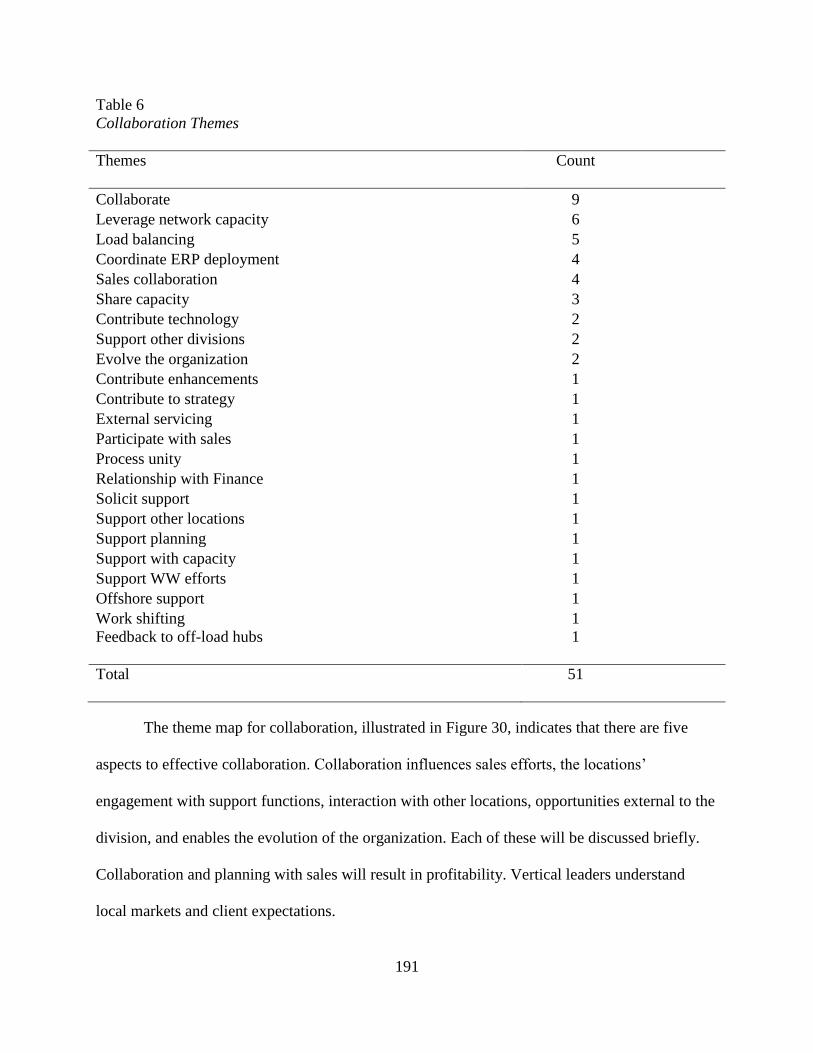
191
Table 6
Collaboration Themes
Themes
Count
Collaborate 9
Leverage network capacity 6
Load balancing 5
Coordinate ERP deployment 4
Sales collaboration 4
Share capacity 3
Contribute technology 2
Support other divisions 2
Evolve the organization 2
Contribute enhancements 1
Contribute to strategy 1
External servicing 1
Participate with sales 1
Process unity 1
Relationship with Finance 1
Solicit support 1
Support other locations 1
Support planning 1
Support with capacity 1
Support WW efforts 1
Offshore support 1
Work shifting 1
Feedback to off-load hubs
1
Total
51
The theme map for collaboration, illustrated in Figure 30, indicates that there are five
aspects to effective collaboration. Collaboration influences sales efforts, the locations’
engagement with support functions, interaction with other locations, opportunities external to the
division, and enables the evolution of the organization. Each of these will be discussed briefly.
Collaboration and planning with sales will result in profitability. Vertical leaders understand
local markets and client expectations.
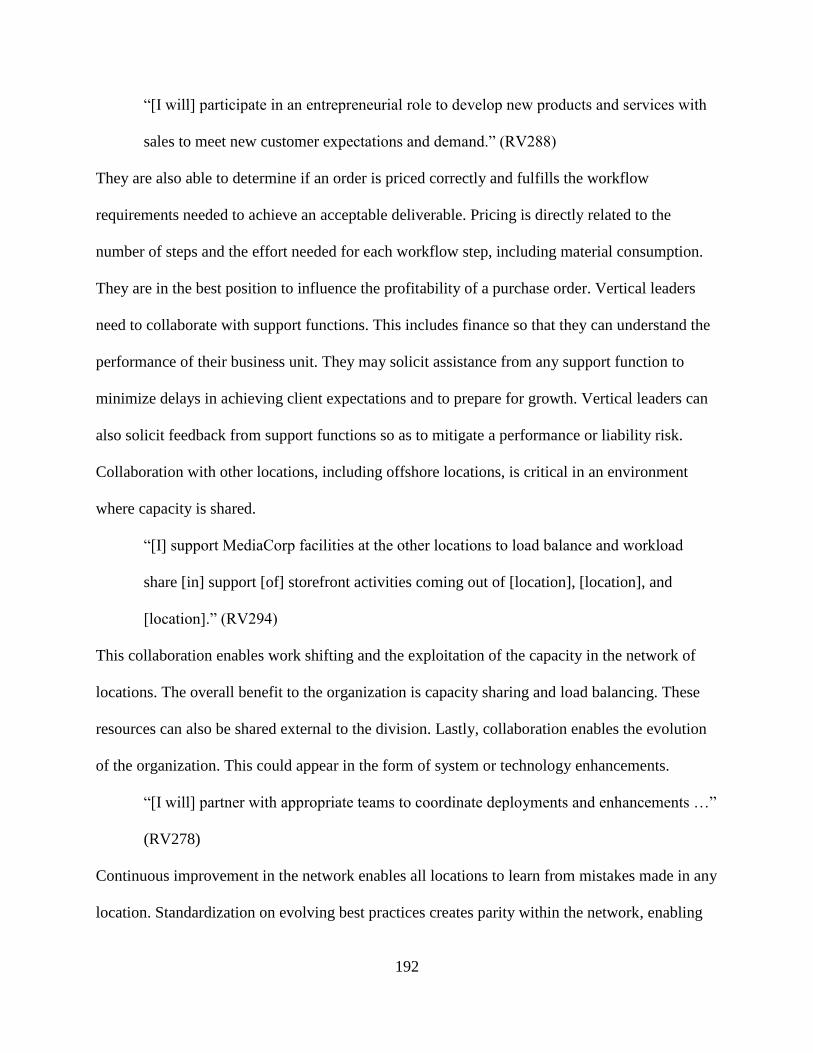
192
“[I will] participate in an entrepreneurial role to develop new products and services with
sales to meet new customer expectations and demand.” (RV288)
They are also able to determine if an order is priced correctly and fulfills the workflow
requirements needed to achieve an acceptable deliverable. Pricing is directly related to the
number of steps and the effort needed for each workflow step, including material consumption.
They are in the best position to influence the profitability of a purchase order. Vertical leaders
need to collaborate with support functions. This includes finance so that they can understand the
performance of their business unit. They may solicit assistance from any support function to
minimize delays in achieving client expectations and to prepare for growth. Vertical leaders can
also solicit feedback from support functions so as to mitigate a performance or liability risk.
Collaboration with other locations, including offshore locations, is critical in an environment
where capacity is shared.
“[I] support MediaCorp facilities at the other locations to load balance and workload
share [in] support [of] storefront activities coming out of [location], [location], and
[location].” (RV294)
This collaboration enables work shifting and the exploitation of the capacity in the network of
locations. The overall benefit to the organization is capacity sharing and load balancing. These
resources can also be shared external to the division. Lastly, collaboration enables the evolution
of the organization. This could appear in the form of system or technology enhancements.
“[I will] partner with appropriate teams to coordinate deployments and enhancements …”
(RV278)
Continuous improvement in the network enables all locations to learn from mistakes made in any
location. Standardization on evolving best practices creates parity within the network, enabling
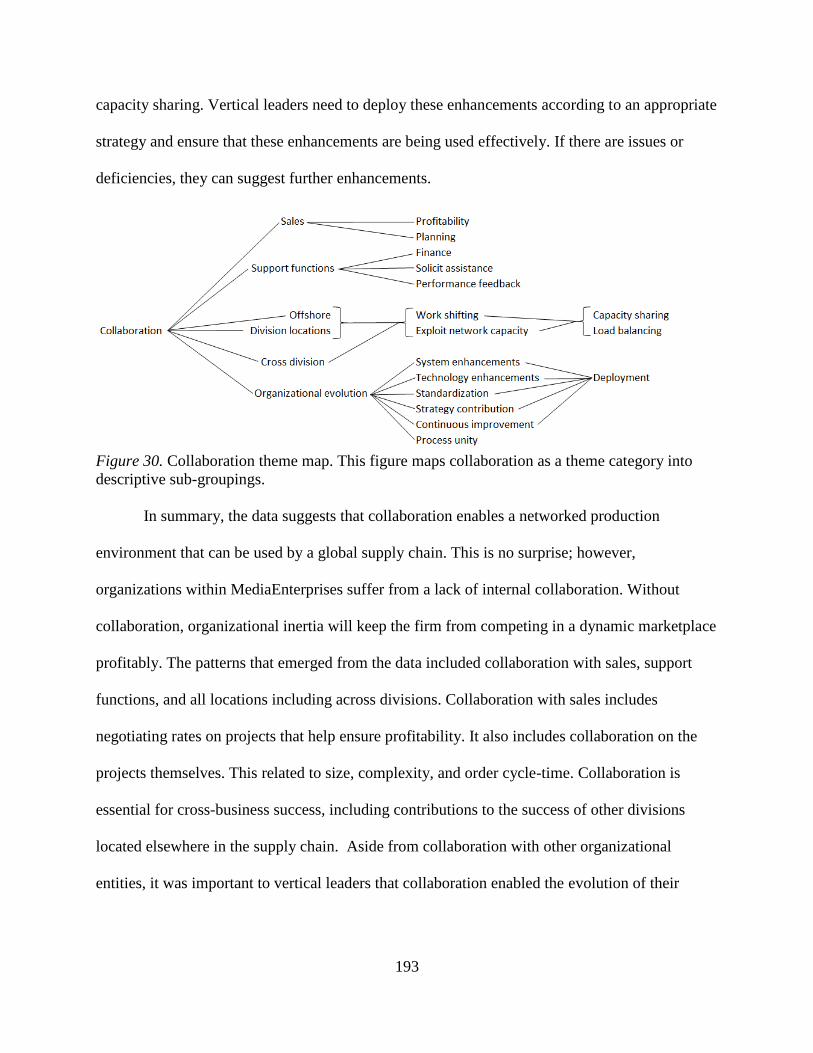
193
capacity sharing. Vertical leaders need to deploy these enhancements according to an appropriate
strategy and ensure that these enhancements are being used effectively. If there are issues or
deficiencies, they can suggest further enhancements.
Figure 30. Collaboration theme map. This figure maps collaboration as a theme category into
descriptive sub-groupings.
In summary, the data suggests that collaboration enables a networked production
environment that can be used by a global supply chain. This is no surprise; however,
organizations within MediaEnterprises suffer from a lack of internal collaboration. Without
collaboration, organizational inertia will keep the firm from competing in a dynamic marketplace
profitably. The patterns that emerged from the data included collaboration with sales, support
functions, and all locations including across divisions. Collaboration with sales includes
negotiating rates on projects that help ensure profitability. It also includes collaboration on the
projects themselves. This related to size, complexity, and order cycle-time. Collaboration is
essential for cross-business success, including contributions to the success of other divisions
located elsewhere in the supply chain. Aside from collaboration with other organizational
entities, it was important to vertical leaders that collaboration enabled the evolution of their
194
organization and the firm in general. The following propositions summarize the key findings of
this section:
Proposition 29 (collaborative dependencies): Network-based production is
dependent on collaboration internal and external to the MOS.
Proposition 30 (collaborative evolution): Collaborative evolution leverages
standardization as a platform for enhancement deployment.
Proposition 31 (multidirectional collaboration): The multi-directional nature of
collaboration includes offering assistance and receiving feedback on support, both
of which are enabled by environmental awareness and active listening.
Awareness. The conscious experience of co-researchers is a continuously changing or
flowing process of awareness (Cosmelli, Lachaux, & Thompson, 2007; Thompson, 2007; Varela
et al., 1993). Participants were, to a varied degree, aware of their environment and how it was
changing. Typically there was a tipping point, or the confluence of awareness and intentionality,
that triggered action planning and subsequent execution. According to Thompson (2007),
intentionality can emerge anonymously, involuntarily, spontaneously, and receptively. These
specifically emerged in the data. A vertical leader needs to be aware of many factors regarding
their operation, including off-load methods, needs, cost, customer expectations, available reports,
local policies, product requirements, deliverable specifications, and understanding the value of
support functions. Metrics are critical to monitoring profitability that will show up in the
financials. Performance evaluation and optimization results are influenced by a minimized cost
structure; however, actions regarding this cannot be known unless current financial performance
is known. Available operational data seen through the lens of mature and defined metrics allows
the vertical leader to monitor work product and deal with operational issues and inefficiencies.
195
This may relate to scheduling inefficiency in a global supply chain that shares capacity, keeps up
with the security threat-scape, and has a quality system that is capable of catching issues before
they are shipped. A culture of transparency enables progress monitoring and issue resolution.
Access to reports and the ability to analyze data can lead to better understanding of underlying
themes in the environment. In some cases, support services may need to help mitigate
inefficiencies. Table 7 lists 19 themes that emerged from 37 rich data descriptions. This
awareness begins with the ability to have data about operational and financial performance. In
the absence of this data, awareness is challenged. Knowing internal and external needs is also the
beginning of awareness.

196
Table 7
Awareness Themes
Awareness
Count
Monitor operational performance 6
Provide data 4
Financial analysis 4
Performance evaluation 3
Understand needs 3
Customer expectation 3
Client specification 2
Analyze cost structure 1
Customer satisfaction 1
Keep up on security changes 1
Monitor progress 1
Monitor reports 1
Network capacity 1
Operational data 1
Other facility cost 1
Productivity measurements 1
Revenue reporting 1
Spot errors 1
Understand support needs
1
Total
37
The theme map for awareness in Figure 31 includes six dependencies: metrics,
operational data, customer expectations, financials, and culture. It also indicates that growth
outcomes are dependent on these six areas. The growth enablers include work shifting, issue
resolution, support needs, scheduling methods, and capacity utilization. Each of these has a
relationship with the critical awareness themes. These critical themes are broken down further
into several sub-areas. For example, financial awareness includes an understanding of awareness,
financial measurements, and analysis. Work shifting has a dependency on the sub-items. For
example, work shifting should be the product of financial analysis, measurement of usage and
performance, and subject to allocations for overhead and coordination cost. Work shifting is also
197
dependent on mature performance-oriented metrics that have been standardized horizontally
across all locations. These must be available timely. Work cannot be shifted unless specifications
and requirements are known. Deliverable creation is guided by policy and methods. Performance
is displayed through an appropriate set of results. Work cannot shift until customer expectations
are understood. These expectations are specific to local markets. The ability to perform tasks in
other geographic locations, such as an off-load site, is not possible without closure of the gap
analysis between what the location does and what the local market expects. Financial results, as
it relates to revenue and profitability, should drive decision making that relates to work shifting.
The location that receives the request for work must have a culture that enables great service.
This includes an appropriate perspective on the sharing of resources, the fact that each location is
a part of a global supply chain that is networked, and that there is a need for full transparency to
guide effective decision making.
“[I will] work closely with facility leaders worldwide, to establish effective load
balancing and off-load methods to eliminate capacity constraints in local offices.”
(RV272)
Issue resolution has a dependency on financial awareness. The local leader understands
that profitability for the division is the goal. To that end, the local leader needs to understand
how revenue and profits are experienced by the location that gets the work, as compared to the
location that does the work. In the event that there is a delay or rework is required, the vertical
leader needs to know the impact of the lack of issue resolution and the time needed to achieve a
resolution. This drives the urgency around the problem resolution activity and may trigger the
request for support services to help, as an example. In a complex system, issues are often
discovered through metrics and associated trends. These metrics should not be misleading,
198
creating a false positive, because the cost to resolve a false positive may be equally prohibitive.
If metrics are not horizontalized the local situation cannot be effectively compared with similar
situations at other locations. They must also be available when needed; otherwise the discovery
time is elongated. Operational data in the form of specifications and requirements are a reference
against which a deliverable can be compared. The gap between the deliverable and client
expectation may determine the size of the issue. An issue in the deliverable points to an issue in
the workflow or the incoming materials used in the process. Reports may point to inadequate or
inappropriate methods or policies that may need to be modified. Culture has a bearing on issue
resolution. A lack of transparency can obfuscate the root cause that may be anywhere in the
supply chain. When resources are shared, dependencies on capabilities and culture emerge in the
form of non-conformances and training disparities that must be resolved in order for the
workflow to be reliable.
The need for support is part of the decision-making process for the vertical leader.
Support may affect financial performance including profitability. Support functions may not
have access to metrics or may interpret them incorrectly. Bias and assumptions may make
support functions impotent.
“[I will] operate as the focal point in MediaCorp, supporting finance, sales and customer
service for any requirement that interfaces directly with the products offered and/or
managed by my [LOB].” (RV133)
They may not be aware of supply chain nuances or have access to the applicable information.
Furthermore, they may not understand the disparity between the resources that are shared.
Vertical leaders take this into consideration as it relates to decision making on whether to solicit
199
support services and consequently, they may decide to use them in a limited and controlled
context to be optimally effective.
“[I will] develop a relationship with finance to make sure you are reviewing and
understanding the numbers.” (RV152)
Capacity availability and utilization is critical for vertical leaders to understand. This does not
just apply to local capability but also to capability within the network of business units. Capacity
cost is directly related to profitability. Carrying costs during slower times is a burden that can be
mitigated by rightsizing and utilizing scalability in the event of a demand spike. Volume,
specification, and complexity variability are a normal part of a vertical leader’s work
environment. A suitable level of awareness and the ability for suitable and effective analysis
allow for optimal decision making. Metrics and performance trends can inform these decisions in
a timely way. These metrics need to be consistently used in all locations so that capacity at any
location can exploited, as vertical leaders are expected to deliver large rush orders not previously
forecasted. Requirements and specifications drive workflow choices and available capacity.
“[I will] direct the planning and preparation of production schedules through subordinates
and identify requirements for the business to improve efficiency.” (RV113)
Scheduling methods may need to be modified to accommodate demand spikes and so must be
understood and flexible. When customer expectations cannot be fulfilled, contingencies and
negotiating tactics can still ensure a success. While a vertical leader must understand that the
resources in the supply chain are available, they must also be compatible to be exploited. A lack
of transparency may keep this knowledge from a local leader, resulting in an expensive decision
that could lead to delays.
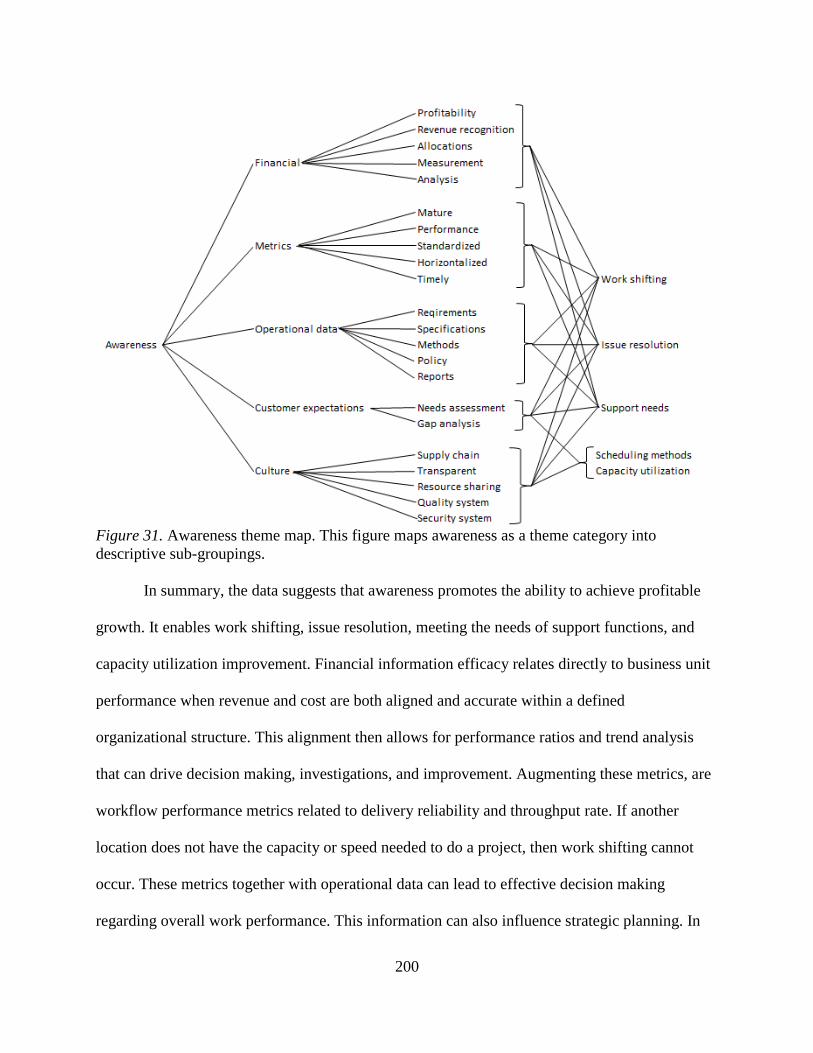
200
Figure 31. Awareness theme map. This figure maps awareness as a theme category into
descriptive sub-groupings.
In summary, the data suggests that awareness promotes the ability to achieve profitable
growth. It enables work shifting, issue resolution, meeting the needs of support functions, and
capacity utilization improvement. Financial information efficacy relates directly to business unit
performance when revenue and cost are both aligned and accurate within a defined
organizational structure. This alignment then allows for performance ratios and trend analysis
that can drive decision making, investigations, and improvement. Augmenting these metrics, are
workflow performance metrics related to delivery reliability and throughput rate. If another
location does not have the capacity or speed needed to do a project, then work shifting cannot
occur. These metrics together with operational data can lead to effective decision making
regarding overall work performance. This information can also influence strategic planning. In
201
some cases support functions such as finance, HR, facilities, etc. will contribute information to
enable decision making and performance measurement. An example would be energy costs or
tax structures. A vertical leader also owns the culture at the location where they lead. This
culture should align with the culture at other sites so that capacity can be leveraged seamlessly.
This culture includes a supply chain perspective that encourages resource sharing, an awareness
of quality and security requirements, and transparency, so that fact based decisions can be made.
The following propositions summarize the key findings of this section:
Proposition 32 (work assignment): Work can be profitably assigned when
available, when capable capacity costs are understood, and when supply chain
leaders aggressively share their resources.
Proposition 33 (issue resolution): Problem resolution is accelerated by operational
performance transparency and a clear awareness of expectations.
Proposition 34 (measurement unification): The timely availability of data used
similarly across all locations, offered up transparently, can accelerate strategic
decision making and issue resolution.
Proposition 35 (aligned culture): The constitution of the location culture must be
appropriate and aligned with other locations to optimize capacity utilization in a
network-based production schema.
Leadership. A MOS that leverages a network-based production scheme requires a
significant leadership component on the part of vertical leaders, as they are internal and external
leaders. The themes that emerged from the data relate significantly to leadership. They were
broken into proactive leadership and execution leadership categories. Each will be discussed
separately. Proactive leadership has a data table that represents 53 themes extracted from 106
202
rich data descriptions, as seen in Table 8. Proactive vertical leaders need to be able to show their
employees that they have a rational roadmap for change. This gives employees the opportunity to
participate in, rather than resist, change. These are not just plans, but include executable
roadmaps. Ideation is one thing, while the development of an executable plan is another.
Strategic planning is simpler if done on a platform of unification. Vertical leaders know that
fragmented methods add complexity and are hard to build on. Making sure that the right people
are being promoted is also critical to plan success. Depending on the wrong people to accomplish
plans, creates significant inertia. Once workflows are standardized, vertical leaders need to be
able to see and eliminate capacity constraints so that local markets can be served efficiently.
Capacity is also managed by capacity optimization and resource redeployments. Suggesting ERP
enhancements can be a significant contributor to efficiencies that free up capacity. Continuous
improvement enhances reliability. This reduces non-conformities against requirements and
rework that consumes capacity better allocated towards growth. For all work, requirements need
to be understood to ensure customer delight. Proactive leadership includes selecting and
maturing leaders at the location. These leaders need to be able to suggest and deploy system
enhancements. The team is effective if it can make sure work is completed using established best
practices. Data and metric driven leadership is needed to create local strategy and optimize
capacity effectiveness. This valuable data can be used to determine growth strategies and set the
direction for the location.
“[Location leaders] implement a manufacturing/supply-chain philosophy to ensure
consistent service levels and [meet] release dates to customers.” (RV110)
Continuous improvement must be accomplished ahead of workflow capacity being sold, in order
to avoid early disappointment in the workflow. Performance requirements may be achieved with
203
less effort through the use of applicable tools that improve reliabilities. Through close contact
with other leadership in the organization, the location leader is a role model for developing
leaders and a strong team. It is expected that local leaders be capable of authoring plans,
including budgets. The vertical leader initiates and leads initiatives that may relate to systems,
resource management, workflow streamlining, and knowledge sharing or enhancement.
“[Location leaders] develop synergistic opportunities that can be aligned with overall
enterprise-level business strategies.” (RV88)
“[Location leaders] drive the process of planning, orchestrating, and evaluating
operations activities and procedures in support of new and future business internally and
externally to the division.” (RV90)
Contingency planning is the proactive responsibility of the location leader. This is
essential for business continuity and profitable growth. Vulnerabilities in location organizations
are exacerbated when a leader leaves the organization. Backup leadership is needed to ensure
business continuity. Consequently, mentoring and training are critical to the location leader’s
responsibility. A location leader needs to have a backup plan for leadership capacity in the event
that leadership capacity is lost.
“[I] lead the cultural effort at the location to drive leadership and career path[s] for staff.”
(RV39)
Finally, a location leader needs to accomplish typical leadership tasks, including creating
an understanding for the vision and mission of the location and how it aligns with the MUF
vision and mission. The vertical leader, according to the data, needs to hire people who can work
within the vision and help the leader execute the mission of the location. The hired person needs
to fit in with the culture. This is a culture of centralization, quality, and security. The new hire
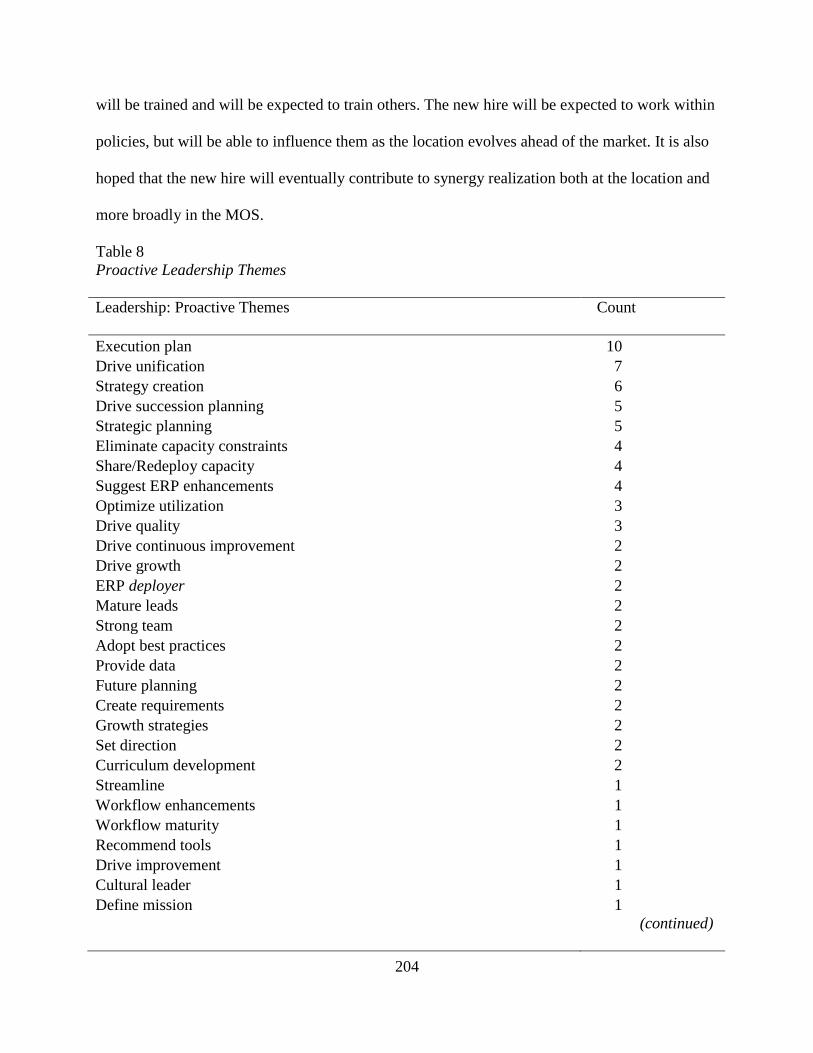
204
will be trained and will be expected to train others. The new hire will be expected to work within
policies, but will be able to influence them as the location evolves ahead of the market. It is also
hoped that the new hire will eventually contribute to synergy realization both at the location and
more broadly in the MOS.
Table 8
Proactive Leadership Themes
Leadership: Proactive Themes
Count
Execution plan 10
Drive unification 7
Strategy creation 6
Drive succession planning 5
Strategic planning 5
Eliminate capacity constraints 4
Share/Redeploy capacity 4
Suggest ERP enhancements 4
Optimize utilization 3
Drive quality 3
Drive continuous improvement 2
Drive growth 2
ERP deployer 2
Mature leads 2
Strong team 2
Adopt best practices 2
Provide data 2
Future planning 2
Create requirements 2
Growth strategies 2
Set direction 2
Curriculum development 2
Streamline 1
Workflow enhancements 1
Workflow maturity 1
Recommend tools 1
Drive improvement 1
Cultural leader 1
Define mission 1
(continued)
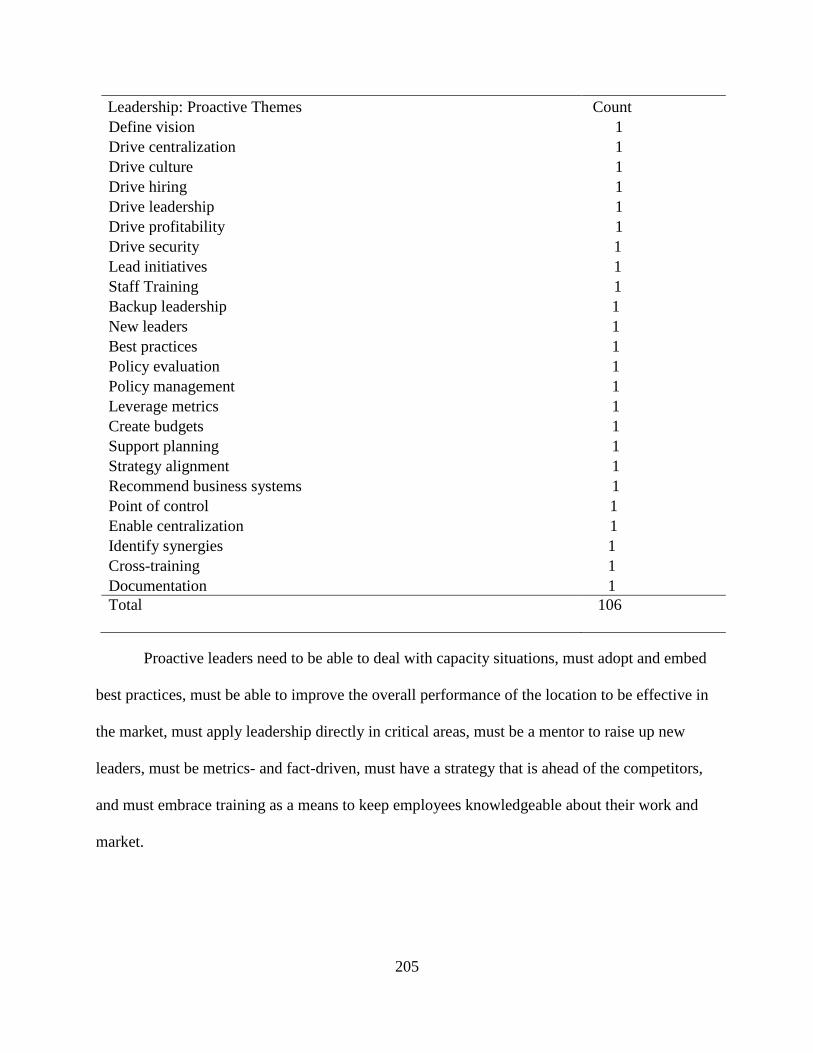
205
Leadership: Proactive Themes
Count
Define vision 1
Drive centralization 1
Drive culture 1
Drive hiring 1
Drive leadership 1
Drive profitability 1
Drive security 1
Lead initiatives 1
Staff Training 1
Backup leadership 1
New leaders 1
Best practices 1
Policy evaluation 1
Policy management 1
Leverage metrics 1
Create budgets 1
Support planning 1
Strategy alignment 1
Recommend business systems 1
Point of control 1
Enable centralization 1
Identify synergies 1
Cross-training 1
Documentation 1
Total
106
Proactive leaders need to be able to deal with capacity situations, must adopt and embed
best practices, must be able to improve the overall performance of the location to be effective in
the market, must apply leadership directly in critical areas, must be a mentor to raise up new
leaders, must be metrics- and fact-driven, must have a strategy that is ahead of the competitors,
and must embrace training as a means to keep employees knowledgeable about their work and
market.
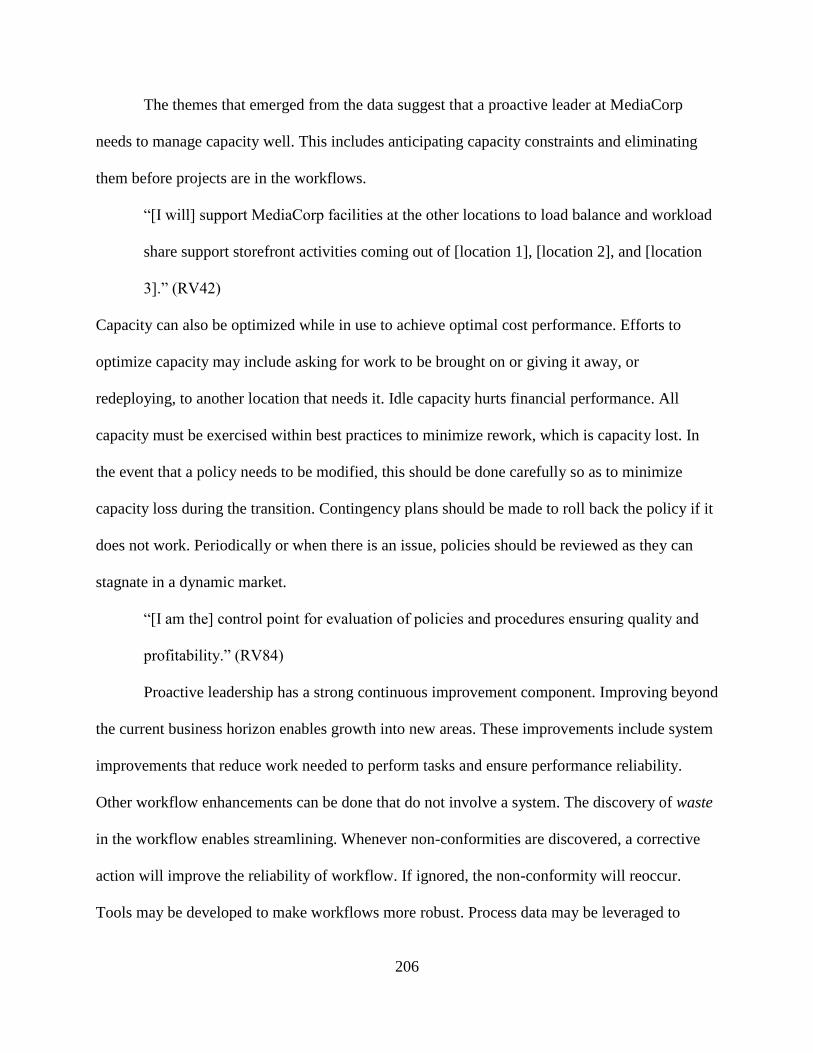
206
The themes that emerged from the data suggest that a proactive leader at MediaCorp
needs to manage capacity well. This includes anticipating capacity constraints and eliminating
them before projects are in the workflows.
“[I will] support MediaCorp facilities at the other locations to load balance and workload
share support storefront activities coming out of [location 1], [location 2], and [location
3].” (RV42)
Capacity can also be optimized while in use to achieve optimal cost performance. Efforts to
optimize capacity may include asking for work to be brought on or giving it away, or
redeploying, to another location that needs it. Idle capacity hurts financial performance. All
capacity must be exercised within best practices to minimize rework, which is capacity lost. In
the event that a policy needs to be modified, this should be done carefully so as to minimize
capacity loss during the transition. Contingency plans should be made to roll back the policy if it
does not work. Periodically or when there is an issue, policies should be reviewed as they can
stagnate in a dynamic market.
“[I am the] control point for evaluation of policies and procedures ensuring quality and
profitability.” (RV84)
Proactive leadership has a strong continuous improvement component. Improving beyond
the current business horizon enables growth into new areas. These improvements include system
improvements that reduce work needed to perform tasks and ensure performance reliability.
Other workflow enhancements can be done that do not involve a system. The discovery of waste
in the workflow enables streamlining. Whenever non-conformities are discovered, a corrective
action will improve the reliability of workflow. If ignored, the non-conformity will reoccur.
Tools may be developed to make workflows more robust. Process data may be leveraged to
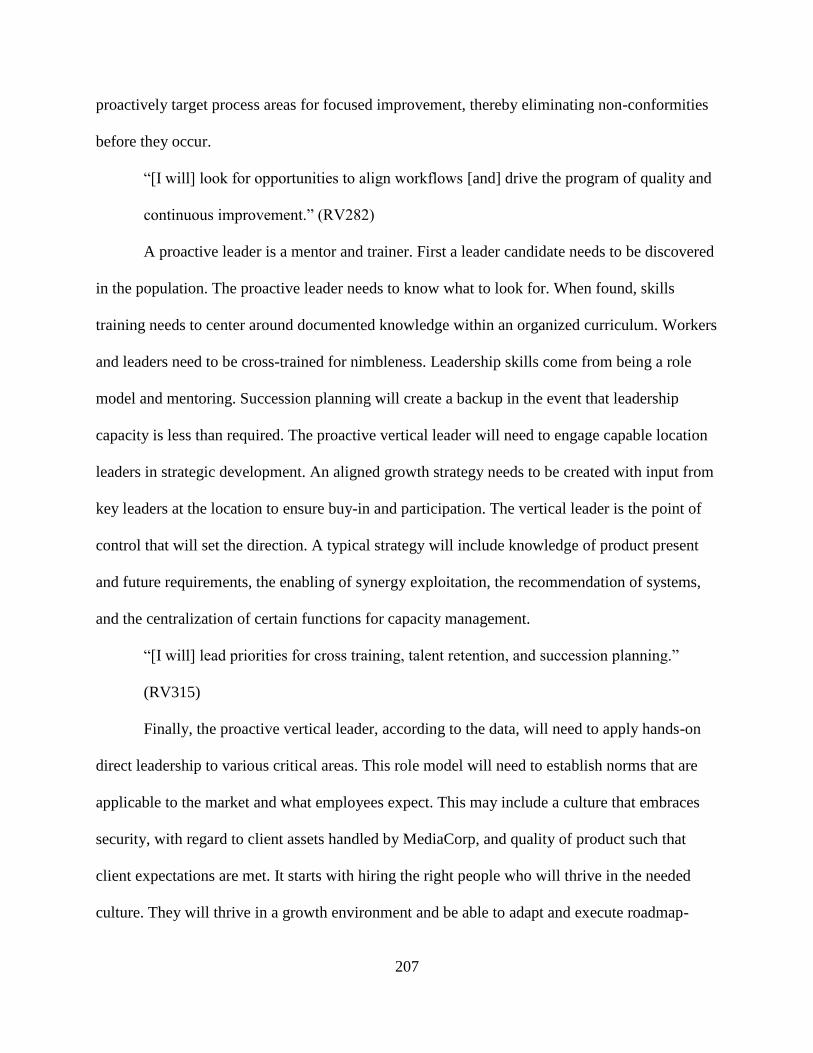
207
proactively target process areas for focused improvement, thereby eliminating non-conformities
before they occur.
“[I will] look for opportunities to align workflows [and] drive the program of quality and
continuous improvement.” (RV282)
A proactive leader is a mentor and trainer. First a leader candidate needs to be discovered
in the population. The proactive leader needs to know what to look for. When found, skills
training needs to center around documented knowledge within an organized curriculum. Workers
and leaders need to be cross-trained for nimbleness. Leadership skills come from being a role
model and mentoring. Succession planning will create a backup in the event that leadership
capacity is less than required. The proactive vertical leader will need to engage capable location
leaders in strategic development. An aligned growth strategy needs to be created with input from
key leaders at the location to ensure buy-in and participation. The vertical leader is the point of
control that will set the direction. A typical strategy will include knowledge of product present
and future requirements, the enabling of synergy exploitation, the recommendation of systems,
and the centralization of certain functions for capacity management.
“[I will] lead priorities for cross training, talent retention, and succession planning.”
(RV315)
Finally, the proactive vertical leader, according to the data, will need to apply hands-on
direct leadership to various critical areas. This role model will need to establish norms that are
applicable to the market and what employees expect. This may include a culture that embraces
security, with regard to client assets handled by MediaCorp, and quality of product such that
client expectations are met. It starts with hiring the right people who will thrive in the needed
culture. They will thrive in a growth environment and be able to adapt and execute roadmap-

208
based initiatives. The unification of methods and the centralization of capacity will likely be a
part of the plan intended to optimize profitability. The proactive leadership theme map in Figure
32 shows that there are several key components to success in this theme category.
“[I will] partner with WW product line leaders to drive unification, standardization,
centralization and operational efficiencies across WW locations.” (RV5)
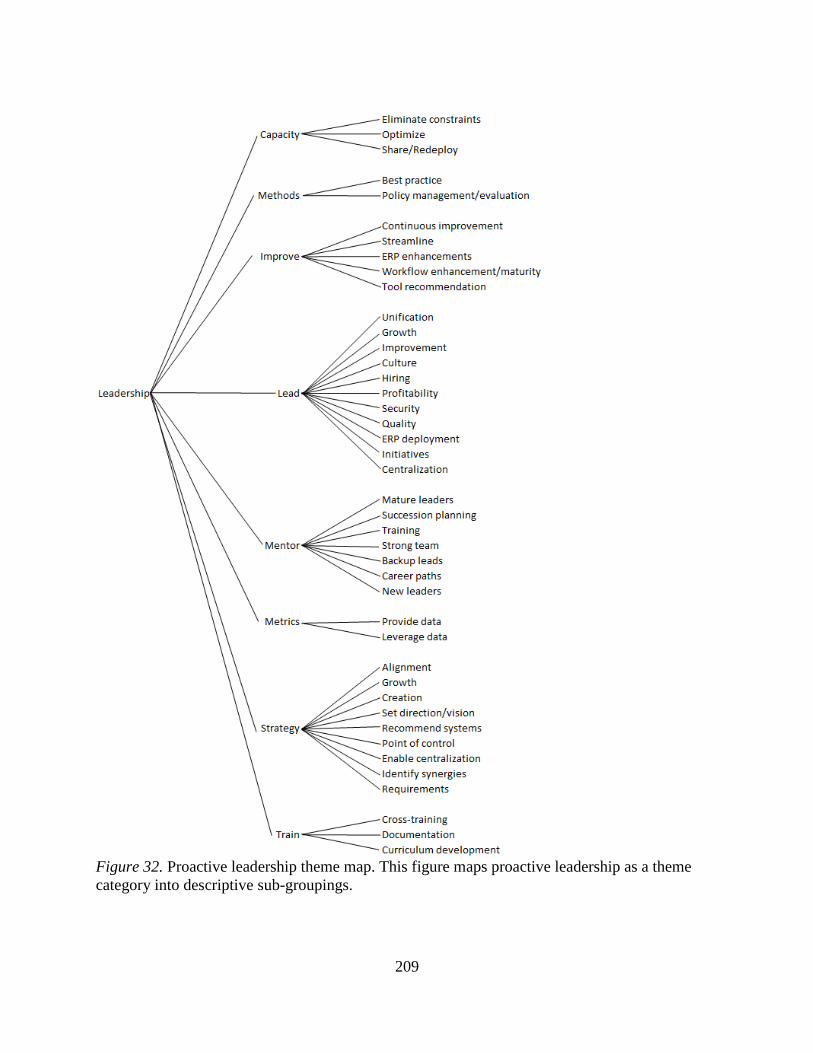
209
Figure 32. Proactive leadership theme map. This figure maps proactive leadership as a theme
category into descriptive sub-groupings.
210
In summary, the data suggests that proactive vertical leaders need to be able to lead and
make leaders. Being a role model, a trainer, and a leadership-selection expert are necessary.
While standing on a platform of suitable norms and excellent performance, a vertical leader can
set strategic growth plans proactively. Typically these plans are reactively conjured up and they
are less effective. The vertical leader needs to be a steward of the capacity given while
continuously improving its effectiveness. Finally, the proactive leader needs to be present and
hands-on to deal with critical issues. The following propositions therefore summarize the key
findings of this section:
Proposition 36 (location capacity): Location capacity, as it relates to existing and
pending work requirements, is something that a proactive vertical leader must be
keenly aware of so that constraints can be mitigated or circumvented.
Proposition 37 (improvement rate): Continuous improvement must occur at a rate
that exceeds market and competitor evolution in order to seal price points and
gain revenues.
Proposition 38 (future culture): Vertical leaders need to proactively select and
mentor leaders that match the culture of the future, as defined by the strategic plan
roadmap.
Proposition 39 (leading ahead): Proactive leaders make their leadership teams
capable to achieve what is about to happen in the marketplace.
Proposition 40 (entropy risk): The proactive leader must personally engage in
critical tasks that would otherwise compromise future performance potential by
mitigating organizational entropy risk.
211
Proposition 41 (better practices): The proactive maintenance of best practices
enables a gap between the current competitive landscape and an advanced
position ahead of potential revenue opportunities.
Proposition 42 (large orders): Sharing or redeploying capacity can enable the
execution of large overcapacity orders that competitors are unable to execute,
which would otherwise be referred to another vendor or split between vendors.
Leadership centers on execution for growth according to the second leadership category
of emerging themes in the data. A vertical leader is responsible for executing plans.
“[I have] responsibility for outlining the strategic plan, budgeting and executing on those
plans with approved staff and resources.” (RV81)
The theme pattern from the comments on execution focused on capacity management and
executing strategic plans. This may include rolling out a new business system or new feature
deployments. It may include technology enhancement rollouts or space optimization measures.
By promoting leadership in the organization, the vertical leader is encouraging P&L
accountability. This leads to involvement in pricing negotiations and cost reduction initiatives to
promote profitability. While a leader oversees and directs the local operation, he or she also
exploits support functions as needed to support growth initiatives. The vertical leader engages
local leadership and encourages employees to be engaged in and influence internal or external
service excellence, as well as growth initiatives thereby encouraging a performance culture. The
success of the P&L would be measured by process-cost and service-performance levels. The
local leader oversees all products that flow through the business unit. On the one hand, the leader
needs to minimize cost and on the other, negotiate the best price for services to create margin.
This leader needs to develop reliable leaders to oversee product reliability and the resources
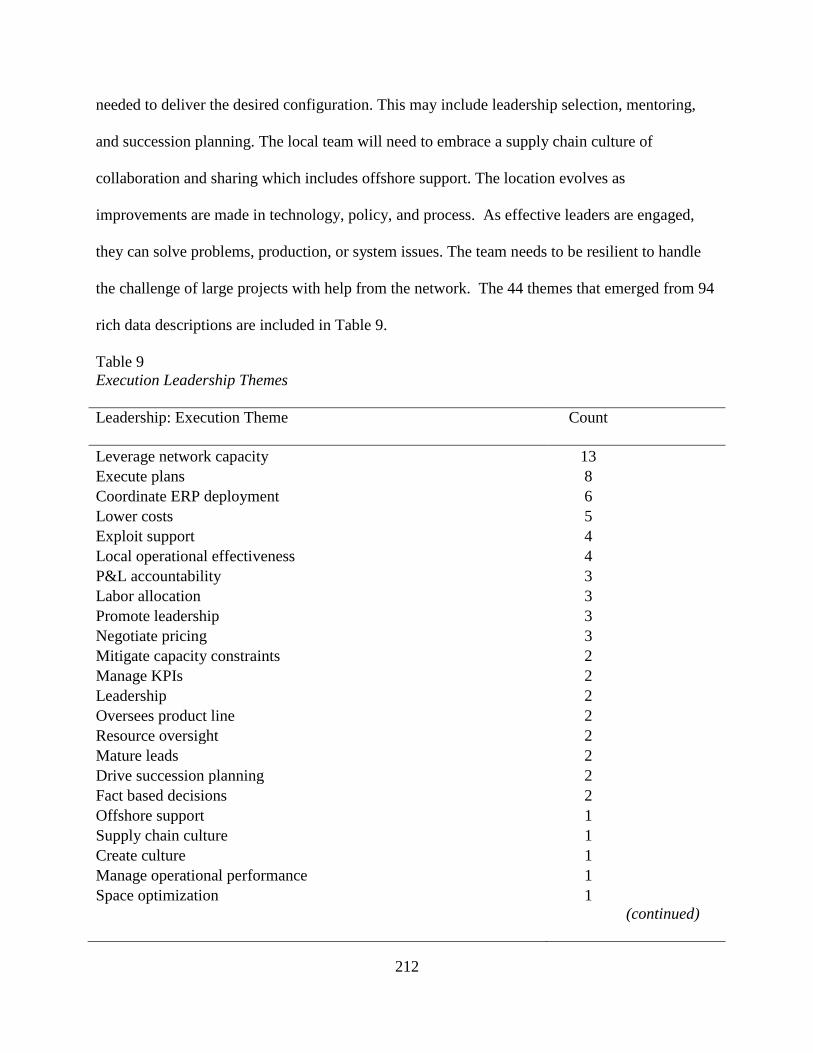
212
needed to deliver the desired configuration. This may include leadership selection, mentoring,
and succession planning. The local team will need to embrace a supply chain culture of
collaboration and sharing which includes offshore support. The location evolves as
improvements are made in technology, policy, and process. As effective leaders are engaged,
they can solve problems, production, or system issues. The team needs to be resilient to handle
the challenge of large projects with help from the network. The 44 themes that emerged from 94
rich data descriptions are included in Table 9.
Table 9
Execution Leadership Themes
Leadership: Execution Theme
Count
Leverage network capacity 13
Execute plans 8
Coordinate ERP deployment 6
Lower costs 5
Exploit support 4
Local operational effectiveness 4
P&L accountability 3
Labor allocation 3
Promote leadership 3
Negotiate pricing 3
Mitigate capacity constraints 2
Manage KPIs 2
Leadership 2
Oversees product line 2
Resource oversight 2
Mature leads 2
Drive succession planning 2
Fact based decisions 2
Offshore support 1
Supply chain culture 1
Create culture 1
Manage operational performance 1
Space optimization 1
(continued)
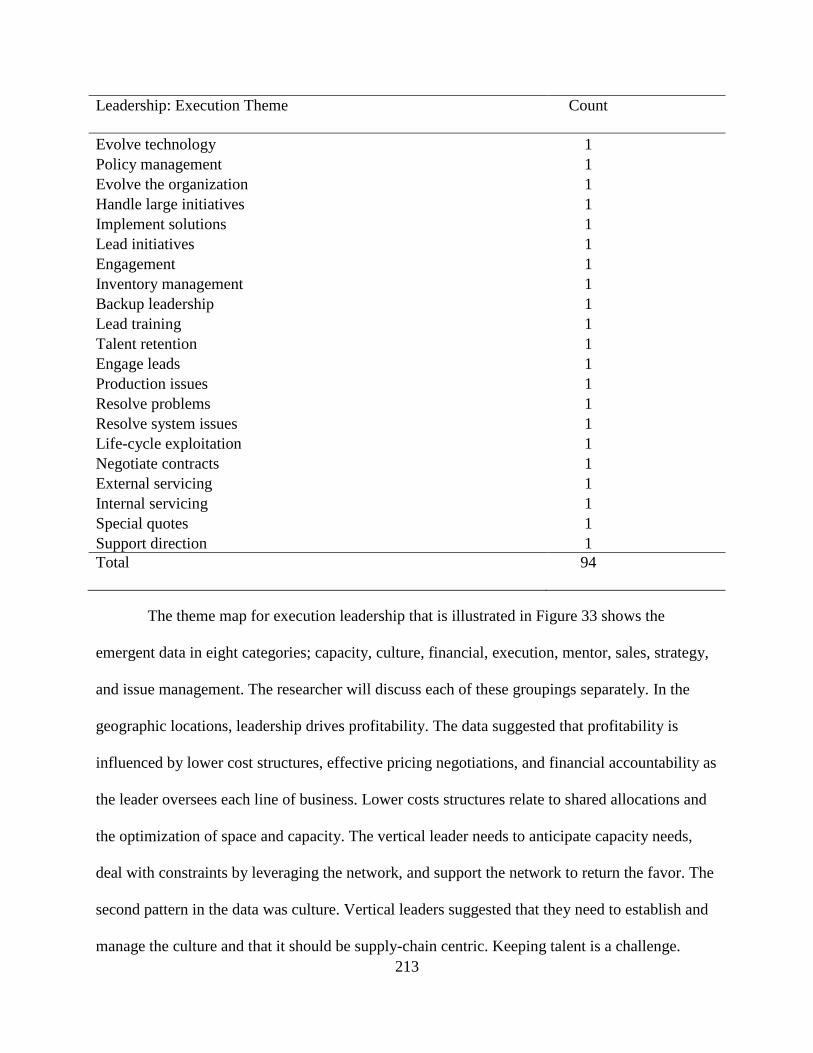
213
Leadership: Execution Theme
Count
Evolve technology 1
Policy management 1
Evolve the organization 1
Handle large initiatives 1
Implement solutions 1
Lead initiatives 1
Engagement 1
Inventory management 1
Backup leadership 1
Lead training 1
Talent retention 1
Engage leads 1
Production issues 1
Resolve problems 1
Resolve system issues 1
Life-cycle exploitation 1
Negotiate contracts 1
External servicing 1
Internal servicing 1
Special quotes 1
Support direction 1
Total
94
The theme map for execution leadership that is illustrated in Figure 33 shows the
emergent data in eight categories; capacity, culture, financial, execution, mentor, sales, strategy,
and issue management. The researcher will discuss each of these groupings separately. In the
geographic locations, leadership drives profitability. The data suggested that profitability is
influenced by lower cost structures, effective pricing negotiations, and financial accountability as
the leader oversees each line of business. Lower costs structures relate to shared allocations and
the optimization of space and capacity. The vertical leader needs to anticipate capacity needs,
deal with constraints by leveraging the network, and support the network to return the favor. The
second pattern in the data was culture. Vertical leaders suggested that they need to establish and
manage the culture and that it should be supply-chain centric. Keeping talent is a challenge.
214
Finding the right talent is a start. Mentoring and being a role model helps to mature this talent.
When this talent is retained, there is good bench strength in the event that a leader decides to
leave.
“[I will] lead priorities for cross training, talent retention, and succession planning.”
(RV315)
Within the location, the leader promotes leadership capability and creates a suitable
culture. Team efficacy is driven by skills training and leadership coaching, while capacity is
hampered by leaders who are not engaged. The location leader ensures engagement by leaders
and encourages leaders to promote engagement within their team leaders. Continuous
performance is critical, as full financial accountability for the P&L falls on this leader. The
location leaders, therefore, need to be aware of the current state and be mitigating costs where
possible to enhance their financial position. Good talent can help with this.
From a sales perspective the vertical leader needs to engage in quoting for work
requested and pushing for overages based on special requests outside of the quoted workflow.
Involvement in contracts is critical, as terms can directly affect profitability. Each line of
business has a life-cycle. This should be understood and pricing strategies should be used
depending on products’ positions in the life-cycle. Furthermore, a proactive leadership stance
promotes growth and profitability in the following ways according to the data: they evolve
technology, deploy and enhance business systems, implement current and create future strategic
plans including budgets, manage requirements, mitigate capacity constraints, create strategy
ensuring alignment, and mature, enhance, streamline, and deploy points of control in workflows.
“Drive growth at [location] office toward increased market share by leveraging global
resources.” (RV17)
215
They plan for contingencies including resource redeployment, alternate workflows, and
leadership-on-demand. Proactively, a location leader can enhance resource utilization through
redeployment to the point of need or through appropriate local allocation.
Location leaders are responsible for executing plans, or roadmaps. They exploit
operational data and metrics to determine plans and monitor changes in capacity utilization. They
exploit support functions to get what they need to complete projects. This could be capital to
increase capacity, as an example, to execute large client initiatives. As problems are solved and
new enhancements are rolled out, the organization evolves to a better performing state. Local
operational excellence is required and execution includes coordination with other business units
to ensure plan completion. Daily performance excellence includes meeting internal and external
client expectations. They exploit resources and manage assets with care. To do this they have to
be engaged.
“[Location leaders] monitor and manage operational performance.” (RV25)
The last pattern that emerged in the data for execution leadership was strategy. Strategy is
by nature proactive if it is executed with the desired results achieved. To start, the vertical leader
needs to support the general direction and be aligned with it. All ideation needs to conform to the
goals of the MUF, while achieving local objectives as well. The leader needs to make sure that
plans are executed effectively. The task list may include system enhancements or physical
enhancements to the workflows.
“[I will execute] strategic analysis and placement of market opportunities by identifying
and implementing solutions to maximize profit.” (RV76)
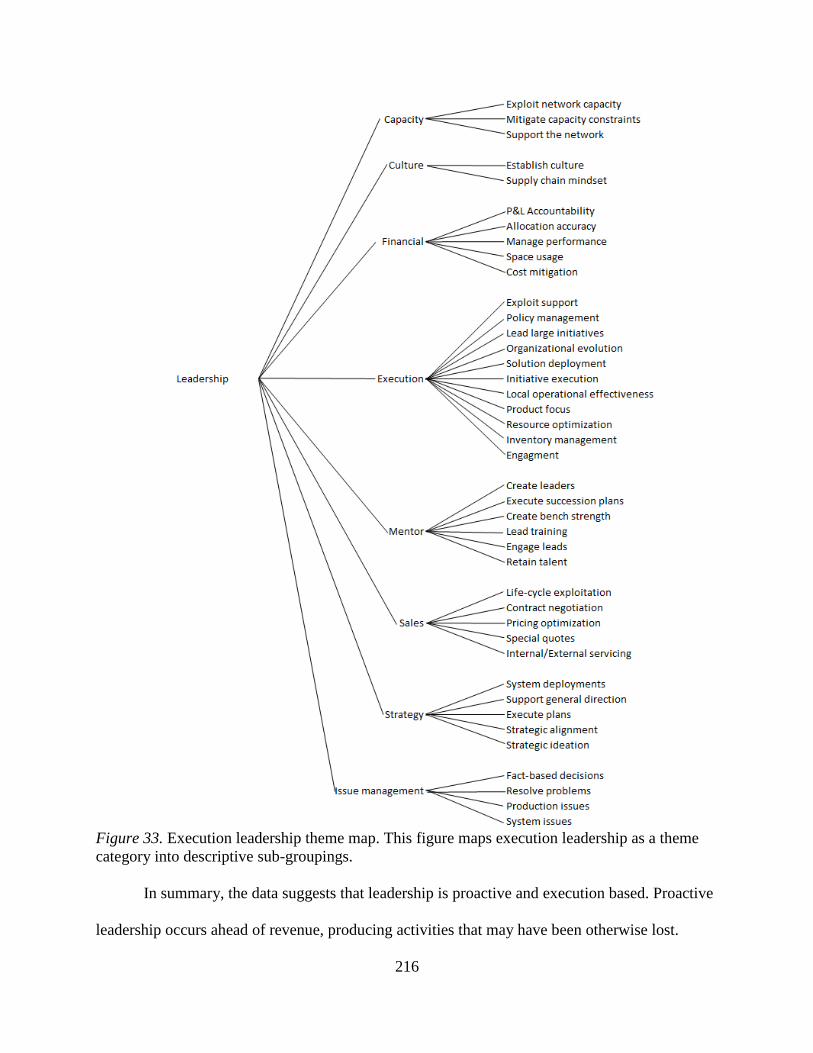
216
Figure 33. Execution leadership theme map. This figure maps execution leadership as a theme
category into descriptive sub-groupings.
In summary, the data suggests that leadership is proactive and execution based. Proactive
leadership occurs ahead of revenue, producing activities that may have been otherwise lost.
217
Consequently, proactive leadership is, by its nature, promoting growth synergies. While
execution leadership does the same, it promotes growth synergies by accomplishing needed tasks
while work is flowing. It sustains the flow and helps to ensure that it too can grow. It is the
platform on which proactive efforts can be made. The following propositions summarize the key
findings of this section:
Proposition 43 (negotiation leadership): Pricing negotiation leadership includes an
awareness of cost reduction opportunity, regardless of current margin, and a
profitability enhancement strategy.
Proposition 44 (predictive processes): Effective leaders act such that their
processes predict the dynamic changes in the marketplace.
Proposition 45 (influential contingencies): Unanticipated influences may be
controlled by contingencies that increase or replace lost capacity.
Proposition 46 (roadmap engagement): An executable roadmap is based on
performance data and is rapidly accomplished in coordination with effective and
engaged leaders.
Proposition 47 (facility network): Vertical leaders support the production facility
network through a supply chain mindset that reduces carrying costs, enables the
execution of high volume, and, therefore, mitigates capacity constraints.
Proposition 48 (operational effectiveness): Local operational effectiveness is
based on leadership efficacy as evidenced by focus, optimization, and
deployment.
Growth. The next main theme that emerged from the data was growth. The co-
researchers indicated that strategic planning was critical to the achievement of growth. Vertical
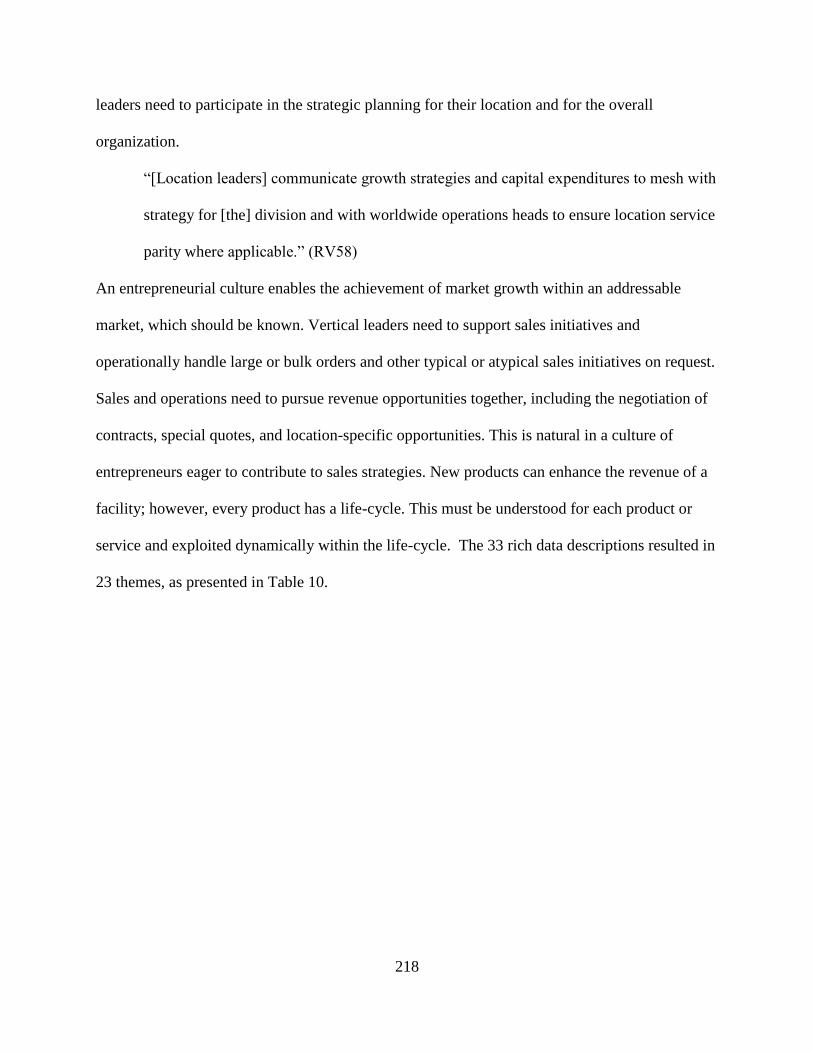
218
leaders need to participate in the strategic planning for their location and for the overall
organization.
“[Location leaders] communicate growth strategies and capital expenditures to mesh with
strategy for [the] division and with worldwide operations heads to ensure location service
parity where applicable.” (RV58)
An entrepreneurial culture enables the achievement of market growth within an addressable
market, which should be known. Vertical leaders need to support sales initiatives and
operationally handle large or bulk orders and other typical or atypical sales initiatives on request.
Sales and operations need to pursue revenue opportunities together, including the negotiation of
contracts, special quotes, and location-specific opportunities. This is natural in a culture of
entrepreneurs eager to contribute to sales strategies. New products can enhance the revenue of a
facility; however, every product has a life-cycle. This must be understood for each product or
service and exploited dynamically within the life-cycle. The 33 rich data descriptions resulted in
23 themes, as presented in Table 10.
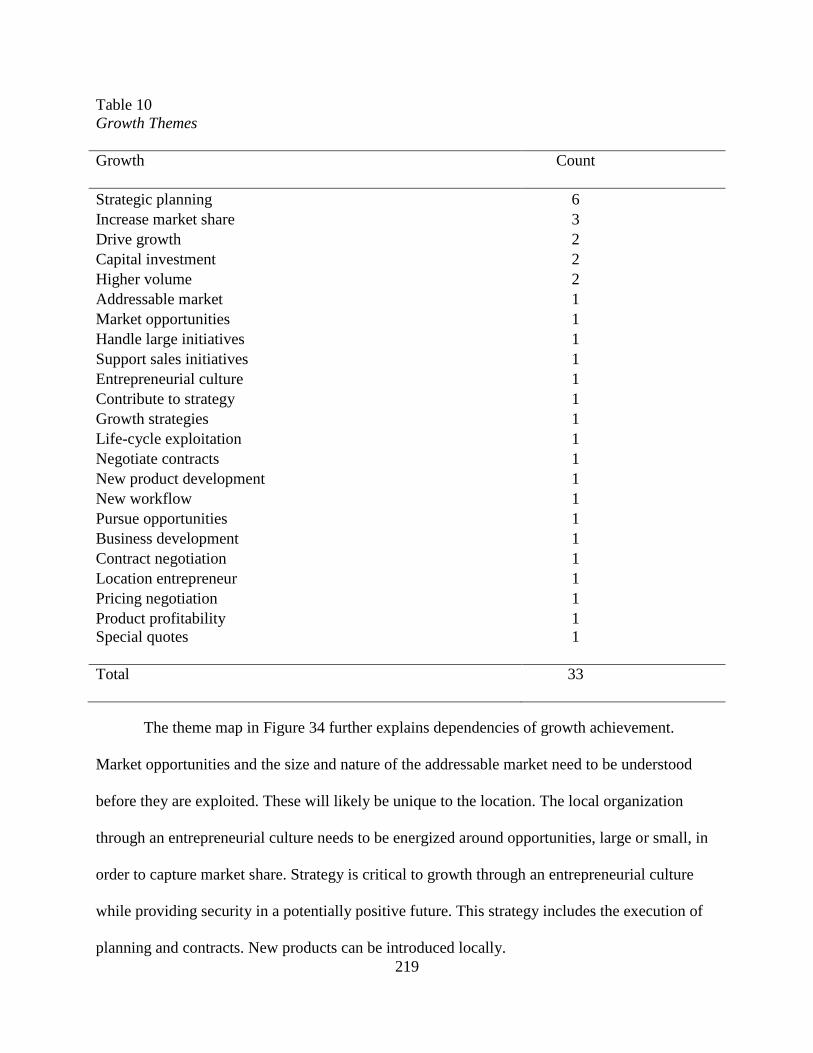
219
Table 10
Growth Themes
Growth
Count
Strategic planning 6
Increase market share 3
Drive growth 2
Capital investment 2
Higher volume 2
Addressable market 1
Market opportunities 1
Handle large initiatives 1
Support sales initiatives 1
Entrepreneurial culture 1
Contribute to strategy 1
Growth strategies 1
Life-cycle exploitation 1
Negotiate contracts 1
New product development 1
New workflow 1
Pursue opportunities 1
Business development 1
Contract negotiation 1
Location entrepreneur 1
Pricing negotiation 1
Product profitability 1
Special quotes
1
Total
33
The theme map in Figure 34 further explains dependencies of growth achievement.
Market opportunities and the size and nature of the addressable market need to be understood
before they are exploited. These will likely be unique to the location. The local organization
through an entrepreneurial culture needs to be energized around opportunities, large or small, in
order to capture market share. Strategy is critical to growth through an entrepreneurial culture
while providing security in a potentially positive future. This strategy includes the execution of
planning and contracts. New products can be introduced locally.
220
“[Location leaders] participate in an entrepreneurial role to develop new products and
services with sales to meet new customer expectations and demand.” (RV36)
This requires the creation of new workflows to accommodate new products. Revenue
opportunities exist during the life-cycle of products and services; however, the contribution of
strategy relates to deployment timing. Pricing and workflow efficiency may need to change
during any product or service life-cycle to harvest as much revenue as possible from the
opportunity. Regardless of the strategy, profitability is the
goal.
Figure 34. Location growth theme map. This figure maps growth as a theme category into
descriptive sub-groupings.
In summary, the data suggests that growth is dependent on how the location addresses the
local market, as well as larger multi-facility markets. Gaining and keeping market share is the
goal. A focused energy is needed to break through loyalty and routine barriers. The opportunity
for a one-time bulk order may be a gateway to a client that could provide sustained advantage.
An entrepreneurial culture will discover, recognize, and exploit an opportunity. Nonetheless,
221
strategy is necessary to penetrate markets and seize opportunities. The ability of a business unit
to be nimble with workflows may allow for additional profitability. The following propositions
summarize the key findings of this section:
Proposition 49 (aggressive entrepreneurialism): The addressable market can be
exploited by an entrepreneurial culture armed with their own aggressive growth
strategy.
Proposition 50 (dynamic pricing): A service and product life-cycle strategy
enables maximal contribution to margins when dynamic pricing plans are
executed timely.
Proposition 51 (nimble action): Profitable opportunities, relentlessly pursued
through searching and strategy execution, are exploited through nimble action.
Communication. In Table 11, the communication driven by location leaders indicates that
performance results should be shared with those that are performing tasks. General
communication breeds trust between leadership and workers. Given that a location leaders sets
the direction for location teams, these plans should be clearly communicated.
“[I will] motivate the teams and keep them engaged in the work through leadership, clear
communication, and specific direction.” (RV100)
The location leader is the point of communication and is responsible for timely information
sharing. Conscientious workers want to know how they are performing and want updates on key
topics, like reliability and financial performance. Workers may also be interested in market
trends to understand organizational strategic plans and their alignment with opportunities in the
markets served. The location leader should also communicate externally, including with support
functions. Workers typically want a high level of transparency between them and the location
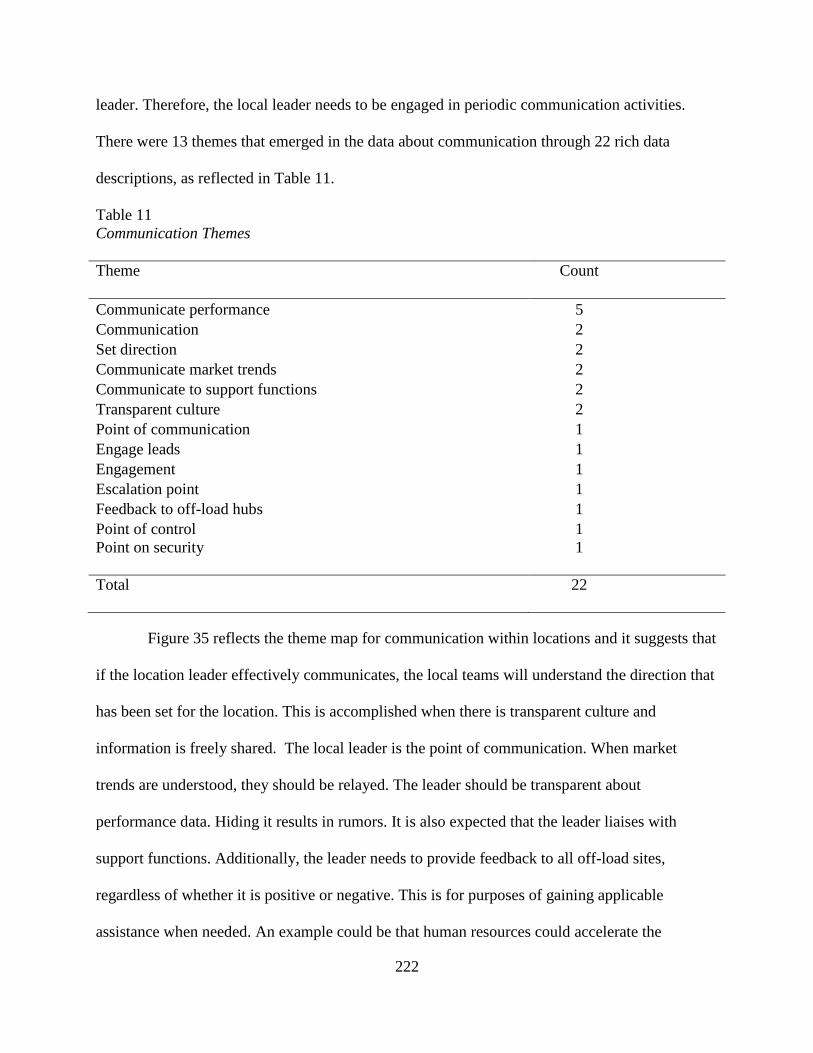
222
leader. Therefore, the local leader needs to be engaged in periodic communication activities.
There were 13 themes that emerged in the data about communication through 22 rich data
descriptions, as reflected in Table 11.
Table 11
Communication Themes
Theme
Count
Communicate performance 5
Communication 2
Set direction 2
Communicate market trends 2
Communicate to support functions 2
Transparent culture 2
Point of communication 1
Engage leads 1
Engagement 1
Escalation point 1
Feedback to off-load hubs 1
Point of control 1
Point on security
1
Total
22
Figure 35 reflects the theme map for communication within locations and it suggests that
if the location leader effectively communicates, the local teams will understand the direction that
has been set for the location. This is accomplished when there is transparent culture and
information is freely shared. The local leader is the point of communication. When market
trends are understood, they should be relayed. The leader should be transparent about
performance data. Hiding it results in rumors. It is also expected that the leader liaises with
support functions. Additionally, the leader needs to provide feedback to all off-load sites,
regardless of whether it is positive or negative. This is for purposes of gaining applicable
assistance when needed. An example could be that human resources could accelerate the
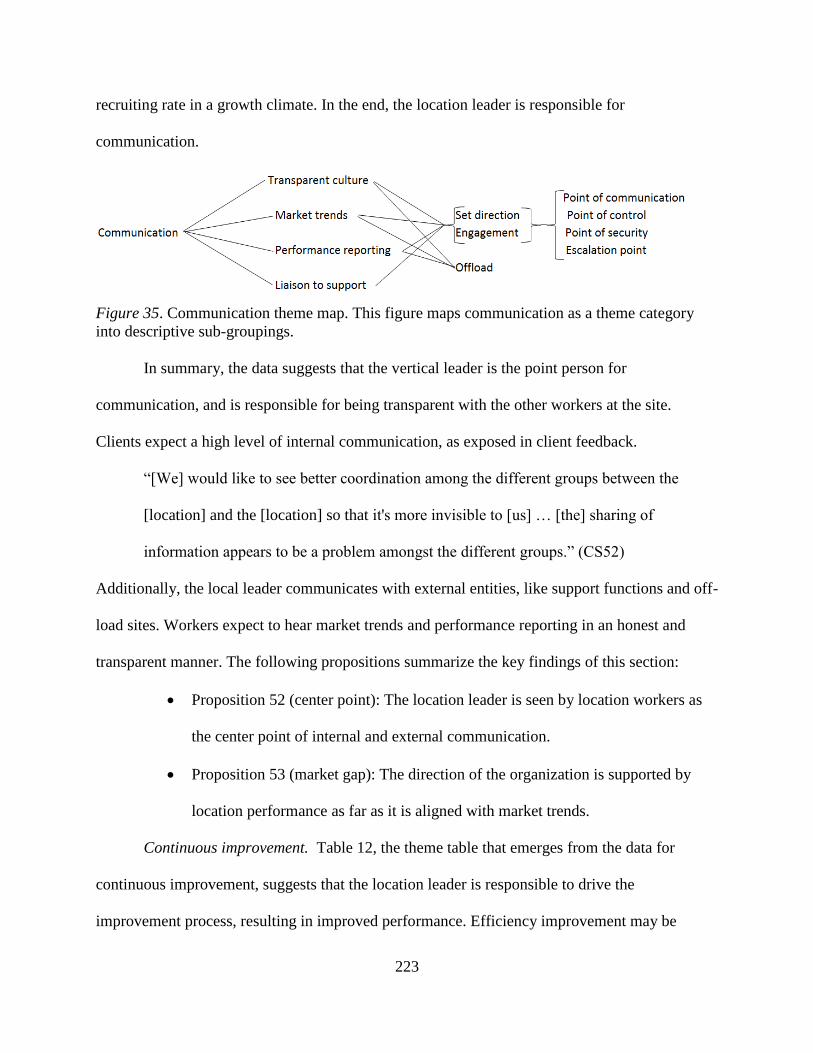
223
recruiting rate in a growth climate. In the end, the location leader is responsible for
communication.
Figure 35. Communication theme map. This figure maps communication as a theme category
into descriptive sub-groupings.
In summary, the data suggests that the vertical leader is the point person for
communication, and is responsible for being transparent with the other workers at the site.
Clients expect a high level of internal communication, as exposed in client feedback.
“[We] would like to see better coordination among the different groups between the
[location] and the [location] so that it's more invisible to [us] … [the] sharing of
information appears to be a problem amongst the different groups.” (CS52)
Additionally, the local leader communicates with external entities, like support functions and off-
load sites. Workers expect to hear market trends and performance reporting in an honest and
transparent manner. The following propositions summarize the key findings of this section:
Proposition 52 (center point): The location leader is seen by location workers as
the center point of internal and external communication.
Proposition 53 (market gap): The direction of the organization is supported by
location performance as far as it is aligned with market trends.
Continuous improvement. Table 12, the theme table that emerges from the data for
continuous improvement, suggests that the location leader is responsible to drive the
improvement process, resulting in improved performance. Efficiency improvement may be
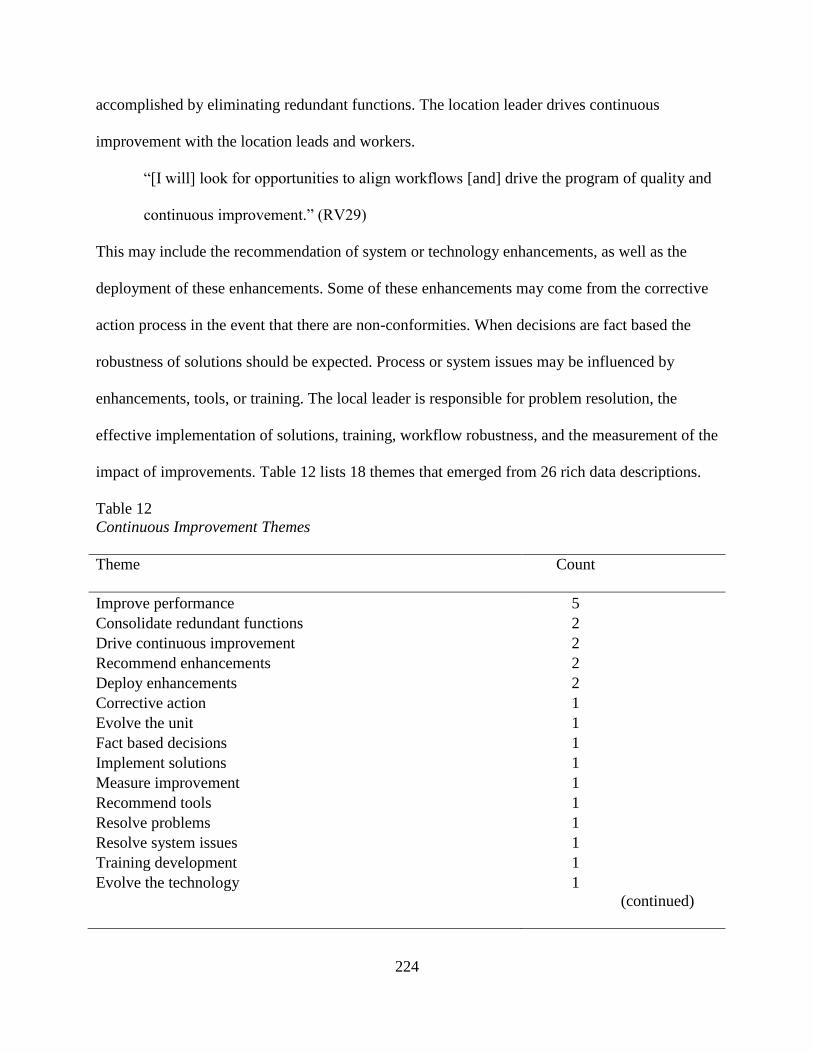
224
accomplished by eliminating redundant functions. The location leader drives continuous
improvement with the location leads and workers.
“[I will] look for opportunities to align workflows [and] drive the program of quality and
continuous improvement.” (RV29)
This may include the recommendation of system or technology enhancements, as well as the
deployment of these enhancements. Some of these enhancements may come from the corrective
action process in the event that there are non-conformities. When decisions are fact based the
robustness of solutions should be expected. Process or system issues may be influenced by
enhancements, tools, or training. The local leader is responsible for problem resolution, the
effective implementation of solutions, training, workflow robustness, and the measurement of the
impact of improvements. Table 12 lists 18 themes that emerged from 26 rich data descriptions.
Table 12
Continuous Improvement Themes
Theme
Count
Improve performance 5
Consolidate redundant functions 2
Drive continuous improvement 2
Recommend enhancements 2
Deploy enhancements 2
Corrective action 1
Evolve the unit 1
Fact based decisions 1
Implement solutions 1
Measure improvement 1
Recommend tools 1
Resolve problems 1
Resolve system issues 1
Training development 1
Evolve the technology 1
(continued)
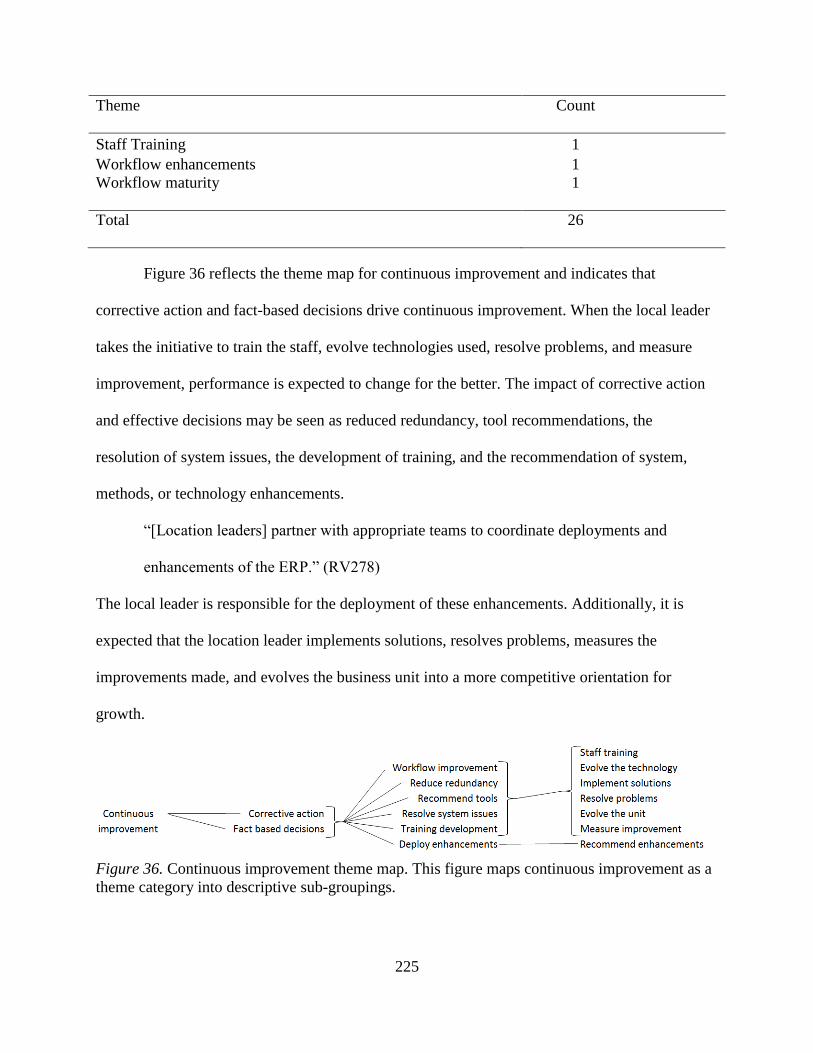
225
Theme
Count
Staff Training 1
Workflow enhancements 1
Workflow maturity
1
Total
26
Figure 36 reflects the theme map for continuous improvement and indicates that
corrective action and fact-based decisions drive continuous improvement. When the local leader
takes the initiative to train the staff, evolve technologies used, resolve problems, and measure
improvement, performance is expected to change for the better. The impact of corrective action
and effective decisions may be seen as reduced redundancy, tool recommendations, the
resolution of system issues, the development of training, and the recommendation of system,
methods, or technology enhancements.
“[Location leaders] partner with appropriate teams to coordinate deployments and
enhancements of the ERP.” (RV278)
The local leader is responsible for the deployment of these enhancements. Additionally, it is
expected that the location leader implements solutions, resolves problems, measures the
improvements made, and evolves the business unit into a more competitive orientation for
growth.
Figure 36. Continuous improvement theme map. This figure maps continuous improvement as a
theme category into descriptive sub-groupings.
226
In summary, the data suggests that continuous improvement is achieved through a fact-
based and continuous corrective action process. When the local leader is able to do certain
things, such as staff training, technology improvements, deal with local quality issues, and
measure improvement, then it should be expected that there is workflow improvement, reduced
redundancy, and resolution of system issues. The following propositions summarize the key
findings of this section:
Proposition 54 (complexity reduction): Continuous improvement is enhanced by
complexity reduction concepts, such as redundancy reduction, tool deployment,
and system deficiency resolution.
Proposition 55 (robust enhancement): Performance data informs real-time and
strategic decisions that lead to robust process enhancements.
Diagonal functions. Another type of dimension in the MOS is the diagonal functions.
One of these dimensions includes client account management staff. The other includes support
staff. The diagonal support leader enables profitable growth, based on synergy realization, by
making sure that the infrastructure and system support the revenue-based roles. Additionally,
diagonal support leaders allow for the evolution of the process through innovation that is ahead
of market demands. Each diagonal leader owns a P&L; however, they are generally a cost center
that supports profit centers. Cost centers do not recognize revenue; rather, they support operative
units that add value to raw assets and bill for them. When MOS leaders were asked about the role
of support functions, three theme patterns emerged from the 82 themes coded from the data
including: infrastructure, development, and system support. Each of these will be discussed
individually. Location and LOB leaders are dependent on infrastructure for workflow capacity.
The system controls the workflows, including automation and tools applied in the workflow.
227
Consequently, support leaders are as critical to profitable growth through synergy realization as
other MOS leaders.
Support diagonal. The first theme pattern that emerged from the data was infrastructure.
Support MOS leaders are needed to support capital expenditures. These expenditures allow for
infrastructure enhancements that keep MediaCorp relevant in its dynamic market. As MediaCorp
expands into various sectors, modifications need to be made to workflows, new workflows need
to be built, the capability of workflows needs to be enhanced, and capacity within workflows
needs to be expanded. These needs typically require capital investment. Diagonal support MOS
leaders are critical to growth and synergy realization because of their involvement in the design,
enhancement, and consolidation of workflows. In some cases workflows can be marginally
enhanced or reconfigured to enable consolidation. Support leaders help with the requirements
and the preparation for these changes. They purchase the hardware and software needed to
realize growth synergy.
“[Support leaders are needed for] … advising operations on software or hardware
solutions on new or changing workflows.” (RDS19)
Support MOS leaders plan and deploy the workflow changes so as to not disrupt revenue
streams. By preserving business continuity, any transition is viewed by clients as seamless.
While support leaders execute change management on workflows, they also monitor workflows
for performance. They are involved in the revenue stream, as they make sure that digital
deliveries happen by monitoring bandwidth utilization on the various delivery mechanisms. They
help the workflows evolve by enhancing the infrastructure. In a predictive fashion, they make
incremental changes, as they keep informed of industry trends.
“[Support leaders] anticipate [function] needs for operations.” (RDS82)
228
“[Support leaders] maintain and evolve [the] production network.” (RDS88)
These trends include the variability in volumes experienced by the infrastructure. Some of the
variability is externally applied, as client volumes are based on sales success in their various
markets. Variability may also relate to regional product launches, for example. In these cases,
support leaders may have to adapt or redeploy infrastructure to meet client volume needs. For
example, storage or hardware may be redeployed to a location to meet local demands. Support
leaders in a MOS collaborate with other MOS leaders to ensure excellent performance. This is an
expectation of their teams as well. Their team structure may need to be recalibrated from time to
time to match the needs of the infrastructure as illustrated in Figure 37. This can include having
the right skill sets available at the right time and with the necessary capacity. The team may
execute large projects to introduce new technologies or to rejuvenate existing workflows. A
sufficient capacity within the team is needed to execute these critical projects. Scheduled
maintenance is strategically executed so as to not interfere with workflow activity. A predictive
aspect of this is deployed, such that maintenance occurs prior to an unscheduled down-time
event. When these events do occur, an escalation policy is timely executed.
“[Business unit (BU) leaders need the] availability [of support leaders] for urgent IT
escalations and immediate resolution to ensure no impact on operational deadlines.”
(RDS15)
The infrastructure is connected to the ERP system. Consequently, any infrastructure change
needs to be complementary to the ERP system architecture, capability, and functionality. Support
leaders need to be knowledgeable about this interface to effectively perform tasks that benefit the
realization of profitability.
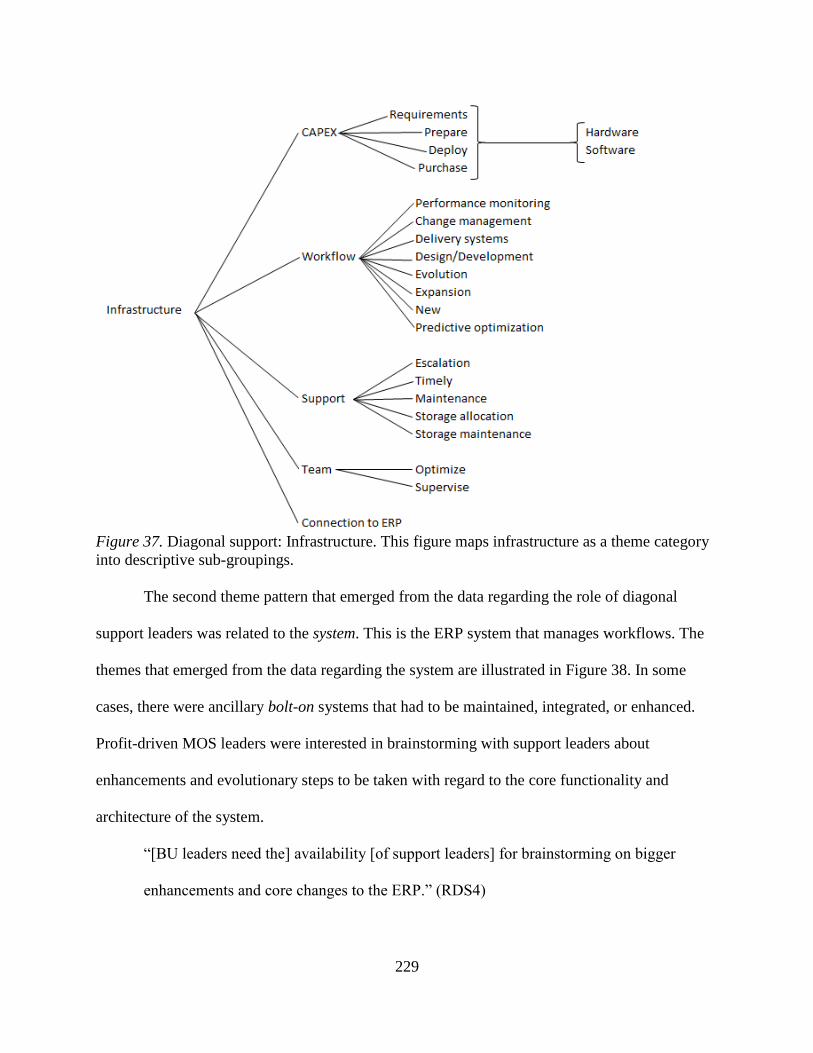
229
Figure 37. Diagonal support: Infrastructure. This figure maps infrastructure as a theme category
into descriptive sub-groupings.
The second theme pattern that emerged from the data regarding the role of diagonal
support leaders was related to the system. This is the ERP system that manages workflows. The
themes that emerged from the data regarding the system are illustrated in Figure 38. In some
cases, there were ancillary bolt-on systems that had to be maintained, integrated, or enhanced.
Profit-driven MOS leaders were interested in brainstorming with support leaders about
enhancements and evolutionary steps to be taken with regard to the core functionality and
architecture of the system.
“[BU leaders need the] availability [of support leaders] for brainstorming on bigger
enhancements and core changes to the ERP.” (RDS4)
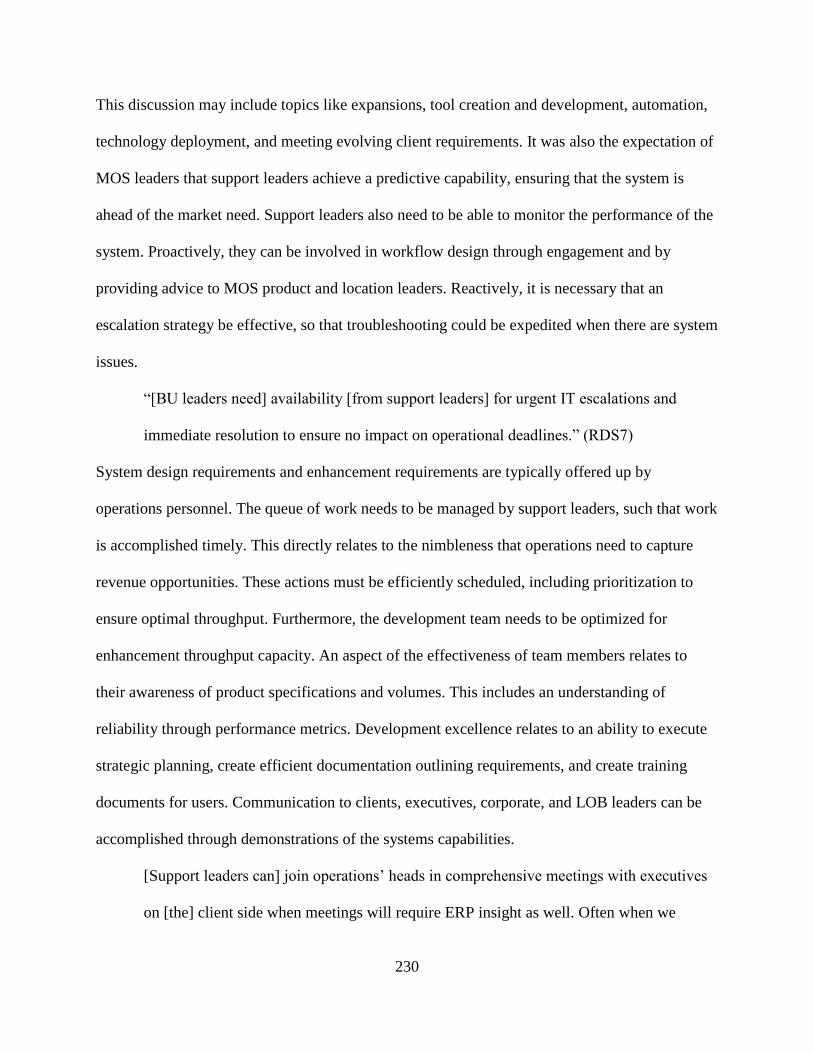
230
This discussion may include topics like expansions, tool creation and development, automation,
technology deployment, and meeting evolving client requirements. It was also the expectation of
MOS leaders that support leaders achieve a predictive capability, ensuring that the system is
ahead of the market need. Support leaders also need to be able to monitor the performance of the
system. Proactively, they can be involved in workflow design through engagement and by
providing advice to MOS product and location leaders. Reactively, it is necessary that an
escalation strategy be effective, so that troubleshooting could be expedited when there are system
issues.
“[BU leaders need] availability [from support leaders] for urgent IT escalations and
immediate resolution to ensure no impact on operational deadlines.” (RDS7)
System design requirements and enhancement requirements are typically offered up by
operations personnel. The queue of work needs to be managed by support leaders, such that work
is accomplished timely. This directly relates to the nimbleness that operations need to capture
revenue opportunities. These actions must be efficiently scheduled, including prioritization to
ensure optimal throughput. Furthermore, the development team needs to be optimized for
enhancement throughput capacity. An aspect of the effectiveness of team members relates to
their awareness of product specifications and volumes. This includes an understanding of
reliability through performance metrics. Development excellence relates to an ability to execute
strategic planning, create efficient documentation outlining requirements, and create training
documents for users. Communication to clients, executives, corporate, and LOB leaders can be
accomplished through demonstrations of the systems capabilities.
[Support leaders can] join operations’ heads in comprehensive meetings with executives
on [the] client side when meetings will require ERP insight as well. Often when we
231
would like to win a customer to start work with us or to expand the services they’re doing
with us, [names] and all of us participate in meetings to give insight on operational
workflow and business systems strength at the same time… (RDS10)
Communication to users about task performance was done through MediaCorp’s university
(MU).
“[We need] more insight into [the] ERP’s functions we may not be aware of – ‘it already
does that….’” (RDS48)
The system also needs to communicate with other systems. Exogenously, this includes client
systems. Endogenously, this would include other disparate systems used by MediaEnterprises.
Figure 38. Diagonal support: System. This figure maps system as a theme category into
descriptive sub-groupings.
The third pattern that emerged from the data was that diagonal support leaders are needed
for the development of system-based capabilities. Again, MOS leaders indicated that
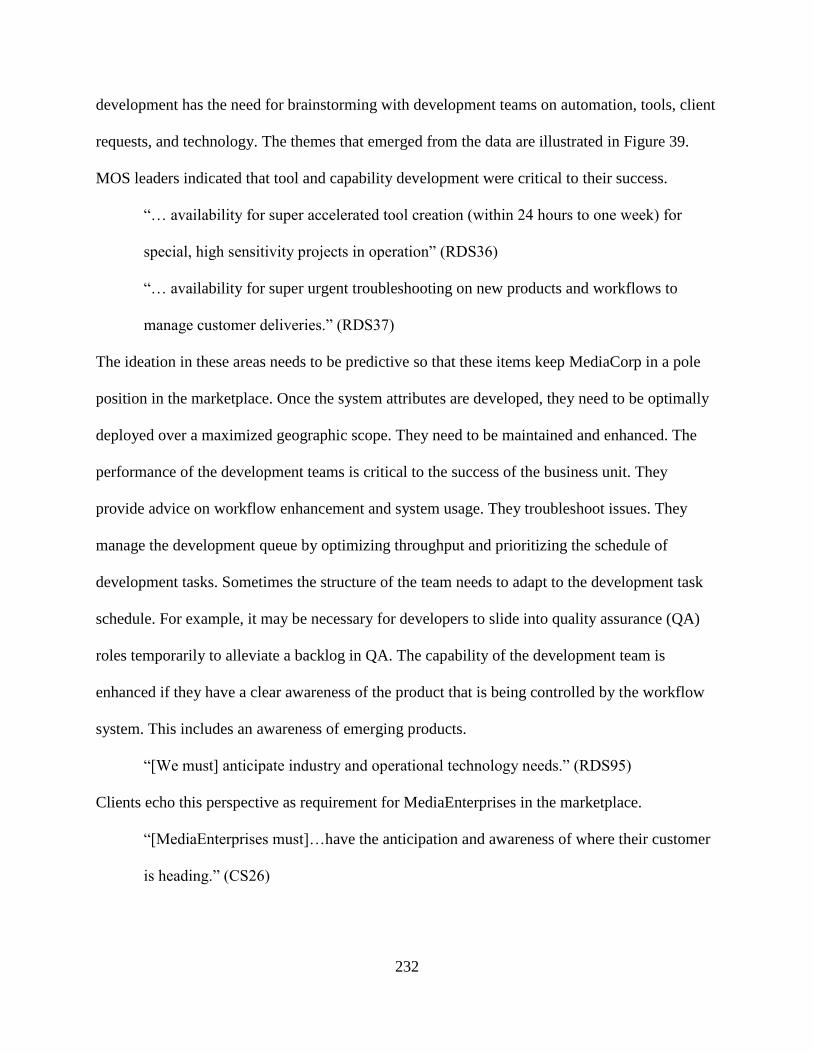
232
development has the need for brainstorming with development teams on automation, tools, client
requests, and technology. The themes that emerged from the data are illustrated in Figure 39.
MOS leaders indicated that tool and capability development were critical to their success.
“… availability for super accelerated tool creation (within 24 hours to one week) for
special, high sensitivity projects in operation” (RDS36)
“… availability for super urgent troubleshooting on new products and workflows to
manage customer deliveries.” (RDS37)
The ideation in these areas needs to be predictive so that these items keep MediaCorp in a pole
position in the marketplace. Once the system attributes are developed, they need to be optimally
deployed over a maximized geographic scope. They need to be maintained and enhanced. The
performance of the development teams is critical to the success of the business unit. They
provide advice on workflow enhancement and system usage. They troubleshoot issues. They
manage the development queue by optimizing throughput and prioritizing the schedule of
development tasks. Sometimes the structure of the team needs to adapt to the development task
schedule. For example, it may be necessary for developers to slide into quality assurance (QA)
roles temporarily to alleviate a backlog in QA. The capability of the development team is
enhanced if they have a clear awareness of the product that is being controlled by the workflow
system. This includes an awareness of emerging products.
“[We must] anticipate industry and operational technology needs.” (RDS95)
Clients echo this perspective as requirement for MediaEnterprises in the marketplace.
“[MediaEnterprises must]…have the anticipation and awareness of where their customer
is heading.” (CS26)
233
We need MediaEnterprises to be out in front of industry trends and relay those [new
products] back to us for evaluation. Too often it feels that we are asking for perspective
rather than have MediaEnterprises share insights into what's happening in the industry.
(CS35)
I can [say] that MediaEnterprises does a great job in … promoting new services to us.
But since [client] has not embraced the [product] to fully experience MediaCorp’s
abilities, we can only say that their services are top-notch for what we do execute. (CS40)
They may also provide an awareness of tools and other developments directly to clients,
corporate executives, and LOB leaders.
“[We need to] continue communication with LOB leads on prioritization and re-
prioritization of tools and R&D efforts in queue.” (RDS31)
Anything they develop will include a connection to the ERP system and to the architecture that is
manipulated by it.
Figure 39. Diagonal support: Development. This figure maps development as a theme category
into descriptive sub-groupings.
234
In summary, the data suggests that diagonal support leaders in a MOS are needed to
enable the realization of growth synergies. These synergies are dependent on infrastructure and
the system that controls it. This control is direct through infrastructure application program
interfaces (APIs) and by controlling the behavior of workers. Workers may be constrained by the
system to execute work correctly through the use of workflow interruptions. The system also
provides a super-additive through the use of tools and data awareness. Diagonal support leaders
have teams whose effectiveness directly relates to profitability. The success of LOB and location
leaders is dependent on the performance of the ERP system and the infrastructure that it controls.
The following propositions summarize the key findings of this section:
Proposition 56 (predictive design): Diagonal support leaders build workflows,
create technologies, and embed existing technologies that ensure predictive
capability against market trends.
Proposition 57 (workflow integration): Slight enhancements to infrastructure may
enable the consolidation of workflows, improving their utilization and the
resulting cost per deliverable.
Proposition 58 (seamless changes): Workflow transitions, integrations,
modifications, and enhancements will not be noticeable to client production
schedules.
Proposition 59 (production system): As infrastructure and workflow management
systems are co-dependent they must also be optimized as a collaborative system
for best results.
Client diagonal. The diagonal client dimension interacts with clients from a sales and
operations perspective as per Figure 40. The role of those who our outward facing is outlined in
235
three categories, each of which is profitability oriented. Synergy is also clear in the figures, as
collaboration between the parties indicated is necessary for the realization of profitable growth.
The role of each entity is listed below their name. The responsibilities are shared between them
in a collaborative way, as indicated between the sales and operational entities. These themes
emerged in the data when MOS leaders were asked about the roles of each diagonal support
function. A total of 73 themes emerged from the data with regard to five roles. One role was the
LOB lead. This is the person who is in charge of a set of products. The second is the account
director (AD), who manages the client from the operations side of the business. The third is the
client service representative or project manager (CSR/PM). This person manages the work
through the facility and connects with the supply chain up and downstream. The fourth is the
technical project manager (TPM). The person is technically skilled in the product and the
workflow. The fifth person is the account manager (AM). This person manages the client on the
sales side of the business. The last person is the sales manager (SM). This person is primarily in
charge of bringing in new business or clients.
Sustaining the profitability of an existing client is reflected in Figure 40. In this case the
revenue stream and its associated profitability need to be sustained. The LOB lead is tasked with
making sure that service issues are resolved for the client in such a way as to not compromise
profitability. The AD is primarily responsible for communicating the general status of work to
the client. The AD also monitors performance levels and communicates internally and externally
as needed to course-correct. The CSR/PM is responsible for managing projects through the
workflow. This may include dealing with issues and exceptions proactively, as well as reactively
depending on their ability to discover potential problems. The CSR/PM is also typically
responsible for updating the ERP with status-related information. The TPM has the technical
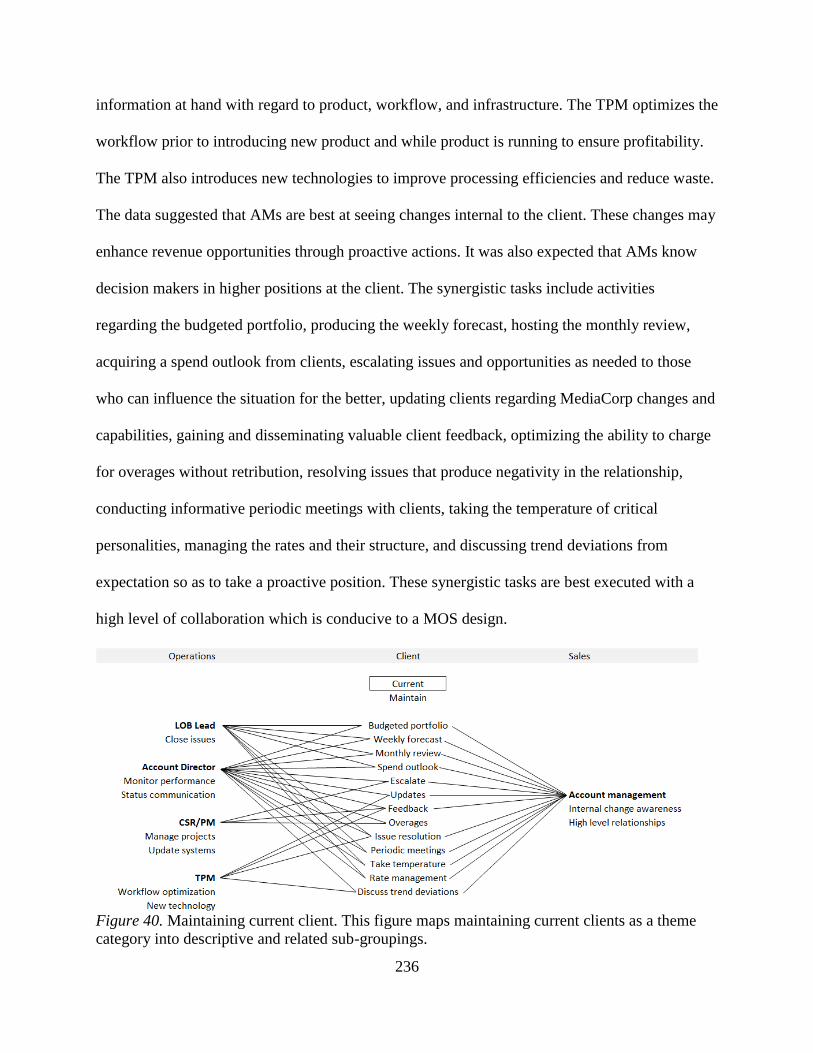
236
information at hand with regard to product, workflow, and infrastructure. The TPM optimizes the
workflow prior to introducing new product and while product is running to ensure profitability.
The TPM also introduces new technologies to improve processing efficiencies and reduce waste.
The data suggested that AMs are best at seeing changes internal to the client. These changes may
enhance revenue opportunities through proactive actions. It was also expected that AMs know
decision makers in higher positions at the client. The synergistic tasks include activities
regarding the budgeted portfolio, producing the weekly forecast, hosting the monthly review,
acquiring a spend outlook from clients, escalating issues and opportunities as needed to those
who can influence the situation for the better, updating clients regarding MediaCorp changes and
capabilities, gaining and disseminating valuable client feedback, optimizing the ability to charge
for overages without retribution, resolving issues that produce negativity in the relationship,
conducting informative periodic meetings with clients, taking the temperature of critical
personalities, managing the rates and their structure, and discussing trend deviations from
expectation so as to take a proactive position. These synergistic tasks are best executed with a
high level of collaboration which is conducive to a MOS design.
Figure 40. Maintaining current client. This figure maps maintaining current clients as a theme
category into descriptive and related sub-groupings.
237
The second way that a MUF can increase profitability exogenously is to assist existing
clients to experience growth. Leveraging existing knowledge and talent for additional revenue is
highly synergistic and therefore, profitability enhancing. In this case the data suggested that the
LOB lead is critical for closing the deal, validating the pricing, dealing with issues, and agreeing
with the validity of the rate card structure. The AD needs to monitor performance for issues and
provide status on the fulfillment of the new additional work. The CSR/PM can help to embed
pricing structures in the ERP system so that they can be exploited with the new work. Getting
this right from the first invoice is important for the brand. The CSR/PM staff may also see
opportunities for growth that should be passed on. Exploiting these opportunities in existing
supply chain BUs is highly synergistic. The TPM provides subject matter expertise to the
workflow design enhancements needed to accommodate the new volume or product. The AM in
this case needs to cross-sell as well to exploit existing workflows. As clients discuss upcoming
opportunities, the AM should relay these to the right parties. The sales tools that are used to
measure the revenue performance of the client are the responsibility of the AM. This should
include a funnel that indicates the pending work type that is in the pipeline for their client.
Knowing the performance and rates of competitors helps the AM know pricing positioning. The
synergistic actions shared between these functions include the approval of the rate structure for
the new work, the establishment of pricing strategy, education of the client and internal
operations on requirements, obtaining feedback on expectations prior to and during expansion,
discovering new opportunities to augment client income to MediaCorp, fulfilling requests for
proposals (RFPs), updating the client as needed on status of the ramp-up, interpreting the impact
of megatrends and life-cycles on the business, upselling other services to augment revenues, and
discovering services that are not being exploited by the client, but that could be leveraged. Again
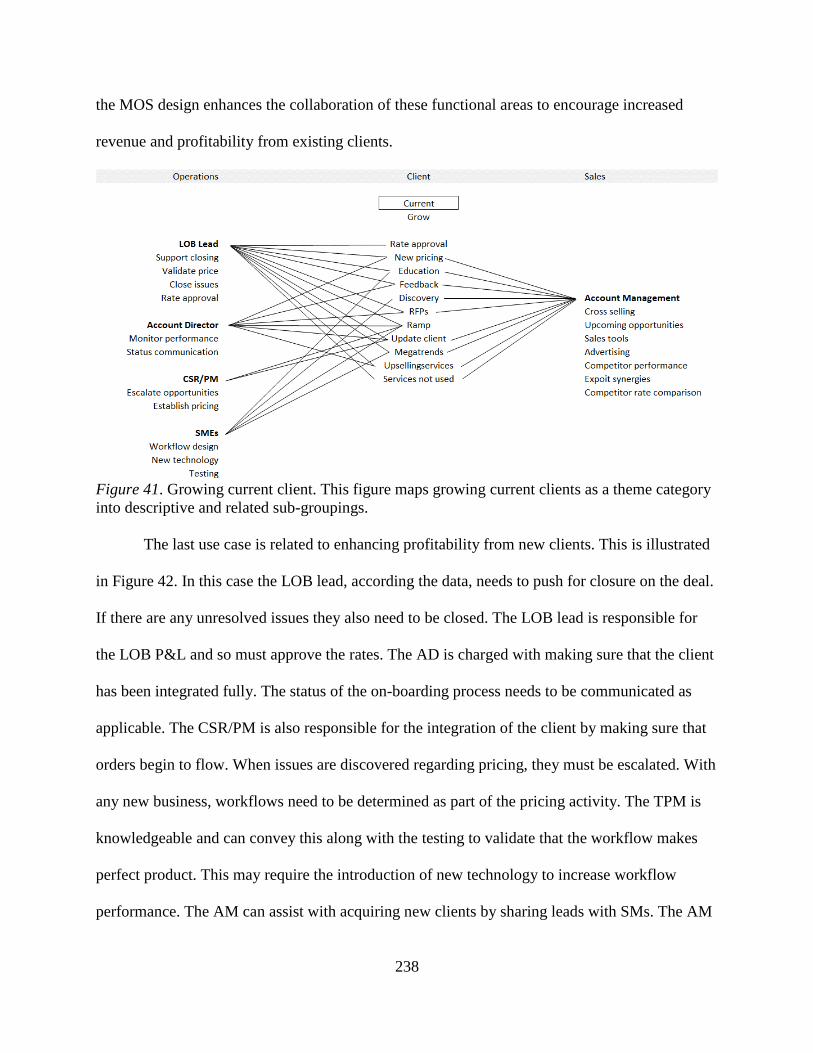
238
the MOS design enhances the collaboration of these functional areas to encourage increased
revenue and profitability from existing clients.
Figure 41. Growing current client. This figure maps growing current clients as a theme category
into descriptive and related sub-groupings.
The last use case is related to enhancing profitability from new clients. This is illustrated
in Figure 42. In this case the LOB lead, according the data, needs to push for closure on the deal.
If there are any unresolved issues they also need to be closed. The LOB lead is responsible for
the LOB P&L and so must approve the rates. The AD is charged with making sure that the client
has been integrated fully. The status of the on-boarding process needs to be communicated as
applicable. The CSR/PM is also responsible for the integration of the client by making sure that
orders begin to flow. When issues are discovered regarding pricing, they must be escalated. With
any new business, workflows need to be determined as part of the pricing activity. The TPM is
knowledgeable and can convey this along with the testing to validate that the workflow makes
perfect product. This may require the introduction of new technology to increase workflow
performance. The AM can assist with acquiring new clients by sharing leads with SMs. The AM
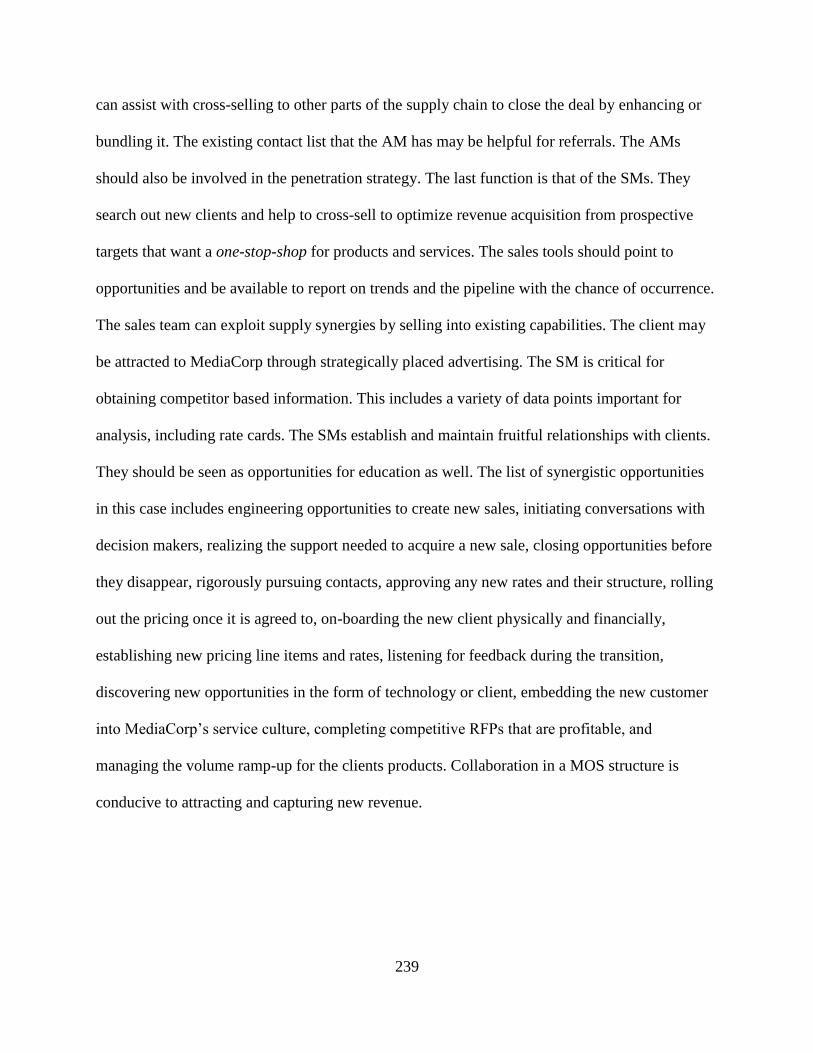
239
can assist with cross-selling to other parts of the supply chain to close the deal by enhancing or
bundling it. The existing contact list that the AM has may be helpful for referrals. The AMs
should also be involved in the penetration strategy. The last function is that of the SMs. They
search out new clients and help to cross-sell to optimize revenue acquisition from prospective
targets that want a one-stop-shop for products and services. The sales tools should point to
opportunities and be available to report on trends and the pipeline with the chance of occurrence.
The sales team can exploit supply synergies by selling into existing capabilities. The client may
be attracted to MediaCorp through strategically placed advertising. The SM is critical for
obtaining competitor based information. This includes a variety of data points important for
analysis, including rate cards. The SMs establish and maintain fruitful relationships with clients.
They should be seen as opportunities for education as well. The list of synergistic opportunities
in this case includes engineering opportunities to create new sales, initiating conversations with
decision makers, realizing the support needed to acquire a new sale, closing opportunities before
they disappear, rigorously pursuing contacts, approving any new rates and their structure, rolling
out the pricing once it is agreed to, on-boarding the new client physically and financially,
establishing new pricing line items and rates, listening for feedback during the transition,
discovering new opportunities in the form of technology or client, embedding the new customer
into MediaCorp’s service culture, completing competitive RFPs that are profitable, and
managing the volume ramp-up for the clients products. Collaboration in a MOS structure is
conducive to attracting and capturing new revenue.
240
Figure 42. Growing new client. This figure maps growing new clients as a theme category into
descriptive and related sub-groupings.
In summary, the data suggests that the MOS structure is conducive to maintaining
existing clients, extracting new revenue from existing clients, and acquiring new clients. The
requirement for collaboration in each of these three cases validates the need for a nimble and
effective structure. Distinct positions have responsibilities and there is a segregation of duties;
however, all members of the MOS can participate in sustaining and creating profitability. The
following propositions summarize the key findings of this section:
241
Proposition 60 (duty segregation): Role definitions in a MOS are required to
ensure accountability; however, synergistic tasks are shared optimally and
selectively by all outward facing employees to maintain the profitability of
existing revenue streams.
Proposition 61 (synergistic tasks): Synergistic tasks are shared by functions
critical to the execution of these tasks and the associated rewards.
Proposition 62 (profitability super-additive): Enhancing the revenue from a client
through additional income streams that are synergistic is a profitability super-
additive.
Proposition 63 (collaborative strengths): Operations and sales achieve mutually
beneficial profitability goals when they collaborate around their strengths, filling
the company's pipeline with sustained corporate advantage.
Proposition 64 (ideation-ramping): Acquiring new business revenue requires
collaborative action, starting with sales lead ideation and ending with the
achievement of billable volume ramping-up at optimized margins.
Products and services. Accountability for workflow and efficiency channels is enabled
by creating clarity around the ownership of product and service categories. The MOS leaders
were aligned, rather than competitive, within their product categories and in their sales channels.
Internal competition was an unnecessary method by which clients could consume company
margins. In the case of sales channels, this clarity retarded encroachment, discouraged
cannibalization, and enabled accountability for performance through sales force effectiveness
(SFE) based measurements. In the case of operative channels, this allowed for alignment
between cost (where it was incurred) and revenue (where it was being recognized). A total
242
number of 28 product categories were identified including 87 unique products that represented
MediaCorp’s portfolio. These were categorized by MOS leaders into three product sectors. A
MOS horizontal leader was assigned to each sector with accountability for the sector
profitability. Any of these products, or their associated workflows, could be exploited in any
adjacent sector. In some cases work in one sector was dependent on work in another sector.
Revenue for adjacent sector work was attributed to the horizontal leader that owned the
workflow exploited by that sector. Furthermore, scalability was supported as new products and
services added to the portfolio were allocated to categories in which they had the most
synergistic attributes regarding skills, workflow steps, infrastructure, and other relevant factors.
With the product-service category clarification and accountability, accurate metrics could be
leveraged for discovery. Additionally, the impact of focused actions could be quantified in the
now accurate financial models. The following propositions summarize the key findings of this
section:
Proposition 65 (cross-sector): Entrepreneurial leadership that owns a product
workflow can be incentivized to pursue cross-sector opportunities.
Proposition 66 (portfolio assignment): An assigned portfolio enhances
accountability for profitability results and focuses growth synergies that are
constructive.
Synergistic experience. This section discusses MOS leader change management
experiences that went well and that did not go well during the precipitating event. Consulting
past experience is a way to find meaning and to develop a plan of action. Change agents shared
and reflected on change practices that helped them to be successful during change activities. The
140 data line items were bifurcated between positive aspects of the activity that enhanced the
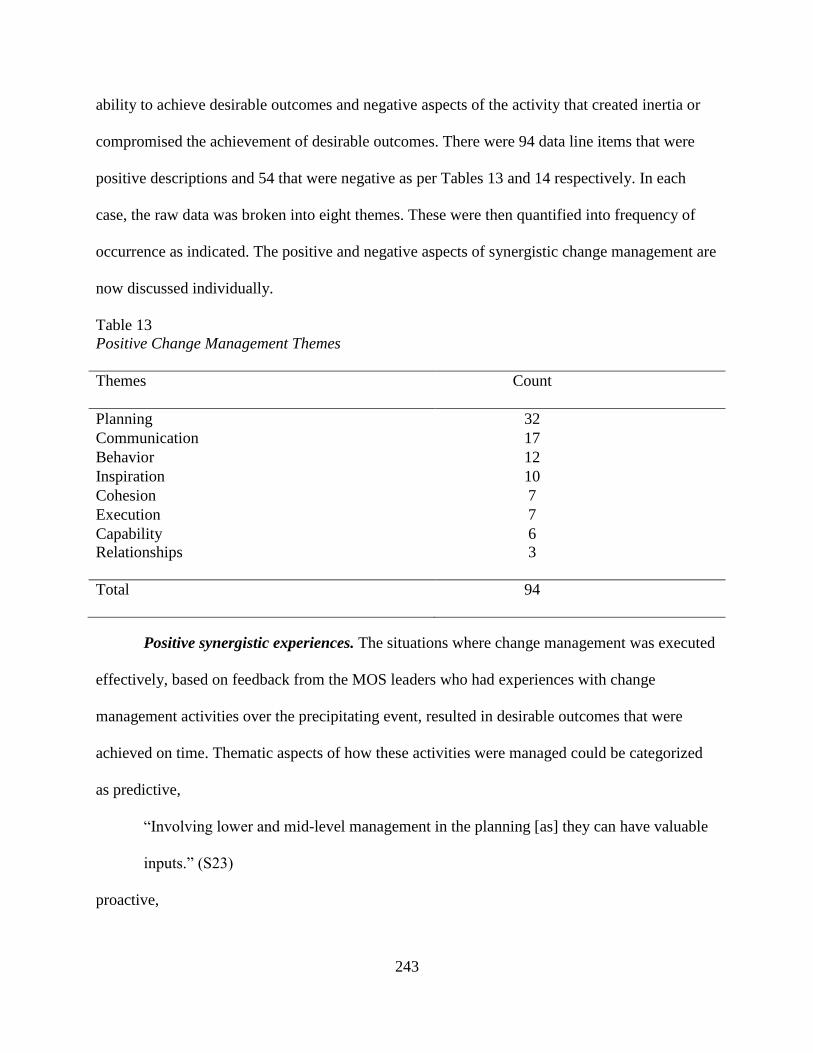
243
ability to achieve desirable outcomes and negative aspects of the activity that created inertia or
compromised the achievement of desirable outcomes. There were 94 data line items that were
positive descriptions and 54 that were negative as per Tables 13 and 14 respectively. In each
case, the raw data was broken into eight themes. These were then quantified into frequency of
occurrence as indicated. The positive and negative aspects of synergistic change management are
now discussed individually.
Table 13
Positive Change Management Themes
Themes
Count
Planning 32
Communication 17
Behavior 12
Inspiration 10
Cohesion 7
Execution 7
Capability 6
Relationships
3
Total
94
Positive synergistic experiences. The situations where change management was executed
effectively, based on feedback from the MOS leaders who had experiences with change
management activities over the precipitating event, resulted in desirable outcomes that were
achieved on time. Thematic aspects of how these activities were managed could be categorized
as predictive,
“Involving lower and mid-level management in the planning [as] they can have valuable
inputs.” (S23)
proactive,
244
Bringing … groups … together and the associated move to [location] worked because it
was handled quickly and openly; once it was time to announce it to the staff… we pulled
everyone into conference rooms and laid out the plan… it got all the employees ‘on
board’ quickly and then everyone was invested and took a piece of the effort to help.
(S27)
and reactive.
…being the owner of [functional areas] made things simpler… since I had a hand in
every piece of the puzzle, I had the ability to make tweaks and changes where changes
were needed and there were no toes in the way to step on… in the end, once we knew it
worked, the hand off to [name] team was painless. (S89)
Social and tactical theme categories also emerged from the data. It was beneficial for MOS
leaders to share and discuss these experiences, so that all of the leaders could benefit from each
other’s change leadership experiences. Again, the frequency of occurrence of themes does not
necessarily imply weighting. Each theme was individually mapped and will be discussed.
Planning. Not surprisingly, the most frequently occurring driver of change success was
planning. Within this proactive code section, a number of comments came up that were
interesting as represented in Figure 43. The MOS leaders indicated that significant attention
needed to be given to planning, including critical aspects such as rigor, requirements, constructs,
involvement, inputs, and buffering. The data suggested that there should be broad involvement to
get buy-in; however, it should be understood up front that not everyone is going to get on board.
Additionally, the execution team should be small for quick decision making. The team may be
allocated by category or by sector. The opportunity discovery process is critical for the
development of a fulsome plan. MOS leaders indicated that discovery should be focused, quick,
245
and thoughtful. All the relevant information should be gathered, including SLAs (service level
agreements), specifications, and contractual agreements. The planning activity should include the
units involved but also consider external dependencies. Attention should be given to make the
plan easy to execute with a detailed timeline for the transition. The plan should include
exploiting redundancies, working with a centralized service model, not reinventing processes
that already work, not creating new silos, and making sure that infrastructure continuously needs
to be aligned with workflows when they are moved. Co-researchers indicated that a phased
rollout is easier for participants to absorb; however, the workflows must be capable to create
deliverables within the specifications prior to a significant migration of work. The strategic
framework must be robust and not be subject to prioritization based on emotional judgments or
noise. The integration plan should be budgeted such that the P&Ls are not damaged during the
transition. This does not otherwise incentivize stakeholders to make the change. Capacity must
be considered also, through the allocation of accountability to make sure local capacity, or
outsourced capacity, is available. The plan must optimally preserve the quality of life (QoL) of
the participants, while maintaining business continuity for clients. There must also be provision
for adequate training, including skills needed for new workflows.
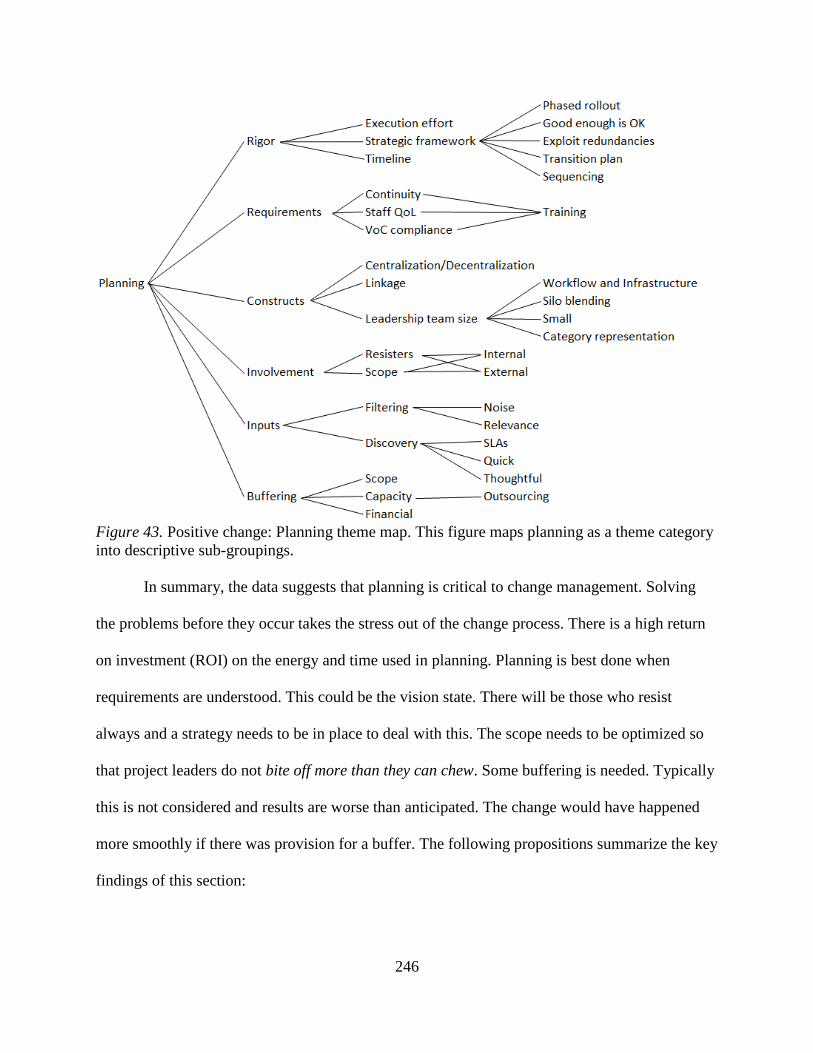
246
Figure 43. Positive change: Planning theme map. This figure maps planning as a theme category
into descriptive sub-groupings.
In summary, the data suggests that planning is critical to change management. Solving
the problems before they occur takes the stress out of the change process. There is a high return
on investment (ROI) on the energy and time used in planning. Planning is best done when
requirements are understood. This could be the vision state. There will be those who resist
always and a strategy needs to be in place to deal with this. The scope needs to be optimized so
that project leaders do not bite off more than they can chew. Some buffering is needed. Typically
this is not considered and results are worse than anticipated. The change would have happened
more smoothly if there was provision for a buffer. The following propositions summarize the key
findings of this section:
247
Proposition 67 (planning rigor): Rigor during the planning phase of a project,
which includes exploiting existing capabilities and a sequenced rollout, will likely
reduce the effort and time needed to execute the plan.
Proposition 68 (transitional capacity): The provision of transitional capacity and
cost allowance within a defined project scope can accelerate results achievement
and mitigate change fatigue.
Proposition 69 (transitional organization): A holistic vision of the detailed
organizational design built for achieving requirements encourages a focused
transition.
Communication. It was important to MOS leaders that the overall plan and the overall
strategy are both clearly outlined to the stakeholders affected.
“[There is a need for the] communication of the overall plan and timeline to the plan.”
(S8)
“[There is a need for] communication on new roles and people involved.” (S13)
This could happen in the form of an official announcement that should include a rationale
showing the mutual benefit of the change. Furthermore, there should be the opportunity for
questions, answers, and input from stakeholders. The presentation has to come off as being
credible. It has to make sense and be logical. This will help the event to be an easy sell.
For starters, all the process owners were on board with this initiative which is always
helpful. This means, the information (… specs, workflow, documentation) I needed to
move this forward was available…. It made sense logistically and it was an easy move so
the idea was easy to sell. (S70)
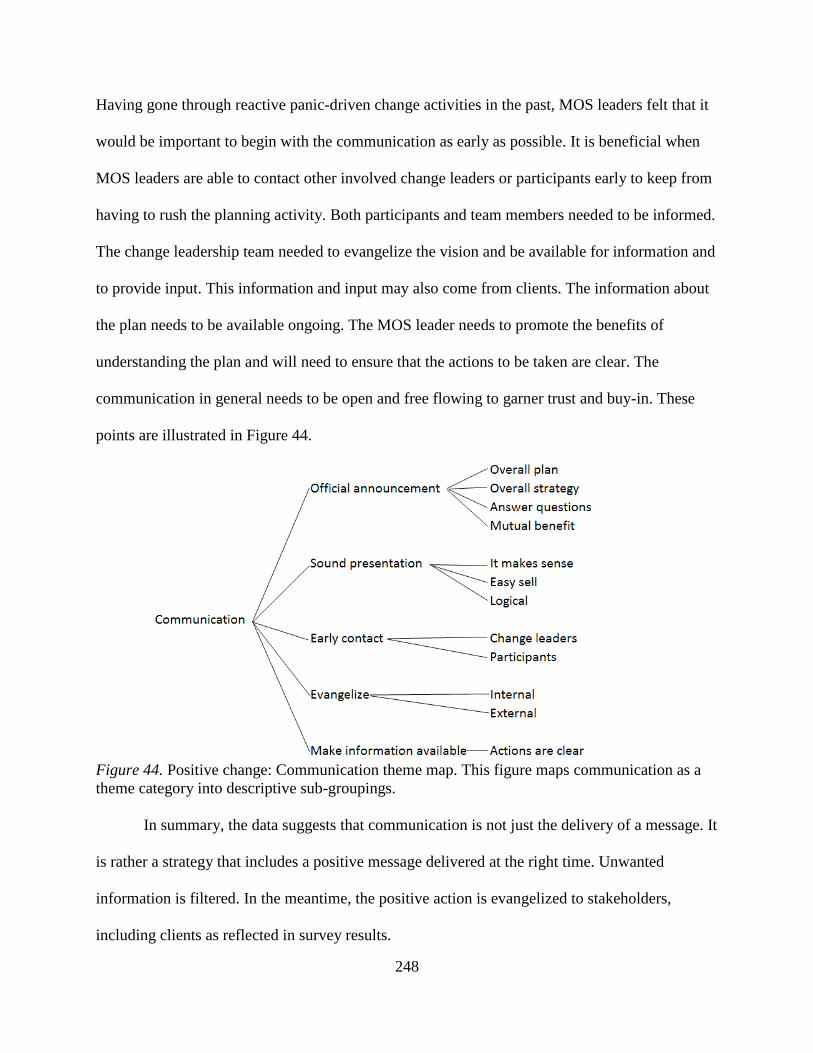
248
Having gone through reactive panic-driven change activities in the past, MOS leaders felt that it
would be important to begin with the communication as early as possible. It is beneficial when
MOS leaders are able to contact other involved change leaders or participants early to keep from
having to rush the planning activity. Both participants and team members needed to be informed.
The change leadership team needed to evangelize the vision and be available for information and
to provide input. This information and input may also come from clients. The information about
the plan needs to be available ongoing. The MOS leader needs to promote the benefits of
understanding the plan and will need to ensure that the actions to be taken are clear. The
communication in general needs to be open and free flowing to garner trust and buy-in. These
points are illustrated in Figure 44.
Figure 44. Positive change: Communication theme map. This figure maps communication as a
theme category into descriptive sub-groupings.
In summary, the data suggests that communication is not just the delivery of a message. It
is rather a strategy that includes a positive message delivered at the right time. Unwanted
information is filtered. In the meantime, the positive action is evangelized to stakeholders,
including clients as reflected in survey results.
249
“Many times suggestions are offered which we take into consideration and are valued by
our [functional areas].” (CS50)
In the end, those that do not want to resist will only need clear instructions. The following
propositions summarize the key findings of this section:
Proposition 70 (communication integrity): The integrity of the communication
strategy, including the nature of the content and the timing scope, can reduce
change inertia.
Proposition 71 (situational communication): Communication is situational in
design, dependent on the current timeline, location, and on relevant audiences.
Behavior. Achieving constructive behavior and reacting proactively to disruptive
behavior, thereby keeping it from spreading, were critical to plan execution in a MOS. This
theme is illustrated in Figure 45.
“Fear and anxiety are high and participants are always guarded around a change agent
because even effective agents are seen as disruptive of the normal flow.” (S125)
The attitude of a MOS leader should be one of assistance and support. This attitude should also
be appropriate to the situation. It should be made clear that cooperation and collaboration are
mutually beneficial and bi-directional. The data suggests that leaders need to recognize the good
in others and the good that is realized from positive outcomes. They must be goal oriented,
resilient, and tenacious. In some cases existing behaviors are appropriate for the realization of
growth. These should be recognized, encouraged, and rewarded. MOS leaders indicated that the
speed of responses to behavior was important. This related both to reactive responses, to
observable situations, and to proactive responses to situations that could be predicted. To
minimize change inertia, disruptive and inappropriate behavior should be mitigated quickly. This
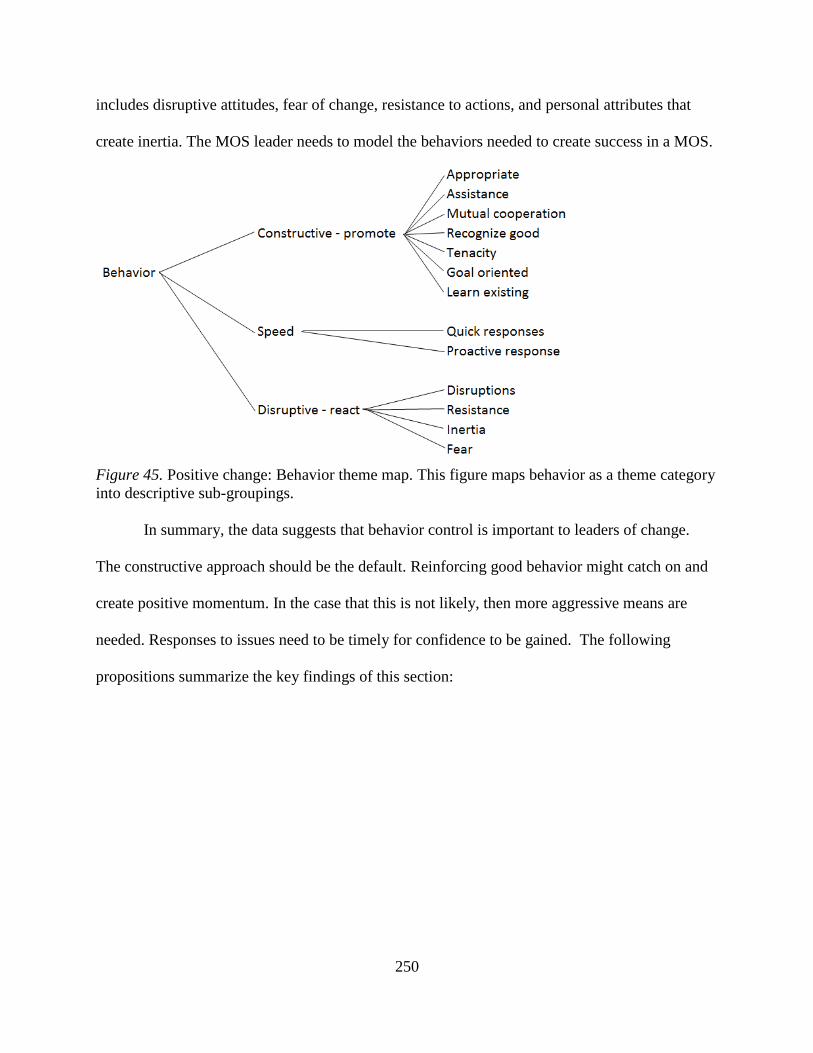
250
includes disruptive attitudes, fear of change, resistance to actions, and personal attributes that
create inertia. The MOS leader needs to model the behaviors needed to create success in a MOS.
Figure 45. Positive change: Behavior theme map. This figure maps behavior as a theme category
into descriptive sub-groupings.
In summary, the data suggests that behavior control is important to leaders of change.
The constructive approach should be the default. Reinforcing good behavior might catch on and
create positive momentum. In the case that this is not likely, then more aggressive means are
needed. Responses to issues need to be timely for confidence to be gained. The following
propositions summarize the key findings of this section:
251
Proposition 72 (immediate reinforcement): An immediate awareness of
constructive behaviors gives a change leader the opportunity to reinforce positive
attributes as they occur.
Proposition 73 (effort mitigation): An acute awareness of inertia-producing
behaviors gives a change leader the immediate opportunity to mitigate an
excessive effort requirement.
Execution. The MOS leaders indicated that execution related to how human resources
were treated. This included how they were inspired to make the transition and achieve growth
goals. It was related to the nature of the relationships.
My successful projects typically ended up being all about attitude – both mine and theirs.
I also need to be able to recognize that not everyone is going to get ‘on board’ all the time
– and that’s ok too. I send a message when I keep moving towards the goal, without
backing off (or getting my feelings hurt) when the reaction is not completely positive.
Change is hard for people. It isn’t about me and my delivery (or ability) most of the
time. It speaks more to their fears. (S143)
The capability of the operation was important for growth realization as was cohesion within the
team. Additional information was provided that related to how product and services were
introduced to the manufacturing environment to ensure performance that met expectations from
the start. Workflow management had to include design and testing, an examination of the first
article to ensure compliance, on-going periodic tests at appropriate intervals as part of the quality
plan, and then lastly, the exporting of a mature process to all relevant locations once the
performance becomes predictable and mature. The data regarding the human aspects of
execution that emerged from the study will be discussed more fully in the next few sections.
252
To get everyone, including P&L owners, invested in the change activity, the MOS leader
needs to be a source of inspiration.
“[I was] helping people understand the benefits and positive experience of the changes.”
(S110)
This includes having a belief in the mission and exhibiting an attitude that everything is possible
within the prescribed timeline. Leaders need to sell the benefits of the change activity. This,
along with conveying the positive experience that will result from the change, will help garner
buy-in from stakeholders. Even so, there will be stakeholders that will have a high level of
sensitivity and anxiety. This may be driven by the magnitude of the change they will need to
endure and how disruptive it is to entrenched routines. MOS leaders need to be aware of these
concerns and plan for them. Finally, the sequence of activities driven by dependencies and
activity duration need to have the attention of the change leader.
The MOS leader needs strong relationships to achieve desired outcomes. MOS leaders
suggested that trust, credibility, professionalism, and a strong core team were critical.
“…have a single management team of two or three (united in the plan and strategy) to
cooperatively disperse the talent, [integrate] process and tools into [business units] and
deploy a load-balanced, sensibly equipped unit for each customer.” (S77)
These relationships provide the capability, trust, and resiliency needed during a transition. There
also needs to be a significant amount of cohesion and alignment within the team. When these
relationships are strong and autonomous, leadership teams can push the organization forward
quickly. The researcher will discuss capability and cohesion to close out the positive change
experiences that emerged from the data.
253
In order for the MOS leader to be successful during times of radical change in a
moderately dynamic market, the capacity of the operation and the human resources component
needs to be capable. Ideally in a MUF, the facility needs to have a 24-hour service scenario even
if it means that increased shift coverage is hired. This always on perspective makes it possible
for additional capability to be available to transitioning business units and it makes it possible for
operational issues to be remedied quickly.
“Adding temporary support help[ed] the team to go through [the] transition.” (S19)
This also helps with quick turn-around times and overall business continuity. The business unit
should be load balanced to avoid capacity shocks that could compromise progress along the
transformational roadmap. When a new business unit is created, it should be deployed with
capacity that is also load balanced. Otherwise, it will experience an extra measure of needless
stress, retarding the rate at which it will mature. Staff recruiting is very important to the business.
Training should be immersive and happen within the business unit. A too conservative posture
on training will add to effort waste, task complexity, and will create rework. The staff should be
augmented such that the capacity is on the high side during the introduction of the new
production work, or whatever the change activity is that will happen as previously discussed.
Training needs should be assessed and facilitated as applicable; however, if work can be
achieved without additional head count (HC) then this preserves capacity that would have
otherwise been redirected to training. The data regarding head count and load balancing showed
that an awareness of the service level agreements (SLAs) in play are critical to know. They
should be achieved from the start while volume throughput is low to avoid negativity. The pace
is then set as the volume increases. The implications of the pace should be thoroughly
understood and introduced during times of negotiation, as overly aggressive SLAs can
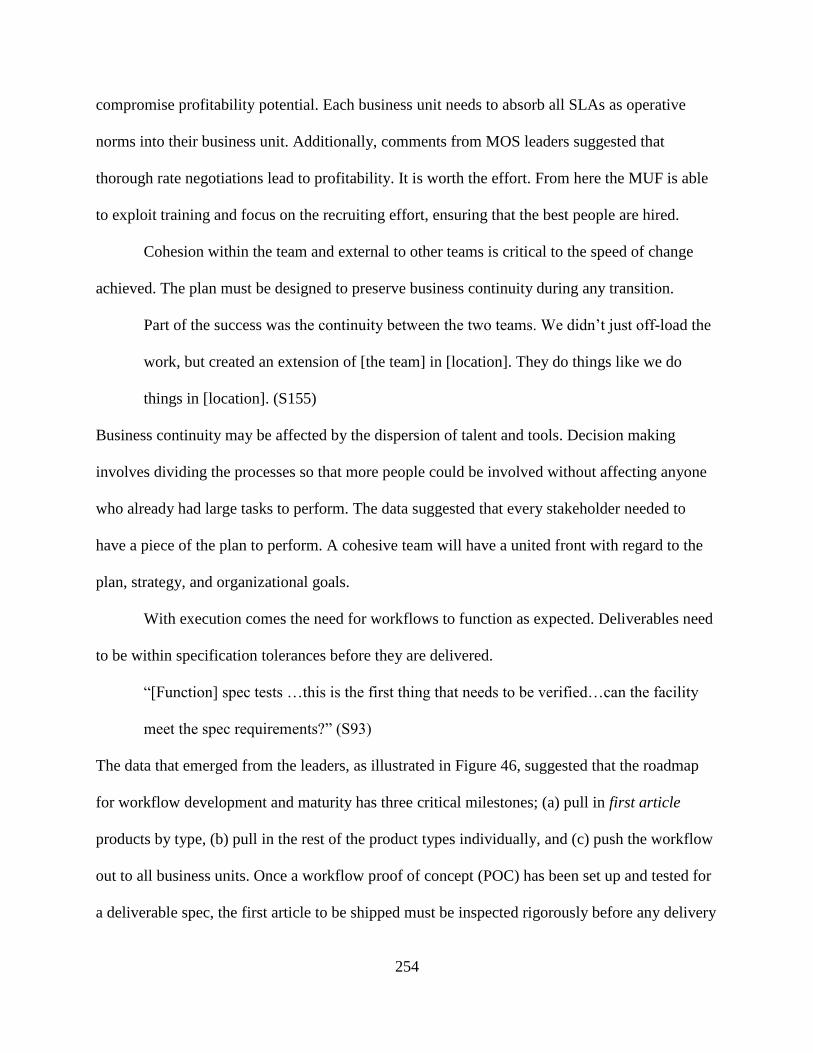
254
compromise profitability potential. Each business unit needs to absorb all SLAs as operative
norms into their business unit. Additionally, comments from MOS leaders suggested that
thorough rate negotiations lead to profitability. It is worth the effort. From here the MUF is able
to exploit training and focus on the recruiting effort, ensuring that the best people are hired.
Cohesion within the team and external to other teams is critical to the speed of change
achieved. The plan must be designed to preserve business continuity during any transition.
Part of the success was the continuity between the two teams. We didn’t just off-load the
work, but created an extension of [the team] in [location]. They do things like we do
things in [location]. (S155)
Business continuity may be affected by the dispersion of talent and tools. Decision making
involves dividing the processes so that more people could be involved without affecting anyone
who already had large tasks to perform. The data suggested that every stakeholder needed to
have a piece of the plan to perform. A cohesive team will have a united front with regard to the
plan, strategy, and organizational goals.
With execution comes the need for workflows to function as expected. Deliverables need
to be within specification tolerances before they are delivered.
“[Function] spec tests …this is the first thing that needs to be verified…can the facility
meet the spec requirements?” (S93)
The data that emerged from the leaders, as illustrated in Figure 46, suggested that the roadmap
for workflow development and maturity has three critical milestones; (a) pull in first article
products by type, (b) pull in the rest of the product types individually, and (c) push the workflow
out to all business units. Once a workflow proof of concept (POC) has been set up and tested for
a deliverable spec, the first article to be shipped must be inspected rigorously before any delivery
255
can be made. When the reliability of the deliveries is at a suitable level, other specifications can
be introduced to the workflow. Synergies between product specifications allow for a variety of
deliverables to be executed within the workflow; however, the scope of deliverables needs to be
specified so as to not stress the workflow. This leads to a risk for the introduction of non-
conformities. When the workflow is mature on the designated variety of specifications, it can be
exploited in as many business units as possible. A workflow development plan with these steps
can optimize synergy, utilization of resources, and positively influence profitability.
Figure 46. Positive change: Execution theme map. This figure maps execution as a theme
category into descriptive sub-groupings.
In summary, the data suggests that for positive change experiences to happen, the leader
of that change needs to inspire. This includes the ability to sell the situation, as well as to sense
the environment. A lack of awareness can inhibit change as much as a charismatic pitch could
push it along. The relationship that the change leader has with the stakeholders will relate to the
outcome. The capability and robustness of the plan will influence the plan outcome. A sequence
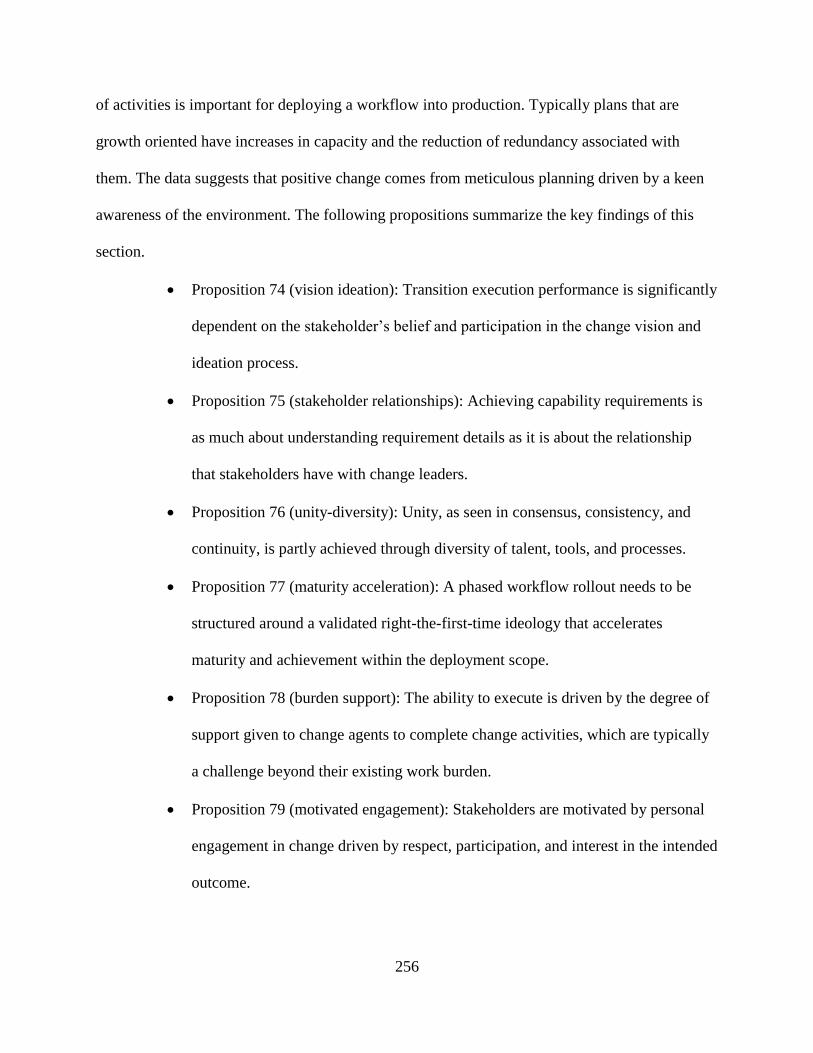
256
of activities is important for deploying a workflow into production. Typically plans that are
growth oriented have increases in capacity and the reduction of redundancy associated with
them. The data suggests that positive change comes from meticulous planning driven by a keen
awareness of the environment. The following propositions summarize the key findings of this
section.
Proposition 74 (vision ideation): Transition execution performance is significantly
dependent on the stakeholder’s belief and participation in the change vision and
ideation process.
Proposition 75 (stakeholder relationships): Achieving capability requirements is
as much about understanding requirement details as it is about the relationship
that stakeholders have with change leaders.
Proposition 76 (unity-diversity): Unity, as seen in consensus, consistency, and
continuity, is partly achieved through diversity of talent, tools, and processes.
Proposition 77 (maturity acceleration): A phased workflow rollout needs to be
structured around a validated right-the-first-time ideology that accelerates
maturity and achievement within the deployment scope.
Proposition 78 (burden support): The ability to execute is driven by the degree of
support given to change agents to complete change activities, which are typically
a challenge beyond their existing work burden.
Proposition 79 (motivated engagement): Stakeholders are motivated by personal
engagement in change driven by respect, participation, and interest in the intended
outcome.
257
Positive experience summary. This section discussed the positive aspects of change
leadership from the data. In situations where change management was executed effectively,
based on feedback from the MOS leaders who had experience with change management
activities, desirable outcomes were achieved on time and within expectations. Transformational
change has attributes and activities that are predictive, proactive, and reactive. Transformational
leaders need to be both aspirational and tactical. It was beneficial for MOS leaders to share
information about their experiences in change management so that all of the leaders could benefit
from their peers experiences.
Negative synergistic experiences. MOS leaders identified 8 themes in 54 qualitative
textural descriptions of issues that negatively contributed to the success of change management
efforts. Within these data points several key themes emerged, such as planning as the most
frequently overlooked aspect of transformational change, followed by behavior and then
communication. Specific leadership attributes were indicated as noted in Table 14. The data
needs to be interpreted from the perspective of the stakeholders in the precipitating event and
may not be generalizable.
Table 14
Negative Change Management Themes
Theme
Count
Planning 17
Behavior 16
Communication 7
Awareness 6
Leadership 5
Cohesion 1
Inspiration 1
Relationship
1
Total
54
258
Planning. The MOS leaders identified a number of execution failures that were planning
oriented as illustrated in Figure 47. They said that the needs of clients were not taken into
consideration and that clients had not clearly indicated when the work would come, the amount
of the work, or the specifications of the work prior to an investment in workflow design or
capacity. The entrepreneurial culture tended to jump quickly at an opportunity so as not to lose
out. The opposite also occurred following disappointment when the client’s request was not
taken seriously. In these cases the thought that clients would suffer during the transition was
considered to be acceptable, and this guided action and its pace. Either way chaos was
introduced or the opportunity was lost.
Emotions and power-influenced agendas were prevalent ... Each [business unit] group
independently maneuvered to get talent, equipment and a boundary drawn around their
‘turf’. The … team felt like they were being dismantled piece by piece without regard for
the customers. (S60)
For example, transition capacity issues were not mitigated by temporary support. To some extent
the plan resulted in the team being dismantled and fragmented rather than strengthened; key
members were pulled off to take care of other emergencies, leaving their tasks for others to
complete. In other cases, a team was moved without the equipment that supported its efforts, but
with the expectation that there would be business continuity. This and other factors hurt growth
potential. The data also revealed that confusion around roles kept leaders from engaging and
being effective.
“[There was] no explanation of what my role in the company was prior to my arrival.”
(S130)
259
Additionally, an unwillingness to contribute enough money to fund the transition resulted in
tasks being incomplete, or less robust.
“[There was a] conservative investment into the operations to match domestic setup and
infrastructure.” (S177)
Furthermore, training is typically needed with any change and off-load sites need coordination
capability in order to be useful.
“[There was a] lack of investment and commitment to training both locally and in off-
loaded offices.” (S181)
A plan can also inhibit growth when business systems are not integrated. Multiple systems then
need to be accommodated, consuming much needed capacity. Moreover, workflows were not
integrated, were disorganized, needlessly complex, and wasteful, making them difficult to
manipulate. In some cases they should have been streamlined or physically moved to another
location early, or moved in a more effective sequence. When the details are unknown, especially
critical ones, this is typically caused by a lack of participation by mid- and low-level managers.
According to the data, these items should have been considered prior to the transition execution.
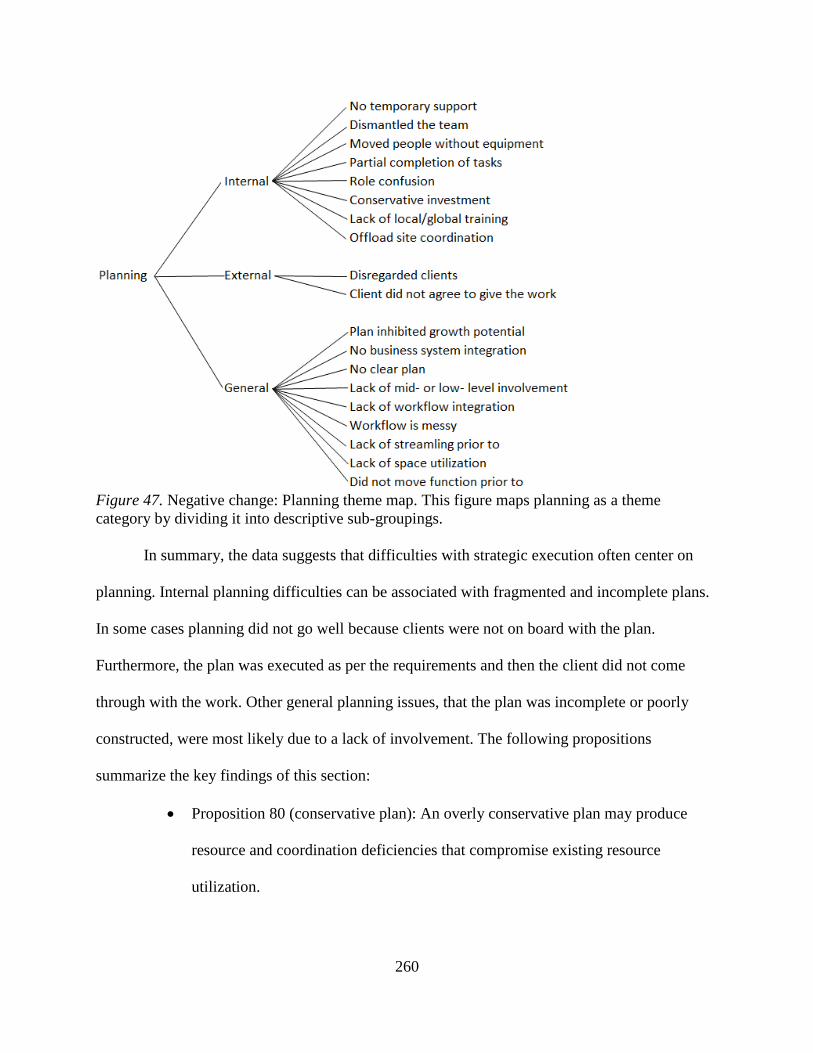
260
Figure 47. Negative change: Planning theme map. This figure maps planning as a theme
category by dividing it into descriptive sub-groupings.
In summary, the data suggests that difficulties with strategic execution often center on
planning. Internal planning difficulties can be associated with fragmented and incomplete plans.
In some cases planning did not go well because clients were not on board with the plan.
Furthermore, the plan was executed as per the requirements and then the client did not come
through with the work. Other general planning issues, that the plan was incomplete or poorly
constructed, were most likely due to a lack of involvement. The following propositions
summarize the key findings of this section:
Proposition 80 (conservative plan): An overly conservative plan may produce
resource and coordination deficiencies that compromise existing resource
utilization.
261
Proposition 81 (voice of the customer (VoC)): Client involvement in transition
planning augments growth potential by designing requirements into plan
elements.
Proposition 82 (involvement levels): If the appropriate levels of management are
not involved in the plan design, the resulting process may require unnecessary
effort to perform acceptable work.
Behavior. The second category related to unsuccessful change events had to do with the
behaviors of the change team and the stakeholders as illustrated in Figure 48. There are attributes
that the data describes as contributors to negative change experiences, including behaviors that
break trust such as being disruptive, childish, and breaking promises. Furthermore, self-interest
and ego can be just as significant a factor as emotional decision making that is neither
constructive nor informed. When the leaders engage in self-serving destructive politics, progress
could be halted. Some of the behaviors that the MOS leaders recognized were arbitrary boundary
drawing, turf wars, and ego-driven agendas. This is made worse with emotion driven agendas
and decision making. This immature behavior can also be seen by those who engage in
independent maneuvering rather than working as a team.
It was certainly a unique situation since this was a large part of the [integration] but the
disconnected agendas drove politics, emotional decision making and turf wars. Egos
were often at the forefront and there was some downright infantile behavior on the parts
of some of the relatively senior stakeholders that wasted time, killed morale, cost the
company money, and had little to do with the primary goals. There was isolated
collaboration instead of collaboration among all the senior stakeholders. Only after the
warring had started did this get visible and got dealt with. (S49)
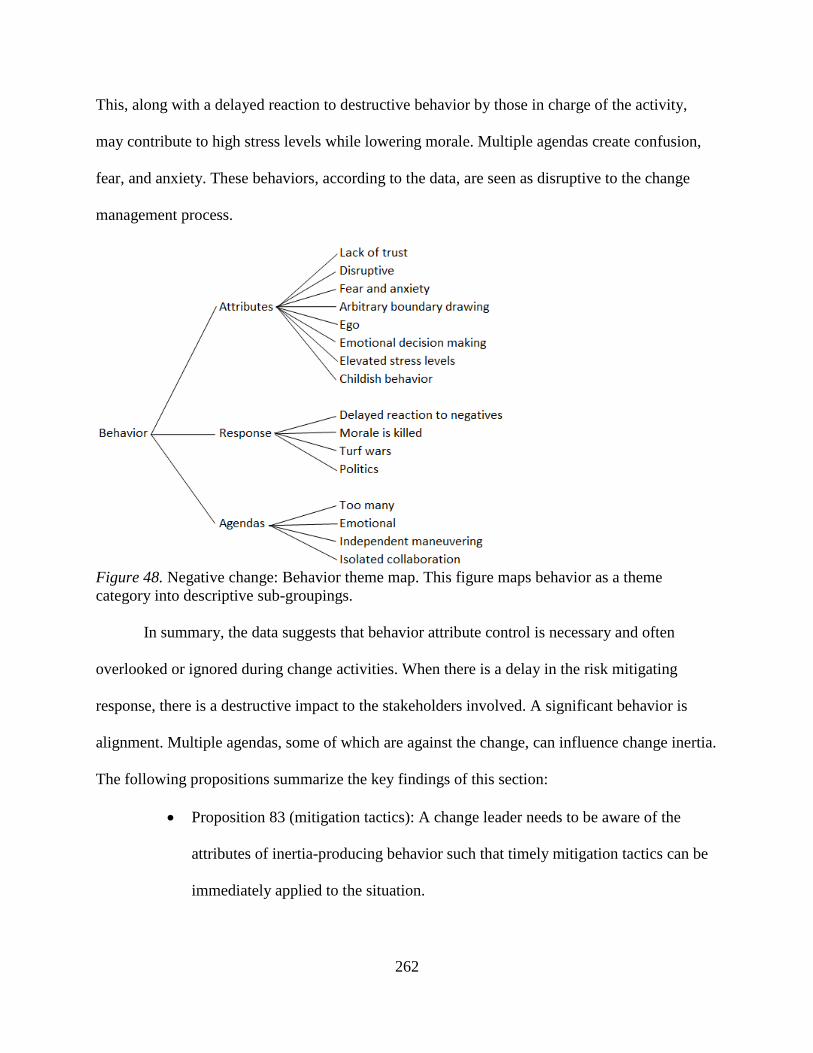
262
This, along with a delayed reaction to destructive behavior by those in charge of the activity,
may contribute to high stress levels while lowering morale. Multiple agendas create confusion,
fear, and anxiety. These behaviors, according to the data, are seen as disruptive to the change
management process.
Figure 48. Negative change: Behavior theme map. This figure maps behavior as a theme
category into descriptive sub-groupings.
In summary, the data suggests that behavior attribute control is necessary and often
overlooked or ignored during change activities. When there is a delay in the risk mitigating
response, there is a destructive impact to the stakeholders involved. A significant behavior is
alignment. Multiple agendas, some of which are against the change, can influence change inertia.
The following propositions summarize the key findings of this section:
Proposition 83 (mitigation tactics): A change leader needs to be aware of the
attributes of inertia-producing behavior such that timely mitigation tactics can be
immediately applied to the situation.
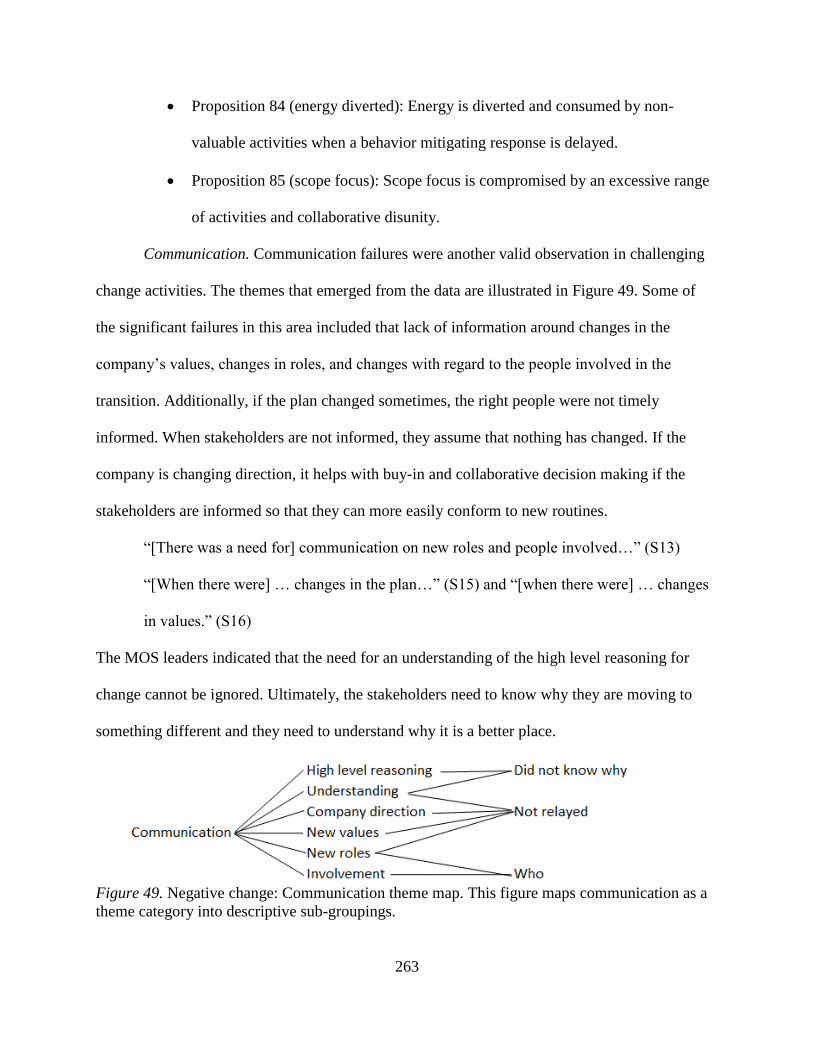
263
Proposition 84 (energy diverted): Energy is diverted and consumed by non-
valuable activities when a behavior mitigating response is delayed.
Proposition 85 (scope focus): Scope focus is compromised by an excessive range
of activities and collaborative disunity.
Communication. Communication failures were another valid observation in challenging
change activities. The themes that emerged from the data are illustrated in Figure 49. Some of
the significant failures in this area included that lack of information around changes in the
company’s values, changes in roles, and changes with regard to the people involved in the
transition. Additionally, if the plan changed sometimes, the right people were not timely
informed. When stakeholders are not informed, they assume that nothing has changed. If the
company is changing direction, it helps with buy-in and collaborative decision making if the
stakeholders are informed so that they can more easily conform to new routines.
“[There was a need for] communication on new roles and people involved…” (S13)
“[When there were] … changes in the plan…” (S15) and “[when there were] … changes
in values.” (S16)
The MOS leaders indicated that the need for an understanding of the high level reasoning for
change cannot be ignored. Ultimately, the stakeholders need to know why they are moving to
something different and they need to understand why it is a better place.
Figure 49. Negative change: Communication theme map. This figure maps communication as a
theme category into descriptive sub-groupings.

264
In summary, the data suggests that communication is critical to change management
success. The stakeholders want to understand the high level plan just as much as they want to
know the details. They also want to know why the change is taking place. Keeping stakeholders
in the dark and then surprising them abruptly with change news, breeds distrust. On the other
hand, when the information about the change is relayed and understood, stakeholders have the
chance to buy-in and prepare. This is especially the case when there is a new direction or when
company values change. Furthermore, when roles change, stakeholders want to know who was
selected and why. Optimally, they would like to be involved in the selection or be considered for
the position if they qualify. When they have no involvement, the data suggests that change
activities will be more difficult. The following propositions summarize the key findings of this
section:
Proposition 86 (plan logic): A stakeholder’s perspective on achieving a new
vision is influenced by an understanding of the logic behind the plan, agreeing
with the logic, and knowing why it has to be achieved now.
Proposition 87 (new roles): The tasks in a plan are as important to participants as
who is involved, and if they agree with the values of those who assume new roles.
Proposition 88 (relaying knowledge): The effective transfer of plan knowledge
drives buy-in, which would be further enhanced if stakeholders were involved in
the decisions regarding the plan.
Awareness. Freeman (2000) suggests that cognitive responses are stimulated by an
understanding of the consequences of behaviors. When change leaders are aware of the
consequences of actions, the present situation, and future environmental conditions, they take
action to correct performance issues (Glenberg, 2007). The themes that emerged from the data
265
are illustrated in Figure 50. They suggested that MOS leaders need to understand the collateral
impact of decisions. In some cases decisions appear to make positive change, however, the
collateral damage is not considered and can accumulate. This accumulation helps to build change
resistance and fatigue. In some cases an emotional decision, or decision pattern, is executed
while being blind to losses internal and external to the organization. This contributes to further
chaos and is a reactive stance that may be more emotionally charged. The root cause of this, and
a general problem, is that high-performing stakeholders are not consulted with regard to the
change plan or its execution.
“[We did not] address high performers’ concerns with [regard to] changes.” (S20)
Leaders need to know who the high performers are and engage them in the change activity.
Another error can occur when work is off-loaded without considering the complexity that this
contributes to the general operating environment. While this may be seen as a simple solution, it
requires coordination and cannot be easily executed if the site being off-loaded to cannot execute
tasks of this complexity.
“[We] underestimated [the] complexity and resource requirement to manage off-load
product[s].” (S178)
From an execution complexity perspective, the gap between where the off-load is and where it
needs to be must be closed in order to execute the work without adding undo effort to all
involved. MOS leaders indicated that optimizing the ratio between off-load site capacity and
geographic storefront location capacity is important. When this is missed low, the labor costs are
too high. When this is too high, carrying costs may be too high at the off-load sites. The planning
function needs to take forecasting, as well as the work eligible for work shifting, into
consideration. There are costs associated with bringing up or expanding an off-load site. This
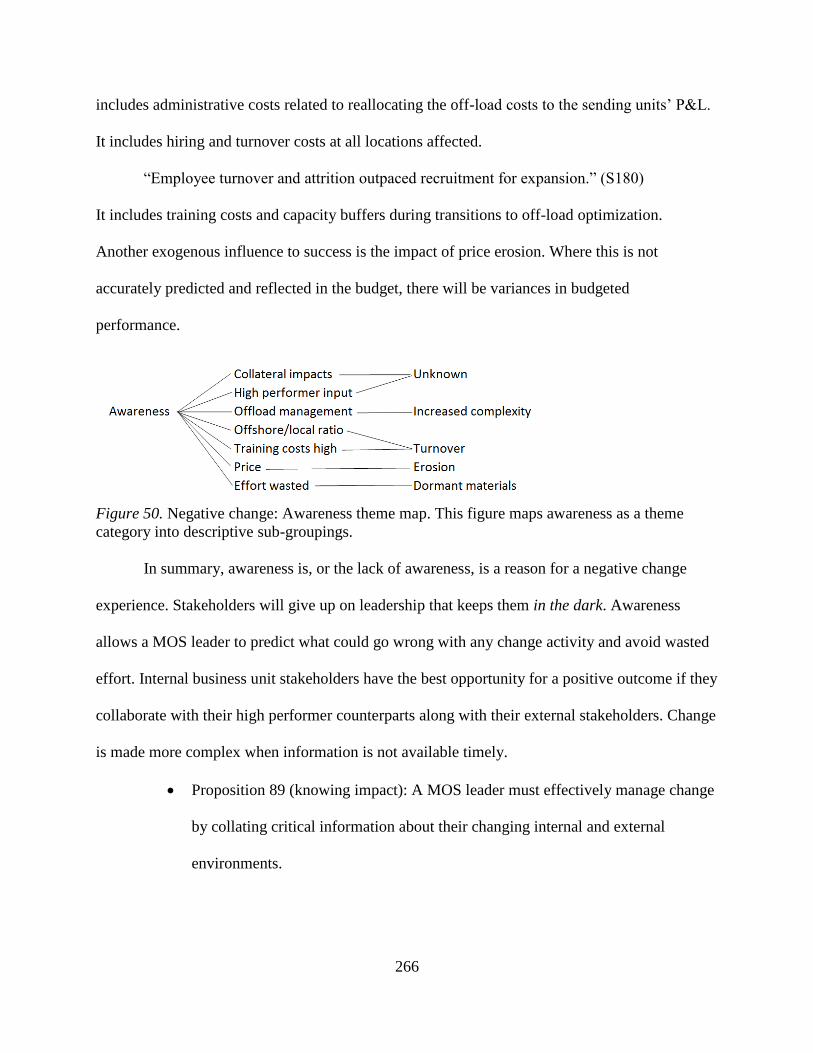
266
includes administrative costs related to reallocating the off-load costs to the sending units’ P&L.
It includes hiring and turnover costs at all locations affected.
“Employee turnover and attrition outpaced recruitment for expansion.” (S180)
It includes training costs and capacity buffers during transitions to off-load optimization.
Another exogenous influence to success is the impact of price erosion. Where this is not
accurately predicted and reflected in the budget, there will be variances in budgeted
performance.
Figure 50. Negative change: Awareness theme map. This figure maps awareness as a theme
category into descriptive sub-groupings.
In summary, awareness is, or the lack of awareness, is a reason for a negative change
experience. Stakeholders will give up on leadership that keeps them in the dark. Awareness
allows a MOS leader to predict what could go wrong with any change activity and avoid wasted
effort. Internal business unit stakeholders have the best opportunity for a positive outcome if they
collaborate with their high performer counterparts along with their external stakeholders. Change
is made more complex when information is not available timely.
Proposition 89 (knowing impact): A MOS leader must effectively manage change
by collating critical information about their changing internal and external
environments.
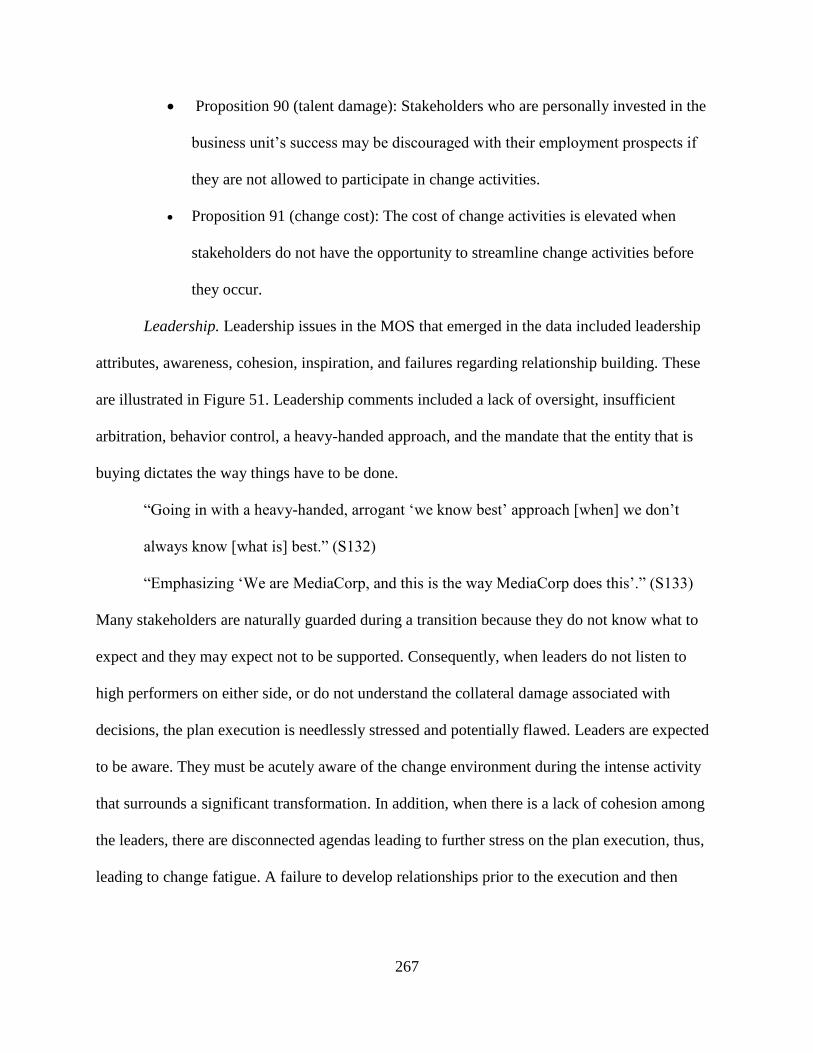
267
Proposition 90 (talent damage): Stakeholders who are personally invested in the
business unit’s success may be discouraged with their employment prospects if
they are not allowed to participate in change activities.
Proposition 91 (change cost): The cost of change activities is elevated when
stakeholders do not have the opportunity to streamline change activities before
they occur.
Leadership. Leadership issues in the MOS that emerged in the data included leadership
attributes, awareness, cohesion, inspiration, and failures regarding relationship building. These
are illustrated in Figure 51. Leadership comments included a lack of oversight, insufficient
arbitration, behavior control, a heavy-handed approach, and the mandate that the entity that is
buying dictates the way things have to be done.
“Going in with a heavy-handed, arrogant ‘we know best’ approach [when] we don’t
always know [what is] best.” (S132)
“Emphasizing ‘We are MediaCorp, and this is the way MediaCorp does this’.” (S133)
Many stakeholders are naturally guarded during a transition because they do not know what to
expect and they may expect not to be supported. Consequently, when leaders do not listen to
high performers on either side, or do not understand the collateral damage associated with
decisions, the plan execution is needlessly stressed and potentially flawed. Leaders are expected
to be aware. They must be acutely aware of the change environment during the intense activity
that surrounds a significant transformation. In addition, when there is a lack of cohesion among
the leaders, there are disconnected agendas leading to further stress on the plan execution, thus,
leading to change fatigue. A failure to develop relationships prior to the execution and then
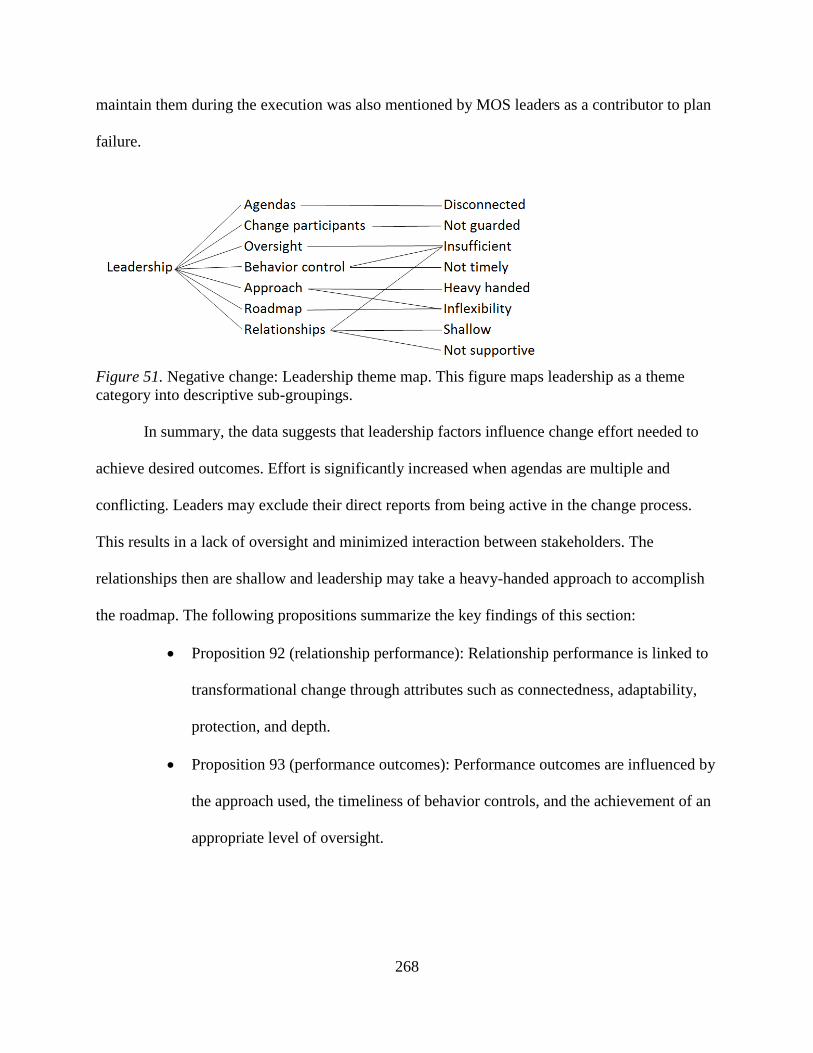
268
maintain them during the execution was also mentioned by MOS leaders as a contributor to plan
failure.
Figure 51. Negative change: Leadership theme map. This figure maps leadership as a theme
category into descriptive sub-groupings.
In summary, the data suggests that leadership factors influence change effort needed to
achieve desired outcomes. Effort is significantly increased when agendas are multiple and
conflicting. Leaders may exclude their direct reports from being active in the change process.
This results in a lack of oversight and minimized interaction between stakeholders. The
relationships then are shallow and leadership may take a heavy-handed approach to accomplish
the roadmap. The following propositions summarize the key findings of this section:
Proposition 92 (relationship performance): Relationship performance is linked to
transformational change through attributes such as connectedness, adaptability,
protection, and depth.
Proposition 93 (performance outcomes): Performance outcomes are influenced by
the approach used, the timeliness of behavior controls, and the achievement of an
appropriate level of oversight.
269
Proposition 94 (stakeholder alignment): The degree to which the change leader
and stakeholders are in alignment of purpose correlates to the effort needed to
execute the change roadmap.
Negative experience summary. The realization of desirable business outcomes from
growth synergies is influenced by change management leadership. The MOS leaders have
identified a number of contributors to change management leadership failure. Failure may be
interpreted as an excess of energy needed to achieve a result. This wasted energy comes at a
price, including wasted time and potentially a permanent loss of talent when stakeholders lose
hope in the change action. Negative contributors to change management need to be understood
and mitigated to streamline and accelerate change management activities.
Self-interest. Business unit self-interest describes the autonomy of financially
accountable organizational units. Humans are self-organizing, autonomous systems that sustain
and generate their own activities based on rational assumptions (Maturana & Varela, 1987;
Varela et al., 1993; Thompson, 2007). Self-interest is therefore a primary engine for synergy
realization. A productive and rewarded self-interest drives behaviors that minimize collaborative
inertia. Additionally, self-interest encourages business units to seek out growth opportunities that
are based on synergies to optimize profitability. Controls and guidance keep business units from
pursuing low quality opportunities that abuse their autonomy and destroy corporate value (dis-
synergies) through the wasteful consumption of resources. Furthermore, guidance is needed such
that self-interest does not create destructive self-interest behaviors that breed distrust,
opportunism, and destroy collaborative interest on the part of stakeholders.
Guidance and balance are provided by the business unit leadership and by corporate
oversight. This guidance needs to breed trust while exerting social controls that mitigate
270
opportunistic behavior. The corporate role includes the provision of an overall strategic
framework, lateral integrative mechanisms, and a cultural context. The overall strategic
framework reflects the preferred future state of the firm, or a vision, that provides strategic intent
(Lovas & Ghoshal, 2000; Prahalad & Doz, 1987). Synergistic growth realization needs to be
guided to follow a strategic theme linked to corporate advantage. The strategic scope and targets
given to business units provide focus and accountability within the appropriate product and
market arenas in which a business unit actively participates (Galunic & Eisenhardt, 1996).
Corporate also provides an administrative context to the realization of strategic targets.
Financial controls, combined with rewards for performance achievement, stimulate productive
self-interest (Eisenhardt & Galunic, 2000; Martin, 2002). The promotion of constructive
behaviors helps to motivate businesses to overcome collaborative inertia. It also helps business
leaders to not abuse their autonomy through the pursuit of dis-synergies. Additionally, an
administrative context stimulates and enables efficient collaboration mechanisms across
businesses and between the business unit and the corporate entity. These LIMs help to establish
trust, impose social control, motivate productive behaviors, reduce transaction costs, promote
focus, align participants, promote nimbleness, preserve knowledge, and help to build up
experience in the relevant domain. Appropriate operational norms reduce the need for
coordination controls and reduce the occurrence of conflict. Shared information systems increase
information-processing capacity and the ability for stakeholders to control operational
complexities.
With self-interest comes growth-oriented behavior from entrepreneurial employees. This
is necessary for the realization of growth synergies because behavior increases action velocity by
reducing or eliminating inertial forces. The implementation of accurate revenue recognition
271
feedback can be provided to stakeholders. The mechanisms in reward systems can then
remunerate self-interest in accordance with the systems design, all of which is expected.
Promoting self-interest has a number of aspects to be considered including (a) autonomy, (b)
strategy, (c) administration, (d) culture, (e) outcomes, and (f) the revenue recognition algorithm.
The researcher will discuss each of these individually.
Autonomy. Social cognition from real-life experiences is based on autonomy and sense-
making (De Jaegher & Di Paolo, 2007, 2008). This self-directed autonomy, guided by a focused
and balanced self-interest, produces profitability through MOS leaders. Expanding this to the
organization, the overriding driver of self-interest is business unit autonomy. It drives the
discovery of synergistic opportunity to reduce cost and leverage complementarity for the
realization of growth. Off-load sites have the decision making autonomy to accept the work they
are being offered, and they are accountable for the reliability of their services in terms of quality
and the timeliness of delivery.
“They have full control with [the] supervision of LOB leads.” (SI2)
The decisions around the off-loading process and its execution also require autonomy to preserve
self-interest. The absence of self-interest may result in win-lose negotiations. These
arrangements usually lead to poor performance from the loser.
“The structure will incentivize them to off-load more and more to off-load hubs as their
allocated cost will be constant … so they can maximize the utilization.” (SI4)
The implementation of the policy requires leadership and coordination. It also requires
MOS leaders in the network to link with support functions, like finance for example. The
reporting of network-based production costs to finance needs to be accurate, timely, and conform
272
to the revenue recognition policy. A streamlined process speeds deployment and reduces
adoption life-cycles due to the absence of issues that are typically driven by needless complexity.
“Because the admin work is very low, we can implement [the policy] fast and easy. The
approach is simple and straightforward.” (SI9)
The sequence of tasks needed to deploy the policy directly relate to timely success. The MOS
leads determined the sequence for deployment. The LOB leads met with finance to agree on the
reporting approach. Following feedback, the policy was deployed. This is one of many examples
of collaborative creation and deployment of a policy in a MOS.
Administration. The optimal policy will have a minimized administrative component.
Administrative burdens create inertia and incur non-value added costs. The willingness for
business unit leaders is typically stalled when the administrative component is revealed. This
may not be understood until after the program has started. Halting an initiative after momentum
has been created hurts the overall culture of change. The results of the administrative component
are inputs to the company’s financial data. A streamlined methodology will encourage accuracy
and timeliness with regard to financial reporting.
Culture. The cultural context of self-interest includes the reward systems deployed and
social mechanisms that promote a collaborative culture. The intent of these social controls is to
encourage motivation and commitment to growth synergy realization. The cultural context helps
to create a corporate identity, establish trust, align initiative intent, enforce constructive norms,
and focus a work ethic around continuous corporate advantage. The corporate model of guided
and constructive self-interest may be viewed as an ecological system that is continuously
evolving (Lovas & Ghoshal, 2000). Corporate is continuously fine-tuning the strategic
framework in accordance with the dynamic marketplace. Corporate may also incubate new
273
growth strategies and enable the launch of new product and service life-cycles. This may include
the assignment of ownership of identified business opportunities. A temporary financial reprieve
may assist with business unit risk aversion.
Changing routines can sometimes be difficult. The group that is to experience the change
may look for any opportunity to reverse the course of an initiative. One significant issue, in this
case, is the confidence level in the off-load site to perform the tasks reliably. Self-interest
encourages location leaders to make needed changes quickly that support the network-based
production environment.
“Since we’re moving costs around … revenue is recognized at local facilities, this
[implementation] was not a problem.” (SI18)
This includes the sequence of activities to complete the deployment effectively. An example
would be to accomplish the training requirement to ensure the sending business unit that the off-
load unit is at parity with regard to expertise. This would apply as well to equipment, tools, and
infrastructure as examples.
“This new structure rewarded early adopters, as it split the cost between all facilities
based on revenue and early adopters were not penalized by additional hours.” (SI19)
The network must function as a system that adapts to the demands of clients regardless of size
and scope. It has to accomplish all tasks with excellence. Organizational agility relates to the rate
at which the organization can stretch and how extensive the stretching can be without
compromising performance. A dynamic marketplace may require significant stretching and
compression.
“Now local offices work more and more with off-load offices without concern of extra
hours [being] charged to them.” (SI21)
274
Additionally, local sites need to be able to handle exceptions and escalate when there are issues
that could compromise performance.
“The structure [and policy] encouraged local sites to go through LOB leads for any non-
standard situation.” (SI23)
Outcomes. Ultimately, it is the financial outcome that validates that profitability has been
influenced. The outcome of the policy was increased profitability. Mature storefronts were able
to reduce overall labor costs by more than 20% normalized to volume.
“Based on the [pro-forma] methodology… showing the potential benefits of the
storefront strategy [storefront location 1] shows annual savings of [amount] and
[storefront location 2] shows annual savings of [amount].” (SI33)
As each business unit leader owns their P&L and is accountable for meeting targets. The success
of this self-interest based financial policy was predicted.
“The outcome should be [an] increase in utilizing off-load hubs, reduce the off-loads to
higher cost facilities, and cleaner financials.” (SI25)
The design of the organization in the network must be aligned to the implementation. The MOS
is ideally suited for this.
“It will be perfectly aligned since it will encourage communication with LOB leads and
communication with off-load hubs.” (SI26)
The collaborative dimensions ensure that all dimensions are involved in and benefit from the
deployment of the policy. The location experienced financial success in their P&L. Each LOB
P&L realized success from the lower cost configuration and the higher volume experienced from
aggressive local sales unconstrained by capacity concerns. Alignment and execution were
encouraged through communication and monitoring.
275
“They [are] all … on board with this…we will escalate as soon as we see deviation from
the plan.” (SI28)
The financial benefit was achieved on the same volume with the same complexity configuration,
even though the storefronts were not fully mature. The network-based production was
measurably augmented by the self-interest policy.
Algorithm. The product leaders assembled and created rules around revenue recognition
to preserve the self-interest of the business units. The rule included an algorithm with regard to
the allocation of off-load costs, regardless of where it was done, that allocated the whole cost of
off-load to the business units based on the revenue that they achieved by LOB.
“All revenues will be realized at local facilities initiating the off-load and costs will be
allocated based on the rules below:” (SI34)
“Corresponding LOB cost will be split between all LOB facilities based on
revenue share of the product. Revenue will be used as a proxy for effort.” (SI35)
“Off-load to non-off-load hubs – the off-load should be discussed/coordinated on
job by job basis with LOB leaders, for the most cost effective allocation and one-
off discussion on revenue/cost allocation.” (SI66)
As a result, if a business unit did not off-load, they received their allocation regardless. If they
aggressively off-loaded because they acquired revenue beyond their capacity and they reduced
costs aggressively, they achieved a super-additive cost benefit as they may have exploited off-
load capacity more than other business units. The algorithm created a healthy competition for
purposes of self-interest advantage. The algorithm energized behaviors that encouraged the
realization of growth synergy.
276
The validity of corporate guidance and oversight in the realization of growth synergies is
present in the literature. Like any organizational construct, corporate leaders can promote dis-
synergies; however, corporate leaders are in a position to promote efficient structures, processes,
and systems (Anand, 2005; Collins & Montgomery, 2005; Goold et al., 2002; Hill & Jones,
2007). In large firms with a diversified portfolio, corporate managers may lack the detailed
knowledge of local markets and the resources needed to implement strategies (Eisenhardt &
Galunic, 2000; Martin, 2002). In contrast, business unit leaders may not have the medium or
long term corporate perspective (Bartlett & Ghoshal, 1999; Eisenhardt & Galunic, 2000). An
evolutionary corporate management approach of guided and balanced self-interest combines
local knowledge and capability with corporate oversight and a long-term perspective to create
both stability and flexibility. This collaborative balance also helps the MUF to navigate the
complexities involved through a decentralized design (Baum, 1999; Kauffman, 1995; Lovas &
Ghoshal, 2000). The themes that emerged from the data regarding the role of self-interests in the
creation of profitable growth are summarized in Figure 52.
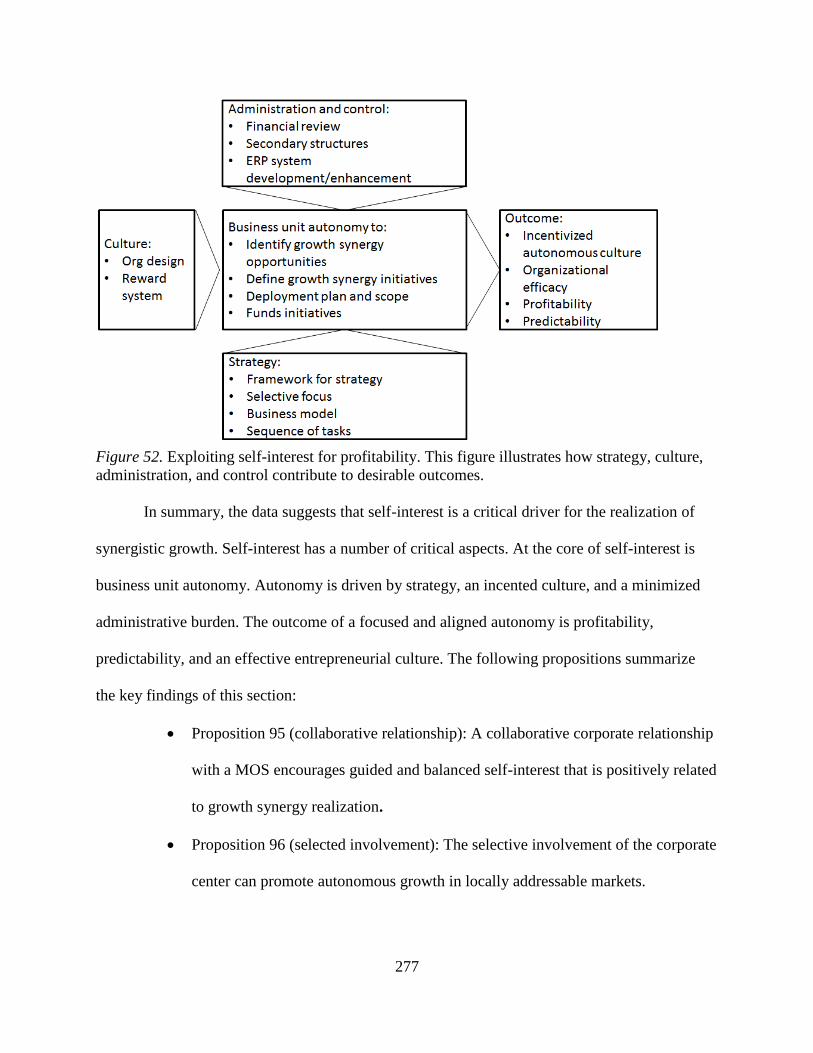
277
Figure 52. Exploiting self-interest for profitability. This figure illustrates how strategy, culture,
administration, and control contribute to desirable outcomes.
In summary, the data suggests that self-interest is a critical driver for the realization of
synergistic growth. Self-interest has a number of critical aspects. At the core of self-interest is
business unit autonomy. Autonomy is driven by strategy, an incented culture, and a minimized
administrative burden. The outcome of a focused and aligned autonomy is profitability,
predictability, and an effective entrepreneurial culture. The following propositions summarize
the key findings of this section:
Proposition 95 (collaborative relationship): A collaborative corporate relationship
with a MOS encourages guided and balanced self-interest that is positively related
to growth synergy realization.
Proposition 96 (selected involvement): The selective involvement of the corporate
center can promote autonomous growth in locally addressable markets.
278
Proposition 97 (service center): The corporate center is a service center that can
contribute to continuous growth by temporarily incubating growth opportunities,
by sharing related resources between businesses, and by helping business units to
select initiatives based on the long term strategic plan for the firm.
Proposition 98 (guided autonomy): A guided autonomy driven by self-interest and
augmented by resource complementarity in a network-based production
environment accelerates the process of achieving profitable growth.
Proposition 99 (task sequence): The discovery of an appropriate task list and its
execution sequence are directly related to the timing of desirable outcome
realization.
Proposition 100 (administrative burden): A business unit self-interest policy is
negatively influenced, and may be compromised by, the administration needed to
manage it.
Proposition 101 (collaborative intent): An effective self-interest policy is a LIM
that encourages a collaborative social environment necessary for profitable
growth realization.
Proposition 102 (allocation algorithm): An effective revenue recognition
algorithm will accommodate critical concerns from stakeholders and drive
behaviors that lead to profitable growth.
Collaboration in a MOS. This section exposes data regarding the aspects of
collaboration needed to make a MOS successful. Table 15 indicates that there are challenges
when it comes to collaboration and there are success drivers depending on how the
transformation is executed. Change leaders were asked about what went well and what did not go
279
well, with regard to collaboration, during the transformation that contributed to the realization of
growth synergies. A variety of information emerged from the data. The ability to forecast and
provide revenue performance went well. The remapping of products and services into production
and sales channels helped to remove ambiguity about accountability and the ownership of tasks.
The MOS strategy was perceived as a good strategy for growth and collaboration. The leaders
were able to merge action trackers, aiding transparency and enhancing the execution pace. The
organization was more nimble such that it could adapt to industry trends. The support for
production needs was enhanced through collaboration. Sales opportunities became apparent and
a unified pricing strategy could be deployed. Cost mitigation strategies were coordinated and
benefitted from shared information, early adopters, and knowledge transfer. What was successful
in one area could be exploited in another, maximizing impact, and saving deployment time.
Collaboration enabled the sharing of capacity, tools, and checklists. Metrics reporting took on a
similar look as dashboards were assembled to measure and track performance trends.
Standardization energized collaborative activities and became a platform for evolutionary
change. Standards were created and deployed collaboratively for reliability performance.
Consequently, the effort needed for change management was optimized through collaboration.
There were several areas where collaboration was challenging according to the data.
Operational leaders felt that they could have been better supported from finance for business
modelling and for financial performance awareness. The effort around the creation of the new
year’s strategies was challenging and the time given to document the plan was short. Sharing
talent between businesses was difficult for a variety of reasons, including an inability to shift
work, load balance, and unwillingness to physically move if required. Cultural differences were
significant. Talent development was a challenge due to a lack of training resources. The global
280
purchasing initiative, for example, was difficult to get approved through finance due to capacity
constraints in finance and local relationships. Maturing the position of account coordination was
a significant transformation and required a significant effort to complete. Leveraging the
resources or the facility at other sites was challenging as they were entrenched in their routines
and work pace. It was determined that it would be easier to move the work than to move the
people; however, there were nuances regarding client expectations at each location that had to be
achieved. Cost mitigation again was difficult due to support function approval procedures.
Exploiting synergies for cost improvement was challenging due to an unwillingness of the
process owners to release control of redundant workflows. Cross-training helped with the
scalability of functions, but with the operations being lean, the ability to allocate capacity to
cross-train was challenging. Sales strategies were determined external to the influence of the
operation that would execute the workflows leading to margin deterioration as billable items
were overlooked. Communication strategies were difficult to determine due to the structure and
the rate of change. Untimely access to P&Ls made it difficult to see the financial impact of
actions. Pro-forma P&Ls were used to predict outcomes; however, these had an accuracy
tolerance that led to ambiguity about results. Equipment sharing was challenged as it had not
been inventoried or located, and its condition was not known. The ability to get key leaders
together was difficult due to workloads in a lean staffing environment. Co-researchers also
indicated that forecast information from clients was not reliable or even available and so
difficulties with staffing and capacity planning were enhanced. Costs allocated to business units
were ambiguous leading to incorrect inference about performance remedies. Leaders did not
have the ability to know if assets could be purged, making way for other assets coming in, due to
a lack of knowledge transfer about existing or new projects. This resulted in a need for additional
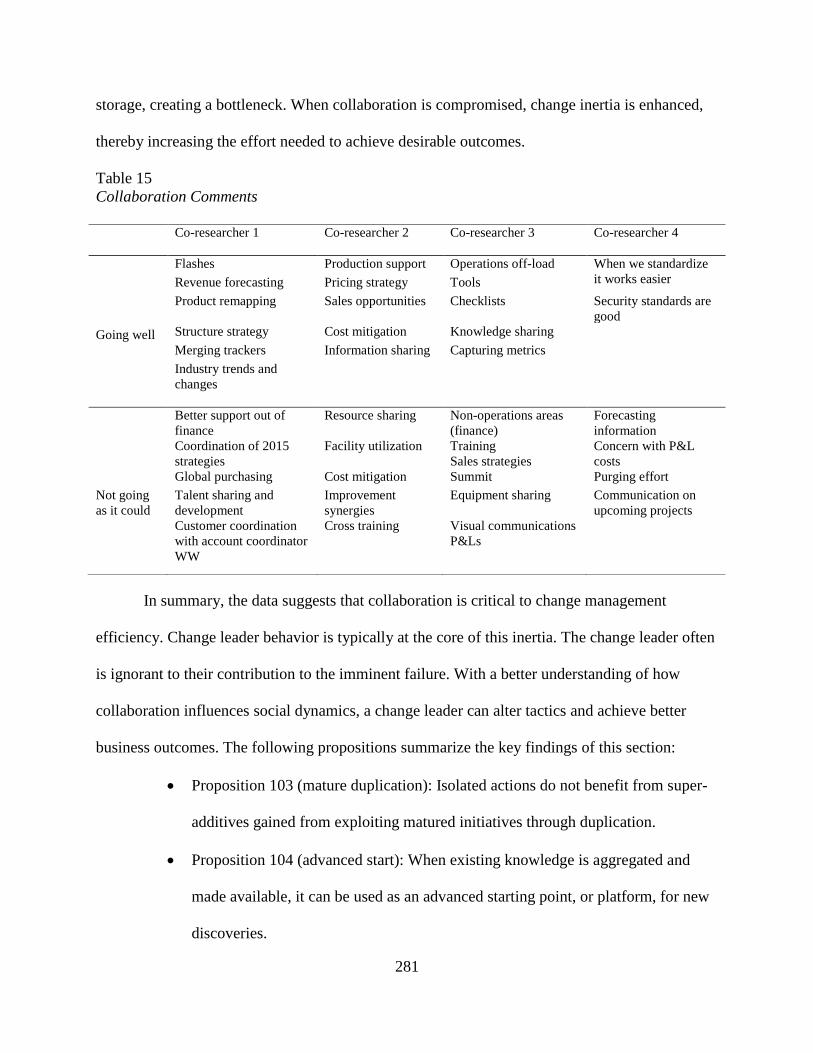
281
storage, creating a bottleneck. When collaboration is compromised, change inertia is enhanced,
thereby increasing the effort needed to achieve desirable outcomes.
Table 15
Collaboration Comments
In summary, the data suggests that collaboration is critical to change management
efficiency. Change leader behavior is typically at the core of this inertia. The change leader often
is ignorant to their contribution to the imminent failure. With a better understanding of how
collaboration influences social dynamics, a change leader can alter tactics and achieve better
business outcomes. The following propositions summarize the key findings of this section:
Proposition 103 (mature duplication): Isolated actions do not benefit from super-
additives gained from exploiting matured initiatives through duplication.
Proposition 104 (advanced start): When existing knowledge is aggregated and
made available, it can be used as an advanced starting point, or platform, for new
discoveries.
Co-researcher 1
Co-researcher 2
Co-researcher 3
Co-researcher 4
Flashes Production support Operations off-load When we standardize
it works easier
Revenue forecasting Pricing strategy Tools
Product remapping Sales opportunities Checklists Security standards are
good
Going well Structure strategy Cost mitigation Knowledge sharing
Merging trackers Information sharing Capturing metrics
Industry trends and
changes
Better support out of
finance
Resource sharing Non-operations areas
(finance)
Forecasting
information
Coordination of 2015
strategies
Facility utilization Training
Sales strategies
Concern with P&L
costs
Global purchasing Cost mitigation Summit Purging effort
Not going
as it could
Talent sharing and
development
Improvement
synergies
Equipment sharing Communication on
upcoming projects
Customer coordination
with account coordinator
WW
Cross training Visual communications
P&Ls
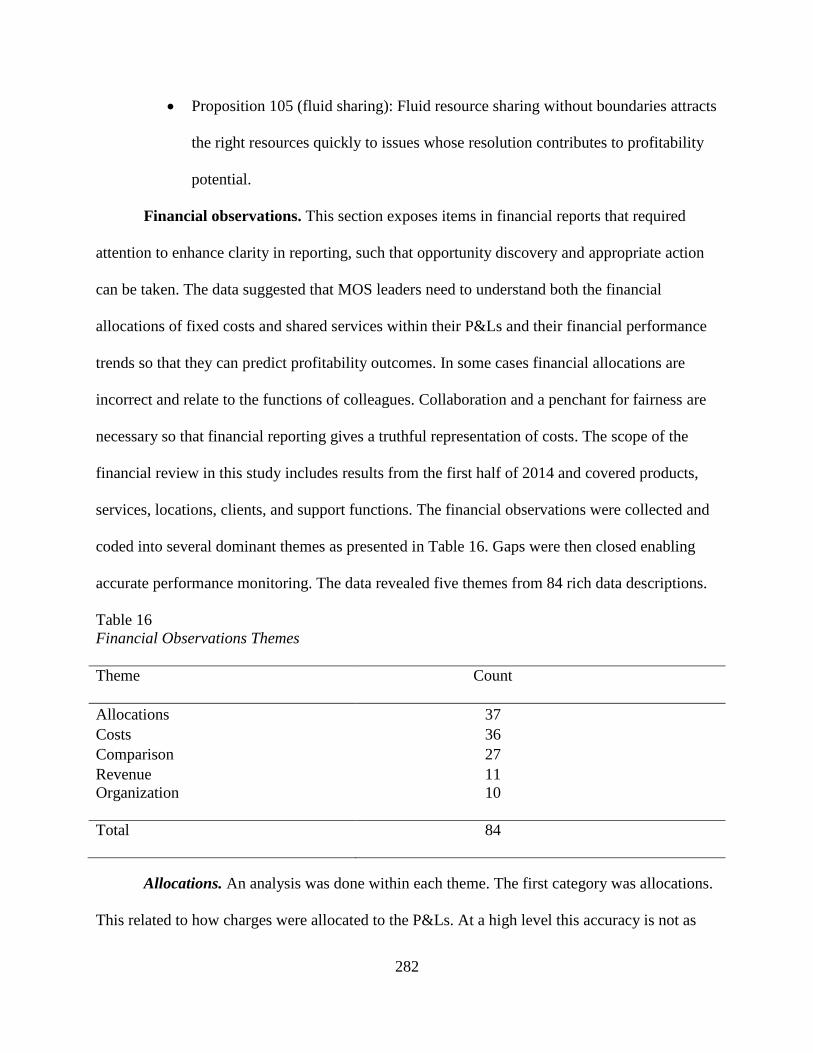
282
Proposition 105 (fluid sharing): Fluid resource sharing without boundaries attracts
the right resources quickly to issues whose resolution contributes to profitability
potential.
Financial observations. This section exposes items in financial reports that required
attention to enhance clarity in reporting, such that opportunity discovery and appropriate action
can be taken. The data suggested that MOS leaders need to understand both the financial
allocations of fixed costs and shared services within their P&Ls and their financial performance
trends so that they can predict profitability outcomes. In some cases financial allocations are
incorrect and relate to the functions of colleagues. Collaboration and a penchant for fairness are
necessary so that financial reporting gives a truthful representation of costs. The scope of the
financial review in this study includes results from the first half of 2014 and covered products,
services, locations, clients, and support functions. The financial observations were collected and
coded into several dominant themes as presented in Table 16. Gaps were then closed enabling
accurate performance monitoring. The data revealed five themes from 84 rich data descriptions.
Table 16
Financial Observations Themes
Theme
Count
Allocations 37
Costs 36
Comparison 27
Revenue 11
Organization
10
Total
84
Allocations. An analysis was done within each theme. The first category was allocations.
This related to how charges were allocated to the P&Ls. At a high level this accuracy is not as
283
relevant as it all rolls up within the divisional P&L regardless of how it is allocated; however, it
is very important for the P&L owners whose business viability and bonuses are dependent on
meeting business unit specific financial targets.
There are … random expenses listed on the [location] shared service P&L…I suspect
folks are dumping expenses they don’t know what to do with in shared services. I will
check with [name] on this. For example, there are entertainment and travel expense
charges for May and July…what are those from? (F113)
More importantly, MOS leaders need to understand the financially related cost and revenue data
of the product, or line of business (LOB), and how it performed in workflows at the locations
where it is produced. Accuracy is also necessary for monitoring, trend analysis, and performance
forecasting. Occasionally there are financial surprises. These are unanticipated costs attributed to
a P&L that influence monthly results. An example would be an unknown, or heretofore, not
leveraged rebate or an unexpected labor transfer for a side project or a favor. These unanticipated
financial events can compromise promised business budget outcomes. Intercompany revenue and
cost are a source of confusion in the absence of appropriate norms. Similarly, shared services
cost allocations need to be applied with an appropriate rule set related to space, energy costs, and
the various services that are used. Table 17 exposes 24 themes extracted from 36 rich data
descriptions within this category.
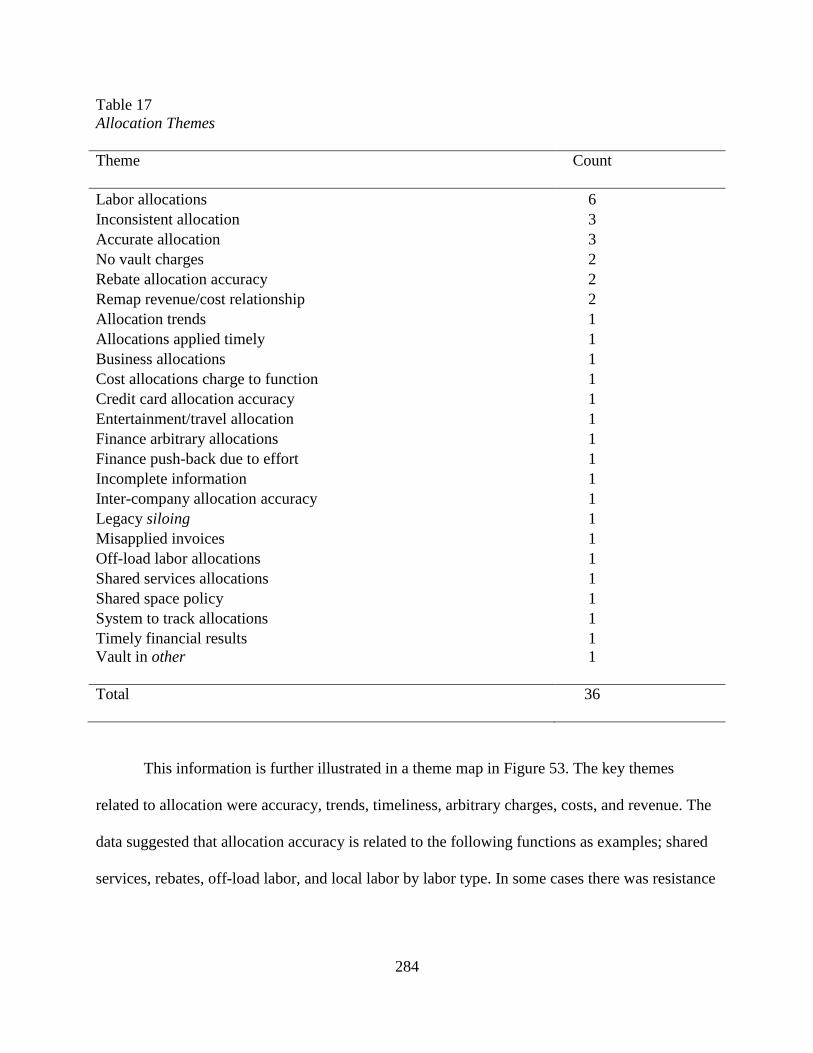
284
Table 17
Allocation Themes
Theme
Count
Labor allocations 6
Inconsistent allocation 3
Accurate allocation 3
No vault charges 2
Rebate allocation accuracy 2
Remap revenue/cost relationship 2
Allocation trends 1
Allocations applied timely 1
Business allocations 1
Cost allocations charge to function 1
Credit card allocation accuracy 1
Entertainment/travel allocation 1
Finance arbitrary allocations 1
Finance push-back due to effort 1
Incomplete information 1
Inter-company allocation accuracy 1
Legacy siloing 1
Misapplied invoices 1
Off-load labor allocations 1
Shared services allocations 1
Shared space policy 1
System to track allocations 1
Timely financial results 1
Vault in other
1
Total
36
This information is further illustrated in a theme map in Figure 53. The key themes
related to allocation were accuracy, trends, timeliness, arbitrary charges, costs, and revenue. The
data suggested that allocation accuracy is related to the following functions as examples; shared
services, rebates, off-load labor, and local labor by labor type. In some cases there was resistance
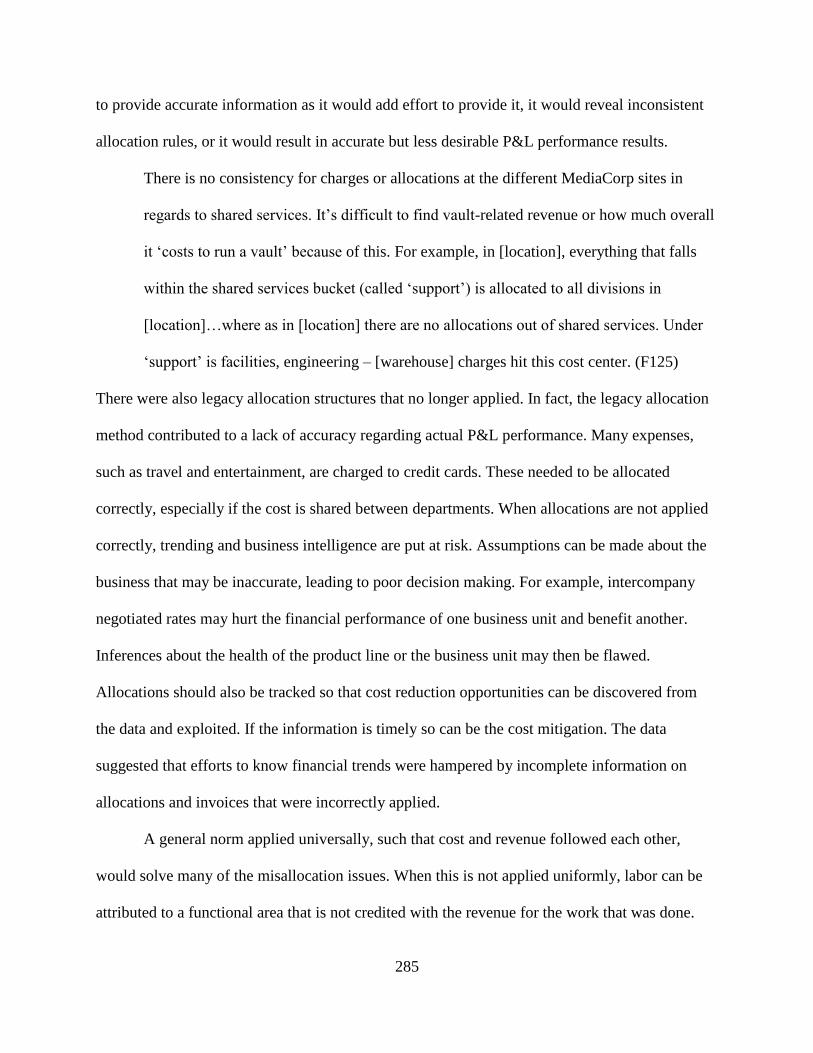
285
to provide accurate information as it would add effort to provide it, it would reveal inconsistent
allocation rules, or it would result in accurate but less desirable P&L performance results.
There is no consistency for charges or allocations at the different MediaCorp sites in
regards to shared services. It’s difficult to find vault-related revenue or how much overall
it ‘costs to run a vault’ because of this. For example, in [location], everything that falls
within the shared services bucket (called ‘support’) is allocated to all divisions in
[location]…where as in [location] there are no allocations out of shared services. Under
‘support’ is facilities, engineering – [warehouse] charges hit this cost center. (F125)
There were also legacy allocation structures that no longer applied. In fact, the legacy allocation
method contributed to a lack of accuracy regarding actual P&L performance. Many expenses,
such as travel and entertainment, are charged to credit cards. These needed to be allocated
correctly, especially if the cost is shared between departments. When allocations are not applied
correctly, trending and business intelligence are put at risk. Assumptions can be made about the
business that may be inaccurate, leading to poor decision making. For example, intercompany
negotiated rates may hurt the financial performance of one business unit and benefit another.
Inferences about the health of the product line or the business unit may then be flawed.
Allocations should also be tracked so that cost reduction opportunities can be discovered from
the data and exploited. If the information is timely so can be the cost mitigation. The data
suggested that efforts to know financial trends were hampered by incomplete information on
allocations and invoices that were incorrectly applied.
A general norm applied universally, such that cost and revenue followed each other,
would solve many of the misallocation issues. When this is not applied uniformly, labor can be
attributed to a functional area that is not credited with the revenue for the work that was done.
286
Once allocations are accurately distributed, performance ratios can be exploited to highlight
opportunities, measure performance, create trending, and forecast performance based on future
work.
Figure 53. Allocation theme map. This figure maps allocations as a theme category into
descriptive sub-groupings.
In summary, the data suggests that misallocations are a source of frustration for P&L
owners that are accountable for their financial performance. This frustration is exacerbated by
arbitrary charges and inaccuracy in cost assignments. Charges may also be obfuscated by
locating them in strange accounts. When P&Ls are not available until a considerable amount of
time beyond month-end closing has passed, the ability to forensically investigate performance
anomalies starts to fade into history. The relevance of the action is lost. The following
propositions summarize the key findings of this section:

287
Proposition 106 (allocation unity): A standardized and appropriate cost allocation
methodology creates predictable financial performance and allows for profit-
producing trend monitoring.
Proposition 107 (report usefulness): Financial report usefulness depends
significantly on the timeliness and accuracy of cost allocations.
Cost. The MOS leaders were able to uncover cost themes that emerged in the collected
data. An understanding of costs helps MOS leaders know where to direct their attention for
purposes of expense mitigation. MOS leaders thought that the most important elemental cost was
the cost line item. An understanding of, and the transparency of, these line items was important
to know. This cost item could relate to operational activities, materials, space, special costs,
waste, other, or the cost of not having a system that would create transparency and potentially
mitigate the cost.
Both [location] and [location] are running similar margins. The revenue to labor
percentages is almost identical. [Location] is 2% more costly at the moment than
[location] but has a better marginal cost curve and a more favorable potential with its
income to expense ratio if we operate beyond budgeted volumes even though [location]
labor rate is cheaper. (F7, F8)
Some costs are internal (labor) while others are external (rebates). Some costs are not entered
into the business system and so are not known to those who get the financial reports. Some costs
are unexpected, more than what they should be, or have mysterious origins. An awareness of cost
leads to the opportunity for mitigation. The raw data was coded and 16 themes were extracted
from 33 rich data descriptions as illustrated in Table 18.
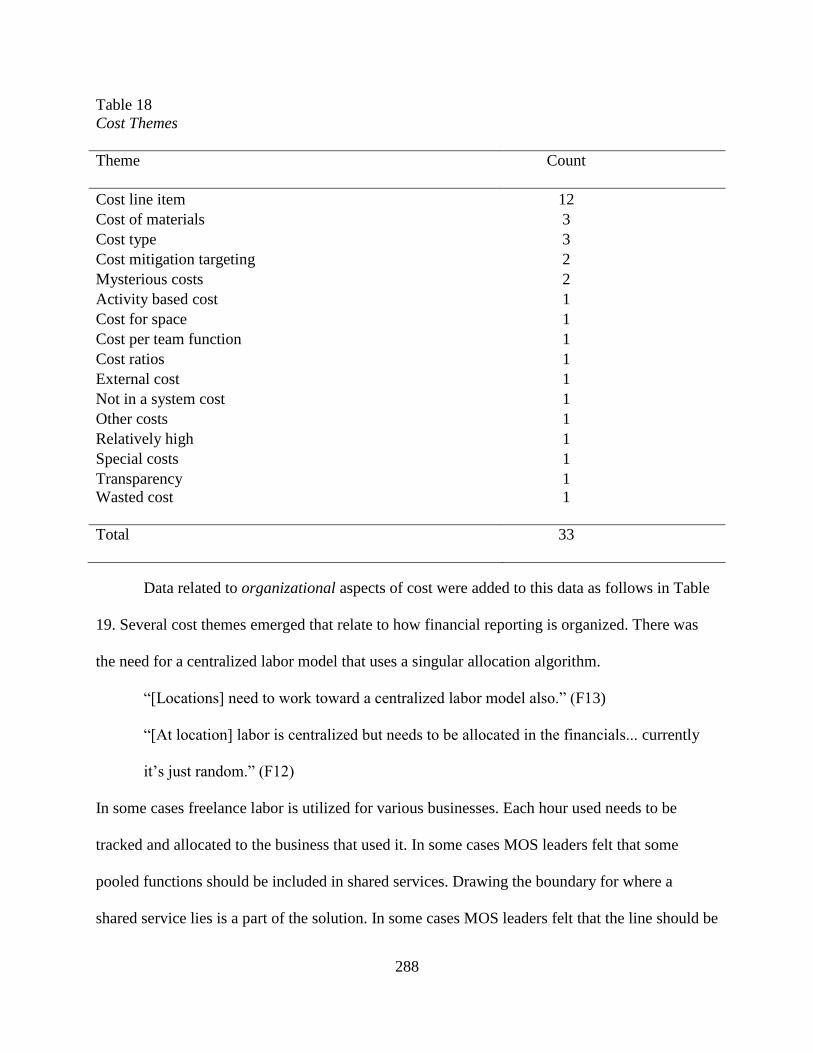
288
Table 18
Cost Themes
Theme
Count
Cost line item 12
Cost of materials 3
Cost type 3
Cost mitigation targeting 2
Mysterious costs 2
Activity based cost 1
Cost for space 1
Cost per team function 1
Cost ratios 1
External cost 1
Not in a system cost 1
Other costs 1
Relatively high 1
Special costs 1
Transparency 1
Wasted cost
1
Total
33
Data related to organizational aspects of cost were added to this data as follows in Table
19. Several cost themes emerged that relate to how financial reporting is organized. There was
the need for a centralized labor model that uses a singular allocation algorithm.
“[Locations] need to work toward a centralized labor model also.” (F13)
“[At location] labor is centralized but needs to be allocated in the financials... currently
it’s just random.” (F12)
In some cases freelance labor is utilized for various businesses. Each hour used needs to be
tracked and allocated to the business that used it. In some cases MOS leaders felt that some
pooled functions should be included in shared services. Drawing the boundary for where a
shared service lies is a part of the solution. In some cases MOS leaders felt that the line should be
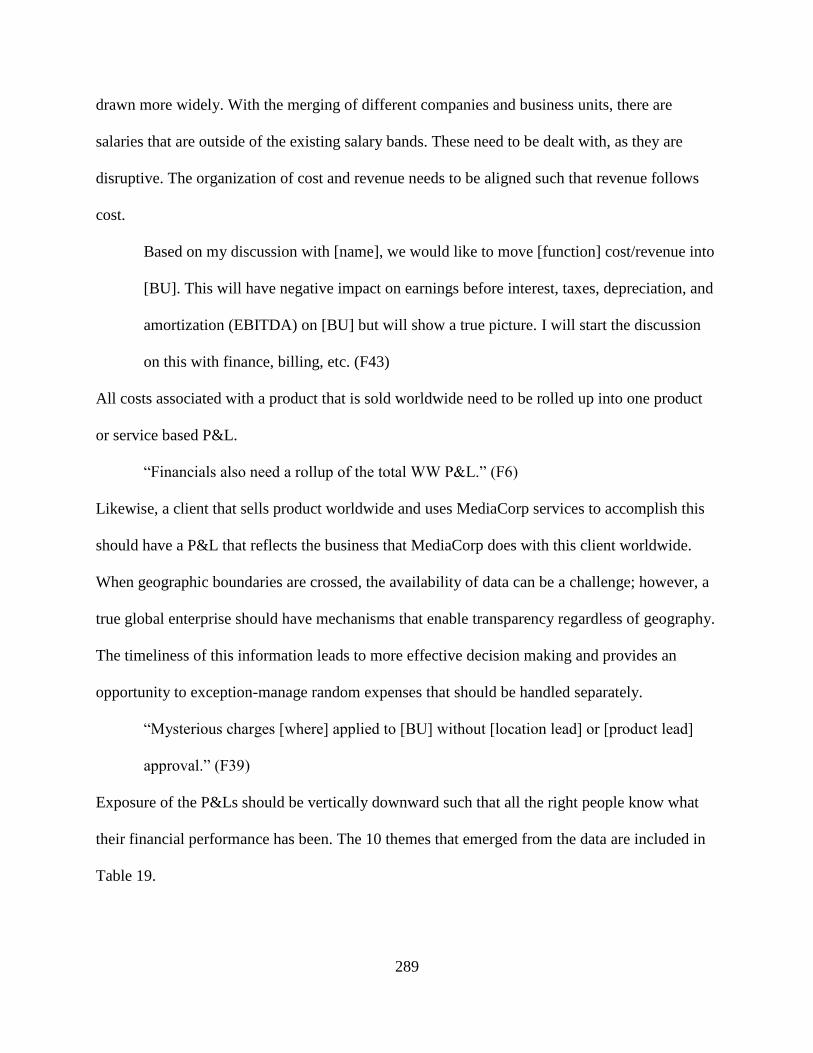
289
drawn more widely. With the merging of different companies and business units, there are
salaries that are outside of the existing salary bands. These need to be dealt with, as they are
disruptive. The organization of cost and revenue needs to be aligned such that revenue follows
cost.
Based on my discussion with [name], we would like to move [function] cost/revenue into
[BU]. This will have negative impact on earnings before interest, taxes, depreciation, and
amortization (EBITDA) on [BU] but will show a true picture. I will start the discussion
on this with finance, billing, etc. (F43)
All costs associated with a product that is sold worldwide need to be rolled up into one product
or service based P&L.
“Financials also need a rollup of the total WW P&L.” (F6)
Likewise, a client that sells product worldwide and uses MediaCorp services to accomplish this
should have a P&L that reflects the business that MediaCorp does with this client worldwide.
When geographic boundaries are crossed, the availability of data can be a challenge; however, a
true global enterprise should have mechanisms that enable transparency regardless of geography.
The timeliness of this information leads to more effective decision making and provides an
opportunity to exception-manage random expenses that should be handled separately.
“Mysterious charges [where] applied to [BU] without [location lead] or [product lead]
approval.” (F39)
Exposure of the P&Ls should be vertically downward such that all the right people know what
their financial performance has been. The 10 themes that emerged from the data are included in
Table 19.
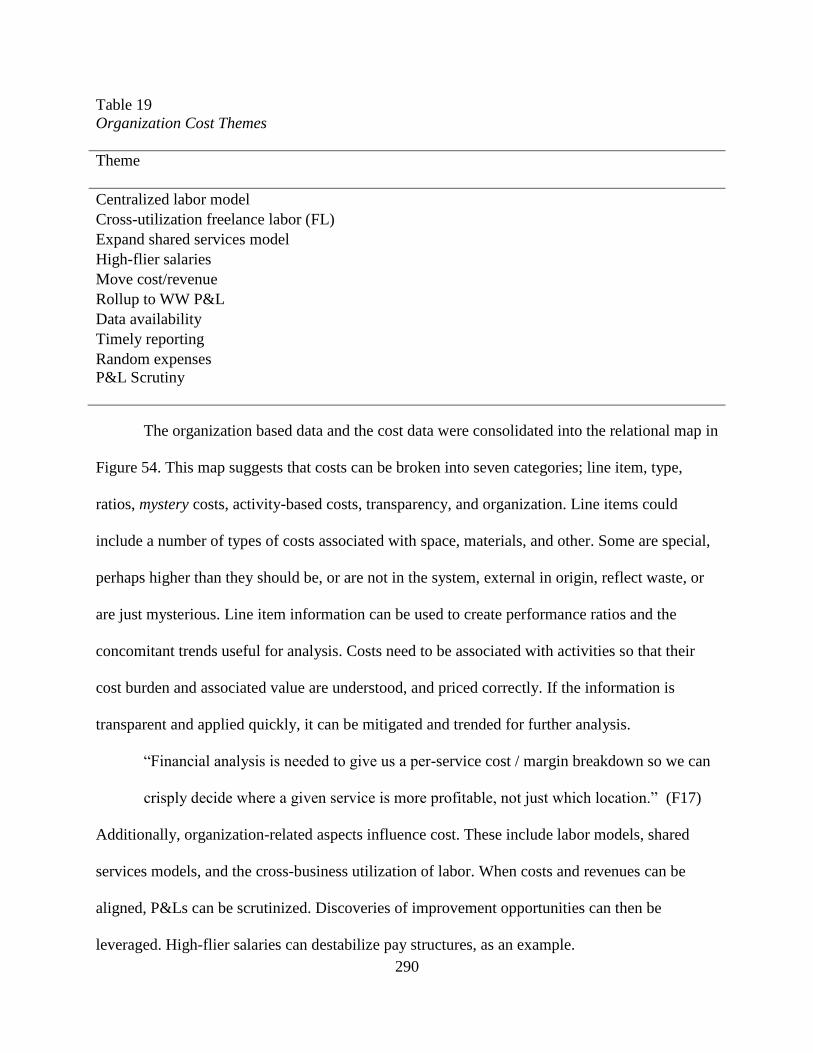
290
Table 19
Organization Cost Themes
Theme
Centralized labor model
Cross-utilization freelance labor (FL)
Expand shared services model
High-flier salaries
Move cost/revenue
Rollup to WW P&L
Data availability
Timely reporting
Random expenses
P&L Scrutiny
The organization based data and the cost data were consolidated into the relational map in
Figure 54. This map suggests that costs can be broken into seven categories; line item, type,
ratios, mystery costs, activity-based costs, transparency, and organization. Line items could
include a number of types of costs associated with space, materials, and other. Some are special,
perhaps higher than they should be, or are not in the system, external in origin, reflect waste, or
are just mysterious. Line item information can be used to create performance ratios and the
concomitant trends useful for analysis. Costs need to be associated with activities so that their
cost burden and associated value are understood, and priced correctly. If the information is
transparent and applied quickly, it can be mitigated and trended for further analysis.
“Financial analysis is needed to give us a per-service cost / margin breakdown so we can
crisply decide where a given service is more profitable, not just which location.” (F17)
Additionally, organization-related aspects influence cost. These include labor models, shared
services models, and the cross-business utilization of labor. When costs and revenues can be
aligned, P&Ls can be scrutinized. Discoveries of improvement opportunities can then be
leveraged. High-flier salaries can destabilize pay structures, as an example.
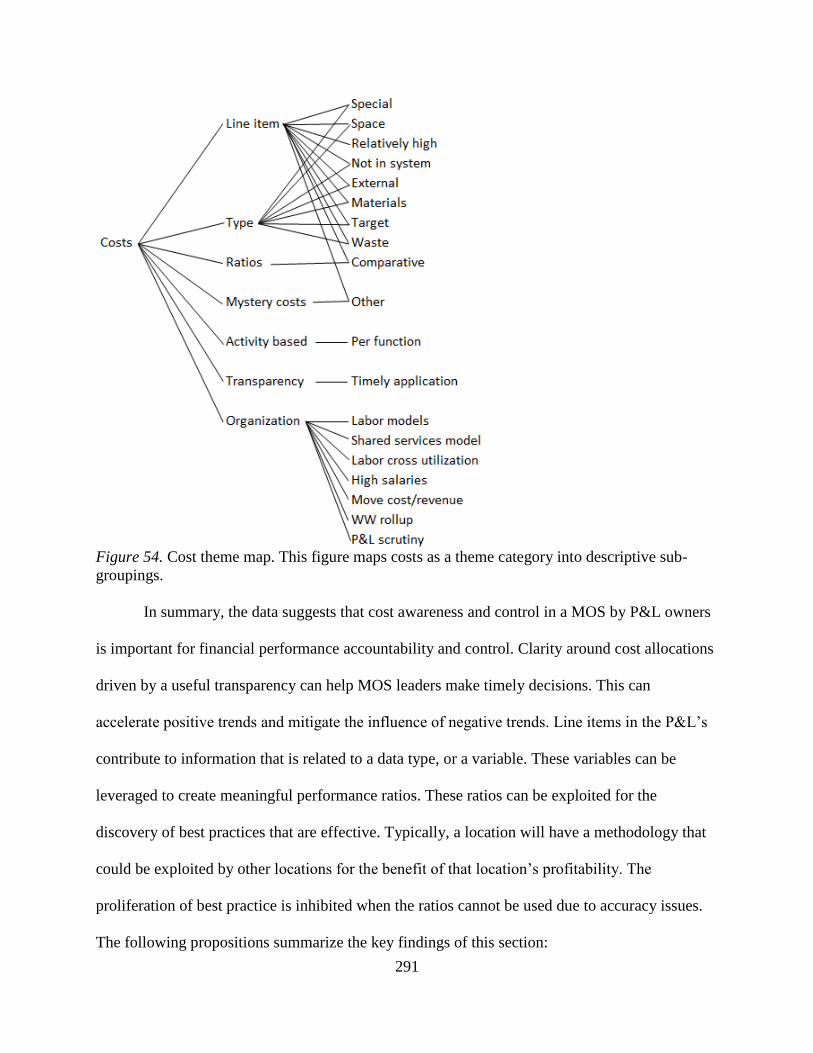
291
Figure 54. Cost theme map. This figure maps costs as a theme category into descriptive sub-
groupings.
In summary, the data suggests that cost awareness and control in a MOS by P&L owners
is important for financial performance accountability and control. Clarity around cost allocations
driven by a useful transparency can help MOS leaders make timely decisions. This can
accelerate positive trends and mitigate the influence of negative trends. Line items in the P&L’s
contribute to information that is related to a data type, or a variable. These variables can be
leveraged to create meaningful performance ratios. These ratios can be exploited for the
discovery of best practices that are effective. Typically, a location will have a methodology that
could be exploited by other locations for the benefit of that location’s profitability. The
proliferation of best practice is inhibited when the ratios cannot be used due to accuracy issues.
The following propositions summarize the key findings of this section:
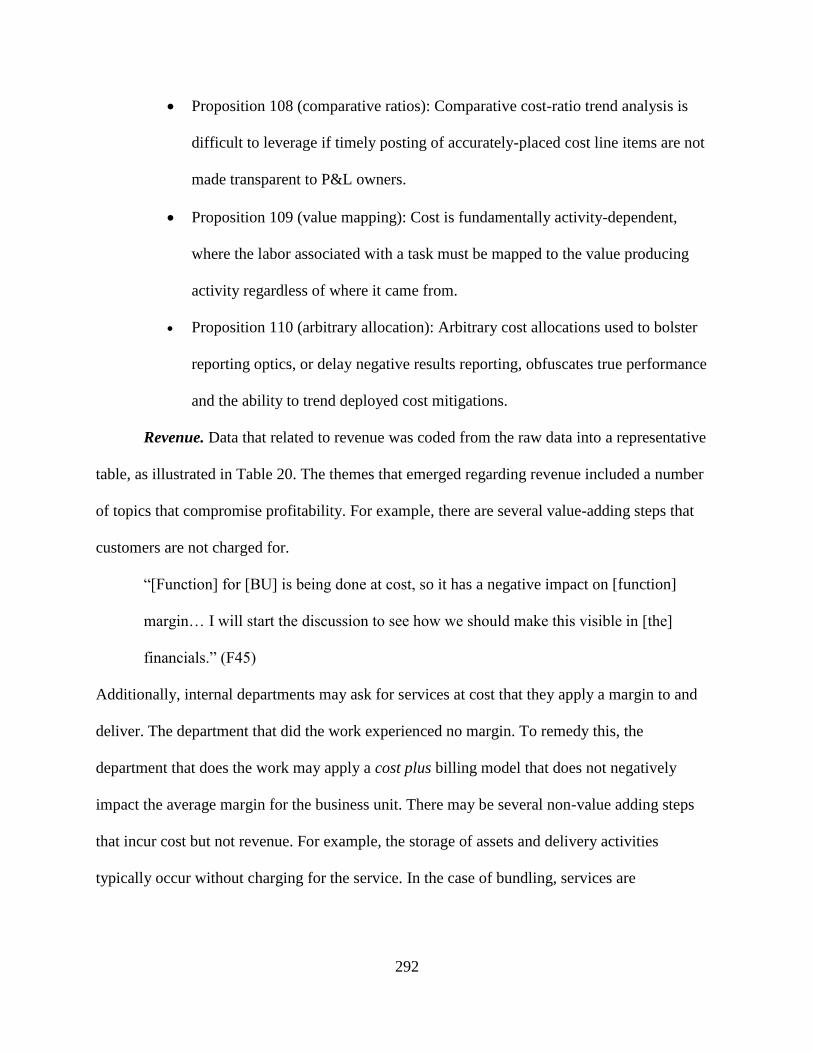
292
Proposition 108 (comparative ratios): Comparative cost-ratio trend analysis is
difficult to leverage if timely posting of accurately-placed cost line items are not
made transparent to P&L owners.
Proposition 109 (value mapping): Cost is fundamentally activity-dependent,
where the labor associated with a task must be mapped to the value producing
activity regardless of where it came from.
Proposition 110 (arbitrary allocation): Arbitrary cost allocations used to bolster
reporting optics, or delay negative results reporting, obfuscates true performance
and the ability to trend deployed cost mitigations.
Revenue. Data that related to revenue was coded from the raw data into a representative
table, as illustrated in Table 20. The themes that emerged regarding revenue included a number
of topics that compromise profitability. For example, there are several value-adding steps that
customers are not charged for.
“[Function] for [BU] is being done at cost, so it has a negative impact on [function]
margin… I will start the discussion to see how we should make this visible in [the]
financials.” (F45)
Additionally, internal departments may ask for services at cost that they apply a margin to and
deliver. The department that did the work experienced no margin. To remedy this, the
department that does the work may apply a cost plus billing model that does not negatively
impact the average margin for the business unit. There may be several non-value adding steps
that incur cost but not revenue. For example, the storage of assets and delivery activities
typically occur without charging for the service. In the case of bundling, services are
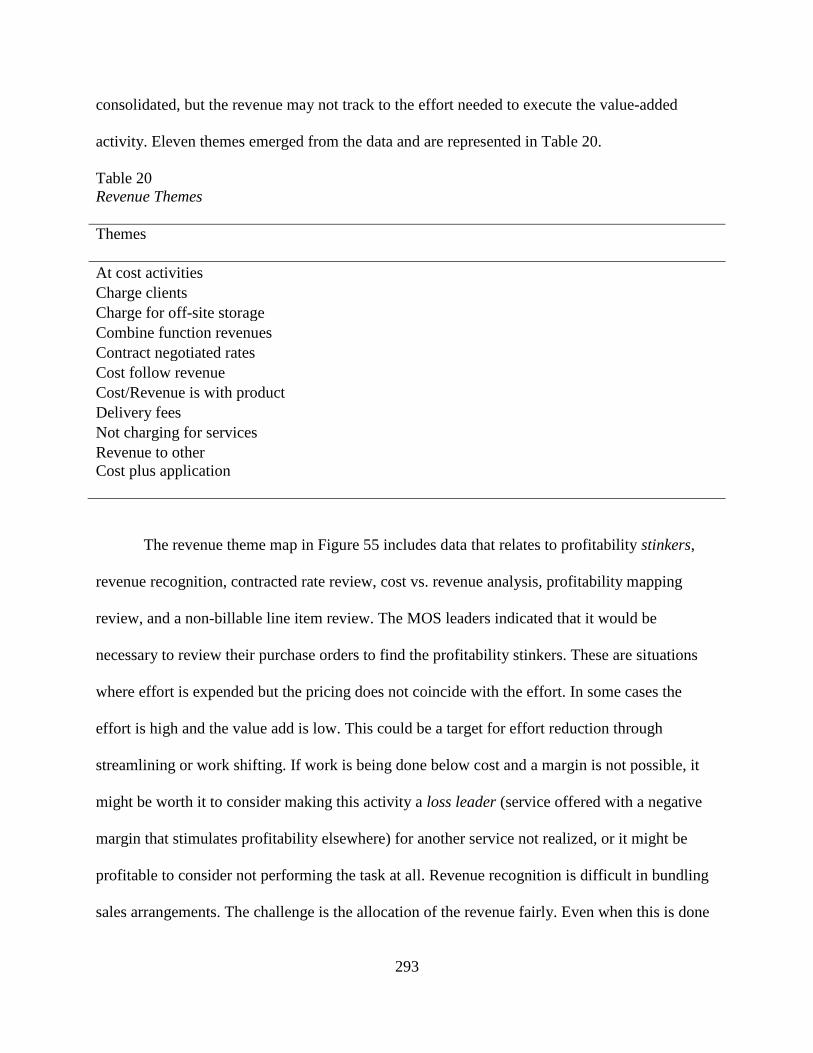
293
consolidated, but the revenue may not track to the effort needed to execute the value-added
activity. Eleven themes emerged from the data and are represented in Table 20.
Table 20
Revenue Themes
Themes
At cost activities
Charge clients
Charge for off-site storage
Combine function revenues
Contract negotiated rates
Cost follow revenue
Cost/Revenue is with product
Delivery fees
Not charging for services
Revenue to other
Cost plus application
The revenue theme map in Figure 55 includes data that relates to profitability stinkers,
revenue recognition, contracted rate review, cost vs. revenue analysis, profitability mapping
review, and a non-billable line item review. The MOS leaders indicated that it would be
necessary to review their purchase orders to find the profitability stinkers. These are situations
where effort is expended but the pricing does not coincide with the effort. In some cases the
effort is high and the value add is low. This could be a target for effort reduction through
streamlining or work shifting. If work is being done below cost and a margin is not possible, it
might be worth it to consider making this activity a loss leader (service offered with a negative
margin that stimulates profitability elsewhere) for another service not realized, or it might be
profitable to consider not performing the task at all. Revenue recognition is difficult in bundling
sales arrangements. The challenge is the allocation of the revenue fairly. Even when this is done
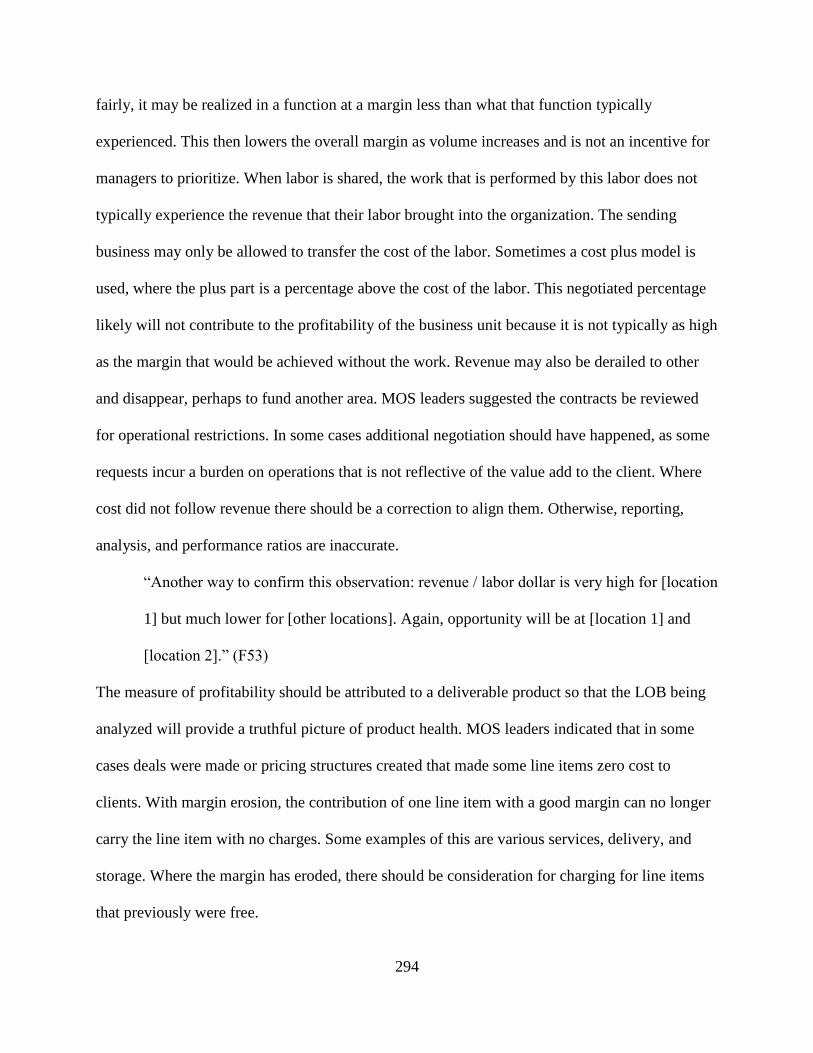
294
fairly, it may be realized in a function at a margin less than what that function typically
experienced. This then lowers the overall margin as volume increases and is not an incentive for
managers to prioritize. When labor is shared, the work that is performed by this labor does not
typically experience the revenue that their labor brought into the organization. The sending
business may only be allowed to transfer the cost of the labor. Sometimes a cost plus model is
used, where the plus part is a percentage above the cost of the labor. This negotiated percentage
likely will not contribute to the profitability of the business unit because it is not typically as high
as the margin that would be achieved without the work. Revenue may also be derailed to other
and disappear, perhaps to fund another area. MOS leaders suggested the contracts be reviewed
for operational restrictions. In some cases additional negotiation should have happened, as some
requests incur a burden on operations that is not reflective of the value add to the client. Where
cost did not follow revenue there should be a correction to align them. Otherwise, reporting,
analysis, and performance ratios are inaccurate.
“Another way to confirm this observation: revenue / labor dollar is very high for [location
1] but much lower for [other locations]. Again, opportunity will be at [location 1] and
[location 2].” (F53)
The measure of profitability should be attributed to a deliverable product so that the LOB being
analyzed will provide a truthful picture of product health. MOS leaders indicated that in some
cases deals were made or pricing structures created that made some line items zero cost to
clients. With margin erosion, the contribution of one line item with a good margin can no longer
carry the line item with no charges. Some examples of this are various services, delivery, and
storage. Where the margin has eroded, there should be consideration for charging for line items
that previously were free.
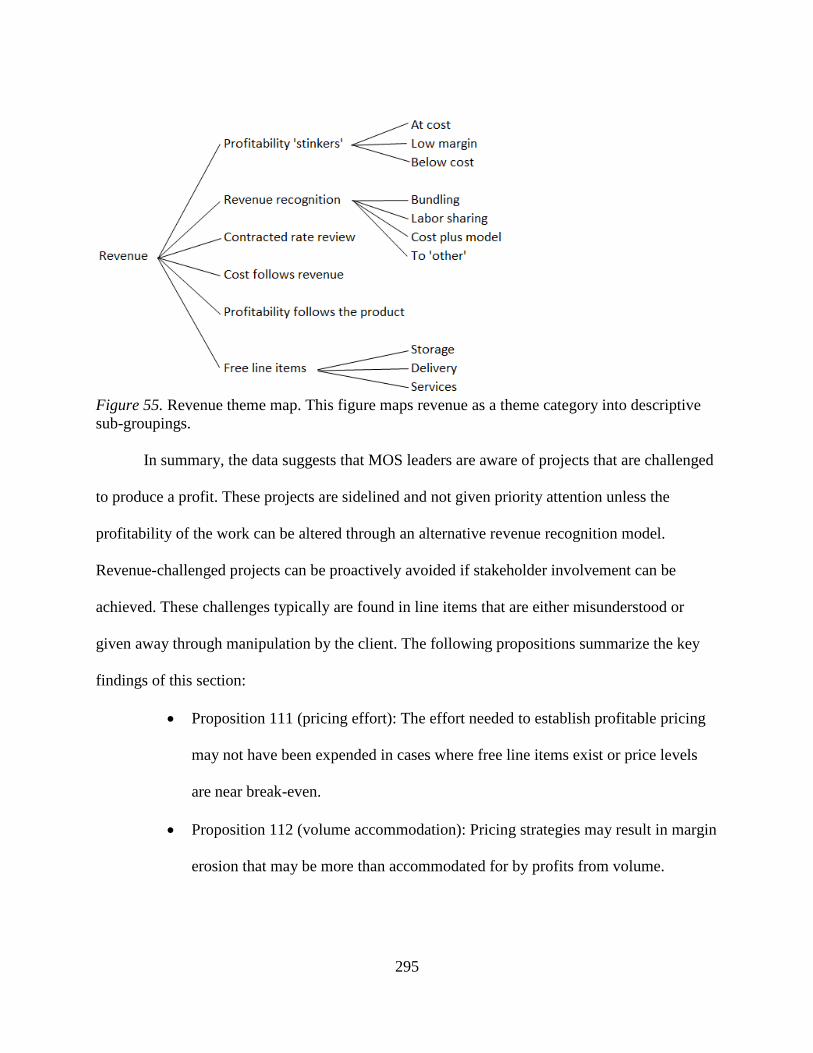
295
Figure 55. Revenue theme map. This figure maps revenue as a theme category into descriptive
sub-groupings.
In summary, the data suggests that MOS leaders are aware of projects that are challenged
to produce a profit. These projects are sidelined and not given priority attention unless the
profitability of the work can be altered through an alternative revenue recognition model.
Revenue-challenged projects can be proactively avoided if stakeholder involvement can be
achieved. These challenges typically are found in line items that are either misunderstood or
given away through manipulation by the client. The following propositions summarize the key
findings of this section:
Proposition 111 (pricing effort): The effort needed to establish profitable pricing
may not have been expended in cases where free line items exist or price levels
are near break-even.
Proposition 112 (volume accommodation): Pricing strategies may result in margin
erosion that may be more than accommodated for by profits from volume.
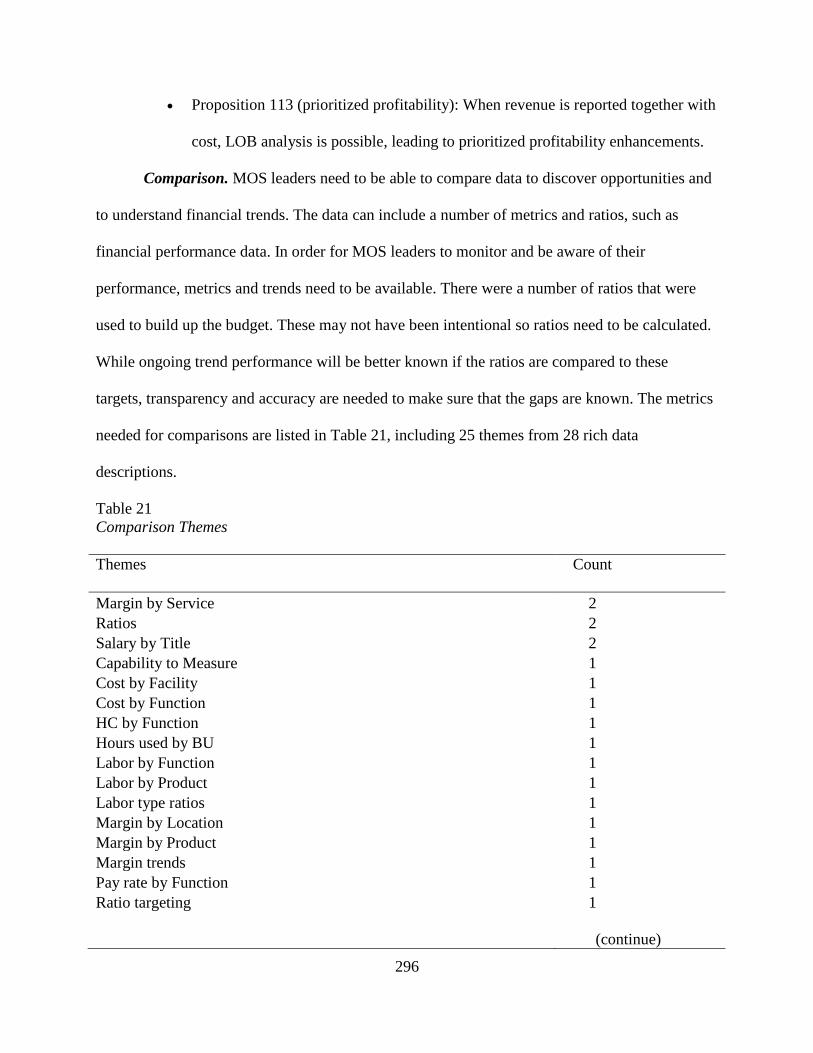
296
Proposition 113 (prioritized profitability): When revenue is reported together with
cost, LOB analysis is possible, leading to prioritized profitability enhancements.
Comparison. MOS leaders need to be able to compare data to discover opportunities and
to understand financial trends. The data can include a number of metrics and ratios, such as
financial performance data. In order for MOS leaders to monitor and be aware of their
performance, metrics and trends need to be available. There were a number of ratios that were
used to build up the budget. These may not have been intentional so ratios need to be calculated.
While ongoing trend performance will be better known if the ratios are compared to these
targets, transparency and accuracy are needed to make sure that the gaps are known. The metrics
needed for comparisons are listed in Table 21, including 25 themes from 28 rich data
descriptions.
Table 21
Comparison Themes
Themes
Count
Margin by Service 2
Ratios 2
Salary by Title 2
Capability to Measure 1
Cost by Facility 1
Cost by Function 1
HC by Function 1
Hours used by BU 1
Labor by Function 1
Labor by Product 1
Labor type ratios 1
Margin by Location 1
Margin by Product 1
Margin trends 1
Pay rate by Function 1
Ratio targeting 1
(continue)
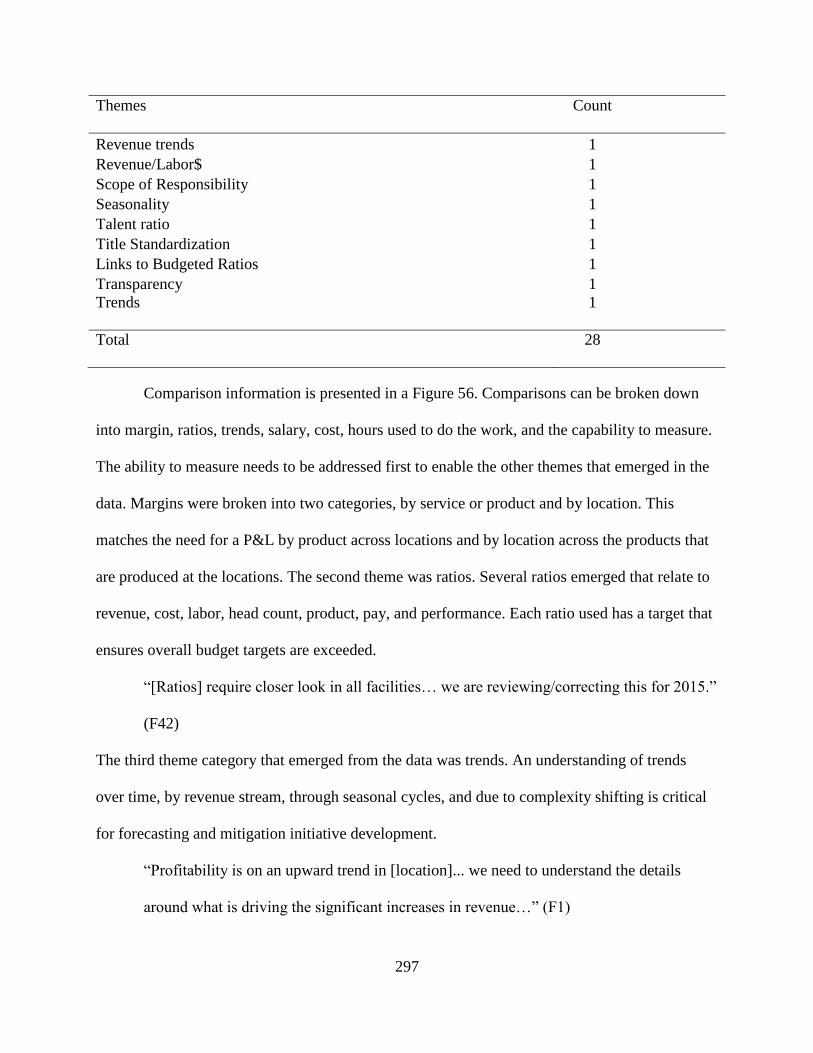
297
Themes
Count
Revenue trends 1
Revenue/Labor$ 1
Scope of Responsibility 1
Seasonality 1
Talent ratio 1
Title Standardization 1
Links to Budgeted Ratios 1
Transparency 1
Trends
1
Total
28
Comparison information is presented in a Figure 56. Comparisons can be broken down
into margin, ratios, trends, salary, cost, hours used to do the work, and the capability to measure.
The ability to measure needs to be addressed first to enable the other themes that emerged in the
data. Margins were broken into two categories, by service or product and by location. This
matches the need for a P&L by product across locations and by location across the products that
are produced at the locations. The second theme was ratios. Several ratios emerged that relate to
revenue, cost, labor, head count, product, pay, and performance. Each ratio used has a target that
ensures overall budget targets are exceeded.
“[Ratios] require closer look in all facilities… we are reviewing/correcting this for 2015.”
(F42)
The third theme category that emerged from the data was trends. An understanding of trends
over time, by revenue stream, through seasonal cycles, and due to complexity shifting is critical
for forecasting and mitigation initiative development.
“Profitability is on an upward trend in [location]... we need to understand the details
around what is driving the significant increases in revenue…” (F1)
298
Decisions may also be made to exit a LOB or divest a business unit. The fourth theme area is
related to labor cost. Salaries are major cost drivers, especially in low material, cost-based
manufacturing environments. MOS leaders indicated that salary by title, facility, and scope of
responsibility was important to know. Mitigating anomalies relative to an appropriate policy
should be planned for. Evolving organizational structures often have title disparities (ex.
different titles for the same function) and structural inconsistencies (ex. organizational design
flatness). The fifth theme related purely to cost by function. The incremental cost needed to add
value should be compared against the amount that the client wants to pay for the billable line
item. The sixth emerging theme related to the elemental unit of cost, hours by function, type, and
by LOB. The last theme was the ability to measure. The measurement system needs to be
accurate and transparent. In many cases inaccuracies become apparent when the information is
known to the participants and criticism is received gladly.
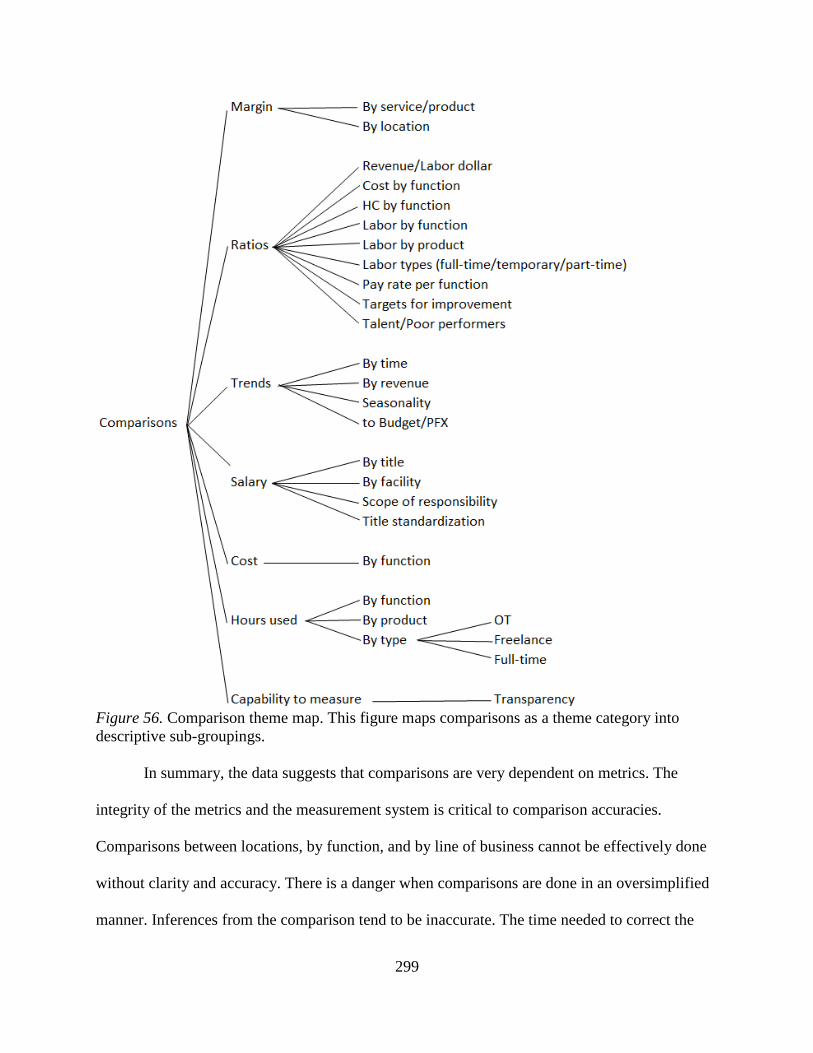
299
Figure 56. Comparison theme map. This figure maps comparisons as a theme category into
descriptive sub-groupings.
In summary, the data suggests that comparisons are very dependent on metrics. The
integrity of the metrics and the measurement system is critical to comparison accuracies.
Comparisons between locations, by function, and by line of business cannot be effectively done
without clarity and accuracy. There is a danger when comparisons are done in an oversimplified
manner. Inferences from the comparison tend to be inaccurate. The time needed to correct the
300
inferences through data reconciliation activities is wasteful. On the other hand, ratios can be very
useful for performance monitoring and improvement, leading to profitability in the MOS. The
following propositions summarize the key findings of this section:
Proposition 114 (life-cycle profits): MOS leaders need to know and monitor
margins by location, type, and client so that product life-cycles are predictable
and so that appropriate pricing strategies can be applied.
Proposition 115 (meaningful comparisons): An optimal level of granularity and
transparency is needed with business unit data such that functional performance
comparisons between locations are meaningful and can be leveraged.
LIMs. This section discusses observations about various constructs that aided the MOS
in being successful by enhancing profitability. It includes both examples and a description of
how they work. Literature suggests that lateral integrative mechanisms can augment a MOS’s
efforts to realize synergistic growth (Hill, et al., 1992; Gupta & Govindarajan, 2000; O’Donnell,
2000). According to De Jaegher and Di Paolo (2007, 2008) the structural coupling between
individuals is social if they engender an autonomous dynamic. Coupling, according to Weick
(1976) is optimally loose when integrative mechanisms can maintain an identity, uniqueness, and
separateness. The looseness of the coupling enhances adaptability to changing conditions
(Eisenhardt & Bhatia, 2005). Ideally, a LIM would be autopoietic, able to create and maintain
itself, its behavior, its connectedness, its growth, and even react to the need to dissolve, expand,
cope, or fold into itself (Capra, 1996; Luhman, 1990; Maturana & Varela, 1980, 1987). This
study suggests that the extensive use of integrative mechanisms may not lead to optimal success
regarding synergy realization. It rather suggests that LIMs should be selectively applied and that
they should be aligned and complementary to optimize the profitability of a MOS. An over-
301
application of LIMs is a burden to the MOS creating inertia and needless decision-making
complexity. An under-application of LIMs also creates inertia as the MOS is under-supported.
Stakeholder fatigue then encourages inertia. An optimal combination will match the MUF
situation, but will be dynamic in that the LIMs will be transitioned in, transitioned out, or
evolved. The data that emerged from MOS leaders suggest that there are three types of LIMs: (a)
formal work-structures, (b) shared systems, and (c) cultural mechanisms.
Formal work-structures. Formal work-structures may include prescribed rules,
structures, or procedures that coordinate cross-business collaboration. These coordination
mechanisms focus on the process of interaction and are a special form of coupling (Maturana &
Varela, 1980) that complement the MOS structure by accelerating decision making (Choo,
1998). They promote predictability, shared meaning, purpose, and the perception of problems or
opportunities that the organization needs to resolve (Choo, 2002). These mechanisms may have a
formal name, membership status, and defined roles. These roles may include responsibilities,
reporting relationships, and accountability. The role could apply to a single person, a team, or a
board with governance. These structures have the ability to make decisions on cross-business
issues. They encourage growth synergy within a decentralized structure by accelerating the
organization’s ability to collaborate with speed. Secondary decision-making structures bring
decision makers together in a structured and focused context. The ability to collaborate and
achieve success in this way builds trust between stakeholders. Trust accelerates synergy
realization and solves turf disputes (Covey, 2006). It may reduce the need for formal agreements
with extensive detail, as both parties know that they have each other’s best interest in mind
(Dirks & Ferrin, 2001; Ferrin & Dirks, 2003, Jennings, Norman, Faratin, O’brien, & Odgers,
2000). Secondary decision-making structures encourage trust in decentralized structures and
302
reduce the cost of collaboration. Dyer (1997) suggests that alliances between parties who have
established mutual trust help to maximize collaborative value. These structures enhance
organizational efficiency by selectively focusing limited attention capacity on prioritized
strategic actions. Discussions around opportunities may also lead to the discovery of additional
needed actions as participants gain a shared intuition and a wider perspective on addressable
markets (Eisenhardt & Galunic, 2000). Knowledge also helps with the more efficient distribution
of tasks across involved business. The ability to select initiatives that have the best profitable
opportunity may more easily come from engaged cross-business team members. Commitment
and cross-business resource trade-offs that leverage strengths may be required to realize the
benefit of initiatives (Martin, 2002). Other operational norms and collaborative values guide
productive relationships that can emerge in decision-making team members (Jones, Felps, &
Bigley, 2007). This culture of collaboration, properly aligned, and executing selected profitable
opportunities, will be beneficial to the continuous realization of growth synergies.
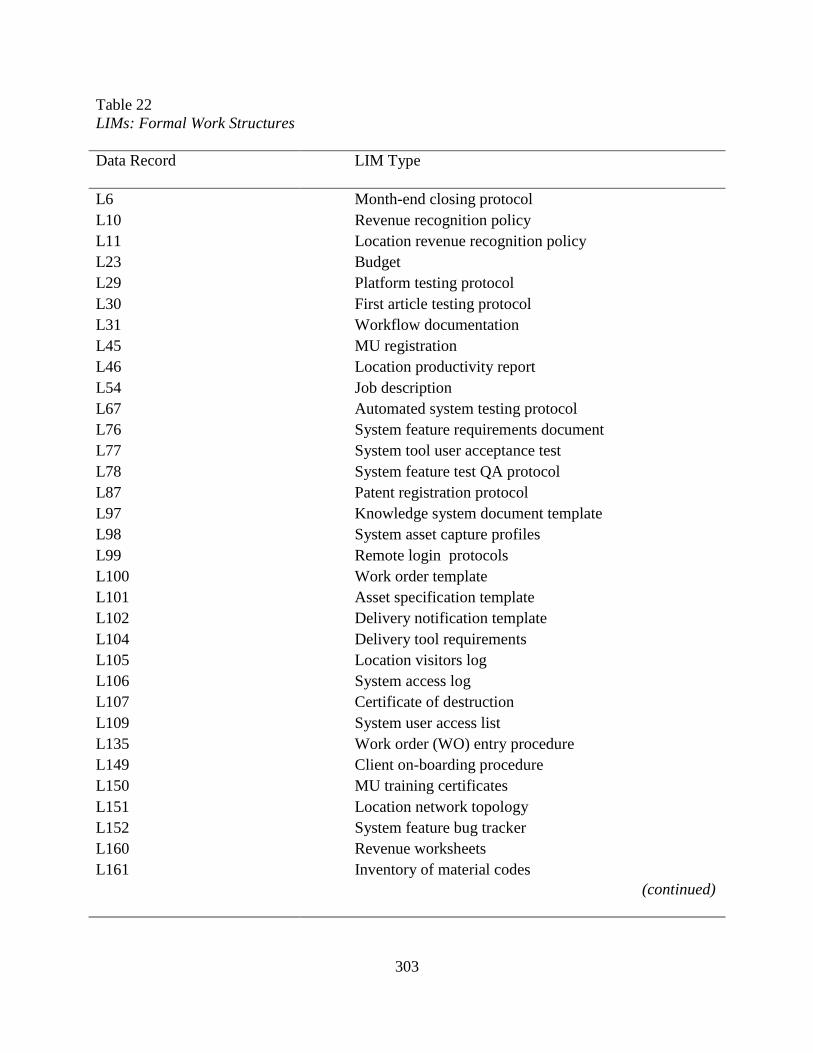
303
Table 22
LIMs: Formal Work Structures
Data Record
LIM Type
L6 Month-end closing protocol
L10 Revenue recognition policy
L11 Location revenue recognition policy
L23 Budget
L29 Platform testing protocol
L30 First article testing protocol
L31 Workflow documentation
L45 MU registration
L46 Location productivity report
L54 Job description
L67 Automated system testing protocol
L76 System feature requirements document
L77 System tool user acceptance test
L78 System feature test QA protocol
L87 Patent registration protocol
L97 Knowledge system document template
L98 System asset capture profiles
L99 Remote login protocols
L100 Work order template
L101 Asset specification template
L102 Delivery notification template
L104 Delivery tool requirements
L105 Location visitors log
L106 System access log
L107 Certificate of destruction
L109 System user access list
L135 Work order (WO) entry procedure
L149 Client on-boarding procedure
L150 MU training certificates
L151 Location network topology
L152 System feature bug tracker
L160 Revenue worksheets
L161 Inventory of material codes
(continued)
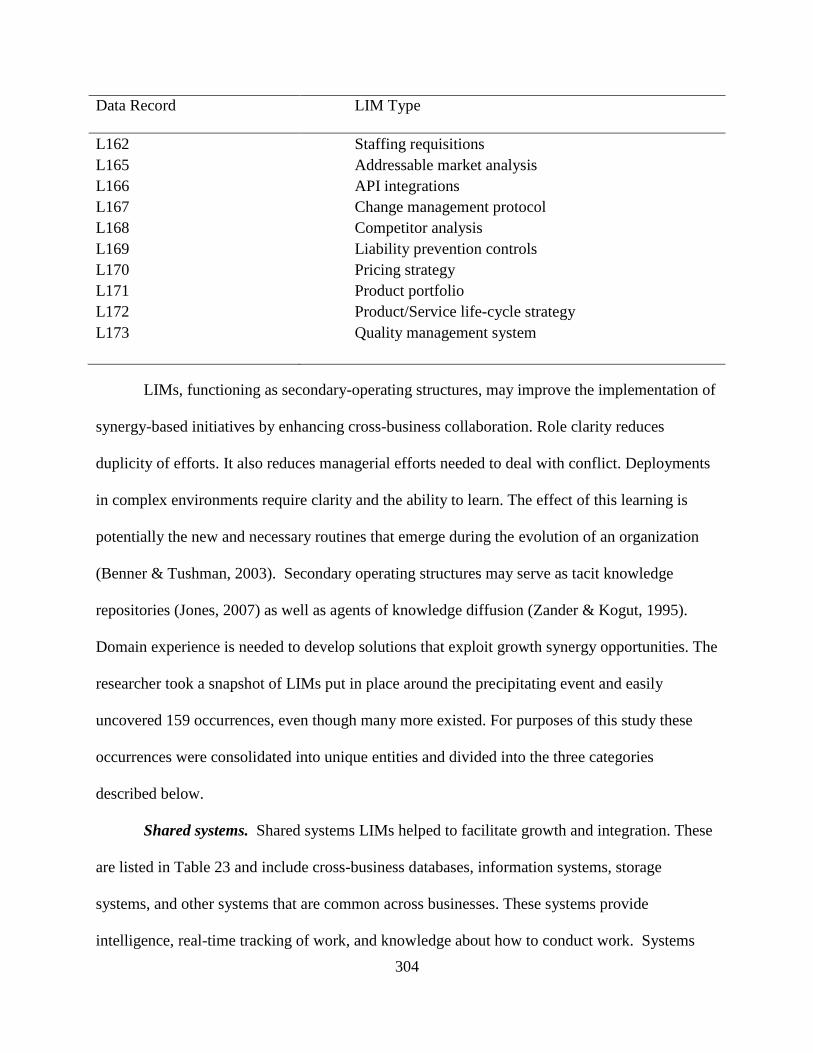
304
Data Record
LIM Type
L162 Staffing requisitions
L165 Addressable market analysis
L166 API integrations
L167 Change management protocol
L168 Competitor analysis
L169 Liability prevention controls
L170 Pricing strategy
L171 Product portfolio
L172 Product/Service life-cycle strategy
L173 Quality management system
LIMs, functioning as secondary-operating structures, may improve the implementation of
synergy-based initiatives by enhancing cross-business collaboration. Role clarity reduces
duplicity of efforts. It also reduces managerial efforts needed to deal with conflict. Deployments
in complex environments require clarity and the ability to learn. The effect of this learning is
potentially the new and necessary routines that emerge during the evolution of an organization
(Benner & Tushman, 2003). Secondary operating structures may serve as tacit knowledge
repositories (Jones, 2007) as well as agents of knowledge diffusion (Zander & Kogut, 1995).
Domain experience is needed to develop solutions that exploit growth synergy opportunities. The
researcher took a snapshot of LIMs put in place around the precipitating event and easily
uncovered 159 occurrences, even though many more existed. For purposes of this study these
occurrences were consolidated into unique entities and divided into the three categories
described below.
Shared systems. Shared systems LIMs helped to facilitate growth and integration. These
are listed in Table 23 and include cross-business databases, information systems, storage
systems, and other systems that are common across businesses. These systems provide
intelligence, real-time tracking of work, and knowledge about how to conduct work. Systems
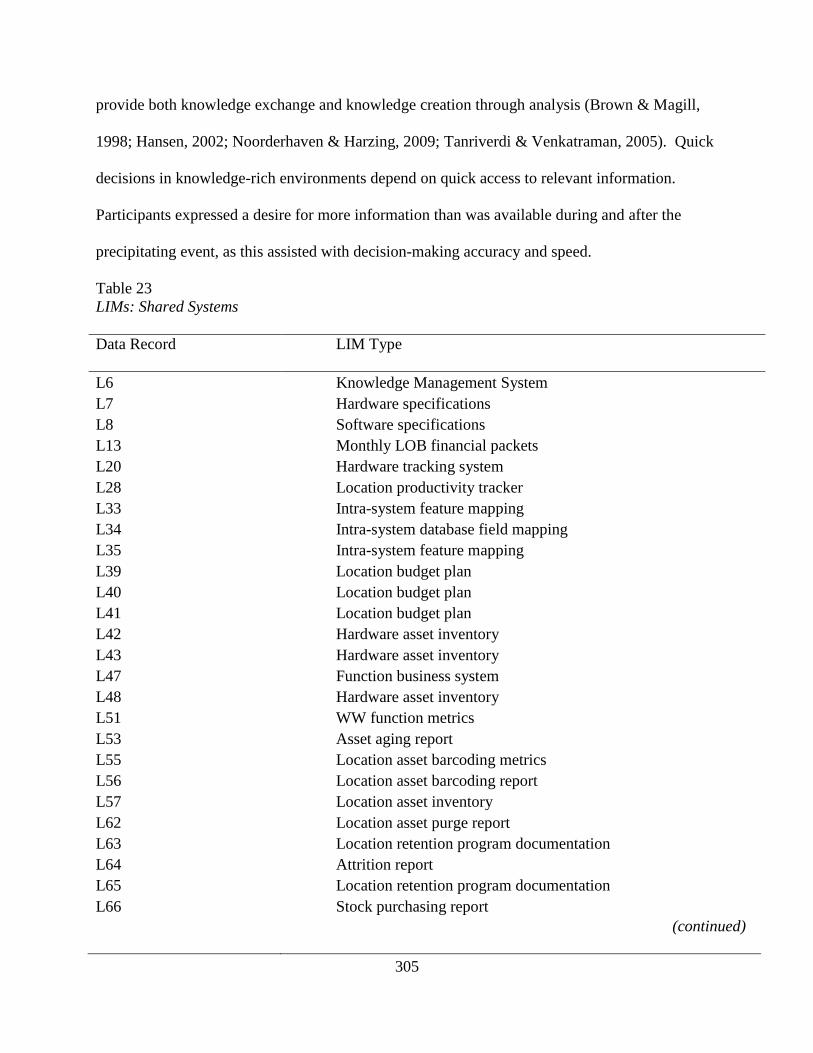
305
provide both knowledge exchange and knowledge creation through analysis (Brown & Magill,
1998; Hansen, 2002; Noorderhaven & Harzing, 2009; Tanriverdi & Venkatraman, 2005). Quick
decisions in knowledge-rich environments depend on quick access to relevant information.
Participants expressed a desire for more information than was available during and after the
precipitating event, as this assisted with decision-making accuracy and speed.
Table 23
LIMs: Shared Systems
Data Record
LIM Type
L6 Knowledge Management System
L7 Hardware specifications
L8 Software specifications
L13 Monthly LOB financial packets
L20 Hardware tracking system
L28 Location productivity tracker
L33 Intra-system feature mapping
L34 Intra-system database field mapping
L35 Intra-system feature mapping
L39 Location budget plan
L40 Location budget plan
L41 Location budget plan
L42 Hardware asset inventory
L43 Hardware asset inventory
L47 Function business system
L48 Hardware asset inventory
L51 WW function metrics
L53 Asset aging report
L55 Location asset barcoding metrics
L56 Location asset barcoding report
L57 Location asset inventory
L62 Location asset purge report
L63 Location retention program documentation
L64 Attrition report
L65 Location retention program documentation
L66 Stock purchasing report
(continued)
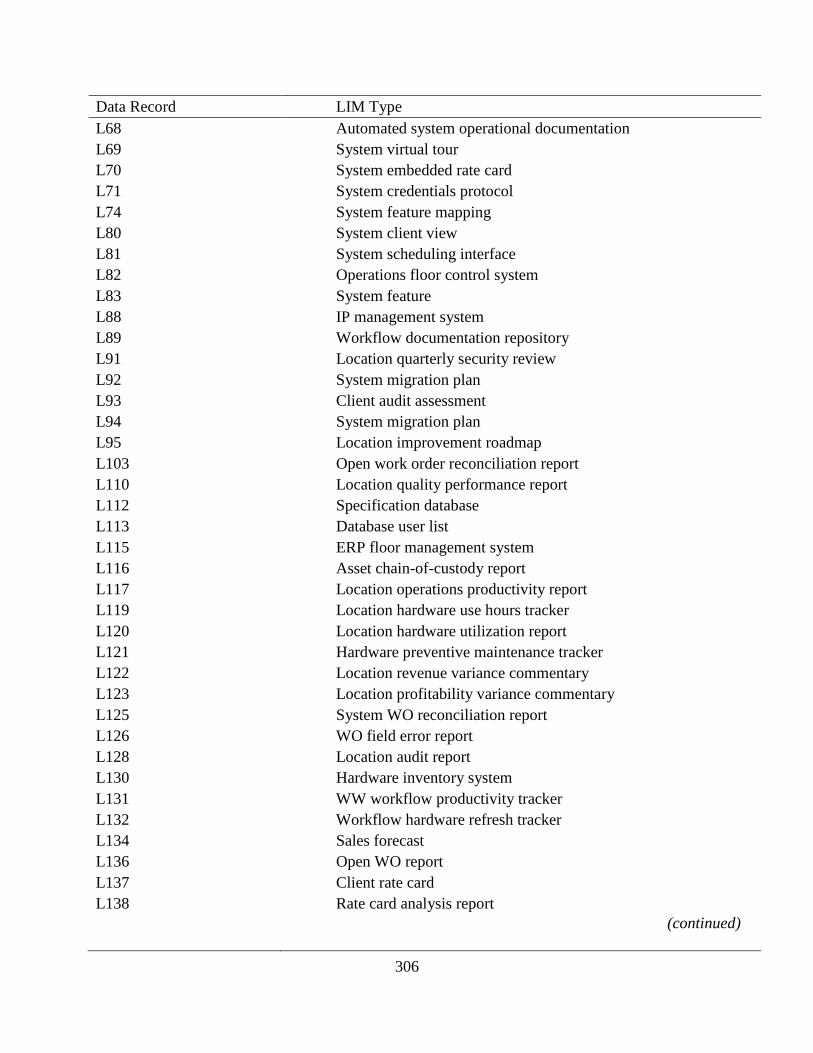
306
Data Record LIM Type
L68 Automated system operational documentation
L69 System virtual tour
L70 System embedded rate card
L71 System credentials protocol
L74 System feature mapping
L80 System client view
L81 System scheduling interface
L82 Operations floor control system
L83 System feature
L88 IP management system
L89 Workflow documentation repository
L91 Location quarterly security review
L92 System migration plan
L93 Client audit assessment
L94 System migration plan
L95 Location improvement roadmap
L103 Open work order reconciliation report
L110 Location quality performance report
L112 Specification database
L113 Database user list
L115 ERP floor management system
L116 Asset chain-of-custody report
L117 Location operations productivity report
L119 Location hardware use hours tracker
L120 Location hardware utilization report
L121 Hardware preventive maintenance tracker
L122 Location revenue variance commentary
L123 Location profitability variance commentary
L125 System WO reconciliation report
L126 WO field error report
L128 Location audit report
L130 Hardware inventory system
L131 WW workflow productivity tracker
L132 Workflow hardware refresh tracker
L134 Sales forecast
L136 Open WO report
L137 Client rate card
L138 Rate card analysis report
(continued)
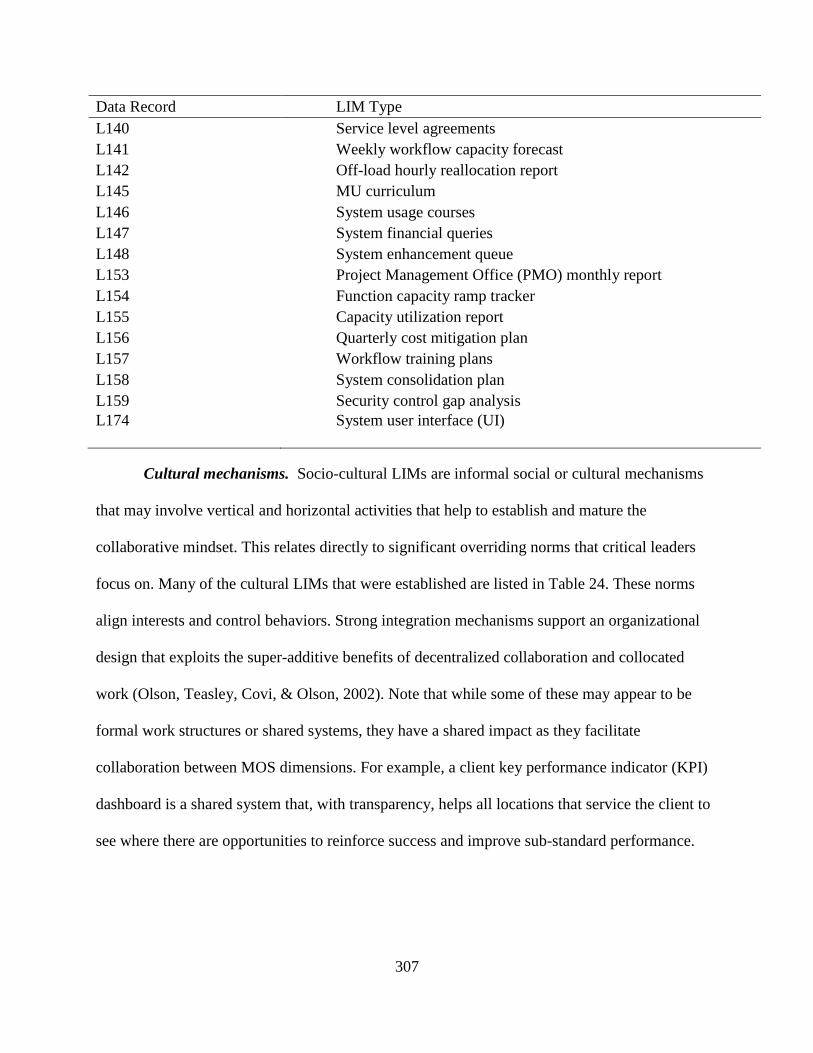
307
Data Record LIM Type
L140 Service level agreements
L141 Weekly workflow capacity forecast
L142 Off-load hourly reallocation report
L145 MU curriculum
L146 System usage courses
L147 System financial queries
L148 System enhancement queue
L153 Project Management Office (PMO) monthly report
L154 Function capacity ramp tracker
L155 Capacity utilization report
L156 Quarterly cost mitigation plan
L157 Workflow training plans
L158 System consolidation plan
L159 Security control gap analysis
L174
System user interface (UI)
Cultural mechanisms. Socio-cultural LIMs are informal social or cultural mechanisms
that may involve vertical and horizontal activities that help to establish and mature the
collaborative mindset. This relates directly to significant overriding norms that critical leaders
focus on. Many of the cultural LIMs that were established are listed in Table 24. These norms
align interests and control behaviors. Strong integration mechanisms support an organizational
design that exploits the super-additive benefits of decentralized collaboration and collocated
work (Olson, Teasley, Covi, & Olson, 2002). Note that while some of these may appear to be
formal work structures or shared systems, they have a shared impact as they facilitate
collaboration between MOS dimensions. For example, a client key performance indicator (KPI)
dashboard is a shared system that, with transparency, helps all locations that service the client to
see where there are opportunities to reinforce success and improve sub-standard performance.
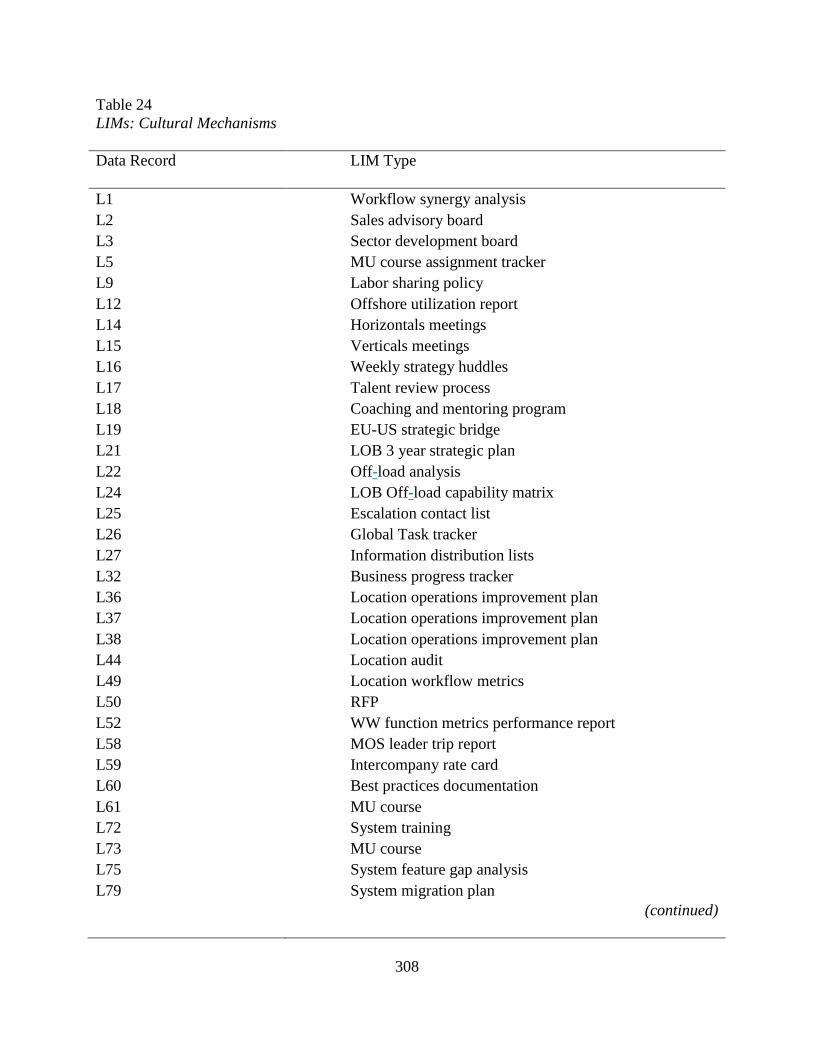
308
Table 24
LIMs: Cultural Mechanisms
Data Record
LIM Type
L1 Workflow synergy analysis
L2 Sales advisory board
L3 Sector development board
L5 MU course assignment tracker
L9 Labor sharing policy
L12 Offshore utilization report
L14 Horizontals meetings
L15 Verticals meetings
L16 Weekly strategy huddles
L17 Talent review process
L18 Coaching and mentoring program
L19 EU-US strategic bridge
L21 LOB 3 year strategic plan
L22 Off-load analysis
L24 LOB Off-load capability matrix
L25 Escalation contact list
L26 Global Task tracker
L27 Information distribution lists
L32 Business progress tracker
L36 Location operations improvement plan
L37 Location operations improvement plan
L38 Location operations improvement plan
L44 Location audit
L49 Location workflow metrics
L50 RFP
L52 WW function metrics performance report
L58 MOS leader trip report
L59 Intercompany rate card
L60 Best practices documentation
L61 MU course
L72 System training
L73 MU course
L75 System feature gap analysis
L79 System migration plan
(continued)
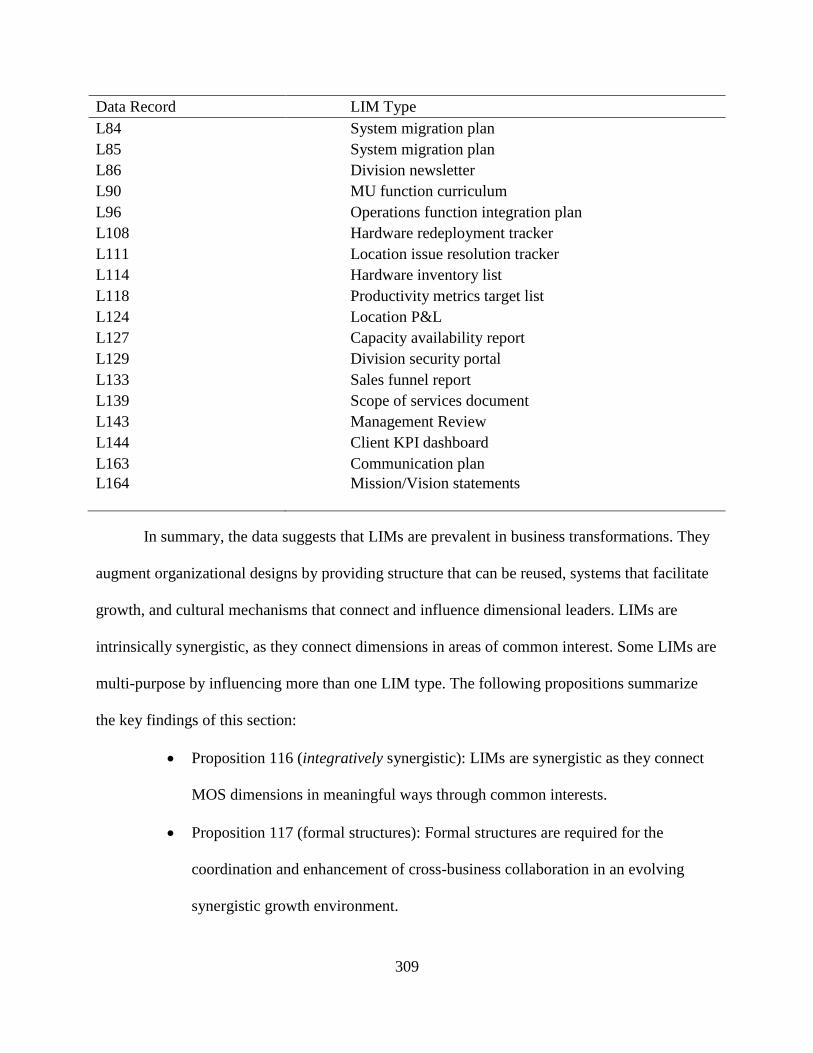
309
Data Record LIM Type
L84 System migration plan
L85 System migration plan
L86 Division newsletter
L90 MU function curriculum
L96 Operations function integration plan
L108 Hardware redeployment tracker
L111 Location issue resolution tracker
L114 Hardware inventory list
L118 Productivity metrics target list
L124 Location P&L
L127 Capacity availability report
L129 Division security portal
L133 Sales funnel report
L139 Scope of services document
L143 Management Review
L144 Client KPI dashboard
L163 Communication plan
L164
Mission/Vision statements
In summary, the data suggests that LIMs are prevalent in business transformations. They
augment organizational designs by providing structure that can be reused, systems that facilitate
growth, and cultural mechanisms that connect and influence dimensional leaders. LIMs are
intrinsically synergistic, as they connect dimensions in areas of common interest. Some LIMs are
multi-purpose by influencing more than one LIM type. The following propositions summarize
the key findings of this section:
Proposition 116 (integratively synergistic): LIMs are synergistic as they connect
MOS dimensions in meaningful ways through common interests.
Proposition 117 (formal structures): Formal structures are required for the
coordination and enhancement of cross-business collaboration in an evolving
synergistic growth environment.
310
Proposition 118 (cultural mechanisms): Socio-cultural activities help MOS
dimensions establish and mature a collaborative mindset in a complex
environment.
Proposition 119 (system sharing): MOS leaders benefit from access to meaningful
and relevant tacit knowledge and domain experience that can be used to accelerate
growth-oriented decision making.
Proposition 120 (decentralized collaboration): Decentralized collaboration
includes business unit autonomy in selecting and implementing growth initiatives,
both of which are directly related to growth synergy realization.
Proposition 121 (mechanism strength): Strong integrative mechanisms applied
appropriately and with the right frequency are positively related to continuous
growth synergy realization.
Drift mitigation. In order to sustain gains made in a MUF, MOS leaders need to be
attentive to organizational entropy that could lead to the erasure of performance gains. This
section discusses techniques used to mitigate this entropy and allow for ongoing gains to be
autonomous. Growth synergies will not be beneficial if the gains made in other related areas are
not sustained. MOS leaders need to address the tendency of an organization to drift if they are
too effectively led across multiple physical locations. With this in mind, qualitative inputs were
collected, coded, and sorted into theme categories and are presented in Table 25. The most
frequent theme that emerged from the data was periodic communication. This would take a
variety of forms. In the absence of information rumor would replace fact, leading to distraction
and poor decision making. The enforcement of values aids with decision making, as it is an
alignment LIM even if it happens in unrelated areas of the organization.
311
“Communicating and enforcing organizational values on daily basis so people
automatically follow them while [I am] not here.” (DM70)
Making sure that the right people are aware of business changes was important. Leaving
someone off of a distribution list or disallowing information to be available to key talent will
result in drift due to a lack of transparency. Many good intentioned actions are not complete due
to a lack of follow through. According to MOS leaders, action trackers, including tool
development trackers, that are prioritized and appropriately delegated, along with frequent
periodic updates, help with this. When dates are in jeopardy, it is necessary to have points of
escalation. As the locations are dependent in the supply chain, consistency is also critical. The
relationship that leaders have with each other helps with the building of trust that results in lower
effort needed for change, communication flow, and peer accountability. This only works if they
are available to each other. Reports are critical for communication and awareness. They include
location production schedules, performance trends, and metrics. Exceptions need to be
investigated with urgency and remedied to avoid performance drift from further non-
conformities. If a MOS leader is not available, a #2 will need to make sure that entropy does not
occur. Table 25 exposes 31 themes from 99 rich data descriptions.
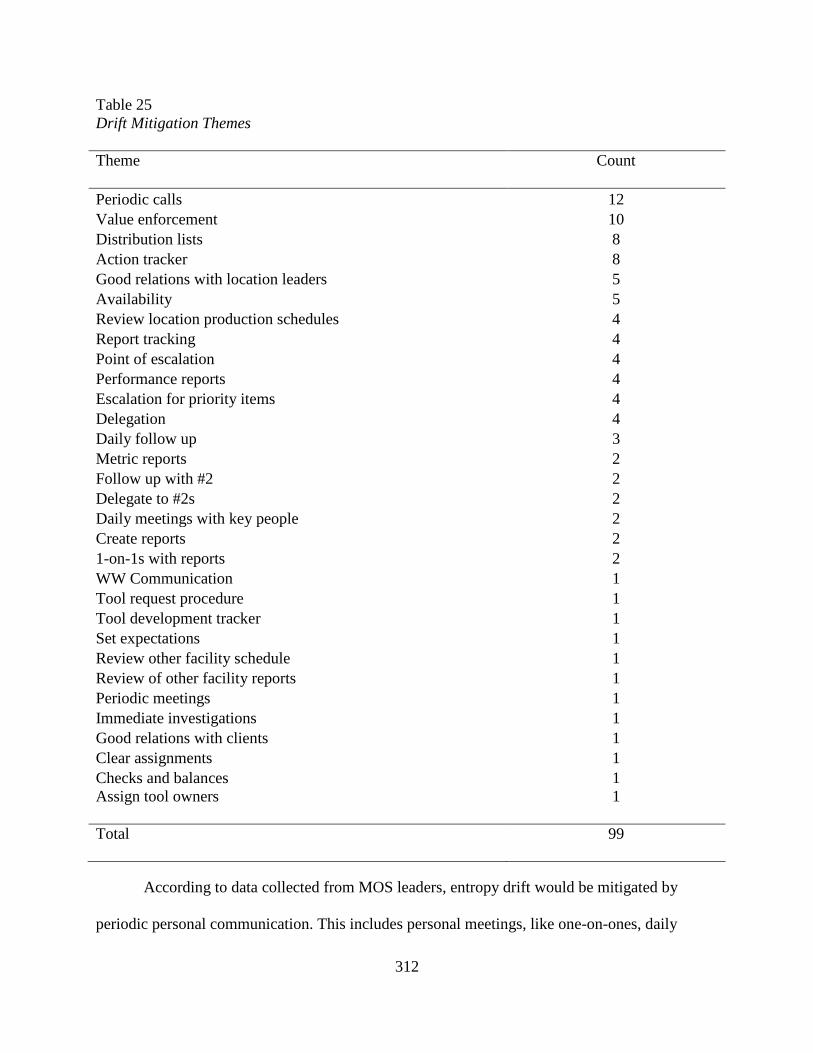
312
Table 25
Drift Mitigation Themes
Theme
Count
Periodic calls 12
Value enforcement 10
Distribution lists 8
Action tracker 8
Good relations with location leaders 5
Availability 5
Review location production schedules 4
Report tracking 4
Point of escalation 4
Performance reports 4
Escalation for priority items 4
Delegation 4
Daily follow up 3
Metric reports 2
Follow up with #2 2
Delegate to #2s 2
Daily meetings with key people 2
Create reports 2
1-on-1s with reports 2
WW Communication 1
Tool request procedure 1
Tool development tracker 1
Set expectations 1
Review other facility schedule 1
Review of other facility reports 1
Periodic meetings 1
Immediate investigations 1
Good relations with clients 1
Clear assignments 1
Checks and balances 1
Assign tool owners
1
Total
99
According to data collected from MOS leaders, entropy drift would be mitigated by
periodic personal communication. This includes personal meetings, like one-on-ones, daily

313
follow up, having issues escalated as needed, being added to distribution lists, having a method
for cross-business communication, and giving clear assignments. A second critical area for drift
mitigation is the culture that is created by the MOS leader. This includes having checks and
balances, enforcing values, setting clear expectations, and delegating tasks appropriately. The
third area of drift mitigation was related to having or creating the right guiding documents. This
includes performance reports, schedules, and action item trackers for each location.
“[I] have a tracker to keep track of WW assignments, action items, and deadlines to
complete them.” (DM27)
The fourth area was relationships. Entropy is mitigated when relationships are strong and there is
trust. This also applies to external relationships with support functions and clients. The last area
for entropy mitigation was response related. This includes the quickness of the response, the
ability to follow up with others, the ability to assign tasks, and the ability to assign owners of
tools. These relationships are mapped out in Figure 57.
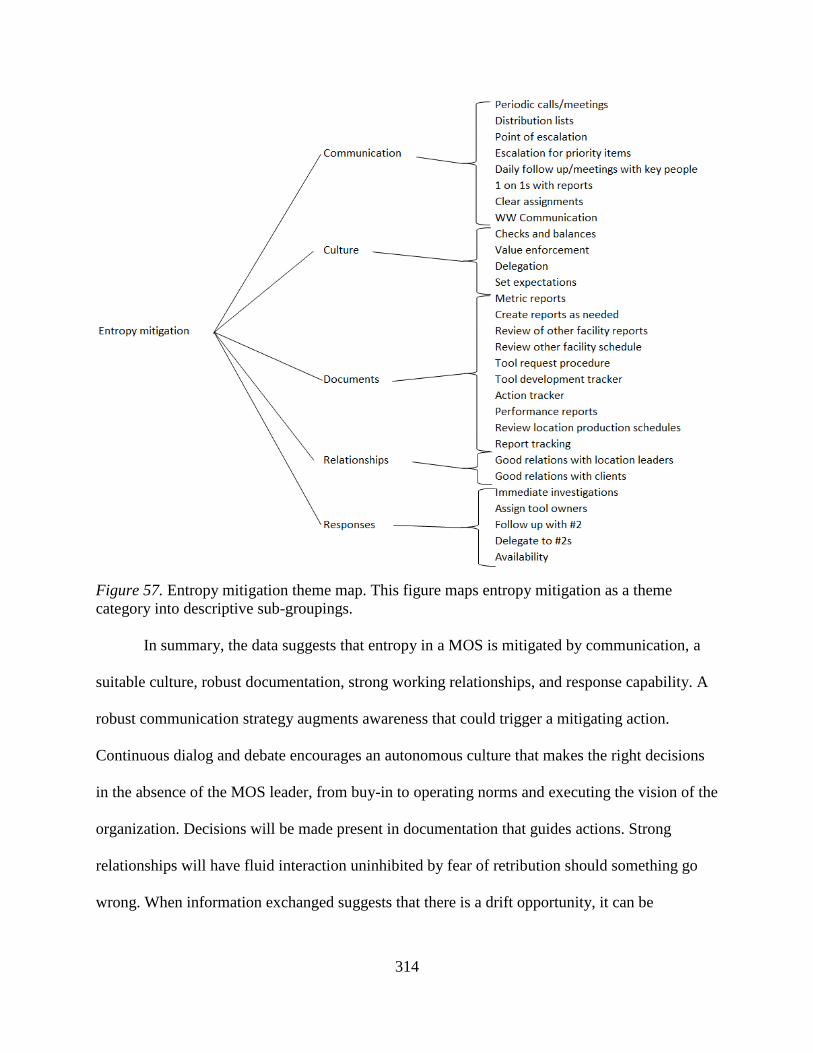
314
Figure 57. Entropy mitigation theme map. This figure maps entropy mitigation as a theme
category into descriptive sub-groupings.
In summary, the data suggests that entropy in a MOS is mitigated by communication, a
suitable culture, robust documentation, strong working relationships, and response capability. A
robust communication strategy augments awareness that could trigger a mitigating action.
Continuous dialog and debate encourages an autonomous culture that makes the right decisions
in the absence of the MOS leader, from buy-in to operating norms and executing the vision of the
organization. Decisions will be made present in documentation that guides actions. Strong
relationships will have fluid interaction uninhibited by fear of retribution should something go
wrong. When information exchanged suggests that there is a drift opportunity, it can be
315
investigated and mitigated. The following propositions summarize the key findings of this
section:
Proposition 122 (movement measurement): The design and strategy of
communication can influence entropy rates; however, an existing reference for
movement can be used to measure expectations against the values of defined
variables to expose the drift rate.
Proposition 123 (reaction speed): Performance reports are snapshots in time that
are a delayed rather than an instantaneous means by which a reaction can ensue.
Proposition 124 (integrating relationships): The ability to timely mitigate
undesirable drift is enabled by relationships built on trust and accountability.
Focused action. Taking steps to significantly reduce noise in the environment aided the
stakeholders in redirecting and focusing mental attention on the purpose of executing focused
action (Fiol & O’Connor, 2004). Action needs to be selective and intense in an environment
where the results would clearly be visible. The MOS had to be nimble to capture opportunities
before competitors were able to pull them away. In order for MediaCorp to achieve sustained
corporate advantage, it had to execute a sequence of steps for each opportunity including: the
identification of opportunities, the selection or prioritization of the opportunities, and the
subsequent exploitation of the opportunity. The exploitation would need to include energy
optimization through prioritization, resource allocation, value creation, plan clarity, and purpose
clarity. Energy is strategically allocated to accomplish tasks that optimize profitability. The
strategy was directional leveraging strategic complementarity as it was focused on profitable
opportunity. Four organizational themes are patterns in the data that emerge as critical roles in
profitable growth including (a) the MOS, (b) finance, (c) LIMs, and (d) corporate, as shown in
316
Table 26. Each role element will be discussed individually. Theme categories within each of the
four organizational categories are listed within the table. They are listed in order of frequency of
occurrence. Preexisting data was retrieved from action trackers during the timeframe around the
precipitating event. The list of selected and focused actions included 325 items that were coded
into 358 rich data descriptions divided into the four organizational categories mentioned above.
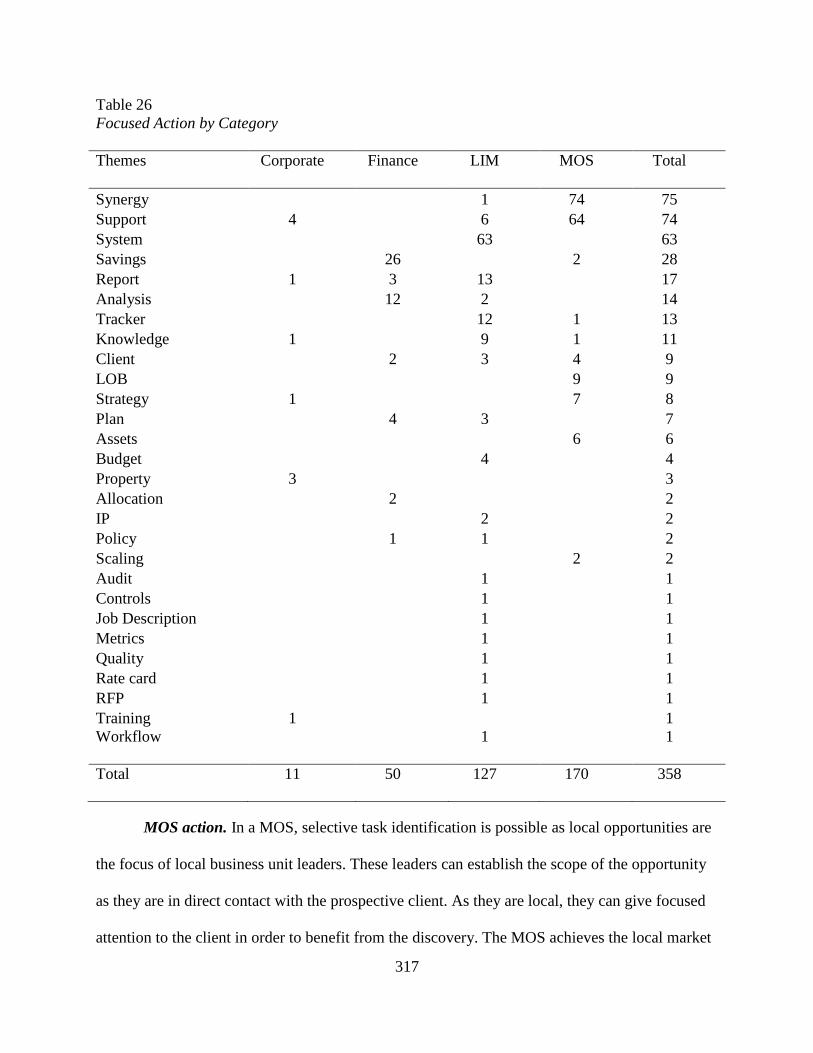
317
Table 26
Focused Action by Category
Themes
Corporate
Finance
LIM
MOS
Total
Synergy 1 74 75
Support 4 6 64 74
System 63 63
Savings 26 2 28
Report 1 3 13 17
Analysis 12 2 14
Tracker 12 1 13
Knowledge 1 9 1 11
Client 2 3 4 9
LOB 9 9
Strategy 1 7 8
Plan 4 3 7
Assets 6 6
Budget 4 4
Property 3 3
Allocation 2 2
IP 2 2
Policy 1 1 2
Scaling 2 2
Audit 1 1
Controls 1 1
Job Description 1 1
Metrics 1 1
Quality 1 1
Rate card 1 1
RFP 1 1
Training 1 1
Workflow
1
1
Total
11
50
127
170
358
MOS action. In a MOS, selective task identification is possible as local opportunities are
the focus of local business unit leaders. These leaders can establish the scope of the opportunity
as they are in direct contact with the prospective client. As they are local, they can give focused
attention to the client in order to benefit from the discovery. The MOS achieves the local market
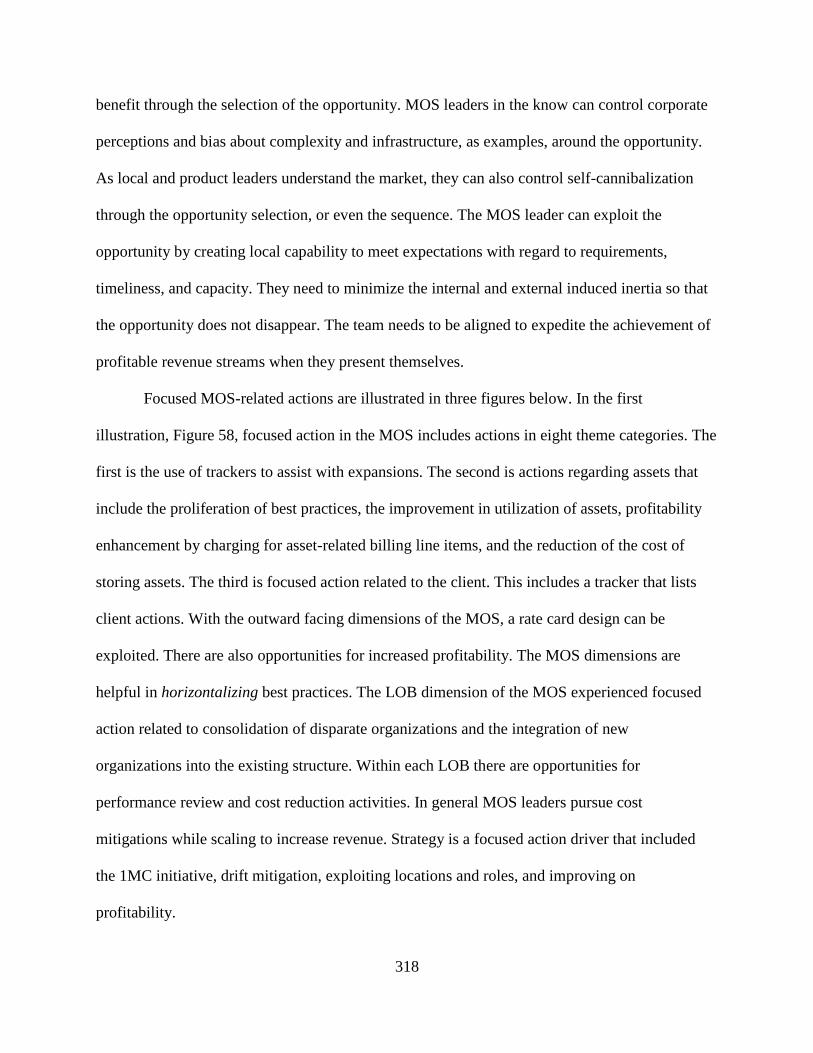
318
benefit through the selection of the opportunity. MOS leaders in the know can control corporate
perceptions and bias about complexity and infrastructure, as examples, around the opportunity.
As local and product leaders understand the market, they can also control self-cannibalization
through the opportunity selection, or even the sequence. The MOS leader can exploit the
opportunity by creating local capability to meet expectations with regard to requirements,
timeliness, and capacity. They need to minimize the internal and external induced inertia so that
the opportunity does not disappear. The team needs to be aligned to expedite the achievement of
profitable revenue streams when they present themselves.
Focused MOS-related actions are illustrated in three figures below. In the first
illustration, Figure 58, focused action in the MOS includes actions in eight theme categories. The
first is the use of trackers to assist with expansions. The second is actions regarding assets that
include the proliferation of best practices, the improvement in utilization of assets, profitability
enhancement by charging for asset-related billing line items, and the reduction of the cost of
storing assets. The third is focused action related to the client. This includes a tracker that lists
client actions. With the outward facing dimensions of the MOS, a rate card design can be
exploited. There are also opportunities for increased profitability. The MOS dimensions are
helpful in horizontalizing best practices. The LOB dimension of the MOS experienced focused
action related to consolidation of disparate organizations and the integration of new
organizations into the existing structure. Within each LOB there are opportunities for
performance review and cost reduction activities. In general MOS leaders pursue cost
mitigations while scaling to increase revenue. Strategy is a focused action driver that included
the 1MC initiative, drift mitigation, exploiting locations and roles, and improving on
profitability.
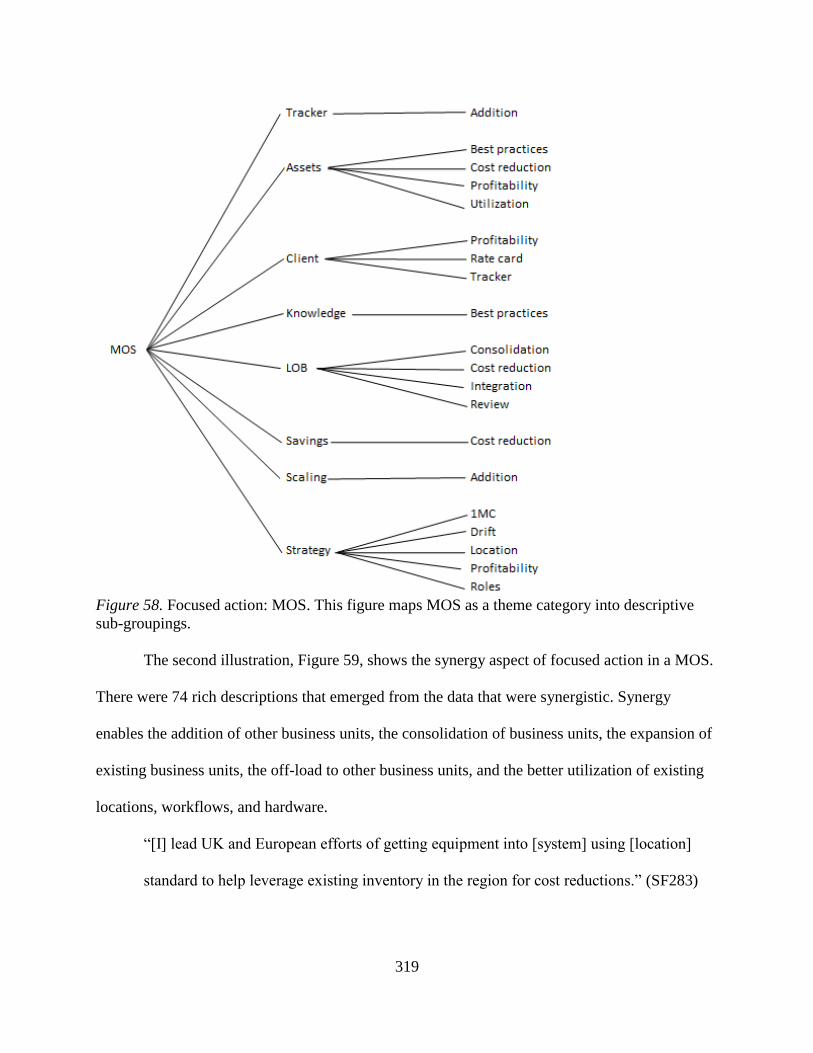
319
Figure 58. Focused action: MOS. This figure maps MOS as a theme category into descriptive
sub-groupings.
The second illustration, Figure 59, shows the synergy aspect of focused action in a MOS.
There were 74 rich descriptions that emerged from the data that were synergistic. Synergy
enables the addition of other business units, the consolidation of business units, the expansion of
existing business units, the off-load to other business units, and the better utilization of existing
locations, workflows, and hardware.
“[I] lead UK and European efforts of getting equipment into [system] using [location]
standard to help leverage existing inventory in the region for cost reductions.” (SF283)
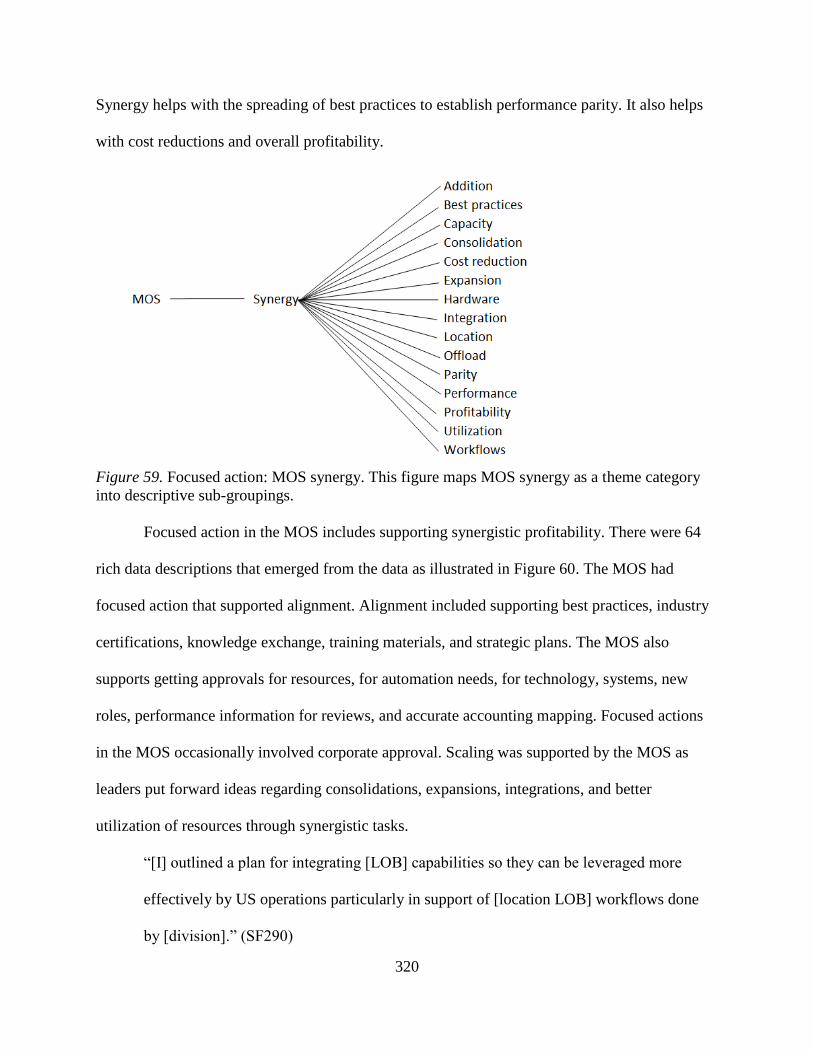
320
Synergy helps with the spreading of best practices to establish performance parity. It also helps
with cost reductions and overall profitability.
Figure 59. Focused action: MOS synergy. This figure maps MOS synergy as a theme category
into descriptive sub-groupings.
Focused action in the MOS includes supporting synergistic profitability. There were 64
rich data descriptions that emerged from the data as illustrated in Figure 60. The MOS had
focused action that supported alignment. Alignment included supporting best practices, industry
certifications, knowledge exchange, training materials, and strategic plans. The MOS also
supports getting approvals for resources, for automation needs, for technology, systems, new
roles, performance information for reviews, and accurate accounting mapping. Focused actions
in the MOS occasionally involved corporate approval. Scaling was supported by the MOS as
leaders put forward ideas regarding consolidations, expansions, integrations, and better
utilization of resources through synergistic tasks.
“[I] outlined a plan for integrating [LOB] capabilities so they can be leveraged more
effectively by US operations particularly in support of [location LOB] workflows done
by [division].” (SF290)
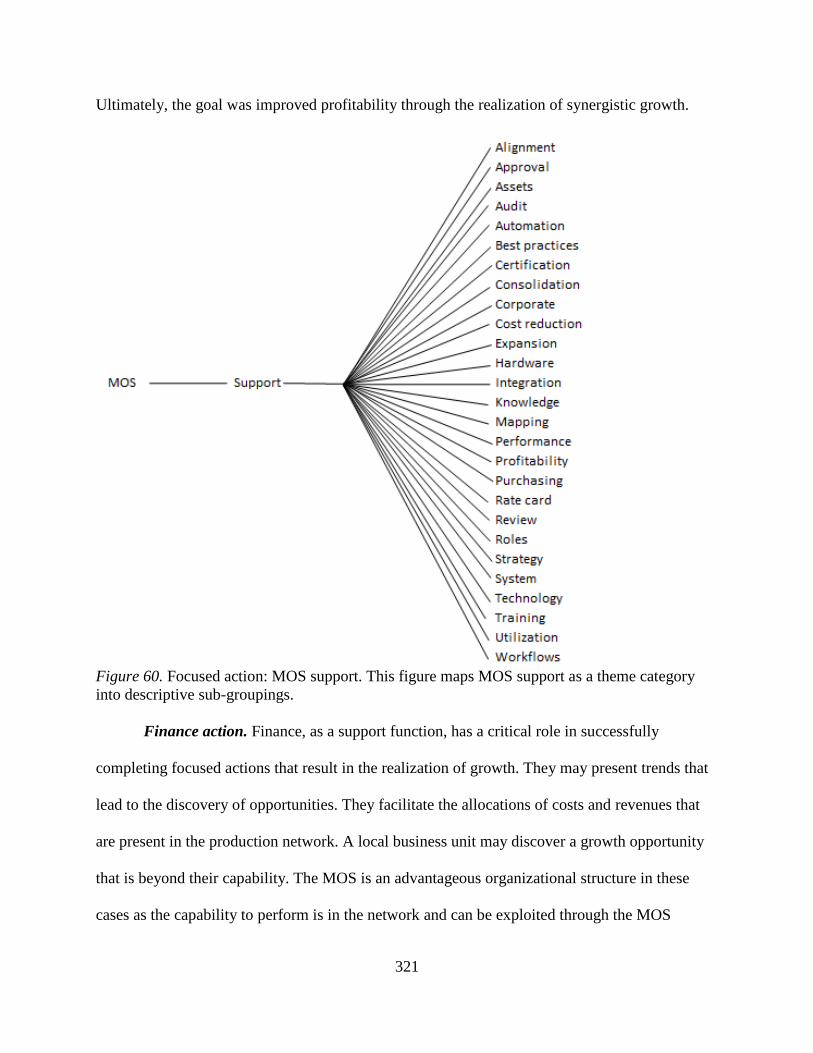
321
Ultimately, the goal was improved profitability through the realization of synergistic growth.
Figure 60. Focused action: MOS support. This figure maps MOS support as a theme category
into descriptive sub-groupings.
Finance action. Finance, as a support function, has a critical role in successfully
completing focused actions that result in the realization of growth. They may present trends that
lead to the discovery of opportunities. They facilitate the allocations of costs and revenues that
are present in the production network. A local business unit may discover a growth opportunity
that is beyond their capability. The MOS is an advantageous organizational structure in these
cases as the capability to perform is in the network and can be exploited through the MOS
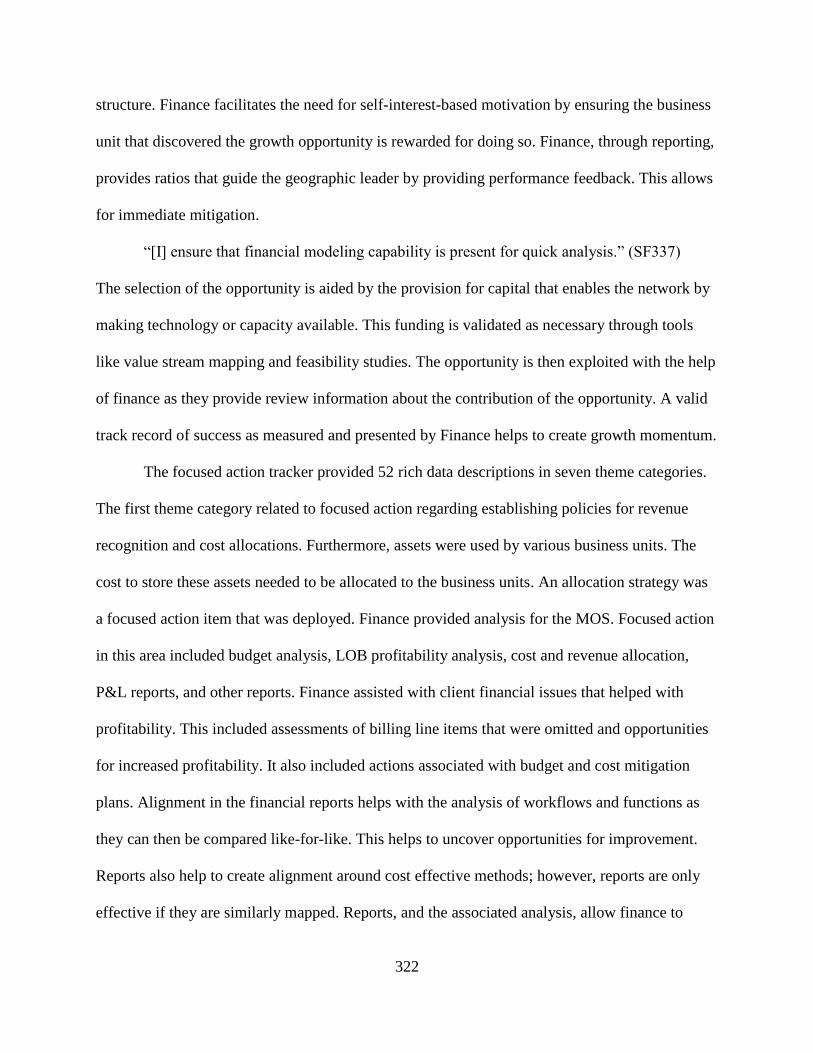
322
structure. Finance facilitates the need for self-interest-based motivation by ensuring the business
unit that discovered the growth opportunity is rewarded for doing so. Finance, through reporting,
provides ratios that guide the geographic leader by providing performance feedback. This allows
for immediate mitigation.
“[I] ensure that financial modeling capability is present for quick analysis.” (SF337)
The selection of the opportunity is aided by the provision for capital that enables the network by
making technology or capacity available. This funding is validated as necessary through tools
like value stream mapping and feasibility studies. The opportunity is then exploited with the help
of finance as they provide review information about the contribution of the opportunity. A valid
track record of success as measured and presented by Finance helps to create growth momentum.
The focused action tracker provided 52 rich data descriptions in seven theme categories.
The first theme category related to focused action regarding establishing policies for revenue
recognition and cost allocations. Furthermore, assets were used by various business units. The
cost to store these assets needed to be allocated to the business units. An allocation strategy was
a focused action item that was deployed. Finance provided analysis for the MOS. Focused action
in this area included budget analysis, LOB profitability analysis, cost and revenue allocation,
P&L reports, and other reports. Finance assisted with client financial issues that helped with
profitability. This included assessments of billing line items that were omitted and opportunities
for increased profitability. It also included actions associated with budget and cost mitigation
plans. Alignment in the financial reports helps with the analysis of workflows and functions as
they can then be compared like-for-like. This helps to uncover opportunities for improvement.
Reports also help to create alignment around cost effective methods; however, reports are only
effective if they are similarly mapped. Reports, and the associated analysis, allow finance to
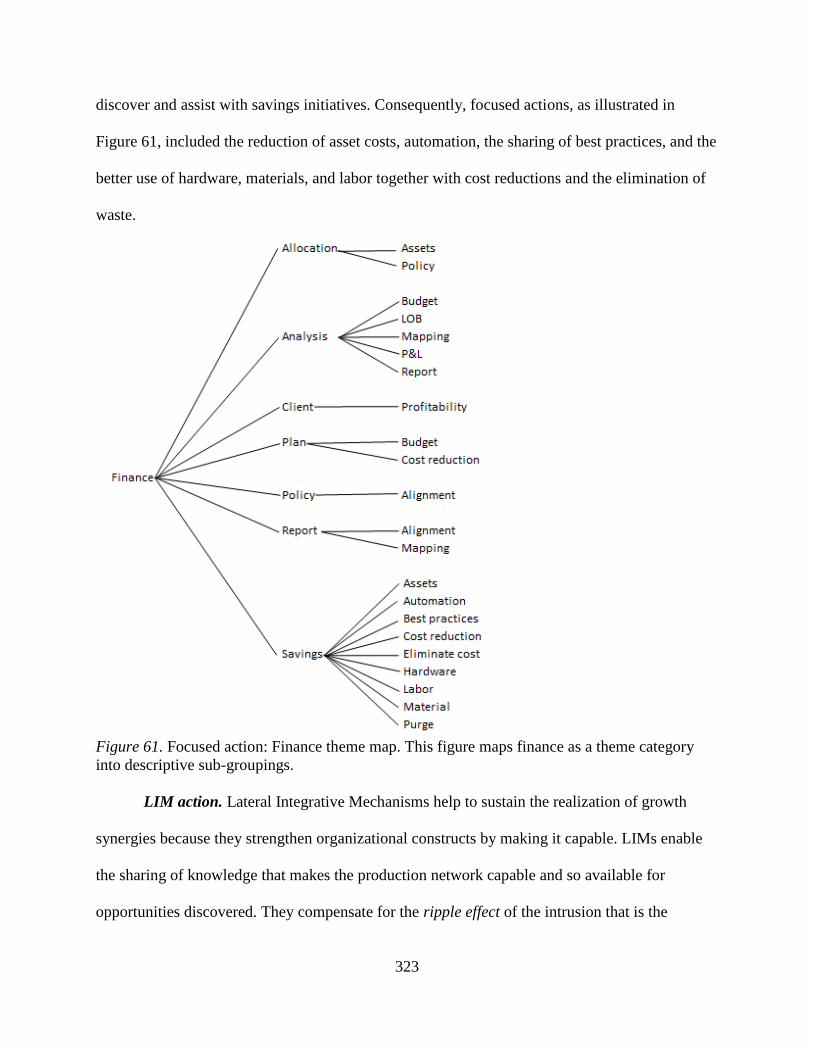
323
discover and assist with savings initiatives. Consequently, focused actions, as illustrated in
Figure 61, included the reduction of asset costs, automation, the sharing of best practices, and the
better use of hardware, materials, and labor together with cost reductions and the elimination of
waste.
Figure 61. Focused action: Finance theme map. This figure maps finance as a theme category
into descriptive sub-groupings.
LIM action. Lateral Integrative Mechanisms help to sustain the realization of growth
synergies because they strengthen organizational constructs by making it capable. LIMs enable
the sharing of knowledge that makes the production network capable and so available for
opportunities discovered. They compensate for the ripple effect of the intrusion that is the
324
opportunity. For example, the temporary increase in capacity consumption to exploit the
opportunity is compensated for through load balancing mechanisms or the introduction of new
technology.
“Provide weekly capacity remaining report for major workflows [LOBs].” (SF301)
The new technology may come through a community of practice LIM. The selection of
opportunities can be influenced by the mutual gain of the MOS in relation to objectives set in
strategic plans. The MOS can enhance the selection of opportunities by optimizing them. This
may include upselling, fulsome rate structures, and opportunities for overages. The collaboration
of MOS leaders, who are interested in profitable growth, is a super-additive as it focuses
constructive attention on the local business unit to enable growth.
“[I initiated an] upselling strategy and training for operations… met with the team to
discuss further and roll out to locations.” (SF274)
The needed collaboration and transparency within the MOS are enabled by LIMs such as ERP
system reports, strategic huddles, or technology groups. A total of 127 rich data descriptions
emerged from the data as illustrated in the following three figures.
In Figure 62, a number of LIMs are illustrated. Focused actions in the LIMs include the
ability to accomplish analysis. The analysis actions allows for the creation of metrics and the use
of them to help with off-loading within the production network. The industry that MediaCorp
operates in requires significant security controls. These are validated through internal and
external audits. Financial focused actions include creating budgets and operational plans that
support them. Related are client actions that include forecast trackers, rate cards, and predicted
profitability. Actions were listed that related to creating parity around controls in all locations.
Technology is a dominant theme in actions that require intellectual property (IP) protection. As
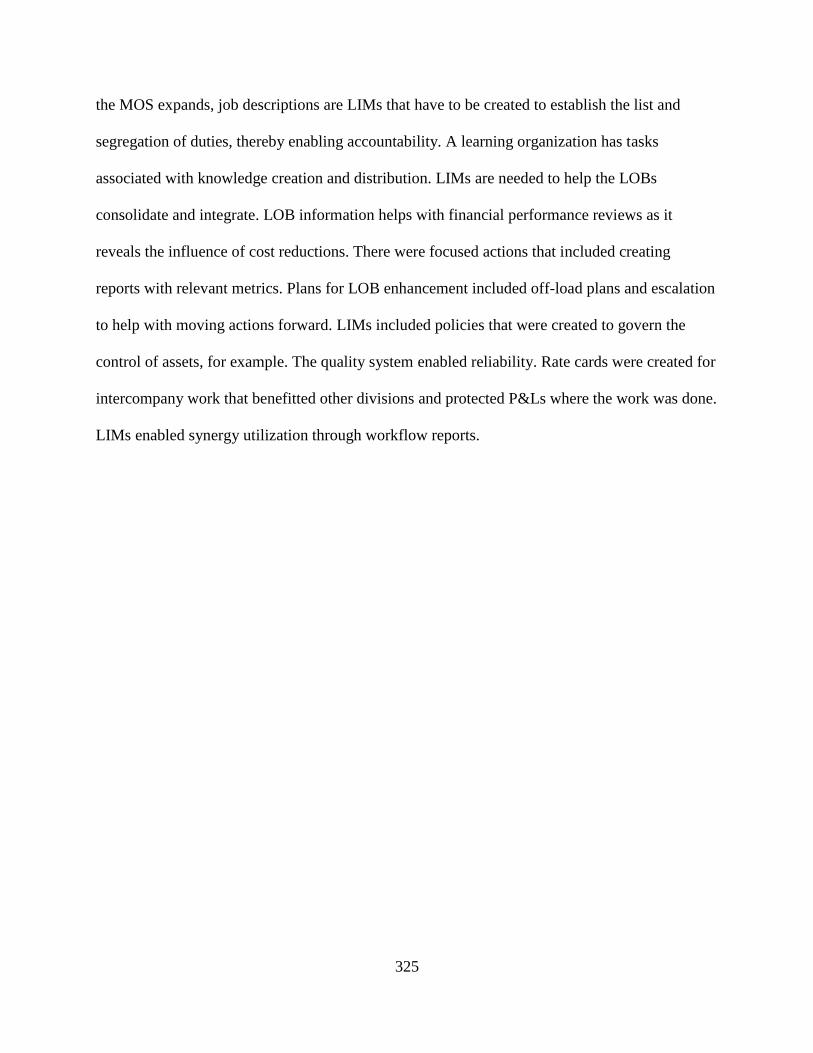
325
the MOS expands, job descriptions are LIMs that have to be created to establish the list and
segregation of duties, thereby enabling accountability. A learning organization has tasks
associated with knowledge creation and distribution. LIMs are needed to help the LOBs
consolidate and integrate. LOB information helps with financial performance reviews as it
reveals the influence of cost reductions. There were focused actions that included creating
reports with relevant metrics. Plans for LOB enhancement included off-load plans and escalation
to help with moving actions forward. LIMs included policies that were created to govern the
control of assets, for example. The quality system enabled reliability. Rate cards were created for
intercompany work that benefitted other divisions and protected P&Ls where the work was done.
LIMs enabled synergy utilization through workflow reports.
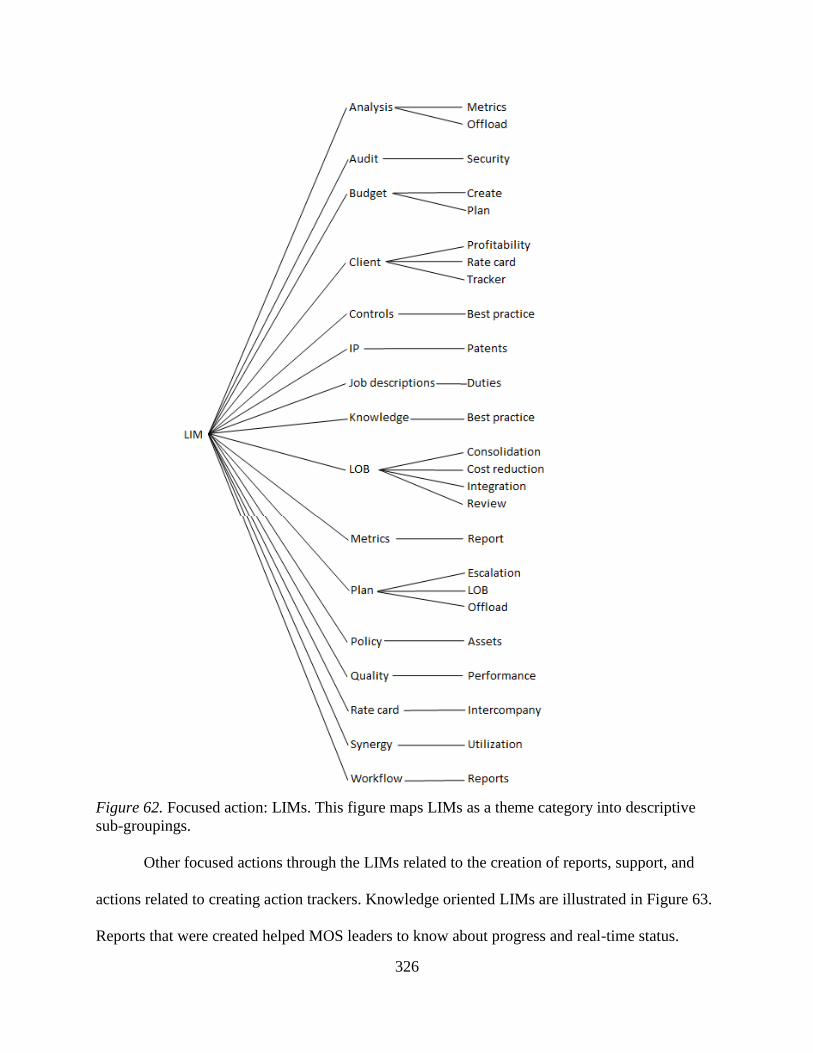
326
Figure 62. Focused action: LIMs. This figure maps LIMs as a theme category into descriptive
sub-groupings.
Other focused actions through the LIMs related to the creation of reports, support, and
actions related to creating action trackers. Knowledge oriented LIMs are illustrated in Figure 63.
Reports that were created helped MOS leaders to know about progress and real-time status.
327
Reports related to the status of assets including aging, counts, and inventory accuracy. Audit
reports showed compliancy. Roadmaps helped MOS leaders know if they were on schedule with
regard to expansion projects, schedules for work, and trending analysis for forecasting purposes.
Reports helped with performance awareness, including profitability. Focused actions included
support activities, which included client on-boarding activities, support for performance related
tasks, the status of tasks themselves, and reports that helped with the review of statuses. The last
area of focus action that is influenced by LIMs is the use of trackers. Trackers include discovery
roadmaps augmented by market analysis. Trackers are roadmaps that were used to monitor status
on roadmaps. Trackers show capacity ramp-ups and performance or productivity.
“[I] participate in unified productivity tracking WW as well as provide regular updates on
available capacity for primary workflows.” (SF284)
“[I] establish capacity targets desired and ramp-up schedule for each.” (SF344)
Lastly, trackers can show resource allocations including hardware. Resources can be redeployed
to fulfill capacity needs at any location.
328
Figure 63. Focused action: LIM knowledge. This figure maps LIM knowledge as a theme
category into descriptive sub-groupings.
The last figure that illustrates focused actions includes LIMs that relate to systems. This
is shown in Figure 64. Systems are prevalent LIM at MediaCorp.
“Many ERP enhancements are in the queue which will increase productivity.” (SF327)
Focused actions regarding systems were numerous and significantly influential in the
transformation of MediaCorp. Tasks related to the uniform use of systems help with alignment
between and within facilities. Systems assisted with the tracking of assets. Systems were critical
for the deployment of automation and they enforce best practices by embedding them into the
workflow. When business consolidations or integrations happen, the new business embraces the
new system, and benefits from it.
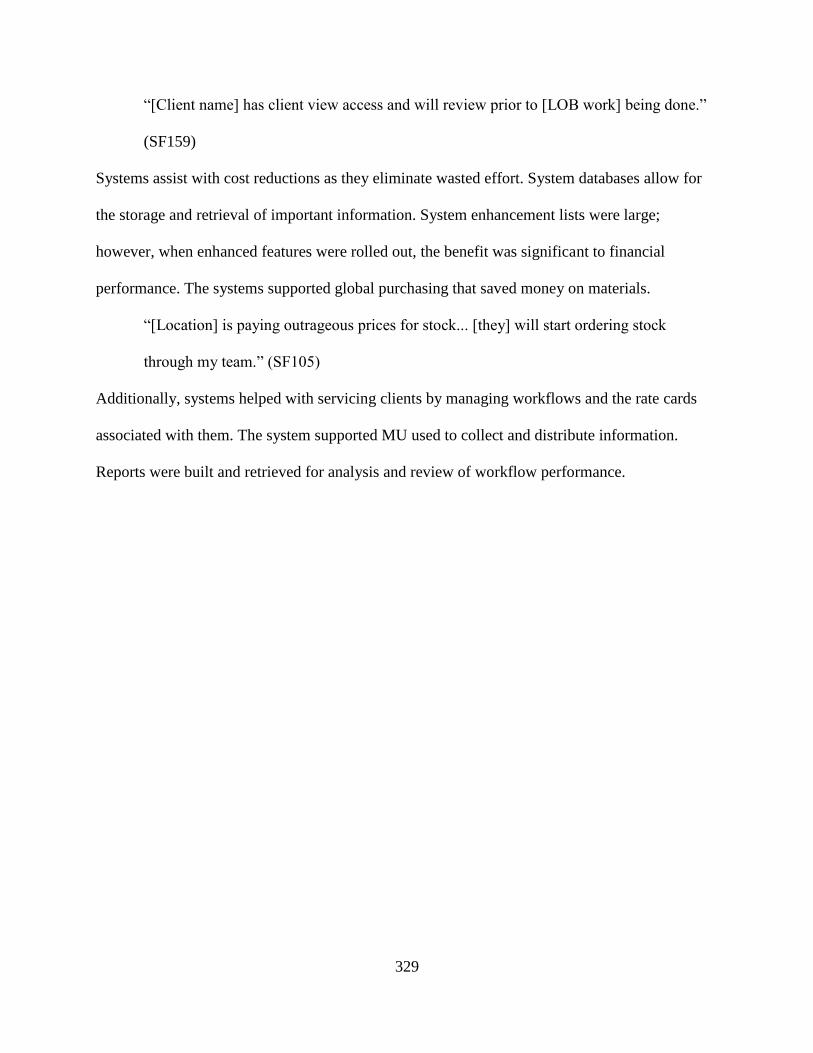
329
“[Client name] has client view access and will review prior to [LOB work] being done.”
(SF159)
Systems assist with cost reductions as they eliminate wasted effort. System databases allow for
the storage and retrieval of important information. System enhancement lists were large;
however, when enhanced features were rolled out, the benefit was significant to financial
performance. The systems supported global purchasing that saved money on materials.
“[Location] is paying outrageous prices for stock... [they] will start ordering stock
through my team.” (SF105)
Additionally, systems helped with servicing clients by managing workflows and the rate cards
associated with them. The system supported MU used to collect and distribute information.
Reports were built and retrieved for analysis and review of workflow performance.
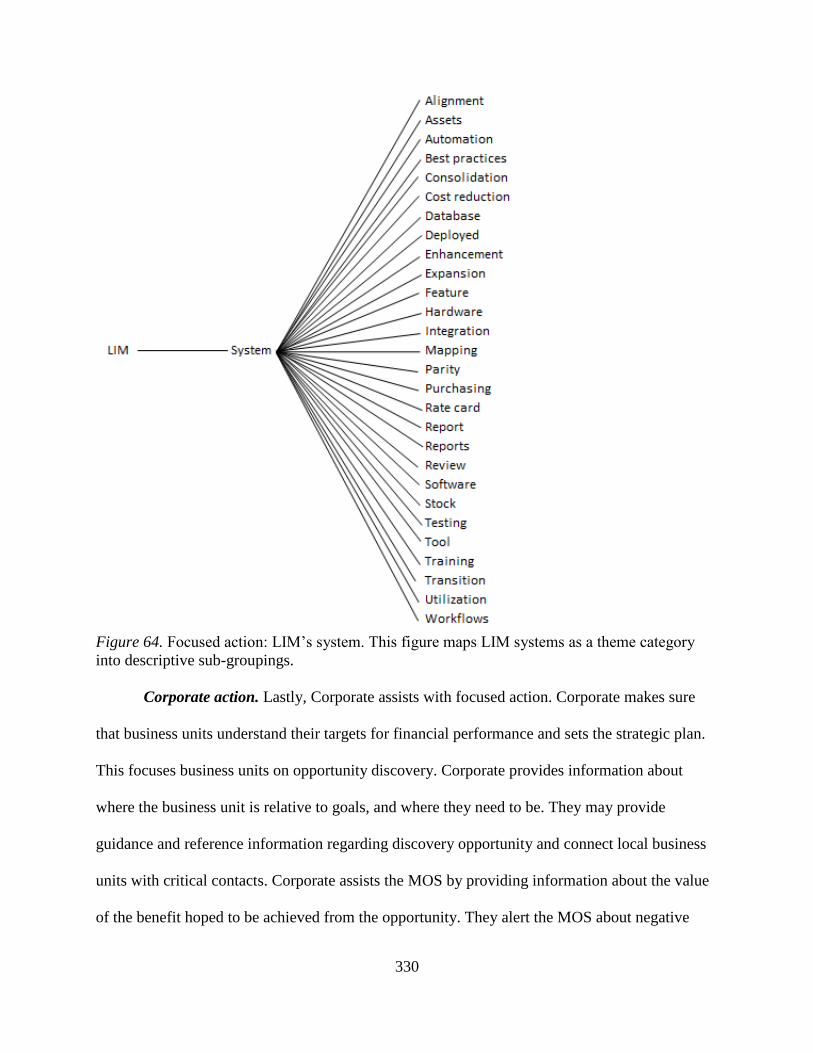
330
Figure 64. Focused action: LIM’s system. This figure maps LIM systems as a theme category
into descriptive sub-groupings.
Corporate action. Lastly, Corporate assists with focused action. Corporate makes sure
that business units understand their targets for financial performance and sets the strategic plan.
This focuses business units on opportunity discovery. Corporate provides information about
where the business unit is relative to goals, and where they need to be. They may provide
guidance and reference information regarding discovery opportunity and connect local business
units with critical contacts. Corporate assists the MOS by providing information about the value
of the benefit hoped to be achieved from the opportunity. They alert the MOS about negative
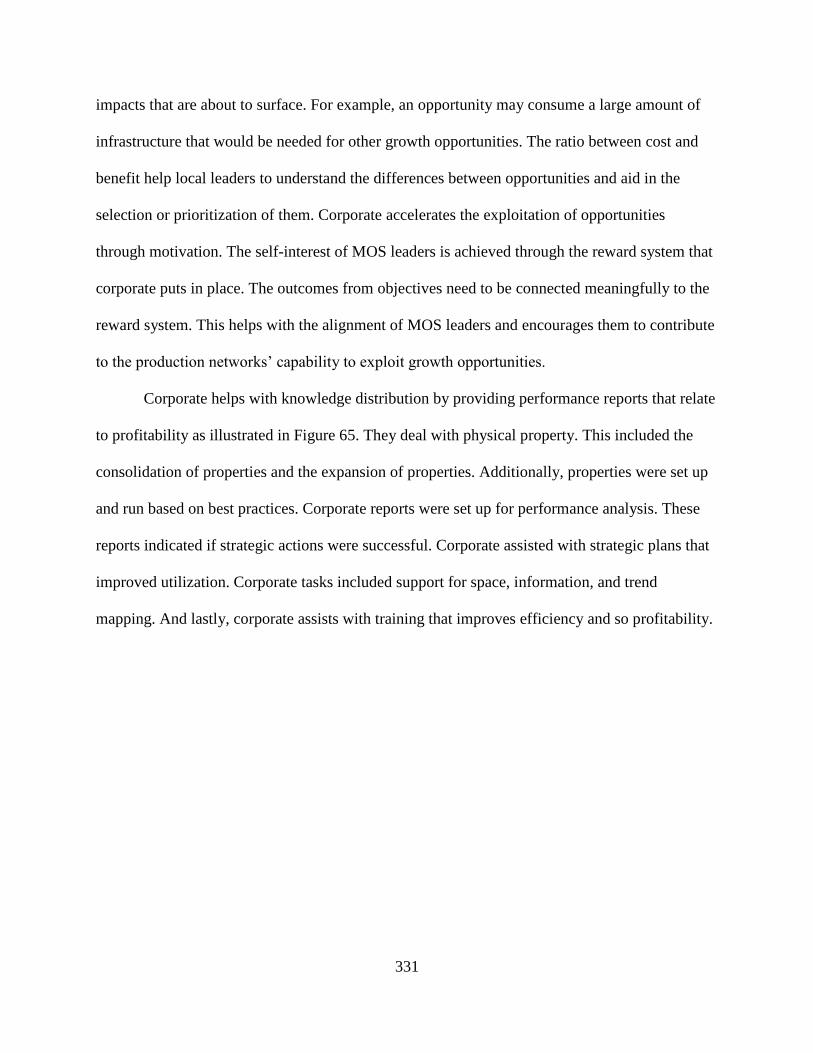
331
impacts that are about to surface. For example, an opportunity may consume a large amount of
infrastructure that would be needed for other growth opportunities. The ratio between cost and
benefit help local leaders to understand the differences between opportunities and aid in the
selection or prioritization of them. Corporate accelerates the exploitation of opportunities
through motivation. The self-interest of MOS leaders is achieved through the reward system that
corporate puts in place. The outcomes from objectives need to be connected meaningfully to the
reward system. This helps with the alignment of MOS leaders and encourages them to contribute
to the production networks’ capability to exploit growth opportunities.
Corporate helps with knowledge distribution by providing performance reports that relate
to profitability as illustrated in Figure 65. They deal with physical property. This included the
consolidation of properties and the expansion of properties. Additionally, properties were set up
and run based on best practices. Corporate reports were set up for performance analysis. These
reports indicated if strategic actions were successful. Corporate assisted with strategic plans that
improved utilization. Corporate tasks included support for space, information, and trend
mapping. And lastly, corporate assists with training that improves efficiency and so profitability.
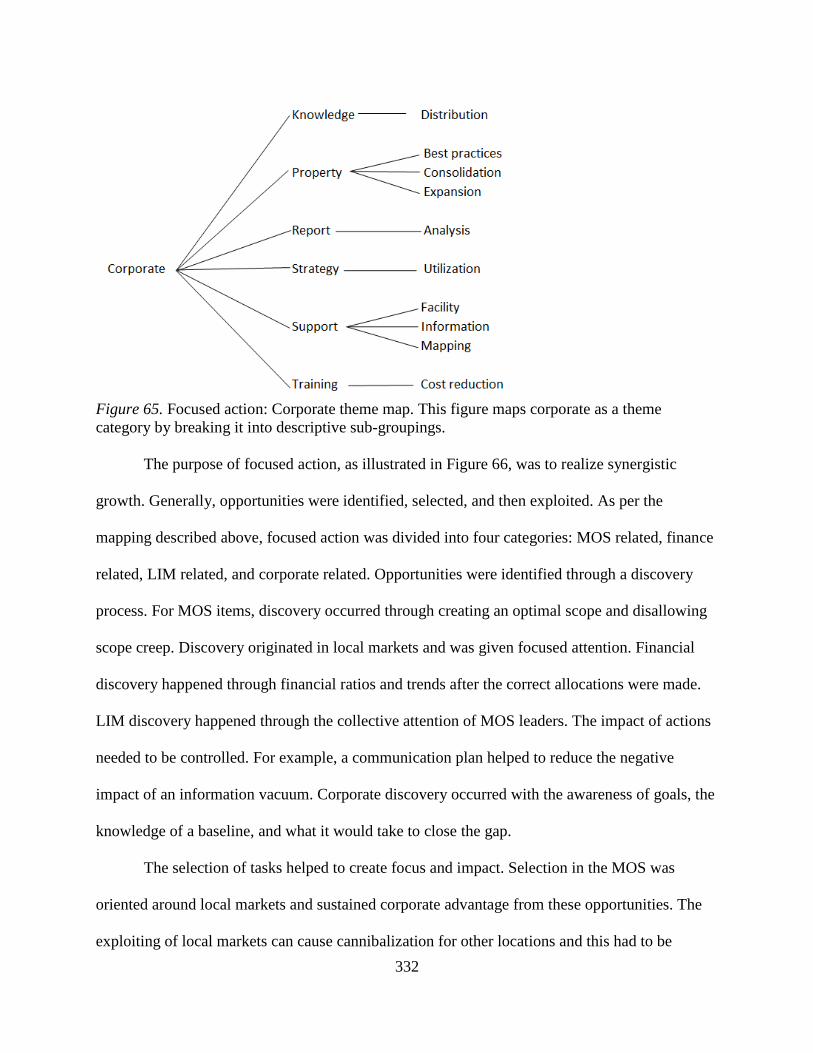
332
Figure 65. Focused action: Corporate theme map. This figure maps corporate as a theme
category by breaking it into descriptive sub-groupings.
The purpose of focused action, as illustrated in Figure 66, was to realize synergistic
growth. Generally, opportunities were identified, selected, and then exploited. As per the
mapping described above, focused action was divided into four categories: MOS related, finance
related, LIM related, and corporate related. Opportunities were identified through a discovery
process. For MOS items, discovery occurred through creating an optimal scope and disallowing
scope creep. Discovery originated in local markets and was given focused attention. Financial
discovery happened through financial ratios and trends after the correct allocations were made.
LIM discovery happened through the collective attention of MOS leaders. The impact of actions
needed to be controlled. For example, a communication plan helped to reduce the negative
impact of an information vacuum. Corporate discovery occurred with the awareness of goals, the
knowledge of a baseline, and what it would take to close the gap.
The selection of tasks helped to create focus and impact. Selection in the MOS was
oriented around local markets and sustained corporate advantage from these opportunities. The
exploiting of local markets can cause cannibalization for other locations and this had to be
333
watched. Additionally, corporate bias needed to be checked as expectations from corporate on
profitability and the support needed to achieve margin were oversimplified. Financial selection
was driven by value-stream mapping. This focused action on the items that created value for
customers. They paid more for this, enabling enhanced profitability potential. If achieving
customer expectations was questionable, finance could assist with a feasibility study.
Furthermore, they could help with the capital investment needed to achieve workflows that could
meet expectations. LIMs assisted with selection as they were able to optimize impact. This might
happen through the sharing of information that could lead to the exploitation of synergistic
capacity. The mutual gain and potential achievement of cross-unit objectives of multiple
functions or business units brought more entities, expertise, and capacity to the opportunity.
Corporate enabled focused selection by minimizing any negative impact of capital investment on
the P&L, for example. Analysis of the cost and reward ration assisted with the selection of the
opportunities with the best profitability. Having this prioritization methodology pushed the
profitability of ventures pursued higher. With these analyses in hand, outcome values could be
predicted and support granted to realize the profitability opportunity.
The exploitation of synergistic opportunities resulted in higher sustained corporate
advantage in relation to the resources applied. The alignment of the MOS structure within an
entrepreneurial culture minimized organizational inertia. The structure and capability of the
MOS was brought to bear on the opportunity. Local leaders were then very capable to exploit the
opportunity.
“[I] provide commentary on monthly financial reporting to help more effectively
understand market changes and workflow trends from a local perspective.” (SF296)
334
Financial review by looking at workflow components and throughput metrics has made it easier
to establish price points. Typically each deliverable at MediaCorp was unique. The incoming
assets were of different component types and different material. A workflow may have been used
repeatedly, but with the asset uniqueness, simple automation was not possible. This presented
pricing challenges. The pricing typically was situational and this discretion had to be monitored.
Metrics from similar workflow or component sub-assemblies could be used to determine optimal
pricing strategies that resulted in optimal profitability.
“[I] identify items that are not charged for or items in package pricing not charged for, to
recover some historical ‘giveaways’ on low priced items.” (SF291)
LIMs aided with transparency by providing system-based intelligence. Problem solving teams
reduced waste and cost in workflows, thereby increasing the competitiveness of MediaCorp.
Other LIMs were employed, usually systemic, to monitor work through workflows designed for
requested deliverables.
“[I] participate in projects to align [system] work order entries to one-another in the three
major WW locations to get data points into parity.” (SF297)
Corporate assisted with profitability by aligned reward systems with achievement. An
entrepreneurial culture is significantly energized by the opportunity to be rewarded for
profitability achievement. Reward systems also motivate alignment of purpose and encourage
leaders to collaborate in order to achieve desirable outcomes.
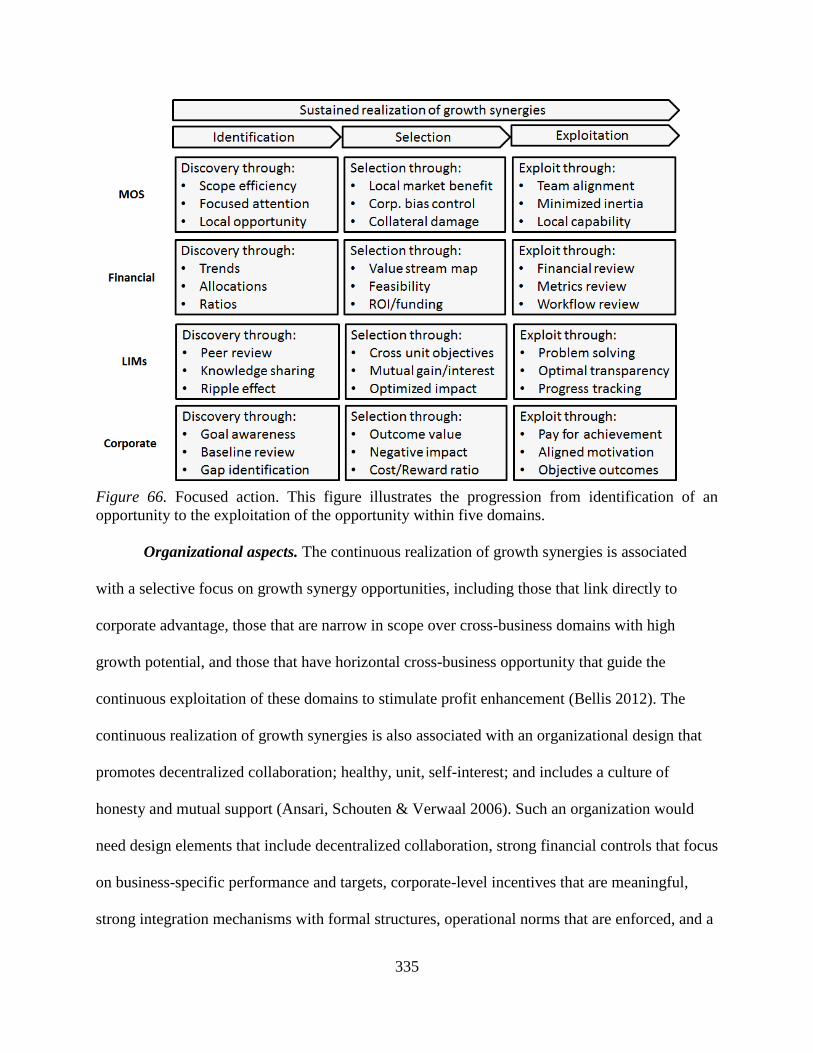
335
Figure 66. Focused action. This figure illustrates the progression from identification of an
opportunity to the exploitation of the opportunity within five domains.
Organizational aspects. The continuous realization of growth synergies is associated
with a selective focus on growth synergy opportunities, including those that link directly to
corporate advantage, those that are narrow in scope over cross-business domains with high
growth potential, and those that have horizontal cross-business opportunity that guide the
continuous exploitation of these domains to stimulate profit enhancement (Bellis 2012). The
continuous realization of growth synergies is also associated with an organizational design that
promotes decentralized collaboration; healthy, unit, self-interest; and includes a culture of
honesty and mutual support (Ansari, Schouten & Verwaal 2006). Such an organization would
need design elements that include decentralized collaboration, strong financial controls that focus
on business-specific performance and targets, corporate-level incentives that are meaningful,
strong integration mechanisms with formal structures, operational norms that are enforced, and a
336
culture that promotes success-promoting behaviors. Finally, selective focus and decentralized
collaboration combine into a model of guided and balanced self-interest, which is promoted by
corporate leaders that establish effective motivational incentives. This is a reward system that
promotes the guided evolution of the organization through growth synergy initiatives.
Strategy and execution. MediaCorp strategy is driven through the discovery and
execution of opportunities. Transparency is provided through the use of strategic task trackers
and periodic progress reviews. To ensure that margins are improved, strategic action may include
business reorientations, megatrend exploitation, portfolio-expanding innovation, customer
enquiry for opportunity, talent optimization, and penetration initiatives. Storefront location
managers were liberated to oversell capacity. Products or services managers had to optimize
product profitability by relocating capacity. Support function leaders were able to standardize
and redeploy hardware, software, and storage, and optimize the performance of systems in all
locations. Sales leaders were able to exploit all opportunities for existing and new customer
spends.
In summary, the data suggests that action, when selected and focused, can achieve high
levels of profitability for multi-unit firms. The organization design that is described by the MOS
is ideal for the discovery, prioritization, and exploitation of profitable opportunities. Financial
support encourages action through measurement, monitoring, and rewarding achievement.
Finance also provides analysis that supports capital investment, appropriate pricing, and
profitability monitoring. LIMs add to the structure of the MOS and support profitable growth.
LIMs help with the sharing of knowledge, gain across the organization, and transparency.
Corporate provides strategic awareness and the gap between current reality and expectations.
337
Corporate can also assist with reward systems that guide the right behavior. The following
propositions summarize the key findings of this section:
Proposition 125 (nimble construct): The MOS is a nimble organizational construct
that can effectively exploit focused action to realize synergistic profitability.
Proposition 126 (mutual profitability): A sequence of tasks, quickly discovered
and effectively executed, can lead to mutual benefit between business units that
collaborate.
Proposition 127 (economized energy): Energy consumption, aligned to realize a
local synergistic opportunity, is minimized in a MOS augmented by LIMs and
supported by the corporate center.
Proposition 128 (intrinsically aligned): A MOS is intrinsically aligned as the
structure that is connected and though which tasks are shared by relevant
functions needed to achieve growth synergies.
Proposition 129 (scalable synergy): A MOS can drive synergistic focused action
that, when exploited, can realize scaling that includes expansion, consolidation,
and the integration of business units.
Proposition 130 (evolving mitigation): A MOS can be leveraged to support cost
mitigation through a continuously evolving organizational effectiveness that is
superior to that of competitors.
Proposition 131 (inspiring finance): Finance, as a supporting function, augments
the self-interest in a MOS by promoting performance transparency and
inspirational reward systems.
338
Proposition 132 (monitoring mechanisms): LIMs augment the MOS’s ability to
realize synergistic growth by focusing action execution through collaborative task
monitoring mechanisms.
Proposition 133 (super system): The ERP system, a significantly influential LIM,
is a super-additive, as it enables scalable organizational efficacy by promoting
cost effectiveness, transparency, and workflow control.
Proposition 134 (corporate resource): The corporate center provides relevant
information needed to exploit resources effectively in fulfillment of MUF
strategic objectives.
Summary of endogenous data. In summary, endogenous data related to information
collected from participants and preexisting data regarding the MUF. This included information
about the roles of the MOS, the corporate center, and LIM structures. Specifically, the MOS
included the four dimensions: LOB leads, location leads, support functions, and client functions.
Endogenous data also included information about products and services for sales and workflow
channel clarity. MOS leaders contributed experiences about synergistic growth that they learned
before, during, and after the precipitating event. These were both positive experiences and
experiences that should not be repeated. As MUFs are driven by profitability, financial reporting
must be aligned and accurate. Opportunities to ensure that this happened were discovered and
provided by MOS leaders. Behaviors in the MOS were then discussed. These included
collaboration, drift mitigation, and focused action.
Exogenous Data
The exogenous issues are areas of influence that are external to the MOS. This section is
divided into six focus areas. The first relates to the impact of megatrends on the products and
339
services at MediaCorp. An awareness of the consequences of these trends informs mitigations
and opportunities for growth. The second focus area is the growth strategy. This is an outward
facing strategy topology that was deployed to achieve desired financial outcomes. The third area
is data related to market penetration. The key to getting access to pockets of revenue in this
industry is to break through customer silos. The fourth focus area external to the MOS is the
design of the corporate center. This data includes information about support roles such that
growth synergies are experienced with minimal inertia from corporate. The fifth relates to
externally-oriented selected and focused actions. The sixth is concerned with the alignment
strategy of the 1MC initiative. These areas all relate to the ability of the MOS to expand or scale.
Megatrend impact. In any business environment megatrends affect the behaviors of
dynamic markets. In this section the megatrends in the entertainment industry are exposed from
the data and linked to consequences. These consequences impact the various products previously
mentioned. With this understanding, a business like MediaCorp can make changes to optimize
profitability and avoid economic pitfalls. The MOS leaders contributed data that is reflected in
Table 27. This table identifies megatrends, their consequence to MediaCorp, how important they
are to achieving MediaCorp’s desirable outcomes, and the impacts on profitability based on
LOBs. Megatrends that are influencing accelerated life-cycle decay require a different response
than life-cycles that are still ramping.
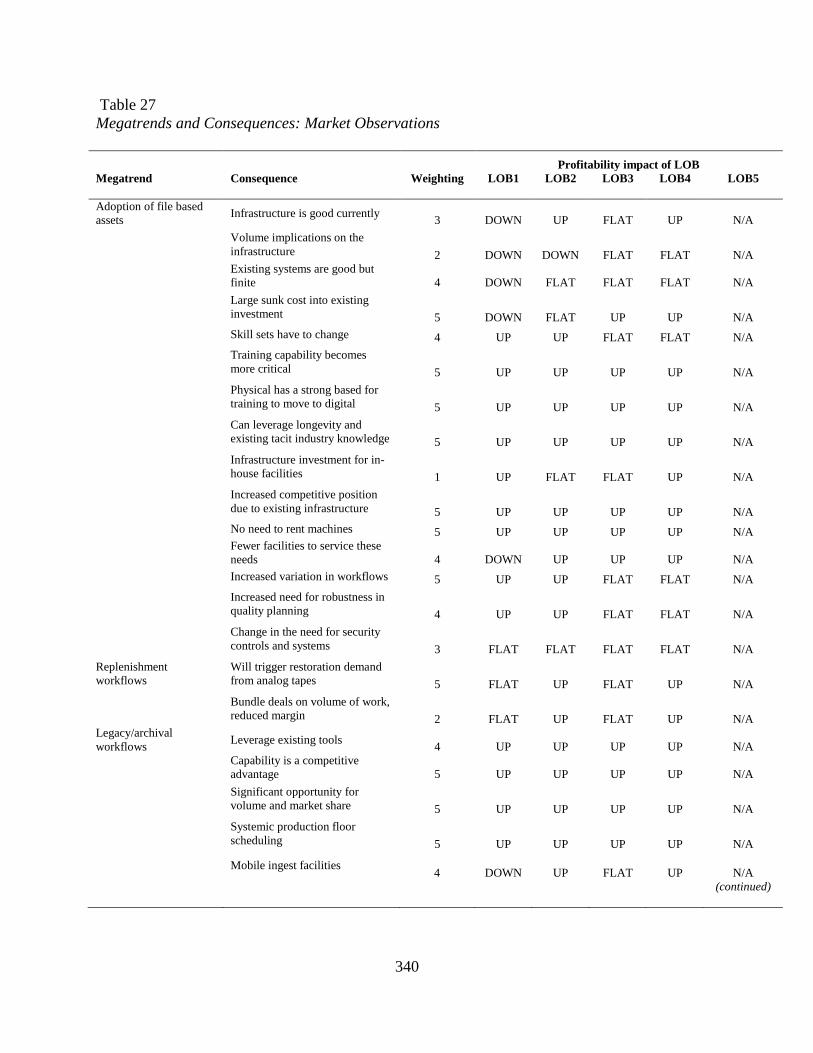
340
Table 27
Megatrends and Consequences: Market Observations
Profitability impact of LOB
Megatrend
Consequence
Weighting
LOB1
LOB2
LOB3
LOB4
LOB5
Adoption of file based
assets Infrastructure is good currently
3 DOWN UP FLAT UP N/A
Volume implications on the
infrastructure 2 DOWN DOWN FLAT FLAT N/A
Existing systems are good but
finite 4 DOWN FLAT FLAT FLAT N/A
Large sunk cost into existing
investment 5 DOWN FLAT UP UP N/A
Skill sets have to change 4 UP UP FLAT FLAT N/A
Training capability becomes
more critical 5 UP UP UP UP N/A
Physical has a strong based for
training to move to digital 5 UP UP UP UP N/A
Can leverage longevity and
existing tacit industry knowledge 5 UP UP UP UP N/A
Infrastructure investment for in-
house facilities 1 UP FLAT FLAT UP N/A
Increased competitive position
due to existing infrastructure 5 UP UP UP UP N/A
No need to rent machines 5 UP UP UP UP N/A
Fewer facilities to service these
needs 4 DOWN UP UP UP N/A
Increased variation in workflows 5 UP UP FLAT FLAT N/A
Increased need for robustness in
quality planning 4 UP UP FLAT FLAT N/A
Change in the need for security
controls and systems 3 FLAT FLAT FLAT FLAT N/A
Replenishment
workflows
Will trigger restoration demand
from analog tapes 5 FLAT UP FLAT UP N/A
Bundle deals on volume of work,
reduced margin 2 FLAT UP FLAT UP N/A
Legacy/archival
workflows Leverage existing tools
4 UP UP UP UP N/A
Capability is a competitive
advantage 5 UP UP UP UP N/A
Significant opportunity for
volume and market share 5 UP UP UP UP N/A
Systemic production floor
scheduling 5 UP UP UP UP N/A
Mobile ingest facilities
4 DOWN UP FLAT UP N/A
(continued)
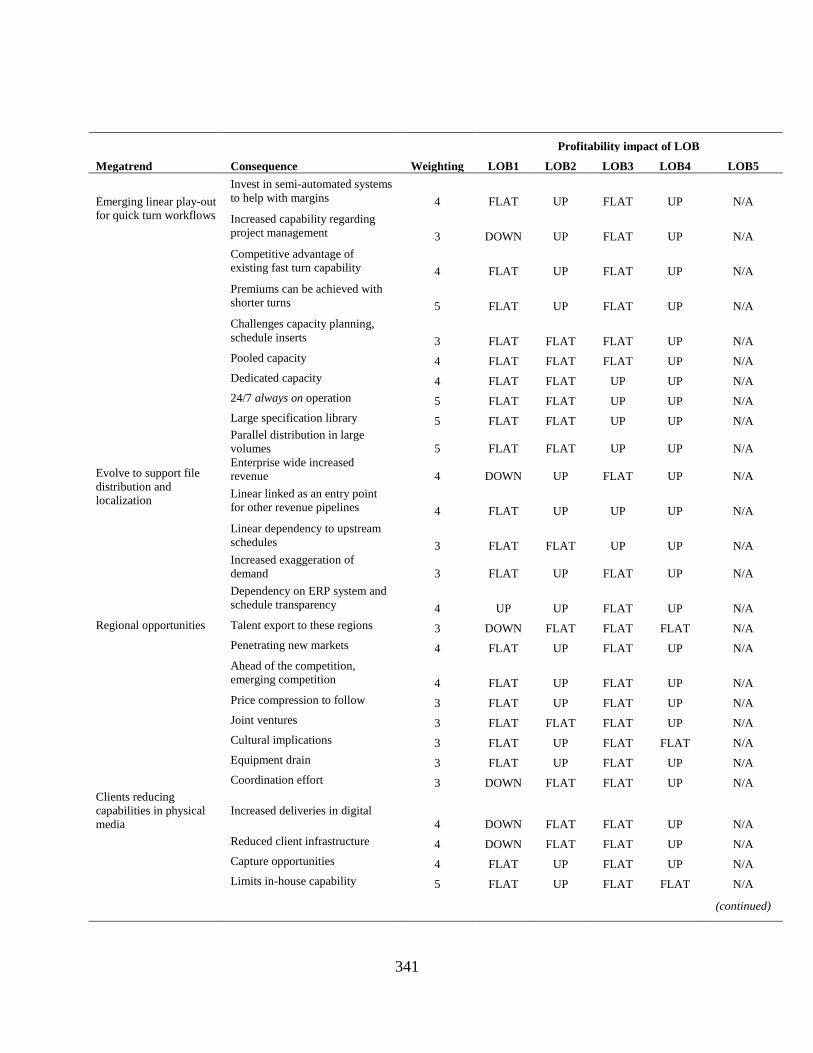
341
Profitability impact of LOB
Megatrend Consequence Weighting LOB1 LOB2 LOB3 LOB4 LOB5
Emerging linear play-out
for quick turn workflows
Invest in semi-automated systems
to help with margins 4 FLAT UP FLAT UP N/A
Increased capability regarding
project management 3 DOWN UP FLAT UP N/A
Competitive advantage of
existing fast turn capability 4 FLAT UP FLAT UP N/A
Premiums can be achieved with
shorter turns 5 FLAT UP FLAT UP N/A
Challenges capacity planning,
schedule inserts 3 FLAT FLAT FLAT UP N/A
Pooled capacity 4 FLAT FLAT FLAT UP N/A
Dedicated capacity 4 FLAT FLAT UP UP N/A
24/7 always on operation 5 FLAT FLAT UP UP N/A
Large specification library 5 FLAT FLAT UP UP N/A
Parallel distribution in large
volumes 5 FLAT FLAT UP UP N/A
Evolve to support file
distribution and
localization
Enterprise wide increased
revenue 4 DOWN UP FLAT UP N/A
Linear linked as an entry point
for other revenue pipelines 4 FLAT UP UP UP N/A
Linear dependency to upstream
schedules 3 FLAT FLAT UP UP N/A
Increased exaggeration of
demand 3 FLAT UP FLAT UP N/A
Dependency on ERP system and
schedule transparency 4 UP UP FLAT UP N/A
Regional opportunities Talent export to these regions 3 DOWN FLAT FLAT FLAT N/A
Penetrating new markets 4 FLAT UP FLAT UP N/A
Ahead of the competition,
emerging competition 4 FLAT UP FLAT UP N/A
Price compression to follow 3 FLAT UP FLAT UP N/A
Joint ventures 3 FLAT FLAT FLAT UP N/A
Cultural implications 3 FLAT UP FLAT FLAT N/A
Equipment drain 3 FLAT UP FLAT UP N/A
Coordination effort 3 DOWN FLAT FLAT UP N/A
Clients reducing
capabilities in physical
media
Increased deliveries in digital
4 DOWN FLAT FLAT UP N/A
Reduced client infrastructure 4 DOWN FLAT FLAT UP N/A
Capture opportunities 4 FLAT UP FLAT UP N/A
Limits in-house capability 5 FLAT UP FLAT FLAT N/A
(continued)
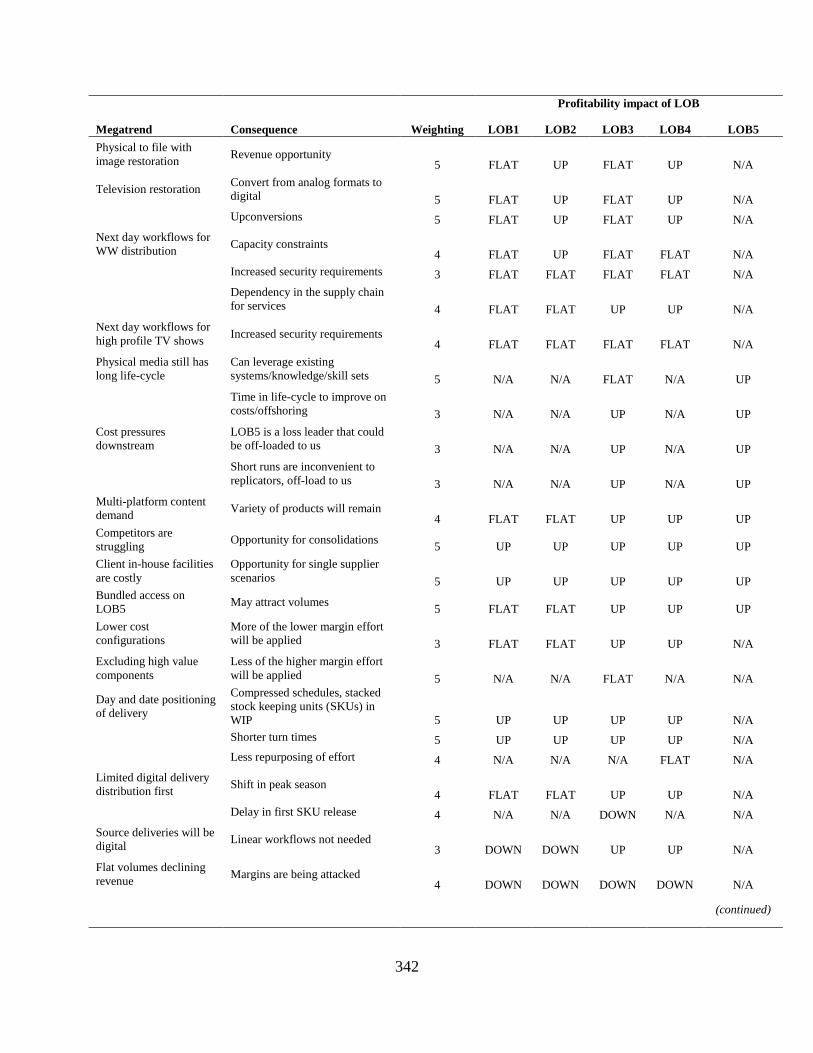
342
Profitability impact of LOB
Megatrend Consequence Weighting LOB1 LOB2 LOB3 LOB4 LOB5
Physical to file with
image restoration Revenue opportunity
5 FLAT UP FLAT UP N/A
Television restoration Convert from analog formats to
digital 5 FLAT UP FLAT UP N/A
Upconversions 5 FLAT UP FLAT UP N/A
Next day workflows for
WW distribution Capacity constraints
4 FLAT UP FLAT FLAT N/A
Increased security requirements 3 FLAT FLAT FLAT FLAT N/A
Dependency in the supply chain
for services 4 FLAT FLAT UP UP N/A
Next day workflows for
high profile TV shows Increased security requirements
4 FLAT FLAT FLAT FLAT N/A
Physical media still has
long life-cycle
Can leverage existing
systems/knowledge/skill sets 5 N/A N/A FLAT N/A UP
Time in life-cycle to improve on
costs/offshoring 3 N/A N/A UP N/A UP
Cost pressures
downstream
LOB5 is a loss leader that could
be off-loaded to us 3 N/A N/A UP N/A UP
Short runs are inconvenient to
replicators, off-load to us 3 N/A N/A UP N/A UP
Multi-platform content
demand Variety of products will remain
4 FLAT FLAT UP UP UP
Competitors are
struggling Opportunity for consolidations
5 UP UP UP UP UP
Client in-house facilities
are costly
Opportunity for single supplier
scenarios 5 UP UP UP UP UP
Bundled access on
LOB5 May attract volumes
5 FLAT FLAT UP UP UP
Lower cost
configurations
More of the lower margin effort
will be applied 3 FLAT FLAT UP UP N/A
Excluding high value
components
Less of the higher margin effort
will be applied 5 N/A N/A FLAT N/A N/A
Day and date positioning
of delivery
Compressed schedules, stacked
stock keeping units (SKUs) in
WIP 5 UP UP UP UP N/A
Shorter turn times 5 UP UP UP UP N/A
Less repurposing of effort 4 N/A N/A N/A FLAT N/A
Limited digital delivery
distribution first Shift in peak season
4 FLAT FLAT UP UP N/A
Delay in first SKU release 4 N/A N/A DOWN N/A N/A
Source deliveries will be
digital Linear workflows not needed
3 DOWN DOWN UP UP N/A
Flat volumes declining
revenue Margins are being attacked
4 DOWN DOWN DOWN DOWN N/A
(continued)
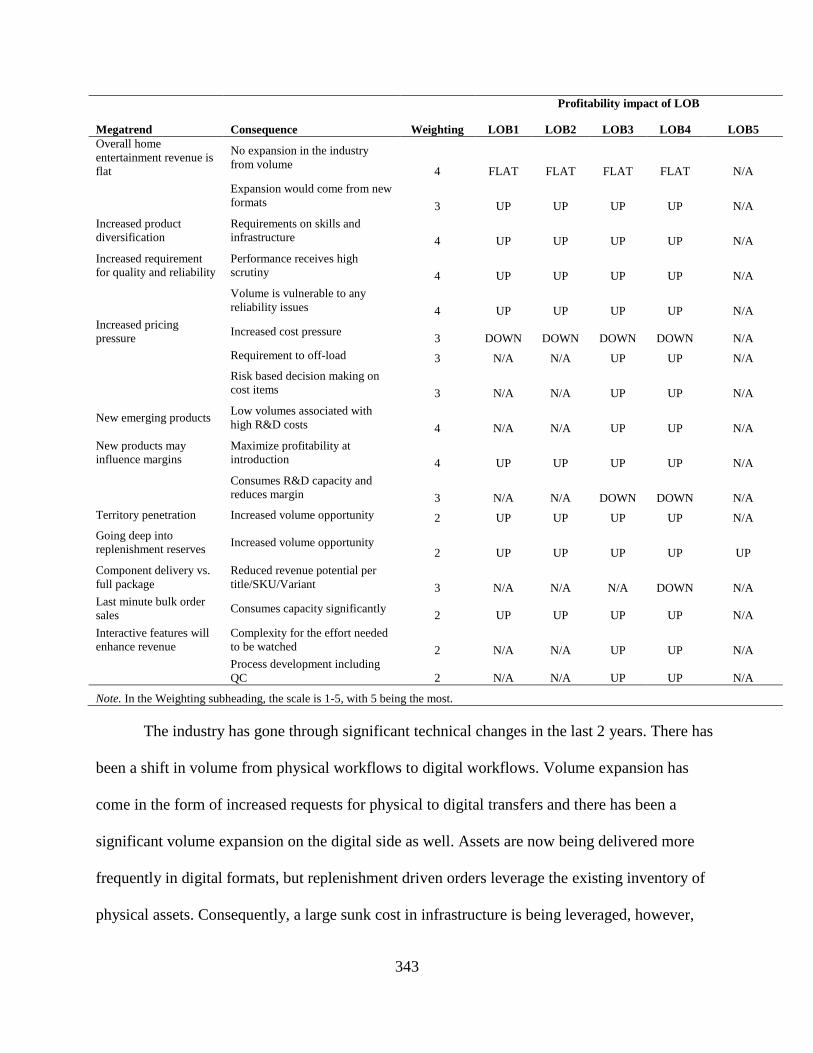
343
Profitability impact of LOB
Megatrend Consequence Weighting LOB1 LOB2 LOB3 LOB4 LOB5
Overall home
entertainment revenue is
flat
No expansion in the industry
from volume 4 FLAT FLAT FLAT FLAT N/A
Expansion would come from new
formats 3 UP UP UP UP N/A
Increased product
diversification
Requirements on skills and
infrastructure 4 UP UP UP UP N/A
Increased requirement
for quality and reliability
Performance receives high
scrutiny 4 UP UP UP UP N/A
Volume is vulnerable to any
reliability issues 4 UP UP UP UP N/A
Increased pricing
pressure Increased cost pressure
3 DOWN DOWN DOWN DOWN N/A
Requirement to off-load 3 N/A N/A UP UP N/A
Risk based decision making on
cost items 3 N/A N/A UP UP N/A
New emerging products Low volumes associated with
high R&D costs 4 N/A N/A UP UP N/A
New products may
influence margins
Maximize profitability at
introduction 4 UP UP UP UP N/A
Consumes R&D capacity and
reduces margin 3 N/A N/A DOWN DOWN N/A
Territory penetration Increased volume opportunity 2 UP UP UP UP N/A
Going deep into
replenishment reserves Increased volume opportunity
2 UP UP UP UP UP
Component delivery vs.
full package
Reduced revenue potential per
title/SKU/Variant 3 N/A N/A N/A DOWN N/A
Last minute bulk order
sales Consumes capacity significantly
2 UP UP UP UP N/A
Interactive features will
enhance revenue
Complexity for the effort needed
to be watched 2 N/A N/A UP UP N/A
Process development including
QC 2 N/A N/A UP UP N/A
Note. In the Weighting subheading, the scale is 1-5, with 5 being the most.
The industry has gone through significant technical changes in the last 2 years. There has
been a shift in volume from physical workflows to digital workflows. Volume expansion has
come in the form of increased requests for physical to digital transfers and there has been a
significant volume expansion on the digital side as well. Assets are now being delivered more
frequently in digital formats, but replenishment driven orders leverage the existing inventory of
physical assets. Consequently, a large sunk cost in infrastructure is being leveraged, however,
344
there is a shift in training to new workflows as they have become more important. This
significant market shift has required existing facilities that have inadequate digital capacity to
invest in new infrastructure. This created a favorable situation for MediaCorp, as the allocated
work gravitated to the available capacity. The adaptability of a MOS to changing workflows,
aided by scalability, allowed for an easy transition. Additionally, physical workflows did not
bottom out, but stabilized as sales efforts to run replenishment work were successful. This made
up for some of the shrinking physical asset volume and allowed for other ancillary services to be
sold.
Legacy workflow capacity could be leveraged as the tools were mature. This capability
was a competitive advantage due to capacity and an extensive range of workflows that drove
consolidation in the industry within MediaCorp. Market share was increased and operational
performance met client expectations. Scheduling efficiency was augmented by a shop floor
system that was part of the ERP. Expansion plans for discovery of other library type work was
assessed and aggressive sales plans were deployed.
Another competitive advantage came from the ability to turn orders around quickly. An
investment in semi-automated systems augmented the physical shop floor. The ERP system
allowed for efficient scheduling and management of bulk orders. Premium pricing was
associated with rush orders, adding to the ability to assign overages to purchase orders. The
ability to execute these orders without incurring additional cost augmented profitability. A
supply chain that is always on is available to clients when they have the need. In some cases,
functions were pooled to enhance capacity. In other functions, the capacity was dedicated to
maximize throughput of predictable tasks.
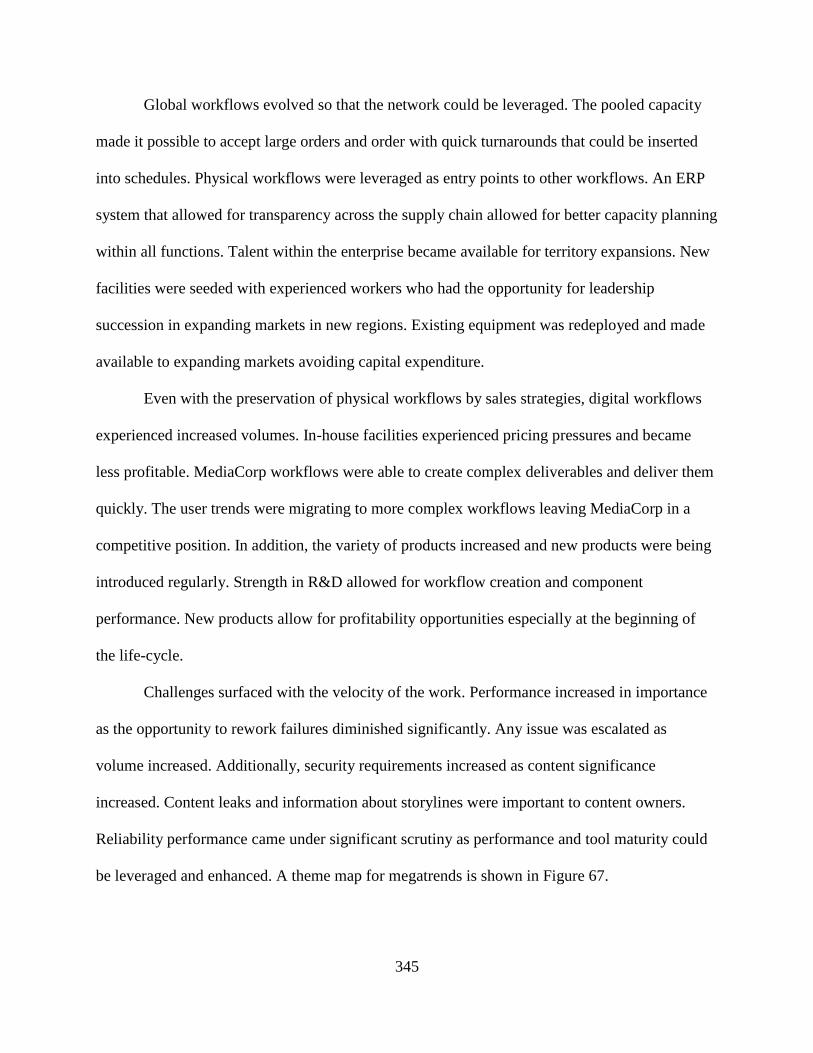
345
Global workflows evolved so that the network could be leveraged. The pooled capacity
made it possible to accept large orders and order with quick turnarounds that could be inserted
into schedules. Physical workflows were leveraged as entry points to other workflows. An ERP
system that allowed for transparency across the supply chain allowed for better capacity planning
within all functions. Talent within the enterprise became available for territory expansions. New
facilities were seeded with experienced workers who had the opportunity for leadership
succession in expanding markets in new regions. Existing equipment was redeployed and made
available to expanding markets avoiding capital expenditure.
Even with the preservation of physical workflows by sales strategies, digital workflows
experienced increased volumes. In-house facilities experienced pricing pressures and became
less profitable. MediaCorp workflows were able to create complex deliverables and deliver them
quickly. The user trends were migrating to more complex workflows leaving MediaCorp in a
competitive position. In addition, the variety of products increased and new products were being
introduced regularly. Strength in R&D allowed for workflow creation and component
performance. New products allow for profitability opportunities especially at the beginning of
the life-cycle.
Challenges surfaced with the velocity of the work. Performance increased in importance
as the opportunity to rework failures diminished significantly. Any issue was escalated as
volume increased. Additionally, security requirements increased as content significance
increased. Content leaks and information about storylines were important to content owners.
Reliability performance came under significant scrutiny as performance and tool maturity could
be leveraged and enhanced. A theme map for megatrends is shown in Figure 67.
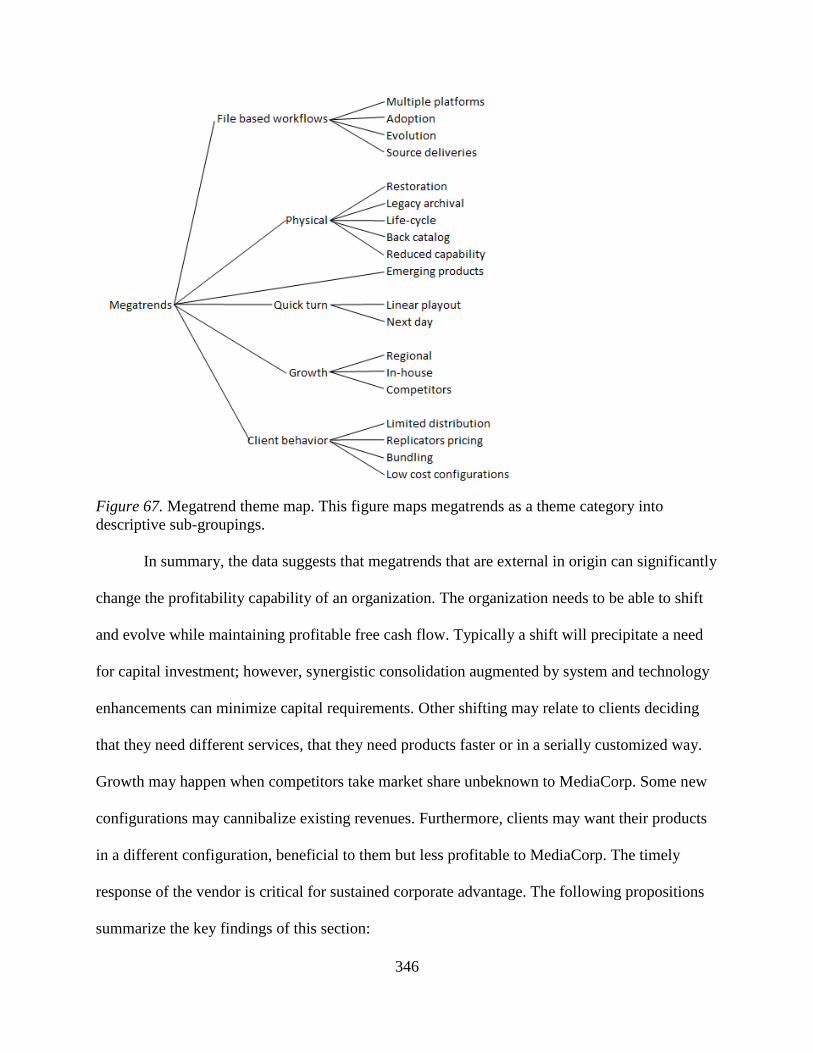
346
Figure 67. Megatrend theme map. This figure maps megatrends as a theme category into
descriptive sub-groupings.
In summary, the data suggests that megatrends that are external in origin can significantly
change the profitability capability of an organization. The organization needs to be able to shift
and evolve while maintaining profitable free cash flow. Typically a shift will precipitate a need
for capital investment; however, synergistic consolidation augmented by system and technology
enhancements can minimize capital requirements. Other shifting may relate to clients deciding
that they need different services, that they need products faster or in a serially customized way.
Growth may happen when competitors take market share unbeknown to MediaCorp. Some new
configurations may cannibalize existing revenues. Furthermore, clients may want their products
in a different configuration, beneficial to them but less profitable to MediaCorp. The timely
response of the vendor is critical for sustained corporate advantage. The following propositions
summarize the key findings of this section:
347
Proposition 135 (nimble organization): A nimble organization that can redeploy
resources and satisfy clients through innovative sales initiatives is able to ride life-
cycles longer than unprepared competitors.
Proposition 136 (dynamic scaling): Dynamically scaling capacity in a global
production network allows for the successful completion of bulk work over a
short duration as a competitive advantage.
Corporate center. Support from the corporate center is a strong dependency on business
agility. The ability to get resources when profitability potential is high is as important as the
ability to reduce costs when it is lower. The MOS leaders were able to influence the design of the
relationship between the MOS and the corporate center. The data that emerged from the
interviews suggests that the following areas of focus were of interest regarding this relationship:
reduce organizational inertia, provide needed information, and support initiatives. Each of these
will be discussed.
Organizational inertia. The reduction of organizational inertia allows a business unit to
be nimble and adapt to a dynamic market as illustrated in Figure 68. This nimbleness is critical
for the realization of synergistic growth. The rate at which the organization is constantly
evolving must be greater than the competition (Grant, et. al., 2002). When there is a need by the
corporate center for data reconciliation for reports or analysis, the operation that is involved
stops evolving and may stop servicing clients in order to obtain the information. Systems and the
reports that they produce need to be synchronized with the questions corporate needs answered.
This allows for quick decision making and reduces hours spent collecting data and analyzing it.
The data that creates inertia revealed another theme, which is the tendency for leaders
who are removed from where the work is being done to oversimplify. This oversimplification
348
results in false inferences about the business unit, the LOB, the support function, or the client. A
decision was made or a path is laid out that resulted in strategic rework. The incorrect steps taken
would then need to be reversed and the correct steps then need to then be executed. This can
delay organizational evolution by years and is a major source of inertia. The approval process is
controlled by corporate. This process is a significant source of inertia. Corporate needs to be able
to connect the staffing models to the effort needed to accomplish the work. In some cases, an
oversimplified view of the complexity or the enormity of the work leads to the belief that staffing
capacity or capability enhancements are not needed. This leads to an inability of staff to execute
work and may lead to service failures or revenue opportunity refusal. In some cases it is possible
to lay out a strategy that requires one large approval. This approval bundle streamlines the effort
needed to pass through the approval stage of the project. These strategy-based approvals required
thorough planning and a big picture perspective. For example, to create these plans the business
units needed information that was financial in order to represent the project benefit to the
company financially. They also needed recruiting information from HR, and infrastructure
information from IT, etc.
The last theme that emerged in the data related to trust. Trust reduces organizational
inertia and speeds the change process. The MOS leaders suggested that trust could be extended
to corporate leaders. This would then give the MOS leaders an opportunity to go directly to the
corporate leaders if there was a need. This process bypassed the bureaucracy that otherwise was
a contributor to delayed approvals. Another suggestion was to have lunch with the CEO. Being
so far removed, the CEO may not be aware of the great people and the excellence they produce
daily. The opportunity to spend some time with the CEO and go directly to corporate officers can
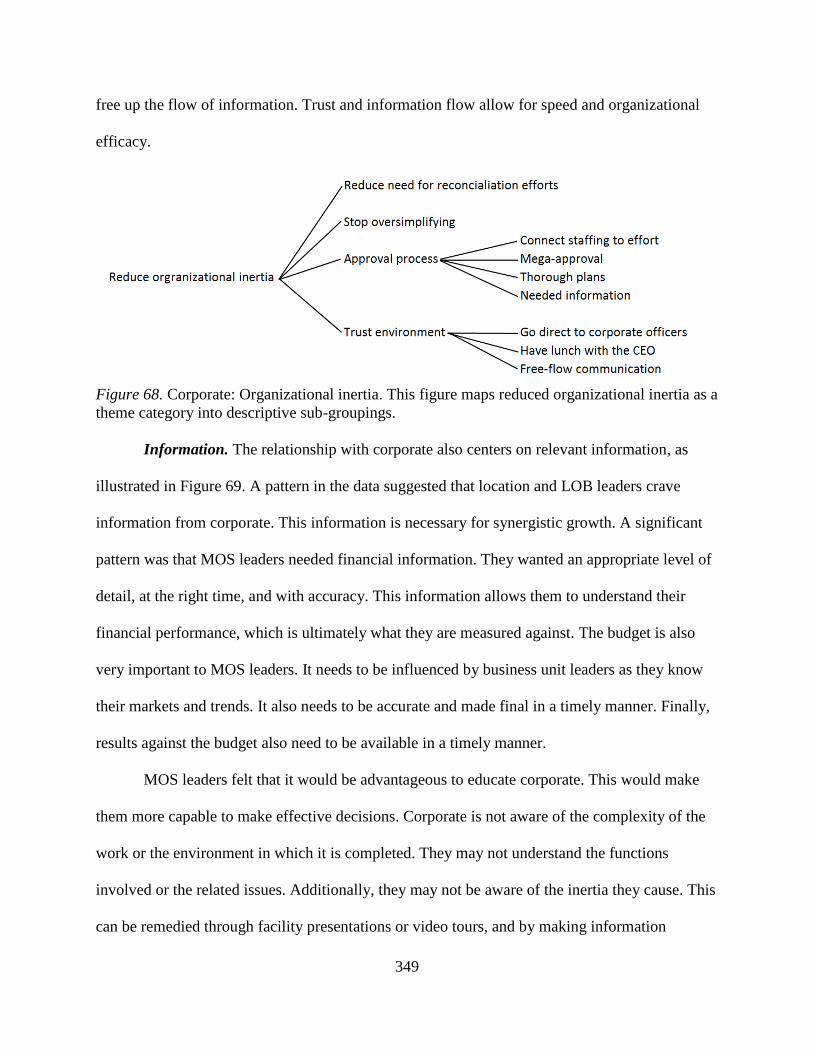
349
free up the flow of information. Trust and information flow allow for speed and organizational
efficacy.
Figure 68. Corporate: Organizational inertia. This figure maps reduced organizational inertia as a
theme category into descriptive sub-groupings.
Information. The relationship with corporate also centers on relevant information, as
illustrated in Figure 69. A pattern in the data suggested that location and LOB leaders crave
information from corporate. This information is necessary for synergistic growth. A significant
pattern was that MOS leaders needed financial information. They wanted an appropriate level of
detail, at the right time, and with accuracy. This information allows them to understand their
financial performance, which is ultimately what they are measured against. The budget is also
very important to MOS leaders. It needs to be influenced by business unit leaders as they know
their markets and trends. It also needs to be accurate and made final in a timely manner. Finally,
results against the budget also need to be available in a timely manner.
MOS leaders felt that it would be advantageous to educate corporate. This would make
them more capable to make effective decisions. Corporate is not aware of the complexity of the
work or the environment in which it is completed. They may not understand the functions
involved or the related issues. Additionally, they may not be aware of the inertia they cause. This
can be remedied through facility presentations or video tours, and by making information
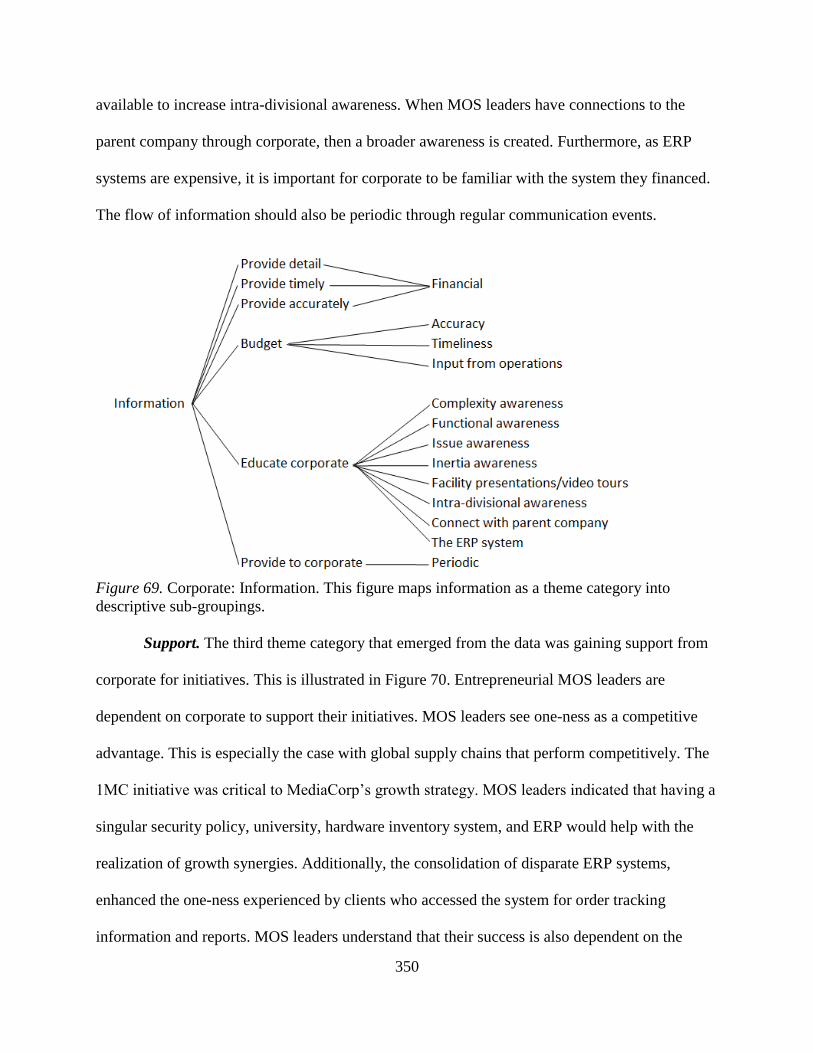
350
available to increase intra-divisional awareness. When MOS leaders have connections to the
parent company through corporate, then a broader awareness is created. Furthermore, as ERP
systems are expensive, it is important for corporate to be familiar with the system they financed.
The flow of information should also be periodic through regular communication events.
Figure 69. Corporate: Information. This figure maps information as a theme category into
descriptive sub-groupings.
Support. The third theme category that emerged from the data was gaining support from
corporate for initiatives. This is illustrated in Figure 70. Entrepreneurial MOS leaders are
dependent on corporate to support their initiatives. MOS leaders see one-ness as a competitive
advantage. This is especially the case with global supply chains that perform competitively. The
1MC initiative was critical to MediaCorp’s growth strategy. MOS leaders indicated that having a
singular security policy, university, hardware inventory system, and ERP would help with the
realization of growth synergies. Additionally, the consolidation of disparate ERP systems,
enhanced the one-ness experienced by clients who accessed the system for order tracking
information and reports. MOS leaders understand that their success is also dependent on the
351
vendors that support them. When these vendors are not paid timely, they are less cooperative, in
a desperate situation, they change the payment method and terms, they raise prices because of
payment risk, and they do not offer the deals that they had previously. A consistent and timely
payment history results in a vendor that will be very cooperative when needed. Additionally, and
relatedly, there is a need for corporate to be supportive with regard to P&L design and reporting
accuracy. The P&L is the basis for financial performance and it needs to be respected. MOS
leaders indicated that corporate can help them to connect to other parts of the company,
including the parent company, corporate officers, clients, and may even assist in penetrating
global company silos. Corporate can then help MOS leaders to initiate and deploy both global
and regional strategies. Performance excellence is realized with the proliferation of best practices
while existing functions can achieve cost goals through synergistic integration. Unwanted
attrition drains talent. Corporate is needed to retain talent through meaningful retention schemes
and opportunities for enhancement. Job enhancement was described as including a meaningful
reward system, mentorship programs, and leadership training. Each of these are enacted when
talented employees complete cost saving projects through a structured continuous improvement
program. When contracts are made with clients, they need to be scrutinized for performance
expectations; however, line items that are billable are often left off. Corporate can help with rate
structures that allow for all billable line items, overages on additional services, and the upselling
of related services internal and external to the division.
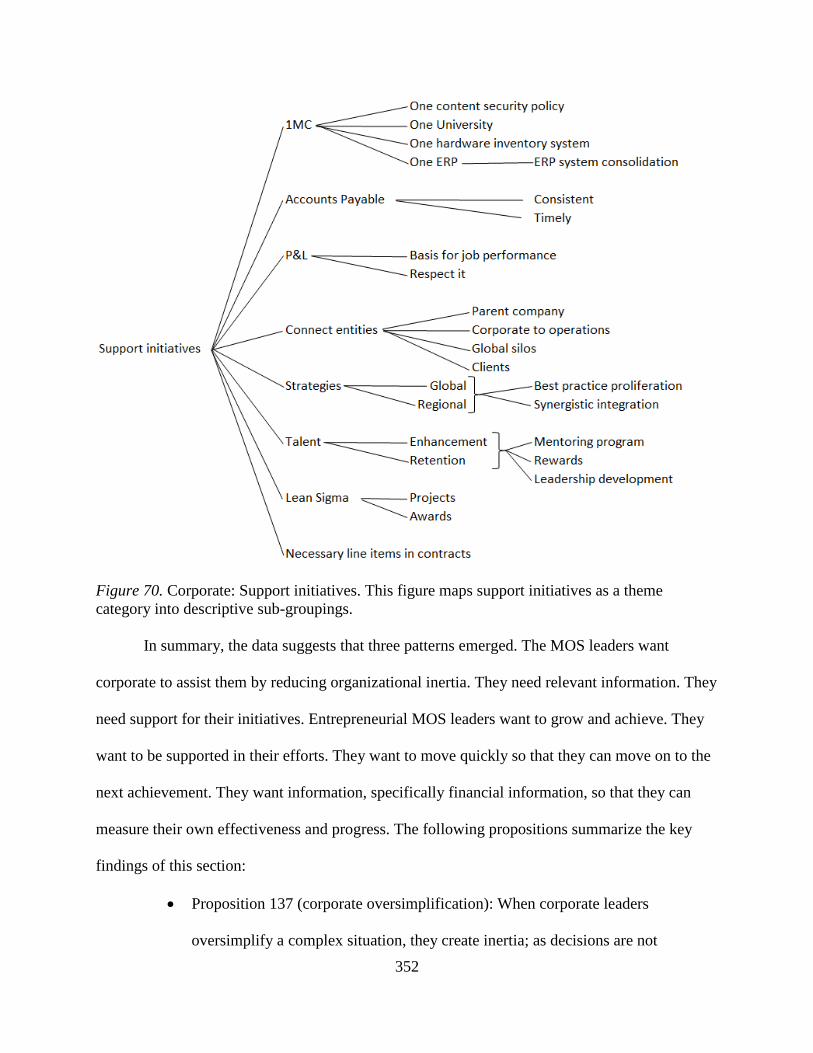
352
Figure 70. Corporate: Support initiatives. This figure maps support initiatives as a theme
category into descriptive sub-groupings.
In summary, the data suggests that three patterns emerged. The MOS leaders want
corporate to assist them by reducing organizational inertia. They need relevant information. They
need support for their initiatives. Entrepreneurial MOS leaders want to grow and achieve. They
want to be supported in their efforts. They want to move quickly so that they can move on to the
next achievement. They want information, specifically financial information, so that they can
measure their own effectiveness and progress. The following propositions summarize the key
findings of this section:
Proposition 137 (corporate oversimplification): When corporate leaders
oversimplify a complex situation, they create inertia; as decisions are not
353
sufficiently robust, residual work or unacceptable and unanticipated collateral
damage are the results.
Proposition 138 (organizational inertia): Entrepreneurial MOS leaders can achieve
synergistic profitability faster when the relationship with corporate is streamlined
and supportive.
Proposition 139 (trust environment): The rate at which the realization of
profitable growth is achieved is influenced by the quality of the relationship with
corporate, specifically with regard to trust between interacting parties.
Proposition 140 (performance information): MOS leaders benefit from
performance information because they use it to recalibrate, course-correct, adapt
plans, and monitor progress for the achievement of desirable outcomes.
Proposition 141 (corporate awareness): In order for corporate to be supportive,
they need to have a minimal understanding of the business unit’s function,
capability, culture, systems, and its relationship with other business units or
divisions.
Proposition 142 (one-ness support): One-ness is a complexity mitigation
technique, embraced by corporate and business units alike, that accelerates
profitable growth because it is a suitable platform on which growth can more
easily take place.
Proposition 143 (synergistic connections): Corporate can help business units
connect with other business units that have achieved synergistic capabilities that
can be exploited.
354
Proposition 144 (talent retention): Corporate can assist business units to retain and
mentor talent so that they can be leveraged to achieve growth synergies.
Alignment as an influence. Alignment is the third significant area of data collection
related to the influence of the MOS, both internal and external to the division. The ability of a
business to influence is dependent on the internal alignment of the organization. Two focus areas
were studied. One was the alignment of the MOS around the 1MC initiative. MediaEnterprises
launched vertical end-to-end product offering to clients, leveraging bundling to acquire market
share. The strategy was also used to attract new clients who would benefit from a one-stop-shop
instead of incurring the additional cost of managing multiple vendors. Corporate did not realize
that MediaEnterprises had silo challenges that needed to be overcome before clients could have
the single vendor experience. Clients commented on this in surveys.
“The different departments within MediaCorp should work together seamlessly from our
viewpoint to complete our work. They still work as standalone silos. I think that is a
great improvement that would help both our teams.” (CS56)
To remedy this and to enable the end-to-end initiative, the 1MC initiative was launched. This
helped corporate pursue the goal of profitable growth and to increase the penetration of
unrealized market share from existing customers. It was also the compelling reason for new
customers to submit orders, as reflected in a client survey comment.
“[Client] has a need for an end-to-end asset/format management system. MediaCorp
needs to get better at integrating [functions] servicing across [the supply chain] and
showing those time and cost advantages.” (CS33)
Market coverage and differentiation was to be achieved by providing industry-specific, cross-
business solutions that leveraged MediaEnterprises portfolio of offerings. The client focus
355
centered on creating value for clients and solving their problems by lowering their costs from a
simplified chain of custody and by reducing order dwell time by eliminating unnecessary
transfers.
Drivers. The key drivers for the initiative were stagnating growth, price erosion, market
dynamics, changing customer needs, and severe pressure on capital expenditures.
MediaEnterprises’ profits were well below budget after the first half of 2014. The end-of-year
forecast suggested that the profitability miss was going to be significant. The growth landscape
was challenging, as competitors were desperate for revenue at almost any price. In other cases,
companies were stretching vertically and they offered these services as loss leaders. Further
pressure came from client-based strategic sourcing. Clients were not willing to give
MediaEnterprises increased market share and their new product release volume was abnormally
small in a fragmented market. Some of the existing markets were already saturated with product
due to aggressive product launches, causing supply to exceed demand. New products were being
released; however, commodity pricing was achieved very early in the product life-cycle, hurting
profits that should have offset research and development expenditures. This discouraged R&D
investments. The situation was exacerbated by a lack of sales coordination that was to be
resolved by a CRM; however, cross-business client poaching and sales channel cannibalization
were enabled by the transparency provide by the CRM. This was further augmented by tension
around the financial performance.
Development. While profitability dwindled, clients looked to MediaEnterprises for R&D
and ERP development services, as other competitors could not financially afford to provide these
services. Additionally, clients expected a significant amount of one-ness in the company in the
form of standardized workflows and systems globally. A counterforce was the proliferation of
356
new services and products which contributed to overall complexity. The demand for service,
advice, and optimized pricing was relentless. The company was destroying rather than adding
corporate value; however, the increasing demand from customers indicated increasing growth
synergy potential that could result in a reduction in the conglomerate discount. And so, corporate
leaders decided to increase the focus on growth synergies through the 1MC initiative, realizing
that the cross-selling initiative was insufficiently impactful. MediaCorp initiated the 1MC
initiative to help align the organization around one-ness. This one-ness enabled clients to more
easily engage the company. The various aspects of 1MC are discussed below. These descriptions
include ways that MediaCorp was not one and what they did to become one. The second focus
area in this section was the ability of MediaCorp to scale. These opportunities for scaling were
discovered, enacted, and the results are discussed.
In summary, alignment is necessary in a market that is consolidating and in which
vendors are expected to solve client supply chain issues. A MOS cannot promote an external
perception of one-ness when internally it does not significantly exist. Clients know the
complexity that comes from a fragmented MUF, as they typically have many touch-points that
provide this feedback to them. On the other hand, simplification and the ease of doing business
with MediaCorp would indicate that one-ness has proliferated within MediaEnterprises. The
competitive advantage is lost if a MUF does not respond to this market demand, especially as
clients themselves are pursuing a more unified posture within their business units. Even so,
profitability can be compromised while achieving unity through self-cannibalization. This can be
minimized through new product and system development. The following propositions
summarize the key findings of this section:
357
Proposition 145 (internally one): The effort to achieve revenue realization from a
client that requires one-ness is significantly more difficult if internal business do
not embrace the alignment vision.
Proposition 146 (problem solving): A fragmented MUF cannot easily solve client
issues that relate to one-ness as they do not understand the root causes of the
problems or where they occur.
Proposition 147 (disruptive change): A MUF may introduce disruptive change to
align it with market dynamics; however, product development must progress at a
suitable rate to replace negative profitability impacts.
1MC. The 1MC initiative was initiated in order to align the firm around opportunities for
the continuous realization of growth synergies. The structure of MediaCorp has been illustrated
in Figure 2. It is a global value chain consisting of a few dozen locations, several on each
continent. Regional companies have a degree of autonomy around their local markets, but some
clients are multi-regional and collaboration between units is needed to serve them globally. An
issue in one location impacts the global relationship. Furthermore, global clients have initiated
one initiatives, and expect the same from MediaCorp. Vendors and industry organizations have
done this as well. MediaCorp is in a position where they are surrounded by entities that have
already moved in this direction.
MediaCorp’s managers unanimously adopted the MOS, stressing the benefit of a scalable
design that optimizes decentralized collaboration providing dimensional guidance over all
dimensions. For example, the product dimension spans all locations and provides guidance for
the unification of best practices, tools, and knowledge management. This dimension has a P&L
for each LOB so the performance of products and services across locations is understood and
358
appropriately influenced. The strategy of MediaCorp is to outperform competitors, exceed
financial performance targets, and grow the company into addressable markets. Together with
corporate guidance, dimension leaders strive to grow MediaCorp’s market presence through
superior strategic positioning and operational excellence. Location leaders strive to position their
businesses in attractive markets with sustainable growth, high earnings potential, and with low
volatility. Operational excellence is achieved through innovation, a global network for
production, world-class performance, and a leading technical capability. Horizontal leaders
leverage and develop cross-business synergies with product lines. Continuous alignment allows
for the realization of efficient synergy, product performance, and knowledge sharing. Diagonal
support leaders enable operational efficiencies through systems and infrastructure. Growth
requires that systems be modified to meet new client needs. Increased throughput requires
infrastructure capability. Infrastructure continuously evolves as equipment achieves end-of-life
and as new workflows are built. Diagonal client leaders have relationships with clients that may
span multiple facilities or be just in one location. The responsibility of these leaders is to exploit
the wallets of clients in the most profitable scenario possible. All of the dimensions in a MOS are
linked, requiring a high degree of collaboration for success.
MediaCorp has an established and continuously evolving portfolio of products and
services. Megatrends affect choices by clients and end users; however, it is necessary that
MediaCorp be proactive in development decisions so as to leverage as much of the product life-
cycle as possible. Furthermore, megatrends as described in Figure 66 also affect strategic
decision making so as to optimize profitability potential in all business units. Operational
excellence enhances the value of products and services and supports higher pricing than
competitors. To a client the product quality is important; however, the arrival of that product, as
359
intended, to the right destination, through the correct method, in the right quantity, on time, and
with an accurate invoice on time are also aspects of the overall product. A delivery may also be
associated with the experience that the client had while ordering the deliverable. This impression
of service is a part of the product and influences the client to order again from MediaCorp.
People excellence focuses on human resource talent in use. The current and evolutionary level of
talent guides recruiting, personal improvement plans, succession planning, and membership in
the talent pool. Corporate excellence relates to best-in-class governance through direction and
support.
The 1MC initiative was introduced to focus on horizontalization of excellence across
locations, but also included the overall scalability of the MOS. It was not desirable to scale until
the correct foundation was in place. The deployment of the MOS at MediaCorp was an ideal
choice because excellence in performance and entrepreneurism was already strongly established
in the culture and continued to evolve. This was an opportunity for MediaEnterprises to exploit a
scalable organizational design augmented by LIMs for the purpose of rapidly achieving growth
synergies. It was also an opportunity for MediaEnterprises to exploit further the one-ness that
had already been achieved in MediaCorp. This initiative aims to promote profitable growth
through a variety of sales strategies designed to increase market share, market coverage, and
market differentiation. Products and services are designed to solve client problems with regard to
their profitability.
This strategic initiative was driven by a number of critical aspects of the business.
Growth stagnation had settled in and the company’s expansion opportunities needed to be
exploited. The market was shifting and it was important that MediaEnterprises was not left
behind. MediaCorp and MediaEnterprises operate within a market that has intense competition.
360
Product commoditization occurred at a rampant pace, reducing life-cycle earning potential and
the ROI on R&D investments. Competitors had strong growth aspirations and were willing to
compromise price in order to get some of the addressable market. Additionally, some of the
markets that MediaCorp operated in had become saturated and the life-cycle of some of the
legacy, money-making products had peaked.
MediaCorp’s clients became annoyed by the lack of coordination in sales and operational
efforts. Not only were sales efforts uncoordinated, but clients were able to get one location of
MediaCorp to give them better pricing than another location. Internal price wars damaged rate
structures and profitability potential. The MediaCorp sales effort was restructured to include
three aspects; (a) winning new customers, (b) harvesting as much as possible from existing
customers across all product lines, and (c) managing service excellence. The objective of the first
initiative was to penetrate existing customer silos and win new customers with respect to each
line of business. The objective of the second was to expand revenue opportunities with clients
with whom MediaCorp already had a relationship. In some cases a client silo had not been
penetrated; however, the relationships with adjacent silos could be exploited to get into the new
spend. Cross-selling initiatives were enabled by a CRM that was deployed to record prospects in
the sales funnel and lead sharing. Existing customers were experiencing rapid changes in a
dynamic market. Furthermore, clients were being restructured internally, the complexity of
products was increasing dramatically, the security landscape was becoming significantly more
intense, and disruptive technologies related to products and workflows were challenging existing
paradigms. Clients had a hunger to learn about these changes. It was necessary that MediaCorp
help its clients deal with their revenue challenges through products and services. They demanded
solutions and advice, and these needed to be given by one voice without conflicting information.
361
MediaCorp could leverage this strategic concept and the opportunity to increase its value to
clients and to shareholders.
MediaCorp leveraged LIMs to promote its 1MC initiative. A strategic leadership team
made up of leaders from the horizontal dimension of the MOS was given the task. As
horizontalization was a quick win, it made sense to start with this team. This team had executive
sponsorship and support. Each of the leaders had extensive experience in the industry and was
well connected. Similarly, the executive sponsor was also well connected and had purview over a
significant domain of support and operational areas such that the 1MC initiative could be
realized. It was believed that when MediaCorp experienced a one-ness internally that this could
be seen and leveraged externally through sales initiatives. It was also believed that if one-ness
was not achieved internally that end-to-end sales initiatives would be very difficult to implement,
as these initiatives demanded a one-ness in execution in order to be profitable and sellable. The
initiative began with the collection of 61 ways that MediaEnterprises was not experiencing one-
ness. These are listed in Table 28. A poll was used to collect this data a root cause was
determined, and a remedy for the lack of one-ness was listed. These will be discussed.
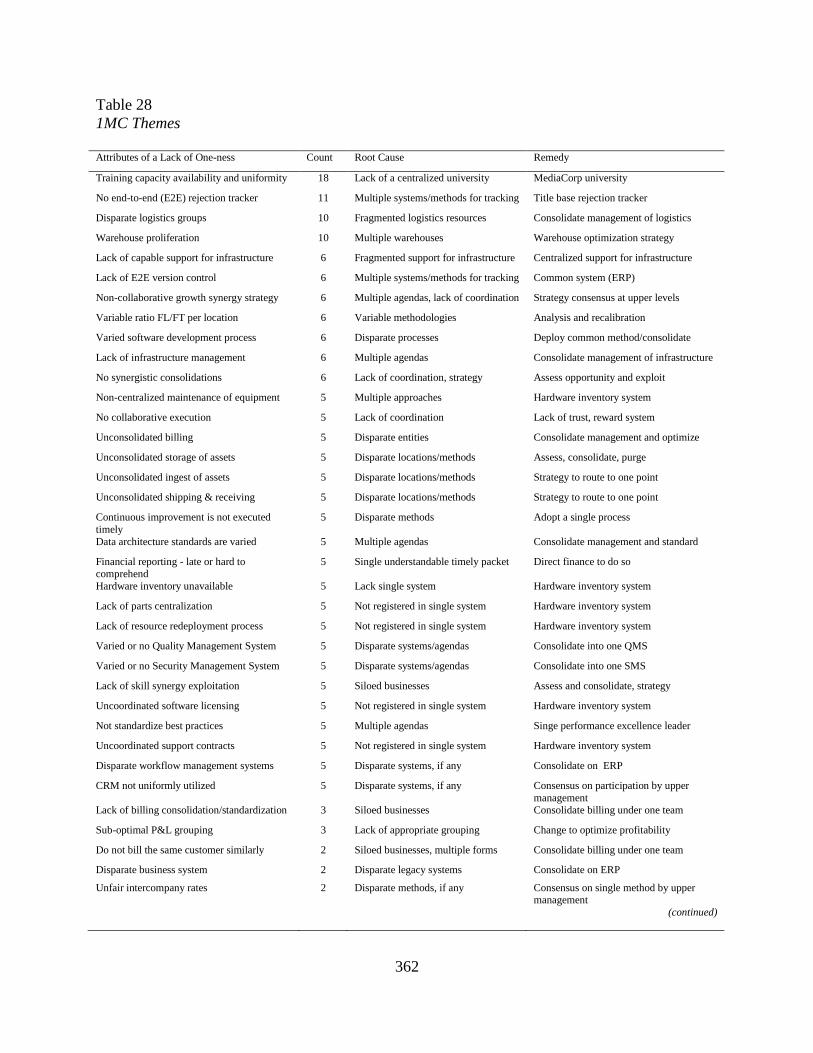
362
Table 28
1MC Themes
Attributes of a Lack of One-ness Count Root Cause Remedy
Training capacity availability and uniformity 18 Lack of a centralized university MediaCorp university
No end-to-end (E2E) rejection tracker 11 Multiple systems/methods for tracking Title base rejection tracker
Disparate logistics groups 10 Fragmented logistics resources Consolidate management of logistics
Warehouse proliferation 10 Multiple warehouses Warehouse optimization strategy
Lack of capable support for infrastructure 6 Fragmented support for infrastructure Centralized support for infrastructure
Lack of E2E version control 6 Multiple systems/methods for tracking Common system (ERP)
Non-collaborative growth synergy strategy 6 Multiple agendas, lack of coordination Strategy consensus at upper levels
Variable ratio FL/FT per location 6 Variable methodologies Analysis and recalibration
Varied software development process 6 Disparate processes Deploy common method/consolidate
Lack of infrastructure management 6 Multiple agendas Consolidate management of infrastructure
No synergistic consolidations 6 Lack of coordination, strategy Assess opportunity and exploit
Non-centralized maintenance of equipment 5 Multiple approaches Hardware inventory system
No collaborative execution 5 Lack of coordination Lack of trust, reward system
Unconsolidated billing 5 Disparate entities Consolidate management and optimize
Unconsolidated storage of assets 5 Disparate locations/methods Assess, consolidate, purge
Unconsolidated ingest of assets 5 Disparate locations/methods Strategy to route to one point
Unconsolidated shipping & receiving 5 Disparate locations/methods Strategy to route to one point
Continuous improvement is not executed
timely
5 Disparate methods Adopt a single process
Data architecture standards are varied 5 Multiple agendas Consolidate management and standard
Financial reporting - late or hard to
comprehend
5 Single understandable timely packet Direct finance to do so
Hardware inventory unavailable 5 Lack single system Hardware inventory system
Lack of parts centralization 5 Not registered in single system Hardware inventory system
Lack of resource redeployment process 5 Not registered in single system Hardware inventory system
Varied or no Quality Management System 5 Disparate systems/agendas Consolidate into one QMS
Varied or no Security Management System 5 Disparate systems/agendas Consolidate into one SMS
Lack of skill synergy exploitation 5 Siloed businesses Assess and consolidate, strategy
Uncoordinated software licensing 5 Not registered in single system Hardware inventory system
Not standardize best practices 5 Multiple agendas Singe performance excellence leader
Uncoordinated support contracts 5 Not registered in single system Hardware inventory system
Disparate workflow management systems 5 Disparate systems, if any Consolidate on ERP
CRM not uniformly utilized 5 Disparate systems, if any Consensus on participation by upper
management
Lack of billing consolidation/standardization 3 Siloed businesses Consolidate billing under one team
Sub-optimal P&L grouping 3 Lack of appropriate grouping Change to optimize profitability
Do not bill the same customer similarly 2 Siloed businesses, multiple forms Consolidate billing under one team
Disparate business system 2 Disparate legacy systems Consolidate on ERP
Unfair intercompany rates 2 Disparate methods, if any Consensus on single method by upper management
(continued)
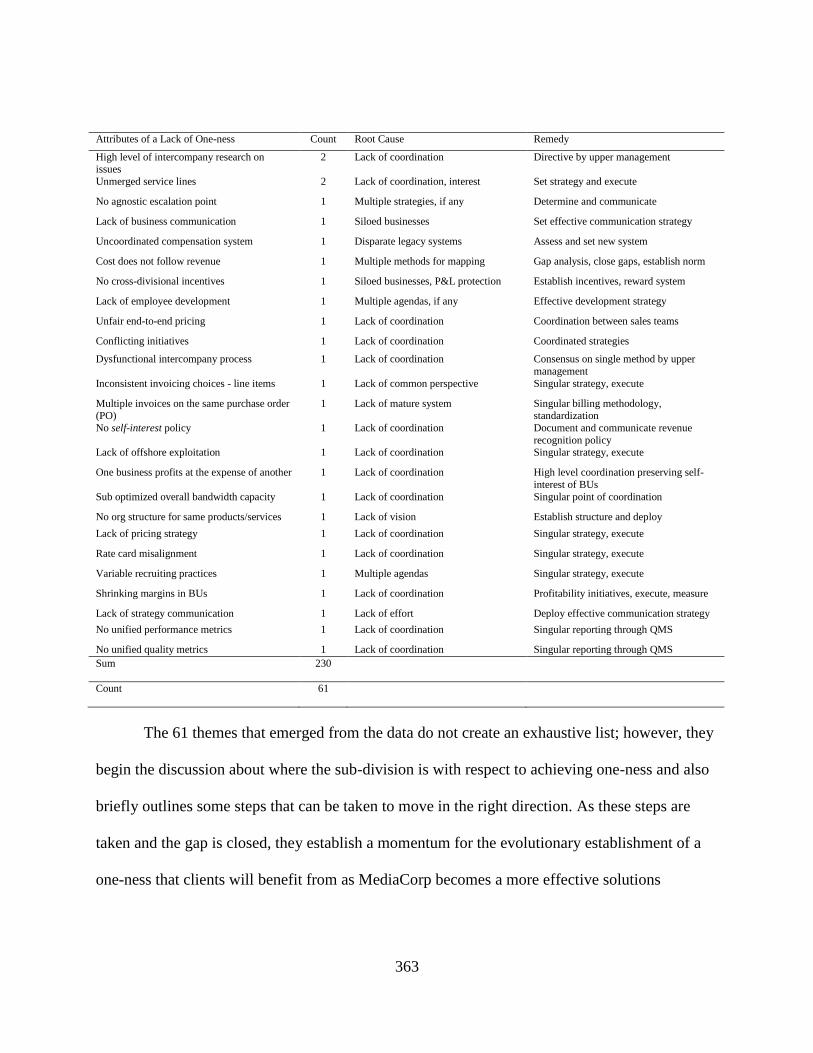
363
Attributes of a Lack of One-ness Count Root Cause Remedy
High level of intercompany research on issues
2 Lack of coordination Directive by upper management
Unmerged service lines 2 Lack of coordination, interest Set strategy and execute
No agnostic escalation point 1 Multiple strategies, if any Determine and communicate
Lack of business communication 1 Siloed businesses Set effective communication strategy
Uncoordinated compensation system 1 Disparate legacy systems Assess and set new system
Cost does not follow revenue 1 Multiple methods for mapping Gap analysis, close gaps, establish norm
No cross-divisional incentives 1 Siloed businesses, P&L protection Establish incentives, reward system
Lack of employee development 1 Multiple agendas, if any Effective development strategy
Unfair end-to-end pricing 1 Lack of coordination Coordination between sales teams
Conflicting initiatives 1 Lack of coordination Coordinated strategies
Dysfunctional intercompany process 1 Lack of coordination Consensus on single method by upper
management
Inconsistent invoicing choices - line items 1 Lack of common perspective Singular strategy, execute
Multiple invoices on the same purchase order (PO)
1 Lack of mature system Singular billing methodology, standardization
No self-interest policy 1 Lack of coordination Document and communicate revenue
recognition policy Lack of offshore exploitation 1 Lack of coordination Singular strategy, execute
One business profits at the expense of another 1 Lack of coordination High level coordination preserving self-
interest of BUs
Sub optimized overall bandwidth capacity 1 Lack of coordination Singular point of coordination
No org structure for same products/services 1 Lack of vision Establish structure and deploy
Lack of pricing strategy 1 Lack of coordination Singular strategy, execute
Rate card misalignment 1 Lack of coordination Singular strategy, execute
Variable recruiting practices 1 Multiple agendas Singular strategy, execute
Shrinking margins in BUs 1 Lack of coordination Profitability initiatives, execute, measure
Lack of strategy communication 1 Lack of effort Deploy effective communication strategy
No unified performance metrics 1 Lack of coordination Singular reporting through QMS
No unified quality metrics 1 Lack of coordination Singular reporting through QMS
Sum
230
Count
61
The 61 themes that emerged from the data do not create an exhaustive list; however, they
begin the discussion about where the sub-division is with respect to achieving one-ness and also
briefly outlines some steps that can be taken to move in the right direction. As these steps are
taken and the gap is closed, they establish a momentum for the evolutionary establishment of a
one-ness that clients will benefit from as MediaCorp becomes a more effective solutions
364
provider. Below, the 61 themes were broken down into 13 theme categories, including a
description of the issue (denoted in regular font) and the remedy (denoted in italics below).
Knowledge management
o The availability of training materials was limited for use. They had not
been collected into a format that was fulsome and standardized. There was
also no mechanism in place to make this information available to all
locations. Clients expected that all of MediaCorp would function similarly
within the scope of a given set of tasks. When clients saw that the methods
were different, they equated MediaCorp locations to being different
vendors. This made the end-to-end initiative a much more difficult sale.
Internal locations wasted effort discovering and documenting processes
that already had documentation.
o A MediaCorp university (MU) was established that included a prescribed
methodology and format for creating content. Curriculums were
developed with regard to processes that included means for
comprehension measurement. These materials, along with general
documentation, were made available worldwide through a knowledge
base that hosted the university and a single coordinator that administered
the system.
Quality management
o The maturity of the quality system varied from BU to BU. This included
BU workflow reliability and the measurement of that reliability level. The
measurement would have been possible if a rejection tracker had been
365
available end-to-end. The client wants the vendor to process a project that
is named. The project has a large number of deliverables in a variety of
formats. Configurations throughout the global supply chain are subject to
progressive invoicing and configuration yields. When a client wants to
know what happened within a configuration, they could be talking to an
isolated vendor, as there is a lack of uniformity in the rejection tracking
and a corrective action process does not exist. Additionally, the ability to
continuously improve the process is not uniform.
o A quality management system was deployed to control the quality process
in a centralized context. This included a single document that outlines our
quality strategy, a single document that records measurements regarding
all process yields, documents that cover quality system principles, and
documents that include work instructions and specifications against which
operational quality is compared.
o A robust and mature quality system is not applied across the end-to-end
supply chain. This is a force against the exploitation of this type of sales
opportunity. The lack of a quality system implies that a culture of
reliability, a standard for performance, a method for a quality system, and
guiding documentation has been applied across the organization in a
variable way. This variability is seen when clients investigate issues. This
variability encourages a lack of confidence in MediaEnterprises’ ability to
perform the tasks that clients give to them and may result in the diversion
of work or even inhibit the rewarding of work.
366
o All business units in MediaEnterprises were brought under one quality
management system (QMS). This system included a quality manual,
quality system documents (QSDs), management review (MR), and work
instructions (WIs). This system set the tone for quality performance
regardless of the product or service. From a growth perspective, the
quality manual influenced the introduction of new products, technologies,
and expansions in capacity. The QSDs influenced aspects of the workflow
that they applied to creating a united quality approach regardless of
location. The MR included a unified set of metrics for all like workflows. It
included performance targets and corrective action information that
would lead to the closing of the gap. The relative measure of performance
encouraged a push or pull strategy for information flow. A business unit
that was performing very well would share their knowledge and transfer
talent if needed. The WIs documented how tasks were performed. These
documents, made available worldwide, allowed all locations to
standardize on best practices. This accelerated performance
improvements and allowed any location to perform tasks with a high
degree of reliability quickly.
o Various business units, some of which have similar workflows and
products, did not have quality performance metrics. In some cases the
metrics existed but were different or were calculated differently. This lack
of standardization made it difficult to assess performance levels and know
where to apply energies for the mitigation of vulnerabilities.
367
o The remedy was singular reporting through one management review. The
review included metrics for all businesses, including their definition and
the method of calculation. These metrics could be applied across all
applicable locations and workflows. They were used to assess where there
was opportunity for improvement. Quality performance was a significant
market differentiator that led to the awarding of additional work from
clients. This was especially the case with sensitive work products that had
short delivery requirements. Once the client could count on
MediaEnterprises because they were easy to work with, they would tend to
award work even at higher prices. This was validated by client survey
information. “Our jobs are made so much easier based on the
performance delivered by this team.” (CS67)
Internal costs at the client were higher when they dealt with a vendor who
could not figure out how to make difficult projects easy. This led to better
profits due to higher price points.
Asset management
o Logistics were managed by a variety of divisional and sub-divisional
groups. Each group had a different perspective on how logistics should be
managed. The level of excellence also varied as they had not standardized
best practices. When a client wanted to know where an asset was or how
it was managed, they received a variety of answers from locations within
the same company.
368
o The unification of practice came from the MOS. A horizontal line included
this dimension. The MOS leader was able to push practices worldwide to
mitigate risk and vulnerability. When a client RFP (request for proposal)
was issued, MediaEnterprises was able to answer asset and logistics
management questions in a singular way, encouraging confidence in a
one-ness. The deployment of mature practices mitigated incidents that
otherwise would have discouraged clients from using MediaEnterprises’
services. These practices mitigated cost, enabling better profitability as
well.
o There was a proliferation of locations where assets were stored. Each
location was managed differently and was in a different state of integrity
with regard to asset tracking. The physical environment in which the
assets were kept also varied significantly, to the point where the condition
of the facility could damage the asset. This could happen through water
damage or a lack of temperature controls for example. When a client
wanted to know where their assets were, they did not want to hear that
they were scattered in different locations, some with asset tracking
capability and others without.
o The consolidation of locations into three worldwide regional storage
locations helped to concentrate inventories. The integrity of the
inventories was controlled through the use of cycle-counting practices that
force asset count accuracies to very high levels. If a client asked for an
asset, it could be quickly located and made available. If the operation
369
needed an asset, the same thing would happen. The consolidation of vaults
reduced complexity and increased the ability for the vaults to serve
internally to operations and externally to clients. The consolidation also
helped with cost synergies, thereby reducing cost and improving
profitability.
o When assets are received they are typically ingested, or digitized, such
that they are digitally available on storage. Access to digital storage is not
provided to operations, slowing their ability to exploit the assets through
availability.
o Digital storage came under centralized control. Previously, storage was
isolated to business units and hoarded for spike capacity requirements. A
shared solution increased utilization and made capacity available to all
through sharing. When there was a spike, the storage was reconfigured
temporarily to allow for the volume requirement. When capacity needs
shrunk, storage capacity was reduced.
o Asset storage charges were applied to some clients but not to others. When
clients were charged for storage, their assets were requested to be returned
soon after their use. When clients were not charged for asset storage, they
would be left in MediaCorp vaults, as they could take advantage of free
secure storage for years. The majority of the assets, based on last
movement aging reports, had not been touched in more than 3 years.
o Inconsistent rates for storage encourage less profitable behaviors due to
storage costs. If storage was free then clients were prone to use it,
370
bloating inventories. They were not motivated to take their assets back, as
this would transfer costs to them. The cost of storage eroded profitability
possibilities. A unified purging program was installed that applied pricing
to storage. This encouraged behaviors that included payment, purging, or
the destruction of assets. These actions improved profitability.
o A consolidation of shipping and receiving by region allowed for
consolidated courier use and shipping efficiency. It also allowed the client
to have a singular ship to address, reducing complexity. These assets could
be received and made available to operations based on an SLA. Feedback
to clients provided information relative to the pre-qualification of the asset
within an SLA as well.
o The consolidation of logistics services enabled a centralized management
structure based on best practices. All clients received similar service
delivered by one pool of drivers in similar looking vehicles. Tracking
capabilities allowed for performance monitoring. Scorecards on SLA
performance inspired confidence from clients. This typically led to the
awarding of work. The pooled resource allowed for better utilization
improving cost per delivery performance levels, and profitability.
Infrastructure
o Decisions about local infrastructure components resulted in the use of
incompatible components in the global supply chain. Disparate
components increased training requirements and service or
troubleshooting complexity. The use of disparate component types
371
hampered scalability and created a larger dependency on service
organizations.
o Centralized control of the purchasing process allowed for standardized
component purchasing based on workflow use and capacity needs. The
reduced complexity ensured the best performance possible based on a
total cost calculation. It enabled component redeployment possibilities,
making locations more nimble for quick capacity expansions. These
measures increased predictability, stabilized capacity planning, enabled
growth, and reduced costs. “Most of the divisions do [function, and] have
their own teams doing this differently versus a [centralized] team that
optimizes [capability].” (1MC49)
o The infrastructure is managed inconsistently. Outages are more complex
to troubleshoot than they would be otherwise. End-of-life issues become
apparent when different equipment refresh philosophies are applied. The
capacity-related dependency on the network was jeopardized due to an
increasing number of surprise outages.
o The attention of infrastructure teams to infrastructure uptime is critical to
business continuity, a contractual expectation of clients that includes
recovery times. Breaches can incur penalties or the removal of work. A
management culture that has the will to beat uptime metrics is less costly
if the ability to troubleshoot is encouraged by similarities in component
usage. A single event at a competitor can redirect work to a more reliable
team, enhancing profitability. Having a simplified and optimized workflow
372
design improved uptime due to component interchangeability, minimized
troubleshooting time, and a reduced need for training.
o Equipment maintenance procedures are redundant and not unified. These
disparate procedures result in additional training efforts. The dynamic
market and the need for rapid technical evolution make it necessary to
simplify and optimize procedures regardless of geography. This is even
more important in a location agnostic capacity model.
o The application of a unified, centralized, predictive maintenance program
improves uptime of equipment. Unscheduled outages will reduce capacity
expectantly and inhibit the shipment of products on time. On the other
hand, a mature predictive maintenance capability will create competitive
advantages through equipment availability. Simplicity makes it possible
for staff to travel to any location to resolve problems. Replacements and
new build-outs are also easier and predictable.
Workflow management system
o Disparate workflow management systems result in the lack of suitable
configuration, version tracking, and control, which could lead to a failed
delivery. This is especially critical for a project that utilizes a large portion
of the supply chain and extends beyond a single division.
“A common system would go a long, long way towards unifying the
different companies… all our disparate systems create inefficiencies and
an inability to present a unified front to ourselves let alone the
customers.” (1MC146)
373
o A system unification initiative led to a system consolidation roadmap.
Operators were then able to go to one system to get the information that
they needed. Their effort regarding the entry of information was reduced
due to data sharing. Asset configurations were shared rather than
recreated. Clients who had access to the system experienced end-to-end
transparency and ease of use. This complexity reduction accelerated
workflow throughput and reduced system management and enhancement
costs.
o Many of the comments that emerged from the data related to systems. In a
MUF, the ability to lead change is a core competency (Burnes, 2004;
Mitroff, 2001). The monitoring of performance is enabled by systems that
impose workflow controls, track the progression of work, and provide data
for review and analysis. Within the end-to-end supply chain, a variety of
systems are in use. This may be due to acquisitions and a subsequent lack
of integration. It may be due to unique requirements that triggered a
development or purchase due to isolated perspectives. This may also be
due to a lack of awareness that other systems exist that could perform the
work. Regardless, disparate systems do not share information well, if at
all, and organization evolution is slowed as a result.
o A plan was developed that reflected an assessment of systems in use and a
roadmap for integration into a single ERP. The plan included the cost
savings associated with not having to maintain disparate systems, the cost
that would have been incurred to benefit from additional features
374
available already in the ERP, the financial benefit of these features, the
training benefits, and workflow efficiency gains. This resulted in a
compelling basis to provide the additional labor to accomplish the
integrations in the shortest amount of time possible.
o System design is based on the user interface, the structure that drives
navigation, and the core database architecture. As customers are
introduced to the varied systems, they see that all of them are variable. For
example, core database architectures drive information required for the
system to function. A client would notice that a field array of data is
required and repeatedly entered for MediaEnterprises. This is needed for
work to be processed. This variability due to a lack of an organization-
wide standard suggests that clients might experience similar issues if they
were using multiple vendors.
o With the consolidation of systems, the user interface (UI) was also
standardized. MediaEnterprises did not assume that this user interface
would be adequate for client usage. As a result, an assessment was done
of client requests and a development roadmap was executed to accomplish
the changes to meet or exceed client expectations. In some cases the client
was not sure what they would want. In these cases the features that were
already accomplished as a result of previous client feedback could be
exploited. Repurposing features accelerated the accomplishment of
meeting client expectations that were desired in their UI to the ERP
system.
375
o The ability to execute work may depend on the availability of equipment.
Capital constraints may inhibit the ability of the organization to purchase
needed capacity. On the other hand, the redeployment of existing
equipment to the point-of-need could increase utilization while
accommodating demand. A capacity planning system is typically needed
in a complex global environment with significant volume variability.
o A system was deployed that listed the inventory of all workflow equipment
and the disposition of the equipment. The maintenance history and run-
time was also listed such that the next interval for preventive maintenance
could be known. This data produced capacity availability information
through the inventory. This inventory was available to all locations. When
a local business unit had the need for equipment or parts for their existing
equipment, they were able to locate suitable components and request
them. The system allowed for components to only be moved if they were
required elsewhere. Consequently, a central storage facility was not
needed.
o Hardware viability is reflected in uptime measurement and output quality.
Proactive maintenance driven by component failure predictability drives
hardware performance metrics. Systems are needed to predict hardware
life-cycles, track maintenance histories, identify parts inventories, and
schedule downtime to avoid hardware outages that could influence
delivery performance. Inconsistent use of a system may lead a business
unit to tell a client that they do not have the capacity to do a job.
376
Furthermore, a BU may be renting equipment that could be replaced by
existing equipment that needs repair. Parts inventories are valuable for
quick repair. Triggers for ordering or sending them to other facilities that
need them is also a requirement of the system.
o The inventory system was used to pull parts and hardware into locations
that had the need. The provision of on-demand capacity allowed
businesses at various locations to accept work, rather than turn it down,
because they were capable to increase capacity as needed. The system
only worked if all locations participated by listing their inventory. The
diagonal support function that manages equipment was able to work with
each location to enter their inventory in the system. Additional support
was given to the location if they did not have the capacity or the skill to
enter the information.
o The inability to monitor delivery systems promoted sub-optimal
utilizations of this capacity. In some cases deliveries could not be made
while capacity to make deliveries was available elsewhere. An inability to
be aware of current usage trends kept managers from knowing what was
available and where the capacity constraints were.
o The delivery function was centralized under a technical group that could
train the delivery teams on optimal practices for shared resource
utilization. Tools were made available so that capacity was known real-
time. This allowed for flexibility and adaptability depending on demand.
377
As a result, the continuous stream of deliveries was seen as consistent and
reliable both internally to departments and externally to clients.
o Systems are useful in tracking licensing of software and support contracts.
When these are not tracked and monitored, licenses can expire leading to
penalties. Additionally, hardware may become unsupported, leading to a
decision to get other equipment or bring support capability in-house.
o All of the support contracts were entered into the equipment inventory
system. Cost was optimized by determining which items would need to be
supported in light of replacement component costs. Other items were
determined to not need support, as parts were easily available and in-
house capability to repair these components was also available. A model
for regional maintenance was set up to assist with regional location
maintenance needs. These locations kept part inventories, performed
repairs, executed preventive maintenance at all locations, and trained
locations on troubleshooting and simple maintenance activities.
o A sales system is beneficial to track leads and manage work through the
sales funnel. A CRM is a typical system type to facilitate this. The system
must be used uniformly in order to ensure that leads turn into revenue.
This may be influenced by a willingness of the sales force to expose leads,
the effectiveness of the system, the timeliness and accuracy of entries, and
the design of the system.
o A commission structure was deployed that linked to the CRM. If the
project was not in the CRM, it was not commissionable. The amount of the
378
commission varied by project type. If it was new business, the commission
was higher for example. If another person could assist with the closing of
the deal, then the extra commission available was shared. This drove
collaborative behaviors, including lead sharing which accelerated the
closing of the deal.
o The end-to-end supply chain uses multiple systems to track work between
business units. Customers are given the opportunity to track their work in
these systems, they receive reports from these systems, and they have to
integrate their new products or features into these systems. The multiple
system environments are difficult for clients, as they need training and
access to multiple database environments. They are challenged to create
one report with regard to the performance of MediaEnterprises.
o The ERP system became common along the supply chain after a
development roadmap was achieved. A performance report was available
for each function in the supply chain. If a client wanted to know the results
of key performance indicators (KPIs) they would only need to enter the
date range and function in the workflow to have a report quickly
displayed.
Strategy
o A strategic-planning coordinated capability was not in place. As a result,
initiatives in one business unit would conflict with the initiatives in
another. A gain could be cancelled by a loss, due to the transfer of work as
a cost reduction strategy, for example.
379
We often have development projects generated in some business
units running at cross purposes. We should try to get some
oversight into development so we don’t ‘re-create the wheel’ or
develop applications that directly oppose initiatives in other
business units. (1MC148)
Externally, clients noticed and were asking for an improved relationship
through strategic discussions.
“We'd [like] to have MediaCorp serve as [a] technological thought leader
as relates to our business… we'd also like to have more strategic
discussions/direction with the MediaCorp team.” (CS13)
o Periodic strategic planning meetings were initiated. The results were
documented and used for follow up. Benefits of each were documented and
used as a partial basis for prioritization. LIMs were deployed in the form
of action trackers and weekly huddles to share information about status.
In these huddles, awareness was created through questions to project
leads. This allowed for inclusion of critical participants that may not have
been anticipated. It also gave business unit leaders information about
deployment plans and status.
o A trend was developing regarding the rapid commoditizing of pricing.
This applied to new products and workflows as well. Clients were quickly
involved in workflow and product design so that they could minimize
prices, citing their involvement in the development. Additionally, they
380
were able to cost out workflows based on legacy pricing structures and
require that these structures be replicated in the new pricing structures.
o A two-fold approach was used to counter this trend and ensure elevated
product introductory pricing. The first approach was that MediaCorp
began to develop their products without direct client involvement. This
allowed for elevated pricing. The second strategy was that an R&D
component was added to rate structures. In cases where commoditized
line items were mandated, an R&D line item was added to reflect
development costs with each product delivery. Prior to a collaborative
initiative with the client, the cost was determined as well as the volume.
The R&D cost per product was then allowed to be applied.
o The communication of strategic endeavors was not known to those
affected or participants. The lack of awareness resulted in critical
information not being made available to leaders, which altered roadmap
designs. A lack of communication during deployment also promoted
dysfunctional effort during implementation. In some cases implementation
died as a result of communication barriers, resulting in deficiencies in
design not being heard from stakeholders.
o A communication strategy was developed. This included template-driven
notifications to ensure fulsomeness for new developments and
enhancements. Feedback was solicited from stakeholders during formal
user acceptance testing. A formal fitness-for-use program was used by a
381
third party department to ensure that the process performed in accordance
with internal and external expectations.
o A complex organization in a MUF requires collaboration in strategy
development and execution to keep ahead of a dynamic marketplace.
Trained behaviors, a culture of isolationism, and silos that are augmented
by disparate reward systems within the business units in a MUF, can
create organizational inertia, especially when there are production network
dependencies. Furthermore, the lack of a North Star vision will keep these
disparate organizations from heading in a singular direction. The inability
to know if progress is on track and proceeding at a suitable speed breeds
confusion among stakeholders.
o A North Star vision did not exist and the organization was largely
reactive. The development of a vision of the deployment of a MOS with the
goal to improve growth synergies through robust strategic task structures
allowed for the execution of a roadmap the led to the vision picture.
Alignment was promoted, reducing wasted effort associated with multiple
agendas and a lack of collaboration. Clients were able to see a singular
design that was scalable and growth oriented.
o The desire to discover synergies is constrained as business unit leaders put
up barriers, disallowing transparency or investigation into potential
synergistic integration. Turf is valued and drives behaviors of protection.
This source of inertia keeps synergistic integrations from getting off the
ground. In the event that they do get off the ground, there will be those
382
who will want the integration effort to fail so that the organization can
return to the previously wasteful equilibrium.
o Business unit leaders are more likely to offer up turf if they understand the
strategy and subscribe to the overall vision of the organization. The self-
interest of each location needed to be respected through a guided process
that promoted organization evolution. Leaders saw that a networked-
production environment allowed them to improve the financial
performance of their business. It allowed them to grow their businesses as
well. “Merging (at a high level), service lines based on overall workflow /
product… for [series of functional areas].” (1MC2-9)
o Skills and the tasks performed by human resources or hardware are
redundant within the silos. Utilization may be high, but there may be an
organization combination with altered methods or workflow and based on
most effective practices that could be a super-additive when these
resources are combined. This benefit may effectively promote growth. The
exploitation of these super-additives may be constrained by isolated work
cultures.
o Skills were established and transferred worldwide through a centralized
learning management system. This included curriculums of training within
functions. Anyone could learn how to use a system. This liberated learning
and normalized methods allowing for continuous improvement from a
common platform. Locations were, therefore, made capable to perform
and acquire more work from clients, as they were now made capable.
383
o If analyzed, it would be clear that there are product and service workflows
that are redundant. These can be consolidated with the associated super-
additives that produce profitability. There is a resistance to converge like
functions due to turf protection and ego-based aspirations for empire
building rather than profitability realization. The discovery of these
opportunities often does not get off the ground. In the event that the
discovery does happen and is made known, the plans for execution to
create consolidation are often difficult to perform.
o A synergy analysis was conducted by business type and location. Many
locations have similar workflows. Also, businesses in the supply chain
have similar workflows. This was assessed and consolidation
opportunities were included in centralized organizational designs.
Increased utilization boosted profitability and capacity to accept more
work.
Organizational design
o There is variability in the perspective of what an organizational design
should be and how it should be constructed.
“There are inefficiencies in how the boxes are laid out… some people
have 2 reports and should have 10… this depends on the position… the
idea is to create an effective design relative to the situation.” (1MC106)
Designs may be situational, based on the maturity of the business unit or
the growth stage it is in. Organizational design may be more or less
effective based on the design itself. For example, the MOS is unique to
384
MediaEnterprises generally. The intent of this study is to show that a MOS
contributes to growth synergies and is scalable. Clean designs that are
understood with accountability may perform better than designs that are
unstructured or convoluted through multiple paths of accountability or
variability regarding flatness. Furthermore, a design may have been
created to accommodate a personality and so this design may introduce
dysfunctional behavior that negatively influences the performance of the
organization.
o The MOS provides a standardized structure that encourages performance
in the dimension assigned to the leader. All leaders are oriented within the
prescribed design and so reduce personality-driven variation in design. It
provides a vision for design and scalability and so is a design control.
Accountability is ensured through performance measurement but also
through collaboration-driven dependency within the structure. Succession
planning is oriented around the ability to function successfully in this
structure. LIMs provide additional structures that accommodate leaders
with unique capabilities and structures with unique missions.
o A lack of business communication caused employees to wonder or rumor
about what might be happening in the company. The evolution of the
organization was unclear, leading to diversion of attention from progress
on the vision roadmap. Leaders said that the communication vacuum was
worse than receiving bad news. They just wanted to know what was
happening and how the company was performing.
385
o This was remedied by a communication strategy that included periodicity,
method, and audience. Leaders were transparent about the next steps that
the organization would take. These actions may be uncomfortable to some,
but the overall effect of having informed employees outweighed any
negativity. The bias to over-communicate turned out to be advantageous
with good-willed employees.
o MediaEnterprises had an established offshore location. This location had
effective leadership and skilled employees. Some businesses took
advantage of these capabilities while others preferred to keep their
processes local. They cited that the offshore location was not able to
perform functions targeted for off-loading. They said that the offshore
location was not able to turn the work around quickly enough. The off-
load location did not understand local needs and so could not do the work.
o This was remedied through shift configurations that allowed for 24-hour
operations. An always on initiative helped the offshore operation to
understand the goal of how they should be perceived by the various
operations. Teams at the offshore location were put on distribution lists
that put them in the know immediately. It was as if the offshore person was
sitting next to a location worker. Capabilities were made available to all
offshore workers through a learning management system. Personnel
exchanges allowed for local cultures to be learned. Representatives for
each location were set up so that a single-point-of-contact liaison
relationship with the offshore location was possible. A collaborative
386
environment was encouraged by one-on-one contact. The impact of this
was better cost structures. This allowed for different pricing structures
that promoted increased volumes and enhanced profitability.
o Similar products and services did not have the influence of a single leader.
This promoted variability in culture and practice. The results of this
variability were seen in financial and reliability performance. In some
isolated cases, performance was very good for a portion of the supply
chain. The clients’ view of performance in a supply chain relates to their
experiences with the weakest link. A failure in one aspect of a workflow is
a failure of the supply chain. Issues negatively influence the workflow
cycle-time due to delays, rework, and resupplies.
o The MOS design has a horizontal product and service leadership
provision. These leaders work collaboratively with each other vertically in
the supply chain and horizontally within their lines of business across the
geographical dimension. They flush out variability and enable the
standardization on best practice by pushing policy uniformity, tools,
system enhancements, and metrics for monitoring.
o A side effect of a dysfunctional organization is the lack of a streamlined
and effective escalation process. Business continuity and performance
predictability are generally desired internal to the business and external to
clients. While this is a panacea perspective, there are exceptions that
occur. The nature of an intense, high-volume business with significant
associated liabilities is that these exceptions tend to have significance.
387
There may be a single $30 delivery that is used politically to sink a $200
million deal. While all risks cannot be predicted and the best, most robust
workflow cannot keep a single non-conformity from occurring, there is the
need for both contingencies and exception management. When a reactive
action is required, the organization needs to have the ability to escalate the
exception to someone who can course-correct a delivery or a re-delivery to
mitigate penalties and brand image tarnishing.
o A template was established and deployed worldwide for purposes of
escalation. The familiarity of the design made it easy for everyone to know
how it worked. Exception management was then accelerated as workers
knew who to contact when they could not handle a situation. Clients
noticed that issues were resolved more quickly. The resulting confidence
encouraged increased work from the client. Sensitive work was assigned
to MediaCorp because clients knew that the work would be accomplished
on time and not stopped by issue resolution problems.
Financial functions
o The preparation of an invoice that is accurate and includes every possible
billable line item with maximum value placed on time is a challenge for
any organization. In some cases it seems like it is more difficult to invoice
than to make the product.
One of the biggest blockers (from my viewpoint) is the
dysfunctional intercompany process that we are following... it
takes my entire team 2 days at the end of every month to reconcile
388
intercompany… that’s nuts. If we add the time and resources that
we are wasting invoicing each other – it really gets crazy.
(1MC127)
An organization that delivers complex and individually unique products to
many customers simultaneously is especially challenged. Adding to the
complexity, when different organizations create invoices for various parts
of the supply chain in isolation from other organizations, inconsistencies
and errors are possible. The client will view this bi-product of a lack of
centralized control as being similar to dealing with multiple vendors. This
then negates the end-to-end strategy.
o A LIM was introduced in the form of a product line manager. This role
made it possible for a product line, in all of its variations, to be tracked
through the supply chain. A single point of communication for the client
inspired confidence. Frequent executive summaries promoted
transparency and issue resolution. The product line manager was able to
monitor billing line items for the product line to ensure a single
representation of the financial cost of the product line. This single point of
contact made it easy for the client to do this work with MediaEnterprises.
o Accountability for financial performance mandates that those held
responsible have feedback on the impact of their decisions over time.
Periodic financial feedback needs to be aligned and timely. The alignment
of financial information includes report design aspects that allow for
analysis and comprehension. Some of these aspects relate to time. For
389
example, the capability to perform year-over-year (YoY) analysis across
locations would suggest that the data is consistently constructed and
applicable over the time frames. Additionally, for those who are
accountable, it would be expected that they would receive feedback on
their decisions soon after the effect of their decisions was experienced by
the organization. If this is not the case, the ability to accelerate progress in
the right direction or course-correct away from a bad direction is slowed.
o A single design for financial performance packages was deployed. This
promoted a consistent look of the documents from month to month. Once a
P&L leader was trained on how to read it, they became much more aware
of their financial performance. The financial packs reduced complexity
and helped them to make quicker decisions. They also helped leaders to
see the impact of their decisions, thereby enhancing profitability.
o The construction of a P&L includes functional groupings and their
associated costs and revenue. These groupings may not be optimal or
practical. The ability to understand performance by LOB would suggest
that the functions that add value to a LOB workflow would be financially
grouped in the P&L. Not understanding this performance leads to pricing
inconsistencies that appear to the client as irrational.
There are huge challenges … the largest from my perspective is
due to our businesses all being on separate P&Ls. The business
leads are being judged against that, and thus, need financial
incentives to place the work where it makes sense. With pricing
390
pressure being what it is, this becomes even less lucrative as
margins shrink further. (1MC139)
Internal competition can lead to a negotiation that hurts profits, as a client
then asks for the lowest pricing for the same value-added activities but
from different sources within the organization.
o Horizontal LOB leaders gained access to financial information from all
locations that produced the products that had been mapped to them. They
were able to review the allocation of expenses and the organizational
designs at all locations and make alignment corrections. They were able
to increase organizational alignment to make sure that the right groupings
of functions were organized within their associated lines of businesses
worldwide. This also enabled performance monitoring and the use of
ratios.
o A single customer may be billed using different methods or multiple
template designs because deliverables came from many BUs at
MediaEnterprises. This leads to inconsistent methods being deployed that
may result in increased error rates. It may also lead to needless discussion
around these inconsistencies so that the client can understand what the
invoice is saying.
o The client would prefer to have a similar looking invoice. This suggests
one-ness in the value chain. It ensures readability and reduces errors or
confusion. A centralized billing department was used for the supply chain.
This department led by a horizontal dimension leader pushed policies that
391
promoted conformity to a single standard across all locations. To the
extent possible, a similar rate structure and strategy was used. In some
cases the structure was driven by contractual documents.
o The rate structure also applies to intercompany situations. A division in
the supply chain may need a workflow output from another division to
make a sale. This becomes even more prevalent in an end-to-end scenario.
Within the sale, the cross-divisional workflow element was priced and
may be an isolated line item on an invoice. Intercompany rates typically
are discounted against this line item and so the organization that performs
the work and bears the cost does not experience the full revenue associated
with the line item. Regardless of how the rates are structured, a lack of
consistency and agreed to billing norms leads to needless negotiations
with every project on what the internal rate is going to be. This influences
the internal behaviors about the desirability of the work and also delays
the execution of the work, which subsequently delays its associated
revenue. It may also lead the client to believe that the organization is not
able to perform the work, leading to a reassignment.
o The intercompany rate card was eliminated by consolidating P&L
structures. The result was that the revenue received for the line item was
fully experienced by the P&L. The transfer of funds between P&Ls, guided
by the intercompany rate card, was eliminated. The effort and research
when discrepancies occurred were eliminated. This, together with the
centralized billing function for all functions, reduced cost. The centralized
392
function also allowed for systemic enhancements to streamline processes
going forward.
o The silo environment does not encourage cross-division revenue
opportunities. Each division is measured independently and is not
incentivized to provide revenue opportunities to upstream or downstream
divisions. In some cases a division was working on a product that could be
exploited vertically. These opportunities are lost due to a lack of
collaboration.
o A LIM was implemented to cross over divisions while looking for
opportunities to share work. This LIM connected a selling group and an
operational group that could make supply chain deals. They could also
vertically expand a deal to benefit other divisions. A commission-based
reward structure was associated with these deals to motivate the sales
group, while bonuses motivated operation groups.
o A dysfunctional rate structure, intercompany or across clients, leads to
effort needed for research. The complexity brought on by variable rate
structure designs and a lack of a common method, leads to inaccuracies
applied to invoices. Training becomes more difficult and human
performance inconsistency becomes more prevalent, leading to
investigations and reconciliations. This research consumes capacity and
increases the cost within the billing function and the operation. Customers
then experience a delay in receiving their invoices. They may even
indicate that one part of the supply chain is able to send invoices timely
393
and accurately, while another section of the organization struggles. This is
confusing and frustrating for clients. The inability to invoice has led
clients to move their work to, or away from, their vendors.
o The centralized billing function was able to deploy a module in the ERP
that standardized billing methods through the system design. Local
nuances were accommodated for, while rate card designs were
standardized so that the system could exploit them. Sales modified rates in
the system when new contracts were won. Billing functions that could be
automated were. Policy and commonality could be pushed through the
system. Training on the use of the system was facilitated through
MediaCorp’s online university.
o Unfair end-to-end pricing resulted when deals were made. Some
businesses were used as loss leaders to make the deal. This hurt P&Ls that
were used as part of the reward system, and so were protected. Giving
some services away for free compromised the performance of business
units and presented the image that they were unhealthy and subject to
divestiture.
o A methodology for the redistribution of revenue was deployed to avoid a
perception of poor financial performance. The redistribution was related
to the business unit total cost as a percentage of the overall cost
associated with the project.
o A dysfunctional intercompany process resulted in negotiations, some of
which were achieved under duress, regarding internal pricing. The intent
394
was to increase margins in the home business unit at the expense of the
business unit that was offering services unavailable to the selling business
unit. The inflated margins created line item targets for discounts. Clients
wanted details of cost in the workflow at the line item level, leading to the
discovery of opportunities for reductions. With this information they were
able to reference market pricing for these line items. This left the business
unit that provided internal services with a loss leader that was
uncompensated for in the selling unit. Additional costs were associated
with coordination, internal transfers, and internal invoicing.
o The selling units became members of a single P&L structure where
intercompany transfers were not needed. The P&L experienced the
revenue and the cost was allocated. As a result all line items were justified
against market pricing standards.
o Revenue was lost due to the inconsistent choices of line items used in the
invoicing process. This inconsistency led to the loss of revenue potential
for services. Rate cards may not have provided adequate information
about the rates that can be used. In this case line items would be
consistently missed.
o Revenue worksheets were set up in the ERP system to provide template-
based invoices that referenced rate cards built into the system. All rate
card structures were reviewed for fulsomeness. Automatic checks were
built into the system such that any changes to the invoices outside of the
template rate card needed approval prior to being sent out.
395
o A client may receive multiple invoices on the same purchase order (PO)
due to the segregation of functions in the value chain. The preference of
the client is to receive one PO for all services in the value chain. This also
reduces costs at the vendor site, as processes are consolidated and
connected providing a general level of transparency.
o The ERP system was used to prepare billing across the value chain in all
supply chain services. As the ERP migrated vertically to business units,
they were able to use automated billing and repurpose data that was
populated once at the beginning of the project. This saved time and met
the clients’ expectations.
o The behaviors of the facilities were influenced by the fact that there was
no self-interest policy. The effort expended to accomplish work that meets
a client’s expectations should be rewarded with revenue and profits that
are part of the location’s reward system. This motivates locations to
accomplish the work with the least cost and the most value to clients.
o A self-interest policy was created to reward locations that accomplish
work in their local markets. This also influenced reward systems as they
were designed with a strong local component to motivate leaders to
exploit addressable markets within their reach.
o In some cases rate structures were set up such that one business profited at
the expense of another. This occurred in deals that were made. A
concession in one area allowed another business to profit. Essentially the
losing business was given a loss leader.
396
o A policy related to the redistribution of funds was implemented. It was
structured in accordance with an allocation policy that related to total
costs in the loss-leading business unit. A monthly transfer was made based
on the calculation. In this way, the cost burden was equalized across all
participating businesses.
o Every project had an aspect that was unique. Consequently, a pricing
structure was created around each project. To optimize profits, a pricing
strategy to optimize profitability would have to be used. The strategy
needed to include various techniques to optimize profitability.
o Each deal was unique and so needed a unique pricing strategy. The
techniques used to optimize profits in each deal came from an assortment
of techniques that could be applied, such as seeking overages and
upselling services. Every billable line item was considered. As an
example, there was the opportunity to upsell other services to gain more
revenue. A strategy may also include the inclusion of line items that were
not previously considered. These line items are needed when other line
items cannot adequately carry the cost of those not listed.
o Rate card misalignment happened as the result of unique deal structures.
Even so, treating every deal as a one-off resulted in the loss of opportunity
to charge for other aspects of the project for which the client would have
paid. This happens when the dealmaker does not understand what is
valuable to the client. In addition, there are nuances to rate structures that
are geographically driven.
397
o The MOS includes geographic locations in the vertical dimension. An
awareness of value in each location was determined. For example, one
location may pay more for security than another that would consider it a
barrier to entry. Horizontal leaders were able to see how their pricing was
handled by client and by location. This allowed for discovery of line items
that could be used, thereby optimizing alignment while allowing for
customization.
Continuous improvement
o Some parts of the organization may have a structured continuous
improvement process while other parts may not have one at all. However,
not learning from failure encourages a repeat of that failure. This is
confusing for clients who want MediaEnterprises to learn from their
mistakes. Typically a mistake will result in a penalty to both the vendor
and the client. For example, the vendor will have the cost of the rework
while the client may have to wait longer to get their product. This will
impact schedules and lead to penalties. An inconsistent or incomplete
application of the corrective action process may lead customers to believe
that in some areas there is no hope of keeping issues from happening or
reoccurring due to the significant existence of residual risk.
o An analysis of all workflows was completed to understand what they were
and where they were located. The quality system was then applied to these
workflows in all locations. The quality system includes a robust corrective
action process. A SLA on corrective action turnaround time was deployed
398
and measured for compliance. All issues were logged in trackers and
reflected in the management review that went to all executives. All
investigations and corrective actions were reviewed by a single capable
person.
Leadership
o While personalities of leaders and their leadership style will differ, clients
want to see 1MC guided by a single set of values that drive behaviors.
They want to see one culture driven by these values. They expect that
these values drive performance that is predictable and desirable.
“When we see things (in our business unit or others) that seem to oppose
this initiative, we need an agnostic escalation point that represents
‘MediaCorp’ ... not just a slice of MediaCorp.” (1MC150)
The lack of leadership conformity within BUs and at corporate suggests to
clients that they cannot predict the behavior of leaders when they engage
leadership at MediaEnterprises.
o A vision and mission statement was made public by MediaEnterprises’
leadership following significant discussion on the topic. Supplemental
statements were made with regard to sub-aspects of the statements related
to security, quality, and service levels to provide additional detail on
responsibilities. As the MOS scaled, the culture driven by these statements
was transferred to each additional business unit in the overall
organization.
Compensation system
399
o With the blending of business units through synergy exploitation or
acquisition, there were anomalies in compensation systems. This included
terms of employment and compensation amounts. This caused issues of
compliance with payment bands and uneasiness among those within the
bands due to a lack of conformity in a few instances.
o The issue was resolved by extending the bands and adjusting the wages of
the high-fliers. This enabled those who were paid at lower rates to be
pushed up further into the band and conversely, it pulled those outside of
the band back into the range. The band creation regulated the hiring of
new employees, including allowing for new employees at higher rates.
This system was deployed to all business units and included regional
nuances.
o Performance in the business units was not linked to compensation. This
was partly due to a lack of a unified set of performance metrics. The
metrics that existed had variations in the methods by which they were
calculated. This prevented relative measurement and made it difficult to
set targets that applied to all business units for like workflows.
o A set of KPIs were created that were agreed to by business unit leads.
These KPIs were defined including the methodology for calculating them.
With this, it was the possible to set annual performance targets and target
improvements. The results of the measurements are published monthly in
the management review. The targets and their definitions are also
published in The Review.
400
Training
o Employees did not experience training such that they could perform at
suitable levels, especially in light of change. Most of the training that
happened was on-the-job, as needed. In some cases training was provided
after a failure occurred. The training function was provided by functional
leaders on location. These leaders could be overwhelmed with production
needs. The lack of training therefore could negatively influence
performance.
o Training curriculums were developed by each functional leader and
included in the MediaCorp University. The university allowed for the
presentation of information regarding work responsibilities for business
unit functions and clients that leveraged MediaEnterprises’ systems. It
also allowed for testing while providing details on comprehension issues.
A single university allowed all functions with similar attributes to exploit
the training materials of other business units. This reduced the effort
needed to create the materials. Updates to the materials were relatively
easy, as leaders were trained on how to create and modify courses.
[Client] wants to leverage MU to help enable their people to
perform tasks in [the] ERP as an example. This gives us the ability
to measure comprehension through testing, the ability to evaluate
test capability through the analysis of question success, the
tracking of who has and who has not passed a test, etc. (1MC19)
Recruiting practices
401
o The recruiting practices at each site varied according to local practice.
While geographical nuances needed to be considered, many of the
functions were similar worldwide. The lack of standardization on best
practice inhibited the transferability of work. When this occurred there
were excessive failures, diminishing confidence in the ability of the
business unit to execute the work. In many cases the performance of the
teams was directly related to getting other work. Poor performance
influenced revenue and profits. In some cases penalties were assigned.
o A process for recruiting was implemented to ensure the best candidate
was awarded the job. This was determined through preliminary knowledge
testing and a structured interview process. The functional leaders were
directly involved in interviews to make sure that the new employees were a
good fit. A better fit also reduced attrition rates. The mix of full-time (FT)
and freelance (FL) workers was also optimized.
… using operator skills in all places possible where they can be
applied... informs our ability to consolidate activities across
functions [including] labor type modeling that relates to the
percentage of freelance staff as compared to full-time relative to
the volatility of volume. (1MC45)
Security management
o The assets that MediaEnterprises handles are not their own; they belong to
clients. These assets are the crown-jewels of the clients. They have
invested significant capital in these creative properties. The loss or leakage
402
of these assets results in significant loss on this capital invested.
Consequently, security management is paramount in this industry. A
single breach could result in significant penalties and financial loss.
Clients expect that when they review the security management in any
division of MediaEnterprises, that they will see similar leadership, culture,
and controls. When this is not the case, they lose confidence that a security
breach will not happen and they award the work elsewhere. This is a
barrier for entry in many cases.
o A unified security approach was applied to all locations through a
security management system. This system was used in all new locations.
An internal assessment tool was made to assess the compliance status of
each location. A centralized team supported the location to bring the new
site up to company standards quickly. Local regulations were taken into
consideration as part of the initiative. Ongoing assessments were
completed through internal and external audits. Non-conformities were
resolved through corrective action. A security standard was constantly
updated to reflect the last threat mitigation controls. This standard
informed the gap analysis. With each update, the gap analysis was used to
ensure that all locations met all the controls, including the new ones. This
also prevented drifted and accommodated new workflow introduction.
“The MediaCorp security policies are very tough and should pass
any industry audit. It will take some serious work to get some of
our facilities up to the new standard.” (1MC62)
403
“I support using [MediaCorp’s] security policy for all of
[MediaEnterprise facilities]. I recommend doing this … to
standardize on one set of policies and improve our overall
security.” (1MC63)
In summary, the data suggests that the 1MC initiative is critical for the growth strategy of
MediaEnterprises. In order for clients to entertain this strategy, they would have to see the
competitive advantage from the one-ness factors that differentiated MediaEnterprises from a
sequence of vendors in the clients’ supply chain.
“[We established] customer decision maker alignment for product [that] lead to
synergistic supply chain opportunities.” (MS58)
The effort on the clients’ side to manage a sequenced vendor chain would be significantly more
than the 1MC alternative. An end-to-end proposition for services would eliminate handoffs,
reduce order dwell time, and reduce the number of outputs needed. The following propositions
summarize the key findings of this section:
Proposition 148 (knowledge consolidated): Effective data management
consolidates knowledge by exploiting a globally accessible framework.
Proposition 149 (reliability system): A mature quality system that promotes a
performance standard should have equal influence on all locations, encouraging
performance parity and improvement.
Proposition 150 (practice unification): Practice unification on excellence assumes
that asset locations are always known and are being cared for, returned, or timely
purged.
404
Proposition 151 (component unity): The standardization of infrastructure
components allows for knowledge of disposition and redeployment to
accommodate local capacity requirements.
Proposition 152 (system unity): The internal unification of systems to streamline
operations also influences external perceptions as API integrations and client data
views may be variably complete.
Proposition 153 (embedded alignment): A common vision-mission will be found
embedded in strategic planning and discovery documents when the parts of a
MUF are aligned.
Proposition 154 (design effectiveness): Unity is easily found in a MUF's
organizational design when the layout of the positions is clear and service failures
are rare.
Proposition 155 (validated transformation): The clients’ impression of the MUF’s
capability as an organization is influenced by how the MOS allows itself to be
transformed and monitored externally.
Proposition 156 (single mindset): A deployed set of values and norms creates the
perception of a single mindset among MOS leaders.
Proposition 157 (acquisition mechanism): A mechanism should be deployed to
verify that training is effectively deployed on a single platform by measuring
comprehension and also to what extent users depend on it for knowledge
acquisition.
405
Proposition 158 (threat-scape): Security awareness and the integrity of
infrastructure at each site indicates the level of concern and control over the threat
environment.
Proposition 159 (competitive one-ness): Competitive enterprises are compelled to
strategically position themselves in alignment with the one megatrend in order to
maintain and enhance market share in a dynamic environment.
Proposition 160 (excellence horizontalized): Consistent excellence across all
locations is foundational to a one initiative, as it validates the single vertical
supply chain perspective of the client.
Proposition 161 (organizational recalibration): Organizations seeking one-ness
must recalibrate their perspective on organizational design to enable or sustain
profitable growth in an evolving market that embraces, or that already has
embraced, the benefits of one-ness.
Proposition 162 (knowledge centralization): Knowledge management engages
entrepreneurialism, producing new knowledge while unifying task knowledge
through centralization, utilization, and influence.
Proposition 163 (one reliability): Clients expect a singular, high-reliability,
performance experience in the value chain that is subject to a mature remediation
process when infrequent non-conformities occur.
Proposition 164 (one vault): Clients expect that their assets are available,
locatable, and treated in a similarly excellent way, regardless of where they are in
the end-to-end vendor supply chain.
406
Proposition 165 (one infrastructure): Clients count on the reliability of the vendor
supply chain workflows, which are dependent on the continuously available
capability of each linked functional element.
Proposition 166 (one strategy): An end-to-end value chain must be aligned in
purpose and destiny in order to realize synergistic growth.
Proposition 167 (financial information): MOS leaders benefit from timely,
concise, and complete financial performance reviews that are linked to cost
mitigations and the result of opportunity exploitation.
Scaling the MOS. An effective structure must be scalable to increase its potential
benefit. The scalability of the MOS was also critical to the preservation of the one-ness inherent
in the MOS design. Figure 71 illustrates this by showing how the MOS can carry the norms to
new businesses through synergistic expansion. The MOS design is scalable in all dimensions. A
new client can be added, just as a new location, product line, or support function can be added.
Some use cases could include the following as illustrated below:
Product four could be sold to other clients in other sector services by other divisions. The
MOS could assist the other division by making and delivering the product to the client.
Profitability comes from additional revenue at an intercompany price that includes a
suitable margin.
The ERP system developed in the sub-division could be exploited in another division. It
could be used as a market penetrator, helping another division to close a sale. The other
division could charge a fee for usage of the system, thereby increasing profits by
leveraging growth synergies.
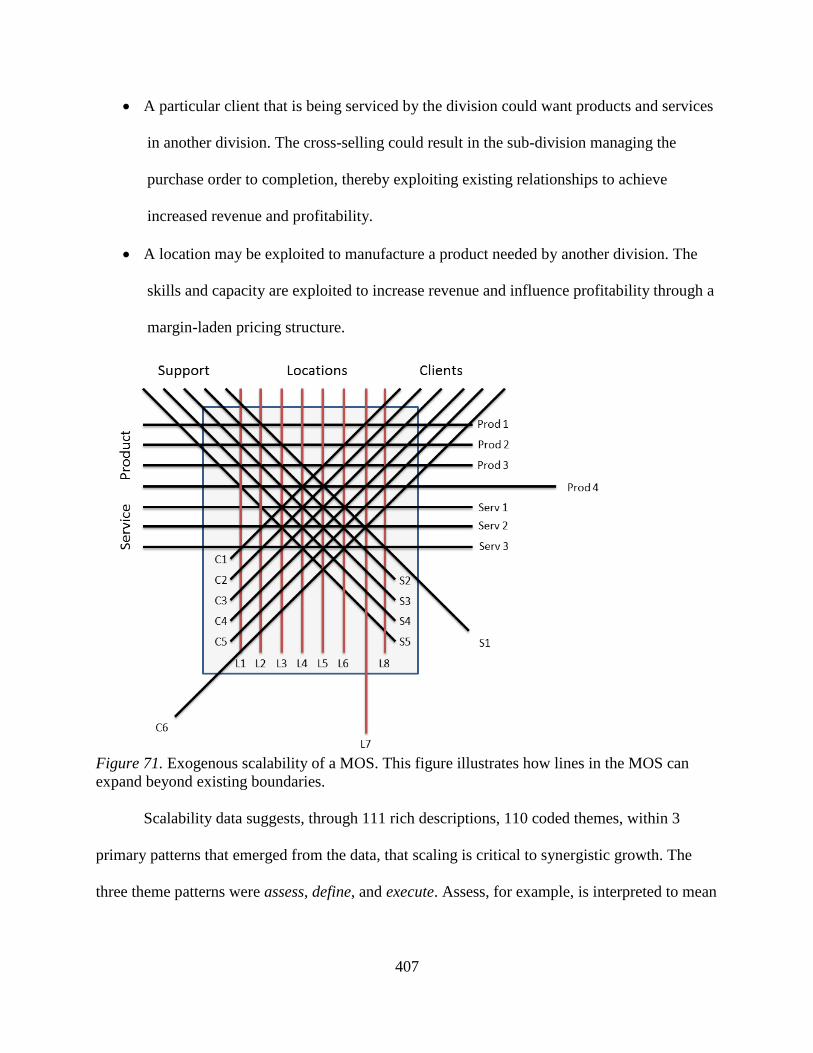
407
A particular client that is being serviced by the division could want products and services
in another division. The cross-selling could result in the sub-division managing the
purchase order to completion, thereby exploiting existing relationships to achieve
increased revenue and profitability.
A location may be exploited to manufacture a product needed by another division. The
skills and capacity are exploited to increase revenue and influence profitability through a
margin-laden pricing structure.
Figure 71. Exogenous scalability of a MOS. This figure illustrates how lines in the MOS can
expand beyond existing boundaries.
Scalability data suggests, through 111 rich descriptions, 110 coded themes, within 3
primary patterns that emerged from the data, that scaling is critical to synergistic growth. The
three theme patterns were assess, define, and execute. Assess, for example, is interpreted to mean
408
that prior to MOS scaling, an assessment should be done to understand what LOB is being
scaled.
“Business review of that specific area (e.g. LOB) to understand their growth strategies,
etc.” (MS5)
The next step that emerged from the data was to define. The context in this case was to
determine the mission to accomplish during the scaling.
“Creating milestone schedule-showing actions need to be performed along with financial
impacts.” (MS17)
The last step in the scaling is to execute. The context in this case is that MOS leaders need to
achieve critical results while aligning the organization and avoiding undesirable outcomes, even
if they are relatively small.
“Bifurcate existing operational entities into components that fit within other entities
without having to add or change optimal organization/operating structures.” (MS63)
MOS leaders understood that assessing and planning were critical to execution. Given that they
have had experience in synergistic change, this is understood. This experience helped them to
provide data relevant to scaling the MOS. Each of these three areas will be discussed in further
detail below.
Prior to scaling execution, the entity to be introduced needs to be assessed. According to
the data that emerged from MOS leaders, this includes seven areas to be considered as illustrated
in Figure 72. The first area to be considered, the order is not relevant per se, is with regard to the
client. This includes assessing the attributes of current relationships with the entity being
integrated or scaled into the MOS.
409
“Reviewing if there is any opportunity for price increases by creating ‘value’ for [the]
client by utilizing [division] resources (e.g. R&D, ERP, etc.).” (MS24)
Additionally, this includes an understanding of what the client thinks is valuable. This may
include existing services and products, as well as those that are not currently provided. An
understanding of value helps with pricing optimization. It also helps to uncover growth
opportunities that might be synergistic with existing business units that could participate in the
relationship.
The second area that emerged was an assessment of infrastructure. Infrastructure is
critical to workflow operation and on-time delivery realization to a prescribed specification.
Hardware and software need to be assessed to determine if they are relevant to ongoing business
continuity. Software may not be licensed or supported. Hardware may be at the end of its life-
cycle and be unsupported. Issues that arise will need to be remedied. Furthermore, an
understanding of efficiency improvements may be discovered during the assessment. Similarly,
systems must be assessed for similar reasons. Questions regarding the possibility of system
consolidations and enhancements need to be discovered. The data also suggested an assessment
of automation opportunities to assist with profitability in the integration or during the scaling to
optimize profitability. In some cases, automation may already exist that can be exploited. An
assessment of disaster recovery and business continuity plans needs to occur to ensure alignment
with client expectations. Lastly, the infrastructure needs to be assessed for compatibility. This
includes compatibility in the existing location. Opportunities for space optimization can be
realized during scaling. These gaps need to be identified and then closed.
Next, the leaders of the facility to be integrated should be asked about their R&D
roadmap. This is the best time to acquire information about the opportunities to make further
410
change that will enhance profitability. The legacy leadership has an opinion about what needs to
change just prior to their knowledge of the acquisition or integration. Not exploiting this may
result in significant discovery effort.
“[We will be] reviewing [to see] if any tasks can be automated by R&D tools or by ERP
enhancements.” (MS20)
These leaders can also provide valuable information on the effectiveness and capabilities of the
support functions. These capabilities would be assumed by the diagonal support dimension in the
MOS and should be known. Specific information that would be valuable includes the capability
and capacity adequacy of these functions. Lastly, an understanding of the administrative burden
of these functions may have impacted their capability and capacity.
“[We spent time] reviewing all admin tasks for off-load to lower cost facilities like
[location A] or [location B].” (MS13)
To the extent that this burden can be minimized, capacity could be influenced, producing a
synergistic gain.
Operational assessments include the discovery of synergistic opportunity. This could
happen through the review of reports that are currently used and an understanding of deliverable
expectations.
“[We will be] reviewing requirements and the possibility of moving the workflow to the
ERP system.” (MS22)
A capacity analysis may also reveal utilization information and other relevant information.
Related to capacity, quality performance information will reveal capacity consumed by rework.
Revenue concessions due to operational failures may also be remedied to improved profitability.
411
Having an understanding of rejection types, frequency, their root causes, the corrective action
process, and general reliability trends would be valuable during MOS scaling.
[Regarding] rejection tracking... we’re on this call with [MOS diagonal support leader]
on the failure mode and effects analysis (FMEA) reporting and we need[ed] to pull her
into this as soon as possible because in some areas there won’t be much in the way of
reporting and we need to make sure it’s there. (MS54)
The assessment of human resources produces valuable information according to
experienced MOS leaders. This assessment includes talent measurement and assignment, an
understanding of churn and its drivers, mediations to stem undesirable churn during the
integration, and an assessment of the organizational design. This assessment may reveal needed
organizational design modifications, promotions, or reassignments.
A financial assessment will reveal the current health of the business along with recent or
long-term trends. MOS leaders recommended that a quick assessment of the current and past
budget is needed to understand trends and performance expectation gaps.
“[We will be] hashing out short-term and long-term P&L impacts [and] working with
finance to create a P&L for integration so it will be very clear what is needed.” (MS28)
A business review will reveal current cost structures, cost efficiency, and pricing strategies. An
assessment of the P&L impact of the scaling or integration is critical to financial performance
during the time of transition. This awareness helps MOS leaders to be aware of challenges so
that mitigations can be prepared.
Lastly, an assessment of support functions was beneficial. This included an assessment
with regard to the support functions’ ability to perform tasks. Where the capability did not exist,
the task was subcontracted. Further to this, their capacity to perform these tasks had to be
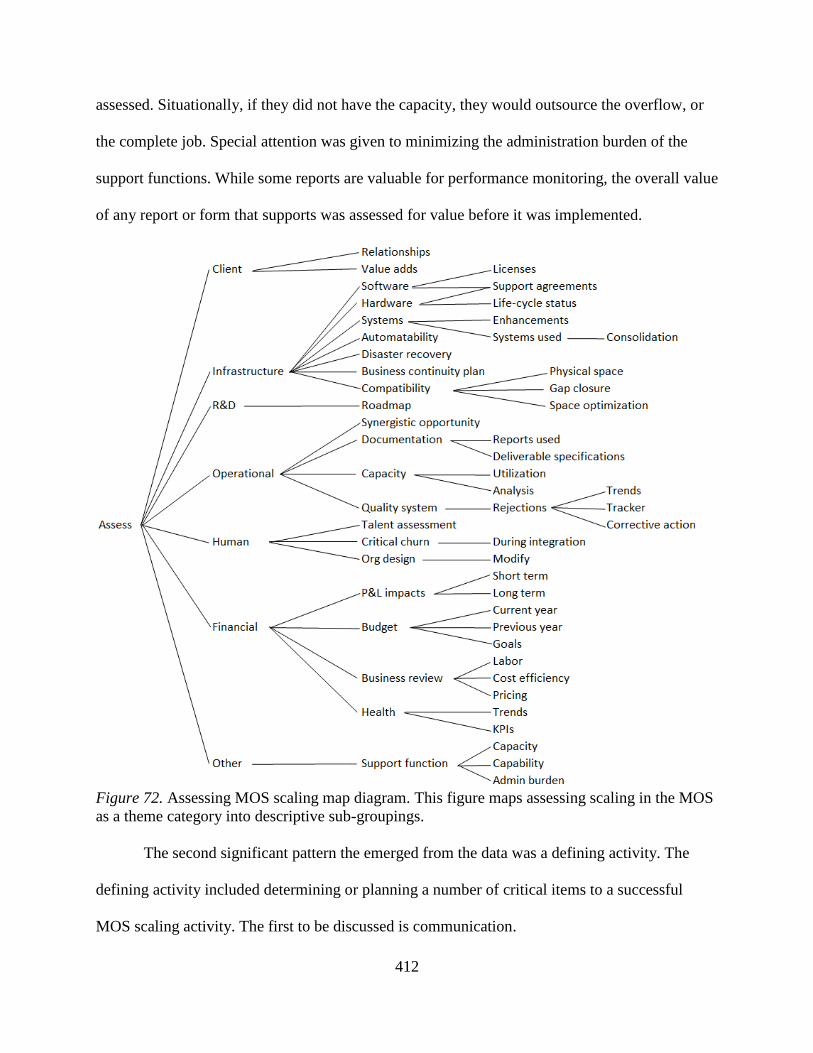
412
assessed. Situationally, if they did not have the capacity, they would outsource the overflow, or
the complete job. Special attention was given to minimizing the administration burden of the
support functions. While some reports are valuable for performance monitoring, the overall value
of any report or form that supports was assessed for value before it was implemented.
Figure 72. Assessing MOS scaling map diagram. This figure maps assessing scaling in the MOS
as a theme category into descriptive sub-groupings.
The second significant pattern the emerged from the data was a defining activity. The
defining activity included determining or planning a number of critical items to a successful
MOS scaling activity. The first to be discussed is communication.
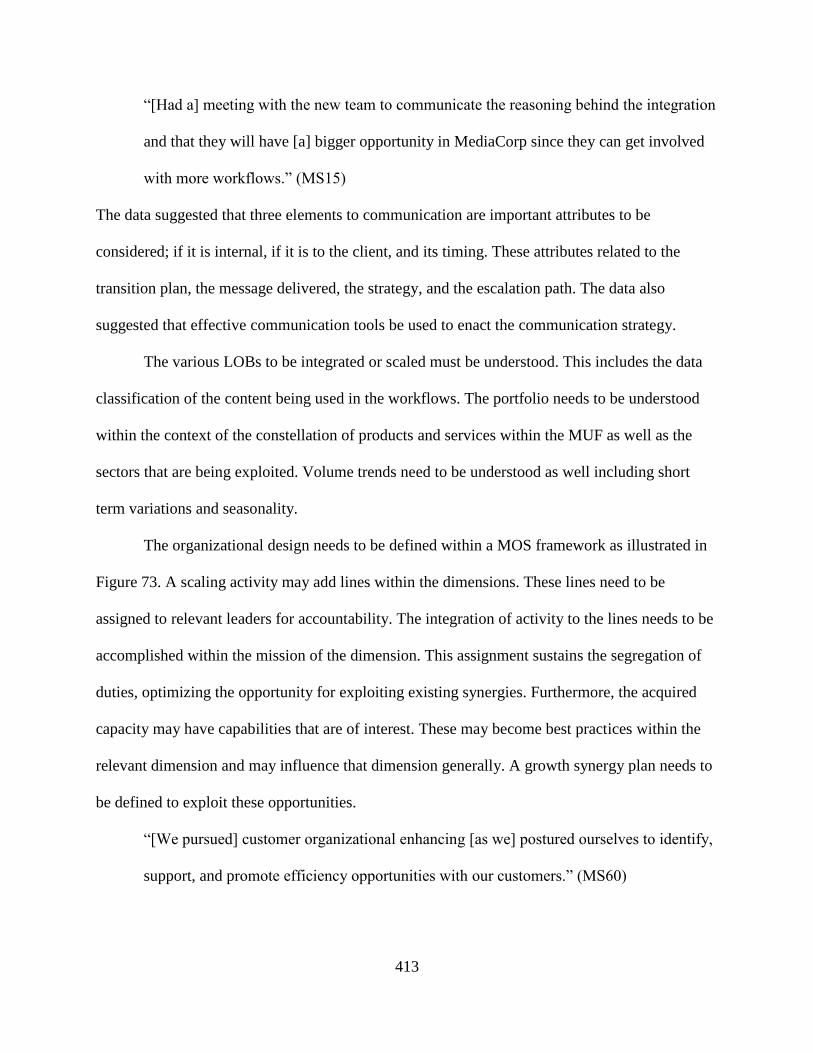
413
“[Had a] meeting with the new team to communicate the reasoning behind the integration
and that they will have [a] bigger opportunity in MediaCorp since they can get involved
with more workflows.” (MS15)
The data suggested that three elements to communication are important attributes to be
considered; if it is internal, if it is to the client, and its timing. These attributes related to the
transition plan, the message delivered, the strategy, and the escalation path. The data also
suggested that effective communication tools be used to enact the communication strategy.
The various LOBs to be integrated or scaled must be understood. This includes the data
classification of the content being used in the workflows. The portfolio needs to be understood
within the context of the constellation of products and services within the MUF as well as the
sectors that are being exploited. Volume trends need to be understood as well including short
term variations and seasonality.
The organizational design needs to be defined within a MOS framework as illustrated in
Figure 73. A scaling activity may add lines within the dimensions. These lines need to be
assigned to relevant leaders for accountability. The integration of activity to the lines needs to be
accomplished within the mission of the dimension. This assignment sustains the segregation of
duties, optimizing the opportunity for exploiting existing synergies. Furthermore, the acquired
capacity may have capabilities that are of interest. These may become best practices within the
relevant dimension and may influence that dimension generally. A growth synergy plan needs to
be defined to exploit these opportunities.
“[We pursued] customer organizational enhancing [as we] postured ourselves to identify,
support, and promote efficiency opportunities with our customers.” (MS60)
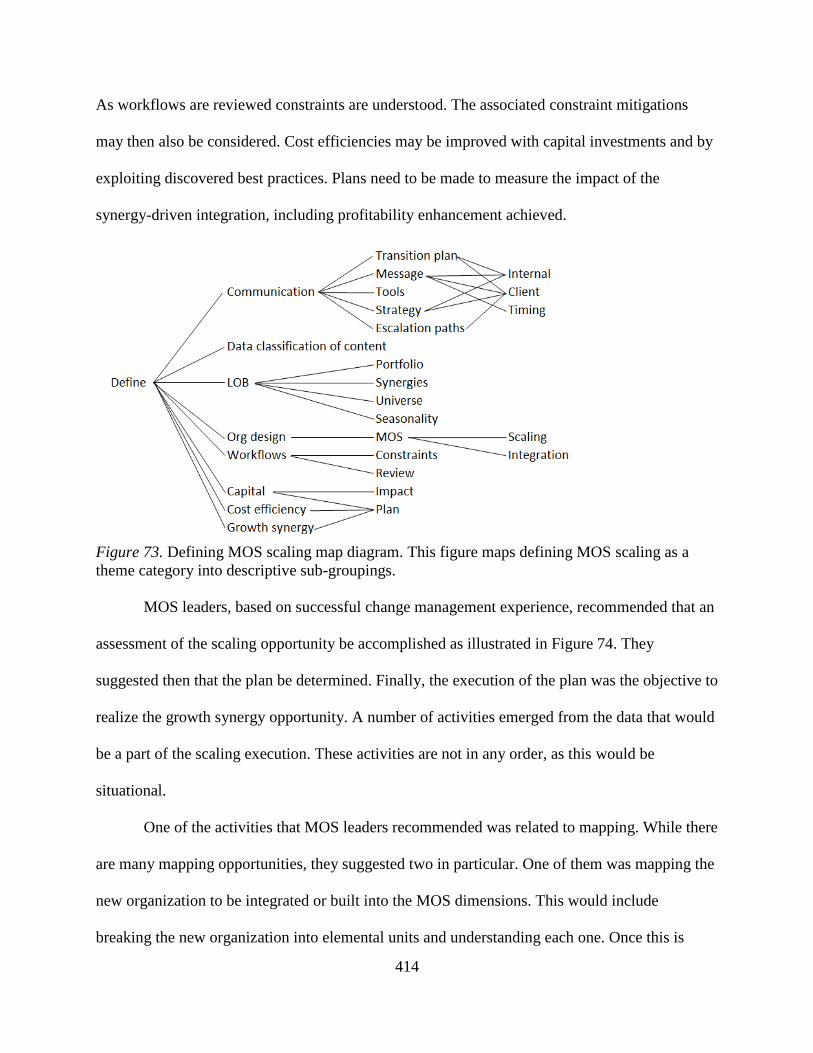
414
As workflows are reviewed constraints are understood. The associated constraint mitigations
may then also be considered. Cost efficiencies may be improved with capital investments and by
exploiting discovered best practices. Plans need to be made to measure the impact of the
synergy-driven integration, including profitability enhancement achieved.
Figure 73. Defining MOS scaling map diagram. This figure maps defining MOS scaling as a
theme category into descriptive sub-groupings.
MOS leaders, based on successful change management experience, recommended that an
assessment of the scaling opportunity be accomplished as illustrated in Figure 74. They
suggested then that the plan be determined. Finally, the execution of the plan was the objective to
realize the growth synergy opportunity. A number of activities emerged from the data that would
be a part of the scaling execution. These activities are not in any order, as this would be
situational.
One of the activities that MOS leaders recommended was related to mapping. While there
are many mapping opportunities, they suggested two in particular. One of them was mapping the
new organization to be integrated or built into the MOS dimensions. This would include
breaking the new organization into elemental units and understanding each one. Once this is
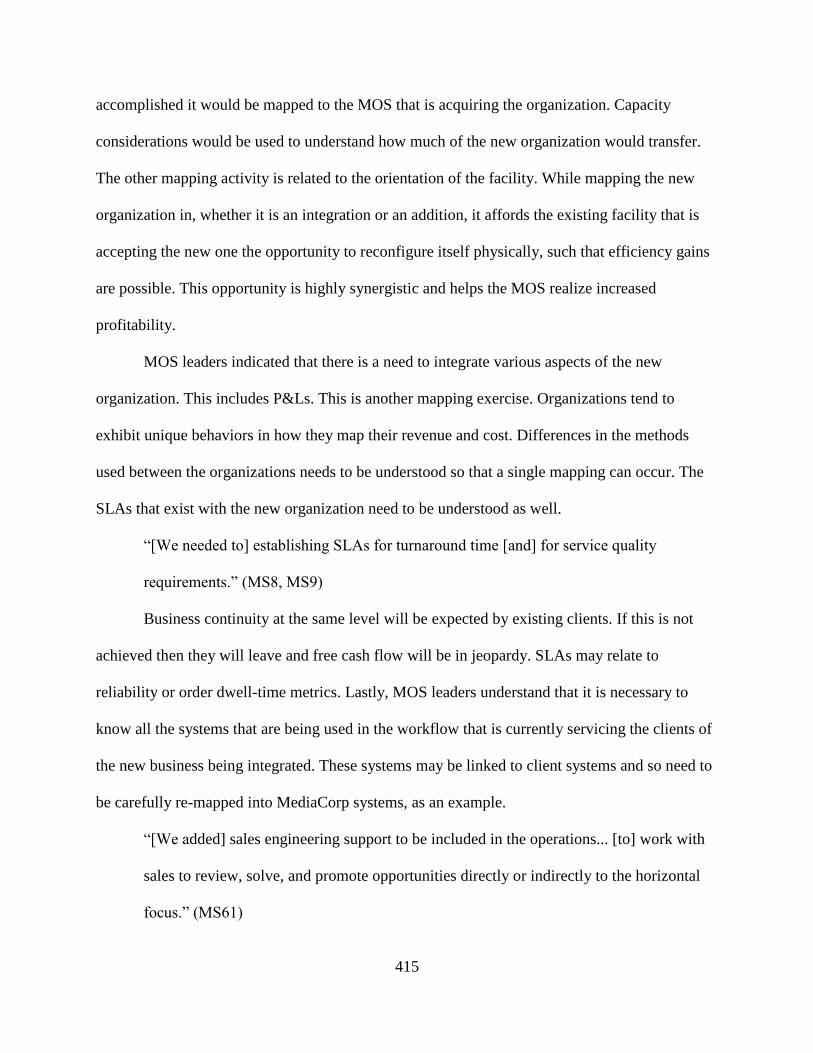
415
accomplished it would be mapped to the MOS that is acquiring the organization. Capacity
considerations would be used to understand how much of the new organization would transfer.
The other mapping activity is related to the orientation of the facility. While mapping the new
organization in, whether it is an integration or an addition, it affords the existing facility that is
accepting the new one the opportunity to reconfigure itself physically, such that efficiency gains
are possible. This opportunity is highly synergistic and helps the MOS realize increased
profitability.
MOS leaders indicated that there is a need to integrate various aspects of the new
organization. This includes P&Ls. This is another mapping exercise. Organizations tend to
exhibit unique behaviors in how they map their revenue and cost. Differences in the methods
used between the organizations needs to be understood so that a single mapping can occur. The
SLAs that exist with the new organization need to be understood as well.
“[We needed to] establishing SLAs for turnaround time [and] for service quality
requirements.” (MS8, MS9)
Business continuity at the same level will be expected by existing clients. If this is not
achieved then they will leave and free cash flow will be in jeopardy. SLAs may relate to
reliability or order dwell-time metrics. Lastly, MOS leaders understand that it is necessary to
know all the systems that are being used in the workflow that is currently servicing the clients of
the new business being integrated. These systems may be linked to client systems and so need to
be carefully re-mapped into MediaCorp systems, as an example.
“[We added] sales engineering support to be included in the operations... [to] work with
sales to review, solve, and promote opportunities directly or indirectly to the horizontal
focus.” (MS61)
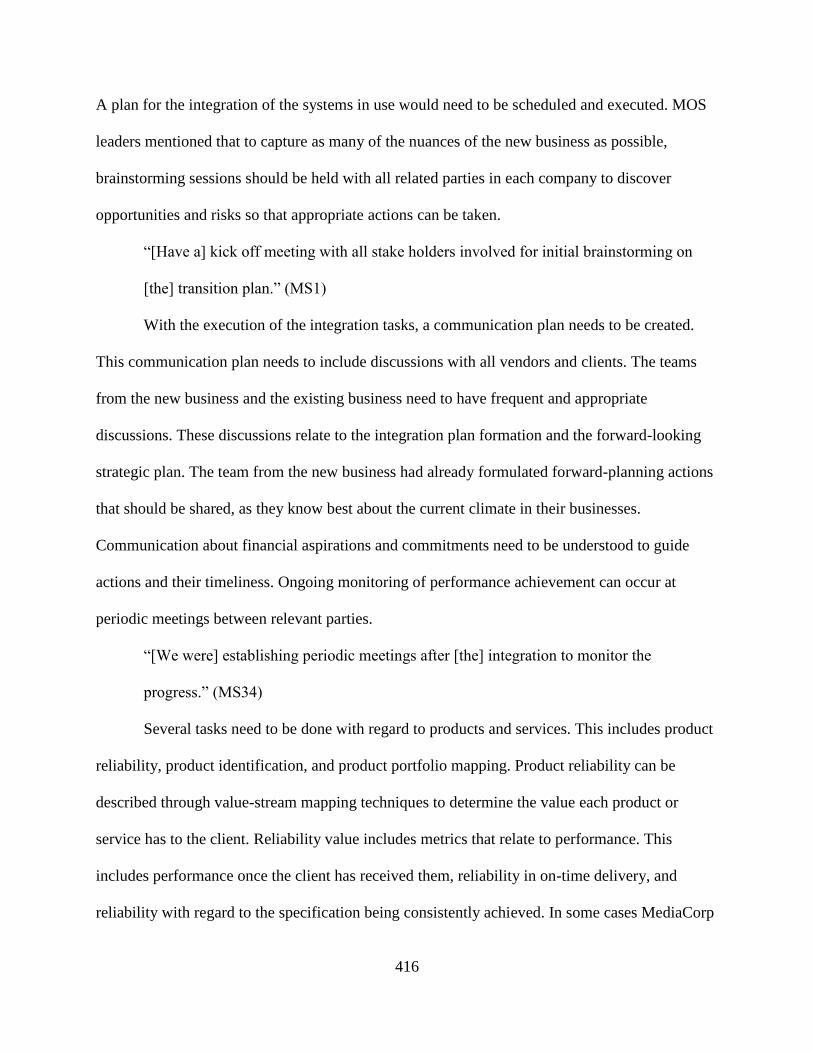
416
A plan for the integration of the systems in use would need to be scheduled and executed. MOS
leaders mentioned that to capture as many of the nuances of the new business as possible,
brainstorming sessions should be held with all related parties in each company to discover
opportunities and risks so that appropriate actions can be taken.
“[Have a] kick off meeting with all stake holders involved for initial brainstorming on
[the] transition plan.” (MS1)
With the execution of the integration tasks, a communication plan needs to be created.
This communication plan needs to include discussions with all vendors and clients. The teams
from the new business and the existing business need to have frequent and appropriate
discussions. These discussions relate to the integration plan formation and the forward-looking
strategic plan. The team from the new business had already formulated forward-planning actions
that should be shared, as they know best about the current climate in their businesses.
Communication about financial aspirations and commitments need to be understood to guide
actions and their timeliness. Ongoing monitoring of performance achievement can occur at
periodic meetings between relevant parties.
“[We were] establishing periodic meetings after [the] integration to monitor the
progress.” (MS34)
Several tasks need to be done with regard to products and services. This includes product
reliability, product identification, and product portfolio mapping. Product reliability can be
described through value-stream mapping techniques to determine the value each product or
service has to the client. Reliability value includes metrics that relate to performance. This
includes performance once the client has received them, reliability in on-time delivery, and
reliability with regard to the specification being consistently achieved. In some cases MediaCorp
417
has to help the client understand their specification, especially with regard to compatibility issues
with the workflows that create the products. The workflow routing to achieve the deliverable
may need to be determined and optimized for reliability and cost. Product identification relates to
the specification and the workflow being used to produce it. Once the specification is known, the
workflow may be further optimized to achieve the same deliverable but more efficiently. This
transition between workflows should not disturb the schedule of deliveries or reliability
performance. Portfolio mapping is important as products may be similar. Existing workflows
may be able to deliver the new products unchanged. In other cases, small changes may be
possible to accommodate the new products. These planned actions can exploit synergies and help
MediaCorp achieve improved profitability with the integration.
“[Regarding] ownership of equipment ... we would need to understand future CAPEX
impact (e.g. equipment maintenance, etc.).” (MS67)
An integration activity is also a good time to upgrade existing systems as part of the project,
allowing for a super-additive regarding profitability across infrastructure and human resources
that is now better utilized.
A critical part of the execution phase is the scaling process itself. MOS leaders indicated
that scaling can happen in at least four ways. One of the ways is for similar functions to
consolidate and improve profitability outcomes through increased utilization. Another way is
through abstract functional coupling. This involves searching widely, even outside of the
division, to find synergistic activities that may relate to the way an order is executed, or another
non-workflow related parameter. This might be viewed as thinking outside of the box as it relates
to synergistic capacity opportunity. While these couplings may not seem logical at first they can
easily be accomplished and have high benefits.
418
“[We needed to] review abstract opportunities to couple businesses/operations
together.” (MS56)
“For example: Businesses that share similar life-cycle windows (amount of days from
order to delivery) could have better success in project management resource pooling.”
(MS57)
The more obvious opportunities could come from adding a business line where there already are
lines or consolidating lines increasing utilization. This approach leverages existing knowledge,
talent, resource, and systems.
MOS leaders need to acquire several critical items to successfully complete an
integration. They need to acquire the knowledge from the business that is being introduced. This
knowledge about workflows, products, services, and specifications must be assimilated with
existing knowledge with gaps reconciled. An example would be a list of clients.
“[In addition to] assessing client relationships, [we need] understanding [regarding] how
demanding the client is” (MS71) [and we need to] “acquire [the] client contact list, [the]
client org chart, and [the] escalation path.” (MS72)
In some cases the clients may already be known, including critical contacts as both businesses
may have competed for the work previously. The KPIs from the new business needs to be
understood. This could point to client issues that need to be remedied or best practices that need
to be assimilated into the combined enterprise. Prior to an integration a buffer capacity should be
acquired. With any integration that includes scaling, the transition period introduces
inefficiencies. These inefficiencies occur as methods change, infrastructure is optimized, and
human resources adjust to the new routine. Once equilibrium has been established, a review of
capacity can be done. The business, in this case MediaCorp, must continue to explore growth
419
opportunities and momentum cannot be disrupted. Growth strategies need to be integrated into
plans to ensure that this does not happen. Knowledge of the production schedule of capacity that
is being introduced must be understood. This includes average capacity as well as short- and
long-term variation in volume. A simple average calculation cannot be used to scale capacity.
Capacity must accommodate variation. This includes the ability to flex to minimize carrying
costs during valleys and the ability to stretch cost effectively during peaks. Typically the rate at
which the volume fluctuations happen are not understood or deemed relevant to reliability or
cost. Ramp-up rates cannot easily be exceeded without compromising reliability or cost per
deliverable. Long-term variation may be interpreted as seasonal variation. This must be
understood so that appropriate capacity planning can occur. During an integration, head count
may be exchanged intentionally or because of need. For example, it could be a part of the deal.
In other cases, an exchange is needed for business continuity due to talent that has tacit
knowledge critical to revenue. The plan execution must be divided into phases including
milestones. These milestones need to be project managed to completion.
Execution must be aligned with the goals of the MUF. These are endogenous and
exogenous. An endogenous example that emerged from the data includes horizontalization. This
is pushing best practices across locations. A horizontal focus allows for the exploiting of existing
synergies. Exogenous execution would relate to meeting the expectations of clients. Clients
should, to a significant extent, guide the MOS with regard to opportunities that actually have
value.
MOS leaders indicated that gains made need to be sustained. Drifting, or organizational
entropy, should be considered and monitored. Profitability gains must not be cancelled by drift
420
that occurs due to a lack of focus. With transitions, focus and the ability to monitor performance
are challenged.
“Drift mitigation during integration [may include] establishing a ‘plan b’ if a drift
happens in servicing.” (MS74)
Organizational entropy cannot affect the transition which typically includes work shifting. Work
shifting is a capacity management within the production network. When work is moved to
available capacity in a cost-optimal way, profitability is also optimized. Opportunities for
capacity utilization at locations that optimize profitability need to be known. This transparency is
made available through the ERP’s scheduling capability. Work cost should easily be calculated
to ensure that the best choices have been made. Pooling is a technique that enables capacity
optimization. Pooling enables the business unit work volume variation to be averaged as it is
cumulative. In other words, the variation from one client when layered on another, and another,
reduces the variation experienced by the pooled resource. An example of pooling that emerged in
the data was administrative work. Additionally, sales engineering support can be pooled.
Another opportunity that is a pooling opportunity not based on function is the pooling of work
that has similar dwell times. This is the kind of thinking needed to optimize human resources
through synergies that may not be obvious.
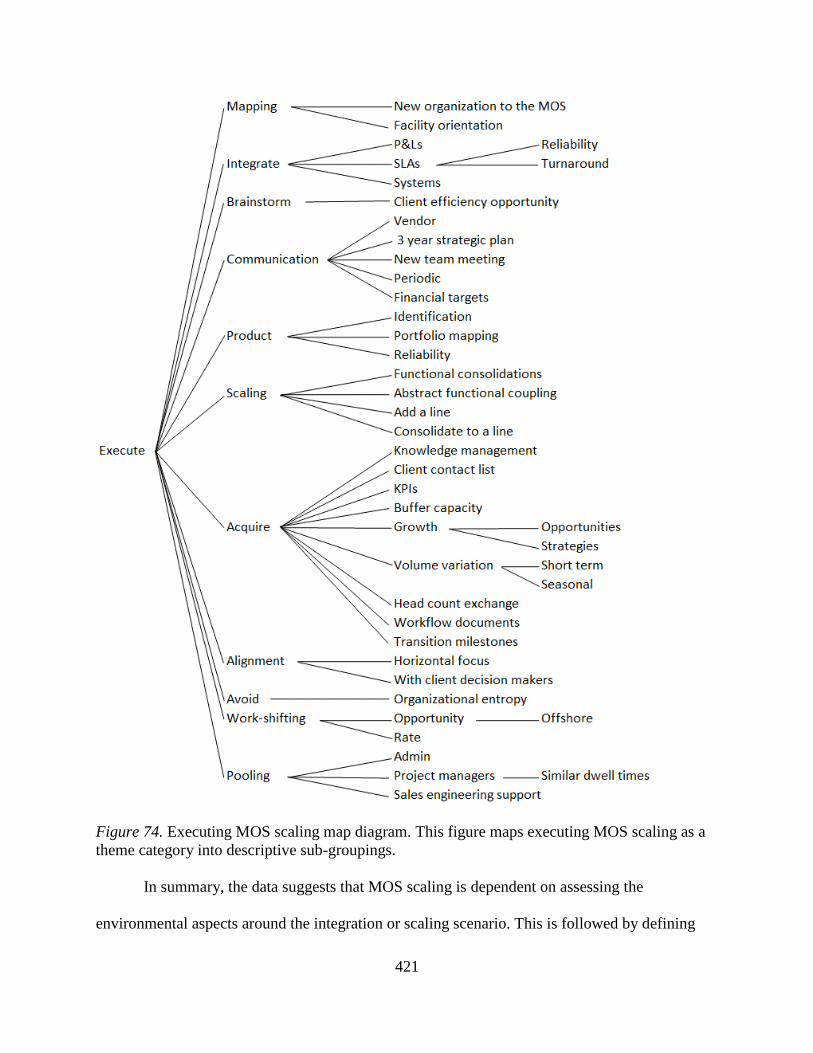
421
Figure 74. Executing MOS scaling map diagram. This figure maps executing MOS scaling as a
theme category into descriptive sub-groupings.
In summary, the data suggests that MOS scaling is dependent on assessing the
environmental aspects around the integration or scaling scenario. This is followed by defining
422
the path forward in all respects necessary. The last pattern that emerged from the data was the
ability to execute on the plans that were made. The MOS is ideal for scaling, as its structure
leverages inherent ability to scale. Additionally, a MOS carries with it alignment and a suitable
culture that is propagated during scaling. The following propositions summarize the key findings
of this section:
Proposition 168 (one-ness scaling): A MOS intrinsically embraces the idea of
one-ness and so is an ideal structure to scale and preserve a single supply chain
view to clients.
Proposition 169 (cultural alignment): A structure that is scalable in all dimensions
can propagate alignment and a suitable culture to improve profitability.
Proposition 170 (environmental assessment): An environmental assessment can
be used as a first step for scaling planning.
Proposition 171 (mission definition): Defining the mission of the MOS, and
making it known strategically, will engage and focus stakeholders in the sequence
of activities needed to realize growth synergies.
Proposition 172 (existing information): Valuable information regarding existing
trends and strategic roadmaps, which are best known by leaders embedded in the
organization to be integrated, need to be embraced by MOS leaders that need to
scale to accommodate their capacity to demands.
Proposition 173 (capacity retention): Capacity needs to be preserved through
talent and infrastructure retention such that a positive buffer can be created prior
to scaling execution.
423
Proposition 174 (elemental attributes): Workflow synergies are best understood
when they are broken into elemental function-based units and then coupled with
functions that have similar attributes.
Proposition 175 (capacity methods): Capacity management includes work shifting
and pooling to optimize cost structures as seen in cost per similar deliverable
measurements.
Growth. While these use-cases demonstrate some of the ways that a MOS can scale,
there are many ways that a MOS can grow resulting in enhanced synergistic profitability. New
opportunities can be quickly exploited, as skills and trained resources are made available to
achieve the revenue. Very little effort would be associated with building a solution, as it already
exists. As product life-cycles come and go in a dynamic market, a profitable company needs to
have a flexible strategy and be agile enough to realize the positive impact of the appropriate
actions. Nimbleness is an organizational attribute of the MOS because it can respond quickly to
an opportunity. Clients have indicated that:
MediaCorp is a leader and far ahead of the curve... [in] attention to detail, customer
service and [meeting] client needs is unmatched. We look forward to a growth business
and always look for opportunities to accelerate the work. Thanks for all the efforts.
(CS48)
Client wheel. The focused effort at MediaCorp was to determine addressable markets
within sectors where growth was possible. A tool called The Wheel was used to determine this
and is illustrated in the Figure 75. The wheel was used in three different ways. In one context it
related to a client, the second context was with regard to a LOB, and the third was related to
market sectors.
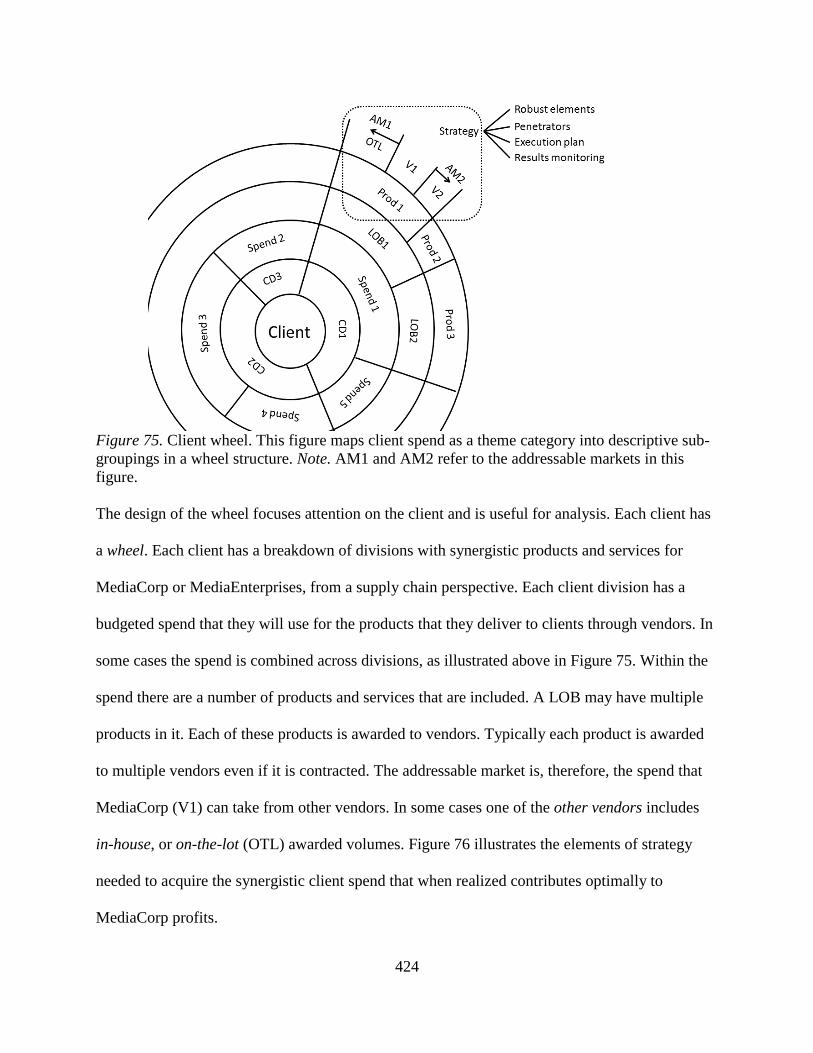
424
Figure 75. Client wheel. This figure maps client spend as a theme category into descriptive sub-
groupings in a wheel structure. Note. AM1 and AM2 refer to the addressable markets in this
figure.
The design of the wheel focuses attention on the client and is useful for analysis. Each client has
a wheel. Each client has a breakdown of divisions with synergistic products and services for
MediaCorp or MediaEnterprises, from a supply chain perspective. Each client division has a
budgeted spend that they will use for the products that they deliver to clients through vendors. In
some cases the spend is combined across divisions, as illustrated above in Figure 75. Within the
spend there are a number of products and services that are included. A LOB may have multiple
products in it. Each of these products is awarded to vendors. Typically each product is awarded
to multiple vendors even if it is contracted. The addressable market is, therefore, the spend that
MediaCorp (V1) can take from other vendors. In some cases one of the other vendors includes
in-house, or on-the-lot (OTL) awarded volumes. Figure 76 illustrates the elements of strategy
needed to acquire the synergistic client spend that when realized contributes optimally to
MediaCorp profits.
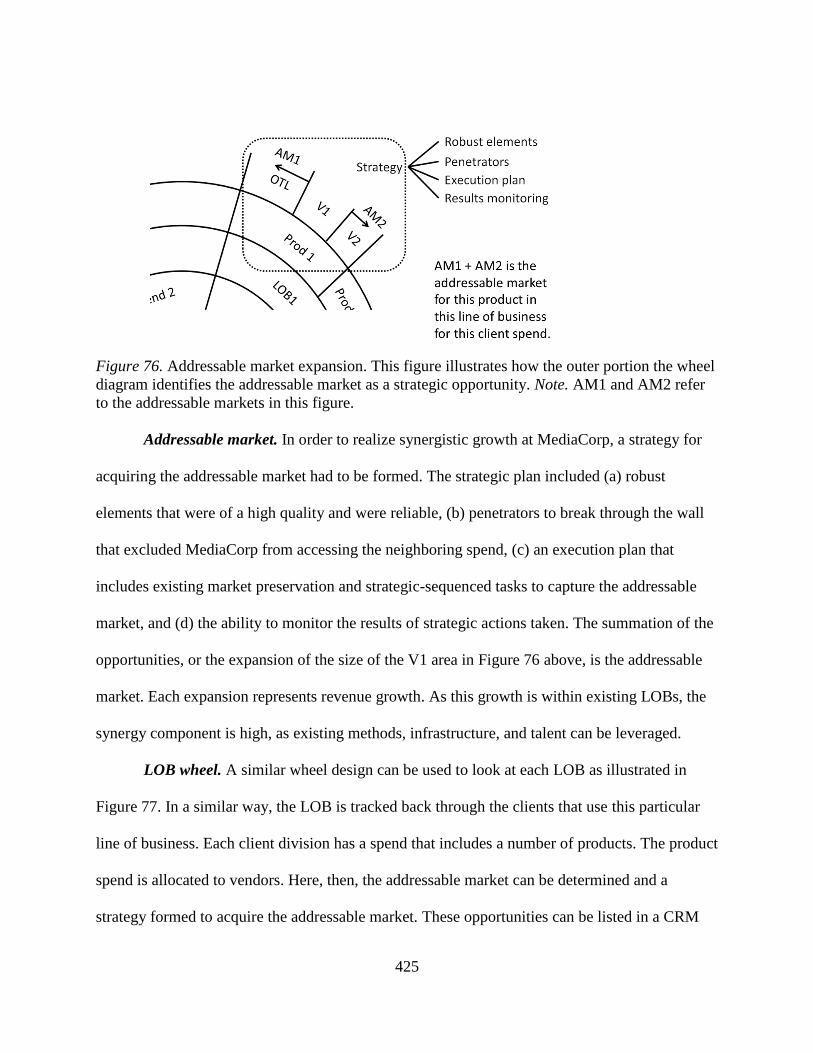
425
Figure 76. Addressable market expansion. This figure illustrates how the outer portion the wheel
diagram identifies the addressable market as a strategic opportunity. Note. AM1 and AM2 refer
to the addressable markets in this figure.
Addressable market. In order to realize synergistic growth at MediaCorp, a strategy for
acquiring the addressable market had to be formed. The strategic plan included (a) robust
elements that were of a high quality and were reliable, (b) penetrators to break through the wall
that excluded MediaCorp from accessing the neighboring spend, (c) an execution plan that
includes existing market preservation and strategic-sequenced tasks to capture the addressable
market, and (d) the ability to monitor the results of strategic actions taken. The summation of the
opportunities, or the expansion of the size of the V1 area in Figure 76 above, is the addressable
market. Each expansion represents revenue growth. As this growth is within existing LOBs, the
synergy component is high, as existing methods, infrastructure, and talent can be leveraged.
LOB wheel. A similar wheel design can be used to look at each LOB as illustrated in
Figure 77. In a similar way, the LOB is tracked back through the clients that use this particular
line of business. Each client division has a spend that includes a number of products. The product
spend is allocated to vendors. Here, then, the addressable market can be determined and a
strategy formed to acquire the addressable market. These opportunities can be listed in a CRM
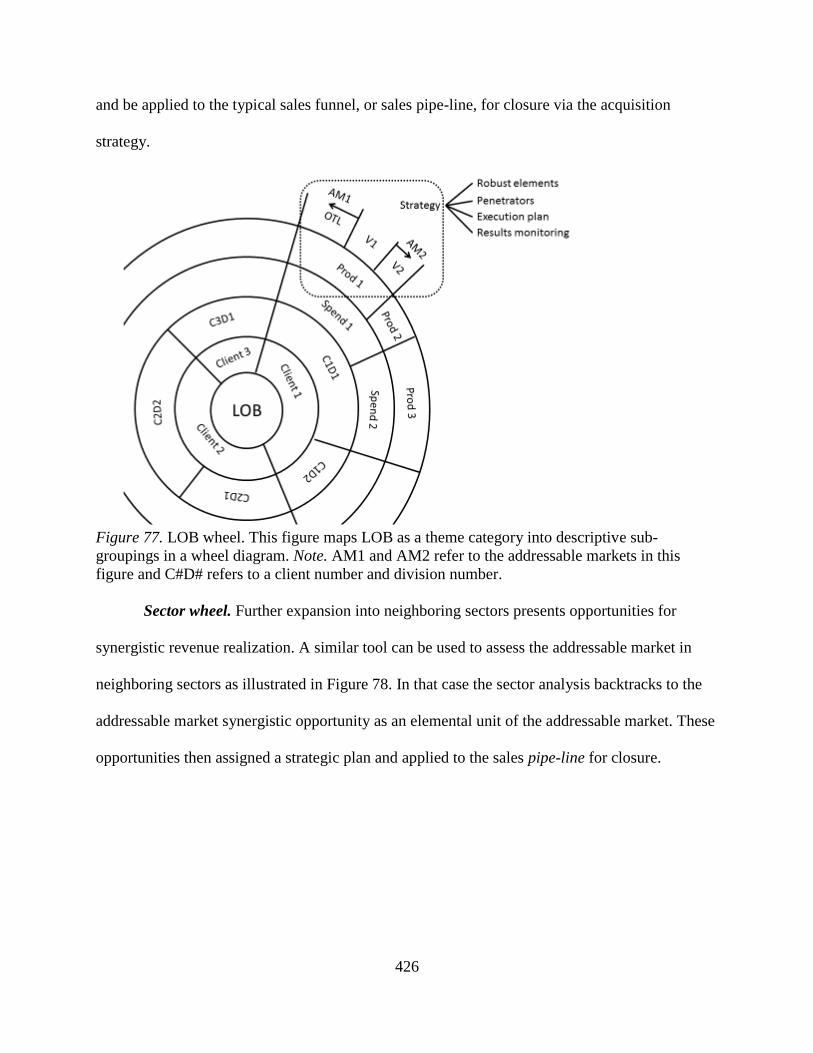
426
and be applied to the typical sales funnel, or sales pipe-line, for closure via the acquisition
strategy.
Figure 77. LOB wheel. This figure maps LOB as a theme category into descriptive sub-
groupings in a wheel diagram. Note. AM1 and AM2 refer to the addressable markets in this
figure and C#D# refers to a client number and division number.
Sector wheel. Further expansion into neighboring sectors presents opportunities for
synergistic revenue realization. A similar tool can be used to assess the addressable market in
neighboring sectors as illustrated in Figure 78. In that case the sector analysis backtracks to the
addressable market synergistic opportunity as an elemental unit of the addressable market. These
opportunities then assigned a strategic plan and applied to the sales pipe-line for closure.
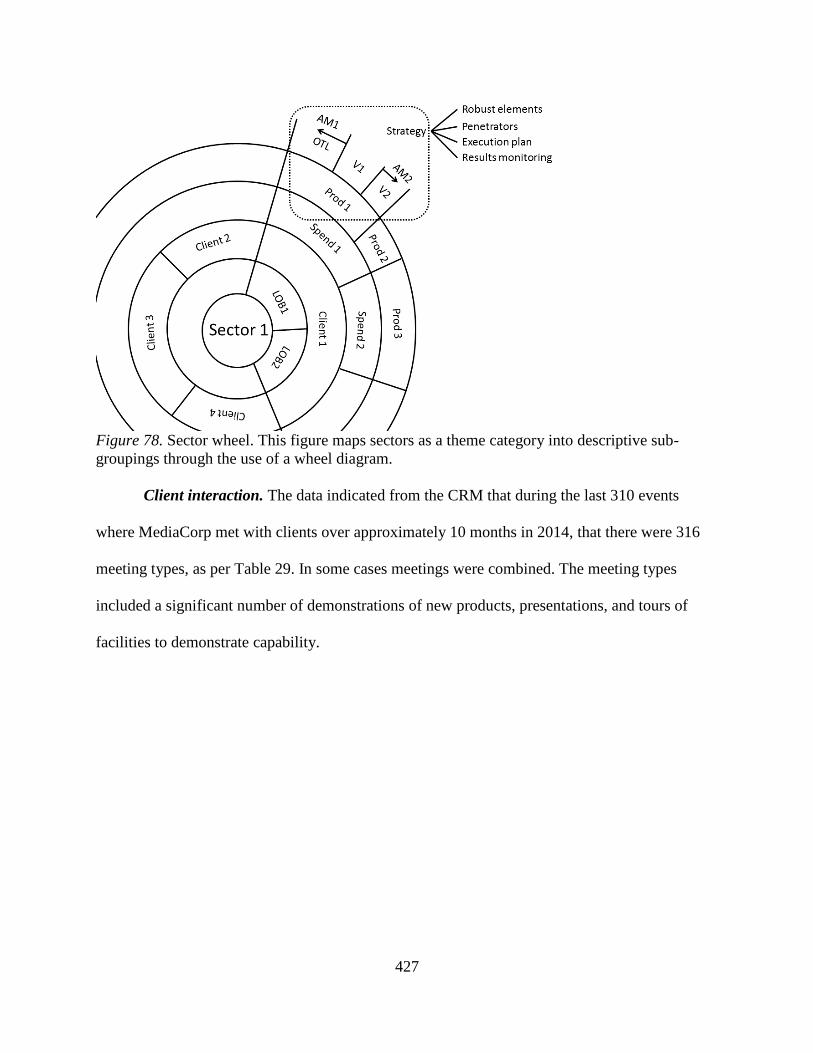
427
Figure 78. Sector wheel. This figure maps sectors as a theme category into descriptive sub-
groupings through the use of a wheel diagram.
Client interaction. The data indicated from the CRM that during the last 310 events
where MediaCorp met with clients over approximately 10 months in 2014, that there were 316
meeting types, as per Table 29. In some cases meetings were combined. The meeting types
included a significant number of demonstrations of new products, presentations, and tours of
facilities to demonstrate capability.
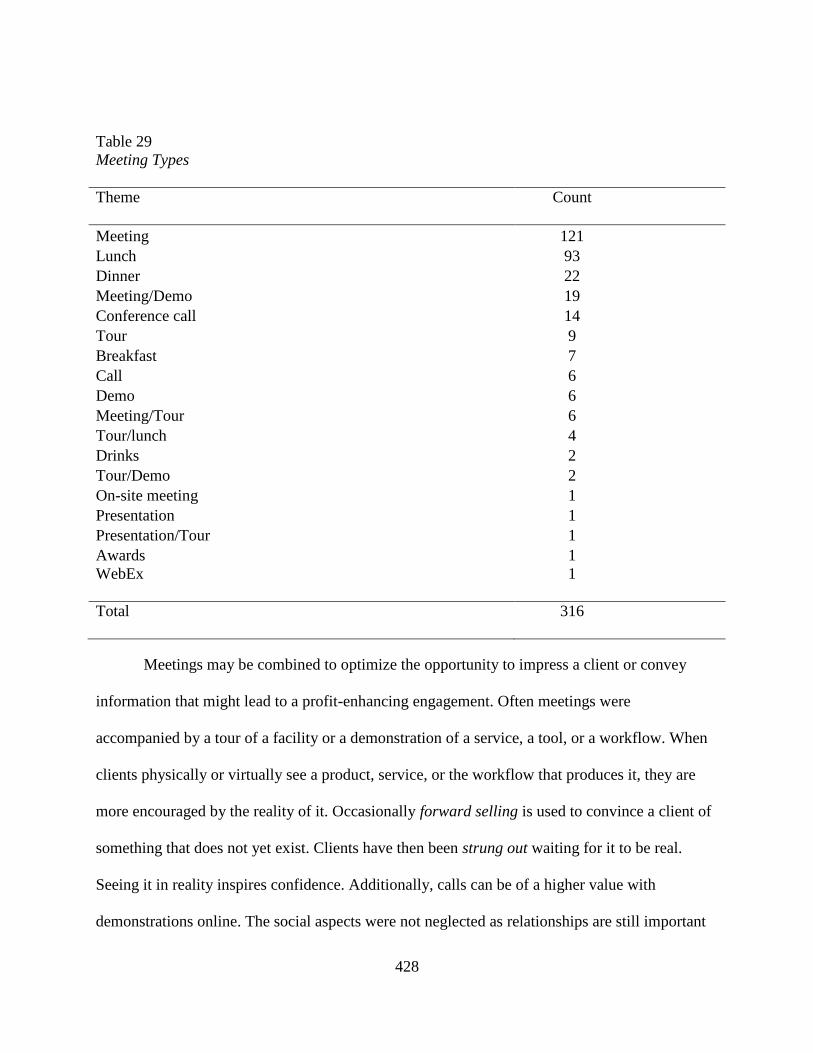
428
Table 29
Meeting Types
Theme
Count
Meeting 121
Lunch 93
Dinner 22
Meeting/Demo 19
Conference call 14
Tour 9
Breakfast 7
Call 6
Demo 6
Meeting/Tour 6
Tour/lunch 4
Drinks 2
Tour/Demo 2
On-site meeting 1
Presentation 1
Presentation/Tour 1
Awards 1
WebEx
1
Total
316
Meetings may be combined to optimize the opportunity to impress a client or convey
information that might lead to a profit-enhancing engagement. Often meetings were
accompanied by a tour of a facility or a demonstration of a service, a tool, or a workflow. When
clients physically or virtually see a product, service, or the workflow that produces it, they are
more encouraged by the reality of it. Occasionally forward selling is used to convince a client of
something that does not yet exist. Clients have then been strung out waiting for it to be real.
Seeing it in reality inspires confidence. Additionally, calls can be of a higher value with
demonstrations online. The social aspects were not neglected as relationships are still important
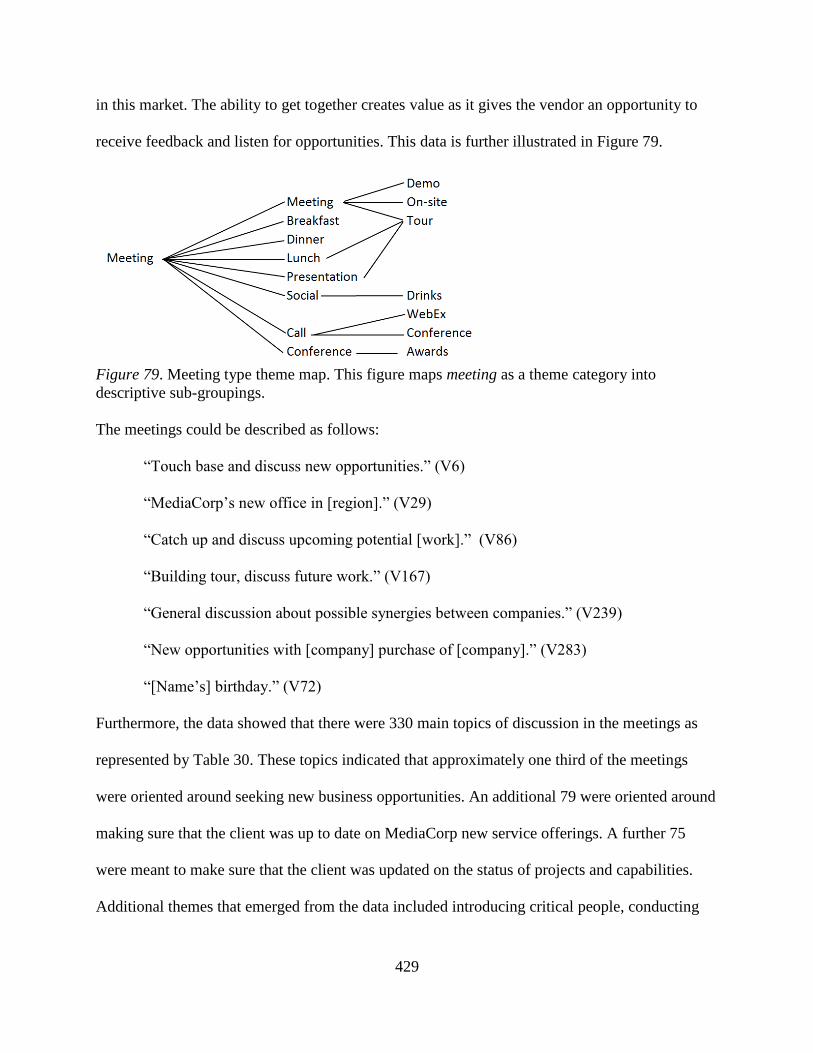
429
in this market. The ability to get together creates value as it gives the vendor an opportunity to
receive feedback and listen for opportunities. This data is further illustrated in Figure 79.
Figure 79. Meeting type theme map. This figure maps meeting as a theme category into
descriptive sub-groupings.
The meetings could be described as follows:
“Touch base and discuss new opportunities.” (V6)
“MediaCorp’s new office in [region].” (V29)
“Catch up and discuss upcoming potential [work].” (V86)
“Building tour, discuss future work.” (V167)
“General discussion about possible synergies between companies.” (V239)
“New opportunities with [company] purchase of [company].” (V283)
“[Name’s] birthday.” (V72)
Furthermore, the data showed that there were 330 main topics of discussion in the meetings as
represented by Table 30. These topics indicated that approximately one third of the meetings
were oriented around seeking new business opportunities. An additional 79 were oriented around
making sure that the client was up to date on MediaCorp new service offerings. A further 75
were meant to make sure that the client was updated on the status of projects and capabilities.
Additional themes that emerged from the data included introducing critical people, conducting
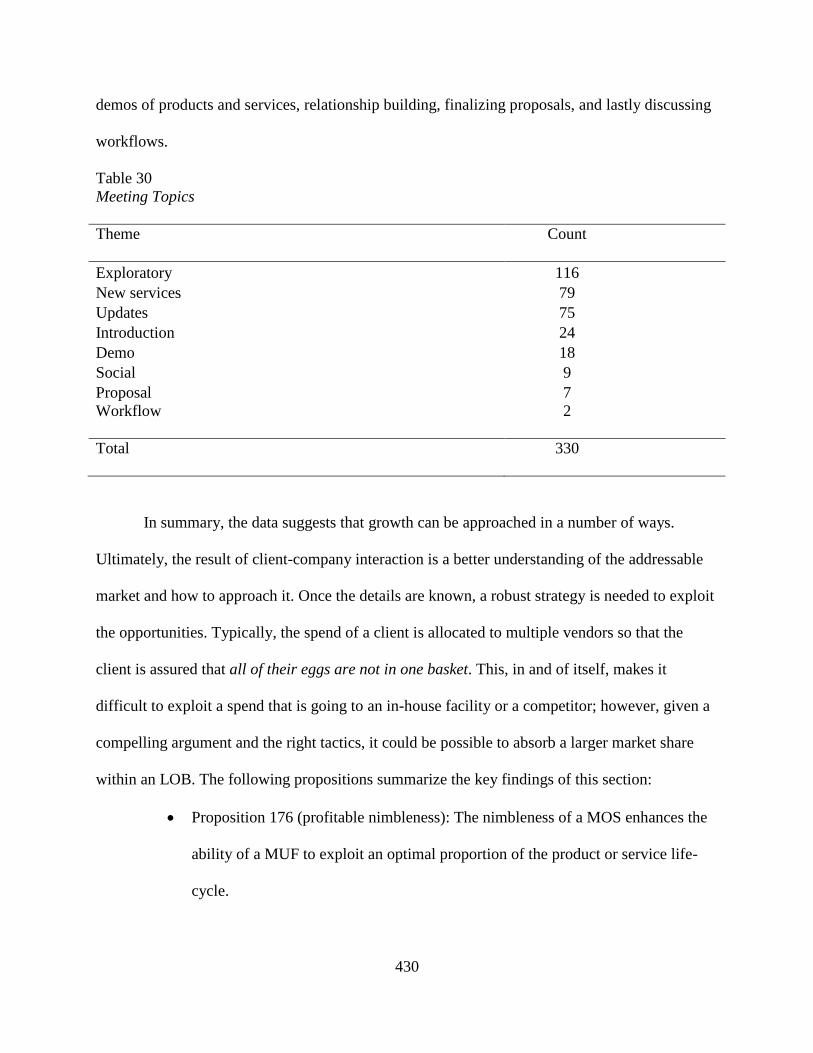
430
demos of products and services, relationship building, finalizing proposals, and lastly discussing
workflows.
Table 30
Meeting Topics
Theme
Count
Exploratory 116
New services 79
Updates 75
Introduction 24
Demo 18
Social 9
Proposal 7
Workflow
2
Total
330
In summary, the data suggests that growth can be approached in a number of ways.
Ultimately, the result of client-company interaction is a better understanding of the addressable
market and how to approach it. Once the details are known, a robust strategy is needed to exploit
the opportunities. Typically, the spend of a client is allocated to multiple vendors so that the
client is assured that all of their eggs are not in one basket. This, in and of itself, makes it
difficult to exploit a spend that is going to an in-house facility or a competitor; however, given a
compelling argument and the right tactics, it could be possible to absorb a larger market share
within an LOB. The following propositions summarize the key findings of this section:
Proposition 176 (profitable nimbleness): The nimbleness of a MOS enhances the
ability of a MUF to exploit an optimal proportion of the product or service life-
cycle.
431
Proposition 177 (exploiting spends): Proactively, a MUF can map out the
addressable market and construct a multi-pronged tactical strategy to exploit
potential unrealized client spends.
Proposition 178 (expansion strategy): The elements of a successful expansion
strategy include a track record of reliability, the ability to penetrate barriers to
entry, an effective execution plan, and the ability to monitor results.
Market penetration. A critical element to the growth opportunities in existing markets
and new markets in neighboring sectors was penetration strategies. An entrepreneurial business
that is interested in leveraging synergies to grow profitability must understand the dynamic
nature of the market so that a suitable strategic posture can be taken. This strategy could be
driven by tactical and deliberate action, or another exogenous force. This section discusses these
forces. Penetrators are illustrated in Figure 80. For example, new products may be introduced as
a result of technical innovation that can be applied to them. These products may be products in
the client portfolio that, heretofore, have not been in the vendor’s portfolio to service. The
introduction of technology enables growth through synergy. Another example of a penetrator
could be the bundling of services that include a series of products that are already in the client’s
portfolio. The bundle deal leverages the vendor’s supply chain, speeds up order dwell time, and
presents an opportunity for increased volume and profitability for the vendor, MediaEnterprises.
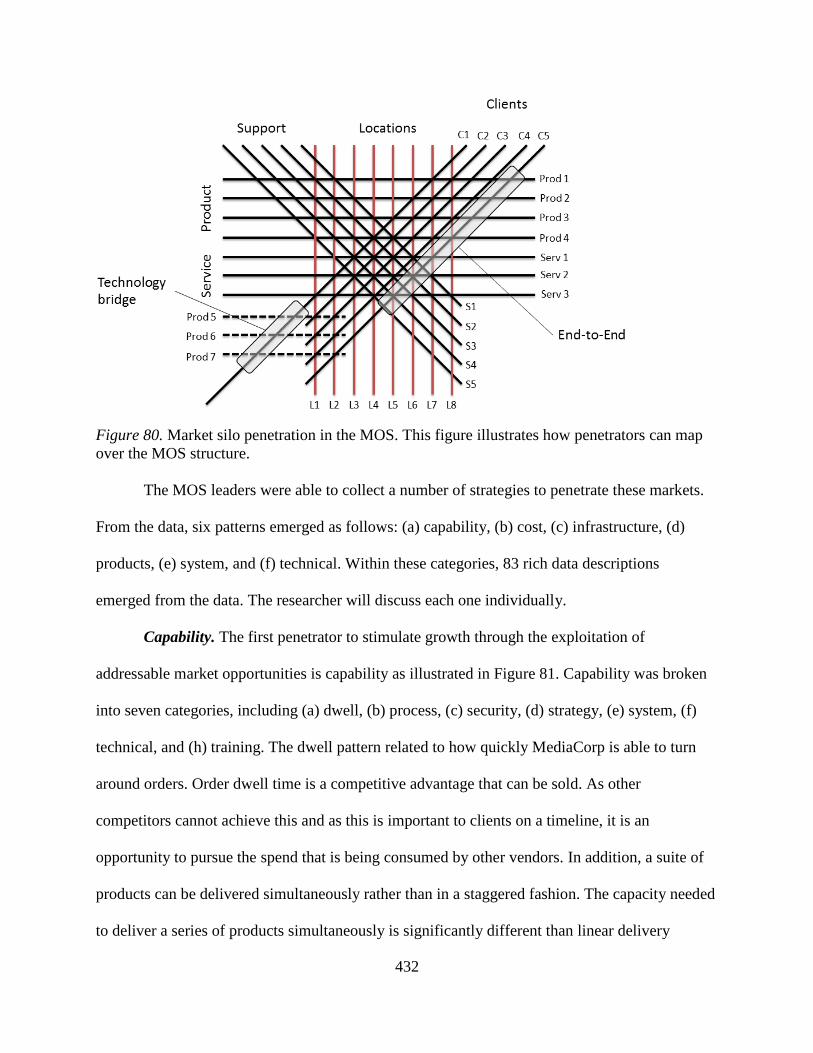
432
Figure 80. Market silo penetration in the MOS. This figure illustrates how penetrators can map
over the MOS structure.
The MOS leaders were able to collect a number of strategies to penetrate these markets.
From the data, six patterns emerged as follows: (a) capability, (b) cost, (c) infrastructure, (d)
products, (e) system, and (f) technical. Within these categories, 83 rich data descriptions
emerged from the data. The researcher will discuss each one individually.
Capability. The first penetrator to stimulate growth through the exploitation of
addressable market opportunities is capability as illustrated in Figure 81. Capability was broken
into seven categories, including (a) dwell, (b) process, (c) security, (d) strategy, (e) system, (f)
technical, and (h) training. The dwell pattern related to how quickly MediaCorp is able to turn
around orders. Order dwell time is a competitive advantage that can be sold. As other
competitors cannot achieve this and as this is important to clients on a timeline, it is an
opportunity to pursue the spend that is being consumed by other vendors. In addition, a suite of
products can be delivered simultaneously rather than in a staggered fashion. The capacity needed
to deliver a series of products simultaneously is significantly different than linear delivery
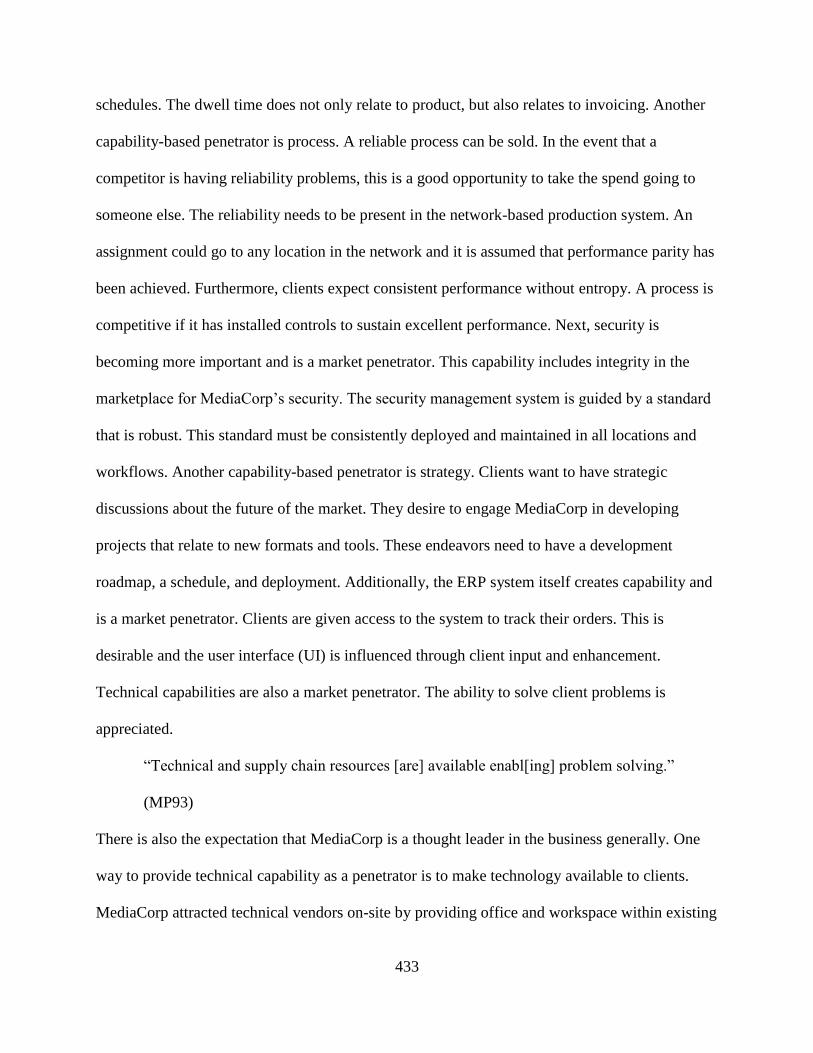
433
schedules. The dwell time does not only relate to product, but also relates to invoicing. Another
capability-based penetrator is process. A reliable process can be sold. In the event that a
competitor is having reliability problems, this is a good opportunity to take the spend going to
someone else. The reliability needs to be present in the network-based production system. An
assignment could go to any location in the network and it is assumed that performance parity has
been achieved. Furthermore, clients expect consistent performance without entropy. A process is
competitive if it has installed controls to sustain excellent performance. Next, security is
becoming more important and is a market penetrator. This capability includes integrity in the
marketplace for MediaCorp’s security. The security management system is guided by a standard
that is robust. This standard must be consistently deployed and maintained in all locations and
workflows. Another capability-based penetrator is strategy. Clients want to have strategic
discussions about the future of the market. They desire to engage MediaCorp in developing
projects that relate to new formats and tools. These endeavors need to have a development
roadmap, a schedule, and deployment. Additionally, the ERP system itself creates capability and
is a market penetrator. Clients are given access to the system to track their orders. This is
desirable and the user interface (UI) is influenced through client input and enhancement.
Technical capabilities are also a market penetrator. The ability to solve client problems is
appreciated.
“Technical and supply chain resources [are] available enabl[ing] problem solving.”
(MP93)
There is also the expectation that MediaCorp is a thought leader in the business generally. One
way to provide technical capability as a penetrator is to make technology available to clients.
MediaCorp attracted technical vendors on-site by providing office and workspace within existing
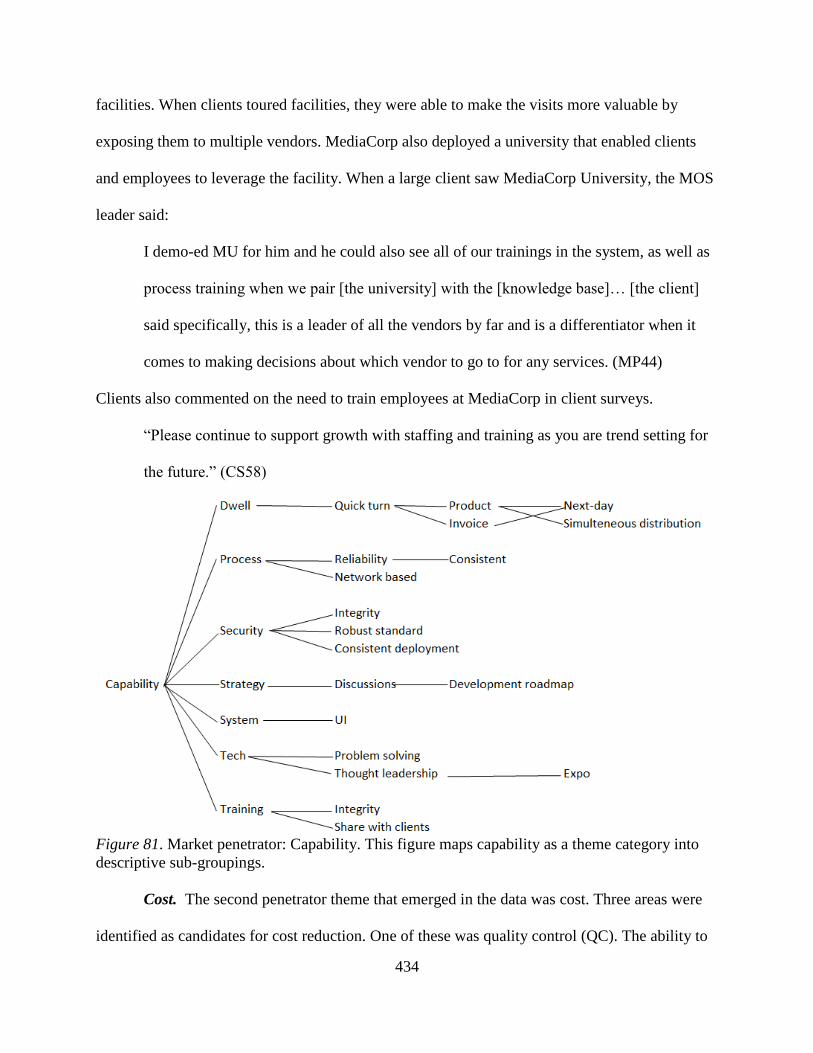
434
facilities. When clients toured facilities, they were able to make the visits more valuable by
exposing them to multiple vendors. MediaCorp also deployed a university that enabled clients
and employees to leverage the facility. When a large client saw MediaCorp University, the MOS
leader said:
I demo-ed MU for him and he could also see all of our trainings in the system, as well as
process training when we pair [the university] with the [knowledge base]… [the client]
said specifically, this is a leader of all the vendors by far and is a differentiator when it
comes to making decisions about which vendor to go to for any services. (MP44)
Clients also commented on the need to train employees at MediaCorp in client surveys.
“Please continue to support growth with staffing and training as you are trend setting for
the future.” (CS58)
Figure 81. Market penetrator: Capability. This figure maps capability as a theme category into
descriptive sub-groupings.
Cost. The second penetrator theme that emerged in the data was cost. Three areas were
identified as candidates for cost reduction. One of these was quality control (QC). The ability to
435
carry out QC tasks with consistent reliability contributed to process robustness and strengthened
MediaCorp’s brand. When an issue was missed, there was significant opportunity for liability
from downstream processes that would incur rework. In addition, an error would result in a time
delay that could compromise the overall schedule. A time delay may result in the need for
expedited fees from downstream vendors to recover the lost time in the schedule. A second
capability was through the offshore capacity that was available. This capacity allowed for
significant expansion and contraction of capacity at a much lower cost. The third penetrator was
through the implant population at the client’s location. These implants were helpful in directing
work to MediaCorp. They are typically placed as part of an offer. This not only enabled the deal,
but also redirected additional work to MediaEnterprises that would have otherwise been given to
competitors.
Infrastructure. The third penetrator was infrastructure. The capacity and capability
afforded by the infrastructure allowed for significant expansion and process reliability. Three
theme categories emerged in the data: security, process, and system. The security capability
related to the ability for clients to feel assured that their work was protected and available when
they wanted it for any reason, even after delivery. Disaster recovery plans (DRP) are robust and
business continuity is critical to client schedules.
Cyber-attack contingency plan – Strategizing using [Disaster Recovery site] for client DR
– Having a well-planned comprehensive contingency plan with clients in case of cyber-
attacks could take our partnership with clients to the next level and can make them want
to work with MediaCorp in order to lower their risk. Also, we can make a case that small
vendors are vulnerable to cyber-attacks and DR. This can be used as a penetrator and the
timing is good now because of [the threat] situation. (MP26)
436
The ability to recover within a suitable amount of time is documented in the DRPs. The ability to
continue to ship was documented in the business continuity plans (BCP). Process capacity is a
penetrator that infrastructure enables. The availability of storage capacity at any location and the
ability to share capacity, or reallocate it, created a flexibility that can only be obtained from a
pooled capacity. The network-based production scheme included the transfer of work to
locations where storage was available. Assets, whether physical or digital, must be received and
stored. Without the availability of the components, the work cannot be executed. Lastly, the
infrastructure includes tools. These tools allow for the control of crowdsource management and
the automated verification that deliverables conform to specifications. In some cases these tools
are proprietary to MediaCorp and so make it possible for a competitive posture.
Products. The fourth penetrator was products. MOS leaders were able to name 5
products, 13 services, and 4 new sectors that should be pursued. Products, as penetrators, are
illustrated in Figure 82. These products leveraged existing capabilities, including workflows and
infrastructure. They were pursued and enabled synergistic growth. The data on products revealed
a pattern related to strategy. The context here was that a strategy could be used with clients to
gain more market share. Each of these strategies was within MediaCorp’s existing expertise. The
first was to leverage the existing implant population at the clients’ site by offering an increased
amount of administration work for the client with the awarding of more work.
Offshore implant position – In short, the idea was to utilize [offshore location] for clients
to take over some of the admin work on their side for the orders they send to us (so it will
be cheaper on their side). We can identify the repetitive work that can be off-loaded to
[offshore location] and help clients to cut cost without big cost addition on our side. We
can review what our implants are doing for [client 1] and [client 2] and see what portion
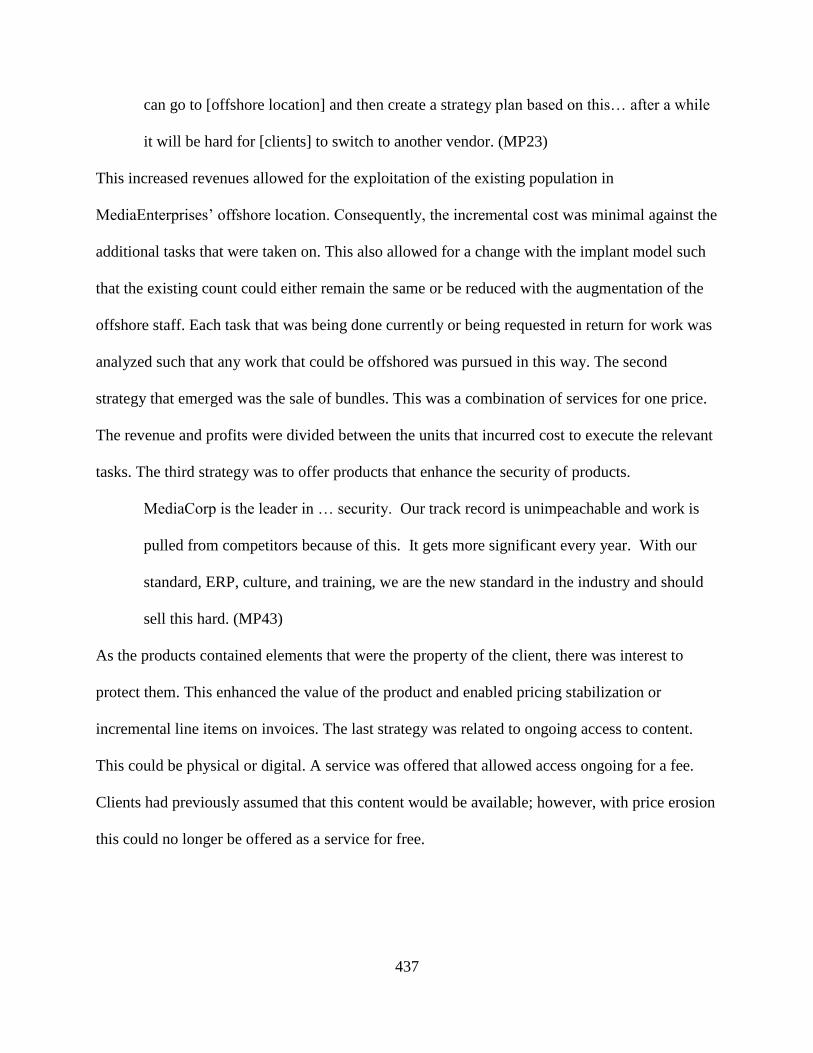
437
can go to [offshore location] and then create a strategy plan based on this… after a while
it will be hard for [clients] to switch to another vendor. (MP23)
This increased revenues allowed for the exploitation of the existing population in
MediaEnterprises’ offshore location. Consequently, the incremental cost was minimal against the
additional tasks that were taken on. This also allowed for a change with the implant model such
that the existing count could either remain the same or be reduced with the augmentation of the
offshore staff. Each task that was being done currently or being requested in return for work was
analyzed such that any work that could be offshored was pursued in this way. The second
strategy that emerged was the sale of bundles. This was a combination of services for one price.
The revenue and profits were divided between the units that incurred cost to execute the relevant
tasks. The third strategy was to offer products that enhance the security of products.
MediaCorp is the leader in … security. Our track record is unimpeachable and work is
pulled from competitors because of this. It gets more significant every year. With our
standard, ERP, culture, and training, we are the new standard in the industry and should
sell this hard. (MP43)
As the products contained elements that were the property of the client, there was interest to
protect them. This enhanced the value of the product and enabled pricing stabilization or
incremental line items on invoices. The last strategy was related to ongoing access to content.
This could be physical or digital. A service was offered that allowed access ongoing for a fee.
Clients had previously assumed that this content would be available; however, with price erosion
this could no longer be offered as a service for free.
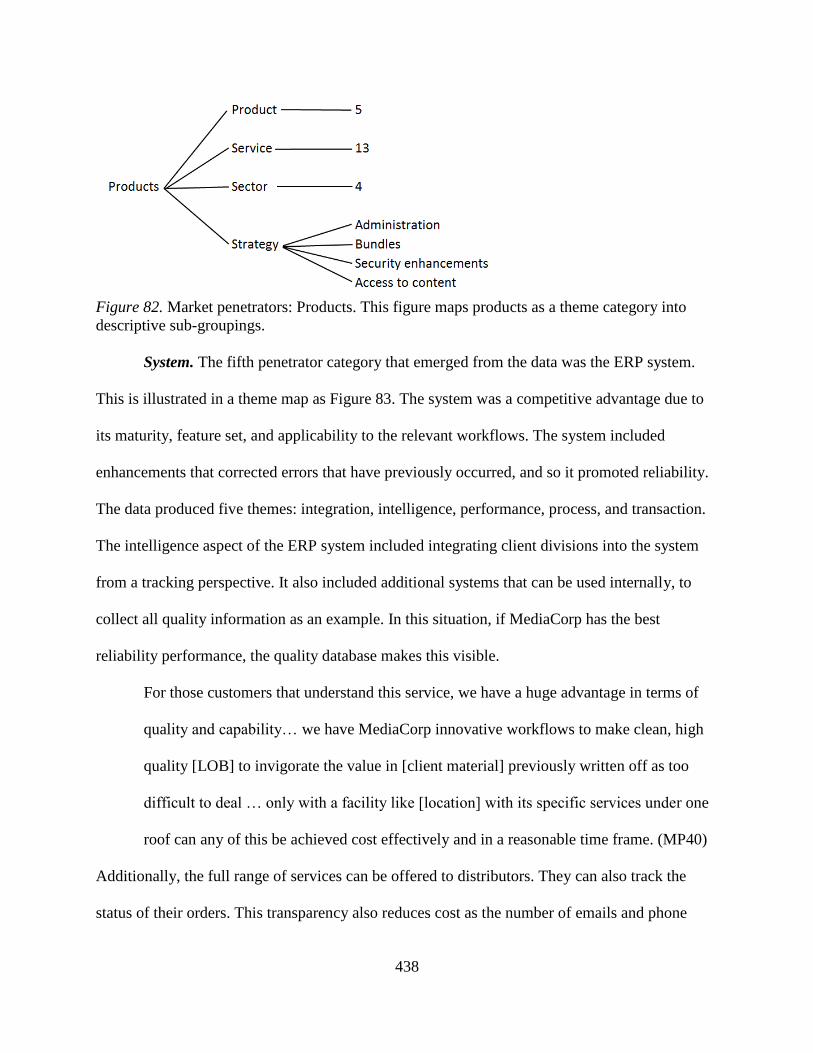
438
Figure 82. Market penetrators: Products. This figure maps products as a theme category into
descriptive sub-groupings.
System. The fifth penetrator category that emerged from the data was the ERP system.
This is illustrated in a theme map as Figure 83. The system was a competitive advantage due to
its maturity, feature set, and applicability to the relevant workflows. The system included
enhancements that corrected errors that have previously occurred, and so it promoted reliability.
The data produced five themes: integration, intelligence, performance, process, and transaction.
The intelligence aspect of the ERP system included integrating client divisions into the system
from a tracking perspective. It also included additional systems that can be used internally, to
collect all quality information as an example. In this situation, if MediaCorp has the best
reliability performance, the quality database makes this visible.
For those customers that understand this service, we have a huge advantage in terms of
quality and capability… we have MediaCorp innovative workflows to make clean, high
quality [LOB] to invigorate the value in [client material] previously written off as too
difficult to deal … only with a facility like [location] with its specific services under one
roof can any of this be achieved cost effectively and in a reasonable time frame. (MP40)
Additionally, the full range of services can be offered to distributors. They can also track the
status of their orders. This transparency also reduces cost as the number of emails and phone

439
calls are significantly reduced. The second penetration aspect of the ERP system that emerged in
the data is related to data and business intelligence (BI).
“[We are] using business intelligence from information in the ERP to help clients with
decision making – something similar to what we have in [our] recommendation engine
but leveraging large data in the ERP.” (MP17)
With a high volume of data being collected on the work being done, analytical capabilities will
emerge. This information can then be used internally and externally for decision making. Clients
can be offered information about the work that is being done for them to help them make
decisions.
“As we are doing work with the [client], we are being relied on by the customer to help
them make the best decisions about how to execute on their program production to ensure
quality and efficient throughput for distribution.” (MP470)
Internally, data from all clients can be used to provide information about trends, etc. This
information can help with internal decision making. A fundamental aspect of this is the data.
Making sure that the data is fulsome and acquired in an architecture that is meaningful is a
primary function of the database. The energy needed to go back and fill in fields on historical
data that are now desired is very wasteful. Entering the order and asset data in at the beginning is
therefore, fundamental just as it is having a field architecture that is accommodating and
fulsome. Having a system that is able to capture and track asset and configuration issues is
needed to ensure that deliverables meet specifications. Exception management must be invoked
to alter the disposition of configurations or assets that are quarantined once issues have been
identified. The issues may require additional information. The ability to add notes is then helpful
so that if someone goes back in the system to move the order they see the note. With the trackers
440
embedded in the system, calls and e-mails are eliminated and data is available for reports. These
reports are helpful for synchronizing quality performance perceptions with clients and for
monitoring trends. Process-related aspects of the system provide an opportunity to penetrate
markets. The system provides opportunities for automation. In the case where pricing pressures
mean that market entry is not possible, automation pricing can be used. If assets are not fit for
use, overage opportunities exist and can enhance profitability, assuming that the activities
associated with them have a margin. The system provides tracking information internally and
externally. Internally, this reduces cost due to the reduced need for altering the status or an asset
or a configuration via e-mail or phone. Operators can see their cue and work it down. Externally,
clients can see if there are issues with their assets and remedy the situation without having
additional communication. Additionally, automatic updates and delivery notifications are sent to
distribution lists. This creates value for a client that needs transparency. The system can also be
used to retrieve assets as all assets are visible depending on permissions for the view. This ability
is a market-leading feature, valuable to clients who want to see their properties. The last value-
producing penetrator that was brought up was the efficiencies that the ERP provides relative to
transactions. With the high volume, customization of each delivery, uniqueness of the assets, and
specification requirements, the complexity is very high.
The product is so complex / complicated now, we need to be involved literally at the
beginning … complexity is huge now and ever growing in our future. It will kill the little
guys and show where MediaCorp really excels. (MP49)
The transactions can be purchase orders, invoices, sales transactions or deals, and asset receipt or
the delivery of a final configuration.
441
Figure 83. Market penetrator: System. This figure maps systems as a penetrator theme category
into descriptive sub-groupings.
Technical. The last penetrator category that emerged from the data was the technical
penetrator. This included six themes. The first was related to technical projects with distributors.
Often distributors were not sure about what they wanted or how to check that it was within
specification when received. MediaCorp was capable of setting up a distributor with regard to
understanding the specification that they would need, as well as providing confidence that what
was received was correct through the use of automated verification tools. In the event that the
distributor was using automated tools, MediaCorp was able to synchronize its tools to the
distributors following consensus on the specification line items.
“We can push the technical envelope.” (MP94)
MOS leaders also suggested that these verification tools provided a competitive advantage for
MediaCorp and provided confidence in delivery capabilities. In some cases, workflows at the
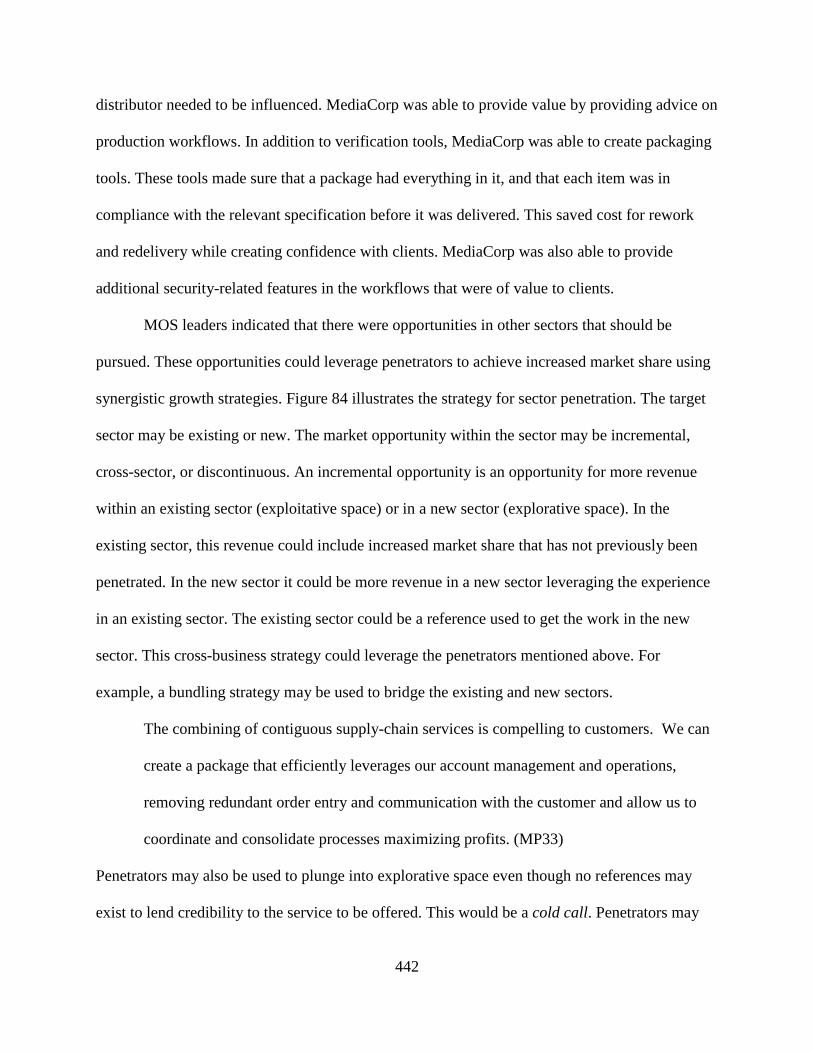
442
distributor needed to be influenced. MediaCorp was able to provide value by providing advice on
production workflows. In addition to verification tools, MediaCorp was able to create packaging
tools. These tools made sure that a package had everything in it, and that each item was in
compliance with the relevant specification before it was delivered. This saved cost for rework
and redelivery while creating confidence with clients. MediaCorp was also able to provide
additional security-related features in the workflows that were of value to clients.
MOS leaders indicated that there were opportunities in other sectors that should be
pursued. These opportunities could leverage penetrators to achieve increased market share using
synergistic growth strategies. Figure 84 illustrates the strategy for sector penetration. The target
sector may be existing or new. The market opportunity within the sector may be incremental,
cross-sector, or discontinuous. An incremental opportunity is an opportunity for more revenue
within an existing sector (exploitative space) or in a new sector (explorative space). In the
existing sector, this revenue could include increased market share that has not previously been
penetrated. In the new sector it could be more revenue in a new sector leveraging the experience
in an existing sector. The existing sector could be a reference used to get the work in the new
sector. This cross-business strategy could leverage the penetrators mentioned above. For
example, a bundling strategy may be used to bridge the existing and new sectors.
The combining of contiguous supply-chain services is compelling to customers. We can
create a package that efficiently leverages our account management and operations,
removing redundant order entry and communication with the customer and allow us to
coordinate and consolidate processes maximizing profits. (MP33)
Penetrators may also be used to plunge into explorative space even though no references may
exist to lend credibility to the service to be offered. This would be a cold call. Penetrators may
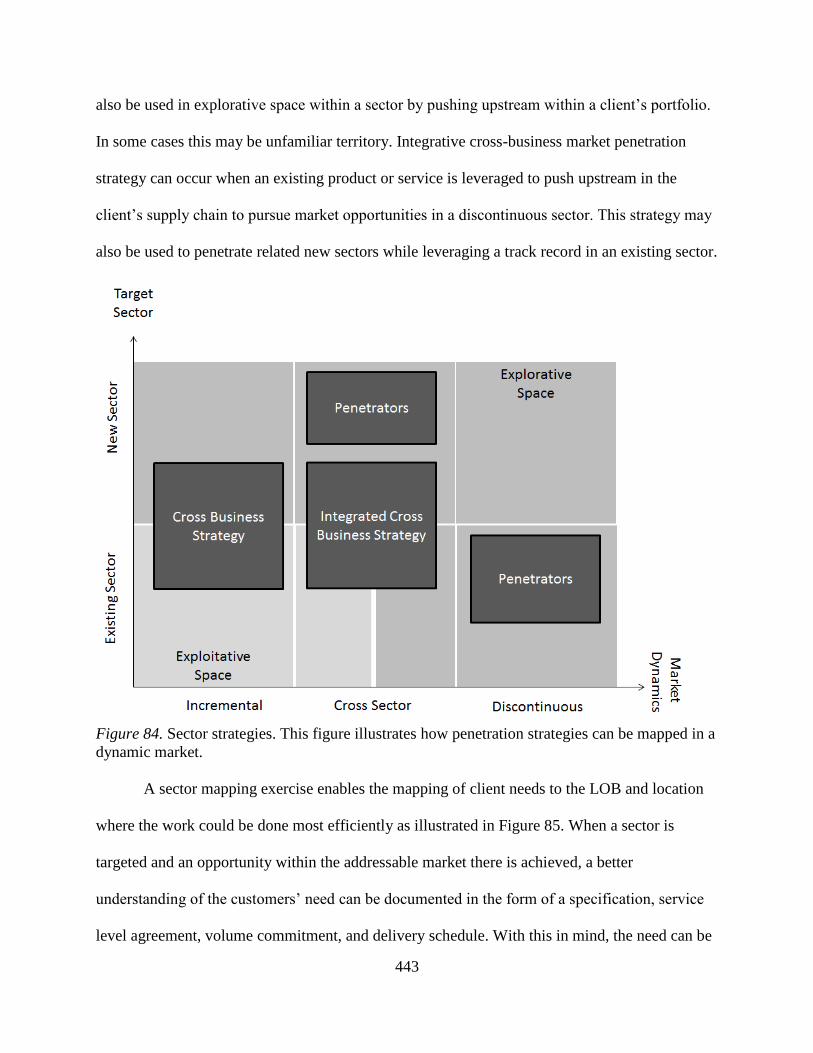
443
also be used in explorative space within a sector by pushing upstream within a client’s portfolio.
In some cases this may be unfamiliar territory. Integrative cross-business market penetration
strategy can occur when an existing product or service is leveraged to push upstream in the
client’s supply chain to pursue market opportunities in a discontinuous sector. This strategy may
also be used to penetrate related new sectors while leveraging a track record in an existing sector.
Figure 84. Sector strategies. This figure illustrates how penetration strategies can be mapped in a
dynamic market.
A sector mapping exercise enables the mapping of client needs to the LOB and location
where the work could be done most efficiently as illustrated in Figure 85. When a sector is
targeted and an opportunity within the addressable market there is achieved, a better
understanding of the customers’ need can be documented in the form of a specification, service
level agreement, volume commitment, and delivery schedule. With this in mind, the need can be
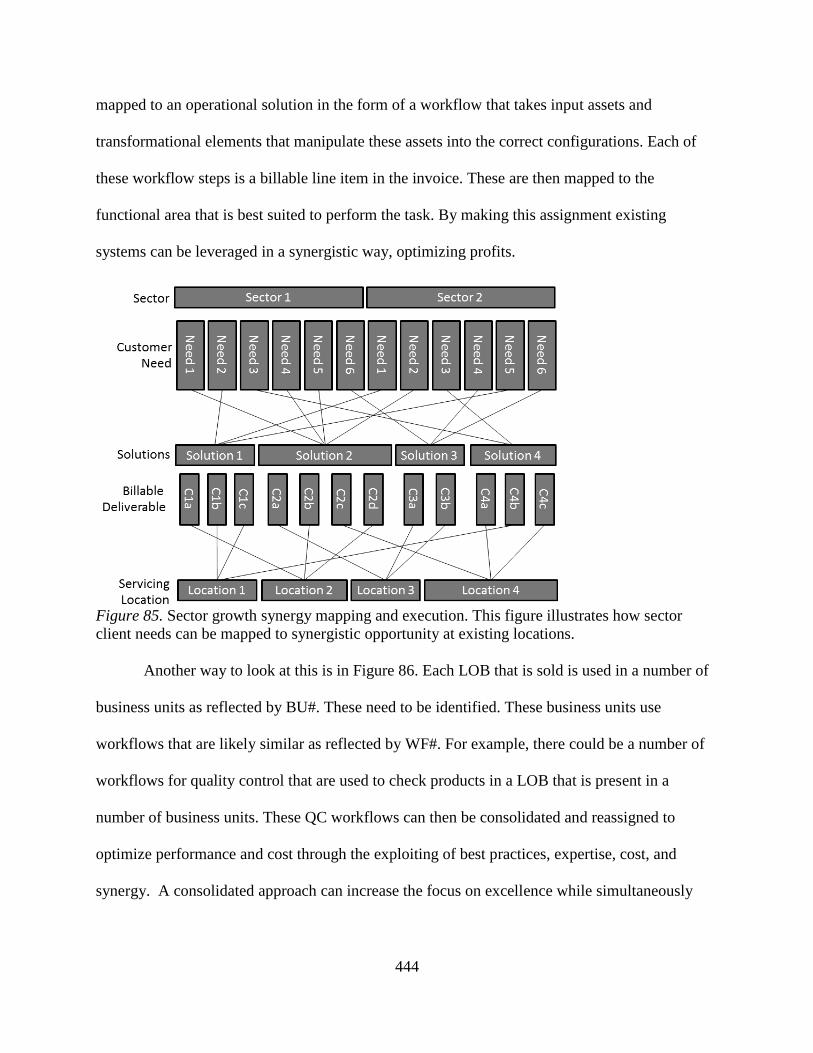
444
mapped to an operational solution in the form of a workflow that takes input assets and
transformational elements that manipulate these assets into the correct configurations. Each of
these workflow steps is a billable line item in the invoice. These are then mapped to the
functional area that is best suited to perform the task. By making this assignment existing
systems can be leveraged in a synergistic way, optimizing profits.
Figure 85. Sector growth synergy mapping and execution. This figure illustrates how sector
client needs can be mapped to synergistic opportunity at existing locations.
Another way to look at this is in Figure 86. Each LOB that is sold is used in a number of
business units as reflected by BU#. These need to be identified. These business units use
workflows that are likely similar as reflected by WF#. For example, there could be a number of
workflows for quality control that are used to check products in a LOB that is present in a
number of business units. These QC workflows can then be consolidated and reassigned to
optimize performance and cost through the exploiting of best practices, expertise, cost, and
synergy. A consolidated approach can increase the focus on excellence while simultaneously
445
achieving parity for the function in all business units. This can be accomplished assuming that
synergies can be discovered and then consolidated.
Figure 86. Synergy optimization. This figure illustrates how synergy discovery can lead to
synergistic consolidation using an LOB wheel structure.
In summary, the data suggests that achieving the profitability of addressable markets
often requires market penetrators and timely strategy execution. MOS leaders identified
penetrators that could be used situationally to capture new and increased market share. The
researcher discussed types of penetrators used to realize profitability. These were synergistically
exploited as they were already available or could be simply customized or applied situationally.
Penetrators applied to the MOS design can leverage existing capabilities, infrastructure,
products, systems, and technical expertise at competitive prices. Capability enabled a
competitive stance. A cost advantage further made possible the penetration of markets by making
bundle deals available with shared discounts to business units involved. An effective
infrastructure can be leveraged for volume deals that competitors cannot accommodate. Products
must also have consistent integrity against requirements and delivery expectations. Clients desire
446
that their vendor has the technical ability to solve their problems. Vendors must therefore be able
to create new products and services. Strategic capabilities allow the entrepreneur to be liberated
and motivated. Synergistic penetrators are less costly to create and deploy and thus, enhance
margin potential. Penetrators help MOS leaders realize synergistic growth. The following
propositions summarize the key findings of this section:
Proposition 179 (situational tactics): Strategic tactics must be viewed as
situational to exploit penetration opportunities in a dynamic market.
Proposition 180 (MOS scaling): The MOS creates a competitive advantage that
can scale through the addition of LOBs and locations while preserving talent,
process, knowledge, and a penchant for excellence.
Proposition 181 (infrastructure reliability): Infrastructure reliability is a penetrator
in an increasingly insecure and liability-oriented commercial environment.
Proposition 182 (enhanced value): The creative and timely application of
enhanced value may enable new profit-producing opportunities to be exploited.
Proposition 183 (tailored UI): Customizing the ERP UI to clients’ wishes makes it
difficult for clients to divorce themselves from the familiar system interface and
the valuable business intelligence that has accumulated.
Proposition 184 (technical prowess): Technical ability is a penetrator because it
inspires confidence in MediaCorp's ability to solve problems the client does not
understand or cannot solve.
Summary of exogenous data. External influences to the MOS include the other
organizational design elements, LIMs, and the designed relationship with the corporate center.
The latter have external linkages through their connectedness with each other, industry groups,
447
clients, and other divisions, as examples. The external, dynamic environment undulates and
moves constantly. The MOS thrives in this environment when compared to the A-form or the M-
form or organizational structure. The MOS also has external influence within MediaEnterprises
through alignment propagation during growth. The MOS creates a larger concentration of one-
ness as it scales. Finally, the MOS design is ideal for growth as it employs penetrators effectively
in a known addressable market.
Summary of Chapter 4
The findings section presented a summary of the key themes observed from the data and
their subsequent analysis. Using a framework for data collection as described in Chapter 3, the
researcher was able to collect and refine the data obtained from interviews. This section
presented the data and findings from key stakeholders employed at MediaEnterprises. This
section also identified the themes from the 20 interviews and the detailed, textural descriptions of
each participant. Finally, this section presented a composite description of endogenous and
exogenous data regarding the MOS’s ability to realize synergistic growth. Endogenous data
included a discussion about the distinct requirements of dimensional roles in the MOS and how
they influence profitability. Distinct theme patterns emerged in the data for the leadership role
within each dimension. Some of the critical horizontal themes included the consistent use of the
ERP system, capacity management, cost mitigation management, standardization as a platform
for growth, communication strategy, revenue growth, the performance of operations, and
leadership in the horizontal dimension. The vertical dimension was then reviewed. Leaders in
this area push for alignment, performance excellence, collaboration, environmental awareness,
and leadership that is proactive and that can execute. The diagonal support function was
reviewed next, with an emphasis on infrastructure, systems, and development. The client
448
diagonal was covered with a discussion on maintaining clients, growing clients, and new clients.
Data regarding products and services was then discussed along with workflow assignments
within functions. Each product and service was included in a sector categorization as well.
Change management success with synergistic changes also emerged from the data. There were
positive change experiences following planning, communication, behavior, and effective
execution. Specifically, execution included data themes such as inspiration, relationships,
capability, cohesion, and workflow. Where change did not go as well as it could have, there was
a lack of planning, unchecked poor behavior, poor communication, a lack of environmental
awareness, and a leadership void. Self-interest is a driver in the MOS that should not be
overlooked. It is reflected in autonomy and the location culture. It is influenced by policy
constraints and administrative burden. When focused, it is a driver for desirable outcomes.
Collaboration is a MOS attribute. Financial observations may also influence performance as they
encourage performance transparency and clarity. Collaboration influences the cost structure and
the margin available within the work. Similarly, top line revenue must be margin laden.
Performance ratios need to be standardized and understood to encourage learning wherever the
LOBs occur. LIMs were discussed as helpers for business entities that take many forms. They
help to make the MOS agile and nimble for future challenges. LIMs are formal work structures
that are dynamic. Examples can include cultural mechanisms or a financial report. A part of the
dynamics is internal. There was a separate section of the data that discussed mitigations for
organizational entropy. Action to counter this and move forward is the basis for executing
directional strategy as long as MOS leaders are involved. Exogenous data includes
environmental impacts on the product workflows. Regardless, in any business, there will be
issues that the MOS will need to address. These issues are less frequent with an aligned and
449
focused effort. Alignment is augmented by the 1MC initiative in a number of ways as discribed.
Furthermore, an aligned and focused MOS can scale efficiently. Profitable growth in the
addressable market is the objective. Effective penetrators gain entry to previously unavailable
spends. The next section, Chapter 5, provides a discussion of the research findings and
conclusions by using the findings to answer the research questions. It also provides further
recommendations for research.
450
Chapter 5. Conclusions
Overview
The purpose of this qualitative phenomenological research study was to explore a single
case study of a multi-unit firm by examining how a multidimensional organizational design
augmented by lateral integrative mechanisms and a designed relationship with the corporate
center contributes to the realization of growth synergies in a moderately dynamic market. For
example, recent studies have begun to suggest that products and services are experiencing shorter
life-cycles (D’Aveni et al., 2010). For the purpose of this study, the phenomenon, or object of the
analysis, was the precipitating event that led to permanent cross-business collaboration within
the MUF. The unit of analysis on which the phenomenon was studied is the strategy and the
organizational design that leads to sustainable desired outcomes. These outcomes are described
as sustained corporate advantage.
The objective of MediaCorp’s strategy was officially to achieve budgeted performance in
terms of cash flow, returns on capital, and profitable growth. Unofficially, it was to outperform
competitors with regard to reliability, on-time client servicing, and problem-solving capability.
Collectively, the strategy was to realize growth synergies. In the newly implemented MOS this
could be achieved by focusing on organizational efficacy and functional optimization within
each dimension. The vertically-oriented bands in the structure represent locations. These were to
be optimized through operational excellence and strategic positioning in local markets. Location
managers attempted to position their businesses in markets where there was sustainable growth,
low volatility, profit potential, and high earnings potential; however, these markets are by nature
dynamic and the clients are fickle. Further opportunities were obtained through global
operational excellence, market leading technology, innovation leadership, and workflow
451
management that is transparent to the client. Additionally, local business aimed at optimizing
costs by taking on off-load during capacity cycles to reduce carrying costs and by leveraging the
global supply chains’ world-class processes.
A phenomenological case study is a means to the experiential reaction and sense-making
of participants as they transform their own role and behavior to adapt to a new paradigm of
leadership while achieving desirable outcomes. Much of the profitability optimization literature
focuses on diversification and operative synergies, like cost optimization, rather than growth
synergies as a phenomenon (Li & Greenwood, 2004). This perspective overlooks the profitability
enhancements that can be experienced through the unique combination of capabilities and
strategy. By examining growth synergies at MediaCorp through a phenomenological single case
study, the researcher was able to explore, discover, and capture findings that have previously
been ignored. The data supporting these findings has a number of strengths including that the
participants were stakeholders, that the participants were knowledgeable, that the timing of the
study allowed for a holistic and reflective view, that the situation was real, that the observations
were based in reality, that the researcher was a participant and stakeholder, that the researcher
was knowledgeable in the subject matter, that the data was triangulated, that an iterative
approach was used to established data clarity and fulsomeness, that the participants were willing
to participate and contribute, and that the participants were able to speak freely to inform the data
collected. The key findings were centered on endogenous and exogenous factors as well as
opportunities for wider influence within MediaEnterprises through an organizational structure
that is scalable. These findings change the way we conceptualize the model of a MOS and how it
can contribute to growth synergy. The researcher will use the findings to create, or extend, mid-
range theory regarding sustainable growth synergy realization in multi-unit firms for the practical

452
purpose of improving corporate performance. Many of the participants reported that the structure
was effective in reality and their excitement to participate in the transition was a source of
motivation. This chapter presents the researcher’s conclusions and implications for theory,
research, and practice.
The conclusions that follow were developed while reflecting on the study’s findings, or
propositions, as they connected with the research questions. The link between the propositions
and the research questions is illustrated in Table 31. This linkage was established by the
researcher who reviewed each proposition and mapped the strength of the linkage to each of the
five research questions. Table 31 is a snapshot from the working table used to determine the
strength of the linkage. As illustrated in the table, the strength of the connection related to the
color in the cell. This table is a window into a larger spreadsheet that tracked the linking activity.
The mapping occurred based on the overall knowledge of the researcher. The shade of each cell
was determined in sequence from the first to the last proposition. To create reasonable accuracy,
the researcher went over the shading of each cell at least three times. Each proposition was listed
in order as indicated by the column labeled Number. Each proposition was listed on the right in
the Description column beyond the view of the window. Each research question was used as
column labels. The overall research question (ORQ) is labelled as Growth. Research question
one (RQ1) is labelled as Synergy, as this is the theme of the question. For purposes of clarity, this
research question was broken into four discrete sub-themes, including: profitability synergy
(PR), pricing power synergy (PP), strength related synergy (LS), and scalability synergy (SC;
Damodaran, 2005). Research question two (RQ2) is labeled as How, as it relates to how a MOS
can achieve growth synergies. Research question three (RQ3) is labelled as Corp as it relates to
the relationship between the MOS and the corporate center. Research question four (RQ4) is
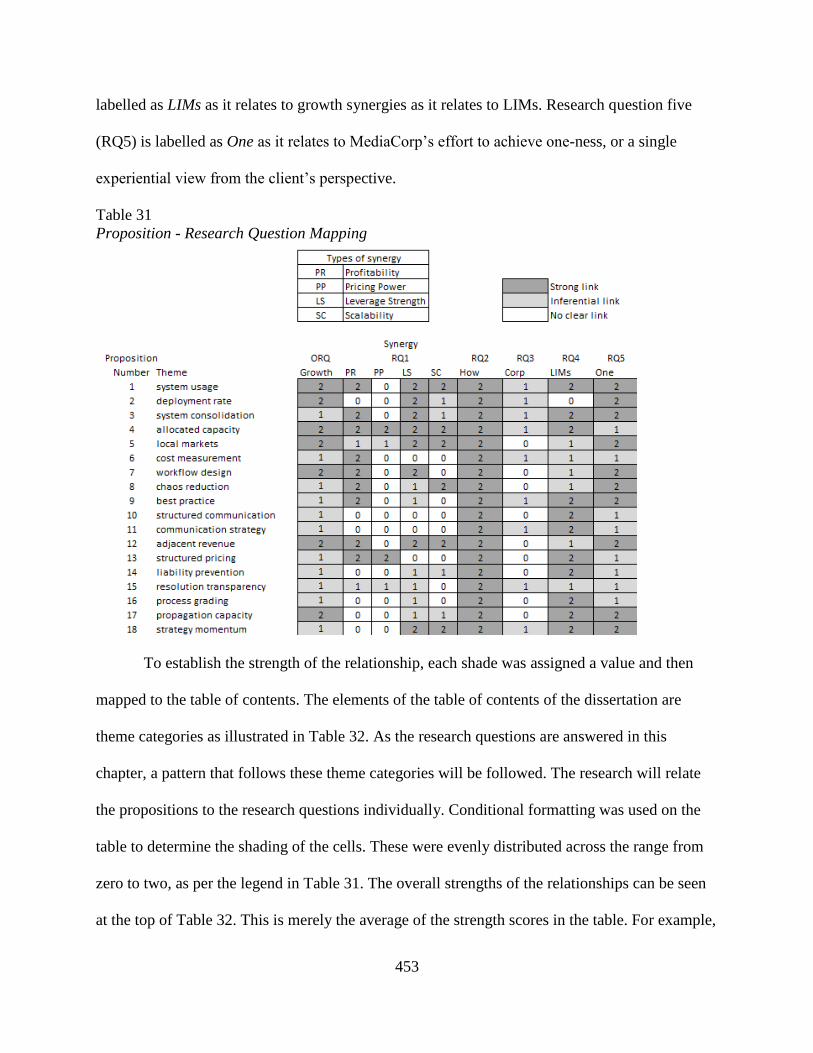
453
labelled as LIMs as it relates to growth synergies as it relates to LIMs. Research question five
(RQ5) is labelled as One as it relates to MediaCorp’s effort to achieve one-ness, or a single
experiential view from the client’s perspective.
Table 31
Proposition - Research Question Mapping
To establish the strength of the relationship, each shade was assigned a value and then
mapped to the table of contents. The elements of the table of contents of the dissertation are
theme categories as illustrated in Table 32. As the research questions are answered in this
chapter, a pattern that follows these theme categories will be followed. The research will relate
the propositions to the research questions individually. Conditional formatting was used on the
table to determine the shading of the cells. These were evenly distributed across the range from
zero to two, as per the legend in Table 31. The overall strengths of the relationships can be seen
at the top of Table 32. This is merely the average of the strength scores in the table. For example,
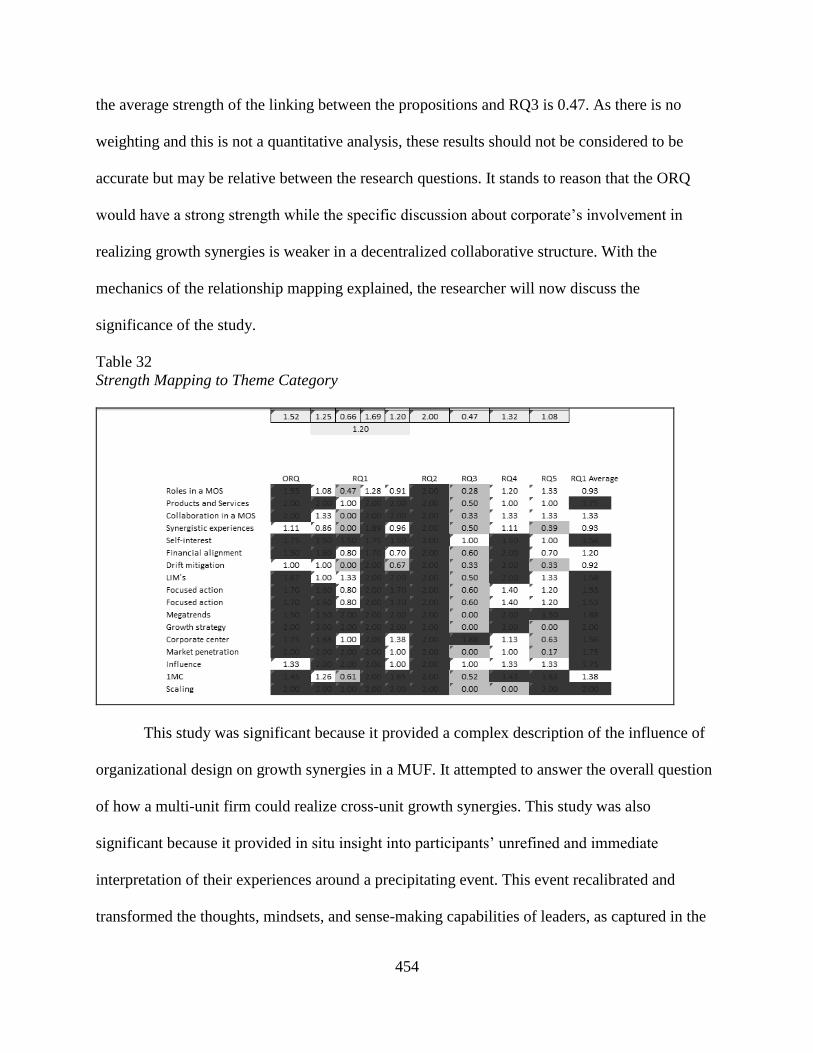
454
the average strength of the linking between the propositions and RQ3 is 0.47. As there is no
weighting and this is not a quantitative analysis, these results should not be considered to be
accurate but may be relative between the research questions. It stands to reason that the ORQ
would have a strong strength while the specific discussion about corporate’s involvement in
realizing growth synergies is weaker in a decentralized collaborative structure. With the
mechanics of the relationship mapping explained, the researcher will now discuss the
significance of the study.
Table 32
Strength Mapping to Theme Category
This study was significant because it provided a complex description of the influence of
organizational design on growth synergies in a MUF. It attempted to answer the overall question
of how a multi-unit firm could realize cross-unit growth synergies. This study was also
significant because it provided in situ insight into participants’ unrefined and immediate
interpretation of their experiences around a precipitating event. This event recalibrated and
transformed the thoughts, mindsets, and sense-making capabilities of leaders, as captured in the
455
data and subsequently, in the propositions. It also reset the design of the organization through the
introduction of a MOS augmented by LIMs and a constructive relationship with the corporate
center. The mapping referred to in Table 31 above allows the researcher to discuss each research
question individually by referring to the propositions that relate to it. This is the definitive link,
therefore, between the data and the research questions. The conclusions from each research
question will be discussed below.
Conclusions
The objective of the empirical part of this dissertation was to analyze how a MUF could
continuously realize growth synergies in a dynamic market. The focus in this case is not on
individual strategies per se, but rather on the co-evolutionary design of the MUF’s organizations
with changing market circumstances to realize growth synergies (Koza & Lewin, 1998; Lewin &
Volberda, 1999; Martin, 2002; McKelvey, 1997). In contrast, MUFs today sometimes see the
path to success through cost efficiencies alone rather than reconfiguring operative resources to
match market opportunities, such as increasing market share (Eisenhardt & Galunic, 2000;
Eisenhardt & Martin, Helfat & Eisenhardt, 2004; 2000; Martin, 2002; Penrose, 1959;
Schumpeter, 1934; 1942). These actions may influence the destruction of value more than the
creation of it (Goold & Campbell, 1998). Based on the data obtained from the case study, the
researcher was able to infer constructs and propositions that provide a mid-range theory of
continuous growth synergies in a MUF. These constructs and propositions identify critical
elements in strategy and organizational design that contribute to desirable outcomes.
Consequently, they conceptualize critical success factors that emerged from the data.
456
Propositions and Findings
The results, discussed below, suggest that a strategic concept that establishes a selective
focus on a few strategic areas of synergistic growth in a structured sequence is a critical success
factor for the realization of continuous growth synergy. When these strategic components are
applied in a suitable organizational structure, they have a continuous effect on growth synergy
realization. This study suggests that a stable-flexible organizational design is most suitable for
the achievement of sustained corporate advantage through synergistic growth. The purpose of
this design is to achieve this growth in a moderately dynamic market. Other designs may be
referred to as stable-mechanistic or flexible-dynamic. A stable-mechanistic design may have
static resource sharing, as the market dynamism has not been assessed or considered. The market
may be static. This design may be heavily centralized and contain weak financial controls (Hitt,
et al., 1992). On the other side of the spectrum, the flexible-dynamic organizational design may
be characterized by dynamic resource combinations in a very dynamic transient market.
Resources may be acquired and divested quickly to capture profits (Martin, 2002). These
findings emphasize the importance of strategy and collaboration such that organizational
elements can identify, select, and implement successful growth synergy initiatives, and execute
them effectively in a moderately dynamic market. Strategy in the literature supports the findings,
as corporate goals that reflect the preferred future position of the firm influence the quality of
selected initiatives (Lovas & Ghoshal, 2000). These initiatives are also closely linked to the
endogenous and exogenous opportunity space of the organization (Simmonds, 1990). In today’s
saturated, low-growth markets, the pursuit of growth synergies is becoming increasingly
important to MUFs. Consequently, selective focus on specific strategic actions linked to
opportunity is needed to concentrate energy, effort, and the attention of entrepreneurial decision
457
makers. The research questions collectively cover aspects of the focused growth effort. These
propositions emerged from the data. In the following section, each research question will be
discussed in terms of the propositions that relate to it. The research questions, again, were as
follows:
RQ1: What types of growth synergies, if any, can a multi-unit business,
multidimensional organizational structure realize?
RQ2: How do multi-unit firms with a multidimensional organizational structure
continuously realize the benefits of growth synergies, if at all?
RQ3: What is the role, if any, of the corporate center in the context of this case study?
RQ4: How can lateral integrative mechanisms influence, if at all, growth synergies in
a MOS?
RQ5: To what extent, if any, does a one-ness strategy align a MUF to influence
growth synergy?
ORQ: How can a multi-unit firm realize cross-unit growth synergies?
In the discussion that follows, each research question will be linked to the associated
propositions that contain content that informs the answer to the question. The propositions
emerged from the data collected and are sequenced to reveal the mid-range theory that attempts
to answer the research questions within the context of the case study. While some of the theory
revealed may be situational, the researcher believes that it is also to some extent generalizable
and applicable in other contexts. Ultimately, the researcher believes that the theory presented
through the proposition discussion and the summaries within the framework of the research
questions are valid and present a thematic focus. While these findings are limited to the case
study used in the research, the causal patterns that emerged can inform higher order constructs
458
that link to the literature when it is available. This experience in the field has theoretical
relevance, as the researcher was open to contributions from stakeholders, which led to the
building of explanations and causal relationships around the precipitating event. Exogenous
reliability is further validated by the researcher’s approach (Yin, 1994). While case study
empirical findings may be difficult to generalize (Denzin, 1989; Yin, 1994), this case study
provides some validation of existing thinking paradigms while promoting new ideas. These ideas
emerged from the novel organizational applications. The researcher intends that these new ideas
reshape or recalibrate existing theories by exposing gaps in them. Generalizability is ultimately
determined through the comparison of case studies and the replicability of findings. This
research and its findings through the proposition detail and summaries below, are formed by the
context in which they occurred and the time during which the study was conducted. Typically,
the propositions were rich in value, such that some of them informed answers to multiple
research questions. As such, they are referred to in all applicable sections. Regardless, the
researcher understands that the reader will draw their own conclusions following an examination
of the study. Each proposition was mapped to each research question in accordance with the
strength of its linkage. Strong linkages were involved in the discussion above weaker ones. The
propositions were summarized to present a perspective within the context of the research
question, as indicated in the discussion below. Each of the critical elements in the discussion is
covered as it relates to each question. For example, the first research question is answered by the
propositions as they relate to the primary elements of the study: the MOS, the LIMs, the
designed relationship with corporate, along with alignment, growth synergies, and leadership.
RQ1. The first research question refers to types of growth synergies that can be realized
by a MUF organized in a MOS. The synergies that are included in this response were broken into
459
four categories, or types, that included (a) profitability, (b) pricing power, (c) leveraging
strengths, and (c) scalability. These operating synergies allow firms to increase their operating
income from existing assets, increased growth, or both. They are discussed in more detail below
with reference to the proposition numbers (P#) that emerged based on the researcher’s
interpretation of the data.
Profitability synergy. The effective combination of valued capabilities enhances free cash
flow. The propositions that emerged from the data suggested that a MUF with a MOS and a
designed relationship with the corporate center and which is augmented by LIMs, can achieve
sustained corporate advantage. The horizontal role in the MOS was made capable through the
consistent usage of the ERP system (P1). The ERP was a valued capability, enabling
accountability for performance and transparency that enabled synergistic growth. Furthermore,
the consolidation of systems enabled visibility to information that was otherwise trapped in a
system silo (P3). Disparate systems required capital to improve and sustain, even though
capabilities were redundant with other systems. The result was a needless, negative impact on
free cash flow in an environment of capital rationing. The opportunity for profitability was
driven by the clients’ perception of technical and volume capability. Once work was awarded,
MediaCorp needed to have the ability to meet specifications and achieve throughput volumes
within client time frames at a cost that resulted in a margin (P4). The installation of network-
based production created this confidence and capability. The network promoted synergistic
alignment within workflows and allowed for capacity pooling of similar functions. This
capability helped MediaCorp accommodate variability in demand while improving utilization of
resources (P7). With a market shift towards fragmented formats and deliverable variability, an
emphasis on standardization countered the opposing increase in complexity. Standardization
460
enabled adaptive transformation through scalability, capability, predictability, updatability, and
transportability of resources in a chaotic environment (P8). When related best practices were
horizontally standardized across locations, a common language emerged that allowed for better
profitability measurement. This standardization functioned as a platform for the efficient
evolution of the organization (P9). Furthermore, existing workflows and infrastructure could be
used for adjacent market opportunities enhancing profitability through the increased utilization
of synergistic capabilities (P12). Profitability is also linked to pricing structures during product
or service life-cycles. At various stages of the life-cycle, pricing strategies may need to change to
achieve optimal profitability. For example, billable line items that were offered previously for
free at the beginning of the life-cycle may need to be revisited after the jump-off-point (P13).
The vertical, or location role, realized that multi-location alignment on a directional
strategy that exploits related capabilities of diverse but synergistic workflows and which is based
on best practice, enhances the possibility for sustained advantage (P21). It is this corporate
advantage based on multi-unit synergies that leads to growth when achievement is optimally
balanced with cost performance (P23). Consistent performance excellence from the perspective
of the client may lead to increased market share and the opportunity for increased free cash flow
(P24). Vertical leaders are close to their local markets and know the profitability enablers that,
when effectively deployed, will achieve desired outcomes (P25). An example of an enabler is
performance excellence as a supply chain cultural element. This must apply at the location and
within the production network. This ensures capability parity regardless of the facility used
(P27). In these cases, work can be assigned to capable capacity-enhancing profitability through
relatedness. These costs are understood and profitability is enhanced through interdependency
when supply chain leaders aggressively share their resources (P32). An aggressive stance also
461
needs to be taken with regard to continuous improvement. This must occur at a rate that exceeds
the expectations of the market and which competitors improve to seal price points and gain
revenues enhancing conglomerate surplus (P37). Once achieved, proactive maintenance is
required to ensure that best practices sustain the gap created between the competitive landscape
and competitors. This advanced position achieved ahead-of-potential revenue opportunities that
allowed the organization to exploit market synergy, thereby occupying a position of market
dominance and agility (P41). Vertical leaders know that sharing or redeploying capacity can
enable the execution of large overcapacity orders that competitors are unable to execute. These
would otherwise be referred to another vendor or split between vendors (P42). Pricing
negotiations are critical for profitability. Leadership in this area includes an awareness of cost
reduction opportunity, regardless of current margin, and a revenue enhancement strategy (P43).
Multidimensional firms choose leaders for their potential to contribute towards the goal. A leader
with the overall goal of firm performance possesses additional skill sets, especially in the area of
soft skills. Profitable opportunities, when relentlessly pursued through searching and strategy
execution, may then be exploited through nimble action (P51). The desire to control resources in
isolation is supplanted by the desire to help the firm achieve its goals. Leaders embrace
information systems that disrupt the monopoly on tacit knowledge which creates exclusivity and
subordinate control. While location autonomy is encouraged in an entrepreneurial culture,
alignment with the directional strategy of the organization and an alignment with market trends
garner support for meaningful synergistic growth (P53).
Diagonal support. The MOS role of the diagonal support leader assists with
infrastructure while creating volume and velocity capabilities. This role cannot be isolated, but
rather needs to be supportive and engaged. The availability of performance data in real-time
462
allows for quick decisions to be made in response to market demands. Many of these decisions
may relate to system or workflow capability enhancements that improve the cost performance of
the business unit (P55). Systems, like MediaCorp’s ERP, can provide each dimension of the
MOS in a MUF with transaction-based data. This includes transfer pricing between units and the
elimination of information asymmetries, while concurrently increasing the value of the global
enterprise system with appropriate data structures. An information vacuum prompted managers
to create requirements for the in-house development team in the diagonal support dimension to
fulfill their need. Account managers should not be tied up in local databases. Additionally,
transfer pricing cannot undermine the profitability of a project for a location. The data
consolidation and segmentation capability of the system allows for analytics that managers can
exploit for the realization of growth synergies. When there are workflow transitions, integrations,
patching, modifications, and enhancements, they should not be noticeable to client production
schedules (P58). The infrastructure and workflow management systems are co-dependent. Their
optimization and alignment allow for the best results because together they are super-additives
(P59).
Diagonal client. Role definitions in a MOS are required to ensure accountability;
however, synergistic tasks are shared optimally and selectively by all outward facing employees
to maintain the profitability of existing revenue streams (P60). All outward facing employees
that interact with clients to produce revenue are considered to be in this diagonal client role.
These employees can enhance the revenue from a client through additional income streams that
are synergistic. This is a profitability super-additive (P62). In the case of MediaCorp, markets
became quickly saturated with product and profitable growth had to be achieved. Vertical growth
opportunities were limited by product offerings from the client and so MediaCorp decided to
463
pursue spot work and expand its client base in other sectors. This was, however, unfamiliar
territory and it was hard to win new work without endangering profitability. The relationship
between operations and sales is critical. This relationship achieves mutually beneficial
profitability goals when both parties collaborate around their strengths, filling the company's
pipeline with sustained corporate advantage (P63). Acquiring new business revenue requires
complementary diversification starting with sales lead ideation and ending with the achievement
of billable volume ramping at optimized margins (P64). An analysis of market needs against
MediaCorp capabilities revealed a number of opportunities. Gaining entry into these markets
resulted in pricing concessions that consumed capacity while producing minimal margins. Sector
nuances with regard to compliance and culture, added complication, created conflict, and
stretched resources. Furthermore, an analysis was done of untapped market segments within the
control of existing clients. These were vigorously pursued as the ability to network using existing
contacts was potentially fruitful. Unfortunately, with penetration comes pricing concessions in
order to gain entry (Porter, 1985). While this increased revenues, it put stress on profitability and
the organization struggled to meet the demands of the undulating life-cycle landscape. Even so,
entrepreneurial and co-evolutionary leadership that owns a product workflow can be incentivized
to pursue cross-sector opportunities (P65). As a result, the portfolio assignments enhanced
accountability for profitability results and focused growth synergies that were constructive (P66).
Self-interest is a critical driver for profitability. If self-interest is ignored, then synergy-
driven profitability is at risk. Furthermore, the impact of dis-synergies may be exaggerated. On
the other hand, if a collaborative relationship exists between corporate and the MOS, a guided
and balanced self-interest may positively relate to autonomous growth synergy realization in
local addressable markets (P95, P96). A guided autonomy, driven by self-interest and augmented
464
by resource complementarity in a network-based production environment, accelerates the
process of achieving profitable growth (P98). There are several ways that the corporate center
can assist with local growth. The corporate center could be seen as a service center that
contributes to continuous growth by temporarily incubating growth opportunities, by sharing
related resources between businesses, and by helping business units select initiatives based on
the long-term strategic plan for the firm (P97). These discovered opportunities and initiatives are
oriented into an appropriate task list. Its execution sequence is directly related to the timing of
desirable outcome realization (P98). An effective self-interest policy is a mechanism that
encourages a collaborative, cross-business, social environment that is necessary for profitable
growth realization (P101). An aspect of the self-interest policy relates to how revenue is
recognized by the business units. In this case, an effective revenue-recognition algorithm will
accommodate critical concerns from stakeholders and drive behaviors that lead to profitable
growth (P102). Collaboration is necessary between members in the production network. For this
to work, fluid resource sharing without boundaries attracts the right resources quickly to issues
whose resolution contributes to profitability potential (P105).
Financial monitoring is necessary to ensure that allocations and cost accuracy are present.
It is also important to track profitability against targets. Therefore, a standardized and
appropriate cost allocation methodology creates predictable financial performance and allows for
profit-producing trend monitoring (P106). With effective monitoring, quick course-corrections
are possible. For example, the effort needed to establish profitable pricing may not have been
expended in cases where free line items exist at near break-even levels (P111) due to a lack of
visibility. Pricing strategies may result in margin erosion that may be more than accommodated
for by profits obtained from volume (P112). Another situation may occur when the cost to
465
produce the revenue is not assigned to it. When revenue is reported together with cost, LOB
analysis is possible, leading to prioritized profitability enhancements (P113). Otherwise, the
analysis is erroneous. Data that can be used for profitability analysis was important to MOS
leaders. MOS leaders needed to know and monitor margins by location, type, and client so that
product life-cycles are predictable and so that appropriate pricing strategies can be applied
(P114). Additionally, it was necessary to know cost differences between locations so that work
could be assigned optimally. For this to be possible, an optimal level of granularity and
transparency was needed with business unit data, such that functional performance comparisons
between locations can be meaningful and leveraged (P115).
Focused action within an optimized scope is a driver for profitability. The MOS is a
nimble organizational construct that can effectively exploit focused action to realize synergistic
profitability (P125). This may include a sequence of tasks, quickly discovered and effectively
executed, that can lead to mutual benefit between business units that collaborate by leveraging
existing synergistic capabilities (P126). The MOS as a structure can effectively drive selective
and focused action that, when exploited, can realize scaling that includes expansion,
consolidation, and the integration of business units (P129). To further enhance productivity, a
MOS can be leveraged to support cost mitigation through a continuously evolving organizational
effectiveness that is superior to competitors (P130). By exploiting boundary-spanning personnel,
LIMs augment the MOS's ability to realize synergistic growth. One of the ways that LIMs do this
is by focusing action execution through collaborative task monitoring mechanisms (P132). One
of these LIMs is the ERP system. The ERP system is a significantly influential LIM, or a super-
additive, as it enables scalable organizational efficacy by promoting cost effectiveness,
transparency, and workflow control (P133). The MOS can also scale. This provides an
466
opportunity for profitability, as capacity is available through a flexible production network.
Scaling capacity dynamically in a global production network allows for the successful
completion of bulk work over a short duration as a competitive advantage (P136).
The corporate center influences profitability through support of the MOS and alignment
of the business units around growth synergy. Entrepreneurial MOS leaders indicated that they
could achieve synergistic profitability faster when the relationship with corporate is streamlined
and supportive (P138). The rate at which the realization of profitable growth is achieved is
influenced by the quality of the relationship with corporate, specifically with regard to trust
between interacting parties (P139). Corporate synergies can be used to strengthen the
competitive position of the elements of the MOS. For example, the corporate center can be a
valuable source of information. MOS leaders benefit from performance information because they
use it to recalibrate, course-correct, adapt plans, and monitor progress for the achievement of
desirable outcomes (P140). They can also explain the strategic method of the MUF. This method
may be used by corporate to help business units connect with other business units that have
achieved synergistic capabilities that could be exploited (P143). They can also assist business
units in retaining and mentoring talent so that they can be leveraged to achieve growth synergies
(P144). These, and other strategic elements, can influence the selected focus of the MOS. The
1MC strategy fits into the strategic plans at MediaEnterprises. One-ness is a complexity-
mitigation technique, embraced by corporate and business units alike, that accelerates profitable
growth because it is a suitable platform on which growth can more easily take place (P142). An
exogenous alignment includes the MUF introducing disruptive change to align it with market
dynamics; however, product development must progress at a suitable rate to replace negative
profitability impacts (P147).
467
1MC. The 1MC initiative introduced and embedded a culture of one-ness. Over the
majority of 2014, the 1MC team drove the designed strategic concept that resulted in the
continuous realization of growth synergies. This new perspective was shared with clients,
enhancing the ability of MediaCorp to sell their supply chain. The organizational design
blueprint had become significantly successful in the facilitation of assessing the situation,
defining a path forward, and executing a roadmap to achieve desired outcomes. After the
alignment to the new structure, sales growth increased significantly even as regional growth was
stagnating. Profitable corporate growth also increased through cross-business sales, integrations,
and capacity utilization improvements. In addition, favorable customer comments were received
in large quantities, suggesting that client utility was being created for MediaCorp clients that
differentiated it from its competitors. In fact, client satisfaction rates soared to 93% based on
customer surveys. The end-to-end supply chain was a distinct competitive advantage on which
the profitability of the company was dependent. Aspects of the 1MC initiative war are
particularly influential in creating profitability. It was important, for example, that organizations,
such as MediaCorp, which seek one-ness recalibrate their perspective on organizational design to
enable or sustain profitable growth in an evolving market that embraces, or already has
embraced, the benefits of one-ness (P161). Endogenously, an end-to-end value chain must be
aligned in purpose and destiny in order to realize synergistic growth that enhances profitability
(P166). In fact, the majority of interviewed managers confirmed that the initiative was meeting
its objective: the successful realignment of the firm for the continuous realization of growth
synergies. This was further validated through a 93% rating on customer surveys during 2014.
Profitability occurs when the MOS scales with a margin. Scaling is an intrinsic capability
of the MOS because it inherently embraces the idea of one-ness by design and so is an ideal
468
structure to scale. It also preserves a single supply chain view to clients (P168). A structure, like
the MOS, that is scalable in all dimensions can propagate alignment as it grows, maintaining
focus on the mission. The mission is executed by a culture whose bias-for-action is focused on
improving profitability (P169). Consequently, opportunities in the addressable market can be
realized when the MOS scales.
Profitability is influenced by the growth potential of the MOS. The realization of growth
synergies is partially dependent on the addressable market and the agility of the organization in a
dynamic market. Proactively, a MUF can map out the addressable market and construct a multi-
pronged tactical strategy to exploit potential unrealized client spends (P177). However, the
nimbleness of a MOS enhances the ability of a MUF to exploit an optimal proportion of the
product or service life-cycle (P176). MediaCorp found that in their markets the elements of a
successful expansion strategy had to include a track record of reliability, the ability to penetrate
barriers to entry, an effective execution plan, and the ability to monitor results (P178).
Market penetration was mandatory for MediaCorp to realize new growth opportunities.
Conglomerate power can leverage relatedness to gain a competitive position. Sector penetration
included the establishment of relationships where penetration opportunities could most easily be
realized. Sector clusters were prioritized and clients within clusters were contacted. Sector
strategies drove activities around roadmaps for the creation of a cross-business portfolio,
solutions, and penetration strategies. The first step in the strategy included screening the overall
market to identify sectors and to identify white spaces within the current market definition.
Secondarily, MediaCorp analyzed the relevant sectors to identify which ones had growth synergy
potential. Sectors that were closest to the existing environment were prioritized for lead-sharing,
bundling, and integration. Strategic tactics had to be viewed situationally to exploit penetration
469
opportunities in the dynamic market (P179). For example, tailoring the ERP UI to the client's
wishes made it difficult for clients to divorce themselves from the familiar system interface and
valuable business intelligence that had accumulated (P183). This is an example of how the
creative and timely application of enhanced value may enable new profit-producing
opportunities to be exploited (P182). Once growth opportunities are realized, the MOS has a
competitive advantage because it can scale through the addition of LOBs and locations while
preserving talent, process, knowledge, and a penchant for excellence (P180). Furthermore,
infrastructure reliability is a penetrator in an increasingly insecure and liability-oriented
commercial environment (P181). Similarly, technical ability is a penetrator because it inspires
confidence in MediaCorp's ability to solve problems the client does not understand (P178).
MediaCorp managers developed strategic concepts for the continuous realization of growth
synergies that were based on norm strategies. This focused attention on selected profitable
sectors and designated key accounts. These concepts provided the strategic grounding for
deriving economic value from the synergy realization that contributes to profitable growth. The
focus on profitable growth sectors and the selection of key clients to approach, initially,
supported profitable growth. Lead-sharing improved business market shares of each business. By
offering new products in untapped sectors and by eliminating white spots in the existing
portfolio, MediaCorp increased market coverage. Innovative products that address customer
needs beyond the current view expanded the overall market.
In summary, profitability is influenced by profitability synergies that include profitability
synergy, pricing power synergy, synergy from leveraging strengths, and scalability synergy.
Profitability synergy comes from the effective combination of valued capabilities that enhance
free cash flow. This synergy increases income from existing assets, or from increased growth, or
470
from both. Profitability synergies are enabled by the novel organizational design deployed by
MediaCorp. The horizontal-dimension leader role in the MOS exploits consolidated systems that
create transparency and opportunity awareness within the global production network. This
network promotes alignment regarding best practices and effort directed at achieving desired
outcomes. Horizontal leaders are responsible for the profitability of their LOB. They influence
this by pushing existing and created capabilities across the network so that it can exploit adjacent
markets. Vertical dimension leaders ensure consistent operational excellence and pursue local
markets. They share available resources while exploiting the production network to fulfill orders
in a cost optimal way. Diagonal support leaders ensure that infrastructure and systems are
performing ahead of market demands. Diagonal client leaders pursue synergistic revenue
streams, ensuring profitable growth through the repurposing and improved utilization of existing
capabilities. A designed relationship with corporate enables the deployment of a guided and
balanced self-interest policy helping to ensure mutual benefit to all dimensions of the MOS.
They provide, through various LIMs, performance transparency, and measurement against
desirable outcomes. Focused action drives a nimble organization that is aligned through a culture
of one-ness to profitability realization. The MOS can scale with a margin when it exploits the
addressable market by executing situational penetration strategies.
The second synergy category that addresses RQ1 is pricing power synergy. This
operating synergy allows firms to increase their operating income from existing assets, increased
growth, or both, putting the firm in a competitive position in the market. A reduction in the
competition or their capacity allows for higher market share and higher pricing. These result in
higher margins and operating income.
471
Pricing power synergy is dependent on the effective execution of roles in a MOS.
Specifically, horizontal roles interface with clients to be awarded work within their LOB. Clients
will allocate volume work at higher price points to the vendors perceived to have both the
technical ability to meet their specifications and the availability of more than sufficient capacity
to process the volume (P4). It is less likely that pricing negotiations will occur if a vendor can
help a client when they have a large or special need. MediaCorp’s corporate leaders emphasized
that lead-sharing, bundling, and integration are complementary norms. Businesses can engage in
lead-sharing while offering the client meaningful solutions. Offerings can be bundled and
business units can be integrated depending on the market situation. The extent to which this is
done depends on market attributes and the competitor landscape. When bundled and integrated
solutions are sold over several clients, the development costs can spread over a large base and
profitability is increased. Strategic relationships with key customers can help with the
monetization of replicable and innovated market penetrating solutions. These solutions can then
become general when they have matured. Every product or service has a life cycle. An optimal
service and product life-cycle strategy enables maximal contribution to margins when dynamic
pricing plans are executed (P50). Pricing structures applied after the jump-off point in the life-
cycle of products or services may need to be reviewed to include line items that previously were
discounted or free (P13). Pricing power synergy is enacted through the complementarity of
norms deployed to pursue addressable markets.
Vertical leaders ensure local performance, enhancing pricing power. When a client is
dependent on vendor performance levels, this workflow performance excellence can lead to
increased market share when execution results are consistent with customer expectations (P24).
When this consistent performance, relative to changing client expectations, continually evolves,
472
the vendor stays ahead of the competition and increases market share (P26). Specifically,
continuous improvement must occur at a rate that exceeds the rate of the market and competitors
in order to seal price points and gain revenues (P37). Proactive leadership will make sure that
once gains are made, they are sustained. The proactive maintenance of achieved best practices
then enables a gap between the current competitive landscape and an advanced position ahead of
potential revenue opportunities (P41). Internally, work can be profitably assigned when available
and capable capacity costs are understood and when supply chain leaders aggressively share their
resources (P32). Sharing or redeploying capacity can enable the execution of large overcapacity
orders that competitors are unable to execute and which would otherwise be referred to another
vendor or split between vendors (P42). This capability creates value in the clients’ view, as they
would rather not have to manage multiple vendors. A broadened margin gives the business unit
pricing strategy flexibility. Pricing negotiation leadership includes an awareness of cost
reduction opportunity, regardless of the current margin, leading to a revenue enhancement
strategy (P43).
Diagonal support functions assist with pricing power synergies. Slight enhancements to
workflows may enable the consolidation of workflows improving their utilization and cost per
deliverable (P57). Diagonal client functions must collaborate with LOB, support, and location
leaders to exploit pricing power synergies. For example, operations and sales achieve mutually
beneficial profitability goals when they collaborate around their strengths, filling the company's
pipeline with sustained corporate advantage (P63). Similarly for support functions, acquiring
new business revenue requires collaborative action starting with sales lead ideation and ending
with the achievement of billable volume ramping at optimized margins (P64).
473
The self-interest of stakeholders influences pricing power synergy. Some of this relates to
cultural attributes present in a MOS environment and how this relates to capacity management.
For example, a guided autonomy driven by self-interest and augmented by resource
complementarity in a network-based production environment accelerates the process of
achieving profitable growth (P98). An effective self-interest policy is a LIM that encourages a
collaborative, social environment necessary for profitable growth realization (P101). The
utilization and capability of the production environment informs cost and pricing. The
relationship that the MOS has with the corporate center also influences pricing power. Regarding
self-interest, a collaborative corporate relationship with a MOS encourages guided and balanced
self-interest that is positively related to growth synergy realization (P95). Regarding local
markets, the selective involvement of the corporate center can promote autonomous growth in
locally addressable markets (P96). The corporate center may also assist with new products to
keep the vendor ahead of the competition. For example, the corporate center is a service center
that can contribute to continuous growth by temporarily incubating growth opportunities, by
sharing related resources between businesses, and by helping business units to select initiatives
based on the long-term strategic plan for the firm (P97). To encourage the sharing, an effective
revenue recognition algorithm once deployed will accommodate critical concerns from
stakeholders and drive behaviors that lead to profitable growth (P102).
Financial observations showed that when there is clarity and understanding regarding
financial data, pricing power synergy is enhanced. When revenue is reported together with cost,
LOB analysis is possible, leading to prioritized profitability enhancements (P113). Financial
synergies leverage financial resources to help business units achieve competitive positions in
their marketplace. When there is transparency regarding financial data, MOS leaders can know
474
and monitor margins by location, type, and client so that product life-cycle profits are
predictable, can be forecasted, and so that appropriate pricing strategies can be applied (P114).
The effort needed to establish profitable pricing may not have been expended in cases where free
line items exist if price levels are near break-even (P111). In these cases line items should be
added to rate structures to recover losses. Additionally, pricing strategies may intentionally
reflect margin erosion; however, this may be more than accommodated for by profits from
increased volume in the event that consolidation in the industry occurs (P112).
LIMs, like financial reports, are transient organizational constructs between dimensions.
They contribute to pricing power synergy. Structures, like these, are required for the coordination
and enhancement of cross-business collaboration in an evolving synergistic growth environment
(P117). Strong integrative mechanisms applied appropriately and with the right frequency are
positively related to continuous growth synergy realization (P121). MOS leaders benefit from
access to meaningful and relevant tacit knowledge, domain experience, and performance data
that can be used to accelerate growth-oriented decision making (P119). While financial data may
be centralized, it is decentralized collaboration that enables business unit autonomy to select and
implement growth initiatives that are directly related to growth synergy realization and pricing
power (P120).
Focused action enhances the ability of a MUF to achieve pricing power in a dynamic
market. This focused action must be aligned with a growth synergy strategy that enables a
competitive advantage. A MOS is intrinsically aligned, as the structure is connected and tasks are
shared by relevant functions commissioned to achieve growth synergies (P128). For example, a
MOS can be leveraged to support cost mitigation through a continuously evolving organizational
effectiveness that is superior to competitors (P130). Furthermore, LIMs augment the MOS's
475
ability to create related profitability. A MOS realizes synergistic growth by focusing action
execution through collaborative task monitoring mechanisms (P132). In this case the ERP
system, a significantly influential LIM, is a super-additive as it enables scalable organizational
efficacy by promoting cost effectiveness, transparency, and workflow control during synergistic
growth (P133).
The way the MUF responds to megatrends enables pricing power in a dynamic market. A
nimble organization that can redeploy resources and satisfy clients through innovative sales
initiatives is able to ride life-cycles longer than unprepared competitors (P135). Dynamically
scaling capacity by leveraging under-utilized, cross-unit capacity in a global production network
allows for the successful completion of bulk work over a short duration. This creates a
competitive advantage (P136). This competitive advantage enhances pricing power synergies.
The corporate center’s capabilities can be used to influence pricing power synergy by
strengthening the business unit’s competitive position. The rate at which the realization of
profitable growth is achieved is influenced by the quality of the relationship with corporate,
specifically with regard to trust between interacting parties (P139). This trust is a cornerstone in
the 1MC initiative. One-ness is embraced by corporate and business units alike. It accelerates
profitable growth because it is a suitable platform on which growth can more easily take place
(P142). Corporate can help business units connect with other business units to achieve
synergistic capabilities that can be exploited (P143). Capabilities are enacted through valuable
human talent that interfaces with system-driven and effective infrastructure. Corporate can assist
business units in retaining and mentoring talent so that they can be leveraged to achieve
sustained corporate advantage (P144).
476
MOS leaders indicated that the MOS structure can be influential regarding pricing power
synergy. The effort needed to realize growth in market share in an entrepreneurial endeavor is
less of a burden in this collaborative environment than it would be otherwise. For example, the
effort needed to achieve revenue realization from a client that requires one-ness is significantly
more difficult if internal businesses do not embrace the alignment vision (P145). Furthermore, a
fragmented MUF cannot easily solve client issues that relate to one-ness as they do not
understand the root causes of problems that originate in other parts of the supply chain (P146).
This is needlessly complex due to destructive self-interest and dis-synergies within silos.
Another example could be that new products need to be introduced to penetrate markets. For
example, a MUF may introduce disruptive change to align it with market dynamics; however, in
these cases product development must progress at a suitable rate to replace negative profitability
impacts (P147). Pricing power can be achieved with a MOS that manipulates collaborative links
to exploit operative and growth synergies among related business units.
The 1MC initiative enables pricing power synergy at MediaEnterprises by providing a
way to position the company against its competitors as an end-to-end supply chain. An end-to-
end value chain must be directionally aligned in purpose and destiny in order to realize
synergistic growth (P166). Organizations seeking one-ness must recalibrate their perspective on
organizational design to enable or sustain profitable growth in an evolving market that embraces,
or already has embraced, the benefits of one-ness (P161). In short, clients are already embracing
this concept and see the advantages of it; therefore, competitive enterprises are compelled to
strategically position themselves in alignment with the one megatrend in order to maintain and
enhance market share in a dynamic environment (P159). With the 1MC initiative in place, MOS
leaders were able to benefit from timely, concise, and complete financial performance reviews
477
that are linked to both cost mitigations and the revenue resulting from opportunity exploitation
(P167). A MOS intrinsically embraces the idea of one-ness and so is an ideal structure to
propagate the norms established in the 1MC initiative (P168). Guided by this critical social and
operational capability, growth strategies can be realized through synergistic growth into
addressable markets.
The capability of a MOS to grow by increasing market share contributes to pricing power
synergy. Proactively, a MUF can map out the addressable market and construct a multi-pronged
tactical strategy to exploit potential unrealized client spends (P183). Exploiting the addressable
market is another matter and is dependent on several critical factors. For example, the
nimbleness of a MOS enhances the ability of a MUF to exploit an optimal proportion of the
product or service life-cycle (P176). Furthermore, the elements of a successful expansion
strategy include a track record of reliability, the ability to penetrate barriers to entry, an effective
execution plan, and the ability to monitor results (P178). These capabilities fit well into the
MOS as it is an organizational structure with the inherent ability to scale by leveraging
complementary resources.
Growth strategies are significantly influenced by the ability to gain access to the
addressable markets identified. This is aided by market or silo penetrators. An example could be
infrastructure reliability in an increasingly insecure and liability-oriented commercial
environment (P181). Another would be through tailoring the ERP UI to the client's wishes
making it attractive for use relative to a competitive offering. Additionally, once the silo is
penetrated, it would be difficult for clients to divorce themselves from the familiar system
interface and the valuable business intelligence that has accumulated (P183). Technical ability is
also a penetrator because it inspires confidence in MediaCorp's ability to solve problems the
478
client does not understand (P178). Ultimately, the strategic concept that was established by
MediaCorp’s managers was centered on the realization of growth synergies to increase corporate
profits by bringing the MUF’s unique portfolio and capabilities to customers across business
units, thereby solving their problems. This objective was specified through norming strategies
and a focus on profitable cross-unit focus areas with an optimized scope. The norm strategy
resulted in a shift from a vertically focused firm to a multidimensional focused firm, with an
emphasis on client profitability. The norm strategies became apparent in three ways: lead-
sharing, cross-product bundling, and cross-unit integration. The value proposition of these three
norms led to sustained corporate advantage. Strategic tactics must be viewed as situational to
exploit penetration opportunities in a dynamic market (P179). The creative and timely
application of enhanced value may enable the exploitation of new profit-producing opportunities
(P182). The MOS creates a competitive advantage that can scale through the addition of LOBs
and locations while preserving talent, process, knowledge, and a penchant for excellence (P180).
In summary, profitability is influenced by pricing power synergies. These synergies occur
when a firm increases its operating income from existing assets, from growth, or both by putting
the firm in a competitive position in the marketplaces in which it chooses to operate. Higher
market share allows for more profitable and stable pricing. Horizontal roles are LOB oriented
across all locations. Horizontal leaders impress upon clients the capability of the MOS in
comparison to competitors. This capability may be technical or it may be capacity based. Supply
chain strategies may also be used to create a dominant position in the marketplace. The LOB
leader optimizes the pricing strategy during each product or service life-cycle to optimize
profitability. Clients become dependent on vertical leaders to perform with excellence.
Consistent reliability must be ensured throughout the production network. Diagonal support
479
leaders optimize workflows placing the MUF in a preferable market position. An effective self-
interest policy encourages collaboration between the roles creating another competitive
advantage. Awareness of financial performance helps MOS leaders to improve their cost
structures when required to enable pricing strategies that result in the awarding of profitable
work. LIMs allow the MOS to adapt to the local market by providing collaborative structures or
tools. Focused action helps the MOS achieve cost mitigations or capabilities placing it in a
competitive position. Pricing strategies relate to megatrends that influence market shifting and
product or service life-cycles. Another advantage, which is a super-additive, is alignment in the
MOS. This is provided through the one-ness initiative.
The ability to leverage strengths is a synergy. The horizontal role in the MOS is primarily
charged with promoting LOBs across locations. The MOS includes a horizontal reach across
locations that relates to products and services. This responsibility focuses on improving the
overall potential for each product and service through the leveraging and developing of multi-
unit synergies. The leaders for each of these LOBs are seasoned and previously had multi-
location experience. MediaCorp’s leader constantly aligned the organization to realize efficiency
synergies and growth synergies through this team of horizontal leaders. This included initiatives
that relate to performance, technology-driven portfolio expansion, operational excellence, people
excellence, best-in-class governance, sustainability, and citizenship. In the combination of
physical entities, strengths of one entity can complement the weaknesses another other entity.
Strengths can be transferred across businesses to improve profitability. One example is the ERP
system. The consistent, accurate use of an ERP is an aligning platform that enables
accountability for performance and synergistic growth through transparency (P1). Centralizing
on one system exploits a significant synergy opportunity. For example, the transparency of
480
relevant data is aided by the consolidation of disparate systems that hold related data otherwise
not easily made available (P3). Once consolidated, the ability to enhance a singular system is
accelerated and recommendations from users can be quickly developed and deployed. The rate at
which enhancements, called out by these stakeholders, are developed and deployed, broadly
influences the growth rate of an enterprise in a moderately dynamic marketplace (P2). Another
synergistic strength is capacity. Clients will allocate volume work to vendors perceived to have
both the technical ability to meet their specifications and the availability of more than sufficient
capacity to process the volume (P4). Furthermore, as local markets originate orders, local
facilities are able to leverage known, available network capacity to meet client expectations,
regardless of the order size or complexity (P5). Where there is demand variability, workflow
synergistic alignment, capacity pooling, and complementary diversification utilization is
improved resulting in increased profitability (P7). Furthermore, when existing workflows and
infrastructure can be used to deliver new products and services to an adjacent, new, or similar
market in a different geography, there may be an opportunity for additional synergistic
profitability (P12). The capacity within the network is made available to clients if an ERP system
is in place. This workflow management system can manage the global production network and
provide needed status information of work in progress. Strategy creation and execution are also
strengths. For example, a strategy for global deployment must include momentum management
and enable the organization’s capability to effectively deploy (P18).
The vertical MOS role is also challenged to leverage strengths that realize growth
synergies. High-performing workers and leaders within the various locations in the production
network want to achieve success in an operation that is measured, monitored, and knowledge
rich (P28). While this is location specific, they also understand that network-based production is
481
dependent on collaboration, internal and external to the MOS (P29). Isolation hinders growth as
collaborative co-evolution leverages standardization as a platform for deploying workflow
enhancements (P30). The multi-directional nature of collaboration includes sharing
complementary resources with the network. This support is enabled by awareness and active
listening (P31). Work assignment within the production network must be accomplished
optimally to maximize profitability. Work can be profitably assigned when available and capable
capacity costs are understood and when supply chain leaders aggressively share their available
capacity (P32). Sharing or redeploying capacity can enable the execution of large orders that a
location alone and competitors are unable to execute. These orders would otherwise be referred
to another vendor or split between vendors (P42). It is myopic for a location leader to assume
that problems will not arise either locally or within the network. Problem resolution as a strength
is accelerated by operational performance transparency and a clear awareness of expectations
(P33). This is augmented by the timely availability of data used similarly across all locations.
This data should be offered up transparently to accelerate strategic decision making and issue
resolution (P34). While the location culture may be unique to some extent, the constitution of the
location culture must be appropriate and aligned with other locations to optimize capacity
utilization in a network-based production schema (P35). Therefore, vertical leaders need to
proactively select and mentor leaders that match the culture of the future (P38). Ultimately,
proactive leaders must make their leadership teams capable to achieve what is about to happen in
the marketplace (P39).
Diagonal support leaders exploit synergy by leveraging strengths within the MOS. For
example, slight enhancements to workflows may be a super-additive, as they enable the
consolidation of workflows thereby improving their utilization and cost per deliverable (P57). As
482
infrastructure and workflow management systems are co-dependent, they must also be optimized
as a system for best results (P59). The system must optimize the cost structure of the operation,
but also needs to support business continuity. Specifically, diagonal support leaders optimize the
realization of sustained corporate advantage in the marketplace when workflow transitions,
integrations, modifications, and enhancements are not noticeable to client production schedules
(P58).
Client facing diagonal leaders exploit MOS strengths in a synergistic way. Synergistic
tasks are shared optimally and selectively by all outward facing employees to maintain the
profitability of existing revenue streams (P60) just as synergistic tasks are shared by functions
critical to the execution of these tasks and their associated rewards (P61). Operations and sales
achieve mutually beneficial profitability goals when they collaborate around their strengths,
filling the company's pipeline with sustained corporate advantage (P63). Acquiring new business
revenue requires collaborative action starting with sales lead ideation and ending with the
achievement of billable volume growing at optimized margins (P64). Further to this, enhancing
the revenue from a client through additional income streams that are synergistic is a profitability
super-additive (P62). This requires entrepreneurial leadership that owns a product workflow.
This leadership must also be incentivized to pursue cross-sector opportunities (P65). These
opportunities contribute to an evolving and expanding product and service portfolio. This
portfolio leverages the synergistic strengths, or complementary diversifiers, of the business units
in the MUF. Assigning the portfolio, or portions of it, to MOS leaders enhances accountability
for profitability results and focuses growth synergies that are constructive (P66).
During change management, complementary diversifiers can be exploited. MOS leaders
determined that there were several key principles regarding synergistic change processes that
483
contributed to the achievement of desirable outcomes. When these change events were
successful, a holistic vision of the detailed organizational design encouraged a focused transition
(P69). Stakeholders are motivated to engage in change that is driven by respect, participation,
and interest in the intended outcome (P79). Furthermore, transition execution performance is
significantly dependent on stakeholder’s belief and participation in change vision ideation (P74).
The relationship that stakeholders have with change leaders is critical. MOS leaders indicated
that achieving capability requirements is as much about understanding requirement details as it is
about the relationship that stakeholders have with change leaders (P75). The ability to execute
change activities is driven by the degree of support given to change agents by stakeholders to
complete change activities. These activities are typically a burden beyond their existing work
(P78). The effectiveness of this relationship is significantly influenced by communication
between change leaders and other stakeholders. The integrity of the communication strategy,
including the nature of the content and the timing, can reduce change inertia (P70). Change
leaders and MOS stakeholders must understand that communication is situational in design
depending on the change phase, on the timeline, and on the relevant audience (P71). Effective
communication produces a sense of unity. This unity as seen in consensus, consistency, and
continuity is partly achieved through diversity of talent, tools, and processes (P76). Unity is also
achieved when behaviors are appropriate to the situation. For example, an immediate awareness
of constructive behaviors gives a change leader the opportunity to reinforce positive attributes as
they occur (P72). On the other hand, an acute awareness of inertia-producing behaviors gives a
change leader the immediate opportunity to mitigate an otherwise excessive effort requirement
(P73). Waste in the execution of the rollout process can produce change fatigue and reduce
customer confidence. As a result, a phased workflow rollout needs to be structured around a
484
validated right-the-first-time ideology that accelerates maturity and achievement within the
deployment timeline (P77).
When synergistic change did not go as well as expected, the issues were centered on the
inability to execute existing synergistic strengths. In some cases an overly conservative plan may
produce resource and coordination deficiencies that compromise existing resource utilization
(P80). The total cost of deployment is then higher. This could have been predicted. Additionally,
it is important that there be client involvement in transition planning, as it augments growth
potential by designing present and future requirements into plan elements (P81). Furthermore,
the importance of the change may not be valued if the appropriate levels of management are not
involved in the plan design. Without input from all relevant entities, the resulting process may
require unnecessary effort to perform acceptable work (P82). A change leader must also be
aware of the attributes of inertia-producing behavior, such that timely mitigation tactics can be
immediately applied to the situation (P83). If not, energy is diverted and consumed by non-
valuable activities while the behavior mitigating response is delayed (P84). Additionally, scope
focus may be compromised by an excessive range of activities and collaborative disunity (P85).
Communication and awareness failure hamper successful strength synergy exploitation.
One of the first tasks in an activity roadmap is to explain the reason behind the plan. This needs
to be communicated from a stakeholder’s perspective. This communication must help
stakeholders achieving a new vision that is influenced by an understanding of the logic behind
the plan, agreeing with the logic, and knowing why it has to be achieved now (P86). Further to
this, and often overlooked, the tasks in a plan are as important to participants as who is involved
and if they agree with the values of those who assume new roles (P87). The transfer of plan
knowledge drives buy-in, which would be further enhanced if stakeholders were involved in the
485
decisions regarding the plan (P88). Communication creates awareness which influences buy-in.
Stakeholders who are personally invested in the business unit’s success may be discouraged with
their employment prospects if they are not allowed to participate in change activities (P90). A
MOS leader must, therefore, effectively manage change by collating critical information about
the changing internal and external environment (P89). If a suitable level of awareness prior to
execution does not occur, additional cost from the resulting confusion should be expected. For
example, the cost of change activities is elevated when stakeholders do not have the opportunity
to streamline change activities before they occur (P91). Social aspects also influence change
related cost. For example, leadership, through relationship performance, is linked to
transformational change through attributes such as connectedness, adaptability, protection, and
the depth of the relationship (P92). It follows then that performance outcomes are influenced by
the approach used, the timeliness of behavior controls, and the achievement of an appropriate
level of oversight (P93). Ultimately, the degree to which the change leader and stakeholders are
in alignment in purpose will correlate to the effort needed to execute the change roadmap and
realize the strength synergy for profitability realization (P94).
A collaborative corporate relationship with a MOS encourages guided and balanced self-
interest that is positively related to growth synergy realization (P95). Specifically, the selective
involvement of the corporate center leveraging its strengths can promote autonomous growth in
locally addressable markets (P96). Furthermore, the corporate center is a service center that can
contribute to continuous growth by temporarily incubating growth opportunities, by sharing
related resources between businesses, and by helping business units to select initiatives based on
the long-term strategic plan for the firm (P97). These contributions can be the genesis for new
strengths needed in a dynamic market; however, the combination of these strengths is super-
486
additive. This is because a guided autonomy driven by self-interest and augmented by resource
complementarity in a network-based production environment accelerates the process of
achieving profitable growth (P98). Strengths may also be strategically exploited at the right time,
in the right place, and in the right sequence. The appropriate task list and its execution sequence
are directly related to the timing of desirable outcome realization (P99). Importantly, a business
unit self-interest policy is negatively influenced and may be compromised by the administrative
burden needed to manage it (P100). Achieving a guided and balanced self-interest is the
motivation to execute a task list that is directly connected to the realization of desired outcomes.
Collaboration in a MOS is needed to leverage strength-oriented synergies. Conversely,
and by way of example, isolated actions do not benefit from super-additives gained from
exploiting matured initiatives through duplication or other means (P103). MediaCorp was
transforming from a physical production model to a knowledge exploitation model. Products
became increasingly technical while the organization was expected to be a problem solver for the
client. Clients became increasingly dependent on MediaCorp, not because of relationships, but
because of their problem-solving capabilities. Strength-based collaboration is enabled when
existing knowledge is consolidated and made generally available. This knowledge can then be
used as an advanced starting point, or platform, for new discoveries and issue resolution (P104).
Multidimensional firms understand that their profitability comes from their ability to create value
for clients. The sources of this profitability has moved from tangible physical assets and codified
knowledge to the meaningful exploitation of tacit personal knowledge of creative workers who
create customer value. As a result, strategies within MUFs tend to be aimed at knowledge
exploitation and organizational leadership rather than physical production. Leadership needs to
be able to foster a climate of teamwork and collaboration to create this customer value at the
487
right time. Additionally, a mental transition has to occur that includes a transformation from
portfolio management to running an integrated firm. This is why the use of resources and the
pursuit of market opportunities are organized on separate dimensions. It increases the
dependencies between managers, mandating the need for collaborative problem solving and
opportunity exploitation. All managers have the common goal of creating value for customers
that is enabled by scarce knowledge resources that are used across the firm. New strengths are
discovered when resource sharing is fluid and without boundaries, as this attracts the right
resources quickly to issues whose resolution contributes to profitability potential (P105).
Problem resolution strengthens controls and capabilities subject synergistic sharing.
Financial functions are a strength that can be shared and exploited widely. For example, a
standardized and appropriate cost allocation methodology creates predictable financial
performance and allows for profit-producing trend monitoring (P106). Additionally, financial
report usefulness depends significantly on the timeliness and accuracy of cost allocations (P107).
Without accuracy and timely reporting, comparative cost ratio trend analysis is difficult to
leverage, as cost line items are not made transparent to P&L owners (P108). Furthermore, line
item mapping is critical for financial information to be relevant. Cost is fundamentally activity
dependent, where the labor associated with a task must be mapped to the value producing
activity, regardless of where it came from (P109). When arbitrary cost allocations are used to
bolster reporting optics, or delay negative results, the resulting reporting activity obfuscates true
performance and the ability to trend deployed cost mitigations (P110). Consequently, to ensure
business unit data usability, an optimal level of granularity and transparency is needed. This data
also enables functional performance comparisons between locations, making them meaningful as
they inform selected action (P115). With accurate financial information, profitability opportunity
488
is potentially exploitable. For example, the effort needed to establish profitable pricing may not
have otherwise been expended in cases where unknown free line items exist or when price levels
are near break-even (P111).
LIMs are strengths that may be situationally exploited within a time frame that is
meaningful for the purpose of the LIM. Strong integrative mechanisms applied appropriately and
with the right frequency are positively related to continuous growth synergy realization (P121).
Additionally, the influence of the LIM may contribute to an adaptable structure that ensures a
meaningful impact. LIMs are synergistic as they connect MOS dimensions in meaningful ways,
through common interests (P116). It is clear to MOS leaders that integrative structures are
required for the coordination and enhancement of cross-business collaboration in an evolving
synergistic growth environment (P117). This also relates to cultural alignment, which is another
strength. For example, cultural activities help MOS dimensions establish and mature a
collaborative mindset in a complex environment (P118). A significant number of LIM types exist
and will be discussed in future sections. A significant LIM, for example, is a knowledge
management system. MOS leaders benefit from access to meaningful and relevant tacit
knowledge and domain experience that can be used to accelerate growth-oriented decision
making (P119). Management structures needed to guide and support self-interest are LIMs.
These LIMs are ideal for decentralized collaboration as they include business unit autonomy
when selecting and implementing growth initiatives; both of which are directly related to growth
synergy realization (P120).
Strengths also come in the form of drift mitigation capabilities that preserve existing
profitability so that growth can be pursued. These capabilities are synergistic and can be
replicated across locations through LIMs and the efforts of the horizontal dimension. Drift
489
mitigation is dependent on leadership activity. The ability to timely mitigate an undesirable drift
is enabled by relationships based on trust and accountability (P124). Communication is a LIM
that helps to prevent drift. The design and strategy of communication can influence entropy
rates; however, an existing reference for movement must be used to measure set expectations
against defined variables to expose the drift rate (P122). The reference, or baseline
measurements, may include published data that includes tolerances that trigger alarms and
proactive mitigation when they are exceeded. A reactive approach may include performance
reports as snapshots-in-time that are a delayed rather than a real-time means by which a reaction
can ensue (P123).
Focused and selected actions leverage strengths to exploit synergy. It is fortuitous that the
MOS is a nimble organizational construct that can effectively exploit focused action to realize
synergistic profitability (P125). The MOS is able to execute a sequence of tasks, quickly
discovered, and effectively execute for mutual benefit between business units (P126). The design
of the MOS expedites change by minimizing inertia. Energy consumption, aligned to realize a
local synergistic opportunity, is minimized in a MOS augmented by LIMs and supported by the
corporate center (P127). This is because the MOS is intrinsically aligned. The structure is
connected, or linked, and tasks are shared by relevant functions needed to achieve growth
synergies (P128). A MOS can drive synergistic focused action that, when exploited, can enable
scaling that may include the expansion, consolidation, or integration of business units (P129). A
MOS can also be leveraged to support cost mitigation action, resulting in a continuously
evolving organizational effectiveness that is superior to competitors (P130). Focused action in a
MOS is augmented through the influence of other organizational structures. For example,
finance, is a supporting function that augments the self-interest in a MOS by promoting
490
inspirational reward systems through performance transparency (P131). LIMs augment the
MOS's ability to realize synergistic growth by focusing action execution through collaborative
task-monitoring mechanisms (P132). For example, the corporate center and the ERP system
provide relevant information needed to exploit resources effectively in fulfillment of MUF
strategic objectives (P134, P133).
In an environment where external megatrends can impact profitability outcomes, the
MOS can adapt and transform to optimize sustained corporate advantage. For example, a nimble
organization that can redeploy resources and satisfy clients through innovative sales initiatives is
able to ride life-cycles longer than unprepared competitors (P135). Another strength synergy is
the ability of the MOS to dynamically scale capacity in a global production network as needed.
This allows for the successful completion of bulk work over a short duration as a competitive
advantage (P136). The MOS must adapt to ever changing megatrends by exploiting
complementary diversification. This strength enables the MOS to co-evolve and achieve
synergistic growth.
A designed relationship with the corporate center can be a strength that is synergistic. Its
influence can be leveraged across all locations and LOBs. Entrepreneurial MOS leaders can
achieve profitability from multi-unit synergies faster when the relationship with corporate is
streamlined and supportive (P138). Furthermore, the rate at which the realization of profitable
growth is achieved is influenced by the quality of the relationship with corporate, specifically
with regard to trust between interacting parties (P139). When corporate oversimplifies a complex
situation, they create inertia and deplete trust, as decisions are not sufficiently robust. This results
in residual work or unacceptable and unanticipated collateral damage (P137). The overall impact
reduces the business unit’s absorptive capacity for change. As a mitigating factor, for corporate
491
to be supportive they need to have a minimal understanding of the business unit’s function,
capability, culture, systems, and its relationship with other business units or divisions (P141).
Corporate can help business units connect with other business units that have achieved
synergistic capabilities that could be exploited (P143). Corporate can also create synergistic
strength by assisting business units with the retention and mentoring of talent, so that they can be
leveraged to achieve growth synergies (P144). Similarly, MOS leaders benefit from financial
performance information because they use it to recalibrate, course-correct, adapt plans, and
monitor progress for the achievement of desirable outcomes (P140). Alignment around a
directional strategy is also a strength synergy. Unity between business units, in many ways, can
only be promoted by the corporate center, which has influence over all entities in the MUF. This
can be helpful to the MOS, as one-ness can function as a complexity-mitigation technique, that
must be embraced by corporate and business units alike, in order to accelerate profitable growth
(P142).
The ability of the MOS to influence other business units is a strength that is synergistic,
as existing elements of the MOS are being shared. The resulting co-evolution includes the
manipulation and alignment of capabilities to exploit synergies across business units. For
example, the effort to achieve revenue realization from a client that requires one-ness is
significantly more difficult if internal businesses do not embrace the alignment vision (P145).
Furthermore, a fragmented MUF cannot easily solve client issues that relate to one-ness as they
cannot see where the root causes of the problems originated (P146). Alignment is a strength that
enables a MUF to take drastic measures, transforming to align with the market. For example, a
MUF may introduce disruptive change to align itself with market dynamics. This is only possible
if product development progresses at a suitable rate to replace resulting negative profitability
492
impacts (P147). Cross-business collaboration allows a MOS to align with markets for sustained
profitability. Consequently, adaptive transformation is synergistic strength.
Following this theme, a strategy of unity is a significant synergistic strength that is
exploitable. It is clear that an end-to-end value chain must be aligned in purpose and destiny in
order to realize synergistic growth (P166). For example, a deployed set of values and norms
creates the perception of a single mindset among MOS leaders (P156). Additionally, a common
vision-mission will be embedded in strategic planning and discovery documents when the parts
of a MUF are aligned (P153). Competitive enterprises are compelled to strategically position
themselves in alignment with the one megatrend in order to maintain and enhance market share
in a dynamic environment (P159). Organizations seeking one-ness must recalibrate their
perspective on organizational design to enable or sustain profitable growth in an evolving market
that embraces, or already has embraced, the benefits of one-ness (P161). It is clear that clients’
perception of the organization is a source of sustained corporate advantage. Consistent
excellence across all locations is foundational to a one initiative, as it validates the single vertical
supply chain perspective of the client (P160). This excellence is subject to the MUF’s ability to
perform and improve where needed. In fact, the client's impression of the MUF is influenced by
how the MOS allows itself to be transformed and monitored externally (P155). Clients expect a
singular, high-reliability, performance experience in the value chain that is subject to a mature
remediation process, when infrequent non-conformities occur (P163). This applies everywhere in
the supply chain, as a mature quality system that promotes a performance standard should have
equal influence on all locations, encouraging performance parity and improvement (P149).
Clients count on the reliability of the vendors’ supply chain workflows, which are dependent on
the continuously available capability of each linked functional element (P165). This applies to
493
specific capabilities. For example, clients expect that their assets are available, locatable, and
treated in a similarly excellent way, regardless of where they are in the end-to-end vendor supply
chain (P164). To ensure this practice, unification on excellence assumes that asset locations are
always known and are being cared for, returned, or purged timely (P150). This information is
hosted by a databased that includes a log of movement transactions and who made them. The
performance of the MOS is dependent on the unified approach to data management, requiring
that an effective data management capability consolidate knowledge by exploiting a globally
accessible framework (P148). Not only does knowledge include workflow status, but knowledge
management also engages entrepreneurialism, producing new knowledge while unifying task
knowledge through centralization, utilization, and influence (P162). The capability of
participants is influenced by knowledge acquisition. Specifically, a mechanism should be used to
verify that training is effectively deployed on a single platform by measuring to what extent
users depend on it for knowledge acquisition (P157). This also applies to infrastructure, as the
standardization of infrastructure components allows for knowledge of hardware disposition and
capability for redeployment to accommodate local capacity requirements (P151). This overall
unification of functional capability is synergy that drives performance capability perceptions
internal and external to the MOS. The internal unification of systems to streamline operations
also influences external perceptions, as API integrations and client data views are variably
complete (P152). Lastly, the organization’s design of the MOS supports alignment. Unity is
easily found in a MUF's organizational design when the layout of the positions is clear and
service failures are rare (P154). This applies to cultural attributes that are necessary for
synergistic growth. For example, security awareness and the integrity of infrastructure at each
site indicate the level of concern and control over the threat environment (P158). Ultimately, the
494
organization exists to be collectively profitable. To monitor this synergistic profitability MOS
leaders benefit from timely, concise, and complete financial performance reviews that are linked
to cost mitigations and the result of opportunity exploitation (P167).
An additional strength of the MOS is its ability to exploit synergies to realize growth
synergy. For example, the MOS intrinsically embraces the idea of one-ness and so is an ideal
structure to scale. Furthermore, the MOS, through its ERP system, is exogenously able to
preserve a single supply chain view to clients (P168). The MOS can prepare to exploit synergies
and scale by performing an environmental assessment (P170). It can define its mission, making it
known strategically to focus stakeholders on the sequence of activities needed to realize growth
synergies (P171). The MOS holds valuable tacit information needed for scaling. Existing trends
and strategic roadmaps are best known by leaders embedded in the organizations to be integrated
(P172). The MOS holds talent and hardware that must be preserved. To do so, a positive capacity
buffer should be created prior to scaling execution (P173). To exploit workflow synergies within
the MOS dimensions, workflow steps need to be understood by breaking them into elemental
function-based units and then coupling them with functions that have similar attributes (P174).
This capability aids the MOS by creating scaling efficiencies through redundant resource
utilization. Furthermore, a MOS may manage capacity through work shifting and pooling. These
sample techniques optimize cost structures as seen in cost-per-similar-deliverable measurements
(P175). These are some of the specific strengths that exist in the MOS structure that are core to
its mission to scale and therefore grow.
The MOS leverages strengths to grow. The MUF must have an appealing reputation, as
the elements of a successful expansion strategy include a track record of reliability, the ability to
penetrate barriers to entry, an effective execution plan, and the ability to monitor results (P178).
495
Knowledge of the opportunity allows the MUF to assign and leverage synergistic strengths as it
approaches the market. Proactively a MUF can map out the addressable market and construct a
multi-pronged tactical strategy to exploit potential unrealized client spends (P183). To realize the
benefit of synergistic strengths, the MOS must be able to respond in a timely manner to
opportunity. The nimbleness of a MOS enhances the ability of a MUF to exploit an optimal
proportion of the product or service life-cycle (P176).
To access the addressable market the MUF must leverage synergistic strengths. Strategic
tactics must be viewed as situational to exploit penetration opportunities in a dynamic market
(P179). The creative and timely application of enhanced value may enable new profit-producing
opportunities to be exploited (P182). The MOS creates a competitive advantage that can scale
through the addition of LOBs and locations while preserving talent, process, knowledge, and a
penchant for excellence (P180). This capability is augmented by synergistic strengths that are
barrier penetrators. For example, infrastructure reliability is a penetrator in an increasingly
insecure and liability-oriented commercial environment (P181). Technical ability is a penetrator
because it inspires confidence in MediaCorp's ability to solve problems the client does not
understand (P178). Additionally, tailoring the ERP UI to the client's wishes makes it difficult for
clients to divorce themselves from the familiar system interface and valuable business
intelligence that has accumulated (P183). This strength can be leveraged by all LOBs and used to
acquire and keep profitable work volume.
In summary, profitability is influenced through the leveraging of strength synergies.
These synergies are best-in-class capabilities that are highly valued by clients and can be shared
in the global production network. These strengths are critical for the realization of synergistic
growth. Strengths are complementary resources that may exist as culture, technology, a global
496
network, systems, strategy, and organizational design. The MOS makes strengths available
across business units and allows them to be transferred to any point of use when needed. The
capability of a geographic location in the MOS is enhanced significantly when it is made capable
to meet the needs of the addressable market through synergistic strengths. While horizontal roles
push strengths across the network, vertical leaders are challenged to acquire them and exploit
them to achieve a dominant position in local markets. An example of a strength would be the
ability to design and optimize workflows with minimal effort. Diagonal support leaders are also
able to proactively transform existing systems and workflows to keep the MOS ahead of its
markets. Diagonal client leaders collaborate with operations for market revenue realization. This
relationship is a super-additive, as it enables the on-boarding of new revenue streams, including
those from adjacent sectors. Mitigating organizational entropy is a synergistic strength.
Cumulative strength allows the MUF to be in a dominant market position, ensuring sustained
corporate advantage. Effective communication enables unity, a strength that is also a super-
additive value to the MOS. Decentralized collaboration in the MOS, as an inherent characteristic,
allows strengths to be moved around within the production network. Financial measurements
quantify the impact of the strengths that have been optimally shared. Financial reporting and
other LIMs bolster the organization’s ability to be adaptable in a dynamic market influenced by
megatrends. Focused and selected actions leverage strengths and exploit synergies. If the
relationship with corporate is designed, it is a strength as opposed to having the MOS conform to
the corporate structure. With the MOS being close to the client, corporate can support the
creation and exploitation of strengths, such as talent capability for example. A strategy of unity
promotes the creation and sharing of strengths for sustained corporate advantage.
497
Scalability synergy is when entities combine and as a result become more cost efficient
and profitable. Growth may occur vertically with markets or horizontally across sectors. For
example, one business unit may leverage the other’s capability, reputation, distribution network,
etc. to increase the sales of its products and services. The horizontal role fulfillment in a MOS
structure is significantly influential for creating synergy that enables scalability. For example, the
horizontal MOS leader is adept with the ERP system, as it provides global visibility. The
consistent accurate use of an ERP is an aligning platform that enables accountability for
performance and synergistic growth through transparency (P1). Scaling into capable and
available capacity is a horizontal MOS leader’s core competency. Clients will allocate volume
work to vendors perceived to have both the technical ability to meet their specifications and the
availability of more than sufficient capacity to process the volume (P4). Working with local
markets that originate orders to local facilities, the MOS leader leverages known available
capacity in the production network to meet client expectations (P5). In a dynamic market, a
strategy for global deployment of change initiatives must include the management of
momentum, as well as the organization’s capability to effectively deploy (P18). Not to be
overlooked, existing workflows and infrastructure can be used to deliver new products and
services to an adjacent, new, or similar market in a different geography where there may be an
opportunity for synergistic profitability (P12). Scalable synergy is based on an achieved platform
of excellence that must be sustained for growth opportunity realization. This standardization on
excellence is a complexity-reduction technique that enhances scalability, capability,
predictability, updatability, and transportability in a chaotic environment (P8).
Location, or vertical, leaders are critical participants in the scalability of the MOS, as
they are the locations in the production network. Network-based production is dependent on
498
collaboration internal and external to the MOS (P29). Location leaders promote collaborative
evolution by leveraging standardization as a platform for enhancement (P30). The multi-
directional nature of collaboration in the network includes offering assistance and the receipt of
feedback and support, all of which are enabled by awareness and active listening rather than
isolationism (P31). Sharing or redeploying capacity can enable the execution of large
overcapacity orders that competitors are unable to execute. These would otherwise be referred to
another vendor or split between vendors (P42). The ability to scale inspires confidence in clients.
It also contributes to utilization and profitability as work can be profitably assigned when
available and capable capacity costs are understood. Resource redeployment is enabled by
vertical supply chain leaders who aggressively share their resources (P32). Decisions to share
capacity are augmented by the ERP, a synergistic LIM that augments scalability synergy. The
timely availability of data used similarly across all locations can accelerate strategic decision
making and issue resolution (P34). Bottlenecks, for example, need to be mitigated expeditiously
to create capacity. Location capacity, as it relates to existing and pending work requirements, is
something that a proactive vertical leader must be keenly aware of, so that constraints like this
can be mitigated or circumvented (P36). This information is matched with a culture that is
aligned in a MOS. The constitution of the location culture must be appropriate and aligned with
other locations to optimize capacity utilization in a network-based production schema (P35).
Vertical leaders need to proactively select and mentor leaders that match the culture of the future
as defined by strategic direction (P38). With data and a suitable culture, the other component that
emerged in the study was the need for a history of reliability. If performance capability is not
present, work cannot be moved and scaling synergy is halted. Conversely, workflow
performance excellence can lead to increased market share when execution results are consistent
499
with customer expectations (P24). Ultimately, high performance location workers want to
achieve success and scale in an operation that is measured, monitored, and knowledge rich (P28).
Diagonal support functions in the MOS contribute to scalability synergies through the
application of their technical capabilities. This applies to the building of the infrastructure that
supports both the ERP feature set and the workflow design. Synergies are exploited, expanding
capacity when slight enhancements to workflows enable consolidation-improving utilization and
cost per deliverable (P57). This consolidation augments scalability by exploiting synergy
opportunity with minimal effort. Even so, any changes in capacity or capability must be
seamless. Specifically, workflow transitions, integrations, modifications, and enhancements may
not be noticeable to client production schedules, thereby avoiding any growth setbacks (P58).
Diagonal client leaders contribute significantly to scalability synergies. Within a MOS,
synergistic tasks are shared by functions critical to the execution of tasks (P61). Acquiring new
business revenue requires collaborative action starting with sales lead ideation and ending with
the achievement of billable volume at optimized margins (P64). Enhancing the revenue from a
client through additional growing income streams that are synergistic, is a profitability super-
additive (P62). Based on a discovery activity by the client, it was discovered that there were
sectors untapped by MediaCorp where clients were spending money. Additionally, there was a
discovery of clients that were not present in the MediaCorp client-base, but who spent money on
services that were at the core of MediaCorp’s offerings. As these clients were in other sectors,
they had not been given our attention. There were clients that MediaCorp was servicing that were
not in their historical market sector. Exploiting opportunities to sell other services to them
increased profitability. The incremental cost to deliver these services was minimized by
exploiting synergies. An analysis of competitor vendors revealed that MediaCorp could take
500
advantage of servicing issues that clients had in order to improve its market share. In fact,
entrepreneurial leadership that owns a product workflow can be incentivized to pursue cross-
sector opportunities (P65). Scaling must also be enabled and controlled within the diagonal client
function. Consequently, an assigned portfolio can be used to enhance accountability for
profitability results. It can also be used to focus growth synergies that are constructive (P66).
MOS leaders found that synergistic scaling success was dependent on several critical
attributes. A dominant pattern that emerged was in regard to planning for scaling. Rigor during
the planning phase of a project, that includes exploiting existing capabilities and a sequenced
rollout, will likely reduce the effort and time needed to execute the plan (P67). Furthermore, the
provision of transitional capacity and cost allowance within a defined project scope can
accelerate results achievement, preserve business continuity, and mitigate change fatigue (P68).
MOS leaders also indicated that transition execution performance is significantly dependent on a
stakeholder’s belief and participation in change vision ideation (P74). When synergistic scaling
execution failed to meet expectations, there was a lack of client involvement in planning. Client
involvement in transition planning augments growth potential by designing future requirements
into plan elements (P81).
Scalability is motivated by self-interest. Self-interest must be balanced within the MOS
dimensions. In fact, a collaborative corporate relationship with a MOS that encourages a guided
and balanced self-interest positively relates to growth synergy realization (P95). Furthermore, the
selective involvement of the corporate center can promote autonomous growth in locally
addressable markets (P96). A guided autonomy driven by self-interest and augmented by
resource complementarity in a network-based production environment accelerates the process of
achieving profitable growth (P98). Scalability synergies are subject to inertial forces. The
501
execution of tasks associated with creating scalability is subject to organizational inertia. For
example, the inability to discover an appropriate task list or its execution sequence is directly
related to the timing of desirable outcome realization (P99). Adding complexity, scalability may
occur within new services or products. In this case the corporate center may function as a service
center that can contribute to continuous growth by temporarily incubating growth opportunities,
by sharing related resources between businesses, and by helping business units to select
initiatives based on the long-term strategic plan for the firm (P97).
Collaboration is a core attribute of the MOS that enhances scalable synergy. The
framework of the MOS demonstrates that isolated actions do not benefit from super-additives
otherwise gained from exploiting matured initiatives through duplication (P103). This
duplication can happen within the construct of the MOS framework by adding lines within the
dimensions that apply. Fluid resource sharing without boundaries attracts the right resources
quickly to issues whose resolution contributes to profitability potential (P105). This resource
fluidity and scalability are augmented by knowledge availability. When existing knowledge is
consolidated and made available, it can be used as an advanced starting point, or platform, for
new discoveries (P104). Multi-unit synergy realization can, consequently, optimize related
profitability.
Financial transparency guides scaling and synergistic opportunity exploitation. The
performance results indicate to what extent the scaling was able to exploit scalability synergy.
Fundamentally, however, a standardized and appropriate cost allocation methodology must be
deemed by P&L owners as fair and be deployed. This policy can be used to create predictable
financial performance allowing for profit-producing trend monitoring and forecasting that
informs decision making (P106). Conversely, arbitrary cost allocations used to bolster reporting
502
optics, or delay negative results reporting, actually obfuscate true performance and the ability to
evaluate deployed cost mitigations (P110). An optimal level of granularity and transparency is
needed with business unit data, such that functional performance comparisons between locations
are meaningful and can be leveraged (P115). With this information, P&L owners can make
decisions needed to optimize scaling for growth synergy realization.
LIMs augment and enable scalability synergies as they connect MOS dimensions in
meaningful ways through common interests (P116). It is clear that integrative structures are
required for the coordination and enhancement of cross-business collaboration in an evolving
synergistic growth environment (P117). Findings from the data indicated that strong integrative
mechanisms, applied appropriately and with the right frequency, are positively related to
continuous growth synergy realization (P121). For example, cultural activities help MOS
dimensions establish and mature a collaborative mindset in a complex environment (P118). MOS
leaders also benefit from access to meaningful and relevant tacit knowledge and domain
experience that can be used to accelerate growth-oriented decision making (P119). The
enablement of decentralized collaboration preserves business unit autonomy to select and
implement growth initiatives, both of which are directly related to growth synergy realization
(P120). LIMs occur in a plethora of forms that can be strategically and situationally applied to
accelerate scaling in a MOS.
Focused action pushes scalability synergy opportunity forward to realization. Selected
action, through a sequence of tasks, quickly discovered and effectively executed, can lead to
mutual benefit between business units that collaborate (P126). More specifically, a MOS can
drive synergistic focused action that, when exploited, can realize scaling that includes expansion,
consolidation, and the integration of business units (P129). Additionally, a MOS is a nimble
503
organizational construct that can effectively exploit focused action to realize synergistic
profitability (P125). LIMs, like strategic plans, project plans, resource plans, etc. augment the
ability of a MOS to execute on focused and selected actions. In short, LIMs augment the MOS's
ability to realize synergistic growth by focusing action execution through collaborative task
monitoring mechanisms (P132). Financial LIMs include profitability performance reporting that
influences the selection and prioritization of actions, thereby providing focus. A MOS can be
leveraged to support cost mitigation through a continuously evolving organizational
effectiveness superior to competitors (P130). Additionally, the corporate center participates by
providing relevant information needed to exploit resources effectively in fulfillment of MUF
strategic objectives (P134).
Scalable synergies are subject to the influence of megatrends. Aligning scalability efforts
with megatrends influences profitability opportunity. Making scalability efforts synergistic is a
super-additive. For example, a nimble organization that can redeploy resources and satisfy
clients through innovative sales initiatives is able to ride life-cycle trajectories longer than
unprepared competitors (P135). Product and service life-cycles are prolonged or shortened by
megatrends. Fortunately, MediaCorp’s global production network can dynamically scale
capacity and engage in adaptive transformation allowing for the successful completion of
atypical client demands over a short duration, creating a competitive advantage (P136). A
dynamic market is significantly influenced by megatrends that may enhance the profitability of a
MUF that is able to adapt to changing requirements.
The corporate center assists the MOS with scaling synergies. For example, one-ness is
embraced by corporate and business unit’s alike, thereby accelerating profitable growth because
it is a suitable platform on which growth can more easily take place (P142). Additionally,
504
corporate can help business units connect with other business units that have achieved
synergistic capabilities that can be exploited (P143). Furthermore, corporate can assist business
units with the retention and mentoring of talent so that it can be leveraged to achieve growth
synergies (P144). The corporate center is selectively and situationally supportive of a MOS’s
ability to scale synergistically while sustaining gains already achieved.
This one-ness, officially known at MediaCorp as 1MC, influences scalability by allowing
synergies to be exploited. For example, a mature quality system that promotes a performance
standard should have equal influence on all locations, encouraging performance parity and
improvement (P149). When this is the case, the ability to use the production network is enabled,
as excellent performance is predictable. Consistent performance across all locations is
foundational to a one initiative as it validates the single supply chain perspective of the client
(P160). Organizations seeking one-ness must recalibrate their perspective on organizational
design to enable or sustain profitable growth in an evolving market that embraces, or already has
embraced, the benefits of one-ness (P161). Clients count on the reliability of the vendor’s supply
chain workflows, which are dependent on the continuously available capability of each linked
functional element (P165). More specifically, clients expect a singular, high-reliability
performance experience in the value chain that is subject to a mature remediation process when
infrequent non-conformities occur (P163).Therefore, an end-to-end value chain must be aligned
in purpose and destiny in order to scale from synergistic growth (P166). Using assets as an
example, practice unification on excellence assumes that asset locations are always known, and
that assets are being cared for, returned, or purged timely (P150). In fact, clients expect that their
assets are available, locatable, and treated in a similarly excellent way, regardless of where they
are in the end-to-end vendor supply chain (P164). Regarding infrastructure, the standardization
505
of infrastructure components allows for knowledge of their disposition and their redeployment to
accommodate local capacity requirements (P151). Regarding systems, the internal unification of
systems to streamline operations also influences external perceptions when API integrations and
client data views are variably complete (P152). Regarding training, a mechanism should be
deployed to verify that training is effectively deployed on a single platform by measuring to what
extent users depend on it for knowledge acquisition (P157). Regarding security, awareness and
the integrity of infrastructure at each site indicates the level of concern and control over the
threat environment (P158). Regarding tacit information, knowledge management engages
entrepreneurialism, producing new knowledge while unifying task knowledge through
centralization, utilization, and influence (P162). Regarding financial information, MOS leaders
benefit from timely, concise, and complete financial performance reviews that are linked to cost
mitigations and the result of opportunity exploitation (P167). Most importantly, a deployed set of
values and norms creates the perception of a single mindset among MOS leaders (P156). All of
these unification areas contribute significantly to synergistic scaling that ultimately results in the
realization of profitability.
Scaling synergy enables the exploitation of addressable markets. A MOS is an ideal
structure to scale and it preserves a single supply chain view to clients (P168). A structure that is
scalable in all dimensions can propagate alignment and a suitable culture to improve profitability
(P169). Planning should include an environmental assessment that includes trends in the
dynamic market (P170). Once understood, risk of failure is partially mitigated by defining the
mission of the MOS and making it known strategically. This will engage and focus stakeholders
in the sequence of activities needed to realize growth synergies (P171). Scalability planning and
success is enhanced through valuable information. This could include existing improvement
506
trends and strategic roadmaps in the organization to be integrated, if this is a scenario. This
information is best known by leaders embedded in the organization to be integrated. This
information needs to be embraced by MOS leaders so that they can efficiently scale to
accommodate the capacity (P172). An aspect of the capacity is the talent and hardware that must
be retained for business continuity. In fact, a positive capacity buffer should be created prior to
scaling execution (P173). To support scaling synergies, workflow synergies should be
understood. They can be determined by breaking workflows into elemental function-based units.
These can then be more easily coupled with functions that have similar attributes (P174). Scaling
may also include work shifting and pooling to optimize capacity and cost structures (P175).
Growth may require scaling or improved utilization of existing capacity. A growth
strategy would proactively include the understanding of the addressable market and a tactical
strategy to exploit potential unrealized client spends (P183). The effort needed to execute the
strategy is minimized if complementary resources are exploited. The rate at which growth can
happen is also influenced by the nimbleness of a MOS. This enhances the ability of a MUF to
exploit existing related diversification or an optimal proportion of new product or service life-
cycles (P176). Growth is also built on an excellent reputation for performance. In fact, the
elements of a successful expansion strategy include a track record of reliability, the ability to
penetrate barriers to entry, an effective execution plan, and the ability to monitor results (P178).
Synergistic penetrators facilitate profitable growth in the addressable market. These
strategic tactics must be viewed as situational in order to effectively leverage penetration
opportunities in a dynamic market (P179). For example, infrastructure reliability is a penetrator
in an increasingly insecure and liability-oriented commercial environment (P181). Furthermore,
the MOS creates a competitive advantage that can scale through the use of penetrators. Examples
507
of penetrators are present within LOBs and locations through various aspects of talent, process,
knowledge, and a penchant for excellence (P180).
In summary, profitability is influenced by scalability synergies. Scalable synergy occurs
when functional units are integrated with other units or their capacity is expanded, and they
become more profitable as a result. Bi-directional growth within or across the supply chain is
enabled by the MOS augmented by LIMs and a designed relationship with corporate. The
horizontal role in the MOS scales capacity by leveraging existing capabilities across relevant
locations. Expanding or enhancing existing capabilities requires less cost than creating
capabilities that do not yet exist. The alignment inherent in the MOS channels and throttles
efforts where there is a need for action. Furthermore, existing capabilities may be moderately
changed to accommodate new products or services with marginal cost impact due to existing
standardization that has already been deployed. Location leaders participate in scaling as they
can leverage the capabilities of the global production network. Synergistic LIMs augment the
MOS’s ability to scale. Diagonal support functions scale infrastructure, potentially enabled by
new technologies or automation. Diagonal client leaders coordinate information relative to
specifications and ramp rates. MOS leaders must understand capacity and its constraints. Self-
interest motivates MOS leaders to scale in order to achieve desired outcomes. While self-interest
provides autonomy to execute, collaboration does this as well through resource fluidity. The
execution of increased capacity is measured through financial performance results. LIMs like
this support the MOS and provide guidance for focused action during the growth cycle. Success
is subject to external megatrends, which may put additional demand on capacity. A culture of
one-ness is significantly easier to scale, because it is an existing, directionally-aligned platform
that minimizes the effort needed for forward motion. When disparate systems must be
508
accommodated, or when enhancements are required to accomplish objectives, complexity is
increased and the timeline may be extended. The ability to scale into addressable markets is
enhanced by propagating excellence and alignment. Growth is further enabled through the use of
penetrators that are meaningful to clients.
RQ2. The second research question is concerned with how a MUF with a MOS can
continuously realize the benefits of growth synergies. In this case the how has been exposed in
most of the responses that emerged from the data. In other words, the data was rich with
information regarding the answer to this question in the context of this single case study. To
begin with, and to follow the preexisting pattern as per the table of contents, the how is answered
through the execution of the roles in the MOS. Each role will be looked at individually starting
with the horizontal, or LOB, role.
Horizontal leaders pointed to the need for a holistic system most frequently. They are
able to influence profitability realization through the use of such an ERP system, as it enables
accountability for performance and promotes synergistic growth through transparency (P1). The
system provides a platform from which enhancements can be made and that broadly relates to
the growth rate of an enterprise in a moderately dynamic marketplace (P2). The system also
provides transparency of relevant data in a timely way (P3). Profitability realization is possible
through capacity management that leverages multi-unit synergies, as clients will allocate volume
work to vendors perceived to have both the technical ability to meet their specifications and the
availability of more than sufficient capacity to process the volume (P4). Beyond these
constructive interdependencies, as local markets originate orders local facilities need to leverage
known available network capacity to meet client expectations (P5). Horizontal leaders make sure
that capacity is available and exploited for their LOBs. They also make sure that cost controls are
509
in place and effective. Accurate cost measurement for each LOB creates awareness of workflow
profitability variations that may lead to targeted cost mitigations (P6). They take action to
optimize the cost side of the business by leveraging synergies within a directional strategy. For
example, workflow synergistic alignment and capacity pooling are enacted when there is demand
variability in order to optimize resource utilization (P7). Horizontal leaders are in the best
position to standardize practices across locations within their LOBs. Standardization is a
complexity-reduction technique that enhances scalability, capability, predictability, updatability,
and transportability in a chaotic environment (P8). Standardizing on best practice includes
deploying a common language needed for more accurate profitability measurement and creating
a platform for efficient organizational co-evolution (P9). However, horizontal leaders can only
manipulate collaborative links to exploit operative and growth synergies between business units
if they own an effective communication strategy within a focused scope. Strategic
communication must be situationally routed and structured to include escalation paths, optimal
timing, and a focused scope (P10). This communication is also optimally frequent, transparent,
and executed timely to reduce ambiguity (P11).
The efficiencies of the MOS as a collaborative structure afford horizontal leaders with the
capacity to increase profit-laden revenues. When existing workflows and infrastructure can be
used to deliver new products and services to an adjacent, new, or similar market in a different
geography there may be an opportunity for synergistic profitability (P12). Furthermore, pricing
structures applied after the jump-off point in the life-cycle of products or services may need to be
reviewed to include line items that previously were discounted or free (P13). The relationships
that horizontal leaders manage allow them to have these conversations with clients. Even so,
horizontal leaders must ensure that operations are functioning with an optimal cost basis,
510
including the change management needed to improve it. Consequently, an appropriate
methodology is needed to propagate best practices at the rate of each business unit’s absorptive
capacity (P17). This propagation methodology is based on transparency that leads to client and
business problem resolution. It is multi-directional, speed-sensitive, and innovative (P15). To
further ensure continuous corporate advantage, liability mitigation must be linked to selected and
focused action. In other words, compliance with liability prevention controls must be at least as
dynamic as the threat-scape (P14). The cost of these mitigations must be optimized for value and
timeliness. In fact, all financial processes should be graded on their accuracy and speed (P16).
Finally, leadership is at the core of how a horizontal leader in a MOS realizes growth synergies.
Leadership efficacy is dependent on awareness augmented by a culture of purpose driven
learning (P19). In addition, strategy efficacy is relevant to profitability. For example, a strategy
for global deployment must include change management momentum and the organization’s
capability to effectively deploy (P18). Horizontal leaders are uniquely positioned in the MOS to
achieve sustained corporate advantage through an established strategic method that is augmented
by complementary resources.
Vertical leaders contribute to how a MUF with a MOS realizes the benefits of growth
synergies. Vertical leaders represent a location in the production network within a local market.
Cross-business collaboration affords the vertical leader influence over the capacity of the
production network. For example, capacity is more easily shared when there is consensus on how
the production network should function (P20). This includes measurable goals that need to be
aligned with the firm’s mission and vision (P22). The nuances of each location allow for the
exploitation of geographically diverse but synergistic workflows, all of which are based on
deployed best practices to ensure capability parity (P21).
511
Vertical leaders ensure financial performance in their location by capturing the
addressable market that is available to them. Profitability leads to growth when operational
achievement is optimally balanced with cost performance (P23). Customers demand service
excellence that is reliable. Consequently, consistent workflow performance excellence can lead
to increased market share in a dynamic market when execution results are consistent with
customer expectations (P24, P26). Within the location, profitability enablers must be effectively
executed to achieve these outcomes (P25). For example, profitability is enabled by network
production capacity that is seamlessly guided by a propensity for excellence parity over all
locations (P27). When this occurs, work from the local addressable market can be realized using
capacity in a network that leverages high performance workers who want to achieve success in
an operation that is measured, monitored, and knowledge rich (P28).
To avoid being isolated, vertical leaders must engage and collaborate. Network-based
production is dependent on collaboration internal and external to the MOS (P29). Collaborative
co-evolution leverages standardization as a platform for capability enhancement (P30). Also, the
multi-directional nature of collaboration includes offering assistance to other locations while
responding to the receipt of feedback and support. This collaboration is enabled by awareness
and active listening between vertical and horizontal leaders in the MOS (P31).
Isolation reduces awareness of supply chain capabilities. Conversely, work can be
profitably assigned when available and capable capacity costs are understood, and when supply
chain leaders aggressively share their resources (P32). Workflow issues are imminent. Even so,
problem resolution is accelerated by operational performance transparency and a clear awareness
of expectations (P33). When another location in the network is performing better, the timely
availability of data used similarly across all locations and which is offered up transparently, can
512
accelerate strategic decision making and issue resolution (P34). Furthermore, a culture of
learning and collaboration can be expected to achieve performance parity with the best location.
For this to occur, the constitution of the location culture must be appropriate and strategically
aligned with other locations to optimize capacity utilization in a network-based production
schema (P35).
The vertical leader must be proactive to sustain and then improve profitability. For
example, the proactive maintenance of best practices enables a gap between the current
competitive landscape and an advanced position ahead of potential revenue opportunities (P41).
To avoid setbacks, the proactive leader must personally engage in critical tasks that would
otherwise compromise future performance potential by mitigating entropy risk (P40).
Furthermore and to evolve the organization, continuous improvement must occur at a rate that
exceeds the rate of the market and competitors in order to seal price points and gain revenues
(P37). To make this happen, vertical leaders need to proactively select and mentor leaders that
match the culture of the future as defined by the strategic plan roadmap (P38). In fact, proactive
leaders make their leadership teams capable to achieve what is about to happen in the
marketplace while avoiding business unit obsolescence (P39). To be a viable entity in a dynamic
market, vertical leaders must manage and acquire capacity as needed. This starts with awareness
as location capacity relates to existing and pending work requirements. It is something that a
proactive vertical leader must be keenly aware of so that constraints can be mitigated or
circumvented (P36). Specifically, sharing or redeploying capacity can enable the execution of
large overcapacity orders that competitors are unable to execute which would otherwise be
referred to another vendor or split between vendors (P42).
513
The ability of a vertical leader to execute is critical to how a MOS can experience growth
synergies. As described earlier, proactive execution enables growth potential. For example,
effective leaders act such that their processes predict the dynamic changes in the marketplace
(P44) and unanticipated influences are controlled by contingencies that increase or replace lost
capacity (P45). These proactive actions are executed based on an executable roadmap influenced
by performance data that is rapidly accomplished in coordination with engaged leaders (P46). In
fact, local operational effectiveness is based on leadership engagement through focus,
optimization, and deployment (P48). Vertical leaders support the production facility network
through a supply chain mindset because it reduces carrying costs, enables the execution of high
volume, and, therefore, mitigates capacity constraints (P47). Lastly, execution on pricing
negotiation significantly influences the profitability outcome. This includes an awareness of cost
reduction opportunity, regardless of current margin, and revenue enhancement strategy (P43).
Vertical leaders are charged with profitable growth. The addressable market can be
exploited by an entrepreneurial culture armed with a leader’s own aggressive growth strategy
(P49). The profitability strategy is centered on the portfolio of product and services, each one of
which has a life-cycle. A service and product life-cycle strategy provides maximal contribution
to margins when dynamic pricing plans are executed (P50). These transient profitable
opportunities when relentlessly pursued through searching and strategy execution may be
exploited through nimble action (P51). This action is enhanced by effective communication. The
location leader is seen by location workers as the center point of internal and external
communication (P52). The location also obtains or creates organizational strategic direction.
This direction is supported by location performance as far as it is aligned with market trends
(P53). There must be a positive gap between market trends and location performance. For
514
example, continuous improvement is enhanced by complexity-reduction concepts such as
redundancy reduction, tool deployment, and system deficiency resolution (P54). This
improvement is also supported by performance data informed by real-time and strategic
decisions that lead to robust process enhancements (P55). While vertical leaders are attached to
their business location, they capitalize on the global production network which affords all the
capability and capacity of the MUF.
Support leaders in the diagonal dimension of the MOS support the realization of growth
synergies. These leaders make sure that as infrastructure and workflow management systems are
co-dependent, they must also be optimized as a system that produces expected results (P59).
Diagonal support leaders build workflows, create technologies, and embed existing technologies
that create predictive capability against market trends (P56). They also make slight
enhancements to workflows and complementary resources that enable the consolidation of
workflows, thereby improving their utilization and the cost per deliverable (P57). It is imperative
that when workflow transitions, integrations, modifications, and enhancements are made, they
are not noticeable to client production schedules (P58).
The diagonal client dimension of the MOS includes outward facing leaders that can
stimulate profitable revenue over achievable time frames. While role definitions in a MOS are
required to ensure accountability, synergistic tasks are shared optimally and selectively by all
outward facing employees to maintain the profitability of existing revenue streams (P60).
Furthermore, enhancing the revenue from a client through additional income streams that are
synergistic is a profitability super-additive (P62). Acquiring new business revenue requires
collaborative action starting with sales lead ideation and ending with the achievement of billable
volume ramping at optimized margins (P64). Operations and sales are both dimensions in the
515
MOS. They achieve mutually beneficial profitability goals when they collaborate around their
strengths, filling the company's pipeline with sustained corporate advantage (P63). An assigned
portfolio enhances accountability for profitability results and focuses growth synergies that are
constructive (P66). Furthermore, entrepreneurial leadership that owns a product workflow can be
incentivized to pursue cross-sector opportunities (P65).
A MOS can realize the benefits of growth synergies when the change management
activities are sufficiently developed and robust. For example, rigor during the planning phase of
a project that includes exploiting existing capabilities and an appropriately sequenced rollout,
will likely reduce the effort and time needed to execute the plan (P67). Furthermore, the
provision of transitional capacity and the related cost allowance within a defined project scope
can accelerate results achievement and mitigate change fatigue (P68). Sometimes the big picture
is not communicated to stakeholders; however, when a holistic vision of the detailed
organizational design built for achieving customer requirements is communicated it encourages a
focused transition (P69). Stakeholder support of the vision and project scope is subject to
communication efficacy. The integrity of the communication strategy, including the nature of the
content scope and the timing can reduce change inertia (P70). The change leader must also
realize that communication is situational in design depending on the position, the timeline, and
the relevant audience (P71). Behaviors, especially among the influential, must be monitored. For
example, an immediate awareness of constructive behaviors gives a change leader the
opportunity to reinforce positive attributes as they occur (P72). On the other hand, an acute
awareness of inertia-producing behaviors gives a change leader the immediate opportunity to
mitigate an excessive effort requirement (P73). The communication strategy, often incomplete or
overlooked, is directly linked to the execution of directional strategies.
516
Positive change management results are possible through effective execution. Regardless
of the type of the change, transition execution performance is significantly dependent on a
stakeholder’s belief and participation in change vision ideation (P74). This participation is
limited and valuable, as the ability to execute is driven by the degree of support given to change
agents to complete change activities. These activities are typically a burden beyond their existing
work responsibilities (P78). Directional alignment will support and promote energy efficiency.
This unity of purpose, as seen in consensus, consistency, and continuity is partly achieved
through diversity of talent, tools, and processes (P76). Stakeholders are motivated by personal
engagement in change driven by respect, participation, and interest in the intended outcome
(P79). A phased workflow rollout needs to be structured around a validated right-the-first-time
ideology that accelerates workflow maturity and achievement within the deployment scope
(P77). This right-the-first-time capability is related to achieving capability requirements quickly.
This achievement is as much about understanding the requirement details as it is about the
relationship that stakeholders have with change leaders (P75). The consistent achievement of
positive change management is itself a strategic element for the achievement of growth
synergies.
When profitability was not realized, MOS leaders made several observations. Internally,
if the appropriate levels of management are not involved in the plan design, the resulting process
may require unnecessary effort to perform acceptable work (P82). Externally, when there is an
unacceptable level of client involvement in transition planning, growth potential is hindered as
requirements are not incorporated into plan elements (P81). Furthermore, an overly conservative
plan may produce resource and coordination deficiencies that compromise existing resource
utilization and result in plan failure (P80). Plan execution failure is also related to the lack of
517
behavior management. A change leader needs to be aware of the attributes of inertia-producing
behavior such that timely mitigation tactics can be immediately applied to the situation (P83).
When this mitigation does not happen timely, energy is diverted and consumed by non-valuable
activities (P84). Additionally, scope focus may be compromised by an excessive range of
activities and collaborative disunity (P85). A weak communication strategy may exacerbate
behavioral issues. A stakeholder’s perspective on achieving a new vision is influenced by an
understanding of the logic behind the plan, agreeing with the logic, and knowing why it has to be
achieved now (P86). If the plan is not known or understood, it follows that behavior issues will
occur. If plan knowledge is not transferred to the stakeholder, buy-in is compromised. This
would be mitigated if stakeholders were involved in the decisions regarding the plan (P88). The
tasks in a plan are as important to participants as who is involved and if they agree with the
values of those who assume new roles (P87). If stakeholders do not understand the selection or
norms or role selections, they may withhold support, and if the norms and values change, then
the plan will likely need to change. The data suggested that there are ways to compromise a
strategic plan, or at least make it more difficult to execute.
Communication is directly related to awareness. A MOS leader must effectively manage
change by collating critical information about the changing internal and external environment
(P89). A keen awareness may lead to preemptive changes prior to plan execution. Furthermore,
the cost of change activities is elevated when stakeholders do not have the opportunity to
streamline change activities before they occur (P91). Awareness is driven by self-interest and
interdependency. Stakeholders who are personally invested in the business unit’s success may be
discouraged with their employment prospects if they are not allowed to participate in change
activities (P90). When participants achieve a state of awareness, leadership efficacy may then be
518
the difference between plan failure or success. Performance outcomes are influenced by
awareness, which informs the approach used, the timeliness of behavior controls, and the
achievement of an appropriate level of oversight (P93). Success is also associated with the
quality of the connections and dependencies that leaders have with each other. Relationship
performance is linked to transformational change through attributes such as connectedness,
interdependency, adaptability, protection, and depth (P92). It also is related to alignment because
the degree to which the change leader and stakeholders are in alignment in purpose will correlate
to the effort needed to execute the change roadmap (P94). Awareness of the plan complexity, the
change environment, the magnitude of change activities, and the self-interest of participants
directly relate to change execution success.
The achievement of the realization of profitable growth is driven by self-interest from
participants. This is human behavior and should be balanced and guided. An effective self-
interest policy is a LIM that encourages a collaborative social environment necessary for
profitable growth realization (P101). Specifically, an effective, revenue-recognition algorithm
will accommodate critical concerns from stakeholders and drive behaviors that lead to profitable
growth (P102). The corporate center may function as a third party to ensure balanced self-
interest is achieved between business units that are positively related to growth synergy
realization (P95). A guided autonomy driven by self-interest and augmented by resource
complementarity in a network-based production environment accelerates the process of
achieving profitable growth (P98). However, the administrative burden of the self-interest policy
must be very low, as a business unit self-interest policy is negatively influenced and may be
compromised by the administration needed to manage it (P100). An efficient self-interest that is
519
balanced and guided should be established prior to change to ensure that the right motivations
are in play during the activity.
The MOS is a collaborative structure that can realize synergistic growth by making
knowledge available quickly to all stakeholders. When existing knowledge is consolidated and
made available, it can be used as an advanced starting point, or platform, for new discoveries
(P104). Knowledge acquisition allows for fluid resource sharing without boundaries. Attracting
the right resources quickly to issues reduces resolution time and contributes to profitability
potential (P105). On the other hand, isolated actions do not benefit from super-additives gained
from exploiting matured knowledge through duplication (P103). MOS leaders have suggested
that knowledge-based collaboration flows through the framework of the MOS to achieve
profitable growth synergies.
Financial aspects of a MOS’s performance help the MUF understand when and to what
extent the MOS has achieved the realization of growth. Several critical financial capabilities
need to be in place so that MOS leaders can know and monitor margins by location, type, and
client so that product life-cycles are predictable and so that appropriate pricing strategies can be
applied (P114). Other critical controls include a standardized and appropriate cost allocation
methodology that creates predictable financial performance that can be forecasted allowing for
profit-producing trend monitoring (P106). Additionally, cost is fundamentally activity
dependent, where the labor associated with a task must be mapped to the value producing
activity, regardless of where it came from (P109). When revenue is reported together with cost,
LOB analysis is possible, leading to prioritized profitability enhancements (P113). As
MediaCorp moved into the MOS, each of the dimensions received a P&L. The traditional P&L
by location encouraged location managers to utilize local resources effectively, to maximize the
520
opportunities in their markets, to be desirous of work that is being done at other locations, and to
compete with other locations on cost and performance. The product managers had a P&L that
related to their product. This P&L revealed the profitability of the product in the MUF. It
included the ability to know the impact of profitability contributions from locations as well as
from the pricing strategies with each client. The last P&L was for the support services. This P&L
revealed the costs associated with the performance of the functions of the support services. They
are cost centers and an optimal level of granularity and transparency is needed with support cost
data, such that functional performance comparisons between locations were meaningful and can
be leveraged (P115). The managers were charged with cost savings challenges while not
diminishing the service to their internal and external clients. Financial report usefulness also
depends significantly on the timeliness and accuracy of cost allocations (P107). For example,
comparative cost ratio trend analysis is difficult to leverage if timely posting of accurately placed
cost line items are not made transparent to P&L owners (P108). With timely and accurate
financial information in hand, MOS leaders can know how to realize growth synergies.
LIMs assist the MOS as it realizes the benefits of growth synergies in the MUF.
Integrative structures are required for the coordination and enhancement of cross-business
collaboration in an ever evolving synergistic growth environment (P117). This collaboration is
required to achieve volume variation and meet client schedules. Decentralized collaboration is
helpful with this as it harnesses business unit autonomy. These business units select and
implement meaningful growth initiatives, both of which are directly related to growth synergy
realization (P120). Strong integrative mechanisms applied appropriately, and with the right
frequency, are positively related to continuous growth synergy realization (P121). For example,
MOS leaders benefit from access to meaningful and relevant tacit knowledge and domain
521
experience through LIMs that can be used to accelerate growth-oriented decision making (P119).
LIMs enhance the ability of a MOS to realize growth synergies through potentially transient,
collaborative, and integrative structures that exploit complementary diversification.
Once profitable growth synergy is achieved, drift mitigation actions are needed to sustain
gains from which further growth can occur. The ability to timely mitigate an undesirable drift is
enabled by relationships based on trust and accountability (P124). For example, the design and
strategy of communication can influence entropy rates. To determine drift, an existing reference
for movement must be used to measure set expectations against defined variables (P122). A
baseline reference can also be used in a streamlined selection of reports. MOS leaders must
realize that performance reports are snapshots in time that are a delayed rather than an
instantaneous means by which a reaction can ensue (P123). Consequently, a proactive stance is
beneficial for the preservation of gains made and the execution of synergistic opportunity.
Selected and focused action helps a MOS achieve synergistic growth. The MOS is a
nimble organizational construct that can effectively exploit focused action to realize synergistic
profitability (P125) and a sequence of tasks, quickly discovered and effectively executed, can
lead to mutual benefit between business units that collaborate (P126). A MOS is intrinsically
aligned as the structure is connected and tasks are shared by relevant functions needed to achieve
growth synergies (P128). A MOS can drive synergistic focused action that, when exploited, can
realize scaling, including expansion, consolidation, and the integration of business units (P129).
A MOS can also be leveraged to support cost mitigating actions, promoting a continuously
evolving organizational effectiveness that is superior to competitors (P130). Energy
consumption, aligned to realize a local synergistic opportunity, is minimized in a MOS
augmented by LIMs and supported by the corporate center (P127). LIMs augment the MOS's
522
ability to realize synergistic growth by focusing action execution through collaborative task-
monitoring mechanisms (P132). For example, a nimble organization that can redeploy resources
and satisfy clients through innovative sales initiatives is able to ride life-cycles longer than
unprepared competitors (P135).
The corporate center can help the MOS achieve profitable growth synergies.
Entrepreneurial MOS leaders can achieve synergistic profitability faster when the relationship
with corporate is streamlined and supportive (P138). In addition, the rate at which the realization
of profitable growth is achieved is influenced by the quality of the relationship with corporate,
specifically with regard to trust between interacting parties (P139). However, for corporate to be
supportive, they need to have a minimal understanding of the business unit’s function, capability,
culture, systems, and its relationship with other business units or divisions (P141) while avoiding
oversimplification that contributes to poor decision making (P137). Corporate can help business
units connect with other business units that have achieved synergistic capabilities that could be
exploited (P143). Corporate can also assist business units with the retention and mentoring of
talent so that they can be leveraged to achieve growth synergies (P144). Ultimately, the one-ness
initiative, embraced by corporate and business units alike, accelerates profitable growth because
it is a suitable platform on which growth can more easily take place (P142). Conversely, the
effort needed to achieve revenue realization from a client that requires one-ness, is significantly
more difficult if internal businesses do not embrace the alignment vision (P145).
The 1MC initiative contributed to one-ness and, consequently, to the realization of
growth synergies. Competitive enterprises are compelled to strategically position themselves in
alignment with the emerging one megatrend in order to maintain and enhance market share in a
dynamic environment (P159). Furthermore, organizations seeking one-ness must recalibrate their
523
perspective on organizational design to enable or sustain profitable growth in markets that
embrace, or already have embraced, the benefits of one-ness (P161). With this as a desirable
outcome, a common vision-mission will be found embedded in strategic planning and discovery
documents when the parts of a supply chain are aligned (P153). This alignment is augmented by
a single deployed set of values and norms that creates a single mindset among MOS leaders
(P156). A norm example is consistent excellence across all locations. This is foundational to a
one initiative as it validates the single vertical supply chain perspective of the client (P160).
Clients count on the reliability of the vendor’s supply chain workflows, which are dependent on
the continuously available capability of each linked functional element (P165). Ultimately, an
end-to-end value chain must be aligned in purpose and destiny in order to realize synergistic
growth (P166).
Scaling the MOS in a MUF to achieve continuous growth synergies requires three steps
that emerged from the data. These steps include an assessment of the environment, the definition
of the mission, and the execution of the mission. Fortunately for MediaCorp, a MOS intrinsically
embraces the idea of one-ness and so is an ideal structure to scale (P168). Furthermore, a
structure that is scalable in all of its dimensions can propagate alignment and a suitable culture to
improve profitability (P169). The MOS is in a position of advantage when it comes to scaling
and so can be situationally exploited. Consequently, an environmental assessment can be used as
a first step for scaling planning (P170). The assessment will reveal the dimensions to be scaled
along with a roadmap to achieve the desired results.
The second pattern that emerged from the data regarding MOS scaling included defining
the mission of the scaling activity. It is not only important to define the mission of the MOS, but
is also important to make it known strategically. This rationale will engage and focus
524
stakeholders on the sequence of activities needed to realize growth synergies (P171). Valuable
information regarding existing trends and strategic roadmaps are best known by leaders
embedded in the organization to be integrated. The strategic roadmap, therefore, needs to be
defined and embraced by MOS leaders that need to scale their organizations to accommodate
increased capacity (P172). Existing pre-scaling capacity needs to be preserved through talent and
hardware retention such that a positive buffer can be created prior to expansions (P173). Without
the transition capacity buffer, the chances of a successful integration realization are further at
risk. In addition, the existing organization may experience organizational entropy during the
execution of the expansion roadmap.
The third pattern that emerged was the execution of this sequence of activities to achieve
the scaled outcome. To create the sequence of activities, workflows need to be broken into
elemental function-based units and then coupled with functions that have similar attributes
(P174). This activity embeds workflow knowledge and the discovery of synergistic opportunity.
This discovery could result in workflows that are optimized for capacity that have been
influenced by work shifting and pooling. These and other methods are needed to optimize cost
structures, as seen in cost per similar deliverable measurements (P175). It is easier for a MOS
leader to scale an optimized workflow than duplicating waste in a workflow that has not been
influenced.
Growth in profitability is realized through strategy, the availability of penetrators, and
execution. Proactively, a MUF can map out the addressable market and construct a multi-
pronged tactical strategy to exploit potential unrealized client spends (P183). The nimbleness of
a MOS enhances the ability of a MUF to exploit these profitable opportunities during an optimal
proportion of the product or service life-cycle (P176). The elements of a successful growth
525
strategy include a track record of reliability, the ability to penetrate barriers to entry, an effective
execution plan, and the ability to monitor the results of plans (P178). Strategic tactics must be
viewed as situational to exploit penetration opportunities in a dynamic market (P179). For
example, infrastructure reliability is a penetrator in an increasingly insecure and liability-oriented
commercial environment (P181). Additionally, technical ability is a penetrator because it inspires
confidence in MediaCorp's ability to solve problems the client does not understand (P178). The
creative and timely application of enhanced value may enable new profit-producing
opportunities to be exploited (P182). Penetrators, when used strategically, provide the super-
additive capability to gain access to the addressable market.
In summary, profitability realization is influenced by how a MUF with a MOS can realize
the benefits of growth synergies. The data that emerged from the study was rich with detail
regarding this research question. The roles of the MOS and the benefits of the design are a
significant portion of the answer. Horizontal leaders influence continuous profitability through
the use of LIMs and their relationship with corporate. They enable capacity in the network by
ensuring that capabilities are present in the right locations when needed. They exploit existing
standardization to ensure the transferability of capabilities. Vertical leaders execute with
excellence and share their resources fluidly as needed. Issues are imminent; therefore,
collaborative relationships in the MOS enable quick resolution of these potential bottlenecks.
Profitability through synergy is the mantra in the MOS. Additionally, diagonal support leaders
make sure that infrastructure and workflow management systems are optimally compatible. The
diagonal client dimension stimulates profitable revenue by optimizing pricing against operational
effort. MOS leaders effectively manage change while ensuring that evolutionary gains made are
sustained. These leaders are motivated by a meaningful self-interest policy that aligns the
526
interests of all MOS dimensions. Autonomy is balanced against the need for collaboration, the
impact of which is tracked in financial reporting. LIMs are a part of how a MOS continuously
realizes the benefits of growth synergies. Decentralized collaborative structures require
integrative mechanisms to be robust in action. The execution of selective and focused action
helps a MOS exploit its nimbleness. The designed relationship with corporate is also an
accelerator through the provision of needed support. The 1MC alignment strategy contributes to
the alignment of all entities around a designated strategy for achieving growth synergies.
RQ3. The third research question seeks to understand the role of the corporate center in
achieving growth synergies. Themes that emerged from the data suggested that the selective
involvement of the corporate center can promote autonomous growth in locally addressable
markets (P96). For example, a collaborative corporate relationship with a MOS encourages
guided and balanced self-interest that is positively related to growth synergy realization (P95).
Furthermore, the corporate center might also contribute to growth by functioning as a service
center by temporarily incubating growth opportunities, by sharing related resources between
businesses, and by helping business units to select initiatives based on the long-term strategic
plan for the firm (P97). The corporate business model evolved to position MediaCorp as a
solution provider. Bundling and integrative offerings across businesses and clients that solve
customer-specific problems meant that MediaCorp was complementing the legacy product-
centric vertical offerings of its business with horizontal solutions. These solutions reduced the
commodity pricing pressures that MediaCorp was facing. The corporate center can assist with
focused and selected action. As a result, energy consumption, aligned to realize a local
synergistic opportunity, is minimized in a MOS that is augmented by LIMs and supported by the
527
corporate center (P127). The corporate center can contribute to growth if the relationship is
strategically deployed as a super-additive.
Finance, as a corporate support function, augments the self-interest in a MOS by creating
performance transparency and inspirational reward systems (P131). The logic of the M-form
organization is typically hardwired into the accounting systems and performance measurement
systems that reinforce the idea that business units are profit centers. This singular dimension is a
poor proxy for the firm’s position with customers and is a source of conflict with them (Galbraith
2005). The performance data at MediaCorp was ported over to all dimensions and to all
managers in the organization as a necessary operating condition. The central accounting system
was leveraged as a trusted source of financial data that could be parsed into dimension-oriented
P&Ls. This eliminated information asymmetry and transfer service invoicing between units,
which are essential for running a customer-centric firm. Transparency enhanced the ability to
plan and control processes as managers focused on improving the development and exploitation
of knowledge resources across the firm, optimizing the firm’s position with customers. The
multidimensional organizational structure enacts the need for teamwork and collaboration. Each
stakeholder knows their role and their area of contribution. They are rewarded based on their
contribution towards a common goal, customer profitability. To this end, the corporate center
provides relevant information needed to exploit resources effectively in fulfillment of MUF
strategic objectives (P134).
The relationship between the corporate center and the MOS is critical to how growth
synergies can be achieved. For example, when the corporate center oversimplifies a complex
situation, they create inertia, as decisions are not sufficiently robust. This results in residual work
or unacceptable and unanticipated collateral damage (P137). Conversely, entrepreneurial MOS
528
leaders can achieve synergistic profitability faster when the relationship with corporate is
streamlined and supportive (P138). The rate at which the realization of profitable growth is
achieved is influenced by the quality of the relationship with corporate, specifically with regard
to trust between interacting parties (P139). Oversimplification and trust are inversely related in
this arrangement. Consequently, in order for corporate to be supportive they need to have a
minimal understanding of the business unit’s function, capability, culture, systems, and its
relationship with other business units or divisions (P141). If the corporate center is considered
capable, it can help business units connect with other business units that have achieved
synergistic capabilities that could be exploited (P143). The strategic concept developed by
MediaEnterprises’ corporate manager’s determined cross-unit opportunities for the continuous
realization of growth synergies. Care was taken to make sure that locations did not lose their
client relationships, that their products or services were not degraded below client expectations,
and that any configurations developed or used were not exchanged, causing firmware or system
compatibility issues. New solutions had to be seen as complementary offerings and not
substitutes that could cannibalize sales revenue. Market nuances dictate that similar markets may
have dissimilarities such as buying behaviors, relationship management, risk-liability
management, delivery requirements, etc. Customers in various markets have dissimilar values
with regard to order dwell time allowance, complexity, integration requirements, and response
time to queries. This variability puts significant pressure on the need for talent. Corporate can
help business units retain and mentor talent so that they can be leveraged to achieve growth
synergies (P144). Furthermore, one-ness as embraced by corporate and business units alike, can
accelerate profitable growth because it is a suitable platform on which growth can more easily
529
take place (P142). The relationship between the corporate center and the MOS can be designed
to increase the ability of the MUF to achieve sustained conglomerate advantage.
In summary, according to the themes that emerged from the data, the corporate center can
contribute to the realization of growth synergies; however, the relationship with the MOS should
be designed and their involvement should be situational. The selective involvement ensures that
business unit autonomy is maintained along with accountability for results. The relationship
must, therefore, be collaborative and promote business unit self-interest in a guided and balanced
way. Corporate can support growth opportunities including significant expansions, integrations,
or incubators of new technologies. While engagement is selected, it is also focused. Corporate
efforts should orient businesses to be competitive in their markets. Corporate can also function as
a feedback mechanism regarding financial, risk, and legal performance. In order for corporate to
be supportive, they need a minimal understanding of the business. With this they can contribute
to growth synergies and sustained corporate advantage in a moderately dynamic market.
RQ4. The fourth research question addresses the role of LIMs in achieving growth
synergies. LIMs are synergistic, as they connect MOS dimensions in meaningful ways through
common interests (P116). Structures are required for the coordination and enhancement of cross-
business collaboration in an evolving synergistic growth environment (P117). Strong integrative
mechanisms, applied appropriately and with the right frequency and duration, are positively
related to continuous growth synergy realization (P121). As examples, cultural activities help
MOS dimensions establish and mature a collaborative mindset in a complex environment (P118).
Additionally, MOS leaders benefit from access to meaningful and relevant tacit knowledge and
domain experience that can be used to accelerate growth-oriented decision making (P119).
530
Horizontal MOS leaders leverage many other types of LIMs in order to integrate dimensions and
organizational constructs, such that they can collaborate to realize synergistic growth.
A horizontal MOS leader needs stakeholders to be consistent and accurate in their use of
the ERP system. This system is a LIM and an aligning platform that enables accountability for
performance and synergistic growth through transparency (P1). Transparency is enhanced and
simplified when relevant data is made available through the consolidation of disparate systems
(P3). Additionally, technical ability attracts revenue awarded by clients. Clients will allocate
volume work to vendors perceived to have the technical ability to meet their specifications (P4).
Best practices are LIMs that enable the deployment of a common language needed for more
accurate profitability measurement (P9). Best practice propagation methodologies are LIMs used
to deploy critical information at the rate of absorptive capacity (P17). The global directional
strategy includes the management change momentum, which is influenced by the organization’s
capability to effectively deploy (P18). Communication strategies are a LIM. They include
meaningful information that is situationally routed and structured to include escalation paths,
optimal timing, and a focused scope (P10). Communication should be optimally frequent,
transparent, correctly routed, and executed timely to reduce ambiguity driven cost (P11). LIMs
are linked to profitability through pricing strategies. Rate cards, or pricing structures, are LIMs
that should be reviewed for optimal profitability during all phases of product and service life-
cycles (P13). Sustained corporate advantage is at risk in the presence of liabilities. Liability
prevention controls are LIMs that must be at least as dynamic as the threat-scape (P14). Profits
are created by value-added activities on asset configurations. Asset management processes are a
LIM that should be graded on accuracy and speed (P16). While being variably sized, placed, and
531
transient in nature, the collection of LIMs deployed at any given time must be collaborative
horizontally across the MUF in order to influence the realization of synergistic growth.
Vertical leaders also exploit LIMs to achieve profitable growth. They are able to exploit
geographically diverse but synergistic workflows based on common best practices (P21). The
proactive maintenance and standardization of best practices enables a gap between the current
competitive landscape and an advanced position ahead of potential revenue opportunities (P41).
Consequently, work can be profitably assigned when available, capable capacity costs are
understood and when supply chain leaders aggressively share their resources (P32).
Collaborative workflow evolution leverages standardization as a platform for enhancement
deployment (P30). Secondary structures support businesses in their evolution and achievement of
growth synergies. These structures create arenas for the continuous identification, selection, and
implementation of growth synergy initiatives. For example, a sector organization can be used to
drive new opportunities within a sector. The sector organization includes LIMs like cross-unit
boards for decision making and permanent work teams for linking value chains in the businesses.
This organization provides structure for internal functions, like R&D and business development,
around portfolio activities. The cross-sector development board is a cross-business unit board for
developing and penetrating specific sectors in addressable markets. Other alignment structures
include strategic planning, corporate financial reporting, corporate incentive systems,
information technology systems, and corporate sales and process tools.
Vertical leaders have measurable goals that are aligned with the firm’s mission and vision
(P22). These, and other, high performance workers want to achieve success in an operation that
is measured, monitored, and knowledge rich (P28). This performance data informs in real-time
and strategic decisions that lead to robust process enhancements (P55). In fact, the timely
532
availability of data used similarly across all locations, and which is offered up transparently, can
accelerate strategic decision making and issue resolution (P34). Executable roadmaps are based
on performance data and are rapidly accomplished in coordination with engaged leaders (P46).
These leaders establish a location culture that is appropriate and aligned with other locations to
optimize capacity utilization in a network-based production schema (P35). Proactively, vertical
leaders select and mentor leaders that match the culture of the future as defined by the strategic
direction (P38). This roadmap identifies an addressable market that can be exploited by an
entrepreneurial culture armed by its own aggressive growth strategy (P49). This culture
understands its products and services life-cycles. It enables maximal contribution to margins
through dynamic pricing plans that optimize profitability (P50). The firm’s mission is
measurable through the strategic use of LIMs.
Diagonal support leaders exploit LIMs as they build workflows, create technologies, and
embed existing technologies that create predictive capability against market trends (P56).
Synergy oriented profitability is enhanced when slight enhancements to workflows enable the
consolidation of complementary capabilities, thereby improving their utilization and the cost per
deliverable (P57). These enhancements are scheduled so as to ensure the continuity of revenue
streams. For example, in order for deployment plans to be successful, they require that workflow
transitions, integrations, modifications, and enhancements are not noticeable to client production
schedules (P58). Specifically, as infrastructure and workflow management systems are co-
dependent they must also be optimized as a system for best results (P59). These systems are
LIMs that help support leaders to support the MOS in achieving synergistic growth. Diagonal
client facing leaders use LIMs to achieve profitability for the MOS. This includes sales tools,
533
sales performance metrics, and reports. These LIMs allow dimensions to work and achieve
growth synergies together.
Synergistic change efforts utilize LIMs to achieve needed transformation. For example,
transitional capacity and cost allowances are frequently overlooked during change activities.
When they are included within a defined project scope, they can accelerate results achievement
and mitigate change fatigue (P68). Furthermore, when a holistic vision of the detailed
organizational design built for achieving financial requirements is made known, it encourages a
focused transition (P69). The communication strategy is a LIM that includes the nature of the
content conveyed and the timing scope (P70). Communication also relates to requirement details
that, when understood, help stakeholders to achieve capabilities that are expected (P75). When
the form of a business unit changes by combining, splitting, eliminating, reducing or expanding,
otherwise known as patching, LIMs help make these synergy-based changes happen.
Transition execution performance is significantly dependent on a stakeholder’s belief and
participation in change vision ideation (P74). It depends as well on client involvement in
planning activities. Transition planning augments growth potential by designing client
requirements into plan elements (P81). This unity, as seen in consensus, consistency, and
continuity is partly achieved through diversity of talent, tools, and processes (P76), all of which
are LIM related. Alignment tools help change leaders and stakeholders to have unity in purpose.
These correlate to the effort needed to execute the change roadmap (P94). Relationship
performance is linked to transformational change through social attributes such as
connectedness, adaptability, protection, and depth (P92). These LIMs are somewhat vague, or
ethereal, however, in these cases performance outcomes are influenced by the approach used, the
timeliness of behavior controls, and the achievement of an appropriate level of oversight (P93).
534
LIMs support a guided and balanced self-interest policy (P100). This policy is positively
related to growth synergy realization (P95). An effective self-interest policy is a LIM that
encourages a collaborative social environment necessary for profitable growth realization
(P101). For example, an effective revenue-recognition algorithm will accommodate critical
concerns from stakeholders and drive behaviors that lead to profitable growth (P102). LIMs
assist with the sharing of related resources between businesses and also help business units to
select initiatives based on the long-term strategic plan for the firm (P97). For example, the
creation of an appropriate task list, including its execution sequence, is directly related to the
timing of desirable outcome realization and self-interest as a motivator (P99). Furthermore,
existing knowledge can be consolidated and made available as an advanced starting point, or
platform, for new discoveries (P104). LIMs enable fluid resource sharing without boundaries,
attracting the right resources quickly to issues whose resolution contributes to profitability
potential (P105). Self-interest-oriented LIMs are super-additives as they help the MOS achieve
sustained corporate advantage.
Financial LIMs provide an optimal level of granularity and transparency as needed with
business unit data, such that functional performance comparisons between locations are
meaningful and can be leveraged (P115). For example, a standardized and appropriate cost
allocation methodology creates predictable financial performance and allows for profit-
producing trend monitoring and forecasting (P106). Financial report usefulness depends
significantly on the timeliness and accuracy of these cost allocations (P107). Furthermore,
comparative cost ratio trend analysis is possible if timely posting of accurately placed cost line
items are made transparent (P108). This analysis helps to determine pricing strategies (P112),
another LIM, so that product life-cycles are predictable and so that profitability is optimized
535
across them (P114). Financial LIMs must be efficient and pointed, so as to bring focus on
selected action needed to enhance profitability.
Drift mitigation is augmented by LIMs that prevent organizational entropy rates;
however, an existing reference for movement must be used to measure set expectations against
defined variables to expose the drift rate (P122). For example, performance reports, as snapshots
in time, can be an instantaneous means by which a mitigating action can be triggered (P123).
This mitigation could be in the form of a sequence of tasks, quickly discovered and effectively
executed (P126). Timely drift mitigation minimizes energy consumption that would otherwise be
required if entropy exceeds expectation tolerances (P127). LIMs, like performance dashboards,
help MOS leaders know where they are, where they are going, and what they should focus on to
prevent undesirable outcomes.
A MOS can drive synergistic focused and selected action that, when exploited, can
realize scaling. Scaling, that emerged from the data, included expansion, consolidation, and the
integration of business units (P129). LIMs augment the MOS's ability to realize this synergistic
growth by focusing action execution through collaborative task monitoring mechanisms (P132).
For example, the ERP system, a significantly influential LIM, is a super-additive as it enables
scalable organizational efficacy. The system does this by promoting cost effectiveness,
transparency, and workflow control (P133). As discussed, finance, as a supporting function,
provides LIMs in a MOS by creating vehicles for performance transparency and inspirational
reward systems (P131). MOS leaders benefit from performance information because they use it
to recalibrate, course-correct, adapt plans, and monitor progress for the achievement of desirable
outcomes (P140). Additionally, the corporate center provides relevant information needed to
exploit resources effectively in fulfillment of MUF strategic objectives (P134). Finally, one-ness
536
strategies are LIMs that exploit synergies and enable profitability through synergistic growth
(P142). The efficacy of the selected and focused action depends on the ability of the organization
as a whole to collaborate and coordinate execution to achieve desired results.
The 1MC initiative provided a number of LIMs that influence the realization of growth
synergies in a MOS. To be specific, these LIMs include effective data management that
consolidates knowledge by exploiting a globally accessible framework (P148), a mature quality
system that promotes a performance standard equally influencing all locations to achieve
performance parity (P149), the standardization of infrastructure components that allows for the
knowledge of disposition and redeployment of hardware to accommodate local capacity
requirements (P151), best practice unification on excellence that assumes asset locations are
always known and are being cared for, returned, or purged timely (P150), and the internal
unification of systems to streamline operations (P152). LIMs are integrative organizational
constructs that promote unity (P154). LIM efficacy is strengthened by a common vision-mission
embedded in strategic planning and discovery (P153).
A common set of values and norms related to the mission creates the perception of a
single mindset among MOS leaders (P156). The mindset promotes consistent excellence across
all locations and validates the value of the single vertical supply chain to clients (P160). This
may be seen in a common liability prevention strategy augmented by a quality and security
management system. These LIMs create quality and security awareness. For example, the quality
management system ensures a high-reliability performance experience by clients in the value
chain that is subject to a mature remediation process when infrequent non-conformities occur
(P163). They influence infrastructure and process integrity at each site mitigating the threat
environment (P158). They contribute to the associated profitability of the MUF. Additionally,
537
learning management systems streamline knowledge acquisition and consolidation. This system
verifies that training is effectively deployed on a single platform by measuring to what extent
users depend on it for knowledge acquisition (P157). Knowledge management engages
entrepreneurialism, producing new knowledge while unifying task knowledge through
centralization, utilization, and influence (P162). MOS leaders also benefit from timely, concise,
and complete financial performance reviews that are linked to cost mitigations and the result of
opportunity exploitation (P167). LIMs, in the form of systems, are guided by the norms and
strategic direction of the MUF to create a single mindset among leaders.
LIMs assist the MOS with growth in the addressable market. They help the MOS be
nimble as it enhances the ability of a MUF to exploit an optimal proportion of product or service
life-cycles (P176). For example, proactively a MUF can map out the addressable market and
construct a multi-pronged tactical strategy to exploit potentially unrealized client spends (P183).
Defining the mission of the MOS, and making it known strategically, will engage and focus
stakeholders in the sequence of activities needed to realize this growth by exploiting synergies
(P171). This tactical strategy, a LIM, is bolstered by a track record of reliability, the ability to
penetrate barriers to entry, an effective execution plan, and the ability to monitor results (P178).
These penetrators are LIMs and can be exploited synergistically within multiple business units.
For example, infrastructure reliability is a penetrator in an increasingly insecure and liability-
oriented commercial environment (P181) and tailoring the ERP UI to the client's wishes will
make it difficult for clients to divorce themselves from the familiar system interface and valuable
business intelligence that accumulates (P183). LIMs are super-additives for growth because they
focus and leverage complementary capabilities to penetrate the addressable market.
538
In summary, LIMs play a significant role in enabling a MOS to achieve profitability
realization. LIMs are inherently synergistic as they connect related aspects of the MOS.
Integrative mechanisms help businesses coordinate and enhance cross-business collaboration.
The ability of a global production network is important in moderately dynamic markets. Many
examples of LIMs have been presented in this dissertation. They may be transient. They may
grow or shrink, referred to earlier as patching. They must be deployed and removed at the right
time. If they are present for too long, are too big, or are not correctly applied or connected, they
contribute to organizational inertia and waste. LIMs are critical to growth, as they accelerate
decision making and provide accountability for results. MOS leaders must exploit LIMs fluidly,
dynamically, and aggressively. LIMs assist with transitions, they help business units or functions
work together, they help create unity and alignment, they assist with resource redeployment, they
help with the avoidance of organizational entropy, and help make the MOS agile. LIMs may be
major initiatives like the 1MC project. LIMs are needed in the right quantity at the right time for
suitable duration.
RQ5. The fifth research question seeks to understand the impact of one-ness on achieving
growth synergies in a MUF. The 1MC mega-initiative helped create alignment through the
division. This is preparation for the further in-depth study of focused action and the
organizational design discussed throughout the dissertation. MediaCorp’s leader introduced a
program whereby the company would be positioned to appear to clients as though they were one
company, without silos. Furthermore, this aligned the efforts of business unit leaders by
implementing a mindset. Caution had to be taken to make sure that this mindset was not
misapplied through behavior meant to achieve personal agendas or dilute accountability by
installing organizational socialism. The initiative included a sequence of initial strategies that
539
created horizontal collaboration between businesses. This resulted in the ongoing realization of
growth synergies. MediaEnterprises had some strategic initiatives aimed at organic cross-unit
growth; however, this was limited to cross-selling with the deteriorating effect of discounts for
the personal purpose of gaining revenue-based, rather than profit-based, commissions on sales.
The 1MC initiative was meant to accelerate organic growth for the sustainable realization of
market share and penetration growth synergies. This was enacted by providing industry-specific,
cross-unit solutions that supported increasing market share, coverage, and differentiation.
Ultimately, the aim was to use MediaCorp’s products and services to solve customers’ problems
and create value opportunities that could be monetized.
The MOS, LIMs, and the corporate center collectively embrace one-ness to achieve
growth synergies. For example, the consistently accurate use of a single ERP is an aligning
platform that enables accountability for performance and synergistic growth through
transparency (P1). Furthermore, the rate at which enhancements, called out by stakeholders, are
developed and deployed broadly relates to the growth rate of an enterprise that is successful in a
moderately dynamic marketplace (P2). One-ness is compromised when data is scattered and
unavailable. With system capability and data consolidation, relevant information from across the
supply chain is made available to MOS leaders (P3). The system allows MOS leaders to leverage
known available network capacity across all locations to meet client expectations (P5). The
alignment of workflows exposes synergies that enable capacity pooling. This capacity
management technique is helpful when there is demand variability, improving utilization and
increasing profitability opportunity (P7). Alignment is synergistic in this case, as existing
workflows and infrastructure can be used to deliver new products and services to an adjacent,
new, or similar market in a different geography (P12). Augmenting alignment, standardization is
540
a complexity-reduction technique that enhances scalability, capability, predictability,
updatability, and transportability in a chaotic environment (P8). Standardizing on best practice
includes deploying a common language needed for more accurate profitability measurement and
creating a platform for efficient organizational evolution (P9). An optimized and appropriate
methodology is needed to propagate best practices at the rate of absorptive capacity (P17).
Unification implies a single purpose and strategy for the business units that consider local
addressable markets. The strategy for global deployment must also include consideration for
change management momentum and the organization’s capability to effectively deploy (P18).
The mission of horizontal leaders is to exploit one-ness to achieve profitability and realize
growth synergy.
Vertical leaders promote and benefit from one-ness to achieve synergistic growth. They
can reach out to nodes in the production network to capture needed capacity. Workflow
alignment enhances profitability through the exploitation of geographically diverse but
synergistic workflows based on best practice (P21). A single set of meaningful and measurable
goals need to be aligned with the firm’s mission and vision (P22). This promotes a common
understanding of performance, allowing high performance workers to achieve success in an
operation that is measured, monitored, and knowledge rich (P28). At the beginning of the 1MC
initiative, most businesses did not have a customer-centric view, as they had multiple customers
that had their work spread over several locations. Additionally, they had come from either a
legacy product-centric construct or a legacy client construct only. This challenged the multi-
dimension design while illuminating opportunity. Over time, brand managers discovered white
spots of value-creating opportunity where a client business sector was untapped, where a client
could be added, or where a location could add a product opportunity, etc. Managers realized over
541
time that the white spots in their cross-unit portfolios disappeared. The sector migration brought
in new opportunities that did not overly stretch the capabilities of the facilities. And, the
increased competencies across business units led to the development of innovative offerings,
expanding MediaCorp’s portfolio and market potential. This one-ness promotes the sharing or
redeployment of capacity, enabling the execution of large overcapacity orders that competitors
are unable to execute. These would otherwise have been referred to another vendor or split
between vendors (P42). Work can be profitably assigned when available and capable capacity
costs are understood and when supply chain leaders aggressively share their resources (P32). A
unified culture, the constitution of which is aligned with other locations, optimizes capacity
utilization in a network-based production (NBP) schema (P35). The vertical leader supports the
production facility network through a supply chain mindset because it reduces carrying costs,
enables the execution of high volume, and, therefore, mitigates capacity constraints (P47). One-
ness also applies to the global workflow management system. The timely availability of data
from the system used similarly across all locations and which is offered up transparently, can
accelerate strategic decision making and issue resolution (P34). Alignment promotes
collaborative evolution that leverages standardization as a platform for achieving and sustaining
ongoing enhancements (P30). For example, slight enhancements to workflows may enable the
consolidation of workflows, improving their utilization and cost per deliverable (P57). One-ness
is further promoted through communication as the location leader is seen by location workers as
the center point of internal and external communication (P52).
One-ness augments the MOS’s ability to execute synergistic change. This unity is seen in
consensus, consistency, and continuity. It is partly achieved through diversity of talent, tools, and
processes (P76). It is guided by a holistic vision that includes a detailed organizational design
542
built for achieving client requirements (P69) and encouraging a collaborative social environment
necessary for profitable growth realization (P101). The dichotomy of a decentralized yet
collaborative network can be agile as it adapts and constantly seeks a new equilibrium in a
dynamic market. A guided autonomy, driven by self-interest and augmented by resource
complementarity in a NBP environment, accelerates the process of achieving profitable growth
(P98). Profitable growth is reflected by the nature of the new equilibrium. The new state may
include common and effective policies that accommodate critical concerns from stakeholders
and drive behaviors that lead to profitable growth (P102). The continuous achievement of
temporary equilibrium is augmented by the corporate center. It is a service center that can
contribute to continuous growth by temporarily incubating growth opportunities, by sharing
related resources between businesses and by helping business units to select initiatives based on
the long-term strategic plan for the firm (P97).
Collaboration intrinsically channels focus and promotes a one, or singular, perspective.
This perspective is brought into unity when existing knowledge is consolidated and made
available. A holistic awareness can be used as an advanced starting point, or platform, for new
discoveries (P104). Furthermore, awareness and collaboration encourage fluid resource sharing
without boundaries. Consequently, the right resources are quickly attracted to issues whose
resolution contributes to profitability potential (P105). An example is the resolution of a
standardized and appropriate cost allocation methodology that creates predictable financial
performance and allows for profit-producing trend monitoring (P106). MOS leaders must be able
to resolve issues through a mindset that includes a one-ness perspective that is understood by all.
LIMs also promote one-ness by their design. They are synergistic, as they connect MOS
dimensions in meaningful ways through common interests (P116). Further to this, collaborative
543
structures are required for the coordination and enhancement of cross-business collaboration in
an evolving synergistic growth environment (P117). For example, cultural activities help MOS
dimensions establish and mature a collaborative mindset in a complex environment (P118).
Additionally, MOS leaders benefit from access to meaningful and relevant tacit knowledge and
domain experience that can be used to accelerate growth-oriented decision making (P119). The
dynamic nature of the LIM makes it an ideal on-demand construct to help propagate a one-ness
perspective.
Selected actions, when focused, promote alignment and unity. Specifically, a MOS can
drive synergistic focused action, that when exploited can realize dynamic scaling, including
expansion, consolidation, the integration of business units, and a competitive advantage (P129,
P136). The energy consumption needed to accomplish patching, or other focused action, in a
MOS that is aligned to realize local synergistic opportunity is minimized (P127). This is because
a MOS is intrinsically and efficiently aligned. The structure is connected and tasks are shared by
relevant functions needed to achieve growth synergies (P128). The relevant sequence of tasks are
quickly discovered and effectively executed. This can lead to mutual benefit between business
units that collaborate (P126).
Corporate promotes one-ness as a complexity-mitigation technique. When it is embraced
by corporate and business units alike, it accelerates profitable growth because it is a suitable
platform on which growth can more easily take place (P142, P168). Corporate helps business
units connect with other business units that have achieved synergistic capabilities that could be
exploited (P143). Conversely, the effort needed to achieve revenue realization from a client that
requires one-ness is significantly more difficult if internal business do not embrace the alignment
vision (P145). Furthermore, a fragmented MUF cannot easily solve client issues that relate to
544
one-ness, as they do not understand the root causes of the problems (P146). Corporate can
encourage the realization of growth synergies oriented towards creating one-ness through
focused and selected action.
One-ness is at the core of the 1MC initiative. It is clear that an end-to-end value chain
must be aligned in purpose and destiny in order to realize synergistic growth (P166). For
example, consistent excellence across all locations is foundational to a one initiative, as it
validates the single, vertical, supply chain perspective of the client (P160). Organizations seeking
one-ness must recalibrate their perspective on organizational design, potentially through patching
activities, to enable or sustain profitable growth in an evolving market that embraces, or already
has embraced, the benefits of one-ness (P161). Fundamentally, competitive enterprises are
compelled to strategically position themselves in alignment with the one megatrend in order to
maintain and enhance market share in a dynamic environment (P159). Evidence of one-ness is
clearly seen in organizations that have achieved it. Such evidence could be a mature quality
system that promotes a performance standard and that has equal influence on all locations,
encouraging performance parity and improvement (P149). There should be a common security
awareness and similarity in infrastructure integrity at each site, indicating the level of concern
and control over the threat environment (P158). This could be augmented by a knowledge
management system that engages entrepreneurialism, producing new knowledge while unifying
task knowledge through centralization, utilization, and influence (P162). A mechanism can be
deployed to verify that training is effectively deployed on a single platform by measuring
comprehension and to what extent users depend on it for knowledge acquisition (P157). An
effective data management system consolidates knowledge by exploiting a globally accessible
framework (P148). The internal unification of systems can streamline operations (P152). For
545
example, the standardization of infrastructure components allows for knowledge of hardware
disposition and the redeployment of it to accommodate local capacity requirements (P151).
Unity is easily found in a MUF's organizational design when the layout of the positions is clear
(P154) and practices are commonly centered on excellence (P150). This organizational unity is
augmented by a common vision-mission that is embedded in strategic planning documents
(P153). This alignment unity is further encouraged through a deployed set of values and norms
that creates a single mindset among MOS leaders (P156). Ultimately, it is the client that decides
if one-ness is achieved. In fact, clients expect a singular, high-reliability performance experience
in the value chain that includes a mature remediation process when infrequent non-conformities
occur (P163). The client's impression of the MUF is influenced by how the MOS allows itself is
to be transformed and monitored externally (P155). Using assets as an example, clients expect
that their assets are available, locatable, and treated in a similarly excellent way, regardless of
where they are in the end-to-end vendor’s supply chain (P164). All in all, clients count on the
reliability of the vendor’s supply chain workflows, which are dependent on the continuously
available capability of each linked functional element (P165). Fortunately for MediaCorp, a
MOS intrinsically embraces the idea of one-ness and so is an ideal structure to scale and preserve
a single supply chain view to clients (P168). A structure that is scalable in all dimensions, such
as the MOS, can propagate alignment and a suitable culture to improve profitability (P169).
Scaling is directly related to the ability of the supply chain to manage its resources effectively.
Scaling may include work shifting and pooling to optimize cost structures as seen in cost per
similar deliverable measurements (P175). The MOS is intrinsically a propagator for one-ness as
it can scale while preserving social or cultural attributes.
546
In summary, the significance of being aligned and collaborative is that it helps the MUF
achieve profitability realization. This one-ness initiative helps businesses achieve collaborative
alignment, which in turn, helps them achieve growth synergies. The 1MC initiative recalibrated
the thinking of employees. It is a mindset, or norm, that guides action plans. The lack of one-ness
fragments the mission and the purpose of the organization. Chaos is present in a dynamic market
and performance issues are imminent regardless of the environment. An organization that
embraces one-ness has a better chance of sustained performance, and will be more able to
survive the future. One-ness is also attractive as it is a complexity-reduction technique that was
applied to the global production network. Two businesses that did similar work could have
diverse performance characteristics due to a lack of one-ness. When this occurs within two
businesses in a MUF, clients are confused. Alignment, on the other hand, accelerates the creation
of trust and collaboration. Selected actions guided by one-ness become simpler for all involved,
as there is less noise. It is clear that scaling is dependent on a singular mindset that is tuned to the
addressable market and the directional strategy.
ORQ. The overall research question is generally concerned with how a MUF can achieve
cross-unit growth synergies. All of the other research questions are sub-questions under the
ORQ. Consequently, this discussion is a form of summary regarding the sub-questions, as it
answers all of them. As discussed previously, synergies are achieved when the value that is
generated by combining two entities create opportunities that would not have been available if
they were operating independently. There are two main types of synergies, operating synergies
and cost synergies. Operating synergies include economies of scale, increased pricing power, and
higher growth potential. Ultimately, the desire is that synergies produce higher than expected
cash flows. Cost, or financial, synergies relate more to tax benefits, portfolio diversification, and
547
beneficial use of excess cash. These synergies are prevalent in the data that emerged from this
dissertation. MediaCorp benefited from focused action that resulted in cross-unit growth
synergies. For example, these synergies were driven by leaders that fulfilled the unique roles of
the dimensions that were their responsibility. They were augmented by LIMs and a designed
relationship with the corporate center. Customers responded to the organizational design change
because it was responsive and agile. Clients allocated work volume to MediaCorp, as they were
perceived to have both the technical ability to meet specifications and the availability of more
than sufficient capacity to process the volume (P4). Work volume that originated in local
markets and was given to local MediaCorp operations, leveraged known available network
capacity to meet client expectations (P5).
Horizontal roles pushed the cross-unit agenda throughout the MOS. For example, they
pushed for the consistent and accurate use of an ERP. This is an aligning platform, enabling
accountability for performance and synergistic growth through transparency (P1). Furthermore,
they encouraged enhancements to be called out by stakeholders, to be rapidly developed, and
then deployed broadly (P2). Horizontal leaders ensured workflow synergistic alignment and
capacity pooling where there was demand variability to improve utilization and increase
profitability (P7). This was due to the fact that existing workflows and infrastructure could be
used to deliver new products and services to an adjacent, new, or similar market in a different
geography. These opportunities, when exploited, created synergistic profitability (P12). Capacity
functionality is guided by best practices. An appropriate methodology was used to propagate best
practices at the rate of absorptive capacity (P17). Horizontal leaders were able to determine the
rate of change deployment. It was throttled situationally to ensure that the related change was
effectively embedded.
548
Vertical leaders contribute to cross-unit growth synergies through their role in the
production network. Network capacity is more easily shared when there is consensus on how the
production network should function (P20). Both locally and in the network, profitability leads to
growth when work achievement is optimally balanced with cost performance (P23). Profitability
enablers, such as cross-unit synergies, when effectively executed, help the MUF achieve
desirable outcomes (P25). Profitability is then enabled by network production capacity that is
seamlessly guided by a propensity for excellence (P27). Workflow performance excellence in all
locations can lead to increased market share when execution results are consistent with customer
expectations (P24). This consistent performance excellence is not static, but rather continually
evolves and allows for increased market share over time (P26). The market share increase is at a
speed commensurate with market dynamics in order to capture profitable price points (P38). For
the network to be effective, vertical leaders share available and capable capacity (P32). In
addition, the constitution of the location culture must be appropriate and aligned with other
locations to optimize capacity utilization in a network-based production schema (P35).
Location leaders are keenly aware of location capacity, as it relates to existing and
pending work requirements, so that constraints can be mitigated or circumvented (P36). Vertical
leaders support the global production network through a supply-chain mindset; this perspective
reduces carrying costs, enables the execution of high volume, and, therefore, mitigates capacity
constraints (P47). Locally, these leaders make their leadership teams capable to achieve what is
about to happen in the marketplace (P39). They act such that their processes predict the dynamic
changes in the marketplace (P44) because the direction of the organization is supported by
location performance as far as it is aligned with market trends (P53). Local operational
effectiveness is based on leadership engagement through focus, optimization, and deployment
549
(P48). To maintain a competitive position, vertical leaders proactively maintain best practices,
enabling a gap between the current competitive landscape and an advanced position ahead of
potential revenue opportunities (P41). The engine of success is informed by performance data
that reflects real-time and strategic decisions and which lead to robust process enhancements
(P55). For example, a competitive position is established when sharing or redeploying capacity
enables the execution of large overcapacity orders that competitors are unable to execute. These
orders would otherwise have been referred to another vendor or split between vendors (P42).
Another profitability benefit comes from the resulting pricing position driven by value to the
client; however, pricing negotiation leadership also includes an awareness of cost reduction
opportunity, regardless of current margin, and revenue enhancement strategy (P43). When there
are unanticipated internal or external influences, they are controlled by contingencies that
increase or replace lost capacity (P45). Ultimately, profitable growth is the objective through the
realization of synergies. The addressable market can be exploited by an entrepreneurial culture
armed with their own aggressive growth strategy that exploits cross-unit synergies (P49). These
super-additives create a nimbleness that is a competitive advantage, as local leaders relentlessly
pursue profitable opportunities (P51). These opportunities are described as service and product
life-cycles. Profitability is optimized through synergy-driven strategy when dynamic pricing
plans are executed (P50).
Diagonal support leaders help a MUF realize cross-unit synergies. Infrastructure and
workflow management systems are co-dependent; consequently, they must be optimized as a
system for best results (P59). These leaders build workflows, create technologies, and embed
existing technologies that create predictive capability against market trends (P56). They make
slight evolutionary enhancements that may enable workflow consolidation, improving utilization
550
and cost per deliverable (P57). These workflow transitions, integrations, modifications, and
enhancements are all made without being noticeable to client production schedules (P58) while
concurrently boosting synergistic profitability.
Client diagonal roles in a MOS are symbiotic with other dimensional roles to achieve
cross-unit growth. For example, vertical leaders and client diagonal leaders achieve mutually
beneficial profitability goals when they collaborate around their strengths. These leaders fill the
company's pipeline with sustained corporate advantage (P63). Acquiring new business revenue
requires collaborative action starting with sales lead ideation and ending with the achievement of
billable volume ramping at optimized margins (P64). This is augmented by role definitions
required to ensure accountability; however, synergistic tasks are shared optimally and selectively
by all employees to maintain the profitability of existing revenue streams (P60). Enhancing the
revenue from a client through additional income streams that are synergistic is a profitability
super-additive (P62). These super-additives may be achieved through creative sales strategies
like lead-sharing and cross-unit bundling. For example, the CRM was leveraged to facilitate lead
sharing and the coordination of customer contacts and sales opportunities. As business units
share this information about fruitful opportunities, the possibility of the coordination of one face
to the customer is possible. Further to this, opportunities through these contacts can lead to the
sale of other products offered in the supply chain. Client costs in dealing with their vendor base
are also reduced, as they have fewer contacts to be managed and the coordination of asset
transfers is minimized. It is clear that competitive cross-unit growth requires focus. Bundling
includes bringing separate and independent, but related configurations from different business
units together into a package for delivery, or a series of deliveries. These cross-product bundles
solve complexity issues and effort consumption on the part of clients by managing projects end-
551
to-end. A one-stop-shop model creates customer value, as client scorecards are more consistent,
asset searches are reduced, sourcing of assets is simplified, invoicing is simplified, and client
solutions are accelerated. Bundling addresses the changing market environment that increases in
complexity, and provides a strong customer value proposition. The challenge with bundling is
that discounting can damage profits; however, the exploitation of interdependent business
synergies can recoup some of the lost margin. In addition, end-to-end strategies are a significant
differentiator and provide a competitive advantage that leads to sales growth and market
penetration. An assigned portfolio enhances accountability for profitability results and focuses
growth synergies that are constructive (P66). Furthermore, entrepreneurial diagonal leadership
that owns a product workflow can be incentivized to pursue cross-sector opportunities (P65).
Cross-unit growth synergies are experienced through effective change management. For
example, during large changes or integrations, the provision of transitional capacity and cost
allowance within a defined project scope can accelerate results achievement and mitigate change
fatigue (P68). Conversely, an overly conservative plan may produce resource and coordination
deficiencies that compromise existing resource utilization (P80). The objective of cross-unit
integration is to explore client spends that are untapped markets for MediaCorp and integrate
offerings into MediaCorp’s businesses as valuable solutions in these specific market areas. These
markets are being serviced by other vendors; however, they are unique growth opportunities
because they share similar assets, infrastructure, QC procedures, and workflows. By leveraging
these complementary attributes, operational synergies can be used to drive value and profits.
These initiatives increase the competitive strength of the firm, as the client becomes increasingly
dependent on its vendor. The additional opportunity to harmonize systems by adding these new
products and services to the existing ERP leverages system synergies. It also creates value for the
552
customer as they now have one less system to go to for status, one less invoice to receive, and
one less vendor relationship to manage. Additional benefits to the client are reduced complexity,
lower total buying costs, long-term vendor commitment, and reduced transaction costs. When
customers buy an integrated solution, they benefit from better-aligned components. If there are
supply chain issues, these are resolved internally by the end-to-end vendor. This and other
factors contribute to shorter turn times on orders and reduced risk of on-time delivery failure. As
MediaCorp integrates their offerings into seamless solutions backed up by a long-term
commitment through risk diversification, they can make claims about the client value proposition
that other competitors cannot. The client is the entity that must be satisfied because they
contribute to business unit profitability. It follows then, to optimize successful client involvement
in transition planning, the MediaCorp leaders should augment growth potential by designing
requirements into plan elements (P81). Plans should include the self-interest of all stakeholders.
Self-interest, if guided and balanced, can positively relate to growth synergy realization
(P95). This study has shown that a guided autonomy, driven by self-interest and augmented by
resource complementarity in a network based production environment, accelerates the process of
achieving profitable growth (P98). Entities external to the MOS can contribute to a balanced
self-interest. For example, the corporate center can contribute to continuous growth by
temporarily incubating growth opportunities, by sharing related resources between businesses,
and by helping business units to select initiatives based on the long-term strategic plan for the
firm (P97). Furthermore, the selective involvement of the corporate center can promote
autonomous growth in locally addressable markets (P96). Ultimately, an effective self-interest
policy is a LIM that encourages a collaborative social environment necessary for profitable
553
growth realization (P101). It accommodates critical concerns from stakeholders, driving
behaviors that lead to profitable growth (P102).
Collaboration within the production network helps a firm realize cross-unit synergies.
Conversely, isolated actions do not benefit from super-additives gained from exploiting matured
initiatives through duplication (103). An example would be, a standardized and appropriate cost
allocation methodology that creates predictable financial performance and allows for profit-
producing trend monitoring (P106). This allocation methodology encourages fluid resource
sharing without boundaries. This attracts the right resources quickly to issues whose resolution
contributes to profitability potential (P105). The resolution of issues contributes to firm
knowledge if it is used. When existing knowledge is consolidated and made available it can be
used as an advanced starting point, or platform, for new discoveries (P104).
Knowledge and clarity around financial information is a case in point. When revenue is
reported together with cost, LOB analysis is possible, leading to prioritized profitability
enhancements (P113). MOS leaders need to know and monitor margins by location, type, and
client so that product life-cycles are predictable and so that appropriate pricing strategies can be
applied (P114). Pricing strategies may result in margin erosion, but which may be more than
compensated for with profits from volume (P112). Accurate analysis is needed to represent this
scenario. Another example could be that effort is needed to establish profitable pricing, but this
may not have been expended in cases where free line-items exist or price levels are near break-
even (P111).
Lateral integrative mechanisms, as structures, are required for the coordination and
enhancement of cross-business collaboration in an evolving synergistic growth environment
(P117). For example, MOS leaders benefit from access to meaningful and relevant tacit
554
knowledge and domain experience that can be used to accelerate growth-oriented decision
making (P119). However, decentralized collaboration includes business unit autonomy in
selecting and implementing growth initiatives, both of which are directly related to growth
synergy realization (P120). Strong integrative mechanisms applied appropriately and with the
right frequency are positively related to continuous growth synergy realization (P121).
Focused action helps a multi-unit firm realize growth synergies. In fact, the right
sequence of tasks, quickly discovered and effectively executed, can lead to mutual benefit
between business units that collaborate (P126). Execution is supported by the structure of the
MOS augmented by LIMs. The MOS is a nimble organizational construct that can effectively
exploit focused action to realize synergistic profitability (P125). Furthermore, a MOS is
intrinsically aligned, as the structure is connected and tasks are shared by relevant functions
needed to achieve growth synergies (P128). To illustrate, a MOS can drive synergistic-focused
action that, when exploited, can realize scaling that includes expansion, consolidation, and
integration of business units (P129). A MOS can be leveraged to support cost mitigation through
a continuously evolving organizational effectiveness that is superior to competitors (P130). LIMs
augment the MOS’s ability to realize synergistic growth by focusing action execution through
collaborative task monitoring mechanisms (P132). For example, the ERP system, a significantly
influential LIM, is a super-additive because it enables scalable organizational efficacy by
promoting cost effectiveness, transparency, and workflow control (P133). Another similar LIM
example would be the tools enable the global production network to dynamically scale capacity
as measure by the successful completion of variable volume throughput rates as a competitive
advantage (P136).
555
The corporate center assists the overall organization to achieve growth synergies in a
MUF. Entrepreneurial MOS leaders can achieve synergistic profitability faster when the
relationship with corporate is streamlined and supportive (P138). The quality of the relationship
with corporate, specifically with regard to trust between interacting parties, influences the rate at
which the realization of profitable growth is achieved (P139). Specifically, corporate can help
business units connect with other business units that have achieved synergistic capabilities that
can be exploited (P143). Corporate can also assist business units to retain and mentor talent so
that they can be leveraged to achieve growth synergies (P144). The relationship with corporate in
the new organizational design was realigned to facilitate the quick implementation of the sector
strategies for continuous growth synergy realization. The new structure included secondary
overlay constructs without P&L responsibilities. Management systems and processes provided
for a horizontal perspective in the strategic-planning process and provide corporate level
rewards. Corporate IT, sales support systems, research and development, and infrastructure
support were integrated into the corporate management systems and processes. Tools, like the
CRM, were provided to sales for account management and solution selling. Rules were put in
place for transfer pricing. MOS leaders benefit from performance information from corporate
because they use it to recalibrate, course-correct, adapt plans, and monitor progress for the
achievement of desirable outcomes (P140). For example, a MUF may introduce disruptive
change to align it with market dynamics; however, product development must progress at a
suitable rate to replace negative profitability impacts (P147). Lastly, cross-unit synergy
realization is influenced by corporate supported one-ness. This is a complexity-mitigation
technique, embraced by corporate and business units alike, that accelerates profitable growth
because it is a suitable platform on which growth can more easily take place (P142).
556
The corporate sponsored one-ness strategy, known as 1MC at MediaCorp, facilitates and
accelerates cross-unit synergy realization. It is clear that competitive enterprises are compelled to
strategically position themselves in alignment with the one megatrend in order to maintain and
enhance market share in a dynamic environment (P159). Organizations seeking one-ness must
recalibrate their perspective on organizational design to enable or sustain profitable growth in an
evolving market that embraces, or already has embraced, the benefits of one-ness (P161). An
end-to-end value chain must be aligned in purpose and destiny in order to realize synergistic
growth (P166). For example, consistent excellence across all locations is foundational to a one
initiative, as it validates the single, vertical, supply-chain perspective of the client (P160). Clients
expect a singular high-reliability performance experience in the value chain that is subject to a
mature remediation process when infrequent non-conformities occur (P163). Clients count on the
reliability of the vendor’s supply chain workflows, which are dependent on the continuously
available capability of each linked functional element (P165). As examples, clients expect that
their assets are available, locatable, and treated in a similarly excellent way, regardless of where
they are in the end-to-end vendor’s supply chain (P164). The standardization of infrastructure
components allows for knowledge of disposition and redeployment to accommodate local
capacity requirements (P151). MOS leaders benefit from timely, concise, and complete financial
performance reviews that are linked to cost mitigations and the result of opportunity exploitation
(P167). MUFs experience desirable outcomes through the realization of growth synergies if a
one-ness allows them to overcome obstacles and organizational inertia.
Synergistic growth across units in a MUF is augmented by strategy, timing, and the use
of penetrators. Proactively, a MUF can map out the addressable market and construct a multi-
pronged tactical strategy to exploit potential unrealized client spends (P183). Strategic tactics
557
must be viewed as situational to exploit penetration opportunities in a dynamic market (P179).
The elements of a successful expansion strategy include a track record of reliability, the ability to
penetrate barriers to entry, an effective execution plan, and the ability to monitor results (P178).
The nimbleness of a MOS enhances the ability of a MUF to exploit an optimal proportion of the
product or service life-cycle (P176). The MOS structure is ideally suited for cross-unit
synergistic growth. The MOS creates a competitive advantage that can scale through the addition
of LOBs and locations while preserving talent, process, knowledge, and a penchant for
excellence (P180). The MOS exploits penetrators to achieve increased market share.
Infrastructure reliability is a penetrator in an increasingly insecure and liability-oriented
commercial environment (P181). Tailoring the ERP UI to the client's wishes makes it difficult
for clients to divorce themselves from the familiar system interface and valuable business
intelligence that has accumulated (P183). Technical ability is a penetrator because it inspires
confidence in MediaCorp's ability to solve problems the client does not understand (P178). The
creative and timely exposure of enhanced value to clients may expose new profit-producing
opportunities that can be exploited (P182). The execution of the roadmap forward, leveraging
synergies across-units, leads to increased synergistic growth.
In summary, the data that emerged from the study indicated that a MUF can achieve
cross-unit synergies. Value is created by leveraging existing or scalable resources. This is more
easily accomplished in a MOS augmented by LIMs and a designed relationship with the
corporate center. Horizontal roles push the standardization of best practices across locations for
all LOBs. Vertical roles ensure operational excellence within their local markets and within their
operations. Local operations are a node in the global production network. Each location
contributes and extracts capacity as needed in order to minimize cost dynamically with volume
558
variations and simultaneously exploit their addressable markets. Diagonal client leaders extract
profits from clients through LOB life-cycle pricing strategies. Diagonal support leaders help the
network to evolve ahead of the market demands. A guided and balanced self-interest is necessary
to motivate and reward the stakeholders in the MOS. Stakeholders are also motivated to
collaborate through the sharing of resources, including infrastructure, human, technology, and
knowledge. LIMs assist with the collaboration requirement by integrating aspects of the
organizational constructs so that they can achieve cross-unit synergy realization. LIMs enable
connections and they compensate for situational needs in a complex dynamic market. They are
transient by necessity, but timely by design. The organizational components are assembled and
dynamic, with a mission fulfilled through focused and selected action execution. LIMs enact
collaborative action between the MOS and the corporate center. The corporate center is
selectively involved so as to not stifle autonomy in the MOS, which is closest to the addressable
market. Collaboration is also directed through the 1MC alignment strategy. This one-ness
strategy recalibrated MediaEnterprises by moving it into a new paradigm centered on the mission
of improving profitability through the realization of growth synergies.
Implications of the Study
The constructs used in this research supported the study in a manner that reflects the
propositions that emerged from the data. These findings and results have implications for theory,
research, and practice and are described below.
Theory. In recent years, theorists have called for a more expanded view of novel
organization designs and their linkage to results in a MUF, potentially with a global supply
chain. The researcher created insight into the attributes of the corporate effect by clarifying and
deriving empirically strategic success factors for sustainable profitability. This study also
559
contributed to theories of managerial practice, organization, and strategy. Additionally, the study
provided a topology of corporate resources that influence the achievement of sustained corporate
advantage. The researcher contributed to corporate strategy theory by exploring the value-
producing effect of combining complementary resources that are energized by growth
opportunities. The role of a corporate center that creates value by combining resources is further
clarified. The study confirmed the importance of similarities and complementarities within and
between resource pools. Furthermore, this research provided an empirical example of dynamic
capabilities through organization design. Finally, this research provided insights into corporate
strategy that is oriented around interactions between business units. This contrasts with literature
that primarily discusses the creation of strategy between businesses and corporate or within
businesses (Burgelman, 1983a; Floyd & Woolridge, 2000).
The major result of this research is a preliminary mid-range theory of continuous growth
realization in such a MUF. This theory was established from themes that emerged from data
specifically tied to a single case study associated with growth synergy realization. Based on this
evidence, the researcher suggests that the concepts of selected focus and organizational design
are two significantly related strategies. A selected focus provides the energy needed to discover
and penetrate markets from a position of organizational strength. The organizational design
strategy promotes decentralized entrepreneurial collaboration supported and guided by a
balanced self-interest.
A selective focus contributes to continuous profitable growth by channeling energy and
focusing attention on market opportunities. This lowers ambiguity, reduces the impact of
corporate biases, improves on the ability to discover growth synergies, and inspires change
leaders to exploit profitability-enhancing opportunities. Selective focus also channels the
560
attention, energy, mindfulness, and sense-making of MOS leaders. The execution of initiatives
that enhance profitability is accomplished by resource redeployment and the scalability of MOS-
based resources. The MOS provides a center of gravity and is the focus of growth attention due
to its inherent ability to propagate one-ness during scaling. This scaling is achieved with minimal
energy expenditure, as the organization is already in a change orientation and has the capabilities
to preserve the established momentum in an efficient way. Cost efficiencies are not ignored in
this construct, but rather accelerate through horizontalization that is enabled through the MOS
structure across all locations. This success is not the content of initiatives, but rather the timely
execution of them. Customers benefit from the sharing of best practices and capabilities, further
enhancing profitability through the addressable market. A customer focus helps MOS leaders to
build market knowledge and domain experience. Growth synergies can be focused on market
segments where the MUF has a competitive advantage. These findings emphasize the
significance of strategic guidance for the realization of growth synergies.
A second key theme in the theory that emerged from the data is that entrepreneurial
decentralized collaboration reinforces the ability of a MUF to grow profitably. Four mutually
reinforcing elements support this capability including: the production network, aligned and
accurate financial controls, corporate support, and strong integrative mechanisms. Decentralized
autonomy can help organizations foster commitment to manage selective focus. An autonomous
agility can provide the flexibility and responsiveness needed to capture market opportunities that
constitute growth synergy initiatives. This delegation of authority allows location leaders to
capitalize on market opportunities that they are close to and thus, can more easily exploit.
Business-specific financial controls enable the discovery of opportunities and the monitoring of
improved profitability that is realized through their exploitation. Financial reporting also helps to

561
generate a productive self-interest by exposing value-destroying growth strategy as compared to
value-enhancing growth strategy. The impact of justified resource reallocation to the highest
margin opportunities enhances overall profitability. Financial feedback encourages business unit
managers to look both inward and outward to exploit growth synergy potential. Functioning as a
common point of reference, the budget encourages constructive self-interest through cross-
business collaboration that enables the exploitation of opportunities. Strong integrative
mechanisms accelerate collaboration and the realization of growth synergies by establishing
trust, reducing conflict, inspiring action, exploiting complexity, economizing attention,
increasing domain knowledge, and promoting a nimble client response.
A third theme is the megatrend that is increasing complexity and that continues to
challenge enterprises aiming to grow. Exogenously-imposed complexity can be a significant
hurdle for profitable growth. Conversely, it can be a great opportunity for customer loyalty by
making the relationship sticky. Complexity can be associated with waste. It includes excessive
workflows, steps in workflows, and a portfolio that includes products with features that
customers do not think are valuable. These reflect redundancy rather than synergy. Excessive
complexity drains the energy needed for profits and growth. Supporting too many products leads
to difficulty earning the cost of capital. However, excessive simplicity may lead to fewer options
or variations than are expected by customers, and thus, missed opportunities. This may throttle
growth even in an expanding market, whereas optimal simplicity may improve the gross margin
and promote revenue growth by targeting customers who are willing to pay a premium. The
MUF must understand, through rigorous analysis, where they stand on this issue and react
accordingly. Complexity-reduction techniques may be realized through lean sigma initiatives, for
example, that deliver increased velocity and quality. Once achieved, optimal complexity is a
562
competitive advantage that must be delivered at the lowest cost to achieve growth synergies. The
MUF can be positioned in the market optimally so that competitors are unable to counterattack
due to an inability to respond. Optimal complexity is achieved by (a) eliminating complexity that
customers will not pay for, (b) exploiting complexity that customers will pay for, and (c)
minimizing the cost of complexity offered. Some examples of complexity management could
include streamlining and standardizing basic product features, automating as many workflow
steps as possible, minimizing the number of workflow steps, cross-training to allow for better
capacity utilization in a volatile demand, utilizing robust and complex pricing schemes,
achieving portfolio optimization through customer value analysis, standardizing internally,
retaining a culture of deep functional expertise and excellence in product design, sharing parts
and engineering, customizing foundational platform designs, and investing in an information
system. Optimal complexity must be delivered at the lowest cost. For example, new products can
be offered without increasing the number of parts significantly. Internal standardization can
allow for the low cost production of highly complex and desirable products. Conversely,
products that are not generating economic profit should be eliminated to reduce complexity in
the portfolio. Standardization makes the workflow systems and training more supportable,
dependable, reliable, and promotes optimal amounts of redundancy. Optimal simplification can
be applied to support areas as well, including the purchasing process for example. The cost of
procurement should be minimized. Internal complexity must improve flexibility so that
customized products can be delivered in the least amount of time, maximizing the value per
dollar of cost incurred. Velocity is relevant because being the first to market can still help the
MUF capture market share because you are fast. These, and other forms of differentiation,
provide opportunities for the realization of growth synergies through performance excellence.
563
The economic profit of complexity is driven by its cost. This is achieved by (a)
identifying which complexity creates value and which destroys it, (b) understanding the costs a
complexity imposes on the business, and (c) exposing the underlying causes of the complexity.
Business leaders need to know whether potential new features are worth the complexity they
introduce into systems. The ability to execute these principles is related to the intellectual capital
that is woven into workflows from lessons learned. This is a culture that is very difficult to copy,
and so it is a competitive advantage. The cost introduced by complexity is evident in increased
setup time, increased learning curves, increased scheduling capability, more defects and rework,
and collateral impacts. Workflow impact is seen by having more work in progress, higher cueing
time, longer lead times, lower process speed, and a lower ratio of value-added steps as compared
to the total number of workflow steps. A critical metric used to measure the efficiency of a
process is the process cycle efficiency (PCE). This is the value-added time in a process divided
by the total lead time. If the PCE is less than 10%, the process is considered to be un-lean and
this workflow is destroying rather than creating value. A high PCE improves the gross profit
margin and is typically influenced by reducing the steps needed to create a deliverable product.
Removing the costs imposed by unnecessary complexity represents a profit pool typically hidden
from view. The biggest factors contributing to the rent associated with maintaining this hidden
factory include having too many product offerings, too many steps in the process, too many
opportunities for errors, significant variation in processing time, lengthening setup time,
excessive overall process time, and variability in demand. Leaders need to understand the effort
spent on non-value-added work tasks. They need to understand that it is easier to remove non-
value-added work than it is to speed up value-added work. To reduce the lead time, a leader can
increase the average completion rate or reduce the number of items in-process. The completion
564
rate can be influenced expensively by adding capacity, people, machines, or off-loading. The
eroding economic benefit needs to be monitored as other less expensive tactics could be used.
This could include inventing a new way to accomplish the same deliverables with fewer steps.
Furthermore, the design of the deliverable may be altered to facilitate an improved economic
profit.
A fourth theme that emerged is the need for information at the right time and in the right
place. The speed of information availability can drive operating practices. For example,
information can inform the billing process so that cash conversion time is minimized. The firm
can then be paid before they have to pay their bills. Information also allows for quicker and more
effective decision making, slower decision lead time, risk limitation, and it encourages
entrepreneurial behavior. Without critical information, a firm can be so focused on meeting their
budget plan that they miss significant market opportunities. Complexity creates noise in
information systems. Typically a few workflows produce most of the economic value in a
company. The non-value-added workflows are still tracked and managed by information
systems. All product lines are not profitable. Clients provide a varying degree of economic profit
to the firm. Information velocity must be integrated into a firm’s culture. Volume should be
steered towards a minimum set of configurations. Overall, complexity hinders management’s
ability to identify, collect, and respond to information that is strategically critical to the business.
Managing all the non-value-added aspects of a firm drains energy that could be better spent
creating economic profits and corporate value. Noise in the information system from non-value-
added activities can obfuscate the best opportunities, resulting in underinvestment in value
generators and over-investment in value destroyers. The minority value destroyers, while
impressive in the portfolio, contribute to the demise of the value generators. Complex decision
565
making compromises market entry or the ability to capture market share due to decision lead
times. Additionally, complexity is a drag on productivity, reducing the PCE and the realizable
free cash flow (economic profit percentage). Traditional information systems tend to grossly
underestimate the resources required for specialty, low-volume products, and overestimate the
resources needed for higher volume, standard products. MUF leaders need to emphasize a
differentiated offering that maximizes operating profit while minimizing invested capital.
Accelerating the growth of products or services with a negative economic profit (EP) magnifies
value destruction. Leaders must be selective about which parts of the value chain they want to
participate in. Reducing non-value-adding workflows will free up assets and capital tied up in
unprofitable operations. Leaders have to be aware and agile with this analysis as product life-
cycles are getting shorter, minimizing windows of opportunity. They also need to be able to
launch products and product extensions that create economic benefit to the firm. Strategy cannot
be based on hope. Rather it should be informed by relevant data so that pockets of value-creation
can be cherry-picked.
All decisions related to economic profits require that (a) existing portfolio offerings be
optimized by increasing complexity by adding new value-generating products of decreasing
complexity by eliminating non-value-generating products, (b) existing value generating offerings
be strengthened through product extensions and new market penetrations, and (c) internal
complexities are reduced so that corporate resources can be shifted towards value-added
activities. The MUF must focus on what adds value and improvements as it considers value-
share (the total potential for value creation in a market) rather than market share. The MUF
needs to increase the value-driven application of finite resources and it must understand the
profit pool available to them in the market. MUFs can defend value creators and reform or
566
eliminate destroyers by identifying their areas of complexity (complexity profile), seeing how
the market is rewarding complexity, identifying market segments where there is value-creation
opportunity, mapping the impact of complexity (value-stream mapping), grading opportunities
using PCE, and prioritizing the value production from focused actions.
Research. The researcher structured the research process to be as systematic and goal-
oriented as possible. Consideration was taken regarding the complexity of the investigated
phenomenon. The research process was iterative and flexible including the exploitation of
preexisting data. The research questions and field scope co-evolved with the discovery of the
research opportunity. This approach is referred to by Pettigrew (1990) as planned opportunism
and is common in qualitative studies of complex phenomena. The research process followed
Eisenhardt’s (1989, 2007) suggestion for building theory from case studies (Strauss & Corbin,
1990, 1996). The flexibility and openness demanded by qualitative research is ensured by having
the ability to frequently switch between data collection and analysis, as was the case (Strauss &
Corbin, 1996). The research cycle included exploration, deep-dive, review, and refinement when
an opportunity presented itself. This was then followed by focused action planning and execution
in phases.
This study demonstrates the value of changing the way we think about the
complementarity of organizational design in a multi-unit firm. The transient nature of
organizational design in a dynamic marketplace requires that a design paradigm be advanced,
ahead-of-market megatrends and agile to co-evolve rapidly in response to resulting client
demand. This study supports generalizable theoretical findings with some limitations. The
research attempted to answer, with some degree of specificity, the overall research question
(ORQ) and the five sub-questions. The research had a number of limitations as discussed below.
567
1. The methodology that the researcher applied to investigate the realization of growth
synergy for sustained corporate advantage, has some generalizability challenges. The
single case study approach based on 20 stakeholder interviews seemed suitable since
the phenomenon being investigated is novel and complex. This research design
required in-depth observations described as rich data descriptions (Eisenhardt, 1989;
Miles & Huberman, 1994; Siggelkow, 2007; Yin, 1994). Given that a qualitative
approach was suitable for this phenomenological case study, the propositions that
emerged from the data are bound by the specific context of the case. However,
several attributes of this case may be transferrable to other cases, such as a
moderately environmental dynamism, a relatively large decentralized organizational
structure, a complex product or service portfolio produced in a network of facilities,
and business units with a relatively high degree of relatedness. Other factors that are
specifically attributable to the MUF used in the case study may limit generalizability;
these factors include the age of the firm, the global nature of the firm, the markets the
firm pursues, and the saturation of those markets, as examples. While the
comparisons with actual theory and the existing literature suggest that the findings in
this dissertation are at least partially generalizable, the use of comparative case
studies could be used to better ground evolving theories.
2. The single case study approach employed by this dissertation cannot effectively
uncover weightings of the success factors for the realization of continuous synergistic
growth. As an example, the researcher cannot attribute the relative importance of
organizational design factors for the realization of sustained corporate advantage.
While critical success factors were identified for growth synergy, the researcher
568
cannot reliably assign importance or relevance to them. These insights would be
better suited for a quantitative research approach that uses deductive methods,
random sampling, and pooled statistical logic. This, therefore, emphasizes the need
for quantitative follow-up studies.
3. This research is limited by interpretations of the data, which are subjective. The
opportunity for subjective bias has been reduced in three ways. First, the co-
researchers, who had intimate knowledge of the case company, reviewed the coding
of the data (Yin, 1994). Second, these key informants confirmed the results of the
coding and subsequent theme mapping (Mayring, 1996). Third, the researcher
followed the data analysis rules of grounded theorizing (Strauss & Corbin, 1990,
1996). Even so, this research still has the risk of subjective and invalid interpretations
of the data that emerged from the investigation.
4. While the researcher used several measures, common to businesses in these markets,
to ensure that growth synergies were, in fact, realized during the study period, the
time span may have been too short to assess continuous growth synergy realization. It
may have been, therefore, difficult to capture all relevant success factors. It is
possible that, had the study been extended, that other important success factors would
have emerged. The organization was set on a path of continuous evolution; however,
a longer period of time was beyond the scope of this study.
5. The research design used in this study was holistic and multi-faceted (strategy,
organization, and corporate) and so inherently has some limitations regarding theory
building. The researcher has reflected the complex nature of the phenomenon under
investigation through his research design. The complexity of the case study may,
569
however, limit the development of coherent theory (Miles & Huberman, 1994). Real
world phenomena, by its nature, are complex and cannot be described with simple
cause and effect descriptions or recommendations. Consequently, while this study
makes contributions to mid-range theory regarding continuous synergistic growth
realization, it also provokes new thought processes and perspectives intended to
inspire future theorizing.
6. Lastly, the selection of variables may not be complete. The study was focused on
MUF-level factors that related to growth synergy realization and was incomplete in
its analysis of individual-level factors, such as management styles, engagement,
social networks. These factors may have an impact on the achievement of desirable
outcomes (Martin, 2002; Martin & Eisenhardt, 2010). Consequently, the researcher is
cognizant of the fact that there is further opportunity regarding the development of
mid-range theory within the research objective of this study.
While the researcher has discussed opportunities for further study above, it would also be
valuable to know, in fact, if:
1. The single case study design used in this study requires additional empirical proof.
Comparative case studies across the industry would deepen understanding and add
empirical evidence. Furthermore, a quantitative approach using a larger sample size
could test the findings put forth from this in-depth single case study. This
supplementary investigation would further enhance the mid-range theory for
continuous, growth synergy realization presented in this study. Future research could
also extend the boundary conditions of the mid-range theory presented in this study.
For example, studies could be conducted in different market sectors with varied
570
degrees of dynamism, they could be done in MUFs with a different degree of
relatedness, they could include size as a more significant variable, studies could
include variability with regard to organizational complexity, and studies could
include varied degrees of centralization. Lastly, future studies could include a more
significant social component that may include more empirical information about
leadership networks and cross-business influence or influence within the LIMs.
2. There is a relationship between efficiency and growth synergies during simultaneous
deployment. This relationship, following more in-depth study, could produce
insightful information. Studies could explore this relationship further by looking at
environmental dynamism, strategy, leadership, and relationships within the industry
to obtain further insights. Researchers could explore internal organizational dynamics
further as it relates to the impact on the organization constructs in play when
efficiency and growth are simultaneously deployed. A study could determine to what
extent, if any, organizational design introduces inertia during profitability-oriented
evolution. Further researcher could focus on organizational design (stable mechanistic
designs vs. flexible organic designs) as it related to the ability of the MUF to tolerate
these changes.
3. There could be further research regarding high level theories that are related with
regard to realizing growth synergies. An integrated theory, or meta-theory, would link
existing theories that explain and allow for the correction of cross-business
deficiencies in a MUF. While this study offers up some recommendations by
evolving mid-range theory for sustained corporate advantage through synergistic
growth, additional research could provide an integrated over-arching theory for
571
MUFs in a broad range of markets. High-range theory interaction needs to be
understood and this could be a challenge for further research.
Practice. This study underscores the perception that an innovative organizational
structure can improve the financial performance of a MUF. Certain patterns have emerged from
this study that expose implications for participants in organizations. This study brings to light the
significance of the following:
1. The study emphasizes that the realization of growth synergies is an important source of
corporate value. The empirical results of the research suggest that MUF leaders should
consider growth synergies across their related businesses in their corporate strategic
plans. As customer requirements change, megatrends influence consumer behavior, and
technology emerges, so must organizational constructs. Conceptual arguments have been
presented to assist managers with these challenges.
2. The key success driver for the continuous realization of growth synergies, based on
induction from empirical data, is a selective focus on actions that contribute to the
capability of a decentralized design that is optimally collaborative. Corporate managers
need to follow a rapid evolution towards location autonomy that is motivated by a guided
and balanced self-interest. This in-depth case study provides themes, theme patterns, and
rich descriptions that provide managers with specific context regarding the researcher’s
recommendations.
3. This study emphasizes the importance of exploiting strategies that include related
diversifiers. This stimulates cross-business growth that should occupy short- and long-
term growth plans. Consequently, MUF leaders are advised to include these concepts into
strategic plans.
572
4. This study reveals that LIMs, as collaborative mechanisms, provide connectedness and
governance. These integrative structures allowing for alignment and focus between
businesses and other relevant entities in the organizational construct presented. LIMs
promote an addressable market focus while promoting stability and efficiency, as seen in
the effort needed to achieve synergistic profitability. This novel and dynamic construct is
offered to managers to achieve stability in a dynamic environment.
5. The study highlights the value of selective and supportive value-adding character of the
corporate center. Supportive behaviors from the corporate center are situational and
should promote entrepreneurial behavior within the MOS dimensions. The corporate
center may be more useful than just providing financial performance feedback to P&L
owners. They can also assist with strategy, reward systems, coaching, and technology
incubation. These functions should exist where there is value-producing opportunity for
the MOS and should not involve assuming operative responsibilities. MUF leaders are
encouraged to minimize the corporate overhead burden as this cost constrains
involvement of locations in their addressable markets due to pricing requirements.
6. The study recommends a flexible organizational form, the MOS. The MOS allows for
co-evolutionary adaptation and growth in dynamic markets that incrementally change.
Organizational change should be incremental, but rapid. The MOS can then realize a
continuous incremental competitive advantage through performance and scalability.
MUF leaders are encouraged to design responsive, multi-dimensional organizations that
can adapt in times of strategic uncertainty and market convergence.
7. Finally, the study provides practitioners with specific information and an overview of
organizational design dimensions that are able to exploit cross-business growth issues.
573
The MOS dimensions, part of a primary structure, can be augmented by LIMs, a
secondary structure, which may be formal or informal, small or large, strong or weak.
These structures have a variable amount of decision-making capability. They are instead
meant to assist with decision making that is informed, aligned, and strategically viable.
Summary of Chapter 5
Chapter 5 presents conclusions and future implications for theory, research, and practice.
This study was undertaken to explore and examine the impact of organizational design on the
synergistic growth of a MUF. This chapter presented the researcher’s conclusions, specifically
that (a) a multi-unit firm can realize cross-unit growth synergies, (b) there are types of growth
synergies that a MUF organized in a MOS can realize, (c) there are multiple ways that a MUF
organized in a MOS can realize the benefits of growth synergies, (d) the corporate center has a
role in achieving growth synergies, (e) LIMs influence the achievement of growth synergies in a
MOS, and that (f) a one-ness strategy aligns the MUF such that it can better achieve growth
synergies. This study encourages theorists to view organizational design elements not as
detached, but rather related within itself and to desired outcomes. These elements are conjoined,
active, and subjective processes that are structured and organically adapting with success to a
dynamic marketplace for the purpose of realizing growth synergies. From a research perspective,
this study demonstrates the value of changing the way we conceptualize organizational structure
and dynamics in a multi-unit global organization. By doing so, the researcher was able to bring
new insights on the requirements needed to achieve desired outcomes. This research confirms
other findings, although they are very limited, that a multi-dimensional organizational design can
be significantly influential in achieving growth synergies.
574
The objective of the corporate strategy for MediaCorp was to achieve financial
expectations through the realization of growth synergies. To achieve this goal, corporate,
location, product, service, support, and sales leaders continuously focused their attention on
opportunity realization and dimensional optimization. Vertical optimization focused on location
profitability through superior service, strategic positioning, and operational excellence.
Corporate and dimensional leaders tried to position these business units in attractive markets
with sustainable growth and high-earnings potential. Operational excellence was achieved
through performance management, innovation leadership, a global presence, and class-leading
workflows. Horizontal optimization focused on product and service profitability optimization
through the realization of cross-unit synergies that were efficiency and growth oriented.
This chapter presented implications for theory, research, and practice. As a result, this
study encourages theorists to view organizational constructs through a lens of growth synergy
realization. From a research perspective, this study demonstrates that while findings could be
extracted from the data, there are limitations to the study that can incentivize researchers to
pursue further investigation. Finally, from a practice perspective, this study underscores how the
organizational constructs that the researcher puts forward can be used to govern the efficient
realization of sustained cross-business corporate advantage.
This study was undertaken to explore the sustained realization of corporate advantage
that can be achieved through the realization of growth synergy. This chapter presented the
researcher’s conclusions regarding the types of synergies that a MUF can realize and how these
synergies can be experienced continuously. While research has listed specific synergies, it has
not discussed the approach needed to realize them in a systemic way. Furthermore, research has
focused more on cost sub-additives (efficiency synergies) rather than profitability super-additives
575
(growth synergies). The realization of profitability-enhancing super-additives through
collaboration within an effective organizational design is typically neglected.
Several major findings were put forward during this study. First, the study emphasized a
topology for resource-based efficiency. This includes the exploitation of profitability, pricing
power, strength, and scalability synergies. This study puts forward, specifically, mid-range
theory regarding growth synergy. This is a profitability advantage for MUFs that are able to
recombine and redeploy complementary operative resources across business units. The study
also puts forward mid-range theory regarding the supporting integrative and selective
involvement of corporate and LIMs, each of which are discussed in detail. This study puts
forward mid-range theory regarding growth synergy realization through the strategic concept of
focused and selective action. Another mid-range theory is discussed regarding decentralized
collaboration within a MOS that inspires performance through a guided and balanced self-
interest. This study focuses on creating corporate value by achieving profitability super-additives
that benefit from cross-business complementarity and related diversifiers. The novel
organizational constructs offered up by the researcher suggest a governance methodology that is
more agile, continuously robust, and significantly able to exploit the addressable market for
increased profitability. These organizational constructs provide competitive opportunities to
MUFs that exploit them, as they provide the ability to achieve the successful recombination of
resources across businesses, dynamic capability in a moderately dynamic market, co-
evolutionary change at a suitable pace, and the ability to exploit innovation across business units
and sectors. The researcher believes that this dissertation puts forward a compelling and under-
explored perspective on strategy and organization in a MUF with the intent of encouraging
further research in this area of study.
576
REFERENCES
Ackoff, R. L. (1977). Towards flexible organizations: A multidimensional design. Omega, 5(6),
649-662.
Alchian, A. A. & Demsetz, H. (1972). Production information costs and economic organization.
American Economic Review, 62, 777-795.
Allard-Poesi, F. (2005). The paradox of sensemaking in organizational analysis. Organization,
12(2), 169-196.
Allen, S. A. (1978). Organizational choices and general management influence networks in
divisionalized companies. Academy of Management Journal, 21(3), 341-365.
Almeida, P. & Grant, R. M. (1998). International corporations and cross-border knowledge
transfer in the semiconductor industry. A Report to the Carnegie-Bosch Institute, March.
Almeida, P. & Phene, A. (2004). Subsidiaries and knowledge creation: The influence of the
MNC and host country. Strategic Management Journal, 25(8-9), 847-864.
Amit, R. & Livnat, J. (1988). Diversification strategies, business cycles and economic
performance. Strategies Management Journal, 9, 99-110.
Anand, B. N. (2005). Strategies of Related Diversification. Harvard Business School Cases, 1.
Anand, B. N. & Byzalov, D. (2007). Diversification and firm value: How important is the
diversification discount versus systematic heterogeneity? (Unpublished working paper).
Harvard Business School, Cambridge, MA.
Ancona, D. G. & Caldwell, D. F. (1992). Bridging the boundary: External activity and
performance in organizational teams. Administrative Science Quarterly, 37(4), 634-665.
Andersen, T. (2008). The performance relationship of effective risk management: Exploring the
firm-specific investment rationale. Long Range Planning, 41(2), 155-176.
577
Andersson, U. & Forsgren, M. (1996). Subsidiary embeddedness and control in the multinational
corporation. International Business Review, 5(5), 487-508.
Andersson, U., Forsgren, M., & Holm, U. (2002). The strategic impact of external networks:
Subsidiary performance and competence development in the multinational corporation.
Strategic Management Journal, 23(11), 979-996.
Ansari, S., Schouten, M., & Verwaal, E. (2006). Unlocking synergies between business units:
Internal value creation at Royal Vopak. Strategic Change, 15(7‐8), 353-360.
Ansoff, I. (1965). Corporate strategy: An analytic approach to business policy for growth and
expansion. New York, NY: McGraw-Hill.
Antonakis, J., & Atwater, L. (2002). Leader distance: A review and a proposed theory. The
Leadership Quarterly, 13(6), 673-704.
Argyres, N. (1996). Capabilities, technological diversification and divisionalization. Strategic
Management Journal, 17(5), 395-410.
Armour, H. & Teece, D. (1978). Organization structure and economic performance: A test of the
multidivisional hypothesis. The Bell Journal of Economics, 9, 106-122.
Armstrong, D. J., & Cole, P. (2002). Managing distances and differences in geographically
distributed work groups. Distributed Work, 167-186.
Arrow, K. J. (1974). The limits of organization. New York, NY: W. W. Norton.
Avolio, B. J., & Kahai, S. S. (2003). Adding the “E” to E-Leadership: How it may impact your
leadership. Organizational Dynamics, 31(4), 325-338.
Bailey, E. & Friedlander, A. (1982). Market structure and multi-product industries. Journal of
Economic Literature, 20, 1024–1048.
578
Bamberger, P. (2008). Beyond contextualization: Using context theories to narrow the micro-
macro gap in management research. Academy of Management Journal, 51, 839-846.
Barney, J. (1991). Firm resources and sustained competitive advantage. Journal of Management,
17, 151-166.
Barney, J. (2007). Gaining and sustaining competitive advantage. (2nd ed.). Upper Saddle River,
NJ: Prentice Hall.
Barney, J. B. (1986). Strategic factor markets: Expectations, luck and business strategy.
Management Science, 42, 1231-1341.
Bartlett, C. A. (1982, Summer). How multinational organizations evolve. The Journal of
Business Strategy, 3(1), 20-32.
Bartlett, C. A. & Ghoshal, S. (1989). Managing across borders. The translation solution.
Boston, MA: Harvard Business School Press.
Bartlett, C. A. & Ghoshal, S. (1993). Beyond the M-form: Toward a managerial theory of the
firm. Strategic Management Journal, 14(1993, Special Winter Issue), 23-46.
Bartlett, C. A., & Ghoshal, S. (1997). The Myth of the generic manager: New personal
competencies for new management. California Management Review, 40(1), 92-116.
Bartlett, C. A., & Ghoshal, S. (1999). The individualized corporation: A fundamentally new
approach to management. New York, NY: HarperCollins.
Barton, L. (2004). Crisis management: Master the skills to prevent disasters. Boston, MA:
Harvard Business School.
Bass, B. M. (1981). Stogdill's handbook of leadership: A survey of theory and research. New
York, NY: Free Press.
579
Baum, J. A. (1999). Whole-part coevolutionary competition in organizations. Variations in
Organization Science, 113-135.
Becker, G. S. & Murphy, K. M. (1992). The division of labor, coordination costs, and
knowledge. Quarterly Journal of Economics, 107(4), 1137-1160.
Beer, M. (1964). Leadership, employee needs, and motivation. (Doctoral dissertation). Retrieved
from Proquest Digital Dissertations. (AAT 302120390)
Bell, B. S., & Kozlowski, S. J. (2002). A Topology of virtual teams: Implications for effective
leadership. Group & Organization Management, 27(1), 14.
Bellis, W. (2012). Synergy insights. Washington, D.C.: Taylor Companies.
Benner, M. J., & Tushman, M. L. (2003). Exploitation, exploration, and process management:
The productivity dilemma revisited. Academy of Management Review, 28(2), 238-256.
Berger, A. N., Hanweck, G. A., & Humphrey, D. B. (1987). Competitive viability in banking:
Scale, scope and product mix economies. Journal of Monetary Economics, 20, 501-520.
Berger, P. & Ofek, E. (1995). Diversification’s effect on firm value. Journal of Financial
Economics, 37, 39-65.
Berggren, C. (1996). Building a truly global organization? ABB and the problems of integrating
a multi-domestic enterprise. Scandinavian Journal of Management, 12(2), 123-137.
Bernheim, B. D. & Whinston, M. D. (1990). Multimarket contact and collusive behavior. The
RAND Journal of Economics, 1-26.
Berry, C. H. (1974). Corporate diversification and market structure. Economic and Management
Science, 5(Spring), 196-204.
Bertrand, R. & Lajtha, C. (2002). A new approach to crisis management. Journal of
Contingencies and Crisis Management, 10(4), 181-191.
580
Besanko, D., Dranove, D., & Shanley, M. (2000). Economics of strategy. New York, NY: John
Wiley & Sons.
Bettis, R. (1981). Performance differences in related and unrelated diversified firms. Strategic
Management Journal, 2, 379-393.
Birkinshaw, J. (1997). Entrepreneurship in multinational corporations: The characteristics of
subsidiary initiatives. Strategic Management Journal, 18(3), 207-229.
Birkinshaw, J., Hamel, G., & Mol, M. J. (2008). Management innovation. Academy of
Management Review, 33(4), 825-845.
Birkinshaw, J. & Hood, N. (1998). Multinational subsidiary evolution: Capability and charter
change in foreign-owned subsidiary companies. Academy of Management Review, 23(4),
773-795.
Birkinshaw, J. & Lingblat, M. (2001). Making sense of internal competition: Designs for
organizational redundancy in response to environmental uncertainty. Paper submitted to
the Academy of Management Review. Retrieved from:
http://citeseerx.ist.psu.edu/viewdoc/download?doi=10.1.1.200.6698&rep=rep1&type=pdf
Björkman, I., Barner-Rasmussen, W., & Li, L. (2004). Managing knowledge transfer in MNCs:
The impact of headquarters control mechanisms. Journal of International Business
Studies, 35(5), 443-455.
Bloch, T. (2008). Dissynergies of mergers among local banks (No. 192). Working paper
series//Johann-Wolfgang-Goethe-Universität, Frankfurt am Main: Fachbereich
Wirtschaftswissenschaften Finance & Accounting. Retrieved from
http://www.econstor.eu/bitstream/10419/36635/1/587977264.pdf
581
Bogardus, E. S. (1927). Leadership and social distance. Sociology and Social Research. 12, 173-
178.
Bower, J. L. (1970). Managing the resource allocation process: A study of corporate planning
and investment. Harvard Business School Press, Boston, MA.
Bower, J. L. (1986). Managing the resource allocation process. Boston, MA: Harvard Business
School Press Books.
Bowman, E. H. & Helfat, C. E. (2001). Does corporate strategy matter? Strategic Management
Journal, 22(1), 1-23.
Boyd, H. W., & Headen, R. S. (1978). Definition and management of the product-market
portfolio. Industrial Marketing Management, 7(5), 337-346.
Bresman, H., Birkinshaw, J., & Nobel, R. (1999). Knowledge transfer in international
acquisitions. Journal of International Business Studies, 30(3), 439-462.
Bright, J. & Pryor, R. (2005). The chaos theory of careers: A user’s guide. Career Development
Quarterly, 53, 291-305.
Brown, C. V., & Magill, S. L. (1998). Reconceptualizing the context-design issue for the
information systems function. Organization Science, 9(2), 176-194.
Brown, J. S. & Duguid, P. (1991). Organizational learning and communities-of-practice: Toward
a unified view of working, learning and innovation. Organizational Science, 2(1), 40-57.
Brown, J. S. & Duguid, P. (2001). Knowledge and organization: A social practice perspective.
Organizational Science, 12(2), 198-213.
Brown, S. & Eisenhardt, K. (1997). The art of continuous change: Linking complexity theory
and time-paced evolution in relentlessly shifting organizations. Administration Science
Quarterly, 42, 1-34.
582
Buono, A. & Bowditch, J. (1989). The human side of mergers and acquisitions. San Francisco,
CA: Josey-Bass.
Burgelman, R. (1983a). A model of the interaction of strategic behavior, corporate context, and
the concept of strategy. Academy of Management Review, 8, 61-70.
Burgelman, R. (1994). Fading memories: A process theory of strategic business exit in dynamic
environments. Administrative Science Quarterly, 39, 24-56.
Burnes, B. (2004). Kurt Lewin and complexity theories: Back to the future? Journal of Change
Management, 4(4), 309-325.
Burns, T. & Stalker, G. M. (1961). The management of innovation. London, UK: Tavistock.
Burns, T. & Stalker, G. M. (1992). Mechanistic and organic systems. In J. M. Shafritz & J. S. Ott
(Eds.), Classics of organizational theory (3rd
ed., pp. 207-211). Pacific Grove, CA:
Brooks/Cole Publishing.
Calvello, A. A. (2013). Risk parity: The gateway drug. Aicio, 2.
Campbell, A. & Goold, M. (2000). The collaborative enterprise: Why links between business
units often fail and how to make them work. New York, NY: Basic Books.
Cantwell, J. & Mudambi, R. (2005). MNE competence-creating subsidiary mandates. Strategic
Management Journal, 26(12), 1109-1128.
Cappron, L. (1999). The long term performance of horizontal acquisitions. Strategic
Management Journal, 20, 987-1018.
Capra, F. (1996). The web of life: A new scientific understanding of living systems. New York,
NY: Anchor Books.
583
Capron, L., Dussuage, P., & Michell, W. (1998). Resource redeployment following horizontal
acquisitions in Europe and North America, 1988-1992. Strategic Management Journal,
19(7), 631-661.
Cartwright, S. & Cooper, C. (1992). Mergers and acquisitions: The human factor. Oxford, UK:
Butterworth-Heinemann.
Chandler, A. D. (1962). Strategy and structure: Chapters in the history of American enterprise.
Cambridge, MA: MIT Press.
Chandler, A. D. (1991). The functions of the HQ unit in the multibusiness firm. Strategic
Management Journal, 12(S2), 31-50.
Chatterjee, S. (1986). Types of synergy and economic value: The impact of acquisitions on
merging and rival firms. Strategic Management Journal, 7(2), 119-139.
Chatterjee, S., Lubatkin, M., Schweiger, D. & Weber, Y. (1992). Cultural differences and
shareholder value in related mergers: Linking equity and human capital. Strategic
Management Journal, 13, 319-334.
Choo, C. W. (1998). The knowledge organization: How organizations use information to
construct meaning, create knowledge, and make decisions. New York, NY: Oxford
University Press.
Choo, C. W. (2002). Sensemaking, knowledge creation and decision making: Organizational
knowing as emergent strategy. In C. W. Choo & N. Bontis (Eds.), The strategic
management of intellectual capital and organizational knowledge. New York, NY:
Oxford University Press.
Christensen, C. M. (1997). The innovator’s dilemma: The revolutionary book that will change
the way you do business. Cambridge, MA: Harvard Business Press.
584
Christensen, H. K. & Montgomery, C. A. (1981). Corporate economic performance:
Diversification strategy versus market structure. Strategic Management Journal, 2(4),
327-343.
Coggin, W. C. (1974). How the multinational structure works at Dow Corning. Harvard
Business Review, 52(1), 54-65.
Collins, D. J. & Montgomery, C. A. (2005). Corporate strategy: A resource-based approach
(2nd ed.). New York, NY: Irwin McGraw-Hill.
Collins, J. C., & Porras, J. (1994). Built to Last: successful habits of visionary companies. New
York, NY: HarperBusiness.
Collis, D., Young, D., & Goold, M. (2007). The size, structure, and performance of corporate
headquarters. Strategic Management Journal, 28, 383-405.
Conner, K. (1991). A historical comparison of resource-based theory and five schools of thought
within industrial organization economics: Do we have a new theory of the firm? Journal
of Management, 17, 121-154.
Contractor, F. J. & Ra, W. (2002). How knowledge attributes influence alliances governance
choices: A theory development note. Journal of International Management, 8, 11-27.
Cook, T. D. & Campbell, D. T. (1976). The design and conduct of quasi-experiments and true
experiments in field settings. In M. D. Dunnette (Ed.), Handbook of industrial and
organizational psychology (pp. 223-326). New York, NY: John Wiley & Sons.
Cosmelli, D. J., Lachaux, J., & Thompson, E. (2007). Neurodynamics of consciousness. In P. D.
Zelazo, M. Moscovitch & E. Thompson (Eds.), Cambridge handbook of consciousness
(pp. 729-770). West Nyack, NY: Cambridge University Press.
585
Covey, S. M. R. (2006). The speed of trust: The one thing that changes everything. New York,
NY: Simon & Schuster.
Crandall, W., Parnell, J. A. & Spillan, J. E. (2010). Crisis management in the new strategy
landscape. Thousand Oaks, CA: Sage.
Creswell, J. W. (1998). Qualitative inquiry and research design. Thousand Oaks, CA: Sage.
Creswell, J. W. (2014). Research design: Qualitative, quantitative, and mixed methods
approaches. Thousand Oaks, CA: Sage.
Cummings, J. & Teng, B. (2003). Transferring R&D knowledge: The key factors affecting
knowledge transfer success. Journal of Engineering and Technology Management, 20,
39-68.
D’Aveni, R. A. (1994). Hypercompetition: Managing the dynamics of strategic maneuvering.
New York, NY: Free Press.
D’Aveni, R. A., Dagnino, G. B., & Smith, K. G. (2010). The age of temporary advantage.
Strategic Management Journal, 31, 1371-1385.
Daft, R. & Weick, K. E. (1984). Toward a model of organizations as interpretation systems.
Academy of Management Review, 9, 284-295.
Damodaran, A. (October 30, 2005). The value of synergy. (Published paper) Retrieved from
http://dx.doi.org/10.2139/ssrn.841486.
Das, T. & Teng, B. (2000). A resource-based theory of strategic alliances. Journal of
Management, 26, 31-61.
Datta, D. (1991). Organizational fit and acquisition performance: Effects of post-acquisition
integration. Strategic Management Journal, 12, 281-297.
586
Davis, L. N. & Meyer, K. E. (2004). Subsidiary research and development, and the local
environment. International Business Review, 13(3), 359-382.
Davis, R. & Thomas, L. G. (1993). Direct estimation of synergy, a new approach to the
diversity-performance debate. Management Science, 39(11), 1334-1346.
De Jaegher, H. & Di Paolo, E. (2007). Participatory sensemaking: An enactive approach to social
cognition. Phenomenology and the Cognitive Sciences, 6, 485-507.
De Jaegher, H. & Di Paolo, E. (2008). Making sense in participation: An enactive approach to
social cognition. In F. Morganti, A. Carassa, & G. Riva (Eds.), Enacting intersubjectivity:
A cognitive and social perspective to the study of interactions. Amsterdam, The
Netherlands: IOS Press.
Deller, S. C., Chicoine, D. L., & Walzer, N. (1988). Economies of size and scope in rural low-
volume roads. Review of Economics and Statistics, 70(3), 459-465.
Denison, D. R., Hart, S. L., & Kahn, J. A. (1996). From chimneys to cross-functional teams:
Developing and validating a diagnostic model. The Academy of Management Journal,
39(4), 1005-1023.
Denzin, N. (1989). The research act. Englewood Cliffs, NJ: Prentice Hall.
Denzin, N. & Lincoln, Y. (1994). Handbook of qualitative research. Thousand Oaks, CA: Sage
Publications.
Depraz, N., Varela, F., & Vermersch, P. (2003). On becoming aware: A pragmatics of
experiencing. Philadelphia, PA: John Benjamins.
Dervitsiotis, K. (2004). Navigating in turbulent environmental conditions for sustainable
business excellence. Total Quality Management, 15(5-6), 807-827.
587
Devos, E., Kadapakkam, P. R., & Krishnamurthy, S. (2009). How do mergers create value? A
comparison of taxes, market power, and efficiency improvements as explanations for
synergies. The Review of Financial Studies, 22(3), 1179-1211.
Dierickx, I. & Cool, K. (1989). Asset stock accumulation and sustainability of competitive
advantage. Management Science, 35, 1989, 1504-1510.
Dirks, K. T., & Ferrin, D. L. (2001). The role of trust in organizational settings. Organization
science, 12(4), 450-467.
Diven, D. (1984). Organization planning: Neglected factor in mergers and acquisition strategy.
Managerial Planning, July-August: 4-12.
Doz, Y. & Kosonen, M. (2008). The dynamics of strategic agility: Nokia’s rollercoaster
experience. California Management Review, 50(3), 95-118.
Doz, Y., Santos, J., & Williamson, P. (2001). From global to metanational: How companies win
in the knowledge economy. Boston, MA: Harvard Business School Press.
Drucker, P. F. (1992). The new society in organizations. Harvard Business Review, 70(5), 95-
104.
Dubofsky, P. & Varadarajan, P. R. (1987). Diversification and measures of performance:
Additional empirical evidence. Academy of Management Journal, 30(September), 597-
608.
Dutta, S., Dutta, U., & Das, S. (2011). Creating synergy through merger and acquisition
integration: An overview. International Journal of Multidisciplinary Studies, 1(3), 168-
175.
Dyer, J. H. 1997. Effective interfirm collaboration: How firms minimize transaction costs and
maximize transaction value. Strategic Management Journal, 18: 553-556.
588
Dyer, J. H. & Singh, H. (1998). The relational view: Cooperative strategy and sources of
interorganizational competitive advantage. Academy Of Management Review, 23(4), 660-
679.
Ebadi, Y. M. & Utterback, J. M. (1984). The effects of communication on technological
innovation. Management Science, 30(5), 572-585.
Edgar, D. & Nisbet, L. (1996). A matter of chaos: Some issues for hospitality businesses.
International Journal of Contemporary Hospitality Management, 8(2), 6-9.
Eisenhardt, K. M. (1989). Building theories from case study research. Academy of Management
Review, 14: 532-550.
Eisenhardt, K. M. & Bharia, M. M. (2002). Organization computation and complexity. In J. A.
C. Baum (Ed.), Companion to organizations. Malden, MA: Blackwell.
Eisenhardt, K. M. & Brown, S. L. (1999). Patching: Restitching business portfolios in dynamic
markets. Harvard Business Review, 77(3), 72-82.
Eisenhardt, K. M. & Galunic, D. (2000). Coevolving: At last, a way to make synergies work.
Harvard Business Review, 78(January-February), 91-101.
Eisenhardt, K. M, & Graebner, M. (2007). Theory building from cases: Opportunities and
challenges. Academy of Management Journal, 50, 25-32.
Eisenhardt, K. M. & Martin, J. (2000). Dynamic capabilities: What are they? Strategic
Management Journal, 21, 1105-1121.
Falk, T., Schepers, J., Hammerschmidt, M., & Bauer, H. H. (2007). Identifying cross-channel
dissynergies for multichannel service providers. Journal of Service Research, 10(2), 143-
160.
589
Farjoun, M. (1998). The independent and joint effects of the skill and physical bases of
relatedness in diversification. Strategic Management Journal, 19, 611-630.
Ferrin, D. L., & Dirks, K. T. (2003). The use of rewards to increase and decrease trust:
Mediating processes and differential effects. Organization science, 14(1), 18-31.
Festinger, L., Riecken, H. W., & Schachter, S. (2008). When prophecy fails. London, UK: Printer
& Martin.
Fiol, C. M. & O’Connor, E. J. (2004). The power of the mind: What if the game is bigger than
we think? Journal of Management Inquiry, 13, 342-352.
Fleishman, E. & Harris, E. (1962). Patterns of leadership behavior related to employee
grievances and turnover. Personnel Psychology, 15, 43-56.
Fligstein, N. (1985). The spread of multidivisional form among large firms, 1919-1979.
American Sociological Review, 50(1985), 377-391.
Fligstein, N. (2001). The architecture of markets: An economic sociology of twenty-first-century
capitalist societies. Princeton, NJ: Princeton University Press.
Florida, R. (2004). The rise of the creative class. New York, NY: Basic Books.
Floyd, S. W. & Wooldridge, B. (2000). Building strategy from the middle. Thousand Oaks, CA:
Sage.
Foddy, W. (1993). Constructing questions for interviews and questionnaires. West Nyack, NY:
Cambridge University Press.
Forsgren, M. & Pedersen, T. (2000). Subsidiary influence and corporate learning: Centers of
excellence in Danish foreign-owned firms. In U. Holm, & T. Pederson (Eds.). The
emergence and impact of MNC centres of excellence. London, UK: Macmillan Press.
590
Forstmann, S. (1998). Managing cultural differences in cross-cultural mergers and acquisitions.
In M. Gersten, A. Soderberg, & J. Torp (Eds.). Cultural dimensions of international
mergers and acquisitions. Berlin, Germany: deGruyter.
Foss, N. (1997). On the rationale of corporate headquarters. Industrial and Corporate Change, 6,
313-383.
Fredrick, W. (1998). Creatures, corporations, communities, chaos, complexity: A naturological
view of the corporate social role. Business and Society, 37(4), 358-389.
Freeman, W. J. (2000). How brains make up their minds. New York, NY: Columbia University
Press.
Frost, T. S. (2001). The geographic sources of foreign subsidiaries’ innovations. Strategic
Management Journal, 22, 101-123.
Fuchs, T. & De Jaegher, H. (2009). Enactive intersubjectivity: Participatory sense-making and
mutual incorporation. Phenomenology and the Cognitive Sciences, 8, 465-486.
Fuller, R. B. (1975). Synergetics: Explorations in the geometry of thinking. New York, NY:
Macmillan Publishing Company, Inc.
Galbraith, J. R. (1971). Matrix organizational designs. Business Horizons, 14(1), 29.
Galbraith, J. R. (1973). Designing complex organizations. Reading, MA: Addison-Wesley.
Galbraith, J. R. (1977). Organization design. Reading, MA: Addison Wesley.
Galbraith, J. R. (1994). Competing with flexible, lateral organizations. (2nd ed.). Reading, MA:
Addison-Wesley.
Galbraith, J. R. (2005). Designing the customer-centric organization: A guide to strategy,
structure, and process. New York, NY: Wiley & Sons.
591
Galbraith, J. R. (2009). Designing matrix organizations that actually work. San Francisco, CA:
Jossey-Bass.
Galunic, D. & Eisenhardt, K. M. (1996). The evolution of intracorporate domains: Divisional
charter losses in high technology, multidivisional corporations. Organization Science, 7,
255-282.
Galunic, D. & Eisenhardt, K. M. (2001). Architectural innovation and modular corporate forms.
Academy of Management Journal, 44, 1229-1249.
Gersick, C. J. G. (1988). Time and transition in work teams: Toward a new model of group
development. The Academy of Management Journal, 31(1), 9-41.
Ghemawat, P. (1988). Sustainable advantage. Harvard Business Review, 64(5), 53-58.
Ghoshal, S. & Bartlett, C. A. (1988). Creation, adoption, and diffusion of innovation of
subsidiaries of multinational corporations. Journal of International Business Studies,
19(3), 365-388.
Ghoshal, S. & Bartlett, C. A. (1990). The multinational corporation as an interorganizational
network. Academy of Management Review, 15(4), 603-625.
Ghoshal, S. & Bartlett, C. A. (1994). Linking organizational context and managerial action: The
dimensions of quality management. Strategic Management Journal. 15, 91-112.
Giorgi, A. (1997). The theory, practice, and evaluation of the phenomenological methods as a
qualitative research procedure. Journal of Phenomenological Psychology, 28, 235-281.
Giorgi, A. (2009). The descriptive phenomenological method in psychology: A modified
Husserlian approach. Pittsburgh, PA: Duquesne University Press.
Glaser, B. & Strauss, A. (1967). The discovery of grounded theory: Strategies of qualitative
research. London, UK: Wiedenfield & Nicholson.

592
Gleick, J. (1987). Chaos: Making a new science. New York, NY: Viking.
Glenberg, A. M. (2007). Language and action: Creating sensible combinations of ideas. In G.
Gaskell (Ed.), The Oxford handbook of psycholinguistics (pp. 361-370). Oxford, UK:
Oxford University Press.
Goold, M. & Campbell, A. (1987). Strategies and styles: The role of the centre in managing
diversified corporations. Oxford, UK: Basil Blackwell.
Goold, M. & Campbell, A. (1998). Desperately seeking synergy. Harvard Business Review, 76,
130-143.
Goold, M. & Campbell, A. (2002). Designing effective organizations: How to create structured
networks. San Francisco, CA: Josey-Bass.
Goold, M. & Campbell, A. (2003). Structured networks: Towards the well-designed matrix.
Long Range Planning, 36(5), 427-439.
Goold, M., Campbell, A., & Alexander, M. (1994). Corporate-level strategy: Creating value in
the multibusiness company. New York, NY: Wiley & Sons.
Goold, M., & Luchs, K. (1993). Why diversity? Four decades of management thinking. Academy
of Management Executive, 7-25.
Grant, R. M. (1991). The resource-based theory of competitive advantage: implications for
strategy formulation. Knowledge and Strategy, 3-23.
Grant, R. M. (1996). Toward a knowledge‐based theory of the firm. Strategic Management
Journal, 17(S2), 109-122.
Grant, R. M. (2005). Contemporary strategy analysis: Concepts, techniques, applications. (5th
ed.). Malden, MA: Blackwell Publishers.
593
Grant, R. M. & Jammine, A. (1988). Performance differences between the Wrigley/Rumelt
strategic categories. Strategic Management Journal, 9, 333-346.
Grant, R. M., Pettigrew, A. M., Thomas, H., & Whittington, R. (2002). Corporate strategy:
Managing scope and strategy content. London, UK: Sage Publications.
Greenwood, R., Hinings, C., & Brown, J. (1994). Merging professional service firms.
Organizational Science, 5, 239-257.
Greenwood, R., Li, S. X., Prakash, R., & Deephouse, D. L. (2005). Reputation, diversification,
and organizational explanations of performance in professional service firms.
Organizational Science, 16(6), 661-673.
Grossman, L. (2005, October 16). How Apple does it? Time Magazine, 166(20).
Gruca, T., Nath, D., & Mehra, A. (1997). Exploiting synergy for competitive advantage. Long
Range Planning, 30(4), 481–482, 605–611.
Guba, E. G. (1990). The paradigm dialogue. Newbury Park, CA: Sage.
Guba, E. G. & Lincoln, Y. (1994). Competing paradigms in qualitative research. In N. K. Denzin
& Y. Lincoln (Eds.), Handbook of qualitative research (pp. 105-117). Thousand Oaks,
CA: Sage.
Gulati, R. (1995). Social structure and alliance formation patterns: A longitudinal analysis.
Administrative Science Quarterly, 40, 619-652.
Gupta, A. K. & Govindarajan, V. (1986). Resource sharing among SBUs: Strategic antecedents
and administrative implications. Academy of Management Journal. 30, 477-500.
Gupta, A. K. & Govindarajan, V. (1994). Organizing for knowledge flows within MNC’s.
International Business Review, 3(4), 443-457.
594
Gupta, A. K. & Govindarajan, V. (2000). Knowledge flows within the multinational corporation.
Strategic Management Journal, 21(4), 473-496.
Hamel, G. (2000). Leading the revolution. Boston, MA: Harvard Business School Press.
Hansen, M. T. (1999). The search transfer problem: The role of weak ties in sharing knowledge
across organizational subunits. Administrative Science Quarterly, 44, 82-111.
Hansen, M. T. (2002). Knowledge networks: Explaining effective knowledge sharing in
multiunit companies. Organizational Science, 13, 232-248.
Hansen, M. T. & Lovas, B. (2004). How do multinational companies leverage technological
competencies? Moving from single to interdependent explanations. Strategic
Management Journal, 25(8-9), 801-822.
Harrison, J., Hitt, M., Hoskisson, R., & Ireland, D. (2001). Resource complementarity in
business combinations: Extending the logic to organizational alliances. Journal of
Management Review, 27, 679-690.
Harzing, A. W., & Noorderhaven, N. (2006). Knowledge flows in MNCs: An empirical test and
extension of Gupta and Govindarajan's typology of subsidiary roles. International
Business Review, 15(3), 195-214.
Haspeslagh, P. & Jamison, D. (1991). Managing acquisitions: Creating value through corporate
renewal. New York, NY: The Free Press.
Hedlund, G. (1994). A model of knowledge management and the N-form corporation. Strategic
Management Journal, 15, 73–90.
Helfat, C. E., & Eisenhardt, K. M. (2004). Inter‐temporal economies of scope, organizational
modularity, and the dynamics of diversification. Strategic Management Journal, 25(13),
1217-1232.
595
Henderson, R. & Cockburn, I. (1994). Measuring competence? Measuring firm effects in
pharmaceutical research. Strategic Management Journal, 15(Winter special issue), 63-84.
Hill, C. (1994). Diversification and economic performance: Bringing structure and corporate
management back into the picture. In R. Rumelt, D. Schendel & D. Teece (Eds.),
Fundamental issues in strategy (pp. 297-322). Boston, MA: Harvard Business School
Press.
Hill, C. & Hoskisson, R. (1987). Strategy and structure in the multiproduct firm. Academy of
Management Review, 12, 331-341.
Hill, C. & Jones, G. (2007). Strategy management – An integrated approach (7th ed.). Boston,
MA: Houghton Mifflin Company.
Hill, C. W. L., Hitt, M. A., & Hoskisson, R. E. (1992). Cooperative versus competitive structures
in related and unrelated diversified firms. Organizational Science, 3(4), 501-521.
Hill, C. W. L. & Hosskisson, R. E. (1994). Strategy and structure in the multiproduct firm.
Academy of Management Review, 12(2), 331-341.
Hirschheim, R., & Klein, H. K. (1992). Paradigmatic influences on information systems
development methodologies: Evolution and conceptual advances. Advances in
Computers, 34, 293-392.
Hirschheim, R. & Klein, H. K. (1994). Realizing emancipatory principles in information systems
development: The case for ethics. MIS quarterly, 18(1), 83-109.
Hobbs, J. E. (1996). A transaction cost approach to supply chain management. Supply Chain
Management: An International Journal, 1(2), 15-27.
596
Howell, J. M. & Hall-Merenda, K. E. (1999). The ties that bind: The impact of leader-member
exchange, transformational and transactional leadership, and distance on predicting
follower performance. Journal of Applied Psychology, 84(5), 680.
Huber, G. P. & Van de Ven, A. H. (1995). Longitudinal field research methods: Studying
processes of organizational change. Thousand Oaks, CA: Sage Publications.
Hudson, C. (2000). At the edge of chaos: A new paradigm for social work? Journal of Social
Work Education, 36(2), 215-230.
Huff, J. O., Huff, A. S., & Thomas, H. (1992). Strategic renewal and the interaction of
cumulative stress and inertia. Strategic Management Journal, 13, 55–75.
Inkpen, A. C. (1997). An examination of knowledge management in international joint ventures.
In P. Beamish & J. Killings (Eds.). Cooperative strategies, North America perspectives.
(pp. 337-369). San Francisco, CA: New Lexington Press.
Isaacs, W. (1999). Dialogue: The art of thinking together. New York, NY: Doubleday.
Jackson, S. E. (2009). Chief synergy officer. Journal of Business Strategy, 30(6), 63-65.
Jacquemin, A. P. & Berry, C. H. (1979). Entropy measure of diversification and corporate
growth. Journal of Industrial Economics, 27(June), 359-369.
Jayaraman, L. L. & Min, B. K. (1993). Business ethics - A developmental perspective: The
evolution of the free and mature corporation. Journal of Business Ethics, 12(9), 665-675.
Jennings, N. R., Norman, T. J., Faratin, P., O'Brien, P., & Odgers, B. (2000). Autonomous agents
for business process management. Applied Artificial Intelligence, 14(2), 145-189.
Joensson, T. (2008). A multidimensional approach to employee participation and the association
with social identification in organizations. Employee Relations, 30(6), 594-607.
597
John, K., Litov, L., & Yeung, B. (2008). Corporate governance and risk-taking. Journal of
Finance, 63(4), 1679-1728.
Jones, G. R. & Hill, C. W. (1988). Transaction cost analysis of strategy‐structure choice.
Strategic Management Journal, 9(2), 159-172.
Jones, T. M., Felps, W., & Bigley, G. A. (2007). Ethical theory and stakeholder-related
decisions: The role of stakeholder culture. Academy of Management Review, 32(1), 137-
155.
Kaplan, S. & Henderson, R. (2005). Inertia and incentives: Bridging organizational economics
and organizational theory. Organization Science, 16(5), 509-521.
Karnani, A. & Wernerfelt, B. (1985). Multiple point competition. Strategic Management
Journal, 6(1), 87-96.
Kauffman, S. (1995). At home in the universe: The search for the laws of self-organization and
complexity. New York, NY: Oxford University Press.
Kelly, D. & Amburgey, T. L. (1991). Organizational inertia and momentum: A dynamic model
of strategic change. Academy of Management Journal, 34(3), 591-612.
Khandwalla, P. (1977). The design of organizations. New York, NY: Hardcourt, Brace, &
Janovich.
Kiel, L. (1995). Chaos theory and disaster response management: Lessons for managing periods
of extreme instability. In G. A. Koehler (Ed.). What disaster response management can
learn from chaos theory. Sacramento, California Research Bureau, California State
Library. Retrieved from http://www.library.ca.gov./CRB/96/05/over_12.html.
Kinnunen, J. (2010). Valuing M&A synergies as (fuzzy) real options. Turku, Finland: Institute for
Advanced Management Systems Research.
598
Klein, H. J. & Kim, J. S. (1998). A field study of the influence of situational constraints leader-
member exchange, and goal commitment on performance. Academy Of Management
Journal, 41(1), 88-95.
Knorr-Cetina, K. (1999). Epistemic cultures: How the sciences make knowledge. Cambridge,
MA: Harvard University Press.
Kotter, J. P. & Heskett, J. L. (1992). Corporate culture and performance. New York, NY: The
Free Press.
Koza, M. P., & Lewin, A. Y. (1998). The co-evolution of strategic alliances. Organization
Science, 9(3), 255-264.
Lamnek, S. (1995). Qualitative sozial/forschung. (3rd ed.). Muenchen, Germany: Psychologie
Verlags Union.
Lang, L. & Stulz, R. (1994). Tobin’s corporate diversification and firm performance. Journal of
Political Economy, 102, 1248-1280.
Langley, A. (1999). Strategies for theorizing from process data. Academy of Management
review, 24(4), 691-710.
Larsson, R. (1993). Case survey methodology: Quantitative analysis of patterns across case
studies. Academy of Management Journal, 36, 1515-1546.
Larsson, R. & Finkelstein, S. (1999). Integrating strategic, organizational, and human resource
perspectives on mergers and acquisitions: A case survey of synergy realization.
Organization Science, 10(1), 1-26.
Lawrence, P. & Lorsch, J. (1967). Organization and environment: Managing differentiation and
integration. Homewood, IL: Irwin.
599
Lazarus, R. S. (2001). Relational meaning and discrete emotions. In K. R. Scherer, A. Schorr, &
T. Johnstone, (Eds.), Appraisal processes in emotion. New York, NY: Oxford University
Press.
Leibold, M., Probst, G., & Gibbert, M. (2002). Strategic management in the knowledge
economy: New approaches and business applications. Erlangen, Germany: Publicis-
Wiley.
Levins, R. (1968). Evolution in changing environments: Some theoretical explorations (No. 2).
Princeton, NJ: Princeton University Press.
Levinthal, D. A. (1997). Adaptation on rugged landscapes. Management Science, 43(7), 934-
950.
Lewin, A. Y., & Volberda, H. W. (1999). Prolegomena on coevolution: A framework for
research on strategy and new organizational forms. Organization Science, 10(5), 519-
534.
Li, S. X. & Greenwood, R. (2004). The effect of within-industry diversification of firm-
performance: Synergy creation, multi-market contact and market structuration. Strategic
Management Journal, 25, 1131-1153.
Life in a matrix. (1980). Management Review, 69(7), 36.
Lincoln, Y. S. & Guba, E. G. (1985). Naturalistic inquiry. Newbury Park, CA: Sage.
Lissack, M. (1999). Complexity: The science, its vocabulary, and its relation to organizations.
Emergence, 1(1), 110-126.
Loomer, S. & Harington, A. (2003). Business valuation-sharing synergies: Ignoring or over-
estimating them is a disservice to vendors and acquirers. CA Magazine-Chartered
Accountant, 136(4), 41-42.
600
Lovas, B. & Ghoshal, S. (2000). Strategy as guided evolution. Strategic Management Journal,
21, 875-896.
Loye, D. & Eisler, R. (1987). Chaos and transformation: Implications of non-equilibrium theory
for social science and society. Behavioral Science, 32(January), 53-65.
Lubatkin, M. & Chatterjee, S. (1994). Extending modern portfolio theory into the domain of
corporate diversification: does it apply? Academy of Management Journal, 37, 109-136.
Luhman, N. (1990). The autopoiesis of social systems. In Essays on self-reference (pp. 1-20).
New York, NY: Columbia University Press.
Lutz, A. & Thompson, E. (2003). Neurophenomenology: Integrating subjective experience and
brain dynamics in the neuroscience of consciousness. Journal of Consciousness Studies,
10, 31-52)
Mahoney, J. T. & Pandian, J. R. (1992). The resource‐based view within the conversation of
strategic management. Strategic Management Journal, 13(5), 363-380.
Manolopoulos, D., Papanastassiou, M., & Pearce, R. (2005). Technology sourcing in
multinational enterprises and the roles of subsidiaries: an empirical investigation.
International Business Review, 14(3), 249-267.
Markides, C. C. (1999). All the right moves: A guide to crafting breakthrough strategy. Boston,
MA: Harvard Business School Press.
Markides, C. C. (2002). Corporate strategy: The role of the corporate centre. In A. Pettigrew, H.
Thomas, & R. Whittington (Eds.). Handbook strategy and management, (pp. 98-112).
London, UK: Sage Publications.
Markides, C. C. & Williamson, P. J. (1994). Related diversification, core competencies and
corporate performance. Strategic Management Journal, 15, 149-165.
601
Markides, C. C. & Williamson, P. J. (1996). Corporate diversification and organizational
structure: A resource based view. Academy of Management Journal, 39, 340-367.
Marks, M. (1982). Merging human resources. Mergers and Acquisitions, 17, 38-42.
Marsden, P. V. & Franklin, N. E. (1993). Network studies of social influence. Social Methods
Research, 22, 127-151.
Marshak, J. & Radner, R. (1972). Economic theory of teams. New Haven, CT: Yale University
Press.
Martin, J. (2002). Cross-business synergies: recombination, modularity, and the multi-business
team. Dissertation, Stanford University.
Martin, J. A. & Eisenhardt, K. M. (2001). Exploring cross-business synergies. Academy of
Management Proceedings & Membership Directory, H1-H6.
Martin, J. A., & Eisenhardt, K. M. (2010). Rewiring: Cross-business-unit collaborations in
multibusiness organizations. Academy of Management Journal, 53(2), 265-301.
Maturana, H. R. (1975). The organization of living: A theory of the living organization.
International Journal of Man-Machine, 7, 313-332.
Maturana, H. R. & Varela, F. J. (1980). Autopoiesis and cognition: the realization of the living.
Boston, MA: D. Reidel.
Maturana, H. R. & Varela, F. J. (1987). The tree of knowledge. Boston, MA: Shambhala.
Maturana, H. R. (1978). Biology of language: The epistemology of reality. In G. A. Miller & E.
Lennegerg (Eds.), Psychology and biology of language and thought: Essays in honor of
Eric Lenneberg (pp. 27-63). New York, NY: Academic Press.
602
Mayring, P. (1996). Einfuehrung in die qualitative sozialforschung: Eine anleitung zu
qualitativem denken (An introduction to qualitative social research: An invitation to
qualitative thinking). Weinheim: Belz/PVU.
McCann, J. E. & Ferry, D. L. (1979). An approach for assessing and managing inter-unit
interdependence. Academy of Management Review, 4, 113-119.
McCann, J. E. & Galbraith, J. R. (1981). Interdepartmental relations. In Nystrom, P. C.,
Starbuck, W. H. (Eds.). Handbook of organizational design (2nd Vol.), Remodeling
organizations and their environments (pp. 60-83). Oxford, UK: Oxford University Press.
McEvily, S. K. & Chakravarthy, B. (2002). The persistence of knowledge-based advantage: an
empirical test for product performance and technological knowledge. Strategic
Management Journal, 23(4), 285-305.
McKelvey, B. (1997). Perspective-quasi-natural organization science. Organization
Science, 8(4), 351-380.
Merriam, S. B. (2001). Qualitative research and case study applications in education. San
Francisco, CA: Jossey-Bass.
Merton, R. (1968). Social theory and social structure. New York, NY: Free Press.
Michel, A. & Shaked, J. (1984). Does business diversification affect performance? Financial
Management, 13(Winter): 18-25.
Michel, J. & Hambrick, D. (1992). Diversification posture and top management team
characteristics. Academy of Management Journal, 35, 9-37.
Miles, M. B. & Huberman, A. M. (1994). Qualitative data analysis: an expanded sourcebook.
Thousand Oaks, CA: Sage Publishing.
603
Miles, R. E. & Snow, C. (1994). Qualitative data analysis. Thousand Oaks, CA: Sage
Publications.
Miles, R. E. & Snow, C. C. (1978). Organizational strategy, structure, and process. New York,
NY: McGraw-Hill.
Miles, R. E., Snow, C. C., Meyer, A. D., & Coleman, H. J. (1978). Organizational strategy,
structure, and process. Academy of Management Review, 3(3), 546-562.
Milgrom, P. & Roberts, J. (1995). Complementarities and fit: Strategy, structure, and
organizational change in manufacturing. Journal of Accounting and Economics, 19, 179-
208.
Mintzberg, H. (1979). The structuring of organizations. Engelwood Cliffs, NJ: Prentice Hall.
Mintzberg, H. & McHugh, A. (1985). Strategy formation in an adhocracy. Administrative
Science Quarterly, 30, 160-197.
Mitroff, I. (2001). Managing crises before they happen: What every executive and manager
needs to know about crises management. New York, NY: AMACOM.
Montgomery, C. A. (1982). The measure of firm diversification: some new empirical evidence.
Academy of Management Journal, 25(June), 299-307.
Montgomery, C. A. & Singh, H. (1984). Diversification strategy and systematic risk. Strategic
Management Journal, 5, 181-191.
Montgomery, C. A., & Wernerfelt, B. (1988). Diversification, Ricardian rents, and Tobin's
q. The Rand Journal of Economics, 623-632.
Morgan, G. & Smircich, L. (1980). The case for qualitative research. Academy of Management
Review, 5(4), 491-500.
604
Mouilso, E., Glenberg, A. M., Havas, D. A., & Lindeman, L. M. (2007). Differences in action
tendencies distinguish anger and sadness after comprehension of emotional sentences. In
D. S. McNamara & J. G. Trafton (Eds.), Proceedings of the 29th
Annual Cognitive
Science Society (pp. 1325-1330). Austin, TX. Cognitive Science Society.
Moustakas, C. (1994). Phenomenological research methods. Thousand Oaks, CA: Sage.
Mowday, R. T., Steers, R. M., & Porter, L. W. (1979). The measurement of organizational
commitment. Journal of Vocational Behavior, 14(2), 224-247.
Mueller-Stewens, G. & Knoll, S. (2006). Smart linking: Steigerung von wachstum und
profitabilitaet durch innovatives geschaeftseinheitenuebergreifendes
synergienmanagement. University of St. Gallen, Switzerland.
Myers, M. D. (1997). Qualitative research in information systems. MIS Quarterly, 21, 241-242.
Nahavandi, A. & Malokzadeh, A. (1988). Acculturation in mergers and acquisitions. Academy of
Management Review, 13, 79-90.
Napier, B. J., & Ferris, G. R. (1993). Distance in organizations. Human Resource Management
Review, 3(4), 321.
Neilsen, B. B. (2005). The role of knowledge embeddedness in the creation of synergies in
strategic alliances. Journal of Business Research, 58, 1194-1204.
Nelson, R. R. & Winter, S. G. (1982). An evolutionary theory of economic change. Cambridge,
MA: Harvard University Press.
Nohria, N. & Ghoshal, S., (1989). Internal differentiation within multinational
corporations. Strategic Management Journal, 10(4), 323-337.
Nohria, N. & Ghoshal, S. (1994). Differentiated fit and shared values: Alternatives for managing
headquarters-subsidiary relations. Strategic Management Journal, 15(6), 491-502.

605
Nohria, N. & Ghoshal, S. (1997). The differentiated network. San Francisco, CA: Jossey-Bass.
Noorderhaven, N. & Harzing, A. W. (2009). Knowledge-sharing and social interaction within
MNEs. Journal of International Business Studies, 40(5), 719-741.
Northouse, P. R. (2013). Leadership theory and practice. Thousand Oaks, CA: Sage
Publications.
O’Donnell, A. (2000). Managing foreign subsidiary: Agents of headquarters or an independent
network? Strategic Management Journal, 21(6), 525-548.
Obel, B., & vander Weide, J. (1979). On the decentralized capital budgeting problem under
uncertainty. Management Science, 25(9), 873-883.
Ocasio, W. (1997). Towards an attention-based view of the firm. Psychology, 1, 403-404.
Olson, J. S., Teasley, S., Covi, L., & Olson, G. (2002). The (currently) unique advantages of
collocated work. Distributed Work, 113-135.
Palepu, K. (1985). Diversification strategy, profit performance and the entropy measure.
Strategic Management Journal, 6, 239-255.
Palich, L., Cardinal, L. & Miller, C. (2000). Curvilinearty in the diversification-performance
linkage: An examination of over three decades of research. Strategic Management
Journal, 21, 155-174.
Palmisano, S. J. (2006). The globally integrated enterprise. Foreign Affairs, 85(3), 127-136.
Pankratz, H. (1991). Strategic alignment: Managing for synergy. Business Quarterly, 55(3), 66-
71.
Panzar, J. & Willig, R. (1981). Economies of scope. American Economic Review, 71, 268-272.
Pedersen, T. & Thomsen, S. (1997). European patterns of corporate ownership. Journal of
International Business Studies, 28, 759-778.
606
Penrose, E. T. (1959). The theory of the growth of the firm. New York, NY: John Wiley & Sons,
Inc.
Peteraf, M. (1993). The cornerstones of competitive advantage: A resource-based view. Strategic
Management Journal, 14, 179-191.
Peters, T. & Waterman, R. (1988). In search of excellence: Lessons from America’s best run
companies. New York, NY: Harper & Row.
Petitmengin, C. (2006). Describing one’s subjective experience in the second person: An
interview method for the science of consciousness. Phenomenology Cognition Science, 5,
229-269.
Pettigrew, A. M. (1990). Longitudinal field research on change: Theory and practice.
Organization Science, 1, 267-291.
Pettigrew, A. M. (1997). What is a processual analysis? Scandinavian Journal of Management,
13, 337-348.
Phelps, J. A., Rogg, K. L., Downey, R. G., & Knight, P. A. (1994). Facing the challenges of the
year 2000: Learning to manage multidimensional workers. International Journal of
Public Administration, 17(3/4), 555-587.
Podsakoff, P. M., MacKenzie, S. B., & Fetter, R. (1993). Substitutes for leadership and the
management of professionals. The Leadership Quarterly, 4(1), 1-44.
Porter, M. E. (1985). Competitive advantage: Creating and sustaining superior performance.
New York, NY: Free Press.
Porter, M. E. (1987). From competitive advantage to corporate strategy. Harvard Business
Review, 65(13).
607
Porter, M. E. (1991). Towards a dynamic theory of strategy. Strategic Management Journal, 12,
95-117.
Porter, M. E. (1996). What is strategy? Harvard Business Review, 74, 61-78.
Powell, W. W. & Snellman, K. (2004). The knowledge economy. Annual Review of Sociology,
199-220.
Prahalad, C. K. (1980). The concept and potential of multidimensional organizations. In F.
Stevens (Ed.). Managing Managers. (pp. 159-176). Eindhoven: NV Philips’
Gloeilampenfabrieken.
Prahalad, C. K. & Bettis, R. (1986). The dominant logic: A new linkage between diversity and
performance. Strategic Management Journal, 7, 485-501.
Prahalad, C. K. & Doz, Y. L. (1979). Strategic reorientation in the multidimensional
organization. (Working Paper No. 195). Retrieved from: http://deepblue.lib.umich.edu/
bitstream/handle/2027.42/35980/b1375490.0001.001.pdf?sequence=2&isAllowed=y.
Prahalad, C. K. & Doz, Y. L. (1987). The multi-national mission: Balancing local demands and
global visions. New York, NY: Free Press.
Prahalad, C. K. & Doz, Y. L. (1998). Evaluating interdependencies across business units. In A.
Campbell & K. Sommers Luchs (Eds.), Strategic synergy (2nd ed.) London, UK:
International Thomson Business Press.
Prahalad, C. K. & Hamel, G. (1990). The core competence of the corporation. Harvard Business
Review, 68(3), 79-91.
Probst, G., Raub, S., & Romhardt, K. (2000). Managing knowledge: Building blocks for success.
West Sussex, UK: John Wiley & Sons.
608
Punch, K. F. (1998). Introduction to social research: Quantitative and qualitative approaches.
London, UK: Sage Publications.
Ramanujam, V. & Varadarajan, P. (1989). Research on corporate diversification: A synthesis.
Strategic Management Journal, 10, 523-551.
Ramos-Sánchez, L., Esnil, E., Goodwin, A., Riggs, S., Touster, L. O., Wright, L. K., & Rodolfa,
E. (2002). Negative supervisory events: Effects on supervision and supervisory
alliance. Professional Psychology: Research and Practice, 33(2), 197.
Raynor, M. (2000a). Real organizations for real options: The limits of established corporate
contingency theory and the sources of corporate value added in hybrid diversifiers.
(Unpublished Dissertation). Harvard University, Cambridge, MA.
Reason, J. T. (1997). Managing the risks of organizational accidents. Ashgate, UK: Aldershot.
Reed, R. & Luffman, G. (1986). Diversification: The growing confusion. Strategic Management
Journal, 7, 29-35.
Richards, L. & Morse, J. M. (2013). Qualitative methods, (3rd ed.). Thousand Oaks, CA: Sage.
Rivkin, J. (2000). Imitation of complex strategies. Management Science, 46, 824-844.
Roberts, J. (2004). The modern firm: Organizational design for performance and growth.
Oxford, UK: Oxford University Press.
Roquebert, J., Phillips, R., & Westfall, P. (1996). Market vs. management: What ‘drives’
profitability? Strategic Management Journal, 17, 653-664.
Rose, A. (1990). Synergistics: A strategy for speed in the ‘90’s. Business Quarterly, 54(4), 70-
75.
Rosen, S. (2004). Markets and diversity. Cambridge, MA: Harvard University Press.
609
Roth, K., & O'Donnell, S. (1996). Foreign subsidiary compensation strategy: An agency theory
perspective. Academy of Management Journal, 39(3), 678-703.
Rugman, A. M., & Verbeke, A. (2004). A perspective on regional and global strategies of
multinational enterprises. Journal of International Business Studies, 35(1), 3-18.
Ruigok, W., Achtenhagen, L., Wagner, M., & Ruegg-Sturm, J. (2000). ABB: Beyond the global
matrix towards the network multidivisional organization. In A. Pettigrew & E. Fenton
(Eds.), Process and practices of new forms of organizing. London and Thousand Oaks,
CA: Sage.
Rumelt, R. (1974). Strategy, structure, and economic performance. Boston, MA: Harvard
Business Press.
Rumelt, R. P. (1982). Diversification strategy and profitability. Strategic Management
Journal, 3(4), 359-369.
Rumelt, R. (1991). How much does industry matter? Strategic Management Journal, 12, 167-
185.
Rumelt, R., Schendel, D., & Teece, D. (1994). Fundamental issues in strategy: A research
agenda. Boston, MA: Harvard Business School Press.
Sales, A. & Mirvis, P. (1984). Acquisition and the collision of cultures. New York, NY:
DowJones.
Salter, M. S. & Weinhold, W. A. (1978). Diversification via acquisition: Creating value.
Harvard Business Review. 56(July-August), 166-176.
Santos, F. M. & Eisenhardt, K. M. (2005). Organizational boundaries and theories of
organization. Organization Science, 16(5), 491-508.
610
Scandura, T. & Williams, E. (2000). Research methodology in management: Current practices,
trends, and implications for future research. Academy of Management Journal, 43, 1248-
1264.
Schlegelmilch, B. B. & Chini, T. C. (2003). Knowledge transfer between marketing functions in
multinational companies: A conceptual model. International Business Review, 12(2),
215-232.
Schoen, D. A. (1991). The reflective practitioner: How professionals think in action. Aldershot,
UK: Arena.
Schumpeter, J. A. (1934). The theory of economic development. Cambridge, MA: Harvard
University Press.
Schumpeter, J. A. (1942). Capitalism, socialism, and democracy. New York, NY: Harper &
Brothers.
Schulz, M. (2001). The uncertain relevance of newness: Organizational learning and knowledge
flows. Academy of Management Journal, 44(4), 661-681.
Sellnow, T., Seeger, M., & Ulmer, R. (2002). Chaos theory, informational needs, and natural
disasters. Journal of Applied Communication Research, 30(4), 269-292.
Semmer, N. K., Jacobshagen, N., Meier, L. L., Elfering, A., Beehr, T. A., Kälin, W., & Tschan,
F. (2015). Illegitimate tasks as a source of work stress. Work & Stress, 29(1), 32-56.
Shaver, J. M. (2006). A paradox of synergy: Contagion and capacity effects in mergers and
acquisitions. Academy of Management Review, 31(4), 962-976.
Siggelkow, N. (2001). Change in the presence of fit: The rise, the fall, and the renaissance of Liz
Claiborne. Academy of Management Journal, 44, 838-857.
611
Siggelkow, N. (2007). Persuasion with case studies. Academy of Management Journal, 50, 20-
24.
Siggelkow, N., & Rivkin, J. W. (2006). When exploration backfires: Unintended consequences
of multilevel organizational search. Academy of Management Journal, 49(4), 779-795.
Simmonds, P. (1990). The combined diversification breadth and mode dimensions and the
performance of large diversified firms. Strategic Management Journal, 11, 399-411.
Sirower, M. L., & Harrigan, K. R. (1997). The synergy limitation paradox. Columbia Business
School, Columbia University.
Sloan, A. P. (1986). My years at General Motors. Hannondsworth, UK: Penguin Books.
Smith, A. (2002). Three scenarios for applying chaos theory in consumer research. Journal of
Marketing Management, 18, 517-531.
Sourabh, S. (n.d.). Calculating synergies in mergers and acquisitions industry. Retrieved from
MBASkool.com.
St John, C. H. & Harrison, J. S. (1999). Manufacturing‐based relatedness, synergy, and
coordination. Strategic Management Journal, 20(2), 129-145.
Stake, R. E. (1994). Case studies. In N. K. Denzin & Y. S. Lincoln (1994). Handbook of
qualitative research. Thousand Oaks, CA: Sage Publications.
Stake, R. E. (1995). The art of case study research. Thousand Oaks, CA: Sage Publications.
Stieglitz, N. & Heine, K. (2007). Innovations and the role of complementarities in a strategic
theory of the firm. Strategic Management Journal, 28, 1-15.
Strasser, S. (1969). The idea of dialogal phenomenology. Pittsburgh, PA: Duquesne University
Press.
612
Strauss, A. & Corbin, J. (1990). Basics of qualitative research techniques and procedures for
developing grounded theory. New York, NY: Sage Publications.
Strauss, A. & Corbin, J. (1996). Grounded Theory: Grundlagen qualitative sozialforschung.
Weinheim, Germany: Beltz.
Strikwerda, J. J. & Stoelhorst, J. W. (2009). The Emergence and Evolution of the
Multidimensional Organization. California Management Review, 51(4), 11-31.
Stringer, L. (2006). The link between the quality of the supervisor-employee relationship and the
level of the employee's job satisfaction. Public Organization Review, 6(2), 125-142.
Subramaniam, M. & Venkatarman, N. (2001). Determinants of transnational new product
development capability: Testing the influence of transferring and deploying tacit overseas
knowledge. Strategic Management Journal, 22(4), 359-378.
Suddaby, R. (2006). From the editors: What grounded theory is not. Academy of Management
Journal, 49, 633-342.
Sutherland, J. W. (1980). A quasi-empirical mapping of optimal scale of enterprise. Management
Science, 26(10), 963-981.
Sutton, R. T. & Straw, B. M. (1995). What theory is not. Administrative Studies Quarterly, 40,
371-384.
Synergy. (n.d.). Dictionary.com Unabridged. Retrieved September 30, 2014, from
Dictionary.com website: http://dictionary.reference.com/browse/synergy
Szulanski, G. (1993). Intra-firm transfer of best practice, appropriative capabilities, and
organizational barriers to appropriation. Academy of Management Proceedings. 47-53.
Szulanski, G. (1996). Exploring internal stickiness: Impediments to the transfer of best practices
within the firm. Strategic Management Journal, 17, 27-43.
613
Takeuchi, H. & Nonaka, I. (1996). The new product game. Harvard Business Review, 64(1),
137-146.
Tannenbaum, A. S. (1962). Control in organizations: Individual adjustment and organizational
performance. Administrative Science Quarterly, 236-257.
Tanriverdi, H. & Venkatraman, N. (2005). Knowledge relatedness and the performance of the
multibusiness firm. Strategic Management Journal, 26, 97-119.
Teece, D. (1980). Economies of scope and the scope of the enterprise. Journal of Economic
Behavior and Organization, 1(3), 223-247.
Thompson, E. (2007). Mind in life: Biology, phenomenology, and the sciences of the mind.
Cambridge, MA: The Belknap Press of Harvard University Press.
Thompson, J. (1967). Organizations in action: Social science bases of administrative theory.
New York, NY: McGraw-Hill.
Tsai, W. (2002). Social structure of “coopetition” within a multiunit organization: Coordination,
competition, and intraorganizational knowledge sharing. Organization Science, 13, 179-
190.
Tsai, W. & Ghoshal, S. (1998). Social capital and value creation: The role of intrafirm networks.
Academy of Management Journal, 41(4), 464-476.
Tushman, M. L. (1977). Special boundary roles in the innovation process. Administrative
Science Quarterly, 22(4), 587-605.
Tushman, M. L. & Katz, R. (1980). External communication and project performance: An
investigation into the role of gatekeepers. Management Science, 26(11), 1071-1085.

614
Tushman, M. L. & Scanlan, T. J. (1981). Boundary spanning individuals: Their role in
information transfer and their antecedents. The Academy of Management Journal, 24(2),
289-305.
van Manen, M. (1990). Researching lived experience: Human science for an action sensitive
pedagogy. London, Ontario: Althouse.
Van Wart, M. & Kapucu, N. (2011). Crisis management competencies: The case of emergency
managers in the USA. Public Management Review, 13(4), 489-511.
Vancil, R. (1980). Decentralization: Managerial ambiguity by design. New York, NY: Financial
Executives Research Foundation.
Varela, F. J. & Shear, J. (1999a). First-person methodologies: What, why, how? Journal of
Consciousness Studies, 6(2-3), 1-14.
Varela, F. J. & Shear, J. (1999b). The view from within: First-person approaches to the study of
consciousness. Thorverton, UK: Imprint Academic.
Varela, F. J., Thompson, E., & Roach, E. (1993). The embodied mind. Cambridge, MA: MIT
Press.
Vermeulen, F. & Berkema, H. (2001). Learning through acquisition. Academy of Management
Journal, 44, 457-476.
Villalonga, B. (2004). Does diversification cause the diversification discount? Financial
Management, 33, 5-27.
Walter, G. A. (1985). Culture collisions in mergers and acquisitions. In J. P. Frost, L. F. Moore,
M. R. Louis, C. C. Lunberg & J. Martin (Eds.), Organizational Culture (pp. 301-314).
Beverly Hills, CA: Sage Publications.
615
Weick, K. (1995). What theory is not, theorizing is. Administration Science Quarterly, 40, 385-
391.
Weick, K. (2007). The generative properties of richness. Academy of Management Journal, 50,
14-19.
Weick, K. E. (1976). Educational organizations as loosely coupled systems. Administrative
Science Quarterly, 21, March, pp. 1-19.
Weick, K. E., Sutcliffe, K. M., & Obstfeld, D. (2005). Organizing and the process of
sensemaking. Organization Science, 16(4), 409-421.
Wernerfelt, B. (1984). A resource‐based view of the firm. Strategic Management Journal, 5(2),
171-180.
Whittington, R. (2002). The role of the corporate center. In A. Pettigrew, H. Thomas & R.
Whittington (Eds.), Handbook of strategy management (pp. 98-113). London, UK: Sage
Publications.
Wiessmeier, G.F. L., Axel, T. & Christoph, S. (2012). Leveraging synergies between R&D and
key account management to drive value creation. Research Technology Management,
55(3), 15-22.
Wiggins, R. R. & Ruefli, T. W. (2005). Schumpter’s ghost: Is hypercompetition making the best
of times shorter? Strategic Management Journal, 26(10), 887-911.
Williamson, O.E. (1975). Markets and hierarchies. New York, NY: The Free Press.
Williamson, O. E. (1985). The economic institutions of capitalism. New York, NY: The Free
Press.
Winter, S. G. (1987). Competition and selection. The new Palgrave: A dictionary of economics.
London, UK: Macmillan, 1, 545-548.
616
Winter, S. G. & Szulanski, G. (2002). Replication of organizational routines: Conceptualizing
the exploitation of knowledge assets. In C. W. Choo & N. Bontis (Eds.), The strategic
management of intellectual capital and organizational knowledge. Oxford, UK: Oxford
University Press.
Witzel, A. (2000a). Verfahren der qualitativen sozailforschung. Ueberblick und Alternativen. 2.
Auflage: Frankfurt, Germany: Campus.
Witzel, A. (2000b). The problem-centered interview. Forum: Qualitative Social Research
(Online Journal). Retrieved from http:\\qualitative-research.
Worthen, V. (2002). Phenomenological research and the making of meaning. In S. B. Merriam
(Ed.), Qualitative research in practice: Examples and discussion. San Francisco, CA:
Jossey-Bass.
Wrigley, L. (1970). Divisional autonomy and diversification. Boston, MA: Harvard Business
School Press.
Xiaokai, Y. (1994). Endogenous vs. exogenous comparative advantage and economies of
specialization vs. economies of scale. Journal of Economics, 60(1), 29-54.
Yin, R. K. (1981). The case study as a serious research strategy. Knowledge: creation, diffusion,
utilization. 3, 97-114.
Yin, R. K. (1989). Case study research: Design and methods, revised edition. Applied Social
Research Methods Series, 5.
Yin, R. K. (1994). Case study research: design and methods. Newbury Park, CA: Sage
Publications.
Zander, I. & Solvell, O. (2000). Cross-border innovation in the multinational corporation.
International Studies of Management and Organization, 30(2), 44-67.

617
Zander, U. & Kogut, B. (1995). Knowledge and the speed of the transfer and imitation of
organizational capabilities: an empirical test. Organization Science, 6, 76-92.
Zhou, Y. M. (2011). Synergy, coordination costs, and diversification choices. Strategic
Management Journal, 32, 624-639.

618
APPENDIX A
GPS IRB APPROVAL LETTER
Graduate & Professional Schools Institutional Review Board
April 2, 2015
Joel Bigley
Protocol #: E0115D01
Project Title: Leveraging Growth Synergies in Multi-Unit Business through the Application of a
Multidimensional Organizational Design Augmented by Lateral Integrative Mechanisms: A
Phenomenological Case Study
Dear Mr. Bigley:
Thank you for submitting your application, Leveraging Growth Synergies in Multi-Unit Business
through the Application of a Multidimensional Organizational Design Augmented by Lateral
Integrative Mechanisms: A Phenomenological Case Study, for exempt review to Pepperdine
University’s Graduate and Professional Schools Institutional Review Board (GPS IRB). The
IRB appreciates the work you and your faculty advisor, Dr. Rhodes, have done on the proposal.
The IRB has reviewed your submitted IRB application and all ancillary materials. Upon review,
the IRB has determined that the above entitled project meets the requirements for exemption
under the federal regulations (45 CFR 46 -
http://www.nihtraining.com/ohsrsite/guidelines/45cfr46.html) that govern the protections of
human subjects. Specifically, section 45 CFR 46.101(b)(2) states:
(b) Unless otherwise required by Department or Agency heads, research activities in which
the only involvement of human subjects will be in one or more of the following categories
are exempt from this policy:
Category (2) of 45 CFR 46.101, research involving the use of educational tests (cognitive,
diagnostic, aptitude, achievement), survey procedures, interview procedures or observation
of public behavior, unless: a) Information obtained is recorded in such a manner that
human subjects can be identified, directly or through identifiers linked to the subjects; and
b) any disclosure of the human subjects' responses outside the research could reasonably
place the subjects at risk of criminal or civil liability or be damaging to the subjects'
financial standing, employability, or reputation.
619
Your research must be conducted according to the proposal that was submitted to the IRB. If
changes to the approved protocol occur, a revised protocol must be reviewed and approved by
the IRB before implementation. For any proposed changes in your research protocol, please
submit a Request for Modification Form to the GPS IRB. Because your study falls under
exemption, there is no requirement for continuing IRB review of your project. Please be aware
that changes to your protocol may prevent the research from qualifying for exemption from 45
CFR 46.101 and require submission of a new IRB application or other materials to the GPS IRB.
A goal of the IRB is to prevent negative occurrences during any research study. However,
despite our best intent, unforeseen circumstances or events may arise during the research. If an
unexpected situation or adverse event happens during your investigation, please notify the GPS
IRB as soon as possible. We will ask for a complete explanation of the event and your response.
Other actions also may be required depending on the nature of the event. Details regarding the
timeframe in which adverse events must be reported to the GPS IRB and the appropriate form to
be used to report this information can be found in the
Pepperdine University Protection of Human Participants in Research: Policies and Procedures
Manual (see link to “policy material” at http://www.pepperdine.edu/irb/graduate/).
Please refer to the protocol number denoted above in all further communication or
correspondence related to this approval. Should you have additional questions, please contact
Kevin Collins, Manager of the Institutional Review Board (IRB) at [email protected].
On behalf of the GPS IRB, I wish you success in this scholarly pursuit.
Sincerely,
Thema Bryant-Davis, Ph.D.
Chair, Graduate and Professional Schools IRB
cc: Dr. Lee Kats, Vice Provost for Research and Strategic Initiatives
Mr. Brett Leach, Compliance Attorney
Dr. Kent Rhodes, Faculty Advisor

620
APPENDIX B
List of Definitions
This section contains definitions that are not defined in the dissertation. The scholar provides
definitions of terms within the context of the dissertation content.
Agency advantages. A cost benefit that comes from the reduced cost of
monitoring human resource utilization and performance.
Boundary spanning personnel. Human resources that come into contact and
work with other resources outside of their department.
Business intelligence. Knowledge derived from the mining and analysis of
business market and transaction data.
Captive vendor. As opposed to a multi-client based revenue model, this model
occurs when a vendor has only a few clients and is therefore under significant
pressure to comply with their clients’ demands or experience significant
revenue loss.
Coal face. The place where the working conditions or the situation in general
is most accurately understood as it is physically or mentally close to reality.
Cognitive inertia. Phenomenon that act as psychological barriers to change.
Collaborative decentralization. Free flowing intelligence sharing at locations
away from the corporate center for purposes of locally created corporate
advantage.
Cross-selling. Encouraging a customer who buys a product to also buy a
621
complementary product.
Disruptive technologies. A new technology that harms a traditional business
method or practice, and so compromises the revenue stream.
Dynamic markets. Radical changes in supply and demand in a given market
that affects available capacity, technology, and pricing accelerating product
life-cycles.
Emerging markets. Immature, volatile, and undeveloped revenue streams that
are exploitable opportunities if existing synergistic capabilities can be utilized.
End-to-end. When a supplier provides all related services in a vertical supply
chain.
Horizontalized. Pushing a policy or practice across similar functions that are
physically separated.
Hunter vs. harvester. A reference to the behavior of sales resources: the former
that aggressively seeks new revenue streams and the latter that tries to exploit
as much from existing clients as is possible.
Implanted personnel. Human resource that is located in the client’s facility for
purposes of facilitating the orders from the vendor that is paying for this
resource.
Intercompany pricing. Rates that are established whereby one business unit
can charge another for goods sold. This provision allows for the temporary
utilization of another business unit’s capability.
Megatrend. Macro-economic forces that impact business, economy, society,
cultures, technology, and personal lives, thereby, altering the future world and
622
its pace of change.
M-form. A multi-divisional firm separated into semi-autonomous business
units guided and controlled by the corporate center.
N-form. Attributes include temporary constellations of people, the importance
of personnel at “lower levels,” lateral communication, a catalytic and
architectural role for top management, strategies aimed at focusing, and
economies of depth (Hedlund, 1994).
One-ness. Resultant company attributes following a transformation that breaks
down company silos for the purpose of creating a singular consistent client
experience regardless of the touch point.
Operational autonomy. Organizational attributes when a degree of decision-
making freedom is given with the assumption that leaders will pursue the
interests of the company in the absence of directional mandates from the
corporate center.
Organizational inertia. The tendency of an organization to continue on its
current path including a lack of motivation to respond with a resource change
as well as a desire to sustain existing routine structure (Kelly & Amburgey,
1991).
Precipitating event. A significant positive response to a crisis that rescues the
company’s financial results and mitigates permanent brand damage and
significant talent loss.
Predictive. Action in anticipation of an action to mitigate its effect.
Proactive. Action prior to an action to mitigate its effect.
623
Product configurations. Supply chain processes alter product elements through
manipulation and combination resulting in a configuration that is ultimately
delivered to a client; however, mass customization and complexity diminish
benefits from economies of scale, while product commonality and workflow
synergies enhance benefits.
Reactive. Action after an action has already happened to mitigate its effect.
Recalibrate. Organizational agility is based on capability to adapt to a
changing environment in response to business intelligence and other feedback.
Researcher. The author of this dissertation when pursuing findings.
Ripple effect. Following an action there is a subsequent broader impact in
response to the initial action that propagates to other entities that may or may
not be related or even noticed.
Saturated markets. An economic situation in which a product has been
distributed, flooding a market such that a further incremental sale is negatively
affected by consumer purchasing power, technology, price, and competition.
Scalable. Capacity that can be increased with no impact to performance and
minimal effort using similar methods and infrastructure.
Scholar. The author of this dissertation when not pursuing findings.
Sector. An industrial market that is distinguished by regulation, product use,
and the involvement of unique communities of practice.
Self-cannibalization. Offering a new product or service to penetrate a new
class of customers in the hope of increasing revenue even though it consumes
sales from an existing core product market. This may be done to replace a core
624
product whose life-cycle is ebbing or extend the core products life-cycle by
making it more attractive through pricing.
Siloed. Functional or geographical organizational constructs that isolate loyal
human resources requiring bridges for collaboration and trust. Self-interest in
silos promotes change inertia and inhibits innovation.
Slack resources. Resource, money, people, or time that is not being utilized
due to a temporary work volume reduction or cycle.
Spend. A budgeted product or service volume with repeated activity over a
period of time.
Stakeholders. Human resources that stand to gain or lose depending on a
business outcome.
Static markets. Markets that experience a small amount of change in volume
or complexity over a period of time.
Sub-additives. The value of two separate entities is more if they act alone that
if they acted together.
Super-additives. The influence of the combination of two separate entities is
more than the sum of their measured contribution had they acted
independently.
Transaction advantages. Supply chain transaction cost efficiencies through
vertical supply-chain coordination (Hobbs, 1996).
U-form. An organizational design with a single unit that produces a single
product.
Undulations. Market changes over time due to life-cycles and seasonality as

625
examples.
Value chain. A supply chain constructed of linked functions that are value
focused.
626
APPENDIX C
List of Abbreviations
Account director (AD).
Account manager (AM).
Analysis of good (ANOG).
Application program interface (API).
Body of knowledge (BOK).
Business continuity plan (BCP).
Business intelligence (BI).
Business unit (BU).
Capital expenditure (CAPEX).
Chief executive officer (CEO).
Client service representative or project manager (CSR/PM).
Code of federal regulations (CFR).
Community of practice (COP).
Customer relationship management (CRM)
Disaster recovery plan (DRP).
Earnings before interest, taxes, depreciation, and amortization (EBITDA).
Economic profit (EP).
End-to-end (E2E).
Enterprise resource planning system (ERP).
et alli – meaning and others (et al.).
et cetera – meaning and so on (etc.).
627
Example (ex.).
Failure mode and effects analysis (FMEA).
Free cash flow (FCF).
Freelance labor (FL).
Full-time labor (FT).
Head count (HC).
Human resources (HR).
id est – meaning that is to say (i.e.).
Information technology (IT).
Institutional review board (IRB).
Intellectual property (IP).
Key performance indicator (KPI).
Lateral integrative mechanism (LIM).
Leader-member exchange theory (LMX).
Line of business (LOB).
Management information system (MIS).
Management review (MR).
MediaCorp - disguised case company (MC).
MediaCorp University (MU).
Merger and acquisition (M&A).
Multi-unit firm (MUF).
Multidimensional organizational structure (MOS).
Network-based production (NBP).
628
On-the-lot (OTL).
One Media Corp - an alignment strategy (1MC).
Overall research question (ORQ).
Pricing power synergy (PP).
Pro-forma P&L for X quarter (PFX).
Process cycle efficiency (PCE).
Profit and loss - may refer to business unit with financial measures (P&L).
Profitability synergy (PR).
Project management office (PMO).
Proof of concept (POC).
Proposition number - followed by a number (P#).
Purchase order (PO).
Quality assurance (QA).
Quality control (QC).
Quality management system (QMS).
Quality of life (QoL).
Quality system documents (QSD).
Request for proposal (RFP).
Research and development (R&D).
Research question - followed by a number (RQ#).
Return on investment (ROI).
Sales force effectiveness (SFE).
Sales manager (SM).
629
Scalability synergy (SC).
Security management system (SMS).
Service level agreement (SLA).
Stock keeping unit (SKU).
Strength related synergy (LS).
Structured planning method used to evaluate the strengths, weaknesses, opportunities, and threats
involved in a project or in a business venture (SWOT analysis).
Subject matter expert (SME).
User interface (UI).
versus – meaning against (vs.).
Voice of the customer (VOC).
Work in progress (WIP).
Work instruction (WI).
Work order (WO).
Worldwide (WW).
Year-over-year (YoY).