sustainable & renewable energy conference
TRANSCRIPT
ةللطاقة المستدامة والمتجدد لثوقائع المؤتمر الثا
Proceeding of the 3 rd
Sustainable & Renewable
Energy Conference
23-24 December 2017
Baghdad-Iraq
www.ise-iq.org
Proceeding of the 3 rd
Sustainable & Renewable Energy Conference
23-24 December 2017, Baghdad-Iraq
لجان المؤتمر
اللجنة التحضيرية
رئيس جمعية المهندسين العراقية االستشاري فـالح كاظم زايــــر . م
العراقيةامين سر جمعية المهندسين االستشاري علي حسين صبيح العالق. م
امين المال لجمعية المهندسين العراقية محمد فاروق عبد الخالق . م
كلية الهندسة/ جامعة بغداد/عضو الهيئة االدارية لجمعية المهندسين العراقية حيدر عامر احمد البغدادي . د.م
عضو الهيئة االدارية لجمعية المهندسين العرقية االستشاري منعم صالح السبع . م
عضو الهيئة االدارية لجمعية المهندسين العرقية االستشاري رياض كتاب حسين . م
عضو الهيئة االدارية لجمعية المهندسين العرقية فالح حمزة عيدان . د
كلية الهندسة/ الجامعة المستنصرية/جمعية لعضو الهيئة االدارية ل احمد صالح مهدي. م.م
عضو الهيئة االدارية لجمعية المهندسين العرقية حمودي خضير محمد. م
عضو الهيئة االدارية لجمعية المهندسين العرقية عبد اللطيف عبد الحسين صنكور. م
كلية الهندسة/ الجمعة المستنصرية لبنى عبد الجبار الزبيدي . د.م.ا
الهندسة كلية/ الجامعة المستنصرية توفيق وسمي محمد. د.م
كلية الهندسة/ جامعة ديالى نبيل طه اسماعيل .د.م
كلية الهندسة / الجامعة المستنصرية اريج محيي عبد الوهاب . م.م
قسم هندسة العمارة / الجامعة التكنولوجية أوس جواد جعفر . م.م
مدير عام هيئة البحث والتطوير الصناعي االستشاري عبد الغني فخري آل جعفر . م
معاون المدير العام دائرة بحوث وتكنولوجيا الطاقات المتجددة ستشاري ييا جليل حسين اال. م
عضو جمعية المهندسين العراقية المعماري االكاديمي موفق جواد الطائي
عضو جمعية المهندسين العراقية االستشاري وهاب رزوقي المرعب . م
ستشارات الهندسية المركز الوطني لال االستشاري عالية مهدي محمد . م
منتدى بغداد االقصادي االستشاري عامر عيسى الجواهري. م
وزارة االعمار واالسكان االستشاري مضا صبيح . م
االستشاري عبد السالم عبد الحسن الجشعمي عضو جمعية المهندسين العراقية. م
عضو جمعية المهندسين العراقية حسنين محمد حسن . م
عضو جمعية المهندسين العراقية حسام احمد الغالي . م
بغداد/ معهد التكنولوجيا/ الجامعة التقنية الوسطى قيس ميخائيل بهنام . م
Proceeding of the 3 rd
Sustainable & Renewable Energy Conference
23-24 December 2017, Baghdad-Iraq
اللجنة العلمية
الهندسةكلية / جامعة بـغداد/نائب رئيس جمعية المهندسين العراقية حسين يــــوسف محــــمود . د.أ
كلية الهندسة/ جامعة بـغداد غادة موسى رزوقي . د.أ
كلية الهندسة/ جامعة بـغداد نـــــــدى مهـــــدي فـــوزي . د.أ
كلية الهندسة/ جامعة بغداد عمار صالح عباس . د.أ
الخوارزمي كلية الهندسة/ جامعة بغداد عال كريم محمد . د.أ
كلية هندسة المعلومات/ جامعة النهرين بيان مهدي صبار . د.أ
لعراقيةعضو الهيئة االدارية لجمعية المهندسين ا ماهر يحيى سلوم . د.م.أ
قسم الميكانيك/ الجامعة التكنولوجية اخالص محمد فياض .د.م.أ
كلية الهندسة/ الجامعة المستنصرية فؤاد علوان صالح . د.م.أ
النهرين للطاقة المتجددة النانونيةمدير مركز بحوث / جامعة النهرين كريم خلف الجبوري. د.م.أ
كلية العلوم / جامعة بغداد عبد الكلريم محمد علي . د.م.أ
كلية الهندسة/ جامعة النهرين احمد وحيد مصطفى. د.م.أ
قسم الهندسة الكهروميكانيكية / رحيق اسماعيل ابراهيم الجامعة التكنولوجية. د.م.أ
مدير مركز النانوتكنولوجي/ الجامعة التكنولوجية الح عجمي خالد ص. د.م.أ
كلية الهندسة / جامعة النهرين شيما حميد حسين. د.م.أ
كلية الهندسة / جامعة النهرين نصير عبود الحبوبي .د.م.أ
كلية الهندسة / الجامعة المستنصرية ناصر احمد العواد . م.أ
و الهيئة االدارية لجمعية المهندسين العراقيةعض صالح رحيمة عبيد. د.م
كلية الهندسة/ جامعة بغداد حنان ميخائيل. د.م
كلية الهندسة / جامعة بغداد شذى عباس حسن . د.م
كلية الهندسة الخوارزمي/ جامعة بغداد اميل محمد رحمن . د.م
Proceeding of the 3th Sustainable & Renewable Energy Conference
23 -24 December 2017, Baghdad-Iraq
الصفحة المحتويات
1………………………………………………...…تصنيع لوح شحن شمسي من الرقائق السليكونية المكسرة
9...................................... باستخدام السطح الماص االسطواني الدوارزيادة كفاءة المقطر الشمسي
11…………………………………….…تصميم وتنفيذ عاكسة منفصلة المصدر ثالثية الطور
11 ..............................تحليل أداء وحدة توليدية مركبة متكاملة بنظام الطاقة الشمسية في العراق
74..................................................... ةفي المؤسسات الحكومي الطاقة الشمسية خطوة اولى
66........................ تصميم مجمع شمسي يستخدم في تسخين المياه بطريقة تقنية االنابيب المفرغة
47.................................................................ستعمال الطاقة الشمسيةاطرق الري الذكية ب
18..الكوفة تأثير الغبار المترسب على القدرة المجهزة من األلواح الشمسية لمنظومة منصبة في جامعة
11......................................المنظومة الكهروضوئية لبناية مركز بحوث الطاقة المتجددة والبيئة
الخاليا الشمسية، أنواعها، تطبيقات ث لطاقة المستدامة والمتجددة الثالورقة عمل مقدمة الى مؤتمر ا
89.....................................................................................................استخداماتها
601.................................مركز بحوث الطاقة المتجددة والبيئة في العراق الواقع واآلفاق المستقبلية
188........................................................... المدن المستدامة بين التطبيق واإلستراتيجية
111......................................أثر السقوف الخضراء على تحقيق مفهوم حفظ الطاقة في األبنية
151..................التابعة للشركات النفطية العراقيةوسائل تصاميم البيوت المستدامة الصديقة للبيئة
151.....................................(دراسة تحليلية)التصميم البيئي في العمارة المستدامة الخضراء
118.......................تصنيع مادة مركبة صديقة للبيئة تساهم في تحقيق إستدامة الموارد الطبيعية
117......الغاز الحيوي وتوليد الطاقة الكهربائية مطامر النفايات القديمة النتاج دراسة حول استغالل
202..................................ائمة الخضرةدراسة حول امكانية انتاج الوقود الحيوي من شجيرات د

Proceeding of the 3 rd
Sustainable & Renewable Energy Conference
23-24 December 2017, Baghdad-Iraq
واألشعة فوقاألكسدة المتقدمة للمواد العضوية في مياه النفايات باستخدام بيروكسيد الهيدروجين
814......................................................................................................البنفسجية
236......................خلية وقود هيدروجينية مفردة بغشاء انتقائي واطئ الكلفة إلنتاج الطاقة الكهربائية
(الصمام الثنائي الباعث للضوء ) حديثة نـوع إنارةترشيد استهالك الطاقة الكهربائية باستخدام مصابيح
LED ....................................................................................................................242
857.............. الكهربائي بجهازالتحليل الهيدروجين غاز انتاج كفاءة لزيادة المسامية المعدنية األلواح
866......................................................توربينات الهواء وانواعها واشهر التطبيقات العملية 272...................................................ورقة عمل قسم تقويم االداء بخصوص الطاقـات المتجـددة

(ASE) محور تطبيقات الطاقة الشمسية
البحوث
Proceeding of the 3th
Sustainable & Renewable Energy Conference
23 -24 December 2017, Baghdad-Iraq
1
تصنيع لوح شحن شمسي من الرقائق السليكونية المكسرة
زينب رحيم مسلم د.أ ,حارث ابراهيم جعفر.د.أ, علي قاسم كاظم .د
قسم الفيزياء –كلية العلوم –جامعة بغداد
مصنع الرشيد/مهندسين أحسان علي محمد .ر
: المقدمة-1
طاقة متجددة ودائمة ال تنضب، ولهذا أضحت الطاقة الشمسية في عصرنا الحالي أشعة الشمس تتصف بأنهاأن
تستخدم بشكل رئيسي وفعال لبعض البلدان وقد استخدمت الطاقة الشمسية لتوليد الكهرباء في تطبيقات عديدة منهاا
رور ولنااارة الشااوارت، وتشااايل بعااض ا هاا ةالكهرباااء وتحليااة المياااغ، وتشااايل لشااارات الماا محطااات توليااد
لن . والمحطاات الضضاائية واآلالت الحاسابة، وتشاايل ا قماار االااطناعية والمر باات الكهربائياة ملال السااعات
قاوة اششاعات )الموقع الجارافي النجاح في استخدام الطاقة الشمسية يعتمد على العديد من العوامل المتكاملة ومنها
.1] [(الحرارة وسرعة الرياحالشمسي ودر ة
Abstract:
Solar energy is used as a renewable and permanent energy that is inexhaustible. Therefore,
solar energy in our time is used mainly for some countries. Solar energy has been used to
generate electricity in many applications including power generation and desalination plants,
operation of traffic lights, street lighting, Such as clocks and calculators, and the operation of
satellites, vehicles and space stations. Success in the use of solar energy depends on many
factors including the geographical location (the strength of solar radiation, temperature and
wind speed).
: هدف وملخص البحث-2
من بقايا الرقائق السليكونية التالضة والمكسرة أثناء العمال أو النقال والتاي ترماى صنعتم تصنيع لوح شحن شمسي ي
cm)وبإبعاااد (gm555)تمتازهااذة ا لااواح بخضااة الااوزن يااز يبلااا الااوزن ا مااالي . نضايااات ضااارة للبي ااة2
11.5X 33.5 ) عناد ملها على الظهربواسطة مالة مخصصة لهاذا اللاوح تاربل علاى الظهار صواااويمكن
و اذل يمكان وضاعة علاى ا ر أو تعليقاة فاي االماا ن التاي ياراد , الحا ة الى شحن هاز النقال أثنااء المساير
والم ارت والر الت االستكشافية للبا لين والطلبة و ذل يمكن أستخدامة من , شحن ا ه ة في المناطق النائية
واا عند الشروت بالوا بات المناطة بهم ارج المدن قبل قوات ا من والكمارك والجيش لتأمين ا تصاالت ص
.
:طريقة عملهاومكونات الخلية الكهروضوئية -3
الكهروضوئية المستخدمة تكون مصنعة من مادة بلورية تدعى السيلكون، وهي ل دى مواد اغلب الخاليا
هذغ المادة هي ا د مواد أشباغ مادة السيلكون الضوئية من طبقة رقيقة من الخلية تتكون. ا ر شيوعا
.الضي يائية بين المواالت و العوازل المعروفة التي تندرج وااها المواالت
Proceeding of the 3th
Sustainable & Renewable Energy Conference
23 -24 December 2017, Baghdad-Iraq
2
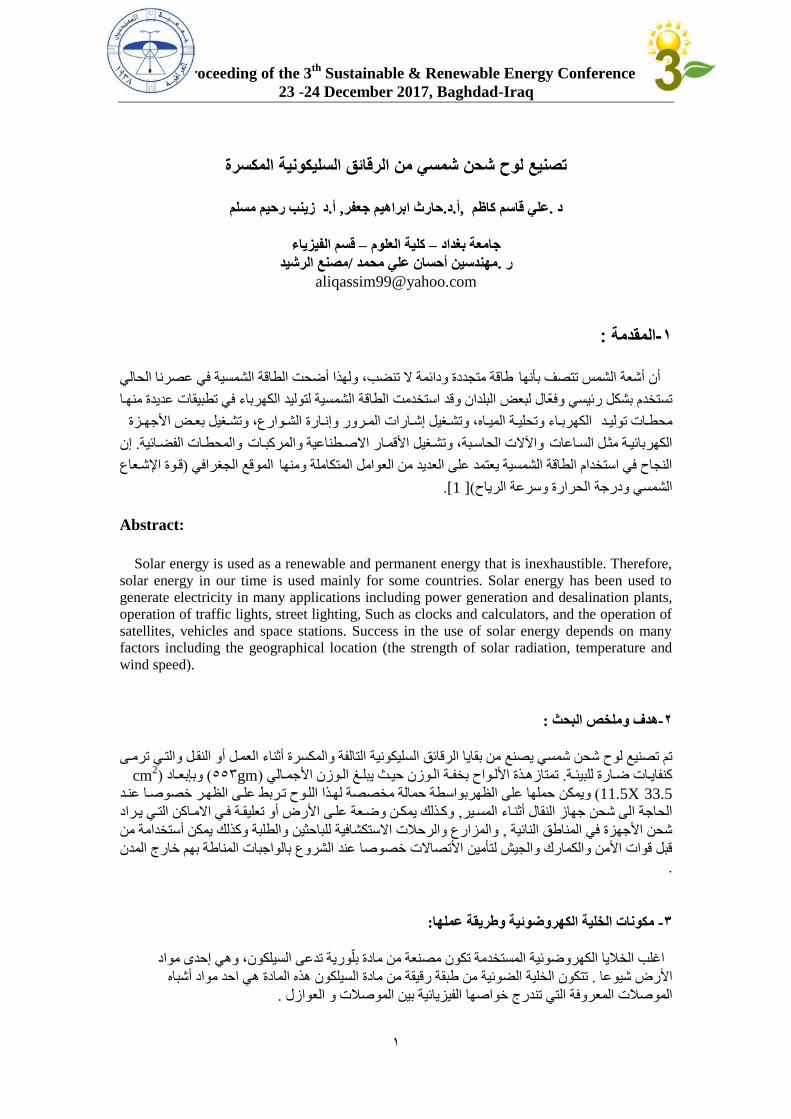
الخلية تتكون الخلية الكهروضوئية من لل مية اايرة دا من البورون مع مادة السيلكون ويرش سطح
-p بمعنى أ ر تتكون والة الـ p-type وتومن ن n-type طبقتين مختلضتين من نوت بطبقة الضسضور وذل لخلق
n junctions للخلية التر يب ا ساسي (1الشكل )يوضح .قرب السطح بين غالف الضسضور و ليل البورون
ويمتص ء منه الخلية يمر هذا الضوء من الل سطح الخلية يال ظ انه عند سقوط ضوء الشمس على يز
الخلية فسضور أما أغلبية الضوء الساقل على هذغ ىطبقة التي تحتوي علال بواسطة الطبقة ا ولى للخلية وهي
تحتوي على ليل السيلكون بالبورون يز يتكون من فيقوم بامتصااه الج ء الخاص بذل وهي الطبقة التي
وت داد الخلية الحر ة يمكنها السريان الل الموال الكهربائي في أطراف الل هذغ العملية الكترونات رة
أطراف هذغ يمكننا توايل مل هربائي على الخلية وبذل هذغ هذغ الحر ة ب يادة لافة الضوء الساقل على
2]. [ الناتجة من تسليل ضوء الشمس على الخلية واالستضادة من ر ة االلكترونات الخلية
عملية تحول ضوء الشمس الى تيار هربائي بو ود مل على طرفي الخلية( 1شكل )
:تجميع الخاليا -
:تجميع الخاليا على التوالي 4-1
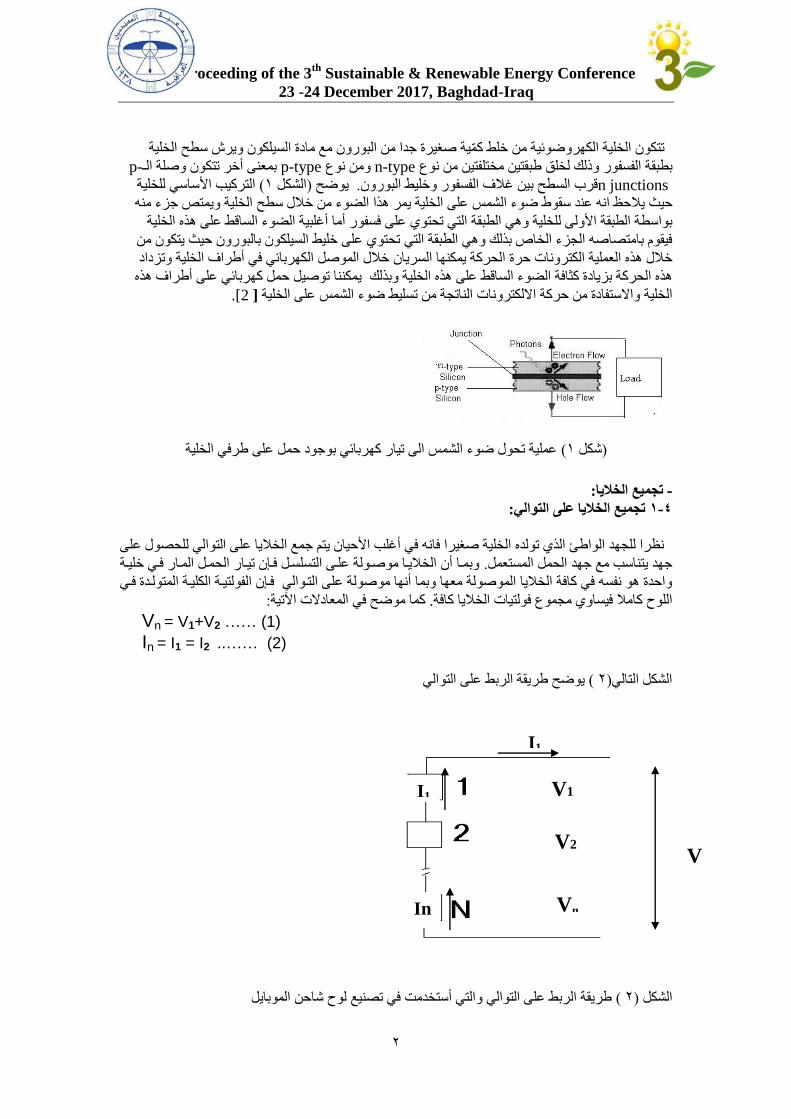
نظرا للجهد الواطئ الذي تولدغ الخلية اايرا فانه في أغلب ا يان يتم مع الخاليا على التوالي للحصول على
وبماا أن الخالياا موااولة علاى التسلسال فاإن تياار الحمال الماار فاي لياة . هد يتناسب مع هد الحمل المستعمل
فاإن الضولتياة الكلياة المتولادة فاي مواولة على التاواليوا دة هو نضسه في افة الخاليا المواولة معها وبما أنها
: ما موضح في المعادالت اآلتية. اللوح امال فيساوي مجموت فولتيات الخاليا افة
Vn = V1+V2 …… (1)
In = I1 = I2 ..…… (2)
يوضح طريقة الربل على التوالي ( 2)الشكل التالي
طريقة الربل على التوالي والتي أستخدمت في تصنيع لوح شا ن الموبايل( 2) الشكل
V1
V2
Vn
V
I1
In
I1
Proceeding of the 3th
Sustainable & Renewable Energy Conference
23 -24 December 2017, Baghdad-Iraq
5
الجزء العملي -5
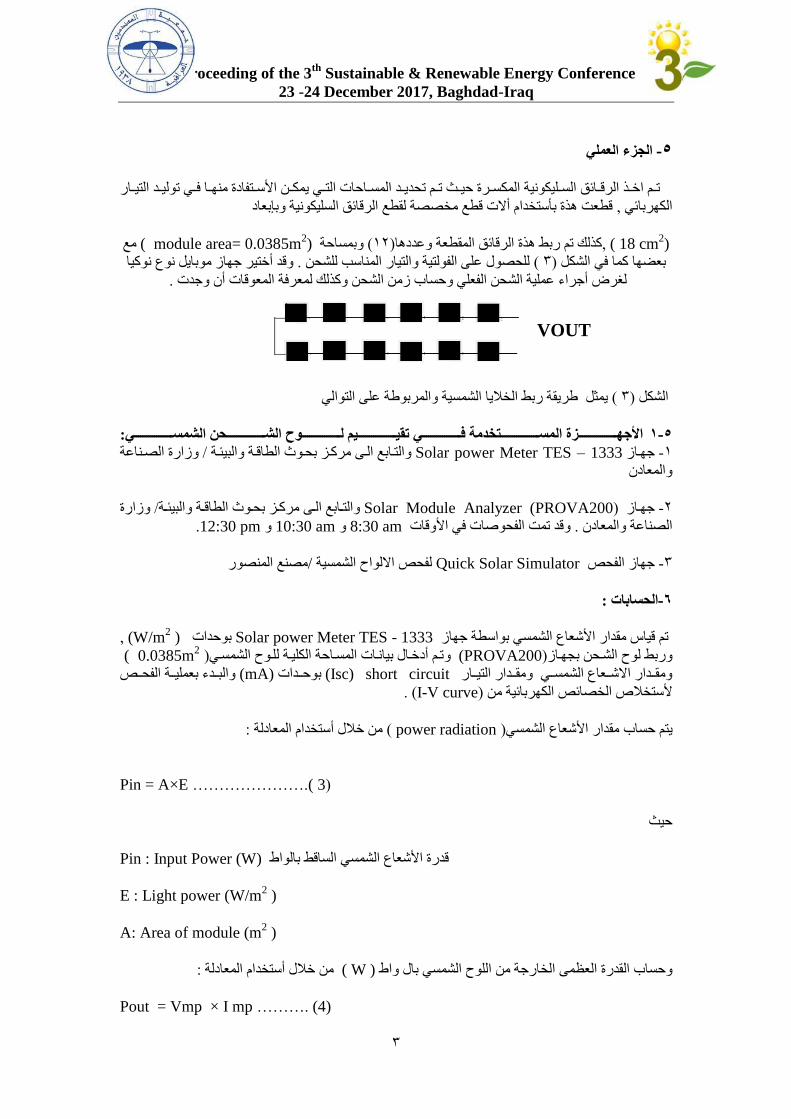
تاام ا ااذ الرقااائق السااليكونية المكساارة يااز تاام تحديااد المسااا ات التااي يمكاان ا سااتضادة منهااا فااي توليااد التيااار
قطعت هذة بأستخدام أالت قطع مخصصة لقطع الرقائق السليكونية وبإبعاد , الكهربائي
18 cm2module area= 0.0385mوبمسا ة (12)وعددها ذل تم ربل هذة الرقائق المقطعة , ) (
2مع ) (
وقد أ تير هاز موبايل نوت نو يا . للحصول على الضولتية والتيار المناسب للشحن ( 5) ما في الشكل بعضها
.لار أ راء عملية الشحن الضعلي و ساب زمن الشحن و ذل لمعرفة المعوقات أن و دت
على التوالي يملل طريقة ربل الخاليا الشمسية والمربوطة ( 5)الشكل
: األجهززززززززززززززززززززم المسزززززززززززززززززززتخدمة زززززززززززززززززززي تقيزززززززززززززززززززيم لزززززززززززززززززززو ال زززززززززززززززززززحن ال مسزززززززززززززززززززي 5-1
وزارة الصاناعة / مر ا بحاوا الطاقاة والبي اة والتاابع الاى Solar power Meter TES – 1333 هااز -1
والمعادن
وزارة / مر اا بحااوا الطاقااة والبي ااةوالتااابع الااى PROVA200 Solar Module Analyzer)) هااز -2
.pm 12:30و am 10:30و am 8:30وقد تمت الضحواات في ا وقات .والمعادن الصناعة
مصنع المنصور/لضحص االلواح الشمسية Quick Solar Simulator هاز الضحص -5
: الحسابات-6
W/m)بو دات Solar power Meter TES - 1333تم قياس مقدار ا شعات الشمسي بواسطة هاز 2 ) ,
0.0385m ) )تام أد اال بياناات المساا ة الكلياة للاوح الشمسايو PROVA200))لوح الشاحن بجهااز وربل2
والباادء بعمليااة الضحااص (mA)بو اادات short circuit (Isc)ومقاادار االشااعات الشمسااي ومقاادار التيااار
( .I-V curve) ستخالص الخصائص الكهربائية من
: من الل أستخدام المعادلة ( power radiation )مقدار ا شعات الشمسي يتم ساب
(3 ………………….( Pin = A×E
يز
Pin : Input Power (W) الساقل بالواطقدرة ا شعات الشمسي
E : Light power (W/m2 )
A: Area of module (m2 )
:من الل أستخدام المعادلة ( W )اللوح الشمسي بال واط الخار ة من و ساب القدرة العظمى
Pout = Vmp × I mp ………. (4)
VOUT

Proceeding of the 3th
Sustainable & Renewable Energy Conference
23 -24 December 2017, Baghdad-Iraq
4
واقصى فولتية I mp وأقصى تيا ر Pout : ( W ) اللوح الشمسي بالواط الخار ة من يز القدرة العظمى
Vmp
:من الل أستخدام المعادلة ( %Fill Factor ) [ 1] ويحسب عامل الملىء
FF% = Vmp × I mp / Voc× Isc ………………. (5)
عامل الملىء ( %Fill Factor ) يز
Isc :تيار الدائرة القصيرة بالملي امبير
Voc :فولتية الدائرة المضتو ة بالضولت
Pin : قدرة ا شعات الشمسي الساقل بالواط
Imp:اقصى تيار للشحن وVmp :اقصى فولتية للشحن
E : Light power (W/m2A: Area of module (mو (
2 )
: سب القانون ( η) [2] ضاءة أداء اللوح الشمسي
η = Pout / Pin
= Vmp×Imp / A×E × 100%..........( 6 )
التطبيق العملي -7
لار معرفة اداء لوح الشحن الشمسي بصورة عملية وتطبيقاه تام ربال لاوح الشاحن الشمساي بجهااز الموبايال
من اللوح الشمسي ، ماا ( Voc) يتم ربل فولتميتر على التوازي لمعرفة الضولتية المتولدة نوت نو يا و ذل
. ية الشحن اثناء عمل( Isc)يتم ربل اميتر لار معرفة التيار المتولد
جراءات التطبيق العملي لل احن ال مسيأ -8
لار معرفة زمن الشحن و ذل تاثير اوقات الشحن اليومية على هاز الموبايل ، تم استخدام بطارية الية
وفي 2115من الشحن يز تم تر يبها في هاز الموبايل نوت نو يا وقد تمت عملية الشحن في شهر ايار عام
قبل غروب " ) عند الخامسة عصراوعند منتصف النهار و( بعد شروق الشمس بساعتين" )ابا ا 7االوقات
(.الشمس بساعتين
، يز وفي الضترات من (نو يا ) لار تقييم اداء هذا اللوح تم ا ذ بطارية الية من الشحن لجهاز نقال نوت -1
.عصرا تم عملية شحن البطارية 5 ظهرا و 12:55, " ابا ا 7الشهر الخامس الساعة
يوضاح ذلا ( 2) ل عملية شاحن تام سااب الضتارة ال منياة للشاحن والتياار والضولتياة المتولادة الجادول رقام يوف
.،بعدها يتم تضريا البطارية ولعادة شحنها مرة أ رى بواسطة هذا اللوح
لوح بالبطارياة تم قياس الضولتية والتيار لدائرة قصيرة قبل عملية الربل ما تم ساب التياروالضولتية بعد ربل ال -2
.بان اتجاغ وموقع اللوح قد ثبت باتجاغ االشعات الشمسي " علما
Proceeding of the 3th
Sustainable & Renewable Energy Conference
23 -24 December 2017, Baghdad-Iraq
5
تم مال ظة عملية شحن البطارية الخاص بجهاز الموبايل لكل مر لة شحن من الل مؤشار الشاحن المو اود -5
.في هاز الموبايل والذي يتكون من اربعة طوط تؤشر مدى االستجابة الى مقدار الشحن
والمناق ةالنتائج -9
يز يتضح ،(1) دول رقم و سب Solar power meter ( PROVA200)بجهازاظهرت نتائج الضحص
با تالف زمن الضحص ويع ى ذل الى شدة االشعات الشمسي الساقل power radiationان هنال تباين في
-6لشحن الشمسي تتراوح مابين ، ذل لو ظ ان ضاءة لوح ا" ظهرا 12:51والتي تكون في ذروتها عند الساعة
و سب النتائج المرفقة من قبل مر بحوا .مما يعطي مؤشرات يدة الستخدامها في التطبيق العملي % 5
.الطاقة والبي ة التابع الى وزارة الصناعة والمعادن
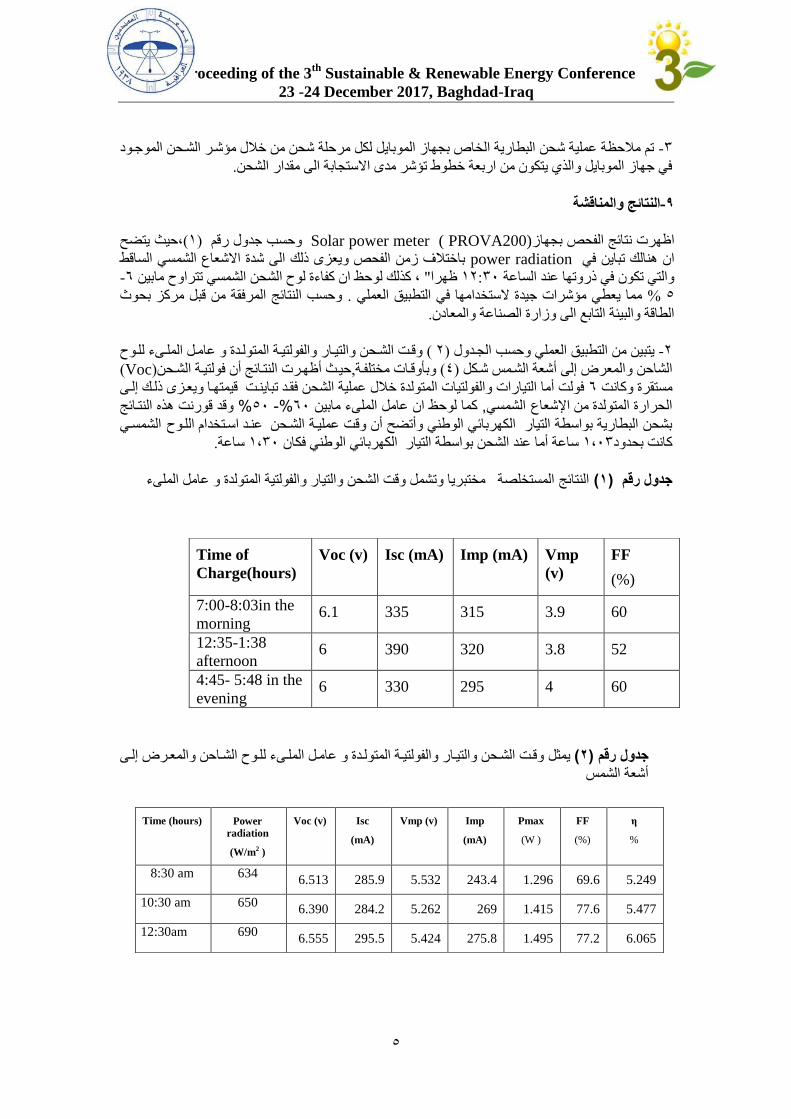
مال الملاىء للاوح عا وقات الشاحن والتياار والضولتياة المتولادة و( 2)و سب الجادول يتبين من التطبيق العملي -2
( Voc) ياز أظهارت النتاائج أن فولتياة الشاحن,وبأوقاات مختلضاة( 4)المعر للى أشعة الشامس شاكل الشا ن و
فولت أما التيارات والضولتيات المتولدة الل عملية الشحن فقاد تباينات قيمتهاا ويعا ى ذلا للاى 6مستقرة و انت
وقد قورنت هذه النتااج % 06 -%06كما لوحظ ان عامل الملىء مابين , الشمسي الحرارة المتولدة من اششعاتالشمساي الشاحن عناد اساتخدام اللاوحبشحن البطارية بواسطة التيار الكهرباجي الوطني وأتضح أن وقت عملياة
.ساعة 1،51ساعة أما عند الشحن بواسطة التيار الكهربائي الوطني فكان 1،15 انت بحدود
النتاج المستخلصة (1)جدول رقم عامل الملىء وقت الشحن والتيار والضولتية المتولدة ويا وتشمل مختبر
المعار للاى عامال الملاىء للاوح الشاا ن و وقات الشاحن والتياار والضولتياة المتولادة ويملل (2)جدول رقم
أشعة الشمس
FF
(%)
Vmp
(v)
Imp (mA) Isc (mA) Voc (v) Time of
Charge(hours)
60 3.9 315 335 6.1 7:00-8:03in the
morning
52 3.8 320 390 6 12:35-1:38
afternoon
60 4 295 330 6 4:45- 5:48 in the
evening
η
%
FF
(%)
Pmax
(W )
Imp
(mA)
Vmp (v) Isc
(mA)
Voc (v) Power
radiation
(W/m2 )
Time (hours)
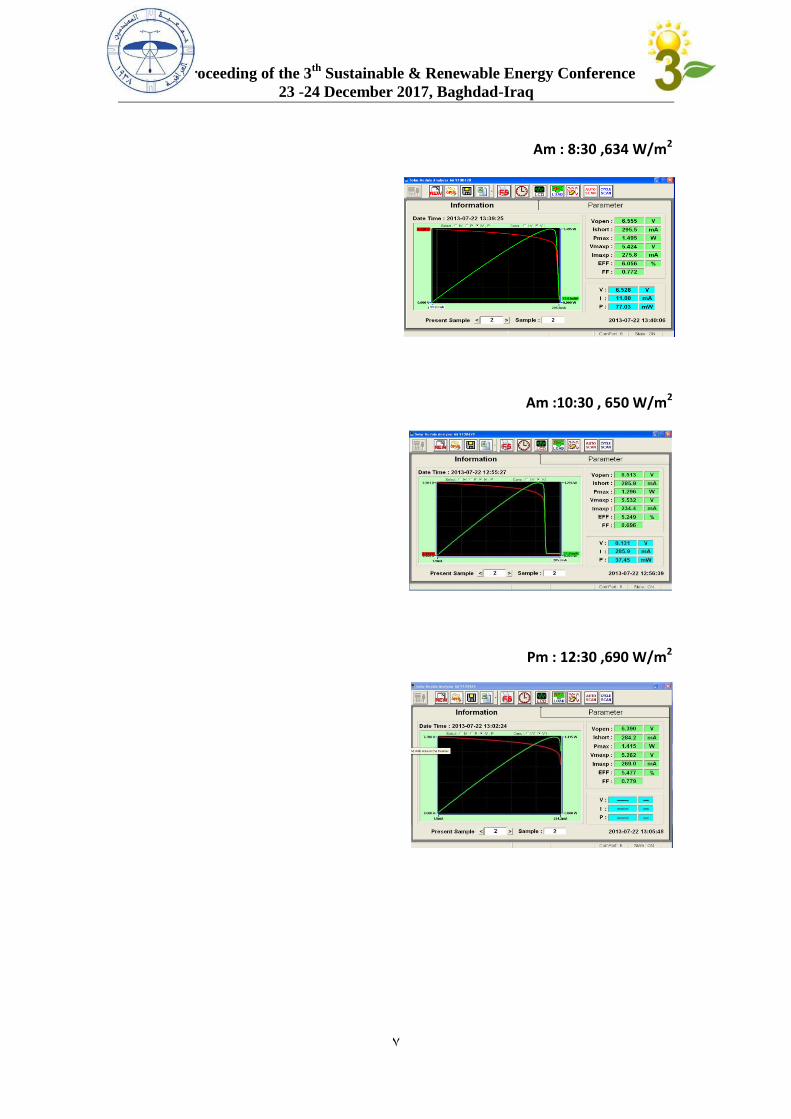
5.249 69.6 1.296 243.4 5.532 285.9 6.513 634 8:30 am
5.477 77.6 1.415 269 5.262 284.2 6.390 650 10:30 am
6.065 77.2 1.495 275.8 5.424 295.5 6.555 690 12:30am
Proceeding of the 3th
Sustainable & Renewable Energy Conference
23 -24 December 2017, Baghdad-Iraq
6
2 ما اظهرت نتائج مؤشر الشحن الخاص بالهاتف النقاال ان الخال االول والاذي يملال فتارة الشاحن اان بحادود
دقيقاة ،لاذا يكاون المجماوت 16دقيقاة والراباع بحادود 21دقيقة واللالز بحدود 25دقيقة والخل اللاني ان بحدود
المؤشاارة فااي وثابتااة لكاال اوقااات الضحااص ساااعة و اناات هااذغ المرا اال 1:15الكلااي لشااحن بطاريااة الموباياال هااي
(.2)الجدول
Stages of charge (min.):
Stage one= 2 min.
Stage two =25 min.
Stage three= 20 min.
Stage four =16 min.
The total times of charge are equal to 1:03 hours
.خلية12والمكون من يوضح شاحن الموبايل ال مسي المصنع ( 4)ال كل
األستنتاجات -11
.يمكن استخدام هذا اللوح لشحن البطاريات للهواتف النقالة وبكضاءة عالية ولكافة االوقات -1
تضاوق الشاحن باساتخدام التياار الكهرباائي االعتيااادي ( سااعة 1:15)سارعة الشاحن باساتخدام الطاقاة الشمساية -2
(.ساعة 1:51)
اللوح في مكان واتجاغ يتوا د أششعات الشمسي وبأوقات وأما ن مختلضة ال راء عملية يمكن مل ووضع -5
.الشحن
.اثبت اللوح ضائته في شحن الموبايل -4
Solar powerبجهاز النتائج المرفقة من قبل مر بحوا الطاقة والبي ة التابع الى وزارة الصناعة والمعادن
meter ( PROVA200) لضحص اللوح المصنع :
Proceeding of the 3th
Sustainable & Renewable Energy Conference
23 -24 December 2017, Baghdad-Iraq
7
Am : 8:30 ,634 W/m2
Am :10:30 , 650 W/m2
Pm : 12:30 ,690 W/m2
Proceeding of the 3th
Sustainable & Renewable Energy Conference
23 -24 December 2017, Baghdad-Iraq
8
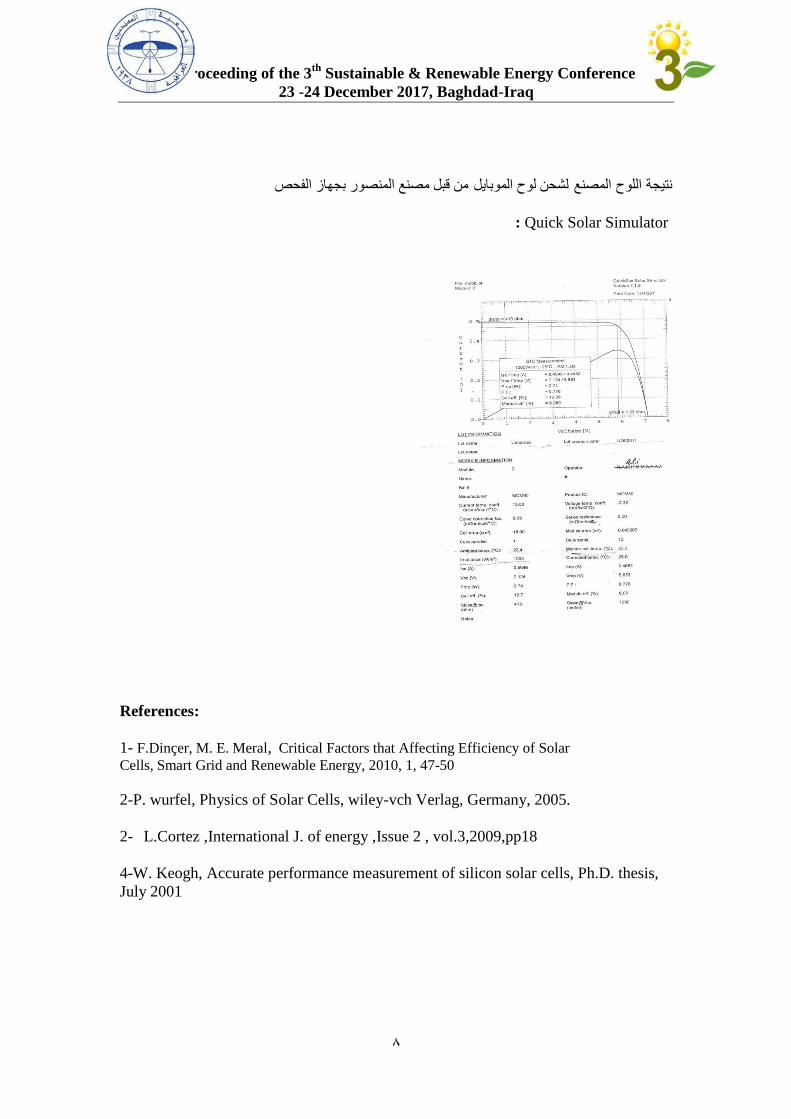
من قبل مصنع المنصور بجهاز الضحص لشحن لوح الموبايل نتيجة اللوح المصنع
: Quick Solar Simulator
References:
1- F.Dinçer, M. E. Meral, Critical Factors that Affecting Efficiency of Solar
Cells, Smart Grid and Renewable Energy, 2010, 1, 47-50
2-P. wurfel, Physics of Solar Cells, wiley-vch Verlag, Germany, 2005.
2- L.Cortez ,International J. of energy ,Issue 2 , vol.3,2009,pp18
4-W. Keogh, Accurate performance measurement of silicon solar cells, Ph.D. thesis,
July 2001
Proceeding of the 3 rd
Sustainable & Renewable Energy Conference
23-24 December 2017, Baghdad-Iraq
9
اءة المقطر الشمسي باستخدام السطح الماص االسطواني الدواركفزيادة
Increasing the Solar Distilled Water Using a Rotary Cylindrical Absorbent
Surface
هند غازي رشيد سعد محمد عواد جبري عبد الجبار ادريس ليلى محمد عباس
بحوث الطاقة والبيئة مركز
[email protected] Mail -E
ABSTRACT
A solar distilled water performance was investigated in this study using a sheet glass cover tilted at 15º.
Underneath the glass, an opaque cylinder coated with a dark absorbent layer type (Rust-Oleum) is located. This
layer has a high solar radiation absorbance. The cover glass is connected to a variable speed motor. The main
thrust of this study is to increase the efficiency of the solar distilled water by increasing the production of the
distilled water per unit area. The results revealed that the distillation rate was varied between (0.8-2 l/m2) during
winter peak (December) based on incident insolation. In addition, the existed cylinder was contributed in
temperature raise due to the increase in the surface area of water inside the cylinder as well as the close distance
between the cylinder and the glass. Moreover, elimination of dissolved salts that can be deposited as sediments
on the bottom contributed to the efficiency increase.
الخالصة
)تم دراسة اداء مقطر شمسي بزاوية ميل الغطاء الزجاجي °
) يحوي بداخله على اسطوانة ذات صبغة معتمة سوداء اللون( 51
RUST-OLEUM )ان الهدف من هذه الدراسة هو . متغير السرع حركمثبت في محورها م .ذو امتصاصية عالية لالشعاع الشمسي
ومن خالل النتائج . المساهمة في زيادة وتحسين كفاءة المقطر الشمسي من خالل الزيادة في انتاج الماء المقطر بالنسبة لوحدة المساحة
ن االول وحسب كمية متر مربع خالل ذروة فصل الشتاء لشهر كانو/لتر( 8.0-2)المستحصلة تبين ان معدل التقطير تراوح بين
. االشعة الشمسية الساقطة عليه
وباالضافة الى ذلك فأن االسطوانة الموجودة قد ساهمت في زيادة درجات الحرارة بسبب زيادة المساحة السطحية للماء المحمل على
ترسب على حوض ماء االسطوانة اضافة الى قربها من السطح الزجاجي الخارجي للمقطر والتخلص من االمالح التي ممكن ان ت
. للمقطر المقطر الشمسي مما يزيد من الكفاءة
المقدمةان فكرة التقطير بواسطة الطاقة الشمسية ليست جديدة اذ انها تتمحور حول امكانية الحصول على الماء العذب من مياه غير
صالحة للشرب من خالل صندوق معدني مطلي باللون االسود وغطاء من الزجاج يدخل فيه الماء من انبوب مربوط به ثم يتقطر الماء
لذا اجريت عدة بحوث ودراسات لتصاميم , الزجاجي ق بسبب االشعاع الشمسي النافذ عبر اللوحالحراري داخل الصندو خزنبفعل ال
عديدة للمقطرات الشمسية لدراسة تأثير الشكل الهندسي للغطاء وزاوية الميل من اجل الوصول الى الحالة المثلى من كمية االشعاع
.الشمسي المستغلة لعملية التقطير
Proceeding of the 3 rd
Sustainable & Renewable Energy Conference
23-24 December 2017, Baghdad-Iraq
58
( Kausch )قام العالم [1]
بتصميم مقطر شمسي مزود بمركزات عديدة لتجميع االشعاع الشمسي على غالية نحاسية تحتوي على ماء
. ( % 18 ) يرسل الى مكثف للحصول على ماء مقطر وكانت كفاءة المقطر, لتوليد البخار الماء
اما الباحث عبدالجبار نعمة [2 ]
لتقليل الضغط وزيادة درجة حرارة الغليان وبالتالي فقد استعمل نظام التفريغ الجزئي للمقطر وذلك
(S.T. Ahmed )زيادة كمية تبخر الماء وسرعة التكثيف على الغطاء الزجاجي ثم قام الباحث[3 ]
بأضافة مكثف ثنائي االممر داخل
(M.A. Samee )الباحث .متر مربع/ كغم 1.9الى 1.1المقطر مما ادى الى زيادة االنتاجية من [4]
اجرى التجارب على مقطر
(A.A. EL.Sebaii etal)اما الباحث % 38.01ووجد ا ن فعالية المقطر تصل الى ( °33.3)شمسي ذو ميل واحد [5]
لوحظ تأثير
كل من ميل وعمق الماء في الحوض لفترة النهار والليل وتم االستنتاج ان انتاج المقطر يقل اذا كان عمق الماء كبير خالل النهار
خالل فصلي الصيف والشتاء على التوالي وكانت الفعالية اليومية للمقطر ( °58.18)وان ميل الزجاج يكون والعكس خالل الليل
(M.A Mahammed )الباحث , ( %22)حوالي [6]
ستعمل عدة عوازل لدراسة تأثير العازل على االنتاج للمقطر واثبتت النتائج ان إ
وان نشارة الخشب من احسن المواد التي ( م° 38 -° 52)زادت درجة حرارة الهواء المحيط من اذا (%31) انتاج المقطر يزداد
.تستعمل في عزل المقطر
(2883)وفي بحث قدمه مهندسون امريكيون في جامعة فلوريدا نشر في المؤتمر الدولي للطاقة الشمسية عام [11]
حيث قامو بتصميم ,
مفرغ من الهواء Uنظام اكثر كفاءة يتكون من اجهزة بسيطة ذات كلفة واطئة وسهلة النصب وهو عبارة عن انبوب على شكل حرف
ويغلف االنبوب بجهاز تبخير يعمل على تدوير الماء المالح الساخن في سخان شمسي ثم يمر باالنبوب المفرغ ليتبخر ويدخل الى جهاز
.يف للحصول على الماء المقطر التكث
توالت الدراسات لتصاميم عديدة منها يتعلق بتصميم المقطر كله واألخر بتغير تصميم اونوعية المادة المستخدمة في التصننيع لجنزء منن
زيادة التبخر وسنرعة اجزاءه وتارة اخرى تتعلق بنظام التفريغ الجزئي للمقطر لتأثيره على تقليل الضغط وزيادة حرارة الغليان وبالتالي
, التكثيف على الغطاء الزجاجي
مجموعة من الدراسات بينت تاثير الشكل الهندسي للغطاء وزاوية الميل من اجل ايجاد الحالة المثلى من كمية األشعاع الشمسي الملتقطة
.بواسطة المقطر
تيرباني وثيوراي [5]
نتاج اليومي قياسا بتغيير اليغيران في اإلرتفاع والعرض أن التغيير في الطول واإلالى توصال
فضل في الشتاء من المقطرات ثنائية الميل التي أتاجية إنالمقطرات احادية الميل ثبت انها تعطي .رتفاع معلوم إرتفاع الجدار الشمالي بإ
فضل في الصيف أتعمل بصورة [6]
الشمسية األحادية يكون للمقطرات ( درجة 28)من الجهة األخرى للمواقع خط العرض اعلى من
افضل بينما للمديات األوطئ فأن المقطرات الشمسية الثنائية الميل المواجهة للشمال والجنوب البد من ميالن غطاء مساوي لزاوية خط
العرض فأنها يمكن ان تستلم اشعاع شمسي اقرب للمستوى األعتيادي طول السنة [7].
نتاجيةإلؤدي الى زيادة في استحداثه لكن لم يإان غطاء بشكل هرمي تم [8]
الباحثون استخدموا افكارا متعددة لألغطية وهناك تغيير
بالمواصفات العامة للمقطر مثل الشكل العمودي والكروي واألنبوبي والمتعدد المراحل والنصف كروية والمقطرات المعدنية البيضوية
األنتاجية تكون بمراجعة دقيقة لهذه التحويرات والتصاميم علىفي التأثيران العوامل المهمة .واألنابيب الشفافة للمقطرات الشمسية
كالشكل الهندسي للغطاء [9]
البساطة في التصنيع والتشغيل في .عن طريق احتساب درجة الحرارة وكمية األنتاجية للماء المقطر
ثيف شمسي واجزاء اخرى من موصالت المقطر الشمسي الذي يجرى عليه التطوير من مكثفات منفصلة ومجمع شمسي وجهاز تك
واجهزة قياس يتطلب مساحة اوسع ويكون اكثر تعقيدا لذلك فان الزيادة باألنتاجية التعوض الكلفة األضافية على مقطر شمسي
تقليدي[10].
لذا فأن تطويرا جديدا بسيطا تم اجراءه على المقطر الشمسي التقليدي اثبت انه زاد بشكل ملحوظ في األنتاجية مع زيادة دنيا اي باقل
تكلفة باستخدام اسطوانه مغمورة تدور ببطئ داخل تجويف المقطر الشمسي وهذا يتيح تكوين غشاء رقيق من المياه الذي ياخذه من قاع
تدوير األسطوانة ممكن محرك لتشغيل المطلوبةالكهربائية يتبخر بسرعة نظرا ألرتفاع حرارة األسطوانه وان الطاقة المقطر والذي
المقطر التقليدي فان مقارنة مع في .واحد كافي لتشغيل المنظومة مرتبط ببطارية للخزن بعد غياب الشمس ( لوح شمسي)تجهيزها من
هناك عامل اضافي ممكن ان يؤثر على إداء المقطر .في سهولة التشغيل والصيانة (%21) ويخفض نسبة( %08-38)الزيادة هي
وألجل إحتساب شكل وتصميم الغطاء على األنتاج للمنظومة المطورة مع األسطوانة فأن اشكال .الشمسي هو شكل الغطاء الخاص به
اسات ويمكن منها المقارنة مع المنظومة التقليدية هندسية متعددة للغطاء يمكن اقتراحها وتكون محاور بحوث عديدة اخرى ودر[12,13].

Proceeding of the 3 rd
Sustainable & Renewable Energy Conference
23-24 December 2017, Baghdad-Iraq
55
الجانب العملي
تم تصنيع مقطر شمسي من االلمنيوم بزاوية ميل للغطاء . اجريت التجربة في بداية شهر تشرين الثاني ولغاية نهاية شهر كانون االول
51)الزجاجي مقدارها °
)
متر كلفن و /واط 8.80التوصيلية الحرارية )بالمواصفات معزول حراريا بمادة الصوف الزجاجي
و (سم08)وعرض (سم588) بأبعاد (سم 3)سمك العازل ب (متر مكعب/كغم 50و الكثافة 218الى 18-والتوصيلية اثناء العمل
وطليت االسطوانة والحوض الداخلي للمقطر بصبغة (سم 08)وطولها (سم38)وضع داخل المقطر اسطوانة من االلمنيوم وبقطر
ذو امتصاصية عالية لالشعاع الشمسي وغمر مكونة من مادة التلوين و االسيتون و الزايلين (RUST-OLUM)سوداء معتمة نوع
طور يحوي على الجزء االسفل من هذه االسطوانة في ماء المقطر الشمسي وثبت في محور االسطوانة شفت حديد وربط هذا الشفت بما
52)من قبل بطارية فولت 20فولتية واط وب 18قدرته بتيار مستمر حركدقيقة وزود الم/دورة0منظم للسرعة وتم تحديد السرعة على
Rated Powewr = 85W, Voc = 22.4V, Isc)من انتاج شركة المنصور وبالمواصفات وتشحن البطارية بخلية شمسية (فولت
= 5A, Vm = 18V, Im = 4.7A) . اما شدة االشعاع الشمسي، فقد تم قياسها باستخدام جهاز قياس شدة االشعاع نوع(SPM-
1116 SD). تم تثبيت مزدوجات حرارية نوع(K) موديل(TM946) على السطح الزجاجي للمقطر، جوف المقطر، الماء داخل
(.5)كما موضح في الشكل رقم . المقطر ودرجة حرارة الجو
يبين تصميم المقطر الشمسي ذو االسطوانة الدوارة( 5) الشكل رقم
متغير السرع محرك
58
واط
Proceeding of the 3 rd
Sustainable & Renewable Energy Conference
23-24 December 2017, Baghdad-Iraq
52
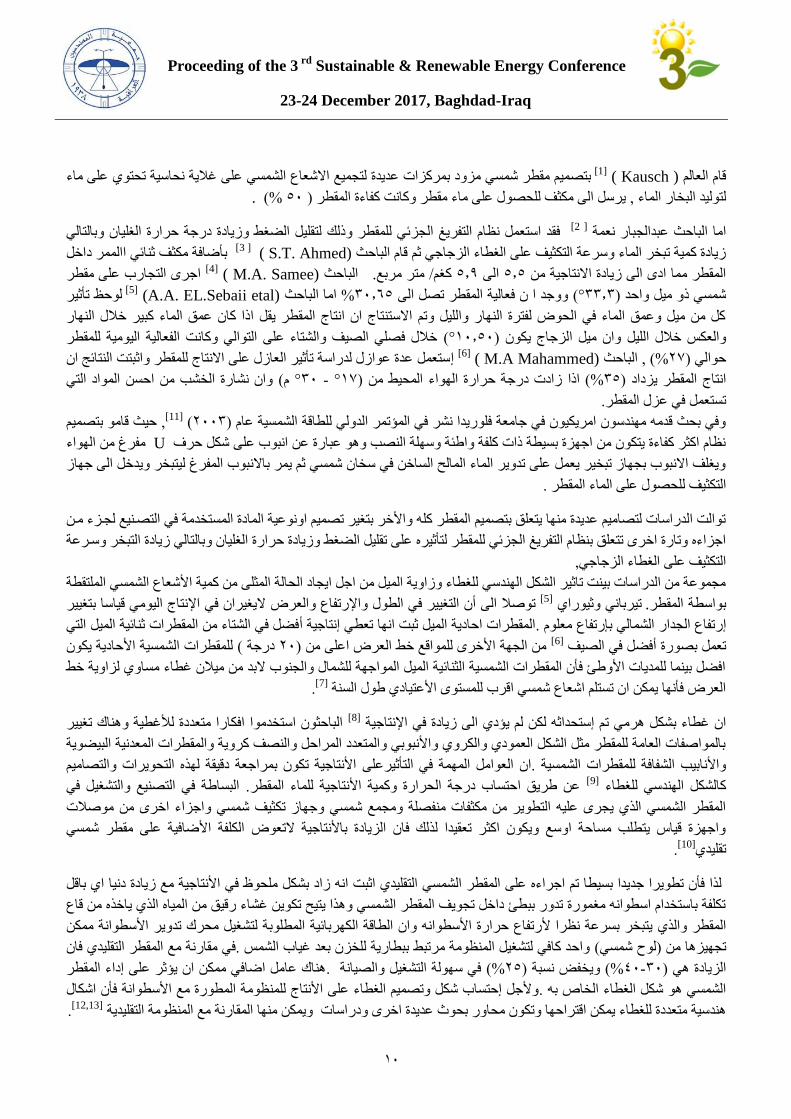
بسبب قلة سمكها المائي عند دوران االسطوانة فأنها تبتل بغشاء من الماء على سطحها الخارجي مما يؤدي الى سرعة تبخر الغشاء
كما مبين في الشكل . وارتفاع درجة حرارة االسطوانة مما يؤدي الى زيادة كمية الماء المتبخر وبالتالي تحسين كفاءة المقطر الشمسي
(. 3،2)رقم
( EC) الموصلية -3( TDS) مجموع المواد العالقة -2،(PH) درجة الحامضية -5 أخذت عينة من الماء المقطر وتم تحليلها لمعرفة
.(WA-2015)موديل (PH-ORD-CD-TDS-DO-Salt Meter)باستخدام جهاز (TSS)المواد الصلبة الذائبة الكلية -4
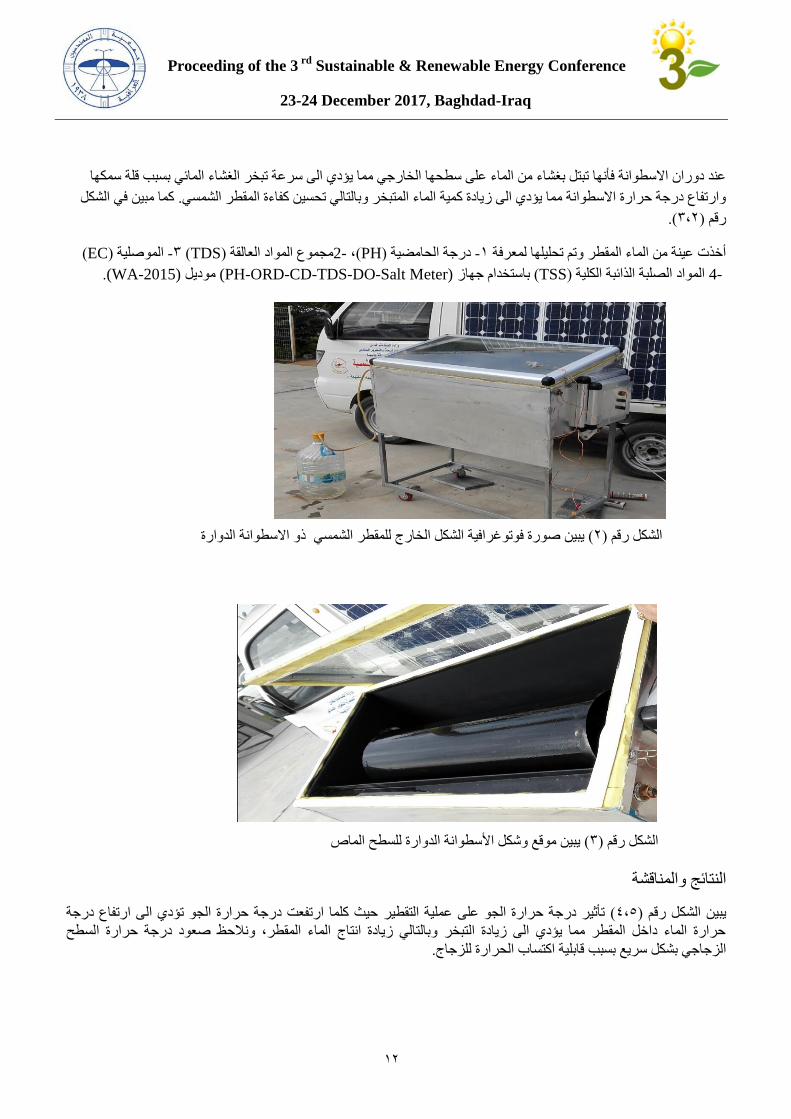
الدوارةذو االسطوانة للمقطر الشمسيالشكل الخارج فوتوغرافية ةيبين صور( 2)الشكل رقم
يبين موقع وشكل األسطوانة الدوارة للسطح الماص( 3)الشكل رقم
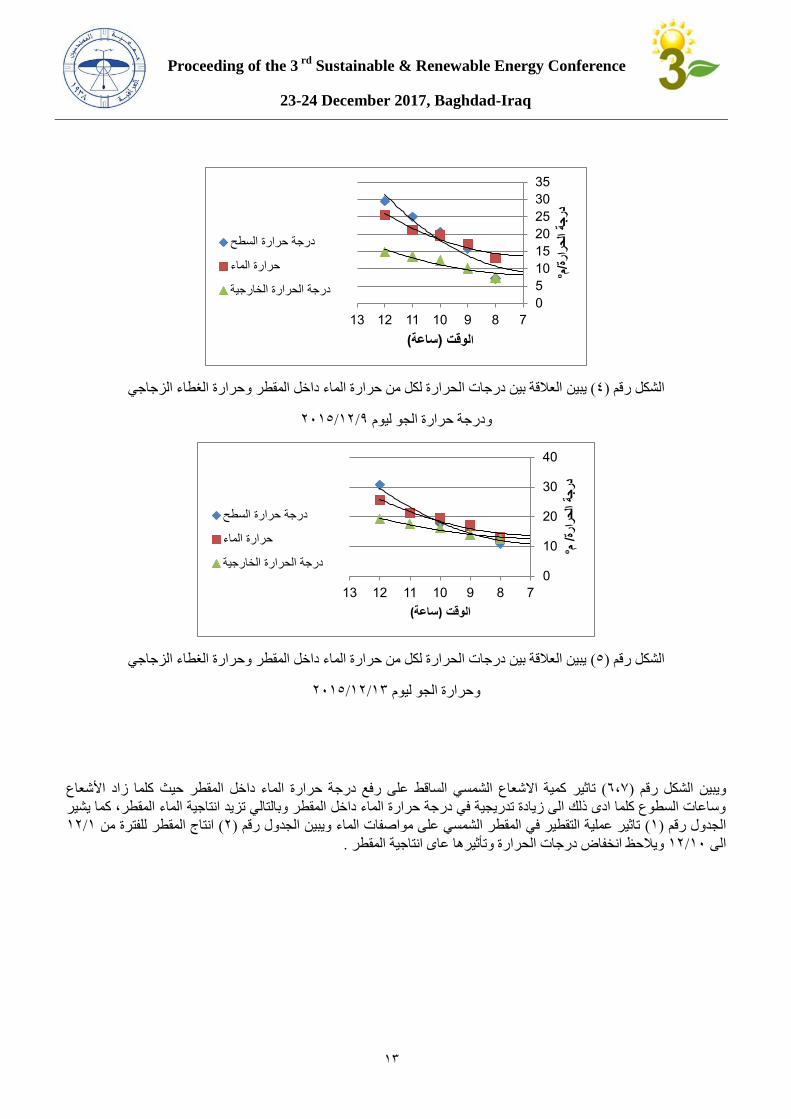
شة النتائج والمناق
حيث كلما ارتفعت درجة حرارة الجو تؤدي الى ارتفاع درجة تأثير درجة حرارة الجو على عملية التقطير ( 0،1) يبين الشكل رقم
حرارة الماء داخل المقطر مما يؤدي الى زيادة التبخر وبالتالي زيادة انتاج الماء المقطر، ونالحظ صعود درجة حرارة السطح
. بسبب قابلية اكتساب الحرارة للزجاجبشكل سريع الزجاجي
Proceeding of the 3 rd
Sustainable & Renewable Energy Conference
23-24 December 2017, Baghdad-Iraq
53
العالقة بين درجات الحرارة لكل من حرارة الماء داخل المقطر وحرارة الغطاء الزجاجي يبين ( 0) الشكل رقم
9/52/2851ودرجة حرارة الجو ليوم
يبين العالقة بين درجات الحرارة لكل من حرارة الماء داخل المقطر وحرارة الغطاء الزجاجي ( 1) الشكل رقم
53/52/2851وحرارة الجو ليوم
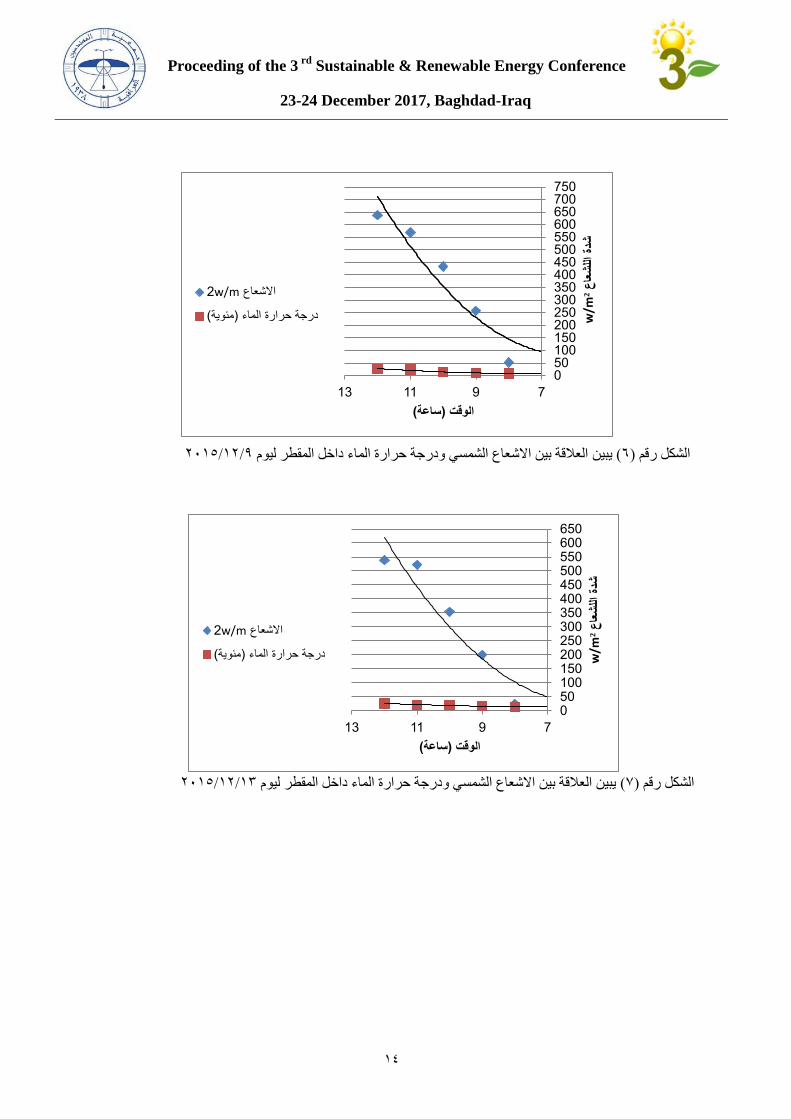
األشعاع حيث كلما زاد مقطر الماء داخل العلى رفع درجة حرارة الساقط الشمسي شعاعكمية اال تاثير( 0،2) رقمويبين الشكل
، كما يشير وساعات السطوع كلما ادى ذلك الى زيادة تدريجية في درجة حرارة الماء داخل المقطر وبالتالي تزيد انتاجية الماء المقطر
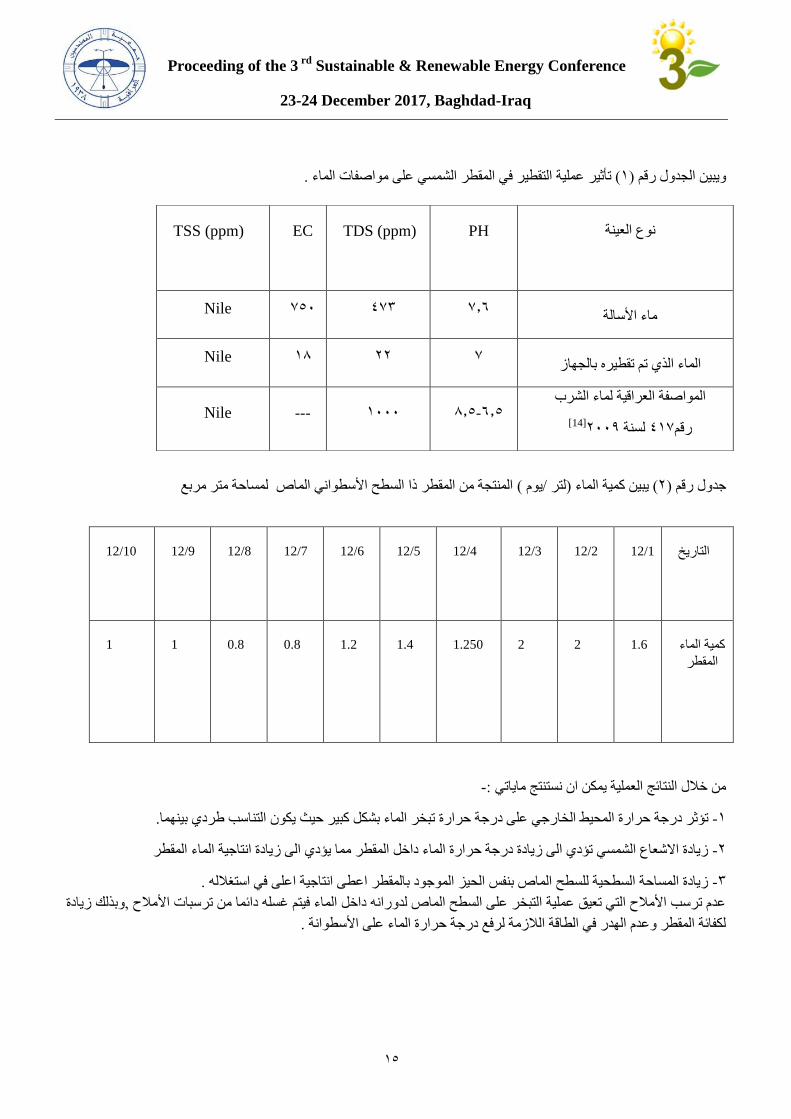
5/52انتاج المقطر للفترة من ( 2)ويبين الجدول رقم تاثير عملية التقطير في المقطر الشمسي على مواصفات الماء (5)الجدول رقم
. ويالحظ انخفاض درجات الحرارة وتأثيرها عاى انتاجية المقطر 58/52الى
0
5
10
15
20
25
30
35
7 8 9 10 11 12 13
رةرا
ح ال
جةدر
ºم/
)ساعة)لوقت ا
درجة حرارة السطح
حرارة الماء
درجة الحرارة الخارجية
0
10
20
30
40
7 8 9 10 11 12 13
رةرا
ح ال
جةدر
ºم/
)ساعة(الوقت
درجة حرارة السطح
حرارة الماء
درجة الحرارة الخارجية
Proceeding of the 3 rd
Sustainable & Renewable Energy Conference
23-24 December 2017, Baghdad-Iraq
50
0 50 100 150 200 250 300 350 400 450 500 550 600 650 700 750
7 9 11 13
ع عا
شالل
ة شد
w/m
²
(ساعة)الوقت
w/m2االشعاع
(مئوية)درجة حرارة الماء
0 50 100 150 200 250 300 350 400 450 500 550 600 650
7 9 11 13
ع عا
شالل
ة شد
w/m
²
(ساعة)الوقت
w/m2االشعاع
(مئوية)درجة حرارة الماء
9/52/2851داخل المقطر ليوم العالقة بين االشعاع الشمسي ودرجة حرارة الماءيبين ( 0) الشكل رقم
53/52/2851يبين العالقة بين االشعاع الشمسي ودرجة حرارة الماء داخل المقطر ليوم ( 2)الشكل رقم
Proceeding of the 3 rd
Sustainable & Renewable Energy Conference
23-24 December 2017, Baghdad-Iraq
51
.عملية التقطير في المقطر الشمسي على مواصفات الماء تأثير( 5)ويبين الجدول رقم
لمساحة متر مربع المنتجة من المقطر ذا السطح األسطواني الماص( يوم /لتر )يبين كمية الماء ( 2)جدول رقم
التاريخ 12/1 12/2 12/3 12/4 12/5 12/6 12/7 12/8 12/9 12/10
كمية الماء 1.6 2 2 1.250 1.4 1.2 0.8 0.8 1 1
المقطر
- :من خالل النتائج العملية يمكن ان نستنتج ماياتي
. تبخر الماء بشكل كبير حيث يكون التناسب طردي بينهماتؤثر درجة حرارة المحيط الخارجي على درجة حرارة -5
زيادة االشعاع الشمسي تؤدي الى زيادة درجة حرارة الماء داخل المقطر مما يؤدي الى زيادة انتاجية الماء المقطر -2
.زيادة المساحة السطحية للسطح الماص بنفس الحيز الموجود بالمقطر اعطى انتاجية اعلى في استغالله -3
وبذلك زيادة ,عدم ترسب األمالح التي تعيق عملية التبخر على السطح الماص لدورانه داخل الماء فيتم غسله دائما من ترسبات األمالح
.لكفائة المقطر وعدم الهدر في الطاقة الالزمة لرفع درجة حرارة الماء على األسطوانة
نوع العينة
PH TDS (ppm) EC TSS (ppm)
ماء األسالة2.0 023 218 Nile
الماء الذي تم تقطيره بالجهاز2 22 50 Nile
لماء الشرب المواصفة العراقية
2889لسنة 052رقم[14]
0.1-0.1 5888 ---Nile
Proceeding of the 3 rd
Sustainable & Renewable Energy Conference
23-24 December 2017, Baghdad-Iraq
50
المصادر1-kausch,O. Die unmittelbare ausnutzung der sonnenergia, Weimar,carl steinert (1920).
2- . 5908( رسالة ماجستير( )تقطير المياه بواسطة الطاقة الشمسية تحت ظروف التفريغ األبتدائي )عبد الجبار نعمة قسم هندسة المكائن والمعدات في
الجامعة التكنلوجية
3-S.T.Ahmed "study of single effect solar still with an internet condenser",Solar and wind technology,vol.5,
no.6,p.p.637-643,Great Britain, july 1988.
4-M.A.Samee,U.K. Mirza, T.Majeed and N. Ahmad;"Design and performance of a simple single basin solar still;
Renewable and Sustainable Energy Reviews,vol.42, p.p.1-8,(2005).
5-Kumar, s., Tiawri, G. Optimization of collector and basing areas for a higher yield for active solar stilles. Desalination (The International Journal on the Science and Technology of Desalting and Water Purification),vol,116 ,no.(1),p.p 1-9,
(1998).
6-Singh, A, Tiwari, G, Sharma,P.,Khan, E.Optimization of orientation for higher yield of solarstill for a given location,
Energy Conversion and Management,vol. 36,p.p.17-187 ,(1995).
7-Abdallah, S.,Badran, O. Sun tracking system for productivity enhancement of solar still. Desalinatin (The
International Journal on the Science and Technology of Desalting and Water Purification),vol.220,p.p. 669-676,(2008).
8- Yadav, Y., Tiwari G. Monthly comparative Performance of solar stills of various desing.Desalination (The International Journal on the Science and Technology of Desalting and Water Purification),p.p.565-578, (1987).كتاب
9- Murugavel, K., Chokalingam, K., Srithar,K. Progresses in improving the effectiveness of the single basin passive
solar still. Desalination (The International Journal on the Science and Technology of Desalting and Water
Purification)vol.220, p.p. 677-686, (2008).
10-Fath, H., El-Samanoudy, M.,Fahmy, k., Hassabou, A.(2003).Thermal-economic analysis and comparison between
pyramid-shaped andsingle slope solar still configurations, Desalination(The International Journal on the Science and Technology of Desalting and Water Purification) vol.159, p.p.69-79.
11- (2883سبتمبر 22السنة الثالثة 5893جريدة الوطن العدد )مهندسون أمريكيون يطورون نظاما لتحلية المياه يعمل بالطاقة الشمسية
12-Dhiman, N. Transient analysis of spherical solar still. under destert climatic conditions.vol.69, no.1, p.p.47-55
,(1988).
13-Lilian Malaeb,George M.Ayoub, M.Al-hindi ,The effect of cover geometry on the productivity of a modified solar
still desalination unit .American University of Beirut, Lebanon(2013). لمؤتمربحث مقدم
14- .2889الجهاز المركزي للتقييس والسيطرة النوعية (مياه الشرب)التحديث الثاني ( 052)المواصفة القياسية العراقية رقم

Proceeding of the 3 rd
Sustainable & Renewable Energy Conference
23-24 December 2017, Baghdad-Iraq
52
يبين مراحل تركيب المقطر الشمسي ذو السطح االسطواني الماص( 5) ملحق رقم
Proceeding of the 3th Sustainable & Renewable Energy Conference 23 -24 December 2017, Baghdad-Iraq
81
تصميم وتنفيذ عاكسة منفصلة المصدر ثالثية الطورDesign And Implementation Of A Three-Phase Split-Source Inverter
عبدالباسط حسن أحمد نورهان موسى يادگار
شركة نفط الشمال/مهندسين أقدم. شركة نفط الشمال ر/مهندس
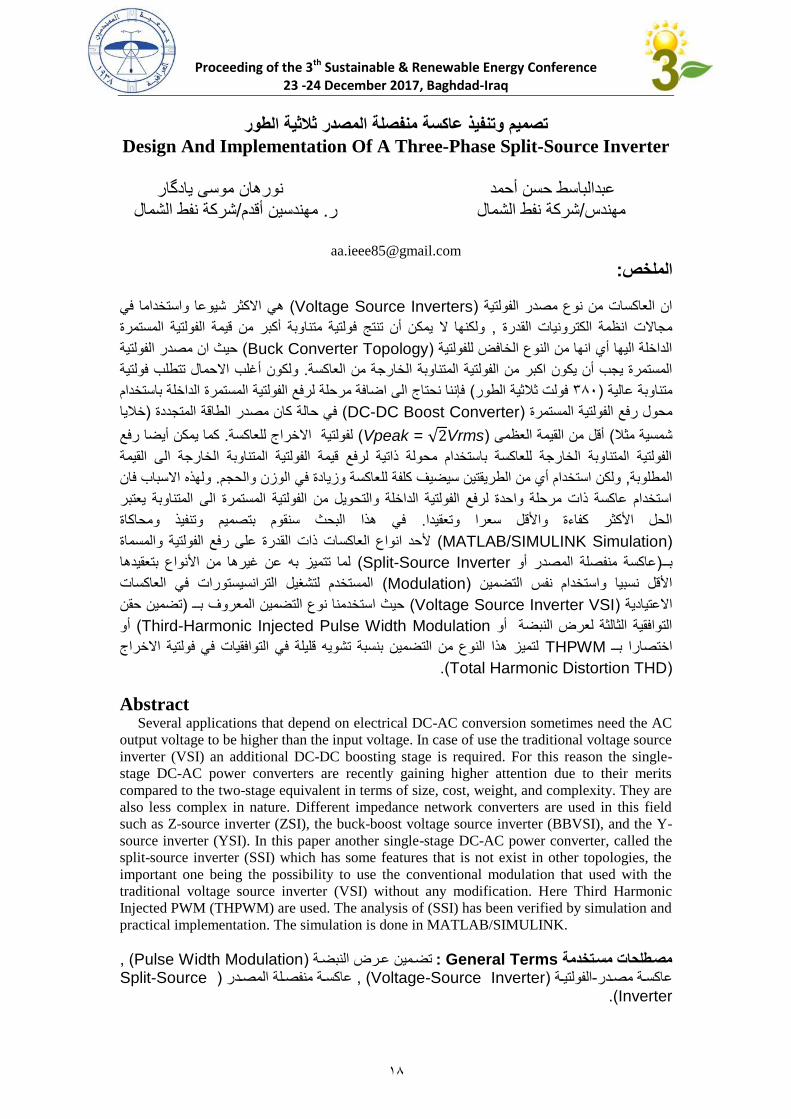
:الملخص
االكثر شيوعا واستخداما في هي ( Voltage Source Inverters)ان العاكسات من نوع مصدر الفولتية
ولكنها ال يمكن أن تنتج فولتية متناوبة أكبر من قيمة الفولتية المستمرة , مجاالت انظمة الكترونيات القدرة
حيث ان مصدر الفولتية ( Buck Converter Topology)الداخلة اليها أي انها من النوع الخافض للفولتية
ولكون أغلب االحمال تتطلب فولتية . تية المتناوبة الخارجة من العاكسةالمستمرة يجب أن يكون اكبر من الفول
فإننا نحتاج الى اضافة مرحلة لرفع الفولتية المستمرة الداخلة باستخدام ( فولت ثالثية الطور 013)متناوبة عالية
خاليا )في حالة كان مصدر الطاقة المتجددة ( DC-DC Boost Converter)محول رفع الفولتية المستمرة
كما يمكن أيضا رفع . لفولتية االخراج للعاكسة( Vpeak = Vrms)أقل من القيمة العظمى ( شمسية مثال
الفولتية المتناوبة الخارجة للعاكسة باستخدام محولة ذاتية لرفع قيمة الفولتية المتناوبة الخارجة الى القيمة
ولهذه االسباب فان . عاكسة وزيادة في الوزن والحجمولكن استخدام أي من الطريقتين سيضيف كلفة لل, المطلوبة
استخدام عاكسة ذات مرحلة واحدة لرفع الفولتية الداخلة والتحويل من الفولتية المستمرة الى المتناوبة يعتبر
في هذا البحث سنقوم بتصميم وتنفيذ ومحاكاة . الحل األكثر كفاءة واألقل سعرا وتعقيدا
(MATLAB/SIMULINK Simulation ) ألحد انواع العاكسات ذات القدرة على رفع الفولتية والمسماة
لما تتميز به عن غيرها من األنواع بتعقيدها ( Split-Source Inverterعاكسة منفصلة المصدر أو )بــ
المستخدم لتشغيل الترانسيستورات في العاكسات ( Modulation)األقل نسبيا واستخدام نفس التضمين
تضمين حقن )حيث استخدمنا نوع التضمين المعروف بــ ( Voltage Source Inverter VSI)االعتيادية
أو ( Third-Harmonic Injected Pulse Width Modulationالتوافقية الثالثة لعرض النبضة أو
لتميز هذا النوع من التضمين بنسبة تشويه قليلة في التوافقيات في فولتية االخراج THPWMاختصارا بــ
(Total Harmonic Distortion THD.)
Abstract Several applications that depend on electrical DC-AC conversion sometimes need the AC
output voltage to be higher than the input voltage. In case of use the traditional voltage source
inverter (VSI) an additional DC-DC boosting stage is required. For this reason the single-
stage DC-AC power converters are recently gaining higher attention due to their merits
compared to the two-stage equivalent in terms of size, cost, weight, and complexity. They are
also less complex in nature. Different impedance network converters are used in this field
such as Z-source inverter (ZSI), the buck-boost voltage source inverter (BBVSI), and the Y-
source inverter (YSI). In this paper another single-stage DC-AC power converter, called the
split-source inverter (SSI) which has some features that is not exist in other topologies, the
important one being the possibility to use the conventional modulation that used with the
traditional voltage source inverter (VSI) without any modification. Here Third Harmonic
Injected PWM (THPWM) are used. The analysis of (SSI) has been verified by simulation and
practical implementation. The simulation is done in MATLAB/SIMULINK.
, ( Pulse Width Modulation)تضممين عمرض النبضمة General Terms :مصططلاا مسطتخدمة Split-Source)عاكسممة منفصمملة المصممدر , ( Voltage-Source Inverter)الفولتيممة -اكسممة مصممدرع
Inverter.)
Proceeding of the 3th Sustainable & Renewable Energy Conference 23 -24 December 2017, Baghdad-Iraq
81
Third-Harmonic)تضممممين حقمممن التوافقيمممة الثالثمممة لعمممرض النبضمممة : Keywordsكلمطططا مفتاايطططة
Injected Pulse Width Modulation THPWM ) , عاكسمة منفصملة المصمدر( Split-Source Inverter SSI.)
مقدمة .8
ان أغلممب االنظمممة المعتمممدة علممى مصممادر الطاقممة المتجممددة تتطلممب فولتيممة متناوبممة أعلممى مممن مصممدر الفولتيممة المسممتمرة لذلك فان الفولتية المستمرة الداخلة يجب أن ترفع الى قيمة تجعل ممن . المستحصل من الخاليا الشمسية أو مولدات الرياح
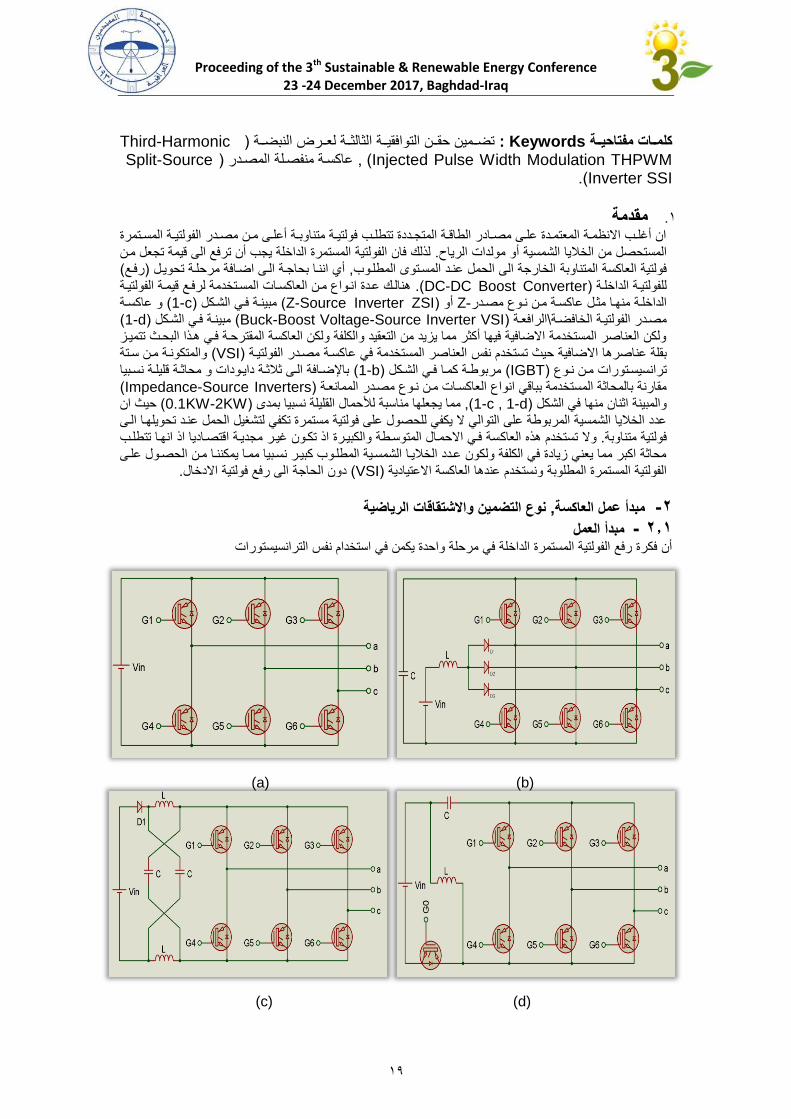
( رفمع)أي اننما بحاجمة المى اضمافة مرحلمة تحويمل , الخارجة الى الحمل عنمد المسمتوا المطلموبفولتية العاكسة المتناوبة هنالمك عمدة انمواع ممن العاكسمات المسمتخدمة لرفمع قيممة الفولتيمة (. DC-DC Boost Converter)للفولتيمة الداخلمة
و عاكسمة ( c-1)كل مبينمة فمي الشم( Z-Source Inverter ZSI)أو Z-الداخلمة منهما مثمل عاكسمة ممن نموع مصمدر( d-1)مبينمة فمي الشمكل ( Buck-Boost Voltage-Source Inverter VSI)الرافعمة \مصمدر الفولتيمة الخافضمة
ولكن العناصر المستخدمة االضافية فيها أكثر مما يزيد من التعقيد والكلفة ولكن العاكسة المقترحمة فمي همذا البحمث تتميمز والمتكونمة ممن سمتة ( VSI)العناصر المستخدمة في عاكسمة مصمدر الفولتيمة بقلة عناصرها االضافية حيث تستخدم نفس
باإلضممافة الممى ثالثممة دايممودات و محاثممة قليلممة نسممبيا ( b-1)مربوطممة كممما فممي الشممكل ( IGBT)ترانسيسممتورات مممن نمموع ( Impedance-Source Inverters)مقارنة بالمحاثة المستخدمة بباقي انواع العاكسمات ممن نموع مصمدر الممانعمة
حيث ان ( 0.1KW-2KW)مما يجعلها مناسبة لألحمال القليلة نسبيا بمدا , (c , 1-d-1)والمبينة اثنان منها في الشكل عدد الخاليا الشمسية المربوطة على التوالي ال يكفي للحصول على فولتية مستمرة تكفي لتشغيل الحمل عنمد تحويلهما المى
سة فمي االحممال المتوسمطة والكبيمرة اذ تكمون غيمر مجديمة اقتصماديا اذ انهما تتطلمب وال تستخدم هذه العاك. فولتية متناوبةمحاثة اكبر مما يعني زيادة في الكلفة ولكون عمدد الخاليما الشمسمية المطلموب كبيمر نسمبيا ممما يمكننما ممن الحصمول علمى
.الى رفع فولتية االدخالدون الحاجة ( VSI)الفولتية المستمرة المطلوبة ونستخدم عندها العاكسة االعتيادية
نوع التضمين واالشتقاقا الرياضية, مبدأ عمل العاكسة -2 مبدأ العمل -2.2
أن فكرة رفع الفولتية المستمرة الداخلة في مرحلة واحدة يكمن في استخدام نفس الترانسيستورات
(a) (b)
(c) (d)
Proceeding of the 3th Sustainable & Renewable Energy Conference 23 -24 December 2017, Baghdad-Iraq
03
Voltage-Source Inverter)عاكسة من نوع مصدر الفولتية( a: )انواع العاكسات األكثر شيوعا( 8)الشكل
VSI) ,(b ) عاكسة منفصلة المصدر(Split-Source Inverter SSI) ,(c )عاكسة من نوع مصدر-Z (Z-source Inverter ZSI) ,(d )الرافعة /نوع مصدر الفولتية الخافضة عاكسة من(Buck-Boost Voltage
Source Inverter BBVSI)
حيمث ( DC-DC Boost converter)المستخدمة لعممل العاكسمة واسمتخدامها كمحمول رافمع للفولتيمة فمي نفمس الوقمت ففمي ( b-1)بين في الشمكل وكما م, كمحول رافع للفولتية( السفلي والعلوي لكل طور)يعمل كل زوج من الترانسيستورات
السفلي ألحد األطموار فمان المحاثمة ستشمحن كميمة ممن الطاقمة وفمي الحالمة المعاكسمة أي ( الترانسيستور)حالة غلق المفتاح عن طريمق تسمليط فولتيمة بمين IGBTيغلق الترانسيستور )الترانسيستور السفلي ( فتح)غلق الترانسيستور العلوي واطفاء
يمتم المتحكم بهما عمن طريمق دا مرة 15Vللترانسيستور وتكون همذه الفولتيمة بحمدود Emitterلباعث وبين ا Gateالبوابة فمان الطاقمة المخزونمة فمي المحاثمة سمتمر عمن طريمق الترانسيسمتور العلموي ( السيطرة والتشغيل التي سيأتي شرحها الحقا
الفولتيمة الناتجمة ممن تحمرر الطاقمة المشمحونة + فولتيمة المصمدر )باإلضافة الى فولتية المصدر حيث تجمع همذه الفولتيمات وفي حالة ( غلق المفتاح العلوي وفتح المفتاح السفلي)وتخزن في المتسعة في حالة تفريغ المحاثة ( كل تياربالمحاثة على ش
تبقى الفولتية بمستوا ثابت تقريبا بسبب خاصية الخزن للمتسمعة ( فتح المفتاح العلوي وغلق المفتاح السفلي)شحن المحاثة بشكل ( شحن للمتسعة\التفريغ للمتسعة و تفريغ المحاثة\شحن المحاثة)ة الى أن يتم شحنه المتسعة مجددا وتتكرر هذه العملي
Switching)حيث اخترنا تردد تشغيل واطفاء الترانسيستورات 50µSمتكرر وتستغرق عملية الشحن والتفريغ بحدود Frequency ) 20ليكون بمقدارKHz .المة اطفا هما بنفس الوقت الذي نسمتخدم بمه الترانسيسمتورات لرفمع الفولتيمة فمي ح
وتشممغيلها فممان الفولتيممة سممتكون متغيممرة فممي النقطممة بممين الترانسيسممتورات وتمثممل هممذه النقطممة أحممد االطمموار الثالثممة للفولتيممة . وبقيمة أعلى من فولتية المصدر المستمرة( متناوبة)المتناوبة الخارجة للعاكسة وبذلك نكون قد حصلنا على فولتية متغيرة
-DC)لتية االخراج المتناوبة للعاكسة برفمع أو خفمض الفولتيمة المسمتمرة للعاكسمة بمرحلمة الرفمع يمكن التحكم بمستوا فوDC Boosting Stage )حيمث كلمما , وذلك عن طريق زيادة أو نقصان النسبة بين زمن الشحن للمحاثة وزمن التفريغ
.صان الفولتية المتناوبة الخارجة من العاكسةزادت هذه النسبة كلما زادت الفولتية للعاكسة وبالعكس وبالتالي زيادة أو نق
التضمين -2.2 Pulse Width)ان معمدل التغييمر فمي النسمبة بمين التوصميل والقطمع للترانسيسمتورات يسممى بتضممين عمرض النبضمة
Modulation ) حيث يتغير عرض النبضة للموجمة الحاملمة(Carrier Frequency ) حسمب شمكل الموجمة المطلموبمن العاكسة فال بد ممن جعمل ( Sine Wave)وبما اننا نرغب بإخراج موجة جيبية . الخروج للعاكسةتوليدها في مرحلة
يتغيمر بشمكل جيبمي ويسممى همذا التضممين 20KHzالنسبة بين زمن االطفاء والتشغيل للموجة الحاملة والتمي ترددهما همو غيمر عمرض النبضمة ممن يجمب يت(. Sine Pulse Width Modulation SPWM)بتضمين عرض النبضمة الجيبمي
ومن ثم يهبط الى النصف ويستمر بالتناقص ليصل الى ادنمى قيممة ( توصيل كامل)نصف عرض الموجة الى أعلى قيمة ان زممن همذا التغييمر فمي عمرض النبضمة يجمب ان , ثم يبدأ بالتزايد وهكذا بشكل يطابق شكل الموجمة الجيبيمة( قطع كامل)
ولمذلك فمان عمدد النبضمات المتغيمرة الواجمب 20mS أي , (50Hz)من العاكسة يساوي معكوس التردد المراد اخراجهنبضة ويكون زمن التوصيل لهذه النبضات 033ويساوي 20mS/50µSاخراجها لتوليد دورة كاملة للموجة الجيبية هو
شكل مصمفوفة بمداخل ومخزونة ب( MATLABتم توليد هذه القيم باستخدام برنامج )محسوب بالطريقة انفة الذكر برمجيا الممذي سمميبرمج إلخممراج هممذه النبضممات لتشممغيل واطفمماء الترانسيسممتورات ( Microcontroller)برنممامج المسمميطر الممدقيق
لقد استخدمنا طريقة للتضمين تكون نسمبة التشموهات قليلمة نسمبيا للموجمة وذلمك بإضمافة مركبمة موجمة توافقيمة ثالثمة . الستة(Third Harmonic )ضممين بتضممين حقمن التوافقيمة الثالثمة لعمرض النبضمة ويسممى همذا الت(Third-Harmonic
Injected Pulse Width Modulation THPWM ) حيمث اسمتخدمنا المعادلمة التاليمة لتوليمد قميم عمرض النبضمات (:50Hz)نبضة لدورة واحدة للموجة 033والتي عددها
------(1)
نالحمظ ممن المعادلمة . 50µSهمو أقصمى عمرض للنبضمة وهمو Pmaxو ( 400المى 1من )هو تسلسل النبضة nحيث
)اعاله اننا اضفنا جزء من التوافقية الثالثمة
المى الموجمة االصملية حيمث وجمدنا وممن خمالل التجمارب (
ان هذه الطريقة تساعد في تحسين MATLAB/SIMULINKعن طريق برنامج الـ ( Simulation)العملية والمحاكاة
كمما تسماعد اضمافة همذه , ( Total Harmonic Distortion THD)التشويه الكلي في التوافقيات في فولتيمة االخمراج
متسمعة -اصمر المرشمح المموجي محاثمةوكمذلك تقليمل قميم عن( وبالتالي تقليمل الكلفمة)المركبة على استخدام قيمة اقل للمحاثة
(Output L-C Filter )( 0)يوضمح الشمكل . المسمتخدم فمي االخمراج لتحويمل الموجمة الخارجمة المى موجمة جيبيمة نقيمة
Proceeding of the 3th Sustainable & Renewable Energy Conference 23 -24 December 2017, Baghdad-Iraq
08
حيمث اسمتخدمنا نبضمات أقمل للتوضميح فقمط ( 50Hz)طريقة توليد عمرض النبضمات لمدورة واحمدة ممن الموجمة الخارجمة
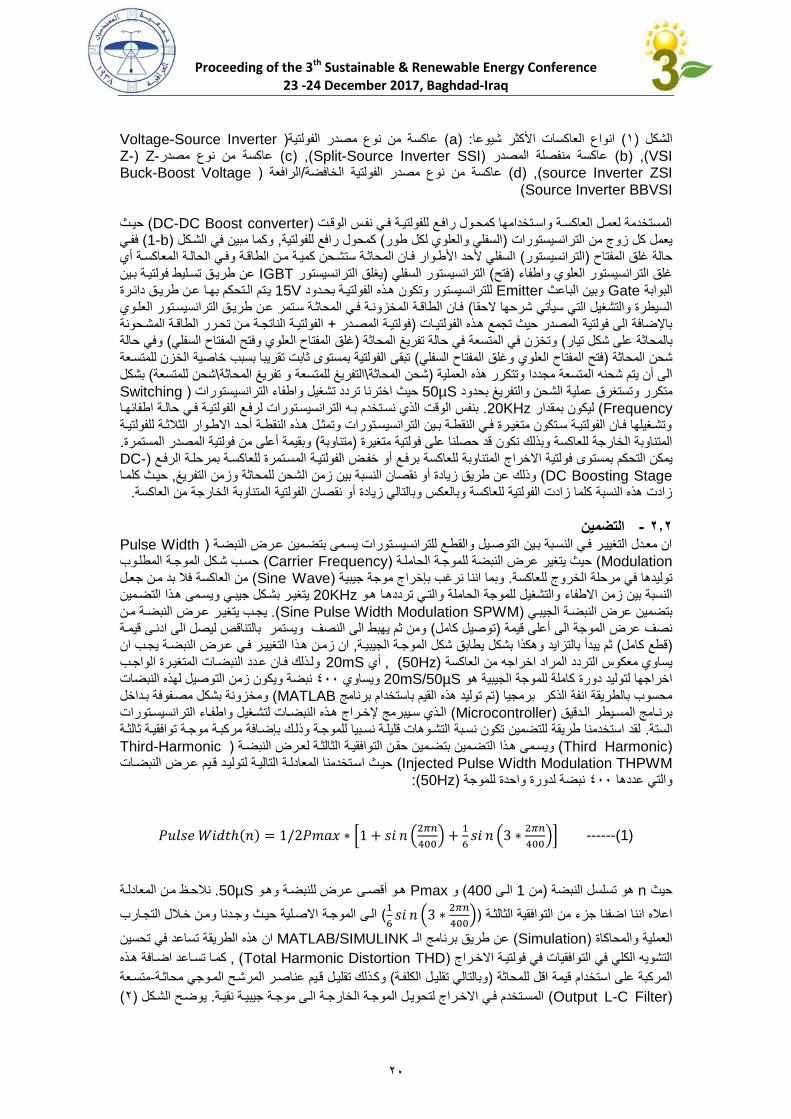
.والموجة الخارجةومبين به العالقة بين عرض النبضة
االشتقاقا الرياضية- 2.2
حسب قيمة الفولتية المطلوب ( b-8على اطراف المتسعة في الشكل ) Vinvيتم التحكم بفولتية االخراج المستمرة للعاكسة
Modulation)أو Mويسمى بمعامل التضمين ( 8-3)اخراجها وذلك بضرب عرض كل نبضة بمعامل يتراوح بين
العالقة بين عرض النبضات المطلوب تجهيزها لكل ترانسيستور وشكل الموجة المستخدمة في التضمين ( 0)الشكل
(THPWM)
Index ) حيمث ان الزيممادة او النقصممان فممي هممذا المعامممل يممىثر مباشمرة علممى معممدل عممرض النبضممة الكلممي(Average
Duty-Cycle ) ويرمز له بالرمزDav ةويمكن حسابه من المعادل:
--------(2)
والمذي بمدوره تعتممد قيمتمه علمى معاممل التضممين ويمكمن Dav تأثيرا مباشمرا بتغييمر Vcحيث تتأثر قيمة فولتية المتسعة
:بالمعادلة التالية Vcحساب قيمة الفولتية المستمرة للعاكسة
------(3)
:ينتج( 0)في ( 0)وبتعويض المعادلة , قيمة فولتية االدخال للعاكسة Vinحيث تمثل
------(4)
اعتممادا مباشمراع علمى قيممة معاممل التضممين Vcاعتمماد قيممة الفولتيمة المسمتمرة للعاكسمة ( 0)حيث نالحمظ ممن المعادلمة
(Modulation Index )لقد قمنا بتصمميم نظمام سميطرة ممن نموع . سب طرديا معهوتتنا(Proportional-Integral or PI Controller ) داخل برنامج المسيطر الدقيق(Microcontroller ) حيث يقوم بقراءة فولتيمة العاكسمة باسمتمرار
ذا كانت القمراءة اكبمر وبمالعكس ا Mويقوم بتقليل قيمة معامل التضمين (Set Point)ويقارنها مع قيمة الفولتية المطلوبة . الى أن نحصل على قيمة الفولتية المطلوبة في االخراج
Proceeding of the 3th Sustainable & Renewable Energy Conference 23 -24 December 2017, Baghdad-Iraq
00
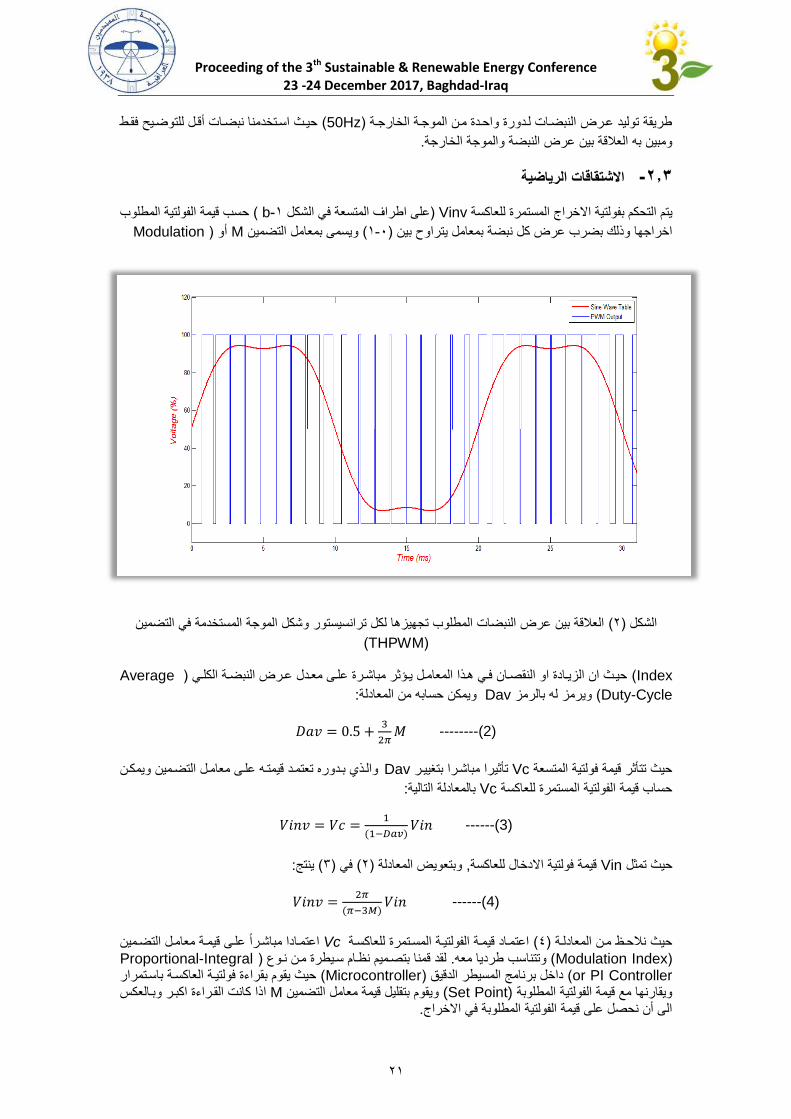
MATLAB/SIMULINK للعاكسة باستخدام الــ Simulationالمااكاة -2لمحاكاة وتحليل عمل العاكسة واالطالع على المشاكل التي من الممكمن MATLAB/SIMULINKلقد استخدمنا برنامج
.مخطط الجزء الخاص بتوليد النبضات( 0)يبين الشكل . ة تنفيذ الجزء العملي من البحثحصولها في حال ,R=150)والحممل ( SSI Inductor = 7mH)وقيمة المحاثة للعاكسة ( Vin = 100V)حيث كانت فولتية االدخال
L= 10mH.)
(THPWM)للجزء الخاص بتوليد النبضات (Simulation Model)مخطط المحاكاة ( 0)الشكل
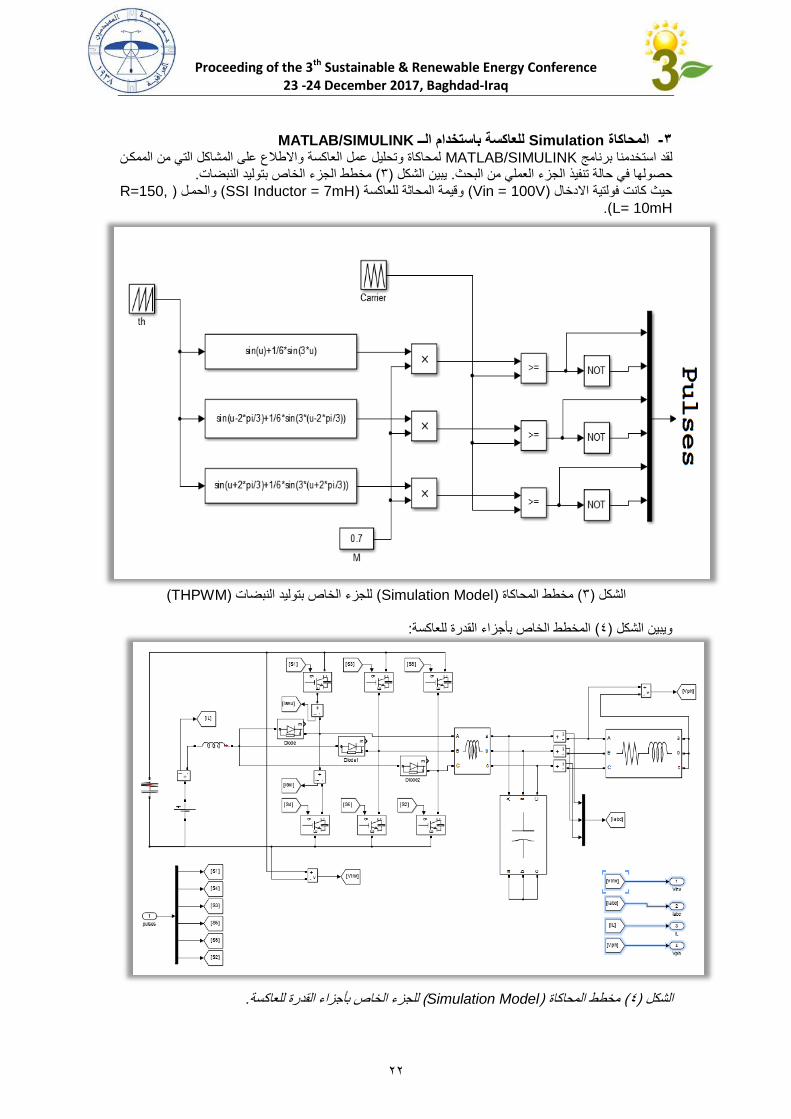
:المخطط الخاص بأجزاء القدرة للعاكسة( 0)ويبين الشكل
.للجزء الخاص بأجزاء القدرة للعاكسة( Simulation Model)مخطط المحاكاة ( 0)الشكل
Proceeding of the 3th Sustainable & Renewable Energy Conference 23 -24 December 2017, Baghdad-Iraq
00
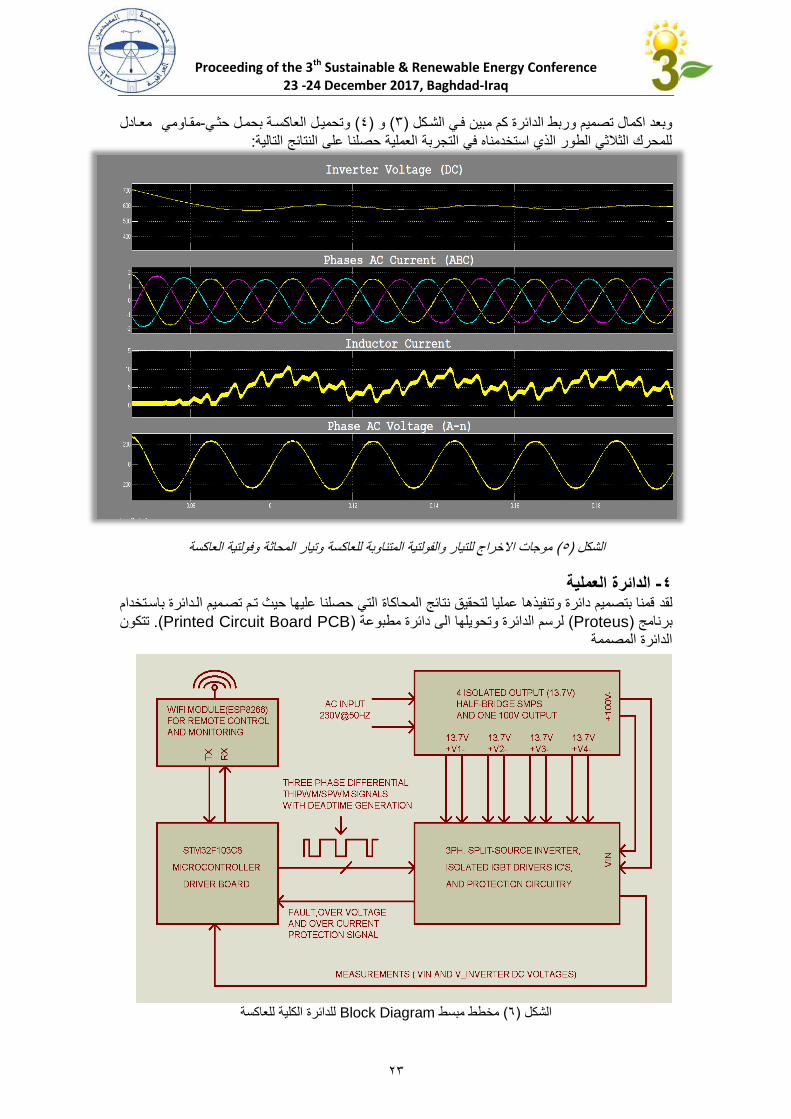
معمادل مقماومي-وتحميمل العاكسمة بحممل حثمي( 0)و ( 0)وبعد اكمال تصميم وربط الدا رة كم مبين فمي الشمكل :للمحرك الثالثي الطور الذي استخدمناه في التجربة العملية حصلنا على النتا ج التالية
موجات االخراج للتيار والفولتية المتناوبة للعاكسة وتيار المحاثة وفولتية العاكسة( 5)الشكل
الدائرة العملية -4قمنا بتصميم دا رة وتنفيذها عمليا لتحقيق نتا ج المحاكاة التي حصلنا عليها حيث تمم تصمميم المدا رة باسمتخدام لقد
تتكون (. Printed Circuit Board PCB)لرسم الدا رة وتحويلها الى دا رة مطبوعة ( Proteus)برنامج الدا رة المصممة
للدا رة الكلية للعاكسةBlock Diagram مخطط مبسط ( 6)الشكل
Proceeding of the 3th Sustainable & Renewable Energy Conference 23 -24 December 2017, Baghdad-Iraq
00
والمذي يخمرج ( Isolated Power Supply)من ثالثة اجزاء وهي جمزء مجهمز القمدرة ممن النموع المعمزول اربعة مصادر معزولة لتجهيز دا رة السميطرة والتشمغيل للترانسيسمتورات بالقمدرة باإلضمافة المى اخمراج فولتيمة
والجمزء ( b-1والمتمثلمة بالشمكل )والجمزء المكمون للعاكسمة , ( 100V) الستخدامها كمصدر االدخال للعاكسةليجهمز الترانسيسمتورات بالنبضمات الضمرورية لعممل العاكسمة وكمذلك ( Control Board)الخماص بالسميطرة
يتكممممون بممممورد السمممميطرة علممممى العاكسممممة مممممن مسمممميطر دقيممممق . للسمممميطرة علممممى فولتيممممة االخممممراج للعاكسممممة(Microcontroller )رمجتممه لتوليممد النبضممات الضممرورية للترانسيسممتورات وكممذلك تممم تزويممد البممورد تمممت ب
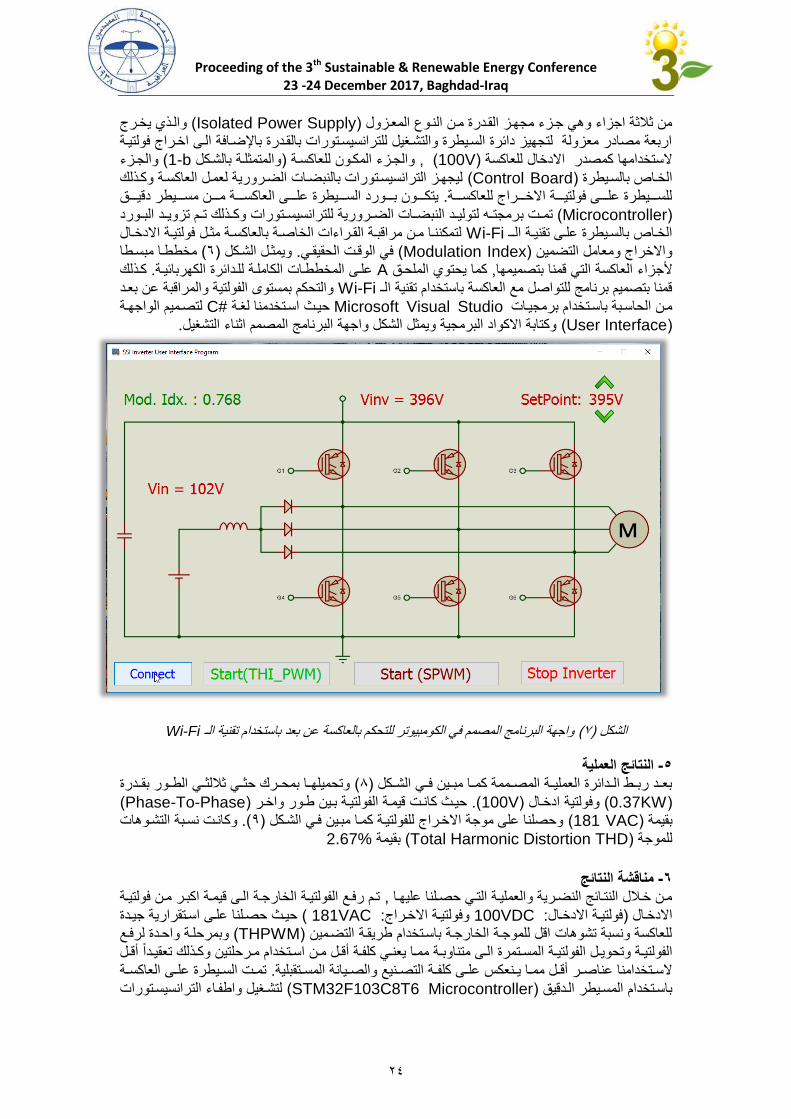
لتمكننمما مممن مراقبممة القممراءات الخاصممة بالعاكسممة مثممل فولتيممة االدخممال Wi-Fiالخمماص بالسمميطرة علممى تقنيممة الممـ مخططما مبسمطا ( 6)ويمثمل الشمكل . في الوقمت الحقيقمي( Modulation Index)واالخراج ومعامل التضمين
كمذلك . علمى المخططمات الكاملمة للمدا رة الكهربا يمة Aكما يحتوي الملحمق , زاء العاكسة التي قمنا بتصميمهاألجوالتحكم بمستوا الفولتية والمراقبة عن بعمد Wi-Fiقمنا بتصميم برنامج للتواصل مع العاكسة باستخدام تقنية الـ
لتصمميم الواجهمة #Cاسمتخدمنا لغمة حيمث Microsoft Visual Studioممن الحاسمبة باسمتخدام برمجيمات(User Interface )وكتابة االكواد البرمجية ويمثل الشكل واجهة البرنامج المصمم اثناء التشغيل.
Wi-Fiواجهة البرنامج المصمم في الكومبيوتر للتحكم بالعاكسة عن بعد باستخدام تقنية الـ( 7)الشكل
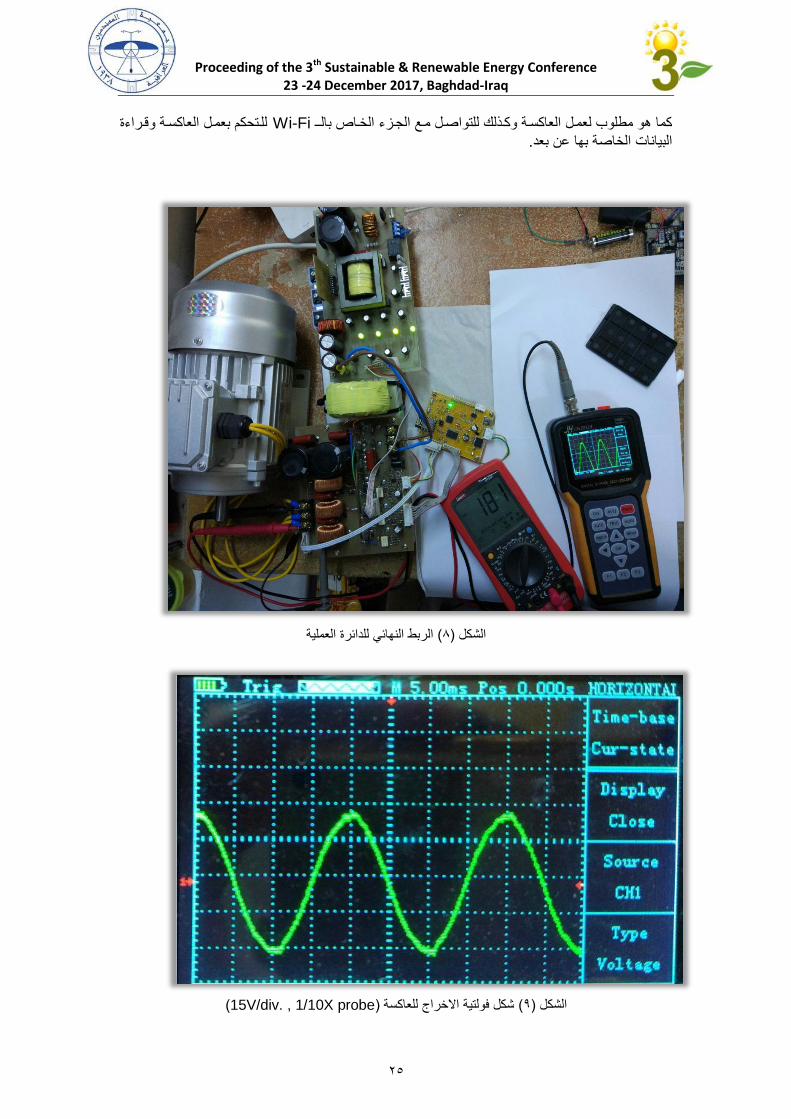
العمليةالنتائج -5وتحميلهمما بمحممرك حثممي ثاللثممي الطممور بقممدرة ( 1)بعممد ربممط الممدا رة العمليممة المصممممة كممما مبممين فممي الشممكل
(0.37KW ) وفولتية ادخمال(100V .) حيمث كانمت قيممة الفولتيمة بمين طمور واخمر(Phase-To-Phase )نسمبة التشموهات وكانمت (. 1)وحصلنا على موجة االخمراج للفولتيمة كمما مبمين فمي الشمكل ( VAC 181)بقيمة
%2.67بقيمة ( Total Harmonic Distortion THD)للموجة
مناقشة النتائج -6
تمم رفمع الفولتيممة الخارجمة المى قيمممة اكبمر ممن فولتيممة , ممن خمالل النتما ج النضممرية والعمليمة التمي حصمملنا عليهما ا علممى اسممتقرارية جيممدة حيممث حصملن( 181VAC:وفولتيممة االخممراج 100VDC:فولتيممة االدخممال)االدخمال
وبمرحلمة واحمدة لرفمع ( THPWM)للعاكسة ونسبة تشوهات اقل للموجمة الخارجمة باسمتخدام طريقمة التضممين الفولتيممة وتحويممل الفولتيممة المسممتمرة الممى متناوبممة مممما يعنممي كلفممة أقممل مممن اسممتخدام مممرحلتين وكممذلك تعقيممداع أقممل
تمممت السمميطرة علممى العاكسممة . نيع والصمميانة المسممتقبليةالسممتخدامنا عناصممر أقممل مممما يممنعكس علممى كلفممة التصمملتشمغيل واطفماء الترانسيسمتورات ( STM32F103C8T6 Microcontroller)باسمتخدام المسميطر المدقيق
Proceeding of the 3th Sustainable & Renewable Energy Conference 23 -24 December 2017, Baghdad-Iraq
05
للمتحكم بعممل العاكسمة وقمراءة Wi-Fi كما هو مطلوب لعممل العاكسمة وكمذلك للتواصمل ممع الجمزء الخماص بالمـ .البيانات الخاصة بها عن بعد
الربط النها ي للدا رة العملية( 1)الشكل
(15V/div. , 1/10X probe)شكل فولتية االخراج للعاكسة ( 1)الشكل
Proceeding of the 3th Sustainable & Renewable Energy Conference 23 -24 December 2017, Baghdad-Iraq
06
Referencesالمراجع -7[1] Ahmed Abdelhakim, Paolo Mattavelli, Giorgio Spiazzi. "Split-Source Inverter", IECON2015-Yokohama, November 9-12, 2015. [2] Ahmed Abdelhakim, Paolo Mattavelli, Giorgio Spiazzi, "Three-phase Split-Source Inverter (SSI): Analysis and Modulation", IEEE Transactions on Power Electronics, DOI 10.1109/TPEL.2015.2513204.
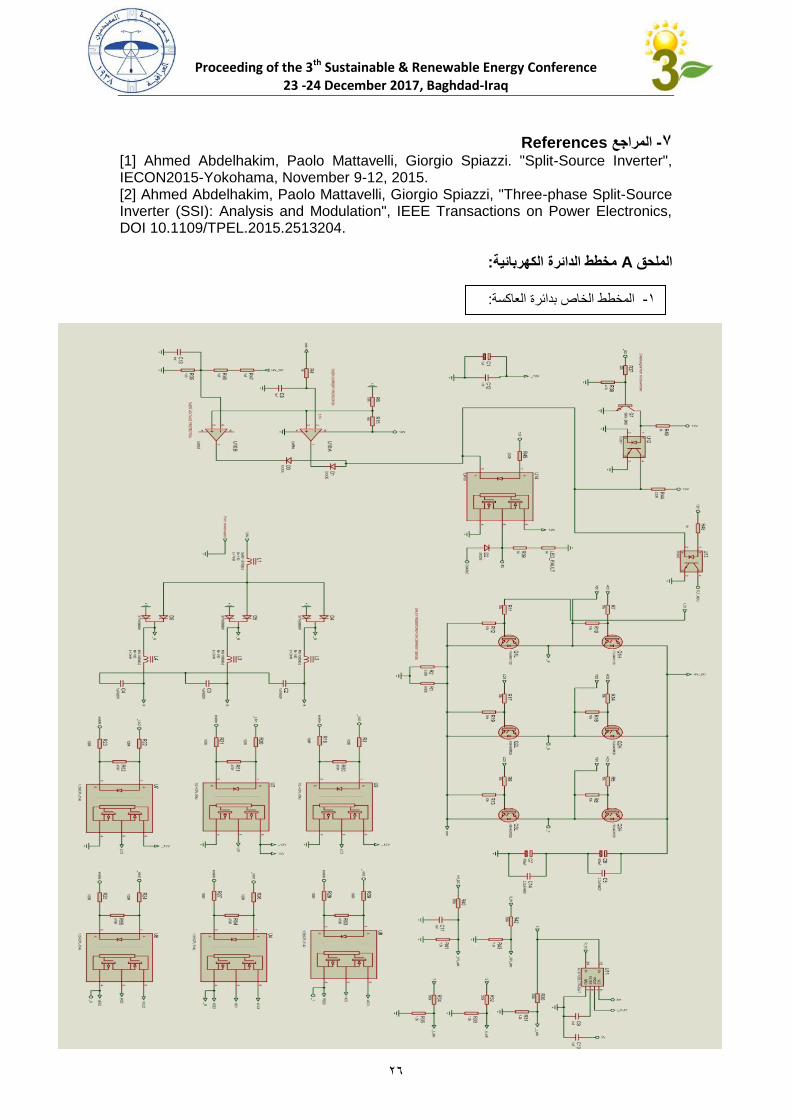
:مخطط الدائرة الكهربائية A الملاق
:المخطط الخاص بدا رة العاكسة -8
Proceeding of the 3th Sustainable & Renewable Energy Conference 23 -24 December 2017, Baghdad-Iraq
07
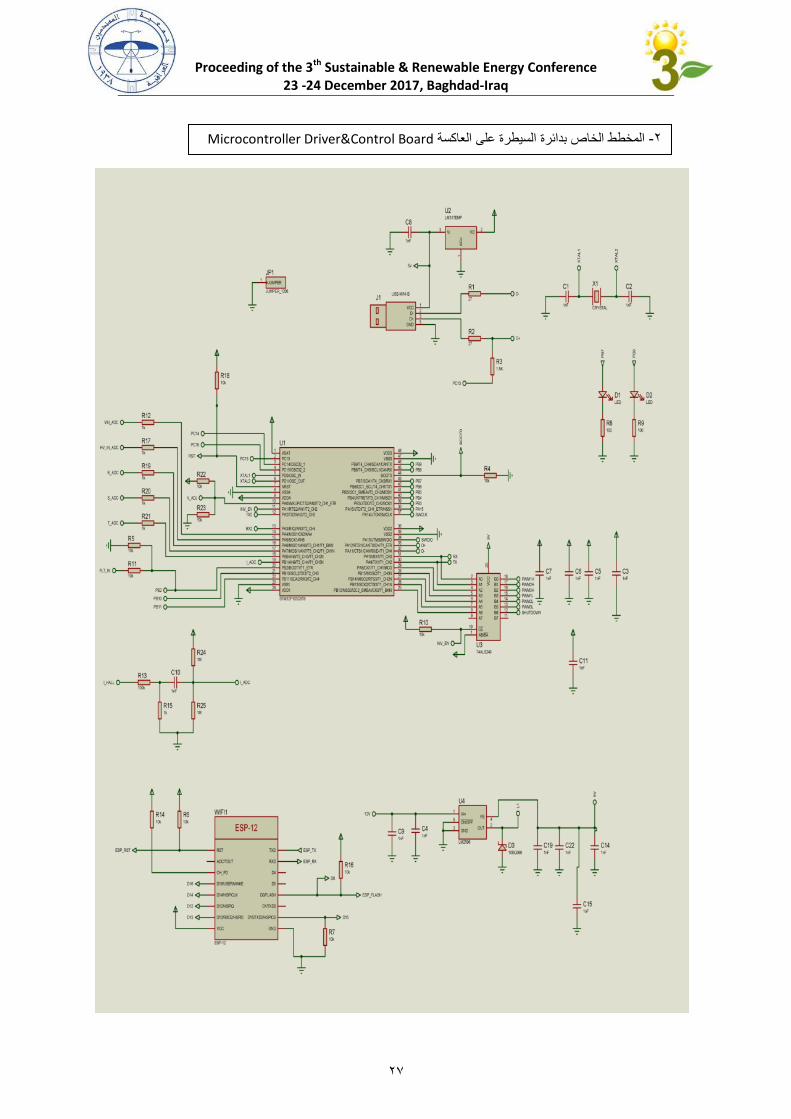
Microcontroller Driver&Control Boardالمخطط الخاص بدا رة السيطرة على العاكسة -0
Proceeding of the 3th Sustainable & Renewable Energy Conference 23 -24 December 2017, Baghdad-Iraq
01
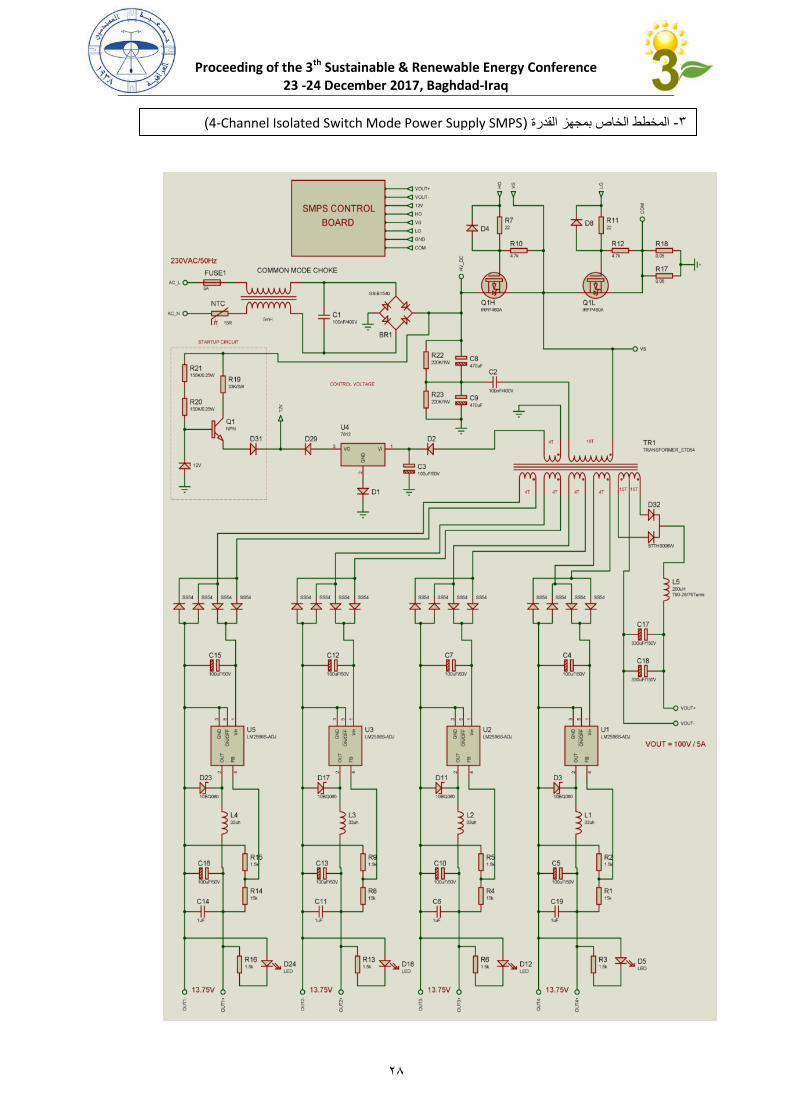
(Channel Isolated Switch Mode Power Supply SMPS-4)المخطط الخاص بمجهز القدرة -0
Proceeding of the 3th Sustainable & Renewable Energy Conference 23 -24 December 2017, Baghdad-Iraq
01
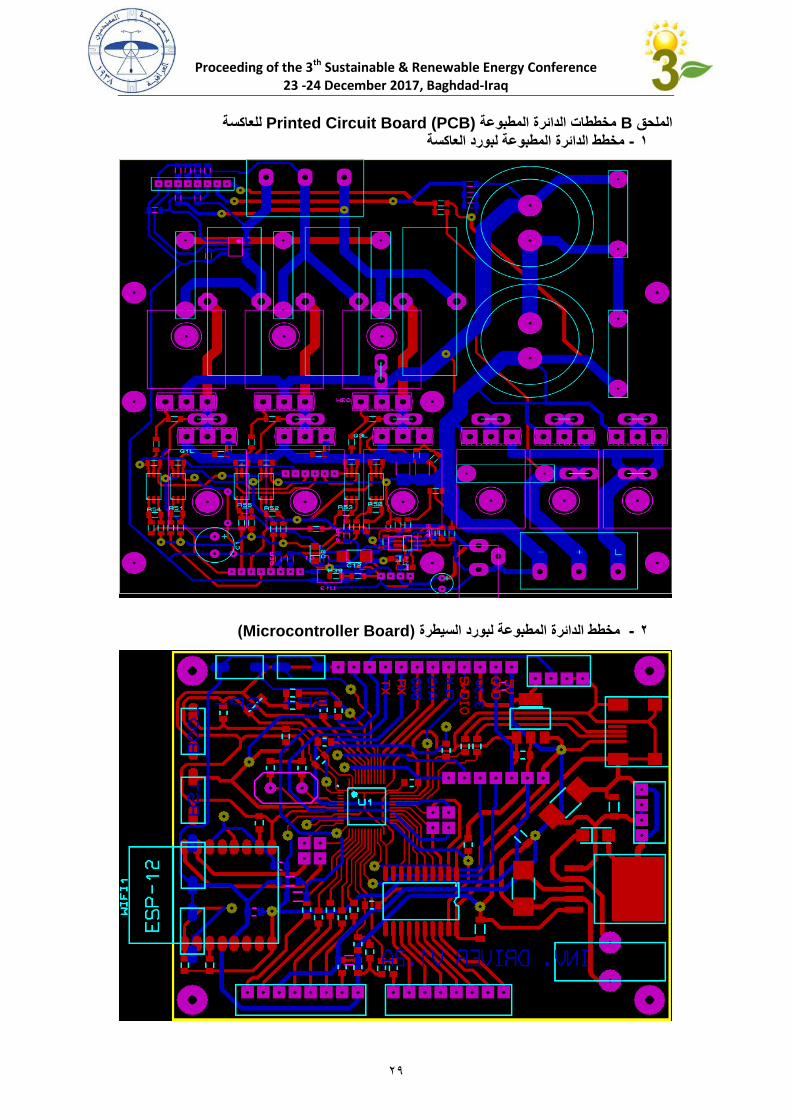
للعاكسة Printed Circuit Board (PCB)مخططا الدائرة المطبوعة Bالملاق مخطط الدائرة المطبوعة لبورد العاكسة -2
(Microcontroller Board)مخطط الدائرة المطبوعة لبورد السيطرة -2
Proceeding of the 3th Sustainable & Renewable Energy Conference 23 -24 December 2017, Baghdad-Iraq
03
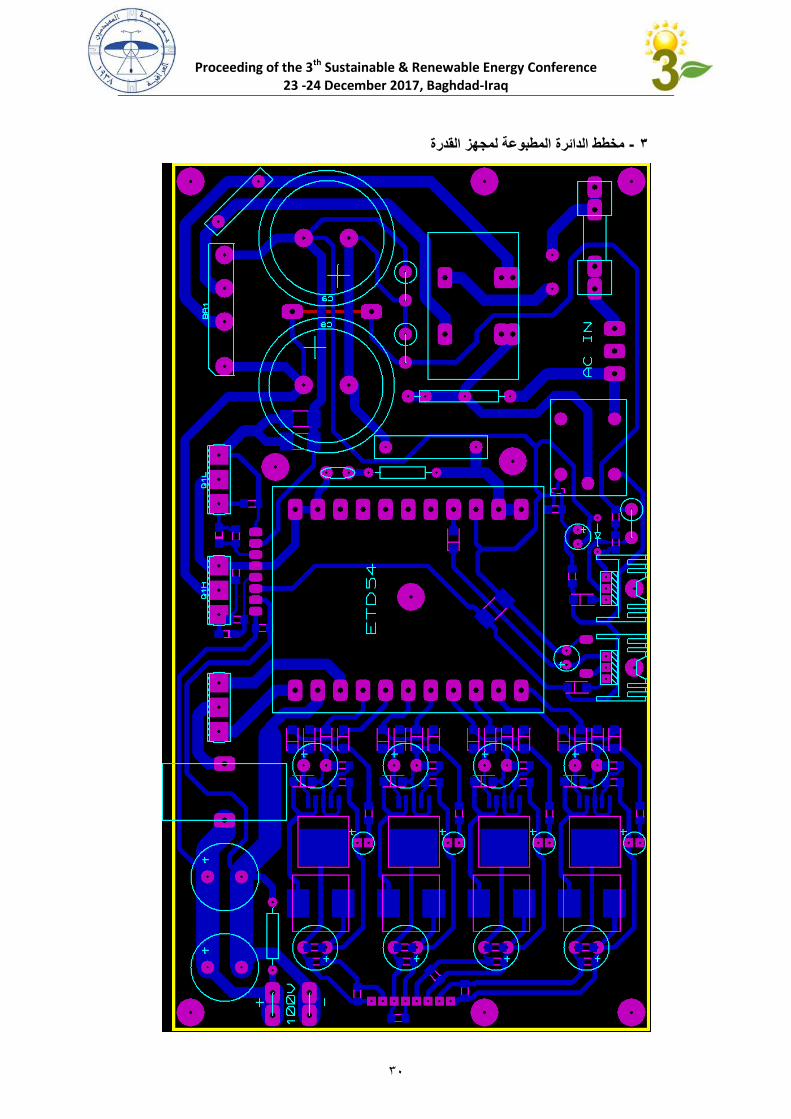
مخطط الدائرة المطبوعة لمجهز القدرة -2
Proceeding of the 3th Sustainable & Renewable Energy Conference
23 -24 December 2017, Baghdad-Iraq
13
تحليل أداء وحدة توليدية مركبة متكاملة بنظام الطاقة الشمسية في العراق
ماجستير هندسة ميكانيك/ ماهر صعب سالمة
بغداد –العراق / المنطقى الوسطى –المديرية العامة النتاج الطاقة الكهربائية / وزارة الكهرباء E-mail: [email protected]
:الخالصة
في استغالل مصادر الطاقات المتجددة وتنمية استخدامتها في في األونة االخيرة هتمام العالمي ان زيادة اال مختلف المجاالت وخاصة الطاقة الشمسية والتي تعتبر مصدر واعد وعلى المدى البعيد في قطاع انتاج الطاقة
يات متعددة من شأنها اشراك الطاقة الكهربائية شجع المهتمين في هذا المجال للتوجة الى ايجاد افكار متقدمة وتقنالشمسية في انتاج محطات الطاقة المركبة التقليدية وهو مايعرف بالمحطات التوليدية المركبة المتكاملة بالطاقة
التي يمكن من التقليدية الشمسية التي تتكون من تكامل المحطات الشمية الحرارية مع المحطات التوليدية المركبة األمر الذي شجع على تكامل الوحدات الغازية البسيطة , م الكفؤ لطاقة الوقود والطاقة الشمسيةخاللها االستخدا
البحث الحالي يتناول تطوير . الى محطات مركبة بتصاميم مناسبة لها القابلية على التكامل بالنظام الشمسي ة توليدية مركبة متكاملة في شمال العراق الى وحد( 150MW)وحدة غازية بسيطة قدرتها األنتاجية بحدود
بالطاقة الشمسية ومحاكاة ادائها باألعتماد على عدة أمور منها شدة األشعاع الشمسي والقدرة التوليدية المستحصلة من الطاقة الشمسية والكفاءة الحرارية ومعدل أستهالك الوقود وأنبعاثات ثاني أوكسيد الكاربون
بينت النتائج من محاكاة النظام ان القدرة (. كانون األول,ايلول,حزيران,أذار)خالل أربعة اشهر في السنة ولكن خالل النهار فأن .أثناء الليل % 22و بكفاءة حرارية 222MWالتوليدية للوحدة التوليدية المتكاملة بحدود
حدة وأزدادت الكفاء الحرارية للو MW 27القدرة الكهربائية المنتجة من الطاقة الشمسية كانت بحدود صافي ممارفع انتاج القدرة التوليدية الكلية باقصى قيمة لألشعاع الشمسي خالل فصل الصيف % 32التوليدية بحدود
مما ادى % 31وأنخفض معدل األستهالك النوعي للوقود بمقدار 6352وبكفاءة حرارية 222MWللوحدة الى بالوحدة التوليدية المركبة التقليدية بدون مقارنة % 31الى تقليل انبعاثات ثاني اوكسيد الكاربون كذلك بمقدار
.الطاقة الشمسية
"Performance Analysis of Integrated Solar Combined Cycle Power
Plant System in Iraq"
Abstract: The great interest in the development of renewable energies and more particularly in solar
energy opens interesting prospects for advanced concepts to integrate solar power in a
conventional energy generation technologies. Integrated Solar Combined Cycle Power Plants
(ISCCs), composed of a Concentrated Solar Power (CSP) plant and a Natural Gas Combined
Cycle (NGCC) power plant, have been recently introduced in the power generation sector as a
technology with the potential to a very efficient use of the solar and fossil resources .This role
encourage to develop simple gas turbine power plants to combined power plants with modern
designs have the potential to integrate with solar energy. In the present work development
simple gas turbine in north of Iraq (150MW) to integrated solar combined power plant is
proposed and the preferred method for converting solar energy into electricity is applied.
Intensity solar irradiation, electricity production, Thermal efficiency, net solar electricity,
specific fuel consumption and Co2 emissions are the main parameters to evaluate the
performance of each component of the solar power station through four months (March, June,
September and December) in the year. The simulation results show that the power plant can
provide about 225MW with efficiency equals 55% at night. At daytime, the net solar
electricity can be very interested and reach the limit of 27 MW and the efficiency of the
ISCCS will be above the combined cycle regime by 12%, which are correspond to 252MW
and 61.5%, respectively at a highest value of Direct normal irradiation through the summer.
Proceeding of the 3th Sustainable & Renewable Energy Conference
23 -24 December 2017, Baghdad-Iraq
12
Reducing specific fuel consumption and CO2 emissions by 10% for each one compart ion to
conventional combined power plant values at night.
Keywords: solar energy; solar power plant; integrated solar combined cycle system, performance.
قائمة الرموز والمصطلحات
وليدية المركبة المتكاملة بالنظام الوحدة الت الشمسي
ISCC الضاغط
COM
CC غرفة االحتراق LP واطىمرحلة الضغط ال
CON المكثف معدل الجريان
الحرارة النوعية NC الشمسية عدد المستجمعات
DNI االشعاع الشمسي الطبيعي المباشر P القدرة التوليدية
DEA محرر الغازات كمية الحرارة
ECO المقتصد SH المحمص
EV المبخر ST D (Steam Drum)خزان البخار
الحقل الشمسيSF
المحتوى الحراري للبخار الداخل للتوربين البخاري
GC دورة الغاز االستهالك النوعي للوقود
GT التوربين الغازي SC دورة البخار
G المولد ST التوربين البخاري
HD االشعاع الشمسي المشتت T الحرارة درجة
HP مرحلة الضغط العالي 𝜂 الكفاءة
:المقدمة -1وارتفاع اسعار الوقود الهيدروكاربوني والرغبة , ان زيادة الطلب العالمي على الطاقة والسيما الطاقة الكهربائية
محطات لتوليد الطاقة الكهربائية ذات في تقليل التلوث البيئي دفع الباحثين والعاملين في مجال الطاقة الى إنشاءقدرات توليدية عالية جدا وكفاءة مقبولة ومن ناحية كلف الوقود الهيدروكاربوني من جهة وتقليل االنبعاثات
دخل نظام تكامل الوحدات الغازية البسيطة الى الوحدات التوليدية المركبة . [3-1]الملوثة للبيئة من جهة أخرى نتاج الطاقة الكهربائية في معظم دول العالم ومنها العراق لتلبية الطلب المتزايد على استهالك في إمجاال واسعا
الطاقة الكهربائية نظرا لما تتمتع به الوحدات المركبة من قدرة عالية وسهولة التشغيل وكلفة إنشاء واطئة ة التوليدية المركبة عادة من الوحدة تتكون الوحدو. [4]وتلوث بيئي قليل مقارنة بالمحطات التوليدية األخرى
Brayton)والتي تعمل على الدورة البسيطة والتي تعرف بدورة برايتون ( الوحدة العليا)الغازية وتسمى cycle ), اما الوحدة الثانية هي الوحدة البخارية وتسمى الوحدة السفلى والتي تعمل على دورة رانكن(Rankin cycle )ين بمنظومة توليد البخار يتم ربط هاتين الوحدت(HRSG ) التي تقوم بدورها بتسخين الماء الداخل الى
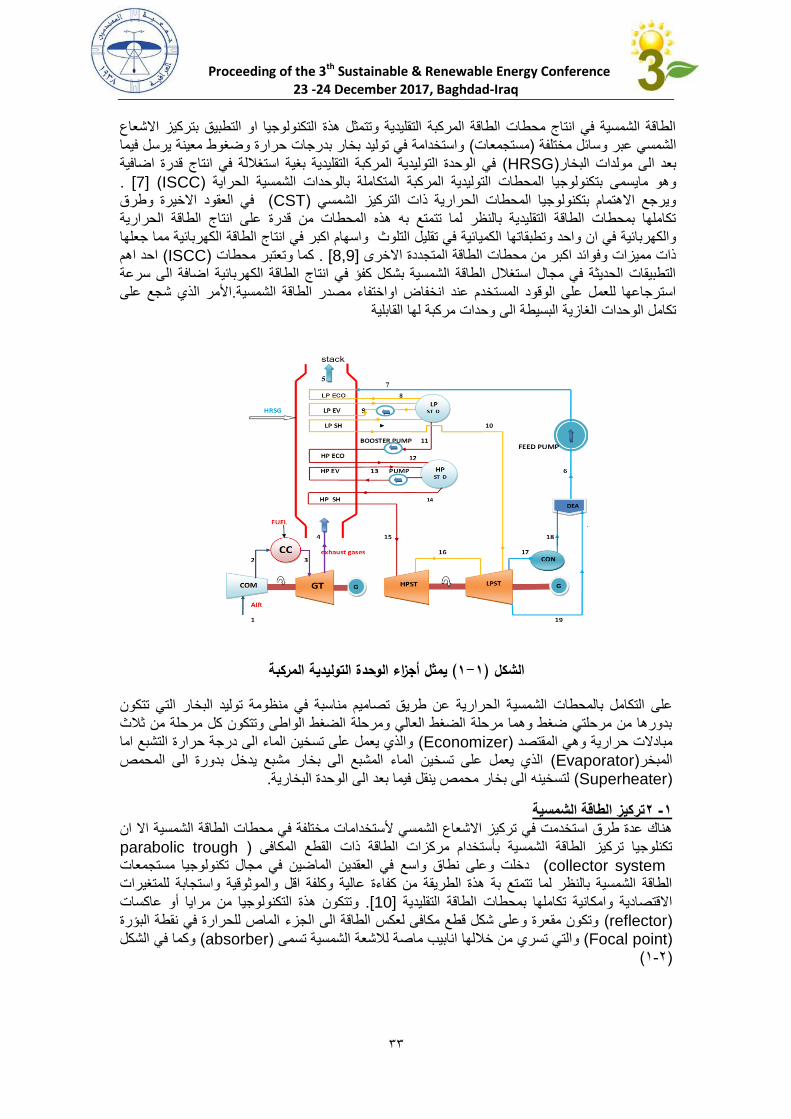
المنظومة عن طريق حرارة الغازات الداخلة اليها من التوربين الغازي عبر سلسلة من المبادالت الحرارية في مام العالمي اال ان زيادة االهت( . 1-1)النتاج بخار محمص يعمل على إدارة الوحدة البخارية وكما في الشكل
في استغالل مصادر الطاقات المتجددة وتنمية استخدامتها في مختلف المجاالت وخاصة الطاقة األونة االخيرة الشمسية والتي تعتبر مصدر واعد وعلى المدى البعيد في قطاع انتاج الطاقة الكهربائية شجع المهتمين في هذا
ت متعددة من شأنها توظيف الطاقة الشميسية في توليد الطاقة المجال للتوجة الى ايجاد افكار متقدمة وتقنياومن اهم التقنيات التي ظهرت في هذا المضمار هو العمل على اشراك [5,6]الكهربائية وبصورة كفؤة جدا
Proceeding of the 3th Sustainable & Renewable Energy Conference
23 -24 December 2017, Baghdad-Iraq
11
الطاقة الشمسية في انتاج محطات الطاقة المركبة التقليدية وتتمثل هذة التكنولوجيا او التطبيق بتركيز االشعاع واستخدامة في توليد بخار بدرجات حرارة وضغوط معينة يرسل فيما ( مستجمعات)لشمسي عبر وسائل مختلفة ا
في الوحدة التوليدية المركبة التقليدية بغية استغاللة في انتاج قدرة اضافية ( HRSG)بعد الى مولدات البخار. [7](ISCC)حدات الشمسية الحراية المتكاملة بالو المحطات التوليدية المركبة وهو مايسمى بتكنولوجيا
في العقود االخيرة وطرق ( CST)ويرجع االهتمام بتكنولوجيا المحطات الحرارية ذات التركيز الشمسي تكاملها بمحطات الطاقة التقليدية بالنظر لما تتمتع به هذه المحطات من قدرة على انتاج الطاقة الحرارية
الكميائية في تقليل التلوث واسهام اكبر في انتاج الطاقة الكهربائية مما جعلها والكهربائية في ان واحد وتطبقاتهااحد اهم ( ISCC)كما وتعتبر محطات . [8,9] ذات مميزات وفوائد اكبر من محطات الطاقة المتجددة االخرى
ة اضافة الى سرعة التطبيقات الحديثة في مجال استغالل الطاقة الشمسية بشكل كفؤ في انتاج الطاقة الكهربائياألمر الذي شجع على .استرجاعها للعمل على الوقود المستخدم عند انخفاض اواختفاء مصدر الطاقة الشمسية
وحدات مركبة لها القابليةتكامل الوحدات الغازية البسيطة الى
يمثل أجزاء الوحدة التوليدية المركبة( 1-1)الشكل
ة الحرارية عن طريق تصاميم مناسبة في منظومة توليد البخار التي تتكون على التكامل بالمحطات الشمسيبدورها من مرحلتي ضغط وهما مرحلة الضغط العالي ومرحلة الضغط الواطى وتتكون كل مرحلة من ثالث
والذي يعمل على تسخين الماء الى درجة حرارة التشبع اما ( Economizer)مبادالت حرارية وهي المقتصد الذي يعمل على تسخين الماء المشبع الى بخار مشبع يدخل بدورة الى المحمص ( Evaporator)المبخر
(Superheater )لتسخينه الى بخار محمص ينقل فيما بعد الى الوحدة البخارية.
تركيز الطاقة الشمسية 2 -1الشمسية اال ان هناك عدة طرق استخدمت في تركيز االشعاع الشمسي ألستخدامات مختلفة في محطات الطاقة
parabolic trough)تكنلوجيا تركيز الطاقة الشمسية بأستخدام مركزات الطاقة ذات القطع المكافى collector system ) دخلت وعلى نطاق واسع في العقدين الماضين في مجال تكنولوجيا مستجمعات
فة اقل والموثوقية واستجابة للمتغيرات الطاقة الشمسية بالنظر لما تتمتع بة هذة الطريقة من كفاءة عالية وكلوتتكون هذة التكنولوجيا من مرايا أو عاكسات . [10]االقتصادية وامكانية تكاملها بمحطات الطاقة التقليدية
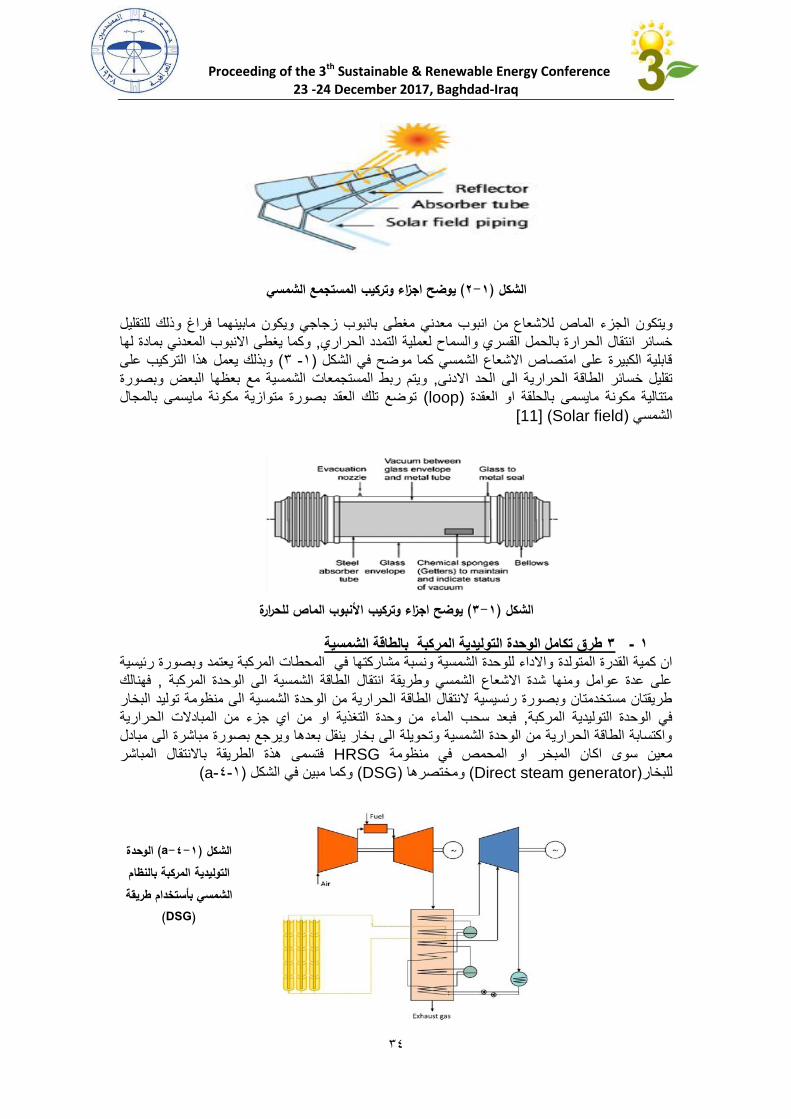
(reflector ) وتكون مقعرة وعلى شكل قطع مكافى لعكس الطاقة الى الجزء الماص للحرارة في نقطة البؤرة(Focal point ) من خاللها انابيب ماصة لالشعة الشمسية تسمى والتي تسري(absorber ) وكما في الشكل(2-3 )
Proceeding of the 3th Sustainable & Renewable Energy Conference
23 -24 December 2017, Baghdad-Iraq
13
يوضح اجزاء وتركيب المستجمع الشمسي (2-1)الشكل
يتكون الجزء الماص لالشعاع من انبوب معدني مغطى بانبوب زجاجي ويكون مابينهما فراغ وذلك للتقليل ووكما يغطى االنبوب المعدني بمادة لها , لسماح لعملية التمدد الحراريخسائر انتقال الحرارة بالحمل القسري وا
وبذلك يعمل هذا التركيب على ( 1 -3)قابلية الكبيرة على امتصاص االشعاع الشمسي كما موضح في الشكل ويتم ربط المستجمعات الشمسية مع بعظها البعض وبصورة , تقليل خسائر الطاقة الحرارية الى الحد االدنى
توضع تلك العقد بصورة متوازية مكونة مايسمى بالمجال ( loop)الية مكونة مايسمى بالحلقة او العقدة متت [11]( Solar field)الشمسي
األنبوب الماص للحرارةيوضح اجزاء وتركيب (3-1)الشكل
طرق تكامل الوحدة التوليدية المركبة بالطاقة الشمسية 3 -1واالداء للوحدة الشمسية ونسبة مشاركتها في المحطات المركبة يعتمد وبصورة رئيسية ان كمية القدرة المتولدة
فهنالك , على عدة عوامل ومنها شدة االشعاع الشمسي وطريقة انتقال الطاقة الشمسية الى الوحدة المركبة ومة توليد البخار طريقتان مستخدمتان وبصورة رئسيسية النتقال الطاقة الحرارية من الوحدة الشمسية الى منظ
فبعد سحب الماء من وحدة التغذية او من اي جزء من المبادالت الحرارية , في الوحدة التوليدية المركبةواكتسابة الطاقة الحرارية من الوحدة الشمسية وتحويلة الى بخار ينقل بعدها ويرجع بصورة مباشرة الى مبادل
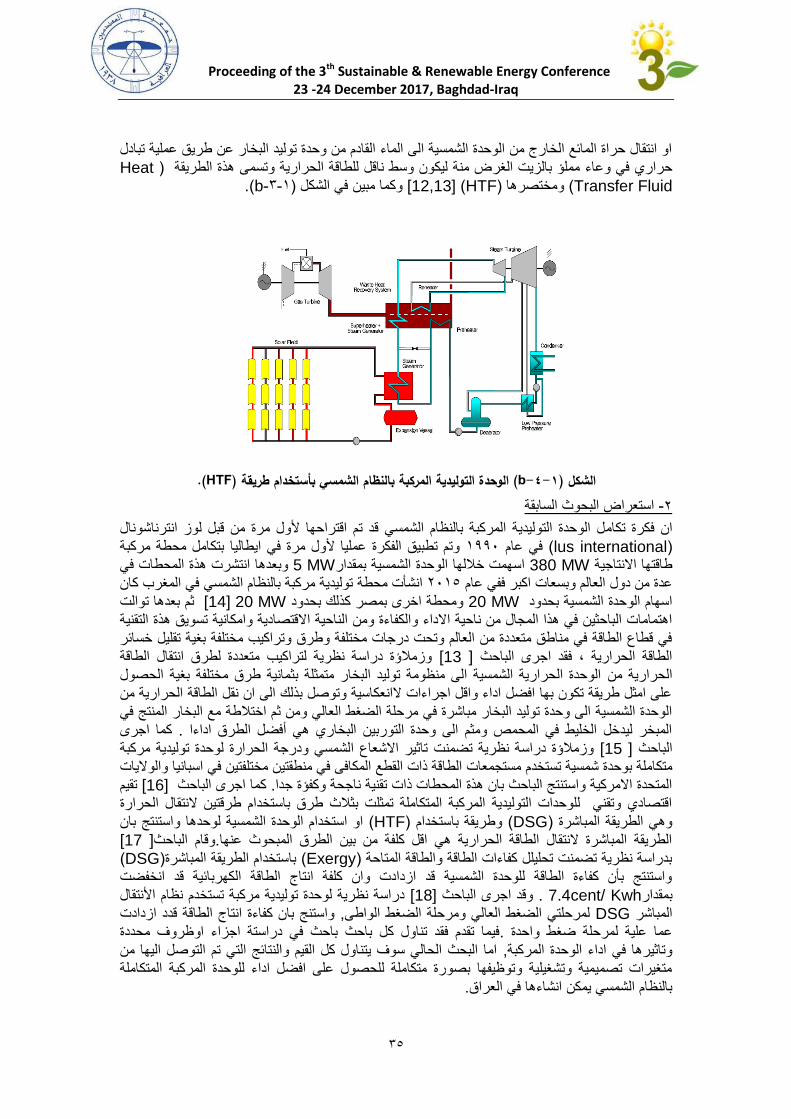
فتسمى هذة الطريقة باالنتقال المباشر HRSGمعين سوى اكان المبخر او المحمص في منظومة ( a-3-3)وكما مبين في الشكل ( DSG)ومختصرها ( Direct steam generator)للبخار
الوحدة (a-4-1)الشكل التوليدية المركبة بالنظام
طريقة الشمسي بأستخدام(DSG)
Proceeding of the 3th Sustainable & Renewable Energy Conference
23 -24 December 2017, Baghdad-Iraq
12
او انتقال حراة المائع الخارج من الوحدة الشمسية الى الماء القادم من وحدة توليد البخار عن طريق عملية تبادل
Heat)ض منة ليكون وسط ناقل للطاقة الحرارية وتسمى هذة الطريقة حراري في وعاء مملؤ بالزيت الغرTransfer Fluid ) ومختصرها(HTF )[12,13] وكما مبين في الشكل(1-3-b.)
.(HTF)الوحدة التوليدية المركبة بالنظام الشمسي بأستخدام طريقة (b-4-1)الشكل استعراض البحوث السابقة -2
ل الوحدة التوليدية المركبة بالنظام الشمسي قد تم اقتراحها ألول مرة من قبل لوز انترناشونال ان فكرة تكام(lus international ) وتم تطبيق الفكرة عمليا ألول مرة في ايطاليا بتكامل محطة مركبة 3991في عام
رت هذة المحطات في وبعدها انتش MW 5اسهمت خاللها الوحدة الشمسية بمقدار MW 380طاقتها االنتاجية انشأت محطة توليدية مركبة بالنظام الشمسي في المغرب كان 2132عدة من دول العالم وبسعات اكبر ففي عام
ثم بعدها توالت MW [14] 20ومحطة اخرى بمصر كذلك بحدود MW 20اسهام الوحدة الشمسية بحدود اءة ومن الناحية االقتصادية وامكانية تسويق هذة التقنية اهتمامات الباحثين في هذا المجال من ناحية االداء والكف
في قطاع الطاقة في مناطق متعددة من العالم وتحت درجات مختلفة وطرق وتراكيب مختلفة بغية تقليل خسائر وزمالؤة دراسة نظرية لتراكيب متعددة لطرق انتقال الطاقة [ 13]الطاقة الحرارية ، فقد اجرى الباحث
الوحدة الحرارية الشمسية الى منظومة توليد البخار متمثلة بثمانية طرق مختلفة بغية الحصول الحرارية من على امثل طريقة تكون بها افضل اداء واقل اجراءات الانعكاسية وتوصل بذلك الى ان نقل الطاقة الحرارية من
م اختالطة مع البخار المنتج في الوحدة الشمسية الى وحدة توليد البخار مباشرة في مرحلة الضغط العالي ومن ثكما اجرى . المبخر ليدخل الخليط في المحمص ومثم الى وحدة التوربين البخاري هي أفضل الطرق اداءا
وزمالؤة دراسة نظرية تضمنت تاثير االشعاع الشمسي ودرجة الحرارة لوحدة توليدية مركبة [ 15]الباحث قة ذات القطع المكافى في منطقتين مختلفتين في اسبانيا والواليات متكاملة بوحدة شمسية تستخدم مستجمعات الطا
تقيم [16]كما اجرى الباحث . المتحدة االمركية واستنتج الباحث بان هذة المحطات ذات تقنية ناجحة وكفؤة جدالحرارة اقتصادي وتقني للوحدات التوليدية المركبة المتكاملة تمثلت بثالث طرق باستخدام طرقتين النتقال ا
او استخدام الوحدة الشمسية لوحدها واستنتج بان ( HTF)وطريقة باستخدام ( DSG)وهي الطريقة المباشرة [ 17]وقام الباحث.الطريقة المباشرة النتقال الطاقة الحرارية هي اقل كلفة من بين الطرق المبحوث عنها
( DSG)باستخدام الطريقة المباشرة( Exergy)بدراسة نظرية تضمنت تحليلل كفاءات الطاقة والطاقة المتاحة واستنتج بأن كفاءة الطاقة للوحدة الشمسية قد ازدادت وان كلفة انتاج الطاقة الكهربائية قد انخفضت
دراسة نظرية لوحدة توليدية مركبة تستخدم نظام األنتقال [18]وقد اجرى الباحث . 7.4cent/ Kwhبمقدارواستنج بان كفاءة انتاج الطاقة قدد ازدادت , لي ومرحلة الضغط الواطىلمرحلتي الضغط العا DSGالمباشر
باحث في دراستة اجزاء اوظروف محددة فيما تقدم فقد تناول كل باحث .عما علية لمرحلة ضغط واحدة اما البحث الحالي سوف يتناول كل القيم والنتائج التي تم التوصل اليها من, وتاثيرها في اداء الوحدة المركبة
متغيرات تصميمية وتشغيلية وتوظيفها بصورة متكاملة للحصول على افضل اداء للوحدة المركبة المتكاملة . بالنظام الشمسي يمكن انشاءها في العراق
Proceeding of the 3th Sustainable & Renewable Energy Conference
23 -24 December 2017, Baghdad-Iraq
16
نظرية البحث 2-1تتضمن نظرية البحث بتكامل وحدة غازية بسيطة الى وحدة توليدية مركبة لها القابلية للتكامل بالنظام الشمسي
ث تتمثل ألية العمل بسحب الماء المشبع بعد خروجة من مقتصد مرحلة الضغط العالي وبدرجة حرارة معينة حيليدخل بدورة الى الوحدة الشمسية وتسخينة الى بخار مشبع وبنفس درجة الحرارة بعد اكتسابة الطاقة الحرارية
ليد البخار مباشررة وهومايعرف بطريقة الالزمة لزيادة معدل جريان البخار الذي يرجع بدورة الى منظومة توليتم تحميصة عن طريق حرارة الغازات الخارجة من التوربين الغازي في محمص ( DSG)األنتقال المباشر
. مرحلة الضغط العالي يرسل فيما بعد ألدارة التوربين البخاري
التحليل الرياضياتي :-3لتبسيط التحليل الرياضياتي في . يقي للنظام بشكل رياضياتي ان محاكاة أي نظام يكون بتمثيل السلوك الحق
اجراءات منظومة توليد البخار التي اعتمدت ضمن الدراسة الحالية ومن اجل تسهيل محاكاة المنظومات - : :الحرارية تم وضع الفرضيات التالية
.أداء النظام يكون مستقرا -1 .اعتمدت السرعة ثابتة -2 (عدم وجود حرق اضافي للغازات)ة المستقرة واالعتماد كليا على حرارة غازات العادم محاكاة النظام بالحال -1 .ال يوجد تبريد للغازات اثناء انتقالها من مبادل حراري الى اخر -3 لتجنب ظاهرة تكثف بعض K 373ال تقل( stack temp)درجة حرارة الغاز الخارج من المنظومة -2
. [19]بة للغاز مسببا تأكل في المبادالت الحراريةالمركبات الكيميائية المصاحفي C°10هي ( ap.p)وقيمة درجة حرارة التقارب C°2هي ( p.p)فرض قيمة درجة حرارة التضايق -6
.[20] .مرحلة الضغط العالي والواطئ :نمذجة الوحدة الغازية البسيطة:3-2
زي تعتبر مهمة في عملية ايجاد العوامل التشغيلية المواصصفات الحرارية للغازات الخارجة من التوربين الغا (3-1)لمنظومة توليد البخار المتكاملة بالمحطات الشمسية الحرارية موضحة في الجدول
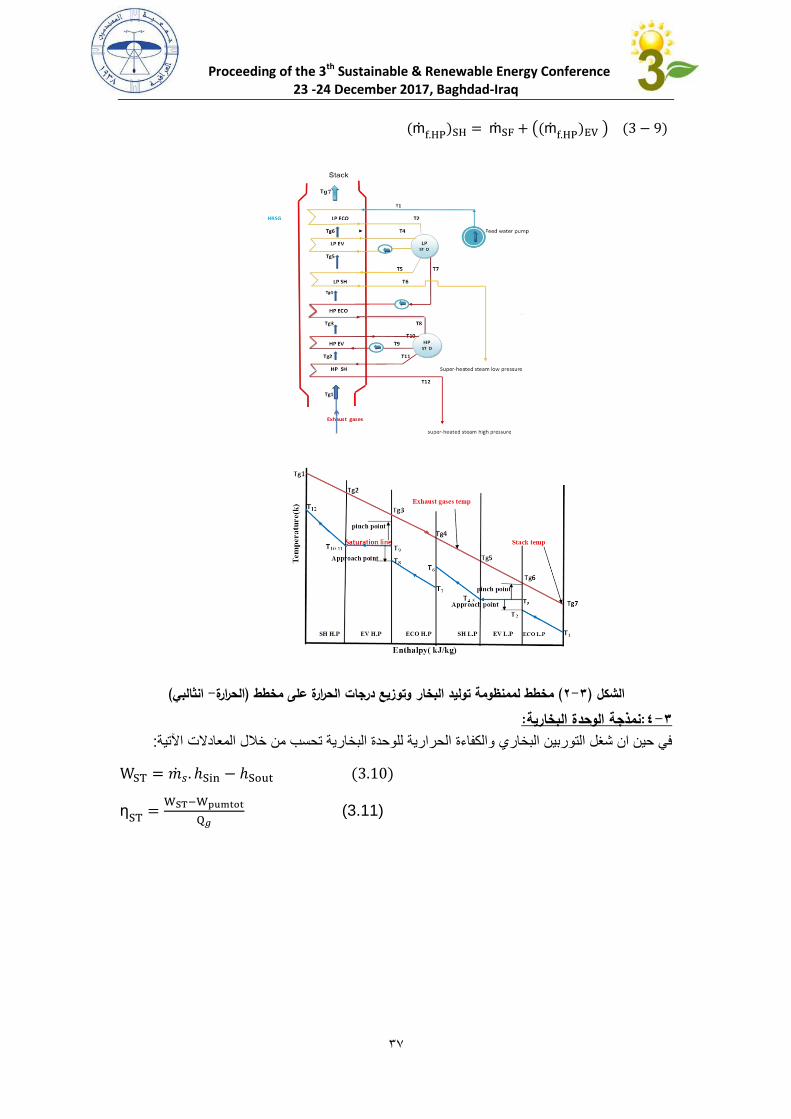
يمثل البيانات الفنية والتقنية للمستجمع الشمسي( 1-3)الجدول
V94.2 Siemens نوع التوربين الغازي
kg/s 509 معدل جريان غازات العادم
K 818 درجة حرارة غازات الخارجة
MW 150 القدرة التوليدية
kg/s 9.7 معدل جريان الوقود
42217 الحرارة النوعية للوقود
0.35 الكفاءة الحرارية
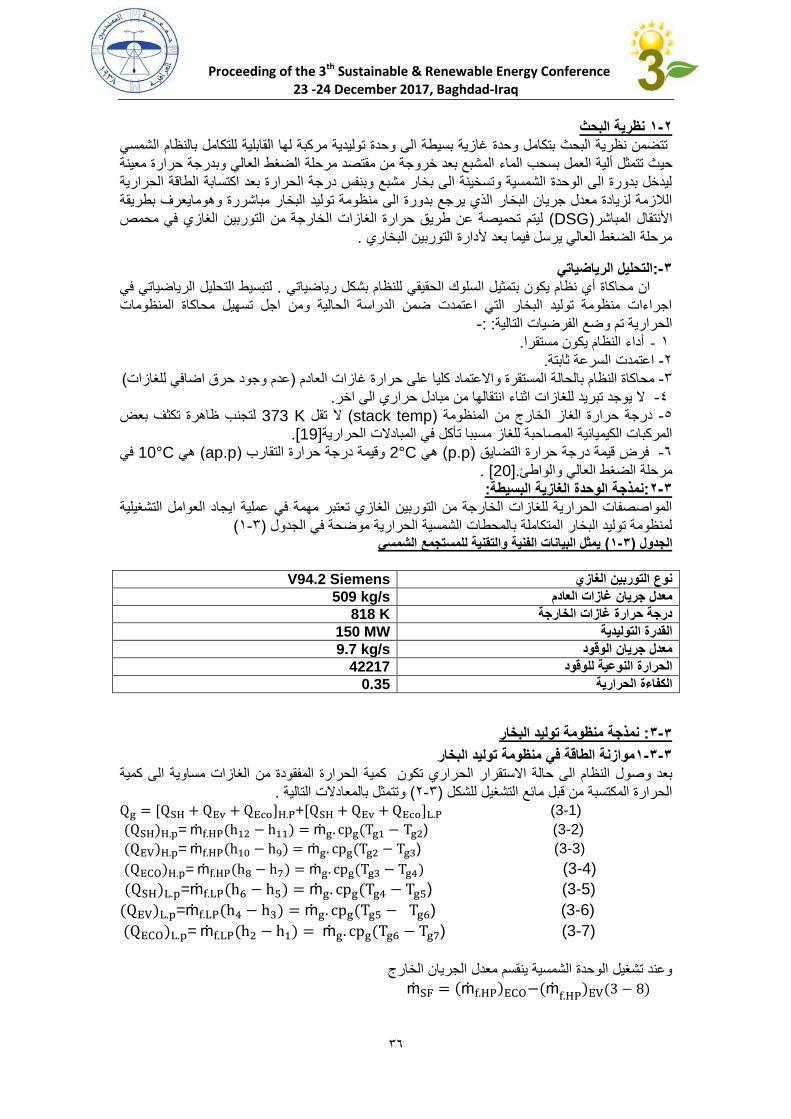
نمذجة منظومة توليد البخار: 3-3
موازنة الطاقة في منظومة توليد البخار3-3-1راري تكون كمية الحرارة المفقودة من الغازات مساوية الى كمية بعد وصول النظام الى حالة االستقرار الح
.وتتمثل بالمعادالت التالية ( 2-1)الحرارة المكتسبة من قبل مائع التشغيل للشكل + (3-1)
= ) (3-2)
= ) (3-3)
= (3-4)
= ) (3-5)
= ) (3-6)
= ) (3-7)
وعند تشغيل الوحدة الشمسية ينقسم معدل الجريان الخارج
Proceeding of the 3th Sustainable & Renewable Energy Conference
23 -24 December 2017, Baghdad-Iraq
13
(انثالبي -الحرارة)مخطط لممنظومة توليد البخار وتوزيع درجات الحرارة على مخطط ( 2-3)الشكل :نمذجة الوحدة البخارية:3-4
:اآلتيةفي حين ان شغل التوربين البخاري والكفاءة الحرارية للوحدة البخارية تحسب من خالل المعادالت
(3.11)
Proceeding of the 3th Sustainable & Renewable Energy Conference
23 -24 December 2017, Baghdad-Iraq
13
:نمذجة الوحدة المركبة: 3-5
الوحدة الغازية البسيطة ومنظومة توليد البخار والوحدة البخارية معا يمكن حساب , بعد دمج المنظومات الثالثاآلتية ية المركبة واالستهالك النوعي للوقود والكفاءة الحرارية من المعادالت كل من القدرة الكلية للوحدة التوليد
.وعلى التوالي
(3.12)
(3.13)
(3.14)
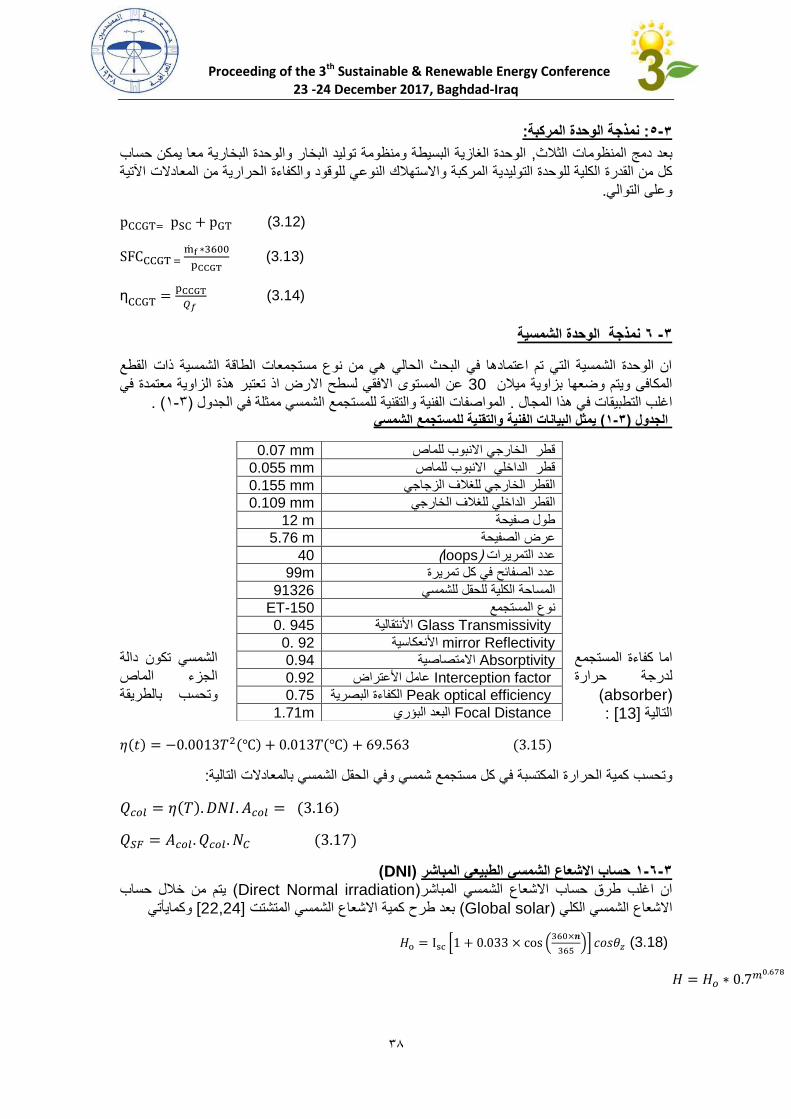
ة نمذجة الوحدة الشمسي 6 -3
ان الوحدة الشمسية التي تم اعتمادها في البحث الحالي هي من نوع مستجمعات الطاقة الشمسية ذات القطع عن المستوى االفقي لسطح االرض اذ تعتبر هذة الزاوية معتمدة في 30المكافى ويتم وضعها بزاوية ميالن
( .3-1)جمع الشمسي ممثلة في الجدول المواصفات الفنية والتقنية للمست. اغلب التطبيقات في هذا المجال يمثل البيانات الفنية والتقنية للمستجمع الشمسي( 1-3)الجدول
الشمسي تكون دالة اما كفاءة المستجمع الجزء الماص لدرجة حرارة وتحسب بالطريقة (absorber )
: [13]التالية
𝜂
:وفي الحقل الشمسي بالمعادالت التاليةفي كل مستجمع شمسي وتحسب كمية الحرارة المكتسبة
𝜂
(DNI) حساب االشعاع الشمسي الطبيعي المباشر 3-6-1يتم من خالل حساب ( Direct Normal irradiation)ان اغلب طرق حساب االشعاع الشمسي المباشر
وكمايأتي [22,24]بعد طرح كمية االشعاع الشمسي المتشتت ( Global solar)االشعاع الشمسي الكلي
(3.18)
mm 0.07 قطر الخارجي االنبوب للماص
mm 0.055 قطر الداخلي االنبوب للماص
mm 0.155 القطر الخارجي للغالف الزجاجي
mm 0.109 القطر الداخلي للغالف الخارجي
m 12 حة طول صفي
m 5.76 عرض الصفيحة
40 (loops) عدد التمريرات 99m عدد الصفائح في كل تمريرة
91326 المساحة الكلية للحقل للشمسي
ET-150 نوع المستجمع
Glass Transmissivity 945 .0 األنتقالية
mirror Reflectivity 92 .0 األنعكاسية Absorptivity 0.94 االمتصاصية
Interception factor 0.92 عامل األعتراض
Peak optical efficiency 0.75 الكفاءة البصرية
Focal Distance 1.71 البعد البؤريm

Proceeding of the 3th Sustainable & Renewable Energy Conference
23 -24 December 2017, Baghdad-Iraq
19
1367 هو ثابت شمسي وقيمتع حواللي حيث ان 2
,Zθ زاوية الذروة للشمسHo االشعاع الشمسي في الفضاء الخارجيH األشعاع الشمسي
الكلي
زاوية انحراف الشمس δساعة زاوية الشمسي و ωخط العرض و ϕوتعتبر :[23]ويحسب االشعاع الشمسي الكلي الساقط على مستجمع مائل تكون زاوية الحدث بالطريقة التالية
كاالتي δزاوية ميالن المستجمع الشمسي عن المستوى االرضي وتحسب βوتمثل
=
d : في اخر يوم في السنة 162به لالول من كانون الثاني وترت 3هو تسلسل اليوم في السنة ويكون ترتبة
:[24]هي وقت حساب االشعاع الشمسي وتحسب بالطريقة التالية STحيث
LL تمثل خط الطول وLS لخط الطول و التوقيت المحلي للمنطقة نسبةET عامل في الوقت تحسب على النحو :التالي
Where
وخط طول ( N′34⁰55)على خط عرض (مجال الدراسة)والتي تقع فيها المحطة ( منطقة بيجي)تقع المنطقة
(43⁰29′E. )تشتت يكون من خالل العالقة ولحساب االشعاع الشمسي الم(model Jordan) [22]التالية :
: S تمثل عدد ساعات شروق الشمس خالل اليومSmax :تمثل طول النهار
الشمسي المباشر واالشعاع الشمسي المشتت االشعاعيبن ( 3-3)الشكل
Proceeding of the 3th Sustainable & Renewable Energy Conference
23 -24 December 2017, Baghdad-Iraq
31
a,b تمثل ثوابت وقيمتها(a=0.25 )و(b=0. 5 ) [25]
:كاالتي أما حساب االشعاع الطبييعي المباشر يكون
(:ISCC)نمذجة الوحدة المركبة المتكاملة بالنظام الشمسي 3-7 :تحسب كفاءة الوحدة التوليدية المركبة بالطريقة التالية
اما كفاءة الحقل الشمسي تحسب بالطريقة التالية
سي ومعدل االستهالك النوعي للوحدة التوليدية المركبة المتكاملة بالنظام الشم
:محاكاة النظام -4باستخدام برنامج حل المعادالت الهندسية يتم برمجة المعادالت أعاله ومحاكاة الوحدة التوليدية المتكاملة
(Engineering Equation Solver )لذي يعتبر من البرامج المستخدمة بشكل كبير في مجال الهندسة اوالكثافة , المحتوى الحراري)الميكانيكية و يحتوي على قاعدة بيانات للخواص الفيزيائية لجميع الموائع مثل
دة لقد اعتمد في البحث الحالي على المواصفات الفنية والظروف التشغيلية للوح, وغيرها( والتوصيلية الحرارية,بإدخال قيم محددة إلى البرنامج كدرجة (العراق)في محطة بيجي الغازية ( V94.2Siemens)الغازية من نوع
حرارة غازات العادم ومعدل جريان الغازات الخارجة من التوربين الغازي والداخلة بدورها الى منظومة توليد واصفات الفنية االخرى والتي تشمل الكفاءة والقيمة الحرارية الدنيا للوقود المستخدم الم( HRSG)البخار
لقد برمجت . والتي تكون مدخالت للعوامل التشغلية لمنظومة توليد البخارالحرارية للوحدة الغازية البسيطة للحصول على الظروف التشغيلية لمنظومة توليد البخار والتي ( 3.1-9 .3) المعادالت الخاصة بموازنة الطاقة
والضغط ونسبة تدفق كتلة البخار في مرحلة الضغط العالي والواطئ في حالة التشغيل تشمل درجات الحرارةواجراء الحسابات الالزمة للوحدة الشمسية مع تغير شدة االشعاع الشمسي لكل شهر في السنة عند , التقليدي
الشمسي ومواصفات التشغيل على النظام الشمسي بعد ادخال قيم محددة للبرنامج كالمواصفات الفنية للمستجمع ينفذ البرنامج للحصول على العوامل الحرارية من ضغط ودرجة . الموقع الجغرافي للمنطقة والتوقيت المحلي
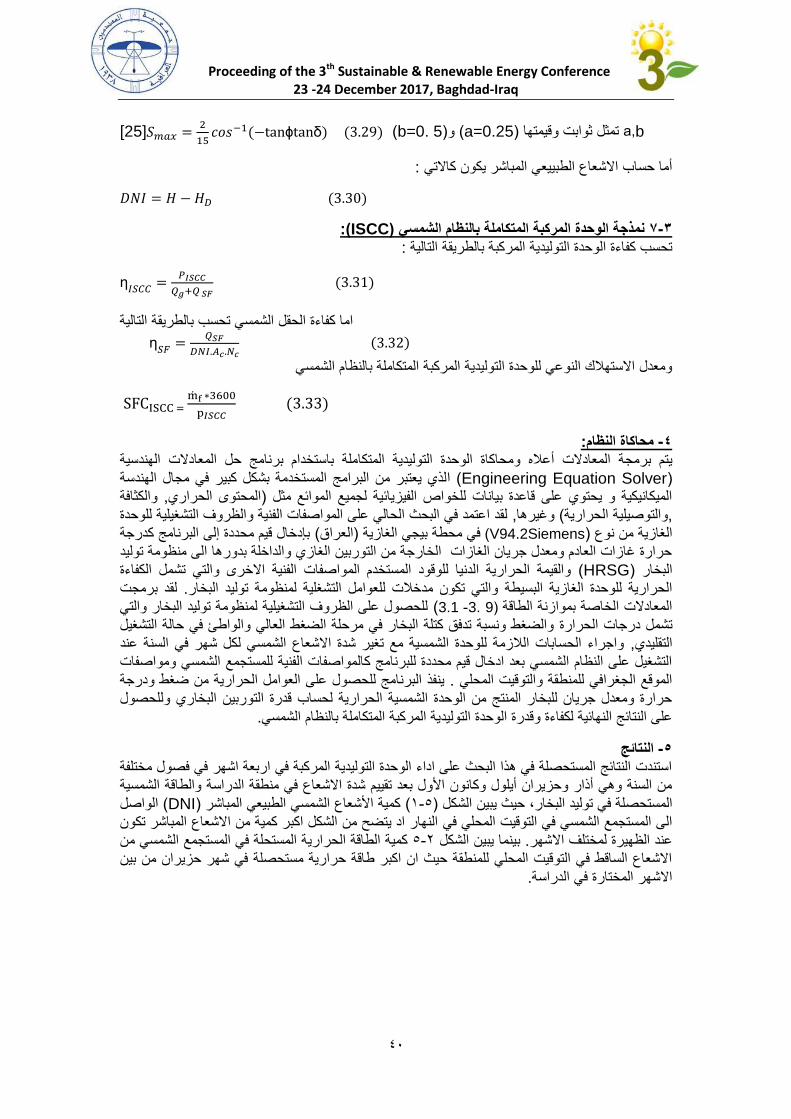
حرارة ومعدل جريان للبخار المنتج من الوحدة الشمسية الحرارية لحساب قدرة التوربين البخاري وللحصول .ية المركبة المتكاملة بالنظام الشمسيعلى النتائج النهائية لكفاءة وقدرة الوحدة التوليد
النتائج -5استندت النتائج المستحصلة في هذا البحث على اداء الوحدة التوليدية المركبة في اربعة اشهر في فصول مختلفة من السنة وهي أذار وحزيران أيلول وكانون األول بعد تقييم شدة االشعاع في منطقة الدراسة والطاقة الشمسية
الواصل ( DNI)كمية األشعاع الشمسي الطبيعي المباشر ( 3-2)لة في توليد البخار، حيث يبين الشكل المستحصالنهار اد يتضح من الشكل اكبر كمية من االشعاع المباشر تكون الى المستجمع الشمسي في التوقيت المحلي في
ة المستحلة في المستجمع الشمسي من كمية الطاقة الحراري 2-2بينما يبين الشكل . عند الظهيرة لمختلف االشهراالشعاع الساقط في التوقيت المحلي للمنطقة حيث ان اكبر طاقة حرارية مستحصلة في شهر حزيران من بين
.االشهر المختارة في الدراسة
Proceeding of the 3th Sustainable & Renewable Energy Conference
23 -24 December 2017, Baghdad-Iraq
33
200
300
400
500
600
700
800
900
4 6 8 10 12 14 16 18 20 22
w/m
2ر
شبالم
اي
يعطب
الي
سشم
الععا
شأل ا
( hour)التوقيت المحلي
آذار-21 حزيران-21
أيلول-21 األول كانون-21
15 19 23 27 31 35 39 43 47 51 55
4 6 8 10 12 14 16 18 20 22
MW
ة
ريرا
ح ال
قةطا
ال
(hour)التوقيت المحلي
آذار-21
حزيران-21
أيلول-21
األول كانون-21
60
66
72
78
84
90
96
102
108
0 2 4 6 8 10 12 14 16 18 20 22 24
kg/s
ر خا
لب انياجر
ل عد
م
(hour)التوقيت المحلي
آذار-21
حزيران-21
أيلول-21
األول كانون-21
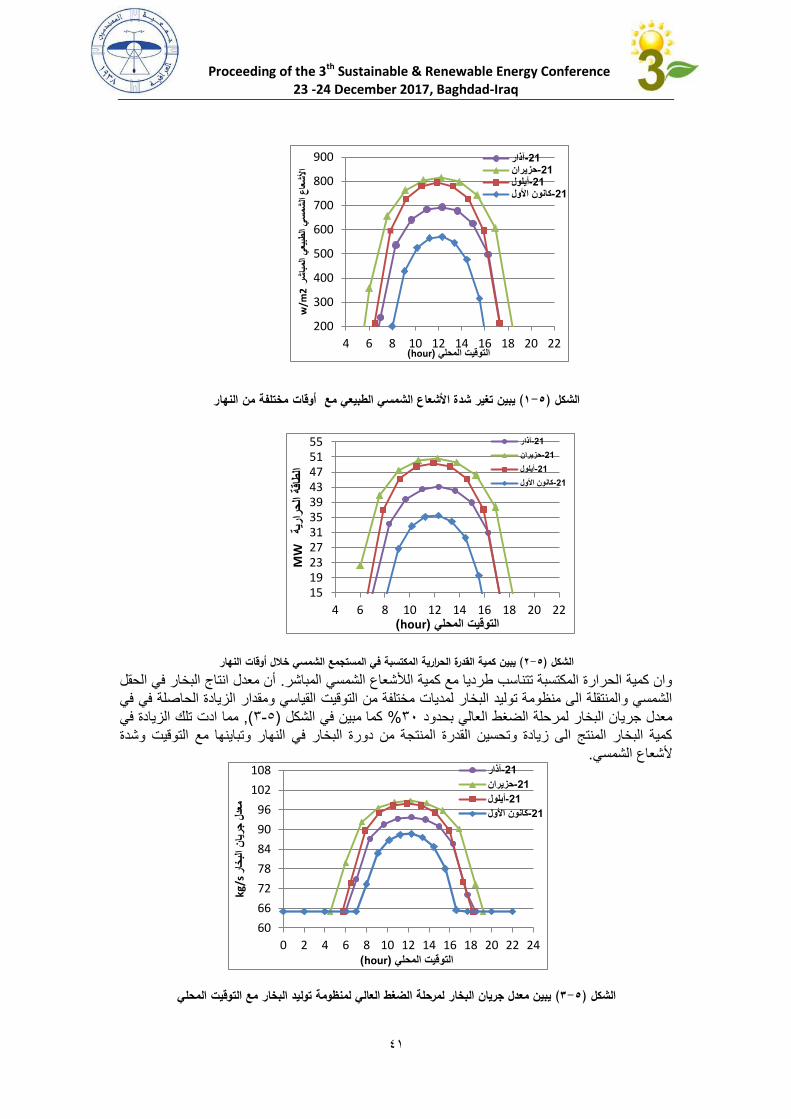
أوقات مختلفة من النهار يبين تغير شدة األشعاع الشمسي الطبيعي مع ( 1-5)الشكل
يبين كمية القدرة الحرارية المكتسبة في المستجمع الشمسي خالل أوقات النهار( 2-5)الشكل أن معدل انتاج البخار في الحقل . وان كمية الحرارة المكتسبة تتناسب طرديا مع كمية الألشعاع الشمسي المباشر
قدار الزيادة الحاصلة في في الشمسي والمنتقلة الى منظومة توليد البخار لمديات مختلفة من التوقيت القياسي وممما ادت تلك الزيادة في , (1-2)كما مبين في الشكل % 11معدل جريان البخار لمرحلة الضغط العالي بحدود
كمية البخار المنتج الى زيادة وتحسين القدرة المنتجة من دورة البخار في النهار وتباينها مع التوقيت وشدة .ألشعاع الشمسي
يبين معدل جريان البخار لمرحلة الضغط العالي لمنظومة توليد البخار مع التوقيت المحلي( 3-5)الشكل
Proceeding of the 3th Sustainable & Renewable Energy Conference
23 -24 December 2017, Baghdad-Iraq
32
30
45
60
75
90
105
120
135
150
165
0 2 4 6 8 10 12 14 16 18 20 22 24
MW
ة
جنتلم
اية
ائرب
كه ال
رةقد
ال
(hour)التوقيت المحلي
( دورة برايتون)دورة الغاز
(دورة رانكن)دورة البخار
222 225 228 231 234 237 240 243 246 249 252 255
0 2 4 6 8 10 12 14 16 18 20 22 24
MW
ة جنتلم
اية
ائرب
كه ال
رةقد
ال
(hour)التوقيت المحلي
آذار-21
حزيران-21
أيلول-21
األول كانون-21
0.54
0.55
0.56
0.57
0.58
0.59
0.6
0.61
0.62
0 2 4 6 8 10 12 14 16 18 20 22 24
يةار
حر ال
ءةفالك
ا
(hour)التوقيت المحلي
آذار-21
حزيران-21
أيلول-21
األول كانون-21
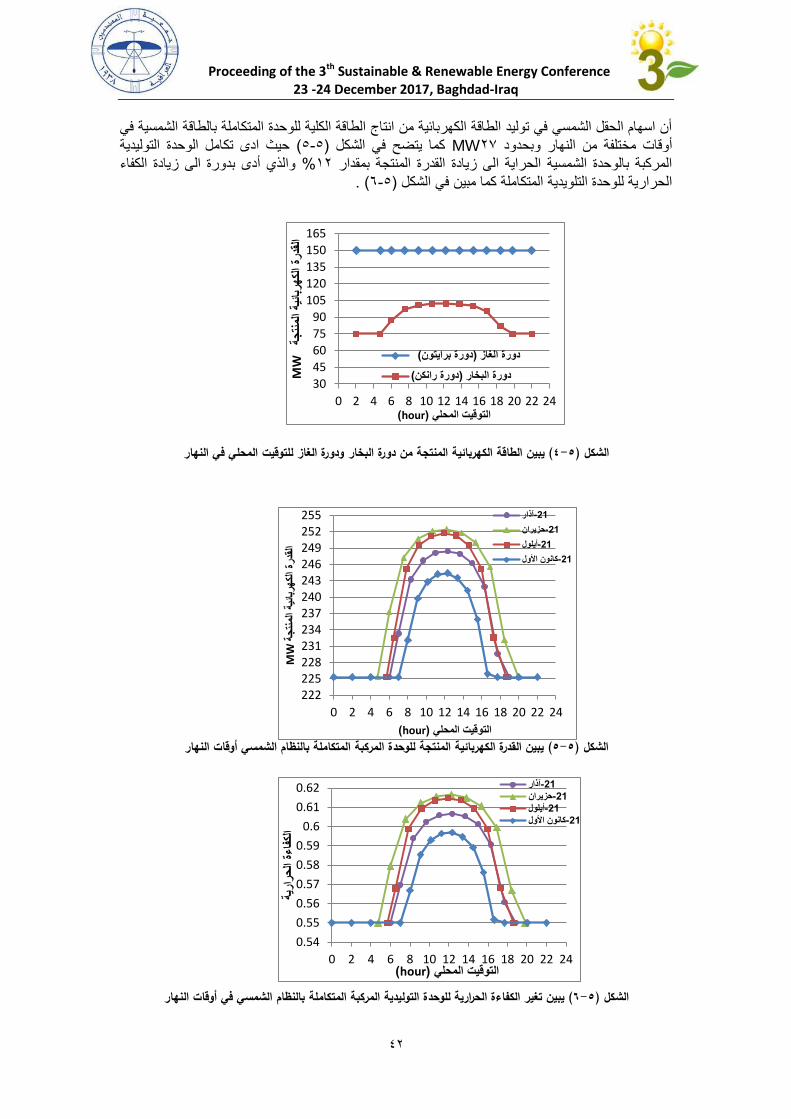
أن اسهام الحقل الشمسي في توليد الطاقة الكهربائية من انتاج الطاقة الكلية للوحدة المتكاملة بالطاقة الشمسية في ادى تكامل الوحدة التوليدية حيث ( 2-2)كما يتضح في الشكل 23MWأوقات مختلفة من النهار وبحدود
والذي أدى بدورة الى زيادة الكفاء % 32المركبة بالوحدة الشمسية الحراية الى زيادة القدرة المنتجة بمقدار ( . 6-2)الحرارية للوحدة التلويدية المتكاملة كما مبين في الشكل
ودورة الغاز للتوقيت المحلي في النهار يبين الطاقة الكهربائية المنتجة من دورة البخار( 4-5)الشكل
يبين القدرة الكهربائية المنتجة للوحدة المركبة المتكاملة بالنظام الشمسي أوقات النهار( 5-5)الشكل
بالنظام الشمسي في أوقات النهار يبين تغير الكفاءة الحرارية للوحدة التوليدية المركبة المتكاملة( 6-5)الشكل
Proceeding of the 3th Sustainable & Renewable Energy Conference
23 -24 December 2017, Baghdad-Iraq
31
0.136
0.138
0.14
0.142
0.144
0.146
0.148
0.15
0.152
0.154
0.156
0 2 4 6 8 10 12 14 16 18 20 22 24
Kg/
Kw
.hr
يعنو
الود
وق ال
كالته
س ادل
مع
(hour)التوقيت المحلي
آذار-21
حزيران-21
أيلول-21
األول كانون-21
28
28.5
29
29.5
30
30.5
31
31.5
32
0 2 4 6 8 10 12 14 16 18 20 22 24
Kg/
Kw
.hr
د سي
وك اي
ان ثت
ثاعا
نبا
نبو
ارلك
ا
(hour)التوقيت المحلي
آذار-21
حزيران-12
أيلول-21
21- األول كانون
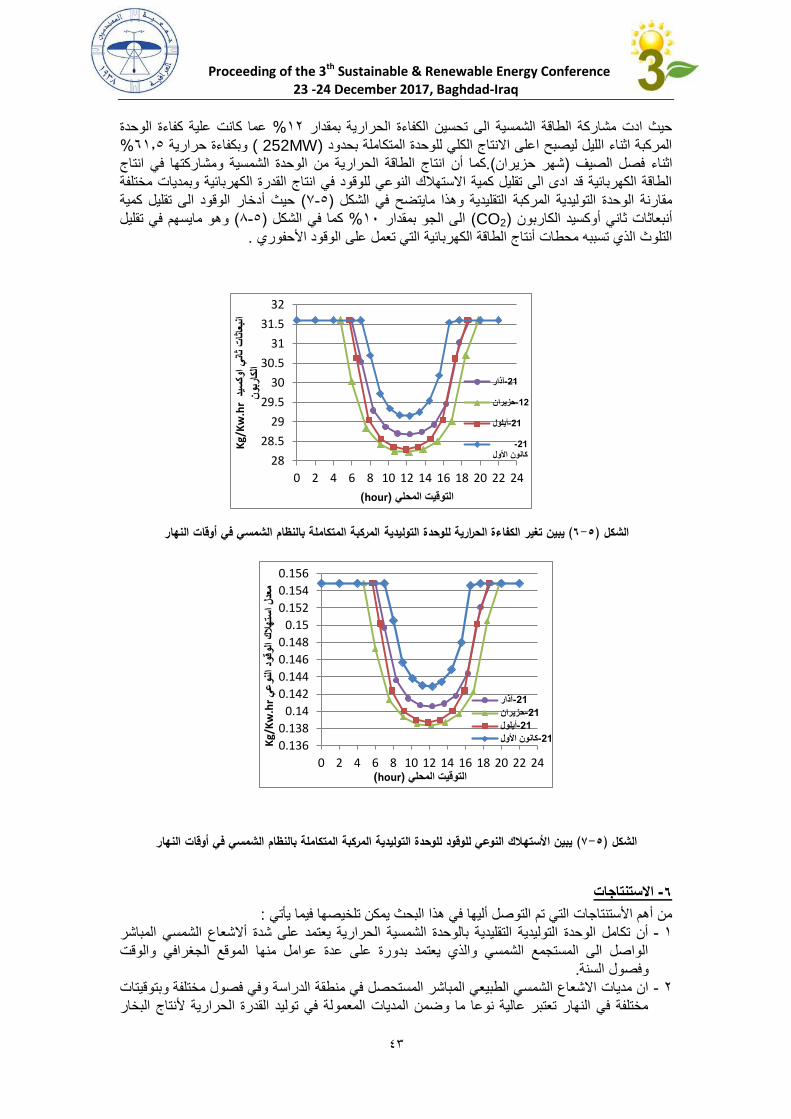
عما كانت علية كفاءة الوحدة % 32حيث ادت مشاركة الطاقة الشمسية الى تحسين الكفاءة الحرارية بمقدار % 6352وبكفاءة حرارية ) (252MWالمركبة اثناء الليل ليصبح اعلى االنتاج الكلي للوحدة المتكاملة بحدود
ا أن انتاج الطاقة الحرارية من الوحدة الشمسية ومشاركتها في انتاج كم(.شهر حزيران)اثناء فصل الصيف الطاقة الكهربائية قد ادى الى تقليل كمية االستهالك النوعي للوقود في انتاج القدرة الكهربائية وبمديات مختلفة
الى تقليل كمية حيث أدخار الوقود( 3-2)مقارنة الوحدة التوليدية المركبة التقليدية وهذا مايتضح في الشكل وهو مايسهم في تقليل ( 3-2)كما في الشكل % 31الى الجو بمقدار ( CO2)أنبعاثات ثاني أوكسيد الكاربون
.التلوث الذي تسببه محطات أنتاج الطاقة الكهربائية التي تعمل على الوقود األحفوري
المركبة المتكاملة بالنظام الشمسي في أوقات النهار يبين تغير الكفاءة الحرارية للوحدة التوليدية( 6-5)الشكل
يبين األستهالك النوعي للوقود للوحدة التوليدية المركبة المتكاملة بالنظام الشمسي في أوقات النهار( 7-5)الشكل
االستنتاجات -6
:تي من أهم األستنتاجات التي تم التوصل أليها في هذا البحث يمكن تلخيصها فيما يأأن تكامل الوحدة التوليدية التقليدية بالوحدة الشمسية الحرارية يعتمد على شدة أالشعاع الشمسي المباشر -3
الواصل الى المستجمع الشمسي والذي يعتمد بدورة على عدة عوامل منها الموقع الجغرافي والوقت .وفصول السنة
نطقة الدراسة وفي فصول مختلفة وبتوقيتات ان مديات االشعاع الشمسي الطبيعي المباشر المستحصل في م -2مختلفة في النهار تعتبر عالية نوعا ما وضمن المديات المعمولة في توليد القدرة الحرارية ألنتاج البخار
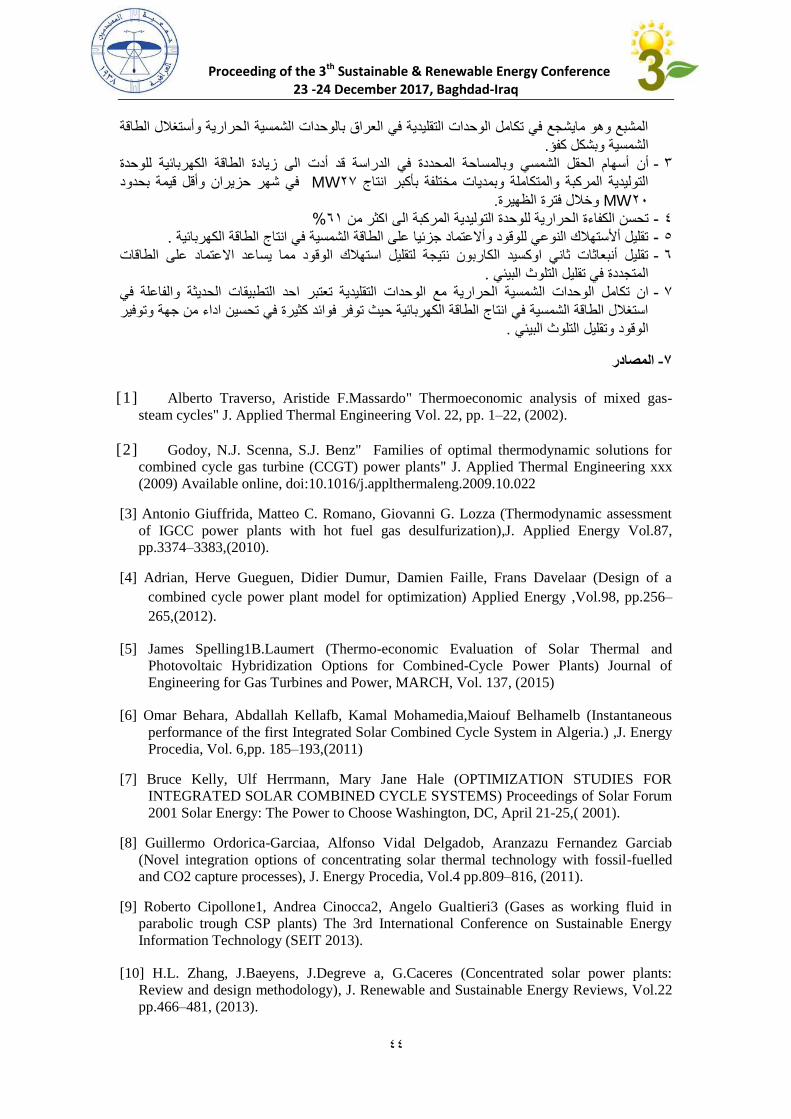
Proceeding of the 3th Sustainable & Renewable Energy Conference
23 -24 December 2017, Baghdad-Iraq
33
المشبع وهو مايشجع في تكامل الوحدات التقليدية في العراق بالوحدات الشمسية الحرارية وأستغالل الطاقة .الشمسية وبشكل كفؤ
أسهام الحقل الشمسي وبالمساحة المحددة في الدراسة قد أدت الى زيادة الطاقة الكهربائية للوحدة أن -1في شهر حزيران وأقل قيمة بحدود 23MWالتوليدية المركبة والمتكاملة وبمديات مختلفة بأكبر انتاج
21MW وخالل فترة الظهيرة. %63ى اكثر من تحسن الكفاءة الحرارية للوحدة التوليدية المركبة ال -3 .تقليل أألستهالك النوعي للوقود وأالعتماد جزئيا على الطاقة الشمسية في انتاج الطاقة الكهربائية -2تقليل أنبعاثات ثاني اوكسيد الكاربون نتيجة لتقليل استهالك الوقود مما يساعد االعتماد على الطاقات -6
.المتجددة في تقليل التلوث البيئي شمسية الحرارية مع الوحدات التقليدية تعتبر احد التطبيقات الحديثة والفاعلة في ان تكامل الوحدات ال -3
استغالل الطاقة الشمسية في انتاج الطاقة الكهربائية حيث توفر فوائد كثيرة في تحسين اداء من جهة وتوفير .الوقود وتقليل التلوث البيئي
المصادر -7
[1] Alberto Traverso, Aristide F.Massardo" Thermoeconomic analysis of mixed gas-
steam cycles" J. Applied Thermal Engineering Vol. 22, pp. 1–22, (2002).
[2] Godoy, N.J. Scenna, S.J. Benz" Families of optimal thermodynamic solutions for
combined cycle gas turbine (CCGT) power plants" J. Applied Thermal Engineering xxx
(2009) Available online, doi:10.1016/j.applthermaleng.2009.10.022
[3] Antonio Giuffrida, Matteo C. Romano, Giovanni G. Lozza (Thermodynamic assessment
of IGCC power plants with hot fuel gas desulfurization),J. Applied Energy Vol.87,
pp.3374–3383,(2010).
[4] Adrian, Herve Gueguen, Didier Dumur, Damien Faille, Frans Davelaar (Design of a
combined cycle power plant model for optimization) Applied Energy ,Vol.98, pp.256–
265,(2012).
[5] James Spelling1B.Laumert (Thermo-economic Evaluation of Solar Thermal and
Photovoltaic Hybridization Options for Combined-Cycle Power Plants) Journal of
Engineering for Gas Turbines and Power, MARCH, Vol. 137, (2015)
[6] Omar Behara, Abdallah Kellafb, Kamal Mohamedia,Maiouf Belhamelb (Instantaneous
performance of the first Integrated Solar Combined Cycle System in Algeria.) ,J. Energy
Procedia, Vol. 6,pp. 185–193,(2011)
[7] Bruce Kelly, Ulf Herrmann, Mary Jane Hale (OPTIMIZATION STUDIES FOR
INTEGRATED SOLAR COMBINED CYCLE SYSTEMS) Proceedings of Solar Forum
2001 Solar Energy: The Power to Choose Washington, DC, April 21-25,( 2001).
[8] Guillermo Ordorica-Garciaa, Alfonso Vidal Delgadob, Aranzazu Fernandez Garciab
(Novel integration options of concentrating solar thermal technology with fossil-fuelled
and CO2 capture processes), J. Energy Procedia, Vol.4 pp.809–816, (2011).
[9] Roberto Cipollone1, Andrea Cinocca2, Angelo Gualtieri3 (Gases as working fluid in
parabolic trough CSP plants) The 3rd International Conference on Sustainable Energy
Information Technology (SEIT 2013).
[10] H.L. Zhang, J.Baeyens, J.Degreve a, G.Caceres (Concentrated solar power plants:
Review and design methodology), J. Renewable and Sustainable Energy Reviews, Vol.22
pp.466–481, (2013).
Proceeding of the 3th Sustainable & Renewable Energy Conference
23 -24 December 2017, Baghdad-Iraq
32
[11] Halima Derbal-Mokranea, Sofiane Bouaichaouib, Najla El Gharbib, Mayouf Belhamelb
(Modeling and numerical simulation of an Integrated Solar Combined Cycle System in
Algeria), J. Procedia Engineering, Vol.33, pp.199 – 208, (2012).
[12] A. M. Abdel Dayema, M. Nabil Metwallya, A. S. Alghamdi and E.M.Marzoukb
(Numerical Simulation and Experimental Validation of Integrated Solar Combined Power
Plant), J. Energy Procedia Vol.50, pp. 290 – 305(2014).
[13] Antonio Rovira, María José Montes, Fernando Varela, Mónica Gil (Comparison of Heat
Transfer Fluid and Direct Steam Generation technologies for Integrated Solar Combined
Cycles) J. Applied Thermal Engineering ,Vol.52 pp .264-274,(2013).
[14] Bandar Jubran Alqahtani, Dalia Patiño-Echeverri (Integrated Solar Combined Cycle
Power Plants: Paving the way for thermal solar) J. Applied Energy, pp.169 927–
936,(2016)
[15] Fernando Antoñanzas,Torres Enrique Sodupe-Ortega, Andrés Sanz-García
(TECHNICAL FEASIBILITY ASSESSMENT OF INTEGRATED SOLAR COMBINED
CYCLE POWER PLANTS IN CIUDAD REAL(SPAIN) AND LAS VEGAS (USA) XVI
Congreso Internacional de Ingeniería de Proyectos Valencia, 11-13 ,( 2012)
[16] H.Nezammahalleh.F.Farhadi.M.Tanhaemami (Conceptual design and techno-economic
assessment of integrated solar combined cycle system with DSG technology) Solar Energy
Volume 84, Issue 9, pp. 1696-1705, (Sep 2010).
[17] Sairam Adibhatla , S.C.Kaushik (Energy, exergy and economic (3E) analysis of
integrated solar direct steam generation combined cycle power plant) Sustainable Energy
Technologies and Assessments Volume 20, pp. 88-97, (April 2017).
[18] Yuanyuan Li , Yongping Yang (Thermodynamic analysis of a novel integrated solar
combined cycle ) J. Applied Energy Volume 122, pp. 133-142,(2014).
[19] M.Nolle, G.Heyen"Mathematical modeling and design advanced once-through heat
recovery steam generator" J. computer and chemical engineering, Vol.28, pp.651-660,
(2004).
[20] J.L. Rapún, "Modelo matemático del comportamiento de ciclos combinados de turbinas
de gas y vapor" PHD Thesis, ETSII-UPM (1999)
[21] Pouria Ahmadi, Ibrahim Dincer " Thermodynamic analysis and thermo economic
optimization of a dual pressure combined cycle power plant with a supplementary firing
unit" J.Energy Conversion and Management Vol.52 , pp.2296–2308,2011
[22] Firas Aziz Ali (Computation of Solar Radiation on Horizontal Surface Over Some Iraqi
Cities) Eng&Tech Journal, Vol .29, No.10, 2011
[23] Asaad RehmanSaeed Al-Hilphy (A theoretical and practical study for the incident solar
radiation intensity in the Basra province (south of Iraq), IOSR Journal of Engineering
(IOSRJEN) Vol.3, Issue.9pp25-35, (Sep, 2013).
[24] Kais J.Al-Jumaily ,Munya F.Al-Zuhairi,Zahraa S.Mahdi (Estimation of clear sky hourly
global solar radiation in Iraq) Int.Journal of Energy and Environment , Vol
3,Issue5,pp.659-666,(2012).
[25] Faleh H.Mahmood, Gheidaa Sabeeh Al-Hassany (Study Global Solar Radiation Based
on Sunshine Hours in Iraq) Iraqi Journal of Science, Vol55, No.4 A , PP. 1663-
1674,(2014).
(ASE) محور تطبيقات الطاقة الشمسية
دراسات ال

Proceeding of the 3th Sustainable & Renewable Energy Conference
23 -24 December 2017, Baghdad-Iraq
ةية خطوة اولى في المؤسسات الحكوميالطاقة الشمس
علي احمد سعيد، زينب ياسين، قابل حمود عباس
مديرية توزيع كهرباء المثنى /مديرية تخطيط المثنى
المقدمة
ا يك الطاقة فاصبح ضروراد استهالدزي العمرانيسع والسكان والت دد عدي، ومع تزا تعتبر الطاقة أحد الركائز االساسية لتلبية احتياجات المجتمعاغلب خالل الشمسيع وتتميز بالسط محافظتناللطاقة ،وحيث أن متجددة وبدائل واكثر جدوى من الناحية االقتصاديةدة يجددر اصم نع البحث
للبيئة وإحدى يقة دصوالظيفة ناع الطاقة الوإنتاج الطاقة الكهربائية حيث أنها احد ان فيالطاقة الشمسية استثمار لذا فمن االجدىالعام ايام .قبلية لتلبية االحتياجات المست االستراتيجيةالخيارات
دعي، وهذا ما فاآلثار المضرة لمصادر الوقود على البيئة أصبحت منتشرة جدا، والتي من مصادرها الديزل والبنزين والمشتقات النفطية األخرىفقد قام العلماء باختراع ما يسمى الشمسية؛ الطاقةالطبيعية إلنتاج الطاقة حفاظا على البيئة، ومن هذه المصادر المصادرالعلماء إلى استخدام
إلنتاج الطاقة الكهربائية باالعتماد على أشعة الشمس وحدها( اليا الشمسيةالخ)بـ
ن تكلفتها يميل البعض إلى الحديث عن مصادر الطاقة البديلة هذه على أنها شديدة التكلفة وغير عملية مقارنة بالوقود األحفوري، إال أوكان ا هي عليه 7711قرن العشرين بحيث أصبحت متدنية جدا؛ ففي سنة شهدت انخفاضا شديدا منذ ثمانينيات ال كانت تكلفة الخلية الواحدة أعلى مم
اقة في الفترة األخيرة، 3172في سنة ة، وهي إحدى التطورات الشاسعة التي جعلتها مصدرا رائجا جدا للط ، 3172ففي سنة بأكثر من مائة مرا يجعلها في مقدمة % 7ان العالم على الطاقة الشمسية بلغت اعتمادية سك .حاليا أنواع الطاقة المتجددةمن جميع مصادر إنتاج الطاقة، مم
:الدراسةفرضية
الطبيعة ، وذات جدوى اقتصادية ، مقارنة في ومتوفرة ناضبة وغير دائمة طبيعية مصادر عن عبارة هي الشمسية كالطاقة المتجددة الطاقة.بأجور الكهرباء التقليدية الحالية للدوائر الحكومية
مبررات الدراسة :
.المستدامة التنمية مع انسجاما للبيئة ملوثة وغير نظيفة المتجددة تلك الطاقة محافظة المثنى تزخر بالطاقة الشمسية وكون
اهداف الدراسة:
حالية والتي بديال عن الطاقة الكهربائية ال والمنازل التعرف على الجدوى االقتصادية من استخدام الطاقة الشمسية للدوائر والمؤسسات الحكوميةوبين كلفة الخاليا الكهرباء لبعض المؤسسات مصدرها المحطات الكهربائية التي تستخدم وقود الديزل او الغاز ، من خالل المقارنة بين اجور
.الشمسية
مجال وحدود الدراسة:
.ي باقي محافظات العراقالدراسة على محافظة المثنى ، ويصح قياسها والعمل بها ف هذه في المكان ناحية من التركيز تم
71
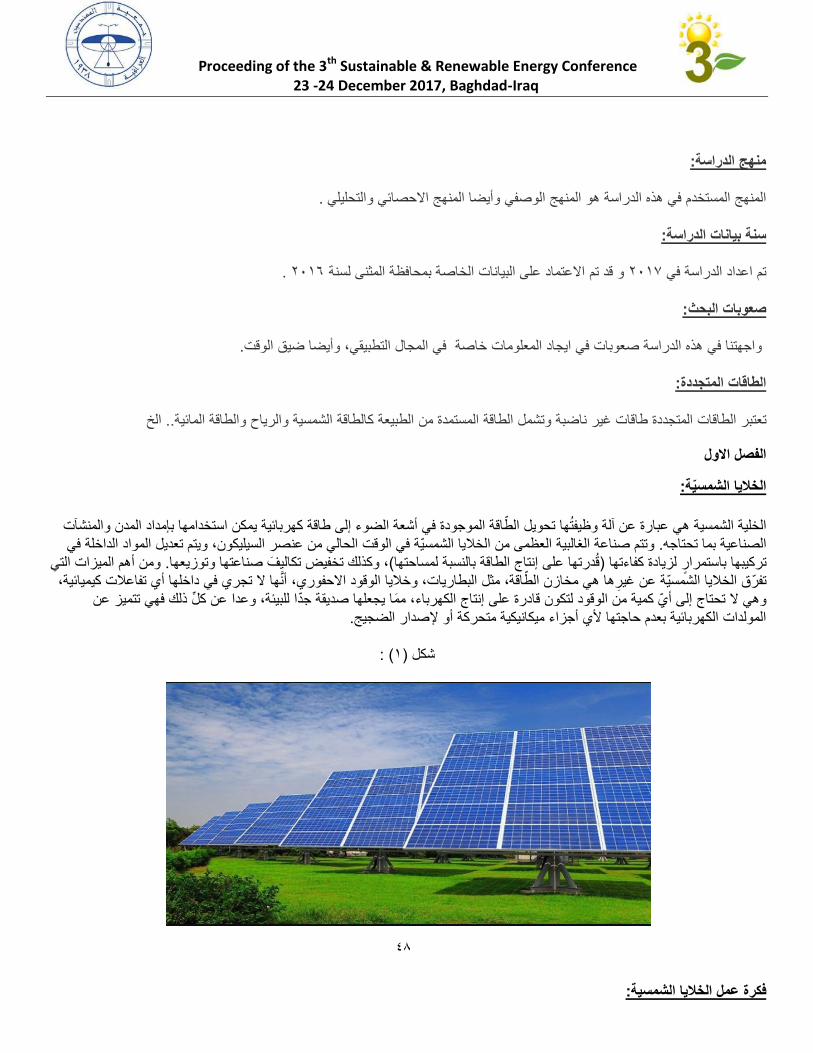
Proceeding of the 3th Sustainable & Renewable Energy Conference
23 -24 December 2017, Baghdad-Iraq
منهج الدراسة:
.والتحليلي االحصائي وأيضا المنهج الوصفي المنهج هو هذه الدراسة في المستخدم المنهج
سنة بيانات الدراسة:
. 3172االعتماد على البيانات الخاصة بمحافظة المثنى لسنة قد تم و 3171اعداد الدراسة في تم
صعوبات البحث:
.الوقت ضيق وأيضا طبيقي،في المجال الت خاصة المعلومات ايجاد في هذه الدراسة صعوبات في واجهتنا
الطاقات المتجددة:
الخ ..المائية والطاقة الشمسية والرياح كالطاقة الطبيعة من المستمدة الطاقة وتشمل ناضبة غير طاقات المتجددة الطاقات تعتبر
الفصل االول
الخاليا الشمسية:
كن استخدامها بإمداد المدن والمنشآت مل الطاقة الموجودة في أشعة الضوء إلى طاقة كهربائية يوظيفتها تحوي عن آلة رةة هي عباالشمسي الخليةي اخلة فصر السيليكون، ويتم تعديل المواد الدنالشمسية في الوقت الحالي من ع ظمى من الخالياوتتم صناعة الغالبية الع. الصناعية بما تحتاجه
ومن أهم الميزات التي . ليف صناعتها وتوزيعها، وكذلك تخفيض تكا(سبة لمساحتهاقدرتها على إنتاج الطاقة بالن)باستمرار لزيادة كفاءتها ركيبها تتفاعالت كيميائية، ا ال تجري في داخلها أيأنه ،الوقود االحفوريات، وخاليا البطاري هي مخازن الطاقة، مثلفرق الخاليا الشمسية عن غيرها ت
عن زئة، وعدا عن كل ذلك فهي تتميللبي وهي ال تحتاج إلى أي كمية من الوقود لتكون قادرة على إنتاج الكهرباء، مما يجعلها صديقة جدا . جيجصدار الضكة أو إلالمولدات الكهربائية بعدم حاجتها ألي أجزاء ميكانيكية متحر
( :7) شكل
:فكرة عمل الخاليا الشمسية
74

Proceeding of the 3th Sustainable & Renewable Energy Conference
23 -24 December 2017, Baghdad-Iraq
ه العملية، يقوم مبدأ عمل الخاليا الشمسية على امتصاص أشعة الشمس وتحويل الطاقة الشمسية إلى طاقة كهربائية تمكن االستفادة منها عبر هذت دور المولدات الكهربائية؛ ففي كل يوم تشرق فيه الشمس تطلق طاقة كبيرة على شكل فوتونات تغطي كل وفي هذه الحالة تكون الشمس قد أد
ة باستقطاب جزء من سطح األرض، وتصل كمية هذه الطاقة إلى أكثر من ألف واط لكل متر مربع من األرض المكشوفة، وتقوم األلواح الشمسي ويتم تجميع هذه على مجموعة من الصفوف، وكل صف يحتوي على خاليا شمسية، الطاقة الشمسيةلوح من ألواح ويحتوي كل. هذه الطاقة
ات الشمسية التي تمد المدن والمصانع بالطاقة في العديد من أنحاء العالم .األلواح في مصفوفات كبيرة جدا لتشكيل المحطتكون القدرة اإلنتاجية للوح تعتمد كمية الطاقة المنتجة على حجم اللوح الشمسي وما يحتويه من خاليا شمسية؛ ففي األلواح الشمسية العادية،
التي تكون مرفقة مع ( Data Sheet)واط تقريبا، ويمكن معرفة القدرة اإلنتاجية للوح الواحد من ورقة البيانات 321الواحد في المتوسط دة منحى كبيرا وحصل على أهمية كبيرة وقد اتخذ هذا النوع من إنتاج الطاقة النظيفة من المصادر ا. األلواح عند شرائها من شركة تجارية لمتجد
مات والحكومات المهتمة بالحفاظ على ، ويبلغ عمر اإلنتاج لأللواح الشمسية ما يقارب الخمسة وعشرين عاما، كما أن تكلفته نظافة البيئةعند المنظر نوعية صناعته وإنتاجه، ويمكن معرفة الجدوى اإلقتصادية لتر كيب هذا النظام عن في اآلونة األخيرة باتت مقبولة وفي متناول األيدي مع تطو
.طريق معرفة مدة االسترداد له التي سيعيد خاللها تكاليفه؛ فكلما قلت هذه المدة كان المشروع أجدى من الناحية المادية
(:3)شكل رقم
:فوائد استخدام الطاقة الشسمسية في توليد الكهرباء
بلة للنفاذ، كما أنها من مصادر الطاقة الطبيعية التي تساهم بشكل كبير، في توليد مختلف الطاقة الشمسية طاقة متجددة أي أنها غير قاأشكال الطاقة، فمن الممكن استخدامها في تسخين الماء بدال من الغاز والكهرباء، أو في تحريك السيارة بدال من النفط، أو حتى في
.إضاءة المنزل بدال من الكهرباء فمن الممكن تركيب األلواح الشمسية على أسطح المنازل، وتوليد الكهرباء الشهرية للكهرباءاليف االشتراك توفر على األفراد تك ،
.الالزمة لتشغيل األدوات الكهربائية وإنارة المنزل، وبالتالي تمكن األفراد من الحصول على الكهرباء من مصادرهم الخاصة التالي توفر على األفراد مجهود العضلي، والمجهود المبذول في الصيانة، حيث إنه ال تطلب الكثير من أعمال الصيانة والتركيب، وب
.بمجرد تركيب األحواض أو األلواح الشمسية تبدأ عملها بأعلى درجات الكفاءة واإلتقان
77

Proceeding of the 3th Sustainable & Renewable Energy Conference
23 -24 December 2017, Baghdad-Iraq
شمسية ال يصدر أي صوت تحافظ على البيئة من التلوث الضوضائي، وذلك ألن إنتاج الطاقة الكهربائية القابلة لالستخدام في األلواح ال .مزعج، كما أنها ال تصدر أي انبعاث ضار يسبب تلوث البيئة
وذلك ألن ألواح الطاقة الشمسية التي تنصب على أسطح المنازل من النادر أن تكون واضحة االبنية او المنازل تحافظ على شكل ، .وظاهرة
مع ميثاق االمم المتحدة في مجال المناخ والبيئة ا يتناسبموهو اي نوع من انواع النفايات او الغازات السامة ال تنتج.
:مشاكل استخدام الطاقة الشمسية في توليد الكهرباء
من كفاءتها، فيجب تنظيفها بشكل شهري لضمان نقائها، وإعطائها نفس القدر من % 21وبالتالي تفقد : تلوث األلواح الشمسية بالغبار .الكفاءة المطلوبة
األلواح الشمسية على الشمس وضوئها إلنتاج الطاقة، فبالتالي ال يمكن االستفادة من هذه األلواح إلنتاج الطاقة في فترات الليل أو تعتمدعند اختفاء ضوء الشمس بسبب بعض األجواء المناخية، على الرغم من إمكانية تخزين الطاقة المنتجة الستخدامها الحقا لكن تتم هذه
.تخدام معدات ذات تكلفة مرتفعة وإضافيةالعملية باس ارتفاع أسعار الخاليا الشمسية ومعداتها؛ حيث تتميز بارتفاع أسعارها وعدم انتشارها بشكل كبير في األسواق؛ ويعود السبب لغالء
.ةالعناصر التي تدخل في تصنيعها وندرة وجودها، لذلك يقل استخدامها في البالد وخاصة في الدول النامي
:واقع استخدام الطاقة الشمسية في العراق ومحافظة المثنى
بالتعاقد مع لم يكن العراق من البلدان التي سجلت نشاطا في استخدامات الطاقة المتجددة ، اال انه في السنوات االخيرة حيث قامت وزارة الكهرباء
عراق ومن ضمنها محافظة المثنى ، حيث وقعت على ثالث عقود شركات ذات اختصاص بنصب محطات توليد الطاقة الشمسية في عموم ال
.ميكاواط تتوزع في مناطق الخضر والمملحة 41استثمارية تخص هذا المجال على صعيد المحافظة بواقع
:معدل السطوع الشهري
الشمسي السطوع وبمعرفة ، الشمسية والطاقة يةالمعمار و الزراعية التطبيقات من العديد في ستعملي أساسيا مؤشرا الشمسي السطوع فترة عتبرت
من أكبر شمسية مجمعات تحتاج الشمسي السطوع قليلة فالمنطقة تصميمه، المراد ةالشمسيالطاقة نظام قدرة حساب بسهولة يمكن معينة لمنطقة
.الشمسي السطوع مرتفعة المنطقة
.دد من السنوات والجدول ادناه يبين معدل السطوع الشهري في مدينة السماوة لع
21

Proceeding of the 3th Sustainable & Renewable Energy Conference
23 -24 December 2017, Baghdad-Iraq
(3177-3117-7771-7747)معدل السطوع الشهري لمدينة السماوة للسنوات ( : 7-7)جدول
Y/M JAN FEB MAR APR
MAY JUN JULY AUG SEP OCT NOV DEC
1981 6.4 7.1 8.4 9.4 9.3 12.0 11.5 11.8 10.4 8.6 8.2 6.4
1990 5.8 6.7 8.5 9.2 10.7 12.1 12.1 11.8 11.5 8.5 7.9 m
2001 7.2 8.6 8.4 9.2 10.2 12.5 12.3 11.1 9.7 9.7 8.1 4.2
2011 7.0 7.6 8.1 8.8 9.7 11.9 12.0 11.7 10.4 8.9 7.5 6.5
مديرية تخطيط المثنى:المصدر
الفصل الثاني
:تكلفة الطاقة الشمسية للدائر الحكومية
وهو نظام استخدام الخاليا الشمسية بدون خزن للطاقة ON Grid) )ا نقترح استخدام نظام بالنظر لعدم حاجة المؤسسات الحكومية للعمل ليال لذ
العالية اي بدون استخدام البطاريات ، ولكون البطاريات ذات تكلفة عالية فيمكن االستغناء عنها في هذه التطبيقات وهو مجدي اقتصاديا ولالحمال
.(رة وزارة الكهرباء العراقيةحسب تسعي) مليار للميكاواط الواحد 7.2وبكلفة
:دراسة حاالت عدد من المؤسسات الحكومية في محافظة المثنى
ها مساحات يتتوفر ف( مشترك)ل بالقطع المبرمجواالخر مشمو( خاص)تم اخذ عيينات من مواقع حكومية بعضها غير مشمول بالقطع المبرمج
حيث تمت مقارنة اجور الكهرباء المفترض دفعها من قبل تلك المؤسسات نتيجة استخدام واسعه يمكن االستفادة منها لتنصيب االلواح الشمسية ،
.وبين هدف الدراسة وهو استخدام االلواح الشمسية كمصدر للكهرباء( الشبكة الوطنية)مصدر الكهرباء الحالية
:الموقع المقترحة
:جامعة المثنى-7
عن طريق ف .ك 22/77من محطة الصياغ الثانوية تتغذى بالطاقة الكهربائية و الصغير الصوب/تقع جامعة المثنى في مركز مدينة السماوة
في الموقع المذكور ووجود وبالنظر لعدم وجود مقاييس مربوطة بصورة صحيحة وهو خط مشمول بالقطع المبرمج (الكلية والمعهد)مغذي
وتم اخذ معدل ل اليومي للمغذيعن طريق حساب الحمرافق الجامعة جميع مقمنا بحساب االستهالك الشهري ل على المغذي تجاوزاتضائعات و
وكاالتي 3172والمبالغ الواجب دفعها لمديرية التوزيع خالل سنة لساعات االشتغال واعلى حمل يصله الموقع
Power= *V*I*PF
Power=1.7*11000* 0.8* باألمبير الحمل الخارج من المحطة
Power= Watt بوحدة
Energy=Power * خالل شهر عدد االيام* عدد ساعات االشتغال
Energy=kwh (وهي الطاقة المستهلكة للموقع) بوحدة
27
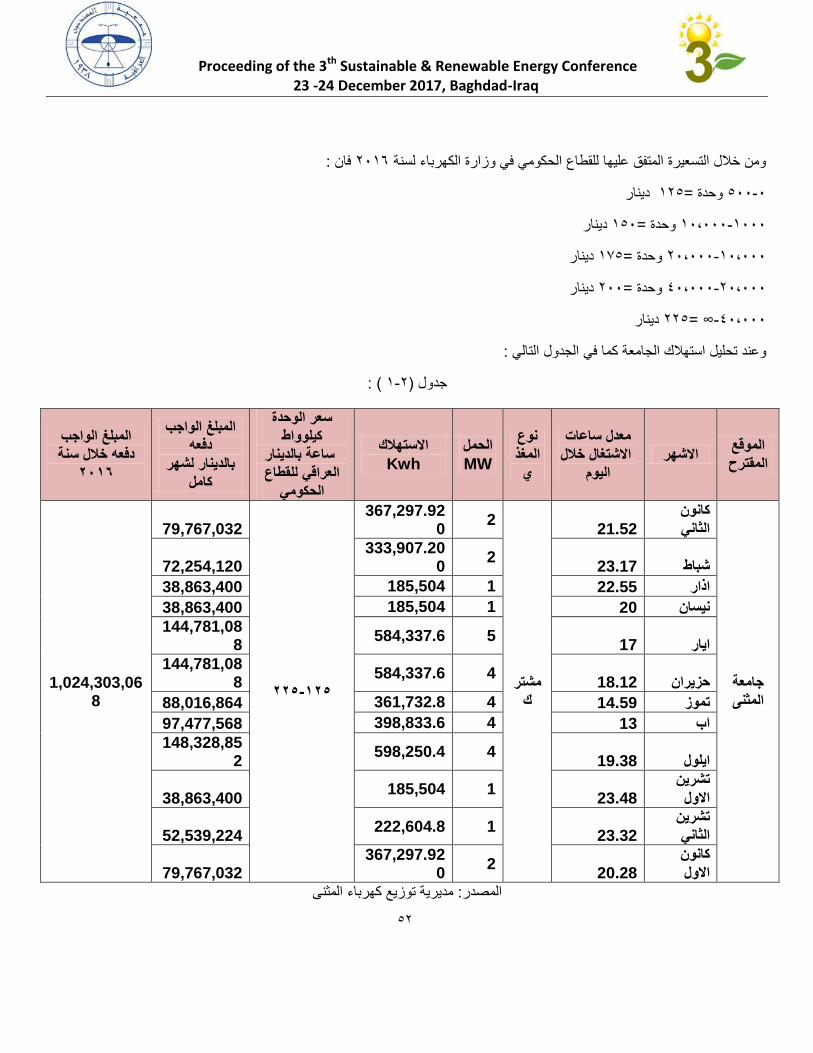
Proceeding of the 3th Sustainable & Renewable Energy Conference
23 -24 December 2017, Baghdad-Iraq
:فان 3172ومن خالل التسعيرة المتفق عليها للقطاع الحكومي في وزارة الكهرباء لسنة
دينار 732=وحدة 1-211
دينار 721=وحدة 7111-71،111
دينار 712=وحدة 71،111-31،111
دينار 311=وحدة 31،111-71،111
دينار 332=∞ -71،111
:التالي كما في الجدول وعند تحليل استهالك الجامعة
( : 7-3)جدول
قع المو المقترح
االشهر معدل ساعات
خالل االشتغال اليوم
نوع المغذ ي
الحمل MW
االستهالك Kwh
سعر الوحدة واطيلوك
ساعة بالدينار للقطاع العراقي
الحكومي
المبلغ الواجب دفعه
بالدينار لشهر كامل
واجب المبلغ الخالل سنة دفعه
6102
جامعة المثنى
كانون 21.52 الثاني
مشتر ك
2 367,297.92
0
061-661
79,767,032
1,024,303,068
23.17 شباط2
333,907.200 72,254,120
38,863,400 185,504 1 22.55 اذار
38,863,400 185,504 1 20 نيسان
17 ايار5 584,337.6
144,781,088
18.12 حزيران4 584,337.6
144,781,088
88,016,864 361,732.8 4 14.59 تموز
97,477,568 398,833.6 4 13 اب
19.38 ايلول4 598,250.4
148,328,852
شرين ت 23.48 االول
1 185,504 38,863,400
تشرين 23.32 الثاني
1 222,604.8 52,539,224
كانون 20.28 االول
2 367,297.92
0 79,767,032
مديرية توزيع كهرباء المثنى: المصدر
23

Proceeding of the 3th Sustainable & Renewable Energy Conference
23 -24 December 2017, Baghdad-Iraq
التسعيرة نوعليه تكو
دينار 232،111=واط 211اول
دينار 7،211،111=واط 7111ثاني
دينار 7،121،111= واط 7111ثالث
دينار 7،111،111=واط 3111رابع
1،412،111 =
دينار 332وبعدها يتم ضرب الوحدات بمبلغ 1،412،111وحدة تعادل 71،111وهذا يعني ان
ة وثالثة الف وثمانية مليار واربعة وعشرون مليون وثالثمائ( 1,024,303,068)هو 3172جور الكهرباء السنوية لجامعة المثنى لعام كون اتف
.وستون دينار
مليار دينار لكل 7.2سنة تكون تكلفتها 32-31استخدام الخاليا الشمسية كطاقة بديلة النتاج الطاقة الكهربائية والتي يفترض عمرها من وعند
والمساحة ظهرا 2صباحا لغاية 7والذي يعمل بفترة السطوع الشمسي من ON Grid) )للنوع ميكاواط حسب تسعيرة وزارة الكهرباء
الخلية الواحدة )واط 321ذات قدرة على اعتبار ان الخاليا المستخدمة (ميكاواط 7ل 3م32211اي ) للميكاواط الواحد 3 م2711المطلوبة
:ميكاواط من الطاقة المطلوبة وحسب الجدول ادناه 7خلية النتاج 72111ونتحتاج ( 3م7.2
( : 3-3)جدول
المقترح الموقع المقترحة البديلة الطاقة المشروع تنفيذ كلفة القدرة المطلوبة المطلوبة المساحة
ميكا واط 7 خاليا شمسية المثنى جامعة
مليار دينار 2.3
3م32211
مديرية توزيع كهرباء المثنى: المصدر
:مستشفى الحسين التعليمي -3
ف عن طريق مغذي .ك 723/22/77الكهربائية من محطة شمال السماوة وتتغذى بالطاقة تقع مستشفى الحسين في مركز مدينة السماوة
شتغال واعلى حمل تم اخذ معدل لساعات االكما في الطريقة السابقة ومستثنى من القطع المبرمج والمستشفى وهو مغذي خاص بالموقع المذكور
:ادناهوتم التوصل للنتائج المبينة في الجدول 3172يصله الموقع والمبالغ الواجب دفعها لمديرية التوزيع خالل سنة
.كليوواط ساعة وبالدينار العراقي 332-732علما ان سعر الوحدة للقطاع الحكومي من
:واجورها ساعة 62ولمدة الوطنية بائيةوالجدول التالي يبين استهالك المستشفى من الطاقة الكهر
22
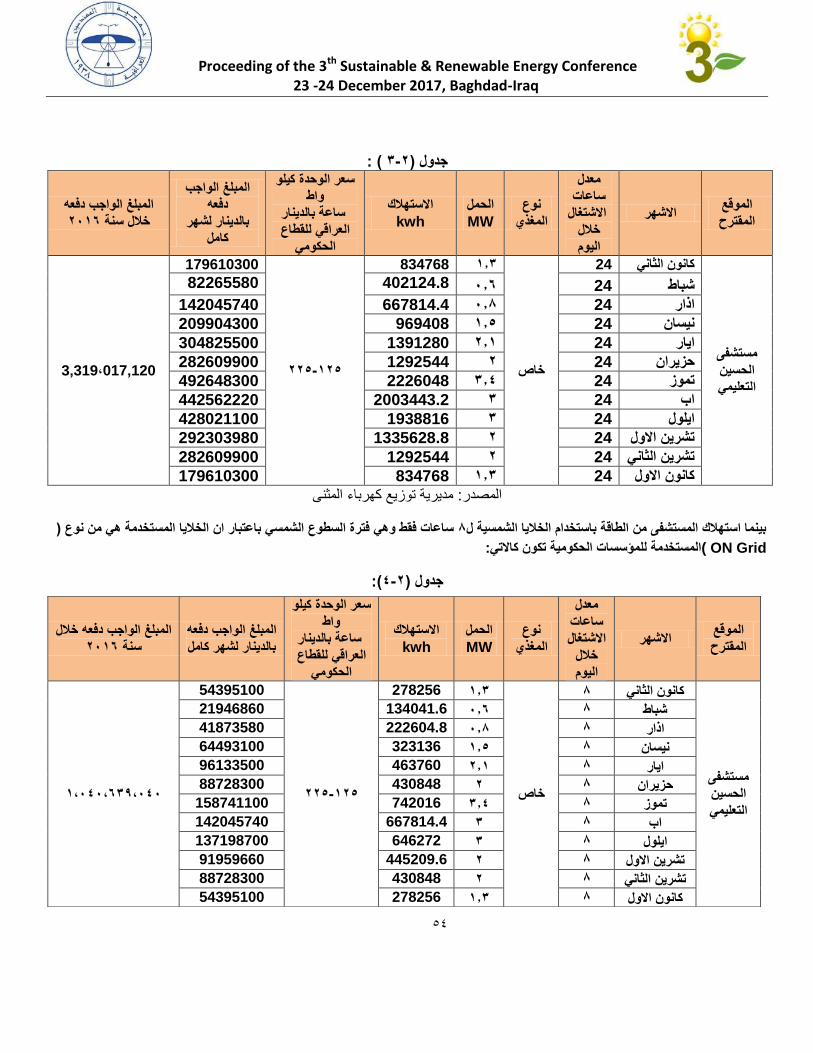
Proceeding of the 3th Sustainable & Renewable Energy Conference
23 -24 December 2017, Baghdad-Iraq
( : 3-6)جدول
الموقع المقترح
االشهر
معدل ساعات
االشتغال خالل اليوم
نوع المغذي
الحمل MW
االستهالك kwh
سعر الوحدة كيلو واط
ساعة بالدينار للقطاع العراقي
الحكومي
المبلغ الواجب دفعه
بالدينار لشهر كامل
هعالواجب دف المبلغ 6102خالل سنة
مستشفى الحسين التعليمي
24 كانون الثاني
خاص
0.3 834768
061-661
179610300
3,319،017,120
82265580 402124.8 1.2 24 شباط
142045740 667814.4 1.0 24 اذار
209904300 969408 0.1 24 نيسان
304825500 1391280 6.0 24 ايار
282609900 1292544 6 24 حزيران
492648300 2226048 3.2 24 تموز
442562220 2003443.2 3 24 اب
428021100 1938816 3 24 ايلول
292303980 1335628.8 6 24 تشرين االول
282609900 1292544 6 24 تشرين الثاني
179610300 834768 0.3 24 كانون االول
مديرية توزيع كهرباء المثنى: درالمص
)ساعات فقط وهي فترة السطوع الشمسي باعتبار ان الخاليا المستخدمة هي من نوع 0بينما استهالك المستشفى من الطاقة باستخدام الخاليا الشمسية ل
( ON Gridالمستخدمة للمؤسسات الحكومية تكون كاالتي:
(:2-6)جدول
الموقع المقترح
راالشه
معدل ساعات االشتغال خالل
اليوم
نوع المغذي
الحمل MW
االستهالك kwh
سعر الوحدة كيلو واط
ساعة بالدينار للقطاع العراقي
الحكومي
المبلغ الواجب دفعه بالدينار لشهر كامل
المبلغ الواجب دفعه خالل 6102سنة
مستشفى الحسين التعليمي
0 كانون الثاني
خاص
0.3 278256
061-661
54395100
0،121،236،121
21946860 134041.6 1.2 0 شباط
41873580 222604.8 1.0 0 اذار
64493100 323136 0.1 0 نيسان
96133500 463760 6.0 0 ايار
88728300 430848 6 0 حزيران
158741100 742016 3.2 0 تموز
142045740 667814.4 3 0 اب
137198700 646272 3 0 ايلول
91959660 445209.6 6 0 تشرين االول
88728300 430848 6 0 تشرين الثاني
54395100 278256 0.3 0 كانون االول
27
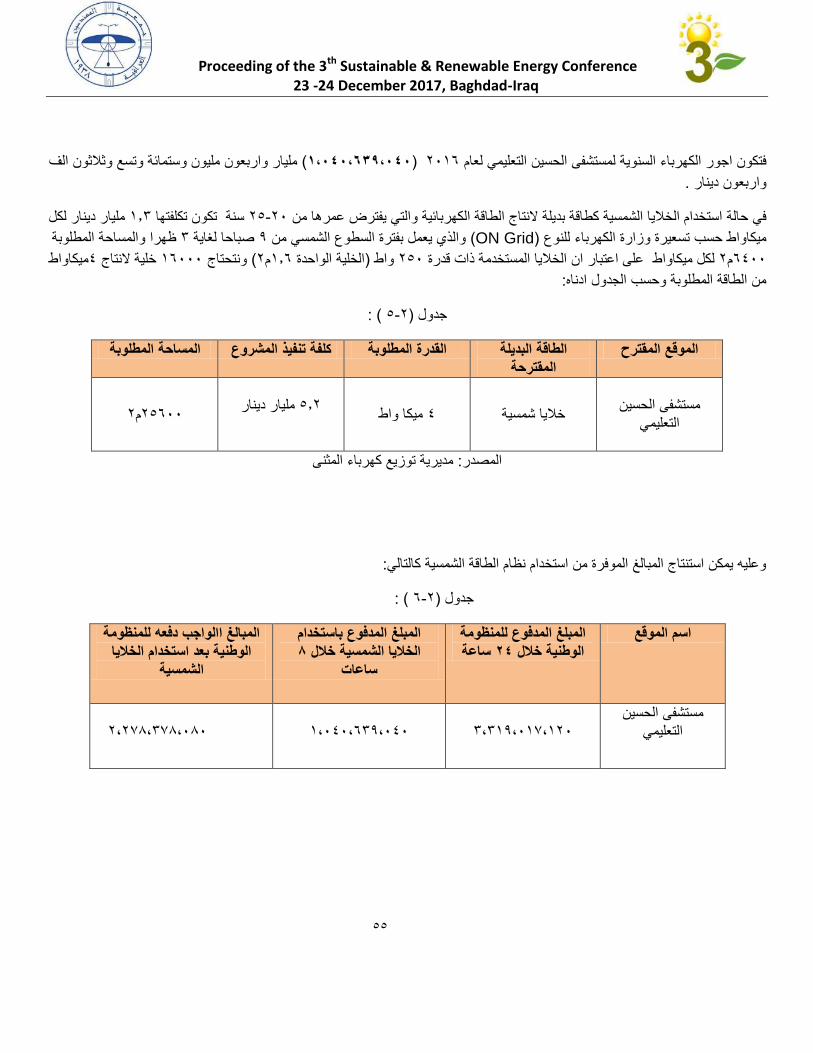
Proceeding of the 3th Sustainable & Renewable Energy Conference
23 -24 December 2017, Baghdad-Iraq
الف ثالثونو تسعة ووستمائمليون اربعونومليار ( 0،121،236،121) 3172لعام لمستشفى الحسين التعليميجور الكهرباء السنوية كون اتف
.دينار واربعون
مليار دينار لكل 7.2سنة تكون تكلفتها 32-31من اعمره يفترضاج الطاقة الكهربائية والتي استخدام الخاليا الشمسية كطاقة بديلة النت في حالة
والمساحة المطلوبة ظهرا 2صباحا لغاية 7من والذي يعمل بفترة السطوع الشمسي( ON Grid) للنوع ميكاواط حسب تسعيرة وزارة الكهرباء
ميكاواط 7خلية النتاج 72111ونتحتاج ( 3م7.2الخلية الواحدة )واط 321على اعتبار ان الخاليا المستخدمة ذات قدرة لكل ميكاواط 3م2711
:من الطاقة المطلوبة وحسب الجدول ادناه
( : 2-3)جدول
البديلة الطاقة المقترح الموقع ترحةالمق
المطلوبة المساحة المشروع تنفيذ كلفة القدرة المطلوبة
مستشفى الحسين التعليمي
ميكا واط 7 خاليا شمسية
مليار دينار 2.3
3م32211
مديرية توزيع كهرباء المثنى: المصدر
:وعليه يمكن استنتاج المبالغ الموفرة من استخدام نظام الطاقة الشمسية كالتالي
( : 2-3) جدول
المبلغ المدفوع للمنظومة اسم الموقع ساعة 62الوطنية خالل
المبلغ المدفوع باستخدام 0الخاليا الشمسية خالل
ساعات
للمنظومة الواجب دفعهالمبالغ ااستخدام الخاليا الوطنية بعد
الشمسية
ن مستشفى الحسي التعليمي
2،277،171،731
7،171،227،171
3،314،214،141
22
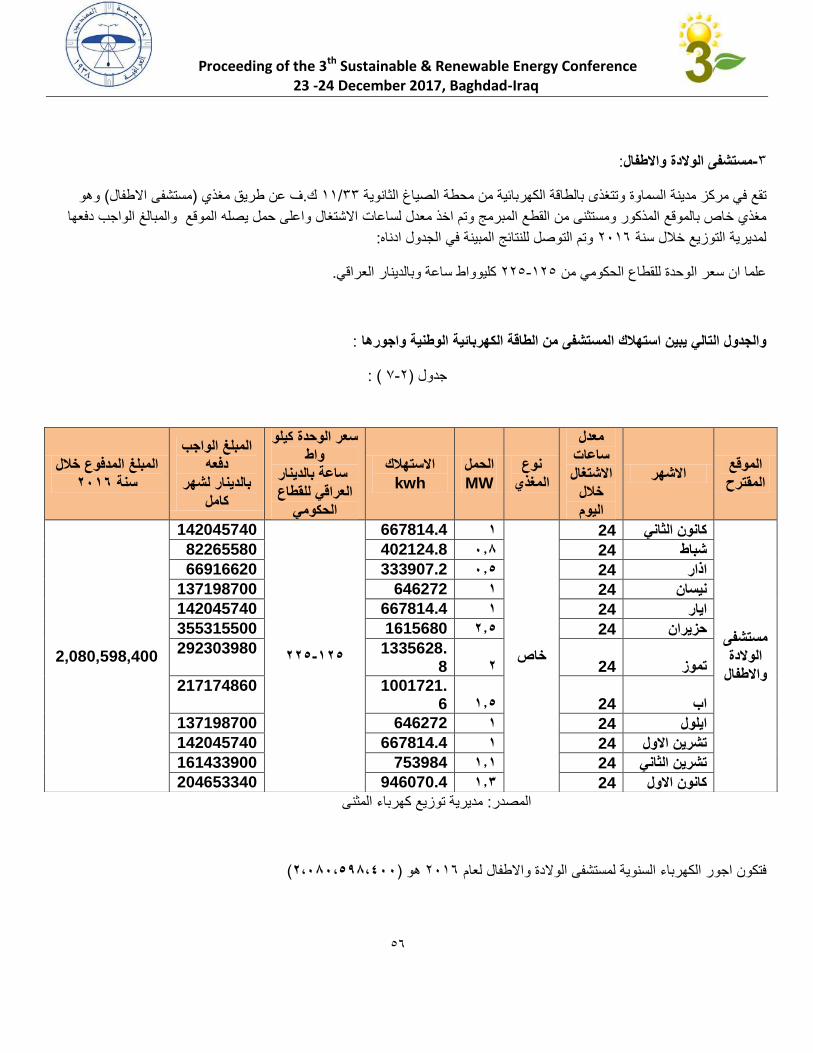
Proceeding of the 3th Sustainable & Renewable Energy Conference
23 -24 December 2017, Baghdad-Iraq
:مستشفى الوالدة واالطفال-2
وهو (مستشفى االطفال)ف عن طريق مغذي .ك 22/77وتتغذى بالطاقة الكهربائية من محطة الصياغ الثانوية ز مدينة السماوة تقع في مرك
ع المبرمج وتم اخذ معدل لساعات االشتغال واعلى حمل يصله الموقع والمبالغ الواجب دفعها مغذي خاص بالموقع المذكور ومستثنى من القط
:ادناهوتم التوصل للنتائج المبينة في الجدول 3172لمديرية التوزيع خالل سنة
.كليوواط ساعة وبالدينار العراقي 332-732علما ان سعر الوحدة للقطاع الحكومي من
: واجورها الوطنية ستهالك المستشفى من الطاقة الكهربائيةوالجدول التالي يبين ا
( : 1-3) جدول
مديرية توزيع كهرباء المثنى: المصدر
(6،101،160،211)هو 3172لعام الوالدة واالطفاللمستشفى جور الكهرباء السنوية كون اتف
الموقع المقترح
االشهر
معدل ساعات
االشتغال خالل
اليوم
نوع المغذي
الحمل MW
االستهالك kwh
سعر الوحدة كيلو واط
ساعة بالدينار للقطاع العراقي
الحكومي
المبلغ الواجب دفعه
بالدينار لشهر كامل
مبلغ المدفوع خالل ال 6102سنة
مستشفى الوالدة واالطفال
24 كانون الثاني
خاص
0 667814.4
061-661
142045740
2,080,598,400
82265580 402124.8 1.0 24 شباط
66916620 333907.2 1.1 24 اذار
137198700 646272 0 24 نيسان
142045740 667814.4 0 24 ايار
355315500 1615680 6.1 24 يرانحز
6 24 تموز1335628.
8 292303980
0.1 24 اب 1001721.
6 217174860
137198700 646272 0 24 ايلول
142045740 667814.4 0 24 تشرين االول
161433900 753984 0.0 24 تشرين الثاني
204653340 946070.4 0.3 24 كانون االول
22
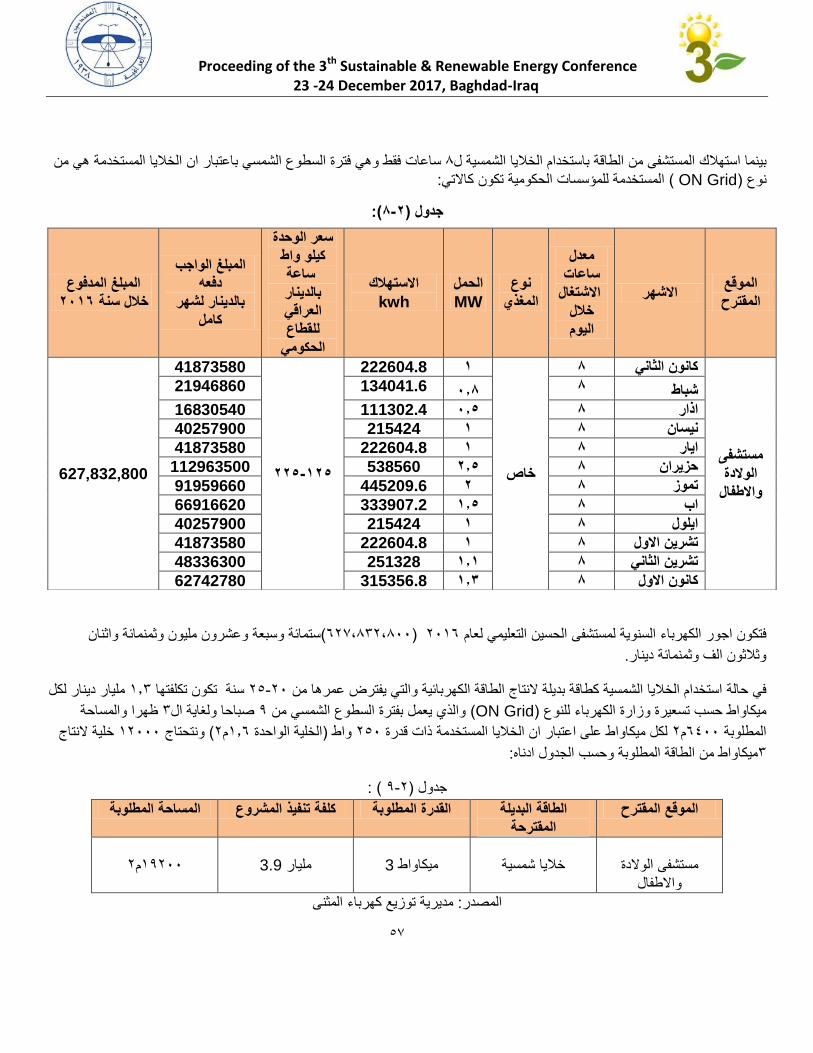
Proceeding of the 3th Sustainable & Renewable Energy Conference
23 -24 December 2017, Baghdad-Iraq
من هي المستخدمة الخاليا ان باعتبار الشمسي السطوع فترة هيو فقط ساعات 4ل الشمسية الخاليا باستخدام الطاقة من المستشفى استهالك بينما :كاالتي تكون الحكومية للمؤسسات لمستخدمةا( ON Grid) نوع
(:0-6)جدول
ستمائة وسبعة وعشرون مليون وثمنمائة واثنان (231،423،411) 3172 لعام التعليمي الحسين لمستشفى السنوية الكهرباء اجور فتكون
.وثالثون الف وثمنمائة دينار
مليار دينار لكل 7.2سنة تكون تكلفتها 32-31من اعمره يفترضهربائية والتي اج الطاقة الكاستخدام الخاليا الشمسية كطاقة بديلة النت في حالة
والمساحة ظهرا 2صباحا ولغاية ال 7والذي يعمل بفترة السطوع الشمسي من ( ON Grid)للنوع ميكاواط حسب تسعيرة وزارة الكهرباء
خلية النتاج 73111ونتحتاج ( 3م7.2الخلية الواحدة )واط 321رة لكل ميكاواط على اعتبار ان الخاليا المستخدمة ذات قد 3م2711المطلوبة
:ميكاواط من الطاقة المطلوبة وحسب الجدول ادناه2
( : 7-3)جدول
البديلة الطاقة المقترح الموقع المقترحة
المطلوبة المساحة المشروع تنفيذ كلفة القدرة المطلوبة
الوالدة مستشفى
واالطفال
شمسية خاليا
يكاواطم 3
مليار 3.9
3م77311
المثنى كهرباء توزيع مديرية: المصدر
الموقع المقترح
االشهر
معدل ساعات
االشتغال خالل
اليوم
نوع المغذي
الحمل MW
االستهالك kwh
سعر الوحدة كيلو واط
ساعة بالدينار
يالعراقللقطاع الحكومي
المبلغ الواجب دفعه
بالدينار لشهر كامل
المبلغ المدفوع 6102خالل سنة
مستشفى الوالدة واالطفال
0 كانون الثاني
خاص
0 222604.8
061-661
41873580
627,832,800
21946860 134041.6 1.0 0 شباط
16830540 111302.4 1.1 0 اذار
40257900 215424 0 0 نيسان
41873580 222604.8 0 0 ايار
112963500 538560 6.1 0 حزيران
91959660 445209.6 6 0 تموز
66916620 333907.2 0.1 0 اب
40257900 215424 0 0 ايلول
41873580 222604.8 0 0 تشرين االول
48336300 251328 0.0 0 تشرين الثاني
62742780 315356.8 0.3 0 انون االولك
21
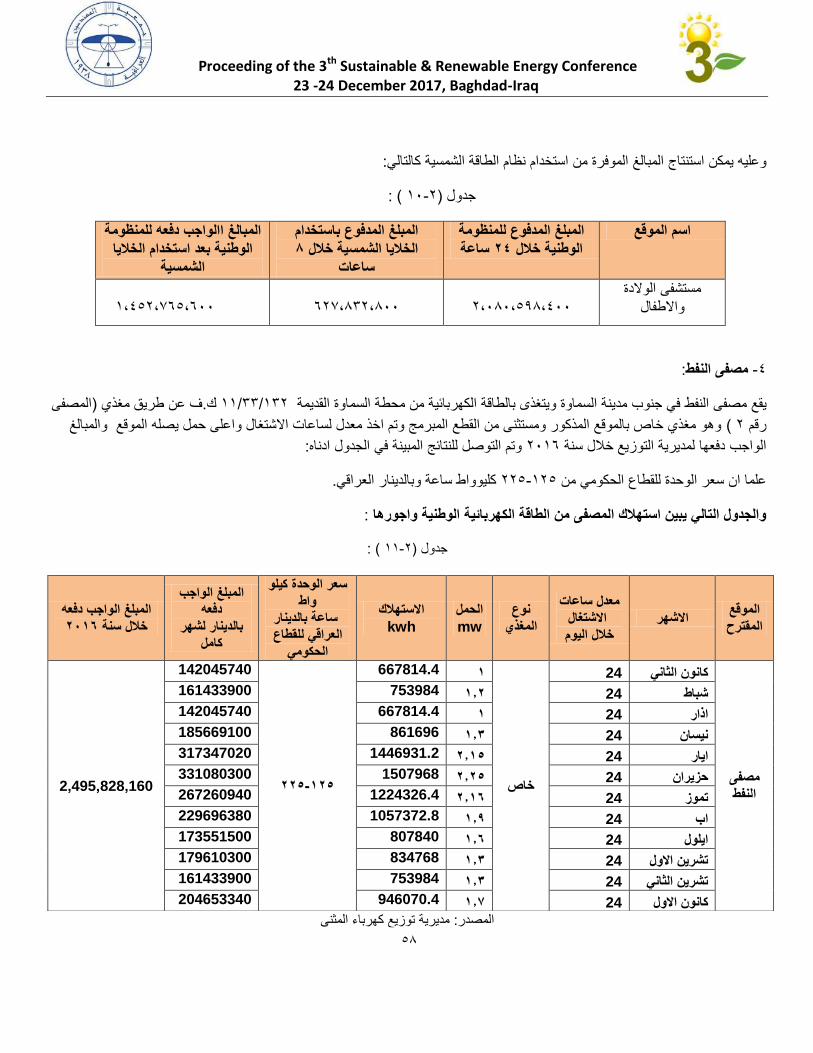
Proceeding of the 3th Sustainable & Renewable Energy Conference
23 -24 December 2017, Baghdad-Iraq
:كالتالي الشمسية الطاقة نظام استخدام من الموفرة المبالغ استنتاج يمكن وعليه
( : 71-3) جدول
المبلغ المدفوع للمنظومة اسم الموقع ساعة 62الوطنية خالل
المبلغ المدفوع باستخدام 0ل الخاليا الشمسية خال
ساعات
للمنظومة دفعه االواجب المبالغ الخاليا استخدام بعد الوطنية
الشمسية
الوالدة مستشفى واالطفال
3،141،274،711
231،423،411
7،723،122،211
:مصفى النفط -7
المصفى )ف عن طريق مغذي .ك 723/22/77في جنوب مدينة السماوة ويتغذى بالطاقة الكهربائية من محطة السماوة القديمة مصفى النفط قعي
وهو مغذي خاص بالموقع المذكور ومستثنى من القطع المبرمج وتم اخذ معدل لساعات االشتغال واعلى حمل يصله الموقع والمبالغ ( 3رقم
:ادناهوتم التوصل للنتائج المبينة في الجدول 3172الواجب دفعها لمديرية التوزيع خالل سنة
.كليوواط ساعة وبالدينار العراقي 332-732الوحدة للقطاع الحكومي من علما ان سعر
: واجورها الوطنية والجدول التالي يبين استهالك المصفى من الطاقة الكهربائية
( : 77-3) جدول
مديرية توزيع كهرباء المثنى: المصدر
الموقع المقترح
االشهر معدل ساعات
االشتغال خالل اليوم
نوع المغذي
الحمل mw
االستهالك kwh
كيلو سعر الوحدة واط
ساعة بالدينار للقطاع العراقي
الحكومي
المبلغ الواجب دفعه
بالدينار لشهر كامل
لواجب دفعهالمبلغ ا 6102خالل سنة
مصفى النفط
24 كانون الثاني
خاص
0 667814.4
061-661
142045740
2,495,828,160
161433900 753984 0.6 24 شباط
142045740 667814.4 0 24 اذار
185669100 861696 0.3 24 نيسان
317347020 1446931.2 6.01 24 ايار
331080300 1507968 6.61 24 حزيران
267260940 1224326.4 6.02 24 تموز
229696380 1057372.8 0.6 24 اب
173551500 807840 0.2 24 ايلول
179610300 834768 0.3 24 تشرين االول
161433900 753984 0.3 24 تشرين الثاني
204653340 946070.4 0.1 24 كانون االول
24
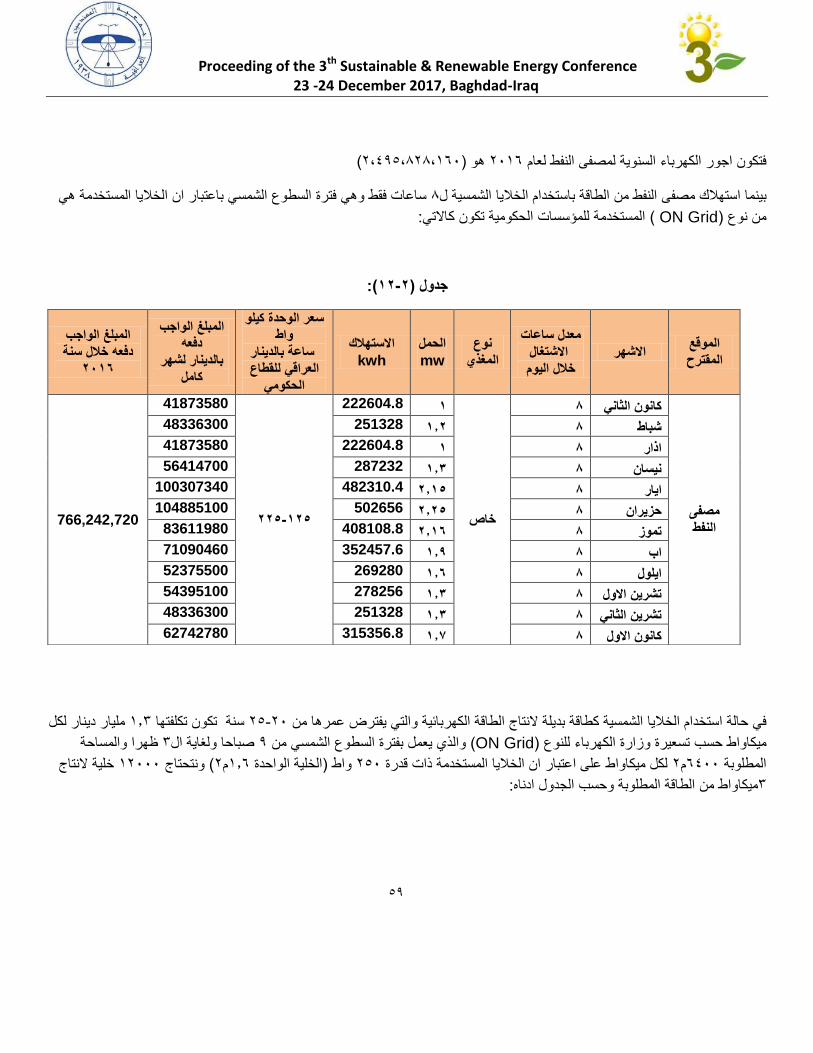
Proceeding of the 3th Sustainable & Renewable Energy Conference
23 -24 December 2017, Baghdad-Iraq
(3،772،434،721) هو 3172 لعام لمصفى النفط السنوية الكهرباء اجور فتكون
هي المستخدمة الخاليا ان باعتبار الشمسي السطوع فترة وهي فقط ساعات 4ل الشمسية الخاليا باستخدام الطاقة من النفط ىصفم استهالك بينما
:كاالتي تكون الحكومية للمؤسسات المستخدمة( ON Grid) نوع من
(:06-6)جدول
لكل دينار مليار 7.2 تكلفتها تكون سنة 32-31 من عمرها يفترض والتي الكهربائية الطاقة النتاج بديلة كطاقة الشمسية الخاليا استخدام حالة في
والمساحة ظهرا 2ال ولغاية صباحا 7 من الشمسي السطوع بفترة مليع والذي( ON Grid) للنوع الكهرباء وزارة تسعيرة حسب ميكاواط
خلية النتاج 73111ونتحتاج ( 3م7.2الخلية الواحدة )واط 321لكل ميكاواط على اعتبار ان الخاليا المستخدمة ذات قدرة 3م2711المطلوبة
:اقة المطلوبة وحسب الجدول ادناهميكاواط من الط2
الموقع المقترح
االشهر معدل ساعات
االشتغال خالل اليوم
نوع المغذي
الحمل mw
االستهالك kwh
سعر الوحدة كيلو اطو
ساعة بالدينار للقطاع العراقي
الحكومي
المبلغ الواجب دفعه
بالدينار لشهر كامل
لواجب المبلغ اخالل سنة دفعه
6102
مصفى النفط
0 كانون الثاني
خاص
0 222604.8
061-661
41873580
766,242,720
48336300 251328 0.6 0 شباط
41873580 222604.8 0 0 اذار
56414700 287232 0.3 0 نيسان
100307340 482310.4 6.01 0 ايار
104885100 502656 6.61 0 حزيران
83611980 408108.8 6.02 0 تموز
71090460 352457.6 0.6 0 اب
52375500 269280 0.2 0 ايلول
54395100 278256 0.3 0 تشرين االول
48336300 251328 0.3 0 تشرين الثاني
62742780 315356.8 0.1 0 كانون االول
27
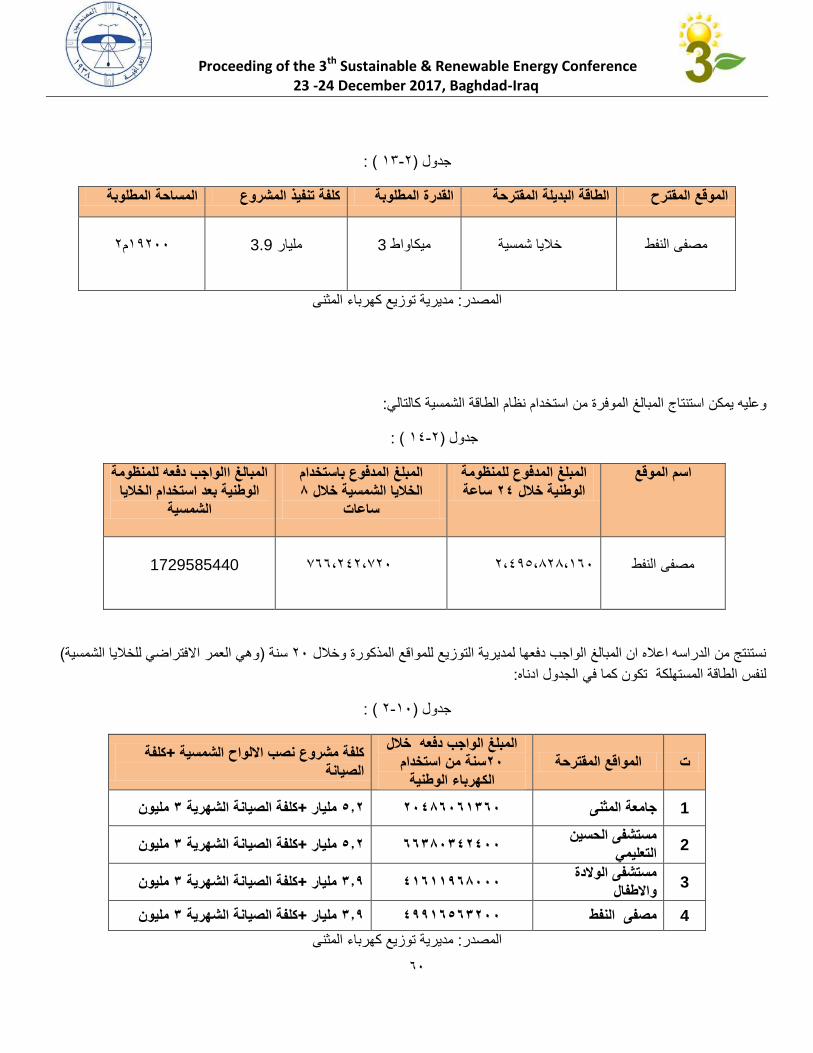
Proceeding of the 3th Sustainable & Renewable Energy Conference
23 -24 December 2017, Baghdad-Iraq
( : 72-3)جدول
لمقترحا الموقع المقترحة البديلة الطاقة المشروع تنفيذ كلفة القدرة المطلوبة المطلوبة المساحة
النفط مصفى
شمسية خاليا
ميكاواط 3
مليار 3.9
3م77311
مديرية توزيع كهرباء المثنى: المصدر
:كالتالي الشمسية الطاقة نظام استخدام من الموفرة المبالغ استنتاج يمكن وعليه
( : 77-3) جدول
المبلغ المدفوع للمنظومة اسم الموقع ساعة 62الوطنية خالل
المبلغ المدفوع باستخدام 0الخاليا الشمسية خالل
ساعات
للمنظومة دفعه االواجب المبالغ الخاليا استخدام بعد الوطنية
الشمسية
النفط صفىم
3،772،434،721
122،373،131
1729585440
( وهي العمر االفتراضي للخاليا الشمسية)سنة 31نستنتج من الدراسه اعاله ان المبالغ الواجب دفعها لمديرية التوزيع للمواقع المذكورة وخالل
:تكون كما في الجدول ادناه لنفس الطاقة المستهلكة
: ( 3-71)جدول
المواقع المقترحة تالمبلغ الواجب دفعه خالل
من استخدام سنة61 الكهرباء الوطنية
كلفة +نصب االلواح الشمسية مشروع كلفة الصيانة
مليون 3كلفة الصيانة الشهرية +مليار 1.6 61202120321 جامعة المثنى 1
2 مستشفى الحسين
التعليمي مليون 3 الشهرية ةالصيان كلفة+ مليار 1.6 22301326211
3 مستشفى الوالدة
واالطفال مليون 3كلفة الصيانة الشهرية +مليار 3.6 20200620111
مليون 3كلفة الصيانة الشهرية +مليار 3.6 26602123611 النفط مصفى 4
مديرية توزيع كهرباء المثنى: المصدر
21
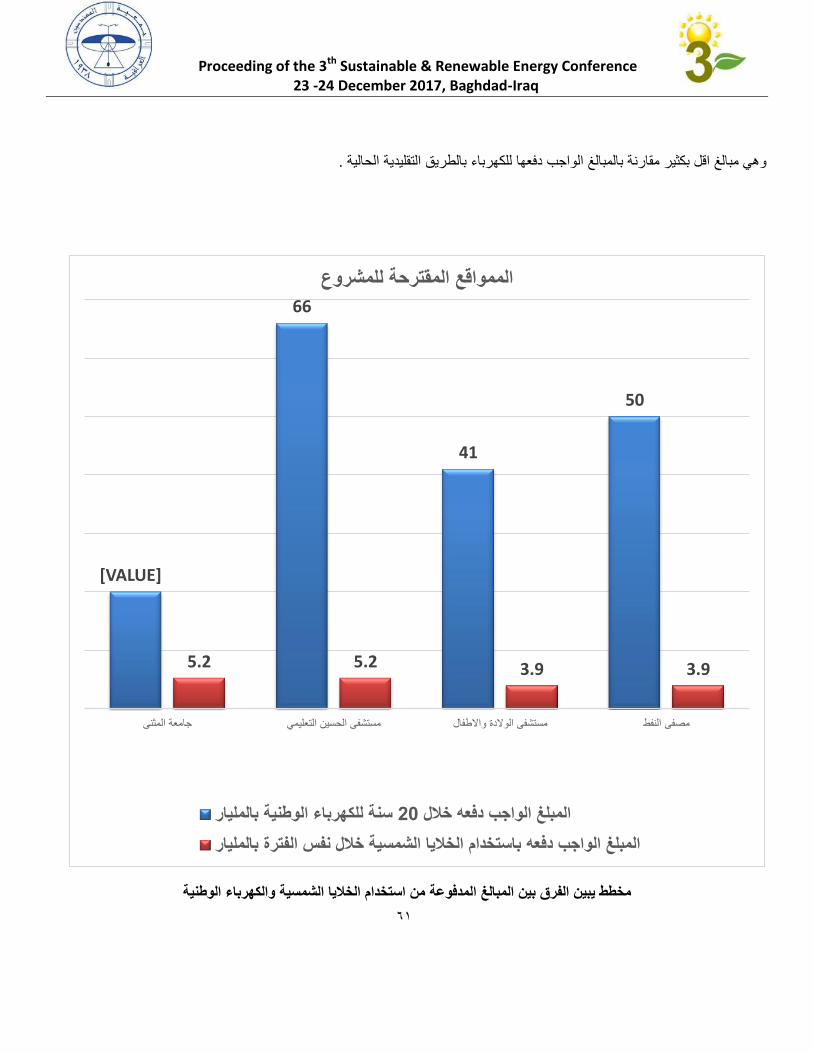
Proceeding of the 3th Sustainable & Renewable Energy Conference
23 -24 December 2017, Baghdad-Iraq
.الحالية التقليدية بالطريقاء للكهربمقارنة بالمبالغ الواجب دفعها اقل بكثيروهي مبالغ
مخطط يبين الفرق بين المبالغ المدفوعة من استخدام الخاليا الشمسية والكهرباء الوطنية
[VALUE]
66
41
50
5.2 5.2 3.9 3.9
مصفى النفط مستشفى الوالدة واالطفال مستشفى الحسين التعليمي جامعة المثنى
الممواقع المقترحة للمشروع
سنة للكهرباء الوطنية بالمليار 20المبلغ الواجب دفعه خالل
المبلغ الواجب دفعه باستخدام الخاليا الشمسية خالل نفس الفترة بالمليار
27
Proceeding of the 3th Sustainable & Renewable Energy Conference
23 -24 December 2017, Baghdad-Iraq
:تكلفة الطاقة الشمسية للمنازل
م الواح الطاقة ة باستخدام نظاتكلفة الحصول على الكهرباء الكافية الدارة منزل من الطاقة الشمسي بها منازل نعنيتكلفة الطاقة الشمسية لل ان
.Photovoltaic panelsالشمسية الفولتوضوئية
ثم حساب تكلفة استخدام الطاقة الشمسية لتلبية 3م 311البد لنا ان نبدا اوال بحساب احمال الكهرباء لمنزل مساحته
.هذه االحتياجات وكذلك المساحة المطلوبة لتثبيت الواح الطاقة الشمسية
:ملاالحمال تش
يتم احتساب الطاقة الالزمة لتشغيل االجهزة الكهربائية حسب الدراسات الحديثة المعدة من قبل وزارة الكهرباء : االجهزة الكهربائية -7
-:الموجودة وكما يلي
واط 500=براد ماء + مجمدة + ثالجة •
واط 400=حاسوب + ستاليت + تلفزيون •
واط 600= 6/عدد/مراوح مختلفة •
واط 500=ماطور ماء •
واط 1500=مكنسة كهربائية •
واط 500=غسالة •
واط 1500= مكواة •
واط 700= 2/مبردة هواء •
(اطو 6200=)المجموع •
-:تصبح الطاقة المطلوبة( 0.35)يتم استخدام معامل الطلب ( (NEC article 210- 11(c) ,220-25طبقا •
2170W=6200×0.35
االنارة-3
-:للحصول على الطاقة المطلوبة لالنارة حسب المواصفة( 0.35)واط لكل متر مربع ونستخدم معامل الطلب 25يتم احتساب
NEC Table 220-42 (National Electrical Code)
Lighting Demand =Max demand x Demand Factor
25×311×0.35=2.6KW
.تقريبا( 8W/Meter SQ)وبذلك فان الطاقة المطلوبة لالنارة
23

Proceeding of the 3th Sustainable & Renewable Energy Conference
23 -24 December 2017, Baghdad-Iraq
طبخمعدات الم-2
%.80واط مع اجهزة المطبخ ويطبق معامل طلب (2500)يحتاج المطبخ "( NEC Table 220-55Column "B)طبقا لـ
2500=2000W×0.8
.واقع الحال فان معامل الطلب يختلف باختالف مساحة الدار ووبالدراسة (Split &Window)باستخدام االجهزة : اجهزة التبريد -7
Max Demand=Connected Load× Demand Factor.
9.6KW =0.6 ×16
.2/طن بصورة مستمرة اضافة الى مبردات هواءعدد( 2)مكيفات سعة ( 4)وتكفي هذة الطاقة لتشغيل
=بجمع االحمال متر مربع 311مساحته لدار( Max Demand)اعلى حمل مطلوب وعليه يكون
15.7 KW =2000+2600+2170+9600
=17KVA
الخلية . واط 321على اعتبار ان الخاليا المستخدمة ذات سعه ) دينار 34321111الطاقة تكلفتها هذه إلنتاجخلية شمسية 22ونحتاج الى
. 3م 711والمساحة المطلوبة ( 3م 7.2الواحدة
التحديات التي تواجه استخدام الطاقة الشمسية
.األولية االستثمارية التكلفة ارتفاع -
.يتطلب النظام مساحات واسعة لنصب االلواح الشمسية -
.االخرى بالدول مقارنة المتجددة الطاقة مجال فى لالستثمار مشجعة تمويل أليات وجود عدم -
ألشعة المستقبل الجهاز تنظيف عدم حالة فى تفقد الشمسية الطاقة فعاليةان نسبة من حيث الشمسية طاقةال أجهزة على واالتربة الغبار تأثير -.الشمس
22

Proceeding of the 3th Sustainable & Renewable Energy Conference
23 -24 December 2017, Baghdad-Iraq
االستنتاجات:
الطاقة الشمسية مستدامة، وهي أيضا متجددة أي أنها طاقة ال تنفذ، فهي مصدر طاقة طبيعي ويمكن استخدامه في توليد اشكال أخرى
.امها كوقود للسيارات كما يمكن ان نسخن بها الماء او أن نضيء بها بيوتنامن الطاقة، فيمكننا استخد
،الحصول على الطاقة الشمسية لن يتطلب الحقا الكثير من أعمال الصيانة، حيث سيتم تركيب األلواح أو االحواض الشمسية مرة واحدة
.فظة على انتظام عملهاوبعدها ستعمل بأقصى كفاءة ممكنة، ويبقى لدينا القليل فقط لنفعله للمحا
الطاقة الشمسية منتج صامت للطاقة، فبالتأكيد ال تتسبب ألواح الخاليا الشمسية بأية ضوضاء عندما تقوم بتحويل ضوء الشمس إلى طاقة
.كهربائية قابلة لالستخدام
على البيانات التي عرضت بناء لحكومية ذات جدوى اقتصادية واضحةان استخدام نظام الطاقة الشمسية وخاصة للمؤسسات ا
.للمؤسسات المستهدفة
ما يزال التقدم في تكنولوجيا الطاقة الشمسية مستمرا لجعلها أكثر فاعلية من الناحية االقتصادية، وباإلضافة إلى االنخفاض في تكلفة
تكلفة الكهرباء التقليدية أو المنتجة من ل مقارنة يجعل تكلفة الطاقة الشمسية تستمر في االنخفاض مما تركيب مستلزمات الطاقة الشمسية،
.الوقود االحفوري
يمكن استخدام اسطح البنايات ومواقف السيارات والمسقفات ومظالت النوافذ لتنصيب الخاليا المطلوبة والتغلب على مشكلة المساحة
لتبريد لمساعدة ن الغراض االنارة او ااو يمكن توليد جزء من الطاقة حسب المساحة المتوفرة كان تكوبالنسبة لالماكن الصغيرة
المنظومة الوطنية
بعض على التشغيل تكلفة وتقتصر لتشغيلها، كهرباء أو وقود إلى تحتاج ال حيث منخفضة الشمسية للخاليا التشغيل تكلفة أن رغم
الناس، لعامة بالنسبة الشرائية القدرة لضعف نظرا العادي للمستهلك بالنسبة مرتفعة تعتبر االستثمارية التكلفة أن إال البسيطة، الصيانات
يمكن التوصية في هذه الفترة ، ولكن أكبر شهرية اجور يتحمل وأن الحالية الكهرباء اجور ودفع البقاء يفضل المستهلك يجعل الذي األمر
.على مستوى المنازل السناد الطاقة الحالية انظمة تسخين الماء بالطاقة الشمسيةباستخدام
:التوصياتنظام الطاقة الشمسية يتطلب توفر مساحات كافية لنصب الخاليا الشمسية حيث يحتاج النظام الى مساحات واسعة ، ويمكن -7
كما ان عدم وماشابه ، ومظالت النوافذ استثمار اسطح المؤسسات الحكومية ، وجدرانها ، كما يمكن استثمار اسقف الكراجات ررا ، حيث يمكن العمل بالمساحات المتوفرة والتي تكافئ نسبة معينة من الطاقة الشمسية وجود المساحات الكافية اليعد مب
، او انشاء مشاريع طاقة شمسية لمدينة او منطقة متكاملة على اراضي والنسبة االخرى من الطاقة الكهربائية التقليدية الحالية .مستقلة تخصص لهذا الغرض
:التعاقد مركزيا -3
وائر والمؤسسات الحكومية بالتعاقد مع احدى الشركات لتجهيز المؤسسة بالطاقة الكهربائية عن طريق الخاليا الشمسية ان قيام الد، لذا ؤسساتفي ظل الوضع المالي الغلب الدوائر والم يتطلب امكانات مالية ال باس بها ، ومن الصعوبة توفر المبالغ المطلوبة
محافظات او الحكومة المركزية بالتعاقد مع شركات متخصصة في مجال نصب الطاقة فمن االفضل ان تقوم الوزارات او الالشمسية على ان يتم دفع تكاليفها بالتقسيط او باالجل مع توفر الضمانات الحكومية ، او دخول المصارف كطرف ضامن وحسب
.االتفاق بين االطراف ذات العالقة
27
Proceeding of the 3th Sustainable & Renewable Energy Conference
23 -24 December 2017, Baghdad-Iraq
: االستثمار -2
في مجال الطاقة الشمسية يتطلب توفر القناعة لدى المؤسسات الحكومية اوال، حيث يمكن ان تقوم ان دخول الشركات االستثمارية الشركات االستثمارية بتوفير نظام الطاقة الشمسية وبيعه للمؤسسات الحكومية ، كما يمكن للشركات االستثمارية مع منحها
على على الدولة او محطات للطاقة الشمسية وبيعها إلقامةمة للحصول على المساحات المطلوبة من االراضي زالتسهيالت الال .متعهدين في الجباية
في عدد من يمكن لوزارة الكهرباء ان تتعاقد مع الشركات المتخصصة في وزارة الصناعة لتنفيذ مشاريع الطاقة الشمسية -7 .خالل استيفاء اجور الكهرباءومن بالتقسيط ارة الكهرباء زمن قبل والمناطق او المحافظات ، على ان يتم الدفع
المنزليةلبعض االستخدامات وخاصة الشمسية الطاقة استخدام بأهمية للتعريف موجهه إعالمية حمالت تنظيمل الحاجة - 2 .وصيانتها ومزاياها بتشغيلها الخاصة وتوضيح االجراءاتكسخانات الماء الشمسية
:يتطلب العمل باالجرءات التالية( كخطوة اولى)الحكومية ان التوجه الستخدام الطاقة الشمسية في المؤسسات -2
الدوائر والمؤسسات الحكومية ببيان حجم استهالكها من الطاقة الكهربائية والمساحات توجيهتتبنى وزارة الكهرباء - أ .المتوفرة لديها
و مع شركات وزارة خطة تنفيذ برنامج الطاقة المتجددة ، كالتعاقد مع شركات متخصصة اتضع وزارة الكهرباء - ب . الصناعة وفق المساحات المتوفرة لكل مؤسسة أو دائرة
يتم الدفع بالتقسيط لتلك الشركات ويفضل ان تقترب مبالغ االقساط من نفس المبالغ التي تدفع عن كلفة استهالك - ت .سنويا الطاقة الكهربائية
تنفيذ باالقساط ، أو عرض بعض المناطق كفرص يتم االنتقال لتطبيق هذا البرنامج على المنازل وبنفس اليات ال - ث .استثمارية
المصادر:1-"About solar energy technologies", Greenpeace International 2-"Solar Power -- About Solar Power", Clean Technica 3- "BP Statistical Review of World Energy 2016 - data workbook", BP, 4- S. Ashok Raymond T. Fonash Stephen Joseph Fonash ، "Solar Cell | Electronics" ، Britannica 5- JESSIKA TOOTHMAN & SCOTT ALDOUS , "How Solar Cells Work" ، HowStuffWorks, 6- "How do solar cells work?", Physics.org, 7- "Solar Cells" ، Chemistry Explained 8-Air condition calculation of rule of thumb* 9-http://electrical-engineering-portal.com/demand-factor-diversity-factor-utilization-factor-load-factor National electrical code Saudi Arabia. 00- بيانات مديرية توزيع كهرباء المثنى 11- مديرية تخطيط المثنى/ 6101قاعدة البيانات المكانية والقطاعية
22
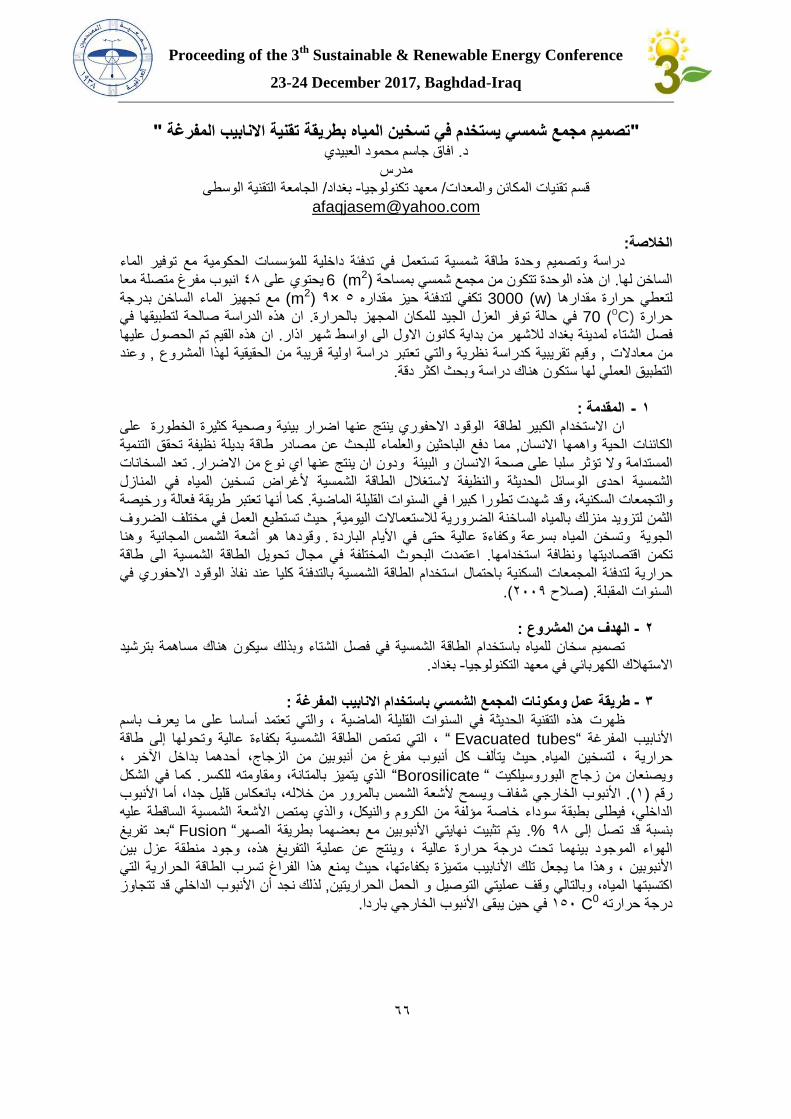
Proceeding of the 3th
Sustainable & Renewable Energy Conference
23-24 December 2017, Baghdad-Iraq
"تصميم مجمع شمسي يستخدم في تسخين المياه بطريقة تقنية االنابيب المفرغة " افاق جاسم محمود العبيدي. د
مدرس الجامعة التقنية الوسطى/ بغداد -معهد تكنولوجيا/ قسم تقنيات المكائن والمعدات
:الخالصة الماء توفير مع الحكومية للمؤسسات داخلية تدفئة في تستعمل شمسية طاقة وحدة وتصميم دراسة
معا متصلة مفرغ انبوب 84 على يحتوي m 6)2) بمساحة شمسي مجمع من تتكون الوحدة هذه ان .لها الساخن بدرجة الساخن الماء تجهيز مع m)2) 9× 5 مقداره حيز لتدفئة تكفي 0003 (w) مقدارها حرارة لتعطي في لتطبيقها صالحة الدراسة هذه ان .بالحرارة المجهز للمكان الجيد العزل توفر حالة في C)o) 70 حرارة عليها الحصول تم القيم هذه ان .اذار شهر اواسط الى االول كانون بداية من لالشهر بغداد لمدينة الشتاء فصل
وعند , المشروع لهذا الحقيقية من قريبة اولية دراسة تعتبر والتي نظرية كدراسة تقريبية وقيم , معادالت من .دقة اكثر وبحث دراسة هناك ستكون لها العملي التطبيق
: المقدمة -1
على الخطورة كثيرة وصحية بيئية اضرار عنها ينتج االحفوري الوقود لطاقة الكبير االستخدام ان التنمية تحقق نظيفة بديلة طاقة مصادر عن للبحث والعلماء الباحثين دفع مما ,االنسان واهمها ةالحي الكائنات
السخانات تعد .االضرار من نوع اي عنها ينتج ان ودون البيئة و االنسان صحة على سلبا تؤثر وال المستدامة المنازل في المياه تسخين ألغراض الشمسية الطاقة الستغالل والنظيفة الحديثة الوسائل احدى الشمسية
ورخيصة فعالة طريقة تعتبر أنها كما .الماضية القليلة السنوات في كبيرا تطورا شهدت وقد السكنية، والتجمعات الضروف مختلف في العمل تستطيع حيث ,اليومية لالستعماالت الضرورية الساخنة بالمياه منزلك يدلتزو الثمن
وهنا المجانية الشمس أشعة هو وقودها . الباردة األيام في حتى عالية وكفاءة بسرعة المياه تسخنو الجوية طاقة الى الشمسية الطاقة ويلتح مجال في المختلفة لبحوثا اعتمدت .استخدامها ونظافة اقتصاديتها تكمن
في االحفوري الوقود نفاذ عند كليا بالتدفئة الشمسية الطاقة استخدام باحتمال السكنية المجمعات لتدفئة حرارية (.9009 صالح) .المقبلة السنوات
: المشروع من الهدف -2
بترشيد مساهمة هناك سيكون وبذلك الشتاء فصل في الشمسية الطاقة باستخدام للمياه سخان تصميم .بغداد -التكنولوجيا معهد في الكهربائي االستهالك
: المفرغة االنابيب باستخدام الشمسي المجمع ومكونات عمل طريقة -3
باسم يعرف ما على أساسا تعتمد والتي ، الماضية القليلة السنوات في الحديثة التقنية هذه ظهرت طاقة إلى وتحولها عالية بكفاءة الشمسية الطاقة تمتص التي ، “ tubes Evacuated“ المفرغة األنابيب ، اآلخر بداخل أحدهما الزجاج، من أنبوبين من مفرغ أنبوب كل يتألف حيث .المياه لتسخين ، حرارية
الشكل في كما .للكسر ومقاومته ،بالمتانة يتميز الذي “Borosilicate “ البوروسيلكيت زجاج من ويصنعان األنبوب أما جدا، قليل بانعكاس خالله، من بالمرور الشمس ألشعة ويسمح شفاف ارجيالخ األنبوب (.1) رقم
عليه الساقطة الشمسية األشعة يمتص والذي والنيكل، الكروم من مؤلفة خاصة سوداء بطبقة فيطلى الداخلي، تفريغ دبع“ Fusion “الصهر بطريقة بعضهما مع األنبوبين نهايتي تثبيت يتم .% 94 إلى تصل قد بنسبة بين عزل منطقة وجود ،ههذ التفريغ عملية عن وينتج ، عالية حرارة درجة تحت بينهما الموجود الهواء
التي الحرارية الطاقة تسرب الفراغ هذا يمنع حيث ،بكفاءتها متميزة األنابيب تلك عليج ما وهذا ، األنبوبين تتجاوز قد الداخلي األنبوب أن نجد لذلك ,حراريتينال الحمل و التوصيل عمليتي وقف وبالتالي المياه، اكتسبتها
.باردا الخارجي األنبوب يبقى حين في 0C 150 حرارته درجة
66
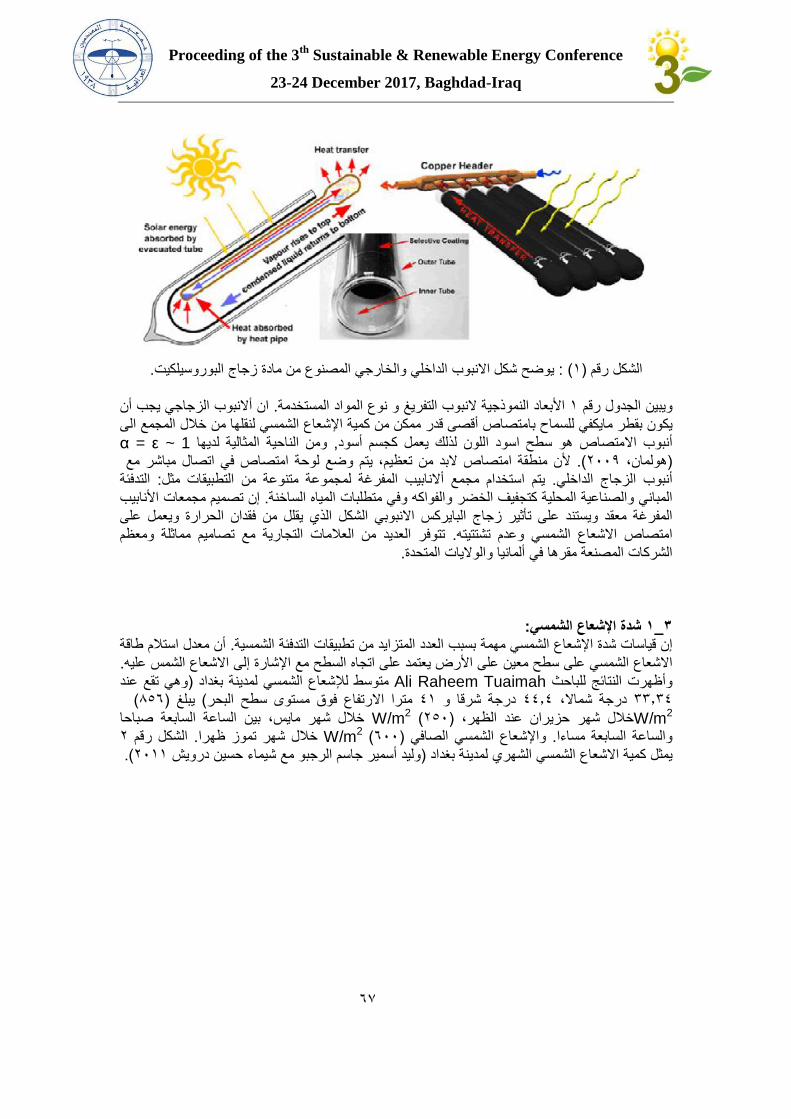
Proceeding of the 3th
Sustainable & Renewable Energy Conference
23-24 December 2017, Baghdad-Iraq
.البوروسيلكيت زجاج مادة من المصنوع والخارجي الداخلي االنبوب شكل يوضح : (1) رقم الشكل
أن يجب يالزجاج نبوبالأ ان .المستخدمة لموادا نوع و التفريغ النبوب النموذجية األبعاد 1 رقم الجدول ويبين الى المجمع خالل من هالنقل الشمسي اإلشعاع كمية من ممكن قدر أقصى بامتصاص للسماح يكفيما قطرب يكون ε = α ~ 1 لديها المثالية الناحية ومن ,أسود كجسم يعمل لذلك اللون اسود سطح هو متصاصالا أنبوب
مع مباشر اتصال في امتصاص لوحة وضع يتم تعظيم، من البد امتصاص منطقة ألن (.9009 هولمان،) التدفئة :مثل التطبيقات من متنوعة لمجموعة المفرغة ابيبنالأ مجمع استخدام يتم .الداخلي الزجاج أنبوب
يببااألن مجمعات تصميم إن .الساخنة المياه متطلبات وفي والفواكه الخضر كتجفيف المحلية والصناعية المباني على ويعمل الحرارة فقدان من يقلل الذي الشكل االنبوبي البايركس زجاج تأثير على ويستند معقد المفرغة
ومعظم مماثلة تصاميم مع التجارية العالمات من العديد تتوفر .تشتتيته وعدم الشمسي االشعاع امتصاص .المتحدة والواليات ألمانيا في مقرها المصنعة الشركات
:الشمسي اإلشعاع شدة 1_3 طاقة استالم معدل أن .الشمسية التدفئة تطبيقات من المتزايد العدد بسبب مهمة الشمسي اإلشعاع شدة قياسات إن
.عليه الشمس االشعاع إلى اإلشارة مع السطح اتجاه على يعتمد األرض على معين سطح على الشمسي االشعاع عند تقع وهي) بغداد لمدينة الشمسي لإلشعاع متوسط Tuaimah Raheem Ali للباحث النتائج وأظهرت (458) يبلغ (البحر سطح مستوى فوق االرتفاع مترا 81 و شرقا درجة 88.8 شماال، درجة 33.38
2W/m2 (950) الظهر، عند حزيران شهر خاللW/m صباحا السابعة الساعة بين ،سماي شهر خالل 9 رقم الشكل .ظهرا تموز شهر خالل 2W/m (800) الصافي شمسيال اإلشعاعو .مساءا السابعة والساعة
(.9011 درويش حسين شيماء مع الرجبو جاسم أسمير وليد) بغداد لمدينة الشهري الشمسي االشعاع كمية يمثل
66
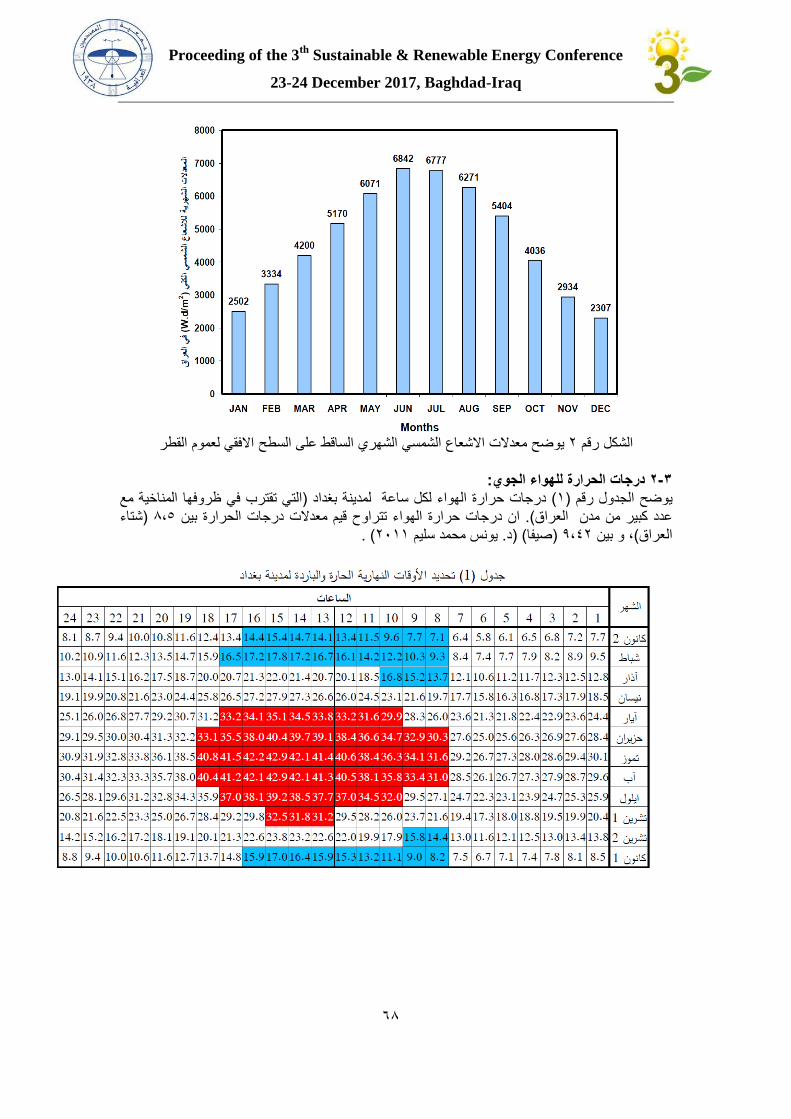
Proceeding of the 3th
Sustainable & Renewable Energy Conference
23-24 December 2017, Baghdad-Iraq
القطر لعموم االفقي السطح على الساقط الشهري الشمسي االشعاع معدالت يوضح 9 رقم الشكل
:الجوي للهواء الحرارة درجات 3-2
مع المناخية ظروفها في تقترب التي) بغداد لمدينة ساعة لكل الهواء حرارة درجات (1) رقم الجدول يوضح شتاء) 4،5 بين الحرارة درجات معدالت قيم تتراوح الهواء حرارة درجات ان .(العراق مدن من كبير عدد
. (9011 سليم محمد يونس .د) (صيفا) 9،89 بين و ،(العراق
66

Proceeding of the 3th
Sustainable & Renewable Energy Conference
23-24 December 2017, Baghdad-Iraq
:التفريغ أنابيب مجمع من حرارية شبكةل عام وصف -4 األنابيب هذه (وداخلي خارجي أنبوب) البايركس زجاج من انبوبين عن عبارة هو المفرغ الحراري االنبوب إن
السوداء امتصاص لوحة من اإلشعاع بسبب الحرارة فقدان من حسمي ال فراغ وبينها نهاية كل في مختومة هي زجاج نبوبالأ طبقة من الخارجي الزجاج على الساقط الشمسي اإلشعاع كما .الخارجي المحيط الى اللون
ينتقل اإلشعاع ومعظم الجوي الغالف في أخرى مرة ينعكس جزء يمتص، الشمسي االشعاع من جزء ،بايركسال .9 رقم الجدول في الخارجي يكاتالبورسل أنبوب خصائص .الداخلي زجاجي أنبوب من التالية الطبقة إلى
.9 رقم الشكل في المفرغ االنبوب زجاج سطح على الشمسي االشعاع السقاط عام وصف ويظهر
(.9005 جان،) جامع لنموذج عام وصف للحرارة الماص الجزء على الساقط االشعاع يمثل 3 رقم الشكل :الشمسية بالطاقة التسخين منظومة مكونات 4-1
تتكون المفرغة االنابيب بطريقة تعمل التي الشمسية المنظومة تصميم مكونات فان (3) رقم بالشكل مبين وكما :من ماء فيها النحاس من اذرع داخلها وفي لحمايتها صندوق في موضوعة الهواء من المفرغة التسخين أنابيب -1
.الكفاءة عالي شمسي كمجمع تعمل , أعلى حرارية نقل لكفاءة الهواء من ومفرغة مقطر بنقل يقوم محلول على يحوي المفرغ الزجاجي االنبوب داخل يقع النحاس من مصنوع حراري انبوب -9
. عليه المار المائع الى االبنوب راس من الحرارة فتنتقل الحراري االنبوب اعلى الى الحرارة .الماء جريان بضبط يقوم الشمسي التحكم نظام -3 .عالية حرارة بدرجات ماء وصول عند عالي لضغط يتعرض ال بان للنظام منيض بارز أمان صمام -8 .الحرارة فقدان لمنع والمعزول الساخن، الماء خزان والى من المعدنية األنابيب من خط -5 .الباردة الشتاء أيام أجل من الحرارة بحفظ يقوم الستيل الستانلس من خزان -8 الناجمة بالضغط الزيادة بامتصاص يقوم والخزان الشمسية الخلية بين الواصل االنابيب خط على تمدد خزان -7
.المغلقة المنظومة في الماء حرارة درجة ارتفاع عن الماء وخزان الشمسية التسخين أنابيب بين المياه لتحريك قليلة طاقة تستهلك ,الماء لضخ الجريان مضخة -4
.الساخن .الشمسية الطاقة بواسطة المسخنة المياه باستخدام منزلية تدفئة منظومة -9
في المطلوبة الماء حرارة درجة الى الوصول عدم عند يعمل السيطرة منظومة مع مربوط كهربائي مسخن -10 .محدد زمن .السيطرة منظومة الى مربوط لسخانا حرارة لدرجة مقياس -11
66
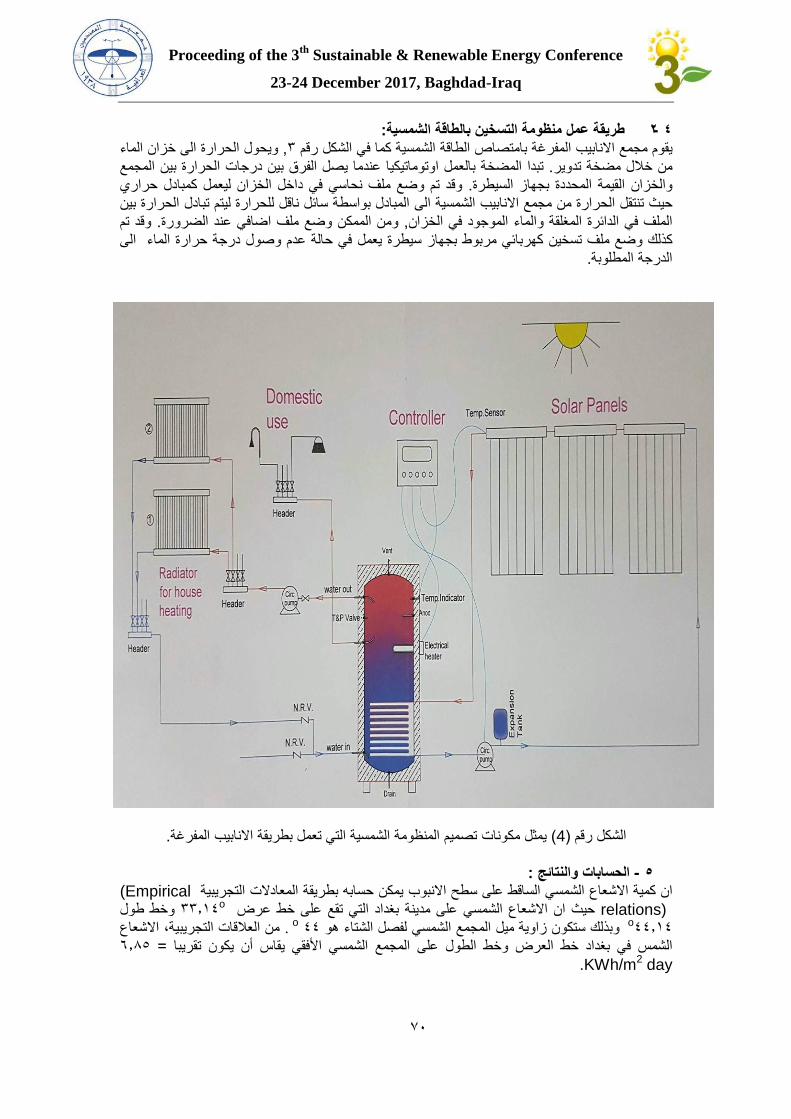
Proceeding of the 3th
Sustainable & Renewable Energy Conference
23-24 December 2017, Baghdad-Iraq
:الشمسية بالطاقة التسخين منظومة عمل طريقة 4-2 الماء خزان الى الحرارة ويحول ,3 رقم الشكل في كما الشمسية الطاقة بامتصاص المفرغة االنابيب مجمع يقوم المجمع بين الحرارة درجات بين الفرق يصل عندما اوتوماتيكيا بالعمل المضخة تبدا .رتدوي مضخة خالل من
حراري كمبادل ليعمل الخزان داخل في نحاسي ملف وضع تم وقد .السيطرة بجهاز المحددة القيمة والخزان بين الحرارة تبادل ليتم للحرارة ناقل سائل بواسطة المبادل الى الشمسية االنابيب مجمع من الحرارة تنتقل حيث
تم وقد .الضرورة عند اضافي ملف وضع الممكن ومن ,الخزان في الموجود والماء المغلقة الدائرة في الملف الى الماء حرارة درجة وصول عدم حالة في يعمل سيطرة بجهاز مربوط يكهربائ تسخين ملف وضع كذلك
.المطلوبة الدرجة
.المفرغة االنابيب بطريقة تعمل التي الشمسية المنظومة تصميم مكونات يمثل (4) رقم الشكل
: والنتائج الحسابات -5
Empirical) التجريبية المعادالت بطريقة حسابه يمكن االنبوب سطح على الساقط الشمسي االشعاع كمية ان relations) عرض خط على تقع التي بغداد مدينة على الشمسي االشعاع ان حيث o33.18 طول وخط
88.18o 88 هو الشتاء لفصل الشمسي المجمع ميل زاوية ستكون وبذلك o . االشعاع التجريبية، العالقات من 8.45 = تقريبا يكون أن يقاس األفقي الشمسي المجمع على الطول وخط العرض خط بغداد في الشمسday 2KWh/m.
67
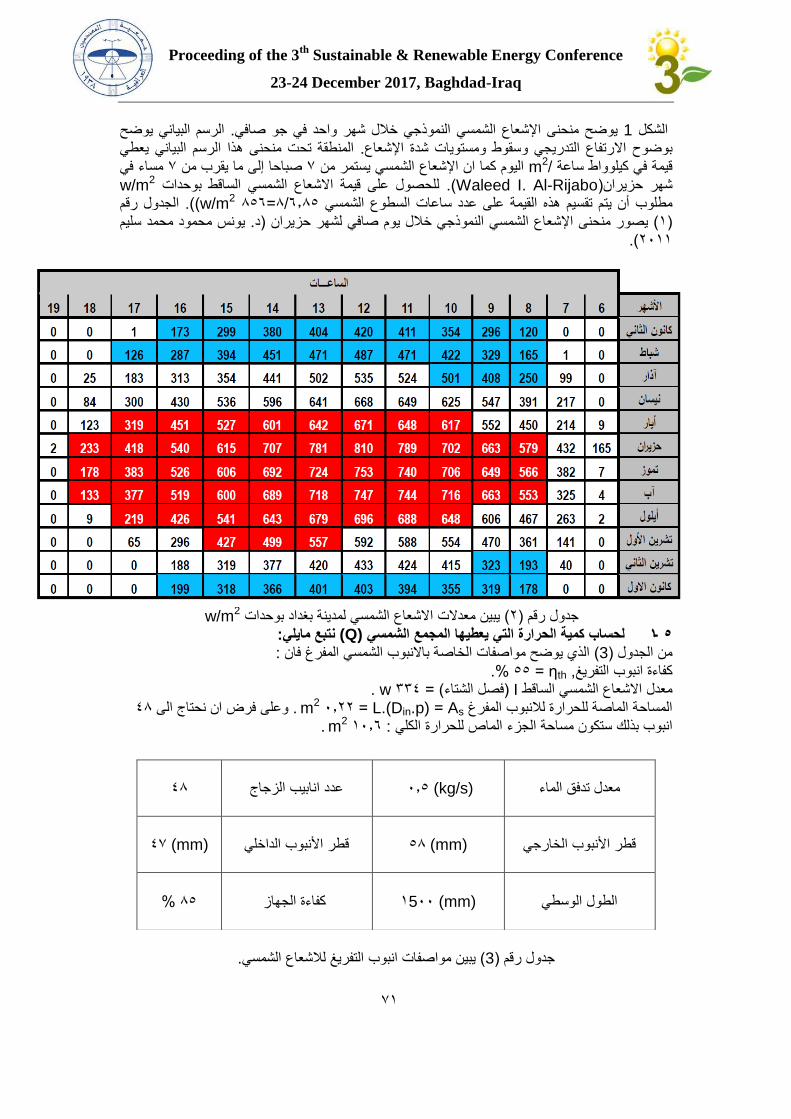
Proceeding of the 3th
Sustainable & Renewable Energy Conference
23-24 December 2017, Baghdad-Iraq
يوضح البياني الرسم .صافي جو في واحد شهر خالل النموذجي الشمسي اإلشعاع منحنى يوضح 1 الشكل يعطي البياني الرسم هذا منحنى تحت المنطقة .اإلشعاع شدة ومستويات وسقوط التدريجي االرتفاع بوضوح
في مساء 7 من يقرب ما إلى صباحا 7 من يستمر الشمسي اإلشعاع ان كما اليوم 2m/ ساعة كيلوواط في قيمة 2w/m بوحدات الساقط الشمسي االشعاع قيمة على للحصول (.Rijabo-Al I. Waleed)حزيران شهر
رقم الجدول ((.2w/m 458=8.45/4 الشمسي السطوع ساعات عدد على القيمة هذه تقسيم يتم أن مطلوب سليم محمد محمود يونس .د) حزيران لشهر صافي يوم خالل النموذجي الشمسي اإلشعاع منحنى يصور (1)
9011.)
2w/m بوحدات بغداد لمدينة الشمسي االشعاع معدالت يبين (9) رقم جدول :مايلي نتبع (Q) الشمسي المجمع يعطيها التي الحرارة كمية لحساب 5-1
: فان المفرغ الشمسي باالنبوب الخاصة مواصفات يوضح الذي (3) الجدول من %. thη = 55 ,التفريغ بوبان كفاءة . w 338 = (الشتاء فصل) I الساقط الشمسي االشعاع معدل
84 الى نحتاج ان فرض وعلى . sA = p).inD(L. = 99.0 2m المفرغ لالنبوب للحرارة الماصة المساحة . 2m 10.8 : الكلي للحرارة الماص الجزء مساحة ستكون بذلك انبوب
.الشمسي لالشعاع التفريغ انبوب مواصفات يبين (3) رقم جدول
معدل تدفق الماء (kg/s) 0.5 عدد انابيب الزجاج 84
87 (mm) 54 قطر األنبوب الداخلي (mm) قطر األنبوب الخارجي
45 % كفاءة الجهاز 1500 (mm) الطول الوسطي
67
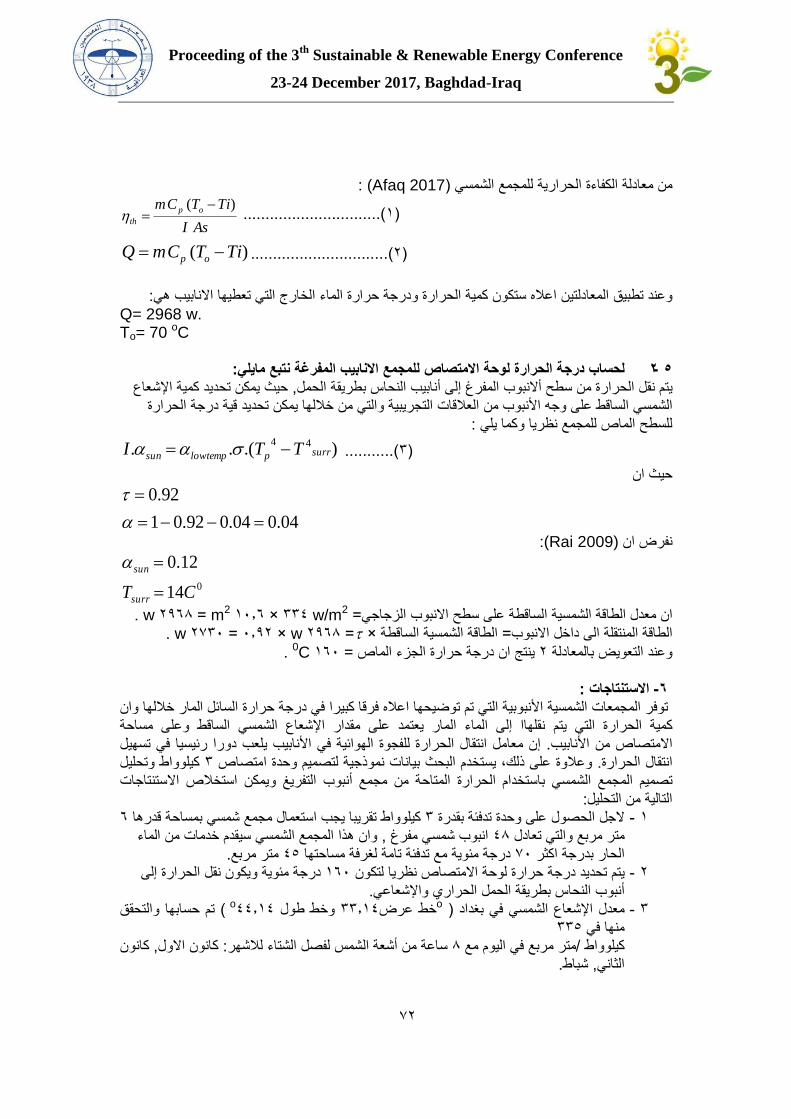
Proceeding of the 3th
Sustainable & Renewable Energy Conference
23-24 December 2017, Baghdad-Iraq
: )Afaq 2017) الشمسي للمجمع الحرارية الكفاءة معادلة من
(1 ...............................)AsI
TiTCm op
th
)(
(9.)..............................)( TiTCmQ op
:هي االنابيب تعطيها التي الخارج الماء حرارة ودرجة الحرارة كمية ستكون اعاله المعادلتين تطبيق وعند
w. 2968 Q= Co 70 =oT
:مايلي نتبع المفرغة االنابيب للمجمع االمتصاص لوحة الحرارة درجة لحساب 5-2 اإلشعاع كمية تحديد يمكن حيث ,الحمل بطريقة النحاس أنابيب إلى المفرغ نبوبالأ سطح من الحرارة نقل يتم
الحرارة درجة قية تحديد يمكن خاللها من والتي التجريبية العالقات من األنبوب وجه على الساقط الشمسي : يلي وكما نظريا للمجمع الماص للسطح
(3...........) ).(.. 44surrplowtempsun TTI
ان حيث
04.004.092.01
92.0
:Rai) (2009 ان نفرض
014
12.0
CTsurr
sun
. 2w/m 338 × 10.8 2m = 9984 w =الزجاجي االنبوب سطح على الساقطة الشمسية الطاقة معدل ان . =9984 w × 0.99 =9730 w× الساقطة الشمسية الطاقة =االنبوب داخل الى المنتقلة الطاقة
. C0 180 = الماص الجزء حرارة درجة ان ينتج 9 بالمعادلة التعويض وعند : االستنتاجات -6 وان خاللها لمارا السائل حرارة درجة في كبيرا فرقا اعاله توضيحها تم التي األنبوبية الشمسية المجمعات توفر
مساحة وعلى الساقط الشمسي اإلشعاع مقدار على يعتمد المار لماءا إلى انقلها يتم التي الحرارة كمية تسهيل في رئيسيا دورا يلعب األنابيب في الهوائية للفجوة الحرارة انتقال معامل إن .األنابيب من االمتصاص
وتحليل كيلوواط 3 امتصاص وحدة لتصميم نموذجية بيانات البحث يستخدم ذلك، على وعالوة .الحرارة انتقال االستنتاجات استخالص يمكنو التفريغ أنبوب مجمع من المتاحة الحرارة باستخدام الشمسي المجمع تصميم :التحليل من التالية
8 قدرها بمساحة شمسي مجمع استعمال يجب تقريبا واطكيلو 3 بقدرة تدفئة وحدة على الحصول الجل -1 الماء من خدمات سيقدم الشمسي المجمع هذا وان , مفرغ شمسي انبوب 84 تعادل والتي مربع متر
.مربع متر 85 مساحتها لغرفة تامة تدفئة مع مئوية درجة 70 اكثر بدرجة الحار إلى الحرارة نقل يكونو مئوية درجة 081 لتكون نظريا االمتصاص لوحة حرارة درجة تحديد يتم -9
.يواإلشعاع الحراري الحمل بطريقة النحاس أنبوب والتحقق حسابها تم ( 88.18o طول وخط 33.18عرض خطo ) بغداد في الشمسي اإلشعاع معدل -3
335 في منها كانون ,االول كانون :لالشهر الشتاء لفصل الشمس أشعة من ساعة 4 مع اليوم في مربع متر/ طكيلووا .شباط ,الثاني
67
Proceeding of the 3th
Sustainable & Renewable Energy Conference
23-24 December 2017, Baghdad-Iraq
:المصادر
1- Salah AA ( 2009). Masheiti , Modelling of lithium-bromide (LiBr) chillers and organic Rankin cycle (ORC) powered by low-temperature geothermal heat source, Research, New Castle University.
2- Holman JP (2005).Heat Transfer, 8th Edition, Mc Graw Hill, Singapore, pp-336-360, 394-484, 553-587.
لتباين المكاني دراسة ا مجلة علوم الرافدين،, وليد اسمر جاسم الرجبو مع شيماء حسين درويش -3 .119،ص 8،العدد 99المجلد لإلشعاع الشمسي الكلي الساقط على السطح األفقي في العراق
المجلة العراقية , تصميم المانعة الشمسية االفقية في مباني مدينة بغداد, يونس محمود محمد سليم. د -8 . 9011, تشرين االول, 99العدد , للهندسة المعمارية
5- Afaq Jasim Mahmood (2017), Experimental Study of a Solar Air Heater With A New Arrangement of Transverse Longitudinal Baffle, Journal of Solar Energy Engineering, Vol. 139 / 031004-1.
6- Rai GD (2009). Non Conventional Energy Sources, Khanna Publishers, 4th edition, New Delhi, pp. 47-122.
67

Proceeding of the 3th
Sustainable & Renewable Energy Conference
23-24 December 2017, Baghdad-Iraq
47
ستعمال الطاقة الشمسيةاب الذكيةري الطرق
ريفان زهير منصور قسم هندسة تقنيات الميكاترونيكس, بغداد /الكلية التقنية الهندسيه,الجامعة التقنية الوسطى
emial: [email protected]
: خالصهال
من هذه الدراسه هو التعرف على طرق الري الذكية باالستعانة بالطاقة الشمسية حيث يمكن أن تقلل من الغرض
الى جانب ذلك، يهدف هذا المشروع إلى تطوير برامج باستخدام .توفير الطاقة المستهلكهقوة العمل البشرية و
كما يهدف إلى الحد من العمل البشري .ةللحفاظ على التوازن السليم للرطوبة في الترب المسيطرات والحساسات
وايضا تستخدم األلواح الشمسية لتوفير الطاقة حيث يتم في النهار استخدام .والجهد واألخطاء بسبب اإلهمال البشري
ويستخدم أجهزة استشعار الرطوبة إلى .الطاقة الشمسية لتشغيل النظام خالل النهار وشحن البطاريات للعمل في الليل
.مستوى الرطوبة في التربةالشعور
إن موارد المياه ضرورية لتلبية االحتياجات البشرية والحماية وكفالة إنتاج األغذية والطاقة فضال عن التنمية
وفي مجال الزراعة، يعتبر استخدام أسلوب الري أمرا مهما ألن السبب .االجتماعية واالقتصادية وللتنمية المستدامة
في هذا البحث حول طرق اختيار سقي النباتات ذاتيا بدون تدخل االنسان عن نتطرق. مطارالرئيسي هو قلة وجوداال
.طريق تصميم منظومات ري ذكيه متكاملة تعمل على الطاقة الشمسية
ثانيا طريقة بناء , اوال طريقة بناء منظومة سقي صغيرة للحدائق والنباتات المنزلية. البحث يتضمن عدة طرق للري
ثالثا طريقا بناء منظومة بيت زجاجي ذكي متكامل من حيث المحافظه على , تكاملة الرض زراعيةمنظومة ري م
جميع الطرق اعاله تحتوي على دارات . على اعتدال درجة الحراره داخل البيت الزجاجي مع سقي المحصول ذاتيا
لتعديل مع تغذيه كامله من منظومة كهرائية والكترونيه ومعالج دقيق مع برمجه متكامله متكيفة مع البيئه وقابلة ل
.خاليا شمسية
:ةالمقدم
واالستخدام اإليجابي للموارد انخفاض مصادر الطاقة تدريجيا وزيادة الطلب على الطاقة في السنوات األخيرة
المائية الحالية جنبا إلى جنب مع االحتباس الحراري واالحترار والجفاف واستهالك كميات كبيرة من المياه العذبه
دورا هاما في طرق االن تلعبالتي ذكيه ريطرق وايجادادارة المياه التوجه الىوبالتالي،. للري الزراعي
.الحديثهةالزراع
حيث ان معظم مولدات .المضخات المستخدمة في الري الزراعي تكون عموما من الطاقة الكهربائية ان الطاقة
الطاقة الكهربائية المستعمله في الري تستعمل الوقود مثل الغاز الطبيعي او مشتقات النفط او وقود احفوري حيث
ه بستعمال مصادر بديله لها مثلتعتبر هذي المصادر مدمره للبيئه ومستهلكه لمصادر االرض حيث قضت الحاج
توجد موارد الطاقة المتجددة في مناطق جغرافية واسعة، على النقيض من مصادر حيث .الطاقه المتجدده مصادر
ويؤدي االنتشار السريع للطاقة المتجددة وكفاءة الطاقة إلى .الطاقة األخرى التي تتركز في عدد محدود من البلدان
وفي حين أن العديد . ن في مجال الطاقة والتخفيف من آثار تغير المناخ والفوائد االقتصاديةتحقيق قدر كبير من األم
من مشاريع الطاقة المتجددة واسعة النطاق، فإن التكنولوجيات المتجددة مناسبة أيضا للمناطق الريفية والنائية
والبلدان النامية،
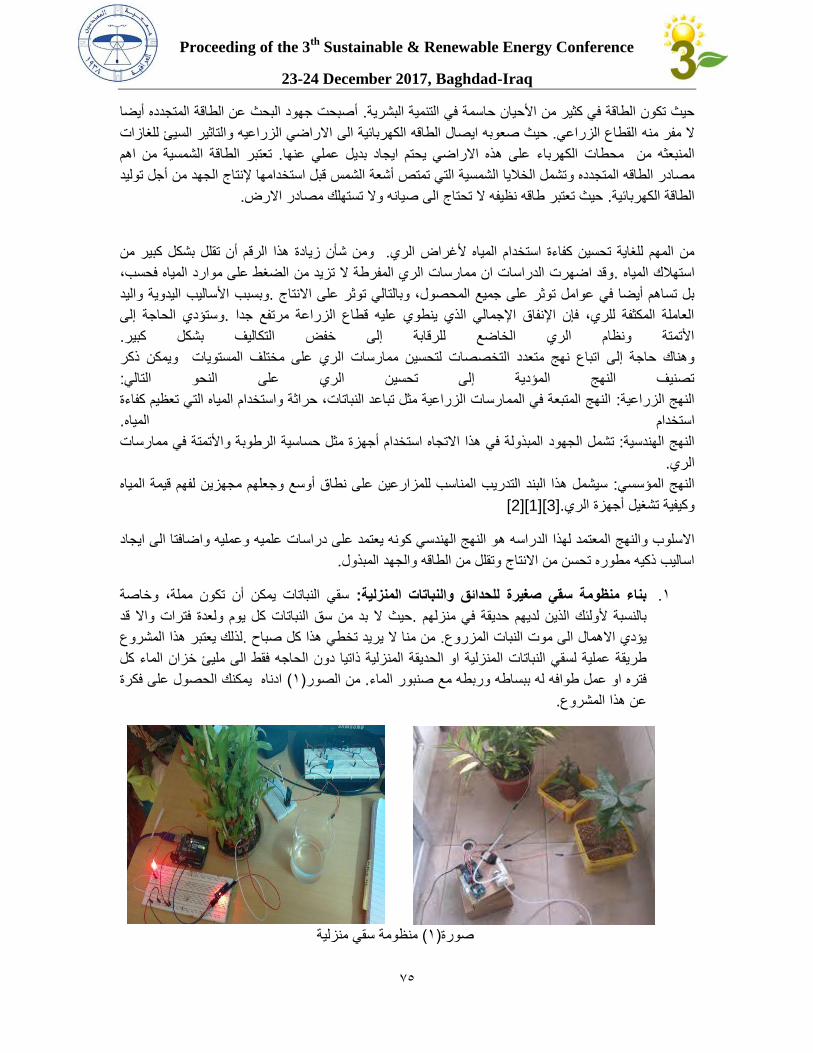
Proceeding of the 3th
Sustainable & Renewable Energy Conference
23-24 December 2017, Baghdad-Iraq
47
أصبحت جهود البحث عن الطاقة المتجدده أيضا .األحيان حاسمة في التنمية البشرية حيث تكون الطاقة في كثير من
االراضي الزراعيه والتاثير السيئ للغازات الكهربائية الى حيث صعوبه ايصال الطاقه .القطاع الزراعي ال مفر منه
تعتبر الطاقة الشمسية من اهم . على هذه االراضي يحتم ايجاد بديل عملي عنهاالكهرباء محطات المنبعثه من
تشمل الخاليا الشمسية التي تمتص أشعة الشمس قبل استخدامها إلنتاج الجهد من أجل توليد ومصادر الطاقه المتجدده
.ضحيث تعتبر طاقه نظيفه ال تحتاج الى صيانه وال تستهلك مصادر االر .الطاقة الكهربائية
ومن شأن زيادة هذا الرقم أن تقلل بشكل كبير من . من المهم للغاية تحسين كفاءة استخدام المياه ألغراض الري
وقد اضهرت الدراسات ان ممارسات الري المفرطة ال تزيد من الضغط على موارد المياه فحسب، .استهالك المياه
وبسبب األساليب اليدوية واليد .لي توثر على االنتاجبل تساهم أيضا في عوامل توثر على جميع المحصول، وبالتا
وستؤدي الحاجة إلى .العاملة المكثفة للري، فإن اإلنفاق اإلجمالي الذي ينطوي عليه قطاع الزراعة مرتفع جدا
.األتمتة ونظام الري الخاضع للرقابة إلى خفض التكاليف بشكل كبير
ويمكن ذكر سين ممارسات الري على مختلف المستويات وهناك حاجة إلى اتباع نهج متعدد التخصصات لتح
:تصنيف النهج المؤدية إلى تحسين الري على النحو التالي
النهج المتبعة في الممارسات الزراعية مثل تباعد النباتات، حراثة واستخدام المياه التي تعظيم كفاءة : النهج الزراعية
.استخدام المياه
المبذولة في هذا االتجاه استخدام أجهزة مثل حساسية الرطوبة واألتمتة في ممارسات تشمل الجهود : النهج الهندسية
.الري
سيشمل هذا البند التدريب المناسب للمزارعين على نطاق أوسع وجعلهم مجهزين لفهم قيمة المياه : النهج المؤسسي
[3][1][2].وكيفية تشغيل أجهزة الري
اضافتا الى ايجاد و النهج الهندسي كونه يعتمد على دراسات علميه وعمليه وه الدراسهاالسلوب والنهج المعتمد لهذا
.المبذول والجهد اساليب ذكيه مطوره تحسن من االنتاج وتقلل من الطاقه
سقي النباتات يمكن أن تكون مملة، وخاصة :بناء منظومة سقي صغيرة للحدائق والنباتات المنزلية .1
حيث ال بد من سق النباتات كل يوم ولعدة فترات واال قد .بالنسبة ألولئك الذين لديهم حديقة في منزلهم
لذلك يعتبر هذا المشروع .من منا ال يريد تخطي هذا كل صباح .يؤدي االهمال الى موت النبات المزروع
منزلية او الحديقة المنزلية ذاتيا دون الحاجه فقط الى مليئ خزان الماء كل طريقة عملية لسقي النباتات ال
ادناه يمكنك الحصول على فكرة ( 1)من الصور .وربطه مع صنبور الماء له ببساطه فتره او عمل طوافه
.عن هذا المشروع
منزليةمنظومة سقي (1)ورةص
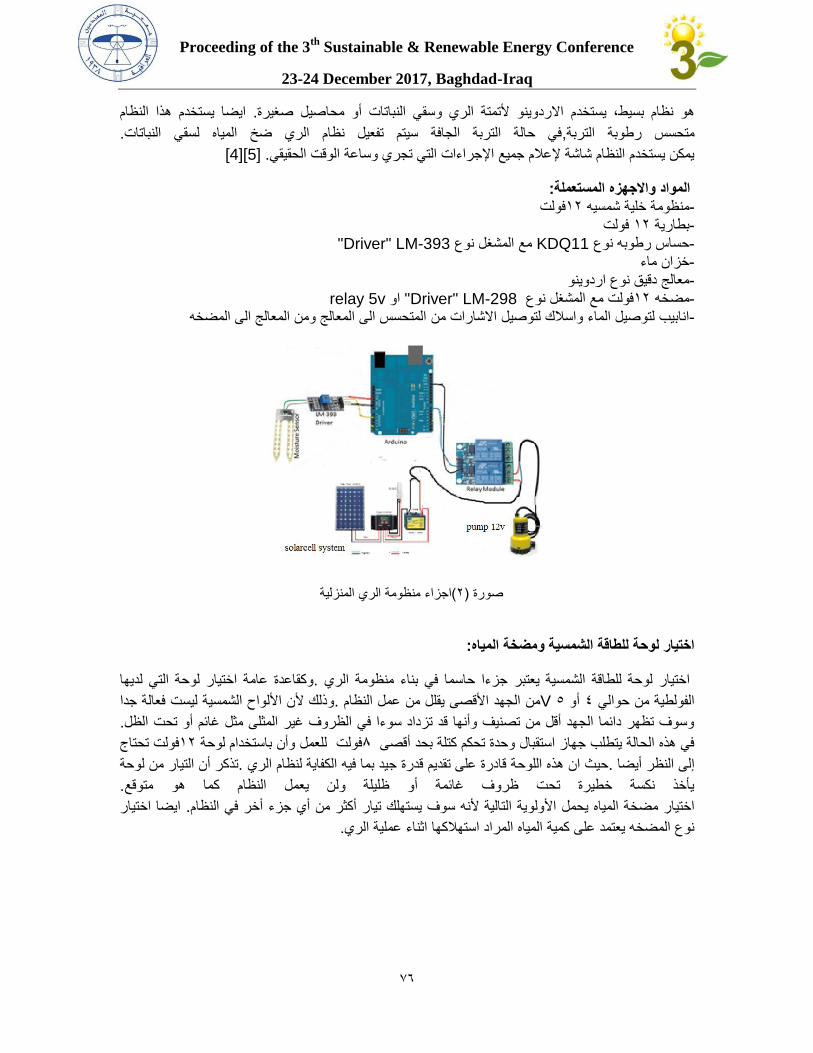
Proceeding of the 3th
Sustainable & Renewable Energy Conference
23-24 December 2017, Baghdad-Iraq
47
ايضا يستخدم هذا النظام .أو محاصيل صغيرة االردوينو ألتمتة الري وسقي النباتاتهو نظام بسيط، يستخدم
.في حالة التربة الجافة سيتم تفعيل نظام الري ضخ المياه لسقي النباتات,متحسس رطوبة التربة
[5][4] .يمكن يستخدم النظام شاشة إلعالم جميع اإلجراءات التي تجري وساعة الوقت الحقيقي
:ةواالجهزه المستعملالمواد فولت11منظومة خلية شمسيه - فولت 11بطارية - Driver" LM-393"مع المشغل نوع KDQ11نوع حساس رطوبه - خزان ماء - معالج دقيق نوع اردوينو- relay 5vاو Driver" LM-298"فولت مع المشغل نوع 11مضخه - المتحسس الى المعالج ومن المعالج الى المضخهانابيب لتوصيل الماء واسالك لتوصيل االشارات من -
:اختيار لوحة للطاقة الشمسية ومضخة المياه
وكقاعدة عامة اختيار لوحة التي لديها .اختيار لوحة للطاقة الشمسية يعتبر جزءا حاسما في بناء منظومة الري
وذلك ألن األلواح الشمسية ليست فعالة جدا .من الجهد األقصى يقلل من عمل النظام 7Vأو 7الفولطية من حوالي
.وسوف تظهر دائما الجهد أقل من تصنيف وأنها قد تزداد سوءا في الظروف غير المثلى مثل غائم أو تحت الظل
فولت تحتاج 11للعمل وأن باستخدام لوحة فولت 8 في هذه الحالة يتطلب جهاز استقبال وحدة تحكم كتلة بحد أقصى
تذكر أن التيار من لوحة .جيد بما فيه الكفاية لنظام الري حيث ان هذه اللوحة قادرة على تقديم قدرة .إلى النظر أيضا
.يأخذ نكسة خطيرة تحت ظروف غائمة أو ظليلة ولن يعمل النظام كما هو متوقع
ايضا اختيار .ية التالية ألنه سوف يستهلك تيار أكثر من أي جزء أخر في النظاماختيار مضخة المياه يحمل األولو
.نوع المضخه يعتمد على كمية المياه المراد استهالكها اثناء عملية الري
اجزاء منظومة الري المنزلية(1)صورة
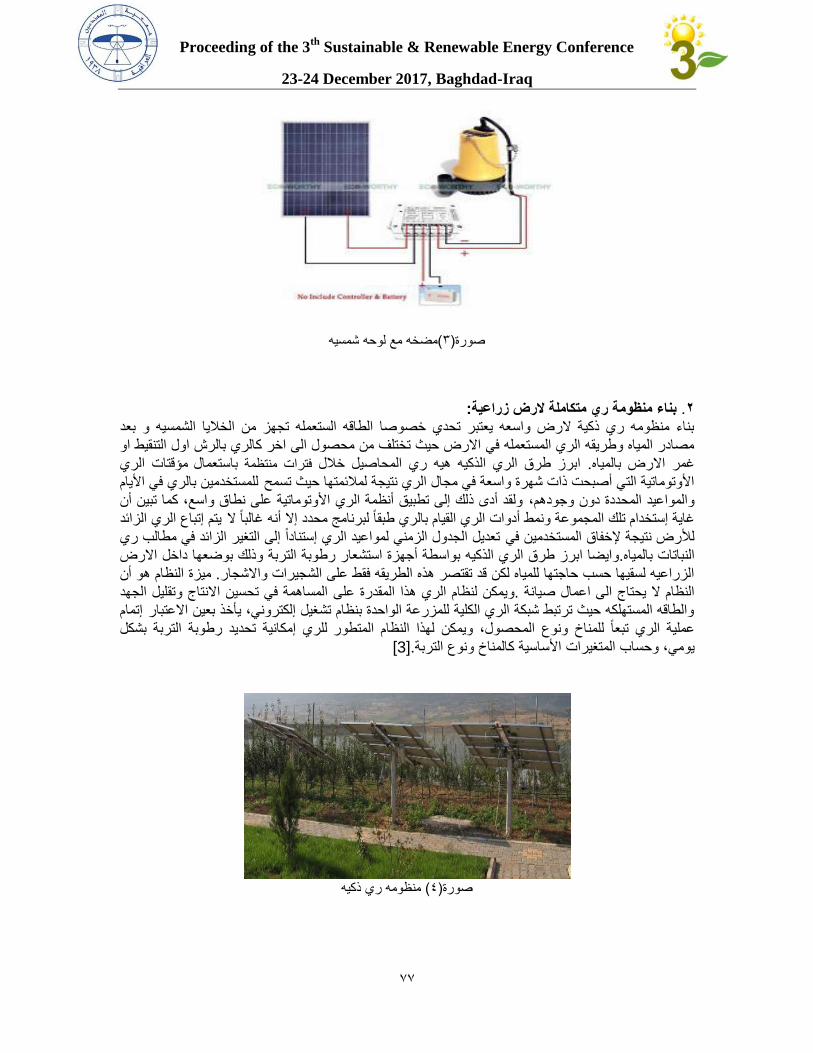
Proceeding of the 3th
Sustainable & Renewable Energy Conference
23-24 December 2017, Baghdad-Iraq
44
مضخه مع لوحه شمسيه(3)صورة
: بناء منظومة ري متكاملة الرض زراعية. 2 بعدبناء منظومه ري ذكية الرض واسعه يعتبر تحدي خصوصا الطاقه الستعمله تجهز من الخاليا الشمسيه و
مصادر المياه وطريقه الري المستعمله في االرض حيث تختلف من محصول الى اخر كالري بالرش اول التنقيط او مؤقتات الري "استعمالب ات منتظمةفتر ري المحاصيل خالل ابرز طرق الري الذكيه هيه. غمر االرض بالمياه
للمستخدمين بالري في األيام "األوتوماتية التي أصبحت ذات شهرة واسعة في مجال الري نتيجة لمالئمتها حيث تسمحولقد أدى ذلك إلى تطبيق أنظمة الري األوتوماتية على نطاق واسع، كما تبين أن "والمواعيد المحددة دون وجودهم،
يتم إتباع الري الزائد "المجموعة ونمط أدوات الري القيام بالري طبقا لبرنامج محدد إال أنه غالبا الغاية إستخدام تلك مطالب ري تعديل الجدول الزمني لمواعيد الري إستنادا إلى التغير الزائد في"المستخدمين فيلألرض نتيجة إلخفاق
وذلك بوضعها داخل االرضبواسطة أجهزة استشعار رطوبة التربة طرق الري الذكيه وايضا ابرز .النباتات بالمياهميزة النظام هو أن .الزراعيه لسقيها حسب حاجتها للمياه لكن قد تقتصر هذه الطريقه فقط على الشجيرات واالشجار
حسين االنتاج وتقليل الجهد المساهمة في ت"علىيمكن لنظام الري هذا المقدرة و .النظام ال يحتاج الى اعمال صيانةإتمام "والطاقه المستهلكه حيث ترتبط شبكة الري الكلية للمزرعة الواحدة بنظام تشغيل إلكتروني، يأخذ بعين االعتبار
للري إمكانية تحديد رطوبة التربة بشكل "عملية الري تبعا للمناخ ونوع المحصول، ويمكن لهذا النظام المتطور [3] .األساسية كالمناخ ونوع التربة يومي، وحساب المتغيرات
منظومه ري ذكيه (7)صورة
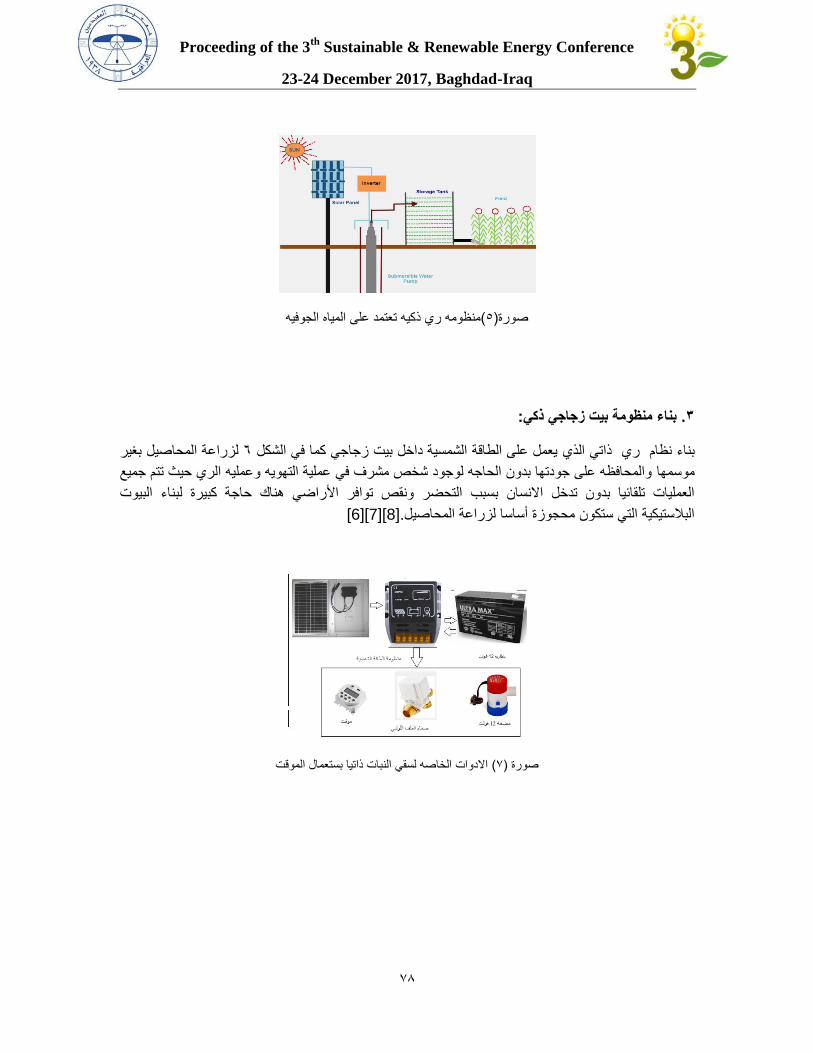
Proceeding of the 3th
Sustainable & Renewable Energy Conference
23-24 December 2017, Baghdad-Iraq
47
منظومه ري ذكيه تعتمد على المياه الجوفيه(7)صورة
:بناء منظومة بيت زجاجي ذكي .3
محاصيل بغير ال ةلزراع 7 يعمل على الطاقة الشمسية داخل بيت زجاجي كما في الشكل ذاتي الذي ري بناء نظام
والمحافظه على جودتها بدون الحاجه لوجود شخص مشرف في عملية التهويه وعمليه الري حيث تتم جميع موسمها
البيوت حاجة كبيرة لبناء بسبب التحضر ونقص توافر األراضي هناك العمليات تلقائيا بدون تدخل االنسان
[8][7][6] .محجوزة أساسا لزراعة المحاصيل البالستيكية التي ستكون
االدوات الخاصه لسقي النبات ذاتيا بستعمال الموقت( 4) صورة
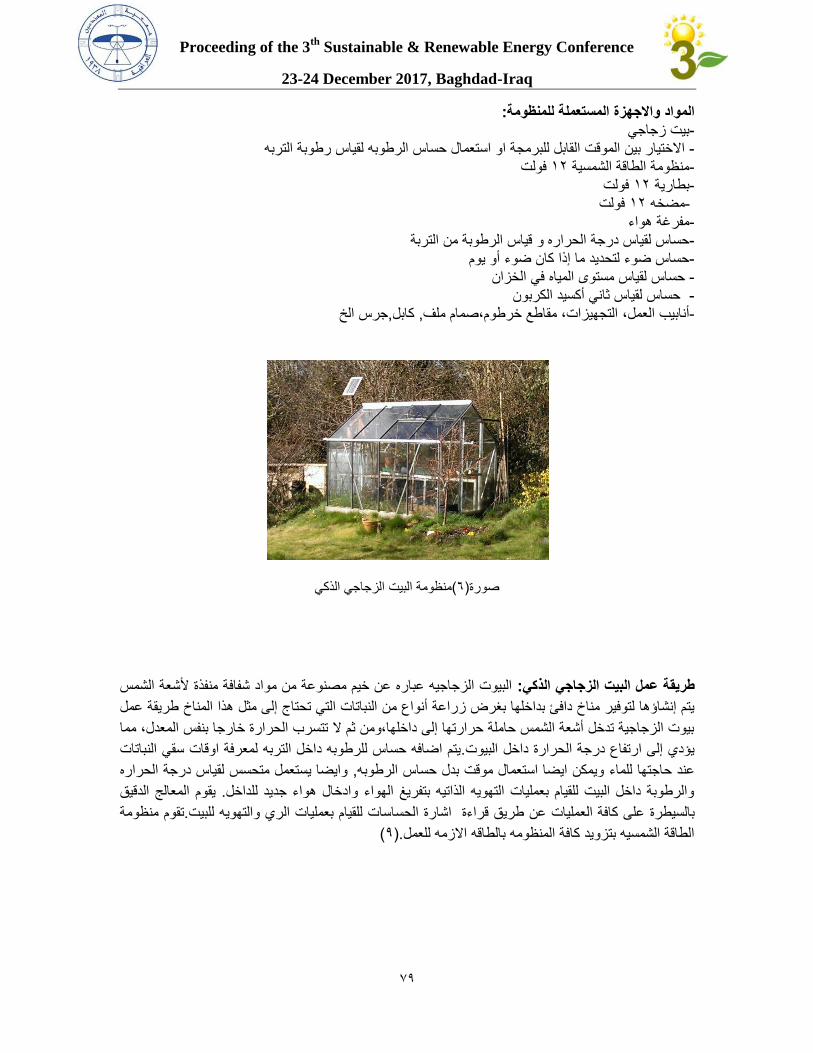
Proceeding of the 3th
Sustainable & Renewable Energy Conference
23-24 December 2017, Baghdad-Iraq
47
:ة للمنظومةالمستعمل ةالمواد واالجهز بيت زجاجي - استعمال حساس الرطوبه لقياس رطوبة التربهاالختيار بين الموقت القابل للبرمجة او - فولت 11منظومة الطاقة الشمسية - فولت 11بطارية - فولت 11مضخه - مفرغة هواء- قياس الرطوبة من التربة حساس لقياس درجة الحراره و- حساس ضوء لتحديد ما إذا كان ضوء أو يوم- لقياس مستوى المياه في الخزان حساس - حساس لقياس ثاني أكسيد الكربون - جرس الخ,كابل, التجهيزات، مقاطع خرطوم،صمام ملفأنابيب العمل، -
منظومة البيت الزجاجي الذكي(7)صورة
البيوت الزجاجيه عباره عن خيم مصنوعة من مواد شفافة منفذة ألشعة الشمس :ة عمل البيت الزجاجي الذكيقطري
طريقة عمل النباتات التي تحتاج إلى مثل هذا المناخيتم إنشاؤها لتوفير مناخ دافئ بداخلها بغرض زراعة أنواع من
بيوت الزجاجية تدخل أشعة الشمس حاملة حرارتها إلى داخلها،ومن ثم ال تتسرب الحرارة خارجا بنفس المعدل، مما
يتم اضافه حساس للرطوبه داخل التربه لمعرفة اوقات سقي النباتات .يؤدي إلى ارتفاع درجة الحرارة داخل البيوت
وايضا يستعمل متحسس لقياس درجة الحراره , حساس الرطوبهويمكن ايضا استعمال موقت بدل للماء حاجتها عند
يقوم المعالج الدقيق . والرطوبة داخل البيت للقيام بعمليات التهويه الذاتيه بتفريغ الهواء وادخال هواء جديد للداخل
تقوم منظومة .اسات للقيام بعمليات الري والتهويه للبيتاشارة الحس ةاءعلى كافة العمليات عن طريق قر ةبالسيطر
(7).الطاقة الشمسيه بتزويد كافة المنظومه بالطاقه االزمه للعمل
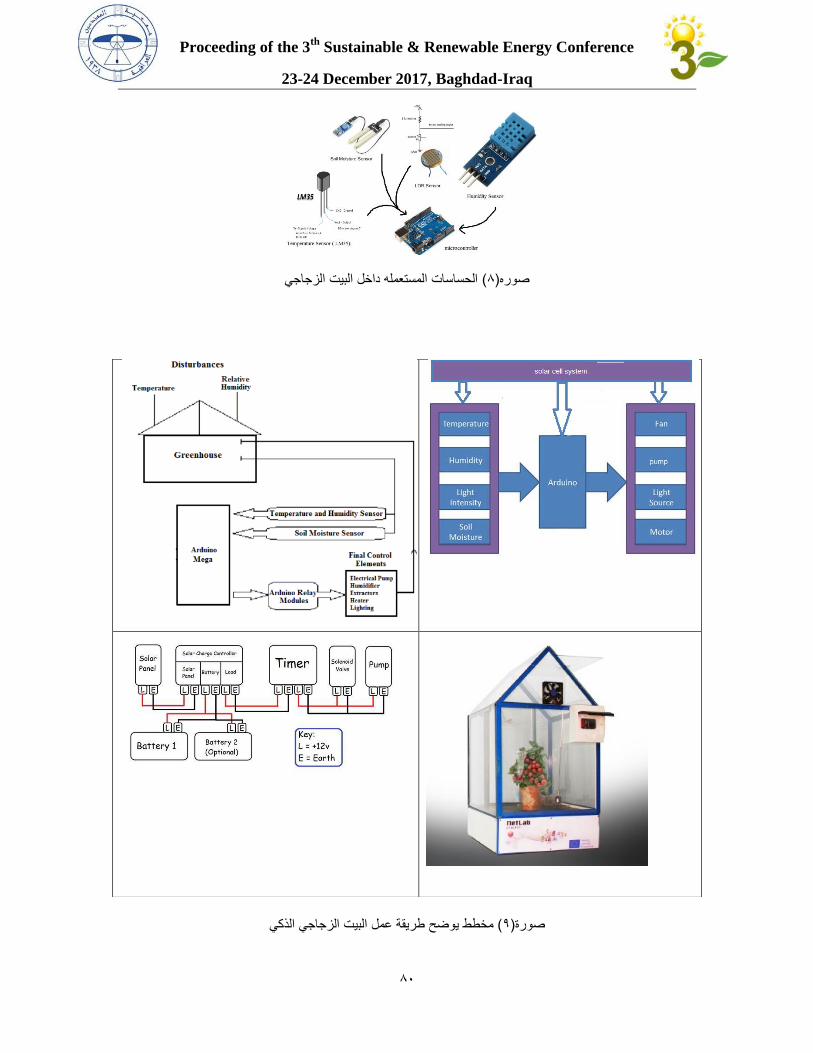
Proceeding of the 3th
Sustainable & Renewable Energy Conference
23-24 December 2017, Baghdad-Iraq
78
الحساسات المستعمله داخل البيت الزجاجي( 7)صوره
يكذلا يجاجزلا تيبلا لمع ةقيرط حضوي ططخم (7)ةروص
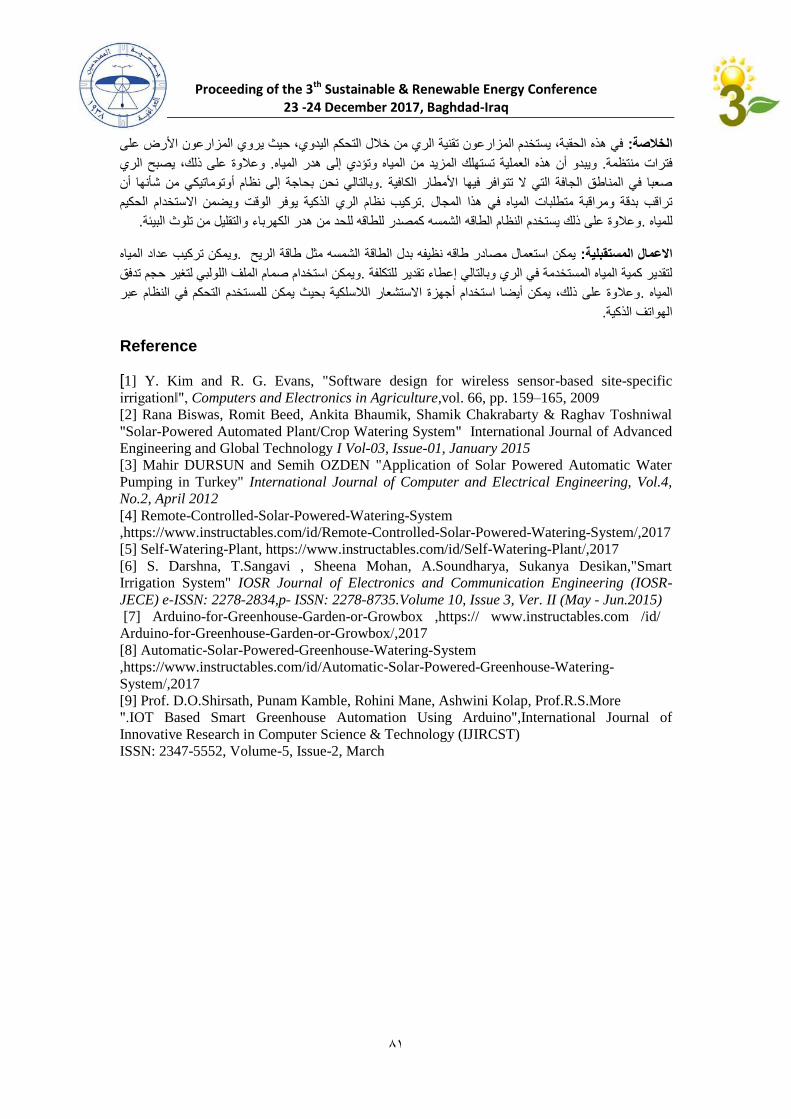
Proceeding of the 3th Sustainable & Renewable Energy Conference 23 -24 December 2017, Baghdad-Iraq
71
في هذه الحقبة، يستخدم المزارعون تقنية الري من خالل التحكم اليدوي، حيث يروي المزارعون األرض على :الخالصة
وعالوة على ذلك، يصبح الري .لية تستهلك المزيد من المياه وتؤدي إلى هدر المياهويبدو أن هذه العم. فترات منتظمة
وبالتالي نحن بحاجة إلى نظام أوتوماتيكي من شأنها أن .صعبا في المناطق الجافة التي ال تتوافر فيها األمطار الكافية
االستخدام الحكيم ية يوفر الوقت ويضمنتركيب نظام الري الذك .تراقب بدقة ومراقبة متطلبات المياه في هذا المجال
.وعالوة على ذلك يستخدم النظام الطاقه الشمسه كمصدر للطاقه للحد من هدر الكهرباء والتقليل من تلوث البيئة .للمياه
ويمكن تركيب عداد المياه .يمكن استعمال مصادر طاقه نظيفه بدل الطاقة الشمسه مثل طاقة الريح : المستقبلية العماال
ويمكن استخدام صمام الملف اللولبي لتغير حجم تدفق .لتقدير كمية المياه المستخدمة في الري وبالتالي إعطاء تقدير للتكلفة
وعالوة على ذلك، يمكن أيضا استخدام أجهزة االستشعار الالسلكية بحيث يمكن للمستخدم التحكم في النظام عبر .المياه
.الهواتف الذكية
Reference
[1] Y. Kim and R. G. Evans, "Software design for wireless sensor-based site-specific
irrigation‖", Computers and Electronics in Agriculture,vol. 66, pp. 159–165, 2009
[2] Rana Biswas, Romit Beed, Ankita Bhaumik, Shamik Chakrabarty & Raghav Toshniwal
"Solar-Powered Automated Plant/Crop Watering System" International Journal of Advanced
Engineering and Global Technology I Vol-03, Issue-01, January 2015
[3] Mahir DURSUN and Semih OZDEN "Application of Solar Powered Automatic Water
Pumping in Turkey" International Journal of Computer and Electrical Engineering, Vol.4,
No.2, April 2012
[4] Remote-Controlled-Solar-Powered-Watering-System
,https://www.instructables.com/id/Remote-Controlled-Solar-Powered-Watering-System/,2017
[5] Self-Watering-Plant, https://www.instructables.com/id/Self-Watering-Plant/,2017
[6] S. Darshna, T.Sangavi , Sheena Mohan, A.Soundharya, Sukanya Desikan,"Smart
Irrigation System" IOSR Journal of Electronics and Communication Engineering (IOSR-
JECE) e-ISSN: 2278-2834,p- ISSN: 2278-8735.Volume 10, Issue 3, Ver. II (May - Jun.2015)
[7] Arduino-for-Greenhouse-Garden-or-Growbox ,https:// www.instructables.com /id/
Arduino-for-Greenhouse-Garden-or-Growbox/,2017
[8] Automatic-Solar-Powered-Greenhouse-Watering-System
,https://www.instructables.com/id/Automatic-Solar-Powered-Greenhouse-Watering-
System/,2017
[9] Prof. D.O.Shirsath, Punam Kamble, Rohini Mane, Ashwini Kolap, Prof.R.S.More
".IOT Based Smart Greenhouse Automation Using Arduino",International Journal of
Innovative Research in Computer Science & Technology (IJIRCST)
ISSN: 2347-5552, Volume-5, Issue-2, March
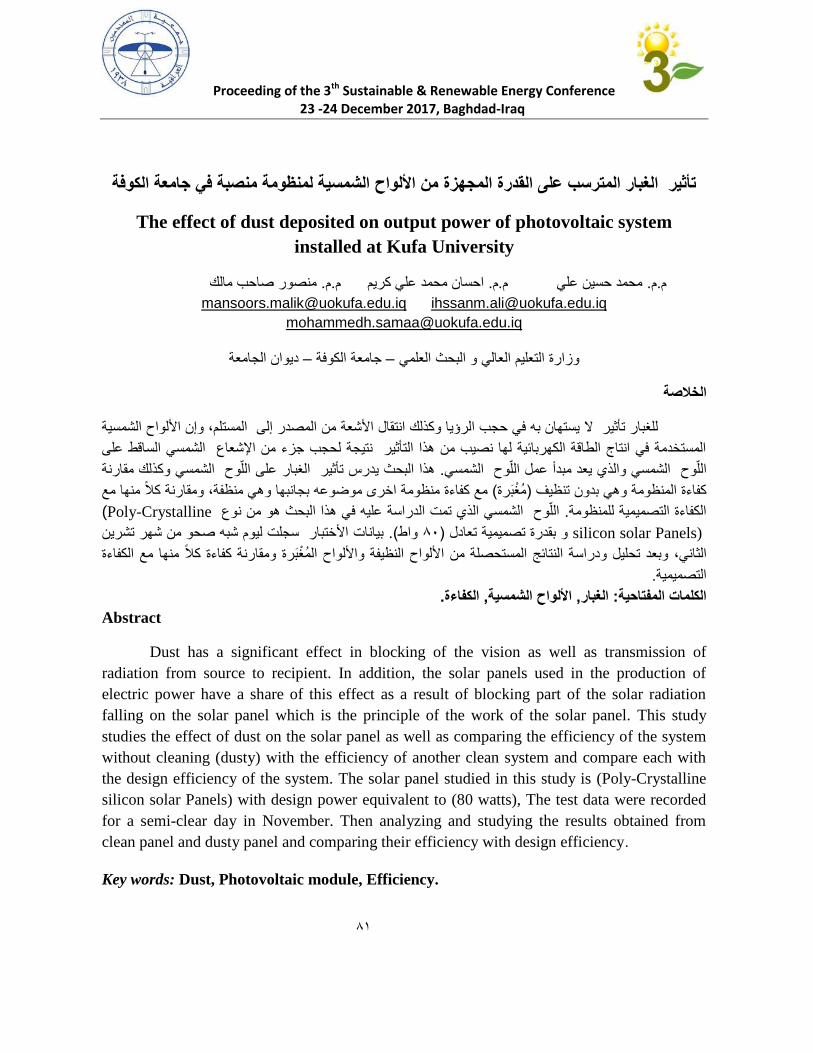
Proceeding of the 3th Sustainable & Renewable Energy Conference
23 -24 December 2017, Baghdad-Iraq
تأثير الغبار المترسب على القدرة المجهزة من األلواح الشمسية لمنظومة منصبة في جامعة الكوفة
The effect of dust deposited on output power of photovoltaic system
installed at Kufa University
منصور صاحب مالك. م.ماحسان محمد علي كريم . م.محمد حسين علي م. م.م
[email protected] [email protected]
ديوان الجامعة –جامعة الكوفة –وزارة التعليم العالي و البحث العلمي
الخالصة
للغبار تأثير ال يستهان به في حجب الرؤيا وكذلك انتقال األشعة من المصدر إلى المستلم، وإن األلواح الشمسية
المستخدمة في انتاج الطاقة الكهربائية لها نصيب من هذا التأثير نتيجة لحجب جزء من اإلشعاع الشمسي الساقط على
هذا البحث يدرس تأثير الغبار على اللوح الشمسي وكذلك مقارنة . شمسياللوح الشمسي والذي يعد مبدأ عمل اللوح ال
مع كفاءة منظومة اخرى موضوعه بجانبها وهي منظفة، ومقارنة كال منها مع ( مغبرة)كفاءة المنظومة وهي بدون تنظيف
Poly-Crystalline)من نوع اللوح الشمسي الذي تمت الدراسة عليه في هذا البحث هو. الكفاءة التصميمية للمنظومة
silicon solar Panels) بيانات األختبار سجلت ليوم شبه صحو من شهر تشرين .(واط 08)و بقدرة تصميمية تعادل
وبعد تحليل ودراسة النتائج المستحصلة من األلواح النظيفة واأللواح المغبرة ومقارنة كفاءة كال منها مع الكفاءة الثاني،
.التصميمية
.الكفاءة, األلواح الشمسية, الغبار: الكلمات المفتاحية
Abstract
Dust has a significant effect in blocking of the vision as well as transmission of
radiation from source to recipient. In addition, the solar panels used in the production of
electric power have a share of this effect as a result of blocking part of the solar radiation
falling on the solar panel which is the principle of the work of the solar panel. This study
studies the effect of dust on the solar panel as well as comparing the efficiency of the system
without cleaning (dusty) with the efficiency of another clean system and compare each with
the design efficiency of the system. The solar panel studied in this study is (Poly-Crystalline
silicon solar Panels) with design power equivalent to (80 watts), The test data were recorded
for a semi-clear day in November. Then analyzing and studying the results obtained from
clean panel and dusty panel and comparing their efficiency with design efficiency.
Key words: Dust, Photovoltaic module, Efficiency.
18

Proceeding of the 3th Sustainable & Renewable Energy Conference
23 -24 December 2017, Baghdad-Iraq
المقدمة
تراكم األتربة على سطح اللوح الشمسي له تأثير كبير في تقليل الطاقة الممتصة وهذا يؤدي إلى نقصان في الطاقة
في الدراسات السابقة أتضح ان المناطق الجافة والصحراوية سوف يكون تأثير األتربة عليها كبير [. 1]الشمسية المنتجة
وفي هذا الحال أصبح من األفضل تنظيف األلواح [. 2% ]11في كفاءة اللوح الشمسي إلى حيث يصل مقدار النقصان
الشمسية بصورة دورية، علما ان هذه العملية غالبا ما تكون كلفتها عالية خصوصا عندما نتحدث عن المناطق الجافة
مجدية اقتصاديا ، الكثير من البحوث والصحراوية والتي تتميز بقلة وفرة المياه وهذه مشكلة يجب مراعاتها بطريقة
السابقة تناولت موضوع اللوح الشمسي ومدى تأثير األتربة عليها وما هي العالقة التي تربط الطاقة الممتصة مع كمية
األتربة المتراكمة على اللوح الشمسي حيث اظهرت النتائج ان معدل خسائر الطاقة في اليوم الواحد بسبب الغبار
في الفترات الطويلة بدون وجود أمطار وهناك أمكانية إلن تصل نسبة % 4.4تراكم على سطح اللوح الشمسي بحدود الم
ان تأثير الغبار على شدة الطاقة الشمسية الممتصة بواسطة المجمع الشمسي المائل [. 3% ]28الخسارة في الطاقة إلى
(inclined flat plate collectors )مناطق صحراوية وضمن اراضي المملكة العربية السعودية تمت دراسته في
الدراسة العملية لحساب معدل الخسارة في [.4]خالل عدة أشهر وتم تسجيل البيانات للوح شمسي واحد ومجمعان شمسيان
ده أنواع وتم دراسة ع[. 1]في الشهر نتيجة لتأثير الغبار على اللوح الشمسي % 7كفاءة اللوح الشمسي وصلت إلى
من الغبار وبمختلف الخصائص الفيزيائية استخدمت في تغطية اللوح الشمسي لدراسة مدى تأثير ها على اللوح الشمسي
حيث تم دراسة تأثير الغبار اعتمادا على [. 6]على المخرجات (حجم الذرات والكثافة)وما هي العوامل المؤثرة مثل
أساس ثالث نقاط أساسية وهي تأثير خصائص الغبار وتأثير معامالت األلواح فقرتين مختلفتين وتم مناقشتهما على
في هذا [. 7]الشمسية وتأثير معامل المحيط الخارجي وهذه الدراسة اشتملت على معظم المتغيرات ومقارنة تأثيرها
الصحراوية وتحديدا في البحث سوف نتناول تأثير الغبار على مخرجات وكفاءة اللوح الشمسي في األراضي الجافة و
مدينة النجف األشرف حيث تم نصب مضخات لسقي الحدائق في جامعة الكوفة تعمل على الطاقة الشمسية وتم اخذ النتائج
.ليوم مشمس
الجانب العملي
–يقع في العراق Poly-crystalline siliconاللوح الشمسي المستخدم في هذه الدراسة من نوع البولي كريستالين
حيث تم أستخدام لوحين ( N 44.22.29.E.32.01.32)جامعة الكوفة عند خطوط طول وعرض -محافظة النجف
شمسيين من مجموعة ألواح شمسية مستخدمة في جامعة الكوفة لتشغيل مضخات سقي الحدائق وان المعلومات الخاصة
(.1)باللوح الشمسي مبينة في الجدول
12
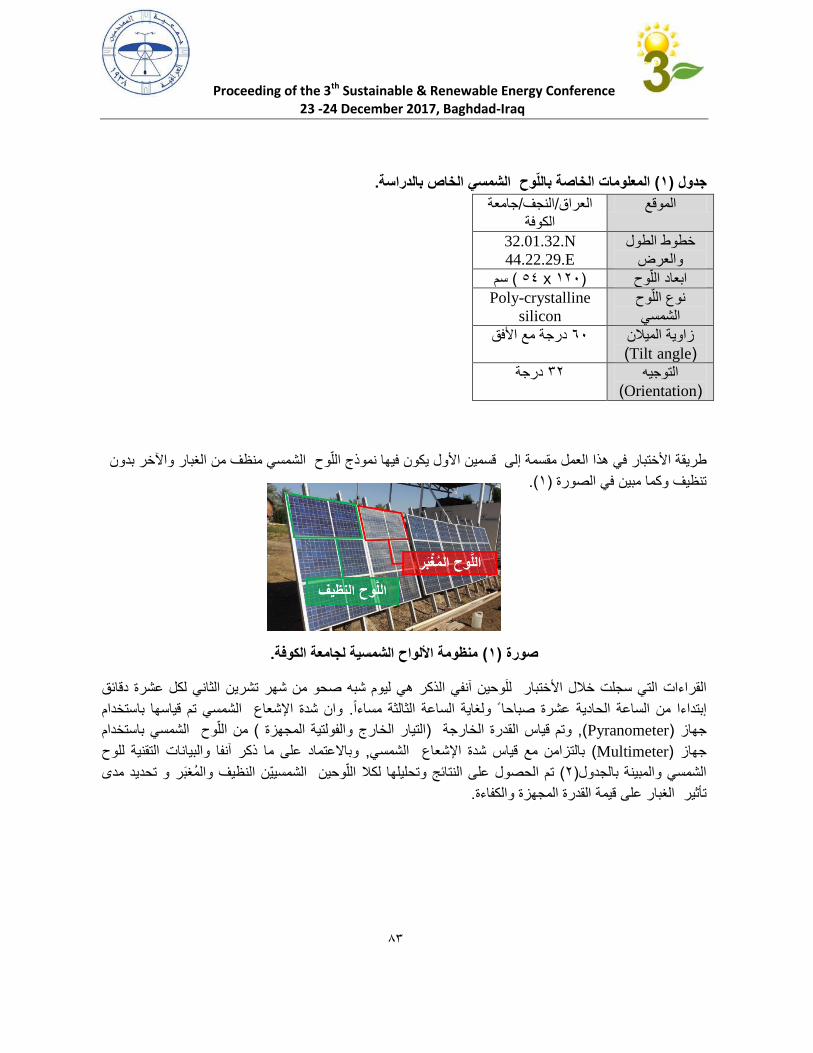
Proceeding of the 3th Sustainable & Renewable Energy Conference
23 -24 December 2017, Baghdad-Iraq
.معلومات الخاصة باللوح الشمسي الخاص بالدراسةال( 1)جدول
جامعة /النجف/العراق الموقع الكوفة
خطوط الطول والعرض
32.01.32.N
44.22.29.E
سم( x 14 128) ابعاد اللوح
نوع اللوح الشمسي
Poly-crystalline
silicon
زاوية الميالن(Tilt angle)
درجة مع األفق 68
التوجيه(Orientation)
درجة 32
في هذا العمل مقسمة إلى قسمين األول يكون فيها نموذج اللوح الشمسي منظف من الغبار واآلخر بدون األختبارطريقة
(.1)تنظيف وكما مبين في الصورة
.منظومة األلواح الشمسية لجامعة الكوفة( 1)صورة
لكل عشرة دقائق ليوم شبه صحو من شهر تشرين الثاني الذكر هي القراءات التي سجلت خالل األختبار للوحين آنفي
وان شدة اإلشعاع الشمسي تم قياسها باستخدام . إبتداءا من الساعة الحادية عشرة صباحا ولغاية الساعة الثالثة مساءا
وح الشمسي باستخدام من الل ( التيار الخارج والفولتية المجهزة )وتم قياس القدرة الخارجة , (Pyranometer)جهاز
وباالعتماد على ما ذكر آنفا والبيانات التقنية للوح , بالتزامن مع قياس شدة اإلشعاع الشمسي( Multimeter)جهاز
تم الحصول على النتائج وتحليلها لكال اللوحين الشمسيين النظيف والمغبر و تحديد مدى ( 2)الشمسي والمبينة بالجدول
.قيمة القدرة المجهزة والكفاءة تأثير الغبار على
13
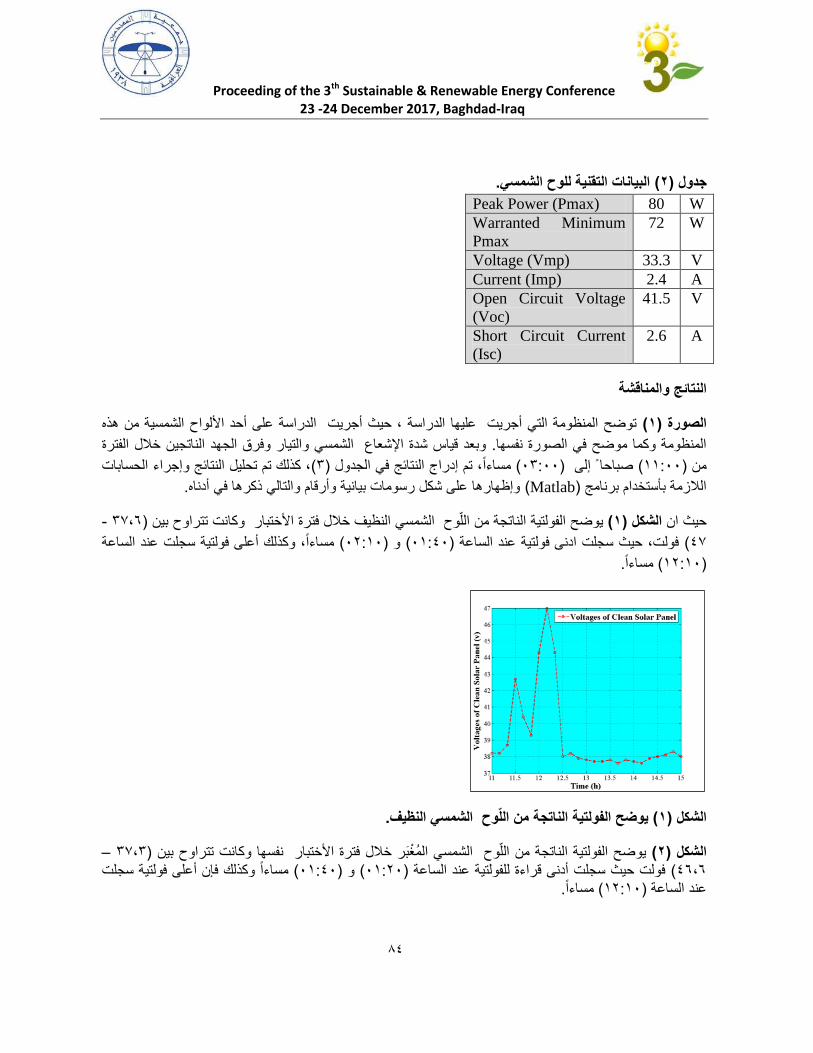
Proceeding of the 3th Sustainable & Renewable Energy Conference
23 -24 December 2017, Baghdad-Iraq
.البيانات التقنية للوح الشمسي( 2)جدول
W 80 Peak Power (Pmax)
W 72 Warranted Minimum
Pmax
V 33.3 Voltage (Vmp)
A 2.4 Current (Imp)
V 41.5 Open Circuit Voltage
(Voc)
A 2.6 Short Circuit Current
(Isc)
والمناقشةالنتائج
توضح المنظومة التي أجريت عليها الدراسة ، حيث أجريت الدراسة على أحد األلواح الشمسية من هذه (1)الصورة
وبعد قياس شدة اإلشعاع الشمسي والتيار وفرق الجهد الناتجين خالل الفترة . المنظومة وكما موضح في الصورة نفسها
، كذلك تم تحليل النتائج وإجراء الحسابات (3)، تم إدراج النتائج في الجدول مساءا ( 83:88)صباحا إلى ( 11:88)من
. وإظهارها على شكل رسومات بيانية وأرقام والتالي ذكرها في أدناه( Matlab)الالزمة بأستخدام برنامج
- 37،6)نت تتراوح بين يوضح الفولتية الناتجة من اللوح الشمسي النظيف خالل فترة األختبار وكا (1)الشكل ان حيث
مساءا، وكذلك أعلى فولتية سجلت عند الساعة ( 82:18)و ( 81:48)فولت، حيث سجلت ادنى فولتية عند الساعة ( 47
.مساءا ( 12:18)
.يوضح الفولتية الناتجة من اللوح الشمسي النظيف( 1)الشكل
– 37،3)المغبر خالل فترة األختبار نفسها وكانت تتراوح بين يوضح الفولتية الناتجة من اللوح الشمسي ( 2)الشكل مساءا وكذلك فإن أعلى فولتية سجلت ( 81:48)و ( 81:28)فولت حيث سجلت أدنى قراءة للفولتية عند الساعة ( 46،6
.مساءا ( 12:18)عند الساعة
14
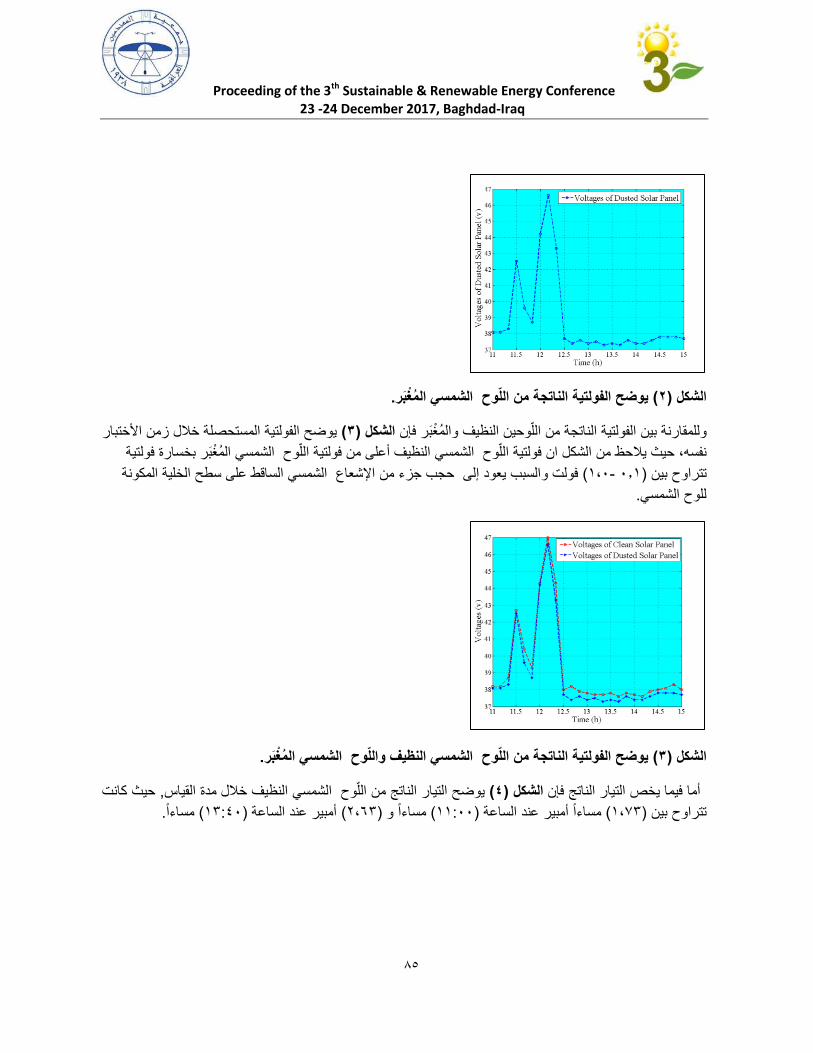
Proceeding of the 3th Sustainable & Renewable Energy Conference
23 -24 December 2017, Baghdad-Iraq
.يوضح الفولتية الناتجة من اللوح الشمسي المغبر( 2)الشكل
يوضح الفولتية المستحصلة خالل زمن األختبار (3)الشكل للمقارنة بين الفولتية الناتجة من اللوحين النظيف والمغبر فإن و
نفسه، حيث يالحظ من الشكل ان فولتية اللوح الشمسي النظيف أعلى من فولتية اللوح الشمسي المغبر بخسارة فولتية
السبب يعود إلى حجب جزء من اإلشعاع الشمسي الساقط على سطح الخلية المكونة فولت و( 1،8- 8.1)تتراوح بين
.للوح الشمسي
.يوضح الفولتية الناتجة من اللوح الشمسي النظيف واللوح الشمسي المغبر( 3)الشكل
حيث كانت , ف خالل مدة القياسيوضح التيار الناتج من اللوح الشمسي النظي (4)الشكل أما فيما يخص التيار الناتج فإن
.مساءا ( 13:48)أمبير عند الساعة ( 2،63)مساءا و ( 11:88)مساءا أمبير عند الساعة ( 1،73)تتراوح بين
15
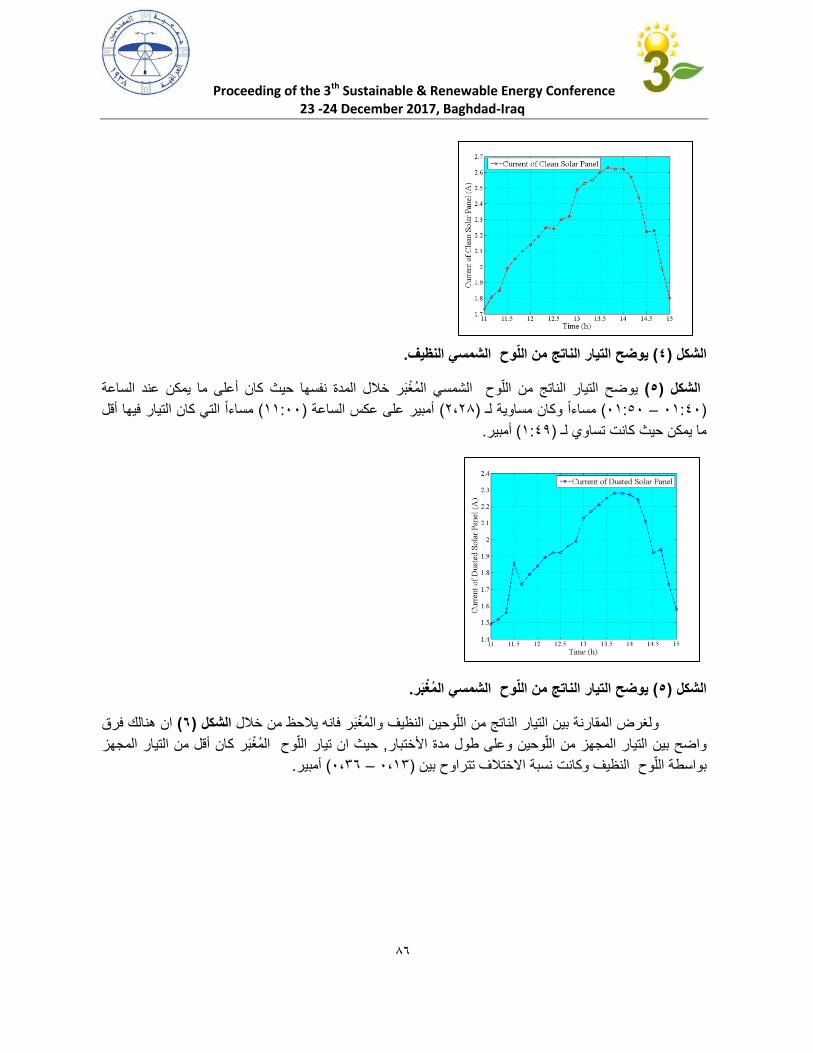
Proceeding of the 3th Sustainable & Renewable Energy Conference
23 -24 December 2017, Baghdad-Iraq
.يوضح التيار الناتج من اللوح الشمسي النظيف( 4)الشكل
حيث كان أعلى ما يمكن عند الساعة يوضح التيار الناتج من اللوح الشمسي المغبر خالل المدة نفسها (5)الشكل
مساءا التي كان التيار فيها أقل ( 11:88)أمبير على عكس الساعة ( 2،20)مساءا وكان مساوية لـ ( 81:18 – 81:48)
. أمبير( 1:41)ما يمكن حيث كانت تساوي لـ
.يوضح التيار الناتج من اللوح الشمسي المغبر( 5)الشكل
ان هنالك فرق (6)الشكل ولغرض المقارنة بين التيار الناتج من اللوحين النظيف والمغبر فانه يالحظ من خالل
حيث ان تيار اللوح المغبر كان أقل من التيار المجهز , واضح بين التيار المجهز من اللوحين وعلى طول مدة األختبار
. أمبير (8،36 – 8،13)الف تتراوح بين بواسطة اللوح النظيف وكانت نسبة االخت
16
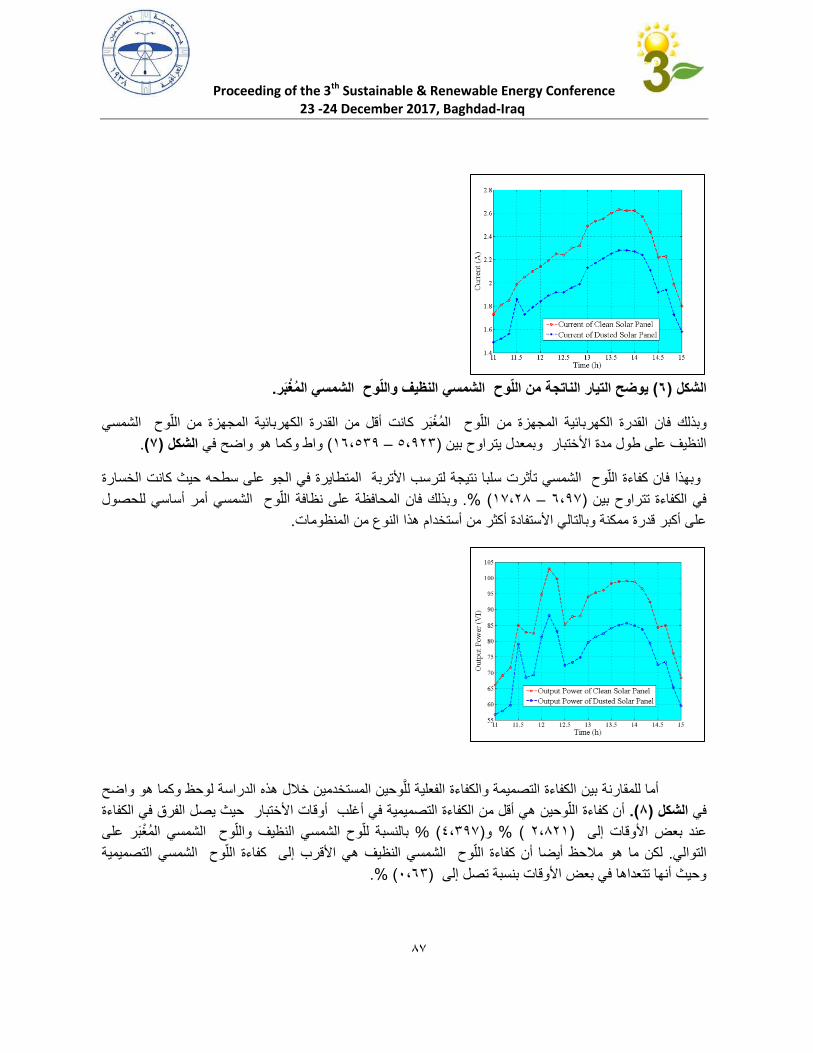
Proceeding of the 3th Sustainable & Renewable Energy Conference
23 -24 December 2017, Baghdad-Iraq
.يوضح التيار الناتجة من اللوح الشمسي النظيف واللوح الشمسي المغبر( 6)الشكل
وبذلك فان القدرة الكهربائية المجهزة من اللوح المغبر كانت أقل من القدرة الكهربائية المجهزة من اللوح الشمسي
.(7)الشكل واط وكما هو واضح في( 16،131 – 1،123)ختبار وبمعدل يتراوح بين النظيف على طول مدة األ
وبهذا فان كفاءة اللوح الشمسي تأثرت سلبا نتيجة لترسب األتربة المتطايرة في الجو على سطحه حيث كانت الخسارة
الشمسي أمر أساسي للحصول وبذلك فان المحافظة على نظافة اللوح ( %. 17،20 – 6،17)في الكفاءة تتراوح بين
.على أكبر قدرة ممكنة وبالتالي األستفادة أكثر من أستخدام هذا النوع من المنظومات
أما للمقارنة بين الكفاءة التصميمة والكفاءة الفعلية للوحين المستخدمين خالل هذه الدراسة لوحظ وكما هو واضح
أن كفاءة اللوحين هي أقل من الكفاءة التصميمية في أغلب أوقات األختبار حيث يصل الفرق في الكفاءة (.8)الشكل في
بالنسبة للوح الشمسي النظيف واللوح الشمسي المغبر على %(4،317)و% ( 2،021)عند بعض األوقات إلى
لكن ما هو مالحظ أيضا أن كفاءة اللوح الشمسي النظيف هي األقرب إلى كفاءة اللوح الشمسي التصميمية . التوالي
( %.8،63)وحيث أنها تتعداها في بعض األوقات بنسبة تصل إلى
17
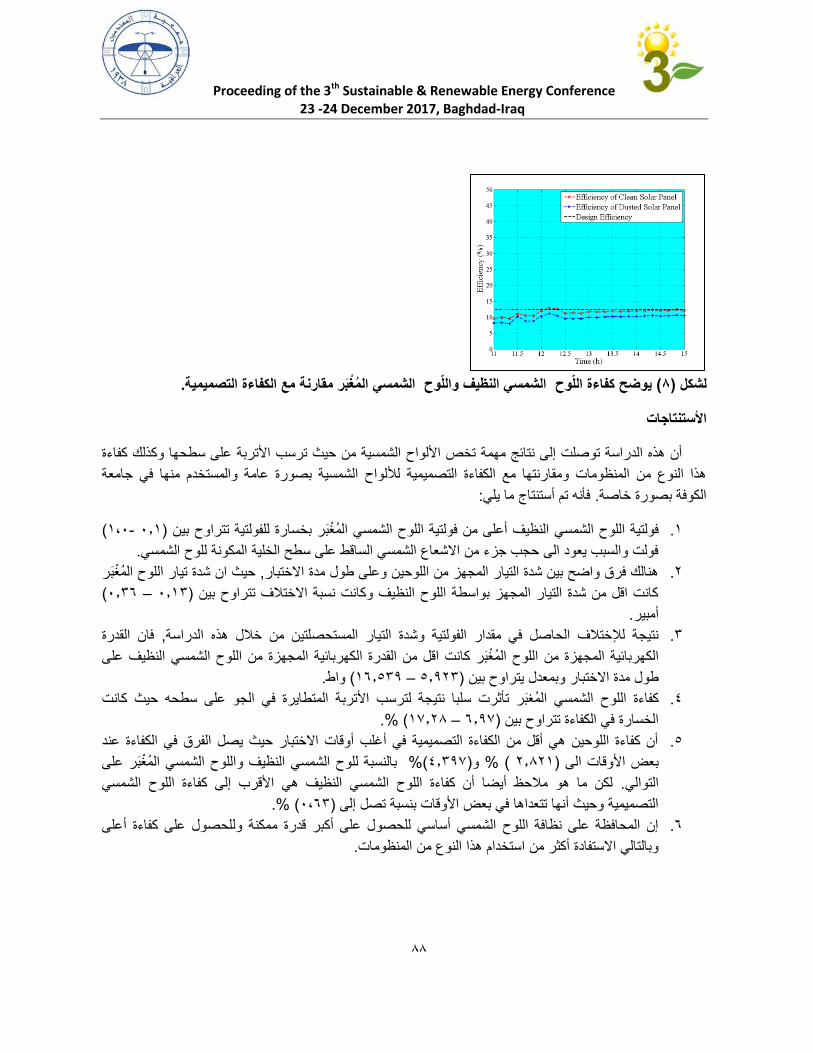
Proceeding of the 3th Sustainable & Renewable Energy Conference
23 -24 December 2017, Baghdad-Iraq
.الشمسي النظيف واللوح الشمسي المغبر مقارنة مع الكفاءة التصميمية يوضح كفاءة اللوح ( 8)لشكل
األستنتاجات
أن هذه الدراسة توصلت إلى نتائج مهمة تخص األلواح الشمسية من حيث ترسب األتربة على سطحها وكذلك كفاءة
عامة والمستخدم منها في جامعة هذا النوع من المنظومات ومقارنتها مع الكفاءة التصميمية لأللواح الشمسية بصورة
:فأنه تم أستنتاج ما يلي. الكوفة بصورة خاصة
( 1،8- 8.1)فولتية اللوح الشمسي النظيف أعلى من فولتية اللوح الشمسي المغبر بخسارة للفولتية تتراوح بين .1
.الشمسي فولت والسبب يعود الى حجب جزء من االشعاع الشمسي الساقط على سطح الخلية المكونة للوح
حيث ان شدة تيار اللوح المغبر , هنالك فرق واضح بين شدة التيار المجهز من اللوحين وعلى طول مدة االختبار .2
( 8.36 – 8.13)كانت اقل من شدة التيار المجهز بواسطة اللوح النظيف وكانت نسبة االختالف تتراوح بين
.أمبير
فان القدرة , دة التيار المستحصلتين من خالل هذه الدراسةنتيجة لإلختالف الحاصل في مقدار الفولتية وش .3
الكهربائية المجهزة من اللوح المغبر كانت اقل من القدرة الكهربائية المجهزة من اللوح الشمسي النظيف على
.واط( 16.131 – 1.123)طول مدة االختبار وبمعدل يتراوح بين
جة لترسب األتربة المتطايرة في الجو على سطحه حيث كانت كفاءة اللوح الشمسي المغبر تأثرت سلبا نتي .4
( %. 17.20 – 6.17)الخسارة في الكفاءة تتراوح بين
أن كفاءة اللوحين هي أقل من الكفاءة التصميمية في أغلب أوقات االختبار حيث يصل الفرق في الكفاءة عند .1
النظيف واللوح الشمسي المغبر على بالنسبة للوح الشمسي(% 4.317)و( % 2.021)بعض األوقات الى
لكن ما هو مالحظ أيضا أن كفاءة اللوح الشمسي النظيف هي األقرب إلى كفاءة اللوح الشمسي . التوالي
( %.8،63)التصميمية وحيث أنها تتعداها في بعض األوقات بنسبة تصل إلى
ممكنة وللحصول على كفاءة أعلى إن المحافظة على نظافة اللوح الشمسي أساسي للحصول على أكبر قدرة .6
.وبالتالي االستفادة أكثر من استخدام هذا النوع من المنظومات
11
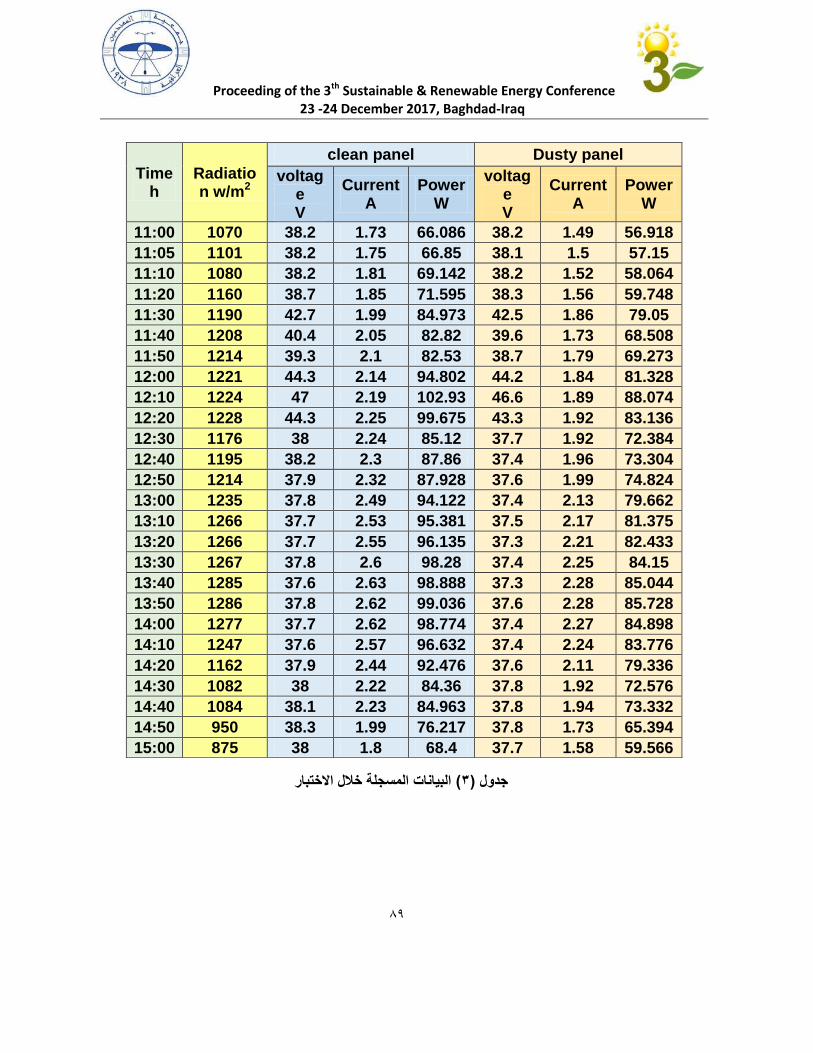
Proceeding of the 3th Sustainable & Renewable Energy Conference
23 -24 December 2017, Baghdad-Iraq
البيانات المسجلة خالل االختبار( 3)جدول
Time h
Radiation w/m2
clean panel Dusty panel
voltage V
Current A
Power W
voltage V
Current A
Power W
11:00 1070 38.2 1.73 66.086 38.2 1.49 56.918
11:05 1101 38.2 1.75 66.85 38.1 1.5 57.15
11:10 1080 38.2 1.81 69.142 38.2 1.52 58.064
11:20 1160 38.7 1.85 71.595 38.3 1.56 59.748
11:30 1190 42.7 1.99 84.973 42.5 1.86 79.05
11:40 1208 40.4 2.05 82.82 39.6 1.73 68.508
11:50 1214 39.3 2.1 82.53 38.7 1.79 69.273
12:00 1221 44.3 2.14 94.802 44.2 1.84 81.328
12:10 1224 47 2.19 102.93 46.6 1.89 88.074
12:20 1228 44.3 2.25 99.675 43.3 1.92 83.136
12:30 1176 38 2.24 85.12 37.7 1.92 72.384
12:40 1195 38.2 2.3 87.86 37.4 1.96 73.304
12:50 1214 37.9 2.32 87.928 37.6 1.99 74.824
13:00 1235 37.8 2.49 94.122 37.4 2.13 79.662
13:10 1266 37.7 2.53 95.381 37.5 2.17 81.375
13:20 1266 37.7 2.55 96.135 37.3 2.21 82.433
13:30 1267 37.8 2.6 98.28 37.4 2.25 84.15
13:40 1285 37.6 2.63 98.888 37.3 2.28 85.044
13:50 1286 37.8 2.62 99.036 37.6 2.28 85.728
14:00 1277 37.7 2.62 98.774 37.4 2.27 84.898
14:10 1247 37.6 2.57 96.632 37.4 2.24 83.776
14:20 1162 37.9 2.44 92.476 37.6 2.11 79.336
14:30 1082 38 2.22 84.36 37.8 1.92 72.576
14:40 1084 38.1 2.23 84.963 37.8 1.94 73.332
14:50 950 38.3 1.99 76.217 37.8 1.73 65.394
15:00 875 38 1.8 68.4 37.7 1.58 59.566
19
Proceeding of the 3th Sustainable & Renewable Energy Conference
23 -24 December 2017, Baghdad-Iraq
المراجع
[1] M. Mani, R. Pillai, "Impact of dust on solar photovoltaic (PV) performance", Research
status, challenges and recommendations, Renewable and Sustainable Energy Reviews
14, 2010, pp. 3124-3131.
[2] M. Piliougine, J. Carretero, M. Sidrach-de-Cardona, D. Montiel, P. Sánchez-Friera.
Comparative analysis of the dust losses in photovoltaic modules with different cover
glasses. Proceedings of 23rd European Solar Energy Conference, 2008, pp. 2698-2700.
[3] Zorrilla-Casanova, M. Piliougine, J. Carretero, P. Bernaola, P. Carpen, L. Mora-López,
M. Sidrach-de-Analysis of dust losses in photovoltaic modules. World Renewable
Energy Congress 8-13 May 2011 Sweden.
[4] S.A.M. Said, Effects of dust accumulation on performances of thermal and photovoltaic
flat-plate collectors, Applied Energy 37 (1), 1990, pp. 73-84.
[5] M.S. El-Shobokshy, F.M. Hussein, Effect of dust with different physical properties on the
performance of photovoltaic cells, Solar Energy 51 (6), 1993, pp. 505-511.
[6] S. Biryukov, D. Faiman, A. Goldfeld, An optical system for the quantitative study of
particulate contamination on solar collector surfaces, Solar Energy 66 (5), 1999, pp. 371-
378.
[7] Zeki Ahmed, Hussein A. Kazem and K. Sopian, Effect of Dust on Photovoltaic
Performance: Review and Research Status, Latest Trends in Renewable Energy and
Environmental Informatics.
99
Proceeding of the 3th Sustainable & Renewable Energy Conference
23 -24 December 2017, Baghdad-Iraq
المنظومة الكهروضوئية لبناية مركز بحوث الطاقة المتجددة والبيئة
عبدالكريم عبدهللا أحمد
المقدمة.1
يعاني العالم من انبعاثات غاز ثاني اوكسيد الكاربون نتيجة ما تطلقه مصانع الدول الصناعية، فاصبح االهتمام العالمي
مستقبلية وبديلة للطاقة األحفورية، إذ أنها ولتوفر االشعاع الشمسي بكميات كبيرة الكبير بالطاقة المتجددة كطاقة نظيفة
أن هناك استعماالت معينة تستطيع الطاقة المتجددة أن تلعب فيها . فباالمكان ان تغطي نسبة الباس بها من احتياجات عالمنا
كما أن كلف إنتاج الكهرباء من طاقة الشمس في انخفاض دورا رئيسيا في تزويد الكهرباء للمناطق الريفية والفقيرة والنائية،
مستمر مصاحبا للتقدم العلمي مما يجعلها أكثر قدرة على المنافسة، إال أن طبيعتها المتقطعة خالل النهارستحول بينها وبين
.لعب الدور الرئيسي إلنتاج الطاقة الكهربائية
الشمس، إذ يعتبر تحويل طاقة الضوء المباشر لإلشعاعات الشمسية إن أفضل التقنيات الواعدة هي التي تسخر طاقة ضوء
إلى طاقة كهربائية عبر الخاليا الشمسية تقنية متطورة وصناعة إستراتيجية باعتبارها مصدرا مستقبليا للطاقة المستدامة
أثمن، عالوة على أن مصدر وسيكون لها األثر األكبر في المحافظة على مصادر الطاقة التقليدية وألغراض أهم واستغالل
.طاقته مجاني ال ينضب ونظيف ودون مخلفات أو أخطار
بتوافق االهداف لتقليل انبعاثات غاز ثاني اوكسيد الكاربون والتوجه الى اعتماد الطاقة الشمسية كبديل للوقود االحفوري مع
انشاء منظومة الطاقة الكهروضوئية لبناية المركز اهداف ومهام مركز بحوث الطاقة المتجددة والبيئة انبثقت فكرة مشروع
حيث تتوفر المستلزمات التقنية والخبرات الالزمة ومالئمة البناية النشاء المنظومة مواجهة الشعة الشمس، فقد صممت
.المنظومة الكهروضوئية لبناية المركز ونفذت بايدي وطنية عراقية
والتي تتيح للبلد ادخال تقنيات متقدمة وتحقق عوائد اقتصادية وبيئية كبيرة يعد هذا المشروع من مشاريع الطاقات النظيفة
:وتوفير فرص عمل، ويهدف المشروع الى
تطوير االقسام العلمية التي يتم من خاللها اجراء البحوث والدراسات العلمية في مجال الطاقات الجديدة والمتجددة وأحد .1
، ولتطوير سبل التعاون مع الجهات المعنية ذات ن الطاقات الصديقة للبيئةاوجهها هو الطاقة الشمسية التي تعتبر م
.االهتمام المشترك
تقليل االعتماد على الطاقة الكهربائية التي تولد من المحطات الكهربائية التقليدية وبالتالي تخفيف كلفة االنتاج .2
.واالستهالك المحلي لتلك الطاقة
لة النتاج الطاقة الكهروضوئية وربطها الى الشبكة الوطنية، وتوفير مصادر طاقة بديلة التشجيع القامة مشاريع كبيرة فاع .3
.للمناطق النائية التي يصعب تجهيزها بالطاقة الكهربائية من الشبكة الوطنية
العمل والتشجيع على توفير واستخدام مصادر طاقة الستخراج او إنتاج الماء الغراض الشرب والزراعة ، واجراء .4
.حوث التصميمية لمثل هذه المنظوماتالب
التخفيف والتكيف ومراعاة متطلبات التغييرات المناخية فان هيأتنا تعمل على خفض االنبعاث لغازثاني اوكسيد الكاربون .5
من خالل ادخال التكنلوجيا الحديثة في استغالل الطاقة المتجددة وتدوير الحرارة بتقديم مشاريع وفق آليات بروتوكول
وهي بانتظار توفير دعم مالي من الجهات المحلية واالجنبية اضافة الى توفير تخصيصات CDM والتقنية النظيفة كيوتو
.مالية لمشروعات تعنى بخفض االنبعاثات
11

Proceeding of the 3th Sustainable & Renewable Energy Conference
23 -24 December 2017, Baghdad-Iraq
مبررات اقامة المشروع. 2
:المبررات االقتصادية القامة المشروع. 2.1
التقليل من انبعاثات غاز ثاني اوكسيد الكاربون وتقليل اثرها على طبقة المساهمة ضمن االجراءات المتخذة عالميا من اجل
.االوزون
زيادة الموفور من العملة االجنبية من خالل التقليل من استهالك الوقود المستخرج والمصنع وبالتالي الدعم بشكل .1.1.2
.مستمر لالقتصاد الوطني
ال الطاقات الجديدة والمتجددة والبيئة في العالم لخدمة االقتصاد إجراء البحوث لمواكبة التطور الحاصل في مج .2.1.2
.الوطني
تقييم البحوث التي تخص الشركات والمراكز االخرى واالستفادة منها اقتصاديا الى بحوث تطورية او تطبيقية .3.1.2
.للحصول على منتجات تخدم االقتصاد الوطني
ل انجاز بحوث مشتركة والتعاون مع طلبة الدراسات العليا الجراء البحوث التعاون مع الجامعات العلمية من خال. 4.1.2
.العلمية الرصينة للوصول الى كفاءات علمية متخصصة في مجال طاقات الجديدة والمتجددة والبيئة
:المبررات االجتماعية القامة المشروع .1.1توفير فرص عمل للباحثين في هذا المجال واستثمار الطاقات العلمية المتاحة وتقليل الفجوة مع باقي المراكز البحثية المتقدمة
. عالميا :المبررات الفنية القامة المشروع . 2.3
حاور التي ان تحقيق اهداف المشروع للصناعات الخضراء تتطلب صياغة اولويات العمل وذلك من خالل تحديد اهم الم :تستجيب الحتياجات العراق وتلبي متطلباتها نحو تحقيق اخضرار واستدامة التنمية الصناعية، وفيما يلي اهم هذه المحاور
الترويج للطاقة النظيفة. 2.3.1وتقليل استهالك يهدف هذا المحور الى تعزيز اتباع تقنيات انتاج الطاقة الكهربائية االنظف وترشيد استهالك الطاقة والمياه
:المواد االحتياطية ويتم في اطار هذا المحور مايلي .المساعدة على اعداد برامج نموذجية في الطاقة النظيفة. 2.2.3.1 .اعداد ادلة استرشادية للطاقة النظيفة في القطاعات الصناعية ذات الصلة وكفاءة الطاقة واالدارة البيئية. 1.2.3.1 .تدريب للمشاريع الصغيرة والمتوسطة بشأن استعمال تكنلوجيا الطاقة النظيفةاعداد برامج . 3.2.3.1
:تعزيز اجراءات التخفيف والتكيف مع التغيرات المناخية. 1.3.1يهدف هذا المحور الى ادراج سياسات التعامل مع قضايا تغير المناخ في كل البرامج والخطط واالستراتيجيات الصناعية
.جم مع النمو االقتصادي المستدام وجهود القضاء على الفقرالوطنية على نحو ينس
12
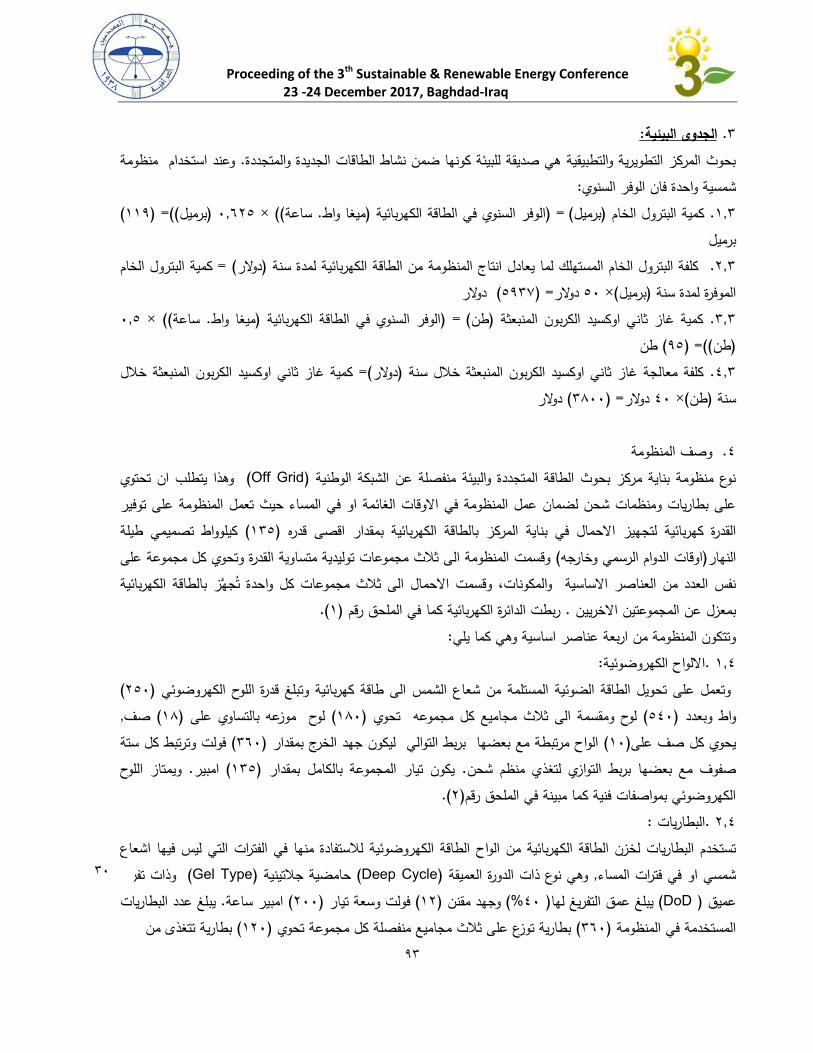
Proceeding of the 3th Sustainable & Renewable Energy Conference
23 -24 December 2017, Baghdad-Iraq
:الجدوى البيئية. 3وعند استخدام منظومة .بحوث المركز التطويرية والتطبيقية هي صديقة للبيئة كونها ضمن نشاط الطاقات الجديدة والمتجددة
:شمسية واحدة فان الوفر السنوي( 221((= )برميل) 5.610× (( ساعة. ميغا واط)الوفر السنوي في الطاقة الكهربائية )= (برميل)كمية البترول الخام . 2.3
برميلكمية البترول الخام ( = دوالر)كلفة البترول الخام المستهلك لما يعادل انتاج المنظومة من الطاقة الكهربائية لمدة سنة . 1.3
دوالر( 0135= )دوالر 05× (برميل)الموفرة لمدة سنة 5.0× (( ساعة. ميغا واط)الوفر السنوي في الطاقة الكهربائية = ) (طن)كمية غاز ثاني اوكسيد الكربون المنبعثة . 3.3
طن( 10((= )طن)كمية غاز ثاني اوكسيد الكربون المنبعثة خالل (= دوالر)كلفة معالجة غاز ثاني اوكسيد الكربون المنبعثة خالل سنة . 3.3 دوالر( 3055= )دوالر 35× (طن)سنة وصف المنظومة. 3
وهذا يتطلب ان تحتوي ( Off Grid)نوع منظومة بناية مركز بحوث الطاقة المتجددة والبيئة منفصلة عن الشبكة الوطنية تعمل المنظومة على توفير على بطاريات ومنظمات شحن لضمان عمل المنظومة في االوقات الغائمة او في المساء حيث
كيلوواط تصميمي طيلة ( 230)هيز االحمال في بناية المركز بالطاقة الكهربائية بمقدار اقصى قدره القدرة كهربائية لتجوقسمت المنظومة الى ثالث مجموعات توليدية متساوية القدرة وتحوي كل مجموعة على ( اوقات الدوام الرسمي وخارجه)النهار
الى ثالث مجموعات كل واحدة تجهز بالطاقة الكهربائية نفس العدد من العناصر االساسية والمكونات، وقسمت االحمال (.2)ربطت الدائرة الكهربائية كما في الملحق رقم .بمعزل عن المجموعتين االخريين
:وتتكون المنظومة من اربعة عناصر اساسية وهي كما يلي : االلواح الكهروضوئية .2.3
( 105)من شعاع الشمس الى طاقة كهربائية وتبلغ قدرة اللوح الكهروضوئي وتعمل على تحويل الطاقة الضوئية المستلمة . صف( 20)لوح موزعه بالتساوي على ( 205)لوح ومقسمة الى ثالث مجاميع كل مجموعه تحوي ( 035)واط وبعدد
رتبط كل ستة فولت وت( 365)الواح مرتبطة مع بعضها بربط التوالي ليكون جهد الخرج بمقدار ( 25)يحوي كل صف علىويمتاز اللوح . امبير( 230)يكون تيار المجموعة بالكامل بمقدار . صفوف مع بعضها بربط التوازي لتغذي منظم شحن (.1)الكهروضوئي بمواصفات فنية كما مبينة في الملحق رقم
:البطاريات .1.3ستفادة منها في الفترات التي ليس فيها اشعاع تستخدم البطاريات لخزن الطاقة الكهربائية من الواح الطاقة الكهروضوئية لال
وذات تفريغ (Gel Type) حامضية جالتينية (Deep Cycle) وهي نوع ذات الدورة العميقة. شمسي او في فترات المساءيبلغ عدد البطاريات . امبير ساعة( 155)فولت وسعة تيار ( 21)وجهد مقنن %( 35) يبلغ عمق التفريغ لها ( DoD) عميق
بطارية تتغذى من ( 215)بطارية توزع على ثالث مجاميع منفصلة كل مجموعة تحوي ( 365)المستخدمة في المنظومة
33
13

Proceeding of the 3th Sustainable & Renewable Energy Conference
23 -24 December 2017, Baghdad-Iraq
بطارية مرتبطة مع بعضها بربط ( 15)على وتحتوي كل مجموعة . مجموعة من االلواح الكهروضوئية الغراض الشحن (.3)وتمتاز البطاريات بمواصفات فنية كما في الملحق رقم . فولت( 135)التوالي لتعطي جهد
عاكس الفولتية .3.3استخدمت ثالث عواكس ذكية لتغذية البناية يقوم جهاز العاكس بتحويل الفولتية المستمرة الى فولتية متناوبة يمكن استخدامها
كيلوواط وجهد ( 35)تبلغ قدرة العاكس .(Newtral) في غرف ومختبرات البناية وبجهد ثالثي االطوار مع نقطة وسط .فولت( 115)الطور الواحد نسبة الى جهد نقطة الوسط
:منظم شحن البطارية .3.3من خالل منظم الشحن حيث يقوم بتثبيت يمر التيار الكهربائي المتولد في االلواح الكهروضوئية الى العاكس والى البطاريات
فولتية الدخل للعاكس وكذلك يقوم بشحن منظمات شحن كل ثالثة ضمن مجموعة توليدية يقوم كل منها بتنظيم عملية شحن ( 1)استخدمت . البطاريات عند تفريغها
الشحن مباشرة من ستة من صفوف االلواح الكهروضوئية عبر تكون تغذية كل منظم. البطارية بالطاقة الكهربائية عند الحاجة .اجهزة الحماية ضد زيادة التيار
الدراسة المالية. 5
الكلف االستثمارية. 1.5
مليون دينار والكلف ( 867)مليون دينار وكانت الكلف االستثمارية الثابتة ( 1313)بلغت الكلف االستثمارية للمنظومة
.مليون دينار( 242)رة االستثمارية المتغي
العائدات والتوفير. 2.5
ميكاواط ( 113)كيلوواط ساعة واالجمالي السنوي ( 511.23) تكون العائدات المحتملة من انتاج الطاقة الكهربائية يوميا
دينار ( 83)ساعة وحسب اخر تعرفة لسعر الكيلوواط ىساعة التي اعلنتها وزارة الكهرباء على موقعها االلكتروني البالغ
مليون دينار اما ( 8.14)ويكون مبلغ توفير الوقود . مليون دينار ( 13.3)للقطاع الصناعي فيكون المبلغ االجمالي السنوي
.مليون دينار( 4.56)العائدات التي تعادل كلفة معالجة انبعاثات غاز ثاني اوكسيد الكاربون
14
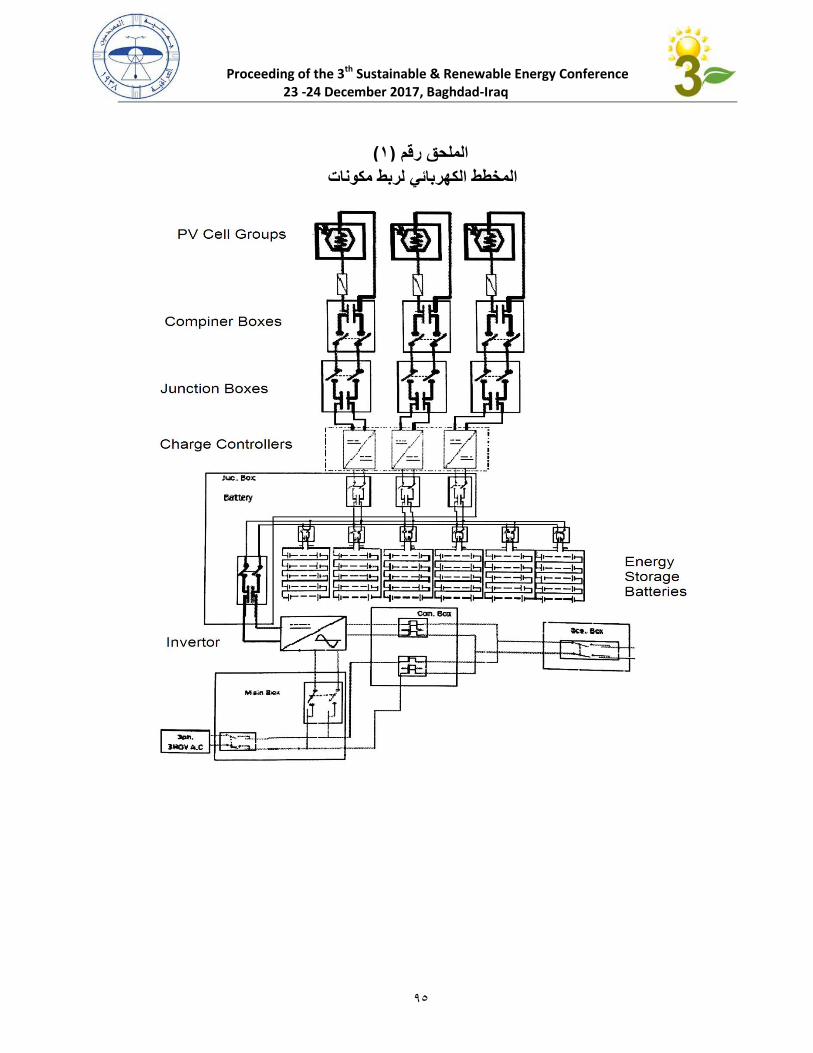
Proceeding of the 3th Sustainable & Renewable Energy Conference
23 -24 December 2017, Baghdad-Iraq
(1)الملحق رقم
المخطط الكهربائي لربط مكونات
المنظومة
15
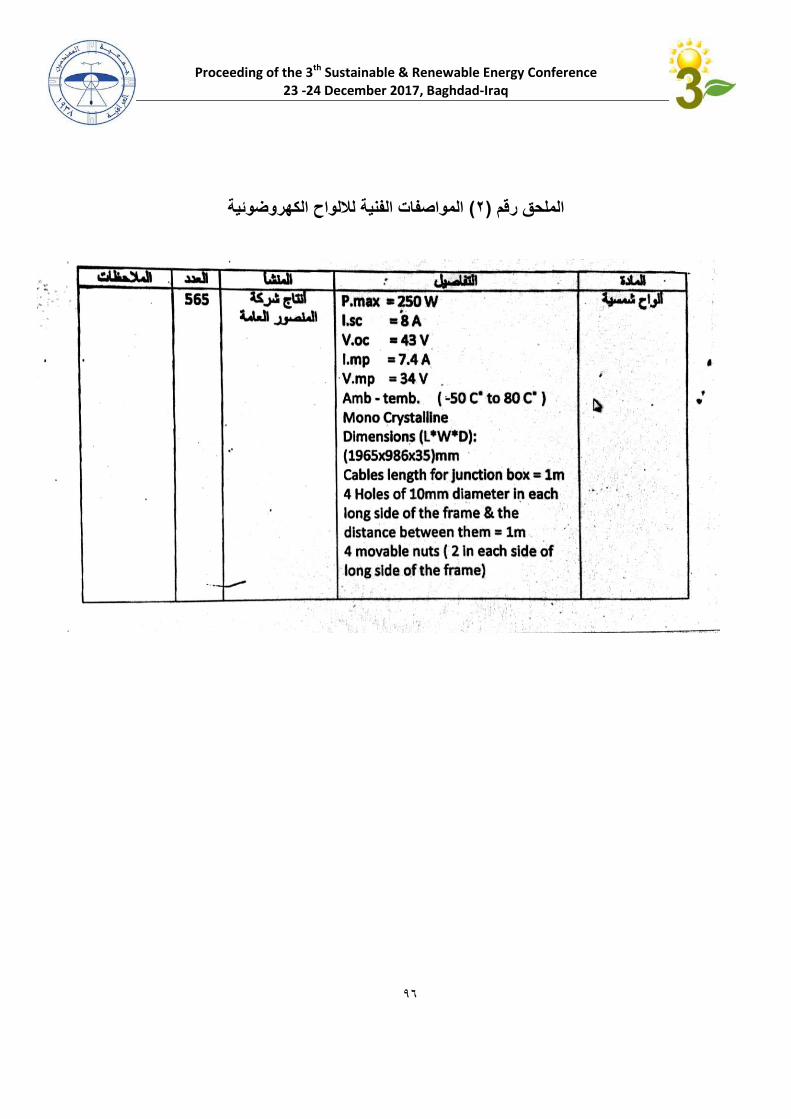
Proceeding of the 3th Sustainable & Renewable Energy Conference
23 -24 December 2017, Baghdad-Iraq
المواصفات الفنية لاللواح الكهروضوئية( 2)الملحق رقم
16
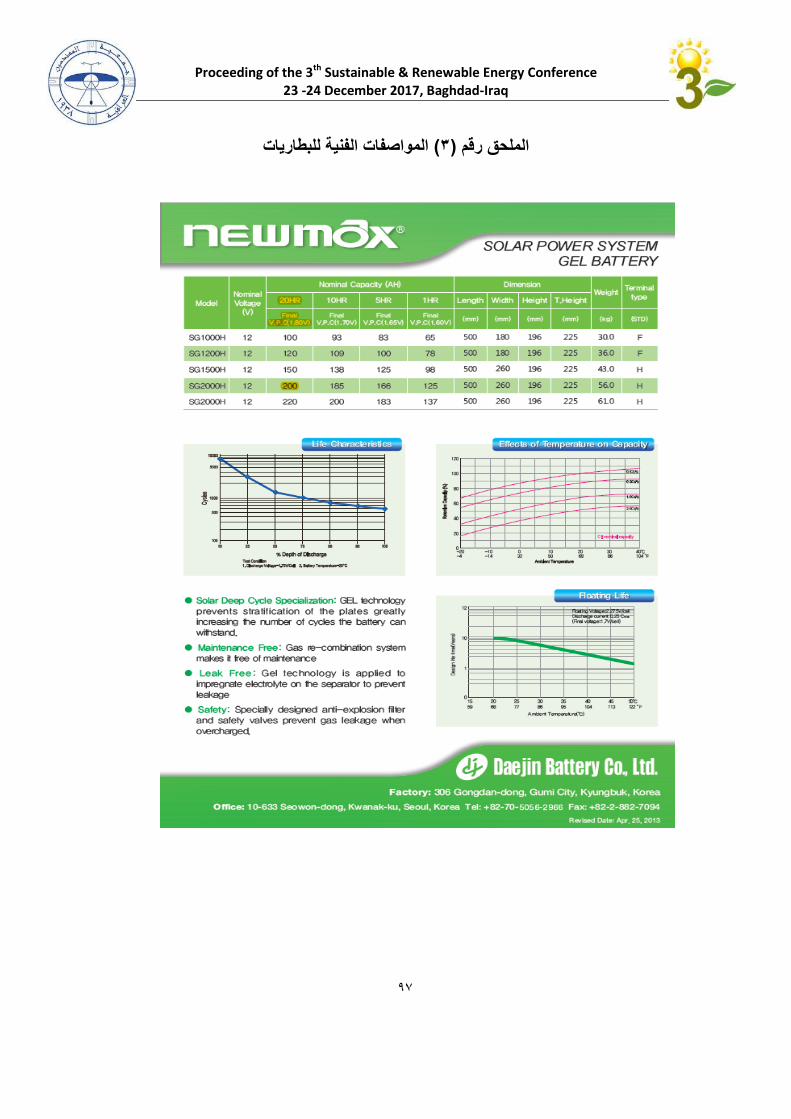
Proceeding of the 3th Sustainable & Renewable Energy Conference
23 -24 December 2017, Baghdad-Iraq
المواصفات الفنية للبطاريات( 3)الملحق رقم
18
Proceeding of the 3th Sustainable & Renewable Energy Conference 23 -24 December 2017, Baghdad-Iraq
الخاليا الشمسية، أنواعها، ث لطاقة المستدامة والمتجددة الثالورقة عمل مقدمة الى مؤتمر ا
تطبيقات استخداماتها
Solar cells, their types, their applications
اكرام هادي صالح العسكريEkram Hadi Saleh Al-Askaree
معهد اعداد المدربين التقنيينInstitute of training of technical trainers
الجامعة التقنية الوسطى
The Middle Technical University - Baghdad / Iraq
:الخالصة
المتطورة الحياة تطبيقات في المتزايدة احتياجاته لتغطية للطاقة جديدة مصادر عن دوما اإلنسان يبحث الستخدامها السلبي والتأثير المرتفعة استغاللها وتكلفة نضوبها الطاقة مصادر من الكثير ويعيب نعيش، التي والتي الشمس أمنا أشعة حرارة من االستفادة إمكانية إلى الحديث العصر في اإلنسان تنبه وقد البيئة، على
الطاقة مصادر استخدام يسببه الذي الكبير الخطر جليا وأدرك تنضب، ال ودائمة متجددة طاقة بأنها تتصف الخيار الشمسية الطاقة يجعل. مما وتدميرها، البيئة تلوث في (الطبيعي والغاز النفط وخاصة ) والشائعة األخرى البلدان لبعض قوميا دخال الحالي عصرنا في الشمسية الطاقة أضحت ولهذا .اإلطالق على األفضل بشكل الشمسية الطاقة تستخدم بالنفط، غنى العالم بالد أكثر من تعتبر والتي العربي الخليج دول في أنه حتى
في ورقة العمل هذه ماذا تعني الخلية الشمسي كتسمية ومم تتكون الخلية الشمية، تتناول، وقد وفعال رئيسي
خلية استخدمت،تاريخ اول خلية وأين استخداماتها،تركيبها وأنواعها، مميزات وعيوب كل نوع، تطبيقات
.انصاف النواقل الشمسية المردود، خاليا العمل،غريتسل،
Conclusion:
Always looking for new sources of human energy to cover the growing needs in
applications of sophisticated life we live, and nothing wrong with a lot of energy depletion
and high exploitation costs and the negative impact of use on the environment, and in modern
times has human cautions to access Heat-rays safe Sun which are renewed and lasting energy
inexhaustible, clearly recognized the great danger posed by using other sources of energy are
common (especially oil and natural gas) in environmental pollution and destruction, which
makes solar energy a better option at all. Why solar has become today a national income of
some countries in the Arab Gulf States and most countries in the world goes with oil, mainly
solar and effectively. Having dealt with in this paper what do you mean solar cell as the label
the olfactory cell, what does their installation and their types, advantages and disadvantages
of each type, the application uses, the history of the first cell and dye-sensitized solar cell,
where used, yielding solar semiconductor cells.
89

Proceeding of the 3th Sustainable & Renewable Energy Conference 23 -24 December 2017, Baghdad-Iraq
:المقدمة
التي تعرف ب الخاليا الشمسية أو الخاليا الفولت ضوئية ( Photovoltaics PV: باإلنكليزية)الفولتية الضوئية
photovoltaic cells . من خاللها يتم تحويل اشعة الشمس مباشرة إلى كهرباء، عن طريق استخدام أشباه
بلورية سميكةوبصفة عامة مواد هذه الخاليا إما مادة . ن الذي يستخرج من الرمل النقيالموصالت مثل السليكو
Amorphous)مادة بلورية رقيقة كمادة السيلكون الالبلوري أو Crystalline Siliconكالسيليكون البلوريSilicon a-Si ) وCadmium (Telluride CdTe )وأ (Copper Indium Di Selenide CuInSe^2,
or CIS ) الجاليوم ( زرنيخيد)من أرسنيد اشباه الموصالت تتكونأو مواد مترسبة كطبقات فوق شرائح من
(Gallium Arsenide GaAs.)
وتعتبر طاقاتها شكال من الطاقة المتجددة والنظيفة، ألنه ال يخلف عن تشغيلها نفايات ملوثة وال ضوضاء وال
والخاليا الشمسية . لكن كلفتها االبتدائية مرتفعة مقارنة بمصادر الطاقة األخرى. إشعاعات وال حتى تحتاج لوقود
(.كما هو في البطاريات السائلة والجافة العادية)تولد كهرباء مستمرة ومباشرة
تعتمد شدة تيارها علي وقت سطوع الشمس وشدة أشعة الشمس، وكذلك على كفاءة الخلية الضوئية نفسها في
. طاقة كهربائية قة الشمسية إلى تحويل الطا
علىهذه الخاليا لو وصلت DC الكهربائي المستمريمكن لهذه الخاليا الشمسية إعطاء مئات الفولتات من التيار
السيارات كما يمكن تخزين الطاقة الناتجة في بطاريات الحامضية المصنوعة من الرصاص كبطاريات . التوالي
.والكادميومالقاعدية المصنوعة من معدني النيكل أو
لالستعمال وإدارة Invertorبواسطة العاكسات ال ACمتناوب إلى تيار DCويمكن تحويل التيار المستمر
.األجهزة الكهربائية المنزلية والصناعية العادية
االقمار الصناعية بكفاءة عالية، لهذا تعمل فوق . من ميزتها أنها ليس بها أجزاء متحركة تتعرض للعطل
إال أن اتساخ الخاليا الضوئية , حيث تعمل في صمت, سيما وأنها ال تحتاج لصيانة أو إصالحات أو وقودوال
.نتيجة التلوث أو الغبار يؤدي إلى خفض في كفاءتها مما يستدعي تنظيفها على فترات
.واطميكا 32أكبر محطة توليد كهرباء تعمل حاليا بالخاليا الشمسية توجد في اسبانيا وقدرتها
.ميكا واط 451ومن المخطط أن يتم بناء أكبر محطة تعمل بالخاليا الشمسية في استراليا بقدرة
بالتيار ISSكما تزود محطة الفضاء الدولية 4691والخاليا الشمسية تعمل في االقمار الصناعية منذ عام
عن طريق استغالل الحرارة وذلككهربائية طاقة الشمسية إلىطريقة أخرى لتحويل الطاقة هناك. الكهربائي
thermal electricity solarالشمسية بتقنية الكهرباء الحرارية وما يسمىالمباشرة ألشعة الشمس
88

Proceeding of the 3th Sustainable & Renewable Energy Conference 23 -24 December 2017, Baghdad-Iraq
أنواع الخاليا الشمسية
وهو عبارة عن خاليا قطعت من ( mono crystalline) :التبلورخلية تصنع من السليكون أحادي .4
مما يعني أن امتصاص الخاليا % 49إلى 44بلورة سيليكون مفردة وكفاءة هذا النوع من الخاليا من
وات لكل متر مربع وذلك في يوم مشمس بالقرب 4111من اإلشعاع القادم من الشمس الذي تبلغ قوته
يمتص اإلشعاع الشمسي بهذه الكفاءة ينتج ما من خط االستواء أي أن الواحد متر مربع من هذه الخاليا
. وات 491إلى 441بين
وهي عبارة عن رقائق من السليكون كشطت من (Multi crystalline)ر والتبل متعددةخاليا .3
بلورات سليكون أسطوانية ثم تعالج كيميائيا في أفران لزيادة خواصها الكهربية وبعد ذلك تغطي أسطح
إلى 6كاس لكي تمتص الخاليا أشعة الشمس بكفاءة عالية وكفاءة هذا النوع من الخاليا بمضاد االنع
42 .%
وفيها مادة السيليكون تترسب على هيئة طبقات ( amorphous)الخاليا المورفية أو خاليا الفيلم الرفيع .2
كفاءتها رفيعة على أسطح من الزجاج أو البالستيك لذلك فإن تصنيع هذه الخاليا يتم بتقنية سهلة ولكن
.وات إلى ما أقل 11وهي مناسبة لتطبيقات من . وأسعارها أيضا أقل% 9إلى 2أقل من
تتسم هذه المنتجات بأن الخاليا مدعمة بإطار من األلومنيوم للحماية وأيضا بزوج من الدايود للحماية
.الكهربية
:تطبيقات استخدام الخاليا
في المؤسسات الضخمة( الموبايلشبكات )في مجال االتصاالت عن بعد .4 الحماية الكاثودية .3 مضخات المياه .2 .أنظمة اإلضاءة .1
تاريخ
أوائل القرن التاسع عشر، لكن لم يتم تطبيقها بشكل فعلي حتى الضوء فيمن توليد الكهرباء تم اكتشاف ظاهرة
حيث الواليات المتحدة،ي أجل برامج الفضاء ف خلية ضوئية جهديه منتم تطوير أول . منتصف القرن العشرين
مخابز الواليات وبدأ بتطوير الخاليا الكهروضوئية كمصدر للطاقة في . كان عدد الخاليا قليال ومرتفعة الثمن
.أوائل سبعينات القرن العشرين المتحدة االمريكية في
لوح ضوئي
الطاقة لتوليد طاقة الشمسيةالهي نظام كهروضوئي يستخدم ( Photovoltaics: باإلنجليزية)األلواح الضوئية
بصورة النفطبكلفة زهيدة وقد بدأت المدن باستخدامها بصورة واسعة، خصوصا بعد ارتفاع أسعار الكهربائية
الكهربائية، ويمكن تخزين الطاقة طاقة كهربائيةوتعمل على تحويل طاقة أشعة الشمس مباشرة إلى . كبيرة
ومن البديهي أن دوال كالسعودية واإلمارات أن . وقت غياب الشمس الناتجة في بطاريات خاصة الستخدامها في
.السنةتهتما بهذه التقنية للحصول على الطاقة لتوفر أشعة الشمس أغلب ايام
011

Proceeding of the 3th Sustainable & Renewable Energy Conference 23 -24 December 2017, Baghdad-Iraq
تركيب النظام وعمله
يتم ضغطها في رقاقة معالجة بشكل خاص ( سيليكون غالبا ) شبه موصالتتتكون الخاليا الكهروضوئية من
إلى الخلية، الطاقة الضوئيةعندما تصل . ، موجبا على طرف وسالبا على الطرف اآلخركهربائيا حقال لتشكل
ولتبسيط المسألة تقوم فوتونات ضوء الشمس بتحفيز . في المادة النصف ناقلة الذراتمن االلكتروناتتتحرر
إذا تم تيار كهربائينات على شكل يتم تجميع االلكترو. اإلليكترونات إلى حالة أعلى من الطاقة لتولد الكهرباء
من الممكن استخدام الطاقة الكهربائية الناتجة في تشغيل . وصل نواقل كهربائية إلى الطرفين السالب والموجب
4.5تنتج ما يقارب بوصات 1إن الخلية الكهروضوئية العادية ذات حجم . المصابيح أو تشغيل مضخات المياه
.ظهيرة يوم مشمسفي الطاقة الكهربائيةمن واط
يتكون النظام الكهروضوئي من خاليا شمسية موصولة كهربائيا مع بعضها البعض لتشكل وحدة توليد طاقة
تعتمد كمية الكهرباء . فولط 43تصمم الوحدات لتزويد الطاقة الكهربائية عند فرق جهد معين، عادة . كهربائية
ممكن تشكيل مصفوفة من الوحدات بربطها مع بعضها من ال. المولدة على كمية الضوء الساقط على الوحدة
من الممكن ربط الخاليا على التسلسل أو التفرع من . إن الخاليا الكهروضوئية تقوم بإنتاج تيار مستمر. البعض
.أجل إنتاج أي شدة تيار أو فرق جهد مطلوب
النظام "خرى، تعرف باسم يتكون النظام الكهروضوئي من مصفوفة أو عدة مصفوفات مع عدد من المكونات األ
يختلف هذا النظام بحسب التطبيق المطلوب منه، وإذا ما كان من المطلوب فقط تشغيل النظام أثناء ". المتوازن
بحيث أنه إذا كان هناك حاجة لتشغيل النظام ليال يجب تأمين نوع من أنظمة تخزين . النهار أم أثناء النهار والليل
.الطاقة الستعمالها ليال
أو أن تزود مركمأو بطاريةبحيث تتمكن من شحن الشمس ضوءالخاليا الشمسية تولد الكهرباء مباشرة من
. المركبات الفضائيةفي معدات كثيرة وفي توليد الكهرباءوقد استخدم هذا النظام بكثافة في . جهازا ما بالكهرباء
شبكة كهربائية عادية البد من تحويل التيار وفي حالة الرغبة بتوصيل نظام توليد الطاقة بهذا النظام إلى
وقد بدأ انتشار تلك التقنية في . وذلك باستخدام عاكس كهربائي تيار مترددإلى تيار مستمرالكهربائي من
.الطاقةالمساكن الموجودة في المناطق النائية والبعيدة عن المدن، أو مصادر
وحين الحاجة إلى طاقة أكبر . وتخزن عادة تحت غالف زجاجيالخاليا بحاجة إلى حماية من عناصر الطبيعة
واللوح الواحد يكفي لتأمين . من قدرة الخلية الواحدة يتم توصيل الخاليا كهربائيا لتشكيل ألواح ضوئية أو شمسية
. ولتأمين الطاقة لمصنع أو منزل فالبد أن تنشأ مصفوفة كبيرة من هذه األلواح. الطاقة لجهاز هاتف واحد
الرغم من غالء أسعار هذه المنظومات نسبيا مقارنة مع شبكات الكهرباء العادية، إال أن انتشار استخدامها أخذ وب
.بالتزايد باطراد في مختلف أنحاء العالم
:الشمسية الخاليا تيار ميكانيكية
إلعطاء الشوائب من صغيرة بمقادير مشابه السيليكون من رفيعة رقاقة هي األرضية للتطبيقات الشمسية الخلية
سالبة شحنة اآلخر والجانب موجبة شحنة واحد جانب
.كبيرة مساحة ذا ثنائيا مكونة
كل يحمل والتي (الفوتونات) الضوئيات حيث الشمس لضوء تتعرض عندما كهربائية قدرة الشمسية الخاليا تولد
بالمادة بالشبكة الذري الرابط وتكسر حراريا تهتز تجعلها طاقة الحرة اإللكترونات يكسب محددا طاقويا كما منها
الشحنة حامالت ذلك بعد تنطلق .الفراغ في اإللكترون من أزواج وإنتاج الشحنات تحرير ويتم موصلة الشبه
الطاقوية الفجوة عبر والتكافؤ التوصيل نطاقي بين متنقلة الثنائي وصلة نحو متجهة هذه
010
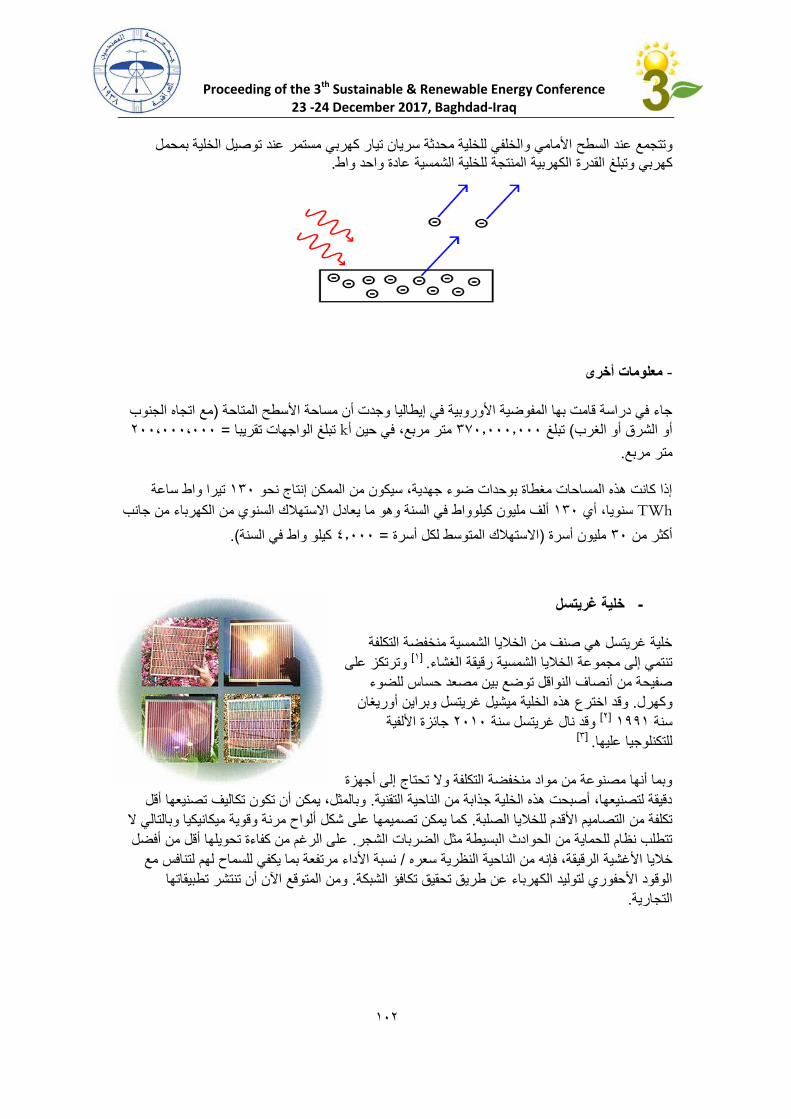
Proceeding of the 3th Sustainable & Renewable Energy Conference 23 -24 December 2017, Baghdad-Iraq
بمحمل الخلية توصيل عند مستمر كهربي تيار سريان محدثة للخلية والخلفي األمامي السطح عند وتتجمع .طوا واحد عادة الشمسية للخلية المنتجة الكهربية القدرة وتبلغ كهربي
معلومات أخرى -
مع اتجاه الجنوب )وجدت أن مساحة األسطح المتاحة إيطالياجاء في دراسة قامت بها المفوضية األوروبية في
311،111،111= تبلغ الواجهات تقريبا kمتر مربع، في حين أ 201.111.111تبلغ ( أو الشرق أو الغرب
. متر مربع
ساعة تيرا واط 421إذا كانت هذه المساحات مغطاة بوحدات ضوء جهدية، سيكون من الممكن إنتاج نحو
TWh في السنة وهو ما يعادل االستهالك السنوي من الكهرباء من جانب كيلوواطألف مليون 421سنويا، أي
(.كيلو واط في السنة 1.111= االستهالك المتوسط لكل أسرة )مليون أسرة 21أكثر من
خلية غريتسل -
خلية غريتسل هي صنف من الخاليا الشمسية منخفضة التكلفة
وترتكز على [4] .الغشاءرقيقة تنتمي إلى مجموعة الخاليا الشمسية
صفيحة من أنصاف النواقل توضع بين مصعد حساس للضوء
هذه الخلية ميشيل غريتسل وبراين أوريغان اخترعوقد . وكهرل
جائزة األلفية 3141وقد نال غريتسل سنة [3] 4664سنة
[2] .عليهاللتكنلوجيا
وبما أنها مصنوعة من مواد منخفضة التكلفة وال تحتاج إلى أجهزة
وبالمثل، يمكن أن تكون تكاليف تصنيعها أقل . دقيقة لتصنيعها، أصبحت هذه الخلية جذابة من الناحية التقنية
ال لتاليميكانيكيا وباكما يمكن تصميمها على شكل ألواح مرنة وقوية . تكلفة من التصاميم األقدم للخاليا الصلبة
على الرغم من كفاءة تحويلها أقل من أفضل . تتطلب نظام للحماية من الحوادث البسيطة مثل الضربات الشجر
نسبة األداء مرتفعة بما يكفي للسماح لهم لتنافس مع / من الناحية النظرية سعره الرقيقة، فإنهخاليا األغشية
اتنتشر تطبيقاتهومن المتوقع اآلن أن .الشبكةافؤ الوقود األحفوري لتوليد الكهرباء عن طريق تحقيق تك
.التجارية
011

Proceeding of the 3th Sustainable & Renewable Energy Conference 23 -24 December 2017, Baghdad-Iraq
خلية غريتسل الشمسيةوصف -
تتألف خلية غريتسل من طبقة مسامية رقيقة من جسيمات نانوية من ثنائي أكسيد التيتانيوم، مغطاة بصباغ
كما هو . وبوجد فوقه محفز بالتيني كهرليويغمر ثاني أكسيد التيتانيوم بمحلول . جزيئي ليمتص أشعة الشمس
على جانبي ( البالتين)والمهبط ( ثاني أكسيد التيتانيوم)الحال في البطاريات القلوية التقليدية، يتم وضع المصعد
.المحلول الكهرلي
الشفاف لتصل إلى الطبقة المصبوغة حيث تقوم بإثارة اإللكترونات اإللكترودتعبر أشعة الشمس من خالل
لتصل إلى اإللكترود الشفاف لتجمع من أجل توفير طاقة ( ثاني أكسيد التيتانيوم) المصعد تخرج منوالتي
وبعد أن يتدفق التيار خالل دارة خارجية، يعاد إدخال اإللكترونات إلى الخلية عبر إالكترود معدني ومن . للحمل
صل خلية غريتسل الوظيفتين التي يقدمها تف. ثم إلى المحلول الكهرلي ومن ثم يعاد إلى جزيئات الصباغ من جديد
الضوئية عادة يكون السيليكون بمثابة مصدر كل من اإللكترونات . السيليكون في تصميم الخلية التقليدية
بينما تستخدم خلية غريتسل .التيارعن توفير الحقل الكهربائي لفصل الشحنات الموجهة إليه وإنشاء باإلضافة
من صبغة حساسة للضوء بشكل الضوئيةوترد االلكترونات الشحنات،لنواقل لنقل الجزء األكبر من أنصاف ا
.والمحلول الكهرلي والصبغة الحساسةيحصل فصل الشحنات في المنطقة ما بين نصف الناقل . منفصل
أو تجميع كمية معقولة من الضوء يجب أن التقاطوليتم ( النانومن مرتبة )تكون جزيئات الصباغ صغيرة جدا
تعمل كسقالة لإلمساك بجزيئات نانويةولحل هذه المشكلة تستخدم مواد . يكون سمك طبقة الصباغ كبيرة نسبيا
تصنع هذه . عدد الجزيئات في أي سطح من الخلية منيزيد امم. البعدالصباغ على شكل بنية ثالثية
.تقوم بوظيفة مزدوجة في التصاميم الحديثة من مواد من أنصاف النواقل وبذلك( الدواعم)السقاالت
التركيب -
توجد في األعلى طبقة . من ثالث أجزاء رئيسية( النموذج األولي من هذه الخلية)تتألف خلية غريتسل األساسية
. هذه الطبقة خلف اللوح الزجاجي وتوضع ثنائي أكسيد القصدير شائبمصعد شفاف يتركب من الفلوريد ال
وتتصل بطبقة رقيقة من ثاني أكسيد التيتانيوم والتي تشكل بنية مليئة بالفجوات اإللكترونية مع مساحة سطح
تغمر الصفيحة بعد ذلك (. بنفسجيةفوق أشعة)الشمسية يمتص أكسيد القصدير جزء قليل من األشعة . كبيرة
طبقة رقيقة توضع الصباغ،ومذيب وبعد وضع الغشاء في محلول يديومالروب بيردينبصباغ يتركب من صباغ
.من الصباغ على الصفيحة تاركة روابط تساندية على السطح مع أكسيد القصدير
. وبشكل عام تكون من البالتين الموصلة،فوق الصفيحة يوديدبعد ذلك تصنع طبقة رقيقة عن طريق رش كهرل
.اإللكتروناتعضهما البعض وتحكمان لمنع تسرب مع ب الصفيحتينوبعد ذلك يتم ضم
العمل -
وهكذا . تدخل أشعة الشمس الخلية عن طريق الفلوريد الشفاف لتضرب الشوائب على سطح ثاني أكسيد القصدير
ولو تم قذف . تضرب الفوتونات الصباغ بكمية كافية من الطاقة مشكلة حالة إثارة للصباغ ليتم قذف اإللكترونات
حساسيته لذلك يتصل بكهرل اليوديد اإللكترونات بدون تعويض هذه اإللكترونات فإن شريط الصباغ سيفقد
ويستعيد ثالثي اليوديد . والذي يتأكسد إلى ثالثي اليوديد وتتم هذه العملية بسرعة مقارنة بعملية قذف اإللكترونات
.في قاع الخلية االنتشارإلكتروناته المفقودة عن طريق ميكانيكية
011
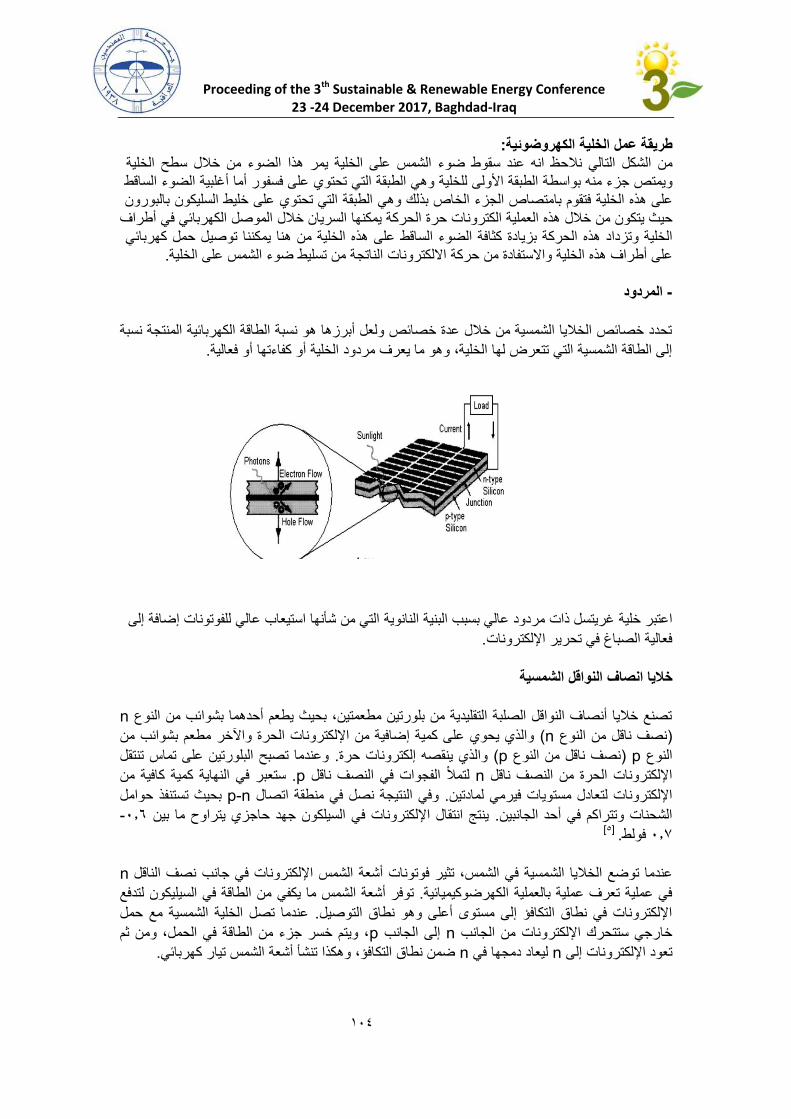
Proceeding of the 3th Sustainable & Renewable Energy Conference 23 -24 December 2017, Baghdad-Iraq
:الكهروضوئية الخلية عمل طريقة ةيالخل سطح خالل من الضوء هذا مري ةيالخل على الشمس ضوء سقوط عنده ان نالحظ التالي الشكل من
الساقط الضوء أغلبية أما فسفور على تحتوي التي الطبقة هيو للخلية األولى الطبقة بواسطة همن جزء ويمتص بالبورون السليكون خليط على تحتوي التي الطبقة وهي بذلك الخاص الجزء بامتصاص فتقوم الخلية هذه على أطراف في الكهربائي الموصل خالل انيالسر مكنهاي الحركة حرة الكترونات العملية هذه خالل من تكوني ثيح
كهربائي حمل توصيل مكنناي هنا من ةيالخل هذه على الساقط الضوء كثافة بزيادة الحركة هذه وتزداد ةيالخل .ةيالخل على الشمس ضوء طيتسل من الناتجة االلكترونات حركة من واالستفادة الخلية هذه أطراف على
المردود -
تحدد خصائص الخاليا الشمسية من خالل عدة خصائص ولعل أبرزها هو نسبة الطاقة الكهربائية المنتجة نسبة
.أو فعالية كفاءتهاأو الخليةد مردوإلى الطاقة الشمسية التي تتعرض لها الخلية، وهو ما يعرف
التي من شأنها استيعاب عالي للفوتونات إضافة إلى ةيغريتسل ذات مردود عالي بسبب البنية النانواعتبر خلية
.فعالية الصباغ في تحرير اإللكترونات
النواقل الشمسية انصافخاليا
nتصنع خاليا أنصاف النواقل الصلبة التقليدية من بلورتين مطعمتين، بحيث يطعم أحدهما بشوائب من النوع
والذي يحوي على كمية إضافية من اإللكترونات الحرة واآلخر مطعم بشوائب من ( nنصف ناقل من النوع )
وعندما تصبح البلورتين على تماس تنتقل . والذي ينقصه إلكترونات حرة( pنصف ناقل من النوع ) pالنوع
بر في النهاية كمية كافية من ستع. pلتمال الفجوات في النصف ناقل nاإللكترونات الحرة من النصف ناقل
بحيث تستنفذ حوامل p-nوفي النتيجة نصل في منطقة اتصال . اإللكترونات لتعادل مستويات فيرمي لمادتين
-1.9ينتج انتقال اإللكترونات في السيلكون جهد حاجزي يتراوح ما بين . الشحنات وتتراكم في أحد الجانبين
[5] .فولط 1.0
nمسية في الشمس، تثير فوتونات أشعة الشمس اإللكترونات في جانب نصف الناقل عندما توضع الخاليا الش
من الطاقة في السيليكون لتدفع يتوفر أشعة الشمس ما يكف. في عملية تعرف عملية بالعملية الكهرضوكيميائية
مع حمل عندما تصل الخلية الشمسية. اإللكترونات في نطاق التكافؤ إلى مستوى أعلى وهو نطاق التوصيل
، ويتم خسر جزء من الطاقة في الحمل، ومن ثم pإلى الجانب nخارجي ستتحرك اإللكترونات من الجانب
.ضمن نطاق التكافؤ، وهكذا تنشأ أشعة الشمس تيار كهربائي nليعاد دمجها في nتعود اإللكترونات إلى
011

Proceeding of the 3th Sustainable & Renewable Energy Conference 23 -24 December 2017, Baghdad-Iraq
الطاقة أو أكثر يمكن أن تساهم في إنشاء تعني فجوة النطاق في أي نصف ناقل بأن الفوتونات بكمية محددة من
، فإن الغالبية العظمى من الضوء المرئي من اللون األحمر إلى البنفسجي ذو نفي حالة السيليكو. تيار كهربائي
وبالتأكيد أن األشعة ذات الطاقة األعلى مثل األزرق والبنفسجي تمتلك القدرة األكثر . طاقة كافية لتحقيق ذلك
كن معظمها يضيع وعلى الرغم من أن نقل بعض من هذه الطاقة االضافية يذهب إلى اإللكترونات، ل. لتوليد تيار
على شكل طاقة حرارية، وبالتالي ومن أجل أن تكون هناك فرصة جيدة اللتقاط الفوتونات، تصنع طبقة من نوع
n هذا يزيد أيضا من احتمال التقاء اإللكترون المقذوف حديثا مع فجوة وجدت . بحيث تكون سميكة نوعا ما
ج هذه اآلثار حدا أعلى من كفاءة خاليا السليكون تنت. n-pمسبقا في المواد قبل الوصول منطقة االتصال
.الشمسية
حيث تتطلب طبقة سميكة نسبيا من السيليكون المشوب من . تعتبر التكلفة المرتفعة أكبر مشاكل الخاليا التقليدية
وقد وجدت عدة طرق للمحاولة من . فوتوني عالية، ومعالجة السيليكون مكلفة طأجل الحصول على نسبة التقا
حد من التكلفة العالية خالل العقود الماضية، وال سيما طريقة األغشية الرقيقة، ولكنها حتى اآلن لم تطبق سوى ال
.على نطاق ضيق، نتيجة لمجموعة كبيرة من المشاكل العملية
:الشمسية الخاليا كهرباء كلفة تصل بينما المستوردة للدول بالنسبة دوالرات 10 ىإل 8 بين ما العالمية األسواق في ذروة الوات تكلفة تتراوح هذه وتزبد دوالر 30 إلى والعالية المتوسطة والقدرة المتوسطة القدرة ذات للتطبيقات بالنسبة ذروة الوات تكلفة بالنسبة ذروة الوات تكلفة أن إال المساعدة واإللكترونات الساكن والتخزين التحكم وأجهزة التصميم وفق التكلفة
.دوالر 20 عن قليال تقل (الميجاواط سعة ذات ةالكهرو شمسي المحطات) ةللقدرة العالي ذلك ريغ اآلخر وبعضها التكلفة فعال وبعضها الشمسية الخاليا ومنظومات لتطبيقات الحالية االقتصاديات إن .الماضي العقد خالل وانخفضت األسعار ثيح تماما يناميكية د صورة هيو
:الشمسية للخاليا المصنعة العالمية الشركات اريأت – الفرنسية ألفواتوات – األلمانية سوالر شركة بينها من كثيرة المجال هذا في العاملة العالمية الشركات عديده وشركات .البرازيل في هيليودينايكاو – كندا في استروبور –يوغسالفيا في كرونار – إيطاليا في سوالر .أيضا الجنسيات متعددة شركات وهناك ابانيوال المتحدة الواليات في
ekramhs2000@Gmail. Com: العراق، االيميل/ بغداد: العنوان: العسكري اكرام هادي صالح
الجامعة / فرع طاقة شمسية وطاقات بديلة/ هندسة المكائن والمعدات :يالماجستير فحاصلة على شهادة
.التكنولوجية
والتبريد والتكييف وقسم السيارات/ معهد تكنولوجيا / في قسم المكائن والمعدات تدريس :الخبرةخالصة
معهد / الجامعة التكنولوجية وفي الجامعة التقنية الوسطى / وقسم هندسة المكائن والمعدات / الكلية التقنية /
ناميك الموائع و مختبر الرسم الهندسي ومختبر الحرارة ومختبر دي: اعداد المدربين التقنيين المواد التالية
القدرة، والحاسوب والديناميكمكائن والسيارات، ةالفنية، وكهربائي ةاللغ: المواد النظرية التاليةالميكانيك و
شاركت في ثالث مؤتمرات داخل العراق واشرفت . الداخلي، وميكانيك السياراتاالحتراق نالحراري، ومكائ
.تخرجعلى ستة مشاريع
011
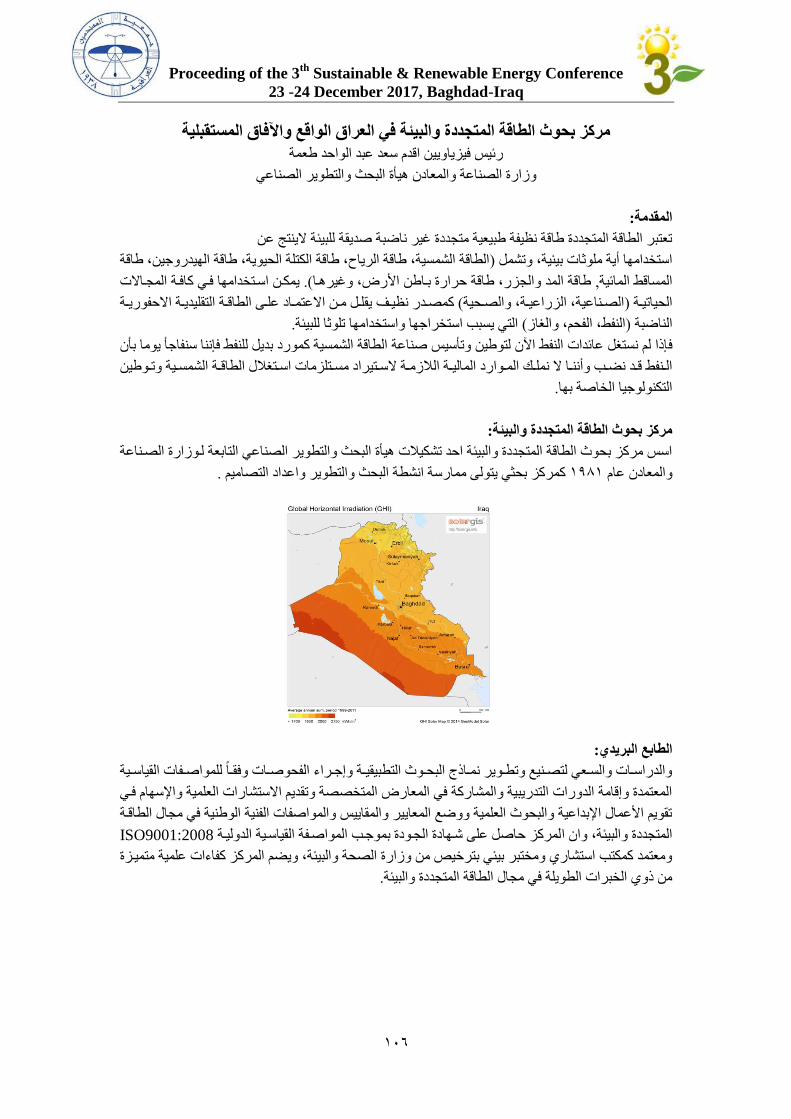
Proceeding of the 3th
Sustainable & Renewable Energy Conference
23 -24 December 2017, Baghdad-Iraq
601
مركز بحوث الطاقة المتجددة والبيئة في العراق الواقع واآلفاق المستقبلية
رئيس فيزياويين اقدم سعد عبد الواحد طعمة
الصناعي ريالبحث والتطو أةيھ وزارة الصناعة والمعادن
:المقدمة
تعتبر الطاقة المتجددة طاقة نظيفة طبيعية متجددة غير ناضبة صديقة للبيئة الينتج عن
الطاقة الشمسية، طاقة الرياح، طاقة الكتلة الحيوية، طاقة الهيدروجين، طاقة )استخدامها أية ملوثات بيئية، وتشمل
يمكان اساتخدامها فاي ةافاة المجااالت (. طاقة المد والجزر، طاقة حرارة بااطن ارر،، وغيرھاا, المساقط المائية
يقلاال ماان االعتماااد علاا الطاقااة التقليديااة االحفوريااة ةمصاادر نظياا ( الصااناعية، الزراعيااة، والصااحية)الحياتيااة
. التي يسبب استخراجها واستخدامها تلوثا للبيئة( النفط، الفحم، والغاز)الناضبة
إذا لم نستغل عائدات النفط اآلن لتوطين وتأسيس صناعة الطاقة الشمسية ةمورد بديل للنفط فإننا سنفاجأ يوما بأن ف
ك المااوارد الماليااة ال زمااة السااتيراد مسااتلزمات اسااتغ م الطاقااة الشمسااية وتااوطين الاانفط قااد نأااب وأننااا ال نملاا
.التكنولوجيا الخاصة بها
:مركز بحوث الطاقة المتجددة والبيئة
اسس مرةز بحوث الطاقة المتجددة والبيئة احد تشكي ت ھيأة البحث والتطوير الصناعي التابعة لاوزارة الصاناعة
.ةز بحثي يتول ممارسة انشطة البحث والتطوير واعداد التصاميم ةمر 6896والمعادن عام
:الطابع البريدي
وفقااال للمواصاافات القياسااية الفحوصاااتوالدراسااات والسااعي لتصاانيي وتطااوير نماااذل البحااوث التطبيقيااة و جاارا
العلمية واإلسهام فاي المعتمدة و قامة الدورات التدريبية والمشارةة في المعار، المتخصصة وتقديم االستشارات
الطاقاة تقويم ارعمام اإلبداعية والبحوث العلمية ووضي المعايير والمقاييس والمواصفات الفنية الوطنية في مجام
ISO9001:2008لمرةز حاصل عل شاهادة الجاودة بموجاب المواصافة القياساية الدولياة المتجددة والبيئة، وان ا
ومعتمد ةمكتب استشاري ومختبر بيئي بترخيص من وزارة الصحة والبيئة، ويأم المرةز ةفا ات علمية متميازة
.من ذوي الخبرات الطويلة في مجام الطاقة المتجددة والبيئة
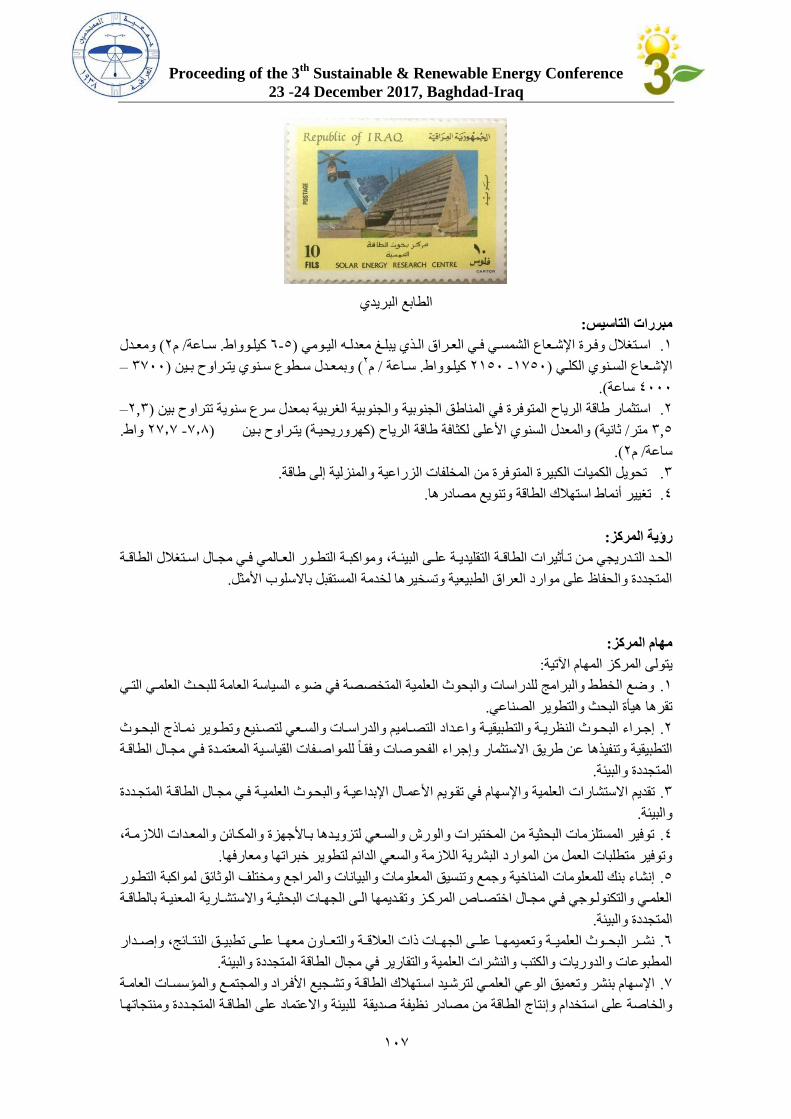
Proceeding of the 3th
Sustainable & Renewable Energy Conference
23 -24 December 2017, Baghdad-Iraq
601
الطابي البريدي
:التاسيس مبررات
ومعاادم (2م/ ساااعة. ةيلااوواط 1-5)معدلااا اليااومي اسااتغ م وفاارة اإلشااعاس الشمسااي فااي العاارا الاا ي يبلاا .6
م/ ساااعة . ةيلااوواط 2650 -6150)اإلشااعاس الساانوي الكلااي 2 – 0100)وبمعاادم سااطوس ساانوي يتااراوح بااين (
(.ساعة 0000
–0,2)والجنوبية الغربية بمعدم سرس سنوية تتراوح بين استثمار طاقة الرياح المتوفرة في المناطق الجنوبية .2
. واط 21.1 -1.9) يتاراوح باين ( ةهروريحياة)والمعدم السنوي ارعل لكثافة طاقة الرياح ( ثانية/ متر 5,0
(.2م/ ساعة
. تحويل الكميات الكبيرة المتوفرة من المخلفات الزراعية والمنزلية ل طاقة .0
.ك الطاقة وتنويي مصادرھاتغيير أنماط استه .0
:رؤية المركز
ومواةبااة التطااور العااالمي فااي مجااام اسااتغ م الطاقااة الحااد التاادريجي ماان تااأثيرات الطاقااة التقليديااة علاا البيئااة،
. المتجددة والحفاظ عل موارد العرا الطبيعية وتسخيرھا لخدمة المستقبل باالسلوب ارمثل
:مهام المركز
:المهام اآلتيةيتول المرةز
وضي الخطط والبرامج للدراسات والبحوث العلمية المتخصصة في ضو السياسة العامة للبحاث العلماي التاي .6
.تقرھا ھيأة البحث والتطوير الصناعي
واعااداد التصاااميم والدراسااات والسااعي لتصاانيي وتطااوير نماااذل البحااوث جاارا البحااوث النظريااة والتطبيقيااة .2
فاي مجاام الطاقاة وفقاال للمواصافات القياساية المعتمادة الفحوصاتاالستثمار و جرا التطبيقية وتنفي ھا عن طريق
.المتجددة والبيئة
ة فاي مجاام الطاقاة المتجاددة العلمية واإلسهام في تقاويم ارعماام اإلبداعياة والبحاوث العلميا تقديم االستشارات .0
.والبيئة
توفير المستلزمات البحثية من المختبرات والورش والساعي لتزويادھا باارجهزة والمكاائن والمعادات ال زماة، .0
.وتوفير متطلبات العمل من الموارد البشرية ال زمة والسعي الدائم لتطوير خبراتها ومعارفها
تنسيق المعلومات والبيانات والمراجي ومختل الوثائق لمواةبة التطاور نشا بنك للمعلومات المناخية وجمي و .5
العلمااي والتكنولااوجي فااي مجااام اختصااات المرةااز وتقااديمها الاا الجهااات البحثيااة واالستشااارية المعنيااة بالطاقااة
.المتجددة والبيئة
النتااائج، و صاادار نشاار البحااوث العلميااة وتعميمهااا علاا الجهااات ذات الع قااة والتعاااون معهااا علاا تطبيااق .1
.المطبوعات والدوريات والكتب والنشرات العلمية والتقارير في مجام الطاقة المتجددة والبيئة
ارفاراد والمجتماي والمسسساات العاماة تشاجييترشايد اساته ك الطاقاة ولاإلسهام بنشر وتعميق الوعي العلماي .1
ومنتجاتهاا واالعتماد عل الطاقاة المتجاددة للبيئة صديقة والخاصة عل استخدام و نتال الطاقة من مصادر نظيفة
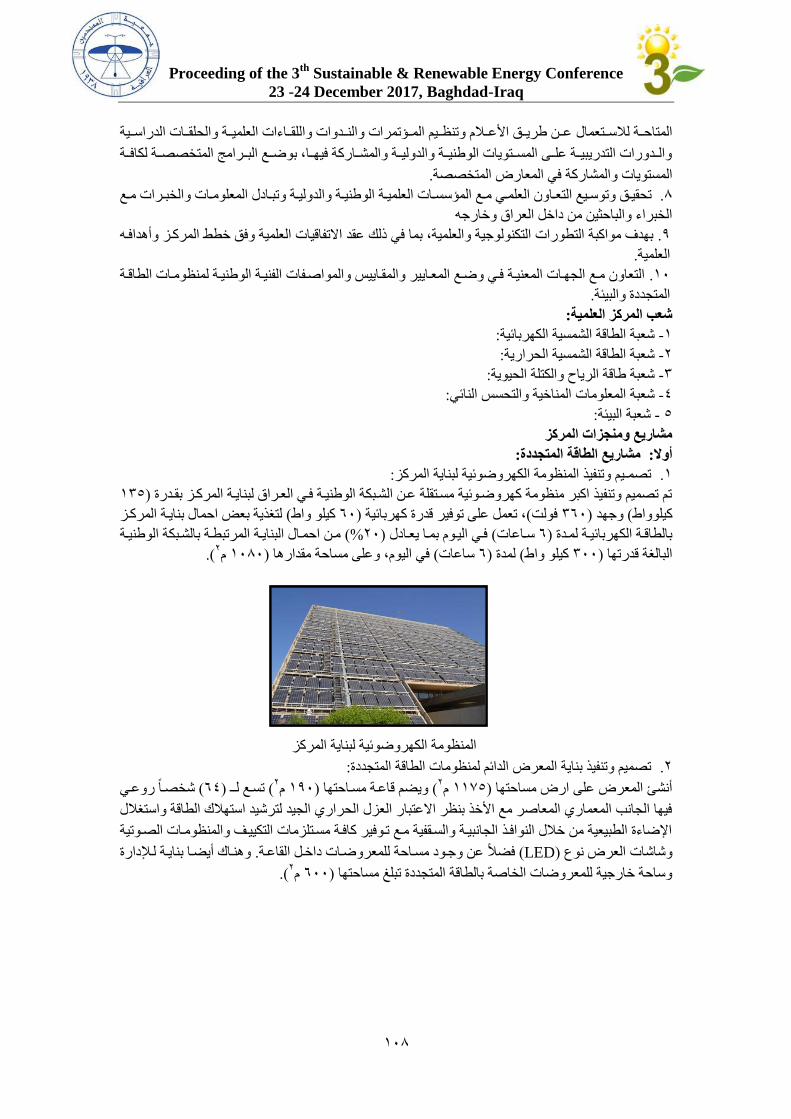
Proceeding of the 3th
Sustainable & Renewable Energy Conference
23 -24 December 2017, Baghdad-Iraq
609
عاان طريااق ارعاا م وتنظاايم المااستمرات والناادوات واللقااا ات العلميااة والحلقااات الدراسااية المتاحااة ل سااتعمام
والاادورات التدريبيااة علاا المسااتويات الوطنيااة والدوليااة والمشااارةة فيهااا، بوضااي الباارامج المتخصصااة لكافااة
.في المعار، المتخصصة المستويات والمشارةة
تحقيااق وتوساايي التعاااون العلمااي مااي المسسسااات العلميااة الوطنيااة والدوليااة وتبااادم المعلومااات والخباارات مااي . 9
الخبرا والباحثين من داخل العرا وخارجا
وأھدافاا بهدف مواةبة التطورات التكنولوجية والعلمية، بما في ذلك عقد االتفاقيات العلمية وفق خطط المرةاز . 8
.العلمية
التعاون ماي الجهاات المعنياة فاي وضاي المعاايير والمقااييس والمواصافات الفنياة الوطنياة لمنظوماات الطاقاة . 60
.المتجددة والبيئة
:شعب المركز العلمية
:شعبة الطاقة الشمسية الكهربائية -6
:شعبة الطاقة الشمسية الحرارية -2
:الحيويةشعبة طاقة الرياح والكتلة -0
:شعبة المعلومات المناخية والتحسس النائي -0
:شعبة البيئة -5
مشاريع ومنجزات المركز
:مشاريع الطاقة المتجددة: أوال
:تصمـيم وتنفي المنظومة الكهروضوئية لبناية المرةز .6
605)تم تصميم وتنفي اةبر منظومة ةهروضاوئية مساتقلة عان الشابكة الوطنياة فاي العارا لبناياة المرةاز بقادرة
لتغ ية بعض احمام بناياة المرةاز ( ةيلو واط 10)، تعمل عل توفير قدرة ةهربائية (فولت 010)وجهد ( ةيلوواط
مان احماام البنايااة المرتبطاة بالشابكة الوطنيااة %( 20)فاي الياوم بمااا يعاادم ( ساااعات 1)بالطاقاة الكهربائياة لمادة
م 6090)في اليوم، وعل مساحة مقدارھا ( ساعات 1)لمدة ( ةيلو واط 000)البالغة قدرتها 2.)
المنظومة الكهروضوئية لبناية المرةز
:تصميم وتنفي بناية المعر، الدائم لمنظومات الطاقة المتجددة .2
م 6615)مساحتها أنشئ المعر، عل ار، 2م 680)ويأم قاعاة مسااحتها (
2شخصاال روعاي ( 10)تساي لاـ (
فيها الجانب المعماري المعاصر مي ارخ بنظر االعتبار العزم الحراري الجيد لترشيد استه ك الطاقة واستغ م
منظوماات الصاوتية اإلضا ة الطبيعية من خ م النوافا الجانبياة والساقفية ماي تاوفير ةافاة مساتلزمات التكييا وال
وھنااك أيأاا بناياة لاةدارة . فأ ل عن وجاود مسااحة للمعروضاات داخال القاعاة( LED)وشاشات العر، نوس
م 100)وساحة خارجية للمعروضات الخاصة بالطاقة المتجددة تبل مساحتها 2.)
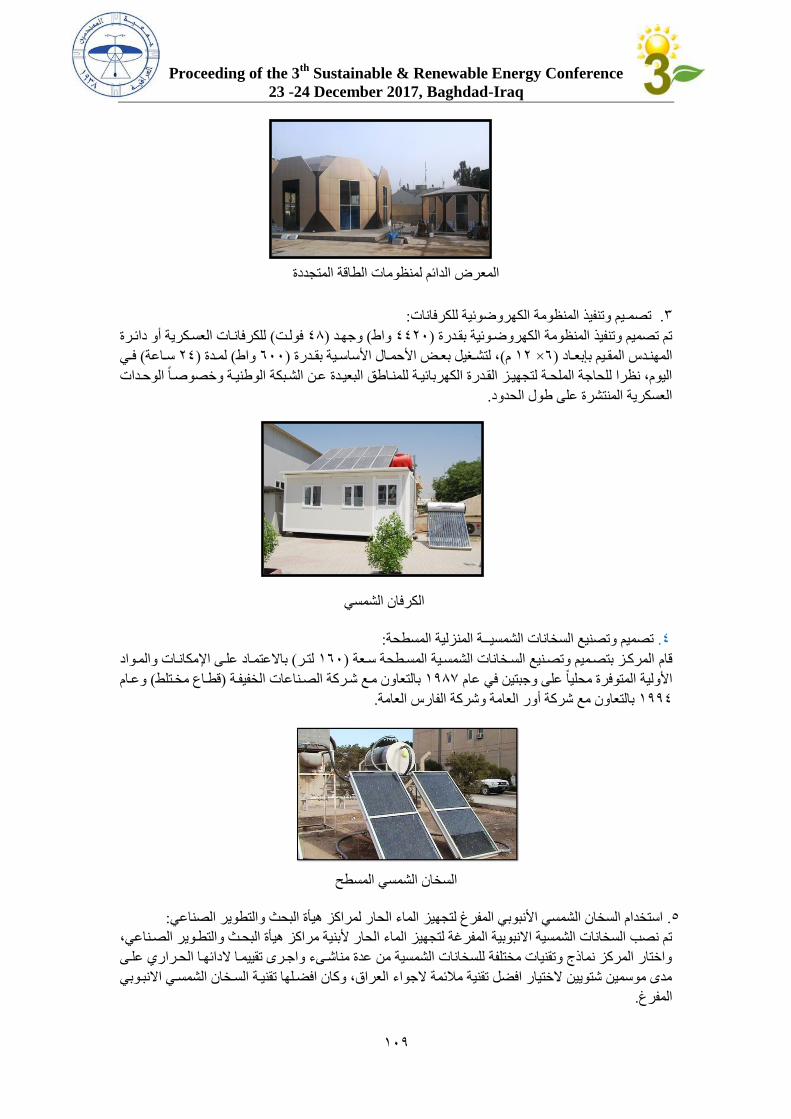
Proceeding of the 3th
Sustainable & Renewable Energy Conference
23 -24 December 2017, Baghdad-Iraq
608
المعر، الدائم لمنظومات الطاقة المتجددة
:الكهروضوئية للكرفاناتتصمـيم وتنفي المنظومة .0
للكرفاناات العساكرية أو دائارة ( فولات 09)وجهاد ( واط 0020)تم تصميم وتنفي المنظومة الكهروضاوئية بقادرة
فااي ( ساااعة 20)لماادة ( واط 100)، لتشااغيل بعااض ارحمااام ارساسااية بقاادرة (م 62× 1)المهناادا المقاايم بإبعاااد
لكهربائياة للمنااطق البعيادة عان الشابكة الوطنياة وخصوصاال الوحادات اليوم، نظرا للحاجة الملحاة لتجهياز القادرة ا
.العسكرية المنتشرة عل طوم الحدود
الكرفان الشمسي
:تصميم وتصنيي السخانات الشمسيــة المنزلية المسطحة. 0
باالعتمااد علا اإلمكاناات والماواد ( لتار 610)المرةاز بتصاميم وتصانيي الساخانات الشمساية المساطحة ساعة قام
وعاام ( قطااس مخاتلط)بالتعاون ماي شارةة الصاناعات الخفيفاة 6891ارولية المتوفرة محليال عل وجبتين في عام
.بالتعاون مي شرةة أور العامة وشرةة الفارا العامة 6880
السخان الشمسي المسطح
:استخدام السخان الشمسي ارنبوبي المفرغ لتجهيز الما الحار لمراةز ھيأة البحث والتطوير الصناعي. 5
الصاناعي، تم نصب السخانات الشمسية االنبوبية المفرغة لتجهيز الما الحار ربنية مراةز ھيأة البحاث والتطاوير
واختار المرةز نماذل وتقنيات مختلفة للسخانات الشمسية من عدة مناشا واجارت تقييماا الدائهاا الحاراري علا
مدت موسمين شتويين الختيار افأل تقنية م ئمة الجوا العرا ، وةان افأالها تقنياة الساخان الشمساي االنباوبي
.المفرغ
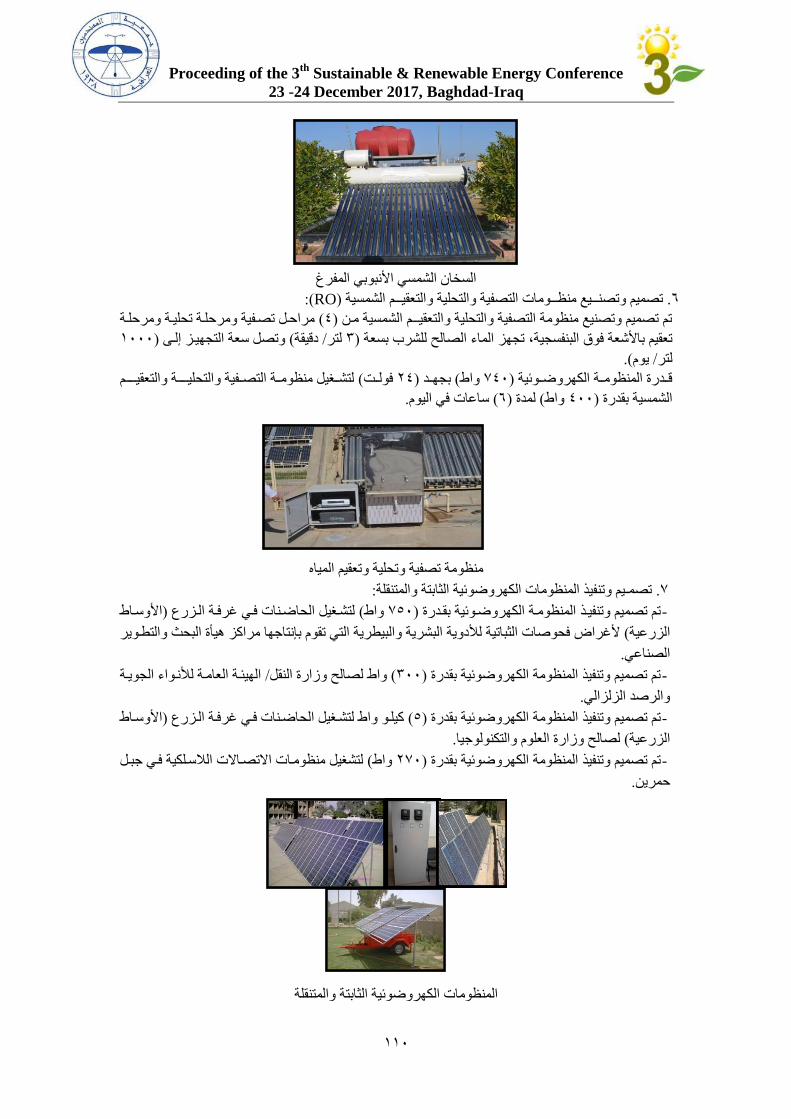
Proceeding of the 3th
Sustainable & Renewable Energy Conference
23 -24 December 2017, Baghdad-Iraq
660
السخان الشمسي ارنبوبي المفرغ
(:RO)تصميم وتصنــيي منظــومات التصفية والتحلية والتعقيــم الشمسية . 1
مراحال تصافية ومرحلاة تحلياة ومرحلاة (0)تم تصميم وتصنيي منظومة التصفية والتحلية والتعقيــم الشمسية مان
6000)وتصل سعة التجهياز لا ( دقيقة/ لتر 0)تجهز الما الصالح للشرب بسعة ،تعقيم بارشعة فو البنفسجية
(.يوم/ لتر
لتشااغيل منظومااة التصاافية والتحليـااـة والتعقيـااـم ( فولاات 20)بجهااد ( واط 100)قاادرة المنظومااة الكهروضااوئية
.ساعات في اليوم( 1)لمدة (واط 000)الشمسية بقدرة
وتعقيم المياهمنظومة تصفية وتحلية
:تصمـيم وتنفي المنظومات الكهروضوئية الثابتة والمتنقلة. 1
اروسااط )لتشاغيل الحاضانات فاي غرفاة الازرس ( واط 150)المنظوماة الكهروضاوئية بقادرة تم تصميم وتنفيا -
حث والتطاوير مراةز ھيأة البرغرا، فحوصات الثباتية لألدوية البشرية والبيطرية التي تقوم بإنتاجها ( الزرعية
.الصناعي
الهيئاة العاماة لألناوا الجوياة / واط لصالح وزارة النقل( 000)تم تصميم وتنفي المنظومة الكهروضوئية بقدرة -
.والرصد الزلزالي
اروسااط )ةيلاو واط لتشاغيل الحاضانات فاي غرفاة الازرس ( 5)المنظومة الكهروضوئية بقدرة تم تصميم وتنفي -
.العلوم والتكنولوجيالصالح وزارة ( الزرعية
لتشغيل منظوماات االتصااالت ال سالكية فاي جبال ( واط 210)بقدرة المنظومة الكهروضوئية تم تصميم وتنفي -
.حمرين
المنظومات الكهروضوئية الثابتة والمتنقلة
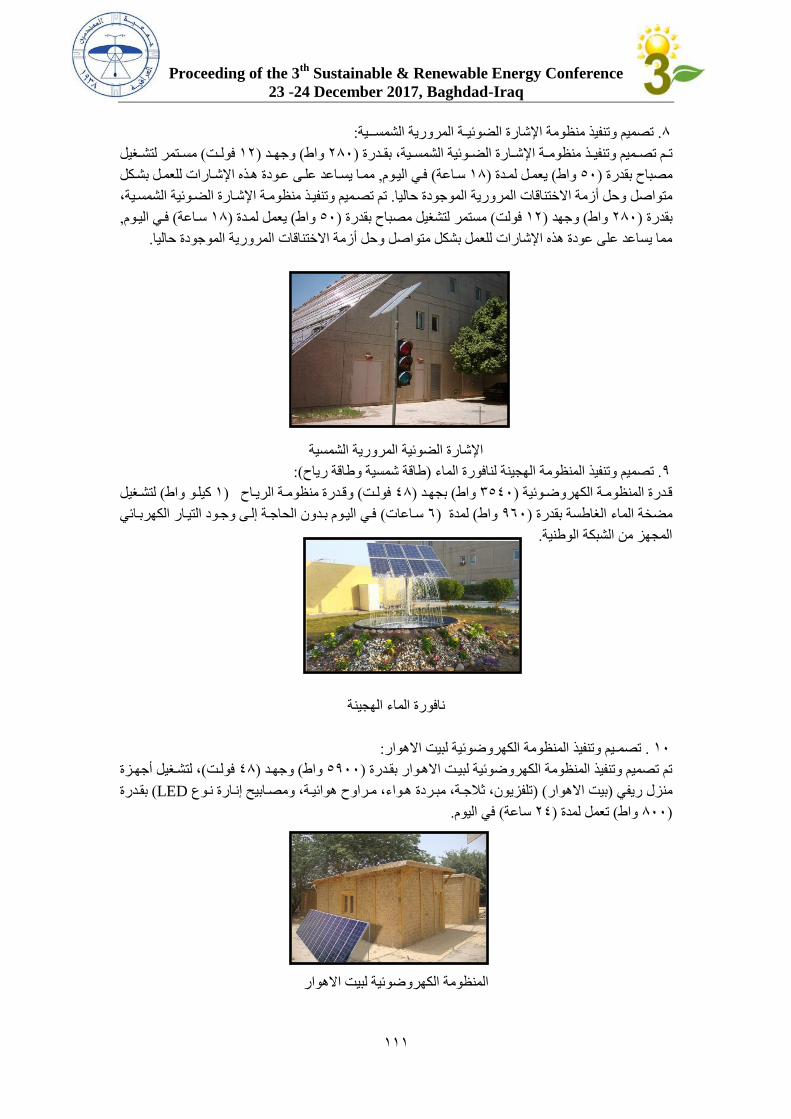
Proceeding of the 3th
Sustainable & Renewable Energy Conference
23 -24 December 2017, Baghdad-Iraq
666
:تصميم وتنفي منظومة اإلشارة الأوئيـة المرورية الشمســية. 9
مسااتمر لتشااغيل ( فولاات 62)وجهااد (واط 290)منظومااة اإلشااارة الأااوئية الشمسااية، بقاادرة تاام تصااميم وتنفياا
ھا ه اإلشاارات للعمال بشاكل مماا يسااعد علا عاودة, فاي الياوم( ةسااع 69)يعمال لمادة ( واط 50)مصباح بقدرة
وئية الشمساية، تم تصاميم وتنفيا منظوماة اإلشاارة الأا. متواصل وحل أزمة االختناقات المرورية الموجودة حاليا
, فاي الياوم( سااعة 69)يعمل لمادة ( واط 50)مستمر لتشغيل مصباح بقدرة ( فولت 62)وجهد ( واط 290)بقدرة
.مما يساعد عل عودة ھ ه اإلشارات للعمل بشكل متواصل وحل أزمة االختناقات المرورية الموجودة حاليا
اإلشارة الأوئية المرورية الشمسية
(:طاقة شمسية وطاقة رياح)وتنفي المنظومة الهجينة لنافورة الما تصميم . 8
لتشااغيل ( ةيلاو واط 6) وقادرة منظوماة الرياااح ( فولاات 09)بجهاد ( واط 0500)قادرة المنظوماة الكهروضااوئية
فاي الياوم بادون الحاجاة لا وجاود التياار الكهرباائي ( سااعات 1) لمدة( واط 810)الغاطسة بقدرة مأخة الما
.المجهز من الشبكة الوطنية
نافورة الما الهجينة
:تصمـيم وتنفي المنظومة الكهروضوئية لبيت االھوار. 60
يل أجهازة ، لتشاغ(فولات 09)وجهاد ( واط 5800)تم تصميم وتنفي المنظومة الكهروضوئية لبيات االھاوار بقادرة
بقادرة ( LEDتلفزيون، ث جاة، مباردة ھاوا ، ماراوح ھوائياة، ومصاابيح ناارة ناوس )( بيت االھوار)منزم ريفي
.في اليوم( ساعة 20)تعمل لمدة ( واط 900)
المنظومة الكهروضوئية لبيت االھوار
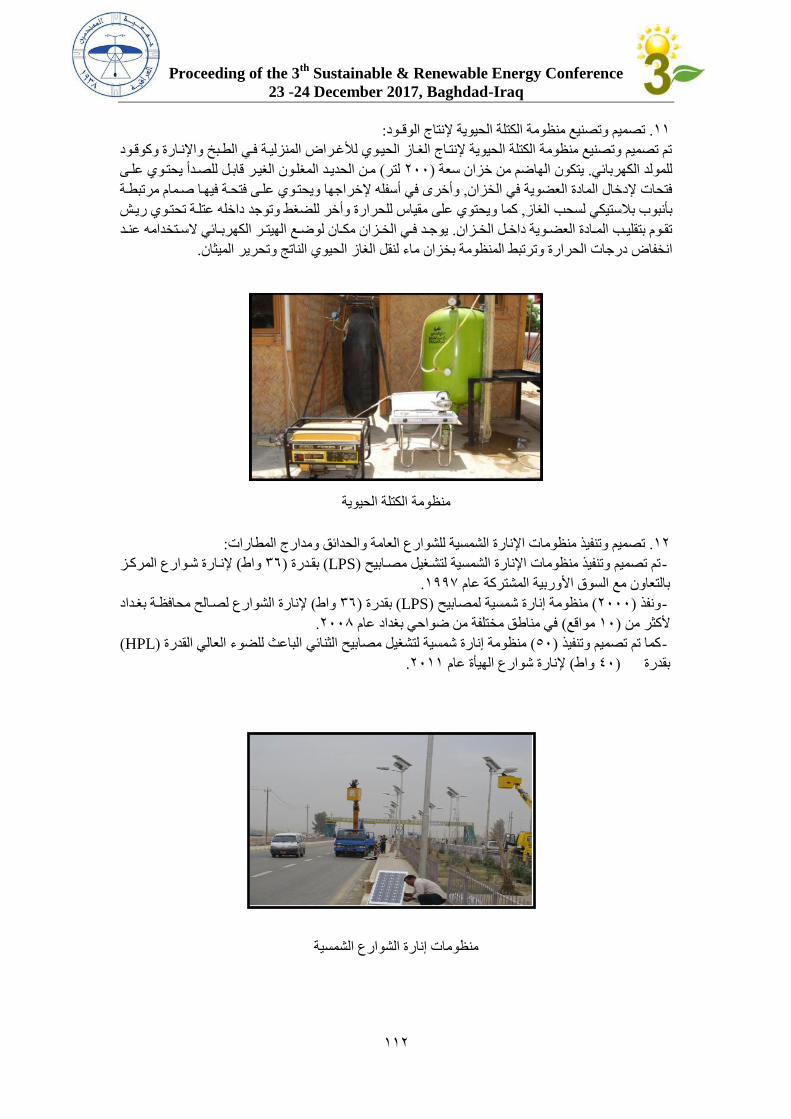
Proceeding of the 3th
Sustainable & Renewable Energy Conference
23 -24 December 2017, Baghdad-Iraq
662
:تصميم وتصنيي منظومة الكتلة الحيوية إلنتال الوقـود. 66
تم تصميم وتصنيي منظومة الكتلة الحيوية إلنتاال الغااز الحياوي لألغارا، المنزلياة فاي الطابر واإلناارة وةوقاود
مان الحدياد المغلاون الغيار قابال للصادأ يحتاوي علا ( لتر 200)يتكون الهاضم من خزان سعة . للمولد الكهربائي
اجها ويحتاوي علا فتحاة فيهاا صامام مرتبطاة وأخرت في أسفلا إلخر, فتحات إلدخام المادة العأوية في الخزان
ويحتوي عل مقياا للحرارة وأخر للأغط وتوجد داخلا عتلاة تحتاوي ريا ةما, بأنبوب ب ستيكي لسحب الغاز
يوجااد فااي الخاازان مكااان لوضااي الهيتاار الكهربااائي السااتخداما عنااد . تقااوم بتقليااب المااادة العأااوية داخاال الخاازان
.وترتبط المنظومة بخزان ما لنقل الغاز الحيوي الناتج وتحرير الميثاندرجات الحرارة انخفا،
الكتلة الحيوية منظومة
:تصميم وتنفي منظومات اإلنارة الشمسية للشوارس العامة والحدائق ومدارل المطارات. 62
إلناارة شاوارس المرةاز ( واط 01)بقادرة ( LPS)تم تصميم وتنفي منظومات اإلنارة الشمسية لتشاغيل مصاابيح -
.6881بالتعاون مي السو اروربية المشترةة عام
بغاداد الشوارس لصاالح محافظاة إلنارة( واط 01)بقدرة ( LPS)لمصابيح منظومة نارة شمسية( 2000)ونف -
.2009عام في مناطق مختلفة من ضواحي بغداد( مواقي 60)رةثر من
(HPL)الباعث للأو العالي القدرة منظومة نارة شمسية لتشغيل مصابيح الثنائي ( 50) ةما تم تصميم وتنفي -
.2066إلنارة شوارس الهيأة عام ( واط 00) بقدرة
منظومات نارة الشوارس الشمسية
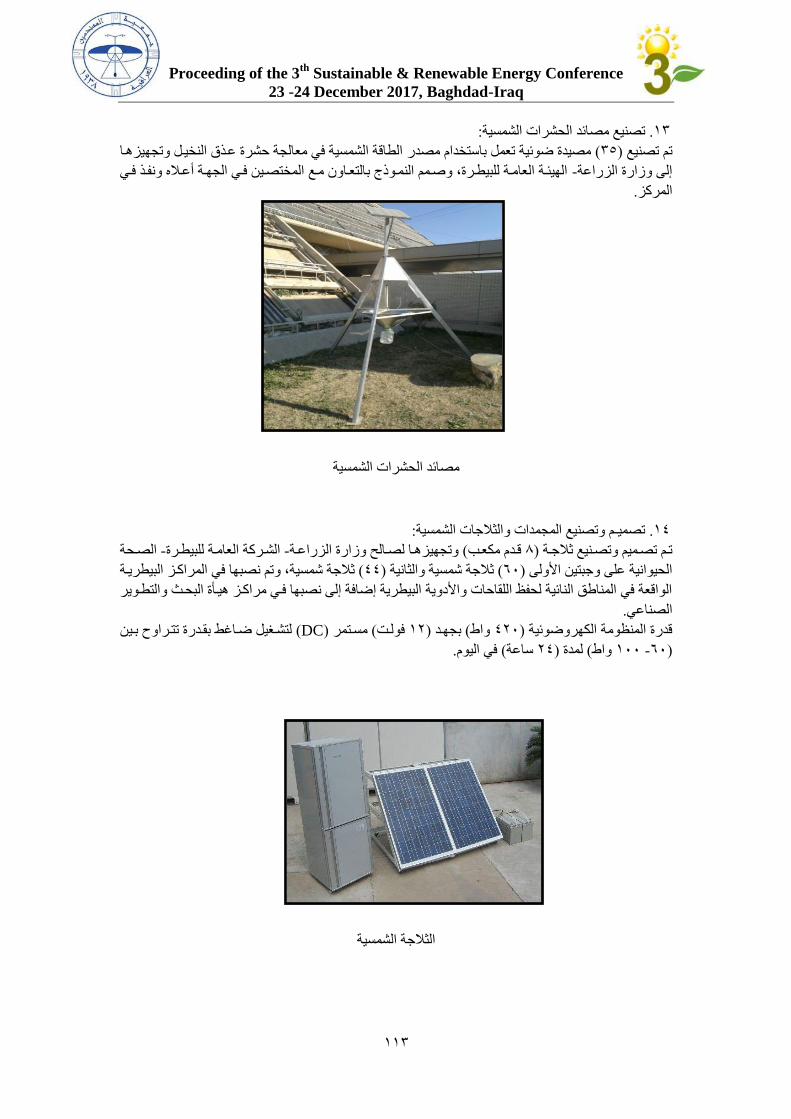
Proceeding of the 3th
Sustainable & Renewable Energy Conference
23 -24 December 2017, Baghdad-Iraq
660
:تصنيي مصائد الحشرات الشمسية. 60
الطاقة الشمسية في معالجة حشرة عا النخيال وتجهيزھاا مصيدة ضوئية تعمل باستخدام مصدر( 05)تم تصنيي
الهيئاة العاماة للبيطارة، وصامم النماوذل بالتعااون ماي المختصاين فاي الجهاة أعا ه ونفا فاي - ل وزارة الزراعة
.المرةز
مصائد الحشرات الشمسية
:تصميـم وتصنيي المجمدات والث جات الشمسية. 60
الصاحة -الشارةة العاماة للبيطارة -وتجهيزھاا لصاالح وزارة الزراعاة( قادم مكعاب 9)تام تصاميم وتصانيي ث جاة
نصبها في المراةاز البيطرياة ث جة شمسية، وتم( 00)ث جة شمسية والثانية ( 10)الحيوانية عل وجبتين ارول
ز ھياأة البحاث والتطاوير الواقعة في المناطق النائية لحفظ اللقاحات واردوية البيطرية ضافة ل نصبها فاي مراةا
.الصناعي
لتشاغيل ضااغط بقادرة تتاراوح باين ( DC)مساتمر ( فولات 62)بجهاد ( واط 020)قدرة المنظومة الكهروضوئية
.في اليوم( ساعة 20)لمدة ( واط 600 -10)
الث جة الشمسية
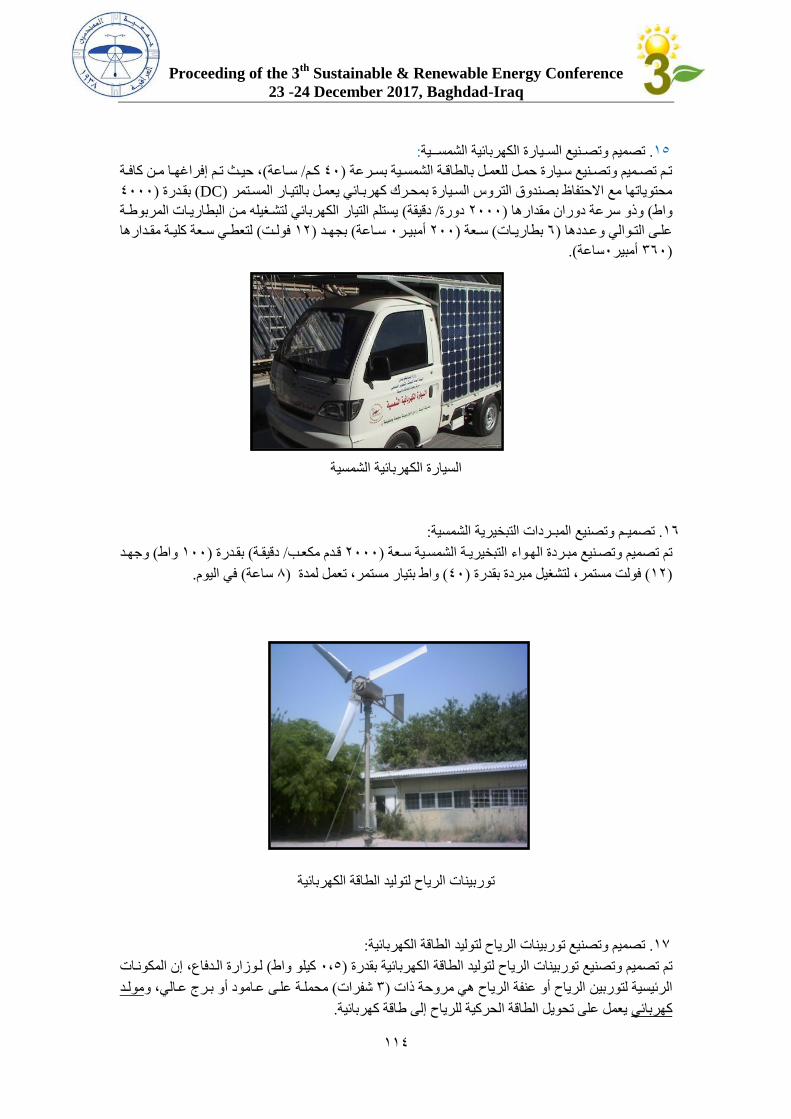
Proceeding of the 3th
Sustainable & Renewable Energy Conference
23 -24 December 2017, Baghdad-Iraq
660
:تصميم وتصـنيي السـيارة الكهربائية الشمســية. 65
، حيااث تاام فراغهااا ماان ةافااة (ساااعة/ ةاام 00)تاام تصااميم وتصاانيي ساايارة حماال للعماال بالطاقااة الشمسااية بساارعة
0000)بقادرة ( DC)محتوياتها مي االحتفاظ بصندو التروا السايارة بمحارك ةهرباائي يعمال بالتياار المساتمر
يستلم التيار الكهربائي لتشاغيلا مان البطارياات المربوطاة ( دقيقة/ دورة 2000) ارھاوذو سرعة دوران مقد( واط
لتعطااي سااعة ةليااة مقاادارھا ( فولاات 62)بجهااد ( ساااعة 0أمبياار 200)سااعة ( بطاريااات 1)علاا التااوالي وعااددھا
(.ساعة0أمبير 010)
الشمسيةالسيارة الكهربائية
:وتصنيي المبـردات التبخيرية الشمسيةتصميـم . 61
وجهاد ( واط 600)بقادرة ( دقيقاة/ قادم مكعاب 2000)الشمساية ساعة مباردة الهاوا التبخيرياة تم تصميم وتصانيي
.في اليوم( ساعة 9) ، تعمل لمدة واط بتيار مستمر( 00) ، لتشغيل مبردة بقدرةفولت مستمر( 62)
توربينات الرياح لتوليد الطاقة الكهربائية
:تصميم وتصنيي توربينات الرياح لتوليد الطاقة الكهربائية. 61
لاوزارة الادفاس، ن المكوناات ( ةيلو واط 0،5)توربينات الرياح لتوليد الطاقة الكهربائية بقدرة وتصنيي صميمتم ت
مولاد بارل عاالي، ومحملاة علا عاامود أو ( شفرات 0)الرياح أو عنفة الرياح ھي مروحة ذات الرئيسية لتوربين
.يعمل عل تحويل الطاقة الحرةية للرياح ل طاقة ةهربائية ةهربائي
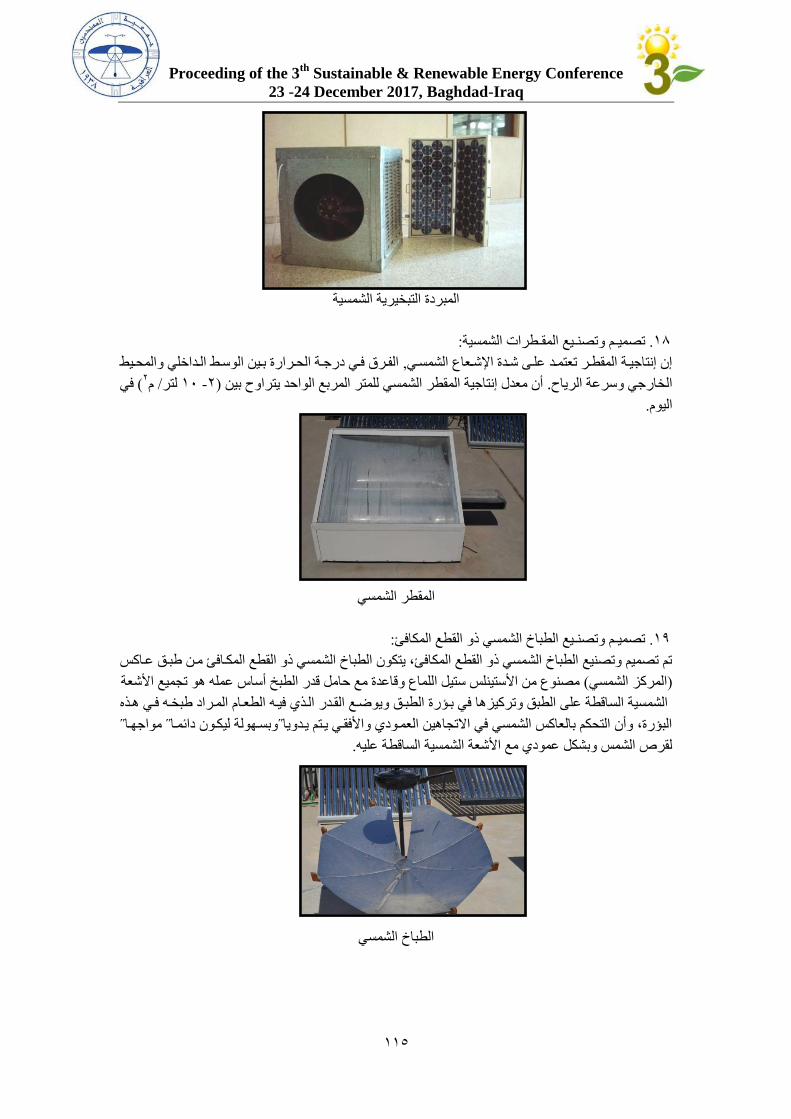
Proceeding of the 3th
Sustainable & Renewable Energy Conference
23 -24 December 2017, Baghdad-Iraq
665
المبردة التبخيرية الشمسية
:تصميـم وتصنـيي المقـطرات الشمسية. 69
الفاار فااي درجاة الحاارارة بااين الوساط الااداخلي والمحاايط , ن نتاجياة المقطاار تعتمااد علا شاادة اإلشااعاس الشمساي
م/ لتر 60 -2)أن معدم نتاجية المقطر الشمسي للمتر المربي الواحد يتراوح بين .الخارجي وسرعة الرياح2في (
.اليوم
المقطر الشمسي
:تصميـم وتصنـيي الطباخ الشمسي ذو القطي المكافئ. 68
تم تصميم وتصنيي الطباخ الشمسي ذو القطي المكافئ، يتكون الطباخ الشمسي ذو القطي المكاافئ مان طباق عااةس
ارشعةمصنوس من ارستينلس ستيل اللماس وقاعدة مي حامل قدر الطبر أساا عملا ھو تجميي ( المرةز الشمسي)
الشمسية الساقطة عل الطبق وترةيزھا في باسرة الطباق ويوضاي القادر الا ي فياا الطعاام الماراد طبخاا فاي ھا ه
˝ مواجهاا˝ وبساهولة ليكاون دائماا˝البسرة، وأن التحكم بالعاةس الشمسي في االتجاھين العماودي وارفقاي ياتم يادويا
.ليالقرت الشمس وبشكل عمودي مي ارشعة الشمسية الساقطة ع
الطباخ الشمسي
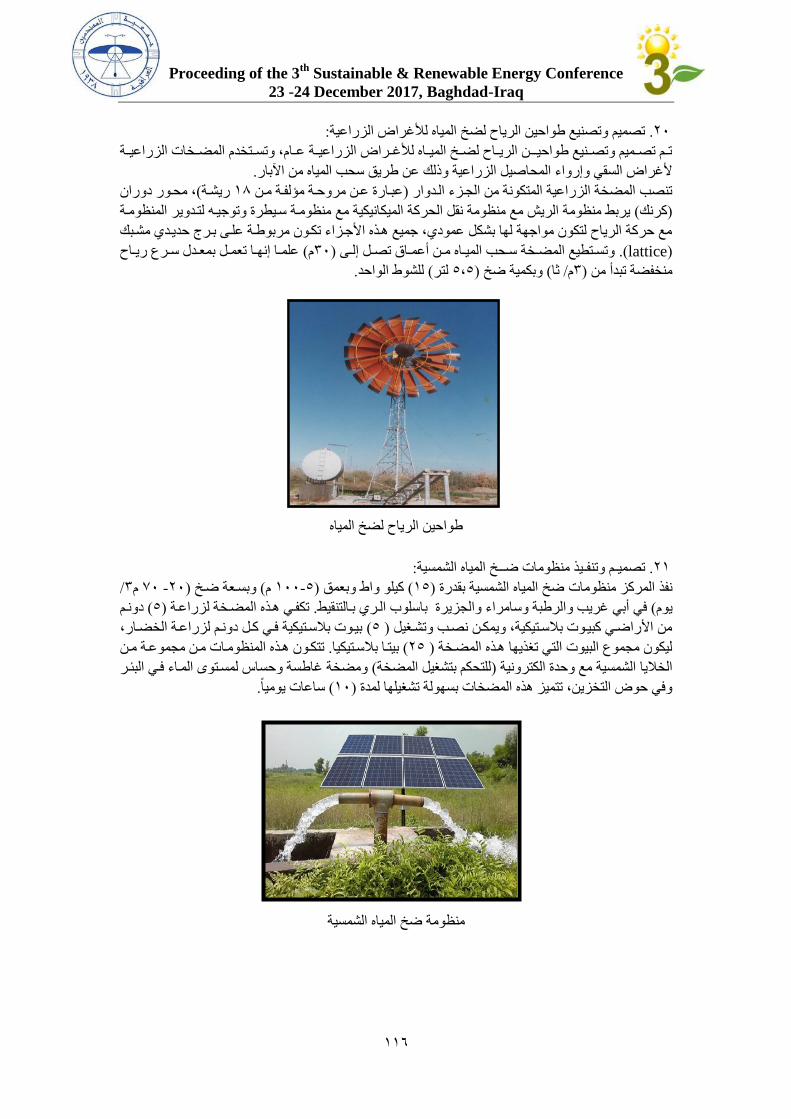
Proceeding of the 3th
Sustainable & Renewable Energy Conference
23 -24 December 2017, Baghdad-Iraq
661
:تصميم وتصنيي طواحين الرياح لأر المياه لألغرا، الزراعية. 20
عااام، وتسااتخدم المأااخات الزراعيااة تاام تصااميم وتصاانيي طواحيااـن الرياااح لأاار المياااه لألغاارا، الزراعيااة
.رغرا، السقي و روا المحاصيل الزراعية وذلك عن طريق سحب المياه من اآلبار
، محاور دوران (ريشاة 69عباارة عان مروحاة مسلفاة مان )تنصب المأخة الزراعية المتكونة من الجاز الادوار
منظوماة سايطرة وتوجياا لتادوير المنظوماة يربط منظومة الري مي منظومة نقل الحرةة الميكانيكية مي( ةرنك)
مي حرةة الرياح لتكون مواجهة لها بشكل عمودي، جميي ھا ه ارجازا تكاون مربوطاة علا بارل حديادي مشابك
(lattice .) علمااا نهااا تعماال بمعاادم ساارس رياااح ( م00)وتسااتطيي المأااخة سااحب المياااه ماان أعمااا تصاال لاا
.للشوط الواحد( لتر 5،5)وبكمية ضر ( ثا/ م0)منخفأة تبدأ من
طواحين الرياح لأر المياه
:تصميـم وتنفـي منظومات ضــر المياه الشمسية. 26
/ 0م 10 -20)ضار ساعةوب( م 600-5)ةيلو واط وبعمق ( 65)ضر المياه الشمسية بقدرة اتنف المرةز منظوم
دونام ( 5)تكفاي ھا ه المأاخة لزراعاة . باسلوب الاري باالتنقيط والجزيرةالرطبة وسامرا و في أبي غريب( يوم
بياوت ب ساتيكية فاي ةال دونام لزراعاة الخأاار، ( 5) من ارراضاي ةبياوت ب ساتيكية، ويمكان نصاب وتشاغيل
تتكاون ھا ه المنظوماات مان مجموعاة مان .بيتاا ب ساتيكيا( 25) ليكون مجموس البيوت التي تغ يها ھا ه المأاخة
ومأخة غاطسة وحساا لمساتوت الماا فاي البئار ( للتحكم بتشغيل المأخة)يا الشمسية مي وحدة الكترونية الخ
.ساعات يوميال ( 60)وفي حو، التخزين، تتميز ھ ه المأخات بسهولة تشغيلها لمدة
منظومة ضر المياه الشمسية
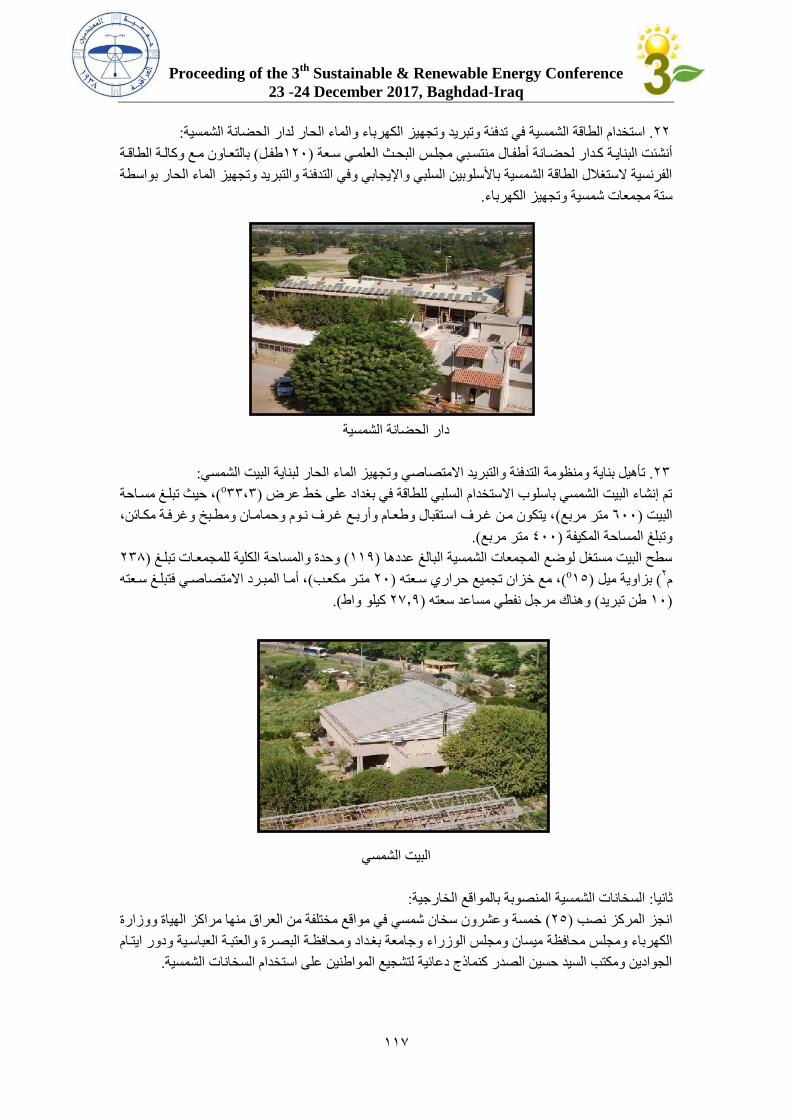
Proceeding of the 3th
Sustainable & Renewable Energy Conference
23 -24 December 2017, Baghdad-Iraq
661
:الكهربا والما الحار لدار الحأانة الشمسيةاستخدام الطاقة الشمسية في تدفئة وتبريد وتجهيز . 22
بالتعااون ماي وةالاة الطاقاة ( طفال620)ة أطفاام منتسابي مجلاس البحاث العلماي ساعة لحأاانأنشئت البناياة ةادار
الفرنسية الستغ م الطاقة الشمسية بارسلوبين السلبي واإليجابي وفي التدفئة والتبريد وتجهيز الما الحار بواسطة
.مجمعات شمسية وتجهيز الكهربا ستة
دار الحأانة الشمسية
:الحار لبناية البيت الشمسي تأھيل بناية ومنظومة التدفئة والتبريد االمتصاصي وتجهيز الما . 20
00،0)تم نشا البيت الشمسي باسلوب االستخدام السلبي للطاقة في بغداد عل خط عر، o، حيث تبلا مسااحة (
، يتكون مان غارف اساتقبام وطعاام وأرباي غارف ناوم وحماماان ومطابر وغرفاة مكاائن، (متر مربي 100) البيت
(.متر مربي 000)وتبل المساحة المكيفة
209)وحدة والمساحة الكلية للمجمعاات تبلا ( 668)سطح البيت مستغل لوضي المجمعات الشمسية البال عددھا
م265)بزاوية ميل (
o، أماا المبارد االمتصاصاي فتبلا ساعتا (متار مكعاب 20)حراري ساعتا ، مي خزان تجميي (
(.ةيلو واط 21.8)وھناك مرجل نفطي مساعد سعتا ( طن تبريد 60)
البيت الشمسي
:السخانات الشمسية المنصوبة بالمواقي الخارجية: ثانيا
مختلفة من العرا منها مراةز الهياة ووزارة خمسة وعشرون سخان شمسي في مواقي ( 25)انجز المرةز نصب
ميسان ومجلس الوزرا وجامعة بغاداد ومحافظاة البصارة والعتباة العباساية ودور ايتاام الكهربا ومجلس محافظة
. الجوادين ومكتب السيد حسين الصدر ةنماذل دعائية لتشجيي المواطنين عل استخدام السخانات الشمسية
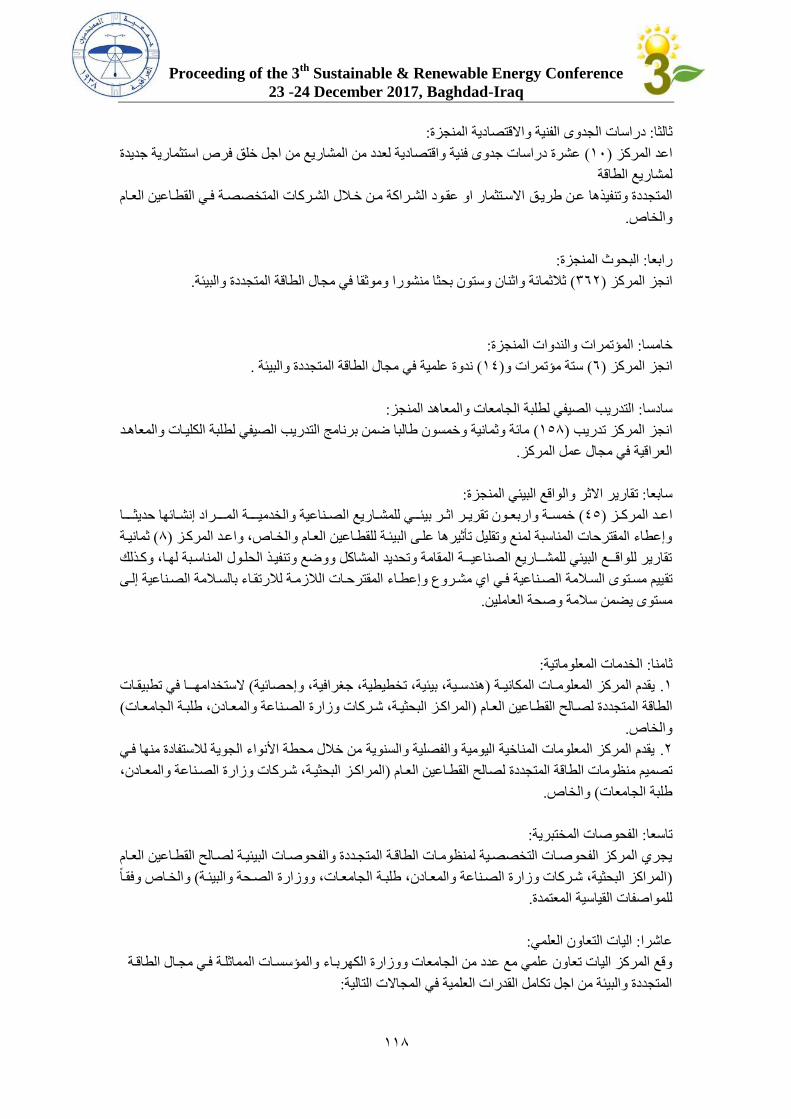
Proceeding of the 3th
Sustainable & Renewable Energy Conference
23 -24 December 2017, Baghdad-Iraq
669
:الفنية واالقتصادية المنجزةدراسات الجدوت : ثالثا
عشرة دراسات جدوت فنية واقتصادية لعدد من المشاريي من اجل خلق فرت استثمارية جديدة ( 60)اعد المرةز
لمشاريي الطاقة
االساتثمار او عقاود الشاراةة مان خا م الشارةات المتخصصاة فاي القطااعين العاام عان طرياقالمتجددة وتنفي ھا
.والخات
:ث المنجزةالبحو: رابعا
.ث ثمائة واثنان وستون بحثا منشورا وموثقا في مجام الطاقة المتجددة والبيئة( 012)انجز المرةز
:المستمرات والندوات المنجزة: خامسا
.ندوة علمية في مجام الطاقة المتجددة والبيئة ( 60)ستة مستمرات و( 1)انجز المرةز
:الجامعات والمعاھد المنجزالتدريب الصيفي لطلبة : سادسا
مائة وثمانية وخمسون طالبا ضمن برنامج التدريب الصيفي لطلبة الكلياات والمعاھاد ( 659)انجز المرةز تدريب
.العراقية في مجام عمل المرةز
:تقارير االثر والواقي البيئي المنجزة: سابعا
لصااناعية والخدميـااـة المـااـراد نشااائها حديثـااـا خمسااة واربعااون تقرياار اثاار بيئااـي للمشاااريي ا( 05)اعااد المرةااز
ثمانياة ( 9)و عطا المقترحات المناسبة لمني وتقليل تأثيرھا علا البيئاة للقطااعين العاام والخاات، واعاد المرةاز
تقارير للواقــي البيئي للمشــاريي الصناعيــة المقامة وتحديد المشاةل ووضي وتنفيا الحلاوم المناسابة لهاا، وةا لك
ييم مساتوت السا مة الصاناعية فاي اي مشاروس و عطاا المقترحاات ال زماة ل رتقاا بالسا مة الصاناعية لا تق
. مستوت يأمن س مة وصحة العاملين
:الخدمات المعلوماتية: ثامنا
الستخدامهــا في تطبيقاات ( ھندسـية، بيئية، تخطيطية، جغرافية، و حصائية)المعلومـات المكانيـة يقدم المرةز .6
( الجامعاات المراةاز البحثياة، شارةات وزارة الصاناعة والمعاادن، طلباة)لصاالح القطااعين العاام الطاقة المتجددة
.والخات
من خ م محطة ارنوا الجوية ل ستفادة منها فاي يقدم المرةز المعلومات المناخية اليومية والفصلية والسنوية .2
المراةاز البحثياة، شارةات وزارة الصاناعة والمعاادن، )لصالح القطااعين العاام تصميم منظومات الطاقة المتجددة
.والخات( الجامعات طلبة
:الفحوصات المختبرية: تاسعا
حوصاات البيئياة لصاالح القطااعين العاام يجري المرةز الفحوصاات التخصصاية لمنظوماات الطاقاة المتجاددة والف
والخاات وفقاال ( الجامعاات، ووزارة الصاحة والبيئاة المراةز البحثية، شارةات وزارة الصاناعة والمعاادن، طلباة)
.للمواصفات القياسية المعتمدة
: اليات التعاون العلمي: عاشرا
والمسسساات المماثلاة فاي مجاام الطاقاة وقي المرةز اليات تعاون علمي مي عدد من الجامعات ووزارة الكهرباا
:المتجددة والبيئة من اجل تكامل القدرات العلمية في المجاالت التالية
Proceeding of the 3th
Sustainable & Renewable Energy Conference
23 -24 December 2017, Baghdad-Iraq
668
تبادم المعلومات والخبرات واالستشارات العلمية والفنية والزيارات والمشارةة في فار العمال المشاترةة باين - أ
.الطرفين بهدف مواةبة التطورات التكنولوجية والعلمية
.التشريعات والمعايير والمقاييس والمواصفات الفنية لمنظومات الطاقة المتجددة والبيئةوضي - ب
.تنفي البحوث التطبيقية والمشاريي المشترةة في مجام الطاقة المتجددة والبيئة وتوفير متطلباتها - ت
جددة والبيئة وفقاال االستفادة من االجهزة والمعدات المتوفرة لدت الطرفين في مجام فحص منظومات الطاقة المت - ث
.للمواصفات القياسية المعتمدة
.تشجيي ودعم االعمام االبتكارية المشترةة وتوفير البيئة المناسبة لها - ل
.اعداد دراسات الجدوت الفنية واالقتصادية للمشاريي ذات االھتمام المشترك - ح
النقاشية واللقاا ات العلمياة فاي المشارةة في اقامة الدورات التدريبية والمستمرات والندوات والورش والحلقات - خ
.مجاالت العمل المشترةة بين الطرفين
.تبادم المصادر العلمية المتوفرة لدت الطرفين - د
.المساعدة في نشر وتقييم البحوث العلمية حسب ارمكانات المتوفرة لدت الطرفين - ذ
.المشارةة في االط س الميداني عل المشاريي المنجزة في دوم العالم - ر
:المشاريي االستراتيجية: شراحدت ع
عاان طريااقالمتجااددة والبيئااة ةالطاقاا يسااعي المرةااز للحصااوم علاا تموياال للمشاااريي اإلسااتراتيجية فااي مجااام
قرو، الميسرة من او ال االستثمار او عقود الشراةة من خ م الشرةات المتخصصة في القطاعين العام والخات
ضاامن اليااة التنميااة النظيفااة المقدمااة القاارو، الدوليااة نح أوعاان طريااق الماا أوالمصااارف الحكوميااة والخاصااة،
CDM اإلتحاد اروروبي )او منEU، الوةالة ارلمانية للتعااون الادوليGIZ ، اإلنماائي لألمام المتحادة البرناامج
UNDP ھيئة المعونة ارمريكية ،USAID البنك الدولي ،WB ووةالاة الياباان للتعااون الادولي ،JICA) حياث ،
المرةز ھو الجهاة االستشاارية العلمياة السااندة للشارةة الناشائة المزماي تاسيساها مان قبال راعاي حملاة شمساك ان
.ياعرا وشرةة الزورا العامة واسناد الشرةة العامة للصناعات الكهربائية وااللكترونية
لطاقاة المتجاددة بالتعااون ماي الخطاة اإلساتراتيجية للمباادرة الوطنياة الساتدامة الطاقاة والتحاوم نحاو ا: اثن عشار
:وزارة الكهربا
لصاناعة والمعاادن ھناك جهود مشترةة من خ م المجلس المشترك للمبادرة الوطنية الستدامة الطاقة باين وزارة ا
ارفااراد والمجتمااي تشااجييترشاايد اسااته ك الطاقااة ولةسااهام بنشاار وتعميااق الااوعي العلمااي ل ووزارة الكهربااا
واالعتمااد علا الطاقاة صديقة للبيئاة والمسسسات العامة والخاصة عل استخدام و نتال الطاقة من مصادر نظيفة
ومنتجاتها المتاحة ل ستعمام واعداد دراسات الجدوت الفنية واالقتصادية من اجل خلق فرت استثمارية المتجددة
:االستثمار في المجاالت التالية عن طريقھا جديدة لمشاريي الطاقة المتجددة وتنفي
مبادرة استخداما في شرةات وزارة الصناعة والمعادن ودوائر وزارة الكهرباا لتشاجيي )السخانات الشمسية -6
(.االستثمار او عقود الشراةة من خ م احدت شرةات وزارة الصناعة والمعادن
.منظومات الأر الشمسية -2
.الشمسي المنظومات الكهروضوئية للبيت -0
.منظومات تصفية وتحلية وتعقيم المياه بالطاقة الشمسية -0
لاادور ايتااام االمااين الثانيااة، دار المساانين )المنظومااات الكهروضااوئية المسااتقلة والمرتبطااة بالشاابكة الوطنيااة -5
(.ومدارا االيتام في الكاظمية، ومحافظة واسط
Proceeding of the 3th
Sustainable & Renewable Energy Conference
23 -24 December 2017, Baghdad-Iraq
620
:التوصيات
ن صادار التشااريعات ورساام السياسااات علاا المسااتوت الااوطني فاي مجااام دعاام وتشااجيي وتنميااة ونشاار اسااتخدام
: الطاقة المتجددة في التطبيقات المختلفة ذات أھمية ةبيرة ومنها
.التقليدية عداد خطة ستراتيجية للتكامل بين الطاقة المتجددة وقطاس الطاقة .6
والدراسات وبنسبة نمو تصاعدية الطاقة المتجددة بزيادة التموي ل زم للبحوثدعم الجهات البحثية في مجام .2
و نشا مختبرات الفحص التخصصية وفق المواصفات القياسية العالمية، وتنمية وتطوير الموارد البشرية العاملة
.خل وخارل العرا االجازات الدراسية وورش العمل والدورات التدريبية دا في مجام الطاقة المتجددة من خ م
الشمساية وخارطاة الريااح لمسااحة العارا دعوة الجهات المعنية بالطاقة المتجددة النجاز وتحاديث الخارطاة .0
.لوضي قاعدة بيانات محدثة باستمرار
نشر وتعميق الوعي العلمي لترشيد استه ك الطاقة وتشجيي ارفراد والمجتمي والمسسساات العاماة والخاصاة .0
ومنتجاتهاا المتاحاة صديقة للبيئاة واالعتمااد علا الطاقاة المتجاددة تال الطاقة من مصادر نظيفةعل استخدام و ن
ل سااتعمام عاان طريااق ارعاا م وتنظاايم المااستمرات والناادوات واللقااا ات العلميااة والحلقااات الدراسااية والاادورات
.التدريبية
المساتخدم فاي صاناعة الخ ياا الشمسايةدعوة وزارة الصناعة والمعادن إلنشا مصني انتال السليكون النقاي .5
مما يقلل ةلفاة تصانيي ارلاواح لتوفر المادة ارولية بكميات ةبيرة في الرمام العراقية والتي تمتاز بنقاوتها العالية،
.ومن ثم ةل المنظومات الشمسية
.تشجيي ودعم و لزام أصحاب اربنية الحديثة الستخدام السخانات الشمسية .1
ااوفارة للطاقااة باسااتخدامدعااوة وزارة اإل .1 اساااليب العاازم الحااراري سااكان والتعمياار باعتماااد تصاااميم البنااا الما
. لترشيد استه ك الكهربا في التدفئة والتبريد
دعوة وزارة الكهربا للعمل علا تشاريي قاانون االساتثمار فاي مشااريي الطاقاة المتجاددة و صادار التعليماات .9
الكهرباا مان تسهي ت وحوافز تسدي لا توسايي االساتثمار فاي مجاام نتاال الخاصة بتنفي ھ ا القانون متأمنا
المصادر المتجددة مرتفعة عن تلك الممنوحة للطاقة مصادر متجددة بتحديد تعرفة لكل وحدة طاقة يتم نتاجها من
يق عائد مجزي للمستثمرينمن المصادر التقليدية تأمن تحق المنتجة
للشروس بربط العدادات العكساية ال ةياة المتزامناة ماي الشابكة الوطنياة لغار، تشاجيي دعوة وزارة الكهربا .8
مسااتخدمي ومنتجااي الكهربااا المتولاادة ماان مصااادر الطاقااة المتجااددة، وھااو نظااام يساامح للمسااتخدمين والمنتجااين
مسااتخدمة بتااداوم الكهربااا الفائأااة عاان احتياجاااتهم مااي الشاابكة الوطنيااة، وياادفي المسااتهلك ثماان الكهربااا ال
خارل نتاجا من الطاقة المتجاددة، او يساتلم قيماة الكهرباا الفائأاة عان حاجتاا المعطااة لا الشابكة " الصافية"
.الوطنية
التصنيي )المناقصات الخاصة بإنتال الكهربا من الطاقة المتجددة بتحقيق قيمة مأافة الزام المشارةين في .60
%(.50 -25)تتراوح بين ( المحلي
وآالالت والمااواد اروليااة والمااواد نصاا يي نتااال الكهربااا ماان الطاقااة المتجااددة والمعاادات عفااا مشااار .66
.الأرائب والرسوم والجمارك الطاقة المتجددة من جميي المصنعة الداخلة في صناعة منظومات
.تشجيي المصارف الحكومية والخاصة لتمويل مشاريي الطاقة المتجددة عن طريق القرو، الميسرة .62
(ASA) العمارة المستدامةمحور تطبيقات
بحوث ال

Proceeding of the 3th Sustainable & Renewable Energy Conference
23 -24 December 2017, Baghdad-Iraq
211
المدن المستدامة بين التطبيق واإلستراتيجية
شروق نعيم جاسم.دانتضار جاسم جبر ، .د
07709286530 E-mail: [email protected]
07711024040 [email protected]
قسم الجغرافية/ كلية االداب/ جامعة بغداد
-: المستخلص
واالجتماعية والثقافية والبيئية ونظام بيئي حساس له مدخالته ان المدينة باعتبارها مجاال لتفاعل مختلف العوامل االقتصادية . منها ومخرجاته المادية والمعنوية جعل منها المهتم االول او تقريبا الوحيد في التدهور البيئي واختالل االنظمة البيئية القريبة والبعيدة
هذه , على الدول وضع برامج واستراتيجيات تسعى من اجل تقليص والحد من تاثير المدن على محيطها الطبيعي نا كان لزاما ومن ه .االستراتيجيات تعتمد في مضمونها على مفهوم التنمية المستدامة وتهدف الى خلق مدن واحياء مستدامة متجانسة مع الوسط الطبيعي
فاهيم وأساليب جديدة للتخطيط واإلدارة الحضرية لم تكن مألوفة من قبل ومن بين هذه المفاهيم نذكر لقد ظهر في اآلونة األخيرة م
طيط وتعكس كل هذه المفاهيم االهتمام المتنامي بقضايا التخ( المدن المستدامة ) و ( األحياء البيئية ) و( التخطيط الحضري المستدام ) للموارد الطبيعية واالعتماد بشكل اكبر على مصادر األمثلخفض استهالك الطاقة واالستغالل الحضرية في ظل حماية البيئة و واإلدارة
.الطاقة المتجددة وتقوية الروابط االجتماعية واالقتصادية والثقافية
تأثيراتوالمجتمع وان هو محور االرتباط بين البيئة واالقتصاد اإلنسان إنوبيئته ويتبنى فكرة اإلنسانفالعمران المستدام يثمن ارتباط هو العنصر المتلقي للضرر في اإلنساناالقتصادية واالجتماعية الواضحة والتي يكون فيها إبعادهاعلى البيئة لها اإلنسانية األنشطةت على وفقا لما تقدم فقد اهتم البحث بموضوع المدن المستدامة كموضوع كنظام ديناميكي يتجاوب مع معطيات االستراتيجيا.النهاية
تعقد هذا النظام وتداخل عناصره الرغم من
Sustainable cities between application and strategy
Abstract :
The city as an area of interaction of various economic, social, cultural, environmental and
environmental factors sensitive to its inputs and its physical and moral outputs made it the
first or almost sole concern in the environmental degradation and disorder of environmental
systems near and far.
Hence, countries have to develop programs and strategies that seek to reduce and reduce the
impact of cities on their natural environment. These strategies depend on the concept of
D. Shorouq Naeem Jassim
Teacher
Ph.D.
Baghdad University / faculty
of Arts
Department of Geography
D. Entezar Jassem Jabor
Assistant
Ph.D.
Baghdad University / Faculty
of Arts
Department of Geography
Proceeding of the 3th Sustainable & Renewable Energy Conference
23 -24 December 2017, Baghdad-Iraq
211
sustainable development and aim at creating sustainable cities and neighborhoods
compatible with the natural environment.
Recent concepts and approaches to urban planning and management have emerged in recent
times, including Sustainable Urban Planning, Ecology and Sustainable Cities. These
concepts reflect the growing interest in urban planning and management issues under the
protection of the environment. Reduce energy consumption, optimize the use of natural
resources, rely more on renewable energy sources and strengthen social, economic and
cultural ties.
Sustainable urbanization appreciates the link between man and his environment and adopts
the idea that man is the focal point of the link between the environment, the economy and
the society. The effects of human activities on the environment have a clear economic and
social exclusion in which man is the ultimate recipient of damage. Dynamic response to the
data of the strategies despite the complexity of this system and the overlap of elements.
-: المقدمة
ان المدينة باعتبارها مجاال لتفاعل مختلف العوامل االقتصادية واالجتماعية والثقافية والبيئية ونظام بيئي حساس له مدخالته ومخرجاته . المادية والمعنوية جعل منها المهتم االول او تقريبا الوحيد في التدهور البيئي واختالل األنظمة البيئية القريبة والبعيدة منها
هذه , نا كان لزاما على الدول وضع برامج واستراتيجيات تسعى من اجل تقليص والحد من تأثير المدن على محيطها الطبيعي ومن ه .االستراتيجيات تعتمد في مضمونها على مفهوم التنمية المستدامة وتهدف الى خلق مدن وأحياء مستدامة متجانسة مع الوسط الطبيعي
السنوات االخيرة مع العديد من االختالالت االخرى الى التوجه نحو اسلوب تعمير العقالني الن اكثر من ادى االنفجار الديمغرافي في النها تمثل مجموعة وظيفية . نصف سكان العالم اصبح يعيش في المدن هذه المدن التي اصبحت بدورها تمثل المركز الحيوي القليمها
, انطالقا من هذا يمكن اعتبار المدينه نظام بيئي خاص , يسيطر عليها المستهلكون , وديناميكية من االنظمة الطبيعية واالصطناعية .تتعلق ديمومته بمدى احترام صيرورته للقوانين البيئية
ان المدينة باعتبارها مجاال لتفاعل مختلف العوامل االقتصادية واالجتماعية والثقافية والبيئية ونظام بيئي حساس له : مشكلة البحث فهل من ثمة تنمية مستدامة بالبعد الديناميكي واالستراتيجي يمكن تحقيقها انطالقا من تحقيق , دخالته ومخرجاته المادية والمعنوية م
.التنمية المستدامة على مستوى األحياء
ة مستدامة على مستوى األحياء ويمكن تحقيق تلك التنمية انطالقا من تحقيق تنمي, باإلمكان تحقيق تنمية مستدامة للمدن :فرضية البحث .
المستدامة وإمكانية تحقيقها على المدنتكمن أهمية البحث في طرحه لقضية في غاية األهمية اال وهي مناقشة مفهوم : البحث أهمية .فضال عن التطرق الى ذكر تجارب دولية بهذا الصدد مستوى أحياء المدينة
:علم البيئة الحضرية
K.G Hoyerو Naessلقد تم التعرض الى مصطلح علم البيئه الحضريه من قبل العديد من الباحثين من اهمهم دراسه تاثير االنشطة البشرية التي تضمها المدينة من المصادر الطبيعية : البيئة الحضرية بانها 2991الذين عرفا سنه
ل تشكيل نوع جديد من العمران يسمح بالمحافظة على التنوع والمحيط حيث يكون التاكيد على الشروط الالزمه من اج .البيئي البيولوجي وعلى نوعية الحياة على المستوى المحلي والعالمي من اجل االجيال القادمة
Proceeding of the 3th Sustainable & Renewable Energy Conference
23 -24 December 2017, Baghdad-Iraq
211
:وهما, ويقدم التاريخ علم البيئة الحضرية وجود تيارين مهمين يقدمان مفهوم عن البيئة الحضرية
:التيار الكالسيكي -2
وقد وضع هذا التيار القواعد االولى للمقاربة البيئية 2911تابع لمدرسة شيكاغو ظهر سنه وهولبعد االجتماعي لها اال انه تعرض الى العديد من ( دراسه السكن الحضري )للمدينة مركزا على ا
. االنتقادات النه اليتجاوز االطار الوصفي للظواهر
: التيار الحديث -1
يئة الحضرية الحديث بالتحديات البيئية للحياة الحضرية ويرتكز على مقاربة متعددة االبعاد يتعلق مصطلح البالنقل والمواصالت : واالختصاصات وتهتم بكل المواضيع التي تسمح بترقية اسلوب حياة مستدام في الوسط الحضري
جتماعية للمدينة التي يتبناها التيار اي انها في الواقع مكملة للمقاربة اال, والعمران ومحاربه كل انواع التلوث حيث ان الهدف االساسي لهذا التيار الذي ظهر في بداية سنوات التسعينات هو الوصول الى مدن مثالية ,الكالسيكي
مدن مستدامه تدمج الطبيعة في المدينة اي
: النظام البيئي الحضري
ادى االنفجار الديمغرافي في السنوات االخيرة مع العديد من االختالالت االخرى الى التوجه نحو اسلوب تعمير العقالني الن اكثر من نصف سكان العالم اصبح يعيش في المدن هذه المدن التي اصبحت بدورها تمثل المركز الحيوي
. يسيطر عليها المستهلكون , نظمة الطبيعية واالصطناعية النها تمثل مجموعة وظيفية وديناميكية من اال. القليمها
تتعلق ديمومته بمدى احترام صيرورته للقوانين , انطالقا من هذا التعريف للمدينة يمكن اعتبار المدينه نظام بيئي خاص .البيئية
ما بينها ومنه فان المدينة هي نظام بيئي اصطناعي يتهيكل مجاليا حول مستويات تنظيمية مرتبطة في
: ومنه فان النظام البيئي الحضري يتميز ب
التقليدية بالمناظر الحضرية ( او الريفية)وهذا مايعوض المناظر الطبيعية ,المدينة تتوسع بطريقة متسارعة -2 .االصطناعية الجديدة
.ة النمو الديمغرافي الحضري ناتج بالدرجه االولى عن الهجره المكثفة اكثر من الزيادة الطبيعي -1 .ويرتكز اساسا على الطاقات غير المتجددة ,استهالك الطاقه يرتفع بطريقه متزايدة ومستمرة -1 ( urbanophile.)ضعف التنوع البيولوجي الن الوسط الحضري يشجع االنواع المتأقلمه معه فقط -1يه ، وانما يتم تجميعها اعادة تدوير النفايات التتم بطريقه طبيعيه النها تتجاوز قدرة استيعاب االنظمه الطبيع -1
. او يتم اتالفها باستهالك كميه معتبره من الطاقة,في اماكن محدودة .تغير المدينه بطريقه مباشره او غير مباشره في اطار النظام البيئي للمناطق المحيطه بها -6 ( 2) ( . السياسه )يعوض بالتنظيم مصطنع يمارس من طرف مركز للتحكم , التنظيم االلي للنظام البيئي -7
والذي بدوره يتكون من ( anthropique)يتكون النظام البيئي الحضري من نظام حضري صنعه االنسان يتكون من المواد االوليه ( biologique)االنظمه االجتماعيه والهياكل والبنى ونظام بيئي طبيعي
حيث يؤثر االنسان على النظام البيئي الحضري بواسطه انشطته المستهلكه للموارد . الحيوانات والنباتات , . والمنتجه للنفايات
اي انه ايض حضري ال يختلف كثيرا عن ايض الكائنات الحيه حيث يغيب فيه دور الطبيعه في تخزين بل هي عنصر اساسي في المبادالت , اده التدوير المسخره لخدمه االنسان وانشطته الموارد او القدره على اع
اي يمكن الي انحراف صغير في التوازن ان يؤدي بالكل الى كارثه كما ان ,التي يضمها هذا النظام المعقد جانس خالل يضمن الت....( دورة الطاقة ,دورة الماء ) االنظمه البيئيه الحضرية تعمل على شكل ايض حلقي
.عمل النظام البيئي الحضري
Proceeding of the 3th Sustainable & Renewable Energy Conference
23 -24 December 2017, Baghdad-Iraq
211
وفي هذا االطار ومن اجل تحقيق استدامه النظام البيئي الحضري يجب ان تكون هذه التدفقات محدودة ، لكي تتمكن المصادر الطبيعيه من التجدد بهذا يلحق اضرار بالنظام البيئي الطبيعي كما يجب االخذ بعين االعتبار
بالمحافظه على مستوى ثابت من خالل تحقيق توازن , ق توازن االيض الحضري خالل بناء المدينه تحقيديناميكي بين تدفقات المصادر المستهلكه وكميه النفايات التي يمكن اتالفها طبيعيا دون اللجوء الى اقاليم
( 1. )اخرى بغيه االستفاده اكثر من المصادر الطبيعيه وعدم نقل مشاكل نظام بيئي الى اخر :يسمح المقطع البيئي باعداد حيث
، ( تنهوع بيولهوجي ومصهادر طبيعيهه , ارض , ههواء , مهاء )تشخيص بيئي يصف حاله العناصر البيئيهه -2وحاله الضغوطات الناتجه عن االنشطه البشريه وحالهه االسهتجابات التهي جهاءت بهها السياسهات العموميهه
والتي يمكن جمعهها فهي , يه استراتجيات التنمية وهذا التشخيص يسمح بتحديد التحديات القادره على توج, . والمخاطر الطبيعيه , المصادر الطبيعيه , االرث الطبيعي : ثالث مواضيع
تحليههل امكانههات وحههدود التنميههه االقتصههاديه واالجتماعيههه لالقلههيم بهههدف تثمههين االمكانههات البيئيههه لالقلههيم -1مههن خهالل اقتهراو حلههول مصهححه او مؤديهه الههى والعمهل فهي نفههس الوقهت علهى تقلههيص معوقهات التنميهه
تطهوير نشهاط اقتصهادي يتمحهور حهول تثمهين المصهادر المحليهه والمتجهدده لالقلهيم : جوانب بيئيهه مهؤثره .كتثمين المناظر الطبيعيه لالقليم
ن النههه يرتكههز حههول المشههاركه الفعالههه لمختلههف الفههاعلين البيئيههي, كمهها يعتبههر المقطههع البيئههي اداة للحههوار -1يوفر المعلومات المطلوبه التي سوف تمثل فيما بعد القاعده االساسهيه التخهاذ , االجتماعيين واالقتصاديين
قرارات وتطبيق اجهراءات المشهاريع الحضهرية واالقليميهه اي انهه اداه ضهروريه مهن اجهل اعهداد انجهاز ، حيههث تعتبههر البصههمة ومتابعههه المشههاريع الحضههريه واالدوات التخطيطيههة وادوات البرمجههة الحضههرية
يعتبهر المقطهع البيئهي وكمها . البيئية من اهم المؤشرات التي تؤخذ بعين االعتبار عند تقيهيم المقطهع البيئهي يئيهين االجتمهاعيين واالقتصهاديين والنه يرتكز حول المشهاركه الفعالهه لمختلهف الفهاعلين الب, اداة للحوار
ما بعهد القاعهده االساسهيه التخهاذ قهرارات وتطبيهق اجهراءات يوفر المعلومات المطلوبه التي سوف تمثل في ( 1( )1) المشاريع الحضرية واالقليميه
، ( المههدى الطويههل والمتوسههط )االسههتراتيجيه : ان الحاجههة الههى اسههتدامه النظههام البيئههي تههدمج مفههاهيم التخطههيط الزمنههي االنتخابيهه يتعلهق االول والثهاني بمهدة العههدة ، حيهث (المهدى المتوسهط والقصهير)والوظيفيهة ( المدى القصهير )التكتيكيه
وتفرض تجانس مجالي وزمني بين ادوات التهئية واهداف التنميه المسهتدامه ، حيهث ان الهربط بهين ههذه االبعهاد الزمنيهه الثالثه يواجه العديد من المشاكل عند التطبيق خاصه فيما يتعلهق بهالفرق بهين مرونهه االقتراحهات االسهتراتيجيه وصهالبه
فهي اطهار اليونسهكو 2911لم يظههر مصهطلح المهدن المسهتدامه حتهى سهنة , والوظيفية يه االجراءات والقوانين التكتيكوالمتعلههق بالبيئههه الحضههرية وبعههد مههؤتمر ريوديجههانيرو اهتمههت العديههد مههن بههرامج التههدخل ( MAP)االنسههان والطبيعههه
. ذا الموضوع انعقدت القمه الثانيه للمدن والسكن وتناولت بحكمه ه 2996الخاصة بهذا الموضوع وفي سنة
في ستوكهولم المدينه فاعل سياسي مهم ومؤثر يهأوي اكثهر مهن نصهف سهكان 2971فمنذ اول ملتقى بيئي لالمم المتحده العالم واسند اليه مهمة معالجة العديد من المشاكل الشامله ، فالعديد من االتفاقات الدولية التي تمهت المصهادقة عليهها فهي
ه اليمكن تطبيق مفهوم التنمية المستدامه بصورة شاملة ، وانه من الضهروري توجيهه جهزء مؤتمر ريوديجانيرو اثبتت انمن الجهود المؤسساتيه نحو البعد المحلي مهن اجهل الهتمكن مهن تجسهيد مقاربهة التنميهه المسهتدامه ومهن ترسهيخ متطلبهات
مناسههبه جههدا مههن اجههل اشههتراك الفههاعلين التنميههه المسههتدامه فههي قلههب االشههكالية االقليميههه ومنههه فههان المدينههه تعتبههر درجههه . المحليين والسكان ، وتجسيد اجراءات الديمقراطية والسماو ومنح المجتمع المدني مفهوم التنميه المستدامه
حيث انه من الممكن مالحظة تحول اشكالية التنمية المستدامه نحو الميهدان الحضهري فالعديهد مهن البهاحثين والمؤسسهات منعطهف 2991لمسهتدامة فقهد سهجلت سهنه ة االوربيه اصدرت العديد مهن المؤلفهات حهول المهدن اواللجن OCDEمثل
( 1) حضري للتنمية المستدامه بشكل علمي قابل للتطبيقالمهم نحو االدراك االقليمي و

Proceeding of the 3th Sustainable & Renewable Energy Conference
23 -24 December 2017, Baghdad-Iraq
216
-: مفهوم المدينة المستدامة
المسهتدامة والعمهران البيئهي، وتعمهل مهن اجهل يمكن تعريف المدينة المستدامة بانها المدينهة التهي تحتهرم مبهاديء التنميهةتسهيل اساليب العمل والتنقل ، ومن اجل تفعيل استهالك الطاقات المتجهددة، وههي فهي غالهب االحيهان عبهارة عهن تجمهع
المحليهة 12من االحياء البيئية التي تهدف الى تقليص بصمتها البيئية، اما طريقة الحكم فيها ترتكز اساسها علهى االجنهدة : ، حيث نجد ان المدينة المستدامة ( 6) لخاصة بها والتي تعتمد على ديمقراطية المشاركةا
فهي فرنسها، lanacy SACHSوDavid MORRIS وههي فرضهية جهاء بهها االقتصهاديين:المدينهة المكتفيهة ذاتيها*حيههث ان التطههور المكتفههي ذاتيهها هههو التطههور الههذي يقههوي القههدرة علههى التلبيههة المحليههة لالحتياجههات االساسههية، وتسههتعمل
البصمة البيئية على مستوى المدينة من اجل توضيح هذه الفرضية
ة ههي المدينهة التهي تسهتطيع المدينة الناجحهة علهى مسهتوى مخطهط تنميتهها المسهتدام:المدينة التي ال تستورد ثمن تنميتها*تحقيق اهداف سكانها ومؤسساتها دون ان يكون ثمن ذلك على حساب منطقة اخرى، وهي شكل من اشكال المدينهة التهي
(.الذي يضم حتى االرياف القريبة)تحترم االقليم الذي يضمها
موسع لمفهوم البيئية ، فالمدينة المستدامة اي دمج البعد االجتماعي الثقافي من خالل االدراك ال:المدينة النشطة اقتصاديا*هي المدينة التي يساهم فيها السكان واالنشطة االقتصادية باستمرار في تحسين محيطهم الطبيعي، والمبني والثقافي على
.المستوى الجواري وعلى المستوى الجهوي، فالكل يعمل من اجل تحقيق هدف تنمية مستدامة شاملة
ان المشههكل : " 2003وهههي معروفههة فههي ميثههاق اثينهها مههن طههرف المبعههوث االوربههي فههي نههوفمبر : ةالمدينههة المتجانسهه* االساسي في المدن اليوم هو غياب التجانس ، ليس فقط من الناحية الفيزيائية ، ولكن ايضا من حيث اسهتمرارية التطهور
، ومنه فالمدينهة المتجانسهة ههي المدينهة التهي ( 7)" الزمني ، وهذا ما اثر على الهياكل االجتماعية واالختالفات الثقافية تضمن
الحكم الراشد، الحفاظ على الثقافهة والهويهة، التجهانس بهين االجيهال ، وسياسهات النقهل المدمجهة، )التجانس االجتماعي _ (وتوفير التجهيزات والخدمات المرنة، وتحقيق التوازن بين المنفعة العامة والمنفعة الشخصية
االقتصهادي الهذي يمكهن تحقيقهه مهن خهالل دمهج المهدن فهي العهوالم وفهي نفهس الوقهت الحفهاظ علهى اقتصهاد والتجانس _ .مختلف
.والتجانس البيئي والذي يمكن تحقيقه من خالل تسيير الموارد، والحماية الصحية ،وحماية التراث_
دف تصحيح االختالالت المجاليهة بهين والتجانس المجالي بين مختلف االنشطة الحضرية وانعاش التركبية الحضرية به_ .مختلف اجزاء المدينة
كما ان المدينة المستدامة هي مدينة متضامنة ومتكافلة ، تعمل علهى دمهج كهل فئهات المجتمهع فهي تسهيير شهؤون المدينهة (1) ن والتجار ، والحرفيين والمؤسساتسواء السكان ،ومراكز البحث والمستهلكي
:، تتميز بـ األوجهالمستدامة هي مدن متعددة ذلك ، فان المدن فضال عن
اين تسود العدالة ، والتغذية ، والتعليم ، واالمل في الحيهاة بصهورة عادلهة ، ويمكهن الجميهع مهن المشهاركة فهي : عادلة _ .الحكم
.اين يحرك االنفتاو والتجربة امكانات المصادر البشرية ، وتسمح بتجاوب سريع مع المتغيرات: خالقة _
تعمل على التقليل من اثرها على المحهيط الطبيعهي ، ايهن نجهد التهوازن بهين المحهيط المبنهي والمنظهر الطبيعهي ، : ئيةبي_ .وتكون المباني والهياكل القاعدية فعالة وعملية في استعمالها للموارد الطبيعية
تبهههادل المعلومهههات مباشهههرة ايهههن يهههدعم القطهههاع العمهههومي االحسهههاس بالمشهههاركة والشهههراكة ، ويهههتم : سههههلة الوصهههول _ .والكترونيا

Proceeding of the 3th Sustainable & Renewable Energy Conference
23 -24 December 2017, Baghdad-Iraq
217
تعمهل علهى حمايهة الريهف و المحافظهة عليهه، وعلهى جمهع وادمهات الجماعهات المحليهة فهي : متراصة ومتعددة المراكز_ .االحياء وتفعيل مبدأ الجوارية
.عموميهة مهمهةتضم مجموعة متنوعة من االنشطة ، تخلق حيوية وحركية فهي المدينهة ،تعطهي للمدينهة حيهاة : متنوعة_(9)
ومنه فان للمدينة المستدامة هي المدينة التي تحترم مباديء التنمية المسهتدامة، فههي نظهام دينهاميكي معقهد ومتجهاوب مهع المتغيرات، يبحث عن االخذ بعين االعتبار وفي نفس الوقت التحديات االجتماعية واالقتصادية والبيئية والثقافية للعمران
الن التنمية المستدامة هي تحول ثقافي في عميق ضروري من اجل مواجههة التحهديات البيئيهة، وفهي وبمشاركة السكان، ميدان صناعة المدينة هو الحكم العادل الذي يدمج كل الفاعلين الحضريين في المسؤولية البيئية التضامنية ، الن المدينهة
إلى غاية اليوم ال توجد مدن تهم تحويلهها الهى مهدن مسهتدامة ، ف.المستدامة هي مدينة العدالة االجتماعية واالقليمية نظريا .بل كل التجارب العالمية المتعلقة بالمدن المستدامة تخص مدن جديدة تم انشاؤها من العدم من اجل ان تكون مستدامة
:مبادئ المدن المستدامة
:دامة ، هي مبادء اساسيات المست 21فإنه يوجد WWFتبعا لتوجيهات المنظمة العالمية
وذلك باالستعمال االمثل للطاقات واستعمال الطاقات المتجددة مهن اجهل تقلهيص انبعاثهات غهاز الدفيئهة ، : صفر كريون - .1121وتحقيق بنايات وتجهيزات بنسبة صفر من الكربون بحلول سنة
او اسهتعمالها كأسهمدة ( الرسكلة)من النفايات خالل اعادة التدوير % 11يجب على االقل اعادة استعمال : صفر نفايات -.
تقلههيص عههدد المركبههات التههي تسههتعمل المحروقههات ، حيههث يجههب ان يتههوفر خههط للنقههل الجمههاعي لكههل : التنقههل المسههتدام - .دقيقة قرب الخدمات والمناطق التجارية 21او 21متر، يكون التوقف كل 111التنقالت التي تزيد عن
فهي جد مالئمة ولها تأثير جدا محدود أثناء نقلها واسهتعمالها ، ههي مهواد قابلهة العهادة :المواد االولية محلية ومستدامة - % .11، وتنتج محليا على االقل % 11التدوير على االقل بنسبة
تشجيع التغذية انطالقا من المواد االوليهة والصهحية ، حيهث ان الههدف المسهطر الهى غايهة : التغذية المحلية والمستدامة - .كلم 211من المواد الغذائية تباع في مكان انتاجها الذي ال يتعدى % 11هو 1111سنة
.ترقية االهتمام بالمحافظة على كمية ونوعية الماء : التسيير المستدام للماء -
.المحافظة ، وخلق وتثمين التنوع البيئي والمسكن الطبيعي : المسكن الطبيعي والتنوع البيئي -
تنمية االحساس باالنتماء مهن خهالل تثمهين االرث الثقهافي والتنميهة الثقافيهة المحليهة ، وتطهوير : محلي الثقافة والتراث ال-في التراث التاريخي ( . االشكال الحضرية ، وتصميم المباني والفضاءات العمومية )استراتيجية لترسيخ الهوية المحلية
.الثقافي والجمالي الحالي
مهن % 11ترقيهة العدالهة االجتماعيهة والتنميهة االقتصهادية المحليهة ، مهثال علهى االقهل : ة االنصاف والتنميهة االقتصهادي- .السكنات تكون اجتماعية
تحسهين الشهروط الصهحية وشهروط الرفاهيهة للمسهتعملين والسهكان وعمهال البنايهات ، وترقيهة : نوعية الحياة والرفاهية - .المشاورة والمشاركة مع السكان

Proceeding of the 3th Sustainable & Renewable Energy Conference
23 -24 December 2017, Baghdad-Iraq
211
:تحقيق االستدامة في المدن استراتيجيات
:يمكن تصنيف برامج خلق مدن مستدامة الى كل من البرامج التالية
المحافظة على البيئة الطبيعية بما فيها المحافظة على الطاقهة والقياسهات للسهيطرة علهى المهواد السهامة وعلهى الملوثهات - ....التي تؤثر على الماء والهواء
نية واطالة عمرها بتحسين متانتها وصهيانتها كصهيانة الطهرق والمركبهات ، اضهافة الهى اعهادة المحافظة على البيئة المب- .االستخدام كبناء الحطام او االنقاض
اعادة تشكيل البيئة المبنية لتحسين الضغط الذي يقع على البيئة الطبيعية بما فيها كل من قرارات اسهتعماالت االراضهي - :تتلخص سياسات تحقيق استدامة المدن في كل من في حين . والمواصالت الحضرية
استبدال معدل المدفوعات للخدمات البلدية بمدفوعات تتناسب وموقع الخدمة ، فالذين يكونون في مواقهع خهدمات عاليهة - .يدفعوا اكثر من الذين يسكنون في اماكن ذات خدمات اقل كلفة
.ائية واالعفاء من قيمة التحسينات لتشجيع زيادة الكثافة فرض ضرائب فردية على االرض تعتمد على قيمتها الشر-
.النظر الى الفضالت كمصدر وتحويل مشكلة القمامة الى صناعات تحويلية
:كما يمكن اقتراو عدد من االستراتيجيات المتعلقة بتحقيق استدامة مدن القرن الواحد والعشرين
.وطلبات السكان المستقبليين ان تلبي منتجات المدينة طلبات السكان الخاصة -
.انتهات المشاركة والتعاون لحل المشاكل -
.اعادة تشكيل اجزاء المجتمع الموجودة لتواكب التغير في االعمال واالحتياجات السكنية -
.توفير البدائل ليجد السكان خيارات اوسع في طرق السفر واالتصال وتوجيه الخدمات -
ة بحيههث يكههون التنههوع مصههدر قههوة ولههيس مصههدر تنههاقض ، عههن طريههق اعههادة تشههكيل تلبيههة مصههالح السههكان المتنوعهه-المجههاورات ومنههاطق االعمههال حتههى تتوافههق ومتطلبههات السههوق ، واقنههاعهم ان المههدن يمكنههها ان تحههافظ علههى صههحتهم
االبقهاء علهى ورغباتهم ، وبهذه الطريقة يمكن التقليل من الضهغط فهي المنهاطق والتوسهع للخهارت ، كمها انهه مهن الممكهن (21. )الفراغات المفتوحة والزراعة وتقليل التكاليف االقليمية للبنية التحتية والخدمات العامة
.وحدة بناء المدن المستدامة : البيئية المستدامة األحياء
يههههتم حاليهههها اسههههتعمال هههههذة المصههههطلحات بكثههههرة رغههههم ان اول تعريههههف رسههههمي لهههههذة االحيههههاء لههههم يظهههههر اال سههههنة األحيههههاءن بههههأ MEDDTLالفرنسههههية والتنميههههة المسههههتدامة االقليميههههة والمحليههههةمههههن طههههرف وزارة البيئيههههة 2011
البيئيهههة ههههي التنميهههة المسهههتدامة لشحيهههاء التهههي تشهههمل االعتبهههارات المتعلقهههة بالنقهههل ، وبالكثافهههة واالشهههكال العمرانيهههة ، بمشههههاركة المجتمههههع المههههدني ، هههههذا ولههههوظيفي والبيانههههات البيئيههههة ، ولكههههن المتعلقههههة خاصههههة بالههههدمج االجتمههههاعي وا
فهههي سههنوات التسههعينات اصهههبح اليههوم مركههز االهتمهههام المختصههين المقيههاس مههن االقلههيم الهههذي لههم يكههن يجهههذب اهتمههام ( 22) .لكل المهتمين بالعمران واالستدامة
الوظههههائف وهههههو وحههههدة هيكلههههة للمجههههال الحضههههري ايههههن تهههههيمن الوظيفههههة السههههكنية بالنسههههبة لبههههاقي : تعريففففح الحففففي . والخدميةواالنشطة االخرى خاصة االنشطة االنتاجية
سهههاكن ، حسهههب مسهههتوى 61111- 11موعهههة مهههن السهههكان يتهههراوو حجهههم بهههين ويمكهههن لههههذة الوحهههدة ان تضهههم مجالحهههي ، كمههها ان مفههههوم( وحهههدة جواريهههه تجمهههع للمسهههاكن او )التجهيهههزات التهههي يضهههمها ومبهههادى تنظهههيم المسهههاكن
اجتماعيهههة محهههددة تشهههكلت فهههي اطهههار مجهههالي ومبنهههي يتميهههز بأحهههداث تاريخيهههة وثقافيهههة ينطبهههق ايضههها علهههى حقيقيهههة ( 21) .مشتركة وبخصائص موضعية خاصة توضح وتؤكد هوية االماكن والعناصر المكونة لها

Proceeding of the 3th Sustainable & Renewable Energy Conference
23 -24 December 2017, Baghdad-Iraq
219
او تجديهههدها وفهههق مقاربهههة بيئيهههة إنشهههاؤهاتهههم أحيهههاءالبيئيهههة ههههي األحيهههاءان : البيئيفففة او المسفففتدامة األحيفففاء تعريفففحوبالنوعيهههة البيئيهههة للمبهههاني ، حيهههث ان ههههذة " األحيهههاءاو المسهههاحات الخضهههراء فهههي " ، خاصهههة بالجانهههب الجمهههالي
المقاربهههة البيئيهههة علهههى مسهههتوى االحيهههاء ههههي حديثهههة نهههوع ظههههرت مهههوازاة مهههه ظههههور النوعيهههة الرفيعهههة للبنايهههات HQE ح بإعهههادة تثمهههين صهههورة االحيهههاء والمسهههاكن االجتماعيهههة التهههي تعهههاني فههههي تعتبهههر احيهههاء مثاليهههة حيهههث تسهههم
.صعوبات ، او التي تعاني من التلوث
هههذة الصههورة المثمنههة تههم اسههتعمالها سههابقا فههي المواقههع الصههناعية التههي تعههاني مههن التلههوث ، حيههث سههميت باإلحيههاء أنهههة السهههكان مهههن حيهههث اعطهههاء صهههورة البيئيهههة مهههن اجهههل التركيهههز علهههى االنقطهههاع مهههن التوجههههات السهههابقة ، وطم
.ايجابية لهذة االحياء الجديدة
ومنههههه فههههان االحيههههاء البيئيههههة او االحيههههاء المسههههتدامة هههههي مصههههطلحات تههههدل علههههة نفههههس الشههههيء ، اال ان مصههههطلح االحيهههاء البيئيهههة احهههدث ، وههههي تتمتهههع عمومههها بالنوعيهههة االجتماعيهههة ، والتشهههاركية ، واالقتصهههادية والبيئيهههة ، حيهههث
الحكههم علههى المههدى الطويههل حههول مشههروع مشههترك بههين الفههاعلين ، يتههوفر فيههه االدمههات والتلههوث االجتمههاعي يكههون العقهههار ، واالحتجاجهههات : العمرانهههي والهههوظيفي ، وتتوافهههق فيهههه ازمنهههة التركيهههب االجتمهههاعي واالقتصهههادي لبهههرامج
ل النهههاعم ، الكثافهههة العادلهههة ، اخهههذ بعهههين التنقههه)، النتهههائج البيئيهههة ..، االنعكاسهههات ، واالقتصهههاد المحلهههي ، والتغييهههر ...وثة والمتقهقرةلمالتدخل ، واعادة فتح المناطق ال االعتبار الطبيعة التنوع البيئي اثناء
ملهههف 400حهههوالي 1122حيهههث يمثهههل ههههذا التوجهههه فهههي فرنسههها طمهههوو كهههل المنتخبهههين المحلهههين ، ففهههي سهههنة ال يتجهههزأ مهههن طمهههوو اي دولهههة فهههي تحقيهههق ، اي انهههه جهههزءلهههى مسهههتوى الهههوزارة لشحيهههاء المسهههتدامة تهههم طرحهههها ع
.االستدامة الحضرية
بههههالترابط ، تسههههتجيب الههههى مبههههدأ وحيههههاء المسههههتدامة هههههي عبهههارة عههههن اقطههههاب عمرانيههههة ، تتميههههز بالكثافهههة ومنهههه فاالكمههها ان خلهههق .االسهههتدامة مهههن حيهههث النوعيهههة العامهههة ، ولكهههل واحهههد منهههها خصهههائص ينفهههرد بهههها عهههن بهههاقي االحيهههاء
االحيهههاء المسهههتدامة ال يمثهههل سهههوى مرحلهههة مهههن مراحهههل التوجهههه نحهههو المهههدن المسهههتدامة ، النهههه عبهههارة عهههن برنهههامج للتهههدريب مهههن اجهههل اختبهههار المبهههاد والتوجههههات قبهههل تعميمهههها علهههى بهههاقي االجهههزاء المتواجهههدة او قبهههل خلهههق المدينهههة
.المستدامة
-:المستدامة األحياءخصائص
فهنههاك بعههض الخصههائص المشههتركة األحيههاءالمسههتدامة يتميههز بخصههائص عههن بههاقي يههاءاألحاذا كههان كههل حههي مههن .التي تجمع بينها
يتطلهههب انشهههاء االحيهههاء المسهههتدامة الهههتحكم المتهههرابط فهههي : والهههدمج الهههوظيفي والتنقهههل المسهههتدام , الكثافهههة -فر مواقهههف التعميهههر والتنقهههل ، اي تجسهههيد حهههي كثيهههف ومهههد مجهههه وظيفيههها ، ايهههن تسهههمح الجواريهههة مهههع تهههو
النقههل الجمههاعي بتحقيههق تههنقالت مسههتدامة ، حيههث نجههد فههي نفههس الحههي منطقههة سههكينة ، ومنطقههة لشنشههطة وللخهههدمات الجواريهههة مههها يحقهههق التهههوازن بهههين المجهههاالت المبنيهههة ويجنهههب مهههن القطاعهههات احاديهههة الوظيفهههة ،
التههههي تضههههمن ( جات ممههههرات الههههراجلين والههههدرا)اذ يههههتم الههههربط بههههين هههههذه الوظههههائف بههههالتنقالت الناعمههههة .ايضا االتصال مع باقي االحياء
ان انجههههاز االحيههههاء المسههههتدامة يكههههون بطريقههههة تعمههههل علههههى التقلههههيص مههههن : النوعيههههة الرفيعههههة للمحههههيط -، وعلههههههى (االرض ، والطاقههههههة ، والمههههههاء ، التنههههههوع البيولههههههوجي )اسههههههتهالك المصههههههادر غيههههههر المتجههههههددة
ن خهههههالل اختيهههههار االسهههههتراتيجيات المعماريهههههة التقلهههههيص مهههههن البصهههههمة البيئيهههههة ، ويهههههتم تحقيهههههق ههههههذا مههههه،باإلضههههافة الههههى تحليههههل دورة حيههههاة ( تجهيههههزات واالت)البيومناخيههههة ، والمعههههدات التكنولوجيههههة المناسههههبة
(.السكان)البنايات وتحسيس المستعمل
مهههن خهههالل تجسهههيد الشهههروط المهههؤطرة التهههي تشهههجع الخلهههط : االدمهههات بهههين االجيهههال واالدمهههات االجتمهههاعي -عي والخلههههط بههههين االجيههههال ، حيههههث ان الحيههههاة المفعمههههة فههههي الحههههي هههههي التههههي تسههههمح بالتبههههادالت االجتمهههها
النوعيهههة بهههين السهههكان ، ويمكهههن تحقيهههق ذلهههك مهههثال مهههن خهههالل االدمهههات بهههين المسهههاكن مهههن حيهههاء االبعهههاد ..(.طلبة ، عائالت)واالنواع نا يجعلها مقصدا لجمهور اكبر
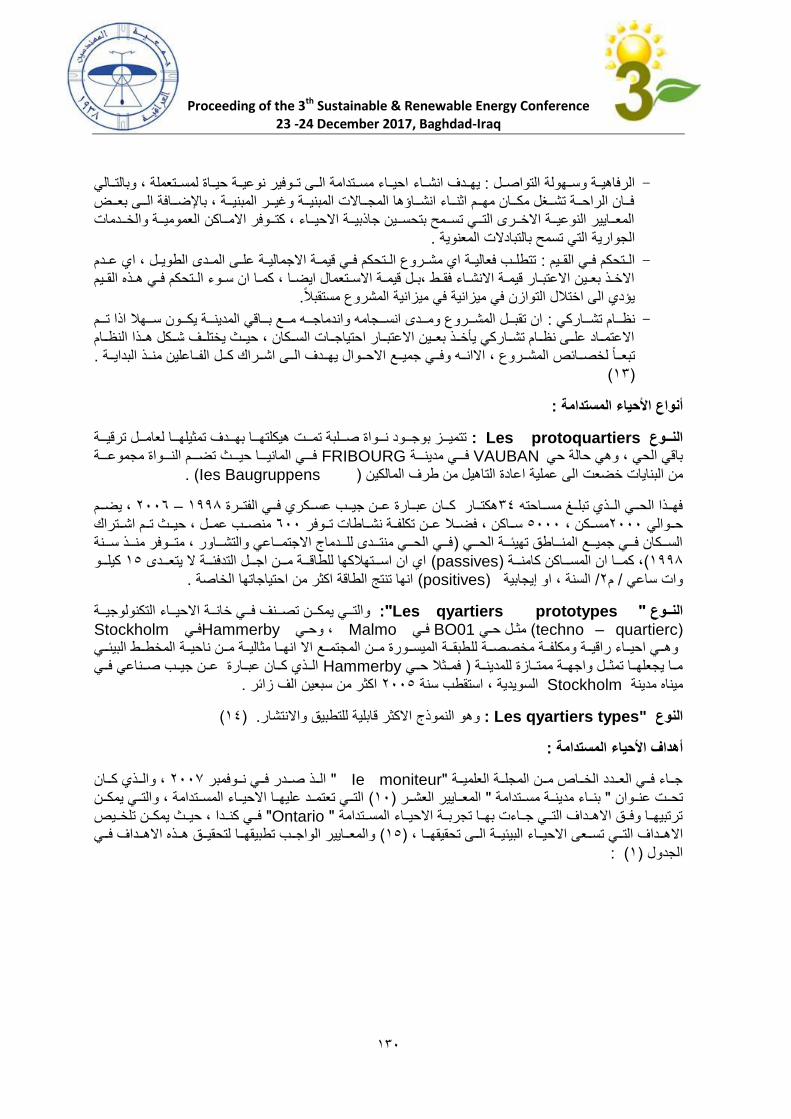
Proceeding of the 3th Sustainable & Renewable Energy Conference
23 -24 December 2017, Baghdad-Iraq
211
احيهههاء مسهههتدامة الهههى تههوفير نوعيهههة حيهههاة لمسهههتعملة ، وبالتهههالي يههههدف انشههاء: الرفاهيههة وسههههولة التواصهههل -فهههان الراحهههة تشهههغل مكهههان مههههم اثنهههاء انشهههاؤها المجهههاالت المبنيهههة وغيهههر المبنيهههة ، باإلضهههافة الهههى بعهههض المعهههايير النوعيهههة االخهههرى التهههي تسهههمح بتحسهههين جاذبيهههة االحيهههاء ، كتهههوفر االمهههاكن العموميهههة والخهههدمات
.تبادالت المعنوية الجوارية التي تسمح بال
تتطلههب فعاليههة اي مشههروع الههتحكم فههي قيمههة االجماليههة علههى المههدى الطويههل ، اي عههدم : الههتحكم فههي القههيم -االخههذ بعههين االعتبههار قيمههة االنشههاء فقههط ،بههل قيمههة االسههتعمال ايضهها ، كمهها ان سههوء الههتحكم فههي هههذه القههيم
.ع مستقبال يؤدي الى اختالل التوازن في ميزانية في ميزانية المشرو
ان تقبهههل المشهههروع ومهههدى انسهههجامه واندماجهههه مهههع بهههاقي المدينهههة يكهههون سههههال اذا تهههم : نظهههام تشهههاركي -االعتمهههاد علهههى نظهههام تشهههاركي يأخهههذ بعهههين االعتبهههار احتياجهههات السهههكان ، حيهههث يختلهههف شهههكل ههههذا النظهههام
.الفهههاعلين منهههذ البدايهههة تبعههها لخصهههائص المشهههروع ، االانهههه وفهههي جميهههع االحهههوال يههههدف الهههى اشهههراك كهههل (21 )
:المستدامة األحياء أنواع
تتميهههز بوجهههود نهههواة صهههلبة تمهههت هيكلتهههها بههههدف تمثيلهههها لعامهههل ترقيهههة : Les protoquartiersالنفففوع فههههي المانيهههها حيههههث تضههههم النههههواة مجموعههههة FRIBOURGفههههي مدينههههة VAUBAN باقي الحي ، وهي حالة حي
( .Ies Baugruppens) الى عملية اعادة التاهيل من طرف المالكين خضعتمن البنايات
، يضهههم 1116 – 2991هكتهههار كهههان عبهههارة عهههن جيهههب عسهههكري فهههي الفتهههرة 11فههههذا الحهههي الهههذي تبلههه مسهههاحته منصهههب عمهههل ، حيهههث تهههم اشهههتراك 611تكلفهههة نشهههاطات تهههوفر فضهههال عهههنسهههاكن ، 1111مسهههكن ، 1111حهههوالي
فهههي الحهههي منتهههدى للهههدمات االجتمهههاعي والتشهههاور ، متهههوفر منهههذ سهههنة )السهههكان فهههي جميهههع المنهههاطق تهيئهههة الحهههي كيلههههو 21اي ان اسههههتهالكها للطاقههههة مههههن اجههههل التدفئههههة ال يتعههههدى ( passives)، كمههها ان المسههههاكن كامنههههة (2991
.انها تنتج الطاقة اكثر من احتياجاتها الخاصة ( positives)او إيجابية السنة ، / 1م/ وات ساعي
والتهههي يمكهههن تصهههنف فهههي خانهههة االحيهههاء التكنولوجيهههة :" Les qyartiers prototypes" النفففوع (techno – quartierc ) مثههل حههيBO01 فههي Malmo وحههي ،Hammerby فههيStockholm طبقهههة الميسهههورة مهههن المجتمهههع اال انهههها مثاليهههة مهههن ناحيهههة المخطهههط البيئهههي وههههي احيهههاء راقيهههة ومكلفهههة مخصصهههة لل
الهههذي كهههان عبهههارة عهههن جيهههب صهههناعي فهههي Hammerbyفمهههثال حهههي ) مههها يجعلهههها تمثهههل واجههههة ممتهههازة للمدينهههة .اكثر من سبعين الف زائر 1111السويدية ، استقطب سنة Stockholmميناه مدينة
(21. )الكثر قابلية للتطبيق واالنتشاروهو النموذت ا : "Les qyartiers typesالنوع
:المستدامة األحياء أهداح
، والهههذي كهههان 1117الهههذ صهههدر فهههي نهههوفمبر " Ie moniteur "جهههاء فهههي العهههدد الخهههاص مهههن المجلهههة العلميهههة التهههي تعتمهههد عليهههها االحيهههاء المسهههتدامة ، والتهههي يمكهههن ( 21)المعهههايير العشهههر " بنهههاء مدينهههة مسهههتدامة " تحهههت عنهههوان
تلخهههيصفهههي كنهههدا ، حيهههث يمكهههن " Ontario" ترتبيهههها وفهههق االههههداف التهههي جهههاءت بهههها تجربهههة االحيهههاء المسهههتدامة لتحقيهههق ههههذه االههههداف فهههي والمعهههايير الواجهههب تطبيقهههها (21) ء البيئيهههة الهههى تحقيقهههها ،ههههداف التهههي تسهههعى االحيهههاالا
: (2)الجدول
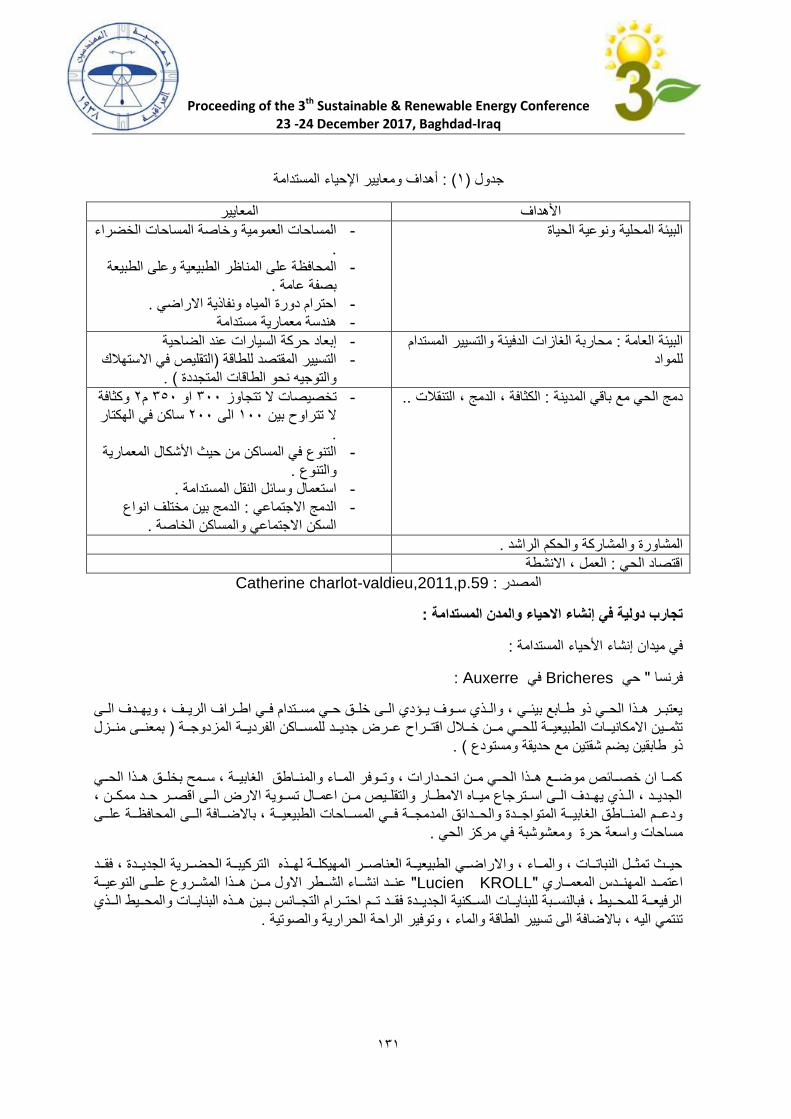
Proceeding of the 3th Sustainable & Renewable Energy Conference
23 -24 December 2017, Baghdad-Iraq
212
المستدامة اإلحياءومعايير أهداف( : 2)جدول
المعايير األهداف
المساحات العمومية وخاصة المساحات الخضراء - البيئة المحلية ونوعية الحياة.
الطبيعية وعلى الطبيعة المحافظة على المناظر - .بصفة عامة
.احترام دورة المياه ونفاذية االراضي - هندسة معمارية مستدامة -
محاربة الغازات الدفيئة والتسيير المستدام : البيئة العامة للمواد
حركة السيارات عند الضاحية إبعاد -التقليص في االستهالك )التسيير المقتصد للطاقة -
( .المتجددة والتوجيه نحو الطاقات
وكثافة 1م 111او 111ال تتجاوز تخصيصات - ..الكثافة ، الدمج ، التنقالت : دمج الحي مع باقي المدينة كتار هساكن في ال 111الى 211ال تتراوو بين
. المعمارية األشكالالتنوع في المساكن من حيث -
.والتنوع .استعمال وسائل النقل المستدامة -الدمج بين مختلف انواع : الدمج االجتماعي -
.السكن االجتماعي والمساكن الخاصة
.المشاورة والمشاركة والحكم الراشد
العمل ، االنشطة: اقتصاد الحي
Catherine charlot-valdieu,2011,p.59: المصدر
:تجارب دولية في إنشاء االحياء والمدن المستدامة
:المستدامة األحياءفي ميدان إنشاء
: Auxerreفي Bricheresحي " فرنسا
يعتبههر هههذا الحههي ذو طههابع بيئههي ، والههذي سههوف يههؤدي الههى خلههق حههي مسههتدام فههي اطههراف الريههف ، ويهههدف الههى بمعنهههى منهههزل ) جديهههد للمسهههاكن الفرديهههة المزدوجهههة عهههرض تثمهههين االمكانيهههات الطبيعيهههة للحهههي مهههن خهههالل اقتهههراو
( .ومستودع حديقة ذو طابقين يضم شقتين مع
كمههها ان خصهههائص موضهههع ههههذا الحهههي مهههن انحهههدارات ، وتهههوفر المهههاء والمنهههاطق الغابيهههة ، سهههمح بخلهههق ههههذا الحهههي الجديههد ، الههذي يهههدف الههى اسههترجاع ميههاه االمطههار والتقلههيص مههن اعمههال تسههوية االرض الههى اقصههر حههد ممكههن ،
، باالضهههافة الهههى المحافظهههة علهههى ودعهههم المنهههاطق الغابيهههة المتواجهههدة والحهههدائق المدمجهههة فهههي المسهههاحات الطبيعيهههة .مساحات واسعة حرة ومعشوشبة في مركز الحي
حيهههث تمثهههل النباتهههات ، والمهههاء ، واالراضهههي الطبيعيهههة العناصهههر المهيكلهههة لههههذه التركيبهههة الحضهههرية الجديهههدة ، فقهههد يهههة عنهههد انشهههاء الشهههطر االول مهههن ههههذا المشهههروع علهههى النوع" Lucien KROLL"اعتمهههد المهنهههدس المعمهههاري
الرفيعهههة للمحهههيط ، فبالنسهههبة للبنايهههات السهههكنية الجديهههدة فقهههد تهههم احتهههرام التجهههانس بهههين ههههذه البنايهههات والمحهههيط الهههذي .تنتمي اليه ، باالضافة الى تسيير الطاقة والماء ، وتوفير الراحة الحرارية والصوتية

Proceeding of the 3th Sustainable & Renewable Energy Conference
23 -24 December 2017, Baghdad-Iraq
211
" :Malmoفي BO01حي " في السويد
ي المنطقههة السههاحلية للمدينههة ، تههم انشههاؤه مههن اجههل اعههادة بعههث الديناميكيههة يقههع هههذا الحههي ذو الطههابع التكنولههوجي فههاالقتصهههادية المحليهههة ، التهههي تهههأثرت نتيجهههة لمقهههر انشهههطة الورشهههات البحريهههة والصهههناعة النسهههيجية بالمنطقهههة ، ودعهههم
.Copenhagueبمدينة Malmoالذي يربط مدينة Oresundهذا الحي بجسر
، وقهههد انتههههت بهههه االعمهههال 1112فهههي اطهههار المعهههرض االوروبهههي للمدينهههة سهههنة حيهههث ان ههههذا الحهههي تهههم انشهههاؤه :، اما تهيئة الحي فقد اعتمدت هيكلتها على ثالثة اهداف بيئية اساسية هي 1111سنة
.الفعالية الطاقوية - .الحد من استعمال السيارات وتشجيع ممرات الراجلين والدراجة الهوائية - .واالهتمام بالمناظر الطبيعية تسيير النفايات ، -
وعليههههه ، فههههإن اخههههتالف االحيههههاء البيئيههههة مههههن حيههههث الهههههدف وظههههروف االنشههههاء ، وانههههها تشههههترك فههههي العديههههد مههههن المميهههزات والتهههي تتمحهههور عمومههها حهههول مراعهههاة الشهههروط البيئيهههة واالجتماعيهههة واالقتصهههادية للحهههي والمدينهههة بصهههفة
.عامة
:في ميدان انشاء المدن المستدامة
:في الصين
تتجهههه السياسهههة الحضهههرية الصهههينية نحهههو اعهههادة تجديهههد المهههدن ولهههيس نحهههو بنهههاء مهههدن جديهههدة ، حيهههث تعتبهههر مدينهههة Guiyang المدينهههة الوحيههدة فهههي العههالم التهههي خططهههت الههى مشهههروع تحويهههل كلههي الهههى مدينهههة مسههتدامة ، ايهههن تهههم
ليب التنقهههل ، وتحويهههل تقنيهههات البنهههاء وعلهههى تشهههجيع المؤسسهههات فلهههم اسهههتعمال مبهههاد االقتصهههاد الحلقهههي ، وتغيهههر اسههها .تكوين السكان في ميدان تقنيات اعادة التدوير
مدينههة مسههتدامة جديههدة 111القادمههة سههنة اال انههه وفههي نفههس الوقههت ، قههد قامههت الصههين ببرمجههة بنههاء فههي العشههرين . األريافسكان منمليون 111، بهدف استيعاب حوالي
مههن اولههى هههذه المههدن ، فهههي مخصصههة Shanghaiالواقعههة بههالقرب مههن مدينههة Dongtingوتعتبههر مدينههة 1110111منصهههههب عمهههههل ، و 110111بحهههههوالي 1121سهههههاكن فهههههي الشهههههطر االول سهههههنة 110111السهههههتقبال
، ARUPمهههن طهههرف المؤسسهههة البريطانيهههة للهندسهههة 111، وقهههد انطلهههق بهههها صهههعودا 1111سهههاكن مهههع افهههاق اقهههات المتجهههددة كالطاقهههة الشمسهههية ، والسهههيارات المسهههتخدمة كوسهههيلة اساسهههية للتنقهههل حيهههث انهههها مهههن اسهههتعمال الط
، والزراعهههة البيلوجيهههة الحضهههرية ، واعهههادة التصهههنيع مهههن النفايهههات الصهههلبة مهههع البنهههي لتركيبهههة حضهههرية متراصهههة طوابهههق 11وكثيفهههة ، الخضهههراء والزرقهههاء فهههي النسهههيج الحضهههري، باالضهههافة الهههى بنايهههات ال يتجهههاوز ارتفاعهههها
هكتههار للفههرد ، اي اقههل بههثالث 1ومنجههزة وفههق مبههاد النوعيههة الرفيعههة للبيئههة ، امهها البصههمة للمدينههة فههال تتجههاوز .مرات من البصمة في مدينة شنغهاي ، ولندن وباريس
اال انهههه والسهههباب تتعلهههق بهههنقص الخبهههرة فهههي مجهههال التهيئهههة االقليميهههة ، وبتنظهههيم نحهههو الشهههبكة الحضهههرية مهههن حيهههث وض العمههل والمههواد االوليههة ، باالضههافة الههى العقاريههة التههي تحههد مههن اسههتقطاب سههكان جههدد ، اصههبح الههبعض حهه
مهههن ههههذه المهههدن الجديهههدة والتهههي بنيهههت بتجنيهههد اسهههتثمارات حكوميهههة ضهههخمة ، اصهههبحت غيهههر متهيئهههة لالسهههتعمال قبهههل ال مليههون سههاكن علههى مسههاحة ، فهههذه المدينههة التههي انجههزت مههن اجههل اسههتقب Kangbashi توظيفههها مثههل مدينههة
كلهههم بسهههبب غيهههاب المهههاء ، اال 101التهههي تبعهههد مسهههافة Ordos، وبهههذلك بههههدف جعهههل سهههكان مدينهههة 1كلهههم 11تقهههدر سهههاكن بسهههبب غيهههاب مناصهههب العمهههل فهههي ههههذه المدينهههة وتجديهههده وتوفرهههها فهههي 110111انهههها حاليههها ال تضهههم سهههوى
فشهههل فهههي قياسهههات التنميهههة المسهههتدامة وانمههها يهههدل علهههى عهههدم ، وههههذا ال يهههدل علهههى( المدينهههة االم) المدينهههة القديمهههة .كفاءة الدراسات االولية للمشروع وعلى االعتماد على االسقاطات عند التدخل

Proceeding of the 3th Sustainable & Renewable Energy Conference
23 -24 December 2017, Baghdad-Iraq
211
:في االمارات العربية المتحدة
فههي وسههط طبيعههي صههحراوي وجههاف ، عملههت االمههارات العربيههة المتحههدة علههى اثبههات انههه حتههى مههن وجهههة النظههر لتكنولوجيهههة يمكهههن تحقيهههق المسهههتحيل مهههن خهههالل انجازاتهههها الجريئهههة الناتجهههة عهههن رغبهههة المسهههتثمرين االنشهههائية وا
.الوطنيين في تجسيد التقاليد العمرانية واساليب الحياة المحلية بطريقة حكيمة وحديثة
ي التههه Ecopolisالتهههي تقهههع قهههرب مدينهههة ابهههو ظبهههي ، ومدينهههة " Masdarماسهههدار " ان المهههدن الجديهههدة كمدينهههة تقهههع قهههرب مدينهههة دبهههي ، تهههدل علهههى عبقريهههة مهههن قهههام بانشهههائها مهههن عهههرب واجانهههب ، والهههذين تعملهههوا مهههن االشهههكال الحضهههرية والمنشهههأة المقتصهههدة للمهههوارد ومحترمهههة للطبيعهههة ، واالدارة الحضهههرية الجماعيهههة والجوانهههب التقليديهههة ،
.ئمة للتطبيق في الوقت الراهن اي انهم توصلوا الى جذور مباد التنمية المستدامة التي تعتبرها مال
امههها مدينهههة مصهههدر اول مدينهههة فهههي العهههالم بهههال كريهههون وال نفايهههات ، تعتمهههد كلهههها علهههى الطاقهههة المتجهههددة ، وههههي ) سهههنوات 1مليهههار دوالر فهههي ظهههرف 11، وسهههوف تبلههه تكلفهههة انشهههائها 1كلهههم 6مدينهههة تمتهههد علهههى مسهههاحة تقهههارب
مؤسسهههههة ، 210111سهههههاكن و 110111سهههههتعدة السهههههتقبال وههههههي مدينهههههة متراصهههههة م( 1126الهههههى 1117مهههههن االجتمهههاعي : حيهههث تهههم االخهههذ بعهههين االعتبهههار كهههل مبهههاد التنميهههة المسهههتدامة عنهههد انشهههاء ههههذه المدينهههة ، وههههي
والهههههوظيفي ، والنسهههههيج الحضهههههري المتهههههراص والكثيهههههف ، كمههههها تهههههم االعتمهههههاد علهههههى مبهههههاد الهندسهههههة المعماريهههههة ايههات ، والههتقلص الههى اقصههى حههد ممكههن مههن انبعههاث الغههازات ، واعههادة تههدوير النفايههات البيومناخيههة عنههد انشههاء البن
.
وهنهههاك اههههداف طموحهههة وراء مشهههروع مدينهههة مصهههدر ، فمنفهههذوه يريهههدون لهههه ام يصهههبح اكثهههر مهههدن العهههالم خضهههرة ملين واكثرههها تقههدما مههن حيههث القههدرة علههى البقههاء كمهها ان المدينههة سههتوفر اجههور وظههروف عمههل عادلههة لجميههع العهها
.بمن فيهم من سيشاركون في عملية التشييد
ويأمههل خبههراء البيئهههة فههي ان تكههون مثهههل هههذه االفكهههار الشههجاعة المعتمههدة علهههى عنصههر الديمومههة محهههل اقتبههاس مهههن حيههههث ان برنههههامج التنميههههة الثههههاني لالمههههم المتحههههدة قههههدم فههههي تقريههههر لههههه السههههنة الماضههههية ان انبعههههاث . بقيههههة الدولههههة
، ويعتبهههر ذلهههك 1111طهههن لكهههل فهههرد سهههنة 1102حتبهههاس الحرايهههري فهههي االمهههارات بلغهههت الغهههازات المسهههببة لالطهههن كمههها سهههيتميز 6011ثالهههث اعلهههى مسهههتوى عهههالمي بعهههد قطهههر والكويهههت ، بينمههها يتعهههدى فهههي الواليهههات المتحهههدة
مركهههز المدينهههة بمظهههالت متحركهههة عمالقهههة مسهههتوحاة مهههن زههههرة دوار الشهههمس ، لتظلهههل االمهههاكن العامهههة صهههباحا ، .لى جانب امتصاصها الحرارة ، ثم تغلق على نفسها مساءا الطالق الحرارة التي امتصتها ا
، وههههي مبهههادرة " الحيهههاة علهههى مركهههب واحهههد " وتكهههون ههههذه المدينهههة ضهههمن مبهههادرة واحهههدة تحمهههل اسهههم مبهههادرة و مهها تههتلخص فههي عههالم يعههيش فيههه السههكان حيههاة صههحية ، يتمتههع كههل فههرد بحصههة عادلههة مههن مههوارد االرض ، وههه
ميجههههاواط مههههن الطاقههههة النظيفههههة ، مقابههههل 111تحققههههه مدينههههة مصههههدر ، مههههن حيههههث سههههتحتات المدينههههة الههههى نحههههو ميهههاه التحليهههة يوميههها ، مقارنهههة بهههاكثر 111ميجهههاواط بالنسهههبة لمدينهههة تقليديهههة بهههنفس الحجهههم ، وسهههتحتات 111مهههن مسهههاحة مدينهههة مصهههدر للسهههكن ، و % 11وسهههيتم تخصهههيص . يوميههها بالنسهههبة لمدينهههة تقليديهههة 1م 11111مهههن لسههههد % 6للشههههماريع التجاريههههة بمهههها فيههههها الصههههناعات الخفيفههههة ، و % 21لمنطقههههة االعمههههال واالبحههههاث ، و% 11
(26) .لفعاليات المدنية والثقافية % 21للخدمات والمواصالت ، و % 29مصدر للعلوم والتكنولوجيا ، و
:في كندا
فههي غربههي كنههدا ، والتههي كانههت قههادرة علههى الرقيههق بههين الكثافههة فههي البنههاء الواقعههة Vancouver فههي مدينههة والمسهههاحات الخضهههراء فهههي المركهههز والضهههاحية اعتبهههر نمهههوذت المدينهههة المسهههتدامة او المدينهههة القابلهههة للعهههيش ، فههههي
المدينهههة والهههذي النظهههام الوحيهههد الهههذي يمكنهههه الجمهههع بهههين االبعهههاد االقتصهههادية ، واالجتماعيهههة ، و الثقافيهههة والبيئيهههة فهههي :يجب احترام االهداف التالية
اي امكانيهههة الوصهههول المتسهههاوية الهههى مسهههاحات الخضهههراء ، والتجهيهههزات والخهههدمات القاعديهههة ، : مالئمهههة العهههيش والههههى وسههههائل النقههههل ، والههههى عمليههههات المشههههاركة ، الن المشههههاركة والمدينههههة المتراصههههة هههههي الوسههههائل المسههههاعدة
.ة لتحقيق ظروف العيش المالئم

Proceeding of the 3th Sustainable & Renewable Energy Conference
23 -24 December 2017, Baghdad-Iraq
211
بتوفيرالسكن وبنسبة الفقر والتي تدمج اثناء التدخل للعوامل المتعلقة بالعمل ، و: االستدامة
قامهههت محافظهههة 2991والتهههي تتطلهههب اتبهههاع االدارة المتأقلمهههة كنمهههوذت للتهههدريب و للتعليهههق ففهههي سهههنة : المرونهههة مهههن عمليهههات المشهههاورة مهههع مههها المدينهههة بوضهههع مخطهههط للتهههدخل مهههن اجهههل تحقيهههق مالئمهههة العهههيش ، بعهههد االنتههههاء
:ساكن ، حيث يهدف هذا المخطط الى ( 611)يقارب
.الحفاظ على محيط صحي - حماية المصادر الطبيعية - .ضمان الخدمات لمجموعة سكانية في نمو مستمر - .الحفاظ على الصحة االقتصادية للمنطقة وادارة المنطقة -
اال ان محافظههههة المدينههههة قههههررت تنفيههههذه وفههههق (27) 12حيههههث ان هههههذا المخطههههط يتطههههابق مههههع توجهههههات االجنههههدة اسهههتراتيجية خاصهههة ، وههههي اسهههتراتيجية فعالهههة تههههدف الهههى اعهههادة تطبيهههق االدارة ، والهههى تحويهههل مخطهههط التهههدخل
تتمثهههل ههههذه االسهههتراتيجية فهههي اربعهههة اههههداف . الهههى مخطهههط وظيفهههي وموضهههوعي ، والهههى مخطهههط للتنميهههة الجهويهههة .مؤشرات تسمح بقياس نمو هذه المدينة المستدامة مستقبال مكملة لبعضها البعض حيث يضم كل هدف
مسهههاحة ههههذه المنطقهههة الخضهههراء : ههههذا الههههدف يضهههم مؤشهههرين ، همههها : حمايهههة المنطقهههة الخضهههراء - .ومساحة االراضي الزراعية
عههدد ونسههبة كههل صههنف مههن المسههاكن فههي : مههن مؤشههرات هههذا الهههدف : تشههكيل منههاطق للحكههم الههذاتي - .يهدف الى تحقيق االدمات الوظيفي في االحياء كل منطقة ، وذاك
لكهههل النسهههبة السهههنوية للنمهههو السهههكاني بالنسهههبة : مهههن اههههم المؤشهههرات نهههذكر : انجهههاز متروبهههول جههههوي متهههراص .قطاع وبالنسبة للمدينة ككل
ونسهههبة عهههدد السهههيارات بالنسهههبة للمسهههكن الواحهههد : والهههذي يضهههم المؤشهههرات التاليهههة : تعهههدد وسهههائل النقهههل المتهههوفرة .استعمال وسائل النقل الجماعي
ومههن اهههم عوامههل نجههاو هههذه االسههتراتيجية هههو العمههل علههى اشههراك القطههاع الخههاص والمجتمههع المههدني والجمهههور .العريض في العمليات التخطيطية ، منذ بداية المشروع ، والى عمليات التقييم والمتابعة النهائية
يم الخاصههههة بهههههذه االسههههتراتيجية ومعرفههههة مههههدى تمكنههههها مههههن تحقيههههق تههههم انطههههالق عمليههههات التقيهههه 1112ففههههي سههههنة االهههداف المرجههوة ، حيههث تههم االعتقههاد علههى مؤشههرات االهههداف االربعههة السههابقة والتههي كانههت جههد فعالههة ، اال انههه اتضههههح انههههها غيههههر مهمههههة لتقيههههيم مقارنههههة للتنميههههة المسههههتدامة ، فمههههثال بعههههض االنشههههغاالت المهمههههة بالنسههههبة للسههههكان
ار مشهههاكل الفقهههر ، والبطالهههة ، والمخهههدرات والجريمهههة ، لهههم يهههتم اخهههذها بعهههين االعتبهههار عنهههد اعهههداد ههههذا كاسهههتمر .المخطط ، باالضافة الى غياب الربط بين االربعة بواسطة مقاربة نظامية
وانطالقهها مهههن ههههذه النتهههائج تههم اعهههادة تنظهههيم مجمهههوع التهههدخالت ، والسياسههات ، والمخططهههات والبهههرامج علهههى ضهههوء .مباد التنمية المستدامة من اجل تحويل محافظة الى محافظة مستدامة حقا
شهههاركت المدينهههة ونجحهههت فهههي مقاربهههة نظمهههها االتحهههاد الهههدولي 1111و 1112والجهههدير بالهههذكر انهههه بهههين سهههنتي سهههنة ، ولهههذي يقهههود الهههى مدينهههة مسهههتدامة ، وقهههد 211النتهههات الغهههاز بههههدف تصهههميم نظهههام حضهههري يصهههمد لمهههدة
خبيهههر كنهههدي مهههن اجهههل تحقيهههق االسهههتدامة ، ومالئمهههة العهههيش ، امههها 11ههههذه المسهههابقة ، حيهههث تهههم تجنيهههد سهههميت مبهههدأ المشهههاركة فقهههد مهههس البعهههد السياسهههي واالقتصهههادي واالجتمهههاعي مهههن اجهههل ايجهههاد حلهههول متكاملهههة تأخهههذ بعهههين
.االعتبار حدود المصادر الطبيعية ، المناخية والتغيرات االجتماعية
العدالههههة االجتماعيههههة ، ومبههههدأ المههههدى الطبيعههههي والتسههههيير المسههههتدام للمصههههادر : اد التههههدخل الجديههههدة فهههههي امهههها مبهههه .ومبدأ الحكم الراشد ، والمطبقة من خالل مقاربة نظامية ، وتحت إشراف مبدأ المشاركة وتعدد الفاعلين
:في دول العالم النامي

Proceeding of the 3th Sustainable & Renewable Energy Conference
23 -24 December 2017, Baghdad-Iraq
211
ي ميهههدان تطبيهههق اسهههتراتيجية التنميهههة المسهههتدامة فهههي المهههدن اذا كانهههت دول العهههالم المتقهههدم تعهههاني مهههن صهههعوبات فههه، فكيهههف ههههي % 11رغهههم ان معهههدل نموهههها الهههديموغرافي فهههي مسهههتمر ومعهههدل التحضهههر بهههها يصهههل الهههى حهههوالي
حالهههة تطبيهههق ههههذه االسهههتراتيجية فهههي الهههدول الناميهههة ايهههن النمهههو الهههديموغرافي فهههي يتزايهههد بهههوتيرة متسهههاوية والنمهههو ان التقبهههل االجتمهههاعي لمفههههوم التنميهههة المسهههتدامة لهههيس مهههن مكتسهههبات ههههذه , القهههة عمالحضهههري يسهههير بخطهههوات
الهههدول ، النههههم ينظهههرون اليهههه بمنظهههور المثاليهههة التهههي ال داعهههي لهههها ، وذاك الحرمهههان مهههن الراحهههة التكنولوجيهههة .الحديثة ، ومن امتيازات حياة سعيدة الى البعض وممنوعة عن االخر
الشههابة فههي الههدول الناميههة ينبغههي لههها ان تكههون مقيههدة بشههروط هامههة ، فههي حههين ان نظههراءهم فههي اذا لمههاذا االجيههال الدول المتقدمة قد استفادت من عقود من واستغالل ثروات الكوكب دون اي قلق ؟
) ولمهههاذا وباسهههم القهههانون ، فقهههط سهههكان الهههدول المتقدمهههة يمكهههن لههههم االسهههتفادة مهههن الخهههدمات التهههي تقهههدمها الحداثهههة ، فههههي حههههين انههههها السههههبب الرئيسههههي فههههي ....( لسههههيارات ، وانظمههههة تصههههريف الميههههاه المكلفههههة ، قضههههاء العموميههههة ا
.المشاكل البيئية التي تؤدي الى تغيرات المناخية التي تهدد االنسانية
ة حيهههث انهههه مهههن المنطقهههي ان نالحهههظ السهههعي نحهههو تنميهههة تحتهههرم البيئهههة ، وتتوافهههق مهههع ابقهههاء االقتصهههادية واالجتماعيهههوالثقافيهههة ، فهههي دول اصهههال التنميهههة فيهههها يرافقهههها نمهههو سهههكاني متنهههاقص وتحضهههر منجهههز ، همهههها الوحيهههد تحقيهههق الرفاهيههههة لالجيههههال الحاليههههة والمسههههتقبلية ، امهههها فههههي الههههدول التههههي يعتبههههر التخلههههف الواقههههع المعههههاش كههههل يههههوم ، فههههان
(21) .الحياة نوعيةفكير في المجاالت االساسية ال تتعدى متطلبات البقاء ، وبالتالي ال يمكن الت
: االستنتاجات
ان المدينههههة باعتبارههههها مجههههاال لتفاعههههل مختلههههف العوامههههل االقتصههههادية واالجتماعيههههة ، والثقافيههههة والبيئيههههة ، -2جعههههل منههههها المههههتهم االول او تقريبهههها ه ومخرجاتههههه الماديههههة والمعنويههههة ونظههههام بيئههههي حسههههاس لههههه مدخالتهههه
.الل االنظمة البيئية القريبة والبعيدة منها الوحيد في التدهور الذي واختومههن هنهها كههان لزامهها علههى الههدول وضههع بههرامج واسههتراتيجيات تسههعى مههن اجههل تقلههيص والحههد مههن تههأثير -1
المسهههتدامة المههدن علههى محيطههها الطبيعهههي ، وهههذه االسههتراتيجية تعتمهههد فههي مضههمونها علهههى مفهههوم التمنيههة . متجانسة مع الوسط الطبيعي و جعلها مستدامة، وتهدف الى خلق مدن و
ة مههدن المسههتدامة الجديههدة تمثههل القمههوهههذا مهها ادى الههى ظهههور العديههد مههن التجههارب العالميههة فههي ميههدان ال -1السهههكان العهههيش فيهههها ، رغهههم ان االسهههتدامة ال تعنهههى التهههي ال يمكهههن اال لعهههدد محهههدود مهههنفهههي الغنهههى ، و
المدينهههة المسهههتدامة ايضههها ال تعنهههى االلمهههام بكهههل علهههى جنهههب ، بهههل ان صهههناعةاألفقرالحيهههاة المكلفهههة وتهههرك التحهههديات االجتماعيهههة واالقتصهههادية والبيئيهههة فهههي ظهههروف مثاليهههة ومهههع االلتهههزام ال يعهههاني مهههن اي نقهههائص
بشهههرط ان يكهههون العمهههل بضهههمير وان يهههتم ، بهههل بهههالعكس فاالزمهههة ههههي فرصهههة للتجديهههد واالبهههداع ، ولكهههن .توى كل المقاييس شخص وعلى مس تحمل المسؤوليات من طرف كل
بنهههاء علهههى ذلهههك يمكهههن القهههول ان االسهههتدامة ههههي طريقهههة وليسهههت نتيجهههة محهههددة وههههي تتناسهههب مهههع قهههوة -1ومرونهههة حهههل المشهههكلة فهههي المكهههان اكثهههر مهههن التوجيهههه نحهههو النتهههائج محهههددة ، كمههها ان االسهههتدامة بشهههكل
لالسهههتدامة فهههي المهههدن اساسهههي عمليهههة سياسهههية اكثهههر منهههها مشهههكلة تصهههميمية او تقنيهههة ، والحهههاجز االعظهههم يقههههع فههههي غيههههاب التصههههاميم المخصصههههة لتعريههههف وتنفيههههذ ممارسههههة االسههههتدامة محليهههها ، لمهههها يشههههكله هههههذا
.المقياس من اهمية في حياة الفرديمكهههن تعريهههف المدينهههة المسهههتدامة بانهههها المدينهههة التهههي تحتهههرم مبهههاديء التنميهههة المسهههتدامة والعمهههران البيئهههي، -1
لعمهههل والتنقهههل ، ومهههن اجهههل تفعيهههل اسهههتهالك الطاقهههات المتجهههددة، وههههي وتعمهههل مهههن اجهههل تسههههيل اسهههاليب ا في غالب االحيان عبارة عن تجمع من االحياء البيئية التي تهدف الى تقليص بصمتها البيئية
Proceeding of the 3th Sustainable & Renewable Energy Conference
23 -24 December 2017, Baghdad-Iraq
216
: التوصيات
ان تعمل على ضبط النمو فعل هذه الدول من اجل تطبيق إستراتيجية التنمية المستدامة على مستوى المدن في دول العالم الثالث -2من تحقيق التنمية المستدامة على مستوى مدنها وأحيائها الن النمو الديمغرافي في هذه الدول يتزايد هذه الدول الديموغرافي لتتمكن
.بوتيرة متسارعة والنمو الحضري يسير بخطوات عمالقة لشجيال الحالية ولشجيال ية وبيان أهمية هذه التنم ة المستدامةالتنمي إستراتيجيةزيادة الوعي االجتماعي ونشر ثقافة تقبل تطبيق -1
.القادمة العمل على توفير البيانات والمعلومات التفصيلية على مستوى األحياء في مدن العالم الثالث لغرض استغاللها في عمليات التقييم -1
.الخاصة بمؤشرات التنمية المستدامة لتحقيق األهداف المرجوة .الفعالة من قبل الدول النامية بالمؤتمرات الدولية المتعلقة بالتنمية المستدامة للبيئة الحضرية المشاركة -1استعانة الدول النامية بتجارب الدول المتقدمة بهذا الصدد فضال عن االستعانة بخبراء من هذه الدول لسهولة تطبيق أهداف التنمية -1
.المستدامة والسيما التنمية الحضرية حياء البيئية هي احياء تم انشاؤها او تجديدها ةفق مقاربة بيئية تهتم خاصة بالجانب الجمالي وبالنوعية البيئية للمباني اي تعتبر ان األ -6
هذه االحياء مثالية مما يستدعي إعادة تثمين صورة األحياء والمساكن االجتماعية التي تعاني من صعوبات او التي تعاني من .ليها في تحقيق التنمية المستدامة عبر تجديدها التلوث ليتم التركيز ع
-: الهوامش
2- Menthon A, Lenvironnement en milieu urban , conceal de I, Europe , Naturopa , 2000, n 94 , France , p. 4
1- Berezowska – Azzag E., projet urbain ; guide methodologique – Connaitre le
context de developpement durable - Synergie 1- Masboungl A., projeets urbains durables , strategies , edition le moniteur,
2012 , p . 163 هو مؤشر االثر الذي يتركه االنسان على االرض في زمن ( : Iempreinte ecologiqe)البصمه البيئيه -1
world wildlife)اما المنظمه العالميه للطبيعه معين ومكان معين والناتج عن استهالك انشطته للموارد الطبيعيهfund )wwf يتم , بانها قياس الضغط الممارس من طرف االنسان على الطبيعه فتعرف البصمه االيكولوجيه
حيث ان المتوسط , حسابها بالنسبه للفرد او مجموعه من السكان وهي المساحه الالزمه لتوفير احتياجاتهم الطبيعيه 9،6صين وهكتار في ال 1, هكتار في فرنسا 1،1يبل 1111االجمالي للبصمه االيكولوجيه بالنسبه للفرد في سنه
( المصدر نفسه ) هكتار في الواليات المتحده charlot valdien c , L urbanisme durable concevoir un eco quartier Le -) ينظر -1
Moniteur , 2 , edition, paris , 2011 , p 22-24 - Huet M , Les equilibres des fonctions dans la vill pour une meilleure qualite
de vie , conseil economque et social , 1993 , p 3-4 ) 6- De la ville a la durable , Laboratoire de sociologie urbaine , 1 chenal Ecole
polytechnique federale de Lausanne , 2010 , p 2 7- charlot valdien , ,Ibid , p 24- 25 1- Sacquet A- M , Les grandes enjeux de la vie durable , les rencotres Angers
, 2005 , p 2 – 21 9- Rogers R , des villes durables pour une petite planete , Le moniteur , 2008 ,
p 203 استراتيجيات وسياسات التخطيط المستدام والمتكامل الستخدامات االرضي , مجد عمر حافظ ادريخ -21
. 11ص , 1111, فلسطين , جامعة النجاو الوطنية , رسالة ماجستير , والمواصالت في مدينة نابلس
Proceeding of the 3th Sustainable & Renewable Energy Conference
23 -24 December 2017, Baghdad-Iraq
217
22- Madec , Ubanisme durable , vers les eco cites ? contribution au colloque parlementaire , urbanisme durable ; vers les ecocitese? Du 16 / 12/2009 ,
maison de chimie , 2009 , p 2 . 21- , Masboungl A., Ibid , p163 21- charlot valdien , Ibid , p 52-53 21- Rey E , Quartiers durables , Defis et opportunites pour le developpement
urbain Office federal du developpement territorial ARE,p 18- 19 21- charlot valdien , Ibid , p 52- 26- Rey E , Ibid , p 21 /charlot valdien , Ibid , p 59 بالرغم من انتشار مفهوم التنمية المستدامة اال ان المعضلة الرئيسية فيه بقيت متمثلة في تحديد مؤشرات -27
indicateurs) ) وبناءا على ذلك ,هذه التنمية ويمكن من خاللها قياس مدى التقدم نحو التنمية المستدامةبيئية : مؤشرا مصنفة الى اربع فئات رئيسية 211اصدرت لجنة االمم المتحدة للتنمية المستدامة كتابا تضمن
. واجتماعية واقتصادية وادارية 21- Berezowska – Azzag E , Ibid 195 p 185-
Proceeding of the 3th Sustainable & Renewable Energy Conference
23 -24 December 2017, Baghdad-Iraq
831
أثر السقوف الخضراء على تحقيق مفهوم حفظ الطاقة في األبنية
غادة محمد إسماعيل عبد الرزاق كمونة. د.م.أ جامعة بغداد –كلية الهندسة / قسم هندسة العمارة
:الملخص
ويمكن عدها بمثابة إحدى ستراتيجيات العمارة المستدامة , التبريد المنفعل في األبنيةتعد السقوف الخضراء إحدى تقنيات
. فضال عن قدرتها على الحد من جريان مياه األمطار, فهي وسيلة فعالة وعملية تعمل على تقليل إستهالك الطاقة في األبنية, بيئيا
ال سيما فيما يتعلق بتحسين المناخ الموضعي لموقع المبنى والبيئة , ة عليهاوتوفر السقوف الخضراء فوائدا عديدة لألبنية المشيد
.الحضرية ككل
, ونظرا ألهمية إنشاء السقوف الخضراء في األبنية لفاعليتها في المساعدة على إعادة العمارة الى مسارها البيئي الصحيح
أما هدف . الخضراء في تحقيق مفهوم حفظ الطاقة في األبنية بوجود نقص معرفي حول فاعلية السقوف: تمثلت المشكلة البحثية بـ
.ومن ثم تحقيق مفهوم حفظ الطاقة فيها, توضيح أهمية إنشاء السقوف الخضراء في األبنية لترشيد إستهالك الطاقة: البحث فهو
ا من أثر فعال في تقليل لما له, توصل البحث الى ضرورة تبني إنشاء السقوف الخضراء في األبنية المعاصرة, بالنتيجة
فضال عن كفاءتها في تحسين المناخ الموضعي لموقع , الطاقة المصروفة ألغراض التهوية والتبريد ومن ثم تحقيق حفظ الطاقة فيها
.المبنى والبيئة الحضرية المحيطة به
.الحراريةالكتلة , السقوف الخضراء واسعة النطاق, حفظ الطاقة, السقف األخضر :كلمات مفتاحية
The Effect of Green Roofs on Achieving
Energy Conservation Concept in Buildings
Assistant Proffessor Dr. Ghada Mohammed Ismaiel Abdulrazzaq Kammouna
Architectural Enhineering – University of Baghdad
Abstract:
Green roofs are one of the passive cooling techniques in buildings, and can be acts as the one
of the strategies of environmentally sustainable architecture; it is an efficient and practical way to
reduce energy consumption in buildings and to reduce rain flow. Green roofs provide many benefits
for buildings, particularly with regard to improving the microclimate of the building site and the
urban environment as a whole.
In view of the importance build up green roofs in buildings for their effectiveness in helping to
restore architecture to its right path, the research problem is: A lack of knowledge about the
effectiveness of green roofs in achieving the concept of energy conservation in buildings. The
objective of the research is: Clarification the importance of build up green roofs to rationalize energy
consumption, and then achieve the concept of energy conservation in buildings.
As a result, the study found the need to adopt the construction of green roofs in contemporary
buildings because of their effective effect in reducing the energy consumption for ventilation and
cooling, and then achieving energy conservation, as well as in improving the microclimate of
building site and the surrounding urban environment.
Keywords: Green Roof, Energy Conservation, Extensive Green Roofs, Thermal Mass.
Proceeding of the 3th Sustainable & Renewable Energy Conference 23 -24 December 2017, Baghdad-Iraq
831
:مفهوم حفظ الطاقة
ملحة للحفاظ على الطاقة وتقليل من ثم، هناك حاجة . أحد أهم اللبنات في مجال التنمية اإلقتصادية لجميع الدول, تعد الطاقة
: على أنه( Energy Conservation)ويمكن تعريف مفهوم حفظ الطاقة . الطلب عليها عن طريق إعتماد تكنولوجيات كفوءة
أو الحد تماما من إستخدام , اإلستخدام الحكيم واإلدارة الواعية لمصادر الطاقة عن طريق إستخدامها لغرض معين بشكل كفوء"
في المحافظة عليها عند القيام بنشاط معين من أجل , (الحفاظ على الطاقة)يكمن المعنى الضمني الذي يحمله مفهوم , من ثم". طاقةال
.عوضا عن إستخدام طاقة أقل للقيام بنشاط معين, توفيرها
كفاءة "و, ("Energy Conservation)حفظ الطاقة : "زال بعض الناس يستخدمون مفهوميأنه ما , من الجدير بالذكر
.(Hong & et al., 2007, P. 279)بالتبادل , ("Energy Efficiency)إستخدام الطاقة
, من أجل توفير الطاقة المستخدمة في تشغيل المبنى, يجب التكامل بين األداء الفعلي لنظم المبنى مع مكونات غالفه, عموما
والتي بدورها تساهم في زيادة إنبعاثات غاز ( األحفورية)وذلك بسبب إعتماد نظم البناء الحالية على مصادر الطاقة غير المتجددة
(CO2) , فإن معظم الجهود التصميمية في الوقت الحاضر تسعى إلعادة دمج , بالنتيجة. الكلف التشغيلية للمبنىمما ينتج عنه إرتفاع
,.Bauer & et al)في المبنى ( Active Systems)مع زيادة اإلستفادة من النظم الفعالة ( Passive Systems)النظم المنفعلة
2010, P. 90) .
:مفهوم السقف األخضر
Passive)بوصفها أحد تقنيات التبريد المنفعل , بشكل متزايد في األبنية( Green Roofs)الخضراء إنتشرت السقوف
Cooling ) واحدا من اإللتزامات ويعد السقف األخضر. تسرب الحرارة الى داخل المبنى بإستخدام النباتات المتناميةالذي يقلل من
إذ يساعد على إدارة مياه األمطار وتوفير بعض ,ها المباني الخضراء والمستدامة بيئيا المرئية واألكثر وضوحا التي يمكن أن تقدم
التخزين المؤقت اإلضافي للبيئة، لتقليل الطلب على التبريد صيفا والتدفئة شتاءا ، فضال عن توفيره الراحة الحرارية لشاغلي المبنى
.(Yudelson, 2007, P. 82) (1الشكل )
(". Green Roof)السقف األخضر "المبنى بالكامل أو جزئيا بطبقة من الغطاء النباتي تعرف بإسم ويمكن تغطية سقف
.(Castleton, H.F. & et al., 2010, P. 1583)والسقف األخضر عبارة عن نظام مؤلف من عدة طبقات
ويتكون السقف األخضر . مبنى طبقة نباتية نمت على سطح أيعبارة عن : "يمكن تعريف السقف األخضر على أنه, من ثم
، والحواجز الجذرية، وطبقة صرف المياه (Waterproofing)طبقة المصمد المائي (: من األسفل الى األعلى)هي , من ست طبقات
. (V. & Mahalle, 2016, P. 2776)" واإلحتفاظ بها، وورقة الترشيح، وطبقة وسط النمو
ف السقف األخضر أيضا على أنه فوق , بمثابة نظام تسقيف هندسي يتضمن نباتات مزروعة في وسط متزايد النمو" :كما يعر
وذلك بغرض , ("Ecoroof)سقف بيئي "أو , ("Living Roof)سقف حي "ويمكن اإلشارة إليه على أنه . مادة غشاء مضادة للمياه
ة مثل تلك التي تغطيها الصور الضوئية أو تمييزه عن السقوف النباتية واسعة النطاق من األنواع األخرى من السقوف المستدام
، والتي غالبا ما تكون مدرجة في البيئة األوسع نطاقا على المدى الطويل من نظم (األسطح البيضاء)األسطح عالية االنعكاس
.(Voelz, 2006, P. 2)" التسقيف الخضراء أو المستدامة
:أنواع السقوف الخضراء
غشاء العزل المائي لحماية السقف، وغشاء الجذر، وتصميم طبقة الصرف لحمل : عادة منتتكون طبقات السقف األخضر
ح، ، والنسيج المرش (ر الپالستيكيةوالتي تتحقق مع بعض الحبيبات الخشنة المسامية أو بعض العناص)جريان المياه الزائدة وتخزينها
ون خاملة بطبيعتها مع وجود المواد الغذائية المضافة فيها لنمو النبات، التي يسهل إختراقها وتكووالتربة اإلصطناعية خفيفة الوزن
.(Perini & Magliocco, 2012, P. 81) (2الشكل )النباتات فضال عن وجود طبقة
: هي, م السقوف الخضراء الى عدة أنواعقس ت
: السقوف الخضراء واسعة النطاق أو الشاملة/ أولا
وتعرف أيضا بإسم التشكيل الجانبي ( )Extensive Green Roofs)تتألف السقوف الخضراء واسعة النطاق أو الشاملة
، وطبقة (تضم نوع أو نوعين من النباتات) طبقة الغطاء النباتي: ، من منظومة خفيفة الوزن تشمل(المنخفض أو المنخفض األداء
سم أو غيرها من وسائل النمو للنبات، ومنظومة للصرف الصحي، ومنظومة (15.24-7.62)رقيقة من التربة يتراوح سمكها بين
ويكون إختيار أصناف النباتات من النوع القوي الذي يتحمل الجفاف مع القليل من الصيانة، وال . حماية الجذر، مع غشاء مقاوم للمياه
.(3الشكل )يحتاج الى األسمدة أو المبيدات الحشرية
Proceeding of the 3th Sustainable & Renewable Energy Conference 23 -24 December 2017, Baghdad-Iraq
841
سم، (15-5)الخضراء واسعة النطاق مع الحلول التقنية الخاصة، ويتراوح سمك الطبقة السفلية فيها ما بين السقوف تتعامل
ألن النباتات تقلل من درجات الحرارة المحيطة مع الخاليا الكهروضوئية، غالبا تستخدم ووتعرف بطبقة الحماية اإليكولوجية،
. (Garrison & Horowitz, 2012, P. 12) أعلىها منالطاقة المتولدة بالخاليا وبالتالي تكون
:السقوف الخضراء الكثيفة/ ثانياا
وتعرف أيضا بإسم الحديقة البارزة أو مرتفعة ( )Intensive Green Roofs)تتشكل منظومة السقوف الخضراء الكثيفة
، وتحتاج الى نظم ري وصيانة متوسطة (سم30)بواسطة سماكة الطبقة السفلية التي تكون أكثر من ( المستوى أو حديقة السطح
مثل األشجار، والشجيرات، والنباتات العشبية، )وتحتوي السقوف الخضراء الكثيفة على مجموعة متنوعة من أنواع النباتات . وعالية
، فضال عن تقليل درجة ضمان العزل والكتلة الحرارية للمبنى بواسطة السقوف الخضراء الكثيفةبالنتيجة، يمكن (. والمروج الخضراء
.(Perini & Magliocco, 2012, P. 81)حرارة سطح السقف
مقارنة بالسقوف , تعد آلية عملها أفضلوتوفير الظل ومساحة مفتوحة لشاغلي المبنى، علىتساعد السقوف الخضراء الكثيفة
(4الشكل )جزر الحرارية الحضرية، وتوفير طاقة تكييف الهواء الخضراء واسعة النطاق من حيث إحتفاظها بمياه األمطار، والحد من تأثير ال
(Garrison & Horowitz, 2012, P. 12).
:السقوف الخضراء ش به الكثيفة/ ثالثاا
حال وسطا بين السقوف الخضراء واسعة ( Semi-Intensive Green Roofs)تمثل السقوف الخضراء شبه الكثيفة
ك الطبقة السفلية فيها يتراوح عادة ما بين النطاق والسقوف الخضراء كما إنها تحتاج الى صيانة دورية , سم(30-15)الكثيفة، ألن سم
ويمكن إستخدام الشجيرات الصغيرة أو النباتات العشبية . متوسطة مع منظومة الري، فضال عن توفيرها عزل جيد لسقف المبنى
.(Perini & Magliocco, 2012, P. 81) (5الشكل ) يفةوالمروج الخضراء في السقوف الخضراء شبه الكث
:إستخدام السقوف الخضراءفي المبنى بتحقيق مفهوم حفظ الطاقة ستراتيجيات
, والتبخر النتحي, والعزل, تمثل السقوف الخضراء نهجا فريدا وغير تقليديا لزيادة أداء الطاقة في المباني عن طريق التظليل
:الستراتيجيات اآلتيةعن طريق في المبنى مفهوم حفظ الطاقةالسقوف الخضراء تحققحيث ,والكتلة الحرارية
الحد من تدفقات الحرارة واإلنعكاسات الشمسية/ أولا
د السقوف الخضراء المبنى عن طريق فقدان الحرارة الكامنة وتحسين إنعكاسية اإلشعاع الشمسي الحادث وبإمكان السقوف . تبر
للسقوف ( 0.2-0.1)مقارنة مع ( 0.85-0.7) أن تبرد بأكبر قدر من الفعالية وكما هو الحال مع السقوف البيضاء، مع ما يعادل الخضراء
, في العديد من التجارب الميدانية وعن طريق قياس درجة حرارة الهواء على إرتفاعات مختلفة فوق السقف األخضر. النموذجية التقليدية
وجد أنه بعد غروب الشمس قلت درجة حرارة الهواء المحيط فوق الغطاء النباتي بشكل ملحوظ وإستمر في تبريد الهواء المحيط بالمبنى
تم إعادة إشعاع الحرارة المخزنة، مما أدى الى زيادة درجة حرارة الهواء المحيط بالمبنى , بينما في السقوف التقليدية لألبنية. طوال الليل
(Castleton, H.F. & et al., 2010, P. 1583).
الكتلة الحرارية/ ثانياا
من األشعة فوق البنفسجية السقففي الصيف، طبقة واقية فوق غشاء العزل المائي، وبالتالي تظليل يشكل السقف األخضر
، حيث تستخدم النباتات الطاقة في ضوء الشمس لتشكيل التمثيل الضوئيتشرين الثاني، عملية وآذار وتحدث بين شهري. المباشرة
تمنع النباتات سطح السقف من إمتصاص الطاقة , من ثم. في التربة ةالموجود في الهواء والمياه الموجود (CO2)الكربوهيدرات من
تكون النباتات في حالة , ا في الشتاءبينم. لى درجة حرارة الفضاءات الواقعة تحت السقف مباشرة ينعكس إيجابا ع مما ,الحرارية للشمس
منع لالكتلة الحرارية وتوفر حاجزا , تضيف طبقة الغطاء النباتي حيث. وال تحدث عمليتي التمثيل الضوئي والتبخر النتحي, سبات عميق
.(FEMP, 2004, pp. 5, 6)السقف عن طريقالهواء الدافئ من الهروب
كتلة حرارية تعمل على تحسين خصائص العزل للمبنى بغرض المساعدة على تحقيق , يضيف السقف األخضر ,بالنتيجة
تقليل فضال عن , ومن ثم تقليل إستهالك الطاقة السنوي فيه, اإلستقرار في درجات الحرارة لفضاءاته الداخلية وعلى مدار العام
.Castleton, H.F( )6الشكل ) فصل الصيفلكسب الحراري الى المبنى في الفقدان الحراري من المبنى في فصل الشتاء وتقليل ا
& et al., 2010, P. 1584).
ك التربة ومحتوى الرطوبة في السقف األخضر / ثالثاا س م
، وتتبخر (بعملية النتح)تأخذ النباتات المياه من التربة وتقوم بنقلها عن طريق أوراقها الى الغالف الجوي , في فصل الصيف
ويساعد مجموع المياه المفقودة بواسطة التبخر النتحي على تبريد درجات حرارة الهواء . المياه أيضا من سطح التربة واألوراق
, أما في فصل الشتاء .آثار الجزر الحرارية في المناطق الحضرية تقليلويؤثر ذلك على . السقف المحيط بشكل فعال على مستوى
منع فقدان حرارة , وقوامها السطحي، على تقليل سرعة الرياح الباردة على السقف، وبالنتيجة لنباتاتاإلرتفاعات المختلفة ل تساعد
.(FEMP, 2004, P. 6)السطح عن طريقإضافية
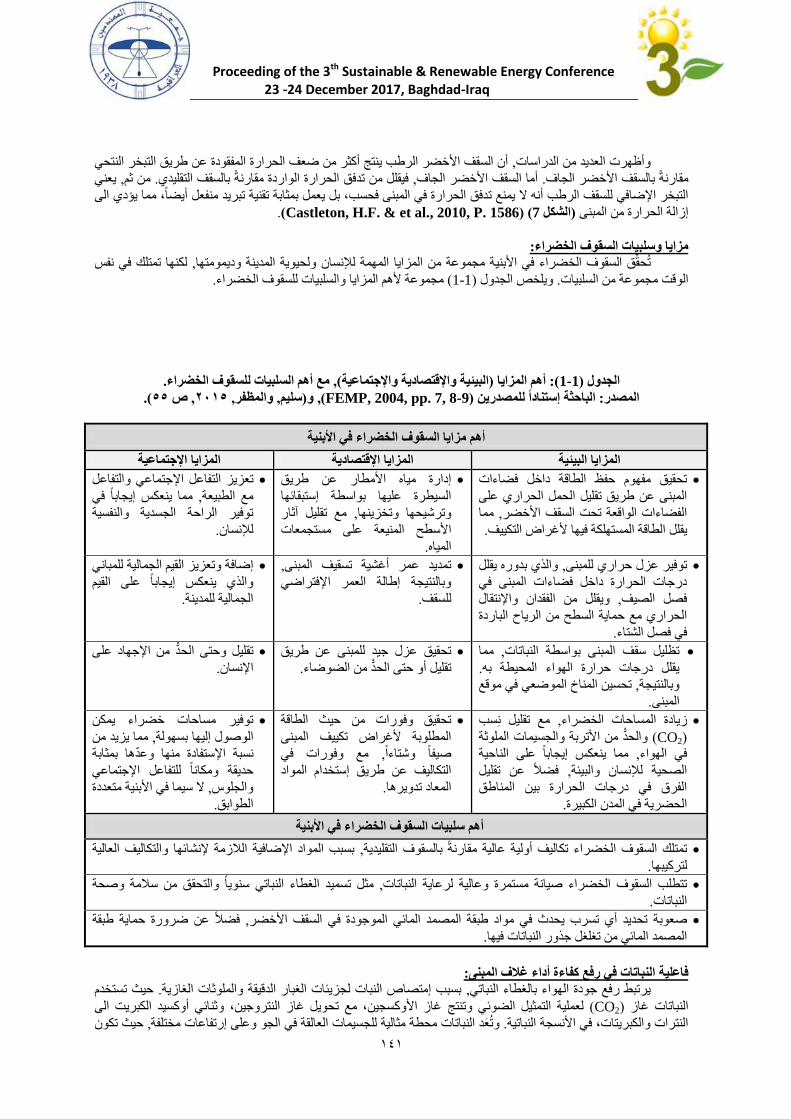
Proceeding of the 3th Sustainable & Renewable Energy Conference 23 -24 December 2017, Baghdad-Iraq
848
أن السقف األخضر الرطب ينتج أكثر من ضعف الحرارة المفقودة عن طريق التبخر النتحي ,تاعديد من الدراسأظهرت الو
يعني , من ثم. فيقلل من تدفق الحرارة الواردة مقارنة بالسقف التقليدي, أما السقف األخضر الجاف. مقارنة بالسقف األخضر الجاف
، مما يؤدي الى أيضا دفق الحرارة في المبنى فحسب، بل يعمل بمثابة تقنية تبريد منفعلالتبخر اإلضافي للسقف الرطب أنه ال يمنع ت
.(Castleton, H.F. & et al., 2010, P. 1586) (7شكل ال)إزالة الحرارة من المبنى
:السقوف الخضراءوسلبيات مزايا
في نفس تمتلك لكنها, ولحيوية المدينة وديمومتهاتحقق السقوف الخضراء في األبنية مجموعة من المزايا المهمة لإلنسان
.والسلبيات للسقوف الخضراء المزايا ألهم مجموعة( 1-1)الجدول ص يلخو .مجموعة من السلبيات الوقت
.الخضراءمع أهم السلبيات للسقوف , (البيئية واإلقتصادية واإلجتماعية)أهم المزايا (: 1-1)الجدول
(.22ص , 5102, والمظفر, سليم)و, (FEMP, 2004, pp. 7, 8-9)الباحثة إستناداا للمصدرين : المصدر
أهم مزايا السقوف الخضراء في األبنية
المزايا اإلجتماعية المزايا اإلقتصادية المزايا البيئية
تحقيق مفهوم حفظ الطاقة داخل فضاءات
المبنى عن طريق تقليل الحمل الحراري على
مما , الفضاءات الواقعة تحت السقف األخضر
.الطاقة المستهلكة فيها ألغراض التكييف يقلل
إدارة مياه األمطار عن طريق
السيطرة عليها بواسطة إستبقائها
مع تقليل آثار , وترشيحها وتخزينها
منيعة على مستجمعات األسطح ال
.المياه
تعزيز التفاعل اإلجتماعي والتفاعل
مما ينعكس إيجابا في , مع الطبيعة
توفير الراحة الجسدية والنفسية
.لإلنسان
ل يقل والذي بدوره, توفير عزل حراري للمبنى
في المبنى درجات الحرارة داخل فضاءات
ويقلل من الفقدان واإلنتقال , فصل الصيف
الحراري مع حماية السطح من الرياح الباردة
. في فصل الشتاء
تمديد عمر أغشية تسقيف المبنى ,
وبالنتيجة إطالة العمر اإلفتراضي
.للسقف
إضافة وتعزيز القيم الجمالية للمباني
والذي ينعكس إيجابا على القيم
.الجمالية للمدينة
مما , سقف المبنى بواسطة النباتاتتظليل
. يقلل درجات حرارة الهواء المحيطة به
تحسين المناخ الموضعي في موقع , وبالنتيجة
.المبنى
تحقيق عزل جيد للمبنى عن طريق
.تقليل أو حتى الحد من الضوضاء
تقليل وحتى الحد من اإلجهاد على
.اإلنسان
ب سمع تقليل ن , زيادة المساحات الخضراء
(CO2 ) والحد من األتربة والجسيمات الملوثة
مما ينعكس إيجابا على الناحية , في الهواء
فضال عن تقليل , الصحية لإلنسان والبيئة
الفرق في درجات الحرارة بين المناطق
.الحضرية في المدن الكبيرة
تحقيق وفورات من حيث الطاقة
المطلوبة ألغراض تكييف المبنى
مع وفورات في ,صيفا وشتاءا
التكاليف عن طريق إستخدام المواد
.المعاد تدويرها
توفير مساحات خضراء يمكن
مما يزيد من , الوصول إليها بسهولة
نسبة اإلستفادة منها وعدها بمثابة
حديقة ومكانا للتفاعل اإلجتماعي
ال سيما في األبنية متعددة , والجلوس
.الطوابق
في األبنيةأهم سلبيات السقوف الخضراء
بسبب المواد اإلضافية الالزمة إلنشائها والتكاليف العالية , تمتلك السقوف الخضراء تكاليف أولية عالية مقارنة بالسقوف التقليدية
.لتركيبها
مثل تسميد الغطاء النباتي سنويا والتحقق من سالمة وصحة , لرعاية النباتات مستمرة وعالية تتطلب السقوف الخضراء صيانة
.النباتات
فضال عن ضرورة حماية طبقة , تحديد أي تسرب يحدث في مواد طبقة المصمد المائي الموجودة في السقف األخضر صعوبة
.المصمد المائي من تغلغل جذور النباتات فيها
:النباتات في رفع كفاءة أداء غالف المبنى فاعلية
حيث تستخدم. الملوثات الغازيةو الدقيقةبسبب إمتصاص النبات لجزيئات الغبار , يرتبط رفع جودة الهواء بالغطاء النباتي
غاز األوكسجين، مع تحويل غاز النتروجين، وثنائي أوكسيد الكبريت الى تنتجو الضوئيلعملية التمثيل ( CO2)النباتات غاز
حيث تكون , وتعد النباتات محطة مثالية للجسيمات العالقة في الجو وعلى إرتفاعات مختلفة. النترات والكبريتات، في األنسجة النباتية
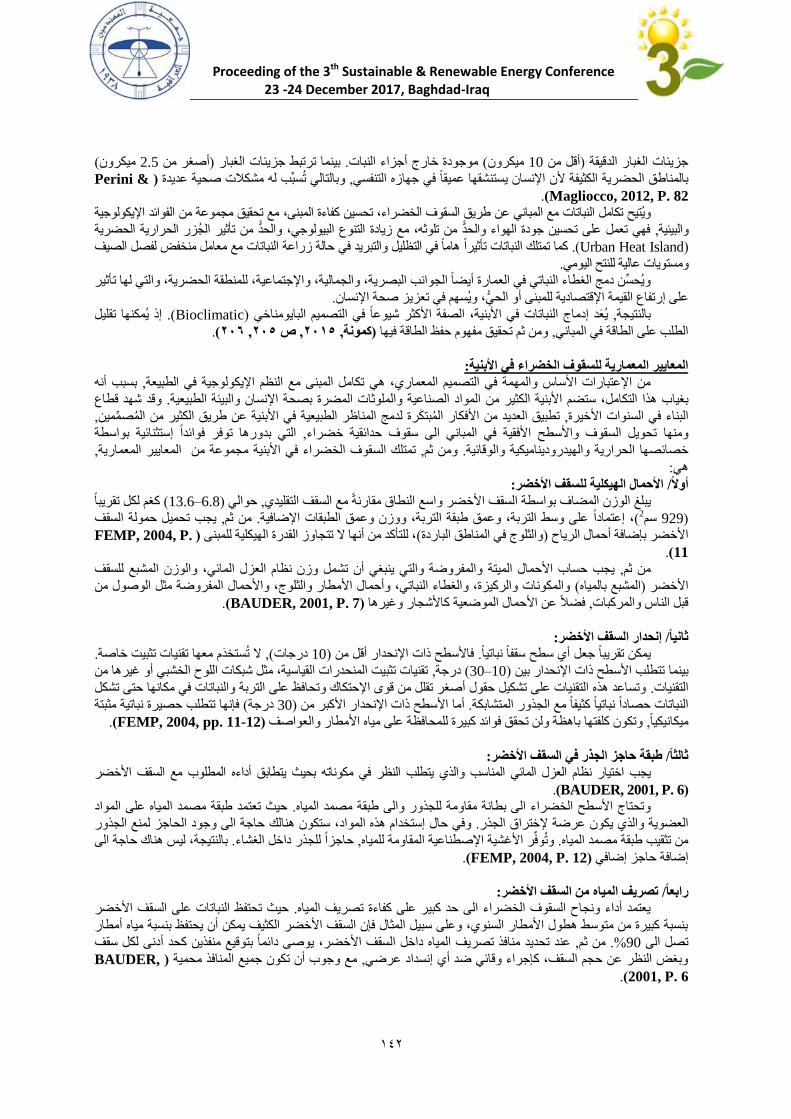
Proceeding of the 3th Sustainable & Renewable Energy Conference 23 -24 December 2017, Baghdad-Iraq
841
( ميكرون 2.5أصغر من )بينما ترتبط جزيئات الغبار . موجودة خارج أجزاء النبات( ميكرون 10أقل من )جزيئات الغبار الدقيقة
& Perini)مشكالت صحية عديدة له تسبب وبالتالي ,عميقا في جهازه التنفسي يستنشقهااإلنسان ألنبالمناطق الحضرية الكثيفة
Magliocco, 2012, P. 82).
الفوائد اإليكولوجية مجموعة من كفاءة المبنى، مع تحقيق ويتيح تكامل النباتات مع المباني عن طريق السقوف الخضراء، تحسين
زيادة التنوع البيولوجي، والحد من تأثير الجزر الحرارية الحضرية مع ة الهواء والحد من تلوثه، جودفهي تعمل على تحسين ,والبيئية
(Urban Heat Island .)حالة زراعة النباتات مع معامل منخفض لفصل الصيف كما تمتلك النباتات تأثيرا هاما في التظليل والتبريد في
.ومستويات عالية للنتح اليومي
يحسن دمج الغطاء النباتي في العمارة أيضا الجوانب البصرية، والجمالية، واإلجتماعية، للمنطقة الحضرية، والتي لها تأثير و
، ويسهم في تعزي .ز صحة اإلنسانعلى إرتفاع القيمة اإلقتصادية للمبنى أو الحي
إذ يمكنها تقليل (. Bioclimatic)يعد إدماج النباتات في األبنية، الصفة األكثر شيوعا في التصميم البايومناخي , بالنتيجة
.(512, 512ص , 5102, كمونة)ومن ثم تحقيق مفهوم حفظ الطاقة فيها , الطلب على الطاقة في المباني
:اء في األبنيةالمعايير المعمارية للسقوف الخضر
أنه بسبب , تكامل المبنى مع النظم اإليكولوجية في الطبيعة هيمن اإلعتبارات األساس والمهمة في التصميم المعماري،
شهد قطاع وقد . المواد الصناعية والملوثات المضرة بصحة اإلنسان والبيئة الطبيعية الكثير مناألبنية تضمبغياب هذا التكامل، س
مين, السنوات األخيرةالبناء في , تطبيق العديد من األفكار المبتكرة لدمج المناظر الطبيعية في األبنية عن طريق الكثير من المصم
بواسطة إستثنائية فوائدا التي بدورها توفر, تحويل السقوف واألسطح األفقية في المباني الى سقوف حدائقية خضراءمنها و
,المعايير المعماريةمجموعة من في األبنيةتمتلك السقوف الخضراء , ومن ثم. والوقائية اميكيةوالهيدرودين الحرارية خصائصها
:هي
:األحمال الهيكلية للسقف األخضر/ أولا
كغم لكل تقريبا ( 13.6–6.8)حوالي , الوزن المضاف بواسطة السقف األخضر واسع النطاق مقارنة مع السقف التقليدي يبلغ
سم 929)2يجب تحميل حمولة السقف , من ثم. على وسط التربة، وعمق طبقة التربة، ووزن وعمق الطبقات اإلضافية عتمادا إ، (
.FEMP, 2004, P)، للتأكد من أنها ال تتجاوز القدرة الهيكلية للمبنى (والثلوج في المناطق الباردة)األخضر بإضافة أحمال الرياح
11).
والمفروضة والتي ينبغي أن تشمل وزن نظام العزل المائي، والوزن المشبع للسقف يجب حساب األحمال الميتة , من ثم
والمكونات والركيزة، والغطاء النباتي، وأحمال األمطار والثلوج، واألحمال المفروضة مثل الوصول من ( المشبع بالمياه)األخضر
.(BAUDER, 2001, P. 7)فضال عن األحمال الموضعية كاألشجار وغيرها , قبل الناس والمركبات
:إنحدار السقف األخضر/ ثانياا
. ال تستخدم معها تقنيات تثبيت خاصة, (درجات 10)فاألسطح ذات اإلنحدار أقل من . نباتيا ا أي سطح سقفجعل تقريبا يمكن
تقنيات تثبيت المنحدرات القياسية، مثل شبكات اللوح الخشبي أو غيرها من ,درجة( 30–10)تتطلب األسطح ذات اإلنحدار بين بينما
وتساعد هذه التقنيات على تشكيل حقول أصغر تقلل من قوى اإلحتكاك وتحافظ على التربة والنباتات في مكانها حتى تشكل . التقنيات
حصيرة نباتية مثبتة فإنها تتطلب (درجة 30)نحدار األكبر من األسطح ذات اإل أما. النباتات حصادا نباتيا كثيفا مع الجذور المتشابكة
.(FEMP, 2004, pp. 11-12) وتكون كلفتها باهظة ولن تحقق فوائد كبيرة للمحافظة على مياه األمطار والعواصف, ميكانيكيا
:طبقة حاجز الجذر في السقف األخضر/ ثالثاا
يجب اختيار نظام العزل المائي المناسب والذي يتطلب النظر في مكوناته بحيث يتطابق أداءه المطلوب مع السقف األخضر
(BAUDER, 2001, P. 6).
حيث تعتمد طبقة مصمد المياه على المواد . تحتاج األسطح الخضراء الى بطانة مقاومة للجذور والى طبقة مصمد المياهو
حاجة الى وجود الحاجز لمنع الجذور ستكون هنالكوفي حال إستخدام هذه المواد، . عرضة إلختراق الجذرالعضوية والذي يكون
بالنتيجة، ليس هناك حاجة الى . حاجزا للجذر داخل الغشاء, وتوفر األغشية اإلصطناعية المقاومة للمياه. من تثقيب طبقة مصمد المياه
.(FEMP, 2004, P. 12)إضافة حاجز إضافي
:تصريف المياه من السقف األخضر/ رابعاا
حيث تحتفظ النباتات على السقف األخضر .يعتمد أداء ونجاح السقوف الخضراء الى حد كبير على كفاءة تصريف المياه
بنسبة كبيرة من متوسط هطول األمطار السنوي، وعلى سبيل المثال فإن السقف األخضر الكثيف يمكن أن يحتفظ بنسبة مياه أمطار
عند تحديد منافذ تصريف المياه داخل السقف األخضر، يوصى دائما بتوقيع منفذين كحد أدنى لكل سقف , من ثم%. 90تصل الى
,BAUDER)مع وجوب أن تكون جميع المنافذ محمية , وبغض النظر عن حجم السقف، كإجراء وقائي ضد أي إنسداد عرضي
2001, P. 6).
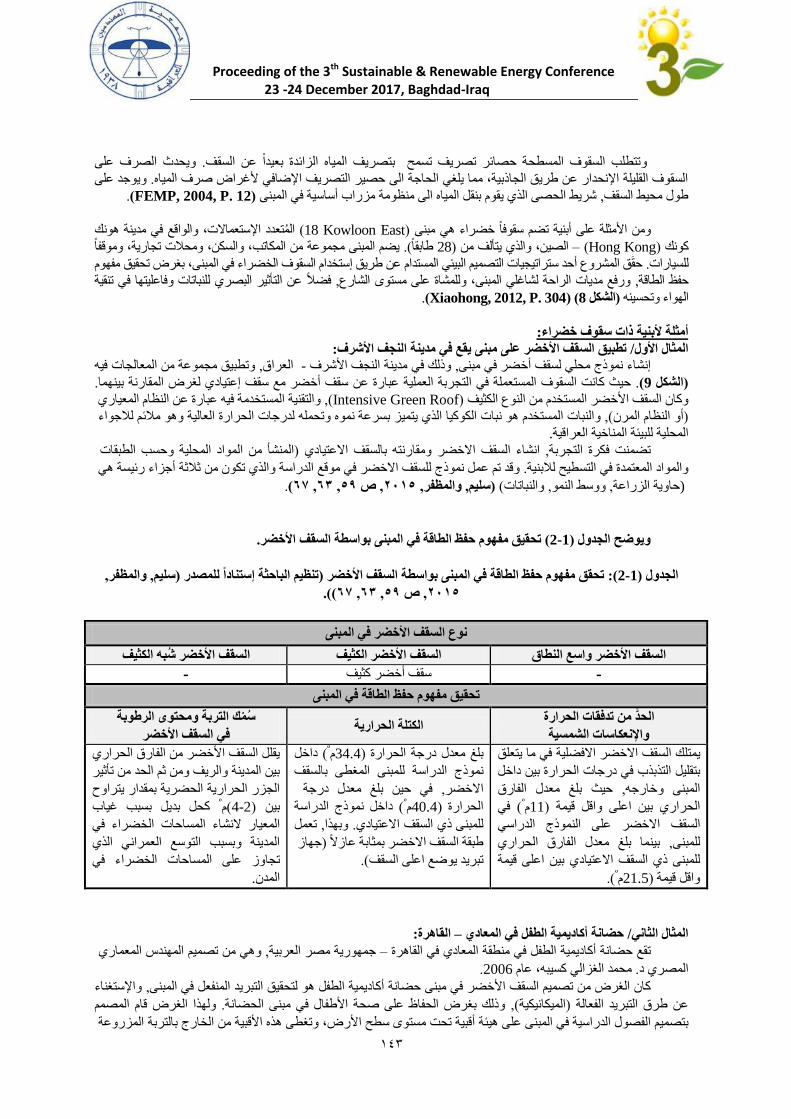
Proceeding of the 3th Sustainable & Renewable Energy Conference 23 -24 December 2017, Baghdad-Iraq
843
ويحدث الصرف على . بتصريف المياه الزائدة بعيدا عن السقفتتطلب السقوف المسطحة حصائر تصريف تسمح و
ويوجد على . السقوف القليلة اإلنحدار عن طريق الجاذبية، مما يلغي الحاجة الى حصير التصريف اإلضافي ألغراض صرف المياه
.(FEMP, 2004, P. 12)المياه الى منظومة مزراب أساسية في المبنى يقوم بنقل شريط الحصى الذي, طول محيط السقف
المتعدد اإلستعماالت، والواقع في مدينة هونك ( Kowloon East 18)مبنى هي تضم سقوفا خضراء ومن األمثلة على أبنية
يضم المبنى مجموعة من المكاتب، والسكن، ومحالت تجارية، وموقفا (. طابقا 28)الصين، والذي يتألف من –( Hong Kong)كونك
حقق المشروع أحد ستراتيجيات التصميم البيئي المستدام عن طريق إستخدام السقوف الخضراء في المبنى، بغرض تحقيق مفهوم . للسيارات
فضال عن التأثير البصري للنباتات وفاعليتها في تنقية , لشارعورفع مديات الراحة لشاغلي المبنى، وللمشاة على مستوى ا, حفظ الطاقة
.(Xiaohong, 2012, P. 304) (8الشكل )الهواء وتحسينه
:أمثلة ألبنية ذات سقوف خضراء
:تطبيق السقف األخضر على مبنى يقع في مدينة النجف األشرف/ المثال األول
وتطبيق مجموعة من المعالجات فيه ,العراق -مدينة النجف األشرف وذلك في , ر في مبنىأخض لسقف محلي نموذج إنشاء
.بينهما المقارنة لغرض إعتيادي مع سقف أخضر سقف عبارة عن العملية التجربة في المستعملة كانت السقوفحيث . (9الشكل )
المعياري النظام عن عبارةوالتقنية المستخدمة فيه , (Intensive Green Roof) الكثيف النوع من المستخدم األخضر السقفوكان
لالجواء مالئم وهو العالية الحرارة لدرجاتوتحمله نموه بسرعة يتميز الذي الكوكيا نبات هو المستخدم النباتو, (المرن النظام وأ)
.ة للبيئة المناخية العراقيةالمحلي
الطبقات وحسب المحلية المواد من المنشأ) االعتيادي بالسقف ومقارنته االخضر السقف انشاء, التجربة فكرة تضمنت
هي رئيسةأجزاء ثالثة من تكون والذي الدراسة موقع في االخضر للسقف نموذج عمل تموقد . لالبنية التسطيح في المعتمدة والمواد
.(26, 26, 25ص , 5102, والمظفر, سليم) (توالنباتا ,النمو ووسط, الزراعة حاوية (
.ق مفهوم حفظ الطاقة في المبنى بواسطة السقف األخضريتحق (1-2)ويوضح الجدول
, والمظفر, سليم)إستناداا للمصدر الباحثةتنظيم ) تحقق مفهوم حفظ الطاقة في المبنى بواسطة السقف األخضر(: 1-2)الجدول
(.(26, 26, 25ص , 5102
في المبنى نوع السقف األخضر
السقف األخضر ش به الكثيف السقف األخضر الكثيف واسع النطاقالسقف األخضر
- سقف أخضر كثيف-
بنىتحقيق مفهوم حفظ الطاقة في الم
الحد من تدفقات الحرارة
واإلنعكاسات الشمسية الكتلة الحرارية
ك التربة ومحتوى الرطوبة س م
في السقف األخضر
في ما يتعلق االفضلية االخضر السقف يمتلك
داخل في درجات الحرارة بين بتقليل التذبذب
الفارق بلغ معدل حيث, المبنى وخارجه
م11) اعلى واقل قيمة الحراري بينº
في (
الدراسي االخضر على النموذج السقف
الحراري بينما بلغ معدل الفارق, للمبنى
بين اعلى قيمة االعتيادي للمبنى ذي السقف
م21.5)قيمة واقلº
.)
م34.4)رارة الح درجة بلغ معدلº داخل (
بالسقف المغطى دراسة للمبنىال نموذج
درجة بلغ معدلفي حين ,االخضر
م40.4)رارة الحºدراسة ال نموذج داخل (
تعمل , وبهذا. ياالعتياد السقفي ذ للمبنى
جهاز) بمثابة عازال االخضر السقف طبقة
(.اعلى السقف يوضع تبريد
يقلل السقف األخضر من الفارق الحراري
بين المدينة والريف ومن ثم الحد من تأثير
الجزر الحرارية الحضرية بمقدار يتراوح
م(2-4)بين º
بسبب غياب بديل كحل
الخضراء في المساحات المعيار النشاء
المدينة وبسبب التوسع العمراني الذي
على المساحات الخضراء في تجاوز
.المدن
:القاهرة –حضانة أكاديمية الطفل في المعادي / المثال الثاني
تصميم المهندس المعماريوهي من , جمهورية مصر العربية –في منطقة المعادي في القاهرة الطفل أكاديمية حضانة تقع
. 2006عام كسيبه، الغزالي محمد. د المصري
واإلستغناء , هو لتحقيق التبريد المنفعل في المبنى الطفل أكاديمية في مبنى حضانة األخضر السقف تصميم من الغرض كان
م المصمم قا ولهذا الغرض. وذلك بغرض الحفاظ على صحة األطفال في مبنى الحضانة, (الميكانيكية)عن طرق التبريد الفعالة
المزروعة بالتربة الخارج وتغطى هذه األقبية من وى سطح األرض،مست أقبية تحت هيئة على الفصول الدراسية في المبنى بتصميم
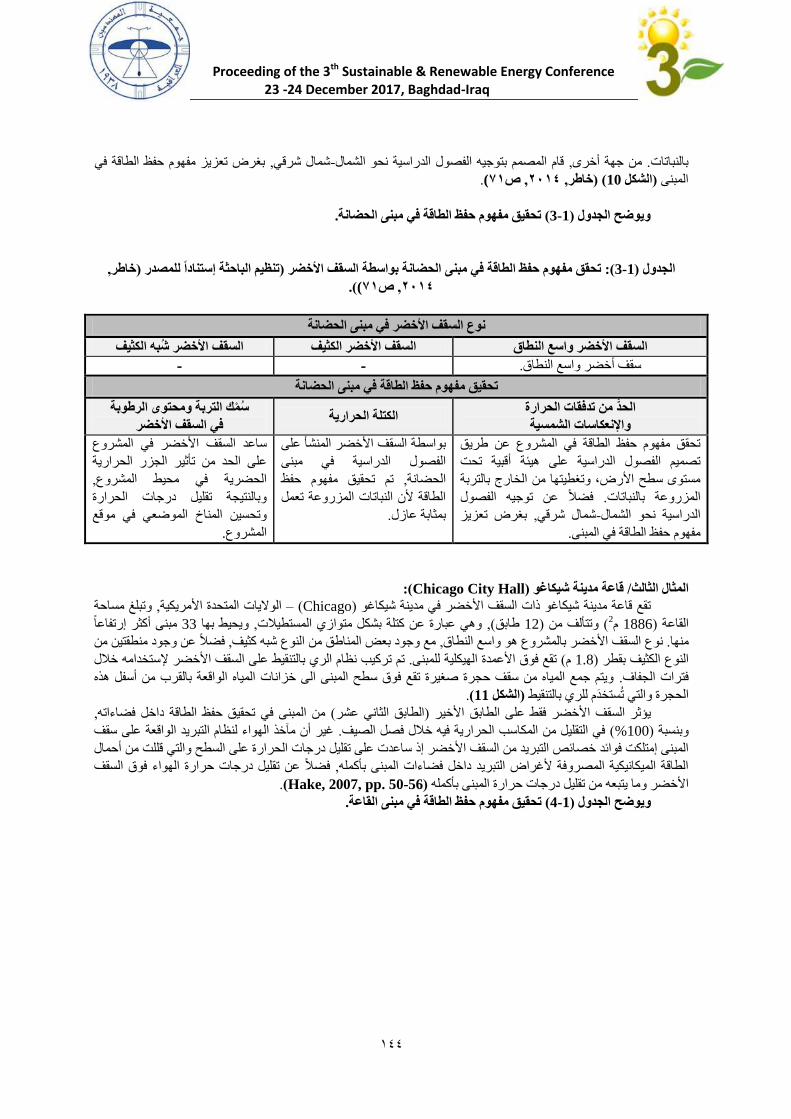
Proceeding of the 3th Sustainable & Renewable Energy Conference 23 -24 December 2017, Baghdad-Iraq
844
بغرض تعزيز مفهوم حفظ الطاقة في , شمال شرقي-الفصول الدراسية نحو الشمال بتوجيهقام المصمم , من جهة أخرى. بالنباتات
.)60ص, 5102, خاطر) (10الشكل )المبنى
.الحضانةق مفهوم حفظ الطاقة في مبنى يتحق (1-3)ويوضح الجدول
, خاطر)إستناداا للمصدر الباحثةتنظيم ) بواسطة السقف األخضرالحضانة تحقق مفهوم حفظ الطاقة في مبنى (: 1-3)الجدول
(.)60ص, 5102
في مبنى الحضانة نوع السقف األخضر
السقف األخضر ش به الكثيف األخضر الكثيف السقف واسع النطاقالسقف األخضر
- - .سقف أخضر واسع النطاق
مبنى الحضانةتحقيق مفهوم حفظ الطاقة في
الحد من تدفقات الحرارة
واإلنعكاسات الشمسية الكتلة الحرارية
ك التربة ومحتوى الرطوبة س م
في السقف األخضر
تحقق مفهوم حفظ الطاقة في المشروع عن طريق
أقبية تحت هيئة تصميم الفصول الدراسية على
مستوى سطح األرض، وتغطيتها من الخارج بالتربة
الفصول توجيهفضال عن . بالنباتات المزروعة
بغرض تعزيز , شمال شرقي-الدراسية نحو الشمال
.مفهوم حفظ الطاقة في المبنى
األخضر المنشأ على بواسطة السقف
الفصول الدراسية في مبنى
تم تحقيق مفهوم حفظ , الحضانة
الطاقة ألن النباتات المزروعة تعمل
.بمثابة عازل
ساعد السقف األخضر في المشروع
على الحد من تأثير الجزر الحرارية
, الحضرية في محيط المشروع
وبالنتيجة تقليل درجات الحرارة
في موقع وتحسين المناخ الموضعي
.المشروع
(:Chicago City Hall)قاعة مدينة شيكاغو / لثالمثال الثا
وتبلغ مساحة , الواليات المتحدة األمريكية –( Chicago)تقع قاعة مدينة شيكاغو ذات السقف األخضر في مدينة شيكاغو
م 1886)القاعة 2
مبنى أكثر إرتفاعا 33ويحيط بها , وهي عبارة عن كتلة بشكل متوازي المستطيالت, (طابق 12)وتتألف من (
فضال عن وجود منطقتين من , شبه كثيف من النوعمع وجود بعض المناطق ,واسع النطاق هوالسقف األخضر بالمشروع نوع. منها
تركيب نظام الري بالتنقيط على السقف األخضر إلستخدامه خالل تم . تقع فوق األعمدة الهيكلية للمبنى( م 1.8)النوع الكثيف بقطر
ويتم جمع المياه من سقف حجرة صغيرة تقع فوق سطح المبنى الى خزانات المياه الواقعة بالقرب من أسفل هذه . فترات الجفاف
.(11الشكل ) الحجرة والتي تستخدم للري بالتنقيط
, من المبنى في تحقيق حفظ الطاقة داخل فضاءاته( الطابق الثاني عشر) يؤثر السقف األخضر فقط على الطابق األخير
غير أن مآخذ الهواء لنظام التبريد الواقعة على سقف . في التقليل من المكاسب الحرارية فيه خالل فصل الصيف( 100%)وبنسبة
حرارة على السطح والتي قللت من أحمال ساعدت على تقليل درجات ال إذالمبنى إمتلكت فوائد خصائص التبريد من السقف األخضر
فضال عن تقليل درجات حرارة الهواء فوق السقف , الطاقة الميكانيكية المصروفة ألغراض التبريد داخل فضاءات المبنى بأكمله
. (Hake, 2007, pp. 50-56) األخضر وما يتبعه من تقليل درجات حرارة المبنى بأكمله
.القاعةق مفهوم حفظ الطاقة في مبنى يتحق (1-4)ويوضح الجدول
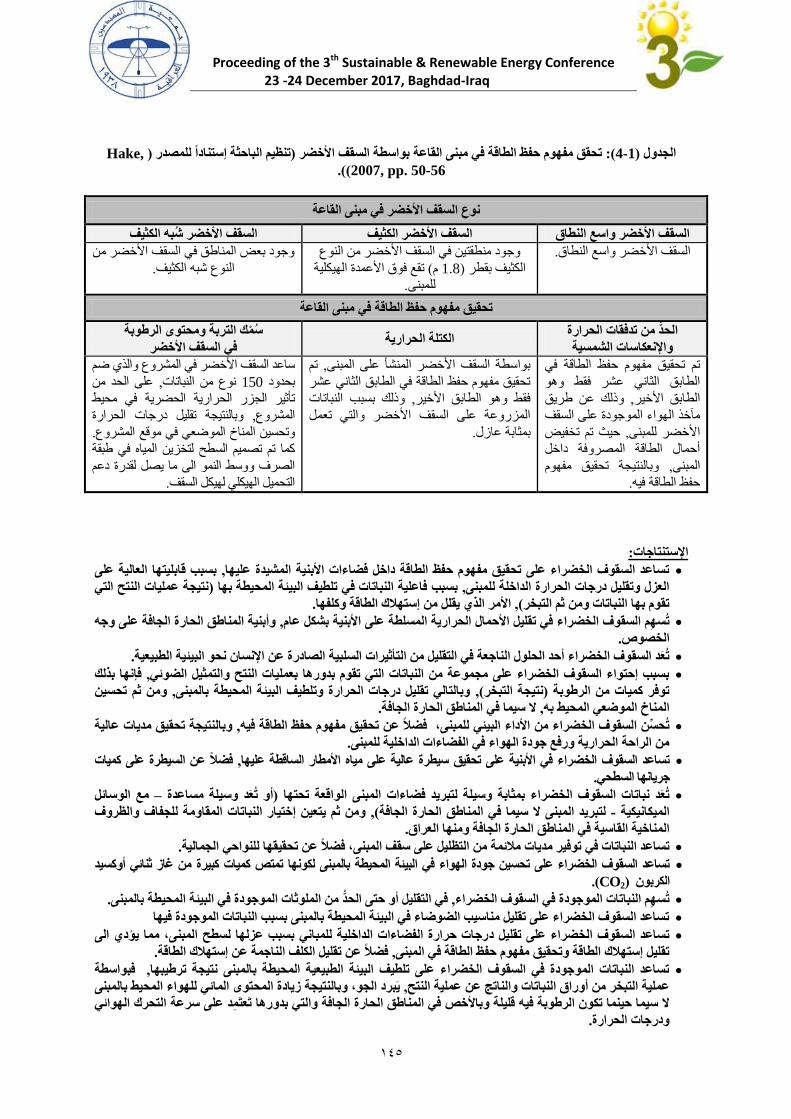
Proceeding of the 3th Sustainable & Renewable Energy Conference
23 -24 December 2017, Baghdad-Iraq
841
,Hake)إستناداا للمصدر الباحثةتنظيم ) بواسطة السقف األخضرالقاعة تحقق مفهوم حفظ الطاقة في مبنى(: 1-4)الجدول
2007, pp. 50-56).)
في مبنى القاعة نوع السقف األخضر
السقف األخضر ش به الكثيف السقف األخضر الكثيف واسع النطاقالسقف األخضر
وجود منطقتين في السقف األخضر من النوع .واسع النطاقالسقف األخضر
تقع فوق األعمدة الهيكلية ( م 1.8)الكثيف بقطر
.للمبنى
وجود بعض المناطق في السقف األخضر من
.الكثيف شبه النوع
مبنى القاعةتحقيق مفهوم حفظ الطاقة في
الحد من تدفقات الحرارة
واإلنعكاسات الشمسية الكتلة الحرارية
ك التربة ومحتوى الرطوبة س م
في السقف األخضر
تم تحقيق مفهوم حفظ الطاقة في
الطابق الثاني عشر فقط وهو
وذلك عن طريق , الطابق األخير
سقف المآخذ الهواء الموجودة على
حيث تم تخفيض , لمبنىاألخضر ل
أحمال الطاقة المصروفة داخل
وبالنتيجة تحقيق مفهوم , المبنى
.حفظ الطاقة فيه
تم , بواسطة السقف األخضر المنشأ على المبنى
تحقيق مفهوم حفظ الطاقة في الطابق الثاني عشر
وذلك بسبب النباتات , فقط وهو الطابق األخير
المزروعة على السقف األخضر والتي تعمل
.عازلثابة بم
والذي ضم ساعد السقف األخضر في المشروع
على الحد من , نوع من النباتات 150بحدود
محيط تأثير الجزر الحرارية الحضرية في
تقليل درجات الحرارة وبالنتيجة, المشروع
.في موقع المشروعالموضعي تحسين المناخو
كما تم تصميم السطح لتخزين المياه في طبقة
الصرف ووسط النمو الى ما يصل لقدرة دعم
.التحميل الهيكلي لهيكل السقف
:اإلستنتاجات
العالية على بسبب قابليتها , دة عليهاياألبنية المشفضاءات تساعد السقوف الخضراء على تحقيق مفهوم حفظ الطاقة داخل
نتيجة عمليات النتح التي )بسبب فاعلية النباتات في تلطيف البيئة المحيطة بها , العزل وتقليل درجات الحرارة الداخلة للمبنى
.األمر الذي يقلل من إستهالك الطاقة وكلفها, (تقوم بها النباتات ومن ثم التبخر
وأبنية المناطق الحارة الجافة على وجه , ة بشكل عامسلطة على األبنيحمال الحرارية المت سهم السقوف الخضراء في تقليل األ
.الخصوص
ت عد السقوف الخضراء أحد الحلول الناجعة في التقليل من التأثيرات السلبية الصادرة عن اإلنسان نحو البيئية الطبيعية.
فإنها بذلك , يات النتح والتمثيل الضوئيبسبب إحتواء السقوف الخضراء على مجموعة من النباتات التي تقوم بدورها بعمل
ومن ثم تحسين ,وبالتالي تقليل درجات الحرارة وتلطيف البيئة المحيطة بالمبنى, (نتيجة التبخر)توفر كميات من الرطوبة
.ل سيما في المناطق الحارة الجافة ,المناخ الموضعي المحيط به
،وبالنتيجة تحقيق مديات عالية , فضالا عن تحقيق مفهوم حفظ الطاقة فيه ت حسن السقوف الخضراء من األداء البيئي للمبنى
.من الراحة الحرارية ورفع جودة الهواء في الفضاءات الداخلية للمبنى
فضالا عن السيطرة على كميات , تساعد السقوف الخضراء في األبنية على تحقيق سيطرة عالية على مياه األمطار الساقطة عليها
.طحيجريانها الس
مع الوسائل –أو ت عد وسيلة مساعدة )ت عد نباتات السقوف الخضراء بمثابة وسيلة لتبريد فضاءات المبنى الواقعة تحتها
ومن ثم يتعين إختيار النباتات المقاومة للجفاف والظروف , (لتبريد المبنى ل سيما في المناطق الحارة الجافة -الميكانيكية
.ناطق الحارة الجافة ومنها العراقالمناخية القاسية في الم
توفير مديات مالئمة من التظليل على سقف المبنى، فضالا عن تحقيقها للنواحي الجماليةتساعد النباتات في.
من غاز ثنائي أوكسيد تساعد السقوف الخضراء على تحسين جودة الهواء في البيئة المحيطة بالمبنى لكونها تمتص كميات كبيرة
(.CO2)الكربون
في التقليل أو حتى الحد من الملوثات الموجودة في البيئة المحيطة بالمبنى, السقوف الخضراءت سهم النباتات الموجودة في.
تساعد السقوف الخضراء على تقليل مناسيب الضوضاء في البيئة المحيطة بالمبنى بسبب النباتات الموجودة فيها
رجات حرارة الفضاءات الداخلية للمباني بسبب عزلها لسطح المبنى، مما يؤدي الى تساعد السقوف الخضراء على تقليل د
. فضالا عن تقليل الكلف الناجمة عن إستهالك الطاقة, تقليل إستهالك الطاقة وتحقيق مفهوم حفظ الطاقة في المبنى
فبواسطة , المبنى نتيجة ترطيبهاتساعد النباتات الموجودة في السقوف الخضراء على تلطيف البيئة الطبيعية المحيطة ب
يبرد الجو، وبالنتيجة زيادة المحتوى المائي للهواء المحيط بالمبنى , عملية التبخر من أوراق النباتات والناتج عن عملية النتح
رك الهوائي ل سيما حينما تكون الرطوبة فيه قليلة وباألخص في المناطق الحارة الجافة والتي بدورها تعتمد على سرعة التح
.ودرجات الحرارة
Proceeding of the 3th Sustainable & Renewable Energy Conference
23 -24 December 2017, Baghdad-Iraq
841
ت ساهم نباتات السقوف الخضراء في تقليل مناسيب الضوضاء المحيطة بالمبنى.
في المناطق الحضرية المكتظة باألبنية والمساحات ل سيما , تأثير الجزر الحرارية الحضرية ت سهم السقوف الخضراء في تقليل
تسبب الكثير من عمليات التبخر الناتجة عن نتح النباتات، مما يؤدي الى تبريد البيئة الخارجية المحيطة نهاأل ,المرصوفة
. بالمبنى
ظاهرة عملية وفع الة لتحقيق مفهوم حفظ الطاقة في األبنية, ي عد تزايد ظهور تقنية السقوف الخضراء المنفعلة في األبنية ,
.ومن ثم ترشيد إستهالك الطاقة فيها
وذلك بسبب, ت عد السقوف الخضراء واسعة النطاق األكثر إستخداماا في المباني:
كفاءة أدائها الحراري والبيئي مع الحد األدنى من الم دخالت .
خفة وزن السقوف الخضراء واسعة النطاق والذي ي حقق أحمالا إضافية قليلة على المبنى.
قليلة جداا مقارنةا ببقية أنواع السقوف الخضراء, النطاقالسقوف الخضراء واسعة متطلبات صيانة.
:المصادر
دراسة لزراعة أسطح المباني القائمة في المناطق ذات الكثافة : األسطح الخضراء في اإلسكان. 4102, دينا عيد سعيد, خاطر .0, جامعة القاهرة –قسم الهندسة المعمارية ,التخطيط والتصميم البيئي –رسالة ماجستير في الهندسة المعمارية , السكانية العالية
. جمهورية مصر العربية
دراسة مقارنة لتأثير السقوف الخضراء في المناخ المحلي . 4102, أحمد فائق عبد الرسول, والمظفر, يونس محمود, سليم .5 .العراق –بغداد , 4102سنة , 1العدد , 10المجلد , المجلة العراقية للهندسة المعمارية, لمدينة النجف األشرف
, أطروحة دكتوراه, منظومات العمارة الخضراء في التصميم البيئي المستدام. 4102, غادة محمد اسماعيل عبد الرزاق, كمونة .6
. العراق –بغداد , جامعة بغداد –قسم هندسة العمارة
4. BAUDER, 2001. Green Roof: Design Consideration, Bauder Limited, United Kingdom.
5. Bauer, Michael & et al., 2010. Green Building - Guidebook for Sustainable Architecture,
Springer-Verlag Berlin Heidelberg, Stuttgart – Germany.
6. Castleton, H.F. & et al., 2010. Green Roofs; Building Energy Savings and the Potential for
Retrofit, Energy and Buildings 42 (2010), pp. 1582–1591, Published by ELSEVIER, UK.
7. FEMP, 2004. Green Roofs, Federal Energy Management Program, Federal Technology Alert: A
New Technology Demonstration Publication DOE/EE-0298, Produced for the U.S. Department
of Energy, Energy Efficiency and Renewable Energy, by the National Renewable Energy
Laboratory, USA.
8. Garrison, Noah & Horowitz, Cara, 2012. Looking Up: How Green Roofs and Cool Roofs Can
Reduce Energy Use, Address Climate Change, and Protect Water Resources in Southern
California, Natural Resources Defense Council (NRDC) Report, Emmett Center on Climate
Change and the Environment, UCLA School of Low, USA.
9. Hake, Aubrey, 2007. Promoting Sustainable Green Roofs through Leadership in Energy and
Environmental Design (LEED), a Thesis Submitted in Partial Fulfillment of the Requirements
for the Degree Master of Landscape Architecture, Department of Landscape Architecture,
Regional & Community Planning, College of Architecture, Planning and Design, Kansas State
University, Manhattan – USA.
10. Hong, Wen & et al., 2007. Building Energy Efficiency: Why Green Buildings are Key to Asia’s
Future, Asia Business Council Book, China.
11. Lehmann, Steffen, 2007. Sustainability on the Urban Scale: Green Urbanism, International
Conference on Sustainable Architectural Design & Urban Planning, Hanoi Architectural University, (15-
16) May 2007, Vietnam.
12. Perini, Katia, & Magliocco, Adriano, 2012. The Integration of Vegetation in Architecture,
Vertical and Horizontal Greened Surfaces, International Journal of Biology, Volume 4, Number
2, Genoa – Italy.
13. Pevzner, Amy, 2013. Living Architecture: Green Roofs for Public Buildings, A Strategy for
Smarter Roofing Decisions, Energy & Sustainability / Safety & Environmental Branch Facilities
Management & Services Progra, USA.
14. Taylor, Brian, 2010. Green Roofs: Restoring Urban Landscapes One Roof at a Time, LID
Workshop, Puyallup, Magnusson Klemencic Associates, USA.
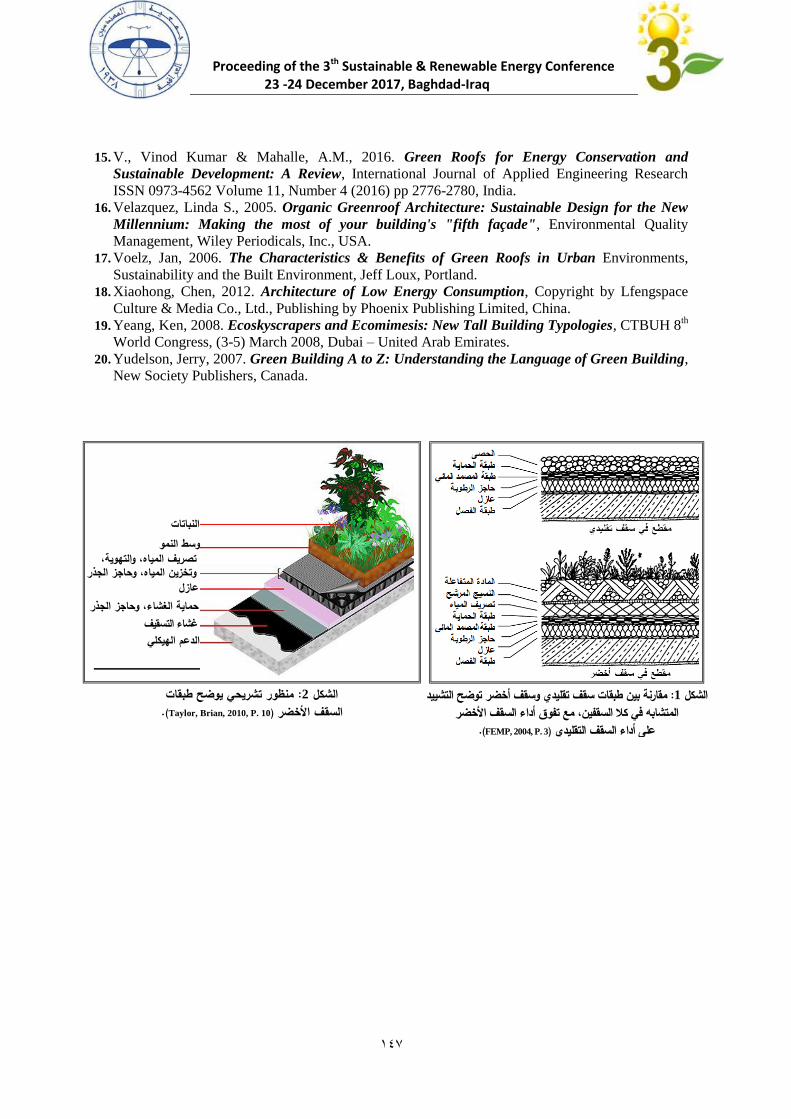
Proceeding of the 3th Sustainable & Renewable Energy Conference
23 -24 December 2017, Baghdad-Iraq
841
15. V., Vinod Kumar & Mahalle, A.M., 2016. Green Roofs for Energy Conservation and
Sustainable Development: A Review, International Journal of Applied Engineering Research
ISSN 0973-4562 Volume 11, Number 4 (2016) pp 2776-2780, India.
16. Velazquez, Linda S., 2005. Organic Greenroof Architecture: Sustainable Design for the New
Millennium: Making the most of your building's "fifth façade", Environmental Quality
Management, Wiley Periodicals, Inc., USA.
17. Voelz, Jan, 2006. The Characteristics & Benefits of Green Roofs in Urban Environments,
Sustainability and the Built Environment, Jeff Loux, Portland.
18. Xiaohong, Chen, 2012. Architecture of Low Energy Consumption, Copyright by Lfengspace
Culture & Media Co., Ltd., Publishing by Phoenix Publishing Limited, China.
19. Yeang, Ken, 2008. Ecoskyscrapers and Ecomimesis: New Tall Building Typologies, CTBUH 8th
World Congress, (3-5) March 2008, Dubai – United Arab Emirates.
20. Yudelson, Jerry, 2007. Green Building A to Z: Understanding the Language of Green Building,
New Society Publishers, Canada.
التشييد توضحمقارنة بين طبقات سقف تقليدي وسقف أخضر : 1الشكل األخضر السقف أداء مع تفوق كال السقفين، في المتشابه
.(FEMP, 2004, P. 3)على أداء السقف التقليدي
منظور تشريحي يوضح طبقات : 2الشكل .(Taylor, Brian, 2010, P. 10) األخضرسقف ال
النباتات وسط النمو
التهوية،و ،تصريف المياه الجذر حاجزو المياه، تخزينو
عازل الجذر حاجزو ،حماية الغشاء غشاء التسقيف الدعم الهيكلي
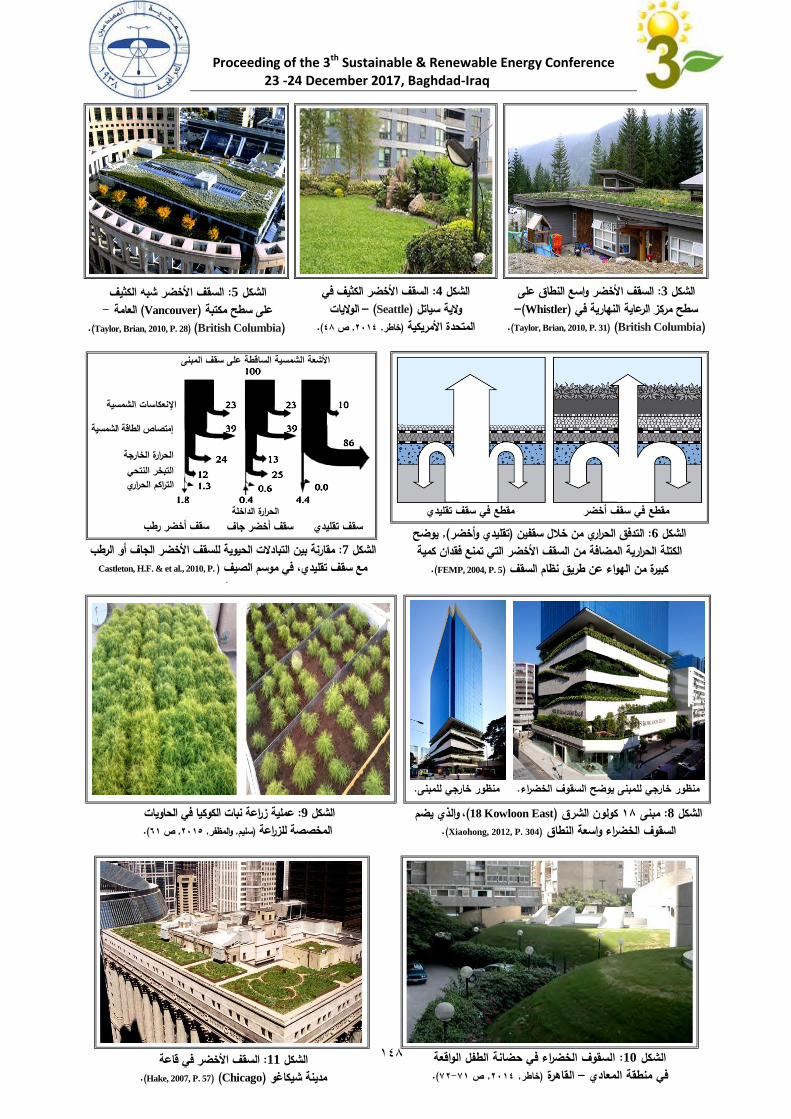
Proceeding of the 3th Sustainable & Renewable Energy Conference
23 -24 December 2017, Baghdad-Iraq
841
في خضر الكييفالسقف األ: 4الشكل الواليات –( Seattle) والية سياتل
.(24ص , 4102, خاطر)المتحدة األمريكية
على واسع النطاقالسقف األخضر : 3الشكل – (Whistler)ركز الرعاية النهارية في سطح م
(British Columbia )(Taylor, Brian, 2010, P. 31).
السقف األخضر شبه الكييف : 5الشكل - العامة( Vancouver) على سطح مكتبة
(British Columbia) (Taylor, Brian, 2010, P. 28).
الحاويات في الكوكيا نبات ة زراعةعملي: 9الشكل .(10ص , 4102, والمظفر, سليم) ة للزراعةالمخصص
والذي يضم ،(Kowloon East 18)كولون الشرق 04 بنىم: 8الشكل .(Xiaohong, 2012, P. 304) السقوف الخضراء واسعة النطاق
.بنىمنظور خارجي للم
.السقوف الخضراء خارجي للمبنى يوضحمنظور
مقارنة بين التبادالت الحيوية للسقف األخضر الجاف أو الرطب : 7الشكل .Castleton, H.F. & et al., 2010, P)في موسم الصيف مع سقف تقليدي،
1586).
األشعة الشمسية الساقطة على سقف المبنى
اإلنعكاسات الشمسية
إمتصاص الطاقة الشمسية
الحرارة الخارجة
الحرارة الداخلة
التبخر النتحي التراكم الحراري
يوضح ,(وأخضر تقليدي) ينسقف خالل من الحراري التدفق: 6الشكل سقف تقليدي سقف أخضر جاف سقف أخضر رطب فقدان كمية التي تمنع األخضر السقف من المضافة لحراريةا الكتلة
.(FEMP, 2004, P. 5) السقف عن طريق نظام الهواء من كبيرة
مقطع في سقف تقليدي مقطع في سقف أخضر
السقف األخضر في قاعة : 11الشكل .(Hake, 2007, P. 57)( Chicago)مدينة شيكاغو
الواقعة السقوف الخضراء في حضانة الطفل: 10الشكل .(14-10ص , 4102, خاطر)القاهرة –المعادي منطقة في
(ASA) العمارة المستدامةمحور تطبيقات
دراسات ال

Proceeding of the 3th Sustainable & Renewable Energy Conference
23 -24 December 2017, Baghdad-Iraq
051
سائل تصاميم البيوت المستدامة الصديقة للبيئة التابعة للشركات النفطية العراقيةو
مهندسين عالء محمد االسدي.ر .م
شركة نفط الشمال
:المقدمة
ضمن خطط شركة نفط الشمال ووزارة النفط العراقية توجد خطة توزيع قطع اراضي على منتسبي الشركة وتوجد افكار حول توزيعها
دعوة شركات محلية او دولية لتقديم عروضها لبناء تلك الوحدات السكنية ونحن هنا نضع مقترحنا البحثي حول التصميم االمثل فقط او
لبيوت صديقة للبيئة وواقعية يمكن انشاءها على ارض الواقع العراقي وتالئم المواصفات القياسية العراقية ورغبات الموظف العراقي
ا التصميم هو تقليل انبعاثات غاز ثاني اوكسيد الكربون وتقليل االحتباس الحراري وهي مشكلة عالمية والهدف من هذ, بشكل خاص
.تنعكس على كل العالم وليس العراق فحسب ومن هنا تكمن اهمية هذا البحث كونه يمس مشكلة جوهرية عالمية وليست فقط محلية
وكيفية تأثيرها على ( العوازل)د االولية والمواد المستخدمة في القواطع العازلة وتتوزع محاور البحث والتصميم حول مواد البناء والموا
تقليل استخدام التيار الكهربائي وتقليل استخدام اجهزة التبريد والتدفئة مما يقلل انبعاثات الكربون المضرة وتقليل كلفة االستهالك
ستفادة من اشعة الشمس في االنارة وسوف نتطرق كذلك الستخدامات نبات الكهربائي وكذلك اهمية زيادة المساحة المخصصة للشبابيك لال
.القنب في المواد العازلة في السقوف والحائط
وكذلك مصادر التيار الكهربائي هي من مصادر الطاقة النظيفة المتجددة مثل الطاقة الشمسية وطاقة الرياح والطاقة المستخلصة من
لبيئة بوضع الواح الطاقة الشمسية لتوليد الطاقة على اسطح الجدران الخارجية وتصميم القرميد يكون من القمامة وتمتاز البيوت الصديقة ل
وبذلك يصبح كل منزل مصدر للطاقة التي يستهلكها solar tiles techniquesالنوع المولد للطاقة الشمسية وهو مايعرف باسم
عتبر احدى اهداف حكومتنا السامية للوصول الى هدف التنمية الشاملة وحسب اهداف ويصبح هذا المشروع مثاال للتنمية المستدامة التي ت
.االمم المتحدة
كما تحتوي هذه البيوت الصديقة للبيئة على مقاييس للحرارة وسرعة الرياح والرطوبة النسبية ومعدات رصد الزالزل وتقنيات مقاومة
anti-earthquake foundation design صميم الرئيسي لدعامات المنزلل التالزالزل والظروف الجوية الغير طبيعية من خال
AEFDاو ما يعرف بالمختصر
.مما يقلل استهالك المياه الصالحة للشرب % 01وحتى مياه الصرف الصحي سوف تخضع لعمليات اعادة تدوير بنسبة
متر مربع 011الف دوالر للبيوت ذات المساحة 001واحد الى والنقطة االهم في هذا المشروع هو الكلفة حيث تصل كلفة المنزل ال
نواة لبناء صناعات صديقة للبيئة في العراق ورفع مستوى الوعي البيئي للمواطنين وكذلك ( اذا تمت الموافقة عليه)وسيكون هذا المشروع
الكلف وزيادة االهتمام بالبيئة وسيكون بصمة ايجابية سيرفع من المستوى المعيشي من خالل االعتماد على تقنيات حديثة تساهم في تقليل
.لوزارة النفط العراقية ولشركة نفط الشمال بشكل خاص
االثار البيئية للمباني
بأن المباني الكونكريتية التقليدية المنتشرة في شتى انحاء العالم مسئولة عن UNECتشير االبحاث الخاصة باللجنة البيئية لالمم المتحدة
من اجمالي استهالك المياه الصالحة للشرب في العالم ويقضي االنسان مامجموعه % 01ن اجمالي استخدام الطاقة و عن حوالي م% 05
وبذلك نجد ان هذه البنايات الكونكريتية , من معدل حياته داخل المباني سواء اثناء فترة العمل او في االستراحة او في البيوت % 08
اهمة بشكل غير مباشر في زيادة استهالك الطاقة التقليدية ممايسبب بشكل غير مباشر في زيادة استهالك الكربون التقليدية تؤدي الى المس
وانبعاثاته غير المرغوب فيها والمؤثرة سلبا على البيئة وهذا كان هو السبب وراء ابتكار البيوت او المباني الخضراء او ما يسمى
.بالمباني الصديقة للبيئة
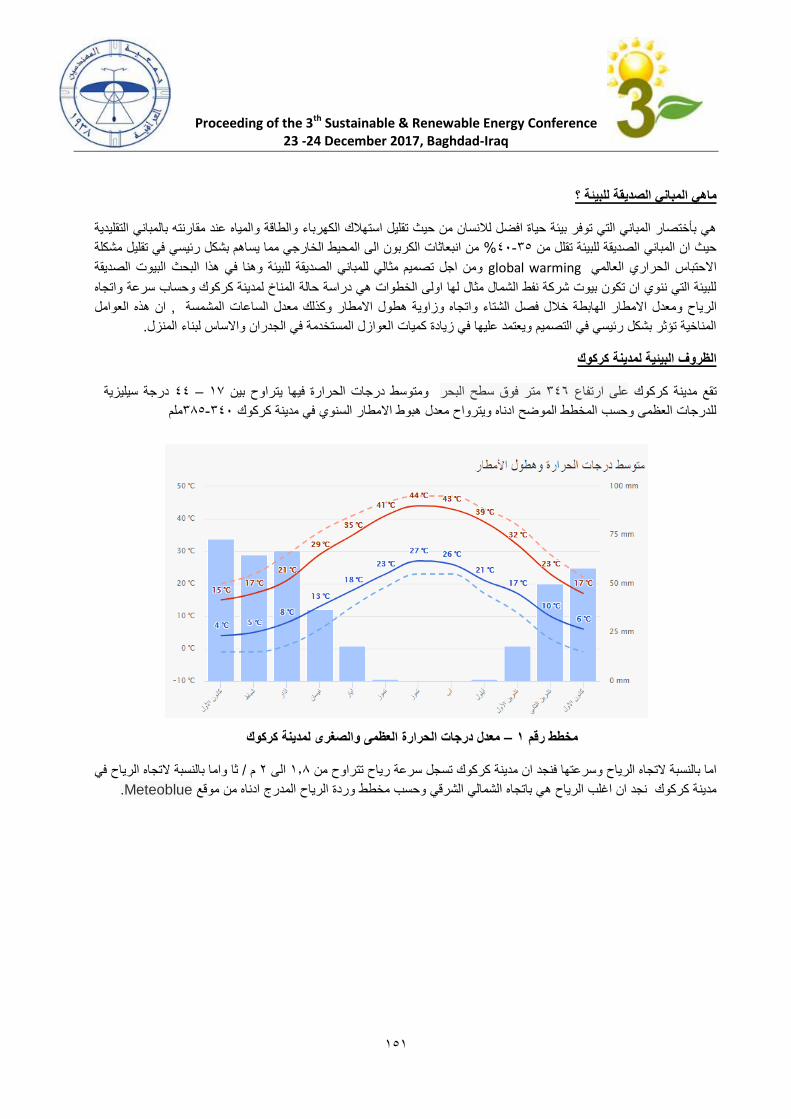
Proceeding of the 3th Sustainable & Renewable Energy Conference
23 -24 December 2017, Baghdad-Iraq
050
باني الصديقة للبيئة ؟ ماهي الم
دية هي بأختصار المباني التي توفر بيئة حياة افضل لالنسان من حيث تقليل استهالك الكهرباء والطاقة والمياه عند مقارنته بالمباني التقلي
في تقليل مشكلة من انبعاثات الكربون الى المحيط الخارجي مما يساهم بشكل رئيسي% 01-55حيث ان المباني الصديقة للبيئة تقلل من
ومن اجل تصميم مثالي للمباني الصديقة للبيئة وهنا في هذا البحث البيوت الصديقة global warmingاالحتباس الحراري العالمي
للبيئة التي ننوي ان تكون بيوت شركة نفط الشمال مثال لها اولى الخطوات هي دراسة حالة المناخ لمدينة كركوك وحساب سرعة واتجاه
ان هذه العوامل , ياح ومعدل االمطار الهابطة خالل فصل الشتاء واتجاه وزاوية هطول االمطار وكذلك معدل الساعات المشمسة الر
.المناخية تؤثر بشكل رئيسي في التصميم ويعتمد عليها في زيادة كميات العوازل المستخدمة في الجدران واالساس لبناء المنزل
الظروف البيئية لمدينة كركوك
درجة سيليزية 00 – 08ومتوسط درجات الحرارة فيها يتراوح بين متر فوق سطح البحر 503على ارتفاع تقع مدينة كركوك
ملم 505-501للدرجات العظمى وحسب المخطط الموضح ادناه ويترواح معدل هبوط االمطار السنوي في مدينة كركوك
معدل درجات الحرارة العظمى والصغرى لمدينة كركوك – 1مخطط رقم
ثا واما بالنسبة التجاه الرياح في / م 0الى 0.0اما بالنسبة التجاه الرياح وسرعتها فنجد ان مدينة كركوك تسجل سرعة رياح تتراوح من
.Meteoblue درج ادناه من موقعمدينة كركوك نجد ان اغلب الرياح هي باتجاه الشمالي الشرقي وحسب مخطط وردة الرياح الم
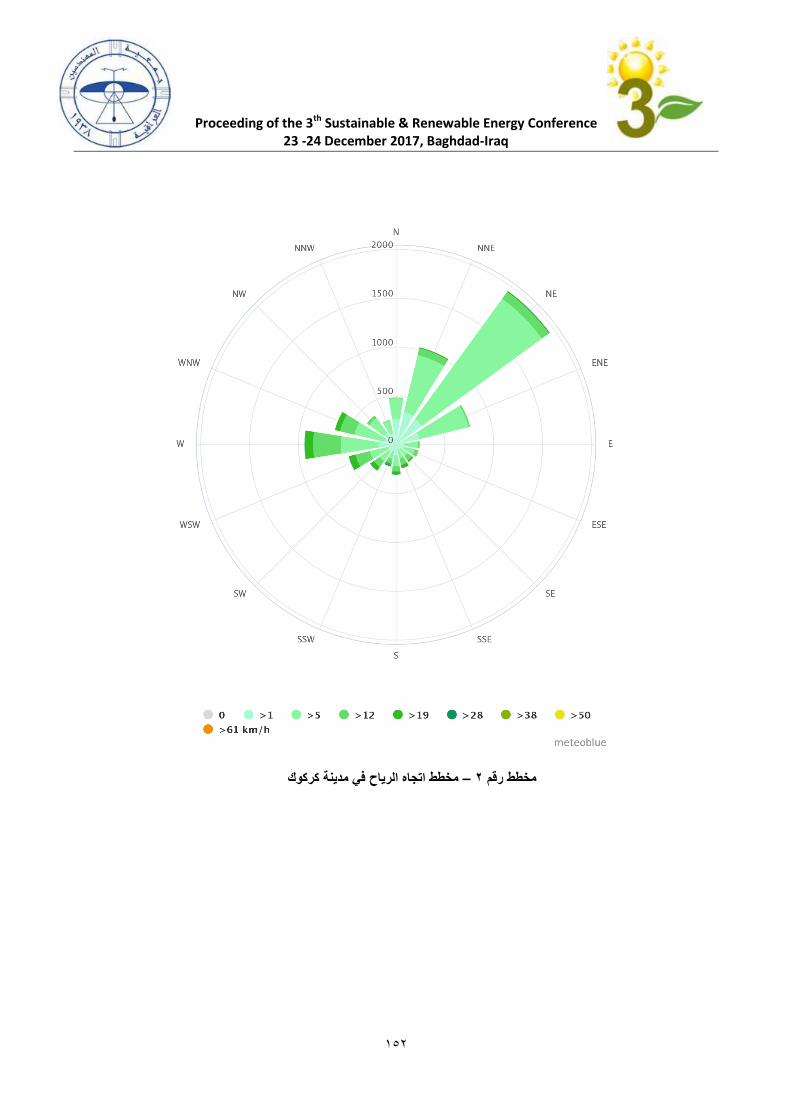
Proceeding of the 3th Sustainable & Renewable Energy Conference
23 -24 December 2017, Baghdad-Iraq
050
مخطط اتجاه الرياح في مدينة كركوك – 2مخطط رقم
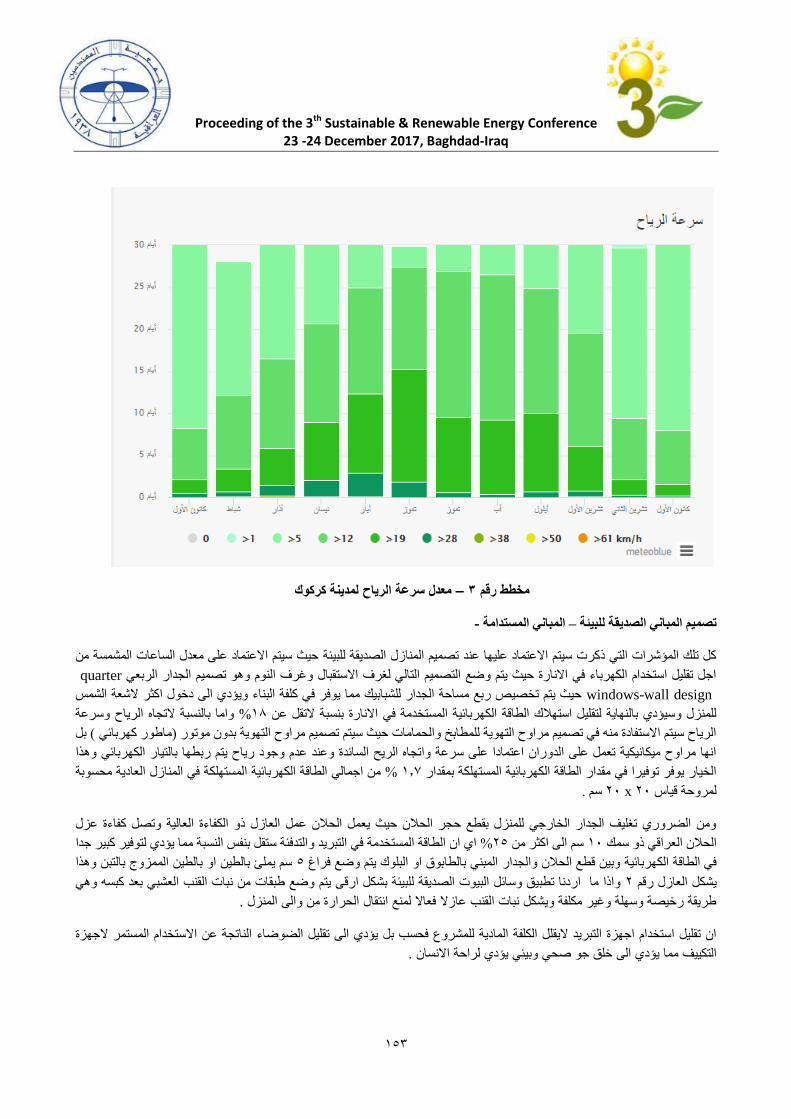
Proceeding of the 3th Sustainable & Renewable Energy Conference
23 -24 December 2017, Baghdad-Iraq
055
معدل سرعة الرياح لمدينة كركوك – 3مخطط رقم
-المباني المستدامة –تصميم المباني الصديقة للبيئة
حيث سيتم االعتماد على معدل الساعات المشمسة من كل تلك المؤشرات التي ذكرت سيتم االعتماد عليها عند تصميم المنازل الصديقة للبيئة
quarter اجل تقليل استخدام الكهرباء في االنارة حيث يتم وضع التصميم التالي لغرف االستقبال وغرف النوم وهو تصميم الجدار الربعي
windows-wall design ؤدي الى دخول اكثر الشعة الشمس حيث يتم تخصيص ربع مساحة الجدار للشبابيك مما يوفر في كلفة البناء وي
واما بالنسبة التجاه الرياح وسرعة % 81للمنزل وسيؤدي بالنهاية لتقليل استهالك الطاقة الكهربائية المستخدمة في االنارة بنسبة التقل عن
بل ( ماطور كهربائي )دون موتور الرياح سيتم االستفادة منه في تصميم مراوح التهوية للمطابخ والحمامات حيث سيتم تصميم مراوح التهوية ب
ذا انها مراوح ميكانيكية تعمل على الدوران اعتمادا على سرعة واتجاه الريح السائدة وعند عدم وجود رياح يتم ربطها بالتيار الكهربائي وه
لمستهلكة في المنازل العادية محسوبة من اجمالي الطاقة الكهربائية ا% 8.1الخيار يوفر توفيرا في مقدار الطاقة الكهربائية المستهلكة بمقدار
.سم x 02 02لمروحة قياس
ومن الضروري تغليف الجدار الخارجي للمنزل بقطع حجر الحالن حيث يعمل الحالن عمل العازل ذو الكفاءة العالية وتصل كفاءة عزل
التدفئة ستقل بنفس النسبة مما يؤدي لتوفير كبير جدا اي ان الطاقة المستخدمة في التبريد و% 02سم الى اكثر من 82الحالن العراقي ذو سمك
سم يملئ بالطين او بالطين الممزوج بالتبن وهذا 5الكهربائية وبين قطع الحالن والجدار المبني بالطابوق او البلوك يتم وضع فراغ في الطاقة
ى يتم وضع طبقات من نبات القنب العشبي بعد كبسه وهي واذا ما اردنا تطبيق وسائل البيوت الصديقة للبيئة بشكل ارق 0يشكل العازل رقم
.طريقة رخيصة وسهلة وغير مكلفة ويشكل نبات القنب عازال فعاال لمنع انتقال الحرارة من والى المنزل
م المستمر الجهزة ان تقليل استخدام اجهزة التبريد اليقلل الكلفة المادية للمشروع فحسب بل يؤدي الى تقليل الضوضاء الناتجة عن االستخدا
.التكييف مما يؤدي الى خلق جو صحي وبيئي يؤدي لراحة االنسان
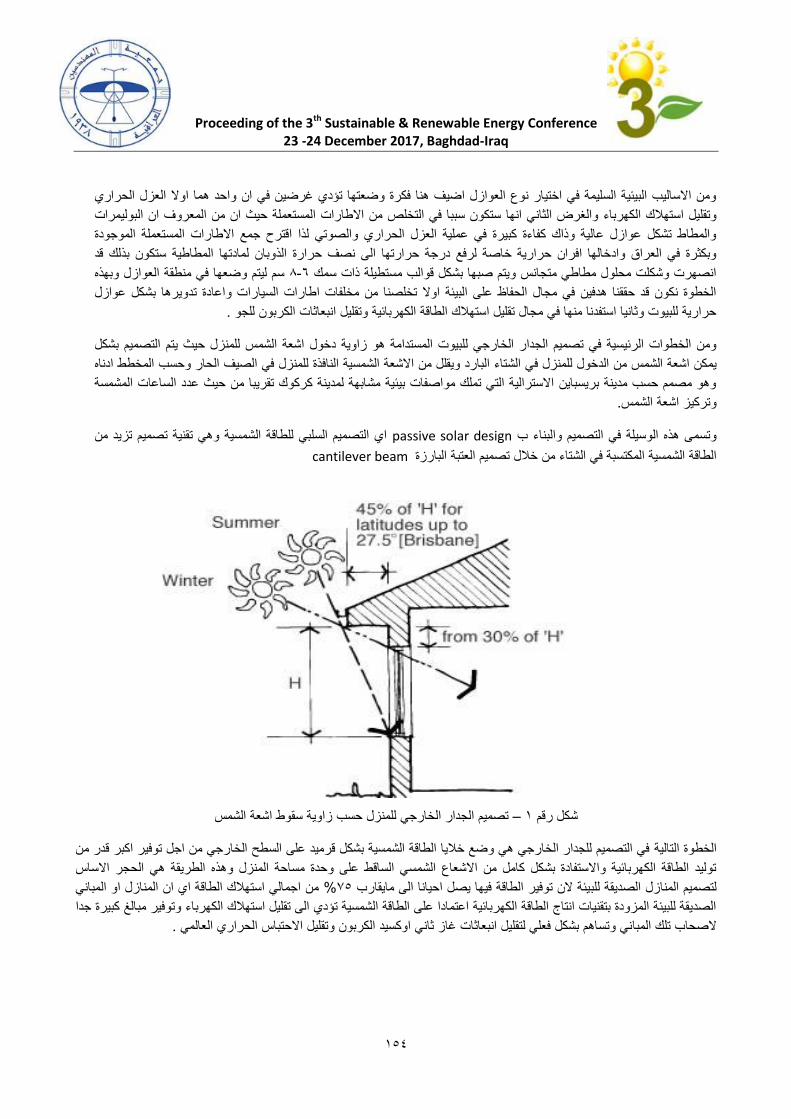
Proceeding of the 3th Sustainable & Renewable Energy Conference
23 -24 December 2017, Baghdad-Iraq
050
ومن االساليب البيئية السليمة في اختيار نوع العوازل اضيف هنا فكرة وضعتها تؤدي غرضين في ان واحد هما اوال العزل الحراري
لص من االطارات المستعملة حيث ان من المعروف ان البوليمرات وتقليل استهالك الكهرباء والغرض الثاني انها ستكون سببا في التخ
والمطاط تشكل عوازل عالية وذاك كفاءة كبيرة في عملية العزل الحراري والصوتي لذا اقترح جمع االطارات المستعملة الموجودة
لمادتها المطاطية ستكون بذلك قد وبكثرة في العراق وادخالها افران حرارية خاصة لرفع درجة حرارتها الى نصف حرارة الذوبان
سم ليتم وضعها في منطقة العوازل وبهذه 0-3انصهرت وشكلت محلول مطاطي متجانس ويتم صبها بشكل قوالب مستطيلة ذات سمك
ل الخطوة نكون قد حققنا هدفين في مجال الحفاظ على البيئة اوال تخلصنا من مخلفات اطارات السيارات واعادة تدويرها بشكل عواز
.حرارية للبيوت وثانيا استفدنا منها في مجال تقليل استهالك الطاقة الكهربائية وتقليل انبعاثات الكربون للجو
ومن الخطوات الرئيسية في تصميم الجدار الخارجي للبيوت المستدامة هو زاوية دخول اشعة الشمس للمنزل حيث يتم التصميم بشكل
ي الشتاء البارد ويقلل من االشعة الشمسية النافذة للمنزل في الصيف الحار وحسب المخطط ادناه يمكن اشعة الشمس من الدخول للمنزل ف
وهو مصمم حسب مدينة بريسباين االسترالية التي تملك مواصفات بيئية مشابهة لمدينة كركوك تقريبا من حيث عدد الساعات المشمسة
.وتركيز اشعة الشمس
اي التصميم السلبي للطاقة الشمسية وهي تقنية تصميم تزيد من passive solar designبناء ب وتسمى هذه الوسيلة في التصميم وال
cantilever beamالطاقة الشمسية المكتسبة في الشتاء من خالل تصميم العتبة البارزة
تصميم الجدار الخارجي للمنزل حسب زاوية سقوط اشعة الشمس – 0شكل رقم
في التصميم للجدار الخارجي هي وضع خاليا الطاقة الشمسية بشكل قرميد على السطح الخارجي من اجل توفير اكبر قدر من الخطوة التالية
توليد الطاقة الكهربائية واالستفادة بشكل كامل من االشعاع الشمسي الساقط على وحدة مساحة المنزل وهذه الطريقة هي الحجر االساس
من اجمالي استهالك الطاقة اي ان المنازل او المباني % 85يئة الن توفير الطاقة فيها يصل احيانا الى مايقارب لتصميم المنازل الصديقة للب
غ كبيرة جدا الصديقة للبيئة المزودة بتقنيات انتاج الطاقة الكهربائية اعتمادا على الطاقة الشمسية تؤدي الى تقليل استهالك الكهرباء وتوفير مبال
.ني وتساهم بشكل فعلي لتقليل انبعاثات غاز ثاني اوكسيد الكربون وتقليل االحتباس الحراري العالمي الصحاب تلك المبا
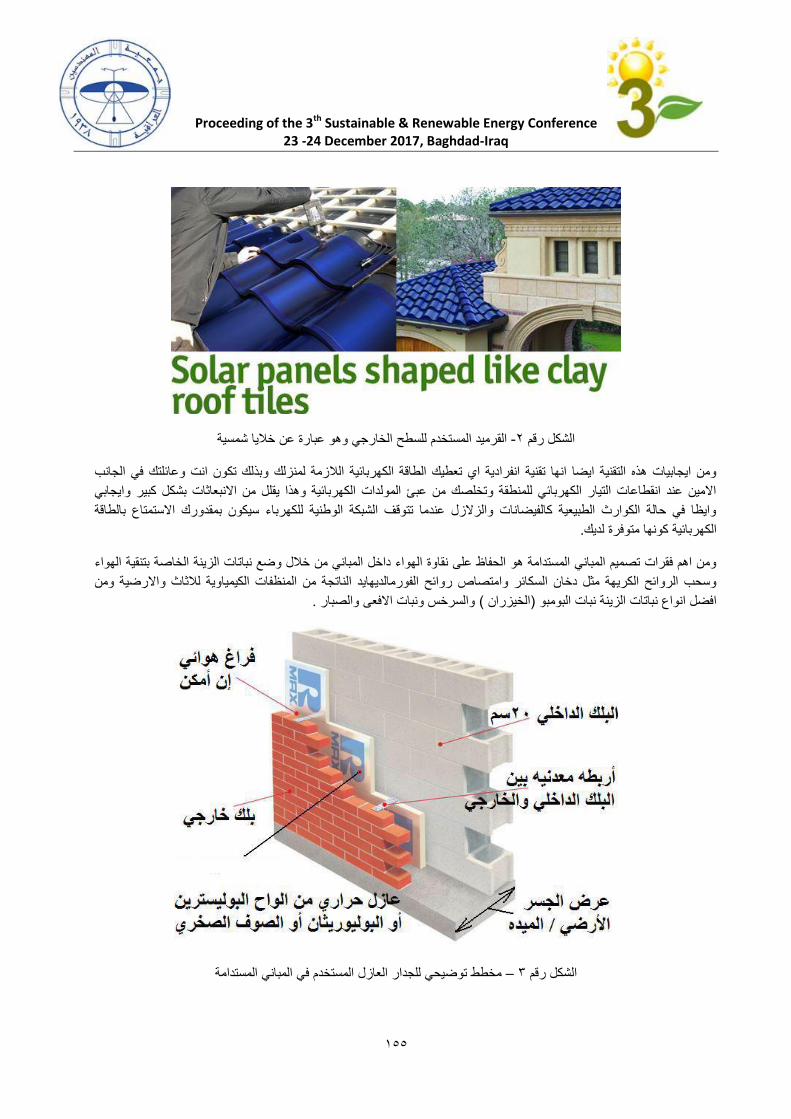
Proceeding of the 3th Sustainable & Renewable Energy Conference
23 -24 December 2017, Baghdad-Iraq
055
القرميد المستخدم للسطح الخارجي وهو عبارة عن خاليا شمسية -0الشكل رقم
وبذلك تكون انت وعائلتك في الجانب ومن ايجابيات هذه التقنية ايضا انها تقنية انفرادية اي تعطيك الطاقة الكهربائية الالزمة لمنزلك
االمين عند انقطاعات التيار الكهربائي للمنطقة وتخلصك من عبئ المولدات الكهربائية وهذا يقلل من االنبعاثات بشكل كبير وايجابي
االستمتاع بالطاقة وايظا في حالة الكوارث الطبيعية كالفيضانات والزالزل عندما تتوقف الشبكة الوطنية للكهرباء سيكون بمقدورك
.الكهربائية كونها متوفرة لديك
ومن اهم فقرات تصميم المباني المستدامة هو الحفاظ على نقاوة الهواء داخل المباني من خالل وضع نباتات الزينة الخاصة بتنقية الهواء
فات الكيمياوية لالثاث واالرضية ومن وسحب الروائح الكريهة مثل دخان السكائر وامتصاص روائح الفورمالديهايد الناتجة من المنظ
.والسرخس ونبات االفعى والصبار ( الخيزران )افضل انواع نباتات الزينة نبات البومبو
مخطط توضيحي للجدار العازل المستخدم في المباني المستدامة – 5الشكل رقم
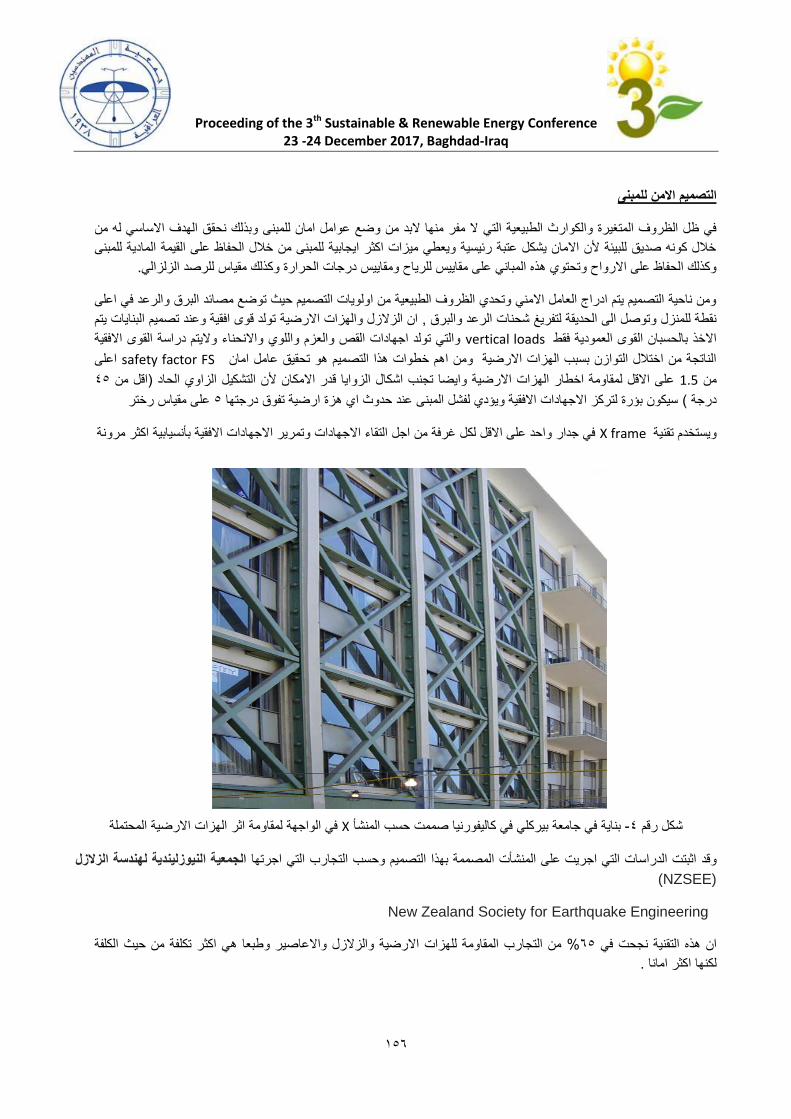
Proceeding of the 3th Sustainable & Renewable Energy Conference
23 -24 December 2017, Baghdad-Iraq
053
التصميم االمن للمبنى
ال مفر منها البد من وضع عوامل امان للمبنى وبذلك نحقق الهدف االساسي له من في ظل الظروف المتغيرة والكوارث الطبيعية التي
خالل كونه صديق للبيئة ألن االمان يشكل عتبة رئيسية ويعطي ميزات اكثر ايجابية للمبنى من خالل الحفاظ على القيمة المادية للمبنى
.اح ومقاييس درجات الحرارة وكذلك مقياس للرصد الزلزاليوكذلك الحفاظ على االرواح وتحتوي هذه المباني على مقاييس للري
ومن ناحية التصميم يتم ادراج العامل االمني وتحدي الظروف الطبيعية من اولويات التصميم حيث توضع مصائد البرق والرعد في اعلى
تولد قوى افقية وعند تصميم البنايات يتم ان الزالزل والهزات االرضية, نقطة للمنزل وتوصل الى الحديقة لتفريغ شحنات الرعد والبرق
والتي تولد اجهادات القص والعزم واللوي واالنحناء واليتم دراسة القوى االفقية vertical loadsاالخذ بالحسبان القوى العمودية فقط
اعلى safety factor FS الناتجة من اختالل التوازن بسبب الهزات االرضية ومن اهم خطوات هذا التصميم هو تحقيق عامل امان
05اقل من )على االقل لمقاومة اخطار الهزات االرضية وايضا تجنب اشكال الزوايا قدر االمكان ألن التشكيل الزاوي الحاد 1.5من
على مقياس رختر 5سيكون بؤرة لتركز االجهادات االفقية ويؤدي لفشل المبنى عند حدوث اي هزة ارضية تفوق درجتها ( درجة
في جدار واحد على االقل لكل غرفة من اجل التقاء االجهادات وتمرير االجهادات االفقية بأنسيابية اكثر مرونة X frameيستخدم تقنية و
في الواجهة لمقاومة اثر الهزات االرضية المحتملة Xبناية في جامعة بيركلي في كاليفورنيا صممت حسب المنشأ -0شكل رقم
الجمعية النيوزليندية لهندسة الزالزل اثبتت الدراسات التي اجريت على المنشأت المصممة بهذا التصميم وحسب التجارب التي اجرتهاوقد
(NZSEE)
New Zealand Society for Earthquake Engineering
ر وطبعا هي اكثر تكلفة من حيث الكلفة من التجارب المقاومة للهزات االرضية والزالزل واالعاصي% 35ان هذه التقنية نجحت في
.لكنها اكثر امانا

Proceeding of the 3th Sustainable & Renewable Energy Conference
23 -24 December 2017, Baghdad-Iraq
058
في الغرفة الواحدة بوضع مادة مع السمنت المستخدم في عملية امالء الرباط ومزج السمنت jointsوكذلك يتم ربط مناطق الربوطات
االلياف Fiber Reinforced Polymersمع مادة ذات مرونة مطاطية تعمل على زيادة التماسك مع حديد التسليح وتسمى هذه المواد
بطات البوليمرية المسلحة تمتاز بمرونتها وتشتيتها لالجهادات االفقية وتحويلها الى قيم اقل من قيمتها الفعلية اي انها تعمل مثل عمل المث
.( السبرنغ )او المخمدات
تصميم منظومات المياه
من اجمالي المياه الموجودة في الكرة االرضية على الرغم من ان المياه تغطي % 0من المعروف ان المياه الصالحة للشرب التتجاوز
من سطح الكرة االرضية لذل من الضروري ان يتم تصميم منظومات تحدد استهالك المياه وتعيد تدوير المياه ان امكن % 85اكثر من
لمياه واعادة التدوير وستزود هذه المنازل بالتقنيات التالية التي تؤدي الى تقليل استهالك ا
0متر مكعب بارتفاع 5.55وهو خزان بسيط يوضع في جانب المنزل وبسعة rain collectorالتقنية االولى هي جامع مياه االمطار
متر مزود بانابيب وقمع لجمع ماء المطر من السقف ومزود بمضخة لتفريغ الخزان 0.5متر وقطر
لتدوير الذي يكون مدفونا في الحديقة التقنية الثانية هي خزان اعادة ا
التقنية الثالثة عملية فصل المياه بعد االستخدام حيث ان المياه الثقيلة تذهب الى المجرى المخصص لها ومياه الحمام والمطبخ والمغاسل
المستخدم في من الماء %01تذهب الى مجرى اخر يمر بخزان اعادة التدوير المدفون في الحديقة وبذلك يتم اعادة تدوير مايقارب
وبعد اعادة تدوير الماء يتم توجيه الماء الناتج من عملية التنقية واعادة التدوير الى مصدرين ماء سقي الحديقة وصنبور , الفعاليات اليومية
. المياه في مرآب المنزل او الى خزان الحمامات اي ال يستخدم في الطبخ والشرب
:النتائج والتوصيات
ا المشروع بصمة ايجابية لشركة نفط الشمال ووزارة النفط وسيحقق اسس التنمية المستدامة التي تسعى الحكومة سيكون هذ -0
لهذه 00وخطة االمم المتحدة واالهداف ال sustainable developmentلتطبيقها وفقا لمعايير اتفاقيات التنمية المستدامة
الخطة
ثانية بعد مشروع مدينة مصدر االماراتية لمدن ومجمعات خالية من التلوث وبذلك ستكون هذه الخطوة هي الخطوة العربية ال -0
يدخل العراق الى سجل الدول االكثر حفاظا على البيئة في العالم
وحدة سكنية حسب المواصفات العالمية للبيوت المستدامة ومن المتوقع اذا ماتم 0111سيؤدي المشروع الى بناء مايقارب -5
ات الخاصة بالسقوف ذات الخاليا الشمسية والعزل الحراري للجدران ان تكون استهالكها للكهرباء هو تطبيق كل التوصي
مقارنة مع البيوت التقليدية الموجودة في العراق حاليا وبذلك نقلل من الحمل على شبكة الكهرباء الوطنية ونساهم في % 01
العالمية تقليل انبعاثات الكربون وتقليل مشكلة االحتباس الحراري
سيكون هذا المشروع مشجعا وحافزا لباقي الوزارات لتطبيقه وبذلك نكون قد ساهمنا في نشر مفاهيم التنمية المستدامة -0
البيوت الخضراء او المستدامة حسب هذا التصميم تم احتساب كلفتها بعد عدة مراسالت ونقاشات مع شركات اسبانية وفرنسية -5
مليون دينار 080دوالر اي مايقارب 001,111متر مربع بكلفة ال تتجاوز 011الواحد ذو مساحة وصينية وتم تقدير البيت
3عراقي وهذه الشركات مستعدة لعرض المشروع كأستثمار لوزارة النفط اي ان المبلغ سيقسط على الموظف على اقساط لمدة
سنوات وبذلك نكون قد قدمنا مشروع متكامل صديق للبيئة وباالقساط
وفر هذه البيوت المستدامة راحة نفسية عالية لساكنيها من حيث تقليل الضوضاء وزيادة المساحات الخضراء واالعتماد بشكل ت -3
.رئيسي على الطاقة الشمسية مما يجعلها تعطي اقامة هادئة مريحة لالعصاب بعيدة عن الضوضاء والبيئة الصاخبة
ي الطاقة الشمسية وطاقة الرياح واعادة تدوير المياه واعادة تدوير النفايات الطاقات المتجددة المستخدمة في هذا المشروع ه -8
.وهو المشروع االول عراقيا الذي يتطرق لكل هذه التقنيات في ان واحد
Proceeding of the 3th
Sustainable & Renewable Energy Conference
23 -24 December 2017, Baghdad-Iraq
851
(ةدراسة تحليلي)الخضراء التصميم البيئي في العمارة المستدامة
مؤيد أكرم أرسالن.د
وزارة االعمار واإلسكان/دائرة االشغال والصيانة العامة
:المستخلص
هذه لتي تلبي حاجات مستخدمي يستحق البحث واقتراح البدائل ا األبنية الخضراء موضوعا هدف البحث أن يكون تطوير
العمارة والتعريف بمفهوم تعاريف التصميم البيئي منهجية البحث بثالث محاور، حيث يتضمن المحور األول وتمثلت. األبنية
االعتباراتاهم الثاني يستعرضاما المحور .األبنية الخضراءوأنماط تصميمها، وكذلك يتناول المكونات الطبيعية واالصطناعية
يالتحليل األسلوب البحث علىالمحور الثالث يتناول الدراسة الميدانية حيث اعتمد و. األبنية الخضراءالتصميمية المؤثرة في
الوسائل العلمية في جمع البيانات منها المخططات المعمارية واعتمد على، الخضراء( العمارة)األبنية حال االحصائي لواقع
وتم االستنتاج بعد البحث والتقصي أن .األبنية الخضراءلمستخدمي قصديةلعينات االستبياناء والمالحظة الموقعية وتم إجر
أن االستبيانتبين من نتائج كما. األبنية الخضراءالمادة النباتية في اختيارالعناصر البيئية للمناخ الموقعي كان العامل الرئيس في
، وبالتالي وصول البحث األبنية الخضراءمستخدمي تفضيال لدىنباتات كانت األكثر التسقيف الطبيعي وتوفير الظالل باستعمال ال
.الى مبتغاه في االستنتاجات والتوصيات وتقديم نموذج تصميمي مقترح
Research Title: Environmental Design in Sustainable Green Architecture (Analytical Study)
The Summary:
The objective of the research is that the development of green buildings is a topic worth
researching and proposing alternatives that meet the needs of the users of these buildings. The
research methodology consisted of three axes. The first axis includes the definitions of
environmental design and the definition of the concept of architecture and design patterns, as
well as the natural and artificial components of green buildings. The second axis reviews the
most important design considerations affecting green buildings. The third axis deals with the
field study. The research was based on the statistical analytical method of the state of green
architecture. It was based on the scientific methods in collecting data, including architectural
drawings and observation. It was concluded after research and investigation that the
environmental elements of the on-site climate were the main factor in the selection of plant
material in green buildings. The results of the questionnaire show that the natural roofing and
the provision of shadows by using plants were the most favored by the users of the green
buildings. Therefore, the research reaches its objectives in the conclusions and
recommendations and presents a proposed design model.
Proceeding of the 3th
Sustainable & Renewable Energy Conference
23 -24 December 2017, Baghdad-Iraq
851
بيئيمفاهيم وتعاريف التصميم ال:المحور األول
، وموضوع البيئة موضوع (العيش، العمل، الراحة فيها)يهتم التصميم البيئي بخلق مساحات أفضل للناس لتمكنهم من
:هام وحساس من جميع الجوانب، فخالل السنوات القليلة الماضية ظهرت عدة اتجاهات تهتم بالجوانب البيئية، وهي كما يلي
.اإلتجاه البيئي -
.المستديمةإتجاه العمارة -
.إتجاه التقنية البيئية -
. إتجاه تحقيق المثالية البيئية -
(.Afify, 2003) (.للوصول إلى المثالية البيئية)إتجاه محاكاة التصميم البيئي عن طريق الحاسوب -
، وقد والمبادئ األساسية الخمسة للتصميم البيئي ترتبط كثيرا ببعضها البعض وتتحقق في كثير من المفاهيم االتجاهات
: لخصها الباحث إلى االتجاهات الخمسة السابقة، والتي هي في األساس تحقق االتجاهات أو المفاهيم التالية
.تصميم للبيئة -
. تصميم علم البيئة -
. التصميم المكيف لمالئمة الظروف البيئية -
.التصميم المكيف لمالئمة ظروف علم البيئة -
.ئةالتصميم المالئم للبي -
.التصميم المستديم -
.العمارة الخضراء -
.تصميم دورة الحياة -
.الكفاءة البيئية -
.العمارة البيئية -
.(Afify, 2003) التصميم الحيوي -
الخمسة السابقة مجموعة من المفاهيم المشتركة التي تتعامل في االساس مع المشاكل البيئية على االتجاهاتتحقق
:وهي قام طوماس فيشير بوضع المبادئ األساسية للعمارة البيئية 8111ي شهر نوفمبر المستوى العالمي، فف
ال تصدر المواد والغازات السامة في البناء والمواداتخاذ كل اإلجراءات المحتملة لضمان أن أنظمة يجب :بيئة داخلية مساعدة -
.إنعاش الهواء الداخلي بواسطة التصفية و التشجير وغير ذلكالجو الداخلي، فيجب اتخاذ كل اإلجراءات اإلضافية لتنظيف و
يجب اتخاذ كل اإلجراءات الممكنة لضمان إستعمال المباني ألقل نسبة ممكنة من الطاقة، فيجب أن تستخدم :فعالية الطاقة -
.طرق و مواد تقلل أو تلغي استخدام الطاقة.... أنظمة التبريد، التسخين، اإلضاءة،
يجب اتخاذ كل اإلجراءات الممكنة إلستعمال مواد البناء و المنتجات التي تقلل من تلف البيئة بشكل :البناء صديقة البيئة مواد -
.عام، فمثال انتقاء الخشب الذي ال يضر البيئة المحيطة ويضمن عدم انقراض هذه النوعية من الخشب في المكان
الممكنة للربط بين الشكل والطراز المعماري للمبنى بالمنطقة المحيطة في الموقع يجب اتخاذ كل اإلجراءات :الشكل البيئي -
.إليجاد االنسجام مع الموقع
يجب اتخاذ كل اإلجراءات الممكنة للحصول على الوظيفية في التصميم وتحقيق أقصى درجات الفاعلية في :تصميم وظيفي -
.(Afify, 2003) اآلداء الوظيفي
:مراحل التطور
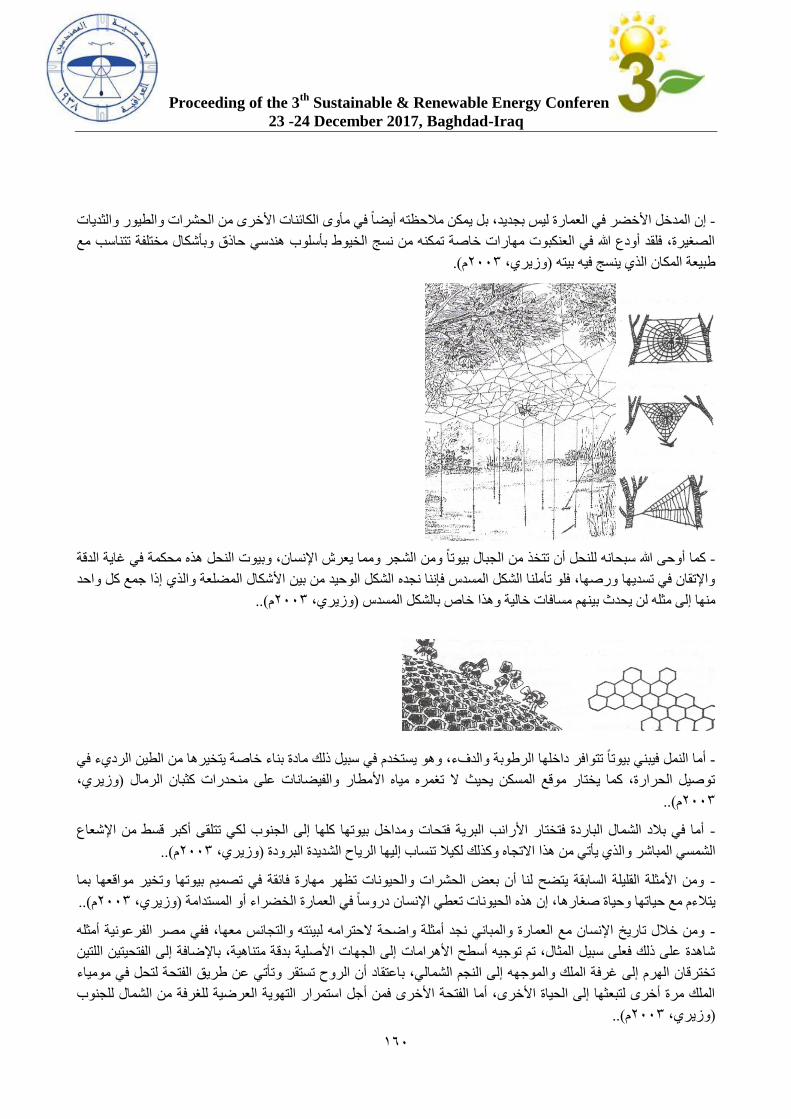
Proceeding of the 3th
Sustainable & Renewable Energy Conference
23 -24 December 2017, Baghdad-Iraq
861
إن المدخل األخضر في العمارة ليس بجديد، بل يمكن مالحظته أيضا في مأوى الكائنات األخرى من الحشرات والطيور والثديات -
الصغيرة، فلقد أودع هللا في العنكبوت مهارات خاصة تمكنه من نسج الخيوط بأسلوب هندسي حاذق وبأشكال مختلفة تتناسب مع
.(م1112وزيري، ) طبيعة المكان الذي ينسج فيه بيته
كما أوحى هللا سبحانه للنحل أن تتخذ من الجبال بيوتا ومن الشجر ومما يعرش اإلنسان، وبيوت النحل هذه محكمة في غاية الدقة -
مضلعة والذي إذا جمع كل واحد واإلتقان في تسديها ورصها، فلو تأملنا الشكل المسدس فإننا نجده الشكل الوحيد من بين األشكال ال
.(.م1112وزيري، ) منها إلى مثله لن يحدث بينهم مسافات خالية وهذا خاص بالشكل المسدس
في أما النمل فيبني بيوتا تتوافر داخلها الرطوبة والدفء، وهو يستخدم في سبيل ذلك مادة بناء خاصة يتخيرها من الطين الرديء -
وزيري، ) توصيل الحرارة، كما يختار موقع المسكن يحيث ال تغمره مياه األمطار والفيضانات على منحدرات كثبان الرمال
.(.م1112
أما في بالد الشمال الباردة فتختار األرانب البرية فتحات ومداخل بيوتها كلها إلى الجنوب لكي تتلقى أكبر قسط من اإلشعاع -
.(.م1112وزيري، ) ذي يأتي من هذا االتجاه وكذلك لكيال تنساب إليها الرياح الشديدة البرودةالشمسي المباشر وال
ومن األمثلة القليلة السابقة يتضح لنا أن بعض الحشرات والحيونات تظهر مهارة فائقة في تصميم بيوتها وتخير مواقعها بما -
.(.م1112وزيري، ) نسان دروسا في العمارة الخضراء أو المستدامةيتالءم مع حياتها وحياة صغارها، إن هذه الحيونات تعطي اإل
ومن خالل تاريخ اإلنسان مع العمارة والمباني نجد أمثلة واضحة الحترامه لبيئته والتجانس معها، ففي مصر الفرعونية أمثله -
ة متناهية، باإلضافة إلى الفتحيتين اللتين شاهدة على ذلك فعلى سبيل المثال، تم توجيه أسطح األهرامات إلى الجهات األصلية بدق
تخترقان الهرم إلى غرفة الملك والموجهه إلى النجم الشمالي، باعتقاد أن الروح تستقر وتأتي عن طريق الفتحة لتحل في مومياء
من الشمال للجنوبالملك مرة أخرى لتبعثها إلى الحياة األخرى، أما الفتحة األخرى فمن أجل استمرار التهوية العرضية للغرفة
.(.م1112وزيري، )
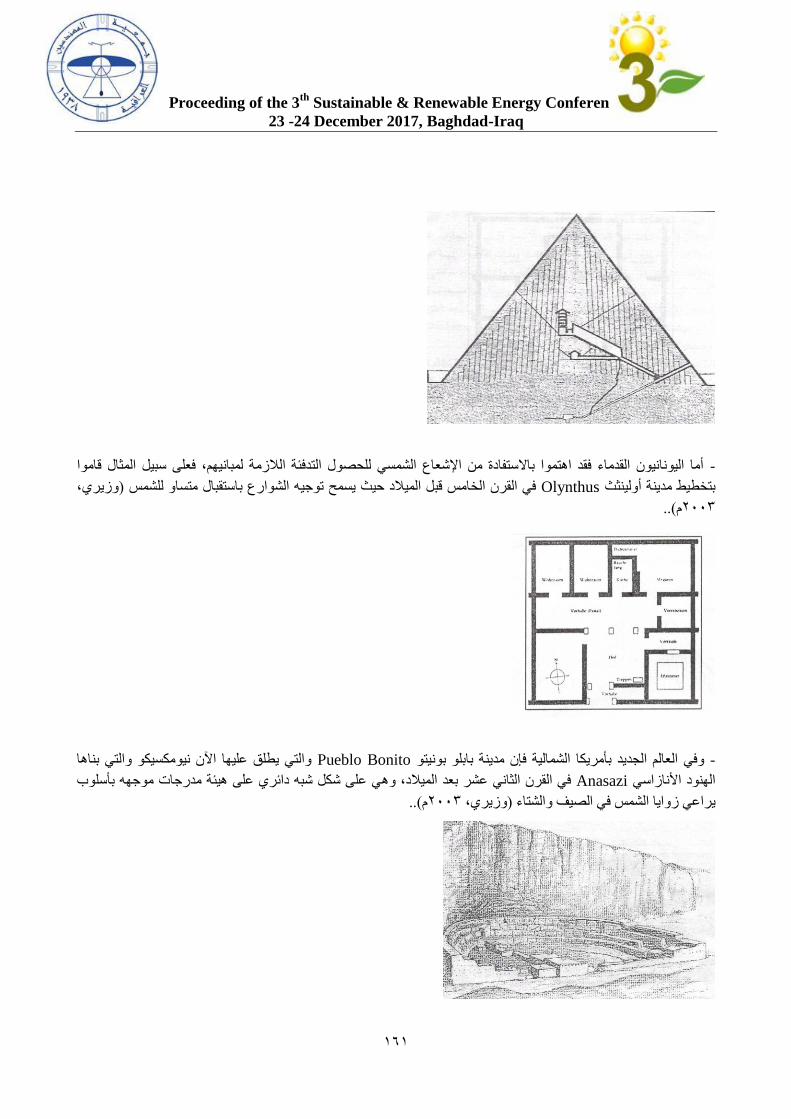
Proceeding of the 3th
Sustainable & Renewable Energy Conference
23 -24 December 2017, Baghdad-Iraq
868
أما اليونانيون القدماء فقد اهتموا باالستفادة من اإلشعاع الشمسي للحصول التدفئة الالزمة لمبانيهم، فعلى سبيل المثال قاموا -
وزيري، ) ه الشوارع باستقبال متساو للشمسفي القرن الخامس قبل الميالد حيث يسمح توجي Olynthusبتخطيط مدينة أولينثث
.(.م1112
والتي يطلق عليها اآلن نيومكسيكو والتي بناها Pueblo Bonitoوفي العالم الجديد بأمريكا الشمالية فإن مدينة بابلو بونيتو -
ي على شكل شبه دائري على هيئة مدرجات موجهه بأسلوب في القرن الثاني عشر بعد الميالد، وه Anasaziالهنود األنازاسي
.(.م1112وزيري، ) يراعي زوايا الشمس في الصيف والشتاء
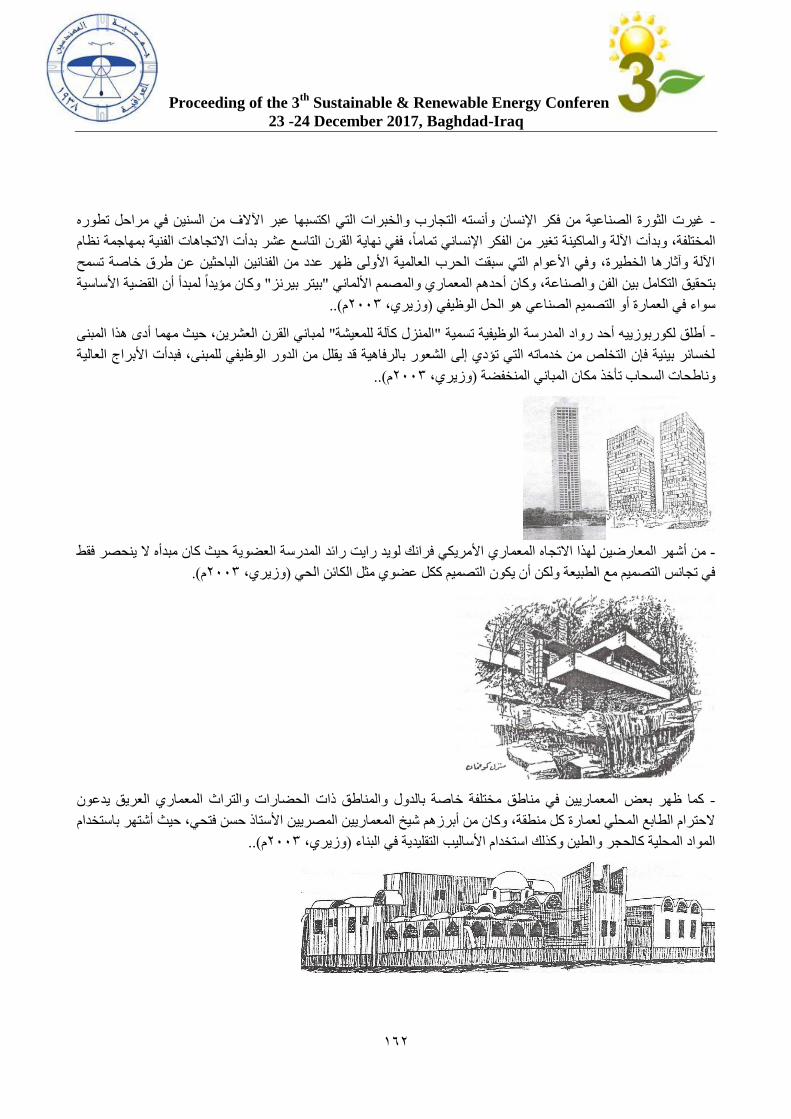
Proceeding of the 3th
Sustainable & Renewable Energy Conference
23 -24 December 2017, Baghdad-Iraq
861
غيرت الثورة الصناعية من فكر اإلنسان وأنسته التجارب والخبرات التي اكتسبها عبر اآلالف من السنين في مراحل تطوره -
اآللة والماكينة تغير من الفكر اإلنساني تماما ، ففي نهاية القرن التاسع عشر بدأت االتجاهات الفنية بمهاجمة نظام المختلفة، وبدأت
اآللة وآثارها الخطيرة، وفي األعوام التي سبقت الحرب العالمية األولى ظهر عدد من الفنانين الباحثين عن طرق خاصة تسمح
وكان مؤيدا لمبدأ أن القضية األساسية " بيتر بيرنز"وكان أحدهم المعماري والمصمم األلماني بتحقيق التكامل بين الفن والصناعة،
.(.م1112وزيري، ) سواء في العمارة أو التصميم الصناعي هو الحل الوظيفي
ما أدى هذا المبنى لمباني القرن العشرين، حيث مه" المنزل كآلة للمعيشة"أطلق لكوربوزييه أحد رواد المدرسة الوظيفية تسمية -
لخسائر بيئية فإن التخلص من خدماته التي تؤدي إلى الشعور بالرفاهية قد يقلل من الدور الوظيفي للمبنى، فبدأت األبراج العالية
.(.م1112وزيري، ) وناطحات السحاب تأخذ مكان المباني المنخفضة
اه المعماري األمريكي فرانك لويد رايت رائد المدرسة العضوية حيث كان مبدأه ال ينحصر فقط رضين لهذا االتجامن أشهر المع -
(.م1112وزيري، ) في تجانس التصميم مع الطبيعة ولكن أن يكون التصميم ككل عضوي مثل الكائن الحي
والمناطق ذات الحضارات والتراث المعماري العريق يدعون كما ظهر بعض المعماريين في مناطق مختلفة خاصة بالدول -
الحترام الطابع المحلي لعمارة كل منطقة، وكان من أبرزهم شيخ المعماريين المصريين األستاذ حسن فتحي، حيث أشتهر باستخدام
.(.م1112وزيري، ) المواد المحلية كالحجر والطين وكذلك استخدام األساليب التقليدية في البناء
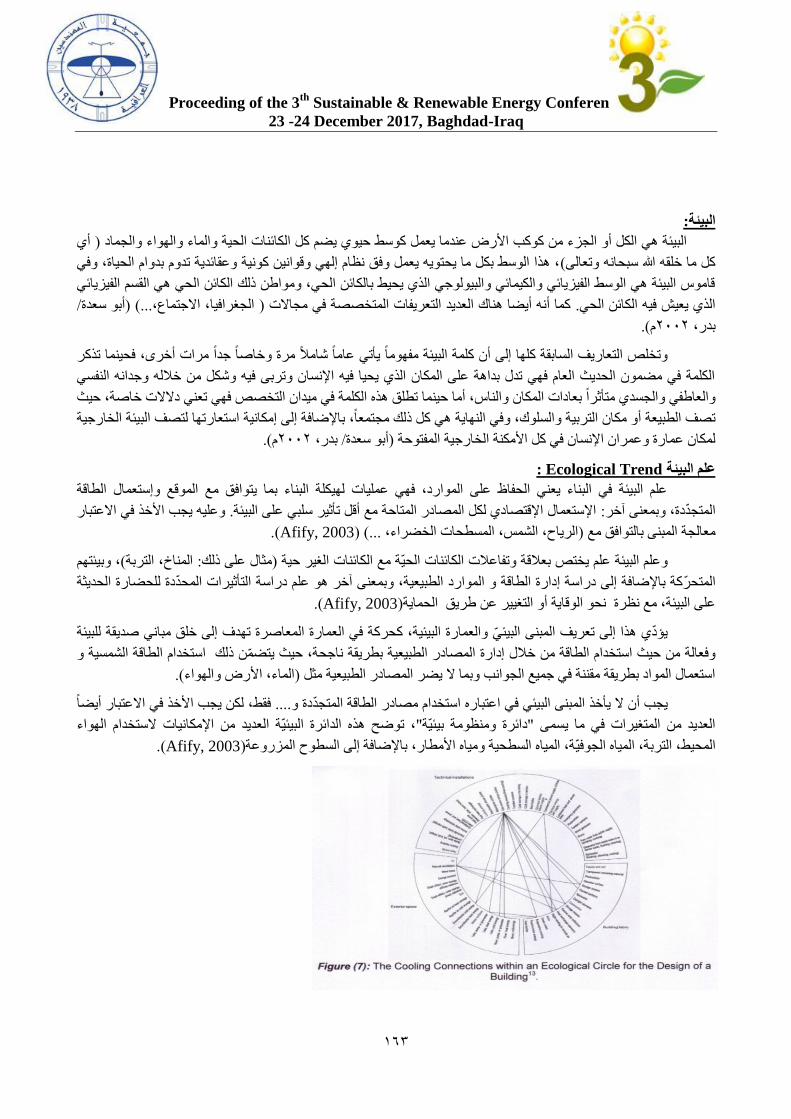
Proceeding of the 3th
Sustainable & Renewable Energy Conference
23 -24 December 2017, Baghdad-Iraq
862
:البيئة
أي ) البيئة هي الكل أو الجزء من كوكب األرض عندما يعمل كوسط حيوي يضم كل الكائنات الحية والماء والهواء والجماد
ام الحياة، وفي ، هذا الوسط بكل ما يحتويه يعمل وفق نظام إلهي وقوانين كونية وعقائدية تدوم بدو(كل ما خلقه هللا سبحانه وتعالى
قاموس البيئة هي الوسط الفيزيائي والكيمائي والبيولوجي الذي يحيط بالكائن الحي، ومواطن ذلك الكائن الحي هي القسم الفيزيائي
/ أبو سعدة) ...(الجغرافيا، االجتماع،) كما أنه أيضا هناك العديد التعريفات المتخصصة في مجاالت . الذي يعيش فيه الكائن الحي
(.م1111، بدر
وتخلص التعاريف السابقة كلها إلى أن كلمة البيئة مفهوما يأتي عاما شامال مرة وخاصا جدا مرات أخرى، فحينما تذكر
الكلمة في مضمون الحديث العام فهي تدل بداهة على المكان الذي يحيا فيه اإلنسان وتربى فيه وشكل من خالله وجدانه النفسي
ثرا بعادات المكان والناس، أما حينما تطلق هذه الكلمة في ميدان التخصص فهي تعني دالالت خاصة، حيث والعاطفي والجسدي متأ
تصف الطبيعة أو مكان التربية والسلوك، وفي النهاية هي كل ذلك مجتمعا ، باإلضافة إلى إمكانية استعارتها لتصف البيئة الخارجية
(.م1111بدر، / أبو سعدة) الخارجية المفتوحةلمكان عمارة وعمران اإلنسان في كل األمكنة
: Ecological Trendعلم البيئة
علم البيئة في البناء يعني الحفاظ على الموارد، فهي عمليات لهيكلة البناء بما يتوافق مع الموقع وإستعمال الطاقة
وعليه يجب األخذ في االعتبار . سلبي على البيئةاإلستعمال اإلقتصادي لكل المصادر المتاحة مع أقل تأثير : المتجددة، وبمعنى آخر
(.Afify, 2003) ...(الرياح، الشمس، المسطحات الخضراء، )معالجة المبنى بالتوافق مع
، وبيئتهم (المناخ، التربة: مثال على ذلك)وعلم البيئة علم يختص بعالقة وتفاعالت الكائنات الحية مع الكائنات الغير حية
فة إلى دراسة إدارة الطاقة و الموارد الطبيعية، وبمعنى آخر هو علم دراسة التأثيرات المحددة للحضارة الحديثة المتحركة باإلضا
(.Afify, 2003)على البيئة، مع نظرة نحو الوقاية أو التغيير عن طريق الحماية
رة تهدف إلى خلق مباني صديقة للبيئة يؤدي هذا إلى تعريف المبنى البيئي والعمارة البيئية، كحركة في العمارة المعاص
وفعالة من حيث استخدام الطاقة من خالل إدارة المصادر الطبيعية بطريقة ناجحة، حيث يتضمن ذلك استخدام الطاقة الشمسية و
(.الماء، األرض والهواء)استعمال المواد بطريقة مقننة في جميع الجوانب وبما ال يضر المصادر الطبيعية مثل
فقط، لكن يجب األخذ في االعتبار أيضا .... ن ال يأخذ المبنى البيئي في اعتباره استخدام مصادر الطاقة المتجددة ويجب أ
، توضح هذه الدائرة البيئية العديد من اإلمكانيات الستخدام الهواء "دائرة ومنظومة بيئية"العديد من المتغيرات في ما يسمى
.(Afify, 2003)ة، المياه السطحية ومياه األمطار، باإلضافة إلى السطوح المزروعةالمحيط، التربة، المياه الجوفي
Proceeding of the 3th
Sustainable & Renewable Energy Conference
23 -24 December 2017, Baghdad-Iraq
861
يجب أن تتهيئ األجيال القادمة للعمل على احترام مصادر الطاقة الطبيعية واستخدامها بطريقة مستديمة، إن المبنى البيئي
.(.Afify, 2003) عية بأقل تأثير سلبي على كوكبناهو نتائج للعمارة الوظيفية اإلقتصادية لكن مع إستعمال للمصادر الطبي
حضي اإلتجاه البيئي مؤخرا بعناية من قبل المعماريين وإختصاصي البيئة، وهؤالء يزيدون من وعي الناس ومعرفتهم
والتعليمية أنهم بحاجة إلى إنشاء وتشييد مباني خضراء، عدد كبير من المباني الصغيرة تم تشيدها مؤخرا وخاصة السكنية منها،
.(.Afify, 2003) والنوادي باإلضافة إلى المباني العامة الصغيرة
ويعرف النظام البيئي بأنه وحدة بيئية متكاملة تتكون من كائنات حية ومكونات غير حية في مكان معين يتفاعل بعضها
.(.Afify, 2003) ببعض وفق نظام دقيق ومتوازن في دينامكية ذاتية لتستمر في أداء دورها
:مكونات أي نظام بيئي
(.مجموعة الثوابت)وتشمل الماء والهواء بغازاته المختلفة وحرارة الشمس : مجموعة العناصر غير الحية/8
(.مجموعة المنتجين)وتتمثل في الكائنات الحية النباتية : مجموعة العناصر الحية المنتجة/1
.الحية الحيوانية التي تعتمد في غذائها على غيرها تتضمن الكائنات: مجموعة العناصر الحية المستهلكة/2
.(.م1112وزيري، ) تتضمن الكائنات المجهرية كالفطريات والبكتيريا: مجموعة العناصر الحية المحللة/1
:تأثير البيئية المبنية على النظام البيئي لألرض ومواردها
جدها الحسي الملموس، وفي نفس الوقت فإن مكوناتها من الطاقة البيئة المبنية تحل محل جزء من النظام البيئي بتوا/ 2-1-1-8
.والمواد تقوم بتعديل مكونات النظام البيئي من الطاقة والمواد
.بعد إنشاء المبنى فإن استعماله يشجع األنشطة البشرية األخرى على التواجد/2-1-1-1
.ثم التخلص من فضالتها وفوائضهااستهالك كميات كبيرة من موارد األرض في صورة طاقة ومن /2-1-1-2
انبعاث كميات من الطاقة الضائعة على شكل حرارة، وكذلك كمية كبيرة من المواد الملوثة للبيئة خالل استعمالها/2-1-1-1
.(.م1112وزيري، )
:المفاهيم واألسس الواجب مراعتها في العملية التصميمية
ة والبيولوجية المحيطة وينظر لعملية تصميم المبنى كجزء من عملية تشغيل يجب األخذ في االعتبار البيئة العضوي/ 2-1-2-8
.النظام البيئي ككل
.يجب فهم أن البيئة لها حدود معينة ال يمكن أن تتعداها كمصدر للموارد وكمستقبل للنفايات/2-1-2-1
لى نظام بيئي معين يؤثر على األنظمة يجب أن يعرف المصمم أن مكونات األنظمة البيئية متداخلة وأي نشاط يؤثر ع/2-1-2-2
.األخرى
كل موقع له نظمه البيئية المتداخلة وعند تصميم المبنى في الموقع يكون هذا التصميم فريد من نوعه بظروف الموقع /2-1-2-1
.نفسه وهي ظروف غير متكررة في موقع آخر
ولكن الشيء المهم أن نقلل من السلبيات المؤثرة على تلك تداخل األنظمة المبنية مع األنظمة البيئية شيء ال بد منه/2-1-2-5
.(.م1112وزيري، ) األنظمة البيئة قدر اإلمكان
:العمارة الخضراء
لعبارة التنمية المستديمة القائل بأنها التنمية التي تلبي احتياجات الحاضر دون أن تنقص من " برونتالند"إذا أخذنا بتعريف لجنة ” -
بلة على أن تلبي احتياجاتها الخاصة، فال بد أن نخلص إلى استنتاج أن المستوطنات البشرية ستحتاج حيئذ إلى أن قدرة األجيال المق
.(.م1112وزيري، )“تعمل على تحقيق االستدامة البيئية
لكي نتفهم هذا الفكر إن العمارة الخضراء أحد االتجاهات الحديثة في الفكر المعماري والذي يهتم بالعالقة بين المباني والبيئة و -
.(.م1112وزيري، ) األخضر فيجب أن نتعرف أوال على التعريفات األساسية له
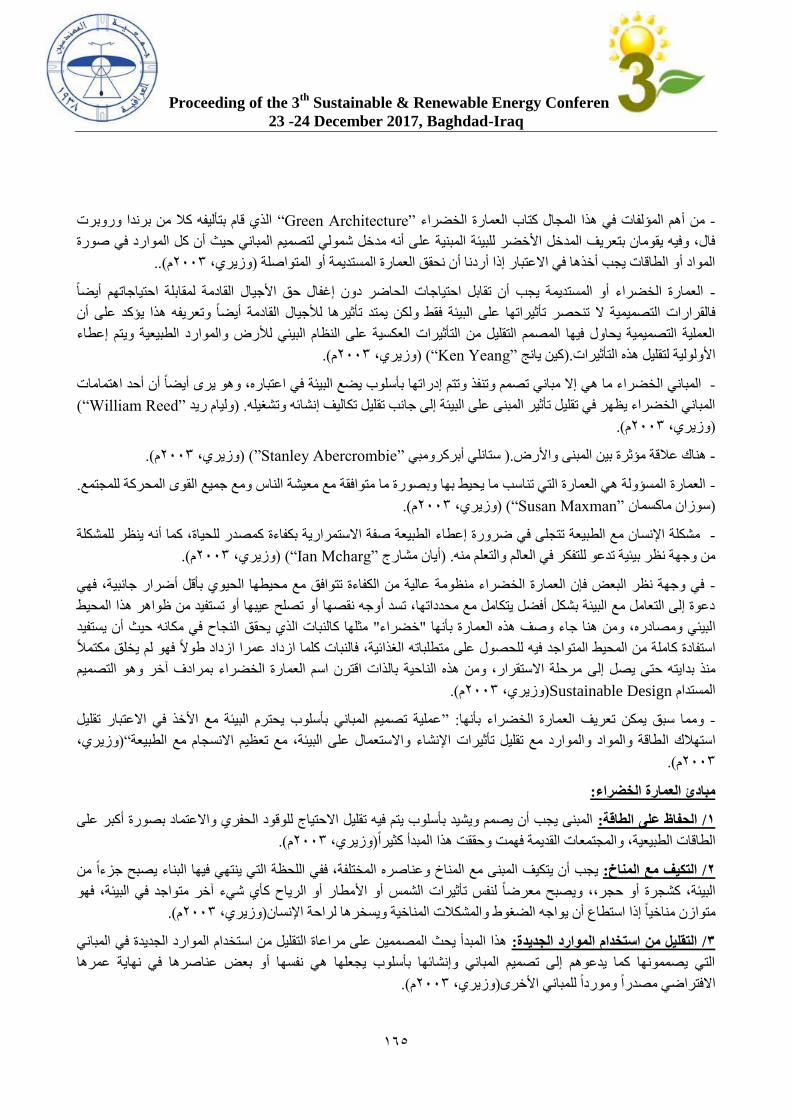
Proceeding of the 3th
Sustainable & Renewable Energy Conference
23 -24 December 2017, Baghdad-Iraq
865
الذي قام بتأليفه كال من برندا وروبرت “ ”Green Architectureمن أهم المؤلفات في هذا المجال كتاب العمارة الخضراء -
ى أنه مدخل شمولي لتصميم المباني حيث أن كل الموارد في صورة فال، وفيه يقومان بتعريف المدخل األخضر للبيئة المبنية عل
.(.م1112وزيري، ) المواد أو الطاقات يجب أخذها في االعتبار إذا أردنا أن نحقق العمارة المستديمة أو المتواصلة
ابلة احتياجاتهم أيضا العمارة الخضراء أو المستديمة يجب أن تقابل احتياجات الحاضر دون إغفال حق األجيال القادمة لمق -
فالقرارات التصميمية ال تنحصر تأثيراتها على البيئة فقط ولكن يمتد تأثيرها لألجيال القادمة أيضا وتعريفه هذا يؤكد على أن
ء العملية التصميمية يحاول فيها المصمم التقليل من التأثيرات العكسية على النظام البيئي لألرض والموارد الطبيعية ويتم إعطا
(.م1112وزيري، ) (“”Ken Yeangكين يانج .)األولولية لتقليل هذه التأثيرات
المباني الخضراء ما هي إال مباني تصمم وتنفذ وتتم إدراتها بأسلوب يضع البيئة في اعتباره، وهو يرى أيضا أن أحد اهتمامات -
(“”William Reedوليام ريد . )ليل تكاليف إنشائه وتشغيلهالمباني الخضراء يظهر في تقليل تأثير المبنى على البيئة إلى جانب تق
(.م1112وزيري، )
(.م1112وزيري، ) Stanley Abercrombie”)”ستانلي أبركرومبي .) هناك عالقة مؤثرة بين المبنى واألرض -
. ميع القوى المحركة للمجتمعالعمارة المسؤولة هي العمارة التي تناسب ما يحيط بها وبصورة ما متوافقة مع معيشة الناس ومع ج -
(.م1112وزيري، ) (“”Susan Maxmanسوزان ماكسمان )
مشكلة اإلنسان مع الطبيعة تتجلى في ضرورة إعطاء الطبيعة صفة االستمرارية بكفاءة كمصدر للحياة، كما أنه ينظر للمشكلة -
(.م1112وزيري، ) (“”Ian Mchargأيان مشارج . )من وجهة نظر بيئية تدعو للتفكر في العالم والتعلم منه
في وجهة نظر البعض فإن العمارة الخضراء منظومة عالية من الكفاءة تتوافق مع محيطها الحيوي بأقل أضرار جانبية، فهي -
دعوة إلى التعامل مع البيئة بشكل أفضل يتكامل مع محدداتها، تسد أوجه نقصها أو تصلح عيبها أو تستفيد من ظواهر هذا المحيط
مثلها كالنبات الذي يحقق النجاح في مكانه حيث أن يستفيد " خضراء"لبيئي ومصادره، ومن هنا جاء وصف هذه العمارة بأنها ا
استفادة كاملة من المحيط المتواجد فيه للحصول على متطلباته الغذائية، فالنبات كلما ازداد عمرا ازداد طوال فهو لم يخلق مكتمال
مرحلة االستقرار، ومن هذه الناحية بالذات اقترن اسم العمارة الخضراء بمرادف آخر وهو التصميم منذ بدايته حتى يصل إلى
(.م1112وزيري، )Sustainable Designالمستدام
عملية تصميم المباني بأسلوب يحترم البيئة مع األخذ في االعتبار تقليل ”: ومما سبق يمكن تعريف العمارة الخضراء بأنها -
وزيري، )“طاقة والمواد والموارد مع تقليل تأثيرات اإلنشاء واالستعمال على البيئة، مع تعظيم االنسجام مع الطبيعةاستهالك ال
(.م1112
:مبادئ العمارة الخضراء
المبنى يجب أن يصمم ويشيد بأسلوب يتم فيه تقليل االحتياج للوقود الحفري واالعتماد بصورة أكبر على :الحفاظ على الطاقة/ 1
(.م1112وزيري، )طاقات الطبيعية، والمجتمعات القديمة فهمت وحققت هذا المبدأ كثيرا ال
يجب أن يتكيف المبنى مع المناخ وعناصره المختلفة، ففي اللحظة التي ينتهي فيها البناء يصبح جزءا من :التكيف مع المناخ/ 2
مطار أو الرياح كأي شيء آخر متواجد في البيئة، فهو البيئة، كشجرة أو حجر،، ويصبح معرضا لنفس تأثيرات الشمس أو األ
(.م1112وزيري، )متوازن مناخيا إذا استطاع أن يواجه الضغوط والمشكالت المناخية ويسخرها لراحة اإلنسان
في المباني هذا المبدأ يحث المصممين على مراعاة التقليل من استخدام الموارد الجديدة :التقليل من استخدام الموارد الجديدة/ 3
التي يصممونها كما يدعوهم إلى تصميم المباني وإنشائها بأسلوب يجعلها هي نفسها أو بعض عناصرها في نهاية عمرها
(.م1112وزيري، )االفتراضي مصدرا وموردا للمباني األخرى
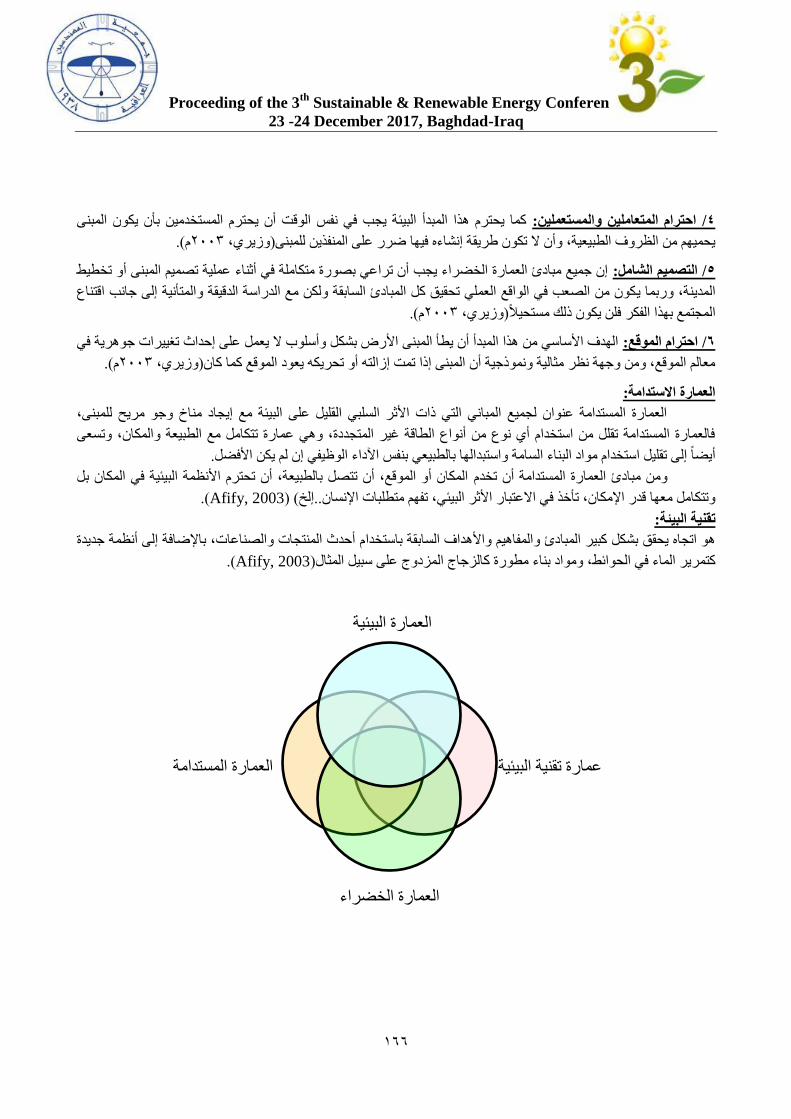
Proceeding of the 3th
Sustainable & Renewable Energy Conference
23 -24 December 2017, Baghdad-Iraq
866
ترم المستخدمين بأن يكون المبنى كما يحترم هذا المبدأ البيئة يجب في نفس الوقت أن يح :احترام المتعاملين والمستعملين/ 4
(.م1112وزيري، )يحميهم من الظروف الطبيعية، وأن ال تكون طريقة إنشاءه فيها ضرر على المنفذين للمبنى
إن جميع مبادئ العمارة الخضراء يجب أن تراعي بصورة متكاملة في أثناء عملية تصميم المبنى أو تخطيط :التصميم الشامل/ 5
كون من الصعب في الواقع العملي تحقيق كل المبادئ السابقة ولكن مع الدراسة الدقيقة والمتأنية إلى جانب اقتناع المدينة، وربما ي
(.م1112وزيري، )المجتمع بهذا الفكر فلن يكون ذلك مستحيال
تغييرات جوهرية في الهدف األساسي من هذا المبدأ أن يطأ المبنى األرض بشكل وأسلوب ال يعمل على إحداث :احترام الموقع/ 6
(.م1112وزيري، )معالم الموقع، ومن وجهة نظر مثالية ونموذجية أن المبنى إذا تمت إزالته أو تحريكه يعود الموقع كما كان
:العمارة االستدامة
بنى، العمارة المستدامة عنوان لجميع المباني التي ذات األثر السلبي القليل على البيئة مع إيجاد مناخ وجو مريح للم
فالعمارة المستدامة تقلل من استخدام أي نوع من أنواع الطاقة غير المتجددة، وهي عمارة تتكامل مع الطبيعة والمكان، وتسعى
.أيضا إلى تقليل استخدام مواد البناء السامة واستبدالها بالطبيعي بنفس اآلداء الوظيفي إن لم يكن األفضل
المكان أو الموقع، أن تتصل بالطبيعة، أن تحترم األنظمة البيئية في المكان بل ومن مبادئ العمارة المستدامة أن تخدم
(.Afify, 2003)( إلخ..ثر البيئي، تفهم متطلبات اإلنسانوتتكامل معها قدر اإلمكان، تأخذ في االعتبار األ
:تقنية البيئة
م أحدث المنتجات والصناعات، باإلضافة إلى أنظمة جديدة هو اتجاه يحقق بشكل كبير المبادئ والمفاهيم واألهداف السابقة باستخدا
(.Afify, 2003)كالزجاج المزدوج على سبيل المثالكتمرير الماء في الحوائط، ومواد بناء مطورة
العمارة البيئية
عمارة تقنية البيئية المستدامةالعمارة
الخضراءالعمارة
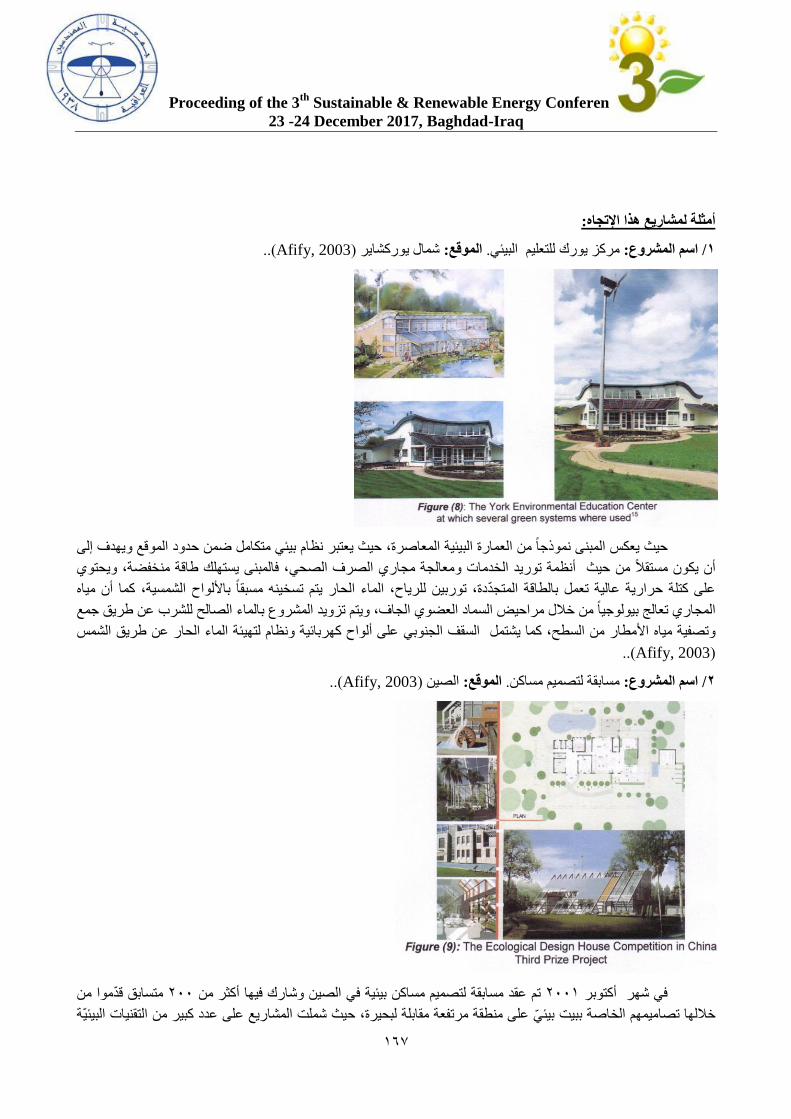
Proceeding of the 3th
Sustainable & Renewable Energy Conference
23 -24 December 2017, Baghdad-Iraq
861
:أمثلة لمشاريع هذا اإلتجاه
.(.Afify, 2003) شمال يوركشاير: الموقع .مركز يورك للتعليم البيئي: اسم المشروع/ 1
قع ويهدف إلى ام بيئي متكامل ضمن حدود الموالمبنى نموذجا من العمارة البيئية المعاصرة، حيث يعتبر نظيعكس حيث
، فالمبنى يستهلك طاقة منخفضة، ويحتوي الصرف الصحيأن يكون مستقال من حيث أنظمة توريد الخدمات ومعالجة مجاري
طاقة المتجددة، توربين للرياح، الماء الحار يتم تسخينه مسبقا باأللواح الشمسية، كما أن مياه على كتلة حرارية عالية تعمل بال
الماء الصالح للشرب عن طريق جمع ب المشروعالمجاري تعالج بيولوجيا من خالل مراحيض السماد العضوي الجاف، ويتم تزويد
على ألواح كهربائية ونظام لتهيئة الماء الحار عن طريق الشمس من السطح، كما يشتمل السقف الجنوبيمياه األمطار وتصفية
(Afify, 2003.).
.(.Afify, 2003) الصين: الموقع .مسابقة لتصميم مساكن: اسم المشروع/ 2
من قدموا متسابق 111أكثر من الصين وشارك فيهافي مسابقة لتصميم مساكن بيئية تم عقد 1118في شهر أكتوبر
ميمهم الخاصة ببيت بيئي على منطقة مرتفعة مقابلة لبحيرة، حيث شملت المشاريع على عدد كبير من التقنيات البيئية تصاخاللها
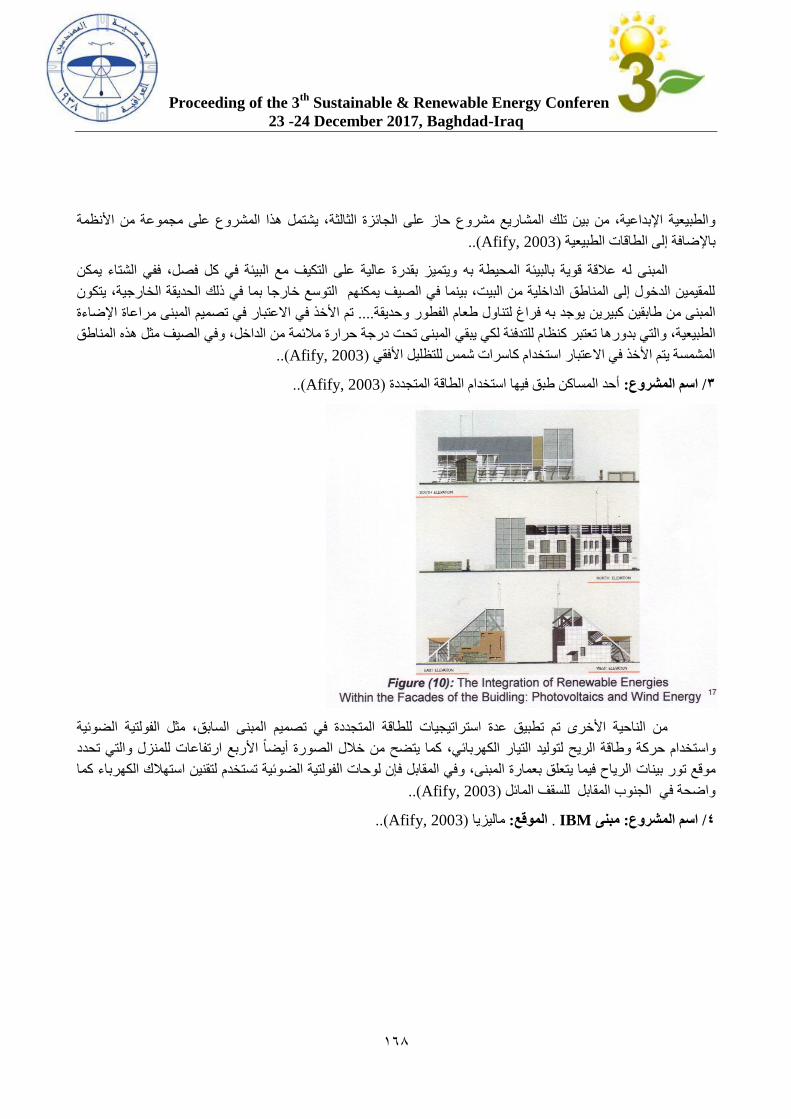
Proceeding of the 3th
Sustainable & Renewable Energy Conference
23 -24 December 2017, Baghdad-Iraq
861
، يشتمل هذا المشروع على مجموعة من األنظمة حاز على الجائزة الثالثةمشروع المشاريع تلك والطبيعية اإلبداعية، من بين
.(.Afify, 2003) باإلضافة إلى الطاقات الطبيعية
ففي الشتاء يمكن ويتميز بقدرة عالية على التكيف مع البيئة في كل فصل، عالقة قوية بالبيئة المحيطة بهالمبنى له
يتكون ، الحديقة الخارجيةللمقيمين الدخول إلى المناطق الداخلية من البيت، بينما في الصيف يمكنهم التوسع خارجا بما في ذلك
اإلضاءة ار في تصميم المبنى مراعاةتم األخذ في االعتب ....وحديقة فراغ لتناول طعام الفطوريوجد به ين طابقين كبيرالمبنى من
وفي الصيف مثل هذه المناطق من الداخل،درجة حرارة مالئمة المبنى تحت نظام للتدفئة لكي يبقي كوالتي بدورها تعتبر الطبيعية،
. (.Afify, 2003) األفقيتظليل للسرات شمس المشمسة يتم األخذ في االعتبار استخدام كا
.(.Afify, 2003) أحد المساكن طبق فيها استخدام الطاقة المتجددة: اسم المشروع/ 3
الضوئية الفولتيةمثل السابق، للطاقة المتجددة في تصميم المبنى استراتيجياتمن الناحية األخرى تم تطبيق عدة
األربع ارتفاعات للمنزل والتي تحدد يتضح من خالل الصورة أيضا التيار الكهربائي، كما طاقة الريح لتوليداستخدام حركة وو
كما لتقنين استهالك الكهرباء تستخدم ةالضوئي الفولتيةفي المقابل فإن لوحات والرياح فيما يتعلق بعمارة المبنى، تتور بيناموقع
.(.Afify, 2003) الجنوب المقابل للسقف المائل واضحة في
.(.Afify, 2003) ماليزيا: الموقع .IBM مبنى : اسم المشروع/ 4
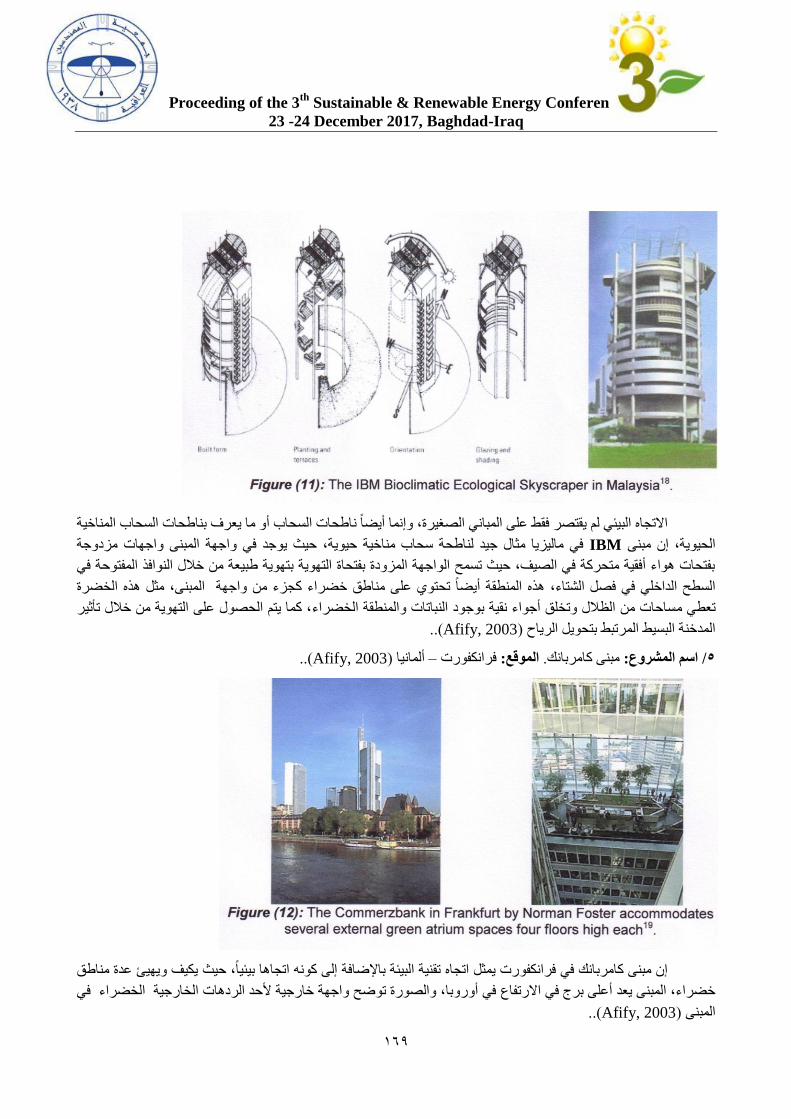
Proceeding of the 3th
Sustainable & Renewable Energy Conference
23 -24 December 2017, Baghdad-Iraq
861
وإنما أيضا ناطحات السحاب أو ما يعرف بناطحات السحاب المناخية يقتصر فقط على المباني الصغيرة، لم البيئي االتجاه
اجهة المبنى واجهات مزدوجة حيث يوجد في و، في ماليزيا مثال جيد لناطحة سحاب مناخية حيوية IBMالحيوية، إن مبنى
بفتحات هواء أفقية متحركة في الصيف، حيث تسمح الواجهة المزودة بفتحاة التهوية بتهوية طبيعة من خالل النوافذ المفتوحة في
السطح الداخلي في فصل الشتاء، هذه المنطقة أيضا تحتوي على مناطق خضراء كجزء من واجهة المبنى، مثل هذه الخضرة
، كما يتم الحصول على التهوية من خالل تأثير ساحات من الظالل وتخلق أجواء نقية بوجود النباتات والمنطقة الخضراءمتعطي
.(.Afify, 2003) بتحويل الرياحالمدخنة البسيط المرتبط
.(.Afify, 2003) ألمانيا –فرانكفورت : الموقع .مبنى كامربانك: اسم المشروع/ 5
فرانكفورت يمثل اتجاه تقنية البيئة باإلضافة إلى كونه اتجاها بيئيا ، حيث يكيف ويهيئ عدة مناطق إن مبنى كامربانك في
في أوروبا، والصورة توضح واجهة خارجية ألحد الردهات الخارجية الخضراء في االرتفاعخضراء، المبنى يعد أعلى برج في
.(.Afify, 2003) المبنى
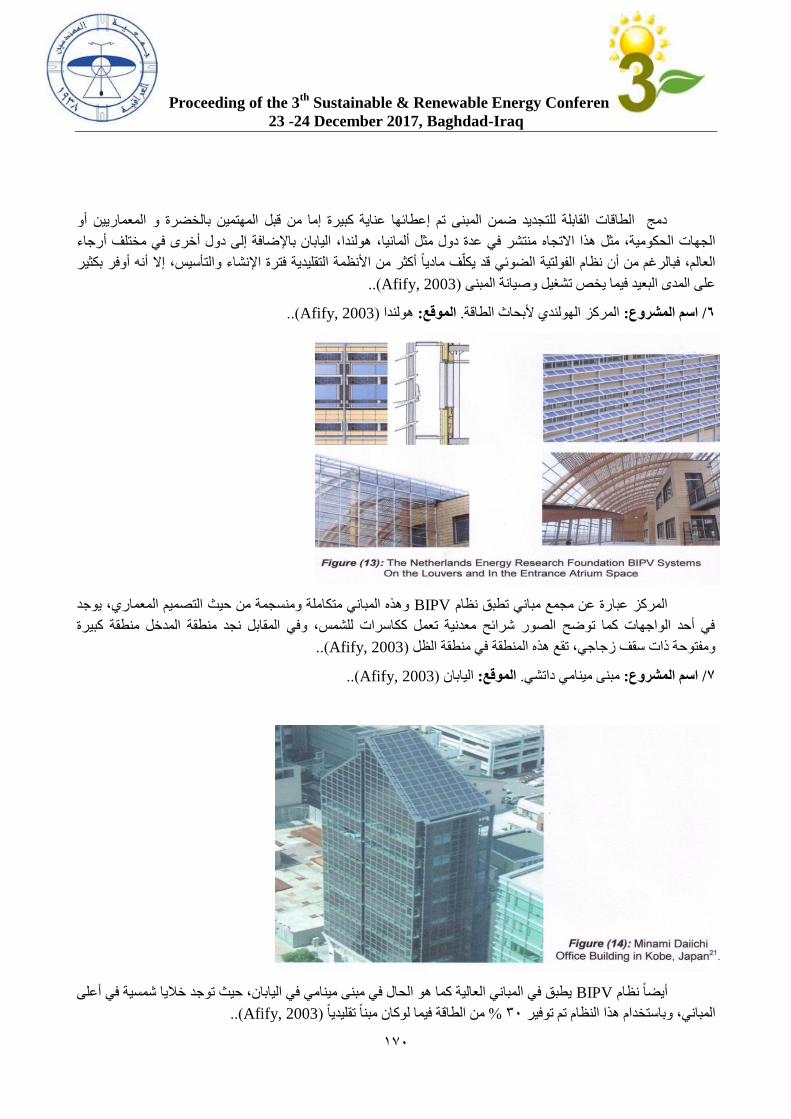
Proceeding of the 3th
Sustainable & Renewable Energy Conference
23 -24 December 2017, Baghdad-Iraq
811
دمج الطاقات القابلة للتجديد ضمن المبنى تم إعطائها عناية كبيرة إما من قبل المهتمين بالخضرة و المعماريين أو
منتشر في عدة دول مثل ألمانيا، هولندا، اليابان باإلضافة إلى دول أخرى في مختلف أرجاء االتجاهالجهات الحكومية، مثل هذا
الضوئي قد يكلف ماديا أكثر من األنظمة التقليدية فترة اإلنشاء والتأسيس، إال أنه أوفر بكثير يةالفولتالعالم، فبالرغم من أن نظام
.(.Afify, 2003) على المدى البعيد فيما يخص تشغيل وصيانة المبنى
.(.Afify, 2003) هولندا: الموقع .المركز الهولندي ألبحاث الطاقة: اسم المشروع/ 6
وهذه المباني متكاملة ومنسجمة من حيث التصميم المعماري، يوجد BIPVمباني تطبق نظام المركز عبارة عن مجمع
في أحد الواجهات كما توضح الصور شرائح معدنية تعمل ككاسرات للشمس، وفي المقابل نجد منطقة المدخل منطقة كبيرة
.(.Afify, 2003) ومفتوحة ذات سقف زجاجي، تقع هذه المنطقة في منطقة الظل
.(.Afify, 2003) اليابان: الموقع .مبنى مينامي داتشي: اسم المشروع/ 7
يطبق في المباني العالية كما هو الحال في مبنى مينامي في اليابان، حيث توجد خاليا شمسية في أعلى BIPVأيضا نظام
.(.Afify, 2003) من الطاقة فيما لوكان مبنا تقليديا % 21وباستخدام هذا النظام تم توفير ، المباني
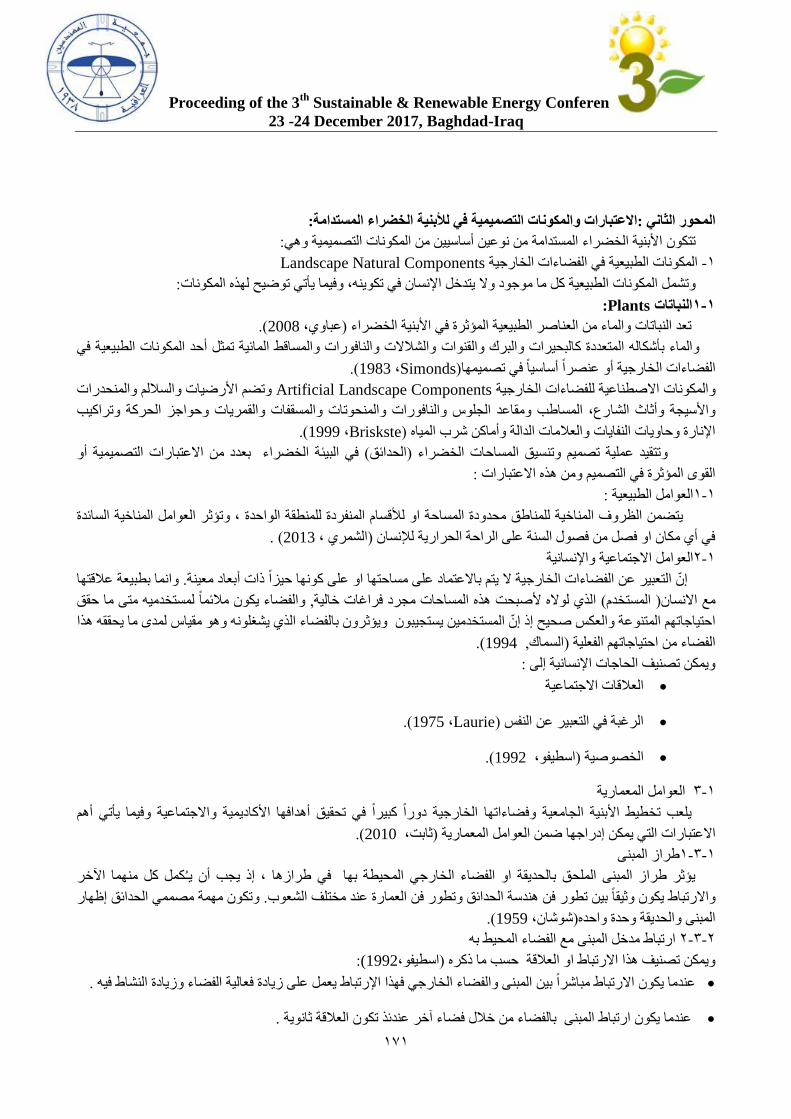
Proceeding of the 3th
Sustainable & Renewable Energy Conference
23 -24 December 2017, Baghdad-Iraq
818
:الخضراء المستدامة لألبنيةالمكونات التصميمية في االعتبارات و:المحور الثاني
: من نوعين أساسيين من المكونات التصميمية وهيالمستدامة األبنية الخضراءتتكون
Landscape Natural Componentsالمكونات الطبيعية في الفضاءات الخارجية -8
:ل المكونات الطبيعية كل ما موجود وال يتدخل اإلنسان في تكوينه، وفيما يأتي توضيح لهذه المكوناتوتشم
: Plantsالنباتات 1-1
(. 2008عباوي، ) األبنية الخضراءتعد النباتات والماء من العناصر الطبيعية المؤثرة في
والشالالت والنافورات والمساقط المائية تمثل أحد المكونات الطبيعية في والماء بأشكاله المتعددة كالبحيرات والبرك والقنوات
(.Simonds ،1983)الفضاءات الخارجية أو عنصرا أساسيا في تصميمها
وتضم األرضيات والساللم والمنحدرات Artificial Landscape Components المكونات االصطناعية للفضاءات الخارجية و
رع، المساطب ومقاعد الجلوس والنافورات والمنحوتات والمسقفات والقمريات وحواجز الحركة وتراكيب واألسيجة وأثاث الشا
.(Briskste ،1999)اإلنارة وحاويات النفايات والعالمات الدالة وأماكن شرب المياه
رات التصميمية أو بعدد من االعتبا الخضراء في البيئة ( الحدائق)المساحات الخضراء تتقيد عملية تصميم وتنسيق و
:القوى المؤثرة في التصميم ومن هذه االعتبارات
:العوامل الطبيعية 8-8
يتضمن الظروف المناخية للمناطق محدودة المساحة او لألقسام المنفردة للمنطقة الواحدة ، وتؤثر العوامل المناخية السائدة
( .2013الشمري ، ) لإلنسانية في أي مكان او فصل من فصول السنة على الراحة الحرار
واإلنسانية االجتماعيةالعوامل 8-1
وانما بطبيعة عالقتها . إن التعبير عن الفضاءات الخارجية ال يتم باالعتماد على مساحتها او على كونها حيزا ذات أبعاد معينة
والفضاء يكون مالئما لمستخدميه متى ما حقق , يةالذي لواله ألصبحت هذه المساحات مجرد فراغات خال( المستخدم) مع االنسان
احتياجاتهم المتنوعة والعكس صحيح إذ إن المستخدمين يستجيبون ويؤثرون بالفضاء الذي يشغلونه وهو مقياس لمدى ما يحققه هذا
(. 1994, السماك)الفضاء من احتياجاتهم الفعلية
:ويمكن تصنيف الحاجات اإلنسانية إلى
جتماعيةالعالقات اال
الرغبة في التعبير عن النفس(Laurie،1975 .)
(.1992اسطيفو، )الخصوصية
العوامل المعمارية 8-2
وفيما يأتي أهم واالجتماعيةيلعب تخطيط األبنية الجامعية وفضاءاتها الخارجية دورا كبيرا في تحقيق أهدافها األكاديمية
(. 2010ثابت،)لعوامل المعمارية التي يمكن إدراجها ضمن ا االعتبارات
طراز المبنى 8-2-8
في طرازها ، إذ يجب أن يـكمل كل منهما اآلخر المحيطة بهايؤثر طراز المبنى الملحق بالحديقة او الفضاء الخارجي
مصممي الحدائق إظهار وتكون مهمة. يكون وثيقا بين تطور فن هندسة الحدائق وتطور فن العمارة عند مختلف الشعوب واالرتباط
(. 1959شوشان،)المبنى والحديقة وحدة واحده
ارتباط مدخل المبنى مع الفضاء المحيط به 1-2-1
:1992)اسطيفو،)ويمكن تصنيف هذا االرتباط او العالقة حسب ما ذكره
عالية الفضاء وزيادة النشاط فيه عندما يكون االرتباط مباشرا بين المبنى والفضاء الخارجي فهذا اإلرتباط يعمل على زيادة ف.
المبنى بالفضاء من خالل فضاء آخر عندئذ تكون العالقة ثانوية ارتباطعندما يكون.
Proceeding of the 3th
Sustainable & Renewable Energy Conference
23 -24 December 2017, Baghdad-Iraq
811
1992)اسطيفو،)عندما يرتبط المبنى مع الفضاء بواسطة أكثر من فضاء فتصبح العالقة خفيفة.
درجة انغالق الفضاءات الخارجية 1-2-2
أطراف الفضاء المحيط بالمباني وقد جرى تحديد درجات االنغالق في الفضاءات الخارجية لتشتمل وتـحدد استنادا الى عدد
على فضاء مفتوح تماما إذا كانت المباني تحيط به من جهاته األربعة إحاطة محكمة وفضاء مفتوح شبه مغلق إذا كان يحتوي على
.1992)اسطيفو،)كون الفضاء مفتوحا فواصل بين هذه المباني أما إذا كان أقل من ذلك عندئذ ي
(Shihara) ،1970 (اإلحساس بالقياس)درجة االحتواء في الفضاءات الخارجية 1-2-1
مستخدمو الفضاءات الخارجي 1-2-5
.1992)اسطيفو،)كفاءة االستعمال للفضاءات الخارجية 1-2-6
المعايير التخطيطية 1-1
م28)خصصت منظمة اليونسيكو معيار 1
أما في (. Unesco ،1975)طالب من الموقع للمساحة المفتوحة والخضراء لكل(
الجامعات العربية فأن المعيار المساحي المخصص لكل طالب من الموقع بأكمله فيتراوح بين
م( 61-811)1 (. 1976,النشار( ) طالب81111)للجامعة التي تزيد سعتها عن
:المحورالثالث الدراسة الميدانية
اءا على ما تم تقديمه في المحورين االول والثاني، اعتمد البحث منهجية التحليل الوصفي باإلضافة الى النقد الموضوعي بن
لالبنية وسوف يتم إعتماد المراحل التالية في الدراسة الميدانية لغرض التوصل الى حلول تصميمية وتطويرية لالبنية الخضراء
. الخضراء(العمارة)
(:عينة البحث)ب موقع الدراسةإنتخا 2-8
حيث تتكون البناية من ثالثة طوابق ويشغلها مجموعة من دوائر وشركات ,موقع مجمع وزارة االعمار واإلسكان في كركوك
.الوزارة
مرحلة الدراسة وجمع المعلومات 2-1
كدرجات الحرارة والرطوبة النسبية وحركة وتشمل معرفة العوامل المؤثرة بالتصميم والظروف البيئية المختلفة وجمعها،
الرياح واإلشعاع الشمسي وخواص التربة لمنطقة الدراسة كي يتم إختيار النباتات التي تتوافق مع هذه الظروف، وكذلك معرفة
عوض )الموقع عنها إضافة الى معرفة الحاجات ورغبات مستخدمي لالستداللالنباتات المتواجدة في الموقع وما عليها من منشآت
:وتم إجراء هذه المرحلة ثم تنفيذها بعدة خطوات منها(. 2005وكامل،
تقيم المكونات الطبيعية 2-1-8-8
.البنايةقلة االعداد واالنواع النباتية في
االصطناعيةتقييم المكونات 2-1-8-1
باالضافة ( الجلوس،االنارة،العالمات الدالة،النافورات مقاعد)من خالل المالحظة الموقعية تبين عدم ادخال العناصر االصطناعية
. من قبل مستخدميها االبنيةمما ادى الى قلة كفاءة استعمال هذه .الى عدم التنوع في مواد االكساء للممرات والمماشي
العوامل البيئية 3-2-1
ل السطوع الشمسي يتطلب من معد وارتفاعتمتاز منطقة الدراسة بتطرف درجات الحرارة خالل فصلي الصيف والشتاء
كعنصر مؤثر للتقليل من األثار السلبية للمناخ الموقعي وتتميز ( النباتات)بعض الوسائل منها الطبيعية استعمالالمصمم
.طوبوغرافية الموقع بأرض مستوية لذا ال توجد مشاكل من هذا الجانب
العوامل المعمارية3-2-3
طراز المباني 3-2-3-1
.الكالسيكي للبناية از الطر
Proceeding of the 3th
Sustainable & Renewable Energy Conference
23 -24 December 2017, Baghdad-Iraq
812
العالقة بين المباني ومداخلها 3-2-3-2
جميع األبنية ارتباط المالحظات الموقعية سجلت وجود عالقة بين األبنية ومداخلها مما حقق عالقة مباشرة بينهما نتيجة
االهتماممما يعطي داللة للمصمم بأن البنايةإن الدخول والخروج من والى بمداخلها مباشرة دون وجود فضاء آخر يربطهما إذ
.استخدامهايؤدي الى الرغبة في البنايةبتصميم
(المقياس االنساني)درجة االحتواء 3-2-3-4
االحتواء تعطي شعورا بعدم اتها أن جميع الفضاءاتوفضاء لواقع البنايةتبين من المالحظة الشخصية والمخططات المعمارية
.وهذا يؤثر في استخدامه
اءة االستعمال كف 3-2-3-5
الفعاليات لتشمل النشاطات االجتماعية ، الراحة والتجوال، والمطالعة ،والتجمع لكن من خالل المجمعات الخضراءتتنوع في
ومن خالل المقابالت الشخصية مع عدد من المستخدمين . قليل جدا األبنية الخضراءالمالحظة الموقعية وجد أن استخدام
تبين بسبب الظروف البيئية القاسية في الموقع وكذلك عدم توفر , رغبتهم في استخدامات األبنية الخضراءعن قلة لالستفسار
مما ضراء خاألبنية الالمكونات الطبيعية واالصطناعية التي تقلل من االثار السلبية للظروف البيئية القاسية وكذلك عدم تأثيث
.من ارتياده خضراءلألبنية العزوف المستخدمين استدعى
المعايير التخطيطية 3-2-4
تبين أن المعايير التخطيطية لم ,من خالل الدراسة الميدانية ودراسة المخططات المعمارية والزيارات الموقعية وصور الموقع
ا الطرق وخصوصا توقيع المكونات الطبيعية وأعداد مكوناتها الصناعية وخصوص البنايةتؤخذ بنظر االعتبار عند تصميم
.والممرات والمماشي ومقاعد الجلوس والعالمات الدالة
(المتطلبات واالحتياجات) االستبيان 3-2-5
يعد االستبيان من أدوات البحث العلمي األكثر شيوعا ازداد استخدام االستبيان في البحوث العلمية حتى أصبح األداة األولى التي
االستبانة التي مرت بناعليبعد تحديد مشكلة الدراسة وأهدافها . الدراسة ضتختبر فروتجمع بها المعلومات التي على ضوئها
:خالل المراحل التالية
تصميم استمارة االستبيان: المرحلة األولى
بعد تحديد المشكلة البحثية وأهدافها بالرجوع الى الدراسات السابقة وتوزيع االستبانة االستطالعية التي تضمنت سؤاال مفتوحا
: مفاده
.؟ العمارة المستدامة واالبنية والمساحات ت الخضراءما مقترحاتك لتطوير
هذا والخروج ببعض المؤشرات التصميمية الستمارة االستبيان التي يمكن االستفادة منها في المهندسيناستمارة على 15وزعت
.الخصوص
المراجعة اللغوية والفنية: المرحلة الثانية
وقد عرض االستبيان بصيغته , تمت المراجعة اللغوية والفنية والتحقق من صدق االختبار, د تصميم فقرات االستبيانوبع
استمارةبآرائهم ومقترحاتهم وفي ضوء ما أبداه المحكمون عدلت لألخذاألولية على محكمين من ذوي الخبرة واالختصاص
. (1)االستبانة لتظهر في صورتها النهائية الملحق
.انشائي ومعماري مهندس( 15)عشوائية قوامهاغير على عينة االستبيانولتحقيق أهداف الدراسة ، وزعت استمارة
مناقشة نتائج االستبيان
Statistical analysisالتحليل اإلحصائي
(.Chi-Square)ع كآي في التحليل اإلحصائي للبيانات المسجلة وباستخدام مربSPSS البرنامج استعمل
Proceeding of the 3th
Sustainable & Renewable Energy Conference
23 -24 December 2017, Baghdad-Iraq
811
ومدى تفاعلهم معها من خالل معرفة تفضيلهم المصممين تم تحديد الهدف من االستبيان بالتقصي عن معرفة حاجات ورغبات
تصميمية يجب أن تؤخذ بنظر مؤشراتالحاجات وتعتبر هذه، وخارج االبنايةللمكونات الطبيعية واالصطناعية داخل
.األعتبارلدى المصمم
3لالستبيان من الملحق (1)شة الفقرة مناق-1
يفضلون تصميم مواقع الجلوس في مداخل االبنية ،اماكن األبنية الخضراءراء مستخدمي آ من% 11شكلت نتائج االستبيان
عالقة تبين من خالل التحليل االحصائي وجود .انتظار وسائل النقل ،على جانبي الممرات والمماشي وداخل المساحات الخضراء
.( 0.01)معنوية بين مواقع تصميم أماكن الجلوس تحت مستوى معنوية
(2)مناقشة الفقرة -2
أن مادة الخشب هي من المواد المفضلة في صنع مقاعد الجلوس عند توقيعها في الفضاءات االستبيانأظهرت نتائج
في العمارة اإلسالمية وتمتاز استخدامار المواد العضوية حيث يعد الخشب أكث. من آراء المبحوثين% 61الخارجية حيث شكل
منها توافقها التام مع البيئة الطبيعية من حيث الخواص الحرارية أو النواحي التشكيلية والتي االعتباراتمادة الخشب بمجموعة من
, إلنشائية االخرى هي خفة الوزنتضم اللون والملمس وكذلك تمتاز األخشاب بمميزات تجعلها متفوقة على غيرها من المواد ا
وهذه الخواص في . المتانة وقلة التخزين الحراري باإلضافة الى امتصاصه الضعيف للحرارة, العزل الحراري, سهولة التشكيل
من آراء المستخدمين يفضلون الحديد % 1بينما ظهرت نسبة , مادة الخشب جعلت منه مادة إنشائية لصناعة مقاعد الجلوس
في صناعة مقاعد الجلوس و يرى الباحث أن مادة الحديد المغلون تمتاز بثقل وزنها باإلضافة لسرعة الكسب واالمتصاص المغلون
بالتحليل اإلحصائي وجود فروقات معنوية تحت مستوى وتبين. الخضراءاألبنية الحراري يجعل منها مادة غير مالئمة في ظروف
, الحديد المغلون, الخشب)بين أنواع المادة المصنعة لمقاعد الجلوس ( 3في الملحق 1جدول )كما مبين في ( 0.01) احتمالية
(.البالستك, الخرسانة
( 3)مناقشة الفقرة -3
من %56تبين أن زراعة األشجار والشجيرات والمتسلقات أفضل وسيلة لتوفير الظالل في الفضاءات الخارجية حيث شكلت
الظالل بواسطة النباتات ويرى الباحث ان السبب وراء ظهور هذه النسبة قد يعود الى العالقة بين يفضلون توفير المستبينينآراء
من خالل ألوانها األبنية الخضراءالى امتالك هذه النباتات مشاهد طبيعية متنوعة تؤثر بمستخدمي باإلضافةاالنسان والطبيعة
االضافة الى ان هذه النباتات تقوم بعملية خفض درجات الحرارة و االشعاع ب.وأوراقها ،فظهرت آراؤهم بناءا على هذه التاثيرات
بينما ظهرت .الشمسي من خالل قيامها بحجب أو إعاقة وصول أشعة الشمس الى سطح االرض وكذلك من خالل تكوينها الظالل
.المظالت االصطناعية استخداممن آراء المستخدمين يؤيدون %8نسبة
والشجيرات والمتسلقات يعطي اإلمكانية للمصمم في زيادة التأثير كاألشجارأن توفير الظالل بوساطة النباتات وكما يعتقد الباحث
هذه الفضاء وكذلك للظروف المناخية الحارة والجافة في موقع الدراسة تأتي استعمالاللوني للفضاء الخارجي وبالتالي زيادة
مقارنة . المظالت بيئيا ومن المظالت أكفأ أنواعحيث اثبتت الدراسات أن المظالت النباتية . النباتات لتوفير الظالل استخدامأهمية
. بالمظالت االصطناعية تكون أما بنائية ثقيلة كالتقبيب والعقد أو مظالت خفيفة كالهياكل القشرية و تراكيب الشد
(4)مناقشة الفقرة. 4
ملحق 1جدول )كما في ( 0.01) احتماليةي باستخدام مربع كاي تحت مستوى ظهرت فروقات معنوية عند التحليل اإلحصائ
و بوابة حسب المتطلب تكمل , بوابة بدون بناء, بوابة عادية, بين األشكال المستخدمة في تصميم مداخل الحديقة كاألقواس( 2
أن طراز المبنى إذ. حديقة على شكل أقواسمن آراء المستبينين يفضلون أن تكون مداخل ال% 51وبينت نتائج االستبيان . التصميم
.
(5)مناقشة الفقرة . -5
من آراء 11% شكلت زراعة النبات المتسلقة الدائمة الخضرة أكثر األنواع تفضيال في تغطية مداخل الحديقة فقد شكلت
الى باإلضافةوتاكيد مداخل الحدائق إن سبب هذا التفضيل وكما يرى الباحث في رغبة المستخدمين إظهار البنايةمستخدمي
Proceeding of the 3th
Sustainable & Renewable Energy Conference
23 -24 December 2017, Baghdad-Iraq
815
المتسلقات دائمة الخضرة في مداخل االبنية يضفي جمالية وتوافر الظل لهذه المداخل و خصوصا في الظروف المناخية استعمال
اع األنو استعمالعند توظيف المتسلقات في مداخل الحديقة تجنب االعتبارلذا يجب على مصممي الحدائق االخذ بنظر . القاسية
كما ( 0.05) احتمالأن هناك فروقات معنوية تحت مستوى وظهر. االنواع التي تتميز بجمال اوراقها اختيارذات األشواك وكذلك
متسلقات دائمة الخضرة ونباتات ممكن قصها و تشكيلها , بين االنواع النباتية كمتسلقات مزهرة( 2من الملحق 5الجدول ) في
.بأشكال مختلفة
(6)الفقرة مناقشة. 6
من آراء المستخدمين للفضاء الخارجي يفضلون زراعة النباتات المائية في مواقع المنشآت 80% اظهرت نتائج االستبيان إن
كان البنايةويرى الباحث أن حاجة المستخدمين لزيادة المساحة الخضراء ولزراعة أنواع مختلفة في مواقع . والتكوينات المائية
من آراء المستبينين الذين ال يفضلون زراعة هذه النباتات في مواقع % 11 ظهور. لهم استخدام هذا العنصر النباتيوراء تفضي
المنشآت المائية ويعتقد الباحث ان سبب ظهور النسبة المنخفضة يعود الى أن هذه النباتات في منطقة الدراسة تكاد تكون غير
ومن خالل التحليل االحصائي ظهرت فروقات معنوية بين زراعة هذه النباتات من . واعهاالى عدم معرفتهم بأن باإلضافةمتوفرة
(.0.01)عدمها وتحت مستوى احتمال
( 7)مناقشة الفقرة . 7
( 0.01) احتمالوظهر بالتحليل االحصائي باختبار مربع كاي أن هناك عالقة معنوية بين هذه التكوينات المائية تحت مستوى
من آراء %36كما بينت نتائج االستبيان أن النافورات إحدى التكوينات المائية التي شكلت(. 2في الملحق 1جدول )ينة في والمب
4يفضلون استخدام القنوات المائية 24%من أراء المستخدمين يفضلون الشالالت 32 % وإن األبنية الخضراءمستخدمي
أن الماء عنصر ليس له مميزات . القنوات الصناعية استخداممين يفضلون من آراء المستخد 4% يفضلون احواضا صناعي%
تصميمية تمكننا من التفاعل معه بدون وجود ما يحتويه لذا يعتمد الماء في تصميمه على السياق البيئي الذي يحتويه و من الصفات
باحث باإلضافة الى التأثير الجمالي و الحسي للماء أنه و يعتقد ال. االنعكاس و الدينامي,الحركة , المرونة) الحسية البصرية للماء
كان لذلك األثر في . ومن خالل استخدام هذه النافورات سوف تؤدي الى تلطيف الهواء وخصوصا في ظروف المناخ الموقعي
تبارأشكال و أحجام مع األخذ بنظر األع, األبنية الخضراءظهور النسبة األعلى لتفضيل النافورات كعنصر تصميمي لدى مستخدمي
. هذه النافورات وكذلك أعمدة الماء المتكونة فيها
االستنتاجات
الخضراء، العمارة المستديمة، عمارة البيئية العمارةالبيئة، العمارة ) مما سبق تم التطرق لعدة تعاريف ومفاهيم ومبادئ عن -8
ميعها من خالل أهدافها التي تنادي بها، فكلها تسعى إلى احترام البيئية ، وكان هناك قواسم مشتركة عديدة تشترك فيها ج(تقنية البيئة
.إلخ... واالنسان واستخدام الطاقة المتجددة وايقاع أقل أثر سلبي على البيئة واالنسجام مع المحيط
طلبات يتحدد نوع ومن خالل هذه المت األبنية الخضراءبينت الدراسة ضرورة توفير بيئة تلبي متطلبات ورغبات مستخدمي -1
.البيئة الطبيعية إلجراء التطوير المطلوب بما يتالءم مع حاجات المستخدمين
التفضيل بين مكونات التصميم الطبيعية واالصطناعية من حيث توفيرها أو مبداعلى باالعتمادأظهرت نتائج االستبيان -2
:لونوإن أفراد عينة االستبيان يفض. األبنية الخضراءفي استعمالها
واستعمالوسائل النقل المسطح األخضر، مداخل األبنية انتظارتوفير مقاعد الجلوس على جانبي الممرات والمماشي ، أماكن -1
.مادة الخشب في صناعة مقاعد ومساطب الجلوس في الفضاءات الخارجية الجامعية

Proceeding of the 3th
Sustainable & Renewable Energy Conference
23 -24 December 2017, Baghdad-Iraq
816
.من المظالت والتراكيب االصطناعية زراعة األشجار والشجيرات والمتسلقات كعنصر طبيعي لتوفير الظل بدال -5
.النافورات كتكوينات مائية بدال من التكوينات االخرى كالشالالت واألحواض المائية والقنوات الصناعية استخدام-6
.الى الخطوط المنحنية باإلضافةتصميم الممرات والمماشي بشكل خطوط مستقيمة وهندسية -1
ية في مجاميع من الصخور وكذلك زراعة النباتات المائية ونصف المائية في مواقع زراعة النباتات الصبارية والعصار-1
.التكوينات المائية
لمصادرا
قسم . رسالة ماجستير. الخصائص التصميمية للفضاءات الخارجية في الجامعات وكفاءة استعمالها.1992اسطيفو، وئام شمعون
.العراق.بغداد. الجامعة التكنولوجية.الهندسة المعمارية
. رسالة ماجستير. الخصائص التصميمية للمساحات الخضراء ومدى مالءمتها للبيئة السكنية العراقية. 1994.السماك، فاز سالم
.العراق.قسم الهندسة المعمارية الجامعة التكنولوجية
ارنة لتاثير المناطق الخضراء في دور المناطق الخضراء في كفاءة النظام البيئي للمدينة، دراسة مق. 2013.الشمري، قصي صافي
.العراق.الجامعة التكنولوجية . قسم الهندسة المعمارية. رسالة ماجستير. المناخ الحضري لمدينة كربالء
كلية االدارة واالقتصاد في –البيئة واالنسانية والبنائية لالبنية الجامعية . 2010.ثابت، نسمة معن
دراسة تحليلية -لبعد الرابع في تحقيق المتعة الحسية للمتلقي في الفضاءات الخارجيةدور ا. 2008.عباوي، رواء فوزي نعوم
.العراق. الجامعة التكنولوجية, اطروحة دكتوراه، قسم الهندسة المعمارية. للخصائص التصميمية
جامعة . لمطبوعاتمديرية الكتب وا. هندسة الحدائق وتنسيقها، الجزء العملي. 2005.عوض، عدنان الشيخ وكامل، اميرة
. سوريا.دمشق
.مكتبة بستان المعرفة، مصر. الحدائق تخطيطها ، تنسيقها، تطورها التاريخي. 2011.نوح، علم الدين االمام
.العراق.بغداد. اساليب تنفيذ االحزمة الخضراء لحماية المدن وتنفيذ مشاريع التشجير في المدن واالقاليم. 1986.وزارة التخطيط

Proceeding of the 3th
Sustainable & Renewable Energy Conference
23 -24 December 2017, Baghdad-Iraq
811
المالحق
(8)ملحق
استمارة استبيان
السالم عليكم ورحمة هللا وبركاته
يرجى أن تكون . التصميم البيئي في العمارة المستدامة أمامكم تمثل استبيانا ألغراض البحث العلمي بهدف تطوير االستمارة التي
ل في تحقيق أهداف هذا االستبيان وتساهم في تطوير الشخصية والتي سوف تساهم وبشكل فعا انطباعاتكمإجاباتكم من خالل
.، إجابتكم هي خدمة جديرة باالحترامالعمارة المستدامة
مؤيد أكرم أرسالن.د -:الباحث
دائرة االشغال والصيانة العامة/وزارة االعمار واإلسكان
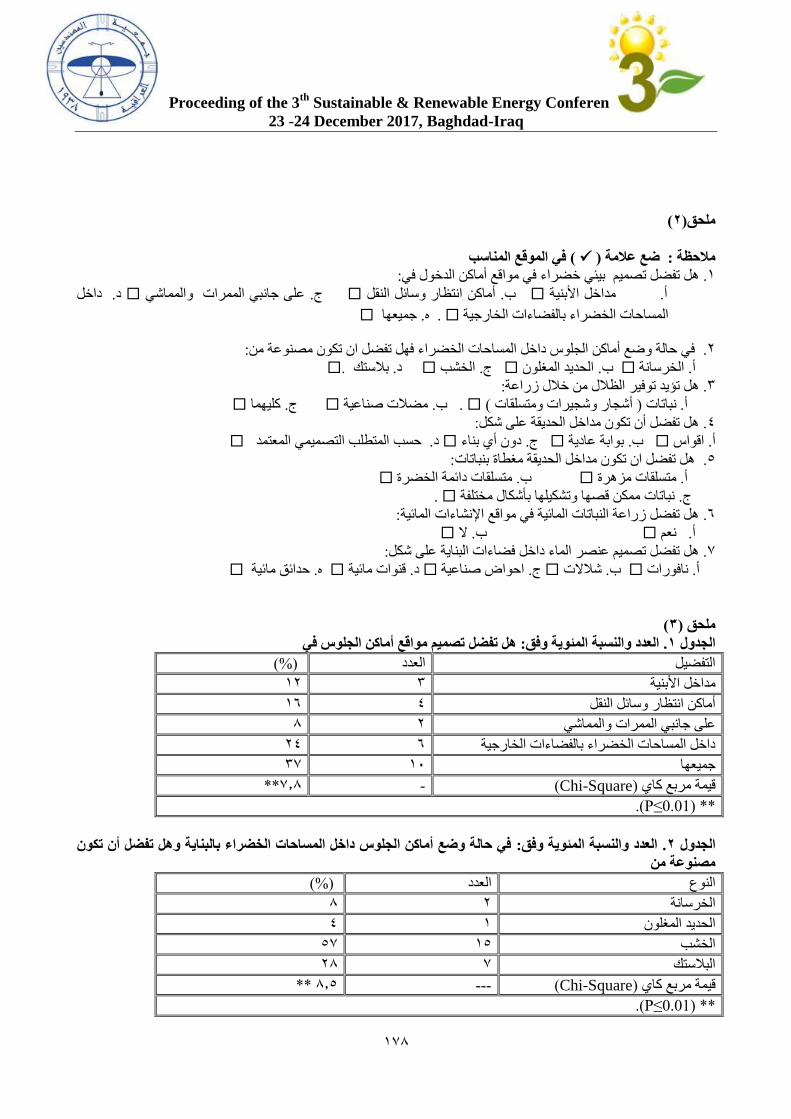
Proceeding of the 3th
Sustainable & Renewable Energy Conference
23 -24 December 2017, Baghdad-Iraq
811
(2)ملحق
في الموقع المناسب( ) عالمة ضع : مالحظة
:في الدخولمواقع أماكن بيئي خضراء في م هل تفضل تصمي. 8
داخل . د على جانبي الممرات والمماشي . ج وسائل النقل انتظارأماكن . ب األبنيةمداخل . أ
جميعها . ه. المساحات الخضراء بالفضاءات الخارجية
:تكون مصنوعة من في حالة وضع أماكن الجلوس داخل المساحات الخضراء فهل تفضل ان. 1
.بالستك . د الخشب . ج الحديد المغلون . ب الخرسانة . أ
:هل تؤيد توفير الظالل من خالل زراعة. 2
كليهما . ج مضالت صناعية . ب. ( أشجار وشجيرات ومتسلقات ) نباتات . أ
:هل تفضل أن تكون مداخل الحديقة على شكل. 1
المعتمد يحسب المتطلب التصميم. د دون أي بناء . ج بوابة عادية . ب اقواس . أ
:هل تفضل ان تكون مداخل الحديقة مغطاة بنباتات. 5
متسلقات دائمة الخضرة . ب متسلقات مزهرة . أ
. مختلفة بأشكالنباتات ممكن قصها وتشكيلها . ج
:هل تفضل زراعة النباتات المائية في مواقع اإلنشاءات المائية. 6
ال . ب نعم . أ
:على شكل لبنايةهل تفضل تصميم عنصر الماء داخل فضاءات ا. 1
ية حدائق مائ. ه قنوات مائية . د احواض صناعية . ج شالالت . ب نافورات . أ
(3)ملحق
هل تفضل تصميم مواقع أماكن الجلوس في: العدد والنسبة المئوية وفق. 1الجدول
)%( العدد التفضيل
81 2 مداخل األبنية
86 1 أماكن انتظار وسائل النقل
1 1 على جانبي الممرات والمماشي
11 6 داخل المساحات الخضراء بالفضاءات الخارجية
21 81 جميعها
**1.1 - (Chi-Square)يمة مربع كاي ق
( **P≤0.01.)
هل تفضل أن تكون وبالبناية في حالة وضع أماكن الجلوس داخل المساحات الخضراء : العدد والنسبة المئوية وفق. 2الجدول
مصنوعة من
)%( العدد النوع
1 1 الخرسانة
1 8 الحديد المغلون
51 85 الخشب
11 1 البالستك
** 1.5--- (Chi-Square)ربع كاي قيمة م
( **P≤0.01.)
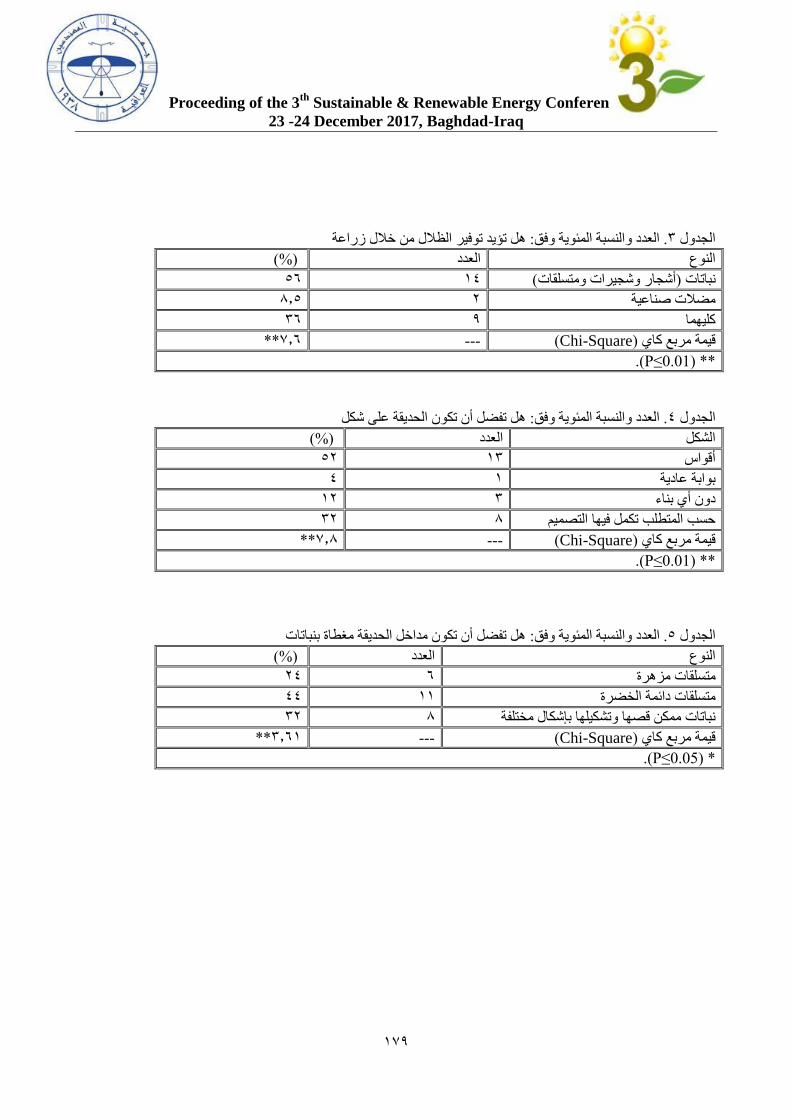
Proceeding of the 3th
Sustainable & Renewable Energy Conference
23 -24 December 2017, Baghdad-Iraq
811
هل تؤيد توفير الظالل من خالل زراعة: العدد والنسبة المئوية وفق. 2الجدول
)%( العدد النوع
56 81 (أشجار وشجيرات ومتسلقات)نباتات
1.5 1 مضالت صناعية
26 1 كليهما
**1.6--- (Chi-Square)قيمة مربع كاي
( **P≤0.01.)
هل تفضل أن تكون الحديقة على شكل: العدد والنسبة المئوية وفق. 1الجدول
)%( العدد الشكل
51 82 أقواس
1 8 بوابة عادية
81 2 دون أي بناء
21 1 حسب المتطلب تكمل فيها التصميم
**1.1--- (Chi-Square)قيمة مربع كاي
( **P≤0.01.)
هل تفضل أن تكون مداخل الحديقة مغطاة بنباتات: لنسبة المئوية وفقالعدد وا. 5الجدول
)%( العدد النوع
11 6 متسلقات مزهرة
11 88 متسلقات دائمة الخضرة
21 1 نباتات ممكن قصها وتشكيلها بإشكال مختلفة
**2.68--- (Chi-Square)قيمة مربع كاي
( *P≤0.05.)
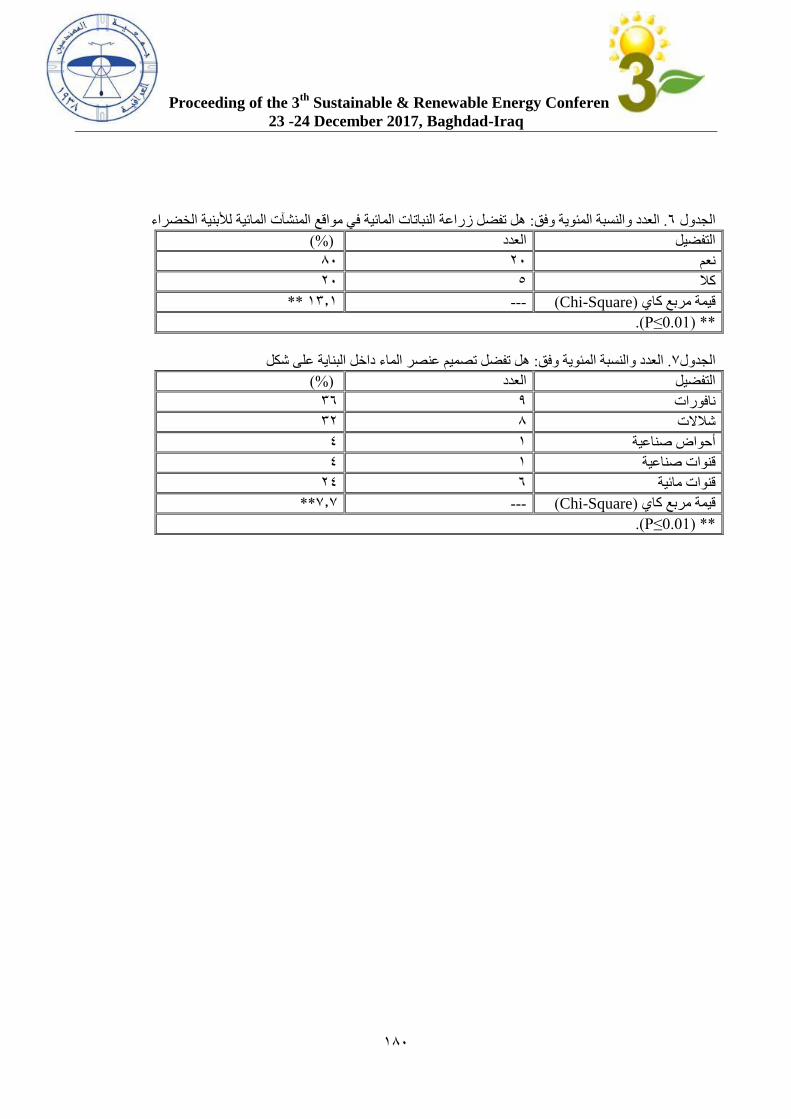
Proceeding of the 3th
Sustainable & Renewable Energy Conference
23 -24 December 2017, Baghdad-Iraq
811
لألبنية الخضراءهل تفضل زراعة النباتات المائية في مواقع المنشآت المائية : مئوية وفقالعدد والنسبة ال. 6الجدول
)%( العدد التفضيل
11 11 نعم
11 5 كال
** 82.8--- (Chi-Square)قيمة مربع كاي
( **P≤0.01.)
شكل على البنايةهل تفضل تصميم عنصر الماء داخل : العدد والنسبة المئوية وفق. 1الجدول
)%( العدد التفضيل
26 1 نافورات
21 1 شالالت
1 8 أحواض صناعية
1 8 قنوات صناعية
11 6 قنوات مائية
**1.1--- (Chi-Square)قيمة مربع كاي
( **P≤0.01.)

(ABE) الكتلة الحيوية محور تطبيقات
دراسات ال
Proceeding of the 3th
Sustainable & Renewable Energy Conference
23 -24 December 2017, Baghdad-Iraq
281
. تصنيع مادة مركبة صديقة للبيئة تساهم في تحقيق إستدامة الموارد الطبيعية
.1122كانون أول 12-12,جمعية المهندسين العراقية-مؤتمر الطاقة المستدامة و المتجددة الثالث
مصطفى أحمد رجب. د
المعهد التقني بعقوبة
قسم الميكانيك
12221121822
علي إبراهيم مسلم الموسوي. م
طالب دكتوراه
هنغارية/كلية الهندسة
شيماء عباس عبد السادة. م
جامعة الكوفة
قسم هندسة المواد/ كلية الهندسة
:الخالصة
حبثو دوار ال ثم كمثادة تقويثة طبيعيثة لثراتنل البثولي اسثتر وبنسثب تم في هذا البحثث إسثتادام دقثاقش ق ثور
ولغرض المقارنة مع الاواص التي تم الحصول عليها فثي هثذه المثادة المركبثة المقثواة %( 2,% 1, % 2)تقوية
تم تصنيع مادة مركبة من نف الراتنل مقثواة بثدقاقش كاربونثال الكالسثيوم وقد. بدقاقش ق ور حبو دوار ال م
الصناعية وبنف نسب التقوية أعاله وأظهرل النتثاقل أن النمثا ا التثي تحتثوي علثى ق ثور حبثو دوار ال ثم
. مقاومة الصدمة مقارنة بالنما ا التي تحتوي على كاربونال الكالسيوم و لديها مقاومة شد عالية
Manufacturing of Environmentally Friendly Composite Material
Contribute to the Sustainability of Natural Resources. Conference on Sustainable and Renewable Energy III - Iraqi Society of Engineers, 23-24 December 2017.
Shaima Abbas Abdel Sada
University of Kufa
Faculty of Engineering / Materials
Engineering Department
Ali Ibrahim Muslim Musawi
PhD student
Faculty of Engineering /
Hungarian [email protected]
Dr. Mustafa Ahmed Rajab
Technical Institute of Baquba
Department of Mechanics
0771257871
Abstract: In this research the use of particles sunflower seeds as a natural strengthening of the
polyester resin and proportions strengthen (1%, 2%, 3%). For the purpose of
comparison with the properties that were obtained in these composite materials
reinforced with sunflower seeds particles have been manufacturing a composite
material of the same resin reinforced particles calcium carbonate industrial, the same
proportions strengthen above. Results showed that the samples that contain a
sunflower seeds have a high resistance strain and impact resistance compared to
models that contain calcium carbonate.
Proceeding of the 3th
Sustainable & Renewable Energy Conference
23 -24 December 2017, Baghdad-Iraq
282
:الهدف من البحث
لكل ن اط سواء أكان صثناعيا او تجاريثا أو مثدميا أثرا سثلبيا علثى البيكثة لثذلك فثطن إيجثاد طثرا جديثدة لمعالجثة
ماينتجه أي ن اط من مالفال من أجل تحقيش التوازن بين التوسع في اإلنتاا وبين اآلار البيكية الناتجثة عثن لثك
. وأحد هذه الطرا وأهمها في الوقث الحثالي هثو إعثادة التثدوير وبما اليؤر على النمو المستدام للموارد الطبيعية
ينتل عن صناعة المواد الغذاقية الكثير من المالفال الغير قابلة لإلستهالك الب ري والتثي تطثرك كنثاتل عر ثي
لهذه الصناعة ومن بين هذه المالفال ق ثور حبثو دوار ال ثم بعثد اإلسثتفادة مثن نواتهثا فثي صثناعة ال يثول
أو إستهالكها كمكسرال مما يؤدي إلى تثراكم ق ثورها من أنواع ال يول المصنعة % 32و ي كل نسبة هفاتية النب
بتكثار فثي إطثار البحثث عثن وسثاقل يثتتي هثذا اإللثذلك . بآالف األطنان سثنويا وت ثكيلها مطثر حقيقثي علثى البيكثة
تسثتادم فثي ستغالل وإدارة مالفال الصثناعال الغذاقيثة التثي تعثاني منهثا الثدول الناميثة فثي إنتثاا مثواد جديثدة إل
.صديقة للبيكةفي نف الوق غير مكلفة والتطبيقال الهندسية
:المقدمة الجمثع هثو تتكون المثادة المركبثة مثن جمثع مثادتين ماتلفتثي الاثواص الميكانيكيثة والفي ياقيثة والغثرض مثن هثذا
وهنالك أمثلة عديدة للمواد المركبثة البيثول المبنيثة مثن . إستنباط مواص جديدة لم تكن متوفرة في المواد األصلية
الطثثين المالثثوط بثثالتبن التثثي بناهثثا البثثابليون وصثثوال إلثثى إسثثتادامها فثثي تطبيقثثال الف ثثاء والتطبيقثثال الطبيثثة
لنثوع المالفثال إسثتفادة منهثا تبعثا لتحقيثش أعظثم الفال ال راعية تتنوع نظم ووساقل تدوير الم[. 3,2,1]المتقدمة
فثي المنثاطش تقليثل نسثبة التلثول البيكثي مصوصثا هو ل المالفال هوالتكنولوجيال المتاحة والغرض من تدوير هذ
ال راعية أو بالقر مثن مصثانع حفثت وتعليثب المثواد الغذاقيثة حيثث تتبثع أسثاليب غيثر سثليمة للثتال مثن هثذه
واسثعةونظرا ل يادة النمو السكاني أصبح مصثانع حفثت وتعليثب المثواد الغذاقيثة وسث كتلثة سثكانية .الفالالم
من ثآل ومبثاني وأصثبح االرض ال راعيثة الباقيثة محاطثة ىاألرا ي ال راعية المحيطثة بهثا إلث حيث تحول
أن جميثثع هثثذه مالفثثال وحيثثث .صثثعوبة الثثتال مثثن المالفثثال ال راعيثثة ىإلثث ىممثثا أد كبيثثربتجمثثع سثثكاني
ال راعية من المواد الع وية سريعة التحلل والتي تعيش عليها العديد من الكاقنال الحية مثل الامثاقر المحاصيل
بالبيكة دامثل المصثانع وعنثد الثتال مثن هثذه المالفثال بالغا والفطريال والح رال وغيرها مما ي كل ررا
يمكن تعريث المالث .الصحة العامة للسكان ىكثر بالبيكة وبالتالي علمارا المصانع فطنها أي ا ت كل ررا أ
أنثه كثل مثا ينثتل بصثورة عار ثة أو انويثة مثالل عمليثال إنتثاا المحاصثيل الحقليثة سثواء أنثاء على ال راعي
لذلك فطن إعادة تدوير هذه المالفال ال راعيثة .الحصاد أو الجمع أو اإلعداد للتسويش أو التصنيع لهذه المحاصيل
الثتال مثن الح ثرال وأطوارهثا ا ، قتصثاديإسثتفادة منهثا التال اآلمن والصحي من المالفال واإليعمل على
لتربة من التثدهور والتلثول بسثبب إن ثاء مثرادم دفثن لالمحافظة على التركيب البناقي ، التي تعيش على المالفال
نبعثثثال الغثثثازال السثثثامة الناتجثثثة عثثثن دفثثثن وحثثثرا إلظثثثة علثثثي الهثثثواء مثثثن التلثثثول نتيجثثثة المحاف، والنفايثثثال
سثتادام المثواد والمنتجثال فثي إهثو والثذي بنثاء المسثتدام ومع ت ايد المطالبال بتطبيش معثايير ال .[4,3]المالفال
سثتادام هثذه المثواد إإعثادة ستادام الموارد الطبيعية وزيثادة القثدرة علثى إالمباني والبناء والتي ستساعد في تقليل
، كثان ل امثا إدمثال المالفثال ال راعيثة التثي تثم تثدويرها فثي والمنتجال لنف الغرض وبالتثالي تقليثل المالفثال
تطبيقال األبنية المسثتدامة والتثي هثي المثواد المركبثة الصثديقة للبيكثة مثثل العثوازل الحراريثة والسثقوف الثانويثة
:[10,9,8]و لتصنيع مادة مركبة يجب توفر مادتين هما .[7,6,5]عالية واألج اء التي التتعرض ألحمال
تكون مواد األساس أما مواد معدنية متكونة من المعادن وسباقكها وتتميث بثقثل وزنهثا ومتانتهثا : مادة األساس .1
العاليثة العالية ،أو قد تكون مواد سيراميكية والتثي تمتثاز بافثة وزنهثا ومقاومتهثا المرتفعثة لثدرجال الحثرارة
كثثذلك تكثثون المثثادة األسثثاس مثثواد بوليميريثثة وهثثي األكثثثر إسثثتعماال . ولكنهثثا ثثعيفة المقاومثثة لقثثوى الصثثدم
. وإنت ارا لما تتمي به من مواص ميكانيكية وحرارية جيدة
ى يجب توفر مي تين أساسيتين فثي هكثذا مثواد وهثي المقاومثة العاليثة والمطيليثة المناف ثة حتث: مادة التقوية .2
هنثاك عثدة طثرا للتقويثة منهثا التقويثة بالثدقاقش . وتكون إما طبيعيثة أو صثناعيةتستطيع تقوية المواد األساس
وبتشثكال ماتلفثة منهثا اإلبريثة والكرويثة والق ثرية ، كثذلك تثتم التقويثة (µm 1)والتي تكون بقطر أكبر مثن
نظثرا أما أكثر أساليب التقوية شيوعا فهثي التقويثة باألليثاف ،(0.1µm)بالت ت ويكون قطر الدقاقش أقل من
.[12,11]لما تتمي به من قوة كبيرة مقارنة بالمواد الراتنجية
Proceeding of the 3th
Sustainable & Renewable Energy Conference
23 -24 December 2017, Baghdad-Iraq
282
:الجزء العملي :المواد المستخدمة
: وهي منها النما ا تصنيع تم والتي التالية المواد ستادامإ البحثهذا في تم
a. ال ركة العامة على ق ور حبو دوار ال م من تم الحصول :دقائق قشور حبوب دوار الشمس
ق ور تم تنظي ,والذي يطرحه كمالفال عند تصنيع ال يول النباتيةلصناعة ال يول النباتية في بغداد
بواسطة غمرها في حوض ماء مقطر وتعري ها إلى الموجال فوا الصوتية إلزالة دوار ال م
وبعد تجفيفها لمدة يوم كامل بواسطة لتصاا الكامل بينها وبين الراتنلواألتربة عنها لتوفير اإلاالوساخ
جامعة /كلية الهندسة/اشعة ال م قمنا بطحنها بطاحونة مايكروية في ماتبرال قسم هندسة المواد
تتكون الث أهم محصول زيتي في العالميعتبر دوار ال م .(0.5µ)الكوفة الى حجم حبيبي مقداره
.[5] وتتحلل ببطئ السليولوز من الحبو ةق ر
b. غير المشبع راتنج البولي أستر: (SIROPOL 8340-PI) هذا الراتنل مجه من قبل شركة
(Saudi International Resin .Ltd (SIR)) , يصلد هذا الراتل بط افة مادة بيروكسيد مثيل أيل
المتصلدة نواع الراتنجال أحد أ راتل البولي أستر غير الم بع %).1)إليه بنسبة (MEKP) كيتون
والذي يستادم بصورة واسعة في تصنيع المواد المتراكبة بسبب رم منه كما انه يوفر بالحرارة
الممكن التعامل مع عمليال التصنيع الماتلفة ب كل سهل ومن,تنوع في االستادامال ب كل واسع
.يو ح التركيب الكيمياقي لراتنل البولي أستر غير الم بع( 1)،وال كل رقم [6] وبصورة تلقاقيا
c. دقائق كاربونات الكالسيوم(CaCO3): حجم الدقاقش لكاربونال الكالسيوم المستادمة في هذا البحث
.المالي ية (Zantat Sdn. Bhd)مجه من قبل شركةو (0.5µ)هو
: تهيئة المواد األوليةساعال لغثرض الثتال 5ولمدة ( C 25)تم تجفيفها بدرجة حرارة دقاقش ق ور حبو دوار ال م المطحونة
أسثتر البثولي والتي هثي راتثنل من المادة األساس مكونة تم تهيكة ملطال .الدقاقش من الرطوبة الممتصة من قبل
%( 2,% 1, % 2)ماتلفثة وزنيثة بنسثبلق ور حبو دوار ال م المطحونة الطبيعية الدقاقشمع الم بعغير
الصثناعية الثدقاقشونفث المثادة األسثاس لكثن مثع الوزنيثة وبثنف النسثب آمثرى إ افة إلى تح ثير ملطثال ،
(.1)لغرض مقارنة النتاقل وكما مو ح في الجدول رقم( كاربونال الكالسيوم)
. (FTIR) فحص باألشعة تحت الحمراءال
الفح يوفر .(IRA ffinity-1 , SHIMADZU)الجهاز المستادم لهذا النوع من الفح هو من نوع
نتاقل تحليل .معلومال حول الرواب الكيمياقية أو التركيب الج يكي للمواد (FTIR)باألشعة تح الحمراء
دقاقش كاربونال نتاقل تحليل و (2)الحمراء مو حة في ال كل باألشعة تح ق ور حبو دوار ال م دقاقش
(.3)مو حة في ال كل الكالسيوم
.واإلختبارات الميكانيكية النماذج تصنيع : وهي إجراءها تم التي باإلمتبارال ماصة النما ا من نوعين تصنيع البحث هذا في تم
a. القياسثية المواصثفة عتمثادإ تم : الشد مقاومة إختبارو نماذج (ASTM- D 638-14) نمثا ا تصثنيع فثي
. حيث تم إستادام جهاز اإلمتبارال العام, ال د مقاومة إمتبار
b. ال مقطع مربع ال ثكل بتبعثاد الصدمة إمتبار نما ا تصنيع تم :الصدمة إختبارو نماذج (10×10 mm )
. اي ودبطريقة الصدمةحيث تالقم جهاز قياس

Proceeding of the 3th
Sustainable & Renewable Energy Conference
23 -24 December 2017, Baghdad-Iraq
281
:النتائج والمناقشة دقائق قشور حبوب دوار الشمس وكاربونات ل (FTIR)تحليل نتائج الفحص باألشعة تحت الحمراء
:الكالسيوم ودقاقش ( Sunflower seeds particles) ق ور حبو دوار ال م المطحونةدقاقش أظهرل نتاقل الفح ل
مجاميع فعالة مثل الكيتونال عن وجود عدة ( Calcium carbonate particles)كاربونال الكالسيوم
(ketone ),األمينال(amines) , البولي امايدال(polyamides) , االلديهايدال(vehicles aldehydes )
( phenolic)و الفينوالل ( compounds of aromatic)أو المجاميع االروماتية ( alcohols)والكحوالل
المجاميع الم دوجة والثالية والحلقال االروماتية هذه(. 2)والجدول رقم (2)كما مو ح في الجدول رقم
ق ور حبو دوار ) الدقاقشوبالتالي ستتولد أواصر رب قوية بين ( استرالبولي )ستتمرك في المادة األساس
ق ور حبو دوار لكن نالحت عدد المجاميع الفعاله في دقاقش , والمادة األساس( كاربونال الكالسيوم)و( ال م
( 2)مجموعة بينما المجاميع الفعالة في دقاقش كاربونال الكالسيوم اقل حيث عددها تقريبا ( 22)ريبا تقال م
سيكون تتيرها وقوة الرب بينها ق ور حبو دوار ال م لذلك من مالل هذا التحليل نستنتل ان دقاقش , مجاميع
.وبين المادة االساس اقوى من دقاقش كاربونال الكالسيوم
:للنماذج المستخدمةبطريقة آيزود الصدمةنتائج فحص
ا ا من مالل ال كل نالحت ان النم, البحثللنما ا المستادمة في هذا مقاومة الصدمةيو ح قيم ( 6)ال كل
تكون مقاومة الصدمة لها اعلى من النما ا المقواة بدقاقش كاربونال ق ور حبو دوار ال م المقواة بدقاقش
والتي ت يد من قوة الرب بينها وبين المادة ق ور حبو دوار ال م و لك بسبب المجاميع الفعالة في الكالسيوم
.االساس وت داد هذه المقاومة مع زيادة نسبة التقوية
:نتائج فحص مقاومة الشد للنماذج المستخدمةحيث ق ور حبو دوار ال م دقاقش من( wt %1)حوي ي الذييو ح مقاومة ال د للنمو ا ( 7)ال كل
واقصى ت وه ( Mpa 28)هو (Tensile strength)تحمله النمو ا قبل الكسرييظهر انه أقصى إجهاد
(max.deformation )مقداره يحصل فيه قبل الكسر(5.282 mm). يو ح مقاومة ال د للنمو ا ( 8)ال كل
تحمله النمو ا قبل يهر انه أقصى إجهاد حيث يظ, دقاقش كاربونال الكالسيوم من( wt %1)حوي ي الذي
يحصل فيه قبل الكسر( max.deformation)وأقصى ت وه ( Mpa 15)هو (Tensile strength)الكسر
.(mm 1.264)مقداره
تملك مقاومة ق ور حبو دوار ال م دقاقش من ( wt %1)حوي ي الذييبينان إن النمو ا ( 8)و (7) ال كالن
الدقاقشهذا يعني إن , دقاقش كاربونال الكالسيوممن ( wt %1) الحاوي علىو ا د الكسر اكبر من النم
بالدقاقش الصناعية والتي هي مقارنة أستر غير الم بعالبولي لراتنل تمنح تقوية أكثر ( الق ور)الطبيعية
أكثر قوة و لك ألنه عند والراتنلق ور حبو دوار ال م دقاقش األواصر بين أي ا , كاربونال الكالسيوم
,OH, CH2, CH3-)ت ح إنها تحوي مجاميع كيمياقية فعالة ناقية والية وحلقية مثل إ الدقاقشتحليل هذه
Si-O-Si, C=C, and Si=H) وان عدد المجاميع الفعالة في , والمادة األساس الدقاقشت يد من قوة الرب بين
المجاميع في دقاقش كربونال الكالسيوم تقريبا وبالتالي هذا ي يد من ع عدد ق ور حبو دوار ال م دقاقش
اقصى ت وه أعاله نالحت إن مقدار أي ا من مالل ال كلين .قوة الرب بين الدقاقش الطبيعية والمادة االساس
ق ور حبو دوار ال م دقاقش من ( wt %1)حوي ي الذيقبل الكسر يكون أعلى في النمو ا الذي يحدل
. دقاقش كاربونال الكالسيوممن ( wt %1)حوي ي بالذينة مقار
حيث ق ور حبو دوار ال م دقاقش من ( wt %2)حوي ي الذييو ح مقاومة ال د للنمو ا ( 9)ال كل
وأقصى ت وه يحصل فيه قبل ( Mpa 30)لكسر هو أن يتعرض لتحمله النمو ا قبل ين أقصى إجهاد إيظهر
.(mm 17.001)مقداره الكسر
حيث يظهر انه , دقاقش كاربونال الكالسيوممن ( wt %2)حوي ي الذييو ح مقاومة ال د للنمو ا ( 10)ال كل
1.31)مقداره واقصى ت وه يحصل فيه قبل الكسر( Mpa 19)تحمله النمو ا قبل الكسر هو يأقصى إجهاد
mm).
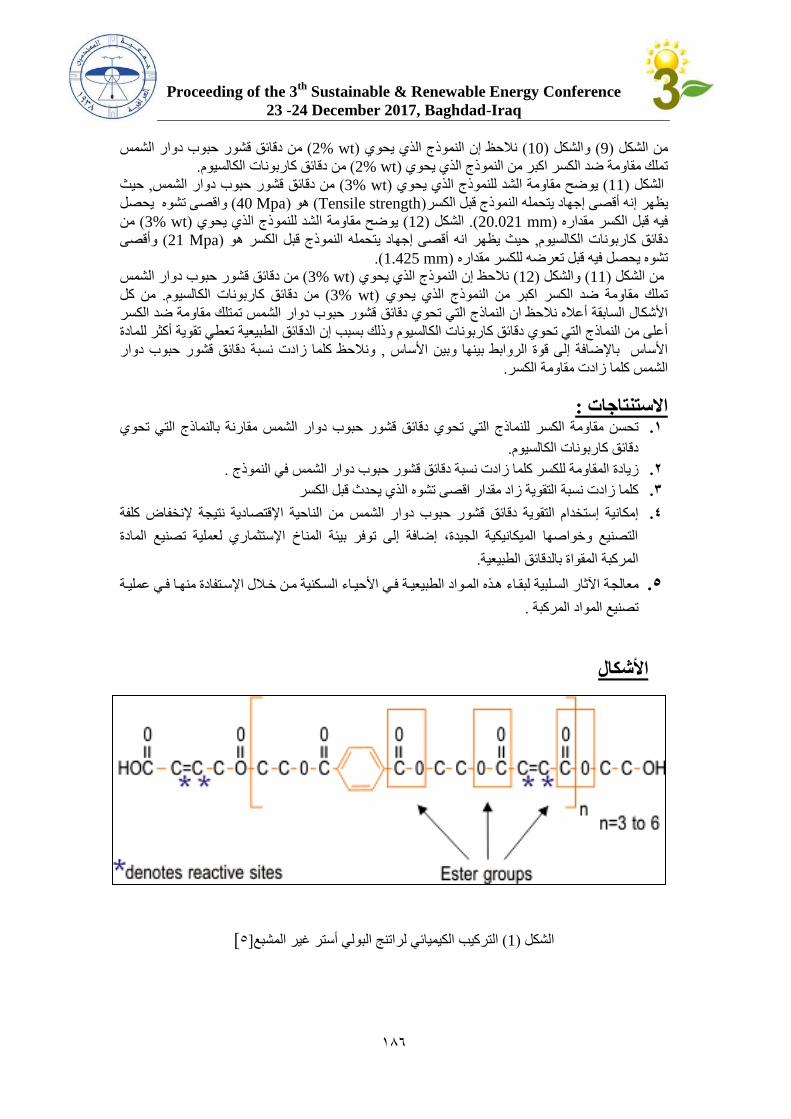
Proceeding of the 3th
Sustainable & Renewable Energy Conference
23 -24 December 2017, Baghdad-Iraq
281
ق ور حبو دوار ال م دقاقش من ( wt %2)حوي ي الذينالحت إن النمو ا ( 10)وال كل ( 9)من ال كل
.دقاقش كاربونال الكالسيوممن ( wt %2)حوي ي الذيتملك مقاومة د الكسر اكبر من النمو ا
حيث , ق ور حبو دوار ال م دقاقشمن ( wt %3)حوي ي الذييو ح مقاومة ال د للنمو ا ( 11)ال كل
واقصى ت وه يحصل ( Mpa 40)هو (Tensile strength)تحمله النمو ا قبل الكسرينه أقصى إجهاد إيظهر
من ( wt %3)حوي ي الذييو ح مقاومة ال د للنمو ا ( 12)ال كل .(mm 20.021)مقداره فيه قبل الكسر
وأقصى ( Mpa 21)تحمله النمو ا قبل الكسر هو يحيث يظهر انه أقصى إجهاد , دقاقش كاربونال الكالسيوم
.(mm 1.425)مقداره ت وه يحصل فيه قبل تعر ه للكسر
ق ور حبو دوار ال م دقاقش من ( wt %3)حوي ي الذينالحت إن النمو ا ( 12)وال كل ( 11)من ال كل
من كل .دقاقش كاربونال الكالسيوممن ( wt %3)حوي ي الذيتملك مقاومة د الكسر اكبر من النمو ا
لك مقاومة د الكسر تمتق ور حبو دوار ال م دقاقشاألشكال السابقة أعاله نالحت ان النما ا التي تحوي
عطي تقوية أكثر للمادة ت ةالطبيعي الدقاقشو لك بسبب إن دقاقش كاربونال الكالسيومأعلى من النما ا التي تحوي
ق ور حبو دوار دقاقش ونالحت كلما زادل نسبة , وبين األساس ااألساس باإل افة إلى قوة الرواب بينه
.ادل مقاومة الكسركلما زال م
:االستنتاجات مقارنة بالنما ا التي تحوي ق ور حبو دوار ال م دقاقش تحسن مقاومة الكسر للنما ا التي تحوي .1
.دقاقش كاربونال الكالسيوم
.في النمو ا ق ور حبو دوار ال م دقاقش زيادة المقاومة للكسر كلما زادل نسبة .2
اقصى ت وه الذي يحدل قبل الكسركلما زادل نسبة التقوية زاد مقدار .3
من الناحية اإلقتصادية نتيجة إلنافاض كلفة ق ور حبو دوار ال م إمكانية إستادام التقوية دقاقش .4
التصنيع ومواصها الميكانيكية الجيدة، إ افة إلى توفر بيكة المناخ اإلستثماري لعملية تصنيع المادة
.المركبة المقواة بالدقاقش الطبيعية
ة اآلار السثلبية لبقثاء هثذه المثواد الطبيعيثة فثي األحيثاء السثكنية مثن مثالل اإلسثتفادة منهثا فثي عمليثة معالج .5
. تصنيع المواد المركبة
األشكال
[1]لراتنل البولي أستر غير الم بع الكيمياقيالتركيب ( 1)ال كل
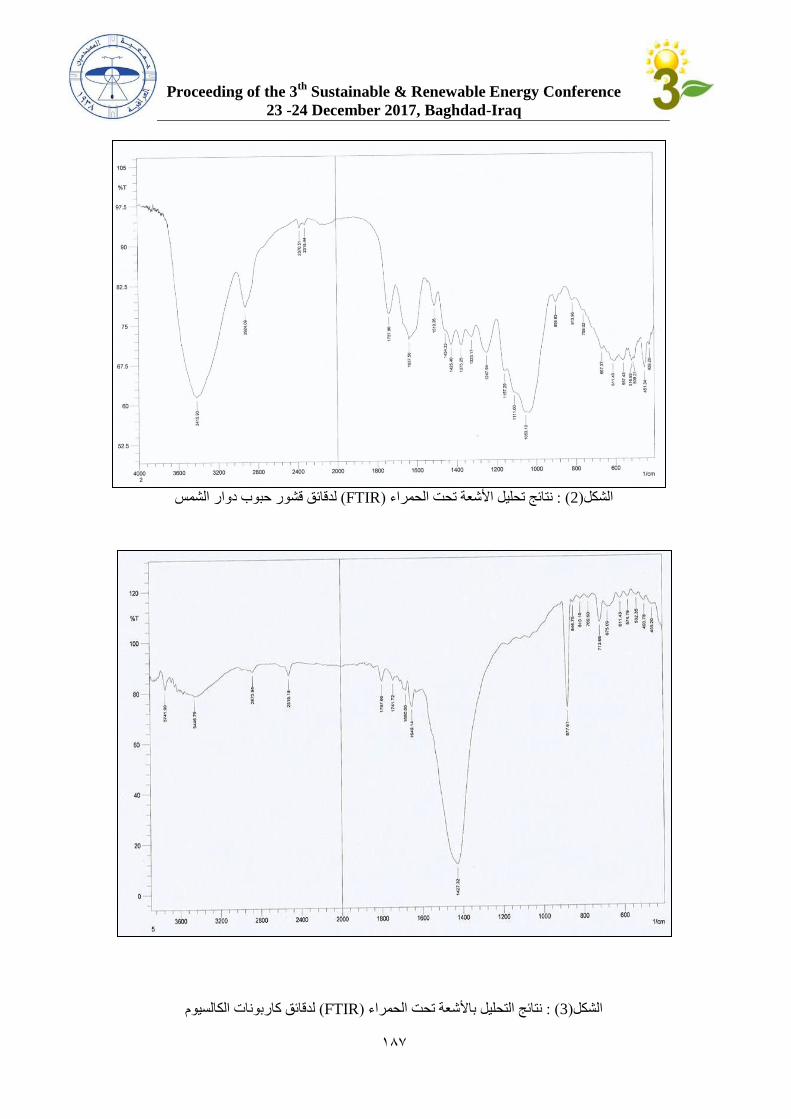
Proceeding of the 3th
Sustainable & Renewable Energy Conference
23 -24 December 2017, Baghdad-Iraq
282
ق ور حبو دوار ال م دقاقش ل( FTIR)نتاقل تحليل األشعة تح الحمراء ( : 2)ال كل
دقاقش كاربونال الكالسيومل( FTIR)نتاقل التحليل باألشعة تح الحمراء ( : 3)ال كل
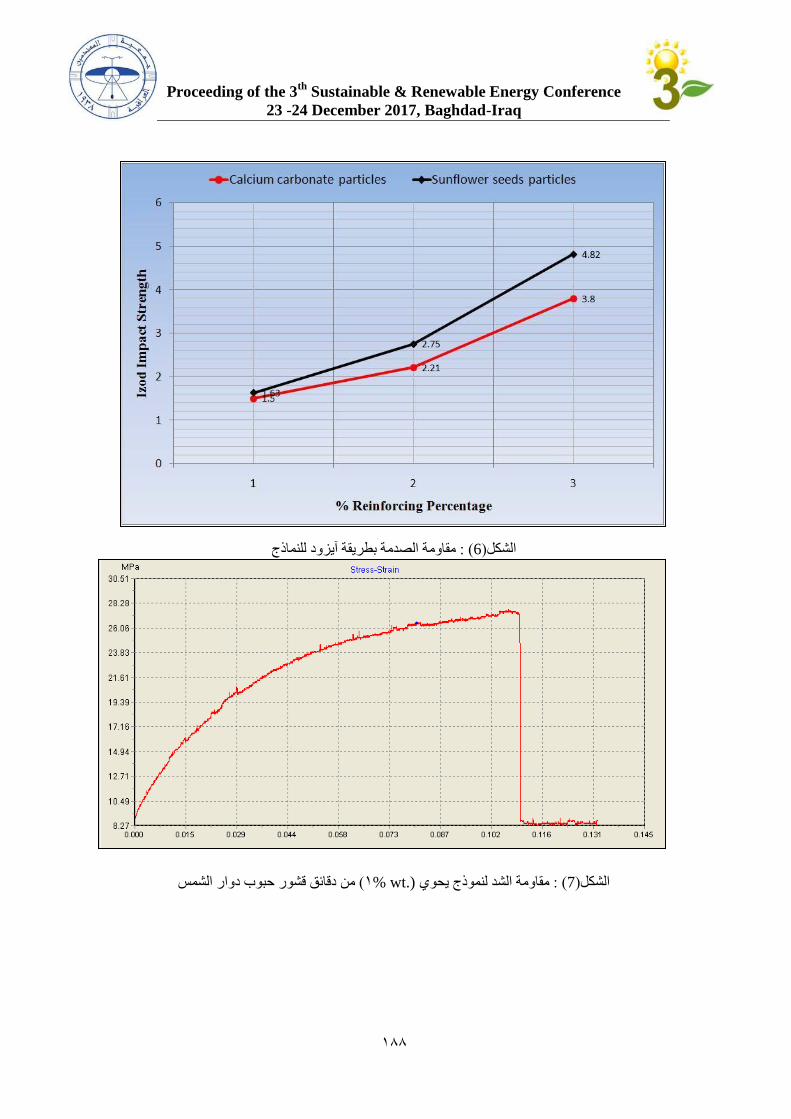
Proceeding of the 3th
Sustainable & Renewable Energy Conference
23 -24 December 2017, Baghdad-Iraq
288
للنما ا آي ودبطريقة مقاومة الصدمة( : 6)ال كل
دقاقش ق ور حبو دوار ال م من ( wt.)2 %حوي يمقاومة ال د لنمو ا ( : 7)ال كل
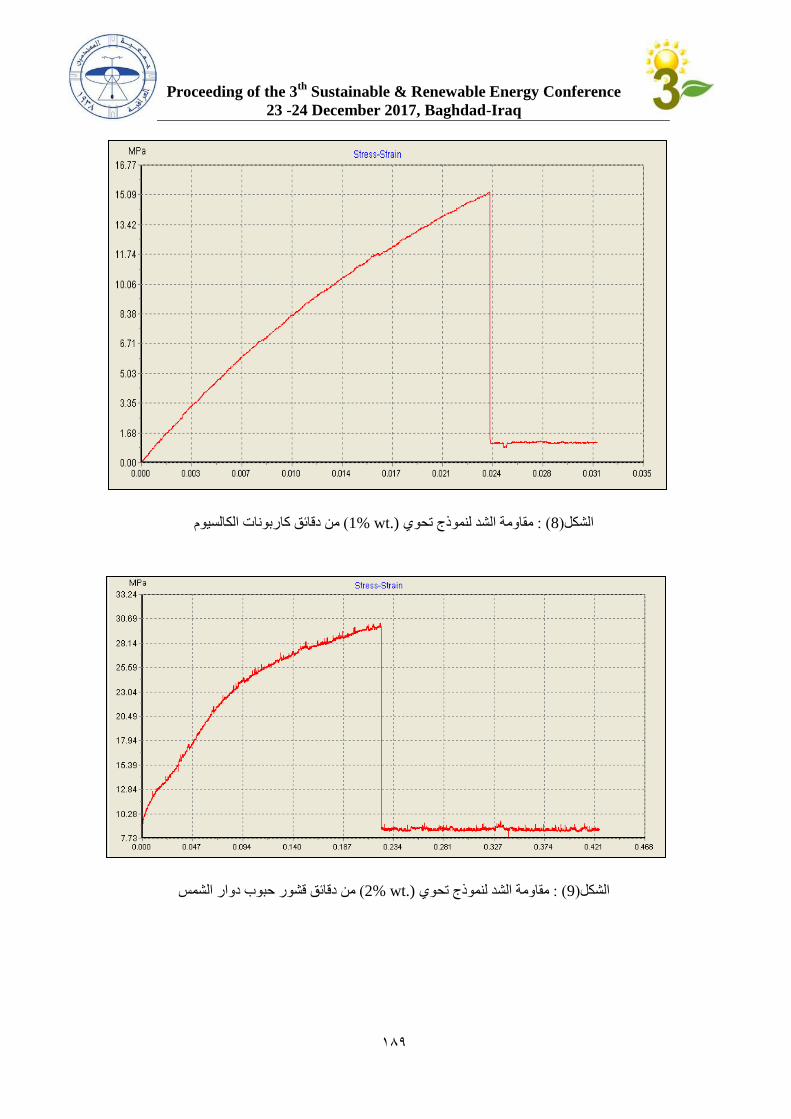
Proceeding of the 3th
Sustainable & Renewable Energy Conference
23 -24 December 2017, Baghdad-Iraq
283
دقاقش كاربونال الكالسيوممن ( (.wt %1مقاومة ال د لنمو ا تحوي ( : 8)ال كل
دقاقش ق ور حبو دوار ال م من ( (.wt %2مقاومة ال د لنمو ا تحوي ( : 9)ال كل
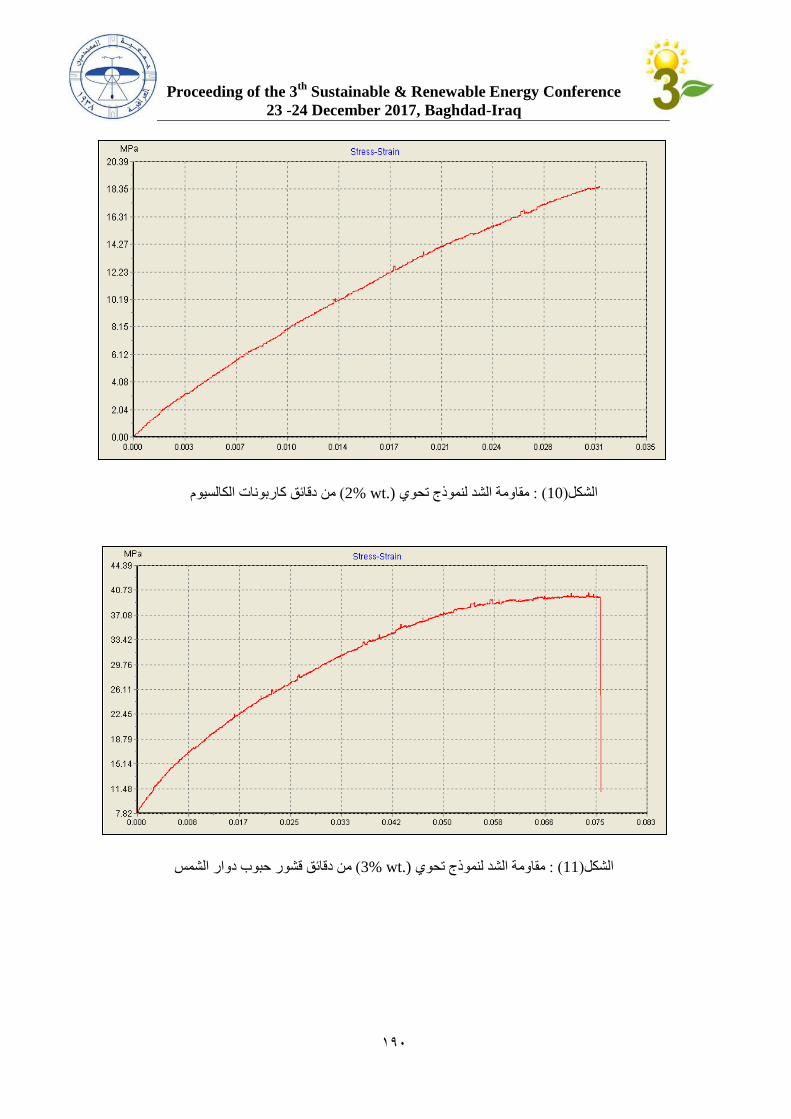
Proceeding of the 3th
Sustainable & Renewable Energy Conference
23 -24 December 2017, Baghdad-Iraq
231
دقاقش كاربونال الكالسيوممن ( (.wt %2مقاومة ال د لنمو ا تحوي ( : 10)ال كل
دقاقش ق ور حبو دوار ال م من ( (.wt %3مقاومة ال د لنمو ا تحوي ( : 11)ال كل

Proceeding of the 3th
Sustainable & Renewable Energy Conference
23 -24 December 2017, Baghdad-Iraq
232
دقاقش كاربونال الكالسيوممن ( (.wt %3مقاومة ال د لنمو ا تحوي ( : 12)ال كل
لجداولا
Calcium
carbonate
particles (Wt.%)
Sunflower seeds
particles (Wt.%)
Resin from poly ester
(Wt.%)
Sample
Number
2 2 33 2
1 1 38 1
2 2 32 2
النسب الوزنية للمواد المستادمة في إنتاا نما ا المادة المركبة( : 1)الجدول
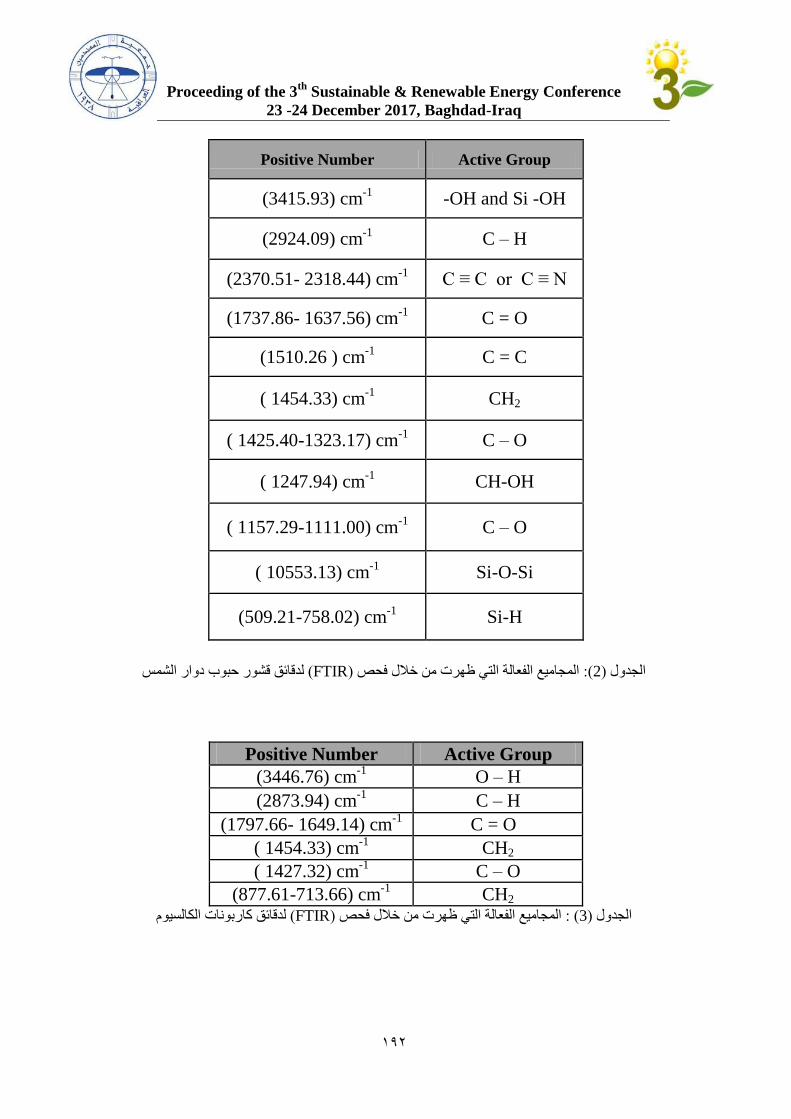
Proceeding of the 3th
Sustainable & Renewable Energy Conference
23 -24 December 2017, Baghdad-Iraq
231
Active Group Positive Number
-OH and Si -OH (3415.93) cm-1
C – H (2924.09) cm-1
C ≡ C or C ≡ N (2370.51- 2318.44) cm-1
C = O (1737.86- 1637.56) cm-1
C = C (1510.26 ) cm-1
CH2 ( 1454.33) cm-1
C – O ( 1425.40-1323.17) cm-1
CH-OH ( 1247.94) cm-1
C – O ( 1157.29-1111.00) cm-1
Si-O-Si ( 10553.13) cm-1
Si-H (509.21-758.02) cm-1
دوار ال م دقاقش ق ور حبو ل( FTIR)مالل فح المجاميع الفعالة التي ظهرل من (:2)الجدول
Active Group Positive Number
O – H (3446.76) cm-1
C – H (2873.94) cm-1
C = O (1797.66- 1649.14) cm-1
CH2 ( 1454.33) cm-1
C – O ( 1427.32) cm-1
CH2 (877.61-713.66) cm-1
دقاقش كاربونال الكالسيومل( FTIR)التي ظهرل من مالل فح المجاميع الفعالة ( : 3)الجدول
Proceeding of the 3th
Sustainable & Renewable Energy Conference
23 -24 December 2017, Baghdad-Iraq
232
:المصادر
.1121، كنانة للدعم الفني والمعرفي ،" أهمية تدوير المالفال ال راعية لل راعة والبيكة "ي عبيرعبدالوها عل.د .1
2. Dr Hüdai Kara " Sustainable building materials", Environmental Center for Arab Towns,
UAE, 2014.
3. Mustafa A. Rijab, Ekhlas I. Kader, Ali A. Hamod, Abdul Hameed I. Hameed " Mechanical
properties of silica, graphiteand carbon fiber reinforced composites" , International Journal
of Engineering and Technology (IJET), ISSN (Print) : 2319-8613, ISSN (Online) : 0975-
4024 . Vol 9 No 5 Oct-Nov 2017, pp 3532-3535.
4. Kahtan K. Al-Khazraji, Ali I. Al-Mosawi "Study of thermal behavior for composite
material consisted from unsaturated polyester resin reinforced by palms and glass fibers" ,
Journal of Babylon University ,9(5) ,pp:867-876, 2004.
5. AZOMaterials ''Resin Systems for Use in Fibre-Reinforced Composite Materials'' , AZoM
company, Australia, 2016.
6. The George Mateljan Foundation "Sunflower seeds". WHFoods, 2005.
7. ASTM International "Standard Test Method for Tensile Properties of Plastics (ASTM-
D638-14)", 2014.
8. Dr. Mustafa A. Rajab, Dr. Ali Adwan Hammod, Dr. Ekhlas I. Kader, Abdul Hameed I.
Hameed, Mechanical properties(Tensile, Hardness and Shock resistance) for The phenol
formaldehyde resin with Epoxy resin, 2018, Diyala Journal of Engineering Sciences 4
(2011) 55 – 60, ISSN 1999-8716.
9. Dr. Mustafa A. Rajab , Ekhlas I. K., Ali Adwan Hamod, Abd Ul-Hameed I. H,
Mechanical Properties of Silica, Graphite and Carbon Fiber Reinforced Composite
Materials, International Conference on Contemporary Global Challenges of
Interdisciplinary Academic Research and Innovation, Cairo Egypt on October 27-28,
2017.
10. Dr. Mustafa Ahmed, Ali I. Al Moussawi, Dr. Ekhlas I. K, Shaymaa A. A, Abd Ul-
Hameed I. H., Flexural and Shock Strength of Silica, Graphite and Carbon Fiber
Reinforced Composite Materials. 5th International Conference on Innovation Challenges
in Multidisciplinary Research Practices (ICMRP-December15-16, 2017) at Singapore.
11. Dr. Mustafa A. Rajab, Ekhlas I. Kader, Ali Adwan Hamod , Abdul Hameed I.
Hameed, Hardness and Wear Resistance of Composite Materials Reinforced by Silica,
Graphite and Carbon Fiber, Fourth edition of the International Congress of the Water
Management, Energy, Food and Agricultural Techniques Istanbul Turkey, 7-10
November 2017.
12. Dr. Mustafa Ahmed Rajab, Ali I. Al Moussawi ,Eklas Edan, Shaymaa A. A, Abu Al
Hammed Ibrahim Hammed, Characteristics of Toughness and Flexural of Composite
Materials Supported by Silica, Graphite and Carbon Fiber Reinforced, 1st Conference of
the College of alkitab- University – 18 October 2017.

Proceeding of the 3th Sustainable & Renewable Energy Conference
23 -24 December 2017, Baghdad-Iraq
491
دراسة حول استغالل مطامر النفايات القديمة النتاج
الغاز الحيوي وتوليد الطاقة الكهربائية
تهطه مجيد لف. ينمهندس.ر.م
E-mail: [email protected]
:مقدمة
يعتبر استغالل الغاز الحيوي الناتج من مطامر النفايات القديمة النتاج الطاقة الكهربائية من التقنيات المنتشرة
عالميا بشكل كبير لما لها من منافع اقتصادية ومنافع بيئية أضافة الى تولد كمية جيدة من الطاقة الكهربائية بشكل
.حجم المطمر وكمية النفايات المدفونة داخله وعوامل اخرىسنة حسب 02مستمر لمدة زمنية تزيد عن
وذلك ( نسبيا ) وتعتبر الوحدات االنتاجية الستغالل الغاز الحيوي من مطامر النفايات غير مكلفة اقتصاديا
وانابيب لجمع الغاز ( مصنوعة من انابيب بالستيكية ) القتصار الوحدات على ابار لسحب الغاز من االرض
ليس من الملزم تنقية الغاز ولكنه افضل لرفع كفائة االحتراق داخل وحدة ) ر وحدة لشفط الغاز وتنقيته من االبا
وأن هذه المعامل التحتاج الى عمالة كبيرة وال , ووحدة التوليد ووحدة حرق الغاز الفائض عن الحاجة ( التوليد
.عمليات صيانة بشكل كبير عدا صيانة وحدة توليد الكهرباء
المنافع االقتصادية كثيرة ومتنوعة ومنها توفير فرص عمل وفتح مشاريع جديدة تتعلق بسوق الطاقة وان
أما المنافع البيئية , المستدامة اضافة الى االرباح المادية الجيدة المتمثلة ببيع الطاقة الكهربائية لشركات الكهرباء
يعتبر من اخطر الغازات المسببة لالحتباس الحرارة فتتمثل بحرق غاز الميثان الموجود في الغاز الحيوي والذي
.مرة على طبقة االوزون 02وهو أكثر ضررا من غاز ثنائي اوكسيد الكاربون ب
ان هذه التقنية ذات ابعاد متعددة ومهمة جدا حيث تمثل سوق واعدة للطاقة المتجددة وتقنية مستدامة وذات ربحية
نها التحتاج الى تكاليف تشغيلية عالية حيث ان كلفة الوقود االزم لتشغيل جيدة للدول والشركات واالفراد حيث ا
وحدات التوليد هي صفر وذلك بسبب استخدام الغاز الحيوي الموجود تحت االرض في المطمر الناتج من عملية
لتقنية ولذلك من الظروري لكل دولة استغالل هذه ا, التحلل الالهوائي المستمرة من سنين طويلة تحت االرض
.لتحقيق التنمية المستدامة الخضراء ولفتح االستثمار في مجال الطاقة المتجددة من اوسع ابوابه
:الهدف من استغالل مطامر النفايات*
.(-4-شكل( أنتاج الطاقة الكهربائية من مصدر نظيف ومتجدد. أوال
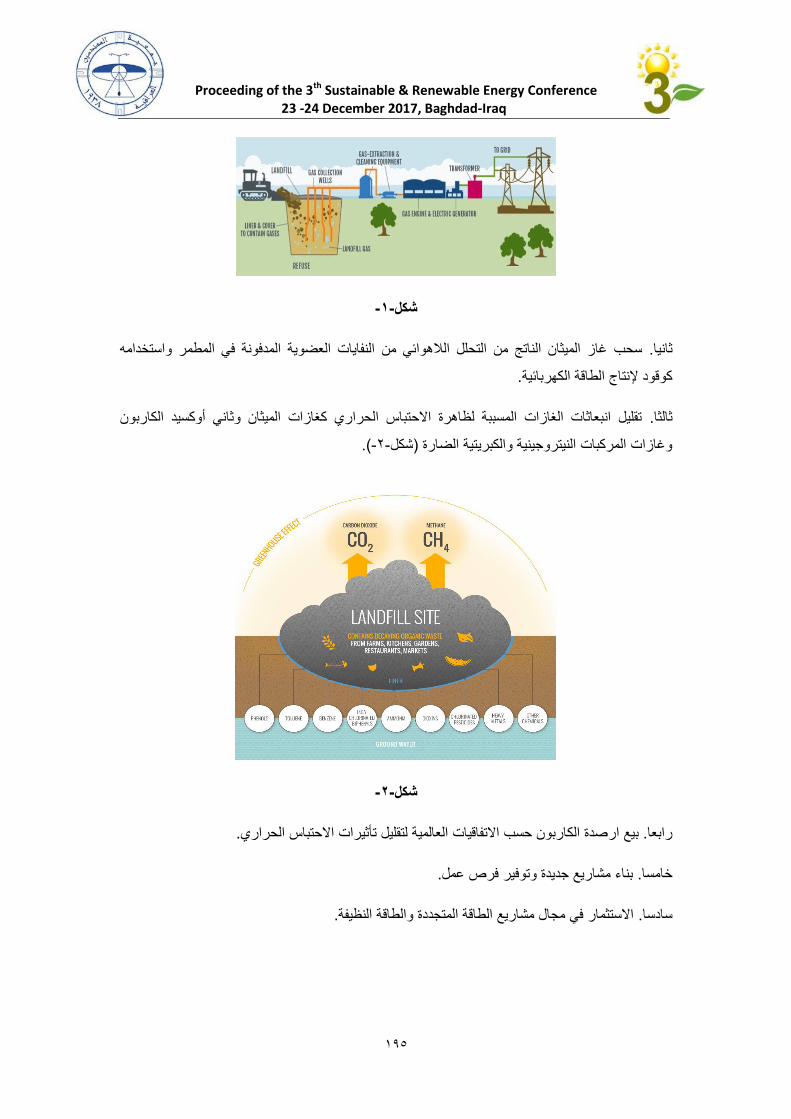
Proceeding of the 3th Sustainable & Renewable Energy Conference
23 -24 December 2017, Baghdad-Iraq
492
-1-شكل
النفايات العضوية المدفونة في المطمر واستخدامه سحب غاز الميثان الناتج من التحلل الالهوائي من . ثانيا
.كوقود إلنتاج الطاقة الكهربائية
تقليل انبعاثات الغازات المسببة لظاهرة االحتباس الحراري كغازات الميثان وثاني أوكسيد الكاربون . ثالثا
.(-0-شكل) وغازات المركبات النيتروجينية والكبريتية الضارة
-2-شكل
.صدة الكاربون حسب االتفاقيات العالمية لتقليل تأثيرات االحتباس الحراريبيع ار. رابعا
.بناء مشاريع جديدة وتوفير فرص عمل. خامسا
.االستثمار في مجال مشاريع الطاقة المتجددة والطاقة النظيفة. سادسا

Proceeding of the 3th Sustainable & Renewable Energy Conference
23 -24 December 2017, Baghdad-Iraq
491
(:الغير نظامي ) استراتيجية انتخاب المطمر *
لقه من فترة ال تقل عن خمسة سنوات ويتم فحص إنتاجية غستراتيجية بانتخاب مطمر قديم قد تم التتمثل ا
المطمر من غاز الميثان وتركيز الغاز وكمية ونسب انبعاثات الغازات المتحللة في الموقع، اما المساحة
كيلومتر مربع 1×2حدود المقترحة لنصب االبار وبناء ونصب وحدات توليد الكهرباء ووحدات التنقية والشفط ب
حيث وحسب الدراسات العالمية تحتوي هذه المساحة على مليون متر مكعب من النفايات العضوية المتحللة
من النفايات البلدية ( تقريبا وذلك لصعوبة حساب الكمية بشكل مضبوط وذلك الن المطمر غير نظامي)
.المدفونة
يتم البدء بتحضير األرض وحفر ونصب االبار الخاصة بسحب وبعد التأكد ان هذه المنطقة جيدة لالستثمار
.الغاز ونصب انابيب الجمع، ويتم نصب منظومة التنقية والشفط ونصب مولدات انتاج الطاقة الكهربائية
ويجب التأكد ان كل عمليات البناء والنصب مطابقة للمعاير الدولية الخاصة بهذا النوع من مشاريع الطاقة
. يفةالمتجددة النظ
:مكونات معمل سحب الغاز الحيوي وانتاج الكهرباء*
:يتكون المشروع من الوحدات اإلنتاجية التالية
جمع الغاز من المطمر وتكون عن طريق نصب مجموعة من االبار العمودية بأشكال : وحدة جمع الغاز. أوال
األرض ونصب مجموعة من لسحب الغاز الناتج من تحت ( حسب مواصفات المطمر ) واطوال مختلفة
.االنابيب االفقية لجمع الغاز من االبار وارساله الى المرحلة الثانية
.(-5-شكل) متر 52الى 02سحب الغاز ويتراوح طول البئر بين عمودية أبار
.(-1-شكل) جمع الغاز من اإلبارأفقية لانابيب
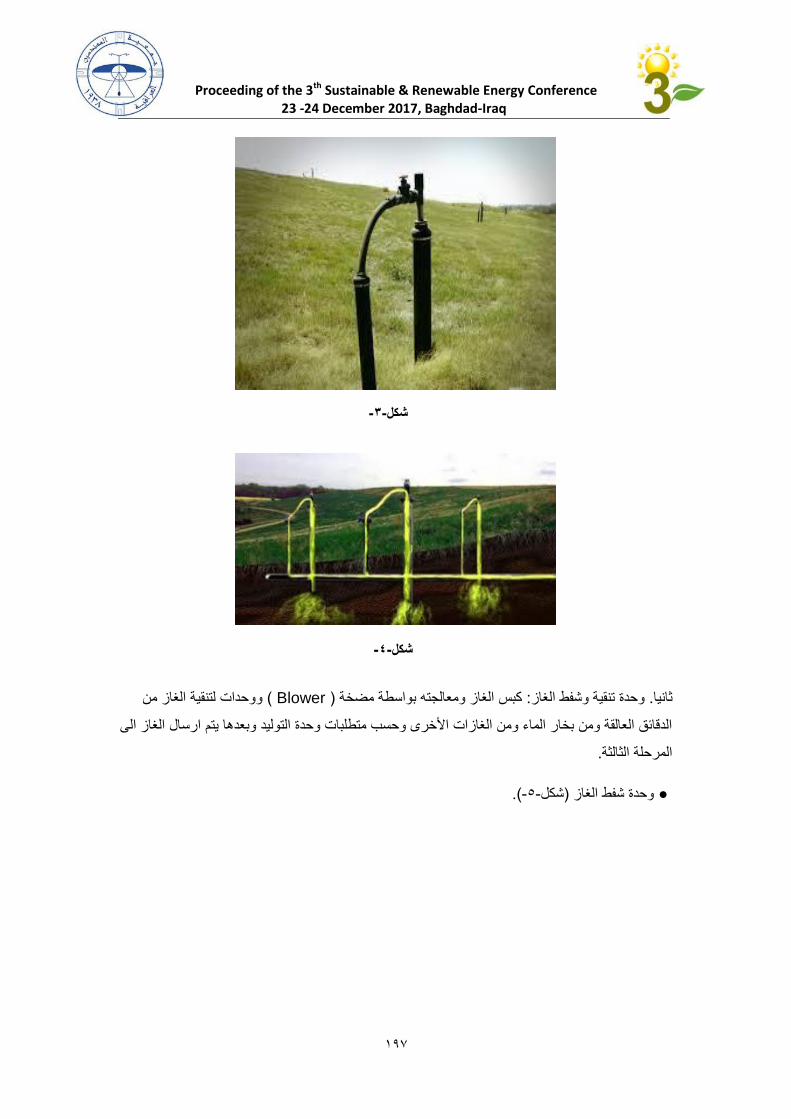
Proceeding of the 3th Sustainable & Renewable Energy Conference
23 -24 December 2017, Baghdad-Iraq
491
ووحدات لتنقية الغاز من ( Blower) كبس الغاز ومعالجته بواسطة مضخة : وحدة تنقية وشفط الغاز. ثانيا
الدقائق العالقة ومن بخار الماء ومن الغازات األخرى وحسب متطلبات وحدة التوليد وبعدها يتم ارسال الغاز الى
.المرحلة الثالثة
.(-2-شكل) وحدة شفط الغاز
-3-شكل
-4-شكل
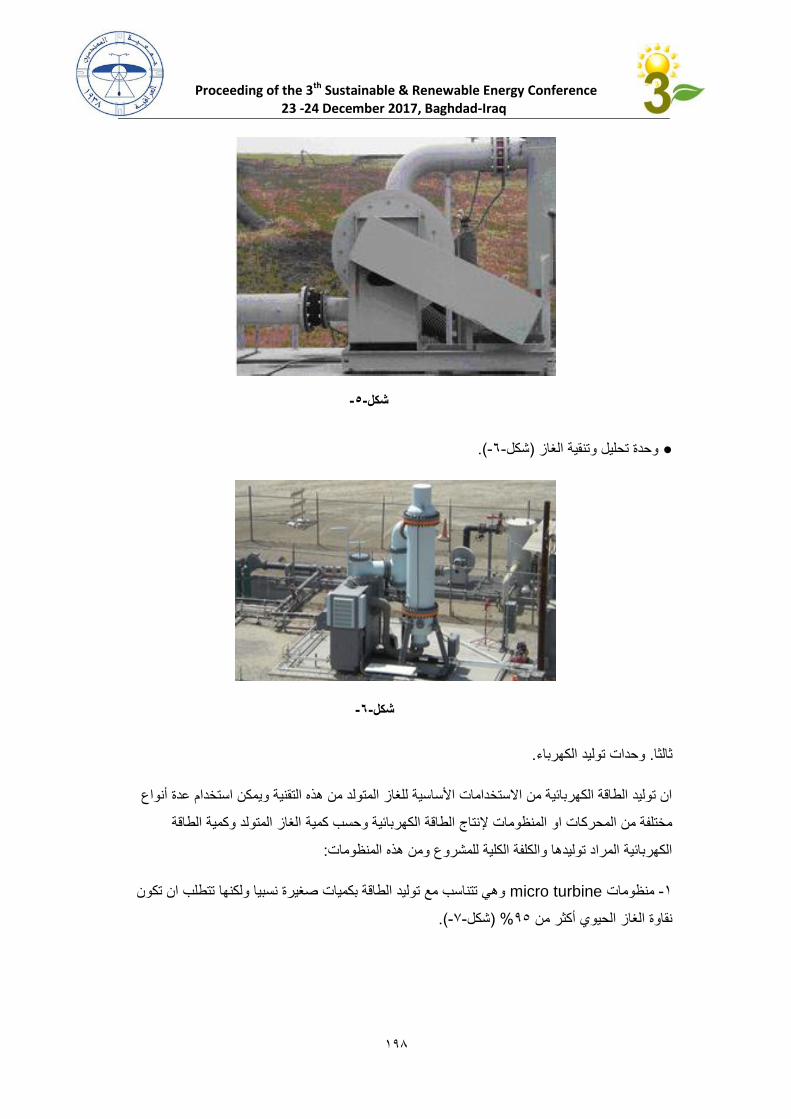
Proceeding of the 3th Sustainable & Renewable Energy Conference
23 -24 December 2017, Baghdad-Iraq
491
.(-1-شكل) تنقية الغازتحليل ووحدة
.توليد الكهرباء اتوحد. ثالثا
ان توليد الطاقة الكهربائية من االستخدامات األساسية للغاز المتولد من هذه التقنية ويمكن استخدام عدة أنواع
الغاز المتولد وكمية الطاقة مختلفة من المحركات او المنظومات إلنتاج الطاقة الكهربائية وحسب كمية
:الكهربائية المراد توليدها والكلفة الكلية للمشروع ومن هذه المنظومات
وهي تتناسب مع توليد الطاقة بكميات صغيرة نسبيا ولكنها تتطلب ان تكون micro turbineمنظومات -4
.(-1-شكل) %92نقاوة الغاز الحيوي أكثر من
-5-شكل
-6-شكل
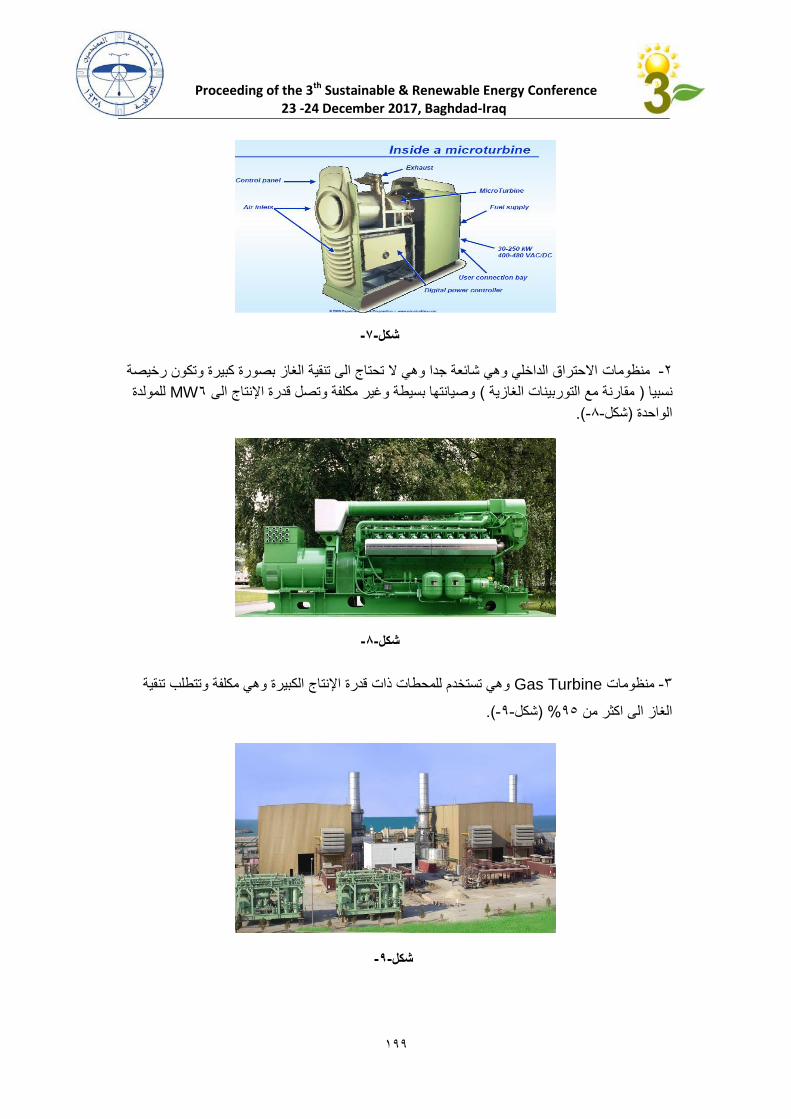
Proceeding of the 3th Sustainable & Renewable Energy Conference
23 -24 December 2017, Baghdad-Iraq
499
االحتراق الداخلي وهي شائعة جدا وهي ال تحتاج الى تنقية الغاز بصورة كبيرة وتكون رخيصة منظومات -0
للمولدة 1MWوصيانتها بسيطة وغير مكلفة وتصل قدرة اإلنتاج الى ( مقارنة مع التوربينات الغازية ) نسبيا
.(-1-شكل) الواحدة
وهي تستخدم للمحطات ذات قدرة اإلنتاج الكبيرة وهي مكلفة وتتطلب تنقية Gas Turbineمنظومات -5
.(-9-شكل) %92الغاز الى اكثر من
-7-شكل
-8-شكل
-9-شكل

Proceeding of the 3th Sustainable & Renewable Energy Conference
23 -24 December 2017, Baghdad-Iraq
022
:بعض المشاريع الموجودة في الوطن العربي*
: مطمر الرصيفة في األردن
بالنفايـات المطمورة في جزء مغروسة ( بئر فقط 55العاملة ) بئر غاز 11وهو مطمر غير نظامي يتكون من
هذه االبار عبارة عن انابيب من البولي اثيلين مخرمة من االسفل 4991من مكب النفايات الذي اغلـــق عـــام
رأس هــذه االنابيب مصمت مزود بصمام ألخذ العينات , متر 42انـــش وطول 2ومصمتــة من االعلى بقطر
انش مزودة بصمام لتنظيم الغاز الخارج مـن البئـر، تلتقـي 1قطر ومن كل بئر يخرج انبوب بشكل عرضي ب
ووحدة Blower انش ويتـم شفـط الغـاز من خــالل 1االنابيب الخارجــة من هذه اآلبار بخط رئيسي بقطر
. ساعة غاز/ 5م122تحكم بكميات الغاز وحاليـــا تولد هذه اآلبار بمعدل
الساعة \ميجاواط 0،2بقدرة ( (DEUTZ إضافة محركين غازيين نوعم ب 0221تم اجراء توسعة في عام
.ساعة\ميجا واط 5،2بئر و الطاقة االسمية للمشروع 91ليصبح عدد االبار
:مطمر القصيصة في دبي
وهو احد مطامر النفايات الخمسة في دبي وقد تم تهيئة المطمر بشكل نموذجي الستقبال ومعالجة النفايات وهو
طن 2222ويعالج هذا المطمر 0202دبي للطاقة المتجددة وتقليل االنبعاثات الضارة لحد سنة ضمن خطة
والحد من 0202ميغاواط من الطاقة بحلول سنة 02يوميا من النفايات وسوف ينتج المطمر طاقة بحدود
.الف طن من غاز ثاني أوكسيد الكاربون 022انبعاثات الغازات الدفيئة بحدود
: اعمة في لبنانمطمر الن
ميغاواط من الكهرباء 1.1وهو مطمر نظامي يحتوي على سبع وحدات توليد تكون الطاقة المنتجة الكلية بحدود
.
:االستنتاجات *
تعتبر تقنية انتاج الغاز الحيوي من مطامر النفايات وانتاج الطاقة الكهربائية منها من التقنيات القديمة نسبيا حيث
ية بجمع وحرق غاز الميثان الناتج من مطامر النفايات وذلك للحفاظ على البيئة وتقليل الروائح بدأت الدول الغرب
السيئة الناتجة من المطامر في بدايات القرن المنصرم ولكن مع تطور العلم والتكنولوجيا بدأت هذه الدول
ة او لالستخدامات الصناعية او ضغ بأستغالل غاز الميثان النتاج الكهرباء او انتاج طاقة حرارية تستخدم للتدفئ
الغاز في انابيب الغاز الطبيعي وذلك بعد أجراء عمليات التنقية ورفع نسبة الميثان لتناسب المواصفات الفنية
.للمعدات واالنابيب
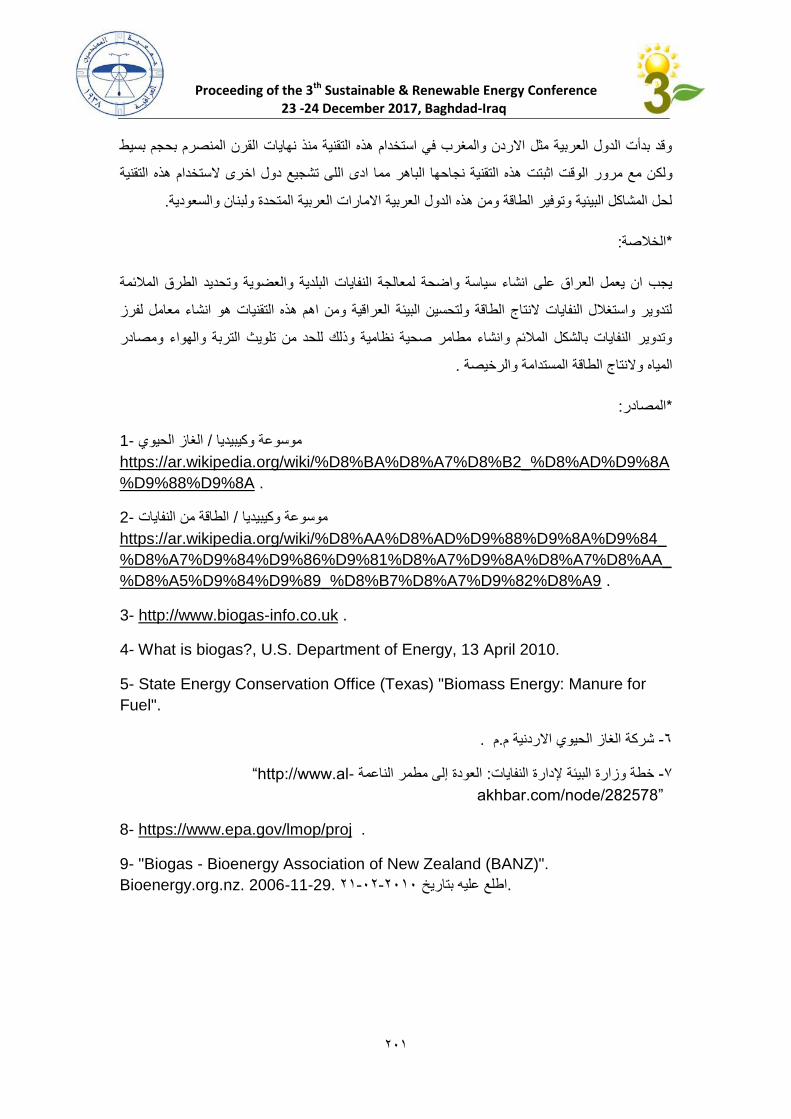
Proceeding of the 3th Sustainable & Renewable Energy Conference
23 -24 December 2017, Baghdad-Iraq
024
وقد بدأت الدول العربية مثل االردن والمغرب في استخدام هذه التقنية منذ نهايات القرن المنصرم بحجم بسيط
ن مع مرور الوقت اثبتت هذه التقنية نجاحها الباهر مما ادى اللى تشجيع دول اخرى الستخدام هذه التقنية ولك
.لحل المشاكل البيئية وتوفير الطاقة ومن هذه الدول العربية االمارات العربية المتحدة ولبنان والسعودية
:الخالصة*
لنفايات البلدية والعضوية وتحديد الطرق المالئمة يجب ان يعمل العراق على انشاء سياسة واضحة لمعالجة ا
لتدوير واستغالل النفايات النتاج الطاقة ولتحسين البيئة العراقية ومن اهم هذه التقنيات هو انشاء معامل لفرز
وتدوير النفايات بالشكل المالئم وانشاء مطامر صحية نظامية وذلك للحد من تلويث التربة والهواء ومصادر
. النتاج الطاقة المستدامة والرخيصة المياه و
: المصادر*
1- الغاز الحيوي / موسوعة وكيبيديا
https://ar.wikipedia.org/wiki/%D8%BA%D8%A7%D8%B2_%D8%AD%D9%8A
%D9%88%D9%8A .
2- الطاقة من النفايات/ موسوعة وكيبيديا
https://ar.wikipedia.org/wiki/%D8%AA%D8%AD%D9%88%D9%8A%D9%84_
%D8%A7%D9%84%D9%86%D9%81%D8%A7%D9%8A%D8%A7%D8%AA_
%D8%A5%D9%84%D9%89_%D8%B7%D8%A7%D9%82%D8%A9 .
. info.co.uk-http://www.biogas -3
4- What is biogas?, U.S. Department of Energy, 13 April 2010.
5- State Energy Conservation Office (Texas) "Biomass Energy: Manure for
Fuel".
. م.شركة الغاز الحيوي االردنية م -1
-http://www.al“ العودة إلى مطمر الناعمة: خطة وزارة البيئة إلدارة النفايات -1
akhbar.com/node/282578”
8- https://www.epa.gov/lmop/proj .
9- "Biogas - Bioenergy Association of New Zealand (BANZ)".
Bioenergy.org.nz. 2006-11-29. 04-20-0242اطلع عليه بتاريخ .
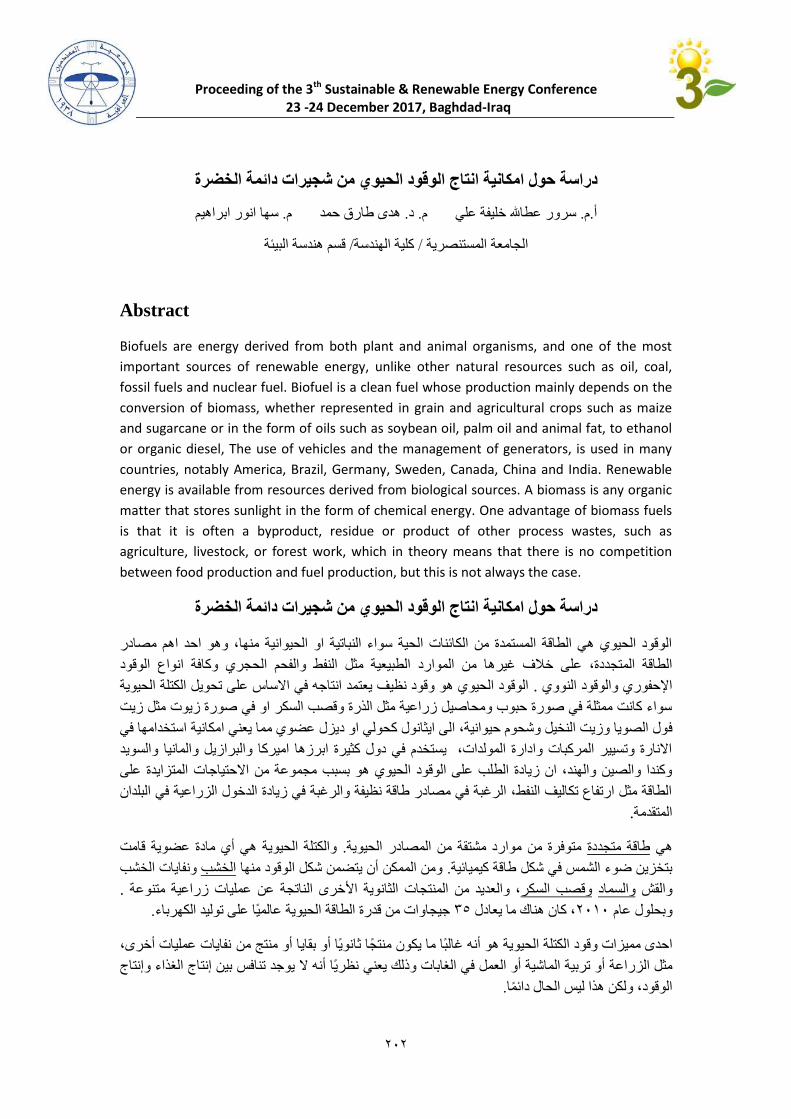
Proceeding of the 3th Sustainable & Renewable Energy Conference 23 -24 December 2017, Baghdad-Iraq
202
دراسة حول امكانية انتاج الوقود الحيوي من شجيرات دائمة الخضرة
سها انور ابراهيم. م هدى طارق حمد. د. م سرور عطاهلل خليفة علي. م.أ
البيئةقسم هندسة / كلية الهندسة/ الجامعة المستنصرية
Abstract
Biofuels are energy derived from both plant and animal organisms, and one of the most
important sources of renewable energy, unlike other natural resources such as oil, coal,
fossil fuels and nuclear fuel. Biofuel is a clean fuel whose production mainly depends on the
conversion of biomass, whether represented in grain and agricultural crops such as maize
and sugarcane or in the form of oils such as soybean oil, palm oil and animal fat, to ethanol
or organic diesel, The use of vehicles and the management of generators, is used in many
countries, notably America, Brazil, Germany, Sweden, Canada, China and India. Renewable
energy is available from resources derived from biological sources. A biomass is any organic
matter that stores sunlight in the form of chemical energy. One advantage of biomass fuels
is that it is often a byproduct, residue or product of other process wastes, such as
agriculture, livestock, or forest work, which in theory means that there is no competition
between food production and fuel production, but this is not always the case.
دراسة حول امكانية انتاج الوقود الحيوي من شجيرات دائمة الخضرة
الوقود الحيوي هي الطاقة المستمدة من الكائنات الحية سواء النباتية او الحيوانية منها، وهو احد اهم مصادر
ا من الموارد الطبيعية مثل النفط والفحم الحجري وكافة انواع الوقود الطاقة المتجددة، على خالف غيره
الوقود الحيوي هو وقود نظيف يعتمد انتاجه في االساس على تحويل الكتلة الحيوية . اإلحفوري والوقود النووي
سواء كانت ممثلة في صورة حبوب ومحاصيل زراعية مثل الذرة وقصب السكر او في صورة زيوت مثل زيت
ول الصويا وزيت النخيل وشحوم حيوانية، الى ايثانول كحولي او ديزل عضوي مما يعني امكانية استخدامها في ف
االنارة وتسيير المركبات وادارة المولدات، يستخدم في دول كثيرة ابرزها اميركا والبرازيل والمانيا والسويد
و بسبب مجموعة من االحتياجات المتزايدة على وكندا والصين والهند، ان زيادة الطلب على الوقود الحيوي ه
الطاقة مثل ارتفاع تكاليف النفط، الرغبة في مصادر طاقة نظيفة والرغبة في زيادة الدخول الزراعية في البلدان
. المتقدمة
والكتلة الحيوية هي أي مادة عضوية قامت . متوفرة من موارد مشتقة من المصادر الحيوية طاقة متجددةهي
ونفايات الخشب الخشبومن الممكن أن يتضمن شكل الوقود منها . بتخزين ضوء الشمس في شكل طاقة كيميائية
.خرى الناتجة عن عمليات زراعية متنوعة، والعديد من المنتجات الثانوية األوقصب السكر والسمادوالقش
.جيجاوات من قدرة الطاقة الحيوية عالميا على توليد الكهرباء 53، كان هناك ما يعادل 0202وبحلول عام
نفايات عمليات أخرى، حدى مميزات وقود الكتلة الحيوية هو أنه غالبا ما يكون منتجا ثانويا أو بقايا أو منتج منا
وذلك يعني نظريا أنه ال يوجد تنافس بين إنتاج الغذاء وإنتاج أو تربية الماشية أو العمل في الغاباتمثل الزراعة
.الوقود، ولكن هذا ليس الحال دائما
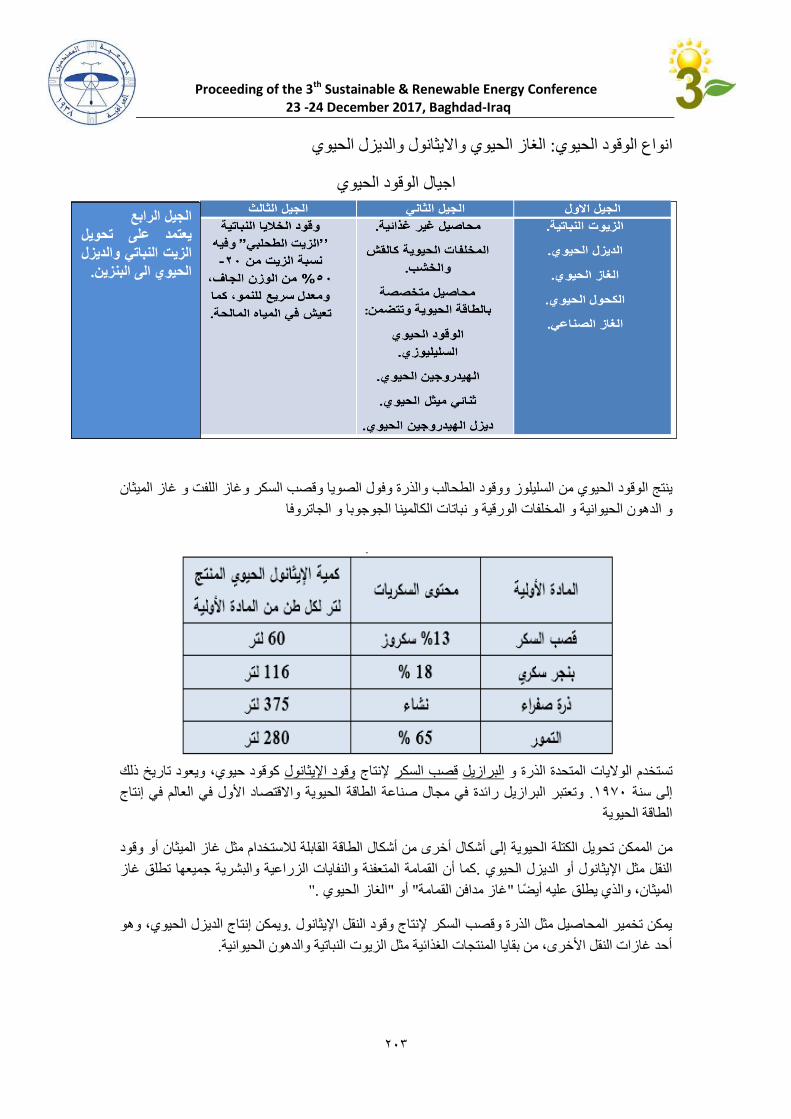
Proceeding of the 3th Sustainable & Renewable Energy Conference 23 -24 December 2017, Baghdad-Iraq
202
اليثانول والديزل الحيويواالغاز الحيوي : نواع الوقود الحيويا
اجيال الوقود الحيوي
غاز الميثانو غاز اللفتو قصب السكرو فول الصوياو الذرةو وقود الطحالبو السليلوزمن ينتج الوقود الحيوي
و الجاتروفاالجوجوبا نباتات الكالميناو المخلفات الورقيةو الدهون الحيوانيةو
كوقود حيوي، ويعود تاريخ ذلك وقود اإليثانولإلنتاج قصب السكر البرازيل الواليات المتحدة الذرة و تستخدم
وتعتبر البرازيل رائدة في مجال صناعة الطاقة الحيوية واالقتصاد األول في العالم في إنتاج . 0792إلى سنة
الطاقة الحيوية
الممكن تحويل الكتلة الحيوية إلى أشكال أخرى من أشكال الطاقة القابلة لالستخدام مثل غاز الميثان أو وقود من
كما أن القمامة المتعفنة والنفايات الزراعية والبشرية جميعها تطلق غاز .النقل مثل اإليثانول أو الديزل الحيوي
."الغاز الحيوي"أو " غاز مدافن القمامة"الميثان، والذي يطلق عليه أيضا
ويمكن إنتاج الديزل الحيوي، وهو .يمكن تخمير المحاصيل مثل الذرة وقصب السكر إلنتاج وقود النقل اإليثانول
. أحد غازات النقل األخرى، من بقايا المنتجات الغذائية مثل الزيوت النباتية والدهون الحيوانية
الجيل الرابعيعتمد على تحويل
النباتي والديزل الزيت
. الحيوي الى البنزين
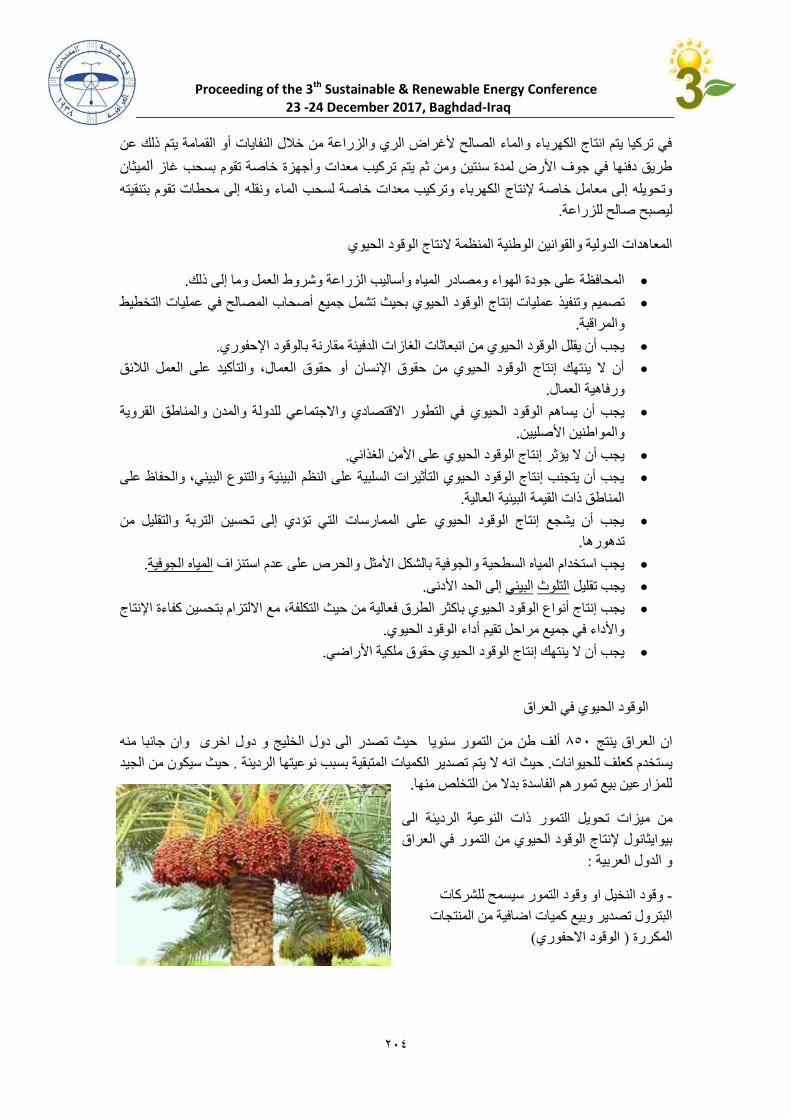
Proceeding of the 3th Sustainable & Renewable Energy Conference 23 -24 December 2017, Baghdad-Iraq
202
في تركيا يتم انتاج الكهرباء والماء الصالح ألغراض الري والزراعة من خالل النفايات أو القمامة يتم ذلك عن
لميثان اطريق دفنها في جوف األرض لمدة سنتين ومن ثم يتم تركيب معدات وأجهزة خاصة تقوم بسحب غاز
الماء ونقله إلى محطات تقوم بتنقيته وتحويله إلى معامل خاصة إلنتاج الكهرباء وتركيب معدات خاصة لسحب
. ليصبح صالح للزراعة
النتاج الوقود الحيوي المعاهدات الدولية والقوانين الوطنية المنظمة
جودة الهواء ومصادر المياه وأساليب الزراعة وشروط العمل وما إلى ذلكالمحافظة على.
أصحاب المصالح في عمليات التخطيط ذ عمليات إنتاج الوقود الحيوي بحيث تشمل جميعيم وتنفيتصم
.والمراقبة
يجب أن يقلل الوقود الحيوي من انبعاثات الغازات الدفيئة مقارنة بالوقود اإلحفوري.
أن ال ينتهك إنتاج الوقود الحيوي من حقوق اإلنسان أو حقوق العمال، والتأكيد على العمل الالئق
.ورفاهية العمال
في التطور االقتصادي واالجتماعي للدولة والمدن والمناطق القروية يجب أن يساهم الوقود الحيوي
.والمواطنين األصليين
يجب أن ال يؤثر إنتاج الوقود الحيوي على األمن الغذائي.
يجب أن يتجنب إنتاج الوقود الحيوي التأثيرات السلبية على النظم البيئية والتنوع البيئي، والحفاظ على
.يئية العاليةالمناطق ذات القيمة الب
يجب أن يشجع إنتاج الوقود الحيوي على الممارسات التي تؤدي إلى تحسين التربة والتقليل من
.تدهورها
المياه الجوفيةيجب استخدام المياه السطحية والجوفية بالشكل األمثل والحرص على عدم استنزاف.
إلى الحد األدنى البيئي التلوثيجب تقليل.
ثر الطرق فعالية من حيث التكلفة، مع االلتزام بتحسين كفاءة اإلنتاج باكحيوي يجب إنتاج أنواع الوقود ال
.واألداء في جميع مراحل تقيم أداء الوقود الحيوي
يجب أن ال ينتهك إنتاج الوقود الحيوي حقوق ملكية األراضي.
الوقود الحيوي في العراق
ان جانبا منه و حيث تصدر الى دول الخليج و دول اخرى ألف طن من التمور سنويا 832ان العراق ينتج
حيث سيكون من الجيد .تصدير الكميات المتبقية بسبب نوعيتها الرديئة تمال يحيث انه .يستخدم كعلف للحيوانات
.للمزارعين بيع تمورهم الفاسدة بدال من التخلص منها
ميزات تحويل التمور ذات النوعية الرديئة الى من
في العراق بيوايثانول إلنتاج الوقود الحيوي من التمور
: و الدول العربية
وقود النخيل او وقود التمور سيسمح للشركات -
البترول تصدير وبيع كميات اضافية من المنتجات
(الوقود االحفوري) المكررة
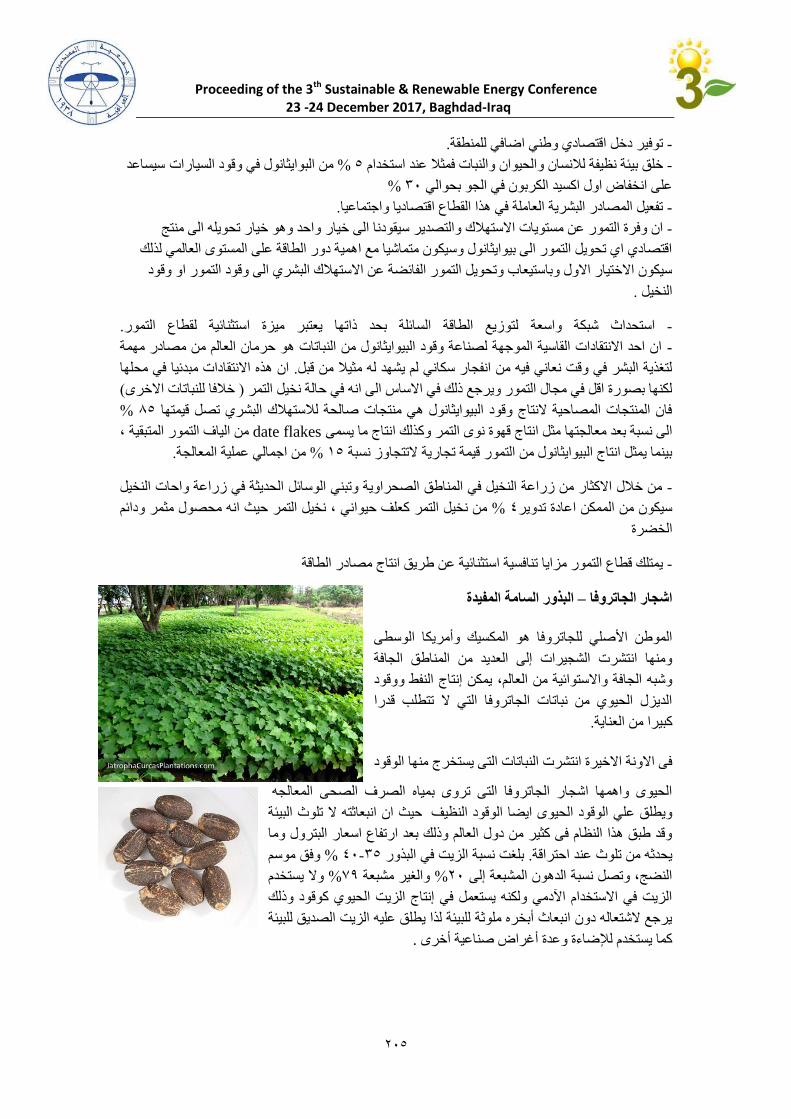
Proceeding of the 3th Sustainable & Renewable Energy Conference 23 -24 December 2017, Baghdad-Iraq
202
. توفير دخل اقتصادي وطني اضافي للمنطقة -
سيساعد من البوايثانول في وقود السيارات% 3الحيوان والنبات فمثال عند استخدام خلق بيئة نظيفة لالنسان و -
% 52على انخفاض اول اكسيد الكربون في الجو بحوالي
. تفعيل المصادر البشرية العاملة في هذا القطاع اقتصاديا واجتماعيا -
واحد وهو خيار تحويله الى منتج ان وفرة التمور عن مستويات االستهالك والتصدير سيقودنا الى خيار -
اقتصادي اي تحويل التمور الى بيوايثانول وسيكون متماشيا مع اهمية دور الطاقة على المستوى العالمي لذلك
سيكون االختيار االول وباستيعاب وتحويل التمور الفائضة عن االستهالك البشري الى وقود التمور او وقود
.النخيل
. لتوزيع الطاقة السائلة بحد ذاتها يعتبر ميزة استثنائية لقطاع التمور استحداث شبكة واسعة -
ان احد االنتقادات القاسية الموجهة لصناعة وقود البيوايثانول من النباتات هو حرمان العالم من مصادر مهمة -
ادات مبدئيا في محلها ان هذه االنتق. لتغذية البشر في وقت نعاني فيه من انفجار سكاني لم يشهد له مثيال من قبل
( خالفا للنباتات االخرى) لكنها بصورة اقل في مجال التمور ويرجع ذلك في االساس الى انه في حالة نخيل التمر
% 83فان المنتجات المصاحية النتاج وقود البيوايثانول هي منتجات صالحة لالستهالك البشري تصل قيمتها
من الياف التمور المتبقية ، date flakesنوى التمر وكذلك انتاج ما يسمى الى نسبة بعد معالجتها مثل انتاج قهوة
. من اجمالي عملية المعالجة% 03بينما يمثل انتاج البيوايثانول من التمور قيمة تجارية التتجاوز نسبة
حات النخيل من خالل االكثار من زراعة النخيل في المناطق الصحراوية وتبني الوسائل الحديثة في زراعة وا -
نخيل التمر حيث انه محصول مثمر ودائم ، من نخيل التمر كعلف حيواني % 4سيكون من الممكن اعادة تدوير
الخضرة
يمتلك قطاع التمور مزايا تنافسية استثنائية عن طريق انتاج مصادر الطاقة -
البذور السامة المفيدة – اشجار الجاتروفا
المكسيك وأمريكا الوسطى الموطن األصلي للجاتروفا هو
ومنها انتشرت الشجيرات إلى العديد من المناطق الجافة
يمكن إنتاج النفط ووقود ، وشبه الجافة واالستوائية من العالم
الديزل الحيوي من نباتات الجاتروفا التي ال تتطلب قدرا
. كبيرا من العناية
الوقود فى االونة االخيرة انتشرت النباتات التى يستخرج منها
الحيوى واهمها اشجار الجاتروفا التى تروى بمياه الصرف الصحى المعالجه
حيث ان انبعاثته ال تلوث البيئة ويطلق علي الوقود الحيوى ايضا الوقود النظيف
وقد طبق هذا النظام فى كثير من دول العالم وذلك بعد ارتفاع اسعار البترول وما
وفق موسم % 42-53نسبة الزيت في البذور بلغت .يحدثه من تلوث عند احتراقة
وال يستخدم % 97والغير مشبعة % 02النضج، وتصل نسبة الدهون المشبعة إلى
الزيت في االستخدام اآلدمي ولكنه يستعمل في إنتاج الزيت الحيوي كوقود وذلك
يرجع الشتعاله دون انبعاث أبخره ملوثة للبيئة لذا يطلق عليه الزيت الصديق للبيئة
.كما يستخدم لإلضاءة وعدة أغراض صناعية أخرى
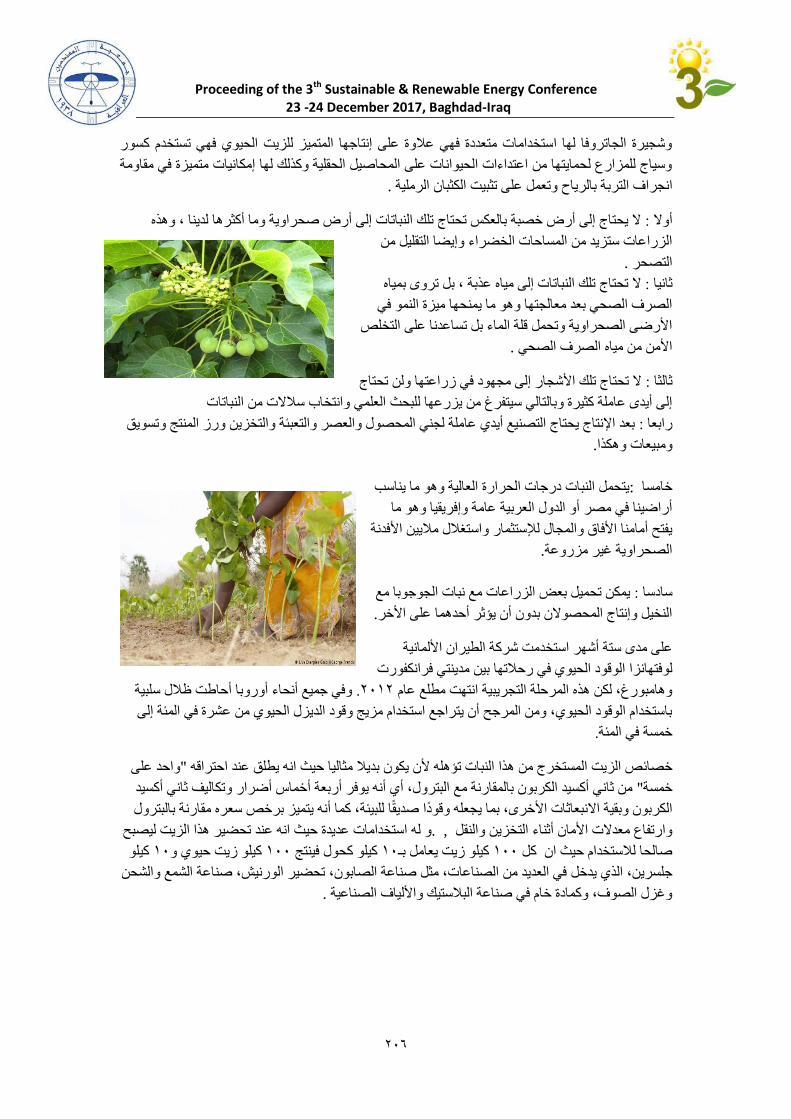
Proceeding of the 3th Sustainable & Renewable Energy Conference 23 -24 December 2017, Baghdad-Iraq
202
وشجيرة الجاتروفا لها استخدامات متعددة فهي عالوة على إنتاجها المتميز للزيت الحيوي فهي تستخدم كسور
وسياج للمزارع لحمايتها من اعتداءات الحيوانات على المحاصيل الحقلية وكذلك لها إمكانيات متميزة في مقاومة
.ة بالرياح وتعمل على تثبيت الكثبان الرمليةانجراف الترب
ال يحتاج إلى أرض خصبة بالعكس تحتاج تلك النباتات إلى أرض صحراوية وما أكثرها لدينا ، وهذه : أوال
الزراعات ستزيد من المساحات الخضراء وإيضا التقليل من
.التصحر
مياه ال تحتاج تلك النباتات إلى مياه عذبة ، بل تروى ب: ثانيا
الصرف الصحي بعد معالجتها وهو ما يمنحها ميزة النمو في
األرضى الصحراوية وتحمل قلة الماء بل تساعدنا على التخلص
.األمن من مياه الصرف الصحي
ال تحتاج تلك األشجار إلى مجهود في زراعتها ولن تحتاج : ثالثا
العلمي وانتخاب سالالت من النباتاتإلى أيدى عاملة كثيرة وبالتالي سيتفرغ من يزرعها للبحث
بعد اإلنتاج يحتاج التصنيع أيدي عاملة لجني المحصول والعصر والتعبئة والتخزين ورز المنتج وتسويق : رابعا
.ومبيعات وهكذا
يتحمل النبات درجات الحرارة العالية وهو ما يناسب :خامسا
ما أراضينا في مصر أو الدول العربية عامة وإفريقيا وهو
يفتح أمامنا األفاق والمجال لإلستثمار واستغالل ماليين األفدنة
.الصحراوية غير مزروعة
يمكن تحميل بعض الزراعات مع نبات الجوجوبا مع : سادسا
.النخيل وإنتاج المحصوالن بدون أن يؤثر أحدهما على األخر
على مدى ستة أشهر استخدمت شركة الطيران األلمانية
قود الحيوي في رحالتها بين مدينتي فرانكفورت لوفتهانزا الو
وفي جميع أنحاء أوروبا أحاطت ظالل سلبية . 0200وهامبورغ، لكن هذه المرحلة التجريبية انتهت مطلع عام
باستخدام الوقود الحيوي، ومن المرجح أن يتراجع استخدام مزيج وقود الديزل الحيوي من عشرة في المئة إلى
.خمسة في المئة
واحد على "ص الزيت المستخرج من هذا النبات تؤهله ألن يكون بديال مثاليا حيث انه يطلق عند احتراقه خصائ
من ثاني أكسيد الكربون بالمقارنة مع البترول، أي أنه يوفر أربعة أخماس أضرار وتكاليف ثاني أكسيد " خمسة
، كما أنه يتميز برخص سعره مقارنة بالبترول الكربون وبقية االنبعاثات األخرى، بما يجعله وقودا صديقا للبيئة
تحضير هذا الزيت ليصبح حيث انه عند استخدامات عديدةو له , .وارتفاع معدالت األمان أثناء التخزين والنقل
كيلو 02كيلو زيت حيوي و 022كيلو كحول فينتج 02كيلو زيت يعامل بـ 022صالحا لالستخدام حيث ان كل
في العديد من الصناعات، مثل صناعة الصابون، تحضير الورنيش، صناعة الشمع والشحن جلسرين، الذي يدخل
.وغزل الصوف، وكمادة خام في صناعة البالستيك واأللياف الصناعية

Proceeding of the 3th Sustainable & Renewable Energy Conference 23 -24 December 2017, Baghdad-Iraq
202
بزراعة نبات الجتروفا حيث ان محصول الشجرة الواحدة بعد سنتين من الزراعة ينتج في مصر قام الباحثون
شجرة، وتبلغ نسبة الزيت في / كجم 08و 12ويزيد بزيادة عمر األشجار ليتراوح بين كجم 4إلى 5حوالي من
الري بالصرف الصحي تمثل متطلبات هذا النبات من الري، وكذلك ظروف و يتم % , 42-53البذور من
على نموه، أحد أهم العوامل المشجعة، إلى جانب خصائص صعيد مصرحيث تمت زراعته بالغابة التي تروى
مياه الصرف الصحي وذلك ضمن المشروع القومي لالستخدام اآلمن لمياه الصرف الصحي المعالج في زراعة
ما أن هذا النبات ال يحتاج ألي نوع من أنواع التسميد سواء العضوي أو المعدني أو بالرش، ك . الغابات الشجرية
باألراضي الصحراوية غير المستصلحة؛ ويكتفى بمياه الصرف الصحي المعالج، وفوق كل ذلك تجود زراعته
.ألنه نبات يتحمل الجفاف
كل هذه المزايا دفعت الشركات األوروبية إلى االلتفات مؤخرا لهذا النبات، وتسابقت الستئجار أراض في إفريقيا
بما لزراعته، حيث إن زراعة ربع أراضي إفريقيا بهذا النبات يعني الحصول على عشرين مليون برميل يوميا،
يحول المنطقة إلى منبع نفط حيوي، باإلضافة إلى إقامة مصانع لتكرير الزيت وكافة مرافق المعالجة والنقل، أي
.إنه سيؤدي لحركة اقتصادية متكاملة
يعملون بصمت على زراعه النبات في باديه السماوه وبعض المناطق في العراق حاليا المهندسون الزراعيون
.الصحراويه
استخالص الزيت
يتم الحصول على زيت الجاتروفا عن طريق العصر في معاصر ضغط عادية بسيطة وهى األفضل لالستخدام
من الزيت الموجود % 77-73في القرى أما االستخالص عن طريق المذيبات فيمكن من خالله الحصول على
.وسطبالبذور، ولكن هذه الطريقة ال تصلح على مستوى المنتج الصغير والمت
استخدامات الجاتروفا
: استخدام الزيت كوقود حيوي
يماثل زيت الجاتروفا وقود الديزل البترولي في التشغيل في اآلالت االحتراق الداخلي وفى األداء ويستخدم أما نقيا
تلويثا وأقل ( خواص احتراق ممتازة ومستوى أداء عالي ) وهو زيت ذو رقم سيتان عالي . أو بنسب خلط مختلفة
للهواء بدرجة ملحوظة من وقود الديزل العادي حيث يقلل من ملوثات الهواء المتطايرة مثل السناج والجسيمات
. العالقة وأول أكسيد الكربون والهيدروكربونات وسميات الهواء وله خواص تزليق فائقة وقابل للتحلل البيولوجي
: الزيت
%79زيوت مشبعة و % 00ويحتوى هذا الزيت على % 53-52تحتوى بذور الجاتروفا على زيت بنسبة
والزيت ال . أو كبريت( آروماتية)زيوت غير مشبعة وهو زيت آمن بيئيا وال يحتوى على مواد عطرية
يصلح لالستخدام اآلدمي ، وهو زيت يخلط مع زيت الديزل والكيروسين بنسب متفاوتة كما يصلح ويستخدم
نائية ويستخدم كذلك في التلميع والرسم وصناعة الصابون والشمع إلنتاج الوقود في المناطق ال
. واالستخدامات الصناعية المختلفة
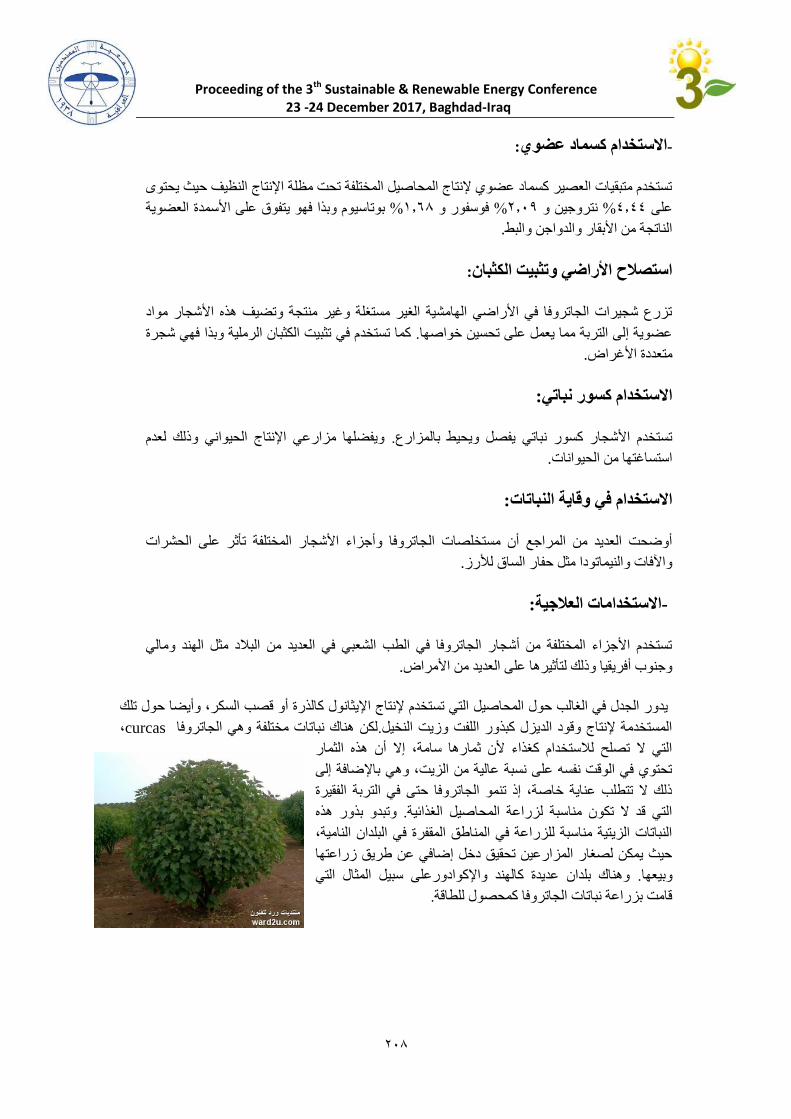
Proceeding of the 3th Sustainable & Renewable Energy Conference 23 -24 December 2017, Baghdad-Iraq
202
: االستخدام كسماد عضوي-
تستخدم متبقيات العصير كسماد عضوي إلنتاج المحاصيل المختلفة تحت مظلة اإلنتاج النظيف حيث يحتوى
وم وبذا فهو يتفوق على األسمدة العضوية بوتاسي% 04.8فوسفور و % 0427نتروجين و % 4444على
. الناتجة من األبقار والدواجن والبط
: استصالح األراضي وتثبيت الكثبان
تزرع شجيرات الجاتروفا في األراضي الهامشية الغير مستغلة وغير منتجة وتضيف هذه األشجار مواد
تثبيت الكثبان الرملية وبذا فهي شجرة كما تستخدم في . عضوية إلى التربة مما يعمل على تحسين خواصها
.متعددة األغراض
: االستخدام كسور نباتي
ويفضلها مزارعي اإلنتاج الحيواني وذلك لعدم . تستخدم األشجار كسور نباتي يفصل ويحيط بالمزارع
.استساغتها من الحيوانات
: االستخدام في وقاية النباتات
جاتروفا وأجزاء األشجار المختلفة تأثر على الحشرات أوضحت العديد من المراجع أن مستخلصات ال
. واآلفات والنيماتودا مثل حفار الساق لألرز
: االستخدامات العالجية -
تستخدم األجزاء المختلفة من أشجار الجاتروفا في الطب الشعبي في العديد من البالد مثل الهند ومالي
. مراضوجنوب أفريقيا وذلك لتأثيرها على العديد من األ
يدور الجدل في الغالب حول المحاصيل التي تستخدم إلنتاج اإليثانول كالذرة أو قصب السكر، وأيضا حول تلك
، curcasلكن هناك نباتات مختلفة وهي الجاتروفا .المستخدمة إلنتاج وقود الديزل كبذور اللفت وزيت النخيل
أن هذه الثمار التي ال تصلح لالستخدام كغذاء ألن ثمارها سامة، إال
تحتوي في الوقت نفسه على نسبة عالية من الزيت، وهي باإلضافة إلى
ذلك ال تتطلب عناية خاصة، إذ تنمو الجاتروفا حتى في التربة الفقيرة
وتبدو بذور هذه . التي قد ال تكون مناسبة لزراعة المحاصيل الغذائية
في البلدان النامية، النباتات الزيتية مناسبة للزراعة في المناطق المقفرة
حيث يمكن لصغار المزارعين تحقيق دخل إضافي عن طريق زراعتها
وهناك بلدان عديدة كالهند واإلكوادورعلى سبيل المثال التي . وبيعها
.قامت بزراعة نباتات الجاتروفا كمحصول للطاقة

Proceeding of the 3th Sustainable & Renewable Energy Conference 23 -24 December 2017, Baghdad-Iraq
202
ويمكن في السنوات . إنتاجية عاليةالجاتروفا نبات يحتاج بعد زراعته إلى نحو ثالث سنوات حتى يصل إلى قدرة
وفي وقت الحق، يمكن للنبتة الواحدة التي تنمو في .األولى حصاد بضع مئات فقط من البذور من النبات الواحد
في المئة من 53إلى 52ظروف جيدة توفير أكثر من ثالثة كيلوغرامات من البذور، مع نسبة تتراوح بين
ة في المحاصيل الزيتية األخرىالزيت، وهذا يعادل النسبة المتوفر
السام المعادلة الصعبة، عبر توفير مصادر بديلة لطاقة نظيفة وفي " الجاتروفا"حقق الوقود المستخلص من نبات
...النبات الحقيقيةهذا ذات الوقت مستخرجة من محاصيل غير غذائية، وجنى العلماء أولى ثمار
ة للخطوط الجوية النيوزيلندية في رحلة تجريبية، في وقت تسعى فيه فتم استخدامه بنجاح في تسيير طائرة لشرك
شركات الطيران التي تتعرض لضغوط من ارتفاع أسعار الوقود وتأثير الطائرات على البيئة إلى وقود صديق
.للبيئة
52اعتين في لمدة سحلقت 949وأصدرت الخطوط الجوية النيوزيلندية بيانا بأن طائرة تابعة لها من طراز بوينج
كميتين متساويتين من وقود الطائرات وزيت ى ، فيما كان أحد محركاتها األربعة يعمل بخليط يحتوي عل0228ديسمبر
.الجاتروفان، في أول رحلة طيران تجارية في العالم تستخدم الزيت المستخرج من الجاتروفا
ال تؤكل تحتوي على الزيت، وينمو في األراضي الجافة والنائية والجاتروفا نبات ينمو إلى ارتفاع ثالثة أمتار، ويؤتي ثمارا
في الهند وأجزاء من إفريقيا وقارات أخرى، ويجري الترويج إلنتاجه على نطاق واسع الستخدامه في الوقود الحيوي، ألنه
.ليس منافسا لموارد المحاصيل الغذائية
(Jatropha curcas)-( جوجوبا) شجرة الذهب األخضر
شجرة قادرة على إنتاج نوع نادر من الزيوت النباتية الذي يتم خلطه مع الوقود، و هو ذو قوة كبيرة و يساعد في
كما أنها تساعد بشكل أساسي على محاربة التصحر ألنها تنبت في األماكن المتصحرة والجافة . عدم تلوث البيئة
الذهب األخضر ويمكن أن تساهم في زيادة الدخل القومي وتسمى كذلك بشجرة .وال تحتاج إلى الكثير من المياه
.للبلدان الفقيرة
وبا جعل عدد من الدول ذات االهتمام الخاص تعطيه أهمية وعناية فائقة خاصة بعد أن جإن وجود شجرة الجو
إال اكتشفت أن زيت بذرة الجوجوبا إضافة إلى دخوله في تصنيع مستحضرات التجميل وعدد من المنتجات الطبية
وخاصة المحركات الثقيلة والهامة .. …أن له صفات أخرى إستراتيجية هائلة الستخدامه في زيوت المحركات
( حالته الطبيعية)لكونه يحتفظ بلزوجته الثقيلة وكافة المحركات –الدبابات –الصواريخ –مثل الطائرات الحربية
ر المحرك ويقلل الحاجة إلى تبديل الزيت مما يطيل عم –درجة 572تحت درجة حرارة مرتفعة تصل إلى
جيرة برية واألرض الصحراوية القاحلة األنسب تعتبر الهوهوبا ش. الميكانيكيةويمكن العلماء من تنفيذ برامجهم
لزراعتها ، تفيد في مكافحة التصحر والتلوث ومكافحة الجراد، تجدد ورقها باستمرار والمتساقط منه يخصب
جات حرارة عالية تصل إلى خمسين درجة تتحمل العطش لفترة زمنية طويلة تصل لسنة التربة، تعيش في در
كاملة، معمرة ألكثر من مائة وخمسين عاما ، كما يدخل زيتها في الصناعات الطبية ومستحضرات التجميل مثل
بها دوليا كريمات الشعر والبشرة وعالج الروماتويد وآالم المفاصل وخشونة البشرة وزيوت المساج معترف
. ويوصى به في كثير من المنتجات
وتدخل مخلفات العصر من هذه ( عالج النيماتودا -حشري -فطري ) يدخل زيتها في صناعة المبيدات الزراعية
الثمار في صناعات متعددة مثل األعالف الحيوانية والداجنة والسمكية حيث تحتوي مخلفات العصر على نسبة
. عالية من البروتين

Proceeding of the 3th Sustainable & Renewable Energy Conference 23 -24 December 2017, Baghdad-Iraq
210
هي ثمرة لشجرة تزرع في صحارى المناطق المتوسطة الحرارة مثل مصر والهند والمكسيك و الواليات المتحدة
. واحد وتتشابه ظواهرها وطبيعة مناخها ومعظم البلدان تقع على خط عرض
عائد ذات. تعتمد على األيدى العاملة وال يشترط فيها التخصص مما يتيح فرص جديدة لتشغيل العمالة العاطلة
تساهم فى . اقتصادي مرتفع ، يبدأ انتاجها نهاية عامها الثالث ، تعتبر مستقبل الطاقة في العشرين سنة القادمة
تحتوي البذور . إنشاء مجتمعات زراعية صناعية فى التجمعات الجديدة المزمع زراعتها بهذا النوع من النبات
شوائب ، يصنف زيتها على انه شمع سائل ذو صفات من وزنها زيتا شمعيا ويستخرج الزيت دون % 32على
بعد مرحلة . ال تتأثر لزوجته بدرجة الحرارة وغير قابل للتأكسد . متميزة، رائحته جيدة خالية من رائحة السمك
العصر ألستخالص الزيت كونه وقودا يمكن أن يدخل في صناعة العديد من المستحضرات الصيدالنية وبالتالي
و والفاو تشجعان على زراعته ألنه يدخل ضمن برنامجهما للقضاء على التلوث، فتمنح منظمة فإن منظمتي كيوت
يورو للهكتار الواحد ما ان ترسل لجنتها المختصة للتأكد من وجود الشجيرات ثم تقوم 922إلى 22.كيوتو من
.بصرف الدعم
تتراوح نسبة الزيت في . و في أشهر الصيفتتكون أزهار الجوجوبا في الشتاء، وبعد تلقيحها تتكون البذور وتنم
. ، ويذكر أن خصائص الزيت ثابتة بغض النظر عن المنطقة الجغرافية التي أتت منها البذور?3.-43البذور من
? 02من الممكن تخزين بذور الجوجوبا لعدة سنوات دون أن تتأثر وذلك عند خفض نسبة الرطوبة في البذور إلى
كغم من البذور 422يعطي الهكتار الواحد ما يقارب الـ . وخال من اآلفات الحشرية وتخزينها في مكان مناسب
في أولى سنوات الحصاد، لكن العناية واالهتمام بالنباتات قد يرفع غلة الهكتار إلى ما يقارب الطنين من البذور
ة أو أربعة أطنان للهكتار بعد عدة سنوات من الزراعة، بل أن بعض األصناف المطورة قد يصل إنتاجها إلى ثالث
من المشاكل التي تواجه زراعة الجوجوبا وإنتاجها بشكل اقتصادي هو الحاجة إلى تصميم معدات وآليات . الواحد
خاصة للزراعة وحصاد محصول البذور وكذلك آالت لفصل البذور وتنظيفها بشكل فعال حيث ال تزال الحاجة
.الت المستمرة في هذا المضمارماسة في هذا المجال على الرغم من المحاو
طن في السنة الثالثة، ويصل للمرحلة القصوى من انتاج 0حوالي ( دونم 4/ فدان 044) متوسط إنتاجية الهكتار
البذور بعد السنة العاشرة حيث تصل إنتاجية الهكتار ثمانية أطنان من البذور ألستخالص أربعة أطنان من
دوالر للطن الواحد ، بحساب بسيط سيؤمن 8.22زيته العالمي يبلغ الزيت، وحسب دراسة الجدوى فسعر
. الهكتار الواحد بعد السنة الثالثة عتبة ربح دائم
من براري الرمادي وصحرائها مرورا بصحراء -على مستوى العراق يمكن زراعة جزء كبير من صحرائه
-عمارة بتلك األرض الشاسعة الخصبة بمشهد كربالء وجنوبا الى بقية السهل الجنوبي من براري الناصرية وال
وصحراء السماوة بما فيها بصوة وبصية والى البصرة كمشروع تضامني ووطني بسقف -السماء والطارق
خمسة أعوام وبدعم خريجي كليات الزراعة المعطلين في العراق سيوفر عائدا اقتصاديا بامكانه المساهمة في
أن تقام على التنمية الزراعية تنمية قومية أخرى من الثروة السمكية من خالل كما يمكن. معالجة جدية للبطالة
االستزراع السمكي في الصحراء باستخدام مياه اآلبار وتخزينها في أحواض خرسانية واستخدامها في االستزراع
عناصر غذائية المكثف ثم استعمال المياه الناتجة عن الصرف من هذه األحواض في الزراعة حيث أنها محملة ب
.وهي العناصر الموجودة بالسماد والتي يحتاجها النبات .مهمة كالبوتاسيوم والنيتروجين والفوسفور
حيث يمكن زراعة الزيتون، . ومن هذا المنطلق يحدث التكامل بين االستزراع السمكي والتنمية الزراعية
. فائدة مزدوجةوهذا يعطي للمزارع . والنخيل، والخضروات، والقمح، والشعير

Proceeding of the 3th Sustainable & Renewable Energy Conference 23 -24 December 2017, Baghdad-Iraq
211
الواليات المتحده ،المكسيك ، بيرو ، شيلى : على مستوى العالم انتشرت زراعة الهوهوبا فى عده دول منها
،البرازيل، االرجنتين ، استراليا ، اسرائيل ونيوزيالندا ، حاليا تستثمر زراعتها فى الهند وتونس ومصر
.والسودان
.زه عبر عملية فرز تخلو من التالمس البشري ومن دون مواد كيميائيةخالصة الهو هوبا شمع زيتي ذهبي يتم فر
تنتج الشجيرات بذورا يتم عصرها عن طريق آالت عصر اعتيادية، ثم تجرى عملية طرد مركزي ينتج بعدها
مادتي السوالر كوقود للمركبات الخفيفة والديزل لمحركات سيارات النقل الكبيرة كذلك فخر صنتاعات الزيوت
علما ان تكلفة اللتر الواحد منه تساوي . يدالنية الخاصة ببشرة األنسان بما فيها زيت العناية ببشرة الطفل الص
من تكلفة إنتاج لتر البترول، وبالتالي فهو اقتصادي جدا، فضال ال تدفع تكلفته بالعملة الصعبة فالثمار من % 2.
. البترول الموارد الموجودة ذاتيا وال يتم شراؤها من الخارج مثل
5تباع البذور لألغراض الصناعية بمعدل . كغم 522-022في السنة الرابعة، ينتج الهكتار الواحد ما يقرب من
بحلول العام الثامن، يصل معدل األنتاج . سنة/دوالرا للهكتار 22.دوالرات للكيلوغرام الواحد، وبمعدل 4إلى
إلى 822من
الجدير بالذكر أن تكلفة زراعة الهو هوبا . سنة كحد األدنى/ للهكتار دوالر 0322كغم حيث ستوفر مبلغ 0022
.هي أقل بكثير من زراعة أي محصول مماثل كالقطن مثال
دوالر تقريبا كرأسمال في تغطية 8322يمكن الشروع بمشاريع صغيرة كبداية بمساحة عشرة هكتارات تكلف
يتميز هذا النبات بمقاومته . داه سيكون صافي ربح مضمونالتكاليف ممكن استردادها بعد خمسة اعوام وكل ما ع
لذا يعتبر نبات مثالي لزراعته وتكثيره في الصحارى الكثيرة في , العالية لألمراض واآلفات واحتياجه القليل للماء
في البالد العربية لالستفادة من إنتاجه من الزيوت بتحويلها إلى وقود نباتي رخيص اضافة إلى استعماالت اخرى
.مجاالت صيدالنية
اعتمدت دولة البرازيل مثال في خطة نهضتها على زراعة الهو هوبا والتوسع في استخدامه في مجال الوقود
الحيوي، وكان سببا في احداث نقلة اقتصادية كبيرة لها حيث وفروا منه مصدرا للطاقة دون أن يدفعوا بالعملة
. ن قبلالصعبة التي كانوا يستوردون بها البترول م
الهو هوبا تتحمل ملوحة المياه فيمكن ريها بمياه الصرف الصحي المعالجة كما ال تحتاج لتقنية في زراعتها
. وبالتالي غير مكلفة على األطالق
سنة دون أن يفسد 03في مصر شركات تمنح البذور وتشتري اإلنتاج، علما ان زيت الهو هوبا يمكن تخزينه لمدة
. يجي، فهو سالح استرات
هوبا هو البديل لزيت كبد الحوت مما جعل عددا من الدول ذات االهتمام الخاص تعطي أهمية وعناية زيت الهو -
خاصة بعد اكتشاف أن زيت بذرة الهوهوبا إضافة إلى دخوله فى تصنيع مستحضرات التجميل وعدد من
المنتجات الطبية
-الصواريخ -الطائرات الحربية )ة والهامة مثل خاصة المحركات الثقيل( زيوت المحركات)يستخدم فى -
.لكونه يحتفظ بلزوجته ( وكافة المحركات الثقيلة -الدبابات
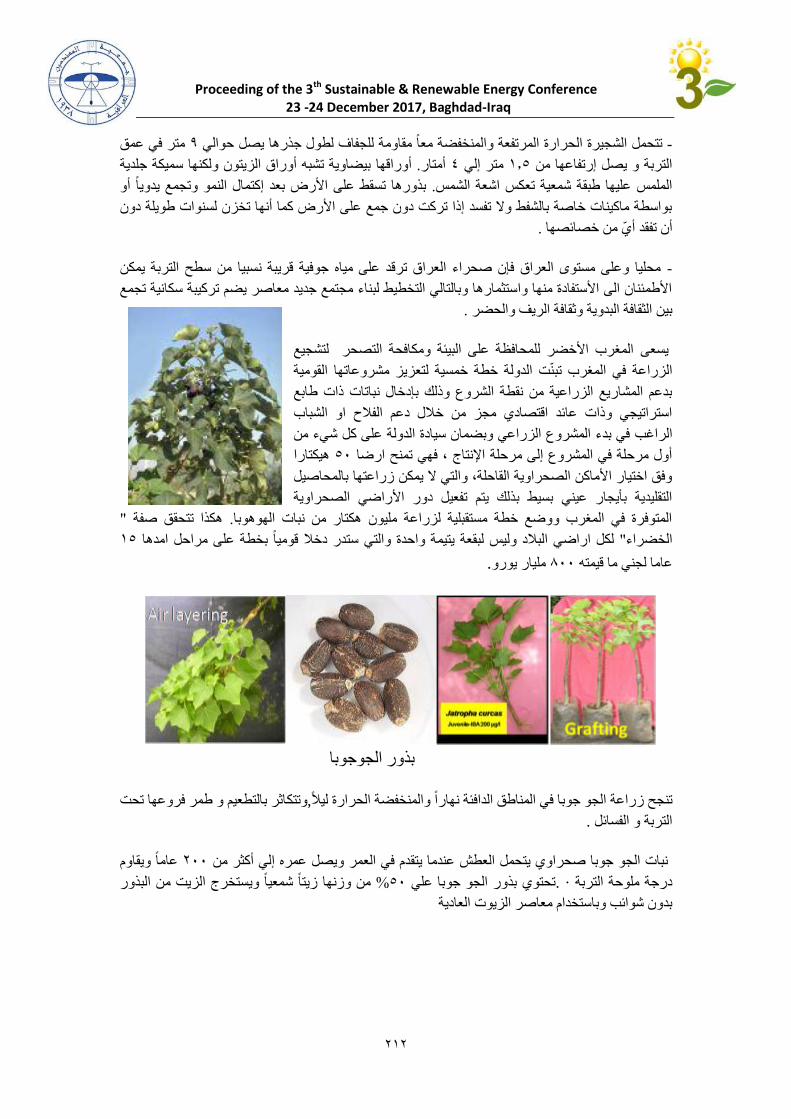
Proceeding of the 3th Sustainable & Renewable Energy Conference 23 -24 December 2017, Baghdad-Iraq
212
متر في عمق 7تتحمل الشجيرة الحرارة المرتفعة والمنخفضة معا مقاومة للجفاف لطول جذرها يصل حوالي -
بيضاوية تشبه أوراق الزيتون ولكنها سميكة جلدية أوراقها . أمتار 4متر إلي 043التربة و يصل إرتفاعها من
بذورها تسقط على األرض بعد إكتمال النمو وتجمع يدويا أو . الملمس عليها طبقة شمعية تعكس اشعة الشمس
بواسطة ماكينات خاصة بالشفط وال تفسد إذا تركت دون جمع على األرض كما أنها تخزن لسنوات طويلة دون
.ها أن تفقد أي من خصائص
محليا وعلى مستوى العراق فإن صحراء العراق ترقد على مياه جوفية قريبة نسبيا من سطح التربة يمكن -
األطمئنان الى األستفادة منها واستثمارها وبالتالي التخطيط لبناء مجتمع جديد معاصر يضم تركيبة سكانية تجمع
. بين الثقافة البدوية وثقافة الريف والحضر
المغرب األخضر للمحافظة على البيئة ومكافحة التصحر لتشجيع يسعى
الزراعة في المغرب تبنت الدولة خطة خمسية لتعزيز مشروعاتها القومية
بدعم المشاريع الزراعية من نقطة الشروع وذلك بإدخال نباتات ذات طابع
استراتيجي وذات عائد اقتصادي مجز من خالل دعم الفالح او الشباب
في بدء المشروع الزراعي وبضمان سيادة الدولة على كل شيء من الراغب
هيكتارا 32أول مرحلة في المشروع إلى مرحلة اإلنتاج ، فهي تمنح ارضا
وفق اختيار األماكن الصحراوية القاحلة، والتي ال يمكن زراعتها بالمحاصيل
ة التقليدية بأيجار عيني بسيط بذلك يتم تفعيل دور األراضي الصحراوي
" هكذا تتحقق صفة . المتوفرة في المغرب ووضع خطة مستقبلية لزراعة مليون هكتار من نبات الهوهوبا
03لكل اراضي البالد وليس لبقعة يتيمة واحدة والتي ستدر دخال قوميا بخطة على مراحل امدها " الخضراء
. مليار يورو 822عاما لجني ما قيمته
بذور الجوجوبا
اثر بالتطعيم و طمر فروعها تحت وتتك,الجو جوبا في المناطق الدافئة نهارا والمنخفضة الحرارة ليال تنجح زراعة
.التربة و الفسائل
عاما ويقاوم 022نبات الجو جوبا صحراوي يتحمل العطش عندما يتقدم في العمر ويصل عمره إلي أكثر من
من وزنها زيتا شمعيا ويستخرج الزيت من البذور % 32تحتوي بذور الجو جوبا علي · .درجة ملوحة التربة
بدون شوائب وباستخدام معاصر الزيوت العادية
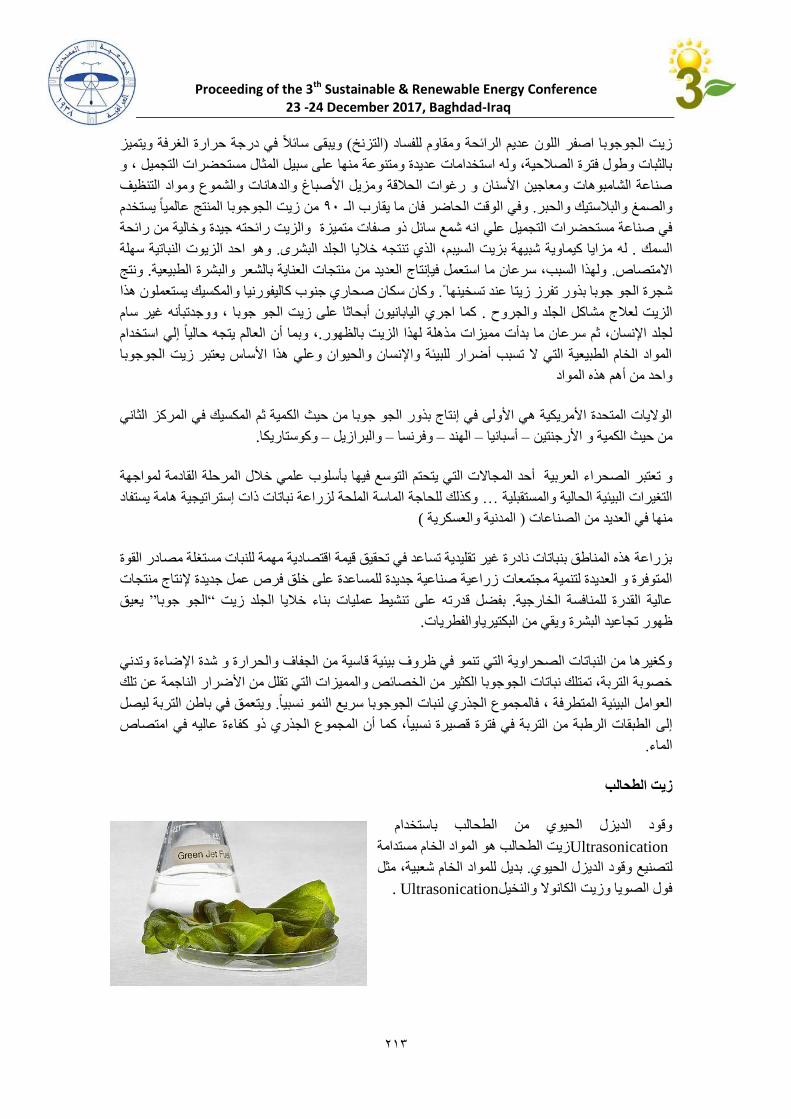
Proceeding of the 3th Sustainable & Renewable Energy Conference 23 -24 December 2017, Baghdad-Iraq
212
ويبقى سائال في درجة حرارة الغرفة ويتميز ( التزنخ)زيت الجوجوبا اصفر اللون عديم الرائحة ومقاوم للفساد
ى سبيل المثال مستحضرات التجميل ، و بالثبات وطول فترة الصالحية، وله استخدامات عديدة ومتنوعة منها عل
صناعة الشامبوهات ومعاجين األسنان و رغوات الحالقة ومزيل األصباغ والدهانات والشموع ومواد التنظيف
من زيت الجوجوبا المنتج عالميا يستخدم 72لوقت الحاضر فان ما يقارب الـ وفي ا. والصمغ والبالستيك والحبر
والزيت رائحته جيدة وخالية من رائحة ة علي انه شمع سائل ذو صفات متميز في صناعة مستحضرات التجميل
وهو احد الزيوت النباتية سهلة . مزايا كيماوية شبيهة بزيت السيبم، الذي تنتجه خاليا الجلد البشرىله .السمك
نتج و. شرة الطبيعيةولهذا السبب، سرعان ما استعمل فيإنتاج العديد من منتجات العناية بالشعر والب. االمتصاص
وكان سكان صحاري جنوب كاليفورنيا والمكسيك يستعملون هذا . شجرة الجو جوبا بذور تفرز زيتا عند تسخينها
كما اجري اليابانيون أبحاثا على زيت الجو جوبا ، ووجدتبأنه غير سام .والجروح لعالج مشاكل الجلد الزيت
، وبما أن العالم يتجه حاليا إلي استخدام .ذهلة لهذا الزيت بالظهورلجلد اإلنسان، ثم سرعان ما بدأت مميزات م
المواد الخام الطبيعية التي ال تسبب أضرار للبيئة واإلنسان والحيوان وعلي هذا األساس يعتبر زيت الجوجوبا
واحد من أهم هذه المواد
الكمية ثم المكسيك في المركز الثاني الواليات المتحدة األمريكية هي األولى في إنتاج بذور الجو جوبا من حيث
.وكوستاريكا –والبرازيل –وفرنسا –الهند –أسبانيا –األرجنتين و من حيث الكمية
أحد المجاالت التي يتحتم التوسع فيها بأسلوب علمي خالل المرحلة القادمة لمواجهة و تعتبر الصحراء العربية
وكذلك للحاجة الماسة الملحة لزراعة نباتات ذات إستراتيجية هامة يستفاد … التغيرات البيئية الحالية والمستقبلية
) المدنية والعسكرية) منها في العديد من الصناعات
بزراعة هذه المناطق بنباتات نادرة غير تقليدية تساعد في تحقيق قيمة اقتصادية مهمة للنبات مستغلة مصادر القوة
زراعية صناعية جديدة للمساعدة على خلق فرص عمل جديدة إلنتاج منتجات المتوفرة و العديدة لتنمية مجتمعات
يعيق ” الجو جوبا“زيت بفضل قدرته على تنشيط عمليات بناء خاليا الجلد .عالية القدرة للمنافسة الخارجية
.ظهور تجاعيد البشرة ويقي من البكتيرياوالفطريات
وكغيرها من النباتات الصحراوية التي تنمو في ظروف بيئية قاسية من الجفاف والحرارة و شدة اإلضاءة وتدني
خصوبة التربة، تمتلك نباتات الجوجوبا الكثير من الخصائص والمميزات التي تقلل من األضرار الناجمة عن تلك
ويتعمق في باطن التربة ليصل . سريع النمو نسبيا العوامل البيئية المتطرفة ، فالمجموع الجذري لنبات الجوجوبا
إلى الطبقات الرطبة من التربة في فترة قصيرة نسبيا، كما أن المجموع الجذري ذو كفاءة عاليه في امتصاص
. الماء
زيت الطحالب
وقود الديزل الحيوي من الطحالب باستخدام
Ultrasonication زيت الطحالب هو المواد الخام مستدامة
الخام شعبية، مثل ديل للموادب. وقود الديزل الحيويلتصنيع
Ultrasonication .فول الصويا وزيت الكانوال والنخيل
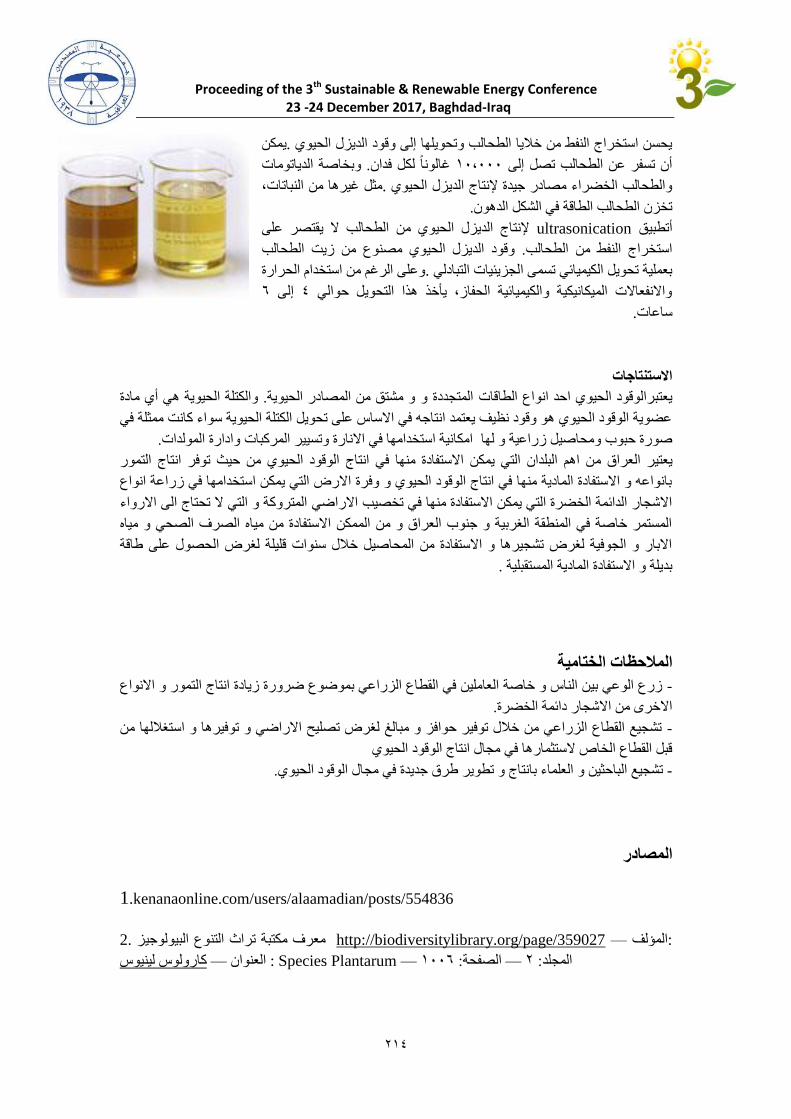
Proceeding of the 3th Sustainable & Renewable Energy Conference 23 -24 December 2017, Baghdad-Iraq
212
يمكن .يحسن استخراج النفط من خاليا الطحالب وتحويلها إلى وقود الديزل الحيوي
وبخاصة الدياتومات . غالونا لكل فدان 02،222أن تسفر عن الطحالب تصل إلى
مثل غيرها من النباتات، .والطحالب الخضراء مصادر جيدة إلنتاج الديزل الحيوي
.تخزن الطحالب الطاقة في الشكل الدهون
إلنتاج الديزل الحيوي من الطحالب ال يقتصر على ultrasonication أتطبيق
وي مصنوع من زيت الطحالب وقود الديزل الحي. استخراج النفط من الطحالب
وعلى الرغم من استخدام الحرارة .بعملية تحويل الكيميائي تسمى الجزيئيات التبادلي
.إلى 4واالنفعاالت الميكانيكية والكيميائية الحفاز، يأخذ هذا التحويل حوالي
.ساعات
االستنتاجات
والكتلة الحيوية هي أي مادة . من المصادر الحيويةو مشتق الطاقات المتجددة و يعتبرالوقود الحيوي احد انواع
عضوية الوقود الحيوي هو وقود نظيف يعتمد انتاجه في االساس على تحويل الكتلة الحيوية سواء كانت ممثلة في
. امكانية استخدامها في االنارة وتسيير المركبات وادارة المولدات و لها صورة حبوب ومحاصيل زراعية
ن اهم البلدان التي يمكن االستفادة منها في انتاج الوقود الحيوي من حيث توفر انتاج التمور يعتير العراق م
بانواعه و االستفادة المادية منها في انتاج الوقود الحيوي و وفرة االرض التي يمكن استخدامها في زراعة انواع
المتروكة و التي ال تحتاج الى االرواء االشجار الدائمة الخضرة التي يمكن االستفادة منها في تخصيب االراضي
المستمر خاصة في المنطقة الغربية و جنوب العراق و من الممكن االستفادة من مياه الصرف الصحي و مياه
االبار و الجوفية لغرض تشجيرها و االستفادة من المحاصيل خالل سنوات قليلة لغرض الحصول على طاقة
.بلية بديلة و االستفادة المادية المستق
المالحظات الختامية
زرع الوعي بين الناس و خاصة العاملين في القطاع الزراعي بموضوع ضرورة زيادة انتاج التمور و االنواع -
.االخرى من االشجار دائمة الخضرة
تشجيع القطاع الزراعي من خالل توفير حوافز و مبالغ لغرض تصليح االراضي و توفيرها و استغاللها من -
قبل القطاع الخاص الستثمارها في مجال انتاج الوقود الحيوي
.تشجيع الباحثين و العلماء بانتاج و تطوير طرق جديدة في مجال الوقود الحيوي -
المصادر
1.kenanaonline.com/users/alaamadian/posts/554836
زمعرف مكتبة تراث التنوع البيولوجي .2 http://biodiversitylibrary.org/page/359027 — المؤلف:
المجلد: 0 — الصفحة: .Species Plantarum — 022 : العنوان — كارولوس لينيوس
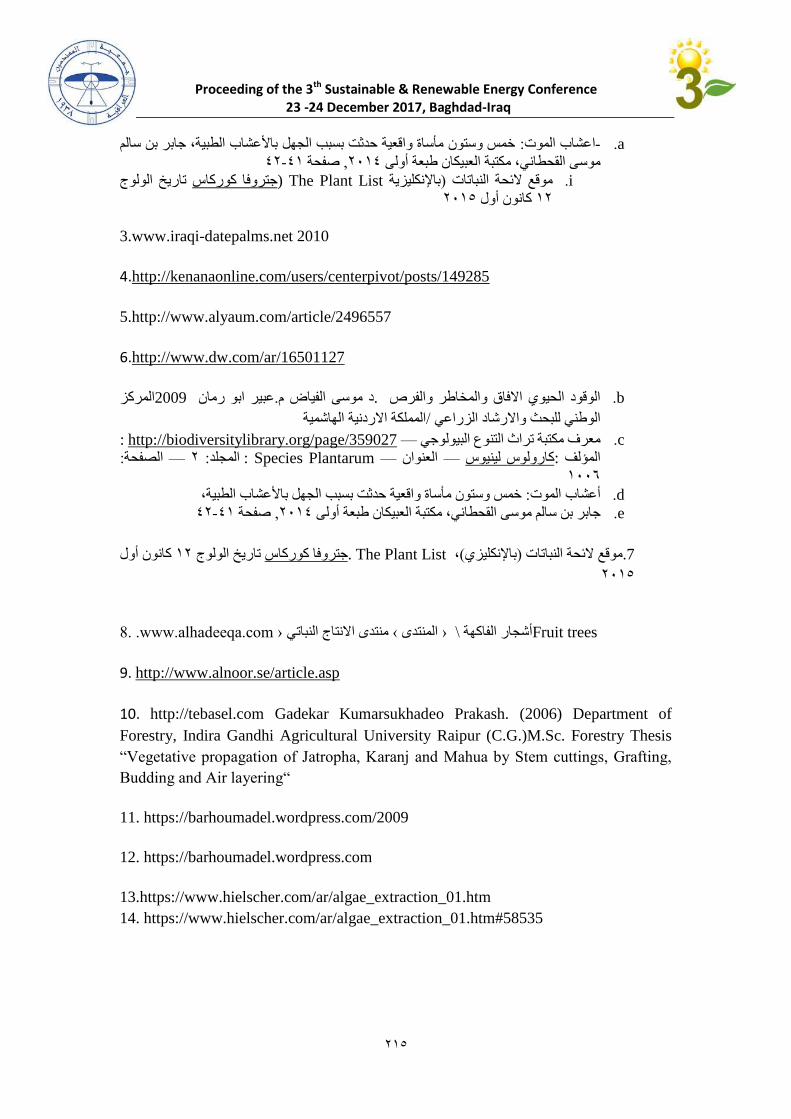
Proceeding of the 3th Sustainable & Renewable Energy Conference 23 -24 December 2017, Baghdad-Iraq
212
a. -خمس وستون مأساة واقعية حدثت بسبب الجهل باألعشاب الطبية، جابر بن سالم : عشاب الموتا
40-40صفحة , 0204موسى القحطاني، مكتبة العبيكان طبعة أولى
i. (باإلنكليزية)موقع الئحة النباتات The Plant List تاريخ الولوج جتروفا كوركاس
0203كانون أول 00
3.www.iraqi-datepalms.net 2010
4.http://kenanaonline.com/users/centerpivot/posts/149285
5.http://www.alyaum.com/article/2496557
6.http://www.dw.com/ar/16501127
b. المركز 2009عبير ابو رمان .د موسى الفياض م .الوقود الحيوي االفاق والمخاطر والفرص
المملكة االردنية الهاشمية/الوطني للبحث واالرشاد الزراعي
c. معرف مكتبة تراث التنوع البيولوجي — http://biodiversitylibrary.org/page/359027:
: الصفحة — 0: المجلد — Species Plantarum : العنوان — كارولوس لينيوس :المؤلف
022.
d. خمس وستون مأساة واقعية حدثت بسبب الجهل باألعشاب الطبية، : أعشاب الموت
e. 40-40صفحة , 0204ني، مكتبة العبيكان طبعة أولى جابر بن سالم موسى القحطا
كانون أول 00تاريخ الولوج جتروفا كوركاس The Plant List .، (زيباإلنكلي)موقع الئحة النباتات 7.
0203
8. .www.alhadeeqa.com › االنتاج النباتيمنتدى ‹ المنتدى Fruit trees \أشجار الفاكهة ‹
9. http://www.alnoor.se/article.asp
10. http://tebasel.com Gadekar Kumarsukhadeo Prakash. (2006) Department of
Forestry, Indira Gandhi Agricultural University Raipur (C.G.)M.Sc. Forestry Thesis
“Vegetative propagation of Jatropha, Karanj and Mahua by Stem cuttings, Grafting,
Budding and Air layering“
11. https://barhoumadel.wordpress.com/2009
12. https://barhoumadel.wordpress.com
13.https://www.hielscher.com/ar/algae_extraction_01.htm
14. https://www.hielscher.com/ar/algae_extraction_01.htm#58535
المتجددة االخرى اتطاقالمحور تطبيقات
(ORE)
بحوث ال

Proceeding of the 3th
Sustainable & Renewable Energy Conference
23 -24 December 2017, Baghdad-Iraq
لبنفسجيةاد الهيدروجين واألشعة فوق يبيروكس باستخدامالمتقدمة للمواد العضوية في مياه النفايات األكسدة
Advance Oxidation of organic compound in waste water using Peroxide
and UV
براهيما عامر جهاد, كريمان رعد ب , الجبار طامي عبد سيلا
متجددة والبيئةمركز بحوث الطاقة ال
:الخالصة
على قيمة األكسدة تأثيربيان و المواد العضوية إلزالة األكسدةستخدام طريقة متقدمة في ا يعتمد البحث على هتسمى شدة الحمولة العضوية في الميا تمثل تركيز المواد العضوية او ما التي (COD)وكسجين لأل الكيميائيةالحاجة
تزيد من وهذه الغير قابلة للتحلل الطبيعي مع الزمنالمجاري الحاوية على الكثير من المواد العضوية مياهالملوثة مثل الذي يمثل الكاربون TOC[1] مثل فحص أخرالصرف الصحي وقد تم استخدام باراميتر في مياه CODقيمة
ايون )وهو عامل مساعد عبارة عن FENTONتخدام الـ طريقة األكسدة المستخدمة على استعتمد العضوي الكلي وحيث يعتبر األكسدةيعمل على توليد جذر الهيدروكسيد الحر من مادة البيروكسيد المستخدمة في ( محمل على رزن
المتقدمة األكسدة أنواعهذه نوع من األكسدةوبالتالي تعتبر طريقة جذر الهيدروكسيد من العوامل المؤكسدة القويةتم .اتلوث تحدث أنيمكن ابسط صورة بحيث ال إلىحويل المواد العضوية التي ليس لها قابلية على التحلل التلقائي لت
داخل منظومة وبعد دراسة ووضعهلتر /ملغم 8860الصرف الصحي ذو محتوى عضوي مياهاخذ نموذج من حيث كانت افضل درجة مالئمة وفظر أحسن تم تثبت pH,سرعة جريان ,مختلفة مثل درجة حرارة الظروف ال
(دقيقة281)مع ثبوت الزمن الدقيقة/مليليتر 251واحسن سرعة جريان PH (5,3)وافضل قيمة للـ ( 35-40)حرارة أثبتتحيث سنتيمتر 13وبطول واط 9بقدرة Lamp of UV وذلك بربط البنفسجيةفوق األشعةتم استخدام و
التي ليس لها المواد العضوية من %99 إلزالة كفؤة األكسدةفي عملية Fenton/UVاستخدام طريقة أنالتجارب .تلقائيافي المياه الملوثة قابلية على التحلل
المقدمة - 1من اخطر المشاكل على الصحة العامة في معظم دول العالم الثالث الن اغلب مياه الصرف الصحي واحدة تعتبر صحي متكامل والمشكلة الكبرى عندما تلقي المدن الساحلية مياه الصرف الصحي الدول ليس لديها شبكة صرف هذه
في البحار دون معالجة مسببة بذلك مشكلة صحية خطيرة وذلك الن مياه المجاري تحوي على كمية كبيرة من عدادالمركبات العضوية الغير قابلة للتحلل التلقائي هذههوائية وتؤثر الة والرهيبة من الكائنات الحية الدقيقة الهوائي وا
712
Proceeding of the 3th
Sustainable & Renewable Energy Conference
23 -24 December 2017, Baghdad-Iraq
في البحر وبذلك تختنق إذا ألقيت األوكسجينمسببة نقص في عضوية والغيرفي المركبات العضوية الكائنات .الكائنات التي تعيش في البحر وقد تموت
المطابخ وكذلك المياه أووتتكون مياه الصرف الصحي من المياه المستخدمة في المنازل سواء في الحمامات
المستخدمة في بعض الورش والمصانع الصغيرة ومحطات الوقود التي تقع داخل المدينة حيث تشكل المركبات والتي تكون صلبة حيث تشمل الكاربوهيدرات مثل السكريات من الملوثات % 01العضوية الغير قابلة للتحلل بنسبة
العضوية ، الدهون والشحوم ، األحماض أمالح إلى إضافةالعضوية األحماض، والثنائية والنشا والسيليلوز األحاديةوكلها أخرىومواد المخلفات الحيوانية إلى إضافةالمعدنية األمالحالمركبات العضوية النايتروجينية مثل البروتينات ،
. [2] [3] التي تعتبر دالة للمحتوى العضوي CODالـ قيمةتساهم في تلوث مياه المجاري وتزيد من
لف المعالجة حسب مواصفات الماء الناتج عن الصناعة والصرف الصحي وحسب كمية الماء المراد وتخت المعالجة البيولوجية ,معالجتها ولكن بشكل عام فأن معالجة مياه الصرف الصحي تتألف من المعالجة الفيزيائية
إضافة إلى مواد أكسدة وتعقيم رسيب ومواد تخثير وتلبيد وت PH المعالجة الكيميائية وفيها تضاف مواد لضبط الـ,زالةومعالجة اللون الغير قابلة للتحللالمواد المختلفة لعزل األساليباستخدام العديد من حيث الرائحة بالفلترة بالرمل وا
لكنفي عمليات التعقيم والقصر و أيضاواستخدام الهايبوكلورات األغشيةباستخدام المايكرويةالفلترة أاليونيوالتبادل واستخدام بيولوجيةمنها أخرىتم استخدام طرق عليه,حيث تبقى قيمة المحتوى العضوي عالية لم يتم حل المشكلة
تستخدمحيث بالعوامل المساعدة األكسدةي طريقة ه المتبعة الطرق فوق بنفسجية والطرق الكهروكيميائية ومن أشعةلكن ما اتبع في البحث استخدام العامل تلوث واقل أوقل سمية ا أخرشكل إلىل المواد العضوية يتحو ل مواد مؤكسدة
هو تحويل األكسدةالن الهدف من األكسدةالفوق بنفسجية لزيادة كفاءة عملية األشعةالمساعد المتجانس الفنتون مع إلى ضافةباإلمادة البيروكسيد خالل تفكك من الحر ولد جذر الهيدروكسيدبت ابسط صورة إلىكل المواد العضوية
وهي من الطرق الضوئية المتبعة في تفكيكهاالمجهرية و األحياءي قتل فالتي تساعد فوق البنفسجية األشعةوجود مع العامل المساعد الطرق الضوئيةمت استخددول العالم كثير منفي و الشمس أشعةفي لوفرتها األكسدةعمليات
هذا لكن في ,[4]المخلفات العضوية في مياه الصرف الصحي إلزالةلايون التيتانيوم مع الماء مثل الغير متجانس وقدرزن العلى +Snالقصدير ايونتحميل تم استخدام الطرق الضوئية مع العامل المساعد المتجانس و ذلك بالبحث
إلى اإلزالة وصلت نسبةمياه صرف صحي حيث تمت على الطريقة من خالل التجارب التي هذهكفاءة إثباتتم .CODقيمة الـ من 99% وهذا عدة مراتلالستعمال إعادتهوهنالك استفادة اقتصادية من فكرة العامل المساعد المتجانس حيث ممكن
إن علما الن سوف يجري مع الماء لإلعادةساعد الغير متجانس حيث يكون غير قابل ممع العامل ال بالمقارنة [5] .غير ملوث استخدام أيون القصدير
712
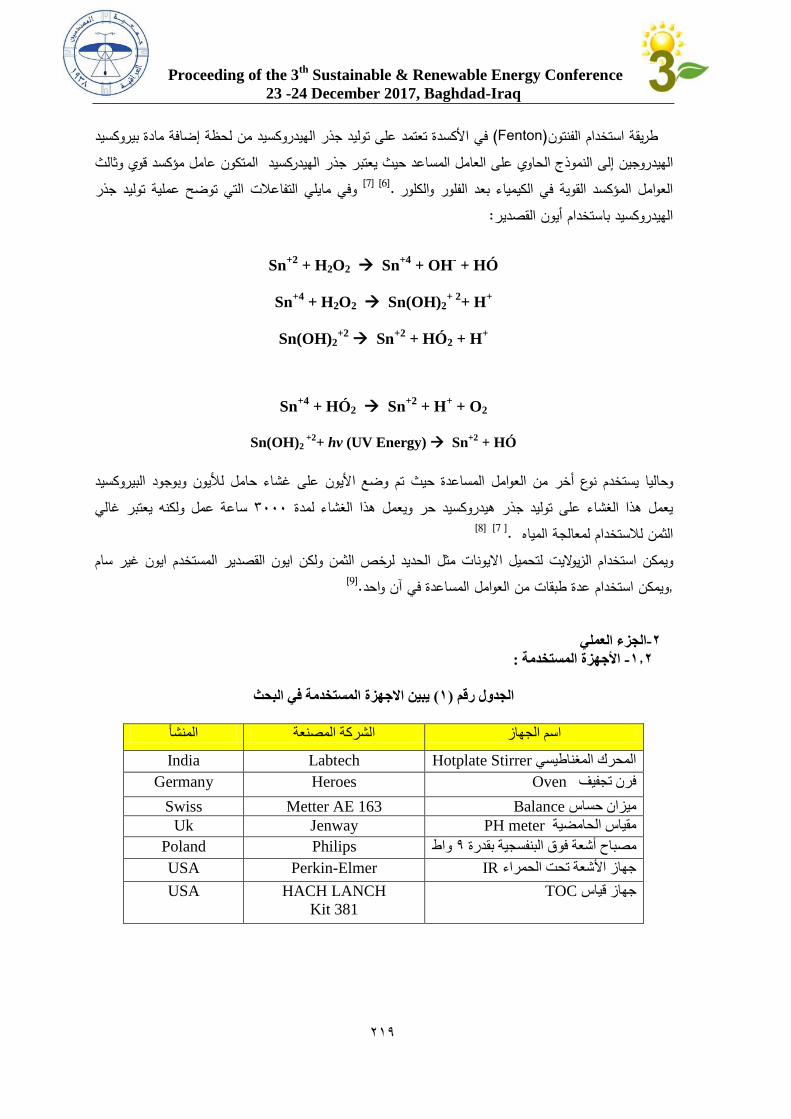
Proceeding of the 3th
Sustainable & Renewable Energy Conference
23 -24 December 2017, Baghdad-Iraq
مادة بيروكسيد إضافةمن لحظة على توليد جذر الهيدروكسيد تعتمد األكسدةفي (Fenton)ريقة استخدام الفنتونط عامل مؤكسد قوي وثالث المتكون جذر الهيدركسيد حيث يعتبرالنموذج الحاوي على العامل المساعد إلىالهيدروجين
وفي مايلي التفاعالت التي توضح عملية توليد جذر .[6] [7]لور والكلورالعوامل المؤكسد القوية في الكيمياء بعد الف :الهيدروكسيد باستخدام أيون القصدير
Sn+2
+ H2O2 Sn+4
+ OH- + HÓ
Sn+4
+ H2O2 Sn(OH)2+ 2
+ H+
Sn(OH)2+2
Sn+2
+ HÓ2 + H+
Sn+4
+ HÓ2 Sn+2
+ H+ + O2
Sn(OH)2 +2
+ hv (UV Energy) Sn+2
+ HÓ
يون وبوجود البيروكسيد أليون على غشاء حامل لألمن العوامل المساعدة حيث تم وضع ا أخرنوع وحاليا يستخدم ساعة عمل ولكنه يعتبر غالي 5111يعمل هذا الغشاء على توليد جذر هيدروكسيد حر ويعمل هذا الغشاء لمدة
[8] [ 7] .ياه لمعالجة الم لالستخدامالثمن
يونات مثل الحديد لرخص الثمن ولكن ايون القصدير المستخدم ايون غير ساملتحميل االستخدام الزيواليت ويمكن ا [9] .ويمكن استخدام عدة طبقات من العوامل المساعدة في آن واحد,
الجزء العملي-2
: المستخدمة األجهزة -2.2
في البحثيبين االجهزة المستخدمة ( 2)الجدول رقم
المنشأ الشركة المصنعة اسم الجهاز
Hotplate Stirrer Labtech Indiaالمحرك المغناطيسي
Oven Heroes Germanyفرن تجفيف
Balance Metter AE 163 Swissميزان حساس
PH meter Jenway Ukمقياس الحامضية
Philips Poland واط 9فوق البنفسجية بقدرة أشعةمصباح
IR Perkin-Elmer USAجهاز األشعة تحت الحمراء
TOC HACH LANCHجهاز قياس
Kit 381
USA
719
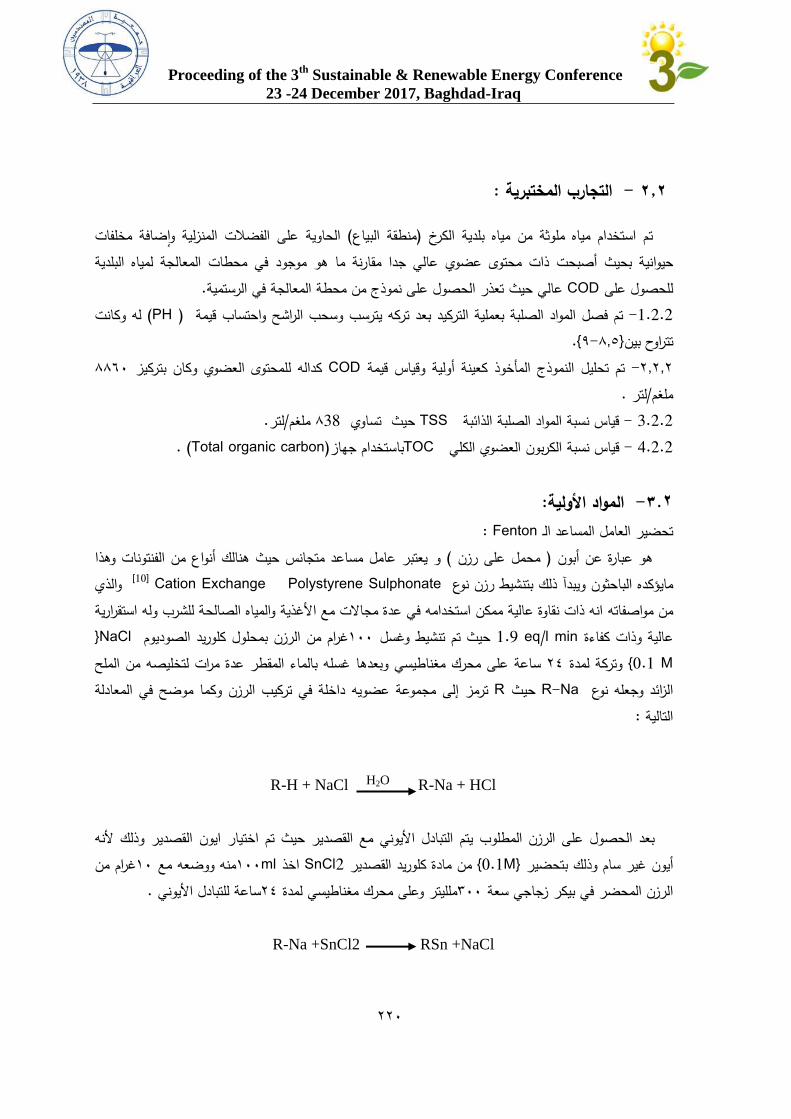
Proceeding of the 3th
Sustainable & Renewable Energy Conference
23 -24 December 2017, Baghdad-Iraq
: التجارب المختبرية - 2.2
ضافةعلى الفضالت المنزلية ةلحاويا( منطقة البياع)الكرخ م استخدام مياه ملوثة من مياه بلدية ت مخلفات وا في محطات المعالجة لمياه البلدية عالي جدا مقارنة ما هو موجودذات محتوى عضوي أصبحتحيوانية بحيث .تعذر الحصول على نموذج من محطة المعالجة في الرستميةحيث عالي CODللحصول على
وكانت له ( PH)قيمة واحتساب الراشحكيد بعد تركه يترسب وسحب تم فصل المواد الصلبة بعملية التر -1.2.2 .9-8,3تتراوح بين 8801وكان بتركيز لمحتوى العضويكداله ل CODوقياس قيمة أوليةكعينة المأخوذتم تحليل النموذج -1,1,1 . لتر/ملغم
.لتر/مملغ 8 38تساوي حيث TSS قياس نسبة المواد الصلبة الذائبة - 3.2.2 . (Total organic carbon)جهاز باستخدام TOC العضوي الكلي الكربوننسبة قياس 4.2.2 -
:األولية المواد -2.3
: Fenton الـ ساعدمتحضير العامل المن الفنتونات وهذا أنواعحيث هنالك و يعتبر عامل مساعد متجانس ( محمل على رزن ) بونأهو عبارة عن
الذي و Polystyrene Sulphonate Cation Exchange [10]رزن نوع نشيطويبدآ ذلك بت مايؤكده الباحثونوالمياه الصالحة للشرب وله استقرارية األغذيةانه ذات نقاوة عالية ممكن استخدامه في عدة مجاالت مع من مواصفاته
NaClالصوديوم غرام من الرزن بمحلول كلوريد211حيث تم تنشيط وغسل eq/l min 1.9عالية وذات كفاءة 0.1 M الملحه بالماء المقطر عدة مرات لتخليصه من على محرك مغناطيسي وبعدها غسلساعة 12وتركة لمدة
وكما موضح في المعادلة داخلة في تركيب الرزن مجموعة عضويه إلىترمز Rحيث R-Naالزائد وجعله نوع : التالية
R-H + NaCl R-Na + HCl
ألنهيار ايون القصدير وذلك تم اختمع القصدير حيث األيونيالتبادل بعد الحصول على الرزن المطلوب يتم غرام من 21مع منه ووضعهml211اخذ SnCl2القصديرمن مادة كلوريد 0.1Mغير سام وذلك بتحضير أيون
.للتبادل األيوني ساعة12ملليتر وعلى محرك مغناطيسي لمدة 511زجاجي سعة بيكرالرزن المحضر في
R-Na +SnCl2 RSn +NaCl
H2O
772
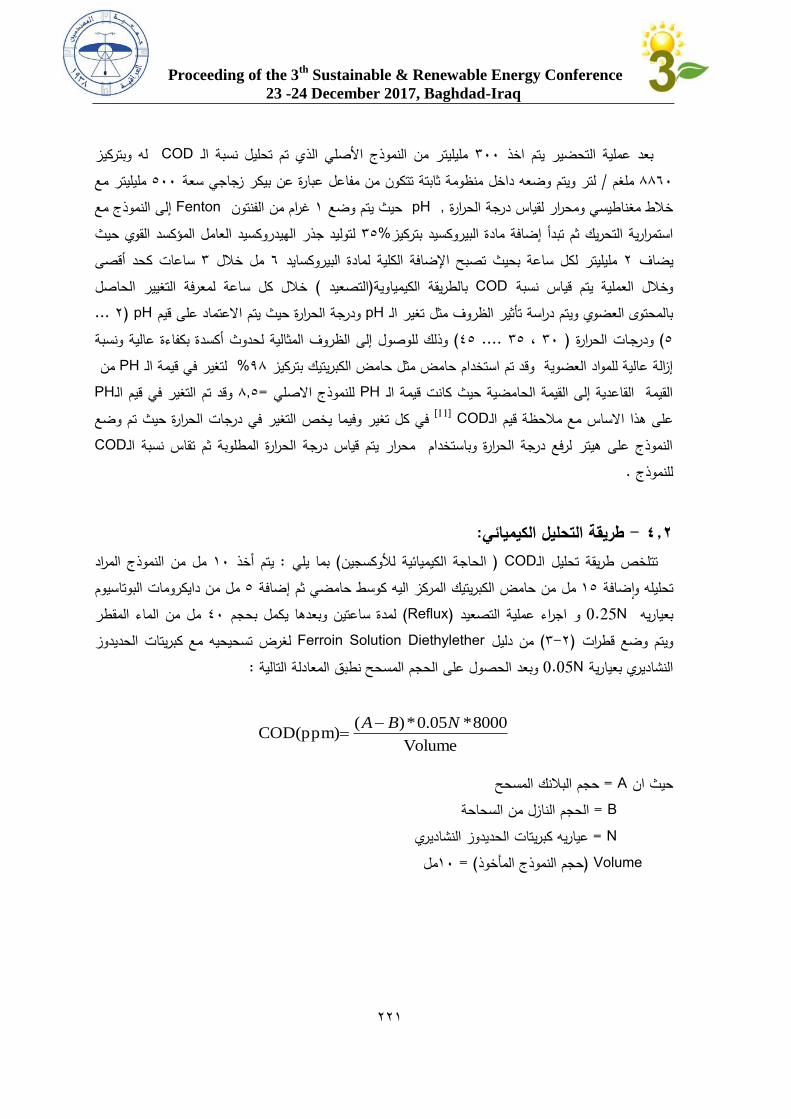
Proceeding of the 3th
Sustainable & Renewable Energy Conference
23 -24 December 2017, Baghdad-Iraq
له وبتركيز CODمليليتر من النموذج األصلي الذي تم تحليل نسبة الـ 511عملية التحضير يتم اخذ بعد مليليتر مع 311لتر ويتم وضعه داخل منظومة ثابتة تتكون من مفاعل عبارة عن بيكر زجاجي سعة / ملغم 8801
إلى النموذج مع Fentonن الفنتون غرام م 2حيث يتم وضع pH, خالط مغناطيسي ومحرار لقياس درجة الحرارة لتوليد جذر الهيدروكسيد العامل المؤكسد القوي حيث 53%استمرارية التحريك ثم تبدأ إضافة مادة البيروكسيد بتركيز
ساعات كحد أقصى 5مل خالل 0مليليتر لكل ساعة بحيث تصبح اإلضافة الكلية لمادة البيروكسايد 1يضاف خالل كل ساعة لمعرفة التغيير الحاصل ( التصعيد )بالطريقة الكيمياوية CODنسبة وخالل العملية يتم قياس
... pH (1ودرجة الحرارة حيث يتم االعتماد على قيم pHبالمحتوى العضوي ويتم دراسة تأثير الظروف مثل تغير الـ كسدة بكفاءة عالية ونسبة وذلك للوصول إلى الظروف المثالية لحدوث أ( 23.... 53، 51) ودرجـات الحرارة ( 3
من PHلتغير في قيمة الـ %98إزالة عالية للمواد العضوية وقد تم استخدام حامض مثل حامض الكبريتيك بتركيز PHوقد تم التغير في قيم الـ 8,3=للنموذج االصلي PHالقيمة القاعدية إلى القيمة الحامضية حيث كانت قيمة الـ
في كل تغير وفيما يخص التغير في درجات الحرارة حيث تم وضع COD [11]قيم الـ على هذا االساس مع مالحظة CODالنموذج على هيتر لرفع درجة الحرارة وباستخدام محرار يتم قياس درجة الحرارة المطلوبة ثم تقاس نسبة الـ
.للنموذج
:طريقة التحليل الكيميائي - 2.2من النموذج المراد مل 21 ذيتم أخ :بما يلي ( لكيميائية لألوكسجينالحاجة ا) CODتتلخص طريقة تحليل الـ
ضافة من دايكرومات البوتاسيوم مل 3من حامض الكبريتيك المركز اليه كوسط حامضي ثم إضافة مل 23تحليله وا طر من الماء المق مل 21لمدة ساعتين وبعدها يكمل بحجم (Reflux)التصعيد اجراء عملية و 0.25Nبعياريه
لغرض تسحيحيه مع كبريتات الحديدوز Ferroin Solution Diethyletherمن دليل( 5-1)ويتم وضع قطرات :وبعد الحصول على الحجم المسحح نطبق المعادلة التالية 0.05Nالنشاديري بعيارية
Volume
8000*05.0*)(COD(ppm)
NBA
حجم البالنك المسحح = Aحيث ان B =ن السحاحةالحجم النازل م
N =ياريه كبريتات الحديدوز النشاديري ع Volume (حجم النموذج المأخوذ = )مل21
771
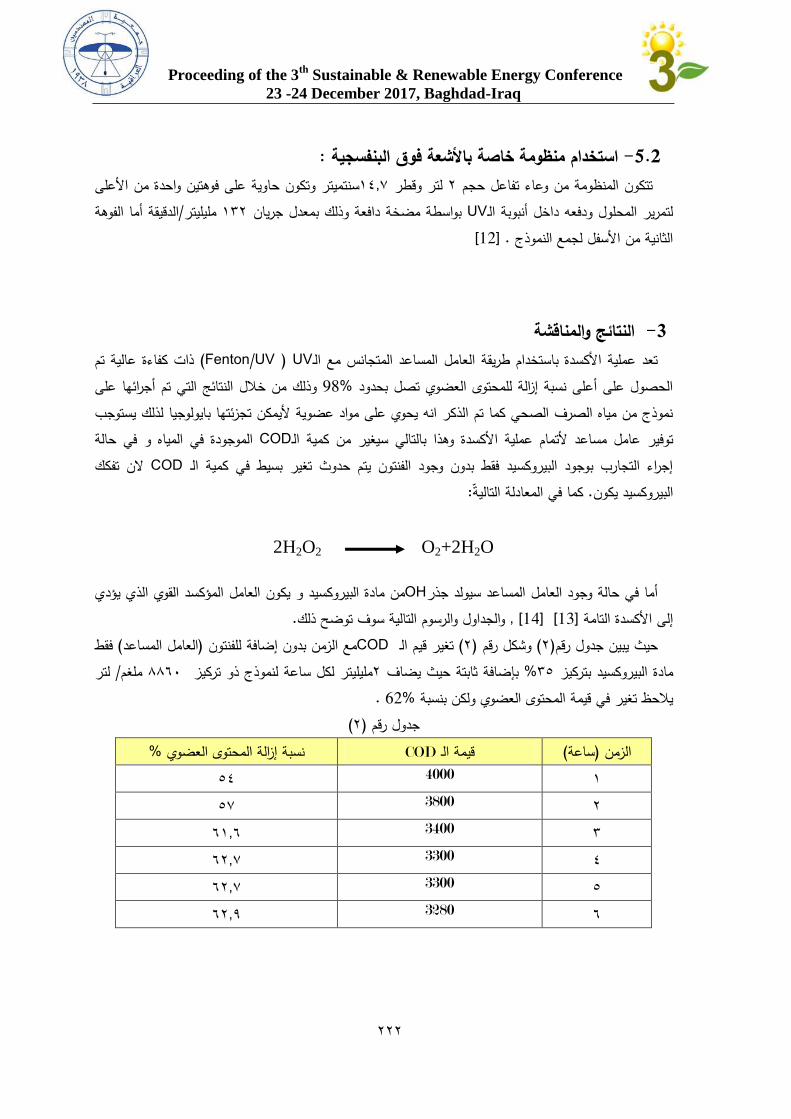
Proceeding of the 3th
Sustainable & Renewable Energy Conference
23 -24 December 2017, Baghdad-Iraq
: استخدام منظومة خاصة باألشعة فوق البنفسجية 5.2- ألعلى سنتميتر وتكون حاوية على فوهتين واحدة من ا22,1لتر وقطر 1تتكون المنظومة من وعاء تفاعل حجم
الدقيقة أما الفوهة /مليليتر 251بواسطة مضخة دافعة وذلك بمعدل جريان UVلتمرير المحلول ودفعه داخل أنبوبة الـ [12]. الثانية من األسفل لجمع النموذج
النتائج والمناقشة 3- ذات كفاءة عالية تم UV (Fenton/UV)تعد عملية األكسدة باستخدام طريقة العامل المساعد المتجانس مع الـ
وذلك من خالل النتائج التي تم أجرائها على %98الحصول على أعلى نسبة إزالة للمحتوى العضوي تصل بحدود نموذج من مياه الصرف الصحي كما تم الذكر انه يحوي على مواد عضوية أليمكن تجزئتها بايولوجيا لذلك يستوجب
الموجودة في المياه و في حالة CODوهذا بالتالي سيغير من كمية الـتوفير عامل مساعد ألتمام عملية األكسدة الن تفكك CODإجراء التجارب بوجود البيروكسيد فقط بدون وجود الفنتون يتم حدوث تغير بسيط في كمية الـ
:كما في المعادلة التالية . البيروكسيد يكون
2H2O2 O2+2H2O
من مادة البيروكسيد و يكون العامل المؤكسد القوي الذي يؤدي OHعد سيولد جذرأما في حالة وجود العامل المسا . والجداول والرسوم التالية سوف توضح ذلك, [14] [13] إلى األكسدة التامة
فقط ( العامل المساعد)مع الزمن بدون إضافة للفنتون CODتغير قيم الـ( 1)وشكل رقم ( 1)حيث يبين جدول رقم لتر / ملغم 8801مليليتر لكل ساعة لنموذج ذو تركيز 1ثابتة حيث يضاف بإضافة% 53وكسيد بتركيز مادة البير
. %62يالحظ تغير في قيمة المحتوى العضوي ولكن بنسبة (1)جدول رقم
%نسبة إزالة المحتوى العضوي CODقيمة الـ (ساعة)الزمن 2 4000 32 1 3800 31 5 3400 02,0 2 3300 01,1 3 3300 01,1 0 3280 01,9
777
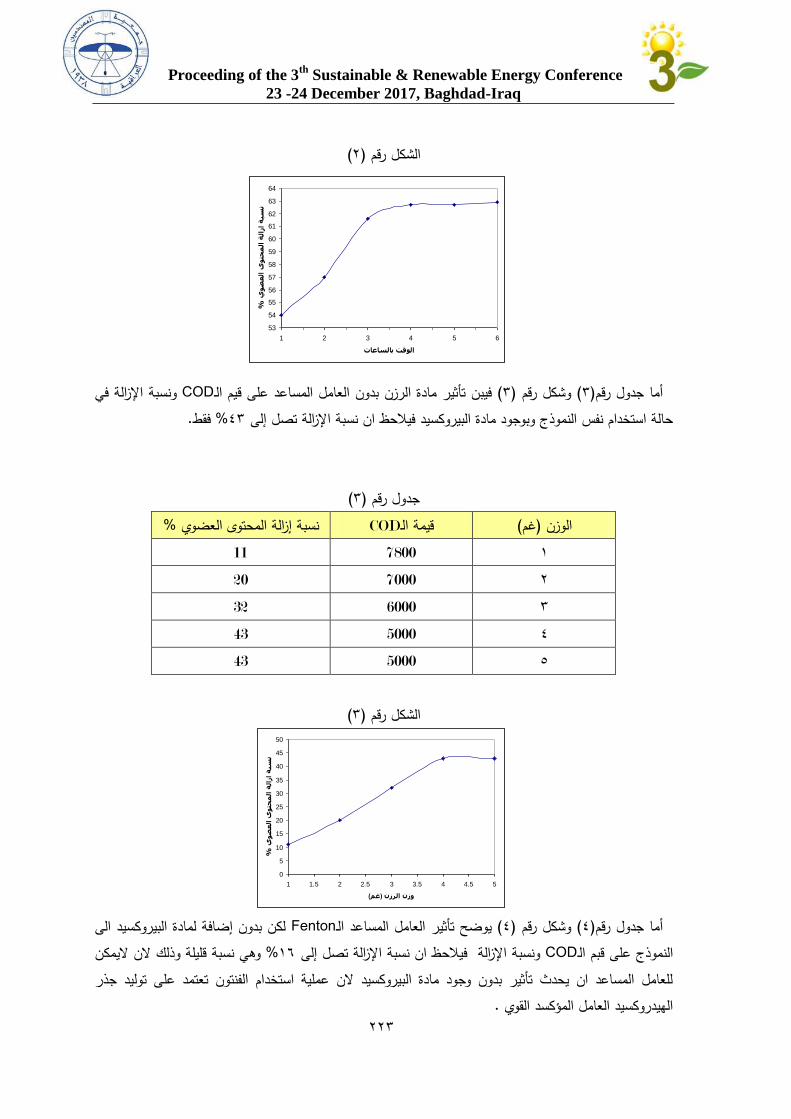
Proceeding of the 3th
Sustainable & Renewable Energy Conference
23 -24 December 2017, Baghdad-Iraq
(1)الشكل رقم
ونسبة اإلزالة في CODفيبن تأثير مادة الرزن بدون العامل المساعد على قيم الـ( 5)وشكل رقم ( 5)أما جدول رقم
.فقط% 25حالة استخدام نفس النموذج وبوجود مادة البيروكسيد فيالحظ ان نسبة اإلزالة تصل إلى
(5)م جدول رق %نسبة إزالة المحتوى العضوي CODقيمة الـ (غم)الوزن 2 7800 11 1 7000 20 5 6000 32 2 5000 43 3 5000 43
(5)الشكل رقم
لكن بدون إضافة لمادة البيروكسيد الى Fentonيوضح تأثير العامل المساعد الـ( 2)وشكل رقم ( 2)أما جدول رقم
وهي نسبة قليلة وذلك الن اليمكن % 20ونسبة اإلزالة فيالحظ ان نسبة اإلزالة تصل إلى CODالـ النموذج على قبمللعامل المساعد ان يحدث تأثير بدون وجود مادة البيروكسيد الن عملية استخدام الفنتون تعتمد على توليد جذر
.الهيدروكسيد العامل المؤكسد القوي
53
54
55
56
57
58
59
60
61
62
63
64
1 2 3 4 5 6
الوقت بالساعات
%ي
وض
عال
ى وحت
مال
ة ال
ازة
سبن
0
5
10
15
20
25
30
35
40
45
50
1 1.5 2 2.5 3 3.5 4 4.5 5
وزن الرزن )غم(
%ي
وض
عال
ى وحت
مال
ة ال
ازة
سبن
772
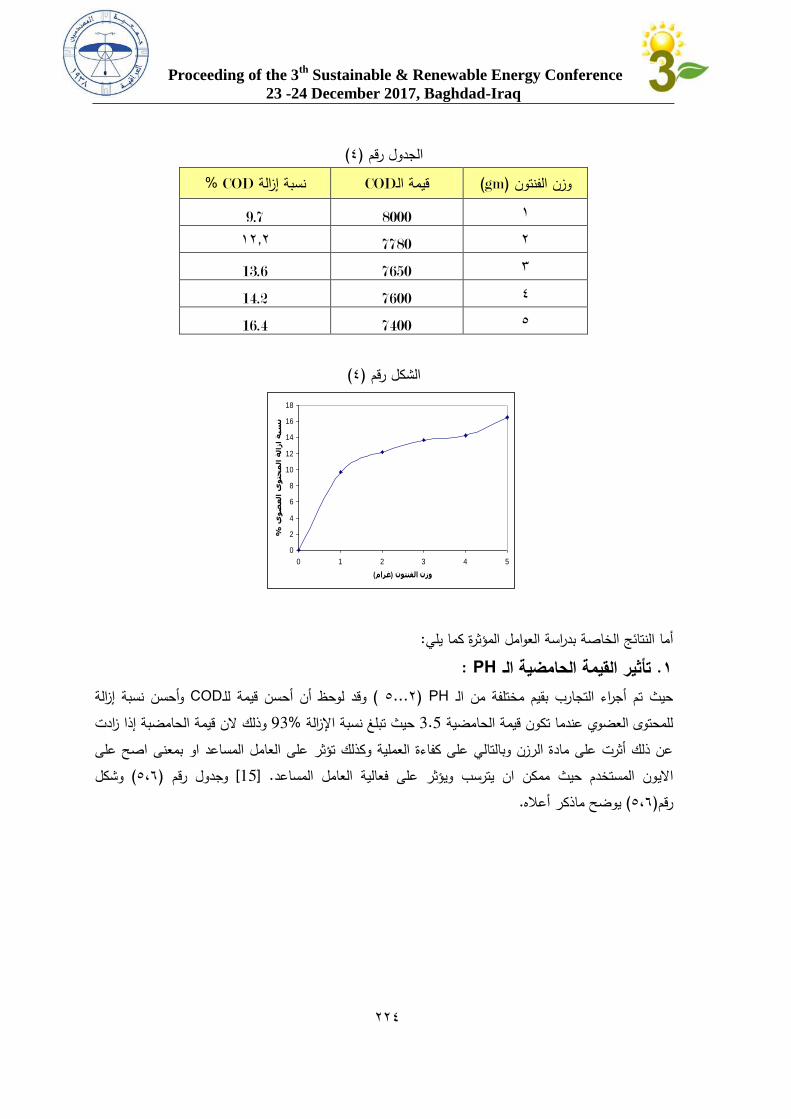
Proceeding of the 3th
Sustainable & Renewable Energy Conference
23 -24 December 2017, Baghdad-Iraq
(2)الجدول رقم % CODنسبة إزالة CODقيمة الـ (gm)وزن الفنتون 2 8000 9.7
1 7780 21,1
5 7650 13.6
2 7600 14.2
3 7400 16.4
(2)الشكل رقم
: ما النتائج الخاصة بدراسة العوامل المؤثرة كما يليأ
: PH تأثير القيمة الحامضية الـ .1وأحسن نسبة إزالة CODوقد لوحظ أن أحسن قيمة للـ ) PH (1...3حيث تم أجراء التجارب بقيم مختلفة من الـ وذلك الن قيمة الحامضبة إذا زادت %93حيث تبلغ نسبة اإلزالة 3.5للمحتوى العضوي عندما تكون قيمة الحامضية
بمعنى اصح على وعن ذلك أثرت على مادة الرزن وبالتالي على كفاءة العملية وكذلك تؤثر على العامل المساعد اوشكل ( 3،0) وجدول رقم [15]. ون المستخدم حيث ممكن ان يترسب ويؤثر على فعالية العامل المساعداالي .يوضح ماذكر أعاله( 3،0)رقم
0
2
4
6
8
10
12
14
16
18
0 1 2 3 4 5
وزن الفنتون )غرام(
%ي
وض
عال
ى وحت
مال
ة ال
ز ا
ةسب
ن
772
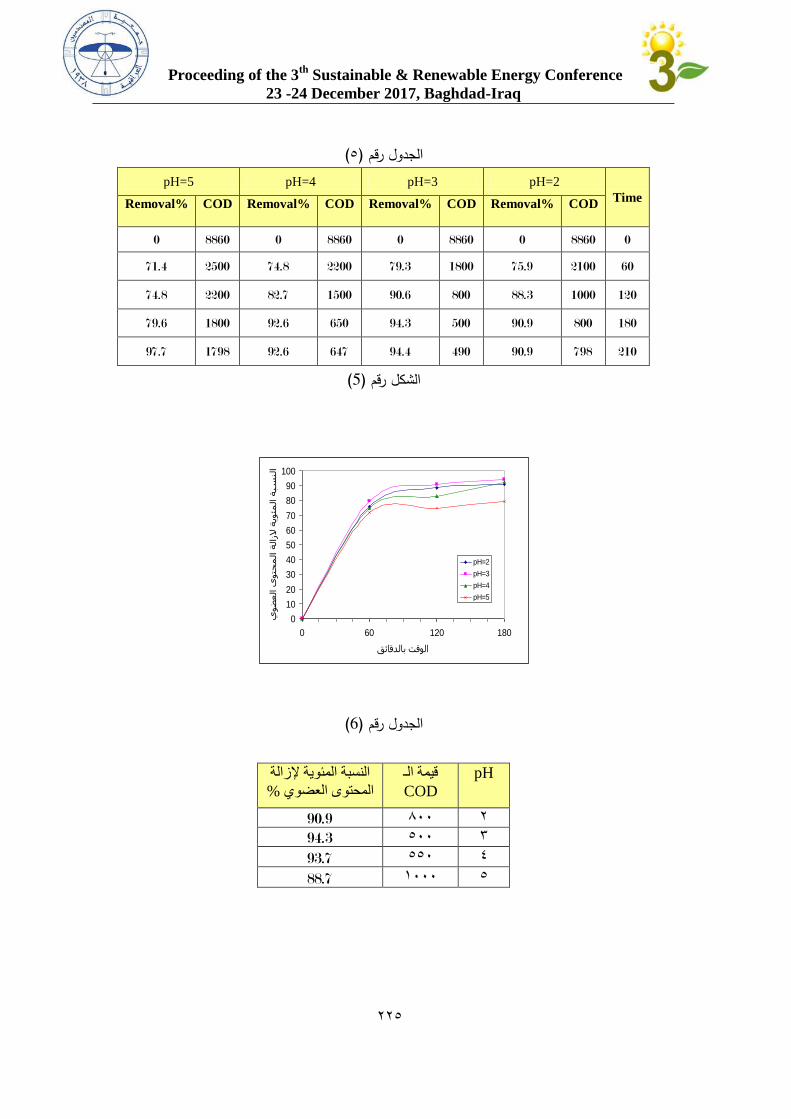
Proceeding of the 3th
Sustainable & Renewable Energy Conference
23 -24 December 2017, Baghdad-Iraq
(3)الجدول رقم
Time
pH=2 pH=3 pH=4 pH=5
COD Removal% COD Removal% COD Removal% COD Removal%
0 8860 0 8860 0 8860 0 8860 0
60 2100 75.9 1800 79.3 2200 74.8 2500 71.4
120 1000 88.3 800 90.6 1500 82.7 2200 74.8
180 800 90.9 500 94.3 650 92.6 1800 79.6
210 798 90.9 490 94.4 647 92.6 1798 97.7
(5)الشكل رقم
(6)الجدول رقم
pH قيمة الـ
COD
النسبة المئوية إلزالة
%لعضوي المحتوى ا
7 222 90.9
2 022 94.3
2 002 93.7
0 1222 88.7
0
10
20
30
40
50
60
70
80
90
100
0 60 120 180
الوقت بالدقائق
يوض
عالى
وحت
مالة
الالز
ة وي
مئالة
سبلن
ا
pH=2
pH=3
pH=4
pH=5
770
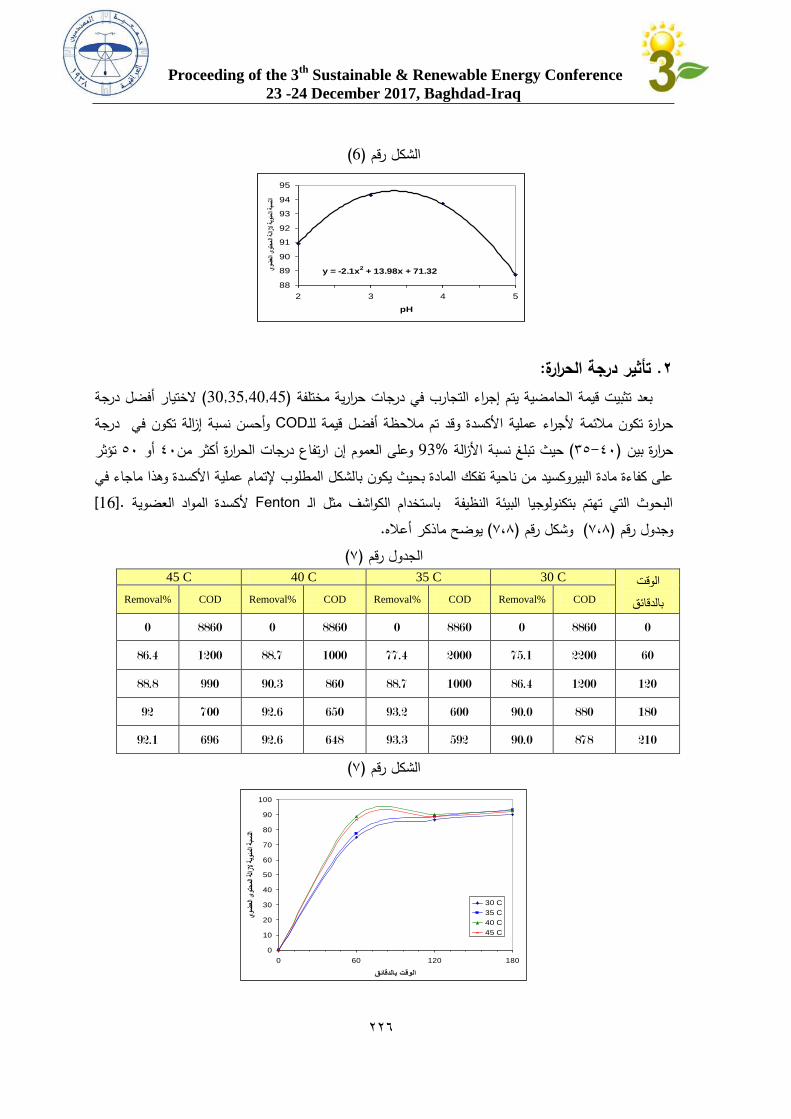
Proceeding of the 3th
Sustainable & Renewable Energy Conference
23 -24 December 2017, Baghdad-Iraq
(6)الشكل رقم :تأثير درجة الحرارة .2الختيار أفضل درجة ( 30,35,40,45)بعد تثبيت قيمة الحامضية يتم إجراء التجارب في درجات حرارية مختلفة
وأحسن نسبة إزالة تكون في درجة CODمالحظة أفضل قيمة للـحرارة تكون مالئمة ألجراء عملية األكسدة وقد تم تؤثر 31أو 21وعلى العموم إن ارتفاع درجات الحرارة أكثر من %93حيث تبلغ نسبة األزالة ( 53-21)حرارة بين
جاء في حيث يكون بالشكل المطلوب إلتمام عملية األكسدة وهذا مابعلى كفاءة مادة البيروكسيد من ناحية تفكك المادة [16].ألكسدة المواد العضوية Fentonالبحوث التي تهتم بتكنولوجيا البيئة النظيفة باستخدام الكواشف مثل الـ
. يوضح ماذكر أعاله( 1،8)وشكل رقم ( 1،8)وجدول رقم (1)الجدول رقم
الوقت بالدقائق
30 C 35 C 40 C 45 C COD Removal% COD Removal% COD Removal% COD Removal%
0 8860 0 8860 0 8860 0 8860 0
60 2200 75.1 2000 77.4 1000 88.7 1200 86.4
120 1200 86.4 1000 88.7 860 90.3 990 88.8
180 880 90.0 600 93.2 650 92.6 700 92
210 878 90.0 592 93.3 648 92.6 696 92.1
(1)الشكل رقم
y = -2.1x2 + 13.98x + 71.32
88
89
90
91
92
93
94
95
2 3 4 5
pH
يضو
لعى ا
تومح
اللة
زا ال
يةئو
لمة ا
سبالن
0
10
20
30
40
50
60
70
80
90
100
0 60 120 180
الوقت بالدقائق
يضو
لعى ا
تومح
اللة
زا ال
يةئو
لمة ا
سبالن
30 C
35 C
40 C
45 C
772
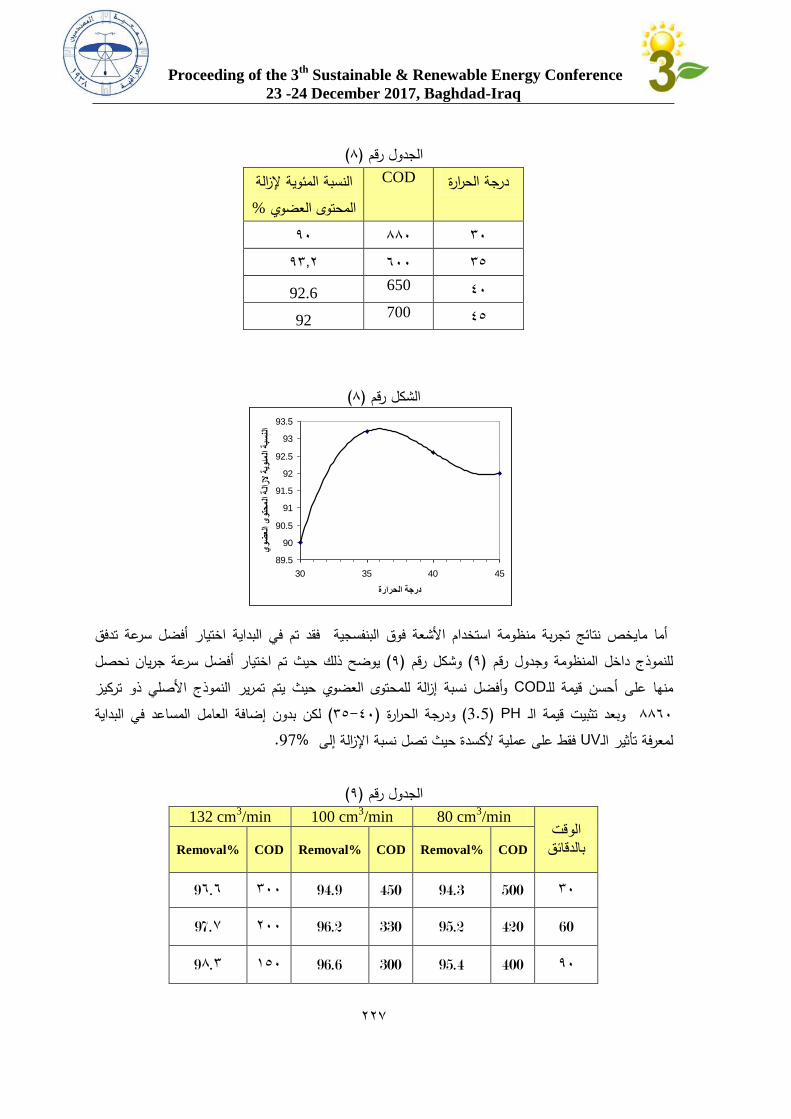
Proceeding of the 3th
Sustainable & Renewable Energy Conference
23 -24 December 2017, Baghdad-Iraq
(8)الجدول رقم النسبة المئوية إلزالة COD رارة درجة الح
%المحتوى العضوي
51 881 91
53 011 95,1
21 650 92.6
23 700 92
(8)الشكل رقم أما مايخص نتائج تجربة منظومة استخدام األشعة فوق البنفسجية فقد تم في البداية اختيار أفضل سرعة تدفق
يوضح ذلك حيث تم اختيار أفضل سرعة جريان نحصل ( 9)وشكل رقم ( 9)ول رقم للنموذج داخل المنظومة وجدوأفضل نسبة إزالة للمحتوى العضوي حيث يتم تمرير النموذج األصلي ذو تركيز CODمنها على أحسن قيمة للـ
بداية لكن بدون إضافة العامل المساعد في ال( 53-21)ودرجة الحرارة ( (PH 3.5وبعد تثبيت قيمة الـ 8801 . %97فقط على عملية ألكسدة حيث تصل نسبة اإلزالة إلى UVلمعرفة تأثير الـ
(9)الجدول رقم
الوقت
بالدقائق
80 cm3/min 100 cm
3/min 132 cm
3/min
COD Removal% COD Removal% COD Removal%
22 500 94.3 450 94.9 222 92.2
60 420 95.2 330 96.2 722 97.2
92 400 95.4 300 96.6 102 92.2
89.5
90
90.5
91
91.5
92
92.5
93
93.5
30 35 40 45
درجة الحرارة
يضو
لعى ا
توحم ال
ةزال
الة
ويمئ
البة
سلنا
772
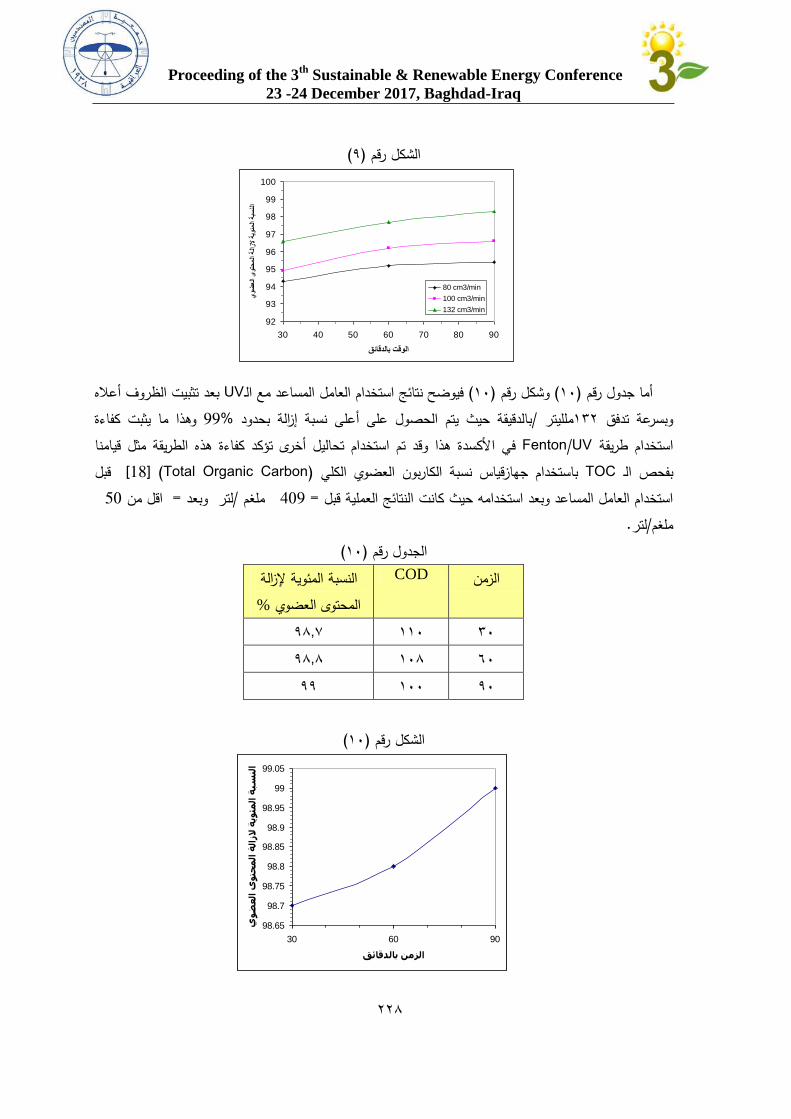
Proceeding of the 3th
Sustainable & Renewable Energy Conference
23 -24 December 2017, Baghdad-Iraq
(9)الشكل رقم
بعد تثبيت الظروف أعاله UVفيوضح نتائج استخدام العامل المساعد مع الـ( 21)وشكل رقم ( 21)أما جدول رقم
وهذا ما يثبت كفاءة %99بالدقيقة حيث يتم الحصول على أعلى نسبة إزالة بحدود /ملليتر 251وبسرعة تدفق قيامنا ألكسدة هذا وقد تم استخدام تحاليل أخرى تؤكد كفاءة هذه الطريقة مثلافي Fenton/UVطريقة استخدام
قبل [18]( Total Organic Carbon)باستخدام جهازقياس نسبة الكاربون العضوي الكلي TOCفحص الـب 50اقل من = لتر وبعد /ملغم 409= قبل النتائج العمليةاستخدام العامل المساعد وبعد استخدامه حيث كانت
. لتر/ملغم (21)الجدول رقم
النسبة المئوية إلزالة COD الزمن %المحتوى العضوي
51 221 98,1
01 218 98,8
91 211 99
(21)الشكل رقم
92
93
94
95
96
97
98
99
100
30 40 50 60 70 80 90
الوقت بالدقائق
يضو
لعى ا
توحم ال
ةزال
الة
ويمئ
البة
سلنا
80 cm3/min
100 cm3/min
132 cm3/min
98.65
98.7
98.75
98.8
98.85
98.9
98.95
99
99.05
30 60 90
الزمن بالدقائق
يوض
عال
ى وحت
مال
ة ال
الزة
ويمئ
الة
سبلن
ا
772
Proceeding of the 3th
Sustainable & Renewable Energy Conference
23 -24 December 2017, Baghdad-Iraq
= بة اإلزالة نس إن حيث CODوقد تم اعتماد قانون النسبة المئوية للحصول على نسبة اإلزالة للـ
100% movalRe0
0
C
CC
لتر/تركيز المحتوى العضوي األصلي قبل األكسدة ملغم = C0حيث ان
C = لتر/تركيز المحتوى العضوي بعد األكسدة ملغم
:االستنتاجات 4- بان لها القابلية على إزالة ( Fenton)ان استخدام االيونات في تكوين العامل المساعد الـ الدراسة اثبت – 2
و بنسب عالية وهذا ما يؤكده الباحثون في العالم الذين استخدموا أنواع أخرى CODالمحتوى العضوي على شكل ألن استخدام هذه الفنتونات تسبب و من االيونات لتكوين أنواع أخرى من الفنتونات مثل ايون الحديد والزنك والنحاس
. [17]ا على ايون القصدير ألنه ايون غير ملوث وغير سام تلوث لذلك اعتمدنالحر الذي يعتبر عامل مؤكسد قوي ومن . OHلتوليد جذر الهيدروكسيد ( Fenton) وجود البيروكسيد مع الـ -1
ونسب اإلزالة للمحتوى العضوي CODوهذا واضح من تغير قيم الـ [17] ثالث العوامل المؤكسدة القوية كيميائيا .تقريبا % 99كل كبير وبكفاءة تصل الى وبش .وجود البيروكسيد أيضا يعتبر عامل غير ملوث في عملية األكسدة وذلك ألنه سوف يتحول الى الماء -5نما فعل كيمياوي على سطح العامل المساعد -2 .أن عملية تجزئة البيروكسيد ال تحتاج إلى طاقة وا وال يحتاج رفع درجة الحرارة بشكل كبير حيث تم االعتماد على درجة حرارة العمل كيمياويا التوجد فيه روائح -3
.درجة مئوية( 21 -53) مناسبة بحدود أن ارتفاع القيمة الحامضية تؤثر على العامل المساعد وبالتالي على كفاءة األكسدة لذلك تم االعتماد على قيمة -0
-.حامضية مناسبة ألجراء عملية األكسدةالذي يوضح ( 2)سبة للرزن المستخدم ممكن إعادة استخدامه عدة مرات تصل إلى مئة مرة كما في الشكل بالن -1
.عالقة كفاءة الرزن مع عدد مرات استخدامه وهذا بمعنى ممكن استخدام العامل المساعد عدة مرات وبدون تبديل التوصيات -5ينة بغداد والمدن األخرى ألنه نظام كفوء في إزالة المواد نوصي باستخدام هذا النظام في مصلحة المجاري لمد -2
العضوية التي ليس لها القدرة على التحلل تلقائيا والتي تكون موجودة دائما في مياه الصرف الصحي مثل المواد دالة CODلـ ة الذائبة التي تعتبر من ضمن المواد العضوية التي تحويها مياه النفايات و التي تمثل قيمة االسيليلوزي
.لهانوصي باستمرار الدراسة لهذه التكنولوجيا التي تعتبر حديثة نوعا ما بالنسبة لما يخص واقعنا البيئي وتطويرها -1
بشكل معمل متكامل يمكن االعتماد عليه مع معداته لغرض نصبه في القطاعات والمعامل التي تهتم بهذا المجال .للحد من التلوث البيئي
779
Proceeding of the 3th
Sustainable & Renewable Energy Conference
23 -24 December 2017, Baghdad-Iraq
.على المياه الصناعية لكن بظروف مختلفة( FENTON)طبيق فكرة األكسدة بالـ ممكن ت -5
المصادر -6
[1] K.Fajerwerg. K,J.N.Foussard (Wet oxidation of phenol by hydrogen peroxide ) center
national of recherché science Technology. France .1997
[2] Kirk- Othmer, Encyclopedia of chemical Technology –Thirdedition –Municipal
water treatment Vol 24 ,1982. [3] The Food and Agriculture Organization of the Unite Nation.1990.
[4] Shanmuy apriya .S,M.Premalatha and N.Anantharaman, (Solar photocatalytic
treatment of phenolic waste water) ,Arpn Journal of Enginering and applied
Sciences. India 2008.
[5] Barbuinski .k, (Modified fenton process for decolorization of waste water) Polish
Journal of Environmtal Studies Vol 14,no.3,Poland 2005.
[6] Miguel rodriguer (Fenton and UV-VIS based advanced oxidation processes in waste
water treatment) University De Barcelona 2003.
[7] Zheng Zhan-Wang,(Heterogeneous U\V Fenton catalytic degration of wast water)
Journal of Zhejiang Universeity science. Chine 2008
[8] Silva .M.R,M.A.Z.Coelhoo, (Minimization of phenol in refinery waste water
bionlogical treatment) ,Cidade University ,Brazil 2002.
[9] Sihoon Lee,Jooyub oh , and Yoonchang park (Degradation of phenol with fenton –
like treatment by using heterogeneous catalysis and hydrogen peroxide)Department of
chemistry , Sungkyunkwan University ,Korea 2005.
[10] Purlite C-100 E( Strong acid cation exchange resion) for use in water softening
application 2000.
[11] Ugurl .M,Karaoglu. M, ( Experimental investigation of chemical oxygen demand )
polish Journal of Environ . Stud.vol.15,no 4,2006.
[12] Erno Kiss, Tatjana Vulic, (photo –fenton catalysis for wet peroxide oxidation of
phonal) University of Novi sad , Germany 2006.
[13] AL-Hayekn, Dorem,( Oxidation of phenol inwaste water by hydrogen peroxide on
alumina supported iron) Journal of Technology and Science 2000.
[14] Maiara Oliveira Salles, Thiago R.L.C,(Hydrogen peroxide monitoring in photo-
fenton reaction by using a metal hexacyano ferrate modified electrode ) International
Journal of electro chemical science Barzil 2007.
[15] Zhou, M.WU.Z.and Dahui,W, Promted UV/Fe+3 process for p-nitrophenol
degradation by electro- catalysis, Journal of chemistry 2001.
[16] L.L.C,U.S. peroxide (General chemistry of fenton ,s reagent ) technologies 2009.
[17] Kitis. M. Adams.G.D (The effect of Fenton’s reaction pretreatment on nonionic
surfactants) University of Technology and Science 1999.
722
Proceeding of the 3th Sustainable & Renewable Energy Conference 23 -24 December 2017, Baghdad-Iraq
132
خلية وقود هيدروجينية مفردة بغشاء انتقائي واطئ الكلفة إلنتاج الطاقة الكهربائية
زينب دخيل عبد علي 1شروق عبد هللا عيدان.د,
1بشير حسن,
1مطور رضا ,
1حيدر عبد الهادي.
1
1 دائرة الطاقات المتجددة/وزارة العلوم والتكنولوجيا
:الخالصة
تم تصنيع خلية وقود هيدروجينية مفردة داخل المختبر حيث تتكون من قطبين على شكل شبكي مصنوع من معدن التيتانيوم المطلي
الهيدروجين من احد االقطاب بينما يتم بالبالتينوم موضوع داخل حجرة مصنوعة من مادة البالستيك وتحتوي على انبوب لتمرير غاز
ويتم ربط االقطاب بجهاز الفولتميتر باستخدام سلك نحاسي رفيع وذلك لقياس الفولتية المتولدة ,تمرير غاز االوكسجين من القطب المقابل
PVAالذي يوضع بين القطبين الغشاء االنتقائي الذي تم تحضيره من محلول ( Membrane)عبر الدائرة الخارجية للغشاء االنتقائي
تم فحص قابلية , %wt%(1%,2%,3%,4%,5 )وبنسب مختلفة حسب الترتيب التالي ( H2SO3)المشوب من حامض السلفونيك
كسجين عبر الغشاء االنتقائي وقد وجد بان الغشاء االنتقائي على توليد الطاقة الكهربائية الناتجة عن تفاعل ايونات الهيدروجين واالو
باالضافة الى ذلك تم حساب التوصيلية الكهربائية , %(4,%3)افضل فولتية تم الحصول عليها باستخدام المركب البوليمري بنسبة
االغشية المشوبة حيث تم الحصول على قيمة التوصيلية الكهربائية لجميع ( 4ـــProbe) resistivityلألغشية المشوبة باستخدام جهاز
%wt (2%,3%,4)وجد بان افضل قيمة للتوصيلية هي لألغشية بنسب
Abstract:
A single hydrogen fuel cell is manufactured inside the laboratory. It consists of two poles in the shape
of a retina made of platinum-plated titanium metal inside a plastic chamber containing a tube to pass
hydrogen gas from one of the electrodes while the oxygen gas is passed from the opposite pole.
Voltmeter using a fine copper wire to measure the voltages generated by the outer circuit of the
membrane selected by the bipolar membrane, which was prepared from the solution of PVA
impregnated with sulfonic acid (H2SO3) and in different percentages in the following order (1%, 2%
wt% 3%, 4%, 5%), was examined The electrophysiological susceptibility of the electrophoresis
generated by the reaction of hydrogen ions and oxygen through the selective membrane was found to be
the best voltages obtained using the polymer compound by 3% and 4%. In addition, the electrical
conductivity of the membranes was calculated using the esistivity (Probe 4) The value of conductivity
was obtained for all membranes where it was found that the best value for conductivity was for
membranes at wt (2%, 3%, 4%.(
:المقدمة .1
حيث , خلية وقود الهيدروجين هي جهاز كهروكيمياوي يعمل على تحويل الطاقة الكيميائية لخاليا الوقود مباشرة الى طاقة كهربائية
( الكتر واليت)تحتوي خلية وقود الهيدروجين على قطبين يفصل بينهما .طاقة عالية يمكنها تزويدنا بمصدر كهربائي نظيف وذو
يمكن تقسيمها الى خاليا وقود ذات درجات الحرارة الواطئة وتضم ثالثة ,تصنف اعتمادا على نوع االلكترو اليت وكيف يتم توظيفه
خلية وقود الميثانول ,(alkaline fuel cell (AFC))لقلوية خلية الوقود ا :انواع تختلف فيما بينها بنوع االلكترو اليت وتضم
proton exchange membrane)خلية وقود الغشاء االيوني االنتقائي , ( direct methanol fuel cell (DMFC))المباشر

Proceeding of the 3th Sustainable & Renewable Energy Conference 23 -24 December 2017, Baghdad-Iraq
131
fuel cell (PEMFC)) ,اللكترو اليت وهي اما خاليا الوقود ذات الدرجة الحرارية العالية فتضم ايضا ثالثة انواع حسب نوع ا :
molten)وخلية وقود الكربونات المنصهرة , (the phosphoric acid fuel cell(PAFC))خلية وقود حامض الفسفوريك
carbonate fuel cell (MCFC)) ) , وخلية وقود االكاسيد الصلبة(solid oxide fuel cell(SOFC))[1] . خلية الوقود ال يمكن
[1](.الهيدروجين)بل تستمر بتجهيز الطاقة الكهربائية طالما تكون مزودة بالوقود( الى اعادة شحن ال تحتاج )اعادة شحنها
( PEM Fuel Cell)خلية وقود الهيدروجين الغشاء االيوني االنتقائي .2
ماء وحرارة عندما ,خلية وقود الغشاء االيوني االنتقائي التي هي محل دراستنا في هذا البحث تعتمد على عملية كيمياوية لتنتج كهرباء
بصورة عامة تصنع اقطاب هذا النوع من الخاليا من قماش الكاربون او ورق الياف ,يكون الهيدروجين هو مصدر الوقود الخلية
فعند , ي يدعم عادة بطبقة من جزيئات معدن البالتنيوم كعامل محفزيقع بين القطبين الغشاء االيوني االنتقائيالكاربون على شكل شبك
الغشاء االنتقائي يعمل ,مرور غاز الهيدروجين عبر االنوديعمل المحفز لتسهيل عملية فصل غاز الهيدروجين الى الكترونات وبروتونات
ويمنع مرور االلكترونات التي تنتقل عبر سلك مربوط بدائرة كهربائية مزودة بحمل الستهالك على جذب ايونات الهيدروجين الموجبة
الطاقة الكهربائية الناتجة من الخلية ليعود مرة اخرى عند الكاثود حيث تتحد االلكترونات مع بروتونات الهيدروجين الموجبة مكونا غاز
رر عبر الكاثودمكونا الماء كناتج من عملية انتاج الطاقة الكهربائية في خلية الوقود الهيدروجين الذي يتحد مع ذرات األوكسجين التي تم
[2]
التي ,في الغشاء االنتقائي االيوني هي اهم ما يميز هذا النوع من االغشيةالبوليميرية ( proton-conducting)ان توصيلية البروتون
.[3]لك فأنها تعمل كحاجز مادي يمنع االكسدة في الخلية باإلضافة الى ذ( ion exchange)يحدث فيها تبادل ايوني
يقوم بتمرير االيونات او الجزيئات من خالله ويمكن تصنيف هذه االغشية ياالغشية االنتقائية تكون مسامية حيث تعمل كعمل المنخل الذ
ion exchange)شاء االنتقائي االيوني غازيةباإلضافة الى الغ,سائلة , صلبة,صناعية ,االنتقائية الى اغشية انتقائية طبيعية
membrane.)[4]
على اكبر قدر من االهتمام بسبب بساطتها وقابليتها في االستمرار ( خلية وقود الغشاء االيوني االنتقائي)وقد استحوذت هذه التقنية
[5].محرك القاطرة وسرعتها في البدء وقد تجلى ذلك في أي تطبيق قابل للتشغيل تقريبا من الهاتف الخلوي الى
وخصائص مكوناتها( PEM Fuel Cell)خلية وقود الهيدروجين الغشاء االيوني االنتقائي .3
من عدة اجزاء رئيسية ولكل جزء عمل خاص للخلية وهي الغشاء االيوني االنتقائي ( PEM Fuel Cell)تتكون خلية وقود الهيدوجين
( Bipolar Plates)االلواح ثنائية القطب , ( Gas Diffusion Layer)انتشار الغازطبقة , (Elecroids)االقطاب , ( PEM()التبادلي)
يوضح تركيب خلية الوقود ( 1)الشكل .سنتطرق في هذا البحث الى جزئيين رئيسين لهذه الخلية وهما الغشاء التبادلي واالقطاب . [6]
(PEM )
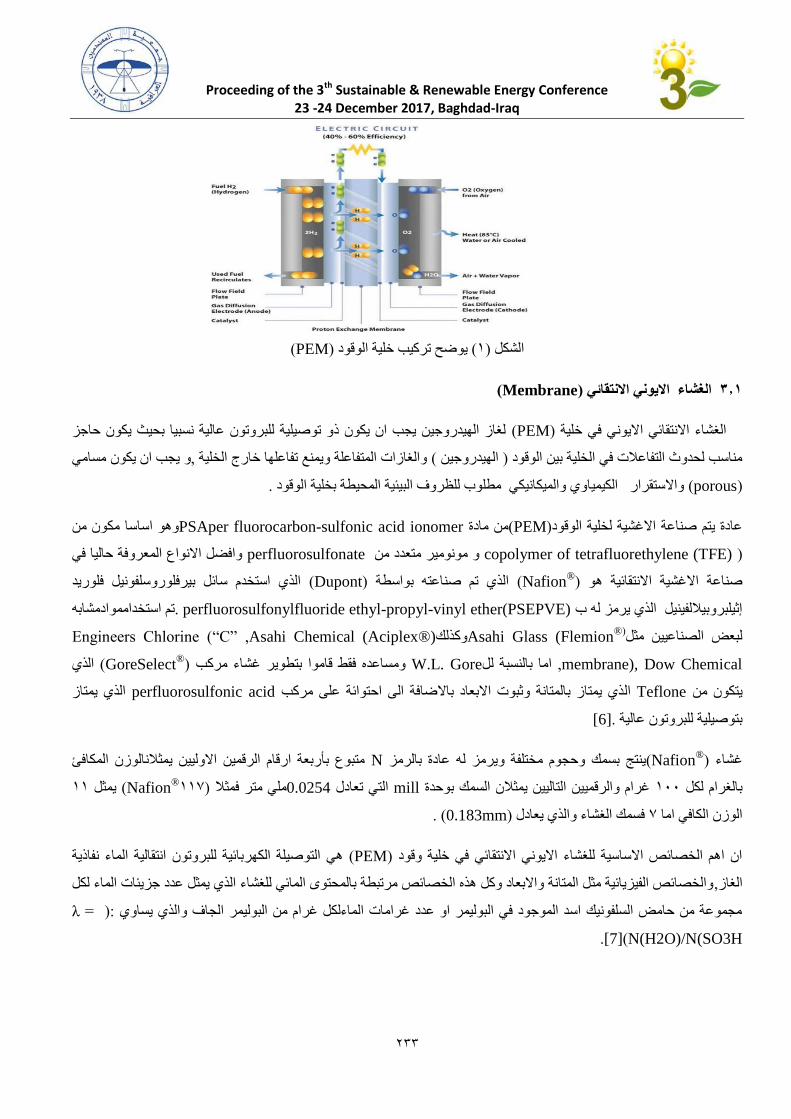
Proceeding of the 3th Sustainable & Renewable Energy Conference 23 -24 December 2017, Baghdad-Iraq
133
(PEM)يوضح تركيب خلية الوقود ( 1)شكل ال
(Membrane)اء االيوني االنتقائي الغش 3.3
لغاز الهيدروجين يجب ان يكون ذو توصيلية للبروتون عالية نسبيا بحيث يكون حاجز ( PEM)الغشاء االنتقائي االيوني في خلية
يجب ان يكون مسامي و,والغازات المتفاعلة ويمنع تفاعلها خارج الخلية ( الهيدروجين ) مناسب لحدوث التفاعالت في الخلية بين الوقود
(porous ) واالستقرار الكيمياوي والميكانيكي مطلوب للظروف البيئية المحيطة بخلية الوقود.
وهو اساسا مكون من PSAper fluorocarbon-sulfonic acid ionomerمن مادة (PEM)عادة يتم صناعة االغشية لخلية الوقود
(copolymer of tetrafluorethylene (TFE) و مونومير متعدد منperfluorosulfonate وافضل االنواع المعروفة حاليا في
Nafion)صناعة االغشية االنتقائية هو ®
الذي استخدم سائل بيرفلوروسلفونيل فلوريد ( Dupont)الذي تم صناعته بواسطة (
تم استخدامموادمشابه . perfluorosulfonylfluoride ethyl-propyl-vinyl ether(PSEPVE)إثيلبروبياللفينيل الذي يرمز له ب
لبعض الصناعيين مثل(®
Asahi Glass (FlemionوكذلكAsahi Chemical (Aciplex®),Engineers Chlorine (“C”
membrane), Dow Chemical ,اما بالنسبة للW.L. Gore ومساعده فقط قاموا بتطوير غشاء مركب(®
GoreSelect ) الذي
الذي يمتاز perfluorosulfonic acidذي يمتاز بالمتانة وثبوت االبعاد باالضافة الى احتوائة على مركب ال Tefloneيتكون من
[6].بتوصيلية للبروتون عالية
Nafion)غشاء ®
متبوع بأربعة ارقام الرقمين االوليين يمثالنالوزن المكافئ Nينتج بسمك وحجوم مختلفة ويرمز له عادة بالرمز (
111Nafion)ملي متر فمثال 0.0254التي تعادل millغرام والرقميين التاليين يمثالن السمك بوحدة 111بالغرام لكل ®
11يمثل (
( .0.183mm)فسمك الغشاء والذي يعادل 1الوزن الكافي اما
انتقالية الماء نفاذية هي التوصيلة الكهربائية للبروتون ( PEM)ان اهم الخصائص االساسية للغشاء االيوني االنتقائي في خلية وقود
والخصائص الفيزيائية مثل المتانة واالبعاد وكل هذه الخصائص مرتبطة بالمحتوى المائي للغشاء الذي يمثل عدد جزيئات الماء لكل ,الغاز
= λ:) مجموعة من حامض السلفونيك اسد الموجود في البوليمر او عدد غرامات الماءلكل غرام من البوليمر الجاف والذي يساوي
N(H2O)/N(SO3H)[7].
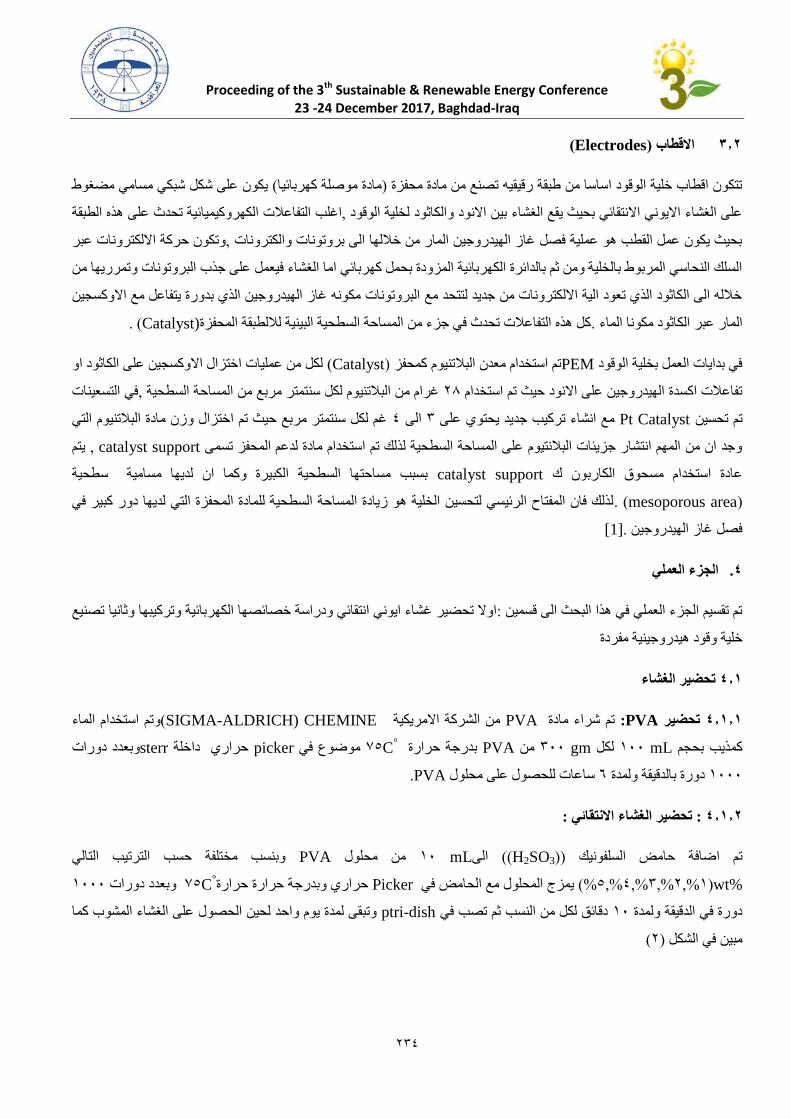
Proceeding of the 3th Sustainable & Renewable Energy Conference 23 -24 December 2017, Baghdad-Iraq
132
(Electrodes)االقطاب 3.3
يكون على شكل شبكي مسامي مضغوط ( مادة موصلة كهربائيا)تتكون اقطاب خلية الوقود اساسا من طبقة رقيقيه تصنع من مادة محفزة
الكهروكيميائية تحدث على هذه الطبقة اغلب التفاعالت ,على الغشاء االيوني االنتقائي بحيث يقع الغشاء بين االنود والكاثود لخلية الوقود
وتكون حركة االلكترونات عبر ,بحيث يكون عمل القطب هو عملية فصل غاز الهيدروجين المار من خاللها الى بروتونات والكترونات
بروتونات وتمرريها من السلك النحاسي المربوط بالخلية ومن ثم بالدائرة الكهربائية المزودة بحمل كهربائي اما الغشاء فيعمل على جذب ال
خالله الى الكاثود الذي تعود الية االلكترونات من جديد لتتحد مع البروتونات مكونه غاز الهيدروجين الذي بدورة يتفاعل مع االوكسجين
( .(Catalystكل هذه التفاعالت تحدث في جزء من المساحة السطحية البينية لاللطبقة المحفزة.المار عبر الكاثود مكونا الماء
لكل من عمليات اختزال االوكسجين على الكاثود او ( Catalyst)تم استخدام معدن البالتنيوم كمحفز PEMفي بدايات العمل بخلية الوقود
في التسعينات ,غرام من البالتنيوم لكل سنتمتر مربع من المساحة السطحية 22تفاعالت اكسدة الهيدروجين على االنود حيث تم استخدام
ختزال وزن مادة البالتنيوم التي غم لكل سنتمتر مربع حيث تم ا 4الى 3مع انشاء تركيب جديد يحتوي على Pt Catalystتم تحسين
يتم , catalyst supportوجد ان من المهم انتشار جزيئات البالنتيوم على المساحة السطحية لذلك تم استخدام مادة لدعم المحفز تسمى
بسبب مساحتها السطحية الكبيرة وكما ان لديها مسامية سطحية catalyst supportعادة استخدام مسحوق الكاربون ك
(mesoporous area. ) لذلك فان المفتاح الرئيسي لتحسين الخلية هو زيادة المساحة السطحية للمادة المحفزة التي لديها دور كبير في
[1].فصل غاز الهيدروجين
الجزء العملي .4
بائية وتركيبها وثانيا تصنيع اوال تحضير غشاء ايوني انتقائي ودراسة خصائصها الكهر:تم تقسيم الجزء العملي في هذا البحث الى قسمين
خلية وقود هيدروجينية مفردة
تحضير الغشاء 4.3
وتم استخدام الماء ( SIGMA-ALDRICH) CHEMINEمن الشركة االمريكية PVAتم شراء مادة :PVAتحضير 4.3.3
Cبدرجة حرارة PVAمن gm 311لكل mL 111كمذيب بحجم °
وبعدد دورات sterrحراري داخلة pickerموضوع في 15
.PVAساعات للحصول على محلول 6دورة بالدقيقة ولمدة 1111
:تحضير الغشاء االنتقائي : 4.3.3
وبنسب مختلفة حسب الترتيب التالي PVAمن محلول mL 11الى(( H2SO3))تم اضافة حامض السلفونيك
wt%(1%,2%,3%,4%,5 )% يمزج المحلول مع الحامض فيPicker رجة حرارة حرارةحراري وبدC°
1111وبعدد دورات 15
وتبقى لمدة يوم واحد لحين الحصول على الغشاء المشوب كما ptri-dishدقائق لكل من النسب ثم تصب في 11دورة في الدقيقة ولمدة
(2)مبين في الشكل
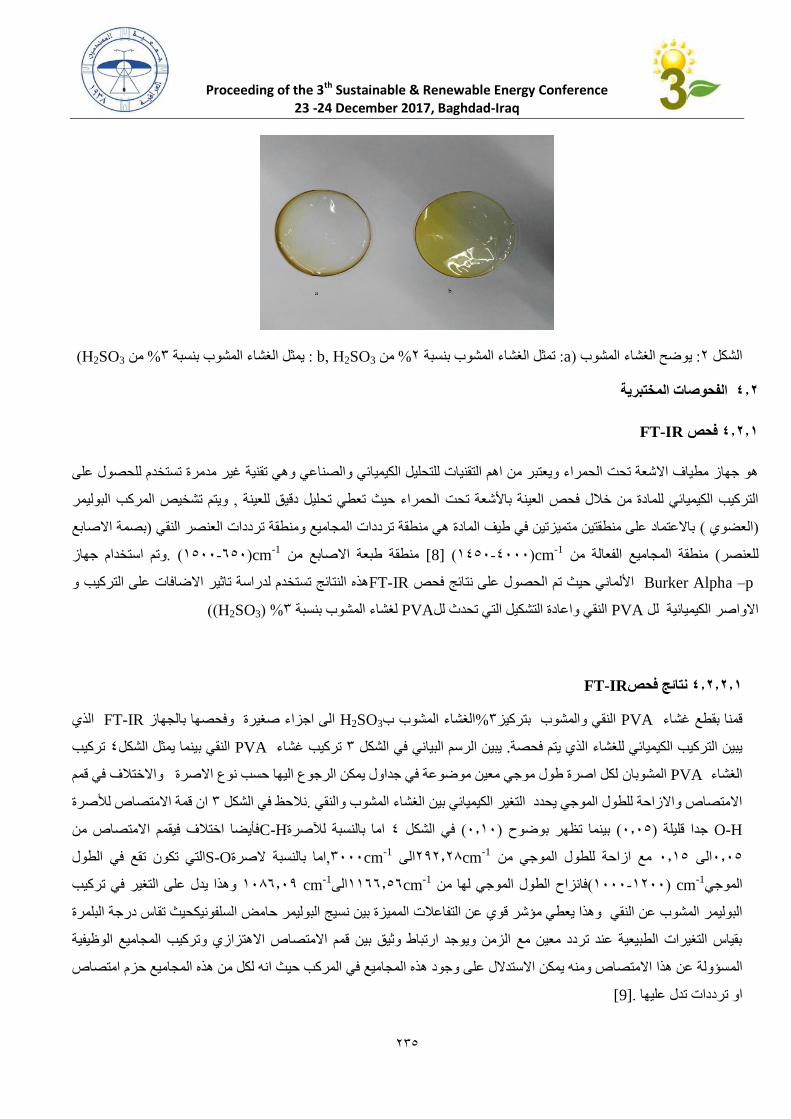
Proceeding of the 3th Sustainable & Renewable Energy Conference 23 -24 December 2017, Baghdad-Iraq
132
(H2SO3من % 3يمثل الغشاء المشوب بنسبة : H2SO3 ,bمن % 2تمثل الغشاء المشوب بنسبة : a)يوضح الغشاء المشوب : 2الشكل
الفحوصات المختبرية 4.3
FT-IRفحص 4.3.3
هو جهاز مطياف االشعة تحت الحمراء ويعتبر من اهم التقنيات للتحليل الكيميائي والصناعي وهي تقنية غير مدمرة تستخدم للحصول على
ويتم تشخيص المركب البوليمر , حت الحمراء حيث تعطي تحليل دقيق للعينة التركيب الكيميائي للمادة من خالل فحص العينة باألشعة ت
بصمة االصابع )باالعتماد على منطقتين متميزتين في طيف المادة هي منطقة ترددات المجاميع ومنطقة ترددات العنصر النقي ( العضوي )
cmمنطقة المجاميع الفعالة من ( للعنصر-1
cmمنطقة طبعة االصابع من [8]( 4111-1451)-1
وتم استخدام جهاز ( .651-1511)
Burker Alpha –p األلماني حيث تم الحصول على نتائج فحصFT-IR هذه النتائج تستخدم لدراسة تاثير االضافات على التركيب و
((H2SO3) %3لغشاء المشوب بنسبة PVA النقي واعادة التشكيل التي تحدث لل PVAاالواصر الكيميائية لل
FT-IRنتائج فحص 4.3.3.3
الذي FT-IR الى اجزاء صغيرة وفحصها بالجهاز H2SO3الغشاء المشوب ب%3النقي والمشوب بتركيز PVAقمنا بقطع غشاء
تركيب 4النقي بينما يمثل الشكل PVAتركيب غشاء 3يبين الرسم البياني في الشكل .يبين التركيب الكيميائي للغشاء الذي يتم فحصة
لكل اصرة طول موجي معين موضوعة في جداول يمكن الرجوع اليها حسب نوع االصرة واالختالف في قمم انالمشوب PVA الغشاء
ان قمة االمتصاص لألصرة 3نالحظ في الشكل .االمتصاص واالزاحة للطول الموجي يحدد التغير الكيميائي بين الغشاء المشوب والنقي
O-H اما بالنسبة لآلصرة 4في الشكل ( 1011)بينما تظهر بوضوح ( 1015)جدا قليلةC-H فأيضا اختالف فيقمم االمتصاص من
cmمع ازاحة للطول الموجي من 1015الى 1015-1
cmالى 222022-1
التي تكون تقع في الطول S-Oاما بالنسبة الصرة,3111
cmالموجي-1
cmفانزاح الطول الموجي لها من (1211-1111) -1
cmالى1166056-1
التغير في تركيب وهذا يدل على 1126012
حيث تقاس درجة البلمرة وهذا يعطي مؤشر قوي عن التفاعالت المميزة بين نسيج البوليمر حامض السلفونيك البوليمر المشوب عن النقي
بقياس التغيرات الطبيعية عند تردد معين مع الزمن ويوجد ارتباط وثيق بين قمم االمتصاص االهتزازي وتركيب المجاميع الوظيفية
سؤولة عن هذا االمتصاص ومنه يمكن االستدالل على وجود هذه المجاميع في المركب حيث انه لكل من هذه المجاميع حزم امتصاص الم
[9].او ترددات تدل عليها
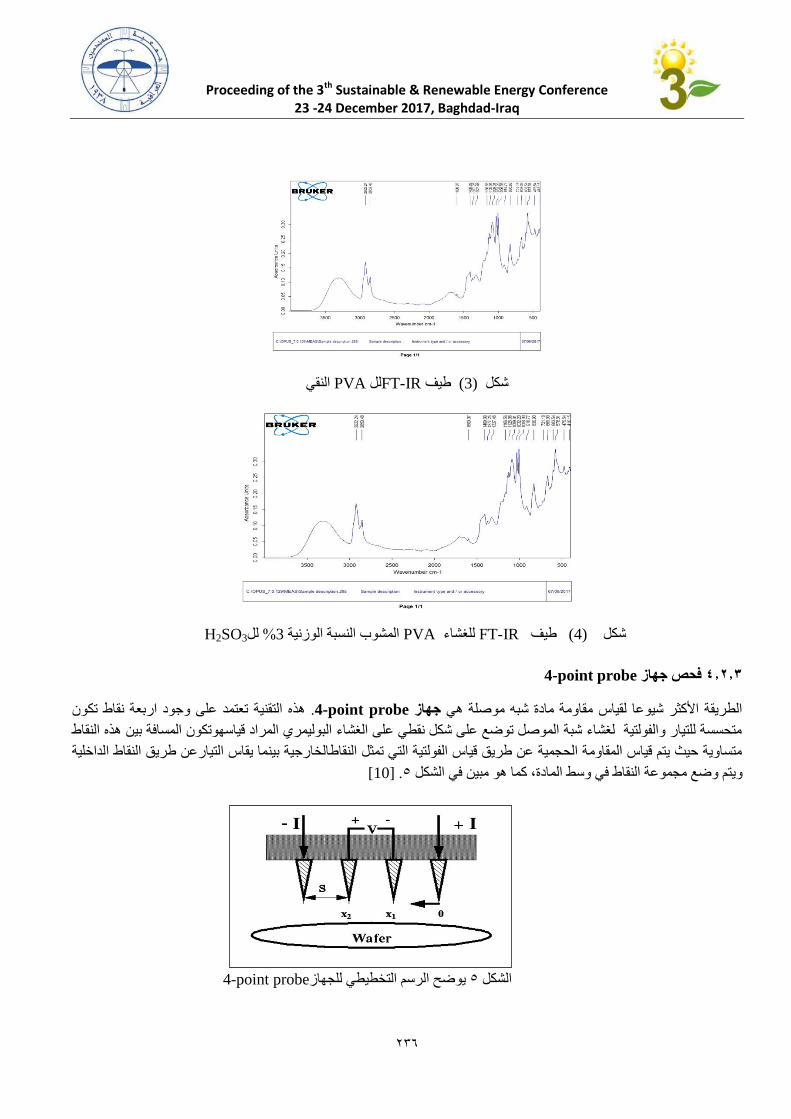
Proceeding of the 3th Sustainable & Renewable Energy Conference 23 -24 December 2017, Baghdad-Iraq
132
النقي PVAللFT-IRطيف (3)شكل
H2SO3لل% 3المشوب النسبة الوزنية PVAللغشاء FT-IRطيف (4)شكل
point probe-4جهاز فحص 4.3.3
تعتمد على وجود اربعة نقاط تكون هذه التقنية. point probe-4جهاز الطريقة األكثر شيوعا لقياس مقاومة مادة شبه موصلة هي
متحسسة للتيار والفولتية لغشاء شبة الموصل توضع على شكل نقطي على الغشاء البوليمري المراد قياسهوتكون المسافة بين هذه النقاط
عن طريق النقاط الداخلية متساوية حيث يتم قياس المقاومة الحجمية عن طريق قياس الفولتية التي تمثل النقاطالخارجية بينما يقاس التيار
[10]. 5تم وضع مجموعة النقاط في وسط المادة، كما هو مبين في الشكل وي
point probe-4يوضح الرسم التخطيطي للجهاز 5الشكل
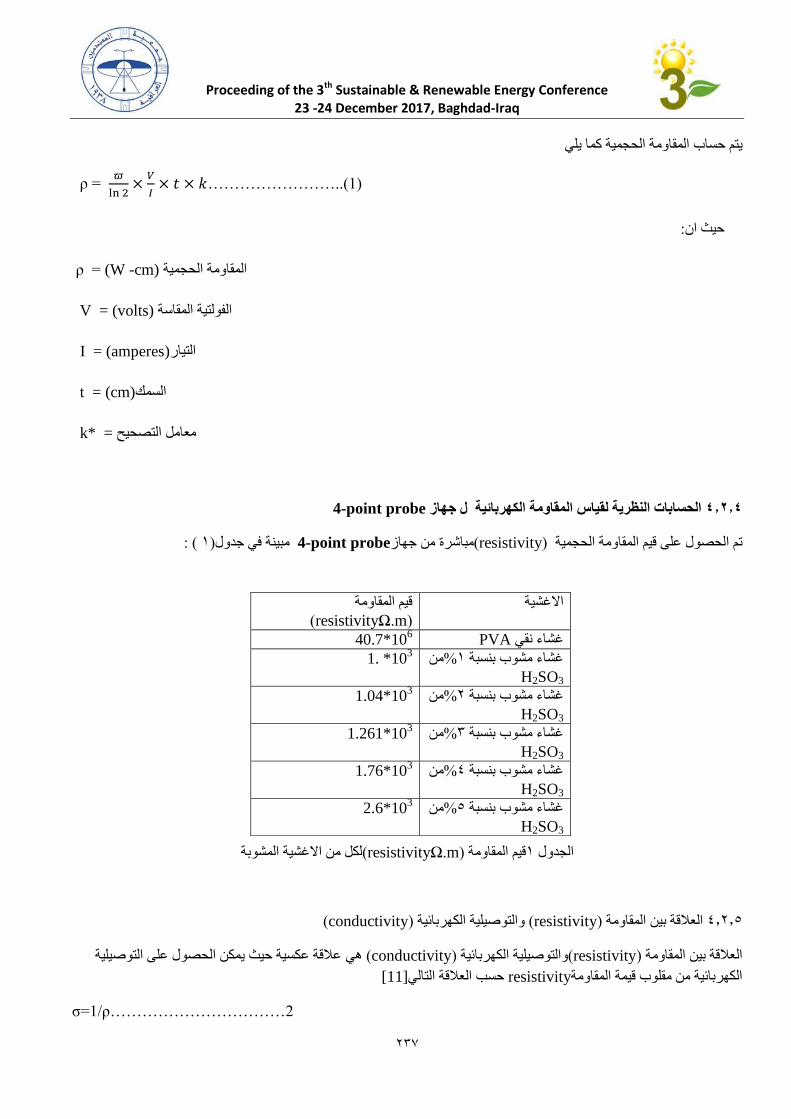
Proceeding of the 3th Sustainable & Renewable Energy Conference 23 -24 December 2017, Baghdad-Iraq
132
يتم حساب المقاومة الحجمية كما يلي
ρ =
……………………..(1)
: حيث ان
ρ = (W -cm) المقاومة الحجمية
V = (volts) الفولتية المقاسة
I = (amperes)التيار
t = (cm)السمك
k* = معامل التصحيح
point probe-4الكهربائية ل جهاز المقاومةالحسابات النظرية لقياس 4.3.4
( : 1)مبينة في جدول point probe-4مباشرة من جهاز(resistivity)تم الحصول على قيم المقاومة الحجمية
لكل من االغشية المشوبة(m.Ωresistivity)قيم المقاومة 1الجدول
(conductivity)والتوصيلية الكهربائية (resistivity)العالقة بين المقاومة 40205
عالقة عكسية حيث يمكن الحصول على التوصيلية هي( conductivity)والتوصيلية الكهربائية (resistivity)العالقة بين المقاومة
[11]حسب العالقة التالي resistivityالكهربائية من مقلوب قيمة المقاومة
1/ρ……………………………2=σ
قيم المقاومة االغشية
(m.Ωresistivity)
PVA 40.7*10غشاء نقي 6
من %1غشاء مشوب بنسبة
H2SO3
1. *103
من %2غشاء مشوب بنسبة
H2SO3
1.04*103
من %3غشاء مشوب بنسبة
H2SO3
1.261*103
من %4غشاء مشوب بنسبة
H2SO3
1.76*103
من %5غشاء مشوب بنسبة
H2SO3
2.6*103
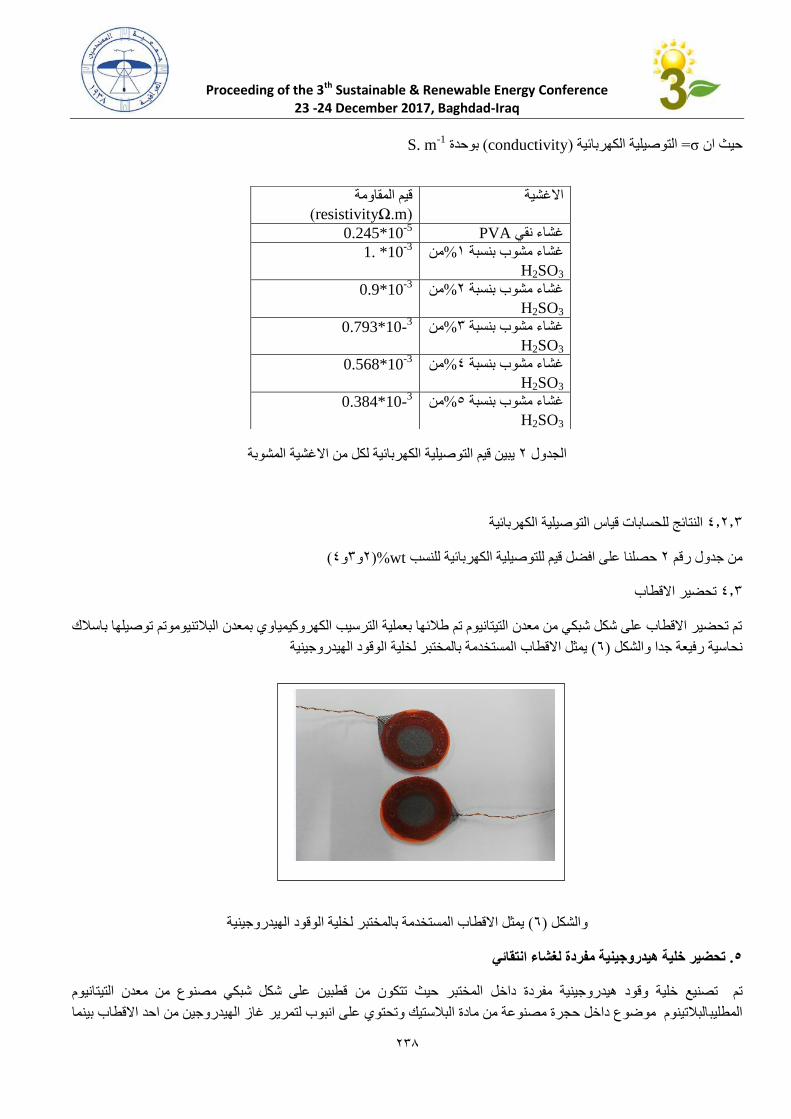
Proceeding of the 3th Sustainable & Renewable Energy Conference 23 -24 December 2017, Baghdad-Iraq
132
S. mبوحدة (conductivity)التوصيلية الكهربائية = σحيث ان -1
المشوبةيبين قيم التوصيلية الكهربائية لكل من االغشية 2الجدول
النتائج للحسابات قياس التوصيلية الكهربائية 40203
( 4و3و%2)wtحصلنا على افضل قيم للتوصيلية الكهربائية للنسب 2من جدول رقم
تحضير االقطاب 403
توصيلها باسالك تم تحضير االقطاب على شكل شبكي من معدن التيتانيوم تم طالئها بعملية الترسيب الكهروكيمياوي بمعدن البالتنيوموتم
يمثل االقطاب المستخدمة بالمختبر لخلية الوقود الهيدروجينية ( 6)نحاسية رفيعة جدا والشكل
يمثل االقطاب المستخدمة بالمختبر لخلية الوقود الهيدروجينية( 6)والشكل
تحضير خلية هيدروجينية مفردة لغشاء انتقائي .5
التيتانيوم قطبين على شكل شبكي مصنوع من معدنتصنيع خلية وقود هيدروجينية مفردة داخل المختبر حيث تتكون من تم
البالتينوم موضوع داخل حجرة مصنوعة من مادة البالستيك وتحتوي على انبوب لتمرير غاز الهيدروجين من احد االقطاب بينما المطليب
قيم المقاومة الغشية ا
(m.Ωresistivity)
PVA 0.245*10غشاء نقي -5
من %1غشاء مشوب بنسبة
H2SO3
1. *10-3
من %2غشاء مشوب بنسبة
H2SO3
0.9*10-3
من %3غشاء مشوب بنسبة
H2SO3
0.793*10-3
من %4غشاء مشوب بنسبة
H2SO3
0.568*10-3
من %5غشاء مشوب بنسبة
H2SO3
0.384*10-3
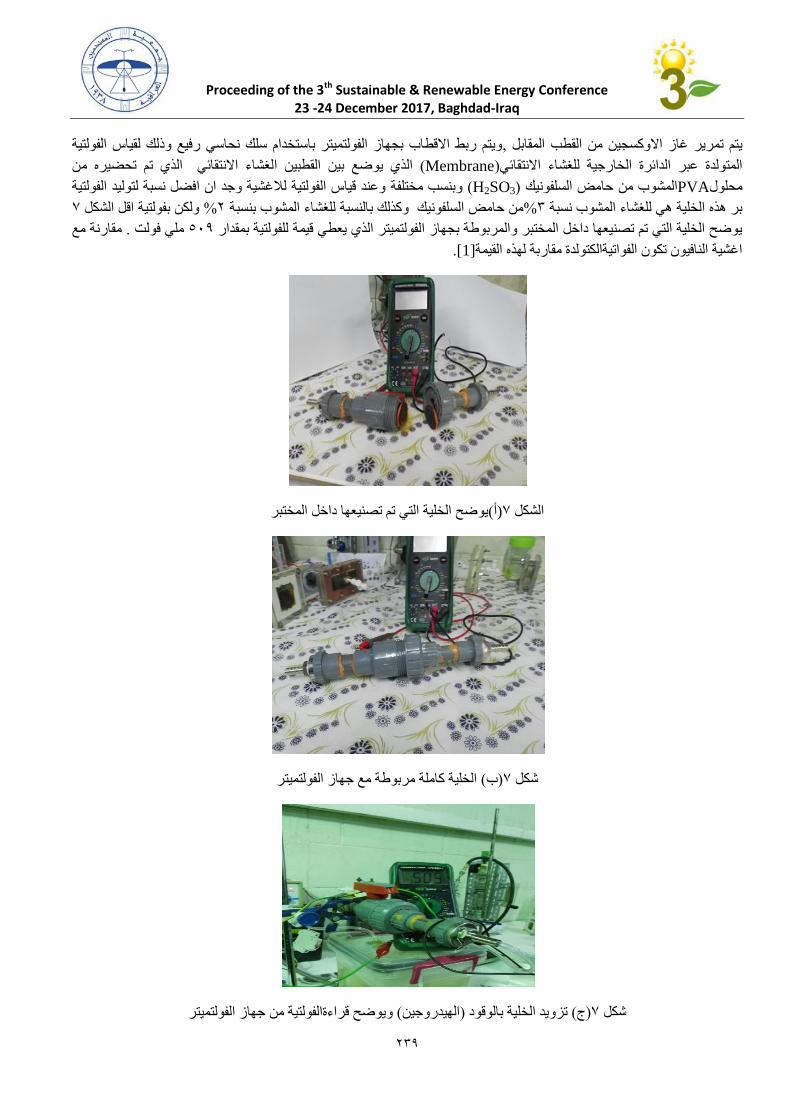
Proceeding of the 3th Sustainable & Renewable Energy Conference 23 -24 December 2017, Baghdad-Iraq
132
ويتم ربط االقطاب بجهاز الفولتميتر باستخدام سلك نحاسي رفيع وذلك لقياس الفولتية ,المقابل يتم تمرير غاز االوكسجين من القطب
منه لغشاء االنتقائي الذي تم تحضيرابين القطبين يوضعالذي ( Membrane)االنتقائيللغشاء المتولدة عبر الدائرة الخارجية
وعند قياس الفولتية لالغشية وجد ان افضل نسبة لتوليد الفولتية وبنسب مختلفة( H2SO3)حامض السلفونيك المشوب من PVAمحلول
1ولكن بفولتية اقل الشكل % 2من حامض السلفونيك وكذلك بالنسبة للغشاء المشوب بنسبة %3بر هذه الخلية هي للغشاء المشوب نسبة
مقارنة مع . ملي فولت 512ي قيمة للفولتية بمقدار يوضح الخلية التي تم تصنيعها داخل المختبر والمربوطة بجهاز الفولتميتر الذي يعط
.[1]اغشية النافيون تكون الفواتيةالكتولدة مقاربة لهذه القيمة
يوضح الخلية التي تم تصنيعها داخل المختبر(أ(1الشكل
الخلية كاملة مربوطة مع جهاز الفولتميتر( ب)1شكل
ويوضح قراءةالفولتية من جهاز الفولتميتر( الهيدروجين)بالوقود تزويد الخلية ( ج)1شكل
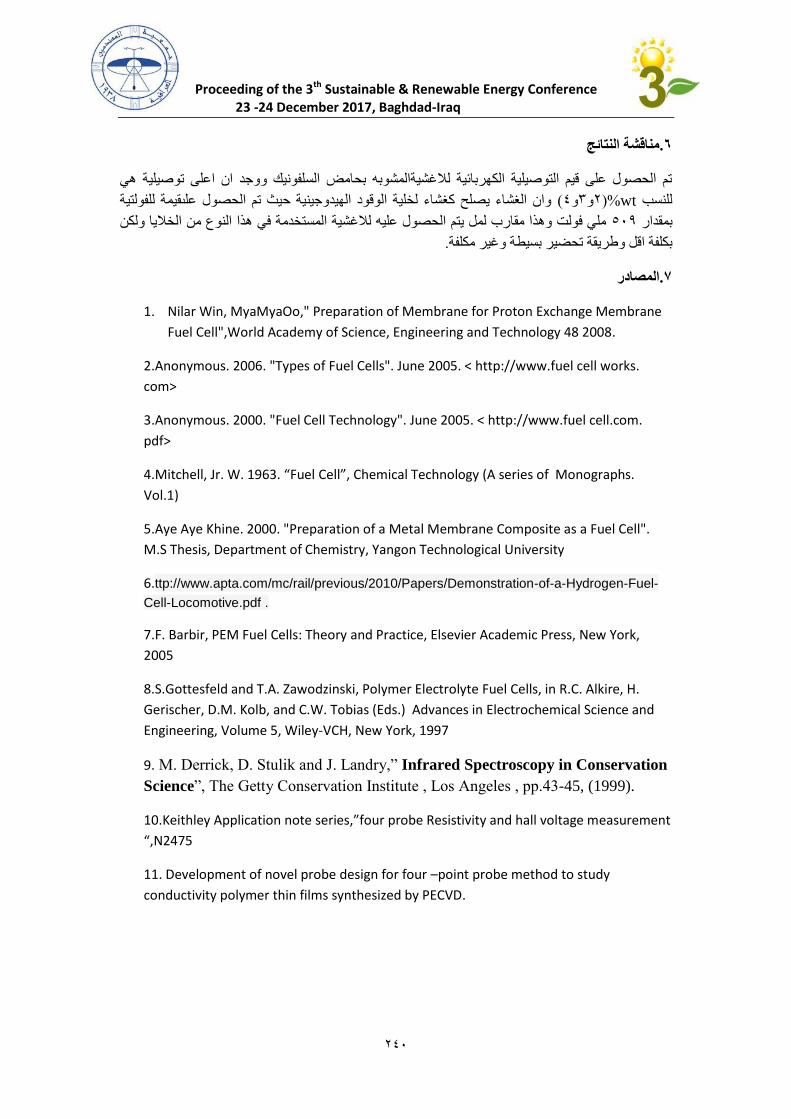
Proceeding of the 3th Sustainable & Renewable Energy Conference 23 -24 December 2017, Baghdad-Iraq
122
مناقشة النتائج.6
تم الحصول على قيم التوصيلية الكهربائية لالغشيةالمشوبه بحامض السلفونيك ووجد ان اعلى توصيلية هي
للفولتية وان الغشاء يصلح كغشاء لخلية الوقود الهيدوجينية حيث تم الحصول علىقيمة( 4و3و%2)wtللنسب
ملي فولت وهذا مقارب لمل يتم الحصول عليه لالغشية المستخدمة في هذا النوع من الخاليا ولكن 512بمقدار
.بكلفة اقل وطريقة تحضير بسيطة وغير مكلفة
المصادر.7
1. Nilar Win, MyaMyaOo," Preparation of Membrane for Proton Exchange Membrane
Fuel Cell",World Academy of Science, Engineering and Technology 48 2008.
2.Anonymous. 2006. "Types of Fuel Cells". June 2005. < http://www.fuel cell works.
com>
3.Anonymous. 2000. "Fuel Cell Technology". June 2005. < http://www.fuel cell.com.
pdf>
4.Mitchell, Jr. W. 1963. “Fuel Cell”, Chemical Technology (A series of Monographs.
Vol.1)
5.Aye Aye Khine. 2000. "Preparation of a Metal Membrane Composite as a Fuel Cell".
M.S Thesis, Department of Chemistry, Yangon Technological University
6.ttp://www.apta.com/mc/rail/previous/2010/Papers/Demonstration-of-a-Hydrogen-Fuel-
Cell-Locomotive.pdf .
7.F. Barbir, PEM Fuel Cells: Theory and Practice, Elsevier Academic Press, New York,
2005
8.S.Gottesfeld and T.A. Zawodzinski, Polymer Electrolyte Fuel Cells, in R.C. Alkire, H.
Gerischer, D.M. Kolb, and C.W. Tobias (Eds.) Advances in Electrochemical Science and
Engineering, Volume 5, Wiley-VCH, New York, 1997
9. M. Derrick, D. Stulik and J. Landry,” Infrared Spectroscopy in Conservation
Science”, The Getty Conservation Institute , Los Angeles , pp.43-45, (1999).
10.Keithley Application note series,”four probe Resistivity and hall voltage measurement
“,N2475
11. Development of novel probe design for four –point probe method to study
conductivity polymer thin films synthesized by PECVD.

المتجددة االخرى اتطاقالمحور تطبيقات
(ORE)
دراسات ال
Proceeding of the 3th Sustainable & Renewable Energy Conference 23 -24 December 2017, Baghdad-Iraq
242
حديثة نـوع إنارةترشيد استهالك الطاقة الكهربائية باستخدام مصابيح
LED (الصمام الثنائي الباعث للضوء )
احمد خليل اسماعيل
دائرة الطاقات المتجددة / وزارة العلوم والتكنولوجيا
:الخالصة
من جهد الباحثين والمهندسين العاملين في مجال الطاقة "ترشيد االستهالك في الطاقة الكهربائية يأخذ جهد كبيرا
إلى نوع " لما لها من أهمية في تقليل الموارد المصروفة من طاقة ومال في هذا المجال وقد تم التوصل مؤخرا نظرا
والتي يمكن ( LED)ماة بالمصابيح ثنائية الباعث الضوئي جديد من المصابيح قليلة االستهالك للطاقة والمس
نارة الداخلية اإلحيث تم تطبيق ذلك على استخدامها في منظومات تجهيز القدرة الكهربائية العاملة بالطاقة الشمسية
جددة في وزارة لبناية دائرة الطاقات المتالقديمة والخارجية فبالنسبة لإلنارة الداخلية تم استبدال مصابيح اإلنارة
كيلو ( 7,03)واط للمصباح الواحد بإجمالي طاقة استهالكية ( 81)العلوم والتكنولوجيا من نوع فلوريسنت بقدرة
واط للمصباح ( ,8)بقدرة ( LED)بأخرى حديثة من نوع الثنائي الباعث للضوء ساعات عمل يوميه 3بمعدل واط
يلو واط حيث تم الحصول على تخفيض في استهالك الطاقة ك( 206)الواحد بإجمالي طاقة استهالكية يومية
وبعد مع االحتفاظ بنفس شدة اإلضاءة للمكاتب %( 39)كيلو واط ساعة أي بنسبة ( 6,02)المستخدمة لإلنارة بحدود
يصا ذلك تم ربط منظومة االنارة للبناية الى منظومة قدرة كهربائية تعمل بالطاقة الشمسية تم تصميمها وتنفيذها خص
بالطاقة الشمسية وبذلك تم توفير الطاقة الكهربائية %( ,,8)لهذا الغرض حيث اصبحت منظومة اإلنارة اآلن تعمل
أما بالنسبة لإلنارة الخارجية فقد تم تبديل مصابيح إنارة المستهلكة إلغراض االنارة من شبكة الكهرباء ألوطنية
واط بعد ,7بقدرة ( LED)واط للمصباح بأخرى من نوع ,,, لوزارة من نوع المصابيح الزئبقية بقدرةاشوارع
تصميم وتنفيذ منظومة تجهيز أجراء العديد من التجارب على أنواع مختلفة منها والوصول إلى األفضل و تم
. كهرباء شمسية لكل مصباح
ترشيد الطاقة و المصباح الثنائي الباعث للضوء: الكلمات االفتتاحية
Electrical Energy Saving by using new Lighting Lamps type (Light-Emitting Diode) (LED)
Ahmed Khaleel Ismael
Ministry of science Technology/ Renewable energy Directorate/ Baghdad/ Iraq
E-mail: [email protected]
Abstract Electrical Energy saving takes a large part of the researchers and engineers efforts working in the
field of energy because it represents a significant reduction of resources in energy and money
that spent in this area. In the recent time a type of lamps with low energy consumption called
light – emitting diode (LED) has been discover these new type of lamps were applied in the inner
and outside lighting applications. For the inner lighting the old lighting fixture type fluorescent
with power of (18 watts) and overall energy consumption (75.095 k wk h) An average of 7 hours
per day were replaced by another modern type Light-Emitting Diode (LED) with power of (10
watts) and overall energy consumption (16.520 k w h) this made a reduction in electrical energy
consumption that used for lighting by (58.75 k w h )with percentage of (78%) while the
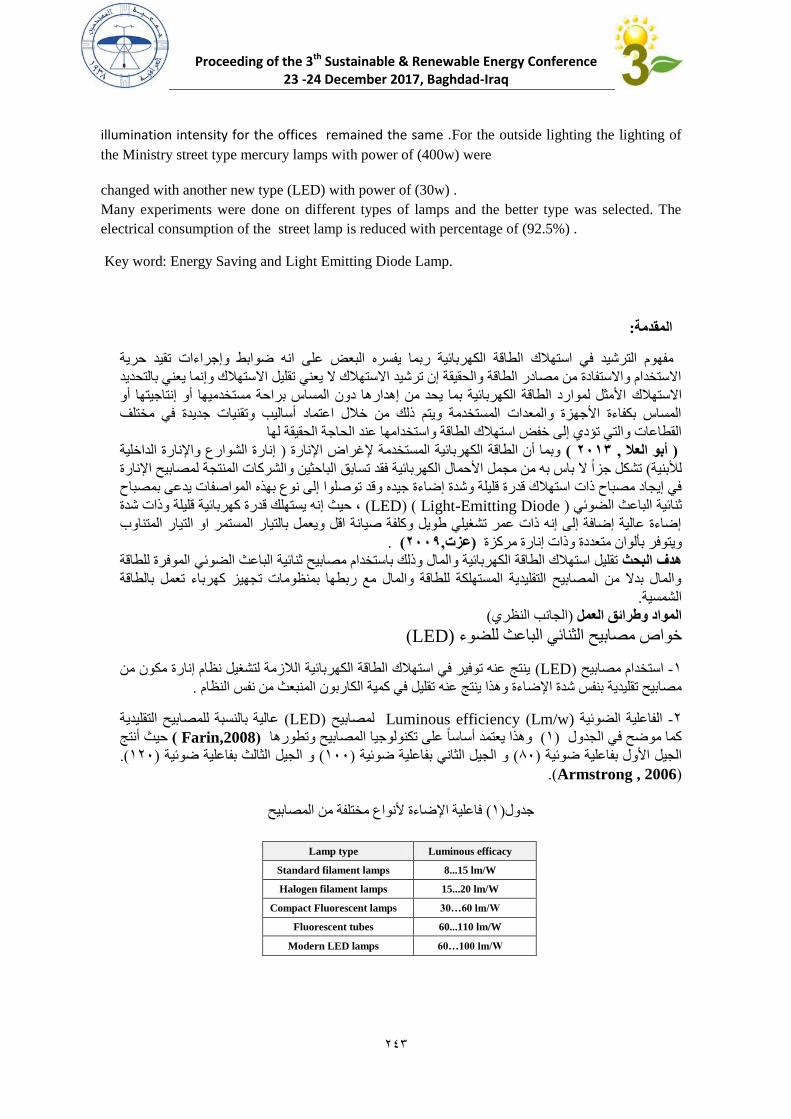
Proceeding of the 3th Sustainable & Renewable Energy Conference 23 -24 December 2017, Baghdad-Iraq
242
illumination intensity for the offices remained the same .For the outside lighting the lighting of
the Ministry street type mercury lamps with power of (400w) were
changed with another new type (LED) with power of (30w) .
Many experiments were done on different types of lamps and the better type was selected. The
electrical consumption of the street lamp is reduced with percentage of (92.5%) .
Key word: Energy Saving and Light Emitting Diode Lamp.
:المقدمة
مفهوم الترشيد في استهالك الطاقة الكهربائية ربما يفسره البعض على انه ضوابط وإجراءات تقيد حرية
االستخدام واالستفادة من مصادر الطاقة والحقيقة إن ترشيد االستهالك ال يعني تقليل االستهالك وإنما يعني بالتحديد
أو ااألمثل لموارد الطاقة الكهربائية بما يحد من إهدارها دون المساس براحة مستخدميها أو إنتاجيتهاالستهالك
المساس بكفاءة األجهزة والمعدات المستخدمة ويتم ذلك من خالل اعتماد أساليب وتقنيات جديدة في مختلف
لها حقيقةالالقطاعات والتي تؤدي إلى خفض استهالك الطاقة واستخدامها عند الحاجة
إنارة الشوارع واإلنارة الداخلية ) وبما أن الطاقة الكهربائية المستخدمة إلغراض اإلنارة ( 3102, أبو العال )
تشكل جزا ال باس به من مجمل األحمال الكهربائية فقد تسابق الباحثين والشركات المنتجة لمصابيح اإلنارة ( لألبنية
ا إلى نوع بهذه المواصفات يدعى بمصباح وقد توصلو جيدهفي إيجاد مصباح ذات استهالك قدرة قليلة وشدة إضاءة
0 حيث إنه يستهلك قدرة كهربائية قليلة وذات شدة (Light-Emitting Diode ( )LED)ثنائية الباعث الضوئي
إضاءة عالية إضافة إلى إنه ذات عمر تشغيلي طويل وكلفة صيانة اقل ويعمل بالتيار المستمر او التيار المتناوب
. (3112,عزت) وذات إنارة مركزة دةمتعدويتوفر بألوان
الموفرة للطاقة ثنائية الباعث الضوئيتقليل استهالك الطاقة الكهربائية والمال وذلك باستخدام مصابيح هدف البحث
والمال بدال من المصابيح التقليدية المستهلكة للطاقة والمال مع ربطها بمنظومات تجهيز كهرباء تعمل بالطاقة
.الشمسية
. (الجانب النظري)المواد وطرائق العمل
((LEDالثنائي الباعث للضوء خواص مصابيح
ينتج عنه توفير في استهالك الطاقة الكهربائية الالزمة لتشغيل نظام إنارة مكون من ( LED)استخدام مصابيح -8
. تقليل في كمية الكاربون المنبعث من نفس النظاممصابيح تقليدية بنفس شدة اإلضاءة وهذا ينتج عنه
عالية بالنسبة للمصابيح التقليدية ( LED)لمصابيح Lm/w) ) Luminous efficiencyالفاعلية الضوئية -6
أنتج حيث (Farin,2008 ) وهذا يعتمد أساسا على تكنولوجيا المصابيح وتطورها ( 8)كما موضح في الجدول
(. ,86)و الجيل الثالث بفاعلية ضوئية ( ,,8)و الجيل الثاني بفاعلية ضوئية ( ,1)علية ضوئية الجيل األول بفا
(Armstrong , 2006 .)
من المصابيح ألنواع مختلفة ةاإلضاء فاعلية( 8)جدول
Luminous efficacy Lamp type
8...15 lm/W Standard filament lamps
15...20 lm/W Halogen filament lamps
30…60 lm/W Compact Fluorescent lamps
60...110 lm/W Fluorescent tubes
60…100 lm/W Modern LED lamps
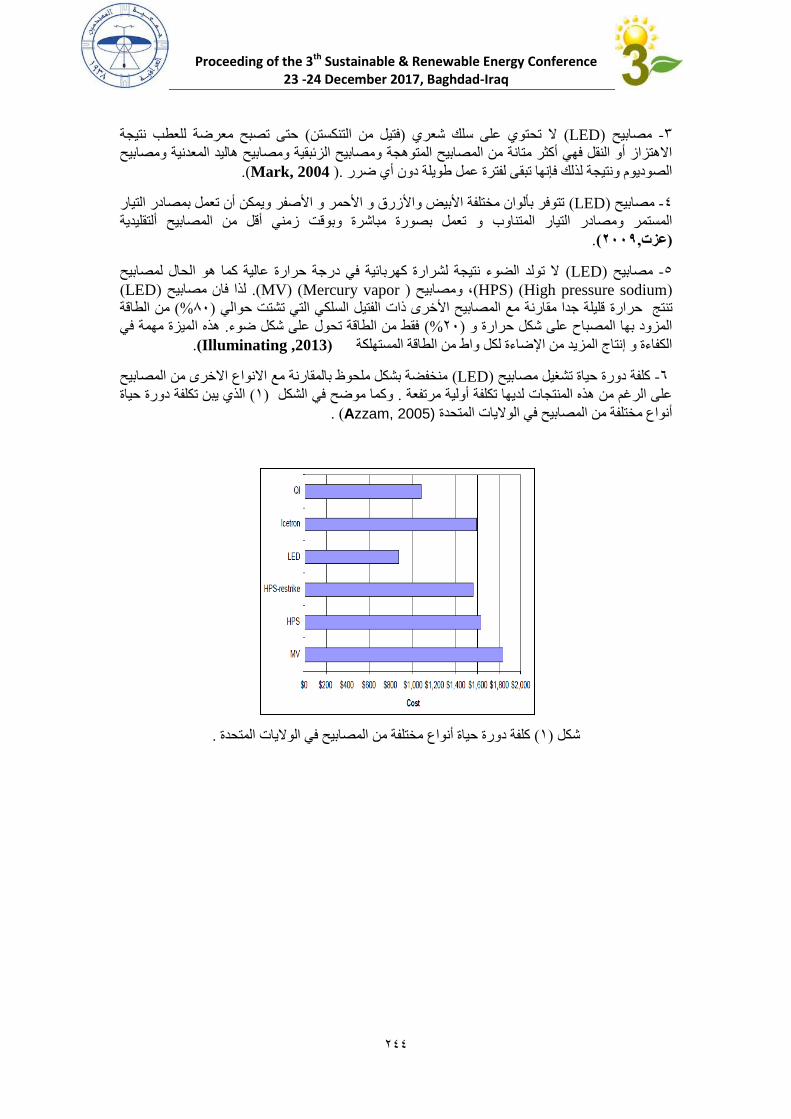
Proceeding of the 3th Sustainable & Renewable Energy Conference 23 -24 December 2017, Baghdad-Iraq
244
حتى تصبح معرضة للعطب نتيجة ( فتيل من التنكستن)ال تحتوي على سلك شعري ( LED)مصابيح -7
ومصابيح الزئبقية ومصابيح هاليد المعدنية ومصابيح االهتزاز أو النقل فهي أكثر متانة من المصابيح المتوهجة
(.Mark, 2004.) الصوديوم ونتيجة لذلك فإنها تبقى لفترة عمل طويلة دون أي ضرر
تتوفر بألوان مختلفة األبيض واألزرق و األحمر و األصفر ويمكن أن تعمل بمصادر التيار ( LED)مصابيح -,
ألتقليديةو تعمل بصورة مباشرة وبوقت زمني أقل من المصابيح المستمر ومصادر التيار المتناوب
.(3112,عزت)
ال تولد الضوء نتيجة لشرارة كهربائية في درجة حرارة عالية كما هو الحال لمصابيح ( LED)مصابيح -2
(High pressure sodium) (HPS) 0 ومصابيح(Mercury vapor ( )MV .) لذا فان مصابيح(LED )
من الطاقة %( ,1)قليلة جدا مقارنة مع المصابيح األخرى ذات الفتيل السلكي التي تشتت حوالي تنتج حرارة
هذه الميزة مهمة في . فقط من الطاقة تحول على شكل ضوء%( ,6)المزود بها المصباح على شكل حرارة و
.(Illuminating ,2013) الكفاءة و إنتاج المزيد من اإلضاءة لكل واط من الطاقة المستهلكة
منخفضة بشكل ملحوظ بالمقارنة مع االنواع االخرى من المصابيح ( LED)كلفة دورة حياة تشغيل مصابيح -2
الذي يبن تكلفة دورة حياة ( 8)وكما موضح في الشكل . على الرغم من هذه المنتجات لديها تكلفة أولية مرتفعة
( .(Azzam, 2005 أنواع مختلفة من المصابيح في الواليات المتحدة
.كلفة دورة حياة أنواع مختلفة من المصابيح في الواليات المتحدة ( 8)شكل
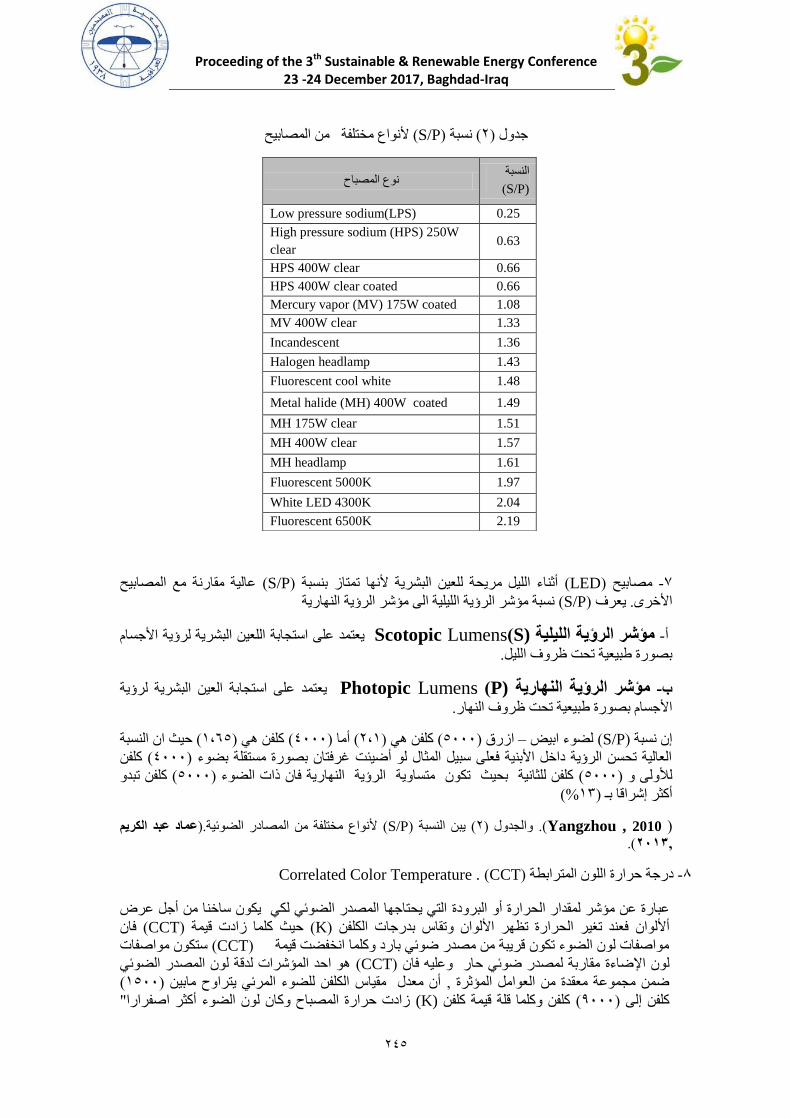
Proceeding of the 3th Sustainable & Renewable Energy Conference 23 -24 December 2017, Baghdad-Iraq
242
من المصابيح ألنواع مختلفة( S/P)نسبة ( 6) جدول
عالية مقارنة مع المصابيح ( S/P)أثناء الليل مريحة للعين البشرية ألنها تمتاز بنسبة ( LED)مصابيح -3
النهاريةنسبة مؤشر الرؤية الليلية الى مؤشر الرؤية ( S/P) يعرف .األخرى
يعتمد على استجابة اللعين البشرية لرؤية األجسام S))Scotopic Lumensمؤشر الرؤية الليلية -أ
.بصورة طبيعية تحت ظروف الليل
يعتمد على استجابة العين البشرية لرؤية P))Photopic Lumensمؤشر الرؤية النهارية -ب
.األجسام بصورة طبيعية تحت ظروف النهار
حيث ان النسبة ( 8022)كلفن هي ( ,,,,)أما ( 608)كلفن هي ( ,,,2)ازرق –لضوء ابيض ( S/P)نسبة إن
كلفن ( ,,,,)العالية تحسن الرؤية داخل األبنية فعلى سبيل المثال لو أضيئت غرفتان بصورة مستقلة بضوء
كلفن تبدو ( ,,,2)ذات الضوء كلفن للثانية بحيث تكون متساوية الرؤية النهارية فان( ,,,2)لألولى و
%( 87)أكثر إشراقا بـ
(Yangzhou , 2010 .) يبن النسبة ( 6)والجدول(S/P )عماد عبد الكريم .)ألنواع مختلفة من المصادر الضوئية
,3102.)
. Correlated Color Temperature( CCT)درجة حرارة اللون المترابطة -1
التي يحتاجها المصدر الضوئي لكي يكون ساخنا من أجل عرض البرودة عبارة عن مؤشر لمقدار الحرارة أو
فان ( CCT)حيث كلما زادت قيمة ( K)فعند تغير الحرارة تظهر األلوان وتقاس بدرجات الكلفن أأللوان
ستكون مواصفات ( CCT)مواصفات لون الضوء تكون قريبة من مصدر ضوئي بارد وكلما انخفضت قيمة
هو احد المؤشرات لدقة لون المصدر الضوئي ( CCT)مقاربة لمصدر ضوئي حار وعليه فان لون اإلضاءة
( ,,82)أن معدل مقياس الكلفن للضوء المرئي يتراوح مابين , ضمن مجموعة معقدة من العوامل المؤثرة
" صفرارازادت حرارة المصباح وكان لون الضوء أكثر ا(K) كلفن وكلما قلة قيمة كلفن ( ,,,9)كلفن إلى
النسبة
S/P)) نوع المصباح
0.25 Low pressure sodium(LPS)
0.63 High pressure sodium (HPS) 250W
clear
0.66 HPS 400W clear
0.66 HPS 400W clear coated
1.08 Mercury vapor (MV) 175W coated
1.33 MV 400W clear
1.36 Incandescent
1.43 Halogen headlamp
1.48 Fluorescent cool white
1.49 Metal halide (MH) 400W coated
1.51 MH 175W clear
1.57 MH 400W clear
1.61 MH headlamp
1.97 Fluorescent 5000K
2.04 White LED 4300K
2.19 Fluorescent 6500K
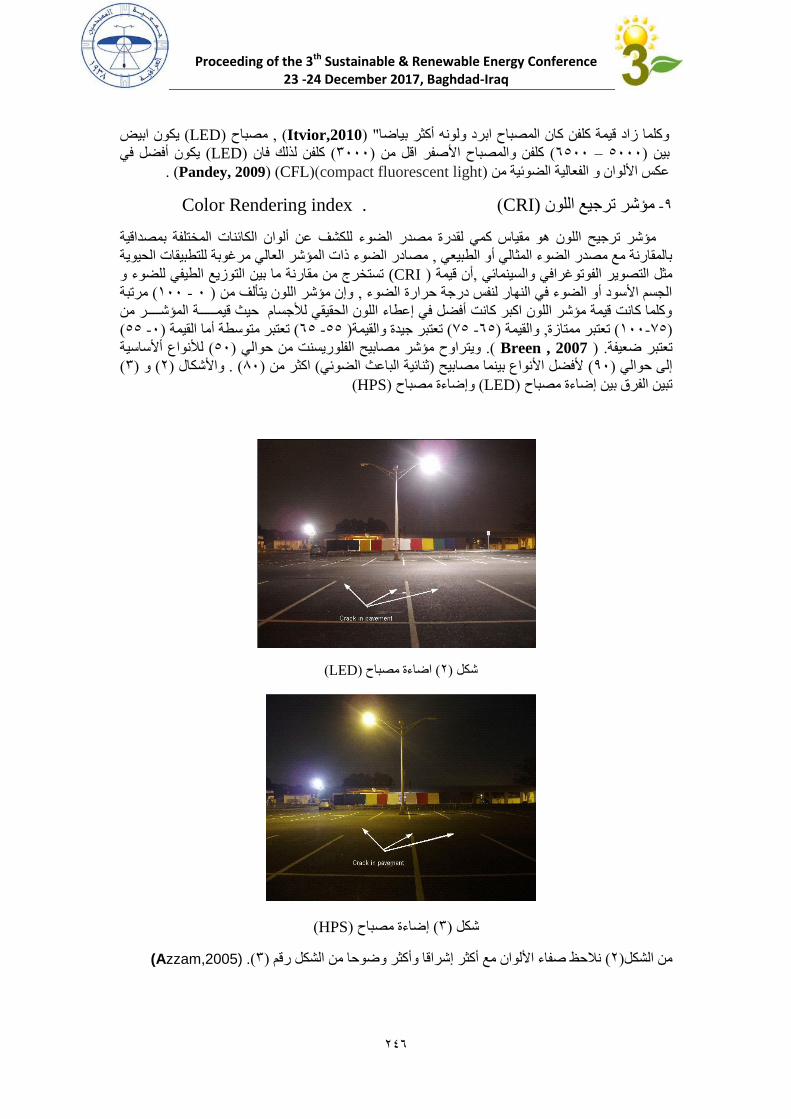
Proceeding of the 3th Sustainable & Renewable Energy Conference 23 -24 December 2017, Baghdad-Iraq
242
يكون ابيض ( LED)مصباح , ( Itvior,2010) "وكلما زاد قيمة كلفن كان المصباح ابرد ولونه أكثر بياضا
يكون أفضل في (LED)كلفن لذلك فان ( ,,,7)كلفن والمصباح األصفر اقل من ( ,,22 – ,,,2)بين
.( CFL( )Pandey, 2009)(compact fluorescent light)عكس األلوان و الفعالية الضوئية من
. CRI) )Color Rendering indexمؤشر ترجيع اللون -9
مؤشر ترجيح اللون هو مقياس كمي لقدرة مصدر الضوء للكشف عن ألوان الكائنات المختلفة بمصداقية
مرغوبة للتطبيقات الحيوية مصادر الضوء ذات المؤشر العالي, بالمقارنة مع مصدر الضوء المثالي أو الطبيعي
تستخرج من مقارنة ما بين التوزيع الطيفي للضوء و CRI)) أن قيمة , مثل التصوير الفوتوغرافي والسينمائي
مرتبة ( ,,8 - ,) وإن مؤشر اللون يتألف من , الجسم األسود أو الضوء في النهار لنفس درجة حرارة الضوء
ة المؤشــــر من ـــــوكلما كانت قيمة مؤشر اللون اكبر كانت أفضل في إعطاء اللون الحقيقي لألجسام حيث قيم
( 22 -,)تعتبر متوسطة أما القيمة ( 22 -22) تعتبر جيدة والقيمة( 32 -22)والقيمة , تعتبر ممتازة( ,,32-8)
أألساسيةلألنواع ( ,2)ويتراوح مؤشر مصابيح الفلوريسنت من حوالي (. Breen , 2007 . )تعتبر ضعيفة
( 7)و ( 6)واألشكال ( . ,1) كثر منا( ثنائية الباعث الضوئي)ألفضل األنواع بينما مصابيح ( ,9)إلى حوالي
( HPS)وإضاءة مصباح ( LED)تبين الفرق بين إضاءة مصباح
(LED)اضاءة مصباح ( 6)شكل
(HPS)إضاءة مصباح ( 7)شكل
(Azzam,2005) (.7)نالحظ صفاء األلوان مع أكثر إشراقا وأكثر وضوحا من الشكل رقم ( 6)من الشكل
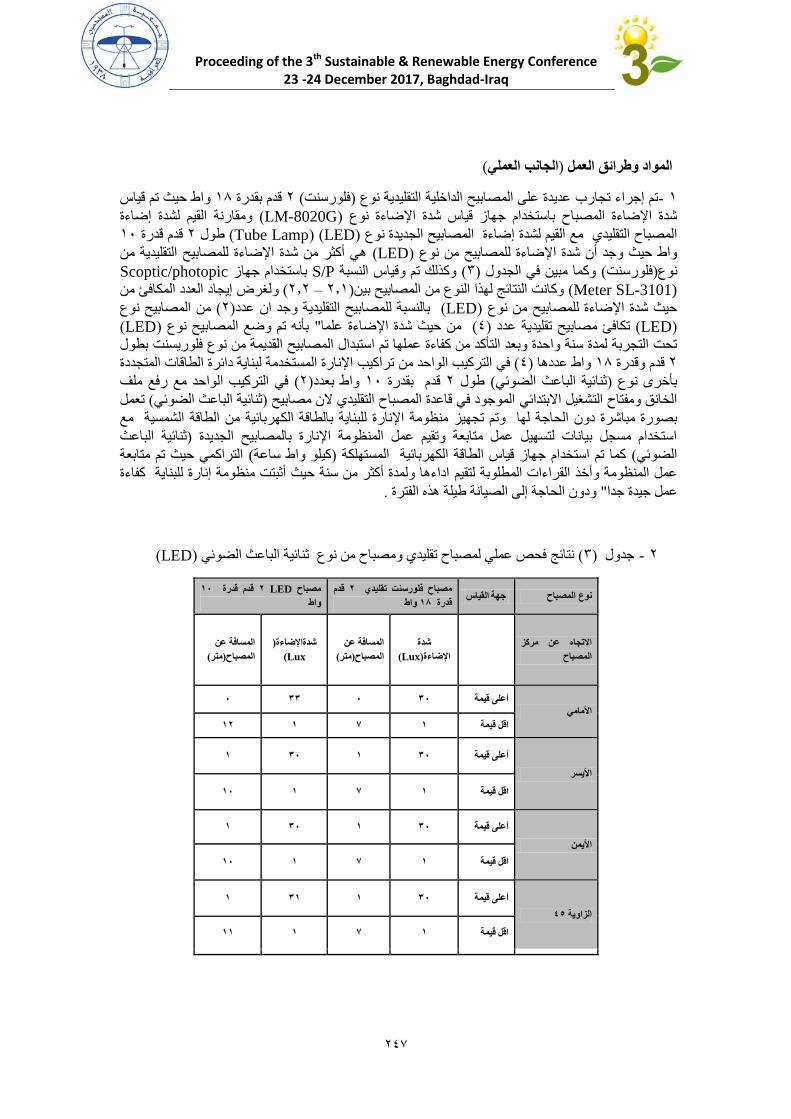
Proceeding of the 3th Sustainable & Renewable Energy Conference 23 -24 December 2017, Baghdad-Iraq
242
(العمليالجانب )المواد وطرائق العمل
واط حيث تم قياس 81قدم بقدرة 6( فلورسنت)نوع التقليديةتم إجراء تجارب عديدة على المصابيح الداخلية -8
لشدة إضاءة ومقارنة القيم ( LM-8020G)استخدام جهاز قياس شدة اإلضاءة نوع شدة اإلضاءة المصباح ب
,8قدم قدرة 6طول ( LED( )Tube Lamp)الجديدة نوع لمصابيح امع القيم لشدة إضاءة المصباح التقليدي
هي أكثر من شدة اإلضاءة للمصابيح التقليدية من ( LED)لمصابيح من نوع ل اإلضاءةواط حيث وجد أن شدة
Scoptic/photopicباستخدام جهاز S/Pوكذلك تم وقياس النسبة (7)وكما مبين في الجدول ( فلورسنت)نوع
Meter SL-3101)) لغرض إيجاد العدد المكافئ من و( 6.6 – 6.8)وكانت النتائج لهذا النوع من المصابيح بين
من المصابيح نوع (6)بالنسبة للمصابيح التقليدية وجد ان عدد( LED)حيث شدة اإلضاءة للمصابيح من نوع
(LED ) بيح نوع بأنه تم وضع المصا" من حيث شدة اإلضاءة علما( ,)تكافئ مصابيح تقليدية عدد(LED )
طول ب المصابيح القديمة من نوع فلوريسنت تحت التجربة لمدة سنة واحدة وبعد التأكد من كفاءة عملها تم استبدال
تراكيب اإلنارة المستخدمة لبناية دائرة الطاقات المتجددة التركيب الواحد من في( ,) هاواط عدد 81قدم وقدرة 6
ملف في التركيب الواحد مع رفع( 6)واط بعدد ,8قدرة بقدم 6طول ( ثنائية الباعث الضوئي)بأخرى نوع
تعمل ( ثنائية الباعث الضوئي)الن مصابيح الموجود في قاعدة المصباح التقليدي الخانق ومفتاح التشغيل االبتدائي
مع قة الشمسيةمن الطا بالطاقة الكهربائية للبنايةوتم تجهيز منظومة اإلنارة بصورة مباشرة دون الحاجة لها
ثنائية الباعث )استخدام مسجل بيانات لتسهيل عمل متابعة وتقيم عمل المنظومة اإلنارة بالمصابيح الجديدة
التراكمي حيث تم متابعة ( كيلو واط ساعة)كما تم استخدام جهاز قياس الطاقة الكهربائية المستهلكة (الضوئي
كفاءة للبناية اداءها ولمدة أكثر من سنة حيث أثبتت منظومة إنارة عمل المنظومة وأخذ القراءات المطلوبة لتقيم
. ودون الحاجة إلى الصيانة طيلة هذه الفترة "عمل جيدة جدا
(LED)ثنائية الباعث الضوئي فحص عملي لمصباح تقليدي ومصباح من نوع نتائج (7)جدول -6
جهة القياس نوع المصباحقدم 3مصباح فلورسنت تقليدي
واط 01قدرة
01 قدرة قدم LED 3مصباح
واط
االتجاه عن مركز
المصباح
شدة
(Lux)اإلضاءة
المسافة عن
(متر)المصباح
)شدةاإلضاءة
Lux)
المسافة عن
(متر)المصباح
األمامي
1 22 1 21 أعلى قيمة
03 0 7 0 اقل قيمة
األيسر
0 21 0 21 أعلى قيمة
01 0 7 0 اقل قيمة
األيمن
0 21 0 21 أعلى قيمة
01 0 7 0 اقل قيمة
54الزاوية
0 20 0 21 أعلى قيمة
00 0 7 0 اقل قيمة
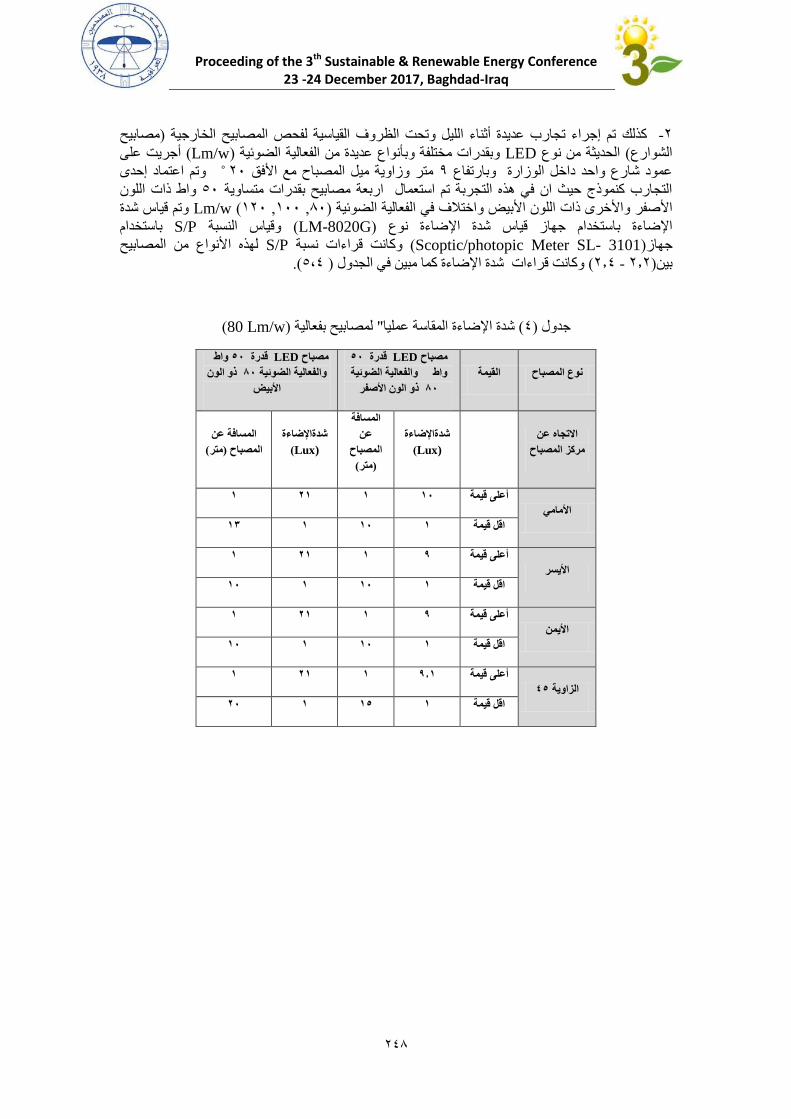
Proceeding of the 3th Sustainable & Renewable Energy Conference 23 -24 December 2017, Baghdad-Iraq
242
مصابيح )تم إجراء تجارب عديدة أثناء الليل وتحت الظروف القياسية لفحص المصابيح الخارجية كذلك -6
أجريت على ( Lm/w)وبقدرات مختلفة وبأنواع عديدة من الفعالية الضوئية LEDالحديثة من نوع ( الشوارع
وتم اعتماد إحدى ,6متر وزاوية ميل المصباح مع األفق 9عمود شارع واحد داخل الوزارة وبارتفاع
ون للاواط ذات ,2مصابيح بقدرات متساوية اربعة التجارب كنموذج حيث ان في هذه التجربة تم استعمال
وتم قياس شدة Lm/w( ,86, ,,8, ,1)الفعالية الضوئية اختالف في وبيض األون للاصفر واألخرى ذات األ
باستخدام S/Pوقياس النسبة ( LM-8020G)استخدام جهاز قياس شدة اإلضاءة نوع اإلضاءة ب
ح لهذه األنواع من المصابي S/Pوكانت قراءات نسبة ( Scoptic/photopic Meter SL- 3101)جهاز
(.,20) وكانت قراءات شدة اإلضاءة كما مبين في الجدول ( ,.6 - 6.6)بين
(Lm/w 80)لمصابيح بفعالية " شدة اإلضاءة المقاسة عمليا( ,)جدول
القيمة نوع المصباح
41 قدرة LEDمصباح
والفعالية الضوئية واط
ذو الون األصفر 11
واط 41 قدرة LEDمصباح
ذو الون 11الضوئية والفعالية
األبيض
االتجاه عن
مركز المصباح
شدةاإلضاءة
Lux))
المسافة
عن
المصباح
(متر)
شدةاإلضاءة
Lux))
المسافة عن
(متر)المصباح
األمامي
0 30 0 01 أعلى قيمة
02 0 01 0 اقل قيمة
األيسر
0 30 0 2 أعلى قيمة
01 0 01 0 اقل قيمة
األيمن
0 30 0 2 أعلى قيمة
01 0 01 0 اقل قيمة
54الزاوية
0 30 0 2.0 أعلى قيمة
31 0 04 0 اقل قيمة
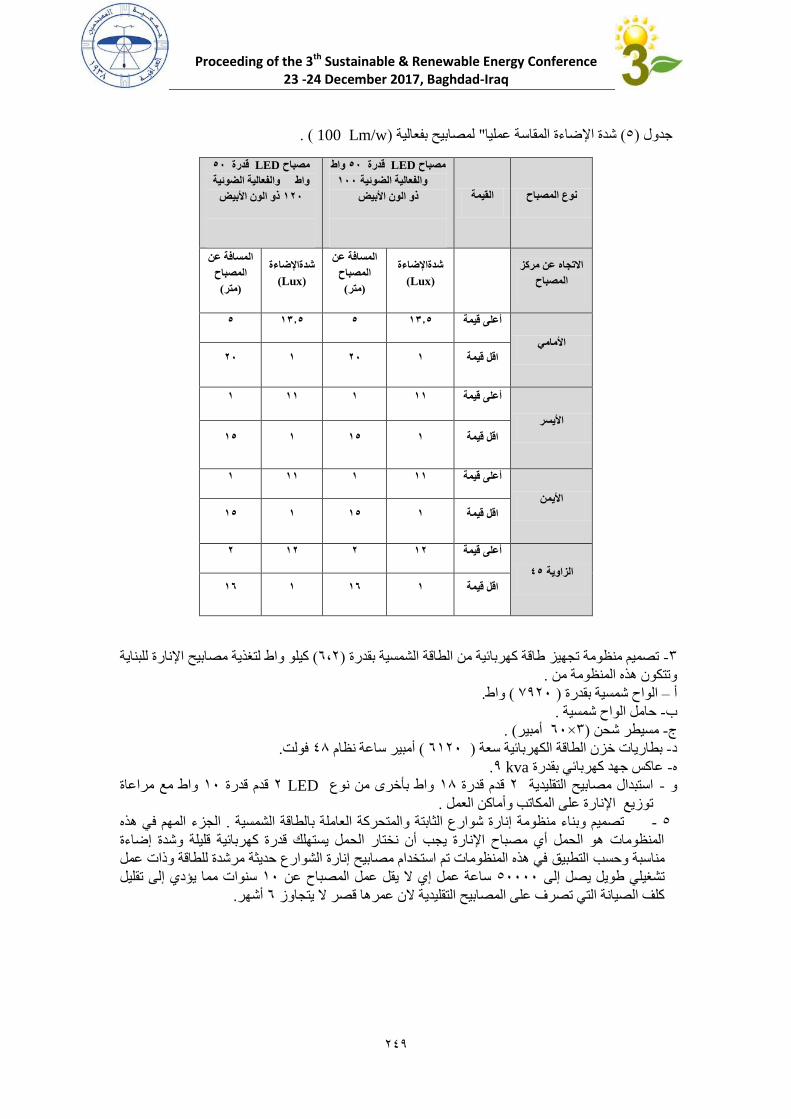
Proceeding of the 3th Sustainable & Renewable Energy Conference 23 -24 December 2017, Baghdad-Iraq
242
( .Lm/w 100 )لمصابيح بفعالية " شدة اإلضاءة المقاسة عمليا( 2)جدول
القيمة نوع المصباح
واط 41 قدرة LEDمصباح
011والفعالية الضوئية
ذو الون األبيض
41 قدرة LEDمصباح
والفعالية الضوئية واط
ذو الون األبيض 031
االتجاه عن مركز
المصباح
شدةاإلضاءة
(Lux)
المسافة عن
المصباح
(متر)
ةشدةاإلضاء
(Lux)
المسافة عن
المصباح
(متر)
األمامي
4 02.4 4 02.4 أعلى قيمة
31 0 31 0 اقل قيمة
األيسر
0 00 0 00 أعلى قيمة
04 0 04 0 قيمةاقل
األيمن
0 00 0 00 أعلى قيمة
04 0 04 0 اقل قيمة
54الزاوية
3 03 3 03 أعلى قيمة
01 0 01 0 اقل قيمة
لتغذية مصابيح اإلنارة للبناية كيلو واط( 206)تصميم منظومة تجهيز طاقة كهربائية من الطاقة الشمسية بقدرة -7
.وتتكون هذه المنظومة من
.واط( ,396) الواح شمسية بقدرة –أ
.حامل الواح شمسية -ب
( .أمبير ,2×7)مسيطر شحن -ج
.فولت 1,أمبير ساعة نظام ( ,286) بطاريات خزن الطاقة الكهربائية سعة -د
.kva 9عاكس جهد كهربائي بقدرة -ه
واط مع مراعاة ,8قدم قدرة LED 6واط بأخرى من نوع 81قدم قدرة 6 ةاستبدال مصابيح التقليدي - و
.توزيع اإلنارة على المكاتب وأماكن العمل
هذه الجزء المهم في .تصميم وبناء منظومة إنارة شوارع الثابتة والمتحركة العاملة بالطاقة الشمسية -2
ة المنظومات هو الحمل أي مصباح اإلنارة يجب أن نختار الحمل يستهلك قدرة كهربائية قليلة وشدة إضاء
في هذه المنظومات تم استخدام مصابيح إنارة الشوارع حديثة مرشدة للطاقة وذات عمل مناسبة وحسب التطبيق
سنوات مما يؤدي إلى تقليل ,8ساعة عمل إي ال يقل عمل المصباح عن ,,,,2تشغيلي طويل يصل إلى
.أشهر 2كلف الصيانة التي تصرف على المصابيح التقليدية الن عمرها قصر ال يتجاوز
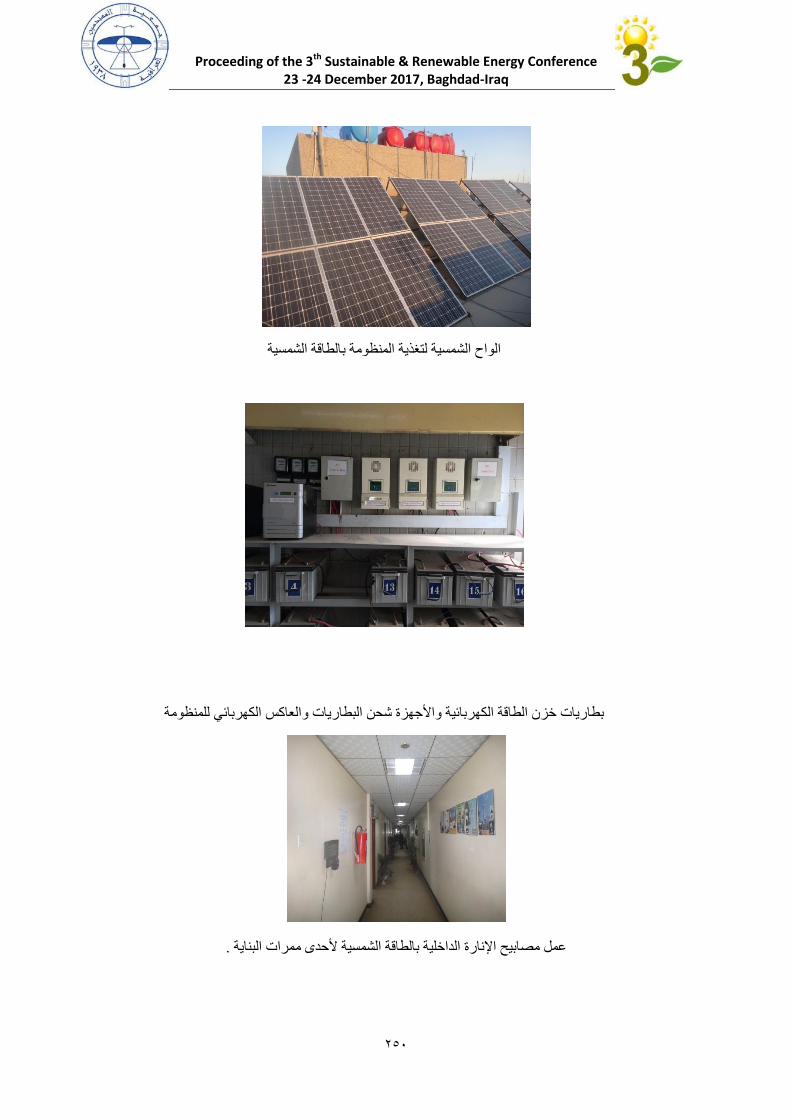
Proceeding of the 3th Sustainable & Renewable Energy Conference 23 -24 December 2017, Baghdad-Iraq
222
الواح الشمسية لتغذية المنظومة بالطاقة الشمسية
بطاريات خزن الطاقة الكهربائية واألجهزة شحن البطاريات والعاكس الكهربائي للمنظومة
.بناية ممرات ال ىألحدبالطاقة الشمسية الداخلية عمل مصابيح اإلنارة
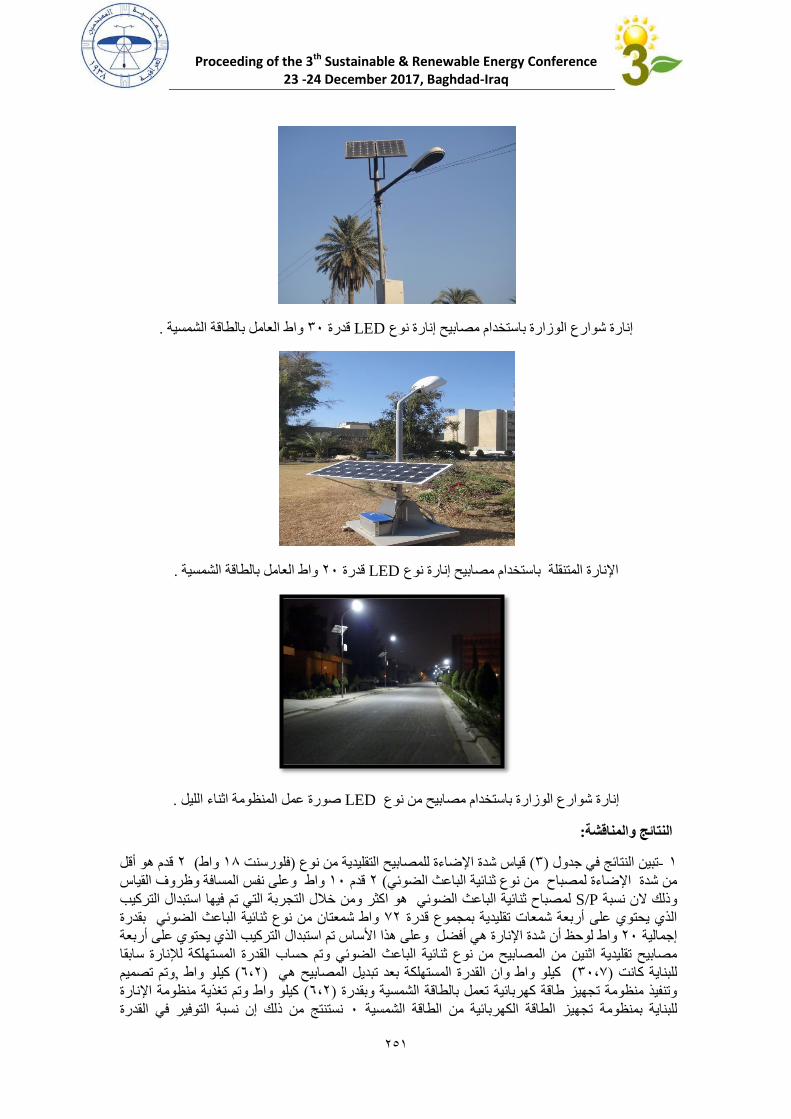
Proceeding of the 3th Sustainable & Renewable Energy Conference 23 -24 December 2017, Baghdad-Iraq
222
.العامل بالطاقة الشمسية واط ,7قدرة LEDإنارة شوارع الوزارة باستخدام مصابيح إنارة نوع
.العامل بالطاقة الشمسية واط ,6قدرة LEDاإلنارة المتنقلة باستخدام مصابيح إنارة نوع
.صورة عمل المنظومة اثناء الليل LEDإنارة شوارع الوزارة باستخدام مصابيح من نوع
:النتائج والمناقشة
قدم هو أقل 6 ( واط 81فلورسنت )قياس شدة اإلضاءة للمصابيح التقليدية من نوع ( 7)جدول تائج فيتبين الن -8
وعلى نفس المسافة وظروف القياس واط ,8قدم 6 (ثنائية الباعث الضوئيمن شدة اإلضاءة لمصباح من نوع
التركيب استبدالكثر ومن خالل التجربة التي تم فيها هو ا الضوئيثنائية الباعث لمصباح S/Pوذلك الن نسبة
بقدرة ثنائية الباعث الضوئيواط شمعتان من نوع 36 ةتقليدية بمجموع قدر عاتشمالذي يحتوي على أربعة
ة التركيب الذي يحتوي على أربع استبدالوعلى هذا األساس تم لوحظ أن شدة اإلنارة هي أفضل واط ,6إجمالية
وتم حساب القدرة المستهلكة لإلنارة سابقا ثنائية الباعث الضوئي مصابيح تقليدية اثنين من المصابيح من نوع
تم تصميم و,كيلو واط ( 206)كيلو واط وان القدرة المستهلكة بعد تبديل المصابيح هي ) 7,03)كانت للبناية
منظومة اإلنارة تغذيةكيلو واط وتم ( 206)الشمسية وبقدرة وتنفيذ منظومة تجهيز طاقة كهربائية تعمل بالطاقة
نستنتج من ذلك إن نسبة التوفير في القدرة ,تجهيز الطاقة الكهربائية من الطاقة الشمسية بمنظومة للبناية

Proceeding of the 3th Sustainable & Renewable Energy Conference 23 -24 December 2017, Baghdad-Iraq
222
أي ترشيد في الطاقة ألمستهلكةكيلو واط من القدرة ( 6,02)حيث تم توفير %(. 39)المستهلكة لإلنارة هي
يبين الفرق في استهالك ( 2)جدول وال ساعة 3الواحد بمعدل عمل كيلو واط ساعة باليوم( ,8380)ار بمقد
. LEDالطاقة الكهربائية للمصابيح القديمة التقليدية وبعد تبديل المصابيح من نوع
واط ومن شركة واحدة وبفعالية ضوئية ,2وبقدرة LEDفحص مصباحي إنارة الشوارع الحديثة من نوع –6
صفر واألخر بلون أبيض من خالل التجربة تبين أن المصباح ذو لون أصفر هو أكثر األلون ذو ا احدهما( ,1)
شدة إنارة من المصباح ذو لون أبيض عند قياسه بجهاز شدة اإلنارة ولكن عند النظر على إنارة المصباح األصفر
المصباح ذو لون أبيض يكون بينما اإلنارة في ية وقليلة اإلضاءة عند النظر على مكان اإلنارةغير واضحة الرؤ
نستنتج أن جهاز قياس شدة اإلنارة خادع عند قياس اإلنارة بلون األصفر ألن الجهاز " أكثر رؤية وأكثر إشراقا
فهو يتحسس للون األصفر ( Candela)مصمم على قياس شدة إضاءة الشمعة
( . ,) ثر من لون األبيض كما موضح في الجدول أك
واط ,2وبقدرة LEDفحص مصباحي إنارة الشوارع الحديثة من نوع (2)أما النتائج الموضحة في جدول– 7
بلون أبيض نالحظ من ( ,,8)بلون أبيض واألخر بفعالية ضوئية ( ,1)ومن شركة واحدة وبفعالية ضوئية
من المصباح ذو " هو أكثر شدة إنارة وأكثر إشراقا( ,,8)الفعالية الضوئية خالل التجربة أن المصباح ذو
.( ,1)الفعالية الضوئية
" هذا يدل على عند اختيار المصباح تدخل الفعالية الضوئية ضمن المواصفات المطلوب حيث تم التوصل حديثا
وبالتالي سوف يؤدي إلى اختيار LEDللمصابيح الحديثة من نوع Lm/w( ,86)إلى الفعالية الضوئية إلى
يبين استهالك الطاقة ( 3)والجدول مصباح ذو قدرة اقل وبالتالي يؤدي إلى تقليل استهالك الطاقة الكهربائية
. LEDالكهربائية للمصابيح التقليدية الزئبقية والمصابيح إنارة الشوارع من نوع
:االستنتاجات والتوصيات
أفضل لكونها تتميز بعمرها ( LED( )الثنائي الباعث للضوء)النوع الحديث استخدام مصابيح إنارة من -8
مع من المصابيح التقليدية كفاءتها عالية مقارنة ببقية األنواع وال ينتج عنها انبعاث حراري التشغيلي الطويل
%( 39)سطوع عالي وال تصدر ضوضاء و موفر للطاقة تصل حتى و للعين البشريةتوفير إضاءة مريحة
.تعمل على التيار المتناوب والمستمر وبدون استخدام الملف الخانق ومفتاح بداية التشغيل متانة عاليةو
يمكن استخدامها بشكل أكثر كفاءة ألنها تصدر الضوء في اتجاه معين0 بدال من اإلضاءة LED مصابيح -6
وألنها عمرها الطويل, ميع االتجاهاتالمتوهجة أو الفلورية المدمجة التقليدية التي تصدر الضوء في ج
.عمل يؤدي إلى تقليل في نفقات الصيانة ساعة( ,,,,2)
مقارنة بالمصابيح التقليدية ولكن األكثربالتكلفة األولية ( LED) نوع من تمتاز اإلضاءة الموفرة للطاقة -7
.باالنخفاض بعد التطور الذي حصل في صناعة هذه المصابيح واألجهزة المرتبطة بها بدأتاسعارها
ينتج عنه توفير في استهالك الطاقة الكهربائية الالزمة لتشغيل نظام اإلنارة بنفس ( LED)تقنية مصباح تبني -,
غرام ,16لكاربون المنبعث شدة اإلضاءة وهذا ينتج عنه تقليل في كمية الكاربون المنبعث من نفس النظام نسبة ا
لكل واحد كيلو واط ساعة طاقة منتجة من محطات الطاقة باستخدام الطاقة األحفورية وهذا يعني إن توفير
طن من الكاربون المنبعث والذي ( 16)ينتج عنه تقليل ( LED)كيلو واط ساعة باستخدام مصابيح ( ,,,0,,8)
( .(Mathew,2011 يقلل من ظاهرة االحتباس الحراري
يوفر من استهالك الطاقة إلنارة الشوارع تعمل على الكهرباء الوطنية LEDاستخدام مصابيح يمكن -2
ويمكن استخدام مصدر الطاقة الشمسية (32ـــ,2)بحدود من كلف الصيانة يوفرو( ,1ـــ ,,)بحدود الكهربائية
اما المناطق المخدومة " إلنارة الشوارع في المناطق الغير مخدومة بالشبكة الوطنية تكون مجدية اقتصاديا
.يكون مجدي وموفر للطاقة والمال LEDهرباء الوطنية يفضل استخدام مصابيح من نوع بمصدر الك
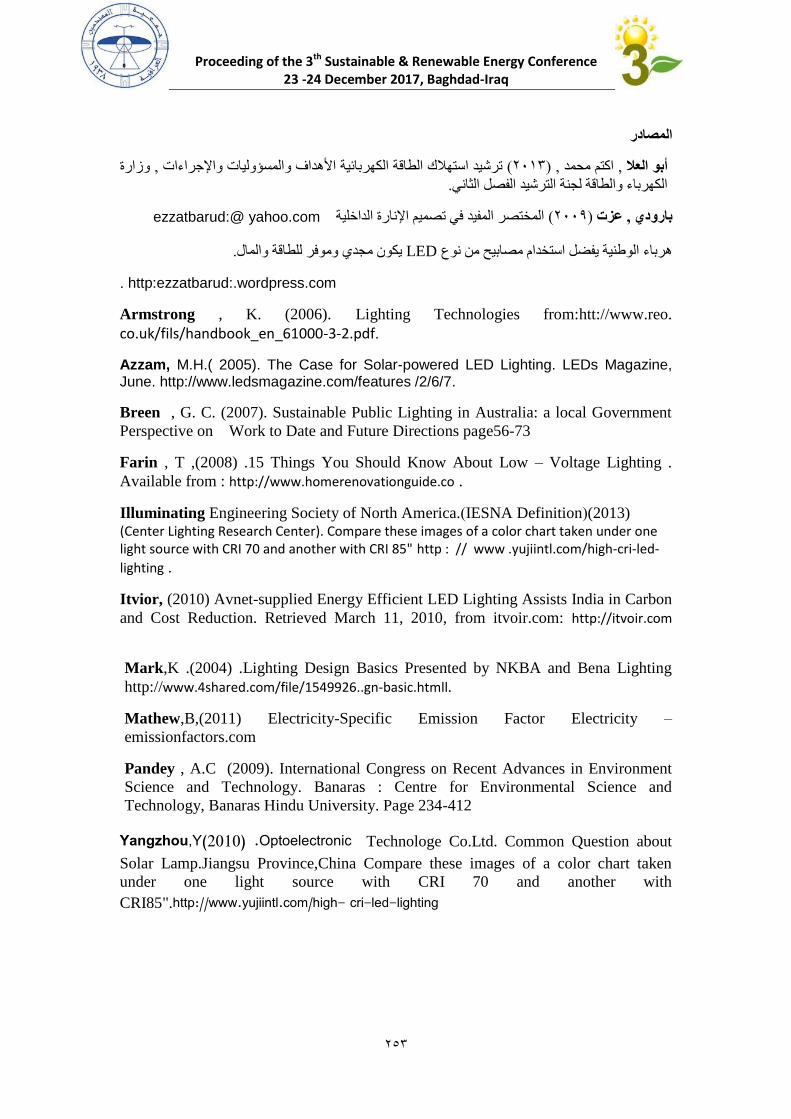
Proceeding of the 3th Sustainable & Renewable Energy Conference 23 -24 December 2017, Baghdad-Iraq
222
المصادر
وزارة ,ترشيد استهالك الطاقة الكهربائية األهداف والمسؤوليات واإلجراءات ( 6,87) ,محمد اكتم , أبو العال
.الفصل الثاني الكهرباء والطاقة لجنة الترشيد
ezzatbarud:@ yahoo.com المختصر المفيد في تصميم اإلنارة الداخلية( 9,,6) عزت, بارودي
.يكون مجدي وموفر للطاقة والمال LEDهرباء الوطنية يفضل استخدام مصابيح من نوع
http:ezzatbarud:.wordpress.com .
Armstrong , K. (2006). Lighting Technologies from:htt://www.reo.
co.uk/fils/handbook_en_61000-3-2.pdf.
Azzam, M.H.( 2005). The Case for Solar-powered LED Lighting. LEDs Magazine, June. http://www.ledsmagazine.com/features /2/6/7.
Breen , G. C. (2007). Sustainable Public Lighting in Australia: a local Government
Perspective on Work to Date and Future Directions page56-73
Farin , T ,(2008) .15 Things You Should Know About Low – Voltage Lighting .
Available from : http://www.homerenovationguide.co .
(2013) (IESNA Definition)Illuminating Engineering Society of North America. (Center Lighting Research Center). Compare these images of a color chart taken under one light source with CRI 70 and another with CRI 85" http : // www .yujiintl.com/high-cri-led-
lighting .
Itvior, (2010) Avnet-supplied Energy Efficient LED Lighting Assists India in Carbon
and Cost Reduction. Retrieved March 11, 2010, from itvoir.com: http://itvoir.com
Mark,K .(2004) .Lighting Design Basics Presented by NKBA and Bena Lighting
http://www.4shared.com/file/1549926..gn-basic.htmll.
Mathew,B,(2011) Electricity-Specific Emission Factor Electricity –
emissionfactors.com
Pandey , A.C (2009). International Congress on Recent Advances in Environment
Science and Technology. Banaras : Centre for Environmental Science and
Technology, Banaras Hindu University. Page 234-412
Yangzhou,Y(2010) .Optoelectronic Technologe Co.Ltd. Common Question about
Solar Lamp.Jiangsu Province,China Compare these images of a color chart taken
under one light source with CRI 70 and another with
CRI85".http://www.yujiintl.com/high- cri-led-lighting
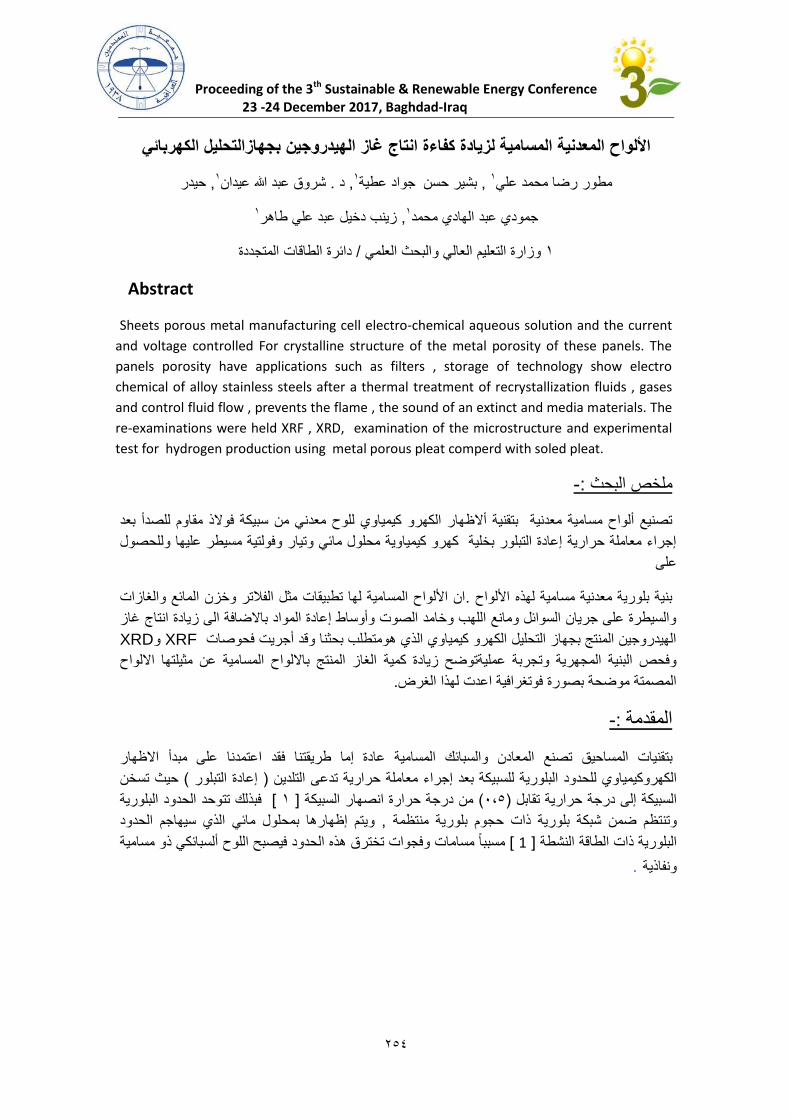
Proceeding of the 3th Sustainable & Renewable Energy Conference 23 -24 December 2017, Baghdad-Iraq
452
الكهربائي بجهازالتحليل الهيدروجين غاز انتاج كفاءة لزيادة المسامية المعدنية األلواح
حيدر, 1عيدان هللا عبد شروق. د, 1عطية جواد سنح بشير, 1علي محمد رضا مطور
1طاهر علي عبد دخيل زينب, 1محمد الهادي عبد جمودي
المتجددة الطاقات دائرة/ العلمي والبحث العالي التعليم وزارة 1
Abstract
Sheets porous metal manufacturing cell electro-chemical aqueous solution and the current
and voltage controlled For crystalline structure of the metal porosity of these panels. The
panels porosity have applications such as filters , storage of technology show electro
chemical of alloy stainless steels after a thermal treatment of recrystallization fluids , gases
and control fluid flow , prevents the flame , the sound of an extinct and media materials. The
re-examinations were held XRF , XRD, examination of the microstructure and experimental
test for hydrogen production using metal porous pleat comperd with soled pleat.
- : البحث ملخص
هار الكهرو كيمياوي للوح معدني من سبيكة فوالذ مقاوم للصدأ بعد ظتصنيع ألواح مسامية معدنية بتقنية أال
إجراء معاملة حرارية إعادة التبلور بخلية كهرو كيمياوية محلول مائي وتيار وفولتية مسيطر عليها وللحصول
على
لمائع والغازات ان األلواح المسامية لها تطبيقات مثل الفالتر وخزن ا.بنية بلورية معدنية مسامية لهذه األلواح
والسيطرة على جريان السوائل ومانع اللهب وخامد الصوت وأوساط إعادة المواد باالضافة الى زيادة انتاج غاز
XRDو XRFالهيدروجين المنتج بجهاز التحليل الكهرو كيمياوي الذي هومتطلب بحثنا وقد أجريت فحوصات
الغاز المنتج بااللواح المسامية عن مثيلتها االلواح وفحص البنية المجهرية وتجربة عمليةتوضح زيادة كمية
.المصمتة موضحة بصورة فوتغرافية اعدت لهذا الغرض
- : المقدمة
هارظاال مبدأ على اعتمدنا فقد طريقتنا إما عادة المسامية والسبائك المعادن تصنع المساحيق بتقنيات
تسخن حيث( التبلور إعادة) التلدين تدعى حرارية معاملة إجراء بعد للسبيكة البلورية للحدود الكهروكيمياوي
البلورية الحدود تتوحد فبذلك[ 1 ] السبيكة انصهار حرارة درجة من( 5,5) تقابل حرارية درجة إلى السبيكة
الحدود سيهاجم الذي مائي بمحلول إظهارها ويتم, منتظمة ةريبلو حجوم ذات بلورية شبكة ضمن وتنتظم
مسامية ذو ألسبائكي اللوح فيصبح الحدود هذه تخترق وفجوات مسامات مسببا [ 1 ] النشطة الطاقة ذات البلورية
. ونفاذية
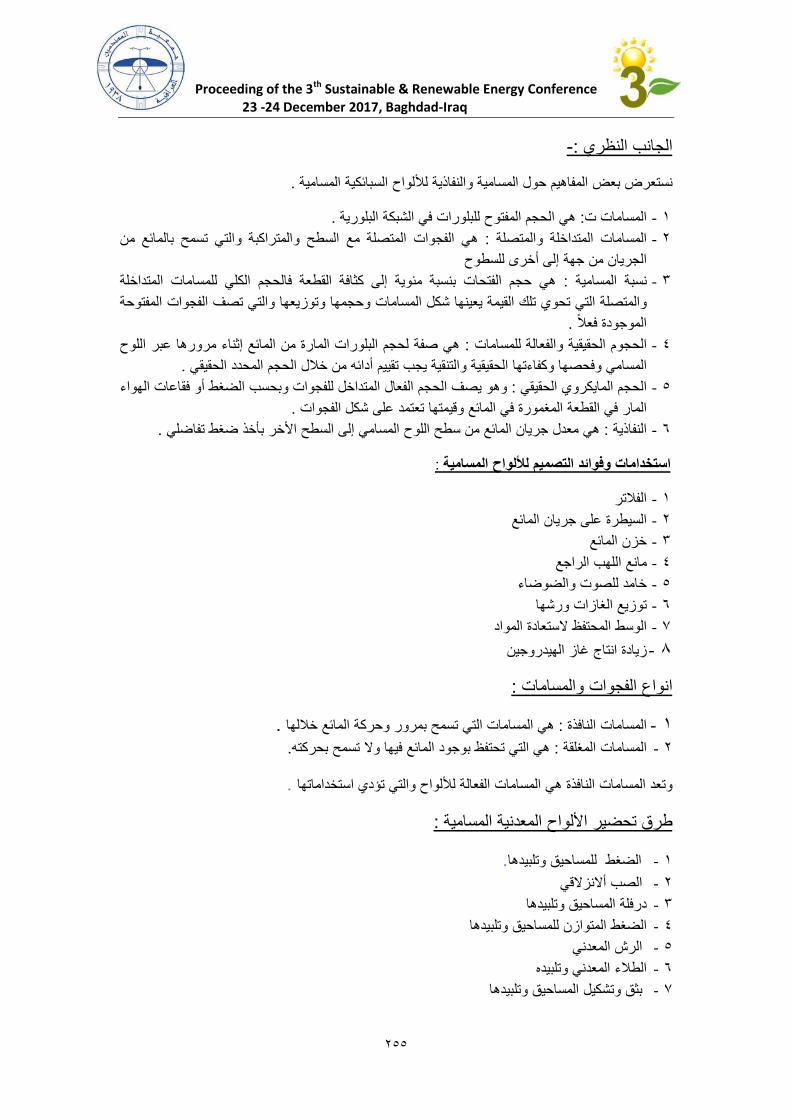
Proceeding of the 3th Sustainable & Renewable Energy Conference 23 -24 December 2017, Baghdad-Iraq
455
-: النظري الجانب
. المسامية السبائكية لأللواح والنفاذية المسامية حول المفاهيم بعض نستعرض
. البلورية الشبكة في للبلورات المفتوح الحجم هي: ت المسامات -1
من بالمائع تسمح والتي والمتراكبة السطح مع المتصلة الفجوات هي: والمتصلة المتداخلة المسامات -2
للسطوح أخرى إلى جهة من الجريان
المتداخلة للمسامات الكلي فالحجم القطعة كثافة إلى مئوية سبةنب الفتحات حجم هي: المسامية نسبة -3
المفتوحة الفجوات تصف والتي وتوزيعها وحجمها المسامات شكل يعينها القيمة تلك تحوي التي والمتصلة
. فعال الموجودة
اللوح عبر مرورها إثناء المائع من المارة البلورات لحجم صفة هي: للمسامات والفعالة الحقيقية الحجوم -4
. الحقيقي المحدد الحجم خالل من أدائه تقييم يجب والتنقية الحقيقية وكفاءتها وفحصها المسامي
الهواء فقاعات أو الضغط وبحسب للفجوات المتداخل الفعال الحجم يصف وهو: الحقيقي المايكروي الحجم -5
. الفجوات شكل على تعتمد وقيمتها المائع في المغمورة القطعة في المار
. تفاضلي ضغط بأخذ األخر السطح إلى المسامي اللوح سطح من المائع جريان معدل هي: النفاذية -6
: المسامية لأللواح التصميم وفوائد استخدامات
الفالتر -1
المائع جريان على السيطرة -2
المائع خزن -3
الراجع اللهب مانع -4
والضوضاء للصوت خامد -5
ورشها الغازات توزيع -6
المواد الستعادة المحتفظ الوسط -7
الهيدروجين غاز انتاج زيادة -8
: والمسامات الفجوات انواع
. خاللها المائع وحركة بمرور تسمح التي المسامات هي: النافذة المسامات -1 . بحركته تسمح وال فيها المائع بوجود تحتفظ التي هي: المغلقة المسامات -2
. استخداماتها تؤدي والتي لأللواح الفعالة المسامات هي النافذة المسامات وتعد
: المسامية المعدنية األلواح تحضير طرق
.وتلبيدها للمساحيق الضغط -1
أالنزالقي الصب -2
وتلبيدها المساحيق درفلة -3
وتلبيدها للمساحيق المتوازن الضغط -4
المعدني الرش -5
وتلبيده المعدني الطالء -6
وتلبيدها المساحيق وتشكيل بثق -7
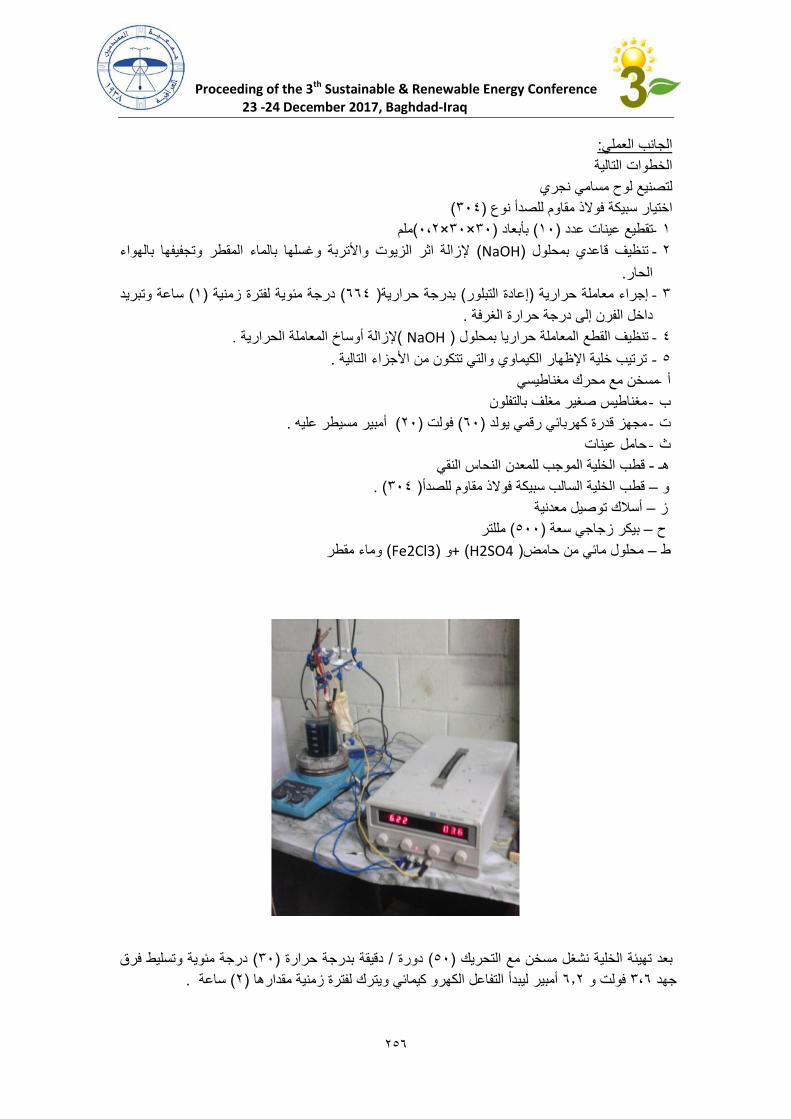
Proceeding of the 3th Sustainable & Renewable Energy Conference 23 -24 December 2017, Baghdad-Iraq
452
:الجانب العملي
التالية الخطوات
نجري مسامي لوح لتصنيع
( 452) نوع للصدأ مقاوم فوالذ سبيكة اختيار
ملم(5,4×45×45) بأبعاد( 15) عدد عينات تقطيع -1
بالهواء وتجفيفها المقطر بالماء وغسلها واألتربة الزيوت اثر إلزالة( NaOH) بمحلول قاعدي تنظيف -2
.الحار
وتبريد ساعة( 1) زمنية لفترة مئوية درجة( 222) حرارية بدرجة( التبلور إعادة) حرارية معاملة إجراء -3
. الغرفة حرارة درجة إلى الفرن داخل
. الحرارية المعاملة أوساخ إلزالة( NaOH) بمحلول حراريا المعاملة القطع تنظيف -4
. التالية األجزاء من تتكون والتي الكيماوي اإلظهار خلية ترتيب -5
مغناطيسي محرك مع مسخن -أ
بالتفلون مغلف صغير مغناطيس -ب
. عليه مسيطر أمبير( 45) فولت( 25) يولد رقمي كهربائي قدرة مجهز -ت
عينات حامل -ث
النقي النحاس للمعدن الموجب الخلية قطب - هـ
( .452) للصدأ مقاوم فوالذ سبيكة السالب الخلية قطب – و
معدنية توصيل أسالك – ز
مللتر( 555) سعة زجاجي بيكر – ح
مقطر وماء( Fe2Cl3) و+( H2SO4) حامض من مائي محلول – ط
فرق وتسليط مئوية درجة( 45) حرارة بدرجة دقيقة/ دورة( 55) التحريك مع مسخن نشغل الخلية تهيئة بعد
. ساعة( 4) مقدارها زمنية لفترة ويترك كيمائي الكهرو التفاعل ليبدأ أمبير 2.4 و فولت 4,2 جهد
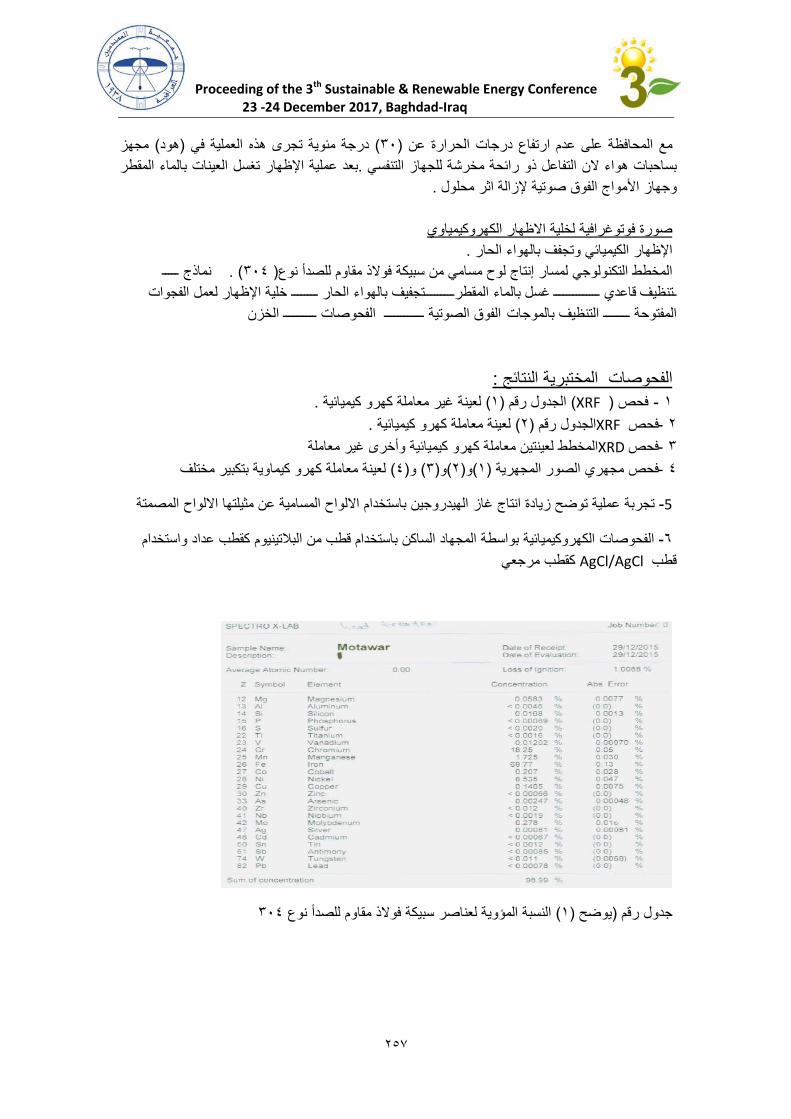
Proceeding of the 3th Sustainable & Renewable Energy Conference 23 -24 December 2017, Baghdad-Iraq
452
مجهز( هود) في العملية هذه تجرى مئوية درجة( 45) عن الحرارة درجات ارتفاع عدم على المحافظة مع
المقطر بالماء العينات تغسل اإلظهار عملية بعد. التنفسي للجهاز مخرشة رائحة ذو التفاعل الن هواء بساحبات
. محلول اثر إلزالة صوتية الفوق األمواج وجهاز
الكهروكيمياوي االظهار لخلية فوتوغرافية صورة
. الحار بالهواء وتجفف الكيميائي اإلظهار
ـــــ نماذج( . 452) نوع للصدأ مقاوم فوالذ سبيكة من مسامي لوح إنتاج لمسار التكنولوجي المخطط
الفجوات لعمل اإلظهار خلية ــــــــ الحار بالهواء المقطرـــــــــتجفيف بالماء غسل ــــــــــــــ قاعدي ـتنظيف
الخزن ــــــــــ الفحوصات ــــــــــــ الصوتية الفوق بالموجات التنظيف ــــــــ المفتوحة
: النتائج المختبرية الفحوصات
. كيميائية كهرو معاملة غير لعينة( 1) رقم الجدول( XRF) فحص -1
. كيميائية كهرو معاملة لعينة( 4) رقم الجدول XRF فحص -4
معاملة غير وأخرى كيميائية كهرو معاملة لعينتين المخطط XRDفحص -4
مختلف بتكبير كيماوية كهرو معاملة لعينة( 2)و( 4)و(4)و(1) المجهرية الصور مجهري فحص -2
المصمتة االلواح مثيلتها عن المسامية االلواح باستخدام الهيدروجين غاز انتاج زيادة توضح عملية تجربة -5
واستخدام عداد كقطب البالتينيوم من قطب باستخدام الساكن المجهاد بواسطة الكهروكيميائية الفحوصات -2
يمرجع كقطب AgCl/AgCl قطب
452 نوع للصدأ مقاوم فوالذ سبيكة لعناصر المؤوية النسبة( 1) يوضح) رقم دولج

Proceeding of the 3th Sustainable & Renewable Energy Conference 23 -24 December 2017, Baghdad-Iraq
452
بعد المعاملة الكهروكيميائية452النسبة المؤوية لعناصر سبيكة فوالد مقاوم للصدأ نوع (4)جدول رقم يوضح
معاملة غير عينة( 1) رقم مخطط
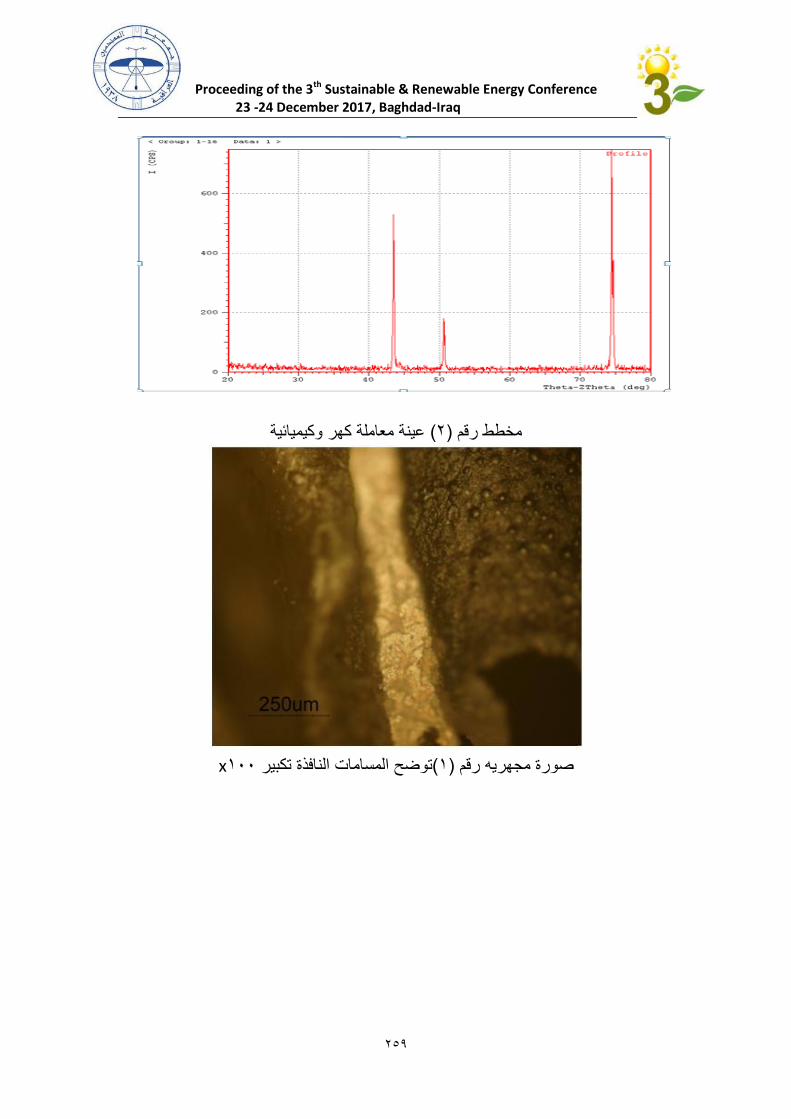
Proceeding of the 3th Sustainable & Renewable Energy Conference 23 -24 December 2017, Baghdad-Iraq
452
وكيميائية كهر معاملة عينة( 4) رقم مخطط
155x تكبير النافذة المسامات توضح(1) رقم مجهريه صورة
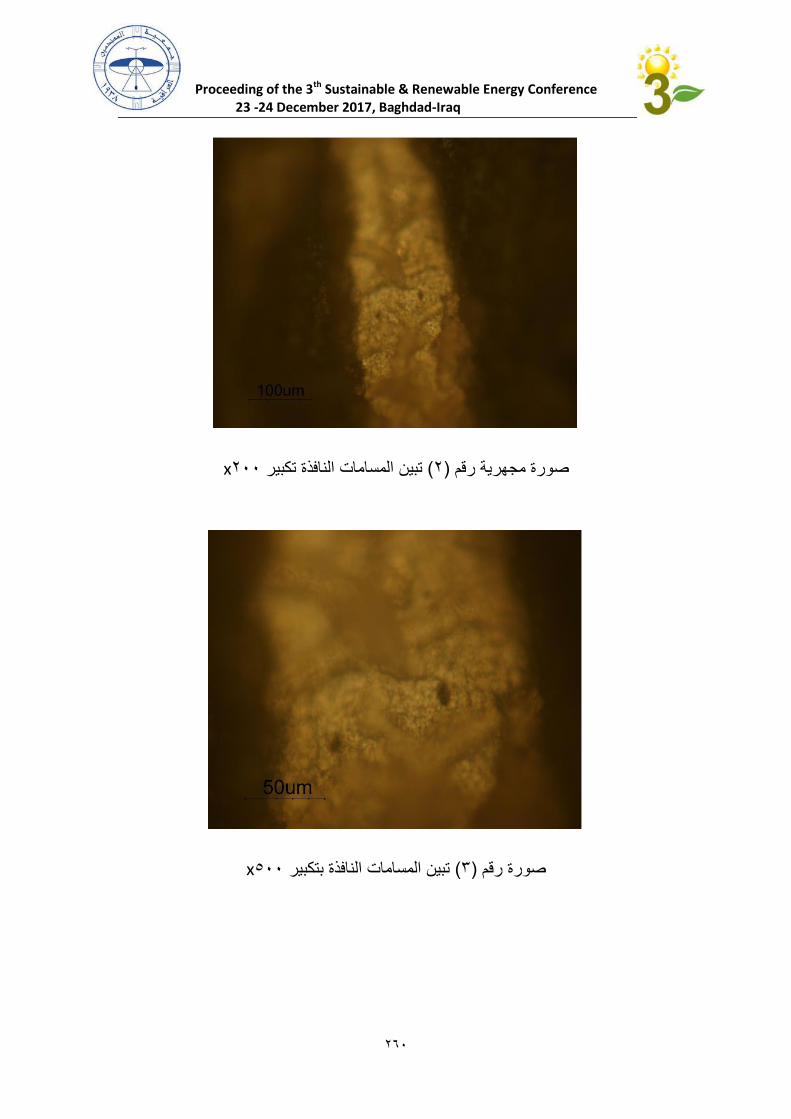
Proceeding of the 3th Sustainable & Renewable Energy Conference 23 -24 December 2017, Baghdad-Iraq
425
455x تكبير النافذة المسامات تبين (4) رقم مجهرية صورة
555x بتكبير النافذة المسامات تبين( 4) رقم صورة
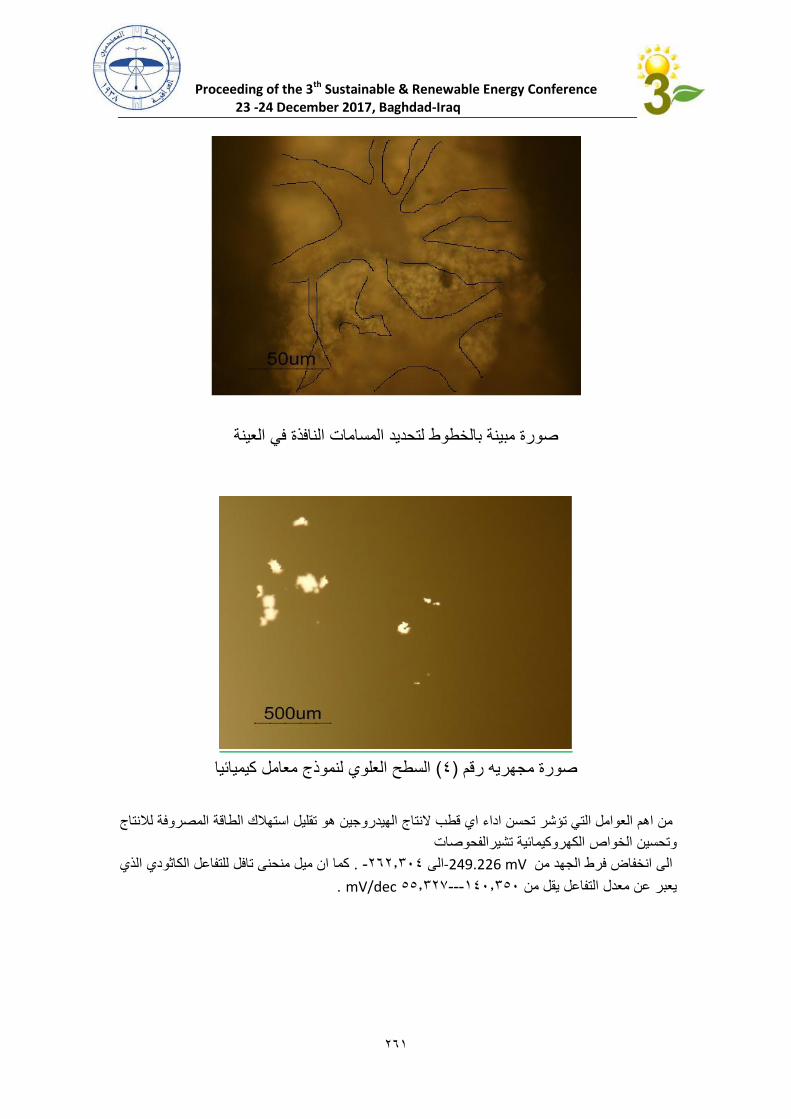
Proceeding of the 3th Sustainable & Renewable Energy Conference 23 -24 December 2017, Baghdad-Iraq
421
العينة في النافذة المسامات لتحديد بالخطوط مبينة صورة
كيميائيا معامل لنموذج العلوي السطح( 2) رقم مجهريه صورة
لالنتاج المصروفة الطاقة استهالك تقليل هو الهيدروجين النتاج قطب اي اداء تحسن تؤشر التي العوامل اهم من
ة تشيرالفحوصاتالكهروكيمائي الخواص وتحسين
الذي الكاثودي للتفاعل تافل منحنى ميل ان كما. -424.452 الى mV 249.226- من الجهد فرط انخفاض الى
. mV/dec 55.442---125.455 من يقل التفاعل معدل عن يعبر
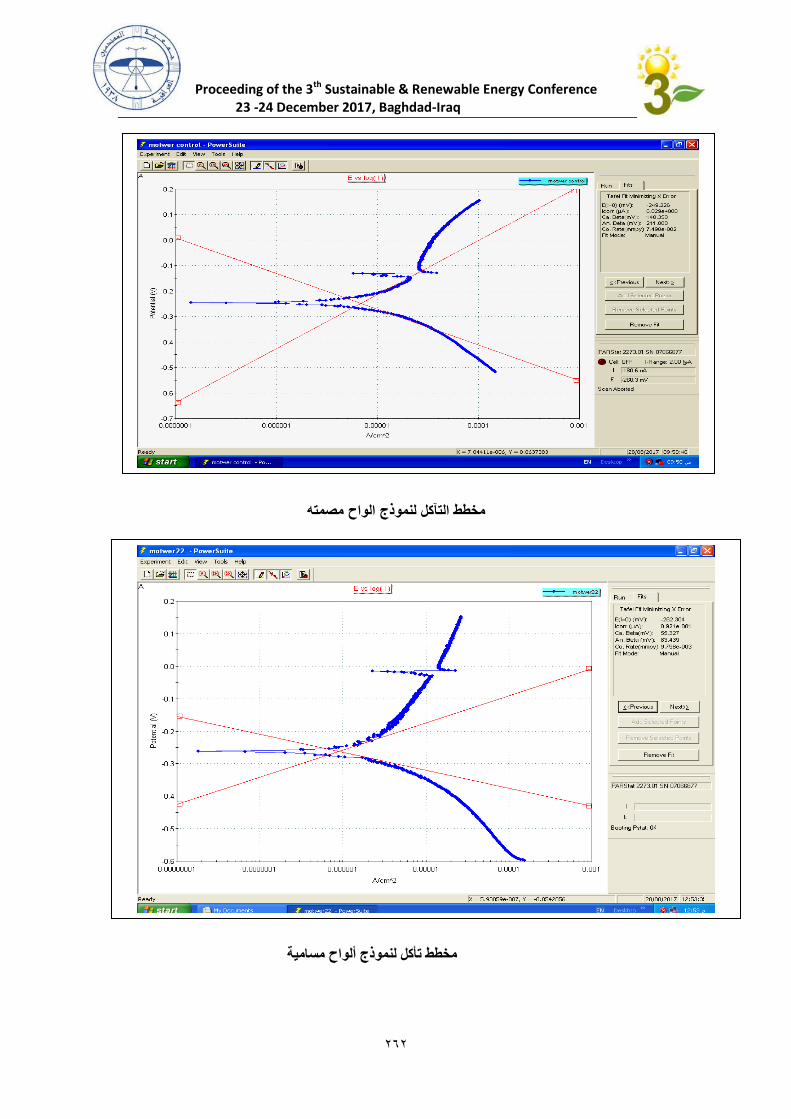
Proceeding of the 3th Sustainable & Renewable Energy Conference 23 -24 December 2017, Baghdad-Iraq
424
مصمته الواح لنموذج التآكل مخطط
مخطط تأكل لنموذج ألواح مسامية
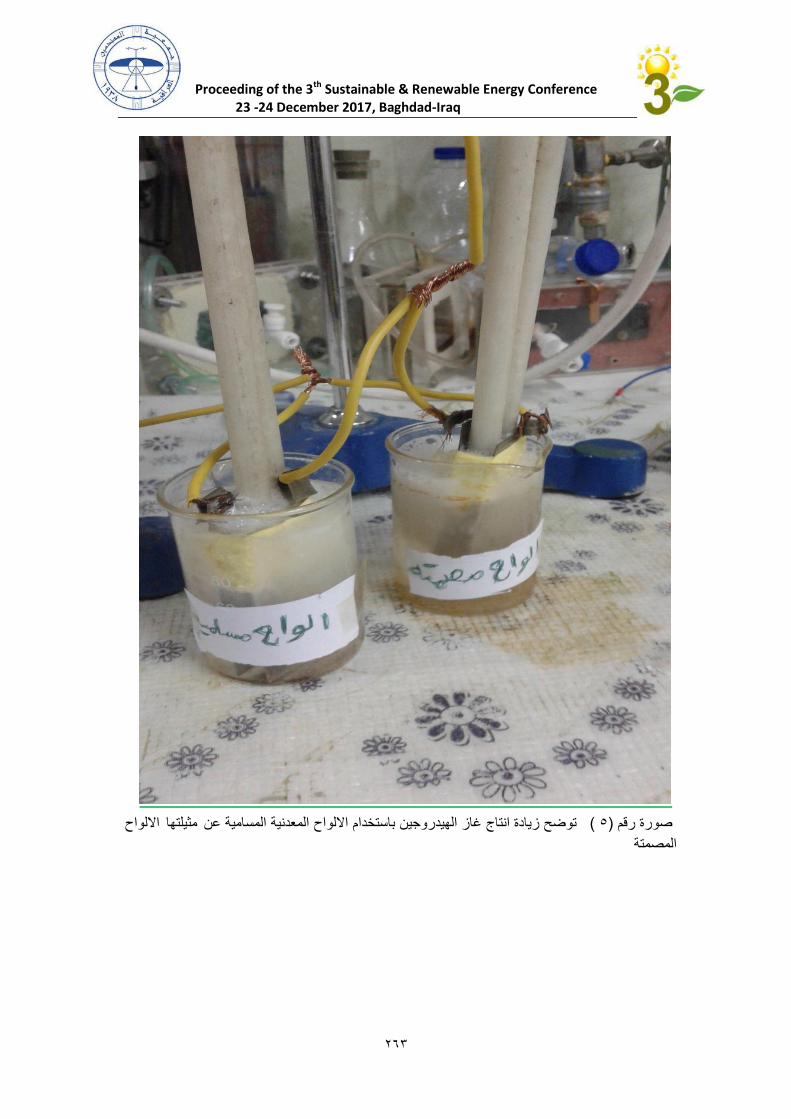
Proceeding of the 3th Sustainable & Renewable Energy Conference 23 -24 December 2017, Baghdad-Iraq
424
االلواح مثيلتها عن المسامية المعدنية االلواح باستخدام الهيدروجين غاز انتاج زيادة توضح( 5) رقم صورة
المصمتة
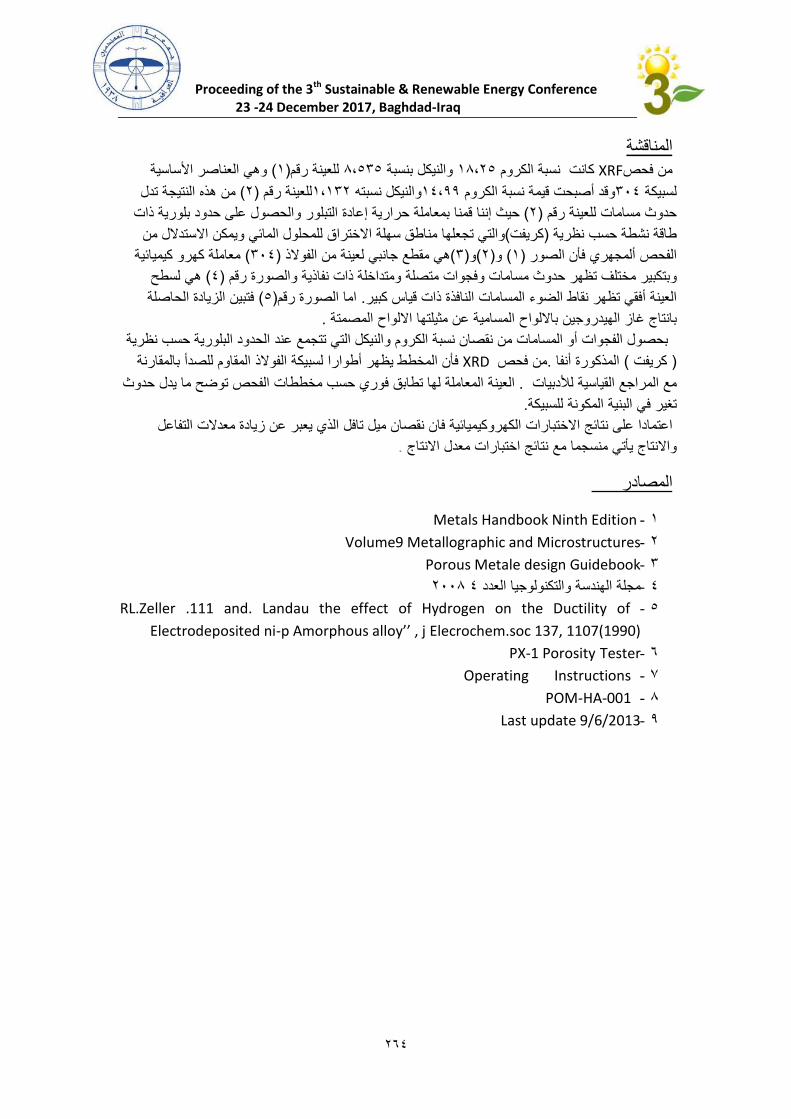
Proceeding of the 3th Sustainable & Renewable Energy Conference 23 -24 December 2017, Baghdad-Iraq
422
المناقشة
األساسية العناصر وهي( 1)رقم للعينة 2,545 بنسبة والنيكل 12,45 الكروم نسبة كانت XRFفحص من
تدل النتيجة هذه من( 4) رقم للعينة1,144 نسبته والنيكل12,22 الكروم نسبة قيمة أصبحت وقد452 لسبيكة
ذات بلورية حدود على والحصول التبلور إعادة حرارية بمعاملة قمنا إننا حيث( 4) رقم للعينة مسامات حدوث
من االستدالل ويمكن المائي للمحلول االختراق سهلة مناطق تجعلها والتي(كريفت) نظرية حسب نشطة طاقة
كيميائية كهرو معاملة( 452) الفوالذ من لعينة جانبي مقطع هي(4)و(4)و( 1) الصور فأن ألمجهري الفحص
لسطح هي( 2) رقم والصورة نفاذية ذات ومتداخلة متصلة وفجوات مسامات حدوث تظهر مختلف وبتكبير
الحاصلة الزيادة فتبين( 5)رقم الصورة اما. كبير قياس ذات النافذة المسامات الضوء نقاط تظهر أفقي العينة
. المصمتة االلواح مثيلتها عن المسامية بااللواح الهيدروجين غاز بانتاج
نظرية حسب البلورية الحدود عند تتجمع التي والنيكل الكروم نسبة نقصان من المسامات أو الفجوات بحصول
بالمقارنة للصدأ المقاوم الفوالذ لسبيكة أطوارا يظهر المخطط فأن XRD فحص من. أنفا المذكورة( كريفت)
حدوث يدلح ما توض الفحص مخططات حسب فوري تطابق لها المعاملة العينة. لألدبيات القياسية المراجع مع
.للسبيكة المكونة البنية في تغير
التفاعل معدالت زيادة عن يعبر الذي تافل ميل نقصان فان الكهروكيميائية االختبارات نتائج على اعتمادا
. االنتاج معدل اختبارات نتائج مع منسجما يأتي واالنتاج
المصادر
1- Metals Handbook Ninth Edition
2- Volume9 Metallographic and Microstructures
3- Porous Metale design Guidebook
4552 2مجلة الهندسة والتكنولوجيا العدد -4
5- RL.Zeller .111 and. Landau the effect of Hydrogen on the Ductility of
Electrodeposited ni-p Amorphous alloy’’ , j Elecrochem.soc 137, 1107(1990)
6- Tester PX-1 Porosity
7- Instructions Operating
8- POM-HA-001
9- Last update 9/6/2013

(AWE) طاقة الرياح محور تطبيقات
دراساتال
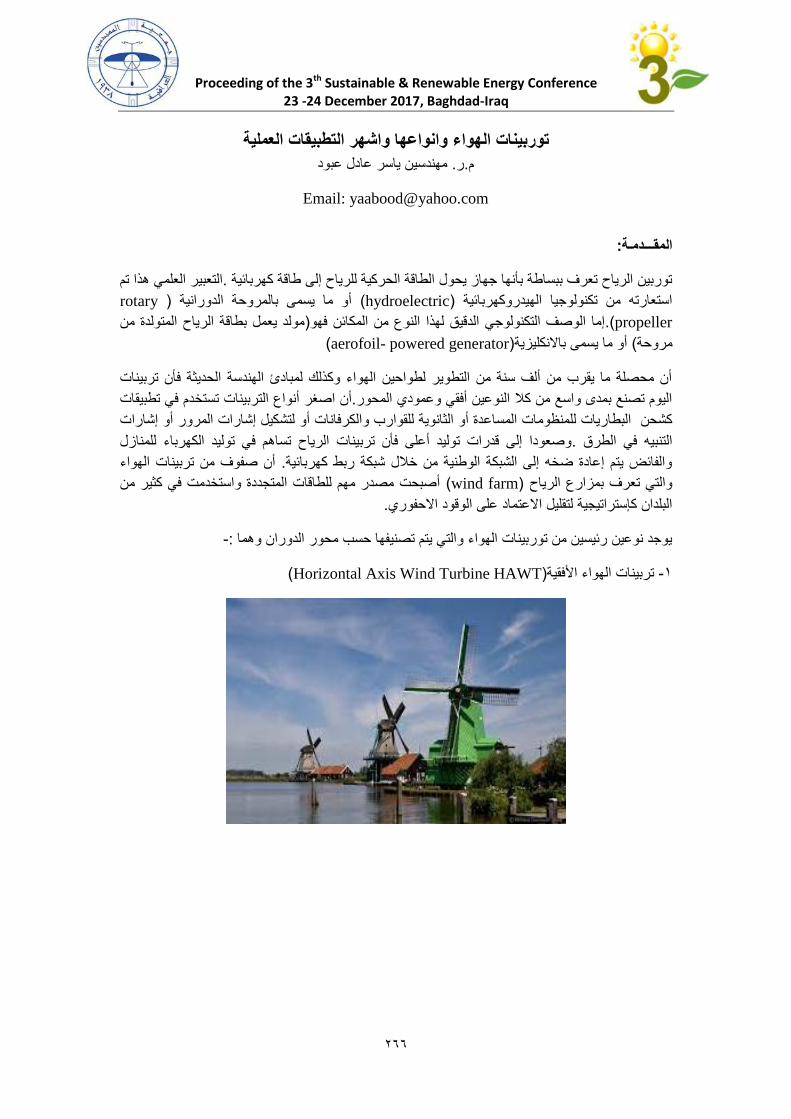
Proceeding of the 3th Sustainable & Renewable Energy Conference
23 -24 December 2017, Baghdad-Iraq
622
توربينات الهواء وانواعها واشهر التطبيقات العملية
:المقـــدمـة
التعبير العلمي هذا تم .طاقة كهربائية توربين الرياح تعرف ببساطة بأنها جهاز يحول الطاقة الحركية للرياح إلى
rotary)أو ما يسمى بالمروحة الدورانية ( hydroelectric)استعارته من تكنولوجيا الهيدروكهربائية
propeller.)مولد يعمل بطاقة الرياح المتولدة من )إما الوصف التكنولوجي الدقيق لهذا النوع من المكائن فهو
(aerofoil- powered generator)يةأو ما يسمى باالنكليز( مروحة
أن محصلة ما يقرب من ألف سنة من التطوير لطواحين الهواء وكذلك لمبادئ الهندسة الحديثة فأن تربينات
أن اصغر أنواع التربينات تستخدم في تطبيقات .اليوم تصنع بمدى واسع من كال النوعين أفقي وعمودي المحور
دة أو الثانوية للقوارب والكرفانات أو لتشكيل إشارات المرور أو إشارات كشحن البطاريات للمنظومات المساع
وصعودا إلى قدرات توليد أعلى فأن تربينات الرياح تساهم في توليد الكهرباء للمنازل .التنبيه في الطرق
اء أن صفوف من تربينات الهو. والفائض يتم إعادة ضخه إلى الشبكة الوطنية من خالل شبكة ربط كهربائية
أصبحت مصدر مهم للطاقات المتجددة واستخدمت في كثير من ( wind farm)والتي تعرف بمزارع الرياح
.االحفوري اد على الوقودالبلدان كإستراتيجية لتقليل االعتم
- :يوجد نوعين رئيسين من توربينات الهواء والتي يتم تصنيفها حسب محور الدوران وهما
(Horizontal Axis Wind Turbine HAWT)تربينات الهواء األفقية -1
مهندسين ياسر عادل عبود. ر.م
Email: [email protected]
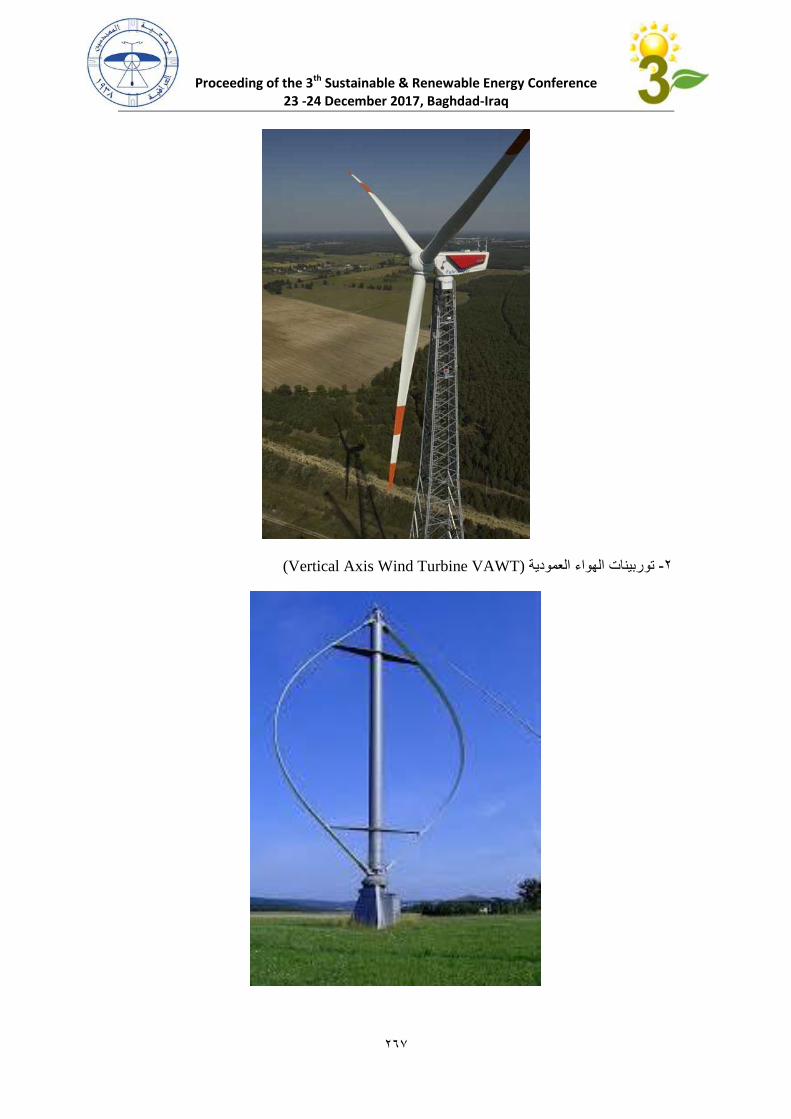
Proceeding of the 3th Sustainable & Renewable Energy Conference
23 -24 December 2017, Baghdad-Iraq
622
(Vertical Axis Wind Turbine VAWT)ربينات الهواء العموديةوت -6
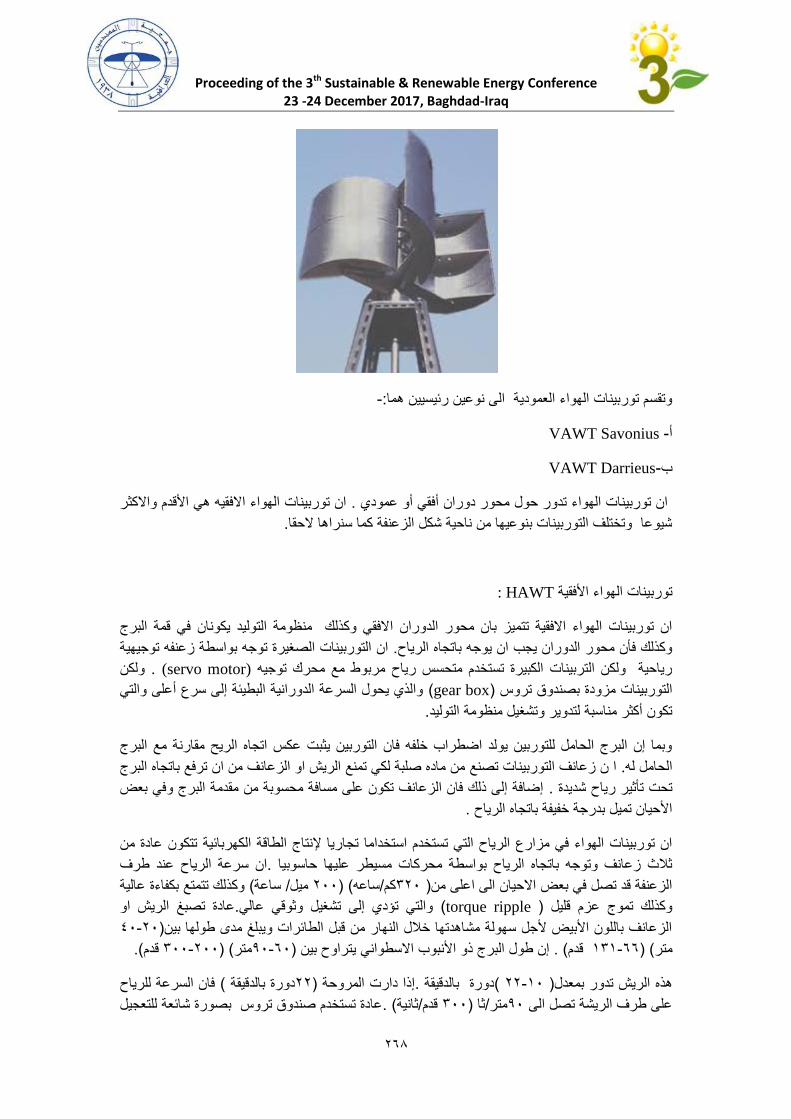
Proceeding of the 3th Sustainable & Renewable Energy Conference
23 -24 December 2017, Baghdad-Iraq
622
- :وتقسم توربينات الهواء العمودية الى نوعين رئيسيين هما
VAWT Savonius -أ
VAWT Darrieus-ب
ان توربينات الهواء االفقيه هي األقدم واالكثر . ان توربينات الهواء تدور حول محور دوران أفقي أو عمودي
.شيوعا وتختلف التوربينات بنوعيها من ناحية شكل الزعنفة كما سنراها الحقا
HAWT :توربينات الهواء األفقية
الفقي وكذلك منظومة التوليد يكونان في قمة البرج ان توربينات الهواء االفقية تتميز بان محور الدوران ا
ان التوربينات الصغيرة توجه بواسطة زعنفه توجيهية . وكذلك فأن محور الدوران يجب ان يوجه باتجاه الرياح
ولكن . (servo motor)رياحية ولكن التربينات الكبيرة تستخدم متحسس رياح مربوط مع محرك توجيه
والذي يحول السرعة الدورانية البطيئة إلى سرع أعلى والتي ( gear box)دوق تروس التوربينات مزودة بصن
.تكون أكثر مناسبة لتدوير وتشغيل منظومة التوليد
وبما إن البرج الحامل للتوربين يولد اضطراب خلفه فان التوربين يثبت عكس اتجاه الريح مقارنة مع البرج
من ماده صلبة لكي تمنع الريش او الزعانف من ان ترفع باتجاه البرج ا ن زعانف التوربينات تصنع . الحامل له
إضافة إلى ذلك فان الزعانف تكون على مسافة محسوبة من مقدمة البرج وفي بعض . تحت تأثير رياح شديدة
.األحيان تميل بدرجة خفيفة باتجاه الرياح
اريا إلنتاج الطاقة الكهربائية تتكون عادة من ان توربينات الهواء في مزارع الرياح التي تستخدم استخداما تج
ان سرعة الرياح عند طرف .ثالث زعانف وتوجه باتجاه الرياح بواسطة محركات مسيطر عليها حاسوبيا
وكذلك تتمتع بكفاءة عالية ( ساعة/ ميل 633( )ساعه/كم063) الزعنفة قد تصل في بعض االحيان الى اعلى من
عادة تصبغ الريش او .والتي تؤدي إلى تشغيل وثوقي عالي( torque ripple)وكذلك تموج عزم قليل
03-63)الزعانف باللون األبيض ألجل سهولة مشاهدتها خالل النهار من قبل الطائرات ويبلغ مدى طولها بين
(. قدم 033-633( )متر03-23)إن طول البرج ذو األنبوب االسطواني يتراوح بين ( . قدم 101-22( )متر
فان السرعة للرياح ( دورة بالدقيقة 66)إذا دارت المروحة .دورة بالدقيقة ( 66-13) ريش تدور بمعدلهذه ال
عادة تستخدم صندوق تروس بصورة شائعة للتعجيل ( .ثانية/قدم 033)ثا /متر03على طرف الريشة تصل الى
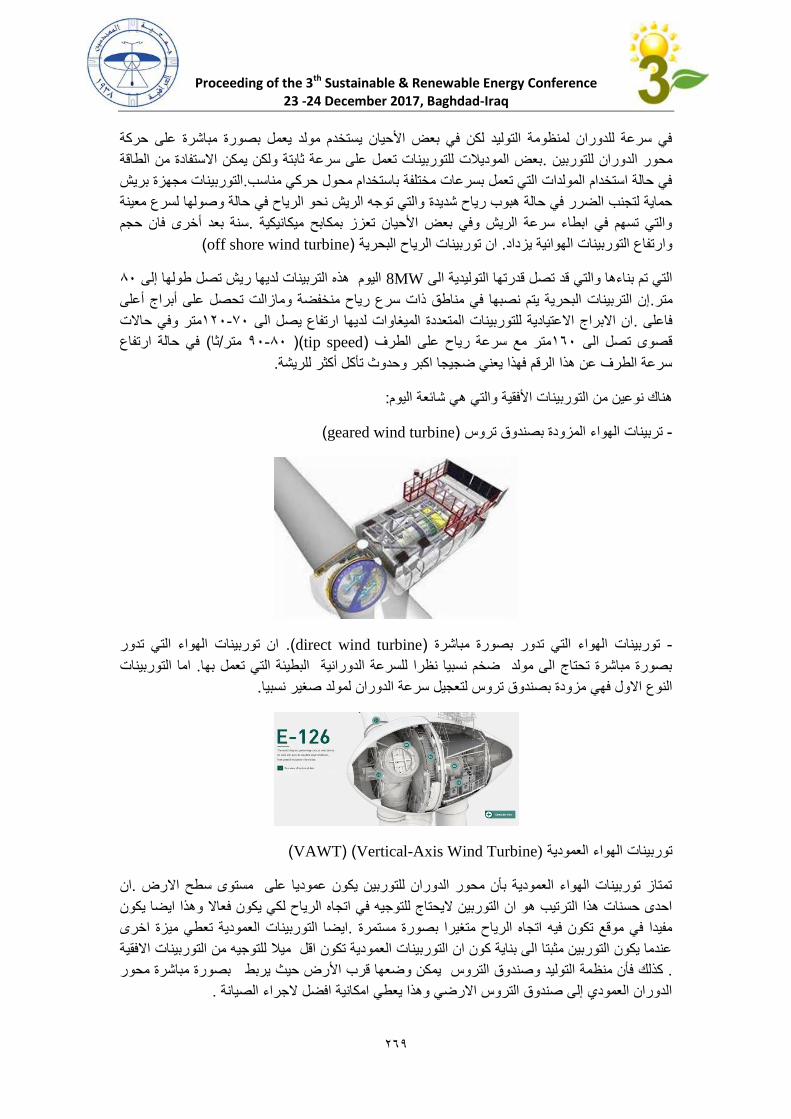
Proceeding of the 3th Sustainable & Renewable Energy Conference
23 -24 December 2017, Baghdad-Iraq
620
ورة مباشرة على حركة في سرعة للدوران لمنظومة التوليد لكن في بعض األحيان يستخدم مولد يعمل بص
بعض الموديالت للتوربينات تعمل على سرعة ثابتة ولكن يمكن االستفادة من الطاقة .محور الدوران للتوربين
التوربينات مجهزة بريش .في حالة استخدام المولدات التي تعمل بسرعات مختلفة باستخدام محول حركي مناسب
والتي توجه الريش نحو الرياح في حالة وصولها لسرع معينة حماية لتجنب الضرر في حالة هبوب رياح شديدة
سنة بعد أخرى فان حجم .والتي تسهم في ابطاء سرعة الريش وفي بعض األحيان تعزز بمكابح ميكانيكية
(off shore wind turbine)ان توربينات الرياح البحرية . وارتفاع التوربينات الهوائية يزداد
23اليوم هذه التربينات لديها ريش تصل طولها إلى 8MWتصل قدرتها التوليدية الى التي تم بناءها والتي قد
إن التربينات البحرية يتم نصبها في مناطق ذات سرع رياح منخفضة ومازالت تحصل على أبراج أعلى .متر
تر وفي حاالت م163-23ان االبراج االعتيادية للتوربينات المتعددة الميغاوات لديها ارتفاع يصل الى .فاعلى
في حالة ارتفاع ( ثا/متر tip speed ()23-03)متر مع سرعة رياح على الطرف 123قصوى تصل الى
.سرعة الطرف عن هذا الرقم فهذا يعني ضجيجا اكبر وحدوث تأكل أكثر للريشة
:هناك نوعين من التوربينات األفقية والتي هي شائعة اليوم
(geared wind turbine)وس تربينات الهواء المزودة بصندوق تر -
ان توربينات الهواء التي تدور (. direct wind turbine)توربينات الهواء التي تدور بصورة مباشرة -
اما التوربينات . بصورة مباشرة تحتاج الى مولد ضخم نسبيا نظرا للسرعة الدورانية البطيئة التي تعمل بها
.عجيل سرعة الدوران لمولد صغير نسبياالنوع االول فهي مزودة بصندوق تروس لت
(Vertical-Axis Wind Turbine)( )VAWTتوربينات الهواء العمودية
ان .تمتاز توربينات الهواء العمودية بأن محور الدوران للتوربين يكون عموديا على مستوى سطح االرض
الرياح لكي يكون فعاال وهذا ايضا يكون احدى حسنات هذا الترتيب هو ان التوربين اليحتاج للتوجيه في اتجاه
ايضا التوربينات العمودية تعطي ميزة اخرى .مفيدا في موقع تكون فيه اتجاه الرياح متغيرا بصورة مستمرة
عندما يكون التوربين مثبتا الى بناية كون ان التوربينات العمودية تكون اقل ميال للتوجيه من التوربينات االفقية
مة التوليد وصندوق التروس يمكن وضعها قرب األرض حيث يربط بصورة مباشرة محور كذلك فأن منظ.
.الدوران العمودي إلى صندوق التروس االرضي وهذا يعطي امكانية افضل الجراء الصيانة
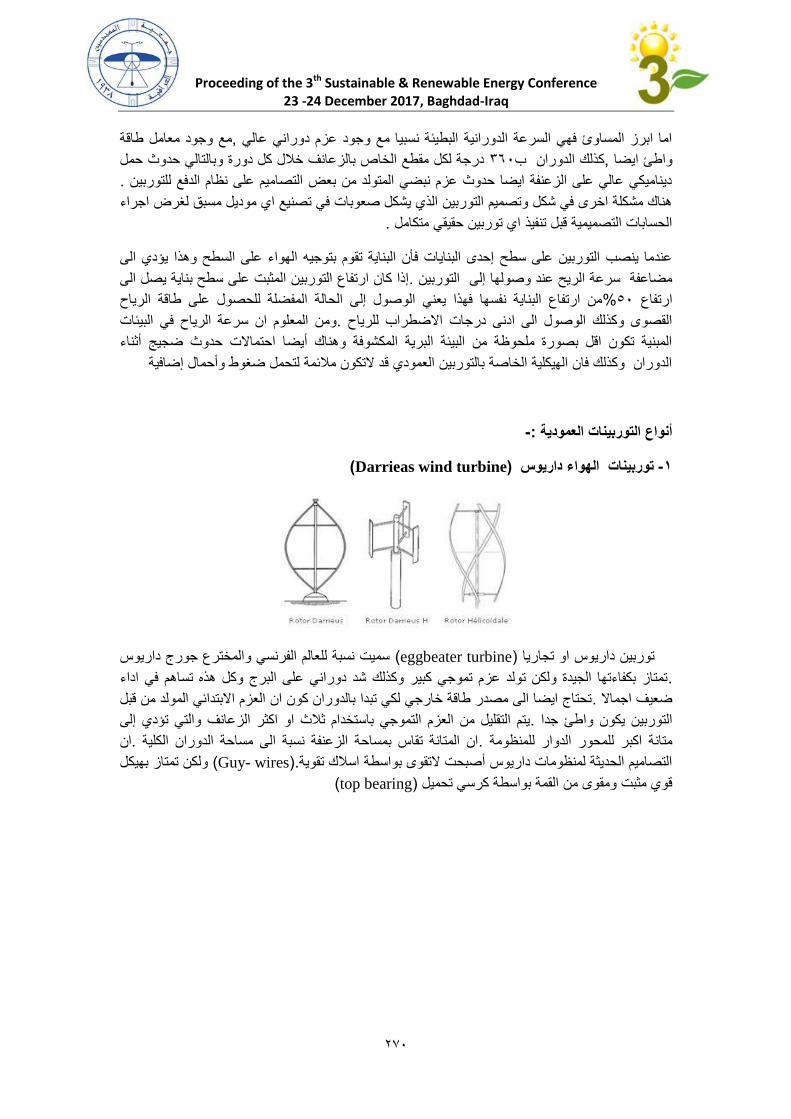
Proceeding of the 3th Sustainable & Renewable Energy Conference
23 -24 December 2017, Baghdad-Iraq
623
مع وجود معامل طاقة ,اما ابرز المساوئ فهي السرعة الدورانية البطيئة نسبيا مع وجود عزم دوراني عالي
درجة لكل مقطع الخاص بالزعانف خالل كل دورة وبالتالي حدوث حمل 023كذلك الدوران ب,ايضا واطئ
. ديناميكي عالي على الزعنفة ايضا حدوث عزم نبضي المتولد من بعض التصاميم على نظام الدفع للتوربين
سبق لغرض اجراء هناك مشكلة اخرى في شكل وتصميم التوربين الذي يشكل صعوبات في تصنيع اي موديل م
.الحسابات التصميمية قبل تنفيذ اي توربين حقيقي متكامل
عندما ينصب التوربين على سطح إحدى البنايات فأن البناية تقوم بتوجيه الهواء على السطح وهذا يؤدي الى
يصل الى إذا كان ارتفاع التوربين المثبت على سطح بناية .مضاعفة سرعة الريح عند وصولها إلى التوربين
من ارتفاع البناية نفسها فهذا يعني الوصول إلى الحالة المفضلة للحصول على طاقة الرياح %03ارتفاع
ومن المعلوم ان سرعة الرياح في البيئات .القصوى وكذلك الوصول الى ادنى درجات االضطراب للرياح
ا احتماالت حدوث ضجيج أثناء المبنية تكون اقل بصورة ملحوظة من البيئة البرية المكشوفة وهناك أيض
الدوران وكذلك فان الهيكلية الخاصة بالتوربين العمودي قد التكون مالئمة لتحمل ضغوط وأحمال إضافية
- :أنواع التوربينات العمودية
(Darrieas wind turbine) ربينات الهواء داريوسوت -1
سميت نسبة للعالم الفرنسي والمخترع جورج داريوس ( eggbeater turbine)توربين داريوس او تجاريا
تمتاز بكفاءتها الجيدة ولكن تولد عزم تموجي كبير وكذلك شد دوراني على البرج وكل هذه تساهم في اداء .
تحتاج ايضا الى مصدر طاقة خارجي لكي تبدا بالدوران كون ان العزم االبتدائي المولد من قبل .ضعيف اجماال
يتم التقليل من العزم التموجي باستخدام ثالث او اكثر الزعانف والتي تؤدي إلى .اطئ جدا التوربين يكون و
ان .ان المتانة تقاس بمساحة الزعنفة نسبة الى مساحة الدوران الكلية .متانة اكبر للمحور الدوار للمنظومة
ولكن تمتاز بهيكل ( Guy- wires.)التصاميم الحديثة لمنظومات داريوس أصبحت التقوى بواسطة اسالك تقوية
(top bearing)قوي مثبت ومقوى من القمة بواسطة كرسي تحميل
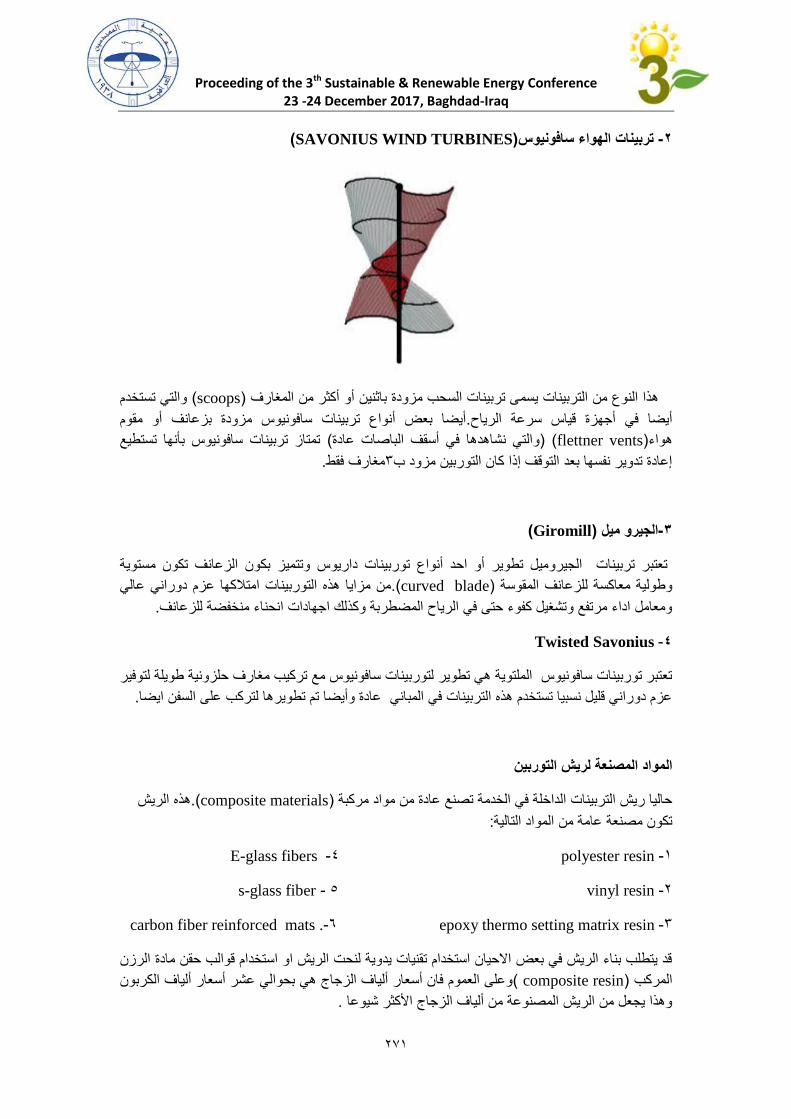
Proceeding of the 3th Sustainable & Renewable Energy Conference
23 -24 December 2017, Baghdad-Iraq
621
(SAVONIUS WIND TURBINES)تربينات الهواء سافونيوس -2
والتي تستخدم ( scoops)هذا النوع من التربينات يسمى تربينات السحب مزودة باثنين أو أكثر من المغارف
أيضا بعض أنواع تربينات سافونيوس مزودة بزعانف أو مقوم .عة الرياحأيضا في أجهزة قياس سر
تمتاز تربينات سافونيوس بأنها تستطيع (والتي نشاهدها في أسقف الباصات عادة( )flettner vents)هواء
.مغارف فقط0إعادة تدوير نفسها بعد التوقف إذا كان التوربين مزود ب
(Giromill)الجيرو ميل -3
تعتبر تربينات الجيروميل تطوير أو احد أنواع توربينات داريوس وتتميز بكون الزعانف تكون مستوية
من مزايا هذه التوربينات امتالكها عزم دوراني عالي (.curved blade)وطولية معاكسة للزعانف المقوسة
.نحناء منخفضة للزعانفومعامل اداء مرتفع وتشغيل كفوء حتى في الرياح المضطربة وكذلك اجهادات ا
4- Twisted Savonius
تعتبر توربينات سافونيوس الملتوية هي تطوير لتوربينات سافونيوس مع تركيب مغارف حلزونية طويلة لتوفير
.عزم دوراني قليل نسبيا تستخدم هذه التربينات في المباني عادة وأيضا تم تطويرها لتركب على السفن ايضا
لريش التوربين المواد المصنعة
هذه الريش (.composite materials)حاليا ريش التربينات الداخلة في الخدمة تصنع عادة من مواد مركبة
:تكون مصنعة عامة من المواد التالية
1-polyester resin 0-E-glass fibers
6-vinyl resin 0 - s-glass fiber
0-epoxy thermo setting matrix resin 2-carbon fiber reinforced mats .
ادة الرزن قد يتطلب بناء الريش في بعض االحيان استخدام تقنيات يدوية لنحت الريش او استخدام قوالب حقن م
وعلى العموم فان أسعار ألياف الزجاج هي بحوالي عشر أسعار ألياف الكربون ( composite resin)المركب
.وهذا يجعل من الريش المصنوعة من ألياف الزجاج األكثر شيوعا
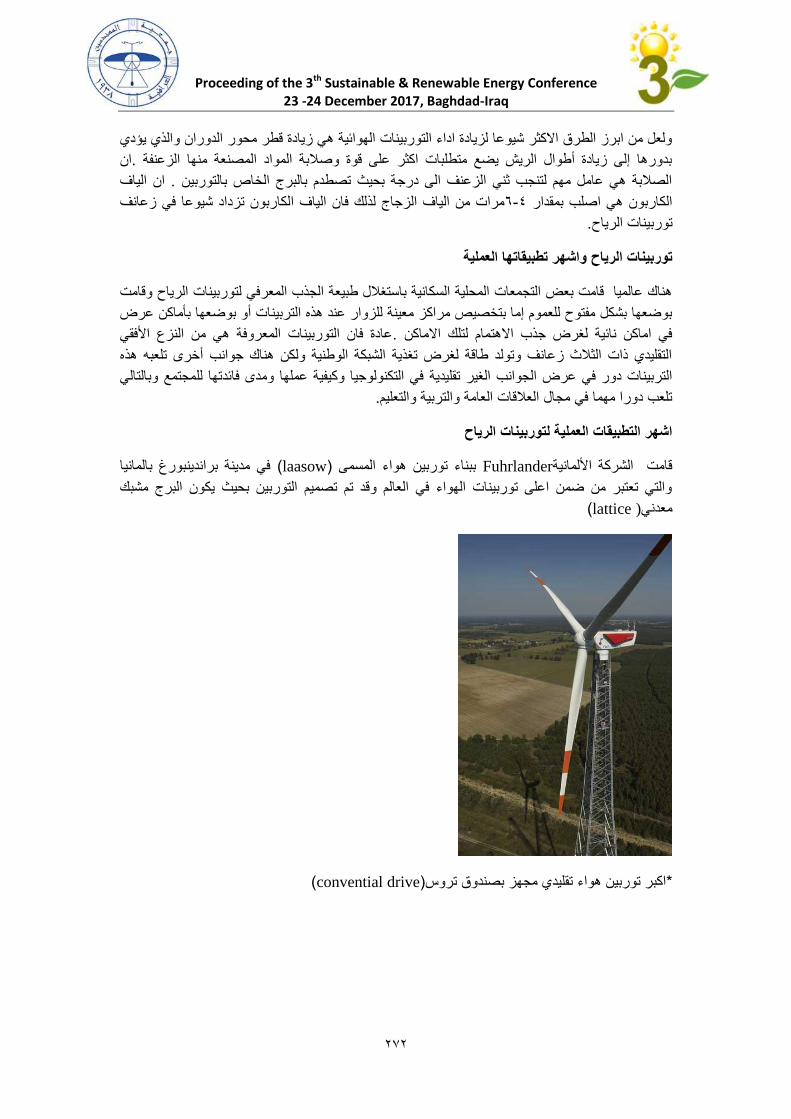
Proceeding of the 3th Sustainable & Renewable Energy Conference
23 -24 December 2017, Baghdad-Iraq
626
ذي يؤدي ولعل من ابرز الطرق االكثر شيوعا لزيادة اداء التوربينات الهوائية هي زيادة قطر محور الدوران وال
ان .بدورها إلى زيادة أطوال الريش يضع متطلبات اكثر على قوة وصالبة المواد المصنعة منها الزعنفة
ان الياف . الصالبة هي عامل مهم لتنجب ثني الزعنف الى درجة بحيث تصطدم بالبرج الخاص بالتوربين
لكاربون تزداد شيوعا في زعانف مرات من الياف الزجاج لذلك فان الياف ا2-0الكاربون هي اصلب بمقدار
.توربينات الرياح
توربينات الرياح واشهر تطبيقاتها العملية
هناك عالميا قامت بعض التجمعات المحلية السكانية باستغالل طبيعة الجذب المعرفي لتوربينات الرياح وقامت
ات أو بوضعها بأماكن عرض بوضعها بشكل مفتوح للعموم إما بتخصيص مراكز معينة للزوار عند هذه التربين
عادة فان التوربينات المعروفة هي من النزع األفقي .في اماكن نائية لغرض جذب االهتمام لتلك االماكن
التقليدي ذات الثالث زعانف وتولد طاقة لغرض تغذية الشبكة الوطنية ولكن هناك جوانب أخرى تلعبه هذه
في التكنولوجيا وكيفية عملها ومدى فائدتها للمجتمع وبالتالي التربينات دور في عرض الجوانب الغير تقليدية
.تلعب دورا مهما في مجال العالقات العامة والتربية والتعليم
اشهر التطبيقات العملية لتوربينات الرياح
في مدينة براندينبورغ بالمانيا ( laasow)ببناء توربين هواء المسمى Fuhrlanderقامت الشركة األلمانية
والتي تعتبر من ضمن اعلى توربينات الهواء في العالم وقد تم تصميم التوربين بحيث يكون البرج مشبك
( lattice (معدني
(convential drive)اكبر توربين هواء تقليدي مجهز بصندوق تروس*
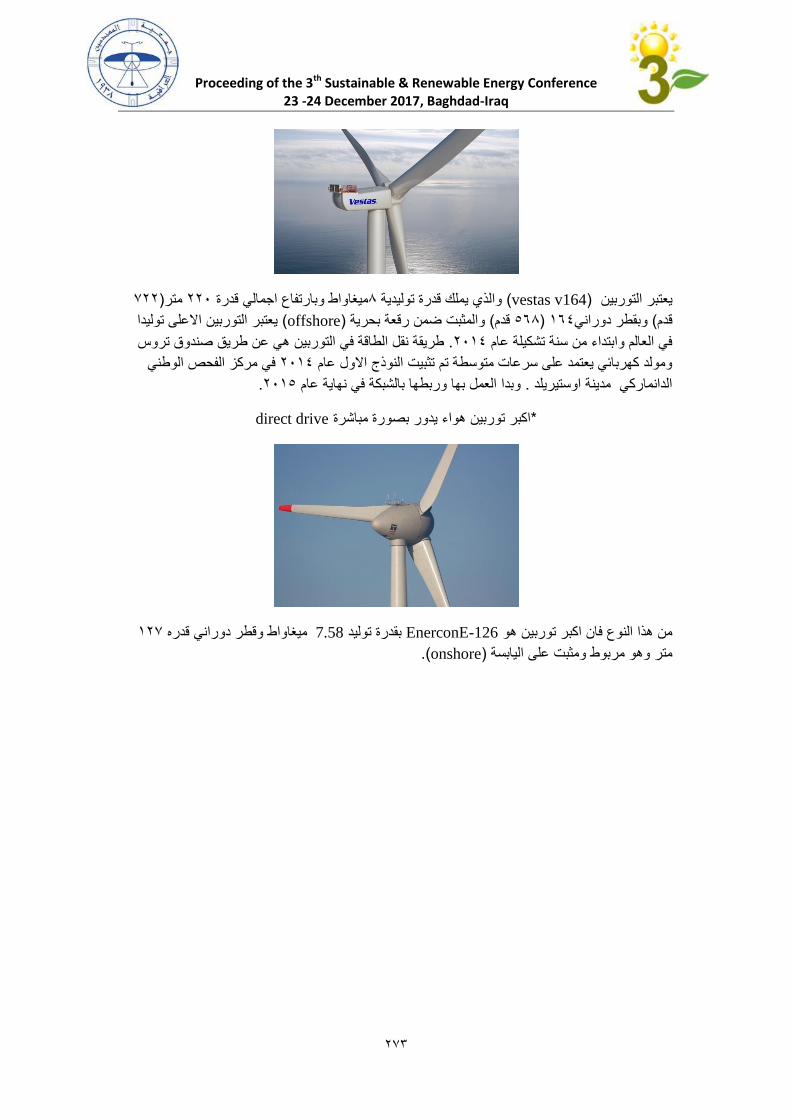
Proceeding of the 3th Sustainable & Renewable Energy Conference
23 -24 December 2017, Baghdad-Iraq
620
266)متر 663قدرة ميغاواط وبارتفاع اجمالي 2والذي يملك قدرة توليدية ( vestas v164)يعتبر التوربين
يعتبر التوربين االعلى توليدا ( offshore)والمثبت ضمن رقعة بحرية ( قدم 022) 120وبقطر دوراني( قدم
طريقة نقل الطاقة في التوربين هي عن طريق صندوق تروس . 6310في العالم وابتداء من سنة تشكيلة عام
في مركز الفحص الوطني 6310ج االول عام ومولد كهربائي يعتمد على سرعات متوسطة تم تثبيت النوذ
.6310وبدا العمل بها وربطها بالشبكة في نهاية عام . الدانماركي مدينة اوستيريلد
direct driveاكبر توربين هواء يدور بصورة مباشرة *
162ميغاواط وقطر دوراني قدره 7.58 بقدرة توليد EnerconE-126من هذا النوع فان اكبر توربين هو
(.onshore)اليابسة متر وهو مربوط ومثبت على
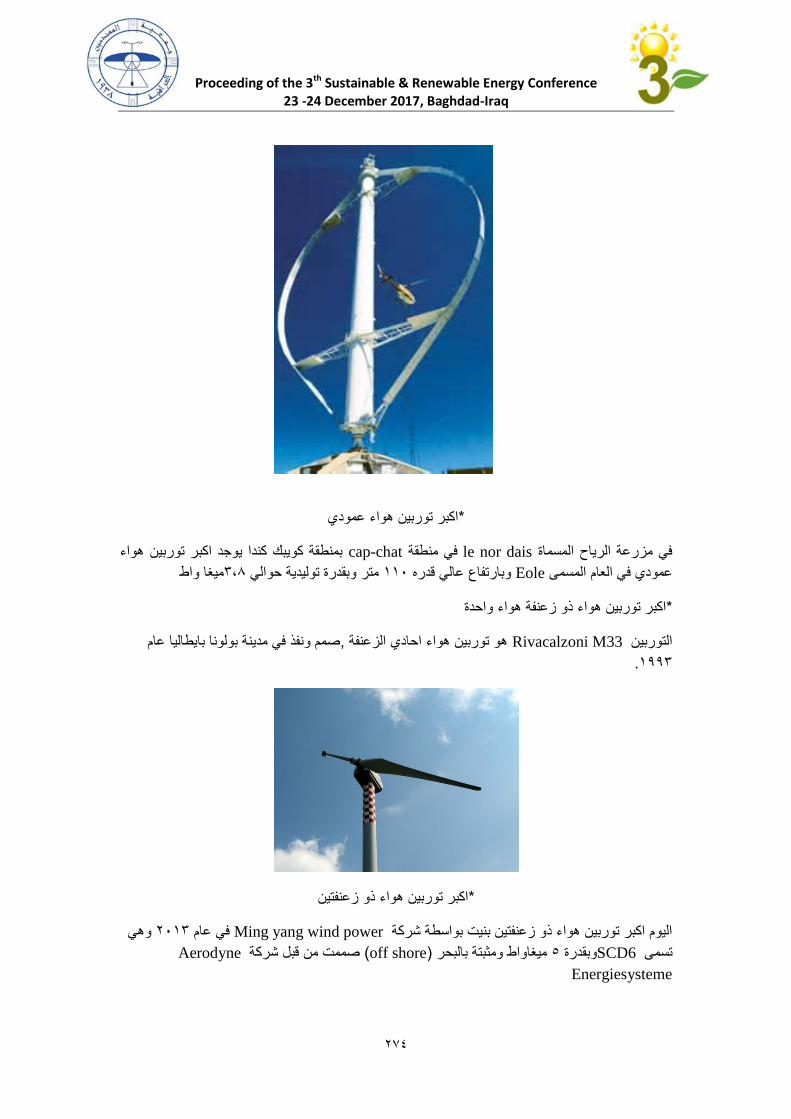
Proceeding of the 3th Sustainable & Renewable Energy Conference
23 -24 December 2017, Baghdad-Iraq
620
اكبر توربين هواء عمودي*
بمنطقة كويبك كندا يوجد اكبر توربين هواء cap-chatفي منطقة le nor dais في مزرعة الرياح المسماة
ميغا واط0,2متر وبقدرة توليدية حوالي 113وبارتفاع عالي قدره Eoleعمودي في العام المسمى
اكبر توربين هواء ذو زعنفة هواء واحدة*
صمم ونفذ في مدينة بولونا بايطاليا عام ,هو توربين هواء احادي الزعنفة Rivacalzoni M33التوربين
1000.
اكبر توربين هواء ذو زعنفتين*
وهي 6310في عام Ming yang wind powerاليوم اكبر توربين هواء ذو زعنفتين بنيت بواسطة شركة
Aerodyneصممت من قبل شركة ( off shore)ميغاواط ومثبتة بالبحر 0وبقدرة SCD6تسمى
Energiesysteme
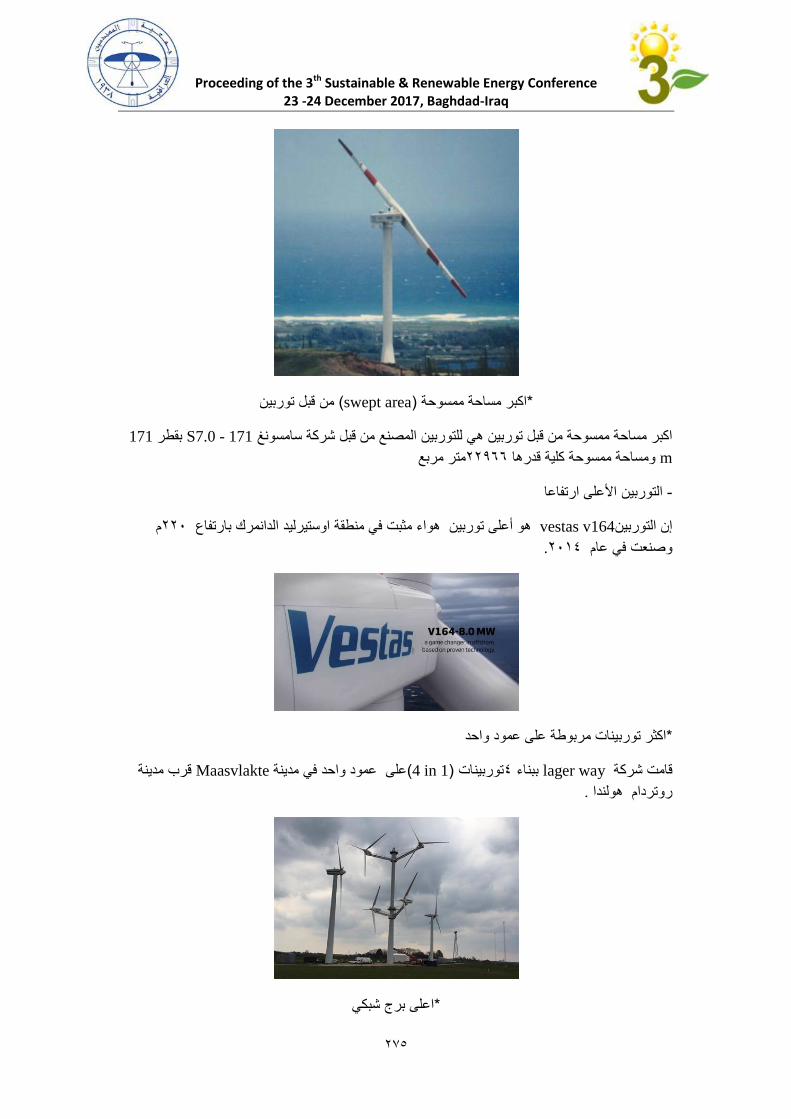
Proceeding of the 3th Sustainable & Renewable Energy Conference
23 -24 December 2017, Baghdad-Iraq
620
من قبل توربين( swept area)اكبر مساحة ممسوحة *
171 بقطر S7.0 - 171توربين هي للتوربين المصنع من قبل شركة سامسونغ اكبر مساحة ممسوحة من قبل
m متر مربع 66022ومساحة ممسوحة كلية قدرها
األعلى ارتفاعاالتوربين -
م 663هو أعلى توربين هواء مثبت في منطقة اوستيرليد الدانمرك بارتفاع vestas v164 إن التوربين
.6310وصنعت في عام
ربينات مربوطة على عمود واحداكثر تو*
قرب مدينة Maasvlakteعلى عمود واحد في مدينة(in 1 4)توربينات 0ببناء lager wayقامت شركة
.روتردام هولندا
اعلى برج شبكي*
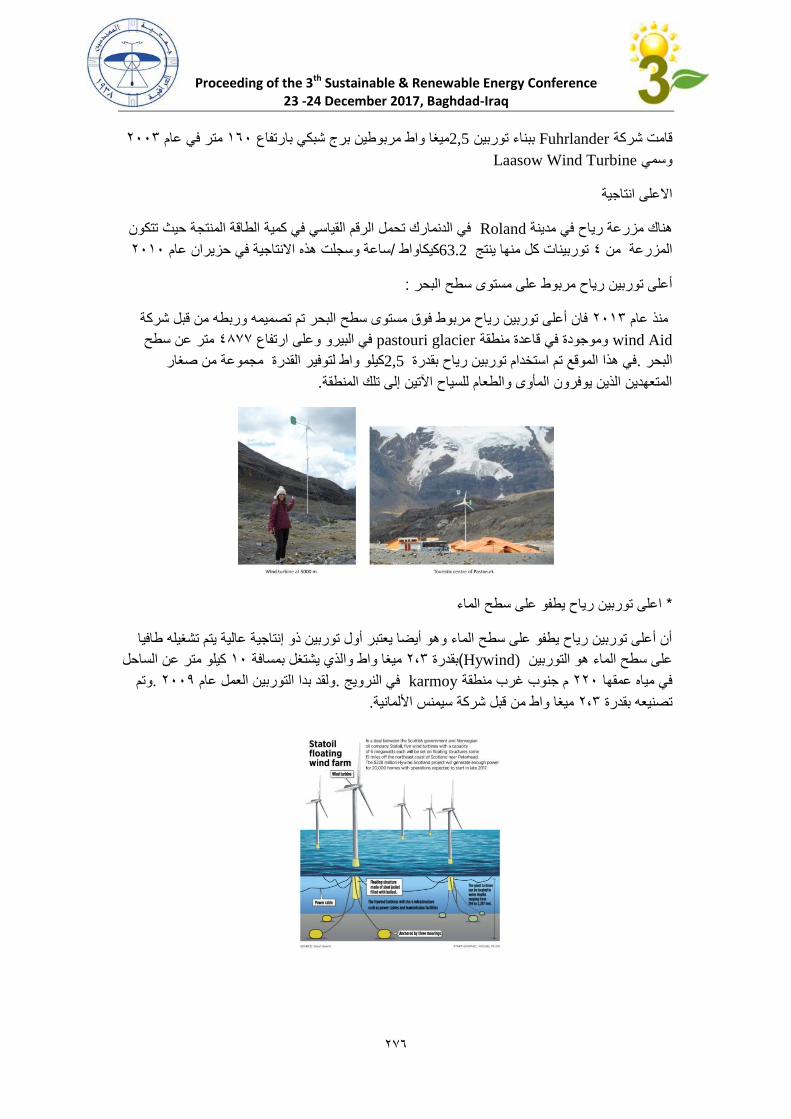
Proceeding of the 3th Sustainable & Renewable Energy Conference
23 -24 December 2017, Baghdad-Iraq
622
6330متر في عام 123ميغا واط مربوطين برج شبكي بارتفاع 2,5ببناء توربين Fuhrlanderقامت شركة
Laasow Wind Turbineوسمي
االعلى انتاجية
في الدنمارك تحمل الرقم القياسي في كمية الطاقة المنتجة حيث تتكون Rolandهناك مزرعة رياح في مدينة
6313ساعة وسجلت هذه االنتاجية في حزيران عام /كيكاواط 63.2توربينات كل منها ينتج 0المزرعة من
:سطح البحر أعلى توربين رياح مربوط على مستوى
فان أعلى توربين رياح مربوط فوق مستوى سطح البحر تم تصميمه وربطه من قبل شركة 6310منذ عام
wind Aid وموجودة في قاعدة منطقةpastouri glacier متر عن سطح 0222في البيرو وعلى ارتفاع
ر القدرة مجموعة من صغار كيلو واط لتوفي 2,5في هذا الموقع تم استخدام توربين رياح بقدرة .البحر
.المتعهدين الذين يوفرون المأوى والطعام للسياح اآلتين إلى تلك المنطقة
اعلى توربين رياح يطفو على سطح الماء*
أن أعلى توربين رياح يطفو على سطح الماء وهو أيضا يعتبر أول توربين ذو إنتاجية عالية يتم تشغيله طافيا
كيلو متر عن الساحل 13ميغا واط والذي يشتغل بمسافة 6,0بقدرة ( (Hywindين على سطح الماء هو التورب
وتم . 6330ولقد بدا التوربين العمل عام .في النرويج karmoyم جنوب غرب منطقة 663في مياه عمقها
. ميغا واط من قبل شركة سيمنس األلمانية 6,0تصنيعه بقدرة

تشريعات الطاقة المستدامة والمتجددة محور
(LSE)
دراسات ال
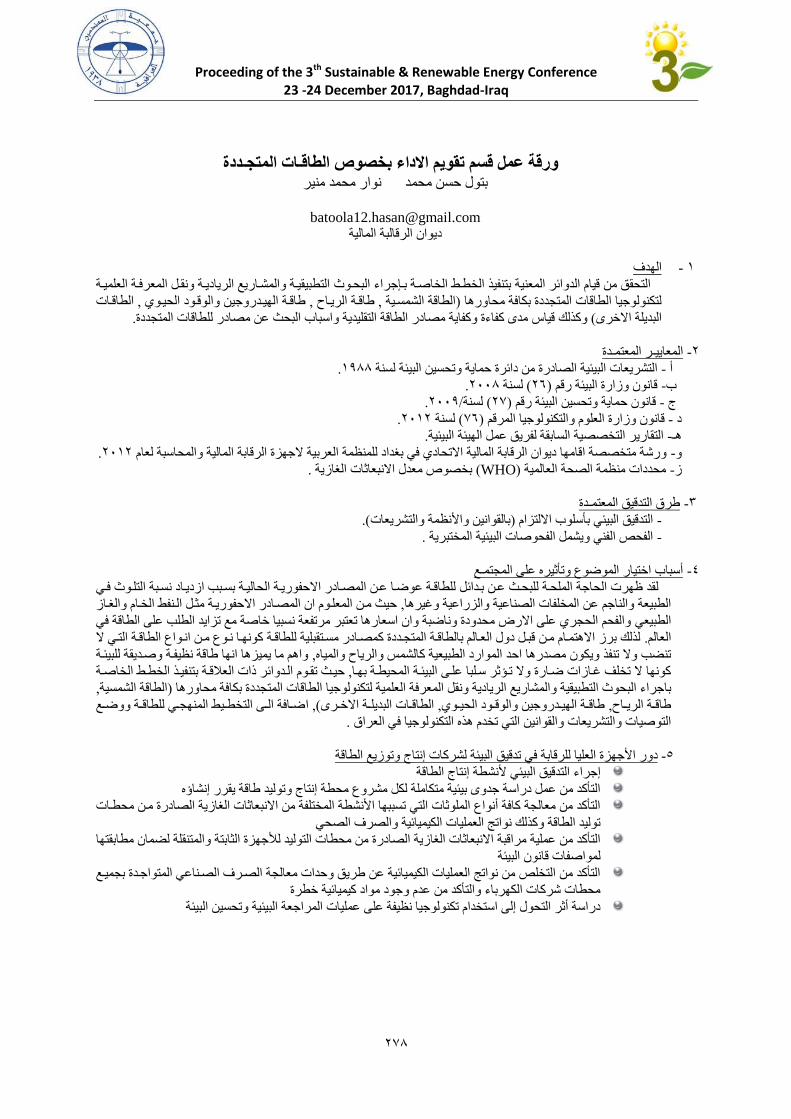
Proceeding of the 3th Sustainable & Renewable Energy Conference 23 -24 December 2017, Baghdad-Iraq
872
الطاقـات المتجـددة ورقة عمل قسم تقويم االداء بخصوص منير محمد نوار محمد حسن بتول
المالية الرقالبة ديوان
الهدف - 1
التطبيقيطة والماطاريا الرياديطة ونقطم المعرلطة الع ميطة البحطو بطجررا بتنفيذ الخطط الخاةطة الدوائر المعنية قيامالتحقق من
الطاقطات , طاقطة الهيطدرورين والوقطود الحيطو , طاقطة الريطا , الطاقة الامسطية )لتكنولوريا الطاقات المتجددة بكالة محاورها
.مدى كفا ة وكفاية مصادر الطاقة التق يدية واسباب البحث عن مصادر ل طاقات المتجددة قياسوكذلك (البدي ة االخرى
دة ـر المعتمـالمعايي -8
.1822التاريعات البيئية الصادرة من دائرة حماية وتحسين البيئة لسنة -أ
.8002لسنة ( 82)قانون وزارة البيئة رقم -ب
.8008/لسنة( 87)قانون حماية وتحسين البيئة رقم - ج
.8018لسنة ( 72)قانون وزارة الع وم والتكنولوريا المرقم - د
.التقارير التخصصية السابقة لفريق عمم الهيئة البيئية -هـ
.8018ام ورشة متخصصة اقامها ديوان الرقابة المالية االتحاد لي بغداد ل منظمة العربية الرهزة الرقابة المالية والمحاسبة لع -و
. بخصوص معدل االنبعاثات الغازية( WHO)محددات منظمة الصحة العالمية -ز
دةـطرق التدقيق المعتم -3
.(بالقوانين واألنظمة والتاريعات)االلتزام التدقيق البيئي بأس وب -
. الفحص الفني ويامم الفحوةات البيئية المختبرية -
اـع ى المجتم أسباب اختيار الموضوع وتأثيره -4
الت طو لطي نسطبةلقد ظهرت الحارة الم حطة ل بحطث عطن بطدائم ل طاقطة عوضطا عطن المصطادر االحفوريطة الحاليطة بسطب ازديطاد
حيث مطن المع طوم ان المصطادر االحفوريطة ملطم الطنف الخطام والغطاز , الطبيعة والنارم عن المخ فات الصناعية والزراعية وغيرها
والفحم الحجر ع ى االرض محدودة وناضبة وان اسعارها تعتبر مرتفعة نسبيا خاةة ما تزايد الط ع ى الطاقة لي الطبيعي
كونهطا نطوع مطن انطواع الطاقطة التطي ال لذلك برز االهتمطام مطن قبطم دول العطالم بالطاقطة المتجطددة كمصطادر مسطتقب ية ل طاقطة . العالم
واهم ما يميزها انها طاقة نظيفطة وةطديقة ل بيئطة , الموارد الطبيعية كالامس والريا والمياهتنض وال تنفذ ويكون مصدرها احد
بتنفيطذ الخطط الخاةطة الطدوائر اات العققطةحيطث تقطوم ,ثر سط با ع طى البيئطة المحيططة بهطاؤكونها ال تخ ف غطازات ضطارة وال تط
, الطاقة الامسية)ع مية لتكنولوريا الطاقات المتجددة بكالة محاورها ررا البحو التطبيقية والمااريا الريادية ونقم المعرلة الاب
ضططالة الططى التخطططي المنهجططي ل طاقططة ووضططا ا, (الطاقططات البدي ططة االخططرى, طاقططة الهيططدرورين والوقططود الحيططو , طاقططة الريططا
. لي العراق التوةيات والتاريعات والقوانين التي تخدم هذه التكنولوريا
البيئة لاركات إنتاج وتوزيا الطاقة تدقيقاألرهزة الع يا ل رقابة لي دور -5
ألناطة إنتاج الطاقة بيئيال التدقيقإررا
التأكد من عمم دراسة ردوى بيئية متكام ة لكم ماروع محطة إنتاج وتوليد طاقة يقرر إنااؤه
التأكد من معالجة كالة أنواع الم وثات التي تسببها األناطة المخت فة من االنبعاثات الغازية الصادرة مطن محططات
توليد الطاقة وكذلك نواتج العم يات الكيميائية والصرف الصحي
لضمان مطابقتها التأكد من عم ية مراقبة االنبعاثات الغازية الصادرة من محطات التوليد لألرهزة اللابتة والمتنق ة
لمواةفات قانون البيئة
التأكد من التخ ص من نواتج العم يات الكيميائية عن طريق وحدات معالجة الصطرف الصطناعي المتوارطدة بجميطا
محطات شركات الكهربا والتأكد من عدم ورود مواد كيميائية خطرة
ارعة البيئية وتحسين البيئةدراسة أثر التحول إلى استخدام تكنولوريا نظيفة ع ى عم يات المر
Proceeding of the 3th Sustainable & Renewable Energy Conference 23 -24 December 2017, Baghdad-Iraq
878
مصادر الطاقة - 2
:تقسيم مصادر الطاقة إلى عدة أقسام طبقا لمعايير معينة ناكر منها نيمك
:ع ى التجدد من ناحية معيار قدرتها :أوال
: لعققني ملل القستغقاال وهي ت ك المصادر المعرضة ل نضوب عبر الزمن نتيجة(: متجددةالغير ) ♦ مصادر الطاقة التق يدية
.الغاز الطبيعي والفحمل، البترو
، طاقة الريا ، أساسا الطاقة الامسيةل وتام، هي ت ك المصادر التي يمكن أن تجدد باستمرار لي البيئة: ♦ مصادر الطاقة المتجددة
ل ستغقالال جددة ألن احتياطاتها ال تنقص بفعوتعتبر هاه المصادر ل طاقة مت، طاقة الكت ة الحية والطاقة المائية، الحرارة الجولية
.المستمر لها
:حس مصدرها الطاقة مصادر : ثانيا
:قسمينهاا المعيار إلى حس الطاقة تنقسم مصادر
وليس لإلنسان أ ومن ةنعها لي الطبيعة ، بمعنى أنها تورد الطبيعياالةم وهي ت ك المصادر اات : الطاقة الطبيعيةمصادر ♦
.وبترولغاز من لحم ، المخت فة االحفور بأنواعها الريا والوقود ، الامس: هاه المصادرتامم لك ولي ادخم
عن الطبيعية من بعض الظواهر ستفادة اللي ااكائه نااط اإلنسان وعن وهي ت ك المصادر التي تناأ : الطاقة الصناعيةمصادر ♦
.الريا الكهربائية، وكذلك الطاقة توليد والخزانات المستعم ة لي السدود: لالملاسبيم ع ى طريق تقنيات معينة، ونذكر
الطاقةأهمية - 7
ة المعتمدة من طرله دائما لي الرقي بمستوى ـع ى مر العصور وهي الوسياإلنسان تعتبر الطاقة المفتا الرئيسي لنمو حضارة
لم استعان ببعض الحيوانات بعدما تمكن من استئناس ، أعماله اليوميةلبعدما كان يعتمد ع ى قوته العض ية لي القيام بجميا ، رلاهيته
ل رلا من مستوى الدائم إال أن سعيه ، عتماد ع ى الحطب والفحم لي الطهي والتدلئة بعدما اكتاف الناراالإلى ل لينتقمنها، بعض
حي أضحت أ الطاقة الوسي ة الرئيسية ،معياته أدى إلى زيادة حاجته إلى مصادر متنوعة ل طاقة خاصة بعد اللورة الصناعية
. ككملي رلا مستوى الرلاه العام ل مجتما ومن لم، قتصادية والخدميةاالاطة المعتمد ع يها لي جميا األن
:الطاقات المتجددة - 2
لعالم ادت الى استنـزاف ان اهم مايميز الط ع ى الطاقة هو االرتفاع المستمر اضالة الى انماط االستهقك واالنتاج السائدة لي ا
موارد الطاقة االمر الذ بات يهدد أمن الطاقة العالمي وهو مايدلا العالم الى البحث عن مصادر بدي ة تكون متجددة لغرض تحقيق
ك باكم أخر من امن الطاقة ع ى المستوى العالمي، اضالة الى ان مايهدد العالم ليس لق امكانية التهديد بنفاا الطاقة التق يدية وانما هنا
اشكال التهديد المرتبطة بالطاقة اال وهو الت و البيئي الذ زادت حدته باكم م حوظ وبات يهدد الحياة ع ى االرض اا لم تكن هناك
ت و البيئة اةق ونظرا لحجم المخاطر النارمة لقد اةبح خطوات لع ية ورادة لي البحث عن مصادر بدي ة تكون اقم ت و او ال
تمام بهذه الماك ة ينحصر ع ى دول بم اةبح عالميا مما يستدعي تكليف وتوحيد الجهود الدولية الراقية الى تطوير الطاقات االه
. المتجددة من ارم تحقيق امن الطاقة من رهة وحماية البيئة من رهة أخرى
: المتجددة مصادر الطاقة - 8
:يكون لها شأن لي تولير الطاقة ل بارية هي المتوقا انصادر الطاقة المستخدمة حاليا وان أهم م
عند ( توليد الكهربا ) وطاقة الريا ولذا تقام محطات( المد والجزر) وهي مساق المياه والسدود وحركة :المصادر الميكانيكية -أ
.يم التوربيناتالسدود والاقالت ومناطق المد العالي وربوع الريا الاديدة الستغقل قوة الدلا الميكانيكية لي تاغ
طاقة ) ي عم يات تسخين المياه والتدلئة والطهي كما يمكن تحوي ها مباشرة الىالتسخين المباشر ليستفاد منها عبر :الطاقة الامسية-ب
( .الخقيا الامسية)بواسطة ( كهربائية

Proceeding of the 3th Sustainable & Renewable Energy Conference 23 -24 December 2017, Baghdad-Iraq
820
الطاقة )ولي بعض المناطق تكون هذه حيث يستفاد من ارتفاع دررة الحرارة لي روف األرض :ـ الطاقة الحرارية الجولية ج
قريبة من سطح األرض لتورد بالتالي الينابيا الحارة لفي ايس ندة ملق تنتار هذه الينابيا ويستفاد منها ألغراض التدلئة ( الجولية
.والتسخين
يتم تخميرها لي حفرة خاةة وهي المخ فات الحيوية وهذا التصنيف يامم الحيوانية والزراعية التي (:Biomass) الكتم الحيوية-د
.ليتصاعد منها غاز الميلان وهو غاز قابم لقشتعال
يملم نوعا مهما من أنواع الوقود وهو مرشح الن يكون له دور كبير لي تامين الطاقة لي المستقبم وقد ظهرت :غاز الهيدرورين-هـ
وهي خقيا واعدة بتطبيقات واسعة لي المستقبم ( خقيا الوقود)سيارات تعمم ع ى غاز الهيدرورين وابرز تطبيقاته االستفادة منه لي
طاقة )األوكسجين نحصم ع ى وا بها وعبر اتحاد الهيدرورين وويتم توليد الكهربا داخ ها مباشرة بتمرير الهيدرورين واله
.البيئةال تساهم لي ت ويث ( خقيا الوقود)واما مخ فات هذه العم ية لهي الما لق إ إن ( كهربائية
الطاقة )لي المفاعقت النووية ويستفاد منها لي تسيير السفن والغواةات وتوليد ( االناطار النوو )تنتج عن :الطاقة النووية-و
الناتجة وماك ة التخ ص منها وضواب السقمة العالية األزمة لمنا انفجار المفاعم او ( النفايات الماعة)وابرز س بياتها ( الكهربائية
.اإلشعاعات منه تسرب
أنواع الطاقة المتجددة - 10
إلى ل الكت ة الحية إال أنها ك ها تعود لي األص، الحرارة الجولية، الماء، الريا ، الامس :دة مصادر ل طاقات المتجددة منهاهناك ع
أو طاقة حرارية كالطاقة الامسية ، هاه المصادر إما أن تنتج طاقة ميكانيكية كطاقة الريا والكت ة الحية والحرارة الجولية، الامس
. ومنه لجن هاه المصادر تنتج طاقة ت بي االحتياجات المباارة ل سكان، الجولية أو كهربائية كالطاقة الامسية والحرارة، والكت ة الحية
الطاقة الامسية -أ
إن الامس هي مصدر الحياة ع ى وجه هاا الكوكب وهي المصدر الرئيسي ل طاقة ع ى وجهه باستلناء :مفهوم الطاقة الامسية : أوال
كالك تعد طاقة ، لالطاقات األحفورية استمدت طاقتها المخزونة منها، من الامسصور الطاقة المتواجدة أص ها ل لك، الطاقة النووية
المد والجزر نوعا من أنواع الطاقة الحركية المستمدة منها كالكألن مناأ المد والجزر هو جدب الامس والقمر لمياه األرض وكالك
. المقاييسل هي طاقة هائ ة بكوطاقة الامس طاقة مستمرة ال ينقطا ليضها و. بالنسبة لطاقة الريا ل الحا
أهمية الطاقة الامسية : ثانيا
، إليهال الوصواألخرى تكمن أهمية الطاقة الامسية لي عدم محدوديتها ومجانيتها ووصولها إلى مناطق نائية ال يمكن لمصادر الطاقة
إضالة ، التحديات التي يواجهها العالم اليومت و البيئة والتي أصبحت اليوم من أعظم ل من أاكال إضالة إلى عدم مساهمتها بأ اك
. مرة يجع ها أكلر مصادر الطاقة ولرة( 5000)منها والا يزيد كما سبق اكره عن احتياجات العالم ب ل إلى الك لجن هاا القدر الهائ
طاقة الريا -ب
( الميكانيكية)تمكنها من تحريك األاياء أ الطاقة الحركية ن طاقة الريا هي القدرة التي تمت كها الريا والتي ا :مفهوم طاقة الريا
حي يؤد تسخين أاعة الامس ل هواء إلى ، وهي طاقة مجانية تعود لي األساس إلى الامس، التي يمت كها الهواء نتيجة الحركة
طاقة الريا ل إاا لأص، ينساب كريا تصاعد هاه الطبقات الهوائية الحارة إلى أع ى تاركة تحتها لراغا يتم م ؤه بالهواء البارد الا
.إلى طاقة ريا ل من الطاقة الامسية الساقطة ع ى سطح األرض تتحو% 8هي الامس بحي قدر الع ماء أن
:طاقة الهيدرورين -ج
؟وكيف يتم إنتاجه؟ لكن ما هو الهيدروجين، لمصادر الطاقة التق يديةل يحظى الهيدروجين باهتمام واسا كبدي

Proceeding of the 3th Sustainable & Renewable Energy Conference 23 -24 December 2017, Baghdad-Iraq
821
إضالة إلى أمكانية واألنظف، المقومات التي تجع ه وقودا ناجحا لهو األخف ل يحوز غاز الهيدروجين ع ى ك: واجد الهيدروجينت
والهيدروجين غاز ليس له طعم أو رائحة وغير سام ويتكون من جز ء لنائي الارة ، أخرى من الطاقة بكفاءة تامةل تحوي ه إلى أاكا
H2 ،ل ملق لهو ياك، اجدا لي الكون لكليرا من الكواكب والنجوم تتكون منه لقط أو تحتو نسبة عالية منهوهو من أكلر العناصر تو
ويمت ك الهيدروجين أصغر ارة ، الهيدروجين مكونة عنصر الهي يوم أيونندماج الوطاقتها تنتج نتيجة من مكونات الامس % 75
لي تركيب العديد من المواد الكيميائية والتي من أهمها الماء والمركبات ل يدخو، بالضغط والتبريدل واإلسالة اتعال لقوأخفها وهو قاب
.العضوية التي تكون األجسام الحية من نباتات وحيوانات
خصائص وعيوب الطاقات المتجددة وأهم معوقات تطورها - 11
ة وإنما متجددة المخزون باستمرار كما أنها غير تتمتا الطاقات المتجددة بمجموعة من الخصائص وع ى رأسها أنها طاقات غير ناضب
د العوائق التي ربما كانت أح، نوع ع ى حدى إال أنها ال تخ و من عيوبل إلى خصائص أخرى يتمتا بها ك، باإلضالة م ولة ل بيئة
.دون تطويرهال تحو
هناك خاصيتين ماتركتين بين مخت ف مصادر الطاقات المتجددة كما سبق اكره آنفا وهما خاصية التجدد :خصائص الطاقة المتجددة
. تفصي هال منها خصائص أخرى سنحاول إال أن لك، وكاا خاصية عدم ت وي البيئة
ة ع ى غيرها من مصادر يجابية التي تجع ها مفض الخصائص الطاقة الامسية تتميز الطاقة الامسية بالعديد من الخصائص ا: أوال
:الطاقة األخرى وناكر منها
التي تعتمد لي ت بية احتياجاتها من المستديمة إمكانية إنااء المااريا ل مما يسهل مقاببق ل نضوب ول تعتبر مصدرا متجددا غير قاب -أ
. الطاقة ع ى الطاقة الامسية
. أ كمية منهاستغقل عدم خضوع الطاقة الامسية لسيطرة النظم السياسية والدولية والمح ية التي قد تحد من التوسا لي ا -ب
ع ى ادة اإلاعاع الامسي الوارد ل الطاقة المخت فة بل وكاا عدم اعتماد تحوي ها ع ى أاكااألماكن تولر الطاقة الامسية لي جميا -ج
.لي أ مكانلقستغقل اب ة مما يجع ها ق, إلى األرض
بالنسبة ل عام ين لي ل األمان إضالة إلى تولر عام، الطاقة المخت فةل الطاقة الامسية إلى أاكال بساطة التقنية المعتمدة لي تحوي -د
.الطاقات التق يديةستغقل ال إنتاج الطاقة من الامس مقارنة بالعام ين لي مجال مجا
كها ت و وهو ما يكسبها وضعا خاصا لي ستهقلالطاقة الامسية طاقة نظيفة ال ينتج عن إنتاجها وا: البيئياألمان تولر مصادر - ـه
.البيئية التي يعرلها العالمل تزايد حدة وخطورة المااكل وخاصة لي ظل، هاا المجا
خصائص طاقة الريا : لانيا
: من بين الخصائص التي تتمتا بها طاقة الريا ناكر
.لها أ غازات م ولةستغقطاقة الريا طاقة مح ية متجددة ال ينتج عن ا -
كما يمكن وضا التوربينات ، ل ريا يمكن استخدامها لي أغراض أخرى كالزراعة والرعيل من األراضي المستخدمة كحقو% 85 -
.لوق المباني
منظمة المقاييس العالمية حجم الطاقة الكهربائية الممكن توليدها تولر طاقة الريا ع ى إمكانات كبيرة لي توليد الكهرباء حي قدرت -
.لهاستغقوهي إمكانات ضخمة لي حالة تحقق ا، م يون ميغاواط 80بواسطة الريا ع ى نطاق عالمي بحوالي
:المتولرةاألنواع ما بالمقارنة ل يتمتا الهيدروجين بمجموعة من الخصائص تجع ه وقودا ملاليا ل مستقب :خصائص الهيدروجين: لاللا
.وال ينتج عن احتراقه أ غازات م ولةل حتراق او محتوى حرار عال لقالهيدروجين عنصر قاب -
Proceeding of the 3th Sustainable & Renewable Energy Conference 23 -24 December 2017, Baghdad-Iraq
828
وهو دائم ومتجدد إا أن ، وخصوصا لي مياه البحار والمحيطات، إنه مصدر غير ناضب ومتولر بكميات كبيرة لي الطبيعة -
.منه الهيدروجين مرات متتالية وغير محدودة احتراقه يولد الماء النقي الا يمكن أن نستخ ص
وهو ما يجع ه األنابي أو غاز سواء لي صهاريج أو عبر ابكات ل سائل كـسهولة نق ه وتخزينه لالهيدروجين يمكن نق ه با -
.كما يمكن خزنه لفترات طوي ة واستعماله عند الحاجة دون أن يؤلر الك لي خصائصه، كال لقستهقودا مقبوـوق
، الطبخ والتسخين والتدلئةألغراض ن استخدام الهيدروجين لي البيوت السكنية بدال من الغاز الطبيعي وبصورة خاصة يمك -
.بها حاليال دون إجراء تغييرات جارية لي أجهزة المحركات المعمول النقل كما يمكن استعماله كوقود لمخت ف وسائ
: خصائص الكت ة الحية: رابعا
:تقدم الكت ة الحية عدد من المزايا ناكر منها
.تولرها الواسا لي مخت ف أرجاء الكرة األرضية -
من الرماد إضالة إلى أن حجم غاز لاني أكسيد الكربون المنط ق من الكت ة %5إلى 3من الكبريت ومن % 0،1من ل احتوائها ع ى أق-
وهاا يعني أنها ال تطر لي الجو أ كمية ، ق منه لي عم ية التركيب الضوئيالحجم المنطل الحية عند حرقها أو معالجتها يعاد
.إضالية من غاز لاني أكسيد الكربون
.الكت ة الحية ع ى نطاق واسا لتوليد الكهرباء والحرارةل تستعم -
عيوب الطاقة المتجددة
عيوب الطاقة الامسية : أوال
اقة المتجددة سواء من ناحية النظالة أو من حي ديمومتها وارتباط ـمصادر الط لع ى الرغم من كون الطاقة الامسية من ألض
ل ماكل ه تطورها وأوـإال أنها ال تخ و من العيوب التي كانت عائقا لي وج، بها إضالة إلى بساطة تقنية التحكم بهااألخرى المصادر
الغائمة كاأليام السنة ل اليوم وال طوال قة ال تكون متوالرة طوالهي طال، يـلها لي أوقات الحاجة كالاتاء وال الستغقخزنها ل هو ماك
تطوير ل بحي يظ، لهاستغقنتاار وتوسا االزمة لقاالت التطوير اـوالممطرة لالك لجن بحو تخزين الطاقة الامسية من أهم مج
.أنظمة تخزين جديدة ومحسنة أمرا حيويا وتحديا يواجه اقتصاد يقوم ع ى مصدر لابت ل طاقة
إن الطاقة الامسية هي طاقة متولرة إال أنها ليست مجانية ألن سعرها الحقيقي هو عبارة عن تكاليف المعدات المستخدمة لي تحوي ها
جع ها ل ع ى خفضها إلى أدنى مستوى ممكن من أجل وهاه التكاليف يجب العم، من طاقة مغناطيسية إلى طاقة كهربائية أو حرارية
. نالسة الطاقات األحفوريةطاقة تجارية قادرة ع ى م
عيوب طاقة الريا : لانيا
: من أهم ما يعاب ع ى هاا المصدر الطاقو
السنة ل لصوخقل و( عواصف وريا عادية)مصدر غير لابت لالطاقة الناتجة عن الريا متغيرة حسب الزمن لي اليوم الواحد
.كما أنها متغيرة حسب المكان أيضا، الواحدة
ب الهيدروجين عيو: لاللا
:بالرغم من المزايا العديدة التي يتمتا بها الهيدروجين إال أنه ال يخ و من العيوب والتي ناكر منها
حفورية وكاا انبعا الماك ة نضوب الطاقات ال عتماد الكبير ع ى الغاز الطبيعي لي إنتاج الهيدروجين وهاا ال يحالا -
.الغازات العادمة
.حتفاظ به إلى وقت الحاجةلقالحجم من الهيدروجين وهو ما يعني الحاجة إلى خزانات كبيرة انخفاض الطاقة لي وحدة -

Proceeding of the 3th Sustainable & Renewable Energy Conference 23 -24 December 2017, Baghdad-Iraq
823
ف البني التحتية لطاقة الهيدروجين عن نظيرتها لمصادر الطاقة الحالية مما يعني ضرورة إجراء تغيرات قد تكون ختقا -
.مك فة
إلى 4،5المنتارة حاليا نحتاج من األرهزة منه لي معظم إنتاج متر مكعب ـم ارتفاع تكاليف إنتاج الهيدروجين لمن أج™ -
.خفض التكاليف تتركز األبحا ع ى تحسين المردود لهاه الخقيال ومن أج، ساعة/ كي وواط 4،2
:من بين ما يؤخا ع ى هاا المصدر ما ي ي :عيوب الكت ة الحية : رابعا
.التوازن البيئيختقل الكت ة الحية لي إنتاج الطاقة يؤد إلى ستغقل زيادة ا -
ستدامة ألن كميات الحطب المتاحة لي تناقص مستمر الأساليب استخدام الكت ة الحية المطبقة حاليا ال تسمح ال بالتجدد وال با -
.الغابات إلى أراضي زراعيةل بسبب قيام السكان بتحوي
.كسماد ل تربةاستعماله ل لضقت الحيوانات كوقود بدل لقدان التربة لخصوصيتها بسبب استعما -
تطور وانتاار الطاقات المتجددة عوقات م - 18
ا نتج عن الك ـتطوير ونار استخدام الطاقات المتجددة ومل اـمنفردة لي مجل ع ى الرغم من الجهود المباولة من طرف بعض الدو
ل وب والك نتيجة لبعض العوائق التي تحوور يبقى دون المستوى المطـإال أن هاا التطل، من تطور ل خبرات الع مية والفنية لي المجا
:اد الواسا ل طاقات المتجددة وناكر منهاـقتصالستخدام االدون تحقيق ا
ق عن ـلضل، لي السياسة العامة ل طاقة أو لي السياسات القطاعية ل دول عدم إدراج سياسات الطاقة المتجددة كجزء متكام -
د يؤلر ع ى أسواق الطاقة وخاصة سوق ـلية بأن تنمية هاه المصادر قخاصة البترول عتقاد السائد لدى بعض الدوالا
.لالبترو
ما غياب ، ستلمارات الضخمة لي الطاقات التق يديةالالمخصص ل طاقات المتجددة مقارنة بحجم ال محدودية التموي -
.لستلمار لي هاا المجالـقالسياسات الجاابة
ات المعنية بتطوير هاه المصادر وقصور برامج التنسيق والتعاون ـبين الجهضعف مستوى التنسيق ع ى المستوى الوطني -
.إلى المسته ك النهائيال بدءا بواضعي السياسات وصول لي المجااإلق يمي
.محدودية قواعد البيانات المقننة والكالية التي ترصد الخبرات والدروس المستفادة من الماروعات التي تم تنفياها -
.األساسيةالتصنيعية ل ضعف الهياك -
.ضعف الجانب التاريعي الداعم ل طاقات المتجددة -
.ارتفاع تك فة إنااء مااريا الطاقات المتجددة مما ينعكس ع ى أسعارها وتجع ها غير تنالسية بالنسبة ل طاقات التق يدية -
.ق ة الموارد البارية الماهرة -
، تطوير اقتصادياتهال ئمة من أجمقالطاقات المتجددة يتط ب التخ ص من هاه العوائق ووضا أرضية ستغقل إاا تطوير وتوسيا ا
.حتياجات الطاقوية العالمية المتزايدةالومن لمة تمكينها من ت بية ا
جــالنتائ - 13
:والخط اات العققة بالموضوع ندرج ادناه ما ي ي التدقيق واالطقع ع ى االناطةمن خقل
و 82)حيث ب غت 8013مقارنة بعام 8015و 8014لقعوام المتع قة بالطاقة المتجددة انخفاض اعداد البحو المنجزة -أ
8012ماروع بحلي لي عام ضالة الى عدم انجاز أ الع ى التوالي با%( 48و% 42)بحلا ع ى التوالي أ بنسبة انخفاض ( 82
- :كـوالجدول التالي يوضح ال
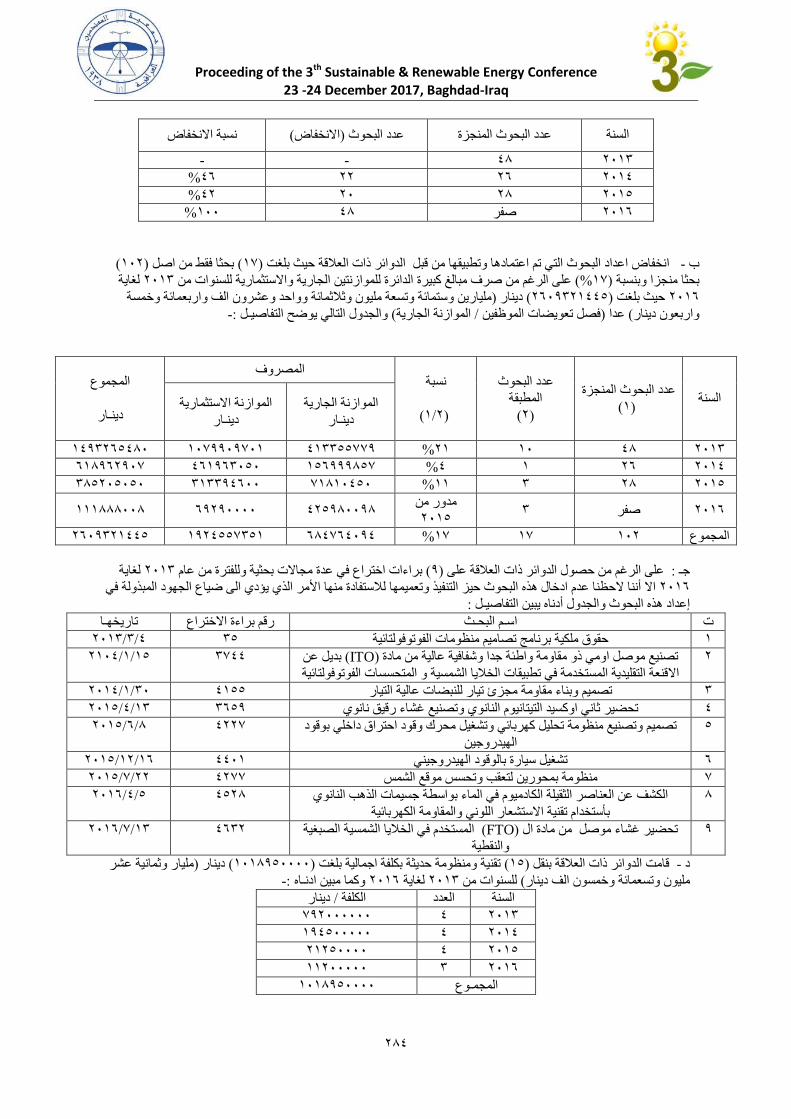
Proceeding of the 3th Sustainable & Renewable Energy Conference 23 -24 December 2017, Baghdad-Iraq
824
نسبة االنخفاض (االنخفاض)عدد البحو عدد البحو المنجزة السنة
8013 42 - -
8014 82 88 42%
8015 82 80 48%
%100 42 ةفر 8012
( 108) بحلا لق من اةم( 17)حيث ب غت العققةاات من قبم الدوائر انخفاض اعداد البحو التي تم اعتمادها وتطبيقها -ب
لغاية 8013الدائرة ل موازنتين الجارية واالستلمارية ل سنوات من ع ى الرغم من ةرف مبالغ كبيرة%( 17)بحلا منجزا وبنسبة
ة وخمسة بعمائم يون وثقثمائة وواحد وعارون الف وار م يارين وستمائة وتسعة)دينار ( 8208381445)حيث ب غت 8012
- : مـوالجدول التالي يوضح التفاةي (الموازنة الجارية / ات الموظفينلصم تعويض) عدا (واربعون دينار
السنة البحو المنجزةعدد
(1)
البحو عدد
المطبقة
(8)
نسبة
(8/1)
المصروف المجموع
ارـدين الموازنة الجارية
ارـدين
الموازنة االستلمارية
ارـدين
8013 42 10 81% 413355778 1078808701 1483825420
8014 82 1 4% 152888257 421823050 212828807
8015 82 3 11% 71210450 313384200 325805050
3 ةفر 8012مدور من
8015 485820082 28880000 111222002
8208381445 1884557351 224724084 %17 17 108 المجموع
لغاية 8013برا ات اختراع لي عدة مجاالت بحلية ول فترة من عام ( 8)ع ى ع ى الرغم من حصول الدوائر اات العققة : رـ
الذ يؤد الى ضياع الجهود المبذولة لي األمرالبحو حيز التنفيذ وتعميمها لقستفادة منها هذهالحظنا عدم ادخال ال أنناا 8012
: مـناه يبين التفاةيحو والجدول أدهذه الب إعداد
اـهتاريخ االختراع رقم برا ة ثـم البحـاس ت
4/3/8013 35 حقوق م كية برنامج تصاميم منظومات الفوتولولتائية 1
بديم عن ( ITO)تصنيا موةم اومي او مقاومة واطئة ردا وشفالية عالية من مادة 8
و المتحسسات الفوتولولتائيةقنعة التق يدية المستخدمة لي تطبيقات الخقيا الامسية اال
3744 15/1/8104
30/1/8014 4155 تصميم وبنا مقاومة مجزئ تيار ل نبضات عالية التيار 3
13/4/8015 3258 اا رقيق نانو يتانيوم النانو وتصنيا غتحضير ثاني اوكسيد الت 4
بوقود تصميم وتصنيا منظومة تح يم كهربائي وتاغيم محرك وقود احتراق داخ ي 5
الهيدرورين
4887 2/2/8015
12/18/8015 4401 تاغيم سيارة بالوقود الهيدروريني 2
88/7/8015 4877 منظومة بمحورين لتعق وتحسس موقا الامس 7
الكاف عن العناةر اللقي ة الكادميوم لي الما بواسطة رسيمات الذه النانو 2
الكهربائيةبأستخدام تقنية االستاعار ال وني والمقاومة
4582 5/4/8012
المستخدم لي الخقيا الامسية الصبغية (FTO)تحضير غاا موةم من مادة ال 8
والنقطية
4238 13/7/8012
م يار وثمانية عار)دينار ( 1012850000)ب غت تقنية ومنظومة حديلة بك فة ارمالية ( 15)بنقم وائر اات العققةقامت الد -د
-: اهـوكما مبين ادن 8012لغاية 8013 ل سنوات من( وخمسون الف دينارئة ام يون وتسعم
دينار/ الك فة العدد السنة
8013 4 788000000
8014 4 184500000
8015 4 81850000
8012 3 11800000
1012850000 وعـالمجم
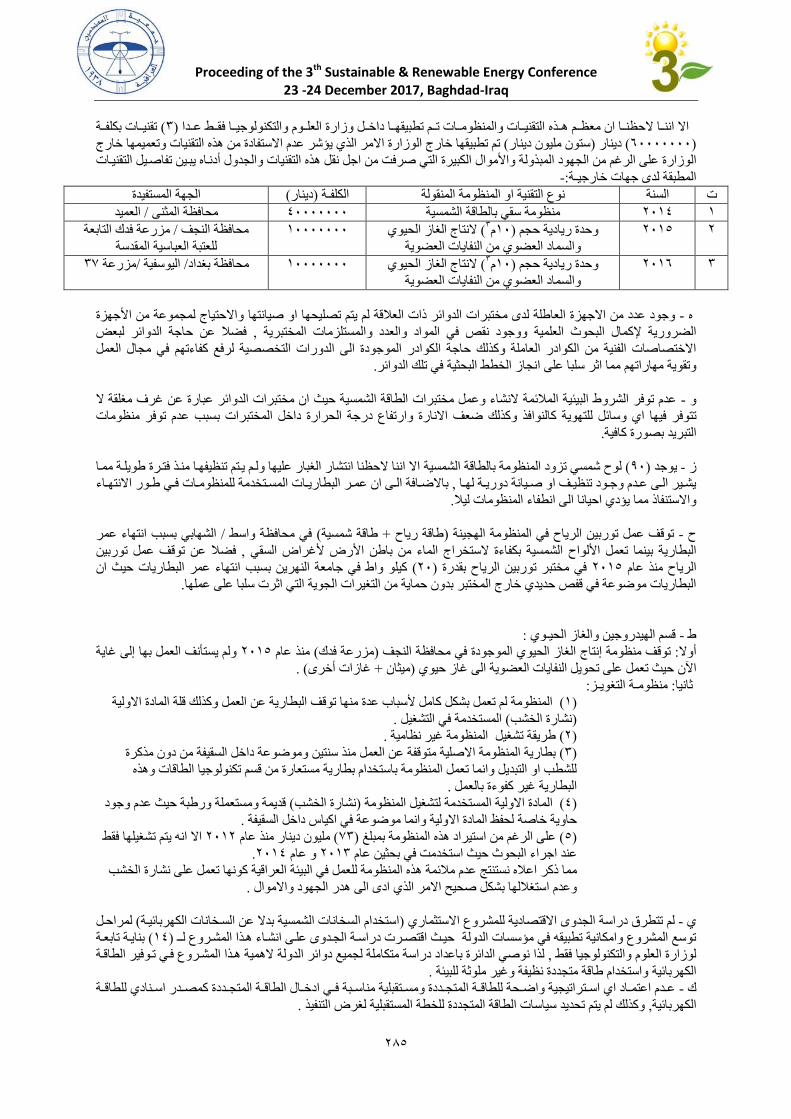
Proceeding of the 3th Sustainable & Renewable Energy Conference 23 -24 December 2017, Baghdad-Iraq
825
تقنيططات بك فططة ( 3)عططدا الع ططوم والتكنولوريططا لقطط التقنيططات والمنظومططات تططم تطبيقهططا داخططم وزارة اال اننططا الحظنططا ان معظططم هططذه
خارج التقنيات وتعميمها ر الذ يؤشر عدم االستفادة من هذهاالمتم تطبيقها خارج الوزارة ( ستون م يون دينار)دينار ( 20000000)
قنيطات يبطين تفاةطيم الت أدنطاهجدول الكبيرة التي ةرلت من ارم نقم هذه التقنيات وال واألموالع ى الرغم من الجهود المبذولة الوزارة
- :ةـالمطبقة لدى رهات خارري
المستفيدة الجهة (دينار) ةـالك ف نوع التقنية او المنظومة المنقولة السنة ت
العميد/ محالظة الملنى 40000000 منظومة سقي بالطاقة الامسية 8014 1
م10)وحدة ريادية حجم 8015 83النتاج الغاز الحيو (
والسماد العضو من النفايات العضوية
مزرعة لدك التابعة / محالظة النجف 10000000
ل عتبة العباسية المقدسة
م10)وحدة ريادية حجم 8012 33النتاج الغاز الحيو (
والسماد العضو من النفايات العضوية
37مزرعة /اليوسفية / لظة بغدادامح 10000000
واالحتياج لمجموعة من األرهزة لم يتم تص يحها او ةيانتها الدوائر اات العققةالعاط ة لدى مختبرات دد من االرهزةورود ع -ه
لضق عن حارة الدوائر لبعض , وورود نقص لي المواد والعدد والمست زمات المختبرية الضرورية إلكمال البحو الع مية
ادر المورودة الى الدورات التخصصية لرلا كفا تهم لي مجال العمم االختصاةات الفنية من الكوادر العام ة وكذلك حارة الكو
.لي ت ك الدوائرمما اثر س با ع ى انجاز الخط البحلية وتقوية مهاراتهم
غرف مغ قة ال عبارة عن دوائرحيث ان مختبرات الالطاقة الامسية مختبرات وعمم عدم تولر الاروط البيئية المقئمة الناا -و
بسب عدم تولر منظومات داخم المختبراتارتفاع دررة الحرارة كذلك ضعف االنارة وكالنوالذ و تهويةل ليها ا وسائمتتولر
.بصورة كالية التبريد
اال اننا الحظنا انتاار الغبار ع يها ولطم يطتم تنظيفهطا منطذ لتطرة طوي طة ممطا الامسية المنظومة بالطاقة لو شمسي تزود( 80)يورد -ز
طططور االنتهططالططي المسططتخدمة ل منظومططات عمططر البطاريططات باالضططالة الططى ان, ياططير الططى عططدم ورططود تنظيططف او ةططيانة دوريططة لهططا
.ليق المنظومات ا يؤد احيانا الى انطفا مواالستنفاا م
انتها عمر بسب الاهابي/ لي محالظة واس ( شمسيةطاقة +طاقة ريا )ن الريا لي المنظومة الهجينة توربي عمم توقف -
توربين عمم توقف لضق عن , ألغراض السقي األرضالامسية بكفا ة الستخراج الما من باطن األلوا البطارية بينما تعمم
سب انتها عمر البطاريات حيث انب كي و واط لي رامعة النهرين (80)لي مختبر توربين الريا بقدرة 8015الريا منذ عام
.الجوية التي اثرت س با ع ى عم هاالبطاريات موضوعة لي قفص حديد خارج المختبر بدون حماية من التغيرات
:و ـقسم الهيدرورين والغاز الحي -ط
غاية إلىولم يستأنف العمم بها 8015منذ عام ( مزرعة لدك)النجف محالظةالغاز الحيو المورودة لي إنتاجتوقف منظومة :أوال
. (أخرىغازات + ميلان )لى غاز حيو حيث تعمم ع ى تحويم النفايات العضوية ا ناآل
:زـة التغويـمنظوم :ثانيا
المنظومة لم تعمم باكم كامم ألسباب عدة منها توقف البطارية عن العمم وكذلك ق ة المادة االولية (1)
. المستخدمة لي التاغيم (ناارة الخا )
.طريقة تاغيم المنظومة غير نظامية ( 8)
وموضوعة داخم السقيفة من دون مذكرة ة ية متوقفة عن العمم منذ سنتينبطارية المنظومة اال (3)
ل اط او التبديم وانما تعمم المنظومة باستخدام بطارية مستعارة من قسم تكنولوريا الطاقات وهذه
. البطارية غير كفو ة بالعمم
قديمة ومستعم ة ورطبة حيث عدم ورود ( ناارة الخا )المادة االولية المستخدمة لتاغيم المنظومة (4)
.لحفظ المادة االولية وانما موضوعة لي اكياس داخم السقيفة حاوية خاةة
تم تاغي ها لق اال انه ي 8018منذ عام م يون دينار (73)المنظومة بمب غ ع ى الرغم من استيراد هذه (5)
.8014و عام 8013عند اررا البحو حيث استخدمت لي بحلين عام
مة ل عمم لي البيئة العراقية كونها تعمم ع ى ناارة الخا مما اكر اعقه نستنتج عدم مقئمة هذه المنظو
.وعدم استغقلها باكم ةحيح االمر الذ ادى الى هدر الجهود واالموال
لمراحطم (بدال عن السطخانات الكهربائيطة استخدام السخانات الامسية)االستلمار ماروعل ى االقتصادية لم تتطرق دراسة الجدو -
بنايطة تابعطة ( 14)ـ لط هطذا الماطروعاناطا ع طىحيطث اقتصطرت دراسطة الجطدوى توسا الماروع وامكانية تطبيقه لي مؤسسات الدولة
الهمية هطذا الماطروع لطي تطولير الطاقطة متكام ة لجميا دوائر الدولة باعداد دراسةنوةي الدائرة لذا , لوزارة الع وم والتكنولوريا لق
. واستخدام طاقة متجددة نظيفة وغير م وثة ل بيئة الكهربائية
ل طاقططة عططدم اعتمططاد ا اسططتراتيجية واضططحة ل طاقططة المتجططددة ومسططتقب ية مناسططبة لططي ادخططال الطاقططة المتجططددة كمصططدر اسططناد -ك
. ل خطة المستقب ية لغرض التنفيذ المتجددة لم يتم تحديد سياسات الطاقة وكذلك, الكهربائية
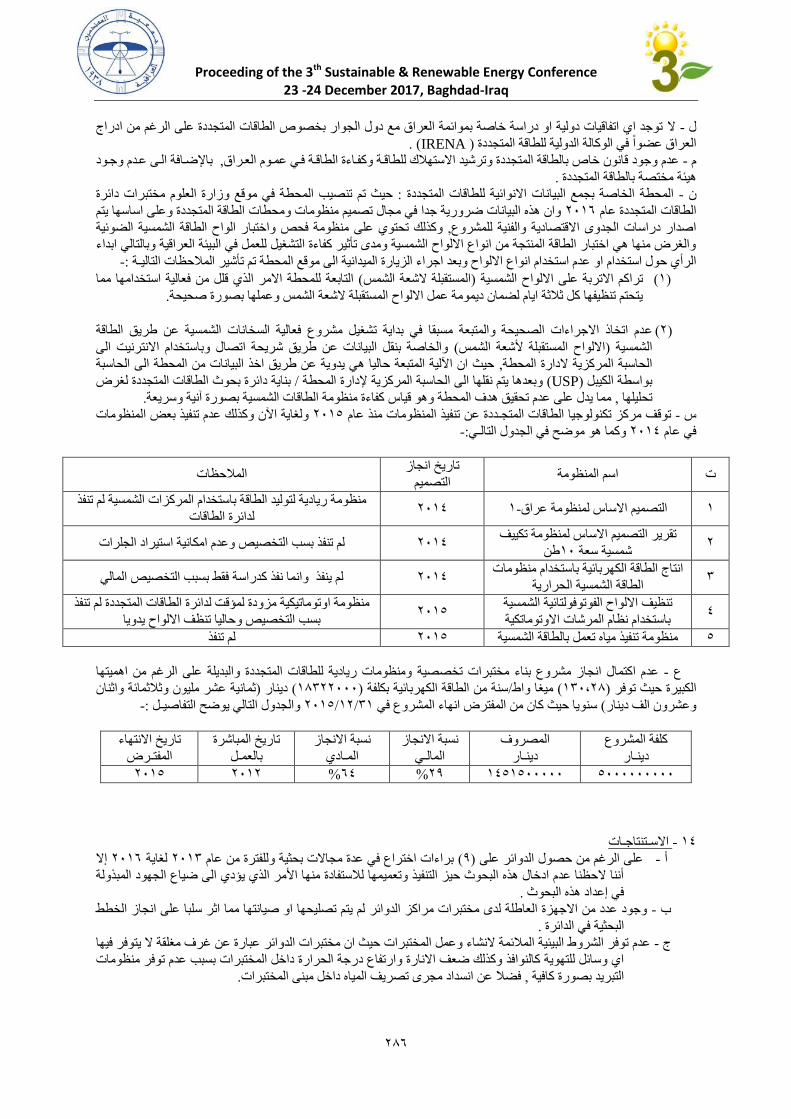
Proceeding of the 3th Sustainable & Renewable Energy Conference 23 -24 December 2017, Baghdad-Iraq
822
تورد ا اتفاقيات دولية او دراسة خاةة بموائمة العراق ما دول الجوار بخصوص الطاقات المتجددة ع ى الرغم من ادراج ال -ل
. (IRENA) العراق عضوا لي الوكالة الدولية ل طاقة المتجددة
عطدم ورطود باإلضطالة الطى ,العطراقعدم ورود قانون خاص بالطاقة المتجددة وترشيد االستهقك ل طاقطة وكفطا ة الطاقطة لطي عمطوم -م
. هيئة مختصة بالطاقة المتجددة
مختبرات دائرة لي موقا وزارة الع وم حطةحيث تم تنصي الم : الخاةة بجما البيانات االنوائية ل طاقات المتجددةلمحطة ا -ن
الطاقة المتجددة وع ى اساسها يتمحطات وان هذه البيانات ضرورية ردا لي مجال تصميم منظومات وم 8012المتجددة عام الطاقات
ر الوا الطاقة الامسية الضوئيةمنظومة لحص واختبا ع ى وكذلك تحتو , اةدار دراسات الجدوى االقتصادية والفنية ل ماروع
اقية وبالتالي ابدا والغرض منها هي اختبار الطاقة المنتجة من انواع االلوا الامسية ومدى تأثير كفا ة التاغيم ل عمم لي البيئة العر
-: ةـالمقحظات التاليتأشير محطة تم ة الى موقا اليالرأ حول استخدام او عدم استخدام انواع االلوا وبعد اررا الزيارة الميدان
ق م من لعالية استخدامها مما ل محطة االمر الذ التابعة ( المستقب ة الشعة الامس)م االتربة ع ى االلوا الامسية تراك (1)
.ةحيحةيتحتم تنظيفها كم ثقثة ايام لضمان ديمومة عمم االلوا المستقب ة الشعة الامس وعم ها بصورة
عن طريق الطاقة دم اتخاا االررا ات الصحيحة والمتبعة مسبقا لي بداية تاغيم ماروع لعالية السخانات الامسيةع (8)
الى والخاةة بنقم البيانات عن طريق شريحة اتصال وباستخدام االنترنيت( ألشعة الامسااللوا المستقب ة )الامسية
حيث ان اآللية المتبعة حاليا هي يدوية عن طريق اخذ البيانات من المحطة الى الحاسبة , دارة المحطةالالحاسبة المركزية
الطاقات المتجددة لغرض بناية دائرة بحو/ المحطة الحاسبة المركزية إلدارة وبعدها يتم نق ها الى( USP)بواسطة الكيبم
.كفا ة منظومة الطاقات الامسية بصورة آنية وسريعةوهو قياس مما يدل ع ى عدم تحقيق هدف المحطة , تح ي ها
وكذلك عدم تنفيذ بعض المنظومات ولغاية اآلن 8015عن تنفيذ المنظومات منذ عام مركز تكنولوريا الطاقات المتجـددةتوقف - س
- :يـوكما هو موضح لي الجدول التال 8014لي عام
اسم المنظومة تتاريخ انجاز
التصميم المقحظات
8014 1-التصميم االساس لمنظومة عراق 1منظومة ريادية لتوليد الطاقة باستخدام المركزات الامسية لم تنفذ
لدائرة الطاقات
8 االساس لمنظومة تكييف تقرير التصميم
طن10شمسية سعة لم تنفذ بس التخصيص وعدم امكانية استيراد الج رات 8014
3 انتاج الطاقة الكهربائية باستخدام منظومات
الطاقة الامسية الحرارية لم ينفذ وانما نفذ كدراسة لق بسب التخصيص المالي 8014
4 تنظيف االلوا الفوتولولتائية الامسية
باستخدام نظام المرشات االوتوماتكية8015
منظومة اوتوماتيكية مزودة لمؤقت لدائرة الطاقات المتجددة لم تنفذ
بس التخصيص وحاليا تنظف االلوا يدويا
لم تنفذ 8015 منظومة تنفيذ مياه تعمم بالطاقة الامسية 5
ومنظومات ريادية ل طاقات المتجددة والبدي ة ع ى الرغم من اهميتها انجاز ماروع بنا مختبرات تخصصية اكتمال عدم - ع
قثمائة واثنان ثمانية عار م يون وث) دينار( 12388000)سنة من الطاقة الكهربائية بك فة /واط ميغا( 130،82)ولر لكبيرة حيث تا
- :م ـدول التالي يوضح التفاةيوالج 31/18/8015سنويا حيث كان من المفترض انها الماروع لي ( وعارون الف دينار
ك فة الماروع
ارـدين
المصروف
ارـدين
نسبة االنجاز
يـالمال
جاز نسبة االن
اد ـالم
تاريخ المباشرة
مـبالعم
تاريخ االنتها
رضـالمفت
5000000000 1451500000 88% 24% 8018 8015
اتـتنتارـاالس - 14
إال 8012لغاية 8013برا ات اختراع لي عدة مجاالت بحلية ول فترة من عام ( 8)ع ى وائرع ى الرغم من حصول الد -أ
أننا الحظنا عدم ادخال هذه البحو حيز التنفيذ وتعميمها لقستفادة منها األمر الذ يؤد الى ضياع الجهود المبذولة
. لي إعداد هذه البحو
لم يتم تص يحها او ةيانتها مما اثر س با ع ى انجاز الخط وائراكز الدورود عدد من االرهزة العاط ة لدى مختبرات مر -ب
. البحلية لي الدائرة
عبارة عن غرف مغ قة ال يتولر ليها وائرعدم تولر الاروط البيئية المقئمة الناا وعمم المختبرات حيث ان مختبرات الد - ج
ررة الحرارة داخم المختبرات بسب عدم تولر منظومات ا وسائم ل تهوية كالنوالذ وكذلك ضعف االنارة وارتفاع د
. لضق عن انسداد مجرى تصريف المياه داخم مبنى المختبرات, التبريد بصورة كالية
Proceeding of the 3th Sustainable & Renewable Energy Conference 23 -24 December 2017, Baghdad-Iraq
827
لبعض المنظومات كمنظومة التبريد الهجينة لي شعبة ( المستقب ة الشعة الامس)تراكم االتربة والغبار ع ى االلوا الامسية -د
رارية ومنظومة المحطة الخاةة بجما البيانات االنوائية بسب عدم تنظيفها بصورة ةحيحة ودورية التطبيقات الح
.مما أدى الى انخفاض لعالية استخدامها
وكذلك توقف ( الاهابي)لي محالظة واس ( طاقة شمسية+طاقة ريا )توقف عمم توربين الريا لي المنظومة الهجينة - ـه
بسب انتها 8015كي و واط لي رامعة النهرين منذ عام ( 80)تبر توربين الريا بقدرة عمم توربين الريا لي مخ
. عمر البطاريات لي المنظومتين
التي تعمم ع ى تحويم النفايات الخابية بعم ية االحتراق الداخ ي الى غاز يحول الى طاقة )توقف العمم بمنظومة التغويز -و
التابعة لمختبر الغاز الحيو لي مركز الطاقات المستحدثة بسب توقف البطارية عن ( كي و لولت 10كهربائية بقدرة
ع ى الرغم من استيراد هذه المستخدمة لي عم ية التاغيم( ناارة الخا )ة العمم منذ سنتين وكذلك ق ة المادة االولي
. م يون دينار (73)المنظومة بمب غ
عدم اعتماد ا استراتيجية واضحة ل طاقة المتجددة ومستقب ية مناسبة لي ادخال الطاقة المتجددة كمصدر اسناد ل طاقة -ز
. اقة المتجددة ل خطة المستقب ية لغرض التنفيذالكهربائية وكذلك لم يتم تحديد سياسات الط
ولغاية اآلن وكذلك عدم تنفيذ 8015توقف مركز تكنولوريا الطاقات المتجددة عن تنفيذ تصاميم المنظومات منذ عام -
.8014تصاميم بعض المنظومات لي عام
قات المتجددة والبدي ة ع ى الرغم من اهميتها عدم اكتمال انجاز ماروع بنا مختبرات تخصصية ومنظومات ريادية ل طا -ط
ثمانية عار م يون )دينار ( 12388000)سنة من الطاقة الكهربائية بك فة /ميغاواط( 130،82)الكبيرة حيث تولر
. سنويا( وثقثمائة واثنان وعارون الف دينار
اتــالتوةي - 2
لي وتعميمها لقستفادة منها وتطبيقها عم يا حيز التنفيذ الدائرةالتي حص ت ع يها ختراع االبرا ات العمم ع ى ادخال -أ
. مخت ف المجاالت
انجاز الخط لقستفادة منها ليتص يحها او ةيانتها لاالرهزة العاط ة لدى مختبرات مراكز الدائرة تاكيم لجنة لنية لبيان -ب
. البحلية
لضق عن حم ,منظومات التبريد و االنارةملم المفرغات ومم المختبرات ر الاروط البيئية المقئمة الناا وعيتول ضرورة - ج
. انسداد مجرى تصريف المياه داخم مبنى المختبرات ماك ة
بصورة دورية والعمم ع ى االتربة والغبار لبعض المنظومات من( المستقب ة الشعة الامس)القيام بتنظيف االلوا الامسية -د
.لة لي تنظيفهاادخال التكنولوريا الحدي
( الاهابي)لي محالظة واس ( طاقة شمسية+طاقة ريا )توربين الريا لي المنظومة الهجينة بعمم التوقف معالجة اسباب - ـه
.كي و واط لي رامعة النهرين( 80)بقدرة وكذلك توربين الريا
ع ى ان البحو قاب ة والتركيز ومعالجة اسباب التوقف توقف العمم بمنظومة التغويزتاكيم لجنة لنية لدراسة اسباب -و
. ل تطبيق لي بيئة العراق
كمصدر اسناد ل طاقة اعتماد استراتيجية واضحة ل طاقة المتجددة ومستقب ية مناسبة لي ادخال الطاقة المتجددة ضرورة -ز
. فيذتحديد سياسات الطاقة المتجددة ل خطة المستقب ية لغرض التنو الكهربائية
توقف مركز تكنولوريا الطاقات المتجددة عن تنفيذ تصاميم المنظومات منذ معالجة اسباب -
.8014ولغاية اآلن وكذلك عدم تنفيذ تصاميم بعض المنظومات لي عام 8015عام
هميتها ال والكريادية ل طاقات المتجددة والبدي ة المنظومات التخصصية والمختبرات المال انجاز ماروع بنا اك العمم ع ى -ط
. سنة من الطاقة الكهربائية /ميغاواط( 130،82)الكبيرة حيث تولر


ةللطاقة المستدامة والمتجدد لثوقائع المؤتمر الثا
Proceeding of the 3 rd
Sustainable & Renewable
Energy Conference
23-24 December 2017
Baghdad-Iraq
www.ise-iq.org

Proceeding of the 3 rd
Sustainable & Renewable Energy Conference
23-24 December 2017, Baghdad-Iraq
Committees of the Conference
Preparatory Committee
Consultant Engineer Falih Kadhim Zayer
President of Iraqi Society of Engineers
Consultant Engineer Ali Hussein Sabeeh
Administrative Board of Iraq Society of Engineers
Engineer Mohammed Farooq Abdulkhaleq
Administrative Board of Iraq Society of Engineers
Dr.Haydar Amer Al-Baghdadi
Administrative Board of Iraq Society of Engineers
Consultant Engineer Munaim Salih Al-Sabie
Administrative Board of Iraq Society of Engineers
Consultant Engineer Riadh Katab Hussein
Administrative Board of Iraq Society of Engineers
Dr. Falih Hamzah Edan
Administrative Board of Iraq Society of Engineers
Assist. Lecturer Ahmed Salih Mahdi
Administrative Board of Iraq Society of Engineers
Al-Mustansiriyah University, Collage of Engineering
Engineer Hammoodi Khudhair Mohammed
Administrative Board of Iraq Society of Engineers
Engineer Abdulateef Abdulhussein Sangoor
Administrative Board of Iraq Society of Engineers
Asst. Prof. Dr. Lubna Abd Aljabar Al-Zubaidi
Al-Mustansiriyah University, Collage of Engineering
Lecturer Dr. Tawfeeq Wasmi Mohammed
Al-Mustansiriyah University, Collage of Engineering
Lecturer Dr. Nabeel Taha Ismail
University of Diyala, Collage of Engineering
Assist. Lecturer Areej Muhy Abdul-wahab
Al-Mustansiriyah University, Collage of Engineering

Proceeding of the 3 rd
Sustainable & Renewable Energy Conference
23-24 December 2017, Baghdad-Iraq
Assist. Lecturer Aws Jawad Jaafar
University of Technology, Dept. of Architecture
Consultant Engineer Abd Algani fakree Al- Gaffer
Director General Authority of industrial research and development
Consultant Engineer Dhiyaa Jaleel Hussein
Renewable Energy Directorate/ Ministry of Scince and technology
Academic Architecture Muwafaq Jawad Al-Tayi
Iraqi Society of Engineers
Consultant Engineer Wahhab Razooqi Al-Murib
Iraqi Society of Engineers
Consultant Engineer Alya Mahdi Mohammed
National Center of Engineering Consultants
Consultant Engineer Amer Essa Al-Jewahiri
Baghdad Economic Forum
Consultant Engineer Madhaa Sabeeh Mohammed Said
Ministry of Construction and Housing
Consultant Engineer Abdulsalam Abdulhassan Elgeshmi
Member of Iraqi Society of Engineers
Engineer Hassanien Mohamed Hassan
Member of Iraqi Society of Engineers
Engineer Hussam Ahmed Hussain
Member of Iraqi Society of Engineers
Engineer Qays Mikheal Bahnam
Middle Technical University/ institute of Technology/ Baghdad
Scientific Committee
Prof. Dr. Hussein Youssef Mahmoud
Vice President of Iraqi Society of Engineers
Prof. Dr. Ghada Mousa Rzoki
University of Baghdad, Collage of Engineering
Prof. Dr. Nada Mahdi Fawzi
University of Baghdad, College of Engineering
Prof. Dr. Ammar Salih Abbas
University of Baghdad, College of Engineering

Proceeding of the 3 rd
Sustainable & Renewable Energy Conference
23-24 December 2017, Baghdad-Iraq
Assist. Prof. Dr. Alaa Karim Mohammed
University of Baghdad, Al-Khwarizmi Collage of Engineering
Asst. Prof. Dr. Maher Yahya Salloom
Administrative Board of the Iraqi Society of Engineers
Assist. Prof. Dr. Ekhlas Mohammed Fayyadh
University of Technology, Mechanical Dept.
Assist. Prof. Dr. Fuwad Alwan Saleh
Al-Mustansiriyah University, College of Engineering
Assist. Prof. Dr. Kareem Khalaf Mohammed
Nahrain University, Renewable Energy Research Center
Assist. Prof. Dr. Abdul-kareem Mohammed Ali
University of Baghdad, College of Sciences
Assist. Prof. Ahmed Waheed Mustafa
Nahrain University, College of Engineering
Assist. Prof. Dr. Raheek Ismael Ibrahim
University of Technology, Electro-Mechanical Dept.
Assist. Prof. Dr. kalid Salih Agmei
University of Technology/ Director of the Nanotecnology Center
Assist. Prof. Dr. Shaimaa Hameed Hussein
Nahrain University, College of Engineering
Assist. Prof. Naseer Abbood Al-Haboubi
Nahrain University, College of Engineering
Assist. Prof. Nasir Amhed Alawad
Al-Mustansiriyah University, College of Engineering
Salah Raheema Abeed
Administrative Board of the Iraqi Society of Engineers
Lecturer Dr. Hanan Michaeel
University of Baghdad, Collage of Engineering
Lecturer Dr. Shatha Abbas Hassan
University of Baghdad, Collage of Engineering
Lecturer Dr. Ameel Mohammed Rahman Al-Mayah
University of Baghdad, Al-Khwarizmi Collage of Engineering
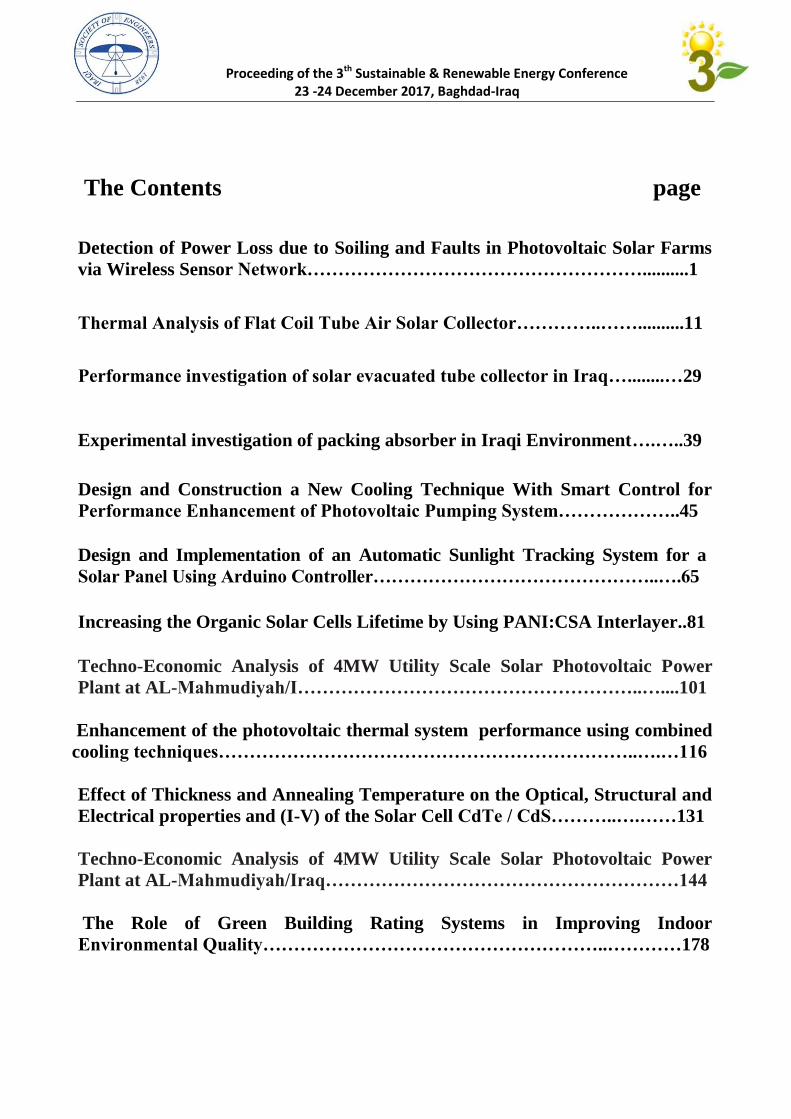
Proceeding of the 3th Sustainable & Renewable Energy Conference 23 -24 December 2017, Baghdad-Iraq
The Contents page
Detection of Power Loss due to Soiling and Faults in Photovoltaic Solar Farms
via Wireless Sensor Network………………………………………………..........1
Thermal Analysis of Flat Coil Tube Air Solar Collector…………..……..........11
Performance investigation of solar evacuated tube collector in Iraq…........…29
Experimental investigation of packing absorber in Iraqi Environment….…..39
Design and Construction a New Cooling Technique With Smart Control for
Performance Enhancement of Photovoltaic Pumping System………………..45
Design and Implementation of an Automatic Sunlight Tracking System for a
Solar Panel Using Arduino Controller………………………………………..….65
Increasing the Organic Solar Cells Lifetime by Using PANI:CSA Interlayer..81
Techno-Economic Analysis of 4MW Utility Scale Solar Photovoltaic Power
Plant at AL-Mahmudiyah/I………………………………………………..…....101
Enhancement of the photovoltaic thermal system performance using combined
cooling techniques…………………………………………………………..….…116
Effect of Thickness and Annealing Temperature on the Optical, Structural and
Electrical properties and (I-V) of the Solar Cell CdTe / CdS………..….……131
Techno-Economic Analysis of 4MW Utility Scale Solar Photovoltaic Power
Plant at AL-Mahmudiyah/Iraq…………………………………………………144
The Role of Green Building Rating Systems in Improving Indoor
Environmental Quality………………………………………………..…………178
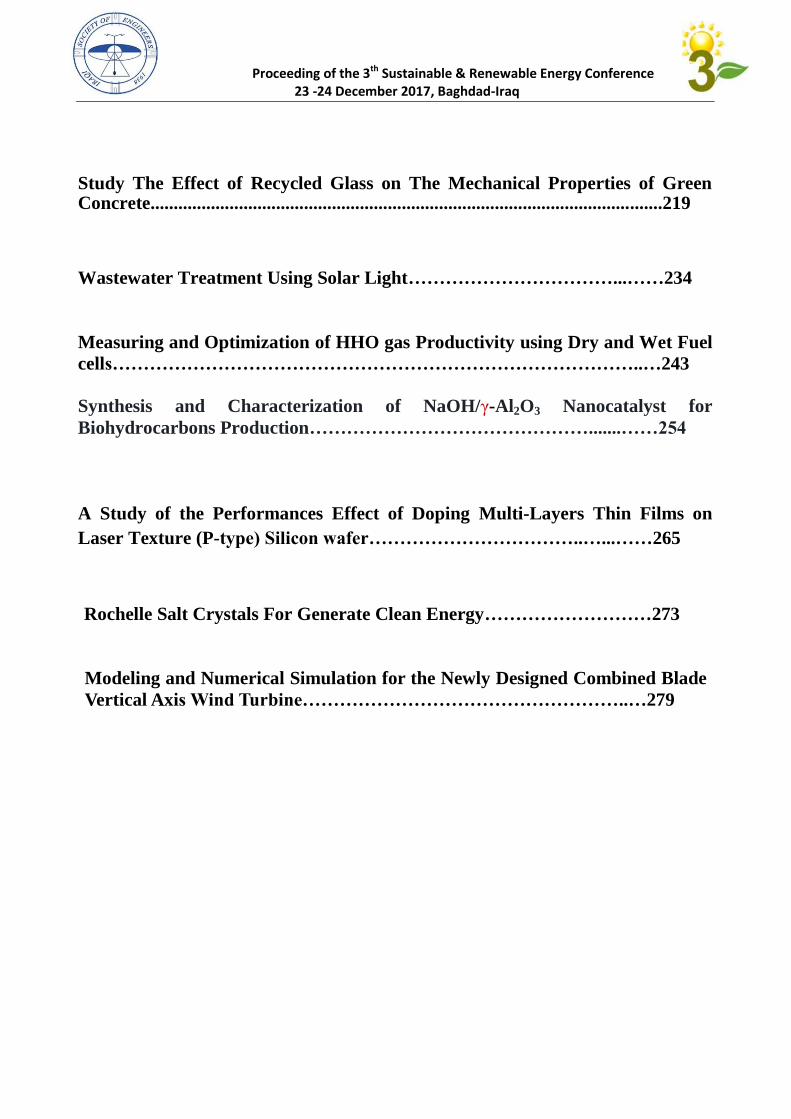
Proceeding of the 3th Sustainable & Renewable Energy Conference 23 -24 December 2017, Baghdad-Iraq
Study The Effect of Recycled Glass on The Mechanical Properties of Green Concrete..............................................................................................................219
Wastewater Treatment Using Solar Light……………………………...……234
Measuring and Optimization of HHO gas Productivity using Dry and Wet Fuel
cells…………………………………………………………………………..…243
Synthesis and Characterization of NaOH/γ-Al2O3 Nanocatalyst for
Biohydrocarbons Production……………………………………….......……254
A Study of the Performances Effect of Doping Multi-Layers Thin Films on
Laser Texture (P-type) Silicon wafer……………………………..…...……265
Rochelle Salt Crystals For Generate Clean Energy………………………273
Modeling and Numerical Simulation for the Newly Designed Combined Blade
Vertical Axis Wind Turbine……………………………………………..…279
Applications of Solar Energy (ASE)
Research
Proceeding of the 3th Sustainable & Renewable Energy Conference 23 -24 December 2017, Baghdad-Iraq
1
Detection of Power Loss due to Soiling and Faults in Photovoltaic Solar Farms via
Wireless Sensor Network
Ahmed J. Abid Fawzi M. Al-Naima
Technical Electronics Department Department of Computer Engineering
Middle Technical University Al-Mamoon University College
Baghdad, Iraq Baghdad, Iraq
[email protected] [email protected]
Abstract:
Solar photovoltaic (PV) farm output power is highly related to the panel conditions. Soiling causes faults in the
PV panels leading to a drastic reduction in the system efficiency. In vast solar PV farms, the detection of faults in an
individual PV panel is a difficult task since it is usually done manually. In this research, a new design is proposed to
detect the production of individual PV panel automatically and periodically to evaluate the condition of each panel
in the farm no matter how it is connected in the array. The proposed design allows the user to measure the open
circuit voltage (VOC), the short circuit current (ISC) and the delivered power for each PV panel in the farm. The
presented system depicts a complete wireless sensor network, which does not need any extra wiring and is
characterized of being of low cost, reliable and efficient
Keywords: Vast solar farm, Photovoltaic; Fault detection, NodeMCU, Arduino Application, WSN.
1. Introduction
There is no doubt that the solar energy is an indispensable source of energy for many reasons, including development of
material science, cost increase of the biofuel, global warming and more. The establishment of a productive PV solar farm
needs a vast open land area to install. This area could be on mountain slopes, floated on the lakes, or any odd land, but even
with a flat land it needs a hard work for monitoring and controlling the performance of all these very large numbers of
individual panels. Checking of each PV panel in farm will be a major problem, especially in the areas that are hardly
affected by soiling. Soiling could affect all the panels in the solar farm or could affect some individual panels, but in both
cases the power production capability will certainly be decreased [1]–[4] even if the PV panels are connected in series, in
parallel, or in array [5], [6]. Dust is a major problem among the soiling factors especially in the middle east and north Africa
[7]–[10]. Researchers [11], [12] proposed using the PV power-line with transceiver to control and monitor the movement of
a solar tracker, however this paper suggests a system for monitoring and control the faults for the fixed solar panels. Wi-Fi
network investment in managing and monitoring the power consumption for indoor usage is discussed briefly in [13], [14].
This research will adopt a similar strategy for an outdoor vast network. It is possible to use the same network to adopt
algorithms in [15]–[18], in case of the solar panel is used a tracker and that can be accomplished easily since all calculations
will be accomplished in the main computer and the data of the tilt and elevation angles will be sent using the adopted
network.
The proposed system of this paper suggests the addition of a low cost electronic circuit attached to each panel. This circuit
can control and measure the produced power in each panel, then broadcast the data via Wi-Fi to the main control and
Monitoring Unit (MCMU). This MCMU consists of a computer and a dedicated HTML website designed for this purpose.
The user can monitor wirelessly individual solar panels in the farm to have a complete idea about the VOC, ISC, and the
produced power to be compared with the ideal values. It is also possible to disconnect any bad PV panel from the string.
The proposed system takes into consideration that all panels are identical when installed, so any mismatching may be
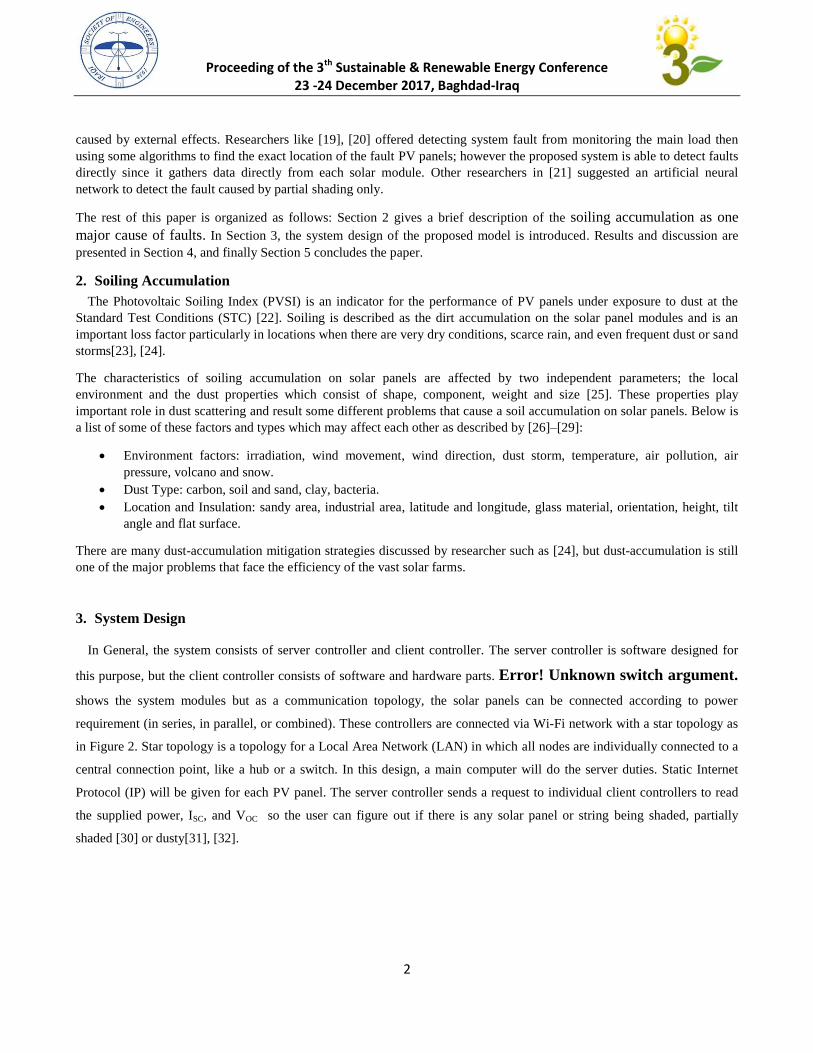
Proceeding of the 3th Sustainable & Renewable Energy Conference 23 -24 December 2017, Baghdad-Iraq
2
caused by external effects. Researchers like [19], [20] offered detecting system fault from monitoring the main load then
using some algorithms to find the exact location of the fault PV panels; however the proposed system is able to detect faults
directly since it gathers data directly from each solar module. Other researchers in [21] suggested an artificial neural
network to detect the fault caused by partial shading only.
The rest of this paper is organized as follows: Section 2 gives a brief description of the soiling accumulation as one
major cause of faults. In Section 3, the system design of the proposed model is introduced. Results and discussion are
presented in Section 4, and finally Section 5 concludes the paper.
2. Soiling Accumulation
The Photovoltaic Soiling Index (PVSI) is an indicator for the performance of PV panels under exposure to dust at the
Standard Test Conditions (STC) [22]. Soiling is described as the dirt accumulation on the solar panel modules and is an
important loss factor particularly in locations when there are very dry conditions, scarce rain, and even frequent dust or sand
storms[23], [24].
The characteristics of soiling accumulation on solar panels are affected by two independent parameters; the local
environment and the dust properties which consist of shape, component, weight and size [25]. These properties play
important role in dust scattering and result some different problems that cause a soil accumulation on solar panels. Below is
a list of some of these factors and types which may affect each other as described by [26]–[29]:
Environment factors: irradiation, wind movement, wind direction, dust storm, temperature, air pollution, air
pressure, volcano and snow.
Dust Type: carbon, soil and sand, clay, bacteria.
Location and Insulation: sandy area, industrial area, latitude and longitude, glass material, orientation, height, tilt
angle and flat surface.
There are many dust-accumulation mitigation strategies discussed by researcher such as [24], but dust-accumulation is still
one of the major problems that face the efficiency of the vast solar farms.
3. System Design
In General, the system consists of server controller and client controller. The server controller is software designed for
this purpose, but the client controller consists of software and hardware parts. Error! Unknown switch argument.
shows the system modules but as a communication topology, the solar panels can be connected according to power
requirement (in series, in parallel, or combined). These controllers are connected via Wi-Fi network with a star topology as
in Figure 2. Star topology is a topology for a Local Area Network (LAN) in which all nodes are individually connected to a
central connection point, like a hub or a switch. In this design, a main computer will do the server duties. Static Internet
Protocol (IP) will be given for each PV panel. The server controller sends a request to individual client controllers to read
the supplied power, ISC, and VOC so the user can figure out if there is any solar panel or string being shaded, partially
shaded [30] or dusty[31], [32].
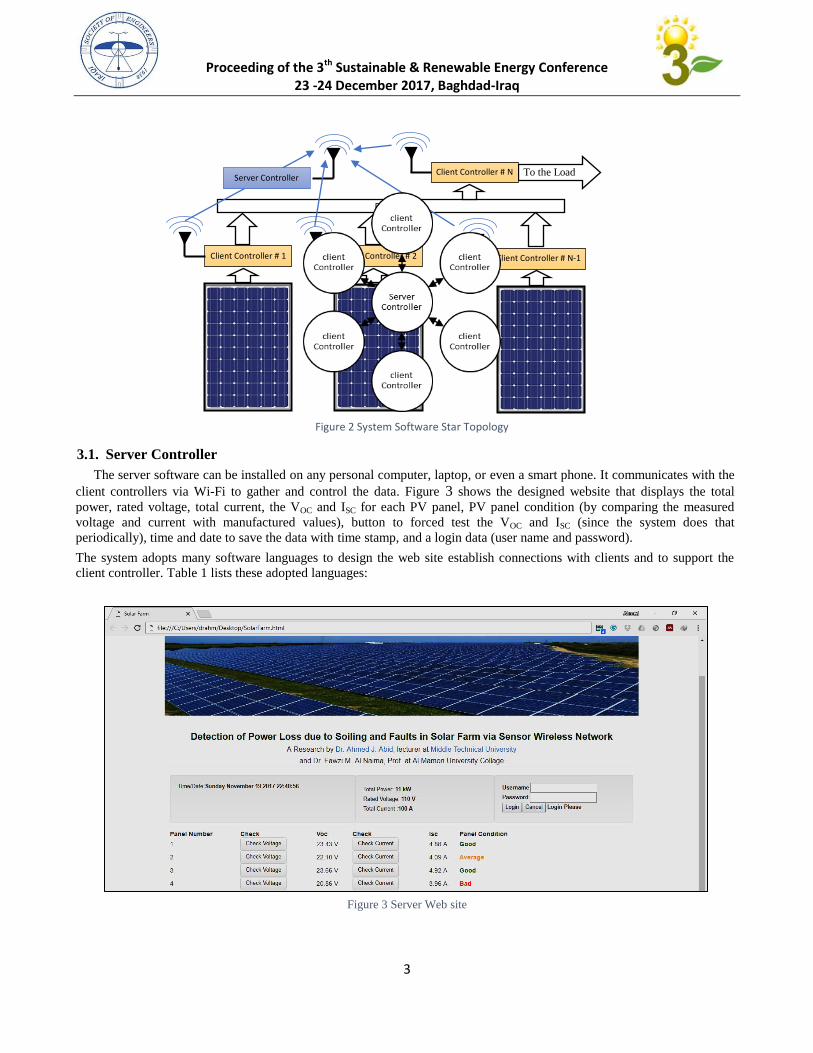
Proceeding of the 3th Sustainable & Renewable Energy Conference 23 -24 December 2017, Baghdad-Iraq
3
3.1. Server Controller
The server software can be installed on any personal computer, laptop, or even a smart phone. It communicates with the
client controllers via Wi-Fi to gather and control the data. Figure 3 shows the designed website that displays the total
power, rated voltage, total current, the VOC and ISC for each PV panel, PV panel condition (by comparing the measured
voltage and current with manufactured values), button to forced test the VOC and ISC (since the system does that
periodically), time and date to save the data with time stamp, and a login data (user name and password).
The system adopts many software languages to design the web site establish connections with clients and to support the
client controller. Table 1 lists these adopted languages:
Figure 3 Server Web site
Figure 1 System Module
Client Controller # 1 Client Controller # 2 Client Controller # N-1
Bus Bar
Client Controller # N
Server Controller To the Load
Figure 2 System Software Star Topology
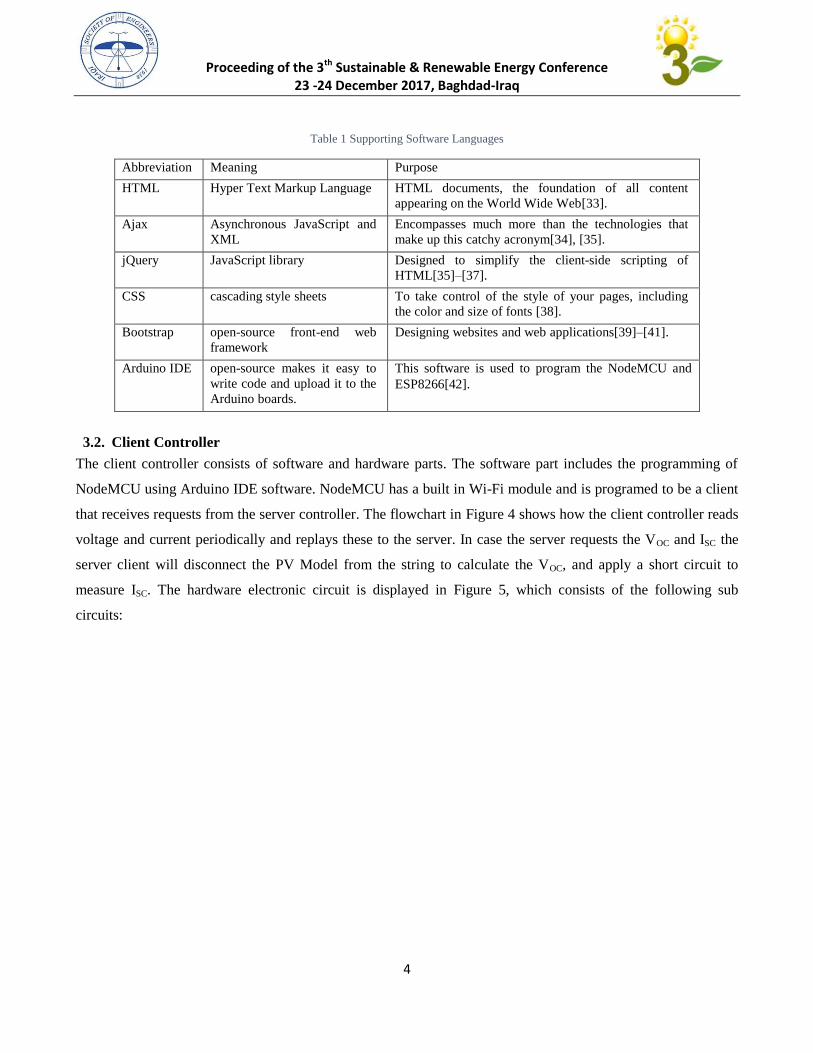
Proceeding of the 3th Sustainable & Renewable Energy Conference 23 -24 December 2017, Baghdad-Iraq
4
Table 1 Supporting Software Languages
Abbreviation Meaning Purpose
HTML Hyper Text Markup Language HTML documents, the foundation of all content
appearing on the World Wide Web[33].
Ajax Asynchronous JavaScript and
XML
Encompasses much more than the technologies that
make up this catchy acronym[34], [35].
jQuery JavaScript library Designed to simplify the client-side scripting of
HTML[35]–[37].
CSS cascading style sheets To take control of the style of your pages, including
the color and size of fonts [38].
Bootstrap open-source front-end web
framework
Designing websites and web applications[39]–[41].
Arduino IDE open-source makes it easy to
write code and upload it to the
Arduino boards.
This software is used to program the NodeMCU and
ESP8266[42].
3.2. Client Controller
The client controller consists of software and hardware parts. The software part includes the programming of
NodeMCU using Arduino IDE software. NodeMCU has a built in Wi-Fi module and is programed to be a client
that receives requests from the server controller. The flowchart in Figure 4 shows how the client controller reads
voltage and current periodically and replays these to the server. In case the server requests the VOC and ISC the
server client will disconnect the PV Model from the string to calculate the VOC, and apply a short circuit to
measure ISC. The hardware electronic circuit is displayed in Figure 5, which consists of the following sub
circuits:
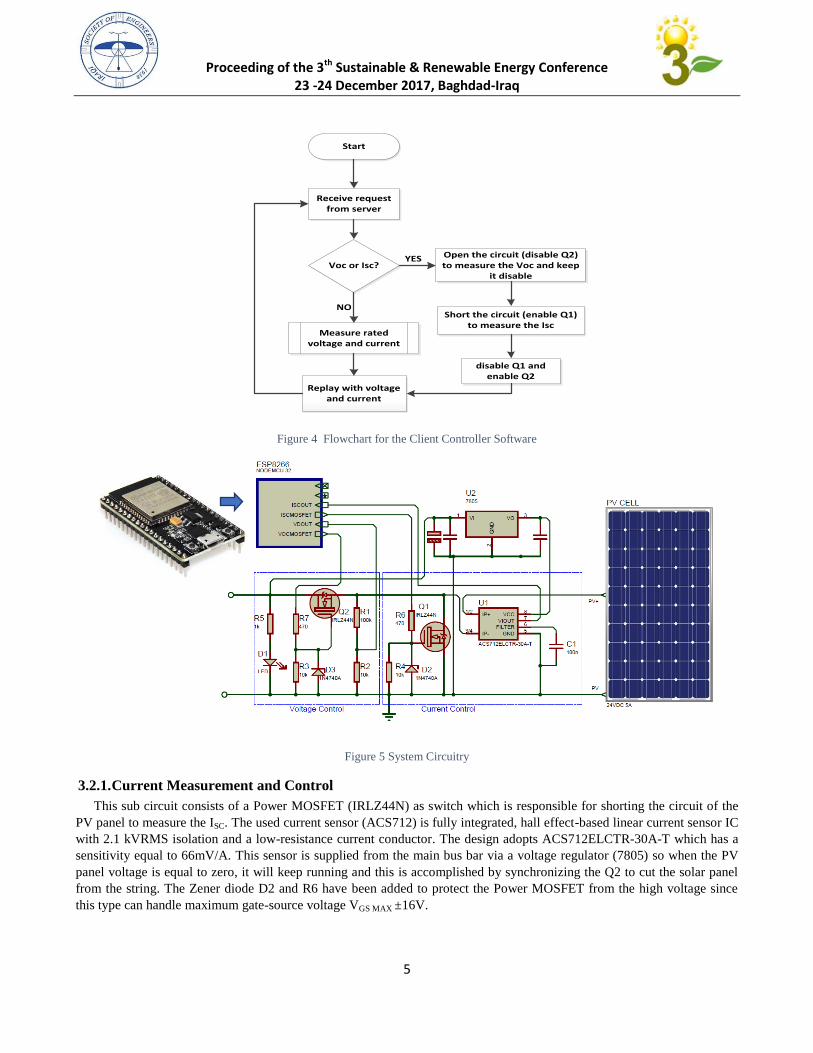
Proceeding of the 3th Sustainable & Renewable Energy Conference 23 -24 December 2017, Baghdad-Iraq
5
Start
Voc or Isc?
Measure rated voltage and current
NO
Receive request from server
Replay with voltage and current
Open the circuit (disable Q2) to measure the Voc and keep
it disable
YES
Short the circuit (enable Q1) to measure the Isc
disable Q1 and enable Q2
Figure 4 Flowchart for the Client Controller Software
Figure 5 System Circuitry
3.2.1. Current Measurement and Control
This sub circuit consists of a Power MOSFET (IRLZ44N) as switch which is responsible for shorting the circuit of the
PV panel to measure the ISC. The used current sensor (ACS712) is fully integrated, hall effect-based linear current sensor IC
with 2.1 kVRMS isolation and a low-resistance current conductor. The design adopts ACS712ELCTR-30A-T which has a
sensitivity equal to 66mV/A. This sensor is supplied from the main bus bar via a voltage regulator (7805) so when the PV
panel voltage is equal to zero, it will keep running and this is accomplished by synchronizing the Q2 to cut the solar panel
from the string. The Zener diode D2 and R6 have been added to protect the Power MOSFET from the high voltage since
this type can handle maximum gate-source voltage VGS MAX ±16V.
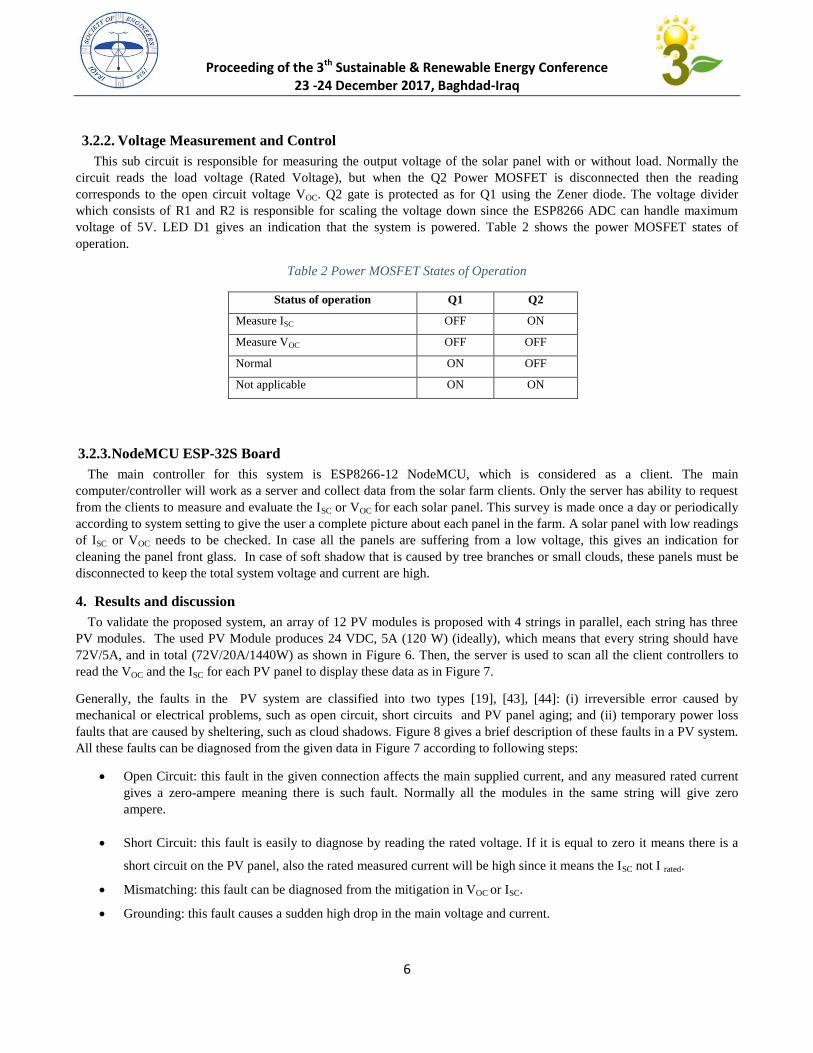
Proceeding of the 3th Sustainable & Renewable Energy Conference 23 -24 December 2017, Baghdad-Iraq
6
3.2.2. Voltage Measurement and Control
This sub circuit is responsible for measuring the output voltage of the solar panel with or without load. Normally the
circuit reads the load voltage (Rated Voltage), but when the Q2 Power MOSFET is disconnected then the reading
corresponds to the open circuit voltage VOC. Q2 gate is protected as for Q1 using the Zener diode. The voltage divider
which consists of R1 and R2 is responsible for scaling the voltage down since the ESP8266 ADC can handle maximum
voltage of 5V. LED D1 gives an indication that the system is powered. Table 2 shows the power MOSFET states of
operation.
Table 2 Power MOSFET States of Operation
Status of operation Q1 Q2
Measure ISC OFF ON
Measure VOC OFF OFF
Normal ON OFF
Not applicable ON ON
3.2.3. NodeMCU ESP-32S Board
The main controller for this system is ESP8266-12 NodeMCU, which is considered as a client. The main
computer/controller will work as a server and collect data from the solar farm clients. Only the server has ability to request
from the clients to measure and evaluate the ISC or VOC for each solar panel. This survey is made once a day or periodically
according to system setting to give the user a complete picture about each panel in the farm. A solar panel with low readings
of ISC or VOC needs to be checked. In case all the panels are suffering from a low voltage, this gives an indication for
cleaning the panel front glass. In case of soft shadow that is caused by tree branches or small clouds, these panels must be
disconnected to keep the total system voltage and current are high.
4. Results and discussion
To validate the proposed system, an array of 12 PV modules is proposed with 4 strings in parallel, each string has three
PV modules. The used PV Module produces 24 VDC, 5A (120 W) (ideally), which means that every string should have
72V/5A, and in total (72V/20A/1440W) as shown in Figure 6. Then, the server is used to scan all the client controllers to
read the VOC and the ISC for each PV panel to display these data as in Figure 7.
Generally, the faults in the PV system are classified into two types [19], [43], [44]: (i) irreversible error caused by
mechanical or electrical problems, such as open circuit, short circuits and PV panel aging; and (ii) temporary power loss
faults that are caused by sheltering, such as cloud shadows. Figure 8 gives a brief description of these faults in a PV system.
All these faults can be diagnosed from the given data in Figure 7 according to following steps:
Open Circuit: this fault in the given connection affects the main supplied current, and any measured rated current
gives a zero-ampere meaning there is such fault. Normally all the modules in the same string will give zero
ampere.
Short Circuit: this fault is easily to diagnose by reading the rated voltage. If it is equal to zero it means there is a
short circuit on the PV panel, also the rated measured current will be high since it means the ISC not I rated.
Mismatching: this fault can be diagnosed from the mitigation in VOC or ISC.
Grounding: this fault causes a sudden high drop in the main voltage and current.
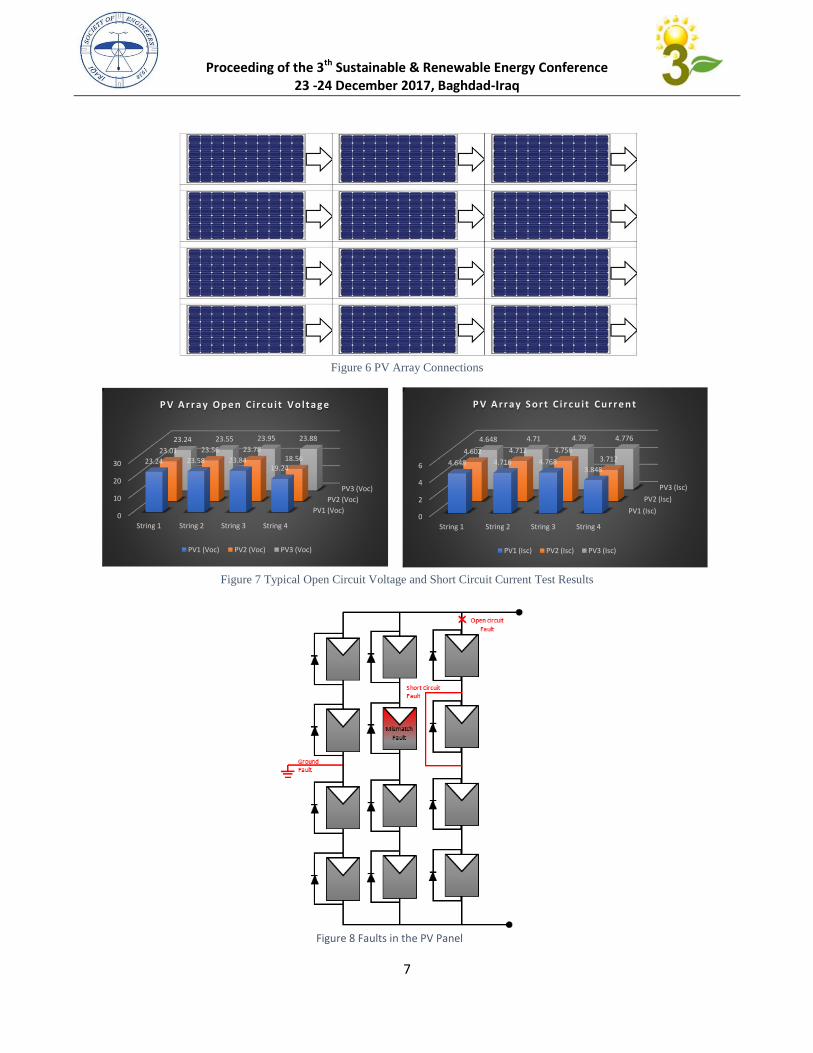
Proceeding of the 3th Sustainable & Renewable Energy Conference 23 -24 December 2017, Baghdad-Iraq
7
Figure 6 PV Array Connections
Figure 7 Typical Open Circuit Voltage and Short Circuit Current Test Results
PV1 (Voc)
PV2 (Voc)
PV3 (Voc)
0
10
20
30
String 1 String 2 String 3 String 4
23.24 23.58 23.84 19.24
23.01 23.56 23.78 18.56
23.24 23.55 23.95 23.88
P V A r r a y O p e n C i r c u i t V o l t a g e
PV1 (Voc) PV2 (Voc) PV3 (Voc)
PV1 (Isc)
PV2 (Isc)
PV3 (Isc)
0
2
4
6
String 1 String 2 String 3 String 4
4.648 4.716 4.768 3.848
4.602 4.712 4.756 3.712
4.648 4.71 4.79 4.776
P V A r r a y S o r t C i r c u i t Cu r r e n t
PV1 (Isc) PV2 (Isc) PV3 (Isc)
Figure 8 Faults in the PV Panel
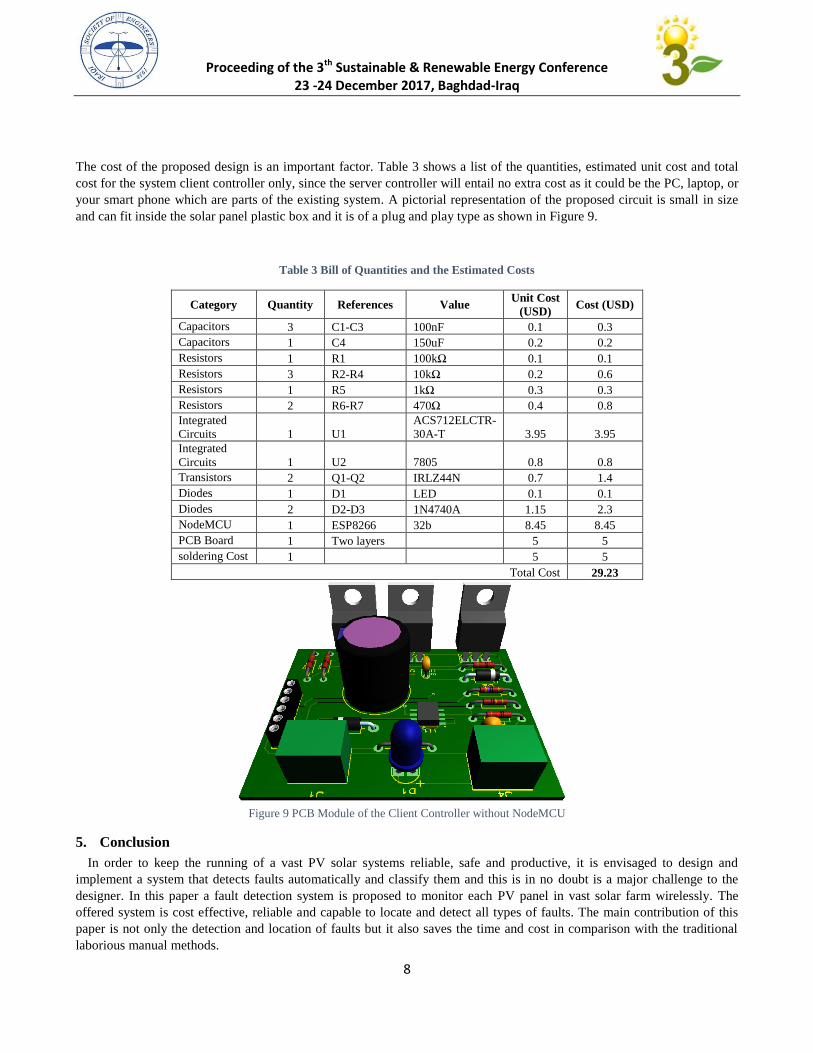
Proceeding of the 3th Sustainable & Renewable Energy Conference 23 -24 December 2017, Baghdad-Iraq
8
The cost of the proposed design is an important factor. Table 3 shows a list of the quantities, estimated unit cost and total
cost for the system client controller only, since the server controller will entail no extra cost as it could be the PC, laptop, or
your smart phone which are parts of the existing system. A pictorial representation of the proposed circuit is small in size
and can fit inside the solar panel plastic box and it is of a plug and play type as shown in Figure 9.
Table 3 Bill of Quantities and the Estimated Costs
Category Quantity References Value Unit Cost
(USD) Cost (USD)
Capacitors 3 C1-C3 100nF 0.1 0.3
Capacitors 1 C4 150uF 0.2 0.2
Resistors 1 R1 100kΩ 0.1 0.1
Resistors 3 R2-R4 10kΩ 0.2 0.6
Resistors 1 R5 1kΩ 0.3 0.3
Resistors 2 R6-R7 470Ω 0.4 0.8
Integrated
Circuits 1 U1
ACS712ELCTR-
30A-T 3.95 3.95
Integrated
Circuits 1 U2 7805 0.8 0.8
Transistors 2 Q1-Q2 IRLZ44N 0.7 1.4
Diodes 1 D1 LED 0.1 0.1
Diodes 2 D2-D3 1N4740A 1.15 2.3
NodeMCU 1 ESP8266 32b 8.45 8.45
PCB Board 1 Two layers 5 5
soldering Cost 1 5 5
Total Cost 29.23
Figure 9 PCB Module of the Client Controller without NodeMCU
5. Conclusion
In order to keep the running of a vast PV solar systems reliable, safe and productive, it is envisaged to design and
implement a system that detects faults automatically and classify them and this is in no doubt is a major challenge to the
designer. In this paper a fault detection system is proposed to monitor each PV panel in vast solar farm wirelessly. The
offered system is cost effective, reliable and capable to locate and detect all types of faults. The main contribution of this
paper is not only the detection and location of faults but it also saves the time and cost in comparison with the traditional
laborious manual methods.
Proceeding of the 3th Sustainable & Renewable Energy Conference 23 -24 December 2017, Baghdad-Iraq
9
References
[1] S. A. Sulaiman, A. K. Singh, M. M. M. Mokhtar, and M. A. Bou-Rabee, “Influence of dirt accumulation on
performance of PV panels,” in Energy Procedia, 2014, vol. 50, pp. 50–56.
[2] M. M. Rahman, M. A. Islam, A. H. M. Z. Karim, and A. H. Ronee, “Effects of Natural Dust on the Performance of
PV Panels in Bangladesh,” Int. J. Mod. Educ. Comput. Sci., vol. 4, no. 10, pp. 26–32, 2012.
[3] K. A. Moharram, M. S. Abd-Elhady, H. A. Kandil, and H. El-Sherif, “Influence of cleaning using water and
surfactants on the performance of photovoltaic panels,” Energy Convers. Manag., vol. 68, pp. 266–272, 2013.
[4] S. A. Sulaiman, M. N. H. Mat, F. M. Guangul, and M. A. Bou-Rabee, “Real-time study on the effect of dust
accumulation on performance of solar PV panels in Malaysia,” in Proceedings of 2015 International Conference on
Electrical and Information Technologies, ICEIT 2015, 2015, pp. 269–274.
[5] C. E. Chamberlin, P. Lehman, J. Zoellick, and G. Pauletto, “Effects of mismatch losses in photovoltaic arrays,” Sol.
Energy, vol. 54, no. 3, pp. 165–171, 1995.
[6] T. S. Wurster, and M. B. Schubert, “Mismatch loss in photovoltaic systems,” Sol. Energy, vol. 105, pp. 505–511,
2014.
[7] N. S. Beattie, R. S. Moir, C. Chacko, G. Buffoni, S. H. Roberts, and N. M. Pearsall, “Understanding the effects of
sand and dust accumulation on photovoltaic modules,” Renew. Energy, vol. 48, pp. 448–452, 2012.
[8] S. A. M. Said, “Effects of dust accumulation on performances of thermal and photovoltaic flat-plate collectors,”
Appl. Energy, vol. 37, no. 1, pp. 73–84, 1990.
[9] R. E. Cabanillas, and H. Munguía, “Dust accumulation effect on efficiency of Si photovoltaic modules,” J. Renew.
Sustain. Energy, vol. 3, no. 4, 2011.
[10] S. Mekhilef, R. Saidur, and M. Kamalisarvestani, “Effect of dust, humidity and air velocity on efficiency of
photovoltaic cells,” Renewable and Sustainable Energy Reviews, vol. 16, no. 5. pp. 2920–2925, 2012.
[11] A. J. Abid, R. S. Ali, F. M. Al-Naima, Z. Ghassemlooy, and Z. Gao, “A new power line communication modem
design with applications to vast solar farm management,” 3rd Int. Conf. Electr. Power Energy Convers. Syst.
EPECS 2013, vol. 4, no. 14, pp. 34–49, 2013.
[12] F. M. Al-Naima, R. S. Ali, and A. J. Abid, “Design of a Control and Data Acquisition System for a Multi-Mode Solar Tracking
Farm,” EWRES - European Workshop on Renewable Energy Systems, 17-28 Sept, 2012, Alanya, Anatalya, Turkey. pp. 1–6.
[13] F. M. Al-Naima, R. S. Ali, and A. J. Abid, “Smart Home Energy Management Design Based on Power line Communication.
First International Conference on Renewable Energies for Developing Countries, REDEC12, 28-29 November, 2012, Beirut,
Lebanon.
[14] A. J. Abid, and A. H. Ali, “Smart Monitoring of the Consumption of Home Electrical Energy,” Int. J. Comput.
Trends Technol., vol. 47, no. 2, pp. 142–148, 2017.
[15] F. M. Al-Naima, R. S. Ali, and A. J. Abid, “Solar Tracking System: Design based on GPS and Astronomical
Equations,” in IT-DREPS Conference & Exhibition, May 29-31 Amman, Jordan 2013, pp. 1–6.
[16] F. M. Al-Naima, R. S. Ali, and A. J. Abid, “Design and Implementation of a Smart Dual Axis Sun Tracker Based
on Astronomical Equations,” in EWRES - The European Workshop on Renewable Energy Systems, Antalya,
TURKEY, 10-20 Sep. 2012.
[17] A. J. Abid, “Arduino Based Blind Solar Tracking Controller,” An Int. Open Access Journal, IETI Trans. Comput.,
vol. 5, no. 10, pp. 24–29, 2017.
[18] F. Al-Naima, R. Ali, and A. J. Abid, “Design of an Embedded Solar Tracking System Based on GPS and
Astronomical Equations,” Int. J. Inf. Technol. Web Eng., vol. 9, no. 1, pp. 12–31, 2014.
[19] D. Ji, C. Zhang, M. Lv, Y. Ma, and N. Guan, “Photovoltaic Array Fault Detection by Automatic Reconfiguration,”
Energies, vol. 10, no. 5, p. 699, 2017.
[20] W. Chine, A. Mellit, A. M. Pavan, and V. Lughi, “Fault diagnosis in photovoltaic arrays,” in 2015 International
Conference on Clean Electrical Power (ICCEP), 2015, pp. 67–72.
[21] H. Mekki, A. Mellit, and H. Salhi, “Artificial neural network-based modelling and fault detection of partial shaded
photovoltaic modules,” Simul. Model. Pract. Theory, vol. 67, pp. 1–13, 2016.
[22] K. Menoufi, “Dust accumulation on the surface of photovoltaic panels: Introducing the Photovoltaic Soiling Index
Proceeding of the 3th Sustainable & Renewable Energy Conference 23 -24 December 2017, Baghdad-Iraq
10
(PVSI),” Sustain., vol. 9, no. 6, 2017.
[23] G. Makrides, B. Zinsser, M. Norton, and G. E., “Performance of Photovoltaics Under Actual Operating
Conditions,” in Third Generation Photovoltaics, 2012.
[24] S. A. M. Said, G. Hassan, H. M. Walwil, and N. Al-Aqeeli, “The effect of environmental factors and dust
accumulation on photovoltaic modules and dust-accumulation mitigation strategies,” Renewable and Sustainable
Energy Reviews, vol. 82. pp. 743–760, 2018.
[25] M. Mani and R. Pillai, “Impact of dust on solar photovoltaic (PV) performance: Research status, challenges and
recommendations,” Renew. Sustain. Energy Rev., vol. 14, no. 9, pp. 3124–3131, 2010.
[26] M. R. Maghami, H. Hizam, C. Gomes, M. A. Radzi, M. I. Rezadad, and S. Hajighorbani, “Power loss due to soiling
on solar panel: A review,” Renewable and Sustainable Energy Reviews, vol. 59. pp. 1307–1316, 2016.
[27] F. A. Mejia, and J. Kleissl, “Soiling losses for solar photovoltaic systems in California,” Sol. Energy, vol. 95, pp.
357–363, 2013.
[28] H. Pedersen, J. Strauss, and J. Selj, “Effect of Soiling on Photovoltaic Modules in Norway,” in Energy Procedia,
2016, vol. 92, pp. 585–589.
[29] S. C. S. Costa, A. S. A. C. Diniz, and L. L. Kazmerski, “Dust and soiling issues and impacts relating to solar energy
systems: Literature review update for 2012-2015,” Renewable and Sustainable Energy Reviews, vol. 63. pp. 33–61,
2016.
[30] F. Bayrak, G. Ertürk, and H. F. Oztop, “Effects of partial shading on energy and exergy efficiencies for photovoltaic
panels,” J. Clean. Prod., vol. 164, pp. 58–69, 2017.
[31] B. R. Paudyal, and S. R. Shakya, “Dust accumulation effects on efficiency of solar PV modules for off grid
purpose: A case study of Kathmandu,” Sol. Energy, vol. 135, pp. 103–110, 2016.
[32] F. M. Al-Naima, and A. G. Albaali, “Analysis of Dust Parameters and Evaluation of Their Impact on Solar
Photovoltaic Panel Performance.,” in International Conference on Renewable Energy and its Future in the Arab
World 2013 ICREFAW 2013,, Amman, Jordan., 2013.
[33] D. R. Brooks, An Introduction to HTML and JavaScript: for Scientists and Engineers, Springer 2007.
[34] T. A. Powell, Ajax: The Complete Reference. 2008. McGraw-Hill, 2008.
[35] J. Hayward, Django Javascript integration: AJAX and jQuery, Packt Publishing 2010.
[36] C. Lindley, “jQuery Cookbook: Solutions & Examples for jQuery Developers, 1st edition,” O’Reilly Media, Inc. ,
2009.
[37] B. I. Design, and W. Development, Learning jQuery. 2007.
[38] R. York, “Beginning CSS: Cascading Style Sheets for Web Design,” Css, no. February, p. 2005, 2005.
[39] B. Efron and R. J. Tibshirani, “An Introduction to the Bootstrap,” Refrig. Air Cond., vol. 57, no. 57, p. 436, 1993.
[40] B. Efron, “Second Thoughts on the Bootstrap,” Stat. Sci., vol. 18, no. 2, pp. 135–140, 2003.
[41] T. Hesterberg, “Bootstrap,” Wiley Interdiscip. Rev. Comput. Stat., vol. 3, no. 6, pp. 497–526, 2011.
[42] A. McEwen and H. Cassimally, Designing the Internet of Things. John Wiley and Sons, Inc., 2014.
[43] Y. Zhao, J. de Palma, J. Mosesian, R. Lyons, and B. Lehman, “Line-Line Fault Analysis and Protection Challenges
in Solar Photovoltaic Arrays,” Ind. Electron. IEEE Trans., vol. 60, no. 9, pp. 3784–3795, 2013.
[44] M. J. Albers and G. Ball, “Comparative Evaluation of DC Fault-Mitigation Techniques in Large PV Systems,”
IEEE J. Photovoltaics, vol. 5, no. 4, pp. 1169–1174, 2015.
Proceeding of the 3th
Sustainable & Renewable Energy Conference
23 -24 December 2017, Baghdad-Iraq
11
Thermal Analysis of Flat Plate Solar Collector
Dr. Kadhim Fadhil Nasir
Farm Machinery and Equipment Eng. Dept., AL Furat Alawsat Technical University –AL Mussaib
Technical College Iraq, [email protected], Mobile No. 07809634391
ABSTRACT Numerical and experimental analysis of employing flat coiled tube as an energy absorber within Flat plate
Solar Collector (FPSC) to heat air was existed in this paper. The experimental setup was designed, fabricated then
experienced with stationary toward of south direction. The experiments are completed outdoor environments at AL-
Mussaib city (Long. of 44.3° East and Latit. of 32.5° North) via 32.5° atilt angle with horizontal from January to
March 2017. Variable air volume flow rates through the absorber are employed during 6 clear days for each month.
The numerical analysis includes the numerical simulation of flat coiled absorber model by a package ANSYS
FLUENT 15. The experimental results indicated the maximum absorber output - input temperatures difference is 49º
C, while maximum output temperature is 80 ºC, and the maximum collector efficiency is 47 %. The numerical
consequences are agreement with experimental consequences with a deviation of 4.17%. The existing experimental
consequences are compared with accessible previous investigations of flat plate solar air collector for output
temperature which contributed 18.75 % greatest consequences for the present work.
KEY WORDS: energy, solar flat plate collector, absorber, efficiency, air heating.
NOMENCLATURE
A Area, apparent m2
Ag Area of glass cover m2
Ar Area of the receiver m2
Cp Specific heat J/kg.k
Dg Cover effective length. m
d Diameter of the tube m
fc Friction Factor
h-(c.g-a) = hw convection heat transfer coefficient between ambient air and glass W/ m2 K
h-(r,g-a) Radiation heat transfer coefficient between glass cover and the ambient W/m2 K
h-(r,r-g) Radiation heat transfer coefficient between receiver tube and glass cover. W/m2 K
I Incident of solar radiation W/ m2
K Thermal conductivity W/m L Tube length m
Nu Nusselt number
Q Heat transfer rate W
Qu energy added of collector W
T Temperature °C
Proceeding of the 3th
Sustainable & Renewable Energy Conference
23 -24 December 2017, Baghdad-Iraq
12
V velocity m/s
∆P Pressure Drop KPa
Subscripts
a Air, ambient, aperture
g glass
i Inlet
o Outlet
r receiver
w wind
1. INTRODUCTION
Solar air heating collectors mostly, are flat plate collectors, which involving of a clear cover, an absorber and
isolation. The analysis of the air heating solar collectors is generally subjective by the weather factors which include
direct and diffuse radiation, wind speed and ambient temperature, the design parameters which consist of collector
type, collector materials and the flow parameters which consist of mode of flow, air flow rate. The main requests of
these designs are a great connection zone between air and the absorber [1]. Using the flat plate collectors for the
drying and space air heating, they are commonly fixing direction, the efficiency of these collectors dependent on the
sun radiation, and sun rays angles touching surfaces of collectors [2, 3]. There are two technologies for mounting a
solar air heating collector, the first is used with closed circlet system, it means the air is circulated from the collector
to the house and go back to the collector, the second is with open circlet system, it means the cold air is occupied
from the ambient outdoor and flows to the collector then it circulated to the building and approaches back to the
ambient outdoor [4]. Direct solar air heating collectors operating in an open loop system have been used for drying,
apace heating and operations of spraying [5]. The flat plate air solar collector represented a simple device involving
of transparent material covers positioned above the absorber by way of the flowing air moreover under or over the
absorbing plate [6,7]. The energy is transported from radiant directly in air [8,9]. (Sanda 2014), presented
experimental study of an air solar collector, in South Eastern Europe climatic conditions. The relations between the
outlet air velocities, the direct solar radiation, air discharge, heat transfer resulted, the input time for the collector
nominal regime and the efficiency were underscored. After 50 minutes, the air solar collectors with double pass of air
and baffles reach 50 % thermal efficiency for the solar radiation of (900-1000) W/m2. Moreover the mathematical
model and the computational program results allow sizing the solar collectors. Experimental tests set up at the
laboratory scale have been established by (Vyas and Dr. Punjabi 2014), for flat plate air solar collector with the
radiation intensity value of 650 W/m2. An Experimental system of (1 x 0.5 x 0.1) m is fabricated. Three designs of
absorber are tested namely (V shape porous ribs, plane absorber, V shape inclined porous ribs). The thermal
efficiencies are obtained as 17.24%, 14.91% and 20.04% respectively. (Aboltins et al 2012), investigated a new
construction of air heating solar collector. Easily available materials were used as absorbers. The collector was tested.
These types of collectors have sensitivity to solar radiation change; a response time is about one minute and
efficiency coefficient of 0.63. Absorber materials made of polypropylene seed boxes and black colored steel are
tested in room heating. The effect of internal recycle on the thermal efficiency of collector in upward-type air heating
solar collector was investigated theoretically by (Yeh 2012). The equations for calculating the outlet air temperature
and the efficiency of collector were derivative from the energy balances of the flow air and absorbing plate.
Improvement in the efficiency of collector is obtainable with an internal recycle. It is found that improvement in the
efficiency of collector is more than 150%. (Bakari 2018), studied experimentally a comparison between ordinary
flat plate solar collectors and collector conducted with several baffles. The heat energy transfer for the air flow inside
the absorber is analyzed. The results show the thermal efficiency of baffles collector is more improvement.
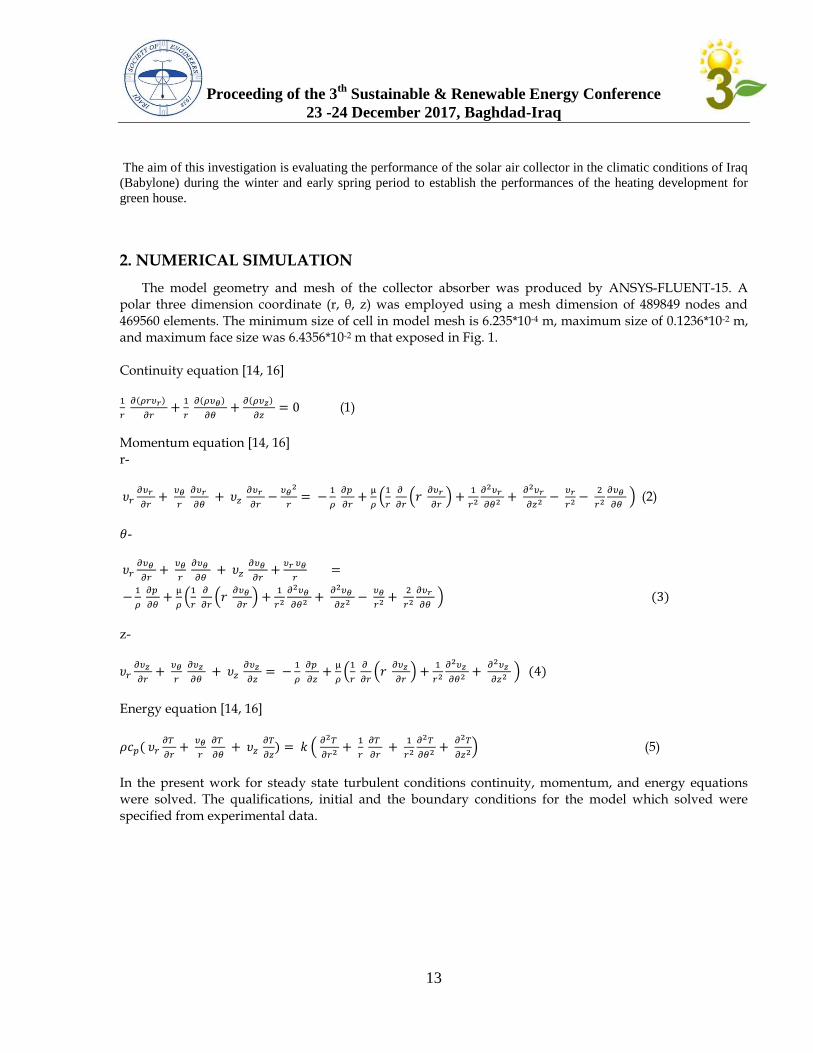
Proceeding of the 3th
Sustainable & Renewable Energy Conference
23 -24 December 2017, Baghdad-Iraq
13
The aim of this investigation is evaluating the performance of the solar air collector in the climatic conditions of Iraq
(Babylone) during the winter and early spring period to establish the performances of the heating development for
green house.
2. NUMERICAL SIMULATION
The model geometry and mesh of the collector absorber was produced by ANSYS-FLUENT-15. A polar three dimension coordinate (r, θ, z) was employed using a mesh dimension of 489849 nodes and 469560 elements. The minimum size of cell in model mesh is 6.235*10-4 m, maximum size of 0.1236*10-2 m, and maximum face size was 6.4356*10-2 m that exposed in Fig. 1. Continuity equation [14, 16]
(1)
Momentum equation [14, 16] r-
(2)
-
z-
Energy equation [14, 16]
(5)
In the present work for steady state turbulent conditions continuity, momentum, and energy equations were solved. The qualifications, initial and the boundary conditions for the model which solved were specified from experimental data.
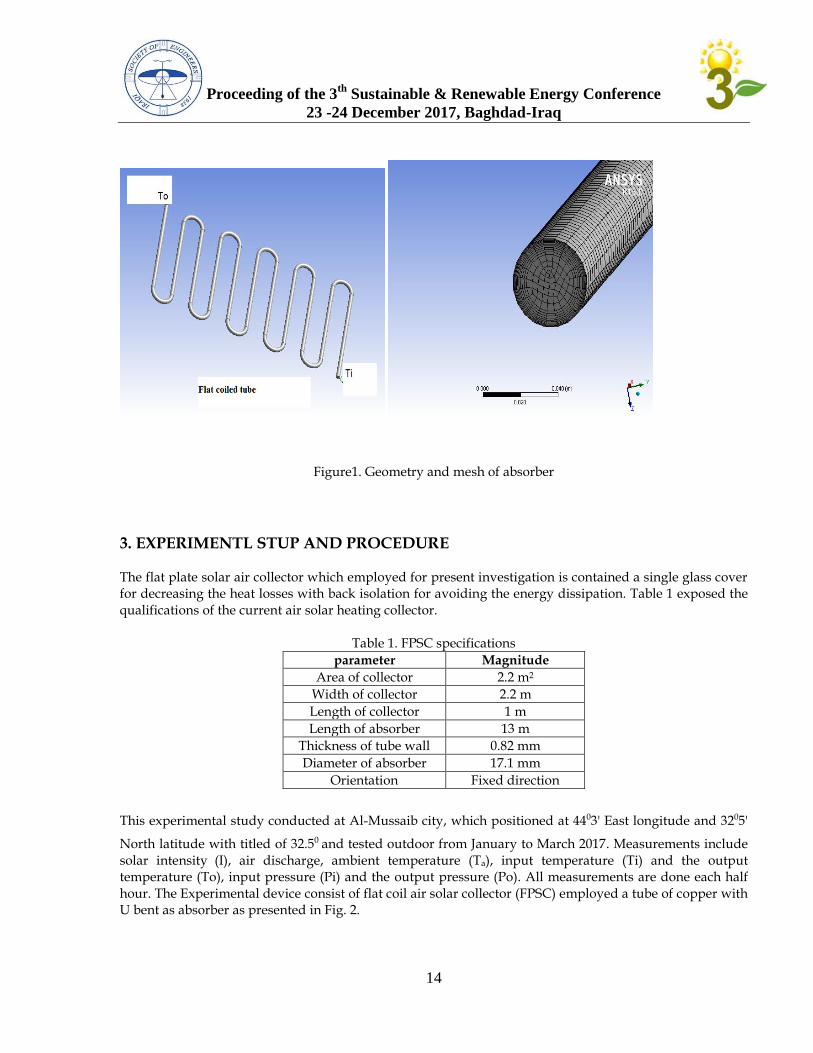
Proceeding of the 3th
Sustainable & Renewable Energy Conference
23 -24 December 2017, Baghdad-Iraq
14
Figure1. Geometry and mesh of absorber
3. EXPERIMENTL STUP AND PROCEDURE
The flat plate solar air collector which employed for present investigation is contained a single glass cover for decreasing the heat losses with back isolation for avoiding the energy dissipation. Table 1 exposed the qualifications of the current air solar heating collector.
Table 1. FPSC specifications
parameter Magnitude
Area of collector 2.2 m2
Width of collector 2.2 m
Length of collector 1 m
Length of absorber 13 m
Thickness of tube wall 0.82 mm
Diameter of absorber 17.1 mm
Orientation Fixed direction
This experimental study conducted at Al-Mussaib city, which positioned at 4403' East longitude and 3205'
North latitude with titled of 32.50 and tested outdoor from January to March 2017. Measurements include solar intensity
(I), air discharge, ambient temperature (Ta), input temperature (Ti) and the output
temperature (To), input pressure (Pi) and the output pressure (Po). All measurements are done each half hour. The Experimental device consist of flat coil air solar collector (FPSC) employed a tube of copper with U bent as absorber as presented in Fig. 2.
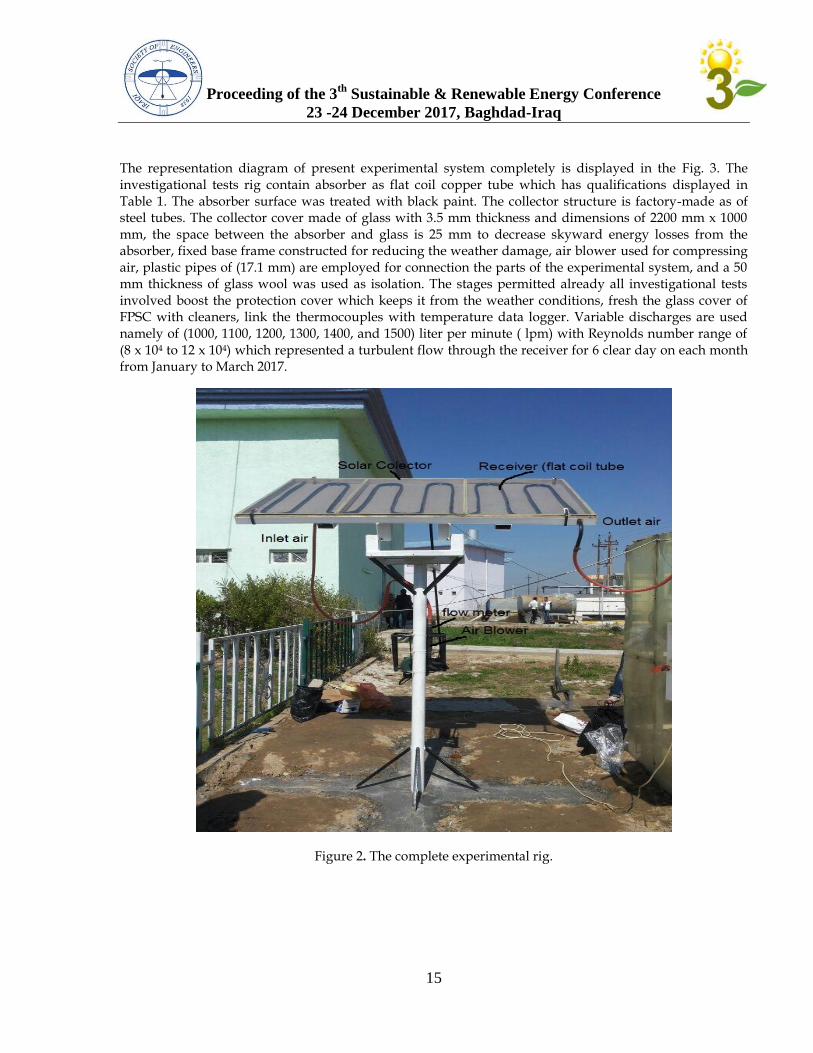
Proceeding of the 3th
Sustainable & Renewable Energy Conference
23 -24 December 2017, Baghdad-Iraq
15
The representation diagram of present experimental system completely is displayed in the Fig. 3. The investigational tests rig contain absorber as flat coil copper tube which has qualifications displayed in Table 1. The absorber surface was treated with black paint. The collector structure is factory-made as of steel tubes. The collector cover made of glass with 3.5 mm thickness and dimensions of 2200 mm x 1000 mm, the space between the absorber and glass is 25 mm to decrease skyward energy losses from the absorber, fixed base frame constructed for reducing the weather damage, air blower used for compressing air, plastic pipes of (17.1 mm) are employed for connection the parts of the experimental system, and a 50 mm thickness of glass wool was used as isolation. The stages permitted already all investigational tests involved boost the protection cover which keeps it from the weather conditions, fresh the glass cover of FPSC with cleaners, link the thermocouples with temperature data logger. Variable discharges are used namely of (1000, 1100, 1200, 1300, 1400, and 1500) liter per minute ( lpm) with Reynolds number range of (8 x 10⁴ to 12 x 104) which represented a turbulent flow through the receiver for 6 clear day on each month from January to March 2017.
Figure 2. The complete experimental rig.
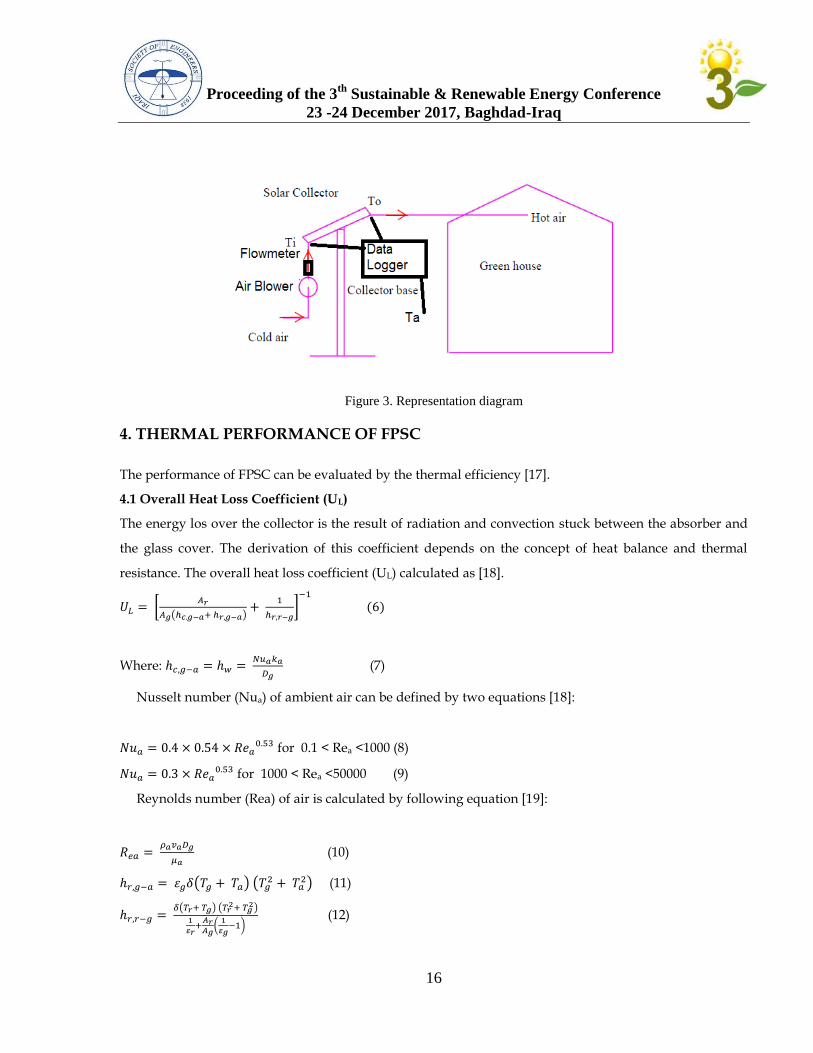
Proceeding of the 3th
Sustainable & Renewable Energy Conference
23 -24 December 2017, Baghdad-Iraq
16
Figure 3. Representation diagram
4. THERMAL PERFORMANCE OF FPSC
The performance of FPSC can be evaluated by the thermal efficiency [17].
4.1 Overall Heat Loss Coefficient (UL)
The energy los over the collector is the result of radiation and convection stuck between the absorber and
the glass cover. The derivation of this coefficient depends on the concept of heat balance and thermal
resistance. The overall heat loss coefficient (UL) calculated as [18].
Where:
(7)
Nusselt number (Nua) of ambient air can be defined by two equations [18]:
for 0.1 < Rea <1000 (8)
for 1000 < Rea <50000 (9)
Reynolds number (Rea) of air is calculated by following equation [19]:
(10)
(11)
(12)
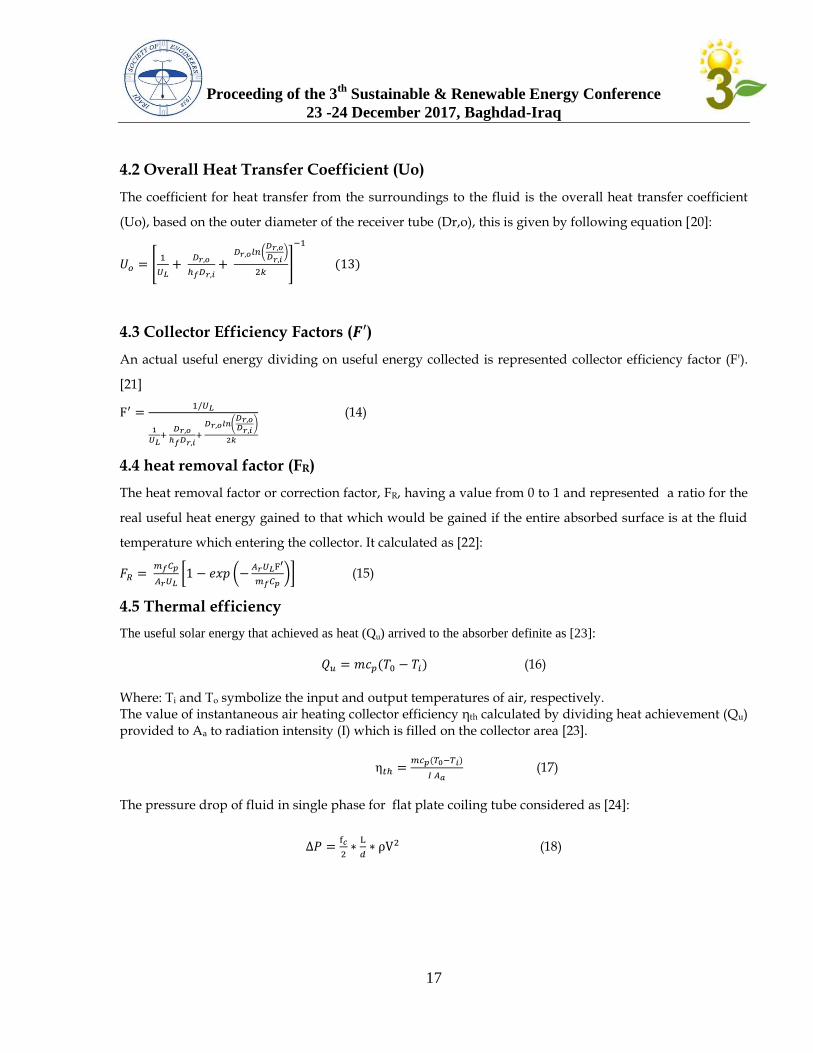
Proceeding of the 3th
Sustainable & Renewable Energy Conference
23 -24 December 2017, Baghdad-Iraq
17
4.2 Overall Heat Transfer Coefficient (Uo)
The coefficient for heat transfer from the surroundings to the fluid is the overall heat transfer coefficient
(Uo), based on the outer diameter of the receiver tube (Dr,o), this is given by following equation [20]:
4.3 Collector Efficiency Factors ( )
An actual useful energy dividing on useful energy collected is represented collector efficiency factor (F').
[21]
(14)
4.4 heat removal factor (FR)
The heat removal factor or correction factor, FR, having a value from 0 to 1 and represented a ratio for the
real useful heat energy gained to that which would be gained if the entire absorbed surface is at the fluid
temperature which entering the collector. It calculated as [22]:
(15)
4.5 Thermal efficiency
The useful solar energy that achieved as heat (Qu) arrived to the absorber definite as [23]:
(16)
Where: Ti and To symbolize the input and output temperatures of air, respectively. The value of instantaneous air heating collector efficiency ηth calculated by dividing heat achievement (Qu) provided to Aa to radiation intensity (I) which is filled on the collector area [23].
(17)
The pressure drop of fluid in single phase for flat plate coiling tube considered as [24]:
(18)

Proceeding of the 3th
Sustainable & Renewable Energy Conference
23 -24 December 2017, Baghdad-Iraq
18
5. EQUIPMENTS
5.1 Temperature
Three thermocouples sensors types (K) of 0.5 mm diameter are employed in existing work with digital
data logger as displayed in fig.(4).
Figure 4. Digital data logger
5.2 Solar radiation Pyranometer CMP22 model with data logger are used for measuring solar intensity was measured.
5.3 Wind speed Lutran anemometer used to measure the wind speed.
6. ERROR PERCENTAGE
The error between numerical and experimental results calculated by root mean square error as [25]:
(19)
where: R is a numerical value and X is the experimental measured.
δR and δX represented error of numerical and experimental quantities respectively.
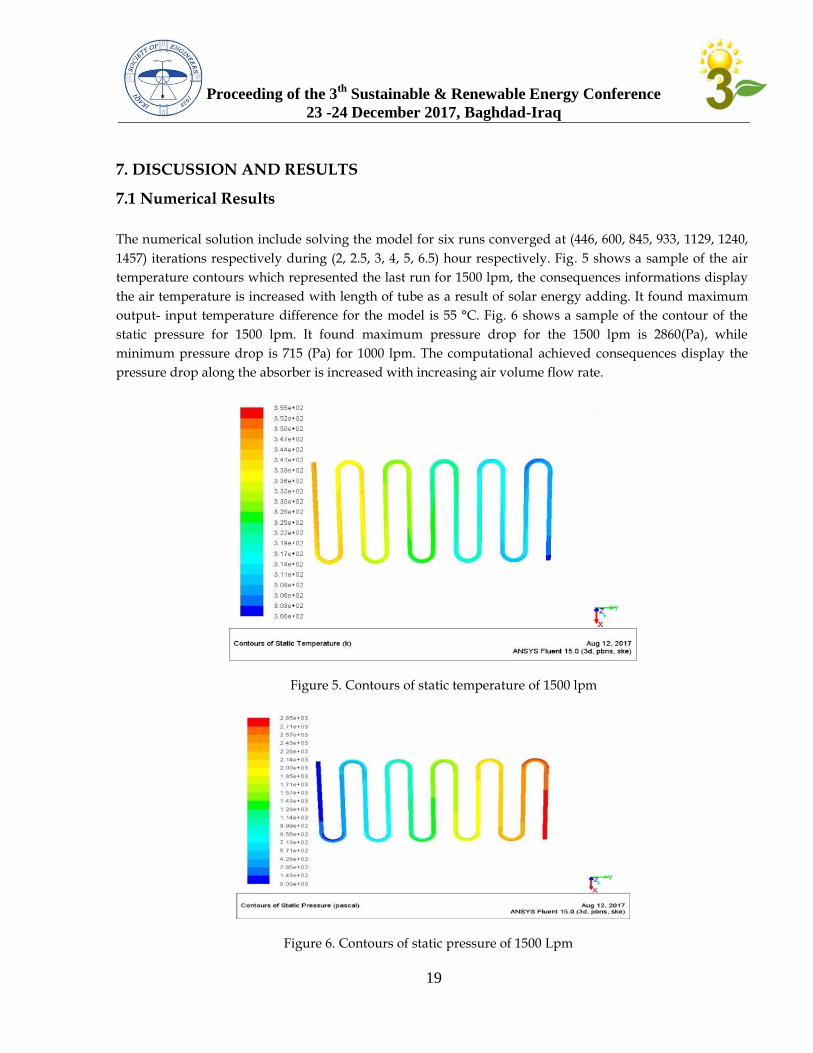
Proceeding of the 3th
Sustainable & Renewable Energy Conference
23 -24 December 2017, Baghdad-Iraq
19
7. DISCUSSION AND RESULTS
7.1 Numerical Results
The numerical solution include solving the model for six runs converged at (446, 600, 845, 933, 1129, 1240,
1457) iterations respectively during (2, 2.5, 3, 4, 5, 6.5) hour respectively. Fig. 5 shows a sample of the air
temperature contours which represented the last run for 1500 lpm, the consequences informations display
the air temperature is increased with length of tube as a result of solar energy adding. It found maximum
output- input temperature difference for the model is 55 °C. Fig. 6 shows a sample of the contour of the
static pressure for 1500 lpm. It found maximum pressure drop for the 1500 lpm is 2860(Pa), while
minimum pressure drop is 715 (Pa) for 1000 lpm. The computational achieved consequences display the
pressure drop along the absorber is increased with increasing air volume flow rate.
Figure 5. Contours of static temperature of 1500 lpm
Figure 6. Contours of static pressure of 1500 Lpm
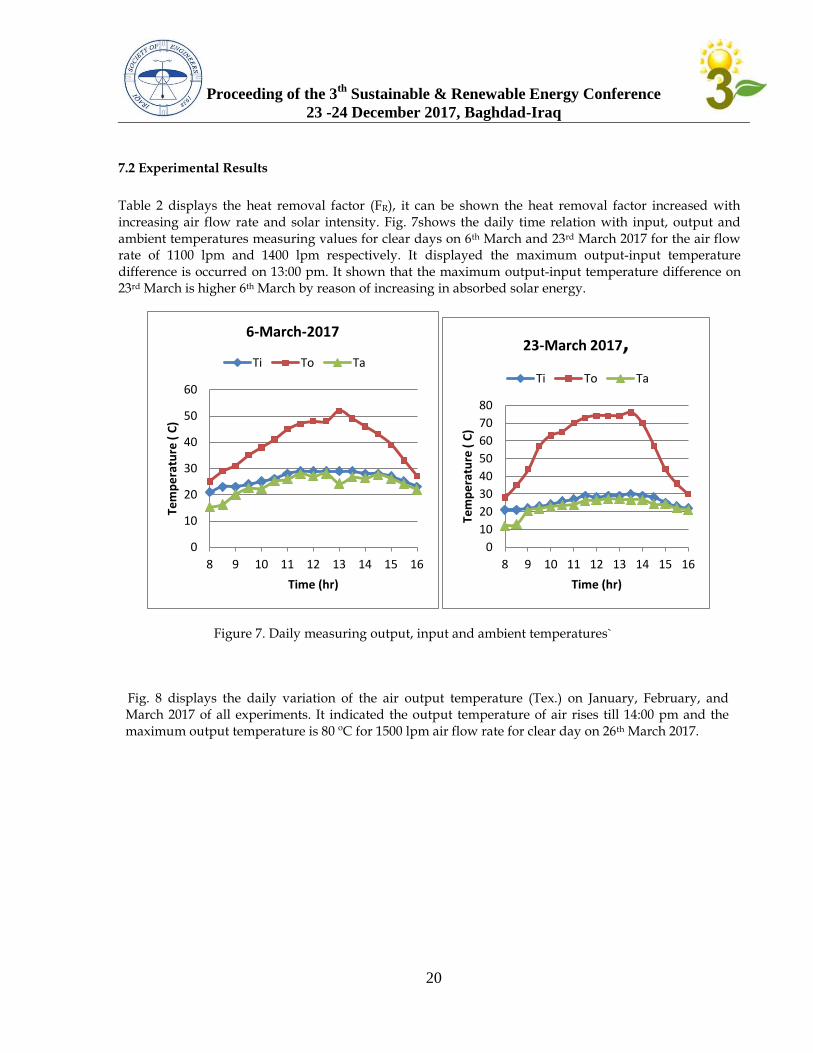
Proceeding of the 3th
Sustainable & Renewable Energy Conference
23 -24 December 2017, Baghdad-Iraq
20
7.2 Experimental Results
Table 2 displays the heat removal factor (FR), it can be shown the heat removal factor increased with increasing air flow rate and solar intensity. Fig. 7shows the daily time relation with input, output and ambient temperatures measuring values for clear days on 6th March and 23rd March 2017 for the air flow rate of 1100 lpm and 1400 lpm respectively. It displayed the maximum output-input temperature difference is occurred on 13:00 pm. It shown that the maximum output-input temperature difference on 23rd March is higher 6th March by reason of increasing in absorbed solar energy.
Figure 7. Daily measuring output, input and ambient temperatures`
Fig. 8 displays the daily variation of the air output temperature (Tex.) on January, February, and March 2017 of all experiments. It indicated the output temperature of air rises till 14:00 pm and the maximum output temperature is 80 ºC for 1500 lpm air flow rate for clear day on 26th March 2017.
0
10
20
30
40
50
60
8 9 10 11 12 13 14 15 16
Tem
pe
ratu
re (
C)
Time (hr)
6-March-2017
Ti To Ta
0
10
20
30
40
50
60
70
80
8 9 10 11 12 13 14 15 16
Tem
pe
ratu
re (
C)
Time (hr)
23-March 2017,
Ti To Ta
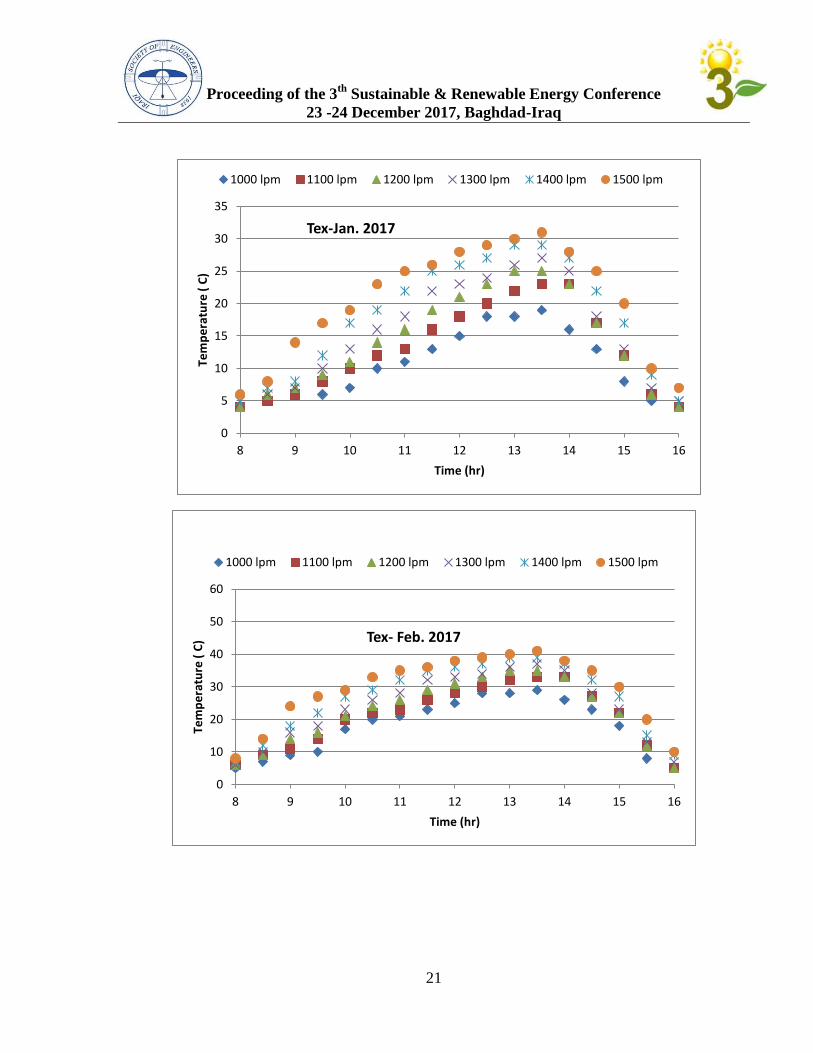
Proceeding of the 3th
Sustainable & Renewable Energy Conference
23 -24 December 2017, Baghdad-Iraq
21
0
5
10
15
20
25
30
35
8 9 10 11 12 13 14 15 16
Tem
pe
ratu
re (
C)
Time (hr)
Tex-Jan. 2017
1000 lpm 1100 lpm 1200 lpm 1300 lpm 1400 lpm 1500 lpm
0
10
20
30
40
50
60
8 9 10 11 12 13 14 15 16
Tem
pe
ratu
re (
C)
Time (hr)
Tex- Feb. 2017
1000 lpm 1100 lpm 1200 lpm 1300 lpm 1400 lpm 1500 lpm
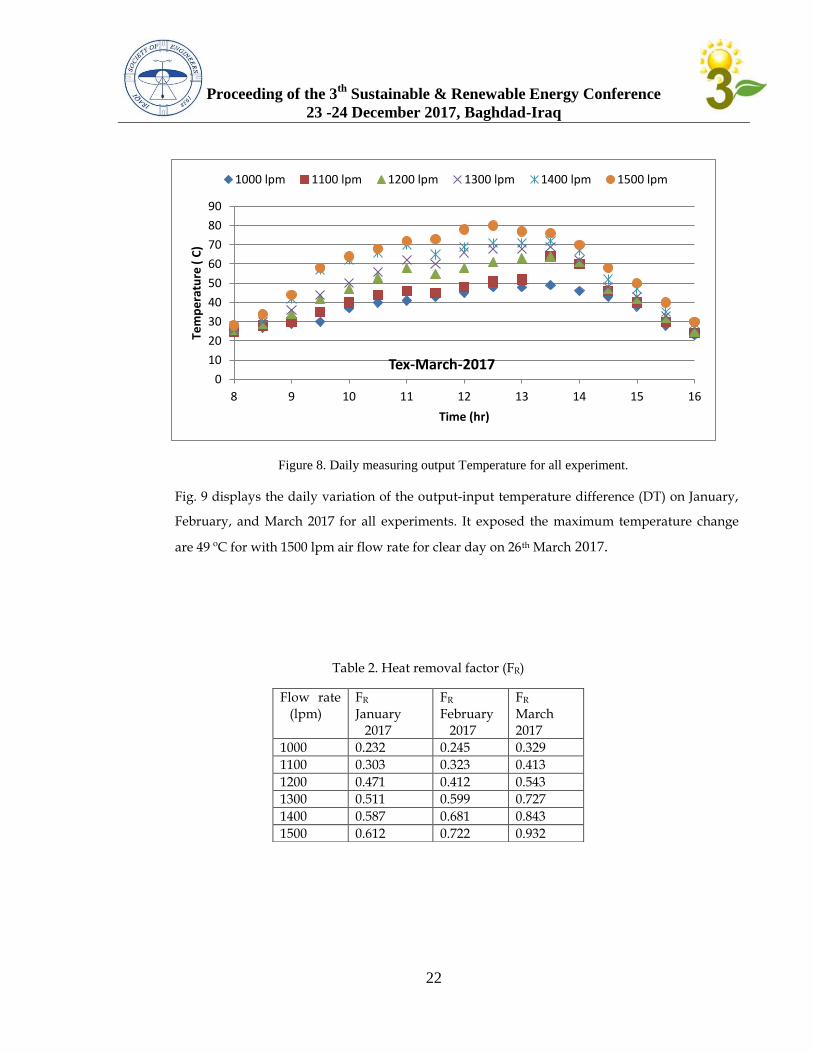
Proceeding of the 3th
Sustainable & Renewable Energy Conference
23 -24 December 2017, Baghdad-Iraq
22
Figure 8. Daily measuring output Temperature for all experiment.
Fig. 9 displays the daily variation of the output-input temperature difference (DT) on January,
February, and March 2017 for all experiments. It exposed the maximum temperature change
are 49 ºC for with 1500 lpm air flow rate for clear day on 26th March 2017.
Table 2. Heat removal factor (FR)
Flow rate (lpm)
FR January
2017
FR February
2017
FR March 2017
1000 0.232 0.245 0.329
1100 0.303 0.323 0.413
1200 0.471 0.412 0.543
1300 0.511 0.599 0.727
1400 0.587 0.681 0.843
1500 0.612 0.722 0.932
0
10
20
30
40
50
60
70
80
90
8 9 10 11 12 13 14 15 16
Tem
pe
ratu
re (
C)
Time (hr)
Tex-March-2017
1000 lpm 1100 lpm 1200 lpm 1300 lpm 1400 lpm 1500 lpm
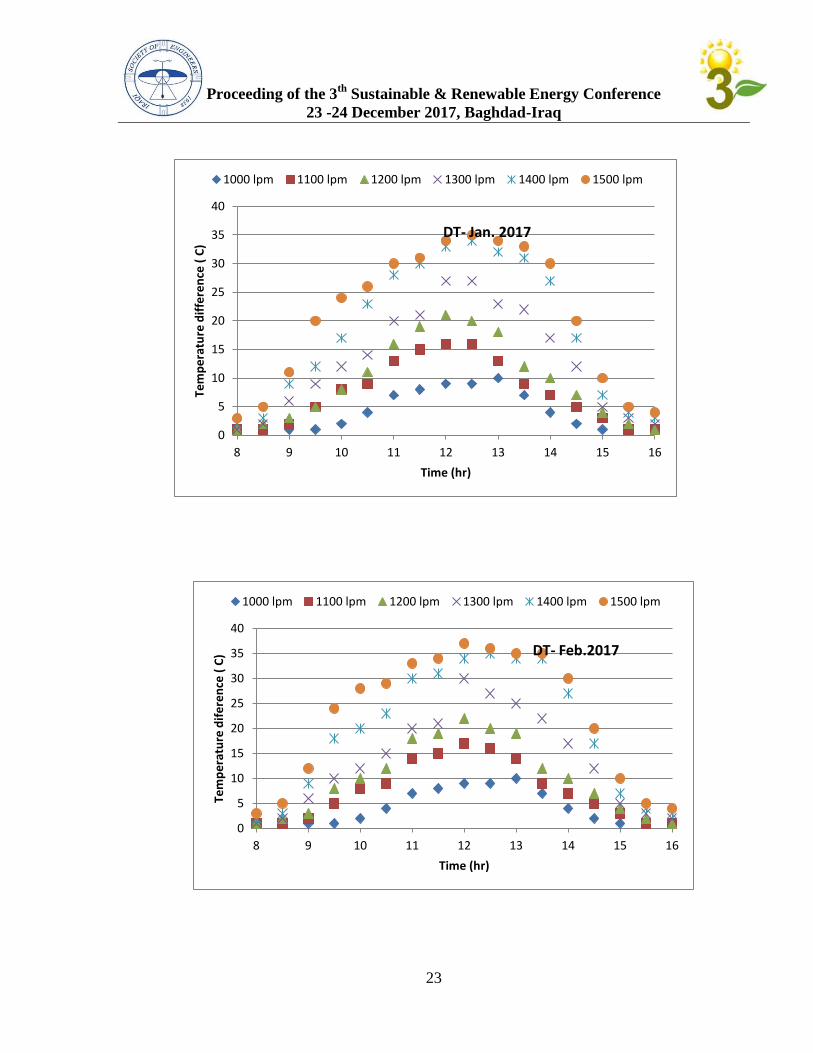
Proceeding of the 3th
Sustainable & Renewable Energy Conference
23 -24 December 2017, Baghdad-Iraq
23
0
5
10
15
20
25
30
35
40
8 9 10 11 12 13 14 15 16
Tem
pe
ratu
re d
iffe
ren
ce (
C)
Time (hr)
DT- Jan. 2017
1000 lpm 1100 lpm 1200 lpm 1300 lpm 1400 lpm 1500 lpm
0
5
10
15
20
25
30
35
40
8 9 10 11 12 13 14 15 16
Tem
pe
ratu
re d
ife
ren
ce (
C)
Time (hr)
DT- Feb.2017
1000 lpm 1100 lpm 1200 lpm 1300 lpm 1400 lpm 1500 lpm
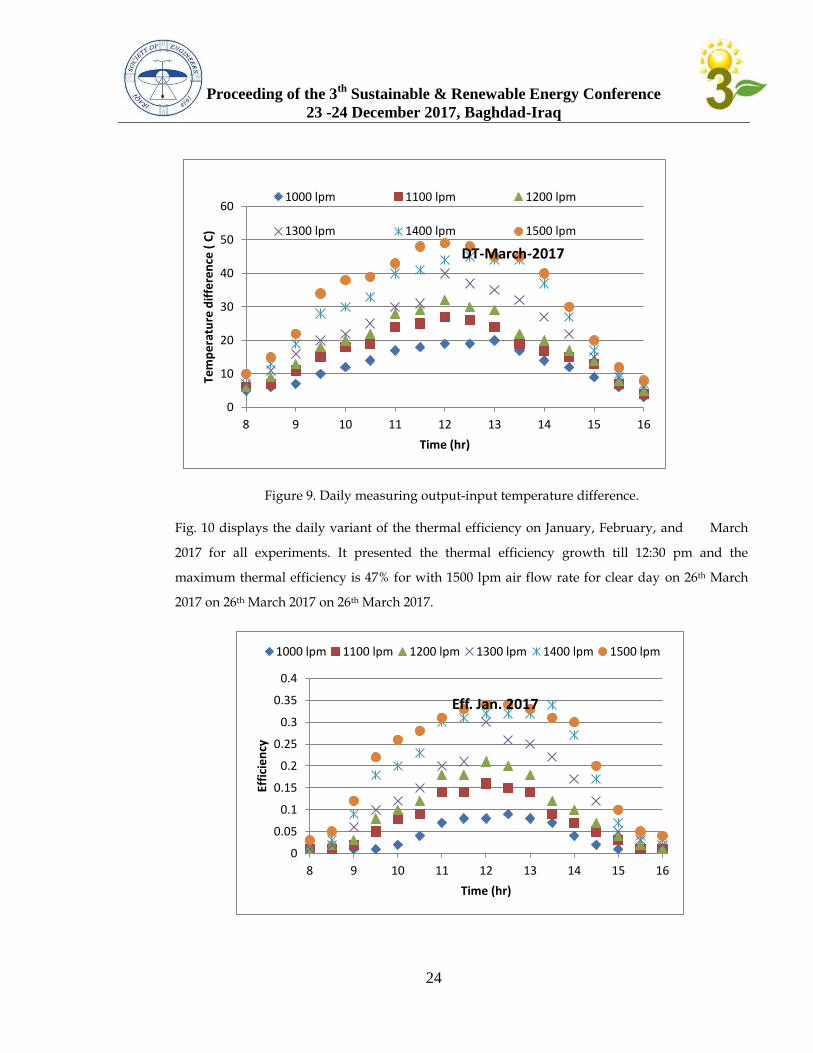
Proceeding of the 3th
Sustainable & Renewable Energy Conference
23 -24 December 2017, Baghdad-Iraq
24
Figure 9. Daily measuring output-input temperature difference.
Fig. 10 displays the daily variant of the thermal efficiency on January, February, and March
2017 for all experiments. It presented the thermal efficiency growth till 12:30 pm and the
maximum thermal efficiency is 47% for with 1500 lpm air flow rate for clear day on 26th March
2017 on 26th March 2017 on 26th March 2017.
0
10
20
30
40
50
60
8 9 10 11 12 13 14 15 16
Tem
pe
ratu
re d
iffe
ren
ce (
C)
Time (hr)
DT-March-2017
1000 lpm 1100 lpm 1200 lpm
1300 lpm 1400 lpm 1500 lpm
0
0.05
0.1
0.15
0.2
0.25
0.3
0.35
0.4
8 9 10 11 12 13 14 15 16
Effi
cie
ncy
Time (hr)
Eff. Jan. 2017
1000 lpm 1100 lpm 1200 lpm 1300 lpm 1400 lpm 1500 lpm
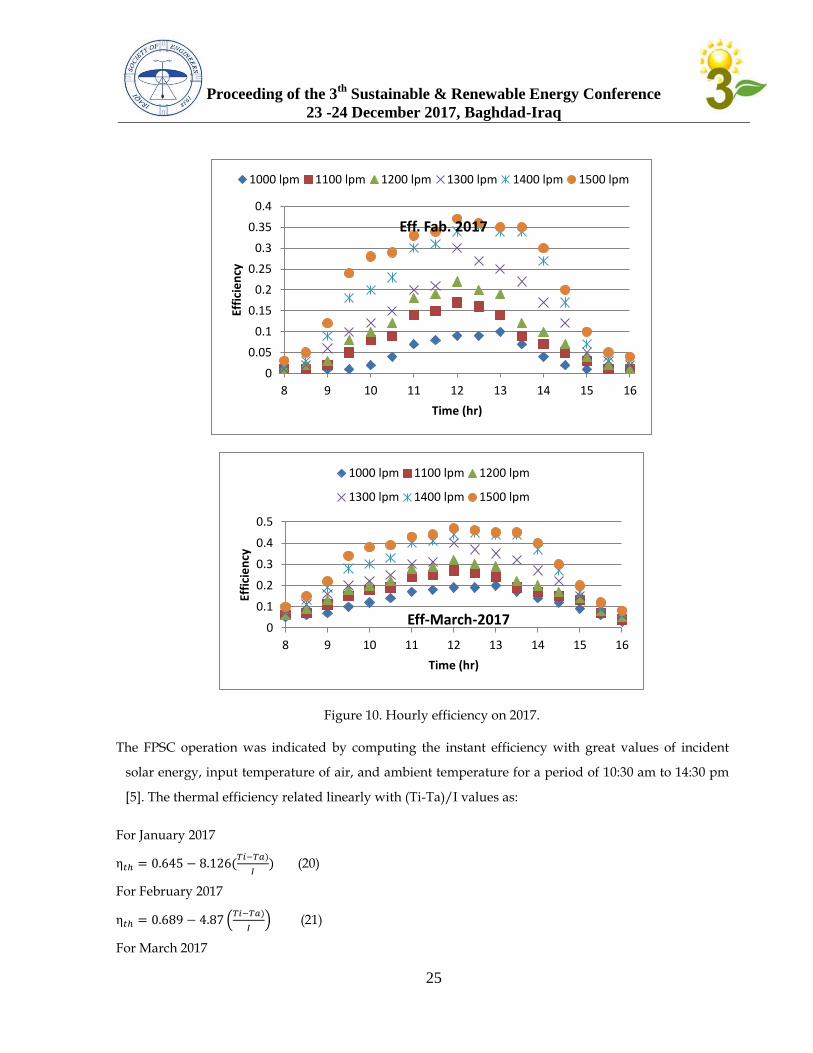
Proceeding of the 3th
Sustainable & Renewable Energy Conference
23 -24 December 2017, Baghdad-Iraq
25
Figure 10. Hourly efficiency on 2017.
The FPSC operation was indicated by computing the instant efficiency with great values of incident
solar energy, input temperature of air, and ambient temperature for a period of 10:30 am to 14:30 pm
[5]. The thermal efficiency related linearly with (Ti-Ta)/I values as:
For January 2017
(20)
For February 2017
(21)
For March 2017
0
0.05
0.1
0.15
0.2
0.25
0.3
0.35
0.4
8 9 10 11 12 13 14 15 16
Effi
cie
ncy
Time (hr)
Eff. Fab. 2017
1000 lpm 1100 lpm 1200 lpm 1300 lpm 1400 lpm 1500 lpm
0
0.1
0.2
0.3
0.4
0.5
8 9 10 11 12 13 14 15 16
Effi
cie
ncy
Time (hr)
Eff-March-2017
1000 lpm 1100 lpm 1200 lpm
1300 lpm 1400 lpm 1500 lpm
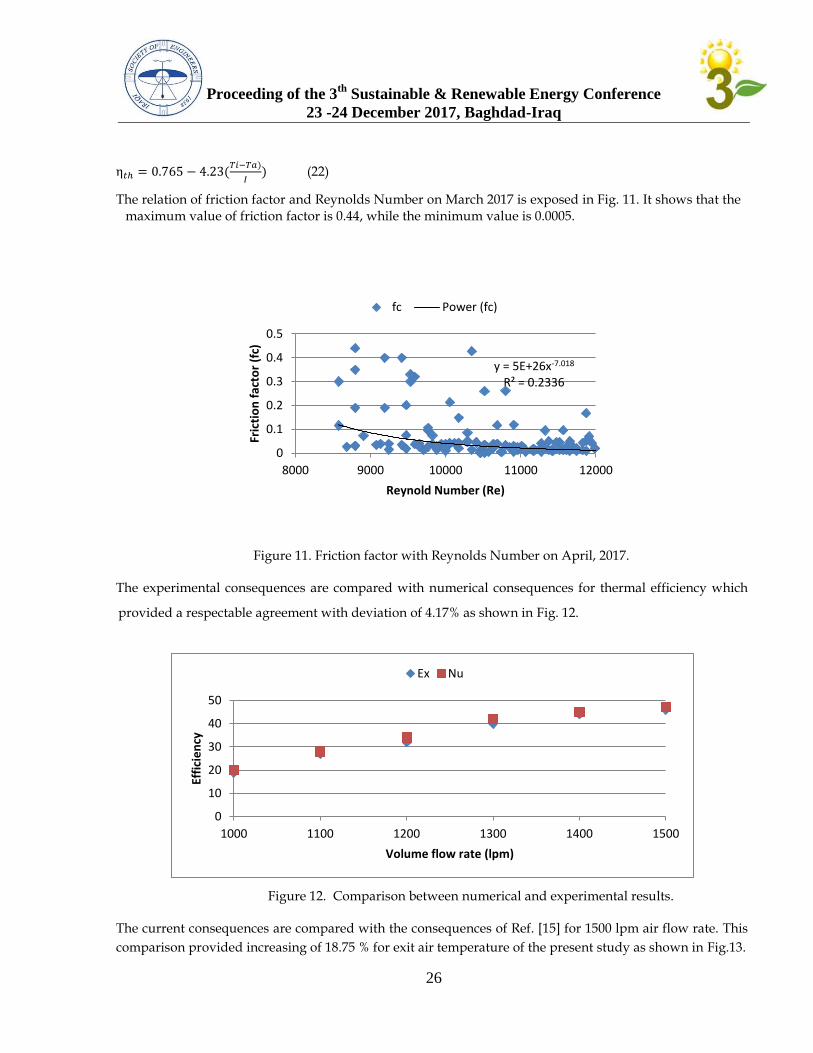
Proceeding of the 3th
Sustainable & Renewable Energy Conference
23 -24 December 2017, Baghdad-Iraq
26
(22)
The relation of friction factor and Reynolds Number on March 2017 is exposed in Fig. 11. It shows that the maximum value of friction factor is 0.44, while the minimum value is 0.0005.
Figure 11. Friction factor with Reynolds Number on April, 2017.
The experimental consequences are compared with numerical consequences for thermal efficiency which
provided a respectable agreement with deviation of 4.17% as shown in Fig. 12.
Figure 12. Comparison between numerical and experimental results.
The current consequences are compared with the consequences of Ref. [15] for 1500 lpm air flow rate. This
comparison provided increasing of 18.75 % for exit air temperature of the present study as shown in Fig.13.
y = 5E+26x-7.018 R² = 0.2336
0
0.1
0.2
0.3
0.4
0.5
8000 9000 10000 11000 12000
Fric
tio
n f
acto
r (f
c)
Reynold Number (Re)
fc Power (fc)
0
10
20
30
40
50
1000 1100 1200 1300 1400 1500
Effi
cie
ncy
Volume flow rate (lpm)
Ex Nu
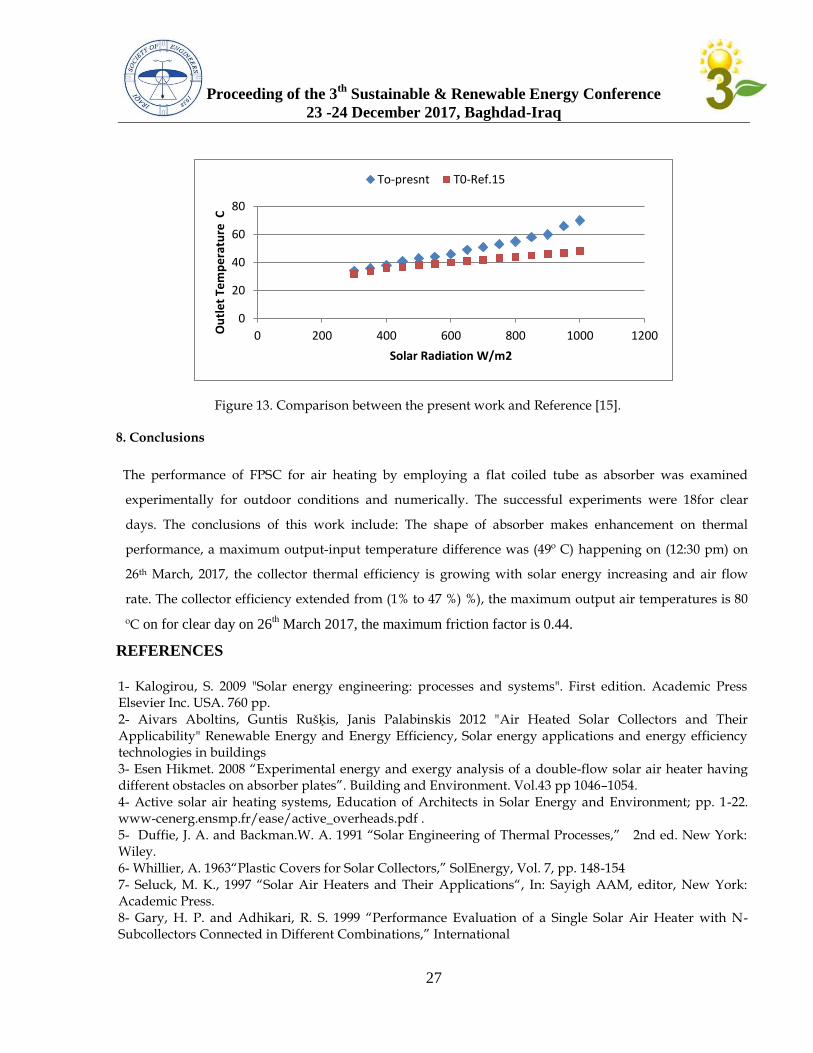
Proceeding of the 3th
Sustainable & Renewable Energy Conference
23 -24 December 2017, Baghdad-Iraq
27
Figure 13. Comparison between the present work and Reference [15].
8. Conclusions
The performance of FPSC for air heating by employing a flat coiled tube as absorber was examined
experimentally for outdoor conditions and numerically. The successful experiments were 18for clear
days. The conclusions of this work include: The shape of absorber makes enhancement on thermal
performance, a maximum output-input temperature difference was (49º C) happening on (12:30 pm) on
26th March, 2017, the collector thermal efficiency is growing with solar energy increasing and air flow
rate. The collector efficiency extended from (1% to 47 %) %), the maximum output air temperatures is 80
ºC on for clear day on 26th March 2017, the maximum friction factor is 0.44.
REFERENCES
1- Kalogirou, S. 2009 "Solar energy engineering: processes and systems". First edition. Academic Press Elsevier Inc. USA. 760 pp.
2- 2- Aivars Aboltins, Guntis Rušķis, Janis Palabinskis 2012 "Air Heated Solar Collectors and Their Applicability" Renewable Energy and Energy Efficiency, Solar energy applications and energy efficiency technologies in buildings
3- 3- Esen Hikmet. 2008 “Experimental energy and exergy analysis of a double-flow solar air heater having different obstacles on absorber plates”. Building and Environment. Vol.43 pp 1046–1054. 4- Active solar air heating systems, Education of Architects in Solar Energy and Environment; pp. 1-22. www-cenerg.ensmp.fr/ease/active_overheads.pdf . 5- Duffie, J. A. and Backman.W. A. 1991 “Solar Engineering of Thermal Processes,” 2nd ed. New York: Wiley. 6- Whillier, A. 1963“Plastic Covers for Solar Collectors,” SolEnergy, Vol. 7, pp. 148-154 7- Seluck, M. K., 1997 “Solar Air Heaters and Their Applications“, In: Sayigh AAM, editor, New York: Academic Press. 8- Gary, H. P. and Adhikari, R. S. 1999 “Performance Evaluation of a Single Solar Air Heater with N-Subcollectors Connected in Different Combinations,” International
0
20
40
60
80
0 200 400 600 800 1000 1200 Ou
tle
t Te
mp
era
ture
C
Solar Radiation W/m2
To-presnt T0-Ref.15
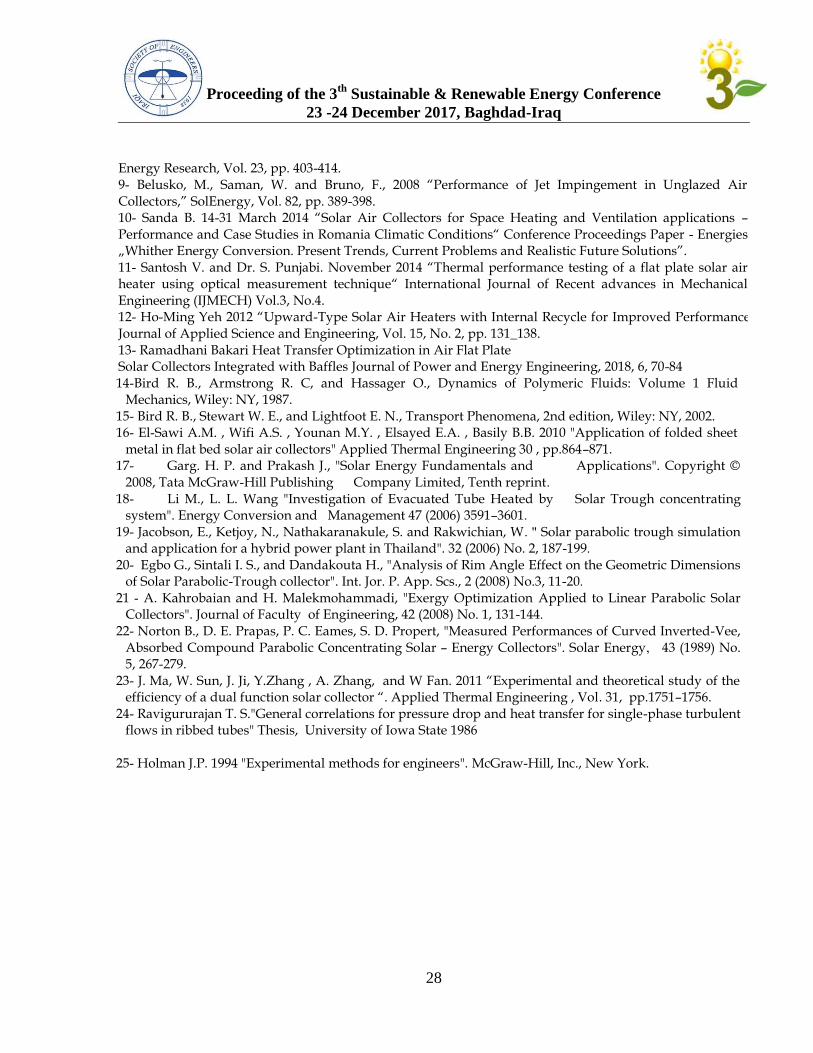
Proceeding of the 3th
Sustainable & Renewable Energy Conference
23 -24 December 2017, Baghdad-Iraq
28
Energy Research, Vol. 23, pp. 403-414. 9- Belusko, M., Saman, W. and Bruno, F., 2008 “Performance of Jet Impingement in Unglazed Air Collectors,” SolEnergy, Vol. 82, pp. 389-398. 10- Sanda B. 14-31 March 2014 “Solar Air Collectors for Space Heating and Ventilation applications – Performance and Case Studies in Romania Climatic Conditions“ Conference Proceedings Paper - Energies „Whither Energy Conversion. Present Trends, Current Problems and Realistic Future Solutions”. 11- Santosh V. and Dr. S. Punjabi. November 2014 “Thermal performance testing of a flat plate solar air heater using optical measurement technique“ International Journal of Recent advances in Mechanical Engineering (IJMECH) Vol.3, No.4. 12- Ho-Ming Yeh 2012 “Upward-Type Solar Air Heaters with Internal Recycle for Improved Performance“ Journal of Applied Science and Engineering, Vol. 15, No. 2, pp. 131_138. 13- Ramadhani Bakari Heat Transfer Optimization in Air Flat Plate Solar Collectors Integrated with Baffles Journal of Power and Energy Engineering, 2018, 6, 70-84 14-Bird R. B., Armstrong R. C, and Hassager O., Dynamics of Polymeric Fluids: Volume 1 Fluid
Mechanics, Wiley: NY, 1987. 15- Bird R. B., Stewart W. E., and Lightfoot E. N., Transport Phenomena, 2nd edition, Wiley: NY, 2002. 16- El-Sawi A.M. , Wifi A.S. , Younan M.Y. , Elsayed E.A. , Basily B.B. 2010 "Application of folded sheet
metal in flat bed solar air collectors" Applied Thermal Engineering 30 , pp.864–871. 17- Garg. H. P. and Prakash J., "Solar Energy Fundamentals and Applications". Copyright ©
2008, Tata McGraw-Hill Publishing Company Limited, Tenth reprint. 18- Li M., L. L. Wang "Investigation of Evacuated Tube Heated by Solar Trough concentrating
system". Energy Conversion and Management 47 (2006) 3591–3601. 19- Jacobson, E., Ketjoy, N., Nathakaranakule, S. and Rakwichian, W. " Solar parabolic trough simulation
and application for a hybrid power plant in Thailand". 32 (2006) No. 2, 187-199. 20- Egbo G., Sintali I. S., and Dandakouta H., "Analysis of Rim Angle Effect on the Geometric Dimensions
of Solar Parabolic-Trough collector". Int. Jor. P. App. Scs., 2 (2008) No.3, 11-20. 21 - A. Kahrobaian and H. Malekmohammadi, "Exergy Optimization Applied to Linear Parabolic Solar
Collectors". Journal of Faculty of Engineering, 42 (2008) No. 1, 131-144. 22- Norton B., D. E. Prapas, P. C. Eames, S. D. Propert, "Measured Performances of Curved Inverted-Vee,
Absorbed Compound Parabolic Concentrating Solar – Energy Collectors". Solar Energy, 43 (1989) No. 5, 267-279.
23- J. Ma, W. Sun, J. Ji, Y.Zhang , A. Zhang, and W Fan. 2011 “Experimental and theoretical study of the efficiency of a dual function solar collector “. Applied Thermal Engineering , Vol. 31, pp.1751–1756.
24- Ravigururajan T. S."General correlations for pressure drop and heat transfer for single-phase turbulent flows in ribbed tubes" Thesis, University of Iowa State 1986
25- Holman J.P. 1994 "Experimental methods for engineers". McGraw-Hill, Inc., New York.
Proceeding of the 3th Sustainable & Renewable Energy Conference 23 -24 December 2017, Baghdad-Iraq
29
Performance investigation of solar evacuated tube collector in Iraq
Abdulrahman Th. Mohammad
Baqubah Technical Institute, Middle Technical University (MTU), Baghdad, Iraq
E-mail: [email protected]
Abstract
In this paper, a new TRNSYS model of a solar space heating is investigated within the
weather data of Baghdad city, Iraq for the period between 1st of November and 30
th of April in
hourly base. The main objective of this paper is to investigate the performance of evacuated tube
solar collector. The performance of collector is represented in outlet temperature, heat collected by
the collectors and collector efficiency. The results of simulation show that the outlet-collector water
temperature in maximum value was (89 °C), the maximum daily energy collected by collector was
1.8 kW d−1
and collector efficiency was 51 %.
Keywords: Solar collector, evacuated tube, TRNSYS.
مفرغ في العراقتحقيق اداء الجامع الشمسي االنبوبي ال
عبدالرحمن ثعبان محمد. د
العراق -بغداد -الجامعة التقنية الوسطى/ بعقوبة–المعهد التقني
المستخلص
في بغداد للفترة بين تشرين لمنظومة تسخين شمسية TRANSYSبرنامج تم تحقيق موديل باستخدام في هذا البحث
اداء الجامع الشمسي تم . المفرغ ذو االنبوب الهدف الرئيسي من هذا البحث هو التحقق من اداء الجامع الشمسي. الثاني و نيسان
نتائج البرنامج اظهرت ان اعظم درجة حرارة . والكفاءة كمية الحرارة الجامعة -من الجامعتمثيله من خالل درجة الحارة الخارجة
.ليعلى التوا% 18اليوم و /كيلووات 8.9ة مئوية اما كمية الحارة الجامعة والكفاءة درج 89خارجة من الجامع الشمسي هي
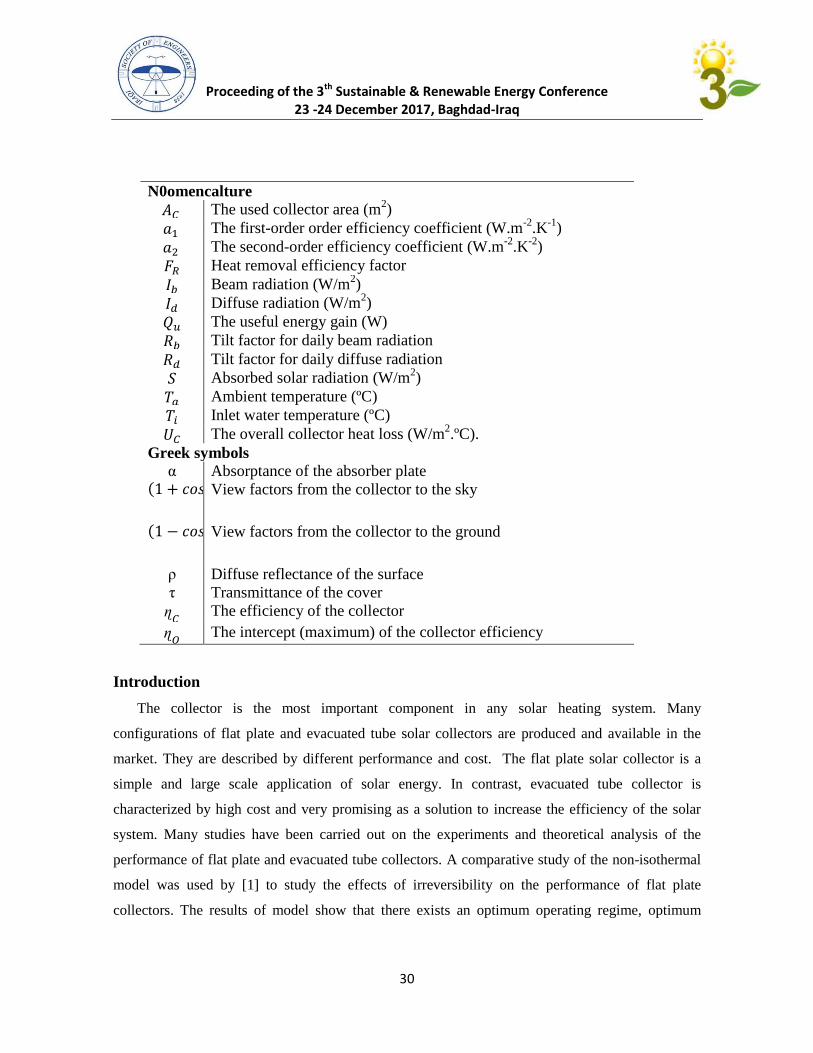
Proceeding of the 3th Sustainable & Renewable Energy Conference 23 -24 December 2017, Baghdad-Iraq
30
N0omencalture
The used collector area (m2)
The first-order order efficiency coefficient (W.m-2
.K-1
)
The second-order efficiency coefficient (W.m-2
.K-2
)
Heat removal efficiency factor
Beam radiation (W/m2)
Diffuse radiation (W/m2)
The useful energy gain (W)
Tilt factor for daily beam radiation
Tilt factor for daily diffuse radiation
Absorbed solar radiation (W/m2)
Ambient temperature (ºC)
Inlet water temperature (ºC)
The overall collector heat loss (W/m2.ºC).
Greek symbols
α Absorptance of the absorber plate
View factors from the collector to the sky
View factors from the collector to the ground
ρ Diffuse reflectance of the surface τ Transmittance of the cover
The efficiency of the collector
The intercept (maximum) of the collector efficiency
Introduction
The collector is the most important component in any solar heating system. Many
configurations of flat plate and evacuated tube solar collectors are produced and available in the
market. They are described by different performance and cost. The flat plate solar collector is a
simple and large scale application of solar energy. In contrast, evacuated tube collector is
characterized by high cost and very promising as a solution to increase the efficiency of the solar
system. Many studies have been carried out on the experiments and theoretical analysis of the
performance of flat plate and evacuated tube collectors. A comparative study of the non-isothermal
model was used by [1] to study the effects of irreversibility on the performance of flat plate
collectors. The results of model show that there exists an optimum operating regime, optimum
Proceeding of the 3th Sustainable & Renewable Energy Conference 23 -24 December 2017, Baghdad-Iraq
31
collector temperature and heat extraction rate at which the generation of entropy is minimum.
Nayak et al. [2] compared three transient methods, namely Perers, DSC and Wijeysundera to test
solar flat-plate collectors. The results of testing were compared with the steady state values obtained
on the basis of the ASHRAE 93-86 standard and show that the Perers' method yields parameters
closer to the steady state values; whereas the Perers and DSC methods were greatly affected by
measurement errors.
An experimental set-up involving full scale collectors made of a row of 20 evacuated tubes was
constructed by [3] to investigate the performance the heat-pipe-based collectors. The results show
that the efficiency is almost 15 to 20% higher than the water-in-glass tubes.
In study of TRNSYS model for forced circulation solar water heating systems validated by [4] to
predict the collector outlet temperature, heat collected by the collectors and heat delivered to the
load for the systems that consist of flat plate collectors and a heat pipe evacuated tube collector. The
model results estimated the three parameters (outlet temperature, heat collected by the collectors
and heat delivered to the load) of 16.9%, 14.1% and 6.9% for the flat plate collector system and
18.4%, 16.8% and 7.6% for the evacuated tube collector system. Numerical analysis used by [5]
was applied to find the coefficient of heat transfer and the performance characteristics in the
evacuated tube collectors. The performance characteristics of these collectors were compared with
commercially available brands to test their capability to power the generator of an absorption
chiller.
The main objective of this paper is to investigate the performance of evacuated tube collector in
Iraq for the period between 1st of November and 30
th of April.
Solar heating system
The general solar heating system includes the solar collector, storage tank with an electrical heater
and thermostat, hot water circulation pump, and a controller. The solar energy is collected and
transmitted to a water storage tank through an internal coil in the storage tank. The tank is assumed
to be very well insulated, and the heat losses are considered. The water in the tank is supposed to be
fully mixed, and, therefore, the stratification is not considered. The application of collector
performance requires information of the solar radiation absorbed by the collector absorber. As
shown in Fig.1, the total solar radiation on the tilted surface at any time can be defined as [6]:

Proceeding of the 3th Sustainable & Renewable Energy Conference 23 -24 December 2017, Baghdad-Iraq
32
Fig. 1 Diagram of solar radiation on tilted surface
(1)
Where:S- Absorbed solar radiation (W/m2), Ib: Beam radiation (W/m
2), Id: Diffuse radiation (W/m
2)
, α: Absorptance of the absorber plate, τ: Transmittance of the cover , ρ: Diffuse reflectance of the
surface ,
: View factors from the collector to the sky ,
: View factors from the collector
to the ground.
Evacuated Tube Solar Collector
Solar energy collectors are special kinds of heat exchangers that transform solar radiation energy
into heat. In steady state, the thermal performance of the solar collector is described by an energy
balance that indicates the distribution of incident solar energy into useful energy, thermal loss, and
optical loss. The general equation describes the useful energy from a solar collector for near normal
incidence angle of the solar radiation can be written as [7].
(2)
Where: Qu is the useful energy gain (W), S is the incident solar radiation on the collector (W/m2),
Ac is the used collector area (m2), FR is heat removal efficiency factor and Uc is the overall
collector heat loss (W/m2.ºC). FR and Uc are collector characteristics coefficients and they change
depending on the collector type. The values could be taken from the data sheet delivered by the
manufacturer, Ti is the inlet temperature (ºC) and Ta is the ambient air temperature (ºC). The useful
energy gain can be determined from the solar collector efficiency is defined as the ratio of the
useful heat gain over any time period to the incident solar radiation over the same period. The
useful energy gain from the solar collector can be written as:
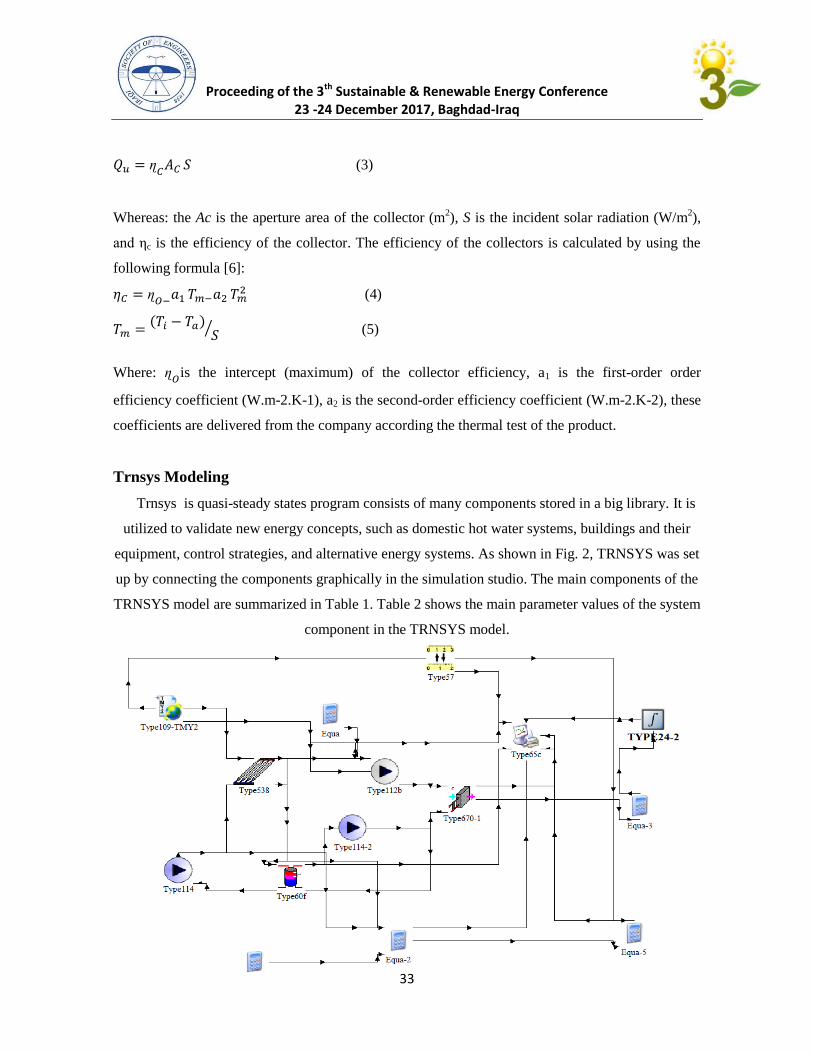
Proceeding of the 3th Sustainable & Renewable Energy Conference 23 -24 December 2017, Baghdad-Iraq
33
(3)
Whereas: the Ac is the aperture area of the collector (m2), S is the incident solar radiation (W/m
2),
and ηc is the efficiency of the collector. The efficiency of the collectors is calculated by using the
following formula [6]:
(4)
(5)
Where:
is the intercept (maximum) of the collector efficiency, a1 is the first-order order
efficiency coefficient (W.m-2.K-1), a2 is the second-order efficiency coefficient (W.m-2.K-2), these
coefficients are delivered from the company according the thermal test of the product.
Trnsys Modeling
Trnsys is quasi-steady states program consists of many components stored in a big library. It is
utilized to validate new energy concepts, such as domestic hot water systems, buildings and their
equipment, control strategies, and alternative energy systems. As shown in Fig. 2, TRNSYS was set
up by connecting the components graphically in the simulation studio. The main components of the
TRNSYS model are summarized in Table 1. Table 2 shows the main parameter values of the system
component in the TRNSYS model.
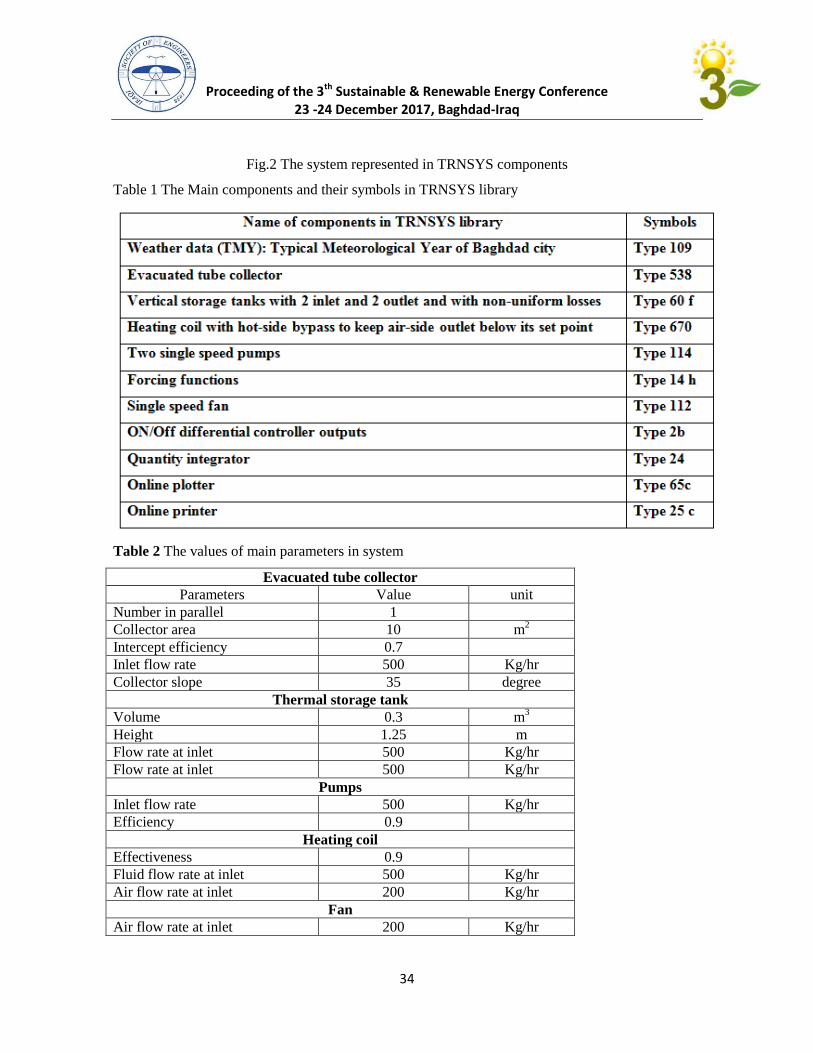
Proceeding of the 3th Sustainable & Renewable Energy Conference 23 -24 December 2017, Baghdad-Iraq
34
Fig.2 The system represented in TRNSYS components
Table 1 The Main components and their symbols in TRNSYS library
Table 2 The values of main parameters in system
Evacuated tube collector
Parameters Value unit
Number in parallel 1
Collector area 10 m2
Intercept efficiency 0.7
Inlet flow rate 500 Kg/hr
Collector slope 35 degree
Thermal storage tank
Volume 0.3 m3
Height 1.25 m
Flow rate at inlet 500 Kg/hr
Flow rate at inlet 500 Kg/hr
Pumps
Inlet flow rate 500 Kg/hr
Efficiency 0.9
Heating coil
Effectiveness 0.9
Fluid flow rate at inlet 500 Kg/hr
Air flow rate at inlet 200 Kg/hr
Fan
Air flow rate at inlet 200 Kg/hr
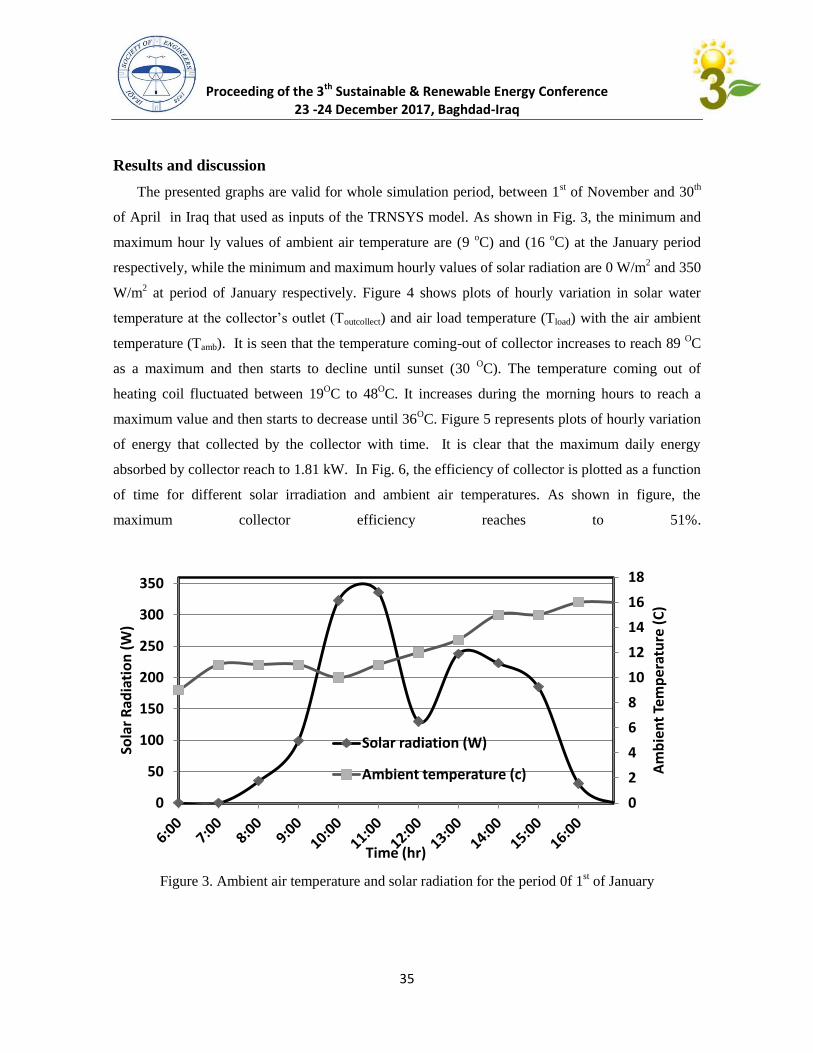
Proceeding of the 3th Sustainable & Renewable Energy Conference 23 -24 December 2017, Baghdad-Iraq
35
Results and discussion
The presented graphs are valid for whole simulation period, between 1st of November and 30
th
of April in Iraq that used as inputs of the TRNSYS model. As shown in Fig. 3, the minimum and
maximum hour ly values of ambient air temperature are (9 oC) and (16
oC) at the January period
respectively, while the minimum and maximum hourly values of solar radiation are 0 W/m2 and 350
W/m2 at period of January respectively. Figure 4 shows plots of hourly variation in solar water
temperature at the collector’s outlet (Toutcollect) and air load temperature (Tload) with the air ambient
temperature (Tamb). It is seen that the temperature coming-out of collector increases to reach 89 OC
as a maximum and then starts to decline until sunset (30 OC). The temperature coming out of
heating coil fluctuated between 19OC to 48
OC. It increases during the morning hours to reach a
maximum value and then starts to decrease until 36OC. Figure 5 represents plots of hourly variation
of energy that collected by the collector with time. It is clear that the maximum daily energy
absorbed by collector reach to 1.81 kW. In Fig. 6, the efficiency of collector is plotted as a function
of time for different solar irradiation and ambient air temperatures. As shown in figure, the
maximum collector efficiency reaches to 51%.
Figure 3. Ambient air temperature and solar radiation for the period 0f 1st of January
0
2
4
6
8
10
12
14
16
18
0
50
100
150
200
250
300
350
Am
bie
nt
Tem
per
atu
re (
C)
Sola
r R
adia
tio
n (
W)
Time (hr)
Solar radiation (W)
Ambient temperature (c)
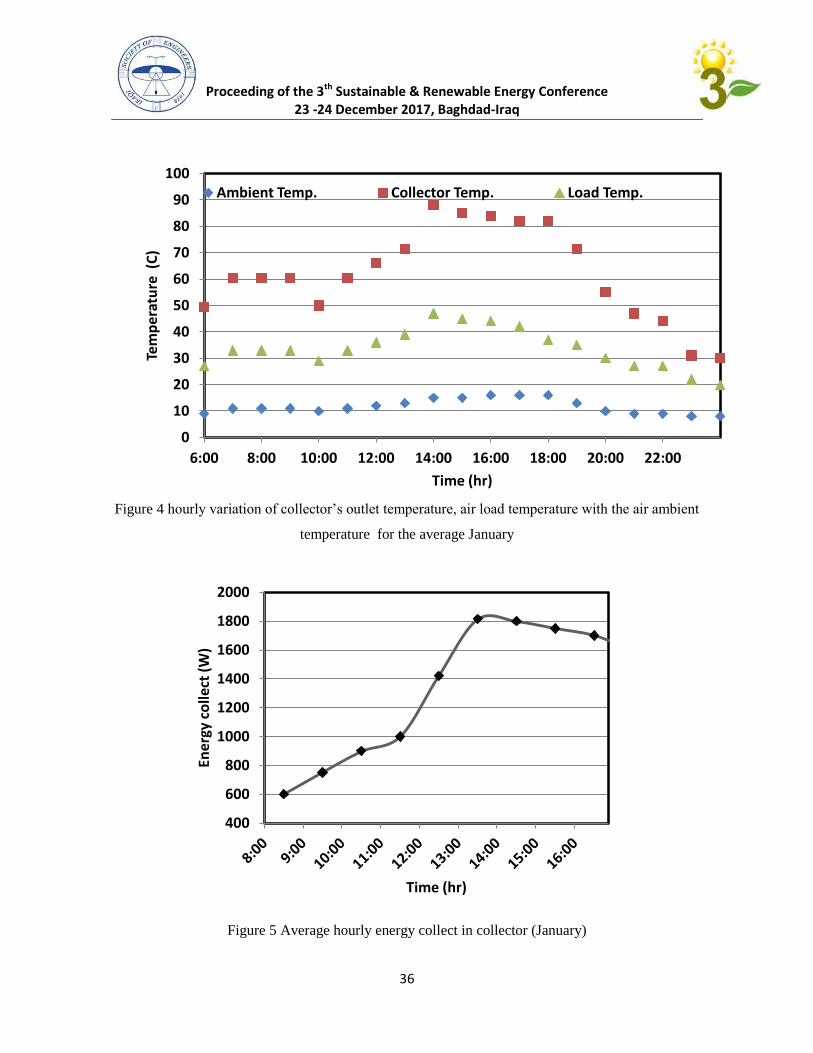
Proceeding of the 3th Sustainable & Renewable Energy Conference 23 -24 December 2017, Baghdad-Iraq
36
Figure 4 hourly variation of collector’s outlet temperature, air load temperature with the air ambient
temperature for the average January
Figure 5 Average hourly energy collect in collector (January)
0
10
20
30
40
50
60
70
80
90
100
6:00 8:00 10:00 12:00 14:00 16:00 18:00 20:00 22:00
Tem
per
atu
re (
C)
Time (hr)
Ambient Temp. Collector Temp. Load Temp.
400
600
800
1000
1200
1400
1600
1800
2000
Ener
gy c
olle
ct (
W)
Time (hr)
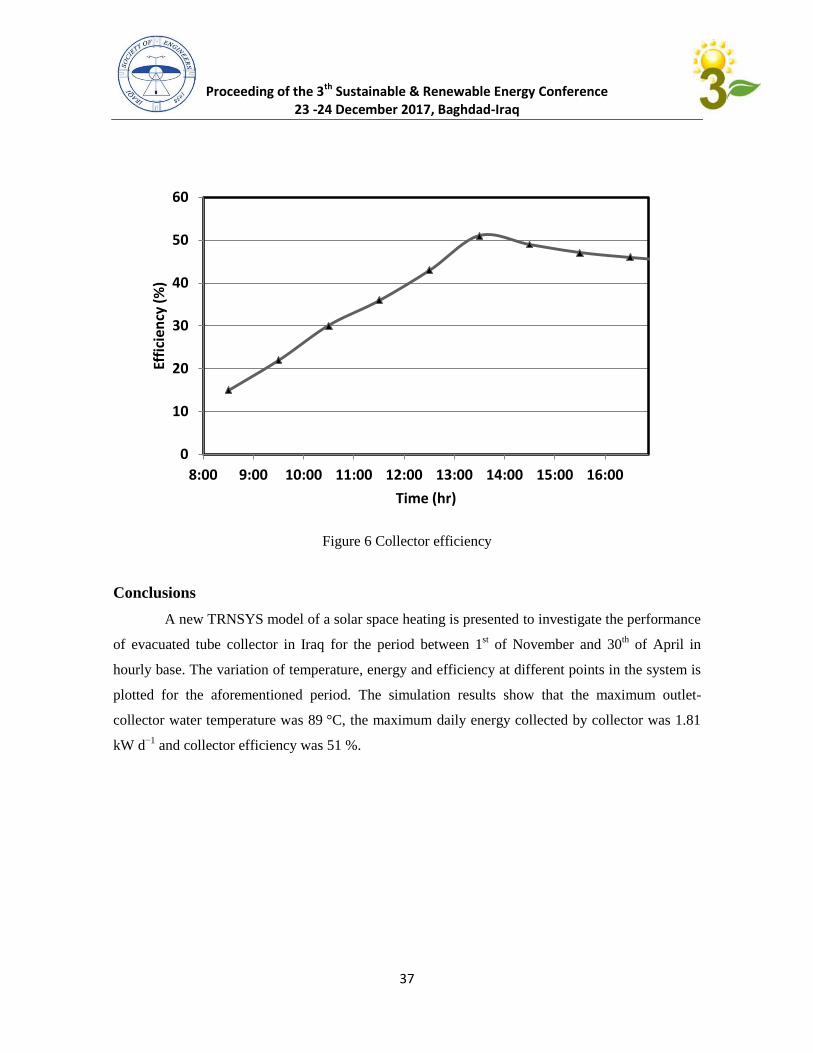
Proceeding of the 3th Sustainable & Renewable Energy Conference 23 -24 December 2017, Baghdad-Iraq
37
Figure 6 Collector efficiency
Conclusions
A new TRNSYS model of a solar space heating is presented to investigate the performance
of evacuated tube collector in Iraq for the period between 1st of November and 30
th of April in
hourly base. The variation of temperature, energy and efficiency at different points in the system is
plotted for the aforementioned period. The simulation results show that the maximum outlet-
collector water temperature was 89 °C, the maximum daily energy collected by collector was 1.81
kW d−1
and collector efficiency was 51 %.
0
10
20
30
40
50
60
8:00 9:00 10:00 11:00 12:00 13:00 14:00 15:00 16:00
Effi
cien
cy (
%)
Time (hr)
Proceeding of the 3th Sustainable & Renewable Energy Conference 23 -24 December 2017, Baghdad-Iraq
38
References
[1] Samir Kumar Saha , D.K. Mahanta, Thermodynamic optimization of solar flat-plate collector,
Renewable Energy 23 (2001) 181–193.
[2] J.K. Nayak, E.H. Amer, S.M. Deshpande, Comparison of three transient methods for testing
solar flat-plate collectors, Energy Conversion & Management 41 (2000) 677-700.
[3] Michel Hayek, JohnnyAssaf, William Lteif, Experimental Investigation of the Performance of
Evacuated-Tube Solar Collectors under Eastern Mediterranean Climatic Conditions, Energy
Procedia, 6 (2011) 618-626.
[4] L.M. Ayompe, A. Duffy, S.J. McCormack, M. Conlon, Validated TRNSYS model for forced
circulation solar water heating systems with flat plate and heat pipe evacuated tube collectors,
Applied Thermal Engineering, 31(2011) 1536-1542.
[5] Siddharth Arora, Shobhit Chitkara, R. Udayakumar, Muhammad Ali, Thermal analysis of
evacuated solar tube collectors, Journal of Petroleum and Gas Engineering, 2(2011) 74-82.
[6] Duffie, J. A. & Beckman, W. A. 2006. Solar engineering of thermal processes. New Jersey:
John Wiley.
[7] Budihardjo I., Morrison G.L., Behnia M, Development of TRNSYS models for predicting the
performance of water-inglass evacuated tube solar water heaters in Australia, Proceedings of
ANSZES Annual Conference (2003).
Proceeding of the 3th Sustainable & Renewable Energy Conference 23 -24 December 2017, Baghdad-Iraq
39
Experimental investigation of packing absorber in Iraqi
Environment
Jalal M. Jalil, Majida K. Ahmed, Hussein A. Idan
Electromechanical Eng. Dept., University of Technology
Baghdad Iraq
Email:[email protected]
Abstract
Experimental investigation of packing absorber was carried in Iraqi environment. 14 and
16/11/2017 in Kut province were chosen to carry the investigation. Four velocities (1, 1.1, 1.2
and 1.3 m/s) were used. Inside lighting was used to simulate the measured solar flux of the
mention two days. The performance was investigated through measuring exit air temperature.
The packing absorber shows good performance, exit temperature reaches 68 oC in mid-
November. The main advantage of the packing absorber is the decrease in absorber surface
area. The increase in price of the packing absorber will compensate by high performance.
1. Introduction
Solar energy has great potential for low temperature applications, particularly for drying of
agricultural products. In drying and space heating, solar energy is an ideal choice because the
warm air can be used directly, eliminating any need for an extra heat exchanger in the thermal
system. A v-grooved absorber plate with another is bottom plate are the body of the duct in
the air solar collector. A deeper understanding in the fluid flow and heat transfer of v-grooved
absorber will assist to improve the performance of solar collector from this type.
Hollands and Shewen 1981[1] studied the effect of the select of form and dimensions of the
air flow channels in plate type (air-heating solar collectors). As well as it is studied effect all
this parameter on U (overall heat transfer coefficient) between the air that flow in channel and
the plate, which has a significant impact on collector efficiency. Garg et al. 1985 [2]
developed solar simulator for workroom testing. The system consists of 14 halogen lamps and
a testing area about (1*1) m2 .The flux can be change from 400 to 1500 W/m
2 by change
input power supplied to one lamp from this system. Joudi and Mohammed 1986 [3]
investigated experimentally the performance of a "V" corrugated-plate solar collector. In
summer the collector was tilted at 20 ° while was at 40 ° in winter during the period of
maximum solar irradiance. The collector performance limits were assessed during clear days
in summer and winter. The mass flow rate of air was changed from 0.016 to 0.0385 kg/s m2,
and outlet temperature of air is 70°C also the collector efficiency of 42% in summer. Ali and
Hanaoka 2002 [4] studied the impacts of the operating factors on laminar flow (enforced-
convection heat transfer) experimentally for air flowing in a channel having a V-grooved
(upper plate) heated by heat flux 400,700 and 1000 w/m2 while the other walls are thermally
insulated. For that flow Reynolds number (Re) ranging from 750 to 2050. The results show
that, the impact of Re on local Nusselt number are clear. Karim and Hawlader 2006 [5]
studied experimentally thermal performance for a v-grooved collector and compared it to
another (flat plate collector). The results indicate to the first type better from the other type
thermally and the effect of operating variables can be control it to reaching this result. Gao et
al. 2007 [6] analyzed and measured thermally the performance of three types of solar air
Proceeding of the 3th Sustainable & Renewable Energy Conference 23 -24 December 2017, Baghdad-Iraq
40
heaters and compared among them under same operating conditions .All the experimental and
analytical results show that the type 2 heater is better slightly from type 1 heater as well as
both of these types (cross-grooved solar air heaters) have a much higher thermal performance
to that of the flat-plate one. Karim and Amin 2014 [7]studied mathematically the predict of
the performance of the air collector by developed a mathematical model for double-pass
counter flow (v-grove collector) that is computed one of the maximum efficient solar air-
collectors and simulation is carried out by MATLAB progrmme. The change between the
experimental and predicted results is 7%, at maximum, approximately. Zheng et al. 2016 [8]
investigated thermally of a solar air collector with metallic grooved packing in the
constructions of cold areas. Mathematical patterns are evolved to study the thermal
performance by experiments. The impacts of the constructional and working constraints, as
the intensity of radiation, velocity, collector dimensions (height, width) and air inlet and
outlet temperature are studied in the experimental examination for the air flows in the
grooved packing.
In this work, Experimental investigation of packing absorber was carried in Iraqi
environment. Two days (14 and 16/11/2017) in Kut province were chosen to carry the
investigation. Different velocities were used and inside lighting was used to simulate the
measured solar flux of the mention two days.
2. Experimental Apparatus
The experimental apparatus consists of:
a) Blower.
b) Pipe and valve
c) Transition piece
d) Test Main Section (solar collector)
e) Artificial simulation
f) Voltage Regulator
g) Sensors
h) Arduino
i) Measuring units
a- Solar power meter
b- Hot Wire Anemometer
c- Voltmeter
Two photos were used to show the experimental apparatus. In Fig. 1, the photo shows the
complete rig. Fig. 2 shows the lighting simulator which simulate the measured real solar flux
during 14 and 16/11/2017. Two days were chosen (14 and 16/11/2017) to perform the
experiments. Four velocities were used 1, 1.1, 1.2, 1.3 m/s and the exit temperatures were
measured each hour. The dimension of the packing absorber were 1.25 m long, 0.8 m wide,
while the packing duct cross section dimensions were 0.04 by 0.04 m and 1.25 long.
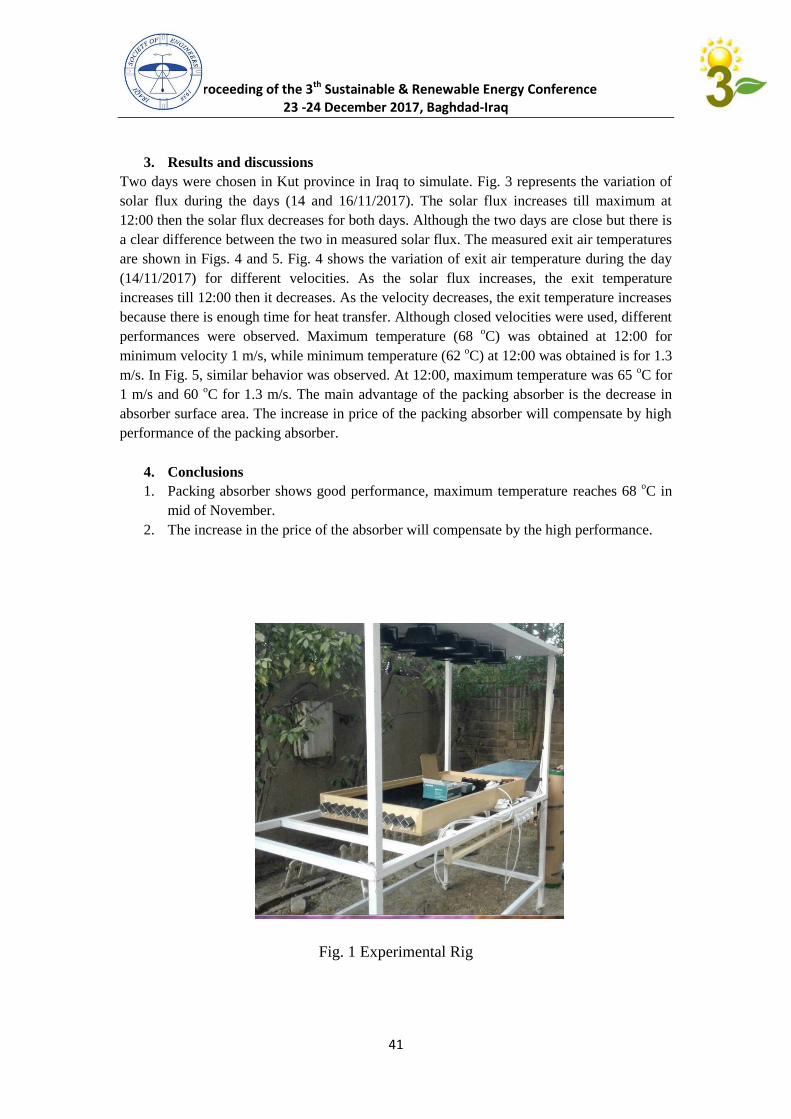
Proceeding of the 3th Sustainable & Renewable Energy Conference 23 -24 December 2017, Baghdad-Iraq
41
3. Results and discussions
Two days were chosen in Kut province in Iraq to simulate. Fig. 3 represents the variation of
solar flux during the days (14 and 16/11/2017). The solar flux increases till maximum at
12:00 then the solar flux decreases for both days. Although the two days are close but there is
a clear difference between the two in measured solar flux. The measured exit air temperatures
are shown in Figs. 4 and 5. Fig. 4 shows the variation of exit air temperature during the day
(14/11/2017) for different velocities. As the solar flux increases, the exit temperature
increases till 12:00 then it decreases. As the velocity decreases, the exit temperature increases
because there is enough time for heat transfer. Although closed velocities were used, different
performances were observed. Maximum temperature (68 oC) was obtained at 12:00 for
minimum velocity 1 m/s, while minimum temperature (62 oC) at 12:00 was obtained is for 1.3
m/s. In Fig. 5, similar behavior was observed. At 12:00, maximum temperature was 65 oC for
1 m/s and 60 oC for 1.3 m/s. The main advantage of the packing absorber is the decrease in
absorber surface area. The increase in price of the packing absorber will compensate by high
performance of the packing absorber.
4. Conclusions
1. Packing absorber shows good performance, maximum temperature reaches 68 oC in
mid of November.
2. The increase in the price of the absorber will compensate by the high performance.
Fig. 1 Experimental Rig
Proceeding of the 3th Sustainable & Renewable Energy Conference 23 -24 December 2017, Baghdad-Iraq
42
Fig. 2 Lighting Simulator
Fig. 3 Variation of solar flux with the time for 14 and 16/11/2017.
200
300
400
500
600
700
800
8 : 2 4 9 : 3 6 1 0 : 4 8 1 2 : 0 0 1 3 : 1 2 1 4 : 2 4 1 5 : 3 6
FLU
X
W
/M2
TIME H
day 14/11/2017 day 16/11/2017
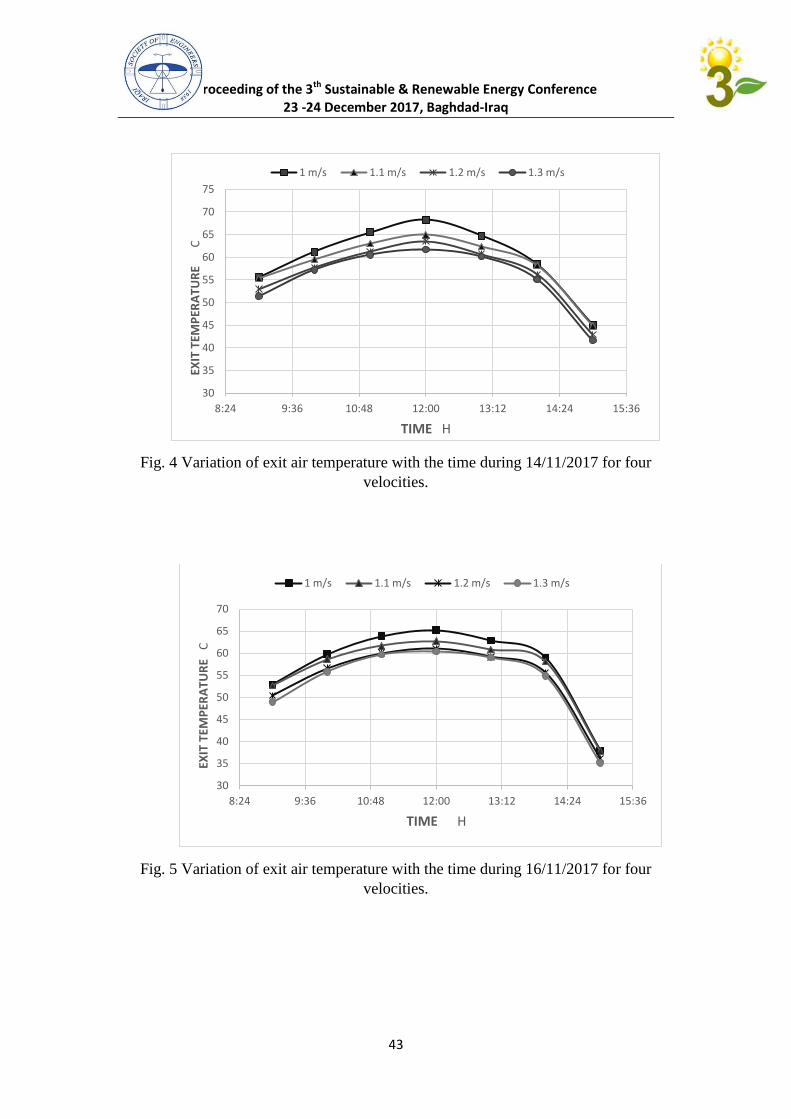
Proceeding of the 3th Sustainable & Renewable Energy Conference 23 -24 December 2017, Baghdad-Iraq
43
Fig. 4 Variation of exit air temperature with the time during 14/11/2017 for four
velocities.
Fig. 5 Variation of exit air temperature with the time during 16/11/2017 for four
velocities.
30
35
40
45
50
55
60
65
70
75
8:24 9:36 10:48 12:00 13:12 14:24 15:36
EXIT
TEM
PER
ATU
RE
C
TIME H
1 m/s 1.1 m/s 1.2 m/s 1.3 m/s
30
35
40
45
50
55
60
65
70
8:24 9:36 10:48 12:00 13:12 14:24 15:36
EXIT
TEM
PER
ATU
RE
C
TIME H
1 m/s 1.1 m/s 1.2 m/s 1.3 m/s
Proceeding of the 3th Sustainable & Renewable Energy Conference 23 -24 December 2017, Baghdad-Iraq
44
References
[1] K G.T Hollands,E C. Shewen,"Optimization of Flow Passage Geometry for Air-Heating,
Plate-Type Solar Collectors", Journal of Solar Energy Engineering, November 1981, Vol.
103/323
[2] H. P. Garg, A. R. Shukla, Indrajit, Madhuri, R. C. Agnihotri and S. Chakravertty,"
Development of a Simple Low-Cost Solar Simulator for Indoor Collector Testing", Applied
Energy 21 (1985) 43-54.
[3] K. A. Joudi and A. I. Mohammed," Experimental performance of a solar
Air heater with a "V" corrugated absorber", Pergamon Journals, Energy Convers. Mgmt Vol.
26, No. 2, pp. 193-200, 1986
[4] Ahmed Hamza H. Ali, Yutaka Hanaoka," Experimental study on laminar flow forced-
convection in channel with upper V-corrugated plate heated by radiation", Int. J. Heat and
Mass Transfer 45 (2002) 2107–2117.
[5] Md Azharul Karima , M.N.A Hawlader," Performance investigation of flat plate, v-
corrugated and finned air collectors", Elsevier Journal, Energy 31 (2006) 452–470.
[6] Wenfeng Gao , Wenxian Lin , Tao Liu , Chaofeng Xia," Analytical and experimental
studies on the thermal performance of cross-corrugated and flat-plate solar air heaters",
Applied Energy 84 (2007) 425–441.
[7] M.A. Karim, E. Perez, Z.M. Amin," Mathematical modelling of counter flow v-grove
solar air collector", Elsevier Journal, Renewable Energy 67 (2014) 192e201.
[8] Wandong Zheng , Bojia Li , Huan Zhang , Shijun You , Ying Li , Tianzhen Ye, "
Thermal characteristics of a glazed transpired solar collector with perforating corrugated plate
in cold regions", Elsevier Journal, Energy 109 (2016) 781e790.
Proceeding of the 3th
Sustainable & Renewable Energy Conference
23 -24 December 2017, Baghdad-Iraq
45
Design and Construction a New Cooling Technique With Smart Control for
Performance Enhancement of Photovoltaic Pumping System
Asst. Prof. Dr. H. A. Hussein1, Asst. Prof. Dr. A. H. Numan
2, M.Sc. H. M. Khuder
3
حمزة محي الدين خضر مهندس, دكتور علي حسين نعمان مساعد استاذ, استاذ مساعد دكتور هاشم عبد حسين 1, 2, 3
Electromechanical Engineering Department, University of Technology, Baghdad, Iraq
Corresponding author: Asst. Prof. Dr. H. A. Hussein
Email: [email protected]
Mob.07904383422
ABSTRACT
This paper presents the experimental investigation of the photovoltaic/thermal system
performance enhancement by dissipating the heat inside the PV panels. Open loop fast dual
(front and back) water cooling system automatically controlled by Arduino Mega 2650
microcontroller designed for this purpose, the back cooling consists of 23 meters of aluminum
pipe twisted and attached directly to the back side of the PV panel and its sides filled with a
thermal conductive grease paste to increase the surface contact between the pipe and the
panel, while the front cooling spray the water on the PV panel making a film of water flowing
on the front surface by perforated pipe. The dual cooling and back cooling are more effective
respectively than the front cooling alone and they may depress the PV module temperature
significantly, where the dual cooling system reduce PV temperature by 57% while back
cooling alone reduced PV temperature by 34%, PV penal output power increase by 2.36 watts
for each 1°C decreasing in panel temperature by using dual cooling system.
Keywords: PV cooling, solar energy, cooling methods, electrical efficiency,
temperature effect, Water pumping system, water film, design and construction.
1. INTRODUCTION
World primary energy demand increases by 36% between 2008 and 2035, from
around 12300 to over 16700 million tons of oil equivalents, or 1.2% per year on
average. Growth remains highest in China, India and the Middle East [1]. According
to the World Energy Outlook 2014, nearly 1.3 billion people did not have access to
electricity in 2012 and nearly 2.7 billion people used traditional biomass for cooking
and other heating energy needs [2]. The global photovoltaic (PV) market in 2004 was
only 3.7 GW which significantly reached to 139 GW in 2013 [2].Iraq as an example
suffers from shortage in electricity and loss of energy in the transmission lines due to
remote locations and there is a distant region are difficult to bring power to them,
therefore establishing of electrical generation units from renewable energy is
paramount important to supply loads by environmentally friendly power. During PV
operation conditions its performance can be affected by various factors and may
significantly decrease its electrical performance. Temperature is one of the major
factors to affect the electrical output especially in hot weather such as in the Iraq
Proceeding of the 3th
Sustainable & Renewable Energy Conference
23 -24 December 2017, Baghdad-Iraq
46
when cell temperature can reach up to 80 °C. Under these conditions, the output
power may decrease by up to 0.65%/K. In fact, more than 80% of the solar radiation
falling on PV cells is not converted to electricity, but either reflected or converted to
thermal energy [3].In order to overcome this problem, a cooling system is essential at
high solar irradiation and hot conditions. Generally, some techniques like air-cooling
and water-cooling are used to cool the PV module to increase its efficiency. Water-
cooling can be considered as one of the most important methods for cooling
photovoltaic modules, as it is more coolant that is efficient and produces hot water
can be used in innumerable areas [3]. Poorya Ooshaksaraei et al (2017) [4] studied the
performance of PV with forced air cooling, presented analytical and experimental
investigation of air based two-faced PV thermal collectors. The experiments were
applied on four two-faced PV panels with four different configurations and tested
under steady-state conditions. The result showed that, the highest exergy efficiency
was in single-path design with (8.2%-8.4%).Ahmed Amine Hachicha et al (2015) [3]
studied different cooling methods trying to enhance the performance of PV system
.The results are compared to conventional non-cooling PV module and the
performance was recorded for each of the methods above and shows the follows: the
dual cooling and front cooling are more effective respectively than the back cooling
alone and they may depress the PV module temperature significantly, where dual
cooling reduced PV temperature by 18% while front cooling and back cooling
reduced PV temperature by 11% and 2% respectively. Salih Mohammed Salih et al
(2015) [5] improved PV array efficiency experimentally by spraying water on front
side of PV, it enhanced the net power. The cooling system consists of forced water
spraying with constant flow rate. The output hot water used as water heating system
for houses, buildings etc. The result showed over time of experiment, the average
heating rate of water and the cooling rate of panel surface was approximately 6.83°C
and 4°C respectively in midday for 5 min. The electrical power increased 7
watt/degree at midday for all 20 panels, on average, the electrical power of each one
panel increased by 0.354 watt/degree. The overall efficiency of the system was 17.8
% along one-day work. Ibrahim, YakubuTsoho et al (2015) [6] used method of
passive heat exchange as back cooling for PV panels, based on natural convection,
called thermosiphonic, which circulates a fluid without the necessity of a mechanical
pump. Thermos phonic solar PV/T water heating system . Sun radiation energy that
received by the PV surface which small amount of it convert directly to electricity by
solar cells, Great value remainder of this energy is transformed into heat wasted, this
waste heat extracted by heat exchanger attached to back of the panel to extract heat
from it. The result showed increasing in electrical and thermal efficiency that reached
to 11.4% and 41.6% respectively in sunny day.
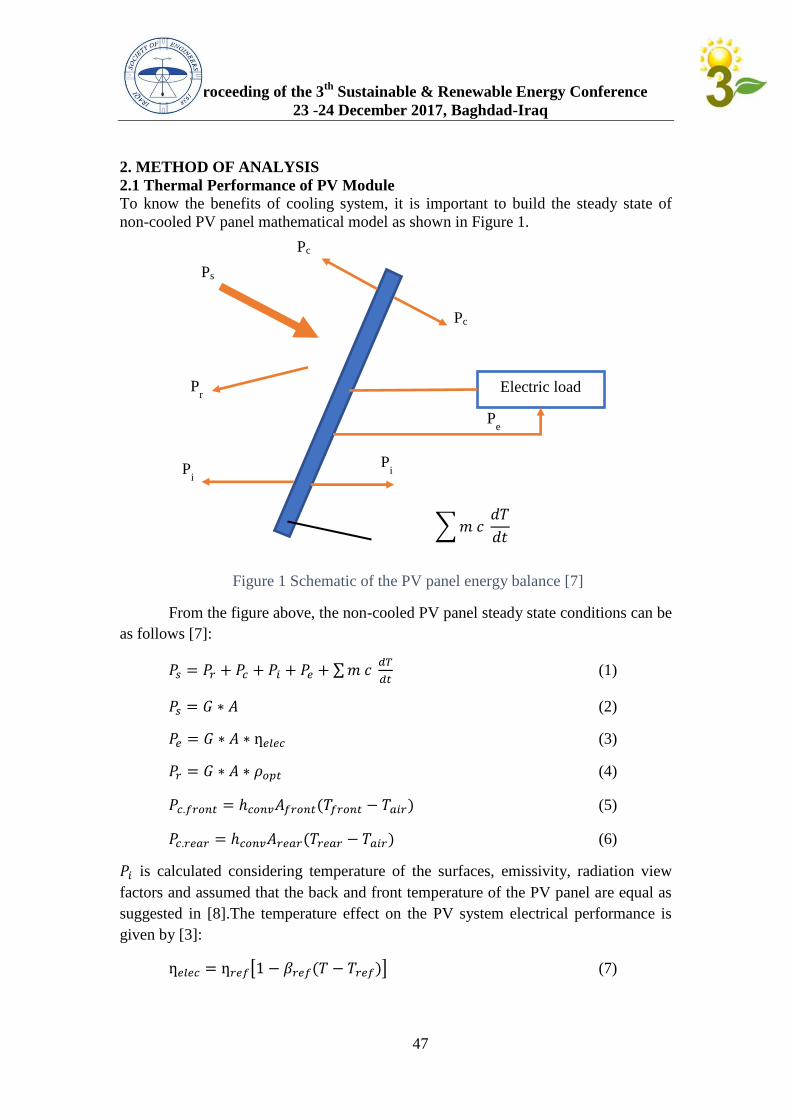
Proceeding of the 3th
Sustainable & Renewable Energy Conference
23 -24 December 2017, Baghdad-Iraq
47
2. METHOD OF ANALYSIS
2.1 Thermal Performance of PV Module
To know the benefits of cooling system, it is important to build the steady state of
non-cooled PV panel mathematical model as shown in Figure 1.
Figure 1 Schematic of the PV panel energy balance [7]
From the figure above, the non-cooled PV panel steady state conditions can be
as follows [7]:
(1)
(2)
(3)
(4)
(5)
(6)
is calculated considering temperature of the surfaces, emissivity, radiation view
factors and assumed that the back and front temperature of the PV panel are equal as
suggested in [8].The temperature effect on the PV system electrical performance is
given by [3]:
(7)
Electric load
Ps
Pr
Pi P
i
Pe
Pc
Pc
Proceeding of the 3th
Sustainable & Renewable Energy Conference
23 -24 December 2017, Baghdad-Iraq
48
The overall convective heat transfer effect is calculated by take in the forced
and natural convection as follows:
(8)
Bottom surface natural convection for an inclined heated plane can described as
follows:
(9)
For upper surface the equation become as follows:
(10)
When water cooling used in, the steady state equation (Eq. 1) must be changed to
include water cooling effect, so it become as follows:
(11)
The previous assumption changes when water front cooling take into account.
Therefore, when water film cooling is used in, the following equation has been carried
out [7]:
(12)
(13)
When spray cooling model is used in, the following equation has been carried
out [7]:
(14)
(15)
(16)
For the back cooling, the thermal energy extracted by water cooling is given by [3]:
(17)
(18)
(19)
Proceeding of the 3th
Sustainable & Renewable Energy Conference
23 -24 December 2017, Baghdad-Iraq
49
Therefore, the total efficiency of PV/T system become as follows [9]:
(20)
2.2 Centrifugal Pump Model
The main part of the operation of the cooling system is the pump, which works to
move the water through the system in order for the cooling process to take place.
There are two types of pump used in PV/T cooling systems widely, which is the
centrifugal and pump volumetric pump.It was found in that the AC centrifugal pump
used much higher than the volumetric pump, because the centrifugal pump operates
for longer times, simple, brushless, has wide flow rates and heads range, inexpensive
and low maintenance. Therefore, the centrifugal pump is chosen in this work.
An AC motor's synchronous speed is the rotation rate of the stator's magnetic field, it
is given by this equation:
(21)
2.3 Experimental Procedure
The major component of the experiment setup is the PV panel itself, it is the energy
source of the system and produces direct current (DC) electricity. In this work, NU-
185A1H (made by Sharp Co.) PV panel made from Monocrystalline 155.55mm
square Sharp silicon solar cells have been used. The PV panel consists of 48 cells
connected in series, it has dimensions of 1318 x 994 x 46 mm, maximum output
power of 185 watt with module efficiency of 14.1% under Standard Test Condition
(STC), maximum short circuit current of 8.54A, maximum open circuit voltage of
30.2V, maximum power current of 7.71A and maximum power voltage of 24V (see
Figure 2).
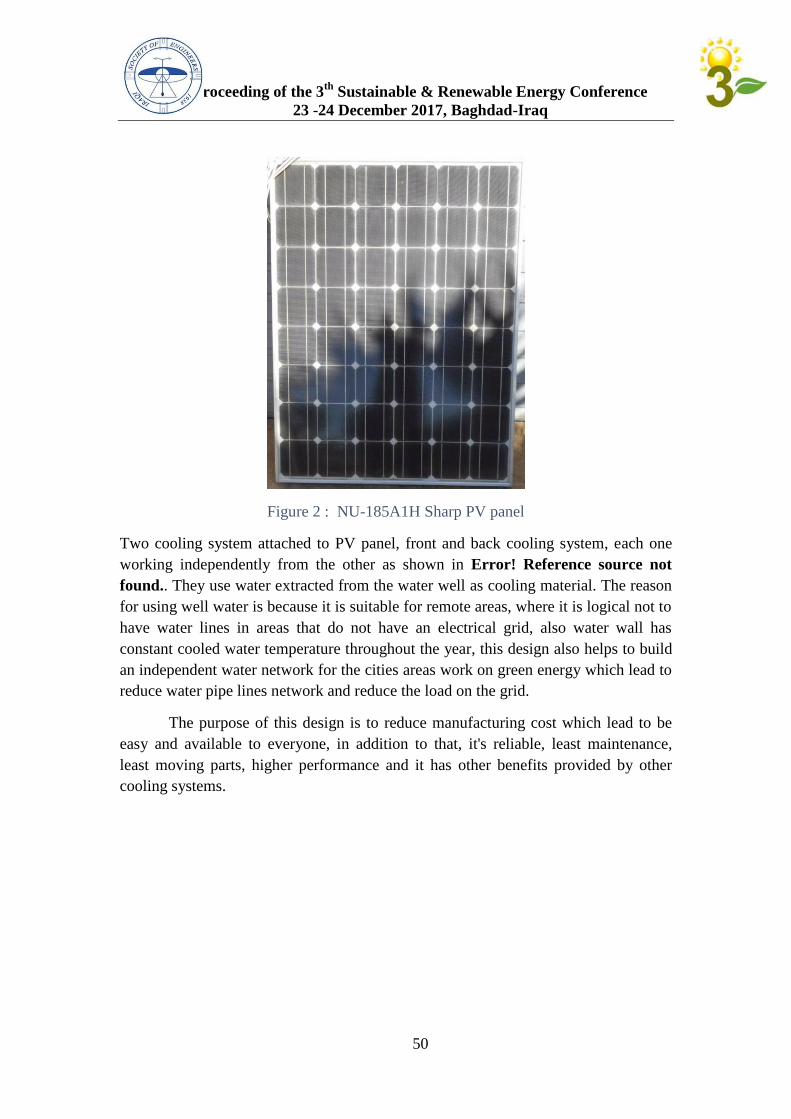
Proceeding of the 3th
Sustainable & Renewable Energy Conference
23 -24 December 2017, Baghdad-Iraq
50
Figure 2 : NU-185A1H Sharp PV panel
Two cooling system attached to PV panel, front and back cooling system, each one
working independently from the other as shown in Error! Reference source not
found.. They use water extracted from the water well as cooling material. The reason
for using well water is because it is suitable for remote areas, where it is logical not to
have water lines in areas that do not have an electrical grid, also water wall has
constant cooled water temperature throughout the year, this design also helps to build
an independent water network for the cities areas work on green energy which lead to
reduce water pipe lines network and reduce the load on the grid.
The purpose of this design is to reduce manufacturing cost which lead to be
easy and available to everyone, in addition to that, it's reliable, least maintenance,
least moving parts, higher performance and it has other benefits provided by other
cooling systems.

Proceeding of the 3th
Sustainable & Renewable Energy Conference
23 -24 December 2017, Baghdad-Iraq
51
Figure 3 cooling system components
Water inlet
Outlet to front cooling
Outlet to
back cooling
Water flow sensor
AC electro valve Water temperature sensor
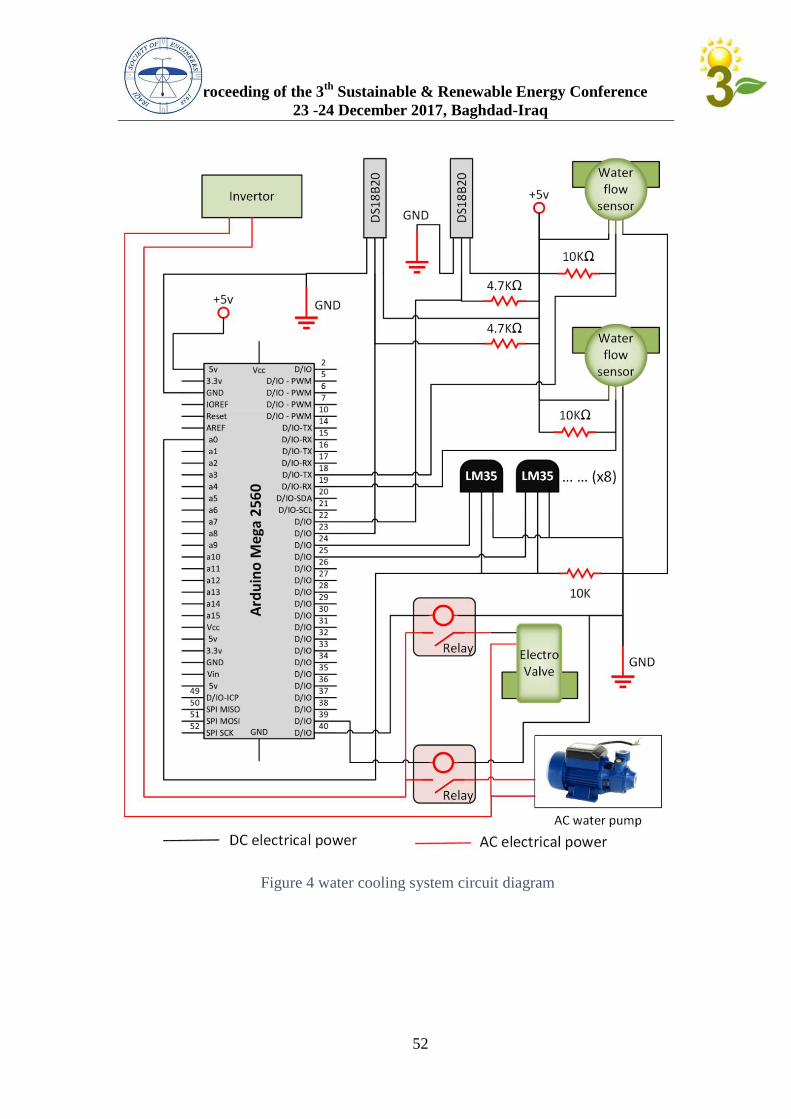
Proceeding of the 3th
Sustainable & Renewable Energy Conference
23 -24 December 2017, Baghdad-Iraq
52
Figure 4 water cooling system circuit diagram
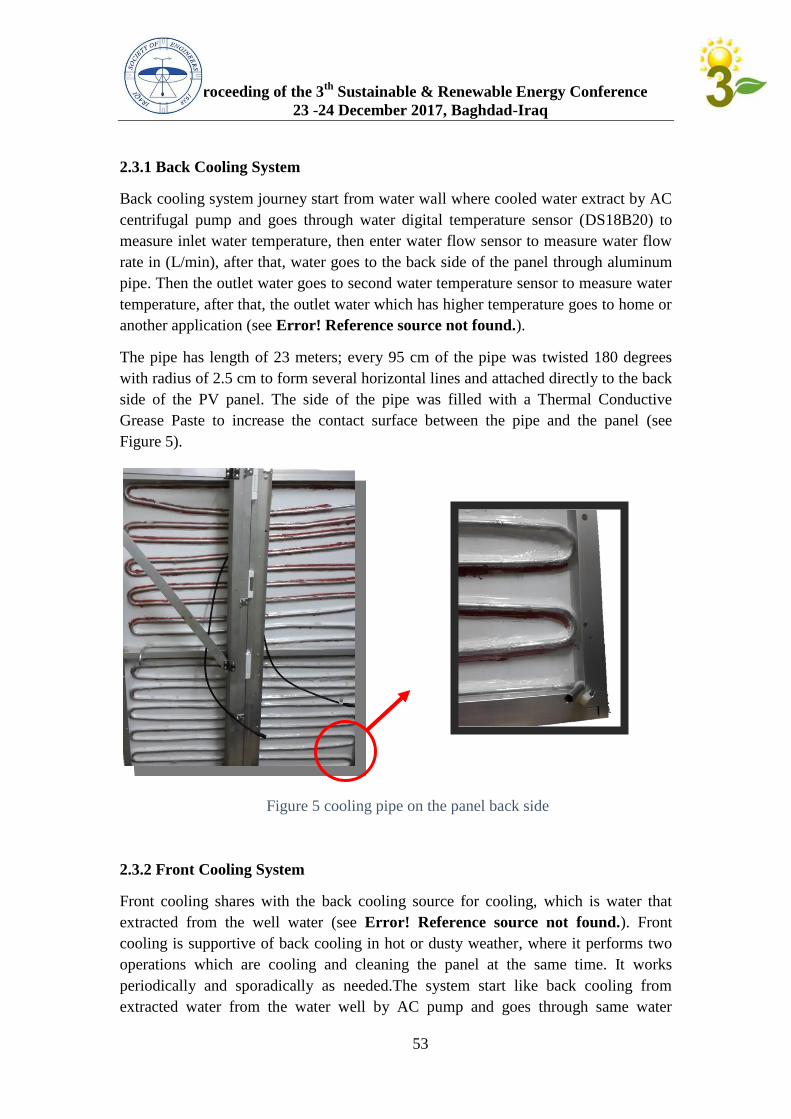
Proceeding of the 3th
Sustainable & Renewable Energy Conference
23 -24 December 2017, Baghdad-Iraq
53
2.3.1 Back Cooling System
Back cooling system journey start from water wall where cooled water extract by AC
centrifugal pump and goes through water digital temperature sensor (DS18B20) to
measure inlet water temperature, then enter water flow sensor to measure water flow
rate in (L/min), after that, water goes to the back side of the panel through aluminum
pipe. Then the outlet water goes to second water temperature sensor to measure water
temperature, after that, the outlet water which has higher temperature goes to home or
another application (see Error! Reference source not found.).
The pipe has length of 23 meters; every 95 cm of the pipe was twisted 180 degrees
with radius of 2.5 cm to form several horizontal lines and attached directly to the back
side of the PV panel. The side of the pipe was filled with a Thermal Conductive
Grease Paste to increase the contact surface between the pipe and the panel (see
Figure 5).
Figure 5 cooling pipe on the panel back side
2.3.2 Front Cooling System
Front cooling shares with the back cooling source for cooling, which is water that
extracted from the well water (see Error! Reference source not found.). Front
cooling is supportive of back cooling in hot or dusty weather, where it performs two
operations which are cooling and cleaning the panel at the same time. It works
periodically and sporadically as needed.The system start like back cooling from
extracted water from the water well by AC pump and goes through same water
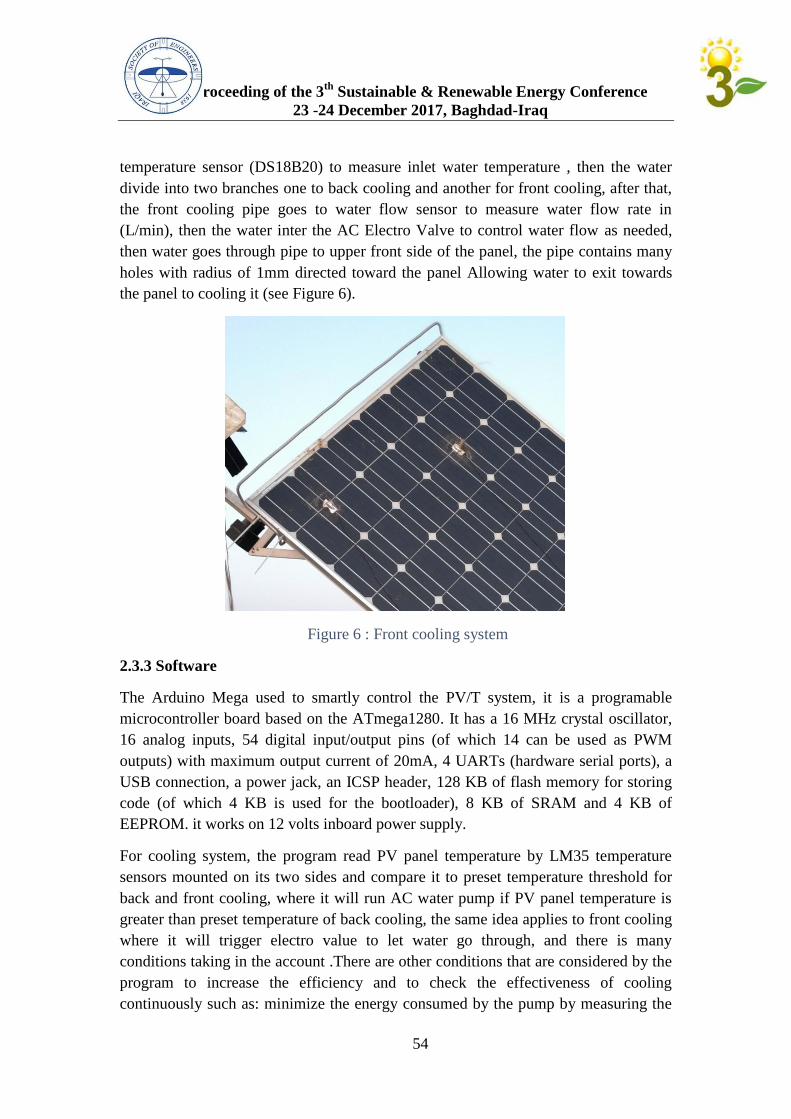
Proceeding of the 3th
Sustainable & Renewable Energy Conference
23 -24 December 2017, Baghdad-Iraq
54
temperature sensor (DS18B20) to measure inlet water temperature , then the water
divide into two branches one to back cooling and another for front cooling, after that,
the front cooling pipe goes to water flow sensor to measure water flow rate in
(L/min), then the water inter the AC Electro Valve to control water flow as needed,
then water goes through pipe to upper front side of the panel, the pipe contains many
holes with radius of 1mm directed toward the panel Allowing water to exit towards
the panel to cooling it (see Figure 6).
Figure 6 : Front cooling system
2.3.3 Software
The Arduino Mega used to smartly control the PV/T system, it is a programable
microcontroller board based on the ATmega1280. It has a 16 MHz crystal oscillator,
16 analog inputs, 54 digital input/output pins (of which 14 can be used as PWM
outputs) with maximum output current of 20mA, 4 UARTs (hardware serial ports), a
USB connection, a power jack, an ICSP header, 128 KB of flash memory for storing
code (of which 4 KB is used for the bootloader), 8 KB of SRAM and 4 KB of
EEPROM. it works on 12 volts inboard power supply.
For cooling system, the program read PV panel temperature by LM35 temperature
sensors mounted on its two sides and compare it to preset temperature threshold for
back and front cooling, where it will run AC water pump if PV panel temperature is
greater than preset temperature of back cooling, the same idea applies to front cooling
where it will trigger electro value to let water go through, and there is many
conditions taking in the account .There are other conditions that are considered by the
program to increase the efficiency and to check the effectiveness of cooling
continuously such as: minimize the energy consumed by the pump by measuring the
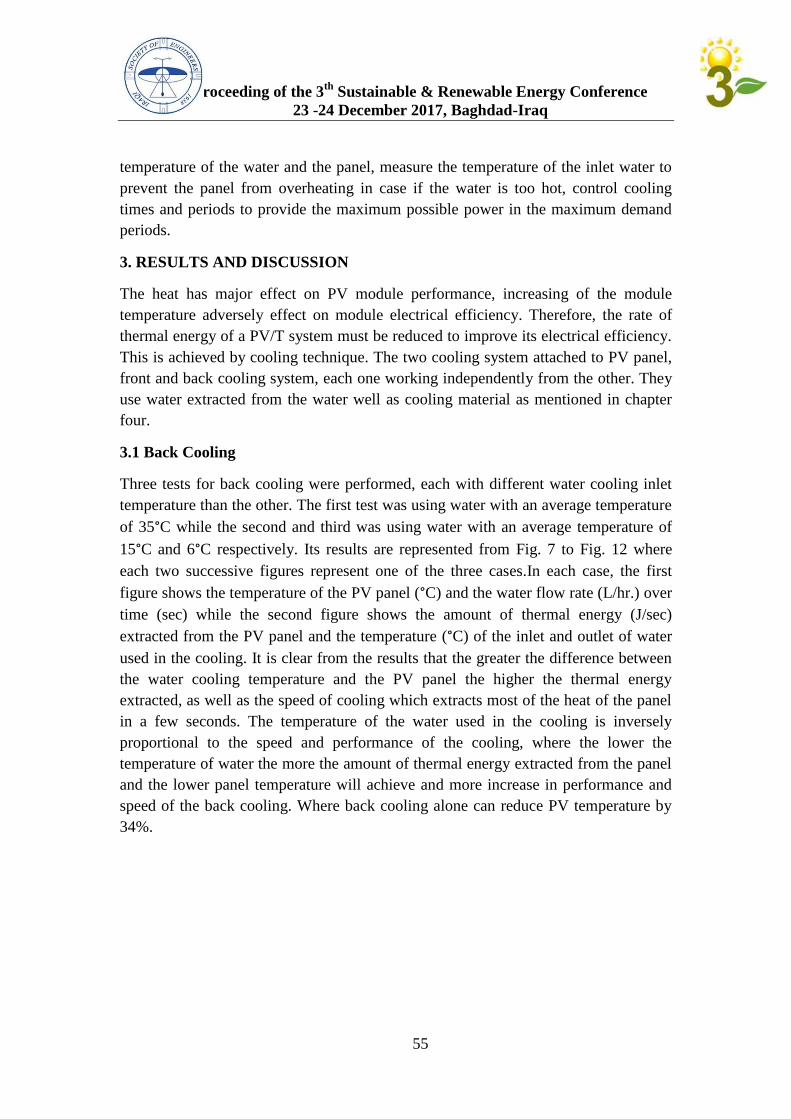
Proceeding of the 3th
Sustainable & Renewable Energy Conference
23 -24 December 2017, Baghdad-Iraq
55
temperature of the water and the panel, measure the temperature of the inlet water to
prevent the panel from overheating in case if the water is too hot, control cooling
times and periods to provide the maximum possible power in the maximum demand
periods.
3. RESULTS AND DISCUSSION
The heat has major effect on PV module performance, increasing of the module
temperature adversely effect on module electrical efficiency. Therefore, the rate of
thermal energy of a PV/T system must be reduced to improve its electrical efficiency.
This is achieved by cooling technique. The two cooling system attached to PV panel,
front and back cooling system, each one working independently from the other. They
use water extracted from the water well as cooling material as mentioned in chapter
four.
3.1 Back Cooling
Three tests for back cooling were performed, each with different water cooling inlet
temperature than the other. The first test was using water with an average temperature
of 35°C while the second and third was using water with an average temperature of
15°C and 6°C respectively. Its results are represented from Fig. 7 to Fig. 12 where
each two successive figures represent one of the three cases.In each case, the first
figure shows the temperature of the PV panel (°C) and the water flow rate (L/hr.) over
time (sec) while the second figure shows the amount of thermal energy (J/sec)
extracted from the PV panel and the temperature (°C) of the inlet and outlet of water
used in the cooling. It is clear from the results that the greater the difference between
the water cooling temperature and the PV panel the higher the thermal energy
extracted, as well as the speed of cooling which extracts most of the heat of the panel
in a few seconds. The temperature of the water used in the cooling is inversely
proportional to the speed and performance of the cooling, where the lower the
temperature of water the more the amount of thermal energy extracted from the panel
and the lower panel temperature will achieve and more increase in performance and
speed of the back cooling. Where back cooling alone can reduce PV temperature by
34%.
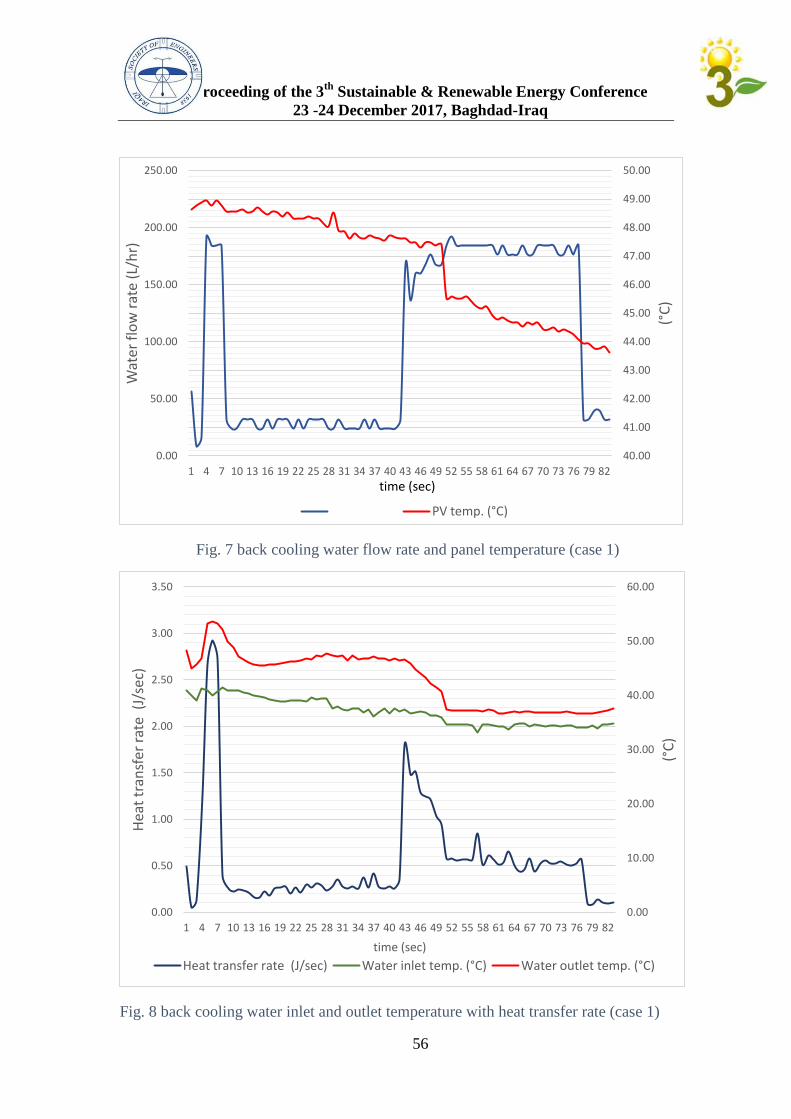
Proceeding of the 3th
Sustainable & Renewable Energy Conference
23 -24 December 2017, Baghdad-Iraq
56
Fig. 7 back cooling water flow rate and panel temperature (case 1)
Fig. 8 back cooling water inlet and outlet temperature with heat transfer rate (case 1)
40.00
41.00
42.00
43.00
44.00
45.00
46.00
47.00
48.00
49.00
50.00
0.00
50.00
100.00
150.00
200.00
250.00
1 4 7 10 13 16 19 22 25 28 31 34 37 40 43 46 49 52 55 58 61 64 67 70 73 76 79 82
(°C
)
Wat
er f
low
rat
e (L
/hr)
PV temp. (°C)
time (sec)
0.00
10.00
20.00
30.00
40.00
50.00
60.00
0.00
0.50
1.00
1.50
2.00
2.50
3.00
3.50
1 4 7 10 13 16 19 22 25 28 31 34 37 40 43 46 49 52 55 58 61 64 67 70 73 76 79 82
(°C
)
Hea
t tr
ansf
er r
ate
(J/
sec)
time (sec)
Heat transfer rate (J/sec) Water inlet temp. (°C) Water outlet temp. (°C)

Proceeding of the 3th
Sustainable & Renewable Energy Conference
23 -24 December 2017, Baghdad-Iraq
57
Fig. 9 back cooling water flow rate and panel temperature (case 2)
20.00
22.00
24.00
26.00
28.00
30.00
32.00
34.00
0.00
20.00
40.00
60.00
80.00
100.00
120.00
140.00
160.00
180.00
1
6
11
16
21
26
31
36
41
46
51
56
61
66
71
76
81
86
91
96
10
1
(°C
)
Wat
er F
low
rat
e (L
/hr)
Heat transfer rate (J/sec)
time (sec)
0.00
5.00
10.00
15.00
20.00
25.00
30.00
35.00
0.00
0.20
0.40
0.60
0.80
1.00
1.20
1.40
1.60
1.80
2.00
1
6
11
16
21
26
31
36
41
46
51
56
61
66
71
76
81
86
91
96
10
1
(°C
)
Hea
t tr
ansf
er r
ate
(J/
sec)
time (sec) Heat transfer rate (J/sec) Water inlet temp. (°C)
Water outlet temp. (°C)
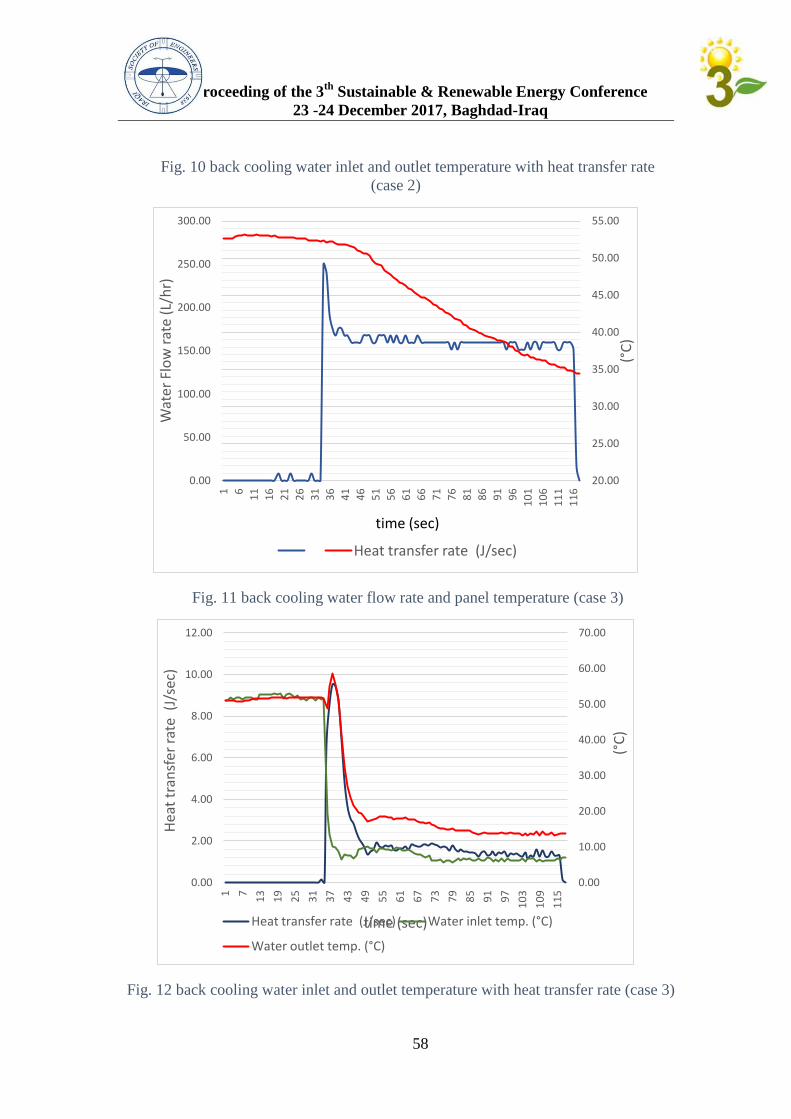
Proceeding of the 3th
Sustainable & Renewable Energy Conference
23 -24 December 2017, Baghdad-Iraq
58
Fig. 10 back cooling water inlet and outlet temperature with heat transfer rate
(case 2)
Fig. 11 back cooling water flow rate and panel temperature (case 3)
Fig. 12 back cooling water inlet and outlet temperature with heat transfer rate (case 3)
20.00
25.00
30.00
35.00
40.00
45.00
50.00
55.00
0.00
50.00
100.00
150.00
200.00
250.00
300.00 1
6
11
16
21
26
31
36
41
46
51
56
61
66
71
76
81
86
91
96
10
1
10
6
11
1
11
6
(°C
)
Wat
er
Flo
w r
ate
(L/
hr)
Heat transfer rate (J/sec)
time (sec)
0.00
10.00
20.00
30.00
40.00
50.00
60.00
70.00
0.00
2.00
4.00
6.00
8.00
10.00
12.00
1
7
13
19
25
31
37
43
49
55
61
67
73
79
85
91
97
10
3
10
9
11
5
(°C
)
Hea
t tr
ansf
er r
ate
(J/
sec)
time (sec) Heat transfer rate (J/sec) Water inlet temp. (°C)
Water outlet temp. (°C)
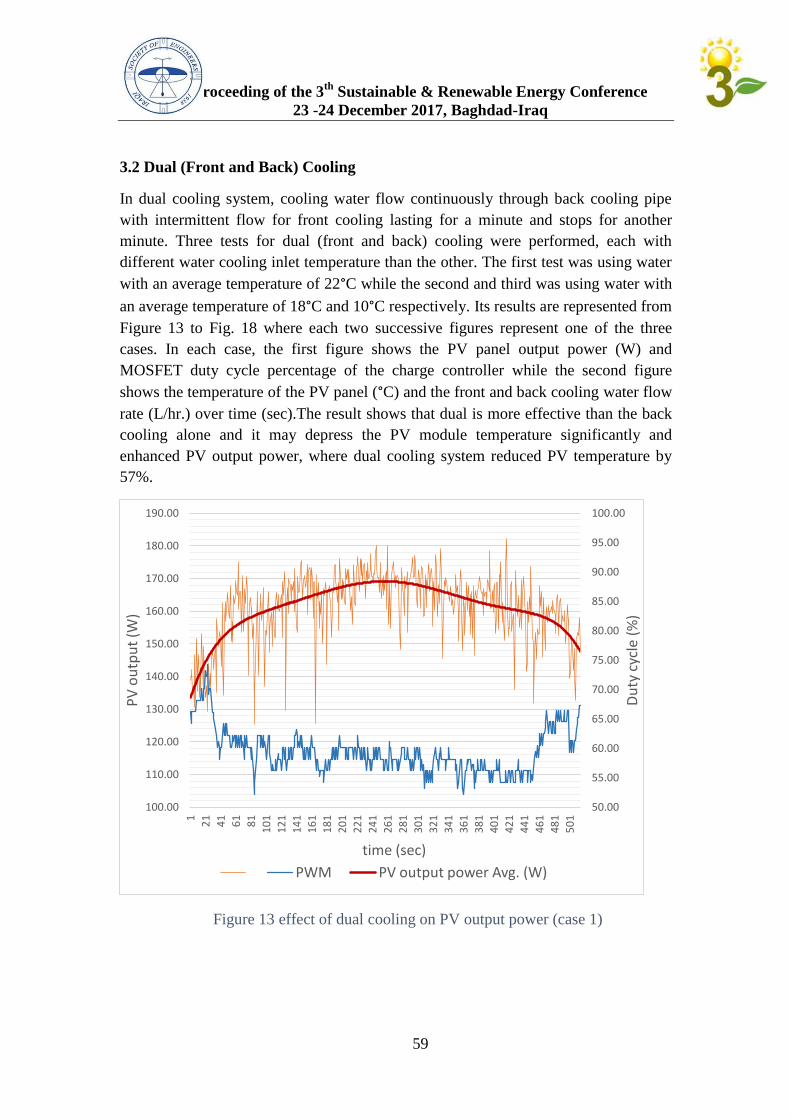
Proceeding of the 3th
Sustainable & Renewable Energy Conference
23 -24 December 2017, Baghdad-Iraq
59
3.2 Dual (Front and Back) Cooling
In dual cooling system, cooling water flow continuously through back cooling pipe
with intermittent flow for front cooling lasting for a minute and stops for another
minute. Three tests for dual (front and back) cooling were performed, each with
different water cooling inlet temperature than the other. The first test was using water
with an average temperature of 22°C while the second and third was using water with
an average temperature of 18°C and 10°C respectively. Its results are represented from
Figure 13 to Fig. 18 where each two successive figures represent one of the three
cases. In each case, the first figure shows the PV panel output power (W) and
MOSFET duty cycle percentage of the charge controller while the second figure
shows the temperature of the PV panel (°C) and the front and back cooling water flow
rate (L/hr.) over time (sec).The result shows that dual is more effective than the back
cooling alone and it may depress the PV module temperature significantly and
enhanced PV output power, where dual cooling system reduced PV temperature by
57%.
Figure 13 effect of dual cooling on PV output power (case 1)
50.00
55.00
60.00
65.00
70.00
75.00
80.00
85.00
90.00
95.00
100.00
100.00
110.00
120.00
130.00
140.00
150.00
160.00
170.00
180.00
190.00
1
21
41
61
81
10
1
12
1
14
1
16
1
18
1
20
1
22
1
24
1
26
1
28
1
30
1
32
1
34
1
36
1
38
1
40
1
42
1
44
1
46
1
48
1
50
1
Du
ty c
ycle
(%
)
PV
ou
tpu
t (W
)
time (sec)
PWM PV output power Avg. (W)
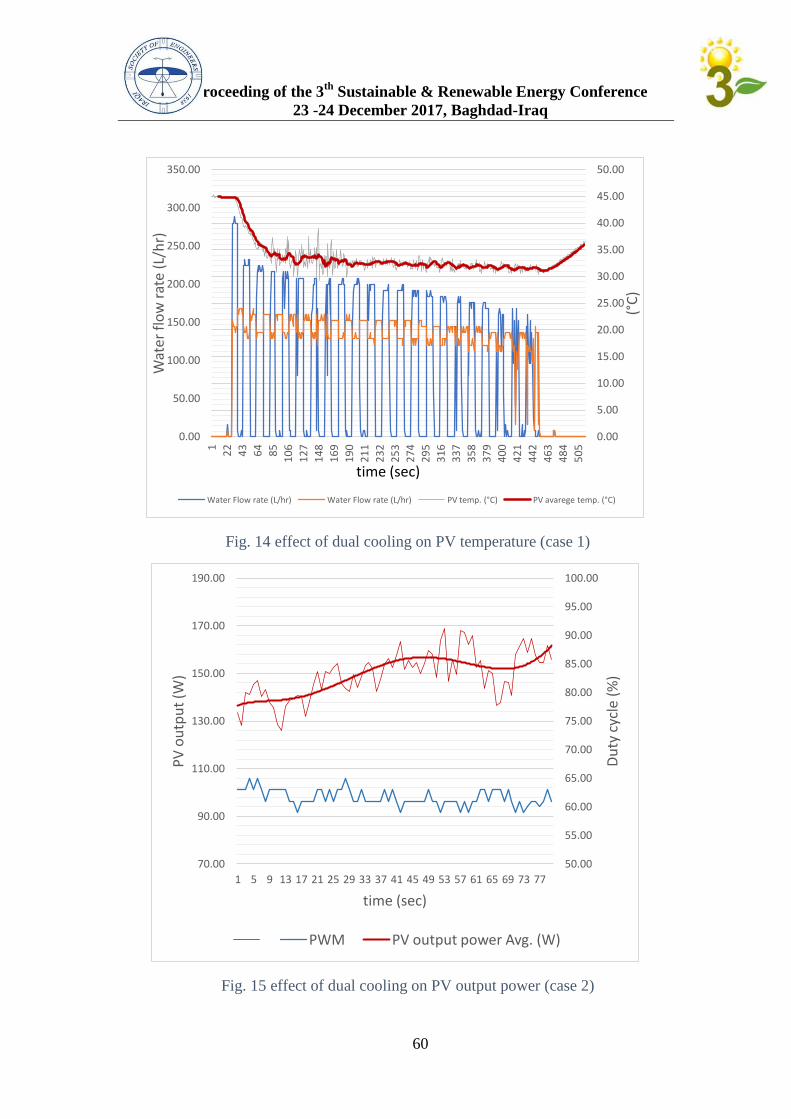
Proceeding of the 3th
Sustainable & Renewable Energy Conference
23 -24 December 2017, Baghdad-Iraq
60
Fig. 14 effect of dual cooling on PV temperature (case 1)
Fig. 15 effect of dual cooling on PV output power (case 2)
0.00
5.00
10.00
15.00
20.00
25.00
30.00
35.00
40.00
45.00
50.00
0.00
50.00
100.00
150.00
200.00
250.00
300.00
350.00
1
22
43
64
85
10
6
12
7
14
8
16
9
19
0
21
1
23
2
25
3
27
4
29
5
31
6
33
7
35
8
37
9
40
0
42
1
44
2
46
3
48
4
50
5
(°C
)
Wat
er f
low
rat
e (L
/hr)
Water Flow rate (L/hr) Water Flow rate (L/hr) PV temp. (°C) PV avarege temp. (°C)
time (sec)
50.00
55.00
60.00
65.00
70.00
75.00
80.00
85.00
90.00
95.00
100.00
70.00
90.00
110.00
130.00
150.00
170.00
190.00
1 5 9 13 17 21 25 29 33 37 41 45 49 53 57 61 65 69 73 77
Du
ty c
ycle
(%
)
PV
ou
tpu
t (W
)
time (sec)
PWM PV output power Avg. (W)
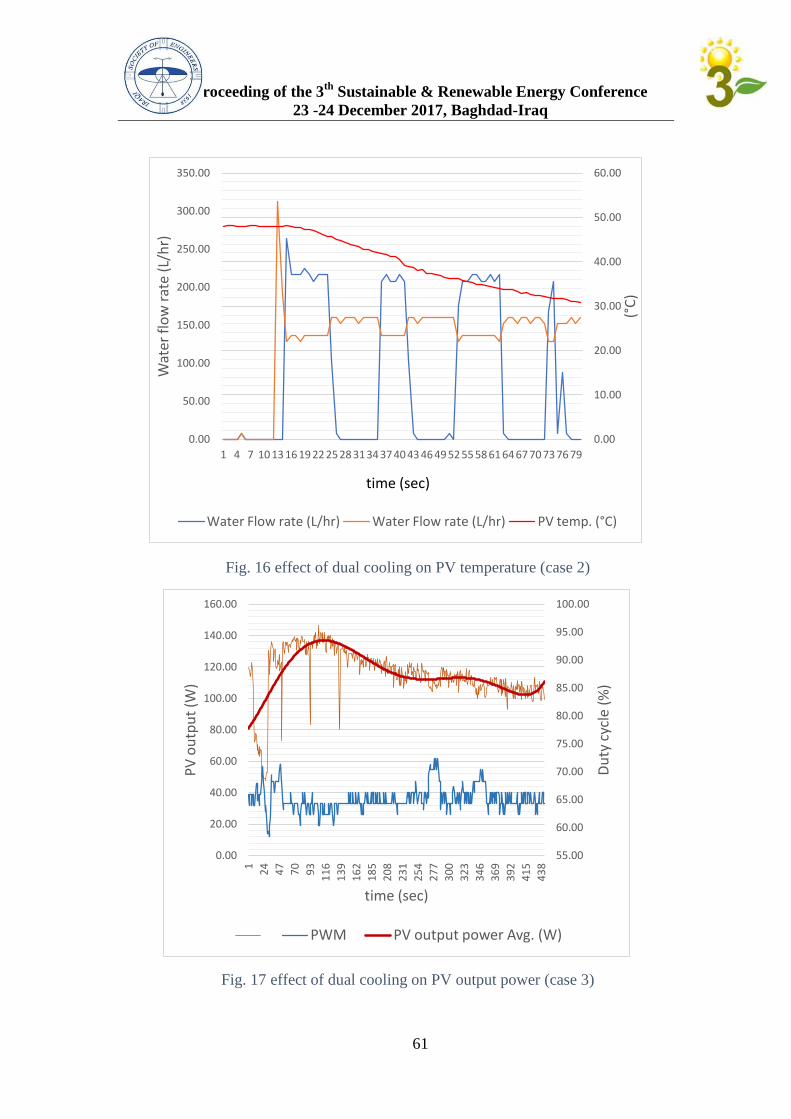
Proceeding of the 3th
Sustainable & Renewable Energy Conference
23 -24 December 2017, Baghdad-Iraq
61
Fig. 16 effect of dual cooling on PV temperature (case 2)
Fig. 17 effect of dual cooling on PV output power (case 3)
0.00
10.00
20.00
30.00
40.00
50.00
60.00
0.00
50.00
100.00
150.00
200.00
250.00
300.00
350.00
1 4 7 10 13 16 19 22 25 28 31 34 37 40 43 46 49 52 55 58 61 64 67 70 73 76 79
(°C
)
Wat
er f
low
rat
e (L
/hr)
Water Flow rate (L/hr) Water Flow rate (L/hr) PV temp. (°C)
time (sec)
55.00
60.00
65.00
70.00
75.00
80.00
85.00
90.00
95.00
100.00
0.00
20.00
40.00
60.00
80.00
100.00
120.00
140.00
160.00
1
24
47
70
93
11
6
13
9
16
2
18
5
20
8
23
1
25
4
27
7
30
0
32
3
34
6
36
9
39
2
41
5
43
8
Du
ty c
ycle
(%
)
PV
ou
tpu
t (W
)
time (sec)
PWM PV output power Avg. (W)
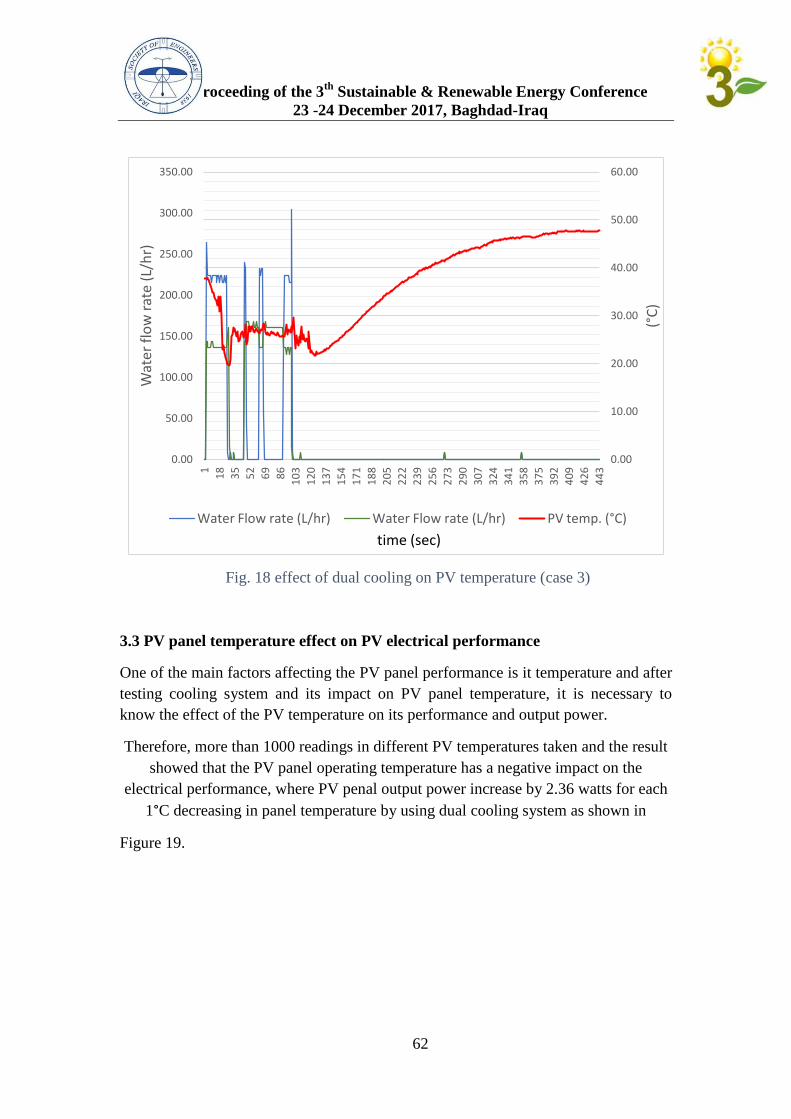
Proceeding of the 3th
Sustainable & Renewable Energy Conference
23 -24 December 2017, Baghdad-Iraq
62
Fig. 18 effect of dual cooling on PV temperature (case 3)
3.3 PV panel temperature effect on PV electrical performance
One of the main factors affecting the PV panel performance is it temperature and after
testing cooling system and its impact on PV panel temperature, it is necessary to
know the effect of the PV temperature on its performance and output power.
Therefore, more than 1000 readings in different PV temperatures taken and the result
showed that the PV panel operating temperature has a negative impact on the
electrical performance, where PV penal output power increase by 2.36 watts for each
1°C decreasing in panel temperature by using dual cooling system as shown in
Figure 19.
0.00
10.00
20.00
30.00
40.00
50.00
60.00
0.00
50.00
100.00
150.00
200.00
250.00
300.00
350.00
1
18
35
52
69
86
10
3
12
0
13
7
15
4
17
1
18
8
20
5
22
2
23
9
25
6
27
3
29
0
30
7
32
4
34
1
35
8
37
5
39
2
40
9
42
6
44
3
(°C
)
Wat
er
flo
w r
ate
(L/
hr)
Water Flow rate (L/hr) Water Flow rate (L/hr) PV temp. (°C)
time (sec)
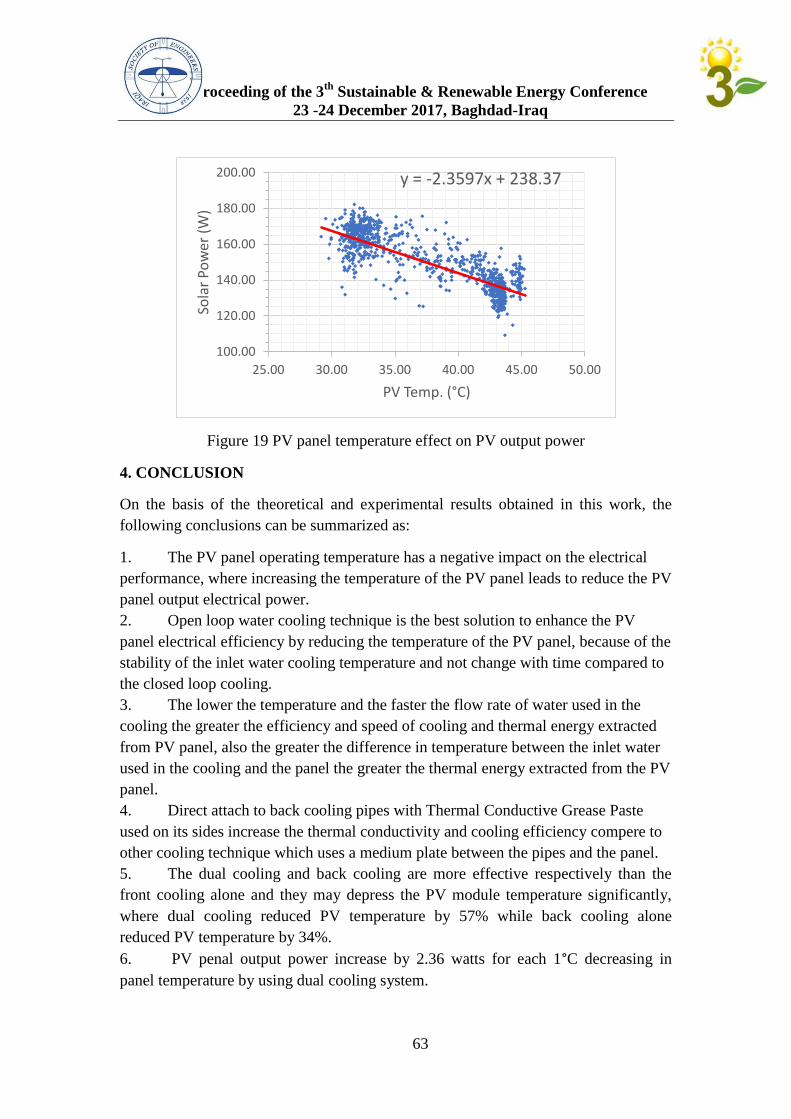
Proceeding of the 3th
Sustainable & Renewable Energy Conference
23 -24 December 2017, Baghdad-Iraq
63
Figure 19 PV panel temperature effect on PV output power
4. CONCLUSION
On the basis of the theoretical and experimental results obtained in this work, the
following conclusions can be summarized as:
1. The PV panel operating temperature has a negative impact on the electrical
performance, where increasing the temperature of the PV panel leads to reduce the PV
panel output electrical power.
2. Open loop water cooling technique is the best solution to enhance the PV
panel electrical efficiency by reducing the temperature of the PV panel, because of the
stability of the inlet water cooling temperature and not change with time compared to
the closed loop cooling.
3. The lower the temperature and the faster the flow rate of water used in the
cooling the greater the efficiency and speed of cooling and thermal energy extracted
from PV panel, also the greater the difference in temperature between the inlet water
used in the cooling and the panel the greater the thermal energy extracted from the PV
panel.
4. Direct attach to back cooling pipes with Thermal Conductive Grease Paste
used on its sides increase the thermal conductivity and cooling efficiency compere to
other cooling technique which uses a medium plate between the pipes and the panel.
5. The dual cooling and back cooling are more effective respectively than the
front cooling alone and they may depress the PV module temperature significantly,
where dual cooling reduced PV temperature by 57% while back cooling alone
reduced PV temperature by 34%.
6. PV penal output power increase by 2.36 watts for each 1°C decreasing in
panel temperature by using dual cooling system.
y = -2.3597x + 238.37
100.00
120.00
140.00
160.00
180.00
200.00
25.00 30.00 35.00 40.00 45.00 50.00
Sola
r Po
wer
(W
)
PV Temp. (°C)
Proceeding of the 3th
Sustainable & Renewable Energy Conference
23 -24 December 2017, Baghdad-Iraq
64
5. REFERENCES
[1] World Energy Outlook, France: OECD/IEA, 2010.
[2] T. ,. M. Parimita Mohanty, Solar Photovoltaic System Applications A
Guidebook for Off-Grid Electrification, UK: Springer, 2016.
[3] C. G. A. K. H. Ahmed Amine Hachicha, "Enhancing the Performance of a
Photovoltaic Module Using Different Cooling Methods," World Academy of Science,
vol. 9, pp. 1068-1071, 2015.
[4] K. S. S. H. Z. R. Z. Poorya Ooshaksaraei, "Performance of Four Air-Based
Photovoltaic Thermal Collectors Configurations with Bifacial Solar Cells,"
Renewable Energy , vol. 102 Part B, p. 279–293, 2017.
[5] O. I. A. K. W. A. Salih Mohammed Salih, "Performance Enhancement of PV
Array Based on Water Spraying Technique," International Journal of Sustainable and
Green Energy , vol. 4, no. 3-1, pp. 8-13, 2015.
[6] Y. Ibrahim, N. Y. Hassan, M. Momoh and M. G. Mahmud, "Design and
Construction of a Thermosiphonic Solar Photovoltaic Thermal Water Heating
System," IOSR-JAP, vol. 7, no. 2, pp. 88-96 , 2015.
[7] A. B. ,. A. S. ,. N. D. Fabio Schiro, "improving photovoltaic efficiency by
water cooling: modelling and experimental approach," Energy, pp. 1-24, 2017.
[8] W. S.Armstrong, "A thermal model for photovoltaic panels under varying
atmospheric conditions," Applied Thermal Engineering, vol. 30, no. 11-12, pp. 1488-
1495, 2010.
[9] A. H. N. a. A. R. A. Hashim A. Hussien, "Improving of the photovoltaic /
thermal system performance using water cooling technique," IOP Conf. Series:
Materials Science and Engineering, vol. 78, 2015.
Proceeding of the 3th Sustainable & Renewable Energy Conference 23 -24 December 2017, Baghdad-Iraq
65
Design and Implementation of an Automatic Sunlight Tracking System
for a Solar Panel Using Arduino Controller
Anmar Kalil Ibrahim, Nasseer K. Bachache2, and Adnan G. Tuaamah Al-Hasnawi1
Electromechanical Engineering/University of Technology
ABSTRACT
The main objective of this research is to create a system for generating electric power
from the sun by using four sensors which can locate and capture maximum sunlight, and
subsequently give signal to Arduino which functions as a controlling device that signals
to the motors to direct the solar tracking panels towards maximum sunlight. Experiment
has proved that the tracking panel is more efficient than the static panel in generating
electric power. The tracking system also includes water sprinklers which serve as a
cooling device to eliminate excessive heat of the solar panels. A sprinkler also serves as
a cleaning device, since dust, like excessive heat, decreases the performance level of the
solar panels. The main contribution of this research is to find a solution to the problem of
excessive heat of the solar panel (especially at midday in summer time) which has a
negative influence on the productivity of the solar panel. It has been observed that the
tracking panel which operates with controlled sprinkling water achieves an energy gain
of (20.3%) compared to the tracking panel without sprinkling water. Results and figures
of this research were analyzed and calculated according to Matlab program.
Keywords: solar tracking panels, Arduino, MATLAB, Sprinklers
تصميم وتنفيذ منظومة الية لتتبع اللوح الشمسي الشعاع الشمس بأستخدام جهاز تحكم اردوينو
الخالصة
ان الهدف الرئيسي لهذا البحث هو انشاء منظومة لتوليد الطاقة الكهربائية من الشمس باستخدام اربعة متحسسات
، والذي (Arduino)اشاره لجهاز تحكم ضوئية لها القدرة على تحديد موقع اقوى اشعاع شمسي ومن ثم اعطاء
وقد . لتقوم بتحريك االلواح الشمسية باتجاه اقوى اشعاع للشمس( DC Motors)بدوره يعطي اشارة الى المحركات
وتشمل منظومة توليد الكهرباء بهذه . اثبتت التجربة تفوق اللوح المتحرك على اللوح الثابت في توليد الطاقة الكهربائية
تخدام مرشات مائية تعمل كجهاز تبريد للتخلص من الحرارة الشديدة لاللواح الشمسية، وتعمل هذه الطريقة اس
وقد . يؤثر سلبا على اداء االلواح الشمسية( شأنه شأن الحرارة الشديدة)المرشات ايضا كأدوات للتنظيف ألن الغبار
كن ان يحقق ربحا في الطاقه بمعدل لوحظ ان اللوح المتحرك الذي يعمل مع مرش مائي خاضع لجهاز تحكم يم
وقد تم تحليل واحتساب النتائج واالرقام . بالمقارنة مع اللوح المتحرك الذي يعمل بدون اداة للتبريد( 20.3%)
(.Matlab)والمعادالت الواردة في هذا البحث وفق برنامج ماتالب
.ات مائيةمرش,ماتالب,اردوينو,االلواح الشمسية المتحركة :الكلمات الرئيسية
Proceeding of the 3th Sustainable & Renewable Energy Conference 23 -24 December 2017, Baghdad-Iraq
66
1. INTRODUCTION
The modern age has witnessed incredible and far-reaching industrial and
technological progress in numerous countries all over the world. The vast development in
industry and the fast growth in world population greatly increased the demand for electric
power. In view of the increasing demand on electric power, considerable research work
was devoted to find alternative sources for generating electricity. The problem of
environmental pollution led scientists and decision makers to search for new, clean, and
renewable sources of energy to replace the conventional sources, i.e. coal and oil, which
are expected to end up from the world sooner or later, [1]. Renewable energies which
come from natural resources e.g., the sun, the wind, etc., are inexhaustible and clean.
Such natural energy resources represent a vast potential which is almost available all over
the world. Moreover, electric energy produced from natural resources is in fact economic,
renewable, efficient, and friendly to the environment, [2].
In Iraq, the shortage in the generation and provision of electric power is an old
problem which lasted for many years. The electric power stations which use gas and oil as
fuel have failed to provide the country with sufficient electric power, although they cost
millions of dollars. In addition, they represent a threat to national health, since they cause
environmental pollution, [3]. Therefore it is essential to focus attention on natural
resources, particularly solar energy, since Iraq has a long summer season and long sunny
day time.
Many researchers consider renewable energy sources, particularly solar energy, as the
optimum alternative to conventional energy sources such as oil and coal. Previous
researchers have successfully developed a solar tracking system which consists of solar
panels that produce electric power from the sun. This research includes references to
various related research projects for the purpose of comparison and identification of
points of difference and similarity in order to enrich our research with ideas and
techniques used in previous research projects. Moharram and his fellow researchers,[4],
focus on economizing on water and electricity required for cooling PV panels. This was
achieved through developing a mathematical model which determines when to start
operating the cooling system as temperature of the PV panels rises to the maximum
allowable level. This is somewhat similar, in principle, to what our research project,
which is based on developing a cooling system, provided with temperature sensors that
read the temperature of PV panels and signal to Arduino which operates sprinklers when
temperature rises to maximum levels and switch them off when temperature falls to
normal levels. Nižetić and his partners, [5], developed a cooling technique that sprays
water on both sides of the PV panel at the same time. This cooling system was tested in
maximum temperature levels and was able achieve a total increase of 16.3% (effective
7.7%) in electric power output. One major difference between this cooling technique and
the cooling device in our research project is that the sprinkler in our system cools the
front surface only because it is covered with solar cells which generate electric power and
therefore require cleaning and cooling to maintain their generating capacity. On the other
hand, cooling the front side only means economizing on water consumed in the process.
Proceeding of the 3th Sustainable & Renewable Energy Conference 23 -24 December 2017, Baghdad-Iraq
67
The cooling process developed by Smith and his colleagues, [6], is based on pumping a
film of water continuously over the PV panel by using a cooling technique that re-
circulates water and is able to keep panel temperature below 40o. We have observed that
this research focuses on the negative impact of very high temperature on the power
generation of PV panels and the need to maintain the PV panel within the allowable
temperature levels. Our project tackles the same problem of high panel temperature in a
different way. Our cooling system is provided with a microcontroller that operates
sprinklers in case of need, i.e. when panel temperature rises above permissible levels; but
when it falls to normal operational level, the microcontroller automatically turns the
sprinklers off. Khan and his colleagues,[7], carried out a research which focused on
investing solar radiation to generate maximum power by developing a solar tracking
system which includes a reflecting mirror , a stepper motor and microcontroller to
increase the efficiency of PV panels. Unlike our research which offers proper solutions to
the problems of excessive heat and dust which undermine the operational capacity of PV
panels, this research does not refer to these problems or offer any solutions for them.
Generally speaking, in common with the first three research projects which we
discussed briefly above, our project focuses on the essential role of a cooling system in
dealing with high panel temperature by using sprinklers to cool and clean the panels.
However, our project differs in the methodology employed to achieve this target. Our
system includes a microcontroller that controls the sprinklers which cool and clean PV
panels automatically in order to minimize amount of water and electric energy consumed
in the cooling process. In other words, our system is able to maximize output in electric
power (20.3%) and also avoid wastage in water and electricity required to operate the
cooling system.
Our research will discuss the methodology we employed in developing our solar tracking
system and also offer a full description of its component parts in addition to a detailed
analysis of their functions. Our research also includes a detailed explanation of the
relative features of each of the component parts of our system in addition to a diagram of
the system. Moreover, a special section of our research will be devoted to results and data
analysis including calculations of voltage and current values as well as power produced
by PV panels on two levels:
For a static system in comparison with a tracking system.
A tracking system without a cooling technique in comparison with a tracking
system provided with a controlled cooling system.
The final goal of these calculations is to determine the relative power gain. The main
conclusion that can be drawn from data analysis process is that a solar tracking system
provided with a cooling system which is controlled by Arduino has given better results in
the generation of electric power.
The main contribution of this research is to find a solution to the problem of
excessive heat of the solar panel (especially at midday in summer time) which has a
negative influence on the productivity of the solar tracking system. This problem was
solved by using water sprinklers which highly improved the efficiency of the system.
Sprinklers offered a suitable solution to the problem of heat and dust, leading to very
Proceeding of the 3th Sustainable & Renewable Energy Conference 23 -24 December 2017, Baghdad-Iraq
68
good results in the generating of solar energy.
2. METHODOLOGY
The main objective of this research is to design an efficient solar tracker. In order to
achieve this objective, a methodology of various components is applied. These
components are inputs and outputs to a controller. A photocell, which forms a basic part
of a solar panel, is simply a photo resistor which is sometimes called Light Dependent
Resistor (LDR). In general, the resistance of an LDR is variable, usually controlled by
light, sometimes as high as Mega ohms. The main advantages of LDR are its simple
structure and low cost, [8].
The system also includes two DC motors that move the solar panels towards the
desired target as shown in Fig.1. Moreover, the system is provided with sprinklers for
the purpose of cooling excessively hot panels. This cooling process is essential because
the solar panel loses part of its productive capacity (particularly in producing electric
power) if its temperature rises above (25co), or if it is covered with dust. To solve the
problem of excessive heat, the system is provided with a temperature sensor that reads
the temperature of the panel.
The solar panels are exposed to two types of sunlight: the first is direct sunlight
which represents 90% of the solar power, and the second is the diffuse sunlight which
represents 10% of the solar power; therefore, special attention was focused on
developing a technique to direct the panels towards the sun to obtain maximum electric
power, [9]. This process was successfully achieved by using light sensors which can
locate maximum sunlight and signal this information to Arduino which is programmed to
control the motors that move the panels towards direct sunlight as shown in Fig.2, [10].
Arduino is used to control the overall operations of the system which can be summarized
as follows.
*Four light sensors were used to identify the location of maximum sunlight and then to
signal this information to Arduino which signals to DC motors to move the panels
towards the target direction. In other words, the signal given by LDR is an interrupting
signal sent to Arduino which in turn signals to the motors to direct the panels to the
location of maximum sunlight. Arduino was programmed in a way that the panel can
move in all directions and in any angle, and that means the movement of the panels will
not be limited to horizontal and vertical directions.
*In view of the high temperature at midday, particularly in summer and its negative
influence on productivity of the solar panel, the system was provided with a temperature
sensor which reads the temperature of the panel and also gives signal to Arduino to
operate the sprinklers in order to eliminate excessive heat of the panel. This cooling
process highly improved the performance level of the system. Fig.3 and Fig.4 show the
completed system.
Proceeding of the 3th Sustainable & Renewable Energy Conference 23 -24 December 2017, Baghdad-Iraq
69
3. IMPLEMENTATION
Implementation of our project includes establishing the fundamental part, i.e.
Arduino Uno which is simply a microcontroller consisting of a single-board that is used
to write software for a specific entity. In this device, the inputs have been taken from sensors
or array of switches, while the physical outputs are multiplicity of signals which control the
motion of motors, lights or any other appliances. The main advantage of Arduino over other
systems is its comparatively low cost. Arduino Uno is characterized by the following
features, [11]:
Microcontroller: ATmega328.
Operating Voltage:5V.
Input Voltage (recommended): 7-12V.
Input Voltage (limits): 6-20V.
Digital I/O Pins: 14 (of which 6 provide PWM output).
Analogue Input Pins:6.
DC Current per I/O Pin: 40 mA.
DC Current for 3.3V Pin: 50 mA.
Flash Memory: 32 KB (ATmega328) of which 0.5 KB used by boot loader.
SRAM: 2 KB (ATmega328).
EEPROM: 1 KB (ATmega328).
Clock Speed: 16 MHz.
Arduino operates and controls the solar tracking system and the cooling system.
1) The Solar Tracking System consists of the following components, [10]:
a) Light dependent resistors (LDR): Cells that have spectral responses similar to
that of the human eye. Application includes smoke detection and automatic
lighting control. LDR has the following features:
Wide spectral response.
Low cost.
Wide temperature range.
b) Resistor: The resistor value was determined at 10 Kohm to protect the system
from damage.
c) Servomotors with the following features: A Servomotor can place its motor
shaft at a specific angle by using control signal. The motor shaft will maintain
this position as long as the control signal is not changed. The servomotor has
three wires: (Ground, positive 5 volt, control signal). Two servomotors were
used, one for horizontal movement and the other for vertical movement.
d) Solar panels with the following features:
Double glass layers for better protection.
Blocking diode.
Operating temperature (-15 to +45co).
e) Battery: Lead acid battery is a single 12-volt battery which consists of several
Proceeding of the 3th Sustainable & Renewable Energy Conference 23 -24 December 2017, Baghdad-Iraq
70
single cells connected in series. Each cell produces about 2.1 volts.
f) LCD display (16x2 characters): The LCD display should be connected to six
Arduino pins (digital outputs). It also needs 5v and GND connections.
2) The Cooling System consists of the following components, [6]:
a) Temperature and Humidity Sensor type (DHT11) is characterized by
excellent stability and great reliability.
Electrical features
Supply current: 0.3mA.
Power supply: DC (3.5 – 5.5V)
b) Valves: These heavy-duty valves are characterized by flexibility in design
and operation. They are economical and easy to install. The valves have the
following features:
Slow closing to prevent system damage.
Glass reinforced nylon construction
Inrush current:0.41 A at 60Hz
Holding current:0.14A at 60 Hz
c) Sprinklers with the following features:
High flexibility in installation and operation
No electric energy is required in operation.
Experiment has proved that the various component parts of the solar tracking system
and the cooling system need low electric energy to operate.
4. RESULTS AND DATA ANALYSIS
The hot sunshine and long day time in summer (in countries like Iraq and other
Middle East and Arab Gulf countries) represent positive factors in the process of
generating electro-solar energy. On the other hand, the high temperature, sometimes
rising above 50o, especially at midday, which may last till 4 o'clock pm, leads to a
decrease in the efficiency and performance level of the solar panels. Experiment has
proved that the early hours of daytime are more productive of power than the hours of
high solar illumination. A day was randomly chosen and the reading started from 5:00 am
and continued till 6:30 pm, taking into consideration the excessively hot sunlight and its
negative influence on the results. Table 1. represents the voltage and current values
produced by both the static and tracking panels for different times on a day. Table 2. and
Fig.5 clarifies the relationship between time and power, by calculating power gain
through Equation 1.
It has been observed that during the early hours of daytime, the static panel
produces less energy than the tracking panel. Power production in the static panel
gradually increases to reach the maximum level of (81.6 watt) at 10:00 am. Later on, it
begins again to decrease, descending to the minimum level of 36.72 watt at 1:00 pm. On
Proceeding of the 3th Sustainable & Renewable Energy Conference 23 -24 December 2017, Baghdad-Iraq
71
the other hand, experiment has also proved that tracking panels are always more
productive of energy than static panels, starting from sunrise until energy output reaches
the maximum level of (102,3 watt) at 10:00 am. However, energy production in tracking
panels also decreases, especially at midday, in spite of the increase in the intensity of
sunlight. This is due to the fact that excessive heat has a negative influence on the
functioning of the tracking panel. In the afternoon, energy output rises again due to the
relative fall in temperature. Experiment has also proved that, throughout the day, the total
power output of the static panel is 535.16 watt, whereas the total power output of the
tracking panel is 1.0749e+03 watt. Therefore, the average power gain by the tracking
panel over static panel is 175.5912%.
The problem of eliminating excessive heat from solar tracking panels has been
tackled in many ways, such as placing a fan behind them. This solution has proved to be
inadequate as far as cost is concerned. It also failed to reduce the temperature of the
panels to the desired level. We also tried to protect PV panels against excessively high
temperature by installing them in shaded areas. However, this step has decreased the
intensity of solar radiation captured by the PV panels and therefore has undermined the
capacity of PV panels to generate electric power. We discovered that using water
sprinklers is very effective in improving the performance level of the panels. Sprinklers
can both reduce the temperature of the panels and also serve as a cleaning device, since
dust, like excessive heat, decreases the efficiency of the panel. Another advantage of
sprinklers is their low cost, compared to other techniques. Table 3 and Table 4 highlight
the role of sprinklers in improving the performance level of the solar tracking system. It
has been observed that without sprinklers the system is less productive of solar power.
Two techniques for the use of sprinklers were employed as follows:
1) Sprinklers were used without a controlling device. Panels were simply sprinkled with
water every twenty minutes and good results were duly obtained in the performance
of the system. But, this technique was inadequate to tackle the problem of excessively
high temperature.
2) The second technique included the use of a controlling system which consists of a
temperature sensor that gives signal to Arduino to operate the sprinklers when
temperature rises. Excessive heat has a negative influence on the functioning of the
tracking system because it causes a decrease in the electrons obtained from the silicon
cells which form the solar panels. It has been observed that better results can be
obtained by using the controlling system and this is clearly illustrated in Table 5 and
Fig. 6.
Fig.7 represents a flowchart of the solar tracking system.
Fig.8 represents a flowchart of the cooling system.
5. CONCLUSIONS
The basic aim of this project is to generate electric power from the sun as a source of
energy which is both renewable and friendly to the environment. In order to achieve this
aim, a solar tracking system has been designed to follow the sun's path from morning to
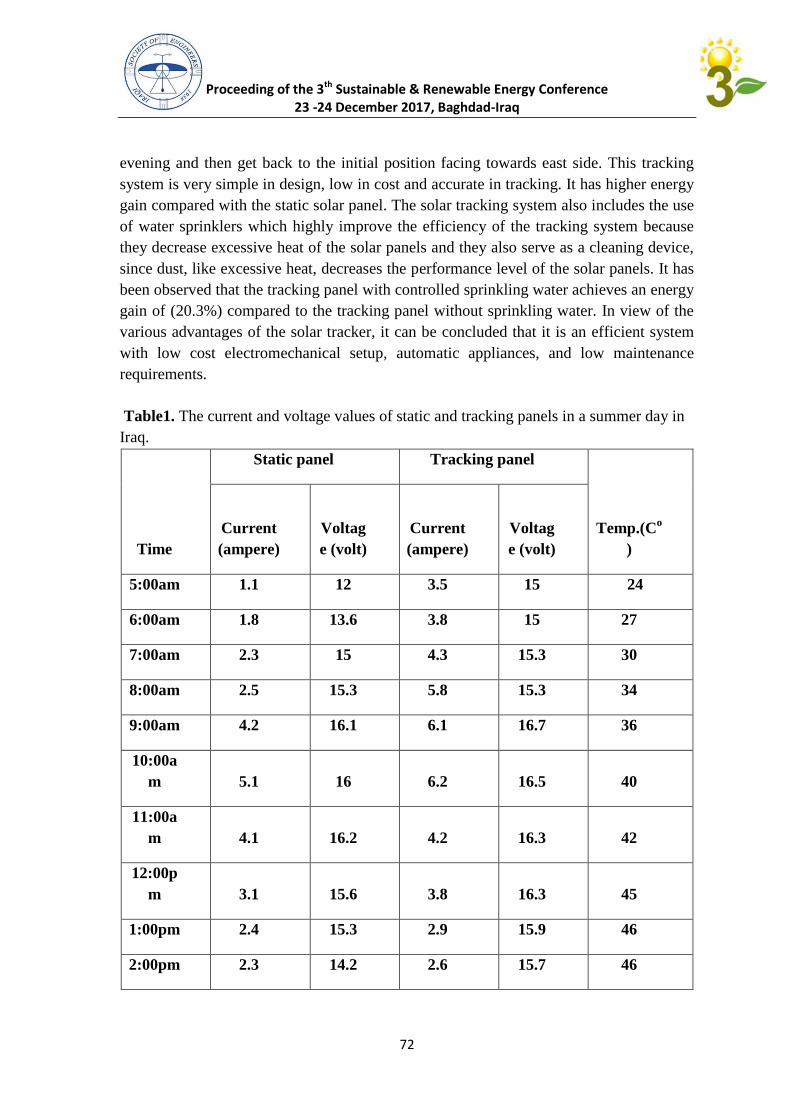
Proceeding of the 3th Sustainable & Renewable Energy Conference 23 -24 December 2017, Baghdad-Iraq
72
evening and then get back to the initial position facing towards east side. This tracking
system is very simple in design, low in cost and accurate in tracking. It has higher energy
gain compared with the static solar panel. The solar tracking system also includes the use
of water sprinklers which highly improve the efficiency of the tracking system because
they decrease excessive heat of the solar panels and they also serve as a cleaning device,
since dust, like excessive heat, decreases the performance level of the solar panels. It has
been observed that the tracking panel with controlled sprinkling water achieves an energy
gain of (20.3%) compared to the tracking panel without sprinkling water. In view of the
various advantages of the solar tracker, it can be concluded that it is an efficient system
with low cost electromechanical setup, automatic appliances, and low maintenance
requirements.
Table1. The current and voltage values of static and tracking panels in a summer day in
Iraq.
Time
Static panel Tracking panel
Temp.(Co
)
Current
(ampere)
Voltag
e (volt)
Current
(ampere)
Voltag
e (volt)
5:00am 1.1 12 3.5 15 24
6:00am 1.8 13.6 3.8 15 27
7:00am 2.3 15 4.3 15.3 30
8:00am 2.5 15.3 5.8 15.3 34
9:00am 4.2 16.1 6.1 16.7 36
10:00a
m 5.1 16 6.2 16.5 40
11:00a
m 4.1 16.2 4.2 16.3 42
12:00p
m 3.1 15.6 3.8 16.3 45
1:00pm 2.4 15.3 2.9 15.9 46
2:00pm 2.3 14.2 2.6 15.7 46
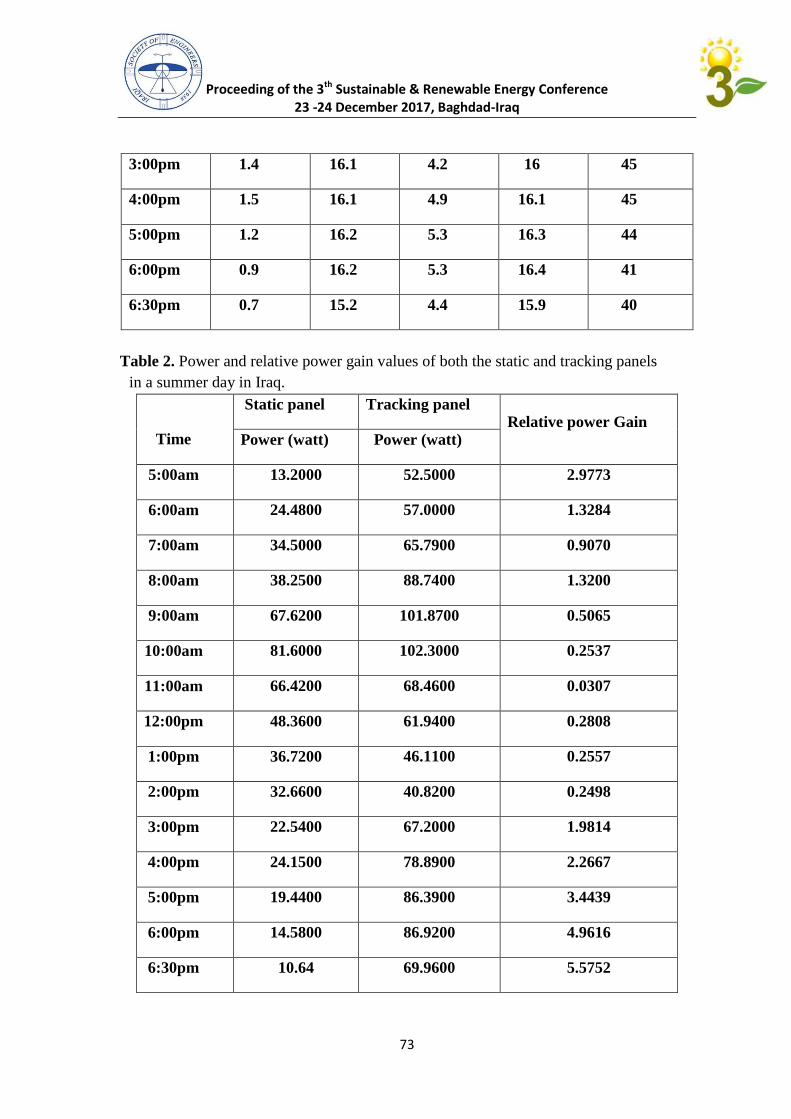
Proceeding of the 3th Sustainable & Renewable Energy Conference 23 -24 December 2017, Baghdad-Iraq
73
3:00pm 1.4 16.1 4.2 16 45
4:00pm 1.5 16.1 4.9 16.1 45
5:00pm 1.2 16.2 5.3 16.3 44
6:00pm 0.9 16.2 5.3 16.4 41
6:30pm 0.7 15.2 4.4 15.9 40
Table 2. Power and relative power gain values of both the static and tracking panels
in a summer day in Iraq.
Time
Static panel Tracking panel Relative power Gain
Power (watt) Power (watt)
5:00am 13.2000 52.5000 2.9773
6:00am 24.4800 57.0000 1.3284
7:00am 34.5000 65.7900 0.9070
8:00am 38.2500 88.7400 1.3200
9:00am 67.6200 101.8700 0.5065
10:00am 81.6000 102.3000 0.2537
11:00am 66.4200 68.4600 0.0307
12:00pm 48.3600 61.9400 0.2808
1:00pm 36.7200 46.1100 0.2557
2:00pm 32.6600 40.8200 0.2498
3:00pm 22.5400 67.2000 1.9814
4:00pm 24.1500 78.8900 2.2667
5:00pm 19.4400 86.3900 3.4439
6:00pm 14.5800 86.9200 4.9616
6:30pm 10.64 69.9600 5.5752
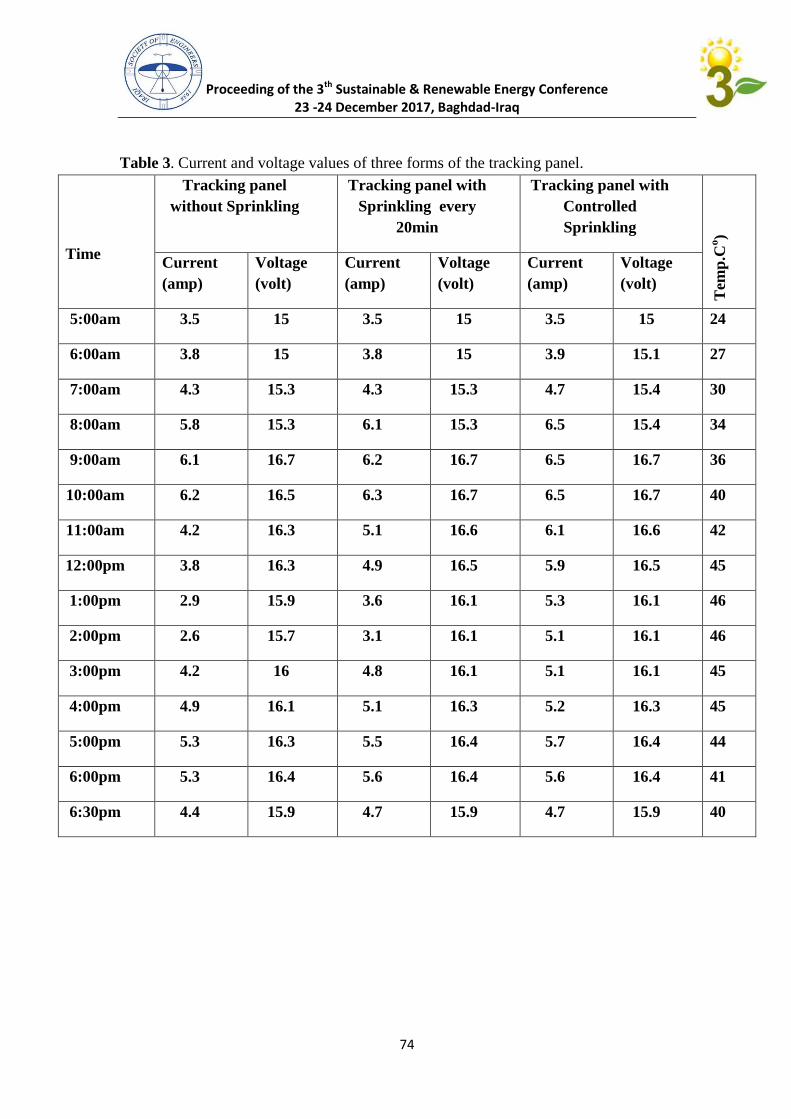
Proceeding of the 3th Sustainable & Renewable Energy Conference 23 -24 December 2017, Baghdad-Iraq
74
Table 3. Current and voltage values of three forms of the tracking panel.
Time
Tracking panel
without Sprinkling
Tracking panel with
Sprinkling every
20min
Tracking panel with
Controlled
Sprinkling
Tem
p.C
o)
Current
(amp)
Voltage
(volt)
Current
(amp)
Voltage
(volt)
Current
(amp)
Voltage
(volt)
5:00am 3.5 15 3.5 15 3.5 15 24
6:00am 3.8 15 3.8 15 3.9 15.1 27
7:00am 4.3 15.3 4.3 15.3 4.7 15.4 30
8:00am 5.8 15.3 6.1 15.3 6.5 15.4 34
9:00am 6.1 16.7 6.2 16.7 6.5 16.7 36
10:00am 6.2 16.5 6.3 16.7 6.5 16.7 40
11:00am 4.2 16.3 5.1 16.6 6.1 16.6 42
12:00pm 3.8 16.3 4.9 16.5 5.9 16.5 45
1:00pm 2.9 15.9 3.6 16.1 5.3 16.1 46
2:00pm 2.6 15.7 3.1 16.1 5.1 16.1 46
3:00pm 4.2 16 4.8 16.1 5.1 16.1 45
4:00pm 4.9 16.1 5.1 16.3 5.2 16.3 45
5:00pm 5.3 16.3 5.5 16.4 5.7 16.4 44
6:00pm 5.3 16.4 5.6 16.4 5.6 16.4 41
6:30pm 4.4 15.9 4.7 15.9 4.7 15.9 40
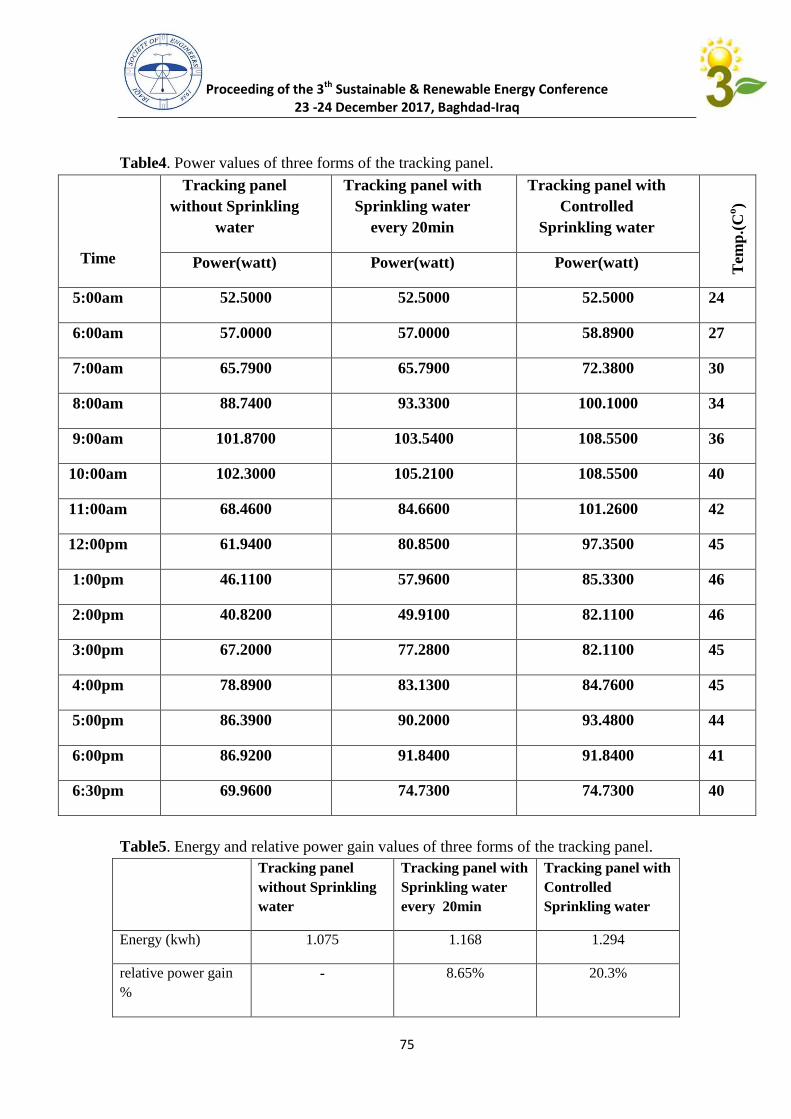
Proceeding of the 3th Sustainable & Renewable Energy Conference 23 -24 December 2017, Baghdad-Iraq
75
Table4. Power values of three forms of the tracking panel.
Time
Tracking panel
without Sprinkling
water
Tracking panel with
Sprinkling water
every 20min
Tracking panel with
Controlled
Sprinkling water
Tem
p.(
Co)
Power(watt) Power(watt) Power(watt)
5:00am 52.5000 52.5000 52.5000 24
6:00am 57.0000 57.0000 58.8900 27
7:00am 65.7900 65.7900 72.3800 30
8:00am 88.7400 93.3300 100.1000 34
9:00am 101.8700 103.5400 108.5500 36
10:00am 102.3000 105.2100 108.5500 40
11:00am 68.4600 84.6600 101.2600 42
12:00pm 61.9400 80.8500 97.3500 45
1:00pm 46.1100 57.9600 85.3300 46
2:00pm 40.8200 49.9100 82.1100 46
3:00pm 67.2000 77.2800 82.1100 45
4:00pm 78.8900 83.1300 84.7600 45
5:00pm 86.3900 90.2000 93.4800 44
6:00pm 86.9200 91.8400 91.8400 41
6:30pm 69.9600 74.7300 74.7300 40
Table5. Energy and relative power gain values of three forms of the tracking panel.
Tracking panel
without Sprinkling
water
Tracking panel with
Sprinkling water
every 20min
Tracking panel with
Controlled
Sprinkling water
Energy (kwh) 1.075 1.168 1.294
relative power gain
%
- 8.65% 20.3%
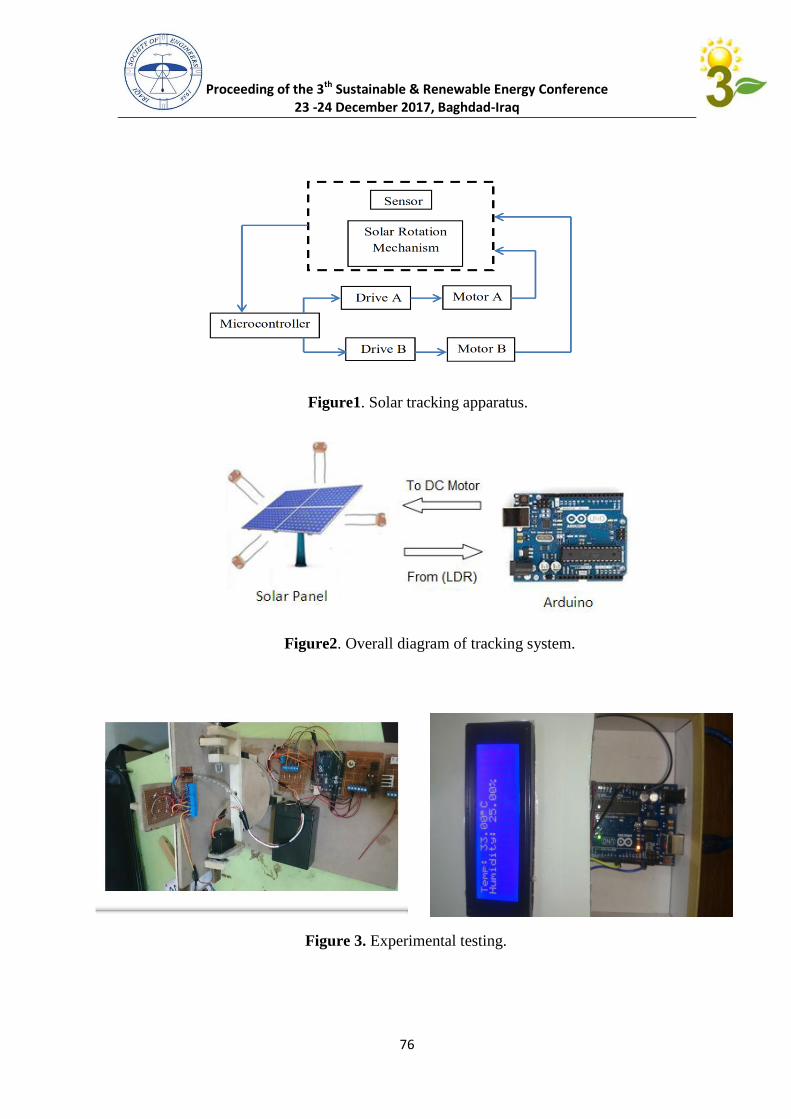
Proceeding of the 3th Sustainable & Renewable Energy Conference 23 -24 December 2017, Baghdad-Iraq
76
Figure1. Solar tracking apparatus.
Figure2. Overall diagram of tracking system.
Figure 3. Experimental testing.
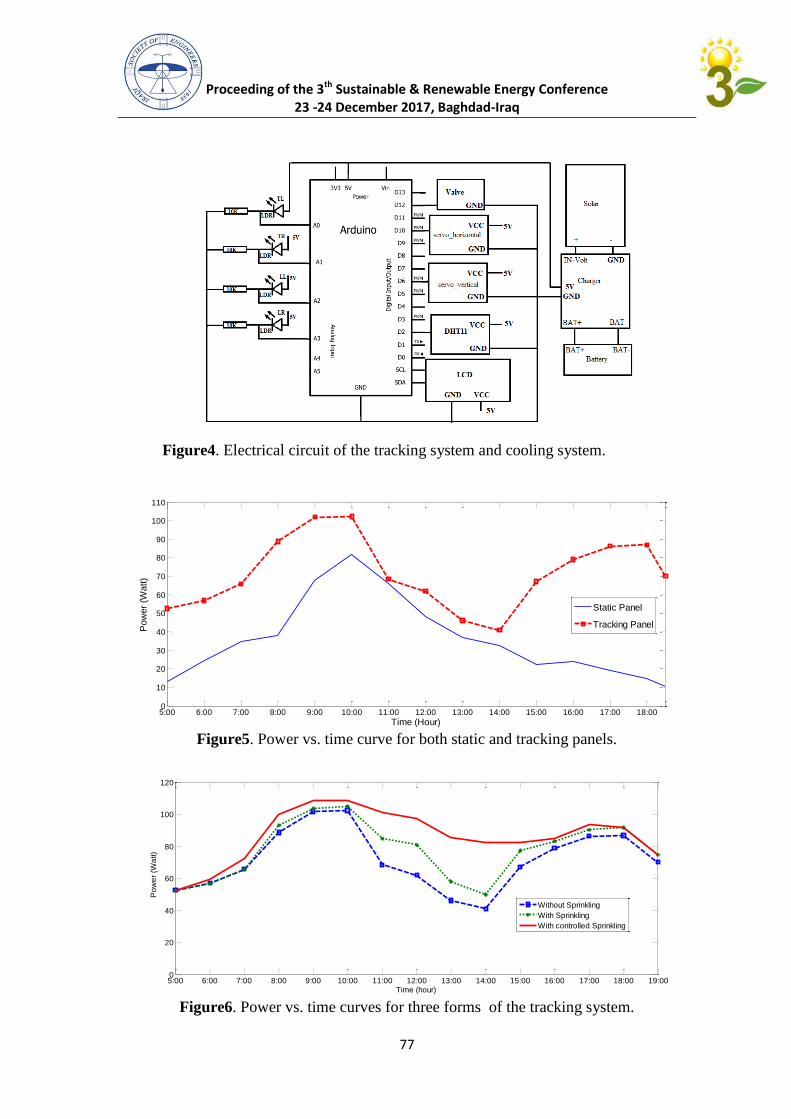
Proceeding of the 3th Sustainable & Renewable Energy Conference 23 -24 December 2017, Baghdad-Iraq
77
Figure4. Electrical circuit of the tracking system and cooling system.
Figure5. Power vs. time curve for both static and tracking panels.
Figure6. Power vs. time curves for three forms of the tracking system.
5:00 6:00 7:00 8:00 9:00 10:00 11:00 12:00 13:00 14:00 15:00 16:00 17:00 18:00 19:000
20
40
60
80
100
120
Time (hour)
Po
we
r (W
att)
Without Sprinkling
With Sprinkling
With controlled Sprinkling
5:00 6:00 7:00 8:00 9:00 10:00 11:00 12:00 13:00 14:00 15:00 16:00 17:00 18:000
10
20
30
40
50
60
70
80
90
100
110
Time (Hour)
Pow
er
(Watt)
Static Panel
Tracking Panel
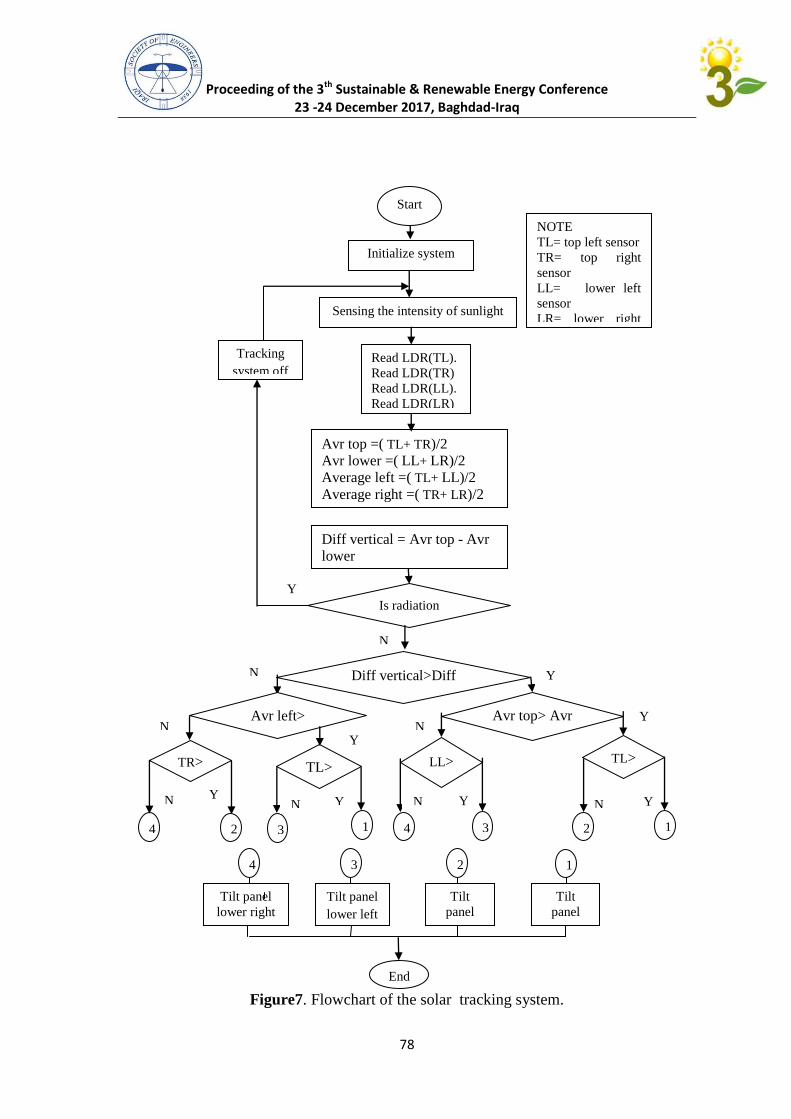
Proceeding of the 3th Sustainable & Renewable Energy Conference 23 -24 December 2017, Baghdad-Iraq
78
Figure7. Flowchart of the solar tracking system.
NOTE
TL= top left sensor
TR= top right
sensor
LL= lower left
sensor
LR= lower right
sensor
Start
Initialize system
NIALIZIAN
SYSTEM Sensing the intensity of sunlight
by LDR
Read LDR(TL).
Read LDR(TR)
Read LDR(LL).
Read LDR(LR)
Avr top =( TL+ TR)/2
Avr lower =( LL+ LR)/2
Average left =( TL+ LL)/2
Average right =( TR+ LR)/2
Is radiation
intensity = 0
Tracking
system off
Avr top> Avr
lower
End
Tilt
panel
top left
Tilt panel
lower right
Tilt panel
lower left
Tilt
panel
top
right
N
o
Y
es
Diff vertical = Avr top - Avr
lower
Diff horizontal = Avr left –
Avr right
Diff vertical>Diff
horizontal
Avr left>
Avr right
TL>
TR
Y
e
s
N
o
LL>
LR TL>
LL
TR>
LR
4 2 1 2 1 3 4
4 3 2 1
3
Y
e
s
N
o
Y
e
s
N
o
Y
e
s
N
o
N
o
Y
e
s
N
o
Y
e
s
Y
e
s
N
o
N
o
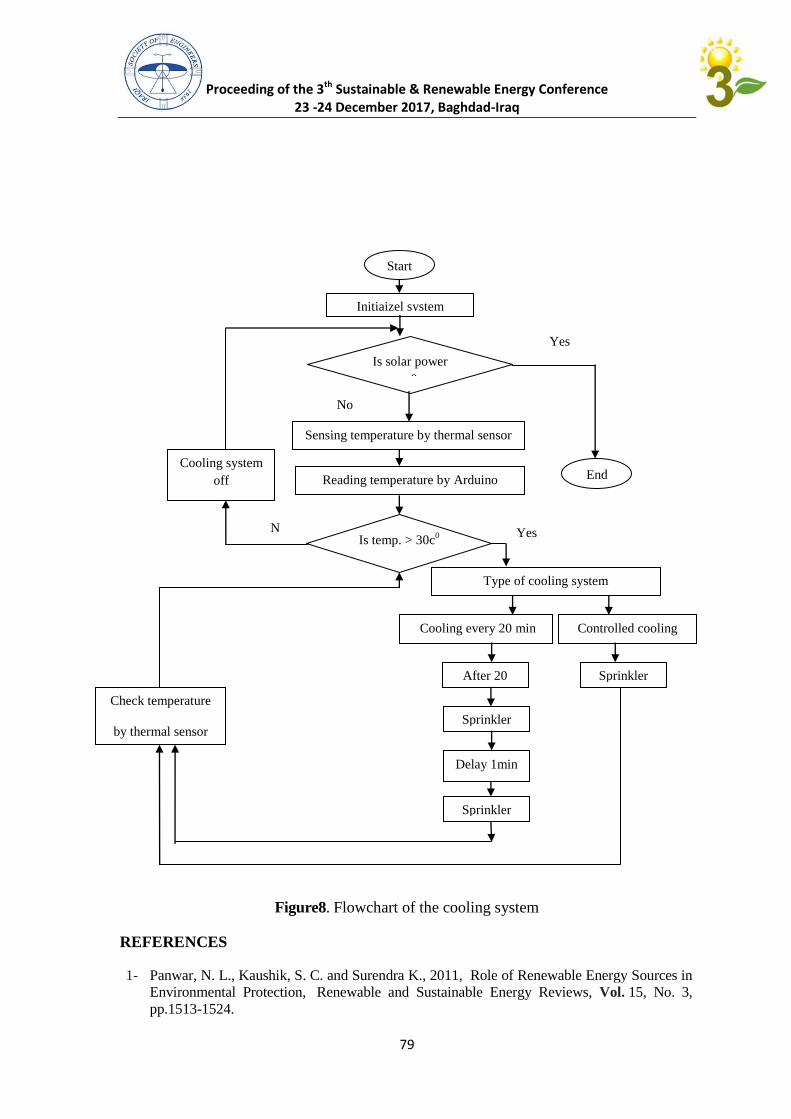
Proceeding of the 3th Sustainable & Renewable Energy Conference 23 -24 December 2017, Baghdad-Iraq
79
Figure8. Flowchart of the cooling system
REFERENCES
1- Panwar, N. L., Kaushik, S. C. and Surendra K., 2011, Role of Renewable Energy Sources in
Environmental Protection, Renewable and Sustainable Energy Reviews, Vol. 15, No. 3,
pp.1513-1524.
Initiaizel system
Reading temperature by Arduino
Is temp. > 30c0
End
Sprinkler
on
N
o Yes
Start
Type of cooling system
Controlled cooling
system
Cooling every 20 min
system
After 20
min
Sprinkler
on
Delay 1min
Sprinkler
off
Check temperature
by thermal sensor
Is solar power
=0
Yes
No
Sensing temperature by thermal sensor
Cooling system
off
Proceeding of the 3th Sustainable & Renewable Energy Conference 23 -24 December 2017, Baghdad-Iraq
80
2- Solangi, K. H., Islam, M. R., Saidur , R., Rahim, N. A., and Fayaz, H., 2015, A review on
Global Solar Energy Policy, Renewable and Sustainable Energy Reviews, Vol. 15, No. 4 ,
pp. 2149-2163.
3- Green, Martin, A., Keith, E., Yoshihiro, H., Wilhelm, W., and Ewan, D., 2014, Solar Cell
Efficiency Tables Version 45, Progress in Photovoltaics, Research and Applications, vol. 23,
No. 1 pp.1-9.
4- Moharram, K. A., Abd-Elhady, M. S., Kandil, H. A., & El-Sherif, H. (2013). Enhancing the
performance of photovoltaic panels by water cooling. Ain Shams Engineering Journal, Vol.
4(4), 869-877.
5- Nižetić, S., Čoko, D., Yadav, A., & Grubišić-Čabo, F. (2016). Water spray cooling
technique applied on a photovoltaic panel: The performance response. Energy Conversion
and Management, Vol. 108, 287-296.
6- Smith, M. K., Selbak, H., Wamser, C. C., Day, N. U., Krieske, M., Sailor, D. J., &
Rosenstiel, T. N. (2014). Water cooling method to improve the performance of field-
mounted, insulated, and concentrating photovoltaic modules. Journal of Solar Energy
Engineering, Vol. 136(3), 034503.
7- Khan, M. Z. H., Al-Mamun, M. R., Hossain, M. I., Hasan, S., & Hasan, M. R. (2016).
Performance improvement study of pv cell with solar tracking system. International Journal
of Renewable Energy Resources (formerly International Journal of Renewable Energy
Research), Vol. 6(1).
8- Asiabanpour, B., Almusaied, Z., Aslan, S., Mitchell, M., Leake, E., Lee, H., ... & Bland,
A.(2017). Fixed versus sun tracking solar panels: an economic analysis. Clean Technologies
and Environmental Policy, Vol. 19(4), 1195-1203.
9- Koussa, M., Cheknane, A., Hadji, S., Haddadi, M., and Noureddine, S., 2011, Measured
and Modelled Improvement in Solar Energy Yield From Flat Plate Photovoltaic Systems
Utilizing Different Tracking Systems and Under A range of Environmental
Conditions, Applied Energy, Vol. 88, No.5, pp.1756-1771.
10- Ponniran, Asmarashid, Hashim, A., and Joret, A., 2011, A design of Low Power Single Axis
Solar Tracking System Regardless of Motor Speed, International Journal of Integrated
Engineering, Vol. 3, No.2.
11- Banzi, M., & Shiloh, M. (2014). Getting Started with Arduino: The Open Source
Electronics Prototyping Platform. Maker Media, Inc..
Proceeding of the 3th
Sustainable & Renewable Energy Conference
23 -24 December 2017, Baghdad-Iraq
81
Increasing the Organic Solar Cells Lifetime by Using PANI:CSA Interlayer
Omar Abdulsattar Abdulrazzaq
Email: [email protected]
Abstract
The aging effect on organic solar cells type P3HT:PCBM was investigated when camphorsulfonic
doped polyaniline (PANI:CSA) or poly(3,4-ethylenedioxythiophene):poly-(styrenesulfonate)
(PEDOT:PSS) is used as a hole transport layer (HTL). The cells were encapsulated and exposed to a
continuous normal atmosphere in dark shelf then characterized intermittently for over two years. The
photovoltaic results revealed that the cells with PEDOT:PSS HTL show better initial results than the cells
with PANI:CSA HTL. Over time, PEDOT:PSS-based cells exhibited faster degradation than PANI:CSA-
based cells, where the average efficiency of six cells dropped to zero in less than one and a half year. On
the other hand, PANI:CSA-based cells exhibited much stable performance with average efficiency drop
of only 15 % of their initial values after one and a half year and 63% after two years. Single-diode model
was utilized to fit the experimental data with the theoretical curve to extract the diode parameters such as
ideality factor to explain the effect of aging on the diode performance.
PANICSAباستخدام طبقة بينية من مادة زيادة العمر االفتراضي للخاليا الشمسية العضوية
على عمر PANI:CSAوالطبقة البينية المطورة نوع PEDOT:PSS، تم دراسة تأثير الطبقة البينية التقليدية في هذا البحث
العادية جرى تغليف الخاليا الشمسية المصنعة ثم تم تعريضها الى الظروف الجوية .P3HT:PCBMالخاليا الشمسية العضوية نوع
بينت النتائج ان الخاليا الشمسية الحاوية على الطبقة التقليدية .حيث جرى بعدها دراسة خصائص هذه الخاليا بشكل دوري ولمدة سنتين
ولكن بمرور الوقت، بدأت الخاليا الحاوية على الطبقة التقليدية . تعطي كفاءة تحويل ابتدائية افضل من تلك الحاوية على الطبقة المطورة
حيث هبطت كفاءة الخاليا التقليدية الى . بفقدان خصائصها بسرعة بينما حافظت تلك الحاوية على الطبقة المطورة على خصائص مستقرة
فقط بعد مرور سنة ونصف %15بينما اظهرت الخاليا المطورة استقرارية عالية حيث هبطت كفائتها الى . الصفر بعد مرور سنة واحدة
.تم تفسير النتائج على ضوء نمذجة موديل الثنائي المنفرد .سنتينبعد مرور % 36ثم الى
Proceeding of the 3th
Sustainable & Renewable Energy Conference
23 -24 December 2017, Baghdad-Iraq
82
1. Introduction
Organic photovoltaics (OPVs) based on conducting polymers and small molecules have several
features that make them desirable, such as lightweight, flexible, inexpensive, simple to fabricate, and easy
to scale up using the roll-to-roll process among others. In the last two decades, an enormous amount of
research has been devoted to develop this type of solar cell technology in order to meet the commercial
needs.1 The two most pressing obstacles that hinder production of commercially viable OPVs are low
power conversion efficiency and lifetime. The average lifetime of well-encapsulated poly(3-
hexylthiophene-2,5-diyl):[6,6]-phenyl-C61-butyric acid methyl ester (P3HT:PCBM) OPVs is now
approximately three years, compared to more than twenty-five years for silicon-based inorganic solar
cells. 2 Organic materials are naturally susceptible to chemical and physical degradation.
3 For example,
the standard architecture of the commonly used organic solar cells, i.e.
ITO/PEDOT:PSS/P3HT:PCBM/Al, where PEDOT:PSS is the poly(3,4-
ethylenedioxythiophene):poly(styrenesulfonate) hole transport layer, degrades markedly with time for
several reasons, which are discussed in subsequent paragraphs. Many of these reasons are inherent to the
materials used and therefore little can be done to limit the degradation.
The P3HT:PCBM blend is a non-equilibrium thermodynamic system, meaning it phase separates
when exposed to heat or when aged under ambient temperature because PCBM tends to segregate from
P3HT and aggregate together forming larger domains.4 The phase separation is desired but only under
certain domain sizes— such that they are less than or equal to the exciton diffusion length (roughly ~40
nm). Domain size is affected by the P3HT-to-PCBM blend ration, the solvent used, and post-fabrication
annealing. Annealing, such as thermal and/or solvent annealing, is usually applied to achieve the best
photovoltaic performance.5 However, as mentioned earlier, long term exposure to elevated temperatures
(annealing) or aging can promote larger domains that result in poor device performance. Migration of the
molecules from the active layer into the electrodes or migration of the electrodes constituents into the
active layer are other reasons for device degradation.6
While the previously mentioned degradation parameters are significant, the most significant
degradation factor in organic solar cells is the effect of oxygen and moisture.7 Oxygen and moisture can
cause the device to degrade in a few hours if it is not well-encapsulated. In the majority of organic
architectures, PEDOT:PSS is used as the hole transport layer (HTL) and exhibits several features that
make it superior as a HTL— high transparency in the visible region, high electrical conductivity, and a
Proceeding of the 3th
Sustainable & Renewable Energy Conference
23 -24 December 2017, Baghdad-Iraq
83
work function value of approximately 5.2 eV, which is compatible for its use as HTL with many active
layer materials. Nonetheless, there are some significant drawbacks to the use of PEDOT:PSS as an HTL.
PEDOT:PSS is acidic, which can lead to the degradation of the ITO anode by etching the indium out of
the anode and transporting it to the active layer leading to the degradation of the active layer, as well.8
The etching occurs during the spin-coating of PEDOT:PSS, during annealing and after aging of the cells.
PEDOT:PSS is also a hygroscopic material, meaning it can absorb water from the environment and
deliver it to the active layer causing rapid degradation of the device.9 The adsorption of water can cause
an increase in the series resistance (Rs) of the solar cell. The electronic grade PEDOT:PSS is a PSS-rich
compound (1 to 6 of PEDOT to PSS), which could lead to PSS migration into the active layer causing cell
degradation.10
Several HTL alternatives for PEDOT:PSS have been investigated: polyaniline,11
nickel oxide,12
and
graphene oxide.13
Polyaniline (PANI) has attracted intense interest over the past three decades due to its
rich chemistry features, such as high chemical and thermal stability, ease of synthesis, and solubility in a
wide range of solvents.14
MacDiarmid et al. has reported that PANI protonated with camphorsulfonic
acid (CSA) and dissolved in m-cresol imparts high electrical conductivity owing to the formation of the
expanded coil conformation instead of the compact coil conformation, which is not the case in other
solvents such as chloroform.15
Systems of P3HT:PCBM with a camphorsulfonic acid doped polyaniline
PANI:CSA as a HTL have been examined and characterized.11
However, the role of polyaniline in OPV
stability has not been widely studied, and the available literature is limited.16, 17
Ecker et al. have studied
the stability of P3HT:PCBM OPVs with PANI:PSS as a HTL. They noticed that increasing PSS content
in the PANI:PSS system can result in more stable devices.17
The majority of the studies on aging
degradation have been performed on PEDOT:PSS-based OPVs under continuous light exposure to mimic
realistic solar panel degradation. However, it is also essential to understand aging degradation due to “on
the shelf” storage, which some other researchers have investigated.9 In addition to the fact that shelf
storage study can provide information about how the photovoltaic performance is affected in the
transition period from the stock to the consumer, it can also provide more information about the light-
independent degradation of organic solar cells. The aim of this work is to introduce an aging study for
P3HT:PCBM organic solar cells with PANI:CSA and PEDOT:PSS as HTLs. The OPV cells
characterized in the course of this study were stored on the shelf (in a dark environment exposed to the
ambient conditions) and periodically characterized over a two year period. In order to support the
experimental data obtained throughout this study, modeling was employed.
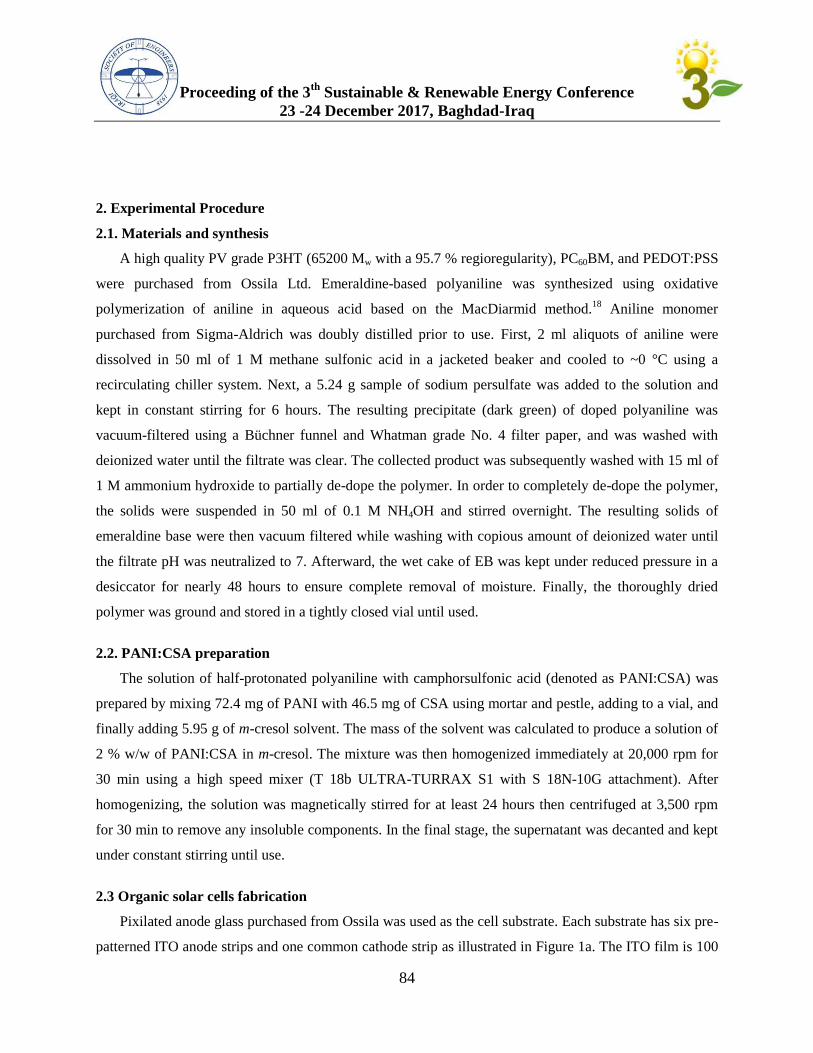
Proceeding of the 3th
Sustainable & Renewable Energy Conference
23 -24 December 2017, Baghdad-Iraq
84
2. Experimental Procedure
2.1. Materials and synthesis
A high quality PV grade P3HT (65200 Mw with a 95.7 % regioregularity), PC60BM, and PEDOT:PSS
were purchased from Ossila Ltd. Emeraldine-based polyaniline was synthesized using oxidative
polymerization of aniline in aqueous acid based on the MacDiarmid method.18
Aniline monomer
purchased from Sigma-Aldrich was doubly distilled prior to use. First, 2 ml aliquots of aniline were
dissolved in 50 ml of 1 M methane sulfonic acid in a jacketed beaker and cooled to ~0 °C using a
recirculating chiller system. Next, a 5.24 g sample of sodium persulfate was added to the solution and
kept in constant stirring for 6 hours. The resulting precipitate (dark green) of doped polyaniline was
vacuum-filtered using a Büchner funnel and Whatman grade No. 4 filter paper, and was washed with
deionized water until the filtrate was clear. The collected product was subsequently washed with 15 ml of
1 M ammonium hydroxide to partially de-dope the polymer. In order to completely de-dope the polymer,
the solids were suspended in 50 ml of 0.1 M NH4OH and stirred overnight. The resulting solids of
emeraldine base were then vacuum filtered while washing with copious amount of deionized water until
the filtrate pH was neutralized to 7. Afterward, the wet cake of EB was kept under reduced pressure in a
desiccator for nearly 48 hours to ensure complete removal of moisture. Finally, the thoroughly dried
polymer was ground and stored in a tightly closed vial until used.
2.2. PANI:CSA preparation
The solution of half-protonated polyaniline with camphorsulfonic acid (denoted as PANI:CSA) was
prepared by mixing 72.4 mg of PANI with 46.5 mg of CSA using mortar and pestle, adding to a vial, and
finally adding 5.95 g of m-cresol solvent. The mass of the solvent was calculated to produce a solution of
2 % w/w of PANI:CSA in m-cresol. The mixture was then homogenized immediately at 20,000 rpm for
30 min using a high speed mixer (T 18b ULTRA-TURRAX S1 with S 18N-10G attachment). After
homogenizing, the solution was magnetically stirred for at least 24 hours then centrifuged at 3,500 rpm
for 30 min to remove any insoluble components. In the final stage, the supernatant was decanted and kept
under constant stirring until use.
2.3 Organic solar cells fabrication
Pixilated anode glass purchased from Ossila was used as the cell substrate. Each substrate has six pre-
patterned ITO anode strips and one common cathode strip as illustrated in Figure 1a. The ITO film is 100
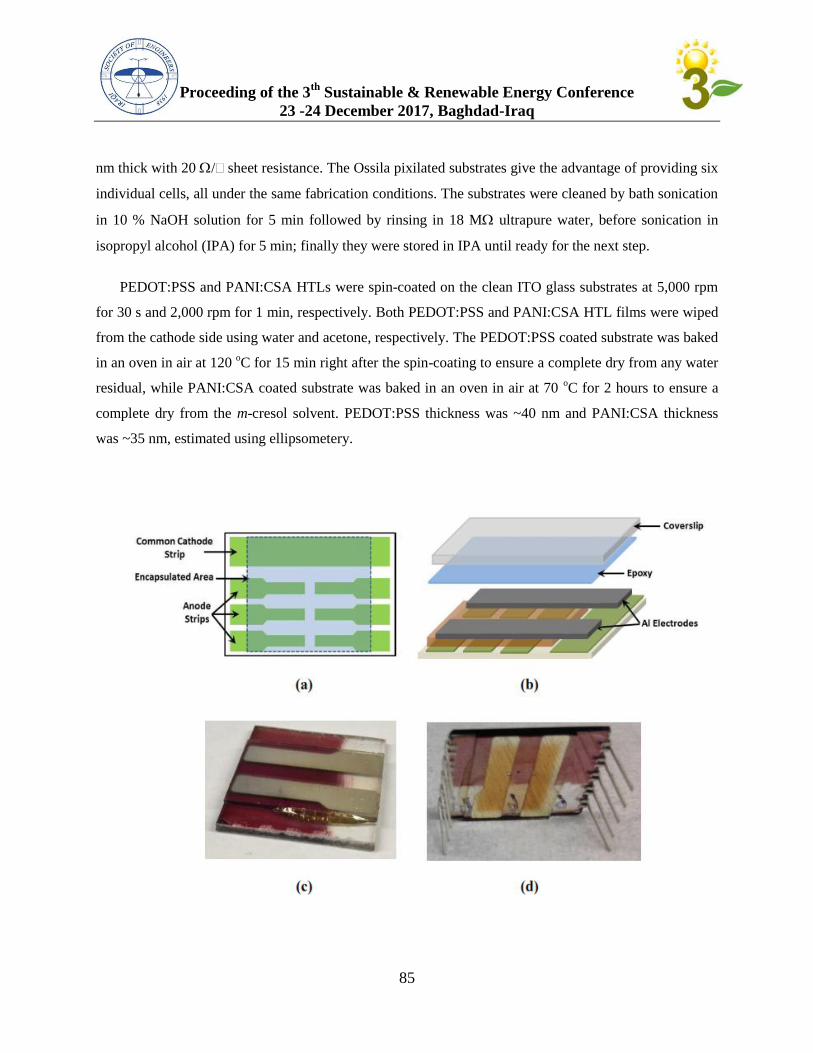
Proceeding of the 3th
Sustainable & Renewable Energy Conference
23 -24 December 2017, Baghdad-Iraq
85
nm thick with 20 / sheet resistance. The Ossila pixilated substrates give the advantage of providing six
individual cells, all under the same fabrication conditions. The substrates were cleaned by bath sonication
in 10 % NaOH solution for 5 min followed by rinsing in 18 M ultrapure water, before sonication in
isopropyl alcohol (IPA) for 5 min; finally they were stored in IPA until ready for the next step.
PEDOT:PSS and PANI:CSA HTLs were spin-coated on the clean ITO glass substrates at 5,000 rpm
for 30 s and 2,000 rpm for 1 min, respectively. Both PEDOT:PSS and PANI:CSA HTL films were wiped
from the cathode side using water and acetone, respectively. The PEDOT:PSS coated substrate was baked
in an oven in air at 120 oC for 15 min right after the spin-coating to ensure a complete dry from any water
residual, while PANI:CSA coated substrate was baked in an oven in air at 70 oC for 2 hours to ensure a
complete dry from the m-cresol solvent. PEDOT:PSS thickness was ~40 nm and PANI:CSA thickness
was ~35 nm, estimated using ellipsometery.
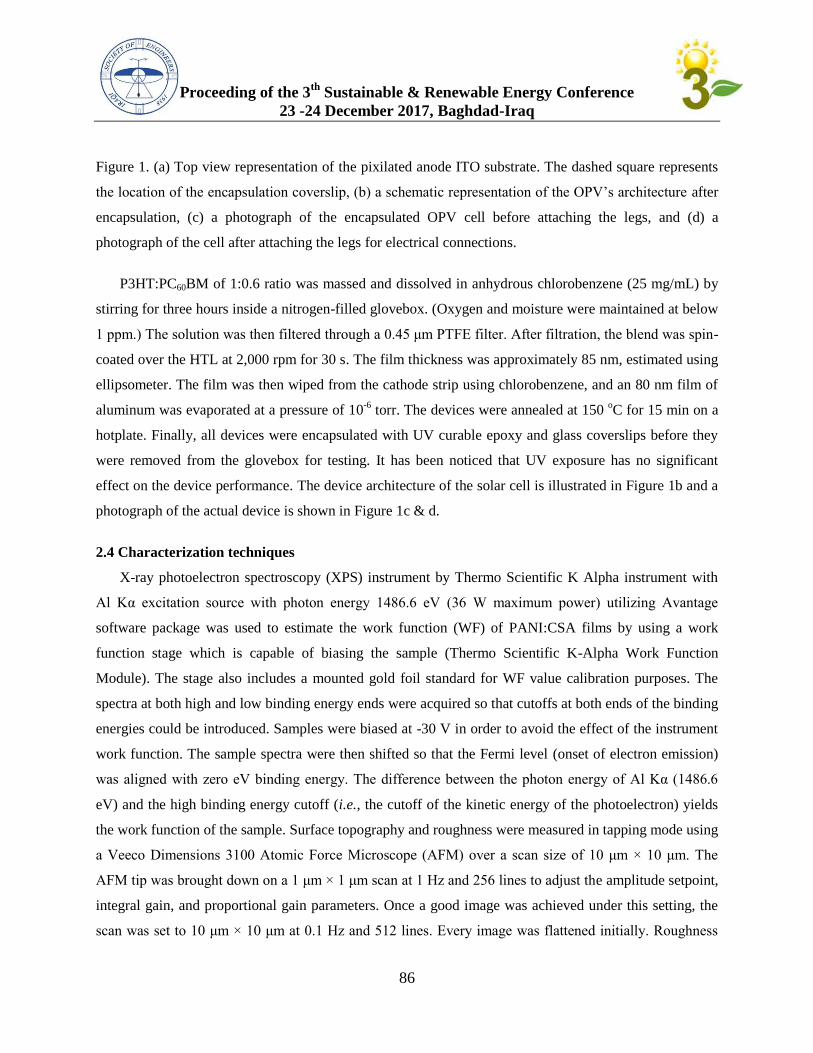
Proceeding of the 3th
Sustainable & Renewable Energy Conference
23 -24 December 2017, Baghdad-Iraq
86
Figure 1. (a) Top view representation of the pixilated anode ITO substrate. The dashed square represents
the location of the encapsulation coverslip, (b) a schematic representation of the OPV’s architecture after
encapsulation, (c) a photograph of the encapsulated OPV cell before attaching the legs, and (d) a
photograph of the cell after attaching the legs for electrical connections.
P3HT:PC60BM of 1:0.6 ratio was massed and dissolved in anhydrous chlorobenzene (25 mg/mL) by
stirring for three hours inside a nitrogen-filled glovebox. (Oxygen and moisture were maintained at below
1 ppm.) The solution was then filtered through a 0.45 μm PTFE filter. After filtration, the blend was spin-
coated over the HTL at 2,000 rpm for 30 s. The film thickness was approximately 85 nm, estimated using
ellipsometer. The film was then wiped from the cathode strip using chlorobenzene, and an 80 nm film of
aluminum was evaporated at a pressure of 10-6
torr. The devices were annealed at 150 oC for 15 min on a
hotplate. Finally, all devices were encapsulated with UV curable epoxy and glass coverslips before they
were removed from the glovebox for testing. It has been noticed that UV exposure has no significant
effect on the device performance. The device architecture of the solar cell is illustrated in Figure 1b and a
photograph of the actual device is shown in Figure 1c & d.
2.4 Characterization techniques
X-ray photoelectron spectroscopy (XPS) instrument by Thermo Scientific K Alpha instrument with
Al Kα excitation source with photon energy 1486.6 eV (36 W maximum power) utilizing Avantage
software package was used to estimate the work function (WF) of PANI:CSA films by using a work
function stage which is capable of biasing the sample (Thermo Scientific K-Alpha Work Function
Module). The stage also includes a mounted gold foil standard for WF value calibration purposes. The
spectra at both high and low binding energy ends were acquired so that cutoffs at both ends of the binding
energies could be introduced. Samples were biased at -30 V in order to avoid the effect of the instrument
work function. The sample spectra were then shifted so that the Fermi level (onset of electron emission)
was aligned with zero eV binding energy. The difference between the photon energy of Al Kα (1486.6
eV) and the high binding energy cutoff (i.e., the cutoff of the kinetic energy of the photoelectron) yields
the work function of the sample. Surface topography and roughness were measured in tapping mode using
a Veeco Dimensions 3100 Atomic Force Microscope (AFM) over a scan size of 10 μm × 10 μm. The
AFM tip was brought down on a 1 μm × 1 μm scan at 1 Hz and 256 lines to adjust the amplitude setpoint,
integral gain, and proportional gain parameters. Once a good image was achieved under this setting, the
scan was set to 10 μm × 10 μm at 0.1 Hz and 512 lines. Every image was flattened initially. Roughness
Proceeding of the 3th
Sustainable & Renewable Energy Conference
23 -24 December 2017, Baghdad-Iraq
87
analysis was performed for each scan. Each film was scanned in three different locations, and the root
mean square roughness values were averaged to represent the surface morphological properties of the
film. The current-voltage (J-V) measurements for the cells were performed under a class B AM 1.5G
sunlight simulator with incident light power of 100 mW.cm-2
(PV Measurements, Inc.), and a Keithley
2400 source meter was used for electrical measurements. The solar simulator was calibrated using a
NREL-certified reference cell prior to measurements. LabView software was used to sweep voltages from
-1 to +1 V and to collect the data, and then Igor software was used to analyze the JV curve and to extract
the cell parameters. PEDOT:PSS-based six pixels substrate and PANI:CSA-based six pixels substrate
were intermittently measured over a period of 732 days. The measurement period varies approximately
from once a week to once a month. Cells were kept inside a cabinet under ambient atmosphere when they
are not under characterization over the whole period of study.
3. Results and Discussion
3.1 Material characterization
The work function (the minimum work required to remove an electron from the surface of a solid) is
dependent on the surface topography, surface contaminant, and the electronic properties of the material;
specifically, it is a function of the position of Fermi level with respect to vacuum level. The work function
(WF) of PANI:CSA and PEDOT:PSS thin films was measured using an XPS based technique, in which
the kinetic energy cutoff curve is extrapolated to the point where the y-axis equals zero as shown in
Figure 2. The results show that PEDOT:PSS has a WF value of 5.0 eV, higher than the WF of PANI:CSA
that was determined to be 4.6 eV. Principally, when the WF of an HTL is aligned closely to the HOMO
level of P3HT, holes will be injected more easily into the anode. Since the HOMO level of P3HT is
around 5.2 eV,19
PEDOT:PSS can induce hole injection more efficient than PANI:CSA. However,
previous investigation showed that the WF of polyaniline can be increased up to 4.9 eV by increasing the
protonation level of CSA, and therefore can act as an effective HTL, on a par with PEDOT:PSS.20
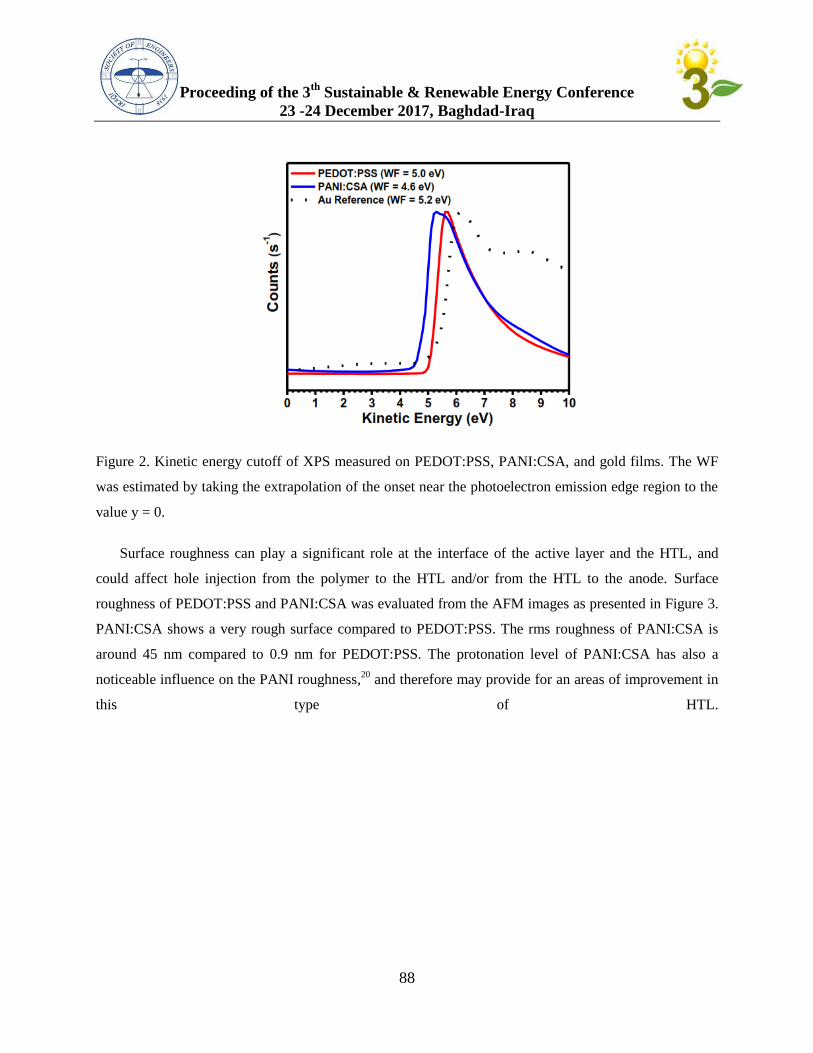
Proceeding of the 3th
Sustainable & Renewable Energy Conference
23 -24 December 2017, Baghdad-Iraq
88
Figure 2. Kinetic energy cutoff of XPS measured on PEDOT:PSS, PANI:CSA, and gold films. The WF
was estimated by taking the extrapolation of the onset near the photoelectron emission edge region to the
value y = 0.
Surface roughness can play a significant role at the interface of the active layer and the HTL, and
could affect hole injection from the polymer to the HTL and/or from the HTL to the anode. Surface
roughness of PEDOT:PSS and PANI:CSA was evaluated from the AFM images as presented in Figure 3.
PANI:CSA shows a very rough surface compared to PEDOT:PSS. The rms roughness of PANI:CSA is
around 45 nm compared to 0.9 nm for PEDOT:PSS. The protonation level of PANI:CSA has also a
noticeable influence on the PANI roughness,20
and therefore may provide for an areas of improvement in
this type of HTL.
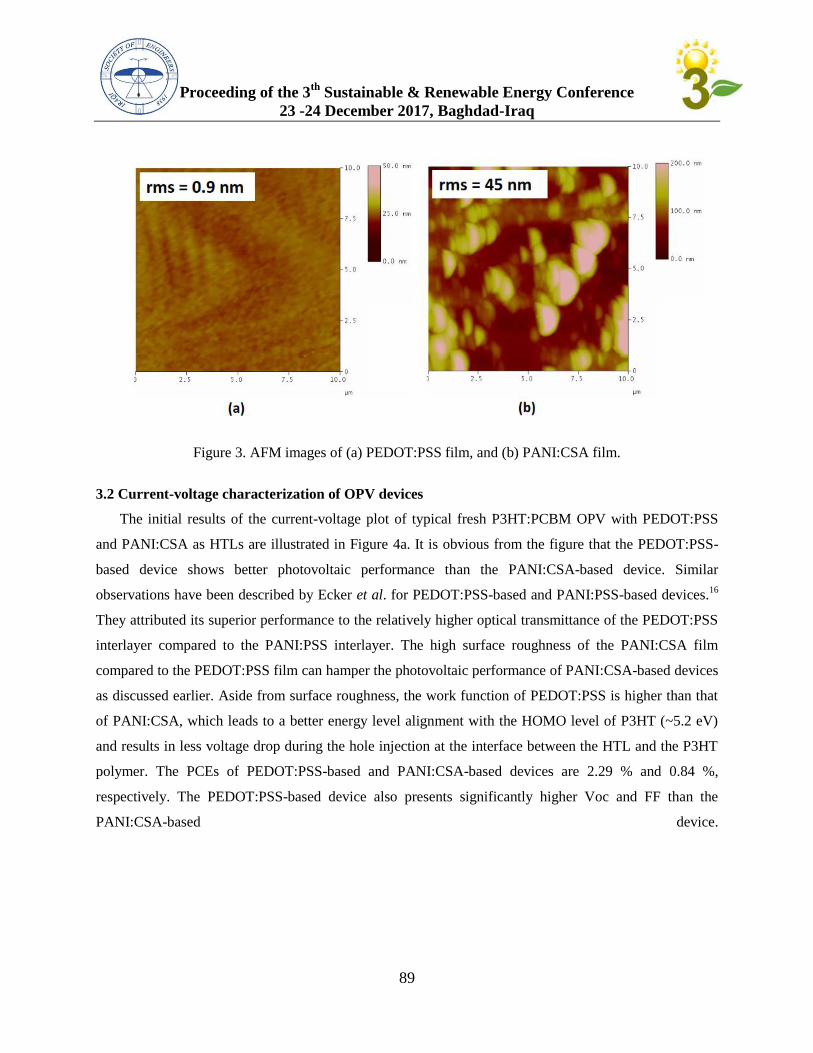
Proceeding of the 3th
Sustainable & Renewable Energy Conference
23 -24 December 2017, Baghdad-Iraq
89
Figure 3. AFM images of (a) PEDOT:PSS film, and (b) PANI:CSA film.
3.2 Current-voltage characterization of OPV devices
The initial results of the current-voltage plot of typical fresh P3HT:PCBM OPV with PEDOT:PSS
and PANI:CSA as HTLs are illustrated in Figure 4a. It is obvious from the figure that the PEDOT:PSS-
based device shows better photovoltaic performance than the PANI:CSA-based device. Similar
observations have been described by Ecker et al. for PEDOT:PSS-based and PANI:PSS-based devices.16
They attributed its superior performance to the relatively higher optical transmittance of the PEDOT:PSS
interlayer compared to the PANI:PSS interlayer. The high surface roughness of the PANI:CSA film
compared to the PEDOT:PSS film can hamper the photovoltaic performance of PANI:CSA-based devices
as discussed earlier. Aside from surface roughness, the work function of PEDOT:PSS is higher than that
of PANI:CSA, which leads to a better energy level alignment with the HOMO level of P3HT (~5.2 eV)
and results in less voltage drop during the hole injection at the interface between the HTL and the P3HT
polymer. The PCEs of PEDOT:PSS-based and PANI:CSA-based devices are 2.29 % and 0.84 %,
respectively. The PEDOT:PSS-based device also presents significantly higher Voc and FF than the
PANI:CSA-based device.
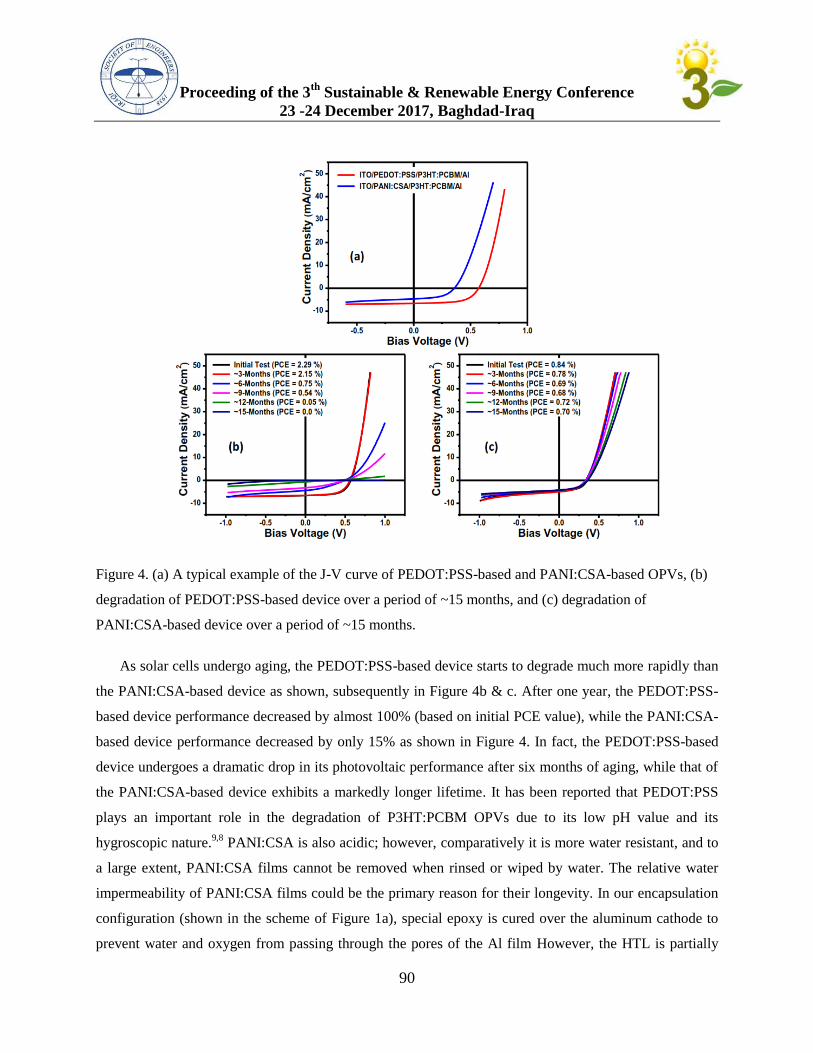
Proceeding of the 3th
Sustainable & Renewable Energy Conference
23 -24 December 2017, Baghdad-Iraq
90
Figure 4. (a) A typical example of the J-V curve of PEDOT:PSS-based and PANI:CSA-based OPVs, (b)
degradation of PEDOT:PSS-based device over a period of ~15 months, and (c) degradation of
PANI:CSA-based device over a period of ~15 months.
As solar cells undergo aging, the PEDOT:PSS-based device starts to degrade much more rapidly than
the PANI:CSA-based device as shown, subsequently in Figure 4b & c. After one year, the PEDOT:PSS-
based device performance decreased by almost 100% (based on initial PCE value), while the PANI:CSA-
based device performance decreased by only 15% as shown in Figure 4. In fact, the PEDOT:PSS-based
device undergoes a dramatic drop in its photovoltaic performance after six months of aging, while that of
the PANI:CSA-based device exhibits a markedly longer lifetime. It has been reported that PEDOT:PSS
plays an important role in the degradation of P3HT:PCBM OPVs due to its low pH value and its
hygroscopic nature.9,8
PANI:CSA is also acidic; however, comparatively it is more water resistant, and to
a large extent, PANI:CSA films cannot be removed when rinsed or wiped by water. The relative water
impermeability of PANI:CSA films could be the primary reason for their longevity. In our encapsulation
configuration (shown in the scheme of Figure 1a), special epoxy is cured over the aluminum cathode to
prevent water and oxygen from passing through the pores of the Al film However, the HTL is partially
Proceeding of the 3th
Sustainable & Renewable Energy Conference
23 -24 December 2017, Baghdad-Iraq
91
exposed from the side of the cell. Therefore, moisture can pass through it to the active layer. In the case of
non-encapsulated cells, both PANI:CSA- and PEDOT:PSS-based cells degraded very quickly— within
48 hours. The degradation in this case arises from the penetration of moisture and oxygen more readily
through the Al electrode’s pores to the active layer. The rapid degradation did not allow us to investigate
the effect of HTL on the degradation of OPVs.
Six pixels of each device configuration (i.e., PANI:CSA-based and PEDOT:PSS-based OPVs) were
intermittently tested over a period of 732 days— Figure 5 displays the PCE behavior over that period of
time. The initial PCE of PANI:CSA-based solar cells ranged from 0.84 % to 0.96 %, whereas that of
PEDOT:PSS-based solar cells ranged from 1.96 % to 2.34 %. The PCE of PEDOT:PSS-based solar cells
dropped to zero after about 17 months. For PEDOT:PSS based devices, pixels 3 and 4 died after 155
days, which was primarily because these pixels were closer to the edge than the other pixels; therefore,
they were more vulnerable to oxygen and moisture. Pixels 1 and 2 died after 323 days, followed by pixel
5 after 422 days. Finally, pixel 6 died after 505 days. The photovoltaic response of each pixel is shown in
Figure 5a and the number and location of each pixel is described in Figure 5b. On the other hand, the PCE
of PANI:CSA-based solar cells showed a stable performance throughout the period of testing. Pixels 3
and 4 died after 239 days, again, because of their proximity to the edge, similar to PEDOT:PSS-based
device. The rest of the pixels have continued to work over the entirety of the study albeit with some
degradation. As can be seen from Figure 5c & d, the mean value of the PCE of six PEDOT:PSS-based
devices started higher than the mean value of the PCE of six PANI:CSA-based devices at the initial test
(about 2.4 folds higher), then the mean value of the PCE of both configurations (PEDOT:PSS-based and
PANI:CSA-based devices) equalized after 270 days (9 months). After that, the values of PANI:CSA-
based devices became higher, starting from day 382. The mean value of the PCE of PANI:CSA-based
devices after 505 days dropped to 0.63 %, ~15 % less than their initial values (0.9 %), compared to the
PEDOT:PSS-based devices that lost 100 % of their initial values after 505 days. Moreover, the PCE of
PANI:CSA-based devices presented a lower standard deviation than that of the PEDOT:PSS-based
devices (See Table 1), indicating that PANI:CSA-based OPV is more stable and reliable than the
PEDOT:PSS-based OPV.
It is worth mentioning that the large standard deviation which is seen in some error bars of Figure 5 is
a result of the fact that when some pixels drop down to low PCE values the error bar becomes much
larger. When those pixels completely die, we exclude them from the calculations, so the size of the error
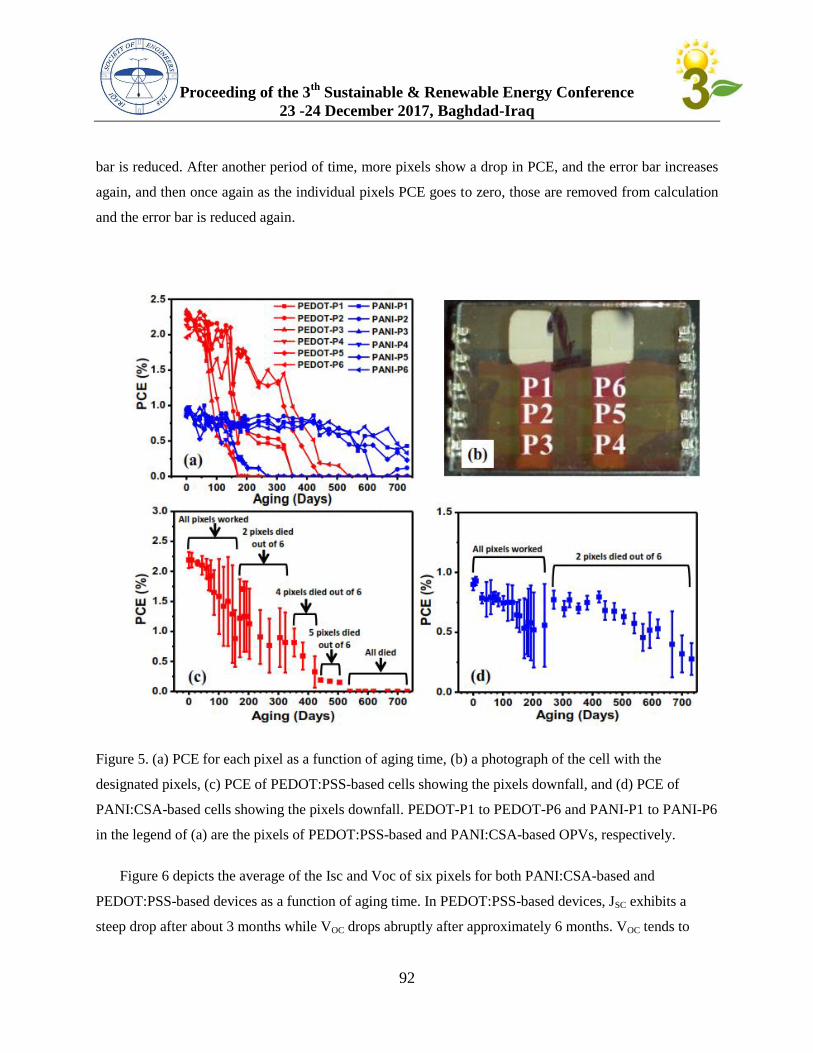
Proceeding of the 3th
Sustainable & Renewable Energy Conference
23 -24 December 2017, Baghdad-Iraq
92
bar is reduced. After another period of time, more pixels show a drop in PCE, and the error bar increases
again, and then once again as the individual pixels PCE goes to zero, those are removed from calculation
and the error bar is reduced again.
Figure 5. (a) PCE for each pixel as a function of aging time, (b) a photograph of the cell with the
designated pixels, (c) PCE of PEDOT:PSS-based cells showing the pixels downfall, and (d) PCE of
PANI:CSA-based cells showing the pixels downfall. PEDOT-P1 to PEDOT-P6 and PANI-P1 to PANI-P6
in the legend of (a) are the pixels of PEDOT:PSS-based and PANI:CSA-based OPVs, respectively.
Figure 6 depicts the average of the Isc and Voc of six pixels for both PANI:CSA-based and
PEDOT:PSS-based devices as a function of aging time. In PEDOT:PSS-based devices, JSC exhibits a
steep drop after about 3 months while VOC drops abruptly after approximately 6 months. VOC tends to
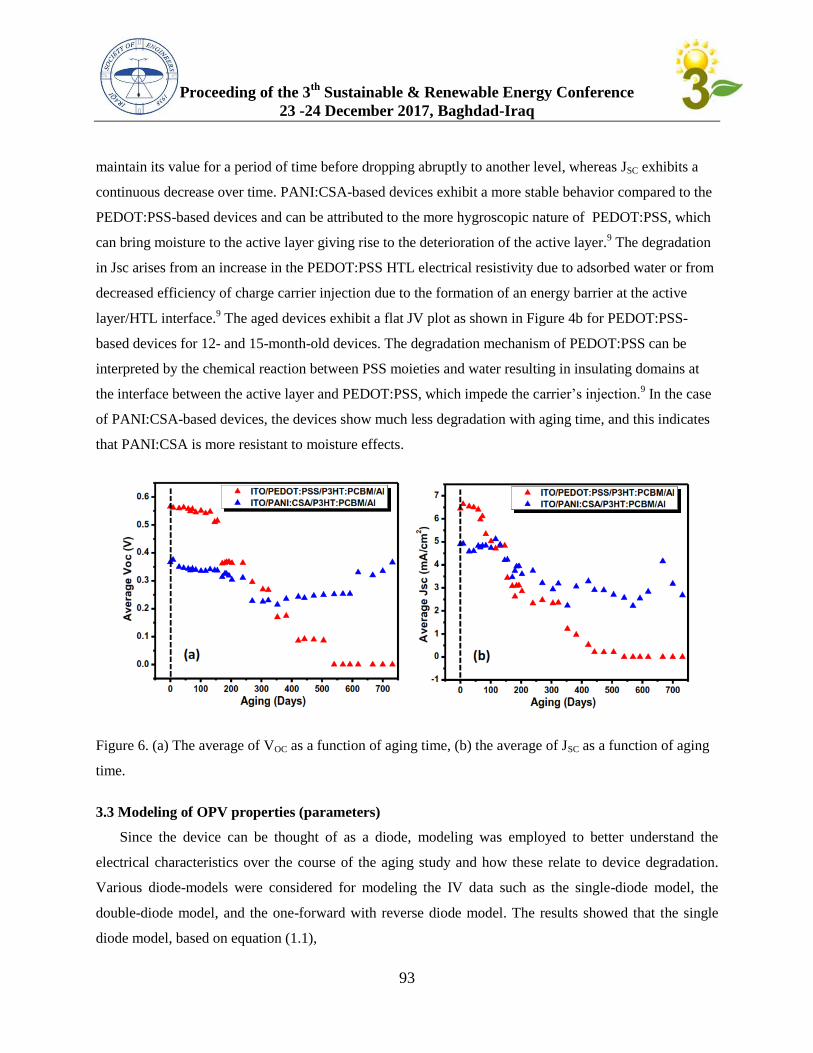
Proceeding of the 3th
Sustainable & Renewable Energy Conference
23 -24 December 2017, Baghdad-Iraq
93
maintain its value for a period of time before dropping abruptly to another level, whereas JSC exhibits a
continuous decrease over time. PANI:CSA-based devices exhibit a more stable behavior compared to the
PEDOT:PSS-based devices and can be attributed to the more hygroscopic nature of PEDOT:PSS, which
can bring moisture to the active layer giving rise to the deterioration of the active layer.9 The degradation
in Jsc arises from an increase in the PEDOT:PSS HTL electrical resistivity due to adsorbed water or from
decreased efficiency of charge carrier injection due to the formation of an energy barrier at the active
layer/HTL interface.9 The aged devices exhibit a flat JV plot as shown in Figure 4b for PEDOT:PSS-
based devices for 12- and 15-month-old devices. The degradation mechanism of PEDOT:PSS can be
interpreted by the chemical reaction between PSS moieties and water resulting in insulating domains at
the interface between the active layer and PEDOT:PSS, which impede the carrier’s injection.9 In the case
of PANI:CSA-based devices, the devices show much less degradation with aging time, and this indicates
that PANI:CSA is more resistant to moisture effects.
Figure 6. (a) The average of VOC as a function of aging time, (b) the average of JSC as a function of aging
time.
3.3 Modeling of OPV properties (parameters)
Since the device can be thought of as a diode, modeling was employed to better understand the
electrical characteristics over the course of the aging study and how these relate to device degradation.
Various diode-models were considered for modeling the IV data such as the single-diode model, the
double-diode model, and the one-forward with reverse diode model. The results showed that the single
diode model, based on equation (1.1),
Proceeding of the 3th
Sustainable & Renewable Energy Conference
23 -24 December 2017, Baghdad-Iraq
94
(1.1),
where IPh is the light current, RS is the series resistance, RSh is the shunt resistance, IS is the saturation
current, and n is the ideality factor of the diode, was the best fit for our data.
A schematic representation of the single diode equivalent circuit model of illuminated solar cells is
provided in Figure 7a. A departure from the curve of the above equation in the actual cell is caused by RS
and RSh. Figure 7b illustrates the I-V characteristics of OPV in the presence of RS and RSh. It has been
determined that shunt resistance does not appreciably change the power output of the cell, and therefore,
the effect of RSh can be neglected, resulting in an output current as follows:
(1.2)
For the single-diode model based on equation (1.2), IV data collected from our cells were used, and
the four remaining variables are as follows: RS, IPh, IS, and n. The RS value was calculated from the slope
of the curve in the region I = 0 (VOC), where RS = 1/slope. The remaining model parameters were
obtained using the multi-start global optimization in Matlab® software with the aid of lsqcurvefit
function. This routine can be applied on many harsh conditions and can be extended to find parameter
values with global minimum error. (Global minimum means finding the model parameters with the lowest
error from multiple local minima, if they exist.) The user can insert a number of starting points to get the
local minimum; we set 50 for the most modeling cases. The current “I” in equation (1.2) is in an implicit
form; therefore, we adopted a two-step approach in the implementation of the objective function. In the
first step, the value of current was calculated based on the assumption that RSh is infinite. The calculated
value of current was used for the further corrected calculations in equation (1.2).
The modeling of aged data provided the information about how the ideality factor (n) changes with
aging of the OPV cells. The ideality factor is a measure of how the solar cell has deviated from the ideal
single-diode model, which can provide a numerical value used to interpret the effect of aging on charge
carrier transport.
The fitted curves, together with the collected data, are presented in Figure 8. The series resistance
(Rs), shunt resistance (Rsh), and ideality factor (n) were extracted based on the single- diode p-n junction
model, and the results are shown in Table 1. As we can see from Figure 8, the modeling curve fits
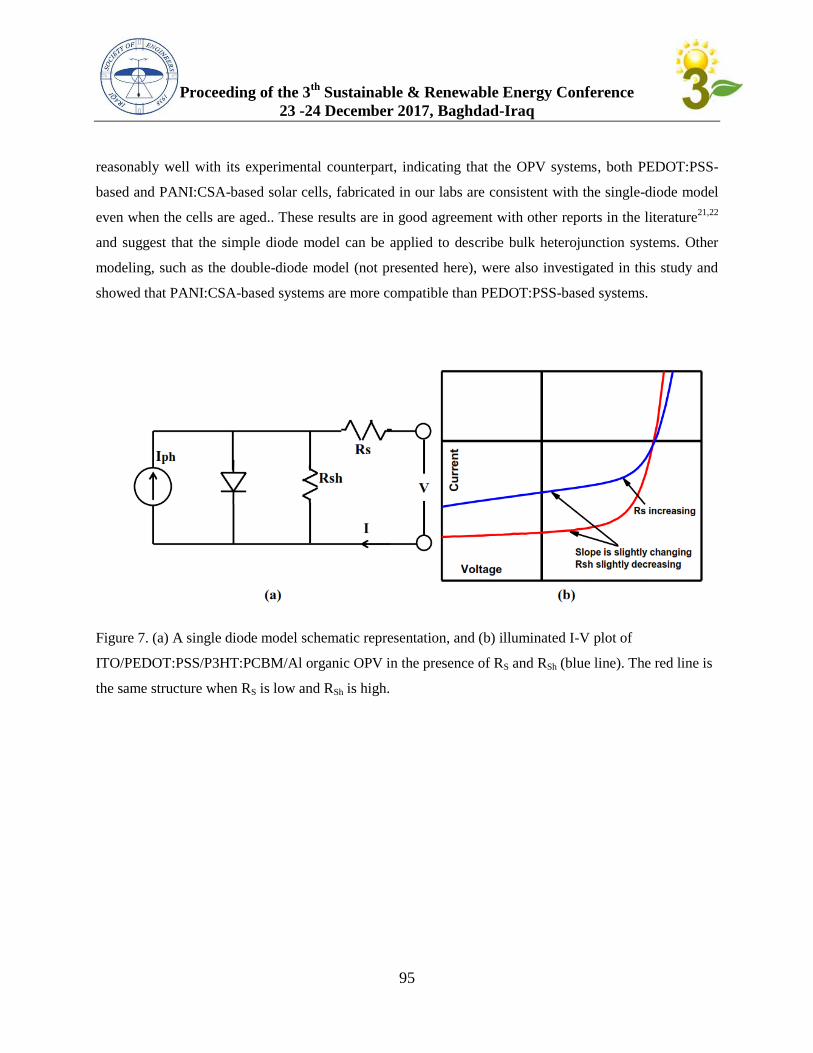
Proceeding of the 3th
Sustainable & Renewable Energy Conference
23 -24 December 2017, Baghdad-Iraq
95
reasonably well with its experimental counterpart, indicating that the OPV systems, both PEDOT:PSS-
based and PANI:CSA-based solar cells, fabricated in our labs are consistent with the single-diode model
even when the cells are aged.. These results are in good agreement with other reports in the literature21,22
and suggest that the simple diode model can be applied to describe bulk heterojunction systems. Other
modeling, such as the double-diode model (not presented here), were also investigated in this study and
showed that PANI:CSA-based systems are more compatible than PEDOT:PSS-based systems.
Figure 7. (a) A single diode model schematic representation, and (b) illuminated I-V plot of
ITO/PEDOT:PSS/P3HT:PCBM/Al organic OPV in the presence of RS and RSh (blue line). The red line is
the same structure when RS is low and RSh is high.
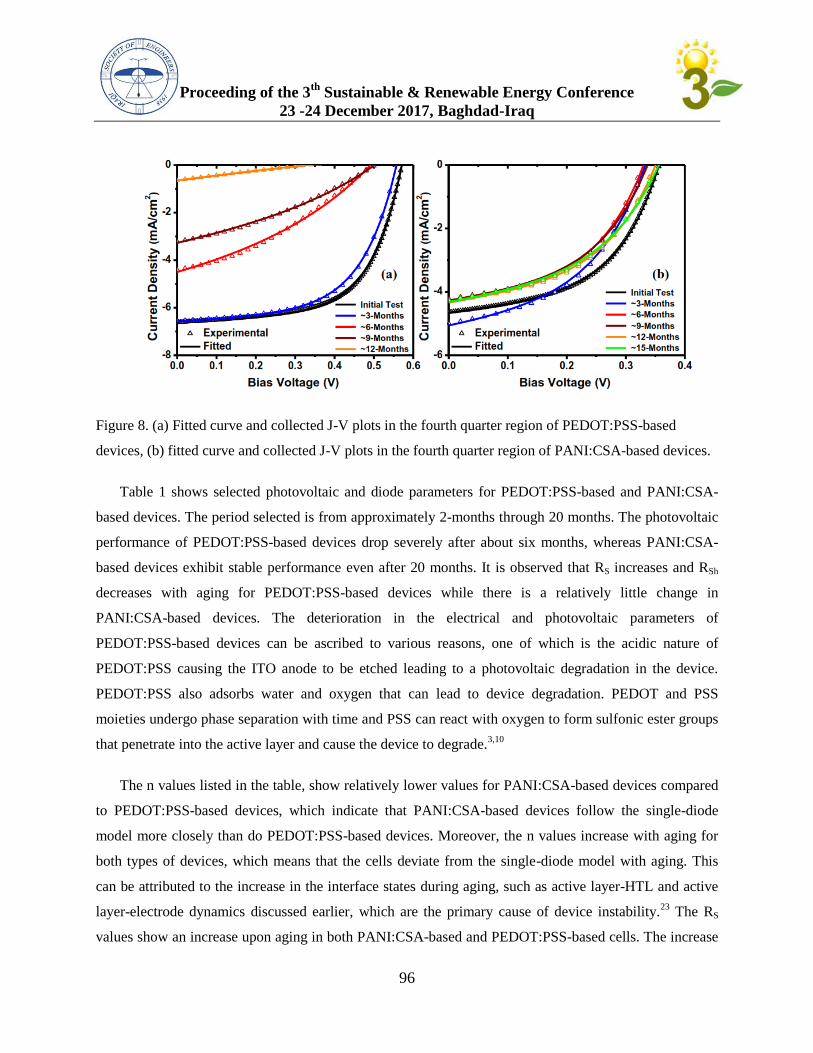
Proceeding of the 3th
Sustainable & Renewable Energy Conference
23 -24 December 2017, Baghdad-Iraq
96
Figure 8. (a) Fitted curve and collected J-V plots in the fourth quarter region of PEDOT:PSS-based
devices, (b) fitted curve and collected J-V plots in the fourth quarter region of PANI:CSA-based devices.
Table 1 shows selected photovoltaic and diode parameters for PEDOT:PSS-based and PANI:CSA-
based devices. The period selected is from approximately 2-months through 20 months. The photovoltaic
performance of PEDOT:PSS-based devices drop severely after about six months, whereas PANI:CSA-
based devices exhibit stable performance even after 20 months. It is observed that RS increases and RSh
decreases with aging for PEDOT:PSS-based devices while there is a relatively little change in
PANI:CSA-based devices. The deterioration in the electrical and photovoltaic parameters of
PEDOT:PSS-based devices can be ascribed to various reasons, one of which is the acidic nature of
PEDOT:PSS causing the ITO anode to be etched leading to a photovoltaic degradation in the device.
PEDOT:PSS also adsorbs water and oxygen that can lead to device degradation. PEDOT and PSS
moieties undergo phase separation with time and PSS can react with oxygen to form sulfonic ester groups
that penetrate into the active layer and cause the device to degrade.3,10
The n values listed in the table, show relatively lower values for PANI:CSA-based devices compared
to PEDOT:PSS-based devices, which indicate that PANI:CSA-based devices follow the single-diode
model more closely than do PEDOT:PSS-based devices. Moreover, the n values increase with aging for
both types of devices, which means that the cells deviate from the single-diode model with aging. This
can be attributed to the increase in the interface states during aging, such as active layer-HTL and active
layer-electrode dynamics discussed earlier, which are the primary cause of device instability.23
The RS
values show an increase upon aging in both PANI:CSA-based and PEDOT:PSS-based cells. The increase
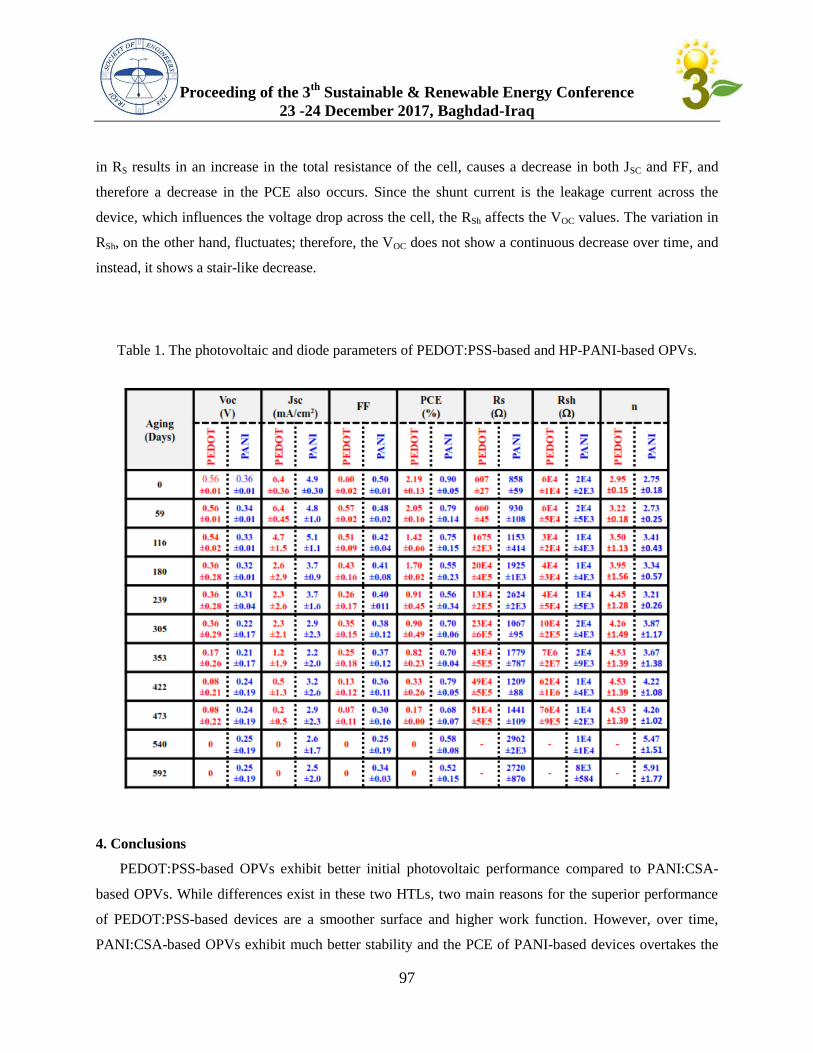
Proceeding of the 3th
Sustainable & Renewable Energy Conference
23 -24 December 2017, Baghdad-Iraq
97
in RS results in an increase in the total resistance of the cell, causes a decrease in both JSC and FF, and
therefore a decrease in the PCE also occurs. Since the shunt current is the leakage current across the
device, which influences the voltage drop across the cell, the RSh affects the VOC values. The variation in
RSh, on the other hand, fluctuates; therefore, the VOC does not show a continuous decrease over time, and
instead, it shows a stair-like decrease.
Table 1. The photovoltaic and diode parameters of PEDOT:PSS-based and HP-PANI-based OPVs.
4. Conclusions
PEDOT:PSS-based OPVs exhibit better initial photovoltaic performance compared to PANI:CSA-
based OPVs. While differences exist in these two HTLs, two main reasons for the superior performance
of PEDOT:PSS-based devices are a smoother surface and higher work function. However, over time,
PANI:CSA-based OPVs exhibit much better stability and the PCE of PANI-based devices overtakes the
Proceeding of the 3th
Sustainable & Renewable Energy Conference
23 -24 December 2017, Baghdad-Iraq
98
PEDOT-based devices after one year. All six PEDOT-based devices under test completely died in less
than 1.5 years, while some PANI-based OPVs are still working even after 2 years. Many reasons for the
increased degradation rate of PEDOT-based OPVs are possible acidity, hygroscopicity, and formation
of a sulfonic ester groups owing to the adsorption of oxygen. Both PEDOT-based and PANI-based OPVs
follow the single-diode model and deviate from the ideal diode upon aging. Modeling provided insight
and supported that degradation of the PEDOT-based cells were due to an increased resistance that can be
attributed to the aforementioned reasons. The findings in this study were unexpectedly welcome as many
reports in the literature of OPVs are all using PEDOT:PSS as a hole transport layer. This current study
shows an increased lifetime of PANI-based OPVs and provides evidence that devices utilizing
PANI:CSA as an HTL may have more to offer, especially as more research work is performed in near
future.
5. References
1. Abdulrazzaq, O. A.; Saini, V.; Bourdo, S.; Dervishi, E.; Biris, A. S., Organic Solar Cells: A
Review of Materials, Limitations, and Possibilities for Improvement. Particulate Science and
Technology 2013, 31 (5), 427-442.
2. Peters, C. H.; Sachs-Quintana, I. T.; Kastrop, J. P.; Beaupré, S.; Leclerc, M.; McGehee, M. D.,
High Efficiency Polymer Solar Cells with Long Operating Lifetimes. Advanced Energy Materials
2011, 1 (4), 491-494.
3. Jørgensen, M.; Norrman, K.; Krebs, F. C., Stability/degradation of polymer solar cells. Solar
Energy Materials and Solar Cells 2008, 92 (7), 686-714.
4. Miyanishi, S.; Tajima, K.; Hashimoto, K., Morphological Stabilization of Polymer Photovoltaic
Cells by Using Cross-Linkable Poly(3-(5-hexenyl)thiophene). Macromolecules 2009, 42 (5),
1610-1618.
5. Zhao, Z.; Rice, L.; Efstathiadis, H.; Haldar, P., Annealing and thickness related performance and
degradation of polymer solar cells. Microelectronics Reliability 2013, 53 (1), 123-128.
6. Lin, W.-C.; Wang, W.-B.; Lin, Y.-C.; Yu, B.-Y.; Chen, Y.-Y.; Hsu, M.-F.; Jou, J.-H.; Shyue, J.-
J., Migration of small molecules during the degradation of organic light-emitting diodes. Organic
Electronics 2009, 10 (4), 581-586.
7. Madsen, M. V.; Norrman, K.; Krebs, F. C., Oxygen- and water-induced degradation of an
inverted polymer solar cell: the barrier effect. Journal of Photonics for Energy 2011, 1 (1),
011104-011104-6.
Proceeding of the 3th
Sustainable & Renewable Energy Conference
23 -24 December 2017, Baghdad-Iraq
99
8. de Jong, M. P.; van IJzendoorn, L. J.; de Voigt, M. J. A., Stability of the interface between
indium-tin-oxide and poly(3,4-ethylenedioxythiophene)/poly(styrenesulfonate) in polymer light-
emitting diodes. Applied Physics Letters 2000, 77 (14), 2255-2257.
9. Kawano, K.; Pacios, R.; Poplavskyy, D.; Nelson, J.; Bradley, D. D. C.; Durrant, J. R.,
Degradation of organic solar cells due to air exposure. Solar Energy Materials and Solar Cells
2006, 90 (20), 3520-3530.
10. Norrman, K.; Madsen, M. V.; Gevorgyan, S. A.; Krebs, F. C., Degradation Patterns in Water and
Oxygen of an Inverted Polymer Solar Cell. Journal of the American Chemical Society 2010, 132
(47), 16883-16892.
11. Abdulrazzaq, O.; Bourdo, S. E.; Saini, V.; Bairi, V. G.; Dervishi , E.; Viswanathan, T.; Nima, Z.
A.; Biris, A. S., Optimization of the Protonation Level of Polyaniline-Based Hole-Transport
Layers in Bulk-Heterojunction Organic Solar Cells. Energy Technology 2013, 1 (8), 463-470.
12. Berry, J. J.; Widjonarko, N. E.; Bailey, B. A.; Sigdel, A. K.; Ginley, D. S.; Olson, D. C., Surface
Treatment of NiO Hole Transport Layers for Organic Solar Cells. Selected Topics in Quantum
Electronics, IEEE Journal of 2010, 16 (6), 1649-1655.
13. Li, S.-S.; Tu, K.-H.; Lin, C.-C.; Chen, C.-W.; Chhowalla, M., Solution-Processable Graphene
Oxide as an Efficient Hole Transport Layer in Polymer Solar Cells. ACS nano 2010, 4 (6), 3169-
3174.
14. Tigelaar, D. M.; Lee, W.; Bates, K. A.; Saprigin, A.; Prigodin, V. N.; Cao, X.; Nafie, L. A.; Platz,
M. S.; Epstein, A. J., Role of Solvent and Secondary Doping in Polyaniline Films Doped with
Chiral Camphorsulfonic Acid: Preparation of a Chiral Metal. Chemistry of Materials 2002, 14
(3), 1430-1438.
15. MacDiarmid, A. G.; Epstein, A. J., Secondary doping in polyaniline. Synthetic Metals 1995, 69
(1–3), 85-92.
16. Ecker, B.; Nolasco, J. C.; Pallarés, J.; Marsal, L. F.; Posdorfer, J.; Parisi, J.; von Hauff, E.,
Degradation Effects Related to the Hole Transport Layer in Organic Solar Cells. Advanced
Functional Materials 2011, 21 (14), 2705-2711.
17. Ecker, B.; Posdorfer, J.; von Hauff, E., Influence of hole extraction efficiency on the performance
and stability of organic solar Cells. Solar Energy Materials and Solar Cells 2013, 116 (0), 176-
181.
18. MacDiarmid, A. G., Nobel Lecture: “Synthetic metals”: A novel role for organic polymers.
Reviews of Modern Physics 2001, 73 (3), 701-712.
Proceeding of the 3th
Sustainable & Renewable Energy Conference
23 -24 December 2017, Baghdad-Iraq
100
19. Saini, V.; Abdulrazzaq, O.; Bourdo, S.; Dervishi, E.; Petre, A.; Bairi, V. G.; Mustafa, T.;
Schnackenberg, L.; Viswanathan, T.; Biris, A. S., Structural and optoelectronic properties of
P3HT-graphene composites prepared by in situ oxidative polymerization. Journal of Applied
Physics 2012, 112 (5), -.
20. Abdulrazzaq, O.; Bourdo, S. E.; Saini, V.; Watanabe, F.; Barnes, B.; Ghosh, A.; Biris, A. S.,
Tuning the work function of polyaniline via camphorsulfonic acid: an X-ray photoelectron
spectroscopy investigation. RSC Advances 2015, 5 (1), 33-40.
21. Cheknane, A.; Hilal, H. S.; Djeffal, F.; Benyoucef, B.; Charles, J.-P., An equivalent circuit
approach to organic solar cell modelling. Microelectronics Journal 2008, 39 (10), 1173-1180.
22. Cheknane, A.; Aernouts, T.; Boudia, M. M., Modelling and Simulation of organic bulk
heterojunction solar cells. Revue des Energies Renouvelables ICRESD 2007, 7, 83-90.
23. Kanwat, A.; Jang, J., Extremely stable organic photovoltaic incorporated with WOx doped
PEDOT:PSS anode buffer layer. Journal of Materials Chemistry C 2014, 2 (5), 901-907.
Proceeding of the 3th Sustainable & Renewable Energy Conference 23 -24 December 2017, Baghdad-Iraq
101
Optimum Configuration for Solar Chimney Used for Cooling Under Iraq
Climate
ᵅProf. Dr. Majid H. Majeed , ᵇIbrahim S. Resen
ᵅ president of Middle Technical University, Iraq, [email protected]
ᵇ Engineering technical College, Middle Technical University, Iraq, [email protected]
ABSTRACT.
The effect of contraction on performance of solar chimney was investigated experimentally
in the context of this work. Experiments were conducted with a vertical solar chimney attached
to the southern wall of wooden chamber having a size of (2.5 m × 1.29 m × 1.07 m). The vertical
solar chimney was designed for cooling purpose in summer. The absorber plate was positioned at
front side of the air gap. To reduce the air temperature of a space and make it appropriate for
human comfort, the evaporative cooling unit was used. Eight different configurations were
examined. The aim of experimental study is to identify the influence of the important parameters
of a vertical solar chimney such as air gap width, chimney width, chimney height and the solar
radiation as well as the effect of the evaporative cooling. Results indicated that the cooling load
can be reduced to (56% at 12 PM), and then saving the energy consumption by using solar
chimney with dimensions: air gap width of 20 cm, chimney width of 15 cm and chimney height
of 80 cm. At this configuration the highest air flow rate and the temperature difference between
outdoor and indoor are obtained, with values of 134 m³/h and 13.1°C respectively.
KEY WORDS: solar chimney, passive cooling, optimum, padding, evaporative cooling.
التكوين االمثل لمدخنة شمسية عمودية تستخدم لتبريد حيز في المناخ العراقي
ابرهيم سويل رسن ماجد حميد مجيد . د.أ
الخالصة
التجارب على مدخنة شمسية اجريت .اداء المدخنة الشمسيةفي سياق هذا العمل تم التحقيق عمليا عن تأثير التقلص على علما ان المدخنة العمودية الشمسية قد (. م1..9 ×م 9.51 ×م 5.2)حجمها مركبة بالجدار الجنوبي لغرفة خشبيةعمودية
رجة للتقليل من د. تم وضع السطح الماص على الجانب االمامي لفجوة الهواء. صممت لغرض التبريد في فصل الصيفثمانية تكوينات مختلفة قد فحصت وكان الهدف . حرارة هواء الحيز وجعله مناسب لراحة الالنسان تم استخدام التبريد التبخري
من الدراسة التجريبيه هو لبيان تأثير العناصر الهامة لمدخنة شمسية عمودية مثل عرض فجوة الهواء وعرض المدخنة و أشارت النتأئج الى ان حمل التبريد يمكن ان يخفض بنسة . تاثير التبريد التبخري طول المدخنة واالشعاع الشمسي وكذلك
سم عرض فجوة .5ظهرآ وبالتالي يخفض استهالك الطاقة بواسطة أستخدام مدخنة شمسية بأبعاد 95عند الساعة % 25م الحصول على اعلى معدل سم ارتفاع مدخنة وعند هذا التكوين للمدخنة الشمسيه يت .0سم عرض مدخنة و 92هواء و
درجة مئوية على التوالي 93.9ساعة و / عبمتر مك 931والخارج وهي وفرق في درجة الحراة بين الداخل تدفق للهواء
Proceeding of the 3th Sustainable & Renewable Energy Conference 23 -24 December 2017, Baghdad-Iraq
102
INTRODUCTION
In Iraq country, solar radiation in summer months is very intense and the outdoor
temperature often reaches to 45°C or above. This require to use the mechanical cooling means.
The latter, causes maximize levels of energy consumption and environmental impacts like
greenhouse gas emissions. Energy cost and availability as well as the increased interest with
environmental issues. This fact led to renewed awareness in passive design, and many studies
conducted on solar chimneys. An experimental solar chimney model with uniform heat flux and
a various ratios of gap width to-chimney height was conducted by Chen et al (2003) [1]. They
found that the air flow rate reached a maximum at a chimney inclination angle of around 45º
with gap width of 0.2m and 1.5m chimney height. Also, the experimental results indicated that
solar chimney with 45º inclination angle gave air flow rate about 45% higher than that for a
vertical chimney under otherwise identical conditions. Ong (2003) [2] derived a mathematical
model for a solar chimney rests on steady-state, considering three methods of heat transfer
(conduction, convection and radiation) using a thermal resistance network. In order to study the
efficiency of a solar chimney, the equations of model developed were solved using the matrix
inversion method. The same model was used by Ong and Chow (2003) [3] to predict the effects
of both air gap and radiation intensity on the thermal efficiency of solar chimneys. In order to
validate the mathematical model, they compared their results with experiments performed on
solar chimney of 2 m high and 0.45 m. Mathur et al.2006 [4] carried out experimental
investigations on a small size solar chimney. The experiment set-up comprises a cubical wooden
chamber having a size of (1 m × 1 m × 1 m). The experiment indicated that for 1m height
chimney the stack height-air gap ratio was found to be 2.83, induced 5.6 air change per hour in
a room of 27 Harris & Helwig (2007) [5] investigated the performance of a solar chimney by
using CFD modelling techniques. The study was conducted under climate of Scotland,
Edinburgh at latitude 52. They found that for a south-facing chimney, an inclination angle of
67.5° from the horizontal was optimum for the location chosen which maximizes the flow rate
by 11% for the location of investigation. The study also showed that the performance at 45° was
approximately similar to that of a vertical solar chimney. In this regard Bassiouny and Korah
(2009) [6] studied numerically and analytically the influences of the inclination on air change per
hour to predict flow pattern using ANSYS computer program. The room dimensions were 3m
length by 3m wide with a window measuring 1m tall and 1m above the floor. The solar chimney
had a length of 1m and air gap of 0.35m. Their results indicated that inclination angles between
to for latitude of 28.4 8 gave an optimum flow pattern in addition air speed. Haghighi
& Maerefat (2014) [7] studied numerically the heat transfer by natural convection and surface
radiation, to determine the effective air gap width, size of openings and outdoor condition of a
solar chimney used for improving indoor conditions. They proved that a good indoor air
condition occurs by using solar chimney even with poor solar intensity of 215 W/ m². Their
results also showed that the highest ACH can be achieved with gap width of 0.2m. Jing et al
(2015) [8] performed experimental study on a solar chimney model using large gap-to-height
ratios between 0.2 and 0.6 with uniform wall heat flux at 200, 300 and 400 W/ . The
maximum air flow rate was achieved at around 1000 mm chimney gap. It was also observed that
the airflow rate through the chimney increased with the increase of heat flux. Majeed & Mishaal
(2016) [9] studied experimentally and numerically an inclined solar chimney integrated with

Proceeding of the 3th Sustainable & Renewable Energy Conference 23 -24 December 2017, Baghdad-Iraq
103
evaporative cooling employed for cooling a room in Iraqi climate. They used model of wood
having a size of (2.5 m×1.29 m×1.07 m). The numerical simulation was carried out using
ANSYS software. The investigation results showed that the indoor temperature can be reduced to
8.5 °C of ambient temperature by a solar chimney.
EXPERIMENTAL WORK
The experimental work was conducted in Baghdad, at technical college of middle technical
university on roof of two storey building. The test rig was operated outdoor with position:
latitude (33.23) north, longitude (44.23) east and altitude (34 +7) m, in a vertical position. The
test rig consists of the wooden test room having a size of (2.5 m×1.29 m ×1.07 m) and vertical
solar chimney. The solar chimney system is positioned to the wall of the test room, that oriented
to the southern. The absorber is placed at the front side of the air gap and is made of a 0.1 cm
thick copper plate, which is painted with a layer of matte-black paint. In order to reduce the
convection losses to ambient, the absorber plate covered with a glass has a thickness of 0.6 cm
and allowed to air stagnant in a small space exist between them. A vertical solar chimney
induces air movement by buoyancy forces, in which warm air rises and then exits from the
chimney top, drawing cooler air through the room in continuous cycle. The air drawn from the
test room passes between its south wall and the back surface of the absorber plate. The air enter
to the test room from inlet has dimensions of (0.1m ×1.22 m) exist at its north wall. The
evaporative cooling unit also used to minimize air temperature when it entered to room. The
evaporative cooling unit was attached to the air inlet using an iron duct identical to it. A padding
which consists of cellulose chips was inserted inside the duct, and it is wetted by small water
pump.
Eight different combination of air gap width, chimney width and chimney height have been
investigated during the study. The chimney heights of (40 cm) was added for both air gap width
0.30m and 0.40m. Two chimney heights (40 and 80 cm) to the air gap of 20 cm were added,
these heights included different chimney widths of (0.20, 0.15 and 0.10m). As illustrated in table
(1) and figure (1)
Table (1) description of cases tested.
No of
configuration
Air gap width (cm) Chimney width (cm) Chimney height (cm)
Configuration 1 40 40 40
Configuration 2 30 30 40
Configuration 3 20 20 40
Configuration 4 20 20 80
Configuration 5 20 15 40
Configuration 6 20 15 80
Configuration 7 20 10 40
Configuration 8 20 10 80
Proceeding of the 3th Sustainable & Renewable Energy Conference 23 -24 December 2017, Baghdad-Iraq
104
For temperature measurements, as shown in figure (2). 14 thermocouples K-type were
distributed at several locations, namely, the back surface of the absorber plate, temperature of air
at the entrance of the test room, air temperature within channel of the solar chimney, air
temperatures inside the test room and ambient temperature. These thermocouples were connected
to two data loggers. The velocity of air at the inlet and inside the chimney as well as at the inlet
of the test model was measured by TES-1341 hot-wire anemometer, having a resolution of 0.1
m/s, range of (0-30) m/s, and an accuracy as ±3% of its reading. The solar radiation intensity was
measured by TES-1333 solar power meter, it has resolution of 0.1 w/m² and accuracy as ±5% of
its reading. This solar power meter was placed parallel to the passive wall.
RESULTS AND DISCUSSION
Temperature Distribution in the Test Model:
To reduce the air temperature of a space and make it appropriate for human comfort, the
evaporative cooling unit was used in the room equipped with a solar chimney. In the solar
chimney the combination of air gap width, chimney width and chimney height were evaluated.
The experimental results of the air temperature distribution are shown in figures (3) to (10). In
these figures the temperature is plotted against the time for different days in summer for
different dimensions of the solar chimney. The temperature distribution inside the test model for
two air gap widths of 30 and 40 cm with the same chimney width and with chimney height of 40
cm is depicted in figures (3) and (4). From figures it is clear that the absorber plate had a minor
effect on the air temperature in the channel of the solar chimney, and that was caused by back
flow which took place in flow channel with large air gaps. Figure (5) shows the significant
temperature difference between the temperature near the roof and the temperature near the floor
of the test model for air gap width and chimney width of 20 cm with chimney height of 40 cm. It
can also be observed that there was a big difference in the temperature of air in flow channel of
the solar chimney and other temperatures. While, there was a little difference in the air
temperature in flow channel the other temperatures as shown in figure (6), at the same of the air
gap width and chimney width but with chimney height of 80 cm. Figure (7) presents the
temperature distribution in the test model for solar chimney with 20 cm air gap width, 15 cm
chimney width and 40 cm chimney height. This figure shows that all temperatures except the air
temperature in flow channel of the solar chimney had approximately the same values during the
time duration from 8:00 am to 10:30 am. This is attributed due to the effect of the evaporative
cooling unit. Later, there was a small difference in the temperature between them during the time
duration from 10:30 am to 2:30 pm, this difference is due to the increase in air velocity as a
result of increase of drawn air by solar chimney. After 2:30 pm, the temperature stability was
maintained. This behavior was also observed for chimney height of 80 cm with the same air gap
width and chimney width for previous figure, as depicted in figure (8). The effect of solar
chimney with dimensions of 20 cm air gap width, 10 cm chimney width and 40 cm chimney
height on the temperature inside the test model is displayed in figure (9). There was has a minor
difference between temperatures except the air temperature above the floor and at a distance of
10 cm from north wall of the test model, which had difference values as compared to others. This
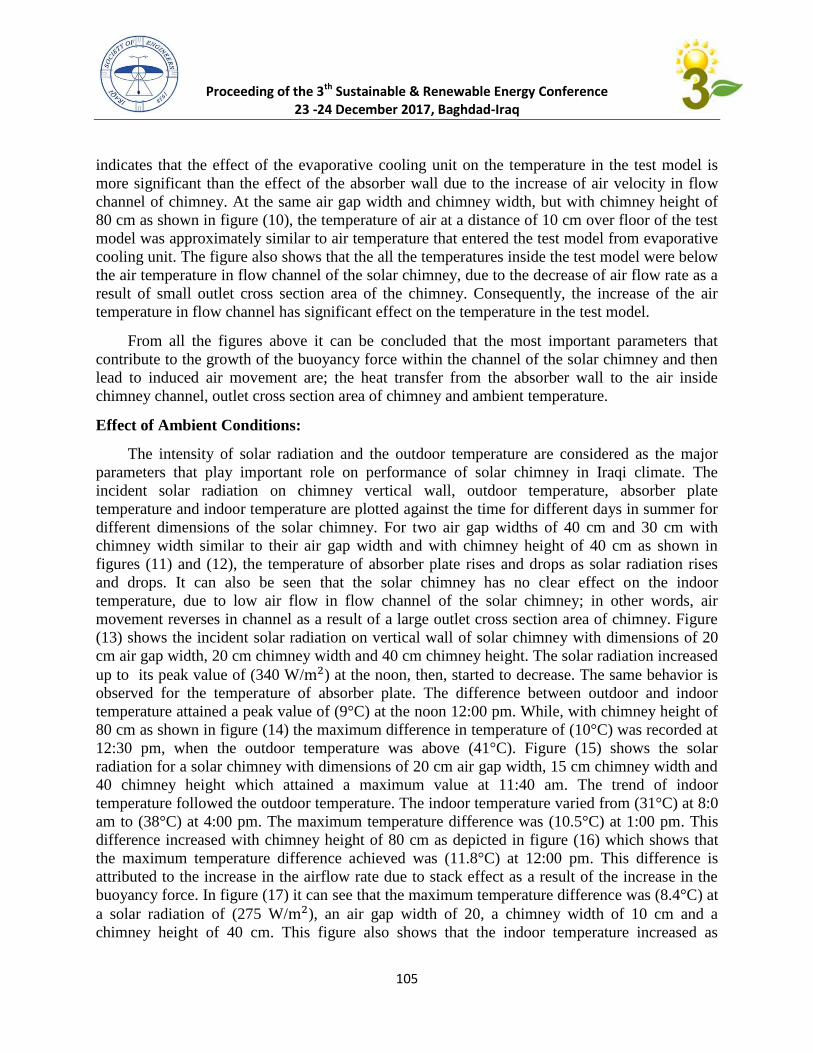
Proceeding of the 3th Sustainable & Renewable Energy Conference 23 -24 December 2017, Baghdad-Iraq
105
indicates that the effect of the evaporative cooling unit on the temperature in the test model is
more significant than the effect of the absorber wall due to the increase of air velocity in flow
channel of chimney. At the same air gap width and chimney width, but with chimney height of
80 cm as shown in figure (10), the temperature of air at a distance of 10 cm over floor of the test
model was approximately similar to air temperature that entered the test model from evaporative
cooling unit. The figure also shows that the all the temperatures inside the test model were below
the air temperature in flow channel of the solar chimney, due to the decrease of air flow rate as a
result of small outlet cross section area of the chimney. Consequently, the increase of the air
temperature in flow channel has significant effect on the temperature in the test model.
From all the figures above it can be concluded that the most important parameters that
contribute to the growth of the buoyancy force within the channel of the solar chimney and then
lead to induced air movement are; the heat transfer from the absorber wall to the air inside
chimney channel, outlet cross section area of chimney and ambient temperature.
Effect of Ambient Conditions:
The intensity of solar radiation and the outdoor temperature are considered as the major
parameters that play important role on performance of solar chimney in Iraqi climate. The
incident solar radiation on chimney vertical wall, outdoor temperature, absorber plate
temperature and indoor temperature are plotted against the time for different days in summer for
different dimensions of the solar chimney. For two air gap widths of 40 cm and 30 cm with
chimney width similar to their air gap width and with chimney height of 40 cm as shown in
figures (11) and (12), the temperature of absorber plate rises and drops as solar radiation rises
and drops. It can also be seen that the solar chimney has no clear effect on the indoor
temperature, due to low air flow in flow channel of the solar chimney; in other words, air
movement reverses in channel as a result of a large outlet cross section area of chimney. Figure
(13) shows the incident solar radiation on vertical wall of solar chimney with dimensions of 20
cm air gap width, 20 cm chimney width and 40 cm chimney height. The solar radiation increased
up to its peak value of (340 W/ ) at the noon, then, started to decrease. The same behavior is
observed for the temperature of absorber plate. The difference between outdoor and indoor
temperature attained a peak value of (9°C) at the noon 12:00 pm. While, with chimney height of
80 cm as shown in figure (14) the maximum difference in temperature of (10°C) was recorded at
12:30 pm, when the outdoor temperature was above (41°C). Figure (15) shows the solar
radiation for a solar chimney with dimensions of 20 cm air gap width, 15 cm chimney width and
40 chimney height which attained a maximum value at 11:40 am. The trend of indoor
temperature followed the outdoor temperature. The indoor temperature varied from (31°C) at 8:0
am to (38°C) at 4:00 pm. The maximum temperature difference was (10.5°C) at 1:00 pm. This
difference increased with chimney height of 80 cm as depicted in figure (16) which shows that
the maximum temperature difference achieved was (11.8°C) at 12:00 pm. This difference is
attributed to the increase in the airflow rate due to stack effect as a result of the increase in the
buoyancy force. In figure (17) it can see that the maximum temperature difference was (8.4°C) at
a solar radiation of (275 W/ ), an air gap width of 20, a chimney width of 10 cm and a
chimney height of 40 cm. This figure also shows that the indoor temperature increased as
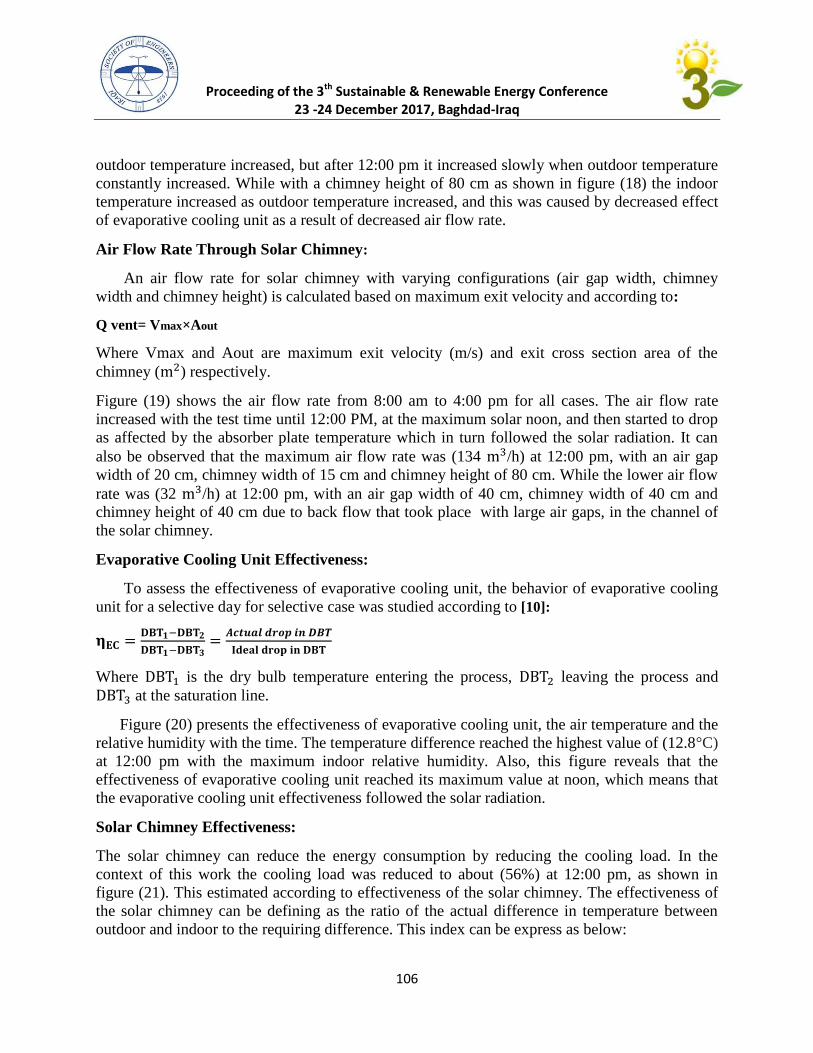
Proceeding of the 3th Sustainable & Renewable Energy Conference 23 -24 December 2017, Baghdad-Iraq
106
outdoor temperature increased, but after 12:00 pm it increased slowly when outdoor temperature
constantly increased. While with a chimney height of 80 cm as shown in figure (18) the indoor
temperature increased as outdoor temperature increased, and this was caused by decreased effect
of evaporative cooling unit as a result of decreased air flow rate.
Air Flow Rate Through Solar Chimney:
An air flow rate for solar chimney with varying configurations (air gap width, chimney
width and chimney height) is calculated based on maximum exit velocity and according to:
Q vent= Vmax×Aout
Where Vmax and Aout are maximum exit velocity (m/s) and exit cross section area of the
chimney ( ) respectively.
Figure (19) shows the air flow rate from 8:00 am to 4:00 pm for all cases. The air flow rate
increased with the test time until 12:00 PM, at the maximum solar noon, and then started to drop
as affected by the absorber plate temperature which in turn followed the solar radiation. It can
also be observed that the maximum air flow rate was (134 /h) at 12:00 pm, with an air gap
width of 20 cm, chimney width of 15 cm and chimney height of 80 cm. While the lower air flow
rate was (32 /h) at 12:00 pm, with an air gap width of 40 cm, chimney width of 40 cm and
chimney height of 40 cm due to back flow that took place with large air gaps, in the channel of
the solar chimney.
Evaporative Cooling Unit Effectiveness:
To assess the effectiveness of evaporative cooling unit, the behavior of evaporative cooling
unit for a selective day for selective case was studied according to [10]:
Where is the dry bulb temperature entering the process, leaving the process and
at the saturation line.
Figure (20) presents the effectiveness of evaporative cooling unit, the air temperature and the
relative humidity with the time. The temperature difference reached the highest value of (12.8°C)
at 12:00 pm with the maximum indoor relative humidity. Also, this figure reveals that the
effectiveness of evaporative cooling unit reached its maximum value at noon, which means that
the evaporative cooling unit effectiveness followed the solar radiation.
Solar Chimney Effectiveness:
The solar chimney can reduce the energy consumption by reducing the cooling load. In the
context of this work the cooling load was reduced to about (56%) at 12:00 pm, as shown in
figure (21). This estimated according to effectiveness of the solar chimney. The effectiveness of
the solar chimney can be defining as the ratio of the actual difference in temperature between
outdoor and indoor to the requiring difference. This index can be express as below:
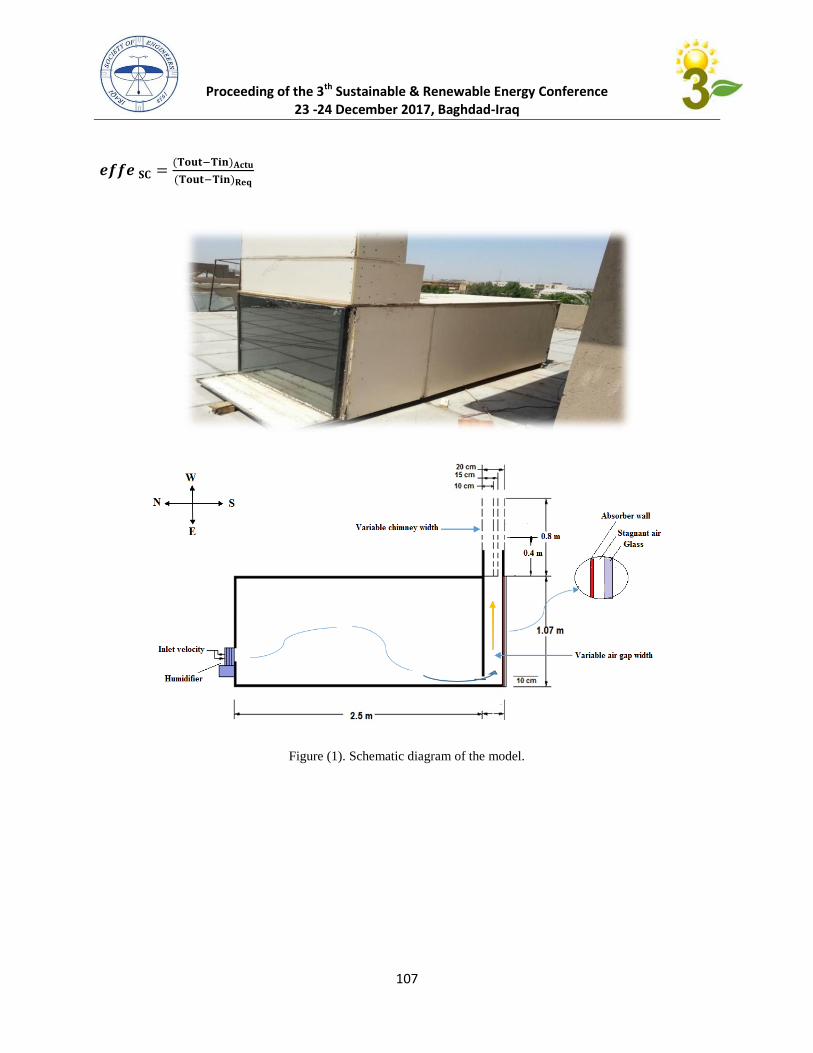
Proceeding of the 3th Sustainable & Renewable Energy Conference 23 -24 December 2017, Baghdad-Iraq
107
Figure (1). Schematic diagram of the model.
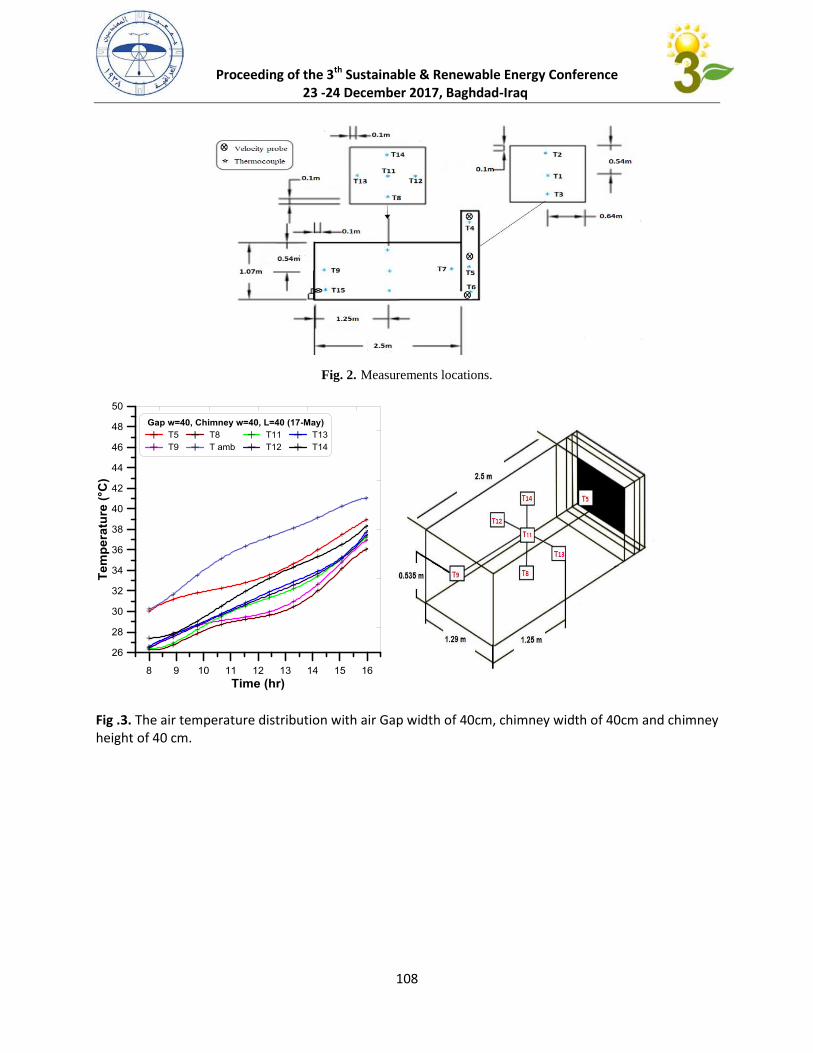
Proceeding of the 3th Sustainable & Renewable Energy Conference
23 -24 December 2017, Baghdad-Iraq
108
Fig. 2. Measurements locations.
Fig .3. The air temperature distribution with air Gap width of 40cm, chimney width of 40cm and chimney height of 40 cm.
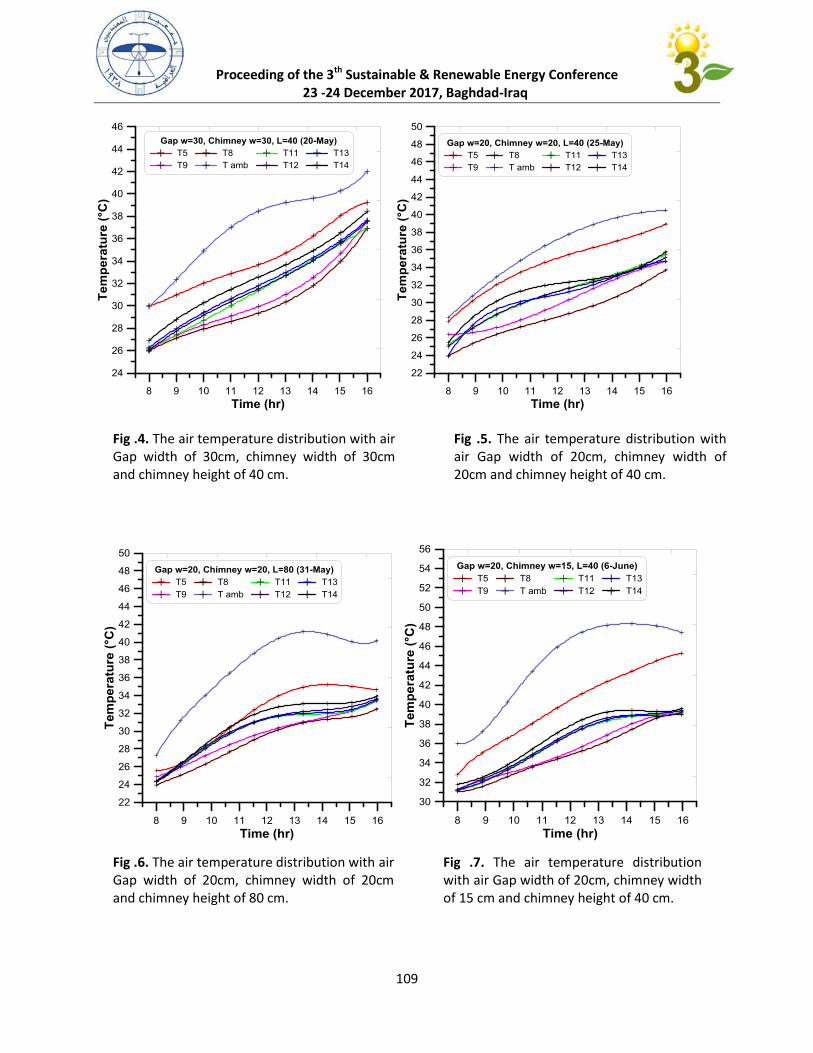
Proceeding of the 3th Sustainable & Renewable Energy Conference
23 -24 December 2017, Baghdad-Iraq
109
Fig .6. The air temperature distribution with air Gap width of 20cm, chimney width of 20cm and chimney height of 80 cm.
Fig .7. The air temperature distribution with air Gap width of 20cm, chimney width of 15 cm and chimney height of 40 cm.
Fig .4. The air temperature distribution with air Gap width of 30cm, chimney width of 30cm and chimney height of 40 cm.
Fig .5. The air temperature distribution with air Gap width of 20cm, chimney width of 20cm and chimney height of 40 cm.
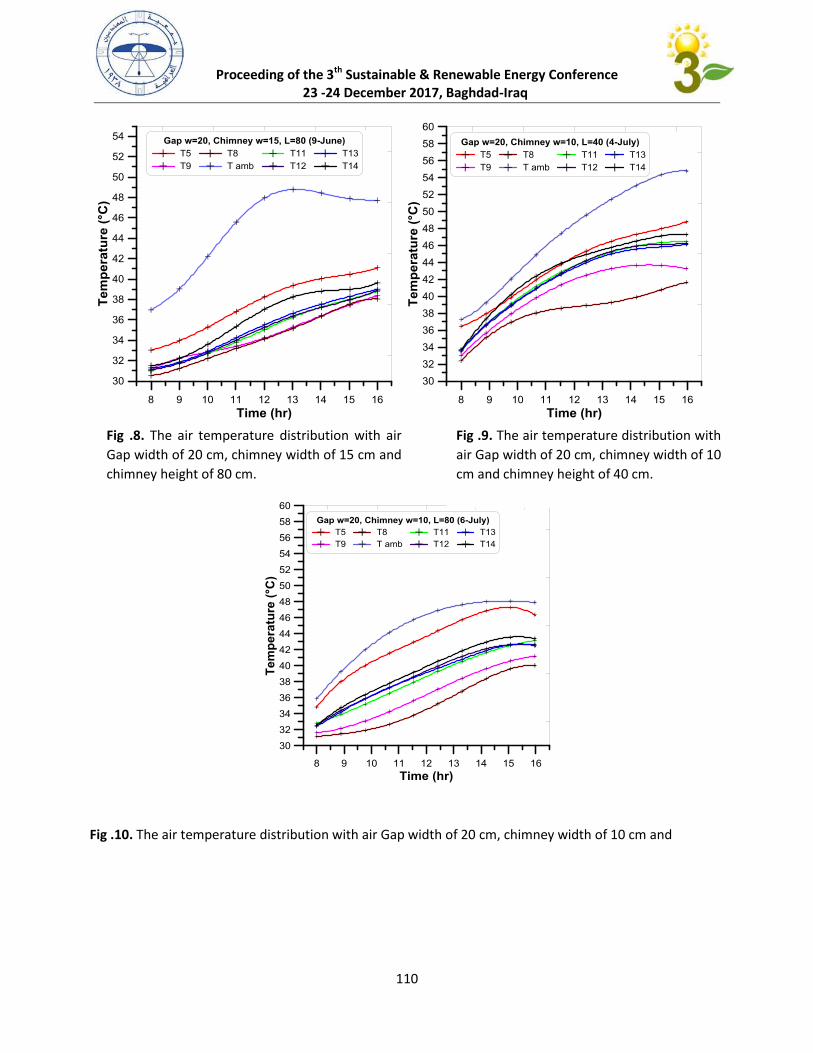
Proceeding of the 3th Sustainable & Renewable Energy Conference
23 -24 December 2017, Baghdad-Iraq
110
Fig .10. The air temperature distribution with air Gap width of 20 cm, chimney width of 10 cm and
Fig .8. The air temperature distribution with air
Gap width of 20 cm, chimney width of 15 cm and
chimney height of 80 cm.
Fig .9. The air temperature distribution with
air Gap width of 20 cm, chimney width of 10
cm and chimney height of 40 cm.
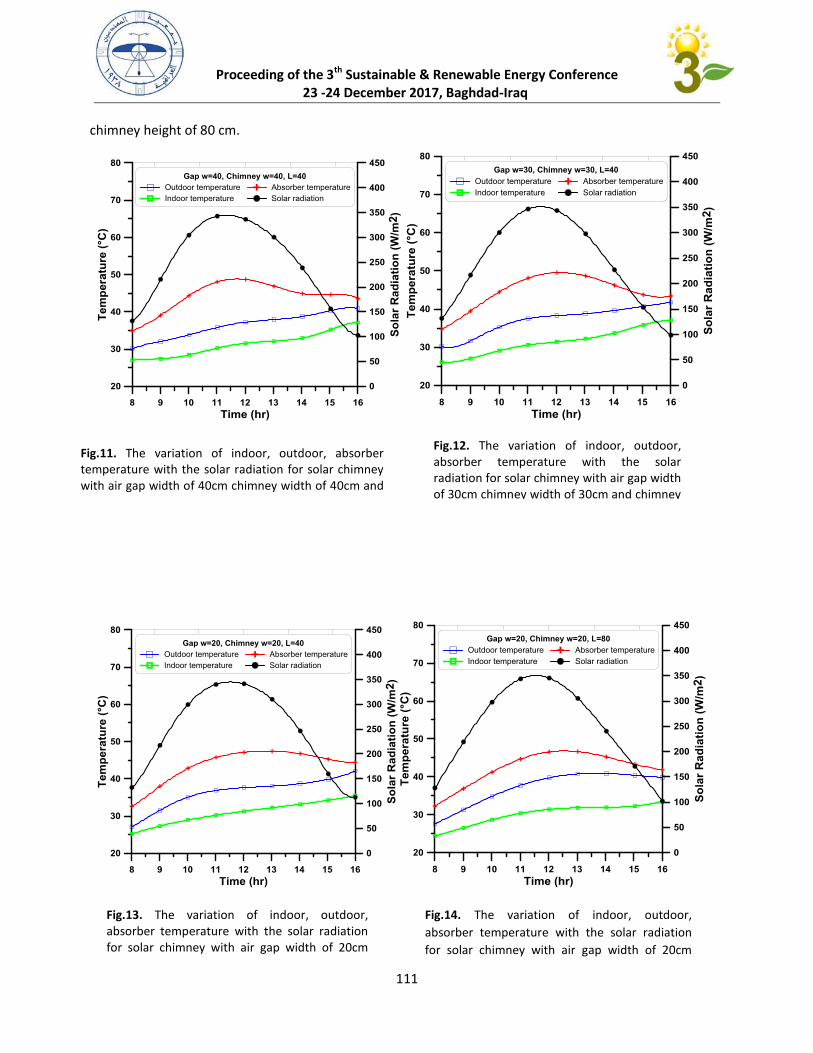
Proceeding of the 3th Sustainable & Renewable Energy Conference
23 -24 December 2017, Baghdad-Iraq
111
chimney height of 80 cm.
Fig.13. The variation of indoor, outdoor, absorber temperature with the solar radiation for solar chimney with air gap width of 20cm chimney width of 20cm and chimney height of 40cm.
Fig.14. The variation of indoor, outdoor,
absorber temperature with the solar radiation
for solar chimney with air gap width of 20cm
chimney width of 20 cm and chimney height of
80cm.
Fig.11. The variation of indoor, outdoor, absorber temperature with the solar radiation for solar chimney with air gap width of 40cm chimney width of 40cm and chimney height of 40cm.
Fig.12. The variation of indoor, outdoor, absorber temperature with the solar radiation for solar chimney with air gap width of 30cm chimney width of 30cm and chimney height of 40cm.
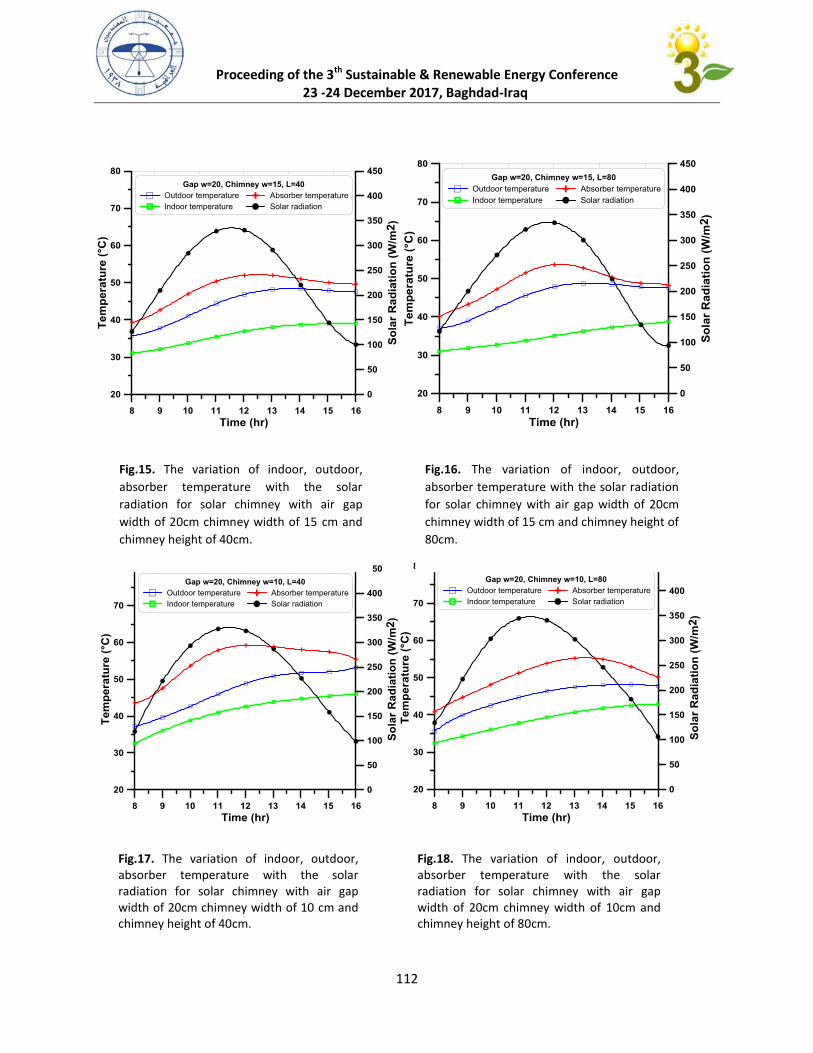
Proceeding of the 3th Sustainable & Renewable Energy Conference
23 -24 December 2017, Baghdad-Iraq
112
Fig.15. The variation of indoor, outdoor,
absorber temperature with the solar
radiation for solar chimney with air gap
width of 20cm chimney width of 15 cm and
chimney height of 40cm.
Fig.16. The variation of indoor, outdoor,
absorber temperature with the solar radiation
for solar chimney with air gap width of 20cm
chimney width of 15 cm and chimney height of
80cm.
Fig.17. The variation of indoor, outdoor, absorber temperature with the solar radiation for solar chimney with air gap width of 20cm chimney width of 10 cm and chimney height of 40cm.
Fig.18. The variation of indoor, outdoor, absorber temperature with the solar radiation for solar chimney with air gap width of 20cm chimney width of 10cm and chimney height of 80cm.
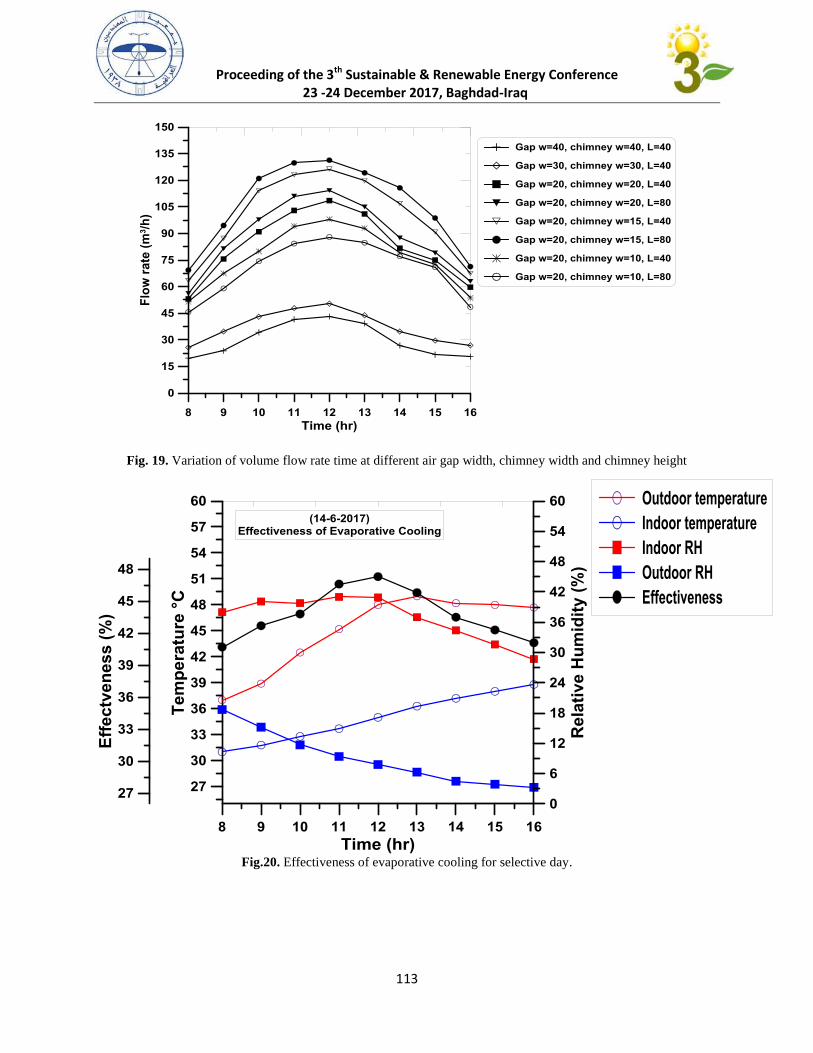
Proceeding of the 3th Sustainable & Renewable Energy Conference
23 -24 December 2017, Baghdad-Iraq
113
Fig. 19. Variation of volume flow rate time at different air gap width, chimney width and chimney height
Fig.20. Effectiveness of evaporative cooling for selective day.
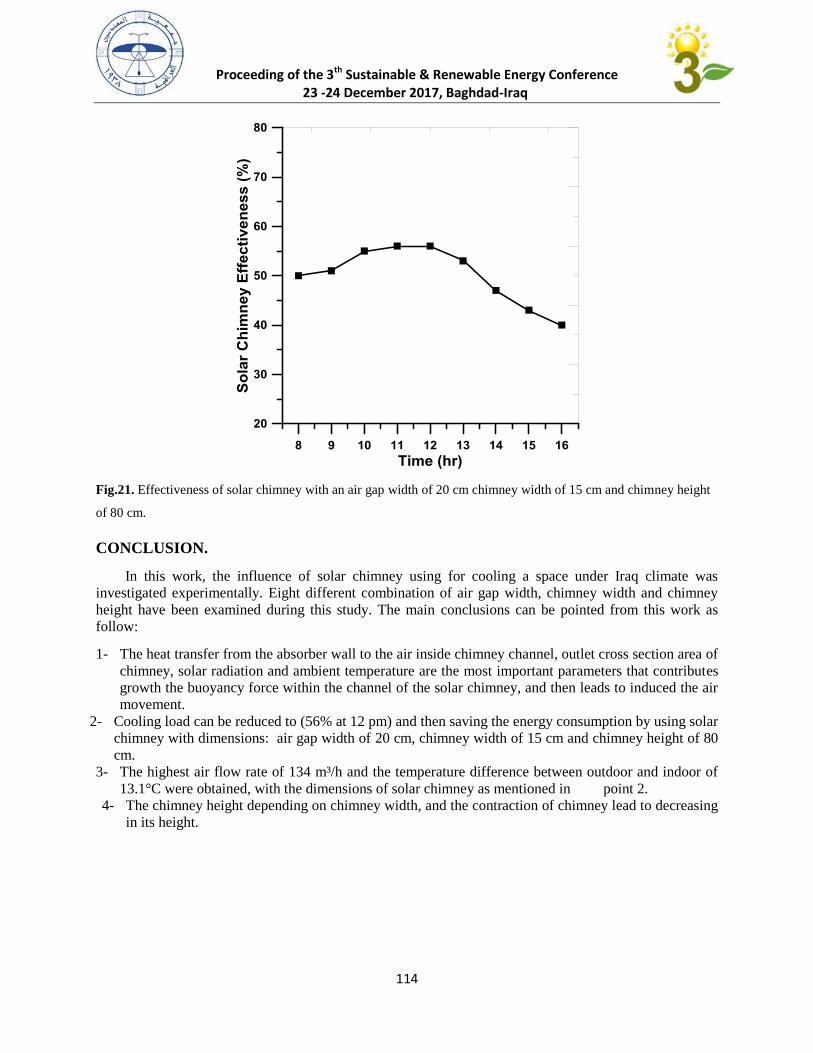
Proceeding of the 3th Sustainable & Renewable Energy Conference
23 -24 December 2017, Baghdad-Iraq
114
Fig.21. Effectiveness of solar chimney with an air gap width of 20 cm chimney width of 15 cm and chimney height
of 80 cm.
CONCLUSION.
In this work, the influence of solar chimney using for cooling a space under Iraq climate was
investigated experimentally. Eight different combination of air gap width, chimney width and chimney
height have been examined during this study. The main conclusions can be pointed from this work as
follow:
1- The heat transfer from the absorber wall to the air inside chimney channel, outlet cross section area of
chimney, solar radiation and ambient temperature are the most important parameters that contributes
growth the buoyancy force within the channel of the solar chimney, and then leads to induced the air
movement.
2- Cooling load can be reduced to (56% at 12 pm) and then saving the energy consumption by using solar
chimney with dimensions: air gap width of 20 cm, chimney width of 15 cm and chimney height of 80
cm.
3- The highest air flow rate of 134 m³/h and the temperature difference between outdoor and indoor of
13.1°C were obtained, with the dimensions of solar chimney as mentioned in point 2.
4- The chimney height depending on chimney width, and the contraction of chimney lead to decreasing
in its height.
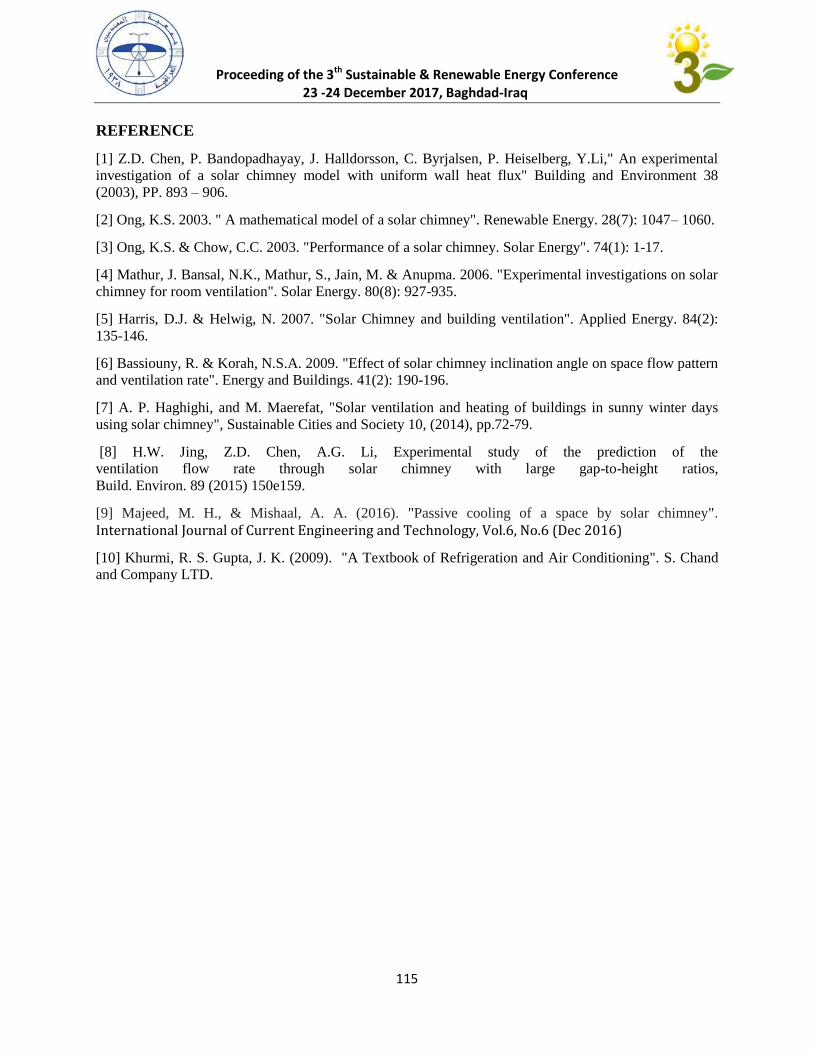
Proceeding of the 3th Sustainable & Renewable Energy Conference
23 -24 December 2017, Baghdad-Iraq
115
REFERENCE
[1] Z.D. Chen, P. Bandopadhayay, J. Halldorsson, C. Byrjalsen, P. Heiselberg, Y.Li," An experimental
investigation of a solar chimney model with uniform wall heat flux" Building and Environment 38
(2003), PP. 893 – 906.
[2] Ong, K.S. 2003. " A mathematical model of a solar chimney". Renewable Energy. 28(7): 1047– 1060.
[3] Ong, K.S. & Chow, C.C. 2003. "Performance of a solar chimney. Solar Energy". 74(1): 1-17.
[4] Mathur, J. Bansal, N.K., Mathur, S., Jain, M. & Anupma. 2006. "Experimental investigations on solar
chimney for room ventilation". Solar Energy. 80(8): 927-935.
[5] Harris, D.J. & Helwig, N. 2007. "Solar Chimney and building ventilation". Applied Energy. 84(2):
135-146.
[6] Bassiouny, R. & Korah, N.S.A. 2009. "Effect of solar chimney inclination angle on space flow pattern
and ventilation rate". Energy and Buildings. 41(2): 190-196.
[7] A. P. Haghighi, and M. Maerefat, "Solar ventilation and heating of buildings in sunny winter days
using solar chimney", Sustainable Cities and Society 10, (2014), pp.72-79.
[8] H.W. Jing, Z.D. Chen, A.G. Li, Experimental study of the prediction of the
ventilation flow rate through solar chimney with large gap-to-height ratios,
Build. Environ. 89 (2015) 150e159.
[9] Majeed, M. H., & Mishaal, A. A. (2016). "Passive cooling of a space by solar chimney".
International Journal of Current Engineering and Technology, Vol.6, No.6 (Dec 2016)
[10] Khurmi, R. S. Gupta, J. K. (2009). "A Textbook of Refrigeration and Air Conditioning". S. Chand
and Company LTD.
Proceeding of the 3th Sustainable & Renewable Energy Conference 23 -24 December 2017, Baghdad-Iraq
116
Enhancement of the photovoltaic thermal system performance using
combined cooling techniques
Jamal. H.Waheb
1*, H. Abed2, R. Muzahim
3
1AlKarkh University Of Science
2 Electromechanical Engineering Department, University of Technology, Baghdad, Iraq
3Mechanical Engineering Department, University of Anbar, Anbar, Iraq
ABSTRACT
The aim of this work is to enhance the photovoltaic / thermal system performance by
dissipating the high heat stored inside the PV panels. A new design of front and back
cooling systems have been made based on making a film of water flowing on the front
surface and circulation of the water in the back cooper pipes with a small heat exchanger
and spraying a water on a heat exchanger. The thermal and electrical performance of
PV/T was recorded as a function of solar irradiation intensity and temperature on the
PV panel surface . The temperature of PV panel dropped from to 69 with a back
cooling only but when using combined cooling the PV temperature dropped from ( to
56) . This dropping in temperature led to increase the average electrical PV efficiency
to (7.5) % at an optimum flow rate of (2L/min.) .
Keywords: PV performance ; PV cooling ; Water pumping system.
NOMENCLATURE
A Area of the PV module collector ( .
: Area of collector (
Specific heat capacity of fluid .
Solar radiation (W/ ).
Maximum current of PV module.
Heat transfer rate (J/s).
Temperature of standard condition (25 ).
Inlet temperature of fluid in PVT ( ).
in PVT ( ).
Pvt :Photovoltaic thermal.
Proceeding of the 3th Sustainable & Renewable Energy Conference 23 -24 December 2017, Baghdad-Iraq
117
: Maximum voltage of PV module.
β : Temperature coefficient of silicon cell i.e ).
: Nominal electrical efficiency.
: Thermal efficiency.
μw : Water viscosity(kg/m.s).
ρf : Density of the base fluid(kg/m3).
1. INTRODUCTION
As the world is confronting the issue of global warming, energy shortfall and the
retrogradation of environment and energy sources, there is a requirement for an alternate
energy to asset generating power instead of using fossil fuels. The energy consumption
all over the world , especially in the industrialized countries, has been growing at an
alarming rate. Most of the world's energy, (86%) of supply originates from the fossil
fuels [1]. It is estimated that the world energy demand will increase by 45% between
(2006 and 2030). The rate of expansion is 1.6% per year. An exciting alternative to
diminish these negative effects is an expansion of the renewable energy utilizations. Solar
energy is one of the most promising sources among renewable energy because it is clean,
available and inexhaustible. Solar energy can be used in different ways such as, thermal
field using thermal collectors or electricity generation through solar Photovoltaic (PV)
cells. A PV cell is a semiconductor device that generates electricity when light falls on it.
The physical process in which a PV cell or solar cell converts sunlight into electricity is
known as the photovoltaic effect [2]. The performance of a photovoltaic (PV) system not
just relies upon its basic electrical characteristics: maximum power, maximum power
voltage, maximum power current, maximum system voltage, open-circuit voltage (Voc),
short-circuit current (Isc), but is also adversely affected by several impediments for
example ambient temperature, dust storms, suspension in air, global solar radiation
intensity, spectrum and angle of irradiance [3,4]. The main factor which plays an
essential role in the performance of solar cells is surface temperature of the solar cells. A
small increment in the temperature of the solar cell decreases the output of the solar cells
significantly [5,6]. PV-T technology is a hybrid system that combines PV panels with
solar thermal collectors and capitalizes on the untapped heat energy of the PVsystem.
Hybrid Photovoltaic/Thermal (PV/T) system is one of the most prominent strategies for
cooling the photovoltaic panels nowadays, by extracting heat from it using heat transfer
fluid. The higher efficiency can be provided by the PV/T system as compared with the
conventional PV and thermal collector systems , therefore it was developed. A PV cell
transforms only a small part (less than 20 %) of the irradiance into electrical energy, thus
PV heating is the result of the absorbed solar radiation that is not converted into
Proceeding of the 3th Sustainable & Renewable Energy Conference 23 -24 December 2017, Baghdad-Iraq
118
electricity [7]. Furthermore, the increased temperature can likewise bring structural harm
to the module if the thermal stress stays for a protracted period, thus cooling the PV is
essential to keep the electrical efficiency at an acceptable level and achieves expectations
level [8].
Salih Mohammed Salih et al (2015) [9] have presented experimentally the performance
enhancement of PV array based on sprayed cooling water on the front side of the panel to
dissipate heat and keep the panel cooling at minimum temperatures. The results of this
study showed that the performance of PV panel had been increased and the cooling rate
for 5 min.was 4 ºC/min in midday and the average value of efficiency of spraying system
along one day was about 17.8 %. Dorobanțu et al (2013) [10] have evaluated PV
panels front water cooling methodology. They concluded that the open voltage of the
panel risies when its temperature diminishes and because of the lower operating
temperature, the life cycle can be increased. Chao-Yang et al (2012) [11] have evaluated
a hybrid Photovoltaic thermal system (PV/T) which involved polycrystalline PV cells,
water pump, controller, water tank. The PV/T collector was erected with copper tube and
copper sheet settled on the rear of PV panel. The consequences of this research
demonstrated that the thermal efficiency of the thermal unit can reach 35.33% and the
electrical effectiveness of PV panel achieved was 12.77%.
The fundamental objectives of this work are: 1- to enhance the thermal and electrical
performance of the photovoltaic / thermal system (PV/T), 2- to solve the problem of
rising temperature by design and construct a cooling water technique in the front and
back surfaces of the PV panel, 3- study the effect of cooling the heat exchanger by
splashing it with water.
2. Method of analysis
2.1- Thermal and electrical performance of the PV/Tsystem
Thermal efficiency is a function of the solar radiation (G), the input temperature of fluid
( ), and the output temperature ( ).The thermal efficiency is estimated by the following
equation [12,13,14,15,16]:
(1)
The nominal electrical efficiency ( ) of a PV module can be calculated by the
following formula for different incident solar irradiations
(2)
The electrical efficiency ( ) as a function of PV temperature is:-
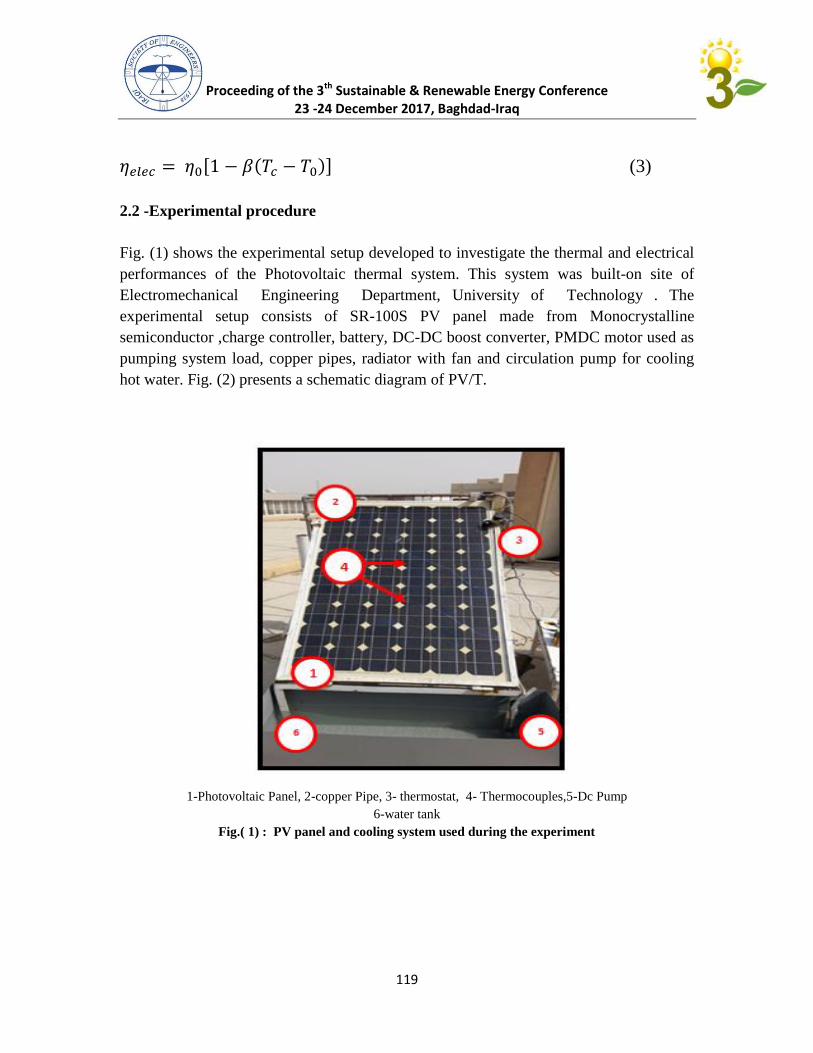
Proceeding of the 3th Sustainable & Renewable Energy Conference 23 -24 December 2017, Baghdad-Iraq
119
(3)
2.2 -Experimental procedure
Fig. (1) shows the experimental setup developed to investigate the thermal and electrical
performances of the Photovoltaic thermal system. This system was built-on site of
Electromechanical Engineering Department, University of Technology . The
experimental setup consists of SR-100S PV panel made from Monocrystalline
semiconductor ,charge controller, battery, DC-DC boost converter, PMDC motor used as
pumping system load, copper pipes, radiator with fan and circulation pump for cooling
hot water. Fig. (2) presents a schematic diagram of PV/T.
1-Photovoltaic Panel, 2-copper Pipe, 3- thermostat, 4- Thermocouples,5-Dc Pump
6-water tank
Fig.( 1) : PV panel and cooling system used during the experiment
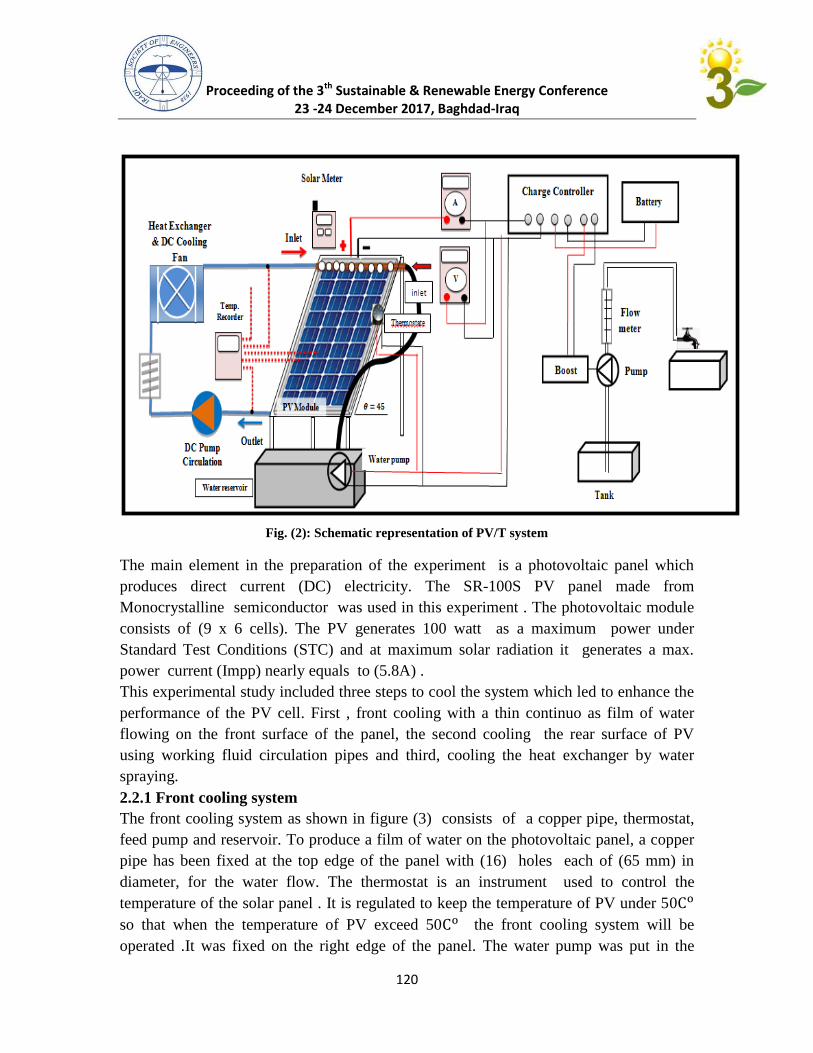
Proceeding of the 3th Sustainable & Renewable Energy Conference 23 -24 December 2017, Baghdad-Iraq
120
Fig. (2): Schematic representation of PV/T system
The main element in the preparation of the experiment is a photovoltaic panel which
produces direct current (DC) electricity. The SR-100S PV panel made from
Monocrystalline semiconductor was used in this experiment . The photovoltaic module
consists of (9 x 6 cells). The PV generates 100 watt as a maximum power under
Standard Test Conditions (STC) and at maximum solar radiation it generates a max.
power current (Impp) nearly equals to (5.8A) .
This experimental study included three steps to cool the system which led to enhance the
performance of the PV cell. First , front cooling with a thin continuo as film of water
flowing on the front surface of the panel, the second cooling the rear surface of PV
using working fluid circulation pipes and third, cooling the heat exchanger by water
spraying.
2.2.1 Front cooling system
The front cooling system as shown in figure (3) consists of a copper pipe, thermostat,
feed pump and reservoir. To produce a film of water on the photovoltaic panel, a copper
pipe has been fixed at the top edge of the panel with (16) holes each of (65 mm) in
diameter, for the water flow. The thermostat is an instrument used to control the
temperature of the solar panel . It is regulated to keep the temperature of PV under 50
so that when the temperature of PV exceed 50 the front cooling system will be
operated .It was fixed on the right edge of the panel. The water pump was put in the
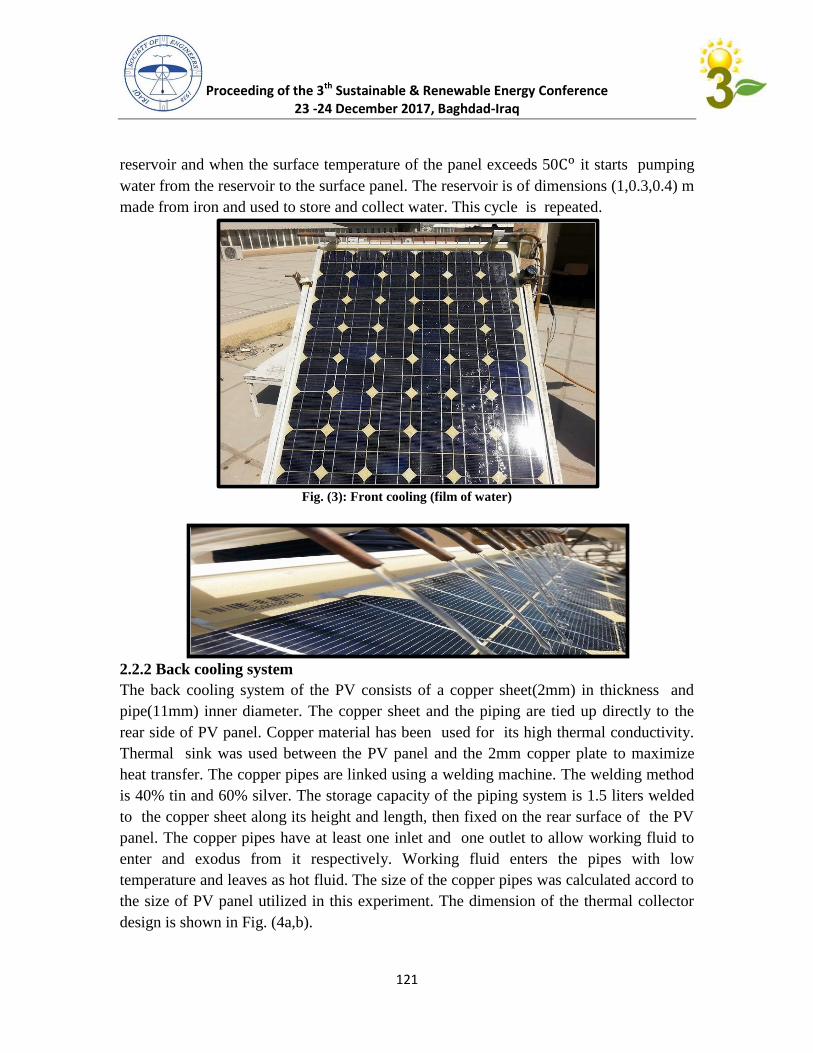
Proceeding of the 3th Sustainable & Renewable Energy Conference 23 -24 December 2017, Baghdad-Iraq
121
reservoir and when the surface temperature of the panel exceeds 50 it starts pumping
water from the reservoir to the surface panel. The reservoir is of dimensions (1,0.3,0.4) m
made from iron and used to store and collect water. This cycle is repeated.
Fig. (3): Front cooling (film of water)
2.2.2 Back cooling system
The back cooling system of the PV consists of a copper sheet(2mm) in thickness and
pipe(11mm) inner diameter. The copper sheet and the piping are tied up directly to the
rear side of PV panel. Copper material has been used for its high thermal conductivity.
Thermal sink was used between the PV panel and the 2mm copper plate to maximize
heat transfer. The copper pipes are linked using a welding machine. The welding method
is 40% tin and 60% silver. The storage capacity of the piping system is 1.5 liters welded
to the copper sheet along its height and length, then fixed on the rear surface of the PV
panel. The copper pipes have at least one inlet and one outlet to allow working fluid to
enter and exodus from it respectively. Working fluid enters the pipes with low
temperature and leaves as hot fluid. The size of the copper pipes was calculated accord to
the size of PV panel utilized in this experiment. The dimension of the thermal collector
design is shown in Fig. (4a,b).
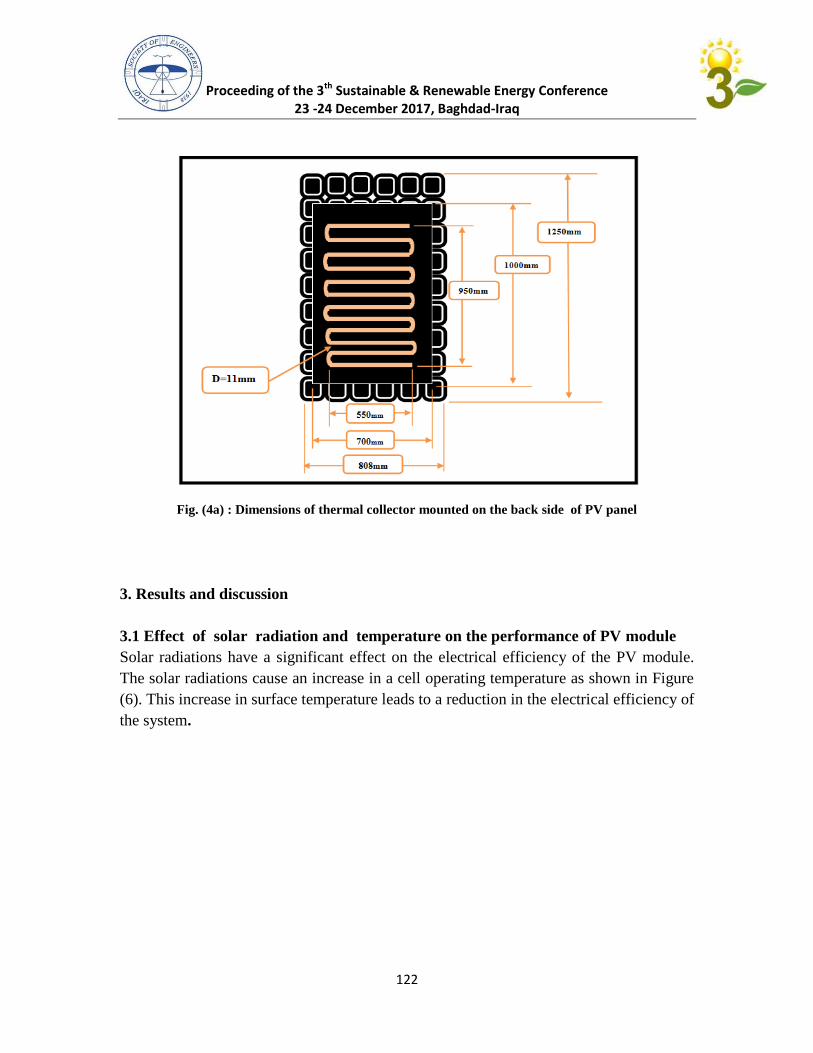
Proceeding of the 3th Sustainable & Renewable Energy Conference 23 -24 December 2017, Baghdad-Iraq
122
Fig. (4a) : Dimensions of thermal collector mounted on the back side of PV panel
3. Results and discussion
3.1 Effect of solar radiation and temperature on the performance of PV module
Solar radiations have a significant effect on the electrical efficiency of the PV module.
The solar radiations cause an increase in a cell operating temperature as shown in Figure
(6). This increase in surface temperature leads to a reduction in the electrical efficiency of
the system.
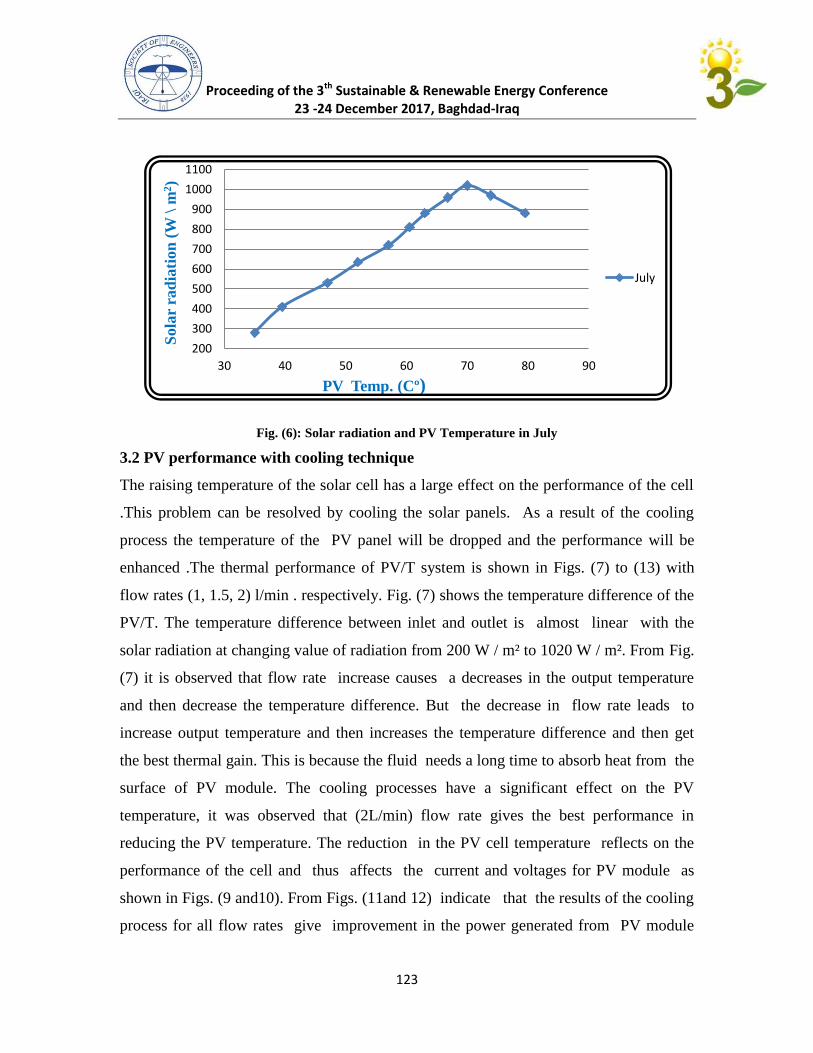
Proceeding of the 3th Sustainable & Renewable Energy Conference 23 -24 December 2017, Baghdad-Iraq
123
Fig. (6): Solar radiation and PV Temperature in July
3.2 PV performance with cooling technique
The raising temperature of the solar cell has a large effect on the performance of the cell
.This problem can be resolved by cooling the solar panels. As a result of the cooling
process the temperature of the PV panel will be dropped and the performance will be
enhanced .The thermal performance of PV/T system is shown in Figs. (7) to (13) with
flow rates (1, 1.5, 2) l/min . respectively. Fig. (7) shows the temperature difference of the
PV/T. The temperature difference between inlet and outlet is almost linear with the
solar radiation at changing value of radiation from 200 W / m² to 1020 W / m². From Fig.
(7) it is observed that flow rate increase causes a decreases in the output temperature
and then decrease the temperature difference. But the decrease in flow rate leads to
increase output temperature and then increases the temperature difference and then get
the best thermal gain. This is because the fluid needs a long time to absorb heat from the
surface of PV module. The cooling processes have a significant effect on the PV
temperature, it was observed that (2L/min) flow rate gives the best performance in
reducing the PV temperature. The reduction in the PV cell temperature reflects on the
performance of the cell and thus affects the current and voltages for PV module as
shown in Figs. (9 and10). From Figs. (11and 12) indicate that the results of the cooling
process for all flow rates give improvement in the power generated from PV module
200
300
400
500
600
700
800
900
1000
1100
30 40 50 60 70 80 90
Sola
r ra
dia
tion
(W
\ m
2)
PV Temp. (Cº)
July
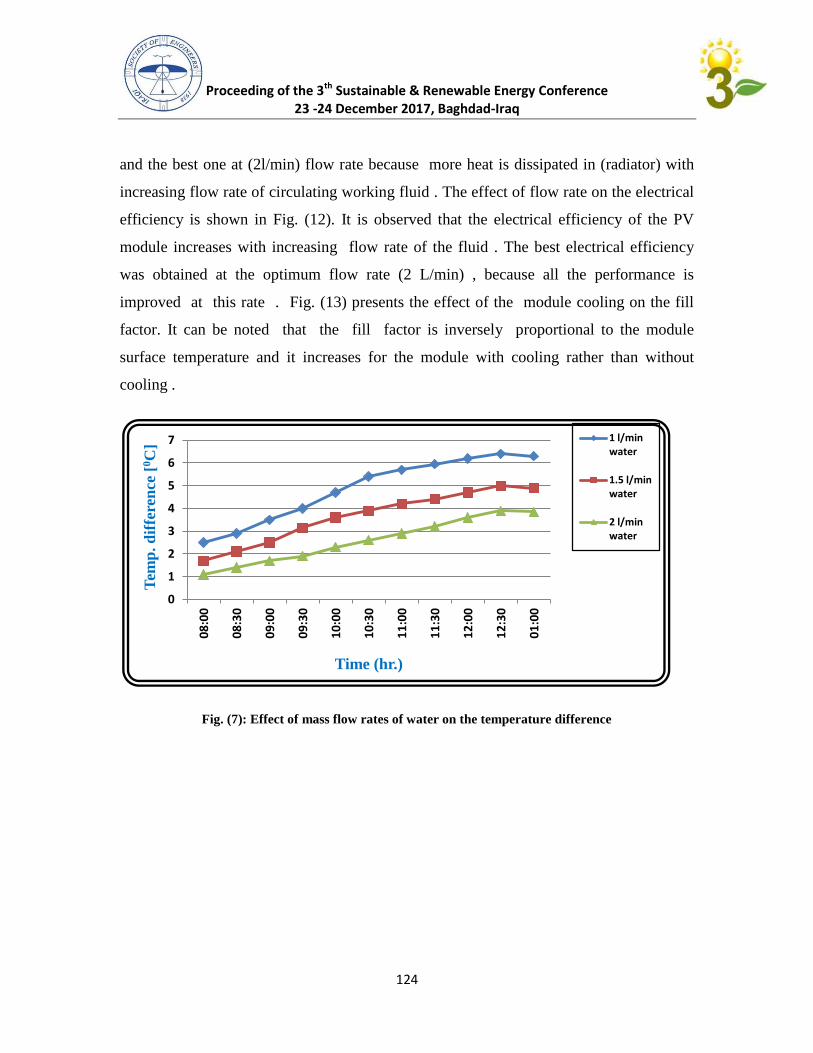
Proceeding of the 3th Sustainable & Renewable Energy Conference 23 -24 December 2017, Baghdad-Iraq
124
and the best one at (2l/min) flow rate because more heat is dissipated in (radiator) with
increasing flow rate of circulating working fluid . The effect of flow rate on the electrical
efficiency is shown in Fig. (12). It is observed that the electrical efficiency of the PV
module increases with increasing flow rate of the fluid . The best electrical efficiency
was obtained at the optimum flow rate (2 L/min) , because all the performance is
improved at this rate . Fig. (13) presents the effect of the module cooling on the fill
factor. It can be noted that the fill factor is inversely proportional to the module
surface temperature and it increases for the module with cooling rather than without
cooling .
Fig. (7): Effect of mass flow rates of water on the temperature difference
0
1
2
3
4
5
6
7
08
:00
08
:30
09
:00
09
:30
10
:00
10
:30
11
:00
11
:30
12
:00
12
:30
01
:00
Tem
p. d
iffe
ren
ce [
0C
]
Time (hr.)
1 l/min water
1.5 l/min water
2 l/min water
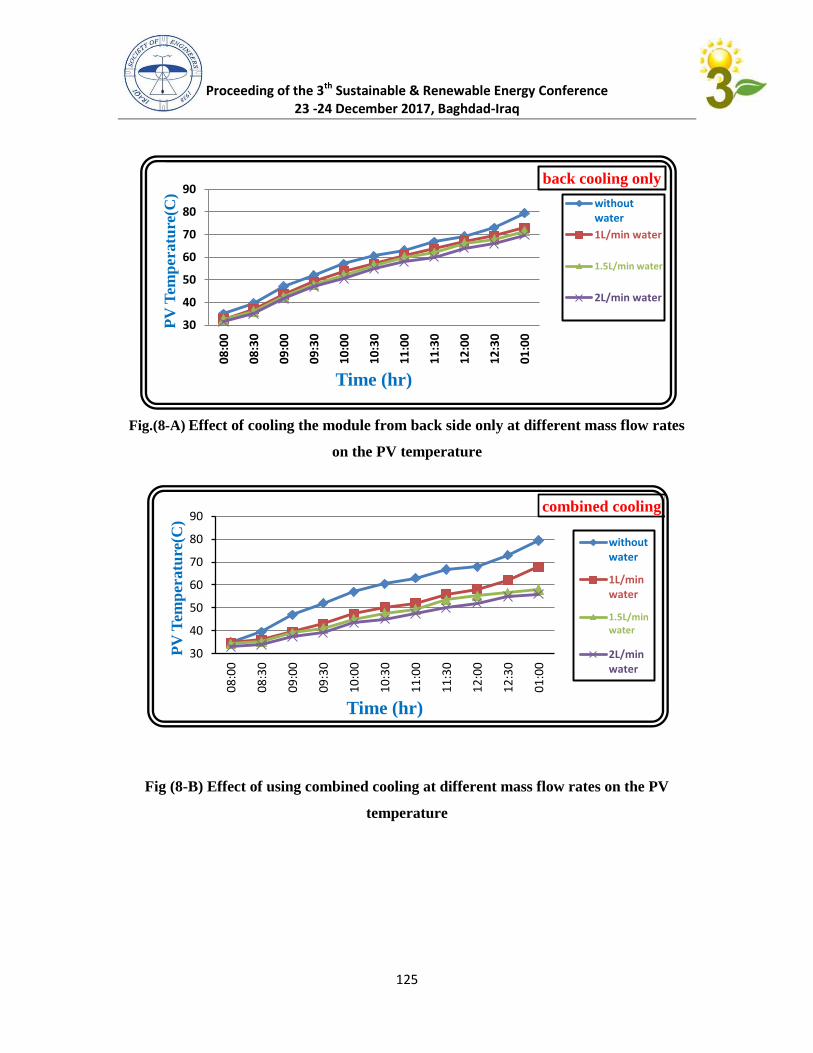
Proceeding of the 3th Sustainable & Renewable Energy Conference 23 -24 December 2017, Baghdad-Iraq
125
Fig.(8-A) Effect of cooling the module from back side only at different mass flow rates
on the PV temperature
Fig (8-B) Effect of using combined cooling at different mass flow rates on the PV
temperature
30
40
50
60
70
80
90
08
:00
08
:30
09
:00
09
:30
10
:00
10
:30
11
:00
11
:30
12
:00
12
:30
01
:00
PV
Tem
per
atu
re(C
)
Time (hr)
back cooling only
without water
1L/min water
1.5L/min water
2L/min water
30
40
50
60
70
80
90
08
:00
08
:30
09
:00
09
:30
10
:00
10
:30
11
:00
11
:30
12
:00
12
:30
01
:00
PV
Tem
per
atu
re(C
)
Time (hr)
combined cooling
without water
1L/min water
1.5L/min water
2L/min water
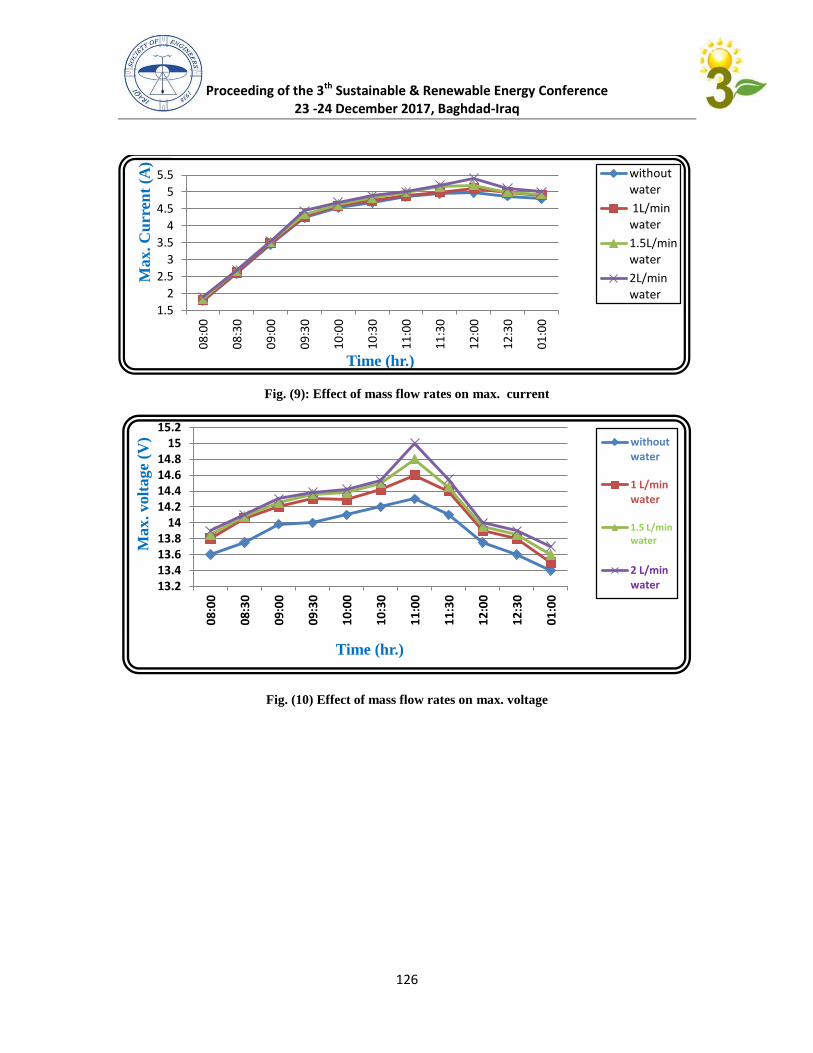
Proceeding of the 3th Sustainable & Renewable Energy Conference 23 -24 December 2017, Baghdad-Iraq
126
Fig. (9): Effect of mass flow rates on max. current
Fig. (10) Effect of mass flow rates on max. voltage
1.5
2
2.5
3
3.5
4
4.5
5
5.5
08
:00
08
:30
09
:00
09
:30
10
:00
10
:30
11
:00
11
:30
12
:00
12
:30
01
:00
Max. C
urr
ent
(A)
Time (hr.)
without water
1L/min water
1.5L/min water
2L/min water
13.2 13.4 13.6 13.8
14 14.2 14.4 14.6 14.8
15 15.2
08
:00
08
:30
09
:00
09
:30
10
:00
10
:30
11
:00
11
:30
12
:00
12
:30
01
:00
Max. volt
age
(V)
Time (hr.)
without water
1 L/min water
1.5 L/min water
2 L/min water
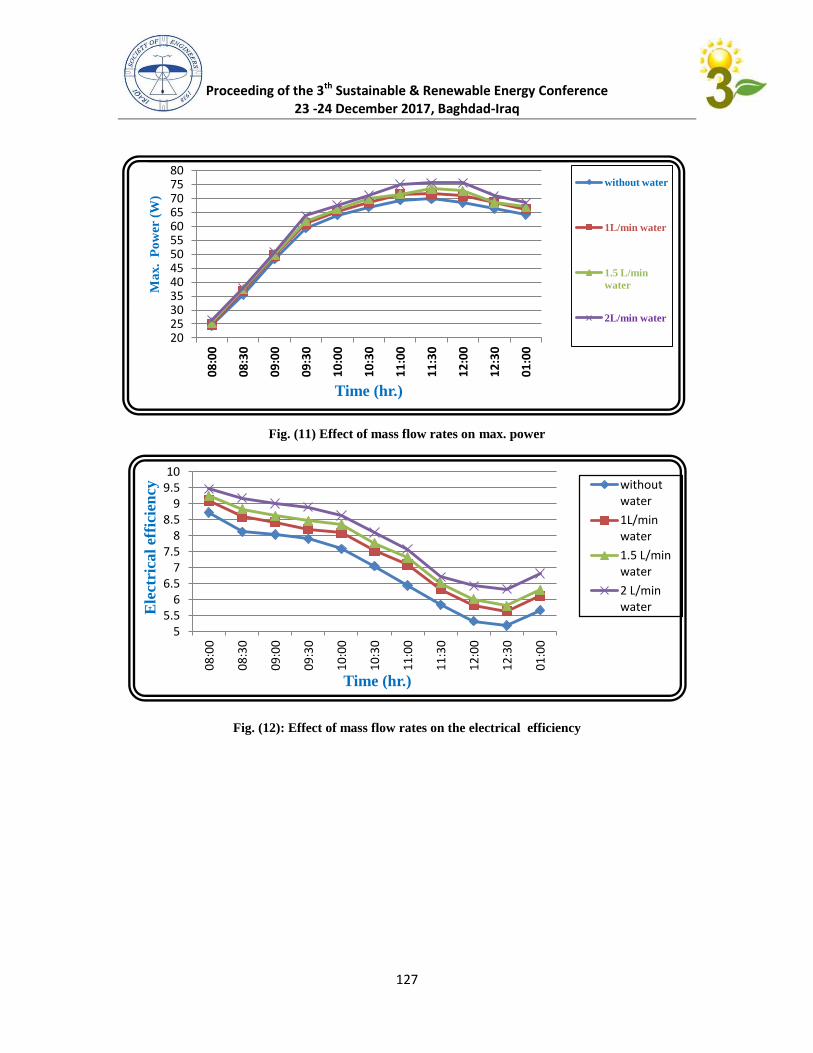
Proceeding of the 3th Sustainable & Renewable Energy Conference 23 -24 December 2017, Baghdad-Iraq
127
Fig. (11) Effect of mass flow rates on max. power
Fig. (12): Effect of mass flow rates on the electrical efficiency
20 25 30 35 40 45 50 55 60 65 70 75 80
08
:00
08
:30
09
:00
09
:30
10
:00
10
:30
11
:00
11
:30
12
:00
12
:30
01
:00
Ma
x. P
ow
er (
W)
Time (hr.)
without water
1L/min water
1.5 L/min
water
2L/min water
5 5.5
6 6.5
7 7.5
8 8.5
9 9.5 10
08
:00
08
:30
09
:00
09
:30
10
:00
10
:30
11
:00
11
:30
12
:00
12
:30
01
:00
Ele
ctri
cal
effi
cien
cy
Time (hr.)
without water
1L/min water
1.5 L/min water
2 L/min water

Proceeding of the 3th Sustainable & Renewable Energy Conference 23 -24 December 2017, Baghdad-Iraq
128
Fig. (13): Effect of mass flow rates on the fill factor
3.3 The performance of PV water pumping system
The objective accomplished through this study is the investigation of the effect of solar
radiation changing on the pumping system performances. From the results, it's observed
that the increase of solar radiation led to increase the pump flow . The speed of
running motor was affected by the value of the voltage , therefore when the PV module
was operate at high temperatures the generated voltage was decreased . Which led to
decrease the output of the DC pump whereas the output of DC pump increased with e
increased the generated voltage .It is inferred that making a film of water on the front
side of the PV panel and circulating the working fluid through pipes at the rear side of the
PV panel led to substantially enhanced performance of the system due to the sizable
increase of the received power by improving performance of PV module as shown in
Figs. (14).
0.4
0.5
0.6
0.7
0.8
08
:00
08
:30
09
:00
09
:30
10
:00
10
:30
11
:00
11
:30
12
:00
12
:30
01
:00
Fil
l f
act
or
Time (hr.)
FF without
water
FF at 1L\min
FF at 1.5L\min
water
FF at 2L\min
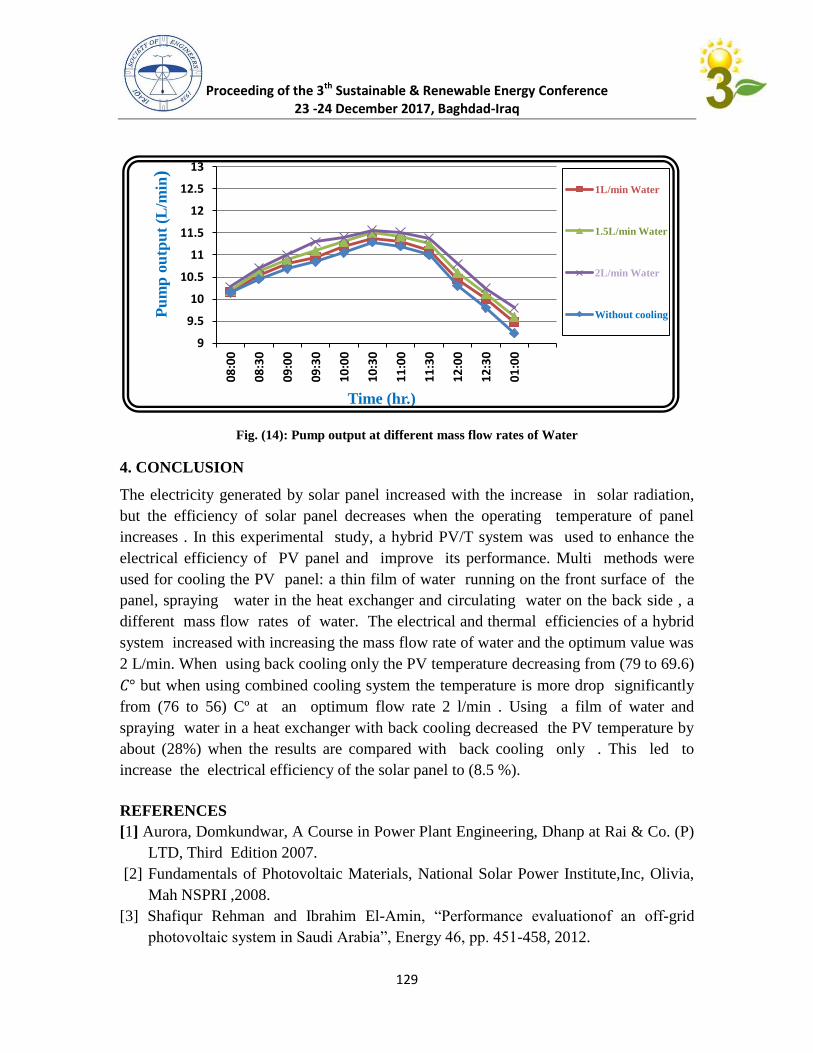
Proceeding of the 3th Sustainable & Renewable Energy Conference 23 -24 December 2017, Baghdad-Iraq
129
Fig. (14): Pump output at different mass flow rates of Water
4. CONCLUSION
The electricity generated by solar panel increased with the increase in solar radiation,
but the efficiency of solar panel decreases when the operating temperature of panel
increases . In this experimental study, a hybrid PV/T system was used to enhance the
electrical efficiency of PV panel and improve its performance. Multi methods were
used for cooling the PV panel: a thin film of water running on the front surface of the
panel, spraying water in the heat exchanger and circulating water on the back side , a
different mass flow rates of water. The electrical and thermal efficiencies of a hybrid
system increased with increasing the mass flow rate of water and the optimum value was
2 L/min. When using back cooling only the PV temperature decreasing from (79 to 69.6)
but when using combined cooling system the temperature is more drop significantly
from (76 to 56) Cº at an optimum flow rate 2 l/min . Using a film of water and
spraying water in a heat exchanger with back cooling decreased the PV temperature by
about (28%) when the results are compared with back cooling only . This led to
increase the electrical efficiency of the solar panel to (8.5 %).
REFERENCES
[1] Aurora, Domkundwar, A Course in Power Plant Engineering, Dhanp at Rai & Co. (P)
LTD, Third Edition 2007.
[2] Fundamentals of Photovoltaic Materials, National Solar Power Institute,Inc, Olivia,
Mah NSPRI ,2008.
[3] Shafiqur Rehman and Ibrahim El-Amin, “Performance evaluationof an off-grid
photovoltaic system in Saudi Arabia”, Energy 46, pp. 451-458, 2012.
9
9.5
10
10.5
11
11.5
12
12.5
13
08
:00
08
:30
09
:00
09
:30
10
:00
10
:30
11
:00
11
:30
12
:00
12
:30
01
:00
Pu
mp
ou
tpu
t (L
/min
)
Time (hr.)
1L/min Water
1.5L/min Water
2L/min Water
Without cooling
Proceeding of the 3th Sustainable & Renewable Energy Conference 23 -24 December 2017, Baghdad-Iraq
130
[4] K.E. Park , G.H. Kang, H.I. Kim, G.J. Yu, and J.T. Kim, “Analysis of thermaland
electrical performance of semi –transparent photovoltaic (PV) module”, Energy,
Vol. 35, pp. 2681–2687, 2012.
[5] Rehan A., Effect of Solar Panel Cooling on Photovoltaic Performance, Thesis,
Southern Illinois University Edwardsville, p.p. 56, 2014.
[6] Rodrigues EMG, Melı´cio R, Mendes VMF, Catala˜o JPS., "Simulation of a solar cell
considering single-diode equivalent circuit model", International conferenceon
renewable energies andpower quality, Spain, 13–15 April 2011.
[7] B.HKhan, Non-Conventional Energy Sources, TatMcGraw- Hill Education Private
Limited, New Delhi, SecondEdition, pp 2-182.
[8] Chow TT, " A review on photovoltaic/thermal hybrid solar technology " ,Applied
Energy,Vol. 87, pp.365–379, 2010.
[9]Salih, S. M., Abd, O. I. and Abid, K. W. "Performance enhancementof PV arraybased
on waterspraying technique", I J of Sustainable and Green Energy,vol.4, pp. 8-13,
2015.
[10] Dorobanțu, L., Popescu, M. O., Popescu, C. L. and Crăciunescu, A., "Experimental
Assessmentof PV Panels FrontWater Cooling Strategy", InternationalConference on
Renewable Energiesand PowerQuality, vol.1, , No.11,pp.1-4, March 2013.
[11] Chao-Yang Huanga, Hsien-Chao Sung, Kun-Lung Yen," Experimental Studyof
Photovoltaic/Thermal (PV/T)Hybrid System", International Journalof Smart Grid
and Clean Energy, Vol. 2, No. 2, p.p. 1-6, 2013.
[12] R. Darby, Chemical engineering fluid mechanics, 2nd
ed. NewYork: MarcelDekker,
Inc; 2001.
[13] Jaafar A.,Satinder Tayal andMushtaqAlasadi. "Heat transferthrougheat
exchangerusing Al2O3 nanofluidatdifferent concentrations", Case Studiesin Thermal
Engineering,vol.1, PP.38-44, 2013.
[14] Adnan M.Hussein, R.," Experimental Measurements of Nanofluids Thermal
Properties", International Journalof Automotive and Mechanical
Engineering(IJAME), Volume 7, pp. 850-863, 2013.
[15]Ibrahim E.El-seesy, T.Khaliand Mohamed H.Ahmed,"Experimental Investigations
and Developing of Photovoltaic /ThermalSystem",World Applied Sciences
Journal,vol.19, pp.1342-1347,2012.
[16] H. CheikhEL Hocine and M.Marir-Benabbas, "Study of Electrical and Thermal
Performance of AHybrid PVT Collector", International Journal of Electrical and
Electronics Engineering Research (IJEEER), vol. 3, No. 4, pp. 95–106, 2013.
Proceeding of the 3th Sustainable & Renewable Energy Conference 23 -24 December 2017, Baghdad-Iraq
131
Effect of Thickness and Annealing Temperature on the Optical,
Structural and Electrical properties and (I-V) of the Solar Cell
CdTe / CdS
* D. Ramez Ahmed Mohamed ** Dr. Falah Ibrahim Mustafa* Dhuha Kareem Harfash
* University of Baghdad / Department of Physics / College of Science for Women
** Solar Research Center/ ministry of science and technology, Baghdad, Iraq
[email protected] [email protected] [email protected]
Abstract
Thin films of CdTe were prepared in the thickness (500 and 1000 nm) on the glass substrate
by vacuum evaporation technique at room temperature then put in different annealing
temperatures (300,373,473,573)K for one hour. from the study Structural properties of the
thin films by the X - ray diffraction, we found polycrystalline nature and with a preferred
orientation along [111] cubic and increasing density when increasing the annealing
temperature and found the new peaks at the annealing temperature of (573) K for CdO. The
Transmittance spectrum were recorded as a function of wavelength range (500-1100) nm. The
energy gap increase when the increase thickness and annealing temperature. Results values of
the electrical conductivity, Hall parameters and the properties of (I-V) were measured in
darkness and light. Were found that the thin films have ability to manufacture solar cells, that
found (η =2.18) for structure solar cell (Algrid / CdS / CdTe / AL) at 1000 nm thickness with
CdTe film at RT.
Keywords: thin films, CdTe, thermal evaporation technique, X - ray diffraction.
I-Vدراسة تاثير تغير السمك ودرجة حرارة التلدين على الخواص البصرية والتركيبية والكهربائية وخواص الغشية
CdTe/CdSالخلية الشمسية
فالح ابراهيم مصطفى .د** ضحى كريم حرفش* رامز احمد محمد . د.م.أ*
مركز بحوث الطاقة الشمسية** كلية العلوم للبنات لفيزياءقسم ا /جامعة بغداد*
الخالصة
المرسبة على قواعد زجاجية بطريقة التبخير الحراري ( 1000nm)و( 500nm)عند السمك CdTeحضرت اغشية
K(373,473,573 )وجرى تلدين النماذج عند درجة حرارة .للقاعدة المرسبة عليها RTحرارة الغرفة بالفراغ عند درجة
فوجد ان تركيب االغشية كان .XRDوقد تمت دراسة الخواص التركيبية باعتماد حيود االشعة السينية .لمدة ساعة واحدة
وحدوث زيادة في شدة الحيود بزيادة درجة جرارة التلدين [111]متعدد البلورات وامتالكها تركيبا مكعبا مع هيمنة االتجاه
-nm(500وسجل طيف النفاذية كدالة للطول الموجي CdOلمادة K(573 )مع ظهور قمم جديدة عند درجة حرارة
وقد شملت الثوابت.وطبيعة االنتقال والثوابت البصرية دالة لطاقة الفوتون ,ولألغشية كافة لمعرفة فجوة الطاقة ( 1100
ولقد وجد ان قيم فجوة الطاقة لالنتقال المباشر المسموح تزداد مع زيادة درجة حرارة ,البصرية حساب معامل االنكسار
تغير قيم كل من تركيز حامالت الشحنة والتحركية ومعامل هول كدالة التلدين كما وتم قياس قيمة التوصيلة الكهربائية و
في الظالم والضوء فتبين ان اغشية لها القابلية لتصنيع خاليا (I-V)اس خواص لدرجات حرارة التلدين والسمك كما وتم قي
الغشية nm(1000 )بسمك (Algrid/CdS/CdTe/AL)للخاليا الشمسية ( η=(%2.18الشمسية كما وتم ايجاد كفاءة
(CdTe ) (300)في درجة حرارةK.
.حيود االشعة السينية ,التبخير الحراري في الفراغ, CdTeأغشية: الكلمات المفتاحية
Proceeding of the 3th Sustainable & Renewable Energy Conference 23 -24 December 2017, Baghdad-Iraq
131
Introduction:
CdTe is a crystalline compound formed from cadmium and tellurium. It is II–VI
semiconductor with zinc blende crystal structure. It is used as an infrared optical window and
a solar cell material.it is usually sandwiched with cadmium sulfide to form a p–n junction
photovoltaic solar cell. CdTe is a direct band gap semiconductor and has a narrow band gap
of 1.44 eV, which is a suitable difference of energy range for converting solar radiation into
electricity. Also, this band gap can bring a large optical absorption coefficient for transporting
photons. It can allow more incidents light to be absorbed within a slight piece of CdTe.
Usually, CdTe shows the p–type semiconductor because the Cd vacancies are present. For the
optical properties, it can emit the light with wavelength 855 nm which belongs to red color.
Moreover, it has fluorescence in the visible range. . It has the greatest electro– optic
coefficient of the linear electro–optic effect among II–VI compound crystals. CdTe doped
with chlorine is used as a radiation for x–rays, gamma rays, beta particles and alpha particles.
It can operate at room temperature allowing the construction of compact detectors for a wide
variety of applications in nuclear spectroscopy[1]CdTe could be doped with both n- and p-
type materials using a large number of preparation methods / techniques such as vacuum
deposition [2], electro-deposition [3], [4], metal-organic chemical vapour deposition [5], [6],
close-space sublimation [7], [8] The band gap values found to be in good agreement with
those published in the literature of CdTe [9], [10].
Experimental Work
In this research, we have arranged a thin layer of cadmium spectra on glass bases at R.T., and
studied the effect of annealing temperature and change of thicknees on structural and optical
properties by finding absorption coefficients and optical constants, such as energy gap and
refractive index. In this study, We use a standard CdTe alloy, of purity (99.999) % on corning
glass substrate, cleaned by methanol and washing in ultrasonic vibrator with deionized water,
were prepared by thermal evaporation technique (Edward Coating system E306A) under a
vacuum of pressure of the order (3*10-5
) mbar.
X-ray diffraction technique was used to investigate the heterojunction structures. The
experiments were carried out usingthe (Philips PW 1840) (Cu- Kα) radiation of average
wavelength 1.54056 Å. The diffraction pattern was recorded between 2θ = (10°- 60°). By
comparing the interpleader distance for different planes (dhkl) value with ASTM card for
CdTe have been examined the structure. The grain size (D) was calculated using XRD
analysis from Scherer relation [11]
D 0.9/ cos………. (1)
Where λ is X-ray wavelength, β is the full width at half maximum intensity (full width at half
maximum intensity (FWHM)) and θ is the diffraction angle (Bragg angle). The grain size was
calculated using FWHM of (111) plane.
The optical properties that include the (T) Transmittance of the annealing temperature
(373,473,573) K were measured for one hour. Using-Vis-Spectrophotometer type (UV-2610)
within the range of wavelength (200-1100) nm, calculation energy gap and refractive
index.Werecalculated the value of the electrical connection was measured using a (Keithly
2182A) nanovoltmeter device. It was found that there was twoactivation energy and a change
in the values of the concentration of the charge and movement carriers and the Hall
coefficient.Were calculated The properties of( I-V) in darkness and light using the( Keithly
6517B) Electrometer device. It was found that the films had the potential to manufacture solar
cells and was found the efficiency of hybrid differs (Algrid / CdS / CdTe / AL).
Proceeding of the 3th Sustainable & Renewable Energy Conference 23 -24 December 2017, Baghdad-Iraq
133
Results and discussion
From Figure (1), which represents XRD results for the pure CdTe films of the temperature K
(300), it has three peaks in the direction [111] [202] [311], which means that the pure films
have a polycrystalline (Cubic) and the dominant trend [111]. shows the effect of annealing
temperature in the films. The results of X-ray diffraction showed a marked change in the
intensity of the diffraction peaks after the thickness and the temperature of the k
(373,473.573) respectively. The thickness of the nm (500) (373,573) was indicative of
crystalline growth and the appearance of other peaks compared to standard ASTM (96-900-
8841) for CdTe. was observed at the annealing temperature (573) KAppearance of peak of
CdO at the direction (200) due to the occurrence of oxidation rate in the films due to working
conditions can be seen as in Figure (2),As for thicknees (1000) nm for the annealing
temperature (573) K In the crystalline direction (020) as well as the appearance of the
material CdO shows that an increase in the thickness and annealing temperature has an effect
on the increased crystallization of thin films, This indicates that the process of annealinghelps
improve the crystallization process. can be seen as in Figure (3).The results showed an
increase in grain size at the annealing temperature of (373,473,573)K and (1000,500) (nm) in
the preferred direction (111) , Due to the increased crystallization and decrease of crystalline
defects, tables (1) to (2) show the obtained results.
CalculatedTransmittance (T) and the relation between the Transmittance and the wavelength
(λ) were plotted with the change of both the thickness and the annealingtemperature. Seen as
in Figure (4)and (5).The increase in Transmittance with increasing wavelength for all
thinfilms.
calculated The optical energy gap of the CdTe films with the change of the thicknees before
and after the annealing by drawing the relation (αhυ) 2 as the function of the photon energy
according calculated from the equation (2)[12]Seen as in Figure (6) and(7)
αhʋ=B (hʋ-Eg opt
) r ……………………………(2)
The absorption results show that the prepared thin films have a high absorbance factor of ( <α
104cm
-1), This resulted in the elimination of the defects in the energy gap after the growth and
rearrangement of the crystalline grains, which confirmed the results of X-ray diffraction, and
this is consistent with the results of the sources [13,14].
The table (3) shows that the energy gap values are increased by (1.48-1.84) eV, (1.42-1.73)
eV, with both the (373,473,573) K and the thickness of 1000,500 (nm).
the refractive index, defined as the ratio between the velocity of light in the vacuum and its
velocity within the material, was calculated using equation (3)[14]
n=
………….…………(3)
Figure (8) (a,b)shows that the refractive index is changed as a wavelength function with each
temperature change And the shapes show that the values of the refractive index decrease by
increasing the wavelength, improvement in the crystal structure and an increase in the density
of compaction.
The effect measurements were carried out at annealing temperatures
(373,473,573) K and (1000,500) (nm)Figure (9) shows changes in the values of the
concentration of charge and kinetic carriers and the hole coefficient as a function of the
annealing temperature and thicknees,Table (4) shows that the values of Hall coefficient for all
films are of the positive type p-type. These results are consistent with the results of the
source[15].The concentration of the charge carriers increases with the increase in the
annealing temperature, while the values of the movement decrease by with the increase in the
annealing temperature.
The values of the continuous conductivity (σ d.c) using equation (4)[16]
𝛔
……………..(4)
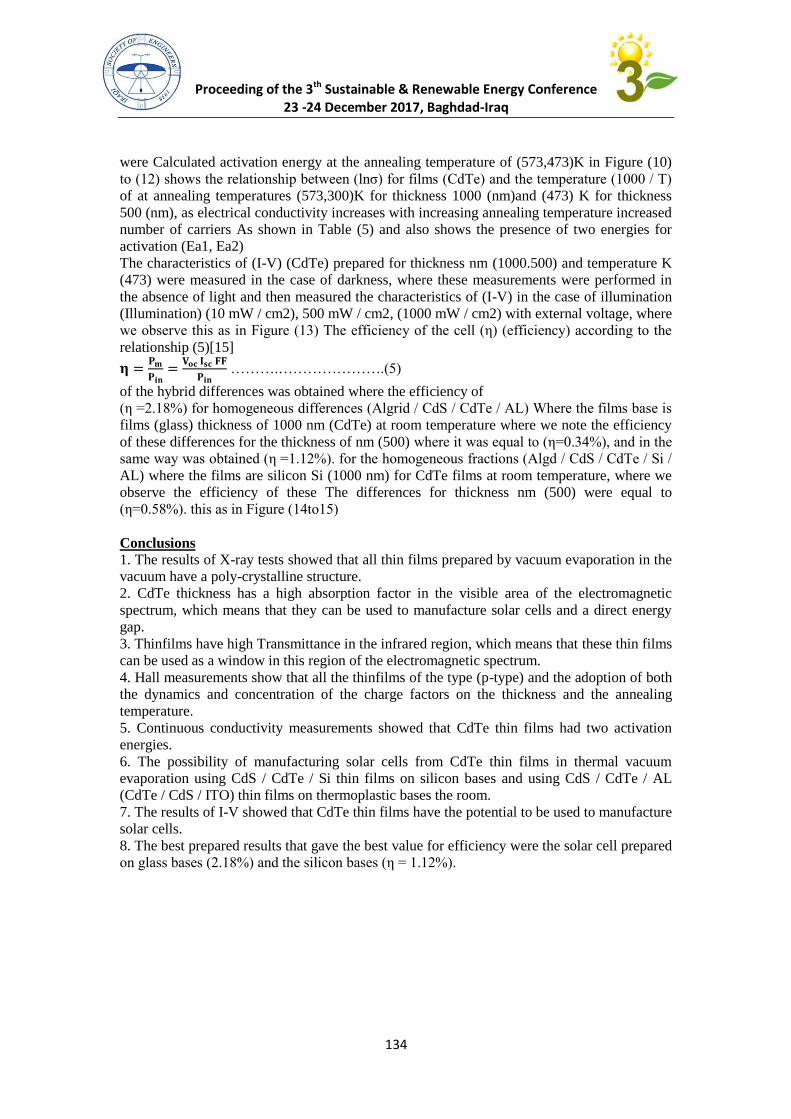
Proceeding of the 3th Sustainable & Renewable Energy Conference 23 -24 December 2017, Baghdad-Iraq
131
were Calculated activation energy at the annealing temperature of (573,473)K in Figure (10)
to (12) shows the relationship between (lnσ) for films (CdTe) and the temperature (1000 / T)
of at annealing temperatures (573,300)K for thickness 1000 (nm)and (473) K for thickness
500 (nm), as electrical conductivity increases with increasing annealing temperature increased
number of carriers As shown in Table (5) and also shows the presence of two energies for
activation (Ea1, Ea2)
The characteristics of (I-V) (CdTe) prepared for thickness nm (1000.500) and temperature K
(473) were measured in the case of darkness, where these measurements were performed in
the absence of light and then measured the characteristics of (I-V) in the case of illumination
(Illumination) (10 mW / cm2), 500 mW / cm2, (1000 mW / cm2) with external voltage, where
we observe this as in Figure (13) The efficiency of the cell (η) (efficiency) according to the
relationship (5)[15]
……….………………….(5)
of the hybrid differences was obtained where the efficiency of
(η =2.18%) for homogeneous differences (Algrid / CdS / CdTe / AL) Where the films base is
films (glass) thickness of 1000 nm (CdTe) at room temperature where we note the efficiency
of these differences for the thickness of nm (500) where it was equal to (η=0.34%), and in the
same way was obtained (η =1.12%). for the homogeneous fractions (Algd / CdS / CdTe / Si /
AL) where the films are silicon Si (1000 nm) for CdTe films at room temperature, where we
observe the efficiency of these The differences for thickness nm (500) were equal to
(η=0.58%). this as in Figure (14to15)
Conclusions
1. The results of X-ray tests showed that all thin films prepared by vacuum evaporation in the
vacuum have a poly-crystalline structure.
2. CdTe thickness has a high absorption factor in the visible area of the electromagnetic
spectrum, which means that they can be used to manufacture solar cells and a direct energy
gap.
3. Thinfilms have high Transmittance in the infrared region, which means that these thin films
can be used as a window in this region of the electromagnetic spectrum.
4. Hall measurements show that all the thinfilms of the type (p-type) and the adoption of both
the dynamics and concentration of the charge factors on the thickness and the annealing
temperature.
5. Continuous conductivity measurements showed that CdTe thin films had two activation
energies.
6. The possibility of manufacturing solar cells from CdTe thin films in thermal vacuum
evaporation using CdS / CdTe / Si thin films on silicon bases and using CdS / CdTe / AL
(CdTe / CdS / ITO) thin films on thermoplastic bases the room.
7. The results of I-V showed that CdTe thin films have the potential to be used to manufacture
solar cells.
8. The best prepared results that gave the best value for efficiency were the solar cell prepared
on glass bases (2.18%) and the silicon bases (η = 1.12%).
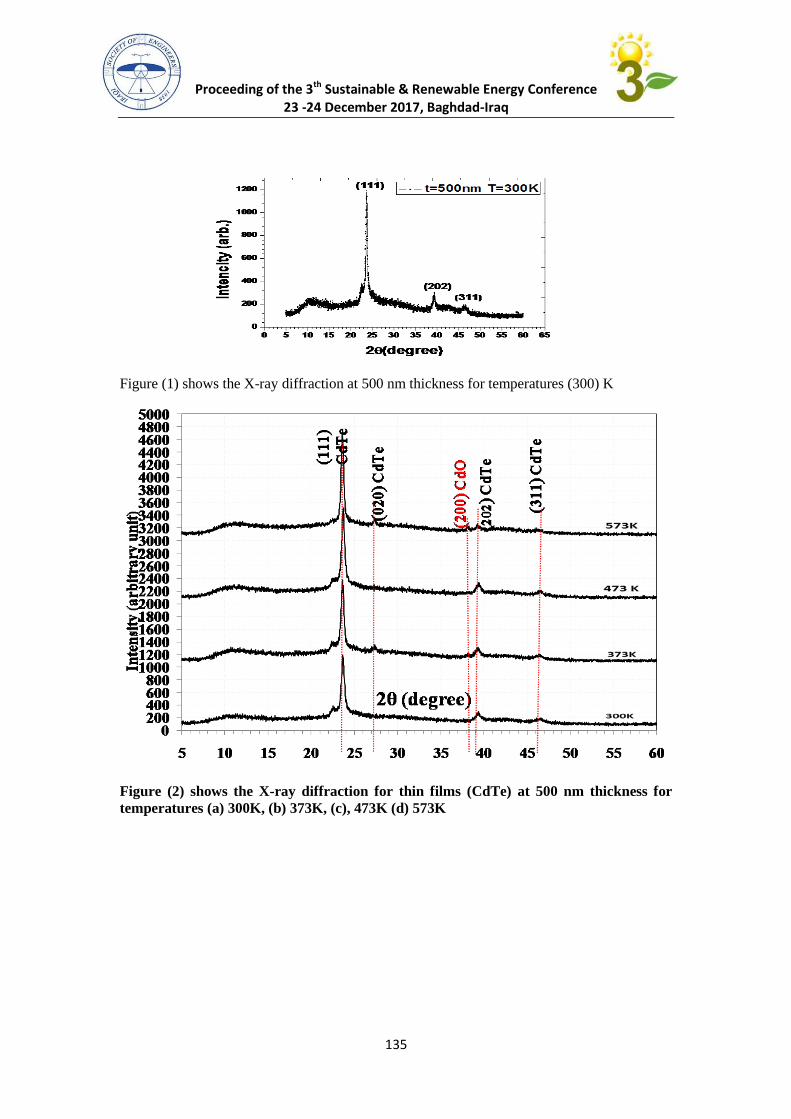
Proceeding of the 3th Sustainable & Renewable Energy Conference 23 -24 December 2017, Baghdad-Iraq
131
Figure (1) shows the X-ray diffraction at 500 nm thickness for temperatures (300) K
Figure (2) shows the X-ray diffraction for thin films (CdTe) at 500 nm thickness for
temperatures (a) 300K, (b) 373K, (c), 473K (d) 573K
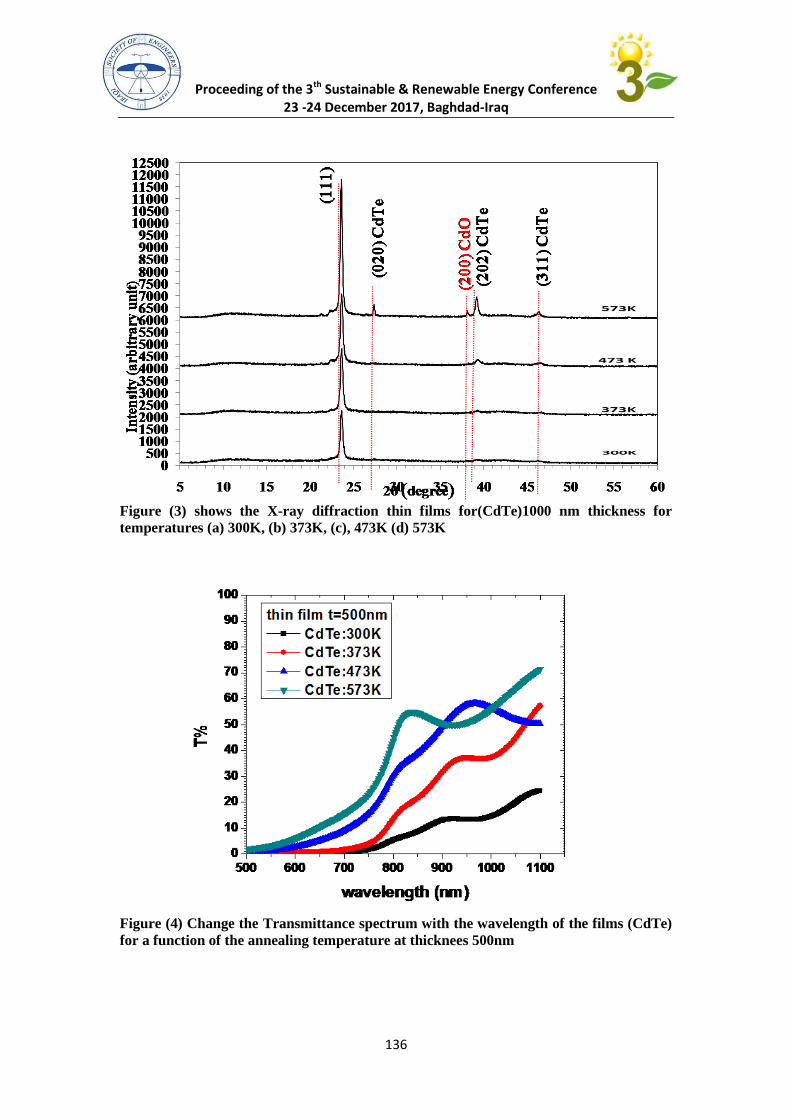
Proceeding of the 3th Sustainable & Renewable Energy Conference 23 -24 December 2017, Baghdad-Iraq
131
Figure (3) shows the X-ray diffraction thin films for(CdTe)1000 nm thickness for
temperatures (a) 300K, (b) 373K, (c), 473K (d) 573K
Figure (4) Change the Transmittance spectrum with the wavelength of the films (CdTe)
for a function of the annealing temperature at thicknees 500nm
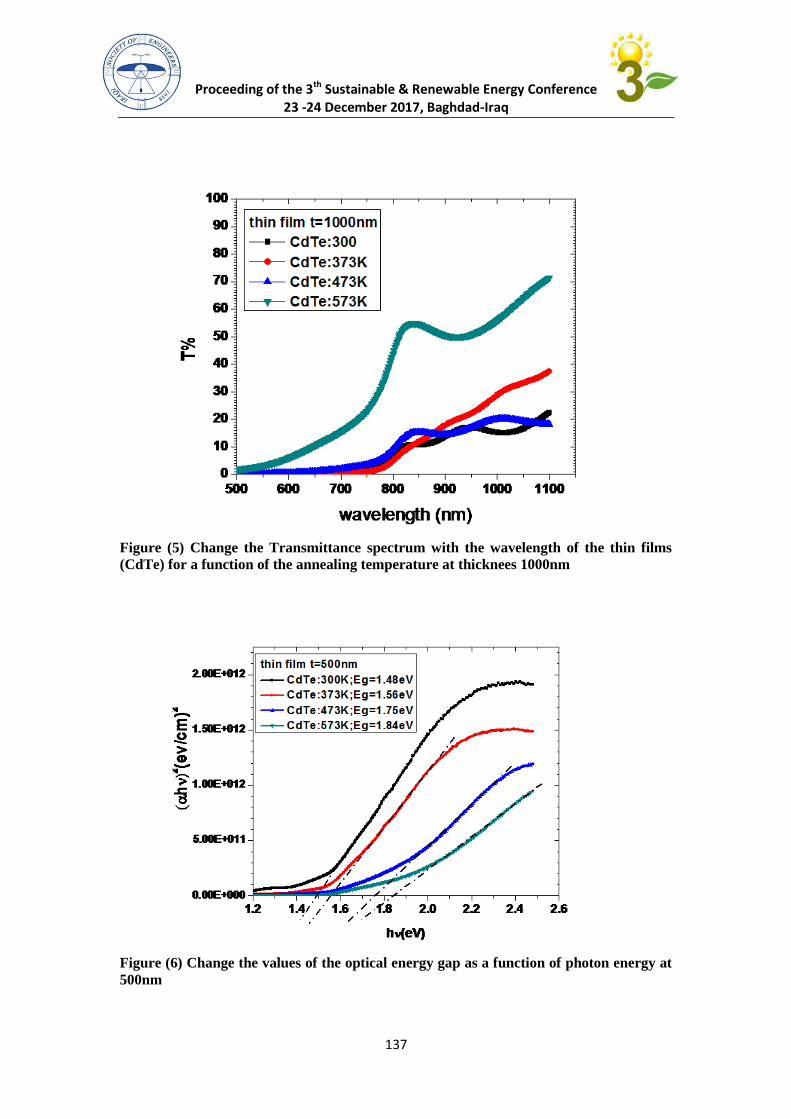
Proceeding of the 3th Sustainable & Renewable Energy Conference 23 -24 December 2017, Baghdad-Iraq
133
Figure (5) Change the Transmittance spectrum with the wavelength of the thin films
(CdTe) for a function of the annealing temperature at thicknees 1000nm
Figure (6) Change the values of the optical energy gap as a function of photon energy at
500nm
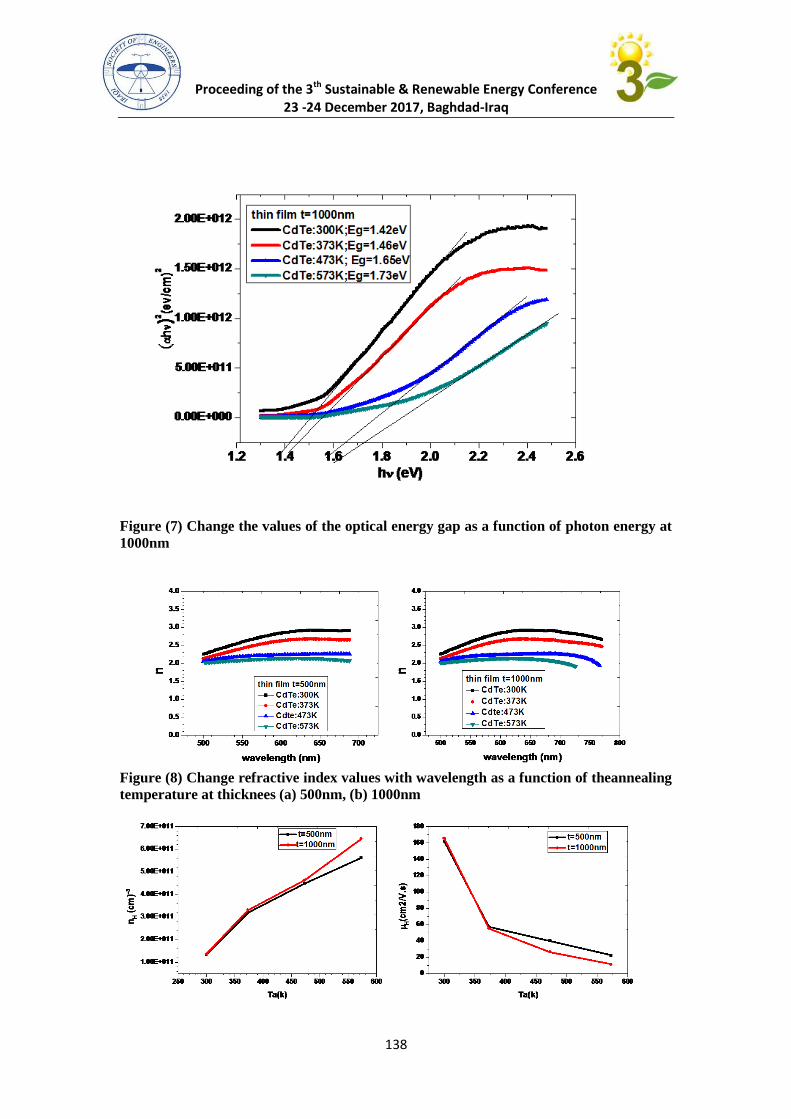
Proceeding of the 3th Sustainable & Renewable Energy Conference 23 -24 December 2017, Baghdad-Iraq
131
Figure (7) Change the values of the optical energy gap as a function of photon energy at
1000nm
Figure (8) Change refractive index values with wavelength as a function of theannealing
temperature at thicknees (a) 500nm, (b) 1000nm
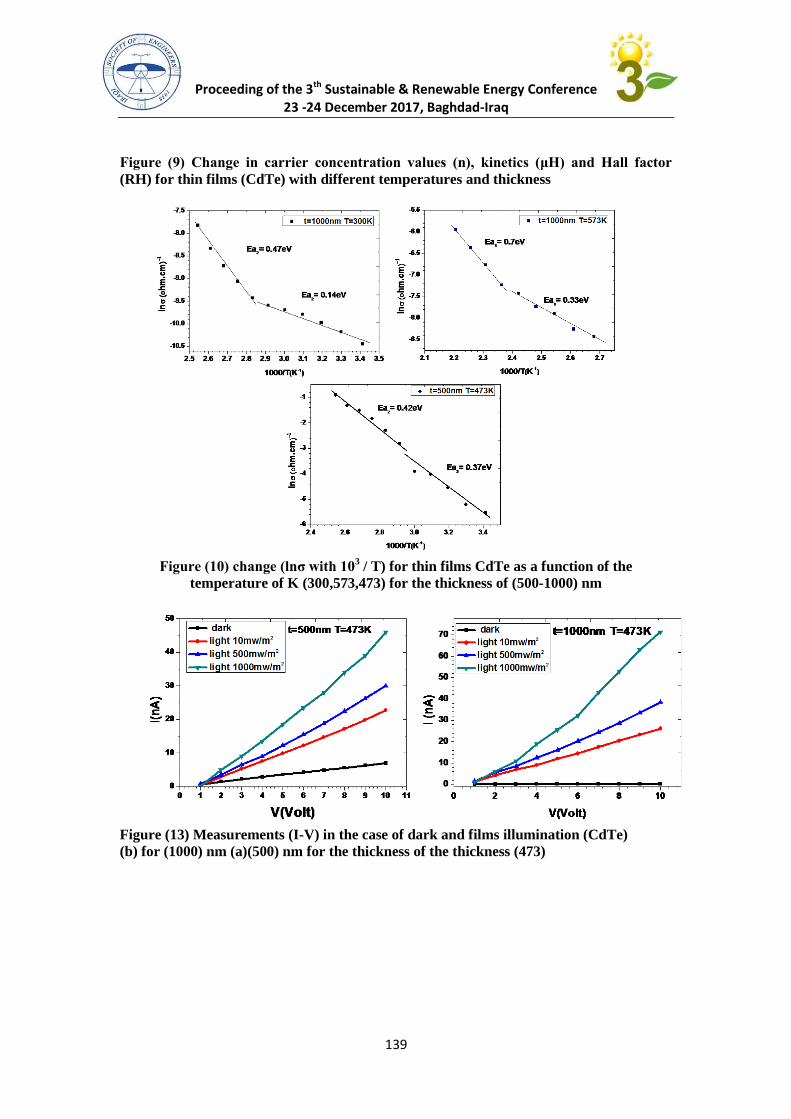
Proceeding of the 3th Sustainable & Renewable Energy Conference 23 -24 December 2017, Baghdad-Iraq
131
Figure (9) Change in carrier concentration values (n), kinetics (μH) and Hall factor
(RH) for thin films (CdTe) with different temperatures and thickness
Figure (10) change (lnσ with 10
3 / T) for thin films CdTe as a function of the
temperature of K (300,573,473) for the thickness of (500-1000) nm
Figure (13) Measurements (I-V) in the case of dark and films illumination (CdTe)
(b) for (1000) nm (a)(500) nm for the thickness of the thickness (473)
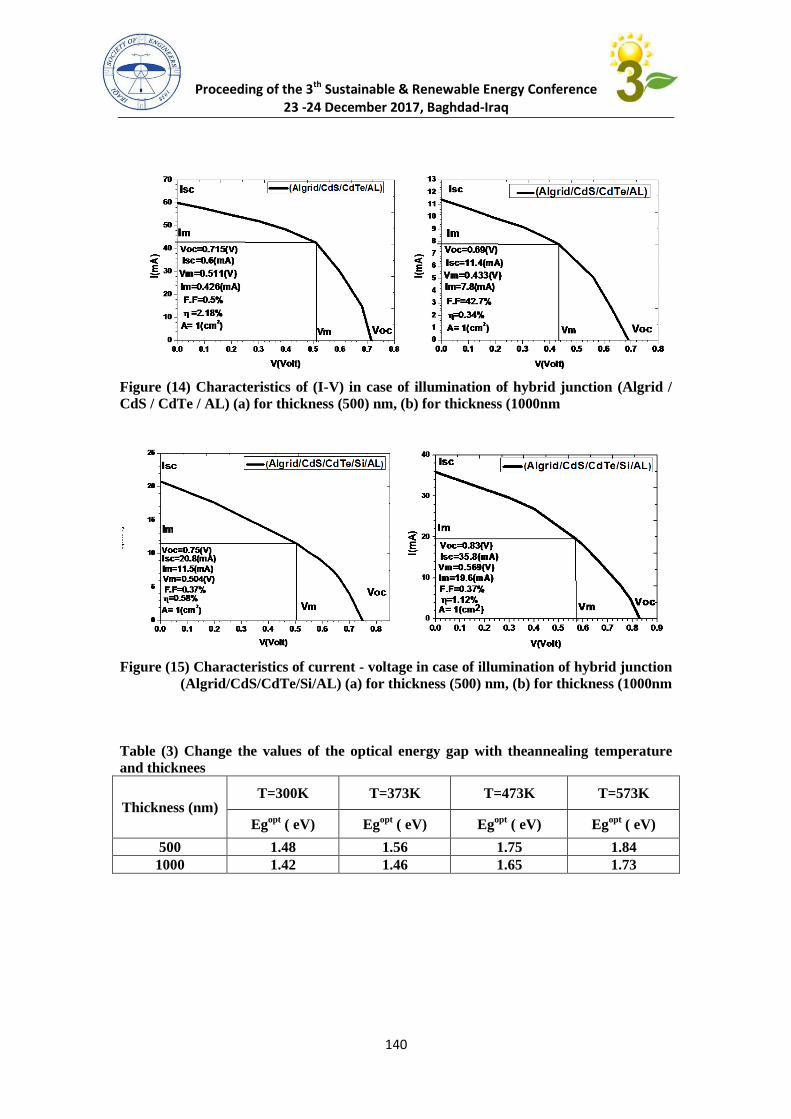
Proceeding of the 3th Sustainable & Renewable Energy Conference 23 -24 December 2017, Baghdad-Iraq
111
Figure (14) Characteristics of (I-V) in case of illumination of hybrid junction (Algrid /
CdS / CdTe / AL) (a) for thickness (500) nm, (b) for thickness (1000nm
Figure (15) Characteristics of current - voltage in case of illumination of hybrid junction
(Algrid/CdS/CdTe/Si/AL) (a) for thickness (500) nm, (b) for thickness (1000nm
Table (3) Change the values of the optical energy gap with theannealing temperature
and thicknees
T=573K T=473K T=373K T=300K Thickness (nm)
Egopt
( eV) Egopt
( eV) Egopt
( eV) Egopt
( eV)
1.84 1.75 1.56 1.48 500
1.73 1.65 1.46 1.42 1000
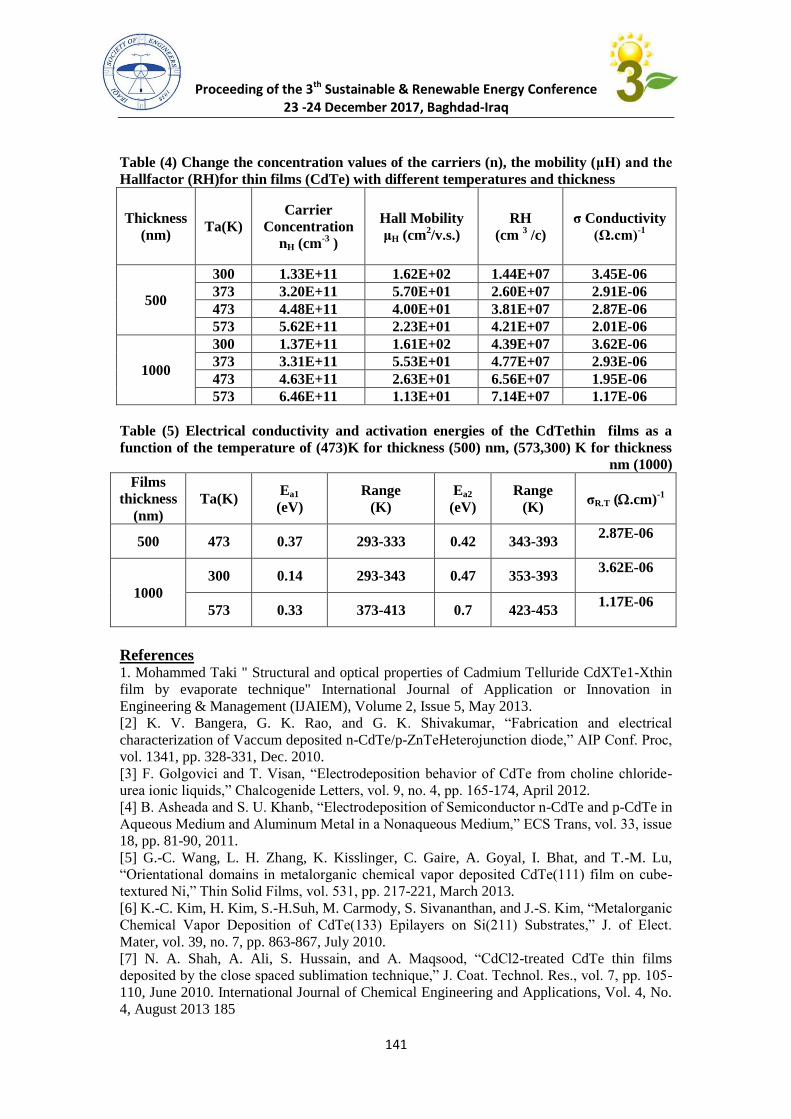
Proceeding of the 3th Sustainable & Renewable Energy Conference 23 -24 December 2017, Baghdad-Iraq
111
Table (4) Change the concentration values of the carriers (n), the mobility (μH) and the
Hallfactor (RH)for thin films (CdTe) with different temperatures and thickness
σ Conductivity
(Ω.cm)-1
RH
(cm 3 /c)
Hall Mobility
μH (cm2/v.s.)
Carrier
Concentration
nH (cm-3
)
Ta(K) Thickness
(nm)
3.45E-06 1.44E+07 1.62E+02 1.33E+11 300
500 2.91E-06 2.60E+07 5.70E+01 3.20E+11 373
2.87E-06 3.81E+07 4.00E+01 4.48E+11 473
2.01E-06 4.21E+07 2.23E+01 5.62E+11 573
3.62E-06 4.39E+07 1.61E+02 1.37E+11 300
1000 2.93E-06 4.77E+07 5.53E+01 3.31E+11 373
1.95E-06 6.56E+07 2.63E+01 4.63E+11 473
1.17E-06 7.14E+07 1.13E+01 6.46E+11 573
Table (5) Electrical conductivity and activation energies of the CdTethin films as a
function of the temperature of (473)K for thickness (500) nm, (573,300) K for thickness
nm (1000)
σR.T (.cm)-1
Range
(K)
Ea2
(eV)
Range
(K)
Ea1
(eV) Ta(K)
Films
thickness
(nm)
2.87E-06
343-393 0.42 293-333 0.37 473 500
3.62E-06
353-393 0.47 293-343 0.14 300
1000 1.17E-06
423-453 0.7 373-413 0.33 573
References 1. Mohammed Taki " Structural and optical properties of Cadmium Telluride CdXTe1-Xthin
film by evaporate technique" International Journal of Application or Innovation in
Engineering & Management (IJAIEM), Volume 2, Issue 5, May 2013.
[2] K. V. Bangera, G. K. Rao, and G. K. Shivakumar, “Fabrication and electrical
characterization of Vaccum deposited n-CdTe/p-ZnTeHeterojunction diode,” AIP Conf. Proc,
vol. 1341, pp. 328-331, Dec. 2010.
[3] F. Golgovici and T. Visan, “Electrodeposition behavior of CdTe from choline chloride-
urea ionic liquids,” Chalcogenide Letters, vol. 9, no. 4, pp. 165-174, April 2012.
[4] B. Asheada and S. U. Khanb, “Electrodeposition of Semiconductor n-CdTe and p-CdTe in
Aqueous Medium and Aluminum Metal in a Nonaqueous Medium,” ECS Trans, vol. 33, issue
18, pp. 81-90, 2011.
[5] G.-C. Wang, L. H. Zhang, K. Kisslinger, C. Gaire, A. Goyal, I. Bhat, and T.-M. Lu,
“Orientational domains in metalorganic chemical vapor deposited CdTe(111) film on cube-
textured Ni,” Thin Solid Films, vol. 531, pp. 217-221, March 2013.
[6] K.-C. Kim, H. Kim, S.-H.Suh, M. Carmody, S. Sivananthan, and J.-S. Kim, “Metalorganic
Chemical Vapor Deposition of CdTe(133) Epilayers on Si(211) Substrates,” J. of Elect.
Mater, vol. 39, no. 7, pp. 863-867, July 2010.
[7] N. A. Shah, A. Ali, S. Hussain, and A. Maqsood, “CdCl2-treated CdTe thin films
deposited by the close spaced sublimation technique,” J. Coat. Technol. Res., vol. 7, pp. 105-
110, June 2010. International Journal of Chemical Engineering and Applications, Vol. 4, No.
4, August 2013 185
Proceeding of the 3th Sustainable & Renewable Energy Conference 23 -24 December 2017, Baghdad-Iraq
111
[8] J. Schaffner, M. Motzko, A. Tueschen, A. Swirschuk, H.-J. Schimper, A. Klein, T. Modes,
O. Zywitzki, and W. Jaegermann, “12% efficient CdTe/CdS thin films solar Cells deposited
by low temperature close space sublimation,” J. Appl. Phys, vol. 110, pp. 1-6, Sept. 2011
[9] S. Sarkar, S. Pal, and P. Sarkar, “Electronic structure and band gap engineering of CdTe
semiconductor nanowires,” J. Mater. Chem., vol. 22, pp. 10716-10724, April 2012.
[10] J. Park, W. M. Jung, M. Song, W. Y. Lee, H. Kim, and I.-W. Shim, “Preparation of PbS-
coated CdTe Nanocrystals through Sono chemical Reaction,” Bull. Korean Chem. Soc. vol.
34, no. 2, pp. 680-682, Jan. 2013.
[11] S. Honey, M. T. Bhatti, S. Riaz, and S. Naseem, “Optical Properties of CdTe Films
Prepared by Centrifugal Coating Technique,” Adv. Sc. Lett, vol. 19, no. 3, pp. 866-868,
March 2013.
[12] Subhash Chander* and M. S. Dhaka"Preparation and physical characterization of CdTe
thin films deposited by vacuum evaporation for photovoltaic applications"
10.5185/amlett.2015.5926,2015
[13] E. R. Shaaban, N. Afify, and A. El-Taher, “Effect of film thickness on
microstructure parameters and optical constants of CdTe thin films”, Journal of Alloys and
Compounds Vol. 482, pp.(400-404), (2009).
[14] Mustafa Mohammed "Study the optical, electrical and structural properties of silicon-
based CdTe solar cell", College of Science, University of Baghdad,(2013).
[15] M. F.A. Alias, R. A. Abdullah, M. A. Razooqi, A.A.Al-Douri, and A.A.Alnajjar" The
Influence of Annealing Temperature on Electrical Properties of Thermally Deposited CdTe
Films " th 4International Conference of Salahaddin University-Erbil, October 18-20, Volume
3 of 4, (2011).
[16] Shaymaa Qasim Abdul Hasan" Preparation and Study Heterojunction From CuInTe2
Material" college of education for pure science(Ibn Al-Haitham) , Baghdad University,
(2017).
Applications of Solar Energy (ASE)
Studies
Proceeding of the 3th Sustainable & Renewable Energy Conference
23 -24 December 2017, Baghdad-Iraq
411
Techno-Economic Analysis of 4MW Utility Scale Solar Photovoltaic Power Plant at
AL-Mahmudiyah/Iraq
*Samah Shyaa Oudah, **Mohammed A. Salah.
*Iraqi Creativity Centre for Sustainable Energy.
**Ministry of Electricity/Iraq.
Abstract:
The aim of this work is to analyze the solar radiation aspects, the performance and the cost-effectiveness of
designing a proposed utility scale, grid-connected PV Power Plant of 4 MW capacity to enhance the energy demand
at AL- Mahmudiyah region and encourage investment in solar PV systems. The data of Monthly averaged daily
insolation incident on a Horizontal Surface (kWh/m2/day) was obtained from NASA-SSE over the 22-year period (Jul
1983 - Jun 2005) satellite measurements. Two methods were adopted (Mathematical modeling and PVsys6.43
software package) in calculation and evaluation of the proposed project.
The average of in-plane global solar radiation of (2130.8) kWh/sq.mt/day. The PV Plant supplied the grid with an
average of 6767 MWh/year at an annual performance ratio (PR) 79.2%. The final yield (Yf) ranged from 3.53 to 5.45
kWh/kWp/day with an annual capacity factor 19.4%. The array yield (Yr) with an average value of 4.7
kWh/kWp/day. The AC output power 3.162 MW at an average system efficiency of 15.5%. The power losses were
calculated and displayed in a diagram loss.
The total investment cost was $3600000 and the internal rate of return (IRR) is 10.0%. The net present value (NPV)
is 5.027 million $ with a discounted payback period 11 years. The benefit cost ratio (B/C) was found 1.4, the overall
CO2 reduction of Emissions 122821.435 tons. The Levelized Cost of Electricity (LCOE was found 0.05 $/kWh which
exported to electric grid at selling price (Feed-in Tariff) of 0.08 $/kWh. The results of the present study illustrate
that it is possible to construct utility-scale, grid-connected PV Power Plant for generation electricity because it is a
cost-effective project and could be generalized to other governorates at Iraq and encourage governments to
impose the basic investment legislations of renewable energy. Sensitivity analysis was done to check the
uncertainty of assumed financial input parameters.
Keywords: Solar energy; Optimization; Tilt angle; Photovoltaic System, Net Present Value, Levelized cost of energy,
Payback period.
:الخالصة
ميكاواط 1افتراضية ذات طاقة تصميمية كهروضوئية طاقة وبيان مدى امكانية تصميم محطة الشمسي اإلشعاع اجراء تحليل إلى البحث يهدف
ولتكون حافزا المحمودية منطقة في الطاقة المتزايد على الطلب وجدواها االقتصادية لتعزيز الشبكة الكهربائية وبيان كفائتها وانتاجيتها تربط على
تم الحصول على بيانات االشعاع الشمسي . والمنشات والتجارية الحكومية للمباني الكهروضوئية الشمسية لالستثمار في مجال الطاقة تشجيعيا
األرصاد برنامج)المستخدمة في التحليل من وكالة الفضاء االمريكية ناسا ( يوم/ 2 م/ ساعة كيلوواط) األفقي السطح على( المتوسطات الشهرية)
تم اجراء الحسابات التصميمية وتقييم المشروع فنيا واقتصاديا .(2002 يونيو - 4891 يوليو) عاما 22 مدى على( الشمسية والطاقة السطحية الجوية
.والثانية بطريقة النمذجة الرياضية ( PVsys6.43) كاةبطريقتين وهما استخدام برنامج المحا
Proceeding of the 3th Sustainable & Renewable Energy Conference
23 -24 December 2017, Baghdad-Iraq
412
الكهروضوئية المحطة تنتج. يوم/ مربع متر/ ساعة كيلوواط( 241019) الكلي على السطوح المائلة لاللواح الشمسية الشمسي اإلشعاع متوسط بلغ
2112 إلى 1121 من النهائي العائد وتراوح. ٪6812 قيمته متوسط أداء وبمعدل سنة/ ساعة ميجاواط 7676 الكهربائية متوسط قدره وتضخ الى الشبكة
كيلوواط/ ساعة كيلوواط 116 قيمة بمتوسط المصفوفة إنتاج معدل يتراوح. ٪4811 هو السنوي القدرة وعامل يوم،/ كيلوواط ذروه/ ساعة كيلوواط
.للمشروع ٪4212 بنسبة سنوية كفاءة بمتوسط ميغاواط 11472 السنوي (AC) انتاج طاقة وتبلغ. يوم/ ذروه
وفترة دوالر، مليون 21026 هي (NPV)والقيمة الصافية الحالية , ،٪4010 هو( IRR) داخلي عائد معدلب$ 1700000 االستثمار تكلفة إجمالي
للغالف الغازي بما انبعاثات الغازات الملوثة المشروع يحد منو ،411 هي (B / C) العائد الى التكلفة وجد ان نسبة عاما، 44 هي المخصومة االسترداد
الكهربائية الشبكة إلى تصديرها يتم وان الطاقة الكهربائية التي ساعة كيلوواط/ $ LCOE) ) 0102تم احتساب . CO2طن من 4229241112 يكافيء
الكهروضوئية الطاقة توليد محطة بناء الممكن من اتبثث أنه الدراسة هذه ان نتائج .ساعة كيلوواط/ $ 0109( حسب تعريفة التغذية) البيع بسعر
وتشجيع العراق في األخرى المحافظات على تعميمها ويمكن التكلفة حيث من فعال كمشروع الكهرباء توليد واسع لغرض نطاق على بالشبكة المتصلة
المالية المدخالت معلمات من التيقن عدم من للتحقق الحساسية تحليل إجراء تم. المتجددة للطاقة األساسية االستثمارية التشريعات فرض على الحكومات
.المفترضة وبيان ايها اكثر تاثيرا على المؤشرات االقتصادية للمشروع1. Introduction
The forecasts demand of electricity which was made by the Ministry of Electricity of Iraq and Parsons Brinckerhoff,
expected to reach to about 32.5 GW by 2030[1]. A significant increasing interest in solar energy all over the world
to reduce the emission of greenhouse gases, increasing energy demand. The investing in solar energy field that are
targeted at household supply needs to be considered to reduce the reliance on fossil fuels. Therefore, the
performance of PV Power and profitability of the investment give assessment its economic viability.
The total estimated solar photovoltaic installation in Iraq till 2016 is 17 MW [2]. The average annual value of global
solar radiation in Iraq varies from (1700 to 2150) kWh/m2/year [3], which is of great importance in order to support
the investor’s expectations for system performance and the associate economic return1 It is clear that PV solar
energy will become one of the major future sources of electricity generation.
A comprehensive study for various sites in Iraq adopting measured values of solar radiation (1961–1992), were
showed the net annual solar radiation in southern 2017.77 kWh/m2/year and central regions 1755.23
kWh/m2/year and higher than in the north. The annual net annual solar radiation was found 1800.3 kWh/m2/year
[4]. In Morocco, an evaluation of a roof grid-connected photovoltaic (PV) system of 5 kW was conducted. The PV
Park supplied the grid with 6411.3 kWh during the year 2015. The performance ratio (PR was found from 58% to
98% and the annual capacity factor was found to be 14.84% while the power losses was 45.6% [2].
A Design Study of 20MW, 50MW and 100MW PV systems by using PVsys6.43. Software package in Saudi Arabia. For
the solar system 20MW it was assumed that the operation cost and maintenance of 5% of the total cost. The
annual energy was found 33.039GWh. The calculated tariff of the solar station varies from 0.216 to 0.24 $/kW/h in
comparing with the applied (Feed in tariff) with 0.013$/kW/h in Saudi Arabia , and this tariff is responsible [7, 6].
The present study proposes utility scale photovoltaic solar plant of 4MW capacity will be constructing in land by
two methods: Mathematical modeling and PVsys6.43 software package simulation. The arising question of how
much this proposed project will be acceptable from view point of technical and economical for both of the investors
and Iraqi government? The answer will be in related to following steps of analysis and evaluation to achieve the
targets of the study to asses and evaluate the following technical and economic output parameters: -
-Evaluation of PV Power Plant performance parameters, monthly and annual production of electricity injected into
the grid.
Proceeding of the 3th Sustainable & Renewable Energy Conference
23 -24 December 2017, Baghdad-Iraq
417
-Assessment of the selected site for construction the proposed PV Power Plant.
-Economic analysis and evaluation to show how the Profitability and suitability to invest in such project.
-studying the effects of technical and financial parameters on the main results of productivity, performance,
viability of the project by doing sensitivity analysis.
-The establishment of the basic outline of the plant will help to carry out a more detailed simulation of future work.
2. The Potential of Solar Radiation at selected site
The proposed Solar PV Power Plant to construct on the land at Al-Khidr district, AL- Mahmudiyah region of Iraq
as seen in the Figure (1). It is located in (40) kilometers in the southern Baghdad. The geographical location of
the selected site at 32.57 N (Latitude), 44.18E (Longitude). The land is free of plantations and it is suitable for
the construction of residential, educational, health or economic utilities. It's located near the highway between
Baghdad and the southern provinces of Iraq. The national grid is located near to the suggested site, which
makes the cost of connection to the grid as low. The cost of the land is free of any, which encourages investing
there.
The monthly averaged solar Insolation Incident on a Horizontal Surface (kWh/m2/day) of the selected site was
obtained from Surface meteorology and Solar Energy of atmospheric science data center of NASA, over 22
years which is an excellent web resource of data [9] as seen in the Figure (2). The annual average of solar
radiation 5.16 kWh/m2 /day.
Fig. (1): Geographic location of proposed Utility Scale Solar PV Power Plant at AL- Mahmudiyah region, 32.958672N
(Latitude), 44.300993E (Longitude).
2.96 3.91
4.86 5.73
6.77 7.94 7.37 6.92
5.82
4 2.95 2.64
5.16
Mo
nth
ly a
vera
ged
inso
lati
on
o
n h
ori
zon
tal
surf
ace
(kW
h/m
2/d
ay)
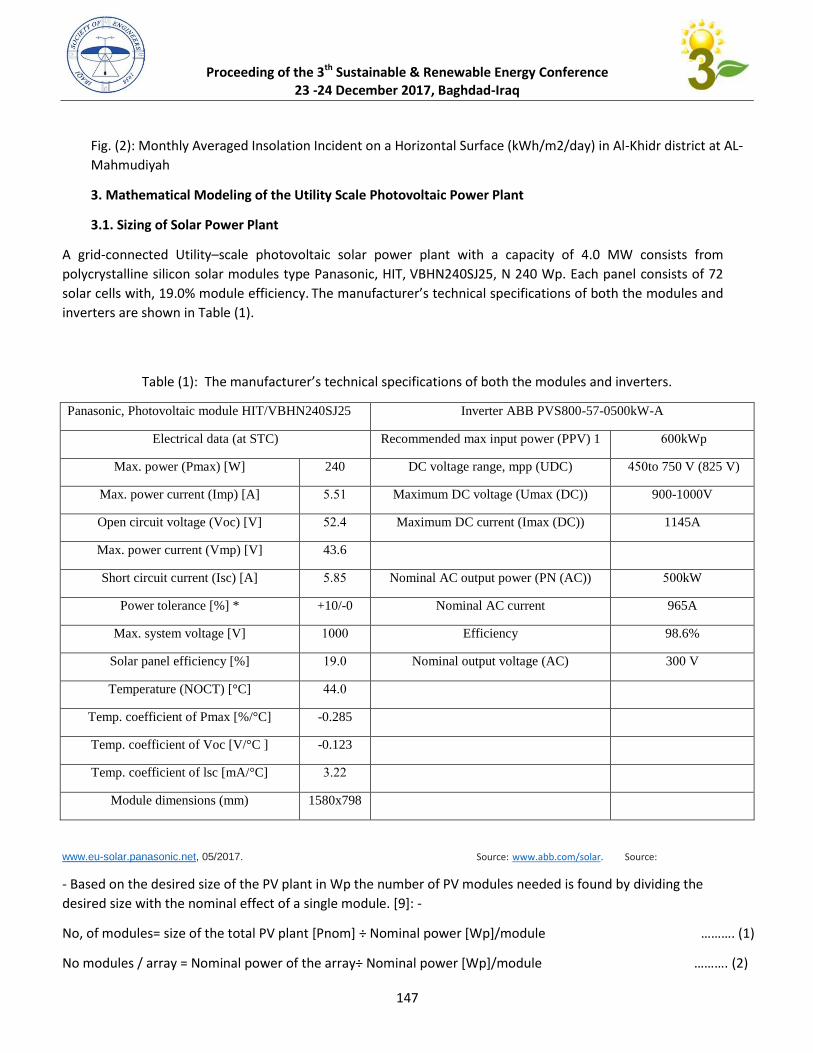
Proceeding of the 3th Sustainable & Renewable Energy Conference
23 -24 December 2017, Baghdad-Iraq
416
Fig. (2): Monthly Averaged Insolation Incident on a Horizontal Surface (kWh/m2/day) in Al-Khidr district at AL-
Mahmudiyah
3. Mathematical Modeling of the Utility Scale Photovoltaic Power Plant
3.1. Sizing of Solar Power Plant
A grid-connected Utility–scale photovoltaic solar power plant with a capacity of 1.0 MW consists from
polycrystalline silicon solar modules type Panasonic, HIT, VBHN240SJ25, N 240 Wp. Each panel consists of 72
solar cells with, 19.0% module efficiency. The manufacturer’s technical specifications of both the modules and
inverters are shown in Table (4).
Table (4): The manufacturer’s technical specifications of both the modules and inverters1
Inverter ABB PVS800-57-0500kW-A Panasonic, Photovoltaic module HIT/VBHN240SJ25
066 kWp Recommended max input power (PPV) 1 Electrical data (at STC)
056 to 750 V (825 V) DC voltage range, mpp (UDC) 240 Max. power (Pmax) [W]
900-1000V Maximum DC voltage (Umax (DC)) 5555 Max. power current (Imp) [A]
1145A Maximum DC current (Imax (DC)) 5.50 Open circuit voltage (Voc) [V]
43.6 Max. power current (Vmp) [V]
566kW Nominal AC output power (PN (AC)) 55.5 Short circuit current (Isc) [A]
965A Nominal AC current +10/-0 Power tolerance [%] *
98.6% Efficiency 5666 Max. system voltage [V]
300 V Nominal output voltage (AC) 5.56 Solar panel efficiency [%]
0056 Temperature (NOCT) [°C]
-0.285 Temp. coefficient of Pmax [%/°C]
-0.123 Temp. coefficient of Voc [V/°C ]
25.. Temp. coefficient of lsc [mA/°C]
1580x798 Module dimensions (mm)
www.eu-solar.panasonic.net, 05/2017. Source: www.abb.com/solar. Source:
- Based on the desired size of the PV plant in Wp the number of PV modules needed is found by dividing the
desired size with the nominal effect of a single module. [8]: -
No, of modules= size of the total PV plant [Pnom] ÷ Nominal power [Wp]/module ………1 (4)
No modules / array = Nominal power of the array÷ Nominal power [Wp]/module ………1 (2)
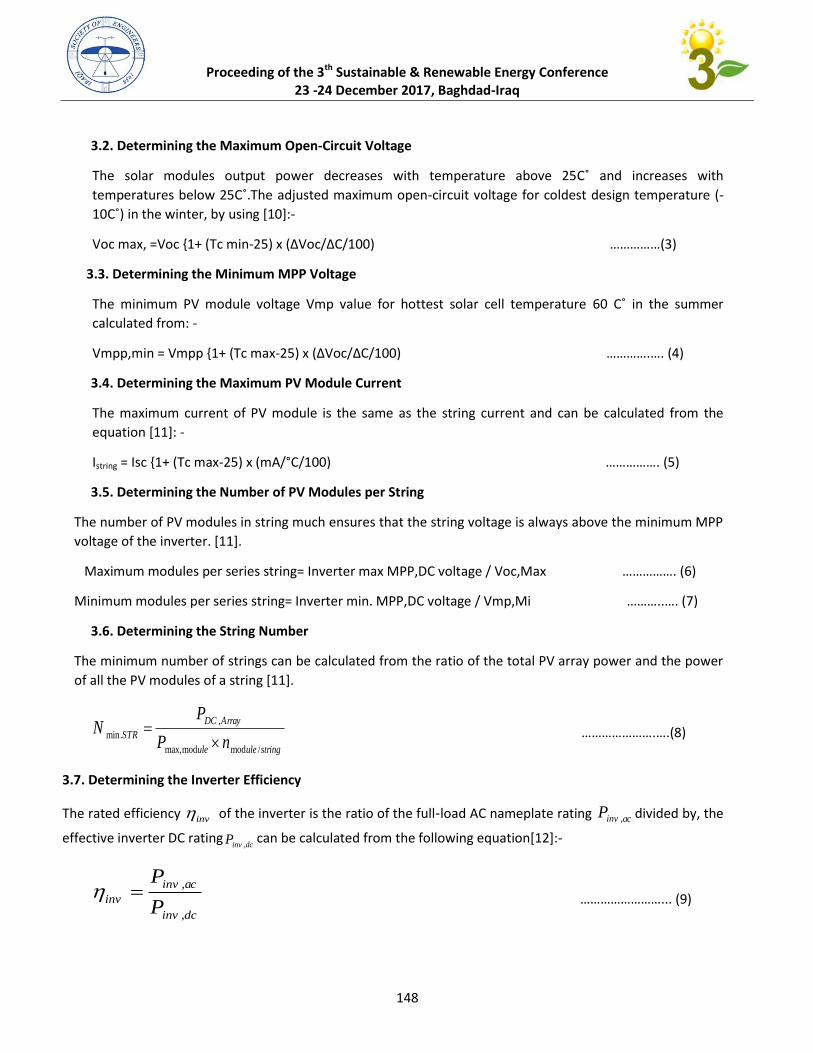
Proceeding of the 3th Sustainable & Renewable Energy Conference
23 -24 December 2017, Baghdad-Iraq
419
3.2. Determining the Maximum Open-Circuit Voltage
The solar modules output power decreases with temperature above 25C˚ and increases with
temperatures below 25C˚1The adjusted maximum open-circuit voltage for coldest design temperature (-
40C˚) in the winter, by using [10]:-
Voc max, =Voc 1+ (Tc min-22) x (∆Voc/∆C/400) ……………(1)
3.3. Determining the Minimum MPP Voltage
The minimum PV module voltage Vmp value for hottest solar cell temperature 70 C˚ in the summer
calculated from: -
Vmpp,min = Vmpp 1+ (Tc max-22) x (∆Voc/∆C/400) …………1…1 (1)
3.4. Determining the Maximum PV Module Current
The maximum current of PV module is the same as the string current and can be calculated from the
equation [14]: -
Istring = Isc 1+ (Tc max-25) x (mA/°C/100) ……………1 (2)
3.5. Determining the Number of PV Modules per String
The number of PV modules in string much ensures that the string voltage is always above the minimum MPP
voltage of the inverter. [14].
Maximum modules per series string= Inverter max MPP,DC voltage / Voc,Max ……………1 (7)
Minimum modules per series string= Inverter min. MPP,DC voltage / Vmp,Mi ………11…1 (6)
3.6. Determining the String Number
The minimum number of strings can be calculated from the ratio of the total PV array power and the power
of all the PV modules of a string [14].
,
min.
max,mod mod /
DC Array
STR
ule ule string
PN
P n
…………………1…1(9)
3.7. Determining the Inverter Efficiency
The rated efficiency inv of the inverter is the ratio of the full‐load AC nameplate rating ,inv acP divided by, the
effective inverter DC rating,inv dcP can be calculated from the following equation[12]:-
,
,
inv ac
inv
inv dc
P
P ……………………11. (9)
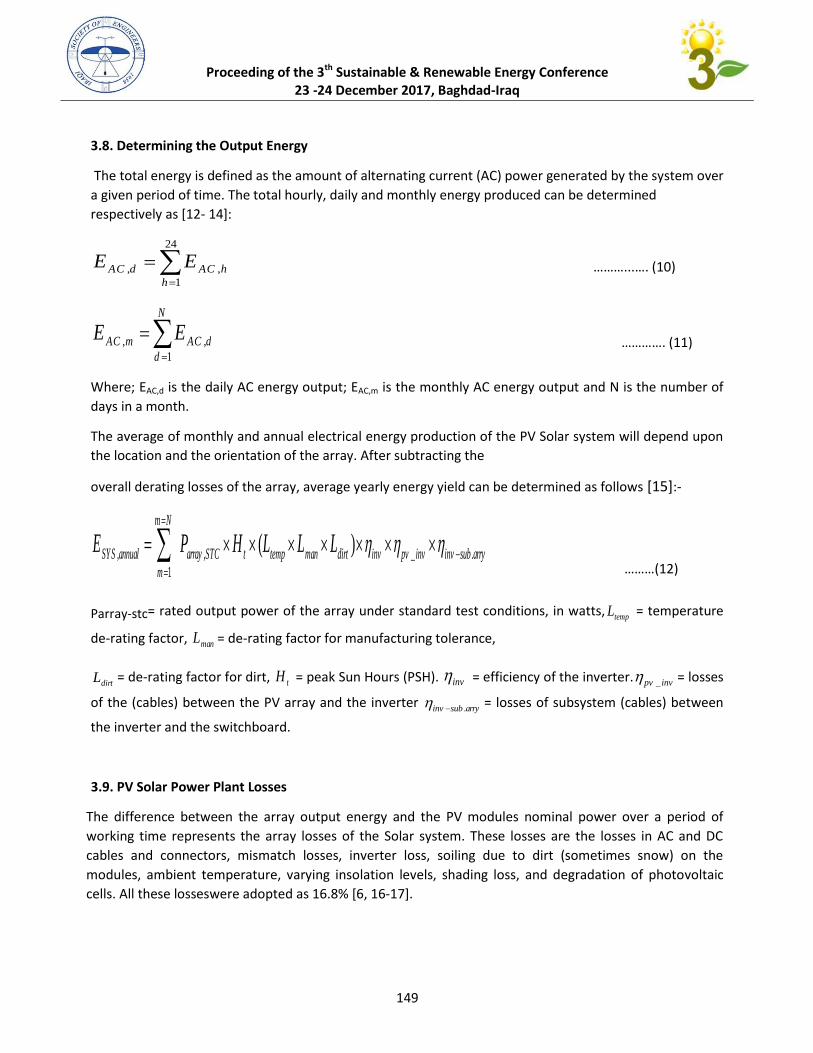
Proceeding of the 3th Sustainable & Renewable Energy Conference
23 -24 December 2017, Baghdad-Iraq
418
3.8. Determining the Output Energy
The total energy is defined as the amount of alternating current (AC) power generated by the system over
a given period of time. The total hourly, daily and monthly energy produced can be determined
respectively as [12- 11]:
24
, ,
1
AC d AC h
h
E E
………111…1 (40)
, ,
1
N
AC m AC d
d
E E
…………1 (44)
Where; EAC,d is the daily AC energy output; EAC,m is the monthly AC energy output and N is the number of
days in a month.
The average of monthly and annual electrical energy production of the PV Solar system will depend upon
the location and the orientation of the array. After subtracting the
overall derating losses of the array, average yearly energy yield can be determined as follows [12]:-
, , _ .
1
( )m N
SY S annual array STC t temp man dirt inv pv inv inv sub arry
m
E P H L L L
………(42)
Parray-stc= rated output power of the array under standard test conditions, in watts,tempL = temperature
de-rating factor, manL = de-rating factor for manufacturing tolerance,
dirtL = de-rating factor for dirt, tH = peak Sun Hours (PSH). inv = efficiency of the inverter. _pv inv = losses
of the (cables) between the PV array and the inverter .inv sub arry
= losses of subsystem (cables) between
the inverter and the switchboard.
3.9. PV Solar Power Plant Losses
The difference between the array output energy and the PV modules nominal power over a period of
working time represents the array losses of the Solar system. These losses are the losses in AC and DC
cables and connectors, mismatch losses, inverter loss, soiling due to dirt (sometimes snow) on the
modules, ambient temperature, varying insolation levels, shading loss, and degradation of photovoltaic
cells. All these losseswere adopted as 16.8% [7, 47-46].
Proceeding of the 3th Sustainable & Renewable Energy Conference
23 -24 December 2017, Baghdad-Iraq
420
3.10. Performance Analysis of Solar PV Power Plant
The performance of the 4 MW grid-connected system is analyzed using the performance parameters final
yield (YF), array yield (YA),, performance ratio (PR) and capacity factor (CF). Energy output, array and
system energy losses, system efficiencies (array efficiency, system efficiency and inverter efficiency),
performance ratio and capacity factor [18-27].
3.10.1. Array yield YA
The array yield (YA) is defined as (DC) energy output from the PV array over a given period of time
normalized by the PV rated power. [28, 29].
,
/DCA P
PV rated
EY kWh kW
P ………1 (41)
Where EDC is the DC energy output (kWh) from the PV array.
3.10.2. Final System Yield (YF)
The Final yield (YF) of PV solar power plant is the ratio of the total annual, monthly or daily net AC energy
output (E) divided by the peak power of the installed PV array at the standard test conditions 1000 W/m2
irradiance, 22˚C ambient temperature and A1M 412) [10-31]. It is given by the expression: -
,
,
,
/AC a
F a P
PV rated
EY kWh kW
P
………1 (41)
Where EAC is the (total) net energy output of the system kWh AC, ,PV ratedP is the peak power of the
installed PV array kW DC.
3.10.3. Performance Ratio PR
Performance ratio (PR) is the ratio of the energy fed to the grid (final yield, YF) to the reference yield (YR). It can
be expressed as [21]: -
FR
R
YP
Y ………1 (42)
3.10.4. Capacity Factor (CF)
The annual capacity factor (CF) is defined as the ratio of the actual annual energy output of the PV system over
a given period of time (usually one year) to the energy output that would have been generated if the system
were operated at full capacity for the entire period. It can expressed as [29, 31- 32]:-
, ,
, 8760 8760 8760
AC a F a R RF
PV rated
E Y P YC
P
………1 (47)
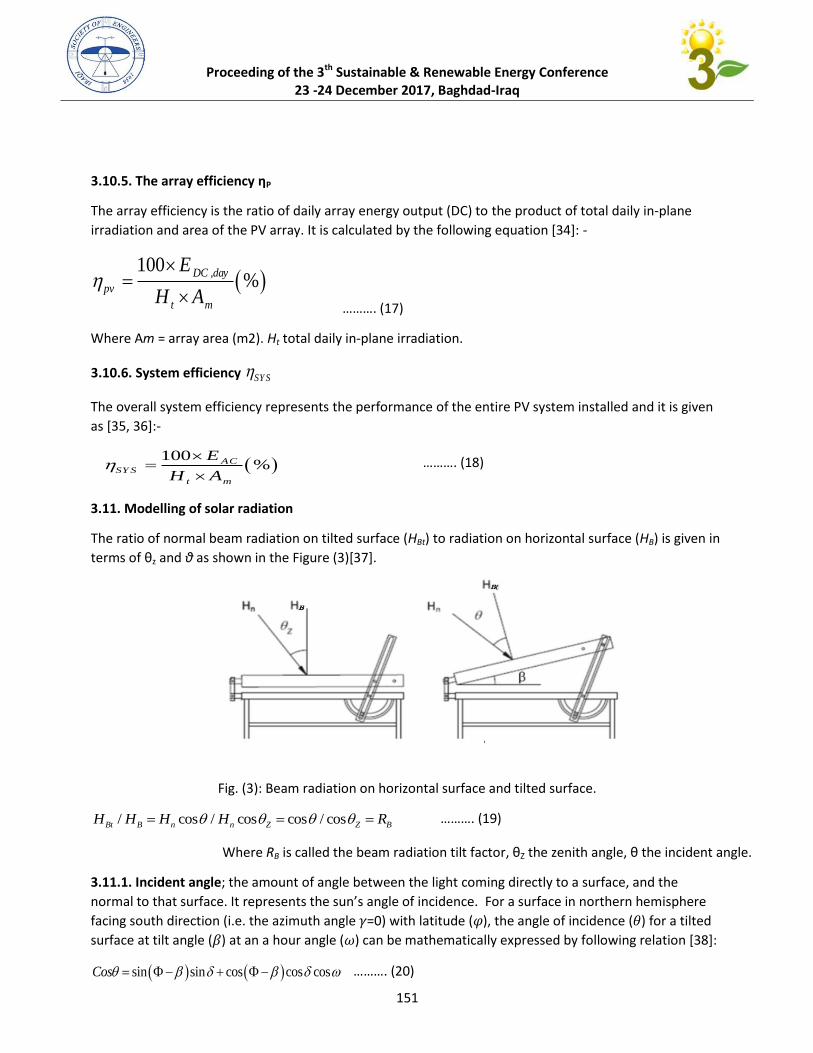
Proceeding of the 3th Sustainable & Renewable Energy Conference
23 -24 December 2017, Baghdad-Iraq
424
3.10.5. The array efficiency ηP
The array efficiency is the ratio of daily array energy output (DC) to the product of total daily in-plane
irradiation and area of the PV array. It is calculated by the following equation [34]: -
,100%
DC day
pv
t m
E
H A
………1 (46)
Where Am = array area (m2). Ht total daily in-plane irradiation.
3.10.6. System efficiency SY S
The overall system efficiency represents the performance of the entire PV system installed and it is given
as [35, 36]:-
100
%ACSY S
t m
E
H A
………1 (49)
3.11. Modelling of solar radiation
The ratio of normal beam radiation on tilted surface (HBt) to radiation on horizontal surface (HB) is given in
terms of θz and θ as shown in the Figure (3)[37].
Fig. (3): Beam radiation on horizontal surface and tilted surface.
/ cos / cos cos / cosBt B n n Z Z BH H H H R ………1 (48)
Where RB is called the beam radiation tilt factor, θZ the zenith angle, θ the incident angle.
3.11.1. Incident angle; the amount of angle between the light coming directly to a surface, and the
normal to that surface1 It represents the sun’s angle of incidence1 For a surface in northern hemisphere
facing south direction (i.e. the azimuth angle =0) with latitude ( ), the angle of incidence ( ) for a tilted
surface at tilt angle ( ) at an a hour angle ( ) can be mathematically expressed by following relation [38]:
sin sin cos cos cosCos ………1 (20)
Proceeding of the 3th Sustainable & Renewable Energy Conference
23 -24 December 2017, Baghdad-Iraq
422
3.11. 2.Hour Angle, ω
The hour angle, ω, is the angular distance between the meridian of the observer and the meridian whose plane
contains the sun. The hour angles at sunrise and sunset (ωS) have the same value and at solar noon equals
zero, however, the sunrise angle is negative and the sunset angle is positive. Both can be calculated for
horizontal surface from:
cos tan tanS ………1 (24)
The sunrise and sunset angles for a titled surface (ωS‘) facing the equator (in the northern hemisphere) is given
by:-
cos ' tan tanS ………1 (22)
A check must be made to find the actual sunrise angle over the tilted plane since ωst cannot have values
greater than ωs, the complete equation for ωst is given by [38]:-
1' min , cos tan tanS t S ar ………1 (21)
3.11. 3. Sun declination angle
, δ, is defined to be that angle made between a ray of the Sun, when extended to the center of the earth and
the equatorial plane.
The declination angle (δ) varies from a maximum value of +21ᶱ.45 on June 21st–22nd to a minimum value 23ᶱ.45
in December 20th –21st. Its value is zero on March 22nd and September 22nd of the year. Declination angle is
calculated using the following relation [39-41]:-
360
23.45 sin 284365
d
………1 (21)
Where d is the day of the year.
3.11.4. Azimuth Angle
The solar azimuth angle is the angle of the sun's rays measured in the horizontal plane from due south
(true south); westward is designated as positive for the northern hemisphere. It is depending on the same
three angles as the solar altitude angle. Following equation can be used to calculate the solar azimuth
angle [42, 43]:-
……11(22)
Proceeding of the 3th Sustainable & Renewable Energy Conference
23 -24 December 2017, Baghdad-Iraq
421
The azimuth angle for the morning hours is ‐π+| | and for the afternoon hours is π‐ .
3.11. 5. Solar Elevation (Altitude) Angle α
The angle of solar elevation, α, is defined the angular measure of the Sun’s rays above the horizon1 For
noon altitude αn for points in the Northern hemisphere, the angle is given by [42, 43]: -
90 z ………1 (27)
The angle of solar elevation for times of day other than local noon can be expressed as: -
1cos sin (sin .sin cos .cos .cos )z ……1 (26)
3.11. 6. Inclination angle (β)
The amount of angle created by the panel surface plane given horizontally.. Inclination angle varies between
0º≤ β≤490º1 The angle value can be calculated by the relation in equation 2 [12, 11]1
Tanβ = |tanθz| cos γs ………1 (29)
3.11. 7. Zenith angle (θz) is the angle between the line to the sun and the vertical axis. Zenith angle is 90º
during sunrise and sunset whereas it is 0º at noon or midday (12:00, it is given by [44,45] : -
1cos (sin .sin cos .cos .cos )z ……1 (28)
Or from
θΖ = 90° - altitude angle (α) ………1 (10)
3.11.8. Modelling of solar irradiation on inclined surfaces
The total of average global radiation solar radiation on horizontal surface represents the summation of
horizontal beam and diffuse radiation as below[46-50]: -
g B dH H H ………1 (14)
The total of solar radiation received on an inclined surface ( t) is the sum of the monthly average daily of
(beam radiation B , diffuse radiation directly incident on a surface D, and reflected by the surroundings
radiations R). Thus, the monthly average total solar radiation in
2/ /kWh m day on an inclined surface is expressed as [51]:-
t B D RH H H H …11(12)
Proceeding of the 3th Sustainable & Renewable Energy Conference 23 -24 December 2017, Baghdad-Iraq
421
The monthly average daily of beam radiation, B, falling on a tilted surface is given as [51]:-
B g d bH H H R ………1 (11)
Where, g and d are the monthly average daily global and diffuse radiation on a horizontal surface.
The mean beam radiation tilt factor can be written in the form of: -
cos cos sin sin sin180
cos cos sin sin sin180
s s
b
s s
R
………1 (11)
The monthly average daily reflected radiation R reflected by the surrounding falling on tilted surface is given
by:-
R g rH H R ………1 (12)
Where, ρg is ground reflectivity assumed as 0.2 for hot and humid tropical location as suggested by [52] and ( r
) the mean reflected conversion factor
1 cos
2r gR
………1 (17)
The monthly average daily diffuse radiation falling on a tilted surface is given by [52]: -
1 cos
2D d d dH H R H
………1 (16)
3.12. Determining Inter-Row Shading and Array Spacing by two methods
The calculation of the inter-row spacing for tilted ground mounted PV systems to avoid potential shading issues
and have the ability to increase the system size was calculated by two methods.
3.12. 1. Landscape and portrait orientation
Shading of any single cell of PV module will drastically reduce the output of the entire PV module. To calculate
shading distance (D) and therefore row space for both portrait and landscape orientations as displayed as in
Figure (4) using the following equations [53]: -
sin( ).sin
Portrait
LD
………1 (19)
sin( ).sin
Landscape
WD
………1 (18)
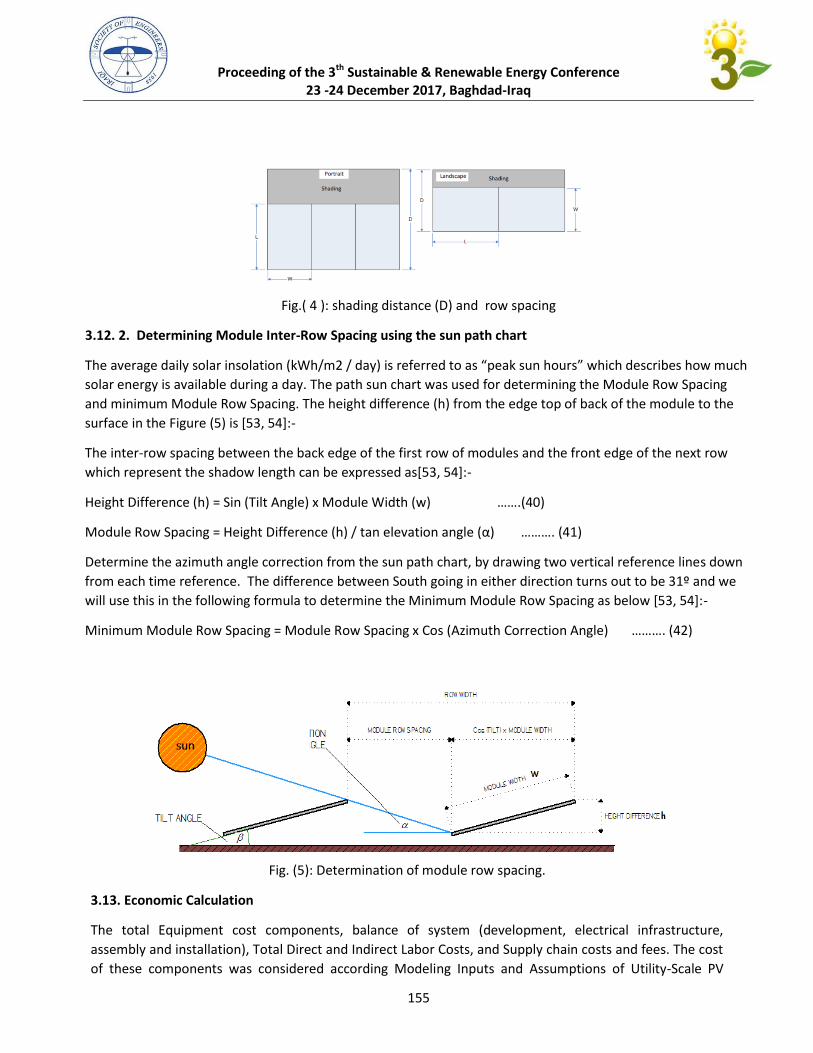
Proceeding of the 3th Sustainable & Renewable Energy Conference 23 -24 December 2017, Baghdad-Iraq
422
Fig.( 4 ): shading distance (D) and row spacing
3.12. 2. Determining Module Inter-Row Spacing using the sun path chart
The average daily solar insolation (kWh/m2 / day) is referred to as “peak sun hours” which describes how much
solar energy is available during a day. The path sun chart was used for determining the Module Row Spacing
and minimum Module Row Spacing. The height difference (h) from the edge top of back of the module to the
surface in the Figure (5) is [53, 54]:-
The inter-row spacing between the back edge of the first row of modules and the front edge of the next row
which represent the shadow length can be expressed as[53, 54]:-
Height Difference (h) = Sin (Tilt Angle) x Module Width (w) ……1(10)
Module Row Spacing = Height Difference (h) / tan elevation angle (α) ………1 (14)
Determine the azimuth angle correction from the sun path chart, by drawing two vertical reference lines down
from each time reference. The difference between South going in either direction turns out to be 31º and we
will use this in the following formula to determine the Minimum Module Row Spacing as below [53, 54]:-
Minimum Module Row Spacing = Module Row Spacing x Cos (Azimuth Correction Angle) ………1 (12)
Fig. (5): Determination of module row spacing.
3.13. Economic Calculation
The total Equipment cost components, balance of system (development, electrical infrastructure,
assembly and installation), Total Direct and Indirect Labor Costs, and Supply chain costs and fees. The cost
of these components was considered according Modeling Inputs and Assumptions of Utility-Scale PV
Proceeding of the 3th Sustainable & Renewable Energy Conference
23 -24 December 2017, Baghdad-Iraq
427
Utility-Scale PV (Fixed-Tilt) of calculation of LCOE which was presented by NREL for utility-scale systems
built in the first quarter of 2017 (Q1 2017) and the expected rapidly annual declining in solar PV costs .
Total Capital Cost (I) was found $ 3600000 for 4MW Project[55].
For calculation of LCOE, the following were taken into consideration in evaluating the costs of kW h of energy
produced: -
4.The discount rate was taken as 5%
2. The inflation rate was taken as 3% [60].
3. Module life time 25 years.
4. The capital cost was taken as according to NERL repot of 2017 [61].
5. PV O&M cost estimates was considered according to NREL, as 0.5% of system initial cost per year for large
systems [62].
6. Annual degradation 0.75%
7. Debt interest rate 2%& Annuity Factor (Fraction of Capital) =6.12.
3.13.1. Levelized Cost of Energy (LCOE) method
The LCOE equation applied in this paper is includes capital expenditures (I), operational expenditures (O&M),
annual energy production (Yo). Levelized Cost of Energy (LCOE), is the net present value of the unit-cost of
electricity over the lifetime of the solar system in cents / kWh or $/MWh. It is a first-order economic
assessment of the cost competitiveness of an electricity-generating system is given by [56, 57]: -
1
1
&
(1 )
(1 )
(1 )
N
nn
nNo
nn
O M RVI
RLCOE
Y D
R
………1 (11)
Where: N = PV system life [years], I = total initial investment [$/kWp], O&M= annual operation and
maintenance expenditures (OPEX) [$/kWp], RV = residual value [$/kWp], r = discount rate [%], Y0 = initial
yield [kWh], D = system degradation rate [%].
3.13.2. Net Present Value (NPV) Method
The net present value (NPV) is the difference between the value of all benefits (cash inflows) and costs
(cash outflows) of the project, discounted back to the beginning of the investment and were calculated
from [58, 59]:-
1 (1 )
n no ni
CNPV C
R
………1 (11)
Where, C0 = Initial Investment Amount, Ci = Cash Flow, n = No. of Years and Nominal Discount Rate(R).
Proceeding of the 3th Sustainable & Renewable Energy Conference
23 -24 December 2017, Baghdad-Iraq
426
The real rate of discount (r) adjusted for inflation rate (i) to obtain Nominal Discount Rate (R) from the
expression [63,64] as:-
Nominal Discount Rate= (1+Real Discount Rate) (1 + Inflation Rate) – 1 ………1 (12)
3.13.3. Discounted Payback Period
Discounted payback period is used to evaluate the time period needed for a project to bring in enough
profits to recoup the initial investment which accounts for time value of money by discounting the cash
inflows of the project by the following equation[65]:-
1 Discounted Payback Period = A + (B÷ C) ………1 (17)
Where, A = Last period with a negative discounted cumulative cash flow; B = Absolute value of discounted
cumulative cash flow at the end of the period A; C = Discounted cash flow during the period after A.
3.13.4. Internal Rate of Return (IRR)
The internal rate of return (IRR) is defined as the discount rate which sets the (NPV) of a series of cash flows
over the project life equal to zero, the rate which is produced by the solution is the project's (IRR).It computed
by either trial and error in excel or by using formula. It can be computed from the following expression [66]:-
1 1 1 11
1 1
n n
n on n
IRR IRRC C m
IRR IRR IRR IRR
.... (47)
3.13.5. Benefit-Cost Ratio (BCR)
The benefit-cost ratio (BCR) is the ratio between discounted total benefits and costs and computed from
the following equation [65, 66]:-
1 1
1
1 11
1
n
n n
n
o n
RC
R RBCR
RC m
R R
………1 (19)
3.13.6. Simple payback period (SPB)
It represents the period to recoup the investment cost of the project. Tax and insurance related issues are not
included in order to make the analysis less complicated. Simple payback is the number of years necessary to
recover the project cost of a Payback period (PBP) is the year in which the net present value of all costs equals
with the net present value of all benefits, i.e .NPV=0, it is computed from [65]:-
ln 1
ln(1 )
o
n o
RC
C mCn
R
………1 (18)
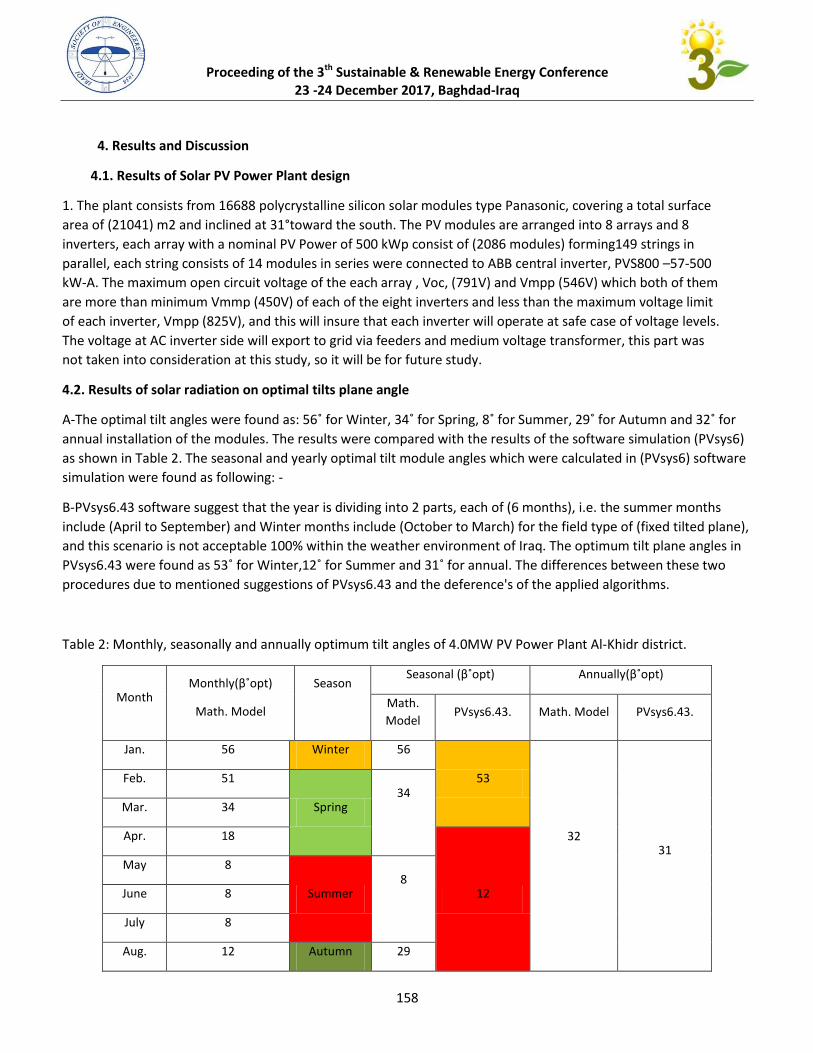
Proceeding of the 3th Sustainable & Renewable Energy Conference
23 -24 December 2017, Baghdad-Iraq
429
4. Results and Discussion
4.1. Results of Solar PV Power Plant design
1. The plant consists from 16688 polycrystalline silicon solar modules type Panasonic, covering a total surface
area of (21041) m2 and inclined at 31°toward the south. The PV modules are arranged into 8 arrays and 8
inverters, each array with a nominal PV Power of 500 kWp consist of (2086 modules) forming149 strings in
parallel, each string consists of 14 modules in series were connected to ABB central inverter, PVS800 –57-500
kW-A. The maximum open circuit voltage of the each array , Voc, (791V) and Vmpp (546V) which both of them
are more than minimum Vmmp (450V) of each of the eight inverters and less than the maximum voltage limit
of each inverter, Vmpp (825V), and this will insure that each inverter will operate at safe case of voltage levels.
The voltage at AC inverter side will export to grid via feeders and medium voltage transformer, this part was
not taken into consideration at this study, so it will be for future study.
4.2. Results of solar radiation on optimal tilts plane angle
A-The optimal tilt angles were found as: 27˚ for Winter, 11˚ for Spring, 9˚ for Summer, 28˚ for Autumn and 12˚ for
annual installation of the modules. The results were compared with the results of the software simulation (PVsys6)
as shown in Table 2. The seasonal and yearly optimal tilt module angles which were calculated in (PVsys6) software
simulation were found as following: -
B-PVsys6.43 software suggest that the year is dividing into 2 parts, each of (6 months), i.e. the summer months
include (April to September) and Winter months include (October to March) for the field type of (fixed tilted plane),
and this scenario is not acceptable 100% within the weather environment of Iraq. The optimum tilt plane angles in
PVsys7111 were found as 21˚ for Winter,42˚ for Summer and 14˚ for annual1 The differences between these two
procedures due to mentioned suggestions of PVsys6.43 and the deference's of the applied algorithms.
Table 2: Monthly, seasonally and annually optimum tilt angles of 4.0MW PV Power Plant Al-Khidr district.
Month Monthly(β˚opt)
Math. Model
Season
Seasonal (β˚opt) Annually(β˚opt)
Math.
Model PVsys6.43. Math. Model PVsys6.43.
Jan. 56 Winter 56
53
32
31
Feb. 51
Spring 34
Mar. 34
Apr. 18
12
May 8
Summer 8
June 8
July 8
Aug. 12 Autumn 29
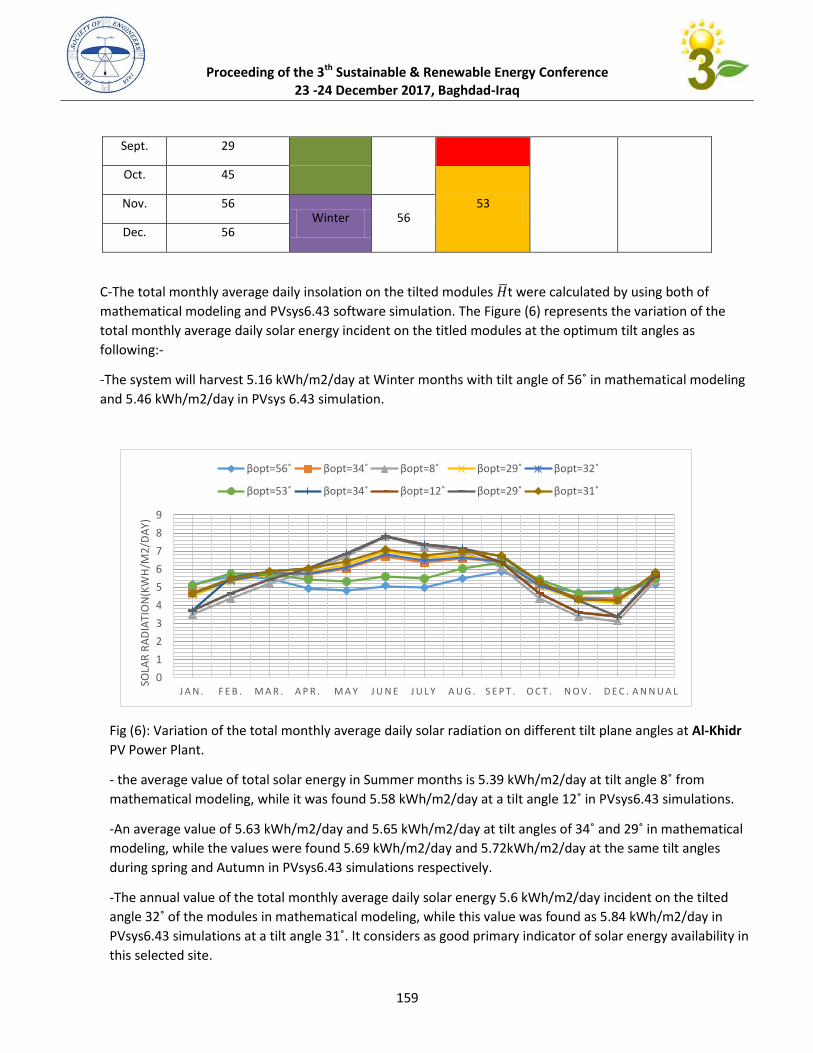
Proceeding of the 3th Sustainable & Renewable Energy Conference
23 -24 December 2017, Baghdad-Iraq
428
Sept. 29
Oct. 45
53 Nov. 56 Winter 56
Dec. 56
C-The total monthly average daily insolation on the tilted modules t were calculated by using both of
mathematical modeling and PVsys6.43 software simulation. The Figure (6) represents the variation of the
total monthly average daily solar energy incident on the titled modules at the optimum tilt angles as
following:-
-The system will harvest 2147 kWh/m2/day at Winter months with tilt angle of 27˚ in mathematical modeling
and 5.46 kWh/m2/day in PVsys 6.43 simulation.
Fig (6): Variation of the total monthly average daily solar radiation on different tilt plane angles at Al-Khidr
PV Power Plant.
- the average value of total solar energy in Summer months is 2118 kWh/m2/day at tilt angle 9˚ from
mathematical modeling, while it was found 2129 kWh/m2/day at a tilt angle 42˚ in PVsys7111 simulations1
-An average value of 2171 kWh/m2/day and 2172 kWh/m2/day at tilt angles of 11˚ and 28˚ in mathematical
modeling, while the values were found 5.69 kWh/m2/day and 5.72kWh/m2/day at the same tilt angles
during spring and Autumn in PVsys6.43 simulations respectively.
-The annual value of the total monthly average daily solar energy 5.6 kWh/m2/day incident on the tilted
angle 12˚ of the modules in mathematical modeling, while this value was found as 2191 kWh/m2/day in
PVsys7111 simulations at a tilt angle 14˚1 It considers as good primary indicator of solar energy availability in
this selected site.
0
1
2
3
4
5
6
7
8
9
J A N . F E B . M A R . A P R . M A Y J U N E J U L Y A U G . S E P T . O C T . N O V . D E C . A N N U A L
SOLA
R R
AD
IATI
ON
(KW
H/M
2/D
AY)
βopt=56˚ βopt=34˚ βopt=8˚ βopt=29˚ βopt=32˚
βopt=21˚ βopt=34˚ βopt=12˚ βopt=29˚ βopt=31˚
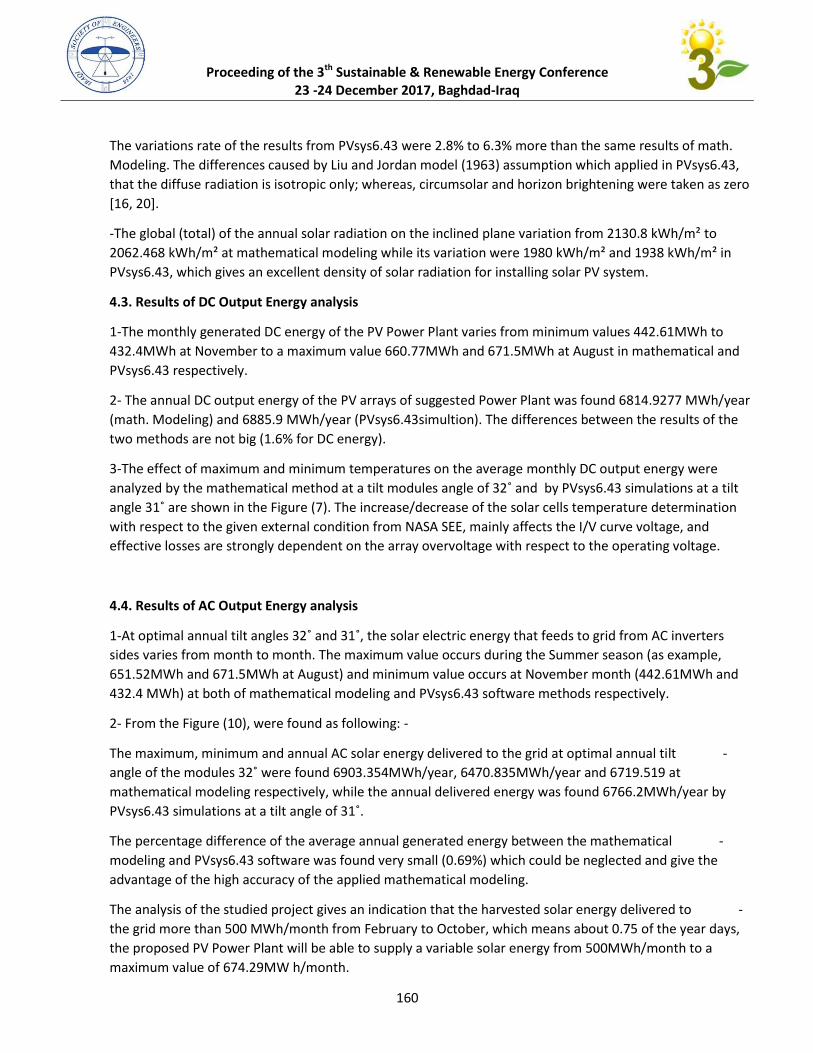
Proceeding of the 3th Sustainable & Renewable Energy Conference
23 -24 December 2017, Baghdad-Iraq
470
The variations rate of the results from PVsys6.43 were 2.8% to 6.3% more than the same results of math.
Modeling. The differences caused by Liu and Jordan model (1963) assumption which applied in PVsys6.43,
that the diffuse radiation is isotropic only; whereas, circumsolar and horizon brightening were taken as zero
[16, 20].
-The global (total) of the annual solar radiation on the inclined plane variation from 2130.8 kWh/m² to
2062.468 kWh/m² at mathematical modeling while its variation were 1980 kWh/m² and 1938 kWh/m² in
PVsys6.43, which gives an excellent density of solar radiation for installing solar PV system.
4.3. Results of DC Output Energy analysis
1-The monthly generated DC energy of the PV Power Plant varies from minimum values 442.61MWh to
432.4MWh at November to a maximum value 660.77MWh and 671.5MWh at August in mathematical and
PVsys6.43 respectively.
2- The annual DC output energy of the PV arrays of suggested Power Plant was found 6814.9277 MWh/year
(math. Modeling) and 6885.9 MWh/year (PVsys6.43simultion). The differences between the results of the
two methods are not big (1.6% for DC energy).
3-The effect of maximum and minimum temperatures on the average monthly DC output energy were
analyzed by the mathematical method at a tilt modules angle of 12˚ and by PVsys7111 simulations at a tilt
angle 14˚ are shown in the Figure (6)1 The increase/decrease of the solar cells temperature determination
with respect to the given external condition from NASA SEE, mainly affects the I/V curve voltage, and
effective losses are strongly dependent on the array overvoltage with respect to the operating voltage.
4.4. Results of AC Output Energy analysis
1-At optimal annual tilt angles 12˚ and 14˚, the solar electric energy that feeds to grid from AC inverters
sides varies from month to month. The maximum value occurs during the Summer season (as example,
651.52MWh and 671.5MWh at August) and minimum value occurs at November month (442.61MWh and
432.4 MWh) at both of mathematical modeling and PVsys6.43 software methods respectively.
2- From the Figure (10), were found as following: -
- The maximum, minimum and annual AC solar energy delivered to the grid at optimal annual tilt
angle of the modules 12˚ were found 78011121MWh/year, 71601912MWh/year and 76481248 at
mathematical modeling respectively, while the annual delivered energy was found 6766.2MWh/year by
PVsys7111 simulations at a tilt angle of 14˚1
- The percentage difference of the average annual generated energy between the mathematical
modeling and PVsys6.43 software was found very small (0.69%) which could be neglected and give the
advantage of the high accuracy of the applied mathematical modeling.
- The analysis of the studied project gives an indication that the harvested solar energy delivered to
the grid more than 500 MWh/month from February to October, which means about 0.75 of the year days,
the proposed PV Power Plant will be able to supply a variable solar energy from 500MWh/month to a
maximum value of 674.29MW h/month.
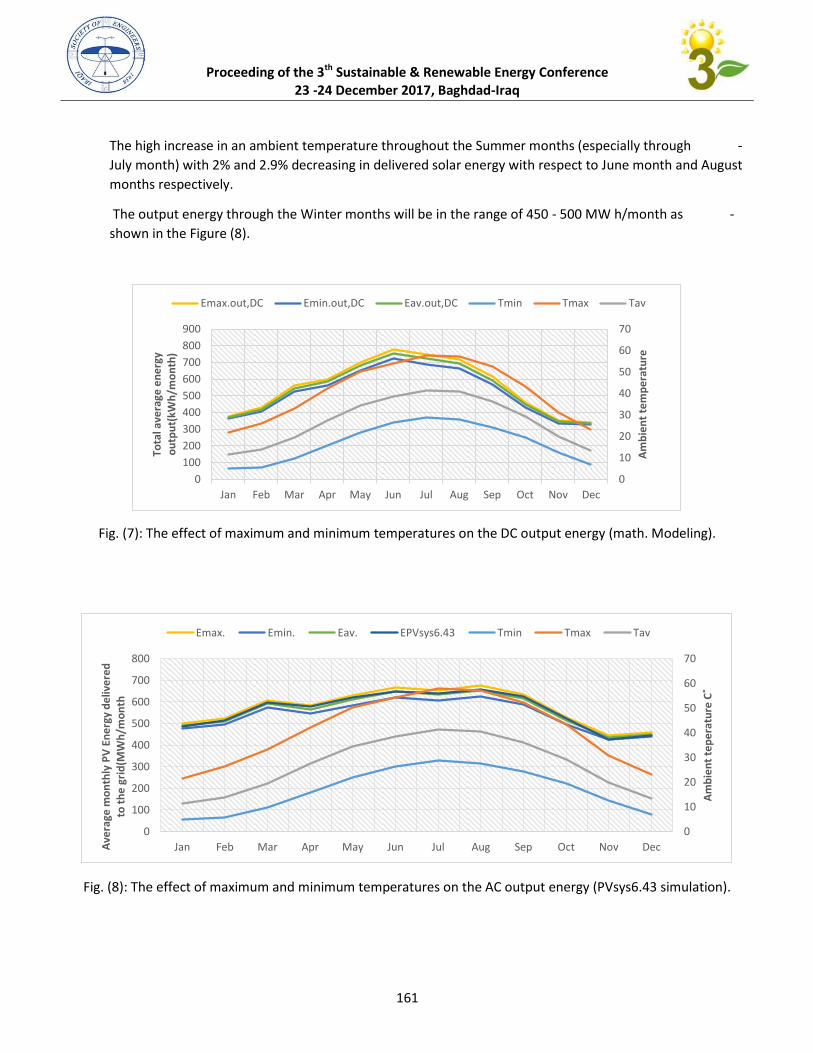
Proceeding of the 3th Sustainable & Renewable Energy Conference
23 -24 December 2017, Baghdad-Iraq
474
- The high increase in an ambient temperature throughout the Summer months (especially through
July month) with 2% and 2.9% decreasing in delivered solar energy with respect to June month and August
months respectively.
- The output energy through the Winter months will be in the range of 450 - 500 MW h/month as
shown in the Figure (8).
Fig. (7): The effect of maximum and minimum temperatures on the DC output energy (math. Modeling).
Fig. (8): The effect of maximum and minimum temperatures on the AC output energy (PVsys6.43 simulation).
0
10
20
30
40
50
60
70
0
100
200
300
400
500
600
700
800
900
Jan Feb Mar Apr May Jun Jul Aug Sep Oct Nov Dec
Am
bie
nt
tem
pe
ratu
re
Tota
l ave
rage
en
erg
y o
utp
ut(
kWh
/mo
nth
)
Emax.out,DC Emin.out,DC Eav.out,DC Tmin Tmax Tav
0
10
20
30
40
50
60
70
0
100
200
300
400
500
600
700
800
Jan Feb Mar Apr May Jun Jul Aug Sep Oct Nov Dec
Am
bie
nt
tep
era
ture
C˚
Ave
rage
mo
nth
ly P
V E
ne
rgy
de
live
red
to
th
e g
rid
(MW
h/m
on
th
Emax. Emin. Eav. EPVsys6.43 Tmin Tmax Tav
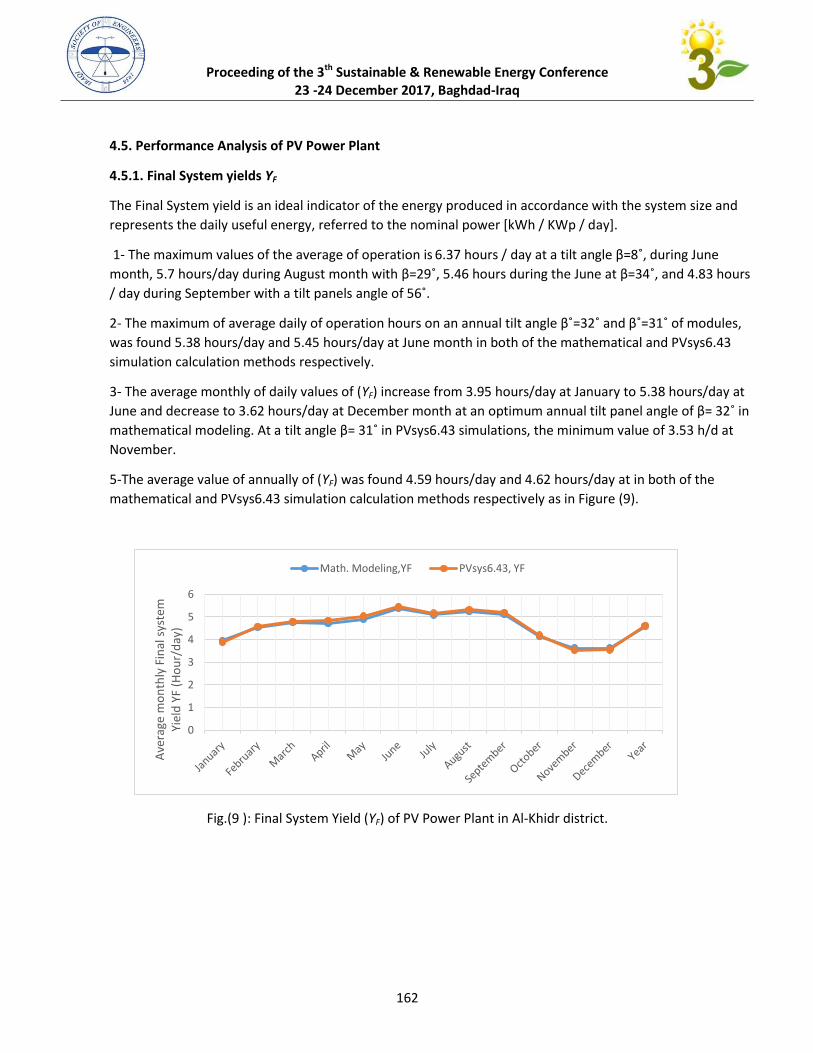
Proceeding of the 3th Sustainable & Renewable Energy Conference
23 -24 December 2017, Baghdad-Iraq
472
4.5. Performance Analysis of PV Power Plant
4.5.1. Final System yields YF
The Final System yield is an ideal indicator of the energy produced in accordance with the system size and
represents the daily useful energy, referred to the nominal power [kWh / KWp / day].
1- The maximum values of the average of operation is 7116 hours / day at a tilt angle β=9˚, during June
month, 5.7 hours/day during August month with β=28˚, 2117 hours during the June at β=11˚, and 1191 hours
/ day during September with a tilt panels angle of 27˚1
2- The maximum of average daily of operation hours on an annual tilt angle β˚=12˚ and β˚=14˚ of modules,
was found 5.38 hours/day and 5.45 hours/day at June month in both of the mathematical and PVsys6.43
simulation calculation methods respectively.
3- The average monthly of daily values of (YF) increase from 3.95 hours/day at January to 5.38 hours/day at
June and decrease to 1172 hours/day at December month at an optimum annual tilt panel angle of β= 12˚ in
mathematical modeling. At a tilt angle β= 14˚ in PVsys7111 simulations, the minimum value of 1121 h/d at
November.
5-The average value of annually of (YF) was found 4.59 hours/day and 4.62 hours/day at in both of the
mathematical and PVsys6.43 simulation calculation methods respectively as in Figure (9).
Fig.(9 ): Final System Yield (YF) of PV Power Plant in Al-Khidr district.
0
1
2
3
4
5
6
Ave
rage
mo
nth
ly F
inal
sys
tem
Yi
eld
YF
(Ho
ur/
day
)
Math. Modeling,YF PVsys6.43, YF
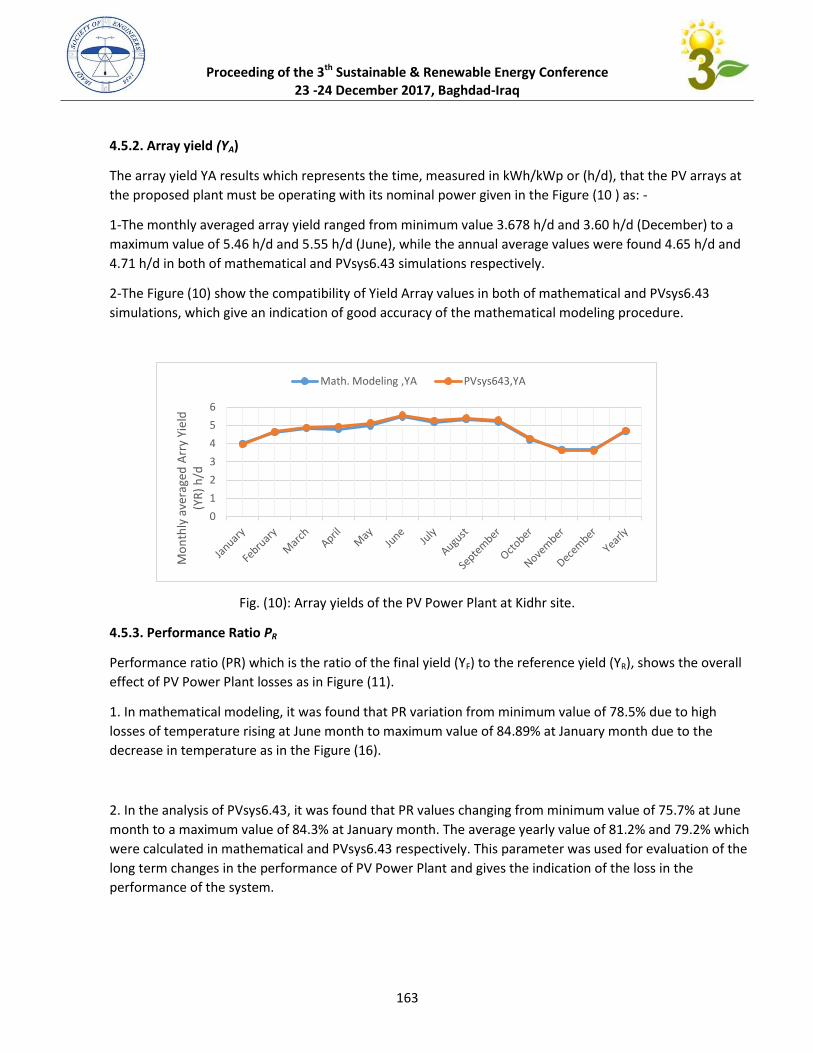
Proceeding of the 3th Sustainable & Renewable Energy Conference
23 -24 December 2017, Baghdad-Iraq
471
4.5.2. Array yield (YA)
The array yield YA results which represents the time, measured in kWh/kWp or (h/d), that the PV arrays at
the proposed plant must be operating with its nominal power given in the Figure (10 ) as: -
1-The monthly averaged array yield ranged from minimum value 3.678 h/d and 3.60 h/d (December) to a
maximum value of 5.46 h/d and 5.55 h/d (June), while the annual average values were found 4.65 h/d and
4.71 h/d in both of mathematical and PVsys6.43 simulations respectively.
2-The Figure (10) show the compatibility of Yield Array values in both of mathematical and PVsys6.43
simulations, which give an indication of good accuracy of the mathematical modeling procedure.
Fig. (10): Array yields of the PV Power Plant at Kidhr site.
4.5.3. Performance Ratio PR
Performance ratio (PR) which is the ratio of the final yield (YF) to the reference yield (YR), shows the overall
effect of PV Power Plant losses as in Figure (11).
1. In mathematical modeling, it was found that PR variation from minimum value of 78.5% due to high
losses of temperature rising at June month to maximum value of 84.89% at January month due to the
decrease in temperature as in the Figure (16).
2. In the analysis of PVsys6.43, it was found that PR values changing from minimum value of 75.7% at June
month to a maximum value of 84.3% at January month. The average yearly value of 81.2% and 79.2% which
were calculated in mathematical and PVsys6.43 respectively. This parameter was used for evaluation of the
long term changes in the performance of PV Power Plant and gives the indication of the loss in the
performance of the system.
0
1
2
3
4
5
6
Mo
nth
ly a
vera
ged
Arr
y Yi
eld
(Y
R)
h/d
Math. Modeling ,YA PVsys643,YA
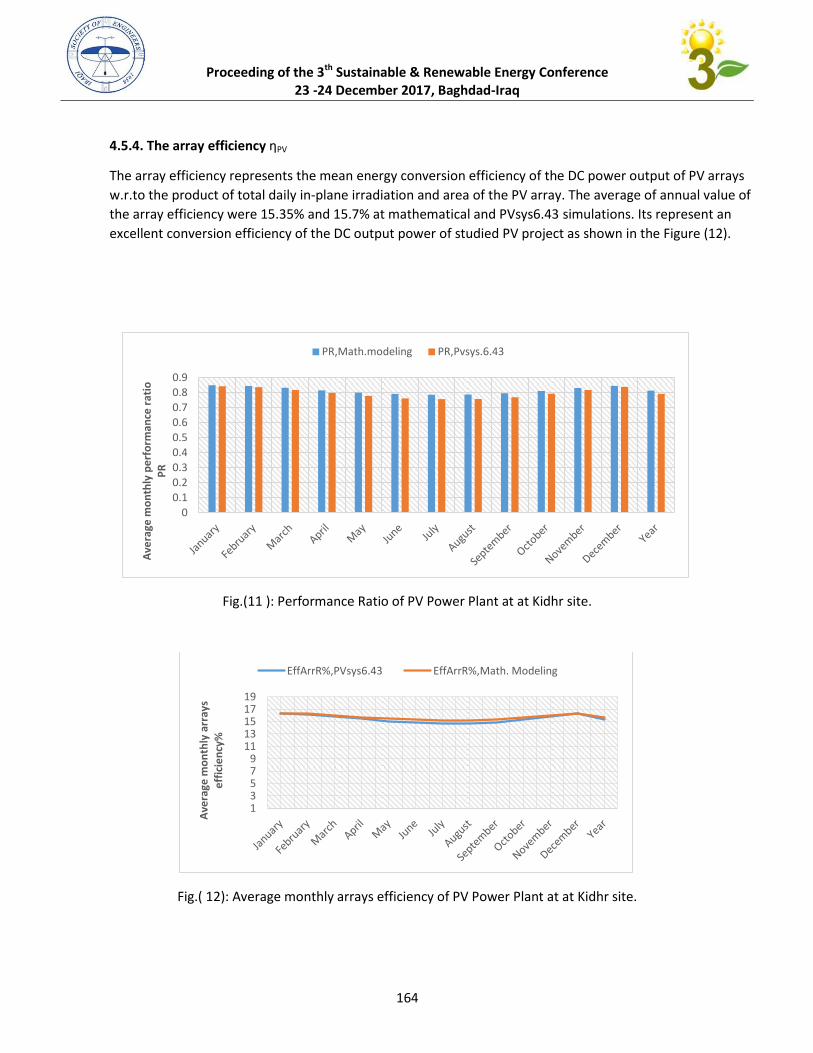
Proceeding of the 3th Sustainable & Renewable Energy Conference
23 -24 December 2017, Baghdad-Iraq
471
4.5.4. The array efficiency ηPV
The array efficiency represents the mean energy conversion efficiency of the DC power output of PV arrays
w.r.to the product of total daily in-plane irradiation and area of the PV array. The average of annual value of
the array efficiency were 15.35% and 15.7% at mathematical and PVsys6.43 simulations. Its represent an
excellent conversion efficiency of the DC output power of studied PV project as shown in the Figure (12).
Fig.(11 ): Performance Ratio of PV Power Plant at at Kidhr site.
Fig.( 12): Average monthly arrays efficiency of PV Power Plant at at Kidhr site.
0
0.1
0.2
0.3
0.4
0.5
0.6
0.7
0.8
0.9
Ave
rage
mo
nth
ly p
erf
orm
ance
rat
io
PR
PR,Math.modeling PR,Pvsys.6.43
1 3 5 7 9
11 13 15 17 19
Ave
rage
mo
nth
ly a
rray
s e
ffic
ien
cy%
EffArrR%,PVsys6.43 EffArrR%,Math. Modeling
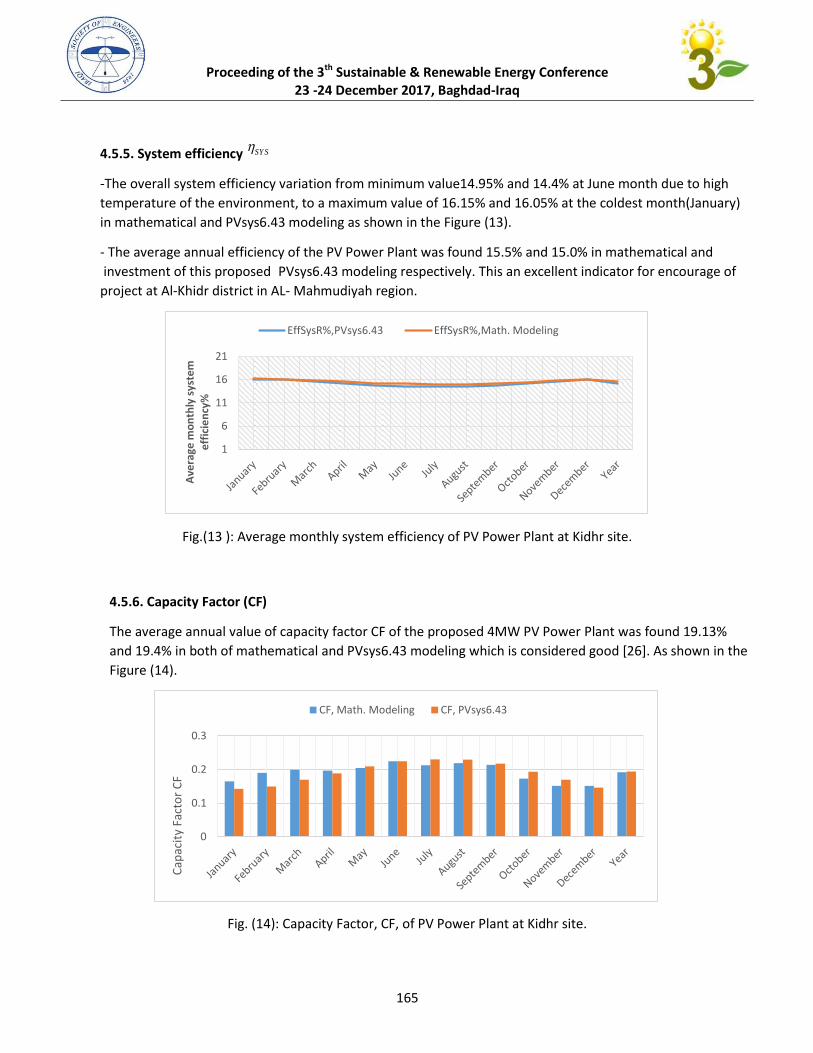
Proceeding of the 3th Sustainable & Renewable Energy Conference
23 -24 December 2017, Baghdad-Iraq
472
4.5.5. System efficiency SY S
-The overall system efficiency variation from minimum value14.95% and 14.4% at June month due to high
temperature of the environment, to a maximum value of 16.15% and 16.05% at the coldest month(January)
in mathematical and PVsys6.43 modeling as shown in the Figure (13).
- The average annual efficiency of the PV Power Plant was found 15.5% and 15.0% in mathematical and
PVsys6.43 modeling respectively. This an excellent indicator for encourage of investment of this proposed
project at Al-Khidr district in AL- Mahmudiyah region.
Fig.(13 ): Average monthly system efficiency of PV Power Plant at Kidhr site.
4.5.6. Capacity Factor (CF)
The average annual value of capacity factor CF of the proposed 4MW PV Power Plant was found 19.13%
and 19.4% in both of mathematical and PVsys6.43 modeling which is considered good [26]. As shown in the
Figure (14).
Fig. (14): Capacity Factor, CF, of PV Power Plant at Kidhr site.
1
6
11
16
21
Ave
rage
mo
nth
ly s
yste
m
eff
icie
ncy
%
EffSysR%,PVsys6.43 EffSysR%,Math. Modeling
0
0.1
0.2
0.3
Cap
acit
y Fa
cto
r C
F
CF, Math. Modeling CF, PVsys6.43
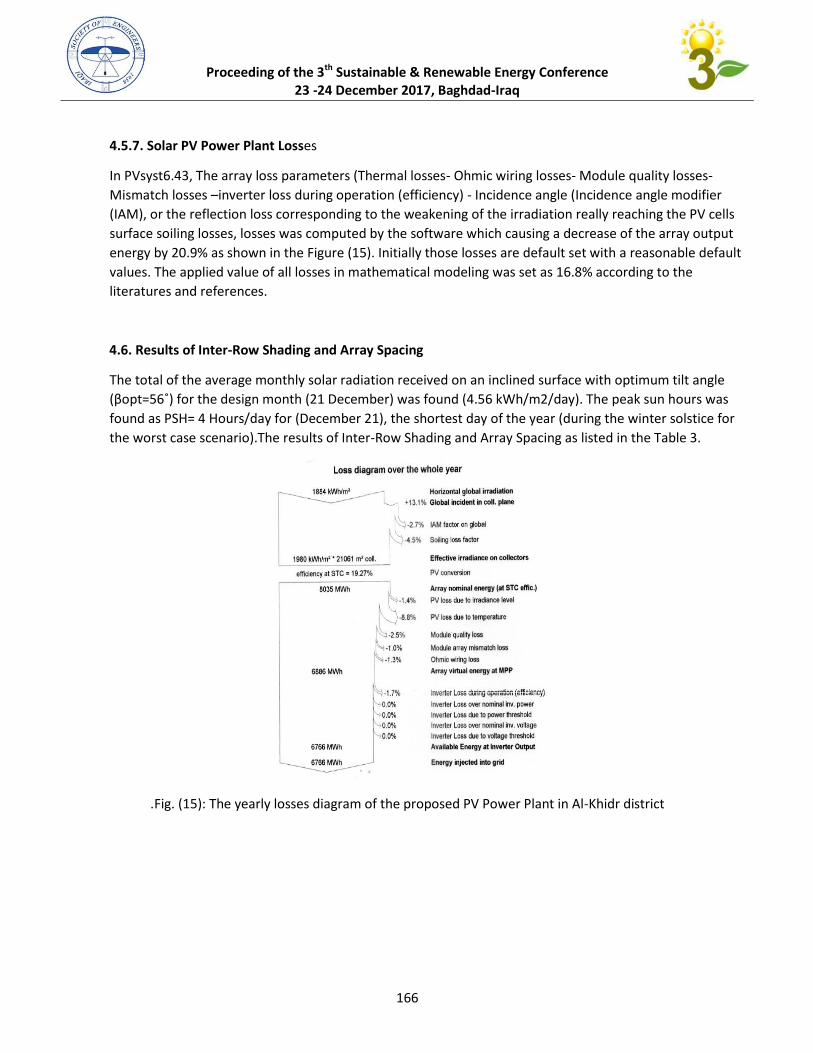
Proceeding of the 3th Sustainable & Renewable Energy Conference
23 -24 December 2017, Baghdad-Iraq
477
4.5.7. Solar PV Power Plant Losses
In PVsyst6.43, The array loss parameters (Thermal losses- Ohmic wiring losses- Module quality losses-
Mismatch losses –inverter loss during operation (efficiency) - Incidence angle (Incidence angle modifier
(IAM), or the reflection loss corresponding to the weakening of the irradiation really reaching the PV cells
surface soiling losses, losses was computed by the software which causing a decrease of the array output
energy by 20.9% as shown in the Figure (15). Initially those losses are default set with a reasonable default
values. The applied value of all losses in mathematical modeling was set as 16.8% according to the
literatures and references.
4.6. Results of Inter-Row Shading and Array Spacing
The total of the average monthly solar radiation received on an inclined surface with optimum tilt angle
(βopt=27˚) for the design month (21 December) was found (4.56 kWh/m2/day). The peak sun hours was
found as PSH= 4 Hours/day for (December 21), the shortest day of the year (during the winter solstice for
the worst case scenario).The results of Inter-Row Shading and Array Spacing as listed in the Table 3.
Fig. (15): The yearly losses diagram of the proposed PV Power Plant in Al-Khidr district.
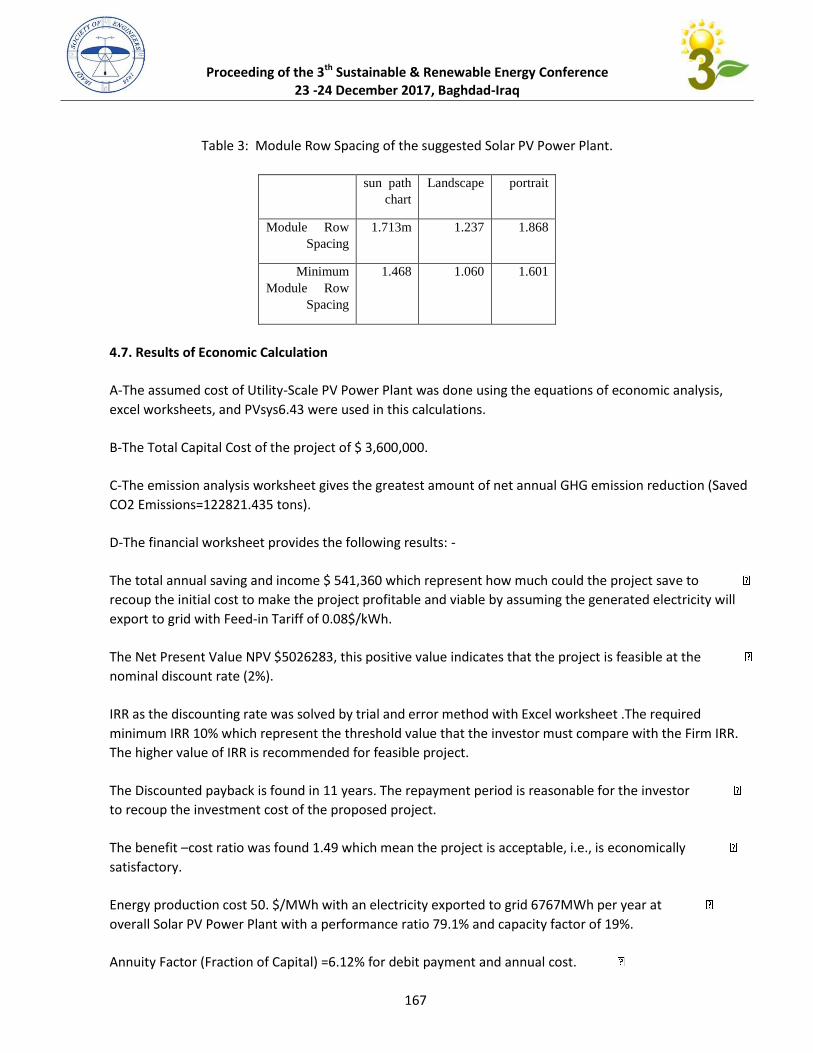
Proceeding of the 3th Sustainable & Renewable Energy Conference
23 -24 December 2017, Baghdad-Iraq
411
Table 3: Module Row Spacing of the suggested Solar PV Power Plant.
sun path
chart
Landscape portrait
Module Row
Spacing
1.713m 1.237 1.868
Minimum
Module Row
Spacing
1.468 1.060 1.601
4.7. Results of Economic Calculation
A-The assumed cost of Utility-Scale PV Power Plant was done using the equations of economic analysis,
excel worksheets, and PVsys6.43 were used in this calculations.
B-The Total Capital Cost of the project of $ 3,600,000.
C-The emission analysis worksheet gives the greatest amount of net annual GHG emission reduction (Saved
CO2 Emissions=122821.435 tons).
D-The financial worksheet provides the following results: -
The total annual saving and income $ 541,360 which represent how much could the project save to
recoup the initial cost to make the project profitable and viable by assuming the generated electricity will
export to grid with Feed-in Tariff of 0.08$/kWh.
The Net Present Value NPV $5026283, this positive value indicates that the project is feasible at the
nominal discount rate (2%).
IRR as the discounting rate was solved by trial and error method with Excel worksheet .The required
minimum IRR 10% which represent the threshold value that the investor must compare with the Firm IRR.
The higher value of IRR is recommended for feasible project.
The Discounted payback is found in 11 years. The repayment period is reasonable for the investor
to recoup the investment cost of the proposed project.
The benefit –cost ratio was found 1.49 which mean the project is acceptable, i.e., is economically
satisfactory.
Energy production cost 50. $/MWh with an electricity exported to grid 6767MWh per year at
overall Solar PV Power Plant with a performance ratio 79.1% and capacity factor of 19%.
Annuity Factor (Fraction of Capital) =6.12% for debit payment and annual cost.
167
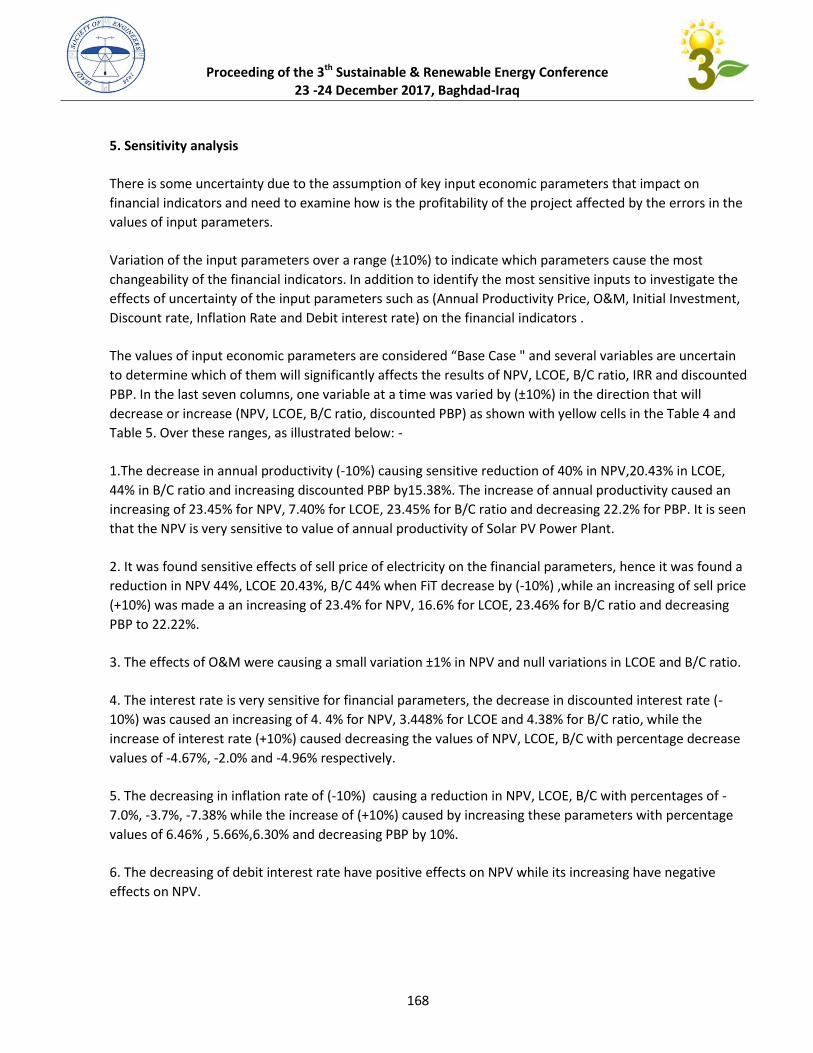
Proceeding of the 3th Sustainable & Renewable Energy Conference
23 -24 December 2017, Baghdad-Iraq
411
5. Sensitivity analysis
There is some uncertainty due to the assumption of key input economic parameters that impact on
financial indicators and need to examine how is the profitability of the project affected by the errors in the
values of input parameters.
Variation of the input parameters over a range (±10%) to indicate which parameters cause the most
changeability of the financial indicators. In addition to identify the most sensitive inputs to investigate the
effects of uncertainty of the input parameters such as (Annual Productivity Price, O&M, Initial Investment,
Discount rate, Inflation Rate and Debit interest rate) on the financial indicators .
The values of input economic parameters are considered “Base Case " and several variables are uncertain
to determine which of them will significantly affects the results of NPV, LCOE, B/C ratio, IRR and discounted
PBP. In the last seven columns, one variable at a time was varied by (±10%) in the direction that will
decrease or increase (NPV, LCOE, B/C ratio, discounted PBP) as shown with yellow cells in the Table 4 and
Table 5. Over these ranges, as illustrated below: -
1.The decrease in annual productivity (-10%) causing sensitive reduction of 40% in NPV,20.43% in LCOE,
44% in B/C ratio and increasing discounted PBP by15.38%. The increase of annual productivity caused an
increasing of 23.45% for NPV, 7.40% for LCOE, 23.45% for B/C ratio and decreasing 22.2% for PBP. It is seen
that the NPV is very sensitive to value of annual productivity of Solar PV Power Plant.
2. It was found sensitive effects of sell price of electricity on the financial parameters, hence it was found a
reduction in NPV 44%, LCOE 20.43%, B/C 44% when FiT decrease by (-10%) ,while an increasing of sell price
(+10%) was made a an increasing of 23.4% for NPV, 16.6% for LCOE, 23.46% for B/C ratio and decreasing
PBP to 22.22%.
3. The effects of O&M were causing a small variation ±1% in NPV and null variations in LCOE and B/C ratio.
4. The interest rate is very sensitive for financial parameters, the decrease in discounted interest rate (-
10%) was caused an increasing of 4. 4% for NPV, 3.448% for LCOE and 4.38% for B/C ratio, while the
increase of interest rate (+10%) caused decreasing the values of NPV, LCOE, B/C with percentage decrease
values of -4.67%, -2.0% and -4.96% respectively.
5. The decreasing in inflation rate of (-10%) causing a reduction in NPV, LCOE, B/C with percentages of -
7.0%, -3.7%, -7.38% while the increase of (+10%) caused by increasing these parameters with percentage
values of 6.46% , 5.66%,6.30% and decreasing PBP by 10%.
6. The decreasing of debit interest rate have positive effects on NPV while its increasing have negative
effects on NPV.
168
Proceeding of the 3th Sustainable & Renewable Energy Conference
23 -24 December 2017, Baghdad-Iraq
412
Table 4: Variables input parameters Deterministic Sensitivity Analysis.
First Scenario of percentages variations with yellow cells corresponds to each of input parameters with (-10%)
Parameters Base Case
Annual
Productiv
ity
Varied
Price
Varied
O&M
Varied
Initial
Investme
nt Varied
Discount
rate
varied
Inflation
rate
varied
Debit
interest rate
varied
Annual
Productivity-KWh 6767000 6090300
6767000 6767000 6767000 6767000 6767000 6767000
FiT(Sell Price-
$/KWh) 0.08 0.08 0.072 0.08 0.08
0.08 0.08 0.08
Annual O&M 5.666 5.666 5.666 50.66 5.666 5.666 5.666 5.666
Initial Investment 2066666 2066666 2066666 2066666 2.06666 2066666 2066666 2066666
Discounted rate 2% 2% 2% 2% 2% 1.8% 2% 2%
Inflation rate 3% 3% 3% 3% 3% 3% 2.7% 3%
Debit interest rate 2% 2% 2% 2% 2% 2% 2% 1.8%
NPV 5026282.9 20.06055
2
20.06055
2
56440.05
0
56.0...5
.
5.5..645
4
00.0.055
0
5146516.478
LCOE 0.05 656005 65605. 65655. 0.05 6565.2 6560. 0.0517
D.PBP 11 52 52 55 56 55 55 11
B/C 1.396 65.0. 65.0. 1.41 552.0 5500 552 1.429
Percentages variations each of output parameters with (-10%)
NPV (variation %) 0% 44% - 44% - 1.0%+ 0% 4. 4%+ 7.0% - 2.33%
LCOE 0% -20.43% -20.43% 1.58% 0% 3.448% -3.7% 2.33%
Discounted .PBP 0% 15.38% 15.38% 0% -10% 0% 0% 0%
B/C 0% -44% -44% 0.99% 0% 4.38% -7.38% -4.96%
169
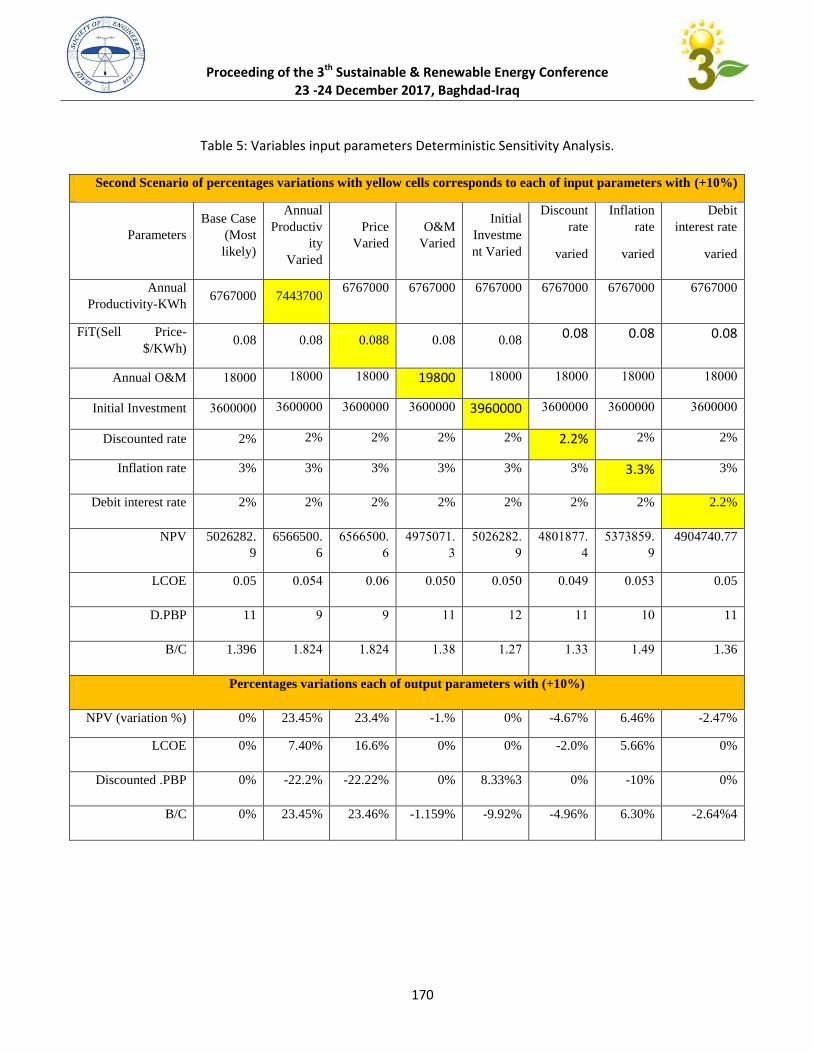
Proceeding of the 3th Sustainable & Renewable Energy Conference
23 -24 December 2017, Baghdad-Iraq
417
Table 5: Variables input parameters Deterministic Sensitivity Analysis.
Second Scenario of percentages variations with yellow cells corresponds to each of input parameters with (+10%)
Parameters
Base Case
(Most
likely)
Annual
Productiv
ity
Varied
Price
Varied
O&M
Varied
Initial
Investme
nt Varied
Discount
rate
varied
Inflation
rate
varied
Debit
interest rate
varied
Annual
Productivity-KWh 6767000 7443700
6767000 6767000 6767000 6767000 6767000 6767000
FiT(Sell Price-
$/KWh) 0.08 0.08 0.088 0.08 0.08
0.08 0.08 0.08
Annual O&M 5.666 5.666 5.666 48900 5.666 5.666 5.666 5.666
Initial Investment 2066666 2066666 2066666 2066666 1870000 2066666 2066666 2066666
Discounted rate 2% 2% 2% 2% 2% 2.2% 2% 2%
Inflation rate 3% 3% 3% 3% 3% 3% 3.3% 3%
Debit interest rate 2% 2% 2% 2% 2% 2% 2% 2.2%
NPV 5026282.
9
6566500.
6
05005665
0
0.456455
2
56.0...5
.
0.65.445
0
5242.5.5
.
4904740.77
LCOE 0.05 65650 6560 65656 65656 6560. 65652 0.05
D.PBP 11 . . 55 5. 55 56 11
B/C 1.396 55..0 55..0 552. 55.4 5522 550. 1.36
Percentages variations each of output parameters with (+10%)
NPV (variation %) 0% 23.45% 23.4% -1.% 0% -4.67% 6.46% -2.47%
LCOE 0% 7.40% 16.6% 0% 0% -2.0% 5.66% 0%
Discounted .PBP 0% -22.2% -22.22% 0% 8.33%3 0% -10% 0%
B/C 0% 23.45% 23.46% -1.159% -9.92% -4.96% 6.30% -2.64%4
170
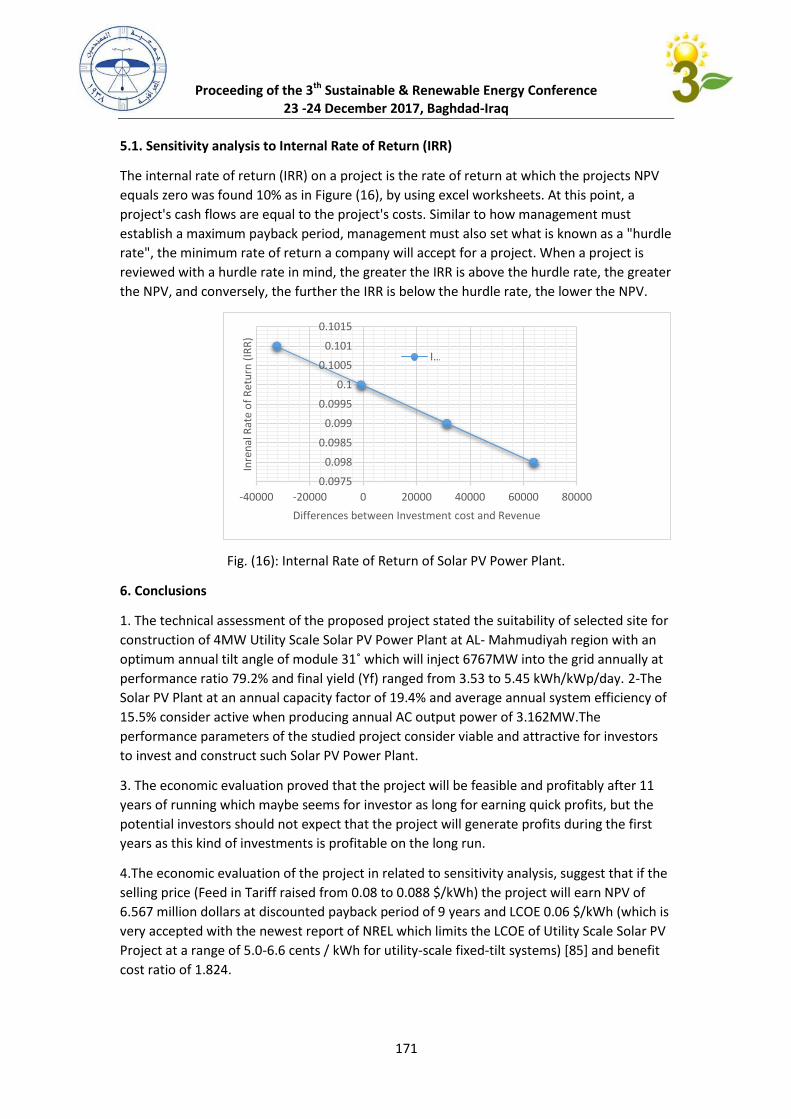
Proceeding of the 3th Sustainable & Renewable Energy Conference 23 -24 December 2017, Baghdad-Iraq
416
5.1. Sensitivity analysis to Internal Rate of Return (IRR)
The internal rate of return (IRR) on a project is the rate of return at which the projects NPV
equals zero was found 10% as in Figure (16), by using excel worksheets. At this point, a
project's cash flows are equal to the project's costs. Similar to how management must
establish a maximum payback period, management must also set what is known as a "hurdle
rate", the minimum rate of return a company will accept for a project. When a project is
reviewed with a hurdle rate in mind, the greater the IRR is above the hurdle rate, the greater
the NPV, and conversely, the further the IRR is below the hurdle rate, the lower the NPV.
Fig. (16): Internal Rate of Return of Solar PV Power Plant.
6. Conclusions
1. The technical assessment of the proposed project stated the suitability of selected site for
construction of 4MW Utility Scale Solar PV Power Plant at AL- Mahmudiyah region with an
optimum annual tilt angle of module 14˚ which will inject 7676MW into the grid annually at
performance ratio 79.2% and final yield (Yf) ranged from 3.53 to 5.45 kWh/kWp/day. 2-The
Solar PV Plant at an annual capacity factor of 19.4% and average annual system efficiency of
15.5% consider active when producing annual AC output power of 3.162MW.The
performance parameters of the studied project consider viable and attractive for investors
to invest and construct such Solar PV Power Plant.
3. The economic evaluation proved that the project will be feasible and profitably after 11
years of running which maybe seems for investor as long for earning quick profits, but the
potential investors should not expect that the project will generate profits during the first
years as this kind of investments is profitable on the long run.
4.The economic evaluation of the project in related to sensitivity analysis, suggest that if the
selling price (Feed in Tariff raised from 0.08 to 0.088 $/kWh) the project will earn NPV of
6.567 million dollars at discounted payback period of 9 years and LCOE 0.06 $/kWh (which is
very accepted with the newest report of NREL which limits the LCOE of Utility Scale Solar PV
Project at a range of 5.0-6.6 cents / kWh for utility-scale fixed-tilt systems) [85] and benefit
cost ratio of 1.824.
0.0975
0.098
0.0985
0.099
0.0995
0.1
0.1005
0.101
0.1015
-40000 -20000 0 20000 40000 60000 80000
Inre
nal
Rat
e o
f R
etu
rn (
IRR
)
Differences between Investment cost and Revenue
I…
171
Proceeding of the 3th Sustainable & Renewable Energy Conference 23 -24 December 2017, Baghdad-Iraq
419
5. The analysis was done for a specific investment strategy that consisted of constructing a 4
MW plant that could be extended to a larger system scale. A more in depth analysis would
be to look at the different ways, the investment can be done and compare them. This
project could be generalized to other Iraq districts for different load types (i.e., industrial,
economic, etc.). The results of this work should encourage governments to impose new
legislations related to renewable energy investments that limit all the financial parameters
such as (FiT, taxes, interest rate, debit interest rate, subsidies, etc...).
7. References
[1]. Harry H. Istepanian* Luay J. Al-Khatteeb, Electricity Consumption and Economic
Growth in Iraq.
[2]. International Renewable Energy Agency (IRENA), RENEWABLE CAPACITY
STATISTICS 2017, (IRENA), Abu Dhabi,2017. www.irena.org/Publications.
resourceirena.irena.org.
[4]. Y. Al-Douri and Fayadh M. Abed, Solar energy status in Iraq: Abundant or not—Steps
forward, JOURNAL OF RENEWABLE AND SUSTAINABLE ENERGY , (2016).
[5]. Kamal Attari, Ali Elyaakoubi, Adel Asselman, Performance analysis and investigation of
a grid-connected photovoltaic installation in Morocco, journal homepage:
www.elsevier.com/locate/egyr, Energy Reports 2 (2016) .
[0]. S. Duggirala and Z. Li, “Case Studies on the Economic Viability of Renewable Energy”
IEEE power engineering society, 2006.
[4]. E. Al-Ammar and A. Al-Aotaibi, “Feasibility study of establishing a PV power plant to
generate electricity in
Saudi Arabia, from technical, geographical, and economical viewpoints,” Technical report,
July 2009.
[.]. The NASA ATMOSPHERIC SCIENCE DATA CENTER, NASA SSE,
http://thegrid.rexel.com/topics/energy_efficiency/w/solar_renewable_and_energy_efficiency/
70.nasa-atmospheric-science-data-center-solar-power-potential-according-to-location.
[.]. International Finance Corporation (IFC), Utility-Scale Solar Photovoltaic Power Plants, A
Project Developer’s Guide, Washington, D.C. 20433,2015.
[16]. Stuart R. Wenham, Martin A. Green, Muriel E. Watt, Richard Corkish, 2006, Applied
Photovoltaics Second Edition, Earthscan, p.33-83
[15]. SMA Solar Technology AG, Central Inverter Planning of a PV Generator Planning
Guidelines, DC-PL-en-11 | Version 1.1,2013.
[1.] Systems, L.P., Industrial 10 to 100KW Grid-Connect Inverters,
www.ltipowersystems.com, Editor 2014: www.ltipowersystems.com.
172
Proceeding of the 3th Sustainable & Renewable Energy Conference 23 -24 December 2017, Baghdad-Iraq
418
[12] .Choi Y, J. Rayl, C. Tammineedi, and J. Brownson. 2011. PV Analyst: Coupling ArcGIS
with TRNSYS to assess distributed photovoltaic potential in urban areas. Solar
Energy 85: 2924-293.
[10]. Adaramola, M., Vagnes, E., 2015. Preliminary assessment of a small-scale rooftop
PV grid tied in Norwegian climatic conditions. Energy Convers. Manage. 90,
458–465.
[15]. NORTHREP,NORTH PACIFIC ACP Renewable Energy and Energy Efficiency
Project, Design of Grid Connect PV systems, SYSTEM DESIGN GUIDELINES.2015.
[50].Bruce Tsuchida, etl , Comparative Generation Costs of Utility Scale and Residential-
Scale PV in Xcel Energy Colorado’s Service Area, July 2015.
[54]. Tutorial- PVSYS6.43 Help, iles.pvsyst.com/help/.
[5.]. AdaramolaMS. Techno-economic analysis of a 2.1 kWrooftop photovoltaic-grid-tied
system base on actual performance. Energy Convers Manag 2015;101:85–93.
[5.]. Mediavilla M, Alonso-Tristán C, Rodríguez-Amigo MC, García-Calderón T, Dieste-
Velasco MI. Performance analysis of PV plants: optimization for improving profitability.
Energy Convers Manag 2012;54:17–23.
[26]. Ayompe LM, Duffy A, McCormack SJ, Conlon M. Measured performance of a 1.72kW
rooftop
grid connected photovoltaic system in Ireland. Energy Convers Manag 2011;52:
816–25.
[25]. IEC Standard 61724. Photovoltaic system performance monitoring-guidelines for
measurement,
data exchange and analysis; 1998.
[2.]. Ozden T, Akinoglu BG, Turan R. Long termoutdoor performance of three different on-
grid
PV arrays in central Anatolia – an extended analysis. Renew Energy 2017;101:
182–95.
[22]. Dobaria B, Pandya M, Aware M. Analytical assessment of 5.05 kWp grid tied
photovoltaic
plant performance on the system level in a composite climate of Western India.
Energy 2016;111:47–51.
[20]. Mpholo M, Nchaba T, Monese M. Yield and performance analysis of the first
gridconnected
173
Proceeding of the 3th Sustainable & Renewable Energy Conference 23 -24 December 2017, Baghdad-Iraq
420
solar farm at Moshoeshoe I International Airport, Lesotho. Renew Energy
2015;81:845–52.
[25]. Sundaram S, Babu JSC. Performance evaluation and validation of 5 MWp grid
connected
solar photovoltaic plant in South India. Energy Convers Manag 2015;100:429–39.
[.0].Kumar KA, Sundareswaran K, Venkateswaram PR. Performance study on a grid
connected
20 kWp solar photovoltaic installation in an industry in Tiruchirappalli (India). Energy
Sustain Dev 2014;23:294–304.
Marques RC, Krauter SCW, de Lima LC.
[27] .Padmavathi K, Daniel SA. Performance analysis of a 3 MWp grid connected solar
photovoltaic
power plant in India. Energy Sustain Dev 2013;17:615–25.
Ruether R, Zilles R.Making the case for grid-connected photovoltaics in Brazil.
[28] . Adaramola MS, Vagnes EET. Preliminary assessment of a small-scale rooftop PV-grid
tied
in Norwegian climatic conditions. Energy Convers Manag 20
[29].Ozden T, Akinoglu BG, Turan R. Long termoutdoor performance of three different on-
grid
PV arrays in central Anatolia – an extended analysis. Renew Energy 2017;101:
182–95.
Padmavathi K,
[30] Hajiah, A., et al., Performance of grid-connected photovoltaic system in two sites in
Kuwait. International Journal of Photoenergy, 2012. 2012.
[31] Kymakis, E., S. Kalykakis, and T.M. Papazoglou, Performance analysis of a grid
connected photovoltaic park on the island of Crete. Energy Conversion and Management,
2009. 50(3): p. 433-438.
[32]. L.M. Ayompe, A. Duffy, S.J. McCormack, M. Conlon. Measured performance of a 1.72
kW rooftop grid connected photovoltaic system in Ireland. Energy Conversion and
Management 52 (2010) 816-825.
[33].Elhadj Sidi CEB, Ndiaye ML, Bah ME, Mbodji A, Ndiaye A, Ndiaye PA. Performance
analysis of the first large-scale (15 MWp) grid-connected photovoltaic plant in
Mauritania.Energy Convers Manag 2016;119:411–21.
[34]. Wittkopf S, Valliappan S, Liu L, Ang KS, Cheng SCJ. Analytical
performancemonitoring of a142.5 kWp grid-connected rooftop BIPV system in Singapore.
Renew Energy 2012.
174
Proceeding of the 3th Sustainable & Renewable Energy Conference 23 -24 December 2017, Baghdad-Iraq
424
[35]. A. Guenounou, A. Malek , M. Aillerie. Comparative performance of PV panels of
different technologies over one year of exposure: Application to a coastal Mediterranean
region of Algeria. Energy Conversion and Management 2016.
[36]. Adaramola, M., Vagnes, E., 2015. Preliminary assessment of a small-scale rooftop PV
grid tied in Norwegian climatic conditions. Energy Convers. Manage. 90, 458–465.
[37].Determination of optimum tilt angles for solar ,Oyewola M Olarenwaju and Odesola I
Ifedayo . collectors in low-latitude tropical region, . International Journal of Energy and
.ijeee.com/content///,2013-http://www.journalEnvironmental Engineering,
[38].. Duffie, J.A., Beckman, W.A.: Solar engineering of thermal processes,3rd edn. John
Wiley & Sons Inc, USA (2006)
[39]. Panchal, H., Shah, P.: Investigation on solar stills having floating plates. Intern. J. Ener.
Environ. Eng. 3, 8 (2012).
[40]. (Petros Axaopoulos, Professor TEI of Athens Greece, Renewable Energy Technology,
Basic principles of solar geometry.)
.http://dx.doi.org/, [41] P.I. Cooper, The absorption of radiation in solar stills, Sol. Energy
[42] Şenpınar, A. (2006). ‘’Bağımsız Güneş Pili Sistemlerinin Bilgisayar ile Kontrolü’’, Fırat
Üniversitesi, Fen Bilimleri Enstitüsü, Doktora Tezi, Elazığ.
[43] Kattakayam T. A. & Srinivasan K., (1997). “Experimental Investigation on a Series-
Parallel Cluster of Photovoltaic Panels”, Solar Energy, 61(4), 231-240
[00]. Jacobson, Mark Z. (2005). Fundamentals of Atmospheric Modeling (2nd ed.).
Cambridge University Press. p. 317. ISBN 0521548659.
[05] . Jump up to: a b c Hartmann, Dennis L. (1994). Global Physical Climatology. Academic
Press. p. 30. ISBN 0080571638.
[46] J. A. Duffie and W. A. Beckman, Solar Engineering of Thermal Process, JohnWiley &
Sons, New York, NY, USA, 1991.
[47] Reindl DT, Beckman WA, Duffie JA (1990), Diffuse
fraction correlation. J. of Solar Energy 45:1-6.
[48]. Paulescu, M.; Schlett, Z. Performances assessment of global solar irradiation models
under Romanian climate. Renew. Energy 2003, 5, 767–777.
[49] B. Y. H. Liu and R. C. Jordan, “The interrelationship and
characteristic distribution of direct, diffuse and total solar
radiation,” Solar Energy, vol. 4, no. 3, pp. 1–19, 1960.
[50]. Foster, R.,Ghassemi, M. & Cota, A. Solar Energy Renewable and the Environment.
CRC Press. 2010.
[51] B. Liu, R. Jordan, Daily insolation on surfaces titled toward the equator, ASHRAE J.
(1961) 10 (United States).
175
Proceeding of the 3th Sustainable & Renewable Energy Conference 23 -24 December 2017, Baghdad-Iraq
422
[52] T. Muneer, G.S. Saluja, A brief review of models for computing solar radiation on
inclined surfaces, Energy Convers. Manage. 25 (4) (1985) .
[53] A Cooper B-Line, Solar Power Panel Orientation: Landscape vs. Portrait, Technical
White Paper October 2010 .
[54]. pveducation.org, (http://www.pveducation.org/pvcdrom/average-solar-radiation
[55].NREL, U.S. Solar Photovoltaic System Cost Benchmark: Q1 2017,
https://www.nrel.gov/news/press/2017/nrel-report-utility-scale-solar-pv-system-cost-fell-last-
year.html,Q1,2017.
[56].IEA, “Projected Costs of Generating Electricity” (2010);
[57]. US DOE, “2008 Solar Technologies Market Report” (2010).
[58].Prof. Beatriz de Blas, Net Present Value, Lesson 1.,April 2006
[59].John Richter, Financial Analysis of Residential PV and Solar Water Heating Systems,
2009.
[60] tradingeconomics.com/iraq/inflation-cpi/forecast and International Monetary Fund ,
Publication Services, International Monetary Fund, IMF Country Report No. 15/235
Washington, D.C.,2015. .http://www.vorpenergy.com/resources/calculators/Refrence
[61]. Ran Fu, David Feldman, Robert Margolis, Mike Woodhouse, and Kristen Ardani,
NREL,U.S. Solar Photovoltaic System Cost Benchmark: Q1 2017
[62]. the National Renewable Energy Laboratory (NREL),The best-practices guide also
reports PV O&M cost estimates from various organizations, which are generally around 0.5%
of system initial cost per year for large systems, NREL/FS-7A40-68281 • May 2017
[63].Ali K. Resen, Dr. Firas H. Abdulrazzaq, Jawad S. Nmr,Suitable Wind Turbine
Identification Using Capacity Factor and Economic Feasibility, International Journal of
Science and Technology Volume 4 No. 8, August, 2015.
[64]. Short, W.; Packey, D.J.; Holt, T. (1995). A Manual for the Economic Evaluation of
Energy Efficiency and Renewable Energy Technologies. Golden, CO, National Renewable
Energy Laboratory. March 1995.
[65]. Mathew, S., “Wind Energy: Fundamentals. Resource Analysis And Economics”,
Springer, Heidelberg ISBN-10 3-540-30905-5 Springer Berlin Heidelberg New York; Printed
in The Netherlands, 2006.
[66]. Samorani, M. Pardalos, P. M. et al. ,“Handbook of Wind Power Systems” , Energy
Systems, Springer-Verlag Berlin Heidelberg , 2013.
176

Application of Sustainable Architecture
(ASA)
Research
Proceeding of the 3th Sustainable & Renewable Energy Conference 23 -24 December 2017, Baghdad-Iraq
178
The Role of Green Building Rating Systems in Improving Indoor
Environmental Quality
(Comparison between Iraq and Middle East Countries)
Huda Abdulkareem Ali
Architect, MSc., LEED Green Associate
Abstract:
With the increasing importance of following the global efforts and taking serious steps to improve
buildings’ indoor environment in sustainable way for human health and productivity. UN reports have
shown serious alarming issues in the indoor environmental quality of many developing countries like
Iraq, while, they are still experience lack of awareness regarding to use green building regulations and
rating systems.
This research is an attempt to examine the implementation of green building rating systems to improve
the quality of the environment inside the buildings. The methodology that has followed to achieve this
goal is mixed research method by depending on two levels; firstly, the international level, by analysing
the current indoor requirements of the most used green building rating systems in Middle East
Countries, which are closed to Iraq environmentally and culturally; and secondly, the local level by
analysing two case studies and examining the current issues in the indoor environment by using IES
software and occupants’ satisfaction questionnaire.
The research has found that Iraqi buildings indoor environment could be improved by encouraging the
use of green building rating systems requirements depending on the type of indoor issue. Further, after
analysing the indoor problems in Iraqi case-study buildings and finding the main causes of those
problems are; the lack of regulations, knowledge and awareness of the problems as well as the current
sustainability goals and strategies, the research recommended to start the establishing of Iraqi green
building rating system by construction experts’ efforts, improving the current practice by involving the
occupants and other recommended steps to achieve sustainability inside the Iraqi buildings.
1. Introduction:
Until quite recently, the term ‘green building’ was just an ideal concept for building design and
construction. But, over the last decade, the concept of sustainable development and green buildings
was one of the significant topics in the construction field. However, it is still difficult to put a perfect
definition of what makes a building green (Kubba, 2012).
In construction industry sustainability is meant to improve design and construction practices so in
order that buildings last longer and cost less to operate, to support human productivity and to reach
better working environments for workers or residents. As human is spending most of his life inside
buildings, and if those buildings are containing any hazardous pollutants, that could be a dangerous
risk of his life (Kibert, 2013).
Proceeding of the 3th Sustainable & Renewable Energy Conference 23 -24 December 2017, Baghdad-Iraq
179
Developed countries have achieved a track record in the number of sustainable buildings that gained
high scores in the indoor environmental quality assessment criteria through different green rating
systems, such as BREEAM and LEED. Moreover, there are serious steps have been made in buildings’
sustainable development throughout the Middle East region, especially, the improved economics in the
Arab Gulf region (GBIG, 2016).
2. Problem Statement and Aim:
One of the big motivations for this research is the many UN reports that have shown serious alarming
issues in the indoor environmental quality in Iraq, such as; Sand and Dust Storms Fact Sheet, Iraq Air
Quality Overview Report and Electricity in Iraq Fact-sheet (JAPU, 2013) (UNEP , 2015)
(UNDP/Ministry of Electricity, 2010). Moreover, the current use of small generators has caused many
environmental problems to the indoor space, like; the high levels of noise and air pollution. With all
that issues, there is a lack of knowledge and awareness among construction industry stakeholders in
Iraq, especially, the designers, of how important indoor environmental quality for human health and
wellbeing.
While, the aim of this research is to investigate the current implementation of green building rating
systems in the indoor environmental quality, and Develop a strategy for improving indoor
environmental quality within Iraqi buildings.
3. Research Methodology:
As this research is aiming to investigate and define the opportunities of using green building rating
systems and developing indoor environmental quality of Iraqi buildings in sustainable way, and hence
this topic has been recognised to be complicated and has different aspects within different countries
depending on the outdoor environment, culture and subjectively on occupants. Thus, mixed methods
research would be appropriate strategy to examine both quantitative and qualitative parameters of data
collection, and to broaden the understanding of this topic.
While, the research structure would be depending on comparative design on two stages; firstly, to
study indoor environmental quality in Middle East Countries depending on the most common green
building rating systems; and then on second stage to compare the first result with the result of
analysing current condition of Iraqi indoor environmental quality. Hence, comparative research design
mainly used to examine particular issues or phenomena in two or more countries or cultures by
comparing them in different settings (Creswell, 2013).
The research is underpinning several steps as follows:
Investigate the current achievement grades of indoor environmental quality for new and
existing buildings in Middle East depending on LEED, BREEAM and Estidama Pearl Rating
Systems by SPSS software.
Analyse the current performance of two different types of buildings in Iraq (energy
consumption, carbon emissions and human comfort) and develop thermal models for the
selected case study buildings by IES Software and occupants’ satisfaction questionnaire.
Compare the results and conclude recommendations for improving indoor environmental
quality in Iraqi buildings.
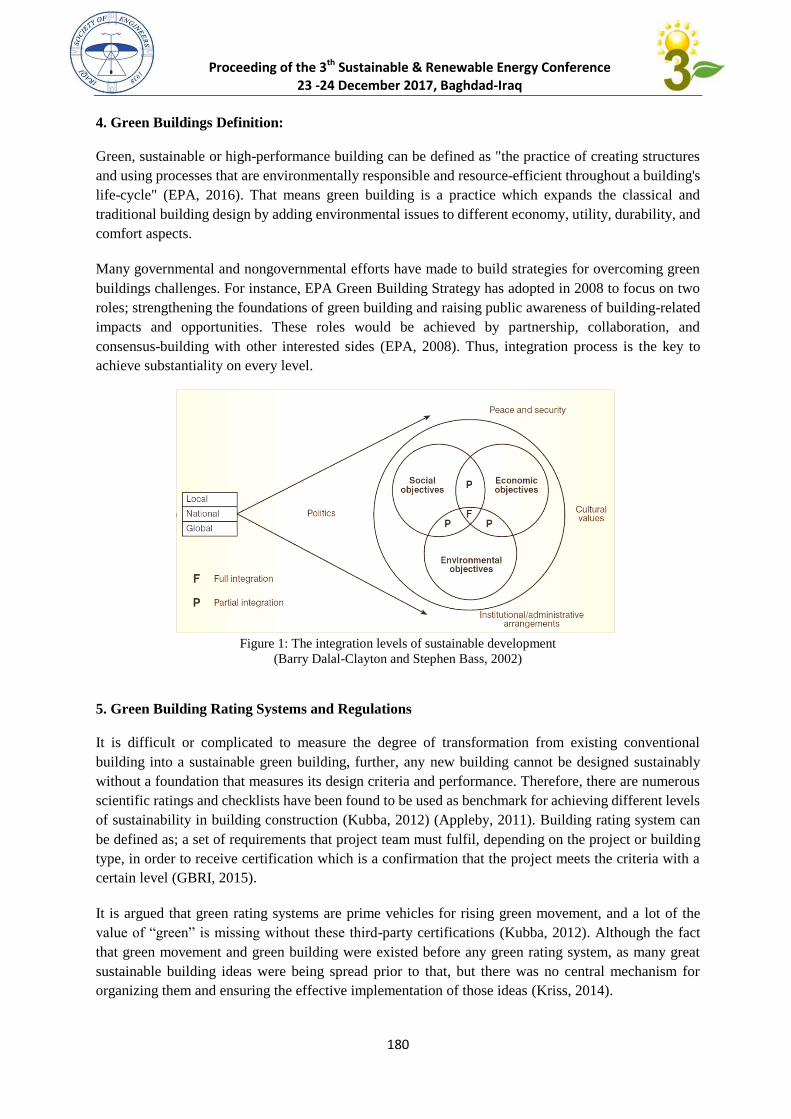
Proceeding of the 3th Sustainable & Renewable Energy Conference 23 -24 December 2017, Baghdad-Iraq
180
4. Green Buildings Definition:
Green, sustainable or high-performance building can be defined as "the practice of creating structures
and using processes that are environmentally responsible and resource-efficient throughout a building's
life-cycle" (EPA, 2016). That means green building is a practice which expands the classical and
traditional building design by adding environmental issues to different economy, utility, durability, and
comfort aspects.
Many governmental and nongovernmental efforts have made to build strategies for overcoming green
buildings challenges. For instance, EPA Green Building Strategy has adopted in 2008 to focus on two
roles; strengthening the foundations of green building and raising public awareness of building-related
impacts and opportunities. These roles would be achieved by partnership, collaboration, and
consensus-building with other interested sides (EPA, 2008). Thus, integration process is the key to
achieve substantiality on every level.
5. Green Building Rating Systems and Regulations
It is difficult or complicated to measure the degree of transformation from existing conventional
building into a sustainable green building, further, any new building cannot be designed sustainably
without a foundation that measures its design criteria and performance. Therefore, there are numerous
scientific ratings and checklists have been found to be used as benchmark for achieving different levels
of sustainability in building construction (Kubba, 2012) (Appleby, 2011). Building rating system can
be defined as; a set of requirements that project team must fulfil, depending on the project or building
type, in order to receive certification which is a confirmation that the project meets the criteria with a
certain level (GBRI, 2015).
It is argued that green rating systems are prime vehicles for rising green movement, and a lot of the
value of “green” is missing without these third-party certifications (Kubba, 2012). Although the fact
that green movement and green building were existed before any green rating system, as many great
sustainable building ideas were being spread prior to that, but there was no central mechanism for
organizing them and ensuring the effective implementation of those ideas (Kriss, 2014).
Figure 1: The integration levels of sustainable development
(Barry Dalal-Clayton and Stephen Bass, 2002)
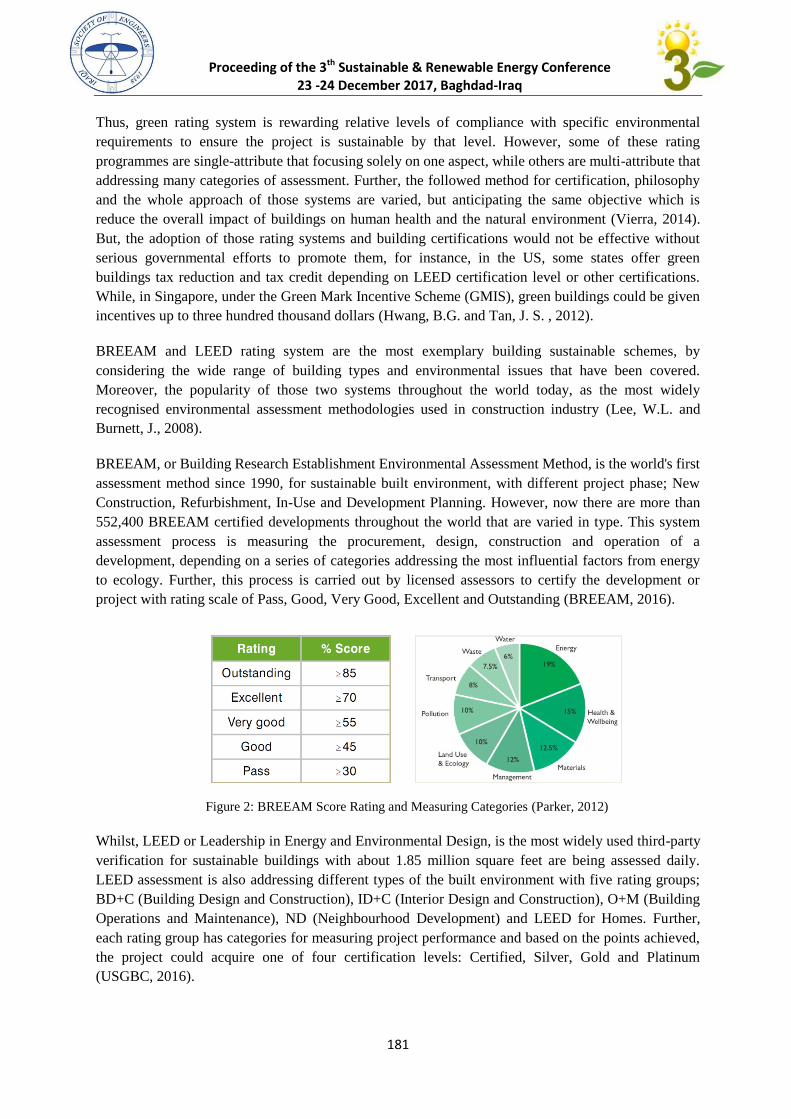
Proceeding of the 3th Sustainable & Renewable Energy Conference 23 -24 December 2017, Baghdad-Iraq
181
Thus, green rating system is rewarding relative levels of compliance with specific environmental
requirements to ensure the project is sustainable by that level. However, some of these rating
programmes are single-attribute that focusing solely on one aspect, while others are multi-attribute that
addressing many categories of assessment. Further, the followed method for certification, philosophy
and the whole approach of those systems are varied, but anticipating the same objective which is
reduce the overall impact of buildings on human health and the natural environment (Vierra, 2014).
But, the adoption of those rating systems and building certifications would not be effective without
serious governmental efforts to promote them, for instance, in the US, some states offer green
buildings tax reduction and tax credit depending on LEED certification level or other certifications.
While, in Singapore, under the Green Mark Incentive Scheme (GMIS), green buildings could be given
incentives up to three hundred thousand dollars (Hwang, B.G. and Tan, J. S. , 2012).
BREEAM and LEED rating system are the most exemplary building sustainable schemes, by
considering the wide range of building types and environmental issues that have been covered.
Moreover, the popularity of those two systems throughout the world today, as the most widely
recognised environmental assessment methodologies used in construction industry (Lee, W.L. and
Burnett, J., 2008).
BREEAM, or Building Research Establishment Environmental Assessment Method, is the world's first
assessment method since 1990, for sustainable built environment, with different project phase; New
Construction, Refurbishment, In-Use and Development Planning. However, now there are more than
552,400 BREEAM certified developments throughout the world that are varied in type. This system
assessment process is measuring the procurement, design, construction and operation of a
development, depending on a series of categories addressing the most influential factors from energy
to ecology. Further, this process is carried out by licensed assessors to certify the development or
project with rating scale of Pass, Good, Very Good, Excellent and Outstanding (BREEAM, 2016).
Whilst, LEED or Leadership in Energy and Environmental Design, is the most widely used third-party
verification for sustainable buildings with about 1.85 million square feet are being assessed daily.
LEED assessment is also addressing different types of the built environment with five rating groups;
BD+C (Building Design and Construction), ID+C (Interior Design and Construction), O+M (Building
Operations and Maintenance), ND (Neighbourhood Development) and LEED for Homes. Further,
each rating group has categories for measuring project performance and based on the points achieved,
the project could acquire one of four certification levels: Certified, Silver, Gold and Platinum
(USGBC, 2016).
Figure 2: BREEAM Score Rating and Measuring Categories (Parker, 2012)
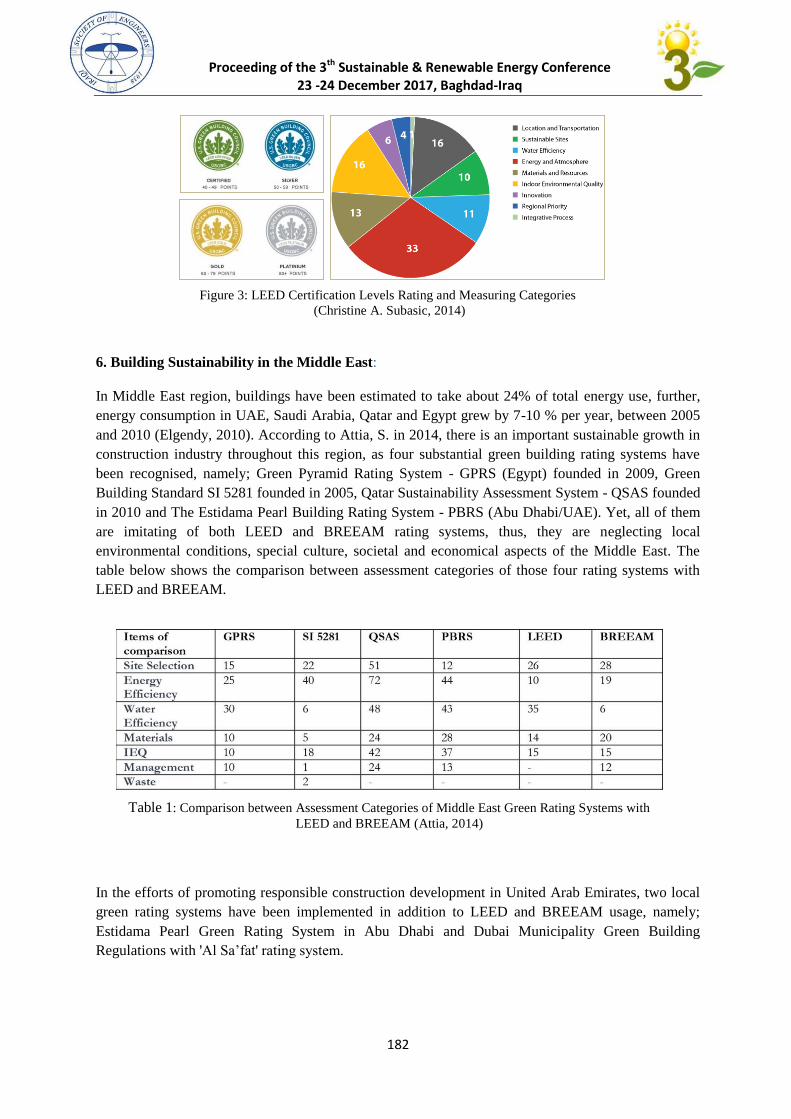
Proceeding of the 3th Sustainable & Renewable Energy Conference 23 -24 December 2017, Baghdad-Iraq
182
6. Building Sustainability in the Middle East:
In Middle East region, buildings have been estimated to take about 24% of total energy use, further,
energy consumption in UAE, Saudi Arabia, Qatar and Egypt grew by 7-10 % per year, between 2005
and 2010 (Elgendy, 2010). According to Attia, S. in 2014, there is an important sustainable growth in
construction industry throughout this region, as four substantial green building rating systems have
been recognised, namely; Green Pyramid Rating System - GPRS (Egypt) founded in 2009, Green
Building Standard SI 5281 founded in 2005, Qatar Sustainability Assessment System - QSAS founded
in 2010 and The Estidama Pearl Building Rating System - PBRS (Abu Dhabi/UAE). Yet, all of them
are imitating of both LEED and BREEAM rating systems, thus, they are neglecting local
environmental conditions, special culture, societal and economical aspects of the Middle East. The
table below shows the comparison between assessment categories of those four rating systems with
LEED and BREEAM.
In the efforts of promoting responsible construction development in United Arab Emirates, two local
green rating systems have been implemented in addition to LEED and BREEAM usage, namely;
Estidama Pearl Green Rating System in Abu Dhabi and Dubai Municipality Green Building
Regulations with 'Al Sa’fat' rating system.
Figure 3: LEED Certification Levels Rating and Measuring Categories
(Christine A. Subasic, 2014)
Table 1: Comparison between Assessment Categories of Middle East Green Rating Systems with
LEED and BREEAM (Attia, 2014)
Table 1: Comparison Between Assessment Categories of Middle East Green Rating Systems with LEED and BREEAM (Attia, 2014)
Table 2: Comparison Between Assessment Categories of Middle East Green Rating Systems with LEED and BREEAM (Attia, 2014)
Table 3: Comparison Between Assessment Categories of Middle East Green Rating Systems with LEED and BREEAM (Attia, 2014)
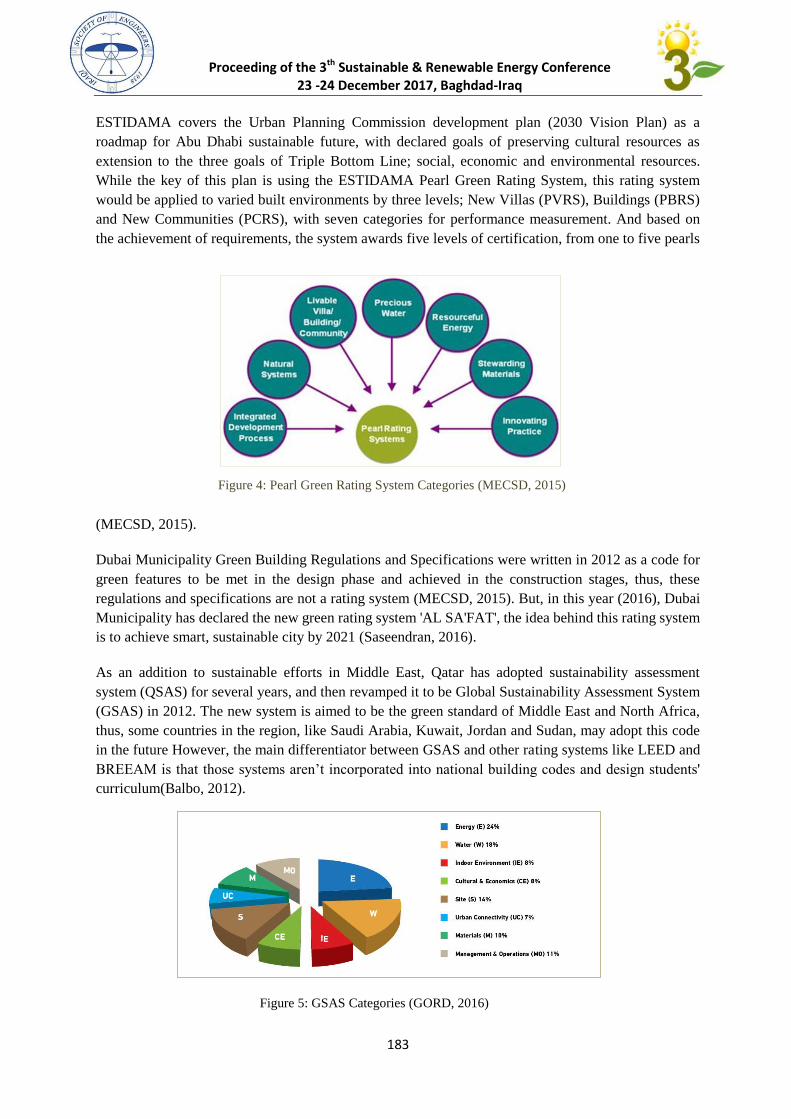
Proceeding of the 3th Sustainable & Renewable Energy Conference 23 -24 December 2017, Baghdad-Iraq
183
ESTIDAMA covers the Urban Planning Commission development plan (2030 Vision Plan) as a
roadmap for Abu Dhabi sustainable future, with declared goals of preserving cultural resources as
extension to the three goals of Triple Bottom Line; social, economic and environmental resources.
While the key of this plan is using the ESTIDAMA Pearl Green Rating System, this rating system
would be applied to varied built environments by three levels; New Villas (PVRS), Buildings (PBRS)
and New Communities (PCRS), with seven categories for performance measurement. And based on
the achievement of requirements, the system awards five levels of certification, from one to five pearls
(MECSD, 2015).
Dubai Municipality Green Building Regulations and Specifications were written in 2012 as a code for
green features to be met in the design phase and achieved in the construction stages, thus, these
regulations and specifications are not a rating system (MECSD, 2015). But, in this year (2016), Dubai
Municipality has declared the new green rating system 'AL SA'FAT', the idea behind this rating system
is to achieve smart, sustainable city by 2021 (Saseendran, 2016).
As an addition to sustainable efforts in Middle East, Qatar has adopted sustainability assessment
system (QSAS) for several years, and then revamped it to be Global Sustainability Assessment System
(GSAS) in 2012. The new system is aimed to be the green standard of Middle East and North Africa,
thus, some countries in the region, like Saudi Arabia, Kuwait, Jordan and Sudan, may adopt this code
in the future However, the main differentiator between GSAS and other rating systems like LEED and
BREEAM is that those systems aren’t incorporated into national building codes and design students'
curriculum(Balbo, 2012).
Figure 4: Pearl Green Rating System Categories (MECSD, 2015)
Figure 1: Pearl Green Rating System Categories (MECSD, 2015)
Figure 2: Pearl Green Rating System Categories (MECSD, 2015)
Figure 3: Pearl Green Rating System Categories (MECSD, 2015)
Figure 5: GSAS Categories (GORD, 2016)
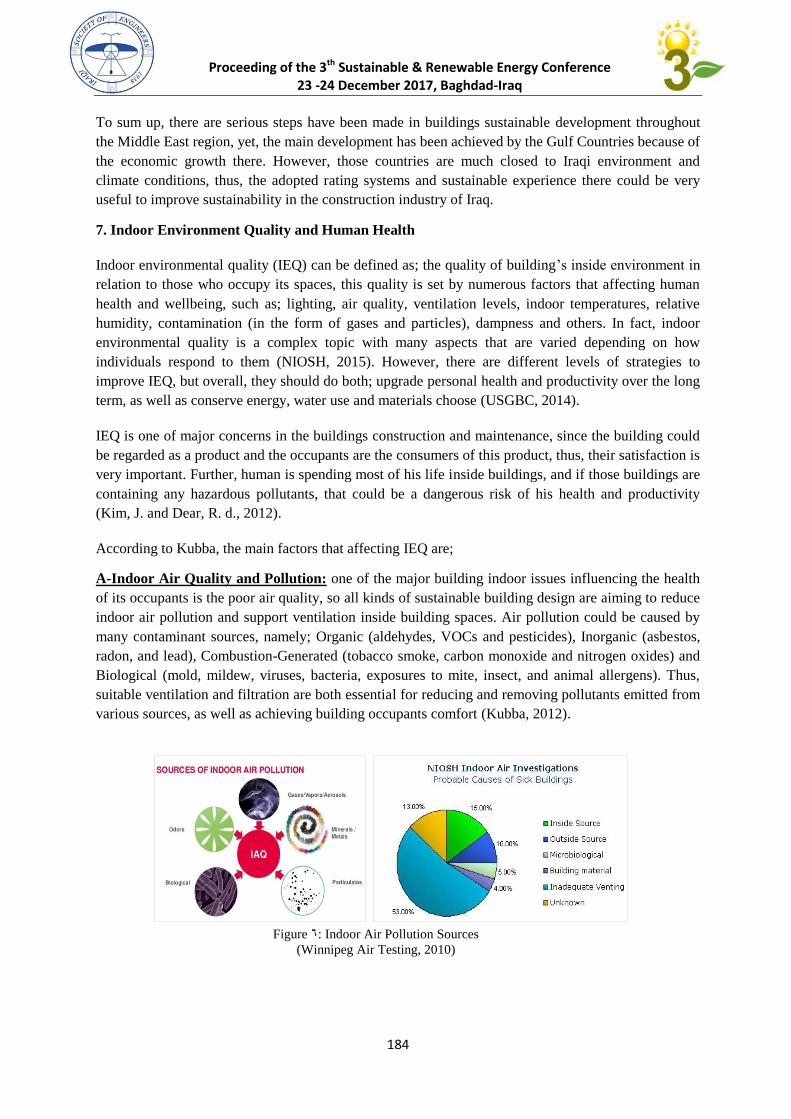
Proceeding of the 3th Sustainable & Renewable Energy Conference 23 -24 December 2017, Baghdad-Iraq
184
To sum up, there are serious steps have been made in buildings sustainable development throughout
the Middle East region, yet, the main development has been achieved by the Gulf Countries because of
the economic growth there. However, those countries are much closed to Iraqi environment and
climate conditions, thus, the adopted rating systems and sustainable experience there could be very
useful to improve sustainability in the construction industry of Iraq.
7. Indoor Environment Quality and Human Health
Indoor environmental quality (IEQ) can be defined as; the quality of building’s inside environment in
relation to those who occupy its spaces, this quality is set by numerous factors that affecting human
health and wellbeing, such as; lighting, air quality, ventilation levels, indoor temperatures, relative
humidity, contamination (in the form of gases and particles), dampness and others. In fact, indoor
environmental quality is a complex topic with many aspects that are varied depending on how
individuals respond to them (NIOSH, 2015). However, there are different levels of strategies to
improve IEQ, but overall, they should do both; upgrade personal health and productivity over the long
term, as well as conserve energy, water use and materials choose (USGBC, 2014).
IEQ is one of major concerns in the buildings construction and maintenance, since the building could
be regarded as a product and the occupants are the consumers of this product, thus, their satisfaction is
very important. Further, human is spending most of his life inside buildings, and if those buildings are
containing any hazardous pollutants, that could be a dangerous risk of his health and productivity
(Kim, J. and Dear, R. d., 2012).
According to Kubba, the main factors that affecting IEQ are;
A-Indoor Air Quality and Pollution: one of the major building indoor issues influencing the health
of its occupants is the poor air quality, so all kinds of sustainable building design are aiming to reduce
indoor air pollution and support ventilation inside building spaces. Air pollution could be caused by
many contaminant sources, namely; Organic (aldehydes, VOCs and pesticides), Inorganic (asbestos,
radon, and lead), Combustion-Generated (tobacco smoke, carbon monoxide and nitrogen oxides) and
Biological (mold, mildew, viruses, bacteria, exposures to mite, insect, and animal allergens). Thus,
suitable ventilation and filtration are both essential for reducing and removing pollutants emitted from
various sources, as well as achieving building occupants comfort (Kubba, 2012).
Figure 6: Indoor Air Pollution Sources
(Winnipeg Air Testing, 2010)
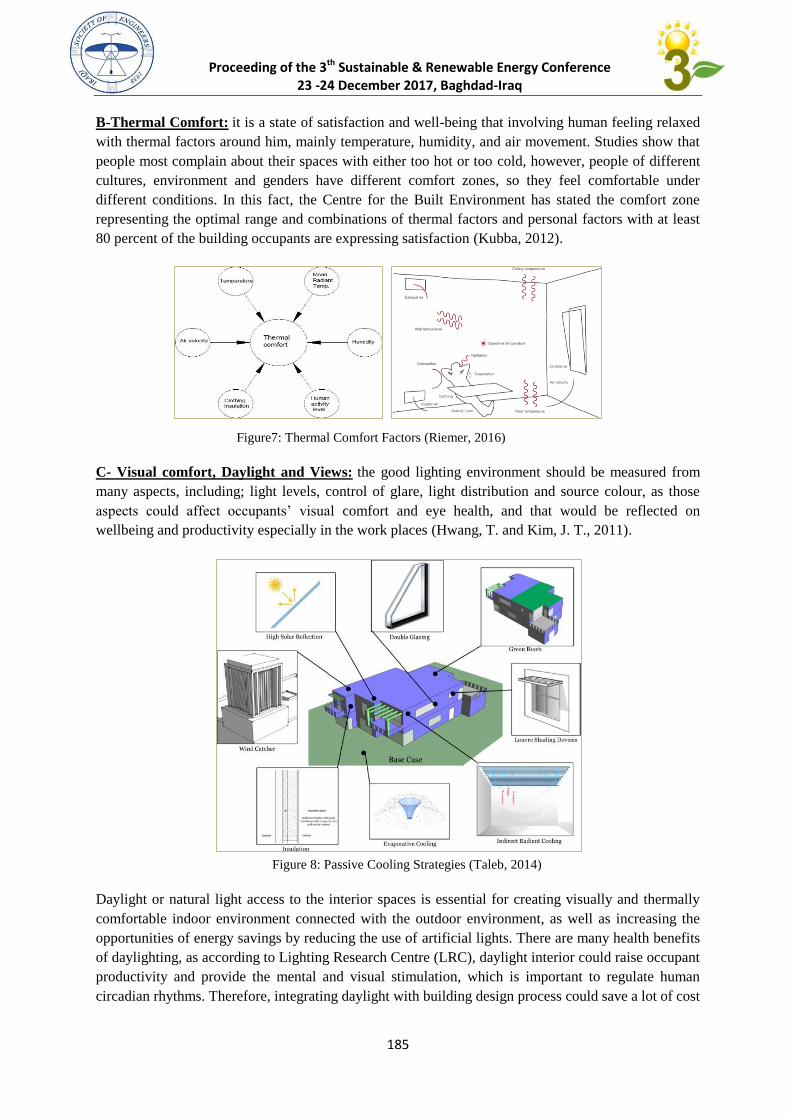
Proceeding of the 3th Sustainable & Renewable Energy Conference 23 -24 December 2017, Baghdad-Iraq
185
B-Thermal Comfort: it is a state of satisfaction and well-being that involving human feeling relaxed
with thermal factors around him, mainly temperature, humidity, and air movement. Studies show that
people most complain about their spaces with either too hot or too cold, however, people of different
cultures, environment and genders have different comfort zones, so they feel comfortable under
different conditions. In this fact, the Centre for the Built Environment has stated the comfort zone
representing the optimal range and combinations of thermal factors and personal factors with at least
80 percent of the building occupants are expressing satisfaction (Kubba, 2012).
C- Visual comfort, Daylight and Views: the good lighting environment should be measured from
many aspects, including; light levels, control of glare, light distribution and source colour, as those
aspects could affect occupants’ visual comfort and eye health, and that would be reflected on
wellbeing and productivity especially in the work places (Hwang, T. and Kim, J. T., 2011).
Daylight or natural light access to the interior spaces is essential for creating visually and thermally
comfortable indoor environment connected with the outdoor environment, as well as increasing the
opportunities of energy savings by reducing the use of artificial lights. There are many health benefits
of daylighting, as according to Lighting Research Centre (LRC), daylight interior could raise occupant
productivity and provide the mental and visual stimulation, which is important to regulate human
circadian rhythms. Therefore, integrating daylight with building design process could save a lot of cost
Figure7: Thermal Comfort Factors (Riemer, 2016)
Figure 8: Passive Cooling Strategies (Taleb, 2014)
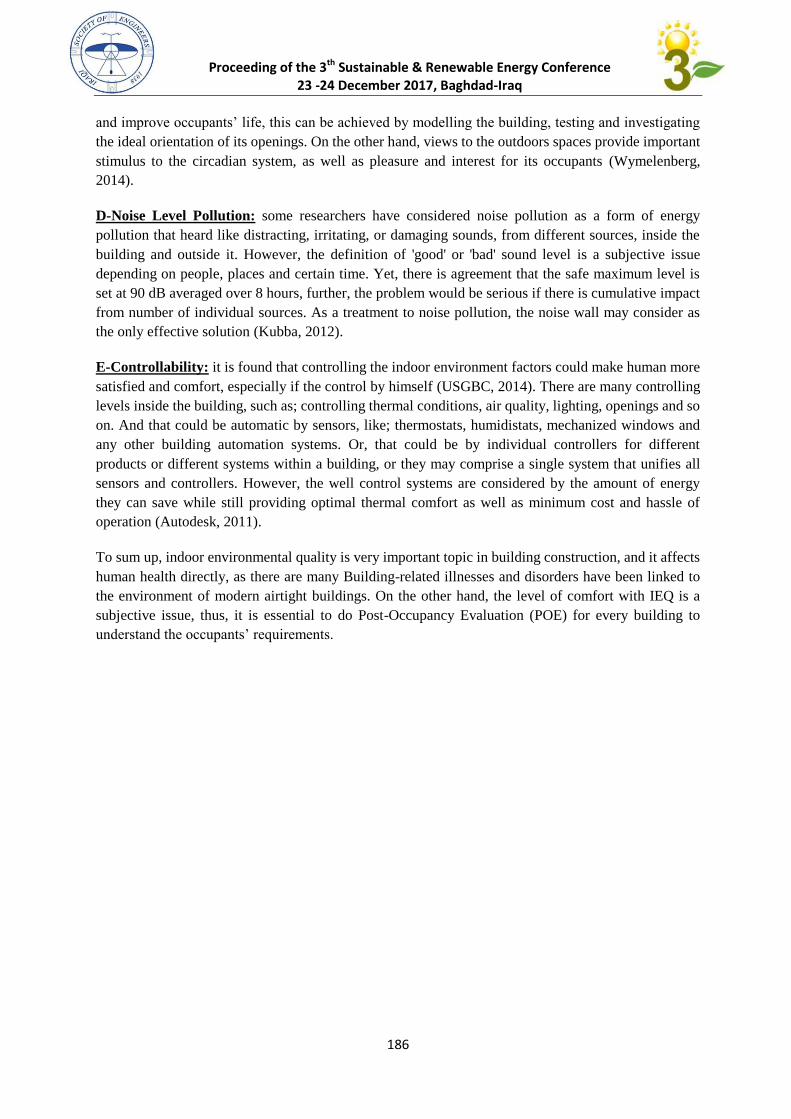
Proceeding of the 3th Sustainable & Renewable Energy Conference 23 -24 December 2017, Baghdad-Iraq
186
and improve occupants’ life, this can be achieved by modelling the building, testing and investigating
the ideal orientation of its openings. On the other hand, views to the outdoors spaces provide important
stimulus to the circadian system, as well as pleasure and interest for its occupants (Wymelenberg,
2014).
D-Noise Level Pollution: some researchers have considered noise pollution as a form of energy
pollution that heard like distracting, irritating, or damaging sounds, from different sources, inside the
building and outside it. However, the definition of 'good' or 'bad' sound level is a subjective issue
depending on people, places and certain time. Yet, there is agreement that the safe maximum level is
set at 90 dB averaged over 8 hours, further, the problem would be serious if there is cumulative impact
from number of individual sources. As a treatment to noise pollution, the noise wall may consider as
the only effective solution (Kubba, 2012).
E-Controllability: it is found that controlling the indoor environment factors could make human more
satisfied and comfort, especially if the control by himself (USGBC, 2014). There are many controlling
levels inside the building, such as; controlling thermal conditions, air quality, lighting, openings and so
on. And that could be automatic by sensors, like; thermostats, humidistats, mechanized windows and
any other building automation systems. Or, that could be by individual controllers for different
products or different systems within a building, or they may comprise a single system that unifies all
sensors and controllers. However, the well control systems are considered by the amount of energy
they can save while still providing optimal thermal comfort as well as minimum cost and hassle of
operation (Autodesk, 2011).
To sum up, indoor environmental quality is very important topic in building construction, and it affects
human health directly, as there are many Building-related illnesses and disorders have been linked to
the environment of modern airtight buildings. On the other hand, the level of comfort with IEQ is a
subjective issue, thus, it is essential to do Post-Occupancy Evaluation (POE) for every building to
understand the occupants’ requirements.
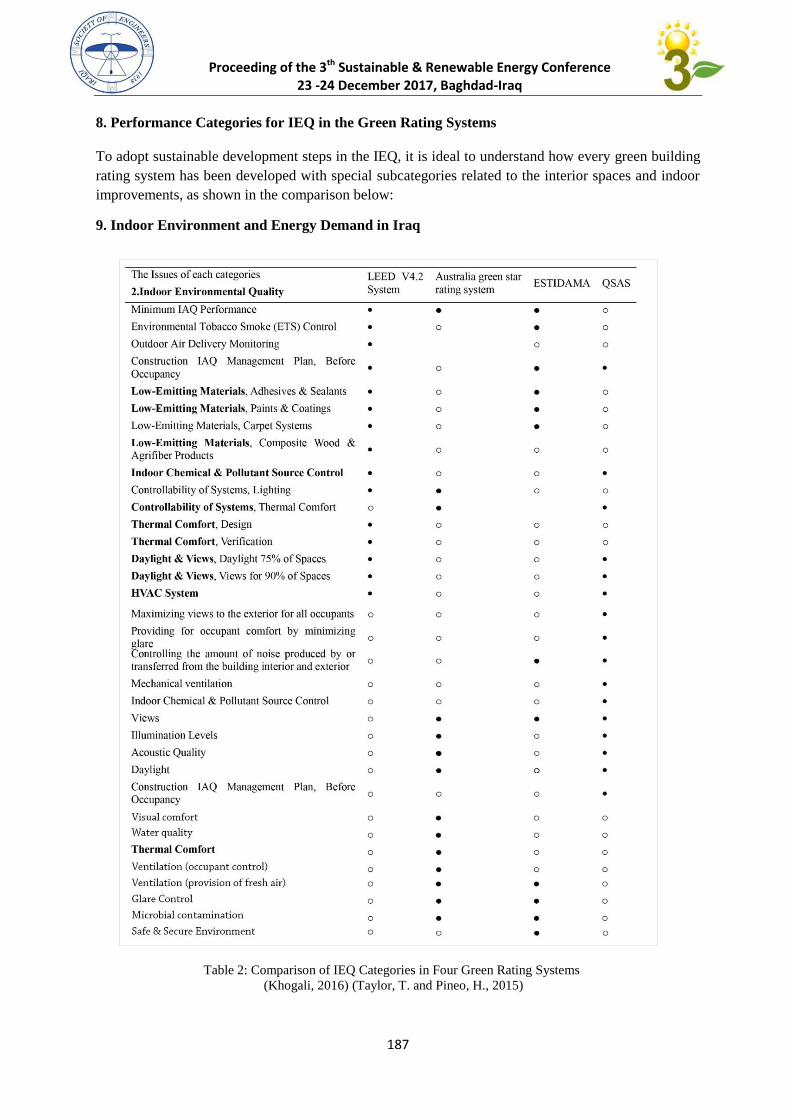
Proceeding of the 3th Sustainable & Renewable Energy Conference 23 -24 December 2017, Baghdad-Iraq
187
8. Performance Categories for IEQ in the Green Rating Systems
To adopt sustainable development steps in the IEQ, it is ideal to understand how every green building
rating system has been developed with special subcategories related to the interior spaces and indoor
improvements, as shown in the comparison below:
9. Indoor Environment and Energy Demand in Iraq
Table 2: Comparison of IEQ Categories in Four Green Rating Systems
(Khogali, 2016) (Taylor, T. and Pineo, H., 2015)
Table 4: Comparison of IEQ Categories in Four Green Rating Systems
(Khogali, 2016) (Taylor, T. and Pineo, H., 2015)
Table 5: Comparison of IEQ Categories in Four Green Rating Systems
(Khogali, 2016) (Taylor, T. and Pineo, H., 2015)
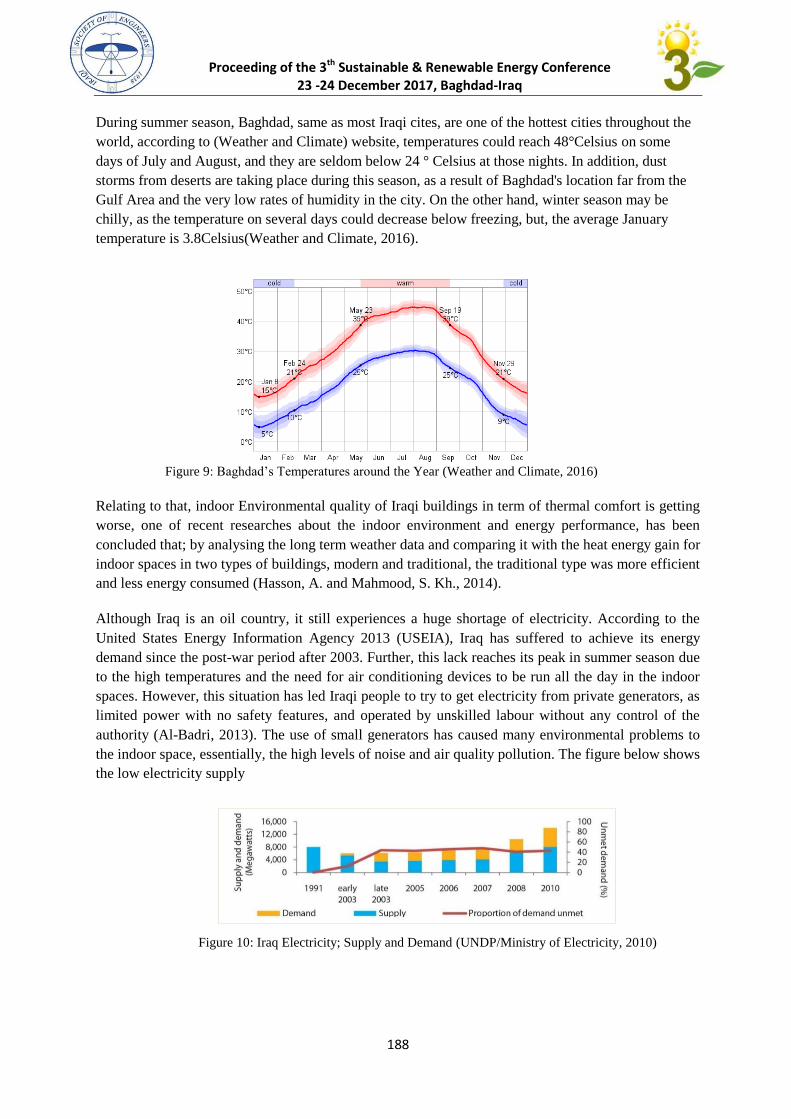
Proceeding of the 3th Sustainable & Renewable Energy Conference 23 -24 December 2017, Baghdad-Iraq
188
During summer season, Baghdad, same as most Iraqi cites, are one of the hottest cities throughout the
world, according to (Weather and Climate) website, temperatures could reach 48°Celsius on some
days of July and August, and they are seldom below 24 ° Celsius at those nights. In addition, dust
storms from deserts are taking place during this season, as a result of Baghdad's location far from the
Gulf Area and the very low rates of humidity in the city. On the other hand, winter season may be
chilly, as the temperature on several days could decrease below freezing, but, the average January
temperature is 3.8Celsius(Weather and Climate, 2016).
Relating to that, indoor Environmental quality of Iraqi buildings in term of thermal comfort is getting
worse, one of recent researches about the indoor environment and energy performance, has been
concluded that; by analysing the long term weather data and comparing it with the heat energy gain for
indoor spaces in two types of buildings, modern and traditional, the traditional type was more efficient
and less energy consumed (Hasson, A. and Mahmood, S. Kh., 2014).
Although Iraq is an oil country, it still experiences a huge shortage of electricity. According to the
United States Energy Information Agency 2013 (USEIA), Iraq has suffered to achieve its energy
demand since the post-war period after 2003. Further, this lack reaches its peak in summer season due
to the high temperatures and the need for air conditioning devices to be run all the day in the indoor
spaces. However, this situation has led Iraqi people to try to get electricity from private generators, as
limited power with no safety features, and operated by unskilled labour without any control of the
authority (Al-Badri, 2013). The use of small generators has caused many environmental problems to
the indoor space, essentially, the high levels of noise and air quality pollution. The figure below shows
the low electricity supply
Figure 9: Baghdad’s Temperatures around the Year (Weather and Climate, 2016)
Figure 10: Iraq Electricity; Supply and Demand (UNDP/Ministry of Electricity, 2010)
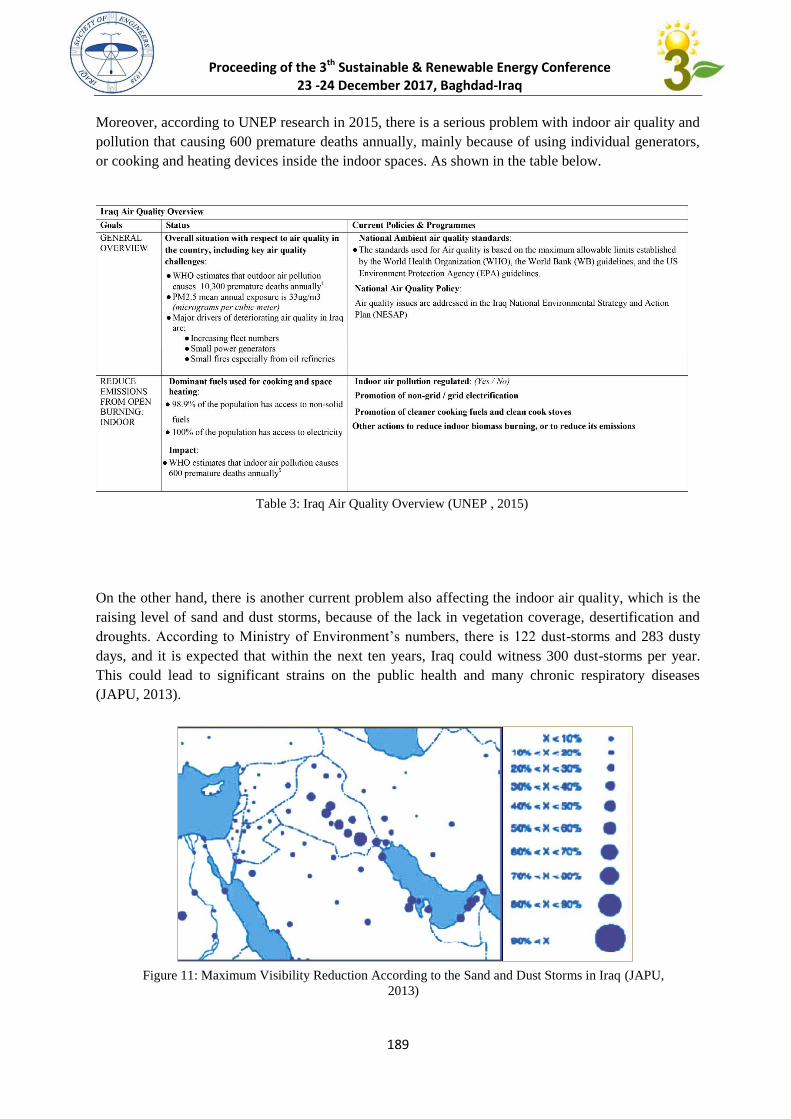
Proceeding of the 3th Sustainable & Renewable Energy Conference 23 -24 December 2017, Baghdad-Iraq
189
Moreover, according to UNEP research in 2015, there is a serious problem with indoor air quality and
pollution that causing 600 premature deaths annually, mainly because of using individual generators,
or cooking and heating devices inside the indoor spaces. As shown in the table below.
On the other hand, there is another current problem also affecting the indoor air quality, which is the
raising level of sand and dust storms, because of the lack in vegetation coverage, desertification and
droughts. According to Ministry of Environment’s numbers, there is 122 dust-storms and 283 dusty
days, and it is expected that within the next ten years, Iraq could witness 300 dust-storms per year.
This could lead to significant strains on the public health and many chronic respiratory diseases
(JAPU, 2013).
Table 3: Iraq Air Quality Overview (UNEP , 2015)
Table 7: Iraq Air Quality Overview (UNEP , 2015)
Table 8: Iraq Air Quality Overview (UNEP , 2015)
Table 9: Iraq Air Quality Overview (UNEP , 2015)
Figure 11: Maximum Visibility Reduction According to the Sand and Dust Storms in Iraq (JAPU,
2013)
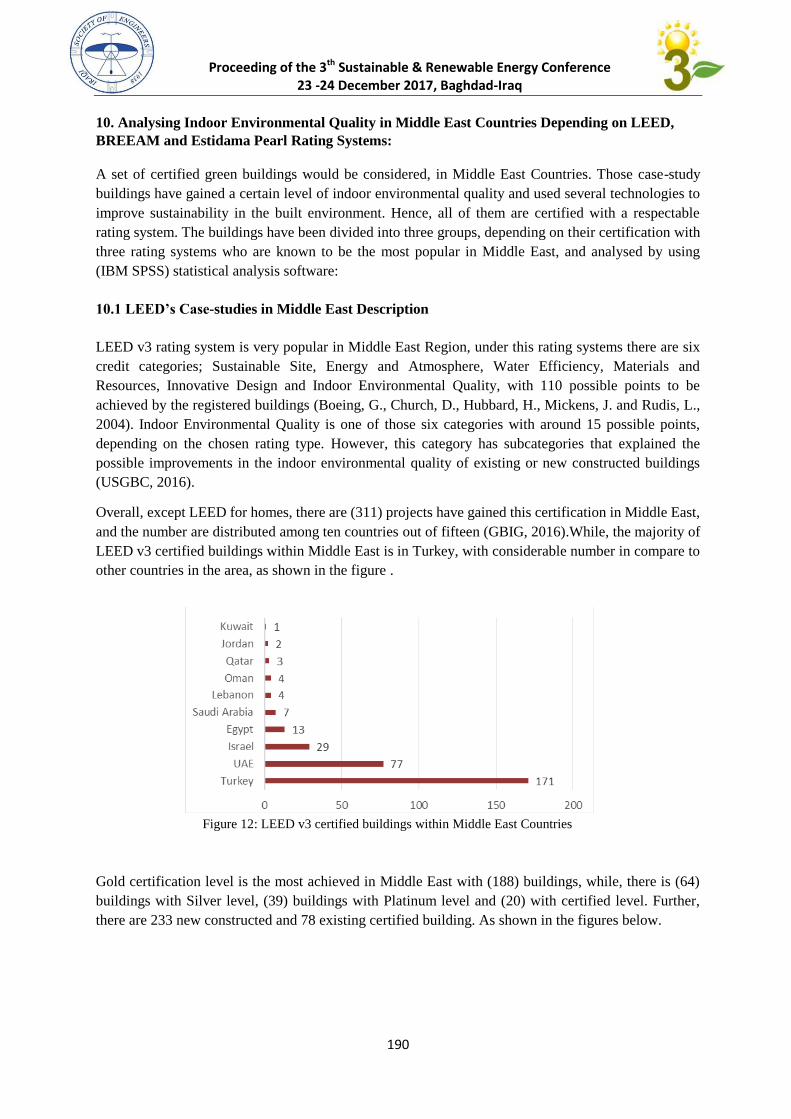
Proceeding of the 3th Sustainable & Renewable Energy Conference 23 -24 December 2017, Baghdad-Iraq
190
10. Analysing Indoor Environmental Quality in Middle East Countries Depending on LEED,
BREEAM and Estidama Pearl Rating Systems:
A set of certified green buildings would be considered, in Middle East Countries. Those case-study
buildings have gained a certain level of indoor environmental quality and used several technologies to
improve sustainability in the built environment. Hence, all of them are certified with a respectable
rating system. The buildings have been divided into three groups, depending on their certification with
three rating systems who are known to be the most popular in Middle East, and analysed by using
(IBM SPSS) statistical analysis software:
10.1 LEED’s Case-studies in Middle East Description
LEED v3 rating system is very popular in Middle East Region, under this rating systems there are six
credit categories; Sustainable Site, Energy and Atmosphere, Water Efficiency, Materials and
Resources, Innovative Design and Indoor Environmental Quality, with 110 possible points to be
achieved by the registered buildings (Boeing, G., Church, D., Hubbard, H., Mickens, J. and Rudis, L.,
2004). Indoor Environmental Quality is one of those six categories with around 15 possible points,
depending on the chosen rating type. However, this category has subcategories that explained the
possible improvements in the indoor environmental quality of existing or new constructed buildings
(USGBC, 2016).
Overall, except LEED for homes, there are (311) projects have gained this certification in Middle East,
and the number are distributed among ten countries out of fifteen (GBIG, 2016).While, the majority of
LEED v3 certified buildings within Middle East is in Turkey, with considerable number in compare to
other countries in the area, as shown in the figure .
Gold certification level is the most achieved in Middle East with (188) buildings, while, there is (64)
buildings with Silver level, (39) buildings with Platinum level and (20) with certified level. Further,
there are 233 new constructed and 78 existing certified building. As shown in the figures below.
Figure 12: LEED v3 certified buildings within Middle East Countries
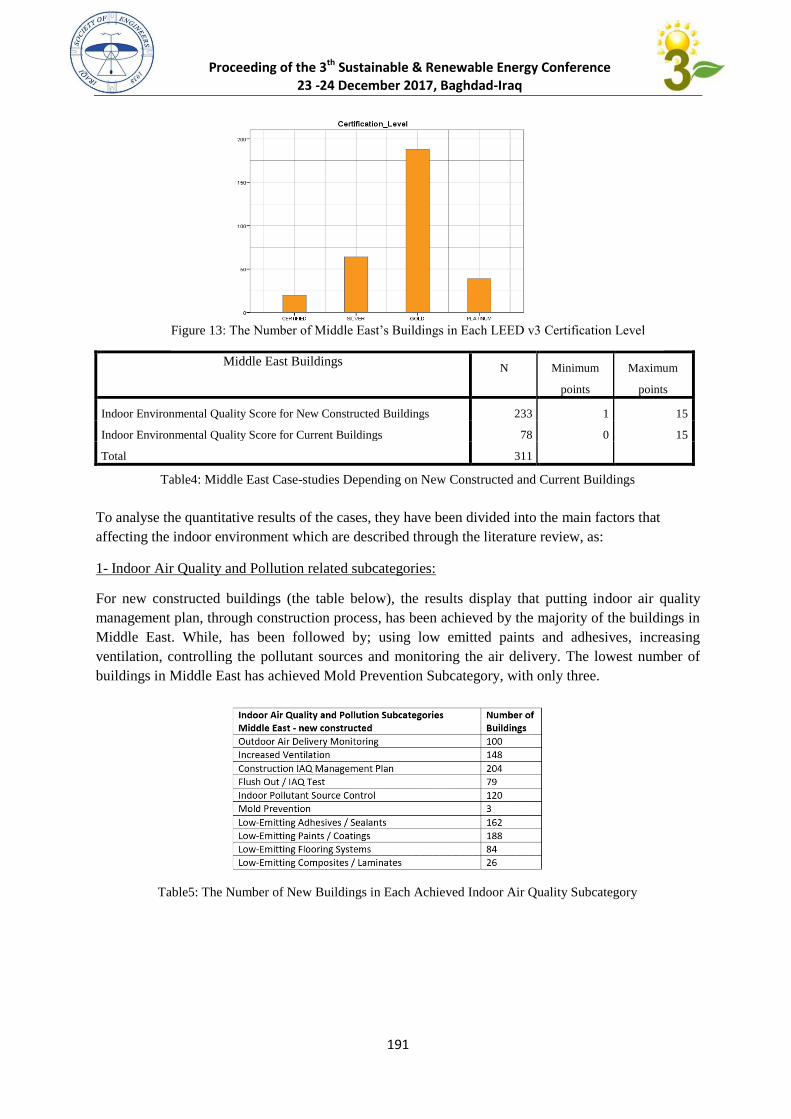
Proceeding of the 3th Sustainable & Renewable Energy Conference 23 -24 December 2017, Baghdad-Iraq
191
Middle East Buildings N Minimum
points
Maximum
points
Indoor Environmental Quality Score for New Constructed Buildings 233 1 15
Indoor Environmental Quality Score for Current Buildings 78 0 15
Total 311
To analyse the quantitative results of the cases, they have been divided into the main factors that
affecting the indoor environment which are described through the literature review, as:
1- Indoor Air Quality and Pollution related subcategories:
For new constructed buildings (the table below), the results display that putting indoor air quality
management plan, through construction process, has been achieved by the majority of the buildings in
Middle East. While, has been followed by; using low emitted paints and adhesives, increasing
ventilation, controlling the pollutant sources and monitoring the air delivery. The lowest number of
buildings in Middle East has achieved Mold Prevention Subcategory, with only three.
Figure 13: The Number of Middle East’s Buildings in Each LEED v3 Certification Level
Table4: Middle East Case-studies Depending on New Constructed and Current Buildings
Table5: The Number of New Buildings in Each Achieved Indoor Air Quality Subcategory
Table 10: The Number of New Buildings in Each Achieved Indoor Air Quality Subcategory
Table 11: The Number of New Buildings in Each Achieved Indoor Air Quality Subcategory

Proceeding of the 3th Sustainable & Renewable Energy Conference 23 -24 December 2017, Baghdad-Iraq
192
For current buildings (with a whole or part sustainable development), using low emitted paints has
been achieved by the majority of the buildings in Middle East. While, this has been followed by;
putting construction indoor air quality management plan, using low emitted adhesives, increasing
ventilation and the other subcategories. As in the table below.
2- Thermal comfort related subcategories:
For new constructed buildings, the results display that achieving thermal comfort in design stage is
much more important than the verification of thermal comfort in Middle East, as in the table below.
In the same way, for current buildings (with a whole or part sustainable development), thermal comfort
in design stage is still the most achieved subcategory for both locations, as in the following table.
Table 6: The Number of Current Buildings in Each Achieved Indoor Air Quality Subcategory
Indoor Air Quality Subcategory
Table 7: The Number of New Buildings in Each Achieved Thermal Comfort Subcategory
Table 8: The Number of Current Buildings in Each Achieved Thermal Comfort Subcategory
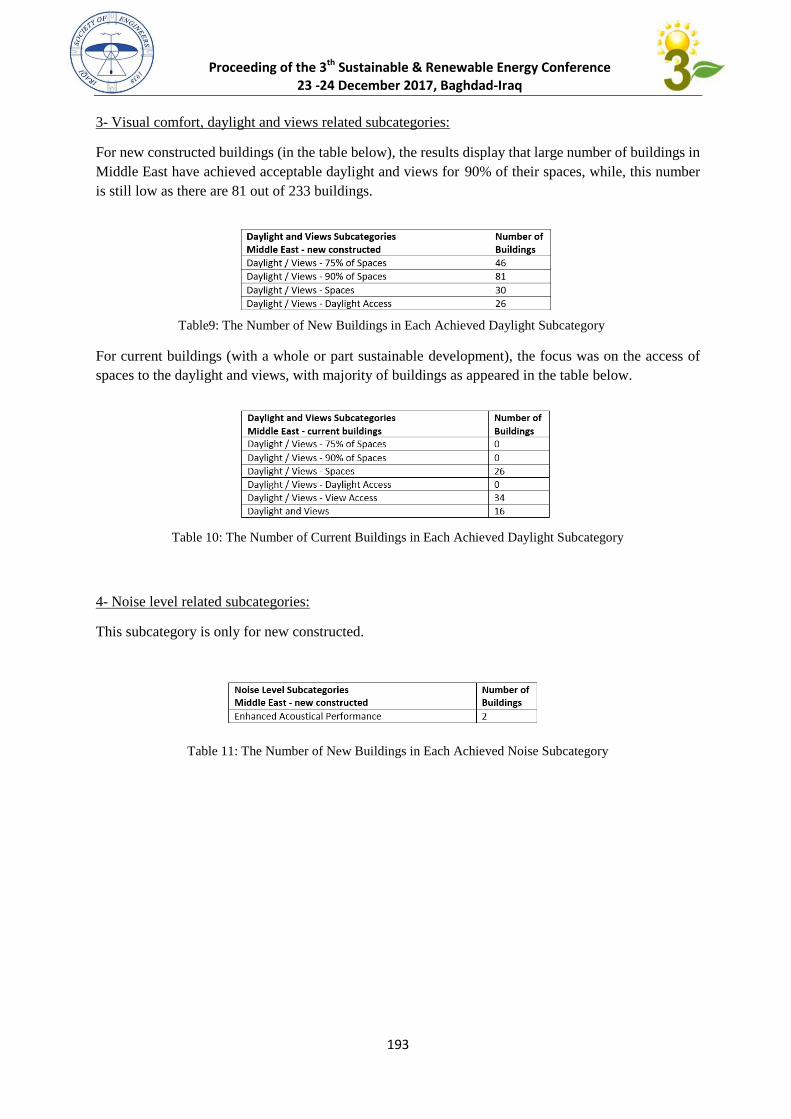
Proceeding of the 3th Sustainable & Renewable Energy Conference 23 -24 December 2017, Baghdad-Iraq
193
3- Visual comfort, daylight and views related subcategories:
For new constructed buildings (in the table below), the results display that large number of buildings in
Middle East have achieved acceptable daylight and views for 90% of their spaces, while, this number
is still low as there are 81 out of 233 buildings.
For current buildings (with a whole or part sustainable development), the focus was on the access of
spaces to the daylight and views, with majority of buildings as appeared in the table below.
Table 10: The Number of Current Buildings in Each Achieved Daylight Subcategory
4- Noise level related subcategories:
This subcategory is only for new constructed.
Table 11: The Number of New Buildings in Each Achieved Noise Subcategory
Table9: The Number of New Buildings in Each Achieved Daylight Subcategory

Proceeding of the 3th Sustainable & Renewable Energy Conference 23 -24 December 2017, Baghdad-Iraq
194
5- Controllability and subjective related subcategories:
New-constructed buildings have focused more on controlling lighting in Middle East.
On the other hand, Middle East countries focused on controlling lighting in current buildings (with a
whole or part sustainable development). As seen in the table below.
10.2 Middle East BREEAM’s Case-studies Description
1- Kanyon Building in Istanbul, Turkey:
Kanyon is a mixed-use centre in Istanbul city that opened in May 2006, the project coasted about $200
million with the participation of various well known national and international companies. As one of
the largest multifunctional projects in Europe, the whole centre area is 250,000 m² and including two
main parts (BRE, 2016):
Mixed residential and business community.
Open-air shopping mall.
The residential part involves 179 apartments that overlooking the long and curving expanse of the
project. While, there is a business tower which includes office spaces spreading over 25 floors, and
shopping mall includes four levels of retail spaces. Generally, Kanyon shopping centre attracts about
35 thousand visitors daily (BRE, 2016).
Table 12: The Number of New Buildings in Each Construability Subcategory
Table 13: The Number of Current Buildings in Each Construability Subcategory
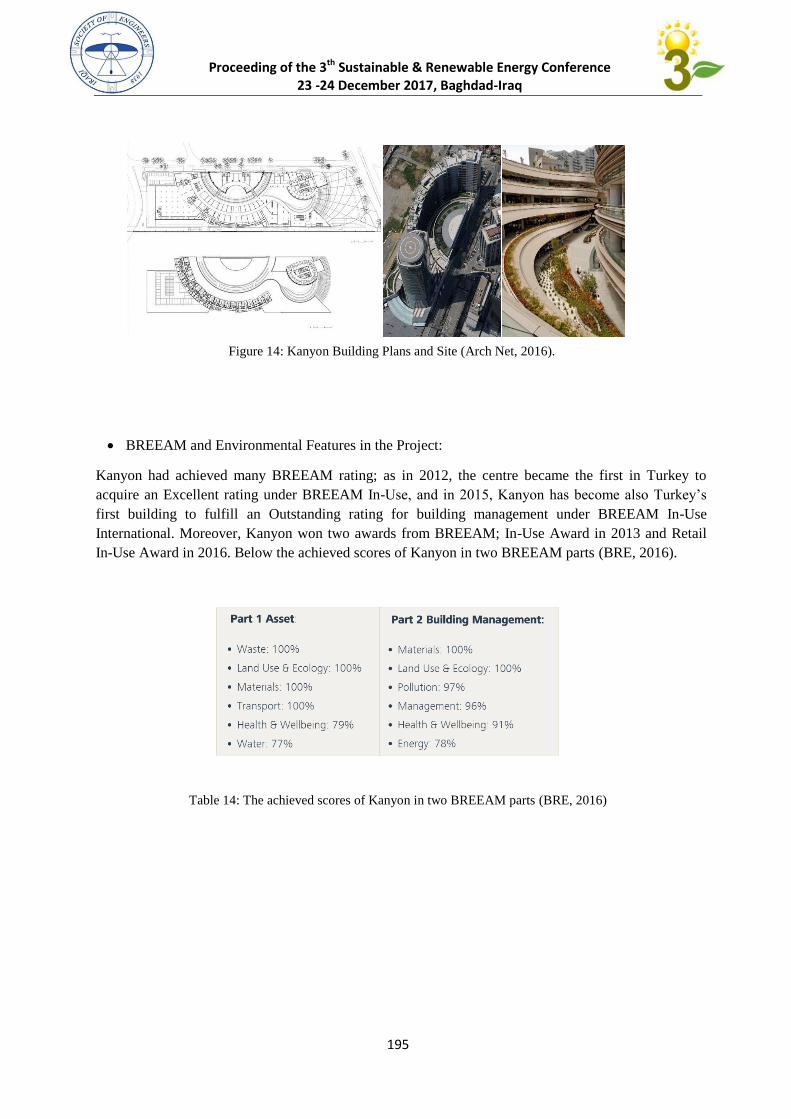
Proceeding of the 3th Sustainable & Renewable Energy Conference 23 -24 December 2017, Baghdad-Iraq
195
BREEAM and Environmental Features in the Project:
Kanyon had achieved many BREEAM rating; as in 2012, the centre became the first in Turkey to
acquire an Excellent rating under BREEAM In-Use, and in 2015, Kanyon has become also Turkey’s
first building to fulfill an Outstanding rating for building management under BREEAM In-Use
International. Moreover, Kanyon won two awards from BREEAM; In-Use Award in 2013 and Retail
In-Use Award in 2016. Below the achieved scores of Kanyon in two BREEAM parts (BRE, 2016).
Table 14: The achieved scores of Kanyon in two BREEAM parts (BRE, 2016)
Figure 14: Kanyon Building Plans and Site (Arch Net, 2016).
Table 13: The achieved scores of Kanyon in two BREEAM parts (BRE, 2016).
Table 14: The achieved scores of Kanyon in two BREEAM parts (BRE, 2016).
Table 15: The achieved scores of Kanyon in two BREEAM parts (BRE, 2016).
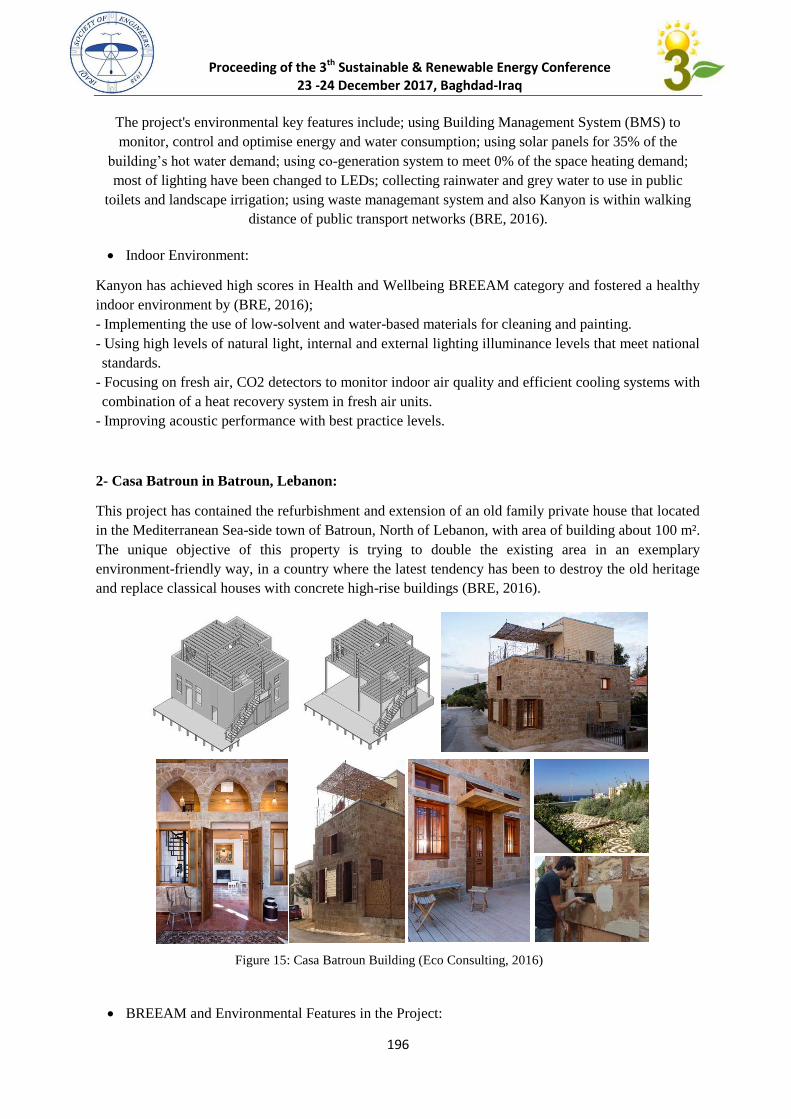
Proceeding of the 3th Sustainable & Renewable Energy Conference 23 -24 December 2017, Baghdad-Iraq
196
The project's environmental key features include; using Building Management System (BMS) to
monitor, control and optimise energy and water consumption; using solar panels for 35% of the
building’s hot water demand; using co-generation system to meet 0% of the space heating demand;
most of lighting have been changed to LEDs; collecting rainwater and grey water to use in public
toilets and landscape irrigation; using waste managemant system and also Kanyon is within walking
distance of public transport networks (BRE, 2016).
Indoor Environment:
Kanyon has achieved high scores in Health and Wellbeing BREEAM category and fostered a healthy
indoor environment by (BRE, 2016);
- Implementing the use of low-solvent and water-based materials for cleaning and painting.
- Using high levels of natural light, internal and external lighting illuminance levels that meet national
standards.
- Focusing on fresh air, CO2 detectors to monitor indoor air quality and efficient cooling systems with
combination of a heat recovery system in fresh air units.
- Improving acoustic performance with best practice levels.
2- Casa Batroun in Batroun, Lebanon:
This project has contained the refurbishment and extension of an old family private house that located
in the Mediterranean Sea-side town of Batroun, North of Lebanon, with area of building about 100 m².
The unique objective of this property is trying to double the existing area in an exemplary
environment-friendly way, in a country where the latest tendency has been to destroy the old heritage
and replace classical houses with concrete high-rise buildings (BRE, 2016).
BREEAM and Environmental Features in the Project:
Figure 15: Casa Batroun Building (Eco Consulting, 2016)
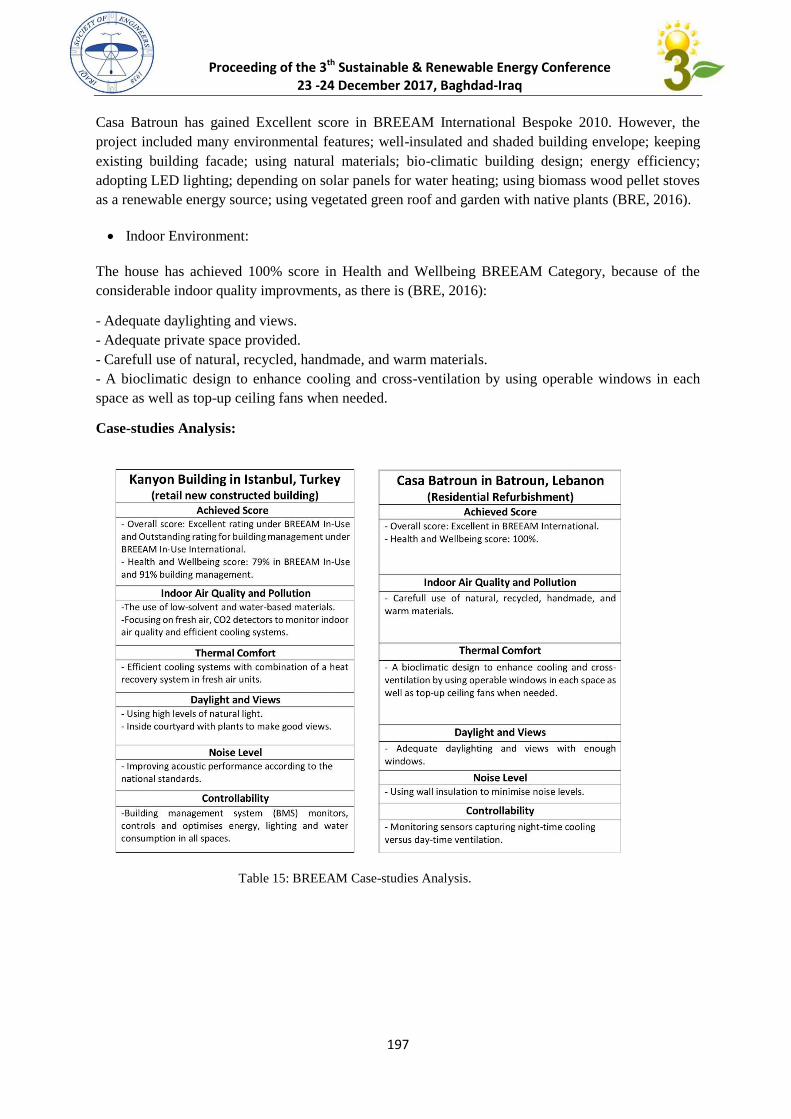
Proceeding of the 3th Sustainable & Renewable Energy Conference 23 -24 December 2017, Baghdad-Iraq
197
Casa Batroun has gained Excellent score in BREEAM International Bespoke 2010. However, the
project included many environmental features; well-insulated and shaded building envelope; keeping
existing building facade; using natural materials; bio-climatic building design; energy efficiency;
adopting LED lighting; depending on solar panels for water heating; using biomass wood pellet stoves
as a renewable energy source; using vegetated green roof and garden with native plants (BRE, 2016).
Indoor Environment:
The house has achieved 100% score in Health and Wellbeing BREEAM Category, because of the
considerable indoor quality improvments, as there is (BRE, 2016):
- Adequate daylighting and views.
- Adequate private space provided.
- Carefull use of natural, recycled, handmade, and warm materials.
- A bioclimatic design to enhance cooling and cross-ventilation by using operable windows in each
space as well as top-up ceiling fans when needed.
Case-studies Analysis:
Table 15: BREEAM Case-studies Analysis.
Table 16: The achieved scores of Kanyon in two BREEAM parts (BRE, 2016).
Table 17: The achieved scores of Kanyon in two BREEAM parts (BRE, 2016).
Table 18: The achieved scores of Kanyon in two BREEAM parts (BRE, 2016).
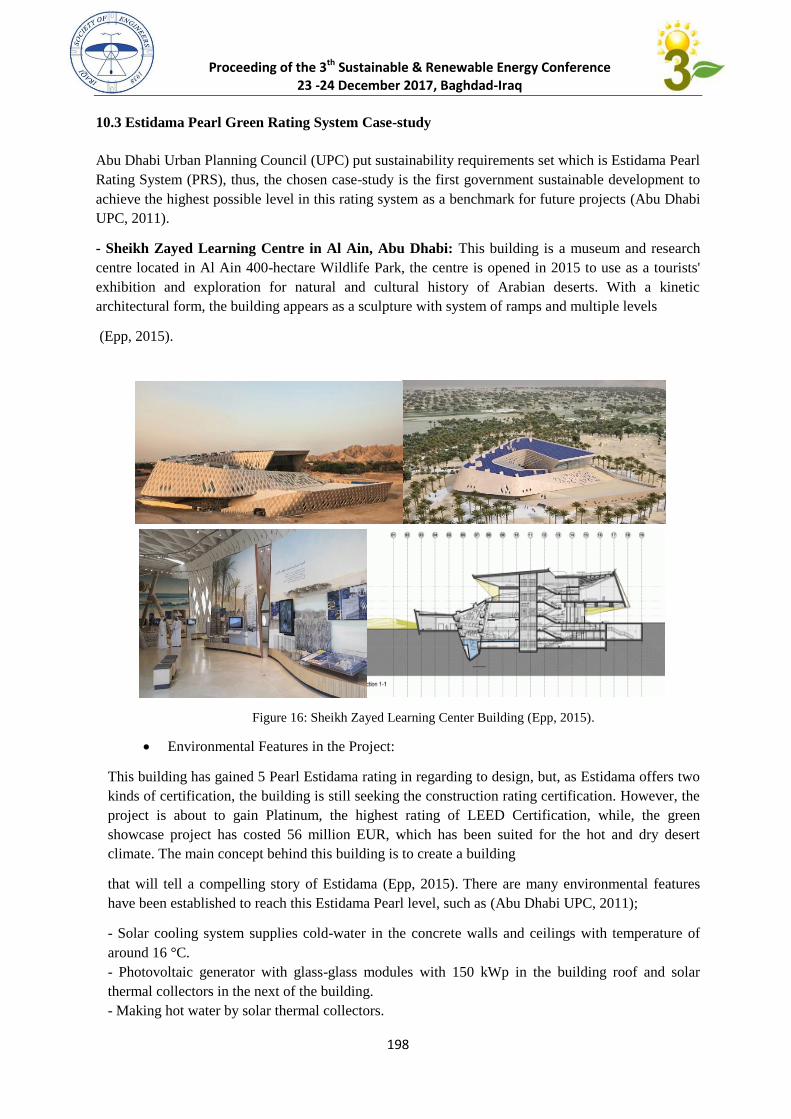
Proceeding of the 3th Sustainable & Renewable Energy Conference 23 -24 December 2017, Baghdad-Iraq
198
10.3 Estidama Pearl Green Rating System Case-study
Abu Dhabi Urban Planning Council (UPC) put sustainability requirements set which is Estidama Pearl
Rating System (PRS), thus, the chosen case-study is the first government sustainable development to
achieve the highest possible level in this rating system as a benchmark for future projects (Abu Dhabi
UPC, 2011).
- Sheikh Zayed Learning Centre in Al Ain, Abu Dhabi: This building is a museum and research
centre located in Al Ain 400-hectare Wildlife Park, the centre is opened in 2015 to use as a tourists'
exhibition and exploration for natural and cultural history of Arabian deserts. With a kinetic
architectural form, the building appears as a sculpture with system of ramps and multiple levels
(Epp, 2015).
Environmental Features in the Project:
This building has gained 5 Pearl Estidama rating in regarding to design, but, as Estidama offers two
kinds of certification, the building is still seeking the construction rating certification. However, the
project is about to gain Platinum, the highest rating of LEED Certification, while, the green
showcase project has costed 56 million EUR, which has been suited for the hot and dry desert
climate. The main concept behind this building is to create a building
that will tell a compelling story of Estidama (Epp, 2015). There are many environmental features
have been established to reach this Estidama Pearl level, such as (Abu Dhabi UPC, 2011);
- Solar cooling system supplies cold-water in the concrete walls and ceilings with temperature of
around 16 °C.
- Photovoltaic generator with glass-glass modules with 150 kWp in the building roof and solar
thermal collectors in the next of the building.
- Making hot water by solar thermal collectors.
Figure 16: Sheikh Zayed Learning Center Building (Epp, 2015).
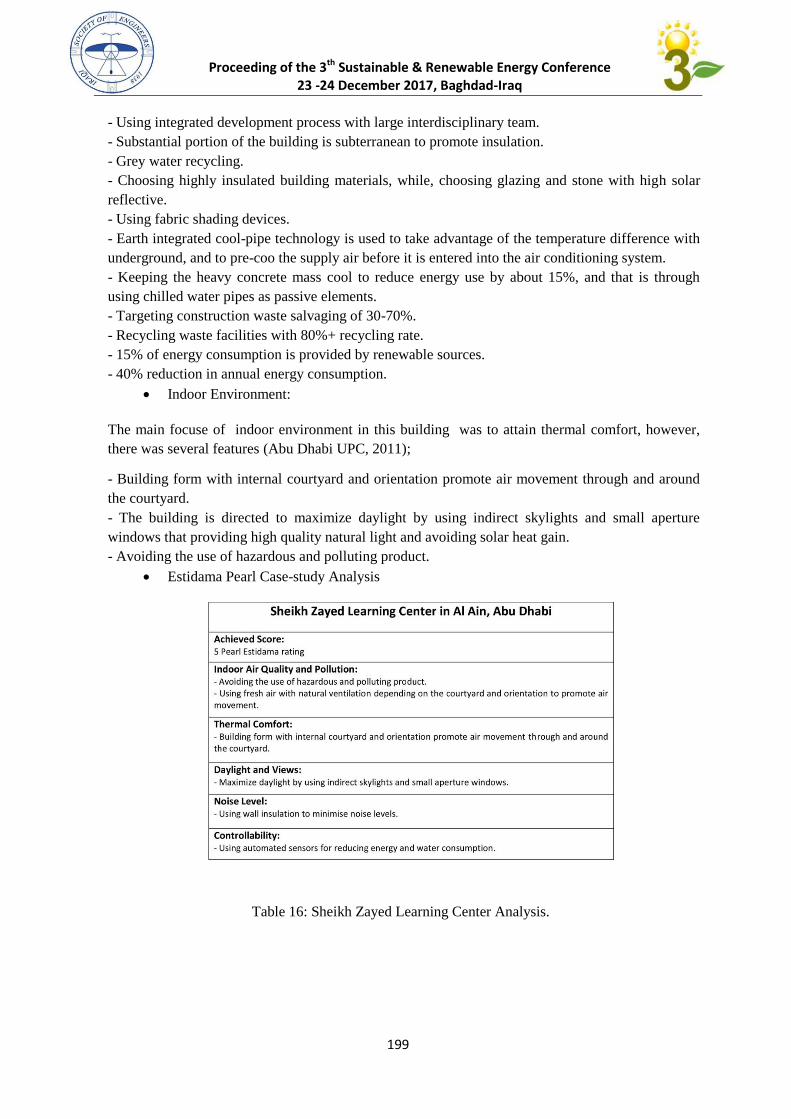
Proceeding of the 3th Sustainable & Renewable Energy Conference 23 -24 December 2017, Baghdad-Iraq
199
- Using integrated development process with large interdisciplinary team.
- Substantial portion of the building is subterranean to promote insulation.
- Grey water recycling.
- Choosing highly insulated building materials, while, choosing glazing and stone with high solar
reflective.
- Using fabric shading devices.
- Earth integrated cool-pipe technology is used to take advantage of the temperature difference with
underground, and to pre-coo the supply air before it is entered into the air conditioning system.
- Keeping the heavy concrete mass cool to reduce energy use by about 15%, and that is through
using chilled water pipes as passive elements.
- Targeting construction waste salvaging of 30-70%.
- Recycling waste facilities with 80%+ recycling rate.
- 15% of energy consumption is provided by renewable sources.
- 40% reduction in annual energy consumption.
Indoor Environment:
The main focuse of indoor environment in this building was to attain thermal comfort, however,
there was several features (Abu Dhabi UPC, 2011);
- Building form with internal courtyard and orientation promote air movement through and around
the courtyard.
- The building is directed to maximize daylight by using indirect skylights and small aperture
windows that providing high quality natural light and avoiding solar heat gain.
- Avoiding the use of hazardous and polluting product.
Estidama Pearl Case-study Analysis
Table 16: Sheikh Zayed Learning Center Analysis.
Table 19: Sheikh Zayed Learning Center Analysis.
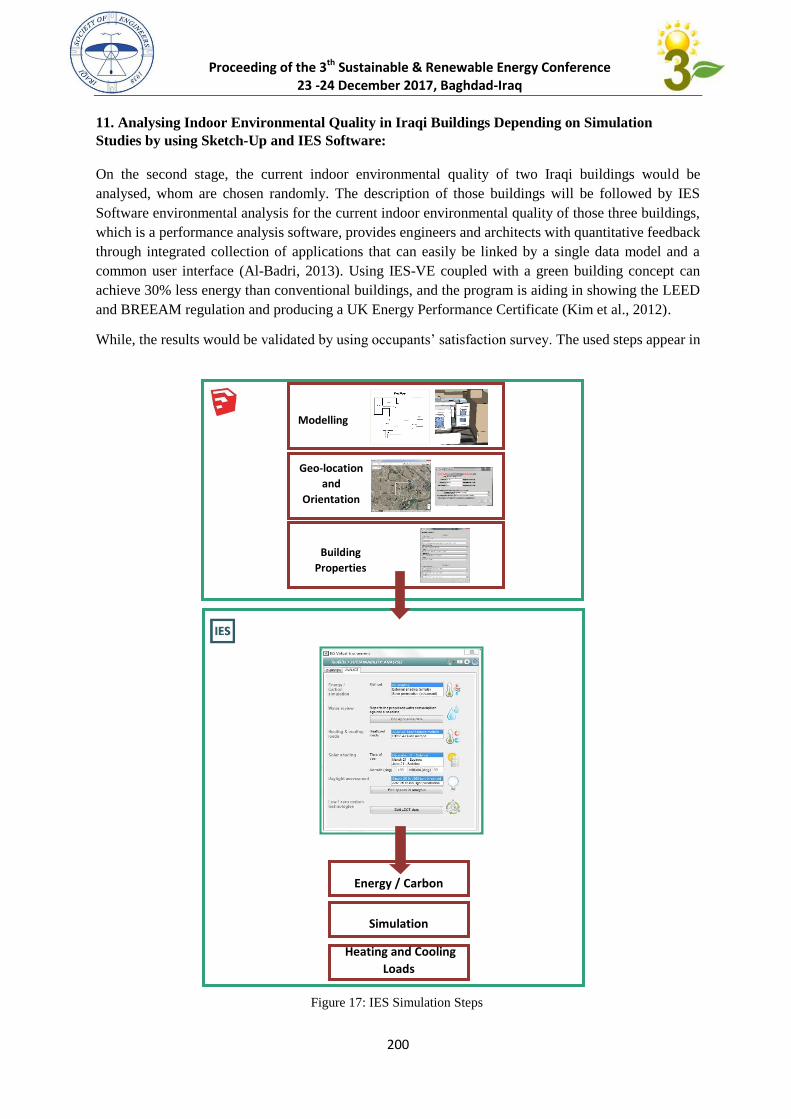
Proceeding of the 3th Sustainable & Renewable Energy Conference 23 -24 December 2017, Baghdad-Iraq
200
11. Analysing Indoor Environmental Quality in Iraqi Buildings Depending on Simulation
Studies by using Sketch-Up and IES Software:
On the second stage, the current indoor environmental quality of two Iraqi buildings would be
analysed, whom are chosen randomly. The description of those buildings will be followed by IES
Software environmental analysis for the current indoor environmental quality of those three buildings,
which is a performance analysis software, provides engineers and architects with quantitative feedback
through integrated collection of applications that can easily be linked by a single data model and a
common user interface (Al-Badri, 2013). Using IES-VE coupled with a green building concept can
achieve 30% less energy than conventional buildings, and the program is aiding in showing the LEED
and BREEAM regulation and producing a UK Energy Performance Certificate (Kim et al., 2012).
While, the results would be validated by using occupants’ satisfaction survey. The used steps appear in
UncomfortableV
E-Toolkits
Energy / Carbon
Simulation
Heating and Cooling
Loads
Solar Shading and
Daylight
Assessment
Figure 17: IES Simulation Steps
Modelling
Geo-location
and
Orientation
Building
Properties
Set
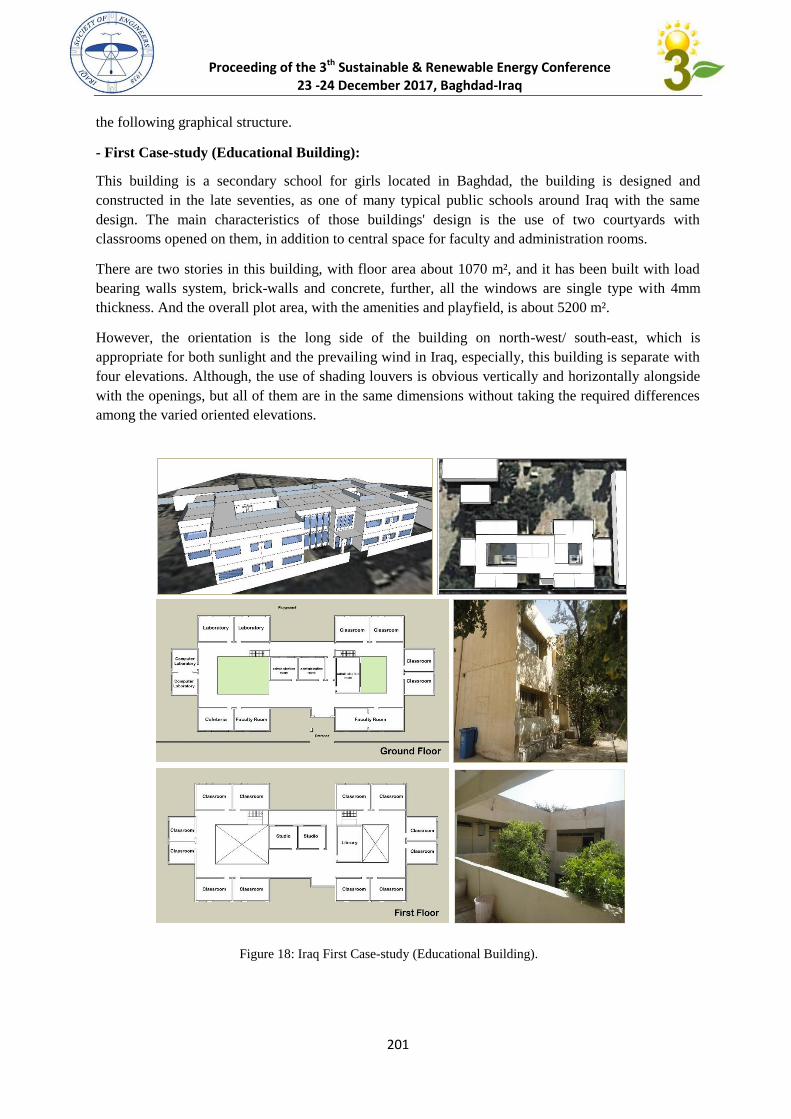
Proceeding of the 3th Sustainable & Renewable Energy Conference 23 -24 December 2017, Baghdad-Iraq
201
the following graphical structure.
- First Case-study (Educational Building):
This building is a secondary school for girls located in Baghdad, the building is designed and
constructed in the late seventies, as one of many typical public schools around Iraq with the same
design. The main characteristics of those buildings' design is the use of two courtyards with
classrooms opened on them, in addition to central space for faculty and administration rooms.
There are two stories in this building, with floor area about 1070 m², and it has been built with load
bearing walls system, brick-walls and concrete, further, all the windows are single type with 4mm
thickness. And the overall plot area, with the amenities and playfield, is about 5200 m².
However, the orientation is the long side of the building on north-west/ south-east, which is
appropriate for both sunlight and the prevailing wind in Iraq, especially, this building is separate with
four elevations. Although, the use of shading louvers is obvious vertically and horizontally alongside
with the openings, but all of them are in the same dimensions without taking the required differences
among the varied oriented elevations.
Figure 18: Iraq First Case-study (Educational Building).
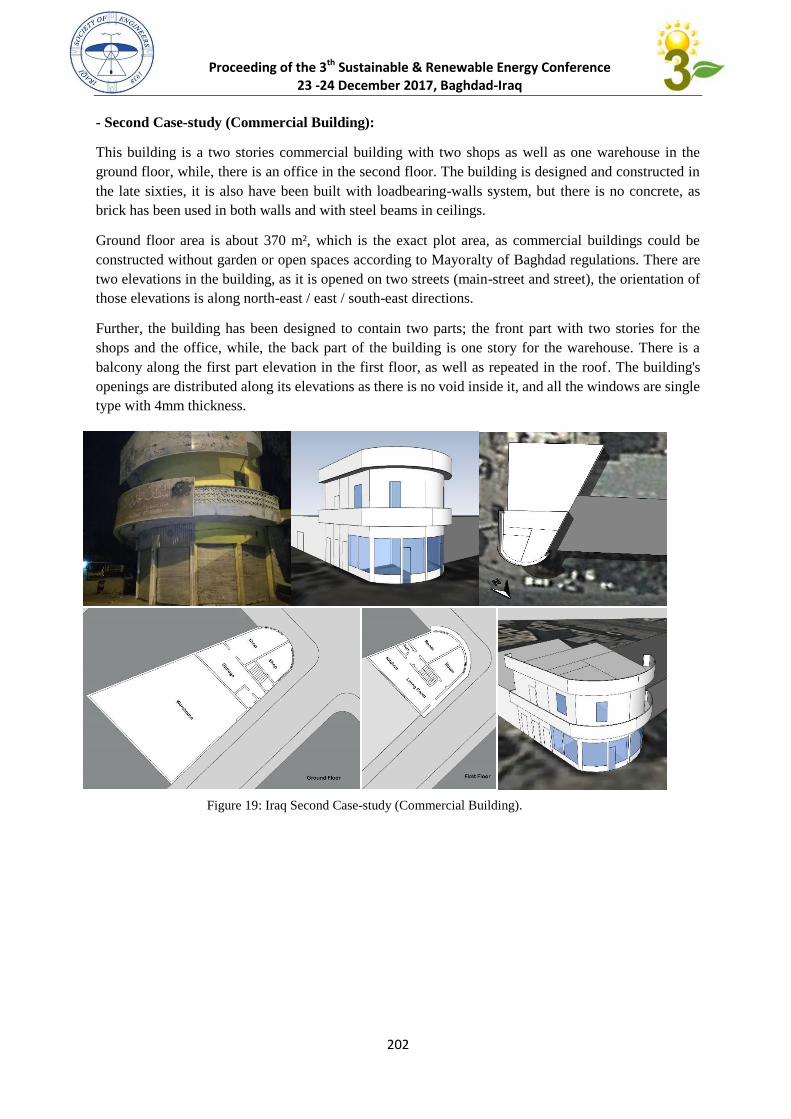
Proceeding of the 3th Sustainable & Renewable Energy Conference 23 -24 December 2017, Baghdad-Iraq
202
- Second Case-study (Commercial Building):
This building is a two stories commercial building with two shops as well as one warehouse in the
ground floor, while, there is an office in the second floor. The building is designed and constructed in
the late sixties, it is also have been built with loadbearing-walls system, but there is no concrete, as
brick has been used in both walls and with steel beams in ceilings.
Ground floor area is about 370 m², which is the exact plot area, as commercial buildings could be
constructed without garden or open spaces according to Mayoralty of Baghdad regulations. There are
two elevations in the building, as it is opened on two streets (main-street and street), the orientation of
those elevations is along north-east / east / south-east directions.
Further, the building has been designed to contain two parts; the front part with two stories for the
shops and the office, while, the back part of the building is one story for the warehouse. There is a
balcony along the first part elevation in the first floor, as well as repeated in the roof. The building's
openings are distributed along its elevations as there is no void inside it, and all the windows are single
type with 4mm thickness.
Figure 19: Iraq Second Case-study (Commercial Building).
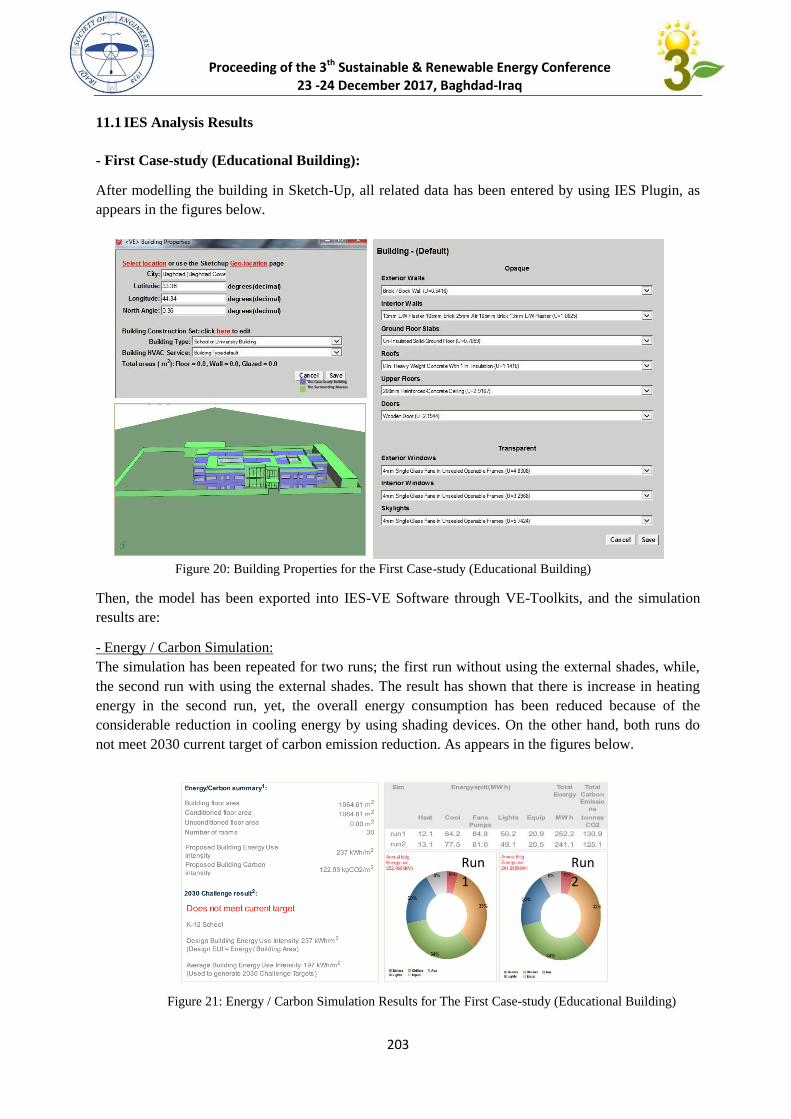
Proceeding of the 3th Sustainable & Renewable Energy Conference 23 -24 December 2017, Baghdad-Iraq
203
11.1 IES Analysis Results
- First Case-stud y (Educational Building):
After modelling the building in Sketch-Up, all related data has been entered by using IES Plugin, as
appears in the figures below.
Then, the model has been exported into IES-VE Software through VE-Toolkits, and the simulation
results are:
- Energy / Carbon Simulation:
The simulation has been repeated for two runs; the first run without using the external shades, while,
the second run with using the external shades. The result has shown that there is increase in heating
energy in the second run, yet, the overall energy consumption has been reduced because of the
considerable reduction in cooling energy by using shading devices. On the other hand, both runs do
not meet 2030 current target of carbon emission reduction. As appears in the figures below.
Figure 20: Building Properties for the First Case-study (Educational Building)
The Case-Study Building
The Surrounding Masses
Figure 21: Energy / Carbon Simulation Results for The First Case-study (Educational Building)
Run
1
Run
2
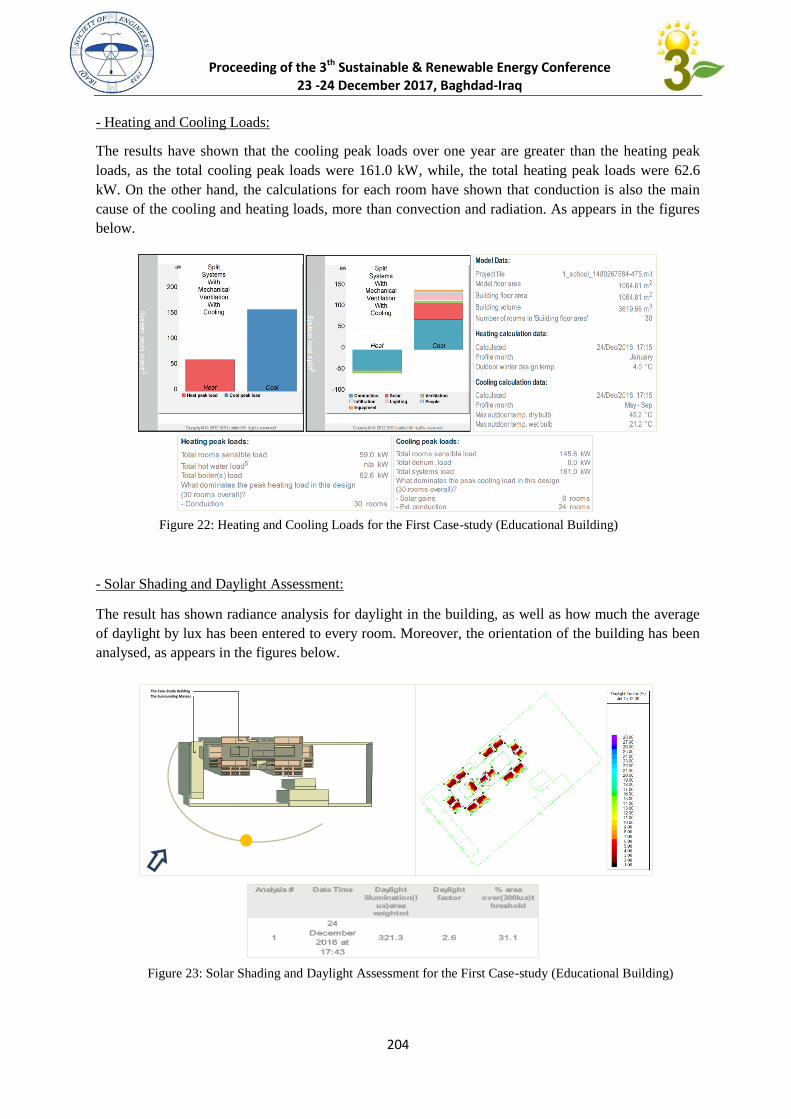
Proceeding of the 3th Sustainable & Renewable Energy Conference 23 -24 December 2017, Baghdad-Iraq
204
- Heating and Cooling Loads:
The results have shown that the cooling peak loads over one year are greater than the heating peak
loads, as the total cooling peak loads were 161.0 kW, while, the total heating peak loads were 62.6
kW. On the other hand, the calculations for each room have shown that conduction is also the main
cause of the cooling and heating loads, more than convection and radiation. As appears in the figures
below.
- Solar Shading and Daylight Assessment:
The result has shown radiance analysis for daylight in the building, as well as how much the average
of daylight by lux has been entered to every room. Moreover, the orientation of the building has been
analysed, as appears in the figures below.
Figure 22: Heating and Cooling Loads for the First Case-study (Educational Building)
2 0 J u l 0 8 : 0 0
Figure 23: Solar Shading and Daylight Assessment for the First Case-study (Educational Building)
The Case-Study Building
The Surrounding Masses
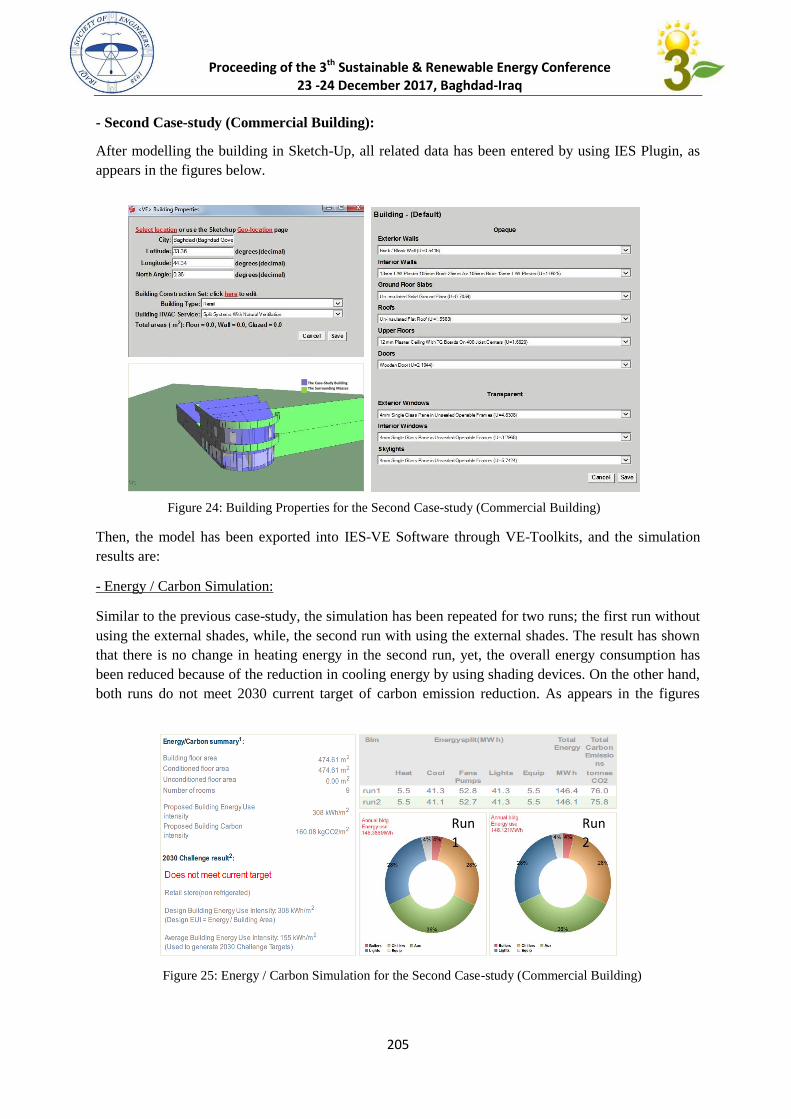
Proceeding of the 3th Sustainable & Renewable Energy Conference 23 -24 December 2017, Baghdad-Iraq
205
- Second Case-study (Commercial Building):
After modelling the building in Sketch-Up, all related data has been entered by using IES Plugin, as
appears in the figures below.
Then, the model has been exported into IES-VE Software through VE-Toolkits, and the simulation
results are:
- Energy / Carbon Simulation:
Similar to the previous case-study, the simulation has been repeated for two runs; the first run without
using the external shades, while, the second run with using the external shades. The result has shown
that there is no change in heating energy in the second run, yet, the overall energy consumption has
been reduced because of the reduction in cooling energy by using shading devices. On the other hand,
both runs do not meet 2030 current target of carbon emission reduction. As appears in the figures
Figure 24: Building Properties for the Second Case-study (Commercial Building)
The Case-Study Building
The Surrounding Masses
Run
1
Run
2
Figure 25: Energy / Carbon Simulation for the Second Case-study (Commercial Building)
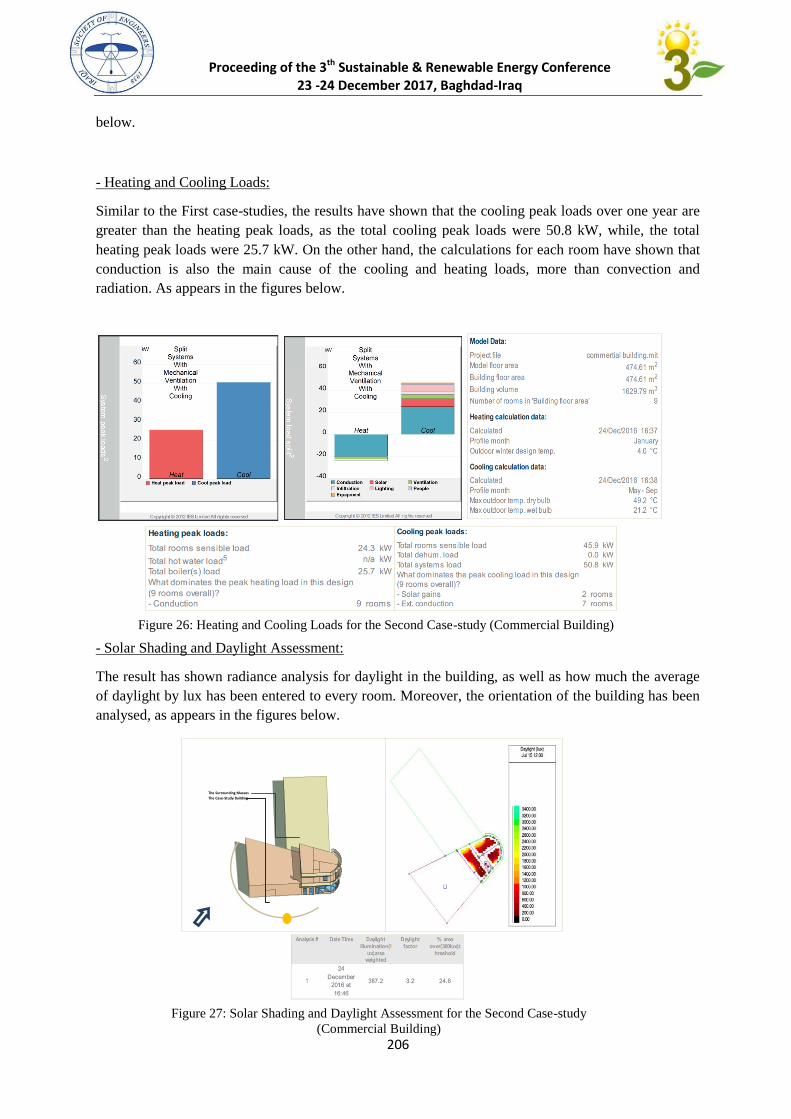
Proceeding of the 3th Sustainable & Renewable Energy Conference 23 -24 December 2017, Baghdad-Iraq
206
below.
- Heating and Cooling Loads:
Similar to the First case-studies, the results have shown that the cooling peak loads over one year are
greater than the heating peak loads, as the total cooling peak loads were 50.8 kW, while, the total
heating peak loads were 25.7 kW. On the other hand, the calculations for each room have shown that
conduction is also the main cause of the cooling and heating loads, more than convection and
radiation. As appears in the figures below.
- Solar Shading and Daylight Assessment:
The result has shown radiance analysis for daylight in the building, as well as how much the average
of daylight by lux has been entered to every room. Moreover, the orientation of the building has been
analysed, as appears in the figures below.
Figure 26: Heating and Cooling Loads for the Second Case-study (Commercial Building)
Figure 4: Heating and Cooling Loads for the Third Case-study (Commercial Building)
2 3 J u l 0 9 : 0 0
Figure 27: Solar Shading and Daylight Assessment for the Second Case-study
(Commercial Building)
The Surrounding Masses
The Case-Study Building
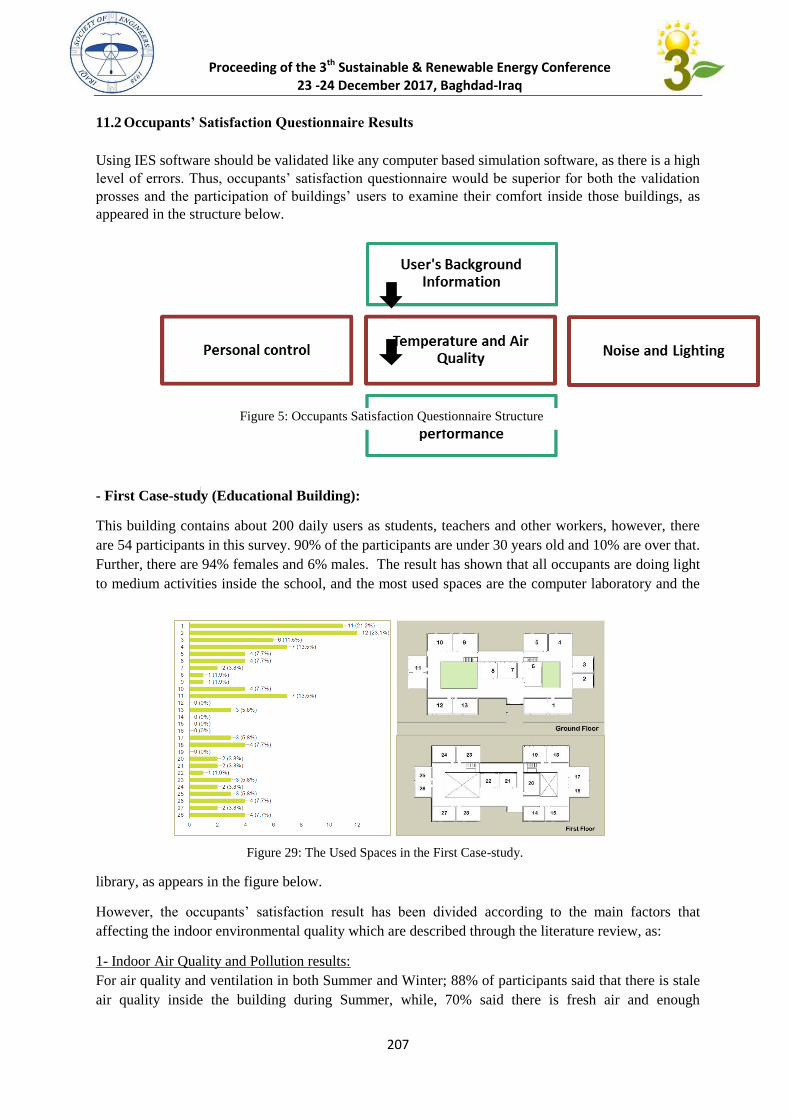
Proceeding of the 3th Sustainable & Renewable Energy Conference 23 -24 December 2017, Baghdad-Iraq
207
11.2 Occupants’ Satisfaction Questionnaire Results
Using IES software should be validated like any computer based simulation software, as there is a high
level of errors. Thus, occupants’ satisfaction questionnaire would be superior for both the validation
prosses and the participation of buildings’ users to examine their comfort inside those buildings, as
appeared in the structure below.
- First Case-stud y (Educational Building):
This building contains about 200 daily users as students, teachers and other workers, however, there
are 54 participants in this survey. 90% of the participants are under 30 years old and 10% are over that.
Further, there are 94% females and 6% males. The result has shown that all occupants are doing light
to medium activities inside the school, and the most used spaces are the computer laboratory and the
library, as appears in the figure below.
However, the occupants’ satisfaction result has been divided according to the main factors that
affecting the indoor environmental quality which are described through the literature review, as:
1- Indoor Air Quality and Pollution results:
For air quality and ventilation in both Summer and Winter; 88% of participants said that there is stale
air quality inside the building during Summer, while, 70% said there is fresh air and enough
Figure 5: Occupants Satisfaction Questionnaire Structure
Figure 29: The Used Spaces in the First Case-study.
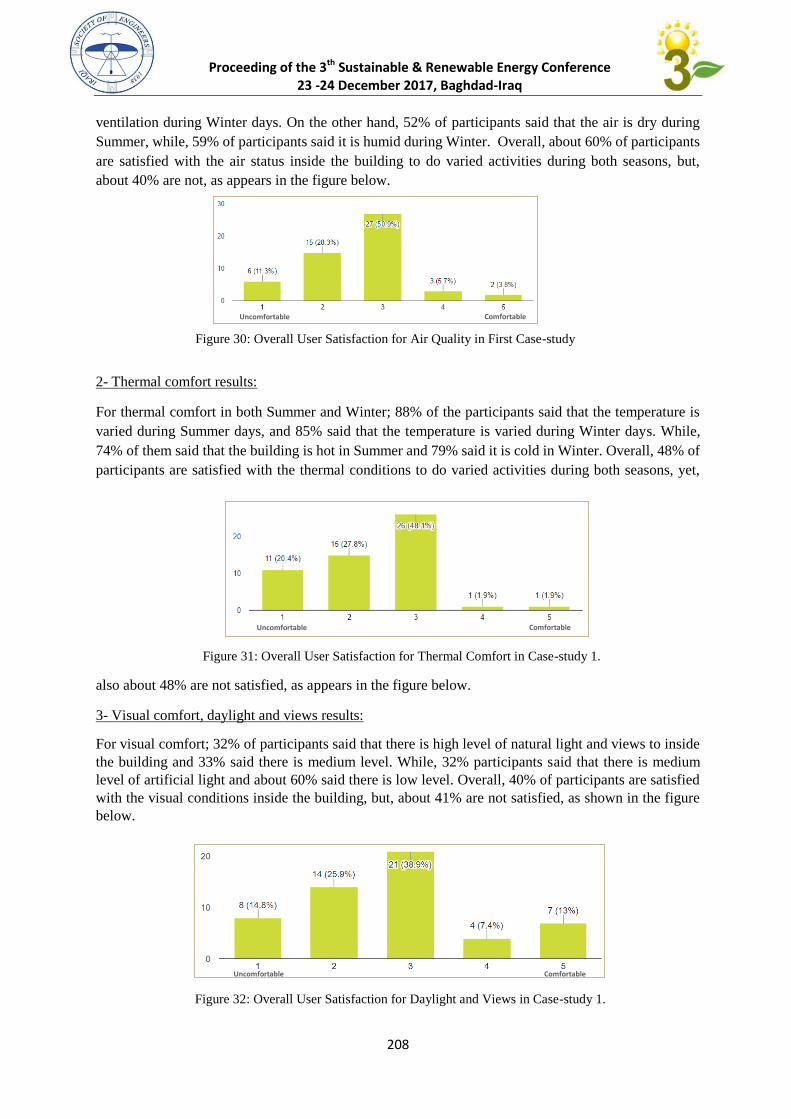
Proceeding of the 3th Sustainable & Renewable Energy Conference 23 -24 December 2017, Baghdad-Iraq
208
ventilation during Winter days. On the other hand, 52% of participants said that the air is dry during
Summer, while, 59% of participants said it is humid during Winter. Overall, about 60% of participants
are satisfied with the air status inside the building to do varied activities during both seasons, but,
about 40% are not, as appears in the figure below.
2- Thermal comfort results:
For thermal comfort in both Summer and Winter; 88% of the participants said that the temperature is
varied during Summer days, and 85% said that the temperature is varied during Winter days. While,
74% of them said that the building is hot in Summer and 79% said it is cold in Winter. Overall, 48% of
participants are satisfied with the thermal conditions to do varied activities during both seasons, yet,
also about 48% are not satisfied, as appears in the figure below.
3- Visual comfort, daylight and views results:
For visual comfort; 32% of participants said that there is high level of natural light and views to inside
the building and 33% said there is medium level. While, 32% participants said that there is medium
level of artificial light and about 60% said there is low level. Overall, 40% of participants are satisfied
with the visual conditions inside the building, but, about 41% are not satisfied, as shown in the figure
below.
Uncomfortable
Uncomfortable
Comfortable
Comfortable
Figure 30: Overall User Satisfaction for Air Quality in First Case-study
Uncomfortable Comfortable
Comfortable
Figure 31: Overall User Satisfaction for Thermal Comfort in Case-study 1.
Uncomfortable
Uncomfortable
Comfortable
Comfortable
Figure 32: Overall User Satisfaction for Daylight and Views in Case-study 1.
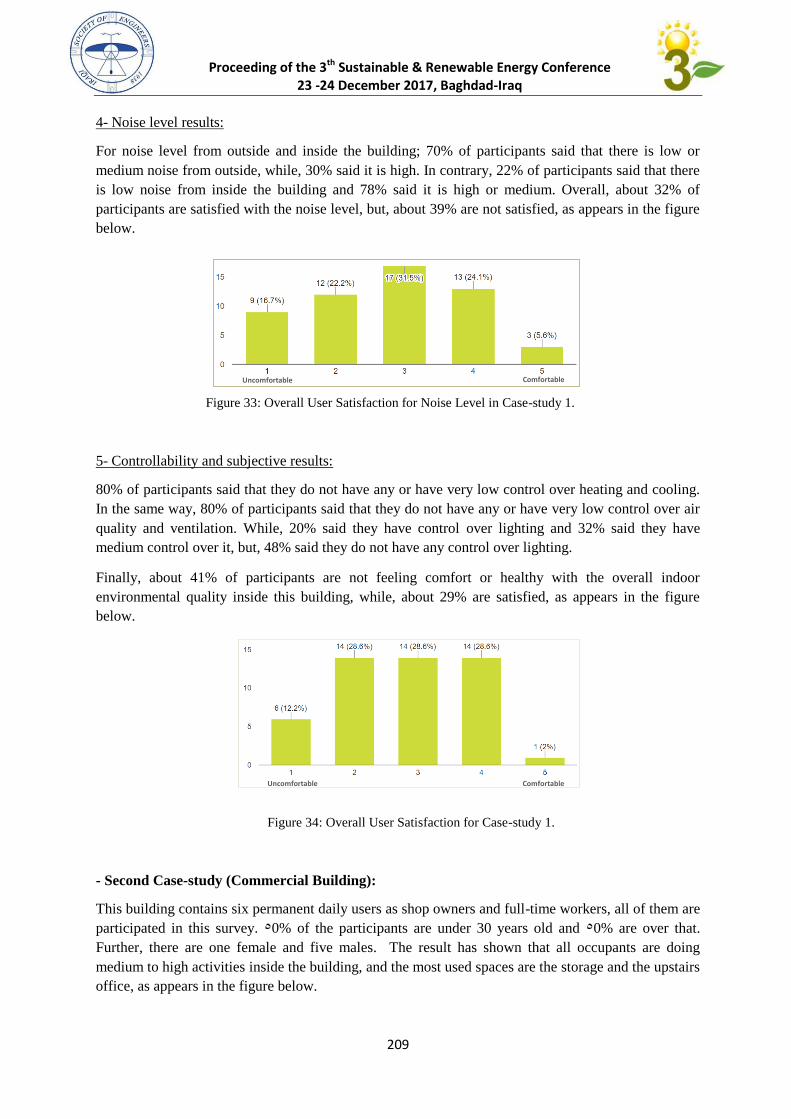
Proceeding of the 3th Sustainable & Renewable Energy Conference 23 -24 December 2017, Baghdad-Iraq
209
4- Noise level results:
For noise level from outside and inside the building; 70% of participants said that there is low or
medium noise from outside, while, 30% said it is high. In contrary, 22% of participants said that there
is low noise from inside the building and 78% said it is high or medium. Overall, about 32% of
participants are satisfied with the noise level, but, about 39% are not satisfied, as appears in the figure
below.
5- Controllability and subjective results:
80% of participants said that they do not have any or have very low control over heating and cooling.
In the same way, 80% of participants said that they do not have any or have very low control over air
quality and ventilation. While, 20% said they have control over lighting and 32% said they have
medium control over it, but, 48% said they do not have any control over lighting.
Finally, about 41% of participants are not feeling comfort or healthy with the overall indoor
environmental quality inside this building, while, about 29% are satisfied, as appears in the figure
below.
- Second Case-study (Commercial Building):
This building contains six permanent daily users as shop owners and full-time workers, all of them are
participated in this survey. 50% of the participants are under 30 years old and 50% are over that.
Further, there are one female and five males. The result has shown that all occupants are doing
medium to high activities inside the building, and the most used spaces are the storage and the upstairs
office, as appears in the figure below.
Uncomfortable
Uncomfortable
Comfortable
Comfortable
Figure 33: Overall User Satisfaction for Noise Level in Case-study 1.
Figure 34: Overall User Satisfaction for Case-study 1.
Uncomfortable
Uncomfortable
Comfortable
Comfortable
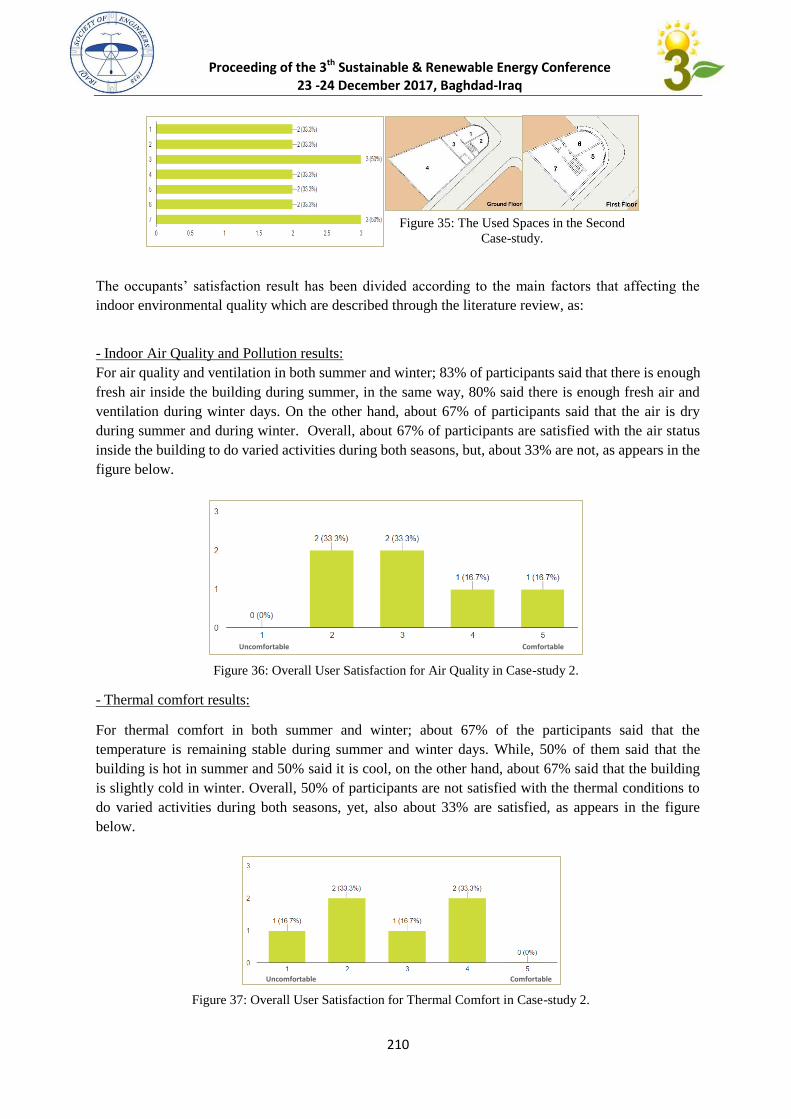
Proceeding of the 3th Sustainable & Renewable Energy Conference 23 -24 December 2017, Baghdad-Iraq
210
The occupants’ satisfaction result has been divided according to the main factors that affecting the
indoor environmental quality which are described through the literature review, as:
- Indoor Air Quality and Pollution results:
For air quality and ventilation in both summer and winter; 83% of participants said that there is enough
fresh air inside the building during summer, in the same way, 80% said there is enough fresh air and
ventilation during winter days. On the other hand, about 67% of participants said that the air is dry
during summer and during winter. Overall, about 67% of participants are satisfied with the air status
inside the building to do varied activities during both seasons, but, about 33% are not, as appears in the
figure below.
- Thermal comfort results:
For thermal comfort in both summer and winter; about 67% of the participants said that the
temperature is remaining stable during summer and winter days. While, 50% of them said that the
building is hot in summer and 50% said it is cool, on the other hand, about 67% said that the building
is slightly cold in winter. Overall, 50% of participants are not satisfied with the thermal conditions to
do varied activities during both seasons, yet, also about 33% are satisfied, as appears in the figure
below.
Figure 35: The Used Spaces in the Second
Case-study.
Uncomfortable
Uncomfortable
Comfortable
Comfortable
Figure 36: Overall User Satisfaction for Air Quality in Case-study 2.
Uncomfortable
Uncomfortable
Comfortable
Comfortable
Figure 37: Overall User Satisfaction for Thermal Comfort in Case-study 2.
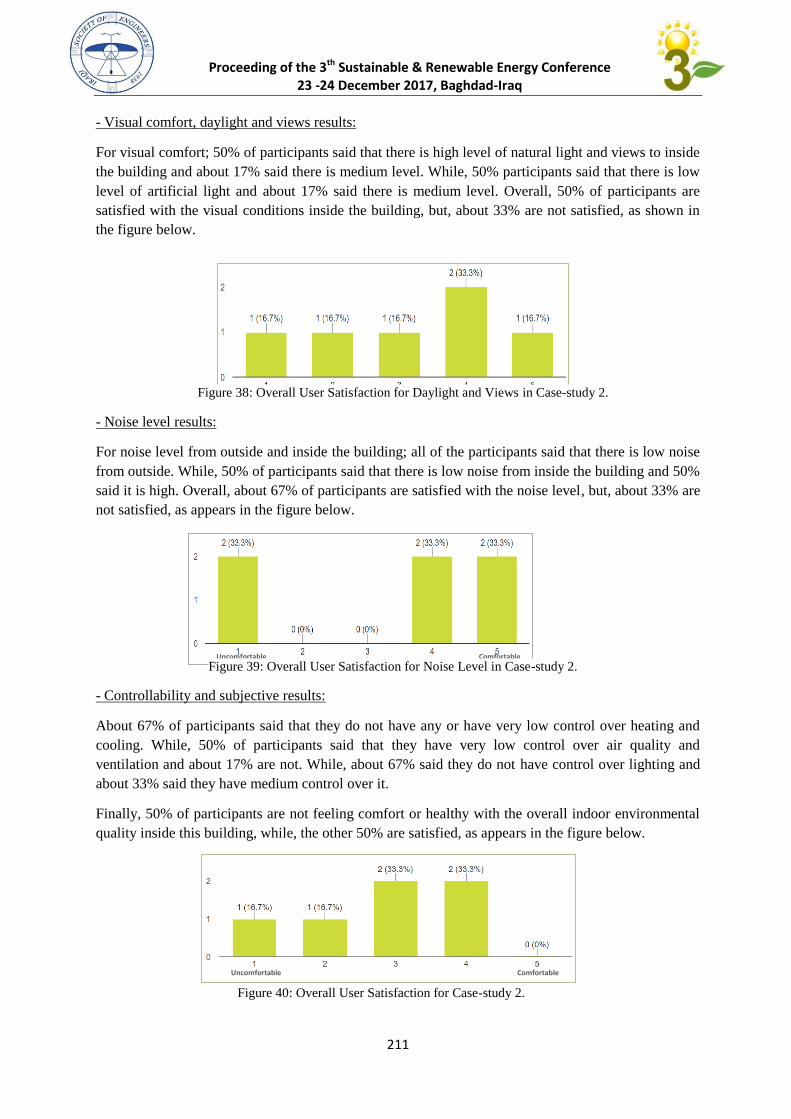
Proceeding of the 3th Sustainable & Renewable Energy Conference 23 -24 December 2017, Baghdad-Iraq
211
Uncomfortable
Uncomfortable
Comfortable
Comfortable
- Visual comfort, daylight and views results:
For visual comfort; 50% of participants said that there is high level of natural light and views to inside
the building and about 17% said there is medium level. While, 50% participants said that there is low
level of artificial light and about 17% said there is medium level. Overall, 50% of participants are
satisfied with the visual conditions inside the building, but, about 33% are not satisfied, as shown in
the figure below.
- Noise level results:
For noise level from outside and inside the building; all of the participants said that there is low noise
from outside. While, 50% of participants said that there is low noise from inside the building and 50%
said it is high. Overall, about 67% of participants are satisfied with the noise level, but, about 33% are
not satisfied, as appears in the figure below.
- Controllability and subjective results:
About 67% of participants said that they do not have any or have very low control over heating and
cooling. While, 50% of participants said that they have very low control over air quality and
ventilation and about 17% are not. While, about 67% said they do not have control over lighting and
about 33% said they have medium control over it.
Finally, 50% of participants are not feeling comfort or healthy with the overall indoor environmental
quality inside this building, while, the other 50% are satisfied, as appears in the figure below.
Uncomfortable
Uncomfortable
Comfortable
Comfortable
Figure 38: Overall User Satisfaction for Daylight and Views in Case-study 2.
Figure 39: Overall User Satisfaction for Noise Level in Case-study 2.
Uncomfortable
Uncomfortable
Comfortable
Comfortable
Figure 40: Overall User Satisfaction for Case-study 2.
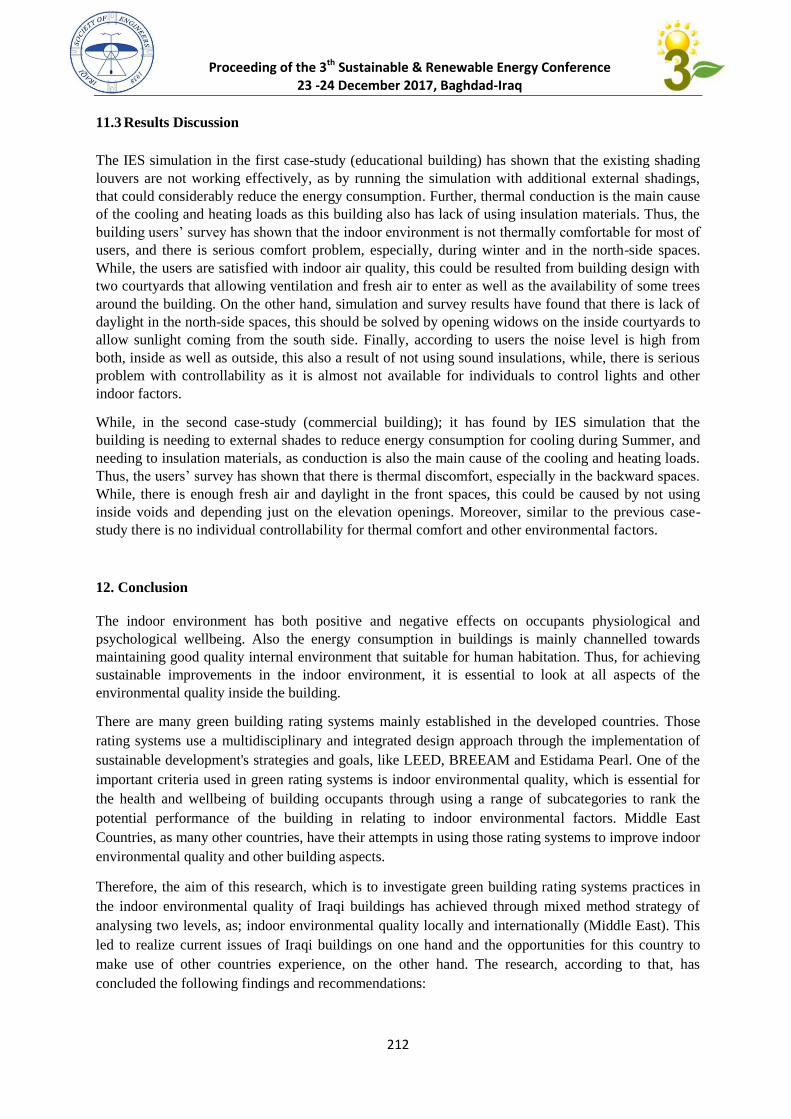
Proceeding of the 3th Sustainable & Renewable Energy Conference 23 -24 December 2017, Baghdad-Iraq
212
11.3 Results Discussion
The IES simulation in the first case-study (educational building) has shown that the existing shading
louvers are not working effectively, as by running the simulation with additional external shadings,
that could considerably reduce the energy consumption. Further, thermal conduction is the main cause
of the cooling and heating loads as this building also has lack of using insulation materials. Thus, the
building users’ survey has shown that the indoor environment is not thermally comfortable for most of
users, and there is serious comfort problem, especially, during winter and in the north-side spaces.
While, the users are satisfied with indoor air quality, this could be resulted from building design with
two courtyards that allowing ventilation and fresh air to enter as well as the availability of some trees
around the building. On the other hand, simulation and survey results have found that there is lack of
daylight in the north-side spaces, this should be solved by opening widows on the inside courtyards to
allow sunlight coming from the south side. Finally, according to users the noise level is high from
both, inside as well as outside, this also a result of not using sound insulations, while, there is serious
problem with controllability as it is almost not available for individuals to control lights and other
indoor factors.
While, in the second case-study (commercial building); it has found by IES simulation that the
building is needing to external shades to reduce energy consumption for cooling during Summer, and
needing to insulation materials, as conduction is also the main cause of the cooling and heating loads.
Thus, the users’ survey has shown that there is thermal discomfort, especially in the backward spaces.
While, there is enough fresh air and daylight in the front spaces, this could be caused by not using
inside voids and depending just on the elevation openings. Moreover, similar to the previous case-
study there is no individual controllability for thermal comfort and other environmental factors.
12. Conclusion
The indoor environment has both positive and negative effects on occupants physiological and
psychological wellbeing. Also the energy consumption in buildings is mainly channelled towards
maintaining good quality internal environment that suitable for human habitation. Thus, for achieving
sustainable improvements in the indoor environment, it is essential to look at all aspects of the
environmental quality inside the building.
There are many green building rating systems mainly established in the developed countries. Those
rating systems use a multidisciplinary and integrated design approach through the implementation of
sustainable development's strategies and goals, like LEED, BREEAM and Estidama Pearl. One of the
important criteria used in green rating systems is indoor environmental quality, which is essential for
the health and wellbeing of building occupants through using a range of subcategories to rank the
potential performance of the building in relating to indoor environmental factors. Middle East
Countries, as many other countries, have their attempts in using those rating systems to improve indoor
environmental quality and other building aspects.
Therefore, the aim of this research, which is to investigate green building rating systems practices in
the indoor environmental quality of Iraqi buildings has achieved through mixed method strategy of
analysing two levels, as; indoor environmental quality locally and internationally (Middle East). This
led to realize current issues of Iraqi buildings on one hand and the opportunities for this country to
make use of other countries experience, on the other hand. The research, according to that, has
concluded the following findings and recommendations:
Proceeding of the 3th Sustainable & Renewable Energy Conference 23 -24 December 2017, Baghdad-Iraq
213
13. Findings and Recommendations
The findings of this research are summarised below relative to the various research objectives:
- It is found through the analysed case-studies that the use of local or global green building
rating systems in Middle East have many benefits, and the most important one is the
enhancing of ‘green concept’ in community by providing branding opportunities and
marketing to those buildings, companies and project owners. In addition, there are many
positive impacts of using those systems on human health and life quality inside the buildings.
- It is realized through the IES analysis and users' satisfaction survey that the main problems of
indoor environmental quality in different types of Iraqi buildings have started from the
preference of short-term solutions and cheap materials over long-term ones in construction
process. Which led to poor air quality, thermal discomfort, lack of insulation and high
consumption of energy. On the other hand, the shortage of related regulations and construction
workers’ practice have also led to many indoor environmental problems. Moreover, the owner
and his awareness is the most important factor to increase sustainable improvements in
different buildings, as well as the lifestyle of individuals and budget.
- The climate analysis and thermal models of Iraqi case-studies have shown that the main indoor
environmental issues to be considered through building design are; the southern-side spaces of
the buildings have enough daylight, while there is thermal discomfort during summer, on the
other hand, the northern-side spaces have lack of daylight and thermal discomfort during
winter. Further, there is enough ventilation and fresh air in the buildings that are using the
central courtyard. Thus, shading devices and passive strategies should be designed in relating
to those issues.
- The IES evaluation and analysis have displayed that passive and low energy strategies are
premium for improving thermal comfort in Iraqi building. Even just by using external shades
with enough size openings that could improve daylight and ventilation as well as reduce the
energy consumption.
- The best strategies to improve indoor environmental quality in Iraqi buildings is by
establishing indoor environmental criteria with local green rating system. And this system
could be started by non-governmental efforts, especially, by construction experts to separate
the knowledge and the awareness of how importance this topic for Iraqi people life quality,
health and productivity.
-Recommendations
After going through the analysis and the conclusion, this research comes out with some important
recommendations in order to achieve sustainable improvements of the indoor environmental quality
within Iraqi buildings and follow the most used green building rating systems, as followed:
- Making users’ satisfaction surveys for existing buildings before any refurbishment process, as
occupants need to be involved to diagnose the indoor environmental issues.
- Making users’ satisfaction surveys for newly constructed buildings after occupancy.
- Construction experts need to start using the most recent technologies and environmental
software programmes, like IES, to analyse the performance of indoor environmental factors
for newly constructed buildings in the early design stages, as well as the existing buildings.
Proceeding of the 3th Sustainable & Renewable Energy Conference 23 -24 December 2017, Baghdad-Iraq
214
- Feedback from buildings’ users can be used to establish baselines for building performance in
the architecture and construction firms in order to monitor the improvements and
implementation of indoor environmental quality in their projects.
- Integration process is the key to achieve substantiality on every level, thus, strengthening the
foundations of green building and raising public awareness of building-related impacts and
opportunities. These roles would be achieved by partnership, collaboration, and consensus-
building with other interested sides, which all lead to the establishment of Iraq Green Building
Council and Green Rating System.
- It is recommended to start following green building rating systems regulations in the indoor
environmental quality of existing buildings, as it could be less costly than new constructed
buildings. Therefore, low-energy and cost refurbishment strategy should be implemented to
improve the performance of existing buildings.
- It is recommended to research more about familiar local products and seek accurate
information to back up any efficient sustainable strategies prior to formulate sustainable
regulations in Iraq, especially, for indoor environmental quality which is connected with
humans’ life quality.
- Universities, schools, non-governmental organisations and other educational bodies should
develop courses, lectures, campaigns and workshops to raise the awareness of indoor
environmental quality and sustainability goals.
- There is a need of specific technical courses in the construction related universities to train
experts in sustainable strategies of the indoor environment.
Proceeding of the 3th Sustainable & Renewable Energy Conference 23 -24 December 2017, Baghdad-Iraq
215
References Abu Dhabi UPC, 2011. Sheikh Zayed learning center. [Online]
Available at: http://estidama.upc.gov.ae/szdlc/vision.html
[Accessed 11 December 2016].
Al-Badri, N. R., 2013. Demand Reduction through Applying Passive and Active Strategies for a House in Baghdad, Iraq, Dubai:
Faculty of Engineering & Information Technology, The British University of Dubai.
Appleby, P., 2011. Integrated Sustainable Design of Buildings. First Edition ed. Abingdon, Oxon and New York: Taylor &
Francis..
Attia, S., 2014. The Usability of Green Building Rating Systems in Hot Arid Climates. Doha, ASHRAE Energy & Indoor
Environment for Hot Climates.
Autodesk, 2011. Autodesk Sustainability Workshop: Controls for Thermal Comfort. [Online]
Available at: https://sustainabilityworkshop.autodesk.com/buildings/controls-thermal-comfort
[Accessed 30 December 2016].
Balbo, L., 2012. Qatar’s GSAS Turns Other Rating Systems Green. [Online]
Available at: http://www.greenprophet.com/2012/06/qatar-green-rating-qsas/
[Accessed 27 November 2016].
Barry Dalal-Clayton and Stephen Bass, 2002. Sustainable Development Strategies: A Resource Book. New York: Organisation
for Economic Co-operation and Development, Paris and United Nations Development Programme.
Boeing, G., Church, D., Hubbard, H., Mickens, J. and Rudis, L., 2004. LEED-ND and livability revisited. Berkeley Planning
Journal, 27(1), pp. 31-55.
BRE, 2016. Building Research Establishment: Casa Batroun, Lebanon. [Online]
Available at: http://www.breeam.com/index.jsp?id=695
[Accessed 10 December 2016].
BRE, 2016. Building Research Establishment; Kanyon, Istanbul. [Online]
Available at: http://www.breeam.com/index.jsp?id=582
[Accessed 10 December 2016].
BREEAM, 2016. What is BREEAM?. [Online]
Available at: http://www.breeam.com/
[Accessed 5 11 2016].
Christine A. Subasic, 2014. What’s New in LEED v4 for Structural Engineers. [Online]
Available at: http://www.structuremag.org/?p=1833
Creswell, J., 2013. Research design: Qualitative, quantitative, and mixed methods approaches. s.l.:Sage publications.
Elgendy, K., 2010. Comparing Estidama’s Pearls Rating Method to LEED and BREEAM. [Online]
Available at: http://www.carboun.com/sustainable-urbanism/comparing-estidama%E2%80%99s-pearls-rating-method-to-
leed-and-breeam/
[Accessed 24 November 2016].
EPA, 2008. EPA GREEN BUILDING Strategy. [Online]
Available at: https://archive.epa.gov/greenbuilding/web/pdf/greenbuilding_strategy_nov08.pdf
[Accessed 31 10 2016].
EPA, 2016. U.S. Environmental Protection Agency: Green Building. [Online]
Available at: https://archive.epa.gov/greenbuilding/web/html/about.html
[Accessed 30 10 2016].
Epp, B., 2015. UAE: Museum in Al Ain garden city receives 5-Pearl Estidama rating. [Online]
Available at: http://www.solarthermalworld.org/content/uae-museum-al-ain-garden-city-receives-5-pearl-estidama-rating
[Accessed 11 December 2016].

Proceeding of the 3th Sustainable & Renewable Energy Conference 23 -24 December 2017, Baghdad-Iraq
216
GBIG, 2016. The Green Building Information Gateway. [Online]
Available at: http://www.gbig.org/
[Accessed 1 November 2016].
GBRI, 2015. What is a Green Building Rating System?. [Online]
Available at: http://homeenergypros.lbl.gov/profiles/blogs/what-is-a-green-building-rating-system
[Accessed 15 October 2016].
GORD, 2016. GSAS Overview. [Online]
Available at: http://www.gord.qa/trust-gsas-resource-center-overview
Hasson, A. and Mahmood, S. Kh., 2014. The Impact of Outdoor Thermal Environment on Iraqi Building Energy Performance.
Civil and Environmental Research, Volume 6.
Hwang, B.G. and Tan, J. S. , 2012. Green building project management: obstacles and solutions for sustainable development.
Sustainable Development, 20(5), pp. 335-349.
Hwang, T. and Kim, J. T., 2011. Effects of Indoor Lighting on Occupants’ Visual Comfort and Eye Health in a Green Building.
Indoor and Built Environment, Volume 20, p. 75–90.
JAPU, 2013. U. N. Iraq: Sand and Dust Storms Fact Sheet. [Online]
Available at: http://reliefweb.int/sites/reliefweb.int/files/resources/SDS%20Fact%20Sheet.pdf
[Accessed 30 December 2016].
Khogali, H. A., 2016. Comparison of Four Global Sustainable Building Rating Systems Carried out With Focus on Hot and Dry
Climate. Journal of Sustainable Development, Volume 9.
Kibert, C. J., 2013. Sustainable Construction: Green Building Design and Delivery. Hoboken, New Jersey: John Wiley & Sons,
Inc..
Kim, J. and Dear, R. d., 2012. How does occupant perception on specific IEQ factors affect overall. London, Network for
Comfort and Energy Use in Buildings.
Kriss, J., 2014. What is green building?. [Online]
Available at: http://www.usgbc.org/articles/what-green-building
[Accessed 30 10 2016].
Kubba, S., 2012. Handbook of green building design, and construction LEED, BREEAM, and Green Globes. Waltham, MA ;
Kidlington: Butterworth-Heinemann/Elsevier.
Lee, W.L. and Burnett, J., 2008. Benchmarking energy use assessment of HK-BEAM, BREEAM and LEED. Building and
Environment, 43(11), pp. 1882-1891.
MECSD, 2015. SUSTAINABLE BUILDING SERVICES: ESTIDAMA PEARL CONSULTANCY. [Online]
Available at: http://www.mecsd.com/estidama-consultancy.html
[Accessed 21 October 2016].
NIOSH, 2015. The National Institute for Occupational Safety and Health (NIOSH): INDOOR ENVIRONMENTAL QUALITY.
[Online]
Available at: http://www.cdc.gov/niosh/topics/indoorenv/
[Accessed 18 October 2016].
Parker, J., 2012. The Value of BREEAM, Bracknell, UK: BSRIA BG.
Riemer, H., 2016. Educate Sustainability: Thermal Balance and Comfort. [Online]
Available at: https://www.educate-sustainability.eu/kb/content/thermal-balance-and-comfort#
[Accessed 29 December 2016].
Saseendran, S., 2016. Dubai launches green building rating system. [Online]
Available at: http://gulfnews.com/news/uae/environment/dubai-launches-green-building-rating-system-1.1861227
[Accessed 23 November 2016].
Taleb, H. M., 2014. Using passive cooling strategies to improve thermal performance and reduce energy consumption of
residential buildings in U.A.E. Buildings, British University in Dubai, UAE: Science Direct.
Proceeding of the 3th Sustainable & Renewable Energy Conference 23 -24 December 2017, Baghdad-Iraq
217
Taylor, T. and Pineo, H., 2015. Health and wellbeing in BREEAM, Bucknalls Lane, Watford: BRE Global Ltd.
UNDP/Ministry of Electricity, 2010. Electricity in Iraq Fact-sheet. [Online]
Available at: http://www.iaccidatabase.com/PDF_files/Electricity%20in%20Ira6025/Electricity_Factsheet_English.pdf
[Accessed 30 December 2016].
UNEP , 2015. United Nations Environment Programme: Iraq Air Quality Overview. [Online]
Available at: http://www.unep.org/transport/airquality/Iraq.pdf
[Accessed 30 December 2016].
USGBC, 2014. Green Building 101: What is indoor environmental quality?. [Online]
Available at: http://www.usgbc.org/articles/green-building-101-what-indoor-environmental-quality
[Accessed 16 November 2016].
USGBC, 2016. LEED: Better Buildings are our Legacy. [Online]
Available at: http://www.usgbc.org/leed
[Accessed 5 11 2016].
USGBC, 2016. U.S. Green building council. [Online]
Available at: http://www.usgbc.org/sampleforms/v3
[Accessed 6 December 2016].
Vierra, S., 2014. Green Building Standards and Certification Systems. [Online]
Available at: https://www.wbdg.org/resources/gbs.php#
[Accessed 15 October 2016].
Weather and Climate, 2016. AVERAGE MONTHLY WEATHER IN BAGDAD, IRAQ. [Online]
Available at: https://weather-and-climate.com/average-monthly-Rainfall-Temperature-Sunshine,Bagdad,Iraq
[Accessed 18 November 2016].
Winnipeg Air Testing, 2010. Winnipeg Air Testing. [Online]
Available at: http://www.winnipegairtesting.com/indoor-air-quality/
[Accessed 29 October 2016].
Wymelenberg, K. V. D., 2014. The Benefits of Natural Light; Research supports daylighting’s positive effect on building
performance and human health.. [Online]
Available at: http://www.archlighting.com/technology/the-benefits-of-natural-light_o
[Accessed 17 October 2016].

Application of Sustainable Architecture
(ASA)
Studies
Proceeding of the 3th Sustainable & Renewable Energy Conference 23 -24 December 2017, Baghdad-Iraq
912
Study The Effect of Recycled Glass on The Mechanical Properties of Green
Concrete
Aseel B. Al-Zubaid , Kadum Muttar Shabeeb, Aynoor Ibrahim Ali
[email protected] Materials Engineering Department/ University of Technology, Baghdad, Iraq
Abstract
The environmental troubles that are related to cement manufacturing makes the new
studies moving forward to using materials have less environmental impact, thus, in
this paper we utilized different type of recycled glass such as (neon glass, brown
glass, and green glass) that has high percentage of silicon dioxide (SiO2) with
different concentrations. Utilization these landfall materials can be considered as
keeping on resources. Different waste glasses used as a partial replacement of cement
with different concentrations 11%, 13%, and 15% of cement weight for each type, and
study the effect of it on the mechanical properties of concrete. After mixing, casting,
and curing in water at (20±2)°C for (7, 14, and 28) days, the mechanical properties
showed that the compressive strength and flexural show highest results at 13% from
cement weight of neon glass, whereas splitting tensile strength appeared the highest
value at the same percentage but from green glass.
Keywords: Recycled glass; Environment impact; Compressive; Splitting; and Tensile
strength.
1. Introduction
The increase in the cost of construction materials, and rapid development in it, In
the same of time the world is heading to use materials have a less harmful effect on
the environment, so there are many ways to get green concrete from recycling
materials. One of them, utilization of colored, crushed, and wastes ground glass
(WGP) in concrete.
The general advantage of using it might prevent creeping of metals because the
ground glass improves the workability of concrete that's led to reducing the
permeability of it all of that due to the high alkali-silica reaction (ASR) that present in
cement and waste glass.
The utilization this type of waste material as a replacement of cement with specific
percentage led to reducing the cost of uses cement also produce concrete with less
environmental impact with low-cost production. Glass is non-crystalline silica have
almost the content of ordinary Portland cement, but with different concentrations, as
shown in Table2 below.
have shown that the utilization of waste glass powder (WGP) as a partial
replacement of cement Manoj Kumar et al. (2016), for normal concrete at three
concentrations (10, 20, and 30)% at curing time up to (28 days). The results appear
increasing in compressive strength and flexural tensile strength at 20% of partially
Proceeding of the 3th Sustainable & Renewable Energy Conference 23 -24 December 2017, Baghdad-Iraq
992
replacement. While, the workability shows increasing in slump test with increasing
partially replacement of cement in the mixture of concrete. Whereas, Jitendra B.
Jangid et al. (2014), have pointed out that the utilization of glass powder as a partially
replacement of cement with (0- 40) % of cement weight, the results appeared
increasing in strength of concrete up to 20% of cement weight. The improvement in
mechanical properties (compressive strength, flexural and splitting tensile strength)
reaches a maximum value at concentration 20%.Also, appear that the compressive
strength decrease with increasing replacement of glass. In the workability of concrete
Jitendra B. Jangid disagreed with Manoj Kumar because of workability of the fresh
concrete decrement with increasing glass powder content.
G.L. Oyekan et al. (2011), have revealed that the crushed waste glass has an
important effect on the compressive strength of the concrete. And the compressive
strength of the concrete increases gradually with crashed waste glass (CWG) content.
Also, ˃5% of CWG leads to decrease the compressive strength. While Roz-Ud-Din
Nassar et. al. (2011), have pointed out that the waste glass milled into micro-scale
particle size, that used as a partial cement replacement that sued in recycled concrete
the presence of waste glass in this form improve the properties of concrete such as
moisture absorption resistance, and harmful transportation.
As a result, milled waste glass (about 20- wt. % are not exceeded) as a partial
replacement of cement improve many properties of concrete such as abrasion
resistance, long-term strength and durability characteristics. Also have many
advantages in saving environment energy, cost benefits, and play an important role in
reducing carbon footprint in structure industry. Recycled concrete glass with 20% of
milled glass replacement of the cement is used in the field of pavement and curb that
applied over two years of vulnerability (exposure) to mid- Michigan weathering
effects (and traffic loads).
2. Research Significance
Study the effect of each type of the glasses (Neon, Brown, and Green glass) as a
partial cementation on mechanical properties (compressive, splitting, and tensile
strength).also to compare the results of different concentrations of the replacement
materials with the control concrete. All of that in order to produce concrete have less
environmental effect that are related to cement production, therefore use materials that
works as a partial replacement of it.
3. Experiment Investigation
Cubic, Cylindrical, and Splitting specimens without steel reinforcement was used
with dimensions (3.94 in. [100mm], 16 in [40mm] length and 3.94 in [100mm] the
dimensions of both width and height, 4 in [10mm] diameter and 8 in [20mm] height)
shown respectively. The utilization materials include ordinary Portland cement
(OPC), water, sand, and aggregate, also the different type of glasses that used as a
partial replacement of cement. The specimen numbers 27 specimens for each
concentration and age and compares it with control concrete.
Proceeding of the 3th Sustainable & Renewable Energy Conference 23 -24 December 2017, Baghdad-Iraq
991
3.1 Materials
The properties of materials that utilized in this research measured according to the
Iraqi specifications IQS. :
3.1.1 Cement
Ordinary Portland cement was used fabricated by United Cement Company is
known for the marketing (Al-Mass Basin), the physical properties of cement shown in
table.
Table 1.Physical properties of cement
Type of test Result
Specific surface (m2/kg) 376 >230
Setting time
(Vicat`s method)
-Initial setting (hrs:min)
-Final setting (hrs:min)
2:05
4:00
≥ 45min
≤ 10 hrs
Compressive Strength of Mortar
-3 Days
-7 Days
20 MPa
25 MPa
≥ 15
≥ 23
Autoclave (Soundness) 0.12 ≤ 0.8
3.1.2 Crashed Waste Glass (CWG)
All type of glasses that used in this research paper was bringing from landfall
ground in Baghdad. Glass is non-crystalline material (amorphous) see fig.1 that
appears the amorphous state for all glass that used in this research, each type of
broken glasses was crushed individually by ball milling machine fig.2 and 3. Also the
range of particle size for neon glass (N.G) (25-90) µm, and (21-75) µm for Brown
glass (B.G), also (18-80) µm for green glass (G.G).Whereas the chemical analysis by
Energy Dispersive X- Ray Fluorescence Spectrometer (EDX-7000) of glasses powder
show that have a high content of CaO, SiO2, Al2O3, and Fe2O3 in the powder.in the
same of time Ordinary Portland Cement have almost the same content but with
different percentages Table2. These results encouraged us to utilize it as a partial
replacement of cement and study its effect in the field of mechanical and physical
properties.
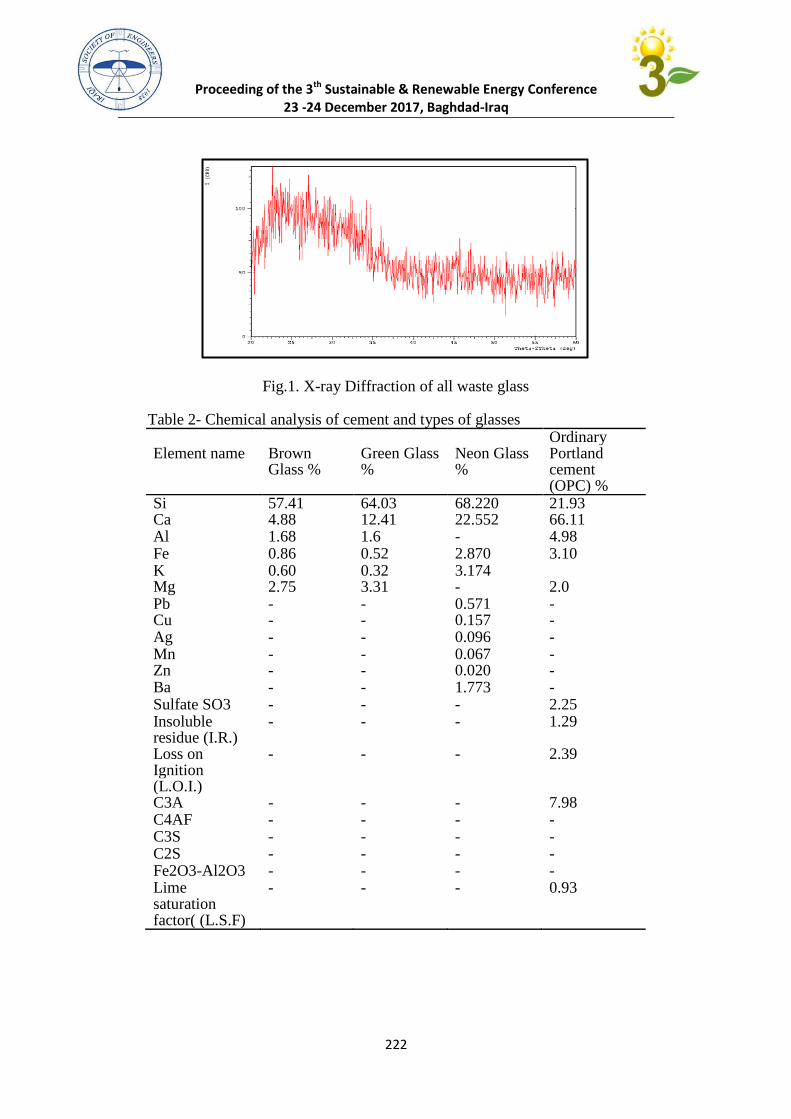
Proceeding of the 3th Sustainable & Renewable Energy Conference 23 -24 December 2017, Baghdad-Iraq
999
Fig.1. X-ray Diffraction of all waste glass
Table 2- Chemical analysis of cement and types of glasses Element name
Brown Glass %
Green Glass %
Neon Glass %
Ordinary Portland cement (OPC) %
Si 57.41 64.03 68.220 21.93 Ca 4.88 12.41 22.552 66.11 Al 1.68 1.6 - 4.98 Fe 0.86 0.52 2.870 3.10 K 0.60 0.32 3.174 Mg 2.75 3.31 - 2.0 Pb - - 0.571 - Cu - - 0.157 - Ag - - 0.096 - Mn - - 0.067 - Zn - - 0.020 - Ba - - 1.773 - Sulfate SO3 - - - 2.25 Insoluble residue (I.R.)
- - - 1.29
Loss on Ignition (L.O.I.)
- - - 2.39
C3A - - - 7.98 C4AF - - - - C3S - - - - C2S - - - - Fe2O3-Al2O3 - - - - Lime saturation factor( (L.S.F)
- - - 0.93
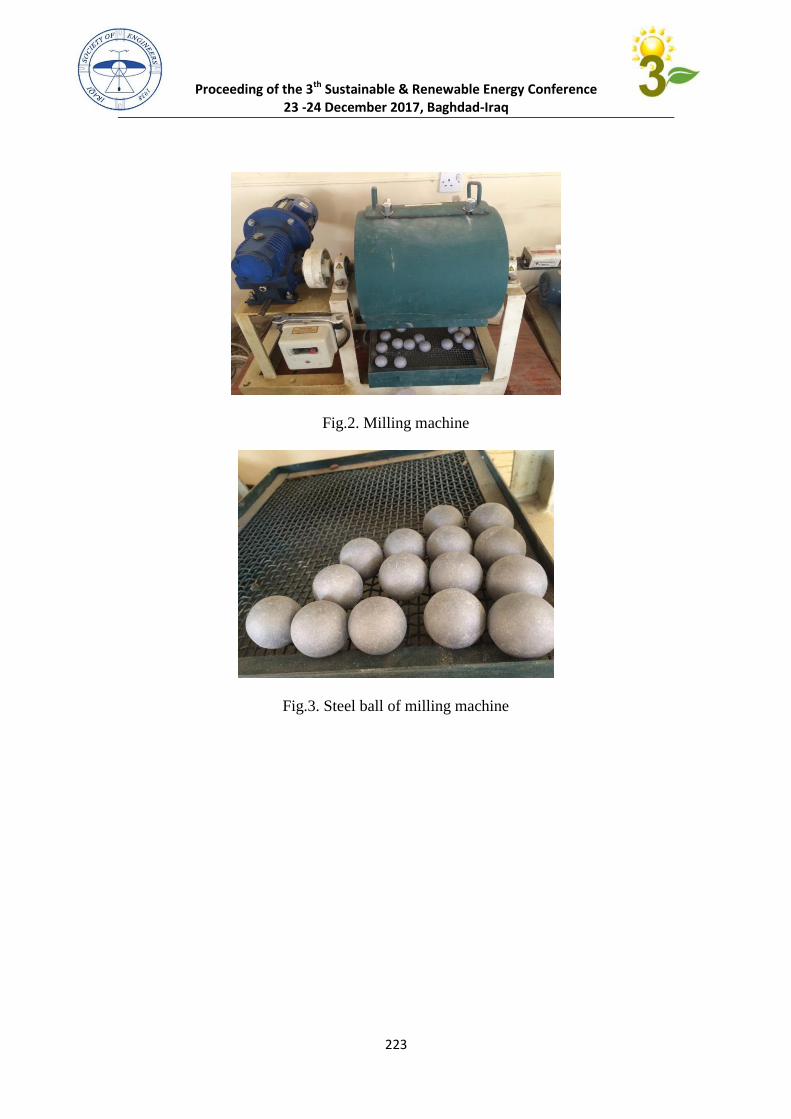
Proceeding of the 3th Sustainable & Renewable Energy Conference 23 -24 December 2017, Baghdad-Iraq
992
Fig.2. Milling machine
Fig.3. Steel ball of milling machine

Proceeding of the 3th Sustainable & Renewable Energy Conference 23 -24 December 2017, Baghdad-Iraq
992
a) Neon glass powder.
b) Brown glass powder.
Fig.4.(a, b, and c) Different type of glasses that used as a replacement of cement
c) Green glass powder.
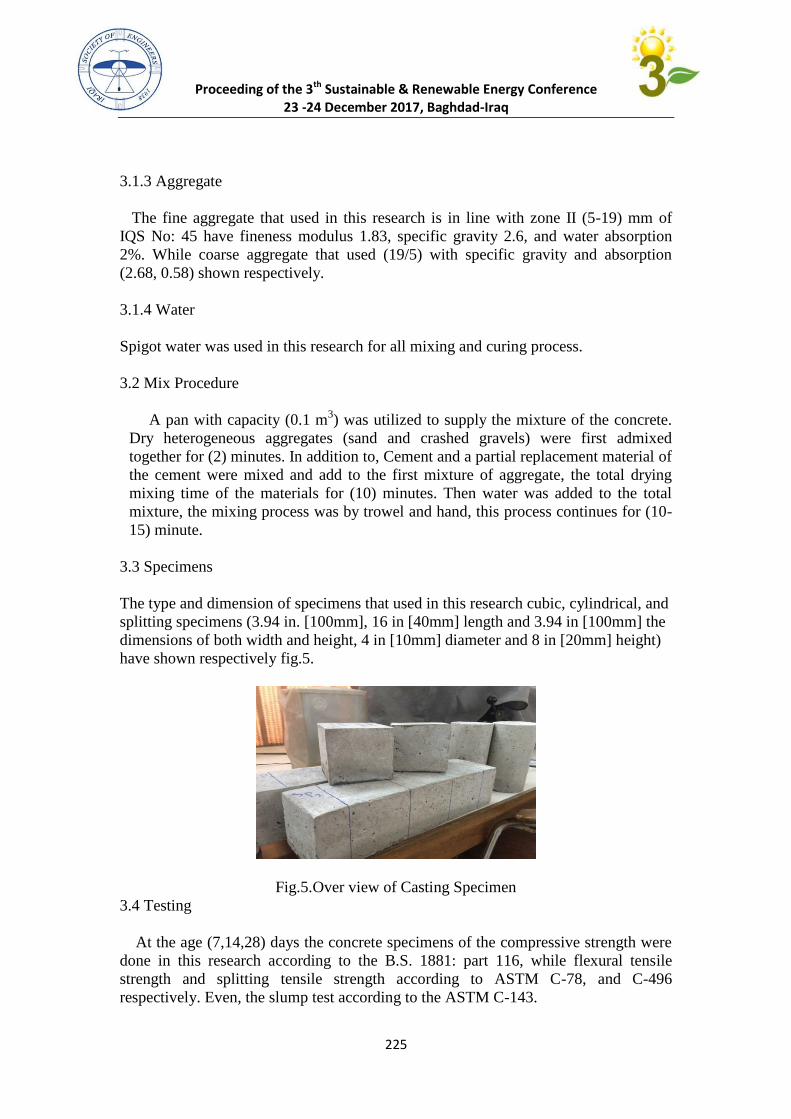
Proceeding of the 3th Sustainable & Renewable Energy Conference 23 -24 December 2017, Baghdad-Iraq
992
3.1.3 Aggregate
The fine aggregate that used in this research is in line with zone II (5-19) mm of
IQS No: 45 have fineness modulus 1.83, specific gravity 2.6, and water absorption
2%. While coarse aggregate that used (19/5) with specific gravity and absorption
(2.68, 0.58) shown respectively.
3.1.4 Water
Spigot water was used in this research for all mixing and curing process.
3.2 Mix Procedure
A pan with capacity (0.1 m3) was utilized to supply the mixture of the concrete.
Dry heterogeneous aggregates (sand and crashed gravels) were first admixed
together for (2) minutes. In addition to, Cement and a partial replacement material of
the cement were mixed and add to the first mixture of aggregate, the total drying
mixing time of the materials for (10) minutes. Then water was added to the total
mixture, the mixing process was by trowel and hand, this process continues for (10-
15) minute.
3.3 Specimens
The type and dimension of specimens that used in this research cubic, cylindrical, and
splitting specimens (3.94 in. [100mm], 16 in [40mm] length and 3.94 in [100mm] the
dimensions of both width and height, 4 in [10mm] diameter and 8 in [20mm] height)
have shown respectively fig.5.
Fig.5.Over view of Casting Specimen
3.4 Testing
At the age (7,14,28) days the concrete specimens of the compressive strength were
done in this research according to the B.S. 1881: part 116, while flexural tensile
strength and splitting tensile strength according to ASTM C-78, and C-496
respectively. Even, the slump test according to the ASTM C-143.
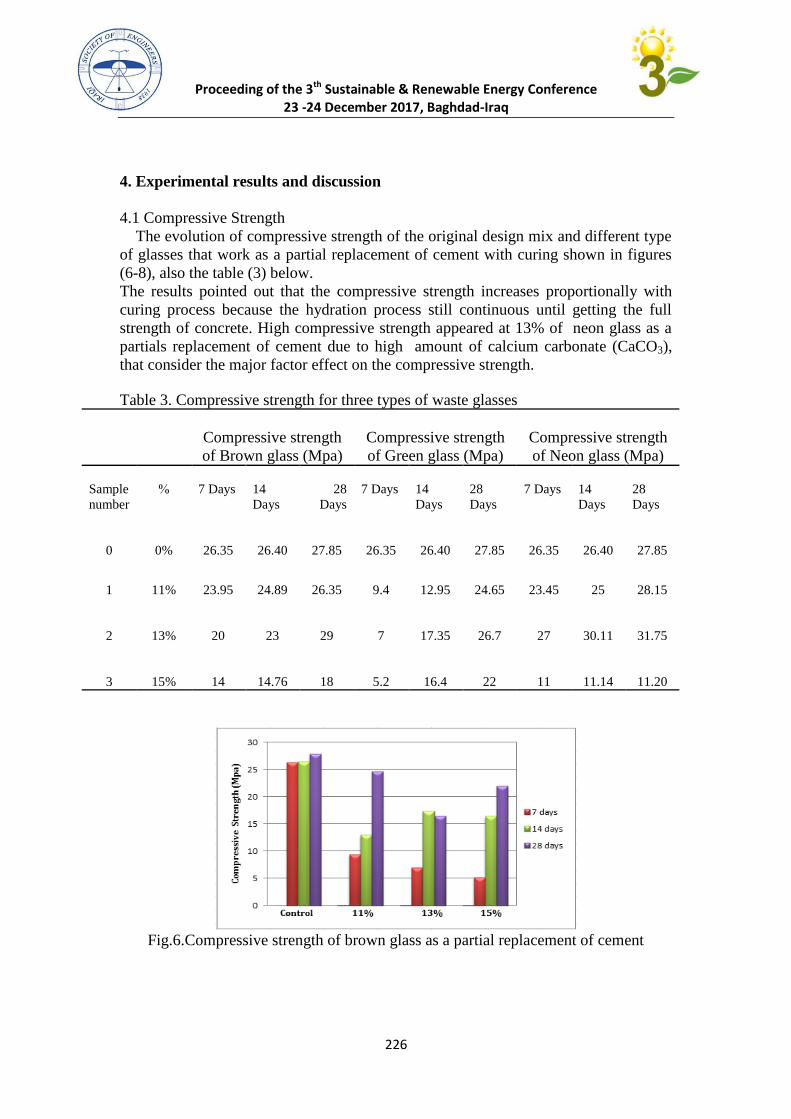
Proceeding of the 3th Sustainable & Renewable Energy Conference 23 -24 December 2017, Baghdad-Iraq
992
4. Experimental results and discussion
4.1 Compressive Strength
The evolution of compressive strength of the original design mix and different type
of glasses that work as a partial replacement of cement with curing shown in figures
(6-8), also the table (3) below.
The results pointed out that the compressive strength increases proportionally with
curing process because the hydration process still continuous until getting the full
strength of concrete. High compressive strength appeared at 13% of neon glass as a
partials replacement of cement due to high amount of calcium carbonate (CaCO3),
that consider the major factor effect on the compressive strength.
Table 3. Compressive strength for three types of waste glasses
Compressive strength
of Neon glass (Mpa)
Compressive strength
of Green glass (Mpa)
Compressive strength
of Brown glass (Mpa)
28
Days
14
Days
7 Days
28
Days
14
Days
7 Days
28
Days
14
Days
7 Days
%
Sample
number
27.85
26.40
26.35
27.85
26.40
26.35
27.85
26.40
26.35
0%
0
28.15
25
23.45
24.65
12.95
9.4
26.35
24.89
23.95
11%
1
31.75
30.11
27
26.7
17.35
7
29
23
20
13%
2
11.20
11.14
11
22
16.4
5.2
18
14.76
14
15%
3
Fig.6.Compressive strength of brown glass as a partial replacement of cement
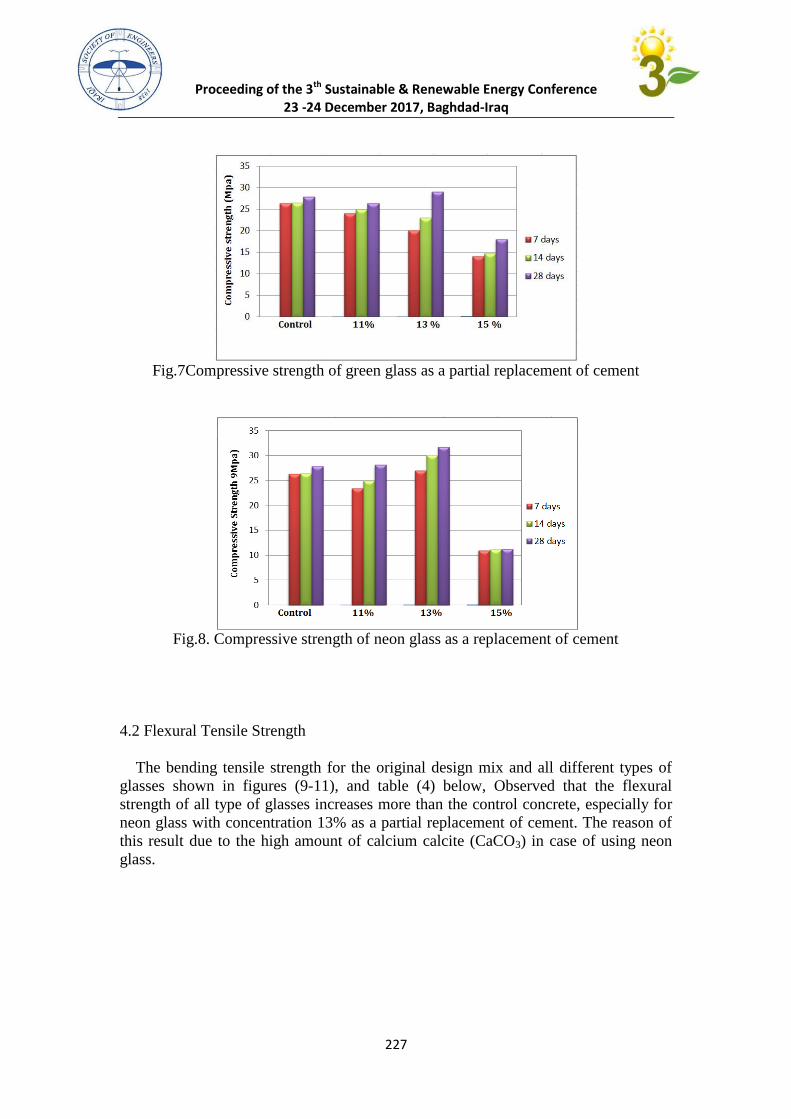
Proceeding of the 3th Sustainable & Renewable Energy Conference 23 -24 December 2017, Baghdad-Iraq
992
Fig.7Compressive strength of green glass as a partial replacement of cement
Fig.8. Compressive strength of neon glass as a replacement of cement
4.2 Flexural Tensile Strength
The bending tensile strength for the original design mix and all different types of
glasses shown in figures (9-11), and table (4) below, Observed that the flexural
strength of all type of glasses increases more than the control concrete, especially for
neon glass with concentration 13% as a partial replacement of cement. The reason of
this result due to the high amount of calcium calcite (CaCO3) in case of using neon
glass.
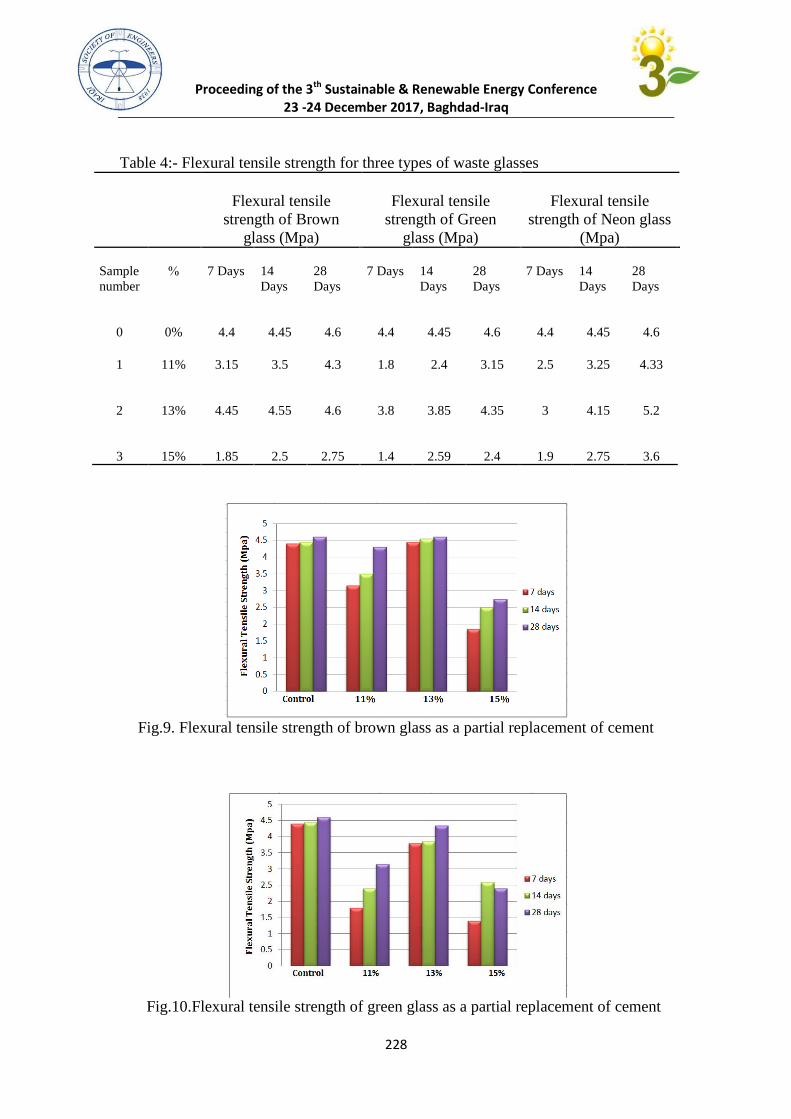
Proceeding of the 3th Sustainable & Renewable Energy Conference 23 -24 December 2017, Baghdad-Iraq
992
Table 4:- Flexural tensile strength for three types of waste glasses
Flexural tensile
strength of Neon glass
(Mpa)
Flexural tensile
strength of Green
glass (Mpa)
Flexural tensile
strength of Brown
glass (Mpa)
28
Days
14
Days
7 Days
28
Days
14
Days
7 Days
28
Days
14
Days
7 Days
%
Sample
number
4.6
4.45
4.4
4.6
4.45
4.4
4.6
4.45
4.4
0%
0
4.33
3.25
2.5
3.15
2.4
1.8
4.3
3.5
3.15
11%
1
5.2
4.15
3
4.35
3.85
3.8
4.6
4.55
4.45
13%
2
3.6
2.75
1.9
2.4
2.59
1.4
2.75
2.5
1.85
15%
3
Fig.9. Flexural tensile strength of brown glass as a partial replacement of cement
Fig.10.Flexural tensile strength of green glass as a partial replacement of cement
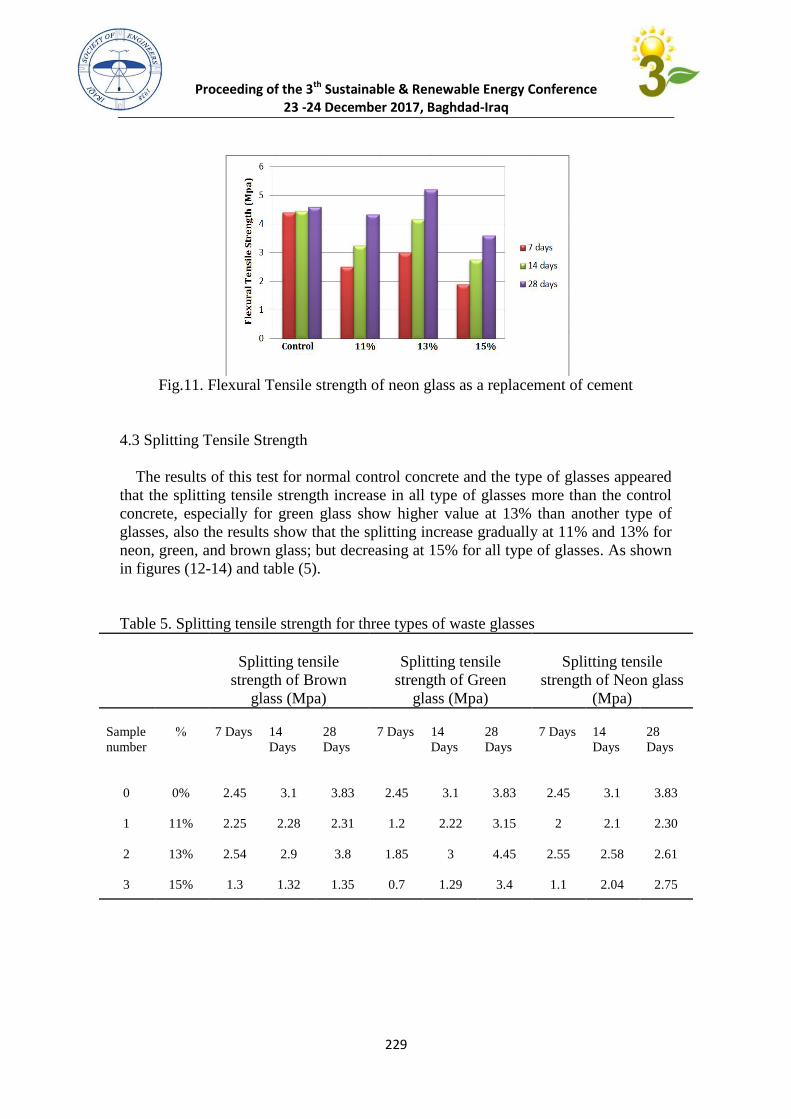
Proceeding of the 3th Sustainable & Renewable Energy Conference 23 -24 December 2017, Baghdad-Iraq
992
Fig.11. Flexural Tensile strength of neon glass as a replacement of cement
4.3 Splitting Tensile Strength
The results of this test for normal control concrete and the type of glasses appeared
that the splitting tensile strength increase in all type of glasses more than the control
concrete, especially for green glass show higher value at 13% than another type of
glasses, also the results show that the splitting increase gradually at 11% and 13% for
neon, green, and brown glass; but decreasing at 15% for all type of glasses. As shown
in figures (12-14) and table (5).
Table 5. Splitting tensile strength for three types of waste glasses
Splitting tensile
strength of Neon glass
(Mpa)
Splitting tensile
strength of Green
glass (Mpa)
Splitting tensile
strength of Brown
glass (Mpa)
28
Days
14
Days
7 Days
28
Days
14
Days
7 Days
28
Days
14
Days
7 Days
%
Sample
number
3.83
3.1
2.45
3.83
3.1
2.45
3.83
3.1
2.45
0%
0
2.30
2.1
2
3.15
2.22
1.2
2.31
2.28
2.25
11%
1
2.61
2.58
2.55
4.45
3
1.85
3.8
2.9
2.54
13%
2
2.75
2.04
1.1
3.4
1.29
0.7
1.35
1.32
1.3
15%
3
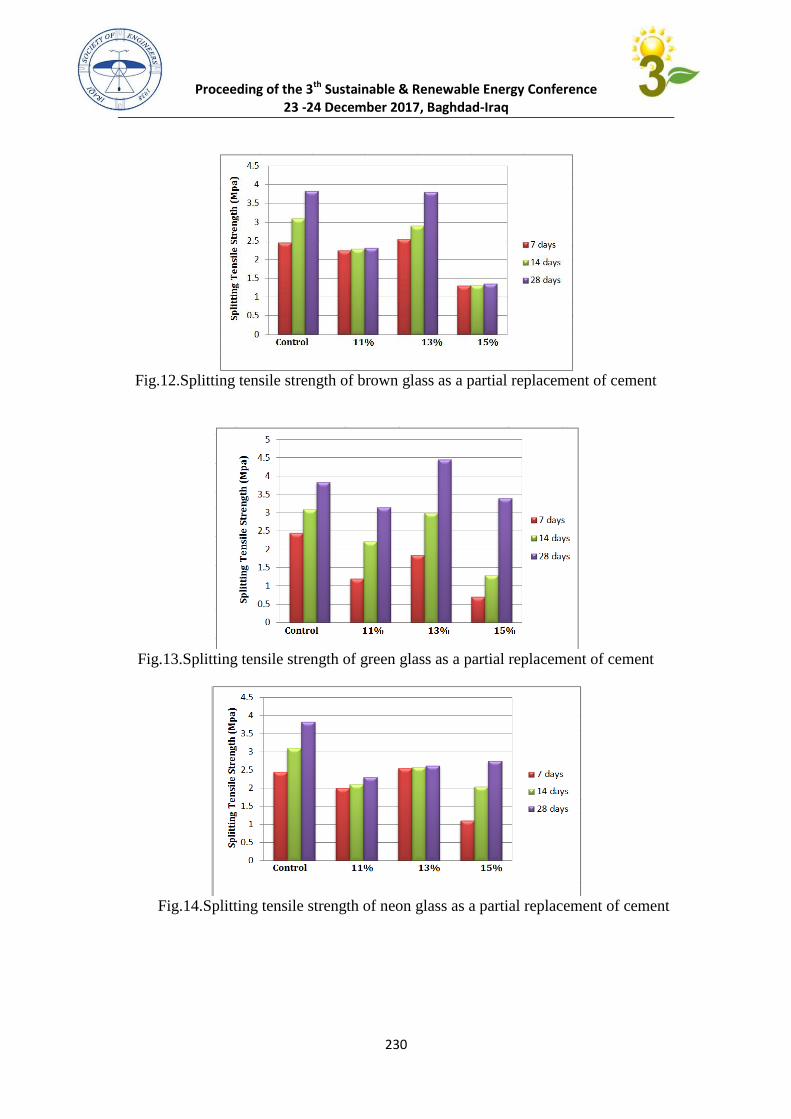
Proceeding of the 3th Sustainable & Renewable Energy Conference 23 -24 December 2017, Baghdad-Iraq
922
Fig.12.Splitting tensile strength of brown glass as a partial replacement of cement
Fig.13.Splitting tensile strength of green glass as a partial replacement of cement
Fig.14.Splitting tensile strength of neon glass as a partial replacement of cement
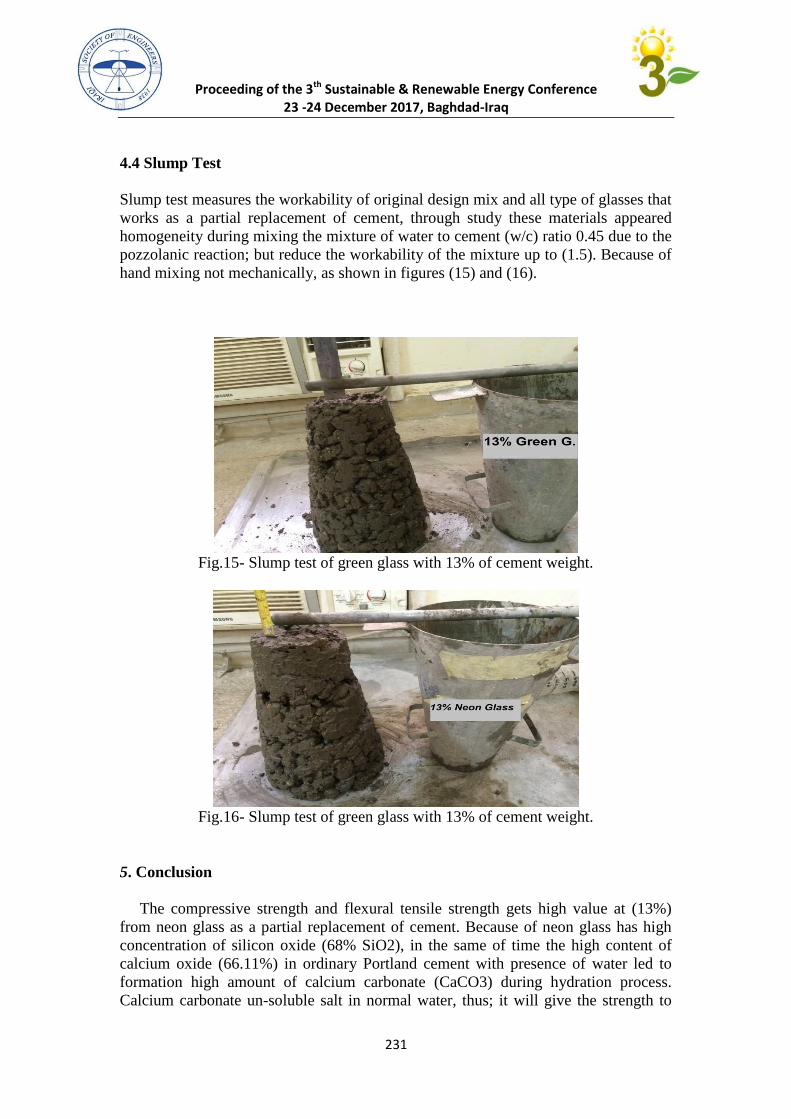
Proceeding of the 3th Sustainable & Renewable Energy Conference 23 -24 December 2017, Baghdad-Iraq
921
4.4 Slump Test
Slump test measures the workability of original design mix and all type of glasses that
works as a partial replacement of cement, through study these materials appeared
homogeneity during mixing the mixture of water to cement (w/c) ratio 0.45 due to the
pozzolanic reaction; but reduce the workability of the mixture up to (1.5). Because of
hand mixing not mechanically, as shown in figures (15) and (16).
Fig.15- Slump test of green glass with 13% of cement weight.
Fig.16- Slump test of green glass with 13% of cement weight.
5. Conclusion
The compressive strength and flexural tensile strength gets high value at (13%)
from neon glass as a partial replacement of cement. Because of neon glass has high
concentration of silicon oxide (68% SiO2), in the same of time the high content of
calcium oxide (66.11%) in ordinary Portland cement with presence of water led to
formation high amount of calcium carbonate (CaCO3) during hydration process.
Calcium carbonate un-soluble salt in normal water, thus; it will give the strength to
Proceeding of the 3th Sustainable & Renewable Energy Conference 23 -24 December 2017, Baghdad-Iraq
929
the concrete. But for pre-long of time cause reduction in the strength and durability of
concrete. Whereas, splitting tensile strength has high value at (13%) of green glass.
The workability of the replacement materials in the concrete appears that the almost
the pozzolans materials (different types of glass), that used in this research paper
shows homogenous blending during mixing and casting at 15% but; keep on the level
of slump (1.5 mm) due to the hand mixing. Finally, the presence un-soluble salts in
the concrete reduce the strength because of reduction in the alkalinity of concrete with
very long of time. Also, it has a negative effect on the environment because of
existing carbon dioxide (CO2). So that, the utilization these types of glass will not
produce Green Concrete.
References
[1] K. V Ramana, and Shaik SS. Study on Influence of Crushed Waste Glass on
Properties of Concrete. International Journal of Science and Research (IJSR), 2015,
ISSN (Online): 2319-7064.
[2] William T. Beneficial use of Waste Glass as partial Substitute for Cement and
Aggregate in Concrete. Tshwane University of Technology, 2013, South Africa.
[3] Manoj K, and Vedpal, and Ravinder. Behaviour of Concrete with Waste Glass
Fiber Powder. International Journal for Research in Applied Science & Engineering
Technology (IJRASET), 2016, Vol. 4, ISSN: 2321-9653.
[4] Jitendra BJ, and Prof.A.C.Saoji. Experimental investigation of waste glass
powder as the partial replacement of cement in concrete production. IOSR Journal of
Mechanical and Civil Engineering (IOSR-JMCE), 2014, ISSN: 2320-334X , PP 55-
60.
[5] GL Oyekan, and OA Oyelade. Crushed Waste Glass as a partial Replacement of
Cement in Normal Concrete Production with Sugar Added as an Admixture.
International Engineering and Applied Sciences, 2011, ISSN:1816-949X, 369-372.
[6] Roz UN, and Parviz S. Field Investigation of Concrete Incorporating Milled Waste
Glass. Elsevier Journal, Construction and Building Materials 29, 2011:368–377.
[7] B.S. 1881: Part 116. Method for Determination of Compressive Strength of
Concrete Cubes. British Standards Institution, 1989.
[8] ASTM C78-04. Standard test Method for Flexural Strength of Concrete. Annual
Book of ASTM Standards, vol. 04.02,2004.
[9] ASTM C496-04. Standard test Method for Splitting Strength of Concrete.
American Society for Testing and Materials'', vol. 04.02, 1-6, 2007.
[10] ASTM C 143-03. Standard Test Method for Slump of Hydraulic-Cement
Concrete. ASTM International, Annual Book of ASTM Standard, American Society
for Testing and Materials, Volume 04-02, pp.1-4, United State, 2007.
Applications of Biomass Energy
(ABE)
Research

Proceeding of the 3th Sustainable & Renewable Energy Conference 23 -24 December 2017, Baghdad-Iraq
432
Wastewater Treatment Using Solar Light
Asst. Prof. Ahmed Hassan Ali
[email protected], [email protected]
hemical Engineering Department \ College of Engineering \ Almuthanna University \ Al-Samawa
Abstract
In the present paper, the degradation of eosin yellowish dye using ZnO as a photocatalysts in
a slurry reactor under solar light.
The optimum values of different parameters viz. catalyst concentration, catalyst type and
initial concentration of the substrate affecting the degradation rate of eosin yellowish dye were
obtained by varying catalyst concentration (0.25 – 1.25 g/l), and initial dye concentration (25–100
mg/l). The disappearance of colour and substrates together with the abatement of total organic
carbon content was monitored.
Keywords: Solar light ; eosin yellowish dye; Photocatalysis; Zinc oxide
معالجة مخلفات المياه الصناعية باستخدام ضوء الشمس
الخالصة
في هذا البحث تمت دراسة معالجة الصبغة االرجوانية المصفرة باستخدام اوكسيد الخارصين كعامل مساعد تحت اشعة
تركيز العامل المساعد حيث تم )حيث تم دراسة العوامل المؤثرة على عملية المعالجة وانحالل الصبغة ومن هذه العوامل .الشمس
لتر كذلك تركيز الصبغة في المحلول واستخدمت /ملغم( 52.0 – 52.0)ل المساعد تراوحت بين استخدام تراكيز مختلفة للعام
ان 2 للحصول على افضل قيم من التراكيز للعامل المساعد وللصبغة2 لتر/ملغم( 555الى 0.)تراكيز مختلفة للصبغة تراوحت بين
اظهرت نتائج البحث ان اوكسيد الزنك له 2 المركبات العضويةاختفاء الصبغة االرجوانية المصفرة يكون مصاحبا النحالل محتوى
2سلوك افضل في معالجة الصبغة وانحاللها باستعماله كعامل مساعد تحت اشعة الشمس
1. Introduction
Photocatalytic processes to degrade organic pollutants in water by utilizing catalyst have
been the subject of research recently. Semiconductor oxides such as ZnO and TiO2 have been
recognized to be preferable materials for photocatalytic processes, due to their high photosensitivity,
non-toxic nature, low cost and chemical stability. The semiconductor or photocatalysis is initiated by
Proceeding of the 3th Sustainable & Renewable Energy Conference 23 -24 December 2017, Baghdad-Iraq
432
the surface trapping of photo-generated electrons (e_) and holes (h+), which induces inter facial
electron-transfer reactions with adsorbed substrates. However, because of the wide band gap of ZnO
and TiO2 [1-3]. The implementation of solar-powered photocatalytic reactors to process wastewater
from textile industries keep a promise for areas receiving powerful sunlight over the year, like Iraq
[4]. Since dyes absorb highly in the visible zone, the energy gathering efficiency should be
sufficiently high to make the photo-assisted processing of dye-polluted wastewater convenient [5,6].
The implementation of solar-powered photocatalytic reactors to process wastewater from textile
industries keep a promise for areas receiving powerful sunlight over the year, like Iraq4. Since dyes
absorb highly in the visible zone, the energy gathering efficiency should be sufficiently high to make
the photo-assisted processing of dye-polluted wastewater convenient. Eosin yellowish was
considered one of the most important dyes because of it is emotional-state lifetime which was very
short and was constant to visible in addition give a useful investigation for the oxidation and
reduction of photo reactions [7]. For the oxidation reaction about photo of Eosin yellowish in a
slurry reactors and TiO2 immobilized reactors, most studies had been made [8,9]. The experimental
data of previous studies would give a good information in estimating the execution of a fluidized bed
photocatalytic reactor in a three-phase. In the present paper, the photocatalytic degradation of eosin
yellowish dye in aquatic solutions using two different photocatalysts has been tested. The major
aims of the study were (a) effect of catalyst concentration; (b) effect of pH. (c) effect of initial
concentration of the dye; (d) studies kinetic of reaction
2. Experimental work
2.1. Materials
In present work commercial ZnO powder were gained from Merck Co. (Germany), eosin
yellowish dye was taken up from Merck (Germany) and was applied without further purification.
Distilled water was used for a preparation of different solutions.
2.2. Instruments
Photochemical degradation was carried out in specially designed insulation walled reaction
containers (volume 500 ml) under solar light Constant stirring of the solution was covered by using
magnetic stirrers. The temperature was kept constant during the reaction time by spreading the water
in the photocatalytic reactor vessel.
Proceeding of the 3th Sustainable & Renewable Energy Conference 23 -24 December 2017, Baghdad-Iraq
432
2.3. Irradiation experiments
For 250 ml of the dye solution, photocatalyst was added and a suspension was an exhibit to
irradiation. Experiments were carried out under solar light. The aqueous suspension was
magnetically stirred over the experiment. At different time periods, an aliquot was taken out with the
help of a syringe and then filtered through Millipore syringe filter of 0.45 µm.
2.4 Absorption Measurements
The absorption spectrum was recorded using double beam UV-1800 (Shmadzo
spectrophotometer) compared with distilled water as a reference liquid and the percentage rate of
degradation was noticed in terms of change in intensity at λmax of the dyes during irradiation time.
The degradation efficiency (%) has been calculated as:
% Degradation = ((Abs 0– Abs t) / Abs 0) * 100
Where :-
% Degradation is a percentage of dye disappearance.
Abs 0 is initial absorption of dye (at time = 0 min.)
Abs t is absorption of dye (at time = t min.)
Similar experiments have used different catalyst concentration (0.25–1.25 g/l), to select the best
concentration of catalyst ZnO at the same dye concentration of the solution (25 ppm)
3. Results and Discussion
3.1 Effect of Photocatalyst Concentration
The effect of catalyst concentration on the degradation of Eosin yellowish (25 ppm) was investigated
using commercial ZnO from 0.25 to 1.25 g\l keeping another parameters like (pH , temperature , and
dye concentration) constant. The results in the Figure 1 showed that the degradation percentage
increased with an increase in ZnO commercial concentration up to 0.75 g\l for ZnO. This
observation can be explained in terms of availability of active sites on the catalyst surface and the
permeation of solar light into the suspension. The total active surface area increases with increasing
catalyst dosage. At the same time, due to an increase in the turbidity of the suspension, there is a
decrease in solar light permeation as a result of increased scattering effect and hence the
photoactivated volume of suspension decreases. Furthermore, at high catalyst loading, it is difficult
to maintain the suspension homogenous due to particles agglomeration, which decreases the number
of active sites [10-12].

Proceeding of the 3th Sustainable & Renewable Energy Conference 23 -24 December 2017, Baghdad-Iraq
432
The results also shows the maximum photodegradation for commercial ZnO (0.75 g/l) achieved after
90 minute (see Figure 1).
Figure 1 : Effect the catalyst dose of ZnO on degradation of Eosin yellowish dye
3.2 Effect of pH on Solution Treatment
The wastewater is produced at different pHs, therefore, study of pH is very important on
photodegradation of Eosin yellowish dye. Experiments have been done at different values of pH
varying from 3 to 11 for 25 mg/L dye solution concentration and for the best of catalyst
concentration (0.75) g/l of ZnO. Figure 2 shows the percentage photodegradation of against values
of pH. It is clearly increasing in pH up to 10 for ZnO because increasing in photodegradation activity
[13]. The utilizing of ZnO as the catalyst is more appropriate at high pH values with the textile
effluent. The interpretation of pH effects on the efficiency of the decolonization is a complex subject
because many reactions can be occur to dye degradation such as “hydroxyl radical reaction, direct
oxidation by the positive hole and direct reduction by the electron in the conducting band”. The
importance of each one depends upon the substrate nature and pH.
0%
10%
20%
30%
40%
50%
60%
70%
80%
90%
100%
Catalyst Dose
0.25 g/l
0.5 g/l
0.75 g/l
1.00 g/l
1.25 g/l
De
grad
atio
n
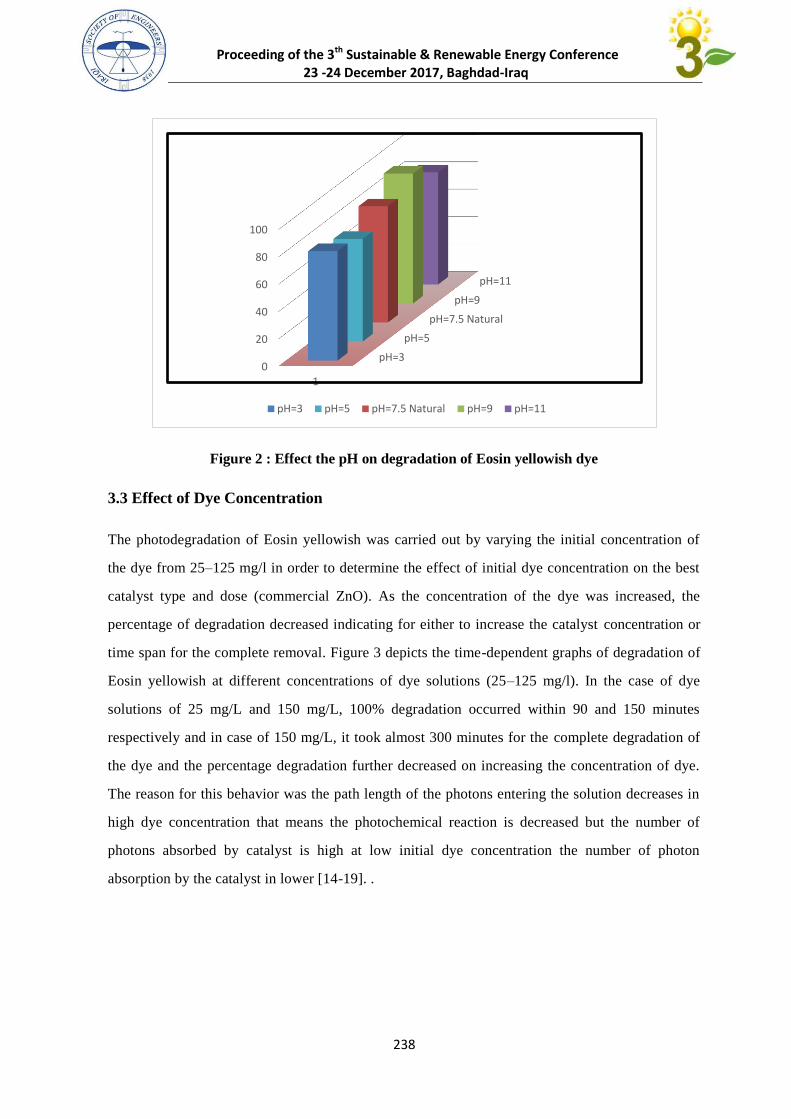
Proceeding of the 3th Sustainable & Renewable Energy Conference 23 -24 December 2017, Baghdad-Iraq
432
Figure 2 : Effect the pH on degradation of Eosin yellowish dye
3.3 Effect of Dye Concentration
The photodegradation of Eosin yellowish was carried out by varying the initial concentration of
the dye from 25–125 mg/l in order to determine the effect of initial dye concentration on the best
catalyst type and dose (commercial ZnO). As the concentration of the dye was increased, the
percentage of degradation decreased indicating for either to increase the catalyst concentration or
time span for the complete removal. Figure 3 depicts the time-dependent graphs of degradation of
Eosin yellowish at different concentrations of dye solutions (25–125 mg/l). In the case of dye
solutions of 25 mg/L and 150 mg/L, 100% degradation occurred within 90 and 150 minutes
respectively and in case of 150 mg/L, it took almost 300 minutes for the complete degradation of
the dye and the percentage degradation further decreased on increasing the concentration of dye.
The reason for this behavior was the path length of the photons entering the solution decreases in
high dye concentration that means the photochemical reaction is decreased but the number of
photons absorbed by catalyst is high at low initial dye concentration the number of photon
absorption by the catalyst in lower [14-19]. .
pH=3
pH=5
pH=7.5 Natural
pH=9
pH=11
0
20
40
60
80
100
1
pH=3 pH=5 pH=7.5 Natural pH=9 pH=11
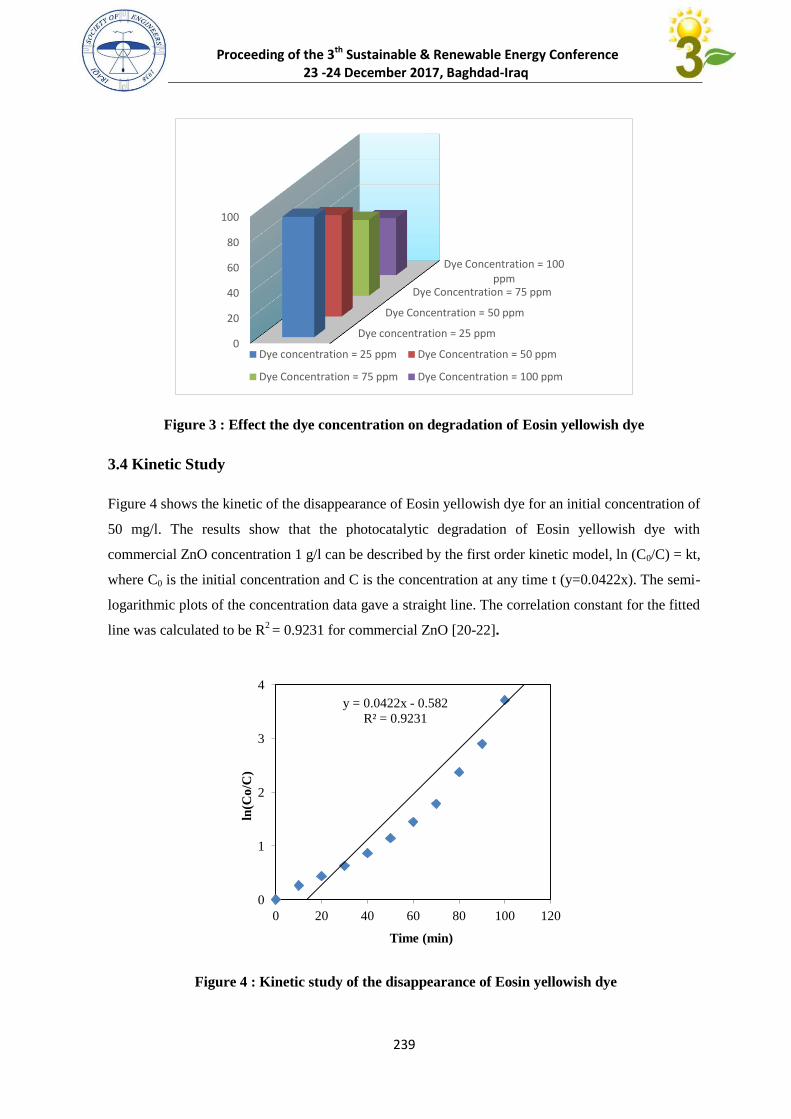
Proceeding of the 3th Sustainable & Renewable Energy Conference 23 -24 December 2017, Baghdad-Iraq
432
Figure 3 : Effect the dye concentration on degradation of Eosin yellowish dye
3.4 Kinetic Study
Figure 4 shows the kinetic of the disappearance of Eosin yellowish dye for an initial concentration of
50 mg/l. The results show that the photocatalytic degradation of Eosin yellowish dye with
commercial ZnO concentration 1 g/l can be described by the first order kinetic model, ln (C0/C) = kt,
where C0 is the initial concentration and C is the concentration at any time t (y=0.0422x). The semi-
logarithmic plots of the concentration data gave a straight line. The correlation constant for the fitted
line was calculated to be R2 = 0.9231 for commercial ZnO [20-22].
Figure 4 : Kinetic study of the disappearance of Eosin yellowish dye
Dye concentration = 25 ppm
Dye Concentration = 50 ppm
Dye Concentration = 75 ppm
Dye Concentration = 100 ppm
0
20
40
60
80
100
Dye concentration = 25 ppm Dye Concentration = 50 ppm
Dye Concentration = 75 ppm Dye Concentration = 100 ppm
y = 0.0422x - 0.582
R² = 0.9231
0
1
2
3
4
0 20 40 60 80 100 120
ln(C
o/C
)n
Time (min)
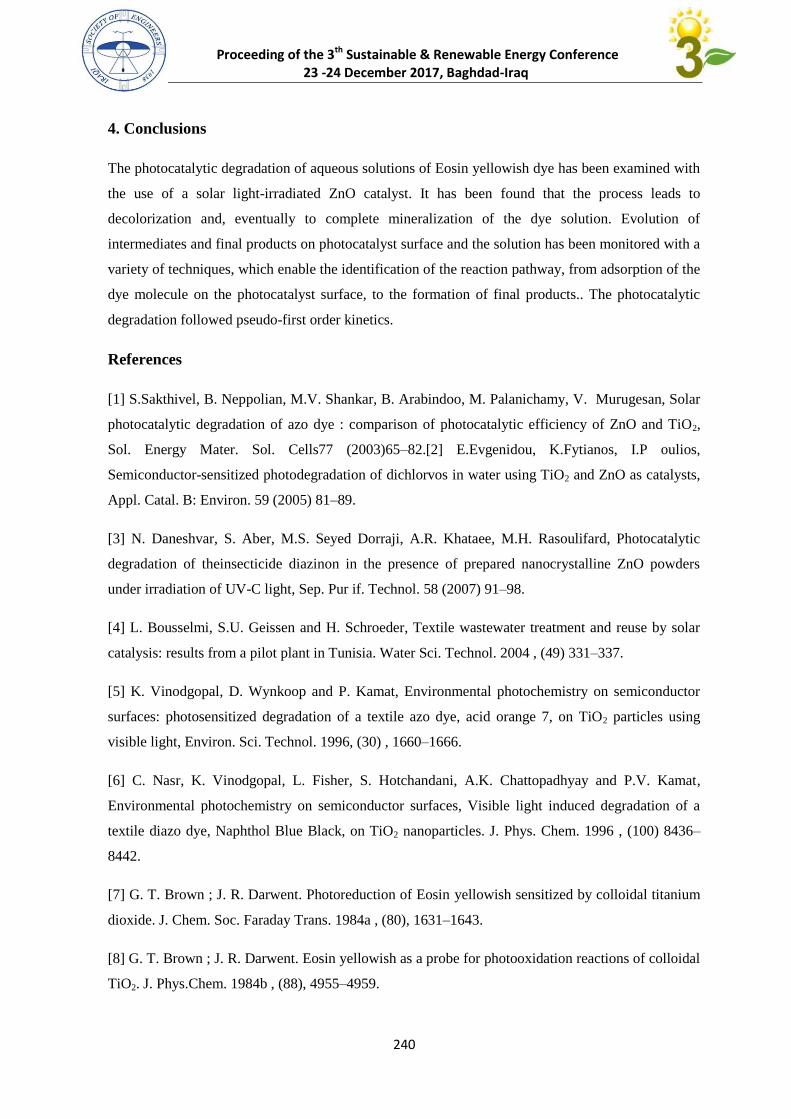
Proceeding of the 3th Sustainable & Renewable Energy Conference 23 -24 December 2017, Baghdad-Iraq
422
4. Conclusions
The photocatalytic degradation of aqueous solutions of Eosin yellowish dye has been examined with
the use of a solar light-irradiated ZnO catalyst. It has been found that the process leads to
decolorization and, eventually to complete mineralization of the dye solution. Evolution of
intermediates and final products on photocatalyst surface and the solution has been monitored with a
variety of techniques, which enable the identification of the reaction pathway, from adsorption of the
dye molecule on the photocatalyst surface, to the formation of final products.. The photocatalytic
degradation followed pseudo-first order kinetics.
References
[1] S.Sakthivel, B. Neppolian, M.V. Shankar, B. Arabindoo, M. Palanichamy, V. Murugesan, Solar
photocatalytic degradation of azo dye : comparison of photocatalytic efficiency of ZnO and TiO2,
Sol. Energy Mater. Sol. Cells77 (2003)65–82.[2] E.Evgenidou, K.Fytianos, I.P oulios,
Semiconductor-sensitized photodegradation of dichlorvos in water using TiO2 and ZnO as catalysts,
Appl. Catal. B: Environ. 59 (2005) 81–89.
[3] N. Daneshvar, S. Aber, M.S. Seyed Dorraji, A.R. Khataee, M.H. Rasoulifard, Photocatalytic
degradation of theinsecticide diazinon in the presence of prepared nanocrystalline ZnO powders
under irradiation of UV-C light, Sep. Pur if. Technol. 58 (2007) 91–98.
[4] L. Bousselmi, S.U. Geissen and H. Schroeder, Textile wastewater treatment and reuse by solar
catalysis: results from a pilot plant in Tunisia. Water Sci. Technol. 2004 , (49) 331–337.
[5] K. Vinodgopal, D. Wynkoop and P. Kamat, Environmental photochemistry on semiconductor
surfaces: photosensitized degradation of a textile azo dye, acid orange 7, on TiO2 particles using
visible light, Environ. Sci. Technol. 1996, (30) , 1660–1666.
[6] C. Nasr, K. Vinodgopal, L. Fisher, S. Hotchandani, A.K. Chattopadhyay and P.V. Kamat,
Environmental photochemistry on semiconductor surfaces, Visible light induced degradation of a
textile diazo dye, Naphthol Blue Black, on TiO2 nanoparticles. J. Phys. Chem. 1996 , (100) 8436–
8442.
[7] G. T. Brown ; J. R. Darwent. Photoreduction of Eosin yellowish sensitized by colloidal titanium
dioxide. J. Chem. Soc. Faraday Trans. 1984a , (80), 1631–1643.
[8] G. T. Brown ; J. R. Darwent. Eosin yellowish as a probe for photooxidation reactions of colloidal
TiO2. J. Phys.Chem. 1984b , (88), 4955–4959.
Proceeding of the 3th Sustainable & Renewable Energy Conference 23 -24 December 2017, Baghdad-Iraq
422
[9] L.C. Chen. Effects of factors and interacted factors on the optimal decolorization process of
Eosin yellowish by ozone. Wat. Res. 2000 (34), 974–982.
[10] C. Zhu ; L. Wang ; L. Kong ; X. Yang ; L. Wang ; S. Zheng ; F. Chen ; F. Maizhi; H. Zong.
Photocatalytic degradation of azo dyes by supported TiO2 and UV in aqueous solution.
Chemosphere. 2000 (41), 303–309.
[11] S. K. Kansal ; Ahmed Hassan Ali ; S. Kapoor. Photocatalytic decolorization of biebrich scarlet
dye in aqueous phase using different nanophotocatalysts. Desalination 2010 (259), 147–155
[12] I.K. Konstantinou, T.A. Albanis, TiO2-assisted photocatalytic degradation of azo dyes in
aqueous solution: kinetic and mechanistic investigation, Appl. Catal. B: Environ. 2004 (49), 1–14.
[13] C. Lizama, J. Freer, J. Baeza, H.D. Mansilla, Optimized photodegradation of reactive blue 19
on TiO2 and ZnO suspensions, Catal. Today , 76 (2002) 235–246.
[14] S. Rabindranathan, D.P. Suja, S. Yesodharan, Photocatalytic degradation of phosphamidon on
semiconductor oxides, J. Hazard. Mater. B. 2003 (102) 217–229.
[15] A.H.C. Chan, J.F. Porter, J.P. Barford and C.K. Chan, Effect of thermal treatment on the
photocatalytic activity of TiO2 coatings for photocatalytic oxidation of benzoic acid, J. Mater. Res.
2002 (17) , 1758–1765.
[16] M. Stylidi, D.I. Kondarides and X.E. Verykios, Pathways of solar light-induced photocatalytic
degradation of azo dyes in aqueous TiO2 suspentions, Appl. Catal. B: Environ. 2003 (40) 271–286.
[17] S. Sakthivel ; B. Neppolian ; M.V. Shankar ; B. Arabindoo. M. Palanichamy ; V. Murugesan.
Solar photocatalytic degradation of azo dye comparison of photocatalytic efficiency of ZnO and
TiO2. Sol. Energy Mater. Sol. C. 2003 (77), 65-82.
[18] S. Chakrabarti, B.K. Dutta, Photocatalytic degradation of model textile dyes in wastewater
using ZnO as semiconductor catalyst, J. Hazard. Mater. 2004 (112) 269–278.
[19] H. Wang, C. Xie, W. Zhang, S. Cai, Z. Cai, Z. Yang, Y. Gui, Comparison of dye degradation
efficiency using ZnO powders with various size scales, J. Hazard. Mater. 2007 (141) , 645–652.
[20] R.J. Davis, J.L. Gainer, G.O. Neal, I.W.Wu, Photocatalytic decolorization of wastewater dyes,
Water Environ. Res. 1994 (66) 50.

Proceeding of the 3th Sustainable & Renewable Energy Conference 23 -24 December 2017, Baghdad-Iraq
424
[21] N. Daneshvar, D. Salari, A.R. Khataee, Photocatalytic degradation of azo dye acid red 14 in
water: investigation of the effect of operational parameters, J. Photochem. Photobiol. A: Chem. 2003
(157) 111–116.
[22] M.V. Shankar, S. Anandan, N. Venkatachalam, B. Arabindoo, V. Murugesan, Novel thin-film
reactor for photocatalytic degradation of pesticides in aqueous solutions, J. Chem. Technol.
Biotechnol. 2004 (79) 1258–1279.
Proceeding of the 3th Sustainable & Renewable Energy Conference 23 -24 December 2017, Baghdad-Iraq
243
Measuring and Optimization of HHO gas Productivity using Dry and
Wet Fuel cells
Raheek I. Ibrahim, Omer A. Thamer
[email protected] Electromechanical Eng. Dpt/ University of technology/ Baghdad- Iraq
Mobile: 07728469947
Abstract
The objective of this work is to produce HHO gas as a bio fuel using two different fuel
cell modules and compare between them in terms of productivity. Dry and wet
electrolyte fuel cells were designed and manufactured. The operating parameters such as
type of electrolyte (base electrolyte using NaOH and acidic as sulfuric acid in addition to
NaCl salt solution) used it at different concentrations (1, 3, 5, 7, and 9 wt %) were
studied. Based on the experimental results, the productivity of HHO using dry fuel cell
is higher than that of wet cell by 51.6 L/min when using alkaline electrolyte at optimum
concentration of 5 wt % for dry cell and 1 wt % for wet cell. The HHO gas produced
will be introduced into the combustion chamber of an engine to increase its power, burn
less gas, and exhaust water particles out to the environment.
Keywords: HHO gas, Dry cell, Wet cell, Electrolyte fuel cell, productivity.
1. Introduction
An HHO or Brown gas generator is an interesting and often misunderstood technology
[1].
The Brown gas generator uses electrolysis to split water (H2O) into it´s base molecules,
two hydrogen molecules and one oxygen molecule, called HHO hydroxy gas. The HHO
is an additive to boost the efficiency of the engine. It does this by using some current
from the cars battery and alternator to fracture water into HHO gas is then added to the
air which is being drawn into the engine [1,2]. Gasoline engines are unfortunately not
burning gasoline to its full potential. The average gasoline engine in a car is about 18%
to 20% efficient, and Brown gas is one good way of improving the efficiency. The
principle is that the hydrogen is highly flammable much more than gasoline so when
engine ignites the hydrogen the explosion ignites the gasoline with much better results
(cleaner, less waste and fewer emissions). The hydrogen explosion is so fast that it fills
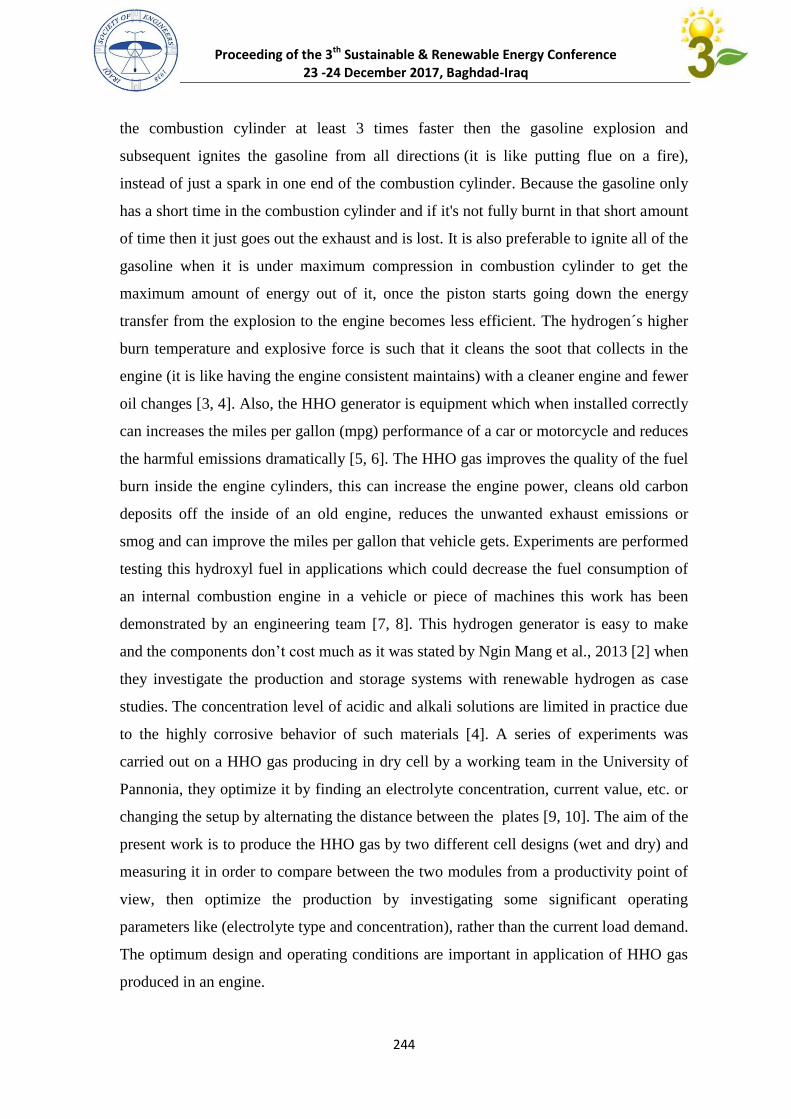
Proceeding of the 3th Sustainable & Renewable Energy Conference 23 -24 December 2017, Baghdad-Iraq
244
the combustion cylinder at least 3 times faster then the gasoline explosion and
subsequent ignites the gasoline from all directions (it is like putting flue on a fire),
instead of just a spark in one end of the combustion cylinder. Because the gasoline only
has a short time in the combustion cylinder and if it's not fully burnt in that short amount
of time then it just goes out the exhaust and is lost. It is also preferable to ignite all of the
gasoline when it is under maximum compression in combustion cylinder to get the
maximum amount of energy out of it, once the piston starts going down the energy
transfer from the explosion to the engine becomes less efficient. The hydrogen´s higher
burn temperature and explosive force is such that it cleans the soot that collects in the
engine (it is like having the engine consistent maintains) with a cleaner engine and fewer
oil changes [3, 4]. Also, the HHO generator is equipment which when installed correctly
can increases the miles per gallon (mpg) performance of a car or motorcycle and reduces
the harmful emissions dramatically [5, 6]. The HHO gas improves the quality of the fuel
burn inside the engine cylinders, this can increase the engine power, cleans old carbon
deposits off the inside of an old engine, reduces the unwanted exhaust emissions or
smog and can improve the miles per gallon that vehicle gets. Experiments are performed
testing this hydroxyl fuel in applications which could decrease the fuel consumption of
an internal combustion engine in a vehicle or piece of machines this work has been
demonstrated by an engineering team [7, 8]. This hydrogen generator is easy to make
and the components don’t cost much as it was stated by Ngin Mang et al., 2013 [2] when
they investigate the production and storage systems with renewable hydrogen as case
studies. The concentration level of acidic and alkali solutions are limited in practice due
to the highly corrosive behavior of such materials [4]. A series of experiments was
carried out on a HHO gas producing in dry cell by a working team in the University of
Pannonia, they optimize it by finding an electrolyte concentration, current value, etc. or
changing the setup by alternating the distance between the plates [9, 10]. The aim of the
present work is to produce the HHO gas by two different cell designs (wet and dry) and
measuring it in order to compare between the two modules from a productivity point of
view, then optimize the production by investigating some significant operating
parameters like (electrolyte type and concentration), rather than the current load demand.
The optimum design and operating conditions are important in application of HHO gas
produced in an engine.
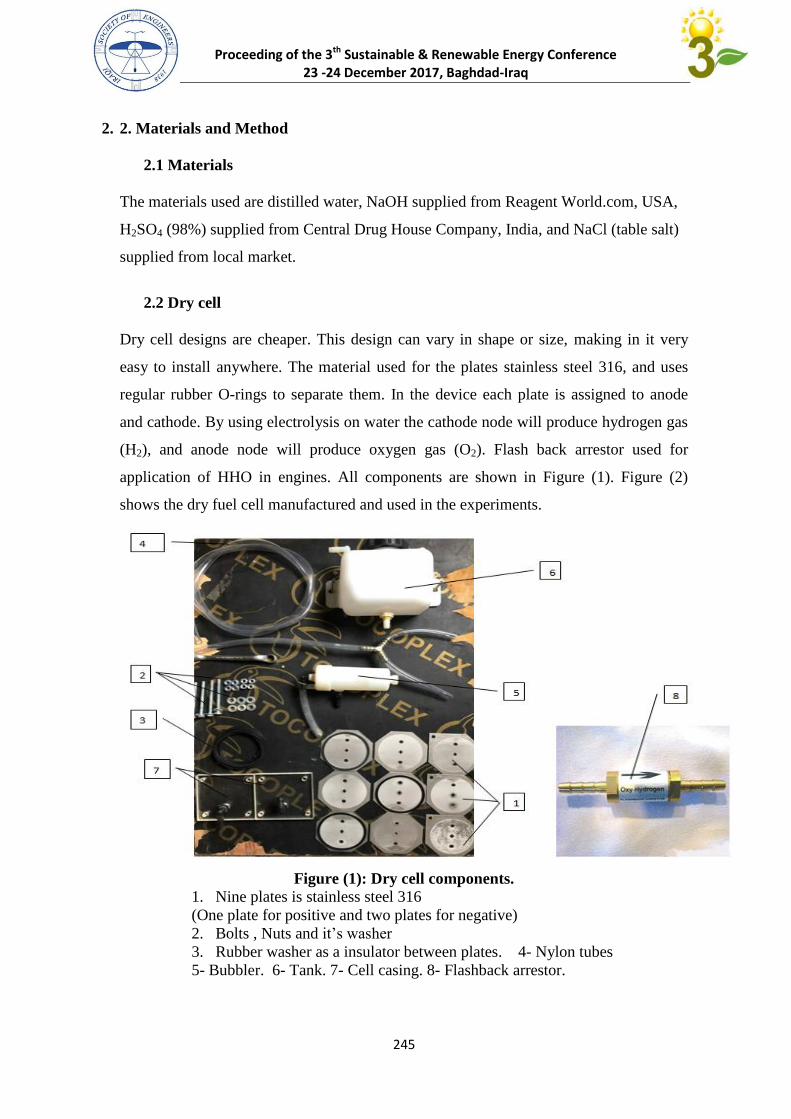
Proceeding of the 3th Sustainable & Renewable Energy Conference 23 -24 December 2017, Baghdad-Iraq
245
2. 2. Materials and Method
2.1 Materials
The materials used are distilled water, NaOH supplied from Reagent World.com, USA,
H2SO4 (98%) supplied from Central Drug House Company, India, and NaCl (table salt)
supplied from local market.
2.2 Dry cell
Dry cell designs are cheaper. This design can vary in shape or size, making in it very
easy to install anywhere. The material used for the plates stainless steel 316, and uses
regular rubber O-rings to separate them. In the device each plate is assigned to anode
and cathode. By using electrolysis on water the cathode node will produce hydrogen gas
(H2), and anode node will produce oxygen gas (O2). Flash back arrestor used for
application of HHO in engines. All components are shown in Figure (1). Figure (2)
shows the dry fuel cell manufactured and used in the experiments.
Figure (1): Dry cell components.
1. Nine plates is stainless steel 316
(One plate for positive and two plates for negative)
2. Bolts , Nuts and it’s washer
3. Rubber washer as a insulator between plates. 4- Nylon tubes
5- Bubbler. 6- Tank. 7- Cell casing. 8- Flashback arrestor.
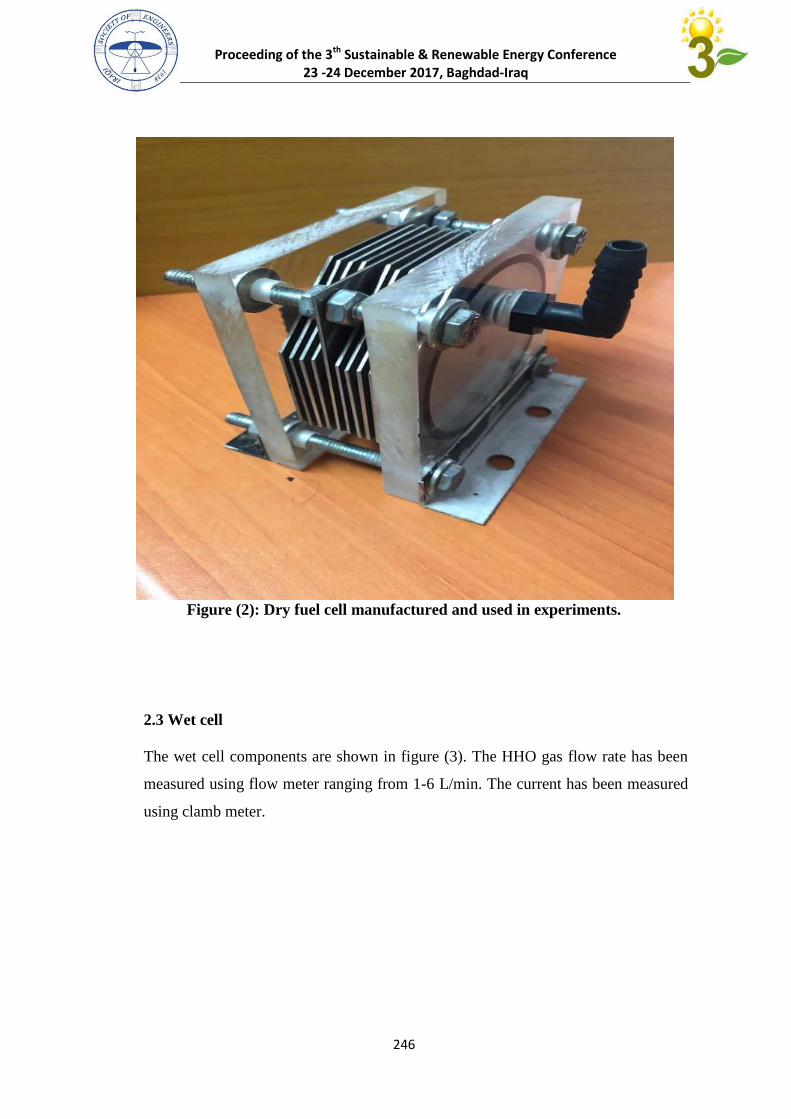
Proceeding of the 3th Sustainable & Renewable Energy Conference 23 -24 December 2017, Baghdad-Iraq
246
Figure (2): Dry fuel cell manufactured and used in experiments.
2.3 Wet cell
The wet cell components are shown in figure (3). The HHO gas flow rate has been
measured using flow meter ranging from 1-6 L/min. The current has been measured
using clamb meter.
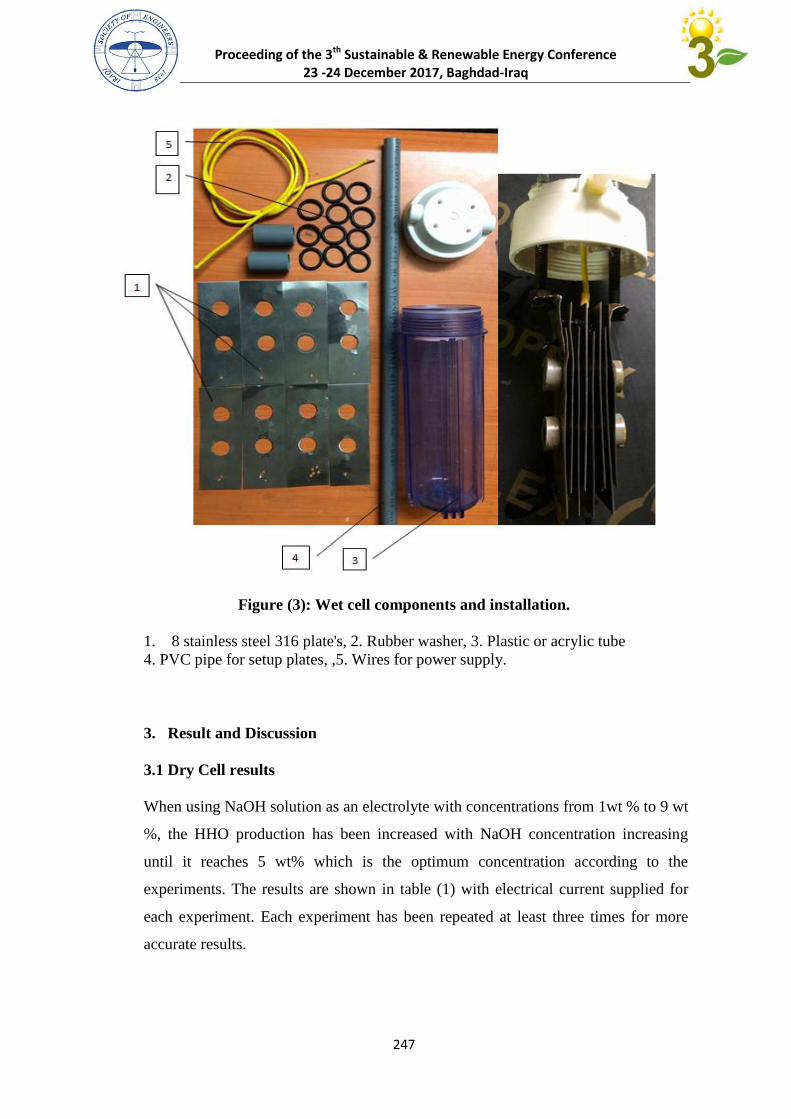
Proceeding of the 3th Sustainable & Renewable Energy Conference 23 -24 December 2017, Baghdad-Iraq
247
Figure (3): Wet cell components and installation.
1. 8 stainless steel 316 plate's, 2. Rubber washer, 3. Plastic or acrylic tube
4. PVC pipe for setup plates, ,5. Wires for power supply.
3. Result and Discussion
3.1 Dry Cell results
When using NaOH solution as an electrolyte with concentrations from 1wt % to 9 wt
%, the HHO production has been increased with NaOH concentration increasing
until it reaches 5 wt% which is the optimum concentration according to the
experiments. The results are shown in table (1) with electrical current supplied for
each experiment. Each experiment has been repeated at least three times for more
accurate results.
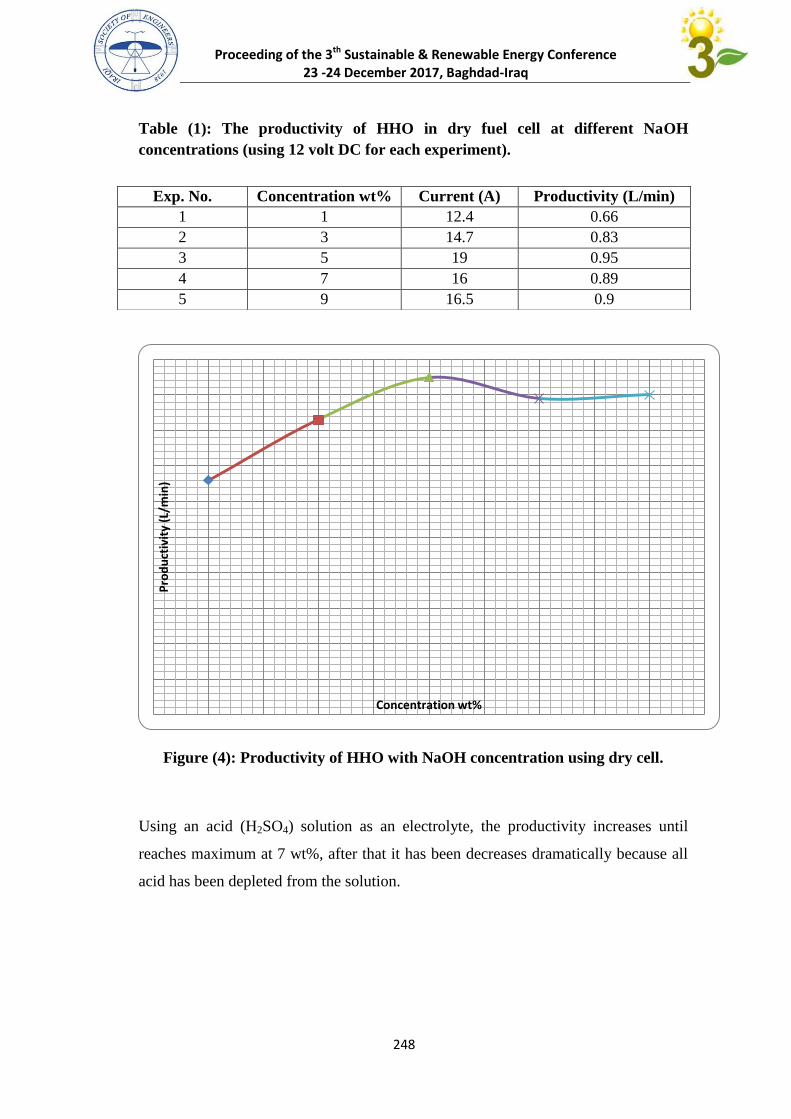
Proceeding of the 3th Sustainable & Renewable Energy Conference 23 -24 December 2017, Baghdad-Iraq
248
Table (1): The productivity of HHO in dry fuel cell at different NaOH
concentrations (using 12 volt DC for each experiment).
Figure (4): Productivity of HHO with NaOH concentration using dry cell.
Using an acid (H2SO4) solution as an electrolyte, the productivity increases until
reaches maximum at 7 wt%, after that it has been decreases dramatically because all
acid has been depleted from the solution.
Pro
du
ctiv
ity
(L/m
in)
Concentration wt%
Exp. No. Concentration wt% Current (A) Productivity (L/min)
1 1 12.4 0.66
2 3 14.7 0.83
3 5 19 0.95
4 7 16 0.89
5 9 16.5 0.9
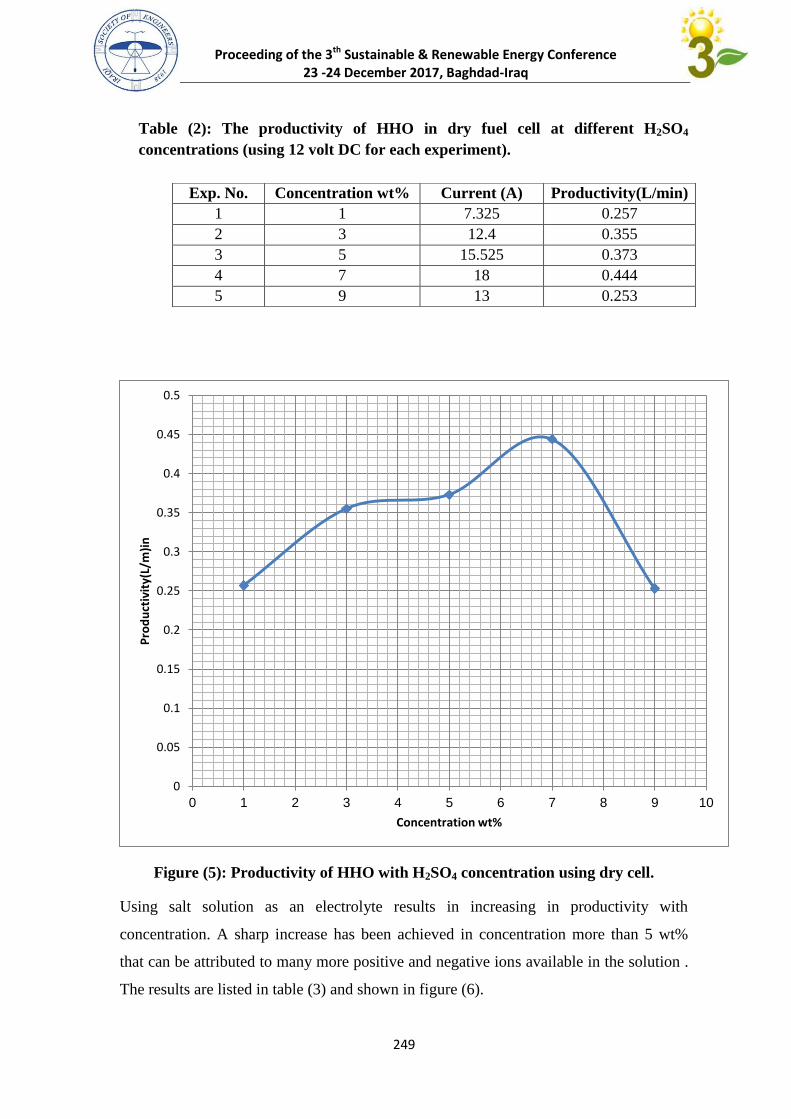
Proceeding of the 3th Sustainable & Renewable Energy Conference 23 -24 December 2017, Baghdad-Iraq
249
Table (2): The productivity of HHO in dry fuel cell at different H2SO4
concentrations (using 12 volt DC for each experiment).
Figure (5): Productivity of HHO with H2SO4 concentration using dry cell.
Using salt solution as an electrolyte results in increasing in productivity with
concentration. A sharp increase has been achieved in concentration more than 5 wt%
that can be attributed to many more positive and negative ions available in the solution .
The results are listed in table (3) and shown in figure (6).
0
0.05
0.1
0.15
0.2
0.25
0.3
0.35
0.4
0.45
0.5
0 1 2 3 4 5 6 7 8 9 10
Pro
du
ctiv
ity(
L/m
)in
Concentration wt%
Exp. No. Concentration wt% Current (A) Productivity(L/min)
1 1 7.325 0.257
2 3 12.4 0.355
3 5 15.525 0.373
4 7 18 0.444
5 9 13 0.253
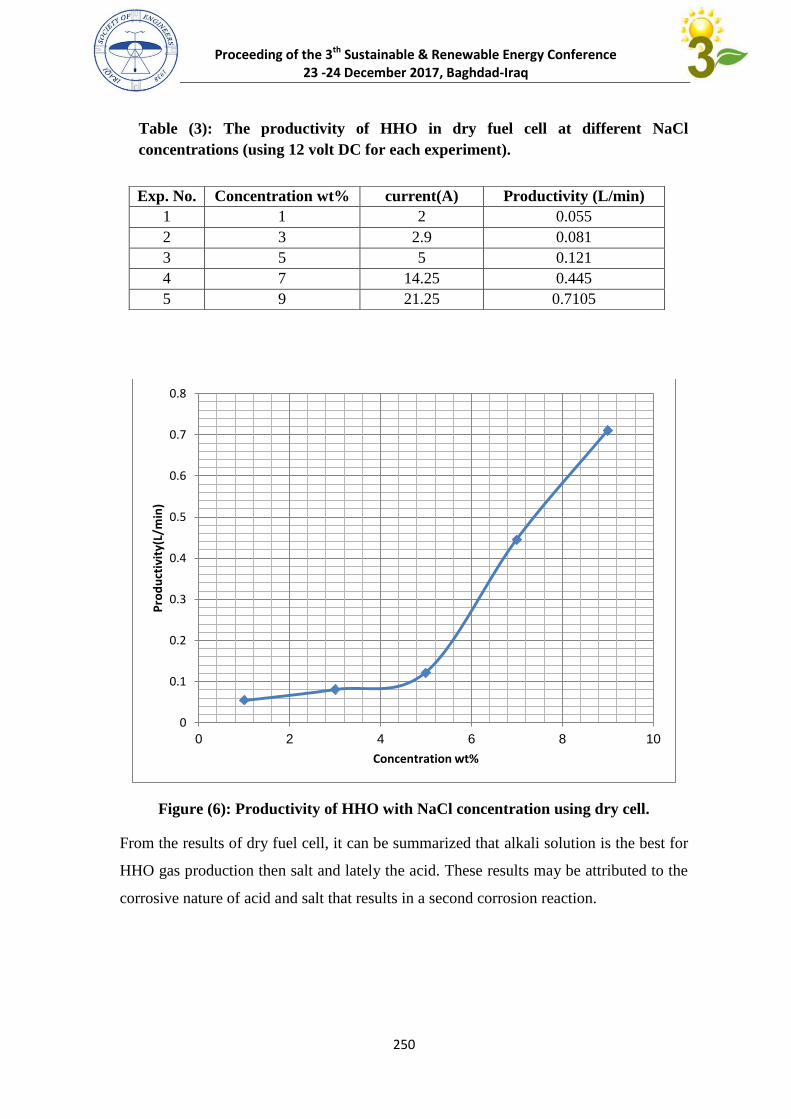
Proceeding of the 3th Sustainable & Renewable Energy Conference 23 -24 December 2017, Baghdad-Iraq
250
Table (3): The productivity of HHO in dry fuel cell at different NaCl
concentrations (using 12 volt DC for each experiment).
Figure (6): Productivity of HHO with NaCl concentration using dry cell.
From the results of dry fuel cell, it can be summarized that alkali solution is the best for
HHO gas production then salt and lately the acid. These results may be attributed to the
corrosive nature of acid and salt that results in a second corrosion reaction.
0
0.1
0.2
0.3
0.4
0.5
0.6
0.7
0.8
0 2 4 6 8 10
Pro
du
ctiv
ity(
L/m
in)
Concentration wt%
Exp. No. Concentration wt% current(A) Productivity (L/min)
1 1 2 0.055
2 3 2.9 0.081
3 5 5 0.121
4 7 14.25 0.445
5 9 21.25 0.7105

Proceeding of the 3th Sustainable & Renewable Energy Conference 23 -24 December 2017, Baghdad-Iraq
251
3.2 Wet cell results
The wet cell was tested using alkaline electrolyte (NaOH), since acidic and salty
solutions are highly corrosive resulting in damaging of cell internals, therefore the
results are included for only alkali solution. Table (4) lists the results of experiments as
an average of three repeated experiments; also figure (7) shows the results. From the
figure we can recognize a sharp decrease in HHO productivity with addition of NaOH
from 1wt % to 3 wt%, after that the productivity has been unchanged (constant as
0.0027 L/min). The reason for this behavior is that when the electrolyte is a dilute alkali
solution it helps in splitting reaction to be more rapid and efficient because of polarity
introduced by NaOH molecules. For concentrations more than 3 wt% the reaction is
steady and NaOH was depleted.
Table (4): The productivity of HHO in wet fuel cell at different NaOH
concentrations (using 12 volt DC for each experiment).
Figure (7): Productivity of HHO with NaOH concentration using wet cell.
Pro
du
ctiv
ity
(L/m
in)
Concentration wt%
Exp. No. Concentration wt % Current (A) Productivity (L/min)
1 1 20.65 0.434
2 3 4.63 0.025
3 5 0.5 0.0027
4 7 0.5 0.0027
5 9 0.5 0.0027
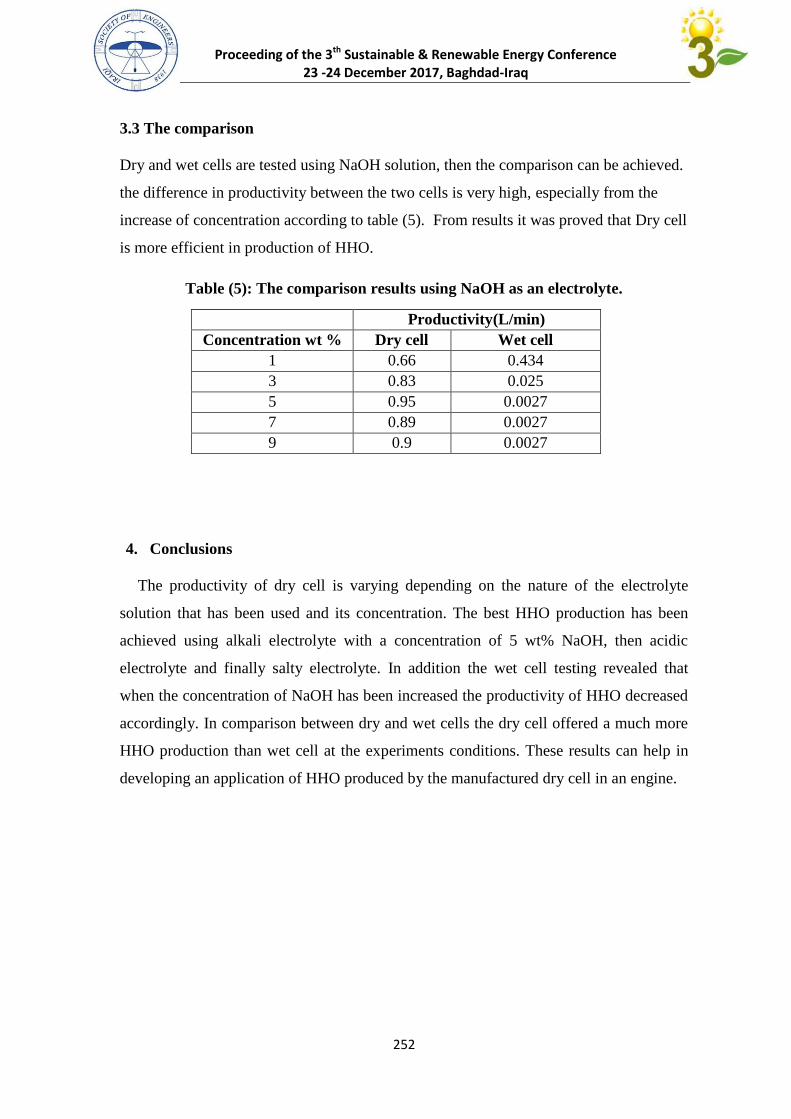
Proceeding of the 3th Sustainable & Renewable Energy Conference 23 -24 December 2017, Baghdad-Iraq
252
3.3 The comparison
Dry and wet cells are tested using NaOH solution, then the comparison can be achieved.
the difference in productivity between the two cells is very high, especially from the
increase of concentration according to table (5). From results it was proved that Dry cell
is more efficient in production of HHO.
Table (5): The comparison results using NaOH as an electrolyte.
4. Conclusions
The productivity of dry cell is varying depending on the nature of the electrolyte
solution that has been used and its concentration. The best HHO production has been
achieved using alkali electrolyte with a concentration of 5 wt% NaOH, then acidic
electrolyte and finally salty electrolyte. In addition the wet cell testing revealed that
when the concentration of NaOH has been increased the productivity of HHO decreased
accordingly. In comparison between dry and wet cells the dry cell offered a much more
HHO production than wet cell at the experiments conditions. These results can help in
developing an application of HHO produced by the manufactured dry cell in an engine.
Productivity(L/min)
Concentration wt % Dry cell Wet cell
1 0.66 0.434
3 0.83 0.025
5 0.95 0.0027
7 0.89 0.0027
9 0.9 0.0027
Proceeding of the 3th Sustainable & Renewable Energy Conference 23 -24 December 2017, Baghdad-Iraq
253
References
1- http://www.instructables.com/id/How-to-assemble-a-HHO-Generator-and-why-it-
works/.
2- Ngin Mang, Juan Barrera, Thwin Siss, Alejandro Paya, "EML 4551 Senior Design
Project", 2013.
3- Timothy Lipman, "An Overview of Hydrogen Production and Storage Systems with
Renewable Hydrogen. Case Studies", Conducted under US DOE Grant DE-
FC3608GO18111 A000, Office of Energy Efficiency and Renewable Energy Fuel
Cell Technologies Program, California 2011.
4- Kaveh Mazloomi, Nasri b. Sulaiman, Hossein Moayedi, "Electrical Efficiency of
Electrolytic Hydrogen Production", International journal of electrochemical science,
2012
5- Omer Abdullah, "Advanced Electrochemistry",
https://uqu.edu.sa/oahazazi/App/CV,2012
6- Guttman F, and Murphy OJ, "Modern Aspects of Electrochemistry" New York:
Plenum Press, 1983.
7- Arthur J. Hale, "The manufacture of chemical electrolysis", WENTWORTH Press,
2016.
8- Dincer, and A.S. Joshi, ," Hydrogen Production Methods", Springer Briefs in
Energy, DOI 10.1007/978-1-4614-7431-9_2, 2013.
9- Attila GÖLLEI "Measuring and Optimization of HHO dry cell for energy
efficiency", University of Pannonia, ACTA TEHNICA CORVINIENSIS – Bulletin
of Engineering, Hungary, 2014.
10- Jeremy vissers," water electrolysis – hydrogen as fuel",
https://www.uwplatt.edu/files/urce/Vissers.
Proceeding of the 3th Sustainable & Renewable Energy Conference 23 -24 December 2017, Baghdad-Iraq
452
Synthesis and Characterization of NaOH/γ-Al2O3 Nanocatalyst for
Biohydrocarbons Production Ali D. Ali, Saad H Ammar, Eng. Yousra S. Kareem
Al-Nahrain University/ Chemical Department
Abstract
In this work, the activity of NaOH loaded on γ-alumina nanoparticles as a solid base and
heterogeneous catalyst was investigated for the transesterification of sunflower oil to
biohydrocarbons. The nano γ-alumina was prepared by control precipitation using aluminium
chloride as precursor and 25% ammonium solution as precipitating agents. The nano γ-
alumina was loaded with NaOH base (20%) by incipient wetness impregnation method. The
morphology and structure of the synthesized NaOH/γ-Al2O3 nanoparticles were characterized
by X-ray diffraction (XRD) and atomic force microscope (AFM). The results have shown that
high stability nano NaOH/γ-Al2O3 catalyst was obtained. The impact of the methanol/oil
molar ratio and the catalyst/oil weight ratio has been considered and highest conversion
reached was 96.4%.
النتاج البايوهايدروكربونات NaOH/γ-Al2O3 تصنيع وتشخيص العامل المساعد النانوي
الخالصة
تم في هذا البحث دراسة فعالية عامل مساعد نانوي صلب وهو عبارة عن هيدروكسيد الصوديوم المحمل على جسيمات
تم تحضير جسيمات .النانوية في تفاعل االسترة لزيت زهرة الشمس النتاج البايوهيدروكربونات γ-Al2O3الومينا -كاما
% 52استخدام ملح كلوريد االلومنيوم كمادة اولية ومحلول االمونيوم الومينا النانوية بطريقة الترسيب المسيطر عليه ب-كاما
وزنا هيدروكسيد الصوديوم بطريقة التشرب الرطب % 52الومينا النانوية بنسبة -تم تحميل جسيمات كاما. كعامل مرسب
خدام جهاز قياس المحضر باست NaOH/γ-Al2O3تم تشخيص الخواص البنائية والشكلية للعامل المساعد النانوي . االولي
-NaOH/γالحصول على مسحوق اظهرت النتائج (. AFM)وجهاز مجهر القوة الذرية ( XRD)حيود االشعة السينية
Al2O3 اجريت تجارب انتاج الديزل الحيوي وتم دراسة تأثير نسبة الميثانول للزيت المولية و نسبة . نانوي ذو ثباتية عالية
%.4,69رت النتائج الحصول على اعلى نسبة تحول ومقدارها العامل المساعد للزيت الوزنية واظه
1. Introduction
Continuously increasing use of petroleum fuels will intensify air pollution, acid rains caused by
SOx and NOx emissions and global warming problems caused by CO2. For the recent few years,
many efforts to produce less pollutants fuel have been underway. Among many fuel sources,
biodiesel fuel produced from vegetable oil or animal fat attracts attention as a promising one to be
substituted for conventional diesel fuels [1].
Proceeding of the 3th Sustainable & Renewable Energy Conference 23 -24 December 2017, Baghdad-Iraq
455
Biodiesel contains higher levels of oxygen and lower levels of nitrogen and sulfur and therefore,
less SOx, NOx, and CO are released upon combustion compared to fossil diesel [2].
The most recent method to produce biodiesel is the solid catalytic transesterification of oil with low
alcohol such as methanol to yield the fatty acid alkyl esters or biodiesel and glycerol as byproduct
[3].
Using heterogeneous solid catalysts would enable the design of an effective and continuous
transesterification process and enhance the economy of biodiesel production [4].
In general, the rate of solid catalyzed transesterification process is lower than that of the
homogeneous catalyst process because of diffusion problems of reactants in particular methanol to
the active sites of catalyst, which is related with a three-phase system oil, methanol and solid
catalyst [5]. In the heterogeneously catalyzed transesterification reaction, methanol diffusion is the
rate controlling step of the methanolysis reaction [6].
The superior properties of nanosized catalysts attracted us to use nanocatalyst to improve contact
between the reactants (methanol) and catalyst surface and therefore reduce mass transfer resistance
between these phases, resulting in the increase of methanolysis reaction rate. Therefore, the present
work investigates the activity of a basic solid catalyst consisting of NaOH supported on nanosized γ-
alumina was investigated for the transesterification of sunflower oil with methanol at 60 oC. A
screening of the reaction conditions has been carried out by examining the effect of the catalyst/oil
weight ratio and the methanol/oil molar ratio. Simple precipitation method for γ-alumina support
preparation and incipient wetness impregnation method for NaOH dispersion on the γ-alumina have
been chosen with a view to a more direct possible transference of the results to the productive part.
2. Experimental
2.1 Materials
Aluminum chloride (AlCl3.6H2O, 95%), ammonium solution (NH4OH, 25%), ethanol (99.9%),
methanol (99.9%), NaOH (99.998%) and deionized water were used as raw materials. All chemicals
were of analytical grade provided by Merck and used as received. Commercial edible grade
sunflower oil (provided from the Bonus Sunflower oil Factory – Erbil, Iraq) was obtained from
market and used without any pretreatment. Acid value and molecular weight of the oil was
calculated according to ASTM D5558 method. The acid value, and average molecular weight (based
on saponification value) of the sunflower oil used in this study were found to be 0.09 mgKOH/g and
895 g/mol respectively.
2.2 Catalysts preparation and characterization
For nano γ-alumina preparation, 0.1 M aluminium chloride solution was prepared by dissolving
appropriate amount of aluminium chloride in 400 ml ethanol using magnetic stirrer. And then
distilled water was added gradually until appearing a transparent solution. 60 mL of 25%
ammonium solution was added while stirring drop by drop to the aluminium chloride solution at a
slow rate (1 mL/min) until precipitation of Al(OH)3 white gel. The preparation temperature was
Proceeding of the 3th Sustainable & Renewable Energy Conference 23 -24 December 2017, Baghdad-Iraq
452
maintained 70 oC during the experiment. The white gel precipitate was aged at 70 C for 2 h, filtered
under vacuum, washed carefully with deionized water and ethanol then drying at 90 oC for 24 h. The
dried precipitate samples were calcined in a programmable furnace at 550 C for 2.5 h in air with
heating rate of 2 oC/min to produce γ-alumina nanoparticles.
Structural phase analysis of alumina sample by X-Ray Diffraction (XRD) was performed by
Rigaku, D/Max-2000 diffractometer using Cu Kα radiation using wavelength (λ) = 1.5406 A0, tube-
voltage = 40 kV, tube-current = 30 mA, and at 2θ range = 10o to 80
o. For surface area and pore
volume measurements, full N2 adsorption-desorption isotherms at -196 °C i were measured using
Surface Area and Pore volume Analyzer (Quantachrome Autosorb-6iSA). The N2 uptake provided a
linear fit to the Brunauer-Emmett-Teller (BET) equation. Particle size distribution and morphology
of samples were studied by an Atomic Force microscope (AFM) and a scanning electron
microscope (SEM).
For NaOH base loading, the required amounts of aqueous NaOH (20 wt.%) solutions were slowly
added to the alumina support using incipient wetness impregnation method. The experimental
argument of the impregnation apparatus consists of 250 ml Buchner flask fitted with a separating
funnel above it and vacuum pump from the side-arm. After impregnation the catalysts were dried
for 24 h at 120 oC then the dried sample was calcined in a muffle furnace at 400
oC for 4 h. BET-
surface area and pore volume measurement, XRD analysis and sodium content were also performed
to the final catalyst.
2.3 Transesterification experiments
All the transesterification experiments were carried out at 60 oC and atmospheric pressure. The
transesterification apparatus consists of 3-necked 250 ml flask (reactor) fitted with reflux condenser,
sampling syringe and thermometer. The reaction flask was immersed in thermostatic water bath and
mounted on a hotplate magnetic stirrer (stirring speed of 300 rpm). Figure 1 show the experimental
argument of the transesterification process. 50 g of sunflower oil, the required amount of catalyst
(using catalyst/oil weight ratios from 0.01 to 0.08) and the volume of methanol required to reach
methanol/oil molar ratios from 5:1 to 40:1 were added into the reaction flask. The reaction mixture
was stirred and refluxed for the required reaction time (60 oC). At the interval of 10–120 min,
samples were taken from the reactor by using sampling syringe for analysis to determine the yield of
fatty acid methyl esters and therefore determining the reaction conversion. The analysis was
performed using gas chromatography (GC) supplied with a flame ionization detector and a stainless
capillary-column. After the transesterification reaction finished, the mixture was filtered and the
residual methanol was separated from the liquid phase by evaporation.
Sodium content of the reaction mixture (leached sodium) was determined in order to investigate the
chemical stability of the catalyst during the transesterification reaction. The method includes using
atomic absorption spectrophotometry [7]. After the end of the reaction, sample taken from the
reaction flask was filtered and evaporated using rotary evaporator, and then the dry portion of the
sample was treated with an appropriate amount of 0.1N HCl. The resulting solution was analyzed to
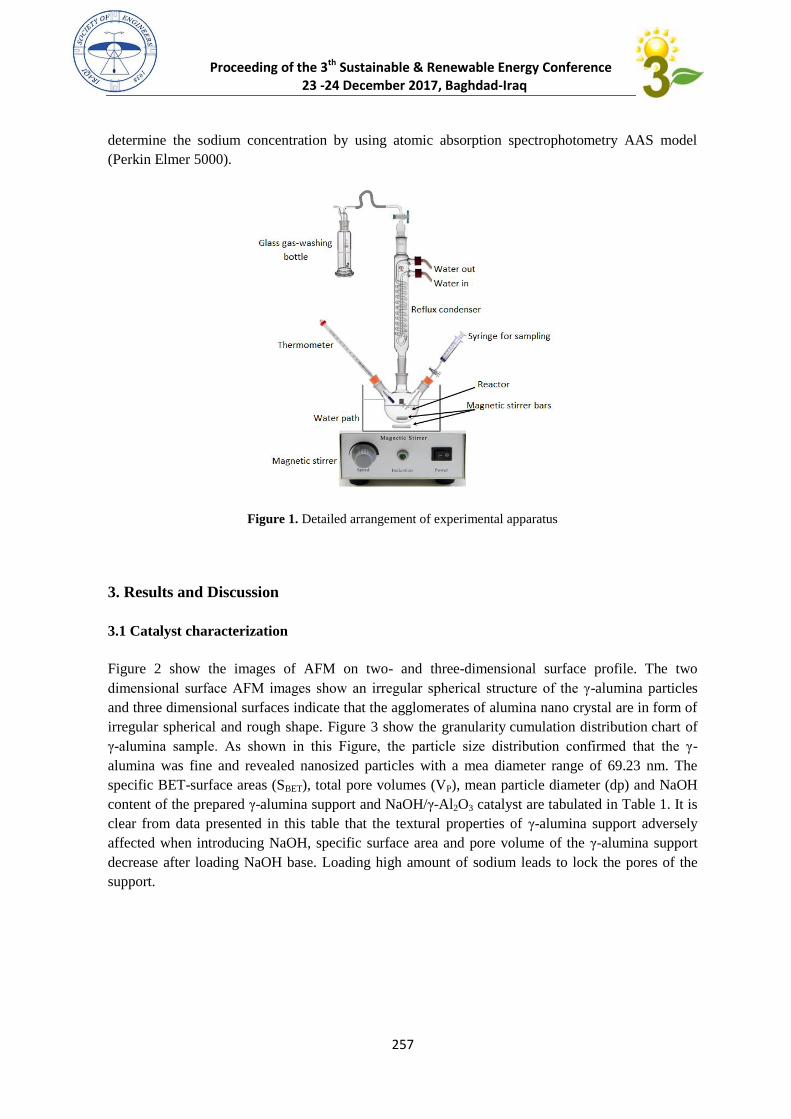
Proceeding of the 3th Sustainable & Renewable Energy Conference 23 -24 December 2017, Baghdad-Iraq
452
determine the sodium concentration by using atomic absorption spectrophotometry AAS model
(Perkin Elmer 5000).
Figure 1. Detailed arrangement of experimental apparatus
3. Results and Discussion
3.1 Catalyst characterization
Figure 2 show the images of AFM on two- and three-dimensional surface profile. The two
dimensional surface AFM images show an irregular spherical structure of the γ-alumina particles
and three dimensional surfaces indicate that the agglomerates of alumina nano crystal are in form of
irregular spherical and rough shape. Figure 3 show the granularity cumulation distribution chart of
γ-alumina sample. As shown in this Figure, the particle size distribution confirmed that the γ-
alumina was fine and revealed nanosized particles with a mea diameter range of 69.23 nm. The
specific BET-surface areas (SBET), total pore volumes (VP), mean particle diameter (dp) and NaOH
content of the prepared γ-alumina support and NaOH/γ-Al2O3 catalyst are tabulated in Table 1. It is
clear from data presented in this table that the textural properties of γ-alumina support adversely
affected when introducing NaOH, specific surface area and pore volume of the γ-alumina support
decrease after loading NaOH base. Loading high amount of sodium leads to lock the pores of the
support.
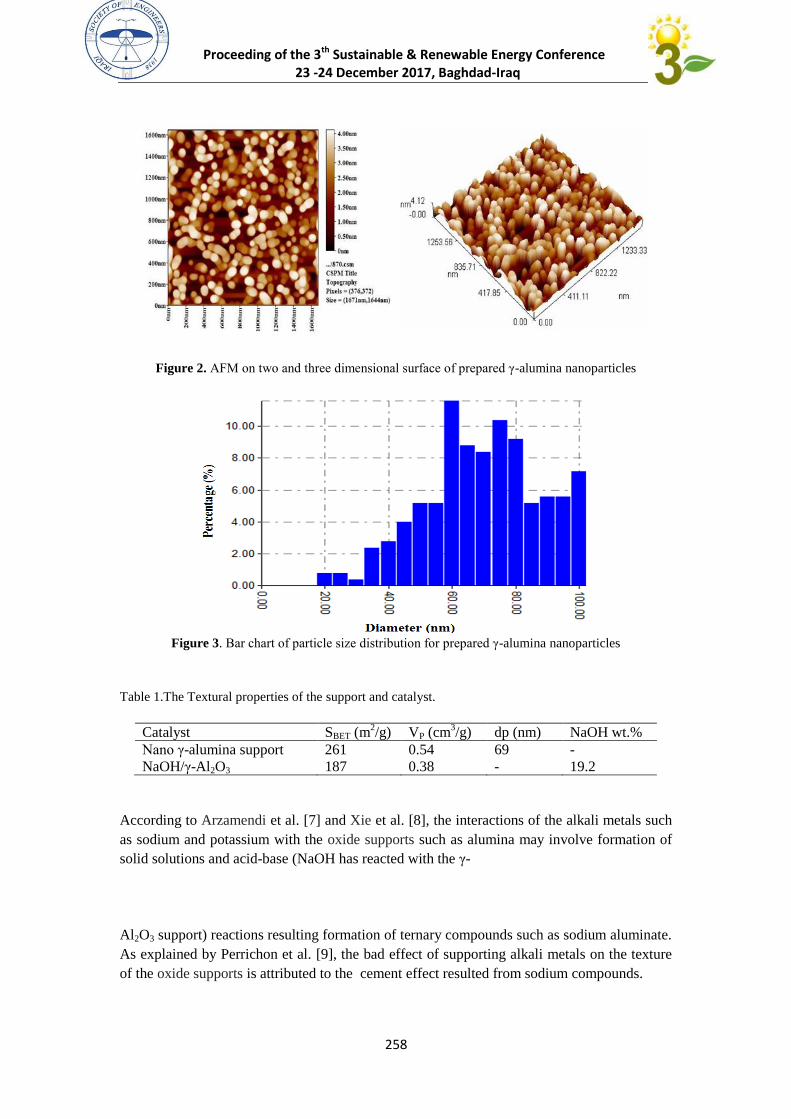
Proceeding of the 3th Sustainable & Renewable Energy Conference 23 -24 December 2017, Baghdad-Iraq
458
Figure 2. AFM on two and three dimensional surface of prepared γ-alumina nanoparticles
Figure 3. Bar chart of particle size distribution for prepared γ-alumina nanoparticles
Table 1.The Textural properties of the support and catalyst.
Catalyst SBET (m2/g) VP (cm
3/g) dp (nm) NaOH wt.%
Nano γ-alumina support 261 0.54 69 -
NaOH/γ-Al2O3 187 0.38 - 19.2
According to Arzamendi et al. [7] and Xie et al. [8], the interactions of the alkali metals such
as sodium and potassium with the oxide supports such as alumina may involve formation of
solid solutions and acid-base (NaOH has reacted with the γ-
Al2O3 support) reactions resulting formation of ternary compounds such as sodium aluminate.
As explained by Perrichon et al. [9], the bad effect of supporting alkali metals on the texture
of the oxide supports is attributed to the cement effect resulted from sodium compounds.
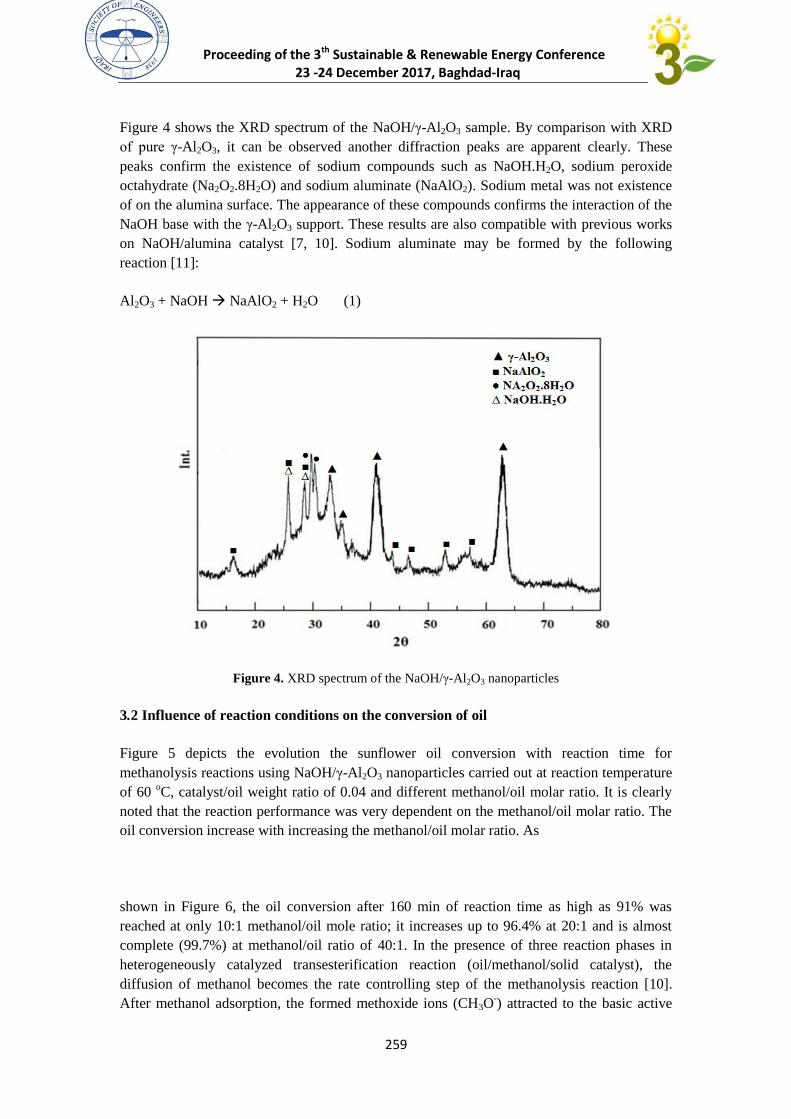
Proceeding of the 3th Sustainable & Renewable Energy Conference 23 -24 December 2017, Baghdad-Iraq
452
Figure 4 shows the XRD spectrum of the NaOH/γ-Al2O3 sample. By comparison with XRD
of pure γ-Al2O3, it can be observed another diffraction peaks are apparent clearly. These
peaks confirm the existence of sodium compounds such as NaOH.H2O, sodium peroxide
octahydrate (Na2O2.8H2O) and sodium aluminate (NaAlO2). Sodium metal was not existence
of on the alumina surface. The appearance of these compounds confirms the interaction of the
NaOH base with the γ-Al2O3 support. These results are also compatible with previous works
on NaOH/alumina catalyst [7, 10]. Sodium aluminate may be formed by the following
reaction [11]:
Al2O3 + NaOH NaAlO2 + H2O (1)
Figure 4. XRD spectrum of the NaOH/γ-Al2O3 nanoparticles
3.2 Influence of reaction conditions on the conversion of oil
Figure 5 depicts the evolution the sunflower oil conversion with reaction time for
methanolysis reactions using NaOH/γ-Al2O3 nanoparticles carried out at reaction temperature
of 60 oC, catalyst/oil weight ratio of 0.04 and different methanol/oil molar ratio. It is clearly
noted that the reaction performance was very dependent on the methanol/oil molar ratio. The
oil conversion increase with increasing the methanol/oil molar ratio. As
shown in Figure 6, the oil conversion after 160 min of reaction time as high as 91% was
reached at only 10:1 methanol/oil mole ratio; it increases up to 96.4% at 20:1 and is almost
complete (99.7%) at methanol/oil ratio of 40:1. In the presence of three reaction phases in
heterogeneously catalyzed transesterification reaction (oil/methanol/solid catalyst), the
diffusion of methanol becomes the rate controlling step of the methanolysis reaction [10].
After methanol adsorption, the formed methoxide ions (CH3O-) attracted to the basic active
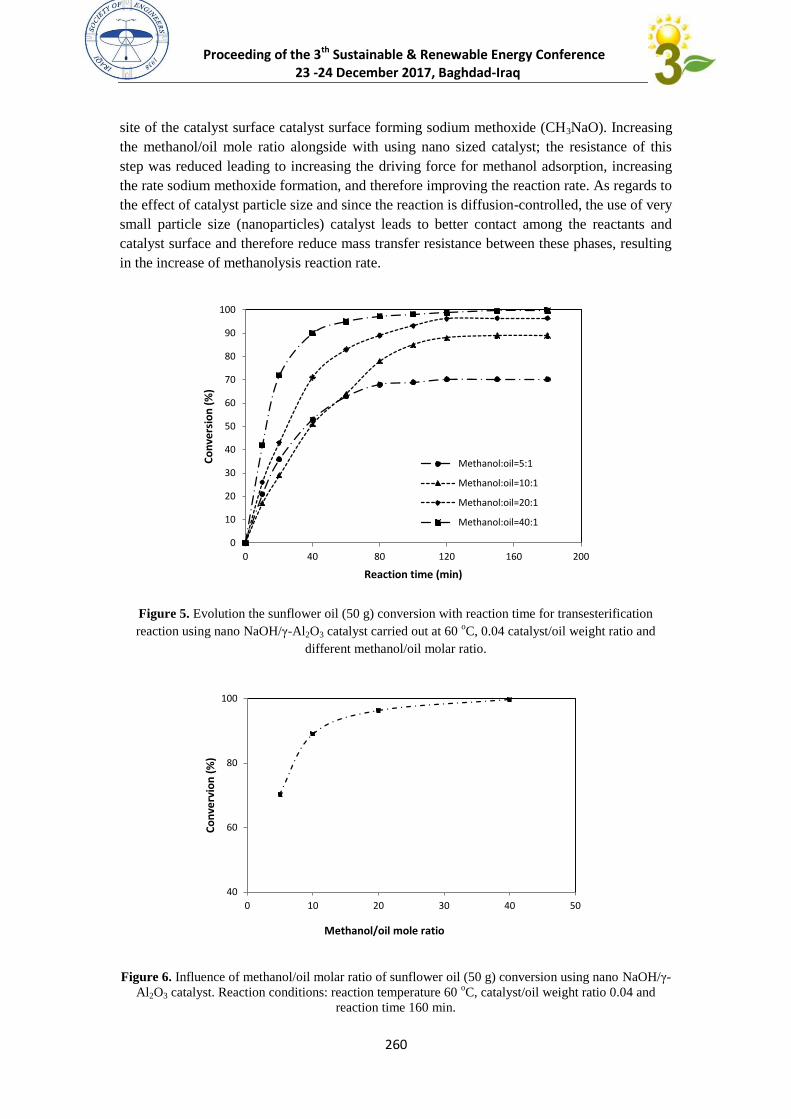
Proceeding of the 3th Sustainable & Renewable Energy Conference 23 -24 December 2017, Baghdad-Iraq
422
site of the catalyst surface catalyst surface forming sodium methoxide (CH3NaO). Increasing
the methanol/oil mole ratio alongside with using nano sized catalyst; the resistance of this
step was reduced leading to increasing the driving force for methanol adsorption, increasing
the rate sodium methoxide formation, and therefore improving the reaction rate. As regards to
the effect of catalyst particle size and since the reaction is diffusion-controlled, the use of very
small particle size (nanoparticles) catalyst leads to better contact among the reactants and
catalyst surface and therefore reduce mass transfer resistance between these phases, resulting
in the increase of methanolysis reaction rate.
Figure 5. Evolution the sunflower oil (50 g) conversion with reaction time for transesterification
reaction using nano NaOH/γ-Al2O3 catalyst carried out at 60 oC, 0.04 catalyst/oil weight ratio and
different methanol/oil molar ratio.
Figure 6. Influence of methanol/oil molar ratio of sunflower oil (50 g) conversion using nano NaOH/γ-
Al2O3 catalyst. Reaction conditions: reaction temperature 60 oC, catalyst/oil weight ratio 0.04 and
reaction time 160 min.
0
10
20
30
40
50
60
70
80
90
100
0 40 80 120 160 200
Co
nve
rsio
n (
%)
Reaction time (min)
Methanol:oil=5:1
Methanol:oil=10:1
Methanol:oil=20:1
Methanol:oil=40:1
40
60
80
100
0 10 20 30 40 50
Co
nve
rvio
n (
%)
Methanol/oil mole ratio
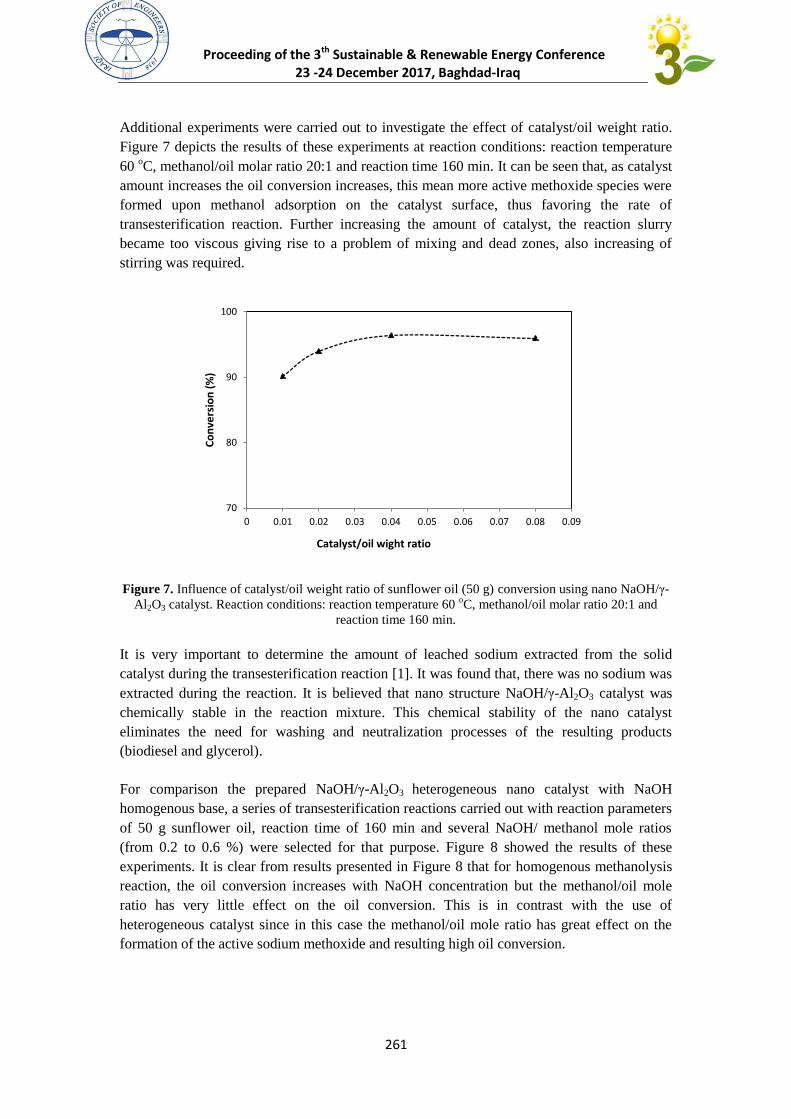
Proceeding of the 3th Sustainable & Renewable Energy Conference 23 -24 December 2017, Baghdad-Iraq
422
Additional experiments were carried out to investigate the effect of catalyst/oil weight ratio.
Figure 7 depicts the results of these experiments at reaction conditions: reaction temperature
60 oC, methanol/oil molar ratio 20:1 and reaction time 160 min. It can be seen that, as catalyst
amount increases the oil conversion increases, this mean more active methoxide species were
formed upon methanol adsorption on the catalyst surface, thus favoring the rate of
transesterification reaction. Further increasing the amount of catalyst, the reaction slurry
became too viscous giving rise to a problem of mixing and dead zones, also increasing of
stirring was required.
Figure 7. Influence of catalyst/oil weight ratio of sunflower oil (50 g) conversion using nano NaOH/γ-
Al2O3 catalyst. Reaction conditions: reaction temperature 60 oC, methanol/oil molar ratio 20:1 and
reaction time 160 min.
It is very important to determine the amount of leached sodium extracted from the solid
catalyst during the transesterification reaction [1]. It was found that, there was no sodium was
extracted during the reaction. It is believed that nano structure NaOH/γ-Al2O3 catalyst was
chemically stable in the reaction mixture. This chemical stability of the nano catalyst
eliminates the need for washing and neutralization processes of the resulting products
(biodiesel and glycerol).
For comparison the prepared NaOH/γ-Al2O3 heterogeneous nano catalyst with NaOH
homogenous base, a series of transesterification reactions carried out with reaction parameters
of 50 g sunflower oil, reaction time of 160 min and several NaOH/ methanol mole ratios
(from 0.2 to 0.6 %) were selected for that purpose. Figure 8 showed the results of these
experiments. It is clear from results presented in Figure 8 that for homogenous methanolysis
reaction, the oil conversion increases with NaOH concentration but the methanol/oil mole
ratio has very little effect on the oil conversion. This is in contrast with the use of
heterogeneous catalyst since in this case the methanol/oil mole ratio has great effect on the
formation of the active sodium methoxide and resulting high oil conversion.
70
80
90
100
0 0.01 0.02 0.03 0.04 0.05 0.06 0.07 0.08 0.09
Co
nve
rsio
n (
%)
Catalyst/oil wight ratio
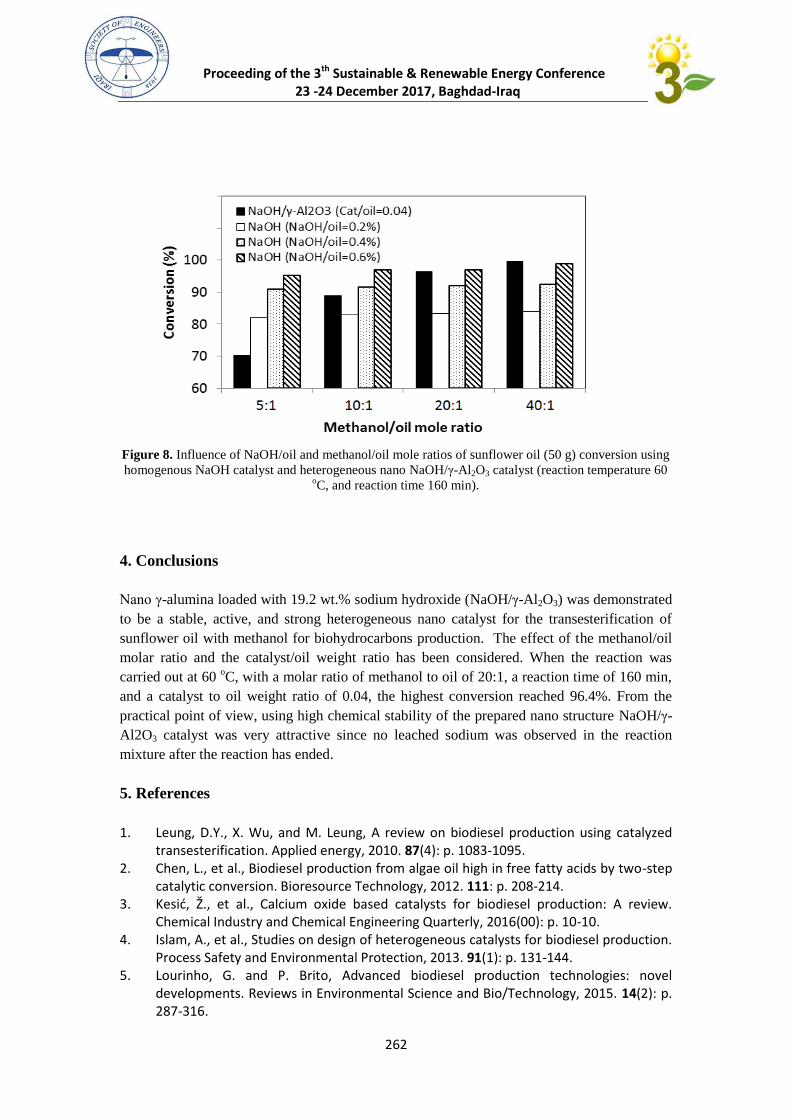
Proceeding of the 3th Sustainable & Renewable Energy Conference 23 -24 December 2017, Baghdad-Iraq
424
Figure 8. Influence of NaOH/oil and methanol/oil mole ratios of sunflower oil (50 g) conversion using
homogenous NaOH catalyst and heterogeneous nano NaOH/γ-Al2O3 catalyst (reaction temperature 60 oC, and reaction time 160 min).
4. Conclusions
Nano γ-alumina loaded with 19.2 wt.% sodium hydroxide (NaOH/γ-Al2O3) was demonstrated
to be a stable, active, and strong heterogeneous nano catalyst for the transesterification of
sunflower oil with methanol for biohydrocarbons production. The effect of the methanol/oil
molar ratio and the catalyst/oil weight ratio has been considered. When the reaction was
carried out at 60 oC, with a molar ratio of methanol to oil of 20:1, a reaction time of 160 min,
and a catalyst to oil weight ratio of 0.04, the highest conversion reached 96.4%. From the
practical point of view, using high chemical stability of the prepared nano structure NaOH/γ-
Al2O3 catalyst was very attractive since no leached sodium was observed in the reaction
mixture after the reaction has ended.
5. References
1. Leung, D.Y., X. Wu, and M. Leung, A review on biodiesel production using catalyzed transesterification. Applied energy, 2010. 87(4): p. 1083-1095.
2. Chen, L., et al., Biodiesel production from algae oil high in free fatty acids by two-step catalytic conversion. Bioresource Technology, 2012. 111: p. 208-214.
3. Kesić, Ž., et al., Calcium oxide based catalysts for biodiesel production: A review. Chemical Industry and Chemical Engineering Quarterly, 2016(00): p. 10-10.
4. Islam, A., et al., Studies on design of heterogeneous catalysts for biodiesel production. Process Safety and Environmental Protection, 2013. 91(1): p. 131-144.
5. Lourinho, G. and P. Brito, Advanced biodiesel production technologies: novel developments. Reviews in Environmental Science and Bio/Technology, 2015. 14(2): p. 287-316.
Proceeding of the 3th Sustainable & Renewable Energy Conference 23 -24 December 2017, Baghdad-Iraq
422
6. Reyero, I., G. Arzamendi, and L.M. Gandía, Heterogenization of the biodiesel synthesis catalysis: CaO and novel calcium compounds as transesterification catalysts. Chemical Engineering Research and Design, 2014. 92(8): p. 1519-1530.
7. Arzamendi, G., et al., Synthesis of biodiesel with heterogeneous NaOH/alumina catalysts: comparison with homogeneous NaOH. Chemical Engineering Journal, 2007. 134(1): p. 123-130.
8. Xie, W., H. Peng, and L. Chen, Transesterification of soybean oil catalyzed by potassium loaded on alumina as a solid-base catalyst. Applied Catalysis A: General, 2006. 300(1): p. 67-74.
9. Perrichon, V. and M. Durupty, Thermal stability of alkali metals deposited on oxide supports and their influence on the surface area of the support. Applied catalysis, 1988. 42(2): p. 217-227.
10. Kim, H.-J., et al., Transesterification of vegetable oil to biodiesel using heterogeneous base catalyst. Catalysis today, 2004. 93: p. 315-320.
11. Gryglewicz, S., Rapeseed oil methyl esters preparation using heterogeneous catalysts. Bioresource Technology, 1999. 70(3): p. 249-253.
Other Renewable Energies (ORE)
Research
Proceeding of the 3th Sustainable & Renewable Energy Conference 23 -24 December 2017, Baghdad-Iraq
562
A Study of the Performances Effect of Doping Multi-Layers Thin Films
on Laser Texture (P-type) Silicon wafer
aEman Abdul Salam, bSami Habana,cSaif Mohammed
alaser Physics Department/College of Science for Women/Babylon University, Baghdad, Iraq.
b laser Physics Department/College of Science for Women/Babylon University, Hilla, Iraq.
c laser Physics Department/College of Science for Women/Babylon University, Hilla, Iraq.
Abstract:
The multi-layers thin films of (TiO2/ZnO/CdS), (TiO2/ZnO/CdS:Se), and (TiO2/ZnO:Se/CdS)
prepared by using pulsed laser deposition technique (PLD) under vacuum of 10-5 mbar using
pulsed Nd:YAG laser with (1064 nm), which deposited on a glass and silicon wafer
substrates. X–ray diffraction measurements for all samples showed that all films have
polycrystalline structures, cubic & orthorhombic CdS structure, tetragonal & monoclinic TiO2
structure, hexagonal ZnO structure and a crystalline structures for Se with its oxide (SeO2) as
a product. The optical properties of all thin films are investigated from absorption spectrum
in the UV-VIS through the range of (300-900) nm. Current–voltage characteristics, under
dark and illumination, are obtained for solar cells of hetero-structure solar cells, illustrated
a significant change in behavior of solar cell performance at Im= 42 mA, and Vm= 0.21 V when
Selenium (Se) is mixed with ZnO as an intermediate layer and gave the best conversion
efficiency equal 7%.
:الخالصة
بواسطة تقنية (TiO2/ZnO/CdS:Se) ,(TiO2/ZnO:Se/CdS)(TiO2/ZnO/CdS),حضرت األغشية متعددة الطبقات
, نانومتر 4661بواسطة ليزر االندياك ذي الطول الموجي ملي بار 5-10تحت ضغط ( PLD)الترسيب بالليزر النبضي
قياس حيود االشعة السينية لكل العينات بينت ان االغشية . حيث رسبت األغشية على قواعدة زجاجية ورقاقة السليكون
مكعب و معيني بينما تركيب التيتانيوم يكون احادي و رباعي و تركيب الزنك cdsمتعدد التبلور حيث يكون تركيب التمتلك تركيب
المنتج وكسيدها يكون سداسي كذلك تركيب السيلينيوم و
ضمن تم التحقيق من الخواص البصرية لكل االغشية الرقيقة من خالل طيف االمتصاص لالشعة المرئية والفوق بنفسجية
فولتية تحت االضاءة والظالم للخلية لشمسية المتعددة -تم الحصول على خصائص تيار. نانومتر( 400-300)المدى
عندما يمزج السليكون مع Vm= 0.21 V,Im= 42 mAاء الخلية الشمسية حيثيتضح تغير ملحوظ في سلوك اد ,التركيب
%7اوكسيد الزنك في الطبقة الوسطية ويعطي افضل كفاءة تحويل تساوي
Key word : nanocompasite , solar cell ,PLD ,CdS ,Solar cell, TiO2 , ZnO , Se ,I-V chractastic
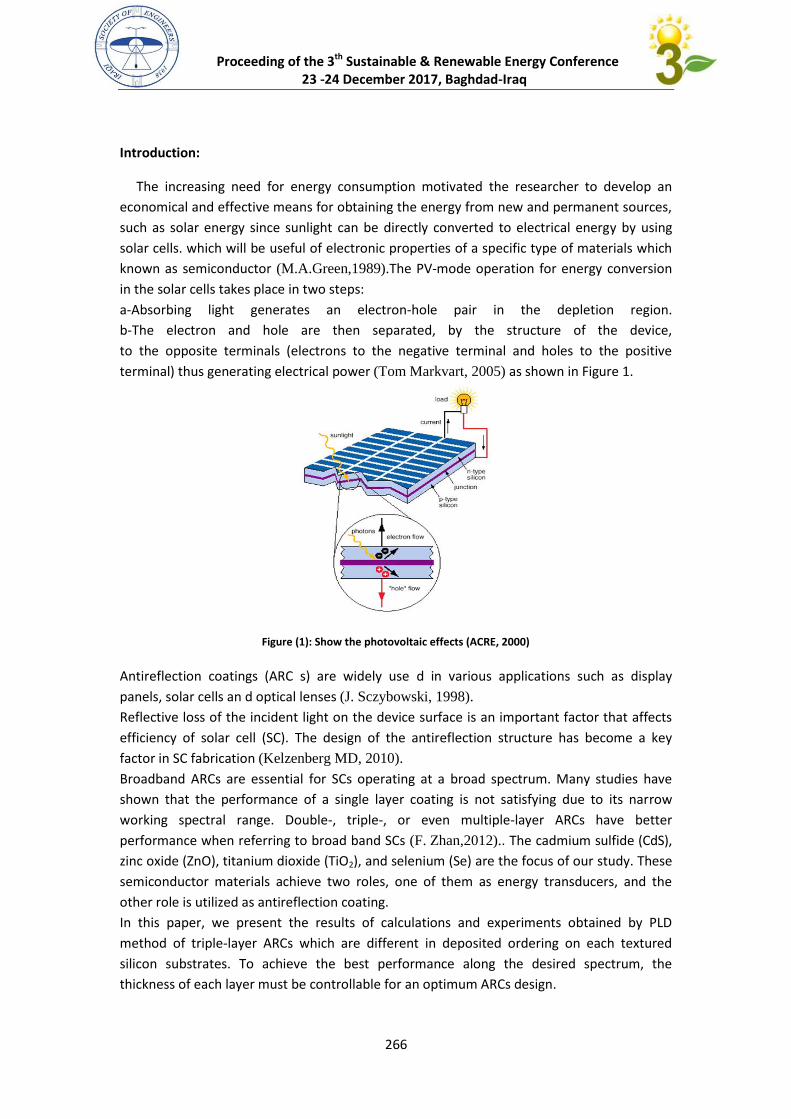
Proceeding of the 3th Sustainable & Renewable Energy Conference 23 -24 December 2017, Baghdad-Iraq
566
Introduction:
The increasing need for energy consumption motivated the researcher to develop an
economical and effective means for obtaining the energy from new and permanent sources,
such as solar energy since sunlight can be directly converted to electrical energy by using
solar cells. which will be useful of electronic properties of a specific type of materials which
known as semiconductor (M.A.Green,1989).The PV-mode operation for energy conversion
in the solar cells takes place in two steps:
a-Absorbing light generates an electron-hole pair in the depletion region.
b-The electron and hole are then separated, by the structure of the device,
to the opposite terminals (electrons to the negative terminal and holes to the positive
terminal) thus generating electrical power (Tom Markvart, 2005) as shown in Figure 1.
Figure (1): Show the photovoltaic effects (ACRE, 2000)
Antireflection coatings (ARC s) are widely use d in various applications such as display
panels, solar cells an d optical lenses (J. Sczybowski, 1998).
Reflective loss of the incident light on the device surface is an important factor that affects
efficiency of solar cell (SC). The design of the antireflection structure has become a key
factor in SC fabrication (Kelzenberg MD, 2010).
Broadband ARCs are essential for SCs operating at a broad spectrum. Many studies have
shown that the performance of a single layer coating is not satisfying due to its narrow
working spectral range. Double-, triple-, or even multiple-layer ARCs have better
performance when referring to broad band SCs (F. Zhan,2012).. The cadmium sulfide (CdS),
zinc oxide (ZnO), titanium dioxide (TiO2), and selenium (Se) are the focus of our study. These
semiconductor materials achieve two roles, one of them as energy transducers, and the
other role is utilized as antireflection coating.
In this paper, we present the results of calculations and experiments obtained by PLD
method of triple-layer ARCs which are different in deposited ordering on each textured
silicon substrates. To achieve the best performance along the desired spectrum, the
thickness of each layer must be controllable for an optimum ARCs design.
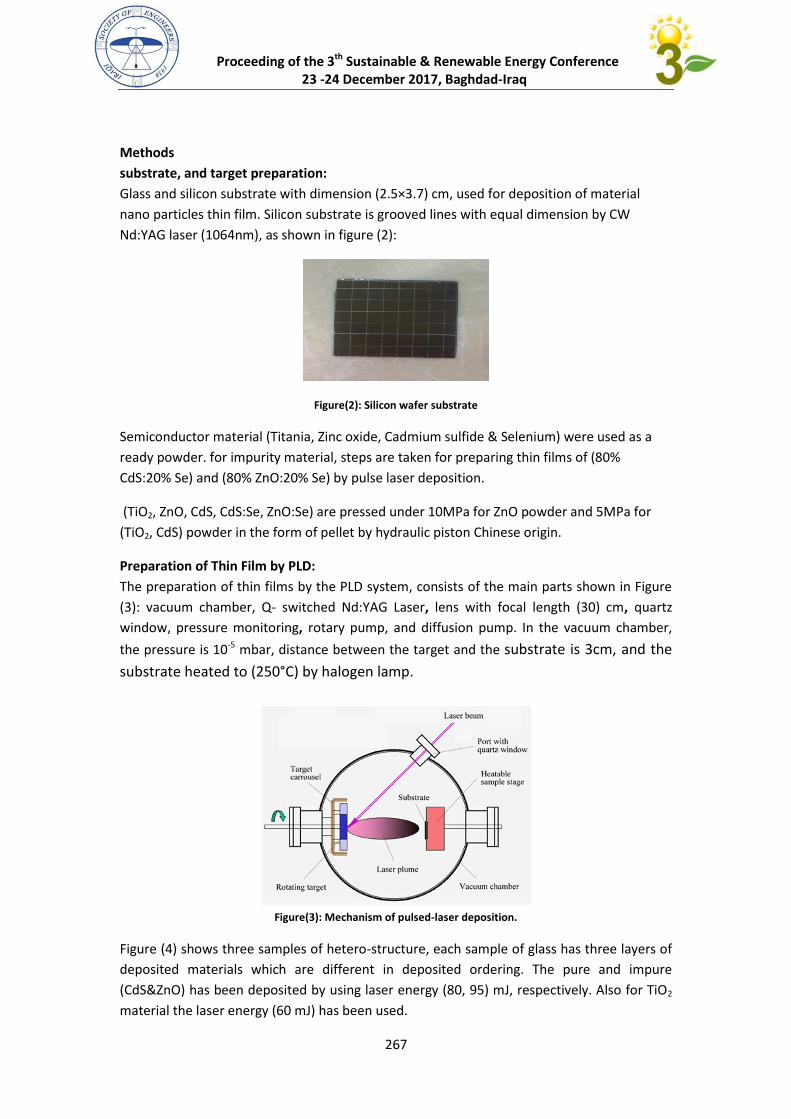
Proceeding of the 3th Sustainable & Renewable Energy Conference 23 -24 December 2017, Baghdad-Iraq
567
Methods
substrate, and target preparation:
Glass and silicon substrate with dimension (2.5×3.7) cm, used for deposition of material
nano particles thin film. Silicon substrate is grooved lines with equal dimension by CW
Nd:YAG laser (1064nm), as shown in figure (2):
Figure(2): Silicon wafer substrate
Semiconductor material (Titania, Zinc oxide, Cadmium sulfide & Selenium) were used as a
ready powder. for impurity material, steps are taken for preparing thin films of (80%
CdS:20% Se) and (80% ZnO:20% Se) by pulse laser deposition.
(TiO2, ZnO, CdS, CdS:Se, ZnO:Se) are pressed under 10MPa for ZnO powder and 5MPa for
(TiO2, CdS) powder in the form of pellet by hydraulic piston Chinese origin.
Preparation of Thin Film by PLD:
The preparation of thin films by the PLD system, consists of the main parts shown in Figure
(3): vacuum chamber, Q- switched Nd:YAG Laser, lens with focal length (30) cm, quartz
window, pressure monitoring, rotary pump, and diffusion pump. In the vacuum chamber,
the pressure is 10-5 mbar, distance between the target and the substrate is 3cm, and the
substrate heated to (250°C) by halogen lamp.
Figure(3): Mechanism of pulsed-laser deposition.
Figure (4) shows three samples of hetero-structure, each sample of glass has three layers of
deposited materials which are different in deposited ordering. The pure and impure
(CdS&ZnO) has been deposited by using laser energy (80, 95) mJ, respectively. Also for TiO2
material the laser energy (60 mJ) has been used.

Proceeding of the 3th Sustainable & Renewable Energy Conference 23 -24 December 2017, Baghdad-Iraq
562
Figure (4): Sample of hetero-structures on glass substrate.
Figure (5), shows three samples, each sample consists of three layer deposited on (p-type)
silicon wafer substrate. The deposited area on (p-type) silicon wafer substrate is (2.5 cm2).
Figure(5): Samples of hetero-structures on silicon wafers substrate.
The deposited thin films on silicon wafer are analyzed by XRD, and AFM, while on glass
substrate is analyzed by UV-VIS spectrophotometer, as shown in Figure (6).
Figure (6): Thin Films on (a) Silicon Wafer substrate, (b) Glass substrate.
Characterization:
The crystal structures of TiO2/ZnO/CdS, TiO2/ZnO/CdS:Se, and TiO2/ZnO:Se/CdS were
examined by X-ray diffraction ((CuKα radiation (λ=4.2166 A°) at a scan rate of 5°/min. X-ray
tube voltage and current were set at 40 Kv and 30 mA, respectively. The optical absorption
coefficient spectra were obtained using a dual-beam UV-visible spectrometer (CECIL 2700).
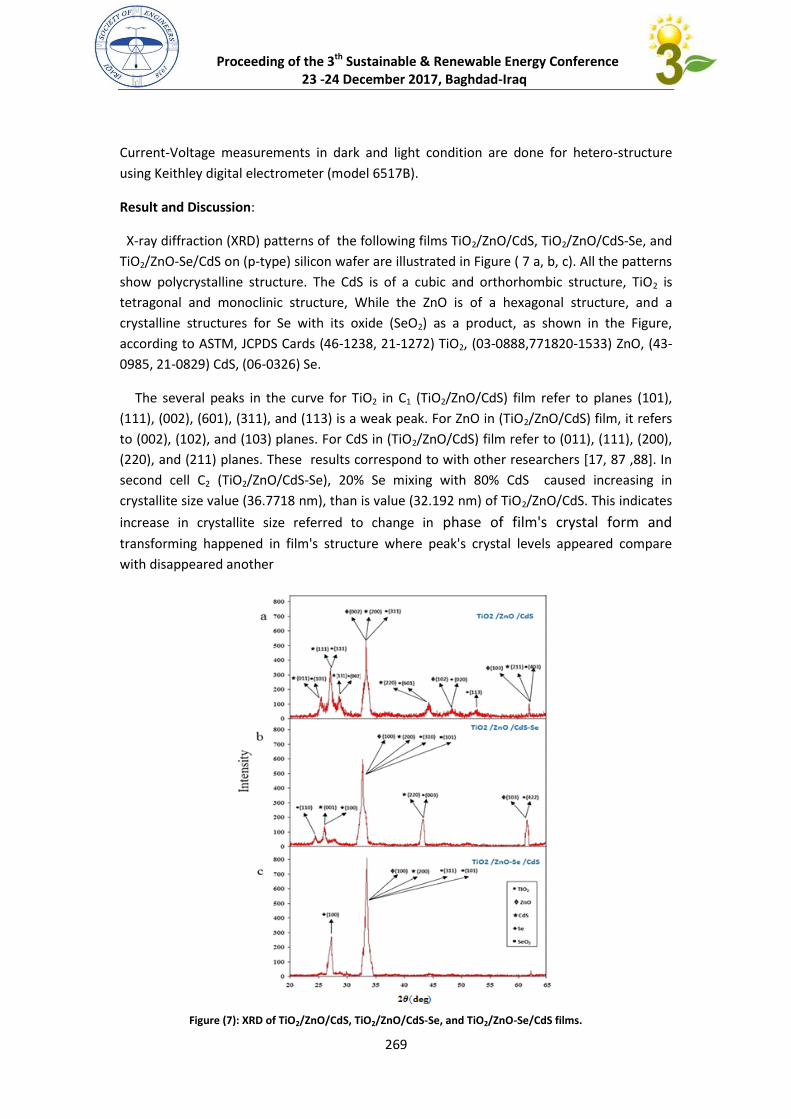
Proceeding of the 3th Sustainable & Renewable Energy Conference 23 -24 December 2017, Baghdad-Iraq
562
Current-Voltage measurements in dark and light condition are done for hetero-structure
using Keithley digital electrometer (model 6517B).
Result and Discussion:
X-ray diffraction (XRD) patterns of the following films TiO2/ZnO/CdS, TiO2/ZnO/CdS-Se, and
TiO2/ZnO-Se/CdS on (p-type) silicon wafer are illustrated in Figure ( 7 a, b, c). All the patterns
show polycrystalline structure. The CdS is of a cubic and orthorhombic structure, TiO2 is
tetragonal and monoclinic structure, While the ZnO is of a hexagonal structure, and a
crystalline structures for Se with its oxide (SeO2) as a product, as shown in the Figure,
according to ASTM, JCPDS Cards (46-1238, 21-1272) TiO2, (03-0888,771820-1533) ZnO, (43-
0985, 21-0829) CdS, (06-0326) Se.
The several peaks in the curve for TiO2 in C1 (TiO2/ZnO/CdS) film refer to planes (101),
(111), (002), (601), (311), and (113) is a weak peak. For ZnO in (TiO2/ZnO/CdS) film, it refers
to (002), (102), and (103) planes. For CdS in (TiO2/ZnO/CdS) film refer to (011), (111), (200),
(220), and (211) planes. These results correspond to with other researchers [17, 87 ,88]. In
second cell C2 (TiO2/ZnO/CdS-Se), 20% Se mixing with 80% CdS caused increasing in
crystallite size value (36.7718 nm), than is value (32.192 nm) of TiO2/ZnO/CdS. This indicates
increase in crystallite size referred to change in phase of film's crystal form and
transforming happened in film's structure where peak's crystal levels appeared compare
with disappeared another
Figure (7): XRD of TiO2/ZnO/CdS, TiO2/ZnO/CdS-Se, and TiO2/ZnO-Se/CdS films.
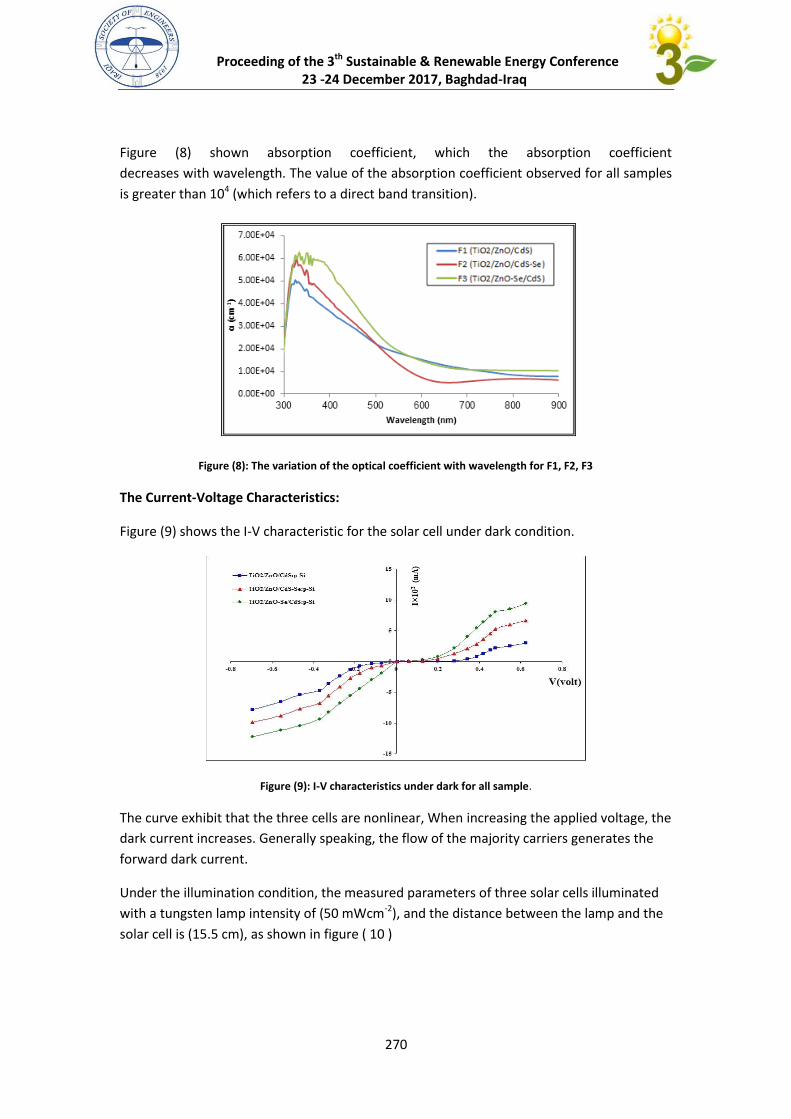
Proceeding of the 3th Sustainable & Renewable Energy Conference 23 -24 December 2017, Baghdad-Iraq
576
Figure (8) shown absorption coefficient, which the absorption coefficient
decreases with wavelength. The value of the absorption coefficient observed for all samples
is greater than 104 (which refers to a direct band transition).
Figure (8): The variation of the optical coefficient with wavelength for F1, F2, F3
The Current-Voltage Characteristics:
Figure (9) shows the I-V characteristic for the solar cell under dark condition.
Figure (9): I-V characteristics under dark for all sample.
The curve exhibit that the three cells are nonlinear, When increasing the applied voltage, the
dark current increases. Generally speaking, the flow of the majority carriers generates the
forward dark current.
Under the illumination condition, the measured parameters of three solar cells illuminated
with a tungsten lamp intensity of (50 mWcm-2), and the distance between the lamp and the
solar cell is (15.5 cm), as shown in figure ( 10 )
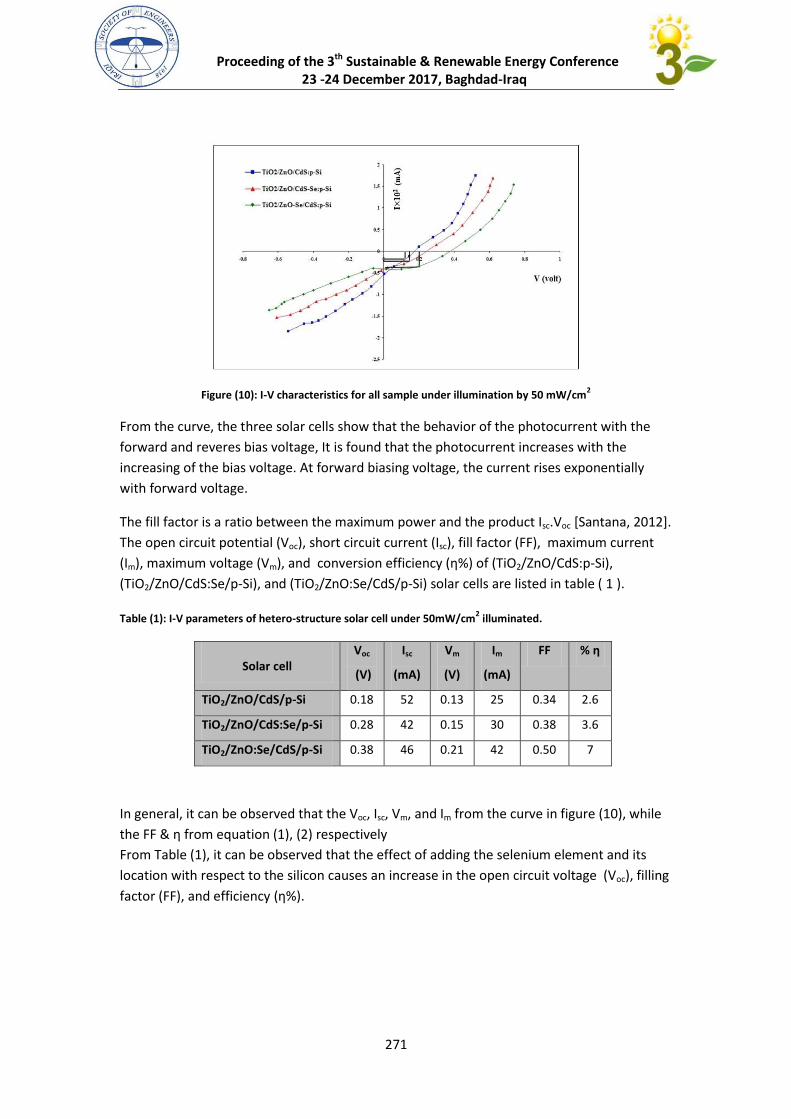
Proceeding of the 3th Sustainable & Renewable Energy Conference 23 -24 December 2017, Baghdad-Iraq
574
Figure (10): I-V characteristics for all sample under illumination by 50 mW/cm2
From the curve, the three solar cells show that the behavior of the photocurrent with the
forward and reveres bias voltage, It is found that the photocurrent increases with the
increasing of the bias voltage. At forward biasing voltage, the current rises exponentially
with forward voltage.
The fill factor is a ratio between the maximum power and the product Isc.Voc [Santana, 2012].
The open circuit potential (Voc), short circuit current (Isc), fill factor (FF), maximum current
(Im), maximum voltage (Vm), and conversion efficiency (η%) of (TiO2/ZnO/CdS:p-Si),
(TiO2/ZnO/CdS:Se/p-Si), and (TiO2/ZnO:Se/CdS/p-Si) solar cells are listed in table ( 1 ).
Table (1): I-V parameters of hetero-structure solar cell under 50mW/cm2 illuminated.
% η FF Im
(mA)
Vm
(V)
Isc
(mA)
Voc
(V) Solar cell
2.6 0.34 25 0.13 52 0.18 TiO2/ZnO/CdS/p-Si
3.6 0.38 30 0.15 42 0.28 TiO2/ZnO/CdS:Se/p-Si
7 0.50 42 0.21 46 0.38 TiO2/ZnO:Se/CdS/p-Si
In general, it can be observed that the Voc, Isc, Vm, and Im from the curve in figure (10), while
the FF & η from equation (4), (5) respectively
From Table (1), it can be observed that the effect of adding the selenium element and its
location with respect to the silicon causes an increase in the open circuit voltage (Voc), filling
factor (FF), and efficiency (η%).
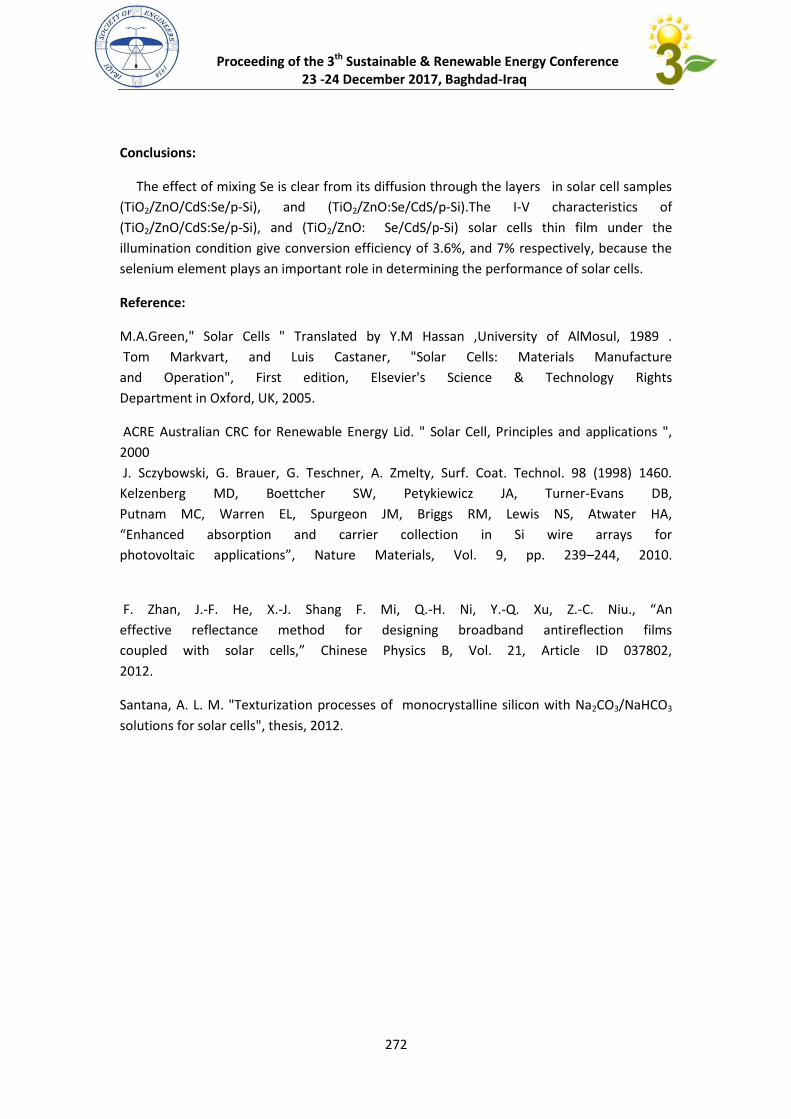
Proceeding of the 3th Sustainable & Renewable Energy Conference 23 -24 December 2017, Baghdad-Iraq
575
Conclusions:
The effect of mixing Se is clear from its diffusion through the layers in solar cell samples
(TiO2/ZnO/CdS:Se/p-Si), and (TiO2/ZnO:Se/CdS/p-Si).The I-V characteristics of
(TiO2/ZnO/CdS:Se/p-Si), and (TiO2/ZnO: Se/CdS/p-Si) solar cells thin film under the
illumination condition give conversion efficiency of 3.6%, and 7% respectively, because the
selenium element plays an important role in determining the performance of solar cells.
Reference:
M.A.Green," Solar Cells " Translated by Y.M Hassan ,University of AlMosul, 1989 .
Tom Markvart, and Luis Castaner, "Solar Cells: Materials Manufacture
and Operation", First edition, Elsevier's Science & Technology Rights
Department in Oxford, UK, 2005.
ACRE Australian CRC for Renewable Energy Lid. " Solar Cell, Principles and applications ",
2000
J. Sczybowski, G. Brauer, G. Teschner, A. Zmelty, Surf. Coat. Technol. 98 (1998) 1460.
Kelzenberg MD, Boettcher SW, Petykiewicz JA, Turner-Evans DB,
Putnam MC, Warren EL, Spurgeon JM, Briggs RM, Lewis NS, Atwater HA,
“Enhanced absorption and carrier collection in Si wire arrays for
photovoltaic applications”, Nature Materials, Vol. 2, pp. 532–244, 2010.
F. Zhan, J.-F. He, X.-J. Shang F. Mi, Q.-H. Ni, Y.-Q. Xu, Z.-C. Niu., “An
effective reflectance method for designing broadband antireflection films
coupled with solar cells,” Chinese Physics B, Vol. 54, Article ID 637265,
2012.
Santana, A. L. M. "Texturization processes of monocrystalline silicon with Na2CO3/NaHCO3
solutions for solar cells", thesis, 2012.
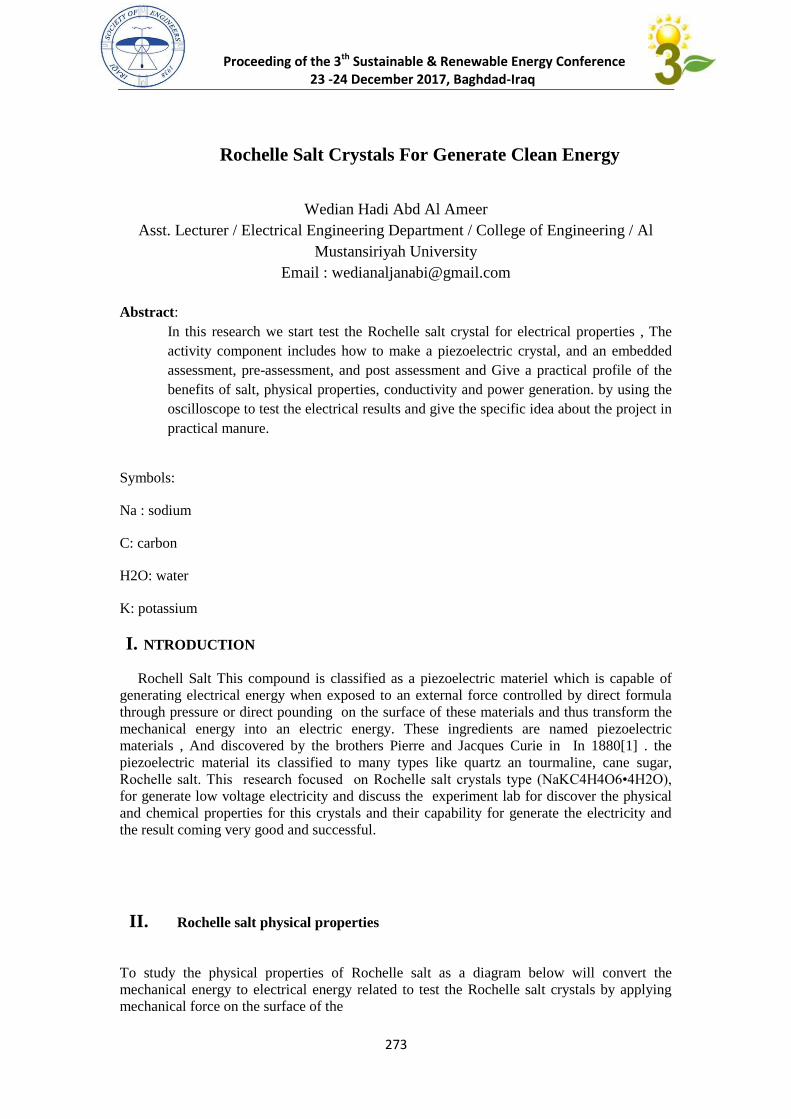
Proceeding of the 3th Sustainable & Renewable Energy Conference 23 -24 December 2017, Baghdad-Iraq
372
Rochelle Salt Crystals For Generate Clean Energy
Wedian Hadi Abd Al Ameer
Asst. Lecturer / Electrical Engineering Department / College of Engineering / Al
Mustansiriyah University
Email : [email protected]
Abstract:
In this research we start test the Rochelle salt crystal for electrical properties , The
activity component includes how to make a piezoelectric crystal, and an embedded
assessment, pre-assessment, and post assessment and Give a practical profile of the
benefits of salt, physical properties, conductivity and power generation. by using the
oscilloscope to test the electrical results and give the specific idea about the project in
practical manure.
Symbols:
Na : sodium
C: carbon
H2O: water
K: potassium
I. NTRODUCTION
Rochell Salt This compound is classified as a piezoelectric materiel which is capable of
generating electrical energy when exposed to an external force controlled by direct formula
through pressure or direct pounding on the surface of these materials and thus transform the
mechanical energy into an electric energy. These ingredients are named piezoelectric
materials , And discovered by the brothers Pierre and Jacques Curie in In 1880[1] . the
piezoelectric material its classified to many types like quartz an tourmaline, cane sugar,
Rochelle salt. This research focused on Rochelle salt crystals type (NaKC4H4O6•4H2O),
for generate low voltage electricity and discuss the experiment lab for discover the physical
and chemical properties for this crystals and their capability for generate the electricity and
the result coming very good and successful.
II. Rochelle salt physical properties
To study the physical properties of Rochelle salt as a diagram below will convert the
mechanical energy to electrical energy related to test the Rochelle salt crystals by applying
mechanical force on the surface of the
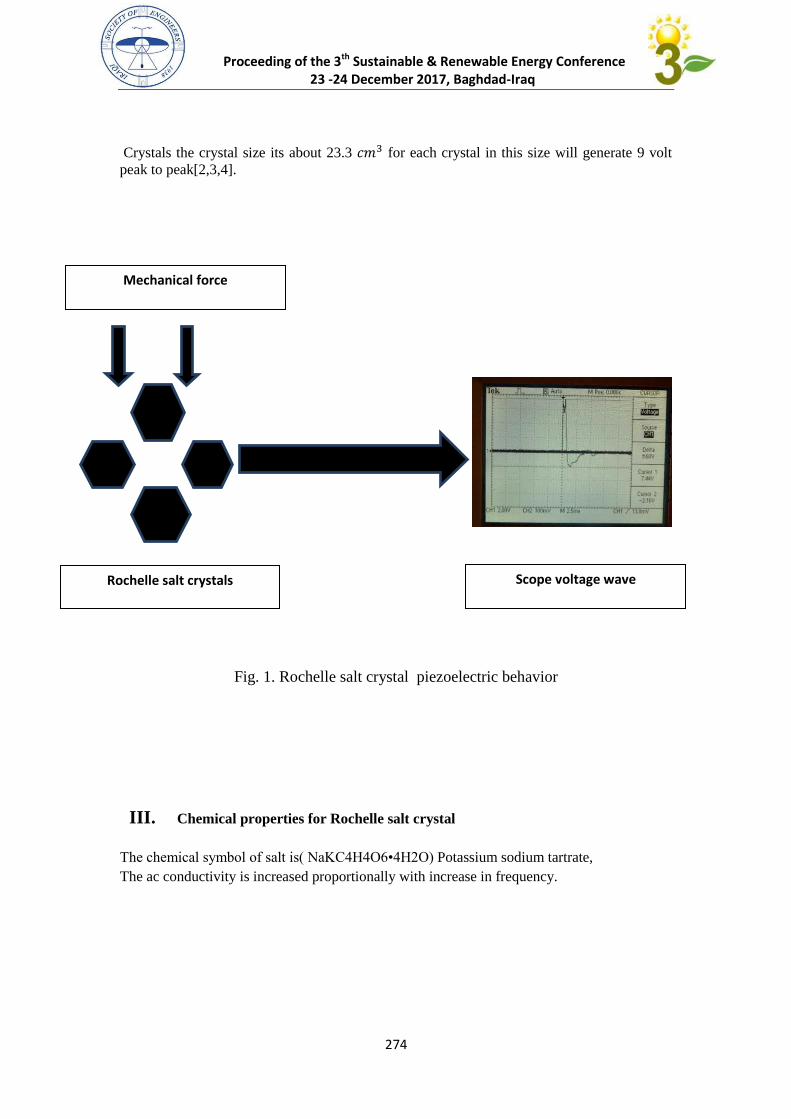
Proceeding of the 3th Sustainable & Renewable Energy Conference 23 -24 December 2017, Baghdad-Iraq
372
Crystals the crystal size its about 23.3 for each crystal in this size will generate 9 volt
peak to peak[2,3,4].
Fig. 1. Rochelle salt crystal piezoelectric behavior
III. Chemical properties for Rochelle salt crystal
The chemical symbol of salt is( NaKC4H4O6•4H2O) Potassium sodium tartrate,
The ac conductivity is increased proportionally with increase in frequency.
Mechanical force
Rochelle salt crystals Scope voltage wave
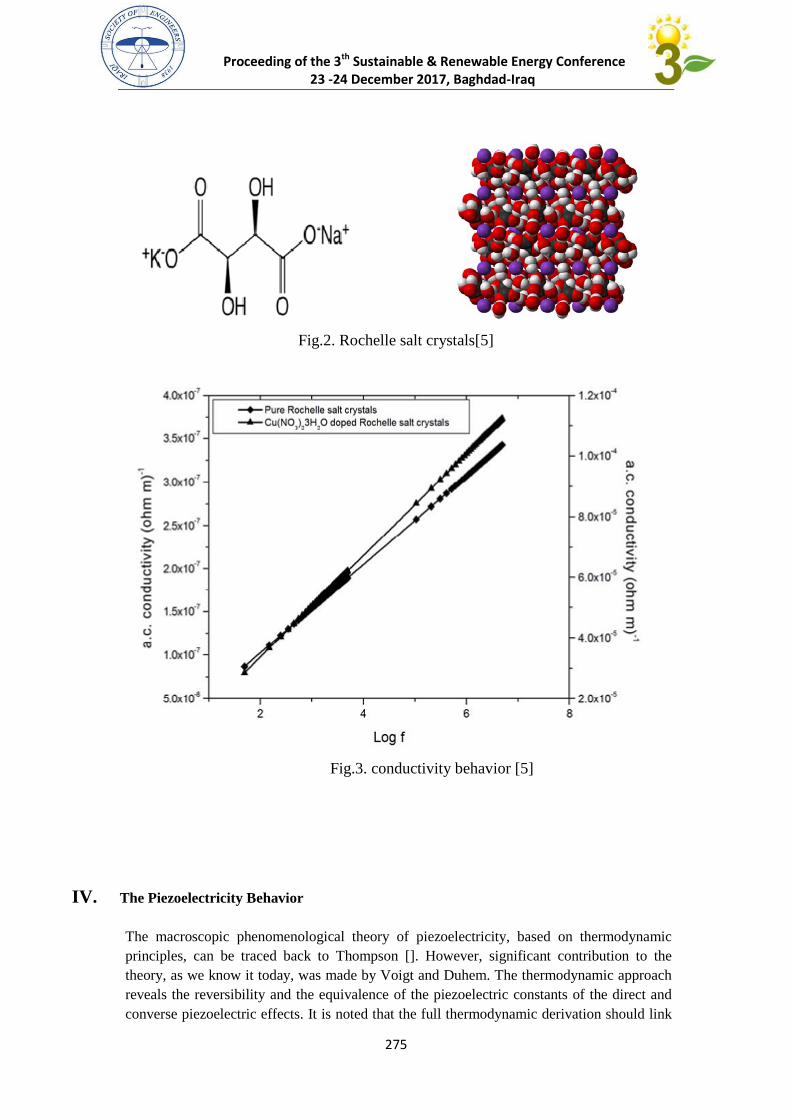
Proceeding of the 3th Sustainable & Renewable Energy Conference 23 -24 December 2017, Baghdad-Iraq
372
Fig.2. Rochelle salt crystals[5]
Fig.3. conductivity behavior [5]
IV. The Piezoelectricity Behavior
The macroscopic phenomenological theory of piezoelectricity, based on thermodynamic
principles, can be traced back to Thompson []. However, significant contribution to the
theory, as we know it today, was made by Voigt and Duhem. The thermodynamic approach
reveals the reversibility and the equivalence of the piezoelectric constants of the direct and
converse piezoelectric effects. It is noted that the full thermodynamic derivation should link
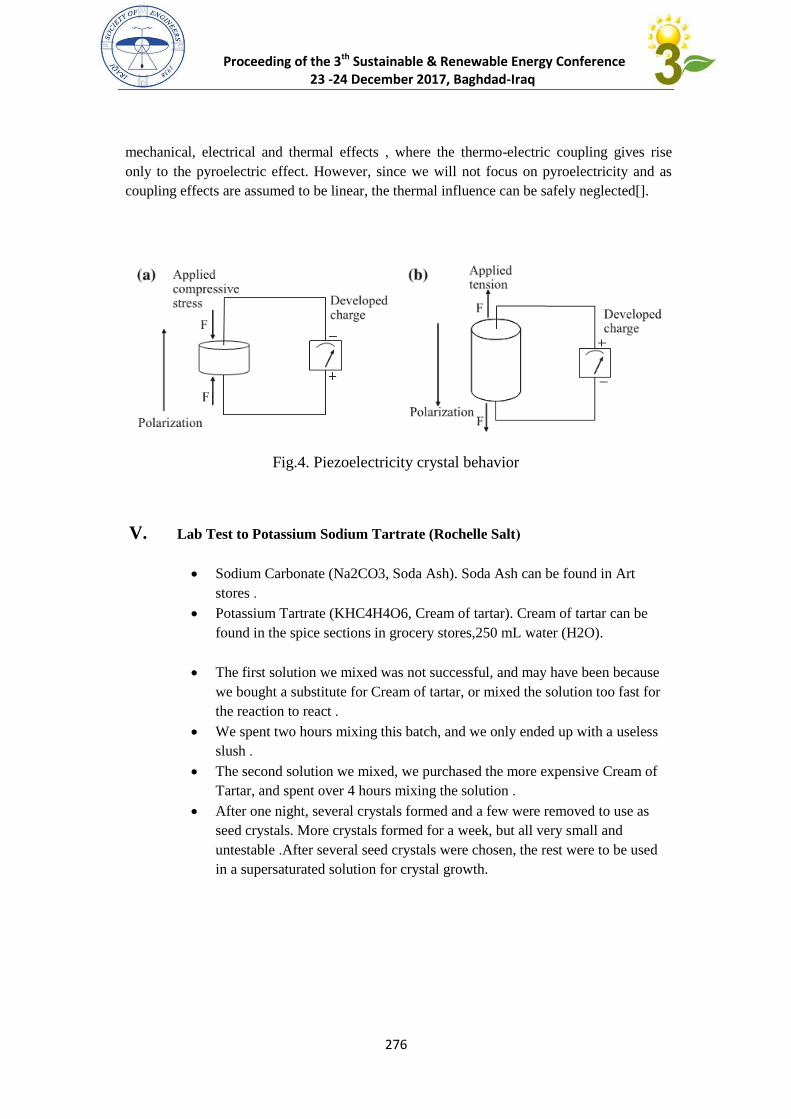
Proceeding of the 3th Sustainable & Renewable Energy Conference 23 -24 December 2017, Baghdad-Iraq
372
mechanical, electrical and thermal effects , where the thermo-electric coupling gives rise
only to the pyroelectric effect. However, since we will not focus on pyroelectricity and as
coupling effects are assumed to be linear, the thermal influence can be safely neglected[].
Fig.4. Piezoelectricity crystal behavior
V. Lab Test to Potassium Sodium Tartrate (Rochelle Salt(
Sodium Carbonate (Na2CO3, Soda Ash). Soda Ash can be found in Art
stores .
Potassium Tartrate (KHC4H4O6, Cream of tartar). Cream of tartar can be
found in the spice sections in grocery stores,250 mL water (H2O).
The first solution we mixed was not successful, and may have been because
we bought a substitute for Cream of tartar, or mixed the solution too fast for
the reaction to react .
We spent two hours mixing this batch, and we only ended up with a useless
slush .
The second solution we mixed, we purchased the more expensive Cream of
Tartar, and spent over 4 hours mixing the solution .
After one night, several crystals formed and a few were removed to use as
seed crystals. More crystals formed for a week, but all very small and
untestable .After several seed crystals were chosen, the rest were to be used
in a supersaturated solution for crystal growth.
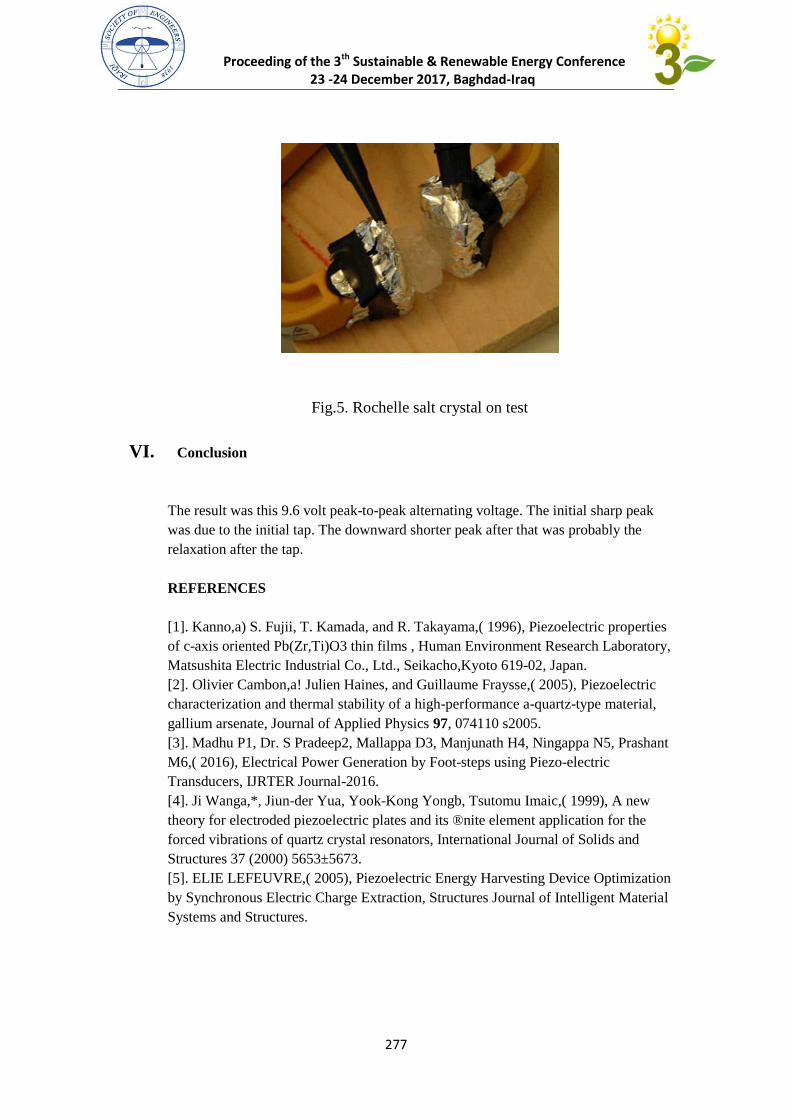
Proceeding of the 3th Sustainable & Renewable Energy Conference 23 -24 December 2017, Baghdad-Iraq
377
Fig.5. Rochelle salt crystal on test
VI. Conclusion
The result was this 9.6 volt peak-to-peak alternating voltage. The initial sharp peak
was due to the initial tap. The downward shorter peak after that was probably the
relaxation after the tap.
REFERENCES
[1]. Kanno,a) S. Fujii, T. Kamada, and R. Takayama,( 1996), Piezoelectric properties
of c-axis oriented Pb(Zr,Ti)O3 thin films , Human Environment Research Laboratory,
Matsushita Electric Industrial Co., Ltd., Seikacho,Kyoto 619-02, Japan.
[2]. Olivier Cambon,a! Julien Haines, and Guillaume Fraysse,( 2005), Piezoelectric
characterization and thermal stability of a high-performance a-quartz-type material,
gallium arsenate, Journal of Applied Physics 97, 074110 s2005.
[3]. Madhu P1, Dr. S Pradeep2, Mallappa D3, Manjunath H4, Ningappa N5, Prashant
M6,( 2016), Electrical Power Generation by Foot-steps using Piezo-electric
Transducers, IJRTER Journal-2016.
[4]. Ji Wanga,*, Jiun-der Yua, Yook-Kong Yongb, Tsutomu Imaic,( 1999), A new
theory for electroded piezoelectric plates and its ®nite element application for the
forced vibrations of quartz crystal resonators, International Journal of Solids and
Structures 37 (2000) 5653±5673.
[5]. ELIE LEFEUVRE,( 2005), Piezoelectric Energy Harvesting Device Optimization
by Synchronous Electric Charge Extraction, Structures Journal of Intelligent Material
Systems and Structures.

Applications of Wind Energy (AWE)
Research
Proceeding of the 3th
Sustainable & Renewable Energy Conference
23 -24 December 2017, Baghdad-Iraq
279
Abstract
The present global energy economy suggests the use of renewable sources such as solar, wind and
biomass to produce the required power. Technology related to wind energy has seen a rapid growth
worldwide. Wind turbines are typical devices that convert the kinetic energy of wind into electricity. A
thorough understanding of the principles of aerodynamics and structural dynamics of the rotor system is
required for designing a wind turbine system that can generate power with high efficiency. The power
generated by a Vertical Axis Wind Turbine (VAWT) depends on the drag force generated by the individual
blades and interactions between them in a rotating configuration. The vane wind turbine was designed
to increase the output of a wind turbine that uses kinetic energy of the wind. The three dimensional
numerical investigations are carried out to predict the aerodynamics characteristic of the combination of
Vane Type (VAWT) having horizontal movable vanes and Helical Darrieus type, using commercially
available computational fluid dynamic (CFD) software - SolidWork2013, GAMBIT and FLUENT. The
Shear Stress Transport (SST), k-ω turbulence model is used, which is better than other turbulence models
available, as suggested by some researchers. The flow field is simulated numerically at a fixed inlet velocity.
The predicted results show that the flow of air pass through the combined blade at the negative side when all
the vanes are freely open. The static pressure drop across the blade decrease when the blade rotates to
negative side and the resistance of the blade to the flow decreased. This case helps to increase turbine
rotation and so, thus, the power of the turbine increases. The predicted results show agreement with those
reported in the literature for VAWT has different blade designs.
Keywords: Wind energy; vertical axis wind turbine; computational fluid dynamics; performance
analysis; k-ω turbulence model.
INTRODUCTION
With the continued rapid development of the economy, the request for energy increased, energy
problem in many countries has become more and more critical. The depletion of fossil energy
resources and global warming trends has led to the recognition of a low carbon economy as an
international strategy for sustainable development. More environmentally friendly types of energy are
wind power, solar power, wave power and marine current power. Among several green and renewable
energy sources, wind energy has seen a rapid growth worldwide and will play an increasingly
important role in the future economy. Wind turbines are typical devices that convert the kinetic energy
of wind into electricity. At present, there are two categories of modern wind turbines, namely
Horizontal Axis Wind Turbine (HAWT) and Vertical Axis Wind Turbine (VAWT), which are used
mainly for electricity generation [1]. There are many advantages of using VAWT. It is able to accept
wind from any direction without yawing, ability to provide direct rotary drive to a fixed load can
capture ground level winds and its components (generator and gearbox) can be mounted at ground
level. VAWT is further divided into lift driven VAWT (Darrieus type) and drag driven VAWT
(Savonius type). Darrieus type VAWT
proves to be more efficient than Savonius type turbine. The theoretical maximum power coefficient of
wind turbine of any design operating in an open atmosphere is lower than 59.3% [2], which is known
Modeling and Numerical Simulation for the Newly Designed Combined Blade
Vertical Axis Wind Turbine Kadhim H. Suffer
Al-Nahrain University, Collage of Engineering, Mechanical Eng. Dep., Baghdad, Iraq
kadhim_askar @yahoo.com

Proceeding of the 3th
Sustainable & Renewable Energy Conference
23 -24 December 2017, Baghdad-Iraq
280
as the Betz limit. It is reached by setting up the ratio between the maximum power extracted from the
turbine rotor and the energy in the wind. However, the real world limit is well below the Betz limit
with values of 0.35-0.45 for the best designed wind turbine. Designing a wind turbine system that can
generate power with high efficiency requires a thorough understanding of the principles of
aerodynamics and structural dynamics of the rotor system. Simple analysis of the available wind
turbine designs shows that the designs are not perfect, and the wind force is not harnessed in full-scale
due to geometrical and technical problems. Therefore, the study of wind turbine has been of interest to
many researchers. Researchers are working to improve the aerodynamic characteristics of VAWT,
which include laboratory measurement to full scale numerical simulation and theoretical prediction for
flow around the turbine. Computational fluid dynamics (CFD), as a promising technique in wind
engineering research, have attracted growing interest in the past two decades. Compared with the
conventional experimental approaches, CFD could provide more details about flow field without any
need for complicated control and measurement systems. It also provides an inexpensive solution to
performing systematic analyses, such as the parametric studies required for performance optimization
of VAWTs. Subject to the constraint of computational resources and time, CFD is a very powerful tool
to solve a wide range of industrial and non-industrial fluid flow problems. Physical characteristics of
the fluid motion around the rotor could be described through the fundamental flow governing
equations, usually in the partial differential forms. In order to solve the governing equations, high,
level computer programming languages or commercial available CFD software’s are used [3]. Where
the finite difference, finite element and finite volume methods are used. Fundamentally, the finite
volume method is originated from the special finite difference formulation. It is the formal integration
of the governing equations of the fluid flow over all the (finite) control volumes of the computational
domain. This is followed by discretization of the terms in the integrated equation representing the flow
over the Turbine rotor. This converts the integral equations into a system of algebraic equations.
Finally, the algebraic equations are solved by different iterative methods. ANSYS-Fluent and ANSYS-
CFX are the widely accepted finite volume software packages to solve complex flow phenomena [4].
R. Nobile, M. Vahdati, J.F. Barlow and A. M. Crook [5] studied two-dimensional unsteady flow
simulations of a vertical axis wind turbine in their CFD analysis with different mesh resolution,
turbulence model and time step size. They found that the mesh resolution and the turbulence model
affect the result accuracy while the time step size examined has small impact on the numerical results.
K. N. Morshed, M. Rahman, G. M. and M. Ahmed [6] carried out feasibility studies on conventional
and modified vertical-axis Savonius wind turbine feasibility improved by, first performimg a series of
wind tunnel investigations on semi-cylindrical three-bladed Savonius scale models with different
overlap ratios and also without overlap at different Reynolds numbers. They also performed
computational fluid dynamics (CFD) simulations using GAMBIT and FLUENT software’s to analyze
the static rotor aerodynamics of those models. The results from the experimental part of their research
show a significant effect of overlap ratio and Reynolds number on the improvement of the
aerodynamic performance of the Savonius wind turbine.. R. Sukanta, K. and U. Saha [7] reported a
review of various computational methods addressing the influence of various operating parameters and
also discussed different augmentation techniques. They observed that with the selection of a proper
computational methodology, the design, performance, and efficiency of a Savonius rotor can be
enhanced significantly.
A. Gorlov Wind Turbine
One of the modifications of Darrieus wind turbine is the Gorlov turbine. The difference between the
original design of Darrieus and the Gorlov is the shape of the airfoil. The Gorlov helical turbine was
introduced by Alexander Gorlov in the 1990’s as an upgrading design of Darrieus turbine. The Gorlov
turbine also contributes a lift force on the rotating blades for energy conversion which allow the
rotational velocities of the turbine to potentially exceed the free stream velocity of the fluid. The
advantage of higher rotational velocities implies that the Gorlov design can have efficiency values that
are adequate to produce the power needed given the size constraints for this project. The difference
made by Gorlov compared to the Darrieus design is the distribution of the blade cross sectional area in
the horizontal lane evenly around the circumferences of the horizontal plane of the cylinder. The
modification is achieved by the blade’s positions being determined by a helix that, between the total
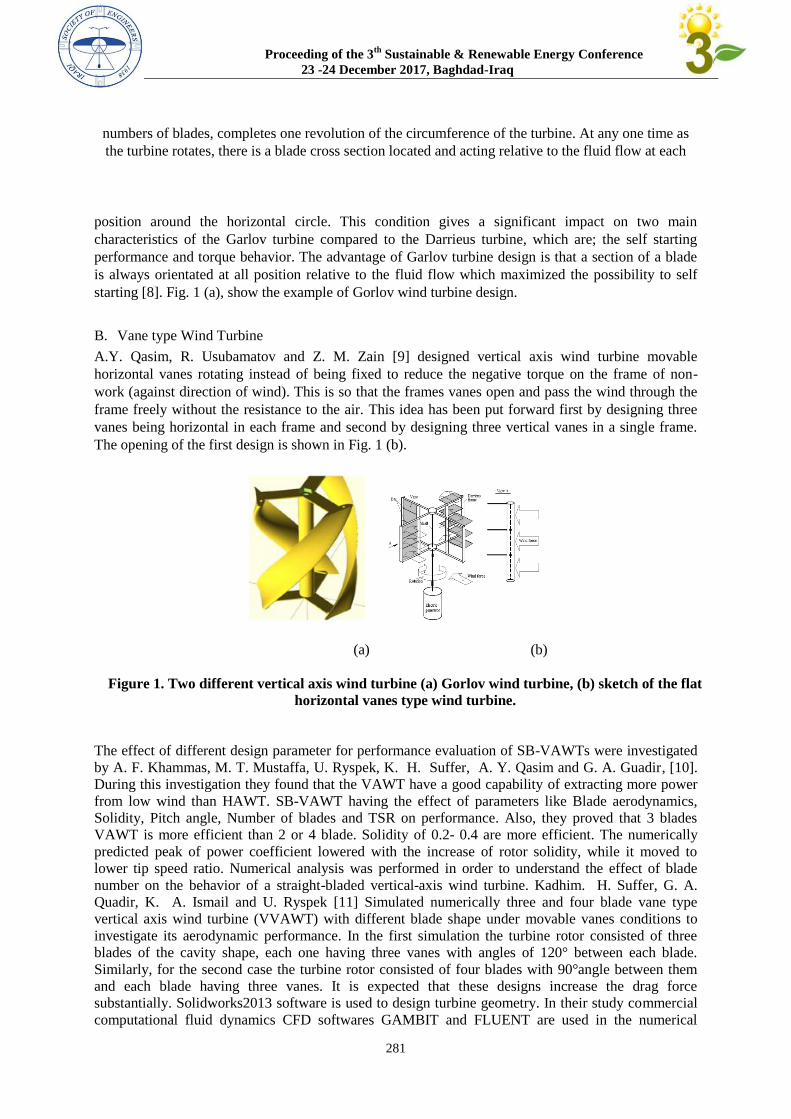
Proceeding of the 3th
Sustainable & Renewable Energy Conference
23 -24 December 2017, Baghdad-Iraq
281
numbers of blades, completes one revolution of the circumference of the turbine. At any one time as
the turbine rotates, there is a blade cross section located and acting relative to the fluid flow at each
position around the horizontal circle. This condition gives a significant impact on two main
characteristics of the Garlov turbine compared to the Darrieus turbine, which are; the self starting
performance and torque behavior. The advantage of Garlov turbine design is that a section of a blade
is always orientated at all position relative to the fluid flow which maximized the possibility to self
starting [8]. Fig. 1 (a), show the example of Gorlov wind turbine design.
B. Vane type Wind Turbine
A.Y. Qasim, R. Usubamatov and Z. M. Zain [9] designed vertical axis wind turbine movable
horizontal vanes rotating instead of being fixed to reduce the negative torque on the frame of non-
work (against direction of wind). This is so that the frames vanes open and pass the wind through the
frame freely without the resistance to the air. This idea has been put forward first by designing three
vanes being horizontal in each frame and second by designing three vertical vanes in a single frame.
The opening of the first design is shown in Fig. 1 (b).
(a) (b)
Figure 1. Two different vertical axis wind turbine (a) Gorlov wind turbine, (b) sketch of the flat
horizontal vanes type wind turbine.
The effect of different design parameter for performance evaluation of SB-VAWTs were investigated
by A. F. Khammas, M. T. Mustaffa, U. Ryspek, K. H. Suffer, A. Y. Qasim and G. A. Guadir, [10].
During this investigation they found that the VAWT have a good capability of extracting more power
from low wind than HAWT. SB-VAWT having the effect of parameters like Blade aerodynamics,
Solidity, Pitch angle, Number of blades and TSR on performance. Also, they proved that 3 blades
VAWT is more efficient than 2 or 4 blade. Solidity of 0.2- 0.4 are more efficient. The numerically
predicted peak of power coefficient lowered with the increase of rotor solidity, while it moved to
lower tip speed ratio. Numerical analysis was performed in order to understand the effect of blade
number on the behavior of a straight-bladed vertical-axis wind turbine. Kadhim. H. Suffer, G. A.
Quadir, K. A. Ismail and U. Ryspek [11] Simulated numerically three and four blade vane type
vertical axis wind turbine (VVAWT) with different blade shape under movable vanes conditions to
investigate its aerodynamic performance. In the first simulation the turbine rotor consisted of three
blades of the cavity shape, each one having three vanes with angles of 120° between each blade.
Similarly, for the second case the turbine rotor consisted of four blades with 90°angle between them
and each blade having three vanes. It is expected that these designs increase the drag force
substantially. Solidworks2013 software is used to design turbine geometry. In their study commercial
computational fluid dynamics CFD softwares GAMBIT and FLUENT are used in the numerical
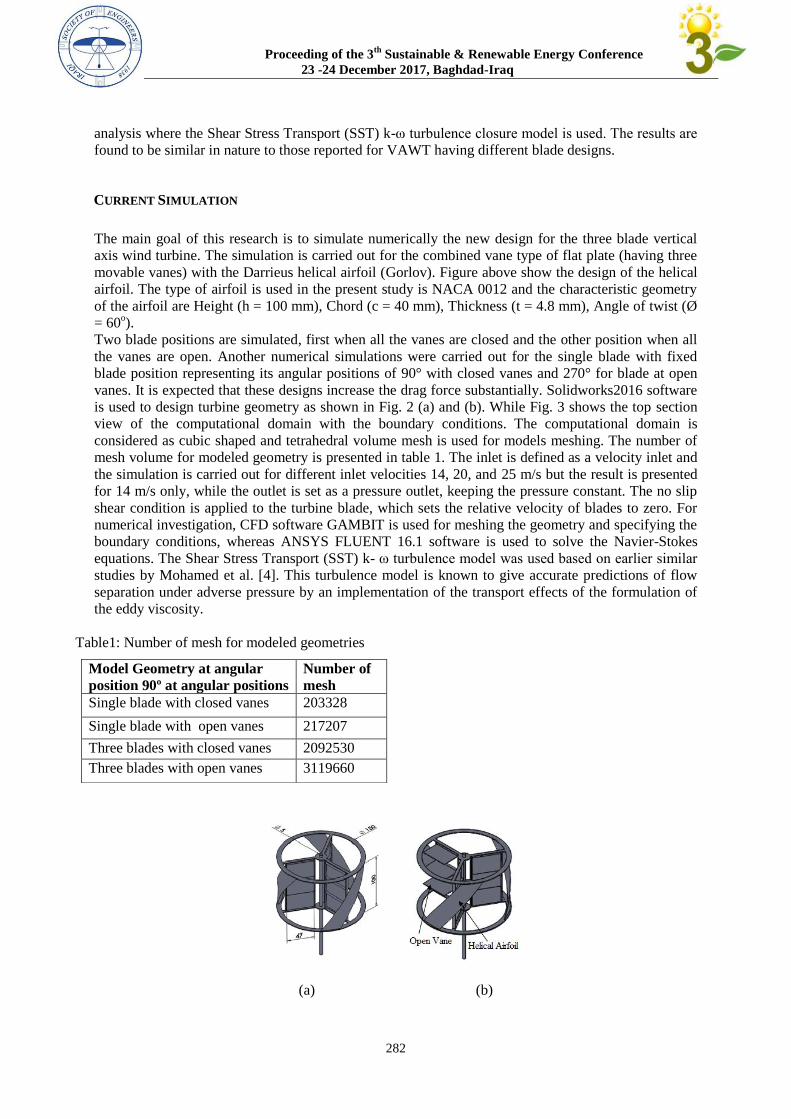
Proceeding of the 3th
Sustainable & Renewable Energy Conference
23 -24 December 2017, Baghdad-Iraq
282
analysis where the Shear Stress Transport (SST) k-ω turbulence closure model is used. The results are
found to be similar in nature to those reported for VAWT having different blade designs.
CURRENT SIMULATION
The main goal of this research is to simulate numerically the new design for the three blade vertical
axis wind turbine. The simulation is carried out for the combined vane type of flat plate (having three
movable vanes) with the Darrieus helical airfoil (Gorlov). Figure above show the design of the helical
airfoil. The type of airfoil is used in the present study is NACA 0012 and the characteristic geometry
of the airfoil are Height (h = 100 mm), Chord (c = 40 mm), Thickness (t = 4.8 mm), Angle of twist (Ø
= 60o).
Two blade positions are simulated, first when all the vanes are closed and the other position when all
the vanes are open. Another numerical simulations were carried out for the single blade with fixed
blade position representing its angular positions of 90° with closed vanes and 270° for blade at open
vanes. It is expected that these designs increase the drag force substantially. Solidworks2016 software
is used to design turbine geometry as shown in Fig. 2 (a) and (b). While Fig. 3 shows the top section
view of the computational domain with the boundary conditions. The computational domain is
considered as cubic shaped and tetrahedral volume mesh is used for models meshing. The number of
mesh volume for modeled geometry is presented in table 1. The inlet is defined as a velocity inlet and
the simulation is carried out for different inlet velocities 14, 20, and 25 m/s but the result is presented
for 14 m/s only, while the outlet is set as a pressure outlet, keeping the pressure constant. The no slip
shear condition is applied to the turbine blade, which sets the relative velocity of blades to zero. For
numerical investigation, CFD software GAMBIT is used for meshing the geometry and specifying the
boundary conditions, whereas ANSYS FLUENT 16.1 software is used to solve the Navier-Stokes
equations. The Shear Stress Transport (SST) k- ω turbulence model was used based on earlier similar
studies by Mohamed et al. [4]. This turbulence model is known to give accurate predictions of flow
separation under adverse pressure by an implementation of the transport effects of the formulation of
the eddy viscosity.
Table1: Number of mesh for modeled geometries
(a) (b)
Model Geometry at angular
position 90º at angular positions
Number of
mesh
Single blade with closed vanes 203328
Single blade with open vanes 217207
Three blades with closed vanes 2092530
Three blades with open vanes 3119660
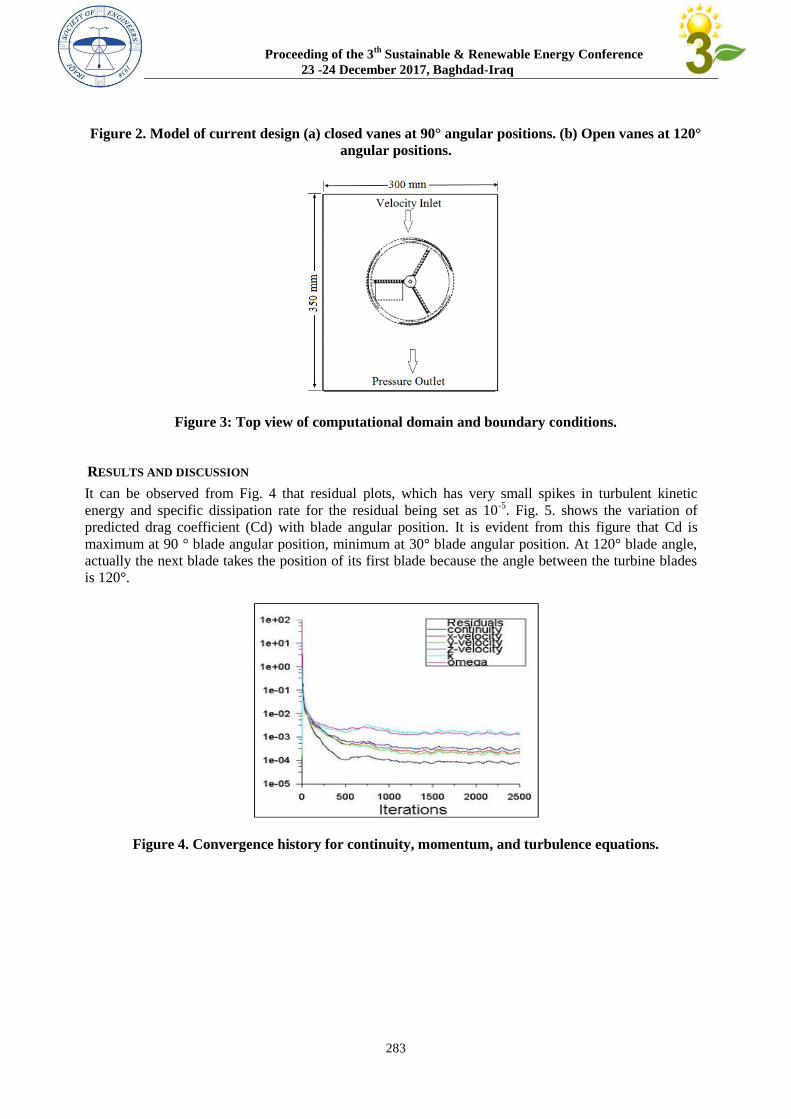
Proceeding of the 3th
Sustainable & Renewable Energy Conference
23 -24 December 2017, Baghdad-Iraq
283
Figure 2. Model of current design (a) closed vanes at 90° angular positions. (b) Open vanes at 120°
angular positions.
Figure 3: Top view of computational domain and boundary conditions.
RESULTS AND DISCUSSION
It can be observed from Fig. 4 that residual plots, which has very small spikes in turbulent kinetic
energy and specific dissipation rate for the residual being set as 10-5
. Fig. 5. shows the variation of
predicted drag coefficient (Cd) with blade angular position. It is evident from this figure that Cd is
maximum at 90 ° blade angular position, minimum at 30° blade angular position. At 120° blade angle,
actually the next blade takes the position of its first blade because the angle between the turbine blades
is 120°.
Figure 4. Convergence history for continuity, momentum, and turbulence equations.
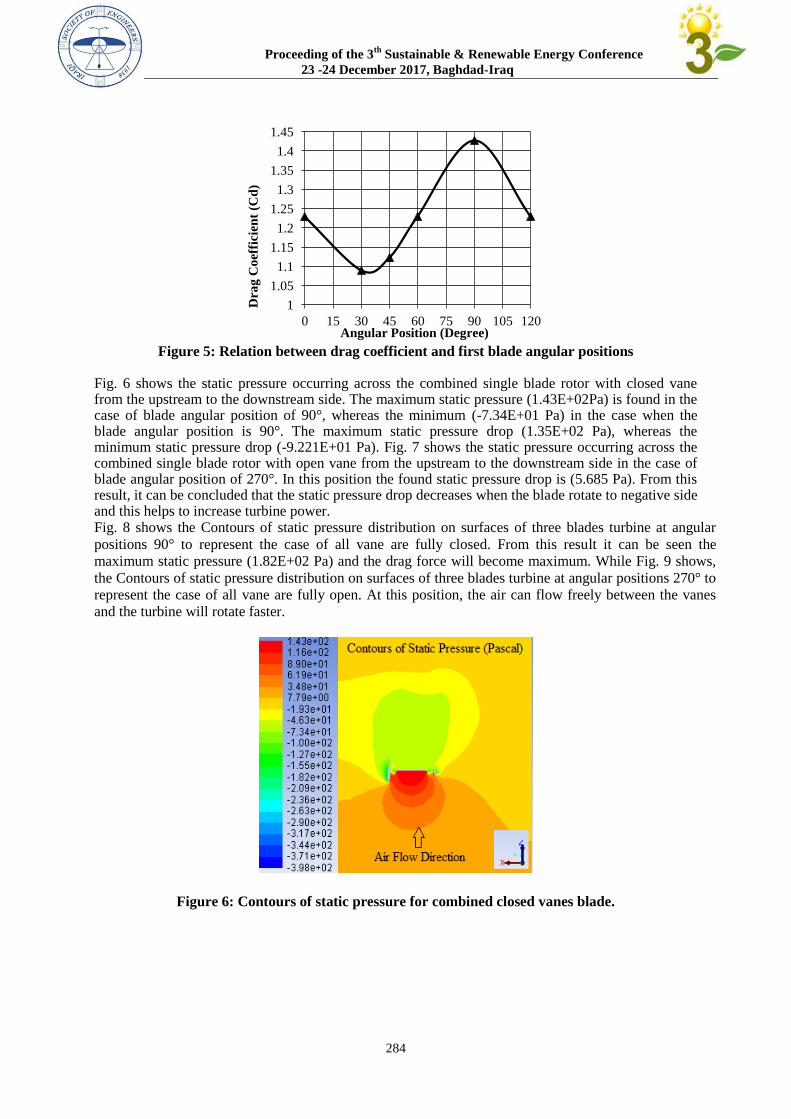
Proceeding of the 3th
Sustainable & Renewable Energy Conference
23 -24 December 2017, Baghdad-Iraq
284
Figure 5: Relation between drag coefficient and first blade angular positions
Fig. 6 shows the static pressure occurring across the combined single blade rotor with closed vane from the upstream to the downstream side. The maximum static pressure (1.43E+02Pa) is found in the case of blade angular position of 90°, whereas the minimum (-7.34E+01 Pa) in the case when the blade angular position is 90°. The maximum static pressure drop (1.35E+02 Pa), whereas the minimum static pressure drop (-9.221E+01 Pa). Fig. 7 shows the static pressure occurring across the combined single blade rotor with open vane from the upstream to the downstream side in the case of blade angular position of 270°. In this position the found static pressure drop is (5.685 Pa). From this result, it can be concluded that the static pressure drop decreases when the blade rotate to negative side and this helps to increase turbine power. Fig. 8 shows the Contours of static pressure distribution on surfaces of three blades turbine at angular
positions 90° to represent the case of all vane are fully closed. From this result it can be seen the
maximum static pressure (1.82E+02 Pa) and the drag force will become maximum. While Fig. 9 shows,
the Contours of static pressure distribution on surfaces of three blades turbine at angular positions 270° to
represent the case of all vane are fully open. At this position, the air can flow freely between the vanes
and the turbine will rotate faster.
Figure 6: Contours of static pressure for combined closed vanes blade.
1
1.05
1.1
1.15
1.2
1.25
1.3
1.35
1.4
1.45
0 15 30 45 60 75 90 105 120
Dra
g C
oef
fici
ent
(Cd
)
Angular Position (Degree)
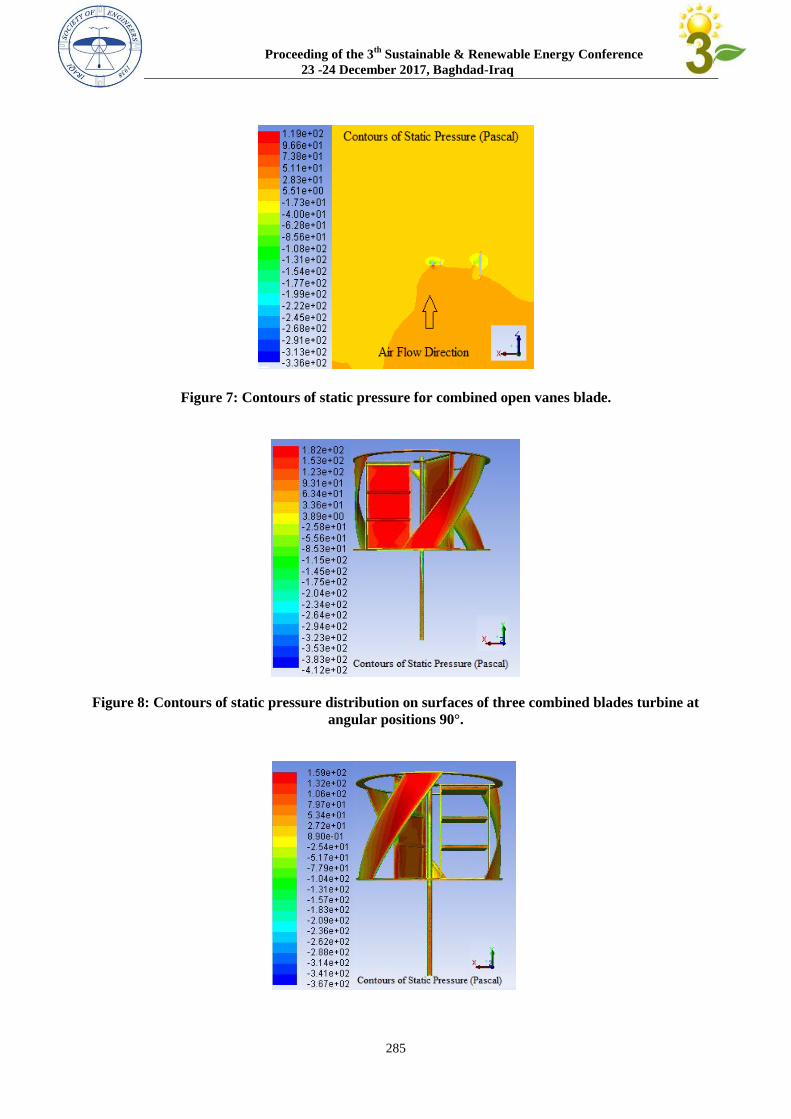
Proceeding of the 3th
Sustainable & Renewable Energy Conference
23 -24 December 2017, Baghdad-Iraq
285
Figure 7: Contours of static pressure for combined open vanes blade.
Figure 8: Contours of static pressure distribution on surfaces of three combined blades turbine at
angular positions 90°.
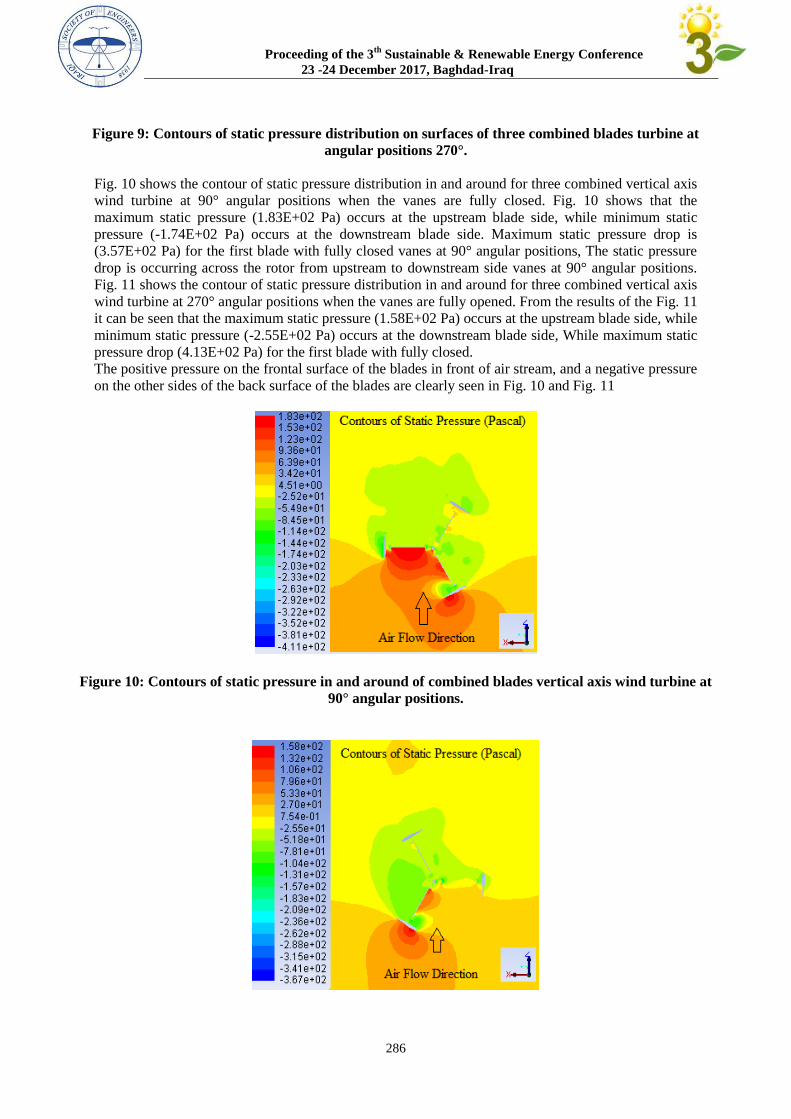
Proceeding of the 3th
Sustainable & Renewable Energy Conference
23 -24 December 2017, Baghdad-Iraq
286
Figure 9: Contours of static pressure distribution on surfaces of three combined blades turbine at
angular positions 270°.
Fig. 10 shows the contour of static pressure distribution in and around for three combined vertical axis
wind turbine at 90° angular positions when the vanes are fully closed. Fig. 10 shows that the
maximum static pressure (1.83E+02 Pa) occurs at the upstream blade side, while minimum static
pressure (-1.74E+02 Pa) occurs at the downstream blade side. Maximum static pressure drop is
(3.57E+02 Pa) for the first blade with fully closed vanes at 90° angular positions, The static pressure
drop is occurring across the rotor from upstream to downstream side vanes at 90° angular positions.
Fig. 11 shows the contour of static pressure distribution in and around for three combined vertical axis
wind turbine at 270° angular positions when the vanes are fully opened. From the results of the Fig. 11
it can be seen that the maximum static pressure (1.58E+02 Pa) occurs at the upstream blade side, while
minimum static pressure (-2.55E+02 Pa) occurs at the downstream blade side, While maximum static
pressure drop (4.13E+02 Pa) for the first blade with fully closed.
The positive pressure on the frontal surface of the blades in front of air stream, and a negative pressure
on the other sides of the back surface of the blades are clearly seen in Fig. 10 and Fig. 11
Figure 10: Contours of static pressure in and around of combined blades vertical axis wind turbine at
90° angular positions.
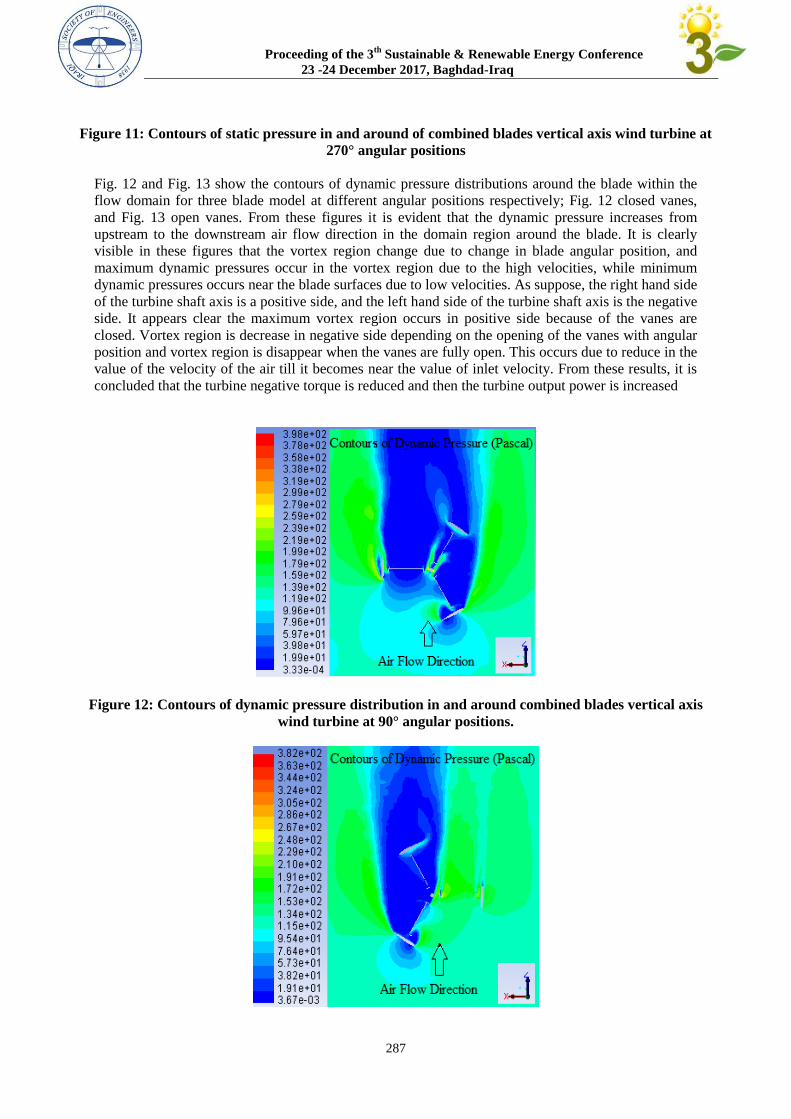
Proceeding of the 3th
Sustainable & Renewable Energy Conference
23 -24 December 2017, Baghdad-Iraq
287
Figure 11: Contours of static pressure in and around of combined blades vertical axis wind turbine at
270° angular positions
Fig. 12 and Fig. 13 show the contours of dynamic pressure distributions around the blade within the
flow domain for three blade model at different angular positions respectively; Fig. 12 closed vanes,
and Fig. 13 open vanes. From these figures it is evident that the dynamic pressure increases from
upstream to the downstream air flow direction in the domain region around the blade. It is clearly
visible in these figures that the vortex region change due to change in blade angular position, and
maximum dynamic pressures occur in the vortex region due to the high velocities, while minimum
dynamic pressures occurs near the blade surfaces due to low velocities. As suppose, the right hand side
of the turbine shaft axis is a positive side, and the left hand side of the turbine shaft axis is the negative
side. It appears clear the maximum vortex region occurs in positive side because of the vanes are
closed. Vortex region is decrease in negative side depending on the opening of the vanes with angular
position and vortex region is disappear when the vanes are fully open. This occurs due to reduce in the
value of the velocity of the air till it becomes near the value of inlet velocity. From these results, it is
concluded that the turbine negative torque is reduced and then the turbine output power is increased
Figure 12: Contours of dynamic pressure distribution in and around combined blades vertical axis
wind turbine at 90° angular positions.
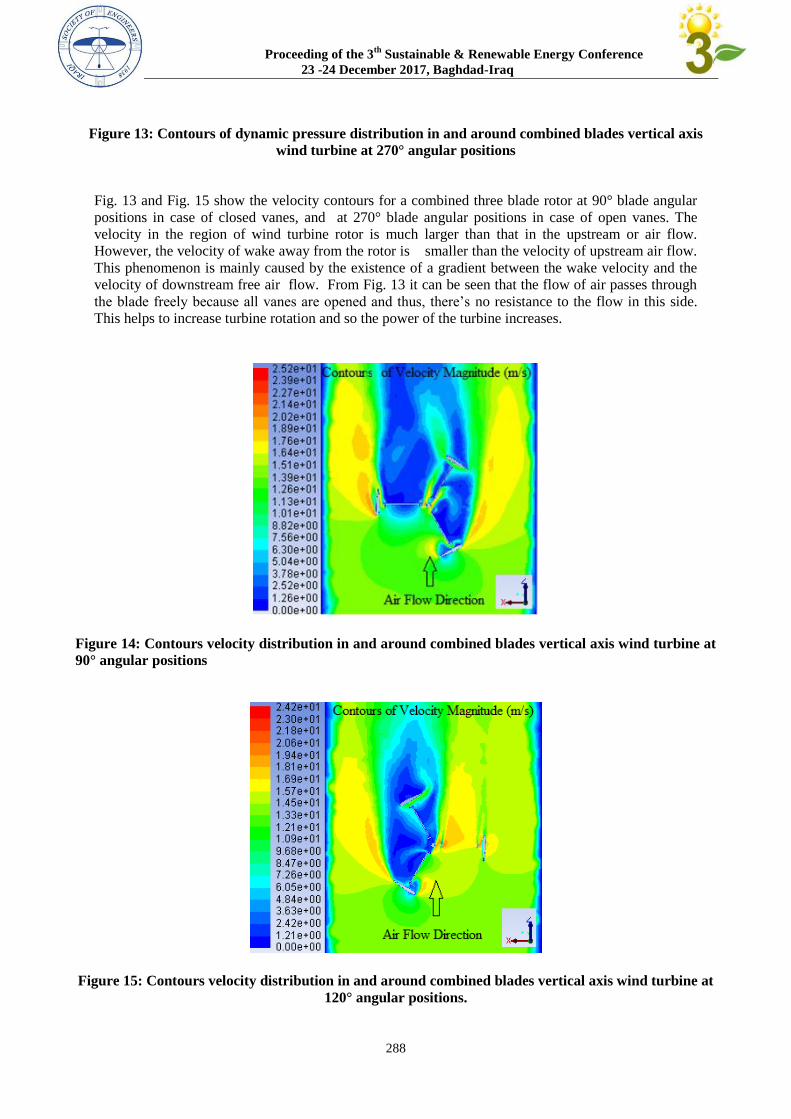
Proceeding of the 3th
Sustainable & Renewable Energy Conference
23 -24 December 2017, Baghdad-Iraq
288
Figure 13: Contours of dynamic pressure distribution in and around combined blades vertical axis
wind turbine at 270° angular positions
Fig. 13 and Fig. 15 show the velocity contours for a combined three blade rotor at 90° blade angular
positions in case of closed vanes, and at 270° blade angular positions in case of open vanes. The
velocity in the region of wind turbine rotor is much larger than that in the upstream or air flow.
However, the velocity of wake away from the rotor is smaller than the velocity of upstream air flow.
This phenomenon is mainly caused by the existence of a gradient between the wake velocity and the
velocity of downstream free air flow. From Fig. 13 it can be seen that the flow of air passes through
the blade freely because all vanes are opened and thus, there’s no resistance to the flow in this side.
This helps to increase turbine rotation and so the power of the turbine increases.
Figure 14: Contours velocity distribution in and around combined blades vertical axis wind turbine at
90° angular positions
Figure 15: Contours velocity distribution in and around combined blades vertical axis wind turbine at
120° angular positions.
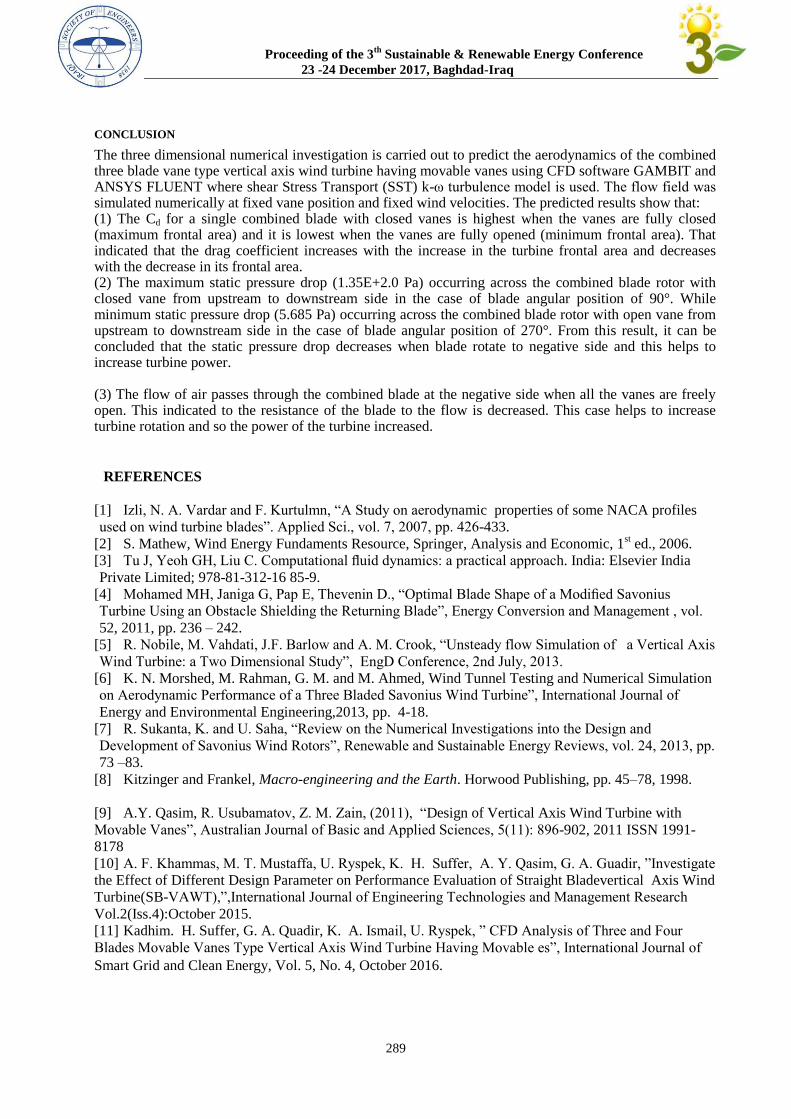
Proceeding of the 3th
Sustainable & Renewable Energy Conference
23 -24 December 2017, Baghdad-Iraq
289
CONCLUSION
The three dimensional numerical investigation is carried out to predict the aerodynamics of the combined three blade vane type vertical axis wind turbine having movable vanes using CFD software GAMBIT and ANSYS FLUENT where shear Stress Transport (SST) k-ω turbulence model is used. The flow field was simulated numerically at fixed vane position and fixed wind velocities. The predicted results show that: (1) The Cd for a single combined blade with closed vanes is highest when the vanes are fully closed (maximum frontal area) and it is lowest when the vanes are fully opened (minimum frontal area). That indicated that the drag coefficient increases with the increase in the turbine frontal area and decreases with the decrease in its frontal area. (2) The maximum static pressure drop (1.35E+2.0 Pa) occurring across the combined blade rotor with closed vane from upstream to downstream side in the case of blade angular position of 90°. While minimum static pressure drop (5.685 Pa) occurring across the combined blade rotor with open vane from upstream to downstream side in the case of blade angular position of 270°. From this result, it can be concluded that the static pressure drop decreases when blade rotate to negative side and this helps to increase turbine power. (3) The flow of air passes through the combined blade at the negative side when all the vanes are freely open. This indicated to the resistance of the blade to the flow is decreased. This case helps to increase turbine rotation and so the power of the turbine increased.
REFERENCES
[1] Izli, N. A. Vardar and F. Kurtulmn, “A Study on aerodynamic properties of some NACA profiles
used on wind turbine blades”. Applied Sci., vol. 7, 2007, pp. 426-433.
[2] S. Mathew, Wind Energy Fundaments Resource, Springer, Analysis and Economic, 1st ed., 2006.
[3] Tu J, Yeoh GH, Liu C. Computational fluid dynamics: a practical approach. India: Elsevier India
Private Limited; 978-81-312-16 85-9.
[4] Mohamed MH, Janiga G, Pap E, Thevenin D., “Optimal Blade Shape of a Modified Savonius
Turbine Using an Obstacle Shielding the Returning Blade”, Energy Conversion and Management , vol.
52, 2011, pp. 236 – 242.
[5] R. Nobile, M. Vahdati, J.F. Barlow and A. M. Crook, “Unsteady flow Simulation of a Vertical Axis
Wind Turbine: a Two Dimensional Study”, EngD Conference, 2nd July, 2013.
[6] K. N. Morshed, M. Rahman, G. M. and M. Ahmed, Wind Tunnel Testing and Numerical Simulation
on Aerodynamic Performance of a Three Bladed Savonius Wind Turbine”, International Journal of
Energy and Environmental Engineering,2013, pp. 4-18.
[7] R. Sukanta, K. and U. Saha, “Review on the Numerical Investigations into the Design and
Development of Savonius Wind Rotors”, Renewable and Sustainable Energy Reviews, vol. 24, 2013, pp.
73 –83.
[8] Kitzinger and Frankel, Macro-engineering and the Earth. Horwood Publishing, pp. 45–78, 1998.
[9] A.Y. Qasim, R. Usubamatov, Z. M. Zain, (2011), “Design of Vertical Axis Wind Turbine with
Movable Vanes”, Australian Journal of Basic and Applied Sciences, 5(11): 896-902, 2011 ISSN 1991-
8178
[10] A. F. Khammas, M. T. Mustaffa, U. Ryspek, K. H. Suffer, A. Y. Qasim, G. A. Guadir, ”Investigate
the Effect of Different Design Parameter on Performance Evaluation of Straight Bladevertical Axis Wind
Turbine(SB-VAWT),”,International Journal of Engineering Technologies and Management Research
Vol.2(Iss.4):October 2015.
[11] Kadhim. H. Suffer, G. A. Quadir, K. A. Ismail, U. Ryspek, ” CFD Analysis of Three and Four
Blades Movable Vanes Type Vertical Axis Wind Turbine Having Movable es”, International Journal of
Smart Grid and Clean Energy, Vol. 5, No. 4, October 2016.