surface chemistry and tip-sample interactions in atomic force microscopy
TRANSCRIPT
COLLOIDS AND A
Colloids and Surfaces SURFACES E L S E V I E R A: Physicochemical and Engineering Aspects 94 (1995) 29 51
Surface chemistry and tip-sample interactions in atomic force microscopy
Tim J. Senden a'*, Calum J. D r u m m o n d a,b,,
aDepartment of Applied Mathematics, Research School of Physical Sciences and Engineering, The Australian National University, GPO Box 4, Canberra, A.C.T., 2601 Australia
bCSIRO Division of Chemicals and Polymers, Private Bag I0, Rosebank MDC, Clayton, Vic. 3169, Australia
Received 14 September 1993; accepted 17 March 1994
Abstract
Microfabricated silicon nitride cantilevers with integral tips are commonly employed in atomic force microscopy. The link between surface chemistry, including surface group acid-base dissociation and counterion complexation, and tip-sample interaction in aqueous electrolyte solution is examined. Silicon nitride tip interaction with "flat plate" samples of both muscovite mica and silicon nitride as a function of aqueous solution pH and electrolyte concentration is investigated. The long-range component of the interaction is normalized with respect to an effective tip radius, and as a result electrical double layer and van der Waals interactions can be discussed quantitatively. Microfracture and tribochemical tip wear is also discussed with reference to atomic force microscope contact mode imaging. Non- retarded Hamaker constants are reported for a range of silicon nitride, silica, silicon and muscovite mica systems.
Keywords: Atomic force microscopy; Silicon nitride; Surface chemistry; Tip-sample interactions
1. Introduction phy. Imaging in aqueous electrolyte solutions has also become popular. This is because imaging in
The atomic force microscope (AFM) can provide aqueous solutions is potentially less destructive to images of surfaces with sub-optical resolution samples, and because there is obviously a great [ 1-93. The most popular imaging procedure is to deal of interest in imaging biological and chemical raster scan a sample under a cantilever attached samples in aqueous environments. The develop- tip. The tip is usually in Born "contact" with the ment of non-destructive imaging procedures may sample but in aqueous solution may also glide on be aided by determining the relationship between either a hydration layer or the electrical double the surface chemistry of both tip and sample and layer [103. During the scanning process, t ip- the total force of interaction between tip and sample interactions are monitored through the sample in aqueous solutions. deflections of the cantilever. In this article we report our investigations of the
Commercial availability [-11,123 has meant that surface chemistry that governs the total force of microfabricated silicon nitride tips [-13] are the interaction between a microfabricated silicon nit-
ride tip and either a muscovite mica or a silicon most commonly used probes of sample topogra- nitride "fiat plate" sample in aqueous solution. We focus on the t ip-sample interaction as a function
* Corresponding authors, of both pH and electrolyte concentration.
0927-7757/95/$09.50 © 1995 Elsevier Science B.V. All rights reserved SSDI 0927-7757(94)02954-Q
30 T.J. Senden, CJ. Drummond~Colloids Surfitces A: Physicochem. Eng. Aspects 94 (1995)29-51
Muscovite mica is a frequently used AFM sub- ous solutions and the interparticle interactions strate [14]. Muscovite mica is chosen as the regulated to form high density compacts [24]. sample because it provides a molecularly smooth surface and it has a well-resolved AFM image. In principle, mica provides an ideal substrate for the 2. Experimental imaging of either adsorbed or deposited organic molecules because AFM images may be interpreted The atomic force microscope (Nanoscope II), in terms of molecular dimensions and/or lattice fluid cell, and the silicon nitride cantilevers with spacings without the complication of substrate tips were supplied by Digital Instruments Inc. surface roughness. Nevertheless, full exploitation (Santa Barbara, California). The silicon nitride tips of the unique properties of muscovite mica as a were treated with a water plasma (10W for 30s; substrate, especially in the area of obtaining non- water vapour pressure 65 mTorr) immediately destructive images of organic molecules in aqueous prior to use. Cantilevers with an experimentally environments, requires a knowledge of the factors determined spring constant [25] (k) of 0.11 + 0.01 that determine the total interaction between a tip N m i were employed. The AFM fluid cell was and a muscovite mica sample [10,15]. connected via a peristaltic pump arrangement to a
The symmetric silicon nitride til:wsample inter- reservoir of aqueous solution that was maintained action was primarily investigated in order to facili- under a nitrogen atmosphere. With the exception tate the interpretation of the asymmetric silicon of when the force measurements were recorded,
solution from the reservoir was continuously circu- nitride-muscovite mica interaction. Nevertheless, lated through the AFM fluid cell. it is worth mentioning that there are two other
The muscovite mica was obtained from Mica silicon nitride applications where further develop- ment would be aided by an increased understand- Supplies (Christchurch, UK). Each mica sample ing of the surface chemistry of silicon nitride in was freshly cleaved before being used. Water was aqueous solutions, viz. ion-sensitive field-effect prepared by passing tap water through a "Krystal
Klear" reverse osmosis system, a distillation stage transistors (ISFETs) and advanced ceramics, and then a MilliQ Plus Ultra-Pure Water System.
ISFETs can be used to measure pH and the The purified water had a conductivity below activities of many other ions in aqueous solutions 0.9 ItS cm a at 25°C. The pH was adjusted with [16]. In these electronic devices the transduction analytical grade NaOH and HC1. NaC1 was also occurs at a gate insulator that is in direct contact of analytical grade. The pH was measured with a with the electrolyte solution. The electrostatic Metrohm 654 pH meter and a combined glass potential at the insulator/electrolyte interface electrode. National Bureau of Standards buffers determines the response of theion-sensitivedevices, were used to calibrate the response of the pH Therefore any understanding of the ISFET's electrode immediately prior to use. response must be based on an understanding of The AFM controls the sample displacement by the electrical double layer properties of the insula- applying a voltage to a calibrated piezoelectric tor. Silicon nitride is a frequently used insulator ceramic tube. Cantilever deflection is detected for pH-sensing ISFETs [ 17-19]. through a laser beam which is focused on the back
Silicon nitride ceramics possess significant hard- of the cantilever and reflected to a position across hess, wear resistance, good thermal shock resis- a two-segment (A and B) photodiode. Photodiode tance, high mechanical strength at elevated signal ( ( A - B ) / ( A + B ) ) v e r s u s sample displace- temperatures, chemical stability and low density meat data are converted in order to obtain the [20]. They are considered to be excellent candi- total force of interaction (F) between tip and dates for engine and turbine construction, sample as a function of the tip sample separation Colloidal processing is a relatively new method (D) [10,15,26,27]. A direct consequence of the that may be used to fabricate ceramics [21--23]. relatively large compressibility moduli of silicon In this procedure, powders are dispersed in aque- nitride and mica is that when the tip and sample
T.J. Senden, C.J. Drummond/Colloids Surfaces A: Physicochem. Eng. Aspects 94 (1995) 29-51 31
are in "contact" (D=0) a change in the sample relatively smooth convex mounds that are roughly displacement (d) causes an equal change in the 100 nm 2 in size [10]. cantilever deflection (x). The relationship describ- A VG Escalab V spectrometer was used to ing this linear coupling of d and x (i.e. Ax/Ad = determine the elemental surface composition of the (2) and Hooke's law (F = - kx) were employed to LPCVD silicon nitride film deposited on the silicon convert the photodiode signal to absolute force, wafer. Angle-dependent X-ray photoelectron Zero force was measured at large tip-sample sepa- spectroscopy (ADXPS) was employed to gain rations where the cantilever was undeflected apparent depth profiles. This work was conducted (Ax/Ad=O). Tip-sample separations were deter- by Thomas Gengenbach (CSIRO, Division of mined by adding the sample displacement and Chemicals and Polymers) and the general pro- cantilever deflection ( D = d + x ) . In general, the cedure has been reported elsewhere [30]. The error in D is _+0.1 nm and the error in F is requisite information for the deconvolution of _+ 10-15%. overlapping bands and the surface group assign-
The silicon nitride cantilevers with integral tip ment was obtained from the reports of Taylor and are microfabricated by a low pressure chemical co-workers [-31-34], Bergstr6m and Pugh E35] vapour deposition (LPCVD) process [28]. The and Brow and Pantano [36]. reactor employed by Digital Instruments includes Both the advancing and receding contact a diffusion style furnace tube, a 60 ft 3 min -1 angles of water drops placed on the LPCVD throttled mechanical pump and mass flow control silicon nitride planar surface were investigated.
Measurements were performed with aqueous solu- of source gases. The nominal LPCVD process utilizes (i) a source gas ratio of SiH2C12:NH3 that tions of both 10 3 and 10 -2 tool dm -3 NaC1 as
a function of pH. The drops were maintained at is 6:1, (ii) a deposition temperature of 790-810°C, ambient temperature in a water-saturated nitrogen (iii) a deposition pressure of 300 mTorr, and (iv) a
deposition rate of 0.2 ~tm h -1. It should also be atmosphere.
noted that the surface of the silicon nitride facing away from the tip has bene subjected to 4 h of
3. Results and discussion l l00c'C steam oxidation, which alters the stress characteristics from those of the as-deposited films.
3.1. Surface chemistry Periodically, when the film stress does not meet
the specifications (as measured by "native" canti- 3.1.1. Muscovite mica lever deflectiont, the cantilever may be stress corn- Muscovite mica is a well-studied substrate and pensated through the deposition of a thin heated from streaming potential [37], plane interface chrome layer (on the non-tip side) which flattens [38], electrophoretic mobility E39] and surface the cantilever, force measurements E40-43], some general state-
Macroscopic LPCVD silicon nitride surfaces ments about the surface charge characteristics can were obtained from Silica Source Technology, be made. Mica is always negatively charged in Corporation (Tempe, Arizona). These samples had water and in aqueous 1 • 1 electrolyte solution. As silicon nitride films (500 nm thick) that were depos- the pH is increased progressively from 3 to about ited on the (100) silicon wafers by employing 7, the mica diffuse layer potential increases mono- an LPCVD process that was similar to the tonically. The mica diffuse layer potential is essen- one employed by Digital Instruments [-29]. The tially invariant in the pH 7-10 range, though the average roughness of the LPCVD surface is depen- actual magnitude of this potential can vary sub- dent on the area imaged. On areas of 1 ~tm 2 the stantially from one mica sample to another [40]. typical roughness is around 14 nm with a standard Increasing the concentration of 1 " 1 electrolyte may deviation of about 2.5 nm [10]. Generally, below cause a decrease in the mica diffuse layer potential areas of 100 nm 2 the roughness drops to around but does not result in charge reversal. 3-5 nm. This is because the surface comprises The surface charge of mica is generally consid-
32 T.J. Senden, CJ. Drummond/Colloids Surfaces A: Physicochem. Eng. Aspects 94 (1995) 29-51
ered to be due to the negative aluminosilicate than the primary silylamine sites, and silazane is lattice charge arising from the isomorphous dis- expected to dominate the total silylamine surface placement of one in four silicon atoms with alu- site population [46]. minium. Nonetheless, there has been a recent Throughout this work, we use the generic term suggestion [37] that surface silanol groups (possi- silylamine to represent both silazane and primary bly resulting from hydrolysed siloxane bonds)may silylamine surface sites. We also use the term play a role in the surface chemistry of mica. silylammonium to represent both silazanium and
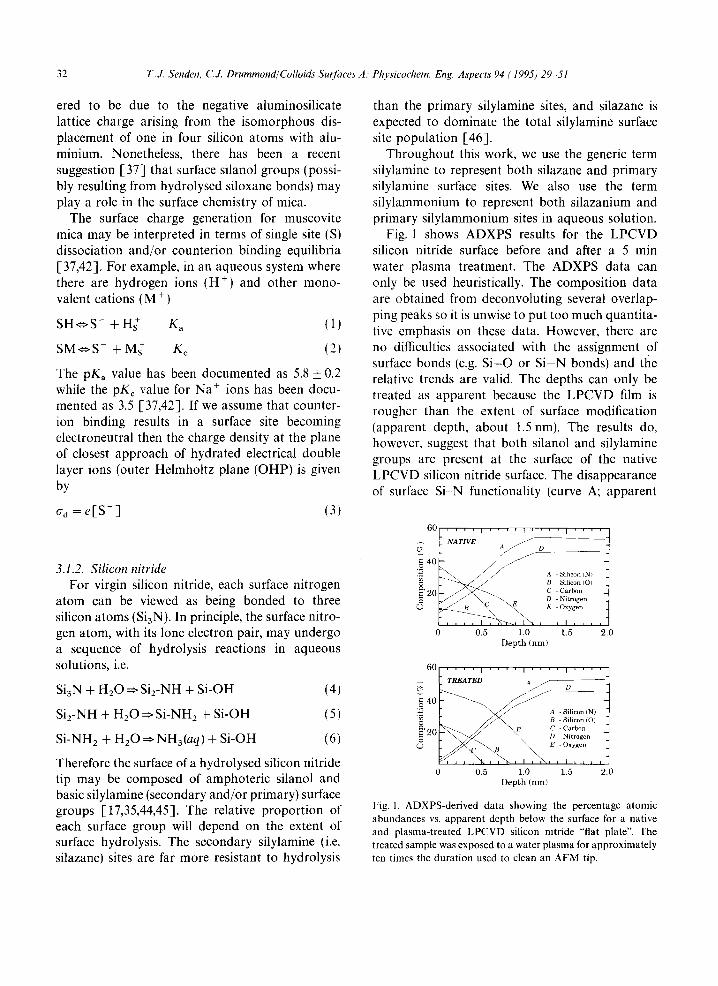
The surface charge generation for muscovite primary silylammonium sites in aqueous solution. mica may be interpreted in terms of single site (S) Fig. I shows ADXPS results for the LPCVD dissociation and/or counterion binding equilibria silicon nitride surface before and after a 5 min [37,42], For example, in an aqueous system where water plasma treatment. The ADXPS data can there are hydrogen ions (H +) and other mono- only be used heuristically. The composition data valent cations (M +) are obtained from deconvoluting several overlap-
ping peaks so it is unwise to put too much quantita- SHe>S- + H~ K a (1) tive emphasis on these data. However, there are S M ~ S - + Ms + Kc (2) no difficulties associated with the assignment of
surface bonds (e.g. S i -O or S i -N bonds) and tile The pKa value has been documented as 5.8 _+ 0.2 relative trends are valid. The depths can only be while the pK c value for Na + ions has been docu- treated as apparent because the LPCVD film is mented as 3.5 [37,42]. If we assume that counter- rougher than the extent of surface modification ion binding results in a surface site becoming (apparent depth, about 1.5 nm). The results do, electroneutral then the charge density at the plane however, suggest that both silanol and silylamine of closest approach of hydrated electrical double groups are present at the surface of the native layer ions (outer Helmholtz plane (OHP) is given LPCVD silicon nitride surface. The disappearance
by of surface Si-N functionality (curve A; apparent
aa = e [ S - ] (3) 60[ . . . . t . . . . r . . . . t . . . . /
N A T I V E - - - - -
3.1.2. Silicon nitride ~ ~ / ~ - .~ °~'40 A - Silicon (N)
For virgin silicon nitride, each surface nitrogen ~2o (,-Carbon
!7 t atom can be viewed as being bonded to three c o , silicon atoms (Si3N). In principle, the surface nitro- , ~ ~en, , , gen atom, with its lone electron pair, may undergo 0 0.5 1.0 1.5 2.0 a sequence of hydrolysis reactions in aqueous Depth(nm)
solutions, i.e. 60 . . . . , . . . . , . . . . , . . . . T R E A T E D A D
Si3N + H 2 0 ~ S i 2 - N H + Si-OH (4) ~ ~ ~ - o= 4o
Si2-NH + H 2 0 :=> Si-NH2 + Si-OH ( 5 ) ~ a -Silicon tN o B Silicon (G
E C - Carlton ~o I=~20 - ~ D - Nitrogen
S i - N H 2 + H 2 0 ~ N H 3 ( a q ) + S i - O H (6) w E_ o.,~o.
Therefore the surface of a hydrolysed silicon nitride ' , ~ , , , 0 0.5 1.0 1.5 2.0
tip may be composed of amphoteric silanol and Depth(nm) basic silylamine (secondary and/or primary) surface groups [17,35,44,45]. The relative proportion of Fig. I. ADXPS-derived data showing the percentage atomic
abundances vs. appa ren t depth below the surface for a nat ive each surface group will depend on the extent of and p lasma- t rea ted L P C V D silicon ni tr ide "flat plate". The surface hydrolysis. The secondary silylamine (i.e. t reated sample was exposed to a water p l a sma for app rox ima te ly
silazane) sites are far more resistant to hydrolysis ten t imes the dura t ion used to clean an A F M tip.
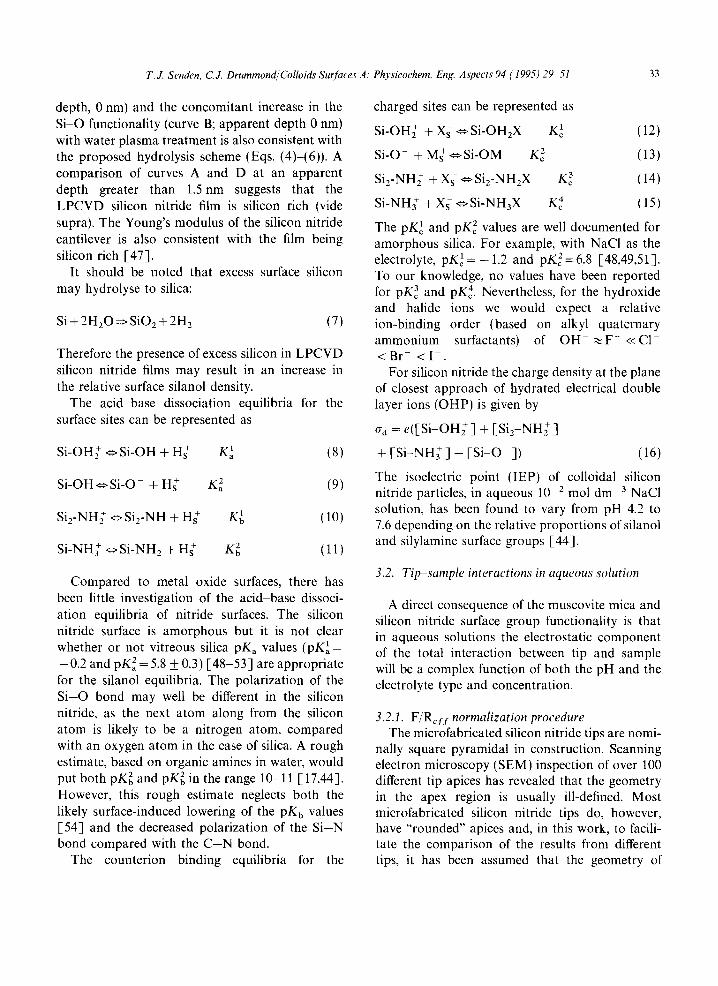
T.J. Senden, C.J. Drummond/Colloids Surfaces A: Physicochem. Eng. Aspects 94 (1995) 29 51 33
depth, 0 nm) and the concomitant increase in the charged sites can be represented as
Si-O functionality (curve B; apparent depth 0 nm) Si-OH~- + Xs-~ Si-OH2X K~ (12) with water plasma treatment is also consistent with the proposed hydrolysis scheme (Eqs. (4)-(6)). A Si-O- + Ms ¢>Si-OM K 2 (13)
comparison of curves A and D at an apparent Si2-NH ~ + Xsc>Siz-NHzX Kc 3 (14) depth greater than 1,5nm suggests that the LPCVD silicon nitride film is silicon rich (vide Si-NH~ + X s ~ S i - N H 3 X K 4 (15)
supra). The Young's modulus of the silicon nitride The pK~ and pK 2 values are well documented for cantilever is also consistent with the film being amorphous silica. For example, with NaCI as the silicon rich [47]. electrolyte, pK 1= -1 .2 and pK2=6.8 [48,49,51].
It should be noted that excess surface silicon To our knowledge, no values have been reported may hydrolyse to silica: for pK 3 and pK 4. Nevertheless, for the hydroxide
and halide ions we would expect a relative S i + 2 H z O ~ S i O z + 2 H 2 (7) ion-binding order (based on alkyl quaternary
ammonium surfactants) of OH ~ F - <<C1 Therefore the presence of excess silicon in LPCVD < Br- < I . silicon nitride films may result in an increase in For silicon nitride the charge density at the plane the relative surface silanol density, of closest approach of hydrated electrical double
The acid base dissociation equilibria for the layer ions (OHP) is given by surface sites can be represented as
aa = e([Si-OH + ] + [Si2-NH + ]
Si-OH~-,~-Si-OH+H~ Ka ~ (8) + [ S i - N H ~ - ] - [ S i O ]) (16)
The isoelectric point (IEP) of colloidal silicon S i -OH~Si -O- + H~- Ka 2 (9) nitride particles, in aqueous 10 -2 mol dm -3 NaC1
Si2-NHf ¢*~Si2-NH + Hs + K~ (10) solution, has been found to vary from pH 4.2 to 7.6 depending on the relative proportions of silanol and silylamine surface groups [44].
Si-NH~" ¢> Si-NH2 + H~ K 2 ( 11 )
3.2. Tip-sample interactions in aqueous solution Compared to metal oxide surfaces, there has
been little investigation of the acid-base dissoci- A direct consequence of the muscovite mica and ation equilibria of nitride surfaces. The silicon silicon nitride surface group functionality is that nitride surface is amorphous but it is not clear in aqueous solutions the electrostatic component whether or not vitreous silica pKa values (pKa ~ = of the total interaction between tip and sample -0 .2 and pK 2 = 5.8 _+ 0.3) [48-53] are appropriate will be a complex function of both the pH and the for the silanol equilibria. The polarization of the electrolyte type and concentration. S i -O bond may well be different in the silicon nitride, as the next atom along from the silicon 3.2.1. F/Reyl normalization procedure atom is likely to be a nitrogen atom, compared The microfabricated silicon nitride tips are nomi- with an oxygen atom in the case of silica. A rough nally square pyramidal in construction. Scanning estimate, based on organic amines in water, would electron microscopy (SEM) inspection of over 100 put both pK 2 and pK 2 in the range 10-11 [ 17,44]. different tip apices has revealed that the geometry However, this rough estimate neglects both the in the apex region is usually ill-defined. Most likely surface-induced lowering of the pK b values microfabricated silicon nitride tips do, however, [54] and the decreased polarization of the S i -N have "rounded" apices and, in this work, to facili- bond compared with the C - N bond. rate the comparison of the results from different
The counterion binding equilibria for the tips, it has been assumed that the geometry of
3 4 T.J. Senden, C.J. Drummond/Colloids Su~/hces A: Physicochem. Eng. Aspects 94 (1995) 29 51
interaction of the tip may be approximated by a unit area is given by
sphere with the same radius of curvature as the /Tvaw= Fvdw/9~rR_- A/12~D 2 (19) apex of the tip. This effective radius of interaction ~PP lsP ! . . . . . .
is denoted Rer f. The procedure for determining Reff where A is the non-retarded Hamaker constant. In has been given in detail elsewhere [ 15]. In essence, this work it has been assumed that the respective we determine the force F as a function of til> non-retarded Hamaker constants for the asymmet- sample separation D in an aqueous hexadecyltri- ric and the symmetric systems are 3.40 x methyl ammonium bromide (CTAB) solution. This 10 2o j and 6.07 x 10 .2o J. These Hamaker con- is then compared with the same interaction stants are based on stoichiometric silicon nitride between a sphere of known radius and a flat and, since the LPCVD films appear to be silicon surface. Here Ref f is the value required to fit the rich, these values may be underestimated (see the particular tip-sample F versus D curve to the appendix for a full treatment). reference FIR versus D curve, at large separations. The free energy of similar electrical double layer
( • e d l edl It needs to be borne in mind that Reff c o r r e s - interaction per unit area ~_pp = F s p / 2 ~ R ) was cal- ponds to a long-range radius of interaction, and it culated from an exact numerical solution of the may be inappropriate to use Ref f to normalize the Poisson Boltzmann equation for both the constant short-range (especially D~<3 nm)interaction, charge and constant potential interaction limits
[58]. Quoted effective diffuse layer potentials ( ~ d ) 3.2.2. Analysis of the normalized interaction refer to separations where the calculated constant
In the quantitative analysis of the force curves charge and constant potential interaction is equiva- we have employed the Derjaguin approximation lent: approximately one Debye length out from the [55] to relate the force of interaction between the onset of the diffuse layer. tip (assumed to be an effective sphere) and the For a symmetrical z:z electrolyte, the Gouy planar sample (Fsp) to the free energy of interaction Chapman treatment of the diffuse layer provides per unit area between two parallel planar surfaces (Epp), i.e. O" d = (2~,'eeokT/ze) sinh(ze~Pd/2kT) (20)
where ~,- is the inverse Debye length Epp = Fsp/27rR (17)
This geometrical simplification greatly facilitates k'=(2zZeZn°/ee°kT)l/2 (21)
the analysis of the various components of the total and no, e and eo represent the number concen- force of interaction between the tip and sample, tration of ions, the bulk dielectric constant and the The obvious caveat on the quantitative analysis is permittivity of free space respectively. that the tip is treated as an effective sphere when It is usual to present surface force curves in a its actual geometry is generally ill-defined [15]. log-linear format. This has not been done in the The appropriateness of using the Derjaguin multiple force curve plots shown in this work, as approximation in the interpretation of AFM tip it was thought that the advantage of demonstrating sample interactions has been discussed previously the exponential character of the interaction was [15]. outweighed by the loss of clarity in the resulting
We makeuseoftheclassicalDerjaguin Landau- plots. This could have been rectified by data Verway-Overbeek (DLVO) [56,57] assumption smoothing, but we prefer to present the raw data. that the summation of the free energy of van der In many cases the measured interaction is close to
tE vdwl } and the the thermal limit. Waals interaction per unit area ~pp ,
free energy of electrical double layer interaction For the pH titration data we have chosen to tFedZ } gives the total free energy of plot the normalized force at a standard reference per unit area ~__pp ,
E x interaction per unit area ( p p ) , i . e . separation where the van der Waals component to ETp = E vdw + F edl ( 1 8 ) the interaction is negligible (10 nm and 15 nm for
~pp -pp the asymmetric and symmetric systems respec- The free energy of van der Waals interaction per tively) as a function of pH. In these plots each of
T.J. Senden, C.J. Drummond/Colloids Surfaces A. Physicochem. Eng. Aspects 94 (1995) 29--51 35
the data points represents a measurement taken ~ A' ' ' ' ' ' ' from a single independent force curve. All the ~ 4.0- ~
"7, B A - pH 10.2 recorded data are shown with some of the data E - ~ B . p H 9 . 4
points coincident so they appear as a single point. ~ 3.0 <,~i. c c - p H S . 9 ~ " ~ _ _ D-pH7.4 When the Debye length is invariant, this method E 2 . 0 - ~ O A ~ t , ~ ~ .~ . E - p f t 5 . 8
provides a simple assessment of the relative ~ changes in aa as a function of pH. In the symmetric ~ 1.0~_ Q ] ~ ~ system the magnitude of the force at the specified a~ 0.0 separation could be related to an effective diffuse i layer potential. | , ~ , ~ , t ,
The presented force curves show a gap in the 0 10 2o 3o 4o data at small separations where a spring instability (a) Tip-Sample Separation (nm)
has occurred. In this region the gradient of the surface force exceeds the spring constant and the .~, A tip "jumps" to the next position of mechanical z-" 2 /, ' -pH W.2, (90 mv~
[ I _ tt, B-pH9.8. (75mV) equilibrium, usually into contact with the surface. E F ~ .~',,Q*,o c - p H 9 . 5 , (40mV)
5.6, (0 m )
3.2.3. pH dependence without background ~ . - electrolyte ~
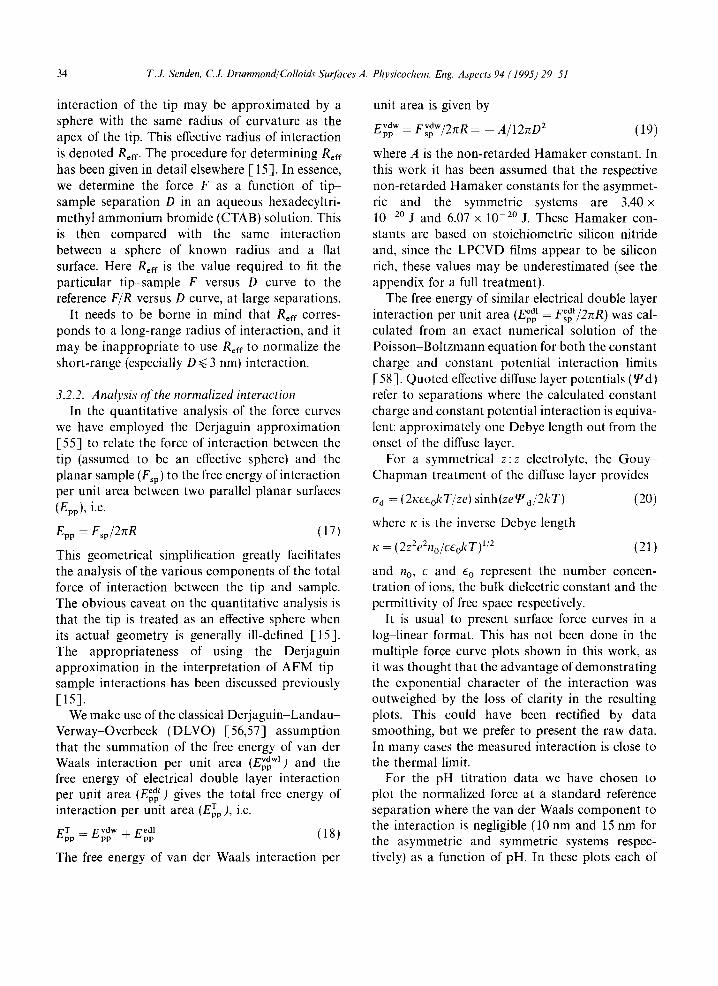
Fig. 2 contains typical force curves that illustrate ~ 0 the pH dependence of the t ip-sample interaction a~ ° in both the symmetric and asymmetric systems. -1 These titrations began in conductivity water at pH 0 10 20 30 40 values around 6 with the pH sequentially increased (b) Tip-Sample Separation (nm) to higher values with the sole addition of NaOH. This procedure was followed in order to minimize Fig. 2. (a) Representative normalized force curves as a function
of pH, with no added background electrolyte, for a muscovite the presence of charged surface group counterions, mica sample opposing a silicon nitride tip (R¢~= 130 nm). (b)
For the example of asymmetric interaction Representative normalized force curves as a function of pH, (Fig. 2(a)) the effective radius was small and the with no added background electrolyte, for a silicon nitride thermal noise in the cantilever appears as a con- sample opposing a silicon nitride tip (R¢~.= 380 nm). The fitted s ide rab le c o m p o n e n t of the t o t a l s ignal . F o r the curves in (b) are discussed in the text. The onset of the diffuse
layer has been set at zero separation (D=0}. Shifting the onset example of symmetric interaction (Fig. 2(b)) of the diffuse layer has little effect on the potentials. DLVO fits are included. For these fits the onset of both the van der Waals and the diffuse layer
interaction was located at the "zero of separation" and "flat plate" is silica-like in character. Therefore (D =0}; vide infra. The effective diffuse layer poten- tial and the Debye length were considered to be we considered the possibility that the "anomolous" adjustable parameters. The fitted curves (Fig. 2(b)) Debye length was due to the dissolution ofmonosi - represent the case where it is assumed that the licic acid from silica surface sites in the system, i.e.
opposing silicon nitride surfaces interact at con- S i O 2 + 2 H 2 0 ~ S i ( O H ) 4 (22)
stant potential. Between pH 9 and 10, the fitted Si(OH)4c,.(HO)3Si_ O - + H + 3 Debye length was invariant and was about 16 nm. Ka (23) This corresponds to a background of about The acid-base equilibrium constant pK ] equals 4 x 10 4 mol dm -3 1" 1 electrolyte, showing the 9.8 [59]. Consequently, if there was a significant presence of some solution impurity, amount of monosilicic acid in solution then one
The fluid cell, cantilever substrate and solution would expect the Debye length to be markedly pH reservoir all consist of glass. In addition, a propor- dependent above pH 9. This is not the case. tion of the surface of the silicon nitride cantilever Moreover, the normal rate of dissolution of mono-
36 T.J. Senden, CJ. Drummond/Colloids Surfiwes A: Physicochem. Eng. Aapects 94 (1995) 29 51
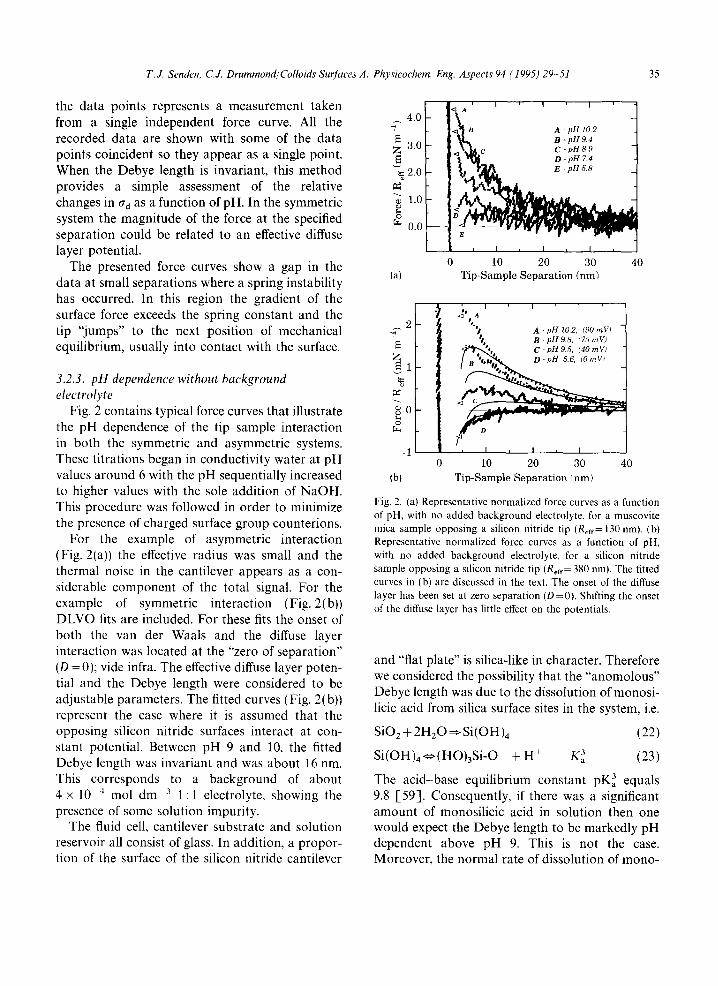
silicic acid from an amorphous silica surface is action as a function of pH. The results are very slow at these pH values [59]. indicative of a silicon nitride surface where (i) ad
The tip-sample jump-in distances are roughly is either net zero or very close to net zero in the consistent with a spring instability induced by the approximate pH range 6-8.5, and (ii) a d monotoni- van der Waals attraction [-15]. For ideal (non- cally increases in the pH range 9-10. The results deformable and smooth) surfaces displaying DLVO in Fig. 3(b), where Refr = 960 nm, display a decrease behaviour, the magnitude of the jump-in distance in the normalized force above pH 10. This is should depend on the tip radius of curvature, the primarily a result of the diminishing Debye length Hamaker function, and ad for both surfaces, with increasing pH (i.e. electrolyte). Fig. 3(b) However, surface roughness effects and thermal includes the corresponding effective diffuse layer noise can cause the jump-in distance to vary mark- potentials (Td) on the right-hand axis and are only edly amongst repeat runs [15]. This spread in the applicable up to pH 10. jump-in distances meant that it was not possible It appears that in the absence of added back- to discern changes in the jump-in distance, in either ground electrolyte the silicon nitride surface is the asymmetric or the symmetric system, as the close to being electrically neutral over a wide pH pH was varied. This was also the case when 10 3 range {from at least pH 6 to 8.5). This unusual mol dm 3 NaC1 was present (vide infra), situation presumably reflects a roughly equal den-
Fig. 3 shows the normalized force at a standard sity of silanol and silylamine surface groups. In the reference separation for different repeat investiga- intermediate pH range both the silanols and silyl- tions of both the asymmetric and symmetric inter- amines are charged. The cationic silylammonium
I I I I
1.5 Reff = 130 n m , • e l l •
e Q I I I I I ]
• R,.ff = 380 nm • 100 1 . 0 , - 1 . 0
~' "- "" so ~
Z 0 5 * 0 5 • 6o
• • : 0 | Z • • 40 ~-
o . o I t F I o o . . . . • 20 . . . . . . . . . . . . . . 0 ~'J"
~2~ 1.5 Reff = 1 5 0 n m - " ~ -- I i ] i ~ [ " * ~:~ ]oo
• . ~ . Ref f = 9 6 0 n m • 1.0
1.0 : =
,, . ~ s': 60 © ~r~ '~o.5 . ,
: s • : " I 0.5 . • • " : " I 40
• e 20 "~ 0.0
- e . . . . . . . . . . . . . 0
0 . 0 _1 I I I I " I I I I I I
5 6 7 8 9 10 6 7 8 9 10 11
(a) pH (b) pH
Fig. 3. (a) F/Raf values at a t ip-sample separation of l0 nm vs. pH (added N a O H only) for mica opposing silicon nitride. (b) F/Reff values at a til:~sample separat ion of 15 nm vs. pH (added N a O H only) for two opposing silicon nitride surfaces. An approximate effective diffuse layer potential scale is also shown. This was derived from the DLVO fit (see text). For both the asymmetric and the symmetric system, two experiments with different effective tip radii have been included to demonstrate the accuracy of estimating an effective radius and the reproducibility of an experiment.
T.J. Senden, CJ. Drummond/Colloids Surfaces A: Physicochem. Eng. Aspects 94 (1995) 29-51 37
groups decrease the apparent pK a of the silanol . . . . groups. Concomitantly, the anionic silanoxide 10 " o groups increase the apparent pK b of the silylam- ~ ""
oo monium groups. This may mean that rather than ~ 9 % having a discrete pH value (i.e. an IEP) where ~ O R e . = 3 8 0 n m °
there is a sharp positive to negative net surface ~ • Rew =960nm °° charge transition, there is an extended pH region s of close to zero net surface charge (i.e. anisoelectric ' ' ' ~ ' J ' ' ' range rather than an isoelectric point). 00 0.2 0.4 o.~ 0s lo
Degr ee of s i l azane ioniza t ion , ~
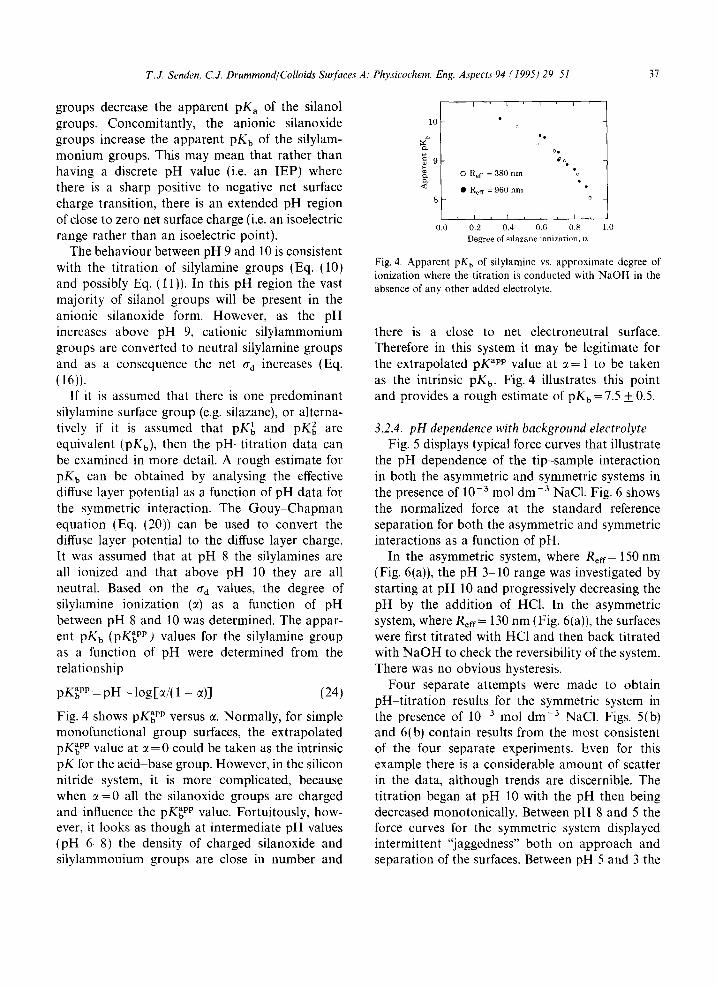
The behaviour between pH 9 and 10 is consistent with the titration of silylamine groups (Eq. (10) Fig. 4. Apparent pKb of silylamine vs. approximate degree of
ionization where the titration is conducted with NaOH in the and possibly Eq. (11 )). In this pH region the vast absence of any other added electrolyte. majority of silanol groups will be present in the anionic silanoxide form, However, as the pH increases above pH 9, cationic silylammonium there is a close to net electroneutral surface. groups are converted to neutral silylamine groups Therefore in this system it may be legitimate for and as a consequence the net ad increases (Eq. the extrapolated pK app value at ,~= 1 to be taken (16)). as the intrinsic pKb. Fig. 4 illustrates this point
If it is assumed that there is one predominant and provides a rough estimate of pK b = 7.5 ± 0.5. silylamine surface group (e.g. silazane), or alterna- tively if it is assumed that pK~ and pK 2 are 3.2.4. pH dependence with background electrolyte equivalent (PKb), then the pH-t i t ra t ion data can Fig. 5 displays typical force curves that illustrate be examined in more detail. A rough estimate for the pH dependence of the tip--sample interaction pK b can be obtained by analysing the effective in both the asymmetric and symmetric systems in diffuse layer potential as a function of pH data for the presence of 10-3 mol dm-3 NaC1. Fig. 6 shows the symmetric interaction. The G o u y - C h a p m a n the normalized force at the standard reference equation (Eq. (20)) can be used to convert the separation for both the asymmetric and symmetric diffuse layer potential to the diffuse layer charge, interactions as a function of pH. It was assumed that at pH 8 the silylamines are In the asymmetric system, where Reff= 150 nm all ionized and that above pH 10 they are all (Fig. 6(a)), the pH 3-10 range was investigated by neutral. Based on the o- a values, the degree of starting at pH 10 and progressively decreasing the silylamine ionization (c 0 as a function of pH pH by the addition of HC1. In the asymmetric between pH 8 and 10 was determined. The appar- system, where Reff= 130 nm (Fig. 6(a)), the surfaces ent pK b (pK~, pp) values for the silylamine group were first titrated with HC1 and then back titrated as a function of pH were determined from the with N a O H to check the reversibility of the system. relationship There was no obvious hysteresis.
p K ~ , P P = p H + l o g [ ~ / ( 1 - c0] (24) Four separate attempts were made to obtain pH-t i t ra t ion results for the symmetric system in
Fig. 4 shows pK~ pp versus c~. Normally, for simple the presence of 10 3 mol dm -3 NaC1. Figs. 5(b) monofunctional group surfaces, the extrapolated and 6(b) contain results from the most consistent pK~ pp value at c~=0 could be taken as the intrinsic of the four separate experiments. Even for this pK for the acid-base group. However, in the silicon example there is a considerable amount of scatter nitride system, it is more complicated, because in the data, although trends are discernible. The when ~- -0 all the silanoxide groups are charged titration began at pH 10 with the pH then being and influence the pK~ pp value. Fortuitously, how- decreased monotonically. Between pH 8 and 5 the ever, it looks as though at intermediate pH values force curves for the symmetric system displayed (pH 6-8) the density of charged silanoxide and intermittent "jaggedness" both on approach and silylammonium groups are close in number and separation of the surfaces. Between pH 5 and 3 the
38 T. ~ Senden, C J. D r u m m o n d / C o l l o i d s S u f f h c e s A: Phys i cochem. Eng. A s p e c t s 94 ( 1 9 9 5 ) 29 51
6 .0 [ - ~A ' i , i ' 2 . 0 I , , , [ 1
L n Ret T = 130 nm * ~" A pH lO.2
t B pl19.0 1.5 e I
4 . 0 - ~ ~ i i c ptf5.8 L D .pH5.0
~ 2 . 0 " ~ k . k ~ ~ 1.0 . '." "1 it
Z ' I . ~ 05 . •
0.0
, , , , , ~ o.o l l {--I I ~--~ 10 20 30 40 ~ R~ff = 150,1,,] ~.
(a) Tip-Sample Separation (rim) "--- 1.5 , , • : • :
~,~ '",, ' ' ' ' ' ' ~ 1.o 2.0 '~ a pH3.o ~ ""
1.5 "~ $" o C pl160 *1 • WI D plllO,withmztCl J 0.5 ~| •
Z 1.0 " < A ~'"~ 0.0 I I I I I [ I 2
,-e 0.5 JI, ~ .8...... 3 4 5 6 7 8 9 0
8 (a) pH 0.0 ,
' ' J ' ' ' 1.5 0 10 20 30 40 I { I I I I { • I
(b) Tip-Sample Separation trim) ~ Reff = 270 n m "
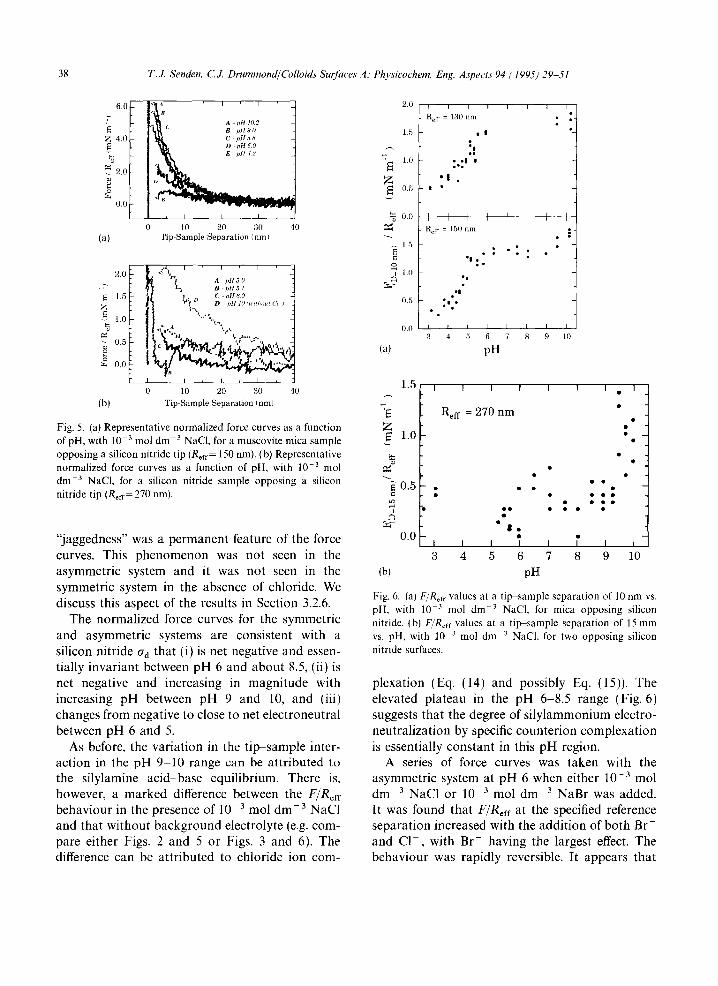
Fig. 5. (a) Representative normalized force curves as a function ~ **
o f p H , w i th 10 3 m o l d m 3 N a C I , for a muscovite mica s a m p l e ~ 1 . 0 •
o p p o s i n g a silicon nitride tip (Rcff = 150 nm) . (b) R e p r e s e n t a t i v e ~ •
normalized force curves as a function of p H , w i th 10 -3 m o l ~ •
d m -3 N a C I , for a silicon nitride s a m p l e o p p o s i n g a s i l icon " -z 0 . 5 ° • • °
nitride tip ( R e f f = 2 7 0 rim). ~ = -" • " • • • -" -" . : . ' : "
i f • "jaggedness" was a permanent feature of the force 0.0 , I I ] , ~' I I curves. This phenomenon was not seen in the 3 4 5 6 7 8 9 10 asymmetric system and it was not seen in the (b) pH symmetric system in the absence of chloride. We
Fig. 6. (a) F/Ref f values at a t i p - s a m p l e s e p a r a t i o n o f 10 n m vs. discuss this aspect of the results in Section 3.2.6. p H , w i th 10 3 m o l d m -3 N a C I , for mica opposing silicon
The normalized force curves for the symmetric nitride. (b) I(./R~u values at a t i l ~ s a m p l e s e p a r a t i o n o f 15 m m
and asymmetric systems are consistent with a vs. pH, with 10 3 m o l d m 3 N a C k for two opposing silicon
silicon nitride cr~ that (i) is net negative and essen- nitride surfaces.
tially invariant between pH 6 and about 8.5, (ii) is net negative and increasing in magnitude with plexation (Eq. (14) and possibly Eq. (15)). The increasing pH between pH 9 and 10, and (iii) elevated plateau in the pH 6-8.5 range (Fig. 6) changes from negative to close to net electroneutral suggests that the degree of s i lylammonium electro- between pH 6 and 5. neutralization by specific counterion complexation
As before, the variation in the t ip-sample inter- is essentially constant in this pH region. action in the pH 9 10 range can be attributed to A series of force curves was taken with the the silylamine acid-base equilibrium. There is, asymmetric system at pH 6 when either 10 - 3 tool however, a marked difference between the F/R~fr dm -3 NaC1 or 10 3 mol dm -3 NaBr was added. behaviour in the presence of 10 -3 mol dm -3 NaCI It was found that F/R~rf at the specified reference and that without background electrolyte (e.g. com- separation increased with the addition of both Br- pare either Figs. 2 and 5 or Figs. 3 and 6). The and C1 , with Br- having the largest effect. The difference can be attributed to chloride ion corn- behaviour was rapidly reversible. It appears that
T.J. Senden, C.J. Drummond/Colloids Surfaces A: Physicochem. Eng. Aspects 94 (1995) 29 51 39
the s i lylammonium groups exhibit a similar coun- 10 terion binding behaviour to the alkyl quaternary z- I ~ . . = l . . i . la a ~/0-: M "
a m m o n i u m surfactants where the relative trend '_ 8~ ~- B-102M - L | ~ C - I O 3 M . in the degree of specific counter ion binding, Z ~L I ~r~ D-164M .
Br > C 1 - > O H - , i s well documented [60] . ~ I r ~ F .... t ..... ~y
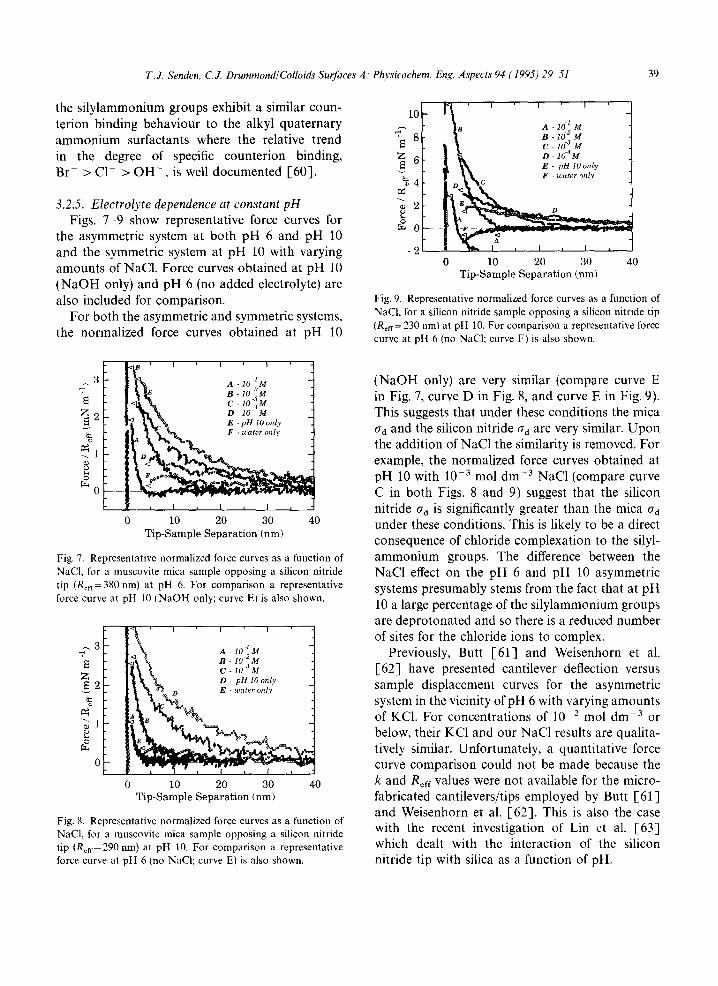
3.2.5. Electrolyte dependence at constant pH 2 Figs. 7 -9 show representative force curves for ~ 0 ...........
the asymmetric system at both pH 6 and pH 10 and the symmetric system at pH 10 with varying -2 " " amounts of NaC1. Force curves obtained at pH 10 0 10 2o 30 4o Tip-Sample Separation (nm) ( N a O H only) and pH 6 (no added electrolyte) are also included for comparison. Fig. 9. Representative normalized force curves as a function of
For both the asymmetric and symmetric systems, NaCI, for a silicon nitride sample opposing a silicon nitride tip the normalized force curves obtained at pH 10 (Rof~=230 nm) at pH 10. For comparison a representative force
curve at pH 6 (no NaCI; curve F) is also shown.
3 a-10 IM ( N a O H only) are very similar (compare curve E '2, I ~ ~ B - 1 0 2M ! <t '~ c-lO~M in Fig. 7, curve D in Fig. 8, and curve E in Fig. 9).
2 L~t~ D IOM This suggests that under these conditions the mica ~ ~ ~ "% E . pH 10 only
~ t l o ' l ~ F t l y t ~ ' . . .... . . . . ad and the silicon nitride aa are very similar. U p o n the addit ion of NaC1 the similarity is removed. For
"~ | ~ ~ ,1i;~,~,~_~£,~1~ . ~ ~ - example, the normalized force curves obtained at It ~ pH 10 with 10 3 mol dm -3 NaC1 (compare curve
0 - t C in both Figs. 8 and 9) suggest that the silicon nitride ad is significantly greater than the mica ad
0 10 2o 3o 4o under these conditions. This is likely to be a direct Tip-Sample Separation (nm)
consequence of chloride complexat ion to the silyl- Fig. 7. Representative normalized force curves as a function of a m m o n i u m groups. The difference between the NaCI, for a muscovite mica sample opposing a silicon nitride NaG1 effect on the pH 6 and pH 10 asymmetric tip (Roll= 380 nm) at pH 6. For comparison a representative systems presumably stems from the fact that at p H force curve at pH 10 (NaOH only; curve E) is also shown.
10 a large percentage of the s i lylammonium groups are deprotonated and so there is a reduced number
~ ' ' ' ~ ' ~ ' of sites for the chloride ions to complex. 3 - A -IOIM ~' ~ \ B-W~M Previously, Butt 1-61] and Weisenhorn et al.
E l~ ~. c - w M [62] have presented cantilever deflection versus z t I~ ~ D- pH 10 only 2 - ~ ~1~ ~ e - ~ t . . . . ~y sample displacement curves for the asymmetric ~ ' ~%=L system in the vicinity of pH 6 with varying amounts ~ '~ " K - = ~ of KC1. For concentrat ions of 10 -2 mol dm -3 or
=o below, their KC1 and our NaC1 results are qualita- . tively similar. Unfortunately, a quantitative force
0 curve compar ison could not be made because the 10 2o 3o 40 k and R~ff values were not available for the micro-
Tip-Sample Separation (nm) fabricated cantilevers/tips employed by Butt 1-61] and Weisenhorn et al. [62] . This is also the case
Fig. 8. Representative normalized force curves as a function of NaC1, for a muscovite mica sample opposing a silicon nitride with the recent investigation of Lin et al. [ 63 ] tip (Raf=290nm) at pH 10. For comparison a representative which dealt with the interaction of the silicon force curve at pH 6 (no NaCI; curve E) is also shown, nitride tip with silica as a function of pH.
40 T.J. Senden, CJ. Drummond~Colloids Sur/~tces A: Physicochem. Eng. A6TJects 94 (1995) 29-.51
Interestingly, there is a clear secondary minimum may be shared between surface groups and displayed in curve A in both Fig. 7 and Fig. 9. This adsorbed ions. minimum is almost certainly overpronounced in The difference in the jump-in distance associated curve A in Fig. 9, possibly because the effective with the displacement of adsorbed layers for the short-range radius is larger than Reff. symmetric and asymmetric systems is intriguing.
As the concentration of NaC1 increases the coun- By inference, about 0.3 nm from the total jump-in terion density at each surface increases. The force distance of 0.9 nm for the asymmetric system must curves for the symmetric system suggest that with be associated with the mica surface. It is difficult approximately 10 2 mol dm -3 NaC1 there is a to reconcile this mica-associated jump-in distance surface monolayer of adsorbed hydrated ions. with the idea of a hydrated layer of ions being Frequently, at relatively high loads the adsorbed displaced from the mica surface. ion layer can be displaced. In order to displace an adsorbed ion from a
Displacement of an adsorbed layer will depend charged surface it is necessary to invoke a surface on the pressure applied (e.g. the Tabor-Israelachvili charge neutralization mechanism. For mica the surface force apparatus has a radius of interaction lattice charge must be compensated by a solution much larger than that of the AFM tip and therefore cation. At low pH it is possible that adsorbed the pressure that can be exerted is significantly metal cations are displaced by protons. The proton smaller). The jump-in distance associated with the is a special case because it can reside, to a certain displacement of adsorbed layers does not suffer degree, within the crystal surface [43,65]. the same uncertainty as the DLVO-associated However, at high pH, and excluding hydrolysis, an
adsorbed metal cation cannot be displaced from van der Waals jump-in distance (vide supra), and the surface of mica; it may dehydrate and imbed is reproducible around the resolution of the dis- into the crystal surface interstices. As silicon nitride
tance measurement. For the asymmetric system this jump-in distance associated with the displace- possesses a zwitterionic surface it has the possibility
of proton exchange between the silylammonium ment of adsorbed layers was always 0.9 + 0.1 nm, and silanoxide groups. Consequently, it may self- for pH > 6. For the symmetric system this jump-in neutralize, with the expulsion of adsorbed counter- distance was 1.2 + 0.1 nm. These jump-in distances
ions. Although proton exchange for silicon nitride were found to be independent of Reff. Butt [61] is speculative it is consistent with the observed has also reported an approximate jump-in distance layer displacements. of 1 nm for the asymmetric system at pH 6 with The layer displacements measured at concen- 10 -2 mol dm -3 KCI. trations of 10 2 mol dm -3 or above may well be
For the symmetric system, if the jump-in distance linked to the distance from the solid surface to the is considered to be proportioned equally per sur- OHP. Therefore this information is potentially face then it can be said that the system jumps very useful for electrical double layer studies. The 0.6_+ 0.05 nm per silicon nitride surface. This jump- O H P is usually regarded as being up to three in distance can be compared with the hydrated ion hydrated ion radii out from the surface, which in diameters reported by Nightingale [64], i.e. our case would place the onset of the diffuse layer 0.716 nm for Na + ions and 0.664 nm for C1 ions. at a maximum of 0.9 nm out from the silicon Apart from the uncertainty associated with any nitride surface. quoted hydrated ion diameter, these quoted Fig. 10(a) shows typical fitted effective diffuse hydrated ion diameters refer to ions residing in the layer potentials for the symmetric system as a bulk solution while the hydration of surface function of NaCI concentration at pH 10. The adsorbed ions may well be different, especially as shaded region marks the regime where it becomes the effective concentration of ions at the surface very dubious to use the force curve normalization can easily be several orders of magnitude larger procedure; hence no potentials are reported for than the bulk concentration. For example, it is not this region. The empty symbols show the fitted unreasonable to suggest that water of hydration potentials if the onset of the diffuse layer is shifted
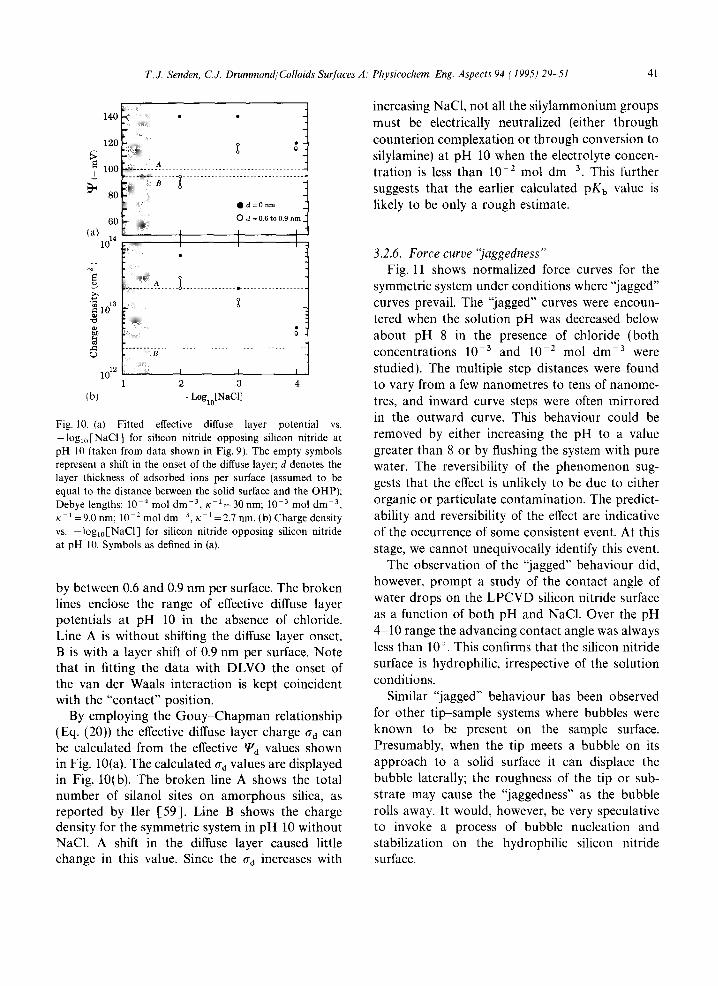
T.J. Senden, CA Drummond/Colloids SurJaces A: Physicochem. Eng. Aspects 94 (1995)29-51 41
increasing NaC1, not all the silylammonium groups 140 : *
2 : must be electrically neutralized (either through .......... counterion complexation or through conversion to 120
silylamine) at pH 10 when the electrolyte concen- ~ 1 0 0 ;:: A . . . . . . . . . . . . . . . . . . . . . . . . . . . . . . . . . . . . . . . . . tration is less than l0 -2 mol dm 3. This further
~ "--~ ... . ~ . . . . . . . . . . . . . . . . . . . . . . . . . . . . . suggests that the earlier calculated pKb value is s0 • a=0nm likely to be only a rough estimate. 6 0 ...... O d = 0 .6 t o 0 .9 n m
~i iii~iiii!?iiii
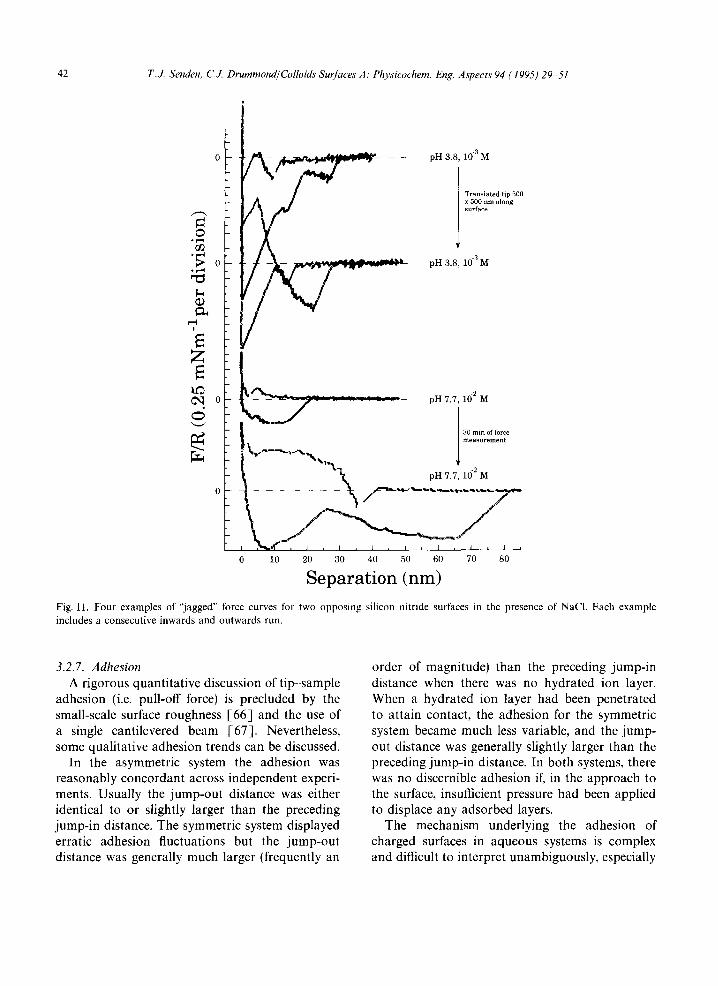
'a'101' ............. 1 I 1 .... • 3 .2 .6 . F o r c e c u r v e ' ~ ] a g g e d n e s s "
Fig. 11 shows normalized force curves for the 'g ~ . . . . . . . . . . . . . . . . . . . . . . . . . symmetric system under conditions where "jagged" • ~ lo~3 ~ curves prevail. The "jagged" curves were encoun- -~ tered when the solution pH was decreased below
.... 3 about pH 8 in the presence of chloride (both . . . . . . . . . . . . . . . . . . . . . . . . concentrations 10 -3 and 10 - 2 tool dm 3 were
iiliii iiiiii
1012 ,:~,~:~,: .... , , , studied). The multiple step distances were found 2 a 4 to vary from a few nanometres to tens of nanome-
(b) -Logl0[NaCl] tres, and inward curve steps were often mirrored in the outward curve. This behaviour could be
Fig. 10. (a) Fitted effective diffuse layer potential vs. -lOglo[NaC1] for silicon nitride opposing silicon nitride at removed by either increasing the pH to a value pH 10 (taken from data shown in Fig. 9). The empty symbols greater than 8 or by flushing the system with pure represent a shift in the onset of the diffuse layer; d denotes the water. The reversibility of the phenomenon sug- layer thickness of adsorbed ions per surface (assumed to be gests that the effect is unlikely to be due to either equal to the distance between the solid surface and the OHP); Debye lengths: 10 4 tool dm -3, tc t = 3 0 n m ; 10 3 mol dm 3, organic or particulate contamination. The predict- ~c-' = 9.0 nm; 10-2 tool dm 3, ~c ~ = 2.7 nm, (b) Charge density ability and reversibility of the effect are indicative vs. - log~o[NaCl] for silicon nitride opposing silicon nitride of the occurrence of some consistent event. At this at pH 10. Symbols as defined in (a). stage, w e c a n n o t unequivocally identify this e v e n t .
The observation of the "jagged" behaviour did,
by between 0.6 and 0.9 nm per surface. The broken however, prompt a study of the contact angle of lines enclose the range of effective diffuse layer water drops on the LPCVD silicon nitride surface potentials at pH 10 in the absence of chloride, as a function of both pH and NaC1. Over the pH
4 10 range the advancing contact angle was always Line A is without shifting the diffuse layer onset, B is with a layer shift of 0.9 nm per surface. Note less than 10 °. This confirms that the silicon nitride that in fitting the data with DLVO the onset of surface is hydrophilic, irrespective of the solution
the van der Waals interaction is kept coincident conditions. with the "contact" position. Similar "jagged" behaviour has been observed
By employing the G o u y - C h a p m a n relationship for other t ip-sample systems where bubbles were (Eq. (20)) the effective diffuse layer charge ad can known to be present on the sample surface. be calculated from the effective Td values shown Presumably, when the tip meets a bubble on its in Fig. 10(a). The calculated ad Values are displayed approach to a solid surface it can displace the in Fig. 10(b). The broken line A shows the total bubble laterally; the roughness of the tip or sub- number of silanol sites on amorphous silica, as strate may cause the "jaggedness" as the bubble reported by Iler [59]. Line B shows the charge rolls away. It would, however, be very speculative density for the symmetric system in pH 10 without to invoke a process of bubble nucleation and NaC1. A shift in the diffuse layer caused little stabilization on the hydrophilic silicon nitride change in this value. Since the ad increases with surface.
42 T.J. Senden, CA Drummond/Colloids Surfaces A: Physicochem. Eng. Aspects 94 (1995) 29 51
0 - / ~ ~ pH 3.8, 10 -3 M
T r a n s l a t e d t ip 500 A x 500 n m a long
su r face
rJ~
• ~ 0 k- pH 3.8, 10 -3M ° F,,'t
2;
0 - -- -- pH7.7,10 -2M
o 30 ra in of force m e a s u r e m e n t
k,. . . . . . .,.x,...x" ~ / pH 7.7, 10 -z M
0 - . . . . . , ~ " h ' - ~ - ' ' " ' ~ ' v " ~ " ~ - ~ ' * , ' ~ " - L /
, ~ , J , I , I , I , I , I , I ~
0 10 20 30 40 50 60 70 80
Separation (nm) Fig. 11. Four examples of "jagged" force curves for two opposing silicon nitride surfaces in the presence of NaC1. Each example includes a consecutive inwards and outwards run.
3.2.7. Adhesion order of magnitude) than the preceding jump-in A rigorous quantitative discussion of tip-sample distance when there was no hydrated ion layer.
adhesion (i.e. pull-off force) is precluded by the When a hydrated ion layer had been penetrated small-scale surface roughness [66] and the use of to attain contact, the adhesion for the symmetric a single cantilevered beam [-67]. Nevertheless, system became much less variable, and the jump- some qualitative adhesion trends can be discussed, out distance was generally slightly larger than the
In the asymmetric system the adhesion was preceding jump-in distance. In both systems, there reasonably concordant across independent experi- was no discernible adhesion if, in the approach to ments. Usually the jump-out distance was either the surface, insufficient pressure had been applied identical to or slightly larger than the preceding to displace any adsorbed layers. jump-in distance. The symmetric system displayed The mechanism underlying the adhesion of erratic adhesion fluctuations but the jump-out charged surfaces in aqueous systems is complex distance was generally much larger (frequently an and difficult to interpret unambiguously, especially
T.J. Senden, C.J. Drummond/Colloids Surfaces A: Physicochem. Eng. Aspects 94 (1995) 29-51 43
when it is mediated by contact asperities. Several tribochemical reaction with water. In a dry envi- factors can contribute to the adhesion of two ronment, microfracture occurs exclusively, while hydrophilic surfaces in aqueous solution. There wear is predominantly tribochemical in water. In will always be a component due to the van der environments with intermediate humidities, both Waals attraction. Additional components of the mechanisms can occur simultaneously. adhesive force may include acid-base (donor- Surface roughness prescribes that contact acceptor) interactions of which hydrogen bonding between opposing surfaces occurs initially on small is a subclass. No attempt was made to analyse surface areas where the stresses are large and statistically the pull-off forces for the trends microfracture is favourable. Wear by microfracture reported by Hoh et al. [68], postulated as being will usually lead to rougher surfaces. due to either hydrogen bonding or water In the presence of water, friction promotes the structuring, completion of the silicon nitride hydrolysis
In the absence of adsorbed layers, the much sequence, Eqs. (4)-(6)). Fischer et al. [69-71] have larger adhesion for the symmetric system compared demonstrated that tribochemical reaction with to the asymmetric system may be attributed to water produces an amorphous silicon dioxide intersurface donor-acceptor interactions con- material on the surface, and that wear occurs by neeted with the acid-base character of the silanol dissolution of this material (Eq. (22)). Fischer et al. and silylamine groups. When surfaces that have [69-71] also concluded that wear does not only an adsorbed layer are in adhesive contact, presum- consist of a polishing of the highest asperities, but ably only a small part of the tip apex has the also ofa filling-in ofthe troughs with wear material. hydrated layer displaced and is residing in a pri- Tribochemical reactions produce relatively smooth mary adhesive minimum. The neighbouring parts surfaces on silicon nitride. This process of smooth- of the tip, just back from the apex, may experience ing will result in an increase in the real contact repulsive interaction. Hence there is a relatively area between two opposing surfaces. weak adhesion overall. Given the wear mechanisms for silicon nitride,
it is possible to envisage how an AFM "image" 3.2.8. Imaging modes and friction and wear may evolve with time. Microfracture may change
Any repulsive tip-sample interaction can be the geometry of the initial imaging contact area. employed to obtain an AFM image [10]. Born Microfracture may also result in a new contact repulsion, arising from electronic overlap, is gen- area governing primarily, but not exclusively [ 10], erally used in contact force microscopy, the "imaging". Under conditions where the tribo-
Amongst AFM practitioners, it is common chemical reaction proceeds, the initial contact area knowledge that on some occasions prolonged may suffer erosion. The eventual smoothing of the AFM scanning, in the Born "contact" mode, can tip surface may result in "images" with less reso- lead to an improvement in "image quality" while lution. Of course, the sample may also undergo on other occasions it can result in "image" deterio- wear and this may contribute to time-dependent ration. For hard inorganic and polymer surfaces, image variation as well. these observations are linked directly to the friction One observable effect on the force curves of and wear of the two surfaces during the imaging extended periods of imaging, at high loads with process, either mica or LPCVD silicon nitride, is less vari-
Fischer and co-workers [-69-71 ] have investi- ability in the jump-in distance measured in aqueous gated the friction and wear of ceramic silicon solutions with 10 3 mol dm -3 NaC1 or less. This nitride at room temperature in a variety of gaseous is indicative of the area near the tip apex becoming ambients as well as in water. Their findings are of more smooth. direct relevance to the scanning process in AFM It should also be noted that, apart from its role imaging. It was found that silicon nitride slides on in tip and sample wear, friction (or alternatively itself with a high friction coefficient, and that there lateral forces) can play a large role in Born mode are two wear mechanisms: microfracture and a image generation [9,72,73]. Born mode images
44 T.J. Senden, C.J. Drummond/Colloids' Surfaces A." Physicochem. Eng. Aspects 94 (1995) 29 51
can be a complex convolution of surface chemistry, and it remains to be seen whether or not it will mechanical properties and geometry of interaction, make an appearance in other systems. especially in aqueous environments. AFM imaging in the Born contact mode has
been discussed with special reference to friction and wear, including the role of tip microfracture
4. Summary and conclusions and tribochemical reactions.
We have found that the long-range interaction between different microfabricated silicon nitride Acknowledgements tips and a particular sample is remarkably consis- tent when the effective long-range geometry of C.J.D. is the recipient of a Queen Elizabeth 1I interaction (Reff) is taken into account. This sug- Fellowship from the Australian Research Council gests that the surface group functionality of the and an Australian National University Visiting different microfabricated silicon nitride tips, within Fellowship. We thank Derek Chan for many a given batch, is essentially invariant. It should be enlightening discussions concerning the use of opti- borne in mind, however, that the surface chemistry cal data to characterize the van der Waals inter- is dictated by the stoichiometry of the LPCVD action, and for supplying a copy of his computer silicon nitride film and by the extent of hydrolysis, program for calculating non-retarded Hamaker Therefore the relative proportions of the silanol constants. We are grateful to Lennart Bergstr6m and silylamine surface groups may vary across for informing us about Phillip's optical data for a different batches of tips. Nevertheless, the prin- CVD silicon nitride film. We thank Virgil Elings, ciples given herein should be generally applicable Jerome Weidmann and Mark Wendmann for to the interpretation of tip-sample interactions, supplying information on the LPCVD silicon
In the interpretation of the total force of inter- nitride film fabrication process employed by action between the microfabricated silicon nitride Digital Instruments. We are grateful to Thomas tip and samples in various aqueous solutions, we Gengenbach for performing the ADXPS analysis, have dealt with and Peter Scales and Kate Drummond for per-
(i) silicon nitride hydrolysis reactions, forming some confirmatory muscovite mica flat (ii) surface group acid-base dissociation plate streaming potential measurements. We have
equilibria, also benefited from discussions with Patrick (iii) surface group counterion complexation K6kicheff.
equilibria, (iv) surface adsorbed layers and double layer
structure, Appendix (v) electrical double layer interaction, (vi) van der Waals interaction, and In at least two areas, atomic force microscopy (vii) the relative magnitude of adhesion, and ceramic materials, it has become important to For silicon nitride, it is usually assumed that the quantify the van der Waals contribution to the
chloride ion is non-specific [35,44]. Our work total force of interaction between two surfaces, suggests that this assumption should be reviewed, where at least one of the surfaces is silicon nitride.
Initial indications are that the AFM can be used In this section, we examine the optical properties to determine the thickness of an adsorbed layer of of silicon nitride, silicon, silica and muscovite mica, hydrated ions on a solid inorganic surface. Models and present the Hamaker constants that quantify of the electrical double layer would benefit the non-retarded van der Waals interaction in immensely from this type of information, some atomic force microscopy and ceramic sys-
A "jagged" force curve has been observed when terns, including the systems discussed in the main low a a silicon nitride surfaces interact in some section of this paper. NaC1 solutions. This phenomenon is intriguing A brief report of the procedure that was used to
T.J. Senden, C.J. Drummond/Colloids Surfaces A: Physicochem. Eng. Aspects 94 (1995) 29 51 45
calculate the non-retarded Hamaker constants fol- side of the UV absorption band, where the absorp- lows. The general method is described in greater tion is negligible and ~ >> Oha can be written as detail in the review article written by Hough and
C u r White [74]. Descriptions of most aspects of the e(i~)= 1 + (A5) procedure are also contained in the monograph 1 + (~/cOtjv) 2
written by Mahanty and Ninham [75] and the Hough and White [74] have presented a procedure book chapter by Parsegian [76]. to obtain the UV part of the e(i~) representation
From Lifshitz theory [77,78] the non-retarded from the refractive index (optical dispersion) data Hamaker constant for the interaction between half- associated with the low frequency side of the UV spaces with dielectric response el(o~) and e3(~o ) absorption. In the frequency region where the separated by a material of dielectric response eZ((D ) extinction coefficient (k) is negligible and ~ >> ~OiR, can be given as to a reasonable approximation (as e(co)=
2 ~( ~k"T,~--(s~ e'(~o)+ ie"(e)),¢'(m) = nZ - k 2, and e"(o~)= 2nk) 3 (A 12132) s (A1) A123 - - i $3 C u v
e(co) = e'(co) = n2(co) = 1 +-1 - (co/OJuv }2 (A6) where
ek(i~,)--ej(i~,) and a "Cauchy plot" of [nZ(~o)-l] versus AkJ = ~(id, ,)+ e i(i~,) ( A 2 ) [ n 2 ( ~ ) - 1 ] ~ 2 should provide a straight line with
- - a gradient 1/~O2v and an intercept Cur. This and approach is equivalent to fitting the optical disper-
sion data in this region to a single-term Sellmeier f 27rk, r~ g , = n ~ ) (13) equation.
For both silicon nitride and silica, refractive The prime on the summation sign in Eq. (A1) index data in the near-UV and visible regions, denotes that the term at zero frequency (n=0) is where there is negligible absorption (k~0), were given half-weight and ka, T and h denote the used for the "Cauchy plot". For muscovite mica, Boltzmann constant, absolute temperature and refractive index data in the visible region were Planck's constant (divided by 2~) respectively. We used. Silicon has its absorption band maximum in deal with e(u)) as a function of the complex variable the near-UV region and has significant absorption
only on the imaginary axis co = (i~). in most of the visible region. Therefore refractive We have employed the Ninham Parsegian rep- index data in the near-IR region were used for the
resentation [79] where a Lorentz harmonic- silicon "Cauchyplot". oscillator model is used to describe the dielectric For silicon nitride, silicon, silica and mica the material and IR representations were obtained by assuming that
U Cq there are no microwave relaxations, and hence the e(i~) = 1 + ~ 1 + (~/U)q)2-~Vq~/fD 2 (A4) sum of all the IR-related oscillator strengths (YC,R)
q~ ~ is given by
where C~ is related to the oscillator strength of the ECru = eo - no 2 (A7) absorption band, ~oq is the frequency of an absorp- tion band maximum, and 7q is related to the where damping coefficient of the oscillator. There is some no 2 = Cuv + 1 (18) evidence that the damping coefficient term can be safely ignored [74 76,80]. Plasma and microwave Individual C,R values were assigned by taking into components are not included in the e(i¢) represen- account relative absorption band strengths ascer- tation [ 74,81 ]. tained from I R spectra. Note that the • (i~) function
If the ultraviolet (UV) absorption is "simple" is sampled first at 4 = 0 rad s 1 and then at ~= then the •(i~) construction on the low frequency 2.41 × 10¹⁴ rad s ~ intervals, and therefore the IR
46 T.J. Senden, CJ. Drummond/Colloids Surfaces A: Physicochem. Eng. Aspects 94 (1995) 29 51
relaxations for most materials do not make a major silicon nitride film [82,83]. In amorphous stoichio- contribution to the calculated Hamaker constant, metric silicon nitride, there are two vibrations that Nevertheless, IR terms have been included in all contribute to the 1R absorption. There is a very the e(i~)representations, strong absorption band at 1.64 x 10¹⁴ rad s -1
For water we have used the Gingell-Parsegian (869 cm-1) and a strong absorption band at e(i~) representation [76,80]. This detailed repre- 0.90 x 10¹⁴ rad s-~ (476 c m - 1 ) due to the Si-N-Si sentation includes six UV terms, five IR terms and antisymmetric and symmetric stretching modes all the associated 7 coefficients. Calculations that respectively [84]. substitute one UV term (obtained from a "Cauchy For amorphous silicon, the refractive index data plot" [74]), without a ~ coefficient, for the six UV of Pierce and Spicer [85] have been used. The terms and associated i' coefficients in the water COvv value is consistent with the broad UV absorp- E(i~) representation are also presented for tion band maximum for silicon centred at about comparison. 5.2 x 10¹⁵ tad s 1 [85]. Crystalline silicon has no
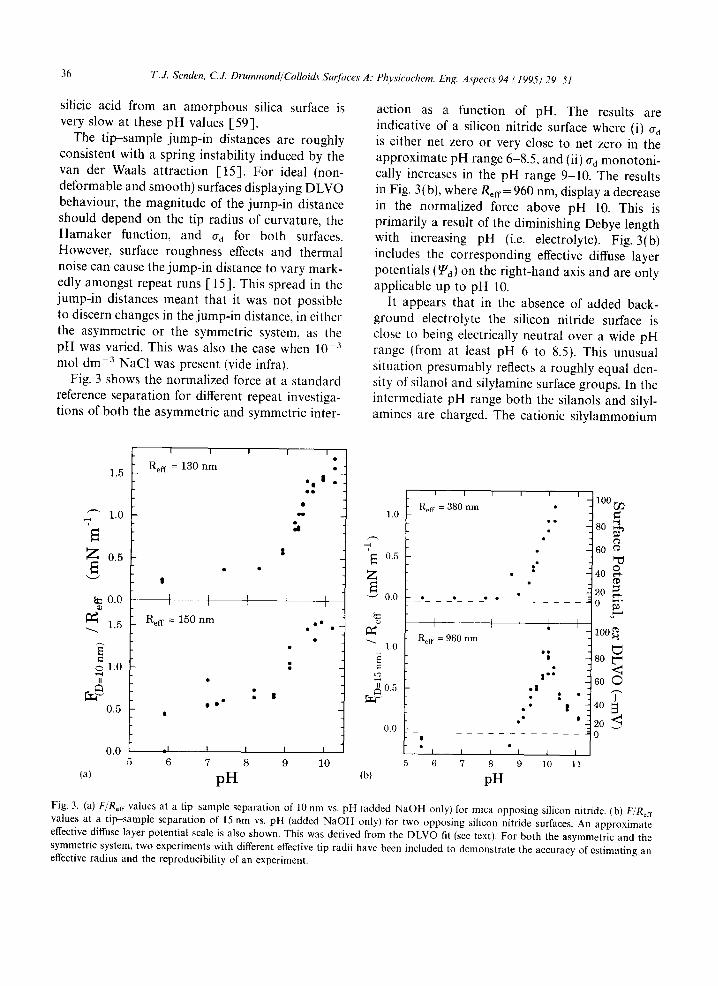
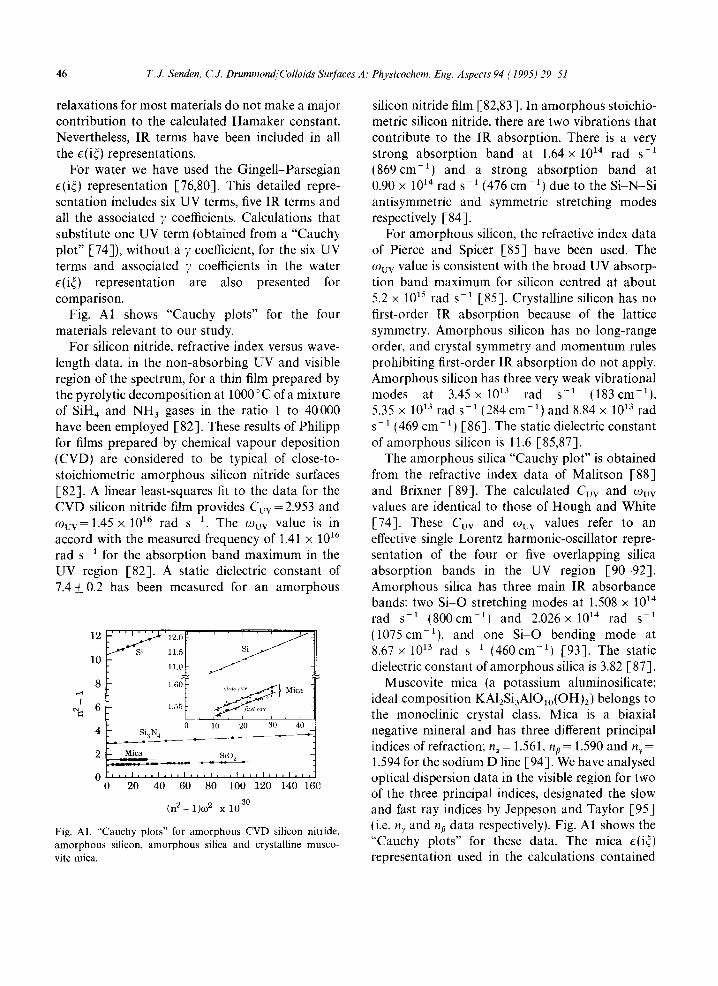
Fig. A1 shows "Cauchy plots" for the four first-order IR absorption because of the lattice materials relevant to our study, symmetry. Amorphous silicon has no long-range
For silicon nitride, refractive index versus wave- order, and crystal symmetry and momentum rules length data, in the non-absorbing UV and visible prohibiting first-order IR absorption do not apply. region of the spectrum, for a thin film prepared by Amorphous silicon has three very weak vibrational the pyrolytic decomposition at 1000 °C ofamixture modes at 3.45 X 10¹³ rad s-1 (183 cm-1), of Sill 4 and NH3 gases in the ratio 1 to 40000 5.35 x 10¹³ rad s 1 (284 cm -1) and 8.84 x 10¹³ rad have been employed [82]. These results of Philipp s ~ (469 cm 1) [86]. The static dielectric constant for films prepared by chemical vapour deposition of amorphous silicon is 11.6 [85,87]. (CVD) are considered to be typical of close-to- The amorphous silica "Cauchy plot" is obtained stoichiometric amorphous silicon nitride surfaces from the refractive index data of Malitson [88] [82]. A linear least-squares fit to the data for the and Brixner [89]. The calculated Cvv and ~Ouv CVD silicon nitride film provides Cuv = 2.953 and values are identical to those of Hough and White C%v=1.45 x 10¹⁶ rad S -1 . The ~Ouv value is in [74]. These Cuv and Ogvv values refer to an accord with the measured frequency of 1.41 x 10¹⁶ effective single Lorentz harmonic-oscillator repre- rad s-1 for the absorption band maximum in the sentation of the four or five overlapping silica UV region [82]. A static dielectric constant of absorption bands in the UV region [90-92]. 7.4 + 0.2 has been measured for an amorphous Amorphous silica has three main IR absorbance
bands: two Si-O stretching modes at 1.508 x 10¹⁴ r a d 5 -1 (800cm 1) and 2.026x 10¹⁴ rad s -1
1 2 - ' ' ' ' . . . . 12"°l' ' si ~ J ] (1075cm 1), and one Si-O bending mode a t l ~ 11.5~ 8.67 × 10¹³ rad s (460cm -1) [93]. The static
10 11.0~ ~ j [ dielectric constant of amorphous silica is 3.82 [ 87]. 8 1"607 ~,,,r,,, ,-e'. Muscovite mica (a potassium aluminosilicate;
.~ , , ,~ j .~ r . ideal composition KA12Si3A1Olo(OH)2) belongs to ~ 6 , , ~ . , ~ ' , . , the monoclinic crystal class. Mica is a biaxial
0 10 20 30 40 4 SiaN 4 ~ negative mineral and has three different principal
- indices of refraction; n~ = 1.561, n~ = 1.590 and n~ = 2 ~- Mica SiO2 1.594 for the sodium D line [94]. We have analysed
0 0 ' ' '201, , ,401, , ,60, ' ' '801, , 100' ~ ' ' 120' ' ' ' 140' ' ' '169, optical dispersion data in the visible region for two of the three principal indices, designated the slow
(n 2- 1)co 2 x 10 -30 and fast ray indices by Jeppeson and Taylor [95]
Fig. AI. "Cauchy plots" for amorphous CVD silicon nitride, (i.e. n~. and n, data respectively). Fig. A1 shows the amorphous silicon, amorphous silica and crystalline musco- "Cauchy plots" for these data. The mica e(i~) vite mica. representation used in the calculations contained
T.J. Senden, C.J. Drummond~Colloids Surfaces A: Physicochem. Eng. Aspects 94 (1995) 29 51 47
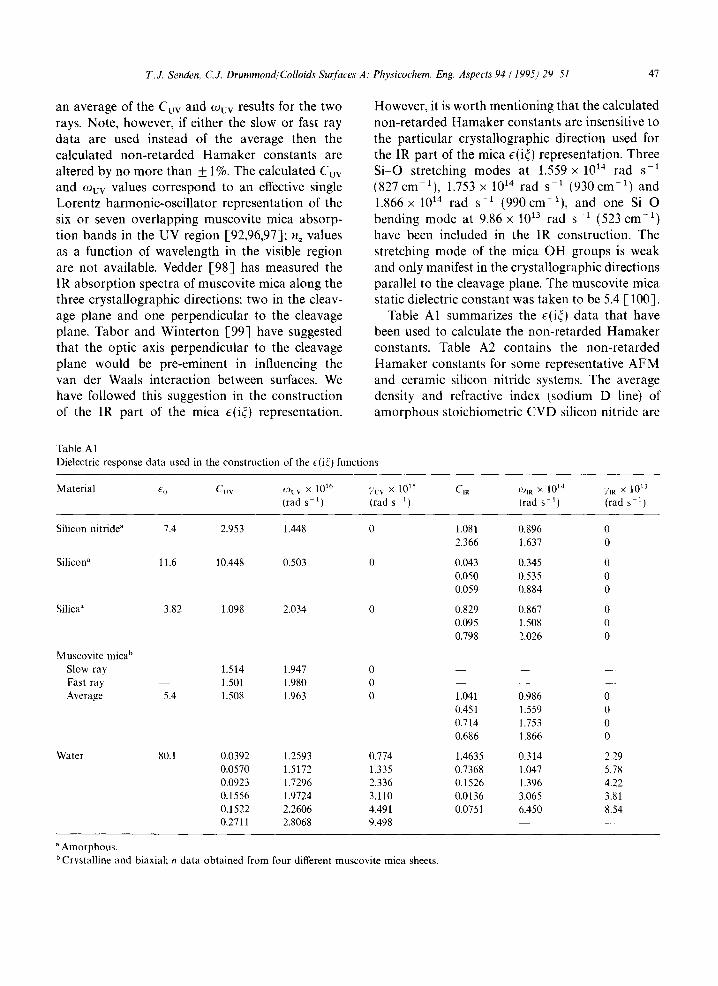
an average of the Cuv and e)tjv results for the two However , it is wor th ment ion ing that the ca lcula ted rays. Note , however, if ei ther the slow or fast ray non - r e t a rded H a m a k e r cons tan ts are insensit ive to da t a are used ins tead of the average then the the pa r t i cu la r c rys ta l lographic di rect ion used for ca lcula ted non - r e t a rded H a m a k e r cons tants are the IR par t of the mica e(i~) representa t ion. Three a l tered by no more than _+ 1%. The ca lcula ted Cuv S i - O st re tching modes at 1.559 x 10 TM rad s -1 and tOuv values co r r e spond to an effective single (827 cm-1) , 1.753 x 10¹⁴ rad s 1 (930 cm 1) and Loren tz ha rmonic -osc i l l a to r represen ta t ion of the 1.866 x 10¹⁴ t ad s -1 (990 cm-1) , and one S i - O six or seven over lapp ing muscovi te mica absorp - bend ing mode at 9.86 x 10¹³ rad s -~ (523 cm -1) t ion bands in the U V region [92,96,97]; n~ values have been included in the IR const ruct ion . The as a funct ion of wavelength in the visible region s t re tching mode of the mica O H groups is weak are not avai lable. Vedder [98 ] has measured the and only manifest in the c rys ta l lographic direct ions IR a bso rp t i on spect ra of muscovi te mica a long the para l le l to the cleavage plane. The muscovi te mica three c rys ta l lograph ic direct ions: two in the cleav- static dielectric cons tan t was taken to be 5.4 [ 100]. age p lane and one pe rpend icu la r to the cleavage Table A1 summarizes the e(i~) da t a that have plane. T a b o r and W i n t e r t o n [99 ] have suggested been used to calculate the non- re t a rded H a m a k e r tha t the opt ic axis pe rpend icu la r to the cleavage constants . Table A2 conta ins the non - r e t a rded plane would be p re -eminen t in influencing the H a m a k e r cons tants for some representa t ive A F M van der Waals in terac t ion between surfaces. We and ceramic silicon ni t r ide systems. The average have fol lowed this suggest ion in the cons t ruc t ion densi ty and refractive index (sodium D line) of of the IR par t of the mica e(i~) representa t ion, a m o r p h o u s s to ichiometr ic C V D silicon ni t r ide are
Table A 1 Dielectric response data used in the construction of the e(i{) functions
Material eo C~v t~uv x 10 TM ~'uv × 1015 CIR O)IR X 10 TM ~'IR × 1013
(rad s -1) (rad s 1) (rad s i) (rad s 1)
Silicon nitride a 7.4 2.953 1.448 0 1.081 0.896 0 2.366 1.637 0
Silicon a 11.6 10.448 0.503 0 0.043 0.345 0 0.050 0.535 0 0.059 0.884 0
Silica a 3.82 1.098 2.034 0 0.829 0.867 0 0.095 1.508 0 0.798 2.026 0
Muscovite mica b Slow ray --- 1.514 1.947 0 - - Fast ray 1.501 1.980 0 - - - Average 5.4 1.508 1.963 0 1.041 0.986 0
0.451 1.559 0 0.714 1.753 0 0.686 1.866 0
Water 80.1 0.0392 1.2593 0.774 1.4635 0.314 2.29 0.0570 1.5172 1.335 0.7368 1.047 5.78 0.0923 1.7296 2.336 0.1526 1.396 4.22 0,1556 1.9724 3.110 0.0136 3.065 3.81 0,1522 2.2606 4.491 0.0751 6.450 8.54 0,2711 2.8068 9.498
a Amorphous. b Crystalline and biaxial; n data obtained from four different muscovite mica sheets.
48 T.J. Senden, C J. Drummond/Colloids Surjaces A. Physicochem. Eng. Aspects 94 (1995) 29 51
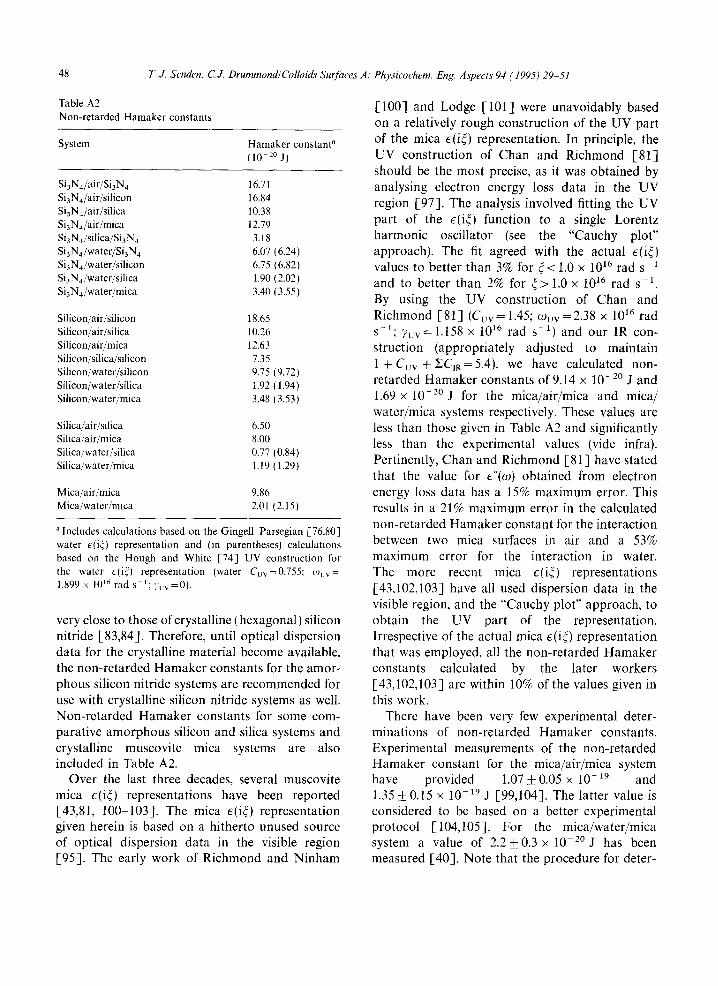
Table A2 [100] and Lodge [101] were unavoidably based Non-retarded Hamaker constants on a relatively rough construction of the UV part
System Hamaker constant" of the mica c(i~) representation. In principle, the (10 2oj) UV construction of Chan and Richmond [81]
should be the most precise, as it was obtained by Si3N4/air/Si3N4 16.71 analysing electron energy loss data in the UV Si3N4/air/silicon 16.84 region [97]. The analysis involved fitting the UV Si3N4/air/silica 10.38 Si~N4/air/mica 12.79 part of the e(i~) function to a single Lorentz Si3N4/silica/Si3N 4 3.18 harmonic oscillator (see the "Cauchy plot" Si3N4/water/Si3N 4 6.07 (6.24) approach). The fit agreed with the actual e(i~) Si3N4/water/silicon 6.75 (6.82) values to better than 3% for ~ < 1.0 x 10¹⁶ rad s x Si3N4/water/silica 1.90 (2.02) and to better than 2% for ¢> 1.0 x 10¹⁶ rad s 1. Si3N4/water/mica 3.40 (3.55)
By using the UV construction of Chan and Silicon/air/silicon 18.65 Richmond [81] (Cuv = 1.45; COvv = 2.38 x 10¹⁶ rad Silicon/air/silica 10.26 S-1; 7uv = 1.158 x 10¹⁶ rad s -1) and our IR con- Silicon/air/mica 12.63 struction (appropriately adjusted to maintain Silicon/silica/silicon 7.35 1 + Cuv + ZCjR=5.4), we have calculated non- Silicon/water/silicon 9.75 (9.72) Silicon/water/silica 1.92 (1.94) retarded Hamaker constants of 9.14 x 10- 20 j and Silicon/water/mica 3.48(3.53) 1.69 x 10⁻²°J for the mica/air/mica and mica/
water/mica systems respectively. These values are Silica/air/silica 6.50 less than those given in Table A2 and significantly Silica/air/mica 8.00 less than the experimental values (vide infra). Silica/water/silica 0.77 t0.84) Silica/water/mica 1.19 (1.29) Pertinently, Chan and Richmond [81 ] have stated
that the value for e"(co) obtained from electron Mica/air/mica 9.86 energy loss data has a 15% maximum error. This Mica/water/mica 2.01 (2.15) results in a 21% maximum error in the calculated
non-retarded Hamaker constant for the interaction "Includes calculations based on the Gingell Parsegian [76,80] water e(i~)representation and (in parentheses)calculations between two mica surfaces in air and a 53% based on the Hough and White [74] UV construction for maximum error for the interaction in water. the water e(i~) representation (water Cuv=0.755; O)uv= T h e m o r e recent mica e(i~) representations 1.899 x 10¹⁶ rad s '; ),uv=0). [43,102,103] have all used dispersion data in the
visible region, and the "Cauchy plot" approach, to very close to those ofcrystalline (hexagonal) silicon obtain the UV part of the representation. nitride [83,84]. Therefore, until optical dispersion Irrespective of the actual mica e(i~) representation data for the crystalline material become available, that was employed, all the non-retarded Hamaker the non-retarded Hamaker constants for the amor- constants calculated by the later workers phous silicon nitride systems are recommended for [43,102,103] are within 10% of the values given in use with crystalline silicon nitride systems as well. this work. Non-retarded Hamaker constants for some corn- There have been very few experimental deter- parative amorphous silicon and silica systems and minations of non-retarded Hamaker constants. crystalline muscovite mica systems are also Experimental measurements of the non-retarded included in Table A2. Hamaker constant for the mica/air/mica system
Over the last three decades, several muscovite have provided 1.07 + 0.05 x 10⁻¹⁹ and mica e(i~) representations have been reported 1.35 __+ 0.15 × 10 -19 J [99,104]. The latter value is [43,81, 100-103]. The mica e(i~) representation considered to be based on a better experimental given herein is based on a hitherto unused source protocol [104,105]. For the mica/water/mica of optical dispersion data in the visible region system a value of 2.2_+0.3 × 10 -2° J has been [95]. The early work of Richmond and Ninham measured [40]. Note that the procedure for deter-
T.J. Senden, C,L Drummond/Colloids Surfaces A. Physicochem. Eng. Aspects 94 (1995) 29-51 49
mining the radius of curvature of the mica cylinders [ 13] T.R. Albrecht, S. Akamine, T.E. Carver and C.F. Quate, in the Tabor-Israelachvili surface force apparatus J. Vac. Sci. Technol. A, 8 (1990) 3386. m a y systematically underestimate the radius of 1-14] R. Erlandsson, G. Hadziioannou, C.M. Mate, G.M.
McClelland and S.J. Chiang, Chem. Phys., 89 (1988) curvature in the region of interaction [-105]. An 5190.
underestimation of the radius of curvature would R.G. Miller and P.J. Bryant, J. Vac. Sci. Technol. A, 7
result in the non-retarded Hamaker constants for (1989) 2879. the mica systems being overestimated. Therefore, J.N. Lin, B. Drake, A.S. Lea, P.K. Hansma and J.D.
Andrade, Langmuir, 6 (1990) 509. for the interaction of two mica surfaces across A.L. Weisenhorn, H.E. Gaub, H.G. Hansma, R.L. either air or water, the calculated non-retarded Sinsheimer, G.L. Kelderman and P.K. Hansma, Hamaker constants (Table A2) are in reasonable Scanning Microsc., 4 (1990)511. agreement with those that have been experimen- A.L. Weisenhorn, B. Drake, C.B. Prater, S.A.C. Gould, tally obtained. P.K. Hansma, F. Ohnesorge, M. Egger, S.-P. Heyn,
The non-retarded Hamaker constants reported s.-P. and H.E. Gaub, Biophys. J., 58 (1990) 1251. H.-J. Butt, K.H. Downing and P.K. Hansma, Biophys.
herein may be used to help (i) describe the van der J., 58 (1990) 1473.
Waals interaction between microfabricated AFM M. Egger, F. Ohnesorge, A.L. Weisenhorn, S.-P. Heyn, tips and samples [10,15], (ii) isolate the van der B. Drake, C.B. Prater, S.A.C. Gould, P.K. Hansma and Waals component in the interaction between colloi- H.E. Gaub, J. Struct. Biol., 103 (1990) 89. dal silicon nitride particles in ceramic processing A.L. Weisenhorn, M. Egger, F. Ohnesorge, S.A.C. Gould,
S.-P. Heyn, H.G. Hansma, R.L. Sinsheimer, H.E. Gaub applications, and (iii) interpret the equilibrium and P.K. Hansma, Langmuir, 7 (1991) 8. thickness of intergranular glass phases in silicon S.A. Lea, A. Pungor, V. Hlady, J.O. Andrade, J.N.
nitride ceramic materials [ 106]. Herron and E.W. Voss, Jr., Langmuir, 8 (1992) 68. R.E. Marchant, A. Scott Lea, J.D. Andrade and P. Bockenstedt, J. Colloid Interface Sci., 148 (1992) 261. C.A. Alves, E.L. Smith and M.D. Porter, J. Am. Chem. Soc., 114 (1992) 1222.
References [15] C.J. Drummond and T.J. Senden, Colloids Surfaces A: Physicochem. Eng. Aspects, 87 (1994) 217.
[ 1 ] G. Binnig, C. Quate and G. Gerber, Phys. Rev. Lett., [ 16] T. Matsuo and M. Esashi, Sensors Actuators, 1 (1981) 77. 56 (1986) 930. [17] D.L. Harame, L.J. Bousse, J.D. Shon and J.D. Meindl,
[2] G. Binnig, C. Gerber, E. Stoll, T.R. Albrecht and C.F. IEEE Trans. Electron Devices, ED-34 (1987) 1700. Quate, Europhys. Lett., 3 (1987)1281. [18] L.J. Bousse and J.D. Shott, IEEE Trans. Electron
[3] G. Binnig, C. Gerber, E. Stoll, T.R. Albrecht and C.F. Devices, 9 (1988) 44. Quate, Surf. Sci., 189/190(1987) 1. [19] N. Jaffrezic-Renault, A. De, P. Clechet and A. Maaref,
[4] B. Drake, A.L. Prater, A.L. Weisenhorn, S.A.C. Gould, Colloids Surfaces, 36 (1989) 59. T.R. Albrecht, C.F. Quate, D.S. Cannell, H.G. Hansma [20] G. Ziegler, J. Heinrich and G. W6tting, J. Mater. Sci., and P.K. Hansma, Science, 243 (1989) 1586. 22 (1987) 3041.
[5] A. Engel, Annu. Rev. Biophys. Biophys. Chem., 20 [21] 1.A. Aksay, in J.A. Mangels and G.L. Messing (Eds.), (1991) 79. Forming of Ceramics, Advances in Ceramics, Vol. 9,
[6] P.K. Hansma, V.B. Elings, O. Marti and C.E. Bracker, American Ceramic Society, Columbus, OH, 1984, Science, 242 (1988) 209. pp. 94 104.
[7] D. Rugar and P. Hansma, Phys. Today, 43 (1990) 23. [22] F.F. Lange, J. Am. Ceram. Soc., 72 (1989) 1. [8] E. Meyer and H. Heinzelmann, in R. Weisendanger and [23] F.F. Lange, Langmuir, 6 (1990) 1323.
H.-J. Gfintherodt (Eds.), Scanning Tunneling [24] F.F. Lange, Ceram. Trans., 22 (1991) 185. Microscopy II, Springer Ser. in Surf. Sci., Vol. 28, [25] T.J. Senden and W.A. Ducker, Langmuir, 10 (1994) Springer-Verlag Berlin, 1992, pp. 99-149. 1003.
[9] M. Radmacher, R.W. Tillmann, M. Fritz and H.E. I. Larson, C.J. Drummond, D.Y.C. Chan and F. Grieser, Gaub, Science, 257 (1992) 1900. J. Am. Chem. Soc., 115 (1993) 11 885.
[10] T.J. Senden, C.J. Drummond and P. K6kicheff, [26] W.A. Ducker, T.J. Senden and R.M. Pashley, Nature Langmuir, 10 (1994) 358. (London), 353 (1991) 2.
[11] Microlevers supplied by Park Scientific Instruments, [27] W.A. Ducker, T.J. Senden and R.M. Pashley, Langmuir, 1171 Borregas Avenue, Sunnyvale, CA 94 089, USA. 8 (1992) 1831.
[12] Nanoprobes supplied by Digital Instruments, 6780 [28] M. Wendman, DigitalInstruments, Santa Barbara, CA, Cortona Drive, Santa Barbara, CA 93 117, USA. personal communication, 1992.
50 T.J. Senden, C.J. Drummond/Colloids Surfaces A." Physicochem. Eng. Aspects 94 (1995)29 51
[29] K. Ridgeway, Silica-Source Technology Corp., Tempe, [59] R.K. Iler, The Chemistry of Silica, Wiley, New York, AZ, personal communication, 1992. 1979.
[30] X. Xie, T.R. Gengenbach and H.J. Griesser, J. Adhes. [60] J.E. Brady, D.F. Evans, G.G. Warr, F. Grieser and B.W. Sci. Technol., 12 (1992) 1411. Ninham, J. Phys. Chem., 90 (1986) 1853.
[31] J.A. Taylor, G.M. Lancaster, A. lgnatiev and J.W. C.J. Drummond, F. Grieser and T.W. Healy, Chem. Rabalais, J. Chem. Phys., 68 (19781 1776. Phys. Lett., 140 (1987) 493.
[32] J.A. Taylor, G.M. Lancaster and J.W. Rabalais, E61] H.-J. Butt, Biophys. J., 60 (1991) 1438. J. Electron Spectrosc. Related Phenom., 13 (1978)435. [62] A.L. Weisenhorn, P. Maivald, H.-J. Butt and P.K.
[33] J.A. Taylor, Appl. Surf. Sci., 7 (1981) 168. Hansma, Phys. Rev. B, 45 (1992) 11 226. [34] C.D. Wagner, D.E. Passoja, H.F. Hillery, T.G. Kin(sky, [63] X.-Y. Lin, F. Cruezet and H. Arribart, J. Phys. Chem.,
H.A. Six, W.T. Jansen and J.A. Taylor, J. Vac. Sci. 97 (1993)7272. Technol., 21 (1982) 933. [64] E.R. Nightingale, J. Phys. Chem., 63 (1959) 1381.
[35] L. Bergstr6m and R.J. Pugh, J. Am. Ceram. Soc., 72 [65] J.P. Quirk and R.M. Pashley, J. Phys. Chem., 95 (1989) 103. (1991) 3300.
[36] R.K. Brow and C.G. Pantano, J. Am. Ceram. Soc., 69 [66] J.A. Greenwood, J. Lubr. Technol., 89 11967) 81. (1986) 314. [67] H.K. Christensen, J. Colloid Interface Sci., 121 (1988)
[37] P.J. Scales, F. Grieser and T.W. Healy, Langmuir, 6 170. (1990) 582. [68] J.H. Hoh, J.P. Cleveland, C.B. Prater, J.-P. Revel and
[38] S. Nishimura, H. Takeyama, K. Tsunematsu and P.K. Hansma, J. Am. Chem. Soc., 114(1992) 4917. K. Jinnai, J. Colloid Interface Sci., 152 (1992) 359. E69] T.E. Fischer and H. Tomizawa, Wear, 105 (1985) 29.
[39] J.S. Lyons, D.N. Furlong and T.W. Healy, Aust. [70] H. Tomizawa and T.E. Fischer, ASLE Trans., 30 J. Chem., 34 (1981) 1177. (1987) 41.
[40] J.N. Israelachvili and G.E. Adams, J. Chem. Soc., [71 ] S. Jahanmir and T.E. Fischer, STLE Trans., 31 (1988) 32. Faraday Trans. 1, 74 (1978) 975. [72] N.A. Burnham, R.J. Colton and H.M. Pollock, J. Vac.
[41] R.M. Pashley, J. Colloid Interface Sci., 80 (1981) 153. Sci. Technol. A, 9 (1991) 2548. [42] R.M. Pashley, J. Colloid Interface Sci., 83 (1981) 531. [73] A.J. den Boef, Rev. Sci. lnstrum., 62 (1991) 88. [43] V.E. Shubin and P.J. K6kichefl; Colloid Interface Sci., [74] D.B. Hough and L.R. White, Adv. Colloid Interface
155 (1993) 108. Sci., 14(1980) 3. [44] L. Bergstr6m and E. Bostedt, Colloids Surfaces, 49 [75] J. Mahanty and B.W. Ninham, Dispersion Forces,
(19901 183. Academic Press, London, 1976. [45] R.K. Brow and C.G. Pantano, J. Am. Ceram. Soc., 70 [76] V.A. Parsegian, in H. van Olphen and K.J. Mysels
(1987) 9. (Eds.), Enriching Topics from Colloid and Surface [46] G. Busca, V. Lorenzelli, M.I. Baraton, P. Quintard and Science, IUPAC Commun. 1.6, California, Theorex,
R. Marchand, J. Mol. Struct., 143 (1986) 525. 1975, p. 27. [47] C.J. Drummond and T.J. Senden, Interfaces I1 Proc., [77] E.M. Lifshitz, J. Exp. Theor. Phys. USSR, 29 (1955) 94
Materials Science Forum, Trans. Tech. Publications, (Sov. Phys. JETP, 2 (1956) 73). AedermansdorL Switzerland, in press. [78] I.E. Dzyaloshinskii, E.M. Lifshitz and L.P. Pitaevskii,
[48] B.S. Murray, J.S. Godfrey, F. Grieser, T.W. Healy, Adv. Phys., 10(1961)165. B. Lovelock and P.J. Scales, Langmuir, 7 (19911 3057. [79] B.W. Ninham and V.A. Parsegian, Biophys. J., 10
[49] P.J. Scales, F. Grieser, T.W. Healy, L.R. White and (1970) 646. D.Y.C. Chan, Langmuir, 8(1992) 965. [80] D. Gingell and V.A. Parsegian, J. Theor. Biol., 36
[50] G.A. Parks, Chem. Rev., 65 (1965) 177. (19721 41. [51] J.A. Davis, R.O. James and J.O. Leckie, J. Colloid [81] D. Chan and P. Richmond, Proc. R. Soc. London, Ser.
Interface Sci., 63 (1978) 480. A, 353 (1977) 163. [52] T.W. Healy and LR. White, Adv. Colloid Interface Sci., [82] H.R. Phillip, J. Electrochem. Soc., 120 (1973) 295.
9(1978) 303. [83] D.M. Brown, P.V. Gray, F.K. Heumann, H.R. Phillip [53] R. Sprycha and J. Szcypa, J. Colloid Interface Sci., 102 and E.A. Taft, J. Electrochem. Soc., 115 (1968) 311.
(1984) 288. [84] E.A. Taft, J. Electrochem. Soc., 118 (1971) 1341. [54] C.J. Drummond, F. Grieser and T.W. Healy, J. Chem. [85] D.T. Pierce and W.E. Spicer, Phys. Rev. B, 5 (1972)
Soc., Faraday Trans. 1, 85 (1989) 521. 3017. [55] B.V. Derjaguin, Kolloid Z., 69 (1934) 155. [86] M.H. Brodsky and A. Lurio, Phys. Rev. B, 9 (1974) 1646. [56] B.V. Derjaguin and L. Landau, Acta Physicochim. [87] C.M. Randall and R.D. Rawcliffe, Appl. Opt., 6
URSS, 14 (1941) 633. 119671 1889. [57] E.J.W. Verwey and J.T.G. Overbeek, Theory of Stability [88] 1.H. Malitson, J. Opt. Soc. Am., 55 (1965) 1205.
of Lyophobic Colloids, Elsevier, Amsterdam, 1948. [89] B. Brixner, J. Opt. Soc. Am., 57 (1967) 674. E58] S.L. Carnie and D.Y.C. Chan, J. Colloid Interface Sci., [90] H.R. Philipp, J. Phys. Chem. Solids, 32 (1971) 1935.
155 (1993) 297. [91] P.L. Lamy, Appl. Opt., 16 (1977) 2212.
T.J. Senden, C.J. Drummond/Colloids Surfaces A: Physicochem. Eng. Aspects 94 (1995) 29 51 5l
[92] U. Buechner, J. Phys. C, 8 (1975) 2781. [100] P, Richmond and B.W. Ninham, J. Colloid Interface [93] H.R. Philipp, J. Appl. Phys., 50 (1979) 1053. Sci., 40 (1972) 406. [-94] D.E. Gray (Ed.), American Institute of Physics [101] K.B. Lodge, J. Colloid Interface Sci., 50 (1975) 462.
Handbook, 2nd edn., McGraw-Hill, New York, 1963, [102] H. Christenson, Doctoral Dissertation, The Australian Table 6f-2. National University, 1983.
[95] M.A. Jeppeson and A.M. Taylor, J. Opt. Soc. Am., 56 [ 103] L.R. White, in R.J. Hunter (Ed.), Foundations of Colloid (1966) 451. Science, Vol. 1, Oxford University Press, Oxford, 1989,
[96] Y. Le Calvez, G. Stephan and S. Robin, Opt. Acta, 15 Chapter 4. (1968) 583. [104] J.N. Israelachvili and D. Tabor, Proc. R. Soc. London,
[97] A.J. Atkins and D.L. Misell, J. Phys. C, 5 (1972) 3153. Ser. A, 331 (1972) 19. [98] W. Vedder, Am. Miner., 49 (1964) 736. [105] L.R. White, J.N. Israelachvili and B.W. Ninham, [99] D. Tabor and R.H.S. Winterton, Proc. R. Soc. London, J. Chem. Soc., Faraday Trans. 1, 72 (1976) 2526.
Ser. A, 312 (1969) 435. [106] D.R. Clarke, J. Am. Ceram. Soc., 70 (1987) 15.