characterization of protein immobilization on nanoporous gold using atomic force microscopy and...
TRANSCRIPT
Characterization of protein immobilization on nanoporous goldusing atomic force microscopy and scanning electronmicroscopy†
Yih Horng Tana,b, John R. Schalloma, N. Vijaya Ganesha, Kohki Fujikawaa, Alexei V.Demchenkoa, and Keith J. Stinea,b
aDepartment of Chemistry and Biochemistry, University of Missouri–Saint Louis, Saint Louis, MO,63121, USAbUM-St. Louis Center for Nanoscience, University of Missouri–Saint Louis, Saint Louis, MO,63121, USA
AbstractNanoporous gold (NPG), made by dealloying low carat gold alloys, is a relatively newnanomaterial finding application in catalysis, sensing, and as a support for biomolecules. NPG hasattracted considerable interest due to its open bicontinuous structure, high surface-to-volume ratio,tunable porosity, chemical stability and biocompatibility. NPG also has the attractive feature ofbeing able to be modified by self-assembled monolayers. Here we use scanning electronmicroscopy (SEM) and atomic force microscopy (AFM) to characterize a highly efficientapproach for protein immobilization on NPG using N-hydroxysuccinimide (NHS) esterfunctionalized self-assembled monolayers on NPG with pore sizes in the range of tens ofnanometres. Comparison of coupling under static versus flow conditions suggests that BSA(Bovine Serum Albumin) and IgG (Immunoglobulin G) can only be immobilized onto the interiorsurfaces of free standing NPG monoliths with good coverage under flow conditions. AFM is usedto examine protein coverage on both the exterior and interior of protein modified NPG. Access tothe interior surface of NPG for AFM imaging is achieved using a special procedure for cleavingNPG. AFM is also used to examine BSA immobilized on rough gold surfaces as a comparativestudy. In principle, the general approach described should be applicable to many enzymes,proteins and protein complexes since both pore sizes and functional groups present on the NPGsurfaces are controllable.
IntroductionImmobilization of proteins from solution onto functionalized surfaces has attractedtremendous amounts of attention, primarily due to the great interest in the development ofbiosensor devices, such as those for point-of-care diagnosis, and also for applications suchas in bioreactors or biofuel cells.1-5 Self-assembled monolayers (SAMs) of organosulfurcompounds on gold surfaces have been widely used to link proteins and other largebiomolecules to gold surfaces, including both those of flat gold and of gold nanoparticles,through a variety of conjugation strategies.6-9 Nanoporous gold (NPG) presents newopportunities as a support for biomolecular immobilization for a range of applications, andits modification can also be achieved by conjugation to SAM modified NPG surfaces.10 Anumber of important questions concerning the efficiency of coupling of proteins to NPG and
†Electronic supplementary information (ESI) available. See DOI: 10.1039/c1nr10427fCorrespondence to: Keith J. Stine.
NIH Public AccessAuthor ManuscriptNanoscale. Author manuscript; available in PMC 2012 August 3.
Published in final edited form as:Nanoscale. 2011 August 3; 3(8): 3395–3407. doi:10.1039/c1nr10427f.
NIH
-PA Author Manuscript
NIH
-PA Author Manuscript
NIH
-PA Author Manuscript
the distribution of immobilized proteins achieved on NPG under different conditions remainto be answered in order to place the possible applications of biomolecules supported onNPG on a stronger foundation. Studies are clearly needed that can examine the distributionof protein on the internal surfaces of NPG.
The influence of surface morphology is an important aspect in the study of proteinadsorption or immobilization. However, the number of analytical techniques available todate that have the capability to visualize individual immobilized proteins are few, and someare beyond the reach of many academic labs. In this study, protein immobilized on NPG ischaracterized using atomic force microscopy (AFM). The atomic force microscope is ideallysuited for characterizing nanometre scale features. It offers the capability of 3D visualizationand provides both qualitative and quantitative information on many physical propertiesincluding size, morphology, surface texture and roughness. Statistical information, includingsize, surface area, and volume distributions, can be determined as well. Further, a widerange of specimen sizes can be characterized in the same scan, from 1 nanometre to 100s ofnanometres, in air, vacuum or under experimental media, such as, a buffer solution forbiological specimens.
Microscope images, such as those provided by AFM, are essential in research anddevelopment projects and can be critical when troubleshooting the packing quality of SAMsused as platforms for protein immobilization and for understanding the surface density andpresentation of the proteins. AFM has several advantages for characterizing biologicalspecimens such as proteins on surfaces. AFM allows one to study native protein without theneed for any labeling or staining, in a variety of possible environments, and at nanometrescale resolution. With AFM, one can also follow dynamic changes of proteins on surfaces inresponse to introduction of other molecules or changes in the aqueous environment usingAFM flow cell techniques.11-13
In recent decades, flat gold surfaces have most commonly been used for thiol-gold SAMpreparation.8 However, recently there has been a surge of interest in functionalizingnanoporous materials for applications in catalysis, separations, and analysis.14,15 Thisinterest has includes the emerging focus on NPG, mainly due to its large surface area andhigh degree of porosity, in addition to its possible role as an active catalyst itself.16 Anumber of studies have reported on the stability, high in-plane conductivity, andbiocompatibility of NPG.17-22
Nanoporous gold is, as the name implies, gold which contains randomly directional andinterconnected pores spanning the material, with these pores having lateral dimensions onthe order of several nanometres to a few hundreds of nanometres depending on preparationand post-preparation annealing steps.22 In general, NPG is prepared from low carat goldalloys containing 20% to at most 50% gold via a de-alloying process in which the less nobleelements are oxidized and diffuse out of the material. De-alloying is achieved either byexposure of the precursor alloy to a strong acid or to a sufficiently positive electrochemicalpotential.10,18 Due to its nanometre scale pore size and ligament framework, by which wemean its interconnected structure of Au ligaments each on the order of 10 to a few 100 nmin size (depending on the processing parameters),10 NPG possesses many potentialapplications, such as direct use as an oxidation catalyst when the average ligament size issufficiently narrow,19,23 use as a catalyst support, as a platform for enhanced chemicalsensing,24 as a gas storage medium,25 support for iterative synthesis,26 support for surface-enhanced Raman spectroscopy,17,27 support for localized or propagating surfaceplasmons,28 and other emerging applications. By convention, the spaces between theinterconnected ligaments are referred to as pores, although they are not necessarilycylindrical in shape. When the pore and ligament framework reaches hundreds of
Tan et al. Page 2
Nanoscale. Author manuscript; available in PMC 2012 August 3.
NIH
-PA Author Manuscript
NIH
-PA Author Manuscript
NIH
-PA Author Manuscript
nanometres, it becomes useful in microfluidic flow control, because the increased surfacearea to volume ratio greatly enhances the chemical reactivity and efficiency.29
In recent years, the use of NPG to construct electrochemical sensors and biosensors hasattracted the interest of analytical chemists.10,21,30 NPG appears to be an attractive highsurface area support for biomolecules due to its chemical stability, ease of modification, andapparently adequate pore sizes for accommodating proteins. A number of successful uses ofNPG as a support for biosensor development or for assay development have been reported.In 2010, Chen et al., took advantage of the unique physical and chemical properties ofnanoporous gold, and adapted NPG as a supporting matrix for immobilizing a redox proteinhemoglobin (Hb) to develop a high-performance hydrogen peroxide biosensor. Usingoptimized cyclic voltammetry (CV) and chronoamperometry parameters, the detection ofH2O2 was achieved over a range from 5 × 10⁻⁸ to 2 × 10⁻⁴ M with a detection limit of 2 ×10⁻⁸ M (based on S/N = 3).31
The unique architecture of NPG provides many possibilities for those who envisionmanufacturing nanobio-devices. However, in order to take advantage of the high surface tovolume ratio of NPG to improve immobilization efficiency or electrocatalytic activity, it isimportant to understand the presentation and the distribution of proteins on the surfacespresent throughout functionalized NPG materials. The porosity and curvature of the NPGstructure introduces additional complexities beyond those of a flat Au surface. While othermethods such as those based on solution depletion and supernatant analysis can provideestimations of the net amount of protein included in an NPG sample, they do not provideinformation on the distribution of immobilized proteins. In this paper, we report thatmonolithic NPG samples can be mechanically cleaved and thus their internal surfacesexposed for AFM examination. In this paper, the immobilization of two common proteins,bovine serum albumin (BSA) and immunoglobulin G (IgG) on NPG samples using AFM isreported. The ligament dimensions of NPG used here are typically in the range of 50–100nm diameter and are larger than the dimensions of these proteins (4–15 nm), and thusindividual protein features can be seen by AFM even in light of tip-surface convolutioneffects. In our study, we examine covalent protein immobilization under both static andflow-through conditions and image both external and internal NPG surfaces. To ourknowledge, AFM visualization of proteins on NPG has thus far not been reported.
Experimental sectionCompounds for SAM formation and activation
Lipoic acid (thioctic acid) and 1-ethyl-3-[3-dimethylaminopropyl] carbodiimidehydrochloride (referred to as EDC, purity > 99.0%) were purchased from Sigma Aldrich (St.Louis, Missouri, USA). N-hydroxysuccinimide (referred to as NHS) with a purity of morethan 97.0% was purchase from Fluka (Milwaukee, Wisconsin, USA). HPLC grade ethanolsolvent was purchased from Sigma Aldrich (St. Louis, Missouri, USA). Lipoic acid wasdissolved in HPLC grade ethanol at a concentration of 0.5 mM. Solutions of EDC and NHSwere each prepared separately in acetonitrile (99.9% purity, Fisher Scientific, Philadelphia,USA) at final concentrations of 5.0 mM. All chemicals and reagents were used as received.
Protein solutionsBovine serum albumin (referred to as BSA, 98.0% purity) and rabbit immunoglobulin G(referred to as IgG, from rabbit serum, greater than 95.0% purity) were purchased fromSigma Aldrich (St. Louis, Missouri, USA) and used as received. The protein solutions, suchas BSA (1.0, 5.0, 10.0 and 20.0 μg ml−1) and rabbit IgG (5.0 μg ml−1), were prepared insodium phosphate buffer (pH 7.0, final ionic strength of 10.0 mM) following the protocolfrom New England Biolabs (Ipswich, Massachusetts, USA).
Tan et al. Page 3
Nanoscale. Author manuscript; available in PMC 2012 August 3.
NIH
-PA Author Manuscript
NIH
-PA Author Manuscript
NIH
-PA Author Manuscript
In order to achieve protein immobilization, the relatively high concentrations of BSA or IgG(as listed above) were used so as to provide an excess of protein in solution available to reactwith the activated functional groups on the gold surfaces. Further, NHS-ester functionalizedrough gold and nanoporous gold was characterized using AFM without protein as a controlexperiment. A minimal amount of adsorption was observed in this blank test, confirmingthat the spots of greater intensity in the AFM topographs are due to protein attachment. Allsamples were thoroughly rinsed with 1% Tween 20, and Milli-Q water, before images wereacquired using AFM.
Protein structuresThe structure of BSA was obtained from Protein Data Bank (ID code 1E7I) and is shown inFig. 1A. To highlight the lysine groups in BSA, the molecular graphics images wereproduced using the University of California, San Francisco (UCSF) Chimera package fromthe Resource for Biocomputing, Visualization, and Informatics at UCSF (supported by NIHP41 RR-01081).32 According to Ortiz et al., BSA (MW = 66382 Da) is a prolate ellipsoid(E-form conformation) with typical dimensions of 4.0 nm × 4.0 nm × 14.0 nm (a = b <c).33-35 The serum albumin protein undergoes reversible conformational isomerization withchanges in pH. At pH around 8, BSA adopts an N-form conformation, with typicaldimensions of 3.0 nm × 8.0 nm × 8.0 nm.35,36 For our study, the most important features arethe lysine (Lys) residues (highlighted in green in Fig. 1) for covalent immobilization ontoactivated N-hydroxysuccinimide ester terminated SAMs on gold.37 Since Lys is the mostabundant on the periphery of protein, for simplicity, we will focus only on the Lys residueson the protein surface for conjugation. Of the 607 residues in BSA, there are 58 lysines atvarious locations on the protein surface. Similarly, by using the (UCSF) Chimera imagerendering software, the 3D space filling model of IgG (protein data bank ID code: 1IgG) ispresented in Fig. 1B. The Y-shaped IgG is composed of two antigen-binding fragments, Fab,and a crystallizable fragment, Fc. Both fragments are heavily decorated with lysine groups(highlighted in green in Fig. 1B), available for covalent immobilization onto activated NHSester termini of SAMs. The typical dimensions of IgG are approximately 4.0 nm × 8.5 nm ×14.5 nm.38 There are 83 lysine groups per IgG.
Atomic force microscopy imaging and analysisThe AFM imaging was performed in Tapping Mode™ with a Multimode™ AFM (Veeco,Santa Barbara, California, USA) operating with a Nanoscope IIIa™ controller. We usedTAP300G (Budget Sensors, Sofia, Bulgaria) silicon cantilevers with a resonance frequencyof about 300 kHz, and a spring constant of 40 N/m. The scan frequency was typically 1.5 Hzper line and the modulation amplitude was a few nanometres. We used a first or secondorder polynomial function to remove the background slope. The proteins (either BSA orIgG) were measured quantitatively from more than 30 cursor profiles per image to obtainsufficient statistics.
Preparation of free-standing nanoporous gold platesPreparation of free-standing nanoporous gold plates was performed according to literatureprocedures, with a few modifications. 10,18 In brief, 10 carat white gold sheets (4.0 inch ×2.0 inch × 0.0098 inch, L × W × H, respectively) were purchased from Hoover and Strong(Richmond, Virginia, USA). The stated atomic composition of this commercial alloy is41.8% Au, 5.0% Ag, 30–35% Cu, 8–9% Zn and 15–20% Ni. The 10 carat sheet was cut to asize of 2.0 mm × 2.0 mm × 0.25 mm, L × W × H, respectively, and placed in a concentratednitric acid bath for 48 h (the acid solution was refreshed at the 24 h time point). The samplesize was specifically chosen for convenience of handling during protein incubation and forfitting into a standard AFM sample holder. After the nitric acid de-alloying treatment, thesample was rinsed thoroughly with Milli-Q water (18.2 MΩ, Millipore Corporation, Boston,
Tan et al. Page 4
Nanoscale. Author manuscript; available in PMC 2012 August 3.
NIH
-PA Author Manuscript
NIH
-PA Author Manuscript
NIH
-PA Author Manuscript
USA) to neutral pH, follow by rinsing with HPLC grade ethanol (Sigma Aldrich, St. Louis,Missouri, USA). The microstructure of NPG was characterized with AFM and also byscanning electron microscopy using a JEOL JSM-6320F field emission SEM.
Preparation of rough gold surfacesThe rough gold films used in this study were prepared by thermal evaporation of high-purity~99.99% gold wire (Electron Microscopy Sciences, Hatfield, Pennsylvania, USA) wrappedaround a small tungsten wire basket in a conventional Denton vacuum thermal-evaporator(Model DV502A, Denton Vacuum, Moorestown, New Jersey, USA) onto the surfaces ofsmall cut pieces of Si-wafer (Nova Electronic Materials, Flower Mound, Texas, USA) whichwere first coated with a nichrome adhesion layer by thermal evaporation of nichrome wire(Alfa Aesar, Ward Hill, Massachusetts, USA). The chamber pressure during evaporationwas less than ~5 × 10⁻⁶ torr and was achieved using a diffusion pump with a liquid nitrogentrap.
Preparation of self-assembled monolayersThe SAM preparation used in this study follows established procedures.10,18,39 Thenanoporous gold template used in static immobilization experiments was transferred tolipoic acid solution (0.5 mM, in ethanol) for 24 h. The EDC (5.0 mM) and NHS (5.0 mM)solutions were prepared separately in acetonitrile. The freshly prepared acid-terminatedalkyl surface was allowed to react with EDC and NHS, sequentially for 1 h at roomtemperature. The resulting NHS ester-terminated surface was copiously rinsed with waterand PBS buffer before coupling with proteins. In the case of experiments using NPG in aflow cell, as explained in detail below, the lipoic acid in ethanol solution was flowedthrough the NPG plate for one hour to achieve SAM formation. For the studies on roughgold surfaces, one set of experiments used only the EDC activation step followed directly byrinsing and exposure to the protein solution. The second set of experiments on the roughgold surfaces used both the EDC activation and substitution by NHS prior to rinsing andexposure to the protein solution.
Energy dispersive X-ray analysisEnergy dispersive X-ray analysis was introduced to confirm the presence of protein. Proteinsmainly consist of hydrogen, carbon, nitrogen and oxygen. Carbon compounds likely to bepresent as laboratory contaminants can be detected using EDS by examining the spectrumfor a peak near 0.28 KeV. In contrast, observing a nitrogen peak, near 0.39 KeV, in a typicalEDS spectrum due to random laboratory contamination is much less likely, and observationof such a peak can be attributed to the presence of protein in these experiments. We havecaptured and analyzed over 300 EDS spectra from different regions of the NPG with andwithout immobilized BSA. The EDS spectra (representative EDS spectrum) for NPGactivated NHS-ester with and without proteins were rendered in an Excel spread sheet forcomparison. Original EDS spectra (captured using Link Pentafet 6886 Model, OxfordMicroanalysis Group, UK) are available in the supplementary information, Figure S1.†
Results and discussionCovalent immobilization of bovine serum albumin on rough gold surfaces
The structure of BSA (3.0 nm × 8.0 nm × 8.0 nm), as obtained from the Protein Data Bank,is shown in Fig. 1A.35-37 Since Lys is the most abundant on the periphery of protein, forsimplicity, we will focus only on the Lys residues on the protein surface for conjugation. Of
†Electronic supplementary information (ESI) available. See DOI: 10.1039/c1nr10427f
Tan et al. Page 5
Nanoscale. Author manuscript; available in PMC 2012 August 3.
NIH
-PA Author Manuscript
NIH
-PA Author Manuscript
NIH
-PA Author Manuscript
the 607 residues in BSA, there are 58 lysines at various locations on the protein surface.Similarly, the 3D space filling model of IgG (4.0 nm × 8.5 nm × 14.5 nm) is presented inFig. 1B.38 There are 83 lysine groups per IgG, available for covalent immobilization ontoactivated NHS ester termini of SAMs.
In order to prove that proteins immobilized on rough gold surfaces could be successfullyimaged using tapping mode AFM (TM-AFM), BSA was covalently linked to EDC-activatedlipoic acid SAMs on specially prepared rough gold films supported on silicon.
We observed that the irregular corrugations (grooves and ridges) of rough gold films (9.7 ±0.2 nm, root-mean-square measurement of surface roughness determined from AFMimages) on silicon are a close mimic to the rough surface of nanoporous gold (13.8 ± 4.8nm, root-mean-square measurement of surface roughness determined from AFM images)formed by ligaments and pores. As illustrated in Fig. 2, the widely utilized covalent proteinimmobilization method through amide bond formation by reaction of amines on exposedlysines with NHS activated esters on the gold surface was employed.11,40-42 In brief, acarboxylic acid terminated self-assembled monolayer (SAM) was prepared by dipping therough gold substrate in lipoic acid (0.5 mM/ethanol) for a duration of 1 h. The SAMmodified gold surface was then reacted with 1-ethyl-3-[3-dimethylaminopropyl]carbodiimide hydrochloride (EDC, 5.0 mM in acetonitrile). EDCreacts with a carboxyl group to form an active ester, an O-acylisourea. In general, covalentattachment of protein to the EDC reactive surface is possible.10,18 However, the EDC activesurface is unstable to hydrolysis. To overcome this limitation, the use of NHS allows theconversion of the O-acylisourea intermediate into a relatively stable amine reactive NHS-ester. This NHS ester can then cross-link with amine group on the protein by forming acovalent amide bond.42
Fig. 3 shows EDC/lipoic acid functionalized rough gold surfaces before and after exposureto the protein BSA, captured using TM-AFM. The EDC functionalized rough gold surfaces,Fig. 3A, before exposure to protein were imaged as a control experiment. Negligibleadsorption was observed in this blank test image and serves to confirm that the numerousbrighter spots in the AFM topographs shown in Fig. 3B, 3C and 3D, are due to proteinattachment.
The protein coverage on the EDC functionalized rough gold surfaces appeared to depend onthe exposure time when subjected to similar immobilization conditions, specifically 1.0 mlof 1.0 μg ml−1 BSA in 1x PBS buffer (pH 7.0 at 25.0 °C) for 1 min (Fig. 3B), 10 min (Fig.3C) and 15 min (Fig. 3D). From Fig. 3B, 3C and 3D, distinctive brighter spots decorated onthe surface of the rough gold were apparent when compared to the control experiment inFig. 3A.
Based on the observed protein coverage on the surface of rough gold, the extent of proteinBSA adsorption is clearly impacted by the incubation time. While there is no obviousprotein adsorbed on the control surface, coverage of approximately 1228 (8 uncertain)protein/μm2 (meaning that an additional ~8 surface features per μm2 possibly due to proteinspresent in aggregates or resulting from tip convolution are not included, see supplementaryinformation for a discussion of our protein counting strategies†) was observed on surfaces asshown in Fig. 3F. For the rough gold surface after exposure to BSA for 10 and 15 min,surface coverages of 1476 (20) and 1644 (28) protein/μm2 were obtained, as shown in Fig.3G and 3H, respectively. This study clearly indicated that protein BSA coverage is enhancedby longer incubation times by at least 25%, based on protein coverage, comparing resultsobtained using 15 min versus 1 min adsorption time. Based on extensive prior literature,when working with a non-flat surface, a correction (roughness) factor should be applied to
Tan et al. Page 6
Nanoscale. Author manuscript; available in PMC 2012 August 3.
NIH
-PA Author Manuscript
NIH
-PA Author Manuscript
NIH
-PA Author Manuscript
correct for the surface area gained as a result of roughness that is equal to the ratio of theactual surface area to the projected surface area. The direct usage of AFM to determine thiscorrection factor was developed by Harris et al. in 2001, and is applied here by using thetotal distance the tip moved over the rough gold surface compared to the lateral distance ofthe AFM scan, and averaging over many line scans.43 The roughness factor obtained for ourrough gold is 2.5 based on multiple analyses. Upon taking the roughness factor into account,we can normalize the protein coverage on the rough gold surface by dividing the proteincoverage by 2.5. Thus, protein coverages of approximately 491 (3), 590 (8) and 658 (11)protein/μm2 were obtained respectively for 1, 10 and 15 min incubation.
We also explored BSA immobilization on rough gold surfaces through conjugation of theNHS ester activated SAM with the amine groups on the proteins. Fig. 4, shows the NHSactive ester functionalized rough gold surface before and after exposure to the protein BSA,captured using TM-AFM.
The topograph of the lipoic acid SAM modified rough gold treated with EDC/NHS beforeexposure to BSA was captured to serve as a reference to the rough gold surface afterexposure to protein, Fig. 4A. The protein immobilization conditions used were similar tothose used for conjugating BSA to EDC functionalized rough gold surfaces as shown in Fig.3. From Fig. 4B (1 min exposure), 4C (10 min exposure), and 4D (15 min exposure),distinctive brighter spots decorated on the surface of the rough gold are apparent whencompared to the control experiment in Fig. 4A.
The protein coverage on the NHS active esters rough gold surfaces was also found to bedependent on the protein exposure time when subjected to similar immobilizationconditions. Surface coverages of 820 (12), 888 (24), 996 (32) protein/μm2 were obtainedfrom Fig. 4F, 4G, and 4H, respectively. Accounting for the roughness factor of 2.5,coverages of 328 (5), 355 (10), 398 (13) protein/μm2 are obtained. The numbers of proteinswere counted using the following dimension as the threshold: 35.0 ± 5.0 nm lateral widthdimension based upon individual bright spots imaged under AFM (see supplementaryinformation for discussion of protein coverage analysis†). This threshold is determined frombright spot capture in the low coverage region and is consistent with multiple repeatedexperiments. Due to the rough corrugation of the gold substrate, this threshold is used as aqualitative guide for counting proteins, as the irregular morphology of the underlying goldsubstrate or sharpness of the AFM probe tip may impact the lateral widths of the brightspots.
The observations of Fig. 3 and 4 confirm that both direct EDC and EDC/NHS treatment ofthe lipoic acid SAMs on rough gold can successfully result in protein immobilization. In thecase studied here, the protein coverage obtained was somewhat higher for the direct EDCtreatment than for the sequential treatment with EDC followed by NHS. Successful couplingof proteins to lipoic acid SAMs directly after treatment with EDC in acetonitrile has beenreported previously.18,44-49 As depicted in Fig. 2, EDC reacts with carboxylic acid groups toyield an O-acylisourea, which is highly susceptible to the nucleophilic attack by lysinerequired for formation of an amide bond.50 In aqueous media, the O-acylisourea will beprone to rapid hydrolysis; however, it will be much more stable in acetonitrile. Thesubsequent treatment with NHS gives the NHS-ester intermediate, which is more stable inaqueous media, but is less reactive than the O-acylisourea intermediate and also somewhatlarger in size.42,51 The hydrolysis rates will be different for these intermediates present insolution versus immobilized on a surface, and will also depend on pH and,52 if immobilized,on the structure of the surface monolayer as it impacts their reactivity/ accessibility.53 Thehalf-life for hydrolysis of EDC in the presence of acetate has been reported to be pHdependent, with the rate 8x faster at pH 4 than at pH 7, and with the hydrolysis half-life
Tan et al. Page 7
Nanoscale. Author manuscript; available in PMC 2012 August 3.
NIH
-PA Author Manuscript
NIH
-PA Author Manuscript
NIH
-PA Author Manuscript
being 806 s (3 mM EDC, 50 mM acetate, pH 7).52 It is known that the NHS-esterintermediate is prone to side reactions to form byproducts such as an anhydride or an N-acylurea.42,51 A study of the hydrolysis of NHS-ester terminated SAMs found that thehydrolysis rate can be as much as 1000 times slower for the monolayer than for analogouscompounds in solution.54 The hydrolysis of the NHS-ester of mercaptohexadecanoic acidSAMs was found to have a half-life of 1700 s upon exposure to 0.01 M NaOH (pH 12), thehalf-life being 125 s for the analogous mercaptoacetic acid derivative.53 These half-liveswould undoubtedly be much longer near pH 7. The half-life for hydrolysis of the O-acylisourea intermediate should also be expected to be much longer in the SAMenvironment than it would be free in solution, although a detailed study does not seemavailable in the literature. The exposure times used here for direct reaction of the EDC-activated rough gold surface with protein are apparently short enough that good proteincoverage is obtained as a consequence of high EDC reactivity promoting amide bondformation prior to loss of EDC from the surface by hydrolysis. The addition of the secondstep of NHS treatment may reduce the conjugation yield to protein if the NHS-activatedsurface is more prone to side reactions or is simply less reactive during our selected times ofprotein exposure. The EDC mediated approach has also been used extensively in diverseapplications to form amide bonds in peptide synthesis, in the labeling of nucleic acidsthrough 5′ phosphate groups, and in creating amine-reactive NHS-esters of biomolecules,amongst other applications.55,56
In both approaches, the activated ester groups are accessible for reaction with lysine residueson the protein. This could be aided by the roughness of the surface contributing additionaldisorder into the SAM packing and making the activated ester groups more accessible. Theblocking capacity towards heterogeneous electron transfer from cytochrome c acrosscarboxylic acid terminated SAMs (14-mercaptotetradecanoic acid and 11-mercaptoundecanoic acid) on gold surfaces of varying roughness factor (r) was compared byBowden for evaporated Au on glass (r = 2.1), Au foil (r = 1.5), single crystal Au (r = 1.1),and Au epitaxially deposited on mica (r = 1.0).57 In this study, it was found that blockingcapacity and hence SAM integrity lessened as roughness increased. It has been reported thatlipoic acid SAMs on flat Au(111) can have fairly disordered structures, and thus are possiblyeven more disordered on rough gold.58-60 The footprint of the protein on the surface willclearly cover many individual molecules of the SAM. Increases in both the surface densityof the activated ester groups and their accessibility/reactivity should contribute to enhancedprotein coverage. In theory, a more disordered and open presentation of O-acylisourea (orNHS ester) groups will facilitate reaction with amine groups on the peripheral lysines of theBSA protein. We hypothesize that the packing of the O-acylisourea (or NHS ester) groupson the surface of the rough gold could adopt many configurations. For example, (i) when thelocal radius of curvature of the gold surface is high, the chain density and spacing betweenO-acylisourea (or NHS ester) groups will increase with distance away from the surface. Inother words, on higher curvature gold surfaces, the spacing between ω-functionalized end-groups increases when compared to the spacing between these groups if the SAM was on aflat gold surface, and the surface is able to accommodate more end-groups per unit area.61-63
For example, examination of PEG-lipoic acid conjugates on Au nanoparticles surfaces foundthat on smaller diameter nanoparticles, the PEG coverage density was increased due tocurvature effects; that is, the smaller the AuNP, the denser its PEG layer.64 The curvatureshould also serve to decrease van der Waal’s interactions between neighboring moleculesand disrupt the molecular packing, serving to make the reactive end-groups more mobile andaccessible.65 (ii) On the other hand, if the radius of curvature of the rough gold substrate ismoderate to low, the effect of the curvature on SAM structure will likely be diminished ornegligible. The packing of the thiolated molecules probably shows no major differencesbetween planar SAMs and SAMs on regions of rough substrates where the curvature is low,such as the faces of larger sized gold grains. (iii) The rough gold surfaces studied herein will
Tan et al. Page 8
Nanoscale. Author manuscript; available in PMC 2012 August 3.
NIH
-PA Author Manuscript
NIH
-PA Author Manuscript
NIH
-PA Author Manuscript
present a distribution of regions of different degrees of curvature. While some of theseregions will be of low curvature and present SAMs more similar to those of flat gold, otherregions will present less-ordered SAMs and hence more accessible reactive end-groups (inthis case, either O-acylisourea or NHS ester) thus facilitating the immobilization of a proteinsuch as BSA through reaction with peripheral lysines and resulting in higher coverage. Ourroughness factor of 2.5 for gold evaporated onto Si is close to that of 2.1 reported byBowden for Au evaporated onto glass slides, for which the ability of SAMs of 14-mercaptotetradecanoic acid to block electron transfer from cytochrome c was severelycompromised. Since EDC (or NHS) are zero length crosslinking agents, they are ideal forstudying the direct conjugation of surface carboxyl termini in the SAM to the primaryamines on the protein surfaces. Use of EDC or NHS removes factors accompanying the useof longer length linkers (such as polyethyleneglycol chains, or extended bifunctional linkers)including their influence on protein coverage and non-specific binding. The EDC/NHSconjugation strategy, in which both reagents are applied in a buffer at a carefully selectedratio and overall concentration of reagents, is a more commonly used strategy than that ofusing EDC alone. Since diffusion and reaction times will be longer for NPG monolithsexposed to protein solution and given that the NHS activated esters are more stable overlonger time periods, we focus on usage of EDC/NHS for the remainder of this studyconcerning protein immobilization onto NPG.
Covalent immobilization of bovine serum albumin on nanoporous goldThe utilization of the rough gold substrates for protein immobilization and characterizationserved to set a foundation, to provide a proof of concept, and enable optimization ofexperimental conditions prior to the exploration of protein immobilization on nanoporousgold. The procedures and reaction conditions were then transferred to the studies onnanoporous gold. In consideration of the internal complexity of nanoporous gold and theneed for much longer protein incubation times, only NHS active ester surfaces were used.The activation of lipoic acid SAMs on nanoporous gold with NHS active esters wasperformed following established procedures reported elsewhere.6,7,66
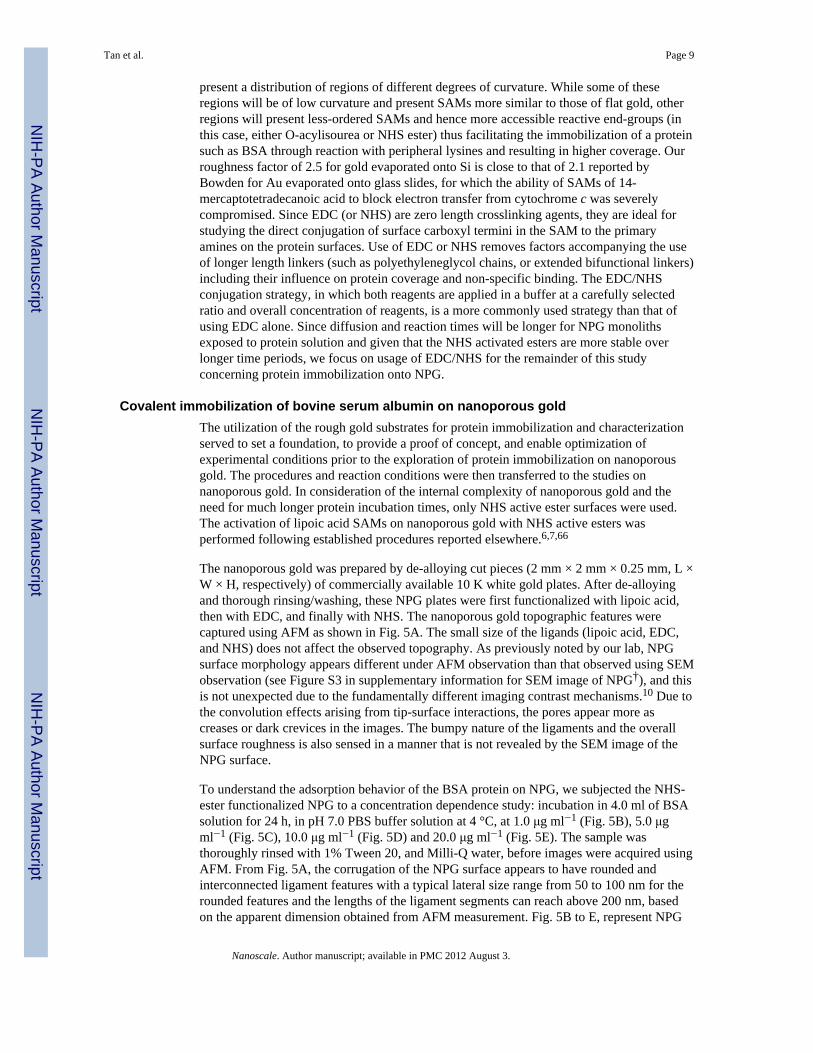
The nanoporous gold was prepared by de-alloying cut pieces (2 mm × 2 mm × 0.25 mm, L ×W × H, respectively) of commercially available 10 K white gold plates. After de-alloyingand thorough rinsing/washing, these NPG plates were first functionalized with lipoic acid,then with EDC, and finally with NHS. The nanoporous gold topographic features werecaptured using AFM as shown in Fig. 5A. The small size of the ligands (lipoic acid, EDC,and NHS) does not affect the observed topography. As previously noted by our lab, NPGsurface morphology appears different under AFM observation than that observed using SEMobservation (see Figure S3 in supplementary information for SEM image of NPG†), and thisis not unexpected due to the fundamentally different imaging contrast mechanisms.10 Due tothe convolution effects arising from tip-surface interactions, the pores appear more ascreases or dark crevices in the images. The bumpy nature of the ligaments and the overallsurface roughness is also sensed in a manner that is not revealed by the SEM image of theNPG surface.
To understand the adsorption behavior of the BSA protein on NPG, we subjected the NHS-ester functionalized NPG to a concentration dependence study: incubation in 4.0 ml of BSAsolution for 24 h, in pH 7.0 PBS buffer solution at 4 °C, at 1.0 μg ml−1 (Fig. 5B), 5.0 μgml−1 (Fig. 5C), 10.0 μg ml−1 (Fig. 5D) and 20.0 μg ml−1 (Fig. 5E). The sample wasthoroughly rinsed with 1% Tween 20, and Milli-Q water, before images were acquired usingAFM. From Fig. 5A, the corrugation of the NPG surface appears to have rounded andinterconnected ligament features with a typical lateral size range from 50 to 100 nm for therounded features and the lengths of the ligament segments can reach above 200 nm, basedon the apparent dimension obtained from AFM measurement. Fig. 5B to E, represent NPG
Tan et al. Page 9
Nanoscale. Author manuscript; available in PMC 2012 August 3.
NIH
-PA Author Manuscript
NIH
-PA Author Manuscript
NIH
-PA Author Manuscript
after exposure to BSA, the topographic images appear to have many small irregularlyshaped features with an average dimension of 29 ± 8 nm, observed on the surface of theNPG. These features are smaller than those of the NPG ligaments of 35–200 nm and thuscan generally be distinguished as topographic features. The smooth appearance of the NPGis no longer apparent; the pores and interconnected ligament features are not as clearlyprominent when compared to the NPG not exposed to protein. To assist visualization of theimmobilized proteins on the nanoporous gold surface, both amplitude and height(topography) images are presented. The top panels (from Fig. 5A to E) represent theamplitude images; the lower panels (Fig. 5A1 to E1) represent the topographic images of thesame areas as in the top panels. Small rounded features are vividly seen and recognizable inthe amplitude images panels. There are more secondary and additional rounded features seenon the NPG surfaces incubated in the protein solutions of concentration 10.0 μg ml−1 and20.0 μg ml−1 when compared to those incubated in the protein solutions of 1.0 μg ml−1 and5.0 μg ml−1 BSA concentration.
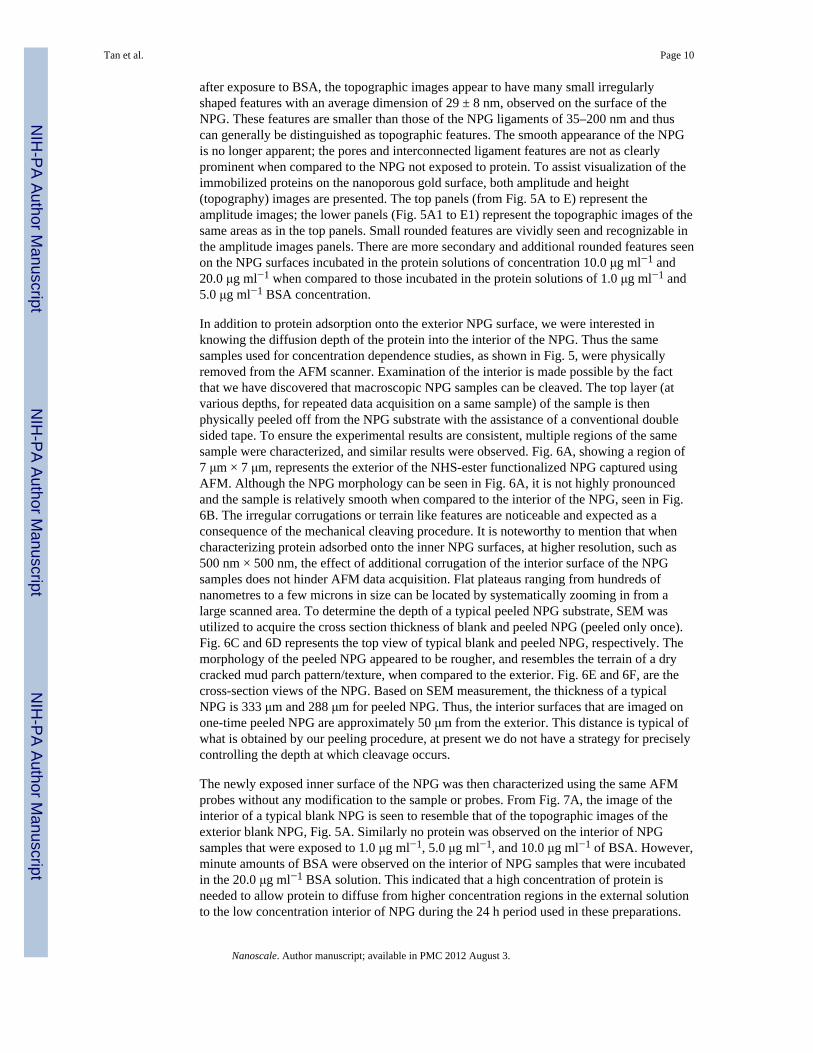
In addition to protein adsorption onto the exterior NPG surface, we were interested inknowing the diffusion depth of the protein into the interior of the NPG. Thus the samesamples used for concentration dependence studies, as shown in Fig. 5, were physicallyremoved from the AFM scanner. Examination of the interior is made possible by the factthat we have discovered that macroscopic NPG samples can be cleaved. The top layer (atvarious depths, for repeated data acquisition on a same sample) of the sample is thenphysically peeled off from the NPG substrate with the assistance of a conventional doublesided tape. To ensure the experimental results are consistent, multiple regions of the samesample were characterized, and similar results were observed. Fig. 6A, showing a region of7 μm × 7 μm, represents the exterior of the NHS-ester functionalized NPG captured usingAFM. Although the NPG morphology can be seen in Fig. 6A, it is not highly pronouncedand the sample is relatively smooth when compared to the interior of the NPG, seen in Fig.6B. The irregular corrugations or terrain like features are noticeable and expected as aconsequence of the mechanical cleaving procedure. It is noteworthy to mention that whencharacterizing protein adsorbed onto the inner NPG surfaces, at higher resolution, such as500 nm × 500 nm, the effect of additional corrugation of the interior surface of the NPGsamples does not hinder AFM data acquisition. Flat plateaus ranging from hundreds ofnanometres to a few microns in size can be located by systematically zooming in from alarge scanned area. To determine the depth of a typical peeled NPG substrate, SEM wasutilized to acquire the cross section thickness of blank and peeled NPG (peeled only once).Fig. 6C and 6D represents the top view of typical blank and peeled NPG, respectively. Themorphology of the peeled NPG appeared to be rougher, and resembles the terrain of a drycracked mud parch pattern/texture, when compared to the exterior. Fig. 6E and 6F, are thecross-section views of the NPG. Based on SEM measurement, the thickness of a typicalNPG is 333 μm and 288 μm for peeled NPG. Thus, the interior surfaces that are imaged onone-time peeled NPG are approximately 50 μm from the exterior. This distance is typical ofwhat is obtained by our peeling procedure, at present we do not have a strategy for preciselycontrolling the depth at which cleavage occurs.
The newly exposed inner surface of the NPG was then characterized using the same AFMprobes without any modification to the sample or probes. From Fig. 7A, the image of theinterior of a typical blank NPG is seen to resemble that of the topographic images of theexterior blank NPG, Fig. 5A. Similarly no protein was observed on the interior of NPGsamples that were exposed to 1.0 μg ml−1, 5.0 μg ml−1, and 10.0 μg ml−1 of BSA. However,minute amounts of BSA were observed on the interior of NPG samples that were incubatedin the 20.0 μg ml−1 BSA solution. This indicated that a high concentration of protein isneeded to allow protein to diffuse from higher concentration regions in the external solutionto the low concentration interior of NPG during the 24 h period used in these preparations.
Tan et al. Page 10
Nanoscale. Author manuscript; available in PMC 2012 August 3.
NIH
-PA Author Manuscript
NIH
-PA Author Manuscript
NIH
-PA Author Manuscript
Bovine serum albumin and immunoglobulin G coupling under flow-through conditionsBased on the above reproducible experimental results, BSA immobilization onto the surfaceof the NHS-functionalized NPG is evident. However, the protein adsorption studies thus farare based on a static incubation method. Given that the pores of NPG range from tens tohundreds of nanometres in size and form a deep network of tortuous paths, the nano-environment may severely hinder protein diffusion throughout the interior of the NPGsubstrate. The possibility for hindered diffusion of the protein solution or low diffusiondepths could explain why minute amount of proteins were observed at the interior of NPGunder the conditions used. To overcome the apparent low penetration of protein throughoutthe nanoporous gold sample, a homemade flow cell system was designed and used inconjunction with a commercially available peristaltic pump (Model 77390–00, Cole-ParmerInstrument Company, Illinois, USA) equipped with polytetrafluoroethylene (PTFE) tubing.A schematic representation of the flow cell system is available in supplementaryinformation, Figure S3.† The design allows a typical de-alloyed NPG plate, 8 mm × 8 mm ×0.25 mm, to be inserted into a sealed chamber. A typical SEM image of the dealloyed NPGis shown in Figure S3, and a typical pore size range from 50 to 100 nm is observed. Tominimize damaging the brittle NPG plate or contaminating the NPG, the setup allows in situfunctionalization of NPG with lipoic acid (0.5 mM / ethanol, 1 h at 1.0 ml min−1), activationusing EDC (5.0 mM / acetonitrile, 1 h) and NHS (5.0 mM / acetonitrile, 1 h), followed byprotein injection at 1.0 ml min −1. We anticipate that the flow cell system permits the proteinsolution to be forced to flow through the porous environment and hence protein can then betethered more efficiently onto the surfaces throughout the interior of the sample.
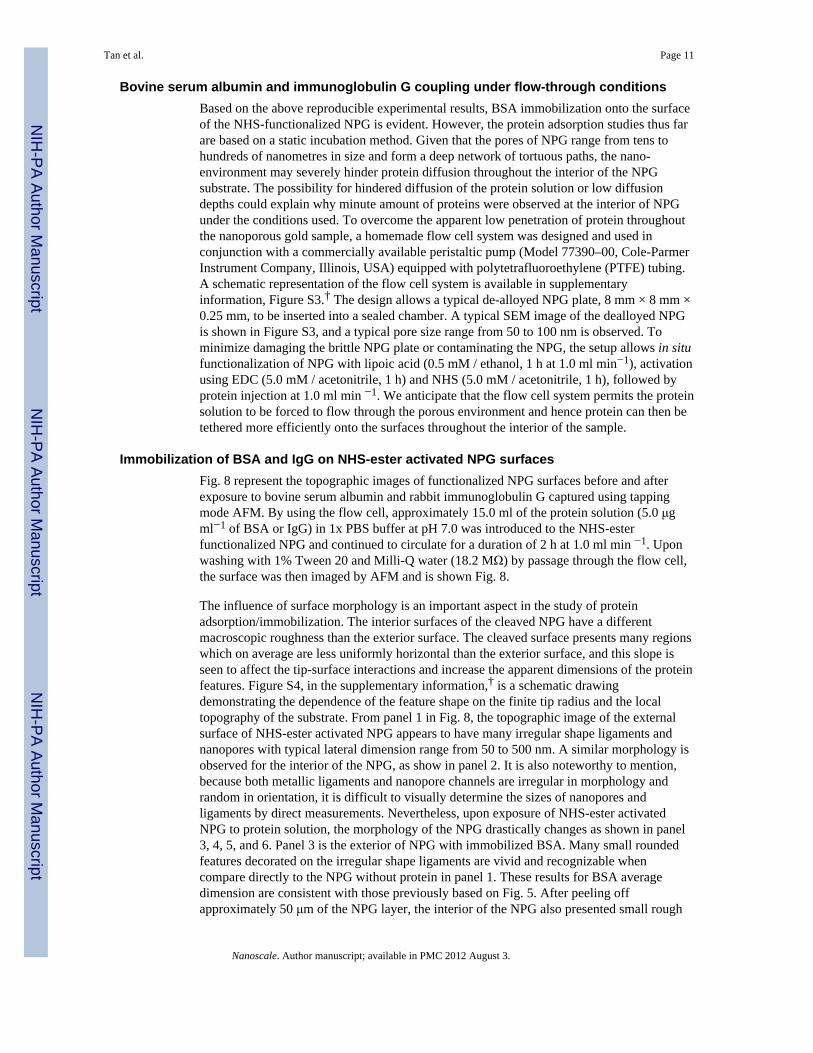
Immobilization of BSA and IgG on NHS-ester activated NPG surfacesFig. 8 represent the topographic images of functionalized NPG surfaces before and afterexposure to bovine serum albumin and rabbit immunoglobulin G captured using tappingmode AFM. By using the flow cell, approximately 15.0 ml of the protein solution (5.0 μgml−1 of BSA or IgG) in 1x PBS buffer at pH 7.0 was introduced to the NHS-esterfunctionalized NPG and continued to circulate for a duration of 2 h at 1.0 ml min −1. Uponwashing with 1% Tween 20 and Milli-Q water (18.2 MΩ) by passage through the flow cell,the surface was then imaged by AFM and is shown Fig. 8.
The influence of surface morphology is an important aspect in the study of proteinadsorption/immobilization. The interior surfaces of the cleaved NPG have a differentmacroscopic roughness than the exterior surface. The cleaved surface presents many regionswhich on average are less uniformly horizontal than the exterior surface, and this slope isseen to affect the tip-surface interactions and increase the apparent dimensions of the proteinfeatures. Figure S4, in the supplementary information,† is a schematic drawingdemonstrating the dependence of the feature shape on the finite tip radius and the localtopography of the substrate. From panel 1 in Fig. 8, the topographic image of the externalsurface of NHS-ester activated NPG appears to have many irregular shape ligaments andnanopores with typical lateral dimension range from 50 to 500 nm. A similar morphology isobserved for the interior of the NPG, as show in panel 2. It is also noteworthy to mention,because both metallic ligaments and nanopore channels are irregular in morphology andrandom in orientation, it is difficult to visually determine the sizes of nanopores andligaments by direct measurements. Nevertheless, upon exposure of NHS-ester activatedNPG to protein solution, the morphology of the NPG drastically changes as shown in panel3, 4, 5, and 6. Panel 3 is the exterior of NPG with immobilized BSA. Many small roundedfeatures decorated on the irregular shape ligaments are vivid and recognizable whencompare directly to the NPG without protein in panel 1. These results for BSA averagedimension are consistent with those previously based on Fig. 5. After peeling offapproximately 50 μm of the NPG layer, the interior of the NPG also presented small rough
Tan et al. Page 11
Nanoscale. Author manuscript; available in PMC 2012 August 3.
NIH
-PA Author Manuscript
NIH
-PA Author Manuscript
NIH
-PA Author Manuscript
features decorated homogeneously on the surface. The corrugation can be seen in theamplitude channel images. The AFM measurement indicates that the protein related featureson the exterior NPG surface are approximately 15 ± 10 nm in lateral dimension versus 30 ±10 nm for protein associated features on the exposed interior surface. The dimensions of 15± 10 nm were used as thresholds in protein counting for determining the BSA coverage onthe exterior NPG surface. Considering the dimensions of the BSA molecules, 3.0 nm × 8.0nm × 8.0 nm, coupled with lateral convolution and the curvature of the substrate, the lateraldimensions obtained from AFM measurement indicated BSA protein was successfullyimmobilized onto the NPG surface. The 3D rendering images in Fig. 8 K and 8O, aremanually colorized to assist visualization of the immobilized protein on the NPG surfaces.Fig. 8L and 8P represent the cursor profiles of the immobilized protein BSA on the exteriorand interior NPG surfaces, respectively. In theory, a wide array of proteins of a few tens ofnanometre in dimension (less than the smaller nanopore dimensions) can be introduced andimmobilized on NPG via the flow cell system.
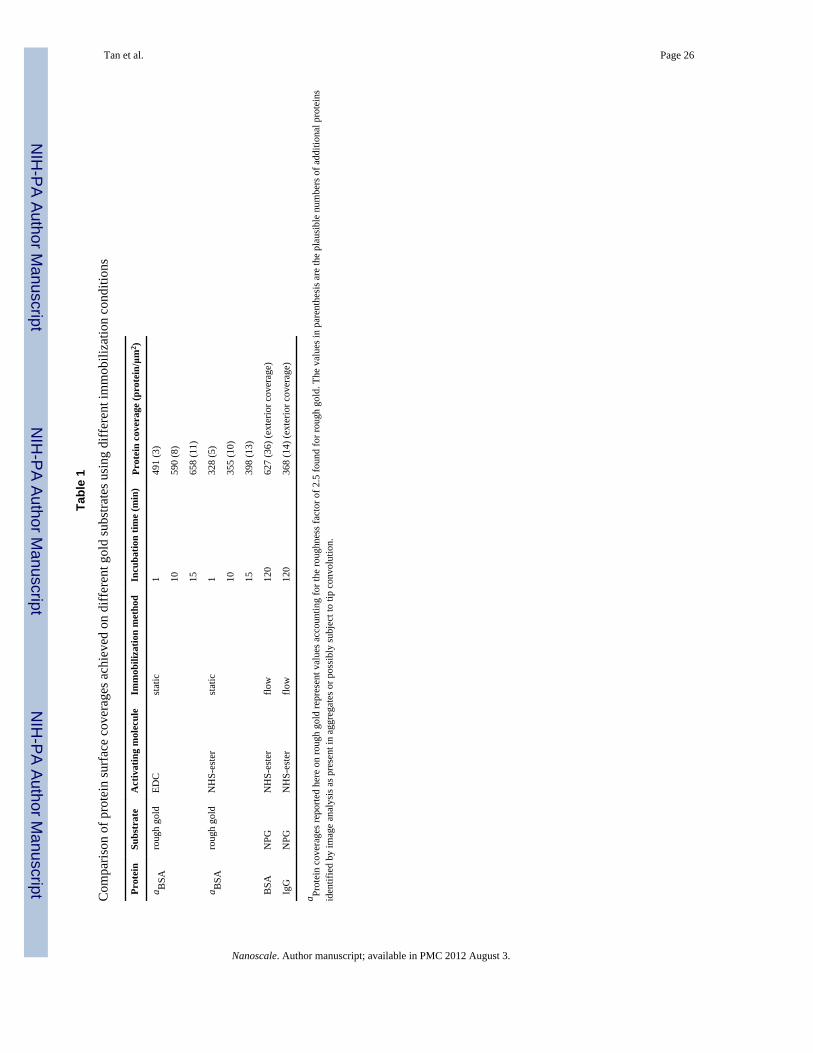
To test the applicability of the flow system for covalent protein immobilization, a larger sizeprotein IgG (in term of lateral dimension, 4.0 nm × 8.5 nm × 14.5 nm) was introduced forcoupling with NHS-ester activated NPG under flow-through conditions. Panel 5 and 6represent the exterior and interior, respectively, of the NPG after passage of IgG undersimilar conditions as used for BSA. Based on Fig. 8Q and 8I, the protein related features onthe exterior NPG surface are approximately 25 ± 10 nm in lateral dimension versus 35 ± 10nm for protein associated features on the exposed interior surface (see supplementaryinformation for protein coverage analysis, Figure S2†). The dimensions of 25 ± 10 nm wereused as thresholds in protein counting for determining the IgG coverage on the exterior NPGsurface. The larger features observed for IgG versus BSA are consistent with the knownlarger dimensions of IgG and provide additional confidence that the topographic featuresexamined are indeed immobilized proteins. The lateral dimensions obtained from AFMcursor profile measurement, appear to be reasonable when accounting for the lateralconvolution and the curvature of the substrate, indicating that protein IgG was successfullyimmobilized onto the NPG surface. To confirm the passage of the protein solution throughthe NPG nano-environment, the front and back sides of the NPG sample were peeled andexamined at different locations on the same sample. The IgG protein coverage, on average368 (14) protein/μm2, was found to be similar on each peeled side after peeling, signifyingthat the protein immobilization is homogeneous in nature; no non-specific protein adsorptionor immobilization gradient was formed inside NPG by using the flow cell system. In thisdirect counting determination of surface coverage, the area used is that of the scan size. Itmust be kept in mind that a significant portion of this surface represents pore space abovewhich the AFM probe will not be able access interactions with proteins on ligaments deeperbelow the surface or on the lower portions of surface ligaments curved away from access tothe tip. An estimation of the total surface area of the outer most surface layer of NPG isincluded in the supplementary information section.† It must also be kept in mind that theNPG surface with which the tip interacts is itself rough. This also demonstrated that the flowthrough method successfully forced the protein solution into the porous environment ofNPG and promoted the protein conjugation reaction and formation of amide bonds with theNHS-functionalized NPG surfaces. These results are significant for applications requiringbiomolecule immobilization throughout NPG samples of thicknesses in the microns rangeand greater. They are also of significance for applications requiring diffusion and reactioninside larger macroscopic or monolithic NPG samples. The quantitative information onsurface coverage obtained by AFM for the two proteins (BSA or IgG) immobilized on therough and porous gold surfaces is summarized in Table 1.
Tan et al. Page 12
Nanoscale. Author manuscript; available in PMC 2012 August 3.
NIH
-PA Author Manuscript
NIH
-PA Author Manuscript
NIH
-PA Author Manuscript
Energy-dispersive X-ray spectrometry analysis confirmation of the presence ofimmobilized protein on NPG
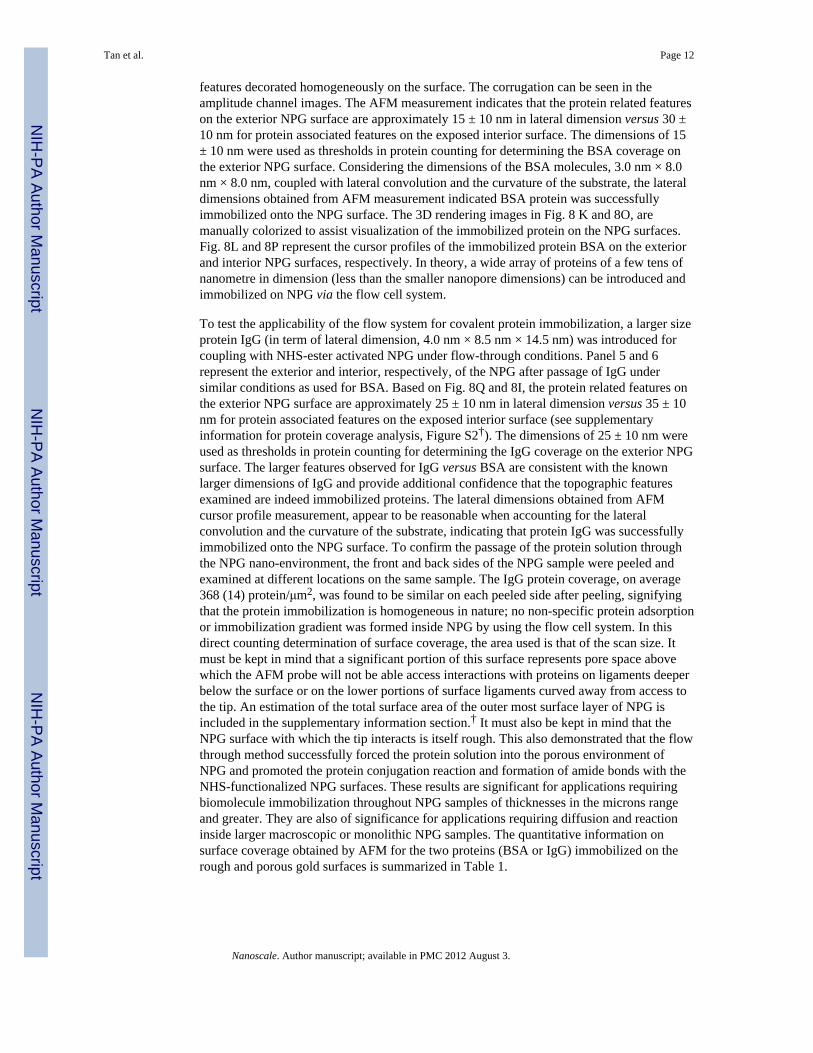
An alternate analytical approach, energy dispersive X-ray analysis, was introduced toconfirm the presence of protein on NPG. This approach is simple and promising, because (1)the structures of most proteins are known from the Protein Data Bank and theirstoichiometric composition can be extracted, and (2) energy dispersive X-ray analysis, alsoknown as EDS, has detection limits of approximately 0.1% in bulk materials.67,68 Fig. 9shows an EDS spectrum obtained using NPG (modified with a NHS-ester activated SAM)and such NPG then covalently modified with BSA. The peak in green (interior) and red(exterior) is from a control (NPG with NHS-ester SAM only), in which a nitrogen peak isclearly not observed in the region near 0.39 KeV. For simplicity, only NPG previouslyconjugated to BSA under flow through conditions was used for EDS analysis. From Fig. 9, acarbon peak is clearly seen at 0.28 KeV and a well-defined nitrogen peak at 0.39 KeV isevident. The increased carbon peak intensity is reasonable because proteins contain highamounts of carbon. The previously unseen nitrogen peak is seen clearly both on the exteriorand interior of the NPG (blue and black lines near 0.39 KeV) after conjugation to BSA.Based on the EDS spectra, the plausibility of protein presence on both the interior andexterior NPG surfaces is confirmed, and the similarity in peak intensities for BSA on theexterior and interior regions signifies that the protein immobilization is homogeneous innature; no specific protein immobilization gradient was formed inside NPG by using theflow cell system.
ConclusionsThe purpose of this study was to use AFM to investigate the formation of BSA and IgGadlayers conjugated to SAM modified NPG, with a typical pore size ranging from fifty to afew hundreds of nanometres. Covalent immobilization under static versus flow-throughconditions was compared. As a proof of concept and also as a comparison with NPG, theproteins were imaged immobilized on rough gold films. The AFM results reveal thatimmobilization of BSA onto rough gold surfaces is favored by longer incubation times. Itwas also observed that immobilization after treatment with EDC (in acetonitrile) alone willgive a surface coverage that is actually greater than that for EDC followed by NHS. Thecoverage obtained for BSA on the exterior surface of NPG was comparable to that found onthe rough gold surface. IgG coverage on the exterior surface of NPG is lower than that ofBSA, as expected given that IgG is larger than BSA. AFM observation of protein on theexterior and interior of the NPG shows that use of a flow cell system greatly enhances theprotein solution passage through NPG and hence protein can be tethered more efficientlyonto the surfaces throughout the interior of the sample. Many variables with respect to NPGstructure, SAM structure and formation time, surface activation and protein incubation, aswell as comparisons of static versus flow conditions remain to be explored and we areactively investigating the influence of these parameters on protein coverage inside NPG. Thepresent study demonstrates that use of the flow through conditions presented here cangreatly enhance protein coverage and distribution inside NPG. The existence of the carbonand nitrogen peaks near 0.28 KeV and 0.39 KeV, respectively, in energy dispersive X-rayanalysis, also qualitatively confirm the presence of protein both on and in NPG.
AFM is a uniquely suited technique for examining protein immobilization on NPG,especially on internal surfaces produced by cleaving NPG monoliths. For the alternate caseof NPG formed as a film on a substrate, exposure of internal surfaces could likely also beachieved by adhesion and pealing onto mica or glass slides. In principle, it should bepossible to cleave different NPG samples at roughly the same depth into the interior but afterdifferent times of exposure to a protein solution. AFM imaging of protein on these internalsurfaces exposed after different times could reveal information about the rate at which
Tan et al. Page 13
Nanoscale. Author manuscript; available in PMC 2012 August 3.
NIH
-PA Author Manuscript
NIH
-PA Author Manuscript
NIH
-PA Author Manuscript
protein diffuses into and becomes immobilized within NPG. Sampling effects would need tobe carefully accounted for, but such experiments could provide unique insights into proteindiffusion inside NPG and how coverage of the interior of NPG progresses with time anddepth and possibly with flow related parameters. If the cleavage of the NPG could beachieved at a series of depths, then protein coverages determined as a function of depth at asingle time point could also provide information on protein diffusion inside NPG. It wouldbe of interest to study protein diffusion inside the torturous pathways within NPG and toexamine different pore sizes and protein sizes to look for evidence of, for example,bottleneck effects or pore clogging. Such study provides important information withimplications for understanding the distribution of immobilized protein on and within NPGand should be beneficial in the engineering of protein sensing platforms and other biologicalapplications based on protein modified nanoporous gold.
Supplementary MaterialRefer to Web version on PubMed Central for supplementary material.
AcknowledgmentsThe authors thank Professor Fraundorf, Dr David Osborn and Dr Dan Zhou of the UM-St. Louis Center forNanoscience for usage and discussion of the AFM and SEM. This work was supported by UM-St. Louis and by theNIGMS award R01-GM090254.
References1. Solomon EI, Sundaram UM, Machonkin TE. Chem Rev. 1996; 96:2563–2606. [PubMed:
11848837]2. Yaropolov A, Skorobogat’ko O, Vartanov S, Varfolomeyev S. Appl Biochem Biotechnol. 1994;
49:257–280.3. Gupta G, Rajendran V, Atanassov P. Electroanalysis. 2003; 15:1577–1583.4. Barton SC, Kim H-H, Binyamin G, Zhang Y, Heller A. J Am Chem Soc. 2001; 123:5802–5803.
[PubMed: 11403615]5. Heller A. Phys Chem Chem Phys. 2004; 6:209–216.6. Frasconi M, Mazzei F, Ferri T. Anal Bioanal Chem. 2010; 398:1545–1564. [PubMed: 20414768]7. Rusmini F, Zhong Z, Feijen J. Biomacromolecules. 2007; 8:1775–1789. [PubMed: 17444679]8. Love JC, Estroff LA, Kriebel JK, Nuzzo RG, Whitesides GM. Chem Rev. 2005; 105:1103–1170.
[PubMed: 15826011]9. Tan, YH.; Stine, KJ. Langmuir Monolayers in Thin Film Technology. Sherwin, JA., editor. Nova
Science Publishers; 2011.10. Shulga OV, Jefferson K, Khan AR, D’Souza VT, Liu J, Demchenko AV, Stine KJ. Chem Mater.
2007; 19:3902–3911. [PubMed: 18820734]11. Tan YH, Liu M, Nolting B, Go JG, Gervay-Hague J, Liu G-y. ACS Nano. 2008; 2:2374–2384.
[PubMed: 19206405]12. Yu J-J, Nolting B, Tan Y, Grvay-Hague XLJ, Lu G-y. Nano Biotechnology. 2005; 1:201–210.13. Haensch, C.; Herzer, N.; Hoeppener, S.; Schubert, US. Nanotechnology. Wiley-VCH Verlag
GmbH & Co. KGaA; 2010.14. Zhang XY, Zhang LD, Lei Y, Zhao LX, Mao YQ. J Mater Chem. 2001; 11:1732–1734.15. Sander MS, Tan LS. Adv Funct Mater. 2003; 13:393–397.16. Wittstock A, Zielasek V, Biener J, Friend CM, Bäumer M. Science. 2010; 327:319–322. [PubMed:
20075249]17. Qian LH, Yan XQ, Fujita T, Inoue A, Chen MW. Appl Phys Lett. 2007; 90:153120–153123.18. Shulga OV, Zhou D, Demchenko AV, Stine KJ. Analyst. 2008; 133:319–322. [PubMed:
18299744]
Tan et al. Page 14
Nanoscale. Author manuscript; available in PMC 2012 August 3.
NIH
-PA Author Manuscript
NIH
-PA Author Manuscript
NIH
-PA Author Manuscript
19. Hartmann M, Jung D. J Mater Chem. 2010; 20:844–857.20. Seker E, Reed M, Begley M. Materials. 2009; 2:2188–2215.21. Erlebacher J, Aziz MJ, Karma A, Dimitrov N, Sieradzki K. Nature. 2001; 410:450–453. [PubMed:
11260708]22. Ding Y, Erlebacher J. J Am Chem Soc. 2003; 125:7772–7773. [PubMed: 12822974]23. He X, Antonelli D. Angew Chem Int Ed. 2002; 41:214–229.24. Tierney MJ, Kim HOL. Anal Chem. 1993; 65:3435–3440.25. Ding Y, Chen M. Mat Res Soc. 2009; 34:569–576.26. Pornsuriyasak P, Ranade SC, Li A, Parlato MC, Sims CR, Shulga OV, Stine KJ, Demchenko AV.
Chem Commun. 2009:1834–1836.27. Kucheyev SO, Hayes JR, Biener J, Huser T, Talley CE, Hamza AV. Appl Phys Lett. 2006;
89:053102–053103.28. Maaroof AI, et al. J Phys D: Appl Phys. 2007; 40:5675.29. Moreau F, Bond GC. Catal Today. 2007; 122:215–221.30. Manso J, Mena ML, Yáñez-Sedeño P, Pingarrón JM. Electrochim Acta. 2008; 53:4007–4012.31. Kafi AKM, Ahmadalinezhad A, Wang J, Thomas DF, Chen A. Biosens Bioelectron. 2010;
25:2458–2463. [PubMed: 20435460]32. Pettersen EF, Goddard TD, Huang CC, Couch GS, Greenblatt DM, Meng EC, Ferrin TE. J Comput
Chem. 2004; 25:1605–1612. [PubMed: 15264254]33. Rixman MA, Dean D, Macias CE, Ortiz C. Langmuir. 2003; 19:6202–6218.34. Wright AK, Thompson MR. Biophys J. 1975; 15:137–141. [PubMed: 1167468]35. Carter, DC.; Ho, JX. Advances in Protein Chemistry. Anfinsen, CB.; Edsall, JT.; Richards, FM.;
Eisenberg, DS., editors. Vol. 45. Academic Press; 1994. p. 153-203.36. Tsai D-H, DelRio FW, Keene AM, Tyner KM, MacCuspie RI, Cho TJ, Zachariah MR, Hackley
VA. Langmuir. 2011; 27:2464–2477.37. Renner C, Piehler J, Schrader T. J Am Chem Soc. 2005; 128:620–628. [PubMed: 16402850]38. Bagçi H, Kohen F, Kusçuoglu U, Bayer EA, Wilchek M. FEBS Lett. 1993; 322:47–50. [PubMed:
8482366]39. Qiu H, Xu C, Huang X, Ding Y, Qu Y, Gao P. J Phys Chem C. 2009; 113:2521–2525.40. Ducker RE, Montague MT, Leggett GJ. Biointerphases. 2008; 3:59–65. [PubMed: 20408701]41. Droumaguet BL, Nicolas J. Polym Chem. 2010; 1:563–598.42. Tan YH, Pandey B, Sharma A, Bhattarai J, Stine K. Glob J Biochem. 2011 accepted for advance
online publication.43. Olson LG, LoBeebe Y-S, Harris JM. Anal Chem. 2001; 73:4268–4276. [PubMed: 11569819]44. Dong Y, Shannon C. Anal Chem. 2000; 72:2371–2376. [PubMed: 10857607]45. Fowler JM, Stuart MC, Wong DKY. Anal Chem. 2006; 79:350–354. [PubMed: 17194160]46. Labib M, Hedström M, Amin M, Mattiasson B. Biotechnol Bioeng. 2009; 104:312–320. [PubMed:
19562733]47. Ducey JMW, Meyerhoff ME. Electroanalysis. 1998; 10:157–162.48. Duan C, Meyerhoff ME. Microchim Acta. 1995; 117:195–206.49. Duan C, Meyerhoff ME. Anal Chem. 1994; 66:1369–1377. [PubMed: 8017631]50. Hermanson, GT. Bioconjugate Techniques. Second. Academic Press; New York: 2008. p. 391-395.51. Gooding JJ, Ciampi S. Chem Soc Rev. 2011; 40:2704–2718. [PubMed: 21290036]52. Wrobel N, Schinkinger M, Mirsky VM. Anal Biochem. 2002; 305:135–138. [PubMed: 12054441]53. Dordi B, Schönherr H, Vancso GJ. Langmuir. 2003; 19:5780–5786.54. Wang J, Kenseth JR, Jones VW, Green J-BD, McDermott MT, Porter MD. J Am Chem Soc. 1997;
119:12796–12799.55. Staros JV, Wright RW, Swingle DM. Anal Biochem. 1986; 156:220–222. [PubMed: 3740412]56. Grabarek Z, Gergely J. Anal Biochem. 1990; 185:131–135. [PubMed: 2344038]57. Leopold MC, Bowden EF. Langmuir. 2002; 18:2239–2245.
Tan et al. Page 15
Nanoscale. Author manuscript; available in PMC 2012 August 3.
NIH
-PA Author Manuscript
NIH
-PA Author Manuscript
NIH
-PA Author Manuscript
58. Willey TM, Vance AL, Bostedt C, van Buuren T, Meulenberg RW, Terminello LJ, Fadley CS.Langmuir. 2004; 20:4939–4944. [PubMed: 15984254]
59. Volkert AA, Subramaniam V, Ivanov MR, Goodman AM, Haes AJ. ACS Nano. 2011; 5:4570–4580. [PubMed: 21524135]
60. Dong Y, Abaci S, Shannon C, Bozack MJ. Langmuir. 2003; 19:8922–8926.61. Braun PV. Nat Mater. 2004; 3:281–282. [PubMed: 15122215]62. Jackson AM, Myerson JW, Stellacci F. Nat Mater. 2004; 3:330–336. [PubMed: 15098025]63. Daniel M-C, Astruc D. Chem Rev. 2004; 104:293–346. [PubMed: 14719978]64. Zhang G, Yang Z, Lu W, Zhang R, Huang Q, Tian M, Li L, Liang D, Li C. Biomaterials. 2009;
30:1928–1936. [PubMed: 19131103]65. Chu Y, Seo B, Kim J. Bull Korean Chem Soc. 2010; 31:3407–3410.66. Wong LS, Khan F, Micklefield J. Chem Rev. 2009; 109:4025–4053. [PubMed: 19572643]67. Wollman DA, Irwin KD, Hilton GC, Dulcie LL, Newbury DE, Martinis JM. J Microsc. 1997;
188:196–223.68. Dunham AC, Wilkinson FCF. X-Ray Spectrom. 1978; 7:50–56.
Tan et al. Page 16
Nanoscale. Author manuscript; available in PMC 2012 August 3.
NIH
-PA Author Manuscript
NIH
-PA Author Manuscript
NIH
-PA Author Manuscript
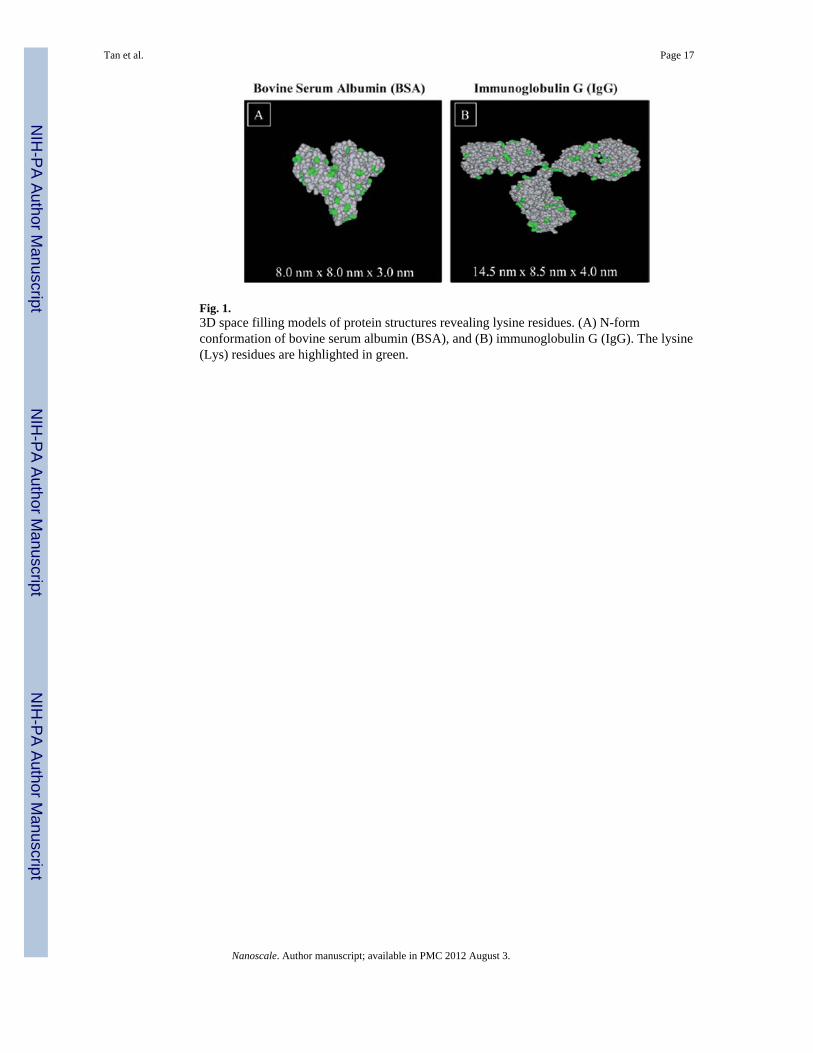
Fig. 1.3D space filling models of protein structures revealing lysine residues. (A) N-formconformation of bovine serum albumin (BSA), and (B) immunoglobulin G (IgG). The lysine(Lys) residues are highlighted in green.
Tan et al. Page 17
Nanoscale. Author manuscript; available in PMC 2012 August 3.
NIH
-PA Author Manuscript
NIH
-PA Author Manuscript
NIH
-PA Author Manuscript
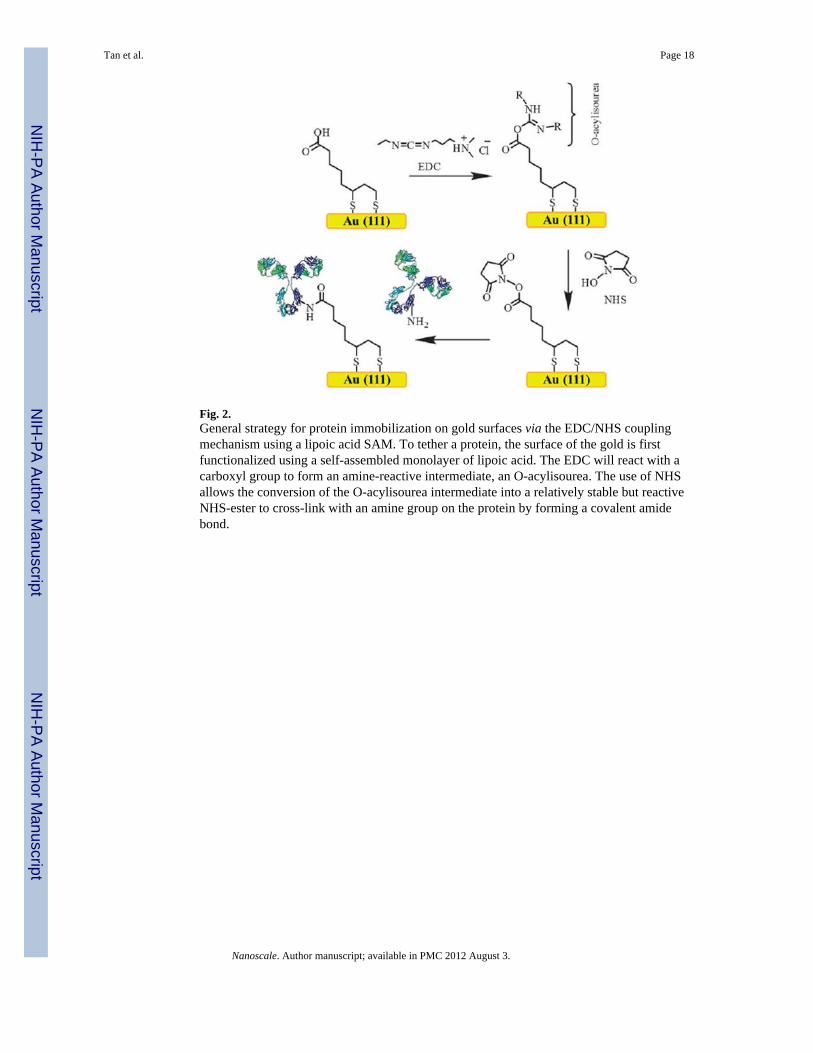
Fig. 2.General strategy for protein immobilization on gold surfaces via the EDC/NHS couplingmechanism using a lipoic acid SAM. To tether a protein, the surface of the gold is firstfunctionalized using a self-assembled monolayer of lipoic acid. The EDC will react with acarboxyl group to form an amine-reactive intermediate, an O-acylisourea. The use of NHSallows the conversion of the O-acylisourea intermediate into a relatively stable but reactiveNHS-ester to cross-link with an amine group on the protein by forming a covalent amidebond.
Tan et al. Page 18
Nanoscale. Author manuscript; available in PMC 2012 August 3.
NIH
-PA Author Manuscript
NIH
-PA Author Manuscript
NIH
-PA Author Manuscript
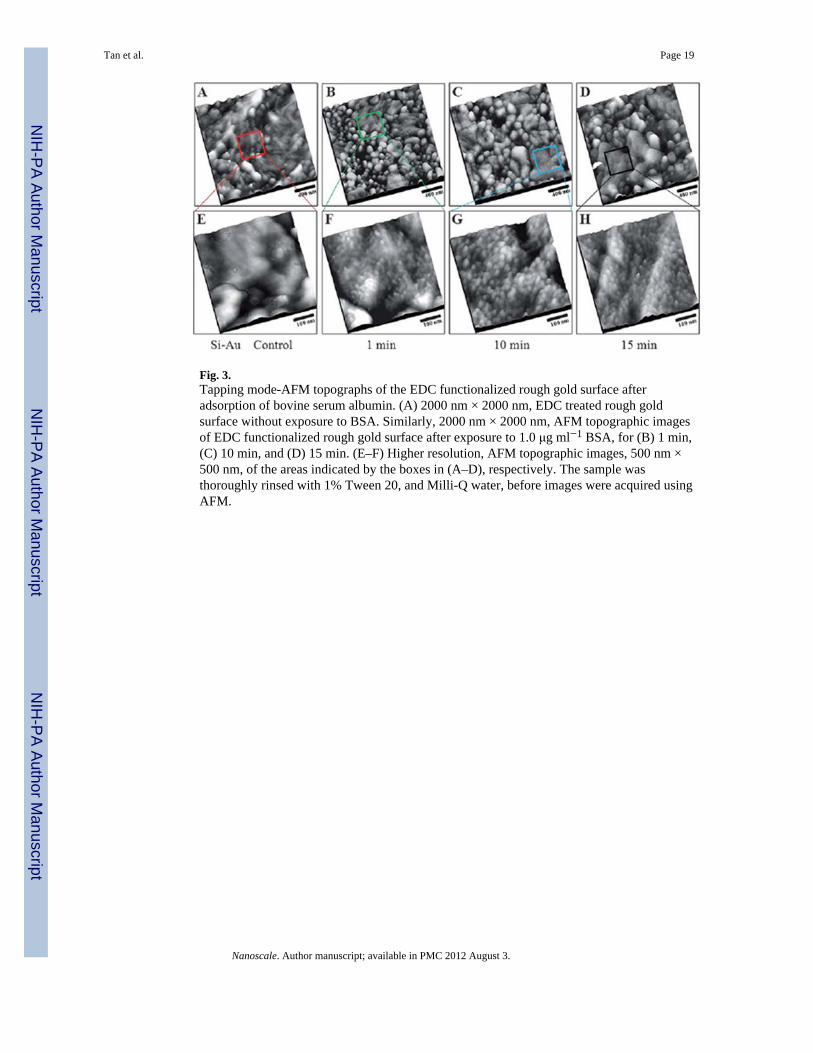
Fig. 3.Tapping mode-AFM topographs of the EDC functionalized rough gold surface afteradsorption of bovine serum albumin. (A) 2000 nm × 2000 nm, EDC treated rough goldsurface without exposure to BSA. Similarly, 2000 nm × 2000 nm, AFM topographic imagesof EDC functionalized rough gold surface after exposure to 1.0 μg ml−1 BSA, for (B) 1 min,(C) 10 min, and (D) 15 min. (E–F) Higher resolution, AFM topographic images, 500 nm ×500 nm, of the areas indicated by the boxes in (A–D), respectively. The sample wasthoroughly rinsed with 1% Tween 20, and Milli-Q water, before images were acquired usingAFM.
Tan et al. Page 19
Nanoscale. Author manuscript; available in PMC 2012 August 3.
NIH
-PA Author Manuscript
NIH
-PA Author Manuscript
NIH
-PA Author Manuscript
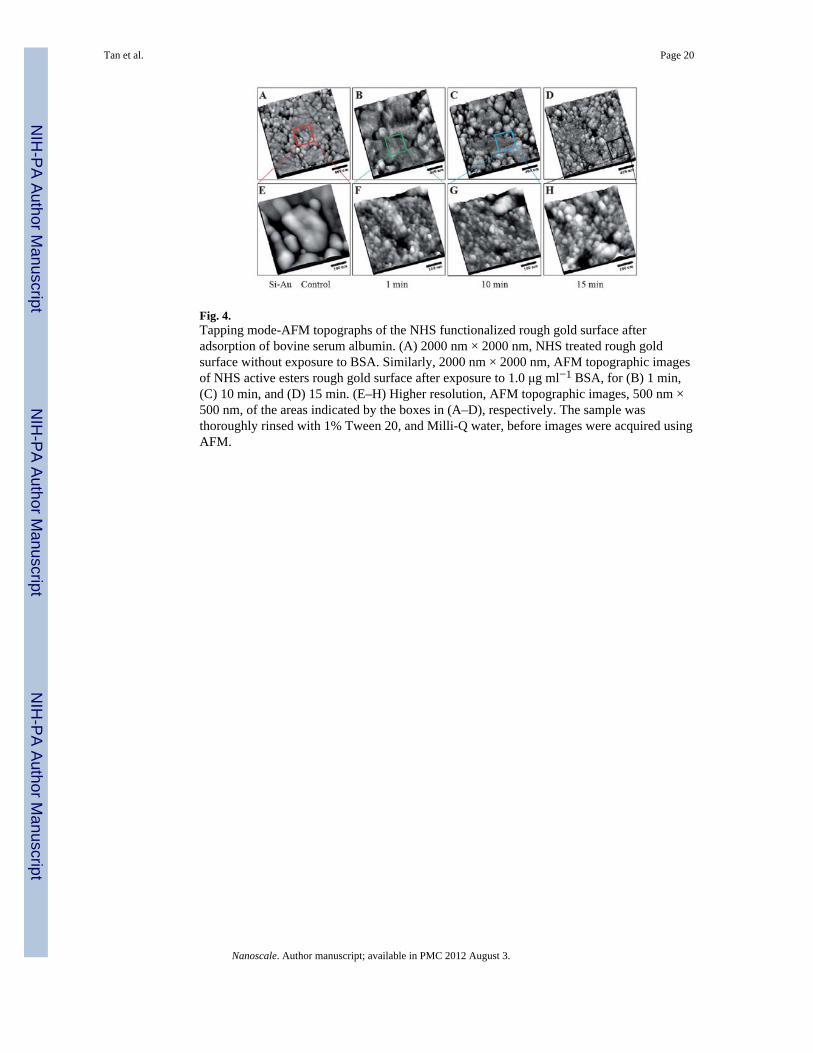
Fig. 4.Tapping mode-AFM topographs of the NHS functionalized rough gold surface afteradsorption of bovine serum albumin. (A) 2000 nm × 2000 nm, NHS treated rough goldsurface without exposure to BSA. Similarly, 2000 nm × 2000 nm, AFM topographic imagesof NHS active esters rough gold surface after exposure to 1.0 μg ml−1 BSA, for (B) 1 min,(C) 10 min, and (D) 15 min. (E–H) Higher resolution, AFM topographic images, 500 nm ×500 nm, of the areas indicated by the boxes in (A–D), respectively. The sample wasthoroughly rinsed with 1% Tween 20, and Milli-Q water, before images were acquired usingAFM.
Tan et al. Page 20
Nanoscale. Author manuscript; available in PMC 2012 August 3.
NIH
-PA Author Manuscript
NIH
-PA Author Manuscript
NIH
-PA Author Manuscript
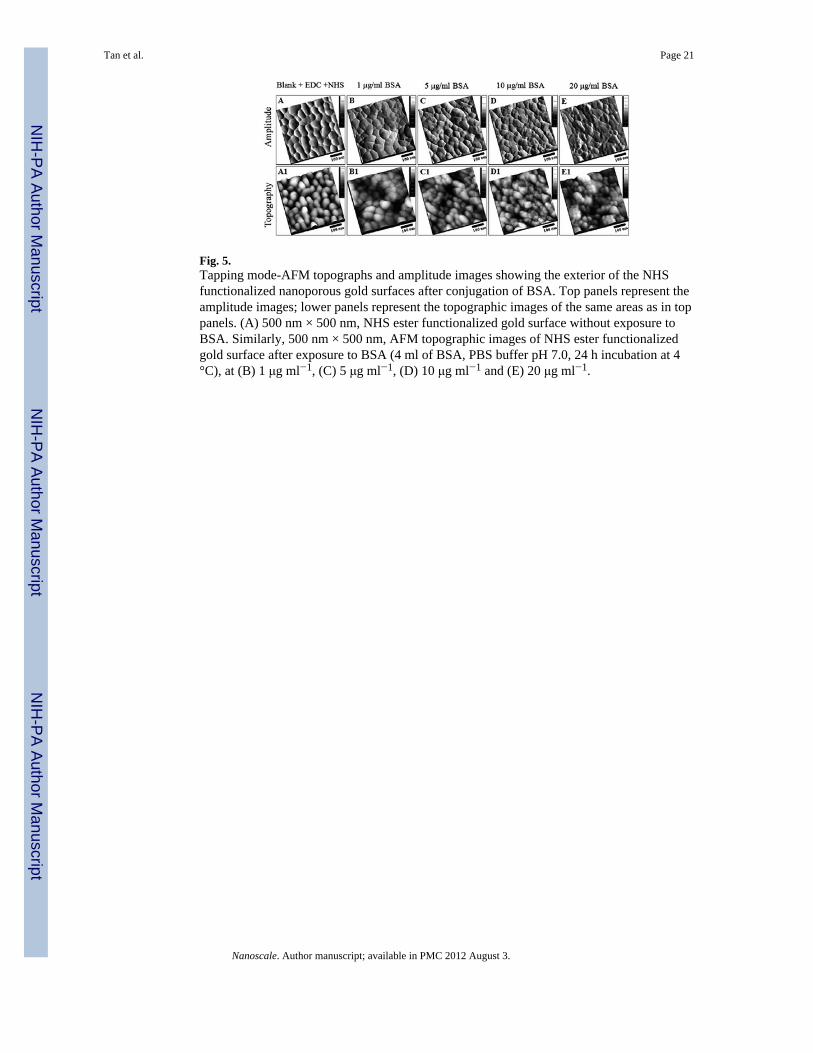
Fig. 5.Tapping mode-AFM topographs and amplitude images showing the exterior of the NHSfunctionalized nanoporous gold surfaces after conjugation of BSA. Top panels represent theamplitude images; lower panels represent the topographic images of the same areas as in toppanels. (A) 500 nm × 500 nm, NHS ester functionalized gold surface without exposure toBSA. Similarly, 500 nm × 500 nm, AFM topographic images of NHS ester functionalizedgold surface after exposure to BSA (4 ml of BSA, PBS buffer pH 7.0, 24 h incubation at 4°C), at (B) 1 μg ml−1, (C) 5 μg ml−1, (D) 10 μg ml−1 and (E) 20 μg ml−1.
Tan et al. Page 21
Nanoscale. Author manuscript; available in PMC 2012 August 3.
NIH
-PA Author Manuscript
NIH
-PA Author Manuscript
NIH
-PA Author Manuscript
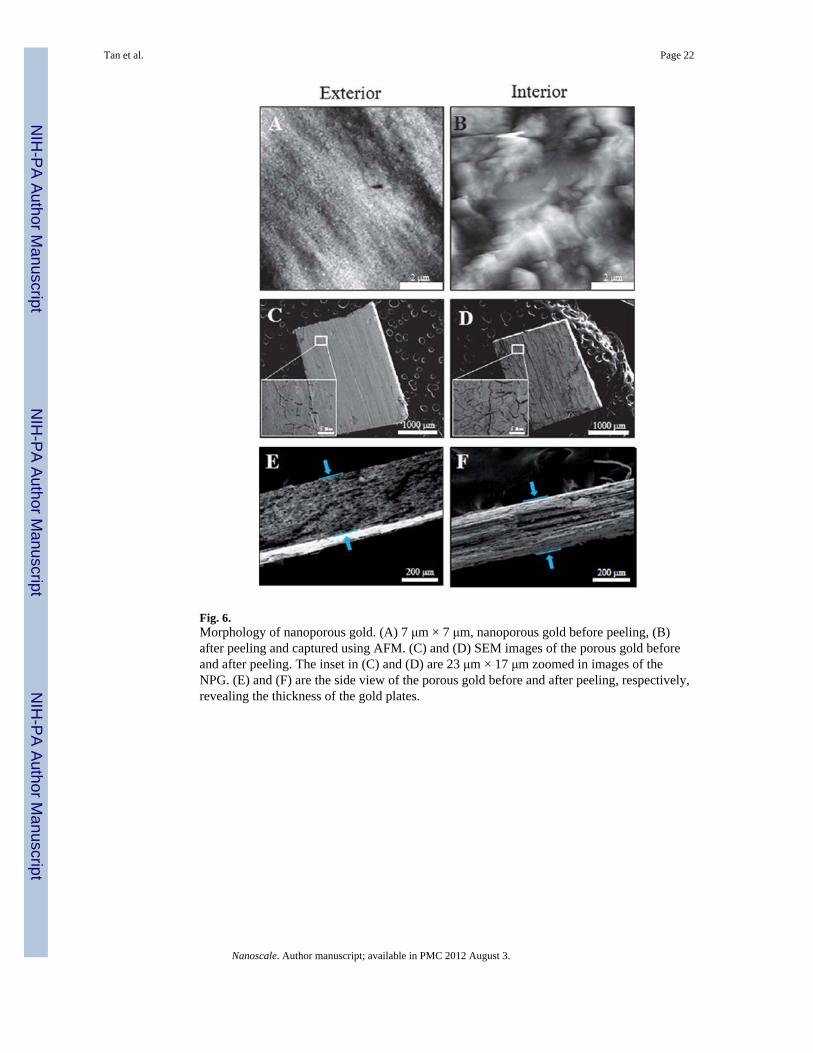
Fig. 6.Morphology of nanoporous gold. (A) 7 μm × 7 μm, nanoporous gold before peeling, (B)after peeling and captured using AFM. (C) and (D) SEM images of the porous gold beforeand after peeling. The inset in (C) and (D) are 23 μm × 17 μm zoomed in images of theNPG. (E) and (F) are the side view of the porous gold before and after peeling, respectively,revealing the thickness of the gold plates.
Tan et al. Page 22
Nanoscale. Author manuscript; available in PMC 2012 August 3.
NIH
-PA Author Manuscript
NIH
-PA Author Manuscript
NIH
-PA Author Manuscript
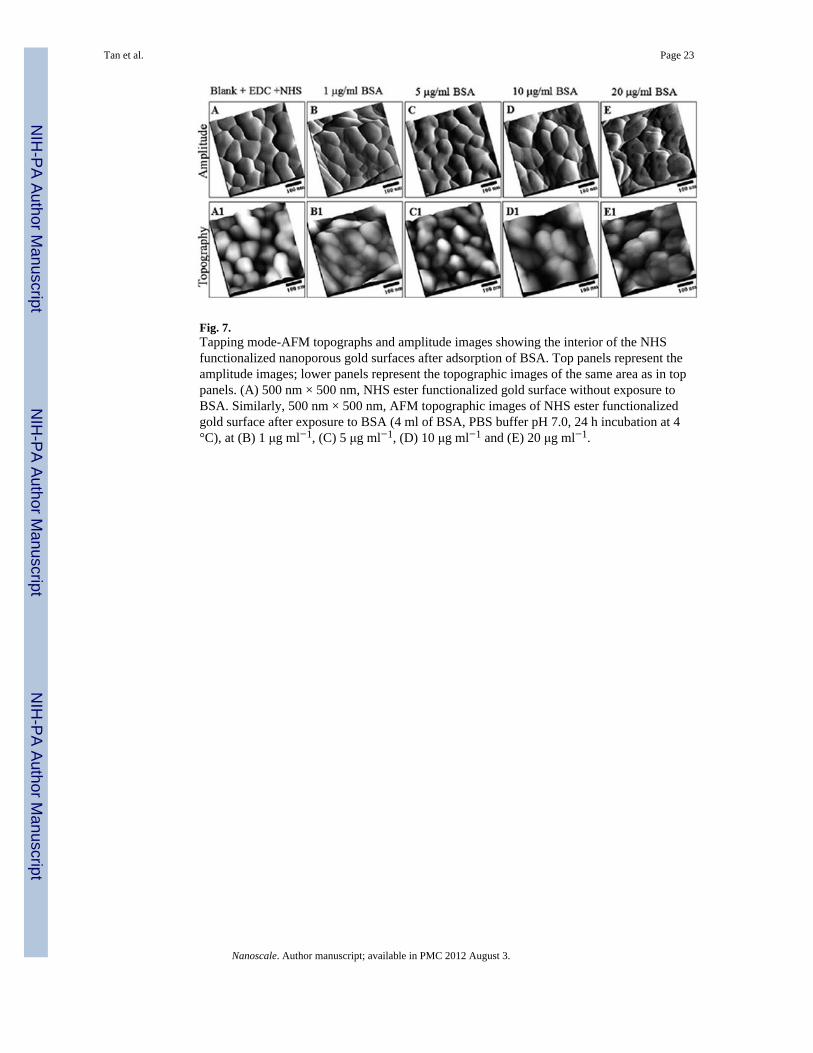
Fig. 7.Tapping mode-AFM topographs and amplitude images showing the interior of the NHSfunctionalized nanoporous gold surfaces after adsorption of BSA. Top panels represent theamplitude images; lower panels represent the topographic images of the same area as in toppanels. (A) 500 nm × 500 nm, NHS ester functionalized gold surface without exposure toBSA. Similarly, 500 nm × 500 nm, AFM topographic images of NHS ester functionalizedgold surface after exposure to BSA (4 ml of BSA, PBS buffer pH 7.0, 24 h incubation at 4°C), at (B) 1 μg ml−1, (C) 5 μg ml−1, (D) 10 μg ml−1 and (E) 20 μg ml−1.
Tan et al. Page 23
Nanoscale. Author manuscript; available in PMC 2012 August 3.
NIH
-PA Author Manuscript
NIH
-PA Author Manuscript
NIH
-PA Author Manuscript
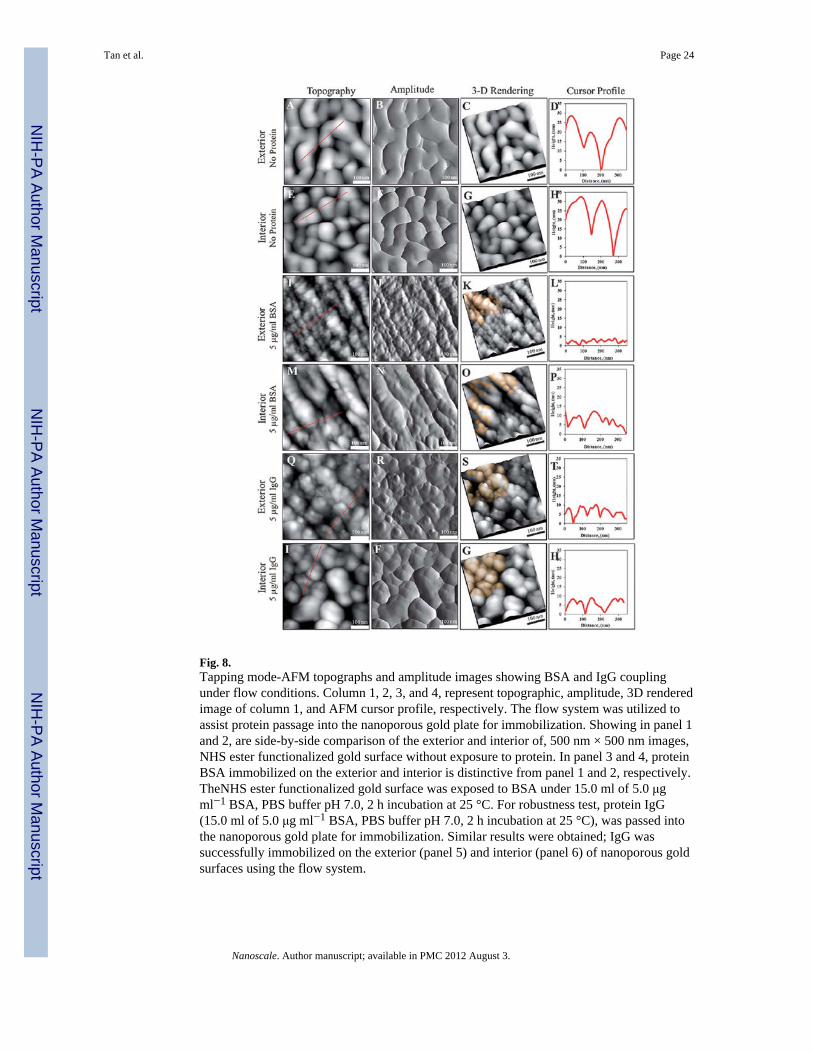
Fig. 8.Tapping mode-AFM topographs and amplitude images showing BSA and IgG couplingunder flow conditions. Column 1, 2, 3, and 4, represent topographic, amplitude, 3D renderedimage of column 1, and AFM cursor profile, respectively. The flow system was utilized toassist protein passage into the nanoporous gold plate for immobilization. Showing in panel 1and 2, are side-by-side comparison of the exterior and interior of, 500 nm × 500 nm images,NHS ester functionalized gold surface without exposure to protein. In panel 3 and 4, proteinBSA immobilized on the exterior and interior is distinctive from panel 1 and 2, respectively.TheNHS ester functionalized gold surface was exposed to BSA under 15.0 ml of 5.0 μgml−1 BSA, PBS buffer pH 7.0, 2 h incubation at 25 °C. For robustness test, protein IgG(15.0 ml of 5.0 μg ml−1 BSA, PBS buffer pH 7.0, 2 h incubation at 25 °C), was passed intothe nanoporous gold plate for immobilization. Similar results were obtained; IgG wassuccessfully immobilized on the exterior (panel 5) and interior (panel 6) of nanoporous goldsurfaces using the flow system.
Tan et al. Page 24
Nanoscale. Author manuscript; available in PMC 2012 August 3.
NIH
-PA Author Manuscript
NIH
-PA Author Manuscript
NIH
-PA Author Manuscript
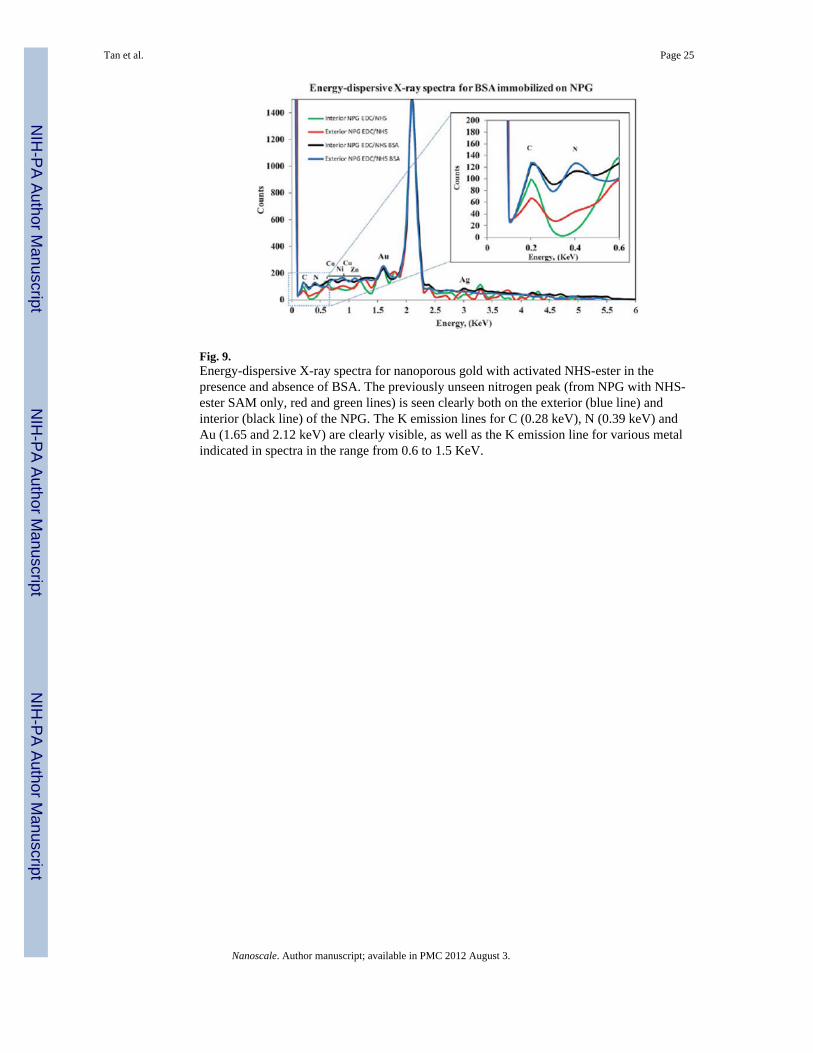
Fig. 9.Energy-dispersive X-ray spectra for nanoporous gold with activated NHS-ester in thepresence and absence of BSA. The previously unseen nitrogen peak (from NPG with NHS-ester SAM only, red and green lines) is seen clearly both on the exterior (blue line) andinterior (black line) of the NPG. The K emission lines for C (0.28 keV), N (0.39 keV) andAu (1.65 and 2.12 keV) are clearly visible, as well as the K emission line for various metalindicated in spectra in the range from 0.6 to 1.5 KeV.
Tan et al. Page 25
Nanoscale. Author manuscript; available in PMC 2012 August 3.
NIH
-PA Author Manuscript
NIH
-PA Author Manuscript
NIH
-PA Author Manuscript
NIH
-PA Author Manuscript
NIH
-PA Author Manuscript
NIH
-PA Author Manuscript
Tan et al. Page 26
Tabl
e 1
Com
paris
on o
f pro
tein
surf
ace
cove
rage
s ach
ieve
d on
diff
eren
t gol
d su
bstra
tes u
sing
diff
eren
t im
mob
iliza
tion
cond
ition
s
Prot
ein
Subs
trat
eA
ctiv
atin
g m
olec
ule
Imm
obili
zatio
n m
etho
dIn
cuba
tion
time
(min
)Pr
otei
n co
vera
ge (p
rote
in/μ
m2 )
a BSA
roug
h go
ldED
Cst
atic
149
1 (3
)
1059
0 (8
)
1565
8 (1
1)
a BSA
roug
h go
ldN
HS-
este
rst
atic
132
8 (5
)
1035
5 (1
0)
1539
8 (1
3)
BSA
NPG
NH
S-es
ter
flow
120
627
(36)
(ext
erio
r cov
erag
e)
IgG
NPG
NH
S-es
ter
flow
120
368
(14)
(ext
erio
r cov
erag
e)
a Prot
ein
cove
rage
s rep
orte
d he
re o
n ro
ugh
gold
repr
esen
t val
ues a
ccou
ntin
g fo
r the
roug
hnes
s fac
tor o
f 2.5
foun
d fo
r rou
gh g
old.
The
val
ues i
n pa
rent
hesi
s are
the
plau
sibl
e nu
mbe
rs o
f add
ition
al p
rote
ins
iden
tifie
d by
imag
e an
alys
is a
s pre
sent
in a
ggre
gate
s or p
ossi
bly
subj
ect t
o tip
con
volu
tion.
Nanoscale. Author manuscript; available in PMC 2012 August 3.