supplemental survey to: creating support structures and services for title i high schools...
TRANSCRIPT

Electronic copy available at: http://ssrn.com/abstract=1875888
Supplemental Survey To: Creating Support Structures and Services for Title I High Schools Implementing the International
Baccalaureate Programs
NYU Wagner Research Paper No. 2011-08
Leslie Santee Siskin NYU- Institute for Education and Social Policy
Meryle Weinstein
NYU- Institute for Education and Social Policy

Electronic copy available at: http://ssrn.com/abstract=1875888Electronic copy available at: http://ssrn.com/abstract=1875888
Leslie Santee Siskin Principal Investigator Meryle Weinstein Project Director
October 2008
SUPPLEMENTAL SURVEY TO
Creating Support Structures and Services for Title I
High Schools Implementing the International Baccalaureate Programs
Supported by the U.S. Department of Education,
API Initiative

Electronic copy available at: http://ssrn.com/abstract=1875888Electronic copy available at: http://ssrn.com/abstract=1875888
EXECUTIVE SUMMARY
1. Introduction Since 2003, International Baccalaureate has been engaged in a deliberate effort to
increase access and expand “pathways” to the IB Diploma, and to create new supports to assist schools, particularly Title I schools, in that effort. In September 2006, International Baccalaureate was awarded a grant, under the federal API Initiative, to further that work. Under this award, International Baccalaureate is undertaking an extensive project to strengthen the pathway through Middle Years Programme (MYP) to the Diploma (DP), and to develop and deliver new supports for schools, such as scaffolding materials and curriculum mapping, coaching support and counselor training.
A team of researchers at the Institute for Education and Social Policy (IESP), located at
NYU, has been engaged in evaluating that endeavor, focusing on four high schools that have generously agreed to participate as ‘pilot’ sites. The close and continued study of those four sites offers considerable depth in understanding challenges and identifying promising strategies toward preparing more students for success in the IB Diploma and beyond. But depth in a small number of sites raises questions about breadth—the degree to which patterns in pilot schools reflect the larger population of Title I schools. As increasing numbers of schools, and even districts, serving high numbers of low income students are adopting IB Programmes, that question becomes increasingly important. International Baccalaureate’s recent Examination Review & Data Summary reports a continuing trend of rapid growth of IB Programmes in North America, where the number of schools adopting IB rose by 50% between 2002 and 2007, while the number of Diploma Candidates rose by 69%, to more than 14,000 students. IB Programmes are not only growing overall, they are growing in traditionally underserved settings: of the schools now affiliated with International Baccalaureate, 92% are public schools, and almost one‐third receive some form of Title I funding. To broaden our understanding of what Title‐I eligible IB schools are like, who they serve, and what kinds of issues and challenges they face, IESP conducted an email survey in the spring of 2008. Collectively, these responses reflect a window into the conditions and experiences of 37 Middle Years Programmes and 105 Diploma Programmes serving 3118 Diploma Candidates and awarding 2177 Diplomas and 5449 Certificates.
2. Key Findings
While the schools invited to participate in the survey were identified by International Baccalaureate as including high school grades (9‐12), they also include a range of configurations, particularly 7‐12th grade. The schools also vary by size and student populations.
• The schools in our sample are generally large, with an average enrollment of 1702 students.
• On average, the schools are 27.8% Hispanic, 31.4% black, 32.7% white, and 8% Asian, Native American or Pacific Islander.
1

• The mean for the percentage of students eligible for free or reduced price lunch is 55%.
• Approximately 14% of students are English Language Learners (ELL) and 14% receive Special Education Services.
• Among graduating students, 55.3% were accepted to a four‐year college.
While a recent International Baccalaureate report says that currently “79% of IB Programmes in the US are in districts with more than one IB Programme” that pattern is slightly less true for schools in our sample.1
• Sixty‐three percent of these schools have other IB Programmes in their area, while 37% report that there are no other schools offering MYP or DP in the district.
• Almost nine percent of districts only offer IB at the high school level, while 52.4% say IB is available at the elementary and/or middle school level, in addition to high school.
• Only two percent report they are part of a district–wide effort to offer IB Programmes.
Almost 90% of the schools offer DP only or DP/MYP while the rest offer only MYP. The remainder of the report focuses on the 105 high schools that offer the DP, 35.2% of which also offer MYP in grades 9‐10.
Many of the schools in our sample have been participating in IB for several years now.
• Almost 60% of the schools offered DP prior to 2001. • Fifteen percent have applied in the past four years. • Since 1978, the number of applicants to the Diploma Programme rose slowly but
steadily with 12 schools having applied to participate before 1990. The reasons that schools adopt the Diploma Programme are wide‐ranging but the most
salient responses center on academics, rigor, and coherence. • Strengthening “critical thinking” (94%), “preparing students for college” (91%),
“enhancing academic rigor for all students” (85%), and “attracting and retaining academic students” (85%) were reported as “very important” factors in choosing to offer IB.
In addition, IB Programmes enroll a wide range of students.
• The percentage of students participating at each school varies considerably, but on average, 13.9% of all students at schools offering only DP are taking IB courses and 37.6% of students at schools offering MYP and DP participate in IB courses.
• A quarter of Coordinators say that both ELL and Special Educations students at their school can take MYP or DP courses, 30.5% said ELL take IB courses and 15.2% said Special Education students actually do participate in IB courses.
1 This included authorized, candidate and interested schools.
2

• The Diploma Programme is not, however, completely open to all students at all schools. Almost two‐thirds of the schools say they have selection criteria to enter Diploma Programme. Of these criteria, GPA, test scores, and recommendations are most frequently reported as the important qualifications for entering IB Programmes.
• Certain student characteristics were identified as strong indicators of ability to handle the DP. Student willingness to do the work is perceived by Coordinators as the most important factor, with 99% responding that this is very important. A strong academic record and honors level courses were viewed as very important by 59.4% and 41.1% in comparison, respectively.
There are differences in Coordinator, teaching staffs, and guidance counselors and their participation in IB among the schools.
• On average, Coordinators have been at their school for 12.8 years, and 25% have been at their school for at least 10 years. Over 60% of the Coordinators have backgrounds in English, literacy or social sciences compared to 25% who come from a science or mathematics background.
• Many of the Coordinators have learned about IB on the job. Slightly fewer than half of respondents said they had previous experience or a background in IB before becoming the IB Coordinator, in most cases having taught DP courses or in the MYP.
• Almost 40% receive a fulltime salary for the IB position. Other reported that they got half‐time off, while less that 20% said that they received a period off or an additional stipend. Slightly more than one quarter (26.7%) report that their compensation is the appreciation of their colleagues.
• On average, there are 109 full‐time teachers on the faculty, although the number ranges from 13 to 250. Only a small proportion of the teaching staff, however, is involved in teaching DP or MYP. On average, 22.5 percent of teaching staffs teach DP courses. Among schools that offer MYP, 38.9% of the teaching staff is involved in MYP. Among those that offer whole school MYP, the percent is higher, with 53.6% of the teaching staff involved in MYP. Among those that teach in DP, 21.3% are teaching IB for the first time, 15.7% are only teaching IB, and 3% have taught IB before coming to their current school.
• Schools have, on average, five guidance counselors, with each counselor providing guidance for approximately 339 students. Even with these caseloads, Coordinators report that guidance counselors play a surprisingly strong role in IB implementation in Title I‐eligible schools. Almost 75% of Coordinators report that guidance counselors are knowledgeable about IB courses, tracks and requirements; 76.3% say they guide students to IB; and 54.6% say that guidance counselors in their school have been to IB trainings, although we did not ask how many had attended.
The schools in our sample provide a wide variety of supports and services to students in
the IB Programmes.
3

• The majority of schools have an examination calendar, IB orientation for parents and students, a CAS Coordinator and an Extended Essay Supervisor. Support for the extended essay and tutoring are the most commonly provided support services for IB students.
These schools face a variety of challenges to successfully implementing IB and having
students receive the IB Diplomas. These include professional development, school and district challenges, and challenges for students themselves.
• While Coordinators say that over 90% of teachers who teach in IB have received training, this has not been without difficulty. Sometimes, simply getting access to IB trainings can be challenge for the schools in our sample.
• Almost 60% said that getting timely approval from the district and money to send people to trainings (48.6%) are additional challenges to IB professional development.
• Coordinators report that finding professional development courses with the appropriate content and level appear to be the biggest hurdle, closely followed by challenges enrolling staff at the appropriate level.
• Over 80% of Coordinators agree or strongly agree that time for collaborative planning is a challenge to implementation, with over half of Coordinators saying they strongly agree with the statement.
• Money and supplies for training (55.7%), retaining trained IB teachers (50.0%), gaining “buy‐in” from teachers (47.2%) and are the major challenges to implementing IB at their school.
• Coordinators agree, or strongly agree, that challenges to implementation of IB Programmes from outside the school, in particular the level of support they receive from International Baccalaureate (82.6%), conflicts with other state and district reforms (63.9%), and from changes in administration (40.2%) or from a more general lack of support from the district, where gaining acceptance for IB has been an issue (58.8%).
• Slightly more than one‐third of Coordinators say that they strongly agree that the level of support they receive from International Baccalaureate is a challenge for implementing the IB Programme in their school.
• Almost 25% say they strongly agree that conflict with other district or state‐level reforms that conflict with IB or divert resources away from IB impact implementation. These include state exams, AYP requirements, health and physical education and athletics, more resources going for remediation, state mandated class size, and school schedules.
• Student motivation appears to be the biggest challenge to IB in these schools. Almost 90% of Coordinators said that student motivation is a great or moderate barrier, while 77.4% said that the skill level of students is also a moderate or great barrier to participation.
• Coordinators believe that student persistence and commitment (84.4%), conflicts of time for students, such as sports or after‐school programs (74.0%), rigor of the IB
4

courses (72.9%), and passing IB tests (70.5%) are moderate or great challenges for students to complete the Diploma Programme.
3. Conclusion The findings from this survey give us a glimpse into IB Programmes at public Title I‐
eligible high schools in the United States, into the issues and challenges facing Coordinators, teachers, and students as they try to implement the IB Programme—but also into the recognition of quality and of the sense of pride that come with them. Since 1978, the number of public schools that offer the IB Programme has increased dramatically, and so, in turn, has access for a greater number of poor and minority students. These schools, and their staffs, have reason to be proud. The survey responses reflect dedicated IB Coordinators and teaching staffs, who have high expectations for their students. They also appear to have supportive principals and district administrators who work to provide them with resources and structural supports for IB. And while these programs may not yet be as successful as they would like in producing IB Diplomas, we see patterns of steady growth in the numbers of Title I‐eligible schools, and the numbers of students participating in IB, passing exams, and earning the Diploma.
Coordinators say that student academic preparation, motivation, and competing activities all impact participation and success in IB. At the school level, we see schools trying to provide the IB Programmes to their students while at the same time meeting district‐, state‐ and federal‐mandates. They are concerned that money, time and the difficulty of coordinating professional development opportunities between their district and International Baccalaureate affects their ability to train teachers and other school staff—and yet they are convinced that the capacity and the will of their teachers is adequate to the task. They stress the need for more support, in areas like more specific professional development that address their issues, such as teaching special needs and ELL students, counseling, and urban issues, but they also describe a range of support services that they have been able to design and deliver (such as tutoring students, teaming teachers, and devising infrastructure for extended essays).
And finally, both the configuration of urban schools and district school choice policies affect a school’s ability to provide MYP and DP as a continuous program from 7th through 12th grade. We see schools needing substantial help connecting the program across schools in their district as a way to prepare students to succeed in the Diploma Programme. Strengthening the pathway between MYP to the Diploma Programme may best help prepare students for the academic challenges and increase their success in completing the Diploma, but that pathway is not yet in place, and is particularly challenging where it must be built across two or more schools (as is the case for almost all of the Title I schools).
5

1. Introduction Since 2003, International Baccalaureate has been engaged in a deliberate effort to
increase access and expand “pathways” to the IB Diploma, and to create new supports to assist schools, particularly Title I schools, in that effort. In September 2006, International Baccalaureate was awarded a grant, under the federal API Initiative, to further that work. Under this award, International Baccalaureate is undertaking an extensive project to strengthen the pathway through Middle Years Programme (MYP) to the Diploma (DP), and to develop and deliver new supports for schools, such as scaffolding materials and curriculum mapping, coaching support and counselor training.
A team of researchers at the Institute for Education and Social Policy (IESP), located at
NYU, has been engaged in evaluating that endeavor, focusing on four high schools that have generously agreed to participate as ‘pilot’ sites. The close and continued study of those four sites offers considerable depth in understanding challenges and identifying promising strategies toward preparing more students for success in the IB Diploma and beyond. But depth in a small number of sites raises questions about breadth—the degree to which patterns in pilot schools reflect the larger population of Title I schools. As increasing numbers of schools, and even districts, serving high numbers of low income students are adopting IB Programmes, that question becomes increasingly important. IBO’s recent Examination Review & Data Summary reports a continuing trend of rapid growth of IB Programmes in North America, where the number of schools adopting IB rose by 50% between 2002 and 2007, while the number of Diploma Candidates rose by 69%, to more than 14,000 students. IB Programmes are not only growing overall, they are growing in traditionally underserved settings: of the schools now affiliated with International Baccalaureate, 92% are public schools, and almost one‐third receive some form of Title I funding. To broaden our understanding of what Title‐I eligible IB schools are like, who they serve, and what kinds of issues and challenges they face, IESP conducted a survey in the spring of 2008, sending out electronic invitations to Coordinators at 302 candidate and authorized high schools identified by International Baccalaureate as public schools serving student populations with poverty rates of 30% or higher. Despite the fact that April might be the cruelest month, that schools were preparing for the end of year and state testing deadlines, and that Coordinators were dealing with IB exams and Diploma Candidacy requirements, 127 individuals (slightly more than 42%) took the time to respond, and to allow us—for the first time‐‐to begin investigating those questions. Collectively, their responses reflect a window into the conditions and experiences of 127 IB Programmes, including 2029 IB teachers, serving 3118 Diploma Candidates, and awarding 2177 Diplomas and 5449 Certificates. In addition, approximately 90% of respondents took the extra time to respond to open‐ended questions and to add comments. Their insights are added below as illustrative quotes to relevant sections.
6

2. About the Schools “a) We are in a portal zone; b) 85% of students speak a language other than English at home; c) area violence and gangs plague the area around us making the school an oasis of safety; d) 15% Special Ed population which now includes students with severe handicaps; e) 20% ESL from China, Asia, and Latin America; f) tremendous overcrowding with no relief in sight, and much more.”
A. Title I Status
“We are an urban school with a dwindling tax base.” “We are located in the ‘rust belt.’ The economy here is tanking faster than anywhere else in the U.S.A.” “Money is a big issue in a big school district.” Title I is a federal category, originally established in 1965 as part of the War on Poverty
to provide additional funds to schools that serve “high concentrations” of poor children. Title I funding is distributed from states to districts to schools, and the decision as to what counts as a ‘high concentration” of poor students is left to the district. While the cutoff varies little year to year within districts, it varies tremendously across districts and is set relative to poverty in the local community and in one setting it can mean 35% of students below the poverty level; in another 60%. Moreover, the determination of economic disadvantage rests primarily on students who fill out and return forms to qualify for free or reduced lunch—a designation that high school students are often reluctant to seek. This causes high schools to be under‐represented among Title I schools nationwide.
According to the latest IB Census, 23% of the schools are designated as Title I and
receive additional federal funding. In our sample, 53% of respondents said their school had been officially designated as Title I in at least one of the past two years. Because of the high rates of poverty reported in the schools, we have chosen to keep all of the schools in the sample, but to follow International Baccalaureate’s lead in describing them as “Title I‐eligible schools,” whether or not they carry the official Title I designation in this particular year.
B. Grades Served The schools that we invited to participate in the survey were all identified by
International Baccalaureate as including high school grades (9‐12). They might, however, include a range of configurations, such as K‐12 schools, or grades 7 to 12, for example. The responses, however, reveal that the overwhelming majority (87%) are high schools. They conform to the traditional U.S. pattern of public high schools and offer grades 9 to 12. None of the Coordinators work in schools that serve students K‐12 and only six percent reported that their schools included 7th or 8th grades, in addition to grades 9 through 12.
7

That pattern implies that these schools, if they were to offer the MYP to DP continuum, would have to coordinate not only across two distinct programs, but across at least two separate schools. Indeed, of the high schools responding, a high percentage (85%) draw students from more than one feeder middle school, which raises questions about the challenge of creating coherent, or even coordinated pathways for IB students traveling from 7th grade to the Diploma.
In addition, eight surveys were completed by Coordinators who reported serving only
middle school grades, without grades 9 to 12. While these might be new and growing secondary schools, ones that started with 7th grade and are adding a grade each year, for this analysis we have included only the responses of Coordinators in schools that currently serve 9 to 12th graders.
C. Demographics
The schools in our sample are generally large, with an average enrollment of 1702 students, and serve large numbers of students from diverse backgrounds. Coordinators reported, on average, that their schools are 27.8% Hispanic, 31.4% black, 32.7% white, and 8% Asian, Native American or Pacific Islander. However, a number of schools are more homogenous. For example, 8.6% of schools have a student population that is at least 75% black, while 6.8% have a student population that is at least 75% Hispanic.
Figure 1: Ethnicity by Quartiles
8

Across our sample, the mean for the percentage of students eligible for free or reduced price lunch is 55%. Over half of the schools, however, have poverty rates greater than 53% percent and ten percent of the schools have poverty rates greater than 90%. Approximately 14% of students are English Language Learners (ELL) and 14% receive Special Education Services. Among graduating students, 55.3% were accepted to a four‐year college.
We did separate analyses to see if there is any variation between schools that are
formally designed as Title I and those that are not and found few statistically significant differences by Title I status in terms of student populations. Title I schools, on average, have higher percentages of Hispanic students (38.1% vs. 18.3%), lower percentages of white students (25.4% vs. 39.2%), and higher rates of students eligible for free and reduced price lunch (64.3% vs. 44.8%).
D. Status under No Child Left Behind “We have been hit over the head because of standardized test scores for over 10 years.” “TAKS [the state] testing ‘rules’ over everything, especially IB.”
Low‐wealth communities, Title I schools, and urban high schools are all commonly
reported as being disproportionately designated as “failing” or in “fear of failing” under the targets set by No Child Left Behind (NCLB). More than one‐quarter of the schools that responded to our survey (26.6%) report being in formal sanction status for not meeting AYP standards; another 13% are in fear of failing next year. Looking within the sample, that relationship becomes more apparent. Title I schools are more likely to be in need of improvement or worried they will not meet AYP requirements than non‐Title I schools.
9

Figure 2: In Need of Improvement by Title I Status
Additionally, while 40% of all schools have adopted some form of comprehensive school‐wide reform program, Title I schools are slightly more likely to have adopted formal academic support programs, for example, Gear Up, Upward Bound, AVID) than non‐Title I schools (37.3% vs. 33.7%).
E. School Conditions and Capacity
Title I‐eligible schools are, as one would expect, likely to confront the challenges often associated poverty, including funding and facilities issues and problems with attendance. They do not, however, correspond to some of the more negative stereotypes of impoverished environments inside the building: student violence and uncaring teachers.
Almost half (48%) report that lack of funding is a serious or moderate problem, and 30% say
they suffer from overcrowding. Nearly a third of Coordinators report serious or moderate problems (27%) with facilities and maintenance issues.
The responses also suggest that educators within these schools face substantial challenges in terms of student behavioral issues: Coordinators report that students who do not come to school at all (69%) or do not come on time (62%) are a serious or moderate problem. Once students are in school, however, problems with their behavior drop substantially, with less than a quarter of Coordinators reporting that problems with physical conflicts in their schools (21%) vandalism (12%) are a serious or moderate problem.
10

Figure 3: Which of the following were a problem this past school year?
F. Teaching Conditions and Capacity “It is a lot of work, so it takes especially dedicated and talented people for it to be successful. Not every teacher can teach an IB course.” “It requires a dedicated and talented teaching staff, which we are blessed to have.”
Despite the fact that high‐poverty schools are known to have issues with staff recruitment
and retention, teacher turnover is reported to be less of a problem in the schools than might have been expected. Only 5% of Coordinators said that staff turnover was a “serious issue,” while an additional 14.9% listed it as a “moderate” concern.
Only 16% of the Coordinators report working in a school where teachers typically leave the
building when the bell rings at the end of the day; fewer than 10% describe schools where teachers are looking to leave the school altogether, to transfer to another school or district. Here, again, the patterns depart from common depictions of Title I schools (particularly urban schools) and from our observations in the pilot schools, where two of the four are in settings with substantial challenges of teacher turnover and transfers.
Across the sample, 86% agree or strongly agree that teachers are supportive of IB, and 86%
say they have high expectations for students—which are strong enabling conditions for the programs. Constraining conditions arise here in two areas: 77% report complaints about
11
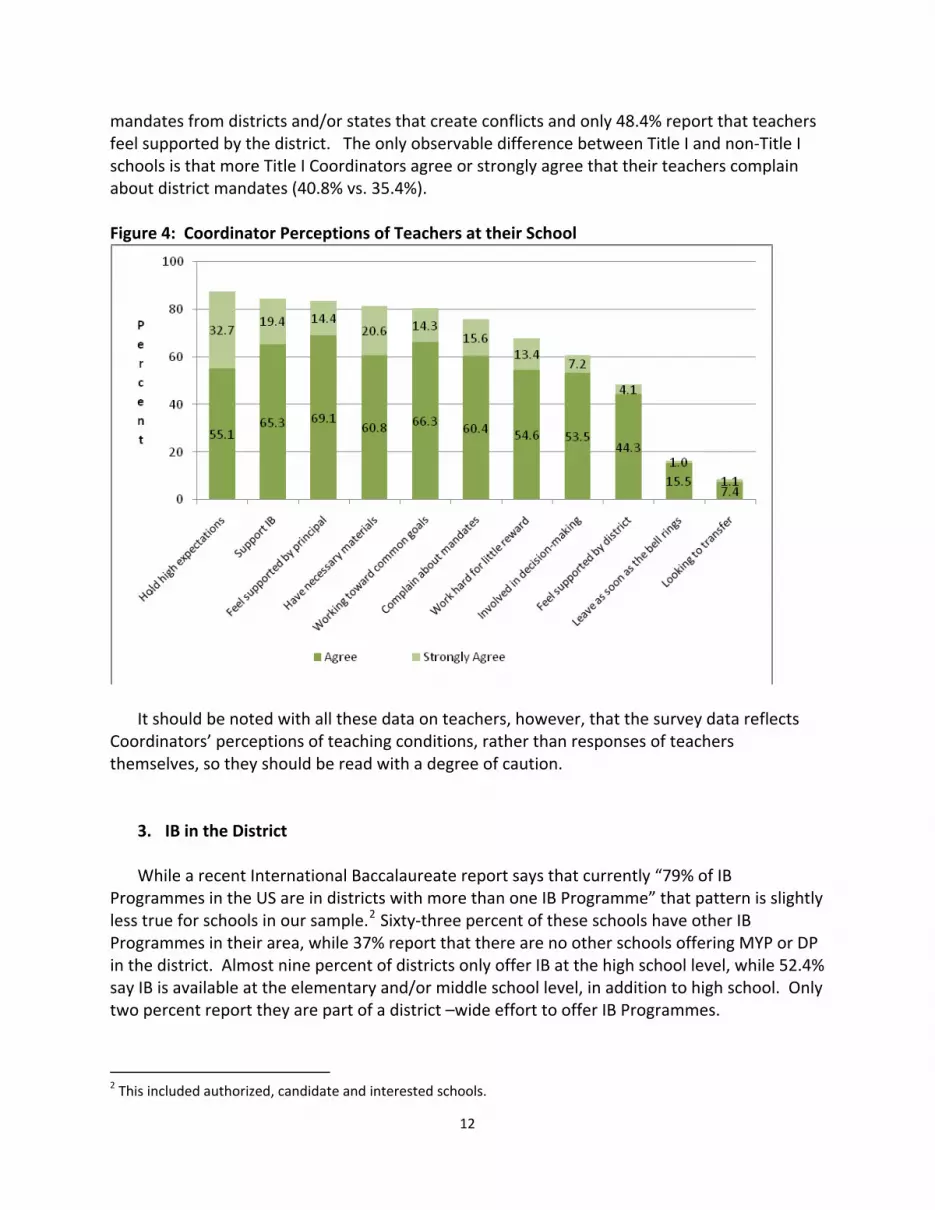
mandates from districts and/or states that create conflicts and only 48.4% report that teachers feel supported by the district. The only observable difference between Title I and non‐Title I schools is that more Title I Coordinators agree or strongly agree that their teachers complain about district mandates (40.8% vs. 35.4%).
Figure 4: Coordinator Perceptions of Teachers at their School
It should be noted with all these data on teachers, however, that the survey data reflects Coordinators’ perceptions of teaching conditions, rather than responses of teachers themselves, so they should be read with a degree of caution.
3. IB in the District
While a recent International Baccalaureate report says that currently “79% of IB Programmes in the US are in districts with more than one IB Programme” that pattern is slightly less true for schools in our sample.2 Sixty‐three percent of these schools have other IB Programmes in their area, while 37% report that there are no other schools offering MYP or DP in the district. Almost nine percent of districts only offer IB at the high school level, while 52.4% say IB is available at the elementary and/or middle school level, in addition to high school. Only two percent report they are part of a district –wide effort to offer IB Programmes.
2 This included authorized, candidate and interested schools.
12

With the overall growth patterns of IB in the U.S., particularly with the rapid rate of expansion of IB Programmes in low‐wealth communities, the availability of IB Programmes across districts may well be in the process of changing. But for now, at least, Title I‐eligible schools seem more likely to be the early adopters of IB and more likely to be adopting and implementing on their own.
Figure 5: Other IB Schools in District
Additionally, these schools must be prepared to explain and “market” IB across their district, since most are in settings with some form of school choice, particularly at the high school level. Forty‐three percent of Coordinators said that students choose where they attend high school and 84% said they draw from more than one middle school. Here again, fostering communication about IB is essential across these districts since there are no constant feeder programs between middle schools and high schools. The continuum may be a positive pathway, but it is not one these schools can rely on to recruit or prepare students.
13
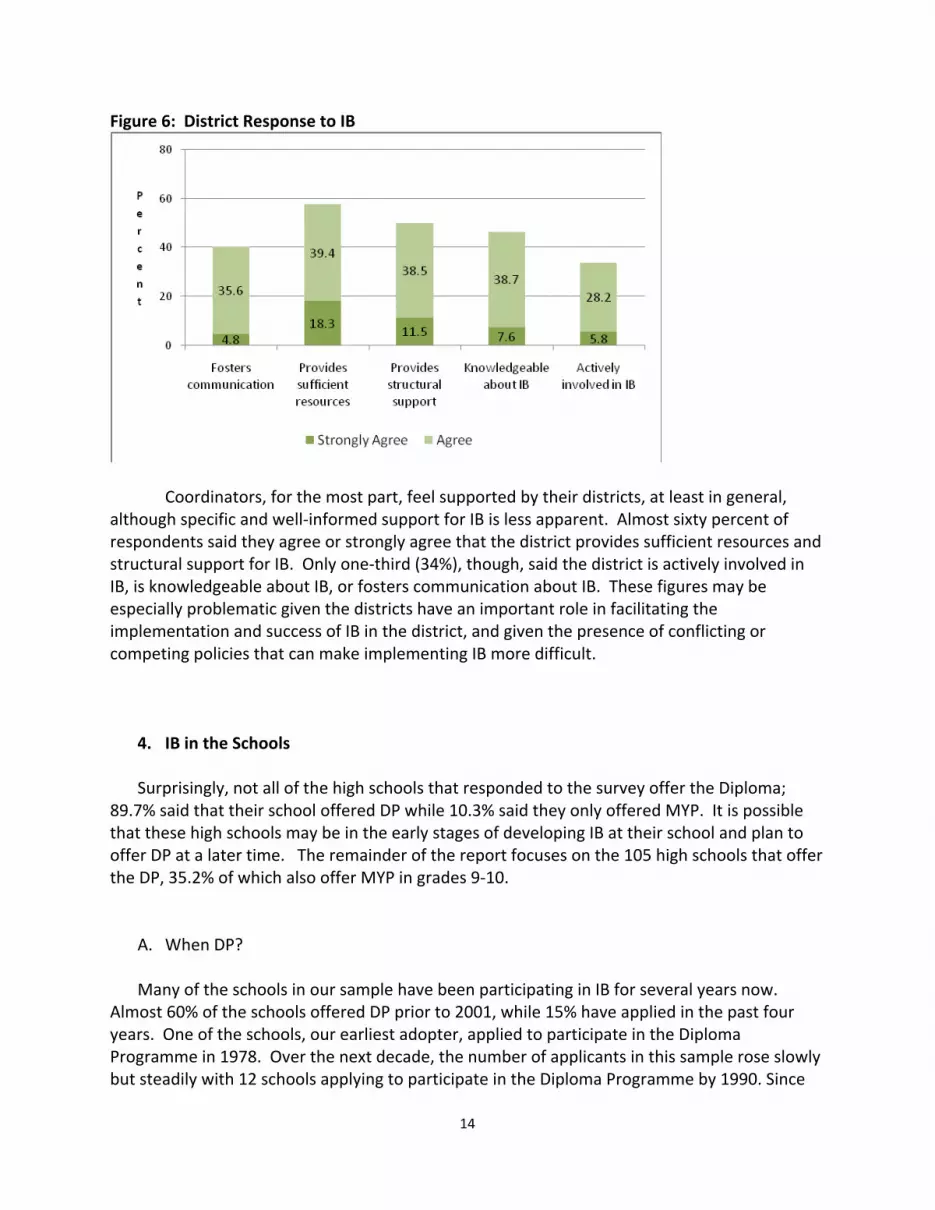
Figure 6: District Response to IB
Coordinators, for the most part, feel supported by their districts, at least in general, although specific and well‐informed support for IB is less apparent. Almost sixty percent of respondents said they agree or strongly agree that the district provides sufficient resources and structural support for IB. Only one‐third (34%), though, said the district is actively involved in IB, is knowledgeable about IB, or fosters communication about IB. These figures may be especially problematic given the districts have an important role in facilitating the implementation and success of IB in the district, and given the presence of conflicting or competing policies that can make implementing IB more difficult.
4. IB in the Schools
Surprisingly, not all of the high schools that responded to the survey offer the Diploma; 89.7% said that their school offered DP while 10.3% said they only offered MYP. It is possible that these high schools may be in the early stages of developing IB at their school and plan to offer DP at a later time. The remainder of the report focuses on the 105 high schools that offer the DP, 35.2% of which also offer MYP in grades 9‐10.
A. When DP? Many of the schools in our sample have been participating in IB for several years now.
Almost 60% of the schools offered DP prior to 2001, while 15% have applied in the past four years. One of the schools, our earliest adopter, applied to participate in the Diploma Programme in 1978. Over the next decade, the number of applicants in this sample rose slowly but steadily with 12 schools applying to participate in the Diploma Programme by 1990. Since
14

then, the reported applications reflect not only growing numbers, but an increasing rate of growth—29 of the schools applied within the past five years. The graph below shows a steep curve indicating that increasing numbers of schools are applying to participate in the Diploma Programme, constituting a rapidly growing presence within the International Baccalaureate school community.
Figure 7: Year School Applied to Participate in the Diploma Program
0
20
40
60
80
100
1978 1983 1985 1987 1992 1994 1996 1998 2000 2002 2004 2006
Perc
e
n
t
B. Why DP? “I have liked the coherence that IB brings, and that as a program we know who we have and where we have to get them.”
The reasons that schools adopt the Diploma Programme are wide‐ranging but the most salient responses center on academics, rigor, and coherence. In fact, the academic emphasis is striking—no other responses are as widely shared, and no other responses are as highly rated. Adding in those who rated these as “somewhat important” makes this set of goals the most prominent for virtually all of the schools. While these responses focus on providing academic programs, there is also a clear pattern of interest in the purpose of attracting and serving academic students.
Overwhelmingly, Coordinators describe strengthening “critical thinking” (94%), “preparing students for college” (91%), “enhancing academic rigor for all students” (85%), and “attracting and retaining academic students” (85%) as “very important” factors in choosing to offer IB. There were some reported difference between the reasons for adopting IB in Title I and non‐Title I schools. The goal of “enhancing the academic rigor available to honors track students” was listed as “very important” at 95.8% of Title I schools, as compared to 75% of non‐Title I schools.
15

While there is some variation in how high or how intensely the other goals are embraced
across the schools, the most striking finding is how many of them are important. These schools, or at least these Coordinators, see DP as serving multiple purposes, from providing general school reform to promoting international mindedness, from raising test scores to supporting ethical values. In this analysis, it seems to be the case that DP is being asked to provide not just something for everyone, but everything for everyone. Figure 8: In choosing the Diploma Programme, how important were the following goals for your school?
While it is positive that the DP is attractive to schools for so many reasons, the results indicate a wide range of goals and a plethora of expectations for one program to meet, with one Coordinators saying that IB brings ‘coherence’ to the curriculum and another saying IB enables us to “educate the ‘whole child’ in contrast to ‘teaching to the test.”
C. Measuring Success
We asked Coordinators how they would know if the IB Programme was successful. While almost 90% said that they will think the program is a success if students are better prepared for college, over 80% also said that they will gauge success of the program by more students receiving diplomas, more students enrolling in our IB courses, and when the IB Programme becomes a permanent and valued part of the school and district program. Less
16

than 10% said that they believe the program will be successful when all students receive diplomas. Figure 9: Measuring Success
D. Who takes IB Courses? “[Students] have grown and soared‐they have met tremendous challenges and conquered them, including in college.” “There are various levels of ‘IB students’ and the true measure of success is the number of students who attempt the Diploma (and not the Pass Rate).” “For the average motivated learner, the Diploma is very hard to earn, and so far that can’t be the ultimate focus of our program because it is too difficult! But the DP has so many other great benefits to focus on, I’m trying to get people to understand that and shift their focus a bit.”
Part of the reason for these diverse goals and expectations in why schools offer IB becomes apparent when we look at who takes IB. Indeed, the numbers of students who earn the Diploma stands in sharp contrast to the numbers of students who participate. The percentage of students participating at each school varies considerably, but on average, 13.9% of all students at schools offering only DP are taking IB courses, compared to 37.6% of students at schools offering MYP and DP. Two‐thirds of the schools offering MYP and DP, however, have a whole school MYP model, which may explain the large difference participation between those that offer only DP.
IB students participate in the DP in a variety of ways, according to our survey. Coordinators reported 3118 Diploma Candidates, with 2177 Diplomas and 5449 Certificates awarded in the
17

past year. While high percentages of students at some schools are taking IB courses, only a small fraction actually complete all the requirements for the diploma or are awarded a certification. On average, in the last school year, there were 25 DP candidates, 15 diplomas awarded and 64 certificates.
Coordinators report that participation in IB is increasing with the number of students at
every level of participation rising. Forty‐three percent reported more Diplomas this year than the year before; 41% have more candidates; and 39% are awarding more certificates.
In addition, IB Programmes enroll a wide range of students. At slightly more than two‐
thirds of the schools, IB courses are open to non‐IB students, for example, students enrolled in AP or honors courses or general education students. Additionally, a quarter of Coordinators say that both ELL and special educations students at their school can take MYP or DP courses, 30.5% said ELL take IB courses and 15.2% said special education students actually do participate in IB courses. Less than 30% Coordinators said that said that IB courses are not taken by ELL or special education students. The IB Census reports 228 IB Programmes in the U.S. have students who are ELL and 297 have students who are special education.
The analyses show few statistically significant different in enrollment patterns between
schools that offer MYP and DP and those with only Diploma Programmes. Schools with both MYP and DP had higher numbers of certificates awarded than schools that only offer DP (114 vs. 36). Schools with MYP and DP were also more likely to have special education students participating in IB than those that offered only DP. Finally, schools offering MYP and DP had significantly higher percentages of students accepted to four‐year colleges than those that offer DP only (65.7% vs. 51.7%).
These data show promising results in terms of expanding access for students to IB
Programmes. They indicate the goal of not only growing numbers of schools serving disadvantaged students, but also growing numbers of students participating in IB within member schools. Because these results are self‐reported by Coordinators that responded to the survey, the true number of students participating in IB could be higher. Even so, these numbers suggest that IB continues to broaden access to disadvantaged students.
The Diploma Programme is not, however, completely open to all students at all schools. Almost two‐thirds of the schools say they employ selection criteria to enter the Diploma Programme.
18

Figure 10: Selection Criteria to Enter the Diploma Programme
Of these criteria, GPA, test scores, and recommendations are most frequently reported as the important qualifications for entering IB Programmes. Contrastingly, taking higher level courses prior to entering the DP (such as “honors track,” “advanced math,” or gifted and talented “g & t” tracks) is less likely to be essential to participation. Almost one‐third of schools, however, do want students to have experience in a foreign language and a high level of math—prerequisites they will need to meet the challenges and requirements of the program.
Certain student characteristics were identified as strong indicators of ability to handle the DP. Student willingness to do the work is perceived by Coordinators as the most important factor, with 99% responding that this is very important. A strong academic record and honors level courses were viewed as very important by 59.4% and 41.1% in comparison, respectively. Experience with MYP in 7‐8th or 9‐10th grade was viewed as very important by less than one‐quarter of respondents. This differs, however, by whether or not the school offers MYP. Among those Coordinators at schools offering DP and MYP, 45.5% say experience in 9th‐10th grade MYP is very important, compared to just 11% of their counterparts at schools that do not offer MYP. It makes sense then that those schools with no experience with MYP do not see the value of MYP in contributing to student success in DP.
19
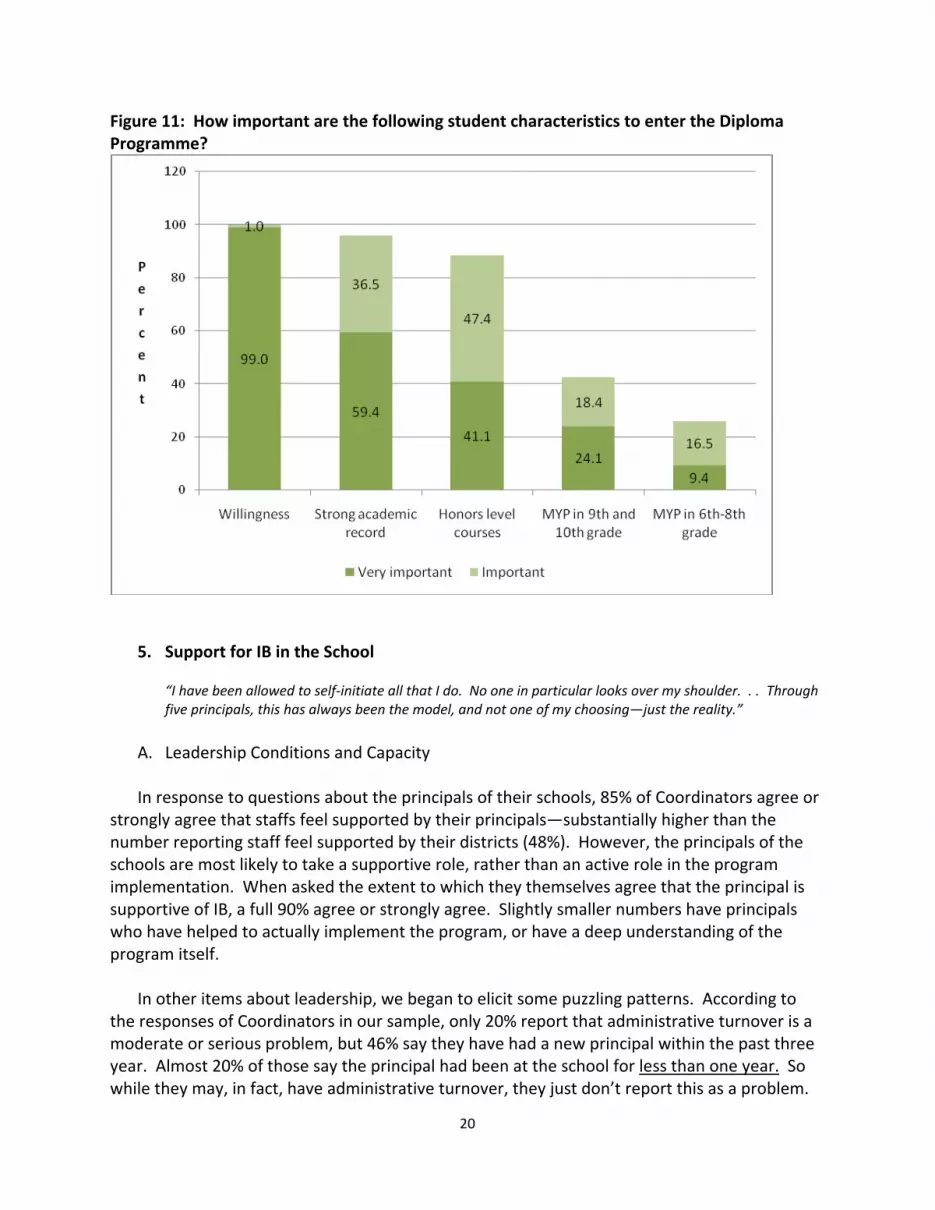
Figure 11: How important are the following student characteristics to enter the Diploma Programme?
5. Support for IB in the School “I have been allowed to self‐initiate all that I do. No one in particular looks over my shoulder. . . Through five principals, this has always been the model, and not one of my choosing—just the reality.”
A. Leadership Conditions and Capacity
In response to questions about the principals of their schools, 85% of Coordinators agree or
strongly agree that staffs feel supported by their principals—substantially higher than the number reporting staff feel supported by their districts (48%). However, the principals of the schools are most likely to take a supportive role, rather than an active role in the program implementation. When asked the extent to which they themselves agree that the principal is supportive of IB, a full 90% agree or strongly agree. Slightly smaller numbers have principals who have helped to actually implement the program, or have a deep understanding of the program itself.
In other items about leadership, we began to elicit some puzzling patterns. According to
the responses of Coordinators in our sample, only 20% report that administrative turnover is a moderate or serious problem, but 46% say they have had a new principal within the past three year. Almost 20% of those say the principal had been at the school for less than one year. So while they may, in fact, have administrative turnover, they just don’t report this as a problem.
20

Whether this is because, as one open‐ended response explained, it’s “just the reality” or because the y are happy with the new principal, we cannot tell from the data here. Surprisingly there are few differences between Coordinators perceptions of principal support for IB and principal tenure. Among principals with less than one year at the school, 50% of Coordinators say that they are knowledgeable about IB, 86% say they are supportive of IB, and 68% say they have helped integrate IB into the school. While these percentages increase with increasing principal tenure, except for principal’s knowledge of IB, over two‐thirds of Coordinators with new principals believe they have contributed to IB at the school. We know little, however, about how the principal has contributed to IB or their prior knowledge of the Programme. While change may not be a problem for a school—and it may even be a positive experience—it does raise questions about the kinds of support principals offer, and the kinds of support new principals themselves may need in becoming informed and knowledgeable supporters for IB Programmes. Figure 12: Principal Involvement in IB
Like most high schools today, particularly schools under pressure to reform, approximately 85% of schools have school leadership teams (SLTs). Teachers, guidance counselors and principals are the most frequently found members of these teams. Almost two‐thirds of the IB Coordinators surveyed said they were also on the SLT. In addition, respondents said parents and department heads were also likely to be on the team. The SLT, however, has little involvement in making decisions about IB; only 3.8% of Coordinators said that the SLT “always makes decisions about IB” and 29.5% said they “sometimes make decisions. “ This may indicate that the DP in the schools in our sample is somewhat isolated from the rest of the
21
operations of the school. This finding is reinforced by the responses indicating that even among the 11 schools where DP is a whole school model, only half report that the SLT is always or sometimes involved in decision‐making about DP. These results raise questions about how the Diploma Programme works within these schools, given the important role that school leadership teams play in improving teaching and learning within their school.
B. IB Coordinator
“I have always thought about my position as having three parts: 1) carrying out the regulations of IB; 2) interpreting IB to all communities –students, parents, teachers, administration, district, community, colleges and universities, guidance counselors etc; and 3) having some fun along the way (traditions, rituals, recognitions). Each of these areas defines a whole domain of activities for me and clarifies my thinking.” “My role changes yearly, but for this year: AP Coordinator and liaison; philosophy teacher for grade 9; Liaison to IB, AP, and universities; Instructional program development; grant writing; school accreditation; dealing with proactive IB/AP issues and resolving problems for teachers and students; consulting with the principal; recruitment and intake of students for IB and AP; anything else that is required or assigned by the principal.”
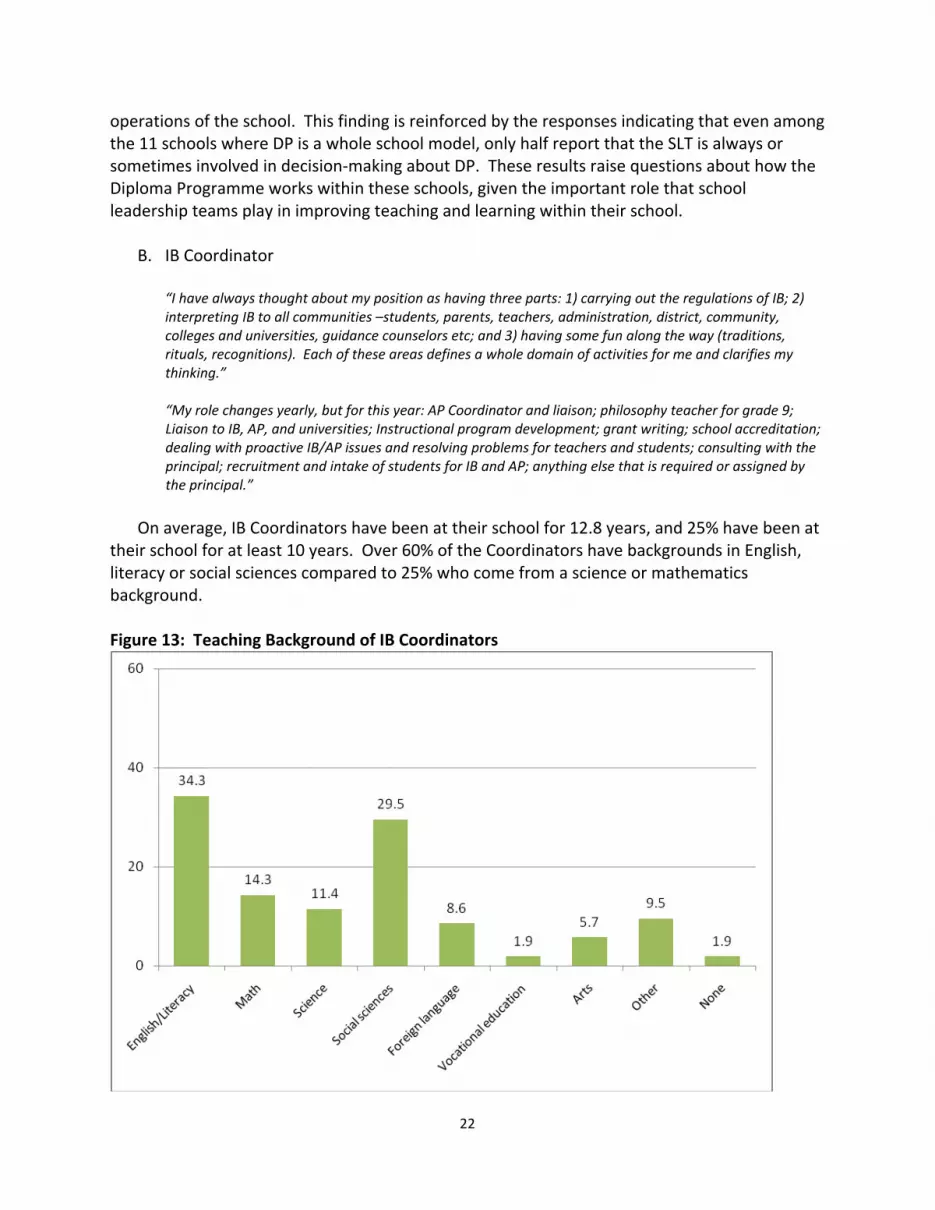
On average, IB Coordinators have been at their school for 12.8 years, and 25% have been at
their school for at least 10 years. Over 60% of the Coordinators have backgrounds in English, literacy or social sciences compared to 25% who come from a science or mathematics background. Figure 13: Teaching Background of IB Coordinators
22

Many of the Coordinators have learned about IB on the job. Slightly fewer than half of
respondents said they had previous experience or a background in IB before becoming the IB Coordinator, in most cases having taught DP courses or in the MYP. However, they have been actively learning about the IB Programme since becoming Coordinator, as only two percent of Coordinators responded that they have not participated in any IB professional development.
Coordinators play a critical role in the implementation and operation of IB and are a
critical resource for both teachers and students. Many of them also play multiple roles within the broader operation of their school and are compensated for their IB work in a variety of ways. Almost 40% receive a fulltime salary for the IB position. Other reported that they got half‐time off, while less that 20% said that they received a period off or an additional stipend. Slightly more than one quarter (26.7%) report that their compensation is the appreciation of their colleagues. Figure 14: Compensation for IB Work
C. Teaching IB Since most of the schools serve large numbers of students, it is not surprising they have
large faculties. On average, there are 109 full‐time teachers, although the number ranges from 13 to 250. Only a small proportion of the teaching staff, however, is involved in teaching DP or MYP. On average, 22.5 percent of teaching staffs teach DP courses. Among schools that offer
23

MYP, 38.9% of the teaching staff is involved in MYP. Among those that offer whole school MYP, the percent is higher, with 53.6% of the teaching staff involved in MYP. Among those that teach in DP, 21.3% are teaching IB for the first time, 15.7% are only teaching IB, and 3% have taught IB before coming to their current school.
The OCC does not appear to be widely used by those involved in DP and was identified as
the most common request for support. According to Coordinators, only 22.7 percent of teachers frequently use the OCC, while 69.7% said teachers sometimes use it. One respondent said, “I’ve looked at the OCC; it’s better, but it’s not clear with regard to the nuts‐and‐bolts. It requires too much time to find specific answers to specific questions.” Figure 15: How often do teachers use the Online Curriculum Center?
D. Guidance to IB
Schools have, on average, five guidance counselors, with each counselor providing guidance
for approximately 339 students. Even with these caseloads, Coordinators report that guidance counselors play a surprisingly strong role in IB implementation in Title I‐eligible schools. Almost 75% of Coordinators report that guidance counselors are knowledgeable about IB courses, tracks and requirements; 76.3% say they guide students to (or away from) IB; and 54.6% say that guidance counselors in their school have been to IB trainings, although we did not ask how many had attended.
24

6. Support Within IB
The schools in our sample have a wide variety of resources available to support students
in the IB Programmes. The majority of schools have an examination calendar, IB orientation for parents and students, a CAS Coordinator and an Extended Essay Supervisor. Seventy‐three percent of schools provide special recognition at graduation to IB students. Title I schools reported having more media recognition for DP students at graduation than non‐Title I schools (55.1% vs. 31.1%). Conversely, many Coordinators reported that IB is not discussed at staff meetings or school leadership team meetings, nor is the Handbook of Procedures for the Diploma Programme distributed to all staff.
Figure 16: Support to Help Students through IB
Support for the extended essay and tutoring are the most commonly provided support services for IB students. Eighty‐six percent of Coordinators report providing some form of support for the extended essay. This includes support students with a mentor or advisor, using the Theory of Knowledge course as the home base for the extended essay, setting aside dedicated time and/or space for students, setting specific due dates and meeting times, taking them to local universities and colleges and providing summer workshops focusing on the extended essay. Additionally, almost three‐quarters of the schools provide tutoring for IB students.
25

Figure 17: Which are currently in place at your school?
We compared schools at the top and bottom 25% of the distribution for the percent of candidates who were awarded the Diploma to see which of the supports and services may contribute to student success in DP. We found no significant differences in the supports provided for IB students between the two groups.
Inside the schools, Coordinators say that preparing for college plays a central role, both
for students who plan to go on to college, and for staffs.
26

Figure 18: Coordinator Perceptions of Teacher Expectations for College
They agree, or strongly agree, that the curriculum is focused toward that end (89%), and that teachers feel that preparing students for college is part of their job (85%). Yet the percentages of teachers that they report actually expect students to go to college is slightly lower (66%) and the percentage who help students with plans to get them there is lower still (62%). In order to support the post‐secondary goals of the students at the schools in our sample, IB Coordinators reported that the schools’ staff most commonly talks to their students about the skills necessary to succeed in college.
27
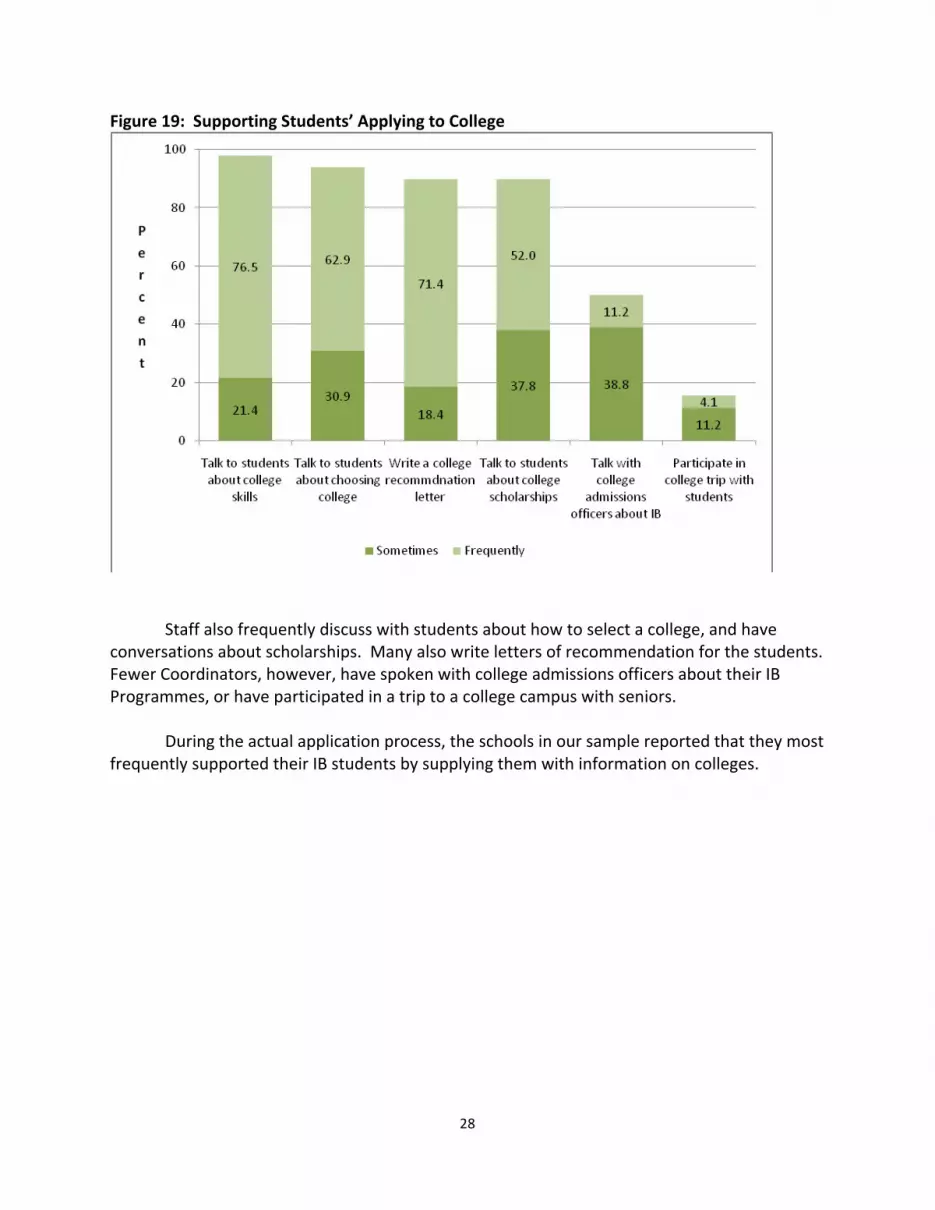
Figure 19: Supporting Students’ Applying to College
Staff also frequently discuss with students about how to select a college, and have conversations about scholarships. Many also write letters of recommendation for the students. Fewer Coordinators, however, have spoken with college admissions officers about their IB Programmes, or have participated in a trip to a college campus with seniors.
During the actual application process, the schools in our sample reported that they most frequently supported their IB students by supplying them with information on colleges.
28

Figure 20: Ways School Supports IB Students in College Application Process
Additionally, in the responses to the open ended questions, several Coordinators added that their schools had a dedicated college counselor, offered a college access course, or arranged for college representatives to come to their school and set up parent meetings with university admissions officers. Only one person said that their school does not have any school‐wide supports for students in the college application process, but added that she provides them to her students as the IB Coordinator.
Title I schools are more likely than non‐Title I schools to help students with financial aid
forms and help connect them to admissions office than non‐Title I schools (85.7% vs. 64.4%, 85.7% vs. 60%).
29

7. Challenges to Implementing IB
“[IB schools] not only have common goals, but also have common problems.” “Time.” “Time.” “Time and money.” “Removing economic barriers is essential to dramatically increasing student participation.”
These schools face a variety of challenges to successfully implementing IB and having students receive the IB Diplomas. Time and money are by far the most frequently mentioned in the open‐ended responses, but the survey data also indicate “common problems” that include professional development, school and district challenges, and challenges for students themselves.
A. Professional Development “Our large district is often unable to process the conference forms as quickly as [other districts] can do it. We are often shut out of the training sessions before our paperwork even gets to the IB organization.” “Trying to get the money approved and then when it’s approved, the workshop is closed, and going back through the long process of again trying to get into workshops.”
Of great concern here is the depth of professional development. While Coordinators
say that over 90% of teachers who teach in IB have received training, this has not been without difficulty. Sometimes, simply getting access to IB trainings can be challenge for the schools in our sample. Only 4.8% of respondents said they did not face any challenges in accessing IB training.
30

Figure 21: Challenges to Accessing International Baccalaureate Trainings
Almost 60%, however, said that getting timely approval from the district and money to send people to trainings (48.6%) are additional challenges to IB professional development. Other big challenges identified by Coordinators included the International Baccalaureate registration process, the lack of available training options and locations, particularly in California and the northeast, and coordinating the schedules of teachers to attend trainings during the school year.
Once the schools are able to access the International Baccalaureate professional development, they may face obstacles with the development itself.
31
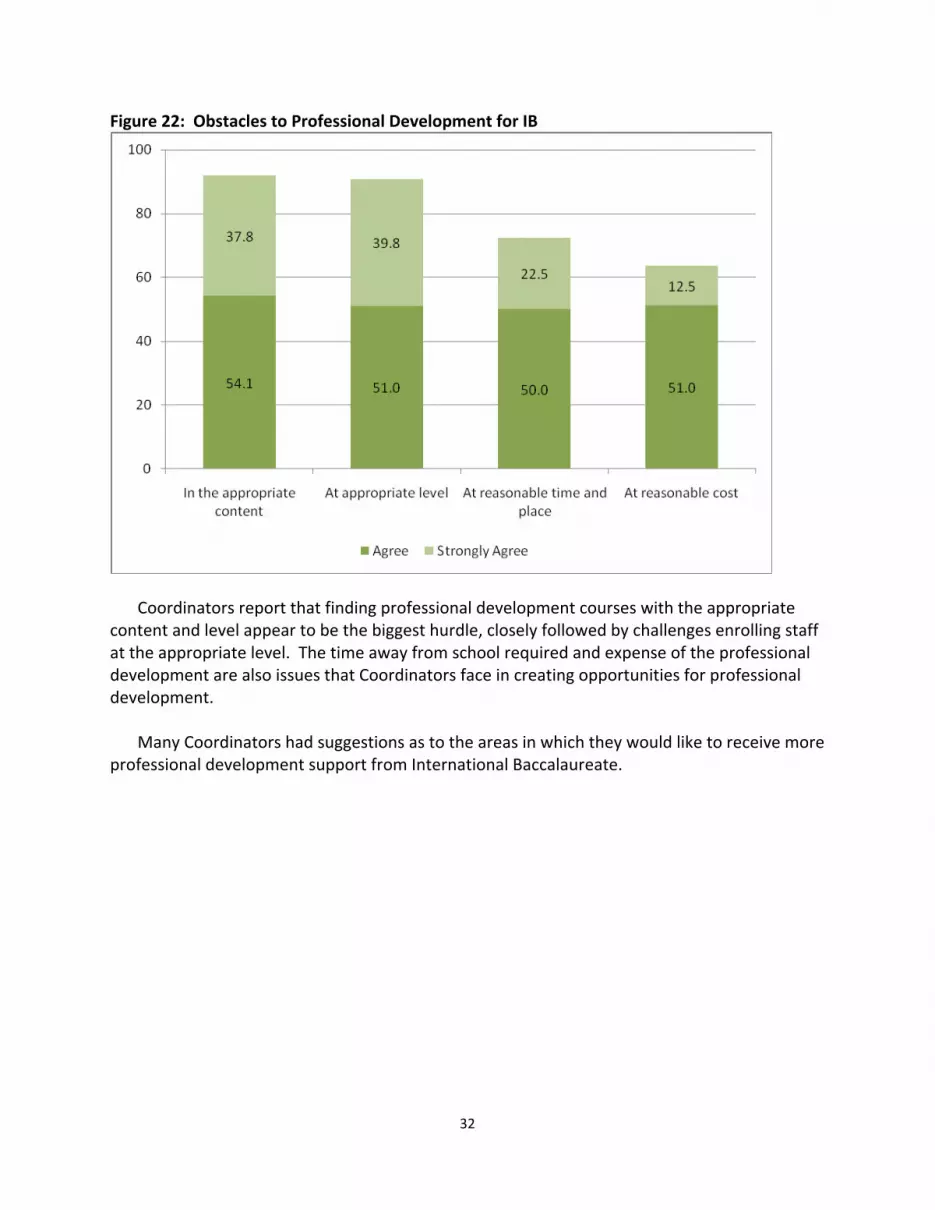
Figure 22: Obstacles to Professional Development for IB
Coordinators report that finding professional development courses with the appropriate
content and level appear to be the biggest hurdle, closely followed by challenges enrolling staff at the appropriate level. The time away from school required and expense of the professional development are also issues that Coordinators face in creating opportunities for professional development.
Many Coordinators had suggestions as to the areas in which they would like to receive more professional development support from International Baccalaureate.
32

Figure 23: In what areas do you think your school could use more support?
Training on the Online Curriculum Center (OCC) was indicated to be the number one request from Coordinators. Second, Coordinators indicated the need for training in counseling of students—those in IB and those thinking of entering. Third, addressing “urban issues” was listed as an area in which Coordinators would like more assistance. Coordinators at Title I schools were far more likely to say they need more support on urban issues for IB than those in non‐Title I schools (44.9% vs. 24.4%).
Course content requests included specific DP course content (sciences, foreign
language, visual arts, design technology) and more IB specific such as best practices, differentiated instruction for MYP, whole school IB, engaging the unengaged in MYP, learner profile, extended essay and assessment.
B. Student Participation and Success
“Feeder students are not prepared—not that they are not capable, but that curriculum does not connect across programs and between schools.” “Students who don’t come to school or don’t come on time.”
In addition to the challenges in obtaining professional development, Coordinators also
identified a number of challenges for students themselves. Student motivation appears to be the biggest challenge that the IB Programmes face. Almost 90% of Coordinators said that student motivation is a great or moderate barrier, while 77.4% said that the skill level of
33
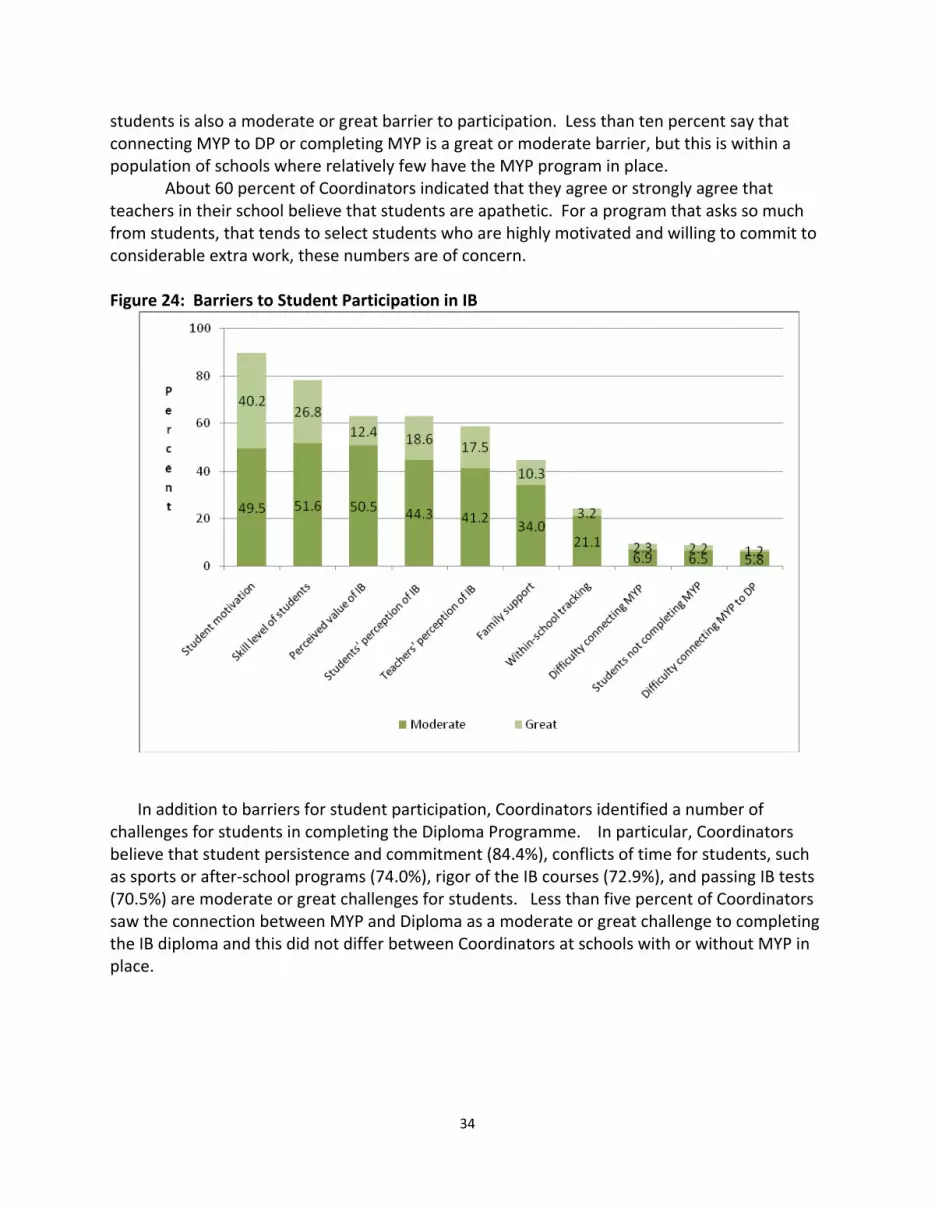
students is also a moderate or great barrier to participation. Less than ten percent say that connecting MYP to DP or completing MYP is a great or moderate barrier, but this is within a population of schools where relatively few have the MYP program in place.
About 60 percent of Coordinators indicated that they agree or strongly agree that teachers in their school believe that students are apathetic. For a program that asks so much from students, that tends to select students who are highly motivated and willing to commit to considerable extra work, these numbers are of concern. Figure 24: Barriers to Student Participation in IB
In addition to barriers for student participation, Coordinators identified a number of challenges for students in completing the Diploma Programme. In particular, Coordinators believe that student persistence and commitment (84.4%), conflicts of time for students, such as sports or after‐school programs (74.0%), rigor of the IB courses (72.9%), and passing IB tests (70.5%) are moderate or great challenges for students. Less than five percent of Coordinators saw the connection between MYP and Diploma as a moderate or great challenge to completing the IB diploma and this did not differ between Coordinators at schools with or without MYP in place.
34
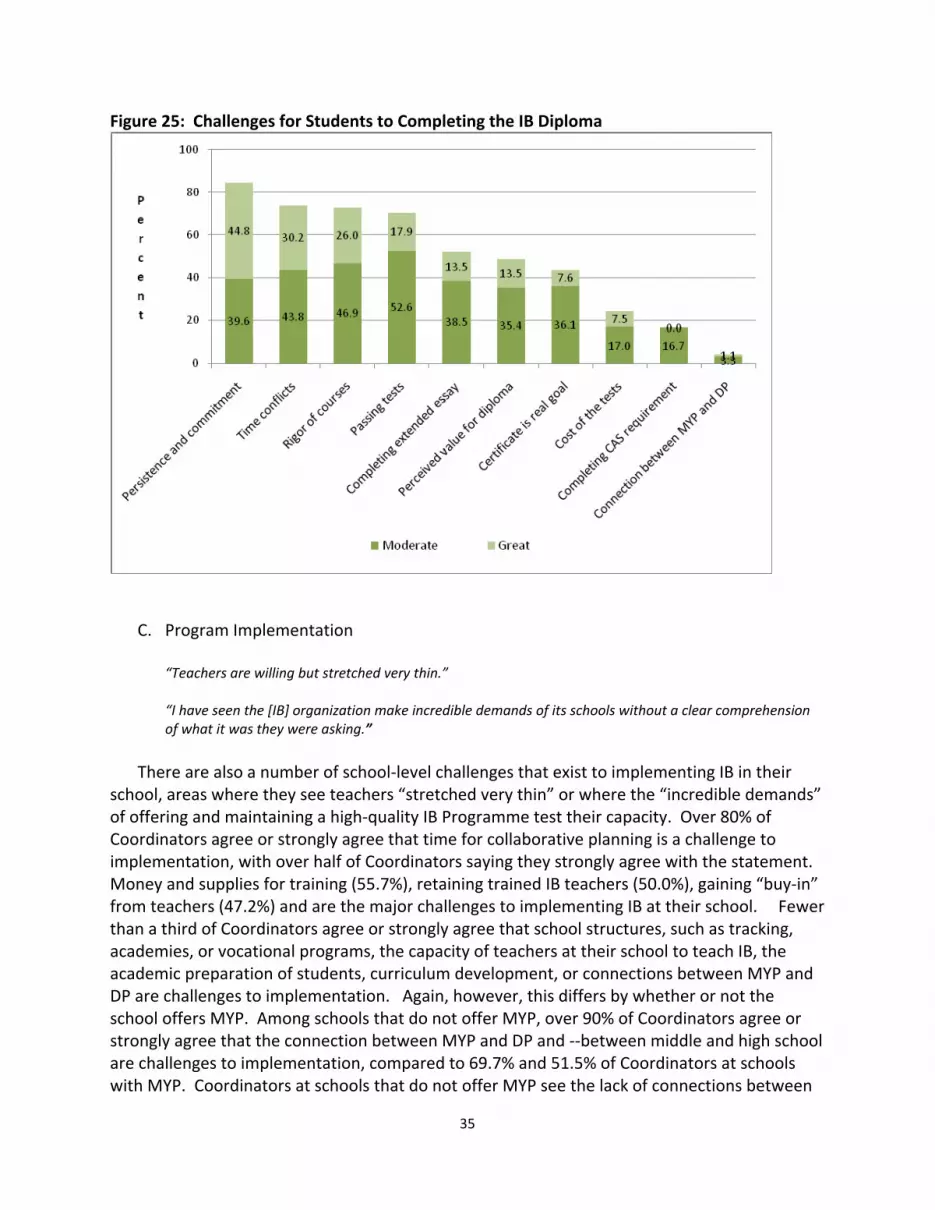
Figure 25: Challenges for Students to Completing the IB Diploma
C. Program Implementation
“Teachers are willing but stretched very thin.” “I have seen the [IB] organization make incredible demands of its schools without a clear comprehension of what it was they were asking.”
There are also a number of school‐level challenges that exist to implementing IB in their
school, areas where they see teachers “stretched very thin” or where the “incredible demands” of offering and maintaining a high‐quality IB Programme test their capacity. Over 80% of Coordinators agree or strongly agree that time for collaborative planning is a challenge to implementation, with over half of Coordinators saying they strongly agree with the statement. Money and supplies for training (55.7%), retaining trained IB teachers (50.0%), gaining “buy‐in” from teachers (47.2%) and are the major challenges to implementing IB at their school. Fewer than a third of Coordinators agree or strongly agree that school structures, such as tracking, academies, or vocational programs, the capacity of teachers at their school to teach IB, the academic preparation of students, curriculum development, or connections between MYP and DP are challenges to implementation. Again, however, this differs by whether or not the school offers MYP. Among schools that do not offer MYP, over 90% of Coordinators agree or strongly agree that the connection between MYP and DP and ‐‐between middle and high school are challenges to implementation, compared to 69.7% and 51.5% of Coordinators at schools with MYP. Coordinators at schools that do not offer MYP see the lack of connections between
35
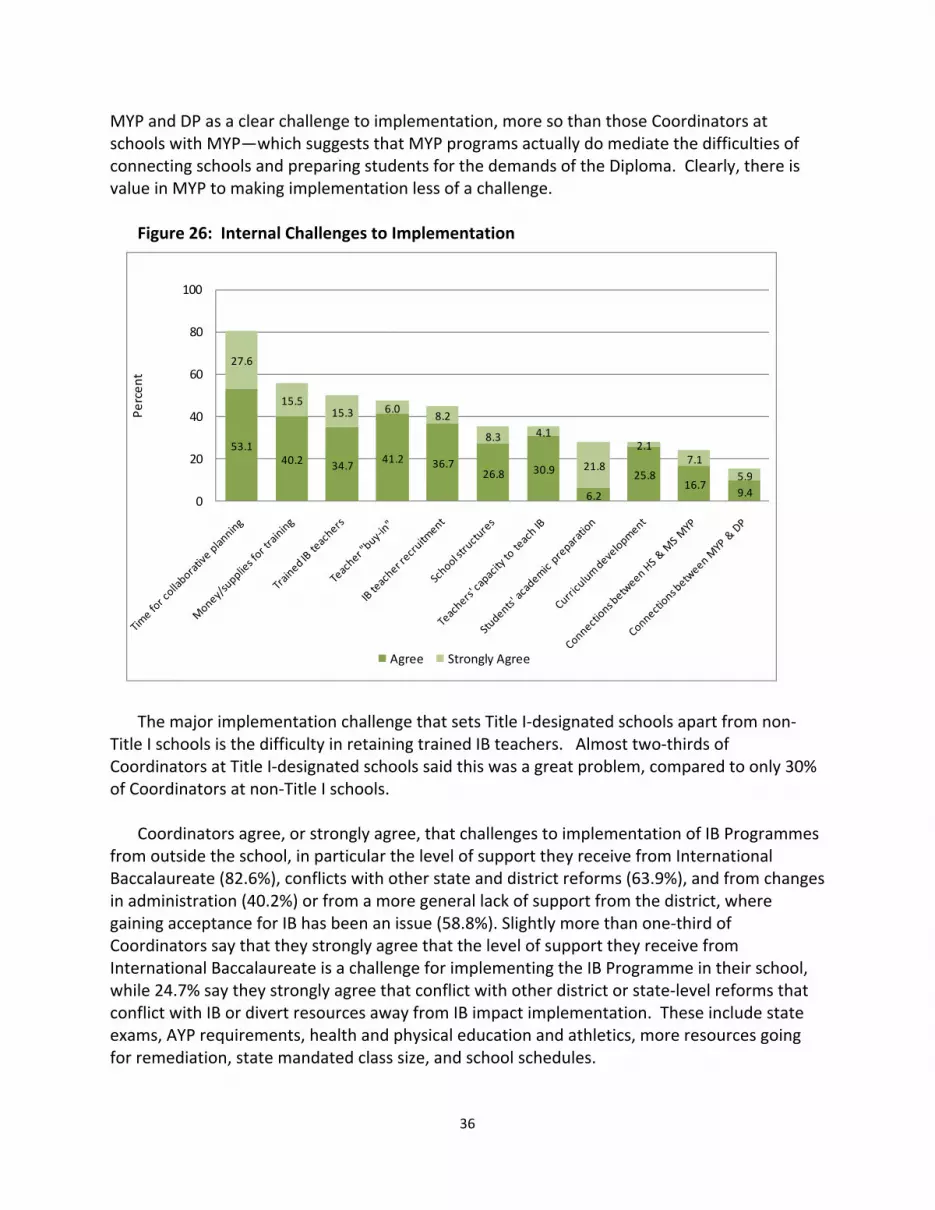
MYP and DP as a clear challenge to implementation, more so than those Coordinators at schools with MYP—which suggests that MYP programs actually do mediate the difficulties of connecting schools and preparing students for the demands of the Diploma. Clearly, there is value in MYP to making implementation less of a challenge.
Figure 26: Internal Challenges to Implementation
53.140.2 34.7
41.2 36.726.8 30.9
6.2
25.816.7
9.4
27.6
15.515.3 6.0
8.2
8.3 4.1
21.8
2.17.1
5.9
0
20
40
60
80
100
Percen
t
Agree Strongly Agree
The major implementation challenge that sets Title I‐designated schools apart from non‐
Title I schools is the difficulty in retaining trained IB teachers. Almost two‐thirds of Coordinators at Title I‐designated schools said this was a great problem, compared to only 30% of Coordinators at non‐Title I schools.
Coordinators agree, or strongly agree, that challenges to implementation of IB Programmes
from outside the school, in particular the level of support they receive from International Baccalaureate (82.6%), conflicts with other state and district reforms (63.9%), and from changes in administration (40.2%) or from a more general lack of support from the district, where gaining acceptance for IB has been an issue (58.8%). Slightly more than one‐third of Coordinators say that they strongly agree that the level of support they receive from International Baccalaureate is a challenge for implementing the IB Programme in their school, while 24.7% say they strongly agree that conflict with other district or state‐level reforms that conflict with IB or divert resources away from IB impact implementation. These include state exams, AYP requirements, health and physical education and athletics, more resources going for remediation, state mandated class size, and school schedules.
36

Figure 27: External Challenges to Implementation
8. Conclusion “IB is the best program we offer here. . and the students and parents of students who have studied IB subjects recognize [that], especially once they are in college. I receive many wonderful emails from students when they are freshmen and I continue to hear wonderful comments from parents wherever I go.” “It brings a sense of pride when you are associated with the program and you start to understand what it represents.” “We are a team! We all work together for the common good of the students and our school. We celebrate the small (and large) successes. This has created a family‐like support structure for our students. We also believe—and model—that anyone who wants to try the program should be able to do so.”
A. Key Findings
The findings from this survey give us a glimpse into IB Programmes at public Title I‐eligible high schools in the United States, into the issues and challenges facing Coordinators, teachers, and students as they try to implement the IB Programmes—but also into the recognition of quality and of the sense of pride that come with them. Since 1978, the number of public schools that offer the IB Programme has increased dramatically, and so, in turn, has access for a greater number of poor and minority students. These schools, and their staffs,
37

have reason to be proud. The survey responses reflect dedicated IB Coordinators and teaching staffs, who hold high expectations for their students. They also appear to have supportive principals and district administrators who work to provide them with resources and structural supports for IB. And while these programs may not yet be as successful as they would like in producing IB Diplomas, we see patterns of steady growth in the numbers of Title I‐eligible schools, and the numbers of students participating in IB, passing exams, and earning the Diploma.
The Coordinators who responded to our survey identified a variety of challenges to overcome to improve success. These challenges are found at all levels – the students they teach, the schools they work at, the districts they are located in, and the state systems that surround them.
Coordinators say that student academic preparation, motivation, and competing activities all impact participation and success in IB. At the school level, we see schools trying to provide the IB Programmes to their students while at the same time meeting district‐, state‐ and federal‐mandates. They are concerned that money, time and the difficulty of coordinating professional development opportunities between their district and International Baccalaureate affects their ability to train teachers and other school staff—and yet they are convinced that the capacity and the will of their teachers is adequate to the task. They stress the need for more support, in areas like more specific courses that address their issues, such as teaching special needs and ELL students, counseling, and urban issues, but they also describe a range of support services that they have been able to design and deliver (such as tutoring students, teaming teachers, and devising infrastructure for extended essays).
Both the configuration of urban schools and school choice policies affect a school’s ability to provide MYP and DP as a continuous program from 7th through 12th grade. Therefore, we see schools needing substantial help connecting the program across schools in their district as a way to prepare students to succeed in the Diploma Programme. Strengthening the pathway between MYP to the Diploma Programme may best help prepare students for the academic challenges and increase their success in completing the Diploma, but that pathway is not yet in place.
Finally, in their willingness to take the time to complete the survey, in their responses, and in their added comments, we see not only a sense of pride in IB and what these schools have accomplished, but also a real desire to share that story, and to see and hear from other schools in similar circumstances. The calls for workshops on IB in urban settings, for regional associations, for conference participation and networks of similar schools, for information about whether and where there are schools that “look like us” comes across strongly. We hope that through this survey schools have a chance to see more about themselves and each other.
B. Areas for Future Research
38

These survey findings highlight the strengths, weaknesses, and opportunities present among IB Programmes in Title I‐eligible high schools during the 2007‐08 school year. They are limited, however, in three particular ways that point to the need for further research. First, the survey only provides information about IB Programmes in this one year, and ‘snapshot’ studies, while they can tell us much, are necessarily restricted by that limit. So, for example, we can ‘see’ little effect of the supports that schools have put in place to improve the odds of success for their students—things like tutoring or exended essay supports. But one could easily hypothesize that schools with lower levels of success would be the most likely to put such interventions in place. In that case, the finding of comparable levels across schools would be a measure of their success. But without repeated surveys, and longitudinal patterns, we simply cannot tell. Annual studies would allow an examination of progress over time, and of effects of program changes and particular supports. Second, the survey responses all come from Coordinators, who can give us good insight into the experiences of the programs in their schools, but can only begin to suggest the experiences of teachers. Similar surveys that extended to teachers’ own responses can confirm and enrich that understanding; surveys that included both IB and non‐IB teachers can explore the variation between groups and the impressions of those in the schools who are not directly involved—but are nonetheless affected by the programs. Third, there are patterns within this study that suggest the need for more information—including more information about the Coordinators. They clearly play a major role in the operation of the programs, but the open‐ended responses describe an extraordinarly number and range of other roles they play in the school. There is a clear need for more systematic information to understand what is being asked of Coordinators, what supports are being provided for them, and what difference those supports (like release time) can make. There is reason, as well, to question whether this is a phenomenon of Title I, or whether similar patterns exist in all IB schools across the U.S. The survey responses also point out a need to include more nuanced questions to distinguish differences between the MYP and DP. While these are clearly separate programs, this survey as it was conducted was not designed to tease out the differences between teaching in those two prorams, between schools that offer DP and those that offer both MYP and DP, and between the middle schools and the high schools. Finally, an additional area for further research is to examine more closely those schools and districts that show stronger pathways between programs, and to correlate that with information available through other datasources such as the census characteristics, exam results, and reviews. For example, the findings show that high schools in districts that offer IB at the elementary and middle school levels are also more likely to have MYP in high school. Understanding how these programs interact and the connection from program to program may provide valuable lessons for other districts. Yearly surveys such as this one would clearly help us better understand the growth of IB in the United States and the challenges and successes that Title I‐eligible schools have had in implementing IB and helping their students succeed in the programs.
39

40
The Institute for Education and Social Policy Steinhardt School of Culture, Education, and Human Development | New York University 82 Washington Square East, 7th Floor | New York, NY 10003 Phone: 212.998.5880 | Fax: 212.995.4564 | Email: [email protected] | Website: steinhardt.nyu.edu/iesp
The Institute for Education and Social Policy is a partnership between the Steinhardt School of Culture, Education, and Human Development and Robert F. Wagner Graduate School of Public Service