study of the influence of micro-oxygenation and oak chip maceration on wine composition using an...
TRANSCRIPT
Sw
Aa
b
c
d
a
ARR1AA
KECMROACP
1
saawpmwbowwao
A
l
0d
Analytica Chimica Acta 642 (2009) 235–245
Contents lists available at ScienceDirect
Analytica Chimica Acta
journa l homepage: www.e lsev ier .com/ locate /aca
tudy of the influence of micro-oxygenation and oak chip maceration onine composition using an electronic tongue and chemical analysis
. Rudnitskayaa,b,∗, L.M. Schmidtkec, I. Delgadilloa, A. Leginb, G. Scollaryd
Chemistry Department, University of Aveiro, Aveiro 3810-193, PortugalChemistry Department, St. Petersburg University, St. Petersburg 199034, RussiaNational Wine and Grape Industry Centre, School of Agricultural and Wine Science, Charles Sturt University, Wagga Wagga, New South Wales 2678, AustraliaSchool of Chemistry, The University of Melbourne, Victoria 3010, Australia
r t i c l e i n f o
rticle history:eceived 11 August 2008eceived in revised form3 November 2008ccepted 17 December 2008vailable online 25 December 2008
eywords:lectronic tonguehemical sensors
a b s t r a c t
The influence of micro-oxygenation (MOX) and maceration with oak chips treatments on wine was stud-ied on wine samples from three vintages produced in the Yarra Valley, Australia. A full factorial designwas employed where two factors (MOX and oak chips treatments) had two levels and one factor (vin-tage) had three levels. Three replicated treatments were run for each factor’s setting. Wine sampleswere analysed using conventional laboratory methods with respect to the phenolic wine compounds andcolour attributes since the phenolic fraction of wine is most affected by both MOX and oak macerationtreatments. The same wine samples were measured with an electronic tongue based on potentiomet-ric chemical sensors. The significance of treatments and vintage effects on wine phenolic compoundswas assessed using ANOVA and ANOVA-Simultaneous Component Analysis (ASCA). Cross-validation was
icro-oxygenationed wineak macerationnalysis of variance-Simultaneousomponent Analysisermutation test
used for the ASCA sub-model optimisations and permutation test for evaluations of the significance ofthe factors. Main effects of vintage and maceration with oak chips were found to be significant for bothphysicochemical and the ET data. Main effect of MOX treatment was also found significant for the physic-ochemical parameters. The largest effect on the phenolic composition of wine was due to its vintage,which accounted for 70% and 33% of total variance in the physicochemical and ET data respectively. The
specthese
ET was calibrated with reand 2 and could predict t
. Introduction
Oxidation reactions play an important role in winemakingtrongly influencing wine composition in both positive and neg-tive way. Oxidation is the main process occurring during wineging and it is believed to be responsible for the improvement ofine organoleptic characteristics [1]. Oxygen reacts primarily withhenolic compounds in wine causing their polymerisation and for-ation of pigments, that affect colour, flavour and the mouth feel ofine [2]. Wine oxidation occurs during maturation in the oak wood
arrels where it is exposed to the slow and continuous diffusion ofxygen through wood pores. A process of micro-oxygenation (MOX)
as developed during the 1990s as an imitation of wine aging inood barrels and it was expected to “accelerate” the process of wineging [3–5]. MOX consists of introducing small measured amountsf oxygen to wines at a dosage less than the maximum permissi-
∗ Corresponding author. Current address: Chemistry Department, University ofveiro, Aveiro 3810-193, Portugal.
E-mail addresses: [email protected] (A. Rudnitskaya),[email protected] (L.M. Schmidtke).
003-2670/$ – see front matter © 2008 Elsevier B.V. All rights reserved.oi:10.1016/j.aca.2008.12.034
to the total phenolic content, colour density and hue and chemical ages 1parameters of wine with good precision.
© 2008 Elsevier B.V. All rights reserved.
ble mass transfer rate and chemical consumption of oxygen, thusavoiding at the same time wine saturation with oxygen, which canlead to undesirable effects such as bacterial spoilage [1]. It wasfound that MOX treatment promotes condensation of monomericanthocyanins with catechin and epicatechin with methylmethinebridges and the formation of pyranoanthocyanins that influenceand stabilise wine colour [1]. The sensorial changes arising from theapplication of MOX to red wine are reported to be rather diverse andinvolve the alteration of mouth feel sensations by softening astrin-gent tannins [6,7], increasing intensity and stability of colour [8,9],and decreasing reductive and vegetative aromas [10–12]. Anotherimportant consequence of wine maturation in barrels is an extrac-tion of aroma compounds enriching wine flavour [13,14]. Oak woodextractives consist mainly of low weight phenolics such as benzoicand cinnamic compounds, gallic and ellagic acids and hydrolysabletannins. These compounds not only confer typical oak flavours towine but also interact with the other wine phenolics influencing
wine colour, bitterness and astringency. Combination of the MOXwith introduction of the alternative oak products such as oak chipsor staves in a stainless steel tank has been suggested as a mean ofreplacing expensive oak barrels [3,15]. Despite the fact that MOXand maceration with oak products are in use for several years now,
2 a Chim
opaMg
pswmascsat(wassmEotadooohmpaaoEaa
ecoiEec
2
2
hsagvaqhtc5f
36 A. Rudnitskaya et al. / Analytic
nly few studies of the influence of these two treatments on thehenolic fraction and sensorial characteristics of wine are avail-ble. It is therefore of interest to compile more information aboutOX and oak maceration effects on the wines from different geo-
raphical zones and produced from different grape varieties.Larger implementation of the modern approaches to wine
roduction also led to the growth of interest in carrying out mea-urements on site that would give information about changes inine composition arising from the application of various treat-ents. Evidently such measurements should be relatively simple
nd inexpensive. Analytical methods currently employed for analy-is of wine polyphenolic fraction such as i.e. determination of tanninondensation products or mean degree of polymerisation compriseeveral steps and quite laborious and expensive [16]. One of thenalytical instruments meeting requirements of simple instrumen-ation and low-cost is the electronic tongue multisensor systemET) [17]. The electronic tongue comprises a set of chemical sensorsith partial selectivity to the compounds of interest. This approach
llows improving selectivity of the system compared to discreteensors [17] as well as performing tasks such as recognition, clas-ification and taste assessment. Since the output of the ET is inost cases non-selective, chemometric methods are necessary for
T data processing. Several applications of the ETs to the analysisf foodstuffs and wines in particular have been reported. Electronicongues based on potentiometric and amperometric sensors werepplied to the recognition of wine varieties and wine origin [18–20],etection of various types of adulterations in wine [21], monitoringf wine aging [22], quantitative determination of organic acids’ andther compounds’ content [19]. Correlations of potentiometric ETutput with sensory characteristics of wine and wine tannins alsoave been reported [19,23,24]. The ET sensor system enables rapideasurements to be conducted and requires little or no sample
reparation. The analytical device is relatively compact and may beutomated quite easily. These features make the ET sensor systemsvery attractive analytical tool for such tasks as quality control,
n-line analysis and process monitoring. Though in many cases theT systems cannot completely replace conventional analysis theyllow a significant reduction in the number and frequency of suchnalysis therefore saving time and labour.
The purpose of the present study was assessment of the influ-nce of micro-oxygenation and maceration with oak chips on wineomposition and specifically on wine phenolic compounds. Effectsf these two treatments on wines from different vintages were stud-ed using a set of conventional physicochemical measurements andT based on potentiometric chemical sensors. Furthermore, ET wasvaluated as an analytical tool for the rapid detection of phenolicompounds in wine.
. Experimental
.1. Winemaking and micro-oxygenation
Shiraz grapes from the 2004, 2005 and 2006 vintages werearvested in the Yarra Valley, Australia at a level of ripeness con-idered mature for commercial winemaking. Grapes from the 2004nd 2005 vintages were sourced from the same vineyard whereasrapes from the 2006 vintages were derived from an alternativeineyard site located in the Yarra Valley. Grapes were de-stemmednd crushed prior to alcoholic fermentation in approximately 20 kLuantities. Malolactic fermentation was completed following alco-
olic fermentation and wine was then racked off gross lees, clarifiedo 5 NTU (nephelometric turbidity units) or less, stabilised, and theoncentration of molecular sulfur dioxide adjusted to 0.6 ppm. AkL parcel of wine was stored until commencement of the trialor each year. For the application of micro-oxygenation wine was
ica Acta 642 (2009) 235–245
transferred to 6 × 300 L stainless steel tanks of dimension 3 mhigh × 360 mm diameter. A further six tanks of 110 L capacity withdimensions 77 cm high by 45 cm diameter were used without MOX.The remainder wine was transferred to a selection of new, 1-year-and 2-year-old oak barrels of 225 or 500 L capacity depending uponvintage.
For each of the six tanks receiving MOX and six tanks withoutMOX, three were randomly assigned oak chips at a total rate of14 g L−1. Oak chips (Quercus sp.), 7–20 mm in size, were sourcedfrom Boise (FRANCE) and the composition of the chips used throughout the trial was chosen on the basis of the suppliers recommen-dations to mimic the extraction of oak constituents from a newmedium toast French oak barrique of 225 L volume with untoastedheadboards. Oak chip types were added to the wine at the follow-ing rates; Fresh 2 g L−1, single toast assorted 10 g L−1, double toast180 l g L−1, double toast 210 l g L−1. Treatment design and levels areshown in Table 1. Therefore, a full factorial design was employed inthis experiment where two factors (MOX and oak chips treatments)had two levels and one factor (vintage) had three levels. Three repli-cated treatments were run for each factor’s setting. Together withwines from the same three vintages, which were not subjected toany treatment and were kept in barrels, it gave 39 samples in total.
Oxygen was added to each MOX tank at the rate of2 mL L−1 month−1 using Oenodev (FRANCE) controllers and ceramicsinters. Wines were maintained between 14 and 18 ◦C using athermostatically controlled heater and free sulfur dioxide levelsadjusted when necessary using Oenosteryl (Laffort) tablets to main-tain a molecular sulfur dioxide concentration between 0.4 and0.8 mg L−1. At the end of each vintage trial oak chips were removedfrom the wine and the concentration of free sulfur dioxide wasadjusted to between 30 and 35 ppm to achieve a minimum of0.6 mg L−1 of molecular sulfur dioxide. During all sampling, mea-surement and mixing processes a blanket of carbon dioxide wasmaintained over the top of the wine to prevent exposure of the sur-face of the wine to the atmosphere. Wine in barrels was transferredinto one tank, homogenised and adjusted for sulfur dioxide con-centration as described prior to bottling. Wine was bottled in the16 × 750 mL screw cap bottles for each treatment replicate. Winesfrom vintages 2004, 2005 and 2006 were stored in a temperatureand humidity controlled cellar for 32, 20 and 8 months respectivelyprior to chemical and ET analysis.
2.2. Electronic tongue and chemical analysis
Each sample was analysed for the typical wine physicochemicalparameters using the following methods: condensed tannin con-centration by methyl cellulose precipitation [25], red wine colourand phenolic measurements using the Somers methods [26], totalphenols, flavonoids and non-flavonoids’ fractions using the Folinmethod [27]. Calculations for wine colour density, wine colourhue, total phenolics, total anthocyanins, ionised anthocyanins, per-centage of anthocyanins in ionised form and percentage of ionisedanthocyanins in the absence of sulfur dioxide bleaching and chemi-cal age were done according to Ref. [28]. Glucose, fructose and aceticacids were measured by enzymatic procedures (Roche Boehringer)in miniaturised format using a Biotek �Quant microplate reader.Wine spectral measures were determined using a Shimadzu UV-3100 scanning spectrophotometer between 250 and 800 nm in0.5 nm increments with UV-Probe software version 2.21, and CIE-Lab colour co-ordinates for a D65 illuminate and 10◦ observer anglecalculated using UVPC Color Analysis version 3.00 software. As MOX
is known to influence the formation of anthocyanin moieties resis-tant to sulfur dioxide bleaching, wine spectral measurements weredetermined in acetaldehyde treated wine as described above. Thefollowing physicochemical parameters were measured: total phe-nols, non-flavonoid phenolics and flavonoid phenolics (all three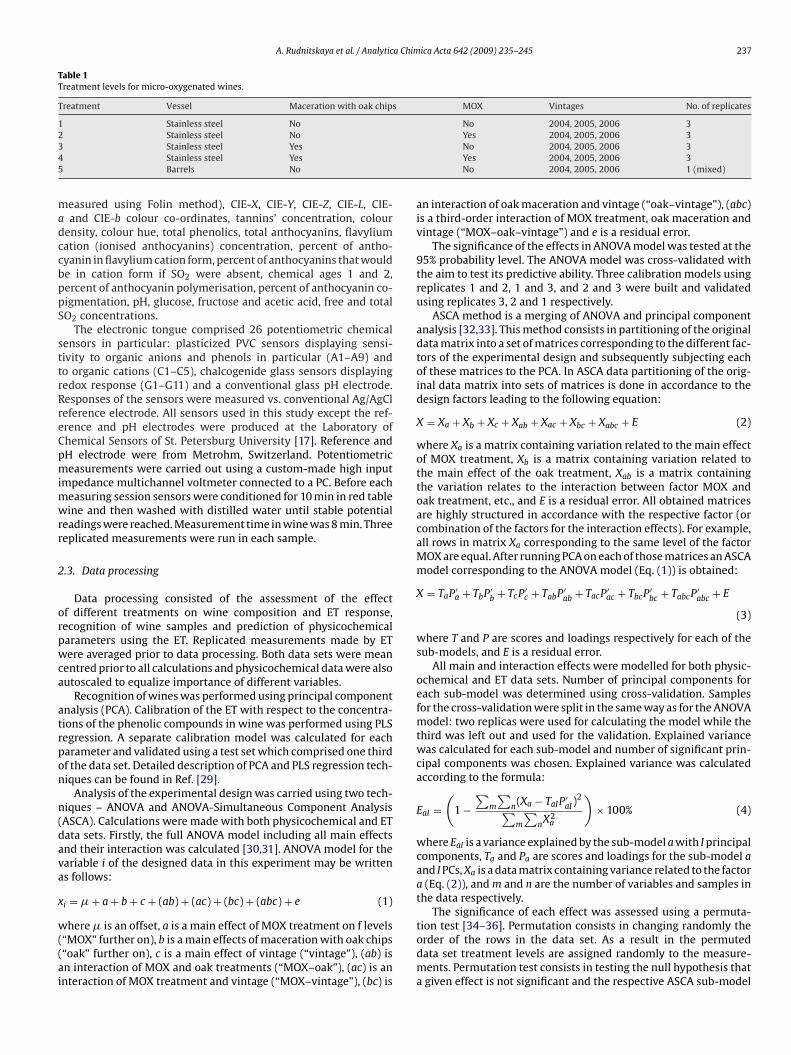
A. Rudnitskaya et al. / Analytica Chimica Acta 642 (2009) 235–245 237
Table 1Treatment levels for micro-oxygenated wines.
Treatment Vessel Maceration with oak chips MOX Vintages No. of replicates
1 Stainless steel No No 2004, 2005, 2006 32345
madccbppS
sttrRreCpmimwrr
2
orpwca
atrpon
n(dava
x
w((ai
Stainless steel NoStainless steel YesStainless steel YesBarrels No
easured using Folin method), CIE-X, CIE-Y, CIE-Z, CIE-L, CIE-and CIE-b colour co-ordinates, tannins’ concentration, colour
ensity, colour hue, total phenolics, total anthocyanins, flavyliumation (ionised anthocyanins) concentration, percent of antho-yanin in flavylium cation form, percent of anthocyanins that woulde in cation form if SO2 were absent, chemical ages 1 and 2,ercent of anthocyanin polymerisation, percent of anthocyanin co-igmentation, pH, glucose, fructose and acetic acid, free and totalO2 concentrations.
The electronic tongue comprised 26 potentiometric chemicalensors in particular: plasticized PVC sensors displaying sensi-ivity to organic anions and phenols in particular (A1–A9) ando organic cations (C1–C5), chalcogenide glass sensors displayingedox response (G1–G11) and a conventional glass pH electrode.esponses of the sensors were measured vs. conventional Ag/AgCleference electrode. All sensors used in this study except the ref-rence and pH electrodes were produced at the Laboratory ofhemical Sensors of St. Petersburg University [17]. Reference andH electrode were from Metrohm, Switzerland. Potentiometriceasurements were carried out using a custom-made high input
mpedance multichannel voltmeter connected to a PC. Before eacheasuring session sensors were conditioned for 10 min in red tableine and then washed with distilled water until stable potential
eadings were reached. Measurement time in wine was 8 min. Threeeplicated measurements were run in each sample.
.3. Data processing
Data processing consisted of the assessment of the effectf different treatments on wine composition and ET response,ecognition of wine samples and prediction of physicochemicalarameters using the ET. Replicated measurements made by ETere averaged prior to data processing. Both data sets were mean
entred prior to all calculations and physicochemical data were alsoutoscaled to equalize importance of different variables.
Recognition of wines was performed using principal componentnalysis (PCA). Calibration of the ET with respect to the concentra-ions of the phenolic compounds in wine was performed using PLSegression. A separate calibration model was calculated for eacharameter and validated using a test set which comprised one thirdf the data set. Detailed description of PCA and PLS regression tech-iques can be found in Ref. [29].
Analysis of the experimental design was carried using two tech-iques – ANOVA and ANOVA-Simultaneous Component AnalysisASCA). Calculations were made with both physicochemical and ETata sets. Firstly, the full ANOVA model including all main effectsnd their interaction was calculated [30,31]. ANOVA model for theariable i of the designed data in this experiment may be writtens follows:
i = � + a + b + c + (ab) + (ac) + (bc) + (abc) + e (1)
here � is an offset, a is a main effect of MOX treatment on f levels“MOX” further on), b is a main effects of maceration with oak chips“oak” further on), c is a main effect of vintage (“vintage”), (ab) isn interaction of MOX and oak treatments (“MOX–oak”), (ac) is annteraction of MOX treatment and vintage (“MOX–vintage”), (bc) is
Yes 2004, 2005, 2006 3No 2004, 2005, 2006 3Yes 2004, 2005, 2006 3No 2004, 2005, 2006 1 (mixed)
an interaction of oak maceration and vintage (“oak–vintage”), (abc)is a third-order interaction of MOX treatment, oak maceration andvintage (“MOX–oak–vintage”) and e is a residual error.
The significance of the effects in ANOVA model was tested at the95% probability level. The ANOVA model was cross-validated withthe aim to test its predictive ability. Three calibration models usingreplicates 1 and 2, 1 and 3, and 2 and 3 were built and validatedusing replicates 3, 2 and 1 respectively.
ASCA method is a merging of ANOVA and principal componentanalysis [32,33]. This method consists in partitioning of the originaldata matrix into a set of matrices corresponding to the different fac-tors of the experimental design and subsequently subjecting eachof these matrices to the PCA. In ASCA data partitioning of the orig-inal data matrix into sets of matrices is done in accordance to thedesign factors leading to the following equation:
X = Xa + Xb + Xc + Xab + Xac + Xbc + Xabc + E (2)
where Xa is a matrix containing variation related to the main effectof MOX treatment, Xb is a matrix containing variation related tothe main effect of the oak treatment, Xab is a matrix containingthe variation relates to the interaction between factor MOX andoak treatment, etc., and E is a residual error. All obtained matricesare highly structured in accordance with the respective factor (orcombination of the factors for the interaction effects). For example,all rows in matrix Xa corresponding to the same level of the factorMOX are equal. After running PCA on each of those matrices an ASCAmodel corresponding to the ANOVA model (Eq. (1)) is obtained:
X = TaP ′a + TbP ′
b + TcP ′c + TabP ′
ab + TacP ′ac + TbcP ′
bc + TabcP ′abc + E
(3)
where T and P are scores and loadings respectively for each of thesub-models, and E is a residual error.
All main and interaction effects were modelled for both physic-ochemical and ET data sets. Number of principal components foreach sub-model was determined using cross-validation. Samplesfor the cross-validation were split in the same way as for the ANOVAmodel: two replicas were used for calculating the model while thethird was left out and used for the validation. Explained variancewas calculated for each sub-model and number of significant prin-cipal components was chosen. Explained variance was calculatedaccording to the formula:
EaI =(
1 −∑
m
∑n(Xa − TaIP ′
aI)2∑
m
∑nX2
a
)× 100% (4)
where EaI is a variance explained by the sub-model a with I principalcomponents, Ta and Pa are scores and loadings for the sub-model aand I PCs, Xa is a data matrix containing variance related to the factora (Eq. (2)), and m and n are the number of variables and samples inthe data respectively.
The significance of each effect was assessed using a permuta-
tion test [34–36]. Permutation consists in changing randomly theorder of the rows in the data set. As a result in the permuteddata set treatment levels are assigned randomly to the measure-ments. Permutation test consists in testing the null hypothesis thata given effect is not significant and the respective ASCA sub-model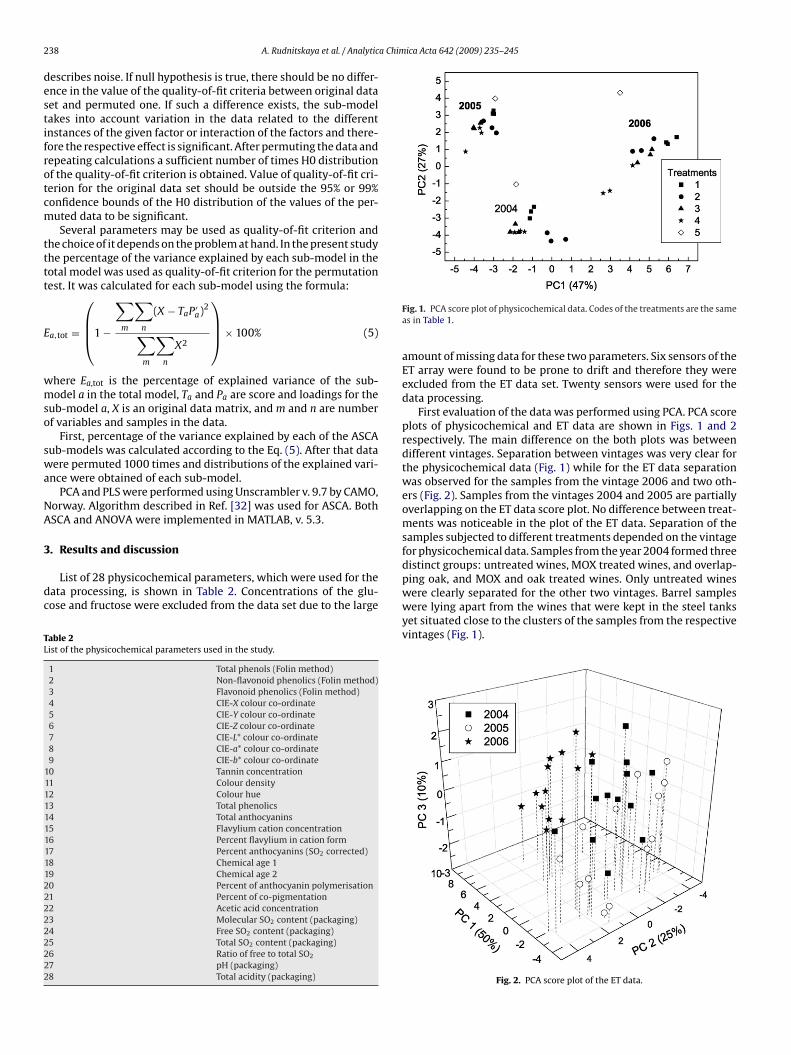
2 a Chimica Acta 642 (2009) 235–245
destifrotcm
tttt
E
wmso
swa
NA
3
dc
TL
2
22222
2
38 A. Rudnitskaya et al. / Analytic
escribes noise. If null hypothesis is true, there should be no differ-nce in the value of the quality-of-fit criteria between original dataet and permuted one. If such a difference exists, the sub-modelakes into account variation in the data related to the differentnstances of the given factor or interaction of the factors and there-ore the respective effect is significant. After permuting the data andepeating calculations a sufficient number of times H0 distributionf the quality-of-fit criterion is obtained. Value of quality-of-fit cri-erion for the original data set should be outside the 95% or 99%onfidence bounds of the H0 distribution of the values of the per-uted data to be significant.Several parameters may be used as quality-of-fit criterion and
he choice of it depends on the problem at hand. In the present studyhe percentage of the variance explained by each sub-model in theotal model was used as quality-of-fit criterion for the permutationest. It was calculated for each sub-model using the formula:
a,tot =
⎛⎜⎜⎝1 −
∑m
∑n
(X − TaP ′a)2
∑m
∑n
X2
⎞⎟⎟⎠ × 100% (5)
here Ea,tot is the percentage of explained variance of the sub-odel a in the total model, Ta and Pa are score and loadings for the
ub-model a, X is an original data matrix, and m and n are numberf variables and samples in the data.
First, percentage of the variance explained by each of the ASCAub-models was calculated according to the Eq. (5). After that dataere permuted 1000 times and distributions of the explained vari-
nce were obtained of each sub-model.PCA and PLS were performed using Unscrambler v. 9.7 by CAMO,
orway. Algorithm described in Ref. [32] was used for ASCA. BothSCA and ANOVA were implemented in MATLAB, v. 5.3.
. Results and discussion
List of 28 physicochemical parameters, which were used for theata processing, is shown in Table 2. Concentrations of the glu-ose and fructose were excluded from the data set due to the large
able 2ist of the physicochemical parameters used in the study.
1 Total phenols (Folin method)2 Non-flavonoid phenolics (Folin method)3 Flavonoid phenolics (Folin method)4 CIE-X colour co-ordinate5 CIE-Y colour co-ordinate6 CIE-Z colour co-ordinate7 CIE-L* colour co-ordinate8 CIE-a* colour co-ordinate9 CIE-b* colour co-ordinate
10 Tannin concentration11 Colour density12 Colour hue13 Total phenolics14 Total anthocyanins15 Flavylium cation concentration16 Percent flavylium in cation form17 Percent anthocyanins (SO2 corrected)18 Chemical age 119 Chemical age 20 Percent of anthocyanin polymerisation
21 Percent of co-pigmentation2 Acetic acid concentration3 Molecular SO2 content (packaging)4 Free SO2 content (packaging)5 Total SO2 content (packaging)6 Ratio of free to total SO2
27 pH (packaging)8 Total acidity (packaging)
Fig. 1. PCA score plot of physicochemical data. Codes of the treatments are the sameas in Table 1.
amount of missing data for these two parameters. Six sensors of theET array were found to be prone to drift and therefore they wereexcluded from the ET data set. Twenty sensors were used for thedata processing.
First evaluation of the data was performed using PCA. PCA scoreplots of physicochemical and ET data are shown in Figs. 1 and 2respectively. The main difference on the both plots was betweendifferent vintages. Separation between vintages was very clear forthe physicochemical data (Fig. 1) while for the ET data separationwas observed for the samples from the vintage 2006 and two oth-ers (Fig. 2). Samples from the vintages 2004 and 2005 are partiallyoverlapping on the ET data score plot. No difference between treat-ments was noticeable in the plot of the ET data. Separation of thesamples subjected to different treatments depended on the vintagefor physicochemical data. Samples from the year 2004 formed threedistinct groups: untreated wines, MOX treated wines, and overlap-ping oak, and MOX and oak treated wines. Only untreated wines
were clearly separated for the other two vintages. Barrel sampleswere lying apart from the wines that were kept in the steel tanksyet situated close to the clusters of the samples from the respectivevintages (Fig. 1).Fig. 2. PCA score plot of the ET data.
A. Rudnitskaya et al. / Analytica Chimica Acta 642 (2009) 235–245 239
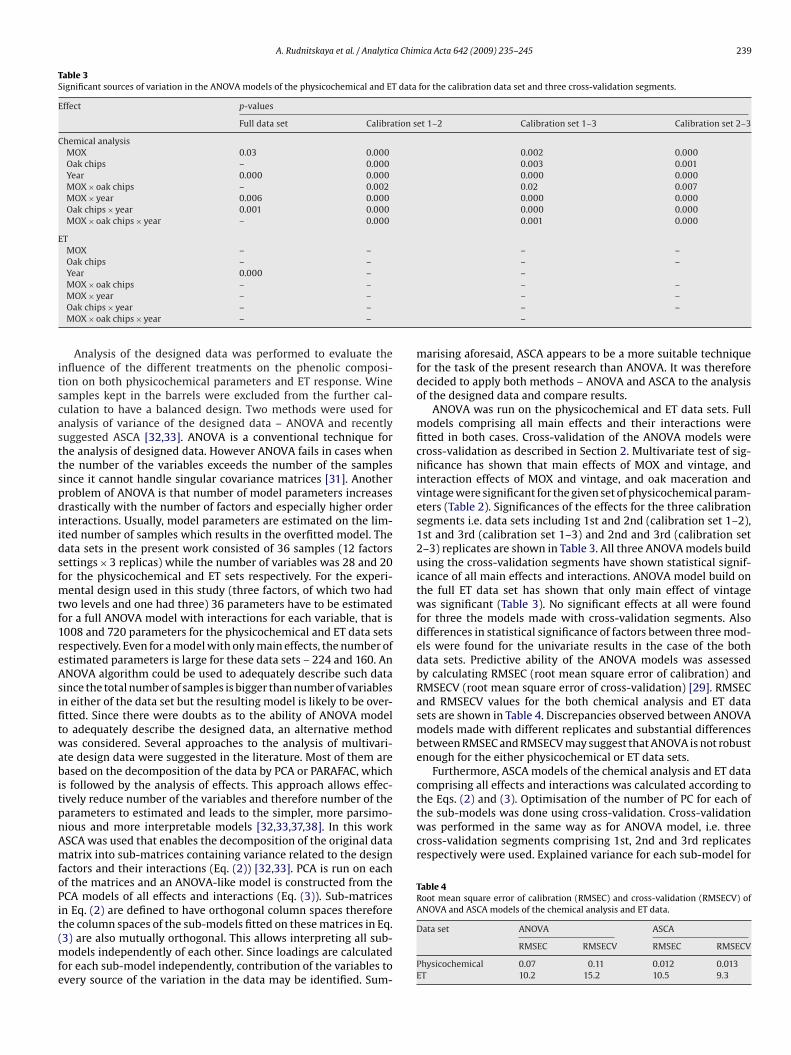
Table 3Significant sources of variation in the ANOVA models of the physicochemical and ET data for the calibration data set and three cross-validation segments.
Effect p-values
Full data set Calibration set 1–2 Calibration set 1–3 Calibration set 2–3
Chemical analysisMOX 0.03 0.000 0.002 0.000Oak chips – 0.000 0.003 0.001Year 0.000 0.000 0.000 0.000MOX × oak chips – 0.002 0.02 0.007MOX × year 0.006 0.000 0.000 0.000Oak chips × year 0.001 0.000 0.000 0.000MOX × oak chips × year – 0.000 0.001 0.000
ETMOX – – – –Oak chips – – – –Year 0.000 – –
itscasttspdiidsfmtf1reAsifitwabitpnAmfoPit(mfe
the Eqs. (2) and (3). Optimisation of the number of PC for each ofthe sub-models was done using cross-validation. Cross-validationwas performed in the same way as for ANOVA model, i.e. threecross-validation segments comprising 1st, 2nd and 3rd replicatesrespectively were used. Explained variance for each sub-model for
Table 4Root mean square error of calibration (RMSEC) and cross-validation (RMSECV) ofANOVA and ASCA models of the chemical analysis and ET data.
MOX × oak chips – –MOX × year – –Oak chips × year – –MOX × oak chips × year – –
Analysis of the designed data was performed to evaluate thenfluence of the different treatments on the phenolic composi-ion on both physicochemical parameters and ET response. Wineamples kept in the barrels were excluded from the further cal-ulation to have a balanced design. Two methods were used fornalysis of variance of the designed data – ANOVA and recentlyuggested ASCA [32,33]. ANOVA is a conventional technique forhe analysis of designed data. However ANOVA fails in cases whenhe number of the variables exceeds the number of the samplesince it cannot handle singular covariance matrices [31]. Anotherroblem of ANOVA is that number of model parameters increasesrastically with the number of factors and especially higher order
nteractions. Usually, model parameters are estimated on the lim-ted number of samples which results in the overfitted model. Theata sets in the present work consisted of 36 samples (12 factorsettings × 3 replicas) while the number of variables was 28 and 20or the physicochemical and ET sets respectively. For the experi-
ental design used in this study (three factors, of which two hadwo levels and one had three) 36 parameters have to be estimatedor a full ANOVA model with interactions for each variable, that is008 and 720 parameters for the physicochemical and ET data setsespectively. Even for a model with only main effects, the number ofstimated parameters is large for these data sets – 224 and 160. AnNOVA algorithm could be used to adequately describe such dataince the total number of samples is bigger than number of variablesn either of the data set but the resulting model is likely to be over-tted. Since there were doubts as to the ability of ANOVA modelo adequately describe the designed data, an alternative methodas considered. Several approaches to the analysis of multivari-
te design data were suggested in the literature. Most of them areased on the decomposition of the data by PCA or PARAFAC, which
s followed by the analysis of effects. This approach allows effec-ively reduce number of the variables and therefore number of thearameters to estimated and leads to the simpler, more parsimo-ious and more interpretable models [32,33,37,38]. In this workSCA was used that enables the decomposition of the original dataatrix into sub-matrices containing variance related to the design
actors and their interactions (Eq. (2)) [32,33]. PCA is run on eachf the matrices and an ANOVA-like model is constructed from theCA models of all effects and interactions (Eq. (3)). Sub-matricesn Eq. (2) are defined to have orthogonal column spaces therefore
he column spaces of the sub-models fitted on these matrices in Eq.3) are also mutually orthogonal. This allows interpreting all sub-odels independently of each other. Since loadings are calculatedor each sub-model independently, contribution of the variables tovery source of the variation in the data may be identified. Sum-
– –– –– ––
marising aforesaid, ASCA appears to be a more suitable techniquefor the task of the present research than ANOVA. It was thereforedecided to apply both methods – ANOVA and ASCA to the analysisof the designed data and compare results.
ANOVA was run on the physicochemical and ET data sets. Fullmodels comprising all main effects and their interactions werefitted in both cases. Cross-validation of the ANOVA models werecross-validation as described in Section 2. Multivariate test of sig-nificance has shown that main effects of MOX and vintage, andinteraction effects of MOX and vintage, and oak maceration andvintage were significant for the given set of physicochemical param-eters (Table 2). Significances of the effects for the three calibrationsegments i.e. data sets including 1st and 2nd (calibration set 1–2),1st and 3rd (calibration set 1–3) and 2nd and 3rd (calibration set2–3) replicates are shown in Table 3. All three ANOVA models buildusing the cross-validation segments have shown statistical signif-icance of all main effects and interactions. ANOVA model build onthe full ET data set has shown that only main effect of vintagewas significant (Table 3). No significant effects at all were foundfor three the models made with cross-validation segments. Alsodifferences in statistical significance of factors between three mod-els were found for the univariate results in the case of the bothdata sets. Predictive ability of the ANOVA models was assessedby calculating RMSEC (root mean square error of calibration) andRMSECV (root mean square error of cross-validation) [29]. RMSECand RMSECV values for the both chemical analysis and ET datasets are shown in Table 4. Discrepancies observed between ANOVAmodels made with different replicates and substantial differencesbetween RMSEC and RMSECV may suggest that ANOVA is not robustenough for the either physicochemical or ET data sets.
Furthermore, ASCA models of the chemical analysis and ET datacomprising all effects and interactions was calculated according to
Data set ANOVA ASCA
RMSEC RMSECV RMSEC RMSECV
Physicochemical 0.07 0.11 0.012 0.013ET 10.2 15.2 10.5 9.3
2 a Chim
tifsg
40 A. Rudnitskaya et al. / Analytic
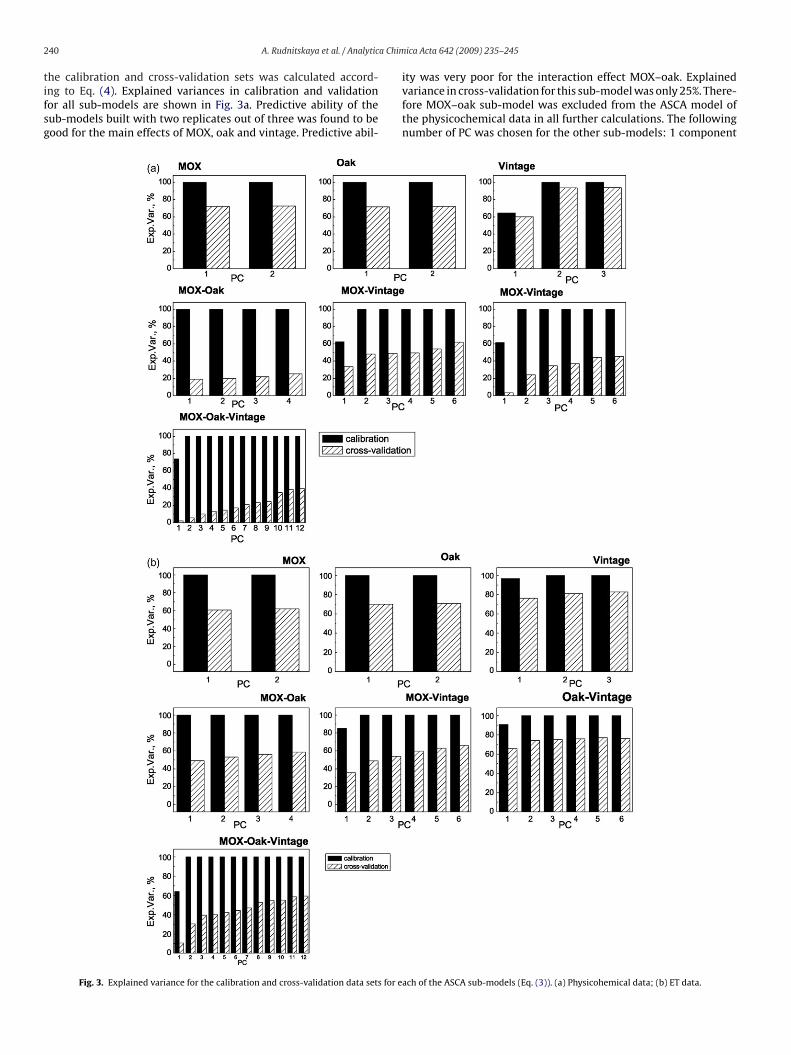
he calibration and cross-validation sets was calculated accord-ng to Eq. (4). Explained variances in calibration and validationor all sub-models are shown in Fig. 3a. Predictive ability of theub-models built with two replicates out of three was found to beood for the main effects of MOX, oak and vintage. Predictive abil-
Fig. 3. Explained variance for the calibration and cross-validation data sets for e
ica Acta 642 (2009) 235–245
ity was very poor for the interaction effect MOX–oak. Explainedvariance in cross-validation for this sub-model was only 25%. There-fore MOX–oak sub-model was excluded from the ASCA model ofthe physicochemical data in all further calculations. The followingnumber of PC was chosen for the other sub-models: 1 component
ach of the ASCA sub-models (Eq. (3)). (a) Physicohemical data; (b) ET data.
a Chimica Acta 642 (2009) 235–245 241
f1
dcooAaM
mnieavdrd(aetnmwia0
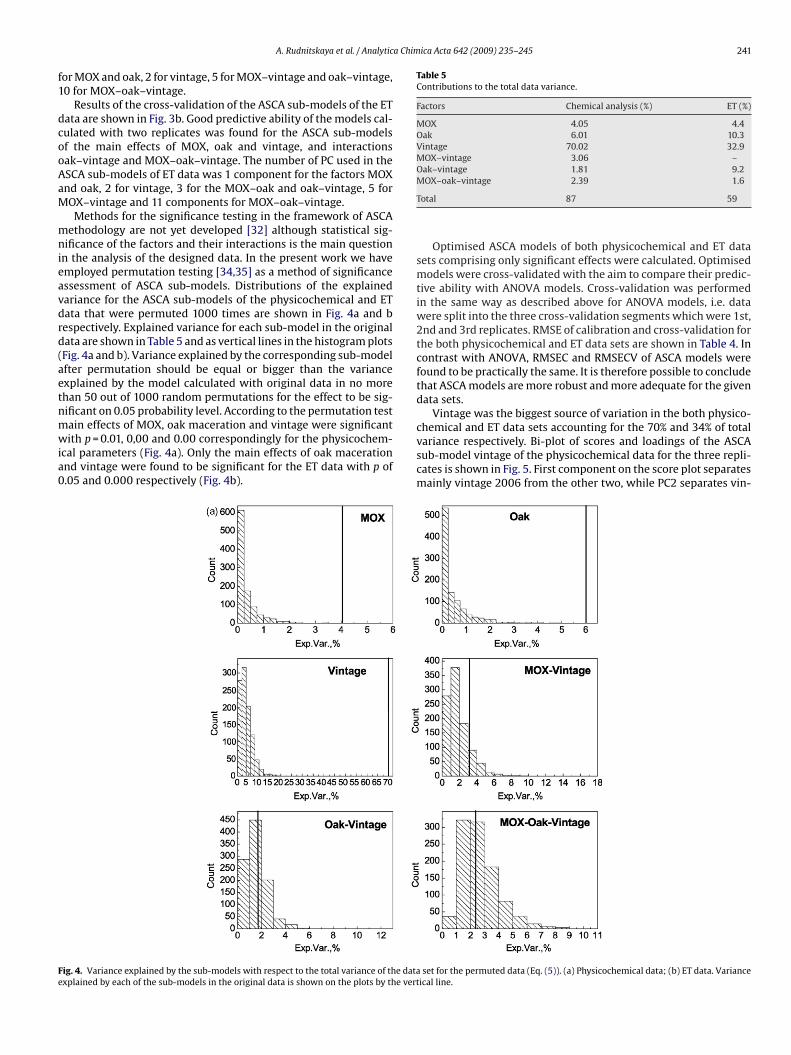
Table 5Contributions to the total data variance.
Factors Chemical analysis (%) ET (%)
MOX 4.05 4.4Oak 6.01 10.3Vintage 70.02 32.9MOX–vintage 3.06 –Oak–vintage 1.81 9.2
Fe
A. Rudnitskaya et al. / Analytic
or MOX and oak, 2 for vintage, 5 for MOX–vintage and oak–vintage,0 for MOX–oak–vintage.
Results of the cross-validation of the ASCA sub-models of the ETata are shown in Fig. 3b. Good predictive ability of the models cal-ulated with two replicates was found for the ASCA sub-modelsf the main effects of MOX, oak and vintage, and interactionsak–vintage and MOX–oak–vintage. The number of PC used in theSCA sub-models of ET data was 1 component for the factors MOXnd oak, 2 for vintage, 3 for the MOX–oak and oak–vintage, 5 forOX–vintage and 11 components for MOX–oak–vintage.Methods for the significance testing in the framework of ASCA
ethodology are not yet developed [32] although statistical sig-ificance of the factors and their interactions is the main question
n the analysis of the designed data. In the present work we havemployed permutation testing [34,35] as a method of significancessessment of ASCA sub-models. Distributions of the explainedariance for the ASCA sub-models of the physicochemical and ETata that were permuted 1000 times are shown in Fig. 4a and bespectively. Explained variance for each sub-model in the originalata are shown in Table 5 and as vertical lines in the histogram plotsFig. 4a and b). Variance explained by the corresponding sub-modelfter permutation should be equal or bigger than the variancexplained by the model calculated with original data in no morehan 50 out of 1000 random permutations for the effect to be sig-ificant on 0.05 probability level. According to the permutation test
ain effects of MOX, oak maceration and vintage were significantith p = 0.01, 0,00 and 0.00 correspondingly for the physicochem-cal parameters (Fig. 4a). Only the main effects of oak macerationnd vintage were found to be significant for the ET data with p of.05 and 0.000 respectively (Fig. 4b).
ig. 4. Variance explained by the sub-models with respect to the total variance of the dataxplained by each of the sub-models in the original data is shown on the plots by the vert
MOX–oak–vintage 2.39 1.6
Total 87 59
Optimised ASCA models of both physicochemical and ET datasets comprising only significant effects were calculated. Optimisedmodels were cross-validated with the aim to compare their predic-tive ability with ANOVA models. Cross-validation was performedin the same way as described above for ANOVA models, i.e. datawere split into the three cross-validation segments which were 1st,2nd and 3rd replicates. RMSE of calibration and cross-validation forthe both physicochemical and ET data sets are shown in Table 4. Incontrast with ANOVA, RMSEC and RMSECV of ASCA models werefound to be practically the same. It is therefore possible to concludethat ASCA models are more robust and more adequate for the givendata sets.
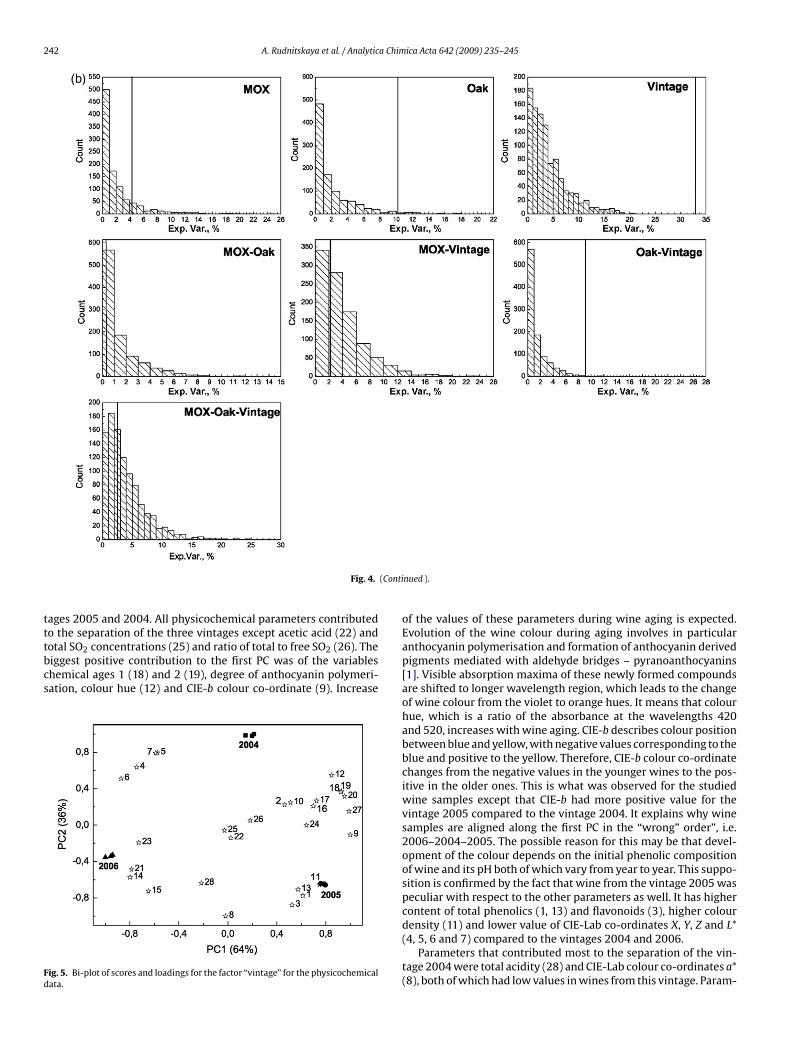
Vintage was the biggest source of variation in the both physico-chemical and ET data sets accounting for the 70% and 34% of total
variance respectively. Bi-plot of scores and loadings of the ASCAsub-model vintage of the physicochemical data for the three repli-cates is shown in Fig. 5. First component on the score plot separatesmainly vintage 2006 from the other two, while PC2 separates vin-set for the permuted data (Eq. (5)). (a) Physicochemical data; (b) ET data. Varianceical line.
242 A. Rudnitskaya et al. / Analytica Chimica Acta 642 (2009) 235–245
(Conti
tttbcs
Fd
Fig. 4.
ages 2005 and 2004. All physicochemical parameters contributedo the separation of the three vintages except acetic acid (22) and
otal SO2 concentrations (25) and ratio of total to free SO2 (26). Theiggest positive contribution to the first PC was of the variableshemical ages 1 (18) and 2 (19), degree of anthocyanin polymeri-ation, colour hue (12) and CIE-b colour co-ordinate (9). Increaseig. 5. Bi-plot of scores and loadings for the factor “vintage” for the physicochemicalata.
nued ).
of the values of these parameters during wine aging is expected.Evolution of the wine colour during aging involves in particularanthocyanin polymerisation and formation of anthocyanin derivedpigments mediated with aldehyde bridges – pyranoanthocyanins[1]. Visible absorption maxima of these newly formed compoundsare shifted to longer wavelength region, which leads to the changeof wine colour from the violet to orange hues. It means that colourhue, which is a ratio of the absorbance at the wavelengths 420and 520, increases with wine aging. CIE-b describes colour positionbetween blue and yellow, with negative values corresponding to theblue and positive to the yellow. Therefore, CIE-b colour co-ordinatechanges from the negative values in the younger wines to the pos-itive in the older ones. This is what was observed for the studiedwine samples except that CIE-b had more positive value for thevintage 2005 compared to the vintage 2004. It explains why winesamples are aligned along the first PC in the “wrong” order”, i.e.2006–2004–2005. The possible reason for this may be that devel-opment of the colour depends on the initial phenolic compositionof wine and its pH both of which vary from year to year. This suppo-sition is confirmed by the fact that wine from the vintage 2005 waspeculiar with respect to the other parameters as well. It has highercontent of total phenolics (1, 13) and flavonoids (3), higher colour
density (11) and lower value of CIE-Lab co-ordinates X, Y, Z and L*(4, 5, 6 and 7) compared to the vintages 2004 and 2006.Parameters that contributed most to the separation of the vin-tage 2004 were total acidity (28) and CIE-Lab colour co-ordinates a*(8), both of which had low values in wines from this vintage. Param-
A. Rudnitskaya et al. / Analytica Chim
eaacfa3mll
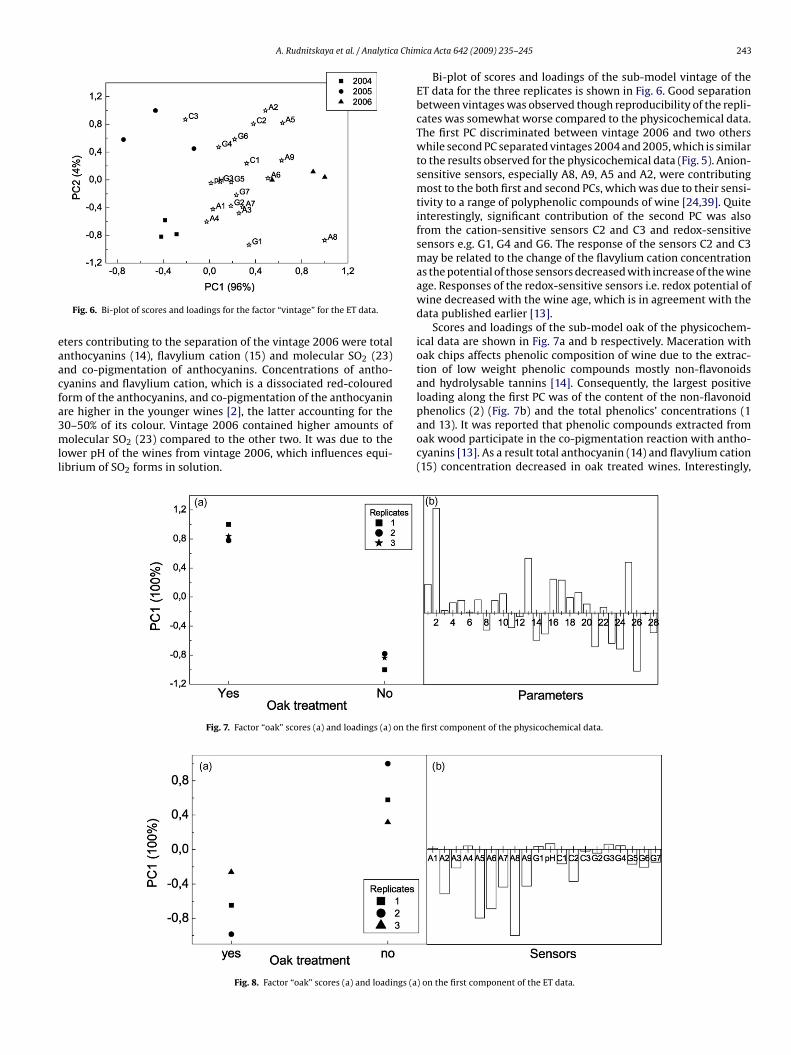
Fig. 6. Bi-plot of scores and loadings for the factor “vintage” for the ET data.
ters contributing to the separation of the vintage 2006 were totalnthocyanins (14), flavylium cation (15) and molecular SO2 (23)nd co-pigmentation of anthocyanins. Concentrations of antho-yanins and flavylium cation, which is a dissociated red-colouredorm of the anthocyanins, and co-pigmentation of the anthocyanin
re higher in the younger wines [2], the latter accounting for the0–50% of its colour. Vintage 2006 contained higher amounts ofolecular SO2 (23) compared to the other two. It was due to theower pH of the wines from vintage 2006, which influences equi-ibrium of SO2 forms in solution.
Fig. 7. Factor “oak” scores (a) and loadings (a) on the
Fig. 8. Factor “oak” scores (a) and loadings (a
ica Acta 642 (2009) 235–245 243
Bi-plot of scores and loadings of the sub-model vintage of theET data for the three replicates is shown in Fig. 6. Good separationbetween vintages was observed though reproducibility of the repli-cates was somewhat worse compared to the physicochemical data.The first PC discriminated between vintage 2006 and two otherswhile second PC separated vintages 2004 and 2005, which is similarto the results observed for the physicochemical data (Fig. 5). Anion-sensitive sensors, especially A8, A9, A5 and A2, were contributingmost to the both first and second PCs, which was due to their sensi-tivity to a range of polyphenolic compounds of wine [24,39]. Quiteinterestingly, significant contribution of the second PC was alsofrom the cation-sensitive sensors C2 and C3 and redox-sensitivesensors e.g. G1, G4 and G6. The response of the sensors C2 and C3may be related to the change of the flavylium cation concentrationas the potential of those sensors decreased with increase of the wineage. Responses of the redox-sensitive sensors i.e. redox potential ofwine decreased with the wine age, which is in agreement with thedata published earlier [13].
Scores and loadings of the sub-model oak of the physicochem-ical data are shown in Fig. 7a and b respectively. Maceration withoak chips affects phenolic composition of wine due to the extrac-tion of low weight phenolic compounds mostly non-flavonoidsand hydrolysable tannins [14]. Consequently, the largest positiveloading along the first PC was of the content of the non-flavonoid
phenolics (2) (Fig. 7b) and the total phenolics’ concentrations (1and 13). It was reported that phenolic compounds extracted fromoak wood participate in the co-pigmentation reaction with antho-cyanins [13]. As a result total anthocyanin (14) and flavylium cation(15) concentration decreased in oak treated wines. Interestingly,first component of the physicochemical data.
) on the first component of the ET data.
244 A. Rudnitskaya et al. / Analytica Chimica Acta 642 (2009) 235–245
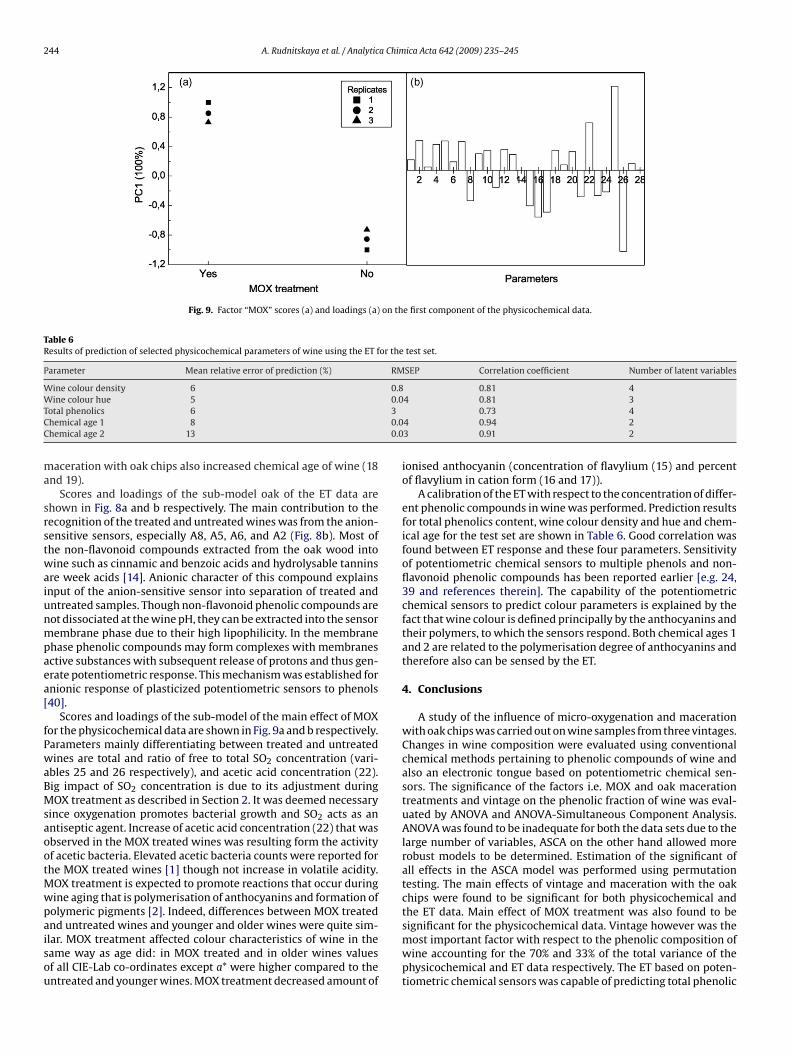
Fig. 9. Factor “MOX” scores (a) and loadings (a) on the first component of the physicochemical data.
Table 6Results of prediction of selected physicochemical parameters of wine using the ET for the test set.
Parameter Mean relative error of prediction (%) RMSEP Correlation coefficient Number of latent variables
Wine colour density 6 0.8 0.81 4W 0.0T 3C 0.0C 0.0
ma
srstwaiunmpaea[
fPwaBMsaootMwpaisou
ine colour hue 5otal phenolics 6hemical age 1 8hemical age 2 13
aceration with oak chips also increased chemical age of wine (18nd 19).
Scores and loadings of the sub-model oak of the ET data arehown in Fig. 8a and b respectively. The main contribution to theecognition of the treated and untreated wines was from the anion-ensitive sensors, especially A8, A5, A6, and A2 (Fig. 8b). Most ofhe non-flavonoid compounds extracted from the oak wood intoine such as cinnamic and benzoic acids and hydrolysable tannins
re week acids [14]. Anionic character of this compound explainsnput of the anion-sensitive sensor into separation of treated andntreated samples. Though non-flavonoid phenolic compounds areot dissociated at the wine pH, they can be extracted into the sensorembrane phase due to their high lipophilicity. In the membrane
hase phenolic compounds may form complexes with membranesctive substances with subsequent release of protons and thus gen-rate potentiometric response. This mechanism was established fornionic response of plasticized potentiometric sensors to phenols40].
Scores and loadings of the sub-model of the main effect of MOXor the physicochemical data are shown in Fig. 9a and b respectively.arameters mainly differentiating between treated and untreatedines are total and ratio of free to total SO2 concentration (vari-
bles 25 and 26 respectively), and acetic acid concentration (22).ig impact of SO2 concentration is due to its adjustment duringOX treatment as described in Section 2. It was deemed necessary
ince oxygenation promotes bacterial growth and SO2 acts as anntiseptic agent. Increase of acetic acid concentration (22) that wasbserved in the MOX treated wines was resulting form the activityf acetic bacteria. Elevated acetic bacteria counts were reported forhe MOX treated wines [1] though not increase in volatile acidity.
OX treatment is expected to promote reactions that occur duringine aging that is polymerisation of anthocyanins and formation ofolymeric pigments [2]. Indeed, differences between MOX treated
nd untreated wines and younger and older wines were quite sim-lar. MOX treatment affected colour characteristics of wine in theame way as age did: in MOX treated and in older wines valuesf all CIE-Lab co-ordinates except a* were higher compared to thentreated and younger wines. MOX treatment decreased amount of4 0.81 30.73 4
4 0.94 23 0.91 2
ionised anthocyanin (concentration of flavylium (15) and percentof flavylium in cation form (16 and 17)).
A calibration of the ET with respect to the concentration of differ-ent phenolic compounds in wine was performed. Prediction resultsfor total phenolics content, wine colour density and hue and chem-ical age for the test set are shown in Table 6. Good correlation wasfound between ET response and these four parameters. Sensitivityof potentiometric chemical sensors to multiple phenols and non-flavonoid phenolic compounds has been reported earlier [e.g. 24,39 and references therein]. The capability of the potentiometricchemical sensors to predict colour parameters is explained by thefact that wine colour is defined principally by the anthocyanins andtheir polymers, to which the sensors respond. Both chemical ages 1and 2 are related to the polymerisation degree of anthocyanins andtherefore also can be sensed by the ET.
4. Conclusions
A study of the influence of micro-oxygenation and macerationwith oak chips was carried out on wine samples from three vintages.Changes in wine composition were evaluated using conventionalchemical methods pertaining to phenolic compounds of wine andalso an electronic tongue based on potentiometric chemical sen-sors. The significance of the factors i.e. MOX and oak macerationtreatments and vintage on the phenolic fraction of wine was eval-uated by ANOVA and ANOVA-Simultaneous Component Analysis.ANOVA was found to be inadequate for both the data sets due to thelarge number of variables, ASCA on the other hand allowed morerobust models to be determined. Estimation of the significant ofall effects in the ASCA model was performed using permutationtesting. The main effects of vintage and maceration with the oakchips were found to be significant for both physicochemical andthe ET data. Main effect of MOX treatment was also found to be
significant for the physicochemical data. Vintage however was themost important factor with respect to the phenolic composition ofwine accounting for the 70% and 33% of the total variance of thephysicochemical and ET data respectively. The ET based on poten-tiometric chemical sensors was capable of predicting total phenolic
a Chim
cwnwsa
A
apG
l
R
[
[
[
[[
[
[
[
[
[
[
[
[[
[
[
[[[
[[[
[
[[
[
[
A. Rudnitskaya et al. / Analytic
ontent, colour density and hue and chemical ages 1 and 2 of wineith good precision. Being able to follow the changes in the phe-olic compounds of wine related to the vintage and macerationith oak chips, the ET based on the potentiometric chemical sen-
ors is a promising analytical tool for the rapid and on-line winenalysis.
cknowledgements
Wine making and micro-oxygenation facilities have been madevailable by Domaine Chandon, Australia. L.M. Schmidtke was sup-orted by a Faculty of Science, Charles Sturt University Study Leaverant.
Work of A. Rudnitskaya was supported by the postdoctoral fel-owship SFRH/BPD/26617/2006 by FCT, Portugal.
eferences
[1] W.J. du-Toit, K. Lisjak, J. Marais, M. du-Toit, S. Afr. J. Enol. Vitic. 27 (2006) 57.[2] C. Alcalde-Eon, M.T. Escribano-Bailón, C. Santos-Buelga, J.C. Rivas-Gonzalo,
Anal. Chim. Acta 563 (2006) 238.[3] M. Parish, D. Wollan, R. Paul, Aust. New Zeal Grapegrower Win. 438a (2000) 47.[4] M. Moutounet, La técnica de microoxigenación, ACE Enologia, 2003.[5] M. Moutounet, J.-P. Mazauric, P. Ducournau, T. Lemaire, Industrie delle Bevande,
XXX (2001) 253.[6] B.W. Zoecklein, R. Carey, P. Sullivan, Wine East 31 (2003) 28.[7] P.R. Jones, M.J. Kwiatkowski, G.K. Skouroumounis, L. Francis, K.A. Lattey, E.J.
Waters, I.S. Pretorius, P.B. Høj, Aust. Wine Ind. J. 19 (2004) 17.[8] V. Atanasova, H. Fulcrand, V. Cheynier, M. Moutounet, Anal. Chim. Acta 458
(2002) 15.[9] M. Cano-López, F. Pardo-Minguez, J.M. López, E. Gómez-Plaza, Eur. J. Food Res.
Technol. 225 (2007) 127.10] T. Lemaire, J.F. Gilis, J.-P. Fort, P. Ducournau, in: R.J. Blair, P.J. Williams, P.B. Høj
(Eds.), Proceedings of the Eleventh Australian Wine Industry Technical Confer-ence, Australian Wine Industry Technical Conference Inc., Adelaide, 2002, p.33.
11] M.D.C. Llaudy, R. Canals, S. González-Manzano, J.M. Canals, C. Santos-Buelga, F.Zamora, J. Agric. Food Chem. 54 (2006) 4246.
12] R. Loch, in: M. Allen (Ed.), ASVO Proceedings of Seminar ‘Use of gases in wine-making’, Australian Society for Viticulture and Oenology, Adeladie, 2002, p.45.
13] M. del Alamo, I. Nevares, L.M. Carcel, Anal. Chim. Acta 563 (2006) 223.14] M. del Alamo Sanza, I. Nevares Dominguez, L.M. Carcel, L. Navas Gracia, Anal.
Chim. Acta 513 (2004) 229.
[[
[
ica Acta 642 (2009) 235–245 245
15] J. McCord, in: M. Allen, S. Bell, N. Rowe, G. Wall (Eds.), Proceedings of the ASVOSeminar ‘Use of gases in winemaking’, Australian Society for Viticulture andOenology, Adelaide, 2002, p. 28.
16] S. Vidal, V. Cheynier, E. Waters, L. Francis, in: M. Allen (Ed.), ASVO Proceedingsof the Seminar ‘Use of gases in winemaking’, Australian Society for Viticultureand Oenology, Adelaide, 2002, p. 34.
[17] A. Legin, A. Rudnitskaya, Y. Vlasov, in: S. Alegret (Ed.), Integrated AnalyticalSystems, Elsevier, Amsterdam, 2003, p. 437.
18] S. Buratti, S. Benedetti, M. Scampicchio, E.C. Pangerod, Anal. Chim. Acta 525(2004) 133.
19] A. Legin, A. Rudnitskaya, L. Lvova, Y. Vlasov, C. Di Natale, A. D’Amico, Anal. Chim.Acta 484 (2003) 33.
20] V. Parra, Á.A. Arrieta, J.A. Fernández-Escudero, H. García, C. Apetrei, M.L.Rodríguez-Méndez, J.A. De Saja, Sens. Actuators B: Chem. 115 (2006) 54.
21] V. Parra, Á.A. Arrieta, J.-A. Fernández-Escudero, M.L. Rodríguez-Méndez, J.A. DeSaja, Sen. Actuators B: Chem. 118 (2006) 448.
22] V. Parra, Á.A. Arrieta, J.A. Fernández-Escudero, M. Íniguez, J.A. De Saja, M.L.Rodríguez-Méndez, Anal. Chim. Acta 563 (2006) 229.
23] S. Buratti, D. Ballabio, S. Benedetti, M.S. Cosio, Food Chem. 100 (2007) 211.24] H. Fontoin, C. Saucier, A. Rudnitskaya, A. Legin, P.-L. Teissedre, Y. Glories, in:
Proceedings of the XXXth World Congress of Vine and Wine, June 10–16, 2007,Budapest, Hungary, p. 268.
25] C.J. Sarneckis, R.G. Dambergs, P. Jones, M. Mercurio, M.J. Herderich, P.A. Smith,Aust. J. Grape Wine Res. 12 (2006) 39.
26] P. Iland, N. Bruer, G. Edwards, S. Weeks, E. Wilkes, Chemical Analysis of Grapesand Wine: Techniques and Concepts, Patrick Iland Wine Promotions Pty Ltd.,Campbelltown, 2004.
27] V.L. Singleton, J.A. Rossi Jr., Am. J. Enol. Vitic. 16 (1965) 144.28] B. Zoecklein, Wine Analysis and Production, Chapman and Hall, New York, 1995.29] K. Esbensen, Multivariate Analysis in Practice, fifth ed., Camo ASA, Norway,
2002.30] L. Stahle, S. Wold, Chemometr. Intell. Lab. Syst. 6 (1989) 259.31] L. Stahle, S. Wold, Chemometr. Intell. Lab. Syst. 9 (1990) 127.32] J.J. Jansen, H.C.J. Hoefsloot, J. van der Greef, M.E. Timmerman, J.A. Westerhuis,
A.K. Smilde, J. Chemometr. 19 (2005) 469.33] A.K. Smilde, J.J. Jansen, H.C.J. Hoefsloot, R.-J.A.N. Lamers, J. van der Greef, M.E.
Timmerman, Bioinformatics 21 (2005) 3043.34] M. Meyners, Food Qual. Preference 12 (2001) 345.35] J.A. Westerhuis, H.C.J. Hoefsloot, S. Smit, D.J. Vis, A.K. Smilde, E.J.J. van Velzen,
J.P.M. van Duijnhoven, F.A. van Dorsten, Metabolomics 4 (2008) 81.36] D.J. Vis, J.A. Westerhuis, A.K. Smilde, J. van der Greef, BMC Bioinform. 8 (2007)
322.37] P. de B. Harrington, N.E. Vieira, J. Espinoza, J.K. Nien, R. Romeroc, A.L. Yergey,
Anal. Chim. Acta 544 (2005) 118.38] R. Bro, M. Jakobsen, J. Chemometr. 16 (2002) 294.39] A. Rudnitskaya, I. Delgadillo, S.M. Rocha, A.-M. Costa, A. Legin, Anal. Chim. Acta
563 (2006) 315.40] T. Ito, H. Radecka, K. Umezawa, T. Kimura, A. Yashiro, X. Ming Lin, M. Kataoka,
E. Kimura, J.L. Sessler, K. Odashima, Y. Umezawa, Anal. Sci. 14 (1998) 89.