studies oo the sy of cerium activated yttrium alumi phosphor by wet-chemical route
TRANSCRIPT
1
STUDIES O� THE SY�THESIS OF CERIUM ACTIVATED YTTRIUM ALUMI�ATE PHOSPHOR
BY WET-CHEMICAL ROUTE
Elisabeth-Jeanne Popovici1, Maria Stefan1, Florica Imre-Lucaci1, Laura Muresan1,
Ecaterina Bica1, Emil Indrea2 and Lucian Barbu-Tudoran3
1“Raluca Ripan” Institute for Research in Chemistry, Babes-Bolyai University,
400294 Cluj-Napoca, Romania 2 National Institute for R &D of Isotopic and Molecular Technologies, 400295 Cluj-Napoca, Romania
3 Electronic Microscopy Centre, Babes-Bolyai University, 400028 Cluj-Napoca, Romania
Corresponding author
Elisabeth-Jeanne Popovici
“Raluca Ripan” Institute for Research in Chemistry, Babes-Bolyai University, Fantanele 30, 400294 Cluj-Napoca,
Romania
Fax: +40-264-420441
Tel: +40-264-580165
[email protected]; [email protected]
Physics Procedia 2 (2009) 603–616
www.elsevier.com/locate/procedia
doi:10.1016/j.phpro.2009.07.046
2
STUDIES O� THE SY�THESIS OF CERIUM ACTIVATED YTTRIUM ALUMI�ATE PHOSPHOR
BY WET-CHEMICAL ROUTE
Elisabeth-Jeanne Popovici1, Maria Stefan1, Florica Imre-Lucaci1, Laura Muresan1,
Ecaterina Bica1, Emil Indrea2 and Lucian Barbu-Tudoran3
1 “Raluca Ripan” Institute for Research in Chemistry, Babes-Bolyai University, 400294 Cluj-Napoca, Romania
2 National Institute for R &D of Isotopic and Molecular Technologies, 400295 Cluj-Napoca, Romania
3 Electronic Microscopy Centre, Babes-Bolyai University, 400028 Cluj-Napoca, Romania
1
Abstract
The synthesis of cerium activated yttrium aluminum garnet Y3Al5O12: Ce by the wet-chemical synthesis route is
reported. Y-Ce-Al precursors were prepared using the reagent simultaneous addition technique –SimAdd from Y-Al-Ce
nitrate mixture and urea and subsequently transformed into phosphor samples. The influence of the thermal synthesis
regime and flux on the phosphor quality was investigated in order to obtain Y3Al5O12: Ce fine powders with pure cubic
structure and quite good photoluminescent properties. Attempts has been made at establishing a correlation between
luminescent properties and morpho-structural parameters of powders.
Keywords: Phosphors; Yttrium aluminum garnet; Wet-chemical synthesis;
PACS classification codes: 81.20.Fw; 78.55.Kz
1. I�TRODUCTIO�
Cerium activated yttrium aluminate phosphor Y3Al5O12: Ce with garnet structure (hereinafter YAG: Ce) exhibit
efficient yellow luminescence under UV and blue excitation. Luminescence efficiency and colour purity, particle
morphology and size distribution or crystalline order degree are decisive factors in determining the use of Y3Al5O12: Ce
powders in various optoelectronic devices such as white light emitting diode-LED [1].
Usually, the phosphor synthesis proceeds from oxide precursors, by the solid-state reaction (SSR) route, at very high
firing temperature and using several calcination-milling cycles. An alternative method is the wet-chemical synthesis
(WCS) route when the co-precipitated precursors are thermally converted into YAG:Ce phosphors. In this case, Y-Al-
Ce precursors are precipitated with ammonia [2,3], urea [4], hydrazine [5] or ammonium carbonate [6,7], using the
reagents sequential addition technique-SeqAdd. Research is on the way to find non-conventional synthesis routes for
YAG: Ce manufacture in less severe thermal conditions [8-10].
Correspondence author: [email protected]; [email protected]
Fax: +40-264-420441/ Tel: +40-264-580165
604 E.-J. Popovici et al. / Physics Procedia 2 (2009) 603–616
3
The goal of our studies is the synthesis by the wet-chemical synthesis route, of fine powders of YAG: Ce phosphor with
good photoluminescence performances, utilisable in white LED manufacture. In this respect, attempts were made to use
and develop a new WCS route based on the reagents simultaneous addition technique-SimAdd, which we have
successfully used for the manufacture of yttrium oxide–based phosphors [11-13]. To the best of our knowledge, the use
of the SimAdd technique for YAG:Ce manufacture was not reported, yet.
The present study is focused on the establishment of the optimal thermal synthesis conditions for SimAdd synthesis
route. With this purpose in mind, the influence of the flux presence and firing regime on the morpho-structural and the
optical properties of YAG: Ce phosphor powders are investigated.
2. EXPERIME�TAL PART
Cerium activated yttrium aluminate phosphors were synthesised by homogeneous precipitation, using the SimAdd
technique [11-13]. For this purpose, Y - Al - Ce precursors were prepared from Y(NO3)3.5H2O (99.9%Aldrich),
Al(NO3)3. 9H2O (Merck), Ce(NO3)3.5H2O (extrapure, Merck) as metallic ion sources and urea H4CN2O (99.3%
AlphaAesar) as anion source. The nitrate mixture contains Y3+, Ce3+ and Al3+ in stoichiometric amounts, corresponding
to the molar ratio Y: Ce: Al = 2.91: 0.09: 5. Equal volumes of solutions of nitrate mixture (0.5M) and urea (2.0M) were
simultaneously added into the urea diluted solution. The precipitation was performed under constant stirring, at 80°C
and under pH control. After maturation, the Y-Al-Ce precursor was well washed, centrifuged and dried. The phosphor
thermal synthesis was performed at 900 - 1600°C, in N2 atmosphere, for 1-4 hrs. YAG: Ce powders were water washed,
dried and sieved; no ball milling was used during the phosphor processing. In order to study the flux influence, prior
the thermal treatment, precursors were mixed with NaCl, NH4Cl, Li2CO3, NaF, MgF2, CaF2 or H3BO3 as flux.
Sample characterization was performed by photoluminescence measurements (JASCO FP-6500 Spectrofluorimeter
Wavel; Glass filter WG 320; For more accuracy, the same YAG: Ce powder sample was used as internal standard
during all the measurement sessions), X-ray diffraction (D8Advanced Brucker Diffractometer, CuKα radiation),
surface area measurements (BET krypton adsorption isotherms) and scanning electron microscopy (JEOL –JSM
5510LV Microscope; Au coated samples). X-ray diffraction was used to determine the microcrystalline parameters
from band-profile analysis, with the XRLINE program based on Warren-Averbach method [14,15]. The cell unit
parameters were also calculated.
3. RESULTS A�D DISCUSSIO�
The reagent simultaneous addition technique-SimAdd was used to prepare Y-Al-Ce precursors from Y3+ - Al3+- Ce3+
nitrates and urea. Under well controlled precipitation conditions, highly disperse amorphous powders of precursor with
general composition xM(OH)3· yM(NO3)3· zNH3. vH2O (M= Y, Al, Ce) were obtained and converted by thermal
synthesis, into phosphor powders with general formula Y2.91 Ce0.09 Al5O12. Different alkaline or alkaline-earth
chloride/fluoride as well as boric acid or lithium carbonate were used as flux in order to control the particle size and
morphology and to assists the formation of the cerium activated yttrium aluminate phosphor with cubic (garnet)
structure. The fluxes used in this study are known for their ability to act as mineralising agents in SSR or WCS
E.-J. Popovici et al. / Physics Procedia 2 (2009) 603–616 605
4
synthesis routes that involve the oxide precursors (compounds). The melting point as well as the cation or anion
dimenssion, was a criterion for their choice as flux for the high temperature stage.
During the thermal synthesis stage, the flux interacts with the Y-Al-Ce precursor and promotes both the incorporation
of the Ce-activator and the crystalization of the yttrium aluminate host-lattice. The photoluminescence and morpho-
structural properties of YAG: Ce samples were investigated in dependence on the thermal synthesis regime i.e. the
firing temperature and duration and also the flux addition.
3.1. Photoluminescence properties
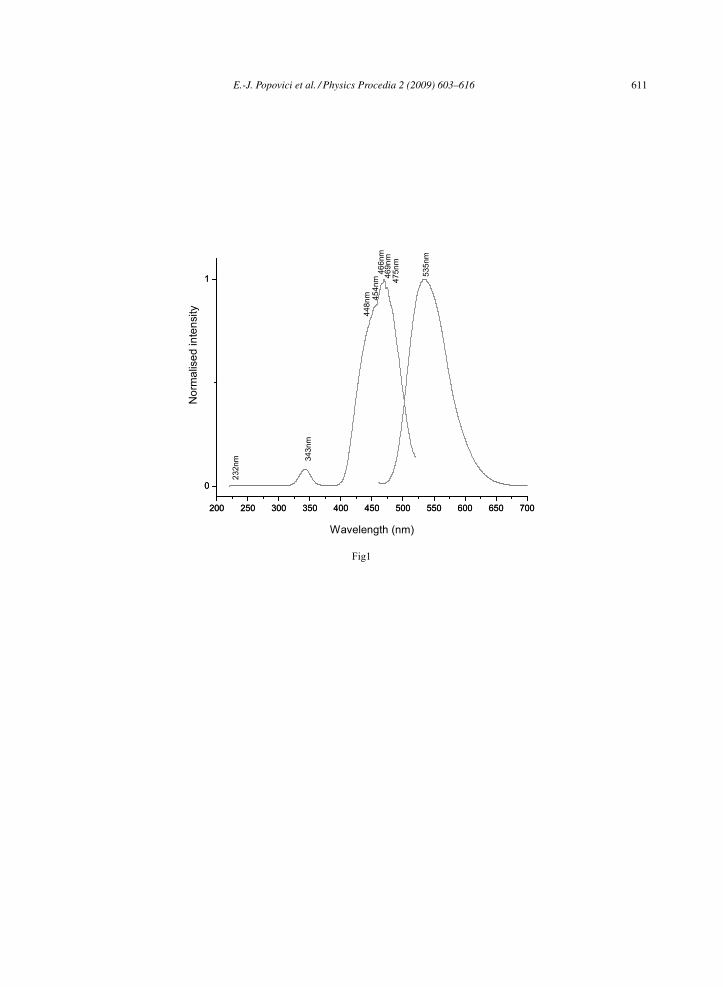
Under ultraviolet or blue light excitation, all samples show green-yellow luminescence characteristic to Ce3+
incorporated into the Y3Al5O12 host lattice [16]. Normalised excitation (PLE) and emission (PL) spectra of YAG:Ce
sample prepared without flux are presented in Fig.1. As expected, the excitation spectrum contains a very weak band at
~232 nm, a weak broad band with maximum at 343 nm and a strong band centered at about 470 nm that has a fine
structure. The emission spectrum registered under 450 nm excitation consists apparently of one broad band centered at
about 535 nm.
Fig.1.
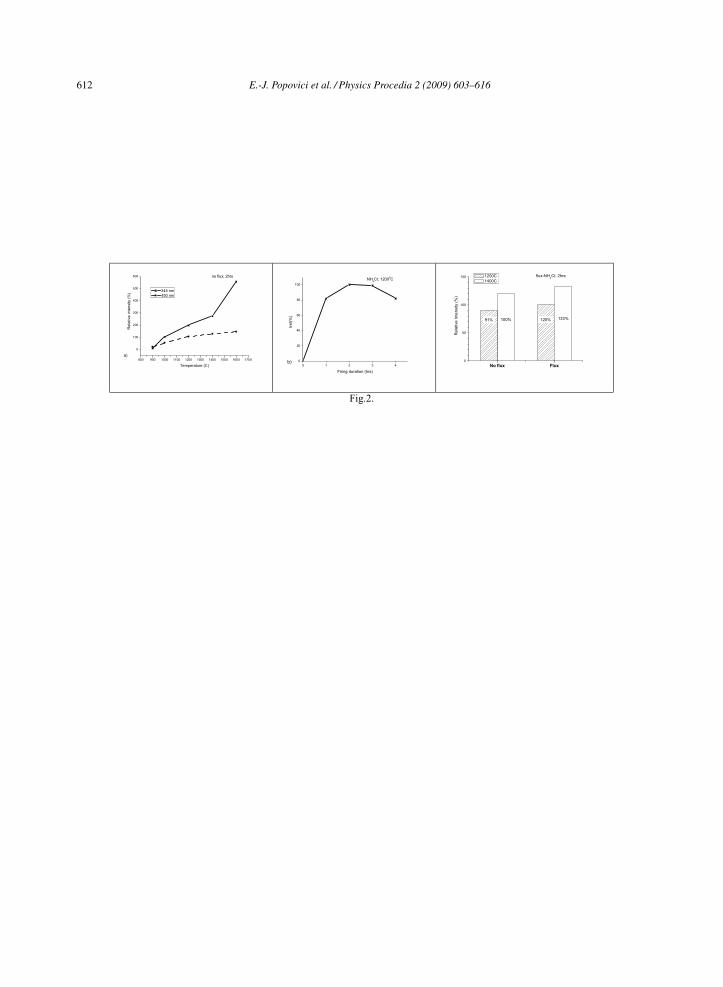
Photoluminescence performances are influenced by the thermal synthesis parameters such as flux presence or firing
temperature and duration (Fig.2). The intensity of the 535 nm emission band registered under UV-345 nm or blue-450
nm excitation increases with temperature, in parallel with the precursor conversion and phosphor crystallization degree.
Effect is more pronounced for excitation with UV-345 nm when the PL intensity of YAG: Ce (1600oC) is ~ 8 times
more intense than that of YAG:Ce (900 oC). The crystalline order degree of the Y3Al5O12 :Ce host lattice as well as the
presence of the segregated CeO2 phase formed at higher temperature could be responsible for this variation.
The intensity also increases with the firing duration, reaches a maximum and decreases, possibly in correlation with the
increase of particle size and particle sintering, respectively. Relative good PL performances can be achieved for YAG:
Ce prepared with ammonium chloride as flux. As expected, the yellow photoluminescence of Y2.91Ce0.09Al5O12 samples
is brighter for samples prepared at 14000C.
2a 2b 2c
Fig.2.
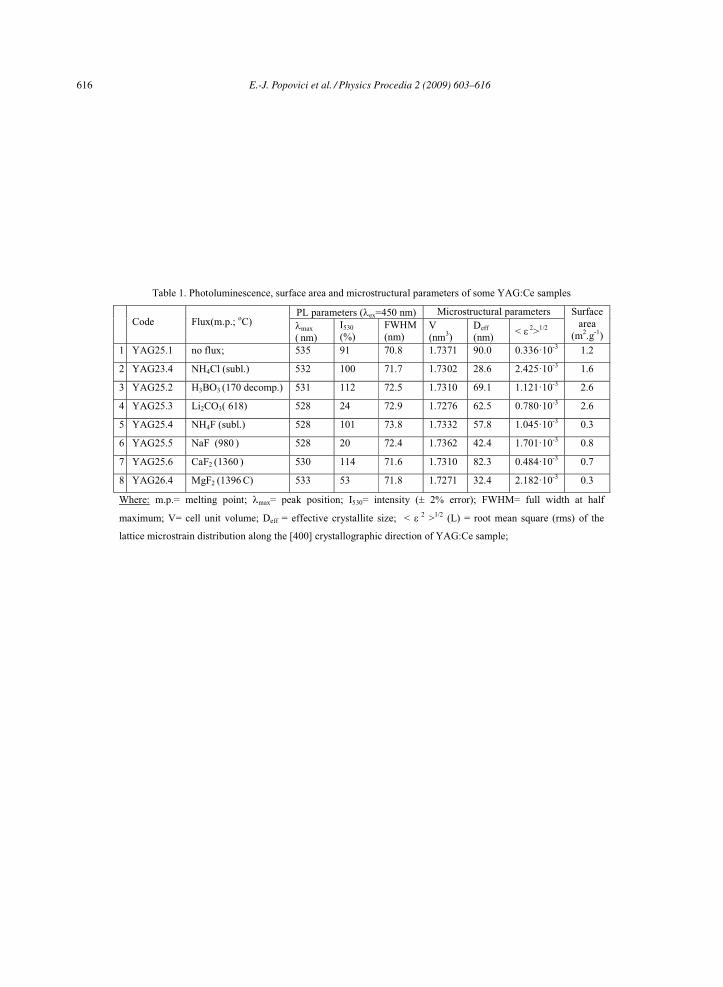
Influence of the flux on the photoluminescence parameters of some Y2.91Ce0.09Al5O12 samples (1200oC) is illustrated in
Table 1. It can be noted that almost all samples show emission bands in the green yellow spectral domain, centered at
528-532 nm, with peak width (FWHM) of 70.5-73.8 nm. As expected, peak position and width of the broad Ce-
emission band are influenced by the flux used for lattice organization.
The addition of the mineralising agent determines the blue shift of the emission bands, the increase of the peak width
and the increase or decrease of the luminescence intensity, as compared with the no-flux YAG:Ce sample. The most
efficient mineralising agents are ammonium salts, calcium fluoride and boric acid. Sodium and lithium salts deteriorate
the yellow photoluminescence, probably by “densifying” the matrix.
Table 1.
606 E.-J. Popovici et al. / Physics Procedia 2 (2009) 603–616
5
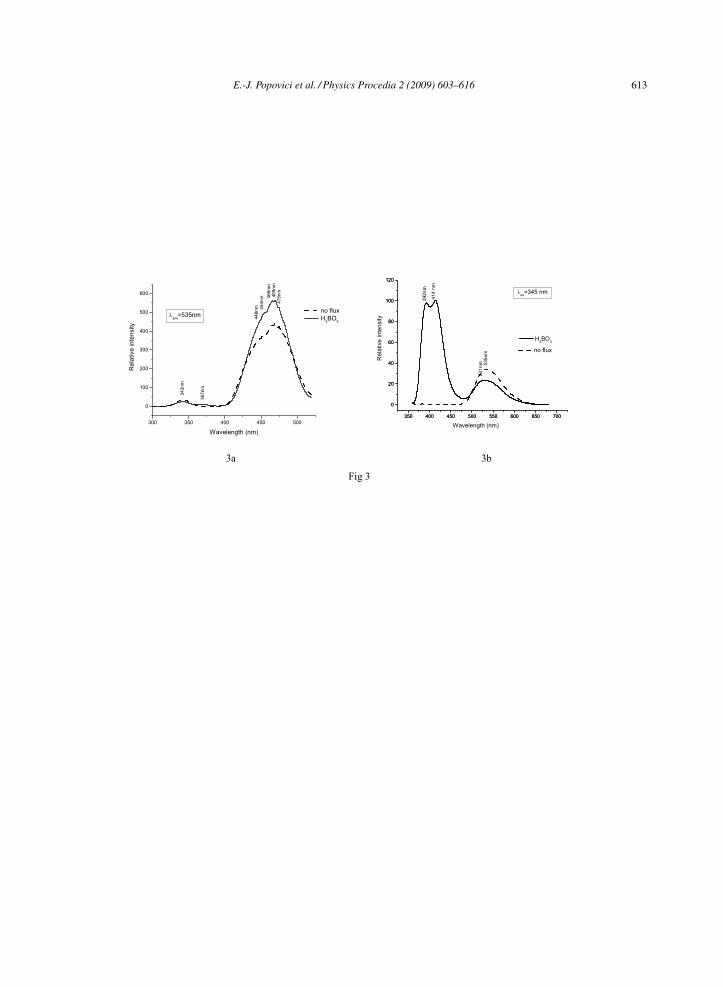
Boric acid is the only mineralising agent that changes the structure and the shape of both, the emission and the
excitation spectra. PL (λem=530 nm) and PLE (λex=345 nm) spectra of YAG:Ce (H3BO3) are presented in figure 3. In
comparison with the PLE spectrum of YAG:Ce sample prepared without flux, the spectrum of YAG:Ce (H3BO3)
contains an additional absorption band at 376 nm whereas the excitation band in the blue domain (~470nm) is with
about 20% weaker. The PL spectrum obtained under 345 nm excitation contains, besides the characteristic 531 nm
band, a strong double shape emission band, with peaks at 392nm and 414nm. On the contrary, the PL spectra of
YAG:Ce (H3BO3) and YAG:Ce (no flux) registered under 450 nm excitation are similar in appearance, but they slightly
differ in the emission characteristics i.e. intensity, peak position and band width (Table 1).
3a 3b
Fig.3.
The observed additional bands suggest that, H3BO3-flux interacts with Y-Al-Ce precursor to form some secondary
products with consequences on the PL performances. The excitation band at 376nm and the double shape emission band
in the UV-blue spectral domain could be correlated with the presence of traces of YBO3:Ce phase [17]. In the same
time, the relative strong emission band at 531nm obtained under 450 nm excitation, sustains the fact that Ce3+is
incorporated mostly into the yttrium aluminate host lattice with cubic (garnet) structure.
The peculiar appearance of the PL spectra of Y3Al5O12 :Ce (H3BO3) could be explained as follows. Trivalent Ce ion has
only one electron in the 4f state and 5d is the next higher energy state. The ground state configuration of Ce3+ion is split
in two levels i.e. 2F5/2 and 2F 7/2 whereas the 5d1 excited configuration is split by the crystal field in 2-to-5 components.
Usually, the excitation takes place between the highest ground level to the split 5d levels while the emission develops
from the lowest excited level toward the two split ground state levels. For this reason, for Ce3+ ion, there are more 4f –
5d absorption bands in the PLE spectrum whereas the 5d-4f emission in the PL spectrum is a typical double-band shape
[16, 17]. The 5d-4f emission of Ce3+ depends strongly on the crystal field. Usually, the Ce3+ emission is in the
ultraviolet or blue spectral region (ex. YBO3: Ce ) but can be shifted toward green-yellow (ex. Y3Al5O12 :Ce ), due to
the influence of the crystallographic environment (ex. next-nearest neighbors effect).
The emission and excitation spectra of YAG:Ce (H3BO3) sample are of a composite nature, probable due to the
simultaneous presence of Y3Al5O12:Ce and YBO3:Ce phases. Moreover, sample Y3Al5O12:Ce (H3BO3) shows white
photoluminescence under UV excitation and yellow photoluminescence under blue radiation, resulting from this
peculiar spectral composition of the emission. Mention has to be made that, although the use of the boric acid as flux in
the synthesis of YAG:Ce by solid state reaction route [18] is known, no such phenomenon was noticed/mentioned.
3.2. Crystalline structure
It is well known that, in Y2O3-Al2O3 system, there are three crystalline phases i.e. hexagonal YAlO3, perovskite type
(YAP), monoclinic type Y4Al2O9, (YAM) and cubic Y3Al5O12 (garnet) type (YAG) [10]. For this reason, the
preparation conditions could influence the structure of phosphors prepared by SimAdd technique. All phosphors
obtained at temperature higher than 900oC are well crystallized powders with cubic structure. This illustrates that the
composition of precursors is appropriate for the formation of the pure garnet structure (PDF 79-1892). No secondary
products such as YAP (PDF 74-1334) and YAM (PDF 78-2428) are noticed in YAG:Ce powders. Traces of CeO2 phase
(PDF 78-0694) are apparent almost in all samples.
E.-J. Popovici et al. / Physics Procedia 2 (2009) 603–616 607
6
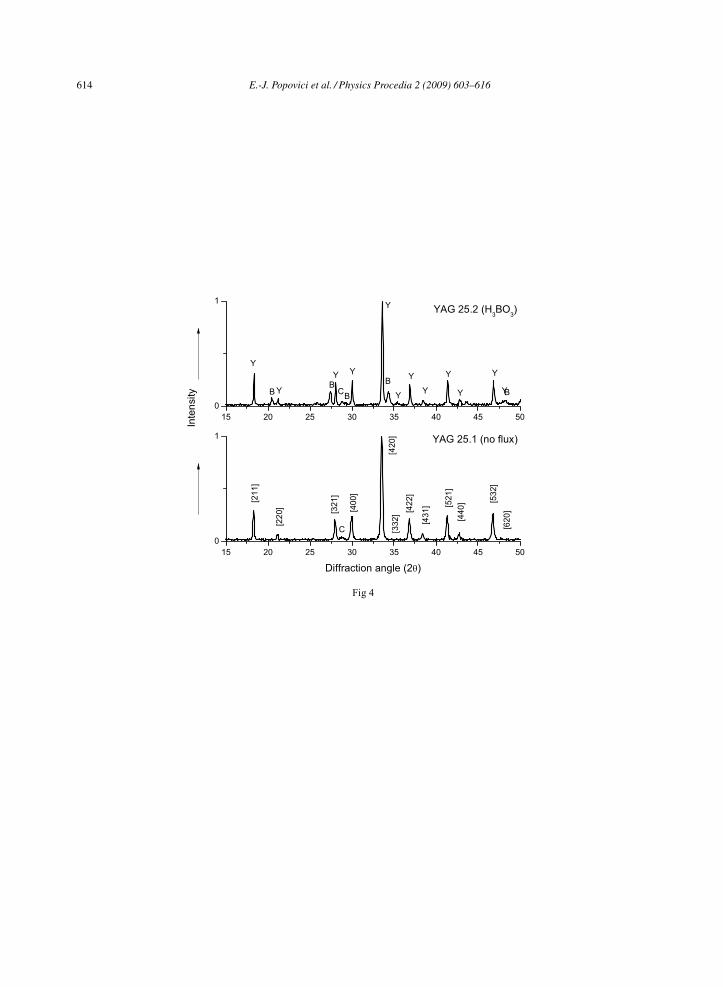
The dependence of the crystalline structure on flux is well evidenced by the XRD patterns. It can be noticed that
most of the compounds used as flux seems to interact with the precursor to form fluoride or borate as solid, inseparable
impurities, which are partially responsible for the alteration of the PL intensity. For instance, the sample YAG:Ce
(H3BO3) contains cub-Y3Al5O12, hex-YBO3 and cub-CeO2 as crystalline phases (Fig.4). In spite of the fact that boric
acid interacts with the host lattice to form small amounts of cerium activated yttrium borate, the flux shows good
influence on luminescence characteristics, as suggested by the PL and PLE spectra.
Fig.4.
Dependence of the crystalline structure of YAG:Ce samples on the mineralising agent is also illustrated by the
corresponding microstructural parameters (Table 1). YAG:Ce powders contain crystallites of different dimensions,
between ~29 and 90 nm and possess a density of lattice microstrains between 0.336·10-3 and 2.425·10-3. The smallest
crystallites and the most disordered lattice are obtained with NH4Cl and MgF2. The cell unit volume that is closest to the
theoretical value (V=1.7319nm3) is obtained with CaF2 and H3BO3 as flux. It can be noted also that, these well
crystallised samples of Y3Al5O12:Ce (CaF2) and Y3Al5O12:Ce (H3BO3) phosphors show relative good luminescent
properties.
3.3. Morphology and particle size
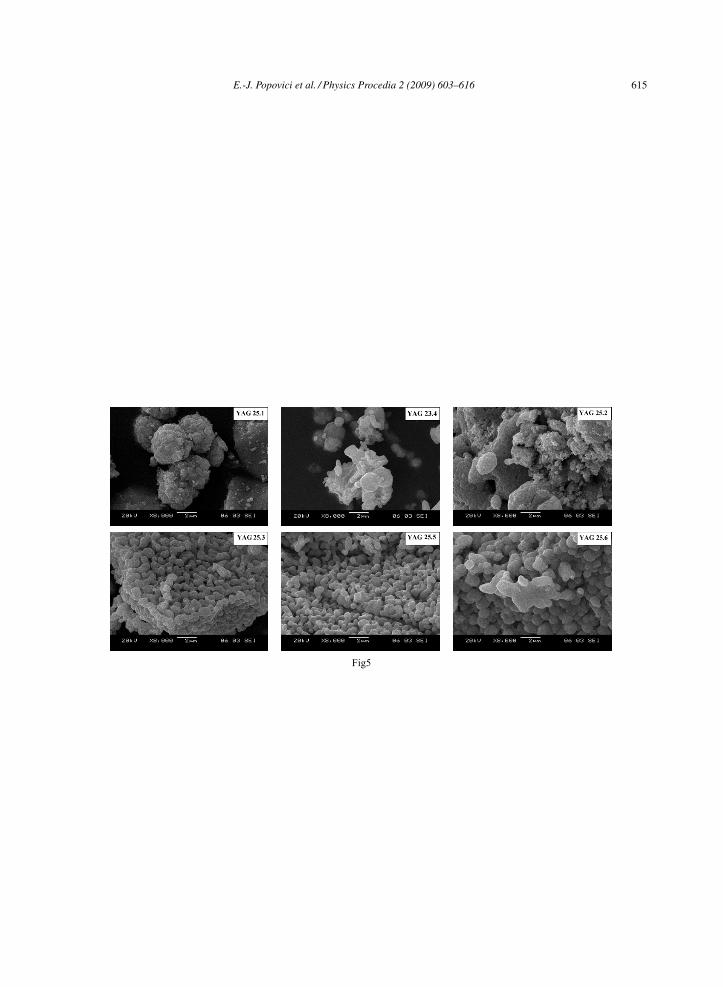
As expected, the mineralising agent influences the particle dimensions and morphology (Fig.5) and also the surface area
and particle porosity (Table 1).
No-flux phosphor (YAG.25.1) consists of compacted aggregates of very small spherical particles, similar to the parent
precursor. Addition of flux facilitates the conversion of precursor into more or less sintered micrometric particles of
YAG:Ce phosphor. Sodium and lithium salts contribute to the regularisation of particle shape and to powder
homogenisation. Unfortunately, alkaline salts seem to determine the matrix “densification” that diminishes the PL
intensity. In the case of boric acid, SEM images illustrate the heterogeneity of the powder that contains Y3Al5O12 and
YBO3 phases, as suggested by the PL results and the XRD patterns (Fig 4).
The phosphor powders surface area depends on flux type. The corroborated action of firing temperature and flux
determine the decrease of the surface area from ~9 m2/g (precursor) to about 0.3 ÷ 2.6 m2/g (phosphor). The fluoride
salts generate powders with small surface area (under 1m2/g) associated with relative large particle dimensions and low
porosity. The relative large surface area of YAG:Ce(H3BO3) and YAG:Ce(Li2CO3) is associated with small particle
dimensions and high porosity, respectively.
YAG 25.1 YAG 23.4 YAG25.2
YAG 25.3 YAG 25.5 YAG 25.6
Fig. 5.
4. CO�CLUSIO�S
The reagent simultaneous addition technique –SimAdd is an alternative wet-chemical synthesis route for phosphor
synthesis, which has the advantage of facilitating the control of precursor composition and morphostructural
characteristics. The present study revealed that the thermal synthesis regime (e.g. flux and firing regime) used for the
608 E.-J. Popovici et al. / Physics Procedia 2 (2009) 603–616
7
conversion of precursor into phosphors influences not only the PL properties but also the microstructure and
morphology of YAG:Ce particles. Some of the optimal thermal synthesis parameters for this synthesis route could be
defined i.e. the mineralizing agent (ammonium chloride) and the firing regime ( 2hr x 1200-1400°C). Moreover, some
peculiar aspects related with the flux role in the Y-Al-Ce precursors conversion into YAG:Ce phosphors could be put in
evidenced.
Microcrystalline Y3Al5O12:Ce powders with bright yellow luminescence and good sensitivity to blue radiation could be
prepared by SimAdd route. Further experiments are to be performed in order to improve the basic requirements for
optoelectronic applications i.e. PL characteristics and powder granulation and dispensability.
Acknowledgments
This work was supported by the Romanian Ministry of Education, Research and Youth (project MATNANTECH
CEEX 31/2005)
References
[1] C.Feldmann, T. Justel, C. Ronda, P. Schmidt, Adv. Funct. Mater. 13 (2003) 511.
[2] X.Zhang, H.Liu, W.He, J.Wang, X.Li, R.Boughton, J. Alloys Compd. 372(2004) 300.
[3] S.Bhattacharyya, S.Ghatak, Ceram. Int. 35 (2009) 29.
[4] Y.Wu, J.Li, Y.Pan, Q.Liu, J.Guoa, Ceram. Int. 35 (2009) 25.
[5] T.Tachiwaki, M.Yoshinaka, K.Hirota, T.Ikegami, O.Yamaguchi, Solid State Commun. 119 (2001) 603.
[6] J.G.Li, T.Ikegami, J.H.Lee, T.Mori, J. Mater. Res. 15 (2000) 1514.
[7] X.Li, H.Liu, J.Y.Wang, H.M.Cui, F.Han, X.D. Zhang, R.I. Boughton, Mater Lett. 58 (2004) 2377.
[8] J. Y. Choe, D. Ravichandran, S. M. Blomquist, J. Lumin. 95 (2001) 119.
[9] X. Li, H. Liu, J. Wang, H. Cui, F. Han, Mat. Res. Bull. 39 (2004) 1923.
[10]Y. Pan, M. Wu, Q. Su, Mat. Science and Eng. B 106 (2004) 251.
[11] A.Hristea, E.-J.Popovici, L.Mureşan, R.Grecu, M.Vasilescu, Studia Universitatis Babes Bolyai, Physica L3
(2005) 455.
[12] E.J. Popovici, L. Muresan, H.Amalia, E.Indrea,M.Vasilescu, J.Alloys Compd. , 434-435 (2007) 809.
[13] L.Muresan, E.J.Popovici, R.Grecu, L.Barbu-Tudoran, J.Alloys Compd. (2008), doi: 10.1016/ j.jallcom.
2008.03.100
[14] E. Indrea, A.Barbu, Appl. Surf. Sci. 106 (1996) 498.
[15] N. Aldea, E. Indrea, Comput. Phys. Commun. 60 (1990)155.
[16]G.Blasse, B.C. Grabmaier, Luminescent Materials, Springer Verlag, Berlin (1994) 46.
[17] G.Blasse, A.Bril, J. Chem. Phys. 47(1967) 5139.
[18] Y.Pan, M. Wu, Q.Su, J. Phys Chem Solids 65 (2004) 845.
E.-J. Popovici et al. / Physics Procedia 2 (2009) 603–616 609
8
Figure captions
Fig.1. PLE (left; λem=530 nm) and PL (right;λex=450nm) spectra of Y3-x Cex Al5O12 (no flux sample)
Fig.2. Dependence of PL intensity on the firing temperature (a) , firing duration (b) and the flux presence (c)
Fig.3. PLE (left) and PL (right) spectra of YAG:Ce (H3BO3) and YAG:Ce (no flux) samples Fig.4. XRD patterns of YAG:Ce (H3BO3) and YAG:Ce (no flux) samples, where: Y –cub Y3Al5O12 (PDF card 79-1892); B- hex Y3BO3(PDF card 74-1929); C-cub CeO2 (PDF card 78-0694) Fig. 5. SEM images of YAG:Ce samples with different fluxes
610 E.-J. Popovici et al. / Physics Procedia 2 (2009) 603–616
9
200 250 300 350 400 450 500 550 600 650 700
0
1
200 250 300 350 400 450 500 550 600 650 700
0
1
232n
m
469n
m
535n
m
475n
m
466n
m45
4nm
448n
m
Nor
mal
ised
inte
nsity
Wavelength (nm)
343n
m
Fig1
E.-J. Popovici et al. / Physics Procedia 2 (2009) 603–616 611
10
800 900 1000 1100 1200 1300 1400 1500 1600 1700
0
100
200
300
400
500
600 no flux; 2hrs
Rel
ativ
e in
tens
ity (%
)
Temperature (C)
345 nm 450 nm
a)
0 1 2 3 4
0
20
40
60
80
100Ire
l(%)
Firing duration (hrs)
NH4Cl; 12000C
b)
No flux Flux
0
50
100
150 flux-NH4Cl; 2hrs
Rel
ativ
e In
tens
ity (%
)
1200C 1400C
91% 100% 120% 133%
Fig.2.
612 E.-J. Popovici et al. / Physics Procedia 2 (2009) 603–616
11
300 350 400 450 500
0
100
200
300
400
500
600
475n
m46
9nm
466n
m45
4nm
448n
m
367n
m
Rel
ativ
e in
tens
ity
Wavelength (nm)
no flux H3BO3
λem
=535nm
343n
m
350 400 450 500 550 600 650 700
0
20
40
60
80
100
120
350 400 450 500 550 600 650 700
0
20
40
60
80
100
120
531n
m
λex=345 nm
Rel
ativ
e in
tens
ity
Wavelength (nm)
H3BO3
392n
m
414
nm
535n
m no flux
3a 3b
Fig 3
E.-J. Popovici et al. / Physics Procedia 2 (2009) 603–616 613
12
15 20 25 30 35 40 45 500
1
15 20 25 30 35 40 45 500
1
C [620
]
[332
] [440
]
[431
] [532
]
[521
]
[422
]
[420
]
[400
]
[321
]
[220
]
Inte
nsity
Diffraction angle (2θ)
YAG 25.1 (no flux)
[211
]
BB
YY
Y
C
Y
Y
Y
Y
YYY
B YY
B
YAG 25.2 (H3BO3)
B
Fig 4
614 E.-J. Popovici et al. / Physics Procedia 2 (2009) 603–616
13
Fig5
E.-J. Popovici et al. / Physics Procedia 2 (2009) 603–616 615
14
Table 1. Photoluminescence, surface area and microstructural parameters of some YAG:Ce samples
Code Flux(m.p.; oC)
PL parameters (λex=450 nm) Microstructural parameters Surface area
(m2.g-1) λmax ( nm)
I530 (%)
FWHM (nm)
V (nm3)
Deff (nm) < ε 2>1/2
1 YAG25.1 no flux; 535 91 70.8 1.7371 90.0 0.336·10-3 1.2
2 YAG23.4 NH4Cl (subl.) 532 100 71.7 1.7302 28.6 2.425·10-3 1.6
3 YAG25.2 H3BO3 (170 decomp.) 531 112 72.5 1.7310 69.1 1.121·10-3 2.6
4 YAG25.3 Li2CO3( 618) 528 24 72.9 1.7276 62.5 0.780·10-3 2.6
5 YAG25.4 NH4F (subl.) 528 101 73.8 1.7332 57.8 1.045·10-3 0.3
6 YAG25.5 NaF (980 ) 528 20 72.4 1.7362 42.4 1.701·10-3 0.8
7 YAG25.6 CaF2 (1360 ) 530 114 71.6 1.7310 82.3 0.484·10-3 0.7
8 YAG26.4 MgF2 (1396C) 533 53 71.8 1.7271 32.4 2.182·10-3 0.3
Where: m.p.= melting point; λmax= peak position; I530= intensity (± 2% error); FWHM= full width at half
maximum; V= cell unit volume; Deff = effective crystallite size; < ε 2 >1/2 (L) = root mean square (rms) of the
lattice microstrain distribution along the [400] crystallographic direction of YAG:Ce sample;
616 E.-J. Popovici et al. / Physics Procedia 2 (2009) 603–616