oo. - university of pretoria
TRANSCRIPT
oo.
the fourth month the uterine wall has been reduced to one-third of
its original (non-pregnant) thickness. In the laat mon'h there is
an 1ns1gn1f1cant inoreaee in thickness. This 1a oaused solely by
the high figuree obtained at the 147tb dq, and :resulting from the
general oeclematoua condition of all the genitalia at thia stage.
pisCUISion. Tbe small, pale a.nd oontrPtote<l u·teru.e of the non-
pregnent eJJ·e undergoes many cllaugee during p:regnar~.ay. By the
eighteenth day the horns appear slightly puffy anti by 1ts slightly
larger aize it is possible to distinguish the horn 1n whioh the ovum
hes become implanted. A.t about this time the colour of the organ
changes to a. distinct pink ana numerous very toxtuoue subserous
bleo<!veesels become visible. As gestation prog.res$es so these
vessele become lare,"ftr and less tortuous, ·the oolou.r beoornes redder,
and the size-difference between the horns beoou1e s muoh ooze di stinot.
After the 38th darjthere is ala:> a ohauge 1n ".;he nllape of tl1e horns,
thia being the result of more rapid growth along the grea.teJ'
curvatures. Seven day~ later the uterine w&ll haa ~ bluish-grey
c6.lou:r and the subserous vessels are large and pursue au almost
straight ooUl~ se. The larEest a:re to be found along the lesaer
curvatures, and from these b.ranohea run across the uterine horne at
J:igbt a.ugle& to their long a•ee. By this time the walls have beoome
Markedly thinner and tlu·ough them the outlines of the cotyledons may
be distinguiahed. From the middle of 6~Ptation the pregu.nt horn
grows much more xa.pidly than its tellow and tbe disorepauoy in size
becom6s so w~.rked thn t towa.rds the end of the fourth mon tb the non-
gJ:avid horn has beoome merely 3Il appendage of the other. At this
s ta.ga tlle w&.ll~ have become verr thin and vaaculs.:r 1 ty is pronounced
throughout the organ. This state is maintained until the approach
of pa.rtut1t1on. At the 147th day the thioknese of tbe wall is
increased as a result of e. general oedema of the genitalia.
In the non-pregnant uterus the mucosa is pale Nld but alightly
moiat. Early 1n pzegnanoy there ia a sligh~ reddening at the a1te
of imple.nta.tion and thia spreads re.p1dly unt1l at the 45th day the
entire mucoea 1• JP&.rkedly vaecular. At this stage the epithelial
Digitised by the University of Pretoria, Library Services, 2012
..... ..., ...... ... .. 'Y ,..,....-.~.,... .... ...
--·~--···-·
g£2!!1!1 of Ewes : No .of • Mean number of Cotyledons. Si§ii!:iC!nOe Teg~a. No : Class : li.iNes. Prejlnant siae : Non•Pre«. aide ~ Total Grouns: w. r.l. : \¥ • .Preced.Gr.
1. : Non-preg : ~1 ~ 46.64 . 45.26 . 46.00 . . . . " . 2. : lst Month : 12 : 44.17 : 42.92 . 43.54 . - . -. . . 3. : 2rad " . 8 ~ 42.13 .. 37.6~ : Z9.38 . XX .. X . . . . 4. : ard ., . 6 ~ 43.83 . 39.33 . 41.58 . X . -. . . . . 5. : 4th " . 1 ~ ~7.'71 . 36.5? . 3'1.14 .. XX .. X . . . . .. J 6. : 5th flt . 5 : 43.00 : 40.80 : 41.90 . - • X . . • -=r
()
Average ~ 43.31 . 41.02 ~ .
Digitised by the University of Pretoria, Library Services, 2012
Gl.
lining appeaza to bave been denl'Oyed. (at lea•i the surtaoe is not
emoo'th and clear) and the auzfaoe is covered w1 th a laye% of dlrt1
g~ey1ab etlOkJ material. Ae a :result of this the allanto-cbor1on
is found to adheze to the 1Dner IJUJ'faoe of the uterine wa.ll and 1D
stripping lt off oaze haa to be exero1aed DOt to ruptuze the sao.
This condition peraiata Wltil midwq tlu:ough the fourth month, after
which the ep1thellal 11n1ng appears to be reato~ed and w1th the
disappearauoe of the al1my coating the I'JUOosa la aga1n 8D'lOOth,
fairly moist and of a 11ght red colour. At thls stage the amount
of adherence between the uterua and the foetal aao le negl1g1ble.
4. fLACEjljj;..
It hae been seen (Table 14 & rtg.la) that the nl~··ht of the
placenta 1noreases to a peek 1n the ttird month• after wh1oh it
drops fairly rapidly. In an attempt to determine the oauoe of thia
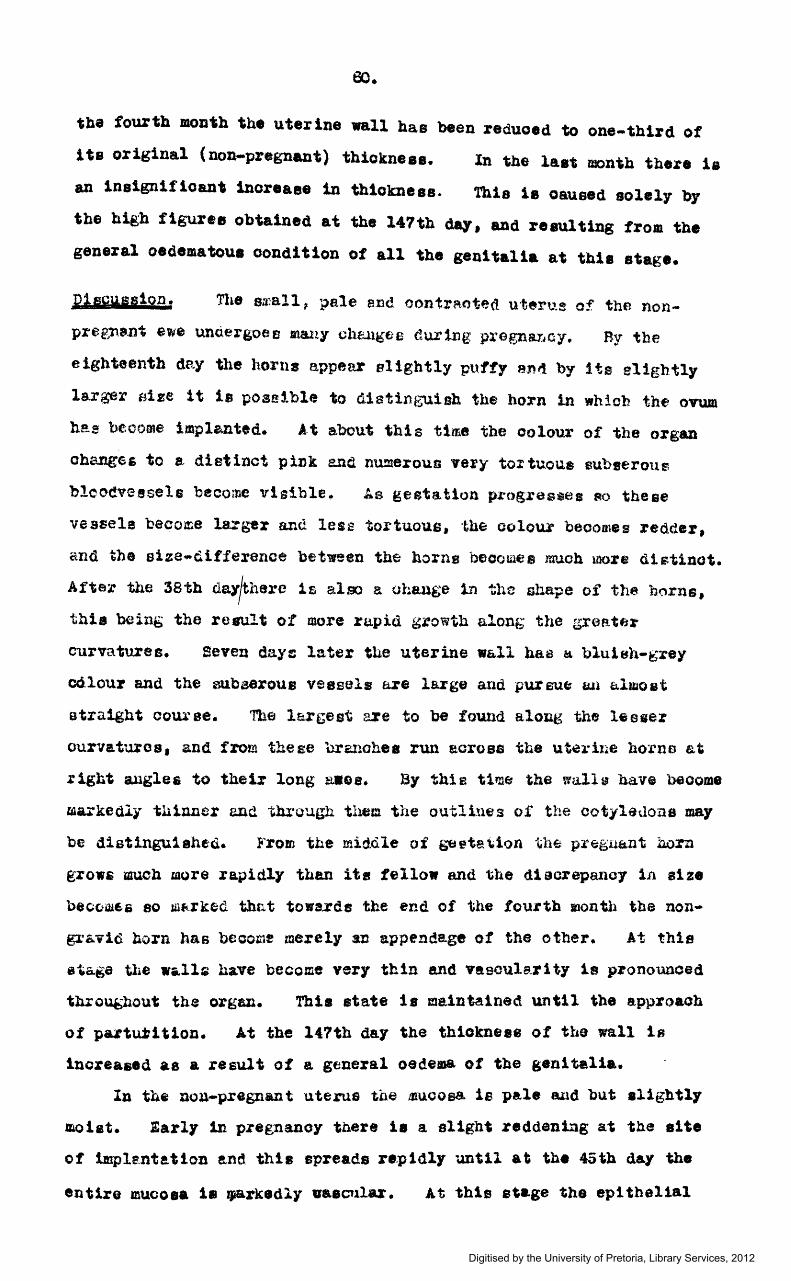
behaviour the numbere and tbe •1zea of the cotyledona bave been
studied. Details of the tozmer are presented in Table 17 & F1g.l5.
When the pe data are analysed in the manner described in
oonneotion with the th1okneaa of the uterine wall• it is found that
there 1a a significant difference between the pregnant and non-
pregnant aides of the uterus. The exceas in favour of the former
side ia never great and falls far short of the figure (50~) mentioned
by Bergmann (19aa) in h1a wo:rk on thtJ bovine. From the testa 1t
appears that there ar~ s1gn1f1oant differonoea at the various stage•
ot pregnaDcy. Here it must be l'emembet:eti that in the f1zet two
sroups 1 t was 1mpoee1ble to diating\&111h between fuuotional and DOD•
functional cotyledons. thue the figures given represent oounts ot
all the ootJledone,aa compared with oounte onl7 of functional
cotyledoDa in 'the :remaining ~oupe. Itenoe lt 1s not surp:r1a1ng to
!1nd that the nur:.bex-s for the fir£t t"'llO group• are highel' than thoae
of any other group. As this method of testing is open to or1 t1o1a,
1t is more satisfaotozr to employ group Ho.3.(the f1%at 1n whioh
tunctlonal cotyledons are eaQ1~ recognizable) aa the standard fo~
Digitised by the University of Pretoria, Library Services, 2012
.. .
l : Bon-preg .. . 2. : lst Month .. . z. : 2nd " .. .. 4. : 3rd " . . 5. : 4th .. . . 6. : 5th " . .
Average
G£2J1Jal g( E'W§S. : No: Cl.ass ..
"
l .. Nor.-preg . . . 2 • lst Month : . 3 . 2nd " . . . 4 . 3rcl u . . . 5 . 4th .. . . . 6 . 5th tt . . .
Average
TABLE 18. DlAYBTBR OF COTYIJ:n)ON.s.
-- - -- -- - - - - ~
Ewes. t Pre2. B1de .. Non-nre&r. S1d.e t TO 'tal. Groups.:: . ll ,28om .. ,30cm . ,28cm . . . . 12 ,42cm . ,39cm : ,40cm .. . .
8 l.86cm . llllcm . 1.67cm . . . • 6 3,45cm . 3,24cm . 3,35CUJ. . . .. 7 3,04cm .. 2,94Cm .. 2,99cm • • . 5 3,00cm . 3,00cm 1: 3,00cm . . .
I ~ l
t 1,63cm . 1,52cm ~ . .
TABI.B 19. HEIGHT OF COTYJ..EDONS.
no.of ~ Bean Height of CotYledons EVl88. .fretl. Side . llon-urea. Side Total GrouDs : . ll Ito ,15om . ,l.6cm ,16cm . . • 12 lo ,l6cm . .15om ,15om . . .
8 = ,63cm . ,55 em ,59cm . . . 6 t 1,42om . 1,37cm 1,39cm . . •
' t 1,50cm . l,46cm 1,48cm • . . 5 ~ l,l6cm . 1,16cm 1.16cm . . .
~ ,681cm : .656cm . .
~.Qr,jL. . \i. ~~recea, ur • .
- • -. XX . XX . X. X . XX . XX . X . XX ! -
S1£mif!CI!1CI T!§tl.a w .Gr.-i .. . Vi. Preced,Gr .
- : -XX . X X . XX . XX . XX .
• -XX . XX .
•
r cl" cf
cs~
Digitised by the University of Pretoria, Library Services, 2012
62.
comparison. When thia ia done it appeara that11n spite of a fair
degree of variation 1n the last four groups, none of the differenoea
are significant. Therefore, the differences observed may be
aacr1bed to "unfair• counts in the firet two groupe, and it may be
concluded that, whatever the true position regarding fdnct1onal
ootyledona in the first montb(in Group l their number ia nil) the
observed variation• 1n the weight of the placenta are not oauaed by
variations in the numbers of ootyladona.
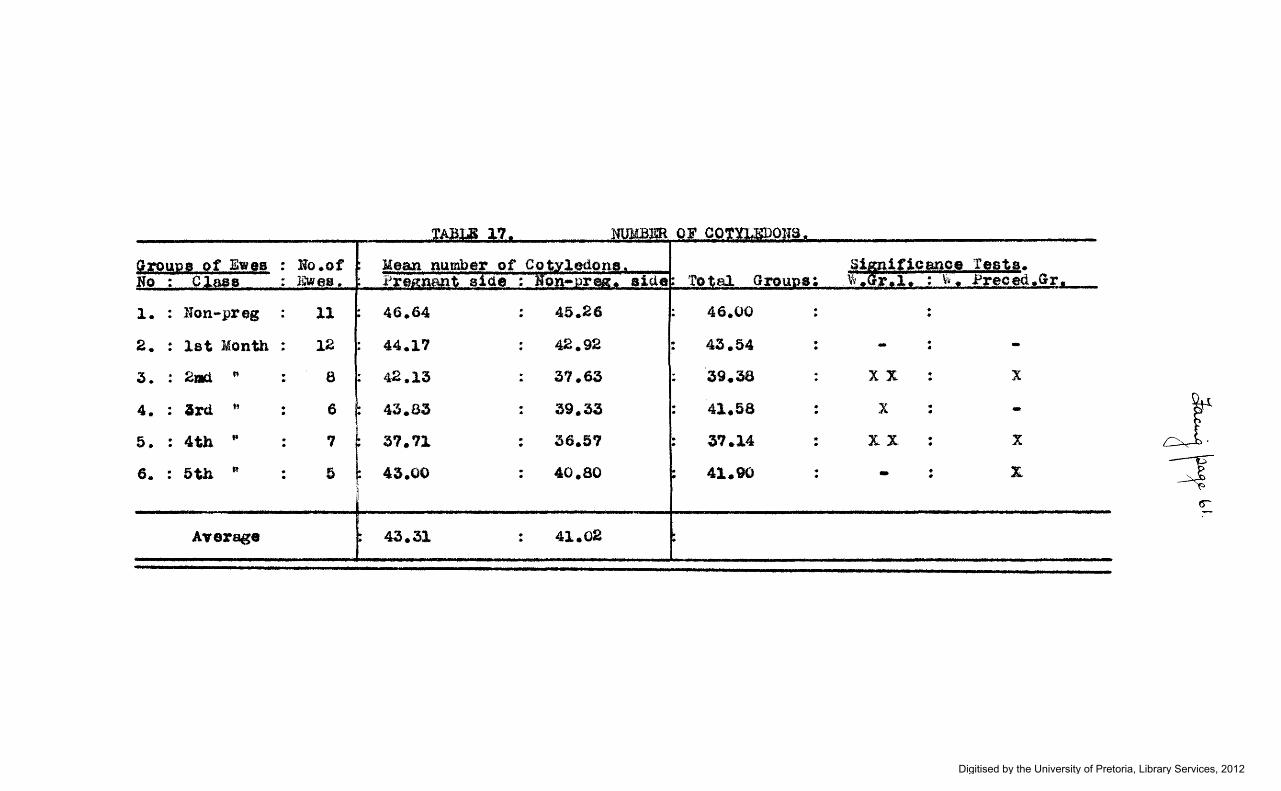
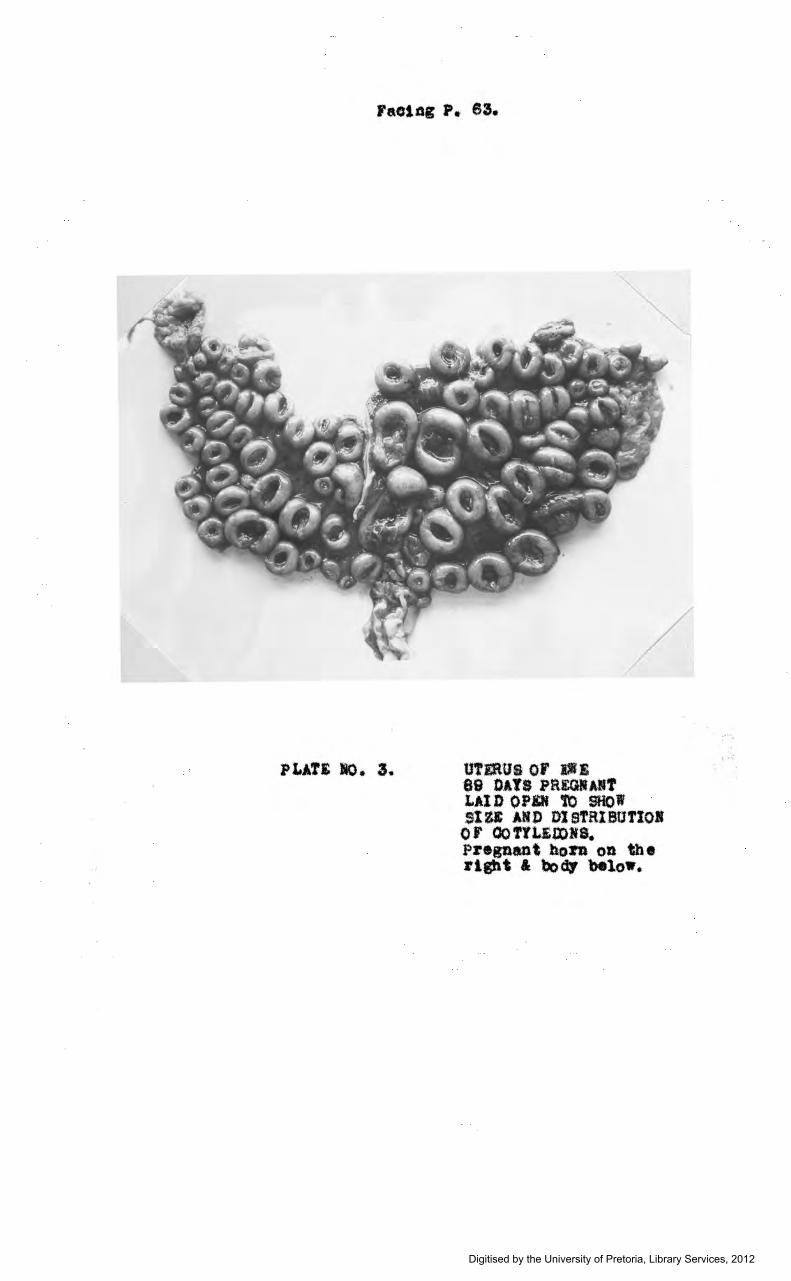
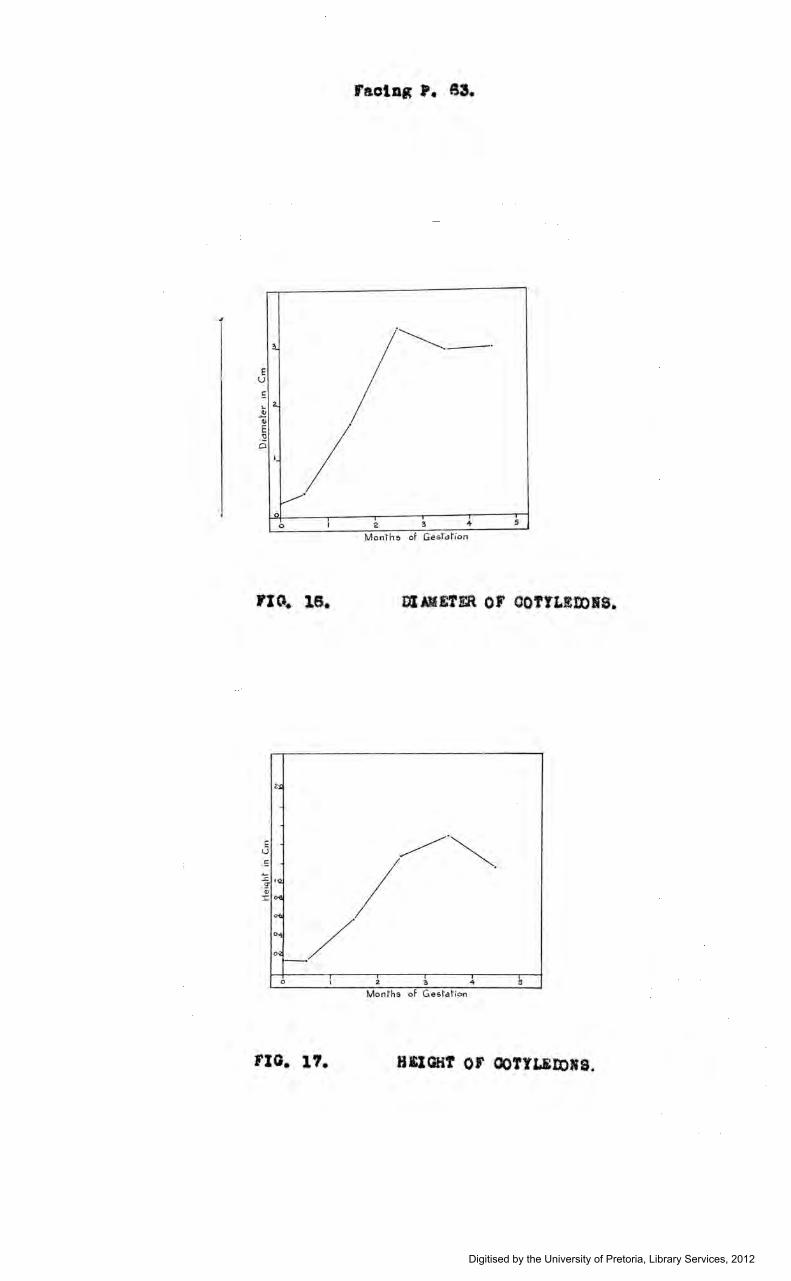
Aa a result of the above conclusion, it becomes neoeaaazy to
consider the size of the cotyledon• at the various atagea of
pregnancy. For this purpose two dimensions (diameter & height)
have been studied. In eaoh instance the average of the readings
for the largeat cotyledon in the born and one representing the modal
size of that horn, is employed. Detaila of these repreaentat1Ye
figurea are preaented in TableA 18 & 19 and Figs. 16 & 17. Both
these dimenaione increase rapidly (becoming a1gn1f1oant in the
second month)up to the end of the third month. After thia their
behaviour differs, the diameter dropping aign1fioantly 1n the fourth
month and then maintaining its level in the fifth, whereae the
height atill increases (although ineignifioantly) 1n the fourth
month and then undergoes a a1gn1f1cant decrease in the last month of
pregnancy. However, by the end of gestation both dimensions are
significantly lower than they were in the third month. It ia clear
that the placental weight 1• affected mainly by thia change in the
alae of eaoh individUal cotyledon.
D1aouas1on. It has been seen that during pregnancy the
cotyledons increase enormously both in diameter and 1n height.
Apart from this enlargement there are other changes wh1oh may be
obeerved maoroaoopioallJ. In the non-pregnant uterus the cotyledons
appear to be arranged in four long1 tudina.l rowe. All are of the
same size and are just visible aa pinhead-aiaed,brownieh oentrea
with pale narrow peripheral zones. In dioestrum they are level
with the surface of the mucosa, but during oestrum they become slightly
awollen and elevated. Early 1n pregnancy a change is evident eB1l
Digitised by the University of Pretoria, Library Services, 2012
PLAT£ 10. 3.
Digitised by the University of Pretoria, Library Services, 2012
i I E
v
E -.'0
Cl
a
2..
I ;· ~·
0
0 I
FlO. 16.
2.:J;
l'(l.
0-8
o-Q
f&OlDtl f • 63.
·~.
2 3 + 5
~~·~.
o,. / o·c -· 0 : 2 ?. 4 5
Months of G estatton
FIG. 1?-. HllGHT Of OOTtLiJl)NS.
Digitised by the University of Pretoria, Library Services, 2012
63.
and by the 2lat d&J both the size of the central portion and the
elevation of the cotyledon are visibly increased. During the next
few days the brownish centre, previously concave, becomes flat and
numerous pin-point red spots appear all over ita surface. on the
a7th day the cotyledon baa the form of a small nodule under the
epithelial layer of the uterus. Four days later the central portion
has a distinct red colour and a pitted appearance, while the periphery
has become elevated to form a thin circular lip around the wide flat
oentre. From this time until the 80th day the cotyledon develope
rapidly: it enlarges and the peripheral lip begins to ourl inward,
thus c1evreae1ng the size of tlle central oup and trapping the foetal
cotyledon which hae come to rest upon the surface of the oup. At
the same time the base of the cotyledon becomes convex and detaches
itaelf from the surrounding tissue to such an extent that finally the
entire cotyledon is attached to the uterine wall merely by a thin
mucosal pendunole.
At about the end of the third month the cotyledons appear to c.
have rea;hed their maximum development. The cups are small and the
rolled-in edges resemble motor-tyrea in miniature. In some instances
the oupa tend to lose their circular shape and become elongated slits.
From this stage onward fairly large blood clots of long standing
are visible in the cups of the cotyledons. Apart from a tendency
to decrease somewhat in aize (partly due to a tighter rolling in of
the«igee) the cotyledons do not undergo fUrther ohange until about
the l40th day, after which the turned-in periphery relaxes and the
whole cotyledon• opena out flat, with the central portion partially
everted and covered with clotted blood. By the 147th day, moat ot
the ootyledona resemble flattened reddiah-black dieoa, while in a
few the eversion has been so marked aa to give the appearance of a
mushroom (similar to the convex cotyledons of the bovine.) At tbia
stage the attachment of the membranes is not firm and they may be
pulled away with ease. Usually the entire central portion of ~he
cotyledon comes away, leaving an empty thin-walled cup.
In the above description only the general appearance of the
Digitised by the University of Pretoria, Library Services, 2012
TABLB 20. LENGTH OF FALLOPIAN TUBBS.
<&roup a . of Ewea : No. ot : Ktan Lepgt4 rq Cez. : Significance Tea£•· _ lio. : Clys : Ewes. : Preg, Side. : Non•preg, Side : Total Groupe : w .or .1. : \\, .Preced,Gr.
1 2 3 4 5 6
1 2 3 4 5 6
: llon-preg : 11 : let llonth: 12 : 2nd tf . 8 . : 3rd .. . 6 . : 4th .. . '7 ' : 5th " . 5 .
Average
TABLE 21,
. . . . . . .. • . : . .
. .
: No, of: : EWf!la . .
: Non-preg : ll : " let Month: 12 . . • : 2nd " . 8 . . .. : 3rd •• . 6 . . .. : 4th ,. . 7 . . . :5th " . 5 . .. .
Average
15.41 15,55 18,00 1'7.&7 1?,64 18,60
16,'73
F;tg 1 Sldl
,21 ,19 .19 .19 .19 ,20
.196
. . . .. . . . • . . . .
. .
15,05 15,88 17.13 17,08 17,5? 1?,90
16,35
. . . . . . . . . . . .
. .
15,23 15,72 17,56 l?.lS 17,61 18,25
DIAMETER OF FALLOPIAN Trr.BXS.
. . • . • . . • . . . .
. • - . -.
XX ,. X JC . X . -.
XX . -• XX . -.
Yean Diamtt'r tq Cf'?. : S1gn1(1canc~ Tests. i Non--pr-- 0 ..a.- • "'-~- .. "--·--- • U ; . ,.._ .. •
41 n----A 1!-
.. . . . . . . . . . . .
. .
,21 ,20 .19 .19 .19 .20
,196
. . t . . . . . .. . •· .
. .
,21 ,20 .19 .19 .19 .20
. . . .. • - • -. . . . . - . -. . . - . -. • . -· . -. . . . - • -. •
~
+
Digitised by the University of Pretoria, Library Services, 2012
64.
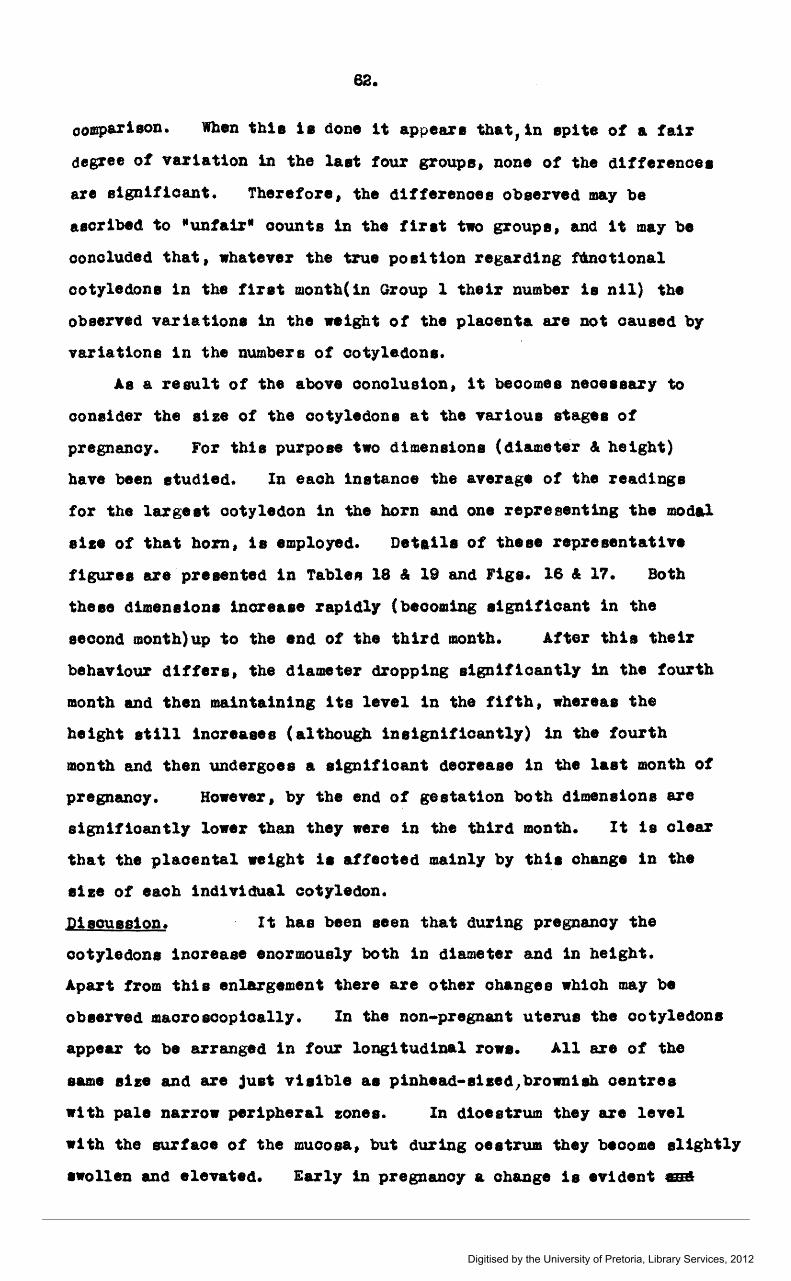
cotyledons at each stage has been mentioned. However, at one and
the same time a variety of phases of developement may be encountered.
This is well illustrated ln the aooompanytng plate (No.3.)
Development is initiated at the aite of implantation and throughout
the progressive stage the largest and best developed cotyledons are
to be found here. In the opp6s1te horn growth is slower and the
maximum ia reached later. In both horne the largest cotyledon• are
found towarde the oentre,while the size deoreaaea towards the ap1cee
and towards the body. In the latter only a few cotyledons are
present and these are but poorly developed. During the last two
months there is practically no difference between the cotyledons of
the pregnant and non-pregnant horne, although the d1fferencea at
different situations 1n the horn peraiet until parturition. The
smaller ootyladona, although slower in growth, appear to reaoh the
eame atage of differentiation aa the largest ones.
The foetal part of the placenta also develop• fairly early.
At the 21st day of pregnancy dull white areas appear on the allanto
ohorion whereYer it touches the surfaces of the maternal cotyledon•·
A few days later these patohea have become almoat opaque and at the
3lat day numerou• oloaely grouped pin-point red spot• .. ~&aaa azaaa
mark out on these areaa the size and shape of the central portion•
of the maternal cotyledons. At this time there 1s a very loose
attachment of membrane to cotyledon. The red epots increase in
size and ooaleeoe and emall vessel• oan be distinguished running
from these oiroumsoribed areaa to the umbilical cord. By the 45th
day these areas have developed into thick d1soa firmly attached to
the outer aurtaoe of the allanto-ohorion. By thia time there ia
a fair deCree of adherenoe between the disoe and the maternal
cotyledons. From now on the edgea of the latter curl inward to
hold the foetal cotyledons firmly in position, thua completing the
cotyledonary attachment.
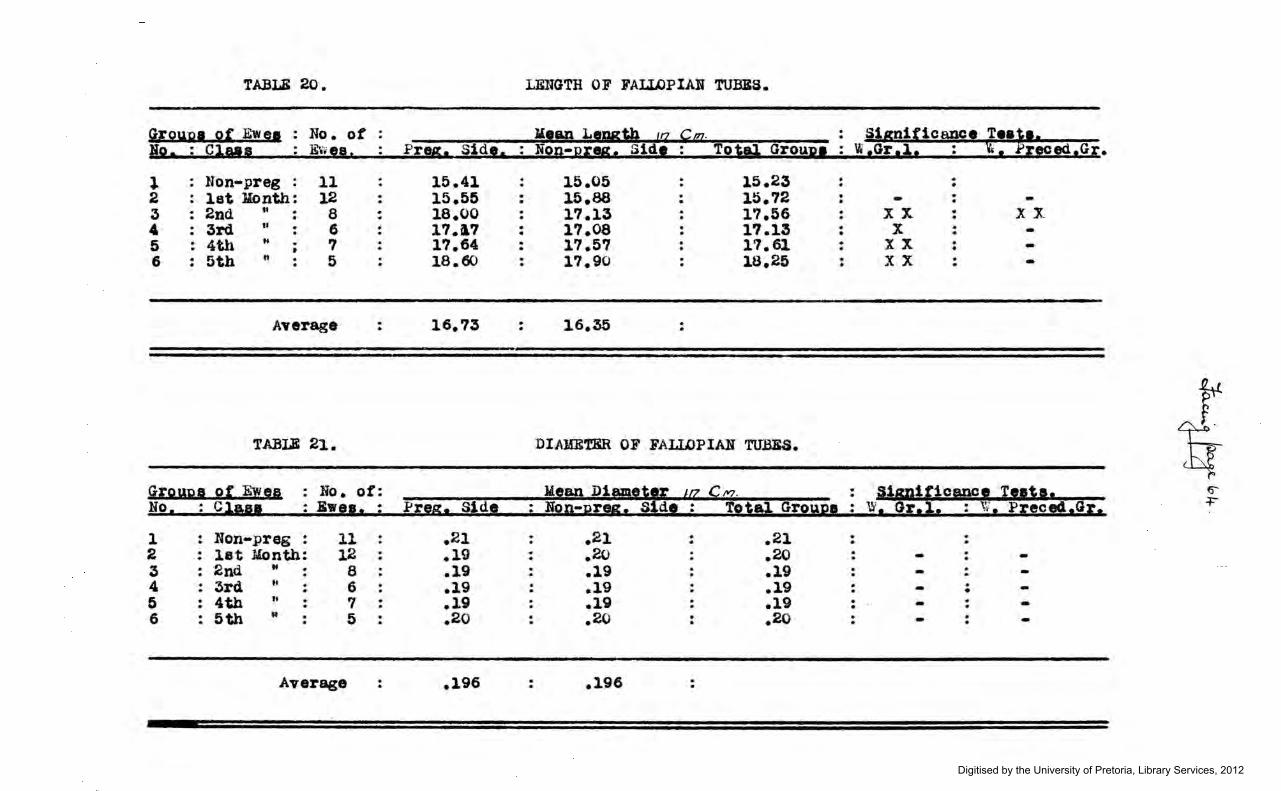
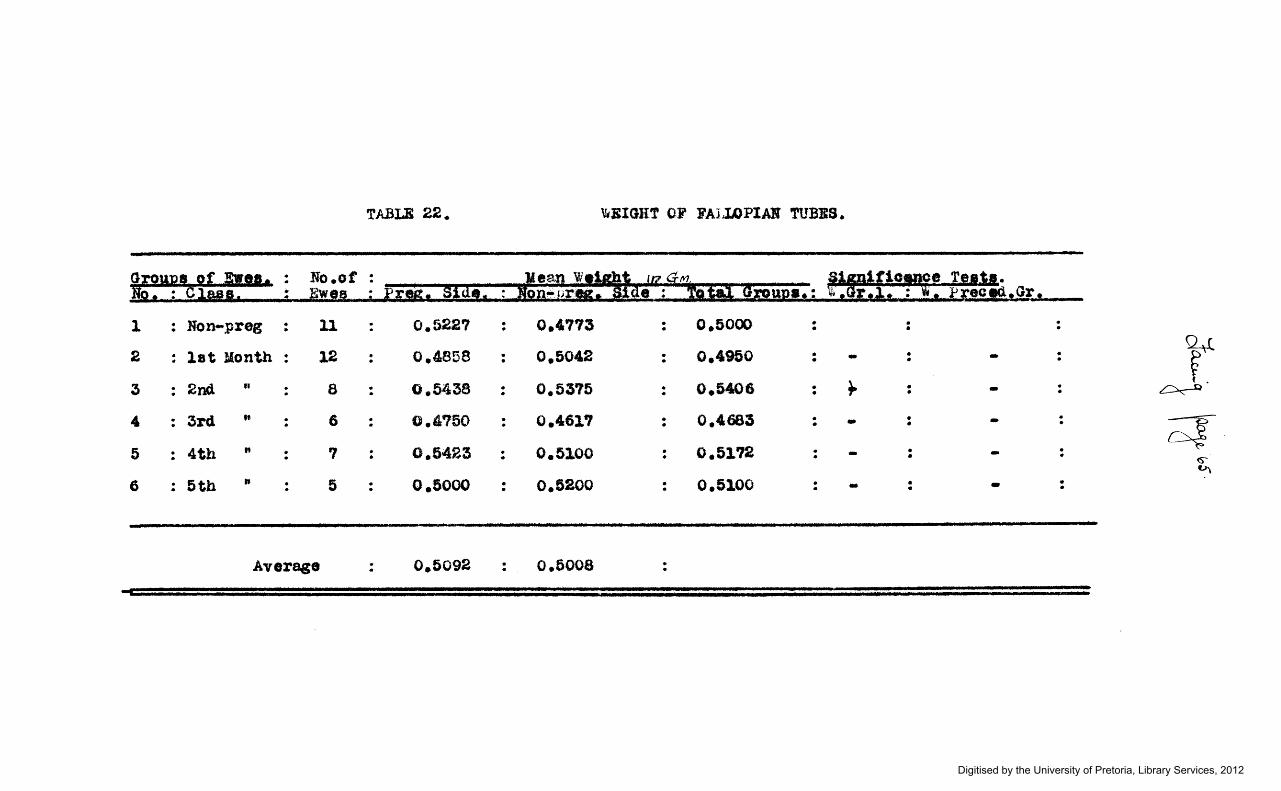
5. FALLOPIAB TUBES.
The tubes were oona1dered from the point of view of length,af
diameter and weight. For each of these cbaraoteriatica an
analysis similar to that described in connection with the ~hiokn•••
Digitised by the University of Pretoria, Library Services, 2012
. . . ..
1 : Non-preg . 11 . 2 : lat Month : 12
3 : 2nd " 8 . . 4 : 3:rd " . 6 . 5 : 4th " . 7 •
6 : 5th tl . 5 .
Average
TABLE 22.
:
. .
. .
. ..
. .
. .
. ..
0.522'7
o.4B58
0.5438
0.4?50
0.5423
0.5000
0.5092
• . . . . •
. .
. .
. .
. .
0.4'173
0.5042
0.5375
0.461?
0.5100
0.5200
0.5008
'hBIGHT o,F FAIJA)PIAB TUBBS •
. .
. . . . . . . . . . .
. .
0.5000 • . 0.4950 .
•
0.5406 . . 0.4683 .
•
0.51'12 . . 0.5100 . .
-~
---
. . • . • - • t . .
. . - ~ . . • - .
~ • . . • . - .
~ "->\
• - . • .
Digitised by the University of Pretoria, Library Services, 2012
65.
of the uterine wall, haa been under~aken and the results are presented
in Tables 20 - 22.
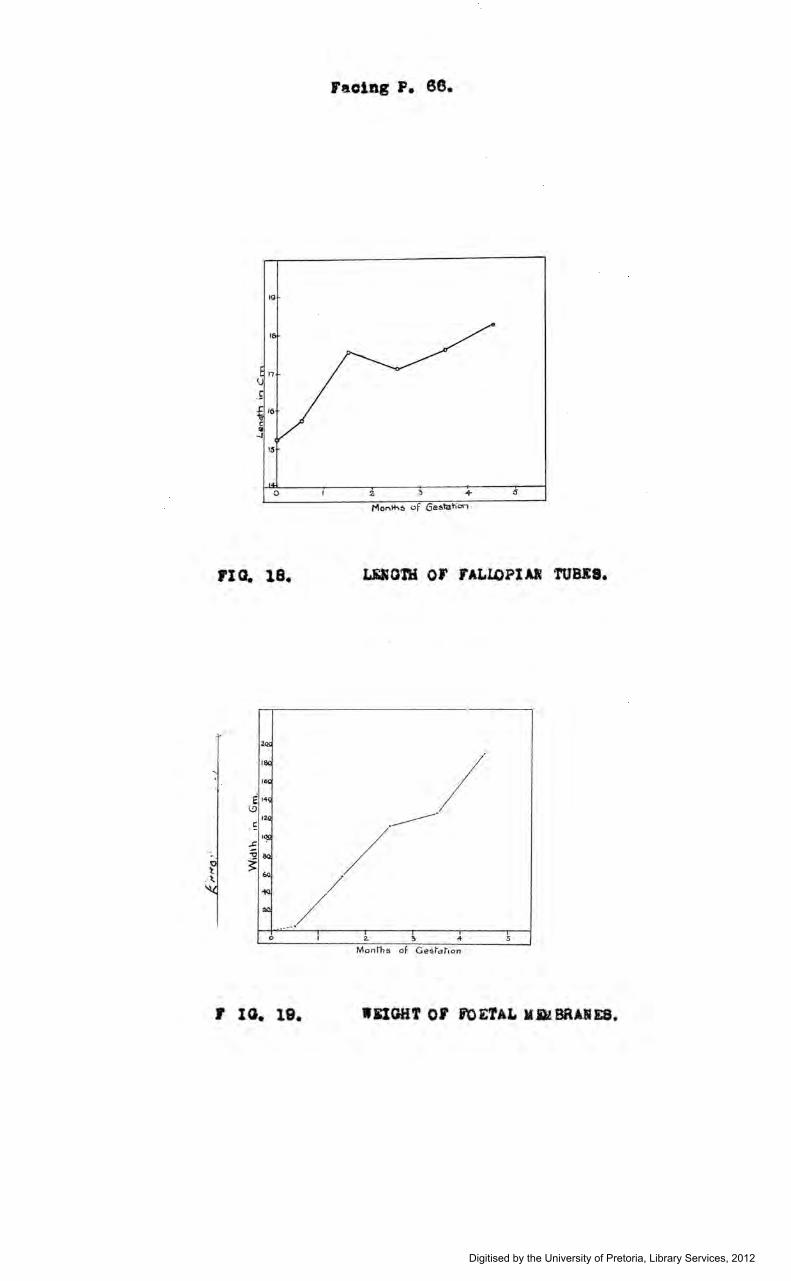
In no instance is it possible to demonstrate any difference
between the tube from the pregnant aide and the opposite one.
However, when the total groups are oonaidere~, algnifioant variations
are encountered. Here the last four groupe are a1gn1f1oantly longer
than the first two, but ahow no real differences among themaelvea.
Thia ia illustrated in F1g.l8. From the second month of gestation
the tube from the pregnant aide is always slightly (but not
significantly) longer than the other.
p1gouas1on. As the increase in length 1a not accompanied by
an inoreaae in weight, actual growth cannot account for the elongation.
It is auggeated that a certain amount of stretching of the tube
occurs early in pregnancy when both curvatures of the horn are
growing steadily. The reason why th1a atretoh1ng does not appear
to oauee a decrease in the diameter of the tube may be that the
latter was measured at the middle of the length, whereae the
etretching is llely to occur mainly at the uterine end of the tube.
It mechanical atretching ·11 the cause of the elongation. then
the latter cannot be :regarded a1 a true change of pregnancy, and
it muat be concluded that it 1e not poae1ble to demonstrate that
gestation hae any effect on the macroscopic appearance of the
Fallopian tubee.
(b) FOETAL KEJ!BRADS & FLUipS.
1. MEKBRANES.
The weights tabulated in Table 23 are those of the two membranes
combined. Theee data are presented graphically in F1g.19. The
rea.on for thto/omieaion of Group 1 ia obvious.
The membranea grow rapidly until the end of the third month;
in the following month there ia hardly any increase in weight, and
then in the last month the rate of 1noreaae exceeds that of any of
the previous montbe. Attention 1e directed to the flattening of
Digitised by the University of Pretoria, Library Services, 2012
Facing P. 68.
19
Monlh!l of Ge~tation ·
rxo. 1&.
2Q!;
ISC ; · 16,
14~
12,
·-------· ·~ / 8<l
6Q
1Q ./ 20
- ~
0 I 2. ~ 4 5
r to. 11. WIIOHT 01 fOETAL MaBRA!IES.
Digitised by the University of Pretoria, Library Services, 2012
66.
the graph during the fourth month. thia being similar to what 1a
observed in connection with the growth of the uterua.
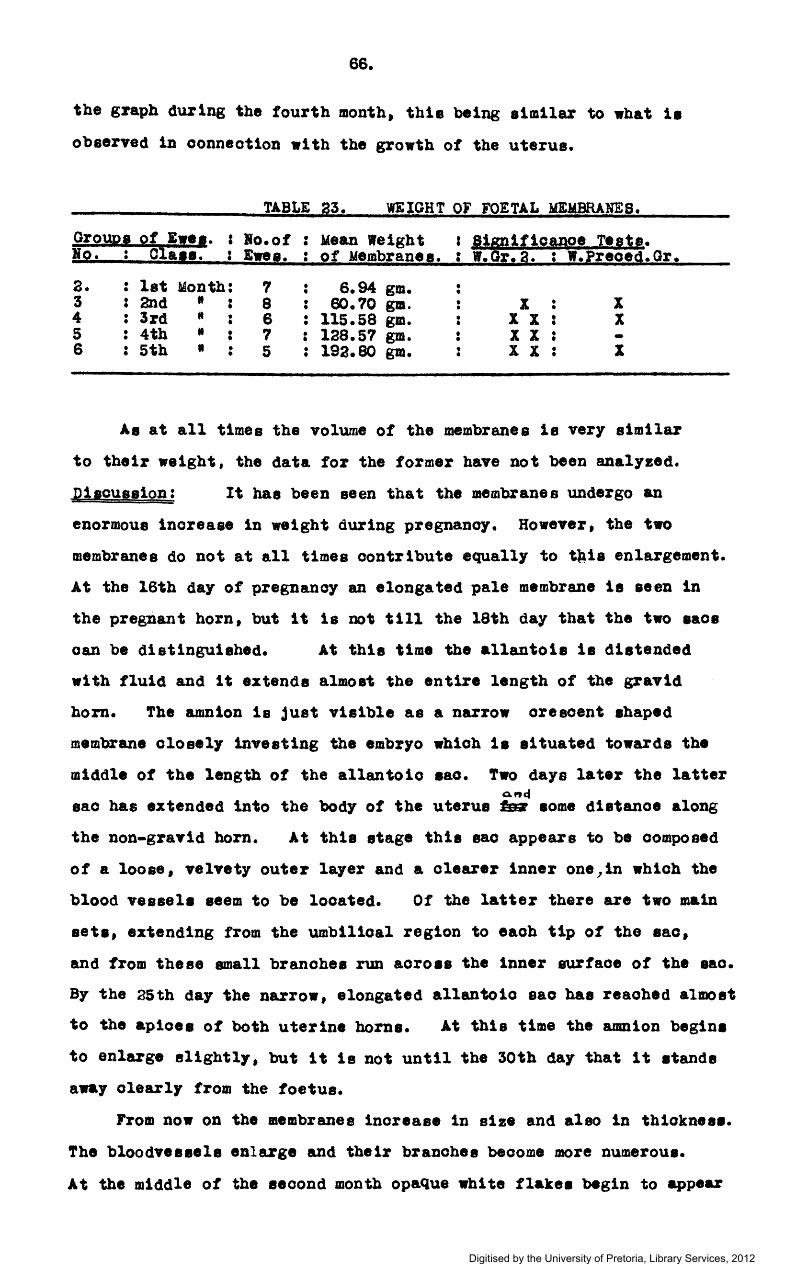
TABLE 23. WEIGHT OF FOETAL !lEMBRANES.
Group• of Ewea. : No.of : Mean Weight 1 S1~1f1oanpe T!ste. lo. : Olate. : Ewes. : of Membranea. : w.~.a. : W.Preoed.Gr.
a. 3 4 5 6
: let Month: 7 : 2nd • : 8
3rd 1 : 6 : 4th " : 7 : 5th • : 5
• • 6.94 gm • • • eo. 70 gm. : 115.58 gm. : 128.57 gm. : 192.80 gm.
• • • • • • • • :
lt • • X I : X X X X :
X X -X
Ae at all times the volume of the membranes is very similar
to their weight, the data for the former have not been analyzed.
Diaouaaion: It has been seen that the membranes undergo an
enormous increase in weight during pregnancy. HoweYer, the two
membranes do not at all times contribute equally to tAia enlargement.
At the 16th day of pregnancy an elongated pale membrane ie seen in
the pregnant horn, but it is not till the 18th day that the two aaca
oan be d1st1ngu1ahed. At this time the allantois ie distended
with fluid and it extends almoat the entire length of the gravid
horn. The amnion ia just visible as a narrow oreecent ehaped
membrane oloaelJ investing the embryo which ia aituated towards the
middle of the length of the allantoic aao. Two days later the latter Q."q
aao has extended into the body of the uterua ~ eome d1atanoe along
the non-graYid horn. At th1a stage thle sao appears to be composed
of a loose, velvety outer layer and a clearer inner one 7 1n which the
blood vessel• seem to be located. Of the latter there are two main
aeta, extending from the umbilical region to each tip of the sao,
and from these small branchea run aoroes the inner surface of the aao.
By the 25th day the narrow, elongated allantoic sao has reached almost
to the apioea of both uterine horne. At this time the amnion begin•
to enlarge elightl7, but it 1a not until the 30th day that it •tande
away clearly from the foetus.
From now on the membranes increase 1n size and also in th1ckne••·
The bloodveaaela enlarge and their branohee become more numerous.
At the middle of the second month opaQue white flakea begin to appear
Digitised by the University of Pretoria, Library Services, 2012
TAB.L'B 24. VOLUKBS OF FO~ FLUIDS.
2 : let Uonth : 9 ~ 24.11 ·• " 1: 1.5 . • . . • • • .
3 : 2nd " • 8 ~ 93.63 . .. . ·- : 112.69 . X . X . " . ... • . •
1 4 : 3rd .. . 5 t 185.20 .. X . - ~ 698.00 . XX . XX. . . . • . . . 5 : 4th ,, . 7 ~ 34'7.29 .. XX ·jl! - : 525.?1 . XX . XX . . . • • . . 6 : 5th .. . 5 k 762.00 .. XX • XX : 329.00 . XX . XX .
~ . . . . • . ~ -;-1.
Digitised by the University of Pretoria, Library Services, 2012
67.
on the surface ot the allantoic membrane. These are aeen first 1n the
region over the foetua, from where they spread towards the tipe.
They are neTer eo dense aa to impair seriously the transparency of the
membrane. low too the necrotic t1pa of the allanto-ohorion a:re
plainly visible. At the 66th day the amnion baa enlarged to auoh an
extent as to bring the central zone of ita outer surface into direct c bol' ICJ/7 a..Zlan lo -c bot-/(JO/C -:5_foce
contact with the overlying parts of the •'''"'ote. Thua the"lattez la
divided' into two compartments which communicate with eaob other,and
with the urachus by means of a narrow tube-like cavity.
Until the lOOth day both sacs are well filled with fluid,blnoe
the membranes are tense. After this time the same degree of d1stena1on
is apparently not maintained, so that by the end of the fourth month
the saoa appear slightly collapsed. Zspeo1allJ is this the oaae with
the amnion. The membranes are now relatively thick and fairly strong.
Till the end of gestation they remain colourless and more-or-leae
transparent.
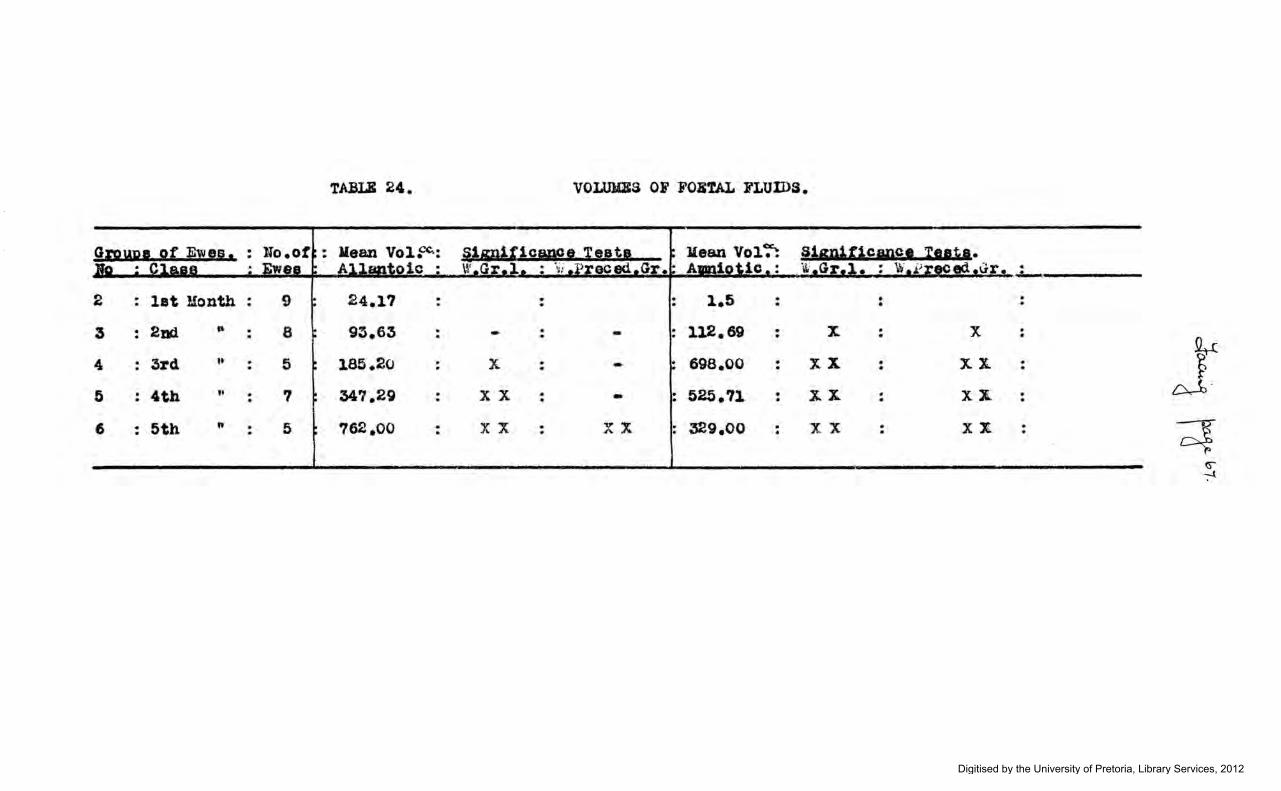
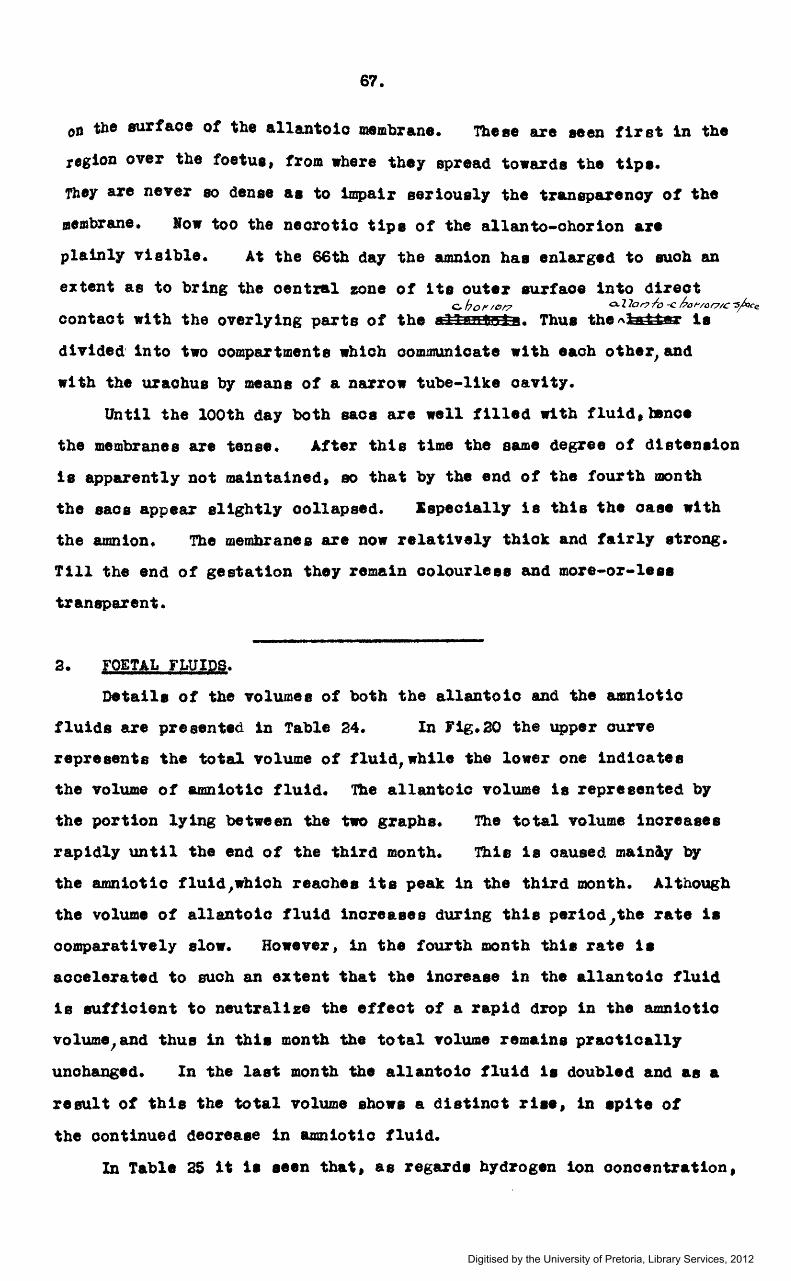
2. FOETAL FLUIDS.
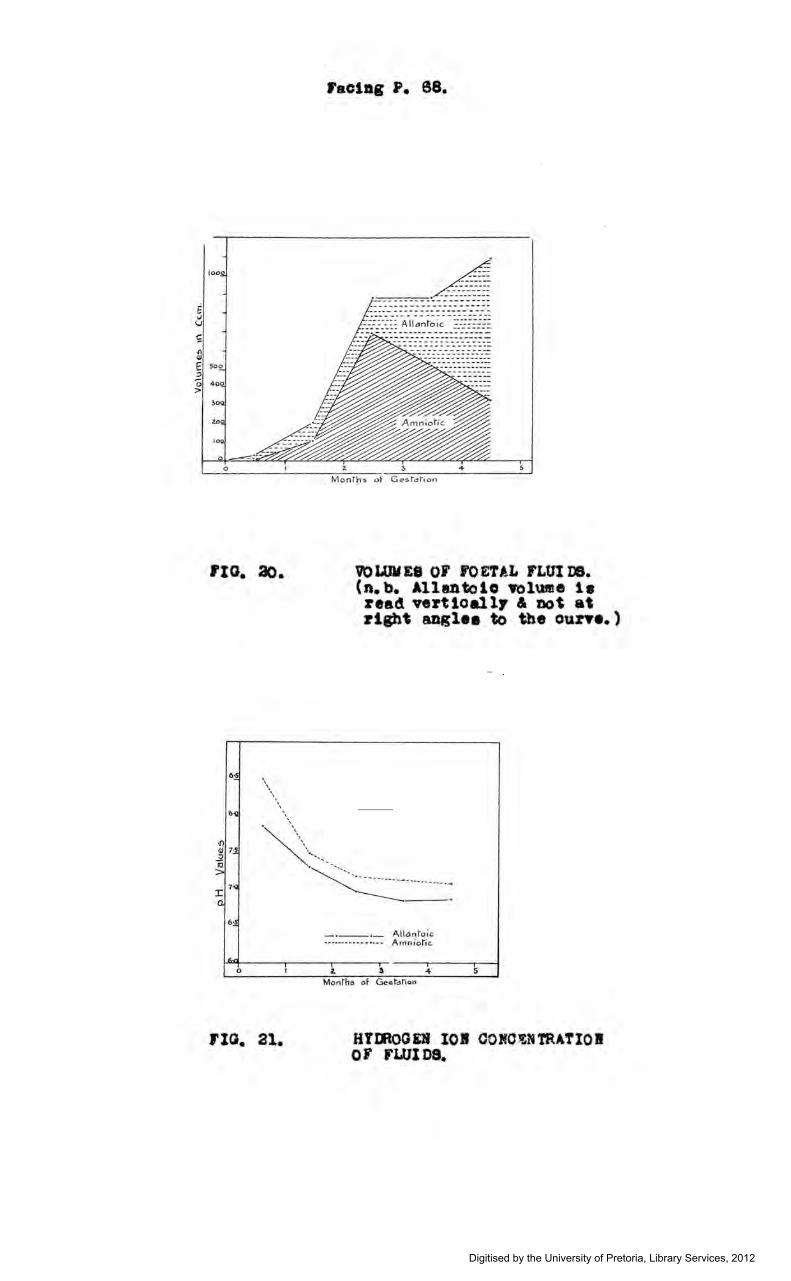
Details of the volumes of both the allantoic and the amniotic
fluids are presented 1n Table 24. In Flg.ao the upper curve
represents the total volume of flu1d,wb1le ~he lower one indioatea
the volume of amniotic fluid. The allantoic volume ia represented by
the portion lying between the two graphs.
rapidly until the end of the third month.
The total volume increases
This is caused mainly by
the amniotic flu1d,wh1oh reaches ita peak in the third month. Although
the volume of allantoic fluid increases during this per1od~the rate 1•
comparatively slow. However, 1n the fourth month tbla rate i•
accelerated to such an extent that the increase in the allantoic fluid
1s sufficient to neutralize the effect of a rapid drop in the amniotic
volume,and thus in thia month the total volume remains practically
unchanged. In the last month the allantoic fluid 1• doubled and ae a
result ot this the total volume abowa a distinct rl•e, 1n epite of
the continued decrease in amniotic fluid.
In Table 25 1~ 1a aeen that, as regard• hydrogen ion concentration,
Digitised by the University of Pretoria, Library Services, 2012
rxo. ao.
\
\
ractag p. ea.
VOWM!S or FOETAL fLUI DB. (n. b. Allan toto YolUJte ts ~ead ve~t1oallr & DO' at rtlbt anglee to the oune. )
I{)
~ 7:§.
10 .""' \\ .... ~-~-· ·· --.... -.. ... . ... . . >
I 7·-.
d.
0
FIG. 21.
\
---- .
-·--·- Allan~oic -·-·-------- ---- Amniotic
2. 4 5 Months of Gee.~.,t.on
HYIROGEH 101 OOMO.!NTRATIOI OF FWIDS.
Digitised by the University of Pretoria, Library Services, 2012
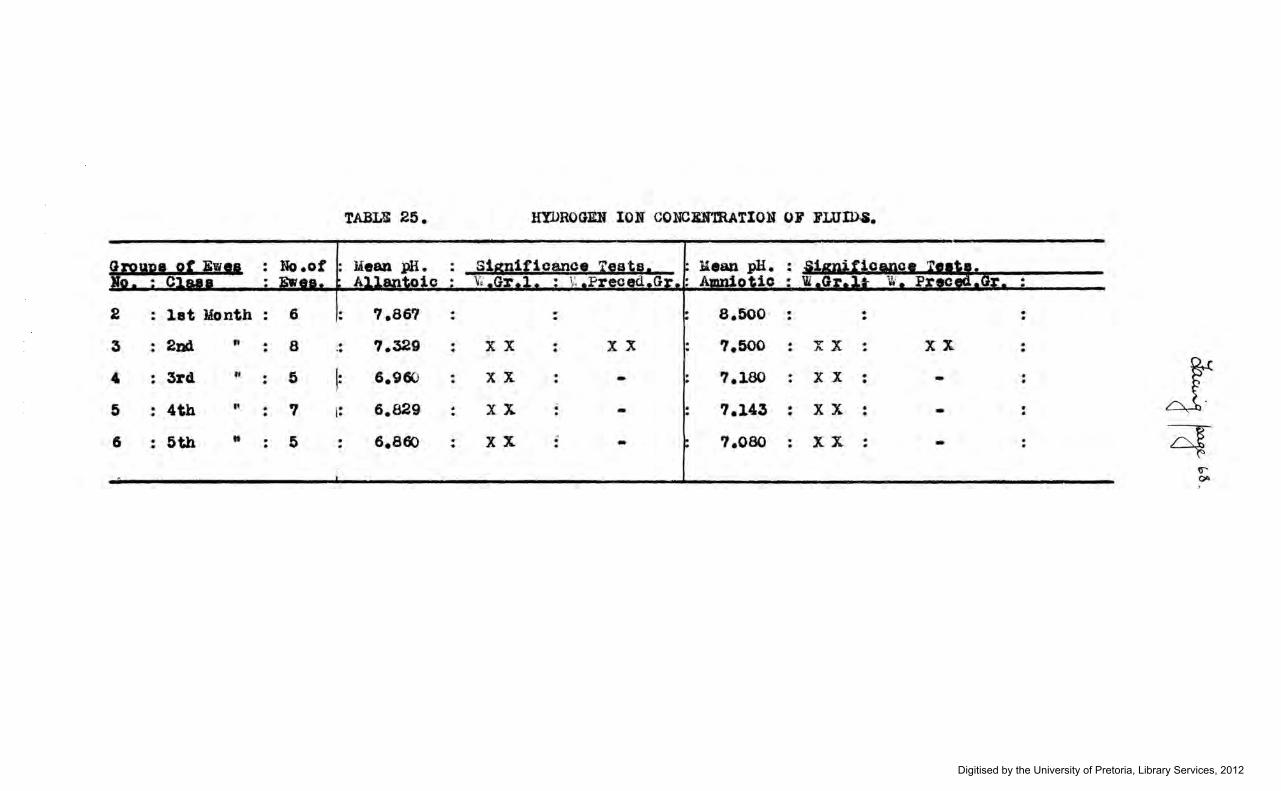
TABLE 25. HYllROGlm ION CONCDTRATION OJ' FLUIDS.
2 : let Month : 6 1: 7 .86'1 . •
t 8.500 • . . . . . • .
3 :2nd " . 8 :. ?.329 . XX -· XX '7.500 . XX .. XX . .. • • . . 4 : 3rc1 If . 5 1: 6.960 . XX . - . 7.180 . X X . - . J . . . . . • . 5 : 4th " .
' ,. 6.829 . XX • - . ?.143 . XX . - . . I• . . . • • .
6 :5th .. . 5 ·• 6.860 . XX . -- ?.080 . XX . - . ~ . . • . . . . ~ CIA
Digitised by the University of Pretoria, Library Services, 2012
68.
there are differences between the two fluids; also 1n eaoh fluid tble
concentration deoreaaea with the advance of gestation. However, in
both flulda, this reduction ia significant only in the aeoond month,
afte~ which the variations are alight.
in F1g.21.
Tbeae facta are illustrated
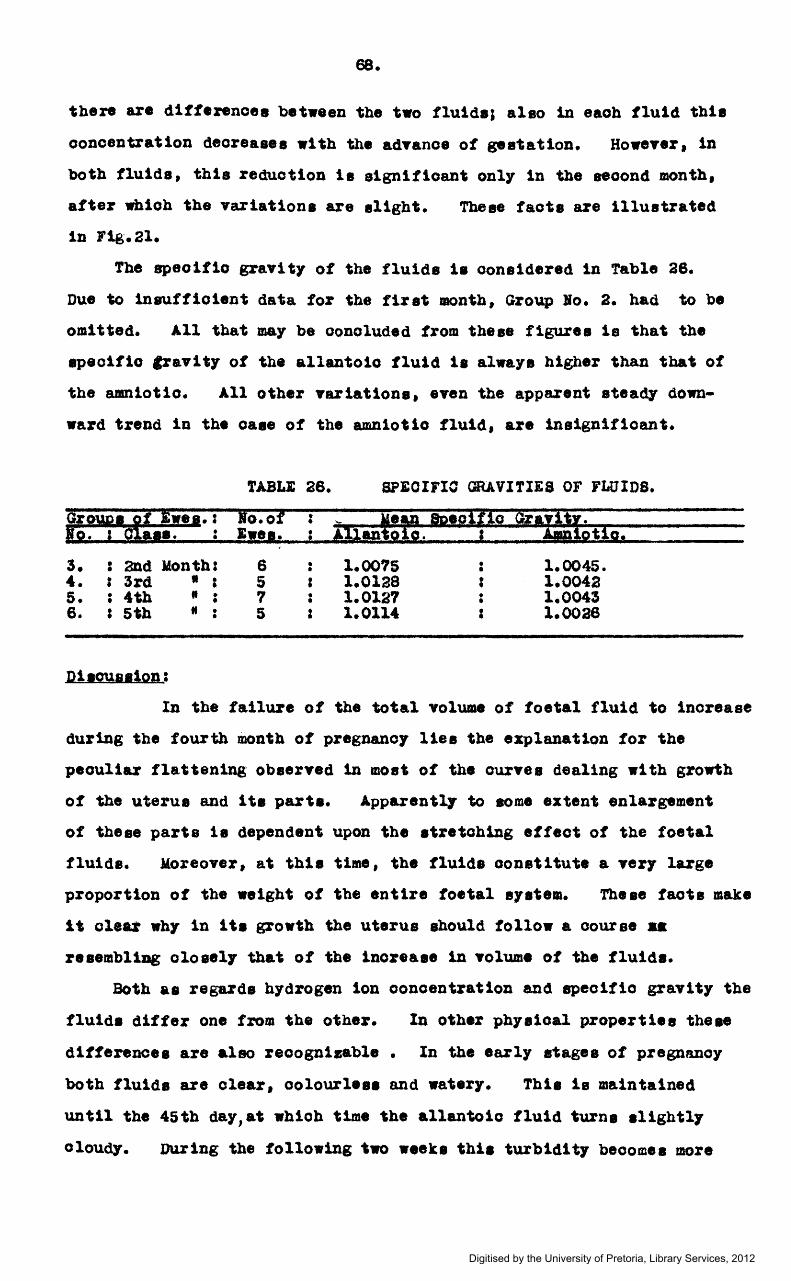
The apeo1f1o gravity of the fluids ia considered in Table 28.
Due \o insufficient data for the firat month, Group Jo. a. had to be
omitted. All that may be oonoluded from tbeee figures is that the
apeoifio Cravi~y of the allantoic fluid ia always higher than that of
the amniotic. All other variations, even the apparent steady down-
wa~d trend in the oaae of the amniotic fluid, are insignificant.
'l'ABLZ 26. SPEOIFIO GRAVITIES OF FLUIDS.
fi~'a!!8!!'•·; iO.of : ~ ~'J; Sptolf&o gl;'l!ft. h•l· AXl'LO . pt{q.
3. : 2Dd lrlonth: 6 • 1.0075 • 1.0045. • • 4. : 3rd • I 5 : 1.0128 ' 1.0042 5. • 4th • • 7 • 1.012'1 • 1.0043 • • • • 6. : 5th ff • 5 : 1.0114 I 1.ooae •
D110U&I10D:
In the failure of the total volume of foetal fluid to increase
duriDg the fourth month of pregnancy liea the explanation for the
peculiar flattening obaerved 1n most of the ourvea dealing with growth
of the uterus and ita parta. Apparentl.J 'to some extent enlargement
of these parts ia dependent upon the atretch1ng effect of the foetal
fluida. Moreover, at th1e time, the fluida oonstitute a very large
proportion of the weight of the entire foetal eratem. Theae faota make
it oleat why in ite growth the uterus should follow a course aa
reaembliag oloselr that of the 1noreaae 1n volume ot the fluide.
Both as regards hydrogen ion concentration and apeo1f1o gravity the
fluid• differ one from the other. In other phyeioal properties theae
differences are alao recognizable • In the eazlr stages of pregnancy
both fluids are clear, oolourl•a• and watery. Th1a ia maintained
until the 45th day,at wh1oh time the allantoic fluid turns aligbtlr
clouey. During the following two weeke thia turbidit.y becomea more
Digitised by the University of Pretoria, Library Services, 2012
2·0
Conhnuou5 line drawn to fotmula ~ ~ g - ~16., )l- 0"4·65~.X.1 -:t~ • 911~
• Repre.senl~ ftduo\ Ob:;ewation
.2·5 ~·0 3·5 -+ ·O
Nlltutal Lo'lz:tril-h!Tl of Aqe. ~
FIG. 23. PARAJilLA 01 BIOORD OROIR FITTID TO U>GARlflDIIC VALUES Of •liGHt' & AG&; DATA.
Digitised by the University of Pretoria, Library Services, 2012
89.
pronounced and a lemon tinge appeare in the previoualJ oolourleae
fluid. This beoomee more 1ntenae ,and then gradually ohangee
~o amber. At the Slat day it 1a difficult to decide whioh of the
two colours ie preaent, but a week later there ie no longer any
doubt. The bright ambez colour then eeen darken• into a goldeD
brown, whioh ehade 1a encountered throughout the remainder of the
period. The turbidity previously mentioned 1noreaeee until the
end of the third month, as doea the visooeity. During the laettJro
months·, the fluid again becomes watery, clear and practically
traneparent.
In the amniotic fluid the lemon tinge is v1a1ble at the 52Dd
day. Within a abort time 1t has changed to amber, but the latter
shade ia never very deep 9 DUring the fourth month the amber colour
dieappeara and the .fluid acquires a very light green colour. ·xn
the meantime the v1ecos1ty and the turbidity have increased so that
by the end of the fourth month the amniotic fluid is thick and
•ayrupya and very cloudy. The colour varies from a pale green to
a dirty white. During the later stages a fair amount of meconium
is found 1n the amniotic fluid.
( o) fOETUS.
All ~etails regarding age, weight snd dimeneione of the
entire eeries of foetuses are presented in tabulAr form in
Appendix A. The trends.of the growth processes exhibited by
these observation& are beat studied through the procese of curve-
fitting. In order not to complicate the te%t with statistical
teohn1ca11t1es all details of the procedure adopted hsve been
relegated to Appendix s,. e a t J t p 1 a 1&9!: • •t t ' f '1.
1. GROWTH IN WEIGHT.
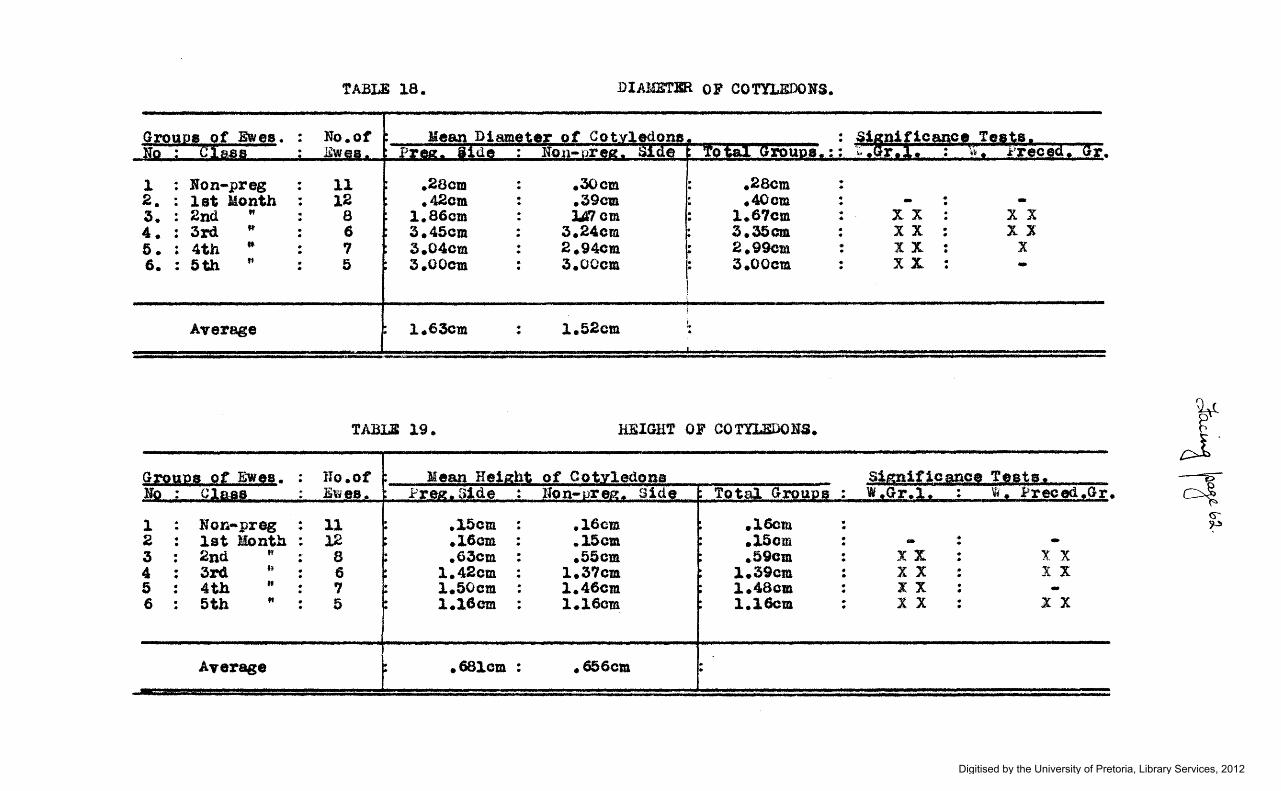
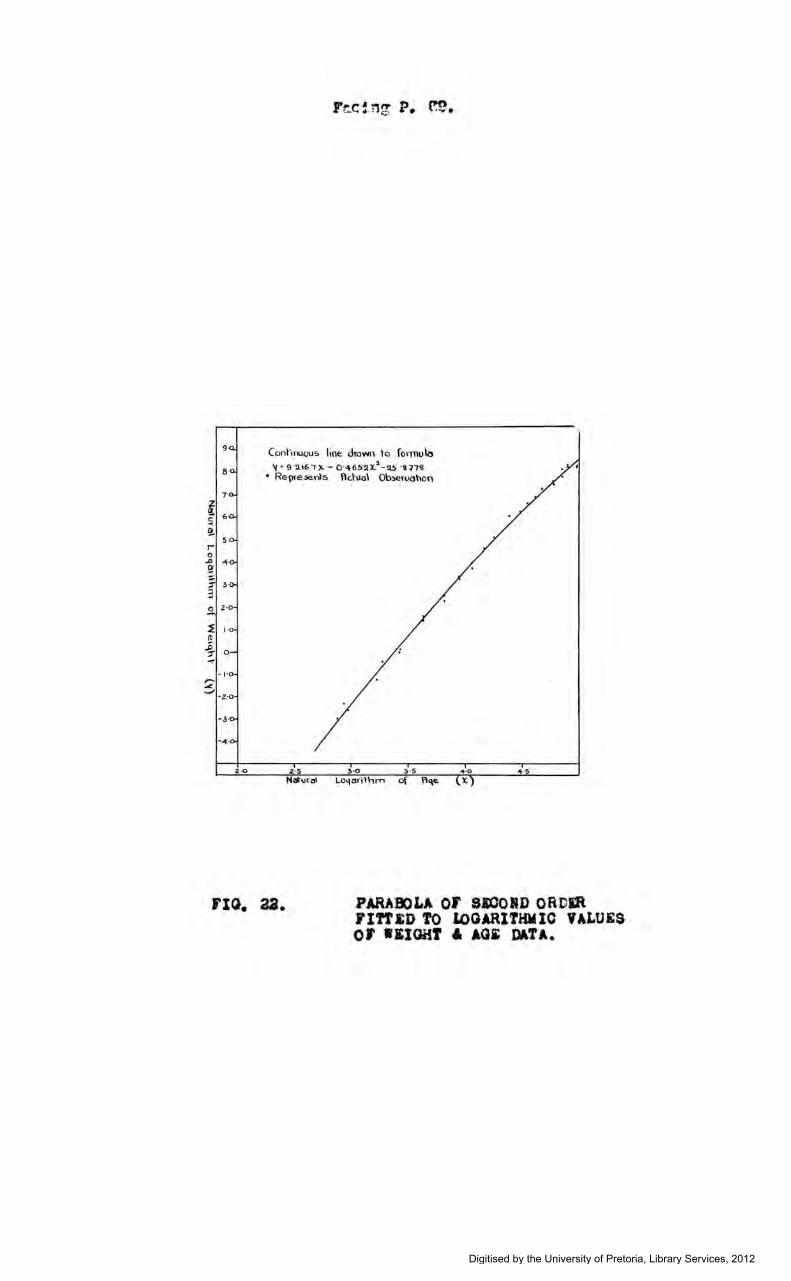
MacDowell et al (1927) maintain that when for a series of
foetuses the natural logarithms of age are plotted against those
of the corresponding weights s straight line distribution results.
However, in their work age 1e calculated not !rom the moment of
Digitised by the University of Pretoria, Library Services, 2012
Continuous \\ne draV'4n to fmmu\a Loqe "{ = 9 ·~161 Lo(\e x. -o ·-+65~ (Loqe:x.Y-~ssl7'3
fiG. 23.
Foe\· a\ Aqe in Days (x)
PARA!OLA OF SECORD OROIR J'ITTED ·ro AOTUAL VAWES or lEIGHT & AGE DATA.
Digitised by the University of Pretoria, Library Services, 2012
70.
fertilization of the ovum, but from the time of formation of the
"embryo proper.• 1 So distinct is the line~r trend of the data
in fig. 22 that one 1e led to surmise that, in spite of the
difference in the method of computation of age, here too the gener&l
type of i\iacDowell's formula will hold good. Moreover, it ia
possible to fit such a parabola (of the f1ret order) to the data
and to obtain a result aign1fiosnt at 1~ probsbil1ty. Mevertllelesa,
the points representing the actual obeerYatione sre not evenly
scattered about this straight line. lhen, by the uee of anti-
logarithms, a weight-age curve is constructed from the formula it
becomes quite evident that the formula in question doee not give a
good representation of the trend of the data. Towarde the latter
end of the period the curve rises much too steeply and thus paesee
well to the left of all the aotual observations.
In view of the aboYe it becomes neoeasary to test the "fit•
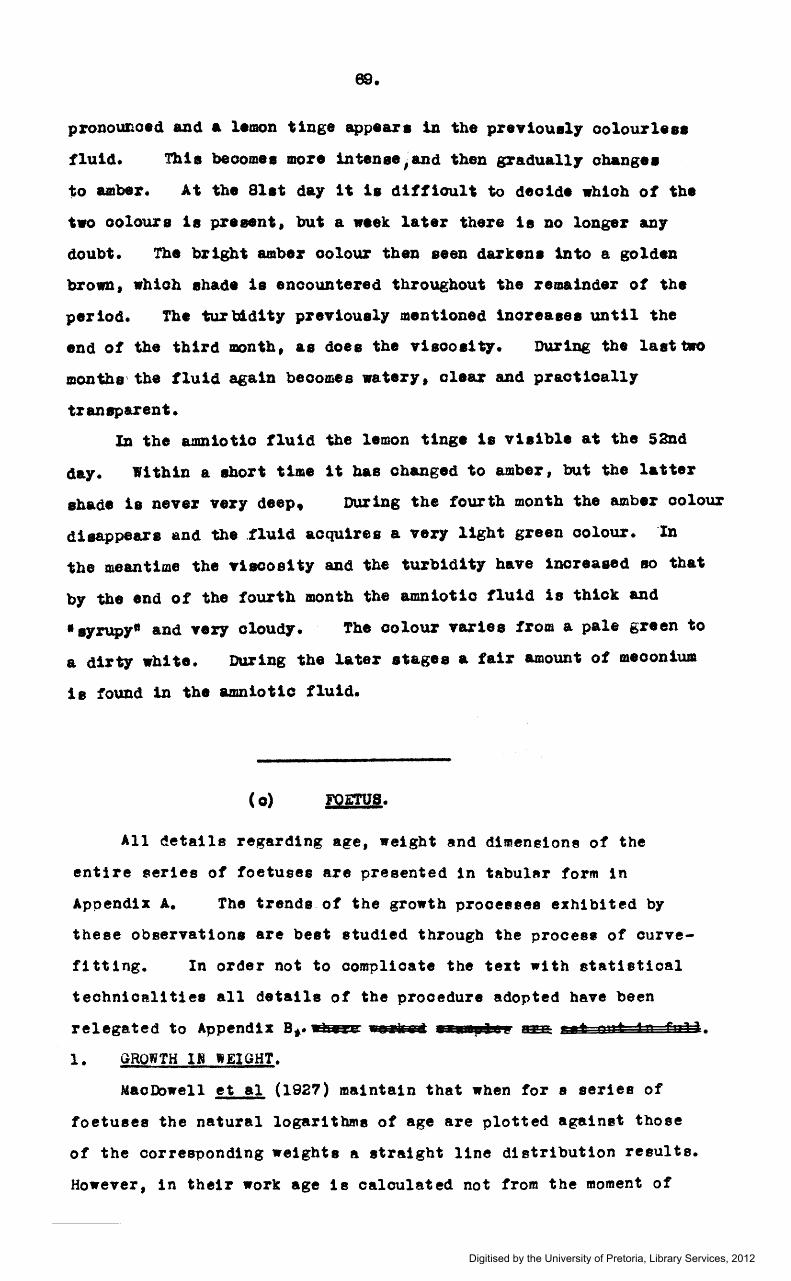
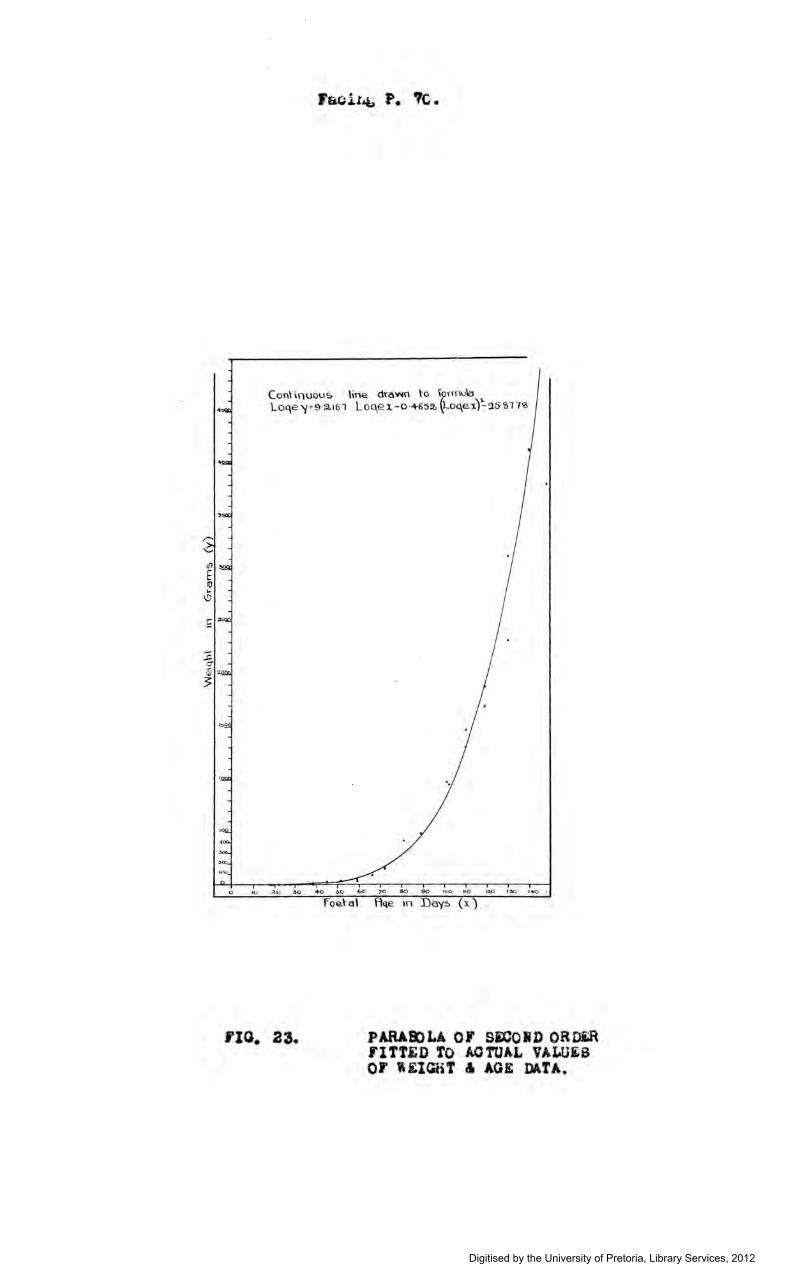
of a pArabola of the second order. The regression formula obtained
ie :--
Log e Wt = 9.2167 Log 8
Age - 0.4852 (Log e Age) 2 - 25.8778,
and the continuous line in Fig. 22 is drawn from it. Both !Rotors
b1 and b2 (eee Appendix B) are highly slgn1f1oant (at P = .01),
while the coefficient of vari~tion ie 20.07~, which is 4~ lower than
that of the straight-line formula. Both in fig 22, snd in the
weigbt-sge curve in fig. 23 1 the actual data 8re well scattered around
the curves, indicating that the formula from which these curves Are
constructed gives a true representation of the trend of the data.
The figure for the coefficient of variation (20%) is etill high, but,
in view of the large var1fttions in the original data (see differences
in weights of foetuses of identical age) this is only to be erpeoted.
fitting to a further degree will certainly not bring about any
improvement and will only serve to complicate the formula. cone ]add
It is , o ' iJ st that the age and weight da.ta obtained from the
seriee of Merino foetuses are best fitted by a parabola of the eeoond
order. This type of formula produoee a curve with two inflections,
X Probably the stage with tbe primitive axis eatabllehed a~ w1th the
formation of somitee just commencing.
Digitised by the University of Pretoria, Library Services, 2012

Digitised by the University of Pretoria, Library Services, 2012

Digitised by the University of Pretoria, Library Services, 2012
9
8
7
6
.,.
2.
0 .....J
~ .:2 0 '0 z
-I
-2.
-3
-4
\ \ \
\ \ \ \ \ \
raolnc P. ?2.
....... .....................
....... ........ _ lnst.:sntaneous Growth Curve Percent.:sqe Growth R.,te
25
zo
5 --._ - -· 0
o 10 zo 3o 40 50 6o 70 so 90 100 110 ow o~o 140 1!:'>0
FIG. 25.
Foetdl Aqe ·In doys
TIO OURV&s to liDIOATI !H:I DlS'l'itiStrfiOI Of log8 WIIGHf AGAlJIST AG&, & . R&LA.flVE PERCJ:MTAOI: CROITH. RAT& CALCULATED 01 A DAILY BASIS AT TiDtTY G\Y XlfTIRVALS.
Digitised by the University of Pretoria, Library Services, 2012
72.
fallacious oomputationa so often encountered in works of this
nature, it is essential to remember that, by virtue of the oonstsntly
changing mass of the growing foetus, it is impossible to arrive at
a true determination of the percentage growth-rate through any
calculation based upon the Heimple interest• conception. The
errors introduced by such methode are exposed by Brody (l927a) who
shows that the rates ~ent1oned by Minot (1908) are all too high, and
that the exaggeration ie greatest when the rate ie highest and wben
the time interval between eucoeseive observations is long.
The growth prooeee 1a beet likened to the increase of capital s •et out at interest which ie being compounded instantaneously i.e.
the increment for one instant forming part of the capital for the
following 1natant. How·ever, the rate of interest (which is the
peroenta.ge growth-rate) does not remain fixed, but ie eubj eot to
change during the course of prenatal life.
Brody (1927a) appears to have been the first investigator to
appreciate these facta. By recourse to the calculus he is able to
demonstrate that the graph resulting from the plotting of the
natural logarithms of weight against age actually represents the
trend of the instantaneous growih-rate 1 and that the slope of the curve
at any point is an indication of the growth-rate at that moment.
from the data at his disposal Brody (1927b) concludes that
euoh instantaneous growth-rate curves are composed of several
segments eet at va.rying and decreasing slope. Thus he maintains
that the growth-rste remains steady over a considerable period 3nd
then changes abruptly to & lower level.
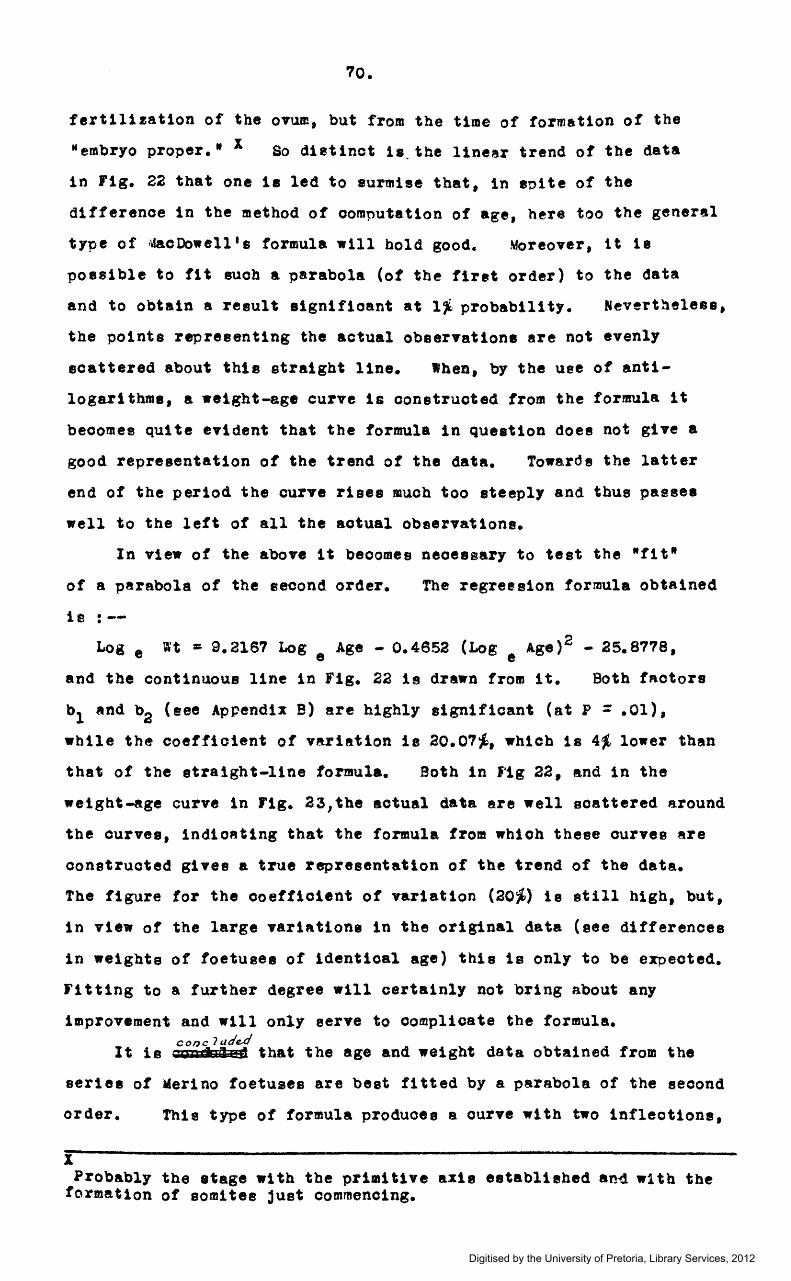
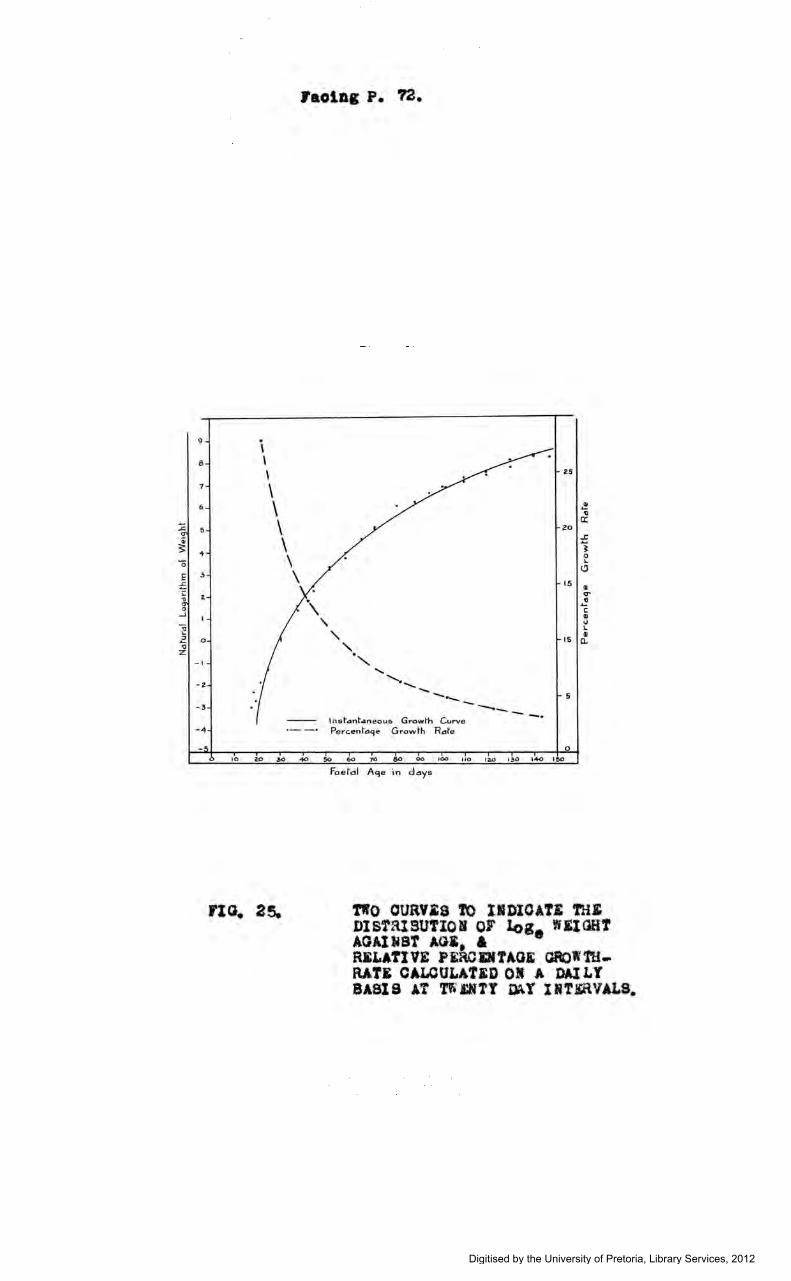
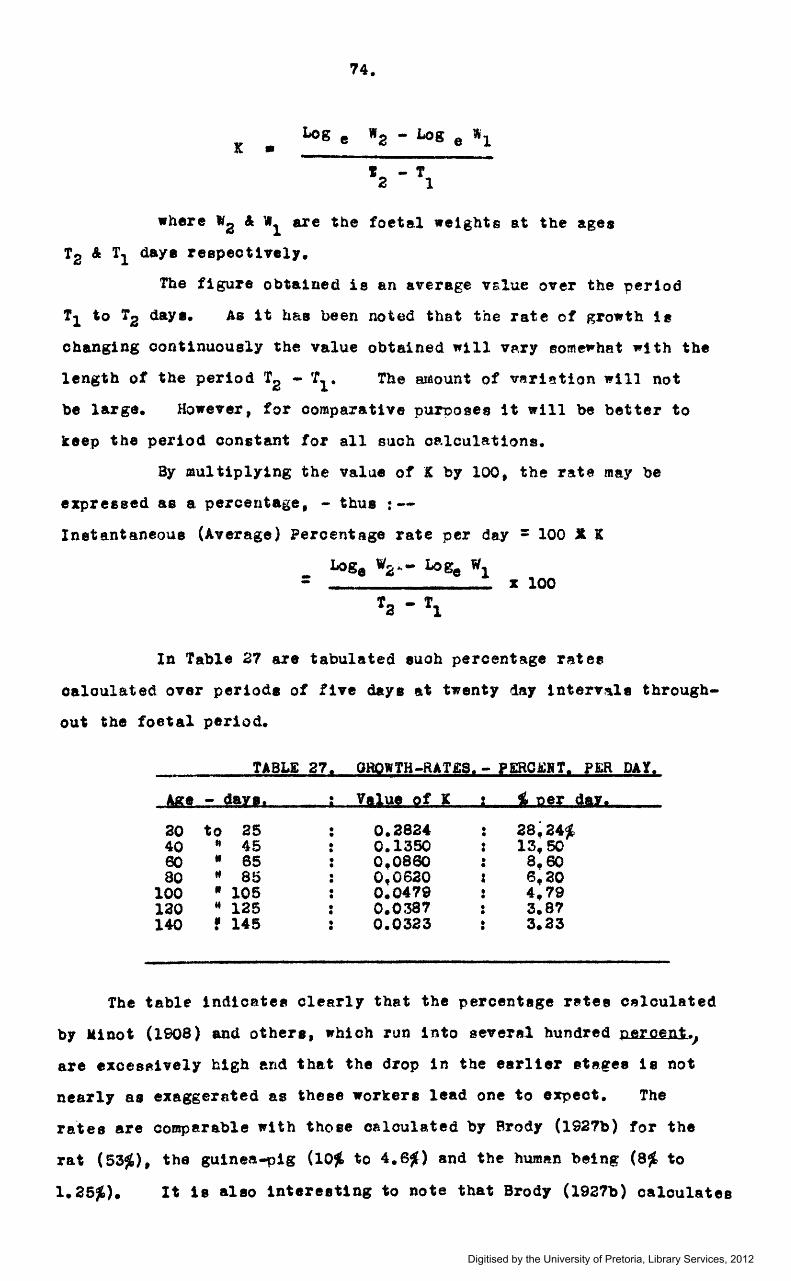
In Fig. 25 ie presented the curve for inetsntftneoue growth of
the Merino foetue. Tbe dots represent the actual obeervations,
while the continuous line is drawn through points obt~ined by
plotting weight values calculated from the formula previously
mentioned. It is observed that the resulting gTaph is a smooth
curve concave to the axis of the figure. This is contrary to Brody's
findings for here there 1m no evidence of straight segments. Here
the decrease in the rate of growth is spread evenly over the entire t~I'M
n• rt 1t! and is not lim1 ted to certain very short and well defined
Digitised by the University of Pretoria, Library Services, 2012

73.
periods. It 18 hardly likely thst the difference in theee findings
is attributable to the species on which the obeervationa h&ve been
made. Not only doea Brody's work cover a wide r&nge (the rat, the
guinea-pig, the ohiok and man) but also regarding the bovine similar
re~ults are claimed by Kialovaky & Larchin (1931.) On the other
hand, in their work on the mouse,MacDowell et al (1927) ~resent a
curve almo~t tdenttal with that in Fig. 25. There 1a much point in
theee authort• or1t1ciam of Brody 1 e wort, namely that the data on
which he relied were uns~tisfactory,~nd that he failed to realise
that any ourve may be approximated by a aeries of etraight linea.
Both Brody and KieloYsky & Larchin merely plot their dats on .a.. ~itblog paper and then draw their atraigbt linea by inspection.
Brody (1927a) aotu~lly olaime for this method the apecial merit
of keeping tbe normal trend of the d&ts more prominently under
cone1deret1on, as compared with the tendency in the method of least
tQueree of etreRP1ng the devi&tions from th1a normal trend.
However, hie argument• do not appear to affect the present situation,
1n which both the actual d~t8 Rnd the 1 f1tted 1 data are plotted.
When it is observed lth~t the numbers of observations in Brody's
and in Kisloveky & Laroh1n's •orke are limited,snd that there·are
fair deviations from the .,.ctual linea drawn, then 1 t must be
realised thet their conolu~t~na Are open to cr1t1c1am.
It is significant that in the preeent investigation and in
Mao Dowell's work, where effort a h8.ve been made to 11m1 t the factors
likely to cause variations in foetal weight, and. where relativelr
large numbers of obeervstione haye been recorded, smooth ourvee are
obtained. further, it is ap~arent from fig. 25 that when the chance
dev1at1one from t~e general trend are eliminated then the plotted
points all fall directly on a smooth ourve.
It must be concluded that the weight of evidence ia agsinat the
occurenoe of abrupt "breake" in the growth-rate. In the sheep
definitely (and moat probably in other mammal• too) the rate deoreaas
1n a atea¢1 and regular mftnner throughout the course of prenatal life.
The instBntaneoue relative growth-rate (designated I) may be
calculated on a daily basia from the following formula :--
Digitised by the University of Pretoria, Library Services, 2012
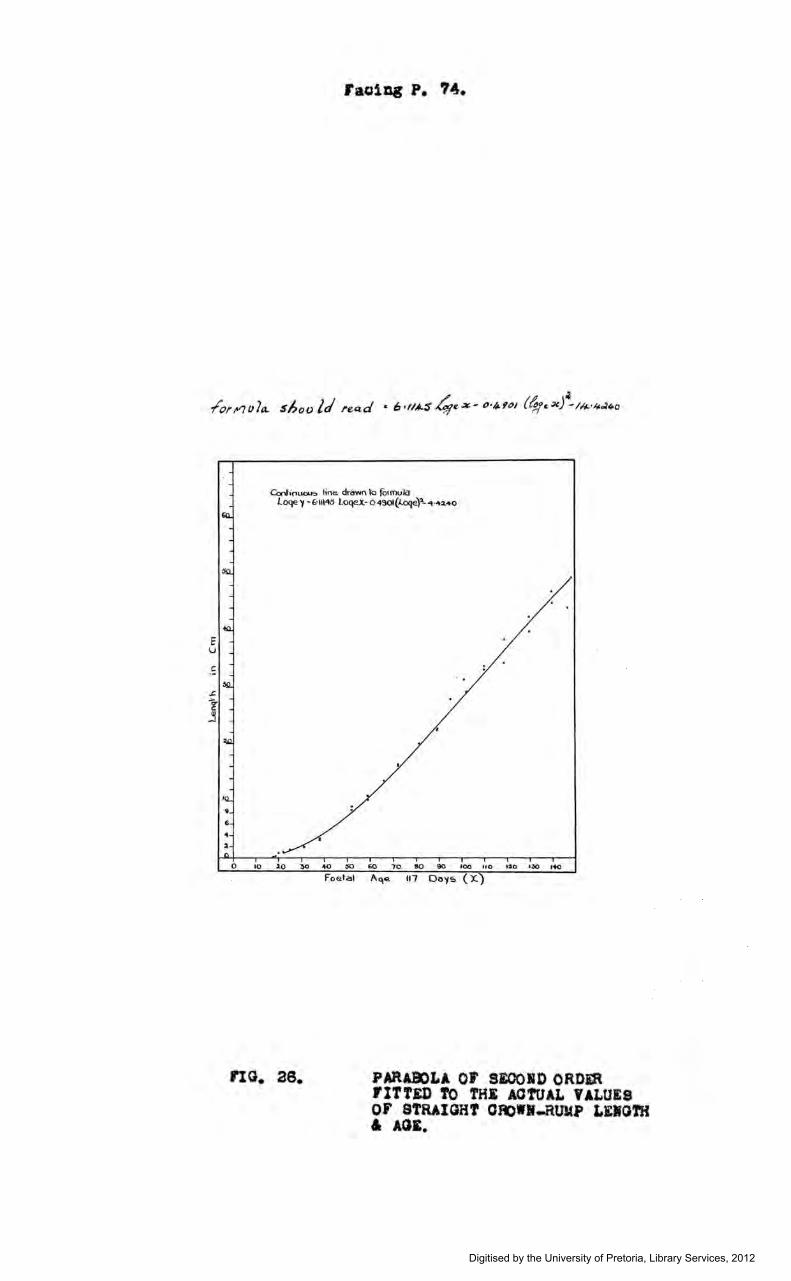
raoing P. 74.
Continu<>U5 line dre~wn Ia formula . Loqe y ~ 6·111'\5 loqe.x.- 0·4901(J..oqe):l- "\ ·4:t4o
0 10 10 30 40 :;o '0 70 110 90 100 110 12.0 130 l+o
na. as.
Foet<31 Aqe. 117 Doy~ (X)
PAJ\AJ:'OLA Of SIOOID ORDiR fiTTED to THI AOTUAL VALUES OF STRAIGHT OOOWJ-RUltP LEIQ!H & AGE.
Digitised by the University of Pretoria, Library Services, 2012
JC •
74.
Log e w2 - Log e wl
12 - Tl
where w2 & w1 are the foetal weights at the ages
T2 & T1 daya respeottvelr.
The figure obtained is an average value over the period
As 1 t has been noted tha.t the rate of growth is
changing oon,1nuously the value obtained will v~.ry eomettrhat •1 th the
length of the period T2 - T1 • The maount of vAriation will not
be large. However, for comparative purposes it will be better to
keep the period constant tor all such calculations.
By multiplying the value of I b7 100, the rate may be
expressed as a percentage, -thus :--
Inete.ntaneoue (Average) Percentage rate per day = 100 lt 1C
- Loge Wa .. - Loge wl - X 100
'a - Tl
In Table 2? are tabulated euoh percentage r~tee
oaloulated over periods of five daya at twenty ~ay 1nterY~la through
out the foetal period.
TABLE 27 1 O~WTH-RAT£§1 - fERCERT1 fER DAY1
Age - clara. • Value of IC • f, per dar. • • 20 to 25 • 0.2824 • aa;a4~ • • 40 f1 45 • 0.1350 • 13,50 • • eo .. 85 • o,oseo • 8,60 • • so .. 85 • o~osao ' 6,20 •
100 .. 105 • 0.0479 • 4,79 • • 120 .. 125 • 0.0387 • 3.87 • • 140 • 145 • 0.0323 • 3.23 • • •
The table lndloatee clearly that the percentage rates c~loulated
by Minot (1908) and others, which run into sever~t.l hundred peroent,J
are exoesAively high end that the drop in the earlier et~gee is not
nearly as exaggerated as these workera lead one to expect. The
rates are comparable with those calculated by 8rody (1927b) for the
rat (53~), the guinea-pig (10~ to 4.6~) and the human being (8~ to
It 1s also interesting to note that Brody (1927b) calculates
Digitised by the University of Pretoria, Library Services, 2012
0
JIG. 27.
raotns P. 7S.
"lO ~ '0 70 liO 90 /00 110 l:IO I~ 1"1-0
foel·al Aqc: in Ooy"'-
D!STRIBU'l%01 OF loSe SfRAIGHf OROWI-RUYP LENGTH AGAliSf AOI. (SUOO!H OtTRVI DRAWl THR>UGH POIITS OBl'AliiO BY OALOULATIIG ABSOJSSAL READIIO 1ROlt REORESSIOI JOFWULA).
Digitised by the University of Pretoria, Library Services, 2012
!5.
tt9e the peroen~Adaily growth-rate of the eheep during the f1rat few
weeks of postnatal life to be approximately 2~, which 1e only
slightly lower than that g1 ven above for the 140 - 145 day period,
thus lending weight to the contention th&t the incident of birth
is not accompanied by any drastic ohftnge in the growth-rate.
2. ~ROWTH IN LENG-TH.
In vie~ of the oonf! ictt ng op1. nionq ~-" to the be~t rnethod of
determining the length of fC">etugea, ,..nd t!le faot th~t there oninions
all reRt unon a theorettoal b•ats, it ha~ been deo1ded to consider
hera a few of the most usual method~,and from the resultg of
stat istioal teste to conclude Whioh ttre tht! most useful as a guid.e
to foetal line~.r d.evelo~ment.
described in ObApter 3.
All the dimen!ions considere~ are
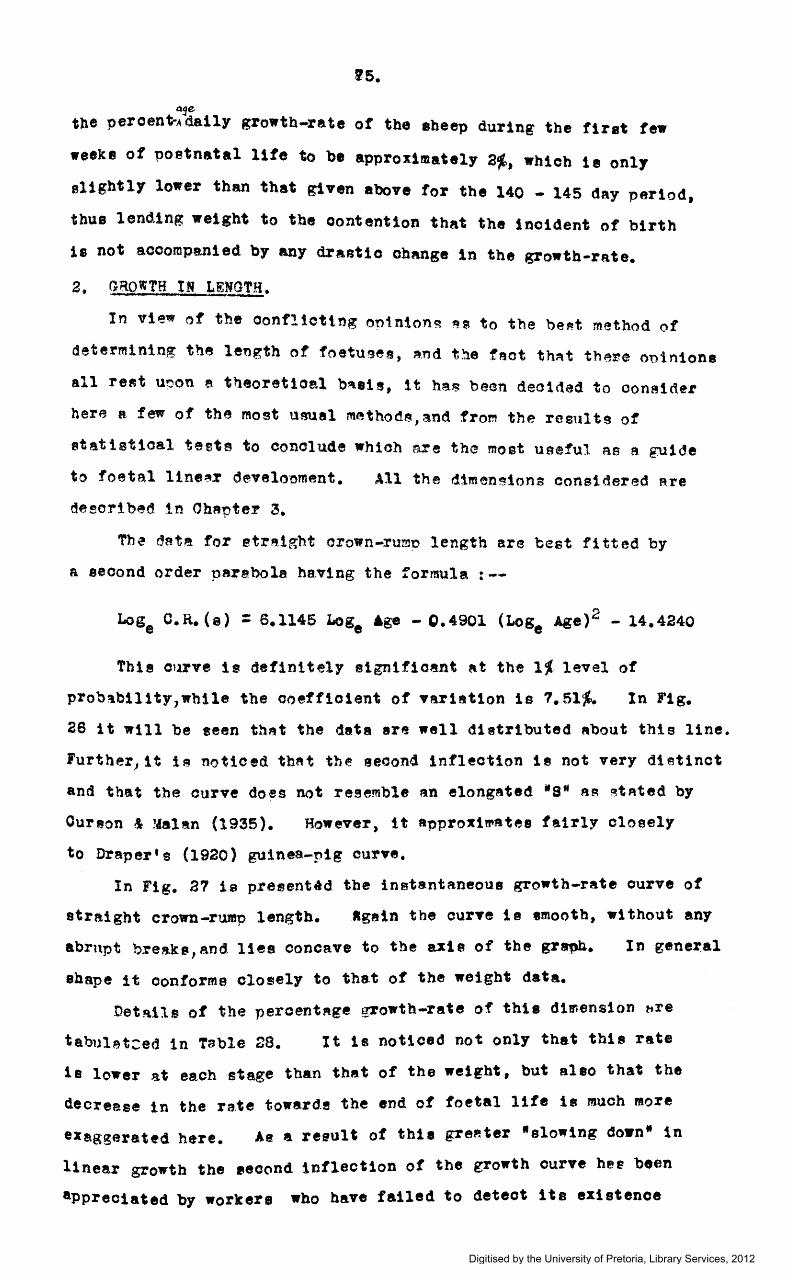
The date. for etr~.1ght orown-rump length are best fitted by
a seoond order parabola having the formula :--
This curve is definitely e1gn1f1o3nt ~tt the 1~ level of
prob~b111ty,wb1le the coefficient of Yar1st1on is 7.51%. In Fig.
28 it w111 be seen th~t the data are well dietr1buted About this line.
Further1 1t is noticed thAt the aeoond inflection ie not very distinct
and thftt the curve do~s not resemble Bn elong8ted 18" AA gtAted by
Ourson & Malan (1935). However, it approxi~Btes f81rly closely
to Draper•s (1920) guinea-pig our•e.
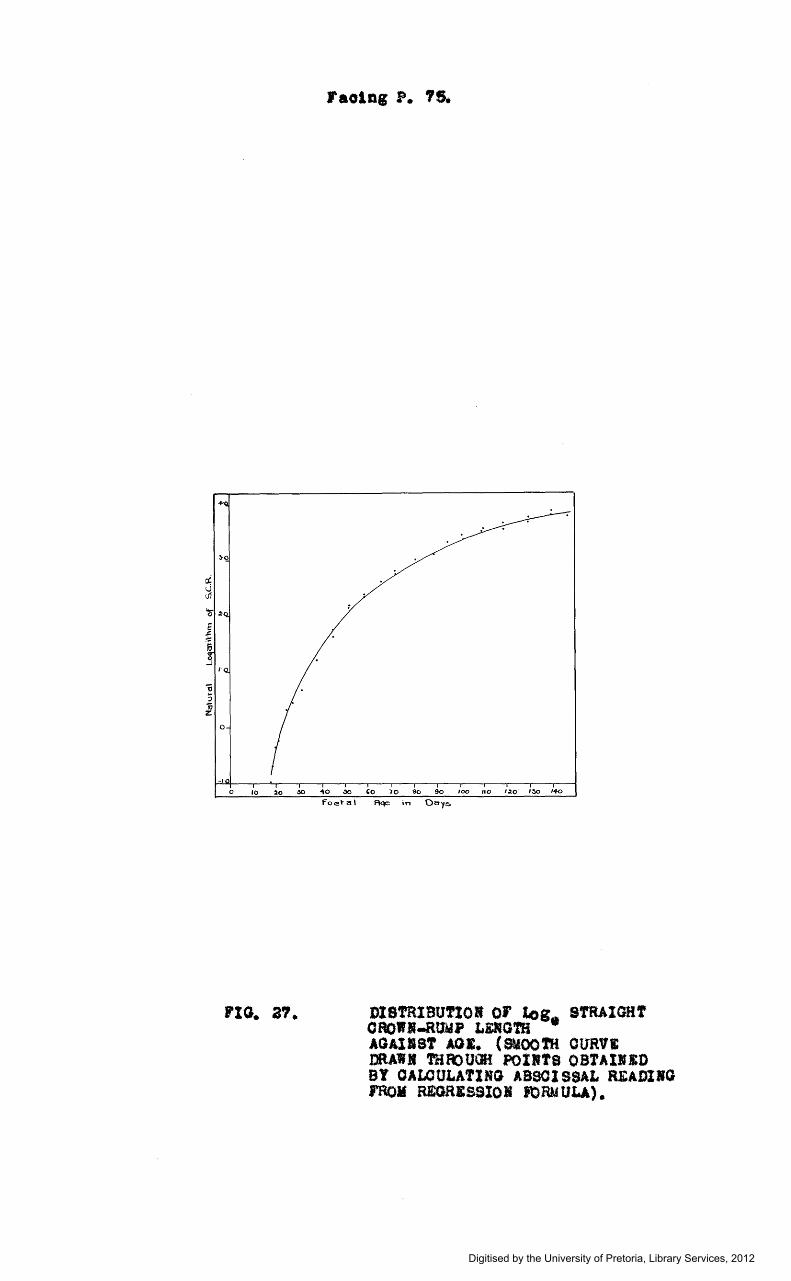
In Fig. 37 is presentttd the inets.ntaneoua growth-rate curve of
straight crown-rump length. Again the ourYe 1e amooth, without any
abrnpt breaks, and. 11ee concave to the axle of the grsph.
shape it oonforme closely to that of the weight data.
In gene~al
Details of the percentAge growth-rate of this dimension tire
tamllet:ed 1n Table zs. It is noticed not only that thi8 r&te
is lower ~t each stage than that of the weight, but also that the
decrease in the ra.te toward.! the end of foetal life is much more
exaggerat~d here. As a reeult of thie gre~ter •slowing down• in
linear growth the •eoond inflection of the growth curve hee been
appreciated by workers who have failed to detect its existence
Digitised by the University of Pretoria, Library Services, 2012
Continuous line dfawn l·o fo~mula loqe y "4'4-t.:t8 Loqe Y..- o · ~311(Loqe x.Y-=- 9·1'65
foe•·a\ Aqe in Day~(:x.
r1o. as.
Digitised by the University of Pretoria, Library Services, 2012
78,
1n connection with weight data.
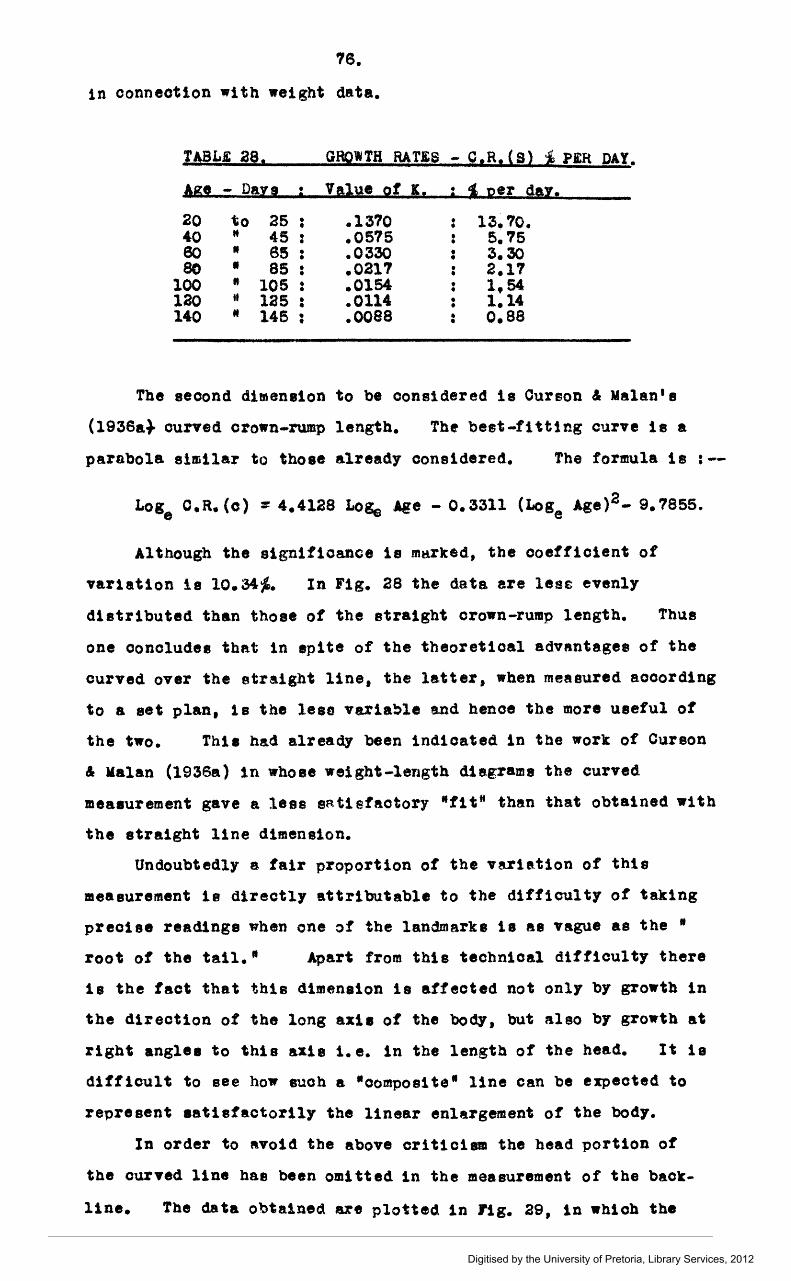
TA8L.E 28. GHQWTH RATiS - C,R, (S) ) Pi:R DAY,
Age - Daxs ' Value of '· • S per dar. . . 20 to 25 • • 1370 • 13~ 70 • • • 40 It 45 • .0575 • 5,75 • • 80 .. 85 • .0330 • 3,30 • • 80 • 85 • .0217 • 2,17 • •
100 ft 10!5 • .0154 • 1,54 • • 120 tf 125 • .0114 • 1,14 • • 140 " 145 : .ooea • o.sa •
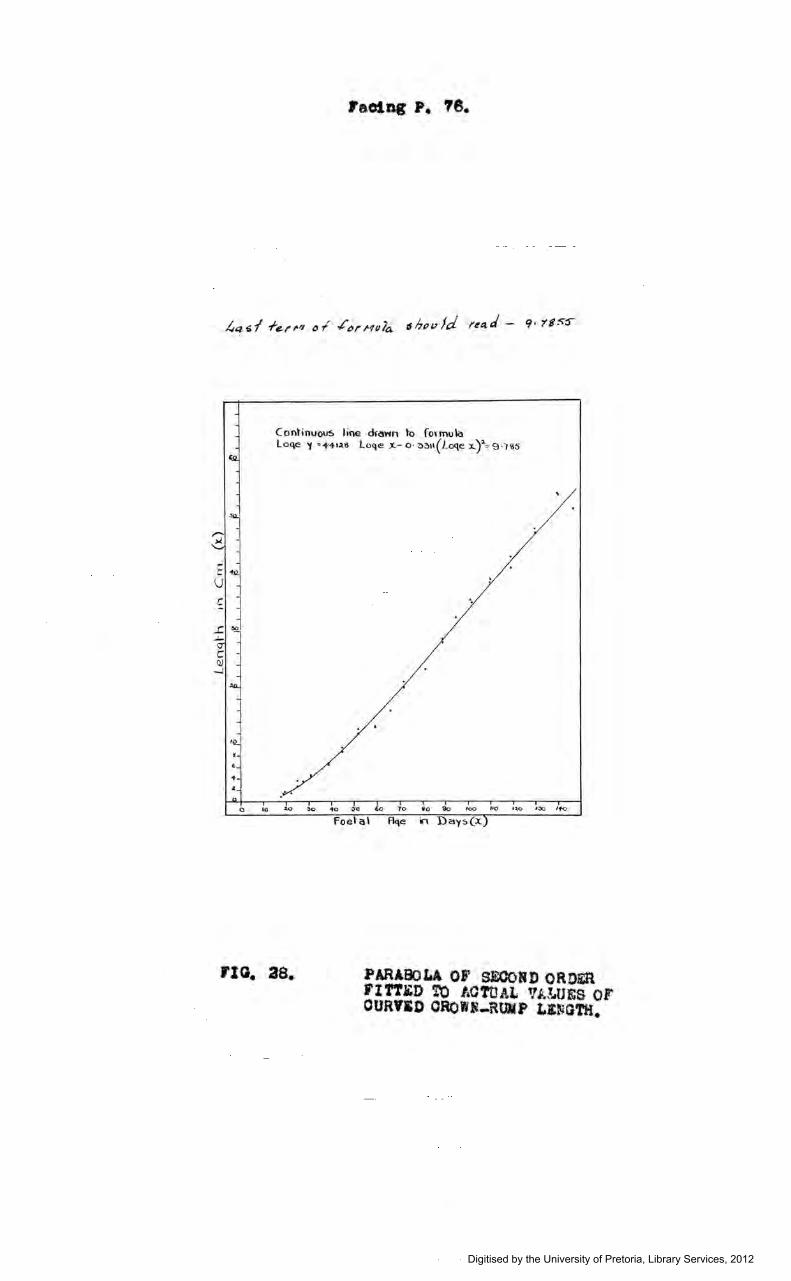
The second dimena1on to be considered is Oureon & Mslan'e
(1938a~ curved crown-rump length, Th« best-fitting curve is a
parabola similar to those already considered, The formula is :--
Log8
o.R. (c) = 4,4128 Loee Age - o. 3311 (Log8
Age)2- 9, 7855.
Although the s1gn1f1oance 1s mgrked, the coefficient of
vartation 1e 10.34~. In Fig, 28 the data are less evenly
distributed than those of the straight crown-rump length. Thus
one oonoludee that in epite of the theoretical advantagee of the
curved over the straight line, the latter. when measured according
to a set plan, is the lese var1a~le and henoe the more useful of
the two. Thie had already been indicated in the work of Curson
& Kalan (193Sa) 1n whoae weight-length diagrams the curved
meaaurement gave a less sRtief&otory •ttt" than that obtained with
the straight line dimension.
Undoubtedly a fair proportion of the ve.r1a.t1on of this
measurement is directly attributable to the difficulty of taking
precise readings when one of the landmarks ia sa vague as the 1
root of the tail,• Apart from this technical difficulty there
is the fact that this dimension ia affected not only by growth in
the direction of the long axle of the body, but also by growth at
right anglee to this axis i.e. in the length of the head, It is
difficult to see how such a •composite• line can be expected to
represent aatisfactorily the linear enlargement of the body.
In order to 8Void the above criticism the head portion of
the curved line hae been omitted tn the measurement of the back-
line. The data obtalne~ are plott~d tn rig, 29, in which the
Digitised by the University of Pretoria, Library Services, 2012
raotnc P. 7?.
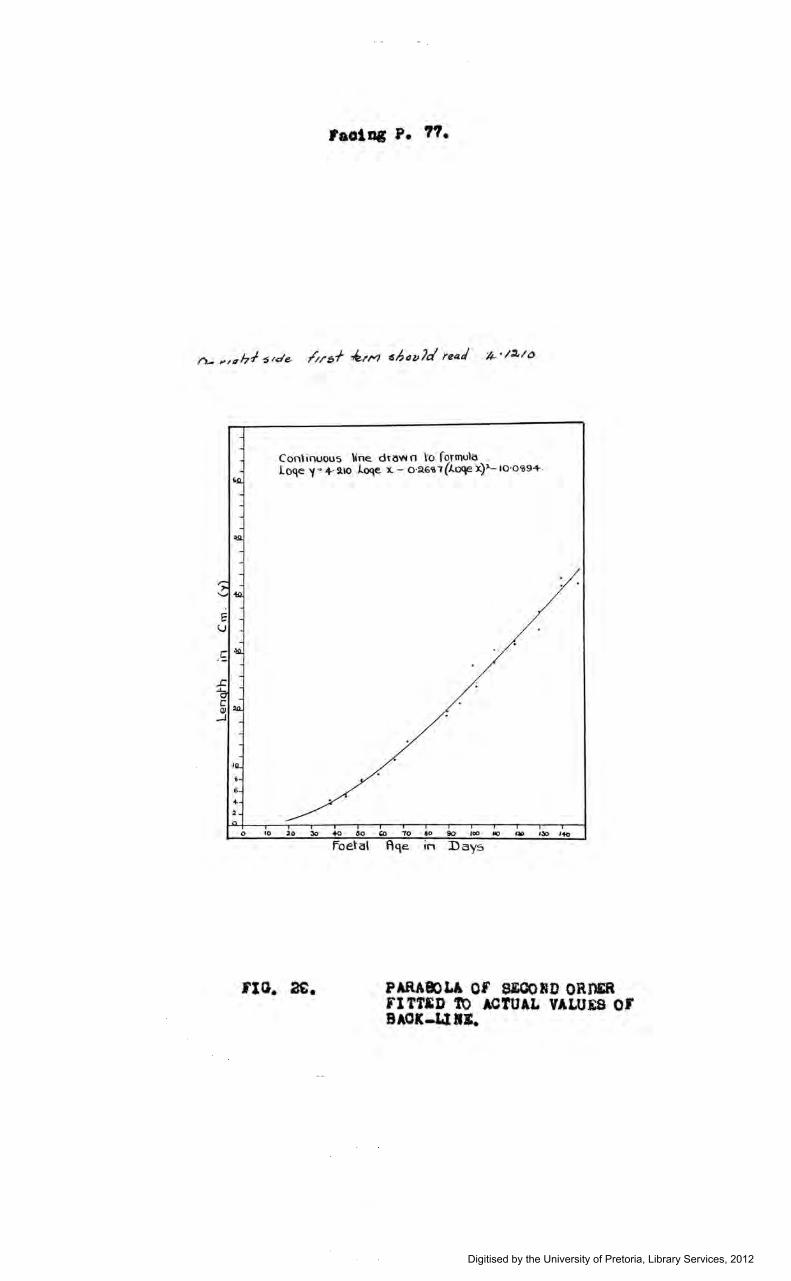
Continuous \ine. dra~ n to formula l oqe 'f-= +· ~·o J..oqe. x. - o ·~6'ii"f (J..oqe x)1
- •o·oco9+.
0 10 ~0 3o +o 50 g) 70 So 90 IOO 110 I~ 1:!0 liO
J'IO. 2£.
Foetal Aqe •n Days
PARAIOLA Ol SiOORD ORnER FITTID 1t> ACTUAL VALUES Of BAOK-Lt IE.
Digitised by the University of Pretoria, Library Services, 2012
77.
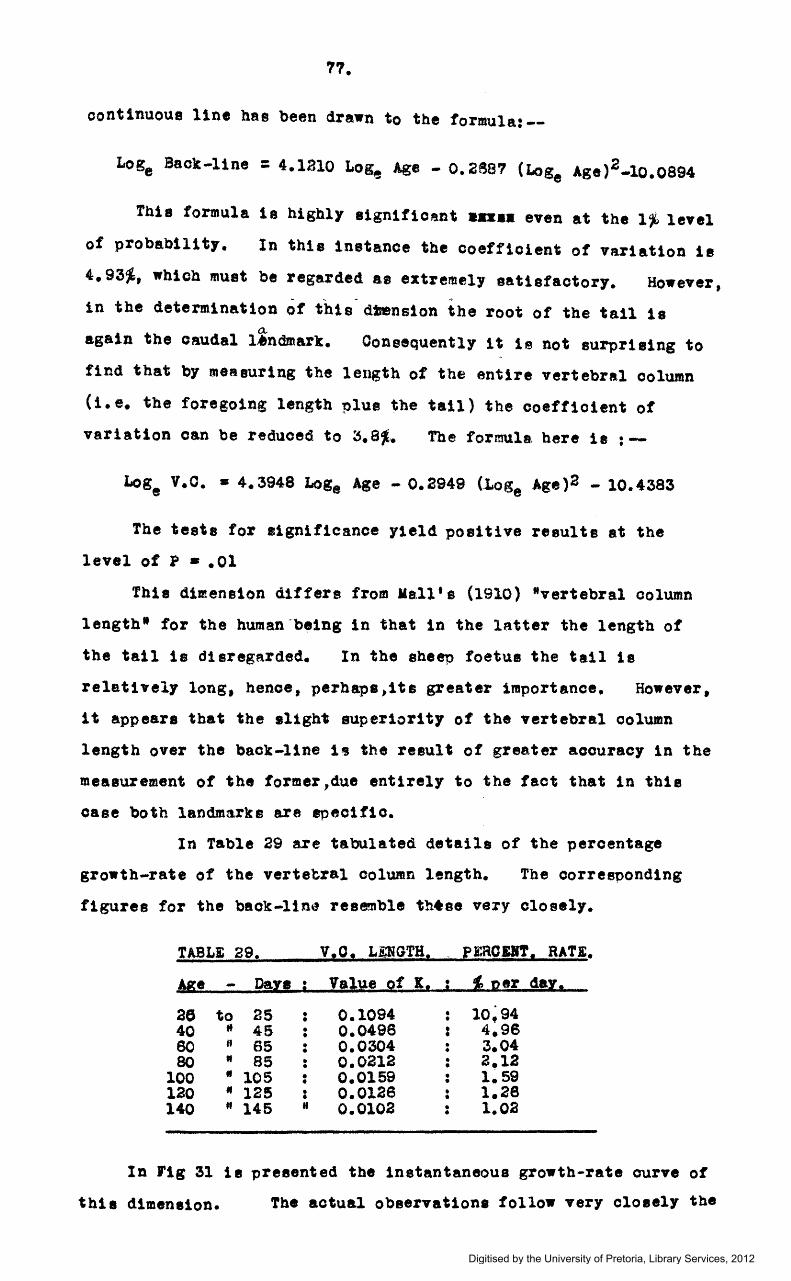
continuous line has been drawn to the formula:--
This formula is highly e1gn1f1c~nt aaaaa even at the 1~ level
of probability. In this instance the coefficient of variation ie
4.93~. which must be regarded ae extremely satisfactory. However,
in the determination of thts dtens1on the root of the tail is a.
again the caudal l.tndmark. Oonsequently it is not surprising to
find that by measuring the lex~th of the entire vertebral column
(i.e. the foregoing length plus the tail) the coefficient of
variation can be reduced to ;s.a~ ..• The formula here ie :--
Loge v.o. • 4.3948 Log8 Age - 0.2949 (~og8 Age)2 - 10.4383
The tests for significance yield positive results at the
level of P • .01
Thia dimension differs from Me.ll • e (1910) "vertebral column
length 1 for the human-being in that in the latter the length of
the tail is disregarded. In the sheep foetua the tail is
relett•ely long, hence, perhapa.ita greater importance, However,
it appears that the slight superiority of the vertebral oolumn
length over the back-line 1• the reeul~ of greater accuracy in the
measurement of the former,due entirely to the fact that in this
case both landmarks are epec1f1o.
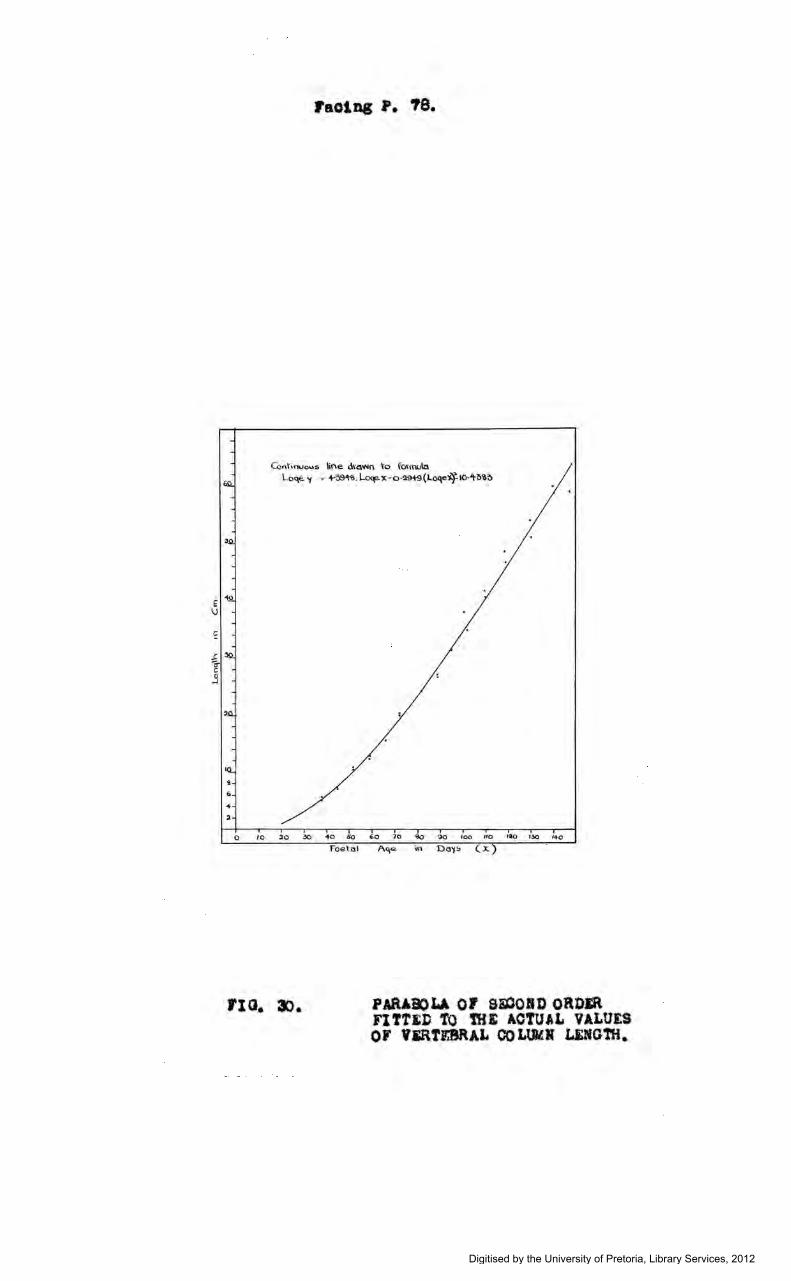
In Table 29 are tabulated detaila of the percentage
growth-rate of the vertetral column length. The corresponding
figures for the back-lin~ resemble th•ae very closely,
TABLE 29. v1o! LDGTH1 fERCIJI! 1 RATE.
Age Dare • Value of lt, • 1e per day, • •
ae to 25 • 0.1094 • 10;94 • • 40 .. 45 • 0.0498 • 4.9S • • ao H 65 • 0.0304 • 3.04 • • 80 .. 85 • 0,0212 • 2.12 • •
100 • 105 • 0.0159 • 1~59 • • 120 it 12! : 0.0128 • 1.28 • 140 .. 145 .. 0.0102 • 1,02 •
In rtg 31 is presented the instantaneous growth-rate curve of
thie dimeneion. Tbe actual observation& follow very closely the
Digitised by the University of Pretoria, Library Services, 2012
raot.q P. te.
Continuous line d~own \"o fowou\a Loqe.. 'f = +·59't~.l-oqe:x:-O ·!l9+9(loqei)~IO· "t-~'6~
(;Q 70 'a() 'lO 100 110 1:10 130 140
foetal Aqe. in DCI'i!> (.X.)
rta. 3>.
Digitised by the University of Pretoria, Library Services, 2012
0
\ I I I I \ \ \ \ \ \
\ \
\
' ·. \
' ' ' ' ' '
raotnc P. 78.
....................
1 ~
h'l5~n\oneou:. 6va"'lh 'i -- C\J"'e. (, '2 -·---·- ~<c;enl'o"" Gtovt\h•• ID
--·- ·----- ,.
o 10 a.o e~o 10 tso coo 10 so 90 100 110 •:to 1.:10 I-tO l(;o
foetal f\~e in Da'f!:>
rto. 31. ftO OURV&S !\) IIDlOAT& ftll 11ISTRIBUTXOI or lo§e VERTKBR.A.L OOLUMR LJ:NCTB AGAINst AGE &. RELATIVE PERCEIT.lGE GROWTHRATE CALOULATID ON A DAILY BASIS AT !WENft DAY I 'NfERVALS.
Digitised by the University of Pretoria, Library Services, 2012
78.
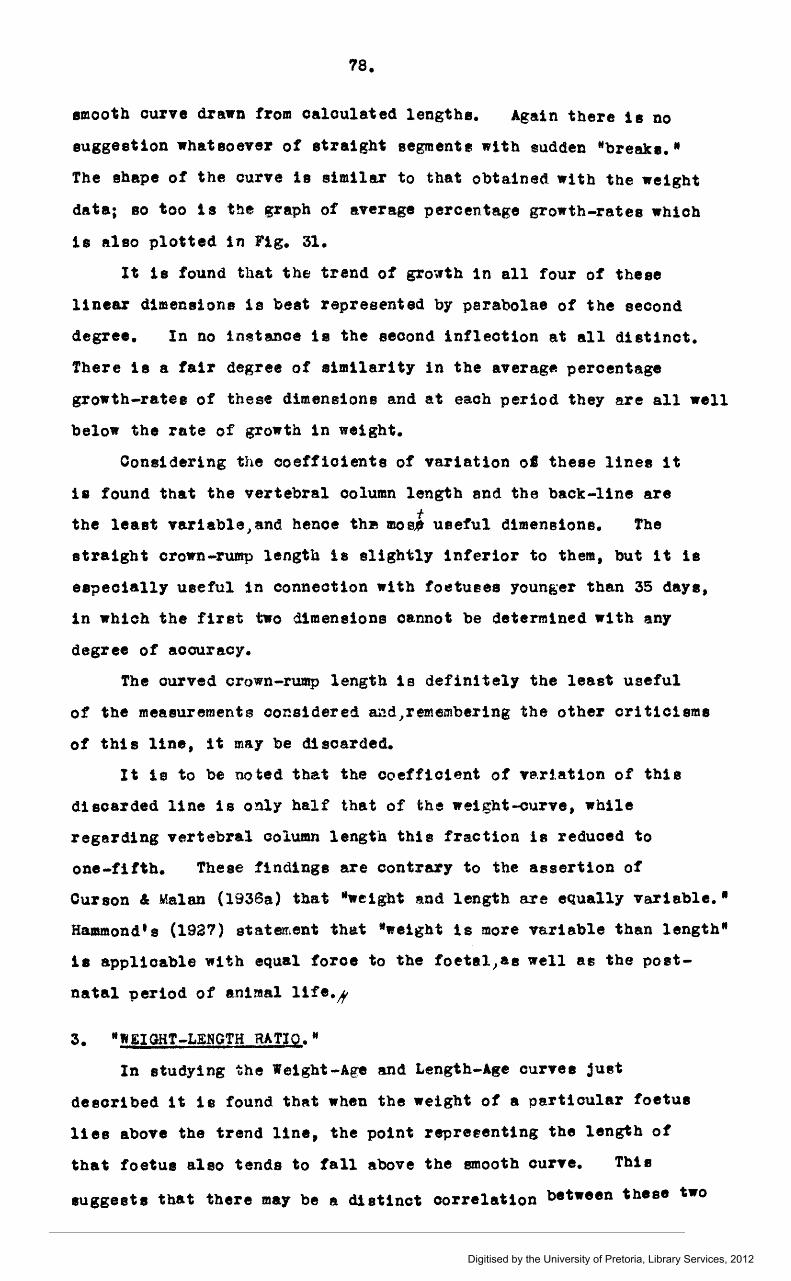
smooth curve drawn from calculated lengths. Again there is no
suggestion whatsoever of straight segments with sudden "breake. •
The shape of the curve 1a similar to that obtained with the weight
data; so too is the iraph of average percentage growth-rates which
is also plotted in Fig. 31.
It is found that the trend of growth 1n all four of these
linear dimensions is best represented by para.bolae of the second
degree. In no instance is the second inflection at all distinct.
There ia a fair degree of similarity in the averag- percentage
growth-ratea of these dimensions and at each period they are all well
below the rate of growth in weight.
Considering the coeffioients of variation ol these linea it
ia found that the vertebral column length and the back-line are f
the least variable,and hence thm moe- useful dimensions. The
straight crown-rump length is slightly interior to them, but it is
eapecially useful in connection with foetuses younger than 35 daya,
in which the first two dimensions cannot be determined with any
degree of accuracy.
The ourved crown-rump length is definitely the least useful
of the measurements considered ~~d,remembering the other cr1t1o1ame
of tb1 s line, 1 t may be d.1 soarded.
It is to be noted that the coefficient of ve.ri.ation of this
discarded line is only half that of 'the weight-curve, while
regarding vertebral column length this fraction 11 reduced to
one-fifth. These findings are contrary to the assertion of
Curson & .Malan (l936a) that •weight and length are equally variable.•
Hammond's (1927) staterr,ent that •weight is more variable than length"
la applicable with equal force to the foetal,ae well a~ the post
natal period of animal life.#
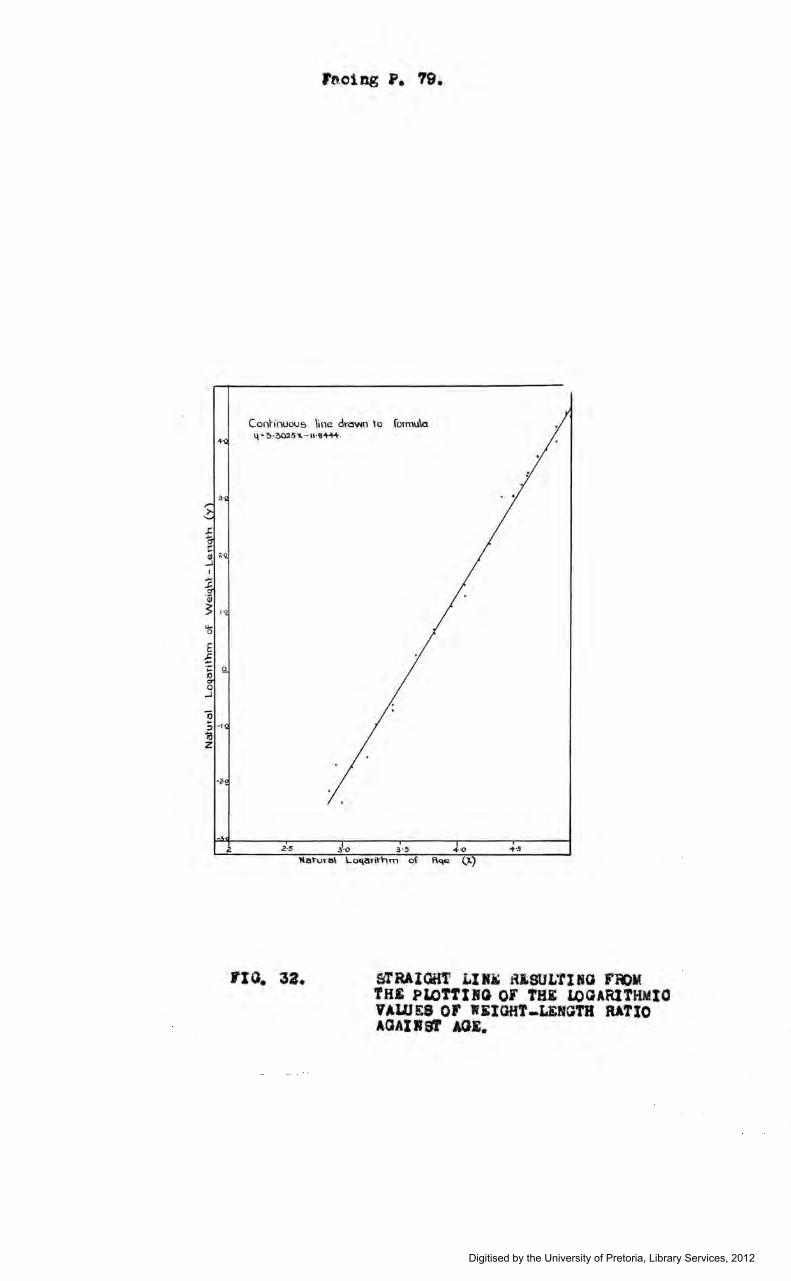
3. 1 WEIGHT-LENGTH RATIQ."
In studying the Weight-Age and Length-Age curves juet
described it is found th~t when the weight of a particular foetus
lies above the trend line, the point repreeenting the length of
that foetus also tends to fall above the smooth curve. Thla
suggests that there may be a distinct correlation between these two
Digitised by the University of Pretoria, Library Services, 2012
,,._oi ng P. 79.
Conhnuou5 \ine. dro'\Nn to formu\a 4 • ~ ·oo:l5"--11·'1J-+-H- ·
2.·5 3 ·0 3·5 ·O +·S
Natura\ Loqarithm cf Rqe (.l.)
rxo. 32. srRAlGHT Lll~ A&SULTINU FHOM TH.& PlOTfl!IG OF THE LOGARlTHMtO VAWES OF WEIGHT-LENGTH RATIO AGAliST AGE.
Digitised by the University of Pretoria, Library Services, 2012
10
FaOi!ll P. 79.
Continuou~ line d<.,.,.o l·o foriT'IUI<:t
Lo'l" y•!!·:>oa6· U.,...x.-u·l-444.
0 10 :1 30 40 150 GO 70 '00 90 100 110 l:lo 1!10 l<f-0
Foetal f\qoo in do'l~ (X.)
rxo. 33. PARAJllLA or J'IRSf ORDIR riTTID TO TH& ACTUAl. VALUES Ot WitGHf-LDGTH RATIO AID AOI.
Digitised by the University of Pretoria, Library Services, 2012
79.
cbaraoter1et1oa &nd th&t 1 t msy be profi ts.ble to calculate for
e~ch foetus the weight-length ratio,and to study the trend of this
ratio with a Yiew to determini~g whether it would not prove lees
variable than either of the two dimene1one from which it 1s
caloula.t ed.
Although it has been proved th8t the length of the vertebrs.l
column is the least ver1e.ble of the length meseurements 1 t is felt
that, on account of its total disregard of the head, this dimension
1 s not the moet eu.i te.ble for the pu:rpo ee of oalouleting a ••1ght-
length index. Consequently, the straight crown-rump length is
preferred,and in each instance t~ia measurement in centimetres 1a
divided into the wetght in grams.
In Fig. 32 it is shown that the plotting of the natural
logarithm• of theee 1nd1cee against thoae of the corresponding
ages results 1n a straight-line distribution. The continuous line
in the figure 1 s drawn ·to the formula :--
~ Log
8 w. L. Ratio • 3.3025 Loge Age - 11.8444,
which ie highly e1gn1f1oant, but haa a coeff1c1ent of variation of
It is quite evident that the oomput&tion of thia index
will not serve any ueeful purpose.
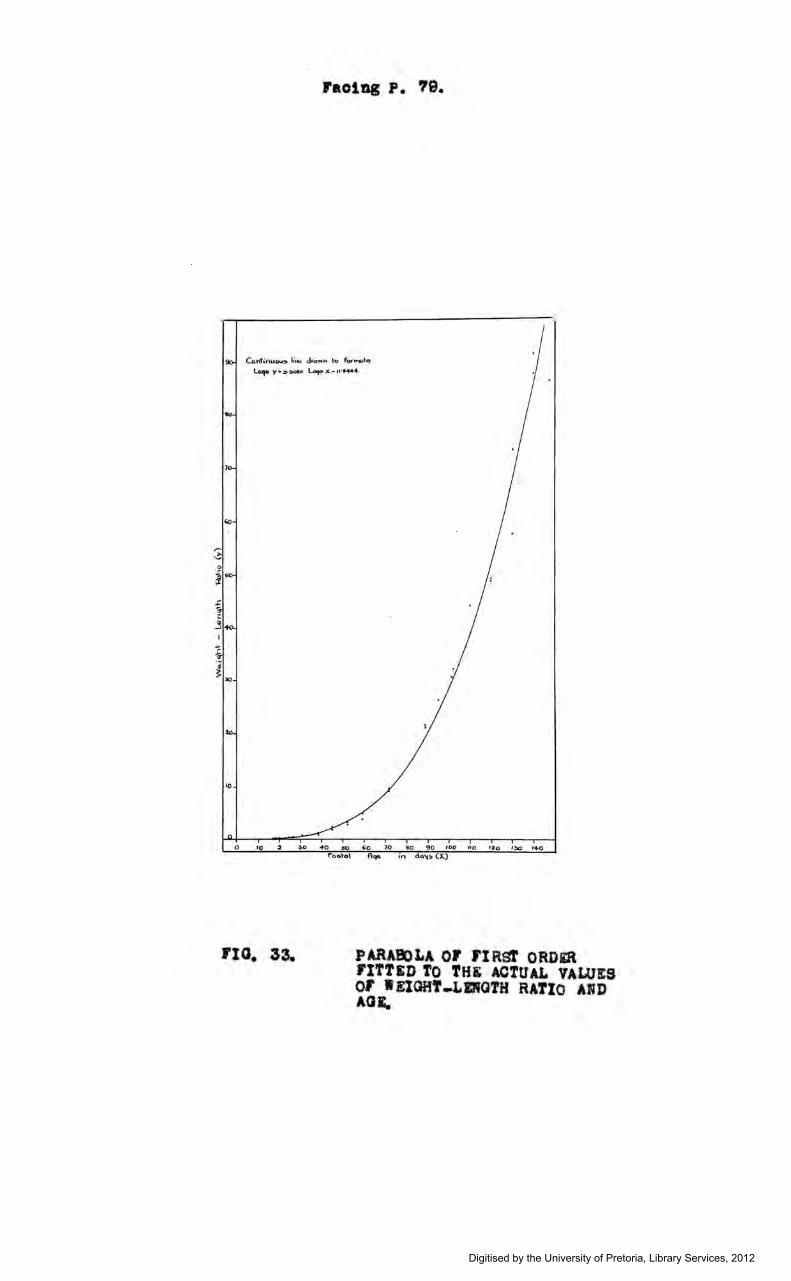
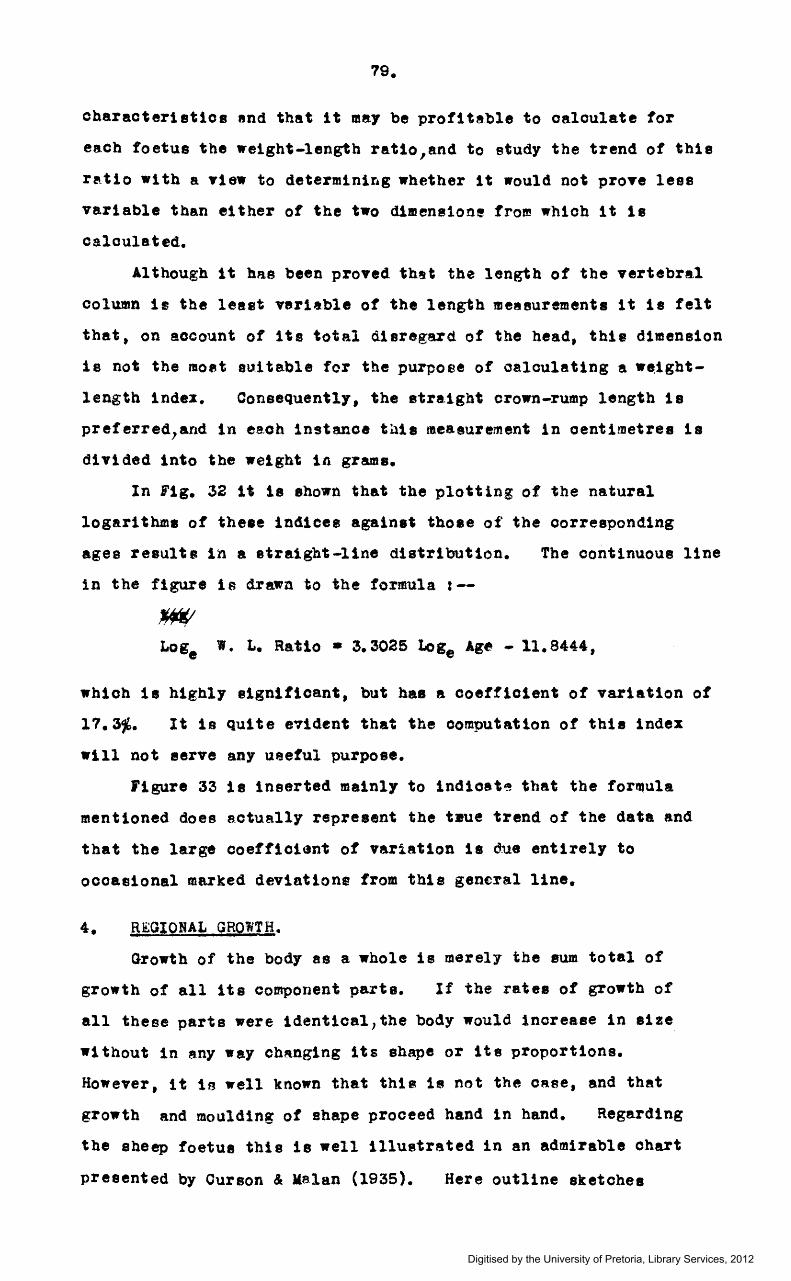
figure 33 is inserted mainly to 1nd1oat~ thst the for~ula
mentioned does e.otually represent the twe trend of the data and
that the large coeff1c1ant of variation 1a due entirely to
occasional marked deviations from this gen~ral line.
4. REGIONAL GRQWT~.
Growth of the body as a whole is merely the sum total of
growth of all its component parts. If the rates of growth of
all these parts were 1dent1cal,the body would increase in size
•1 thout in e.ny way Ch8ng1ng 1 t s shape or 1 t e proportions.
However, it is well known that this is not the oaee, and th8t
growth and moulding of shape proceed hand in hand. Regarding
the sheep foetua this is well illustrated in an &dmirable chart
presented by Ourson & Ka.lan (1935). Here outline sketches
Digitised by the University of Pretoria, Library Services, 2012
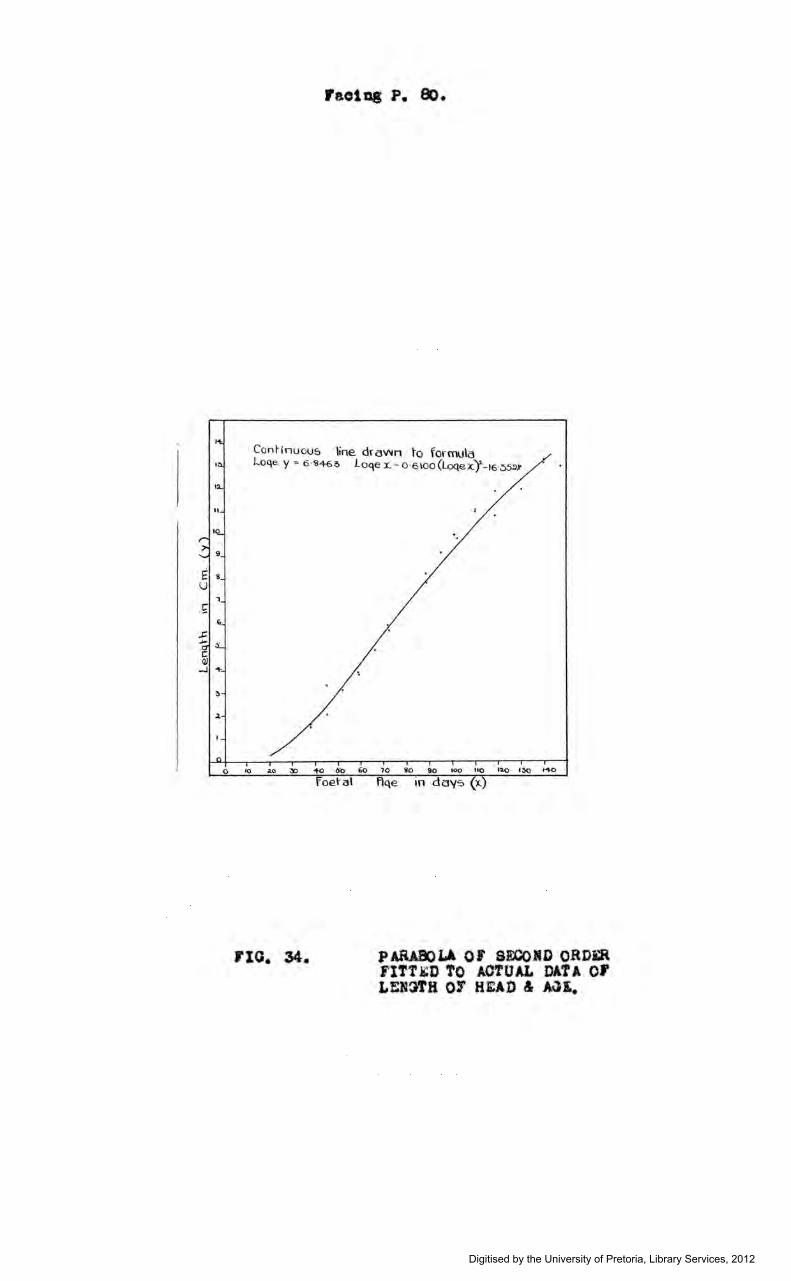
raotcs P. eo.
Continuous line. drawn to formula loqe Y .,_ 6 ·'64-6?> Loqe x. - 0 ·6\0o(Loqe.x"f-t€ .:>5~
·.
o •o .1.0 ;,a -to o·o 6o 10 1Jo 90 1oo uo •ao ·~ , ... o
foet-a\ flqe in days (x.)
Digitised by the University of Pretoria, Library Services, 2012
E u
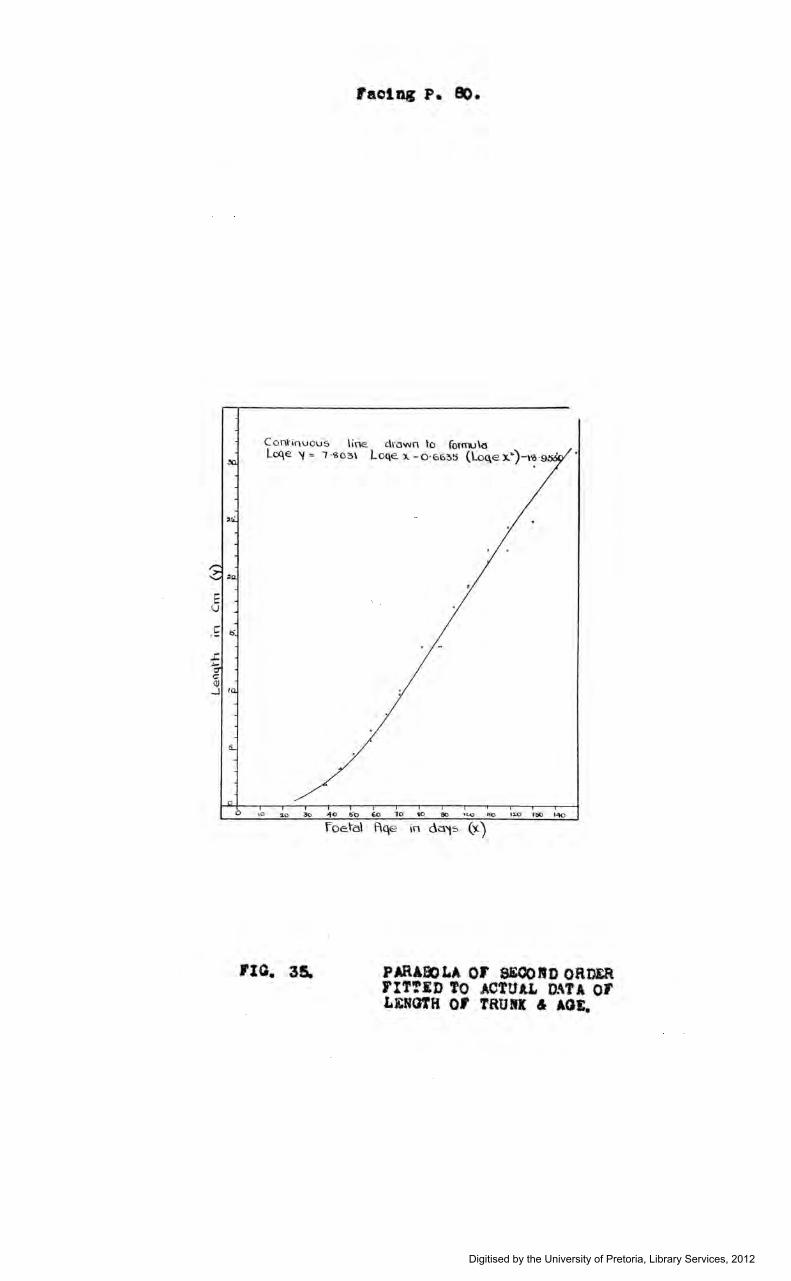
factq P. eo.
Conhnvou5 \ine. drawn to fetmu\a Loqe 'I-= l ·<&03\ Loqe :x.- 0 · 663t> (lo(\e ::x.'-)-,~ · 9 · • •
rxo. 3S.
Rqe in c\a'i~ ('i)
PARA}l)LA Of SiOOIID ORDER FITT.itJ TO ACTUAL DATA Of LENGTH OF TRUll It AGE.
Digitised by the University of Pretoria, Library Services, 2012