studies on acoustic properties of nonwoven fabrics
TRANSCRIPT
STUDIES ON ACOUSTIC
PROPERTIES OF NONWOVEN
FABRICS
M.B. MVUBU
2017
Studies on Acoustic Properties of
Nonwoven Fabrics
Mlando Basel Mvubu
(Student Number: 212462431)
2017
Studies on Acoustic Properties of
Nonwoven Fabrics
By
Mlando Basel Mvubu
Submitted in partial fulfilment of the requirements for
the degree of Philosophiae Doctor in the Faculty of
Science at the Nelson Mandela Metropolitan University
April 2017
Promoter: Prof. Rajesh D. Anandjiwala
Co-Promoter: Dr.Asis Patnaik
i
Declaration
I, Mlando Basel Mvubu, student number 21246243, hereby declare that the thesis for
Philosophiae Doctor (PhD) in Textile Science is my own work and that it has not
previously been submitted for assessment or completion of any postgraduate qualification
to another University or for another qualification. .
Mlando Basel Mvubu.
ii
Acknowledgements
First and foremost I would like to express gratitude to my promoters, Professor R.D.
Anandjiwala and Dr A. Patnaik for teaching, pushing and guiding me through this journey.
Many thanks to the CSIR-MSM colleagues for all the contributions, big and small, made
towards the fulfilment of this study. Also thanks to Dr J. Pietersen of NMMU Statistics
Department for his help in data analysis. .
I would also like to acknowledge and thank my employer, CSIR-MSM (P&C) for their
support, financial, time and resources without which this study would not have been
possible.
Finally, I would like to thank my family, my Mother, Mrs Lindiwe P. Mvubu, my
Grandmother, Ms Margaret Nkabinde, my siblings and the extended family, for having
been my pillars of strength throughout.
This work is dedicated to the memory of my late Father, Mr Jabulani E. Mvubu and my
late Aunt, Ms Norma Nkabinde, who had always been the guiding lights in my academic
path since early childhood, and to the honour of all my dearly departed Forbearers.
iii
Abstract
This study is divided in to two main parts. The first part deals with the optimization of
process parameters of needle-punched nonwoven fabrics for achieving maximum sound
absorption by employing a Box-Behnken factorial design. The influence of fibre type,
depth of needle penetration and stroke frequency on sound absorption properties were
studied. These parameters were varied at three levels during experimental trials. From
multiple regression analysis, it was observed that the depth of needle penetration alone was
the most dominant factor among the selected parameters, which was followed by the
interaction between depth of needle penetration and stroke frequency. Fibre type was the
least dominant parameter affecting sound absorption. A maximum sound absorption
coefficient of 47% (0.47) was obtained from the selected parameters. The results showed
that for a process such as needle-punching, which is influenced by multiple variables, it is
important to also study the interactive effects of process parameters for achieving optimum
sound absorption.
The second part of the study deals with the effect of type of natural fibre (fineness), and the
blending ratio (with PET fibres) on the air permeability of the needle-punched nonwoven
fabrics and then it proceeds to study the effect of the air-gap, type of natural fibre
(fineness) and blending ratio (with PET fibres) on sound absorption of needle-punched
nonwoven fabrics. These parameters are tested individually and their two way interaction
(synergy) effect using ANOVA. The air-gap was varied from 0mm to 25mm with 5mm
increments, three natural fibre types were used and all were blended with polyester fibres
at three blending ratios for each natural fibre type. The Univariate Tests of Significance
shows that all three parameters have a significant effect on sound absorption together with
iv
two two-way interactions, with the exception of the Blend Ratio × Air Gap two-way
interaction which was not significant. It was found that the sound absorption improves with
the increase in the air-gap size up to 15mm after which sound absorption decreased slightly
with the further increase in the air-gap up to 25mm.
v
Table of Contents
Declaration ……………………………………………………………………...………… i
Acknowledgements ………………………………………………………………………..ii
Abstract …………………………………………………………………………………...iii
List of Figures ……………………………………………………………………………..x
List of Tables …………………………………………………………………………….xiv
List of Abbreviations and Symbols …………………………………………………….xvi
1. INTRODUCTION ……………………………………………………………………1
1.1. Noise………………………………………………………………………………….1
1.2. Noise Control ………………………………………………………………………..2
1.3. Nonwovens …………………………………………………………………………..5
1.4. Nonwovens Production Processes ………………………………………………….8
1.5. Nonwovens in Sound Absorption …………………………………………...........10
1.6. Nonwovens and the Environment ………………………………………………..11
2. LITERATURE REVIEW …………………………………………………………..12
2.1. The Sound Phenomenon …………………………………………………………..12
2.1.1. The Nature of Sound ………………………………………………...... ….12
2.1.2. Properties of Sound ………………………………………………………..13
2.1.3. Sound Mechanics ………………………………………………………….14
2.1.4. Sound Levels-The Decibel Scale ………………………………………….20
2.2. Noise Control …………………………………………………………………….23
2.2.1. Noise Control at the Source ……………………………………………24
2.2.2. Control Of Noise in Transmission ………………………………...........26
vi
2.2.3. Noise Control at the Receiver ……………………………………...........32
2.3. Porous Sound absorbing Materials …………………………………………….33
2.3.1. Cellular Porous Sound Absorbing Materials …………………………..34
2.3.2. Granular Porous Sound Absorbing Materials …………………………36
2.3.3. Porous Fibrous Materials ……………………………………………….37
2.3.4. Smart Absorbing Materials ……………………………………………..38
2.3.5. Nonwoven Fabrics as Sound Absorbers ………………………………..39
2.4. Different Types of Nonwovens ………………………………………………….40
2.4.1. Mechanical Bonding Methods …………………………………………..40
2.4.2. Chemical Bonding Methods …………………………………………….44
2.4.3. Thermal Bonding Methods ………………………………………...........45
2.5. The Needlepunching Process ……………………………………………………49
2.5.1. Web and Batt Formation Options ………………………………………51
2.5.2. Needles Design Considerations ………………………………………….52
2.5.3. Fibres for Needlepunching ………………………………………...........53
2.5.4. Applications of Needlepunched Fabrics ………………………………..56
2.6. Factors Influencing Sound Absorption in Nonwovens …………………...........58
2.6.1. Fibre Parameters …………………………………………………...........58
2.6.2. Production Process Parameters ………………………………………...61
2.6.3. Fabric Parameters ……………………………………………………….64
2.6.4. Other (In-Situ) Parameters ……………………………………………..69
2.6.5. Secondary Factors ………………………………………………………71
2.7. Methods of Testing Sound Absorption of Materials …………………………..72
2.7.1. The Reverberation Chamber Method ………………………………….72
2.7.2. Impedance Tube Measurement Using The Standing Wave Ratio
Method ……………………………………………………………………73
2.7.3. Impedance Tube Measurement Using The Transfer Function
Method ……………………………………………………………………75
vii
2.8. Problem Statement ………………………………………………………………78
2.8.1. Motivation ………………………………………………………………..79
2.9. Objective of the Research ……………………………………………………….79
2.10. Research Methodology …………………………………………………………..80
3. EXPERIMENTAL DESIGN AND METHODS …………………………………..82
3.1. Preliminaries ……………………………………………………………………..82
3.2. Optimization of Process Parameters of Needle-punched Nonwovens for Sound
Absorption Application ………………………………………………………….86
3.2.1. Box-Behnken –Response Surface Design ………………………………86
3.2.2. Materials ………………………………………………………………….87
3.2.3. Fabric Production ………………………………………………………..88
3.2.3.1. Fibre Preparation ………………………………………………..88
3.2.3.2. Fibre Processing …………………………………………………90
3.2.3.3. Needle Punching …………………………………………………93
3.2.4. Fabric Characterisation …………………………………………………94
3.2.4.1. Fabric Area Weight (Mass per Unit Area) …………………….95
3.2.4.2. Fabric Thickness ………………………………………………...95
3.2.4.3. Sound Absorption ……………………………………………….95
3.3. Effects of Air-gap Size, Fibre Type and Blend Ratio on Sound Absorption
Coefficients of Needle-Punched Nonwoven Fabrics ……………………...........96
3.3.1. Materials ………………………………………………………………….96
3.3.2. Fabric Production ……………………………………………………….97
3.3.2.1. Fibre Preparation ………………………………………………..97
3.3.2.2. Fibre Processing …………………………………………………98
3.3.2.3. Needle-punching …………………………………………………98
3.3.3. Fabric Characterisation ………………………………………………..100
3.3.3.1. Air Permeability/ Air Flow Resistance ………………………..100
viii
3.3.3.2. Testing For Sound Absorption …………………………...........100
4. RESULTS AND DISCUSSION …………………………………………………...102
4.1. Preliminary Results …………………………………………………………….102
4.2. Optimization of Needlepunching Process Parameters For Sound Absorption
Applications …………………………………………………………………….107
4.2.1. Effect of Thickness, Fibre Type, Depth of Needle Penetration and
Stroke Frequency on Sound Absorption ………………………...........107
4.2.1.1. The Synergy Effect of the Tested Parameters on Sound
Absorption –The Rationale for Optimization ……………….114
4.2.2. Effect of Selected Parameters on Sound Absorption Coefficients and
Process Optimization ………………………………………...................117
4.2.2.1. Effect of Depth of Needle Penetration’s and Stroke Frequency
on Sound Absorption coefficients for Different Fiber Types
……………………………………………….................................118
4.2.2.2. Effect of Fibre Type and Depth of Needle Penetration on Sound
Absorption Coefficients at Different Values of Stroke
Frequency ……………………………………………………….122
4.2.2.3. Effects of Stroke Frequency and Fibre Type on Sound
Absorption Coefficients at Different Depths of Needle
Penetrations ……………………………………………………..126
4.2.2.4. Effect of the Optimized Parameters on Fabric
Characteristics …………………………………………………..130
4.3. Effects of Air-gap Size, Fibre Type and Blend Ratio on Sound Absorption
Performance of Needle-Punched Nonwoven Fabrics …………………...........132
4.3.1. Air Permeability ………………………………………………………...132
4.3.1.1. The Effect of Fibre Type (Size) on Air Permeability …...........134
4.3.1.2. The Effect of the Blending Ratio on Air Permeability ……….135
4.3.1.3. Statistical Analysis of the Effect of Fibre Fineness and Blending
Ratio on Air Permeability ……………………...........................138
ix
4.3.2. Sound Absorption ………………………………………………………142
4.3.2.1. Effect of Fibre Type (Fineness) on Sound Absorption
Coefficients ……………………………………………………...146
4.3.2.2. The Effect of Blending Ratio on Sound Absorption
Coefficients ………………………………………………..........148
4.3.2.3. Effect of Air-gaps on Sound Absorption Coefficients ………..150
4.3.2.4. Statistical Analysis of the Effect of Fibre Type (Fineness),
Blending Ratio and Air-gap on Sound Absorption
Coefficients ……………………………………………………...156
4.4. Evaluation and Selection of Parameters for Sound Absorption
Application ……………………………………………………………………...167
5. SUMMARY AND CONCLUSIONS ……………………………………………...171
5.1. Optimization of Needlepunching Process Parameters For Sound Absorption
Applications …………………………………………………………………….172
5.2. Effects of Air-gap Size, Fiber Type and Blend Ratio on Sound Absorption
Performance of Needle-Punched Nonwoven Fabrics …………………...........176
5.3. Recommendations for Future Work …………………………………………..181
x
List of Figures
Figure 1.1. The hierarchy of control for noise reduction …………………………………..3
Figure 2.1. Alternative patterns of dense and sparse particles ……………………………12
Figure 2.2. Schematics of a sound wave ………………………………………………….13
Figure 2.3. Sound pressure in reflection, transmission and diffraction …………………...17
Figure 2.4. Illustration of the Sound (Acoustic) Shadow .…………………………...........18
Figure 2.5. Noise comparisons in decibels ………………………………………………..22
Figure 2.6. Isolation of a stiff panel from a machine frame ………………………………25
Figure 2.7. Close shielding or acoustic lagging …………………………………………..26
Figure 2.8. Hybrid passive/active absorber cell …………………………………………..39
Figure 2.9. Needlepunching action on fibres ……………………………………………..49
Figure 2.10. Basic Parts of a Needlepunching Machine ………………………………….50
Figure 2.11. Typical Needle Parts …………………………………………………...........52
Figure 2.12. Relation between structure factor and porosity ……………………………..69
Figure 2.13. Standing wave method ………………………………………………………74
Figure 2.14. The transfer function method using two microphones ………………............76
Figure 3.1. Three factor Box-Behnken design ……………………………………………87
Figure 3.2. Scutched flax (L) and cottonised flax (R) …………………………………….89
Figure 3.3. Schematics showing carding and cross-lapping processes ……………...........92
Figure 3.4. LMS sound absorption measurement set up …………………………………96
Figure 3.5. Schematic of the set-up inside the impedance tube …………………………..97
Figure 3.6. Specimens from samples produced …………………………………………...99
Figure 3.7a. Testing set-up with air gap of 0 mm (no air gap).with nonwoven specimen in
contact with the polystyrene sheet specimen ….……….................................101
xi
Figure 3.7b. Testing set-up with a variable air gap between the nonwoven specimen and
the polystyrene sheet specimen ………………………………....................101
Figure 4.2.1 Comparison of thicknesses of nonwoven fabrics (run number and fiber
type) ……………………………………………………………………….109
Figure 4.2.2. Comparison of measured sound absorption coefficients (run number and fiber
type) ……………………………………………………………………….112
Figure 4.2.3. The correlation coefficient between fabric thickness and sound absorption
coefficient (50-5700Hz) …………………………………………………...113
Figure 4.2.4. Contour plots showing interaction effects between depth of needle
penetration and stroke frequency on sound absorption coefficients of fabrics
produced from different natural fibres: (a) Hemp, (b) Flax and
(c) Agave …………………………………………………………………..119
Figure 4.2.5. Contour plots showing interaction effects between different fibres and depth
of needle penetration on sound absorption coefficients of fabrics produced at
variable stroke frequencies: (a) 250/min, (b) 300/min and
(c) 350/min …………………………………………………......................123
Figure 4.2.6. Contour plots showing interaction effects between stroke frequency and fibre
type on sound absorption coefficients of the fabrics at variable depth of
needle penetrations: (a) 4mm, (b) 7mm and (c) 10mm ……………………127
Figure 4.3.1. Air permeability of the nonwoven fabrics …………………………...........133
Figure 4.3.2. Comparison of air permeability of fabrics produced from: (a) 30:70 % blend
of natural and PET fibres, (b) 50:50 % blend of natural and PET fibres and c)
70:30 % blend of natural and PET fibres …………….................................134
Figure 4.3.3 Comparison of Air Permeability of Fabrics Produced at Different Blending
Ratios of: (a) Wool (b) Flax, (c) Agave and PET Fibres ………………….136
xii
Figure 4.3.4. Least Square Mean values of the effect of fibre type on air
permeability ……………………………………………………...…...........140
Figure 4.3.5. Least Square Mean values of air permeability vs blend ratio ……………..141
Figure 4.3.6. Sound absorption coefficient curves of the fabrics produced ……………..145
Figure 4.3.7. Comparison of sound absorption coefficients of fabrics by fibre
type ………………………………………………………………………..147
Figure 4.3.8. Comparison of sound absorption coefficients of the fabrics by blending
ratios ……………………………………………………………………….149
Figure 4.3.9. Sound absorption coefficients of 50:50 blends of (a) wool-PET, (b) flax-
PET and (c) agave-PET at different air-gaps measured in the sound
frequency range of 50-5700 Hz …………………………….....................151
Figure 4.3.10. Sound absorption coefficients (50-5700Hz) at air gap of 0mm (Left) and
15mm (Right) for different blending ratios of the same natural fibre
type …………………………………………………………....................153
Figure 4.3.11. Sound absorption coefficients at 0mm and 15mm air gaps for different
natural fibre types at the same blending ratio ……………………………155
Figure 4.3.12. Least square mean values of sound absorption vs fibre type for the three
blending ratios …………………………………………….......................158
Figure 4.3.13. Least square mean values of sound absorption vs blending ratio for all the
fabrics tested …………………………………………………..................159
Figure 4.3.14 Least square mean values of sound absorption vs air gap size (mm) for all the
fabrics tested ………………………………………………......................161
Figure 4.3.15. Least square mean values of sound absorption vs fibre type × blend ratio for
different fibre types ………………………………………………………162
xiii
Figure 4.3.16. Least square mean values of sound absorption vs the interaction of fibre
type and air gap for different fibre types ……………………....................164
Figure 4.3.17 Least Square mean values of sound absorption vs blending ratio × air gap
size for different fibre types ……………………………………………...166
xiv
List of Tables
Table 2.1. Average Diameter of Fibres ……………………………………………...........61
Table 3.1. Fibre length and fineness with percentage CV in brackets. ……………...........88
Table 3.2. Machine settings during the second pass carding and needle punching ………91
Table 3.3. Coded levels of fibre blends and needle-punching process parameters during the
second pass on needle-punching machine ………………................................93
Table 3.4 Machine settings for the first-pass needle-punching of the fabrics ……………98
Table 3.5 Tested Parameters and Their Variations ……………………………………….99
Table 4.1 (a): Average sound absorption coefficient (50-5700 Hz) and thickness of
nonwoven fabrics produced from 100% natural fibres at different process
variables ……………………………………………………………………..103
Table 4.1. (b): Average sound absorption coefficient (50-5700 Hz) and thickness of
nonwoven fabrics produced from a blend of 70% natural and 30% pet fibres at
different production variables ……………………………...………………..104
Table 4.1. (c): Average sound absorption coefficient (50-5700 Hz) and thickness of
nonwoven fabrics produced from a blend of 30% natural and 70% pet fibres at
different process variables …………………………………..........................105
Table 4.1. (d): Average sound absorption coefficient (50-5700 Hz) and thickness of
nonwoven fabrics produced from a blend of 20% natural and 80% pet fibres at
different process variables …………………………………..........................106
Table 4.2.1 Average sound absorption coefficient (50-5700 Hz) and thickness of
nonwoven fabrics produced with different experimental variables …...........108
Table 4.2.2. ANOVA for the three parameters and their interactions, probability
(P-value) and correlation coefficient ………………………………………116
Table 4.3.1. Air permeability values of the tested fabrics ………………………………132
xv
Table 4.3.2. ANOVA for fibre type and blend ratio as parameters affecting air
permeability ………………………………………………………………..138
Table 4.3.3. Tukey HSD test for fibre type ………………………………………...........139
Table 4.3.4. Tukey HSD Test for blending ratio …………………………………...........141
Table 4.3.5. Sound absorption coefficients of nonwoven fabrics backed by an XPS sheet at
varying air-gaps and different fibre types …………………........................144
Table 4.3.6. Univariate test of significance for sound absorption ……………………….156
Table 4.3.7. Tukey HSD Test for Fibre Type ……………………………………...........157
Table 4.3.8. Tukey HSD Test for Blending Ratio ……………………………………….158
Table 4.3.9. Tukey HSD Test for Air Gap Size …………………………………………160
Table 4.3.10. Tukey HSD Test for Fibre Type × Blend Ratio …………………………..162
Table 4.3.11. Tukey HSD Test for Fibre Type × Air Gap Size …………………………164
Table 4.3.12 Tukey HSD Test for Blending Ratio × Air Gap Size ………………...........165
xvi
List of abbreviations and symbols
EDANA European Disposables and Nonwovens Association
INDA Association of the Nonwoven Fabrics Industry
λ Wave length
c Speed of sound
f Wave frequency
P Atmospheric pressure
po Pressure amplitude constant
z Acoustic impedance
v Volume velocity
D Obstacle to sound wave propagation
R Fraction of sound energy which is reflected
dB Decibels
I Sound intensity
W Sound power
SPL or Lp Sound Pressure Level
α Sound absorption coefficient
NRC Noise reduction coefficient
NAC Noise absorption coefficient
STL Sound transmission loss
CFC Chlorofluorocarbon
PVDF polyvinylidene fluoride
Tg Glass transition temperature
PET Polyester
xvii
PP Polypropylene
PLA Polylactic Acid
PTFE Polytetrafluoroethylene
R1 Specific flow resistance
Va Volume of the air in the voids
Vm Total volume of the sample
T60 Reverberation time
H Transfer function
ASTM American Society for Testing and Materials
ANOVA Analysis of Variance
XPS Extruded polystyrene
OFDA Optical fibre diameter analysis
1
1. INTRODUCTION
1.1. Noise
Excessive noise is becoming an increasingly annoying disturbance in society. Increased
noise disturbance, particularly in urban areas, is largely due to rise in population density
and modern industrialisation. In general, no clear distinction between sound and noise is
perceivable. Sound is a sensory perception and its complex pattern is termed as noise,
music, speech etc. Noise is thus defined as unwanted sound causing discomfort to human
ears [1].
The negative effects of noise on human health and social environment have been studied
for a long time since the middle of the 20th
Century [2]. Consequently, many methods have
been devised to mitigate this problem of noise disturbance. The significance of noise
pollution according to the specific effects are: noise-induced hearing impairment;
interference with speech communication; disturbance during rest and sleep; adverse effects
on psycho-social and mental-health performance; effects on residential behaviour and
annoyance; as well as interference in intended activities [2].
Noise can also adversely affect productivity in many environments [3]. For example, noise
in the passenger cabin of vehicles, which is generated by tyres, road, traffic, and the
engine; interferes with speech, causes driver fatigue, and affects safety [4]. Car owners also
usually complain about the noise inside the cabin. Hence, the noise in the passenger
compartment not only harms the health and safety of occupants but it also adversely affects
the perception on quality of the vehicle [5]. As more electronic communication and
2
entertainment systems are integrated into the vehicle, it is increasingly important to control
noise in the passenger compartment.
Main sources of noise include road, rail and air traffic, industries, construction, public
works and the neighbourhood. The main sources of indoor noise are ventilation systems
(propeller), office machines, home appliances and neighbours. All sound measures
consider the frequency of the sound, overall sound pressure level and variations in these
levels with respect to time. Sound pressure is a basic measure of the vibrations of air that
produces sound.
1.2. Noise Control
The control of noise is as much a matter of awareness as one of action. Many problems
arise because noise control is considered only when it occurs rather than in advance as a
precautionary measure. Historically, a lot of work in this field has been remedial, solution
based, rather than proactive. But experience has led to increasing efforts in the building
industry to anticipate and control noise by appropriate design [4].
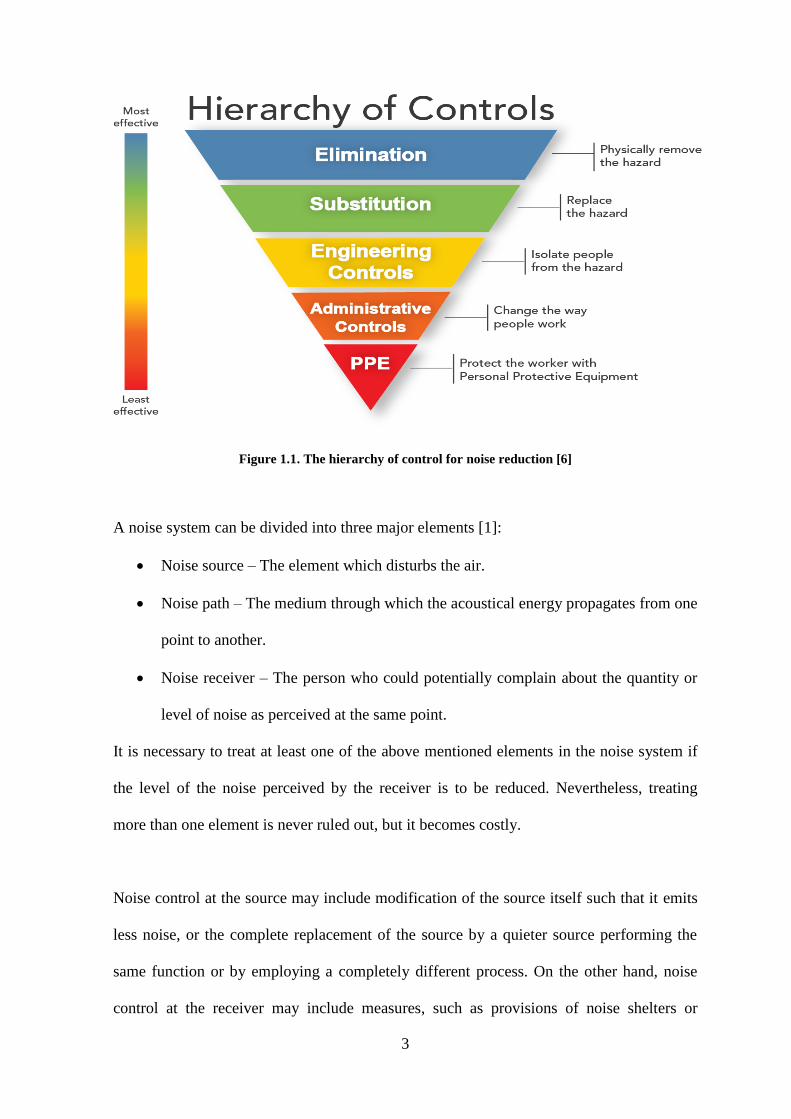
Given the practicalities of most noisy environments such as industrial plants, together with
the cost implications of dealing effectively with noise and its effect on humans (and
animals in some instances), the noise control interventions can be arranged in a
hierarchical manner like in Figure 1.1. The hierarchy is in a form of an upside down
pyramid to demonstrate that the noise control interventions become more expensive the
higher you go in the pyramid [6].
3
Figure 1.1. The hierarchy of control for noise reduction [6]
A noise system can be divided into three major elements [1]:
Noise source – The element which disturbs the air.
Noise path – The medium through which the acoustical energy propagates from one
point to another.
Noise receiver – The person who could potentially complain about the quantity or
level of noise as perceived at the same point.
It is necessary to treat at least one of the above mentioned elements in the noise system if
the level of the noise perceived by the receiver is to be reduced. Nevertheless, treating
more than one element is never ruled out, but it becomes costly.
Noise control at the source may include modification of the source itself such that it emits
less noise, or the complete replacement of the source by a quieter source performing the
same function or by employing a completely different process. On the other hand, noise
control at the receiver may include measures, such as provisions of noise shelters or
4
refuges and/or the use of hearing protection. In controlling the noise path, however, if the
noise is airborne, insulation and absorption is used and if the noise is structure-borne,
isolation or damping is used [1].
The treatment of the noise path is conceptually the simplest and therefore the most
common approach to a localized noise problem; see Figure 1.1 [6]. The treatment of the
other two elements, namely, noise receiver and noise source; are more expensive and/or
impractical, for example, using hearing protection may not be practical if other processes
require normal hearing. The approach is to place the material in the path of the noise
(generally between the noise source and the noise receiver) to create a barrier so as to
reduce the level of noise at the receiver.
In general, four basic principles are employed to reduce noise [7]: isolation, absorption/
barrier, vibration isolation and vibration damping. The scope of our study here is focused
only on sound absorption/barrier phenomenon, where sound energy is converted into
thermal energy.
Sound absorption materials reduce airborne sound by converting airborne sound energy
into heat energy via frictional mechanism. Generally, the reflection of sound from hard
surfaces is reduced and thereby the build-up of reverberant sound in rooms or any other
enclosed spaces is reduced [1].
Various types of materials are used for sound absorption; among them are different types
of porous media, such as cellular, granular and fibrous porous materials and the nonwoven
fabrics fall in this category.
5
Sound Insulation materials reduce the transmission of airborne sound between spaces.
They are used for noise reduction by screens, barriers, partitions and enclosures, as well as
for acoustic lagging of ducts and pipes and mechanic panels [1].
Sound Isolation employs resilient materials to reduce the transmission of structure-borne
sound or vibration. The principles may be used for many situations including isolation of
sound radiating panels from vibrating machine frames, motors, pumps and fans from diesel
engine generators and compressors, the isolation of sound from entire rooms etc. [1].
Damping is the process whereby vibrational or structure-borne sound energy is converted
to heat, thereby reducing the level of vibration and sound, this is achieved through a
resistive frictional process. It is the counterpart to sound absorption, which converts
airborne sound energy into heat via frictional process thus reducing the level of air borne
sound [2].
1.3. Nonwovens
There are two main processes involved in nonwoven production, namely web formation
and web bonding. Three different types of web formation techniques, such as dry-laid, wet-
laid, and polymer-laid are generally employed for producing nonwoven fabrics. Dry-laid
nonwovens have their roots in classical textiles processes such as spinning and use similar
staple fibers as well. The wet-laid process is the adaptation of the paper making process
and the polymer-laid originates from polymer extrusion and plastic processing.
The web formation stage in dry-laid nonwovens is carried out by carding and cross lapping
or aerodynamically by air laying the fibres on a moving belt. Thereafter, a batt is
6
mechanically bonded by needle punching and /or hydro-entanglement or chemically or
thermally using heated air or direct heating by calendaring rollers. Dry-laid nonwovens are
the largest segment of the nonwoven production and they are forecasted to grow by 5.3%
every year for the next 10 years [8].
Wet-laid nonwovens are produced through a system that is designed to process short fibers
suspended in liquid. To distinguish from conventional paper product, a wet-laid nonwoven
fabric is classified by EDANA as a nonwoven textile material if more than 50% of its mass
is from fibres with a fibre length to diameter ratio greater than 300, or more than 30%
fibre content if the material density is less than 0.40g/m3 [8]. The wet-laid process is not
common due to the fact that it is capital intensive and it uses a large volume of water.
Therefore, it is employed for highly specialised applications using cellulose fibers to
produce technical papers composed of high performance fibres, such as aramids and
ceramics.
Polymer laid nonwovens include spunbond, meltblown and flash-spun. Spunbonding is
basically characterised by extrusion of synthetic filaments from molten polymer and laying
on to a moving conveyor to form a web. This technology is widely used in producing such
materials as coverstocks, backings, distribution layers, and leg cuffs. The polymer-laid
nonwovens account for 65% of components in hygiene products [8].
As reported in many studies, nonwoven fabrics have been extensively utilised in sound
absorption applications. They are well suited for this function due to their bulkiness (high
volume-to-mass ratio) and porosity resulting from air cavities [9, 10 and 11]. Moreover,
7
the nonwoven fabrics are cost effective as they are relatively easier to manufacture at high
production rates.
Nonwoven fabrics are produced from environmentally friendly processes in comparison to
other alternative materials like glass fibres and chip boards. The nonwoven production
process is not energy intensive and very minimal use of chemicals is required which may
harm the environment [8]. Nonwoven fabrics can also be produced from natural fibres
which result in an environmentally friendly product compared to that produced from glass
fibres.
Another advantage of nonwoven fabrics over classical woven and knitted fabrics is that it
is possible to process a wide variety of fibers with different finenesses and lengths. This
makes it possible to use almost all types of natural fibres without lengthy preparatory
process as is the case when preparing the fibers for yarn spinning. This also makes it
cheaper and quicker to produce nonwoven fabrics from natural fibers as compared to
classical textiles which require yarn production and weaving or knitting processes.
However, in some cases the natural fibers are required to be blended with other natural and
synthetic fibers, for enhancing thermoformability and strength and to act as carrier fibre
during the manufacturing process [12]; synthetic fibers may also be used to increase bulk
where necessary. This means that in some cases natural fibers are blended in various
proportions with synthetic fibers for achieving synergy in fulfilling specific functions.
8
1.4. Nonwoven Production Processes
Like most production processes, the type of nonwoven production process to be used is
also decided by the required characteristics of the fabric, which in turn determines the
choice of fiber(s) and their blending ratio. Next step is to choose the method of web
formation together with the bonding method. Then finally it is the choice of finishing, if
required by the final product.
Manmade fibers dominate the nonwoven production which accounts for 90% of the output
with polypropylene and polyester accounting for 63% and 23%, respectively [8]. However,
with the rise in the demand for biodegradable and environmentally friendly products, a
steady increase in the use of natural fibers, such as flax, hemp, kenaf, etc. is witnessed. In
some instances, synthetic fibers are blended with these natural fibers.
The web formation process is characterised by depositing the fibres or filaments onto a
forming surface to form a web or condensed into a web and deposited on the surface of a
moving conveyor . In simple terms, web formation involves arranging staple fibers or
filaments into a two dimensional web or a three dimensional batt. Their structure and
composition strongly influence the structure and characteristics of the final fabric. The
arrangement of the fibres in the web governs the isotropy of final fabric properties;
however, most nonwoven fabrics are generally anisotropic.
The choice of web bonding method is crucial, as it decides the properties of the fabric,
such as strength, porosity, flexibility, density, loftiness and thickness. In some instances,
depending on the desired fabric characteristics, more than one bonding method is
employed. Needlepunching is the most common bonding method accounting for 35% of
9
the nonwoven output [8]. Hydroentanglement bonding produces comparatively thinner
fabrics as compared to needle-punched fabrics but achieve higher tensile strength.
Hydroentangled nonwoven fabrics also look similar to woven fabrics, sometimes with
similar drape as well.
Chemical bonding is largely employed in combination with another bonding method for
applying finishes, such as anti-microbial , anti-static and fire-retardants, but it can be
applied for only bonding the web as well. Thermal bonding by heated air produces loftier
materials with high thickness and low tensile strength, e.g. duvet inners. Whereas
calendaring process applies direct heat under pressure to soften and fuse fibers to bond
them without melting.
Various finishing methods are employed in the nonwoven industry and the choice is
dictated by the end-use of the fabric. The main types are wet, chemical, lamination,
mechanical and surface finishing. Wet finishing includes washing (scouring), coloration
(e.g. dying) and printing (pigment applied with binder). As stated above, chemical
finishing is sometimes combined with chemical bonding to reduce processing steps.
Chemical finishing methods include padding, coating and spraying. Lamination is used for
joining two or more layers of pre-formed nonwoven fabrics or a layer of nonwoven fabric
with other materials like films, scrims, and other textile materials, for example, woven
fabric. Mechanical finishing includes splitting and winding, perforating and drying.
Surface finishing includes singeing (removal of protruding fibers form fabric with heat),
shearing, flocking, raising, polishing and softening.
10
1.5. Nonwovens in Sound Absorption
Needle-punched nonwoven fabrics as sound absorbing media have been studied at length
in the past few years. Many parameters affecting their efficacy in sound absorption have
also been studied [13-17]. These can be grouped in terms of materials (fiber type and
composition), production process and product parameters. Material parameters include
fiber dimensions, fiber surface area and fiber blending ratio. Process parameters include
depth of needle penetration, stroke frequency, web thickness, density and surface
treatments. Product parameters include airflow resistance, porosity, tortuosity and surface
impedance [18]. Besides these parameters, other variables influence their efficacy in sound
barrier application, for example, layering sequence and the gap between layers (size of the
air gap) as factors that have not been widely investigated in sound barrier capabilities of
nonwoven fabrics particularly in automotive and building applications.
Mirjalili and Mohammad-Shahi [13] studied the amount of sound absorption in different
multi-layered structures made from nonwoven fabrics, these structures in various
configurations, including incorporation of the air-gap, were applied for sound absorption,
however, these parameters were not optimised. Other researchers have also studied the
effect of air-gap on sound absorption properties of nonwovens [14, 19] without optimising
or testing synergistic effects with other production parameters.
Applications of nonwoven fabrics for noise control in buildings include wall claddings,
acoustic barriers and acoustic ceilings [20], and in passenger vehicles are noise absorbers,
dash insulators, engine insulators, carpets, door panels, hood liners etc. [21]. The modern
trend in technological advancement is such that one needs to be mindful of the
11
environmental impacts of the materials used. This includes, time of production, time of use
and disposal at the end of the service life of the material.
1.6. Nonwovens and the Environment
The recent trend on environmental impact awareness means that producers need to be
considerate in terms of mass and volumes of the materials used. Hence, industrialists are
increasingly becoming interested in natural or renewable materials as society becomes
more aware of the adverse effects of producing and using synthetic non-renewable
materials in the eco-system [22].
Natural fibers are renewable and biodegradable, therefore making them an effective choice
for the noise absorbing materials particularly for automotive and built environment
applications. Recent upsurge in research on the use of recyclable and biodegradable
materials in manufactured products has triggered a need for biodegradable nonwovens for
nearly forty interior components in automotive production, which include door inner
panels, headliners, carpets etc. These components are currently made of traditional
materials, such as glass and other synthetic fibers and foams which are difficult to recycle
[12].
12
2. LITERATURE REVIEW
2.1. The Sound Phenomenon
2.1.1. The Nature of Sound
Sound is a result of fluctuations in the pressure of air that is perceived by sensory nerves of
the human ear. These fluctuations are in the form of longitudinal wave motions and they
can be set up in a number of ways, but usually by some vibrating object [4]. Sound,
however, can travel through any medium, including air, liquid and solid, as long as the
medium has mass and elasticity [7].
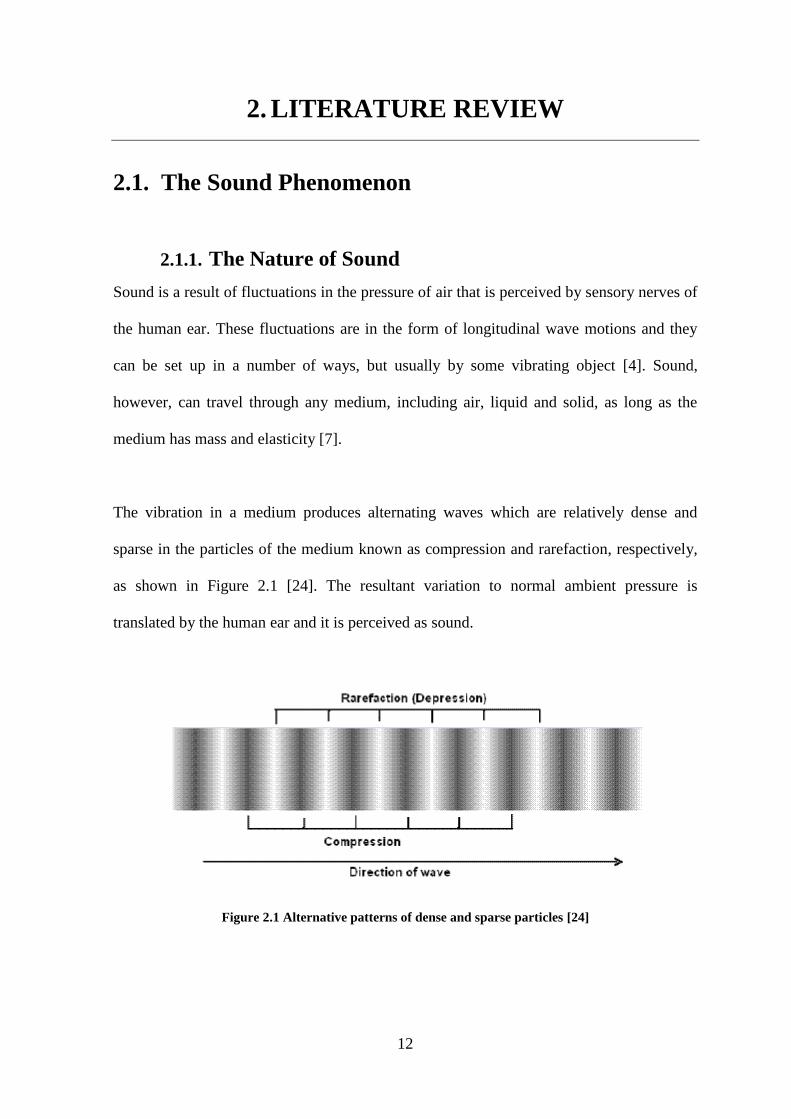
The vibration in a medium produces alternating waves which are relatively dense and
sparse in the particles of the medium known as compression and rarefaction, respectively,
as shown in Figure 2.1 [24]. The resultant variation to normal ambient pressure is
translated by the human ear and it is perceived as sound.
Figure 2.1 Alternative patterns of dense and sparse particles [24]
13
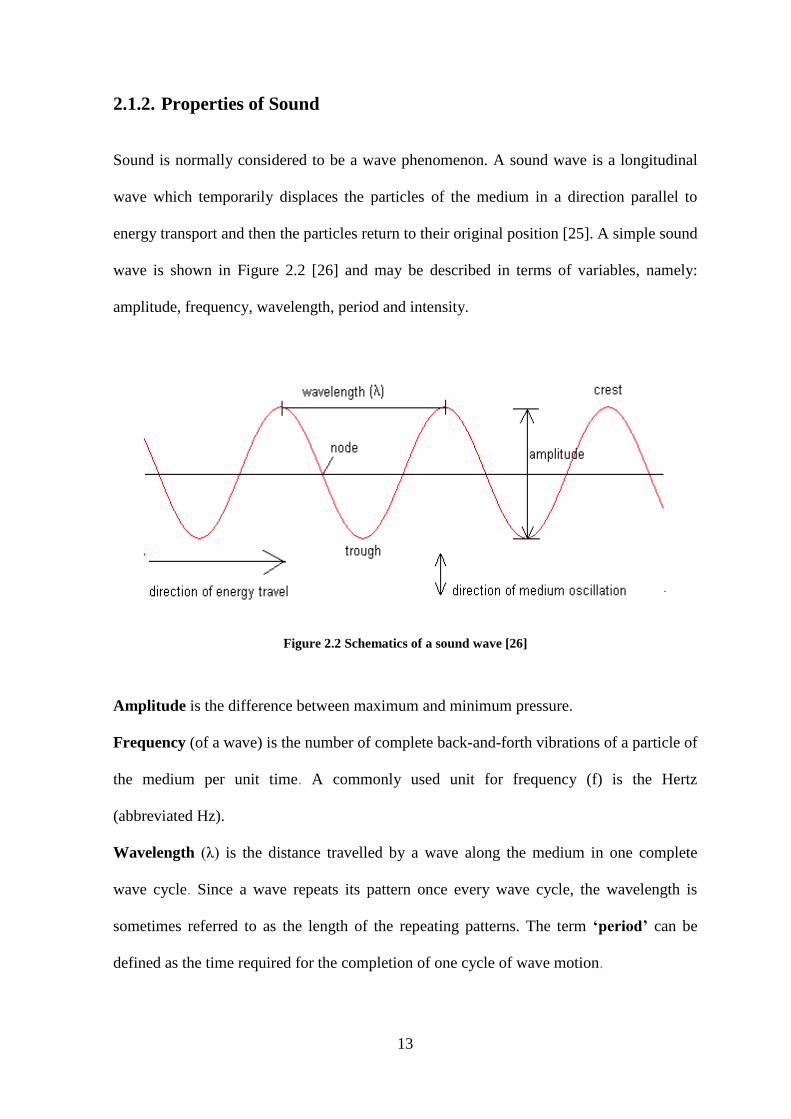
2.1.2. Properties of Sound
Sound is normally considered to be a wave phenomenon. A sound wave is a longitudinal
wave which temporarily displaces the particles of the medium in a direction parallel to
energy transport and then the particles return to their original position [25]. A simple sound
wave is shown in Figure 2.2 [26] and may be described in terms of variables, namely:
amplitude, frequency, wavelength, period and intensity.
Figure 2.2 Schematics of a sound wave [26]
Amplitude is the difference between maximum and minimum pressure.
Frequency (of a wave) is the number of complete back-and-forth vibrations of a particle of
the medium per unit time. A commonly used unit for frequency (f) is the Hertz
(abbreviated Hz).
Wavelength (λ) is the distance travelled by a wave along the medium in one complete
wave cycle. Since a wave repeats its pattern once every wave cycle, the wavelength is
sometimes referred to as the length of the repeating patterns. The term ‘period’ can be
defined as the time required for the completion of one cycle of wave motion.
14
Intensity (of a sound wave) is the average rate at which sound energy is transmitted
through a unit area.
2.1.3. Sound Mechanics
The Speed of Sound, denoted by c, is the rate at which sound waves travel. At 20 oC
(68oF) the speed of sound in air is approximately 344 m/s. The temperature of the air
(medium) has a significant effect on the speed of sound, the speed increases by about 0.61
m/s for each 1oC increase in temperature of the air [7]. Sound wave travels faster in solids
than in air, for example, the speed of sound in a brick is 11 times higher than that in the
air.
Therefore, the relationship between the speed of sound c, the wavelength λ and frequency f
is given by:
c = f λ (1)
Sound Pressure can be defined by considering a point in the space near the sound source,
for example, a speaker [7]. At a point of observation, before the passage of the sound
waves, the atmospheric pressure is denoted by P. Then when the sound waves pass the
point of observation, the additional pressure P (the sound pressure) is given by:
P = po .sin (2π f)t (2)
15
Where, po is a constant called the pressure amplitude. The sin part comes from the fact that
the wave motion is described by a sin wave in a simple harmonic motion [7]. Thus, the
total pressure at the point of observation is equal to:
P + p = P + po .sin( 2π f)t (3)
The audible range of sound pressure ranges from 20 µPa to 20 Pa. On the other hand, the
audible range of sound frequencies varies from 20Hz to 20 000Hz (20 kHz). Acoustic
waves with frequencies above the audible range are called ultrasonic waves and those with
frequencies below the audible range are called infrasonic waves [1].
From elementary physics we learn that Power is a product of the Force and the Velocity of
the particle. Hence the power per unit area in a sound wave equals the product of the
excess pressure (force per unit area) and the particle velocity. The maximum power per
unit area is the product of the maximum pressure variation Pmax and the maximum
velocity [25].
Sound Power from different sound sources varies widely. It varies from 10-9
Watts (W)
for a whisper of the human voice to 20 × 10-6
W during a conversation and this further
increases to about 10-3
W on average when shouting. The average sound power of a
crawler tractor is about 1 W when in operation and that of a large rocket engine is about
100 MW on average [7].
Audible sound varies from 10-12
W/m2
(a millionth of a millionth per square meter) to 100
W/m2, which is approaching the pain threshold. Therefore, the sound intensity (I) is a
16
useful quantity as it relates to the sound power of the noise source, and is one of the
important factors in determining loudness of the sound [1].
Acoustic Impedance
Acoustic impedance (z) is the ratio of the sound pressure, p, averaged over the surface to
the volume velocity, v, as given by Equation 4. The volume velocity is the product of the
surface area and acoustic particle velocity.
z = p/v (4)
Specific acoustic impedance is defined at a point in a sound field, which is a ratio of sound
pressure to the acoustic particle velocity; expressed in (kg.m/s2).
Sound Absorption
Sound absorption occurs when sound energy is dissipated from a sound wave and is
converted to heat resulting from a frictional process. The normal energy content of a sound
wave is usually very small and as such the increase in temperature due to sound absorption
is very negligible. Sound absorption can be thought of as a frictional process occurring
between vibrating molecules when the sound is transmitted through the medium. Frictional
processes occur in vibrating bodies as well, like panels but in these cases the energy loss is
referred to as damping. Sound absorption can occur within the transmitting medium or at
the interface with another medium during reflection and scattering. Further discussion on
sound absorption will be presented in Section 2.2 on noise control.
17
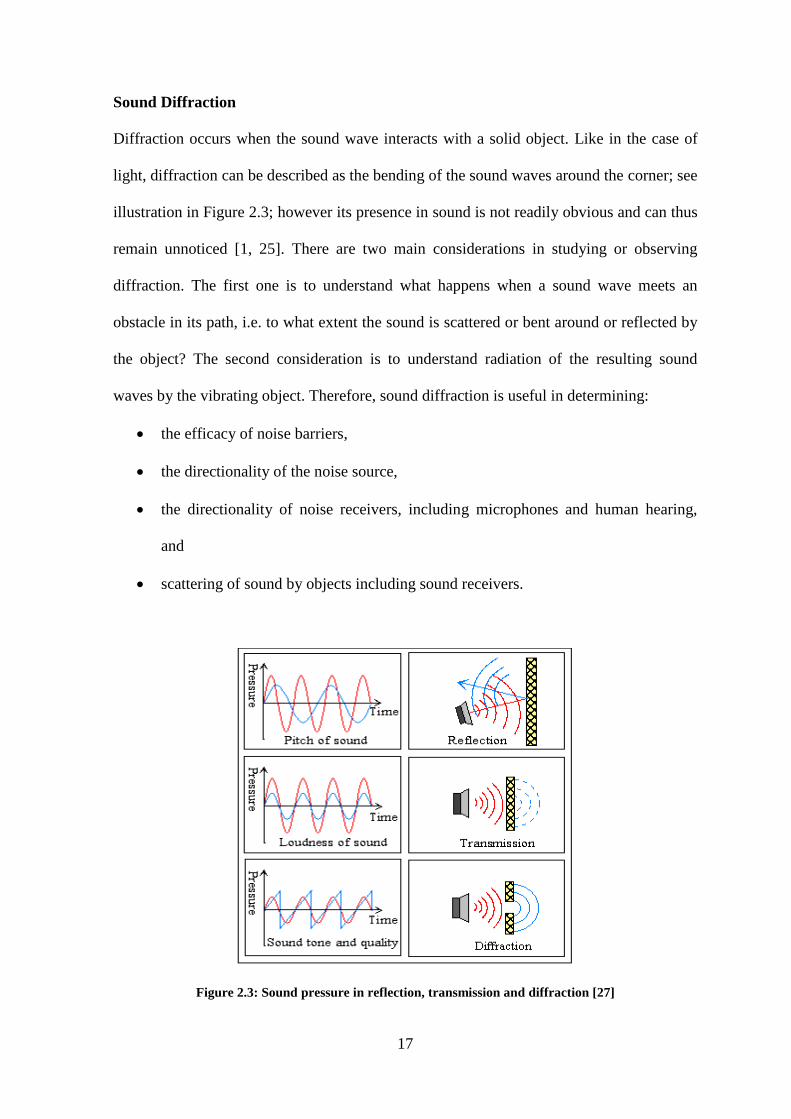
Sound Diffraction
Diffraction occurs when the sound wave interacts with a solid object. Like in the case of
light, diffraction can be described as the bending of the sound waves around the corner; see
illustration in Figure 2.3; however its presence in sound is not readily obvious and can thus
remain unnoticed [1, 25]. There are two main considerations in studying or observing
diffraction. The first one is to understand what happens when a sound wave meets an
obstacle in its path, i.e. to what extent the sound is scattered or bent around or reflected by
the object? The second consideration is to understand radiation of the resulting sound
waves by the vibrating object. Therefore, sound diffraction is useful in determining:
the efficacy of noise barriers,
the directionality of the noise source,
the directionality of noise receivers, including microphones and human hearing,
and
scattering of sound by objects including sound receivers.
Figure 2.3: Sound pressure in reflection, transmission and diffraction [27]
18
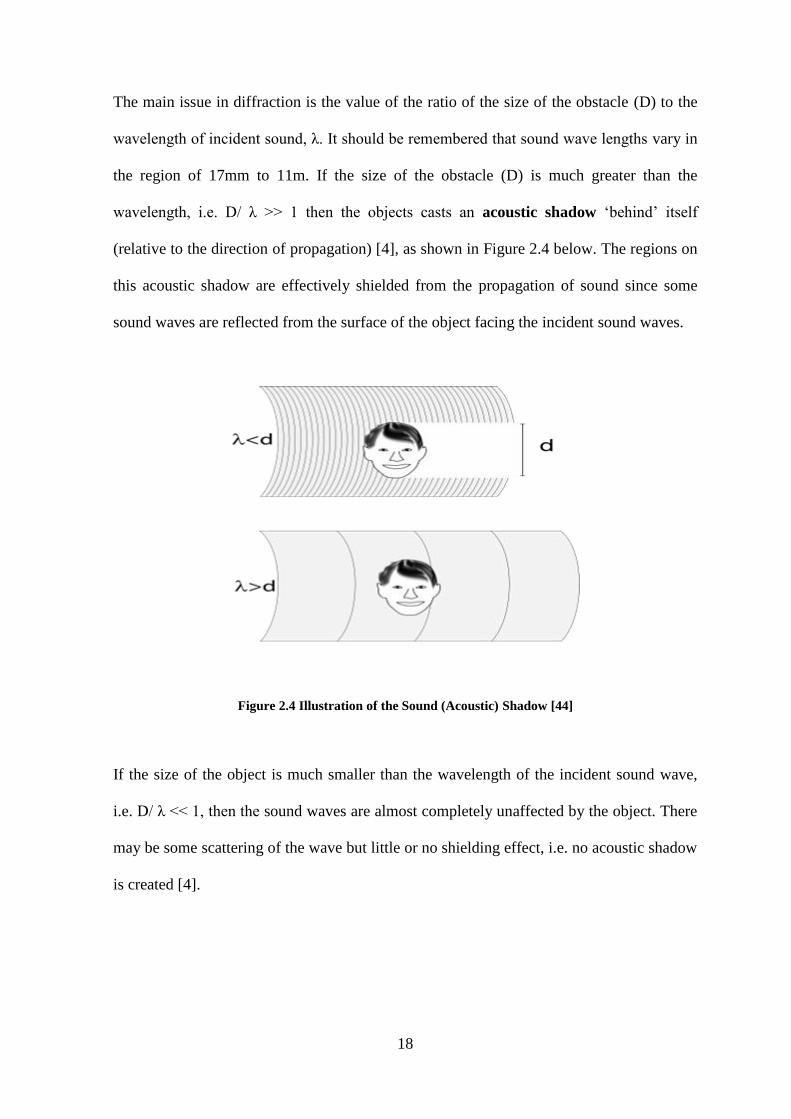
The main issue in diffraction is the value of the ratio of the size of the obstacle (D) to the
wavelength of incident sound, λ. It should be remembered that sound wave lengths vary in
the region of 17mm to 11m. If the size of the obstacle (D) is much greater than the
wavelength, i.e. D/ λ >> 1 then the objects casts an acoustic shadow ‘behind’ itself
(relative to the direction of propagation) [4], as shown in Figure 2.4 below. The regions on
this acoustic shadow are effectively shielded from the propagation of sound since some
sound waves are reflected from the surface of the object facing the incident sound waves.
Figure 2.4 Illustration of the Sound (Acoustic) Shadow [44]
If the size of the object is much smaller than the wavelength of the incident sound wave,
i.e. D/ λ << 1, then the sound waves are almost completely unaffected by the object. There
may be some scattering of the wave but little or no shielding effect, i.e. no acoustic shadow
is created [4].
19
If the size of the object is similar to the wavelength of the incident sound, i.e. D/ λ ≈ 1, the
interaction between the sound wave and the object is very complex and the theory is
covered at length in the study on physics of sound [1, 25].
Sound Reflection
Reflection is actually a special kind of diffraction; see illustration in Figure 2.3 above,
when sound waves encounter an object which is relatively larger than the wavelength, and
then sound is reflected. If the reflecting surface is flat and smooth then specular reflection
occurs, i.e. the angle of incidence is equal to the angle of reflection. In the case of a rough
surface, the diffuse reflection occurs with sound being scattered in all directions [1].
Similar to light waves, a concave surface can cause sound waves to be focused on one
point and a convex surface can cause dispersion of sound waves.
When sound waves encounter two consecutive media, sound waves are reflected by the
first medium but some sound energy will be transmitted into the second medium, this is
called partial reflection. The greater the change in specific acoustic impedance, the higher
is the fraction of reflected sound energy. For instance, specific impedance values of air and
water at room temperature are about 415kg.m/s2 and 1.5 million kg.m/s
2, respectively.
Therefore, given this large difference between the two specific acoustic impedances, it can
be expected that most of the sound energy will be reflected at the air-water interface, and
only a small proportion will be transmitted [1].
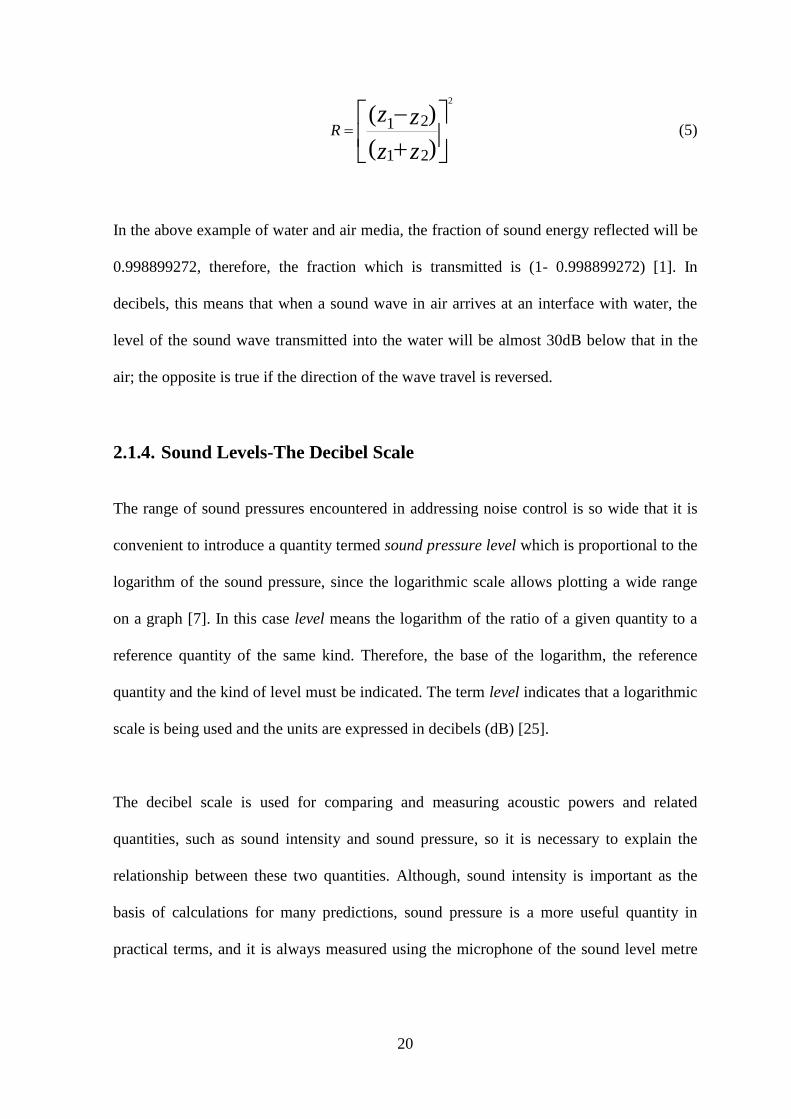
The fraction of sound energy, R, which is reflected at an interface between two media with
acoustic impedances z1 and z2 is given by:
20
)(
)(
21
21
2
zz
zzR (5)
In the above example of water and air media, the fraction of sound energy reflected will be
0.998899272, therefore, the fraction which is transmitted is (1- 0.998899272) [1]. In
decibels, this means that when a sound wave in air arrives at an interface with water, the
level of the sound wave transmitted into the water will be almost 30dB below that in the
air; the opposite is true if the direction of the wave travel is reversed.
2.1.4. Sound Levels-The Decibel Scale
The range of sound pressures encountered in addressing noise control is so wide that it is
convenient to introduce a quantity termed sound pressure level which is proportional to the
logarithm of the sound pressure, since the logarithmic scale allows plotting a wide range
on a graph [7]. In this case level means the logarithm of the ratio of a given quantity to a
reference quantity of the same kind. Therefore, the base of the logarithm, the reference
quantity and the kind of level must be indicated. The term level indicates that a logarithmic
scale is being used and the units are expressed in decibels (dB) [25].
The decibel scale is used for comparing and measuring acoustic powers and related
quantities, such as sound intensity and sound pressure, so it is necessary to explain the
relationship between these two quantities. Although, sound intensity is important as the
basis of calculations for many predictions, sound pressure is a more useful quantity in
practical terms, and it is always measured using the microphone of the sound level metre
21
[1]. The intensity of sound (I) at a point is proportional to the square of the sound pressure
(p) at that point:
I α p2
(6)
Therefore, if the sound pressure is doubled, the intensity increases four times. Now, in
decibel scale, when comparing two sounds, with respective intensities I1 and I2, it can be
said that I2 is N dB above I1, where:
N =10 log (I2 / I1) (7)
A similar scale may be used to compare the sound power outputs (W2 and W1) from two
noise sources, i.e.
N =10 log (W2 / W1) (8)
Now since sound pressure is related to sound intensity as discussed above, then two sounds
with sound pressures p1 and p2 may also be compared on the decibel scale [28].
N =10 log (I2 / I1) = 10 log (p2 / p1)2
= 20 log (p2 / p1) (9)
Therefore a 20dB noise reduction, typically achieved by a single glazed window for
example, corresponds to a 100 fold reduction in sound intensity, and the 50 dB sound
insulation which is typically achieved by a masonry wall means that the wall only
transmits one part out of 100 000 parts of incident sound energy.
22
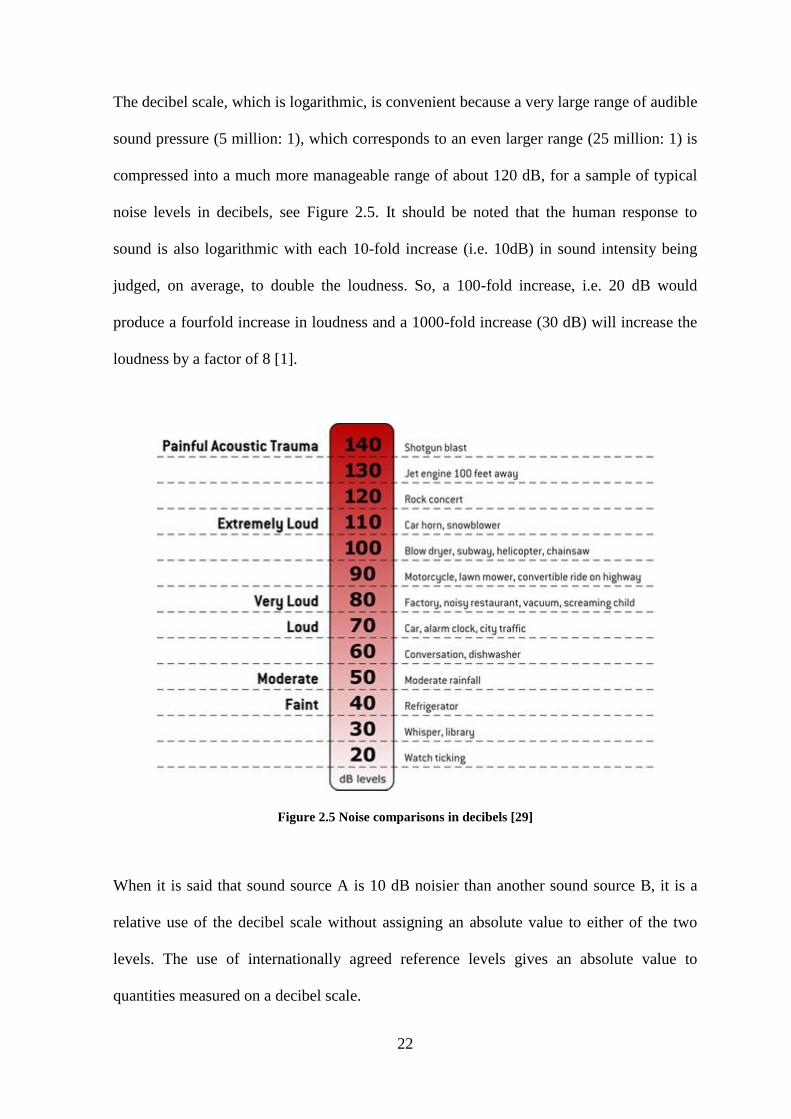
The decibel scale, which is logarithmic, is convenient because a very large range of audible
sound pressure (5 million: 1), which corresponds to an even larger range (25 million: 1) is
compressed into a much more manageable range of about 120 dB, for a sample of typical
noise levels in decibels, see Figure 2.5. It should be noted that the human response to
sound is also logarithmic with each 10-fold increase (i.e. 10dB) in sound intensity being
judged, on average, to double the loudness. So, a 100-fold increase, i.e. 20 dB would
produce a fourfold increase in loudness and a 1000-fold increase (30 dB) will increase the
loudness by a factor of 8 [1].
Figure 2.5 Noise comparisons in decibels [29]
When it is said that sound source A is 10 dB noisier than another sound source B, it is a
relative use of the decibel scale without assigning an absolute value to either of the two
levels. The use of internationally agreed reference levels gives an absolute value to
quantities measured on a decibel scale.
23
The reference value of sound pressure, p0 , is 2×10⁻⁶
or 20 micropascals, which represents a
threshold for an average young person with normal hearing corresponding to 0 dB. Values
measured on a decibel scale relative to this value are called sound pressure levels, and
denoted by the symbol SPL or Lp, the reference value, W0, for the sound power level scale
(Lw) is 10-12
W, and for the sound power level scale (LI) the reference value (I0) is 10-12
W/m2
[1].
Lp = 20 log (p/p0)
LI = 10 log (I/ I0)
Lw = 10 log (W/W0) (10)
These scales represent three different physical quantities, i.e. sound pressure, sound power
and sound intensity, although they are all measured in dB. It can be understood from the
context which one of these three quantities is being referred to, however sometimes it may
be necessary to specify them explicitly.
2.2. Noise Control
Various methods for reducing noise in the source-transmission path-receiver model are
available; however, treating the transmission path is usually the most viable approach.
However, it is not always difficult or unviable to treat the other two elements, i.e. source
and receiver. It is important to understand the mechanism of noise generation at the source,
i.e. what is it exactly that is making the noise, and the underlying principle at work. By this
approach, it is possible to respond with an effective method to reduce the noise. Some
simple methods based on common sense relating to general housekeeping also may be
employed to reduce noise or its effects. Four standard techniques for reducing noise in the
transmission path are employed as already discussed in Section 1.2., i.e., the use of sound
24
absorbing and/or sound insulating materials for reducing airborne sound and the use of
vibration isolation and damping for reducing structure borne sound. Sometimes it may be
necessary to treat the receiver (of noise) element as well, for example, the use of personal
ear protectors, such as ear-plugs and headphones/earmuffs.
2.2.1. Noise Control at the Source
There are two main considerations of noise sources which must be examined. Firstly, the
extent, type and manner of noise emission must be known before any meaningful
assessment of its effect can be attempted. Secondly, it is important to know whether it is
practical to reduce the noise output at the source without reducing its effectiveness and
causing malfunctioning, i.e. easy break-down [1].
Although there are many technical solutions, much can be done to avoid noise problems by
good noise control management. Some of the common measures are as follows:
Avoid making unnecessary noise, for example when leaving machines running
even though not required.
Select the quietest procedure when alternatives exists.
Arrange regular maintenance of machines and noise control equipment to avoid
unnecessary increases in noise levels.
Educate, inform and train people so that they are aware of the purpose of noise
control equipment and how it should be used.
The other approach in dealing with the noise problem at the source is to modify the source
itself so as to reduce the noise it emits. In this approach, the main aim is to reduce the noise
resulting from vibrating surfaces by controlling the amplitudes of vibrations. The possible
25
solutions here are stiffening or damping the vibrating surfaces, otherwise, other options
could be isolation or shielding (acoustic lagging) of moving parts.
Increasing stiffness of the vibrating panel may improve the efficiency of noise, however,
the most effective method is to increase its damping rather than to stiffen it particularly for
a thin panel. However, for very stiff panels, damping may not be effective since the
damping mechanism requires a large amplitude of vibration to convert vibration energy
into heat.
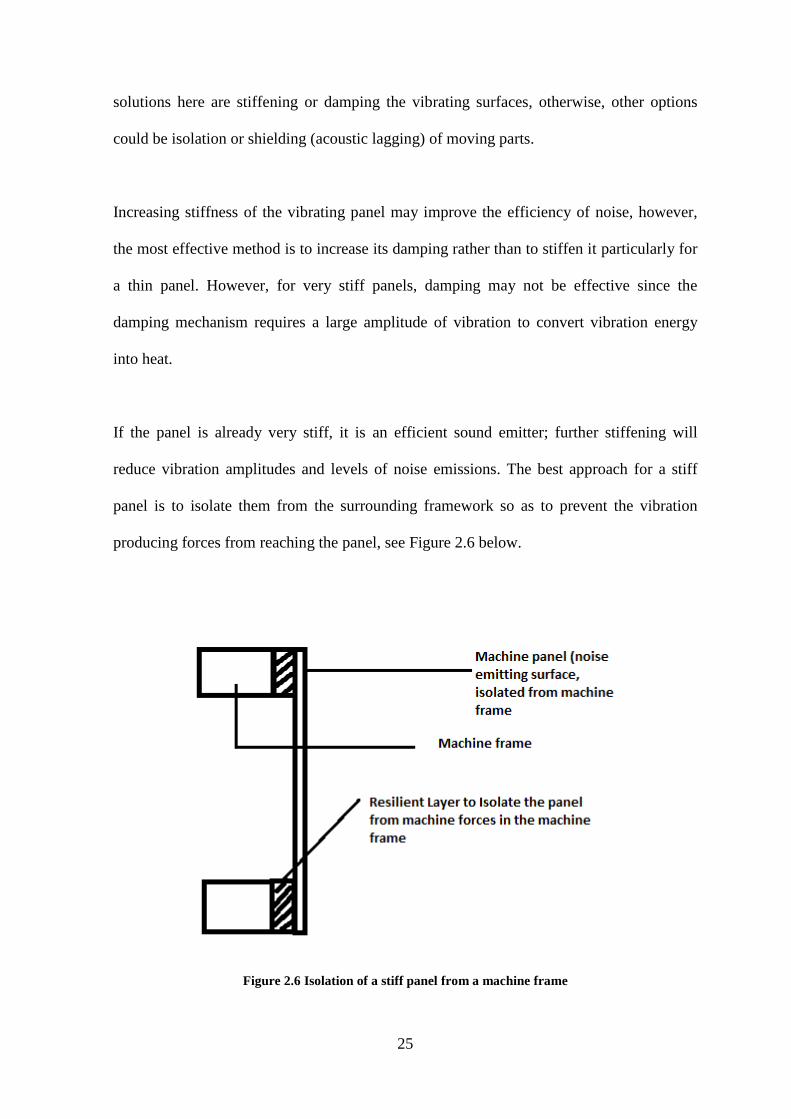
If the panel is already very stiff, it is an efficient sound emitter; further stiffening will
reduce vibration amplitudes and levels of noise emissions. The best approach for a stiff
panel is to isolate them from the surrounding framework so as to prevent the vibration
producing forces from reaching the panel, see Figure 2.6 below.
Figure 2.6 Isolation of a stiff panel from a machine frame
26
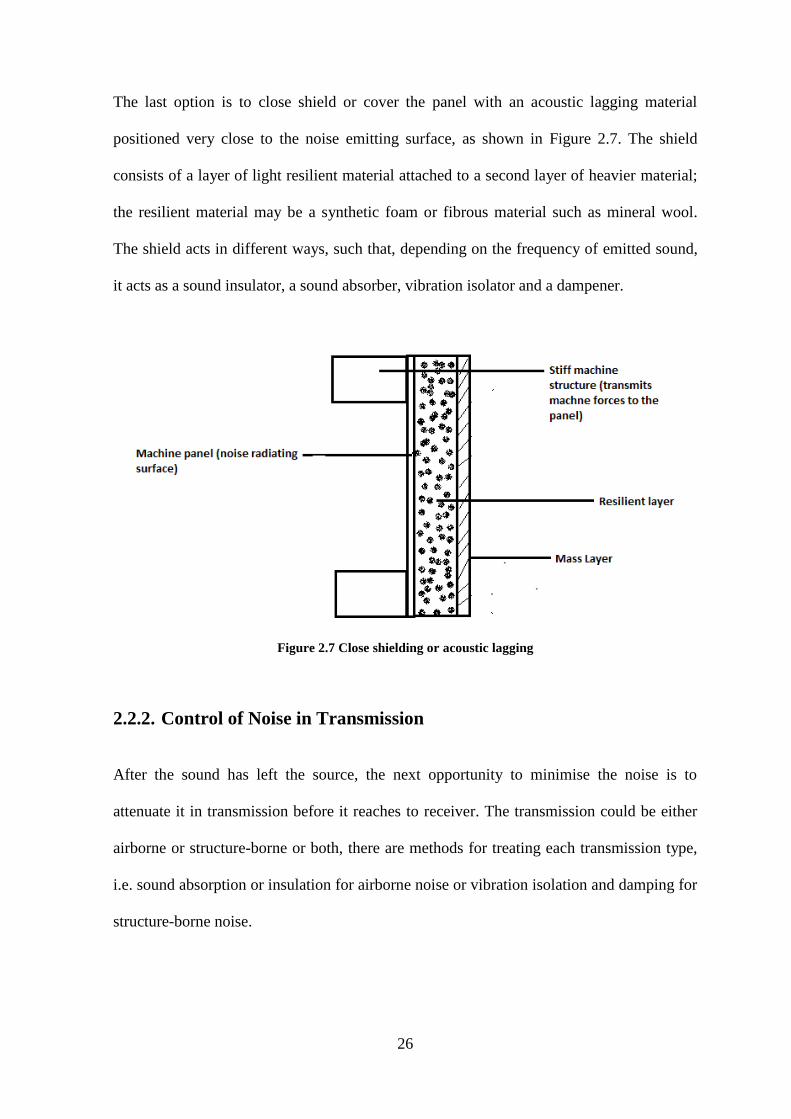
The last option is to close shield or cover the panel with an acoustic lagging material
positioned very close to the noise emitting surface, as shown in Figure 2.7. The shield
consists of a layer of light resilient material attached to a second layer of heavier material;
the resilient material may be a synthetic foam or fibrous material such as mineral wool.
The shield acts in different ways, such that, depending on the frequency of emitted sound,
it acts as a sound insulator, a sound absorber, vibration isolator and a dampener.
Figure 2.7 Close shielding or acoustic lagging
2.2.2. Control of Noise in Transmission
After the sound has left the source, the next opportunity to minimise the noise is to
attenuate it in transmission before it reaches to receiver. The transmission could be either
airborne or structure-borne or both, there are methods for treating each transmission type,
i.e. sound absorption or insulation for airborne noise or vibration isolation and damping for
structure-borne noise.
27
a. Sound Absorption
It is the property of a material to absorb sound, by converting sound into a small amount of
heat energy. When sound waves strike the surface of the material, a fraction of the incident
energy is absorbed by conversion to heat. All materials absorb sound to some extent,
however, a material is referred to as an acoustic material only if it is able to absorb a large
fraction of the acoustic energy which strikes it [7, 25, 28].
The porosity of an acoustic material is the most responsible attribute for the dissipation of
sound energy. The pores may be formed by a felted mineral, fiberglass or staple fibres, by
interstices between small granules or by a foamed composition in which the solidified
bubbles interconnect throughout the material. When a sound wave enters a porous material,
the amplitude of vibration of the air molecules is progressively dampened by friction
against the surfaces of the fibres or particles forming the porous structure [5].
Another factor affecting sound absorption properties is the thickness of the acoustic
material, particularly when dealing with low frequency sounds. A similar factor to this is a
case when there is an air space or gap between the acoustic material and the rigid backing.
When the thickness of the air-gap is less than a quarter of the wavelength, then the sound
absorption at low frequencies decreases with decreasing frequency. The frequency f (Hz)
below which the absorption decreases is approximated by:
d
cf
2
(11)
28
Where, c is the speed of sound and d is the thickness of the air gap. Thus an air-gap of at
least 10.2 cm is necessary to maintain a high level of sound absorption particularly at low
frequencies [7].
When a beam of incident sound is striking a wall, the sound energy will be reflected back,
transmitted through the wall or absorbed within the wall or within an acoustic lining
applied to the wall. Let the incident sound intensity be Ii , and the reflected sound intensity,
absorbed sound intensity and the transmitted sound intensity are denoted as Ir , Ia and It.
respectively, then [1]:
Ii =Ir + Ia+ It (12)
The fractions of sound that are reflected (r.) and transmitted (t) can then be given by:
II
i
rr (13)
II
i
tt (14)
The coefficient of sound absorption is defined differently when compared to coefficients of
reflection and sound transmission intensities described above. The absorption coefficient
(α) is a fraction of incident sound intensity which is either absorbed or transmitted, i.e. the
fraction of incident sound intensity, which is not reflected [1].
29
III
i
ta)(
(15)
Which becomes [1]:
α = 1- r (16)
The sound absorption co-efficient then varies between 0 and 1, 1 being a perfect absorber
and 0 being a perfect reflector, i.e. no absorption.
The noise reduction coefficient, NRC (or NAC) of a material, is a single value expressed
as an average of the absorption coefficient of the material at specific frequencies. Noise
reduction coefficients are specified for the materials employed in noise control
applications. However, at low or very high frequencies, it is better to use the absorption
coefficient at that particular frequency for comparing different materials as the use of NRC
may become misleading, a material can have a high NRC value but may have low
absorption coefficient at low or very high frequencies [7].
It should be noted that sound absorption coefficient varies with variations in sound
frequency, incident angle and the type of mounting used. It is necessary to note these
parameters when reporting sound absorption coefficients of the material.
There are three main types of sound absorbing materials, namely, porous, panel/membrane
and Helmholtz/cavity absorbers. Porous absorbers work over a wide range of sound
frequencies, although they are much more effective at high sound frequencies than at low
30
sound frequencies, while the other two types are effective only over a limited range of
sound frequency centred around the resonance frequency of the sound absorption material.
b. Sound Insulation
Sound insulation, like sound absorption, is also a method of dealing with airborne noise.
When sound waves with varying sound pressures strike the insulation medium then it
vibrates, a fraction of the vibrational energy carried by the sound wave is transferred
through the medium and causes it to vibrate and thereby sets off the air on the other side to
start vibrating and thus transferring sound [7].
.
The structural characteristics of the partition such as density and thickness, determine its
effectiveness in insulating noise. In many cases the structures of the partitions are complex,
they consist of layers of different materials and cavities and thus some of the energy of the
sound wave dissipates within the partition and thereby reducing the transfer of sound
energy on the other side [7].
Sound Transmission Loss (STL) is the ratio of the sound energy incident on the partition to
the transmitted sound energy, expressed in decibels (dB). Therefore, lower the sound
energy transmitted higher is the transmission loss.
c. Vibration Isolation
Structure borne noise originates from the vibration of structures, these vibrations can
propagate in the structure to various locations with very little attenuation and thereby cause
surfaces to vibrate and create airborne noise [7]. Structure-borne noise is caused by forces
acting on the structure. These vibrations can be caused by steady state sources, for
31
example, air-conditioners and fans, and impact of sources, such as slamming of doors or
dropping of objects [7].
The principle of vibration isolation is simply to reduce the amplitude of vibration of a
vibrating system. In order to achieve significant amount of vibration isolation, the value of
the vibration frequency, f, should be at least 3 times that of natural frequency, f0 , of free
and natural vibrations [1].
A wide range of materials can be used as vibration isolators depending upon the specific
frequency range of the vibrating system. For high frequency (25Hz and above) vibrations,
where static deflections are very small, typical vibration isolators include cork, cork
composites, felts and foamed plastics. These materials derive their elasticity from the air
they contain within their internal cavities and they should be used in compressed state.
In the mid-range of vibration frequency (5-35Hz) rubber and elastomer materials in a wide
variety of shapes, are used in compressed state for vibration isolation. In the low-range
vibration frequency (2-15Hz) where mostly static deflections occur, metal springs are
commonly used. The advantage of the metal springs is that they can be designed into
various shapes and levels of stiffness and are thus able to withstand heavy loads, however,
springs are not suitable for higher frequency vibration systems since the high frequency
vibration can travel along the coils of the spring.
d. Damping
Damping is a mechanism occurring between the components in a vibrating system which
leads to a conversion of vibrational energy into heat energy and a reduction in the
32
amplitude of vibration. Strictly speaking, every system has some damping mechanism;
otherwise there would be perpetual motion or vibration [1].
Hysteretic damping occurs within materials depending on their atomic, molecular and
crystal structure, it results from phase changes between stress and strain occurring during
vibration. Friction damping occurs because of mechanical contacts between components.
Viscous damping occurs if a mass-spring system is fitted with a dashpot where a plunger
moves through a viscous fluid (commonly seen in physics and basic mechanics textbooks)
[1].
2.2.3. Noise Control at the Receiver
Noise control at the receiver is in fact hearing protection. Generally, this should be the last
resort as a method to control noise when the other two approaches (at source and in
transmission) have been ineffective or are not practical.
Various types of earmuffs are being used for hearing protection. The main types are: (i)
Moulded plastic cups which fit over ears with sound absorbing foam plastic fitted in each
cup to minimise vibrations. (ii)Alternatively, flexible plastic cushions are fitted, which
enable tight fit of the cups over the ears to minimize leakage of sound around the cups into
the ear with adjustable elastic. (iii) Flexible headband which holds the cups in place and
helps the cushions to seal around the ear.
For specialised applications, such as in situations with sudden burst of noise, specially
developed ear muffs are utilised which allow only low amplitude sound (e.g. from
conversation) but prevent transmission of high intensity sound [1].
33
2.3. Porous Sound absorbing Materials
Porous sound-absorbing materials are capable to absorb a sizable amount of sound energy
striking them and reflecting very little sound. Therefore, these materials are very useful for
controlling noise. A wide range of sound-absorbing materials exists and their sound
absorption properties depend upon sound frequency and composition, thickness and
surface finish of the material and method of mounting. However, materials showing a high
value of sound absorption coefficient are usually porous [30].
In most cases, sound barriers are confused with sound absorbing materials. Generally,
materials providing good sound absorption are poor sound barriers. Unlike barriers and
damping materials, the mass of the material has no direct effect on the performance of the
sound absorption materials [31].
Porous materials for sound absorption can be classified as cellular, fibrous, or granular
according to this is based on their microscopic compositions and configurations. Porous
materials are characterized by the fact that their surfaces allow sound waves to enter the
materials through a multitude of small holes or openings.
Materials produced from open-celled polyurethane and foams are examples of cellular
materials. Fibrous materials consist of a series of tunnel-like openings which are formed by
interstices of fibers. Fibrous materials include those made from natural fibres, such as
cotton, flax and wool and synthetic fibers such as glass and mineral fibres [32].
The granular porous materials for sound absorption are made up of consolidated granules.
These materials consist of relatively rigid, macroscopic granules whose dimensions exceed
34
those of the internal voids. Unconsolidated granular materials consist of loosely packed
assemblages of individual granules [30]. Granular sound absorbing materials include some
types of asphalt, porous concrete, granular clays, sands, gravel, and soils [33-34]. So the
acoustic properties of granular materials are important in controlling sound propagation in
outdoor environment [30].
2.3.1. Cellular Porous Sound Absorbing materials
Polyurethane and melamine foams are commonly available cellular porous materials for
sound absorption. However, other types of foams have been designed for applications
where heat and corrosion resistances are required in addition to sound absorption. Metal
foams are relatively new materials which have proven to be suitable for manufacturing
lightweight structures, biomedical implants, filters, heat exchangers, sound absorbers and
mechanical damping devices [30]. Aluminium foams have traditionally been the most
commonly used materials for sound absorption. Metal foams exhibit high stiffness, low
weight, good fire resistance and low moisture absorption. Metal foams though relatively
more expensive than synthetic foams; they can be recycled after use [30].
Ceramic foams are excellent alternatives to metal foams particularly for high-temperature
applications. These foams can be produced in a similar way to polyurethane foams with a
network of interconnected open cell walls. They are usually made of silicon-based
elements. However, it is also possible to find foams made of other ceramic core elements,
such as zirconium, titanium, and boron.
The porosities of ceramic foams range from 80% to 90% and can withstand temperatures
above 1500° C. However, new ceramic foams made of aluminium oxide provide higher
35
porosity values of above 94%. Currently, ceramic foams are used extensively in aerospace
and industrial applications, such as rocket nozzle components, composite panels, heat
shield elements, and acoustic liners in aircraft mufflers [30].
Aerogels are another type of microporous materials used in hi-tech applications [30].
Aerogels are also known as frozen smoke and have been claimed to be the best thermal
insulators ever made, about 40 times better than common fiberglass insulation materials.
Aerogels are produced by removing the liquid content from gel by a super critical drying
process. Aerogel has a monolithic internal structure, which is made-up of a highly porous,
extremely lightweight and translucent material in which most of its volume is filled with
air [30].
Many different types of raw materials have been used to produce aerogels, but silica
aerogels are the most common. Its structure is composed of small spherical silicon dioxide
clusters of 3-4 nm in diameter which are interlinked to form chains consisting of a spatial
grid with air-filled pores [35]. The typical average size of the pores in aerogel is 30 to 40
nm with porosity value greater than 75% and melting point of 1200° C.
One of the biggest disadvantages of aerogels is that they are very expensive and primarily
utilized in high-tech aerospace missions by the National Aeronautics and Space
Administration (NASA) in the USA. However, recent research is focused on their use in
granular form as sound-absorbing materials, where their mechanical properties lie between
that of a gel and a granular material. Experimental results of multilayer sound absorbing
panels made of silica aerogels have been presented elsewhere in some published work [36].
36
2.3.2. Granular Porous Sound Absorbing Materials
Most of the outdoor noise emitted by modern cars and trucks, particularly at medium to
high speeds, is attributed to friction between tyres and the roads. The noise level peaks
between about 800 and 1,000 Hz, at a somewhat higher frequency in the range of 800 to
1,200 Hz for light and heavy trucks [30].
One way to reduce this noise is to create porous surfaces on the paved roads which can be
classified as granular sound-absorbing material. Such porous surfaces offer an advantage
by not only reducing noise generated between tyres and the road, but also attenuate it by
absorption of sound before it propagates to nearby residential areas. This method is also
adopted for noise control in the power plants. Such porous surfaces on the paved roads
offer a further advantage of effective rain-water drainage and reduced splashing [37]. The
sound absorption of porous surfaces on the paved roads is affected by several geometrical
and other parameters of the road pavements, namely:
• Thickness of the porous layer
• Air voids or road surface porosity
• Air flow resistance per unit length
• Tortuosity
• Coarseness of the aggregate mix (small or large aggregates, etc.)
For most common dense asphalt mixes, the air void is about 5%, while for new porous
mixes, it varies from about 15 to 30% [37]
37
2.3.3. Porous Fibrous Materials
Most commercially available porous sound-absorbing materials are fibrous and they are
manufactured from continuous filaments or staple fibres to develop pores with air
entrapped within them. They are produced in rolls or in slabs with different thermal,
acoustic, and mechanical properties. The fibres used can be either natural or synthetic
(manmade). Natural fibres can be plant based (e.g. sisal, kenaf, hemp, flax, cotton, wood,
etc.), or animal based (e.g. wool, fur felt). Synthetic fibers can be cellulose (viscose, for
example), mineral (fiberglass, mineral wool, glass wool, graphite, ceramic, etc.), or
polymer (polyester, polypropylene, Kevlar, etc.) based.
Synthetic fibrous materials made from minerals and polymers are the most widely
available and therefore they are more common in sound absorption and thermal insulation
applications. However, since they are made from high-temperature polymer extrusion and
industrial processes based on synthetic chemicals, often from petrochemical sources, they
have a significant carbon footprint [30].
In recent years, a steady increase in the use of natural fibers in manufacturing sound
absorbing materials is witnessed [38-41]. Natural fibers are essentially completely
biodegradable and modern technical developments have made their processing more
economical and environmentally friendly. These new manufacturing techniques may result
in increased use of natural fibers in producing industrial products at competitive prices.
The sound absorption properties of the materials made from natural and synthetic fibres
can be similar to those made from mineral fibers [30]. These properties can be modified by
pre-treatments such as drying, carbonizing, impregnation, and mineralization. In addition,
38
natural fibers are also safer for human health in comparison to most mineral and synthetic
fibers, and they do not need additional precautions in handling.
Materials for thermal insulation and acoustic absorption produced from a blend of kenaf
and polyester fibers, treated with a natural fire retardant, are commercially available
commercially [41]. Sound absorption materials produced from natural fibers, such as hemp
and kenaf can be disposed of easily, and their production involves a low carbon footprint
and no chlorofluorocarbon (CFC) emissions, so they can be classified as ecologically green
building materials. Therefore, they provide an alternative to building materials produced
from harmful chemicals, polymers, and other non-sustainable synthetic materials.
2.3.4. Smart Sound Absorbing Materials
A recent development in the noise control sector is to develop hybrid sound absorbers by
combining active noise control mechanisms with passive control methods [30]. Active
control technologies appear to be the only effective way to attenuate the low-frequency
noise components. Therefore, the hybrid sound absorber can absorb the incident sound
over a wide range of frequencies. Figure 2.8 shows the principle of such a device, which
combines passive absorbent properties of a porous layer and active control at its rear face,
where the controller can be actuated using digital techniques [42-43].
Thin active liners composed of several juxtaposed cells of absorbers for reducing noise in
flow ducts have been designed using a piezoelectric actuator as a secondary source (active
sound absorption) and wire meshes as porous material (passive sound absorption). Recent
research is aimed at producing a broadband (wider range of sound frequency) sound
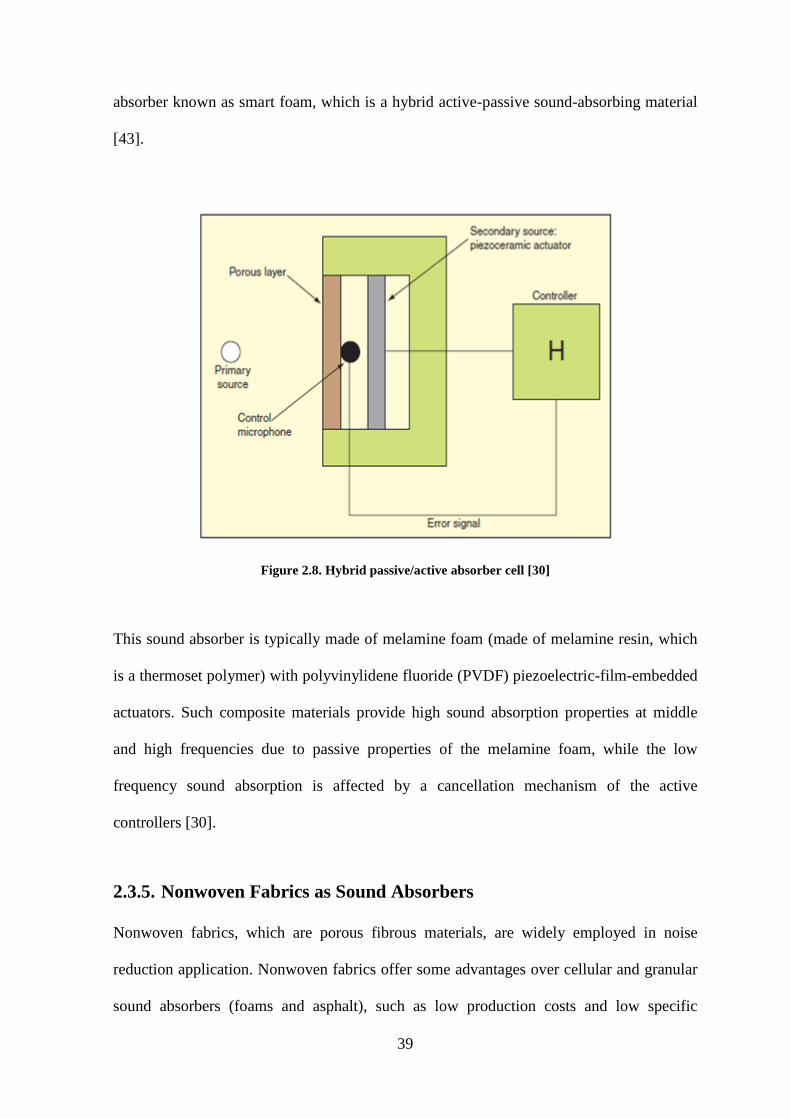
39
absorber known as smart foam, which is a hybrid active-passive sound-absorbing material
[43].
Figure 2.8. Hybrid passive/active absorber cell [30]
This sound absorber is typically made of melamine foam (made of melamine resin, which
is a thermoset polymer) with polyvinylidene fluoride (PVDF) piezoelectric-film-embedded
actuators. Such composite materials provide high sound absorption properties at middle
and high frequencies due to passive properties of the melamine foam, while the low
frequency sound absorption is affected by a cancellation mechanism of the active
controllers [30].
2.3.5. Nonwoven Fabrics as Sound Absorbers
Nonwoven fabrics, which are porous fibrous materials, are widely employed in noise
reduction application. Nonwoven fabrics offer some advantages over cellular and granular
sound absorbers (foams and asphalt), such as low production costs and low specific
40
gravity. Nonwoven fabrics produced from natural fibres, in particular, are more
environmentally-friendly than conventional polyurethane foams used for sound absorption
as the latter are not recyclable and they are produced by environmentally harmful
manufacturing processes [18].
Nonwoven fabrics produced from polyester fibres are increasingly replacing glass fiber
mats due to health and safety concerns regarding the handling and use of glass fibres [45].
These materials are used in trims of passenger vehicles [12, 46], interior linings for
insulations of apartments, aircraft, and ducts, as enclosures for noisy equipment, and as
insulations for appliances [47].
2.4. Different Types of Nonwovens
Nonwovens are generally classified by the bonding technique employed to produce the
fabric rather than the web formation method; this is largely due to the fact that different
bonding techniques can be applied with any particular web formation method. Also, web
bonding techniques employed significantly influence the properties of the fabric in
comparison to the effect of the web formation methods.
2.4.1. Mechanical Bonding Methods
There are three main types of mechanical bonding methods, namely, needlepunching,
stitch bonding and hydro-entanglement.
a. Needlepunching
The needlepunching process will be discussed in detail in section 2.5.
41
b. Stitch Bonding
In Stitch bonded fabrics the fibres and/or yarns are held together by stitching or knitting-in
with additional yarns. In the most common cases, it involves warp knitting of yarns
through a fibrous mat [8].
Few stitch bonded fabrics are included in the industry definition of nonwovens since many
of them include preformed and ground fabrics. A number of different stitch bonding
systems have been developed and commercially available, which include the Maliwatt and
Malivlies, Voltex and Malimo [8].
In the Maliwatt system, polyester filament is mainly used as the stitching yarn. The web
component varies between 80-95% and area density ranges from 15-3000 g/m2, with
thickness ranging from 0.5 to 20mm [8]. The main applications of the fabrics include soft
furnishings, mattress and bed linen, upholstery, insulating materials and linings. The
Malivlies system does not involve any filaments and the fabric comprises of fibres only.
Bonding achieved by hooking and looping of some of the surface fibres of the web by the
stitching needles. Their area weights range between 120 to 1200 g/m2. The applications of
these fabrics include polishing cloths, filter fabrics, medical and hygiene products.
The Malimo system is very similar to weaving; it involves plain overstitching of loose yarn
sheets laid on top of one another (weft and warp yarns – featuring different possibilities for
modifications). In this system, various weft insertion techniques, depending on envisaged
fabric structure and end-uses are employed [8]. The Malimo bonded fabrics are usd in
industrial textiles as reinforcements of composite for high-tech applications (fiberglass,
42
carbon, Kevlar), sandwiched nonwovens, geotextiles, insulating materials, laminating
substrates, packing textiles, etc.
Voltex fabrics are characteristically lofty due to high piles. Two preformed elements are
involved, i.e. a ground fabric and a web which is continuously fed. As no stitching yarn is
required in the process, a continuous Voltex system consists of a web forming process
followed by a stitch bonding unit. Voltex Fabrics are used in linings, soft toys, imitation
furs, shoe uppers and upholstery [8].
c. Hydroentanglement
Hydroentanglement, also known as spunlacing, is a web bonding technology which uses
fine, high pressure water jets to cause the entanglement of fibres. These high pressure
water jets re-orientate fibers according to the shape of the support screen (sieve belt or
perforated drum). This bonding method can be applied to a wide range of web formation
methods producing: carded, spunbonded and meltblown , wetlaid and airlaid webs [8].
The first step in the process is to pre-wet the incoming web to eliminate air pockets. The
thin collimated water jets pass through the fibrous web and support screen (one
hydroentanglement unit). To obtain better bonding efficiency water is extracted through a
suction process from the oposite (underneeth) side of the support screen. The water is then
purified and returned to the jet manifold for re-use. The structure of the bonded fabric
depends on the parameters of the water jets and the structure of the support screen. It is
possible (and often used) to have several consequitive hydroentanglement units for better
consolidation of the web. The bonded fabric is then dewatered, dried and wound on a roll.
43
The main parameters influencing the hydroentanglement process are fiber type, web
dimensions and process parameters, such as water jets, speed of the web, shape of the sieve
belt of perforated drum, quality of water and the drying process. The water jet parameters
include water pressure, density and diameter of jets , distribution (spacing between
individual jets), and water suction zone. The quality of water is defined by temperature,
surface density, viscosity and pH.
The main features of Hydroentangled fabrics include:
• Very good drape (low stiffness) and very soft handle, simmilar to woven fabrics in
some cases.
• No chemical or melt binders needed; it is possible to prepare 100 % natural fibers,
ideally suitable for sanitary products.
• A wide range of fabric area weights can be produced as well as high density fabrics
compared to needlepunch nonwoven fabrics.
• The fabrics produced by hydroentanglement have reletively high tensile strength, in
comparison that of needle-punched fabrics of the same area weight.
• Spunlaced fabrics provide more uniform surface in comparison to that of
needlepunched fabrics due to higher entanglement of fibres.
Hydroentangled fabrics are used in the medical sector for producing surgical gowns and
various wound dressings. Hygiene uses of hydroentangled nonwoven fabrics include
sanitary towels, baby and adult diapers and technical applications include filtration, wipes,
linings and insulation [8].
44
2.4.2. Chemical Bonding Methods
Chemical bonding mainly refers to the application of a liquid based bonding agent to the
web. There are many ways of applying the chemical binder. It can be applied by
impregnating with a foam or saturation, coating or spraying or intermittently, as in print
bonding. The physical properties of a chemical bonded fabric are determined by the fibre,
polymer, additives and the interaction between them [8].
a. Foam Bonding
Foam bonding is a means of applying a binder at high binder-solids concentration levels.
The basic concept employed involves using air as well as water as the binder diluent and
carrier media. Foam-bonded nonwovens require less energy in drying, since less water is
used. The foam is generated by introducing air into the formulated latex while
mechanically agitating the binder solution. Air/latex dilution ratio in the order of 5:25 is
normally maintained for various products [8]. With the addition of a stabilizing agent to
the binder solution, the foam can resist collapsing during application and curing, and the
bonded fabric will exhibit enhanced loft, handle, and resilience.
b. Saturation Bonding
Saturation bonding is used in conjunction with processes that require rapid binder addition,
such as card-bond systems, and for applications which require high fabric strength,
stiffness, and maximum fibre saturation [8]. Fibre saturation is achieved by totally
immersing the web in a binder bath or by flooding the web as it enters between a set of
pressure rolls. Excess binder is removed by vacuum or by squeezing between rolls under
45
high pressure. Three variations of saturation bonding exist, i.e. screen, dip/squeeze, and
size-press. Screen saturation is used for medium-weight nonwovens, such as interlinings.
Dip/squeeze saturation is used for web structures with enough strength to withstand
immersion without support, such as spunbonds. Size-press saturation is used in high speed
processes, such as wet-laid nonwovens [8].
c. Spray Bonding
In spray bonding, binders are sprayed onto continuously moving webs. Spray bonding is
applied for high loft or bulky fabrics, such as fiberfill and wipes made from air-laid pulp.
The binder is atomized by air pressure, hydraulic pressure, or centrifugal force. The
spraying is applied to the upper surface of the web in fine droplet form through a set of
nozzles. Addition of a binder on the other side of the web is accomplished by reversing
web direction on a second conveyor and passing the web under a second spraying station
[8].
d. Print Bonding
Print bonding applies binder on a specific pattern in only predetermined areas. It is useful
for applications that require a part of the area of the fabric to be binder-free, such as wipes
and coverstocks. Many lightweight nonwoven fabrics are print bonded. Printing patterns
are designed to enhance strength, fluid transport, softness, hand, absorbency, and drape.
2.4.3. Thermal Bonding Methods
Thermal bonding methods use the thermoplastic properties of synthetic fibres to form
bonds under controlled heating. In some cases conventional synthetic fibres can be used,
46
but more often a low melt or bi-component fibres are blended during web formation stage
to perform thermal bonding subsequently. Several thermal bonding systems are available,
namely, powder, through-air and calendar bonding.
a. Powder Bonding
In powder bonding, the adhesive powder of thermoplastic polymers is applied onto webs.
Polyesters and polyolefin resins with low glass transition temperature (Tg) and low
molecular weight can be used in powder foam as binders. Powder bonded fabrics are
typically bulky. The disadvantage of this bonding method lies in difficulties of suitable
particle sizes and ranges in comparison to fineness of the fibres in use, and particle
distribution during powder application [8].
b. Through-Air Bonding
Through-air bonding technology is ideal for air-permeable products such as thermos-fused
nonwovens. In the through-air bonding technology, heated air is circulated in the enclosed
chamber through a perforated plenum mounted above the product line in one section of the
machine and the other mounted below the product line in the second section. A suction
plenum beneath the line (and above the line in second chamber) pulls hot air through the
product and the conveyor to facilitate high heat transfer throughout the fabric. Heat transfer
is almost instant and thorough along the thickness of the product.
The temperature of the air is set above the melting temperature of the thermoplastic fibres,
so that the molten fiber bonds to other fibers and interconnects with them. In the case of bi-
component fibers, where the outer layer is of one component with a lower melting point
47
polymers and the inner part made from a different high melting polymer, then only the
outer shell of the fiber is molten to bond, thus giving even better stability to the nonwoven.
Three main operating parameters, namely the energy distribution, temperature profile, and
air velocity in the oven influence the thermal bonding process. Nonwovens made of
through-air thermal bonding process find their applications in various fields, such as
upholstery padding, mattress protection, thermal and sound insulation, protective and
wrapping material [8].
c. Calendar Bonding
Calendar bonding is a process in which a fibrous web containing thermoplastic fibres
(could also be powders or films) is passed through a pair of heated rollers pressed against
each other. As the web passes through the nip of the rollers, the fibres are both heated and
pressed. Three main types of calendar bonding are: area bonding, point bonding and
embossing.
In area bonding, the bonding occurs at the surface of the metal roll, heated by conduction
from oil circulated through its centre. The composition rolls obtain heat through contact
with the heated metal roll. Before the start of a production run, the roll stacks are operated
until the composition rolls achieve dynamic heat equilibrium. Pressure is also an important
consideration; it is applied simultaneously with the heat. The application of heat causes the
thermoplastic fibres to become softer and the applied pressure enhances mechanical
bonding by forcing the binder polymer to flow in and around the carrier fibers [8].
Point-bonding calendaring process is mostly used to thermally bond disposable fabrics
such as those used in diapers, sanitary products, and medical products. This method
48
involves the use of a two-roll set up consisting of a heated patterned (engraved) metal roll
and a smooth or sometimes patterned metal roll as well. Depending upon the application of
the fabrics, this second roll may or may not be heated. The heating time is typically very
short, in the order of milliseconds. The fabric properties are dependent on the process
temperature, pressure between the rolls and contact time [8].
The embossing method is a calendaring process for bonding only in the specific area of the
fabric, usually also creating (imprinting) figurines. In this case the area bonding is three
dimensional. A "bulky but thin" product can be produced in any aesthetic or functional
construction, depending on the figures on the embossing rolls. The calendar roll
combination has a ‘male’ patterned heated metal roll and a matching ‘female’ patterned
felt-covered roll [8].
d. Ultrasonic Bonding
Thermal radiation has been extensively employed in textile finishing processes,
particularly as a drying method. A new application of this is in the production of thermal
bonded nonwoven fabrics which requires the inclusion of thermoplastic materials (fibers or
powders) in the web to be bonded. Unlike in the other thermal bonding methods where
heating is affected by conduction and convection which requires a medium, radiation
heating does not require any medium [8].
In ultrasonic bonding, heat energy is transferred by high frequency vibration of the web
surface. This happens with short contact time and under limited pressure between the
ultrasonic horn and the web at an ultrasonic frequency of about 20 000 Hz. Energy is thus
transferred to localised areas in the web to induce thermal bonding as the mechanical
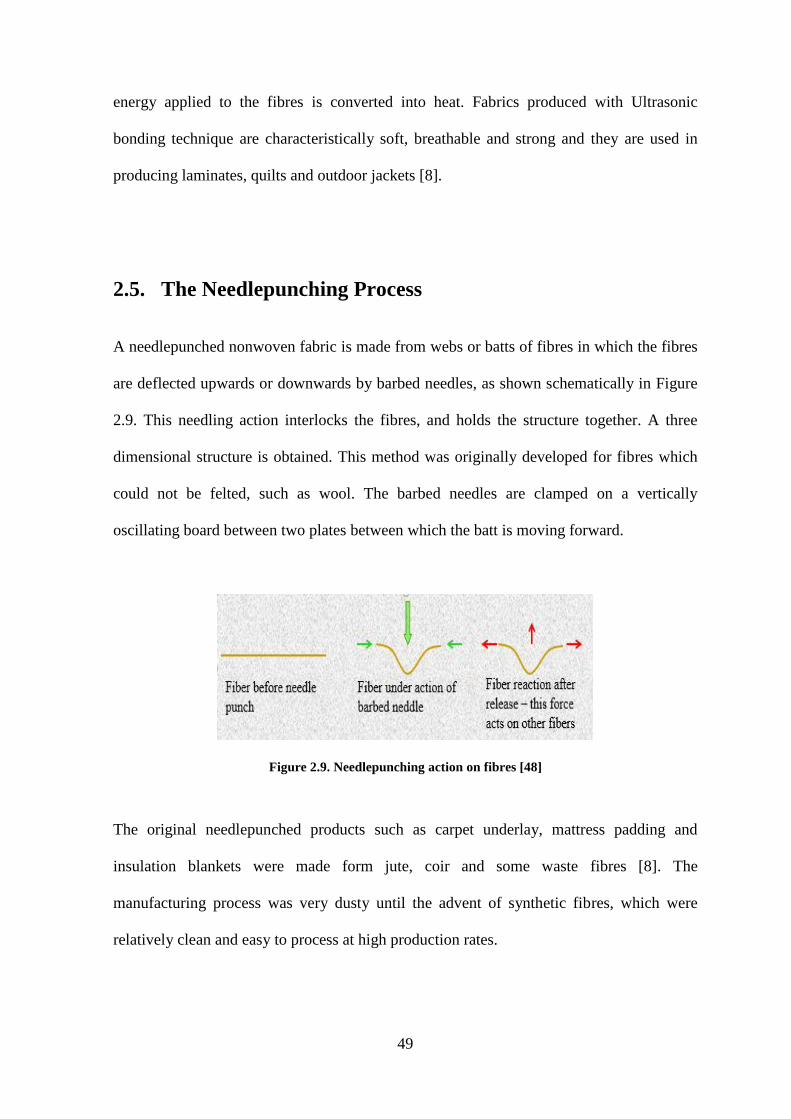
49
energy applied to the fibres is converted into heat. Fabrics produced with Ultrasonic
bonding technique are characteristically soft, breathable and strong and they are used in
producing laminates, quilts and outdoor jackets [8].
2.5. The Needlepunching Process
A needlepunched nonwoven fabric is made from webs or batts of fibres in which the fibres
are deflected upwards or downwards by barbed needles, as shown schematically in Figure
2.9. This needling action interlocks the fibres, and holds the structure together. A three
dimensional structure is obtained. This method was originally developed for fibres which
could not be felted, such as wool. The barbed needles are clamped on a vertically
oscillating board between two plates between which the batt is moving forward.
Figure 2.9. Needlepunching action on fibres [48]
The original needlepunched products such as carpet underlay, mattress padding and
insulation blankets were made form jute, coir and some waste fibres [8]. The
manufacturing process was very dusty until the advent of synthetic fibres, which were
relatively clean and easy to process at high production rates.
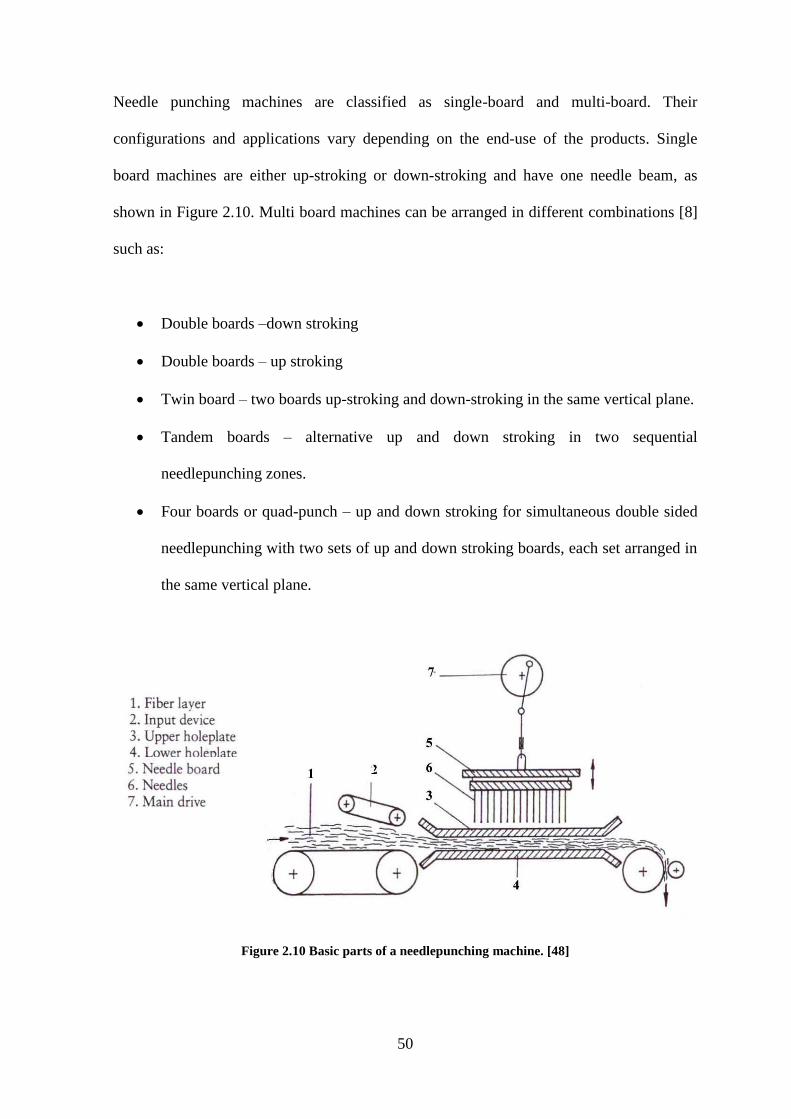
50
Needle punching machines are classified as single-board and multi-board. Their
configurations and applications vary depending on the end-use of the products. Single
board machines are either up-stroking or down-stroking and have one needle beam, as
shown in Figure 2.10. Multi board machines can be arranged in different combinations [8]
such as:
Double boards –down stroking
Double boards – up stroking
Twin board – two boards up-stroking and down-stroking in the same vertical plane.
Tandem boards – alternative up and down stroking in two sequential
needlepunching zones.
Four boards or quad-punch – up and down stroking for simultaneous double sided
needlepunching with two sets of up and down stroking boards, each set arranged in
the same vertical plane.
Figure 2.10 Basic parts of a needlepunching machine. [48]
51
In a basic needlepunching set up like the one described above, and shown in Figure 2.9, the
needle loom consists of a heavy metal frame carrying the fixed bed plate and the stripper
plate between which a batt is moving forward and vertically reciprocating needle board
carrying the needles penetrate in the moving batt to entangle the fibres. Here, significant
vibration forces are generated at high speeds which must be absorbed by the sturdy frame.
The low density batt must be supported by aprons or rollers as it is guided through the gap
between the bed plate and the stripper plate (Figure 2.10). The gap between these two
plates may be adjusted to control the compression of the batt during needling. After
needling, the fabric is transported away from the needling zone by take-up rollers [8].
2.5.1. Web and Batt Formation
Among the three main classifications of web formation, needlepunched fabrics are
produced mostly from the dry laid batts, formed by carding and garneting, to a lesser
extent. Air laying is also used to produce a web but very seldomly. The continuous
filament polymer laid webs can also be needlepunched in some cases [8].
The carding process has many variations in terms of the number of cards used. The cross-
lapping may also provide flexibility of laydown and fiber orientation in the machine
direction and cross machine directions. Cotton cards are sometimes used to manufacture
feminine hygiene products from short staple fibres as well as absorbent products for
medical applications. However, the use of short staple or cotton cards in nonwovens is not
common because the revolving flats limit the maximum width of the card to 1.5 m and the
blending capability of the machine is much lower than that of a card equipped with the
worker-stripper rollers commonly used in wool processing [8].
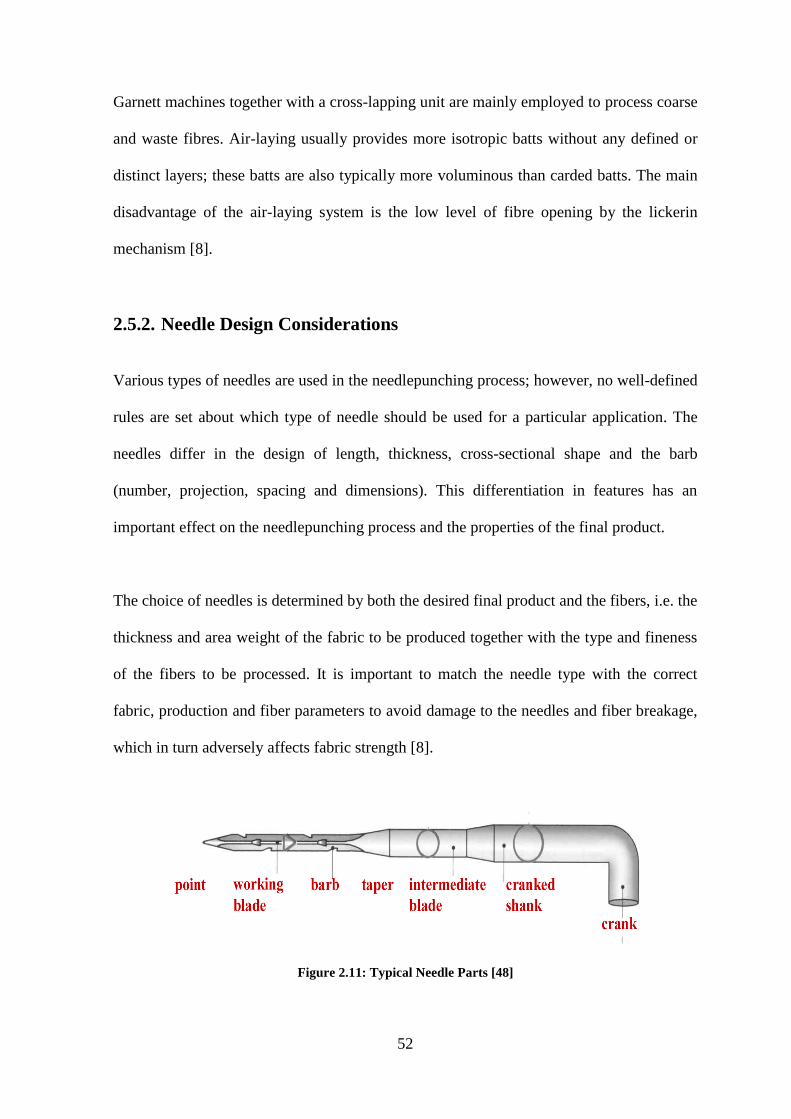
52
Garnett machines together with a cross-lapping unit are mainly employed to process coarse
and waste fibres. Air-laying usually provides more isotropic batts without any defined or
distinct layers; these batts are also typically more voluminous than carded batts. The main
disadvantage of the air-laying system is the low level of fibre opening by the lickerin
mechanism [8].
2.5.2. Needle Design Considerations
Various types of needles are used in the needlepunching process; however, no well-defined
rules are set about which type of needle should be used for a particular application. The
needles differ in the design of length, thickness, cross-sectional shape and the barb
(number, projection, spacing and dimensions). This differentiation in features has an
important effect on the needlepunching process and the properties of the final product.
The choice of needles is determined by both the desired final product and the fibers, i.e. the
thickness and area weight of the fabric to be produced together with the type and fineness
of the fibers to be processed. It is important to match the needle type with the correct
fabric, production and fiber parameters to avoid damage to the needles and fiber breakage,
which in turn adversely affects fabric strength [8].
Figure 2.11: Typical Needle Parts [48]
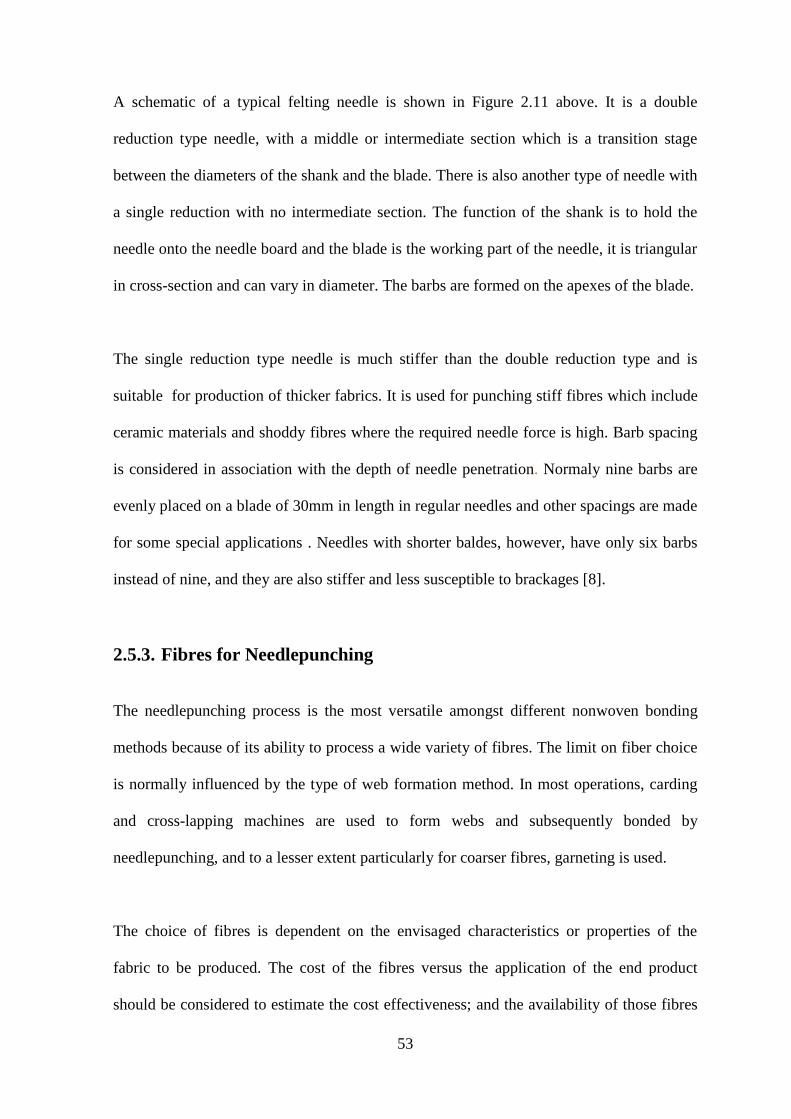
53
A schematic of a typical felting needle is shown in Figure 2.11 above. It is a double
reduction type needle, with a middle or intermediate section which is a transition stage
between the diameters of the shank and the blade. There is also another type of needle with
a single reduction with no intermediate section. The function of the shank is to hold the
needle onto the needle board and the blade is the working part of the needle, it is triangular
in cross-section and can vary in diameter. The barbs are formed on the apexes of the blade.
The single reduction type needle is much stiffer than the double reduction type and is
suitable for production of thicker fabrics. It is used for punching stiff fibres which include
ceramic materials and shoddy fibres where the required needle force is high. Barb spacing
is considered in association with the depth of needle penetration. Normaly nine barbs are
evenly placed on a blade of 30mm in length in regular needles and other spacings are made
for some special applications . Needles with shorter baldes, however, have only six barbs
instead of nine, and they are also stiffer and less susceptible to brackages [8].
2.5.3. Fibres for Needlepunching
The needlepunching process is the most versatile amongst different nonwoven bonding
methods because of its ability to process a wide variety of fibres. The limit on fiber choice
is normally influenced by the type of web formation method. In most operations, carding
and cross-lapping machines are used to form webs and subsequently bonded by
needlepunching, and to a lesser extent particularly for coarser fibres, garneting is used.
The choice of fibres is dependent on the envisaged characteristics or properties of the
fabric to be produced. The cost of the fibres versus the application of the end product
should be considered to estimate the cost effectiveness; and the availability of those fibres
54
is also important consideration. Currently, synthetic fibres such as PET and PP are the
most widely used fibres in production nonwovens in general and particularly in needle-
punching process [49].
PET fibres are suitable for most applications and their costs are comparatively low. PP
fibres are largely suitable for manufacturing heavyweight needle-punched fabrics for
durable products, such as floorcoverings, geotextiles, filtration media and disposables
hygiene products. Viscose fibres are extensively used in medical and hygiene sectors
mainly because of its high moisture regain capabilities. Other synthetic fibers such as
Polylactic Acid (PLA), nylon and aramid fibres are used mainly in certain specialised
applications because they are expensive.
Since the early development of needlepunching technology, nonwoven fabrics were
produced from traditional natural fibres like wool and cotton. However, their use in
producing nonwoven fabrics has always been limited due to the fact that they are costly for
nonwovens in disposable applications, thus adding to the cost factor. The demand
therefore, outweighs the supply for these fibres [49]. These factors led to the wide spread
adoption of synthetic fibres, in producing nonwovens as they are relatively inexpensive.
Other natural fibres derived from the bast, leaves and fruits of the plant include flax, hemp,
jute, sisal, coir, ramie and kenaf, are mainly utilized for certain specialized applications
such as geotextiles and paddings [50] largely due to their coarseness and low crimp.
Recently, natural fibers like kenaf to produce absorbent nonwovens for cleaning up oil
spillage have been reported [50]. Other recent developments on natural fibre based
55
needlepunched nonwovens have been reported for car interiors [12] and as reinforcement
in bio-composite applications [51].
Fibre properties directly influence the fabric properties as well as processing performance
during fabric production. Processing characteristics, such as web cohesion, fibre breakage,
nep formation and web weight uniformity are influenced by fibre diameter, fibre length,
tensile properties and crimp.
There are many recently developed fibers whose use in nonwovens has not been
widespread due to processing problems particularly during carding. These processing
problems include uncontrollable static electricity, low fibre to fibre cohesion and
inadequate fibre extension (minimum is 2-5%) leading to fibre breakages and poor yield
[8].
The physical properties of the fibres suitable for carding and therefore suitable for needle-
punching range from 1-30dtex in fineness and fibre length of 30-100 mm; however this
excludes the fibres which require garneting instead of carding [8]. Such a wide range of
fibre dimensions therefore requires a variety of needle types, further, also require a variety
of roller configuration and layout, settings and the card wire on the carding machine. It
would be impossible to process such a wide range of fibre dimensions with one needle type
and machine setting. However, fiber blending can be used to minimise the need to change
these settings and in some cases carrier fibers are added to help in processing short and
stiff fibres.
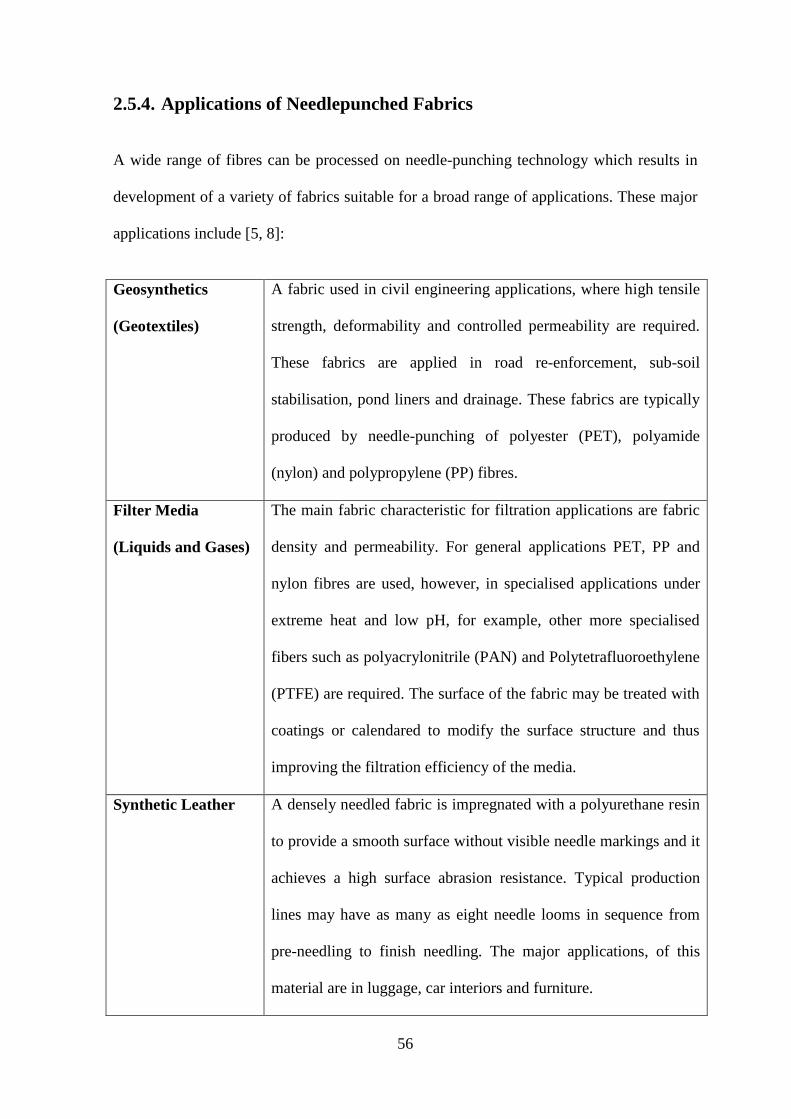
56
2.5.4. Applications of Needlepunched Fabrics
A wide range of fibres can be processed on needle-punching technology which results in
development of a variety of fabrics suitable for a broad range of applications. These major
applications include [5, 8]:
Geosynthetics
(Geotextiles)
A fabric used in civil engineering applications, where high tensile
strength, deformability and controlled permeability are required.
These fabrics are applied in road re-enforcement, sub-soil
stabilisation, pond liners and drainage. These fabrics are typically
produced by needle-punching of polyester (PET), polyamide
(nylon) and polypropylene (PP) fibres.
Filter Media
(Liquids and Gases)
The main fabric characteristic for filtration applications are fabric
density and permeability. For general applications PET, PP and
nylon fibres are used, however, in specialised applications under
extreme heat and low pH, for example, other more specialised
fibers such as polyacrylonitrile (PAN) and Polytetrafluoroethylene
(PTFE) are required. The surface of the fabric may be treated with
coatings or calendared to modify the surface structure and thus
improving the filtration efficiency of the media.
Synthetic Leather A densely needled fabric is impregnated with a polyurethane resin
to provide a smooth surface without visible needle markings and it
achieves a high surface abrasion resistance. Typical production
lines may have as many as eight needle looms in sequence from
pre-needling to finish needling. The major applications, of this
material are in luggage, car interiors and furniture.
57
Waddings and
Paddings
This is one of the highest uses of needlepunched nonwovens by
fiber consumption. The major applications are in mattresses,
furniture and carpet underlay. Fibres used include that reclaimed
from shredded waste clothing, recycled natural and synthetic
fibers, jute, sisal, coir and cotton as well as virgin PET and PP.
Automotive Fabrics These fabrics are applied in decorative trims, seat backings, sound
dampers and boot liners. The fabrics are required to have high
abrasion resistance, therefore the choice of fibre fineness ranges
from 15-18 deniers (16.7 -20dTex). Most widely used fibres are
PP and PET, but research to incorporate natural fibres, such as
hemp in the production of various automotive nonwoven fabrics is
in progress.
Insulation Both thermal and acoustic insulators are made from
needlepunched fabrics. Recycled PET fibres are also used in
insulation paddings. In high temperature insulation applications,
blown ceramic fibers in a batt form are needle-punched to produce
up to 75mm thick insulating media.
Wipes Heavy duty household and industrial wipes can be produced by
needlepunching process. Popular choice of fibres is viscose
blended with a thermo-plastic bonding fibres. In pre-moistened
wipes, needlepunched nonwoven fabrics are competing with
spunlaced fabrics, which have traditionally been used in this
sector, because a needlepunched fabric holds larger volumes of
moisturiser than that of spunlaced fabric.
58
2.6. Factors Influencing Sound Absorption of Nonwoven
Fabrics
One of the major advantages of nonwoven fabrics is the fact that they can be produced
from a wide range of fibres of varying fineness and length. In addition to fibre
characteristics, process parameters during the production of the nonwoven fabric also
require consideration. These two types of variations (fibre and process) then lead to a
variation in fabric parameters. Besides variations in fabric parameters, in-situ variables
during applications also influence the efficacy of the nonwovens as sound absorption
media.
Therefore, many parameters influence sound absorption capabilities of needle punched
nonwoven fabrics. Studies on various parameters influencing the sound absorption
properties of fibrous materials have been published widely in the literature [13-17], and
they are reviewed briefly in the following sections:
2.6.1. Fibre Parameters
Fibre Type
The effect of fibre type on sound absorption characteristics of nonwoven fabrics is very
broad particularly when considering the variation in fineness and length of natural fibres.
Fibre type determines the relationship between the fibre size and air flow resistivity [52].
Thilavagathi et al. [12] reported development of natural fiber nonwoven fabrics for
acoustic barrier applications in car interiors. They studied sound insulation and other
properties of needlepunched nonwoven fabrics produced from natural fibers (banana,
59
bamboo and jute) blended with polypropylene in the frequency range of 100–3200 Hz.
They found that nonwoven fabrics produced from a blend of bamboo and polypropylene
fibres provided the highest sound absorption coefficient at all levels of sound frequencies.
Nick et al. [53] compared the sound absorption coefficients of nonwoven fabrics produced
from blends of cotton and polypropylene (PP), flax and polypropylene and hemp-
polypropylene fibres for automotive applications. They found higher sound absorption
coefficients for the nonwoven fabrics produced from cotton and PP blend in comparison to
other blends, probably due to better fineness of cotton fibres in comparison to that of flax
and hemp fibres.
Fibre Dimensions
An important parameter of a fibre is its diameter. The fiber diameter is directly related to
the sound-absorption characteristics of the material. Table 2.1 shows a comparison of the
average fiber diameters of several types of industrial fibres as measured on a scanning
electron microscope [30]. In general, the diameters of natural fibers are larger than those of
synthetic fibers produced by extrusion techniques.
It has been reported that sound absorption coefficient increases with the decrease in fibre
diameter [15, 17, 54]. This is attributed to the fact that finer fibres offer higher frictional
hindrance than coarser fibres. Finer fibres are required to fill a given volume in comparison
to coarser fibres, which results in a more tortuous path and therefore offer higher airflow
resistance [55, 56].
Lee et al. [57] concluded that increase in fibre content of fine fibres in nonwoven fabrics
increases the noise absorption coefficient (NAC) values, which was attributed to an
60
increase in airflow resistance by means of friction. Koizumi et al. [54] also showed that
finer fibers, ranging from 1.5 to 6 denier, provided better acoustic properties in comparison
to coarser fibers. Moreover, it has been reported that the use of micro denier fibers provide
a dramatic increase in acoustic performance of nonwoven fabrics [54].
Fibre Surface Area
A direct correlation between sound absorption and fibre surface area has been reported [58,
59]. Studies also showed that friction between fibres and air increased with the increase in
fibre surface area, thus resulting in higher sound absorption. Moreover, it has been reported
that, in the frequency range of 1125 Hz – 5000 Hz, the nonwoven fabrics produced from
fibres with serrated cross sections (e.g., Kenaf) absorb more sound than those produced
from fibres with round cross-sections [58].
Bo‐ Young Hur et al. [60] explained that the sound absorption in porous material is a
function of the viscosity and pressure of the air in the pores or the friction on the pore
walls. Therefore, sound absorption increases with the increase in specific surface area of
fibers and with the increase of relative density of the medium and friction of pore walls.
Man‐made fibres are available in various cross‐sectional shapes, for example; hollow,
trilobal, pentalobal and other novel shapes like 4DG fibers. These cross sectional shapes of
fibres can add to the improvement in acoustic properties of the medium due to larger
surface area in comparison to normal fibres with circular cross-sections [56].
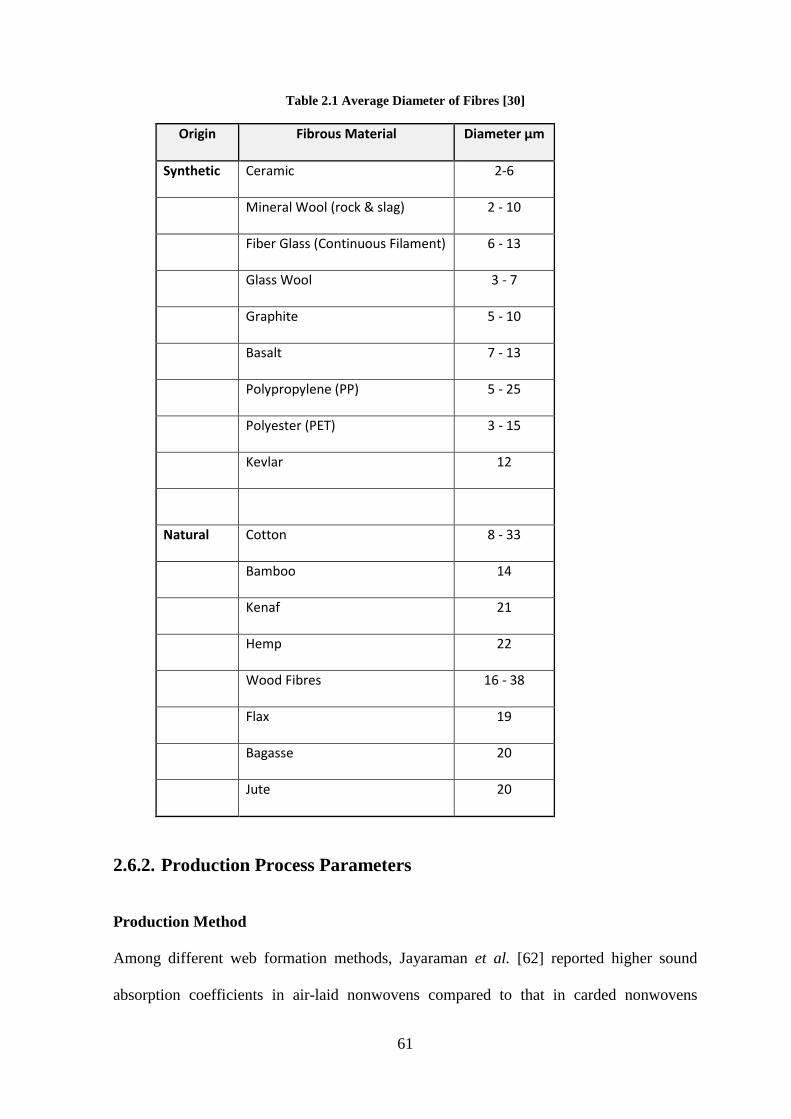
61
Table 2.1 Average Diameter of Fibres [30]
Origin Fibrous Material Diameter μm
Synthetic Ceramic 2-6
Mineral Wool (rock & slag) 2 - 10
Fiber Glass (Continuous Filament) 6 - 13
Glass Wool 3 - 7
Graphite 5 - 10
Basalt 7 - 13
Polypropylene (PP) 5 - 25
Polyester (PET) 3 - 15
Kevlar 12
Natural Cotton 8 - 33
Bamboo 14
Kenaf 21
Hemp 22
Wood Fibres 16 - 38
Flax 19
Bagasse 20
Jute 20
2.6.2. Production Process Parameters
Production Method
Among different web formation methods, Jayaraman et al. [62] reported higher sound
absorption coefficients in air-laid nonwovens compared to that in carded nonwovens
62
irrespective of fibre content. This might be due to higher resistance to flow in the case of
air-laid nonwovens in which fibres are relatively randomly oriented, and thus have higher
tortuosity, attributed to a higher number of fibre to fibre contact points with smaller pores.
Genis et al. [63] found that the sound absorption coefficient of needle-punched
polypropylene nonwovens reach its maximum when material density and punching density
were 100 kg/m3
and 28/ cm2, respectively.
Thickness
Among different nonwoven web bonding methods, the needlepunching process provide the
highest variation in thickness of the materials produced. While thickness can be set initially
during web formation, the final adjustments can be achieved during needlepunching,
primarily by varying the depth of needle penetration, and to a lesser extent, by varying
stroke frequency and needle density on the needle board.
Many studies dealing with the sound absorption properties of the nonwoven materials have
reported a direct correlation between the sound absorption coefficient and the thickness of
the material [19]. The rule of thumb is that effective sound absorption in a porous absorber
is achieved when the material thickness is about one tenth of the wavelength of the
incident sound wave [64] and peak sound absorption occurs at a resonant frequency of
one‐quarter wavelength of the incident sound wave [30]. This requirement of thickness to
wavelength ratio renders porous materials inefficient sound absorbers at low frequencies.
This ratio is very small at low frequencies as the wavelength of the sound wave may reach
values that are in the order of 10 meters [52].
63
Ibrahim et al [66] reported an increase in sound absorption with the increase in material
thickness only at low frequencies. However, at higher frequencies the effect of material
thickness on sound absorption becomes insignificant. The maximum value of the sound
absorption coefficient moves from high to low frequency range when the material has air
spaces within and behind it [54].
Compression
Only a few studies have been published on the effect of fabric compression on sound
absorption properties of nonwoven fabrics. Castagnede et al. [68] showed that compression
of fibrous web decreases the sound absorption properties, because under compression the
various fibres in the web are brought closer to each other without any deformation (without
any change in fibre size). However, the compression of a fibrous medium results in a
decrease in its thickness and therefore reduction in sound absorption properties.
The study by Castagnede et al.[68] also found variations in other properties occurring
during compression, they found that compression resulted in increases in tortuosity and
airflow resistivity and a decrease in porosity and thermal characteristic length (shape
factor). Despite these changes in physical parameters of the compressed material, the
reason for a drop in sound absorption value is mainly attributed to decrease in thickness of
the fibrous medium [68].
Levels of compression and its effect on sound absorption require special attention,
particularly in the automotive acoustics. The paddings in a seat of a passenger vehicle are
subjected to cycles of compression and recovery from load exerted by the occupants. This
64
results in the compression of the porous materials, which in turn results in variation of the
thickness of the medium and therefore variation in sound absorption capabilities [47].
Surface Treatments
Most of the time acoustic materials are used inside buildings or vehicle cabins and they
have to satisfy certain aesthetic norms. Often when used inside buildings, acoustic
materials are coated with paints or some finishes [70]. Therefore, it is necessary to study
the effect of these surface coatings on sound absorption behaviour of the material.
It was found that the materials with more open surface are the most adversely affected due
to the application of paint. Therefore, Price [71] suggested that a very thin layer of paint
coating with a spray gun should be applied over the surface of the material.
The study by Ingard [72] showed that the increase in sound absorption capacity at low
frequencies is at the expense of that at higher frequencies. Sometimes, fibrous materials are
covered with a film in order to improve the sound absorption properties at low frequencies,
which is attributed to the phenomenon of surface vibration of the film [73].
2.6.3. Fabric Parameters
Density
The density of a material is often considered to be an important factor which governs the
sound absorption behaviour of that material; however, the cost of an acoustic material is
directly related to its density. A study by Koizumi et al. [54] showed increases in sound
absorption values with the increase in density of the sample particularly in the middle and
higher frequencies (2000Hz and above). The number of fibers increases per unit volume
65
when the apparent density of the material increases; therefore energy loss (of the sound
wave) also increases due to increase in surface function, therefore the sound absorption
coefficient increases. Moreover, in a presentation by INDA [74] the following effects of
fabric density on sound absorption behaviour of nonwoven materials are shown:
Less dense and more open structure absorbs sound at low frequencies (500 Hz).
Denser structure performs better at frequencies above 2000 Hz.
Fibre Orientation
Generally, the fibres in a nonwoven fabric are oriented in the machine and cross machine
directions as well as parallel to the fabric surface. Thus, nonwoven fabrics are inherently
anisotropic and therefore sound propagation within the structure and surface impedance are
affected by the orientation of the fibres. Sound waves must enter the material in order to
absorb the sound rather than reflect it [45]. Nonwoven fabrics with fibres arranged
vertically to the surface, such as needle-punched products, allow sound to enter the
material [75].
Composition
Multi-layered materials generally achieve higher sound absorption than the single-layer
materials of the same thickness [45]. Ingard [72] reported a significant drop in the critical
frequency above which maximum sound absorption is achieved when the fibrous material
is composed of several layers of different porosity. The critical frequency is significantly
higher for a single layer material of the same total thickness and air flow resistance.
66
Shoshani [77] reported an increase in the noise absorption capability in the medium
frequency range for layered materials made up of a combination of nonwoven and woven
fabrics. The highest sound absorption was achieved when the woven fabric was facing the
noise source and the effect was more pronounced in low frequency range, i.e. f < 500 Hz.
Ingard [72] reported that for frequencies above 150 Hz, the sound absorption was higher
when the flow resistivity within the material increased from the surface toward the rigid
backing. On the contrary, Jayaraman et al. [62] found that the sound absorption increased
when a part of the needlepunched nonwoven composition with higher density was facing
the sound source. Ackermann et al. [78] reported that the smoothness and evenness of the
surface of the sound absorbing medium facing the sound source reduced frictional losses
and thus allowed higher sound absorption.
Airflow Resistance
Specific air flow resistance per unit thickness of the medium is one of the most important
parameters that influence the sound absorption characteristics of a nonwoven material. The
impedance and propagation constants, which describe the acoustic properties of porous
materials, are governed by air flow resistance of the medium [79].
The interlocking of the fibres in nonwoven fabrics provides resistance to acoustic wave
motion. Generally, when sound enters a porous material, such as a nonwoven fabric, its
amplitude is decreased by friction as the waves pass through the tortuous passages. Thus
the acoustic energy is converted into heat [80]. This friction quantity which can be
expressed in terms of resistance of the material to airflow is called airflow resistance and is
defined in equation given below [81]:

67
Tu
pR
1 (17)
Where:
R1 = Specific flow resistance (Rayls/m),
u = Particle velocity through the material (m/sec),
Δp = Sound pressure differential across the thickness of the sample measured in
direction of particle velocity (newtons /m2), and
ΔT = Incremental thickness, (m).
It should be noted that the unit used for the flow resistance is Rayls (N.S/m3 x10).
According to Delany et al. [82], air flow resistance is proportional to the bulk density of
the material and fibre dimensions. An increase in fiber packing density of the nonwovens
decreases the air permeability with a resultant increase in pressure drop and hence
increased air flow resistance [83, 84].
Porosity
Porosity of the material is an important factor which should be taken into consideration
while investigating sound absorption mechanism, in particular their quantity (per unit
area), size and type. Sound dissipation by friction takes place as the sound wave enters and
travels through the porous medium. This means that there should be enough pores on the
surface of the medium for the sound to pass through and get dampened. The porosity of a
porous material is defined as the ratio of the volume of the voids in the material to its total
volume, as expressed mathematically by the following equation [73]:
68
Porosity (H) = m
a
V
V (19)
Where:
Va = Volume of the air in the voids, and
Vm = Total volume of the sample of the acoustic material being tested.
A nonwoven web designed to achieve high sound absorption coefficient, should have
porosity that increases along the propagation of the sound wave [86].
Tortuosity
Tortuosity is defined as the length of the passage through the pores compared to the
thickness of the sample. Tortuosity can also be described as the influence of the internal
structure of a material to its acoustic properties [87]. Wassilieff [88] describes tortuosity as
a measure of how far the pores deviate from the normal or meander within the material.
Horoshenkov et al. [89] found that tortuosity mainly affected the location of the
quarter‐wavelength peaks whereas porosity and flow resistivity affect the height and width
of the peaks. They also found that the value of tortuosity influenced the sound absorption
properties of the porous materials particularly at high frequencies.
Zwikker and Kosten [90] describe the inner structure of porous materials by the term
‘structure factor’. The approximate relation between porosity (Y) and structure factor (K)
for homogenous materials made of fibers or granules with interconnecting pores is shown
in the figure below [81].
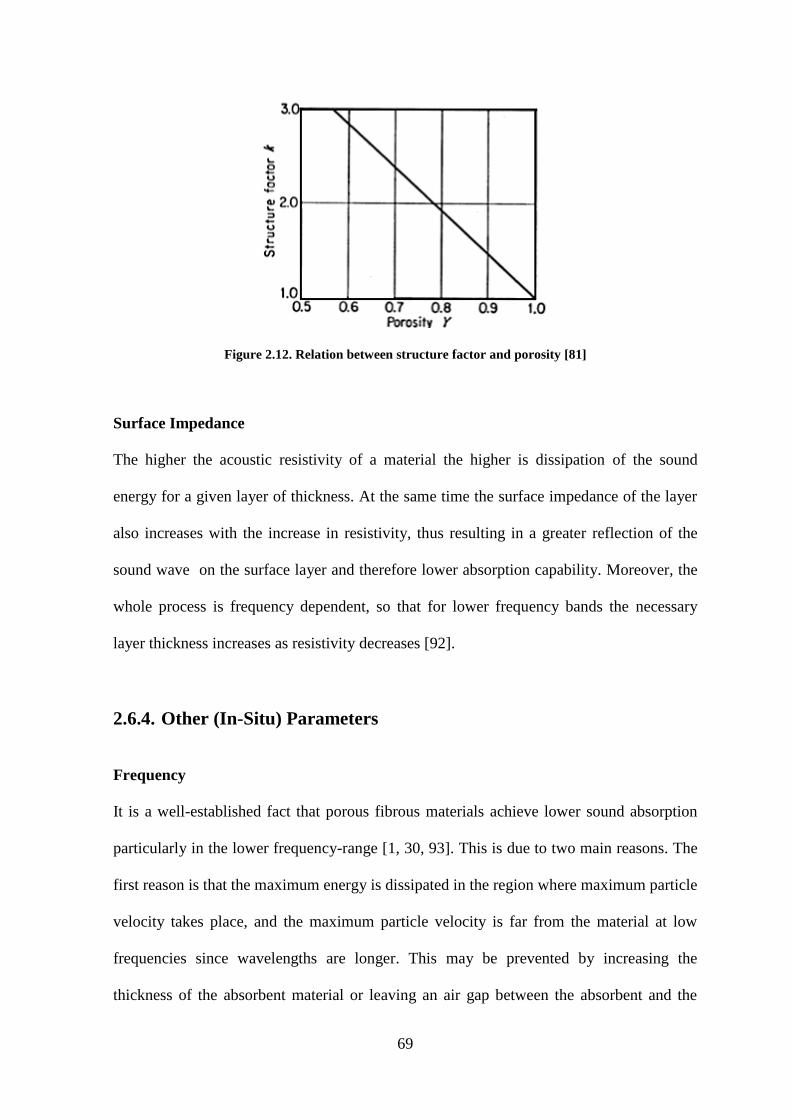
69
Figure 2.12. Relation between structure factor and porosity [81]
Surface Impedance
The higher the acoustic resistivity of a material the higher is dissipation of the sound
energy for a given layer of thickness. At the same time the surface impedance of the layer
also increases with the increase in resistivity, thus resulting in a greater reflection of the
sound wave on the surface layer and therefore lower absorption capability. Moreover, the
whole process is frequency dependent, so that for lower frequency bands the necessary
layer thickness increases as resistivity decreases [92].
2.6.4. Other (In-Situ) Parameters
Frequency
It is a well-established fact that porous fibrous materials achieve lower sound absorption
particularly in the lower frequency-range [1, 30, 93]. This is due to two main reasons. The
first reason is that the maximum energy is dissipated in the region where maximum particle
velocity takes place, and the maximum particle velocity is far from the material at low
frequencies since wavelengths are longer. This may be prevented by increasing the
thickness of the absorbent material or leaving an air gap between the absorbent and the
70
backing. The second reason is that sound waves of shorter wavelengths, with higher
frequencies are able to penetrate and dissipate more easily compared to that at longer
wavelengths [75].
Placement / Position of Sound Absorption Material
Sound absorption capability of materials also depends on their position and placement.
Alton [94] found that if several types of sound absorption material are used, then it was
desirable to place some of each type on ends, sides and ceilings of the building so that all
three axial modes (longitudinal, transverse and vertical) of sound waves would be
influenced.
It has been demonstrated that in a rectangular room, the sound absorbing materials are
most effective when placed near the corners and along the edges of room surfaces. In
speech studios, some sound absorbents that are effective at higher audio frequencies should
be placed on the walls at head (ear) level of the human beings. In fact, the material placed
at the lower portions of high walls can be twice more effective than the same material
placed elsewhere [94]. Furthermore, it is recommended that untreated surfaces should
never face each other within a room.
Air-gap Backing
Mirjalili and Mohammad-Shahi [13] studied the effect of the distance (air gap) between
layers of a multi-layered structure of sound insulation media. They found that sound
diffraction occurs when a sound wave passes through a multi-layered structure, i.e. a
medium alternates between fibre bundles and air (gap). When the material changes the
velocity of the sound wave, this change causes the sound absorption coefficient of the
71
multi-layered structures to be different from that of the homogenous multi-layered
structures. In fact, a part of the sound energy within different materials is reflected. As is
known, the sound waves are transferred by air molecules, therefore, the distance between
layers or the gaps between them in the multi-layered structures can improve the sound
insulation.
Seddeq et al, [19] also found similar results when studying the sound absorption of
nonwoven fabrics produced from recycled natural fibers blended with synthetic fibers and
backed by air-gaps ranging from 1cm to 4 cm together with a perforated plate placed in
front of the nonwoven sample (plate-sample-air gap). Air gap behind the material increases
normal incidence sound absorption coefficient (NAC) substantially in the low frequency
range [47].
2.6.5. Secondary Factors
There are some other factors not related to acoustic performance that may affect their
usefulness as sound absorption media, these include aesthetic, structural and safety
considerations [7]. Furthermore, material selection for acoustic applications may be
affected by factors, such as those concerning exposure to solvents, vibrations, corrosion,
and regulatory restrictions, such as load bearing materials in food and drug areas, firebreak
requirements, ducts, shafts etc. [59].
Apart from all the parameters mentioned above, the efficacy of sound absorption materials
is dependent on the frequency of the sound to be absorbed. Generally, the sound absorption
increases with the increase in sound wave frequency. Thus, in real world applications,
sound absorption materials are chosen according to the prevailing spectrum of sound wave
72
frequency being emitted. For example, in automotive noise control, thinner materials that
are capable of absorbing sound at high frequencies are employed in headliners. At the
same time, thicker materials capable of absorbing sound at lower frequencies are used for
door panels and carpet backings [98]. Thus, it is essential to know the range of sound wave
frequencies required to be controlled in order to utilize sound absorption materials more
effectively.
2.7. Methods of Testing Sound Absorption of Materials
The basic principle of measuring sound absorption in a material is to find the difference
between the incident and reflected sound which then provides a value quantifying the
absorbed sound energy. There are three standardised methods for measuring sound
absorption properties of materials [99]:
The reverberation chamber method (ISO -354:2003/ ASTM C423) [100].
Impedance tube measurement using the standing wave ratio method (ISO-10534-
1:2001 / ASTM C384) [101].
Impedance tube measurement using the transfer function method (ISO 10534-2:
2001 / ASTM 1050-98) [102].
2.7.1. The Reverberation Chamber Method
This method is based on the concept of measuring reverberation time (T60) which is
defined as the time required for the decay of steady sound pressure level in an enclosed
space by 60 dB, measured from the moment the sound source is switched off [1].
73
The definition of reverberation time is simple but the actual measurement is not well
defined [103]. The task is to find how the room responds to an impulse. The most common
method uses a loudspeaker as a sound source, a microphone, and a computer with software
which controls and analyses the acquired data. Methods vary in terms of sound source and
measurement signal. All the methods aim to produce an impulse response from which the
value of the T60 can be calculated.
Sound absorption is then calculated using the difference in measured reverberation times
between the T60 of an empty room and T60 of the same room with the absorption material in
place. The sound absorption coefficient is calculated from [100]
S=
S
AT (20)
Where AT is the equivelent sound absorption area of the test specimen and S is the area
covered by the test specimen.
2.7.2. Impedance Tube Measurement Using The Standing Wave Ratio
Method
In this method, the sound field inside a tube is measured [101]. A sample material is placed
at one end of a straight, rigid and smooth tube and a loud speaker is placed at the other end
of the tube. Microphones are attached in such a way that they can be moved inside along
the length of the tube. The loud speaker produces a static sound field inside the tube, which
is then measured and analysed. The sound absorption coefficient is measured for normal
(perpendicular to the sample) incident sound wave only.
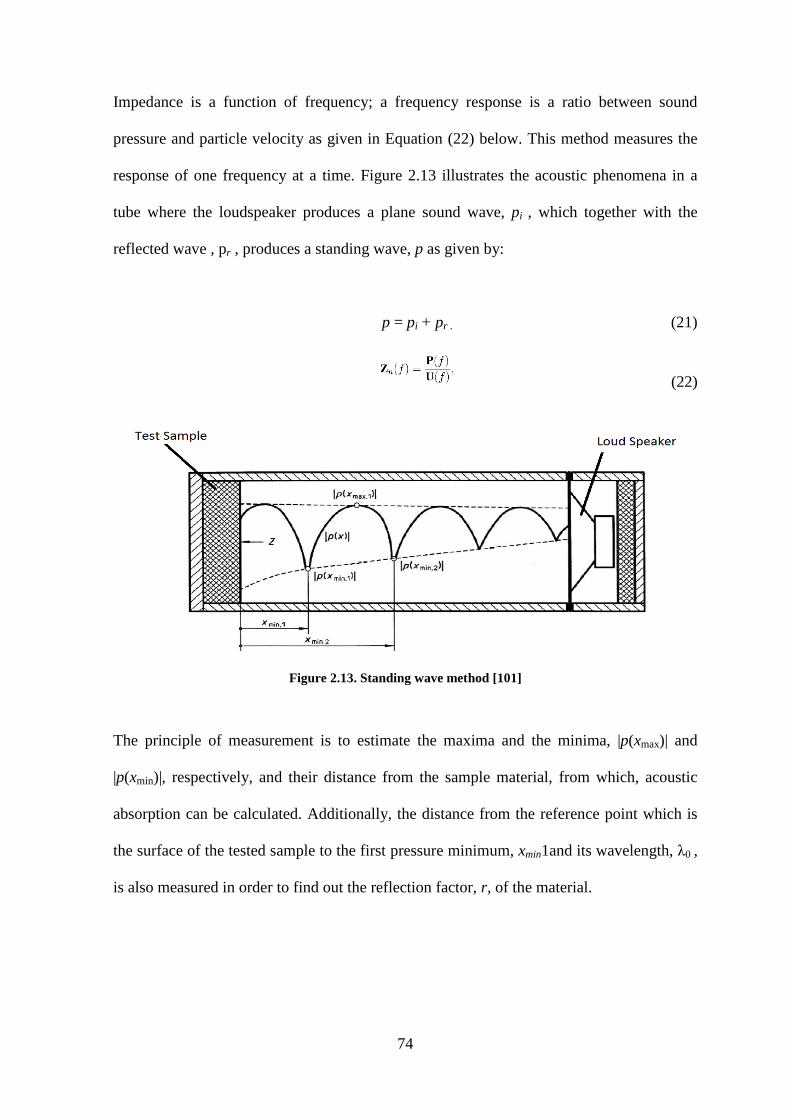
74
Impedance is a function of frequency; a frequency response is a ratio between sound
pressure and particle velocity as given in Equation (22) below. This method measures the
response of one frequency at a time. Figure 2.13 illustrates the acoustic phenomena in a
tube where the loudspeaker produces a plane sound wave, pi , which together with the
reflected wave , pr , produces a standing wave, p as given by:
p = pi + pr . (21)
(22)
Figure 2.13. Standing wave method [101]
The principle of measurement is to estimate the maxima and the minima, |p(xmax)| and
|p(xmin)|, respectively, and their distance from the sample material, from which, acoustic
absorption can be calculated. Additionally, the distance from the reference point which is
the surface of the tested sample to the first pressure minimum, xmin1and its wavelength, λ0 ,
is also measured in order to find out the reflection factor, r, of the material.
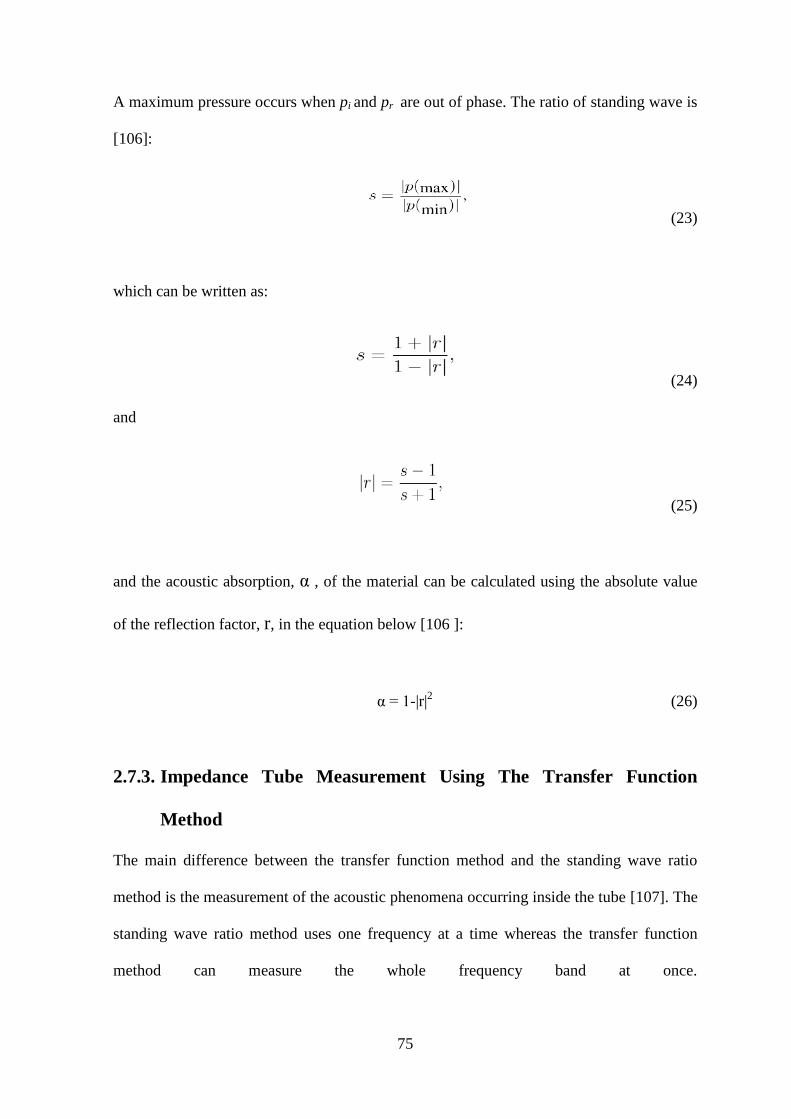
75
A maximum pressure occurs when pi and pr are out of phase. The ratio of standing wave is
[106]:
(23)
which can be written as:
(24)
and
(25)
and the acoustic absorption, α , of the material can be calculated using the absolute value
of the reflection factor, r, in the equation below [106 ]:
α = 1-|r|2
(26)
2.7.3. Impedance Tube Measurement Using The Transfer Function
Method
The main difference between the transfer function method and the standing wave ratio
method is the measurement of the acoustic phenomena occurring inside the tube [107]. The
standing wave ratio method uses one frequency at a time whereas the transfer function
method can measure the whole frequency band at once.
76
Like in the standing wave ratio method, the sample is placed at one end of the tube and the
speaker on the other end and the microphones placed inside the tube to measure the
occurring acoustic phenomena. In this method [102], the complex transfer function, H12, as
given in equation (27) between the two microphone points is measured in order to calculate
the acoustic descriptors similar to that in the standing wave ratio method.
The microphones can be attached to the edges of the tube, as shown by labels 1 and 2 and
by a label 3 in figure 2.14 below a is the test sample. The microphone used in this
measurement must be an identical pair.
Figure 2.14: The transfer function method using two microphones [102]
The transfer function between the microphones is given by [102]:
SS
H11
12
12 (27)
77
Where S12 is the cross spectrum between the two microphones and S11 is the autospectrum
of the first microphone. The reflection factor can be calculated from the measured transfer
function as given by [102]:
eHHHH xkr
j
R
I 102
12
12
(29)
Where HI is the transfer function for the incident wave alone and HR is the transfer
function for the reflected signal alone. HI and HR are measured between two microphone
positions, x1 is the distance between the test sample and the first microphone and k0 is the
wave number, which is defined as:
ck
f
0
0
2 (30)
Acoustic absorption is then calculated using:
α = 1-|r|2
(31)
78
2.8. Problem Statement
High levels of noise emission are one of the major health hazards affecting the quality of
human life. The significance of noise pollution according to the specific effects are: noise-
induced hearing impairment; interference in speech communication; disturbance in rest and
sleep; adverse effects on psycho-social and mental-health performance; effects on
residential behaviour and annoyance; as well as interference in intended activities.
There are three main ways to mitigate noise pollution. It can be treated at the source, the
medium or at the receiver. Amongst these, controlling the noise by placing a sound
absorption/barrier medium between the source and the receiver is the most practical
approach. One of the methods to mitigate the propagation of noise and its adverse effects is
to use a sound barrier medium. Needle punched nonwoven fabrics are widely used for this
function as they are porous and therefore act as good sound absorption media.
The nonwoven fabrics for sound absorption are usually produced from polyester (PET)
and/ or polypropylene (PP) fibers, but in recent years, developments in introducing some
natural fibers such as flax, bamboo and jute have been reported [12]. But this is still in
early stage of development and the research is still required. One of the main motivations
for using natural fibre to produce “greener” material to replace existing synthetic fiber
based materials which are environmentally unfriendly and not biodegradable.
Most of the published research reports in this field are focused on studying the effect of
needlepunched nonwoven parameters on sound absorption behaviour. Most of these
parameters have been studied individually for different fibre types and their blends;
however, not much focus has been directed to investigate the synergistic and interactive
79
effects of these parameters. Therefore, this study is aimed at bridging this gap in the body
of knowledge on sound absorption behaviour of nonwoven fabrics by optimizing some of
the governing parameters of needlepunching process. This work will also study the effect
of an air gap backing on the needle punched nonwoven fabrics in sound absorption. This
study is aimed at assessing the potential of nonwoven fabrics produced from natural fibres
for sound absorption application.
2.8.1. Motivation
Needle punched nonwoven fabrics are relatively simple and cost effective to produce; they
can be also produced from a wide variety of fibres. Nonwoven production lines operate at
high production rates and these materials are utilized in a wide range of applications in
various fields including sound absorption and heat insulation. In view of this, it is expected
that with more research and development efforts, environmentally friendly natural fibre
based needlepunched fabrics can be also extensively applied in sound absorption.
The outcome of this study will assist in determining optimum process parameters for the
natural fibres and their blends for producing needlepunched nonwoven fabrics for sound
absorption applications. The findings from the effects of the air-gap tests will assist in
incorporating the air-gap in sound insulating structures, thereby saving material and
processing costs.
2.9. Objective of the Research
The main objectives of this research work are:
To study the effects of nonwoven fabric production parameters on sound absorption
properties of needle punched nonwoven fabrics with a view to establish optimized
80
conditions for processing parameters. This will include the use of different natural
fibres and their blends with PET with the purpose of producing “green materials”.
To study the effect of air-gap backing on sound absorption capability of
needlepunched nonwoven fabrics and to optimize the size of the air-gap to achieve
maximum sound absorption. The nonwoven fabrics and the air-gap will be further
backed by a commercial roof ceiling material made from extruded polystyrene. So,
all three components, i.e. nonwoven fabric specimen, air gap and polystyrene
sample will be tested as one unit-specimen, with the air-gap being varied to achieve
best results.
2.10. Research Methodology
To achieve the objectives stated above, the following methodology will be adopted. The
first part of the research will be directed to production of needlepunched nonwoven fabrics
from 50:50 blends of natural fibres and polyester (PET), i.e. agave-PET, flax-PET and
hemp-PET. These fabrics will be produced by varying the depth of needle penetration and
stroke frequency of the needle loom. The Box-Behnken factorial experimental design
resulting in the production of 15 different samples will be adopted to study the effects of
governing parameters, i.e. fibre type, depth of needle penetration and stroke frequency
during needlepunching.
The samples will then be tested for physical properties such as area weight and thickness,
according to the ASTM D 3776-96 and (EDANA) -WSP 120.6 (05) testing standards,
respectively. The main test on sound absorption properties will be carried out according to
81
ASTM E 1050-98. After obtaining the sound absorption results, response surface plots will
be drawn to ascertain the optimum parameters for the production of needlepunched
nonwoven fabrics for sound absorption applications.
The second part of the study will also be on the production of the needle punched
nonwovens produced from blends of wool-PET, hemp-PET agave-PET. The blend ratio
will be varied, i.e. for all three blends; some samples will be produced with 30:70 blends of
natural fibres and PET and others will be produced with 50:50 blends of natural fibres and
PET. All the other production parameters such as, stroke frequency, speed of conveyor
belts and area weigh will be held constant and not varied. An attempt will also be made to
keep the sample thickness as similar as possible for all the fabrics to exclude the influence
of variation in thickness on sound absorption.
In total, six samples will be produced, i.e. 2 blend ratios for all 3 natural fibres blended
with PET. The produced samples will be tested for thickness and area weight. In the main
test of sound absorption, each specimen will be mounted together with a backing of
polystyrene sample used to make ceiling boards with an air gap between them. The air gap
will be varied from 0mm (nonwoven and polystyrene touching) up to 25mm in 5mm
increments for each of the six samples under study. A three-way ANOVA will be carried
out which includes two-way interactions of the output data to test the parametric effect on
sound absorption.
82
3. EXPERIMENTAL DESIGN AND METHODS
The experimental work was divided into two parts. The first part dealt with the
optimization of material variables such as fibre type and needle-punching process
parameters, namely, depth of needle penetration and stroke frequency in producing
nonwoven fabrics for sound absorption application. Preliminary trials were carried out to
establish the ranges within which selected variables would be varied for an optimization
study. Subsequently, optimisation of these selected process parameters was attempted.
The second part focused on the application of the developed nonwoven fabrics for sound
absorption application in the building industry. The objective was to study the synergistic
effect of the nonwoven fabric parameters (i.e. fibre type and blend ratio) and air-gap on
sound absorption capabilities. The air-gap, which was varied, was maintained between the
nonwoven specimen and the commercial ceiling insulation material made from extruded
polystyrene (XPS) used as a backing layer. Furthermore, the aim of the study was to
ascertain the factors playing the most dominant role in sound absorption properties in the
developed samples.
3.1. Preliminaries
Part A – Optimisation of Production Parameters
The aim of this work was to establish the domain of governing parameters of the
needlepunched nonwoven fabrics, such as fibre type (agave, flax and hemp each blended
with polyester fibres), stroke frequency and depth of needle penetration on sound
83
absorption properties. It was necessary to establish the minimum and maximum values of
the depth of needle penetration and stroke frequency, as well as to determine the optimum
blending ratio of natural and PET fibres.
Blending
Different blending ratios, namely; 20:80%, 30:70%, 50:50%, 70:30% and 100:0% of
natural fibres to polyester fibres (by weight), were selected. The preliminary results for
fabrics produced from 100% natural fibres and those blended with high natural fibre
content (higher than PET fibres) showed that sound absorption coefficients of the resultant
nonwoven fabrics were very low in the frequency range of 50-5700Hz. All the samples
produced from 100% natural fibres achieved sound absorption coefficients that were below
0.2 (20%) and those produced from 70% natural fibres and 30% PET fibres achieved
sound absorption coefficients below 0.25 ( 25%) in the frequency range of 50 -5700Hz.
On the other hand, blends with a high content of PET fibres showed high sound absorption
coefficients, ranging between 0.45 (45%) and 0.65 (65% ), in the same sound frequency
range. However, with the aim to produce nonwoven fabrics that can be classified as natural
fibre based materials, it was felt that a 50:50% blend of natural and PET fibres would be
ideal in terms of desired performance properties and processing these fibres without
significant fibre damage. Hence, further work was carried out only on 50:50% blends of
each of the three natural selected and PET fibres.
Depth of Needle Penetration
Initially, depths of needle penetration of 6 mm, 8 mm and 10 mm were chosen. However,
these depths of needle penetration produced fabrics with nearly the same thicknesses,
84
mostly ranging between 2.4 mm and 3.2 mm. This implied that the chosen variation in the
depths of needle penetration of only 2mm was inadequate to produce nonwoven fabrics
with different thickness values. Therefore, depths of needle penetrations of 4 mm, 7 mm
and 10 mm were selected while keeping in mind the desirable structural integrity of the
final fabric samples.
Stroke Frequency
Initially, levels of stroke frequency were set at 240/min, 255/min and 270/min, however, as
observed in the case of depths of needle penetration, these settings were also found to
produce nonwoven fabrics with insufficient variations compared to what was desired.
Therefore, the settings for stroke frequency were changed to 250/min, 300/min and
350/min, and necessary precautions were taken to avoid or minimise damage to natural
fibres.
Part B – Application of Nonwoven Fabrics with Variable Air
Gap and Extruded Polystyrene Sheet (XPS) Backing
The main aim of this work was to study the effect of the air-gap and XPS backing on sound
absorption coefficients of the needlepunched fabrics. It was necessary to vary the air-gaps
between the nonwoven fabric specimen and the XPS sheet as well as other production
parameters to study their simultaneous effects on sound absorption coefficients.
Fibre Choice and Blending Ratios in Nonwoven Fabrics
As discussed in Part A above, fibres were chosen such that they vary in their physical
properties. It was also decided to produce nonwoven fabrics from three blending ratios,
85
namely, 30:70%, 50:50% and 70:30% (natural fibre to PET). Furthermore, it was
anticipated that there would be variation in the thickness of nonwoven fabrics resulting
from variations in blend ratios and fibre types (fineness) which would influence sound
absorption properties. Therefore, it was decided that variation in thickness of the
nonwoven samples should be controlled and maintained between 7 mm and 8 mm.
Materials Tested
In the context of the work carried out in Part A; it was necessary to use similar
needlepunched fabrics in this part of the study, for effective comparison. Moreover, for the
sake of practical relevance of this study, it should incorporate a commercially available
sound absorption material because nonwoven fabrics used for sound absorption in
buildings are normally used along with other materials as backing. Therefore, it was
decided that needlepunched fabrics backed by an XPS sheet at different air-gaps will be
tested as a unit.
Air Gap Size
The air-gaps between the nonwoven fabrics and the XPS sheet were initially varied from 0
to 8mm in increments of 2 mm. It was observed that sound absorption increased with an
increase in air-gap. However, the observed change in sound absorption was too little to
draw any meaningful conclusions from the data obtained. Therefore, the increment was
then increased from 2 mm to 5 mm, and the air-gap was varied from 0 mm to 25 mm.
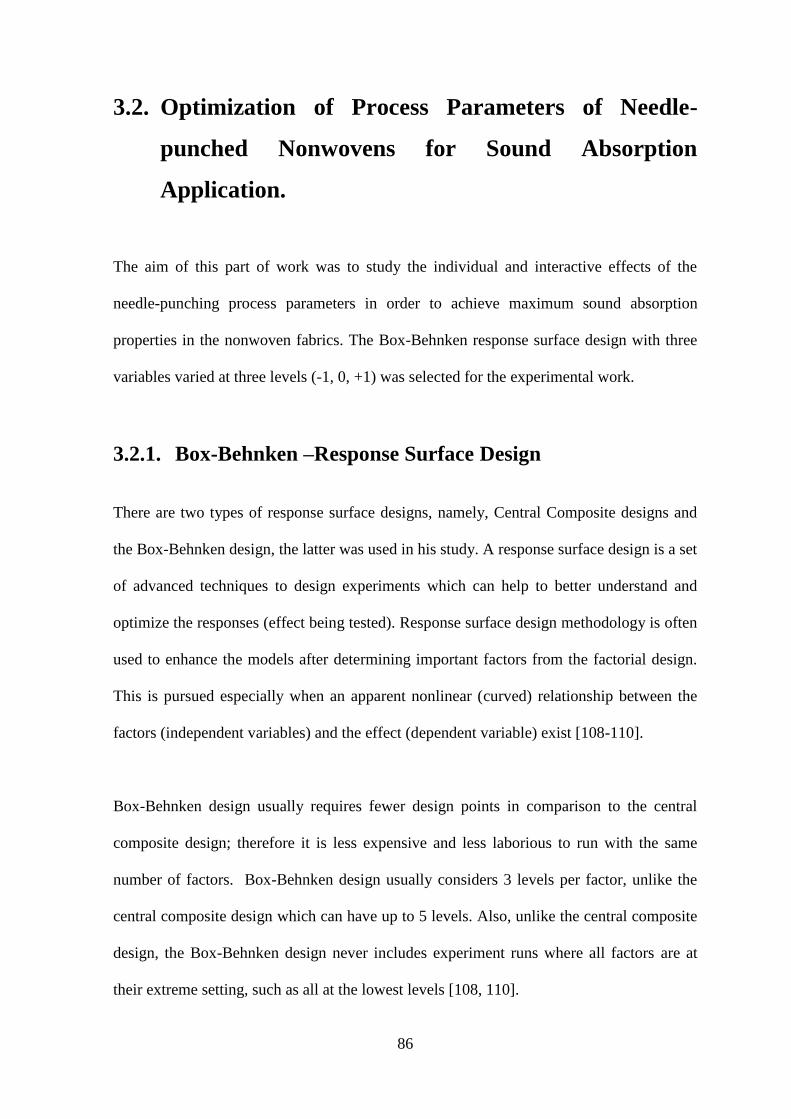
86
3.2. Optimization of Process Parameters of Needle-
punched Nonwovens for Sound Absorption
Application.
The aim of this part of work was to study the individual and interactive effects of the
needle-punching process parameters in order to achieve maximum sound absorption
properties in the nonwoven fabrics. The Box-Behnken response surface design with three
variables varied at three levels (-1, 0, +1) was selected for the experimental work.
3.2.1. Box-Behnken –Response Surface Design
There are two types of response surface designs, namely, Central Composite designs and
the Box-Behnken design, the latter was used in his study. A response surface design is a set
of advanced techniques to design experiments which can help to better understand and
optimize the responses (effect being tested). Response surface design methodology is often
used to enhance the models after determining important factors from the factorial design.
This is pursued especially when an apparent nonlinear (curved) relationship between the
factors (independent variables) and the effect (dependent variable) exist [108-110].
Box-Behnken design usually requires fewer design points in comparison to the central
composite design; therefore it is less expensive and less laborious to run with the same
number of factors. Box-Behnken design usually considers 3 levels per factor, unlike the
central composite design which can have up to 5 levels. Also, unlike the central composite
design, the Box-Behnken design never includes experiment runs where all factors are at
their extreme setting, such as all at the lowest levels [108, 110].
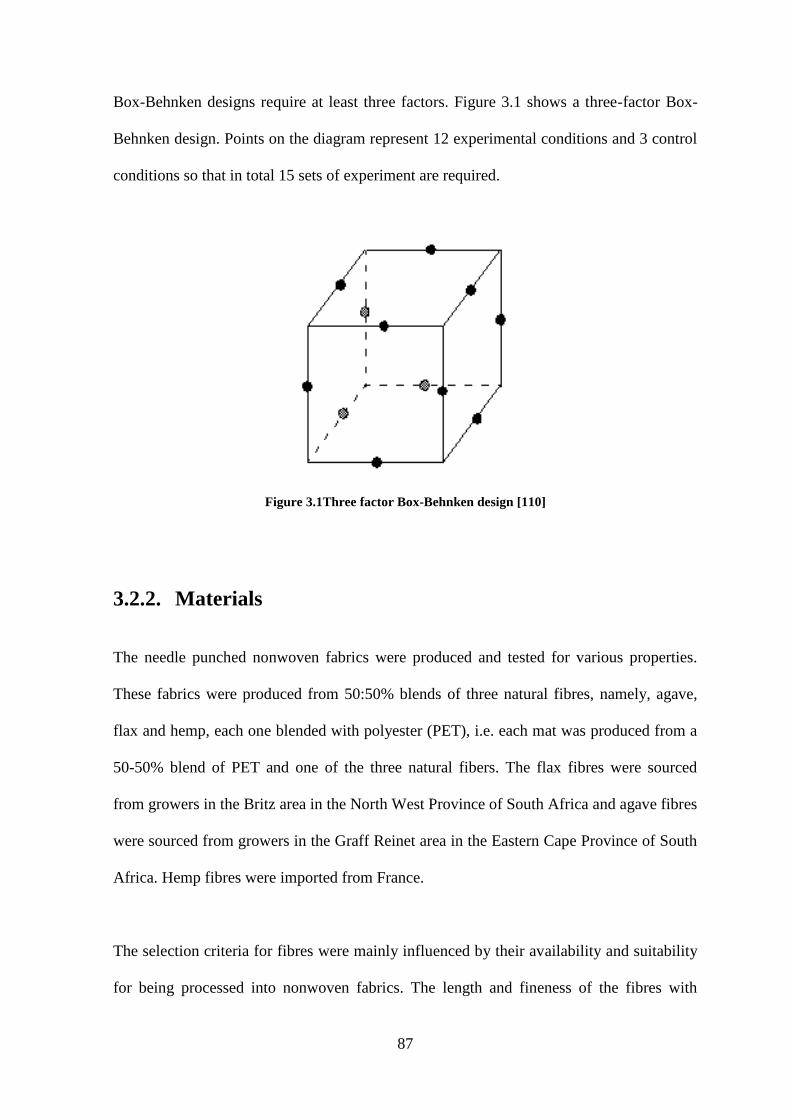
87
Box-Behnken designs require at least three factors. Figure 3.1 shows a three-factor Box-
Behnken design. Points on the diagram represent 12 experimental conditions and 3 control
conditions so that in total 15 sets of experiment are required.
Figure 3.1Three factor Box-Behnken design [110]
3.2.2. Materials
The needle punched nonwoven fabrics were produced and tested for various properties.
These fabrics were produced from 50:50% blends of three natural fibres, namely, agave,
flax and hemp, each one blended with polyester (PET), i.e. each mat was produced from a
50-50% blend of PET and one of the three natural fibers. The flax fibres were sourced
from growers in the Britz area in the North West Province of South Africa and agave fibres
were sourced from growers in the Graff Reinet area in the Eastern Cape Province of South
Africa. Hemp fibres were imported from France.
The selection criteria for fibres were mainly influenced by their availability and suitability
for being processed into nonwoven fabrics. The length and fineness of the fibres with
88
CV% values are shown in Table 3.1 below. The plant based natural fibres (agave, flax and
hemp) were measured for lengths and fineness. Length was measured by sampling 5
bundles from each lot, and then from each bundle 5 fibres were measure by a measuring
tape for length making it a total of 25 fibres measured for each fibre type, a mean and
CV% were then calculated and reported. The fibre fineness was measured via the optical
fibre diameter analysis (OFDA) method, which measures the fibre micronaire from which
fineness in dTex can be calculated, five readings were done for each fibre type from which
the mean and CV% were calculated and reported. For wool fibres, length and diameter
were measured on OFDA as well. All the fibres were measured after conditioning for 24
hours in a standard testing laboratory atmosphere maintained at 21oC ± 2
oC and 65% ± 2%
RH [111].
Table 3.1 Fibre length and fineness with percentage CV in brackets
Fibre Length(mm) Fineness(dtex)
Agave 95 (22%) 16.8 (16%)
Flax 62 (49%) 10.2 (87%)
Hemp 60 (49%) 12.5 (92%)
Coring Waste Wool 22 (25%) 20.7 µm (28.5%)
(diameter)
PET 60 6.6
3.2.3. Fabric Production
3.2.3.1. Fibre Preparation
The most important fibre characteristics are fibre diameter or fineness and fibre length.
Other fibre parameters are for specific niche applications, depending on a specific function
89
envisaged. “Textile character” or usability of fibres can be determined by factors such as
mechanical properties and desired technical functions.
All the natural fibres were received after scutching in a long tow form, this means that
further processing on a cottoniser was required to obtain short-staple fibres for processing
on a nonwoven carding machine, see Figure 3.2. The natural fibres were cottonised in-
house by a 2-pass process in a pre-opener and cottoniser on the Temafa natural fibre
preparation line. The function of the opener is to unbundle the fibres from the scutched
bundles into individual strands and the cottoniser, in turn, shortens the fibre strands into
staple fibres suitable for processing on a nonwoven carding machine.
After the natural fibers were cottonised to a desired staple form, 50:50% (by mass) blends
of natural and polyester fibres were manually prepared before feeding to the carding
machine.
Figure 3.2. Scutched flax (L) and cottonised flax (R).
90
3.2.3.2. Fibre Processing
Each fibre blend was carded twice to ensure homogeneous blending of the fibres since the
fibres were manually mixed without processing in a fibre mixer. The blended fibres were
fed to the carding machine via a chute equipped with sensors to control the feeding rate
which ensures uniformity of the fibrous web.
The production of needle-punched nonwoven fabric comprised of three main processes, i.e.
roller carding, followed by cross-lapping and needle-punching. As it has already been
indicated, the main carding, i.e. web formation process, occurs during the second pass on
the carding machine, as the first pass is used only to improve blending of the natural and
PET fibres.
The carding machine used in this study is equipped with a main cylinder of 800mm in
diameter and 600mm wide (working width) covered by universal card clothing. The main
cylinder is the heart of a carding machine and it distributes the fibres during the process.
On its upper side, the main cylinder is partly surrounded by a series of pairs of “worker”
and “stripper” rollers which accomplish the dual function of carding and mixing
(blending). The doffer stripper rollers condense and remove the fibres in a form of a
continuous web [8]. The carding machine settings during the second pass are shown in
Table 3.2. The density of the web produced is influenced by the rate of feeding of the
fibres into the card, i.e. the higher the rate of feeding the denser is the fibre web produced.
The carding machine produces a web of desired area weight which is then carried by a
conveyor belt to a cross-lapping unit whose function is to layer up the web in a cross-
machine direction to form a batt of desired thickness and density. The speed of the
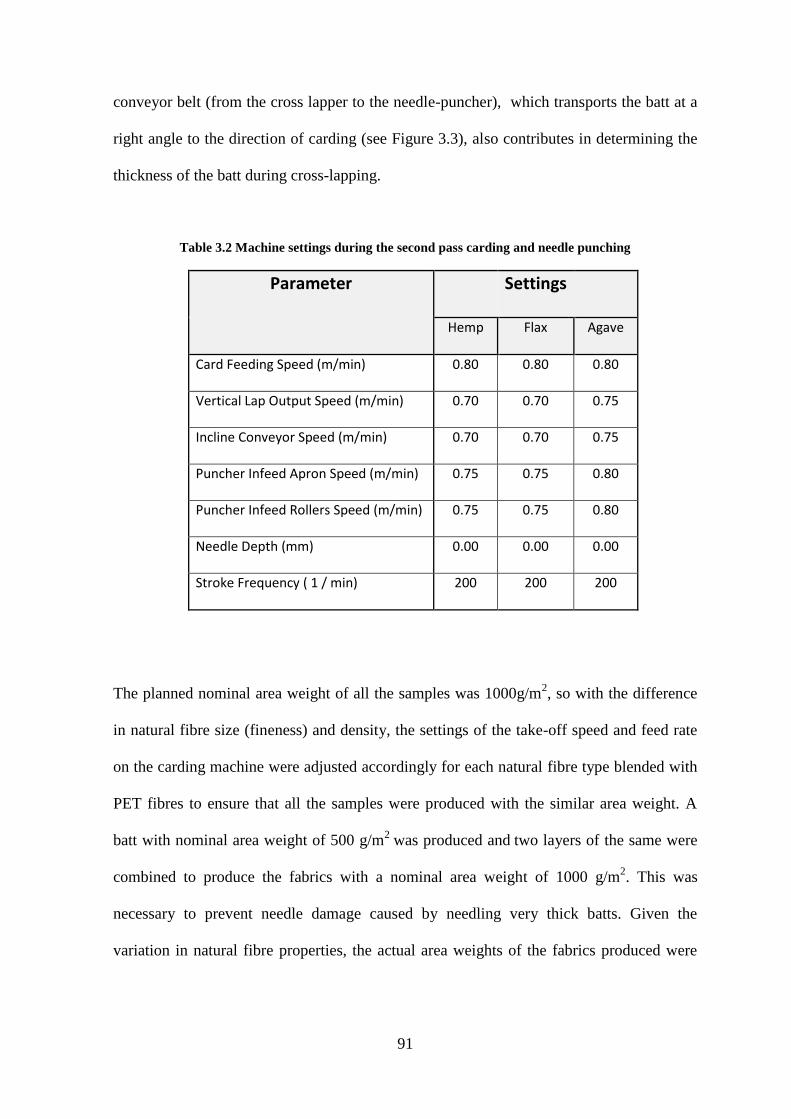
91
conveyor belt (from the cross lapper to the needle-puncher), which transports the batt at a
right angle to the direction of carding (see Figure 3.3), also contributes in determining the
thickness of the batt during cross-lapping.
Table 3.2 Machine settings during the second pass carding and needle punching
Parameter
Settings
Hemp Flax Agave
Card Feeding Speed (m/min) 0.80 0.80 0.80
Vertical Lap Output Speed (m/min) 0.70 0.70 0.75
Incline Conveyor Speed (m/min) 0.70 0.70 0.75
Puncher Infeed Apron Speed (m/min) 0.75 0.75 0.80
Puncher Infeed Rollers Speed (m/min) 0.75 0.75 0.80
Needle Depth (mm) 0.00 0.00 0.00
Stroke Frequency ( 1 / min) 200 200 200
The planned nominal area weight of all the samples was 1000g/m2, so with the difference
in natural fibre size (fineness) and density, the settings of the take-off speed and feed rate
on the carding machine were adjusted accordingly for each natural fibre type blended with
PET fibres to ensure that all the samples were produced with the similar area weight. A
batt with nominal area weight of 500 g/m2
was produced and two layers of the same were
combined to produce the fabrics with a nominal area weight of 1000 g/m2. This was
necessary to prevent needle damage caused by needling very thick batts. Given the
variation in natural fibre properties, the actual area weights of the fabrics produced were
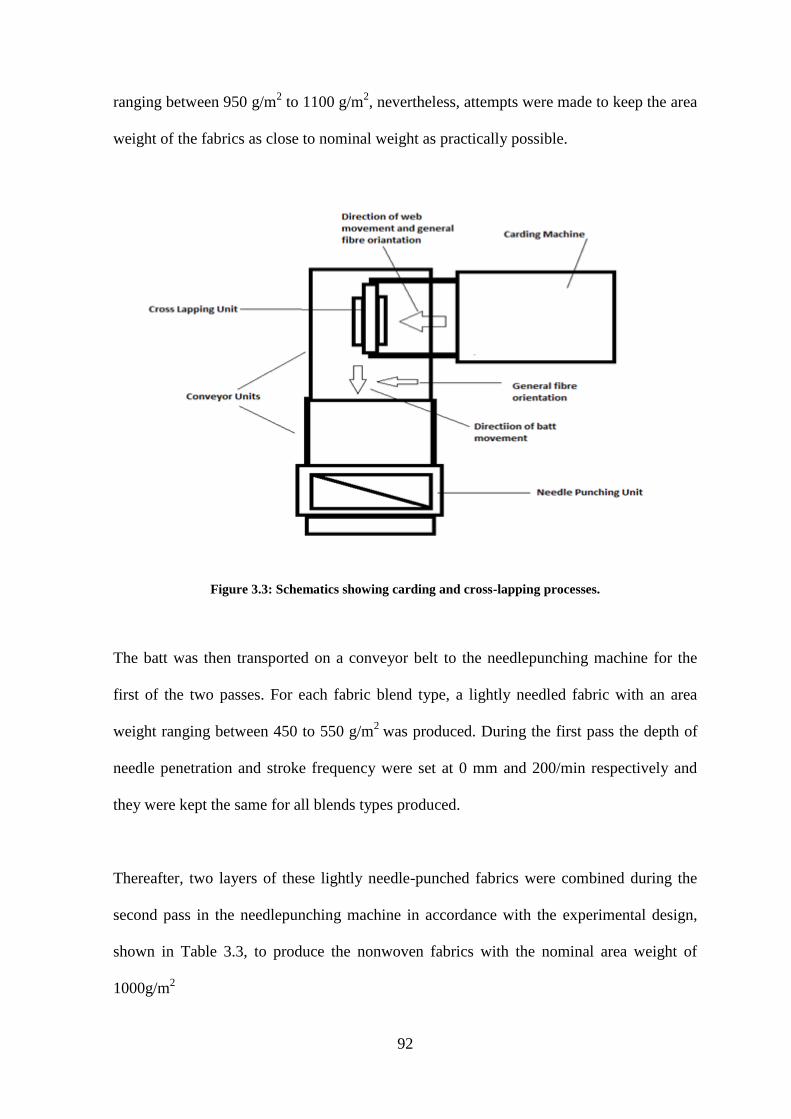
92
ranging between 950 g/m2 to 1100 g/m
2, nevertheless, attempts were made to keep the area
weight of the fabrics as close to nominal weight as practically possible.
Figure 3.3: Schematics showing carding and cross-lapping processes.
The batt was then transported on a conveyor belt to the needlepunching machine for the
first of the two passes. For each fabric blend type, a lightly needled fabric with an area
weight ranging between 450 to 550 g/m2
was produced. During the first pass the depth of
needle penetration and stroke frequency were set at 0 mm and 200/min respectively and
they were kept the same for all blends types produced.
Thereafter, two layers of these lightly needle-punched fabrics were combined during the
second pass in the needlepunching machine in accordance with the experimental design,
shown in Table 3.3, to produce the nonwoven fabrics with the nominal area weight of
1000g/m2
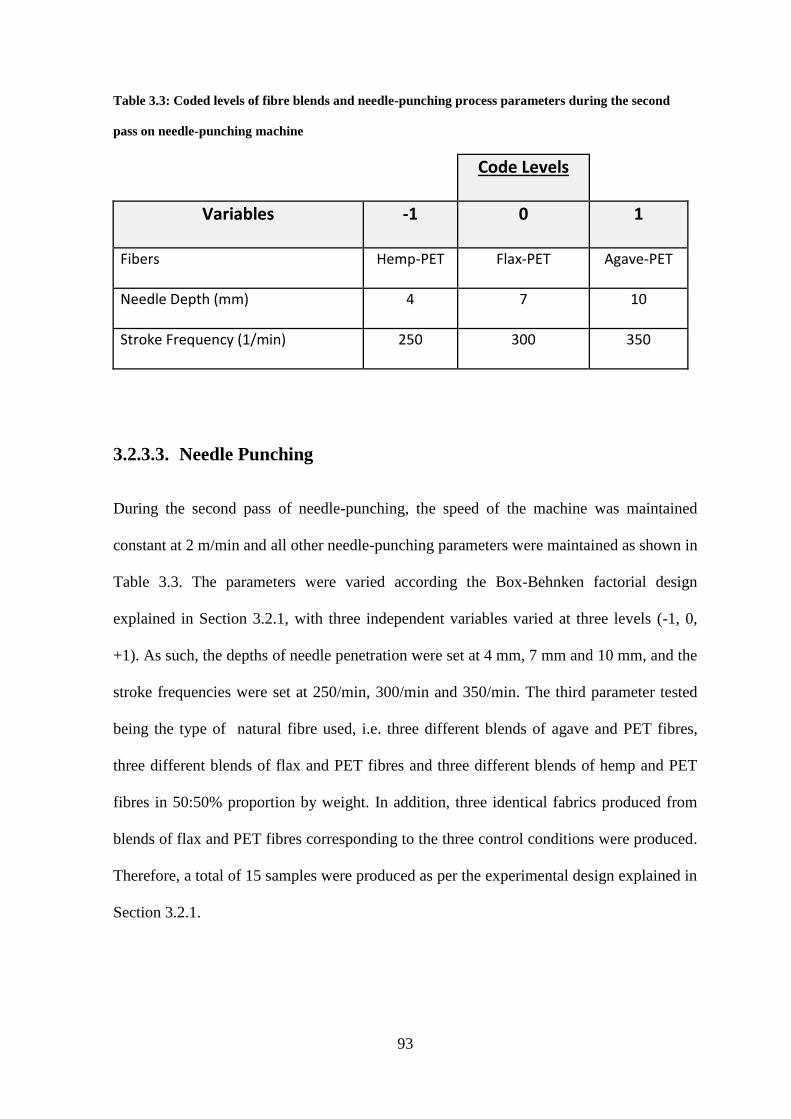
93
Table 3.3: Coded levels of fibre blends and needle-punching process parameters during the second
pass on needle-punching machine
Code Levels
Variables -1 0 1
Fibers Hemp-PET Flax-PET Agave-PET
Needle Depth (mm) 4 7 10
Stroke Frequency (1/min) 250 300 350
3.2.3.3. Needle Punching
During the second pass of needle-punching, the speed of the machine was maintained
constant at 2 m/min and all other needle-punching parameters were maintained as shown in
Table 3.3. The parameters were varied according the Box-Behnken factorial design
explained in Section 3.2.1, with three independent variables varied at three levels (-1, 0,
+1). As such, the depths of needle penetration were set at 4 mm, 7 mm and 10 mm, and the
stroke frequencies were set at 250/min, 300/min and 350/min. The third parameter tested
being the type of natural fibre used, i.e. three different blends of agave and PET fibres,
three different blends of flax and PET fibres and three different blends of hemp and PET
fibres in 50:50% proportion by weight. In addition, three identical fabrics produced from
blends of flax and PET fibres corresponding to the three control conditions were produced.
Therefore, a total of 15 samples were produced as per the experimental design explained in
Section 3.2.1.
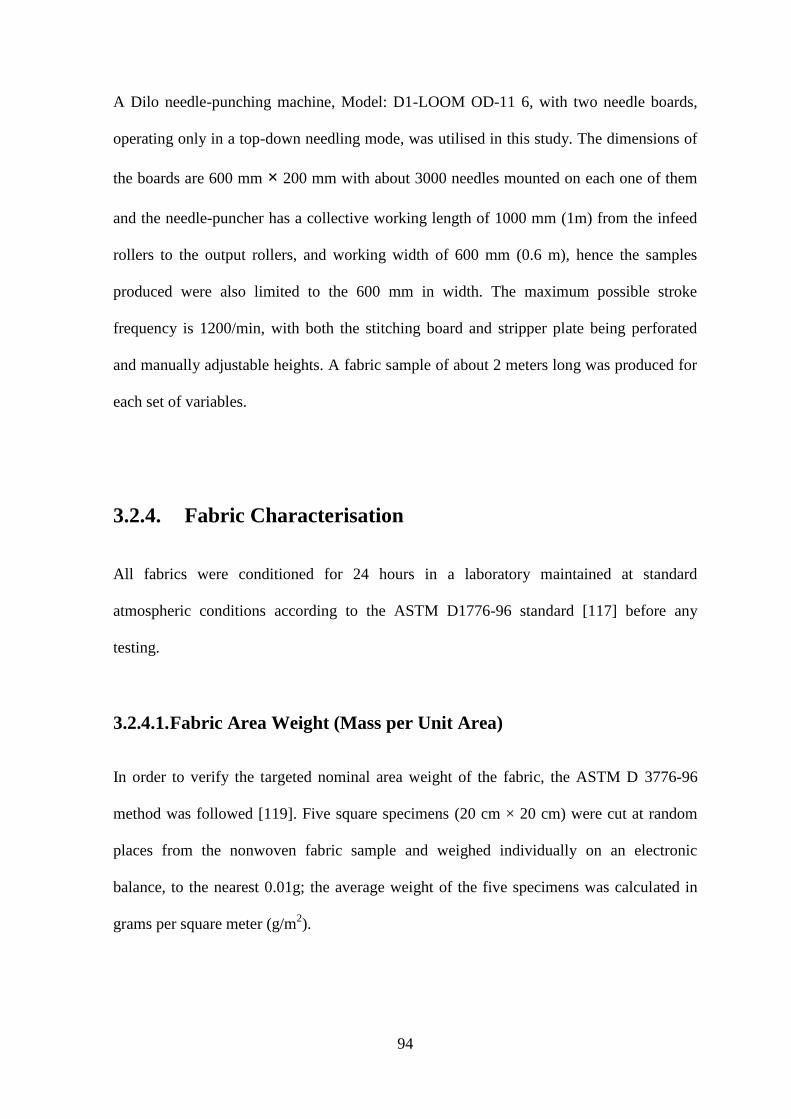
94
A Dilo needle-punching machine, Model: D1-LOOM OD-11 6, with two needle boards,
operating only in a top-down needling mode, was utilised in this study. The dimensions of
the boards are 600 mm × 200 mm with about 3000 needles mounted on each one of them
and the needle-puncher has a collective working length of 1000 mm (1m) from the infeed
rollers to the output rollers, and working width of 600 mm (0.6 m), hence the samples
produced were also limited to the 600 mm in width. The maximum possible stroke
frequency is 1200/min, with both the stitching board and stripper plate being perforated
and manually adjustable heights. A fabric sample of about 2 meters long was produced for
each set of variables.
3.2.4. Fabric Characterisation
All fabrics were conditioned for 24 hours in a laboratory maintained at standard
atmospheric conditions according to the ASTM D1776-96 standard [117] before any
testing.
3.2.4.1. Fabric Area Weight (Mass per Unit Area)
In order to verify the targeted nominal area weight of the fabric, the ASTM D 3776-96
method was followed [119]. Five square specimens (20 cm × 20 cm) were cut at random
places from the nonwoven fabric sample and weighed individually on an electronic
balance, to the nearest 0.01g; the average weight of the five specimens was calculated in
grams per square meter (g/m2).
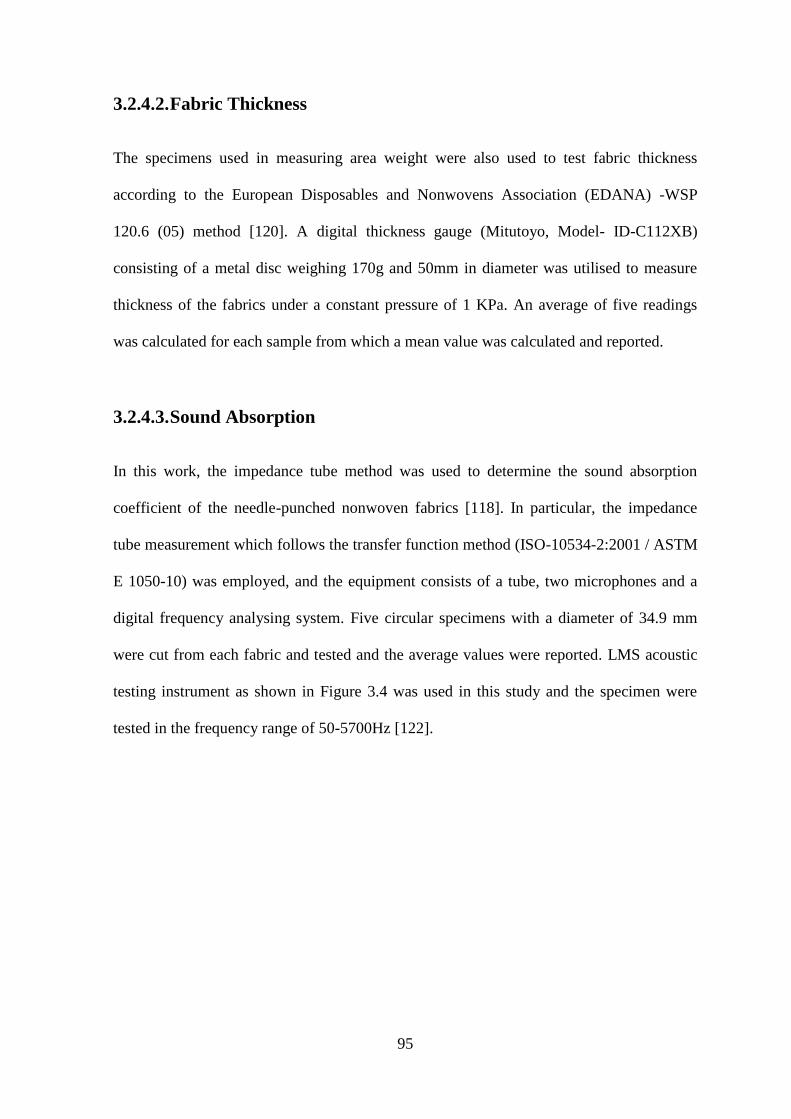
95
3.2.4.2. Fabric Thickness
The specimens used in measuring area weight were also used to test fabric thickness
according to the European Disposables and Nonwovens Association (EDANA) -WSP
120.6 (05) method [120]. A digital thickness gauge (Mitutoyo, Model- ID-C112XB)
consisting of a metal disc weighing 170g and 50mm in diameter was utilised to measure
thickness of the fabrics under a constant pressure of 1 KPa. An average of five readings
was calculated for each sample from which a mean value was calculated and reported.
3.2.4.3. Sound Absorption
In this work, the impedance tube method was used to determine the sound absorption
coefficient of the needle-punched nonwoven fabrics [118]. In particular, the impedance
tube measurement which follows the transfer function method (ISO-10534-2:2001 / ASTM
E 1050-10) was employed, and the equipment consists of a tube, two microphones and a
digital frequency analysing system. Five circular specimens with a diameter of 34.9 mm
were cut from each fabric and tested and the average values were reported. LMS acoustic
testing instrument as shown in Figure 3.4 was used in this study and the specimen were
tested in the frequency range of 50-5700Hz [122].
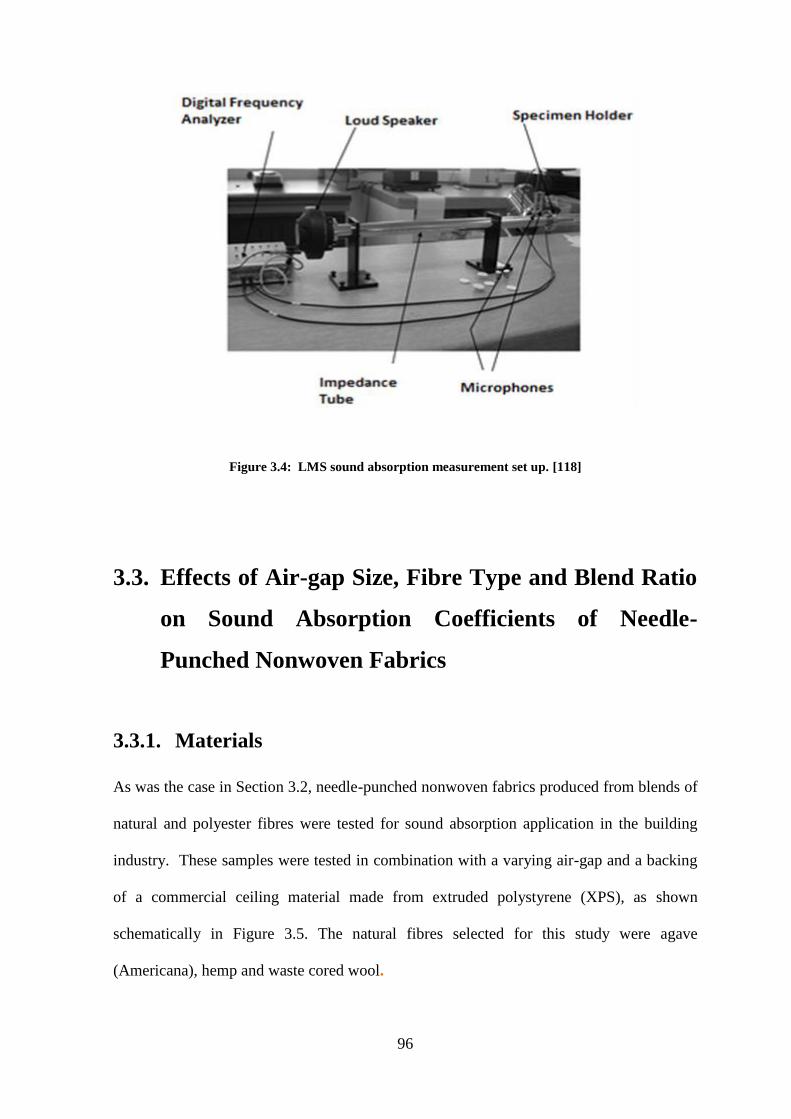
96
Figure 3.4: LMS sound absorption measurement set up. [118]
3.3. Effects of Air-gap Size, Fibre Type and Blend Ratio
on Sound Absorption Coefficients of Needle-
Punched Nonwoven Fabrics
3.3.1. Materials
As was the case in Section 3.2, needle-punched nonwoven fabrics produced from blends of
natural and polyester fibres were tested for sound absorption application in the building
industry. These samples were tested in combination with a varying air-gap and a backing
of a commercial ceiling material made from extruded polystyrene (XPS), as shown
schematically in Figure 3.5. The natural fibres selected for this study were agave
(Americana), hemp and waste cored wool.
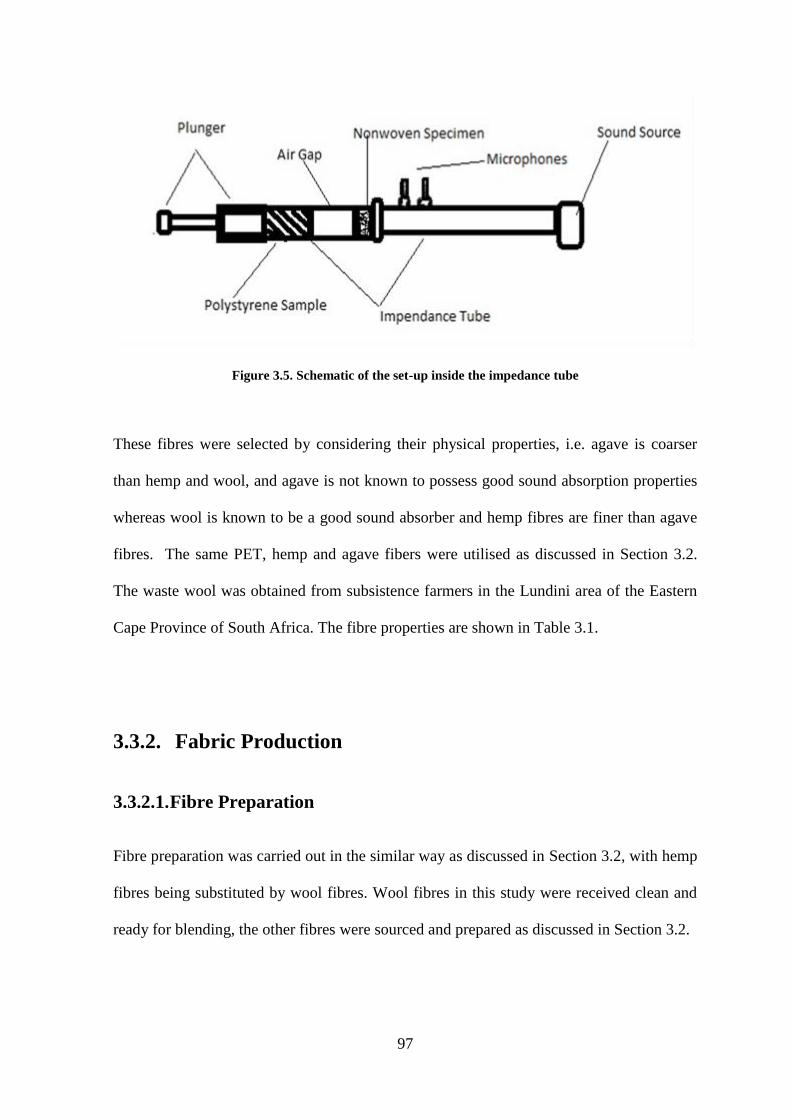
97
Figure 3.5. Schematic of the set-up inside the impedance tube
These fibres were selected by considering their physical properties, i.e. agave is coarser
than hemp and wool, and agave is not known to possess good sound absorption properties
whereas wool is known to be a good sound absorber and hemp fibres are finer than agave
fibres. The same PET, hemp and agave fibers were utilised as discussed in Section 3.2.
The waste wool was obtained from subsistence farmers in the Lundini area of the Eastern
Cape Province of South Africa. The fibre properties are shown in Table 3.1.
3.3.2. Fabric Production
3.3.2.1. Fibre Preparation
Fibre preparation was carried out in the similar way as discussed in Section 3.2, with hemp
fibres being substituted by wool fibres. Wool fibres in this study were received clean and
ready for blending, the other fibres were sourced and prepared as discussed in Section 3.2.
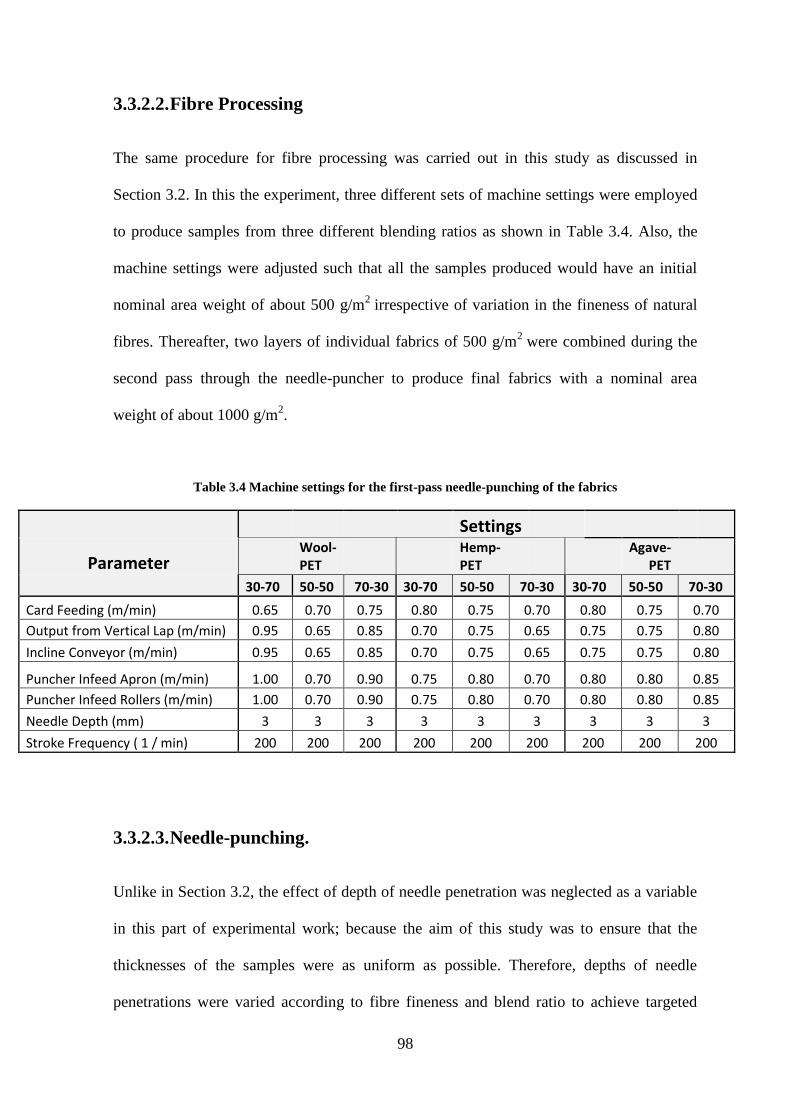
98
3.3.2.2. Fibre Processing
The same procedure for fibre processing was carried out in this study as discussed in
Section 3.2. In this the experiment, three different sets of machine settings were employed
to produce samples from three different blending ratios as shown in Table 3.4. Also, the
machine settings were adjusted such that all the samples produced would have an initial
nominal area weight of about 500 g/m2
irrespective of variation in the fineness of natural
fibres. Thereafter, two layers of individual fabrics of 500 g/m2
were combined during the
second pass through the needle-puncher to produce final fabrics with a nominal area
weight of about 1000 g/m2.
Table 3.4 Machine settings for the first-pass needle-punching of the fabrics
Settings
Parameter Wool-PET
Hemp-PET
Agave-PET
30-70 50-50 70-30 30-70 50-50 70-30 30-70 50-50 70-30
Card Feeding (m/min) 0.65 0.70 0.75 0.80 0.75 0.70 0.80 0.75 0.70
Output from Vertical Lap (m/min) 0.95 0.65 0.85 0.70 0.75 0.65 0.75 0.75 0.80
Incline Conveyor (m/min) 0.95 0.65 0.85 0.70 0.75 0.65 0.75 0.75 0.80
Puncher Infeed Apron (m/min) 1.00 0.70 0.90 0.75 0.80 0.70 0.80 0.80 0.85
Puncher Infeed Rollers (m/min) 1.00 0.70 0.90 0.75 0.80 0.70 0.80 0.80 0.85
Needle Depth (mm) 3 3 3 3 3 3 3 3 3
Stroke Frequency ( 1 / min) 200 200 200 200 200 200 200 200 200
3.3.2.3. Needle-punching.
Unlike in Section 3.2, the effect of depth of needle penetration was neglected as a variable
in this part of experimental work; because the aim of this study was to ensure that the
thicknesses of the samples were as uniform as possible. Therefore, depths of needle
penetrations were varied according to fibre fineness and blend ratio to achieve targeted
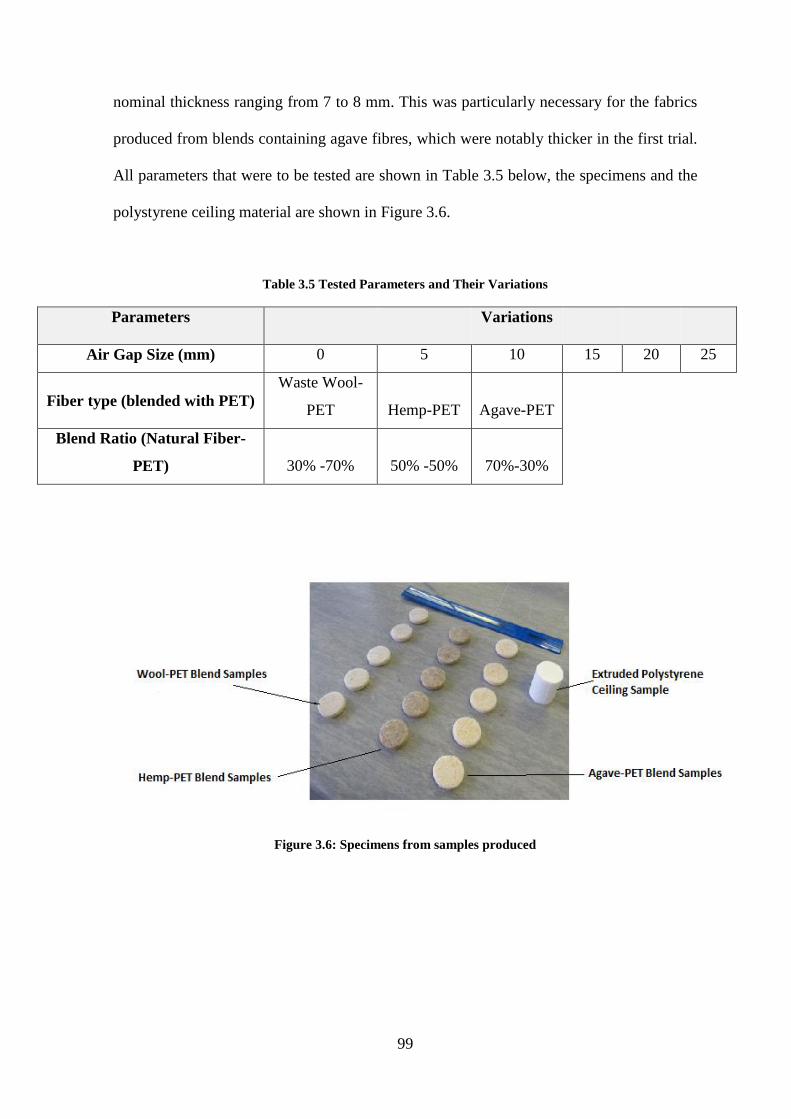
99
nominal thickness ranging from 7 to 8 mm. This was particularly necessary for the fabrics
produced from blends containing agave fibres, which were notably thicker in the first trial.
All parameters that were to be tested are shown in Table 3.5 below, the specimens and the
polystyrene ceiling material are shown in Figure 3.6.
Table 3.5 Tested Parameters and Their Variations
Parameters Variations
Air Gap Size (mm) 0 5 10 15 20 25
Fiber type (blended with PET)
Waste Wool-
PET Hemp-PET Agave-PET
Blend Ratio (Natural Fiber-
PET) 30% -70% 50% -50% 70%-30%
Figure 3.6: Specimens from samples produced
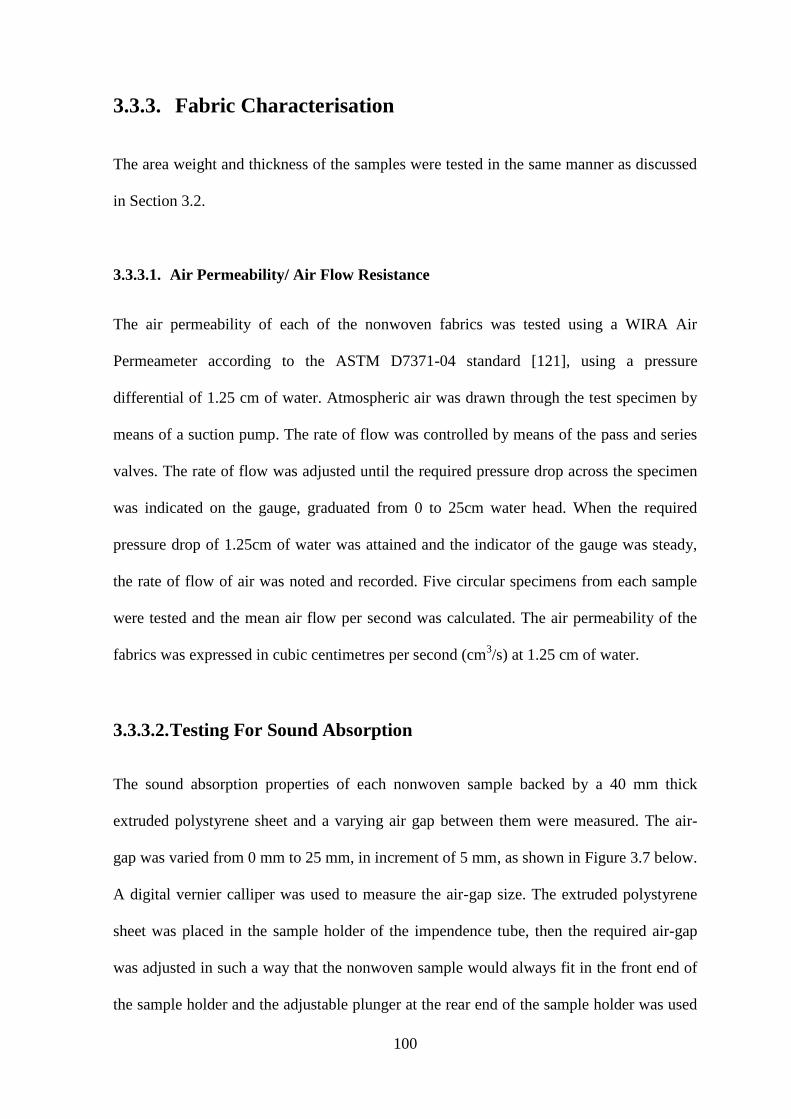
100
3.3.3. Fabric Characterisation
The area weight and thickness of the samples were tested in the same manner as discussed
in Section 3.2.
3.3.3.1. Air Permeability/ Air Flow Resistance
The air permeability of each of the nonwoven fabrics was tested using a WIRA Air
Permeameter according to the ASTM D7371-04 standard [121], using a pressure
differential of 1.25 cm of water. Atmospheric air was drawn through the test specimen by
means of a suction pump. The rate of flow was controlled by means of the pass and series
valves. The rate of flow was adjusted until the required pressure drop across the specimen
was indicated on the gauge, graduated from 0 to 25cm water head. When the required
pressure drop of 1.25cm of water was attained and the indicator of the gauge was steady,
the rate of flow of air was noted and recorded. Five circular specimens from each sample
were tested and the mean air flow per second was calculated. The air permeability of the
fabrics was expressed in cubic centimetres per second (cm3/s) at 1.25 cm of water.
3.3.3.2. Testing For Sound Absorption
The sound absorption properties of each nonwoven sample backed by a 40 mm thick
extruded polystyrene sheet and a varying air gap between them were measured. The air-
gap was varied from 0 mm to 25 mm, in increment of 5 mm, as shown in Figure 3.7 below.
A digital vernier calliper was used to measure the air-gap size. The extruded polystyrene
sheet was placed in the sample holder of the impendence tube, then the required air-gap
was adjusted in such a way that the nonwoven sample would always fit in the front end of
the sample holder and the adjustable plunger at the rear end of the sample holder was used
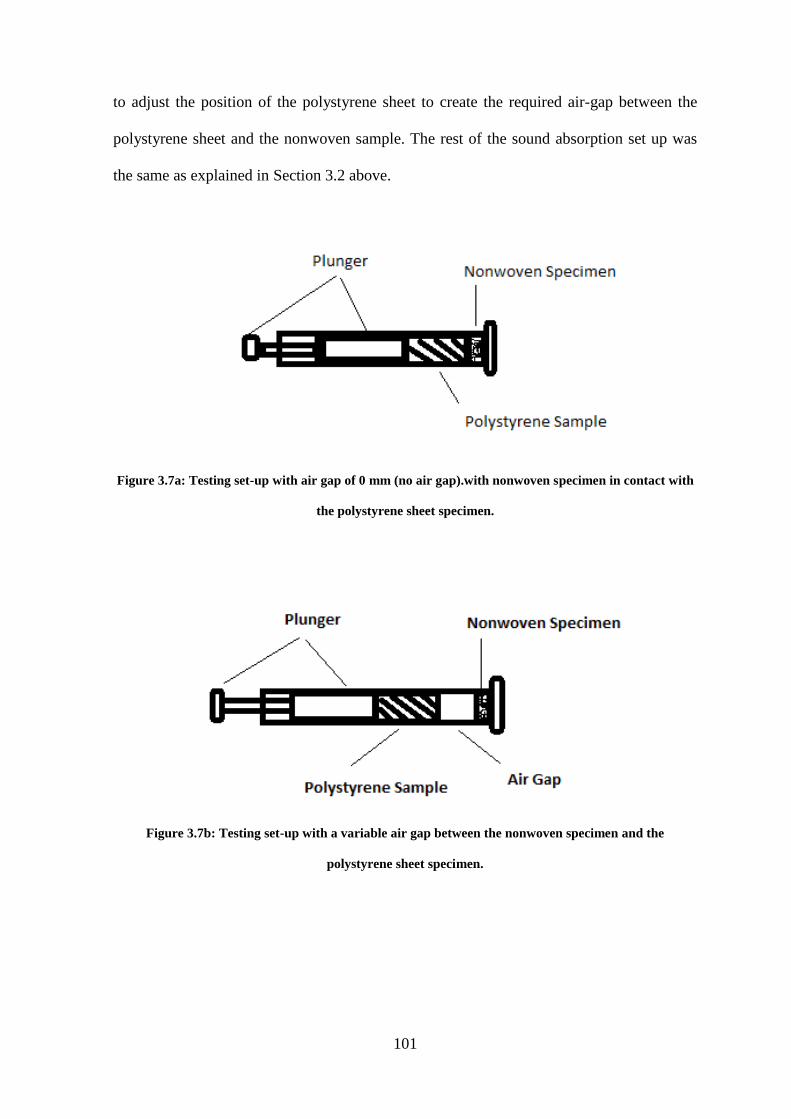
101
to adjust the position of the polystyrene sheet to create the required air-gap between the
polystyrene sheet and the nonwoven sample. The rest of the sound absorption set up was
the same as explained in Section 3.2 above.
Figure 3.7a: Testing set-up with air gap of 0 mm (no air gap).with nonwoven specimen in contact with
the polystyrene sheet specimen.
Figure 3.7b: Testing set-up with a variable air gap between the nonwoven specimen and the
polystyrene sheet specimen.
102
4. RESULTS AND DISCUSSION
This chapter reports detailed analysis of the results obtained from the experimental work
conducted in two distinct parts. The results and analysis are separated and discussed in
three sections. The first section reports preliminary results obtained for establishing
suitable ranges of the chosen variables for the optimization study. The second section deals
with the results on optimization of production parameters in producing needlepunched
nonwoven fabrics for sound absorption application. The third section reports the results on
application of the needlepunched nonwoven fabrics backed by extruded polystyrene (XPS)
sheet with varying air gaps in between the fabric and the XPS sheet. The objective of this
study was to achieve maximum possible sound absorption coefficients.
4.1. Preliminary Results
The sound absorption coefficients and sample thicknesses of the nonwoven fabrics are
shown in Tables 4.1. (a-d). In general, both fabric thickness and sound absorption
coefficients increased with an increase in PET fibre content within a blend for the fabrics
under study.
As shown in Table 4.1(a), the sound absorption coefficients of the nonwoven fabrics
produced from 100% natural fibres were generally lower than those for all the fabrics
produced from natural fibre blends. This was largely due to the fact that natural fibres are
generally coarse and have low crimp, which minimises the level of tortuosity, thus offering
minimum resistance to air-flow within the fabric. Therefore, the sound absorption
coefficients were lower in the fabrics containing a high amount of natural fibres, which is
attributed to minimised frictional hindrance.
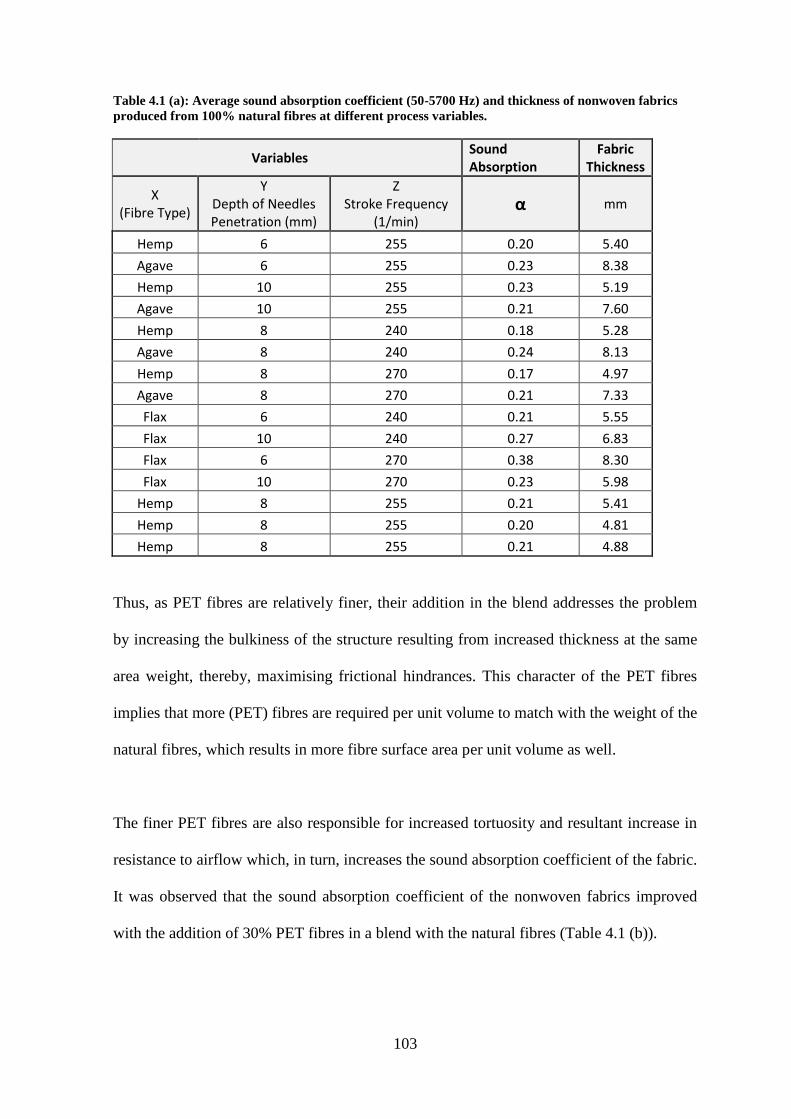
103
Table 4.1 (a): Average sound absorption coefficient (50-5700 Hz) and thickness of nonwoven fabrics
produced from 100% natural fibres at different process variables.
Variables Sound Absorption
Fabric Thickness
X (Fibre Type)
Y Depth of Needles Penetration (mm)
Z Stroke Frequency
(1/min) α mm
Hemp 6 255 0.20 5.40
Agave 6 255 0.23 8.38
Hemp 10 255 0.23 5.19
Agave 10 255 0.21 7.60
Hemp 8 240 0.18 5.28
Agave 8 240 0.24 8.13
Hemp 8 270 0.17 4.97
Agave 8 270 0.21 7.33
Flax 6 240 0.21 5.55
Flax 10 240 0.27 6.83
Flax 6 270 0.38 8.30
Flax 10 270 0.23 5.98
Hemp 8 255 0.21 5.41
Hemp 8 255 0.20 4.81
Hemp 8 255 0.21 4.88
Thus, as PET fibres are relatively finer, their addition in the blend addresses the problem
by increasing the bulkiness of the structure resulting from increased thickness at the same
area weight, thereby, maximising frictional hindrances. This character of the PET fibres
implies that more (PET) fibres are required per unit volume to match with the weight of the
natural fibres, which results in more fibre surface area per unit volume as well.
The finer PET fibres are also responsible for increased tortuosity and resultant increase in
resistance to airflow which, in turn, increases the sound absorption coefficient of the fabric.
It was observed that the sound absorption coefficient of the nonwoven fabrics improved
with the addition of 30% PET fibres in a blend with the natural fibres (Table 4.1 (b)).
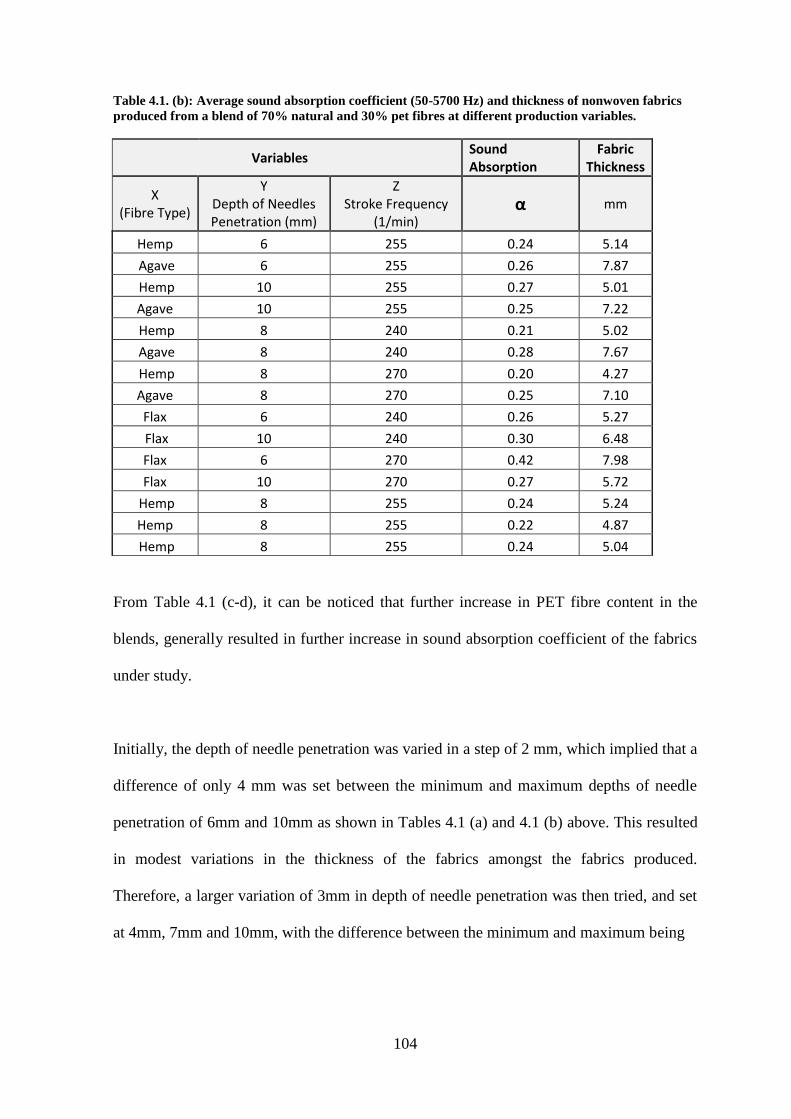
104
Table 4.1. (b): Average sound absorption coefficient (50-5700 Hz) and thickness of nonwoven fabrics
produced from a blend of 70% natural and 30% pet fibres at different production variables.
Variables Sound Absorption
Fabric Thickness
X (Fibre Type)
Y Depth of Needles Penetration (mm)
Z Stroke Frequency
(1/min) α mm
Hemp 6 255 0.24 5.14
Agave 6 255 0.26 7.87
Hemp 10 255 0.27 5.01
Agave 10 255 0.25 7.22
Hemp 8 240 0.21 5.02
Agave 8 240 0.28 7.67
Hemp 8 270 0.20 4.27
Agave 8 270 0.25 7.10
Flax 6 240 0.26 5.27
Flax 10 240 0.30 6.48
Flax 6 270 0.42 7.98
Flax 10 270 0.27 5.72
Hemp 8 255 0.24 5.24
Hemp 8 255 0.22 4.87
Hemp 8 255 0.24 5.04
From Table 4.1 (c-d), it can be noticed that further increase in PET fibre content in the
blends, generally resulted in further increase in sound absorption coefficient of the fabrics
under study.
Initially, the depth of needle penetration was varied in a step of 2 mm, which implied that a
difference of only 4 mm was set between the minimum and maximum depths of needle
penetration of 6mm and 10mm as shown in Tables 4.1 (a) and 4.1 (b) above. This resulted
in modest variations in the thickness of the fabrics amongst the fabrics produced.
Therefore, a larger variation of 3mm in depth of needle penetration was then tried, and set
at 4mm, 7mm and 10mm, with the difference between the minimum and maximum being
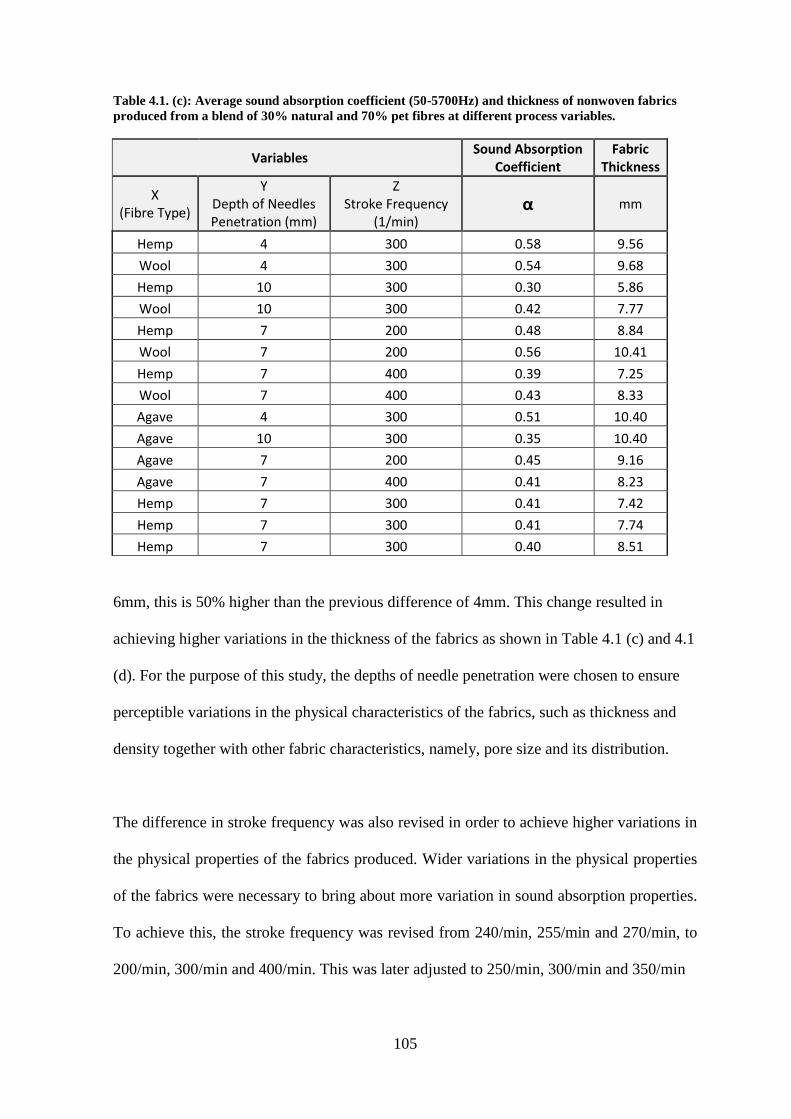
105
Table 4.1. (c): Average sound absorption coefficient (50-5700Hz) and thickness of nonwoven fabrics
produced from a blend of 30% natural and 70% pet fibres at different process variables.
Variables Sound Absorption
Coefficient Fabric
Thickness
X (Fibre Type)
Y Depth of Needles Penetration (mm)
Z Stroke Frequency
(1/min) α mm
Hemp 4 300 0.58 9.56
Wool 4 300 0.54 9.68
Hemp 10 300 0.30 5.86
Wool 10 300 0.42 7.77
Hemp 7 200 0.48 8.84
Wool 7 200 0.56 10.41
Hemp 7 400 0.39 7.25
Wool 7 400 0.43 8.33
Agave 4 300 0.51 10.40
Agave 10 300 0.35 10.40
Agave 7 200 0.45 9.16
Agave 7 400 0.41 8.23
Hemp 7 300 0.41 7.42
Hemp 7 300 0.41 7.74
Hemp 7 300 0.40 8.51
6mm, this is 50% higher than the previous difference of 4mm. This change resulted in
achieving higher variations in the thickness of the fabrics as shown in Table 4.1 (c) and 4.1
(d). For the purpose of this study, the depths of needle penetration were chosen to ensure
perceptible variations in the physical characteristics of the fabrics, such as thickness and
density together with other fabric characteristics, namely, pore size and its distribution.
The difference in stroke frequency was also revised in order to achieve higher variations in
the physical properties of the fabrics produced. Wider variations in the physical properties
of the fabrics were necessary to bring about more variation in sound absorption properties.
To achieve this, the stroke frequency was revised from 240/min, 255/min and 270/min, to
200/min, 300/min and 400/min. This was later adjusted to 250/min, 300/min and 350/min
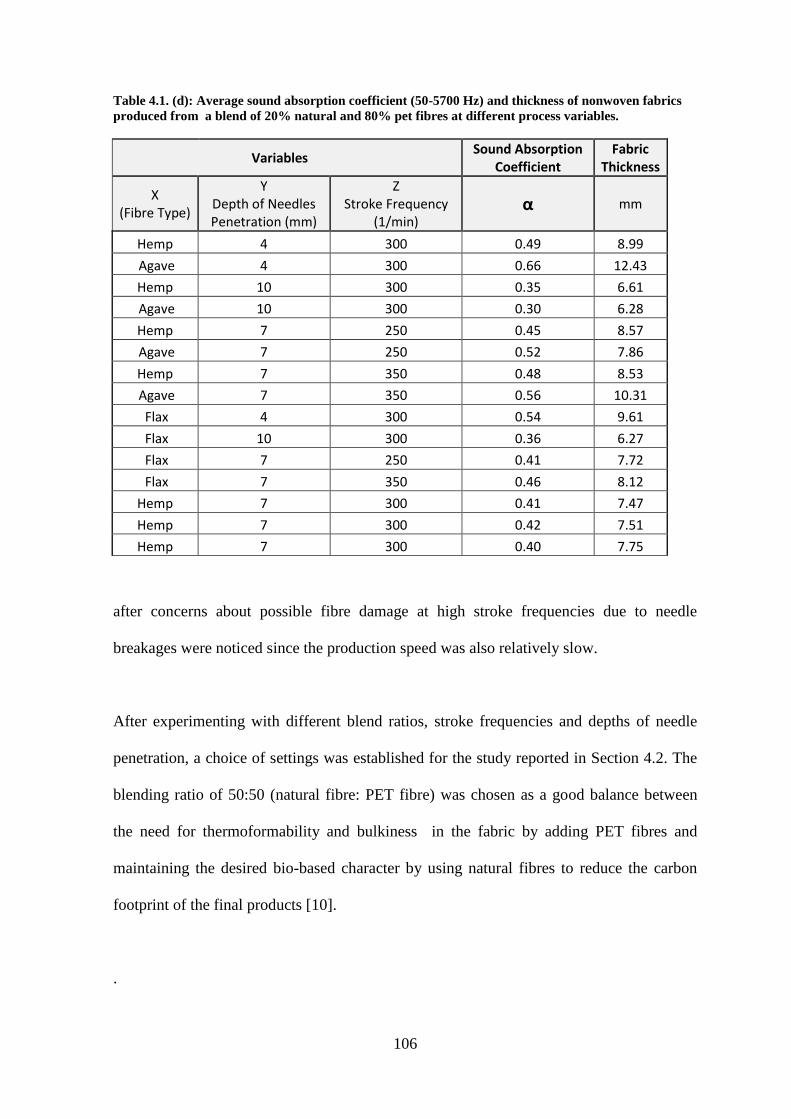
106
Table 4.1. (d): Average sound absorption coefficient (50-5700 Hz) and thickness of nonwoven fabrics
produced from a blend of 20% natural and 80% pet fibres at different process variables.
Variables Sound Absorption
Coefficient Fabric
Thickness
X (Fibre Type)
Y Depth of Needles Penetration (mm)
Z Stroke Frequency
(1/min) α mm
Hemp 4 300 0.49 8.99
Agave 4 300 0.66 12.43
Hemp 10 300 0.35 6.61
Agave 10 300 0.30 6.28
Hemp 7 250 0.45 8.57
Agave 7 250 0.52 7.86
Hemp 7 350 0.48 8.53
Agave 7 350 0.56 10.31
Flax 4 300 0.54 9.61
Flax 10 300 0.36 6.27
Flax 7 250 0.41 7.72
Flax 7 350 0.46 8.12
Hemp 7 300 0.41 7.47
Hemp 7 300 0.42 7.51
Hemp 7 300 0.40 7.75
after concerns about possible fibre damage at high stroke frequencies due to needle
breakages were noticed since the production speed was also relatively slow.
After experimenting with different blend ratios, stroke frequencies and depths of needle
penetration, a choice of settings was established for the study reported in Section 4.2. The
blending ratio of 50:50 (natural fibre: PET fibre) was chosen as a good balance between
the need for thermoformability and bulkiness in the fabric by adding PET fibres and
maintaining the desired bio-based character by using natural fibres to reduce the carbon
footprint of the final products [10].
.
107
4.2. Optimization of Needlepunching Process
Parameters For Sound Absorption Applications
After the nonwoven fabrics were produced, the area weight was measured to ensure that
this chosen independent variable was held as uniform (minimum variation) as possible
among the samples produced for this study. Therefore, it was necessary to eliminate any
samples with unacceptable variations (outside the 900-1100 g/m2) in nominal area weight
of 1000 g/m2
and those samples were reproduced. The area weight is an important
parameter as it affects density and thickness of the needlepunched nonwoven fabrics.
Thickness is a major factor which influences sound absorption properties of the nonwoven
fabrics, particularly at low sound frequencies [75, 19]. Density of the fabrics plays an
indirect role in determining the tortuosity and air voids (porosity) within the material,
which influences sound absorption coefficient as discussed in Section 2.6.
4.2.1. Effect of Thickness, Fibre Type, Depth of Needle
Penetration and Stroke Frequency on Sound Absorption
Table 4.2.1 shows the coded and actual values of the parameters used to produce each
fabric together with values of average fabric thickness and average sound absorption
coefficients measured in the frequency range of 50-5700 Hz. These values of thickness and
sound absorption coefficients were compared to corresponding values of a commercial
needle-punched fabric produced by Feltex Trim.
Since the area weight of 1000 g/m2
was maintained as uniform as practically possible for
all the samples in this study, other production parameters were varied according to the
experimental design explained in Section 3.2. It followed that the thickness of the
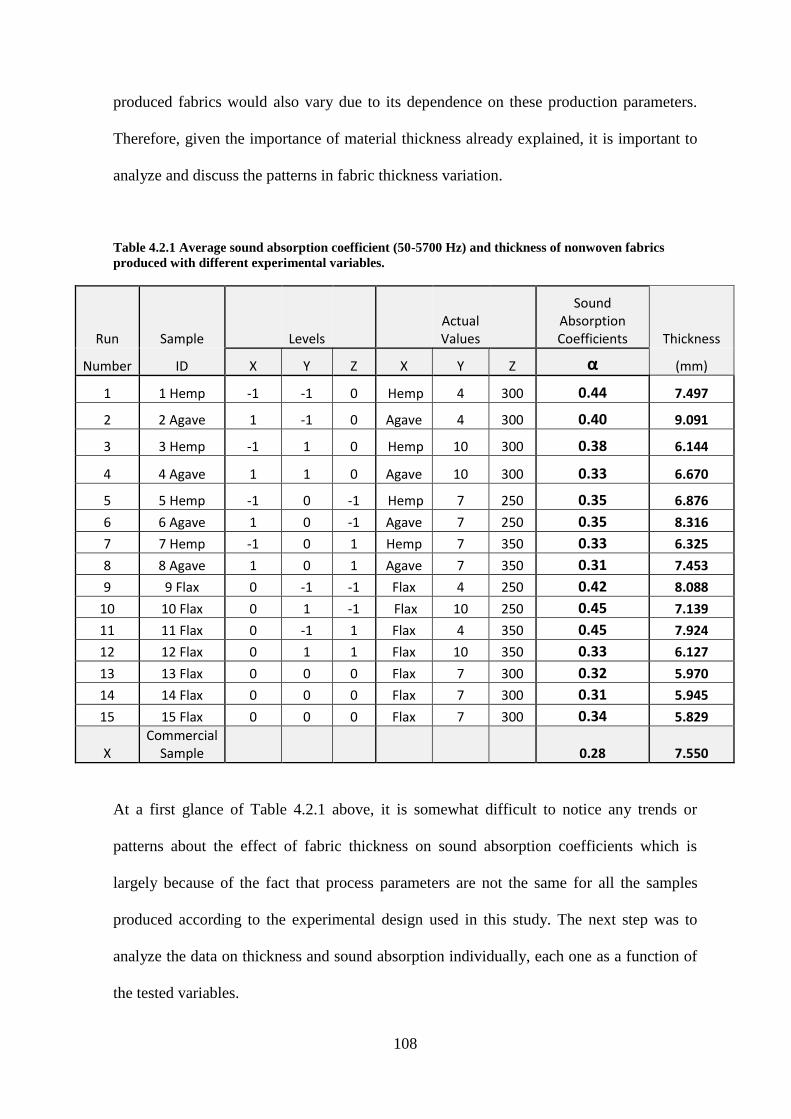
108
produced fabrics would also vary due to its dependence on these production parameters.
Therefore, given the importance of material thickness already explained, it is important to
analyze and discuss the patterns in fabric thickness variation.
Table 4.2.1 Average sound absorption coefficient (50-5700 Hz) and thickness of nonwoven fabrics
produced with different experimental variables.
Run Sample Levels Actual Values
Sound Absorption Coefficients Thickness
Number ID X Y Z X Y Z α (mm)
1 1 Hemp -1 -1 0 Hemp 4 300 0.44 7.497
2 2 Agave 1 -1 0 Agave 4 300 0.40 9.091
3 3 Hemp -1 1 0 Hemp 10 300 0.38 6.144
4 4 Agave 1 1 0 Agave 10 300 0.33 6.670
5 5 Hemp -1 0 -1 Hemp 7 250 0.35 6.876
6 6 Agave 1 0 -1 Agave 7 250 0.35 8.316
7 7 Hemp -1 0 1 Hemp 7 350 0.33 6.325
8 8 Agave 1 0 1 Agave 7 350 0.31 7.453
9 9 Flax 0 -1 -1 Flax 4 250 0.42 8.088
10 10 Flax 0 1 -1 Flax 10 250 0.45 7.139
11 11 Flax 0 -1 1 Flax 4 350 0.45 7.924
12 12 Flax 0 1 1 Flax 10 350 0.33 6.127
13 13 Flax 0 0 0 Flax 7 300 0.32 5.970
14 14 Flax 0 0 0 Flax 7 300 0.31 5.945
15 15 Flax 0 0 0 Flax 7 300 0.34 5.829
X Commercial
Sample
0.28 7.550
At a first glance of Table 4.2.1 above, it is somewhat difficult to notice any trends or
patterns about the effect of fabric thickness on sound absorption coefficients which is
largely because of the fact that process parameters are not the same for all the samples
produced according to the experimental design used in this study. The next step was to
analyze the data on thickness and sound absorption individually, each one as a function of
the tested variables.
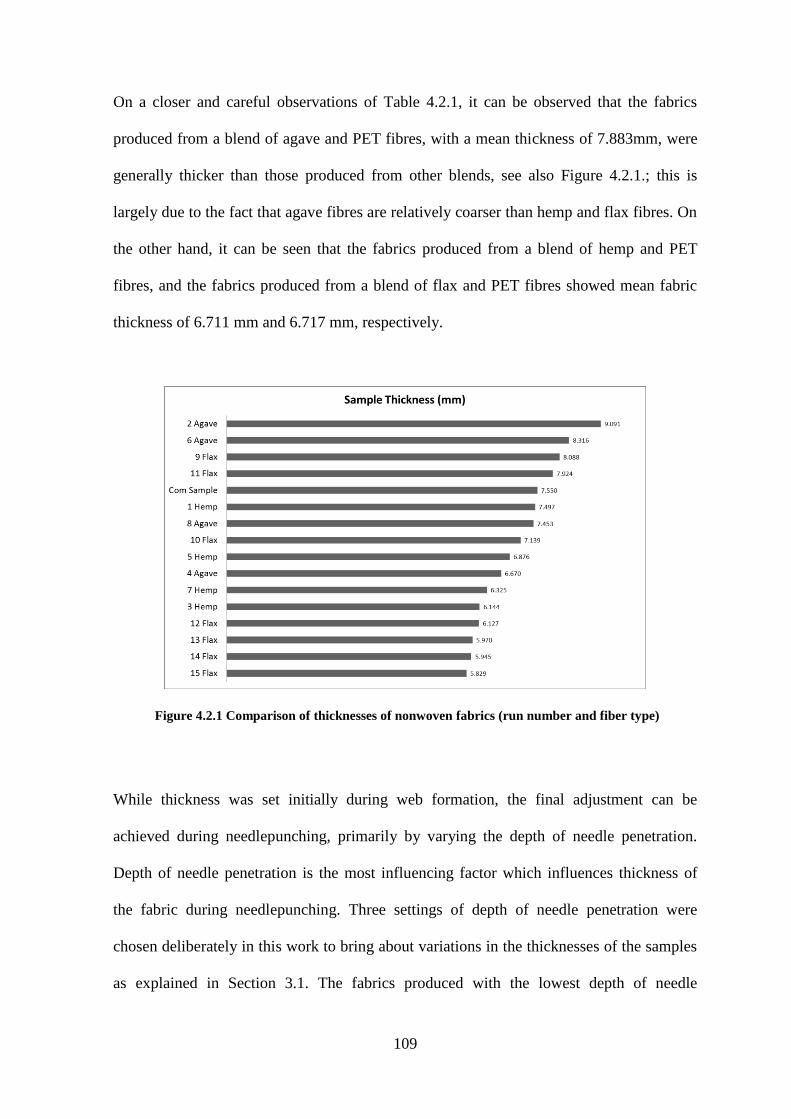
109
On a closer and careful observations of Table 4.2.1, it can be observed that the fabrics
produced from a blend of agave and PET fibres, with a mean thickness of 7.883mm, were
generally thicker than those produced from other blends, see also Figure 4.2.1.; this is
largely due to the fact that agave fibres are relatively coarser than hemp and flax fibres. On
the other hand, it can be seen that the fabrics produced from a blend of hemp and PET
fibres, and the fabrics produced from a blend of flax and PET fibres showed mean fabric
thickness of 6.711 mm and 6.717 mm, respectively.
Figure 4.2.1 Comparison of thicknesses of nonwoven fabrics (run number and fiber type)
While thickness was set initially during web formation, the final adjustment can be
achieved during needlepunching, primarily by varying the depth of needle penetration.
Depth of needle penetration is the most influencing factor which influences thickness of
the fabric during needlepunching. Three settings of depth of needle penetration were
chosen deliberately in this work to bring about variations in the thicknesses of the samples
as explained in Section 3.1. The fabrics produced with the lowest depth of needle
110
penetration are generally expected to be thicker than those produced with the highest depth
of needle penetration. From Table 4.2.1 and Figure 4.2.1 it is observed that the fabrics
produced from agave and flax fibres with depth of needle penetration of 4mm tended to be
in the majority of the top third of the thickest fabrics.
Stroke frequency is not generally a major factor influencing the thickness of the
needlepunched nonwoven fabrics. However, since the stroke frequency, the number of
needles per width (cm) and production speed, together determine “punch density”, stroke
frequency may indirectly influence the thickness of the fabrics [8]. A careful observation
of Table 4.2.1 shows that when comparing the fabrics produced from the same fibres and
same depth of needle penetration but different stroke frequencies, those produced at a
lower stroke frequency were generally thicker. As shown in Table 4.2.1 this can be
observed by comparing the samples 5Hemp vs 7Hemp both produced at 7mm depth of
needle penetration with 250/min vs 350/min stroke frequency, 6Agave vs 8Agave
produced at 7mm depth of needle penetration and 250/min vs 350/min stroke frequency
and 10Flax vs 12Flax produced at 10mm depth of needle penetration and 250/min vs
350/min stroke frequency. The fabrics produced at 250/min stroke frequency were
generally thicker than those produced at 350/min stroke frequency. This can be attributed
to the fact that at high stroke frequency the fabric experiences higher number of needle
punching strokes per unit area in given time and thus achieve more compact fabric [116].
It may be concluded that all the three parameters studied here influence the fabric
thickness, so, they also influence sound absorption coefficients of the fabrics because
sound absorption is directly related to the fabric thickness. As explained in Section 2.6.2,
fabric thickness is a main influencing factor particularly at low sound frequencies in
111
comparison to high sound frequencies [66]. This is due to the fact that sound absorption of
a porous material is effective when the material thickness is about one tenth of the
wavelength of the incident sound wave [64].
This relationship between thickness and sound absorption implies that, in general, high
sound absorption coefficient is achieved when the fabric thickness is higher. However, as
observed from Figure 4.2.2, this was not the case for all the fabrics which implies that
other fabric characteristics may be affecting sound absorption properties. It should also be
quickly pointed out that the parameters studied here do not determine or affect fabric
thickness alone, there are other parameters which affect thickness that were not part of this
study.
As shown in Figure 4.2.2, all experimental fabrics achieved relatively better sound
absorption coefficient than that of the commercial sample (α = 0.28). The commercial
reference sample is a needlepunched nonwoven fabric which consists of a mixture of
polyester (PET) and recycled shoddy fibres with an area weight of about 1000 g/m2 and a
thickness of about 7.55mm; which is used in automotive carpets for acoustic insulation by
the majority of South African automotive manufacturers.
In Figure 4.2.2, the comparison of sound absorption coefficients by sample type shows that
it is difficult to conclusively explain any general trend or pattern relating to any one of the
parameters studied here.
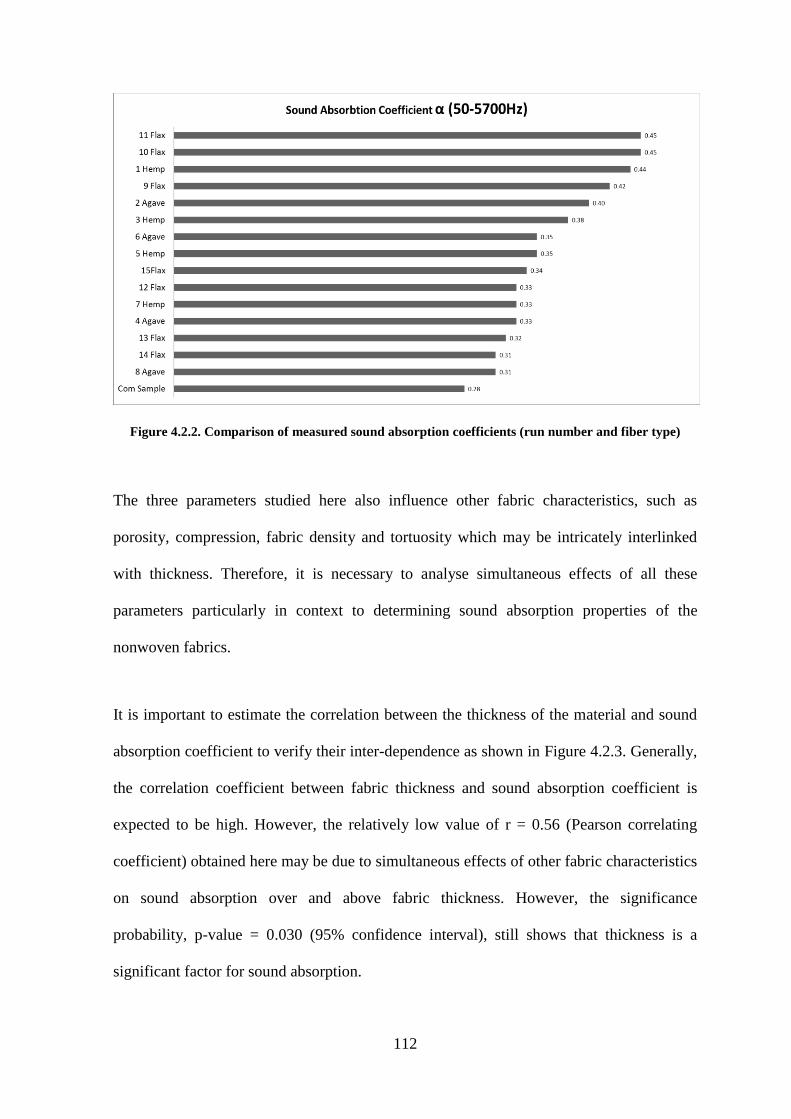
112
Figure 4.2.2. Comparison of measured sound absorption coefficients (run number and fiber type)
The three parameters studied here also influence other fabric characteristics, such as
porosity, compression, fabric density and tortuosity which may be intricately interlinked
with thickness. Therefore, it is necessary to analyse simultaneous effects of all these
parameters particularly in context to determining sound absorption properties of the
nonwoven fabrics.
It is important to estimate the correlation between the thickness of the material and sound
absorption coefficient to verify their inter-dependence as shown in Figure 4.2.3. Generally,
the correlation coefficient between fabric thickness and sound absorption coefficient is
expected to be high. However, the relatively low value of r = 0.56 (Pearson correlating
coefficient) obtained here may be due to simultaneous effects of other fabric characteristics
on sound absorption over and above fabric thickness. However, the significance
probability, p-value = 0.030 (95% confidence interval), still shows that thickness is a
significant factor for sound absorption.
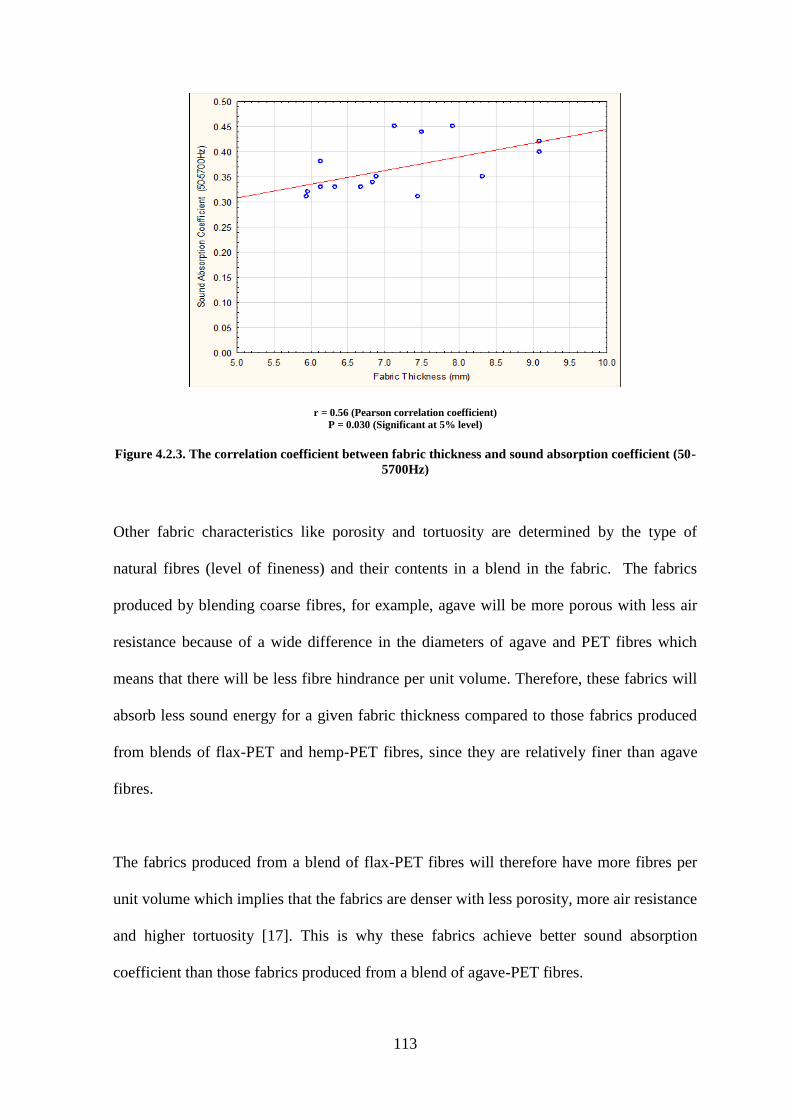
113
r = 0.56 (Pearson correlation coefficient)
P = 0.030 (Significant at 5% level)
Figure 4.2.3. The correlation coefficient between fabric thickness and sound absorption coefficient (50-
5700Hz)
Other fabric characteristics like porosity and tortuosity are determined by the type of
natural fibres (level of fineness) and their contents in a blend in the fabric. The fabrics
produced by blending coarse fibres, for example, agave will be more porous with less air
resistance because of a wide difference in the diameters of agave and PET fibres which
means that there will be less fibre hindrance per unit volume. Therefore, these fabrics will
absorb less sound energy for a given fabric thickness compared to those fabrics produced
from blends of flax-PET and hemp-PET fibres, since they are relatively finer than agave
fibres.
The fabrics produced from a blend of flax-PET fibres will therefore have more fibres per
unit volume which implies that the fabrics are denser with less porosity, more air resistance
and higher tortuosity [17]. This is why these fabrics achieve better sound absorption
coefficient than those fabrics produced from a blend of agave-PET fibres.
114
Fabric density and fabric compression are directly linked to the depth of needle
penetration, stroke frequency and fabric area weight. The number of fibres per unit volume
increases when the apparent fabric density increases; therefore, energy loss (of the sound
wave) increases due to the increase in surface friction, which results in a better value of the
sound absorption coefficient.
The compression of the nonwoven fabrics also results in variation in other fabric properties
such as increased tortuosity and air flow resistivity and decreased porosity. Despite these
changes in physical parameters of the compressed material, the reason for a drop in sound
absorption value is mainly attributed to the decrease in thickness of the fibrous medium
[68].
Now, given that the area weight was not varied in this work, variation in fabric thickness
also resulted in variation in fabric density, i.e. the denser fabrics (more fibres per unit
volume) were also comparatively thinner than the other fabrics. Therefore, comparing
sound absorption as a function of fabric density and compression individually was difficult
due to the fact that thickness of the fabric is a major factor in determining sound absorption
properties.
4.2.1.1. The Synergistic Effect of the Tested Parameters on Sound
Absorption Coefficient –The Rationale for Optimization
A conclusion that can be drawn from the analysis in Section 4.2.1 above is that all the
fabric characteristics influencing sound absorption properties of the needlepunched fabrics
discussed in Section 2.6 are dependent upon more than one parameter, be it process
parameters or fibre parameters. Therefore, it is apparent that some of the effects of varying
115
natural fibre type (which is effectively a variation in physical dimension of the fibres and
surface area) are the same as the effects of varying depth of needle penetration and stroke
frequency. In other words, the effects of varying these parameters are interlinked for all the
parameters.
Therefore, it can be generally argued that the production parameters interactively influence
the properties and functionality of the needlepunched nonwoven fabrics. This is also the
case with fabric characteristics, such as thickness and density, which influence the sound
absorption coefficient of the fabric. It is, therefore, important to analyse individual and
interactive effects of these parameters on sound absorption coefficients.
The interactive effects of the process parameters may be analyzed by a systematic
optimization study. Therefore, by multiple regression analysis, coefficients of parameters
(fiber type, depth of needle penetration and stroke frequency) and significance probability
(P-value) were calculated, as shown in Table 4.2.2. The statistical significance of
probability, P-value at 95% confidence interval was determined; if it is less than 0.05 then
the effect of the parameter on sound absorption is significant and vice versa.
From Table 4.2.2, it is observed that all the selected parameters showed significant effect
on measured sound absorption since all the P-values were less than 0.05. As evident from
the table, the depth of needle penetration played the most dominant role among all the
selected parameters. This was expected as the depth of needle penetration is the main
determinant of fabric thickness and it has already been explained that the fabric thickness
has the most dominant effect on sound absorption ability of a porous material [12].
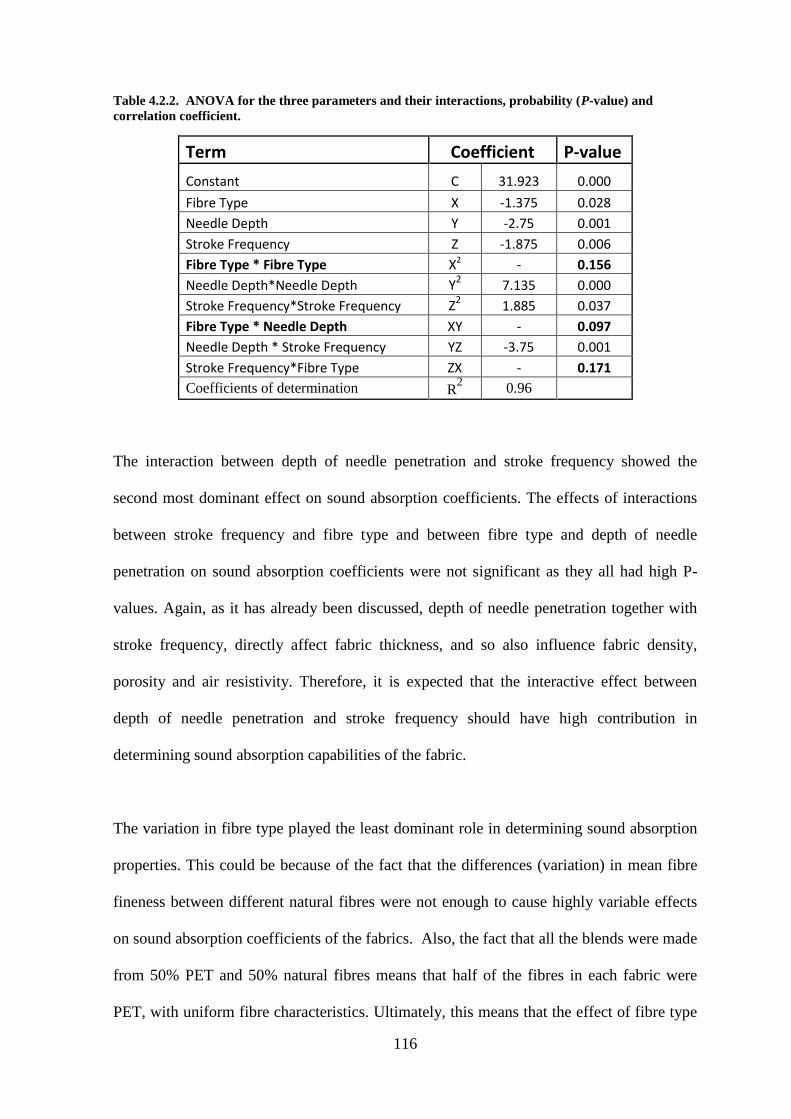
116
Table 4.2.2. ANOVA for the three parameters and their interactions, probability (P-value) and
correlation coefficient.
Term Coefficient P-value
Constant C 31.923 0.000
Fibre Type X -1.375 0.028
Needle Depth Y -2.75 0.001
Stroke Frequency Z -1.875 0.006
Fibre Type * Fibre Type X2 - 0.156
Needle Depth*Needle Depth Y2 7.135 0.000
Stroke Frequency*Stroke Frequency Z2 1.885 0.037
Fibre Type * Needle Depth XY - 0.097
Needle Depth * Stroke Frequency YZ -3.75 0.001
Stroke Frequency*Fibre Type ZX - 0.171
Coefficients of determination R2 0.96
The interaction between depth of needle penetration and stroke frequency showed the
second most dominant effect on sound absorption coefficients. The effects of interactions
between stroke frequency and fibre type and between fibre type and depth of needle
penetration on sound absorption coefficients were not significant as they all had high P-
values. Again, as it has already been discussed, depth of needle penetration together with
stroke frequency, directly affect fabric thickness, and so also influence fabric density,
porosity and air resistivity. Therefore, it is expected that the interactive effect between
depth of needle penetration and stroke frequency should have high contribution in
determining sound absorption capabilities of the fabric.
The variation in fibre type played the least dominant role in determining sound absorption
properties. This could be because of the fact that the differences (variation) in mean fibre
fineness between different natural fibres were not enough to cause highly variable effects
on sound absorption coefficients of the fabrics. Also, the fact that all the blends were made
from 50% PET and 50% natural fibres means that half of the fibres in each fabric were
PET, with uniform fibre characteristics. Ultimately, this means that the effect of fibre type
117
(fineness) on sound absorption will be minimized. For evaluating a complete picture on the
role of different parameters and their interaction effects on sound absorption coefficients, a
response surface methodology was employed.
The response surface equation for sound absorption is given by:
YZCZCYCZCYCXCC 23
2
33
2
223210 (32)
Where α is the coefficient of sound absorption and C is the coefficient of a particular
variable, after substituting relevant values, we obtain the following equation with
coefficient of determination, R2 , value of 0.96.
α = 31.923 – 1.375X - 2.75Y – 1.875Z +7.135Y2+ 1.885Z
2 - 3.75YZ (33)
4.2.2. Effect of Selected Parameters on Sound Absorption
Coefficients and Process Optimization
The response surfaces of sound absorption coefficients (50-5700Hz) as a function of
different levels of selected parameters and optimized regions are discussed in this section.
The different cases have been evaluated based on statistical significance and dominance of
the selected parameters in achieving maximum possible sound absorption coefficients as
shown above in Table 4.2.2.
118
4.2.2.1. Effect of Depth of Needle Penetration’s and Stroke Frequency on
Sound Absorption coefficients for Different Fiber Types
From Table 4.2.2, it is observed that depth of needle penetration showed the most
dominant effect followed by the interaction between depth of needle penetration and stroke
frequency. Figure 4.2.4 shows the response surface plots of interaction effect between
different levels of depth of needle penetration and stroke frequency for different fibre types
(hemp, flax and agave) on sound absorption coefficients.
For the fabrics produced from a blend of 50% hemp and 50% PET fibres, an interaction
effect between depth of needle penetration and stroke frequency on sound absorption
coefficient at different levels is shown in Figure 4.2.4 (a). The values of percentage sound
absorption coefficient at -1 level (4mm), 0 levels (7mm) and +1 level (10mm) of depth of
needle penetration were 41%, 36% and 42%, respectively. It can be observed that with the
increase in depth of needle penetration from -1 level (4mm) to 0 level (7mm), the
percentage sound absorption coefficient decreased by 12%, however, it increased by 17%
when depth of needle penetration is increased from 0 level (7mm) to +1 level (10mm).
This trend remains the same for the fabrics produced from the other two natural fibres, i.e.
flax and agave as shown in Figures 3b and 3c respectively. For the fabrics produced from
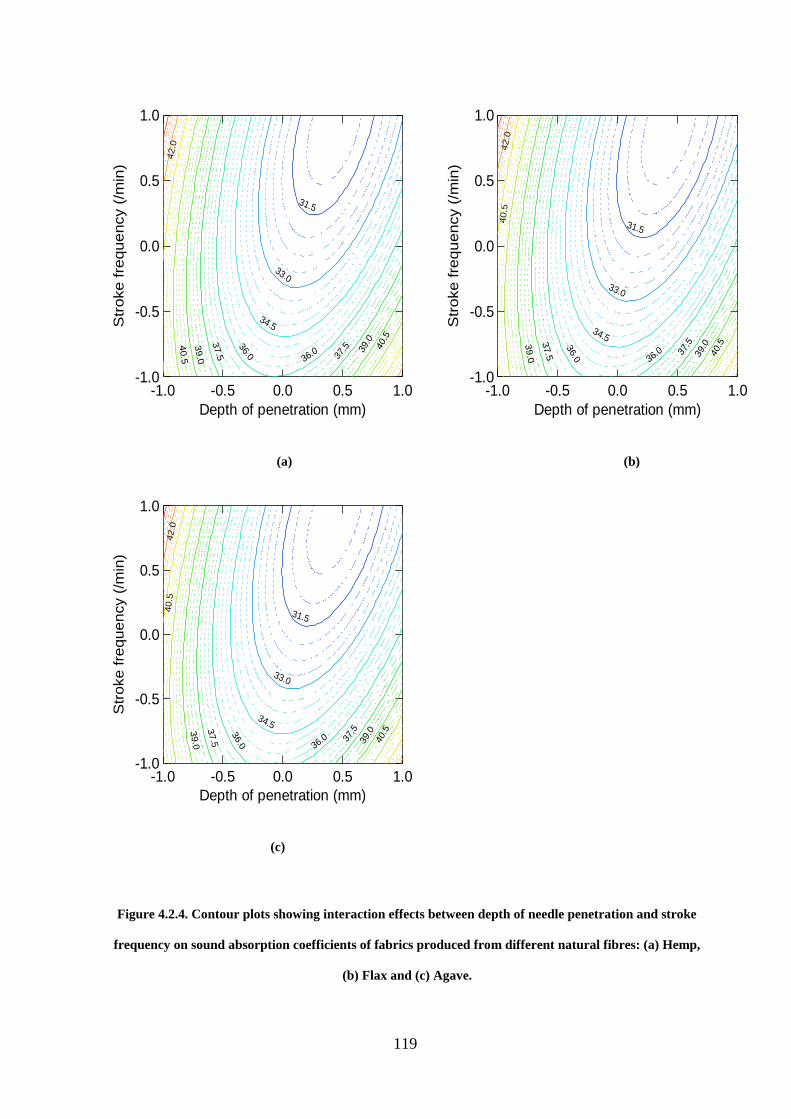
119
-1.0 -0.5 0.0 0.5 1.0
Depth of penetration (mm)
-1.0
-0.5
0.0
0.5
1.0S
tro
ke
fre
qu
en
cy (
/min
)
31.5
33.0
34.5
36.0
36.0
37.5 37
.5
39.0
39.04
0.5
40.5
42.0
(a)
-1.0 -0.5 0.0 0.5 1.0
Depth of penetration (mm)
-1.0
-0.5
0.0
0.5
1.0
Str
oke
fre
qu
en
cy (
/min
)
31.5
33.0
34.5
36.0 36.0
37.5 37
.539.0 3
9.0
40.5
40.5
42.0
(c)
-1.0 -0.5 0.0 0.5 1.0
Depth of penetration (mm)
-1.0
-0.5
0.0
0.5
1.0
Str
oke
fre
qu
en
cy (
/min
)
31.5
33.0
34.5
36.0 36.0
37.5 37
.539.0 3
9.0
40.5
40.5
42.0
(b)
Figure 4.2.4. Contour plots showing interaction effects between depth of needle penetration and stroke
frequency on sound absorption coefficients of fabrics produced from different natural fibres: (a) Hemp,
(b) Flax and (c) Agave.
120
a blend of flax and PET fibres, the values of percentage sound absorption coefficients at -1
level (4mm), 0 level (7mm) and +1 level(10mm) of depth of needle penetration were
41.5%, 35.5% and 43%, respectively. For the fabric produced from agave and PET fibres,
the values of percentage sound absorption coefficients at -1 level (4mm), 0 level (7mm) and
+1 level (10mm) of depth of needle penetration were 42%, 35.5% and 45%, respectively.
Sound absorption coefficients decreased when the depth of needle penetration increased
from 4mm to 7mm but it increased when the depth of needle penetration was increased
from 7mm to 10mm.
This could be attributed to fabric thickness playing a major role between -1 level (4mm)
and 0 level (7mm) of depth of needle penetration, i.e. with the increase in depth of needle
penetration the fabric thickness decreased which led to the decrease in sound absorption
coefficient [10,11]. On the other hand, between 0 level (7mm) and +1 level (10mm) of
depth of needle penetration, when the density of the fabric is increased due to the decrease
in thickness (same area weight), the sound absorption coefficient was increased, which is
consistent with the results reported by Koizumi et al [54].
Furthermore, as the fabric structure becomes more compact, the average pore size decreases
but with more pores in any given unit volume, therefore, hindrances to the passage of sound
also increase with the increase in frictional resistance. In other words, the fabric structure
becomes more tortuous; thereby sound absorption coefficients also increase due to energy
losses resulted from conversion of sound energy to heat energy [89].
The values of percentage sound absorption at -1 level (250/min), 0 level (300/min) and +1
level (350/min) of stroke frequency were 41%, 41% and 43.5%, respectively for hemp
121
fibre, as shown in Figure 4.2.4 (a). With the increase in stroke frequency from -1 level
(250/min) to 0 level (300/min), no change in sound absorption coefficients was observed
and when stroke frequency increased from 0 level (300/min) to +1 level (350/min) only a
modest increase of 6% was observed.
The trend is similar for the other two fibres, where between -1 level (250/min) and 0 level
(300/min) of stroke frequency, change in sound absorption coefficient was marginal and
then a modest increase between 0 level (300/min) and +1 level (350/min) of stroke
frequency (or a slight decrease of 3.5% and 5% for flax and agave fibres, respectively).
This general trend is similar to that observed above in the case of depth of needle
penetration. This also confirms that the effects of depth of needle penetration and stroke
frequency are interlinked in determining the resultant fabric structure as evident from the
P-values of 0.001 and 0.006, respectively shown in Table 4.2.2 above, where the effect of
interaction between depth of needle penetration and stroke frequency on sound absorption
coefficients was statistically significant. Furthermore, the levels of stroke frequency
selected in the present set of experiment may not be high enough to cause significant
variations in sound absorption coefficient.
Maximum percentage sound absorption coefficient of 45% (0.45) was achieved for fabrics
produced from flax fibres at -1 level (4mm) of depth of needle penetration and +1 level
(350/min) of stroke frequency which corresponds to experimental trial run 11, see Table
4.2.1.
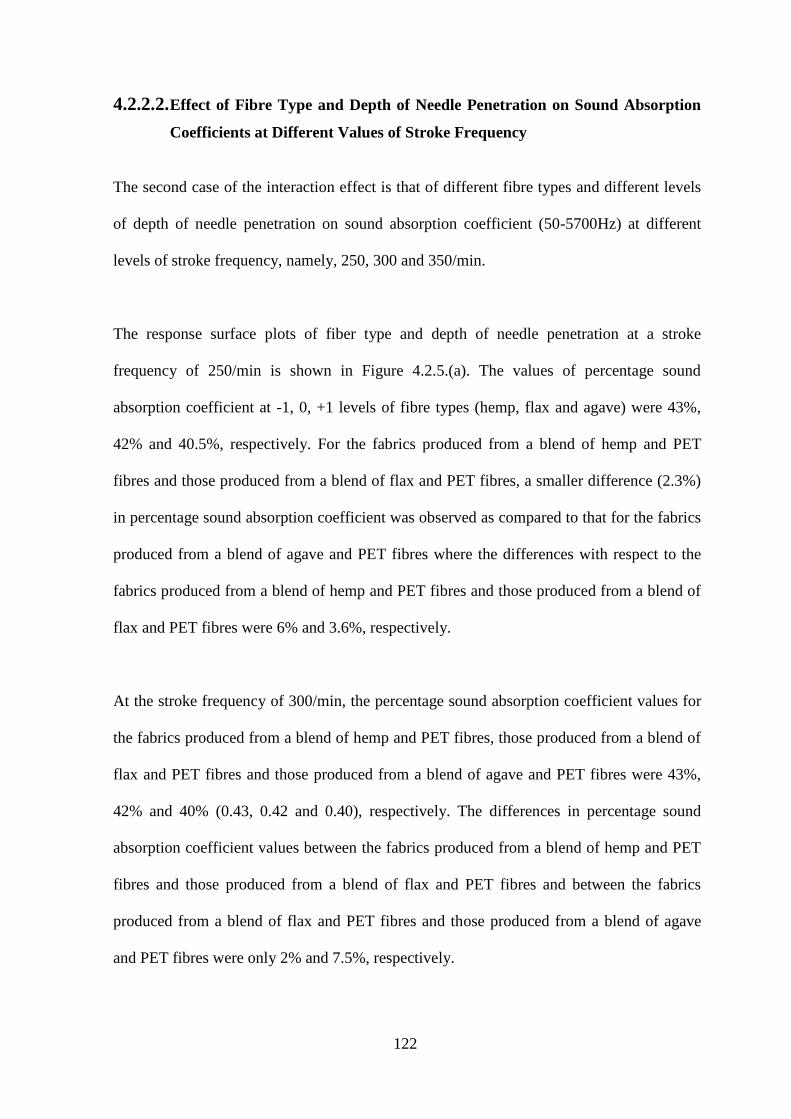
122
4.2.2.2. Effect of Fibre Type and Depth of Needle Penetration on Sound Absorption
Coefficients at Different Values of Stroke Frequency
The second case of the interaction effect is that of different fibre types and different levels
of depth of needle penetration on sound absorption coefficient (50-5700Hz) at different
levels of stroke frequency, namely, 250, 300 and 350/min.
The response surface plots of fiber type and depth of needle penetration at a stroke
frequency of 250/min is shown in Figure 4.2.5.(a). The values of percentage sound
absorption coefficient at -1, 0, +1 levels of fibre types (hemp, flax and agave) were 43%,
42% and 40.5%, respectively. For the fabrics produced from a blend of hemp and PET
fibres and those produced from a blend of flax and PET fibres, a smaller difference (2.3%)
in percentage sound absorption coefficient was observed as compared to that for the fabrics
produced from a blend of agave and PET fibres where the differences with respect to the
fabrics produced from a blend of hemp and PET fibres and those produced from a blend of
flax and PET fibres were 6% and 3.6%, respectively.
At the stroke frequency of 300/min, the percentage sound absorption coefficient values for
the fabrics produced from a blend of hemp and PET fibres, those produced from a blend of
flax and PET fibres and those produced from a blend of agave and PET fibres were 43%,
42% and 40% (0.43, 0.42 and 0.40), respectively. The differences in percentage sound
absorption coefficient values between the fabrics produced from a blend of hemp and PET
fibres and those produced from a blend of flax and PET fibres and between the fabrics
produced from a blend of flax and PET fibres and those produced from a blend of agave
and PET fibres were only 2% and 7.5%, respectively.
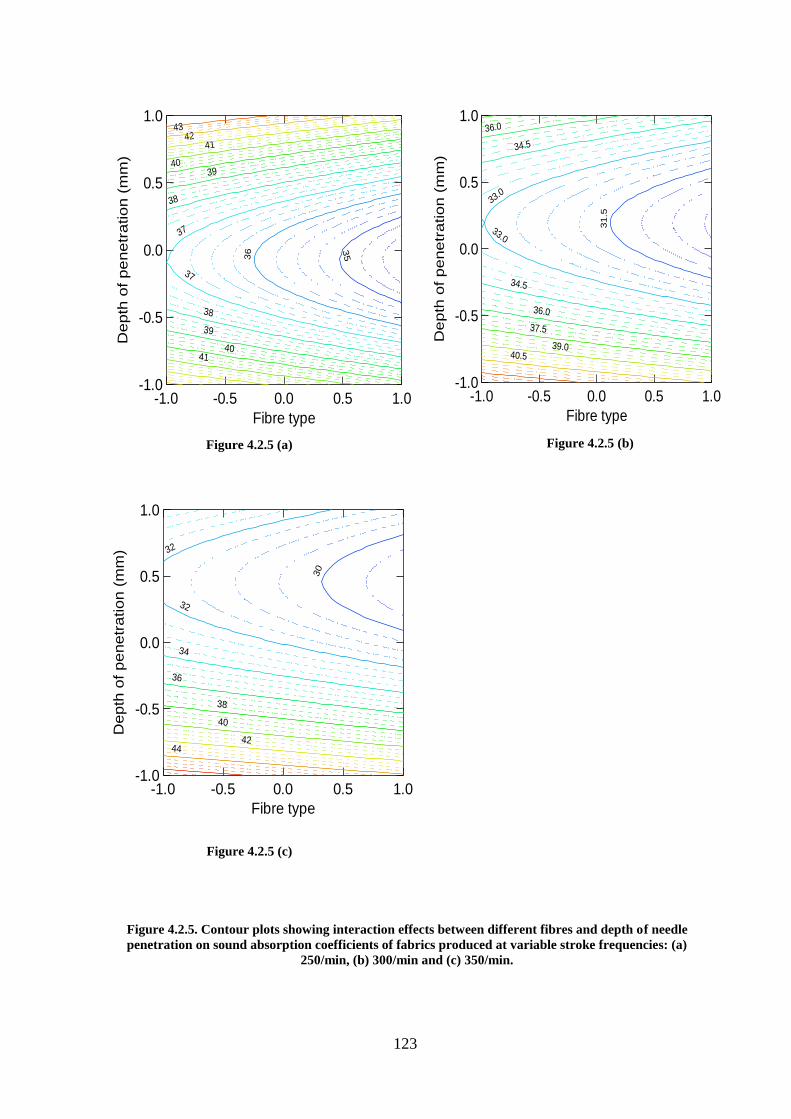
123
-1.0 -0.5 0.0 0.5 1.0
Fibre type
-1.0
-0.5
0.0
0.5
1.0D
epth
of p
enetr
ation
(m
m)
353
6
37
37
38
38
39
39
40
40
41
4142
43
Figure 4.2.5 (a)
-1.0 -0.5 0.0 0.5 1.0
Fibre type
-1.0
-0.5
0.0
0.5
1.0
De
pth
of
pe
ne
tra
tio
n (
mm
)
30
32
32
34
36
38
40
4244
Figure 4.2.5 (c)
-1.0 -0.5 0.0 0.5 1.0
Fibre type
-1.0
-0.5
0.0
0.5
1.0
De
pth
of
pe
ne
tra
tio
n (
mm
)
31.5
33.0
33.0
34.5
34.5
36.0
36.0
37.5
39.040.5
Figure 4.2.5 (b)
Figure 4.2.5. Contour plots showing interaction effects between different fibres and depth of needle
penetration on sound absorption coefficients of fabrics produced at variable stroke frequencies: (a)
250/min, (b) 300/min and (c) 350/min.
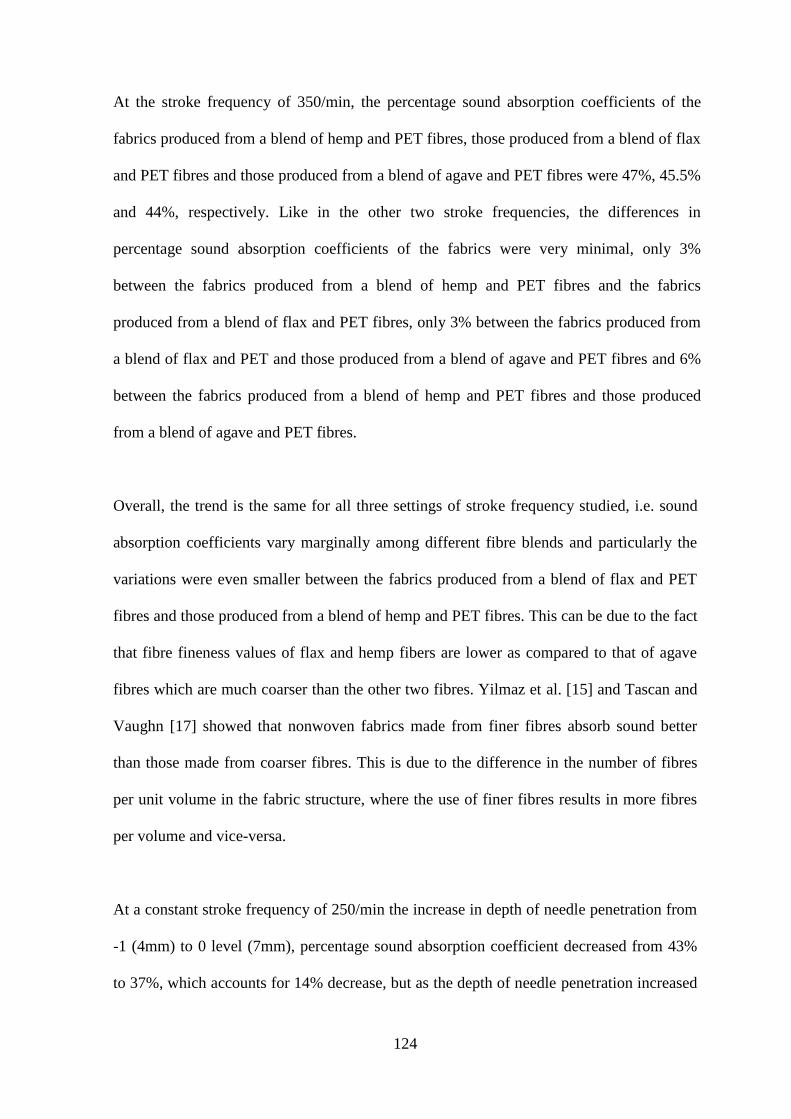
124
At the stroke frequency of 350/min, the percentage sound absorption coefficients of the
fabrics produced from a blend of hemp and PET fibres, those produced from a blend of flax
and PET fibres and those produced from a blend of agave and PET fibres were 47%, 45.5%
and 44%, respectively. Like in the other two stroke frequencies, the differences in
percentage sound absorption coefficients of the fabrics were very minimal, only 3%
between the fabrics produced from a blend of hemp and PET fibres and the fabrics
produced from a blend of flax and PET fibres, only 3% between the fabrics produced from
a blend of flax and PET and those produced from a blend of agave and PET fibres and 6%
between the fabrics produced from a blend of hemp and PET fibres and those produced
from a blend of agave and PET fibres.
Overall, the trend is the same for all three settings of stroke frequency studied, i.e. sound
absorption coefficients vary marginally among different fibre blends and particularly the
variations were even smaller between the fabrics produced from a blend of flax and PET
fibres and those produced from a blend of hemp and PET fibres. This can be due to the fact
that fibre fineness values of flax and hemp fibers are lower as compared to that of agave
fibres which are much coarser than the other two fibres. Yilmaz et al. [15] and Tascan and
Vaughn [17] showed that nonwoven fabrics made from finer fibres absorb sound better
than those made from coarser fibres. This is due to the difference in the number of fibres
per unit volume in the fabric structure, where the use of finer fibres results in more fibres
per volume and vice-versa.
At a constant stroke frequency of 250/min the increase in depth of needle penetration from
-1 (4mm) to 0 level (7mm), percentage sound absorption coefficient decreased from 43%
to 37%, which accounts for 14% decrease, but as the depth of needle penetration increased
125
from 0 level (7mm) to +1 level (10mm), percentage sound absorption coefficient increased
again from 37% to 45%, which accounts for 22% increase, this trend is similar to that
observed in Section 4.2.2.1 above.
At a stroke frequency of 300/min, with the increase in depth of needle penetration from -1
level (4mm) to 0 level (7mm), the percentage sound absorption coefficients decreased from
45.5% to 33.5% which is about 26% decrease. When the depth of needle penetration was
further increased from 0 level (7mm) to +1 level (10mm), the percentage sound absorption
coefficients increased from 33.5% to 37.5%, which is about a 12% increase. This trend is
the same as observed in the case of 250/min stroke frequency and discussed in Section
4.2.2.1 above.
In the last case, at a stroke frequency of 350/min, when the depth of needle penetration was
increased from -1 level (4mm) to 0 level (7mm), the percentage sound absorption
coefficients decreased from 46.5% to 33.5%, which is about 28% decrease. When the
depth of needle penetration was further increased from 0 level (7mm) to +1 level (10mm),
the percentage sound absorption coefficients increased slightly from 33.5% to 34%, which
is about 1.5% increase. Although, this is the smallest increase when compared to the
corresponding change in depth of needle penetration and stroke frequencies, the trend is
still the same.
The combined influence of fibre type (fineness), depth of needle penetration and stroke
frequency showed that -1 level of fibre type (hemp), -1 level of depth of needle penetration
(4mm) and +1 level of stroke frequency (350/min) provided the fabrics with highest
percentage sound absorption coefficient of 47% (0.47). However, no fabric was produced
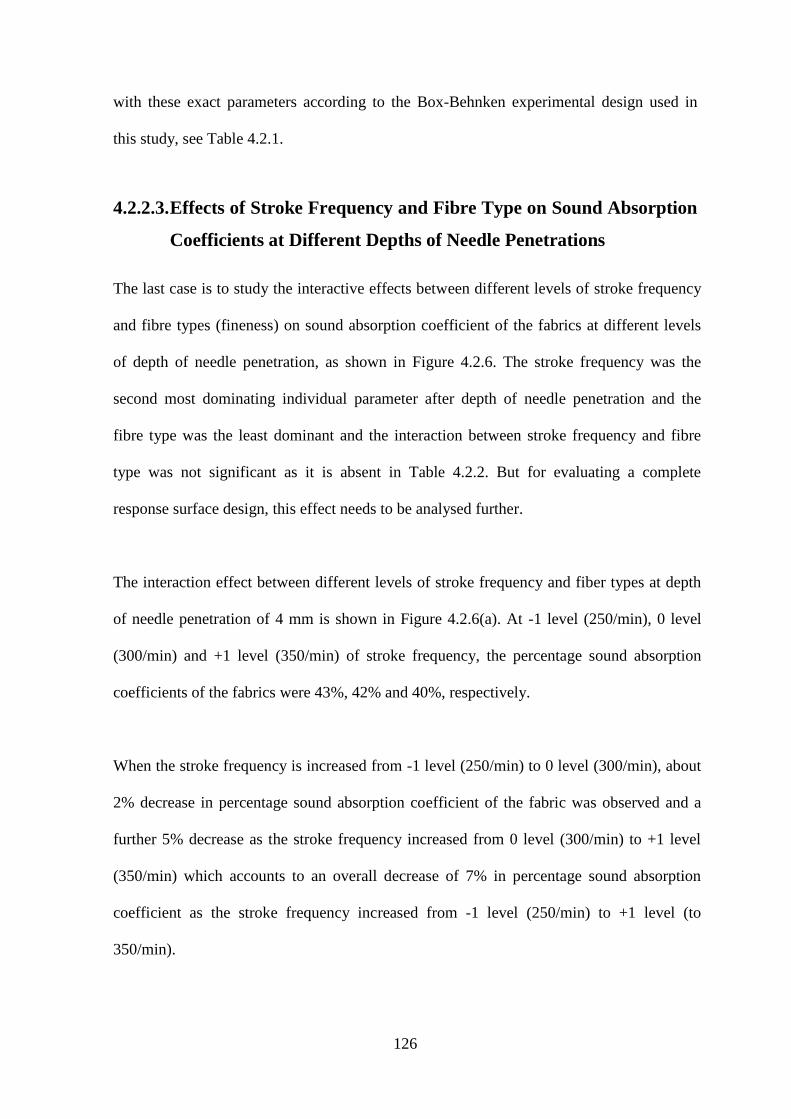
126
with these exact parameters according to the Box-Behnken experimental design used in
this study, see Table 4.2.1.
4.2.2.3. Effects of Stroke Frequency and Fibre Type on Sound Absorption
Coefficients at Different Depths of Needle Penetrations
The last case is to study the interactive effects between different levels of stroke frequency
and fibre types (fineness) on sound absorption coefficient of the fabrics at different levels
of depth of needle penetration, as shown in Figure 4.2.6. The stroke frequency was the
second most dominating individual parameter after depth of needle penetration and the
fibre type was the least dominant and the interaction between stroke frequency and fibre
type was not significant as it is absent in Table 4.2.2. But for evaluating a complete
response surface design, this effect needs to be analysed further.
The interaction effect between different levels of stroke frequency and fiber types at depth
of needle penetration of 4 mm is shown in Figure 4.2.6(a). At -1 level (250/min), 0 level
(300/min) and +1 level (350/min) of stroke frequency, the percentage sound absorption
coefficients of the fabrics were 43%, 42% and 40%, respectively.
When the stroke frequency is increased from -1 level (250/min) to 0 level (300/min), about
2% decrease in percentage sound absorption coefficient of the fabric was observed and a
further 5% decrease as the stroke frequency increased from 0 level (300/min) to +1 level
(350/min) which accounts to an overall decrease of 7% in percentage sound absorption
coefficient as the stroke frequency increased from -1 level (250/min) to +1 level (to
350/min).
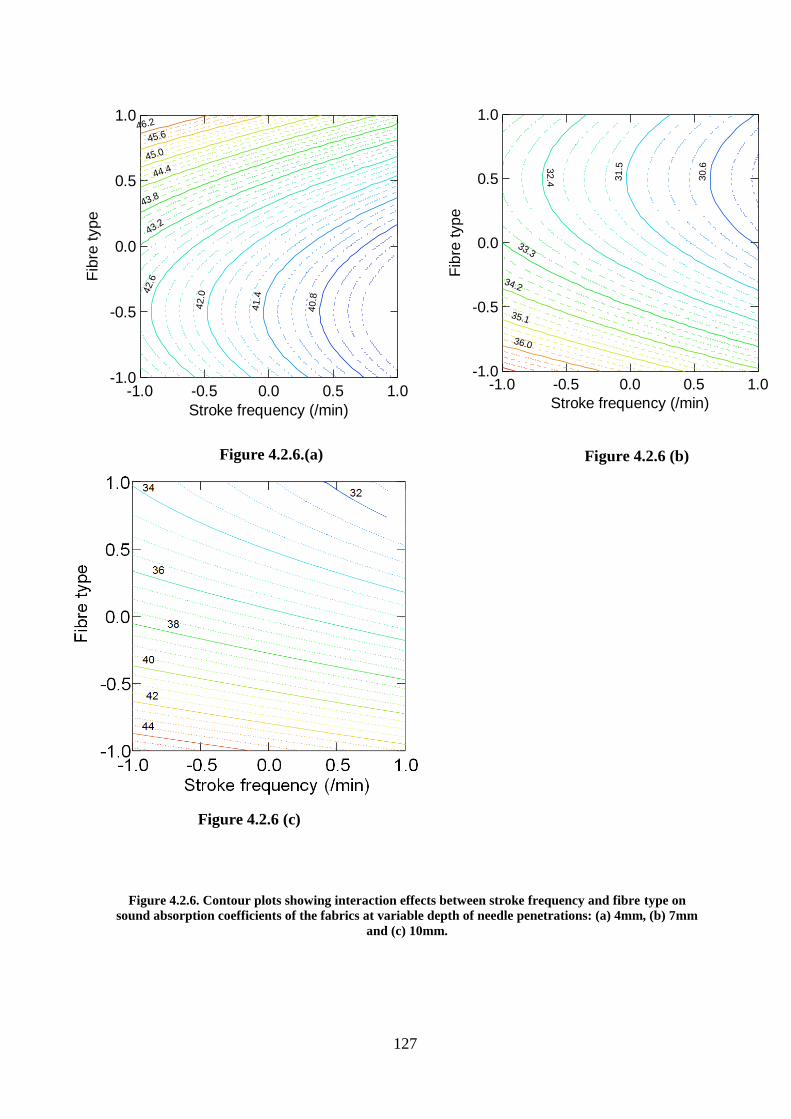
127
-1.0 -0.5 0.0 0.5 1.0
Stroke frequency (/min)
-1.0
-0.5
0.0
0.5
1.0
Fib
re t
ype
40.8
41.4
42.0
42.6
43.2
43.8
44.4
45.0
45.646.2
Figure 4.2.6.(a)
Figure 4.2.6 (c)
-1.0 -0.5 0.0 0.5 1.0
Stroke frequency (/min)
-1.0
-0.5
0.0
0.5
1.0
Fib
re t
yp
e
30.6
31.53
2.4
33.3
34.2
35.1
36.0
Figure 4.2.6 (b)
Figure 4.2.6. Contour plots showing interaction effects between stroke frequency and fibre type on
sound absorption coefficients of the fabrics at variable depth of needle penetrations: (a) 4mm, (b) 7mm
and (c) 10mm.
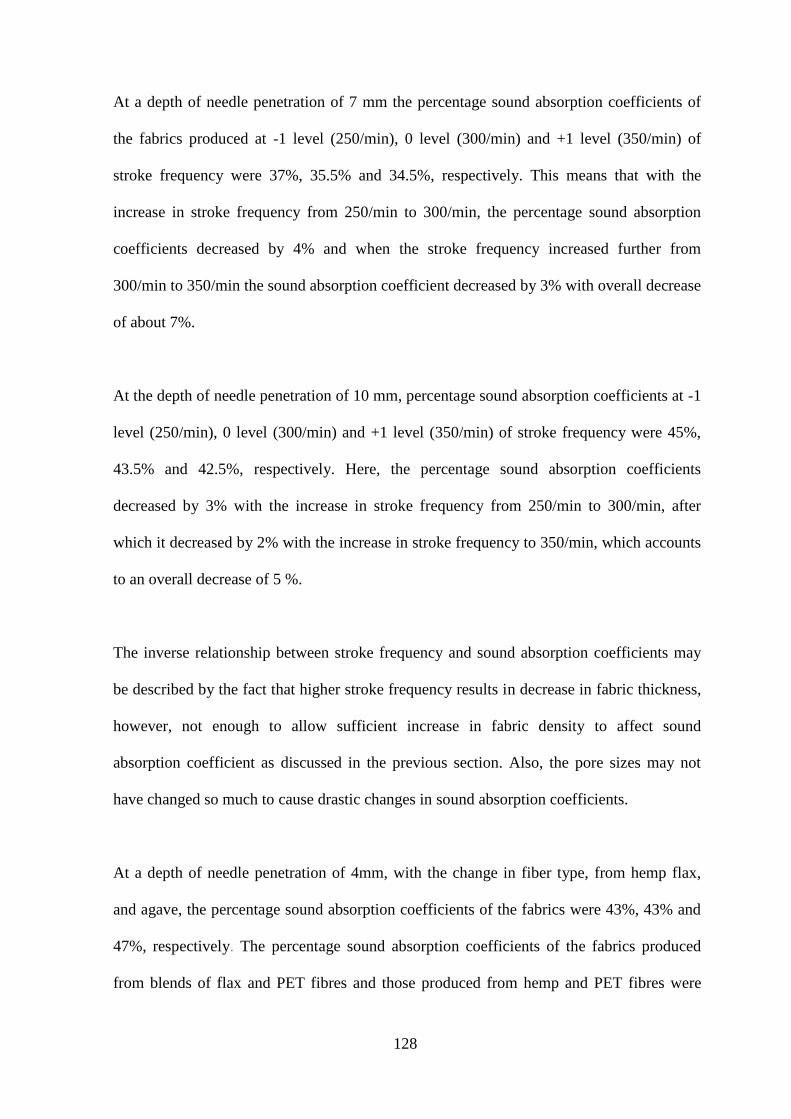
128
At a depth of needle penetration of 7 mm the percentage sound absorption coefficients of
the fabrics produced at -1 level (250/min), 0 level (300/min) and +1 level (350/min) of
stroke frequency were 37%, 35.5% and 34.5%, respectively. This means that with the
increase in stroke frequency from 250/min to 300/min, the percentage sound absorption
coefficients decreased by 4% and when the stroke frequency increased further from
300/min to 350/min the sound absorption coefficient decreased by 3% with overall decrease
of about 7%.
At the depth of needle penetration of 10 mm, percentage sound absorption coefficients at -1
level (250/min), 0 level (300/min) and +1 level (350/min) of stroke frequency were 45%,
43.5% and 42.5%, respectively. Here, the percentage sound absorption coefficients
decreased by 3% with the increase in stroke frequency from 250/min to 300/min, after
which it decreased by 2% with the increase in stroke frequency to 350/min, which accounts
to an overall decrease of 5 %.
The inverse relationship between stroke frequency and sound absorption coefficients may
be described by the fact that higher stroke frequency results in decrease in fabric thickness,
however, not enough to allow sufficient increase in fabric density to affect sound
absorption coefficient as discussed in the previous section. Also, the pore sizes may not
have changed so much to cause drastic changes in sound absorption coefficients.
At a depth of needle penetration of 4mm, with the change in fiber type, from hemp flax,
and agave, the percentage sound absorption coefficients of the fabrics were 43%, 43% and
47%, respectively. The percentage sound absorption coefficients of the fabrics produced
from blends of flax and PET fibres and those produced from hemp and PET fibres were
129
similar but about 9% higher in the case of fabrics produced from agave fibres. However, at
a depth of needle penetration of 7 mm, the percentage sound absorption coefficient of the
fabrics produced from blends of agave and PET fibres was 33% which is similar to that of
fabrics produced from blends of flax and PET fibres but lower than that produced from
hemp fibres (37%), which is higher by about 12%. At a depth of needle penetration of 10
mm, for the fabrics produced from a blend of hemp and PET fibres, a blend of flax and PET
fibres and a blend of agave and PET fibres, the percentage sound absorption coefficients
were 45%, 37.5% and 34% , respectively.
The fabrics produced from a blend of agave and PET fibres performed better at lower
depths of needle penetration than the fabrics produced from blends of the other two natural
fibres with PET fibres because of the coarseness of agave fibres, which resulted in a bulky
nonwoven. The fabrics produced from hemp and PET fibres performed better than those
produced from blends of the other two natural fibres with PET fibres at a higher depth of
needle penetration because a relatively compact fabric structure was produced. In this case,
a combined influence of fibre type and stroke frequency showed the maximum percentage
sound absorption coefficient of 47% (0.47) for the fabrics produced from agave fibres at
4mm depth of needle penetration and 250/min stroke frequency. However, no fabric was
produced with these exact parameters according to the Box-Behnken experimental design
used in this study, see Table 4.2.1.
130
4.2.2.4. Effect of the Optimized Parameters on Fabric Characteristics.
After the process of optimizing the three parameters from the response surface plots of
three different two way interactions, furthermore, it was necessary to analyse the
implications of the effects of these optimized parameters on fabric characteristics. As it can
be seen from the analysis in the previous Sections 4.2.2.1 to 4.2.2.3, the highest percentage
sound absorption coefficient of 47% (0.47) was obtained in two different response surface
plots.
In the interaction between fibre type and depth of needle penetration at different values of
stroke frequency, the percentage sound absorption coefficient of 47% (0.47) was obtained
at -1 level of fiber type (hemp), -1 level of depth of needle penetration (4mm) and +1 level
of stroke frequency (350/min). While for the interaction between stroke frequency and fiber
type at different depths of needle penetration, the percentage sound absorption coefficient
of 47% (0.47) was obtained at +1 level of fibre type (agave), -1 level of depth of needle
penetration (4mm) and -1 level of stroke frequency (250/min).
Both these samples were not produced as part of this work, see Table 4.2.1. Also, the effect
of interaction between stroke frequency and fibre type on sound absorption coefficients was
not significant according to the high P-values (95% confidence interval) in Table 4.2.2.
Therefore, only the maximum percentage sound absorption coefficient of 47% (0.47) for
the interaction between fibre type and depth of needle penetration will be considered here
as well as the second highest percentage sound absorption coefficient of 45% (0.45)
achieved among the fabric samples actually produced (experimental run 11, Table 4.2.1)
131
from flax fibres at -1 level (4min) of depth of needle penetration and +1 level (350/min)
obtained on the interaction effect between depth of needle penetration and stroke frequency.
According to the optimization exercise reported above, the optimized depth of needle
penetration is 4 mm, which is the minimum setting in this study. Given that the main fabric
characteristic, namely, thickness, is affected by the depth of needle penetration, a thicker
fabric with less density is produced in comparison to that at higher depth of needle
penetration.
It has already been stated, thicker fabrics achieve better sound absorption coefficients at
low sound frequencies. Also, it has been discussed that an increase in fabric density
increased the sound absorption coefficients particularly in the middle and higher sound
frequencies [54]. Therefore, the converse is true; a less dense fabric would not achieve
higher sound absorbing at middle to high sound frequencies. Therefore, in context to these
two attributes of the fabrics, namely, thickness and fabric density, the fabrics produced with
the optimized parameters are suitable for sound absorption application at low sound
frequencies.
The optimum fibre type is hemp fibre, which is finer than agave fibre but slightly coarser
than flax fibre. It must also be noted that out of the three tested parameters, fibre type was
the least significant parameter with the P-value of 0.028 in comparison to 0.001 and 0.006
for depth of needle penetration and stroke frequency, respectively, as shown in Table 4.2.2.
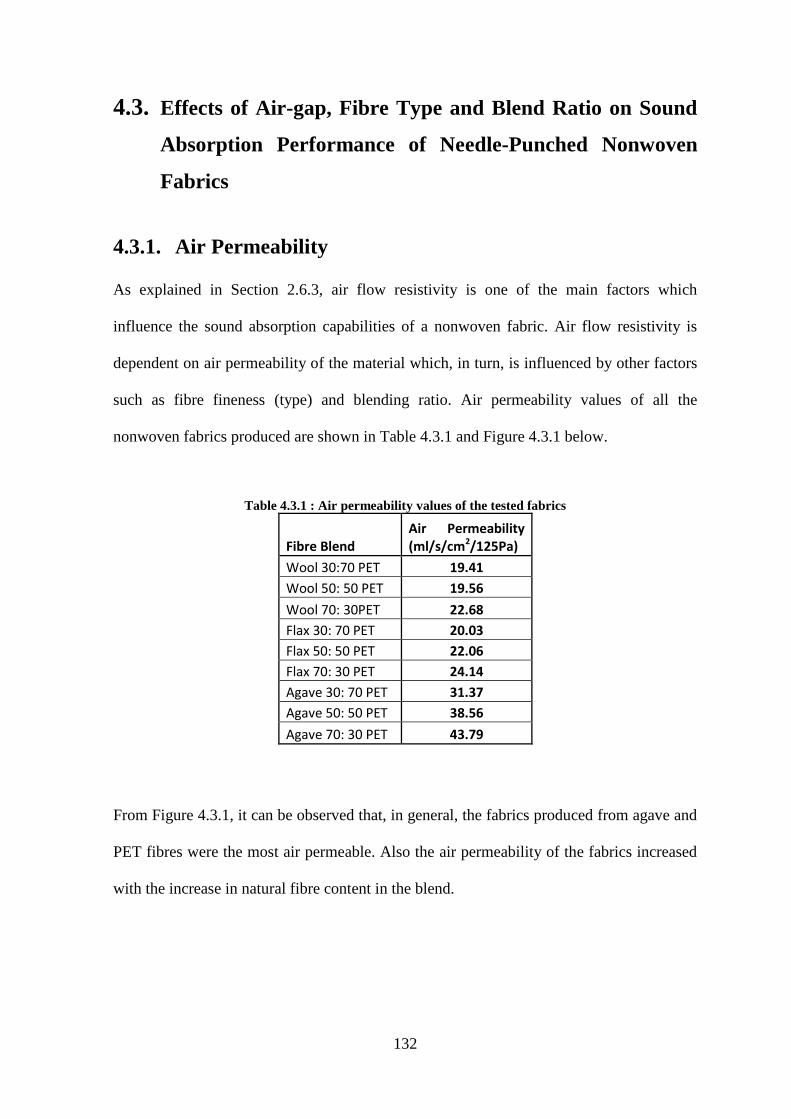
132
4.3. Effects of Air-gap, Fibre Type and Blend Ratio on Sound
Absorption Performance of Needle-Punched Nonwoven
Fabrics
4.3.1. Air Permeability
As explained in Section 2.6.3, air flow resistivity is one of the main factors which
influence the sound absorption capabilities of a nonwoven fabric. Air flow resistivity is
dependent on air permeability of the material which, in turn, is influenced by other factors
such as fibre fineness (type) and blending ratio. Air permeability values of all the
nonwoven fabrics produced are shown in Table 4.3.1 and Figure 4.3.1 below.
Table 4.3.1 : Air permeability values of the tested fabrics
Fibre Blend Air Permeability (ml/s/cm2/125Pa)
Wool 30:70 PET 19.41
Wool 50: 50 PET 19.56
Wool 70: 30PET 22.68
Flax 30: 70 PET 20.03
Flax 50: 50 PET 22.06
Flax 70: 30 PET 24.14
Agave 30: 70 PET 31.37
Agave 50: 50 PET 38.56
Agave 70: 30 PET 43.79
From Figure 4.3.1, it can be observed that, in general, the fabrics produced from agave and
PET fibres were the most air permeable. Also the air permeability of the fabrics increased
with the increase in natural fibre content in the blend.
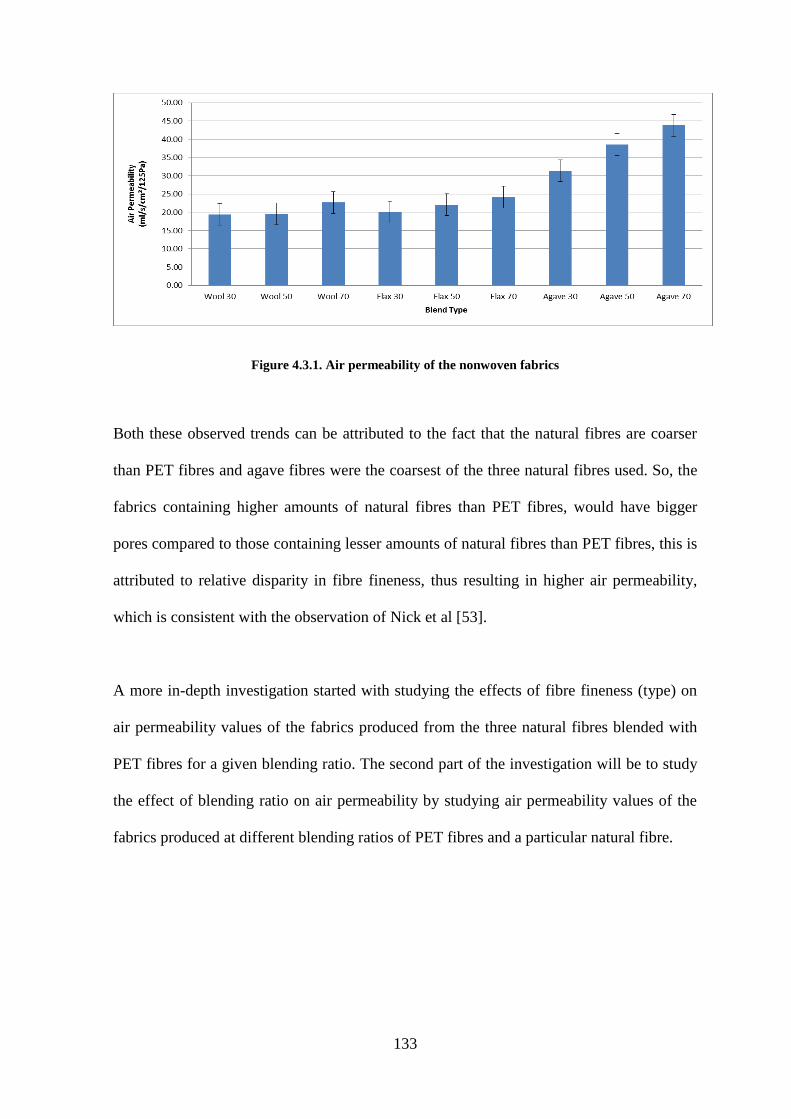
133
Figure 4.3.1. Air permeability of the nonwoven fabrics
Both these observed trends can be attributed to the fact that the natural fibres are coarser
than PET fibres and agave fibres were the coarsest of the three natural fibres used. So, the
fabrics containing higher amounts of natural fibres than PET fibres, would have bigger
pores compared to those containing lesser amounts of natural fibres than PET fibres, this is
attributed to relative disparity in fibre fineness, thus resulting in higher air permeability,
which is consistent with the observation of Nick et al [53].
A more in-depth investigation started with studying the effects of fibre fineness (type) on
air permeability values of the fabrics produced from the three natural fibres blended with
PET fibres for a given blending ratio. The second part of the investigation will be to study
the effect of blending ratio on air permeability by studying air permeability values of the
fabrics produced at different blending ratios of PET fibres and a particular natural fibre.
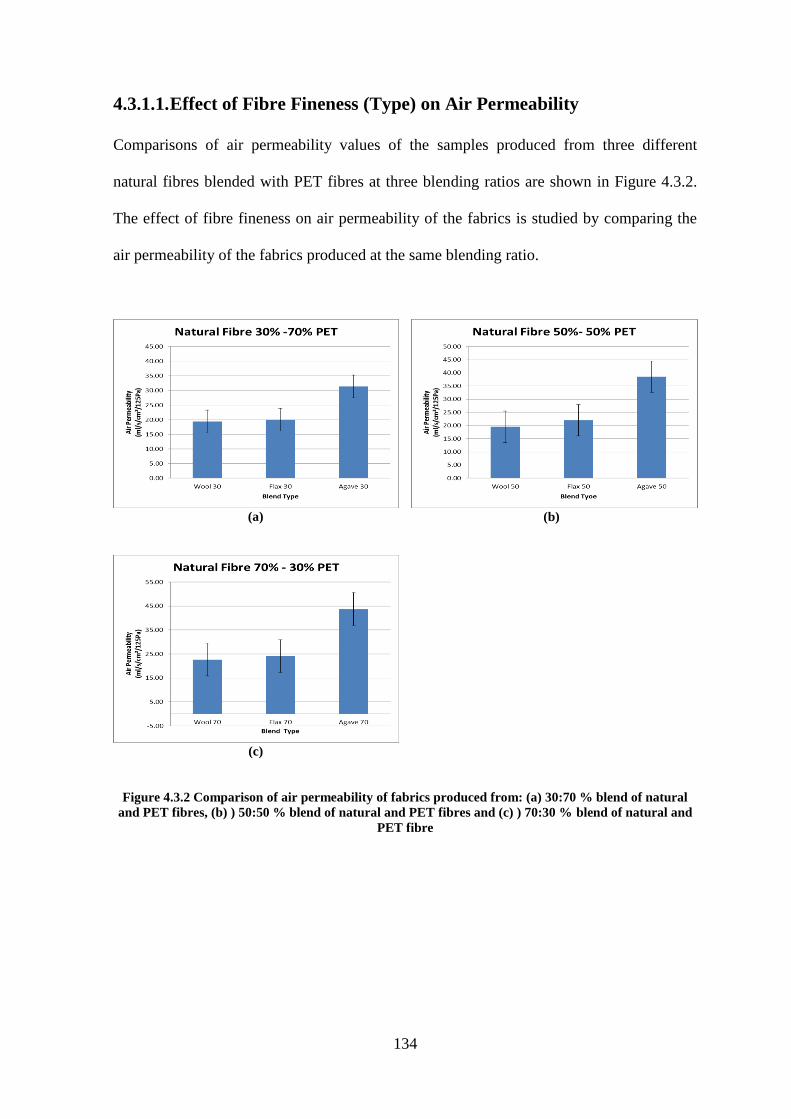
134
4.3.1.1. Effect of Fibre Fineness (Type) on Air Permeability
Comparisons of air permeability values of the samples produced from three different
natural fibres blended with PET fibres at three blending ratios are shown in Figure 4.3.2.
The effect of fibre fineness on air permeability of the fabrics is studied by comparing the
air permeability of the fabrics produced at the same blending ratio.
(a)
(b)
(c)
Figure 4.3.2 Comparison of air permeability of fabrics produced from: (a) 30:70 % blend of natural
and PET fibres, (b) ) 50:50 % blend of natural and PET fibres and (c) ) 70:30 % blend of natural and
PET fibre
135
It can be observed that amongst all the fabrics in all three blend ratios, the fabrics produced
from a blend of agave and PET fibres achieved the highest air permeability, followed in
general, by fabrics produced from blends of flax and PET fibres. Fabrics produced from
blends of wool and PET fibres generally had the least air permeability. In all the blends
containing 70% natural fibres, the difference in air permeability values between the fabrics
produced from agave and PET fibres and the one produced from flax and PET fibres is
about 45%, while the difference between the fabrics produced from agave and PET fibres
and the one produced from wool and PET fibres is about 48%. Yet the difference in air
permeability between the fabrics produced from flax and PET fibres and the one produced
from wool and PET fibres is 6%. A similar comparison exists in the fabrics produced from
the other two blend ratios as well.
This trend can be attributed to the fact that agave fibres are considerably coarser than PET
fibres, more so than wool and flax fibres. This disparity in fibre fineness results in higher
porosity in the fabrics produced from agave fibres and thus they are more air permeable
than the fabrics produced from wool and flax fibres. This observation of a direct link
between fibre fineness and air permeability is consistent with the results reported by Cox
and D'antonio [52].
4.3.1.2. Effect of the Blending Ratio on Air Permeability
As shown in Figure 4.3.3, the effect of blending ratio on air permeability is studied by
comparing air permeability results of the fabrics produced from the blends of three
different natural fibres, each one blended with PET fibres at three blending ratios.
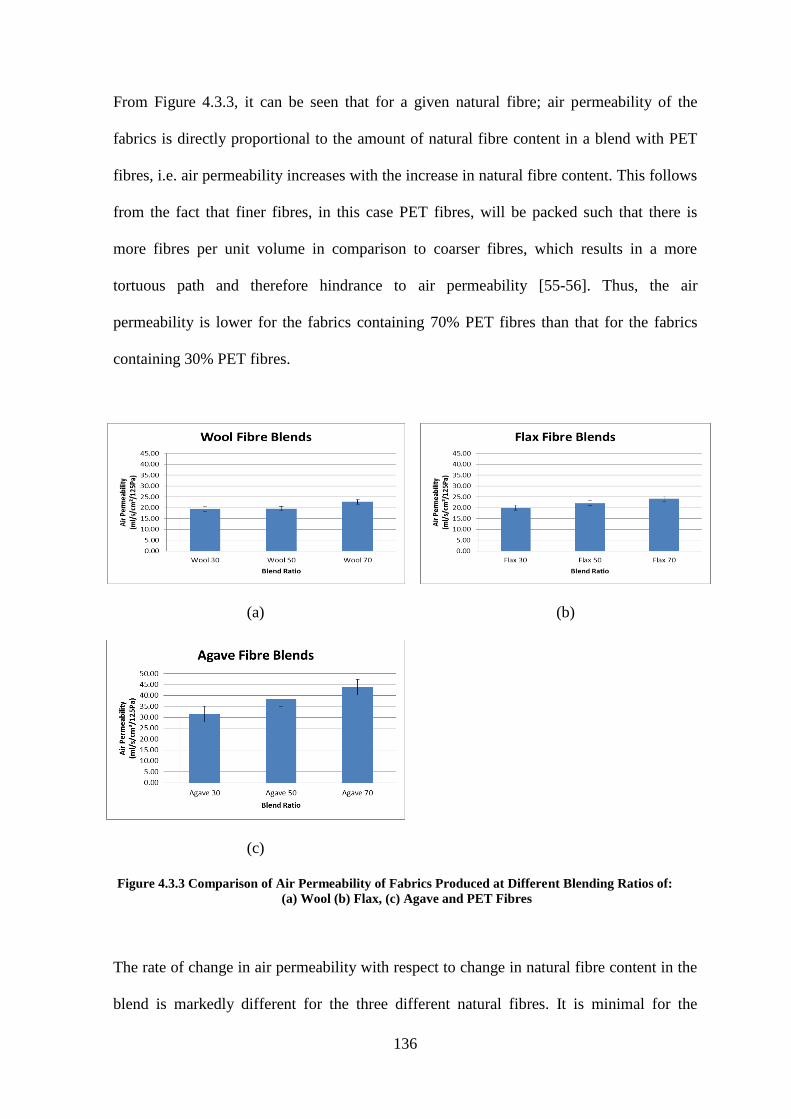
136
From Figure 4.3.3, it can be seen that for a given natural fibre; air permeability of the
fabrics is directly proportional to the amount of natural fibre content in a blend with PET
fibres, i.e. air permeability increases with the increase in natural fibre content. This follows
from the fact that finer fibres, in this case PET fibres, will be packed such that there is
more fibres per unit volume in comparison to coarser fibres, which results in a more
tortuous path and therefore hindrance to air permeability [55-56]. Thus, the air
permeability is lower for the fabrics containing 70% PET fibres than that for the fabrics
containing 30% PET fibres.
(a)
(b)
(c)
Figure 4.3.3 Comparison of Air Permeability of Fabrics Produced at Different Blending Ratios of:
(a) Wool (b) Flax, (c) Agave and PET Fibres
The rate of change in air permeability with respect to change in natural fibre content in the
blend is markedly different for the three different natural fibres. It is minimal for the
137
fabrics produced from a blend of wool and PET fibres and more defined in the fabrics
produced from a blend of agave and PET fibres. About 1% increment in air permeability
was noticed as the wool fibre content in the blend increased from 30% to 50% and about
16% increment in air permeability as the wool fibre content increased from 50% to 70%.
Overall, as the wool fibre content in the fabrics increased from 30% to 70%, the air
permeability of the fabric increased by 17%.
As the flax fibre content in the blend increased from 30% to 50% the resultant increase in
air permeability of the fabric was 10% and with further increase in flax fibre content from
50% to 70% the air permeability increased by 9.5%. Overall, as the flax fibre content
increased from 30% to 70%, air permeability of the fabric increased by 21%. In the case of
fabrics produced from a blend of agave and PET fibres, it can be seen that when the agave
fibre content increased from 30% to 50%, the air permeability increased by 23% and with
further increase of the agave fibre content from 50% to 70%, the air permeability of the
fabric increased by 13.5%. So overall, as the agave fibre content increased from 30% to
70%, the air permeability of the fabric increased by 40%.
In summary, with the increase in natural fibre content from 30% to 70%, the air
permeability of the blended fabrics increased by 17%, 21% and 40%, for the fabrics
produced from wool and PET fibres, flax and PET fibres and agave and PET fibres,
respectively. These observations together with those reported in Section 4.3.1.1 above
showed that while both fibre type (fineness) and blending ratio affected air permeability of
the fabric, the effect of fibre type was the most pronounced. The biggest change in air
permeability with the change in natural fibre content was observed in the fabrics produced
from a blend of agave and PET fibres, more so than the change in air permeability
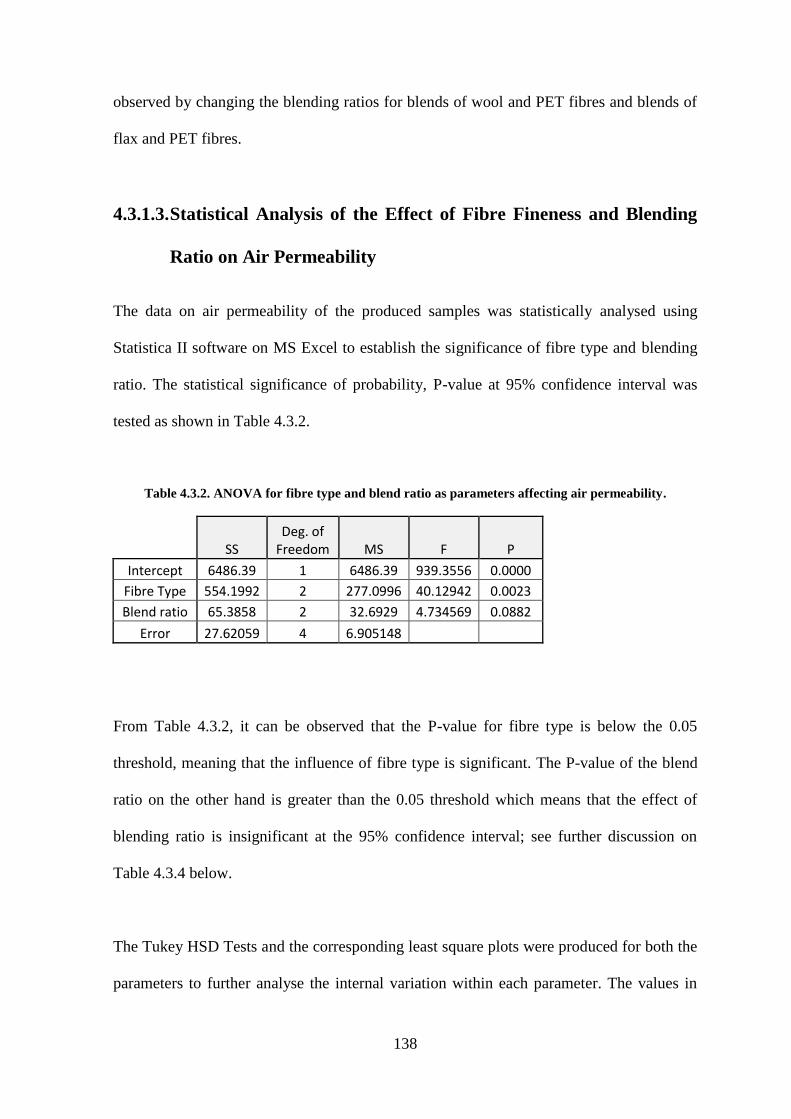
138
observed by changing the blending ratios for blends of wool and PET fibres and blends of
flax and PET fibres.
4.3.1.3. Statistical Analysis of the Effect of Fibre Fineness and Blending
Ratio on Air Permeability
The data on air permeability of the produced samples was statistically analysed using
Statistica II software on MS Excel to establish the significance of fibre type and blending
ratio. The statistical significance of probability, P-value at 95% confidence interval was
tested as shown in Table 4.3.2.
Table 4.3.2. ANOVA for fibre type and blend ratio as parameters affecting air permeability.
SS
Deg. of Freedom MS F P
Intercept 6486.39 1 6486.39 939.3556 0.0000
Fibre Type 554.1992 2 277.0996 40.12942 0.0023
Blend ratio 65.3858 2 32.6929 4.734569 0.0882
Error 27.62059 4 6.905148
From Table 4.3.2, it can be observed that the P-value for fibre type is below the 0.05
threshold, meaning that the influence of fibre type is significant. The P-value of the blend
ratio on the other hand is greater than the 0.05 threshold which means that the effect of
blending ratio is insignificant at the 95% confidence interval; see further discussion on
Table 4.3.4 below.
The Tukey HSD Tests and the corresponding least square plots were produced for both the
parameters to further analyse the internal variation within each parameter. The values in
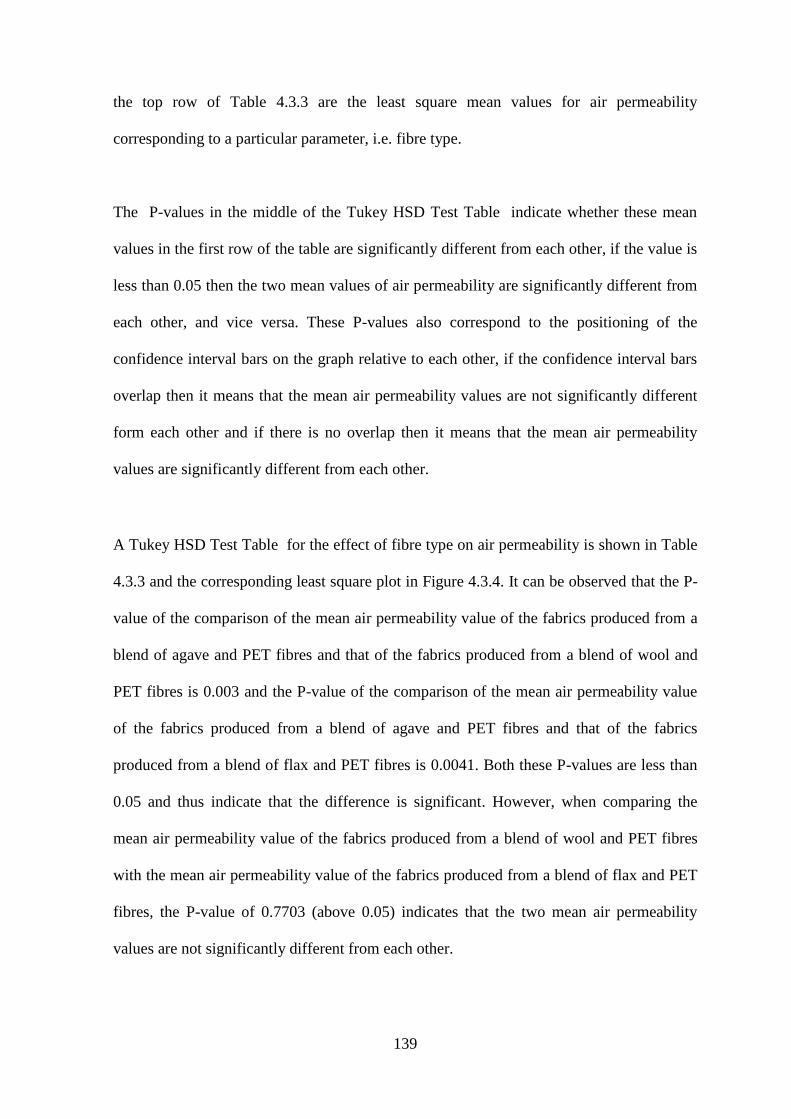
139
the top row of Table 4.3.3 are the least square mean values for air permeability
corresponding to a particular parameter, i.e. fibre type.
The P-values in the middle of the Tukey HSD Test Table indicate whether these mean
values in the first row of the table are significantly different from each other, if the value is
less than 0.05 then the two mean values of air permeability are significantly different from
each other, and vice versa. These P-values also correspond to the positioning of the
confidence interval bars on the graph relative to each other, if the confidence interval bars
overlap then it means that the mean air permeability values are not significantly different
form each other and if there is no overlap then it means that the mean air permeability
values are significantly different from each other.
A Tukey HSD Test Table for the effect of fibre type on air permeability is shown in Table
4.3.3 and the corresponding least square plot in Figure 4.3.4. It can be observed that the P-
value of the comparison of the mean air permeability value of the fabrics produced from a
blend of agave and PET fibres and that of the fabrics produced from a blend of wool and
PET fibres is 0.003 and the P-value of the comparison of the mean air permeability value
of the fabrics produced from a blend of agave and PET fibres and that of the fabrics
produced from a blend of flax and PET fibres is 0.0041. Both these P-values are less than
0.05 and thus indicate that the difference is significant. However, when comparing the
mean air permeability value of the fabrics produced from a blend of wool and PET fibres
with the mean air permeability value of the fabrics produced from a blend of flax and PET
fibres, the P-value of 0.7703 (above 0.05) indicates that the two mean air permeability
values are not significantly different from each other.
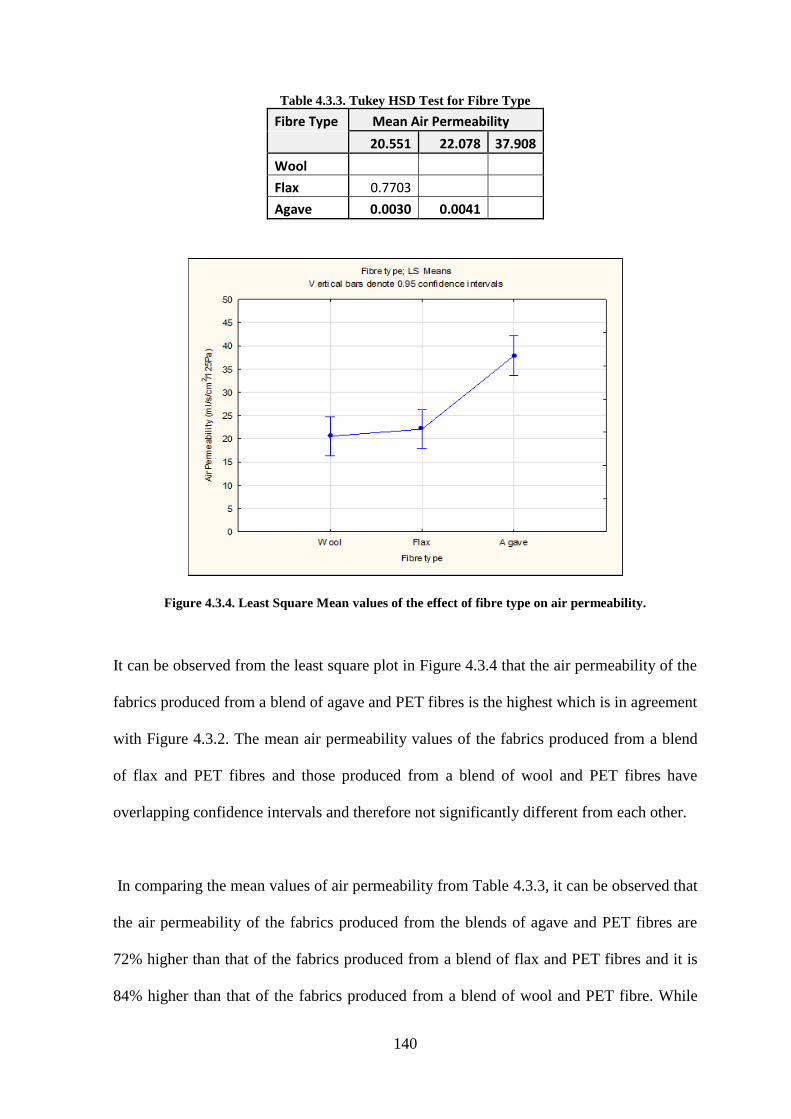
140
Table 4.3.3. Tukey HSD Test for Fibre Type
Fibre Type Mean Air Permeability
20.551 22.078 37.908
Wool
Flax 0.7703
Agave 0.0030 0.0041
Figure 4.3.4. Least Square Mean values of the effect of fibre type on air permeability.
It can be observed from the least square plot in Figure 4.3.4 that the air permeability of the
fabrics produced from a blend of agave and PET fibres is the highest which is in agreement
with Figure 4.3.2. The mean air permeability values of the fabrics produced from a blend
of flax and PET fibres and those produced from a blend of wool and PET fibres have
overlapping confidence intervals and therefore not significantly different from each other.
In comparing the mean values of air permeability from Table 4.3.3, it can be observed that
the air permeability of the fabrics produced from the blends of agave and PET fibres are
72% higher than that of the fabrics produced from a blend of flax and PET fibres and it is
84% higher than that of the fabrics produced from a blend of wool and PET fibre. While
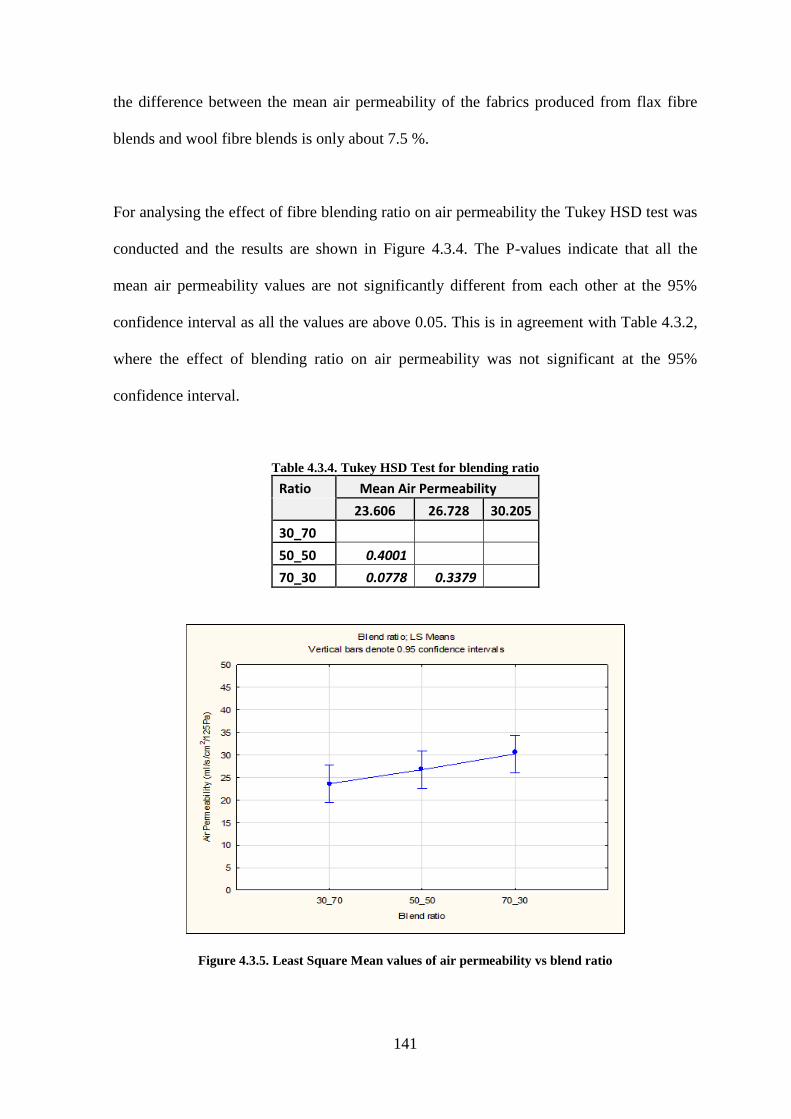
141
the difference between the mean air permeability of the fabrics produced from flax fibre
blends and wool fibre blends is only about 7.5 %.
For analysing the effect of fibre blending ratio on air permeability the Tukey HSD test was
conducted and the results are shown in Figure 4.3.4. The P-values indicate that all the
mean air permeability values are not significantly different from each other at the 95%
confidence interval as all the values are above 0.05. This is in agreement with Table 4.3.2,
where the effect of blending ratio on air permeability was not significant at the 95%
confidence interval.
Table 4.3.4. Tukey HSD Test for blending ratio
Ratio Mean Air Permeability
23.606 26.728 30.205
30_70
50_50 0.4001
70_30 0.0778 0.3379
Figure 4.3.5. Least Square Mean values of air permeability vs blend ratio
142
The overlap of the confidence interval bars is evident in Figure 4.3.5 which indicates
statistically insignificant difference in the three mean air permeability values. This
observation also confirmed that the effect of blending ratio on air permeability was not
significant as shown by P-value in Table 4.3.2. However, on a closer inspection of the
results, since the P-value is still small (< 0.10), the effect is significant at the 90%
confidence level. In the Tukey Test results shown in Table 4.3.4, it shows that the
difference in air permeability values between the 30%-70% blend ratio (mean air
permeability=23.6 ml/s/cm2/125Pa) and the 70%-30% blend ratio (mean air
permeability=30.2 ml/s/cm2/125Pa), although statistically insignificant at the 95%
confidence level, it is still significant at the 90% confidence level (P = 0.0778).
The least square plot in Figure 4.3.5 showing the effect of blending ratios on air
permeability is also in agreement with Figure 4.3.3 showing that air permeability is
directly proportional to natural fibre content for a particular natural fibre type, i.e. with the
increase in natural fibre content in a blend, from 30% to 70%, the air permeability of the
fabric also increases.
4.3.2. Sound Absorption
In this section the effect of each parameter, namely, fibre type (fineness), blend ratio and
air gap on sound absorption coefficients is described, and it is followed by a statistical
analysis of the overall results by ANOVA.
The average sound absorption coefficients in the frequency range of 50-5700 Hz for each
fabric produced from blending natural fibres with PET fibres backed by a varying air gaps
and an XPS sheet were evaluated as shown in Table 4.3.5 and Figure 4.3.6. The fabrics
143
produced from wool and PET fibres, in general, showed better sound absorption
coefficients than the other fabrics. Amongst the three different fabric blends, the fabrics
produced from agave and PET fibres showed the lowest sound absorption coefficients.
This was expected because wool fibre is known for its good sound absorption properties
due to fibre surface morphology characterized by scales [38]. These scales play a major
role in absorbing sound as they increase fibre surface area and thus create higher hindrance
to the sound wave.
Agave fibres on the other hand is thick with poor crimp which means that fibre surface
area per unit volume is relatively lesser in the fabrics produced from a blend of agave and
PET fibres and the porosity is generally higher and therefore air permeability of the fabrics
is higher as discussed in Section 4.3.1.
The fabrics produced from different blend ratios of flax and PET fibres generally showed
the second highest sound absorption coefficients due to the fact that the flax fibres were
relatively finer than agave fibres so the fabrics produced from a blend of flax and PET
fibres have more fibre surface area per unit volume compared to those produced from a
blend of agave and PET fibres and thus have less air permeability and are more tortuous.
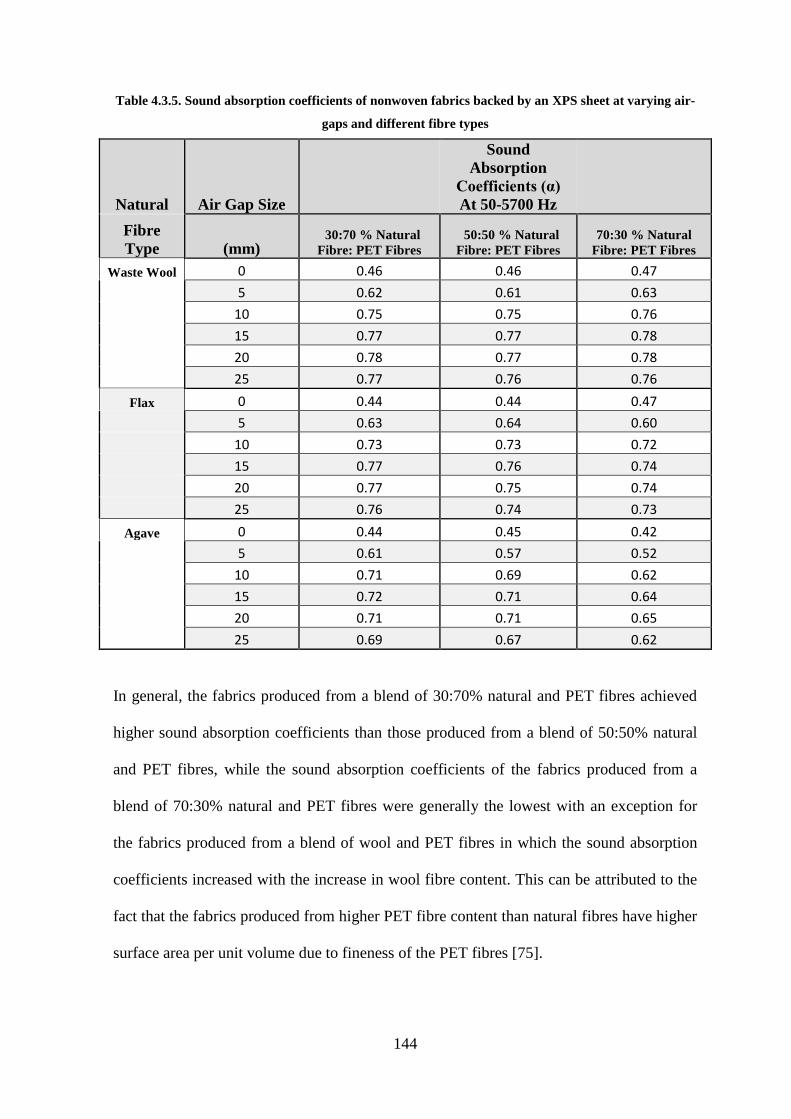
144
Table 4.3.5. Sound absorption coefficients of nonwoven fabrics backed by an XPS sheet at varying air-
gaps and different fibre types
Natural Air Gap Size
Sound
Absorption
Coefficients (α)
At 50-5700 Hz
Fibre
Type (mm) 30:70 % Natural
Fibre: PET Fibres
50:50 % Natural
Fibre: PET Fibres
70:30 % Natural
Fibre: PET Fibres
Waste Wool 0 0.46 0.46 0.47
5 0.62 0.61 0.63
10 0.75 0.75 0.76
15 0.77 0.77 0.78
20 0.78 0.77 0.78
25 0.77 0.76 0.76
Flax 0 0.44 0.44 0.47
5 0.63 0.64 0.60
10 0.73 0.73 0.72
15 0.77 0.76 0.74
20 0.77 0.75 0.74
25 0.76 0.74 0.73
Agave 0 0.44 0.45 0.42
5 0.61 0.57 0.52
10 0.71 0.69 0.62
15 0.72 0.71 0.64
20 0.71 0.71 0.65
25 0.69 0.67 0.62
In general, the fabrics produced from a blend of 30:70% natural and PET fibres achieved
higher sound absorption coefficients than those produced from a blend of 50:50% natural
and PET fibres, while the sound absorption coefficients of the fabrics produced from a
blend of 70:30% natural and PET fibres were generally the lowest with an exception for
the fabrics produced from a blend of wool and PET fibres in which the sound absorption
coefficients increased with the increase in wool fibre content. This can be attributed to the
fact that the fabrics produced from higher PET fibre content than natural fibres have higher
surface area per unit volume due to fineness of the PET fibres [75].
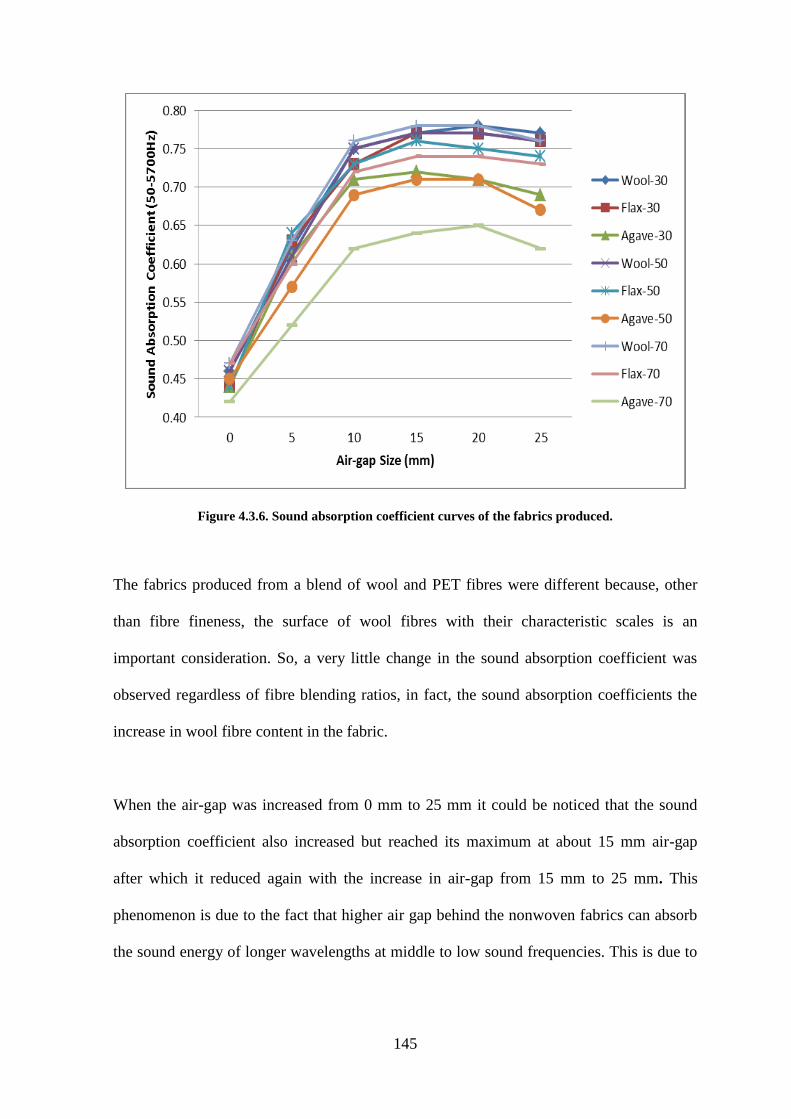
145
Figure 4.3.6. Sound absorption coefficient curves of the fabrics produced.
The fabrics produced from a blend of wool and PET fibres were different because, other
than fibre fineness, the surface of wool fibres with their characteristic scales is an
important consideration. So, a very little change in the sound absorption coefficient was
observed regardless of fibre blending ratios, in fact, the sound absorption coefficients the
increase in wool fibre content in the fabric.
When the air-gap was increased from 0 mm to 25 mm it could be noticed that the sound
absorption coefficient also increased but reached its maximum at about 15 mm air-gap
after which it reduced again with the increase in air-gap from 15 mm to 25 mm. This
phenomenon is due to the fact that higher air gap behind the nonwoven fabrics can absorb
the sound energy of longer wavelengths at middle to low sound frequencies. This is due to
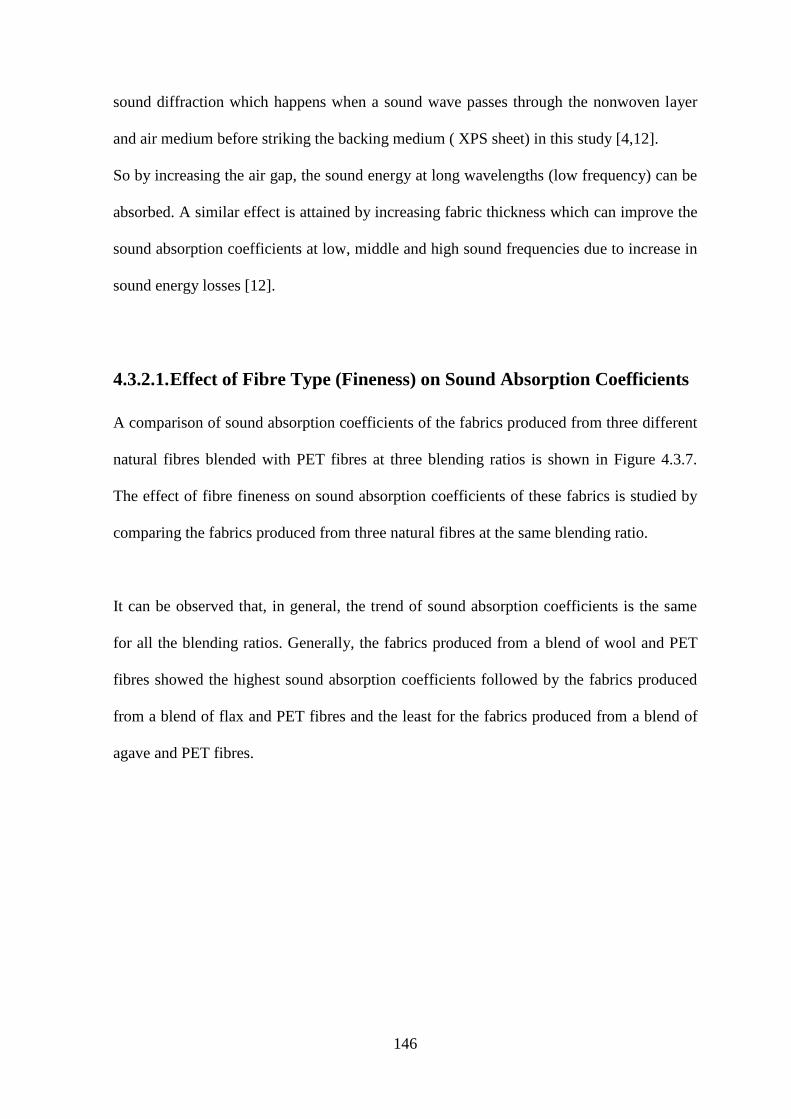
146
sound diffraction which happens when a sound wave passes through the nonwoven layer
and air medium before striking the backing medium ( XPS sheet) in this study [4,12].
So by increasing the air gap, the sound energy at long wavelengths (low frequency) can be
absorbed. A similar effect is attained by increasing fabric thickness which can improve the
sound absorption coefficients at low, middle and high sound frequencies due to increase in
sound energy losses [12].
4.3.2.1. Effect of Fibre Type (Fineness) on Sound Absorption Coefficients
A comparison of sound absorption coefficients of the fabrics produced from three different
natural fibres blended with PET fibres at three blending ratios is shown in Figure 4.3.7.
The effect of fibre fineness on sound absorption coefficients of these fabrics is studied by
comparing the fabrics produced from three natural fibres at the same blending ratio.
It can be observed that, in general, the trend of sound absorption coefficients is the same
for all the blending ratios. Generally, the fabrics produced from a blend of wool and PET
fibres showed the highest sound absorption coefficients followed by the fabrics produced
from a blend of flax and PET fibres and the least for the fabrics produced from a blend of
agave and PET fibres.
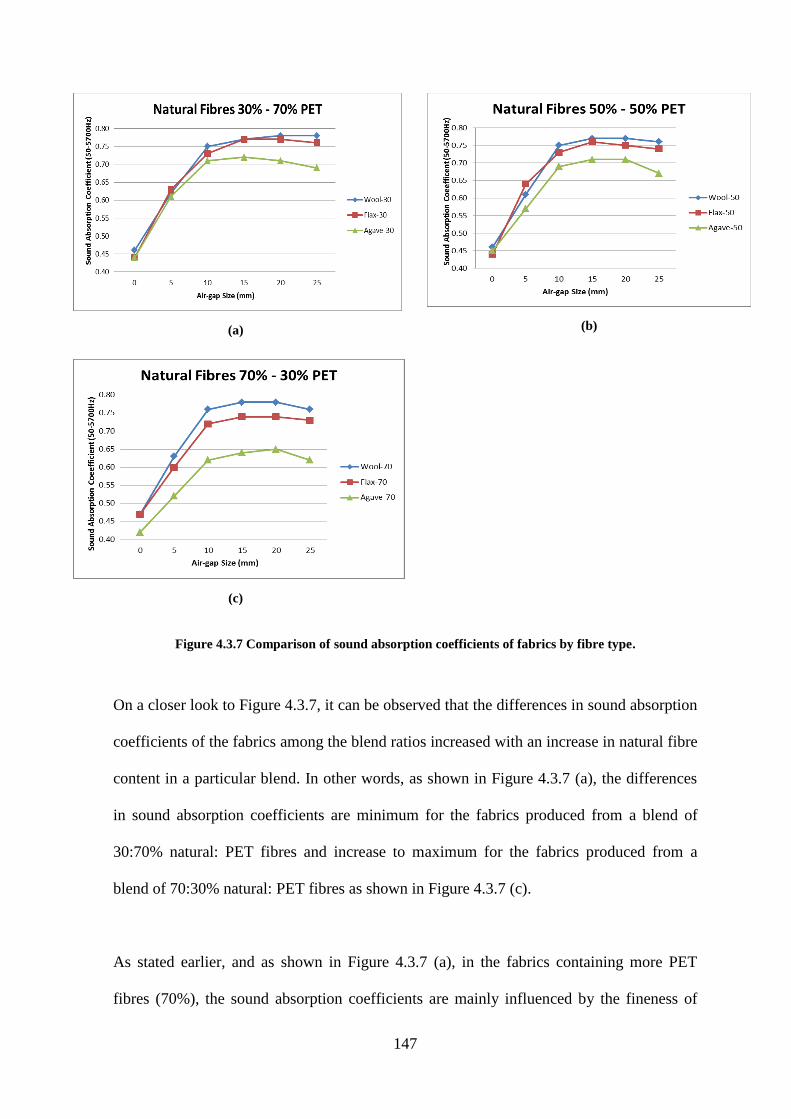
147
(a)
(b)
(c)
Figure 4.3.7 Comparison of sound absorption coefficients of fabrics by fibre type.
On a closer look to Figure 4.3.7, it can be observed that the differences in sound absorption
coefficients of the fabrics among the blend ratios increased with an increase in natural fibre
content in a particular blend. In other words, as shown in Figure 4.3.7 (a), the differences
in sound absorption coefficients are minimum for the fabrics produced from a blend of
30:70% natural: PET fibres and increase to maximum for the fabrics produced from a
blend of 70:30% natural: PET fibres as shown in Figure 4.3.7 (c).
As stated earlier, and as shown in Figure 4.3.7 (a), in the fabrics containing more PET
fibres (70%), the sound absorption coefficients are mainly influenced by the fineness of
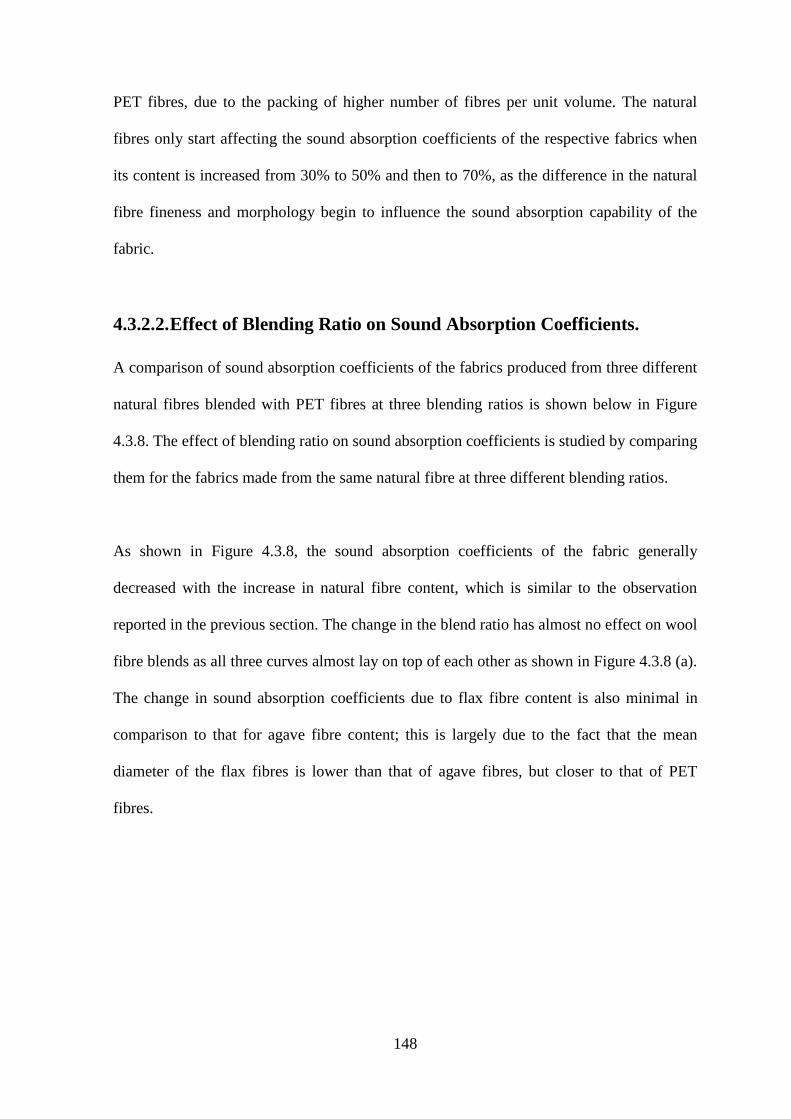
148
PET fibres, due to the packing of higher number of fibres per unit volume. The natural
fibres only start affecting the sound absorption coefficients of the respective fabrics when
its content is increased from 30% to 50% and then to 70%, as the difference in the natural
fibre fineness and morphology begin to influence the sound absorption capability of the
fabric.
4.3.2.2. Effect of Blending Ratio on Sound Absorption Coefficients.
A comparison of sound absorption coefficients of the fabrics produced from three different
natural fibres blended with PET fibres at three blending ratios is shown below in Figure
4.3.8. The effect of blending ratio on sound absorption coefficients is studied by comparing
them for the fabrics made from the same natural fibre at three different blending ratios.
As shown in Figure 4.3.8, the sound absorption coefficients of the fabric generally
decreased with the increase in natural fibre content, which is similar to the observation
reported in the previous section. The change in the blend ratio has almost no effect on wool
fibre blends as all three curves almost lay on top of each other as shown in Figure 4.3.8 (a).
The change in sound absorption coefficients due to flax fibre content is also minimal in
comparison to that for agave fibre content; this is largely due to the fact that the mean
diameter of the flax fibres is lower than that of agave fibres, but closer to that of PET
fibres.
149
(a)
(b)
(c)
Figure 4.3.8 Comparison of sound absorption coefficients of the fabrics by blending ratios
Among different fabrics produced at different blending ratios of agave and PET fibres, as
shown in Figure 4.3.8 (c), the fabrics produced from 70%-30% blend achieved the least
sound absorption coefficients, because agave fibre is comparatively more thicker (coarser)
than PET fibres, therefore, when agave fibre content is increased to 70%, the fabric
becomes the most porous and the least tortuous.
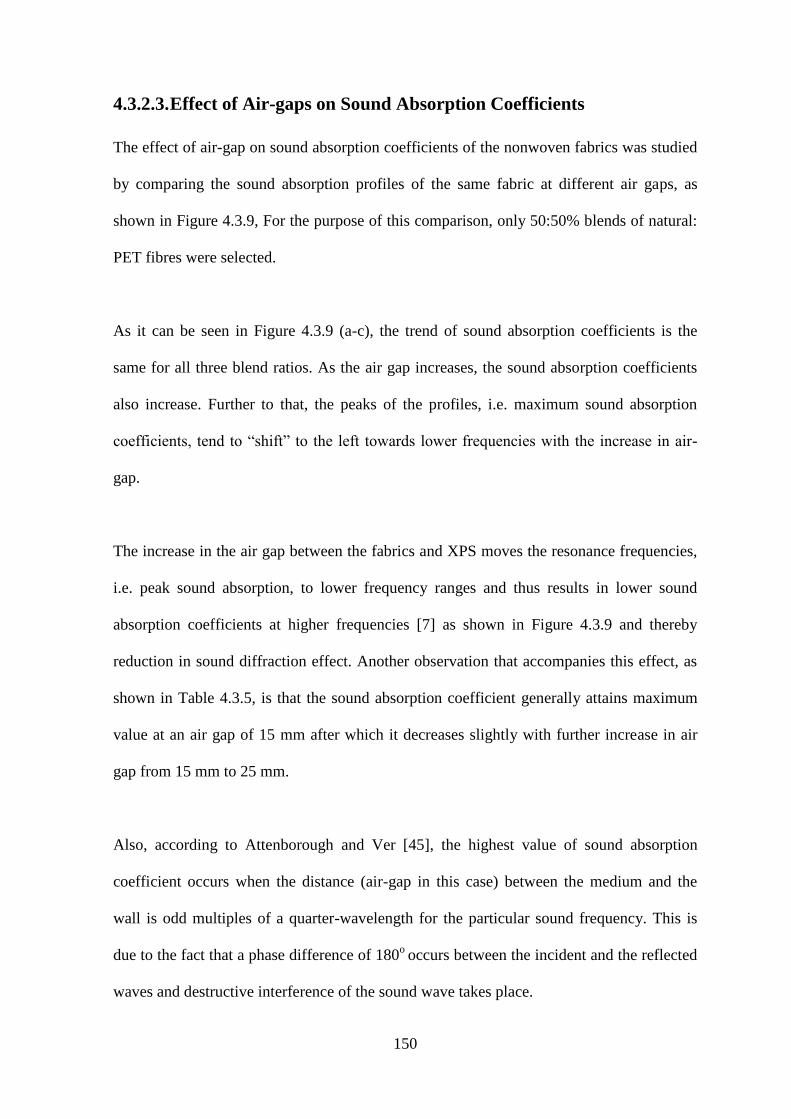
150
4.3.2.3. Effect of Air-gaps on Sound Absorption Coefficients
The effect of air-gap on sound absorption coefficients of the nonwoven fabrics was studied
by comparing the sound absorption profiles of the same fabric at different air gaps, as
shown in Figure 4.3.9, For the purpose of this comparison, only 50:50% blends of natural:
PET fibres were selected.
As it can be seen in Figure 4.3.9 (a-c), the trend of sound absorption coefficients is the
same for all three blend ratios. As the air gap increases, the sound absorption coefficients
also increase. Further to that, the peaks of the profiles, i.e. maximum sound absorption
coefficients, tend to “shift” to the left towards lower frequencies with the increase in air-
gap.
The increase in the air gap between the fabrics and XPS moves the resonance frequencies,
i.e. peak sound absorption, to lower frequency ranges and thus results in lower sound
absorption coefficients at higher frequencies [7] as shown in Figure 4.3.9 and thereby
reduction in sound diffraction effect. Another observation that accompanies this effect, as
shown in Table 4.3.5, is that the sound absorption coefficient generally attains maximum
value at an air gap of 15 mm after which it decreases slightly with further increase in air
gap from 15 mm to 25 mm.
Also, according to Attenborough and Ver [45], the highest value of sound absorption
coefficient occurs when the distance (air-gap in this case) between the medium and the
wall is odd multiples of a quarter-wavelength for the particular sound frequency. This is
due to the fact that a phase difference of 180o
occurs between the incident and the reflected
waves and destructive interference of the sound wave takes place.
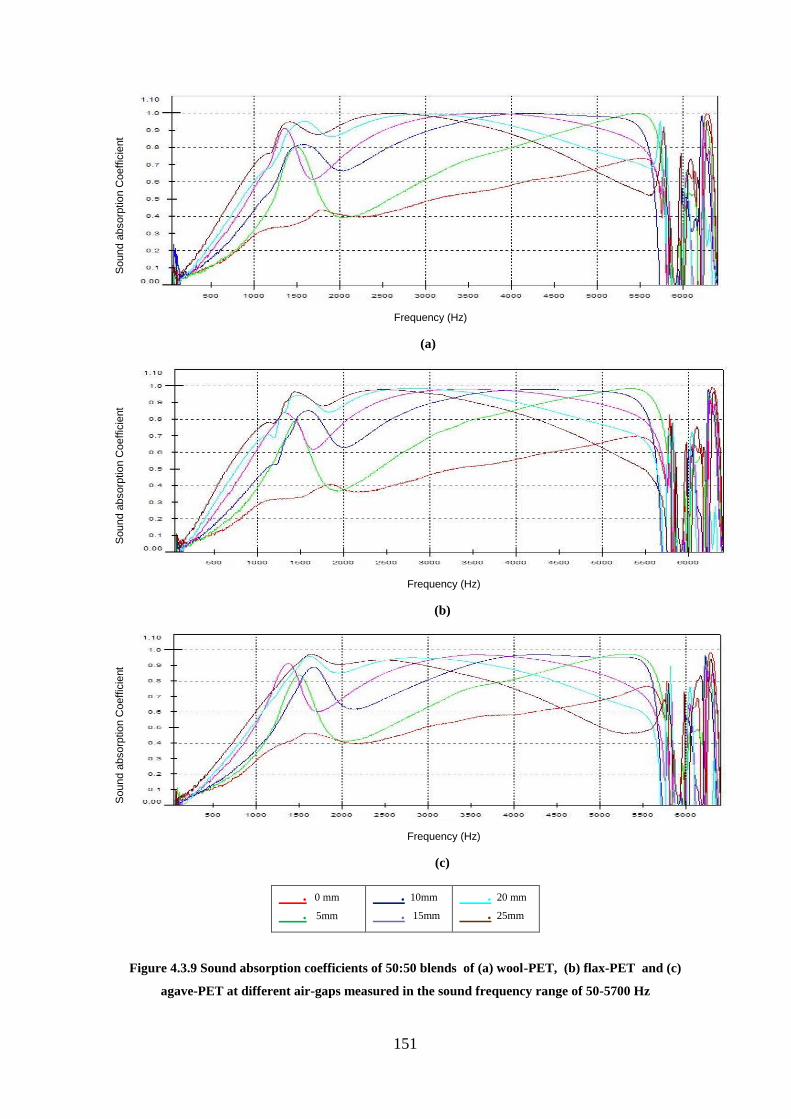
151
Sound a
bsorp
tio
n C
oeffic
ient
Frequency (Hz)
(a)
Sound a
bsorp
tio
n C
oeffic
ient
Frequency (Hz)
(b)
Sound a
bsorp
tio
n C
oeffic
ient
Frequency (Hz)
(c)
. 0 mm
. 5mm
. 10mm
. 15mm
. 20 mm
. 25mm
Figure 4.3.9 Sound absorption coefficients of 50:50 blends of (a) wool-PET, (b) flax-PET and (c)
agave-PET at different air-gaps measured in the sound frequency range of 50-5700 Hz
152
Conversely, when the air gap is an even multiple of a quarter-wavelength of the incident
sound wave ( and thus a multiple of half-wavelengths as well), it becomes totally
ineffective as the incident and reflected waves are in phase, i.e. constructive sound wave
interference takes place [45]. Therefore, sound absorption coefficient decreased slightly
when the air-gap was increased from 15mm to 25mm. This could be due to the change in
air-gap from being odd multiples of quarter-wavelengths at about 15mm air-gap
(maximum sound absorption) to being multiples of half-wavelengths as the air-gap
increased to 25mm.
So by increasing the air gap, the sound energy at long wavelengths (low frequency) can be
absorbed. A similar effect can be obtained by increasing sample thickness, which can
improve the sound absorption coefficients at low, middle and high frequencies due to
increased losses in sound energy losses [13].
Furthermore, the effect of constant air-gap on sound absorption coefficients of the fabrics
produced with different blending ratios was evaluated as shown in Figure 4.3.10 and then
the third case was studied to evaluate the sound absorption coefficients of the fabrics
produced from different natural fibres at the same air-gap as shown in Figure 4.3.11.
Figure 4.3.10 shows the sound absorption coefficient profiles at the same air-gap (0mm
and 15mm) for the three blending ratios of each of the natural fibres used in this section. In
both the air-gaps, the differences in sound absorption coefficients among the fabrics
produced from blends of wool and PET fibres and among the fabrics produced from blends
of flax and PET fibres were minimal as evident from closely lying profiles in Figures
153
So
un
d A
bso
rpti
on
Co
effi
cien
t
Sound Frequency (Hz)
.Wool30% . Wool 50% . Wool70%
(a) Wool /PET Fibres – 0mm Air Gap
Sou
nd
Ab
sorp
tio
n C
oef
fici
ent
Sound Frequency (Hz)
.Wool 30% . Wool 50% . Wool 70%
(b) Wool /PET Fibres – 15mm Air Gap
S
ou
nd
Ab
sorp
tio
n
Co
effi
cien
t
Sound Frequency (Hz)
. Flax 30% . Flax 50% . Flax 70%
(c) Flax /PET Fibres – 0mm Air Gap
Sou
nd
Ab
sorp
tio
n C
oef
fici
ent
Sound Frequency (Hz)
. Flax 30% .Flax 50% .Flax 70%
(d) Flax/PET Fibres – 15mm Air Gap
S
ou
nd
Ab
sorp
tio
n
Co
effi
cien
t
Sound Frequency (Hz)
.Agave 30% .Agave 50% .Agave 70%
(e) Agave/PET Fibres – 0mm Air Gap
So
un
d A
bso
rpti
on
Co
effi
cien
t
Sound Frequency (Hz)
.Agave30% .Agave 50% .Agave 70%
(f) Agave/PET Fibres – 15mm Air Gap
Figure 4.3.10. Sound absorption coefficients (50-5700Hz) at air gap of 0mm (Left) and 15mm (Right) for
different blending ratios of the same natural fibre type
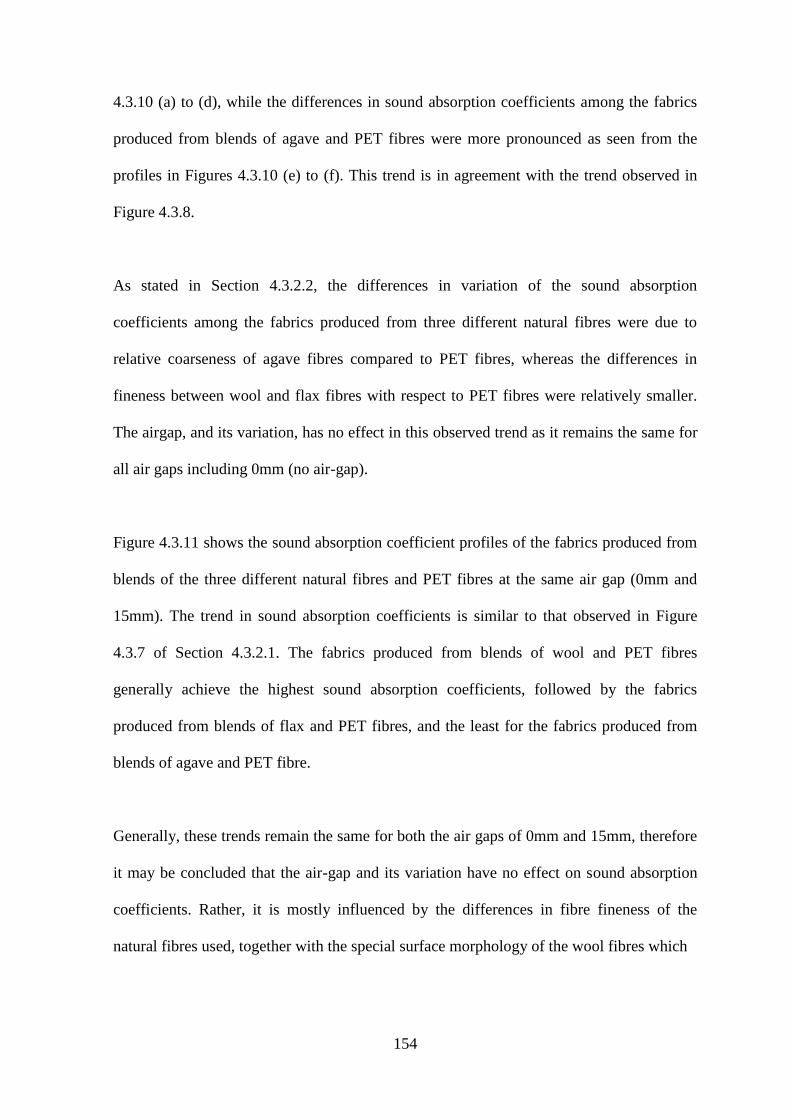
154
4.3.10 (a) to (d), while the differences in sound absorption coefficients among the fabrics
produced from blends of agave and PET fibres were more pronounced as seen from the
profiles in Figures 4.3.10 (e) to (f). This trend is in agreement with the trend observed in
Figure 4.3.8.
As stated in Section 4.3.2.2, the differences in variation of the sound absorption
coefficients among the fabrics produced from three different natural fibres were due to
relative coarseness of agave fibres compared to PET fibres, whereas the differences in
fineness between wool and flax fibres with respect to PET fibres were relatively smaller.
The airgap, and its variation, has no effect in this observed trend as it remains the same for
all air gaps including 0mm (no air-gap).
Figure 4.3.11 shows the sound absorption coefficient profiles of the fabrics produced from
blends of the three different natural fibres and PET fibres at the same air gap (0mm and
15mm). The trend in sound absorption coefficients is similar to that observed in Figure
4.3.7 of Section 4.3.2.1. The fabrics produced from blends of wool and PET fibres
generally achieve the highest sound absorption coefficients, followed by the fabrics
produced from blends of flax and PET fibres, and the least for the fabrics produced from
blends of agave and PET fibre.
Generally, these trends remain the same for both the air gaps of 0mm and 15mm, therefore
it may be concluded that the air-gap and its variation have no effect on sound absorption
coefficients. Rather, it is mostly influenced by the differences in fibre fineness of the
natural fibres used, together with the special surface morphology of the wool fibres which
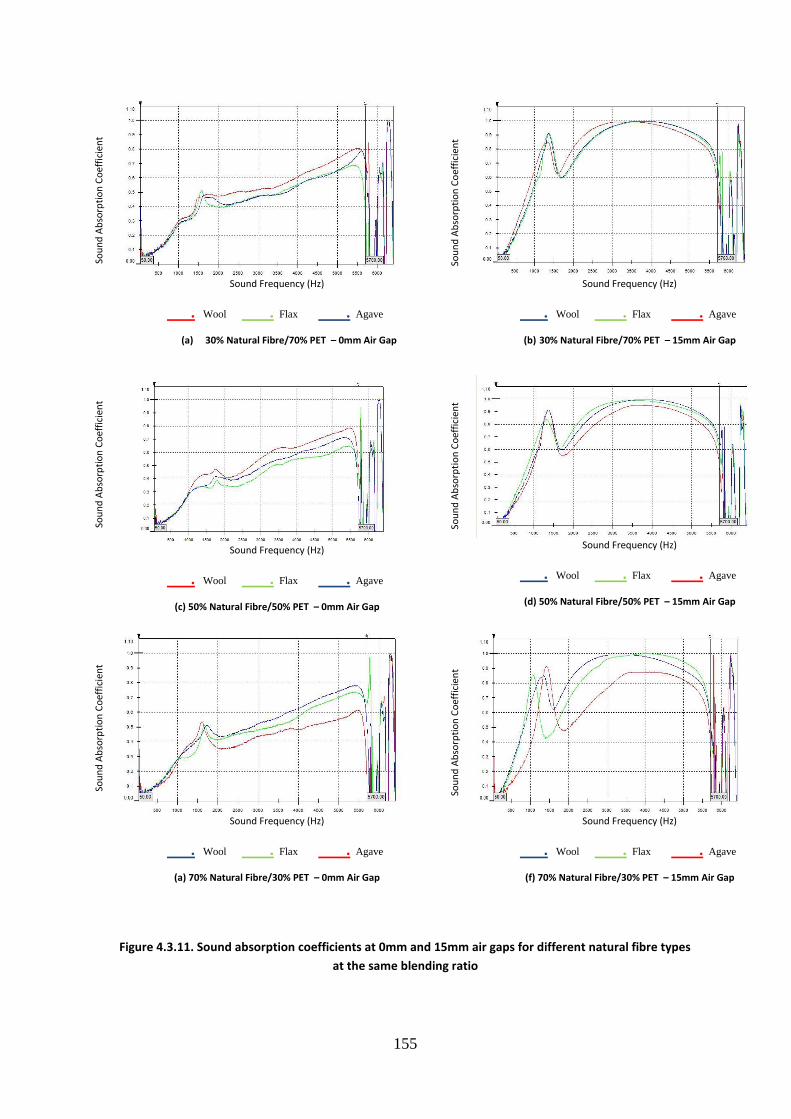
155
So
un
d A
bso
rpti
on
Co
effi
cien
t
Sound Frequency (Hz)
. Wool . Flax . Agave
(a) 30% Natural Fibre/70% PET – 0mm Air Gap
S
ou
nd
Ab
sorp
tio
n C
oef
fici
ent
Sound Frequency (Hz)
. Wool . Flax . Agave
(b) 30% Natural Fibre/70% PET – 15mm Air Gap
So
un
d A
bso
rpti
on
Co
effi
cien
t
Sound Frequency (Hz)
. Wool . Flax . Agave
(c) 50% Natural Fibre/50% PET – 0mm Air Gap
S
ou
nd
Ab
sorp
tio
n C
oef
fici
ent
Sound Frequency (Hz)
. Wool . Flax . Agave
(d) 50% Natural Fibre/50% PET – 15mm Air Gap
So
un
d A
bso
rpti
on
Co
effi
cien
t
Sound Frequency (Hz)
. Wool . Flax . Agave
(a) 70% Natural Fibre/30% PET – 0mm Air Gap
So
un
d A
bso
rpti
on
Co
effi
cien
t
Sound Frequency (Hz)
. Wool . Flax . Agave
(f) 70% Natural Fibre/30% PET – 15mm Air Gap
Figure 4.3.11. Sound absorption coefficients at 0mm and 15mm air gaps for different natural fibre types
at the same blending ratio
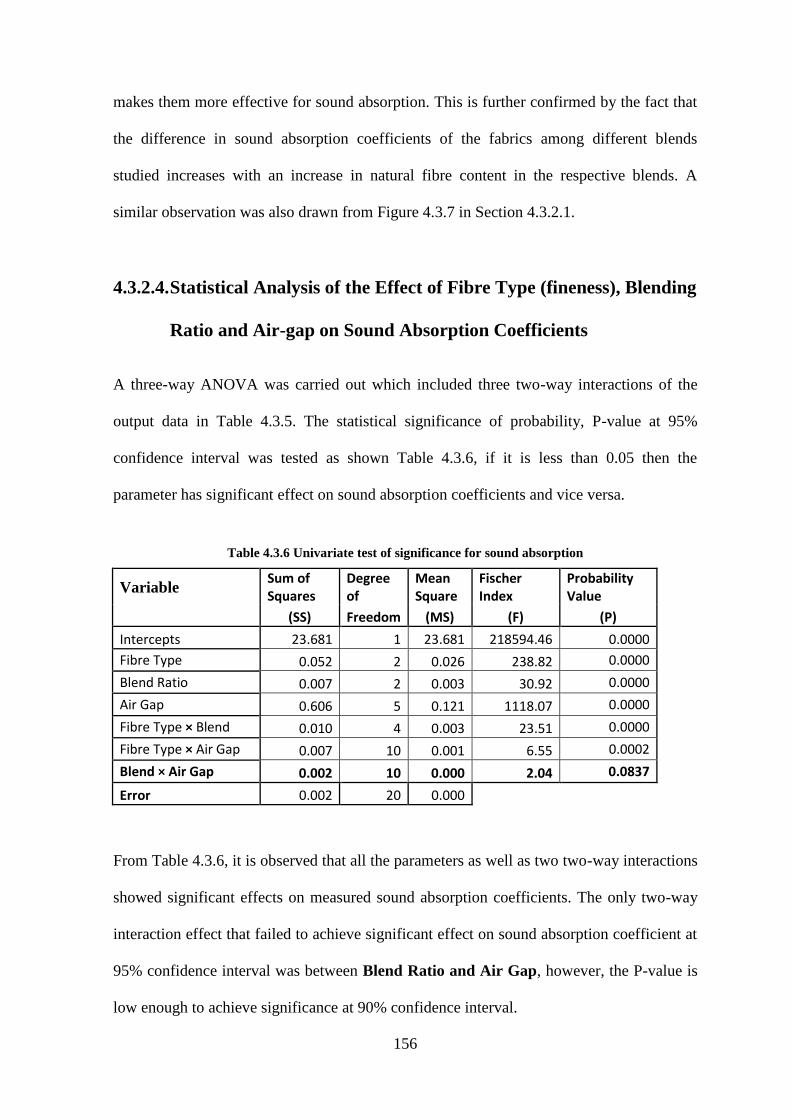
156
makes them more effective for sound absorption. This is further confirmed by the fact that
the difference in sound absorption coefficients of the fabrics among different blends
studied increases with an increase in natural fibre content in the respective blends. A
similar observation was also drawn from Figure 4.3.7 in Section 4.3.2.1.
4.3.2.4. Statistical Analysis of the Effect of Fibre Type (fineness), Blending
Ratio and Air-gap on Sound Absorption Coefficients
A three-way ANOVA was carried out which included three two-way interactions of the
output data in Table 4.3.5. The statistical significance of probability, P-value at 95%
confidence interval was tested as shown Table 4.3.6, if it is less than 0.05 then the
parameter has significant effect on sound absorption coefficients and vice versa.
Table 4.3.6 Univariate test of significance for sound absorption
Variable Sum of Squares
Degree of
Mean Square
Fischer Index
Probability Value
(SS) Freedom (MS) (F) (P)
Intercepts 23.681 1 23.681 218594.46 0.0000
Fibre Type 0.052 2 0.026 238.82 0.0000
Blend Ratio 0.007 2 0.003 30.92 0.0000
Air Gap 0.606 5 0.121 1118.07 0.0000
Fibre Type × Blend 0.010 4 0.003 23.51 0.0000
Fibre Type × Air Gap 0.007 10 0.001 6.55 0.0002
Blend × Air Gap 0.002 10 0.000 2.04 0.0837
Error 0.002 20 0.000
From Table 4.3.6, it is observed that all the parameters as well as two two-way interactions
showed significant effects on measured sound absorption coefficients. The only two-way
interaction effect that failed to achieve significant effect on sound absorption coefficient at
95% confidence interval was between Blend Ratio and Air Gap, however, the P-value is
low enough to achieve significance at 90% confidence interval.
157
The Tukey HSD tests and their corresponding least square plots were produced for all the
parameters to further analyse internal variations within each parameter, to assess the two-
way interactions, to elaborate the effects of the variables on sound absorption coefficient
and to compare them with each other.
Table 4.3.7 Tukey HSD Test for Fibre Type
Fiber Type Mean Sound Absorption
0.69 0.68 0.62
Wool
Flax 0.0006
Agave 0.0001 0.0001
The P-values in Table 4.3.7 show that all the values of mean sound absorption coefficients
are significantly different from each other since they are all below 0.05. Figure 4.3.12
shows a comparison of mean sound absorption coefficients of the three natural fibre
blends, it shows that the fabrics produced from wool and PET fibres achieved the best
sound absorption coefficient followed by the fabrics produced from flax and PET fibres.
The fabrics produced from agave and PET fibres achieved considerably lower sound
absorption coefficient in comparison to the fabrics produced from blends of other two
natural fibres.
The mean sound absorption coefficients of the fabrics produced from blends of agave and
PET fibres are about 11% and 9.5% below the fabrics produced from blends of wool and
PET fibres and blends of flax and PET fibres, respectively, yet the difference between the
sound absorption coefficients of the fabrics produced from blends of wool and PET fibres
and those produced from blends of flax and PET fibres is only 1.5%. The reasons for this
difference in the performance of the fabrics produced from the three different natural fibres
have already been discussed at length in the previous sections. Also, it is already well
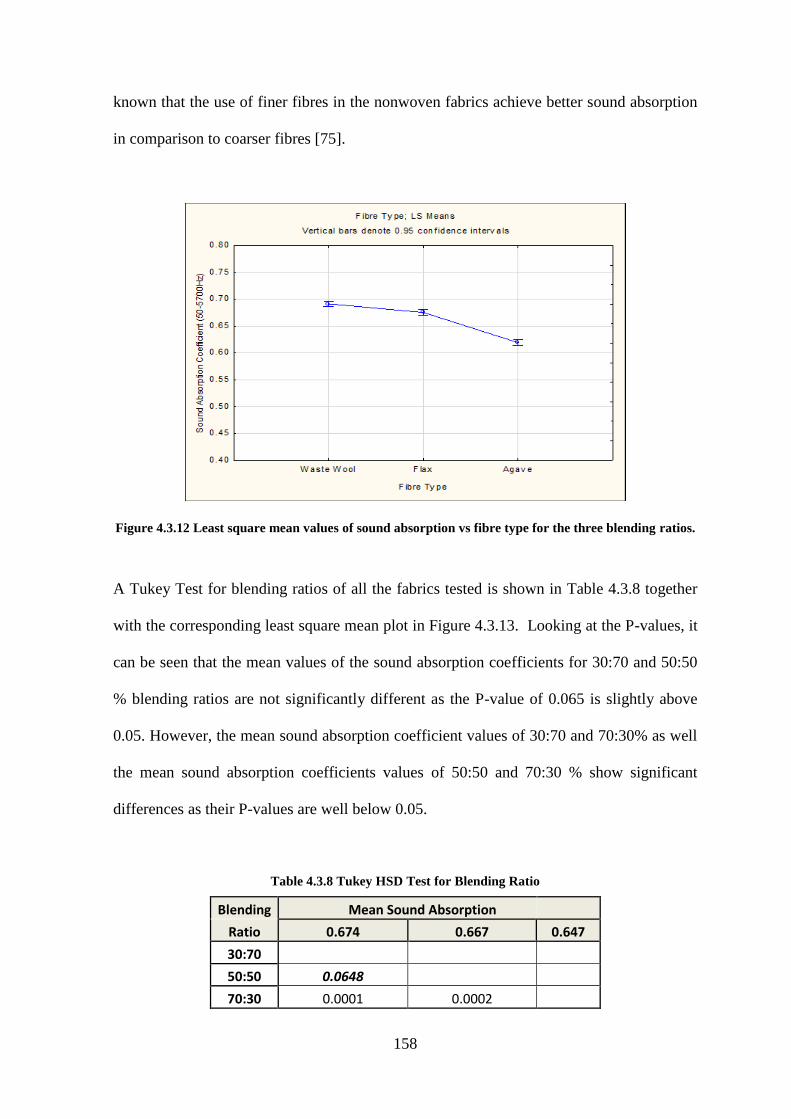
158
known that the use of finer fibres in the nonwoven fabrics achieve better sound absorption
in comparison to coarser fibres [75].
Figure 4.3.12 Least square mean values of sound absorption vs fibre type for the three blending ratios.
A Tukey Test for blending ratios of all the fabrics tested is shown in Table 4.3.8 together
with the corresponding least square mean plot in Figure 4.3.13. Looking at the P-values, it
can be seen that the mean values of the sound absorption coefficients for 30:70 and 50:50
% blending ratios are not significantly different as the P-value of 0.065 is slightly above
0.05. However, the mean sound absorption coefficient values of 30:70 and 70:30% as well
the mean sound absorption coefficients values of 50:50 and 70:30 % show significant
differences as their P-values are well below 0.05.
Table 4.3.8 Tukey HSD Test for Blending Ratio
Blending Mean Sound Absorption
Ratio 0.674 0.667 0.647
30:70
50:50 0.0648
70:30 0.0001 0.0002
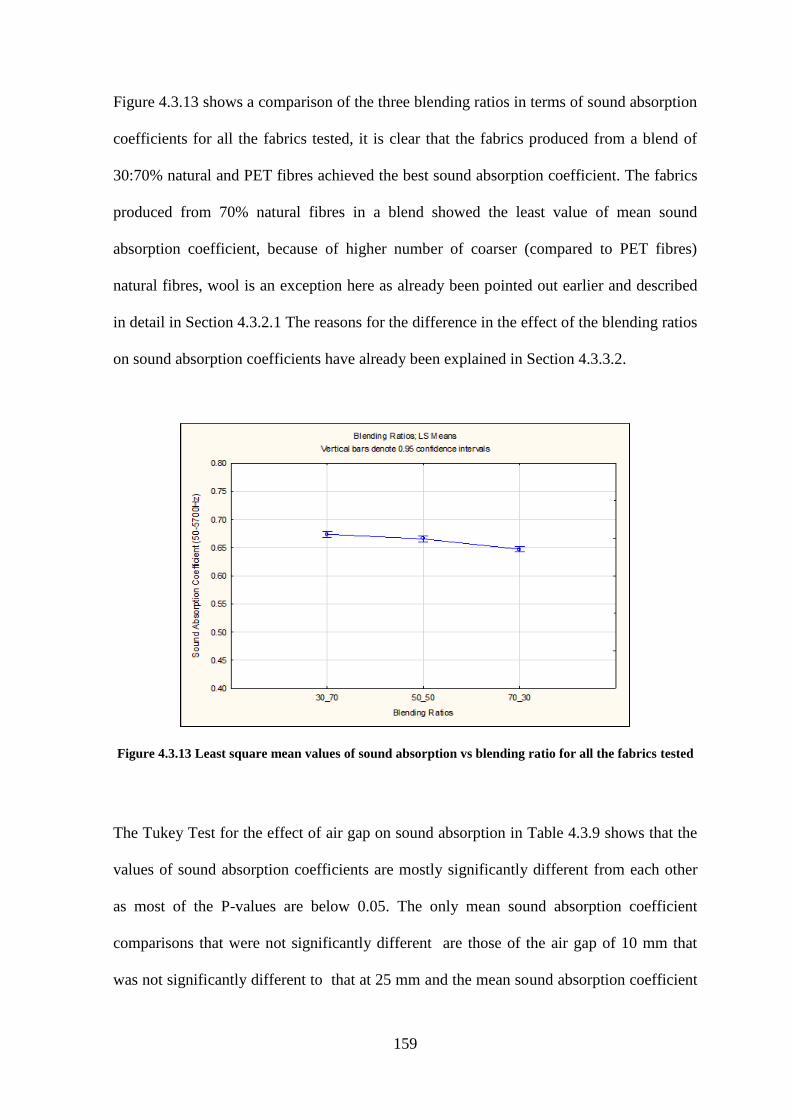
159
Figure 4.3.13 shows a comparison of the three blending ratios in terms of sound absorption
coefficients for all the fabrics tested, it is clear that the fabrics produced from a blend of
30:70% natural and PET fibres achieved the best sound absorption coefficient. The fabrics
produced from 70% natural fibres in a blend showed the least value of mean sound
absorption coefficient, because of higher number of coarser (compared to PET fibres)
natural fibres, wool is an exception here as already been pointed out earlier and described
in detail in Section 4.3.2.1 The reasons for the difference in the effect of the blending ratios
on sound absorption coefficients have already been explained in Section 4.3.3.2.
Figure 4.3.13 Least square mean values of sound absorption vs blending ratio for all the fabrics tested
The Tukey Test for the effect of air gap on sound absorption in Table 4.3.9 shows that the
values of sound absorption coefficients are mostly significantly different from each other
as most of the P-values are below 0.05. The only mean sound absorption coefficient
comparisons that were not significantly different are those of the air gap of 10 mm that
was not significantly different to that at 25 mm and the mean sound absorption coefficient
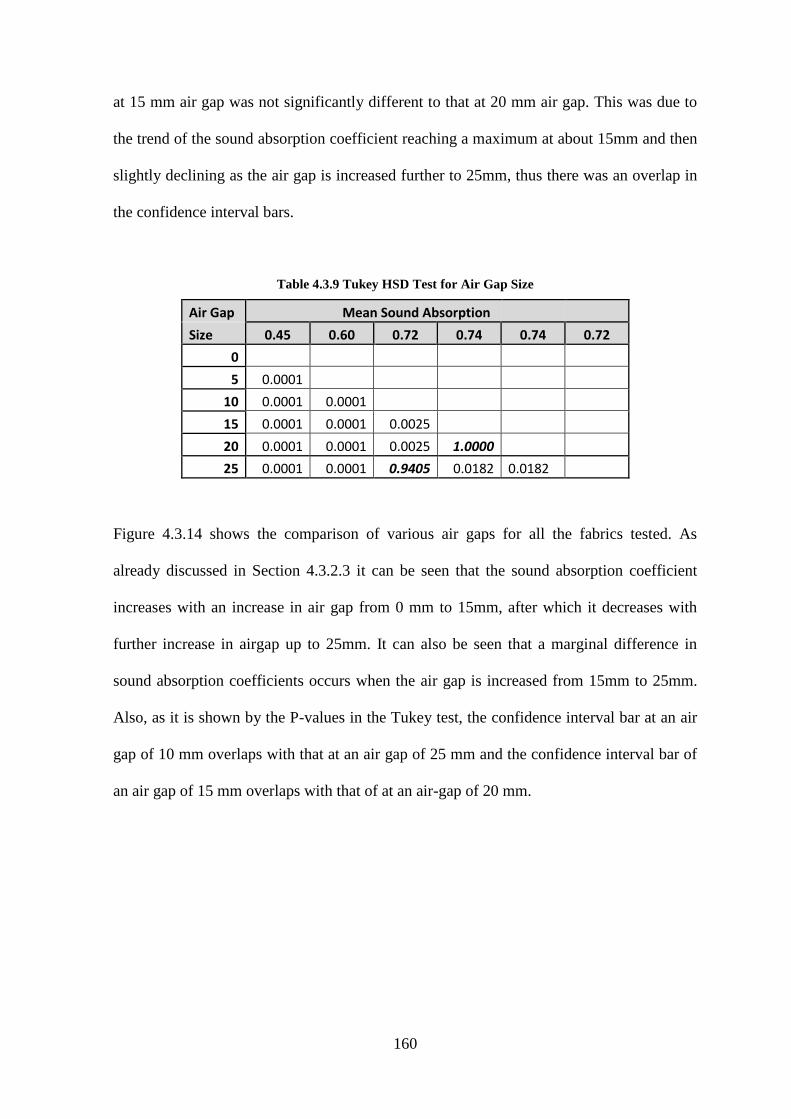
160
at 15 mm air gap was not significantly different to that at 20 mm air gap. This was due to
the trend of the sound absorption coefficient reaching a maximum at about 15mm and then
slightly declining as the air gap is increased further to 25mm, thus there was an overlap in
the confidence interval bars.
Table 4.3.9 Tukey HSD Test for Air Gap Size
Air Gap Mean Sound Absorption
Size 0.45 0.60 0.72 0.74 0.74 0.72
0
5 0.0001
10 0.0001 0.0001
15 0.0001 0.0001 0.0025
20 0.0001 0.0001 0.0025 1.0000
25 0.0001 0.0001 0.9405 0.0182 0.0182
Figure 4.3.14 shows the comparison of various air gaps for all the fabrics tested. As
already discussed in Section 4.3.2.3 it can be seen that the sound absorption coefficient
increases with an increase in air gap from 0 mm to 15mm, after which it decreases with
further increase in airgap up to 25mm. It can also be seen that a marginal difference in
sound absorption coefficients occurs when the air gap is increased from 15mm to 25mm.
Also, as it is shown by the P-values in the Tukey test, the confidence interval bar at an air
gap of 10 mm overlaps with that at an air gap of 25 mm and the confidence interval bar of
an air gap of 15 mm overlaps with that of at an air-gap of 20 mm.
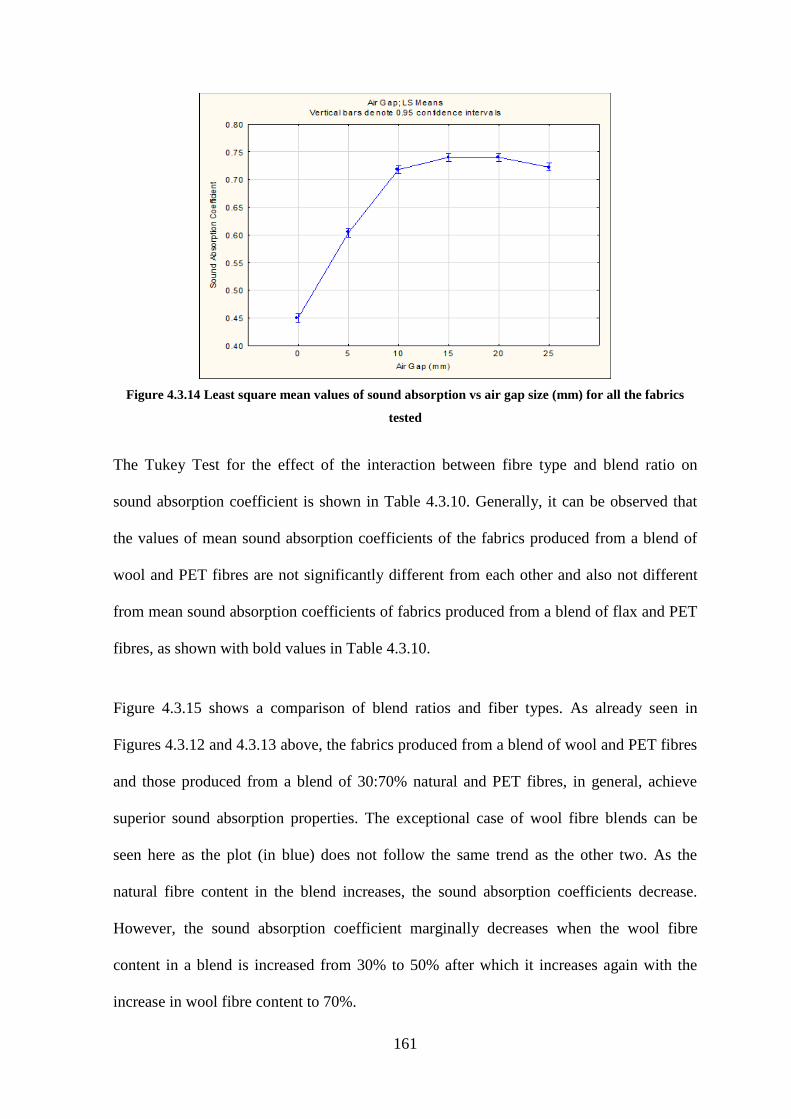
161
Figure 4.3.14 Least square mean values of sound absorption vs air gap size (mm) for all the fabrics
tested
The Tukey Test for the effect of the interaction between fibre type and blend ratio on
sound absorption coefficient is shown in Table 4.3.10. Generally, it can be observed that
the values of mean sound absorption coefficients of the fabrics produced from a blend of
wool and PET fibres are not significantly different from each other and also not different
from mean sound absorption coefficients of fabrics produced from a blend of flax and PET
fibres, as shown with bold values in Table 4.3.10.
Figure 4.3.15 shows a comparison of blend ratios and fiber types. As already seen in
Figures 4.3.12 and 4.3.13 above, the fabrics produced from a blend of wool and PET fibres
and those produced from a blend of 30:70% natural and PET fibres, in general, achieve
superior sound absorption properties. The exceptional case of wool fibre blends can be
seen here as the plot (in blue) does not follow the same trend as the other two. As the
natural fibre content in the blend increases, the sound absorption coefficients decrease.
However, the sound absorption coefficient marginally decreases when the wool fibre
content in a blend is increased from 30% to 50% after which it increases again with the
increase in wool fibre content to 70%.
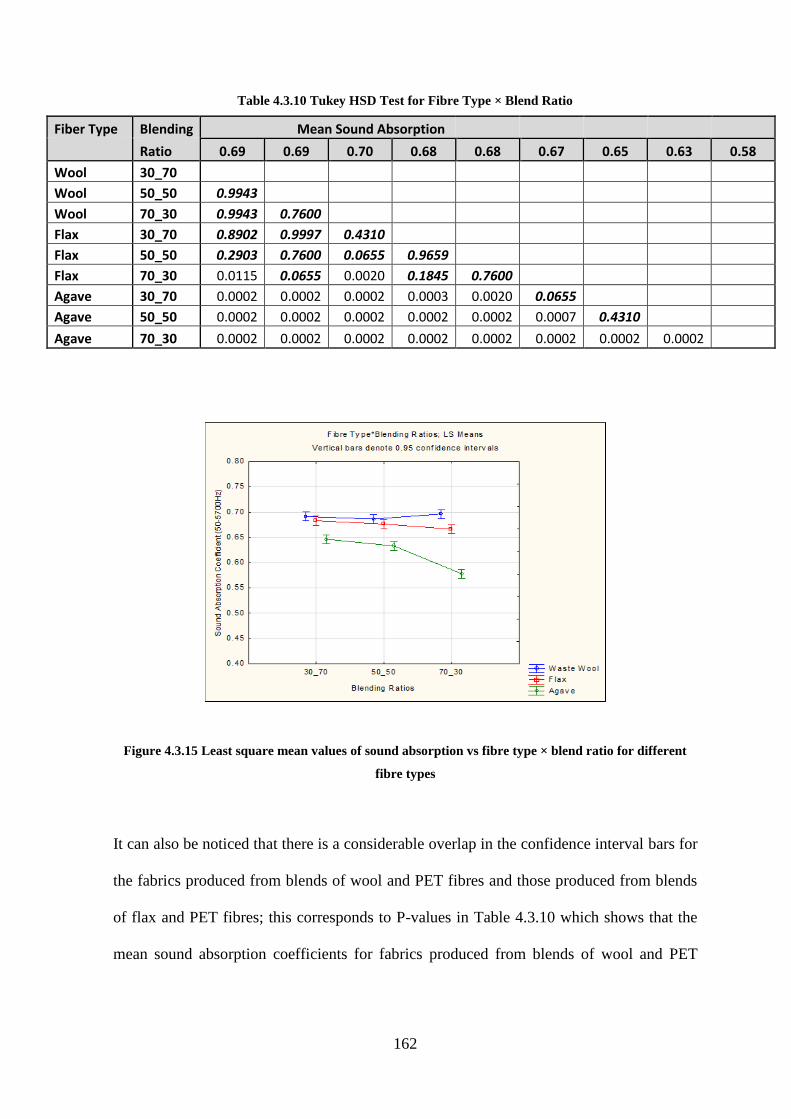
162
Table 4.3.10 Tukey HSD Test for Fibre Type × Blend Ratio
Fiber Type Blending Mean Sound Absorption
Ratio 0.69 0.69 0.70 0.68 0.68 0.67 0.65 0.63 0.58
Wool 30_70
Wool 50_50 0.9943
Wool 70_30 0.9943 0.7600
Flax 30_70 0.8902 0.9997 0.4310
Flax 50_50 0.2903 0.7600 0.0655 0.9659
Flax 70_30 0.0115 0.0655 0.0020 0.1845 0.7600
Agave 30_70 0.0002 0.0002 0.0002 0.0003 0.0020 0.0655
Agave 50_50 0.0002 0.0002 0.0002 0.0002 0.0002 0.0007 0.4310
Agave 70_30 0.0002 0.0002 0.0002 0.0002 0.0002 0.0002 0.0002 0.0002
Figure 4.3.15 Least square mean values of sound absorption vs fibre type × blend ratio for different
fibre types
It can also be noticed that there is a considerable overlap in the confidence interval bars for
the fabrics produced from blends of wool and PET fibres and those produced from blends
of flax and PET fibres; this corresponds to P-values in Table 4.3.10 which shows that the
mean sound absorption coefficients for fabrics produced from blends of wool and PET
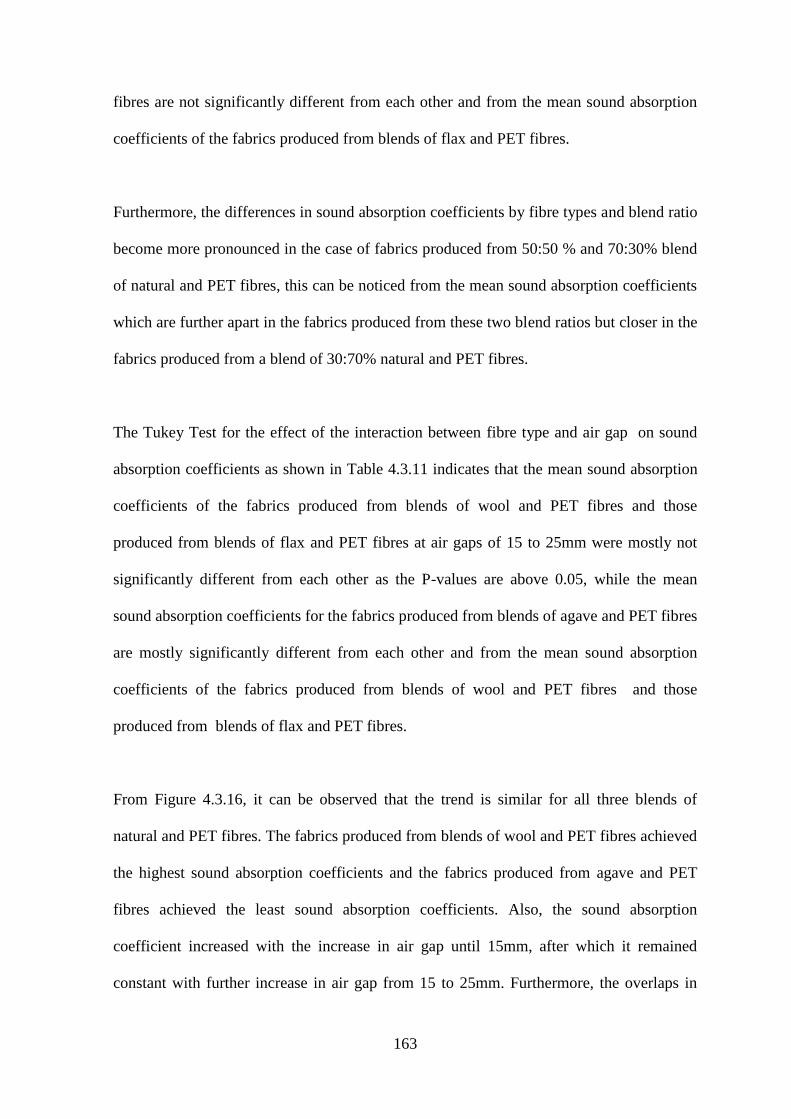
163
fibres are not significantly different from each other and from the mean sound absorption
coefficients of the fabrics produced from blends of flax and PET fibres.
Furthermore, the differences in sound absorption coefficients by fibre types and blend ratio
become more pronounced in the case of fabrics produced from 50:50 % and 70:30% blend
of natural and PET fibres, this can be noticed from the mean sound absorption coefficients
which are further apart in the fabrics produced from these two blend ratios but closer in the
fabrics produced from a blend of 30:70% natural and PET fibres.
The Tukey Test for the effect of the interaction between fibre type and air gap on sound
absorption coefficients as shown in Table 4.3.11 indicates that the mean sound absorption
coefficients of the fabrics produced from blends of wool and PET fibres and those
produced from blends of flax and PET fibres at air gaps of 15 to 25mm were mostly not
significantly different from each other as the P-values are above 0.05, while the mean
sound absorption coefficients for the fabrics produced from blends of agave and PET fibres
are mostly significantly different from each other and from the mean sound absorption
coefficients of the fabrics produced from blends of wool and PET fibres and those
produced from blends of flax and PET fibres.
From Figure 4.3.16, it can be observed that the trend is similar for all three blends of
natural and PET fibres. The fabrics produced from blends of wool and PET fibres achieved
the highest sound absorption coefficients and the fabrics produced from agave and PET
fibres achieved the least sound absorption coefficients. Also, the sound absorption
coefficient increased with the increase in air gap until 15mm, after which it remained
constant with further increase in air gap from 15 to 25mm. Furthermore, the overlaps in
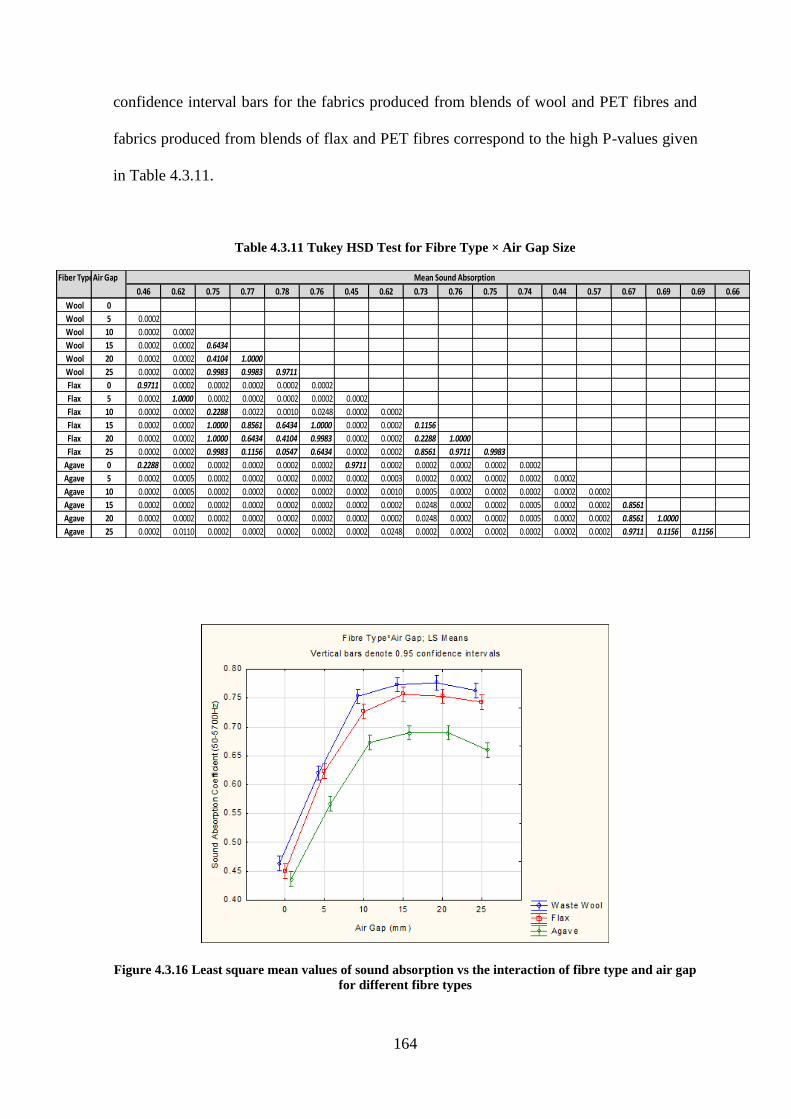
164
confidence interval bars for the fabrics produced from blends of wool and PET fibres and
fabrics produced from blends of flax and PET fibres correspond to the high P-values given
in Table 4.3.11.
Table 4.3.11 Tukey HSD Test for Fibre Type × Air Gap Size
Fiber TypeAir Gap Mean Sound Absorption
0.46 0.62 0.75 0.77 0.78 0.76 0.45 0.62 0.73 0.76 0.75 0.74 0.44 0.57 0.67 0.69 0.69 0.66
Wool 0
Wool 5 0.0002
Wool 10 0.0002 0.0002
Wool 15 0.0002 0.0002 0.6434
Wool 20 0.0002 0.0002 0.4104 1.0000
Wool 25 0.0002 0.0002 0.9983 0.9983 0.9711
Flax 0 0.9711 0.0002 0.0002 0.0002 0.0002 0.0002
Flax 5 0.0002 1.0000 0.0002 0.0002 0.0002 0.0002 0.0002
Flax 10 0.0002 0.0002 0.2288 0.0022 0.0010 0.0248 0.0002 0.0002
Flax 15 0.0002 0.0002 1.0000 0.8561 0.6434 1.0000 0.0002 0.0002 0.1156
Flax 20 0.0002 0.0002 1.0000 0.6434 0.4104 0.9983 0.0002 0.0002 0.2288 1.0000
Flax 25 0.0002 0.0002 0.9983 0.1156 0.0547 0.6434 0.0002 0.0002 0.8561 0.9711 0.9983
Agave 0 0.2288 0.0002 0.0002 0.0002 0.0002 0.0002 0.9711 0.0002 0.0002 0.0002 0.0002 0.0002
Agave 5 0.0002 0.0005 0.0002 0.0002 0.0002 0.0002 0.0002 0.0003 0.0002 0.0002 0.0002 0.0002 0.0002
Agave 10 0.0002 0.0005 0.0002 0.0002 0.0002 0.0002 0.0002 0.0010 0.0005 0.0002 0.0002 0.0002 0.0002 0.0002
Agave 15 0.0002 0.0002 0.0002 0.0002 0.0002 0.0002 0.0002 0.0002 0.0248 0.0002 0.0002 0.0005 0.0002 0.0002 0.8561
Agave 20 0.0002 0.0002 0.0002 0.0002 0.0002 0.0002 0.0002 0.0002 0.0248 0.0002 0.0002 0.0005 0.0002 0.0002 0.8561 1.0000
Agave 25 0.0002 0.0110 0.0002 0.0002 0.0002 0.0002 0.0002 0.0248 0.0002 0.0002 0.0002 0.0002 0.0002 0.0002 0.9711 0.1156 0.1156
Figure 4.3.16 Least square mean values of sound absorption vs the interaction of fibre type and air gap
for different fibre types
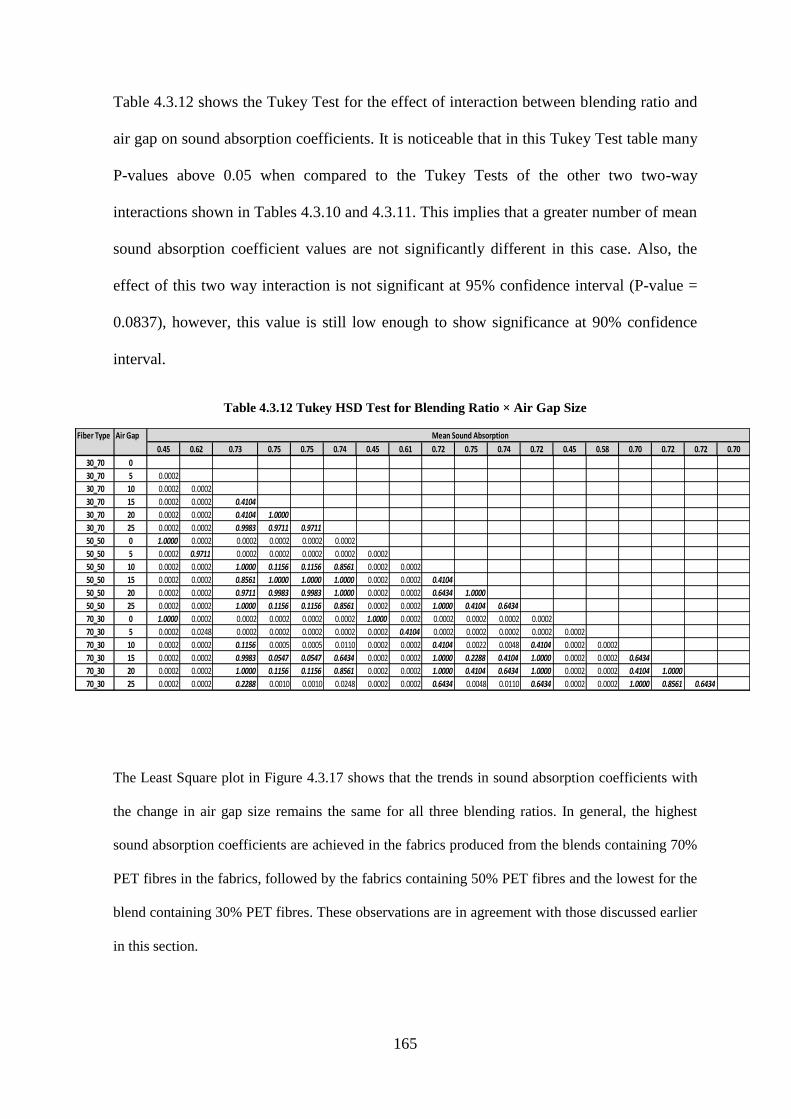
165
Table 4.3.12 shows the Tukey Test for the effect of interaction between blending ratio and
air gap on sound absorption coefficients. It is noticeable that in this Tukey Test table many
P-values above 0.05 when compared to the Tukey Tests of the other two two-way
interactions shown in Tables 4.3.10 and 4.3.11. This implies that a greater number of mean
sound absorption coefficient values are not significantly different in this case. Also, the
effect of this two way interaction is not significant at 95% confidence interval (P-value =
0.0837), however, this value is still low enough to show significance at 90% confidence
interval.
Table 4.3.12 Tukey HSD Test for Blending Ratio × Air Gap Size
Fiber Type Air Gap Mean Sound Absorption
0.45 0.62 0.73 0.75 0.75 0.74 0.45 0.61 0.72 0.75 0.74 0.72 0.45 0.58 0.70 0.72 0.72 0.70
30_70 0
30_70 5 0.0002
30_70 10 0.0002 0.0002
30_70 15 0.0002 0.0002 0.4104
30_70 20 0.0002 0.0002 0.4104 1.0000
30_70 25 0.0002 0.0002 0.9983 0.9711 0.9711
50_50 0 1.0000 0.0002 0.0002 0.0002 0.0002 0.0002
50_50 5 0.0002 0.9711 0.0002 0.0002 0.0002 0.0002 0.0002
50_50 10 0.0002 0.0002 1.0000 0.1156 0.1156 0.8561 0.0002 0.0002
50_50 15 0.0002 0.0002 0.8561 1.0000 1.0000 1.0000 0.0002 0.0002 0.4104
50_50 20 0.0002 0.0002 0.9711 0.9983 0.9983 1.0000 0.0002 0.0002 0.6434 1.0000
50_50 25 0.0002 0.0002 1.0000 0.1156 0.1156 0.8561 0.0002 0.0002 1.0000 0.4104 0.6434
70_30 0 1.0000 0.0002 0.0002 0.0002 0.0002 0.0002 1.0000 0.0002 0.0002 0.0002 0.0002 0.0002
70_30 5 0.0002 0.0248 0.0002 0.0002 0.0002 0.0002 0.0002 0.4104 0.0002 0.0002 0.0002 0.0002 0.0002
70_30 10 0.0002 0.0002 0.1156 0.0005 0.0005 0.0110 0.0002 0.0002 0.4104 0.0022 0.0048 0.4104 0.0002 0.0002
70_30 15 0.0002 0.0002 0.9983 0.0547 0.0547 0.6434 0.0002 0.0002 1.0000 0.2288 0.4104 1.0000 0.0002 0.0002 0.6434
70_30 20 0.0002 0.0002 1.0000 0.1156 0.1156 0.8561 0.0002 0.0002 1.0000 0.4104 0.6434 1.0000 0.0002 0.0002 0.4104 1.0000
70_30 25 0.0002 0.0002 0.2288 0.0010 0.0010 0.0248 0.0002 0.0002 0.6434 0.0048 0.0110 0.6434 0.0002 0.0002 1.0000 0.8561 0.6434
The Least Square plot in Figure 4.3.17 shows that the trends in sound absorption coefficients with
the change in air gap size remains the same for all three blending ratios. In general, the highest
sound absorption coefficients are achieved in the fabrics produced from the blends containing 70%
PET fibres in the fabrics, followed by the fabrics containing 50% PET fibres and the lowest for the
blend containing 30% PET fibres. These observations are in agreement with those discussed earlier
in this section.
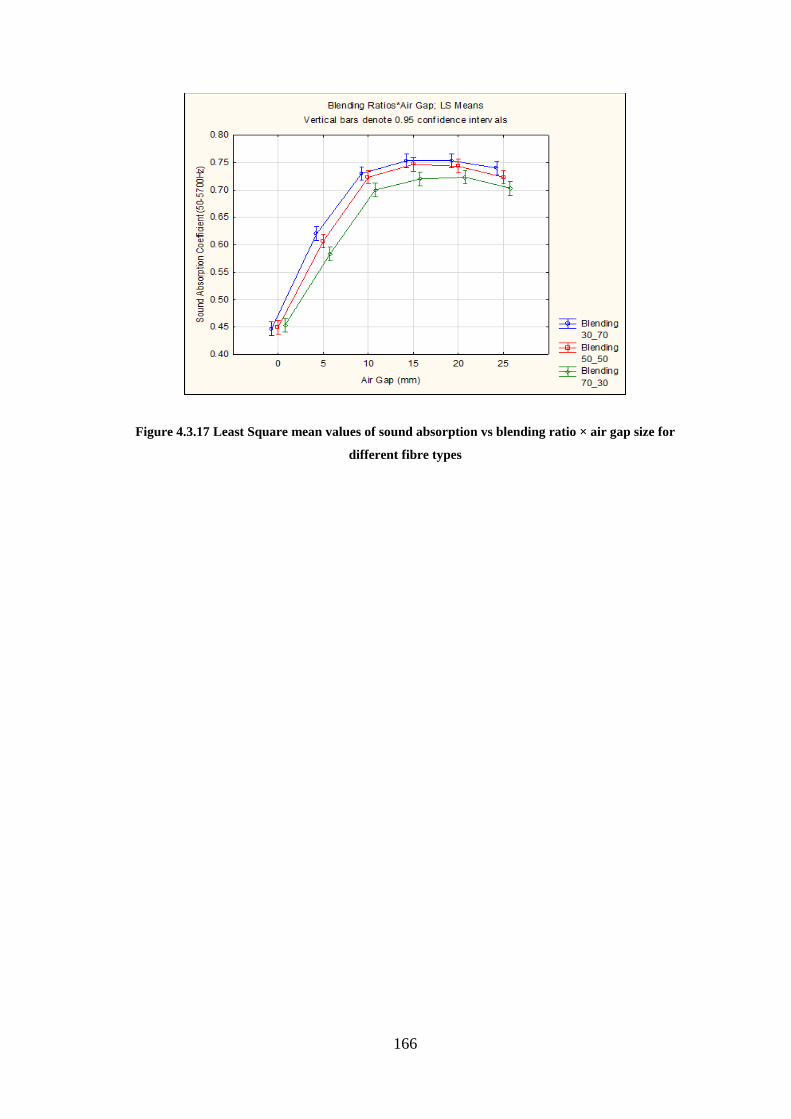
166
Figure 4.3.17 Least Square mean values of sound absorption vs blending ratio × air gap size for
different fibre types
167
4.4. Evaluation and Selection of Parameters for Sound
Absorption Application
The evaluation and selection of suitable parameters and machine settings for the fabrics
produced for sound absorption application and tested with varying air gap and XPS
backing was mainly based on their ability to absorb sound. However, some other factors
should also be considered to arrive at a final decision. Besides the ability to absorb sound,
other factors which include; availability of raw materials, cost-effectiveness and
manufacturing efficiency, adaptability and environmental friendliness should also be
considered.
Sound Absorption Ability
From the results on measurement of sound absorption coefficients, it was noticed that the
fabrics produced from blends of wool and PET fibres achieved superior sound absorption
performance. It was also seen that the differences in the sound absorption coefficients
among the three different blend ratios were marginal and not enough to conclusively
choose one blend ratio over the other as the best choice. This can be substantiated by the
fact that the means of sound absorption coefficients of the fabrics for the three blend ratios
of wool and PET fibres were almost identical, i.e. 0.69, 0.69 and 0.70 for 30:70%, 50:50%
and 70:30% blends of wool and PET fibres, respectively. Therefore, the final selection
should be based on other factors, outlined in the previous section, besides sound absorption
coefficients.
168
The Availability of Raw Materials
The input and raw materials required to produce this type of units are the XPS board and
four different fibre types. The XPS boards are already commercially available. PET fibres
with various physical properties are widely available in the market. The same is the case
with flax fibres which are also commercially grown and available in South Africa.
Therefore, the question of availability mainly affects waste wool fibres and agave fibres, as
they are not widely available and used commercially.
The problem with waste wool fibre is that while it is a by-product of commercial wool
fibre processing, currently no formal method of collecting and packaging exists with
subsistence farmers, however, some wool washers in the Eastern Cape Province (South
Africa) have reported availability of coring wool waste in substantial quantities (excluding
the waste from other wool types).
The situation is similar for agave fibres, there are some local initiatives to develop agave
cultivation, however, no formal commercial entity exists currently to cultivate, process and
grade agave fibres. However, a big potential for sufficient supply exists as more alternative
uses of agave fibres are being developed and thus demand for the fibres would be expected
to increase the supply (cultivation and processing).
Adaptability
The materials produced are better suited for application in the construction sector, mainly
because the whole system consisting of nonwoven fabrics backed by XPS at varying air
gaps limits the options for application due to space requirements. Therefore, the main
considerations, among the characteristics of the produced material, are their adaptability in
169
real life applications, dimensions and handling. The main criterion here is total thickness of
the system, to fit well with the other building materials in-situ.
The thickness of the nonwoven fabrics, optimum air-gap size and thickness of XPS was 7-
8 mm, 15 mm and 40mm, respectively. Therefore, the total thickness of the unit is about
63mm. This is still thinner than the average dry-wall partition thickness of 90-190mm
currently prevalent in the building sector. Also, this sound absorption unit is ideally suited
for internal wall partitioning especially as a pre-fabricated panel for dry-wall partitioning.
However, the means of fixing the air gap between the nonwoven fabric and XPS may still
pose a challenge.
Cost-effectiveness and Manufacturing Efficiency
As it has already been discussed, the most practical mode of application of these sound
absorption units is in the form of pre-fabricated panels for internal room partitioning.
Therefore, the costs of the fibres are major input costs in the production of such pre-
fabricated boards as the XPS is already used commercially for ceiling and wall partitioning
applications. See Table 4.3.12 below for the prices of fibres used in this work.
Table 4.3.12 Prices of the fibres used.
Fibre Type Price (ZAR/kg) PET 16.10
Waste Wool 0.50 - 8
Flax 5-8
Agave 8-10
Other costs are associated with the production of nonwoven fabrics and assembling
prefabricated panels. These costs will then inform the comparison of the total cost of the
pre-fabricated panels with other types of panels used in room partitioning with or without
sound absorption ability. The question of manufacturing efficiency of this prefabricated
170
panel only lies in the stage of forming the panel as nonwoven fabric production is an
established technology. The main determining factor here would be the finishing materials
(face of the wall panel) and the means of fixing the air-gap.
Environmental_Friendliness
All the nonwoven fabrics produced contain natural fibres blended in different proportions
with PET fibres. PET fibres are synthetic and not bio-degradable and they are extruded
from energy intensive processes. Therefore, the PET fibres are not considered
environmentally friendly green material. Wool fibres are from animal origin and are
biodegradable; however, the washing of wool may consume a lot of energy and water but
still it is regarded as a green material. Flax and agave fibres are from plant origin and are
bio-degradable. However, irrigation water and pesticides are the main considerations
during cultivation, and the mechanical processing of the fibres consumes energy which
should be accounted in the life cycle analysis of the final product.
Summary
When considering all the factors evaluated above, it is clear that some of them are
applicable to all products regardless of the natural fibre used. Among the factors that are
dependent on fibre choice, it is clear that the fabrics produced from a blend of 70:30%
Wool: PET fibres are the most desirable since they achieved the highest sound absorption
coefficients. The fabrics also have high natural fibre content to promote better
biodegradability and thus can be considered environmentally friendly “green material”.
Waste wool fibres are also the cheapest among the fibres used in this work and promoting
their use in such value-added products will benefit subsistent farmers in rural areas.
171
5. SUMMARY AND CONCLUSIONS
Needle-punched nonwoven fabrics are widely used in sound absorption application
because of their porous structure. Traditionally, these needle-punched nonwoven fabrics
have been mainly produced from synthetic fibres, such as PET and PP. The review of
literature carried out in this work showed a gradual shift in attempts to introduce natural
fibres particularly in the products used in sound absorption applications. Also, many
studies have been carried out to study the effects of production parameters on the sound
absorption properties of the needle-punched nonwoven fabrics but very little work has
been carried out to optimize and study the synergistic effects of these parameters.
The major objectives of this work included studying the effects of some important
production parameters on sound absorption properties of the needle-punched nonwoven
fabrics, and then to optimize the variables to achieve the best functionality of the final
product. The fabrics were produced by blending natural fibres such as agave, hemp and
flax fibres with PET fibres. Furthermore, the effect of the production parameters on air
permeability of the needle-punched fabrics was studied. In the last part of this work, the
effect of air gap between needlepunched nonwoven fabric and extruded polystyrene sheet
(XPS) backing material was studied. The effect of varying air gap together with the effect
of varying some major production parameters on sound absorption coefficient was studied.
172
5.1. Optimization of Needlepunching Process
Parameters For Sound Absorption Applications
The optimization of process parameters was carried out on the fabrics produced from a
blend of 50% PET and 50% of natural fibres (agave, flax and hemp). The needle-punching
parameters, such as depth of needle penetration, stroke frequency and natural fibre type
were optimized. The nominal area weight of 1000g/m2
was kept as uniform as possible
for all the samples produced to eliminate the effect of variation in area weight. The Box-
Behnken experimental design was employed to optimize the parameters under study.
The thickness of the fabric and sound absorption coefficients were evaluated for all
samples. Fabric thickness is dependent on production parameters, such as depth of needle
penetration, area weight, and to a lesser extent on fibre type (fineness). Fabric thickness
also has a major effect on sound absorption properties of the fabric, therefore, it was
necessary to measure and analyse it.
The results showed that the samples produced from a blend of agave and PET fibres, with
a mean thickness of 7.88 mm, were generally thicker than the other fabrics, this is largely
because of the fact that agave fibres are coarser than hemp and flax fibres. On the other
hand it can be seen that the fabrics produced from a blend of hemp and PET fibres, with a
mean thickness of 6.37 mm, were generally the thinnest of the three blend types, with
fabrics produced from a blend of flax and PET fibres showing a mean thickness of 7.32
mm.
173
The fabrics produced with the lowest depth of needle penetration are generally expected to
be thicker than those produced with the highest depth of needle penetration. The results
showed that the fabrics produced with the lowest depth of needle penetration of 4 mm,
were amongst the top third (ranked by thickness) among all the fabrics produced in this
study. While the fabrics produced with depth of needle penetration of 10 mm were
generally thinner.
Generally, stroke frequency is not considered to be a major factor influencing the thickness
of the needlepunched nonwoven fabrics. However, since the stroke frequency is used to
determine “punch density”, stroke frequency may be considered as an indirect determinant
of sample thickness. The results showed that when comparing the fabrics produced from
the same fibres and at the same depth of needle penetration but different stroke
frequencies, those produced at a lower stroke frequency were generally thicker.
Thus, it may be concluded that all the three parameters studied here influence the fabric
thickness and fabric density. So, these tested parameters affect sound absorption of the
fabrics through fabric thickness and fabric density, in other words, the parameters affect
fabric thickness and fabric density directly and, in turn, affect sound absorption properties
of the fabric.
It was important to determine the correlation between fabric thickness and the sound
absorption coefficient. The Pearson correlation coefficient, r = 0.56, was obtained.
Generally, the correlation coefficient between fabric thickness and sound absorption is
expected to be higher, however this relatively lower value might be due to simultaneous
effects of other fabric characteristics on sound absorption over and above fabric thickness.
174
However, the significance probability, p-value = 0.030 (95% confidence) still implied that
thickness of the fabric was a significant factor in determining sound absorption coefficient
in this study.
A conclusion drawn from the analysis of the results on sound absorption coefficient for
individual parameters was that all the fabric characteristics influencing sound absorption
properties of the needlepunched nonwoven fabrics discussed in Section 2.6, were
dependent upon more than one parameter, namely process parameters or fibre properties.
Therefore, it was necessary to study the synergistic/interactive effects of these parameters.
Thus, by multiple regression analysis, coefficients of parameters (fiber type, depth of
needle penetration and stroke frequency) and significance probability (P-value) were
calculated. The statistical significance of probability, P-value at 95% confidence interval
was tested. The results revealed that effects of all the selected parameters were statistically
significant on measured sound absorption coefficients. For evaluating a complete picture
on the role of different parameters and their interaction effects on sound absorption, a
response surface methodology based on Box- Behnken experimental design was employed.
The response surface plots of sound absorption coefficients at different levels of selected
parameters and optimized regions were studied and discussed. The different cases were
considered as per the statistical significance and dominance of the selected parameters in
achieving maximum possible value of sound absorption coefficient.
The analysis of the three different two-way interaction response surface showed that the
highest sound absorption coefficient attained was 47% (0.47) and it was found in two
175
different cases. In the interaction between fibre type and depth of needle penetration at
different values of stroke frequency, the sound absorption coefficient of 47% (0.47) was
obtained for the fabric produced from hemp and PET fibres, produced at 4mm depth of
needle penetration and 350/min stroke frequency. While for the interaction between stroke
frequency and fiber type at different depths of needle penetrations, the sound absorption
coefficient of 47% (0.47) was obtained for the fabrics produced from agave and PET
fibres, produced at 4mm depth of needle penetration and 250/min stroke frequency. Also,
the interaction of stroke frequency and fibre type did not show a significant effect on sound
absorption coefficient as the P-value was above 0.05 at 95% confidence interval level.
Therefore, only maximum sound absorption coefficient of 47% (0.47) in the interaction of
fibre type and depth of needle penetration was considered.
In the optimized parameters, the depth of needle penetration is required to be 4mm, which
is the minimum setting in this study. Given that thickness is affected by the depth of needle
penetration, a minimum setting produced a thicker fabric with less density in comparison
to that produced at higher depths of needle penetration. The optimum fibre type was found
to be hemp, which is finer than agave but slightly coarser than flax. It must also be noted
that, of the three tested parameters, fibre type was the least significant according to results
obtained by multiple regression analysis. Therefore, fibre type would be regarded as less
important factor, as compared to depth of needle penetration and stroke frequency.
The possible application of these developed materials was discuissed extensively in
Section 4.2.2.4.
176
5.2. Effects of Air-gap Size, Fiber Type and Blend Ratio on
Sound Absorption Performance of Needle-Punched
Nonwoven Fabrics
Air Permeability
Air flow resistance is one of the main factors influencing sound absorption capabilities of
the nonwoven fabric. Air flow resistivity is a function of air permeability of the material,
which in turn, is influenced by factors, such as fibre fineness (type) and blending ratio. It
was observed that overall; the fabrics produced from agave and PET fibres were the most
air permeable. It can also be observed that the air permeability increased with the increase
in the natural fibre content in a blend.
A more in-depth investigation on air permeability started with the effect of fibre type
(fineness) by observing the air permeability of the fabrics produced from three different
natural fibres blended with PET for a given blending ratio. Then further investigation was
conducted to assess the effect of blending ratio on air permeability at different blend ratios
of natural fibres (with PET) for a particular natural fibre.
The effect of fibre fineness on air permeability was studied by comparing the air
permeability of the fabrics at the same blending ratio produced from the three different
natural fibres, each blended with PET fibres. It was observed that the fabrics produced
from blends of agave and PET fibres achieved the highest air permeability, while the
fabrics produced from blends of wool and PET fibres were the least air permeable. This
trend is attributed to the fact that agave fibres are considerably coarser than PET fibres,
more so than wool and flax fibres. This disparity in fibre fineness results in more porous
177
fabrics from a blend of agave and PET fibres and thus more air permeable than the fabrics
produced from blends of wool and PET fibres and flax and PET fibres. This points to a
direct link between fibre fineness and air permeability.
The effect of blending ratio on air permeability is studied by comparing the air
permeability of the fabrics made from the same natural fibre at three different blending
ratios. It was observed that for a given natural fibre; air permeability of the fabrics is
directly proportional to the amount of natural fibres blended with PET fibres, i.e. air
permeability increases with an increase in natural fibre content. This is attributed to the
diminishing component of finer fibres, in this case PET fibres, which tend to occupy more
fibres per unit volume in comparison to coarser fibres, thus resulting in a more tortuous
path and higher hindrance to air passage through the medium.
The rate of change in air permeability with the change in the natural fibre content in the
blend was markedly different for the three natural fibres studied. It was minimal for wool-
PET blend and more defined in agave-PET blend. It was found that while both fibre type
(fineness) and blending ratio affected air permeability, however, the effect of fibre type
was the most pronounced. This was further confirmed by the ANOVA results and the least
square plots.
Sound Absorption
The effect of each parameter, namely, fibre type (size), blending ratio and air gap on sound
absorption coefficient were studied, subsequently; a statistical analysis of the overall
results using ANOVA was carried out. The fabrics produced from a blend of wool and
PET fibres, in general, showed better sound absorption coefficients than the other fabrics,
178
with the fabrics produced from a blend of agave and PET fibres achieved the lowest sound
absorption coefficients of the three fibre blends. This was expected because wool fibres are
known to have good sound absorption properties due to scales on the fibre surface.
In general, the fabrics produced from a blend of 30:70% natural: PET fibres showed higher
sound absorption coefficients than the fabrics produced from 50:50% natural: PET fibres,
while the sound absorption coefficients of the fabrics produced from a blend of 70: 30%
natural: PET fibres were generally the lowest with an exception for fabrics produced from
a blend of wool and PET fibres.
When the air-gap was increased from 0mm to 25mm the sound absorption coefficients also
increased but reached its maximum at 15mm air-gap after which it slightly decreased again
with further increase in air-gap from 15mm to 25mm. This phenomenon is attributed to the
fact that higher air gap behind the sample can absorb the sound energy of longer
wavelengths particularly at middle and low sound frequencies. This is due to sound
diffraction, which happens when a sound wave passes through the nonwoven layer, enters
the new medium (air) and passes into the third medium (Extruded Polystyrene sheet in this
study) .
The effect of fibre fineness on sound absorption coefficients of the fabrics was studied by
comparing the fabrics produced from three different natural fibres at the same blending
ratio. It was observed that the trends in sound absorption coefficients are generally the
same for all blending ratios. Generally, the fabrics produced from a blend of wool and PET
fibres achieve the highest sound absorption coefficients, followed by those fabrics
produced from blends of flax and PET fibres and the fabrics produced from blends of
179
agave and PET fibres showing the lowest sound absorption coefficient. It was also
observed that the difference in sound absorption coefficients of the fabrics among the
natural fibre blends increased with the increase in natural fibre content in respective blends
of natural and PET fibres, i.e. for the blends of 30:70% natural: PET fibres the difference
in sound absorption coefficient among the three blends is minimal, then it increases to
maximum among the fabrics produced form blends of 70: 30% natural and PET fibres.
The effect of blending ratio was studied by comparing the sound absorption coefficients of
the fabrics produced from the same natural fibres at three blending ratios. Again, it was
observed that the sound absorption coefficients of the fabric generally decreased with an
increase in natural fibre content. The change in blend ratio was found to have very little
effect on sound absorption, especially for wool fibre blends. The change in sound
absorption coefficients due to flax fibre content was also minimal when compared to agave
fibre content. The fabrics produced from a blend of 70:30% agave and PET fibres achieved
the lowest values of sound absorption coefficients.
The effect of air-gap size on sound absorption coefficients of the nonwoven fabrics was
studied by comparing the sound absorption profiles of the same fabric at different air gaps.
The trend for the effect of sound absorption was found to be the same for all three natural
fibre blends, i.e. as the air gap was increased the sound absorption coefficients also
increased. Furthermore, with the increase in air-gap, the peaks of the sound absorption
coefficient profiles at maximum sound absorption tend to shift to the left (towards lower
sound frequencies).
180
It was observed that the sound absorption coefficients generally reach maximum at an air-
gap of 15 mm, after which it decreases slightly with an increase in air gap from 15mm to
25mm. This general decrease in sound absorption coefficient is caused by the shifting of
resonance frequencies (peak absorption) towards lower frequencies with the increase in
air-gap beyond 15 mm. Also, according to Attenborough and Ver [45], the highest sound
absorption coefficient occurs when the distance (air-gap in this case) between the sound
absorber and the wall is in odd multiples of a quarter-wavelength for the particular sound
frequency. This is due to the fact that the incident wave and the reflected wave will have a
phase difference of 180o, i.e. destructive sound wave interference will occur. Conversely,
when the air-gap is a multiple of a half-wavelength (even multiples of quarter-
wavelengths), the air-gap becomes totally ineffective as the incident and the reflected
waves will be in phase, i.e. constructive sound wave interference will occur, in this study it
happens, when the air-gap is increased from 15mm to 25mm.
So, by increasing the air gap, the sound energy at long wavelengths (low frequency) can be
absorbed. A similar effect obtained by the increase in sample thickness which can improve
the sound absorption coefficients at low, middle and high frequencies due to the increase in
sound energy losses. All these results were further processed by ANOVA and the least
square plots were in agreement with these observations.
The possible application of these developed materials was discussed extensively in Section
4.4.
181
5.3. Recommendations for Future Work
1. Optimized Production Parameters: Only three parameters were optimized in this
study, namely fibre type (fineness), depth of needle penetration and stroke
frequency. More work is required to study and optimise other parameters such as
production speed and stroke frequency so that the outcome can be more than just
academic interest and it can be translated into industrial practice.
2. Types of Fibres: The type of fibres used in this study may not have required
variations, particularly since flax and hemp fibres are very similar in
characteristics. In a future study, an attempt should be made to use different fibres
with larger variation in fibre properties.. Also, the sound absorption coefficients of
the same fibre type but at different levels of cottonization / fibre preparation can
also be studied to analyse the real cost benefit of using highly cottonised natural
fibres.
3. Study other fabrics characteristics in conjunction with the air-gap size: Only the
effects of fibre type (fineness) and blending ratio were studied in this section of
work. Other parameters, such as fabric thickness, density and pore size and its
distribution can also be included. Other parameters may also be optimised at an air-
gap size of 15mm which was found to be an optimum air gap in this study.
182
References
1. Peters, R.J., Hollins, M., Smith, B.J. (2011). Acoustics and noise control, (3rd
ed.).
Prentrice Hall, Harlow - England.
2. Guidelines For Community Noise (1999).World Health Organisation.
3. Na, Y., Lancaster, J., Casali, J., Cho, G. (2007). Sound Absorption Coefficients of
Micro-fiber Fabrics by Reverberation Room Method. Textile Research Journal, 77(5),
330-335.
4. Parkin, P.H., Cowell, J.R., Humphreys, H.R. (1979). Acoustics, noise, and buildings.
(4th
ed.). Faber & Faber.
5. Tecnon Ltd. Nonwoven Textiles 1997-2007 World Survey. Tecnon Ltd .
6. http://www.cdc.gov/niosh/topics/noisecontrol/ (Retrieved: February 2014)
7. Harris, C. (1991). Handbook of acoustical measurements and noise control (3rd
ed.).
Mcgraw-Hill (Tx), United States.
8. Russel, S.J. (2007). Hand Book of Nonwovens, The Textile Institute, Manchester.
9. Seddeq, H.S. (2009). Factors Influencing Acoustic Performance of Sound Absorptive
Materials. Australian Journal of Basic and Applied Sciences, 3, 4610-4617.
10. Teli, M.D., Pal, A., Roy, D. (2007) Efficacy of nonwoven materials as sound insulator.
Indian Journal of Fibre & Textile Research, 32.
11. Küçük, M., Korkmaz, Y. (2012). The effect of physical parameters on sound
absorption properties of natural fiber mixed nonwoven composites. Textile Research
Journal, 82(20), 2043-2053.
183
12. Thilagavathi, G., Pradeep, E., Kannaian, T., Sasikala, L. (2010). Development of
Natural Fiber Nonwovens for Application as Car Interiors for Noise Control. Journal of
Industrial Textiles, 39(3), 267-278.
13. Mirjalili, S.A., Mohammad-Shahi, M. (2012). Investigation on the Acoustic
Characteristics of Multi-Layer Nonwoven Structures. Part 1 - Multi-Layer Nonwoven
Structures with the Simple Configuration. Fibres and Textiles in Eastern Europe, 20(3),
73-77.
14. Fatima, S., Mohanty, A.R. (2011). Acoustical and fire-retardant properties of jute
composite materials. Applied acoustics, 72, 1084.
15. Yilmaz, N.D., Banks-Lee, P., Powell, N.B., Michielsen, S. (2011). Effects of porosity,
fiber size and layering sequence on sound absorption performance of needlepunched
nonwovens. Journal of Applied Polymer Science, 121, 3056-3069.
16. Yilmaz, N.D., Michielsen, S., Banks-Lee, P., Powell, N.B. (2012). Effect of Material
and treatment parameters on noise-control performance of compressed three-layerd
multifibre needlepunched nonwovens. Journal of Applied Polymer Science, 123, 2095-
2106.
17. Tascan, M., Vaughn, E.A. (2008). Effects of Fiber Denier, Fiber Cross-Sectional Shape
and Fabric Density on Acoustical Behavior of Vertically Lapped Nonwoven Fabrics.
Journal of Engineered Fibers and Fabrics, 3(2), 32-38.
18. Yilmaz, N.D. (2007). Acoustic Properties of Biodegradable Nonwovens, North
Carolina State University, PhD Thesis.
19. Seddeq, H.S., Aly, N.M., Marwa, A. A., Elshakankery, M. (2013). Investigation on
sound absorption properties for recycled fibrous materials. Journal of Industrial
Textiles 43(1), 56-73.
20. Shoshani, Y.,Yakubov, Y. (1999). A model for calculating the noise absorption
capacity of nonwoven fiber webs. Textile Research Journal, 69 (7).
184
21. Khambethe, S., Care, M.J., Griffen, C., Skidmore, F. (2003).Sound attenuating
composite articles incorporating scrim material and methods of making same. U.S.
Patent.US6631785B2,
22. Hughes M. (2004). Polymer Composites and the Environment. Edited by Baillie, C.
Green Composites Burlington. Woodhead Publishing , 233-251.
23. Tascan, M., Vaughn, E.A., Stevens, K.A., Brown, P.J. (2011). Effects of total surface
area and fabric density on the acoustical behaviour of traditional thermal‐bonded high-
loft nonwoven fabrics. Journal of The Textile Institute, 102 (9), 746-751.
24. http://www.excellup.com/classnine/sciencenine/soundCompressionRarefaction.aspx
(Retrieved: August 2013)
25. Sears, F., Zemansky, M., Young, H. (1984). College Physics, (6th
ed.). Addison-
Wesley. Pittsburgh, Pennsylvania, USA.
26. http://www.dbooth.net/mhs/chem/lightenergy00.html (Retrieved: August 2013)
27. https://www.onosokki.co.jp/English/hp_e/whats_new/SV_rpt/SV_3/sv3.htm
(Retrieved: September 2013)
28. Berg, R.E., Stork, D.G. (2005). The physics of sound, (3rd
ed). Pearson. San Francisco,
USA.
29. http://howardsgoodyearblog.com/2012/02/07/f-35-noise-comparison/ (Retrieved:
September 2013)
30. Arenas, J.P., Crocker, M.J. (2010). Recent Trends in Porous Sound-Absorbing
Materials. Sound and Vibration, 44(7).
31. Hirabayashi , T., McCaa, D., Rebandt, R.D., Rusch, P., Saha, P. (1999). Automotive
Noise and Vibration Control Treatments. Noise and Vibration.
185
32. Kazragis, A., Gailius, A., Jukneviciute, A. (2002). Thermal and Acoustical Insulating
Materials Containing Mineral and Polymeric Binders with Celluloses Fillers. Material
Sciences, 8(2), 193-195.
33. Magrini, U., Ricciardi, P. (2000). Surface Sound Acoustical Absorption and
Application of Panels Composed of Granular Porous Materials. Proceedings of Inter-
Noise 2000, Nice, France, 27-30.
34. Asdrubali, F., Horoshenkov, K.V. (2002). The Acoustic Properties of Expanded Clay
Granulates. Building Acoustics, 9(2), 85-98.
35. Schmidt M, Schwertfeger F. (1998). Applications for silica aerogel products. Journal of
Non-Crystalline Solids, 225, 364-368.
36. Ricciardi, P., Gibiat, V., and Hooley, A. (2002). Multilayer Absorbers of Silica
Aerogel. Proceedings of Forum Acusticum, Sevilla, Spain.
37. Crocker, M. J., Li, Z., and Arenas, J. P. (2005). Measurements of tyre/road noise and of
acoustical properties of porous road surfaces. International Journal of Acoustics and
Vibration, 10(2), 52-60.
38. Ballagh, K. O. (1996). Acoustical Properties of Wool. Applied Acoustics, 48(2), 101-
120.
39. Zulkifli, R., Nor, M.J.M., Tahir, M.F.M., Ismail, A.R., Nuawi, M.Z. (2008). Acoustic
Properties of Multi-layer Coir Fibres Sound Absorption Panel. Journal of Applied
Sciences, 8 (20), 3709-3714.
40. Koizumi, T. (2002). The Development of Sound Absorbing Materials Using Natural
Bamboo Fibers and their Acoustic Properties. Proceedings of Inter-Noise 2002,
Dearborn, Michigan, USA.
186
41. Del Rey, R., Alba, J., Sanchiz, V. (2007). Proposal of an Empirical Model for
Absorbent Acoustical Materials Based in Kenaf. Proceedings of the 19th International
Congress on Acoustics, Madrid, Spain.
42. Furstoss, M., Thenail, D., Galland, M. A. (1997). Surface Impedance Control for
Sound Absorption: Direct and Hybrid Passive/Active Strategies. Journal of Sound and
Vibration, 203(2) , 219-236.
43. Galland, M. A., Mazeaud, B., and Sellen, N. (2005). Hybrid Passive/Active Absorbers
for Flow Ducts. Applied Acoustics, 66(6) , 691-708.
44. https://commons.wikimedia.org/wiki/File:Sound_shadow.svg (Retrieved: January
2016)
45. Attenborough, K., Ver, I.L. (2005). Sound-absorbing materials and sound absorbers.
In: Baranek LL, Editor. Noise and Vibration Control Engineering , (2nd
ed), 215-277.
46. Fahy, F. (2001). Foundations of Engineering Acoustics. Academic Press. San Diego,
Carlifonia.
47. Jayaraman, K. A., (2005). Acoustical Absorptive Properties of Nonwovens, North
Carolina State University , MSc Thesis;.
48. Needlepunching Lecture Notes (2008). Faculty of Textile Engineering- Technical
University of Liberec.
49. Pierre, W. (2008). The Contribution of Nonwovens to a Suitable World, EDANA,
ICTN . Presented at IIT-Delhi, India.
50. Choi, H.M. and Cloud, R.M. (1992). Natural sorbents in oil spill cleanup.
Environmental Science & Technology, 26(4), 772-776.
51. Chiparus, O.I. (2004). Bagasse fiber for production of nonwoven materials, Louisiana
State University, PhD Thesis.
187
52. Cox, T.J., D'antonio, P. (2004). Acoustic Absorbers and Diffusers. (Sound Absorptive
Materials), Taylor &Francis. New York, New York.
53. Nick, A., Becker, U., and Thoma, W. (2002). Improved Acoustic Behaviour of Interior
Parts of Renewable Resources in the Automotive Industry. Journal of Polymers and the
Environment, 10(3), 115-118.
54. Koizumi, T., Tsujiuchi, N., Adachi, A. (2002). The development of sound absorbing
materials using natural bamboo fibres in High Performance Structures and Composites.
High Performance Structures and Materials, edited by Brebbia , C. A. and De Wilde,
W. P. , Ch. 4. Witpress, 157-166.
55. Cherkassky, A., Kit, B., Porat, I. (2000). Two-Dimensional Analysis of Card Web
Irregularity. Textile Research Journal, 70(10), 901-909.
56. Monna, A.F. (1938). Absorption of sound by porous walls. Physica, 5(3), 129-142.
57. Lee, E.Y., Joo, C.W. (2003). Sound Absorption Properties Of Recycled Polyester
Fibrous Assembly Absorbers. AUTEX Research Journal, 3(2).
58. Tascan. M., Vaughn, E.A. (2008). Effects of Total Surface Area and Fabric Density on
the Acoustical Behaviour of Needlepunched Nonwoven Fabrics. Textile Research
Journal, 78(4):289-296.
59. Narang, P.P. (1995). Material parameter selection in polyester fibre insulation for
sound transmission and absorption. Applied Acoustics, 45(4), 335-358.
60. Hur, B.Y., Park, B.K., Ha, D., Um, Y.S. (2005). Sound Absorption Properties of Fiber
and Porous Materials. Materials Science Forum , 475-479:2687-2690.
61. Kuttruff, H. (2007). Acoustics: An Introduction. Taylor & Francis, New York.
188
62. Jayaraman, K.A., Banks-Lee, P., Jones, M. (2005). Joint INDA-TAPPI Conference -
INTC 2005: International Nonwovens Technical Conference Proceedings, 403-411.
Association of Nonwoven Fabrics Industry. St. Louis, Missouri.
63. Genis, A.V., Kostyleva, E.Y., Martem'yanov, V.A. (1990). Comparative evaluation of
acoustical properties of heat-bonded and needlepunched fibrous materials prepared
from polymer melts. Fibre Chemistry, 21(6).
64. Coates, M., Kierzkowski, M. (2002). Acoustic textiles-lighter, thinner and more sound-
absorbent. Technical Textiles International (TTI 2002 ),11(7),15.
65. Li, J. (2007). A Study on the Relationship between the Thickness Of Nonwoven and Its
Sound Absorption Capability. Modern Applied Science;1(4):74-76, 2007.
66. Ibrahim, M. A., Melik, R. W. (1978). Physical Parameters Affecting Acoustic
Absorption Characteristics Of Fibrous Materials, Proceedings of the Mathematical and
physical society of Egypt, 46.
67. Mahmoud, A., El-Shenawy, G., Ramadan, E. (2012). Using Nonwoven Hollow Fibers
to Improve Cars Interior Acoustic Properties. Research Journal of Textile and Apparel;
16(3):49-56.
68. Castagnède, B., Aknine, A., Brouard, B., Tarnow, V. (2000). Effects of compression on
the sound absorption of fibrous materials. Applied Acoustics, 61(2), 173-182.
69. Fouladi, M.H., Ayub, M.D., Nor, M.J.M. (2010). Analysis of coir fiber acoustical
characteristics. Applied Acoustics, Elsevier Publishing Company Ltd, 72, 35-42.
70. Davern, W.A. (2010). Perforated facings backed with porous materials as sound
absorbers-An experimental study. Applied Acoustics, 10(2), 85-112.
71. Price, A.J., Mulholland, K.A. (1968). The effect of surface treatment on sound-
absorbing materials. Applied Acoustics, Elsevier Publishing Company Ltd, 1(1), 67-72.
189
72. Ingard, K.U. (1994). Notes on sound absorption technology. Noise Control
Foundation. Poughkeepsie, New York.
73. Allard, J.F., Depollier, C., Guignouard, P. (1989). Free field surface impedance
measurements of sound-absorbing materials with surface coatings. Applied Acoustics,
Elsevier Publishing Company Ltd, 26(3), 199-207.
74. www.inda.org/automotiveinteriorshow/innotherm (Retrieved: May 2014)
75. Tascan, M. (2005). Acoustical properties of nonwoven fiber network structures,
Clemson University. Pro-Quest Dissertations Publishing. Ph.D Thesis.
76. Yang, S., Yu, W. (2011). Air Permeability and Acoustic Absorbing Behavior of
Nonwovens. Journal of Fiber Bioengineering and Informatics, 3(4), 204-208.
77. Shoshani, Y., Rosenhouse, G. (1995). Book of Papers.International Nonwovens,
Network, Conference, INDA-TEC 1995, Showcase, 267.
78. Ackermann, U., Fuchs, H.V., Rambausek, N. (1988). Sound absorbers of a novel
membrane construction. Applied Acoustics, Elsevier Publishing Company Ltd, 25(3),
197-215.
79. Ren, M., Jacobsen, F. (1993) .A method of measuring the dynamic flow resistance and
reactance of porous materials. Applied Acoustics, Elsevier Publishing Company Ltd,
39(4), 265-276.
80. Conrad, J. (1983). Engineering Acoustics and Noise Control. Prentice‐Hall.
Englewood Cliffs, New York.
81. Beranek, L.L. (1960). Noise Reduction, (3rd
ed.). McGraw-Hill. New York.
82. Delany, M.E., Bazley, E.N. (1970). Acoustical properties of fibrous absorbent
materials. Applied Acoustics, Elsevier Publishing Company Ltd; 3(2), 105-116.
190
83. Bies, D.A., Hansen, C.H. (1980). Flow resistance information for acoustical design.
Applied Acoustics, Elsevier Publishing Company Ltd,13(5), 357-39.
84. Imai, Y., Asano, T. (1982). Studies of acoustical absorption of flexible polyurethane
foam. Journal of Applied Polymer Science, 27(1), 183-195.
85. Roy, A.N., Ray, P. (2009). Optimization of Jute Needle-Punched Nonwoven Fabric
Properties: Part II—Some Mechanical and Functional Properties. Journal of Natural
Fibres, 6(4), 303-318.
86. Shoshani, Y., Yakubov, Y. (2003). Use of Nonwovens of Variable Porosity as Noise
Control Elements . INJ.
87. Knapen, E., Lanoye, R., Vermeir, G., Van Gemert, D. (2003) .Sound Absorption By
Polymer‐Modified Porous Cement Mortars. 6th
International Conference on Materials
Science and Restoration, 347–358, MSR‐VI Aedification Publishers.
88. Wassilieff, C. (1996). Sound absorption of wood-based materials. Applied Acoustics,
Elsevier Publishing Company Ltd, 48(4), 339-356.
89. Horoshenkov, K.V., Swift, M.J. (2001). The effect of consolidation on the acoustic
properties of loose rubber granulates. Applied Acoustics, Elsevier Publishing Company
Ltd, 62(6), 665-690.
90. Zwikker, C., Kosten, C.W. (1949). Sound Absorbing Materials. Elsevier Publishing
Company Ltd. New York.
91. Sengupta S. (2010). Sound Reduction by Needlepunched Nonwoven Fabrics. Indian
Journal of Fibre & Textile Research, 35, 237-242.
92. Simón, F., Pfretzschner, J. (2004). Guidelines for the Acoustic Design of Absorptive
Devices. Noise & Vibration Worldwide, 35(1), 12-21.
191
93. Fellah, Z.E.A., Berger, S., Lauriks, W., Depollier, C. (2004).Verification of Kramers–
Kronig relationship in porous materials having a rigid frame. Journal of Sound and
Vibration, 270(4), 865-885.
94. Everest, F.A. (2001). Master Handbook of Acoustic, (4th
ed.). McGraw-Hill
Publishing. New York.
95. Chen, Y., Jiang, N. (2007). Carbonized and Activated Nonwovens as High
Performance Acoustic Materials: Part I- Noise Absorption. Textile Research Journal,
77(10), 785-791.
96. Chen, Y., Jiang, N. (2009). Carbonized and Activated Nonwoven as High Performance
Acoustic Materials: Part II Noise Insulation. Textile Research Journal, 79(3), 213–218.
97. Ersoy, S., Küçük, H. (2009). Investigation of industrial tea-leaf-fibre waste material for
its sound absorption properties. Applied Acoustics-Elsevier Publishing Company Ltd,
70(1), 215-220.
98. Barron RF. (2003). Industrial noise control and acoustics. Marcel Dekker. New York.
99. Muehleisen, R.T. Measurement of the Acoustic Properties of Acoustic Absorbers.
Lecture Notes. Illinois Institute Of Technology.
100. ISO 354: (2003) (E). Acoustics- Measurement of sound absorption in a reverberant
room. ISO, Geneva, Switzerland, May 2003
101. EN ISO 10534-1: (2001) E. Acoustics – Determination of sound absorption coefficient
and impendence in impedance tubes- Part 1: Standing Wave Ratio Method (ISO 10534
– 1: 1996). ISO, Geneva, Switzerland, May 2001.
102. EN ISO 10534-2: (2001) E. Acoustics – Determination of sound absorption coefficient
and impendence in impedance tubes- Part 2: Transfer Function Method (ISO 10534 –
2: 1998). ISO, Geneva, Switzerland, May 2001
192
103. Beranek, L.L. (1988). Acoustical measurements, (rev. ed.). American Institute of
Physics. Cambridge, Massachusetts.
104. Lee, Y.Y., Lee, E.W.M., Ng, C.F. (2005). Sound absorption of a finite flexible micro-
perforated panel backed by an air cavity. Journal of Sound and Vibration, 287(1), 227-
243.
105. Parikh, D.V., Chen, Y., Sun, L. (2006). Reducing Automotive Interior Noise with
Natural Fiber Nonwoven Floor Covering Systems. Textile Research Journal, 76(11),
813-820.
106. Soltani, P., Zerrebini, M. (2012). The analysis of acoustical characteristics and sound
absorption coefficient of woven fabrics. Textile Research Journal, 82(9), 875-882.
107. Jaatinen, J. (2001). Alternative Methods of Measuring Acoustic Absorption. Aalto
University, MSc Thesis.
108. Ferreira, S.L.C., Bruns, R.E., Ferreira, H.S., Matos, G.D., David, J.M., Brandao, G.C.,
da Silva, E.G.P., Portugal, L.A., dos Reis, P.S., Souza, A.S., dos Santos, W.N.L.
(2007). Box-Behnken design: An alternative for the optimization of analytical
methods. Analytica Chemica Acta, 597, 179-186.
109. Box, G.E.P., Behnken D.W. (1960). Some New Three Level Designs for the Study of
Quantitative Variables. Technometrics, 2 (4):455-475.
110. http://support.minitab.com/en-us/minitab/17/ (Retrieved: November 2012)
111. Yang, S., Yu, W., Pan, N. (2011). Investigation of the sound-absorbing behaviour of
fiber assemblies. Textile Research Journal, 81(7), 673-682,.
112. Patnaik, A., Mvubu, M., Muniyasamy, S., Botha, A., Anandjiwala, R. (2015).
Thermal and sound insulation materials from waste wool and recycled polyester fibers
and their biodegradation studies. Energy and Buildings, 92, 161–169.
193
113. Anandjiwala, R.D., Boguslavsky, L. (2008). Development of needlepunched
nonwoven fabrics from flax fibres for air filtration applications. Textile Research
Journal, 78 (7), 614-624.
114. Nick, A., Becker, U., Thoma, W. (2002). Improved Acoustic Behavior of Interior
Parts of Renewable Resources in the Automotive Industry. Journal of Polymers and
the Environment, 10(3), 115-118.
115. Ayub, M.D., Nor, M.J.M., Fouladi, M.H., Zulkifli, R., Amin, N. (2012). A Practical
Acoustical Absorption Analysis of Coir Fiber Based on Rigid Frame Modelling.
Acoustical Physics, 58 (2), 246-255.
116. Shahani, F., Soltani, P., Serrebini, M. (2014). The analysis of acoustic characteristics
and sound absorption coefficient of needlepunched nonwoven fabrics. Journal of
Engineered Fibers and Fabrics, 9(2), 84-92.
117. American Society for Testing and Materials, ASTM D 1776-96, Standard practice for
conditioning Textiles for Testing
118. LMS acoustic testing instrument. (2011). Instruction Manual. Leuven, Belgium.
119. American Society for Testing and Materials, ASTM D 3776-07, Standard Test Method
for Mass Per Unit Area.
120. EDANA WSP 120.6 (2005). Standard Test Methods For The Nonwovens and
Related Industries—Thickness, European Disposables And Nonwoven Association
(EDANA), Brussels.
121. American Society for Testing and Materials, ASTM D737-04, Standard test Method
for air permeability of textile fabrics.
122. American Society for Testing and Materials, ASTM 1050-2010, Standard test method
for impedance and absorption of acoustical materials using a tube, two microphones
and a digital frequency analyser.
194
Appendix
This study resulted into published manuscripts and manuscripts in preparation for
publication.
Published Manuscripts
Mvubu M., Patnaik A., Anandjiwala R.D. (2015). Process Parameters Optimization of
Needle-punched Nonwovens for Sound Absorption Application. Journal of
Engineered Fibres and Fabrics, 10 (4), 47-54.
- On Line
Patnaik A., Mvubu M., Muniyasamy S., Botha A., Anandjiwala R.D. (2015).
Thermal and sound insulation materials from waste wool and recycled polyester fibers
and their biodegradation studies. Energy and Buildings (Elsevier), 92, 161–169.
- On Line
Manuscript in Preparation
Mvubu M., Patnaik A., Anandjiwala R.D. Effects of Air-gap, Fiber Type and
Blending Ratio on Sound Absorption Performance of Needle-Punched Nonwovens