student improvement - eric
TRANSCRIPT

ED 099 345
AUTHORTITLE
INSTITUTION
SPONS AGENCY
FOB DJ TECONTRACTNOTE
EDRS PRICEDESCRIPTORS
DOCUNENT RESUME
95 SP 008 650
Brophy, Jere E.; Ever son, Carolyn N.The Texas Teacher Effectiveness Project: Presentationof Non-Linear Relationships and Summary Discussion.Report No. 74-6.Texas Univ., Austin. Research and Development Centerfor Teacher Education.National Inst. of Education (DREW), Washington,D.C.Sep 74OEC-6-10-103395p.; For =elated document, see SP 003 651
MF-$0.75 HC- $18.60 PLUS POSTAGE*Achievement; *Data Analysis; *Educational Research;*Effective Teaching; Grade 2; Grade 3; Learning;Primary Education; *Student Improvement; Students
ABSTRACTThis report summarizes and discusses the results of
the Texas Teacher Effectiveness Project, a two-year, replicated,naturalistic-correlational study of the relationships between presageand process variables with student learning product criteria at thesecond- and third-grade levels. Both linear and nonlinearrelationships between predictor variables and the student learninggains criteria (class means averaged across four consecutive years oneach of five subtests of Metropolitan Achievement Test battery) arereported. In general, the data make more sense in separate analysesfor low versus high SES (socioeconomic status) schools than they dofor the combined sample, and a great many significant relationshipsproved to be curvilinear or otherwise nonlinear. Major findingsconsistently contrast with findings from instruction in higher gradelevels, suggesting that teaching fundamental tool skills in the earlygrades is fundamentally different from verbal manipulation ofsymbolic materials that typifies teaching at later grades, andtherefore it should be conceptualized and studies separately.Additional points are detailed in the report. (Author)

'A
,- , -.1, z I II * z. ' ' - ,7.
I. Z . ; ' Z..: . a , - ' t. s
- 1 ' :. n * ,. .
i ; : * A 1, : IN;
' ' * - ,.: ' :. ..; : . t. . P
Z .
1
Z 7.
:., .. t4L: t
4 - 7. 1
a :, to "; .4 1:
' :
t - ; I ; t ...... , t "I, 0 ; V. .
CS I. I' 1. ,: a
: 1 ii - ;...+:U. ' : 4 :1
a : T. . 41. = : '" ; 4 " 4 : II * ;
' a ; I V ' I* :. :
a . _a .. :, a
; : . :. : t . .. :a ; a -,-1 ; .;. a I . t - ..: 2 $
j. ; .. . - . Z.
:L'i 7' ':. t I Z
-9 a
't O 4
" '
19,A1
*Ii
4 4.
4 ttt .
led
. *
tAz; I
' :
Z.
T
I'*
tl.
:"
7...z '
;- t.
I As
5.
.: 5. - 7 54 5.
tt' p t'. 't :. i Z .
.."; : 'a ' 4
; . it .

"tt
wTHE TEXAS TEACHER EFFECTIVENESS PROJECT:
Presentation of Non-linearRelationships and Summary Discussion
Jere E. Brophy'
Carolyn M. Evartson
$ DEPARTMENT OF HEALTHE DUCATc1N WELFARENATIONAL INSTITUTE OF
EDUCATIONRt I N 1..E Pwo
t f I-. . v .1 . k ( ROMOW,Cs'Ne
A r , 1,0 % opitsoCW,..1W Nei.
,t $. NA. ' %'.? TOTE 01
Report No. 74-6
The University of Texas at Austin
September, 1974

Footnotes to Author
T!..e Authors wish to acknowledge and thank the following individuals
who participated In the research described herein and/or in the preparation
of this report:
Connie Anderson, Dr. Shyam Ahuja, Maria Buczynski W. John Crawford,
Carol King, Karen Mays, Dr. Mark Mays, Nancy Moore, Piara Pannu, Brian Peck,
Dr. Teresa Peck, Kathleen Senior, Carol Watkins, Michael Weissberg, and
Andrea Winter, who observed in classrooms and helped prepare data for analysis;
Michael Baum, James Btackweil, Barbara Butera, Gwen Calloway, Pat Chew,
Paul Cockreham, Cynthia Coulter, Jackie Dillon, Bucky Evertson, Bruce Gardner,
Carol Greenhaigh, Janet Honea, Judase Hutchinson, Cindy Hutzler, Sherry
Johnson, Bob Kelley, David Latimer, Mary Jane Leahy, Linda Mahaffey,
Bonnie Murchey, Jane Ogden, Eileen Raffanielin, Georgia Reed, Mark Rothman,
Gael Sherman, ',like Tebeleff, Ann Turney, Joni Wendt, and Cicely Wynne, who
helped prepare data for analysis;
John Brozovsky, W. JoLn Crawford, Marc McGee, Brian Peck, Jon Sheffield,
James Sherrill, and Wally Washington, who were involved in programming and
statistical analyses of the data; and
Susan Florence, Janet Honea, Karen Mays, Beatrice Miadenka, Gwen Newman,
Marilyn Turner, and Jean Waltman, who assisted In manuscript preparation.
Special recognition is extended to W. John Crawford, Carol King, Nancy
Moore, Brian Peck, and Dr. Teresa Peck, who assumed major responsibilities
for the project as a wholo.
4
This project was supported by the National institute of Education
Contract'OEC 6-10-108, Research and Development Cenl.qr for Teacher Education.
The opinions expressed herein do not necessarily reflect the position or
policy of the National Institute of Education and no official endorsement
by that office should be inferred.

Brophy, & Evertson, C The Texas Teacher Effectiveness Project:
Presentation of non-linear relationships and summary discussion.
The Texas Teacher Effectiveness Study has been a naturalistic investigation
of the presage and process correlates of the relative success of second and
third grade teachers in producing student learning gains on standardized
achievement tests. The search for presage and process correlates of teachers'
ability to produce student learning gains has produced weak and often conflicting
results, at least until recently (Rosenshine and Furst, 1973; Dunkin and Biddle,
1974). The present study has been similar to previous work in this tradition
in its underlying logic and intent, but it has introduced several methodological
innovations. it was hoped that, in combination, these innovations would be more
successful in identifying presage and process correlates of teacher effective-
ness (defined as the relative ability to produce student learning gains on
standardized achievement tests, but recognizing that this Is not the only or
even necessarily the best criterion) than previous studies had been.
Several of the most important innovations had to do with sample selection.
A review of teacher effectiveness by Rosenshine (1970) revealed only five
studies conducted over long periods of time (a semester or more) that contained
any information on teacher reliability in producing student learning gains.
One involved instructors teaching short courses in military topics to Air
Force recruits, and two of the others involved teachers implementing an innovative
curriculum. None of these seem generalizable to everyday classrooms in ordinary
schools. The remaining two studies were conducted or' ordinary teachers in
ordinary schools, but the stability coefficients were disappointing. One study

2
didn't give a specific coefficient but reported that stability was quite tow,
while the stability coefficient in the second study was .09 (Rosenshine, 1970).
These data cast doubt upon the entire enterprise of searching for correlates
of teacher effectiveness, since they suggested that "effectiveness" does not
exist as a stable teacher variable or trait.
However, inspection of the teacher effectiveness literature revealed that
the majority of studies have involved student teachers, new teachers, teachers
implementing a new curriculum, or random samples of teachers which contained
some unknown proportion of the types of teachers mentioned above. These
teachers have in common the high probability that their classroom behavior, and
thus their probable success in producing student learning gains, will be variable
while they adjust to teaching in general or to teaching the particular new
curriculum they are learning to teach. In short, it seemed to us that research
on correlates of teacher effectiveness is handicapped from the start if the
sample is not restricted to teachers who are experienced in teaching the
curriculum and grade level at which they are working. After a few years of
experience in a reasonable constant setting, teachers could be expected to have
established a stable style or pattern of teaching, and thus to be much more
appropriate as subjects in a study of the correlates of teaching effectiveness
than teachers who are known to be changing their behavior or teachers who are
unknown quantities with regard to this constancy vs. change dimension.
A second implication of Rosenshine's data was that teacher effectiveness
might not be a stable trait, even if experienced teachers were studied. Thus,
the first order of business was to collect effectiveness data on a sample of
experienced teachers to find out whether or not they showed the kind of extreme
7

3
instability that Rosenshine had found in the five studies he reviewed. The
Texas Teacher Effectiveness Project began with this search. One hundred
sixty-five second and third grade teachers, who comprised the entire teaching
staff who had been working at the same grade level (either second or third)
for a period of four years or more in an -ban school district, were selected
for study. The district administered cc An subtests of the Metropolitan
Achievement Tests each fell to all of the students in these grades, and these
data were available in the files. Stabirty of teacher effectiveness was
assessed by collecting the grade level equivalent scores of each student on
each of the subtests included (Word Knowledge, Word Discrimination, Reading,
Arithmetic Computation, and Arithmetic Reasoning), computing resFduai gain
scores from one year to the next, and then computing mean residual gain scores,
for each teacher's classes across three consecutive years. The data on a
fourth year were added Inter, when teachers were selected for observational
study.
The details of the teacher selection research have been reported previously
(Brophy, 1973; Veldman and Brophy, 1974). Briefly, it was found that about
one -half of the subtest patterns for individual teachers showed some form of
constancy (linear constancy across four years, linear gain, or linear drop),
while the other half of the patterns showed erratic inconsistency. Although
girls outperformed boys in the raw scores, as expected, the teachers tended
to be relatively equally effective in producing learning gains in boys vs.
girls. Only four of the 165 teachers showed a clearcut tendency to produce
consistently better learning gains either in boys or in girls.
Also, teacher effectiveness scores tended to intercornslate fairly highly
within years across the subtests. Thus, although there were a few teachers
8

4
who regularly obtained higher achievement gains in language arts than in math
or vice versa, the majority of the teachers obtained similar relative student
learning gains across these two subject matter areas.
There was a ciearcut year or class cohort effect in the data even though
residual scores were used, indicating that certain factors operating within a
given year (perhaps teacher and/or student health, class leadership and
cooperation, or similar factors that might make an important difference in
the learning gains of the entire class within a given school year) were not
eliminated even through the residualizing process (Brophy, 1973).
The obtained stability coefficients for mean q2in on a given subtest from
one year to the next were much higher than those noted in Rosenshine's neview,
Although a few were low, the great majority were between .30 and .50. Although
these certainly are not high enough to justify the use of standardized achieve-
ment tests for teacher accountability purposes, they were high enough to make
possible the selection from the total sample of teachers a subsample who were
notably consistent across four years in the Melva amounts of stuiant learning
gains that they produced across flit five subtests of the Metropolitan Achievement
Tests, across the two sexes, and across time (four years).
Thus, sample selection procedures for this study involved not only the
restriction of the sample to teachers who were likely to have developed some
consistency in their pattern of classroom teaching; they also involved selection
of teachers who had already demonstrated a tendency to be relatively consistent
in the kinds of student learning gains which they produced. These two factors
in combination are among the more important innovations involved in this research.
By selecting teachers who had shown high consistency In their measured effect-
iveness and who also could be expected to show relatively high consistency in
9

5
their classroom process behavior, we probably increased the probability of
finding meaningful and valid process-product relationships between teacher
behavior and student learning, compared to earlier studies which had used
student teachers, teachers starting a new curriculum, or random samples of
teachers.
Procedures
This research was a two-year replicated study of the presage and process
correlates of student learning gain. The design and procodural aspects of the
study will be summarized briefly here, since they have been discussed in detail
In several previous reports dealing with the design of the study as a whole or
with the data from the first year of investigation (Brophy, 1973, 1974: Brophy
and Evertson, 1973a, 1973b, 1974a; Evertson and Brophy, 1973; Peck and
Veldman, 1973; Veldean and Brophy, 1974). These reports contain detailed
Information including copies of the instruments used and tables showing the
complete data, for readers interested In this material.
Sample Selection
As noted above, the teachers included in the sample were those who had
shown relative constancy In the degree of student learning gains they produced
across the two sexes and the five subtexts of the Metropolitan Achievement
rests, across four consecutive years of study. Thirty-one teachers were
included In the first year of study. These thirty-one were the most consistent
In the sample who were still teaching at the same grade level at the time the
study was begun (1971.4972 school year). the second year of the study involved
28 teachers, including 19 who had been In the study the year before. Thus,
the replication the second year involved 19 of the same teachers studied the
10

6
first year, but it also involved nine new teachers end the elimination of 12
teachers studied previously. The majority of the teachers studied the first
year who were dropped the second year were dropped because they were transferred
to a new grade, although a few retired, a few went on maternity leave, and a
few refused further continuation.
Data Collection Instruments
Following the advice of several critics of process-product research in
teacher effectiveness, we deliberately i. iuded both low and high Inference
measures In assessing teacher behavior. The low Intlrence measuremens° system
was an expansion and adaptation of tho Brophy-Good D;adic Interact:on Obserwe-
tion System (Brophy and Good, 1970), which is designed to record each interaction
that the teacher shares with a single individual child (as opposed to lecturing
or other teacher behavior that Is directed at the entire class or at a group).
This instrument was selected because it subsumes a wide range of variables,
including most of those stressed by the observational systems that have been
used most frequently in previous educational research, as well as some unique
to this system. The major adaptations and expansions were done to add variables
based on Kounin's (1970) research on classroom management techniques, and
to, reek down teacher behavior more +hely according to context variables
corning the time and nature of classroom interaction during which a parti-
cular observation took place. The variables will be described more fully in
the results section when the process-product data from this low inference
Instrument are presented (the coding manual Is Included In Brophy and Evertson,
1973b). Teachers were observed with this instrument 4 times the first year
and 14 times the second year. The first year, since the observation system
11

7
was new and the observers were new trained, observers worked in pairs and
their scores were averaged. Since observer agreement was generally quite high,
in the second year observers worked in pairs until They reached en 80% reliability
criterion (procedures are srucified in Brophy and Wad, 1970, for training
observers and assessing reliability), and .then worked !ingly. Teachers were
observed only 4 times Juring the first year of stig:v sue to flniNgclal constraints;
obviously, considerarons of the reliability cf teacher enavlor from one
observational visit to the next dictate that the teachers be observed as meny
times as possible in order to obtain a reliable and valid Index of their typical
classroom behavior, This was approached much more closely in the second year
of study, in which we were able to observe teachers 14 times each.
Here, each teacher was observed by two coders who alternated in visiting
the classroom. Pairs of coders were assigned to a given teacher so that reli-
ability on high inference ratings and other high inference measures could be
obtained. A variety of high inference measures of teacher behavior were used.
One was a set of 12 classroom observation scales based on factor analytic
studies of five of the more heavily used observation systems in existence (Emmor
and Peck, 1973). These were five -point scales that were rated several times
during each classroom visit by the observer, and then averaged to obtain a score
for each teacher. The variables were among those most heavily stressed by
Flanders, Medley, Smith, and other major Investigators in the development and
application of classroom observation systems. Other high inference instruments
included rating scales and checklists geared to yet at aspects of teaching
which are observable in repeated exposures to the teacher but which are difficult
to measure reliably or validly through low inference observations of specific,
concrete interactions. These include such variables as teacher warmth,
12

8
democratic vs. authoritarian leadership style, child orientation, credibility
with students, and the like. Variables such as these are not only easy to rate
reliably by raters familiar with teachers; there is reason to believe that this
measurement method is preferable to low inference coding when the variable is
not amenable to coding of frequent discrete units of behavior (Rosenshine and
Furst, 1973).
One instrument was used in a low inference manner the first year but In
a high inference manner the second year. This was an instrument designed to
measure aspects of teachers' lesson presentation, particularly the amounts of
time (if any) devoted to various activities that teachers sometimes include in
lessons. The first year these data were collected from a subsample of 10 of the
teachers who were observed twice while they taught lessons. The data were
collected in a low inference manner which involved actual timing of the different
aspects of the lessons observed. During the second year, this low inference
method was abandoned because it required separate visits to the classroom (It
was not possible for coders to code with this method and code with the other
low inference system at the same time, so rather than get only seven observations
with each system, we decided to get 14 observations with the larger system and
get the other information through high inference ratings). Consequently, in
the second year, all 28 teachers involved in the study were measured on these
aspects of lesson presentation, but they were measured through high inference
estimates of the average amount of time that they typically spent In various
activities during structured lesson times. linear correlations between these
process observation variables and student learning criteria are reported in
Brophy and Evertson (1974a).
9
In addition to these high and low inference process measures of teaching
behavior, presage date were collected from the teachers during both years of
study. The first year, each teacher filled out the COMPASS battery developed
by the Research and Development Center for Teacher Education (Veldman, 1972).
This is a battery of pencil and paper tests designed to measure attitudes and
orientations toward teaching, coping skills, defense mechanisms, personality
variables, and other assorted traits and attitudes, particularly related to
teaching. The battery was developed kir use in diagnosing the personal needs
of preservice teachers as an aid in helping to make decisions about counseling
them during their preservice teaching preparation and it was used with inservice
teachers in the present preject to see what correlates would emerge between
variables it measures and the teachers' success in producing student learning
gains. These data were reported previously (Peck and Veldman, 1973).
In the second year, presage variables were collected from the 28 teachers
via a questionnaire and an interview. The questionnaire contained 495 items
culled from a variety of sources and measuring a great variety of variables.
Included were such matters as the teacher's attitudes toward teaching, beliefs
about good teaching, perceived satisfactions and dissatisfactions and their
sources, leadership style preferences, process vs. product orientation, and
a great many other variables. In addition, each teacher was Interviewed with
a 165-item interview designed to allow the teacher an opportunity to respond
freely to questions dealing with opinions about classroom management, curriculum
and instruction, the differential needs of different social classes and ethnic
groups, and other matters. The correlations of interview and questionnaire data
with student learning criteri a are presented in Evertson and Brophy (1974).
14

IU
Wring the second year the students in each teacher's class were
administered the SET II test (Haak, Klelber, and Peck, 1972), a student self-
report measure designed to reveal students' perceptions of the teacher on
three major dimensions: stimulating interactive style (vs. dull and uninspiring),
unreasonable negativity (vs. reasonableness), and tosterance of positive self -
esteem (vs. tendency to behaviors that would lower self-esteem). Although this
Instrument had shown good reliability and favorable indicators of validity in
previous development work, unfortunately it proved to be invalid for measuring
tne affective perceptions of the students in the present study. The correlations
obtained with it were internally conflicting and contradictory, and gave no
evidence that they reflected the students' actual evaluations of their teachers.
The data appeared to reflect various response sets, especially yea-saying.
Consequently, data on this instrument will not be reported. therefore, we do
not have direct product data on affective criteria, although inferences can
be drawn about the affective apsects of teaching from the low and high inference
process observation data and from the interview and questionnaire data obtained
from each of the teachers.
Uata Analyses
In both years, the basic plan was to analyze the associations between
presage or process measures of the teachers and the five student gain criteria
(mean residual gains across four years on each of the five subtexts of the
Metropolitan Achievement Tests). The present report will deal with both the
Pearson correlations between Presage and process measures and the student gain
criteria and with the results of multiple regression analyses geared to indicate
presage-product and process-product non-linear relationships. it Is the third
15

11
and last of a set of second year reports on correlates of teacher effectiveness,
and the most comprehensive. However, readers may also wish to consult the
other two reports, which present linear presage-product correlations (Evertson
and Brophy, 1974) and processproduct,correiations (Brophy and Evertson, 1974a).
In any case, the data analyses involved summing the data for each teacher
across all observations. A few means were computed by dividing totals In each
category by the amount of time that the teacher was observed. These means,
and other percentage scores that were derived by arithmetic manipulations of
raw scores, were then entered into multiple linear regression analyses of
their relationships with student learning gain criteria. The high inference
data were treated as follows. Each teacher, as noted above, was observed by
two observers who more or less alternated their observations and therefore
both became familiar with the teacher and her typical classroom behavior. AT
the end of the year, each of the two observers rated each teacher independently
on all of the high inference measures. These measures were then summed to
obtain a mean rating for the two observers, which were used as the measures
for the high inference data, and interobserver reliabilty figures also were computed.
Results
The data to be presented in the following tables are from these low
inference and high inference correlational analyses. in each case, three
sets of correlations were obtained for each of the student gain criteria. One
was for the total group of teachers (31 the first year and 28 the second year,
or fewer, in cases where certain teachers had no data on a particular variable).
The second and third sets of correlations are for low and high SES (socioeconomic
status) schools. The first year, SES was taken into account by separately
12
analyzing Title I and non-Tit!3 1 schools. :IS Data were obtained the second
year by having six administrators of the school district involved characterize
the 50 elementary schools In the district on a forced-choice, seven-poirt scale
of SES (with choices forced to approximate a normal distribution). These
administrator ratings, which were done independently but showed very high
agreement (r's alt) .90), were then summed across schools to obte';, A trltal
score for each school. This score was used as the index of SES for each school,
and was included In some correlational analyses that were performe:
purposes. For the present report, however, the scores in this ,Ion
were split at the median, with 15 schools classified as high SES and 13 as low
SES. In the first year there were 13 Title 1 classrooms. Correlatinnal
analyses wifhn the two social class groups were then performed in additirm io
the correlational analyses for the total sample of teachers, because the first
year's data showed that there were many contrasting patterns in the kinds of
teaching than appeared to be optimal In these two different types of schools.
For convenience, the data will be presented in sets clustered togetner
because they are derived from the same measurement instrument or set of Instru-
ments. Integration of the data from different data sets will be reserved for
the discussion section, for the most part.
Key to interpretation of Tables
Construction of the tables for this report presented formidable concep-
tualization and communication problems. Decisions had to be made about how
much information to include, out the format of the tables themselves, and
about how to handle situatiols where only a few subjects v- available for
analysis.
17

13
Decisions about what to include were made easier by the fact that this
report has been preceded by two earlier one 'trophy b Evertson, 1974a; Evertson
urophy, 1910 dealing with the linear correlations between process and
product measures and between presage and product measures, respectively.
These reports contain the full data on linear correlations for all analyses
where six or more subjects had valid data available for analysis, along with
the relevant inter -coder agreement data for each process variable. Thus,
the decision was made to eliminate these data from the present report, except
for including linear correlation coefficients which were statistically signi-
ficant when no curvilinear analyses were statistically significant, and also
Including the correlation coefficients to Indicate the strength of relationships
when the non-linear analyses revealed a different linear relationship In each
of the two SES groups.
The logic for these decisions is as follows:
1. Inclusion of all of the linear correlation coefficients and the inter-
coder agreement data would be redundant with the previous reports and would
clutter already overcrowded tables.
2. The cutoff figure of six subjects with varying scores was chosen arbitrarily.
Whenever data for the entire sample or (more typically) for one of the two SES
subsamples contained five or fewer subjects with any data at all or only five
or fewer subjects with scores different from the scores of the rest of the
subjects, the data were disregarded and treated as "no data." The first case
Is a total "no data" situation, meaning that fewer than 6 subjects in the
group of interest had data on the variable (many of the behavioral process
observation variables were contingent upon contextual situations which may
18

14
or may not have occurred in a given classroom, so that certain of them were
Scored for only a few teachers because these situations came up in only a few
classrooms). in these cases, most of the teachers had no data on the variable
because the situation involved in coding it never arose during observations
in that classroom. The second case mentioned above occurred when many teachers
had data but a majority had the same score (usually "0"). in these situations,
the "0" scores of the teachers were real, but the distribution was an extreme
4-curve, with all but a few teachers having "0" scores. Under the circumstances,
it seemed better to enter "no data" on the table rather than to report findings
from such an unusual and obviously misleading analysis. Thus, in all three of
the reports relating presage and process measures to product measures, "no
data" appears on the table both in cases where fewer than 6 teachers had usable
data and in cases where more than 6 had usable data but fewer than 6 had scores
which differed from the modal scores (usually "0").
3. The data for non-linear relationships come from a series of step-wise
curve fitting regression analyses which tested the following hypotheses in
sequential order: A) The relationship between the presage or process variable
and the product variable is curvilinear in both SES groups but different for
each group; B) The relationship is curvilinear in both groups and both groups
share the same curve; C) The relationship Is linear in both groups but each
group has a different linear relationship. if none of these three tests was
statistically significant, the zero-order correlation coefficients for each
of the two SES groups were used.
4. A probability level of .10 was selected as the cutoff point for statis-
tical significance. The decision to use this figure rather than the more
19

15
typical .05 level was made because the study deliberately included "anything"
which might relate to student learning gains, including many variables thought
to be marginally likely to succeed at best. Also, some of the variables were
in sets with ipsative relationships to one another, so that high figures in
one or two of the categories meant that the other categories would have no
data or such little data that significant relationships would be very unlikely.
Also, Cohen's (1969) investigations of the relationships between the power of
statistical tests and sample size indicate that correlations which are signi-
ficant but moderate rather than very high (as would be expected in the present
investigation) are especially likely to be missed when the sample size is
small. In short, the danger of missing a correlation that actually is
significant (a false negative) is greater in such studies than the danger of
false positive errors which make it appear that a relationship which actually
doesn't exist is significant. The latter danger was further reduced in this
study by the fact that many of the variables were measured separately in
different contexts and with both high and low inference measures, so that it
is usually possible to assess whether or not a given finding holds up across
a range of contextual and measurement variations. Finally, this research was
essentially an emperical, hypothesis generating study rather than a hypothesis
testing study, so that we were more concerned with the danger of missing a
hypothesis worth following up than with turr:Ig up a few false positives. We
believe these arguments to be persuasive, but readers should bear in mind
that a cut-off of .10 was used in determining statistical significance.
However, relationships which reach the .05 level of significance are indicated
In the tables.
2C)

16
5. Readers should also look upon the probability values from our analyses
as general indicators of the strength of relationships and not as exact
probability estimates. This is because the study violates several of the
assumptions underlying the use of such probability coefficients. The most
serious and obvious problem is that several hundred relationships were tested
both in year 1 and year 2, but there were only 31 subjects in year l and 28
in year Z. Thus, there were many more variables than subjects, instead of
the opposite, as is recommended. ibis problem was due to financial and
practical considerations and to our desire to include "anything" that might
prove to be important, rather than to any questioning or rejection of the
usual reasons given for exercising caution In Interpreting relationships
where the number of variables exceeds the number of subjects.
6. The tables are arranged In quadrants, with one set of quadrants depicting
tree relationships between each presage or process variable and each product
variable. The two left side quadrants are for low SL5 classrooms and the two
right side quadrants are for high SES classrooms. Within these, the top
quadrant Is for presentation of correlation coefficients and the bottom
quadrant is for graphic depiction of the relationships among the variables
when one of the three statistical tests from the curve fitting regression
analyses mentioned above reached statistical significance. The graphic
depictions in the bottom quadrants have been very carefully drawn in an
effort to reproduce faithfully the exact angles of straight lines and the
precise form of curved lines.
7. A multiple R appears below the quadrant, except where no data were
available and therefore "ND" appears instead. This multiple R represents the
2i

17
percentage of product criterion variance accounted for by the presage or process
measure for the total group (low SES and high SES combined). If none of the
curve fitting regression tests reached statistical significance, this multiple
R corresponds to the square of the zero-order correlation between the presage
or process variable and the product criterion variable. if one of the curve
fitting regression tests did reach statistical significance (using the .10
cutoff criterion), the multiple R Is from this test. if the R is from the
first test (indicating that the relationship was non-linear in both groups but
that the non-linear relationships differed), it reflects the percentage of
criterion variance accounted for using a regression model predicting contrasting
non - linear relationships in the two subgroups. However, if the R appears when
one of the other two relationships is graphed (common curvilinear slopes or
contrasting linear slopes, respectively), it results from a step-down analysis
in which the associated probability value comes from a test of the significance
of increase in multiple R when one moves from one model to the next. Thus, in
each case, the multiple R reflects the percentage of criterion variance accounted
for when the model which reached the statistical significance criterion Is used.
However, in the case of multiple R's accompanying the second model (common
curvilinear slope) or the third model (contrasting linear relationships), the
2 -value attached to this multiple R will reflect the significance of the
increase due to the shift from the earlier model to the later one, rather than
the significance of the model itself used in Isolation as a prediction in an
independent test rather than as part of a step-down series.
8. Occasionally more than one of the regression models and/or the zero-order
correlation coefficients would surpass the statistical significance criterion,
24)
18
causing a problem of choice among statistics to present. In such situations,
the first model to reach statistical significance is presented, even if a later
model had a lower probability value. This is because the models are entered
In order of specificity, and theoretically the earliest model to reach the
statistical significance criterion represents the best fit between the two
variables, regardless of the significance levels of tests of models later in
the series. Therefore, lines or curves from the step-down regression analyses
are presented whenever these were significant, even if the zero-order correla-
tions were also significant. However, if the significant test was the third
test reflecting different linear slopes in the two SES populations, the zero-
order correlation coefficients are presented in the upper quadrants In addition
to the lines presented in the lower quadrants, to provide additional information
to readers about the relative strength of the relationships. It should be kept
in mind, however, that the multiple R below the quadrant reflects the signifi
cance of the addition to the variance accounted for when the switch was made
from the second model to the third model in the regression analyses, and is
not the square of the correlation between the variables for the total group.
9. in summary, then, the quadrants will contain one of four kinds of data
in the simple case: different curves for each group in the tower quadrants
(indicating that the first test was significant); common curves in the lower
quadrants for each group (indicating that the second test was significant);
contrasting straight lines in the lower quadrants for each group accompanied
by correlation coefficients in the upper quadrants (indicating that the third
test was significant); or nothing in the lower quadrants and correlation
coefficients in the upper quadrants (indicating that none of the regression

19
models was significant, so that the zero-order correlation coefficients are
presented). Multiple R's will be presented beneath each quadrant for each
analysis, although the specific meaning of the valuas associated with these
multiple R's, will differ somewhat depending upon which (If:any) of the models
or analyses yielded significant relationships.
10. In the case where insufficient data were available for analysis because
fewer than 6 teachers in the whole group or in the subset had data at all or
had data differing from the modal sore, the notation "ND" wilt appear in
the quadrant. In the most extreme case, where fewer than 6 teachers had
available data for the entire sample, "NO" will appear in ail 4 quadrants
and also directly under the quadrants where the multiple R usually appears.
If neither subgroup (low nor high SES) had enough teachers for analysis but
the combination of the two did have enough,"ND" will appear in each of the
4 quadrants but a figure for the multiple R will appear below the quadrants.
This will be the square of the zero-order correlation coefficient for the
total group, which appears in Brophy & Evertson (1974a). Very few of these
are statistically significant, of course, because of the low N's involved.
11. A more complex case of missing data occurs when there were enough data
to analyze for one of the SES subgroups but not for the other. In this tase,
"ND" will appear in the two left quadrants if there were Insufficient data
for analysis In the low ShS subgroup, or it wilt appear in theTwo right
quadrants If there ware insufficient data for analysis In the high SES subgroup.
Usually the low N problem In these situations caused the curve fitting tests
to fail to reach significance, although occasionally a test involving a group
with 6 or more usable scores In one SLS set but fewer than 6 In the other SES
4N1

ZU
set would yield a stnntttcent result. In this case, the curve is drawn In
on the side of the ouadrant that is reflective of the group that had sufficient
data, but the corresponding curve for the other group has been deleted and
the notation "NU" appears instead. This procedure reflects the decision that
it would be better to present no data at all in situations where N was very
low and data were suspect than to present suspect and probably misleading
data. (he multiple R' are labeled as significant In these situations,
although these, too, are suspect in view of the nature of the analysis. Given
our general finding that the data usually hove to bti interpreted by SES because
the relationships between presage and process variables and student outcome
criteria are more often different than similar for ,these two groups, we believe
that the safest and most sensible way to view these unusual analyses is to
ignore the data for total group and for the group which had insufficient N
to allow analyses, and to interpret only the data for the group which did have
sufficient data for analyses (assuming that it is interpretable; see below).
12, The graphic depictions may at first appear confusing in some cases where
the second test was significant (Indicating that a common curve depicted the
relationship between the variables in each SES group). This Is usually taken
to mean that an identical or very similar curve will appear for each group,
and in many cases this is what does appear. However, the test assesses whether
or not the two groups appear on a common curve, and not whether or not they
appear on the same place on that curve. Therefore, sometimes a test of a
significant common curve yielded strikingly different graphic depictions of
the relationships. This appeared when the relationship for the entire group
was curvilinear, but the data for one SES group was on the left half of the
tJ

21
curve and the data for the second SITS group was on the right half of the curve.
In cases like these, the direction of the relationships for the two groups
Is opposite, and is similar to the situation for the following test indicating
contrasting linear relationships, except that the relationships tend to become
soemwhat curvilinear. In short, occasionally the test of a common curve was
significant but the relationships between presage or process variables and
student outcome criterion variables were quite different for the two groups,
with one group being on the dropping portion of the curve indicating a generally
negative relationship and the other group being on the rising portion of the
curve indicating a generally positive relationship. This problem, along with
our desire to indicate the best fit relationships as precisely as possible rather
than use less exact zero-order correlation coefficients (in cases where the
curve-fitting regression tests were significant), led us to the decision to depict
graphically the relationships whenever the curve fitting tests yielded signi-
, ficant results. Consequently, where curves appear in either or both of the lower
quadrants, these represent the graphic depiction of the best fit between the two
variables. Some of these graphic depictions are quite easily interpretable,
but some are not. This problem will be discussed in the following section.
Rules for Interpreting Graphic Depictions
In addition to the decisions described above concerning what data to
present and how to present it, decisions had to be made about how to interpret
some of the curves that appeared in the curve fitting regression analyses when
one of the three tests reached statistical significance. Unless otherwise
noted, the interpretation of the data in the following text is based upon the
following decision rules.

22
A. "urves - If either of the first two tests were significant, curves
depicting the relationship between the variables within each SES group appear
in the two lower quadrants. Interpretation for some of these curves is straight-
forward and obvious, but for others it is questionable or even impossible.
The major types of curves are listed below, along with the interpretation given
for each and the rationale given for this interpretation. It should be noted,
however, that these curves are ideal types, whereas the actual curves to be
found in the tables include all of the possible segments that can be found on
a U-shaped or an inverted U-shaped curve, and thus include many curves which are
in between some of the extreme ideal types discussed below. In these cases,
interpretation will be less clearcut than it will be when the curves are more
idealized.
I. Inverted U-shaped curves. These curves depict a relationship in which
some medium or optimal amount of the presage or process variable is associated
with highest scores on the product criterion variable, with either too little
or too much of the presage or process variable being less desirable than the
medium ontimcl amount. This interpretation is straightforward, Plthough the
strength of the relationship depends upon the steepness of the curve. Occasion-
ally an inverted U curve will appear which is clearly recognizable as such
but which is so shallow that is is virtually a flat line and thus uninter-
pretable.
2. Decelerating curves. Many curves are decelerating curves which rise
or fall for a while and then trail off, becoming virtually horizontal at one
end. These curves Indicate that the presage or process variable Is related to
the product criterion only at one of tt,e extremes. For example, a decelerating
11,

23
curve which rises but thentai is off as a near-horizontal line moving to the
right, would indicate that teachers who were very low on the presage or process
variable tended to get low student gains on the criterion measure, but that
teachers very high on the presage or process variable did not get any better
gains than teachers who were more medium on it. In other words, curves like
these represent threshold relationships, in which increases in presage or
process variables are associated with increases In student learning gains up
to some point, but beyond that point further increases in the presage or process
variables do not lead to further increases in the criterion variables.
Decelerating curves which fall rather than rise have the same. kind of threshold
relationship, except that the relationship is negative rather than positive for
part of the curve that is d-opping (before it trails off into a horizontal line).
The nature of these decelerating curves varies considerably, and affects
interpretation. Some (//' Y are essentially minor variations of linear
relationships, indicating a generally positive or negative relationship between
the two variables which tails off at one extreme of the presage or process
variable. These relationships are quite strong and easily interpretable. In
contrast, another kind of decelerating curve (-.Nyr--.1-- __J) indicates that
there is essentially no relationship betweo1i the variables for most levels
of scores on the presage or process variable, with the exception that extreme
scores on one end tend to be associated with higher or lower student learning
gains. Interpretation here is somewhat different. In the case mentioned
above, the basic interpretation is that the two variables are related in an
almost linear fashion except at one extreme. In the present case, the inter-
pretation is that the va-iables are essentially unrelated except at one extreme.
"it

24
Decelerating curves which lie between these extreme examples will be interpreted
congruently with the interpretations given above. That is, a relationship
between the two variables will be interpreted to the extent that significant
portions of the curve angle upward or downward from the horizontal. Conversely,
to the extent that significant portions of the curve lie on or near the hori-
zontal, the interpretation will be that a relationship between the variables
exists only at one extreme of the presage or process variable.
3. "Candy cane" curves. A variation of the decelerating curves
mentioned above are "candy cane" curves which not only decelerate and become
horizontal but also hook back up or down again to some degree. Here again,
the precise interpretation will depend upon the precise nature of the curve.
Where the portion of the curve which hooks back again from the horizontal is
very small fr'1 ) so that the curve closely represents the type mentioned
in section 2 above, the interpretation wilt be similar. That is, the slight
hooking back will be ignored and will be treated as if it decelerated into a
horizontal line.
In contrast, in situations where one side of the curve is definitely
longer than the other but nevertheless the shorter side clearly hooks
significantly away from the max N ti fl r), interpretation is more arbitrary.
The problem here is that any of several different things might be going on.
One possibility is that the variable is essentially linearly related to the
criterion, but that there are exceptions in some classrooms for some unknown
reasons. A related interpretation is that the variable Is actually complex
and multidimensional and/or that it is affected by contextual factors, so
that a curve of this type is obtained when more refined measuring techniques

25
might have produced simpler and more interpretable relationships. Other
explanations for the appearance of such curves are also possible.
In any case, when such curves appear, only the extremes on the long parts
of the curves will be interpreted. Regardless. of the reasons for the relation-
ship, when such curves appear it still can be said that teachers who are extremely
high or extremely low (depending upon the curve) on the presage or process
variable involved tend to get higher or lower student learning gains. in short,
in these situations we will interpret only the extreme end of the curve,
treating the rest as if it were a flat line.
4. U-shaped curves. U-shaped curves appear to be inherently unInter-
pretable, at least not without other information about how a variable might
be interacting with other variables. Such curves indicate that teachers who
are either low or high on the variable tend to produce greater student learning
gains than teachers who are In between. With only a very few exceptions,
relationships of this sort make little psychological sense. Many of the
U-shaped curves are extremely shallow and will be ignored anyway, treated
as if they were essentially flat horizontal lines. However, some steep U-shaped
curves were obtained. These will be reported but usually not interpreted,
unless we were able to discover a psychologically meaningful (i.e., face
valid) reason why such a relationship should appear. Usually such relation-
ships appear because the presage or process variable is multidimensional
and/or interacts with context effects, so that different scores for different
teachers do not reflect precisely the same behavior. Another possibility is
that the variable interacts in some complex way with some other variable.
We will check for such complex relationships later, but for the present,
U-shaped curves will be left uninterpreted for the most part.

26
B. Straight Lines - Straight lines resulting from significant multiple R's
from the third test (contrasting linear relationships) will be interpreted
much like correlation coefficients. The lines indicate a linear relationship
between the presage or process variable and the criterion variable, with the
strength and importance of the relationship being dependent upon the angle of
the line. Sharp rising or dropping tines indicate a strong and interpretable
relationship, while horizontal or near-horizontal lines indicate no significant
relationship. The latter frequently appear, because the tests for contrasting
linear relationships frequently indicated a strong linear relationship in one
group and essentially no relationship In the other. In any case, straight
lines will be interpreted as linear relationships, with their strength and
importance dependent upon the angle of the line, just as the strength and
importance of correlation coefficients are dependent upon the size of the
coefficient.
Data Presentation
For convenience, data will be presented in clusters according to the
measurement instruments useu to collect them. High and low inference measures
of Interaction process variables will be presented first, followed by
questionnaire and interview presage measures. Variables will be discussed
briefly as they are presented, and the concluding discussion section will
present more broad ranging and integrative discussion of the results for the
project as a whole.
For each variable, except where data were missing altogether or were too
sparse to warrant presentation, information about it's relationship with each
of the five student learning gain criteria is presented in the four quadrants
discussed Previously. Data for low SES schools are presented in the two
left quadrants, with correlation coefficients in the top quadrant and/or
graphic depictions of relationships in the bottom quadrant, Data for the high
SES schools are presented in the two right quadrants, with correlation coef-
ficients presented in the upper quadrant and/or graphic depictions of relation-
ships presented in the lower quadrants. A multiple R representing the
proportion of criterion variance accounted for by the presage or process variable
for the total sample of teachers (N = 31 for year 1 and N = 28 for year 2)
appears below the quadrant.
Although data for both years are separated for low and high Sth schools,
the separation criteria were slightly different. The first year, data for
Title 1 schools (schools populated by low income families primarily) were
presented separately from data from non - Title 1 schools. There were 13
classrooms in Title 1 schools and 18 classrooms in non -Title 1 schools among the
total of 31 classrooms. In the second year, schools were split at the median
on a composite SES score obtained by having several school administrators
from the district rank the schools on SES and then averaging these ranks
(which correlated very highly with one another). This split for the second
year yielded 13 low SES classrooms and 15 high SES classrooms.
The five student learning gains criteria are average mean residual gains
across 4 consecutive years (classes) for each teacher on 5 subtests of the
Metropolitan Achievement Tests (word knowledge, word discrimination, reading,
arithmetic computation, and arithmetic reasoning). Since the teachers had
been selected on the basis of their consistency in producing student learning
gains on these tests, the average across the 4 years for which data were

28
available was considered the best estimate of teacher effectiveness in
Producing student learning gains.
Readers should bear in mind that the data apply only to a measure of
success in producing student learning gains, and not to any measures of success
in the affective area. This is mentioned not only because it is important in
its own right, but because many of our data sqggest that some of the success
that teachers attain in producing learning gains (especially in high SES schools1
may come at the expense of affective gains. This has been discussed in some
detail in a previous report (Brophy & Evertson, 1974a), and it wilt be further
elaborated here. Attempts to collect affective data via a student self-report
instrument were unsuccessful and presented validity problems as mentioned
previously.
Given that data from the curve fitting analyses take precedence over
zero-order correlation coefficients, the present report in a sense supplants
(although in effect it really only expands) the previous report (Brophy &
Evertson, 1974a). In most cases, significant correlation coefficients that
appeared and were discussed in that report remain in the present one, although
in a few cases they have been supplanted by graphic depictions of relationships
because one of the curve fitting regression analyses yielded a significant
result. More typically, however, the correlation coefficients in the previous
report are supplemented by additional non-linear relationships in the present
report. In any case, the present report is the more complete and definitive,
although readers interested in some of the fine points of the data might wish
to consult previous reports.

19
Finally, it should he noted that distinct ons among the b student
learning criterion variables are rarely made, even though they represent 5
different tests which group into two different major areas (language arts and
mathemetics respectively. Thus, the report sheds little light on differential
teacher behavior which relates to student learning in these different curri-
culum areas.
No doubt, this is partially or wholly due to the fact that our teachers
were selected because of their general consistency in producing student learning
gains across all five of the subtests. Given this sample, the chances of finding
particular clusters of teache.- variables related to particular student tests
were drastically reduced. Thus, the present findings do not necessarily imply
that teacher behavior will not show more differentiated and specific
relationships to learning in different curriculum areas in studies using random
samples of teachers. However, it should also be noted that our original data
on 165 teachers revealed very few who consistently achieved greater success
In language arts than in math or vice versa. Thus, these data suggested that,
at the early grades at least, teacher success in producing student learning
gains tends to be rather general across subtests. Even the teachers who were
inconsistent across years tended to be consistent within years. That is, in
a "good" year they tended to have relatively high mean residual gain scores across
all subtests, while in "bad" years they tended to have relatively poor mean
residual gain scores across all subtests. Only a handful of teachers consistently
did bettor or worse on particular subtests or on language arts vs. math across
the four years. In any case, In presenting and discussing the results we will
typic&Ily refer to teacher success In producing learning gains as a single

30
general variable, even though 5 separate learning criteria were used. This
is a simplification, but it holds for the most part.
A final general point to bear in mind in reading the data is that they
make much more sense when considered separately for low and high SES groups
than they do when considered for the total group. This is one of the major
findings of our study, indicating that the kind of teaching that produces the
best learning gains in high SES schools differs systematically from the kind
of teaching that produces the best learning gains in the same grades in low
SES schools. To the extent that SES primarily reflects differences in the
abilities or levels of cognitive maturity of the students involved, these
data constitute in effect a broad set of aptitude-treatment interaction hypo-
theses and help point the way toward more prescriptive advice about teaching
particular types of students, as opposed to the more typical tendency to present
particular teaching techniques or characteristics as good or bad for all
students and in all contexts. We will return to this point frequently during
the presentation of the data and the discussion. In any case, it is the rule
rather than the exception that the relationships between presage and process
variables and student learning gain criteria hold for one but not both of
the two SES groups.
Classroom Observation Scales
ihe data in Table 1 are from 12 high Inference ratings developed by
Limier and Peck (1973) from factor analyses of five heavily used observation
systems. these 12 variables are among those used most often in process
observation systems developed for the classroom, and perhaps the most Important
finding concerning them is the general absence of significant correlation

31
coefficients. The picture changes somewhat when the non-linear analyses are
added, because significant relationships become more frequent. Even so, however,
the frequency and strength of relationships for these 12 variables were rather
low considering the importance given to them in the literature.
Student attention was generally positively associated with learning, as
expected, although the relationships were weak and often curvilinear. The apparent
reason for this is that although apparent student attention can be rated reliably
by classroom observers, it does not appear to be a very valid measure of actual
student attention as assessed by student self-report or measures of student
ability to remember what was going on in an earlier class (Taylor, 1968). The
curves for this variable Indicate that observable and ratable student attention is
reliably associated with learning only at the negative end. That is, classrooms
where attention is notably poor tend to yield poor student learning, but beyond
this, observable student attention does not relate reliably to measured student
learning.
The second measure concerned the frequency with which teachers posed
questions to the class (one aspect of discussion-oriented indirect teaching).
This measure had no significant linear relationships with learning, and the
non-linear relationships indicated that relationships with learning were
generally weak. The only notable relationship occurred for high SES classrooms
featuring high frequencies of such questions, which were associated with high
student learning gains. This is the first of a number of findings in our
study to the effect that indirect teaching methods are ineffective (sometimes
contraindicated and sometimes merely unimportant) in low SES schools and of
only weak Importance in high SES schools. We believe that these findings do
Wit)

32
not invalidate the earlier work supporting the methods of indirect teaching;
instead, we believe that they reflect the nature of interaction at the early
grade levels. At these grades, the students, particularly those from low SES
schools, are mastering fundamental tool skills. Teaching and learning these
kinds of skills requires teacher-structured lessons and much time devoted to
physical practice of skills and opportunities for feedback. The variables of
indirect teaching, which largely concern verbal interaction between teachers
and students, are less relevant at these grade levels, although they become more
relevant as the children move away from learning tool skills and into more ver-
bally oriented Interactions.
The measure of teacher task orientation showed a few correlations in the
expected (positive) direction, but these were relatively few compared to expec-
tations based upon past research. The data in general suggest that this variable
was more important for low than for high SES, and the curvilinear data are mostly
uninterpretable curves which approach being flat horizontal lines. Thus, in
general, the variable of teacher task orientation which is important at higher
levels appears to be relatively unimportant at these early grades. This relative
unimportance is surprising, not only In view of earlier research on the variable
itself, but also because other data from the present study indicate the importance
of those teacher variables stressed by Kounin (1970) which help maintain student
engagement in relevant tasks and avoid the inactivity which breeds control
problems. The latter is particularly puzzling. The fact that the variable did
not prove important despite previous research on older populations might be
explained by the ages of the children in these grades. Perhaps young children
have not yet developed a sense of organization and a sensitivity to wasting time

33
to tne point that they would notice and become irritated by such behaviors in
a teacher tne way older students usually will.
The next variable concerns frequent pupil-to-pupil interaction. Like the
data on the frequency of teacher questions (and thus the frequency of discussions),
the present data reveal little support for the importance of indirect teaching
at these grade levels. The data for low SES are conflicting, showing a single
positive correlation for year 1 but negative correlations for year 2. The data
for high SES schools also conflict, showing no significant findings for year 1,
a significant negative correlation for reading group interaction in year 2, but
some generally rising curves for whole class activities in year 2. Thus,
although frequent pupil-to-pupil interaction may be a good thing at higher grade
levels, it appears to be unimportant and perhaps even maladaptive for teaching
at the early grades. The only support for it in our study comes from general
class discussions (not reading groups) in high SES schools from the second year
of the study, and even here the curves are such that only the classes that were
very high on this variable showed higher learning gains.
The next variable deals with the percentage of teacher time devoted to
lecturing and demonstrating (as opposed to questions and discussions and to
allowing children to practice skills and receive feedback). The first year data
showed weak positive relationships for high SES. The second year data showed
consistent and somewhat strong negative relationships for low SES and mixed
and weak findings for high SES. Again, this is another example of weak and
conflicting data for a variable connected with the concept of indirect teaching,
and it again shows that such teaching appears to be unimportant at these grade
levels. The negative correlations in low SES do not indicate support for

34
indirect teaching because, as will be noted later, the data suggest that in
lieu of lecture and demonstration in low SES schools, the children needed
practice and feedback as opposed to questioning and opportunities for discussion.
The data on teacher negative affect expressed toward the children showed
remarkably few significant relationships. It was expected that this variable
would consistently correlate negatively with student learning gains, but this
was not the case. There was a slight negative trend In low SES and a slight
positive trend in high SES, but none of the relationships were particularly
strong or noteworthy.
The data for positive affect mirror those for negative affect in many ways,
except that several significant relationships were found. Positive affect was
associated positively with learning gains in the low SES schools, but mostly
negatively in the high SES schools. Taken together, these two variables are
the first evidence of a pattern that is repeated again in many different measures
from our study, to the effect that the more successful teachers in low SES
schools were warm and encouraging towards the children while the more successful
teachers in high SES schools were demanding and critical.
It should be noted that the high SES data do not conflict with previous
findings to the effect that learning is reduced under conditions of pressure,
frustration, and negative affect. Although the relative differences among the
high SES teachers indicated that the teachers who showed relatively more negative
affect tended to produce higher learning gains than those who showed relatively
less, the absolute scores on measures of both positive and negative affect
indicate that the affect shown was overwhelmingly positive. Thus, the teachers
high on negative affect in the relative sense were not showing much negative
14")
1-44 -1

35
affect in any absolute sense. Careful examination of the data suggests that
much of the negative affect came in the form of expressions of displeasure or
criticism when students failed to respond to questions or otherwise to meet
teacher expectations. Thus, it came in the form of a somewhat critical demand-
ingness restricted mostly to the issue of student ability to meet teacher achieve-
ment demands, and was not a more general negative affect characterized by such
indices as punitiveness, hostility, or a rejecting attitude towards the children.
Even though the absolute frequency of negative affect was low, its importance
should not be minimized, however. The relationships between affect measures
and student learning gains were quite consistent and striking, including the
consistent difference between low and high SES schools. Thus, even though
relatively small differences are involved in the absolute sense, it appears that
successful teachers in low SES schools avoided negative affect and motivated
through encouragement and other positive methods, while the more successful
teachers in high SES schools tended to motivate more through challenge and
chiding criticism.
The next variable deals with the degree to which the teacher asked
questions and gave assignments which required high levels of generalization,
inference, or explanation. No significant relationships of any kind appeared
in year 1 for this variable, although several appeared for year 2. These
indicated that a relatively high level of generalization in questioning was
positively associated with learning in high SES schools, although there was
only one significant linear correlation and most of the relationships were
curvilinear. The data for low SES schools were mixed. In general, these
findings fit in with a larger pattern found across several measures in the study
suggesting that the high SES students profited from being challenged with
difficult material, but that the low SES students did not (in fact, sometimes
they did better by being taught less but having this lesser amount taught more
thoroughly).
The next variable deals with observer ratings of student withdrawal,
passivity, or aimless behavior in the classroom. This variable showed the
expected negative correlations, although they were much stronger for high SES
than for low SES classrooms. The reasons why the findings were not more wide-
spread or stronger are probably similar to those mentioned above for observed
student attention. That is, observed student behavior of this type is suggestive
but not necessarily conclusive of an absence of student involvement in learning
or mastery of the tasks. The fact that the findings were a little more consistent
than those for student attention is probably due to the fact that behavior of
this sort is a somewhat more positive and clearcut indicator of absence of
student involvement than is apparent lack of attention. Also, this variable
has connotations of poor motivation or even helplessness on the part of students,
whereas simple inattention does not (inattention may indicate weak motivation
for learning or a tendency toward distractability or hyperactivity, but it does
not necessarily connote despair or withdrawal from the learning situation).
The ratings of teacher clarity showed no significant associations for year
but showed primarily positive associations, as expected, for year 2. This
was especially notable in the low SES classrooms. The latter finding Is one
of many indicating that the low SES students, who had both less general ability
and fewer school-relevant experiences compared to the high SES students, were
more dependent upon the teacher for their learning and less able to learn on

37
their own or from one another. Consequently, variables such as teacher clarity
were particularly important in the low SLS group. The more general principle
here would seem to be that the importance of teacher clarity will vary with the
ability of the student to learn on his own, with teacher clarity being increas-
ingly important to the extent that the student who lacks this ability and is
thus more dependent upon the teacher.
The ratings for teacher enthusiasm also showed no singificant findings in
year 1 but a pattern of significant relationships in year 2. The data for low
SLS schools revealed a generally positive pattern, as expected. However, the
data for high SES schools were mixed, instead of positive as expected. Based
upon the data as a whole and upon the comments of our classroom observers, we
interpret this finding as follows. For low SES schools, these data are part
of a general pattern suggesting that the more successful teachers were warm,
encouraging, enthusiastic, and otherwise generally positive and student oriented
in their approach to teaching. For high SES schools, however, the situation was
considerably different. First, positive teacher affect variables were relatively
unimportant in these schools, with the findings typically being either non-
significant or mixed in direction. Second, our classroom observers suggested
that the teachers rated highest on this variable did not have the complex of
generally desirable qualities that the term "enthusiasm" usually connotes in
educational research. When this variable has been included in studies done
at higher grade levels, teachers rated as enthusiastic are usually described as
animated, theatrical, and talented in "bringing the subject matter alive" to
their student, through a combination of techniques including student involvement
and teacher modeling of interest and excitement in the topic. Although these

38
qualities were present in some degree in teachers rated high on "enthu5iase in
our study, the observers indicated that the teachers rated extremely high in
"enthusiasm" tended to show somewhat ass desirable qualities which might be
more prevalent at the early elementary grades: gushiness and a generally
melodramatic but unconvincing manner. This was especially true of the teachers
rated high on "enthusiasm" in the high SES schools. Thus, the negative
correlations in the high SES schools on this variable may reflect an overdone
Gushiness rather than a more reasonable and genuine enthusiasm.
The next variable concerns the frequency of convergent questioning vs.
divergent questioning. Again, there were no significant findings for year 1,
nor were there any significant findings for the total group data for year 2.
However, several curivilnear analyses revealed significant findings for the
reading group and general class data in year 2. These analyses, although
mixed, Indicated a generally negative relationship in low SES and a generally
positive relationship in high SES, but with the nature of the relationships
being somewhat weak and tending to be curvilinear. Interpretation of this
variable is further compounded by the fact that the most obviously Interpretable
data occurred for reading group process measures correlated with mathematics
gains, relationships which are inherently uninterpretable. Thus, perhaps the
most conservative and appropriate general conclusion here is that this dimension
is not important to student learning at these grade levels. This Is another
part of the general pattern to the effect that indirect teaching and the concepts
associated with it appear to be of little importance to instruction in the
early elementary grades, because teaching in these grades has not yet begun
to concentrate on the. verbal interchanges between teachers and the class as a
7. 3

39
whole which characterize education at higher levels. Since general class
discussion is a relatively infrequent and unimportant aspect of instruction
in the early elementary grades, aspects of Indirect teaching and other classroom
interaction variables which are closely connected with the activity of general
class discussion are necessarily unimportant also. This does not mean, however,
that they are unimportant at later grades where discussion is a frequent if
not predominant mode of instruction.
Although the non-linear analyses added several significant relationships
which did not appear in the correlational analyses, the general conclusion
that the variables included in this set of classroom observation scales were
relatively unimportant and unrelated to student learning remains true. Despite
the heavy emphasis on these variables and their popularity in teacher-student
interaction research, as a set they were quite weak in our research, compared to
the tow inference data and to other high inference data. As noted above, we
believe that the most fundamental reason for this is that most of these variables
have come from studies which have concentrated on teacher-student interaction
at higher grade levels, where verbal interchanges between the teacher and the
class are a much more frequent and important aspect of schooling than they are
in the early elementary grades.
Checklist Variables
At the end of the school year, each of two coders who had observed each
teacher filled out a series of checklists. The checklists concerned alternative
methods of behaviors that a teacher might use in a given situation. If the
teacher had been observed using any one of the possible methods, the coder
indicated this by checking it. If more than one of the alternative methods or

40
behaviors was observed, more than one check was entered in the section. To
get final scores, the data from the too coders were added together. This
section contains many variables which do not have enough variance to allow
usable data (indicated by "NO" on Table 2). This indicates that the variable
was not observed or was observed so rarely that meaningful statistical analyses
could not be completed.
The first checklist variable concerns teacher methods of handling catchup
work when a student missed some time due to illness or some other reason for
missing school. Data from the first year did not allow any analyses to be
done on this variable, because the teachers were not observed often enough to
permit observers to rate it reliably. Data for the second year were sparse.
One curvilinear analysis reached significance for the variable of no remediation
at ail; treat is, having the child simply skip missed work. This did not show
a meaninoful relationship in either group, although the curve for the high SES
group suggested that teachers who consistently used this method were relatively
more successful than other teachers. ?lore meaningful data appeared for the
variable "teacher explains work and has child do part of it." This variable
was mixed in direction in low SES schools (although one negative correlation was
significant), but was positive in direction in high SES schools. Thus, for high
SES schools, this method of dealing with missed work appeared to be optimal.
Nothing can be said from these data concerning methods of handling catchup work
in low SES schools, sincn there were no positive correlations or curves for any
of the variables listed.
The next section concerns rules regarding physical movement by the
children in the classroom (without permission? In year 1, mixed and confusing
data appeared for the variable "must always get permission to 'cove seat."

41
Both low and high SES groups showed different and contrasting curves for
reading and arithmetic computation, suggesting that the curves be left uninter-
preted. In contrast, the variable "can go quietly to specified places without
permisSion at any time" yielded significant and interpretable data both years.
The first year, this showed a significant negative correlation in low SES and
a non-significant positive one in high SES. In year 2, this variable appeared
mixed and slightly negative in low SES and generally positive in high SES. In
combination, the above data suggest that more rules are required in low SES
classrooms, but that in high SES classrooms children are better able to handle
responsibilities and freedom on their own.
Finally, the variable "no restrictions" showed an inverted-U curve in low
SES and a dropping curve in high SES, indicating that some restrictions are
appropriate and necessary for children of this age. The remaining variables
of this set did not have enough data to allow meaningful analyses.
The next section deals with punishment methods used by teachers when they
felt it necessary to punish children. In year 1, the method of keeping children
after school correlated positively for low SES and positively but not signifi-
cantlY for high SES. The data for year 2 show mixed reusits, with mostly
negative curves for low SES but positive relationships for high SES. Thus,
the data for low SES do not replicate or hang together, but the data for high
SES suggest that keeping students after school was an effective punishment
method among the methods surveyed. Spanking did not occur frequently enough
to analyze in the first year, and in the second year it could be analyzed only
for tow SES and only in certain cases. These analyses were relatively unrevealing,
Because they were mixed in direction and low in magnitude. They did not, however,

42
clearly indicate that spanking was inappropriate or ineffective, as might have
been predicted. At the same time, though, they did not provide any support
for the effectiveness of spanking.
Isolation within the classroom could not be analyzed for low SES in the
first year, but it showed negative relationships for high SES, indicating that
this method was not effective. in the second year, however, there were no
significant relationships of any kind for either SES group. Thus, this variable
did not receive support In our data, despite the emphasis placed on it as a
deisrable technique by behavior modifiers. However, the data concern attempts
to use the technique and not measurement of whether or not it was used appro-
priately, so it is conceivable that the negative correlations resulted from
inappropriate use of the technique rather than from the technique itself.
The more complete method of isolation involving remove! from the classroom
showed no significant correlations of any kind in the first year, but several
curvilinear relationships appeared in the second year. These curves generally
were negative In slope, indicating again that removal from the classroom was not
a very effective technique. However, the curves were quite shallow and the
relationships wore not very strong. In any case, neither measure of student
isolation, a commonly suggested behavior modification punishment technique,
received support in the data.
Data on attempts to use peer pressure to get students to conform showed
low frequencies for low SES in the first year and negative relationships for
high SES, indicating that this method was ineffective. However, the data for
the second year showed a significant positive correlation for high SES,
contrasting w;th the findings for the first year. Thus the data concerning this
variable are sparse and did not replicate across years.

43
The data on scolding showed no significant relationships the first year
and only one significant set of relationships the second year, although this
set involved quite high correlations. Scolding was strongly negatively
correlated with success in producing student learning gains in low SES schools,
but almost as strongly correlated positively in high SES schools. This fits
in with the general pattern that low SES effective teachers were warm dnd
encouraging while high SES effective teachers tended to be more critical.
Scolding was relatively infrequent, however, so that the present findings should
not be taken to indicate that high absolute amounts of scolding were optimal or
that scolding was frequent in these classrooms. This is shown in the data for
the next variable.
The data for discussion of the incident with the student, which did not
involve any scolding but instead involved an attempt to make the student
understand why what he was doing was wrong, showed clearcut relationships the
first year. This variable was negatively correlated with success in low SES
schools but positively in high SES schools. This same basic finding appeared
In the data for the second year, although there were slight curves rather than
straight lines. In any case, discussing the incident with the student was
ineffective for low SES students but was effective for high SES students.
TaKen together, the data on punishment methods do not make any sense at
all for the low SES schools, since few correlations or relationships were
significant and the ones which were significant were negative. None of the
methods listed appeared to be regularly successful with low SES students. In
contrast, with the single exception of a significant correlation for scolding,
the data for high SES schools suggest that the less punitive and more informative
44
methods were the most effective (keeping children after school and discussing
the incident with them but without scolding them).
The next section deals with rewards used by the teacher. The first method
concerns having classmates clap or cheer for a student. This method produced
several significant relationships, mostly curvilinear, in each year. The first
year's curves showed negative, dropping curves for low SES, and positive, rising
curves for high SES. Thus, this method was inappropriate in low SES schools but
effective in high SES schools. However, these first year findings did not
replicate the second year. The data for low SES in the second year showed
generally negative relationships but not as strongly or clearly as those shown
in the first year data, and the second year data for high SES schools showed
clearly negative relationships in place of the positive ones that had appeared
in year I. Thus, the data across years in this particular variable are flatly
contradictory.
Data on the giving of special privileges as rewards were not sufficient
to analyze in year 1. In year 2, a significant positive correlation appeared
for high SES. The relationship in low SES was also positive, but not significant.
Waiver and reduction of assignments did not appear frequently enough to allow
analysis in either year.
The use of symbols such as stars or smiling faces was insignificant In
year 1, but it showed positive correlations in year 2. Thus, in this case some
support for bheavior modification ideas, at least as they concern rewards
rather than punishments, was seen in the data. The variable concerning tokens
or other methods of rewarding children with material rewards did not appear
frequently enough to analyze. The same was true for the use of concrete

rewards. Thus, the few data that exist for the behavior modification methods
of providing rewards to children at least supported the idea of providing
symbolic rewards, although in a more general sense the data also revealed that
behavior modification reward methods were not being used very frequently by
the teachers.
The attempt to reward children by giving them monitor jobs or other
responsibilities showed no data for low SES and primarily rising curves for high
SES the first year. However, the second year data produced significant negative
correlations for low SES and steeply dropping curves for high SES. Thus, the data
suggest that these attempts to reward students were ineffective in low SES schools.
The date for high SES schools were mixed and generally curvilinear, indicating
that these methods can be effective up to a point, but that attempts to use them
too often will ruin their usefulness as motivating or rewarding techniques.
The method of providing public recognition to the student did not show
any significant relationships either year.
As a set, the data on rewards mostly failed to replicate across years.
The most clearcut findings concerned the use of symbolic rewards such as stars
and smiling faces, which appeared to be effective for both low and high SES
students. The data on giving jobs as rewards indicated that this method was
ineffective for low SES students and curvilinearly related to effectiveness in
high SES schools. The other reward methods checked either did not occur often
enough to allow meaningful analyses or failed to produce significant relationships.
The following section concerns the rated-appropriateness of assignments.
Assignments rated as too short or too easy showed the same relationships both
years: they were mildly but generally positively associated with learning

46
gains in low SES schools but more strongly and clearly negatively associated
in high SES schools, This fits with data from several other aspects of the
study indicating that the low SES students benefitted most from teaching which
involved briefer and more redundant chunks, while the high SES students
benefitted more from difficult and more challenging questions and exercises.
This same general relationship can be seen in the data on the following variables
concerning boring, repetitive and monotonous assignments. Here again, although
the data were somewhat mixed, they were generally positive for high SES and
negative for low SES in year 1, though this did not replicate in year 2. The
pattern continued in the following variable concerning assignments which were
rated as too hard. No singificant relationships appeared in the first year
data, but the second year data revealed some significant negative correlations
for low SES schools and no data for high SES schools (indicating that overly
difficult assignments were not a problem in these schools). Taken together,
these data lent some support to the idea that the more successful teachers in
low SES schools tended to give relatively easy assignments, while the mare
successful teachers in high SES schools tended to give relatively harder
assignments.
The data concerning continuing activities for too long until they get
boring showed no significant relationships the first year. in the second year
the data were mixed, although again, the general tenor of the findings was
for positive relationships in low SES schools and negative relationships in
high SES schools, fitting with the pattern described above. Finally, the
rating "no inappropriate assignments" correlated positively for both groups for
both years, as expected.
170IL) 4L-

47
As a set, thuLie data concerning appropriateness of assignments hung
together quite well and replicated across years. They indicated that teachers
who had an optimal level of appropriateness which was matched to student ability
were most successful, and *hat in low SES schools the danger was erring in the
direction of overly difficult assignments, while in high SES schools the danger
was erring in the direction of overly simple or redundant assignments. Low
SES students needed to get material in shorter chunks and with more opportunity
for overlearning; high SES students required challenge and faster pacing.
The following sections concern what the students do when they are dis-
tracted from their work when they are supposed to be doing seatwork. Use of
the washroom revealed no significant relationships the first year. In the
second year, this behavior related mostly negatively to learning in low SES
schools and positively in high SES schools. There Is no obvious explanation
for this; it may mean that the high SES students were using the washroom only
when necessary and were using it appropriately, whereas low SES students may
have been abusing their privileges by using the washroom as a place to play
or as a ploy to escape work.
The variable concerning repeatedly leaving the seat to get supplies for
free time activities showed a single negative correlation for low SES in the
first year data. However, in the second year, the data for low SES were
essentially ,ininterpretable and suggested that this variable was not very
important. The data for high SES showed a variety of inverted-U type curves,
indicating That a certain optimal amount of this behavior was good. In
general, tha teachers who were at the optimal level probably were those who
had a good variety and quantity of supplies available for free time activities

48
and who had trained their students to responsibly ani independently get these
supplies as needed. The downward slope of the curves could have occurred
because of cases where these supplies were available but where the teachers
were too loose or inattentive about how students were using them and/or where
students were using them inappropriately.
The data for watching the reading group or other activities showed mixed
and confusing findings acorns years, The first year showed mixed relationships
in low Si 7) and negative relationships in high SES; the second year showed mixed
and very weak relationships in low SES and generally positive relationships in
high SES. The data for year 2 make more intuitive sense (given that the student
is distracted, it seems that he would benefit more from watching an instructional
activity than from the other kinds of distractive behavior included within this
section), but the data from the first year do not. Given the obvious contra-
dictions across years, these data are probably best left uninterpreted. The
data for students talking to one another produced no significant relationships
the first year and not enough data to analyze sufficiently the second year.
Thus, students talking to one another was not a very important source of
distraction and did not relate to student learning gains.
The data for students playing with one another when distracted also
showed mixed findings which failed to replicate across years. The first year
showed one significantly positive relationship for low SES schools, but also
a U-shaped curve. The data for high SES schools had no significant relation-
ships, and the relationships which did appear were opposite i direction. In
the second year, this variable correlated negatively in low SES schools and
positively in SES schools. Again, this makes more sense than the first
year data, but again it is contradictory to the first year data and thus best
left uhinterpreted.

49
The data for daydreaming showed negative correlations in low SES for
the first year and one generaliy negative curvilinear relationship for low SES
in the second year, indicating that daydreaming (which probably is an indicator
of overly difficult assignments) was negatively associated with student learning
gains in low SES schools. The data for high SES schools were weak, indicating
that daydreaming either was not much of a problem or was not strongly associated
in any ciearcut way with learning gains.
students asking for help or lo,fming more closely at work en the board
showed inverted-U shaped relationships to learning in year 1 and negative
correlations in year 2. The much stronger correlations in low SES again under-
scored the point that overly difficult or confusing assignments are contra-
indicated for low SES schools.
The data for disrupting other students showed no significant relationships
the first year, but some significant correlat'ons and relationships the second
year (generally negative). Negative relltionships were expected here, although
the frequency and size of the relationships obtained were below the levels
expected for this variable. Disrupting other students was not much of an imped-
iment to learning, mostly because it did not happen with any great frequency in
most classrooms.
The next se;tion concerns student attitudes toward the teacher. The
first variable concerns student tendencies to seek help or concentrate harder
when they were heving trouble with their work. This was considered to be an
indicator of good motivation and was expected to show positive relationships
with learning gains. However, these appeared only in year 2. No significant
relationships appeared in year 1. In year 2, there were two positive relation-

50
ships and three ambiguous curves in low SES, as well as four rising curves
indicating positive relationships in high SES. Thus, the second year data bore
out the u,pectation that this variable would be positively associated with
learning gains.
The next variable, indicating that students merely copied from their
neighbors when having trouble, showed the expected negative correlations with
learning gains in low SES, but weak and mixed correlations in high SES. The
latter finding may be due to a relative absence of this problem in high SES
classrooms.
The next variable concerns students working as well when they were not
watched as when they were watched. This was expected to correlate strongly with
learning gains, but only one set of analyses produced significant findings in
each of the two years, and these were rather weak and minimally interpretable
curves. Thus, this variable proved not to be very useful as a correlate of
learning gams.
The same was true for the following variable concerning student tendencies
to "act up" when not watched by the teacher. Strong negative associations with
learning gains wore expected here, but the first year data produced no significant
findings and the second year data produced shallow and minimally interpretable
curves. Thus, student behavior when
useful correlate of student learning
"students seem to respect teacher."
learning gains were expected, but no
either year.
The next section concerns free
the teacher was not watching was not a very
gains. The same was true for the variable
Here again, positive correlations with
sigr.;ficant relationships appeared for
time materials available in the classroom.
ectedly, books correlated negatively in both SES groups the first year,

51
while in the second year there was not enough variance to allow meaningful
analyses. In this case the lack of analyses was not for lack of data, but
for lack of variance; virtually every classroom had books available for use in
free time. The data for the first year are believed to reflect the availability
of materials other than books. That is, coder comments suggest that classrooms
which had greater amounts of books available as free time materials also tended
be classrooms that were relatively lacking in other kinds of free time materials.
Thus, the negative relationships do not so much mean that the availability of books
was bad; they mean that other free time materials in addition to books were
unavailable.
Similar unusual findings occurred for the presence of learning centers.
In the first year there were not enough data in the low SES classrooms to allow
meaningful analyses and there were no significant ana'yses in the high SES
schools. In contrast, the second year data showed generally positive relationships
in low SES schools and negative relationships in high SES schools. Coder comments
here suggested that the positive relationships in low SES schools reflected the
usefulness of such centers in a general context of relative absence of them,
while the negative relationships in the high SES schools suggested that there were
too many learning centers being introduced at one time and many of them were being
used inappropriately during the second year of the study (at this time, the school
district was moving forcefully in the direction of introducing learning centers
to the classroom).
The data for listening centers in particular parallel those for learning
centers in general, indicating positive relationships in low SES schools and
negative relationships in high SES schools. This general pattern appears also,

52
but more weakly, for picture files and filmstrips, science demonstrations and
experiments, painting and art activity, and games. interpretation is difficult
because meaning of the correlations interacts with the general degree of
availability and degree of appropriate use of these resources in the classrooms.
Coders felt that these resources were less available in low SES classrooms and
that this was a primary reason for the positive relationships noted in these
classrooms. In contrast, such resources were plentifu: in most high SES class-
rooms, and the negative relationships appear to reflect inappropriate use
(primarily the attempt to introduce Too many learning centers and other special
activities at once rather than phasing them in gradually and instructing the
children in the proper use of them).
Instructional games surprisingly showed a negative correlation in low
SES, and non-instructional games showed negative relationships I-. both SES
groups. Aquariums and looking exhibits also showed negative relationships in
both groups. There is no obvious reason why the presence of these activities
should detract from learning; in any case, the negative relationrohips provide
no support for their usefulness or importance.
The following section deals with the same materials from the perspective
of the degree to which they were used as opposed to whether or not they were
merely available. A somewhat different pattern of findings emerges which
helps clarify some of the data from the previous set. For example, the negative
relationships involving the use of books disappear in this set of data; the
frequency of books actually used showed no significant relationships in either
year. However, the data for learning centers in general and for some of the
more -,,-)ecifio kinds of activities showed again the general pattern of positive
r)

correlations in low SES and negative correlations in high SES. Again, the
explanation for these different findings probably resides in their availability
and proper use, and not in differences in the chsldren or the teachers.
Most of the puzzling negative relationships regarding instructional games,
non-instructional games, and aquariums and other looking exhibits that appeared
for simple availability of these items disappeared when the ratings of actual
use of the items were taken into account. Thus, the puzzling and inexplicable
relationships mentioned above have disappeared, although the data still provide
no positive support for the usefulness or importance of these activities and
resources.
The next variable concerns the use of peer tutoring. No significant
relationships were produced in the first year; in the second year there were
significant negative relationships in math for low SES and non-significant
positive ones in high SES. This is yet another example of the general finding
that indirect teaching and other learning methods that require students to learn
on their own, rather than from the teacher, tend to be inappropriate at this
grade level, particularly in low SES schools.
The next variable concerns assignments of homework in addition to seat-
work. In the first year this variable was negatively related to learning gains
in low SES and positively in high SES. The second year data revealed several
weak and mostly uninterpretable curves. However, the general nature of the data
suggests that homework is undesirable at these grade levels in low SES schools
possibly because the student will have difficulty with it and may end up practicing
errors in the absence of a teacher to check his work and give feedback), although
it may be useful to some degree in high SES schools.

54
The final variable concerns teacher underreaction to control problems
so that they sometimes go unresolved. This did not happen often enough h the
second year to allow menaingful analyses, but in the first year a significant
negative correlation appeared for low SES and a non - significant positive one
in high SES. This is part of a general pattern suggesting the importance
of maintaining tight control over the classroom in low SES schools, even to the
extent that it might be better for the teacher to err on the side of over-
reaction rather than delay or underreact when some kind of discipline problem
breaks out. However, this finding should be taken in the more general context
of findings supporting Kounin's contentions that the most effective classroom
managers are those who keep the students actively engaged in productive
activities so that the disruption ooes not break out in the first place.
Observer Ratings
Table 3 contains data from 41 high inference coder ratings. These ratings
were made on 5-point scales (13-point scales for the first three variables),
and dealt with general teacher personality traits or characteristics which are
more reliably and validly measured through high inference ratings than through
low inference coding of discrete units of interaction. Again, each of two
raters, who had periodically observed the teacher each year, made independent
ratings, and the ratings were then added to obtain a final score.
The first three ratings deal with teacher affectionateness towards the
children. These ratings indicate the point made above that the demandingness
and criticism seen in high SES teachers was largely restricted to their
responses to student work and answers to questions, and was not part of a more
general pattern of negativism. Note that although not many relationships for
the three measures of teacher affectionateness reached significance, those that
r.:.)a.)

55
did for the high SES teachers indicated positive, or at least positively
rising curve relationships between affectionateness level and student learning
gains. Thus, in high SES, teachers'general affectionateness toward the children
was positively associated with student learning gains, at least up to a point.
in contrast, the relationship of affectionateness to student learning gains in
low SES classrooms was more ambiguous, showing a variety of curves and a few
negative correlations or linear relationships. The negative linear relationships
occurred for the ratings of extreme affectionateness, indicating that teachers
who were either gushy and melodramatically affectionate on the one hand, or cold,
hostile, and rejecting on the other hand, were less successful than teachers
with a more moderate level of overt affectionate behavior toward the children
in low SES schools.
Given the more general context of findings in low SES vs. high SES schools,
it might be argued that the relationships between teacher affectionateness and
student !earning are curvilinear (in invertedU shaped fashion) for both groups,
if we proceed from the assumption that the low SES teachers were generally
somewhat more affectionate toward the students than the high SES teachers.
This assumption would explain the various findings that exist for different
measures of teacher affect, including the general nature of findings that the
low SES effective teachers worked through patience and encouragement while the
high SES effective teachers worked through demandingness and criticism, even
though the preseet affectionateness data suggests that affectionateness correlates
negatively with learning gains in low SES schools but positively in high SES
schools.

The next variable deals with solidarity with the class and promotion of
a "we" feeling. unexpectedly, this variable correlated negatively in low SL
the first year. The high SES data revealed inverted-U curves, as expected.
The data from the second year failed to produce interpretable results, indicating
that this variable was not very useful as a correlate of student learning gains.
The variable "patient and supportive when correcting" produced no
significant relationships the first year and mixed findings the second year.
This variable was correlated negatively with student learning gains for high
SES (paralleling several other findings), but showed weak and mixed relationships
in low SE'S. This again reveals the role of demandingness in the behavior of
tne more successful high SES teachers.
The variable "students allowed choice in assignments" showed no significant
relationships in the first year. In the second year, some positive relationships
appeared for high SES classes only. This fits in with the more general finding
that high SLS students appear to benefit from opportunities to work independently.
The next variable deals with accepting student ideas and/or integrating
them into the discussion. In the first year, this variable was consistently
negatively correlated with student learning gains in the low SES classrooms,
and mostly curvilinearly related (in Inverted-Li fashion) to learning gains in
high SE'S classrooms. In the second year the data were weak and near-zero for
low SES classrooms but negative for high SES classrooms. This again is part
of the general pattern of non-support for the ideas concerning indirect teaching
as relevant or advisable In teaching students at the early elementary grades.
They well may be appropriate and perhaps optimal at the higher grades, but they
apparontly arc not at these early grades.

57
The next variable dLals with the teacher's ability to admit her own
mistakes and laugh at herself in appropriate situations. As expected, the
only significant correlation here was a positive one, occurring in low SES
classrooms during the first year. However, the variable did not appear to be
very important, paralleling the data for simiJar variables such as teacher
credibility, promotion of a "we" feeling, and other measures of the teacher's
student orientation. As with indirect teaching, a student oriented attitude
appears to be relatively unimportant in the early grades, at least in its
relationship to student learning.
The next variable, "usually bends, gets down to child's level,"
showed the expected positive relationship to learning, but here again only
one of a possible ten relationships reached statistical significance.
The next variable deals with the teacher's method of going to students'
seats to check work rather than having them come to her desk. This variable
yielded no significant relationships in the first year, in the second year
the relationships were uninterpretable for low SES, but the variable showed
strong negative relationships for high SES. This is part of the broad pattern
in high SES schools suggesting that the more effective teachers expected and
allowed students to take personal responsbility for much of their activity
during seatwork and free times, as opposed to supervising them overly closely
and unnecessarily.
The variable "usually speaks to individuals rather than to the whole
class" snowed only one rather uninterpretable relationship across the two
years, and thus appeared to be relatively unimportant. The same was true
for the variable "uses advance organizers in introducing activities," Thus,

58
little support for the importance of this variable is evident in the data,
despite the stress upon it by Ausubel and others. Again, the reason probably
Lies in the age level of the students and the kinds of activities going on
at the time, rather than in an absence of importance of the variable itself.
It probably is much more important at higher levels, particularly when teachers
are lecturing on new and difficult material.
Similar findings appeared for the next variable "gives complete, detailed
instruction; prevents errors before they happen." Although thera was some
weak evidence of a positive relationship in high SES schools, the more generio
nature of the data suggests that this variable is not very important to student
learning at this grade level.
The variable "students eager to respond; no fear" showed no significant
relationships in the first year, but some significant negative relationships
in high SES schools in the second year. This finding was of course unexpected,
although given the data for high SES schools it is easily seen as part of the
general pattern of demandingness and criticism that characterize the high SES
teachers who were most successful in producing student learning gains. This
is one suggestion that the methods used by the high SES teachers who were most
successful in producing learning gains may have and probably did involve a trade-
off between success in producing learning gains vs. success in producing optimal
student attitudes. The high level of demandingness could have reduced student
eagerness to respond to teacher questions.
The variable "teacher waits patiently if student doesn't respond" showed
generally nagative but weak relationships with learning gains, although there
was one positive relationship in year 1 for low SES. This is another indication

59
of the relationship between demandingness and student learning, although the
relatively weak daya for this variable, in combination with the data for
general affect and for criticism of specific student failures again indicates
that the domandingness associated with learning gains was primarily restricted
to student failure to perform successfully, and was not part of a general
pattern of negativistic and hostile behavior.
The variable "non-competitive atmosphere; no signs of eagerness to see
others fail" showed contrasting curves for the two SES groves. Relationships
were generally weaker and less interpretable for low SES, although the data
in general suggest that the teachers who had notably non-competitive atmospheres
were less successful than other teachers. This held only for teachers at the
extremes of non-competitiveness, however, and may have reflected a relative
unconcern about student learning among these tea ;hers.
The data for high SES classrooms, in contrast, generally show inverted-U
curves indicating an optimal relationship on this variable. That is, a certain
degree of competitiveness appeared to be associated with maximal learning
gains, with lower gains being achieved in classrooms that had either less or
more of this competitiveness.
The variable "students allowed to work in cooperative groups" produced
significant relationships for each analysis in each year. However, the data
are much more interpretable for high than for low SES. In high SES this
method was generally positive although ultimately curvilinear, indicating
that cooperative group assignments were a good idea in high SES schools if
not carried too far. The curves and lines for low SES are much less consistent,
although those whiCh are interpretable suggest a generally negative relationship

Go
between this type of teaching method and student learning gains. Thus, the
data fit the more general pattern suggesting that methods based upon allowing
and expecting students to assume independent responsibility for managing their
own learning are more likely to succeed in high than in low SES at these grade
levels. Had the study been conducted at higher grade levels, the data might
have been more positive in both SES groups.
The teacher behavior of recognizing good thinking even when it doesn't
lead to correct answers produced conflicting but primarily positive curves in
the low SLS schools and inverted-U shaped curves in the high SES schools in
the first year, and a single positive correlation in the low SES schools in
the second year. Thus, this teacher behavior appeared to be positively asso-
ciated with learning, although only up to some optimal point. Perhaps too
much of this kind of behavior ruins the pacing and flow of a lesson and becomes
more distracting than helpful. In any case, although the general relationship
with learning was positive, it was curvilinear and not linear.
A democratic leadership style produced only two inverted-U relationships
in the first year and no significant relationships at all in the second year.
Here again, there is only weak and somewhat mixed support for some of the ideas
traditionally stressed in textbooks. Again, we believe that the reason for
this lies in the grades being studied. Democratic leadership styles could be
expected to be more important and more effective with older students.
The variable "few restrictions on students during seatwork periods"
produced no significant relationships the first year and mixed findings the
second yearvindicating negative relationships in low SES and weak positive
ones in h igh SES. This again fits with the general pattern that teachers in

61
low qrS classrooms imposed more restrictions and generally tighter controls
on student oehavior than did teachers in high SES classrooms.
Expecting students to care for their own needs without getting permission
was consistently correlated positively with learning gains in high SES schools
but was essewtially unimportant in low SES schools. This again fits with the
pattern of findings on a number of variables to the effect that high SES students
appeared to benefit from being allowed and expected to assume independent
responsibility for meeting many of their needs.
Teacher concern with substantive content rather than form of student
responses produced generally positive but curvilinear relationships with learning,
indicating that this was in general a good thing if not carried too far. The
same was true of teacher stress on factual realism vs. rejection or correction
of childish idealism. it was also true, although there were fewer and fess
interpretable relationships, for teacher credibility. Thus, several variables
dealina with the credibility, realism, and student orientation of teachers
showed expected positive correlations with learning, but most relationships were
curvilinear and were generally weak.
Teacher showmanship proved to be important as a correlate of learning gains
in low SES schools, but it had non-significant negative relationships with
high SES schools. These data are similar for the related variable of teacher
enthusiasm.
Teacher getting attention before starting a lesson correlated positively
with learning gains in high SES schools the first year. The second year
produced some uninterpretable and weak curves and lines for low SES schools,
and some mild inverted-U curves for high SES schools. Thus, this variable

G2
appeared to be somewhat important in high SES schools, but its relationship
with learning was curvilinear rather than clearly linearly positive.
Teachers rated as having chaotic and poorly planned schedules showed the
expected negative correlations with learning in high SES schools the first
year, but relationships in low SES schools were mixed. The data were also
mixed in the second year, and there was even a positive correlation for high
SES schools, reversing the negative relationships seen the year before. Thus,
the data on this variable did not replicate across years and are internally
inconsistent.
Teachers rated as self-confident and self-assured did not do systematically
better than other teachers; only one analysis for this variable revealed signi-
ficant relationships, and these are only minimally interpretable. Thus, like
other variables that apparently are important with older students, this variable
is relatively unimportant with younger students in the early elementary grades.
Teacher politeness in dealing with the children showed curvilinear
relationships in both SES groups, indicating that a certain amount of this was
good but that teachers very nigh on the variable were less successful in pro-
clueing learning gains than teachers with medium scores. These findings differ
somewhat from the expected linear positive relationships. Perhaps the teachers
who were extremely high on this measure were the same ones who were rated as
ineffectively over-emotional (gushy).
The variable high concern about achievement showed no significant
correlations the first year and a single significant positive correlation for
low SES schools only in the second year. The positive correlation was expected,
but the lack of other significant relationships is surprising. This is not only

63
because high teacher concern about and expectations In the areas of achievement
were expected to be highly correlated with gains in achievement, but also
because data from other aspects of the study suggest that high teacher expec-
tations and demandingness are associated with student learning gains. These
considerations suggest that what the coders were rating on this variable was
not quite the same thing as the evidence of high teacher expectations and concern
about achievement that is revealed in some of the low inference data.
Ratings of the room as physically attractive showed mixed correlations
with learning gains. The data were generally inconsistent and contradictory
both within and across years and for both social class groups. There is some
tendency for the positive correlations to be associated with gains in language
arts and the negative ones to be associated with gains in math. This is one
of the very few places where the pattern of data signifinantly differs between
these two major curriculum areas. However, the reasons for this differential
relationship to language arts vs. math are unknown.
The variable "teacher gives much encouragement to students" failed to
show significant relationships in either year. This is something of a surprise
given the data for low SES suggesting that the more encouraging teachers were
more successful,and it again calls into question what the raters may have been
rating on this variable.
The rating "room is uncrowded" showed clearcut and consistently strong
positive correlations with learning gains in the first year, but these
relationships were not well replicated in the second year. The second year
data show weak and mixed findings in low SES, and inverted-U curves for high
SES. Armin, the data are too inconsistent and conflicting to allow clear
interpretation.

64
Tho variable " teacher exhloihS rules or decisions when reasons aren't
obvious" snowed positive uut occasionally curvilinear relationships to student
learning. In general t'lis appears to be important, but especially so for low
SES classrooms. This fits in with other data suggesting that these children
are especially in need of teacher structure and explanation.
The rating of the teacher as well organized and well prepared showed
mostly positive but nevertheless mixed findings the first year and no signifi-
cant correlations the second year. Positive correlations were expected on the
basis of existing literature, but these did not appear.
The rating of the teacher as regularly monitoring the class and keeping
up with what is going on showed positive relationships in the first year
(essentially for low SES only), and generally weak findings the second year
except for a single significant correlation (again in low SES). Thus, insofar
as they go, these positive findings support the ideas of Kounin concerning
"withitness" in monitoring the classroom for better classroom management, but
the findings are not very strong or consistent. They also show that this
variable is more important for low than for high SES.
Teachers rated as having smooth and efficient transitions which involve
little .'fisted time showed positive correlations in low SES but no notable
relationships at all in high SES. Taken together with the previous variable,
the data suggest that the ideas of Kounin concerning keeping students continually
engaged, monitoring them to prevent outbreaks from happening, or preventing them
from getting worse once they are begun are important in low SES schools, but
not so much in high SES schools.
Teachers who have an automatic system to determine monitors tended to
be more successful titan other teachers who picked monitors randomly or used

monitor Appointments as rewards, although this variable was sometimes curvilinearly
rather than linearly related to achievement.
Teachers who were rated as having a "busy" or "quiet" classroom tended
to be less successful in producing learning gains than other teachers, although
the findings are mixed. Also, the variable did not appear to be of any great
importance given the lack of consistent relationships and the lack of strong
relationships even when statistically significant ones were observed.
Ratings of students as compliant and obedient showed differential findings
by social class. In low SES classrooms there was a significant negative correla
tion the first year and mixed and weak curves the second year. in high SES
there were no significant relationships the first year but in the second year
there were several rising curves. Thus, up to a point at least, student
compliance and obedience was positively associated with learning, but only in
high SES classrooms.
Teachers who gave overly explicit and mpetitive directions showed most
curvilinear relationships with learning, although there were some significant
negative relationships also. in general it was not a good idea for teachers
to be overly repetitive to the point of boring the students, although a certain
amount of redundancy and repetition appears to be useful.
Finally, teachers who had well established routines for taking care of
daily housekeeping needs and minimized interruptions for this purpose did not
differ systematically in their success in producing learning gains from other
teachers. the, first year this variable showed a single negative correlation in
low SES, but this was contradicted by a single significant positive correlation,
also in low SES, the second year. The curves produced in the second year data
were mostly weak and uninterpretable, suggesting that this variable is relatively
unimportant as a correlate of student learning pains.
66
Time Utilization Measures
Several variables concerned with utilization of classroom time were
measured through high inference estimations of the time spent in various
activities. These data are presented in Table 4.
The percentage of total available time which was actually structured by
the teacher showed no relationships for low SES. For high SES, there was a
significant negative correlation in year 1 but a significant rising curve in
year 2. Thus, this variable did not have consistent and important relationships
to student learning.
The percentage of teacher structured time which was related to language
arts showed some puzzling correlations. In the first year it had a significant
negative correlation with learning gains in word knowledge (a language arts
subtest) in low SES schools. in the second year it had inverted-U curvilinear
relationships to word knowledge gains and negative relationships to reading
gains. It also had negative relationships to gains in arithmetic. The negative
gains with arithmetic were expected, but the negative relationships to learning
gains in the two language arts subtests, and more generally the lack of positive
correlations between this variable and gains in language arts, is confusing.
Observer reports suggest that the reason may have been the variability of the
teachers; the majority of the teachers spent much time each day on language
arts, while the time spent on math was more variable.
The next variable, percentage of structured time spent in math, showed
slight positive correlations with reading gains the first year and slight
negative correlations with word discrimination gains the second year. For
the math criterion tests, significant data were obtained only for arithmetic

67
computation in the first year, and even here the data were contradictory: the
curve is mostly negative in low SLS but positive in high SES. Again, it was
expected that this variable would correlate positively with math gains and
perhaps negatively with language arts gains, but this was not the case.
Thus, in general, the percentage of classroom time devoted to tne two
major subject matter areas tapped by the criterion tests did not in itself
relate consistently to learning gains. in fact, most relationships between
time spent in a subject area and student scores in that area were negative.
However, it should be noted that teachers spend considerable portions of
their time in both of these areas; the data would have been considerably
different if certain teachers spent little or no time in an area.
Percentage of structured time spent in art activities showed positive
correlations, particularly in the first year, with student learning gains in
high SLS schools. It was expected that this va-lable would be more positively
associated with learning gains in high SES schools than in low SES schools,
Out the general pattern of findings, particularly with the previous two variables
taken into account, was surprising. It is unclear as to why time spent in art
should correlate positively with learning gains in language arts and mathematics,
when time spent in these two subject matters does not. It cannot be determined
from the data whether the art activities themselves contributed to the learning
gains or whether time spent in art activities is a "proxy" variable which is
associated with general teacher competence and more specifically with planning
and implementing a variety of activities in the classroom.
The percentage of time spent in spelling showed a number of significant
curves which are largely uninterpretable, along with some negative correlations

68
the second year for gains in arithmetic. The last finding was expected, in
that it shows that the more time spent in spelling the less the students
learned in arithmetic, but the rest of the data do not hang together to support
this as a general statement across all ten sets of data.
The percentage of 'lme spent in reading groups correlated positively with
learning gains in both reading and mathematics in low SES but negatively in
high SES in the first year, and there was a tendency for this same kind of
relationship in the curves seen for word knowledge in the second year. Thus,
time spent in reading groups was generally associated positively with learning
gains in low SES schools but negatively in high SES schools. The reasons for
this appeared to lie in the grade levels studied and the relative abilities of
children. The low SES children in these grades were still learning the
fundamentals of reading which appear to be taught best (or at least well) in
small reading groups. In contrast, the high SES students were often to the
point where they no longer needed heavy dosages of time spent in reading groups
practicing the fundamentals and were moving toward the point that they could
read on their own and move Into morc, independent activities.
The percentage of structured time spent in social studies showed no
significant relationships the first year. The second year data revealed mixed
lines and curves in low SES but generally negative ones in high SES, indicating
that much time spent in social studies was negatively associated with learning
gains in language arts and mathematics. This Is the sort of relationship that
was expected, but it Is difficult to evaluate because the more direct relationships
between time spent in the two curriculum areas of language arts and math did not
show such clean relationships with learning gains.

69
The proportion of time spent in transitions between activities showed mixed
and uninterpretable relationships in low SES but generally downward sloping curves
in high SLS. The high SES data provide more support for the suggestions of Kounin
to the effect teat successful classroom management involves, among other things,
keepinq Things moving and avoiding time spent in getting organized or making
tranliitions from one activity to another.
Time spent in routine activities done in the morn'ng before school actually
got under way did not show any relationships in either year. The percentage of
time spent in special activities showed a negative correlation with arithmetic
computation gains in low SES for the first year, and some mixed curves in the
second year. These data are not very interpretable, most probably because
" special activities" included a large number of diverse activities.
The percentage of time spent in structured seatwork showet no significant
relationships the first year. In the second year there was a positive relation-
ship with word knowledge gains In low SES and a negative one in high SES. This
again probably represents the same kind of difference in pupil learning of basic
tool skills and early curriculum goals as was mentioned above concerning structured
time in reading groups. Low SES children still could benefit from heavy dosages
of structured seatwork, but high SES children were moving to the point where they
would benefit more from different kinds o' activities and from being given more
choice.
The proportion of time spent in free choice seatwork showed no significant
relationships the first year. in the second year there were not enough data to
analyze for high SES but the relationships were negative for low SES. These
data for low SES parallel the data for the previous variable, indicating, in
70
general, that these children benefitted from structured seatwork rather than
from being allowed free choice of assignments.
The percentage of time spent with a leader other than the teacher showed
no data in either subgroup for either year (because it happened so infrequently).
As a set, the time utilization variables raised more questions than they
answered. The expected relationships between time spent in language arts and
mathematics and learning gains in these two areas did not materialize, and the
relatively few consistent relationships that did appear tended to be more
confusing than enliahtening.
Lesson r'resentation Variables
Information about several aspects of teacher behavior during presentation
of formal lessons are presented in Table 5. In the first year of the study,
these were measured with a low inference coding system that was used on only
ten teachers, so that there are not enough data to allow multiple regression
analyses of these first year relationships. Consequently, Table 5 contains
data for the second year only. These data came from rating scales completed by
the observers during visits to the classroom. Coders estimated time spent by
the teacher on each of the possible steps in presenting a lesson to the class.
The scale ranged from I (no time spent) to 5 (over 10 minutes spent).
The use of advance organizers in beginning lessons showed a weak negative
correlation in low SES and a weak positive one in high SES. Again, there is no
eleareut support for the ideas of Ausubel concerning the importance of advance
organizers. However, the SES difference does suggest that this variable will
become more important as the children get older and as learning becomes more
71
and more concentrated upon verbal presentation symbolic content as opposed to
demonstration And practice of physical skills.
Review of old material showed weak and uninterpretabie relationships in
low SLS but positive correlations in word knowledge and reading for high SES.
it should be noted that this variable does not indicate time spent reviewing
old material in general, it refers to reviewing old material in the process
of introducing a lesson,.and thus is a form of advance organizer. Teachers
who do this are linking the new lesson to what was learned yesterday or at some
time in the past. Thus, the relationship for high SES parallels the one for the
use of advance oragnizers. The lack of positive findings for low SES is some-
what confusing, however, since it would seem that this teacher behavior should
relate positively to learning gains in low SES schools, too.
Presentation of new material showed inverted-U shaped but generally dropping
curves in both groups. This is more evidence of the fact that children learn
best when an optimal amount of information is presented at a given time. The
nature of the curves suggested that teachers tended to err on the side of
presenting too much rather than too little.
Practice of new material was unrelated to learning in low SES but positively
related to learning in high SES. Again, the low SES data are puzzling, since
we had expected this variable to relate positively to learning in both groups.
Summarizing reviews at the ends of lessons correlated negatively with
learning in low SES and positively in high SES. Taken together with the data
for advance organizers and for review of old material, a more general statement
might be that the high SES children tended to benefit from teacher verbalizations
which placed a lesson in context and which fol lowed the old maxim of "tell
72
them what you're (loin° to tell them, then tell them, then tell them what you
told them." dohever, the data for low SLS are virtually uninterpretable because
.all of the relationships are negative; there is nothing in this set of five
variables that correlated positively with student learning in the low SES schools.
Teacher afforded evaluation correlated negatively with student learning
in Low SES schools and showed a mixed but generally positive pattern in high
SES schools. This is probably related to the praise and criticism data that
are discussed elsewhere, which indicate that teacher evaluative reactions,
particularly criticism of incorrect or inappropriate answers, was positively
related to student learning gains in high SES schools but negatively in low
SES schools.
Teacher elicited student self-evaluation did not happen often enough
to allow analysis. Instructions concerning follow-up assignments correlated
negatively in low SES and positively in high SES. This is another example
of a variable that was expected to correlate generally positive with student
learning, but did so only for high SES children.
Independent activities during lessons (children given a chance to work on
their own with the teacher spot checking them), had generally positive relation-
ships with learning for both groups, although the relationships were more
consistent for high SES.
Finally, dead spots during a lesson showed weak and uninterpretable
curves for word discrimination gains.
Taken as a whole, the lesson presentation variables are confusing and
uninterprotable for low SES students because of the generally negative nature
of the data. Only independent activity showed a positive relationship with

73
learning, and even this was curvilinear and somewhat inconsistent. As far as
it goes, it fits with the general pattern that low SES students learn more
from actual practice than from verbal discussion or from watching and listening,
but this pattern was not borne out in other variables in this set. in contrast,
the data for high SES children hold together nicely, indicating that they benefit
from most of these lesson presentation variables which had been stressed by
various writers. The SES difference in itself fits with our general interpre-
tation that much of the teacher behavior stressed by textbooks is relevant for
teaching that is primarily verbal discussion of symbolic material but less
relevant for teaching which involves demonstration and practice of physical skills.
The next set of variables deals with categories of teaching methods that
teachers used to try to put across the content.
Lecturing was unrelated to student learning, contrary to the predications
that might have been made by those who stress indirect teaching and would expect
a negative relationship here.
Teacher demonstrations were curvilinearly related to student learning
in language arts. In mathematics they were post'. vely associated with learning
gains for low SES but unrelated to learning gains in high SES. This is one
of several examples showing that the low SES children were more dependent upon
teacher demonstration and correction than were high SES children.
Focused discussion revealed mixed but mostly negative correlations in low
SES and mixed and largely uninterpretable correlations in high SES. Unfocused
discussion revealed weak and uninterpretabie relationships in low SES and
slight positive relationships in high SES. Taken together and In combination
with the data for lecture and demonstration, these four method variables

74
indicate that the low SLS children benefit more from teacher directed instruc-
tion and do not benefit much from verbal discussions, in contrast to high SES
students who may not be so dependent upon the teacher and who do appear to
benefit at least some from verbal discussions.
Silent reading showed a single positive correlation with learning (in
arithmetic reasoning, however), for low SES. This makes sense at one level
because performance on an arithmetic reasoning test requires silent reading
of the problems, although more generally we expected this variable to relate
more consistently to learning gains in language arts than to learning gains
in mathematics.
Oral reading showed no significant relationships in either group for any
of the criteria.
Drill (mostly mathematics drill, but sometimes phonics or other language
arts drill) showed weak relationships with word knowledge gains (negative for
low SLS and positive for high SES). Coder comments suggest that the relationship
here (which was the opposite of what was expected) might be best understood by
taking into account the frequencies of these activities at the two different
types of.schools. There was heavy use of drill (mostly appropriately) in the
low SES schools, but not nearly as much in the high SES schools. Thus, the
relationships miont reflect a tendency of certain low SES teachers to overdo
drill and certain hign SES teachers to overlook it, rather than the simple
linear relationships that are suggested if one takes the findings at face value.
The percentage of time in Problem solving activities showed generally
positive relationships for both groups, although the correlations were more
consitently positivt: for high SES than for low SES schools, as might have been

75
expected. In any case, this set of findings, along with those discussed earlier
concerning teacher interest in the substance rather than the form of student
responses, suggest that teachers who were tyring to help the children learn
how to think, in addition to what to think, and who stressed such activities
as reasoning, generalization, and problem solving were more effective than
teachers who did not. It is worth noting that this finding came through even
though the criteria used were standardized achievement tests which are often
criticized for stressing only the low level curriculum objectives involving
primarily factual memory and not placing enough emphasis on reasoning and
problem solving abilities. It is also notable that the variable correlated
with all of the learning criteria except arithmetic reasoning, which is the
test that most clearly involved problem solving. These seemingly paradoxical
data are not unique; Soar (1972) has also noted that concentration on lower
level activities sometimes leads to better performance on tests of higher
level abilities, and vice versa. In any case, teachers who went beyond drilling
the children in simple facts and skills by challenging them to apply what they
had learned to solving problems were more successful than teachers who did not.
The next set of variables deal with the curriculum materials and teaching
venicles used by the teachers.
The use of standardized materials provided with the curriculum showed
mixed but mostly negative relationships with student learning in low SES schools
but consistently positive (although sometimes curvilinear) relationships with
learning in high SES schools. This parallels the results from last year, and
also the teacher comments on the interview and questionnaire, which indicate
that sticking with the prescribed curriculum materials was associated with

76
success in nigh SLS schools, but that the more successful teachers in low SES
schools supplemented or substituted by using other methods and materials.
The use of teacher-created materials showed mixed findings in low SES but
generally positive findings in high SES. However, the high SES data appear
to result primarily from the activities of a few teachers who were at the
extremes, particularly the ones who made heavy use of their own homemade
materials. These teachers tended to be relatively more successful than the
others. Teachers who were medium on this variable were no more successful than
teachers who were low on it.
The use of audio -- visual aids showed curvilinear relationships in both
groups. The nature of the curve suggests that these aids were more useful in
low SES schools than in high SES schools, but in general an optimal relationship
appeared to produce the best gains. That is, teachers who were either very
low or very high in their use of audio-visual aids generally got poorer results
th3n teachers who were more moderate, particularly in high SES schools.
Games and activities did not appear frequently enough in low SES schools
to allow anlayses. The high SES schools anlayses produced only a single
uninterpretable curve. Tho use of learning centers did not appear frequently
enough to allow analyses in either group.
Taken together, the data indicate that teachers in high SES schools did
best when they stayed with the standardized materials for the most part, although
teachers who made heavy use (as opposed to low or moderate use) of their own
homemade materials and who used audio-visual aids judiciously were more success-
ful than the others. in low SES schools, teachers who deviated from the

77
standardized materials, particularly by using the audio-visual aids, were more
successful than those who stuck strictly with the materials provided in the
curriculum.
The next three variables deal with the degree of individualization during
lesson presentation. Specifically, they account for the amount of time the
teacher spent with the whole group, with pairs of individuals, or with Indivi-
The next three variables deal with the degree of individualization during
lesson presentation. Specifically, they account for the amount of time the
teacher spent with the whole group, with pairs of individuals, or in dyadic inter-
action with single individuals. In general, teachers who spent much time with indivi-
duals, even within group context, were more successful than teachers who tried
to work with the group as a whole or with pairs. Children at these grade levels
appear to need individual monitoring and feedback, particularly when they are
learning brand new material and trying to apply it for the first time.
The final variable on the table concerns the use of non-patterned turns
in group lessons, particularly reading groups. Non-patterned turns refers to
the practice of calling on children randomly or at least in some uninpredictable
way, as opposed to calling on them In a pattern which allows the children to
know when their turn will come up. Like last year, this variable unexpectedly
correlated negatively with student learning gains, particularly in low SES
schools. We had expected a positive relationship on the theory that non-
patterned turns would keep the children continually accountable. However,
whatever gains this aspect might involve appear to be overcome by the problems
of anxiety that are Introduced in this method. Also, our own observations In
past work and the comments of certain teachers suggest that the use of patterned
turns serves to Insure that each child gets about the same number of opportunities
to interact with the teacher and to recite in the group. When the teacher calls
on students "randomly," she sometimes calls on the higher achieving or more
eager students much more often than she calls on the lower achieving or less
t,2

78
eager students. Thus, all things considered, patterned turns appear to be
superior to non-patterned turns as a method of calling on students to recite
or answer questions in small group settings at these grade levels.
Low :;Terence Process Variables
The variables prt.11ented and discussed from Tables 1 through 5 all came
from high inference ratings, checklists, and other high inference measures.
In contrast, the behavioral process data in Tables 6, 7, and 8 come from
the low inference observations made with the modified Brophy-Good Dyadic
Interaction Obse vation System. The data of Table 6 come from whole class
interactions in the mornings; the data of Table 7 from whole class interactions
in the afternoons; and the data of Table 8 from interactions occurring during
reading groups. Most variables appear on all three tables; the behavior
involved is the same but context differed. Consequently, the three tables
will be discussed jointly, going through the variables in order and taking
into account the data on the three tables simultaneously rather than
discussing each table separately.
The first four variables deal with the teachers' methods of selecting
respondents to their questions. Every time a teacher asked a question', the
observer coded whether th9 teacher preselected the respondent before asking
quet'rn' asked a question but then called on a non-volunteer; asked
the que.; 'ion and then called on a volunteer who had his hand up; or did not
get a chance to identify a respondent because some student called out the
answer without permission. Data on these four alternative methods by which
students could g. a response opportunity are shown In the first four variables
of the tables.

79
c,it;) on nrc,Allectil a respondent before asking the euustion showed
(2,;! r," Lontradictor, correlations. In the first year tne data were
ri .! for low !.:S but donsitontly negative for hT3h SES. However, in
tho ;0,cond yelr the data were still mixed for low SE!) but now consistently
r ,GI'iyo for nirk SEE. Wu do not know why this variable correlated sU
cr,n',intently :o-itiv:?ly with learning gains in the high SES schools.
Cal !inn on non-olunteers yielded f..w significant relationshipi and
tho%e wear were inverted-0 shaped curves indicating that a pertain
ortIr40 dmount of thi ,.bi.:havior was hotter than either too much or too little.
MI5 confirmed exectations, although the number of sinnificant relationships
The data for calling on volunteers indicated a fairly consistently
necIdtivtl rulation,,hip in low SES and positive relationship in hirPt SES for the
fircet year, but this was no .eplicated tha second year when only a few
cc produced ';innificdnt relationships and these were mostly uninterpretable
curves.
Finally, the data for student call outs indicated positive relationships
in k)w (JI_S (,!xcent for reading group) in the first year and mixed relationships
in ilh SLS. The data for the second year .ndicate mixedpsomewhat positive
relationshipi:, for low SES but consistently negative relationships for high SES.
Taken rog9ther, the data for year 2 suggest that it was better for teachers
to ;,rw-,eleet-resbondens or call on volunteers than to allow students to call
out answers. This is one indication of the prol,lem of competitiveness and
over-uagurnes to re.)pons! in the high SCS schoots. This apparently was not
a problem in low SF7. sct'ools. Unfortunately, however, the data do not ha,p
toliothor in an/ cl.ear-cut fashion for low SES schools to indicate that ary

80
n )rf: ,l it :etter- Gf selectincl erefereble. Th, / do if-di ecte,
:iceever, t' tu,e' t call out; the low 7FS xd_ were Neutral +c
they tw-ded to be negativ. H high r,;r, schools. Thus, in t!,.: tcw
sc.:,(Ail; call outs probatily represented an index ef good motivation end
attentien, and they apparently do net occur eu often as tc constitute a manage-
ment robler wnereas in tho schools thug occurred more often and
presented enough of a pro: tern to cauee them to relate neeatively rather than
poritively to loarein:: gains.
Ike next te, iteme dual with tL+ difficulty level of teacher questions.
in eeneral, proceee questions were the meet difficult (hoe and why questions)
and choice euestirns (where thc child cinly has to indicate one of a series of
alternetives) wore the easiest, with product questions (recalling a fact from
Tomer() eein!J in between. Process questions produced one pesitive relationship
in each SIS group the first year. In the second yeer process questions
produced several curves in Beth groups for mornine interact ions, taut the
curves for both groups were rather weak. We be that this is because
process questions were very infrequent at these grade levels, and even the
ones thct wore asked were relatively low level process questions rather than
hi9hly abstract or complex ones. Process questions should begin to become
roc,;itively associated with learning gains as children get older.
Choice questions showed a mixed pattern across eiroups and years.
In the first year, cnoice questions in morning interactions correlated po:itively
with gains In low SES, but there findings were not mlicated the t7eceed year.
In afternoon interactions, the data show one positive and one neqative relation-
ship for each SES grou2 in the afternoon, and no significant retalionships in
the second year. For reading group interactions, the data showed negative
83

dl
correlations for low SES the first year and positive relationships for high
SLS the second year. This is one of the few variables that shows sizeable
and clear differences in the pattern of correlations of criteria dependent
upon context (morning vs. afternoon vs. reading group). With some exceptions,
the data for general class interactions supported expectations that choice
questions would correlate positively with learning gains in low SES and process
questions would correlate positively though weakly in high SES. However, the
pattern was reversed in the reading group, for unknown reasons. We plan to
investigate correlates of these variables to see if some clues can be discovered
as to why tnese context differences in the relationship of question difficulty
to student learning gains appeared.
The next five variables on each table deal with the quality of student
response (correct, part correct, wrong, "don't know," and no response). Like
question difficulty, to which the quality of student response is related,
this variable showed context differences between reading group and general
class interaction. It also showed failures to replicate (at least in terms
of precise relationships) across years. In the first year, correct answers
in morning interactions were correlated negatively with learning gains in
both groups for the most part, but in the second year the correlations were
more positive for low SES but still mostly negative for high SES. Afternoon
interactions in the first year indicated poiitive relationships for low. SES
and uninterpretable U-shaped curves for high SES. The second year data yielded
a slightly positive relationship for low SES and a significant negative
relationship for high SES. Reading group data indicated positive relationships
for low SES and negative ones for high SES the first year, but in the second
year there were only two uninterpretable curves. Thus, the majority of the

82
Lit : of :,..)rri.;ct answers was r(,sifively rriat(id
1,;(irriihn for low EELS schouls and nestively for hiq
data 7)n morning intnractions from the first year also show some
nel(:ative relations for t? low ir..;
pcxct,ntdpo of part correct answers yielded only curvilinear r.:lation-
sips. These were mixed for low US and mostly positive for high SAS. The
data on wrong answer:; in the morning revealed mixed findings for low SE_') and
invorte:.!-;t relationships for high SES in the first year, but negative relationshins
for low SLS and positive ones for high SES the second year. The data for
the afternoon yielded no significant relationships the first year, and wt,ak
and mixod data fur low SES t,ut positive relationships for high SES the second
ycjiir, Finally, th data for reading groups indicated negative relationships
tte first year for low SES and positive or inverted -t1 relationships for high
SES, while the second year data indicated uninterpretable flat curves for
1_41 and mixed moistly positively rising curves for high SES. in sum,
the data on wrong answers suggest that they are mostly negatively related to
learning in low US schools and posilively but somewhat curvilinearly related
to learning in high SES schools.
The next set of data deals with situations where the teacher asks a
question and the child sws (aloud) that he doesn't know the answer. The
relationships involving this variable are mostly curvilinear, the majority
sugqestinq positive but mildly inveried-U shaped relationships. Thus,
student tendencies to say "I don't know" when they cannot respond are generally
positively related to learning gains, although learning gains are lowcr in
classrooms where this particular behavior is extremely freluent.
7

83
The final category of student responses Is "no response," indicating
that the student not only didn't answer the question, but said nothing. lb
significant relationships were found for the 'oading group, and only some
negative corr3lations with arithmetic reasoning gains were found for afternoon
reactions. However, morning interaction data revealed mixed findings for
both SES groups. In general, fai ure to respond appeared to be less negative
in high SES than in low SES schools, fitting in with some of the data described
earlier to the effect that it is important for teachers in low SES schools to
get a response but somewhat more important for teachers in high SES schools to
keep lesson pace moving.
Taken together, the da on question difficulty and student answers
suggest that an Inverted-U sha ed curve represents the relationship of these
variables to student learning. This would indicate that medium difficulty
levels of questioning are preferable and more beneficial than questions which
are consistently too easy or too difficult. Furthermore, although the preceding
statcment holds for both SES groups, inspection of the raw percentages reveals
that the optimal difficulty level is somewhat higher in high SES schools than
in low SES schools, as might have been expected from the general tenor of the
findings so far. The data suggest that the most successful teachers in the
high SES schools have their questions answered correctly about 70% of the time,
while the most successful teachers In low SES schools have their questions
answered correctly about 80", of the time. Both of these figures are sufficiently
different from IOO to contradict the reasoning of errorless learning advocates,
although they do confirm the general Idea that learning proceeds most efficiently
when new material is quickly and easily assimilated into existing schemes without
undue cognitive strain or difficulty. Thus, the findings seem to confirm the

ra I
34
aa,a, aritera as Auauaal, ,unt, Jrd
era also sufficiently different from f.,-7;, tc,
di,:aafira aacfulaoa of achiavaaent motivation ther,ry for
,;art--Me conditions, a proaaLility of aucaess of K.
tend; to :A) as5ociatod with maxinum achievement motivatian amore; individuals
. ,,trive for success, while probabilities either nearazero or near 100;
()naval more la, inc:ividuals who fear failure. The present findings do not
confraaiat these sugestians from achievement motivation theory al much as they
aemons*raty that several contextual factors are involved which male a difference
botwean pradictina the or.timal difficulty level for a school !claming situation
vs. a lame-like situation. First, students do riot have much, if any, free
choice ataut curriculum rajeetives; these are set by the srhocl or the teacher.
Second, the present data deaf with cognitive activities, while most achievement
motivation research has teen conducted with skill performance in qamealike
Third, achievement motivation theory discusses the relationship
lietv.cen brohabiWy of success to maximal achievement motivation rather than
to rlaximal performance. it also notes that motivation itself (presumably
inciudinn achievement motivation) is curvi linearly rather thnr linearly
ralafed to perfarmance. Applying this to the present situation, we mipt,t
predict that ,laximum achievement might ue expected at either a 251 or a 7!,;.:
difficulty level. The 757. level is around what was actually found. Tho: 25%
iovel might actually anpaal more in terms of achievement 1,clivation to
individuals who hava hioh naeds for success and low fear of failure Itut
appar ntly it involves too much aognitive strain or difficulty to allf,4 efficient
leaning, oven when motivation is high. In any case, learning was most efficient
in high SEb schools when about "r., of teacher questions were answered correctly,

85
any r ,-;fficient i!1 low '..)17, scflooL, when about 8C of teacher questions
ac rl nr. .i , rt cc rrk. t
The next si't of data d.2al with teacher roactinns to correct answers b,
studwIt-,, ThL first variabl, nraise, yielded few sinnif;cant relationshins
and wri. contradictory. In tho. first year there was a negative correlation
nraiso and learning in low SLS, but this, is rontrarlieted by a primarily
positivt;iy r i i nr curve in the second year. .'ore Tinerally, the absencc of
relationsnips is part of a much larler picture: reveal inn praise
to Lo relativ unimortant, contrary to the attention given to it in moat
textLoor,s and Ly Nos,'
follo,.in,) correct answers was rare, as expected, althowjh
dig show ;ore positive rclationships with learning in high 5E5 schools only.
Ttia is oart liroader pattern of .ositive relationsHrs between criticism
and student 1,:arning in the hinh SLS schools. Irt general, tligh US teachers
',Mc, went; most succt. sful ruhdvd t) bf. critical and deandin in responding to
tne academic efforts of their student: although in other respects they v,Iro
,fienerally warm aryl student-orientod.
As other data are d iscussed, a pattern will be one cicar indicating that
patience, -and :rncouragemht were associated with success in .0w SLS
scLols, derlanneness and criticism were associated with success in
rlip i SLS TLis dif;erence appears to be rel cited to differences in the
,;uhf,.t matter Iknow lcdtic1 and motivation of the students and it probably also
i5 rt.!latcd to the fHding that high self-osteen individuals tend to resi,ond
more to ohallenqe and criticism ortiii !cm s(.1f-w,teem +Wit; tr,
respond more To relativel easier tasks and to encouragt and ',raise.
The failure to niv#? feedback followino correct answers

86
was rar,ip as ww., expected, although the analyses that did yield significant
results showed contradictory findings. In general, failure to give feedback
was somewhat positively related to learning gains in low SES schools but
generally had an inverted -U shaped relationship to learning in high SES schools.
The latter was expected on the theory that feedback should be given most of
the time. However, in certain circumstances, particularly during quick moving
drills when most student answers are correct and the students have been con-
ditioned to understand that non-response indicates a correct answer, failure
to give feedback may not necessarily be harmful (or might even be helpful in
tha; it would help the lesson move along more quickly). The positive trends
seen in the low SES schools are inexplicable, however. Intercorrelations of
this variable with other process measures and with presage measures will be
inspected to see if some interpretation of its meaning can be developed.
Process feedback was too rare to allow meaningful analyses the first year.
In th,) second year the data showed weak negative and strong and consistent
positive associations with student learning in low SES and high SES schools,
respectively. The positive relations with learning in high SES schools
were expected, but the weak negative relationships in low SES schools were
mildly surprising. it had been expected that process feedback would be one
of the teacher reaction variables that would consistently correlate positively
with student learning gains, but in low SES schciAls process feedback did not
appear to be particularly facilitative. Perhaps the nature of the interactions
was such that more ,tas to be gained through maintaining brisk pacing by quickly
giving an answer and moving on. This could aglow more repetition and redun-
dancy to be built into the lesson instead of stopping and giving an extended
explanation to one student and perhaps ruining lesson pacing and losing student
attention.

e.7
Asking a new question following j correct answer showed contradictory
relationship,: In the tir:,s year this was strongly negatively correlated
with learning in low SLS schools but interactions in the reading group reversed
this pattern, The second year revealed a single positive correlation for
1QW SE. ') in morning interactions (contradicting the finding for the first
year) and some weak curves for reading groups. In general, these data are
not very interpretable given the contradictory tindings and the nature of
the variable. New questions included too many different kinds of possible
new Questions, and apparently two or three or four different kinds of things
were included in it so that the relationships are somewhat ambiguous. in
future researchpcoding of this variable should be adjusted to differentiate
now questions which involve attempting to get the student to expand upon hiS
answer or transfer his thinking to a more complex levelpand other kinds of
new questions that might involve changing the subject or switching from
academic questions to self or opinion questions.
Al a set, the data for teacher responses to correct answer- hung together
well for high SES but not for low SES (as is frequently the case in these data).
They revealed that teacher criticism and particularly process feedback
following correct answers was associated with student learning gains. The data
for low 515 were mixed and generally confused. They failed to support expec-
tationE or to indicate any particular teacher behavior that was regularly
associated positively with student learning gains, although they disconfirmed
several expectations based upon existing literature.
The next set of data deal with teacher reaction, to part-correct answers
by students. The data in this set are very sparse bycause part-correct answers

88
we , rare. flivinl students the answer was generally positively related to
learning, althour,h most relationships were curvilinear and only one or two
were strong. Calling on someone else showed a single inverted-U relationship
in high SL5 and an uninterpretable weak U-shaped relationship in each SES
group. having other students calling out the answer following part-correct
answers showed no data in any of the three contexts. Repeat'ng the question
showed a few generally positive but curvilinear relationships. Rephrasing
or giving a clue showed generally positive relationships in low SES but
generally negative ones in high U.S. The same was true for asking new questions.
The data in this set are difficult to interpret with confidence because
pari-correct answers appeared infrequently and also because some part - correct
answers wore mostly correct while others were only correct to a minor degree.
Jne variable that came through as effective in these situations was giving the
student the answer. This was mildly surprising in that it was expected that
sticking with the student and trying to get him to come up with the answer
on his own would be the most ideal teacher reaction. This was in fact helpful
as a rule for low SES students, but it was negatively related to learning for
high SLS students. We believe that the latter is because at this grade level
the majority of questions were product or simple fact questions which required
the student to respond with a single word or brief phrase from memory. Many
of these questions were of the sort that students either knew or did not know
how to answer. Consequently, if the student failed to answer the question
correctly after a second or two, he was unlikely to benefit from addiAonal time
or from teacher attempts to provide clues. This interpretation assumes the
the student has answered the best he could however, and other data suggest that
or,16.,?

89
this may often h,iyo not bean the case in the low SES schools. It seems likely
tnat many of the part correct answers from these students were halting and
tentative resnonses rather than responses that the children stated loudly and
confidently. Under these circumstances, the children would be in a position
to benefit from teacher encouragement in the form of sanctionin'- the correctness
of what they have said so far and encouraging them to continue and finish the
response.
The newt set of data deal with teacher responses to wrong answers (i.e.,
situations in which the child makes a response but the response is clearly
incorrect). Praise did not occur frequently enough to allow analyses in either
year, although occasionally a teacher would praise a child for making a
good try even though his answer was incorrect. Criticism was also very
infrequent and allowed analyses only during second year. In the afternoon
interactions there was a single weak negative relationship between criticism
of wrong answers and learning gains in low SES. In reading there was a pattern
of negative relationships in low SES and rather strong positive relationships
In high SES. This is another example of the kind of critical demandingness
that the more successful high SES teachers revealed compared to all other
teachers.
Failure to give feedback was also very rare when a student gave a wrong
answer, and the places where it occt.rred often enough to allow analyses (morning
data for year 2) failed to reveal any interpretable relationships.
Process feedback was not frequent enough to allow analyses the first
year, but the second year r,,ome relationships appeared. There was a single
negative corr.tation L,etween process feedback and learning gains for high
94

90
'AS in the morning data, some weak and mostly inverted U-shaped curves in low
KS and some weak and uninterpretable curves in high SES in the afternoon
data, and no signlficant rekAtionships in the reading green data. Thus, in
contrast to the data in other situations, process feedback following wrong
answers did not appear to be an effective teacher response.
The next data concern giving the student the answer. In the first year
this diu not occur frequently, although some relationships appeared. in the
first year, the morning data revealed positive associations between giving the
answer and student learning in high SES. There were not enough .ta to analyze
for the afternoon in high SES, while the data for low SES in the afternoons
yielded m..)stly uninterpretable curves. Finally, the data for the reading group
in the first v'ar yielded mostly negatively sloped curves in low SES but
inverted U-shaped curves in high SES. For the second year, the morning data
revealed negative relationships in high SES and weak and mixed data in low SES
in the mornings, no significant data in the afternoon, and a dropping curve
for low SES and a rising curve for high SES in reading group.
Thus, taken together, the data for giving the student the answer provide
mixed and somewhat confusing findings. As is typically 'the case the data
for low SES in particular do not hang together in a clear-cut pattern. The
data for high SES a.re not completely consistent either, although the general
tendency indicates that giving the answer foltowing wrong anst "ers was for the
most part an ineffective method of dealing with wrong answers, although this
relationship was mostly curvilinear rather than linearly nesative.
The next variable deals with calling on someone else. In year 1 this
method of dealing with wrong answers was negatively correlated with learning
gains in low SLS for *me two significant correlations that appeared. The data
91
for high St:; sugeusted weak positive relationseles. In the second year, t'le
data again revealed mostly negative correlations in low SES and positive ones
in high SES, but the latter again were notably weaver. Also, the data for
reading groups were not as clear-cut and did not fit together with the data
for general class as we In general then, calling on another student to
give the answer was nenerally negatively associated with learning in fow SES,
uut positively,though mildly, associated with learning in high SES following
wrong answers by the original respondent.
The next variable deals with situations where the teacher did not
get a chance to give feedback or to ask another question because another
student called out the answer. This was rare both years, although a few
relationships did apnea r. In the first year there was a single negative
correlation between cal louts in these situations and learning gains in low
SLS. In tne second year there were no interpretable relationships. One
multiple regreseion analysis did reach significance and revealed a positive
linear slope in low SES, but the zero-order correlation was not statietically
significant. Thus, in general, calling out by other students was not a major
problem following wrong answers, but to the extent that it was, it seemed
to be negatively correlated with student learning gains, particularly in low
SES schools.
The next variable concerns repeating, rephrasing, or asking new questions.
This combined some of th, more specific variables dealt with below0so it will
not be dealt with in detail, except to note that as a general rule it is more
effective in low SLS than in high SES schools.
More specifically, repeating the question (that is, asking the student
again to respond to the original question without giving him any help) was

92
mostly negatively correlated with learning gains in both groups, particularly
in high SES schools. There are also a variety of types of curvilinear relation-
ships, although most of these also reveal primarily negative relationships.
This is the first of several sets of findings showing that simply repeating
the question when the student has not answered it the first time is not very
effective, as might be expected. Given the nature of the questions asked at
this grade level (mostly factual questions which the student will answer
quickly if ho knows the answer but is not likely to answer if he doesn't come
up with the answer quickly) repeating the question, without giving help amounts
to a kind of "pointless pumping" of the student. Without help, he is unlikely
to improve upon his original response.
The contrast is shown somewhat in the data for the next variable concerning
rephrasing or giving a clue, which includes most of the situations where the
teacher tried to get the child to improve his response by giving him some help.
Although few relationships were significant, it is clear that this was an
effective strategy for teachers in low SES schools. The data for high SES
schools are weak and uninterpretable, however. This is worth noting, though,
because this is one of the relatively few instances in which a teacher behavior
clearly correlates positively and consistently with student learning gains in
low SES schools. Thus, when a student in a low SES school gave a wrong answer,
it was helpful for the teacher to stick with that student and try to get him
to come up with the right answer by rephrasing the question or providing some
kind of clue or help, as opposed to giving him the answer or moving on to
someone else. This finding may seem puzzling to those who would have expected
the opposite SES difference on the grounds that the higher SES children would
be more likely to benefit from help and improve their response. We believe

93
that the data result from a difference in the style of responding by the two
BLS groups. 'lore of the wrong answers the came from low SES students were
blurted out impulsively or were simply wild guesses, so that teacher persistence
in seeking a better response was more likely to succeed and also was helpful
in conditioning the children to learn to think before responding.
The last variable deals with teacher asking a new question following
a wrong answer. This variable is a somewhat mixed one, since some new questions
involved rephrasings or simplifications of questions (such as switching from
"what color is this?" to Is this red or blue?"), while other new questions
were switches from academic questions ("What color is this?") to non-academic
questions ("Did you do your work?" "Did you hear the question?"). Thus,
interpretation of this variable is somewhat tenuous. In any case, the data
reveal that the behavior 485 relatively infrequent both years, and that it
was mostly positively, but somewhat curvilinearly, associated with learning
gains in low SES schools and showed mixed but mostly negative relationships
in high SES schools. Here again, it was more helpful for teachers to stick
with the student and ask another question if he was in a low SES school than
if he was in a high SES school.
The next set of data deal with teacher reactions to situations where
children say "I don't know" or make no response at ail. These will not be
discussed in much detail because they are discussed more specifically in the
following two sections. It Is noteworthy, however, that these data were
infrequent in general, indicating that situations In which students said
"I don't know" or made no response to teacher questions were relatively
infrequent in the observations.

94
The remaining data are rather sparse, but they suggest that calling on
someone else was negatively associated with learning gains in low SES schools
but positively in high SES schools; that having another student call out the
answer was slightly positively associated with gains in low SES schools but
fairly strongly negatively associated with gains in high SES schools) and
that providing "some kind of help or repeating the question was generally
positively associated in low SES schools and negatively in high SES schools.
These will be discussed more specifically in subsequent sections.
The next section deals with teacher reactions when a student stated
"I don't know," or words to that effect, when asked a question. Data in
Year I for this set of variables are not available. The student response of
"I don't know" and the no response category were combined and were not analyzed
separately. Separate analyses are shown for year 2, however. Criticism in
this situation occurred very rarely and showed no significant relationships
to student learning. The same was true of failure to give feedback and of
giving the answer. Teachers sometimes gave the answer when the student gave
a wrong response, but they tended to do more than simply give the answer when
the student said "I don't know." In these situations they were more likely to
stick with the student and try to get the answer or to call on someone else,
at least in high SES classrooms.
Calling on comeone else was a relatively infrequent teacher response to
the situation. It showed no significant relationships in year 1. The year
2 data show it to be negatively associated with learning gains in the low SES
schools but positively In high SES schools. This is one of a pattern of findings
suggesting that it is Important for the teachers in low SES schools to stick
93

95
with the student that they originally called on and get some kind of response
from him. In the t,igh SES schools it appears to be more important for the
teacher to get the answer and less important that she get the answer from the
original respondent. Apparently, students in high SES schools can learn as
well from hearing answers given by other students as from giving the answers
themselves. Also, when students said that they did not know the answer in
high SES schools, this was usually an accurate statement of the situation,
whereas in low SLS schools this response could have meant that the student
was unwilling to respond or was inhibited about responding because he was
unsure. inus, in these situations teachers in low SES schools were more likely
to get the answer through persistence, but in high SES schools, attempts to get
The answer from a student who said that he didn't know amounted to pointless
pumping.
Having another student call out the answer did not occur very frequently.
Data were so infrequent i in the second year that no analyses could be run. Thus,
student callouts were particularly infrequent in situations where the student
replied "I don't know."
there were not enough data for analyses In low SLS and for the most part
In high SES in the second year for repeating, rephrasing and asking new question,
although analyses were run for the whole class interactions in the mornings.
These yielded significant negative correlations with student learning gains
in high SES, further supporting the idea that attempting to get the student
to respond in high SES schools after he has already stated that he doesn't
know the answer tends to be an ineffective tactic. The more specific data on
repeating the question vs. rephrasing or giving a clue vs. asking a new

96
question all happened so infrequently that meaningful data analyses could not
be run. This was essentially because there were relatively few instances of
students saying "I don't know" in the first place.
The next section deals with teacher reactions in situations where a
student fails to answer the question but remains silent. Again, criticism,
failure to give feedback, and giving the answer were all infrequent
responses. Only giving the answer yielded a significant finding, anti this
was a weak and unintorpretable curve. Thus, these three teacher re.. .0,+ses were
infrequent and unrelated to student learning in situations where the I. udent
failed to respond.
Calling on someone else shows the same relationship noted earlier; it
was negatively associated with learning in low SES schools but positively
in high SES schools. Again, it was important for low SES teachers to stick with
the original respondent and work to get some kind of answer, while in high SES
schools it appeared to be more important to move along and get the answer, not
necessarily from tne original student.
Other students calling out the answer were somewhat more of a problem
in cases of no response than in cases where the original respondent said
"I don't know." In the second year the data suggested weak positive relationships
in the low SES schools and weak negative ones in the high SES schools. The
general weakness of the data appears to be a function of their infrequency;
student call outs were relatively infrequent even in this situation, essentially
because teachers did not allow them.

97
Repeating, rephrasing, or asking a new question showed no significant
relationships in either year for whole class interactions in the mornings.
In the data for afternoons,the second year findings show a tendency toward
positive correlations In low SES and negative correlations in high SES, although
some of the relationships are curvilinear. Similar findings, although less
frequent ones, appear for reneating the question and for rephrasing or giving
a clue. The data for asking new questions did not produce significant
relationships. Thus, in general, the data on teacher reactions in situations
whore the student made no repsonse at all to the original question hang
together consistently. They showed that student learning gains were higher in
low St:5 schools when the teacher stayed with the original student and worked
to get a response, but the student learning gains were higher in high SES
schools when the teacher moved on and called on someone else. A student who
failed to respond or who said "I don't know" in high SES schools usually did
not answer the question or improve his response when the teacher persisted
in dealing with him.
The next section deals with teacher reactions combined across all
response opportunities (correct answers, wrong answers, part-correct answers,
"I don't know" answers, and failures to respond). These data will not be
discussedpsince they combine the more specific data that have already been
reviewed. The trends already discussed are evident in the data from this
set, for the most part, although occasionally some contrasting findings
appear because the data for teacher responses to correct answers have been
lumped in with the data for teacher reactions when the child has failed to
give a correct answer.
02

98
The data fur praise and criticism are worth noting, however. The prdise
data, as elsewhere, reveal sparse findings, and the findings that did reach
statistical significance are largely contradictory. Praise showed two positive
and one negative relationship to learning gains in low SES, and three inverted-U
curves of varying steepness in high S.S. Thus, the data reinforce the more
general tendency found throughout the study that teacher verbal praise is not
particularly important at these ,age levels. Data from child development
research suggests that verbal praise (as opposed to other kinds of rewards)
from female adults (and all the teachers involved in this study were female
adults) is a relatively weak reinforcer for children of these age levels, and
this may explain the findings in part. Despite the stress on the importance
of praise in textbooks, verbal praise does not appear to be a very important
corre'Rie of student learnini gains. However, we do not wish to imply that
praise should not be given; the lack of significant findings may Indicate
the teachers were praising sufficiently rather than that praise was unimportant.
Also, behavior modification studies have revealed that contingent praise is
more effective than non-contingent praise. It may be that the teachers were
failing to praise contingently and thus were not making their praise as useful
or effective a reinforcer as they might have if they had praised more
effectively. These are but two possible interpretations and qualifications
of the praise data. In any case, the lack of positive support for praise does
not necessarily indicate (and it should not be inferred) that praise is
unimportant or should not be given.
The criticism data are notable in that they again show positive relation-
ships between criticism and student learning gains in high
.1, C3
SES schools, and
99
also because they show the negative relationships between criticism and
student learning gains in low SES schools. Here again we see the pattern of
criticism and demandingnoss in the hl.gh SES classroom teachers who got the best
learning gains, but a pattern of praise and encouragement on the part of low
SES teachers who got the best gains.
Other variables in this set reinforce the (let Jted earlier. Generally, when
the original student failed to respond, the more successful teachers in high
SES schools tended to give the answer or call on somemne else, while the more
successfel teachers in low SES schools tended to stick with the original
respondent ard provide some kind of help in an attempt to get him to answer.
The next section deals with the frequency of student response opportunities.
This is, in effect, a measure of 'he amount of classroom time devoted to public
question and answer sequences as opposed to seatwork or other kinds of non-
public learning situations. The data for the first year revealed a consistent
pattern of negative correlations in low SES and positive correlations in high
SES for the morning. The afternoon data were more mixed,although the positive
correlations in high SES were consistent. The reading group data yielded no
significant relationships. This was interpreted last year as an indication
that indirect teaching is inappropriate for low SES students at this grade but
more appropriate for high SES students. It was also considered an indication
that students who are still working on mastering tool skills need more time
devoted to demonstration and practice of such skills and 4111 not benefit as
much from verbal discussion until they have mastered these tool skills. The
findings were generally not replicated the second year. There was one sig-
nificant neoative correlation between this variable and student learning gains
IL U
in low ',LS 50,0)15, olonq with o number of generally weak and uninternrutable
curves from tho reddino group data. Thus, flit! negative mlationship for low
SLS scnools was replicated but for only one of a possible 15 analyses, and the
consistent pattern of positive reiationships seen for high SES schools in first
year did not reappear in the second year. These relationships were not negative,
but neither did they indicate any consistent positive relationship between this
variable and student learning gains in the high SES schools. Thus, the general
comment that verbal interaction is contraindicated for low SES students still
concentrating on tool skills holds kg), but the support that appeared for verbal
interaction in the niW1 SES schools in the first year data do not appear in the
second year data.
It is worth notine in this regard that in the second year of the study the
school district involved was in the process of introducing learning centersoand
most teachers were devoting time and effort to this endeavor. Consequently,
there was much more individualized activity going on in learning centers in all
of the schools during the second year of the study, but particularly in the
high SES schools. This; probably affected ti-e correlations for this variable in
some way, although it is difficult to guess exactly what the effects might have
been. If anything,we might have expected It to accentuate the positive
correlations between verbal interactions and learning gains in the high SES
students, because learning center activities were mostly individualized and
did not involve this kind of verbal interchange, but this clearly was not the
case.
Probably the most important and most general interpretation of these data
is that verbal interchanges are simply less relevant to instruction for young

101
children in the early elementary grades than they are at higher grade levels,
where more time is spent in verbal discussion of symbolic materials. This
sot of data in particular, and the findings for this project as a whole, also
indicate the need not only for research on teaching in the early elementary
grades but for conceptualizing it and discussing it in textbooks as a Qualitatively
different process from teaching at higher grade levels. Teaching in the early
grades is in many ways qualitatively G fferent from teaching at the later grades,
where more ruliance is placed on verba' interchange. It Is beginning to appear
not only that research on teaching in early grades must involve somewhat
different variables and coding systems than research in latter grades, but that
teacher preparation for teaching in early grades must involve training in
different kinds of skills than teaching for later grades.
The next set of date deal with student initiated questions. Beginning
hem discussion switches from public response opportunities initiated by the
teachers to response opportunities that occurred because the students initiated
them by asking a question or making a comment. As can be noted from the
table* these were relatively infrequent, although other studies indicate that
student initiated questions and comments occur much more frequently at higher
grade levels.
The data for student initiated questions revealed few analyses that could
be done, and even those which were done are of little usefulness because they
yielded mostly uninterpretabie curves. For the most part they showed the
variables related in Inverted-U fashion to student learning gain although
curves were infrequent and usually weak. It is worth noting that relevant
student question,, did not appear to be systematically better than irrelevant

IOZ
student questions, although this must bn taken in the more general context
of The low frequency of questions of any kind. if student initiated questions,
particularly irrelevant ones, had been more frequent, it seems reasonable to
hypothesize that negative relationships would have occurred for the percentage
of such questions which were irrelevant and for the percentane which were called
out. These did not appear, however, probably because student initiated questions
were rare at these grade levels.
The data for teacher reactions to relevant student questions were sparse,
although brief feedback to such questions showed mixed correlations in low
SES but rather consistently positive relationships in high SES. Long feedback
yielded consistently negative relationships in high SES in the first year,
but the data were mixed in the second year. In general, these data on teacher
responses to student initiated questions are not very interpretable, both
because of their low frequency in the first place and because of Their con-
trasting and contradictory pattern of correlations with learning gains. There
is a fairly general pattern suggesting that brief feedback was superior to
long feedback in the high SLS classrooms, but there were occasional exceptions
to this pattern. The data for low SES schools were completely mixed and
contradictory.
It is noteworthy that neither behavioral warnings nor criticism following
relevant student initiated questions were frequent enough to allow analysis.
This indicates that the teachers as a group were receptive to such student
initiated questions.
The data on teacher responses to irrelevant student initiated questions did
not allow analyses because those questions were so infrequent.

103
The next section deals with student initiated public interactions (comments
and rluestions directed to the teacher) over total response opportunities. This
index indicates the fraction of each student's public response opportunities
which were comments or questions initiated by himself as opposed to recitation
opportunities or attempts to answer questions posed by the teacher. In general,
this variable showed weak positive relationships in low SES schools and stronger
negative relationships in high :rS schools. Although a variety of interpretations
are possible, consideration of the data as a whole lead us to believe that this
is one indication of a pattern in which student initiation and willingness to
discuss academic material with the teacher was infrequent in the low SES schools
(hence, the positive correlations), while it was frequent in the high SES
schools, perhaps even to the point of over eagerness and unhealthy competitive-
ness (hence, the negative correlations) . in any ease, the data for this variable
provide little support for the idea that student initiated interactions are
somehow superior to teacher inititated interactions, or that they represent
an index of desirable and positive student motivation. The data for the high
SES schools suggest that they may represent undesirable competitiveness or a
relative absence of sufficient controls over the flow of classroom discussion
by hiqh SES teachers.
The. next section deals with student initiated comments (as contrasted with
student initiated questions described earlier). These were also relatively
infrequent, but they were more frequent than student initiated questions and
thus allowed more analyses to be performed.
The percentage of such comments which were re levant showed strong positive
correlations in the morninn interaction in the first year for tow SES schools,

104
but no significant relationships in the high SEG schools. However, the
afternoon data revealed negative relationships for both schools, significantly
for high 5LS. The reading nroup yielded no significant relationships at all.
In the second year, the data revealed weak and mixed findings with the exception
of one significant negative correlation in the reading group for low SLS
schools, but a consistent pattern of positive correlations for high ;ES schools.
Thus, the data on this variable are largely :ontradictory from year one to year
two. However, the preponderance of significant correlations were positive, as
expected. The occasional significant negative coefficients serve as a reminder
that student initiated comments can sometimes be beneficial even when they are
not relevant to the topic under discussion, although the broader pattern of data
suggest that relevant comments are more helpful than irrelevant comments.
The data for the 3ercentage of student initiated comments which were
called out by the students (as opposed to comments made after they had raised
their hand and necieved recognition from the teacher) showed the preponderance
of negative relationships to student learning gains,which was expected. However,
in the first year there were a few positive relationships in the high SES
classrooms. in general, these data fit the expectation that called out comments
would correlate negofively with learning gains because they probably represent
deficient classroom control on the part of the teacher. However, this was more
of a problem in low SES schools. In high SES schools, where more of the called
out student comments were relevant and appropriate, called out comments occasion-
ally correlated positively with student learning gains.
Unfortunately, praise of relevant student initiated comments was too
infrequent to allow analysis. This is one place where praise would seem to
I Cr)

105
have been particularly appropriate, but it did not occur very often (although
student initiated comments themselves did not occur very ofteleither).
Also, unfortunately, failure to give feedback to relevant student initiated
comments occasionally did occur often enough to allow analyses. Although there
are some exceptions, this teacher failure was negatively associated with student
learning gains in low SES schools, as expected. in high SES schools it did
not happen enough to allow analysis. Thus, when a student made a relevant
comment, it was important that the teacher provide him with some feedback, at
the minimum letting him know whether his comment was appropriate or not.
Uelaying student initiated comments did not occur often enough to allow
analyses in either year. Refusing to except such comments (informing the
student that this was not the tine for comments or that his comment was not
relevant and would not be taken up at the moment) yielded mostly curvilinear
findings, as exwected. Taken together, the data suggest that this variable
correlates in an inverted U fashion to student learning gains, with teachers
who are generally receptive to student comments, but who place some limits and
types of such comments by refusing to accept them in certain contexts, being
more successful than teachers who arcs less receptive to such comments or who
allow any kind of comment at all regardless of appropriateness.
The next variable deals with the percentage of student initiated comments
which wls accepted by the teacher (the student was informed that his comment
was appropriate and that the teacher agreed with it or at least thought that it
was a good idea). The data for this variable are similar to those for the
previous variable, showing several significant relationships but a generally
mixed and somewhat contradictory pattern. The general relationship appeared to
nJ

106
be similar for the previous variable: teachers who accepted a certain optimal
type and frequency of relevant student initiated comments did better than
teachers who did not accept such comments or who were overly accepting of
virtually any comment that a student made. in addition, the data for this
variable suggest that acceptance of student initiated comments was more positive
in its association with learning gains and generally more important as a variable
in Low SES schools than in high SES schools, where most significant correlations
were negative. This supports a more general pattern sugg.iiii:rng that it was
important for low SES teachers to encourage their students to participate in
discussion and to model a willingness to listen to what they had to say.
However, in high SES classrooms it appeared important for the teacher to main-
tain some control over the flow of interaction, since overeagerness to respond
and perhaps a certain amount of unhealthy competitiveness seemed to typify
the interaction in these classrooms.
The data on the percentage of relevant student initiated comments which
was integrated into the discussion topic by the teacher showed the expected
positive correlations for the most part, although the data are much weaker
than might have been expected on the basis of literature suggesting that this
is an extremely important teacher variable. Again, we suspect that the findings
are another example of the difference between teaching in the early elementary
grades and teaching at higher levels where variables directly concerned with
action and reaction in verbal interchanges during class discussion become more
important.
The percentage of relevant student initiated comments which caused a shift
in topic did not appear with enough frequency to allow meaningful analysis.
1

107
Thus, ir these grades at least, teachers do not allow student comment to shift
the topic of a discussion very frequently.
The data on behavioral praise following student initiated comments showed
that this never occurred in either year, although this would have been a good
opportunity for teachers to congratulate and generally encourage students for
making such comments. Thus, in general teachers failed to praise relevant
student initiated comments. This was true for both making comments per se and
for the quality of the comment itself.
More positively, behavioral criticism was also totally absent in response
to student initiated relevant comments and behavioral warnings occurred so
infrequently that meaningful analyses could not be done. Thus, although teachers
did not take the opportunity presented to them to encourage the students when
they made relevant comments, neither did they criticize or warn them for speaking
out of turn or for taking the initiative in a discussion.
Irrelevant student initiated comments were never praised, as expected.
OTher data on irrelevant student initiated comments are sparse, essentially
because these comments themselves were infrequent. A single significant
correlation indicated the positive r ',;rionship between refusing to accept an
irrelevant student initiated comment and student learning gains in high SES.
This was paralleled by a mostly negative curve for acceptance of irrelevant
student initiated comments in high SES. However, in the reading group there
was a positive association between acceptance of irrelevant student comments
and student learning in both SES groups. Thus, the data, while generally weak
and sparse, suggest that acceptance of irrelevant student initiated comments
may be positively associated to learning In low SES schools, although in high
0 A,

108
SES schools it seems to be more appropriate for the teacher to establish
rules about acceptable and unacceptable student initiated comments rather than
accept anything that students decide to contribute to a discussion.
As expected, irrelevant student initiated comments were neither integrated
into the discussion topic nor used to shift the topic. Also, they were not
praised, as expected. They were also not criticized, however, and teachers did
not warn students in a negative way for making such comments. Thus, teachers
seem to be aware of the positive aspects of student initiated comments, even
when they were irrelevant. They did not praise them or shift the topic in
response to them, but neither did they warn or criticize students against such
comments in the relatively few instances in which they were observed.
The next section deals with self and opinion questions. Self questions had
to do with personal likes and dislikes, personal experien...s, and other matters
that had little or nothing to do with the curriculum. Opinion questions solicited
the student's opinion on some matter. Many had to do with the curriculumbut
in these cases there were no right or wrong answers as was the case with clearly
academic questions (process questions, product questions, or choice questions).
Self and opinion questions tended to occur during social interactions between
teacher and the students, although often they were used as lead-ins to dis-
cussions (for example, the teacher might introduce a lesson on animals by
asking one or more students if they had been to the zoo and about what they
saw there).
The percentage of self questions relative to the percentage of academic
ouestionS showed consistently negative relationships to student learning gains
in the first year, but in the second year the data revealed weak and uninteN
113

109
pretable relationships for low SES and mixed but primarily positive relationships
for high SES. Negative correlations had been expected on the theory that
learning gains would be greatest when the greatest amount of time was spent in
direct discussion of curriculum relevant material, but this predication was
borne out only for the first year data. The reasons for the positive relation-
ships between the percentage of self questions and learning gains in high SES
schools in the second year remain unknown.
The proportions of self questions which were subject matter related showed
not enough data to allow analyses in the first year. The second year data
revealed the expected positive relationships in low SES, but weak and mixed
data in high SES. Similarly, the proportion of self questions related to
personal preference had no data the first year. The second year data show mixed
relationships between this variable and student learning gains in both SES groups.
Thus, the general variable of self questions and the more specific matter
of whether self questions were related to the curriculum do any way or whether
they simply dealt with personal matters was not systematically or consistently
related to student learning. Several significant relationships appearedpbut
they often were either uninterpretable or contradictory. This Is most probably
because the category of self questions includes a broad range of different
kinds of questions and thus probably Is too crude in general a category to be
meaningfully Interpreted.
The next section deals with opinion questions. The frequency of opinion
questions relative to academic questions with clear-cut or wrong answers
showed one inverted U relationship and two significant negative correlations
for high SES in the first year. In the second year the data showed mixed but

110
mostly positive relationships for low SES and consistently negative but relatively
weak relationships for high SES. These findings contradict both our own expec-
tations and the gerv,ral literature which tends to favor opinion questions as one
method by which a teacher can motivate students and get them to "think for
themselves" about the subject matter at hand. Instead of the expected positive
correlations, the data reveal only weak positive relationships for low SES
students and consistently negative relationships for high SES students. The
discrepancy is probably due in part to the fact that we were studying second
and third grade children, whereas most studies supporting opinion questions were
done with older children. Also, it should be kept in mind that our learning
gains criteria are such that teachers who stuck with curriculum relevant questions
would generally be likely to do better than teachers who wandered from the
specific curriculum goals into related but, nevertheless, different areas. In
this context, it is worth noting that the successful high SES teachers tended
to stick to the curriculum and materials provided them, whereas the successful
low SES teachers tended to supplement or substitute these materials.
The teachers never failed to give feedback to a student who had expressed
his opinion. However, as was the case with student initiated comments, they
rarely praised an opinion given by a student. However, the few analyses that
could be run suggested that such praise was important. It was strongly posi-
tively correlated with student learning gains in low SES students (the only one
of the two groups for which analyses were available). This is one of the few
instances of praise which showed clearly positive and strong correlations with
student learning measures. Reasons for this are unknown, although it seems
likely that praise of student opinions would be more likely to to genuine and

Ill
to be experienced as reinforcing and motivating than the perhaps more perfunctory
praise given to correct responses to academic questions. in any case, praise
following student opinions was not only positively associated with learning
gains in the low SES students, but was correlated more strongly with gains
than was praise following correct answers to academic questions.
Criticism of student opinions was rare. No data in this category were
available for the first year, and in the second year, frequencies were too low
to allow analyses. The same was true for failure to give feedback to student
opinions. Also, teachers very rarely disagree with student opinions. This
seems appropriate at this grade level, when opinion questions are intended
largely as motivational devices and "discussion starters," as opposed to opinion
questions asked of older students under circumstances where disagreement with
the student's opinion (expressed without derogation of the student, of course)
nigh* be a useful and productive teacher response.
The proportion of student opinions which was simply accepted without much
commentary by the teachers was low, and did not yield interpretable findings.
The percentage of student opinions which was integrated into the discussion
topic was even lower, never occurring enough to allow analyses. This is
further evidence that opinion questions are used largely as motivating devices
at these grade levels, as opposed to higher grade levels where the teacher is
more genuinely interested in soliciting a cognitive and reasoned opinion from
the student concerning a complex question under discussion.
In summary, self and opinion questions were relatively unimportant as
correlates of student learning gains in this study, apparently because of the
age of the students and the grade level involved. Much of the classroom time

1 1 2
is spent in demon,.,t alion and practice of tool 5ieills in these early grades,
and even the verbal interchanges whic.i, do occur am corrfirlud almost exclurdively
to cluction and answer sessions and di' cus,,ions dealing with low level factual
matters that have clear-cut right or wrong answers. Consequently, opinion
questions are much less relevant and important than they are at higher grade
levels when students begin to deal with more abstract matters and to discuss
questions that have no simple right or wrong answers.
The hundred-thirty-one (131) variables discussed So far have all dealt
with aspects of public response or recitation opportunities. We now turn to
private contacts in which the teacher is interacting with an individual student
only and where the interaction concerns the student alone and not the class
as c whole. These interactions are labeled "private" because they deal with
the individual student's needs or behavior, although some of them are carried
on loudly enough so that other members of the class or even as the class as
a whole might hear them. Nevertheless, the interaction is intended by the
teacher to concern only the individual student with whom she is dealing, and
is not meant as a teaching vehicle or managerial message to the class as a whole.
The percentage of private contacts which was student initiated (vs. teacher
initiated) showed mixed findings rather than the positive correlations which
had been expected. The general trend was toward negative relationships in low
SES and positive ones in high SES, but there are several exceptions and quali-
fications to this statement. As with a number of other variables which have
been positively related to student learning gains in studies done at higher
grade levels, the present variable aopeared to be relatively unimportant as a
correlate of student learning gains with these second and third graders. The
1 P7

I13
SES difference, to the extent that it is genuine, probably represents a difference
in the general proclivities of the teachers in these two types of schools. The
low SES teachers in general were particularly open to student initiated contacts,
and thus the tendency toward negative correlation probably resulted from the
classrooms of teachers who were too open and who therefore had control and
management problems. Conversely, the high SES teachers tended to be, if anything,
somewhat less open to student initiated contacts, so that the positive correlations
which tended to appear for this group are probably reflective of this. Also,
in general, relatively more of the student initiated contacts in low SES schools
dealt with procedural or behavioral matters rather than with work related matters.
The percentage of student initiated work contacts which led to praise
from the teacher showed mixed, but mostly negative, correlations with student
learning gains. These data fit fairly well with other data Involving teacher
praise, including praise during,. teacher initiated work contacts. One exception,
however, was praise of opinions given by the students following opinion questions
asked by the teachers. Praise in this case was positively correlated with gain
especially in low SES.
In addition to this difference In the nature of praise itself, it is possible
that the negative correlations for praise occurring in student initiated work
contacts appeared because much of it was directed at teacher dependent children
who may have been overly responsive and in need of teacher praise to the point
where they came to the teacher to show off any and all work. If this is true,
it may also be true that teachers who were higher on praise in these situations
were teachers who failed to recognize what was happening and who, in general,
were more open to havin-: their own behavior conditioned by the activities of

114
the children in,..toad of vice versa. In short, high rates of praise in student
initiated work contacts (particularly if accompanied by relatively low rater,
of praise in other contextual situations), nay indicate the teachert lack of
awareness of the student. dependency on her, and she may rtlinforce this dependency
unwittingly.
Studet initiated work contacts involving criticism were infrequent the
first year, with the only significant relationship being a negative correlation
in low SETS. The second year data reveal generally negative relationships in
low SES and generdily positive relationships in high .CS. This fits with the
pattern for criticism noted in the public response opportunity data to the
effect that criticism is negatively associated with learning gains in high LES.
This has already been discussed at some length.
The percentage of private work contacts (as opposed to contacts dealing
with procedural matters) which were initiated by the student (as opposed to the
teacher) showed a mixed pattern of relationships rather than the expected
pattern of positive correlations. The first year data did reveal generally
positive relationships (although most were relatively weak and somewhat
curvi linear), but the ,ocond ycar data revealed weak positive relationships in
low SES and weak negative relationships in high SES. Note that this pattgrn
conflicts with the measure described earlier ( 132) dealing with the percentage
of total private contacts which were student initiated. Taken togeihor, these
data indicate that in the low SES schools high rates of student initiation of
work related contacts wore mostly positively related to student learning gains,
while high rates of student Initiation of procedural contacts were mostly
negatively related to student learning gains. In short, the low SES students
119
115
learned best when they came to the teacher, for help when they needed it, but
not when they continually came t' the teacher to ask questions about procedural
matters rather than to gut help witn their work. These data from the low SLS
schools bear out expectations. However, the data from the high SES schools
do not hallo together very well and are puzzling. The first year data suggest
that the percentage of private work contacts which were student initiated was
generally positively related to learning gains, but the second year data suggest
the opposite. Neither set of data involves very strong relationships, so that
perhaps the most that should be said is that this variable is not a very import-
ant correlate of student learning gains in th,, high SIS schools.
The following set of variables c.)ncerns teacher behavior when students
initiated individual contacts with them. Deleying dealing with the student
(selling hiwr, to come back later or to wait unlil the teacher had a chance to
go to his desk and deal with the problem) showed mixed relationships in both
SES groups. The data for low SES indicate a general inverted U relationship
for this variable, suggesting that delay was smatimes appropriate and that
this was a freauont problem in low SES schools. The data for high SES schools
are generally positive except for a significant negative correlation in the
first year, indicating that in general delay is even more appropriate in high
SES schools, although again ttu: data are neither completely consistent nor
particularly strong in some instances. 'lost likely, the appropriateness of
delay depends on what the teacher is doing at the time. If a student is
seeking the teachers attention in the middle of a reading group or other activity
which would be unwise to interrupt, delay is probably appropriate. In contrast,
f the teacher has nothing more important to do, it is probably appropriate to
X4'3s"4v

116
deal with this stueont'q need at the moment. Other data suggest thatpat a
more general levelothe most successful teachers minimize such delays ty
developing specific rules about when students can or should approach them for
help. They also provide alternative ways in which students can get help during
times that they are not supposed to interrupt the teacher. The less successful
teachers who lack such rules and procedures are often interrupted continually
by students seeking individualized help, sometimes to the point that their group
lessons are ineffective because of these constant interruptions.
The next two variables concern brief vs. extended feedback to students who
initiate interactions. The data on brief feedback indicate generally inverted
0 relationships, although there are some exceptions. The data on long feedback
suggest positive relationships for low SES and negative relationships for
high SES the first year, but these are not replicated the second year. Here
again, the confused findings are probably due to failure to take into account
context and appropriateness. It seems likely that extended feedback would be
appropriate in situations where the student does not understand the material
and needs an extended explanation and where the teacher has the time to give
it to him. in contrast, brief feedback would be more appropriate where the
student only needs a quick answer to a specific question and/or where the
leacher does not have the time to interrupt something more important in order
to provide extended feedback to a student at the moment.
The next variable deals with the percentage of student initiated contacts
which involved personal concerns of the student (as opposed to work related
interactions). In tne first year, this variable yielded mixed findings for low
SES but consistent and rather strongly negative correlations for high SES.
However, the second year data revealed weak and mixed curves in both SES groups.
Th4s, the first year data confirmed the expectation that high percentages of

ill
student initiated contacts which involved personal concerns rather than
academic work would relate negatively to student learning, but these relationships
do not appear in the second year. We do not know why thew first year findings
did not replicate in year 2.
Student initiated requests which were granted by the teacher showed a
tendency toward negative relationships in low SES and consistently positive
relationships in high SES the first year. In the second year, the data on this
variable were more sparse, but this time the low SES data were mixed and the
high SES data were consistently positive. The meaning of this Is not unam-
biguously clear; however, it seems likely that the SES difference reflects the
difference in the nature of student requests. That is, it seems probable that
high proportions of student requests in the high SES schools were appropriate,
and thus it was appropriate for teachers to grant time. In contrast, it seems
likely that a sizeable percentage of student requests in low SES schools was
inappropriate or unfeasible, hence the negative correlations in this SES group.
The percentage of student initiated requests which was delayed (the
teacher ultimately grants the request but makes the student wait for some
reason) showed mixed but mostly positive relations in low SES and mixed but
mostly negative ones in high SES. Again, this probably reflects differences
In the nature of the student requests.
Student initiated requests which were not granted by the teachers showed
mixed data in low SES and a tendency toweld inverted U relationships in high
SES. The high SES curves were primarily negative, however, fitting with the
data reported above.
In summary, data concerning granting vs. delaying vs. not granting
student initiated requests suggested that tLe student initiated requests in
high SES schools wore probably more consistently featlbie and appropriate than
1.,T2

118
the student!: requests in low LS schools, and consequently that granting of
such request-, tended to be po-,itively associated with learning gains in high
SES schools but negatively associated with learning gains in low SE, schools.
The data on percentage of student initiated contacts which involved sharing
personal experiences (i.e., basically social interactions with the teacher)
were not collected the first year. In the second year, the coding system was
revised to include this variable. There was a significant positive correlation
for low SES and several negative relationships for high SES. This fits in with
the general pattern to the effect that successful low SES teachers were warm
and student oriented in a more general and more effective way than successful
high SES teachers, who tended to be more focused on academic interactions and
teaching the curriculum.
The percentage of private work contacts over itself plus public response
opportunities provides an index of the relative frequencies of interactions with
the teacher that occurred privately vs. those that occurred during public
discussions or reading groups. This variable showed curvilinear, but mostly
negative, relationships in the first year, but the second year data were more
mixed and 'ess interpretable, particularly for the low SES students. Thus,
at best, these data provide weak support for the idea that frequent public
response opportunities in reading groups and in whole class discussions are
positively associated with learning gains in high'SES classrooms. This variable
appears to be essentially unrelated to learning gains in low SES classrooms.
The variable procedural contacts over itself plus response opportunities
gives an indication of the relative percentage:, of interactions with teachers
that were devoted to procedural matters vs. those responses to questions devoted
I

119
to dealing with the curriculum. Negative correlations were expected for this
variable, but the findings were sparse and mixed. The low SES data are somewhat
positive, suggesting that individualized contacts with the teacher, even when
they deal with procedural rather than academic matters, may be more helpful
than whole class discussions or other veGbal interactions. The data for high
SES classrooms did show the expected negative relationships, although they are
usually curvilinear and there is at least on.3 exception.
The variable teacher initiated work contacts over teacher initiated work
contacts plus teacher initiated procedural contacts indicates the degree to
which the teacher focused on curriculum relevant topics in initiating contacts
with the children. The expected positive correlations for this variable
were observed in low SES, although the : elationships tended to be inverted U's
rather than linear positive ones, while the relationships in high SES tended to
be primarily negative curves. These data are part of the broad pattern suggesting
that teacher directiveness in general and teacher initiated inspection and
discussion of student work ;s positively associated with student learning gains
in low SES schools but negatively in high SES schools. We interpret this to
mean that the low SES children require or at least benefit maximally from this
kind of teacher behavior, whereas the students in the h:gh SES schools seem to
do better if they are instructed to let the teacher know if and when they need
help. Systematic and frequent teacher inspection of student work in high SLS
schools could amount to needless over-kill and could be generally less successful
in producing student learninr, gains than a system involving promotinfj student
initiation of work contacts when the student feels that he needs help.

120
Teacher initiated work contacts involving praise correlated generally
negatively with student learning gains in the first year. in the second
year, the relationships were positive for low SES but still negative for high
SES. Here again, praise not only failed to show the expected positive correla-
tions with student learning but even showed some significant negative ones.
For low SES students, at least, the second year data suggest that praise in
teacher initiated contacts was useful.
The next three variables involve thQ degree of teacher observation and
feedback to students in teacher initiated work contacts (mere observation
without feedback vs. brief feedback vs. long feedback). Mere observation
without any feedback at all correlated mostly negatively in low SES. Also,
all of the significant correlations for high SES were negative, but some of
the curvilinear analyses revealed positive curves in year 1. In general,
however, the data suggest that teachers who go around the room and watch the
children work by looking over their shoulders but do not say anything to the
children are relatively unsuccessful.
Provision of brief feedback to the students showed mixed and largely
curvilinear relationships. Provision of long feedback also showed mixed
relationships, although here there was something of a preponderance of positive
relationships in low SES and negative ones in high SES. The inconsistency
of the data suggests that these categories are too broad to be interpreted
very meaningfully, and appropriateness of these types of feedback would vary
with the situation. However, there is some evidence that as a general rule
high SES students more often need only brief feedback compared to low SES
students who often need more extended feedback, as would be expected.
121
Data on percentage of teacher initiated interactions involving -,haring
personal experiences or other purely social matters was not collected the first
year. The second year data reveal generally mixed results for both groups.
Thus, this variable was not very important as a correlate of student learning
gains. High frequencies of teacher initiated social contacts neither motivated
students strongly enough to affect their learning gains noticeably, nor cut
into the time they spent on academic work noticeably enough to affect learning
gains significantly.
Teacher initiated contacts which were management requests showed mixed
data for low SES but mostly negative correlations for high SES. The latter
data tie in with other evidence that the more successful teachers had worked
out some kind of "automatic" method of dealing with everyday management
problems, so that they seldom had to make management requests.
The next two variables deal with whether or not the teacher thanks a
student when he complies with a request to do a favor or a management task.
The data on these two variables are mixed but mostly positive in low SES and
mixed but mostly negative in high SES. The low SES data make intuitive sense
and fit with the general pattern of warmth and student orientation revealed
by these successful teachers in these schools. The negative relationships in
high SES were unexpected and remain puzzling. It is possible that the teachers
with high scores for thanking students for such requests tended to do it in
a way that seemed "phony," that embarrassed the students, or that had some
kind of unintended negative effect on the students. It seems unlikely that
thanking a student would in itself have a negative effect. However, the

122
thanks usually came after the request was completed by the student. Frequently,
the task took some time. Meanwhile, the teacher was usually involved in some-
thing else, so thanking often meant breaking from present activity to turn
attention to the student. Since management and favor requests were usually
made to a student so the teacher didn't have to interrupt her activities with
the class, it is likely that failure to thank is related to keeping up the
momentum and pacing of class activity more than to "phony" thanks. Thus, our
interpretation of these high SES findings is that this variable is
associated in some unknown way with more powerful and meaningful negative
teacher behaviors. That is, we do not believe that thanking students by
itself is bad; we believe that teachers who are high on the variable of thanking
students also are teachers who do or do not de certain things that are more
directly associated with student learning gains.
The next three variables combine teacher evaluative reactions toward
students across different contextual situations. The first variable is
academic praise over academic praise plus academic criticism. Relationships
are mostly curvilinear, in both groups, although as might have been expected
from earlier data, the general drift of the data is positive in low SES and
somewhat negative in high SES. Probably the most noteworthy aspect of these
data is that the lines and curves for the him SES teachers are not nearly as
negative as might have been predicted from some of the earlier data on
criticism. This is more evidence that although these teachers were demanding
and critical to a degree, they were not hypercritical or negativistic toward the
students. In fact, the data on this variable suggest a good balance between
praise and criticism of student work.

123
The next variable deals with behavioral pra 500 which was infrequent but
still allowed several analyses to be completed. Behavioral praise was praise
for behavior that the teacher defined as "good," such as cleaninn up the desk
properly, getting in line promptly or appropriately, etc. The data reveal
mixed and very weak relationships in high 5LS, but consistent and rather strong
negative relationships in low SES. Taken at flee value, at least, these data
contradict notions based on behavior modification ideas. Behavior modifiers
would predict a positive relationship between behavioral praise and good class-
room behavior which in turn should yield a positive relationship between
behavioral praise and student learning gains. However, the opposite was found
in the low SES schools. It should be noted, though, that behavioral praise
data take into account only frequency of occurrence; the teacners were not
coded for whether or not they praised appropriately or contingently. Also,
several teachers in low SES noted that public recognition and praise was
embarrassino for students, making them feel awkward in front of their peers,
so some teachers at least tended to avoid it. Thus, it is possible that the
behavioral praise that did appear was given inappropriately, was given to only
a few children who were "teacher's pets." etc. In any case, behavioral praise
correlated strongly and consistently negatively with student learninn gains in
low SES schools.
The next variable is behavioral warnings over warnings plus criticism.
This variable indicates the tendency for teachers to respond with a relatively
mild and nonrejecting warning as opposed to a more intense and rejecting
criticism in situations where they felt it necessary to call attention to
a student misbehavior. These data show a sharp contrast between general

124
class data and reading group data. The data for general class reveal positive
correlations with student learning gains for both SES groups. In contrast, the
reading group data reveal negative relationships for low SES and mixed relation-
ships for high SES. Positive relationships had been expected based upon
Kounin's (1970) findings that overreactions by the teachers tended to produce
a ripple effect and to compound rather than classroom control problems.
Fruthermore, it was expected that teachers who tended to warn students would be
generally more successful than teachers who failed to give such warnings and
then ended up lashing out at students critically when misbehavior occurred.
Thus, the data for whole group interactions in the mornings and afternoons fit
expectations, but the reading group data largely contradict expectations. We
do not know exactly why the differences occurred, although there was a
systematic whole group vs. reading group difference In the nature of teacher
behavioral interactions. Teacher behavioral interactions occurring in the
whole group situation tended to occur as soon as something happened and when
the teacher was paying attention to the class as a whole. In contrast,
behavioral interactions that occurred when the teacher was busy with a reading
group usually involved cnildrer who were not in the reading group. In effect,
children elsewhere in the class had become sufficiently disruptive that the
teacher nad to take time out from th: reading group in order to correct the
misbehavior going on outside of the reading group. it is probable, although
there is no way to tell for sure from the data, that teachers waited for more
intense and provocative kinds of disruptive misbehavior before interrupting
their reading groups to intervene, and consequently that more of the misbehavior
that they had to deal with while busy with a reading group was frustrating

125
enough to them to cause them to react with critici5m rehor than simple war-
ning. This may be the major reason for tho contextual diffemnce between the
data for whole group interactions vs. the data for reading group interactions.
The next five variables deal with aspects of classroom control based upon
the work of Kounin (1970). The percentage of disciplinary contacts with
students that involved one or more error (target error, timing error, or emo-
tional overreaction) unexpectedly correlated positively with learning gains in
low SES, although it showed the expected negative correlation in high SES.
This will be explained below. The relative frequency of target errors over to-
tal errors was low, so that few analyses could be completed. Those that were
done suggested thaT target errors were slightly positively correlated with lear-
ning gains in both groups, but the data were quite sparse. The data on timing
errors (allowing a minor problem get out of hand so that it becomes a major
disruption) was strongly negatively related to learning gains in low SES schools
but showed a mixed pattern of relationships to gains in high SES schools.
Finally, overreactions showed a generally positive pattern of relationships to
learning gains.
The data fur low SES teachers indicate that overreactions were somewhat
positively related to learning gains and that timing errors were strongly
negatively related to learning gains. Thus, in these classrooms it was
particularly important to "nip a problem in the bud" before it spread to other
students or became more intensely disruptive. In contrast, the more successful
teachers in high SES schools tended to be those who made no errors at all in
dealing with student misbehavior, but who tended to err on the side of over-
reaction when they did err. Thus, these teachers apparently were generally
good classroom managers who seldom had to deal with classroom misbehavior,

126
but when they were sufficiently provoked to deal with it, they often overreacted,
at least in the oyes of the classroom observers.
The final variable in this set deals with teacher attempts to deal with
misbehavior through non-verbal control (moving close to the disruptive student
or touching him or getting his attention and making a meaningful facial expression
or gesture). This variable showed generally weak and mixed relationships in
both social class groups, although there was some tendency toward negative
patterns for reading group contacts in the high SES schools. In any case, there
was little support for this as a discipline method, despite its frequent recom-
mendation by behavior modifiers. The fact that the most consistent negative
relationships were obtained for reading groups is especially surprising, in
that it is most easy to use non-verbal communication as control mechanism in
small group sitations where the children are close enough to be tapped or
otherwise contacted non-verbally.
The next three variables combine teacher feedback data in responding to
student answers or in giving feedback during private contacts. Across all response
opportunities, repeating the question divided by repeating plus rephrasing or
giving a clue plus asking a new question, showed a general pattern of negative
correlations in low SLS (with one notable exception) and mixed data for high SES.
These data for the combination of response opportunities are less enlightening
*hen some of the earlier data on these variables that broke them down more
specifically. The general principle that appears to underline the findings is
the one mentioned earlier that low SES students benefit to some degree from
attempts to rephrase the questien or give a clue, and that neither group stu-
dents, but partizularly net tree high SLS students, benefit from simple repetition
of the question without any form of help.
diJ

127
The next variable indicate:, the relationship of giving help to alterna-
tives which do not involve providing help. This again :,howl a primarily positive
although somewhat curvilinear set of relationships for low SES, and a curvilinear
but more mixed set of relationships for high SES.
Finally, brief feedback over brief plus long feedback also shows mixed
findings but a trend toward negative relationships in low SES and a positive
one in high SES. As pointed out earlier, high SES students generally need less
extended teacher help than low SES students in completing their seatwork.
The next set of data deal with mathematics contacts. Consequently, data
appear in the tables only for morning and afternoon interactions, and not for
reading prouns (which did not involve math contacts by definition). There was
not enough information the first year on these variables to allow meaningful
analyses. The second year data showed that the proportions of math contacts
which were public rather than private was positively associated with student
learning gains in the high SES schools and unrelated to student learning gains
in the low SES schools. This indicates again that high SES students were
capable of learning in larger groups and did not seem to require the personal
supervision and attention of the teacher that the low SES student needed.
Similarly, teacher initiated private math contacts over total math contacts
correlated negatively with gains in high SES schools consistently, but had mild
positive relationships in low SES schools. This again indicates that the low
SES students needed teacher structuring but that the high SES students learned
best when taught in groups and then left to their own initiative if they
needed help. Teachers who spent a lot of time initiating contacts with the
students for purposes of inspecting their work were less effective in high SES
schools than teachers who presented the lesson and then had the students come

128
to them for help if they needed it.
The data on total teacher initiated math contacts over total math time
Showed positive relationships with student learning in language arts in the
high SES schools but no significant relationships with math, which was the
learning criterion of interest.
Total mathematics response opportunities over total math time correlated
positively with learning gains in the high SES schools, indicating again that
high SES students could learn and apparently learn most efficiently from verbal
presentations and group settings, in contrast to the low SES students who
appeared to learn better from more individualized and non-verbal practice.
The last variable on the table, total teacher initiated contacts over
total teaching time, is an indication of the frequency with which teachers
Initiated contacts with individual students. This variable showed mixed
relationships for both groups, although the data for low SP:, were stronger
and fit with the general pattern noted previously to the effect that teacher
initiated contacts were beneficial in those schools.
Teacher r)ueStionmaire
The nuestionnairo was administered to all 28 teachers narticipattrh in
the study In veer 2, plus two teachers from year i who cnuld nr)t he observed
in year 2 but who wanted to be Included. Thus, thirtv comr.letrA
the questionnaire and interview. The questionnaire cortal,rA 14,-Ar, consisting
of checklists, scales, and percentage estimates, to which t1-: teachr.re,
responded by checkinn, circling, or fillino in a number. The items deal*
with such tonics as proportion of time spent In lecturirn vs. class discussion
3.33

l2q
vs. individual seatwork; amount of time spont in lessor preparation; pro-
portion of objective vs. subjective impressions used in grading students;
types of motivating devices used; and factors felt to be essential or un-
essential to good teaching. The questionnaire also included scales on which
teachers could rate their teaching concerns, sources of teaching satisfaction,
and beliefs about good teaching.
Once the questionnaires were scored, the number of items was reduced to
a more managable form for purposes of interpretation. Since standard factor
analytic methods were inappropriate in this case because the number of
variables exceeded the number of subjects, the questionnaire was broken
down into smaller units which appeared to be logically related on a common
sense basis. Smaller parts of the questionnaire were analyzed, such as the
sections on teacher concerns, the teacher opinion inventory, and the section
on satisfactions in teaching. Variables which showed good factor structure
and high factor loadings in these analyses were combined into sum scores, after
adjustinq the various items to make them uniform. For example, the new item
"motivating by use of public rewards" was made up of such items as "high use
of public recognition," "exemption from tests," "high use of competition and
contests," and "giving individual prizes and rewards."
Where ND annears in the table, frequently curvilinear analyses could
not be performed because variance on tin item was too low. In many of these
cases subjects were nearly unanimous in agreeing or disagreeirq with the item,
A (agree) or Q (disagree) are typed to Mr? far right of the table to Indicate
the direction of unanimity on the item.
1.31

130
Questionnaire Variables
Data from the questionnaire variables appear on Table '4. The first
214 variables on the table are individual items that did not cluster to-
gether on factors; the remaining items are combination scores reflecting two
or more items which were added together after factor analyses Nvealed high
intercorrelations and good factor structure.
The first variable, high percentage of objective grading, showed a
single positive correlation with learning gains in low SES schools.
Teachers reported that frequent discipline problems, in their view,
were due to lack of interest in subject matter. This produced generally
negative correlations in both groups including one significant one in low
SES. These negative relationships were expected; they probably reflect
teachers' inability to match their subject matter instruction to their students'
needs.
The teacher's staying at her desk a high percentage of tne tim, (as
reported by the teachers) showed weak and mixed relationshies for low '',ES
but generally negative correlations for high SES. The latter retationshios
had been expected for both groups.
The use of a high percentage of lectures and demonstrations s.,>/ec
Only generally negative curves for arithmetic reasoning for both grruns.
Once again, the lecture-discussion dTmension was found to Le rrliatiwfly
unimportant at these grade levels. Ising a high percentage ef
with only one correct answer Produced two negative correlations, -gain
in arithmetic reasoning, and two small curves for both grouts. These two
variables, high percentage of lectures an demonstrations and high per-
133

131
centage of ouestions with one correct answer, would seem to be appropriate
methods for teaching math, at least in low SES schools. However, the negative
relationships were confirmed to arithmetic reasoning and were stronger in high
SES schools,
A !gh errorless performance required for general class discussion
showed generally negative relationships and two inverted U-shaped relationships,
indicating an optimal error rate, as found in thl process data from the study.
Likewise, a high ideal errorless rate in reading groups showed negative
relationships for high SES and mixed relationships for low SES. This again
fits with other findings indicating that an error rate which is too low is
ineffective for high SES children, who benefit more from harder questions
and more challenge.
Teachers reporting a high use of the context or whole word approach
In teaching reading tended to be less effective in high SES classrooms.
However, the relationship was with arithmetic computation gains, and thus
is of questionable meaning. Silent reading In reading groups showed one
significantly negetive correlation with word knouedge gains for tow SES
teachers. Apparently, low SES children need practice in reading aloud before
they are able to read silently very effectively.
Teachers reporting a high percentage of individual reading in reading
groups for high SES showed an optimal level of individual reading; the
inverted U-shaped curves for low SES were uninterpretable.
The practice of allowing students to call out comm olts showed nc data
at all in high SES and one weakly positive relationship in low SES.
The reported assignment of a large amount of seatwork showed a single

strongly positive correlation for low SES schools. This ma/ be related to a
larger cluster of variables indicating that practice anA drill at these grade
levels is an effective teaching method for low SES children, because it allows
for repetition of skills they need to practice. Assignment of large amounts
of homework, however, showed mostly negative relationships for low SES and
no data for high SES, as erneeted.
No important relationships show un again until variablri i'38. Teacher
reporting a high frequency of severe disruptions in their classes tend tn
show postitive relationships in both groups, but with only one significant
one for high SES. this Is surprising, since most of our data indicate that
effective classroom management tends to inhibit disruptions from breaking out
at all and that good classroom control was associated positively with learning.
Perhaps teachers who report this as a problem actually exert tighter control
in their classes than teachers who are less concerned about dtsruptins.
Teachers reporting that they publicly praise a child freauentiv as
motivation to others tended to be effective in both SES groups. This is
at some variance with the data from our high and low inference measures,
which show that very little praise actually occurs, and that the results of
this praise tend to be mixed and generally weak. In any case, the relatively
successful teachers believed that they used public praise more often than
other teachers, even though observations showed that they did not.
Giving a high number of different assignments on any given day shored
one weak inverted-U curve for low SES and one slightly negative sloping curve
for high SES, which are better left uninterpreted.
Effective low SES teachers reported that they frequently had students
react to other students' answers. This is possibly related to patterns in
137

133
other data indicating that it is especially important to get responses from
students in low SES, and it probably also helped keep students attentive.
The regular use of praise as a motivational technique showed no data
in high SES. This tack of data for high SES is actually a lack of variance,
since almost all high SES teachers reported that they used praise to a great
extent. Almost no teachers in high SES indicated that they praised any less
than "frequently". Relationships were mixed for low SES, however, showing one
positive and one negative relationship. Again, teachers in general believed
that they praised much more often than they actually did.
The reported use of smiling faces and gold stars as rewards revealed
generally negative relationships in both groups. This was especially strong
in high SES, where there were several significant curvilinear relationships
which were mixed but generally negative. These teacher perceptions also
conflict with process observations, which indicated that the more successful
teachers used symbolic rewards more often (i.e., the relationships were
positive).
Granting of special privileges showed generally shallow U-shaped curves
in both groups. These curves tended to be more in the negative direction for
low SES, but slightly positive for high SES. In general, teacher perceptions
of their praise and reward behavior were inaccurate (contrasting with generally
accurate perceptions In most other areas).
The belief that initiating, direction, and administering were necessary
to good teaching tended to correlate negatively in high SES and positively
in low SES, although only a single weak relationship showed un for each group.
This is additional evidence to the effect that teacher direction is important

I 'A
for low SES children, but less so for high SES children.
The belief that unifyinn the proun was important to good toachinr1 showed
two uninterpretable U-shaped curves for both (-;-oups. Tho belief that
diagnosing learning problems is necessary to good teaching revealed no data
for low SES (because all teachers rated this as extremely important), and
essentially positive relationships in high SES, as expected.
Making curriculum materials showed generally positive reiationships
across the board, as expected, for high SES, although the curves peaked at
optimal levels. For low SES, the curves tend to be mixed and somewhat con-
flicting. The SES differences could have resulted from differential teacher
perceptions of the item. Perhaps low SES teachers read this duestion as making
remedial material where necessary, while high SES teachers read it as making
enrichment materials. In any case, here again the teacher perception data do
not fit observed behavior: coder ratings suggested that use of homemade
materials was positively related to learning in low SES but negatively in
high SES.
The belief in exposing children to enriching community activities was
strongly negatively correlated in low SES but showed no relationships at all
In high SES. At this point, this is a difficult finding to Interpret. There
is no reason to suspect that exposing low SES children to enriching community
activities would be "bad" or ineffective. One possibility is that teachers of
low SES children do not see this as a high priority Item compared to diagnosing
learning problems or other variables more immediately related to classroom
learning.
There were two generally positive relationships for the importance of
participating in school activities for each group, while participating in

135
professional and civic life revealed one negative relationship for low SES
and one positive relationship in high SES. Thus, neither of these variables
was strongly related to learning.
Involving students in ugly or distressful aspects of subjects showed a
single negative relationship for low SES schools, and no other relationships.
Apparently, effective low SES teachers did not feel that this was important
or desirable for their students.
Quickly informing students of the correctness of their answers showed
negative relationships to word knowledge gains in both groups. These curves
contradict the idea that feedback must be Immediate to be effective, although
the relationship was significant for only one criterion test.
Encouraging the tackling of hard problems showed two inverted U-shaped
relationships for high SES and two positive correlations as well, indicating
that there is an optimal level In the tackling of hard mroblems and an optimal
level of difficulty involved. This fits in well with the optimal error rate
findings reported earlier. Up to a certain point, difficult problems are
challenging for high SES students and tend to maximize pains. The relationships
in low SES were relatively weak and mixed, however.
Stress on giving exact instructions on each task showed two generally
negative relationships in high SES. This could be interpreted as overdwelling
to the point of boredom] a practice which other data has shown to hr., rather
ineffective for high SES students. The relationships Ti low TS arm rather
shallow and difficult to interpret.
Engaging students in drama and music showed generally negetive hut weak
relationships for both groups, suggesting that, while important, these did
not rank as hiah as some of the other activities believed necessary for ',mod
. 3

136
teaching. ALIO, these teachers' gains were in subject matter areas, so that
proficiency In music and drama was not expected to bo important.
High use of peer to showed no data for high ::ES and Onr. rather weak
negative relationship in low SCS. The latter finding is the same as the one
noted in the observations, suggesting that low SES children do not benefit
much from peer tutoring in these early grades when they ar(,, still more
dependent on the teacher.
frequent praise showed strong negative relationships In low SES and weak
and mixed relationships in high SES. This is one of several findings for
praise which are mutually conflicting. In some instances, no data apncar
because all teachers reported that they believed praise to be extremely
important. In other cases, relationships simply failed to show up. In this
case, there are strong negative relationships. As we have stated before, even
though teachers may report that praise is extremely important, their reports
do not coincide with the behavioral data and with other data from the study
showing that praise, overall, tends to occur relatively infrequently.
We suspect that this may be one of the several variables on which teachers
say one thing and do another. A possibility for the strong negative findings
for praise is that there is a tendency, at least in low SES, for children to
be embarrassed by public praise. Many low SES teachers mentioned that they
tried to avoid publicly embarrassing a child by praising him In front of his
peers, thereby setting him up for possible peer rejection. However, private
prise from the teacher tends to be seen as facilitating and encouraging.
Belief in preparing students for the 4etropolitan and Stanford Achievement
Tests tended to be rautlyty related to gains. This was surprising, since
these teachers were selected on the basis of their performance in producing

137
student gains on these tests. Ironically, teachers least concerned about test
performance were most successful in producing it, and vice verse.
Two shallow and rather uninterpretable curves appear for arranging
attractive bulletin boards, one for low and one for high SES. Thus, data on
bulletin boards proved unimportant, despite the stress someTmes placed on
this aspect of teaching.
Becoming involved in out-of-school problems tended to show generally
positive relationships in high SES and U-shaped relationshins in low SES,
makinn it difficult to interpret findings for the latter. The data for high
SES teachers fit data for "participating in professional and civic life," which
also was positively related to learning in high SES.
High effective high SES teachers reported that working with bocks and
ideas is a source of high satisfaction for them. No data, however, appeared
for low SES teachers. Given that these teachers were selected on th.3 basis
of their success in producing cognitive gains in children, It is not surprisinn
that reported satisfactions in working with books and ideas was correlated
with teaching success.
Satisfaction from non-teaching duties showed mixed relationships which
are difficult to interpret.
For the set of variables involving general practices in presenting seat
work, stress on presentation of new material showed one negative correlation
for SES. There were U-shaped curves in each group for summarizing new
material, and weak negative correlations for both groups for practicing
new material. Negative relationships appeared In low fnr !irrctions
for follow-up seatwork. There were positive but weak relationships for high
SES for this variable. In general, the teacher self-report for 4.1s oro..)n of
5 41 r)err
13f3
of seatwork presentation variables showed no consistent positive relationships
with learning gains, only negative relationships which are difficult to
interpret appeared.
Having the entire class line up often was negatively correlated in both
groups, as expected. This Is probably an Indicator of poor classroom manage-
ment, involving over-emphasis on lining up and perhaps also wasting time with
unnecessarily long transitions.
An Inverted U-shaped relationship appeared for each SES group for using
the success or failure of assigned work as the most important basis for assigning
grades. There was a single negative relationship in low SES for the acknow-
ledgment of effort In assigning grades. it appears that level of success deter-
mines the grades students will get, although the relationship is curvilinear
rather than absolute.
Teachers in high SES schools reported that their own teacher-made tests
were less effective in determining or making decisions about students. No
other data appear for this group of variables. This supports some other Infor-
mation in our data indicating that standardized achievement tests or curriculum
based tests tend to work well with high SES children but not necessarily
with low SES children.
There were generally negative and weak relationships for the use of
learning centers without audio-visual aids. Teachers in both groups tended
not to report this as a frequently used teacher resource.
The next variables deal with things reported as serious problems. A
wide range of student achievement showed one positive correlation in low SES
classrooms but no data for high SES (because all teachers in these schools
did not see this as a problem). The nature and quality of instructional

139
materials showed a sinnle negative curve for low SES. The relationship was
exactly the opposite, however, in high SES. The nature and quality of
instructional materials was often mentioned by low SES teachers as a serious
concern, chiefly because they saw a need for materials specifically designed
for children in low SES classrooms. In any case, low SES teachers who were
dissatisfied with materials were more successful, but dissatisfied high SES
teachers were less successful.
Effective low SES teachers also reported that they would like more help
from clerical and secretarial staff, This is of major concern in low income
schools which are frequently short-handed. In high SES schools, however,
teachers who voiced this complaint were less successful than average.
More time to develop new programs showed a single negative correlation
for low SES, which is not readily explainable. Also, more time to plan daily
activities showed generally negative correlations for low SES, though some
positive correlations for high SES. High SES teachers also reoort that they
would like more time to relax and think. There were several positive corre-
lations for this variable. No data appeared for low SES teachers, since alt
of them saw this as a serious need.
The next set of relationships concerns beliefs, attitudes, and opinions
about teaching and its methods and goals. There were negative correlations
for avoiding competition in front of the whole class. Successful low SES
teachers believed that some forms of whole class competition were beneficial.
Effective high SES teachers believed that good teachers admitted their
ignorance openly. Several positive correlations appeared for this variable in
high SES. No data appear In low SES because all teachers agree. In high SES,
this was one of the strongest and most general correlates of student learning.
J41

140
Both groups of effective teachers tended to agree that it was not good
to enter grades in a grade book while children recited in front of the class,
as expected.
Low SES teachers reported that math was as easy to learn as any other
subject. This is one of several variables showing the importance of nositive
expectations (the belief that the teacher can and will succeed in meeting her
goals).
Generally negative relationships across the board appeared for having
children repeat poor work as punishment. Successful teachers do not see this
as an effective punishment, believing that it would only serve to turn students
off.
Two weak negative relationships, also appeared in both groups for gearing
teaching to city-wide tests. Although there were no city-wide tests as such,
nationally normed achievement tests, tests based on the textbooks, or specially
prepared tests produced by the teachers themselves were used. Again, the
teachers least concerned about test scores tended to be the most successful.
Effective teachers in low SES tended to discount the idea that the
teacher's personality is more important than her teaching methods. However,
this was not true for high SES teachers, where there were generally positive
relationships. Perhaps low SES teachers spent a great deal of time in prac-
ticing, remediation, and in getting across skills to their students, so that
teacher personality was less of a factor for them than their ability to engage
their students in practice of needed material.
Strong positive relationships appeared in high SES on all subtests for
the belief that effective teaching requires the teacher to know the backgrounds
of her students. The relationships for low SES were positive but weak. The
g.S3

141
strong and impressive results for high SES were expected, but not the weak
ones in low SES, since the practice of knowing students' backgrounds should
be effective for low SES teachers as well.
The belief that without proper training mental abilities remain u-deve-
loped showed shallow inverted U-shaped curves for two of the math suhtests,
suggesting that to some extent training is important but too lit-le or too
much to the point of overdwelling and boredom Is detrimental. It is appro-
priate that these relationships should show up in the math sutests rather
than in the others, since math involves more drill and memorization.
The reported belief that the teacher's main Job is intellectual training
for students showed two conflicting curves for low SES and two inverted U-
shpaed curves for nigh SES. Thus suggests that, at least in high SES, there
is an optimal level of intellectual training that is desirable for students.
Effective high SES teachers tended to agree that some students ask too
many questions. The relationships for low SES, however, were shallow and
mixed. It is likely that high SES teachers encounter more frequent student
questions, since students in high SES classrooms are likely to be less shy,
to show a greater anount of eagerness to respond, and to how competitiveness
In gaining the teacher's attention.
No readily interpretable data appear for the belief in the importance
of small group discussions. This bears out other data suggesting that this
technique is of little importance In the early grades.
High SES teachers do not agree that problem solving is one of the main
purposes of school. This Is a rather surprising finding considering the
emphasis on academic achievement at this levet. Perhaps the negative rela-
tionships reflect an affective interest, although they may reflect belief in
BEST COPY AVAILABLE142
the importance of teaching basic tool skills in the early grades and saving
probler"- solvinn for later.
Effective high SES teachers agreed that it Is natural and healthy for
children to racist the teacher. There wfre strongly positive relationships
across several of the 6uhtest groups for high SES. it is likely that
"resisting the teacher" was not seen as a behavioral problem so much as an
assertion of independence. The relationships for low SES show no particular
pattern (serious behavioral resistance was probably more common here).
The statement that the teacher should talk to the child as she would to
an adult revealed one significant negative relationship in low SES and one
significant positive relationship in high SES, again showing difterent
beliefs for these two groups. It is possible that this attitude is reinforced
by the facts that ialkinfj to high ¶ES cniHren as adults i-. I Da, cff
and that verbal control is effective. other high Inference data indicated
that a simple, calm discussion of the Incident tends to be an effective method
of control with high SES children, but not for low SES.
There is general agreement among effective teachers in both SFS groups
that a good teacher lets the kids do the work rather than doing it for them
or allowing them to cony from other children. These relationships are
especially consistent in high SES.
Effective nigh SES teachers tend not to agree with the notion +het the
only important thing to teach is a principle. One negative relationship
appears for this varlible, along with onc: 7nherally nerlativ,7 curvy;.
This fits with other interview items indicatinq 1-at hirTh 4eachor prefer
teaching facts over global concepts. t:r1 intorDrr: this a-, an rDchres.51r.g, r04
the teacher's concerns that children recently have not ',een taueht facts
BEST COPY AVAILABLE 143
sufficiently, and that there has been an over-emphasis on -rocess, as In the
"new math". Aigh SES teachers have expressed concern *hat while children
understand process they have not had enough practice in rote memorization of
those skills which must be learned by rote, e.g. multinlication tables.
A single negative correlation appeared for low sr, teachers for theOAS
statement that explanations should ho short in order to retain interest. -.le
e0Atn indicates that successful teachers, especial,' in low SES, had
high expectations.
The belief that peer tutoring is good teaching technique is not supeorted
in low SES. This is replicated in other data suggesting low SES children are
more dependent on the teacher and have not vet gained the skills needed to
benefit maximally from peer tutoring.
One negative relationship and one inverted U-shaped curve appeared, for
high SES only, for the practice of ass :ling material and then insuring *het
the students get to work.
The rated importance of acquiring knowledge .)asic to a eatisfying family
life showed general negative correlations In both groups, but these corre-
lations were stronger for high SES teachers. We suspect that these negative
relationships are related to the fact that these tcachors were selected or
the basis of their ability to produce cognitive gains in their children and,
consequently, that the more successful ones should emphasize mastery of skills
necessary to cognitive development (even thounh *hey deemnhasized the impor-
tance of test scores as such).
No data appeared in low SES for the impertance of using adv.:nce crllnilers
because these teachers all agreed wite tni; ite-. rke unintatice
appeared for high SES. This variable Droved unimportant Tn nrrIVISS .eta

BEST COPY AVAILABLE
144
as noted earlier.
High effective low SES teachers r,portel the te.cr ';rileved t.,3* *Pr:clers
should ask frequently if students understand. is pf,ssi°J- H thl* variable
Is related to pacing; it may be one method Nhich log SC', 'nee -q,rs use tc, nuage
the level of their students and the beet pacinn of their ilssor,s,
Conflicting relationships appear for tne he teat a 4-ellar..hir holl
discourage students from moving around the room freely.
Low SES teachers tended to not anrea that dir.-ctive seacnine nroduces
a more passive student. This Is an additional, thoulh small, niece of
evidence in support of the effectiveness of teacher controlled learning for
(ow SES children.
One surprising set of negative findings appeared, for high SES teachers
only, concerning encouraging children to believe that they can succeed.
There are no data for low SES, becauso teachers wore unanimeus in agreeihi
with this statement. We do not know why this item correleted nogatively
for high SES; most other data regarding expectations s",nwed positive rela-
tionships with learning. Perhans the succesOul high SES teachers inter-retid
this item to Imply unrealistic encouraeeeent (urging children to strive far
goals which they are unable to meet).
High SES teachers reported that they often ielone students who continually
raise their hands. we susoect that this is a healthy strateny, at least at
this level, because everly eager and competitive students, if they condition
the teacher to call on them toe often, mly prevent her from calling on oeher,
less eager students. We suspect that this is a deliberate attempt 0*, the Dart
of these teachers tc re earteie that eact, stuient iets 9 charce.
The belief that effective loarnine come-. from a leeicaily organized

BEST COPY AVAILABLE145
text showed a single negative relationship for low SES. Low SES successful
teachers felt that e loically organized toxt may not be the best vehicle: for
1rdnsferrinj informtion cr for t,ettinq i skill across to children. Other
data suggest that curriculum materials may he more aPpropriate for high ',ES
students than for low SES students.
There were two positive relationships, one in high SES and one in low
SES, for the belief that teachers should be wrong sometimes. Tnis is probably
a method of challenging students and keeping their attention.
The belief that the teacher's primary jot is explaining subject matter
showed only one positive correlation in low SES. In high SES, there were a
series of U-shaped curves suggesting an interaction between this variable and
one or more others.
Reminding children to ask when they don't understand had no data for low
SES and negative relationships in high SES. Perhaps the majority of children
in high SES schools are less timid and do not need to be reminded to ask when
they don't understaii. in any case, these teacher, felt that it was not impor-
tant to emphasize this with them.
The belief that there aro no specific rules for effective teaching showed
one negative correlation for low SES. This suggests that low SES teachers are
very aware of specific strategies used to teach their students.
The belief that routine can adversely affect !earning wal nelaiye in
high SES and produced no data for low SFS. "ost low :FS tr:achrrs disqoret-Jd
with this item. This is one of a series of variables surJr v Fr,,jt more
challenging, stimulating, and less routinized organization of the cllssroom
works well for teaching high SES pupils. t:c. data appeared for high SES for
the belief that teaching should be evaluatIc! inder'ender4lv of ilarninm msults,
Two negative correlations appeared for low SES classrooms. This relationship

BEST COPY MARE146
is not surprising in view of the fact that these teachers were selected on the
basis of their consistency in producing learning gains. Consequently, they
would be expected to be concerned about learning results and tc tie their
teaching methods to strategies which produce these results.
The belief that without practical usefulness, knowledge is without value
showed an expected negative correlation (for low SES) and two weak curves.
Negative relationships were expected on the basis that successful teachers
would value knowledge for its own sake.
One single negative correlation appeared for high SES for the belief that
teaching techniques must be adapted to individual students. Perhaps successful
high SES teachers believe that their children can benefit from group instruction
and that individualization is not crucial.
The teachers' opinion that in most classes students showld be ability
grouped produced no data for high SES classes, since all high SES teachers
agreed with the idea of grouping. A few weak negative, correlations appeared
for low SES classes.
The next variable showing interpretable data is the belief that a good
teacher never uses compulsion. This produced strong negative correlations across
the board in low SES, and weaker negative correlations in high ;FS. Anparently,
effective teachers have found ways to get their students to perform withr,ut
resorting to compulsion.
The belief that It is unnecessary tc %now individual students well
showed positively rising curves in high SES but no data for low SES. t;Jck of
variance for low SES was due to the fact that almost all of these teachers
disagreed with the statement. The data for niph SES teachers agree 4i.4h an
earlier item 1; suggesting, contrary to expectations, that thp more successful

147
teachers were not concerned about individualization.
The opinion that objective exams are not good because they produce no
original ideas showed positive relationships for high SES and weak, but
negative, relationships in low SES. This was somewhat expected, because, as
with previous variables, more challenge, more stimulating teaching, and more
emphasis on creativity, tends to be positively related to learning, in the
high SES clae,srooms. The negative relationships for low SES suggest that
many objective exams are testing product-type knowledge, and low SES children
are better able to respond to this type of examination question than they are
to the more complex process-type questions.
The belief that students should reneat grammar construction until correct
produced no data in low SES and one uninterpretable curve in high SES. The
curve suggests a slightly negative relationship for this variable.
Effective teachers in both groups tended to report that it was important
to make definite rules about good teaching. This is confusing, because
those teachers also stated that they saw .eaching as an art rathr,r than a
science (item 192).
The reported belief that teachers should be expected to spend son free
time with students if it would help them learn produced no data for loo 'LES
because all teachers agreed with the item, but there were several inv,:rte'd
U-shaped curves in high SES. These suggest a belief that a cr,,rtein amount
of teacher time is beneficial, but that too much is counter- productive
and can produce student dependency.
The belief that it is unrealistic that students can get along without
teachers showed negative correlations in nilh SES, fitting in with thq pattern
previously seen, that high SES children can work more independently and work

148
alone longer without help from the teacher. suspect that this is less
true for loW S students, however.
The belief that one should not do a lot of oril oviluati-n of ',+,;1ont'-
work showed nelative relationshins in low SES, suggesting that oral nvaluation
of student's work is viewed as a method for introducing redundancy and feedhaol,
into daily lessons so that children may get a better idea of correct or
appropriate answers. There were no data for high SES because all teachers
disagreed with the statement.
The next variable for which data weer is the belief that teaching is
an art, not a science. Effective high SES teachers agreed with this state-
ment, though no data appear for low SES because the entire group of teachers
agreed with the item.
Conflicting data appear for the belief that if instruction is clear, few
discipline problems occur. Generally, no relationships showed up in low SEE.
There were two inverted U-shaped curves for high SES suggesting that clear
instructions are valuable to a point tut that after that more explaining could
amount to over-dwelling, hence boredom and more discipline problems.
Effective high SES teachers generally agreed that non-achievers should be
failed, while no data appeared fe:r low SES for this variable since all low SES
teachers disagreed that these students should be failed. Low SES teachers
tended to disagree with the statement that lecture is seldom desirable. This
relates to other data suggesting that explaining and practice are important
at this grade level for these children.
Competition in bees is believed desirable Dy effective high SES teachers,
but it relates negatively in low SES. This supports earlier data suggesting
that competition, stimulation, motivation, nd independent activity are seen
53

VITIT COPY AVAILABLE 149
as more important for high SES children than for low SES children.
The next set of variables are those on which teachers rated their
degree of concern. The nature and quality of instructional materials was not
a great coocern In either group. Negative correlations appeared for this variable
in both groups. However, frustration with routine and inflexibility of- the
classroom situation was positively related to learning in high SES. This fits
with the previous data suggesting that routine can adversely affect learning.
This is more support for the notion that high SES students can accommodate to
changes in schedule and routine without a great deal of upset, can work
independently, and frequently require challenge and st !mutation.
Becoming too personally involved with students showed a oeneraliy nenative
trend in low SES, suggesting that this is not a concern for #esr? teachers,
and a shallow inverted U-shaped curve In high SES. Diihnosing studen t Ir;arninn
problems did not appear to be a concern in either group. Althounh too many
non-instructional duties were of concern to effective low SES teachers, this
relationship did not hold for high SES.
Insuring that students grasp subject matter fundamentals showed two
curves, one in each group. The curve for high SES is irneraffy negativ.-
in slope.
Working with too many students each day showed a si.ql 0! negatIvn relation-
ship in each group. This apparently wls not a major concern for effective
teachers. Concern about understanding the philosophy of the schrpci was
generally negatively related in high SES, with mixed finlinT. for low
Concern about students who disrupt class showed an inverted EJ-shane',4 curve
for low SES and a shallow U-shaped curve for high ;1h,-.ut
use of drugs was strongly negatively related in both groups. This is uc-= loss
150
of a concern at these early grades than it right be at higher grade levels.
Effective low SES teachers indicatn1 concern about whether each student
was getting what he needed. This variable produced several positively rising
curves, as was expected. in high SES, on the other hand, inverted Ushaped
curves indicated that concern about making sure that each student got what
he needed was facilitative only up to a point.
Concern about the emotional and social needs of students was minimal,
showing only one negative relationship for high effective low SES teachers.
The next set of variables, beginning with #215, are those which clustered
together on factors. Item scores were coilansed to produce 62 combined scores.
The first of these items is the practice of using public rewards such as
peer approval, symbols, or stars. Positive relationshins were found for high
SES and also for low SES, though none of the latter were significant. This
bears out the data from observer ratings of teacher behavior.
Emphasis on good classroom control showed inverted Ushaped relationships
for high SES, indicating that there is an optimal level of classroom control.
Little control yields low gains due to chaos, while too much control may lead
to a restrictive repressive classroom climate which is detrimental to academic
achievement. The patterns for low SES are conflicting and less easy to
interpret, however.
The belief in the Importance of individualizing student learning showed
two shallow curves, one for each group. These relationshies are best be
left uninterpreted.
Belief in the importance of organizing and motivating was generally
negatively related in low SES, and no particular patterns emerged for nirr.
SES. it is possible that organizing and ,notivating were not of high concern
to these teachers because they were not a problem. They may do their things
5 5 5

151
routinely.
Belief In the importance of affectivr, aspects of teaching showed no
particular patterns. Only a single negative correlation for low SES emerged
for teachers' gaining satisfaction from working with people.
High effective high SES teachers reported satisfaction from dedicating
themselves to difficult teaching problems. This is supportive of other
evidence showins: that there is a certain determination in the teachers
to get across subject matter and to produce gains in students.
Effective low SES teachrws did not agree with the statement that exams
were good devices to help teachers evaluate student learninn. This fits with
some other evidence to The effect that exams, in neneral, lack validity
for many low SES students. Some children at this level lack test takinp
skills, abiliti to folloN directions, or ability to out down on nennil and
paper tests what they know. However, low r;fr, teachers tendcld to rate highly
the importance 0 IQ in teaching and evaluating students. 7his is somewhat'
contradictory with other evidence, sirce they apnInr to re sect thn evidence
of achievement exams, but to accept fho evidnce of 10 scores in evaivatinq
students. Hi9h S:S teachers tended to rinort `flat tcsts s',c-J11 5r
improve teaching, not to evalue.i. st .AJvnts. Inera were sli .7ta.rvl
relationships for low SES teachers, though none of these were sinnificant.
Getting along with children and with school personnel r2vnaled only 3 weak
negative correlation in each Iroup. Thus, this is not a probrnm for t'lese
teachers.
Connern 'with guiding students and hrr:if!ino 1 stefilc2 .;.1c! Intel
leeeual clim3tT shown: weak .7,,ositiy-, r 1,14
weak, shallow curve in low SES.
1.5G
r;f,

152
Surprisingly, low SES teachers were not concerned .pith physical limitations
In time and materials. Likewise, effective teachers were not concerned about
being favorably evaluated for doing a good job. We suspect that this is
because these teachers were more concerned with producing gains in teaching
their children than they were about evaluations of themselves.
Classes centering around student input showed strong negative relationships
in high SES. Apparently, while students tend to take a more active part in
these classes, the teacher must remain in control. Pelationships here were
more mixed for low SES, although they suggest that high effective icw SEr,
teachers did not feel that lessons should be flexible and open to student
input.
High effective high SES teachers felt that it was not important to
summarize and review lessons. Again, overdwelitng is not necessary or effec-
tive in high SES classrooms. However, teaching facts rather than global
concepts was correlated positively in high SES but neeatively in low SES,
a reversal of what we had been led to expect. Ne believe this reflects
changing attitudes on the part of the teachers in each of these SEC groups.
Many high SES teachers reported that too many abstract concerts were being
taught to children and not enough facts and drill were being given them.
They cited as an example the new math. Children were familiar with the process
of finding the right sums, and yet were unable to recite nuickly muitiplication
tab les or addition and subtraction facts. In low SES, teachers irdicated that
they tried to put the facts that they were teechtne their children ieto some
relevant and more eleaningful context in order to increase motivation to learn.
Both low and high SES high of teachers tender: to prefer !:cture
or explanation to multi-media presenta*fors, i.e. the use of audio-visual aids,

153
etc. Relationships were consistently positive for high SES but somewhat
mixed and not quite w stroll for law Sr..
Low SES effective teachers also preferred o involve perents directly in
the classroom. Relationships were negative but weak for hine 3ES on this
variable. Parental involvement for low SES classes probably is lese fre-
quent and no doubt extremely important.
The use of visitors from the community showed two rather weak relaeion-
ships, which are best left uninterpreted. Effective hie!, FS teachers
agreed that elaborate planning and preparation were not necessary,
relationships were mixed and weak for low SES.
Effective high SES teachers did not agree that pressure to achieve and
emphasis on academic mastery was beneficial. This somewhat contradicts
other evidence that effective high SE'S teachers were more demanding, emreasized
academic skills, etc. However, at tee level of self report, the teeciers
did not feel that pressure to achieve was beneficial to Inc...1r children,
even though other evidence suggests that they actual!y do push for gai-.
High SES effective teachers reeortsd that lessons should not be flexible.
This fits with other data showing that tnese teachers tended to stick to the
curriculum. The low SES data were somewhat loss intereretable, with mixed
and shallow curves, generally. Hirb SES effective teachers did not agree that
learning was easy for not but not e!I students. This eeincides ,fifn ether
data that the Mac ,7.rs ds'dic4ta t'sfr,:-.!trrs to difficult tenc.ling pree;lems.
The are aware that 1-J3rni-11 is not ),;-,y, but neyerteelees teere is an emphasis
on academic success.
Effective low ',CZ) teachers tun foci ±o rect tne idea that students eould
work on their cen and establish tneir oen indiviu.eal level. Again, this is
more evidence that teese children are more dependent on the eeacher for

t
structuring and sequencing.
There was a single positive corrf)iltion for low SES on emphasis on
discipline and academic work, as expecte,J.
High SES effective teachers generally agreed that teachers should make
lessons interesting. Other data also support the picture that challenge,
interest, and stimulation are important in high SES.
The belief that learning is more important than attitudes and happiness
of students showed conflicting results, making this variable difficult to
interpret.
The belief that success is measured hi classwork efforts and teachers'
success in teaching slower children showed shallow inverted U-shaped curves
across the board for high SES, and uninterpretahle, generally fie curves In
low SES. These relationships suggest that in high SES success can be measured
in this way to a point, but that using these two indicators exclusively
may lead teachers to overlook other important determiners of success.
High effective high SES teachers tent to reject the idea that they measure
success through chltdrens' apparent understanding, i.e., that they feel they
have gotten across a concept or a lesexn because the children appelr to
understand. This suggests that +hese teachers remain skeptical about how well
pupils have grasned the material until they havr; checked seatwork or some
type of written work or assignment. Students simply aponarin7 to understand
because they don't ask questions or look nuzzled is not sufficient evidence
for the high SES teachers 4c. be that they have nod '`en across their point.
Effective low SES teachers feel that drill and excessive nrobiem solving
is beneficial in teaching math well. althr,udh these relatIons!,!ps apnear in
the word knowledge ?id word discrimination subtests. Still teachers wire
chosen for their general consistency in producing fairly dairy across

all five of the subtests, so It is reasonable to sugpest that hPavy usr, of
drill is an effective method fcr low r,[77, teachers.
The idea tnat teaching should be teacher-centered and well structured
showed uninterpretable U-shaped curves in both groups, suggestinp the
this variable interacts with one or more o+hers.
Belief that subject matter is more important than social and emotional
factors showed consistent inverted U-shaped curves in both croups acrcss
the board, indicating that subject matter is important to a point, but after
that point it no longer Is more important than social-emotional factors.
Several other variables throujnout the study have sugge-ited that subject
matter is emnhasizeJ these high affcctiw, teachers, ',ut that they do not
stress subject matter exclusively to the neglect of social and emotional
factors.
Effective low SES teachers rejected the idea that it is important to
integrate subject matter for teaching a large class. it is nossiblo that low
SES teacners individualize more and, therefore, do not feel the necessity
to Integrate subject matter for the entire class.
A preference for and orientation to high achievers was nositivdy related
for high SES effective teachers, which joneraily fits with other data suggesting
that these teachers did push mastery any challenge their students.
The belief that instruction time is reduced because of control problems
and too few personrel in the school showed two generally uninterbretable curves,
one in low and one in high SES. The feeling that problems stem from children
themselves and their environment was generally positive for high SES, contrary
to expectations, but rel3tionship5 tmded to be negative or mixed for low SES.
The high SES data here contradict the more general set of findings to 4-he effect

BEST COPY AVAILABLE 156
thet effective teacners as.lurne personal rrn,nor.ni!.ility fnr student 1,;lr,,inn.
A ;Ingle positive correlation for high apprJdred for the use of stuleht
conduct and personal qualities in assirrling academic grades.
Teacher Interview Variables
The next set of variables are curvilinear relationshins, shown in Table
10, between the teacher interview variables and student gain scores. Only
those items which combined into larger variables or which loaded on factors
will be discussed here. Items which did not load on factors were two-point
variables (scored 1-0) on which curvilinear analyses could not be run.
The variables shown in Table 10 have more tin too points and could be
curvilinearly analyzed.
Each teacher was interviewed privately by one of the authors or by one
or two experienced staff members. The items included in the interview mainly
required information difficult to obtain by checklists or scales and usually
required lengthy responses from the teachers. The interviews generally
began with a broad question such as "How do you provide for Individual
differences among students?" then narrowed down to more specifically "What
do you especially do for hicJh achievers? LOw achievers?" Som- teachers
contributed their own questions for the interview ;4t our invit'ution,
these were included.
Teachers' placing restrictions on vr-en*al invrIvrrrent 7?nlraIlv
shallow inverted '.1-shaped curves for indicating that there milnt be
an optimal level of restriction on parental involvement. The curves for high
SES, however, were mixed and less internrc4*abl,-.
Low SE teachers named disadvantaeas of .,using in 7ermn, of childrens'
3

157
emotional harm. we suspect treat this is tescause they arc in a better pcsition
to understand the posiele enotioral harm 4h1ch car come to childrrn through
busing, and because only low SLS children presently are bused in this school
district (not until sixth grade, however).
High effective lew SES teachers did not see black student;' needs as
instructional, but as social and emotional. This bears out the findirgs of
St. John (1971). The reverse was true fer effective hiqh SES teacher;. They
tended to see black students coming into the school as needing remediation
and help and as being behind their white peers In cognitive skills.
Individual reading about education was negatively correlated for high
SES teachers, but somewhat pus,;tively for low SES teachers. We could inter-
pret this to mean that low SES teachers are continually searching for new
and improved methods for remediating and improving Instruction for their
children, and that the standard materials and manuals are less aperoprlate
for them. The data for the high SES teachers are puzzling, however.
Effective low SES teachers also implied that they take an active role in
individual reteaching. This was expected, and it tends to fit with en
data on remediatlon, reteaching, practice, and drill for low SES students.
Effective low SES teachers also eenibited a favorable attitude towards
conduct grades. We suspect that this reflects an attempt to establish and
maintain control in the classroom perhaps with the aid of oarents.
The statement that a teacher uses her own diagnoses to plan teaching is
pusitively correlated in low SES but neeatively in high SES. This is one
of several measures which has supported the idea that low SES teachers doubt
the usefulness of standardized tests and irstead use their own technieues for
assessing students. In contrast, '-,;(1. SE, teacners stated that they felt that

158
standardized tests were effective enough In measuring their students' ability.
Fitting In with this is the variable that teacher uses her own judgment based
on the child's performance, I.e. a non-testing situation. This was also
positively correlated in low SES.
Low SES teacaers did not use subjective criteria to judge their SUCC3SS,
Low SES teachers who produce good student gaihs reported that they keep up
the pace of the class by not waiting, sustaining, or correcting a student
answer. If the student didn't answer, they would give the anwer or call or
someone else. They Also reported having a specific approach to "no responses"
from students, instead of simply waiting. This is further evidence supporting
the process data suggesting that getting some kind of response is important
in teaching low SES students. Inverted r curves appear for sustaining a child
who Is not paying attention, suggesting that there is an optimal level for use
of this technique.
Mixed curves appear in low SES for sustaining a student after an Incorrect
response. The majority of these curves, however, are inverted U-shaped,
suggesting that home sustaining Is effective but waiting teo long or pushing
the student too hard becomes counter-productive. U-shaped curves appear in
high SES. These are difficult to Internrt and suggest some interaction with
one or more other variables.
The use of special techniaues to teach language arts showed generally
conflicting patterns in both groups, and tended to be uninterpretable.
Tho reported use of non -took materials to teach rr.,ading showrd two strong
negative correlations for high SES classrooms. One interpretation of this
Is that non-textbook materials are not necessary to teach rading effectively
for high SES children, and that -f(?xt-,cloks trnd to c adn,-7.13f, fr;r

159
purpose. However, this would conflict with the variable already discussed
that multi-media presentations and use of a variety of sources and techniques
were effective in getting across content to high SES children. It is
consonant with the finding that high SES effective teachers stick closely to
the curriculum,
The teachers' reported arranging of student activities which do not
require direct teacher supervision showed one positive correlation for low
SES, suggesting that If low SES teachers organize in this way it could allow
them more time for individual remedial instruction with their students.
The reported use of T.V. showed inverted U-shaped curves for high SES
which nad primarily negative slopes suggesting that this was not a generally
effective technique. Several high SES toaceers did mention that frequently
the programming timing did not allow them to use T.V. very much. A high use
of spelling bees did reveal one positive correlation for high SES, suggesting,
as we have seen before, that competition and chalienge were effective here.
Effective high SE'S teachers reported that they based their Judgment of
innovations on their social and emotional effect on children. This coincides
with some other data suggesting tt-,at effective high SES teachers are not
completely oblivious to the social or emotional effects of classroom activities
on their students, although they do stress cognitive skills. However, they
also reported the belief that problems with rapport stem from the child
himself, though only one positive correlation was significant.
High SES effective teachers also mentioned concern with the social-
emotional needs of Mexican-American children, This was negatively related
for effective low SES teachers. It is possibly that, with new hucine regulatiene
in Austin, these high SES teachers were meeting 9exican-American and black

coI
children for the first time, ane that all at once this has become a prime
concern to them. in contrast, the effective lotiS teachers have had this
as a concern for some time. and have manahed to deal with it in ways which
were somewhat effective, so that it no longer is high on their concern 11st.
Although effective high SES teachers did not reoort the frequent use
of T.V., they cll.! demonstrate positive attitudes toward T.V.
Low SES effective teachers reported that their reaction to the district's
curriculum changes was to change their own teaching. This also was slightly
positive for high SES teachers, but less so than for low.
Using a variety of different ways to plan lessons: by subject, by unit,
and by time was positively correlated with learning in high SES.
Not publicizing test scores was negatively related for low SES students.
Perhaps this prevents children from gaining needed feedback.
Using a humanistic approach and trying to see the child's side showed
negatively sloping curves in low SES, suggesting that an overemphasis on this
approach is not effective. The relationships for nigh SES, however, were
more positive. This supports other evidence that a discussion with the child
of his misbehavior is a more appropriate controlling strateg/ for ilie7h SES
children than it is for low SES.
The use of non-punitive techniques Instead of Isolation or loss of privilege
showed inverted U curves in high SES, suggesting that non-punitive techniques
4ork to a point, probably depending upon the severity of the misbehavior.
The curves for low SES are less interpretable, however.
Involving children in determining classroom rules also was somewhat
positive for high SES, showing inverted U-shaped curves, hut less so for low
SES, suggestinh that high SES children can take part in managing their own
J.(;5

161
behavior to a point at this level, allhough 'wing too far in allowinc children
to determine rules becomes counter-productive and can lead to disorder.
The belief that the most common discipline problem is noise and not
childrens' disrespect for one another was positively related for high SES
effective teachers, and it showed one Inverted U-shaped relationship for low
SES. Positive relationships were expected here, since they indicate relatively
good classroom atmosphere and control.
BEST COPY AVAILABLE
019cus,-,inn
'flueh discussion of seecific niis air Cy ven ;resented when
the findines themselves were presented in this or prev:eus napers, so fhit
the present discussion will focus primarily on the implications of the study
for educational research and practice. In general, the study succeeded
reasonably well in its primary goal of generating a laree number of testable
and apparently relevant and useful hypotheses concerning the relationshies
between teacher behavior and student learning at these grade levels. Lioeever,
even this general statement r:quires zeveral qualifications.
First, the many improvements and innovetions in the researce desien that
were part of this study succeeded in eroducirej results which oven up several
new possible lines of investignilon and whfth care/ previous indi-7; it
ether lines of investigation to nnw (eseeciarty to more apec'fic and Drr-
scriptive) levels of development, but 1-!-,e study did not succeed in moOinn
one hoped for 2oal--findine several very strong, replicated relethereele-,
between teacher behavior and student learning. With benefit of eindsieet,
we can now say that the search for such extremely strong relationships appears
to have been e naive one doomed failure from the start. From the earspectlya
of loeical analysis, or even fror, everday observations, it seems '"hvir:us at
this point teat successful teacning invoiess orchestratine a Ierr1A numer of
principles in sucn a eay as to insure thlt they are used and need preberly
at the appropriate moment, as onposee fe mesterir a short lie* of "crucial"
or "basic" terIcltn'. +e-1 Ides hicn 4ill ,uccese ir a'y or ell eitu3tions.
With hindsignt an perspective, tee eearre, fer a fed "crucial" toachinc eeheviors
seems clearly futile, if net downrient silly. This does not mean that very
high relationships between teacher and student learning or other student out-
Cr;

163
comes can not b9 obtained, but it means that such extremely stronn relationships
are only likely to be obtained when several variables of context and of teacher
and student Individual difference have been taken into account. In short, we
need to switch emphasis In teacher effectiveness research from attempts to
establish certain behaviors as Important and facilitative in all situations
to attempts to establish the relationships between certain teacher behaviors
and student outcomes in more clearly specified situations involving more
clearly specified types of teachers and students.
The preceding comments flow from the general finding of our study that
the data are much more interpretable when considered separately by social class
than when considered together with the entire sample. Social class, of course,
is simply a proxy variable standing for a complex of cognitive and affective
individual differences which car be controlled to sons dcy-ef, through measuring
social class but ultimately must be examln-d by studyinq IIdlyidual students.
Thus, one obvious and important implication for future research in this area
is that the individual student be made the unit of analysis and that Investigators
seek information about the kinds of teaching that optimize outcomes in individual
students in addition to teaching that optimizes outcomes for the class as a
group.
Failure to collect data on Individual students appear: to be one of the
reasons for tne confusing and ambiguous data collected on many of the measures
included on this study. Another reason I-, the nee1 for better control for
context differences. The present study was breakin new ^r,--unc; for r0;1-
part, so it attempted to study "everything" tha* went 0- To r. classroom
which might relate to student learning. To-text w.,27, fak:in int^ account to
some degree in the low Inference measures by separating morning vs. afternoon
1 G3

BEST COPY AVAILABLE
vs. reading group data and try sen,irltinn resnonse v7;. private..
work related interaction vs. brocurll inter3ction vs. +;ehavi,nr-11 intr:rar:tion
(along with the various ';ubdivisions nt each of these ,.tr:Igoris).
th aims of the present furl/ ccvltrol for context rr.1:14-iv,,11 good.
However, future research should control context even more clr);0,, nnrhaps
by concentrating on specific su5ject matter areas or by concentrating or
certain kinds of classroom events (small group reading instruction; whole
class discussions; patterned drills; presenting and monitoring seatwork; etc.)
Sequential changes in the teacher's goals in such interaction should also be
taken into account. For example, teacher b,havior which is optimal in situations
where the teacher is introducing a ned tonic should be different frcm teacher
behavior which is optimal in situations where the teacher is reviewing and
summarizing a topic.
Many of our measures failed to yield interpretable data because they
were too general or am:)iguous to he very useful. For example, the category
of "new questions" needs to be broken into more meaningful sub-categories.
At minimum, new questions intended to provide help to the student and to
elicit the answer from him should be separated from new questions which change
the focuS from getting the answer to the original question to inquiring about
whether or not the student has studied the material, has heard the question,
etc. Other such categories could also be included here.
A related need on several measures was attention to the duality of appro-
priateness of the teacher behavior, in addition to simply noting the occurrence
or frequency of it. For example, many of the teacher reactions to students
during individual work related interactions were simply coded as "brief" or
"long." This convention as adapted to accommodate in the fact that many such
1 '13
I e5
interactions could not ge heard by the coders and this could not be coded
with more meaningful categories. However, ultimately such interactions are
going to have to he coded with more meaningful categories than simple time
designations if valuable Information in to bc discovered. Similarly, variahlr:n
such as praise or criticism of students and use of student ideas need to be
coded for the appropriateness and effectiveness of the teacher's use of these
techniques, not merely for frequency with which the teacher uses them.
Another obvious need is for better measures of affective outcomes. We
were aware of this need in the nresent study, but the measure we used proved
not to be useful, and we were loft eith indirect data on affective outcomes
which could he inferred from the behavioral observations. This is of course
general problem in research involving young children, /there to seirch for
reliable and valid measures of attitudes toward teacher and school so far has
produced relatively little. This searcn must continue, however, since e'er
data reaffirmed the oeservations of many others tnat some teacher behaviors
may foster learning but depress student enteustasm or other cegnitive student
aspects, or vice versa. Thus, tho need for development of reliable and valid
measures of affective outcomes that slh t, used with young stedants is a
serious and important one.
The many contrasts between our findings and tnose soeeorle found in the
majority of previous studies of teacher behavior suggest the need for several
distiections to be introduced into the literature ;.nd fcr several chanqrs in
emphasis in research which is intended to tic eeneralizee to the evervlai
classroom. Perhaps the most obvious implication is that our 4indincs end
others based on data taken from naturalistic classroom settings freeuently
conflict with the findings of data taken from laboratory situations. The

16u
implication here seems to be straight forward; investigators wishinn is gen-
eralize findings to everyday classrooms should collect their data in every-
day classrooms.
Another implication is that teachers should be included as consultants- -
partners in classroom research, particularly in exploratory or hyncthesis
generating research, as opposed to being kept in the dark or treated as
individuals who don't know anything about teaching. Our self-report data
suggest that, by and large, the observations and opinions of teachers concerning
what is best for the children are fertile and largely correct sources of
hypotheses. This is not to say that teachers are clearly aware of everything
that they do in the classroom or that the usual cautions against bias and
erroneous information due to sc.lf-deception should be ignored. However,
it appears that most of the studies showing teacher perceptions to be in-
accurate deal with matters that the teachers do not usually think about or
do not have any special reason to know about (sociometric peer relationships;
differences in the ways that teachers interact with different individual
students in the classroom, particularly on dimensions which have never been
brought to their attention). in contrast, when teachers are asked about areas
which they do think about (particularly matters of curriculum and instruction
and of how the teacher should adapt the curriculum and materials available to
meet the needs of individual children), their observations seem to be parti-
cularly insightful and worth investigators' attention.
The observations of soar (1972) and tho findings of the present study,
among other sources, point to the need for routinely Investigating non-linear
as welt as linear relationships between teacher behavior and student outcomes.
This point has been made several times by many individuals, but the fact

BEST COPY AVAILABLE le7
remains that it is not often Zone. Thr present study has shown that many
reletionshins Nhicn do not appear in correlational analyses are revealed
when nen-linear analyses are performed, are, more importantly, *hat most
teacher behaviors are related non-linearly to student outcome me isures.
Reflec+ion suggests that most teacher bonaviors should be related to student
outcome measures in non-linear fashion, if our internretntion that tcachino
Is a matter of orchestrating a large number of nri nciples in the nroper
fashion rather than mastering a few central principles is correct. Statis-
tical ernorams wnice allow teese Kind-, of analyses are now availeole in forms
that can be easily used; consequently, we suelest that thee should be used
and used regulerly.
Another imeortant point highlighted ee the tindinns of eee present study
is that teaching in the early grades, then the emehasts is en neesentatIon and
mastery of larnely physical tool skills, is qualitatively different in many
wa\,s from teeceinq in later eredes, weere the emphasis is or verbal nresentation
and discussion of Largely svmeolic materiel. We believe that this distinction
is a fundamental ono, and snould be ieteeeeeee irtr litereture end taken
into consideration we ..luetine rc7e.elre! Co-ellile eaea free tee
eerly eredes or from nrescneol with deta from the later grades or secondary
schools amounts to mixing apples with oranges, ann is more likely to confuse
than to shed light on an issue. Thus, w would stress the need for ievestioators
to conceptualize, study, and discuss teaching in these different areas as two
different enterprises. A corollary of this, implication fir future research
is the implication that, ultimately, +-emeers trained for !teeeire? le tht
early elementary grades ce,ould he trainee eiffereetli (t'rr.,6,1' le in ereer
programs) from teachers trained for to later elelentar ereees. The ercsent
p'..),

168
divisien of elerertare teaching vs. seco-dare teaching appears to be too
general.
This suggoetion makes sense not only from the perspective of research
and teacninp, eut also from the data from child development and relaTed fields.
The learning styles of children who are functioning at what Piaget would cell
a preonerational level (children in the first few grades) differ from the
learning styles of children who have achieved the concrete operational
level. liese differences in children have imnortant implications, not only
for what is or is not appropriate curriculum, tut also for what is or is
not appropriate teaching methods and goals. The point eeuld be expanded at
length, but in any case It seems rensonaUle to us to state that learainq
in the first few grades is qualitatively different from learning in the
middle grades, so much so that separate teacher training is in order.
The present research provided tentative answers to a large number of
questions, but ale° raised a number of euestions and left early others unanswered.
The latter problem occurred because of some of the methodological deficiencies
mentioned earlier, and also because in many cases the relevant data could not
be obtained because the teacherstudent interactions involved did not occur
often enough to allow meaningful analyses to be performea. in many cases,
this may simply mean that the interaction in question is not very important
because it does nct happen much, but some relatively infreouent interactions
are important because of their intensily. in any case, many relationships
that we wished to investigate could not be studied because there were no data
or not enough variance among the teachers.
The problem of limited variance brings out a point that was mentioned

169
before but is worth repeatinrj again: the nrorability niven 1r the tables
for this study should not be taken at face value, and should he used as only
rough indicators of the strength of relationships. They study involved a
large number of variables and a small number of subjects, so that one of the
basic assumptions underlying the use of inferential statistics was violated.
Furthermore, in many cases the data involved very low ills or unusual distri-
butions that departed drastically from normality. We considered correcting
for attenuation, but this seemed to be a futile exercise because even this
procedure assumes many things that were not nresent in the study.
Th upshot of all this is that the real probability of a given finding
Is unknown and for all intents and purposes unknowable. This also goes for
the probability of finding a given percentage of our relationships to be
"statistically significant," regardless of what significance level is chosen
as "significant." Given that a very large number of variables were included
in an attempt to study "anything" which might be related to student learning,
that many variables had no data, no variance, and/or dras.. cafly abnormal
distributions, and that many variables had ipsative relationlhips with one
another, it simply is not possible to ascertain the probabiHtv level of a
given finding or to estimate with any confidence the percentage of findings
which "should be expected" to be statistically significant at a given
probability level.
Our attempt to deal with this problem involved a two-stage plan. The
first was to include a replication year in the correlational study itself.
These data have been presented already, and the degree fin whidn a finding
replicates is one clue as to its validity and stability. Thy: second, and
ultimately the more definitive, method of establishing whTc findings are

real and will hold up is to move from correlational to experimental designs.
One such study has already been completed (Crawford, 1974). It is mentioned
4
briefly as an example of the kind of study that can take one of the corre-
lational findings from the present work and convert it into an experiment
designed to test out causal relationships. This study began with the obser-
vation noted earlier that the difficulty level of teacher questions (and,
consquently the percentage of correct answers by students) appeared to be
curviltnearly related to student learning. The most successful teachers in
high SES schools had about 70% of their questions answered correctly, while
the most successful teachers in low SES schools had about 80t of their questions
answered correctly. These findings suggested that the optimal difficulty level
would be questions that could be answered correctly about 3/4 of the time.with
the udditional implication that the optimal level of difficulty for low ability
students would be somewhat lower (easier) than the optimal level for high
ability students.
Crawford (1974) tested this hypothesis by investigating the learning of
college students studying programmed materials arranged at difficulty levels
(correct answer rates) of about 43%, 85%, and 96%, respectively. As predicted,
the subjects in the 85% difficulty group learned the material significantly
better than subjects in either of the other two groups. This was a pilot
study conducted on a small number of subjects which presently is being replicated
on a much larger number of subjects and with some additional experimental
conditions, but It provides support for the curvilinear relationships found
in the present study. it also exemplifies the kind of experimental study
that can be conducted as a natural follow-up to one or more of the corre-
lational findings from the present study.

171
Another example is a larger experimental study 49 have underway nrr,sently
which ties together several principles of reading group instruction into an
integrated system which Is taught to experimental (treatment) teachers.
This study will determine whether experimental teachers taught to use these
principles systematically produce better cognitive and/or affective outcome
than control teachers, in addition, both groups will he otservcd and cnded
for their use of each principle, so that the effects of eac separate principle
can be evaluated in addition to evaluation of the treatment an integrated
system.
We invite and encourage our research colleagues to conctuct othor vxneri-
mental tests of the possible causal relationships underlying the correlational
findings of this research, particularly through experiments involving rralistic
treatments in naturalistic settings.

BEST COPY AVAILABLE
REFERENCES
Brophy, J. Stability of teacher effectiveness. American Educational
Research Journal, 1973, 10, 245-252.
Brophy, J. Achievement correlates. In H. walberg (Ed.). Evaluating,
educational erformance: A source book of methods, instruments,
and examples. Berkeley: McCutchan Publishing Corp., 1974.
Brophy, J. & Evertson, C. Low-Inference observational coding measures and
teacher effectiveness. Catalog of Selected Documents in Psychology,
1973a, 3, 97.
Brophy, J. & Evertson, C. Appendix to first-year data of Texas Teacher
Effectiveness Project: Complex relationships between teacher process
variables and student outcome measures. Catalos of Selected Documents
in Psycholuy, 1973b, 3, 137.
Brophy, J. & Evertson, C. Process-product correlations in the Texas Teacher
Effectiveness study: final report. Plsearch Report '10. 74-4. Te,v,
research and Development Center for reac'ler clucaticn, The Untvity
of Texas at Austin, 1974a.
Brophy, J. & Evertson, C. The Texas Teacher Effectiveness Proirxt. in
T. Good (Ed.). trends in the study of classroom. New York: APS
Publications, 1974b.
177

BEST COPY AVAILA3LE
Bron J. & T. The '..3rophy-ocd dvaciic interectihn
Simon and L. E'oyer (Leis.). -irrors for n vior: ,..tnc):v7v
of observation instruments continued 1371 subnleme 1.
'esearrh for 'ntter Schools, Inc., IV7.
Cohen, J. Statistical power anal a i s for the behavioral
Vrlurnn
York: Academic "ress, 1969.
Dunkin, M. & Addle, The study of teaching. 'Jew Yore:
Rinehart and Winston, 1974.
Emmert E. & Peck, R. jimenns of classroom blhavior. Journal of
Educational Psycholczy, 1973, 64, 223-240.
Evertson, C. & Brophy, J. ,J.igh-inforence behavioral refines as correlates
of teaching effectiveness. Cataloe of Selected Documnnts i^ osichology,
1973, 3, 97.
Evertson, C. & Brophy, J. Texas Toachsr Effectlytiness
questionnaire and interview data. Research Report No. 74-5. The
Research and Development Canter for Teacher Education, The University
of Texas at Austin., 1974.
Haak, R., Klaiber, it & neck, R. Student evalueirn of teacher instrument,
11. Test Manual, The Research and rlevelonment Ce:.,nter for Teacher
Education, The University of Texas at Austin, 1972.
Krunin, J. .2.i..scl2ftm_1,5=42......2....._manaementin Aassrooms. New York: Holt,
Rinehart and winstcn, 1970.

Peck, R. & Veidman, D. Personal characteristics associated with effective
teaching. Paper presented at the Annual 'leeting of the American
Educational Research Association, 1973.
B. The stability of teacher effects upon student achievement.
Review of Educational Research, 1970, 40, 647-662.
Rosenshine, B. & Furst,-N. The use of direct observation to study
teaching. In R. Travers (Ed.). Second handbook of research on
teaching. Chicago: Rand McNally, 1973.
St. John, N. Thirty-six techers: their characteristics, and outcomes for
black and white pupils, American Educational Research Journal, 1971,
e, 635-648.
Soar, R. An empirical analysis of selected Follow Through programs: an
example of a process approach to evaluation. In 1. Gordon (Ed.).
Early childhood education. (71st Yearbook of the l'4ational Society for
the Study of Education). Chicago: NSSE, 1972.
Taylor, '1. intercorrelations among three methods of estimatino students'
attention. Report Series No. 39, Stanford Cen+er for rcnearch on
Teaching, Stanford University, 1963.
Ve:dman, D. r.omprehcnsive personal assessment system for teacher education
programs. Research and Development Center for Teacher Education, The
University of Texas at Austin, 1972.
Veidman, D. & Brophy, J. '.1uring teacher effects on OUDII achievement.
Journal of Educational Ps ..hology, 1974, 66 31) -324.
4
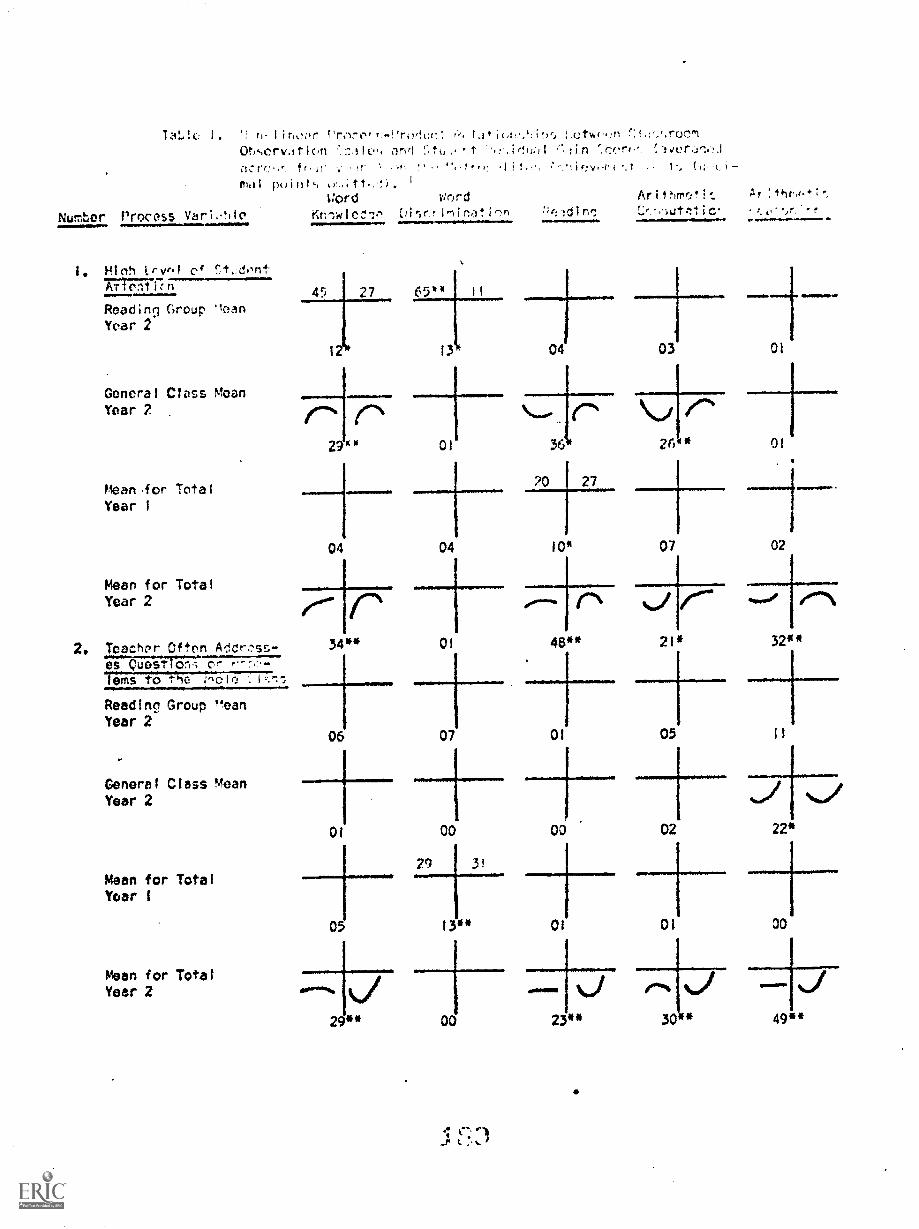
laLic I. rro7o,c.-Pro,!Gr: !A3tvo...:n
01),,ervAtion Orr, Tfverx-I.L1
ff, At' -, !r- .1 i .1
mist puint', 1
Word We,rd
Number Process Vari..!'lle E1kr,r1-111-Ali,-)nmINMEMMINKR. .am.O.amOONNINUIPS Oemommame. .
I. Minh try... of ! lont
7-1717n
Reading Group 'lean
Year 2
General Class MoanYear 7
Mean .for Total
Year 1
Mean for Total
Year 2
2, Teacher Often Adcrss-77.17hams to the ;',c10
Reading Group "earsYear 2
General Class meanYear 2
Mean for TotalYear I
Mean for TotalYear 2
45 27 65w
Ar:lhr4.r. ' fr.-....-.-
110
12 13 04 03 01
04 04 10*
Feg'er +
34** 01 48**
06 07 01
01 00 00
01
02
.0.111.100.0
00 23**
21* 32**
05 1i
02 22*
01 00
30 49**

Tat,10 t , %ontid.
Numbor Process varla1,1e
3. Teacher is Talk
V7 7777,u, L;oesn'tWafe liro
Peadlnp Croup MeanYear 2
General Class MeanYear 2
Mean for Total
Year 1
Mean for Total
Year 2
4. Frenuent Puoll-tc-Punit ihteration1C ass Relev7.nt)
Reading Croup MeanYear 2
General Class MeanYear 2
Mean for Total
Year 1
Mean for TotalYear 2
Word Word
Knowledce Discrlminilflon Re31dinel
24
660* i3
07
Ar1thmr,.icCA1-nut;:tir,-
Ar'101v-1:
30*
01 03 02 21 40 *
47 17 24
07 09 10 02 01
0! ,01 03 01 00
05 -484fr
09 01 06 05 03
31** 46** 34** Cl 220
.591 05
05 01 04 03
01 Of 00 00

Table 1 , Cont'd.
Number Process Variable
5. % of Time TeacherLectures or Lemon-
strafes
Reading Group MeanYear 2
General Class MeanYear 2
Mean for TotalYear 1
Mean for Total
Year 2
6. Negative Affect:Criticism, Hostility
Reading Group MeanYear 2
General Class MeanYear 2
Mean for TotalYear 1
Mean for TotalYear 2
Word Word Arithmetic Arithmetic
Knowledge Discrimination Reading Computation Reaschinc
-46 33
17*
I-67** -02
04
36 33 22 41*
13!!* 16
-57 * *1 29
N190* 06
-32 38
. 29* 15**
,
01 00
01 05
00 00
11 I'N13'fte
92 01 01
02 01 02
04 02 01
01 00 01
41* 05 09
04 02
03
I
oo
00
.11.101111101.4.
00 00 02
r".

Table r:ontid.
Number Process Variable
7. Positive Affect;
EcaLmf.222.Reading Group meanYear 2
General Class "iaanYear 2
Mean for TotalYear 1
Mean for TotalYear 2
8. Requires Hirsh Level
of Generalization,Vire7717773777(Fron-atIon
Reading Group meanYear 2
General Class MeanYear 2
Moen for TotalYear 1
Mean for TotalYear 2
Word Word
Knowleclie uiscrimtna
04
Ot
66** 01
10
De3dirl
0
02 19** 02
01
00
29
-47 32
16
01
51* 13
09
04
00
01
03
18 34
1
01
-----1------
05 04
00 02
Arithmetic Arlthmet?,2
Comnutatir:- Peasrdninc
25**
23 -40
000°' \
12*
K
03
02
02
00
48.11111.1MNIPM
30 51** 07 -51*
"1.20"
~Wm
27*
05 11
02 06
01 00
.0,01
18 28

Table 1 r'xntid,
Number Process Varia!Ae
9, Hillh Student ';1111-
Arayir Pas!-.1vit%or Aimless or
Reeding Group "canYear 2
General Class MoanYear 2
Mean for Total
Year I
Mean for Total
Year 2 411,
Word WordKnowledge Discrimination "...
-43 -44
17**
ArlthmelcCTIhuta'11or
07 07 03 05
01
05 02 34* 30** 05
-22 56**
10, Clarity: SturtShow Clear ;ih,i,yr-
standing ofit'resentationli
Reading Group "eanYear 2
Genera. Class MeanYear 2
Mean for TotalYear 1
Moan tor TotalYear 2
26*
23
01
+ -----I-----01 04 01 00
-35 -45e
02 12* 06 04
40# g'llissiNe
67** 10 56s° ,
07 03
. 06 04
19** 00
21* 32"
62" 06
00 04 01 01 G2
1S4

Table 1 ,
Number Process VarlaMe
11, Enthusiasm: Tc:Ichnr
Shows Enthus13,.7-
17.1tementi Lnjc,yment
Reading Group *leanYear 2
General Class MeanYear 2
Mean for TotalYear 1
Mean for TotalYear 2
12, Convergent Westion-laL Most DurastionsHave Clear-Cut CrxrectRsvers
Reading Group moanYear 2
General Class MeanYear 2
Mean for TotalYear 1
Mean for TotalYear 2
Word Word Arithmetic Arithmetic
Knowledge Discrimination Rqading Comoutaticn Peason:ha
38' 04
53* 41
47* 19
03 01
+- +00 14 01 00 04+ + +
00 00 00 01
53* 16
07
29 -47*
24
05 01 03 01 07
Probability values are indicated by letenisks. One asterisk indicates a value of S. .10;
two asterisks indicate a value of s.05.
185

'etwo,?n
`1,n1 t',,,.i,tuot Scer.!'; (uvr!n,!go't orrnss
cur (1, /t,o "otropelit,In i'rtlievomr.n1 7y-A!", (dc(jt' 11 Doin
omitte(J). I
Word Word
Number Process Vdria'; e Know1ed19 DiscriminAtion 11dinl -----------
Methods of Handily, CrItchzupWork
1, No RI-mediation; CnildSkip-, Missed Work
ND ND ND ND
ND Ni) ND ND
At
ND ND ND ND ND
ND ND ND ND ND
ND ND ND ND ND
ND
NI)
01 01 17" 02 00
2, Child Must Make ltnWork But ls Not GivenHelp
ND ND
ND ND
ND ND NO
ND ND ND
00 01 01 00 02
.--7[-----
07 05 00
3. Teacher Explains Work ND ND ND ND ND
and Has Child Do PartNDof It ND ND ND ND ND
4, Another Chifd isAssigned to Help
03 03
04 47*
04
-61' 23
01
13'
ND ND
Ifte
\14
ND
.004
ND
IN
29'
ND ND
ND ND ND ND ND NO
02
00
02 04
02 00 01 00

Table C.ontsd.
Word Word
Number Process voria!de knowledoe Discrimination
5. Child Put In Slower ND ND
Group TemnorarllyND. ND ND ND
ND
ND 1 ND ND ND ND ND
ND ND ND NDND ND
ND ND ND j ND
ND
ND 1 ND
ND
Readinn
6. Other
ND
ND
ND
ND
ND
ND
ND
ArithmeticComautatio- yeas ;r
ND ND ND ND
ND ND ND f ND
ND
ND
ND
ND
ND ND ND ND ND ND
ND
ND
ND
ND
ND
ND
ND
Nn
ND
ND
ND
ND
ND ND ND ND ND NO
ND
ND
ND
ND
ND
ND
ND
ND
Rules Recardinn r"vsical Movpment7, Must Always Cet
Permission to LeaveSeat
ND
ND
8. One at a Time Without NDPermission
ND
ND
ND
04
ND
ND ND
ND
00 03
ND
ND
ND ND
05
ND ND ND
ND ND ND
ND ND ND
ND ND ND
03
22"
ND
ND
ND ND ND
ND ND ND
ND
ND ND I ND
ND ND 1 ND
ND
14* 01
ND ND ND ND ND ND
ND ND ND ND ND NO
17** ID 24**
ND ND ND ND ND ND
ND ND ND ND ND ND
ND ND ND
ND ND ND ND ND ND
ND NO ND ND ND ND
01 03 02 00
1S7

Table 2 Ccnt'd.
Number Process Variable
Word Word
Knowledae Discrimination ;.4-31dinl
9. As Many as 4 or 5 with-
out Permission
HD ND ND ND ND NO
ND ND ND ND ND ND
ND ND ND
ND ND ND ND ND ND
ND ND ND ND ND ND
ND ND ND
IQ. Can Go Quietly to -50* 15
Specified PlacesWithout Permissionat Any Time
00 03 00
01 57** -23 51**
II. No Restrictions
26* 03
Arithmr;ti,-,COmbutlt:!-,- ;1.:37rn 7 '1C
ND ND ND ND
ND ND ND ND
ND ND
ND ND ND ND
ND ND ND ND
ND ND
-23
00 Q0
* *
24** 20** 60**
oo 00 00 00
12. Some Children AllowedFree Movement butNot Others
ND ND
ND
NO
ND
C/0
ND
ND
ND
ND
ND
ND
ND
N'
ND
ND I ND
ND ND
1
1
ND ND
ND ND
ND
ND ND
ND ND
Ni
ND ND ND ND ND ND
ND ND ND ND ND ND
03 05 05
ND ND ND ND ND ND
ND ND ND ND ND ND
ND ND ND
ND ND ND ND ND ND
ND ND ND ND ND ND
N' N

Table C:cnt'd.
Number
13.
14.
Process Vert:3H°
WordKnowledae
Word
Discrimination RladiniAritnmoicComnutml'o,
Only Monitors AllowedFree Movement
Other
ND ND NI" ND ND ND ND ND ND ND
ND
ND
ND
ND
ND
ND
ND
ND
ND
ND
ND
ND
ND
ND
ND
ND
ND
ND
ND
ND
ND
ND
ND
ND
ND
ND
NO
ND
r4r)
ND
ND
,ir,
ND
erl
ND
ND
'n
ND
?:"
ND
ND
N7
ND ND
ND
r-)
ND
f?r,
ND
ND
ND
ND
ND
ND
NO
ND
ND
ND
Nt1
siL
ND
ti?)
ND
ND
ND 1 ND
W.,
rJD N1
ND
ND
ND ND
ND
ND ND
ND
ND ND 1
ND
ND ND I
ND
ND
Punishments Used Ry Teachers
15. Stay After School
16. Spanking
01
45*
ND ND
ND ND
11
09* 03 0201
-10
ND
42**
ND ND
ND ND ND
ND ND
ND
ND NO
06 00
5
54**
26** 25** 40*
ND ND ND ND ND
ND ND ND ND ND
ND ND
4)6 f ND 39 ND 35 ND
ND
eik.... ND .0,/ ND ...#1. ND
25** 35* 21"*

lanIe 2, '.cnt'd.
Numter Process VariahleWord Word Arithmetic Ar"hrlf,°1%
Knowledge Discrimination Readirl Comnutatic. Peasonine
17. Writing Sentences onBoard
ND ND ND ND
ND ND ND ND
ND ND
ND ND ND ND
ND ND ND ND
ND ND
18, Isolation Within the
ClassroomND ND
ND ND
18
19. Removal from theClassroom
ND ND
ND ND
ND
ND ND
ND ND
ND
ND
ND
02
10* 01 31**
ND ND ND Ni
ND ND ND ND
ND ND
ND ND NC ND
ND ND ND ND
ND ND
ND
ND "1 ND
17 * 18*
ND
03 05
01 00
"7"IFIN.61411
39** 44 **
20. Note to Parents ND ND ND ND ND I ND ND
ND
ND
ND
ND
ND
ND
ND
ND
ND
ND
ND
ND
ND
ND
ND
ND
ND
ND
ND ND ND ND ND ND ND
06 08 05 02
ND ND ND
ND ND ND
ND
ND ND
ND AID
03
ND
ND

Table 2 , Comt'd.
Number Process VariableWord Word Arithmclic Ar!lhme*T:
Knodledge Discrimination Reading ( noutAticr Pr.:ase;nino
21. Send to Principal ND ND ND ND ND ND ND
ND ND ND ND ND ND ND
ND ND ND ND
ND ND ND ND ND ND ND
ND ND ND ND ND ND ND
02 04 01 01
22. Extra Reading, Math,etc., Work
ND ND ND ND ND ND ND
ND ND ND ND ND ND ND
ND ND ND ND
ND ND ND ND ND ND ND
ND ND ND ND ND ND ND
ND ND ND ND
23. Poor Pressure (e.g.,"You Lost the Pace for
ND ND ND ND
Your Group.") NO ND ND ND
24. Scolding
ND ND ND
ND ND ND
ND
ND ND ND
ND t41) ND
00
ND ND ND
ND ND NC
ND
ND ND ND
ND ND ND
ND
ND
\ ND
01 00 23* IS 00
-16 145*-----[-----
18 02 02 01 01
01 00
_591t0 51*0
02 31 *
00 02 03
9 I

Table 2 1%,2nt'd.
Number Process varia!,le
WordKnowiedoe
25.
26.
Discussion of
Incident (No Sooldlnl)
Other
-25 3P
15*
32**
ND
ND
05
Rewardc Used by Teacher
27. Classmatos-Ciao orCheer
28. Special Priyitenes
NO "7
ND
8**
WordDiscrimination qoldrlo
00 05
ND
ND
00
evN r29*
NO 29
ND
01 10'
ND -31 ND
ND ND
15 00
25* 29**
14" 26*
ND ND ND ND
ND ND ND ND
ND ND
29 44*
130*
09
ND ND
ND ND
ND
+-02 03
192
Arithmetic ArithmeticComnutation Reasonihe
CO
28**
ND
ND
01
ND
ND
00
39**
39*
ND ND
ND ND
ND
00
44*
220
ND
ND
0l
ND 51*
ND
27*
46**
-19 -83",`63"
ND ND
ND ND
ND
00

Table 2, Cont'd.
Number Process VariableWord
Knowiedoe
29. Waiver or Reduction of ND ND
AasignmentsND ND
ND
ND ND
NO ND
OS
30. Symbols (Stars, SmilingFaces, etc.)
00
Word Arithmetic Artthmelqc
Discrimination Reading Computation Reasoning
ND ND
ND ND
ND
ND ND
ND ND
0
00
52' 1 46'
04 21 *
31 Tokens Redeemable for ND I ND ND I ND
Other RewardsND ND ND ND
ND ND
ND t ND ND ND
ND ND ND ND
ND ND
t32. Concrete (Candy,
Money, Prizes)ND ND ND ND
ND ND ND ND
ND ND
ND ND ND ND
ND ND ND ND
01 01
193
ND ND
ND ND
ND
ND ND ND ND
ND ND ND ND
ND ND
ND ND ND ND ND ND
ND
07
......
ND ND
02
ND ND
04
ND
.---i......-
02 00 03
63' 01
00 07 06
ND ND ND ND ND ND
ND ND ND ND ND ND
ND ND ND
ND ND ND ND ND ND
ND ND ND ND ND ND
ND ND ND
ND ND ND 1 ND ND ND
ND ND ND ND ND ND
ND ND ND
ND ND ND ND ND ND
ND ND ND ND ND ND
00 01 DO

Table 2, Cont'd.
Word Word Arithmetic Arithmetic
Ntmber Process Variable Knowledge Discrimination Reading Computation Reasoning
33. Jobs (Monitor, Helper, NDEraser, Cleaner)
34. Public Recognition (Getsto Read or Work Problemon Board)
35. Other
NO INND ND Ni) ND
ND ND
1fND /04% tiU
40 30 *
07
03
20
48**
-69** -42
18**
22** 01
04
01 07 01' 01
04 i 01 01 07
ND ND ND ND ND ND ND ND ND ND
ND ND ND ND ND ND ND ND ND ND
ND ND ND ND ND
I IND ND ND ND ND ND ND ND ND ND
ND ND ND ND ND ND ND ND ND ND
ND ND ND ND
27 [35
NDtsmpteztesatirWaLments
. oo Short or asy
05
ood"%
03' 00 10* 01
9* 08 1-53** 34 -51**
10* 04 25* 17** 05

Table 2 Cont0d.
Word Word Arithmetic Arithme+fc
Number Process Variable IKnowledge, Discrimination Reading Computation Reasoning,
37, Wring, Repetitive, 45*
Monotonous
38. Too Hard: Students
20** CO
01 Co
Can't Get Startedor Continually NeedHelp
01 02
ND 48* ND
ND ND
00 03
39. Continued ActivityToo Long, Until ItSets Boring
40. No InappropriateAssignments
1hoe
15* 17* 02
04
-571 ND
NO
03
00
ND
ND
00
08
04
11MMIdll!
04
05
35**
06
00
ND
NO
06
06 01 Ott
I i
-#5* 33 -49* 39* -49*
10* 20** 30**
20 40 28 44*
05 16** 12* 06
1
61* 07 47* I 06
00 05 03 04 01

Table 2 a Confide
Number Process Variable
Word Word Arithmetic Arlthmatic
Knowledge, Discrimination Reading. Comoutatic., Peasonlnq
Distractions: What do Studentsen Tbo WATno
se as raom
42. Retpeatedly Get Supplies
for Free TimeActivities
43. Watch Reading Group orOther Activity
44. Talk
00 01 00 00
00
00
05
35**
90*
" %ern, rib ..,00 dol
06 00
03 00 00 02
-22*
37** 30*
24*
23*
01
ND
ND
03 12* 03 00 00
19* 46 32"
04 22*
-27 -35 -31
12* 17** 11
00
-46*
%,/
52**
01 00 02 00
ND ND ND ND ND ND NO ND ND
ND ND ND ND ND NDND ND ND

Table 2, Conted.
Word Word Arlthmotic ArTthmelcNumber Process Variable Knowledge, Discrimination at111.2.1 Computaflon Reasoning
45. Play
46. Daydream
47. Ask for Help or LookMore Closely atWork on Board
1/400 °N
00 05 00 18*
-47* 23
00 33*
00
-48* -25
06
8 * *
02
01 04 10
L49* -04
I
,* If +06 02 00
01 07 28" 00
Of
.69** _to
A J A20 * 05 06
12* 12* 01 01
48. Disrupt Other Students
00 01 01 00
eN
17 06 30** 02
197
02
00
01

Table 2, Cont'd.
Number Process variableWord Word Arithmetic Ar tbme+
Knowledge Discrimination Reading Comoutat i on Reason flq
49. Other 26 ND ND -23 ND ND BI-/ ND ND ND fl ND ND
15'' 03 13** 34 04
ND ND ND ND ND ND ND ND ND ND
ND ND ND ND ND ND ND ND ND ND
Student Attitudes Towardthe Teacher50. When Having Trouble
Students Concentrateor seek Help
ND ND ND I'D
02 01 00
48" 00Mt
37** 05 29**
51. When Having Trouble -68** -'0 -6800 -10Students Merely Copyfrom Neighbor
1 1
08 1 4** 05
.47** 10 -51* 09
52. Students Work as WellWhen Not Watched asWhen Watched
03 02
01
20w*
01
01
16*
01
NO
03
22°
ND
ND
00
03 00 05
27** 02 05
00 02I
05 03

Table 2, Confer!.
Word Word Arithmetic ArithmloNumber Process Variable 100wiedge Discrimination Reading Comoutation Reasoning
53. Students "Act Up"When Unwatched
00 04
18 00
54. Students Seem Amusedby Teacher
ND1
ND ND
CO 00
ND ND ND ND
ND ND ND ND
04 00
55. Students Seem to Fear ND ND ND NDTeacher.
.ND ND ND ND
ND ND
ND I ND ND ND
ND ND ND ND
00 01
01 26**
I 1ND NO
ND ND
00 01
ND ND ND ND ND ND
ND ND ND ND ND ND
08 05 02
ND NO ND ND ND ND
ND ND ND ND ND ND
ND ND NDii
ND ND ND I ND ND # ND
0f
21*
00
ND
ND ND ND ND ND ND
02 00 00 02 02
56. Students Seem toRespect Teacher
02 02 00 Of 00
04 03 06
193

Table 2 Cont'd.
Word WordNumber Process Variable Knowledge Discrimination Readlno
Free Time Materials Available(Not Necessaril Used)7.811oks -10 -45'
19
OND N
ND ND ND ND
04 07
ND ND
58. Learning Centers (My) ND ND
01 04
33 -50** 55** -12
/ \ i "%ft
24** 14*
59. Listening Centers
00
56**
0/f
-41
24"
1
60. Visual (Picture Files, 74** -12Filinistrips)
DI
00
32*
02
-28 --54**
29*
ND ND
ND ND
ArithmeticCOmoutation
Arlthmesicclsas,:ninq
-38 -30 -33 746*
ND
10*
ND ND
16*
ND
ND ND ND ND
10 01
04
331
ND
00
re
33*
V V15*
37**
08
03
00 01 01
°I\ V
01 03 20* 33** 12

Table 2, Cantle.
Monter Process Variable
WordKnowledge
61. Science Etmonstratlons ND
or Experiments ND
1
02
-25 ND
ftiommi ND
29*
WordDiscrimination Reading
ArithmeticComputation
Arrthmein.Peasonno
ND ND ND M.,,
ND
19*
-03
\
ND
ND
01
ND
ND
00
ND
ND
VI)
ND
ND
......,
21**
ND
02
ND
00
ND
05
ND
62. Other Learning Centers ND ND ND ND ND ND ND MR ND ND
ND ND ND ND ND ND ND ND ND ND
03 00 00 02 04
ND ND ND ND ND ND ND ND ND ND
ND ND ND ND ND ND ND ND ND ND
63. Coloring Pictures
64. Pointing, Art Activities
04
00
r16*
04 04 03 03
05 01 01 00
06 00
33
00
-33
03
09 16* 01 06
-16
04 00 02
I59*
00

Table 2 Cont'd.
Word Word Arithmetic Arithme*IcNumber Process variable Knowledge Discrimination Reading Comnutation Reasoning
65. Games, (Any)
66. Instructional Games
67. Non - Instructional
Games
66, Aquarium, OtherLooking Exhibits
00
71** -43
it
31**
I-56** -06
03
00
51* -01
02
02
00
20*
05
06
00
05
I00 oo 01
11* 33*s
01 01
00 00
02 16*
02 22**
%./
02 22*
38*
01
03
00
H--06
00
14 02 05 01 00
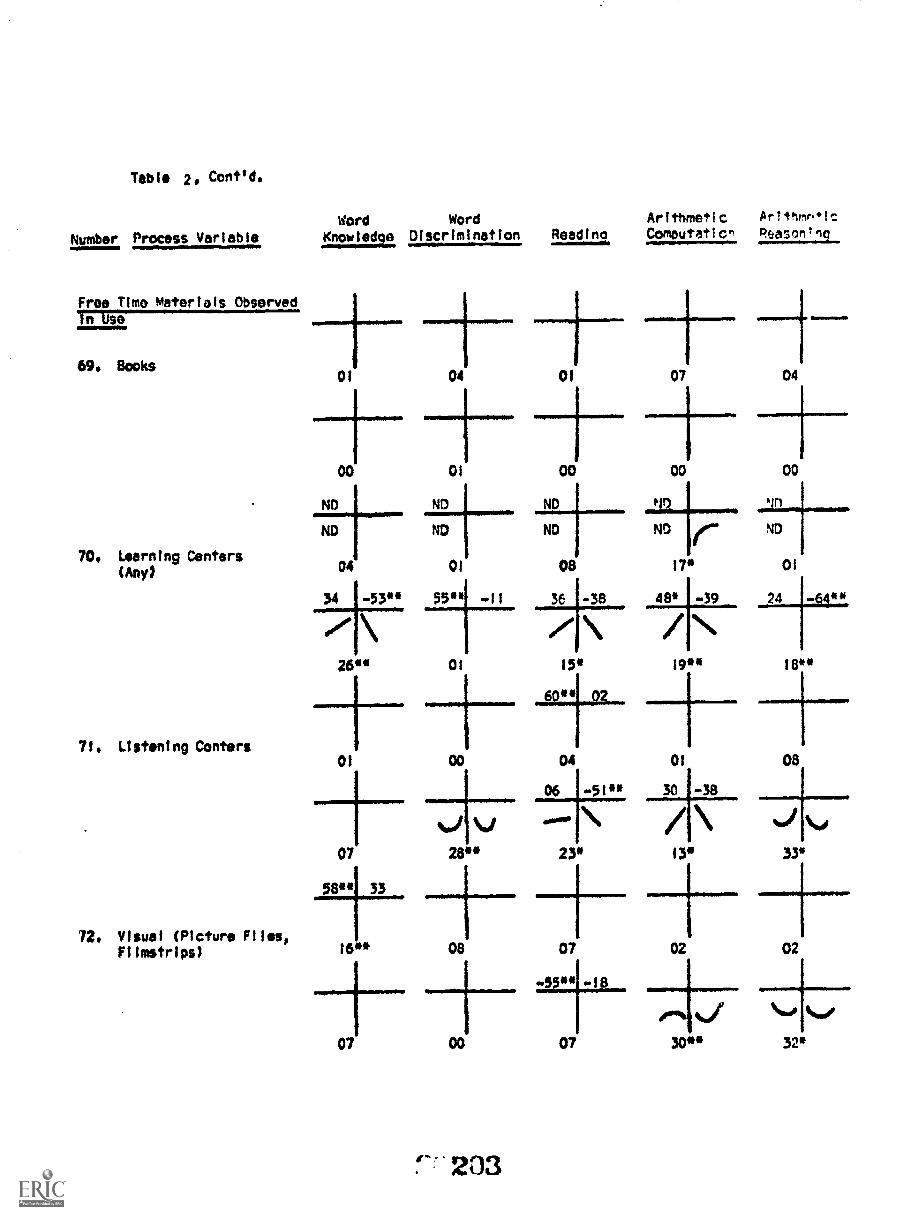
Table 2. Cont'd,
Word Word Arithmetic Artihmroqc
Number Process Variable Knowledge Discrimination Readlna CovoutatIc.., Reasamine
Free Time Materials ObservedIn Use
69. Books01 04 01 07 04
00 01 00 00 00
70, Learning Centers(Any)
71. Listening Centers
72. Visual (Picture Files,Filmstrips)
NO
ND
04
34 -530°
.# \
26**
01
ND ND
ND ND IrIrl
ND
.22.1..m...m.
ND
01 08 17*
55* -II 36 1-38 48* -39
I01 15* 19**
6041411 Ql..
00
%./
07 28**
58** 33
16**
07
08
00
203
01
24 **
04 01 08
-510* 30 -38I06
\.0
23* 13* 33
07 02 02
07
00q %..,
30" 32*

Table 2 , (ont'd.
Word Word Arithmetic ArithmeticNumber Process Variable Knowledoe Discrimination Rea Comoutaticn Reasoning
73. Science Demonstrationor Experiments
74, Other LearningCenters
75. Coloring Pictures
76. Painting, ArtActivities
N
ND
ND
22* 22*
ND ND NO
02
0
ND
ND
Nn
ND.hIP NWWWWWW 1
ND
01 03
ND ND ND
04 14
ND ND
02 06
ND
um I NO
ND ND
10* 03
02
I
00
13
01 01 00
03 00
01 27**
15* 04
2C .1
200
13
03
08
00 01

Table 2 , Conttd.
Number Process Varlablo
77. Games (Any)
Word Word Arithmetic ArIthmoroir;
2211121z! Discrimination Reams dina Computation Reason:no
I +00 02 00
79** -34 -11
30 * 29** 01
I53*
76, Instructional Games
00 02 02
02 01 Cl
79. NonInstructionalGames 03 00
04 02 02
80. Aquariums, Otherbooking Exhibits
NDND
01
2'5
01
ND ND
ND ND
11*
00 01
40** 39"
eN IN +15** 01
02 08
00 29*
04 10
NND
07
NO
01
02
ND ND
00

Table 2, Cont'd.
Word Word Arithmetic ArithrlcNumber Process Variable Knowledge Discrimination Readln2 Comoutetion Reasoning
81. Use of Pear Tutoring
82. Assigns HomeworkBesides Seatwork
01 01
02 03
02
37** 28
21
83, Teacher SometimesUnderreacts to Control 02 15*
I-52*
Problems, So SeriousProblems Go Unresolved
ND ND ND NO
ND ND ND ND
09 02
00 01
66ww
02
26 -73** 32
00 21** 20*
12* 03 01
43 01
Sift"
22**
%se
00
Probability values are Indicated by asterisks. One asterisk indicates a value of C .10;two asterisks indicate a value of
2

Table 3. Nom-linear Process-Product Relationships between Coder Retinasand f,tudent !:esidual (lain Scores (averaged across four years)on the Metropolitan Achievement Tests (decimal points emitted).'
Numbor Process VariableWord Word Arithmetic Arithme'it:
Knowledge Discrimination Readlnq Computation Peasrmlnq
Coder Ratings
I. Typical Affection-ateness Lcvoi 07 02 29* 04 01
%poOf simft4,46
01 04 02 14* 03
.52* 44*
2. Most intense AffectionExpression Observed 25** 00 05 08 56**
07 24
01 10*
1
01 17* 01
-28 42
3, Most Intense Negative
[
Affect Observed 03 03 00 15* 02
14* 00 00 00 08
Solidarity WithClass: TeacherIdentifies, Promotes"We" Feeling
33*
00
03
2.
37*
Loi
29**
00
01 00

Table 3 Cont'd.
Word Word Arithmetic Arrthrrf*Ir;
Number Process Variable Knowledge Discrimination Reading Computation Reas-dni22_
5. Patient and SupportiveWhen Correcting 04 00 01 00 OQ
6. Students AllowedChoice in Assignments 00
7. Accepts Student ideasand/or Integrates Thominto Discussion
6. Admits Own Mistakes;Laughs at Self orUses Occasion to Teachor Motivate
03
16, 00
31
32 j-42
19 * 1
76** -30
00
00
06 31
10*
*
0 04
0
0
06
04
0
* *
0
-13 -56"
04
021 J 01 -J-

Table 3 Cont'd.
Number Process Variable
9. Usually BendsClose, Gets Downto Child's Level
10. Goes to Seatsto Check Work;Doesn't Stay atDesk
11. Usually Speaks toIndividuals ratherthan Whole Class
Word Word Arithmetic ArIthme.ic
Knowledqo Discrimination leading Computation Reasoning
140* 08 04 00 02
01 00 Ot
00
-13 -54**
19**
01
0."% N\o0
43**
16
00 -55** II i -52**
02 02
21**
\
02
03
12. Uses Advance OrganizersIn Introducing ActivitleS 09
00 0
21 :9
03 QQ 00
0 *
71'IV
0 0

Table 3 Cont'd.
Number Process Variable
13, Gives Complete, DetailedInstructions; PreventsErrors before TheyHappen
14. Students Eager toRespond; No Fear
15. Teacher Watts Patientlyif Student Doesn'tRespond
16. Non-CompetitiveAtmosphere; No Signsof Eagerness to SeeOthers Fail
Word Word Arithmetic Ar!thmetic
Knowledge Discrimination Reading Computation Reasonimo
i01 36
10* 04 01 41* 00
01 00 03 0! 06
03 06 07 04 00
12 -42 45
05 01 13* 29**
44 -31
02 18* 00 02 02
-32 -47 -43
00 05 II*
ie% ieN
0l 23* 34** 45**
17*
36**
06 00
210
290* 30* 04

Table 3, Cont'd.
Number Process Variable
17. Students Allowed toWork In CooperativeGroups
18. Teacher RecognizedGood Thinking EvenWhen It Doesn't Leadto "Right" Answers
Word WordKnowledge Discrimination Reading Computation ReasonInc
Arithmetic Arithmeic
Pt19*
deN 0" /N1117* 30*
1
68* 10
03 10
19. Democratic Leader-ship Style: StudentS 04
Share in Planningand Decision Making
20. Few Restrictions onStudents DuringSeatwork Periods
01
01
01
"1 V v32* 16*
07 52** -45 37
ftimmi. 000° \ /24**
30*
01
II28*
0
61** 26
dloo'f 0-44, r-20** 32*
0
18** 25"
26** 24*
00 03
01 03
Of 00
02 00

Table 3 Cont'd.
Number Process Variable
21. Students Expected toCare for Needs withoutGetting Permission
22. Teacher Concerned withSubstantive Content,Not Form, or StudentResponses
Word Word Arithmetic Arithmetic
14howledRe Discrimination Reading Combutation Reasontio
22 1 41
14**
440*
0t
02
03
08
-06 54**
"Iftwo
26*
03
1
-12 47*
06
07
08 1 64N*
231*
01. 28** 31*
03 11* 02
23. Teacher Stresses Fact-
ual Realism, Rejects or 00Corrects Childish Idealism
24, Teacher Credibitity:Students Seem toBelieve and RespectTeacher
04
09 11
01 27* 03 03
53* 14
10* 02 20* 00
VA18* 03 01
-02 1 45*
06 03 19* 03 00

Table 3, Cont'd.
Number Process Variable
25. Showmanship: Teacheris Melodramatic,Expressive, Gushy,Emotive
26. Teacher GetsAttention beforeStarting, Doesn'tTry to Talk overDin
27. Chaotic, UnplannedPoorly Scheduled
28. Teacher Seems Confident,Self-Assured
Word Word Arithmetic Arithmetic
Knowledge Discrimination Reading Comoutation Reasontrio
all
01 01 01
49*
18*
.43
08 00
40#1
21**
.05
02
45*
09 07 27* 00 00
53**
"IN %awe iem
63**46"
%sof dr
30**
ND
ND
01
NO
ND
06
-20
14**
23
26* 24" 47**
-10 47*
NS14**
ogoe
00 01 01 24*
4000"
05 22* 00 00 00
07 04 04 01 00

Table 3 , Cont'd.
Number Process Variable
29, Politeness: TeacherRegularly Says "Plane,""Thank you," etc.
30. Nigh Concern AboutAchievement
31. Room Is Attractive
52, Teacher Gives MuchEncouragement toStudents
Word Word Arithmetic Ar!thmi...1t
Knowledge Discrimination Readino Comoutaticn Reas-.rOnc
el vn00 34** 24*
00 25**
ri
00
05 02
651 02
01
05
36 45*
05
55* 4
01
7
20** 12* 10*
04 00 00
00 00 01
00 02 00
,0; '.t.
31** 67**
01 02
00
00
N.
26**
-55** 10 .44I19
woo.
21**
4414%, oPsPose
21*
01 01
01 04

Table 3 Cont'd.
Number Process Variable
WordKnowledge
WordDiscrimination
21 41
o/ i',33, Room is Uncrowded
34** 16 **
..001
32** 00
32 41 53* Or
34, Teacher Explains Rulesor Decisions WhenReasons aren't Obvious
16** 09
15
50 4211
EN. (IN33**
55* 09
35, Teacher Well Organized,
Prepared , 22 10*
36, Teacher RegularlyMonitors Class, KnowsWhat's Going On
01 00
34 t 31 53* 1 08
1211
%Nod EN
5000
Arithmetic ArithmeicReadinp Computation Reasoning
i40 50** 60
22 ** 19*
\Remo A ...of ieN
26* 27* 07
04 00 00
00
04
04 10
-47 27
16* 02
03
05 00 00
%NJ
37** 32** 01

Table 3 Cont'd.
WordNumber Process Variable Knowledge
37. Smooth, EfficientTransitions, LillieTime Wasted
38, Monitors Determined"Automatically" by aSystematic Procedure
50 47*
24**
45* 14
00
41 29
14**
18*
39, "'Busy," Cluttered
Classroom
40, Students Compliant,Obedient
00
Word Arithmetic Arithmetic
Discrimination fluam Computation Reasoning
64 15
16
13**
01
00
1
-40 38
N, 0/
01 18"
08 37
12* 02 02
00
41 44*
17* 08
25** 07 03
01 01
-16 ..43*
02
01 04 01
01 Cl 02
07 05
21**
05 01
46** 00 56**
01
32**

Table 3, Cont'd.
Word Word Arithmetic Ar!tftme+1,-,
Number Process Variable Knowledoe Discrimination Readin9 Comoutation Reasonino
41, Teacher Gives OverlyExplicit, RepetitiveDirections
42, Well EstablishedRoutines Minimizeinterruptions; RoamRuns "Automatically"
134 *
18
08
480a
03_ -51** -62*
1. N%
240* 31* 28**
03 03 17*
05 07 00
581-11
18* 44** 30**
4510
eN30*
-831 17
01
35**
1 Probability values are indicated by asterisks. One asterisk Indicates a value of C.10;
two asterisks Indicate a value ofli.05.
217
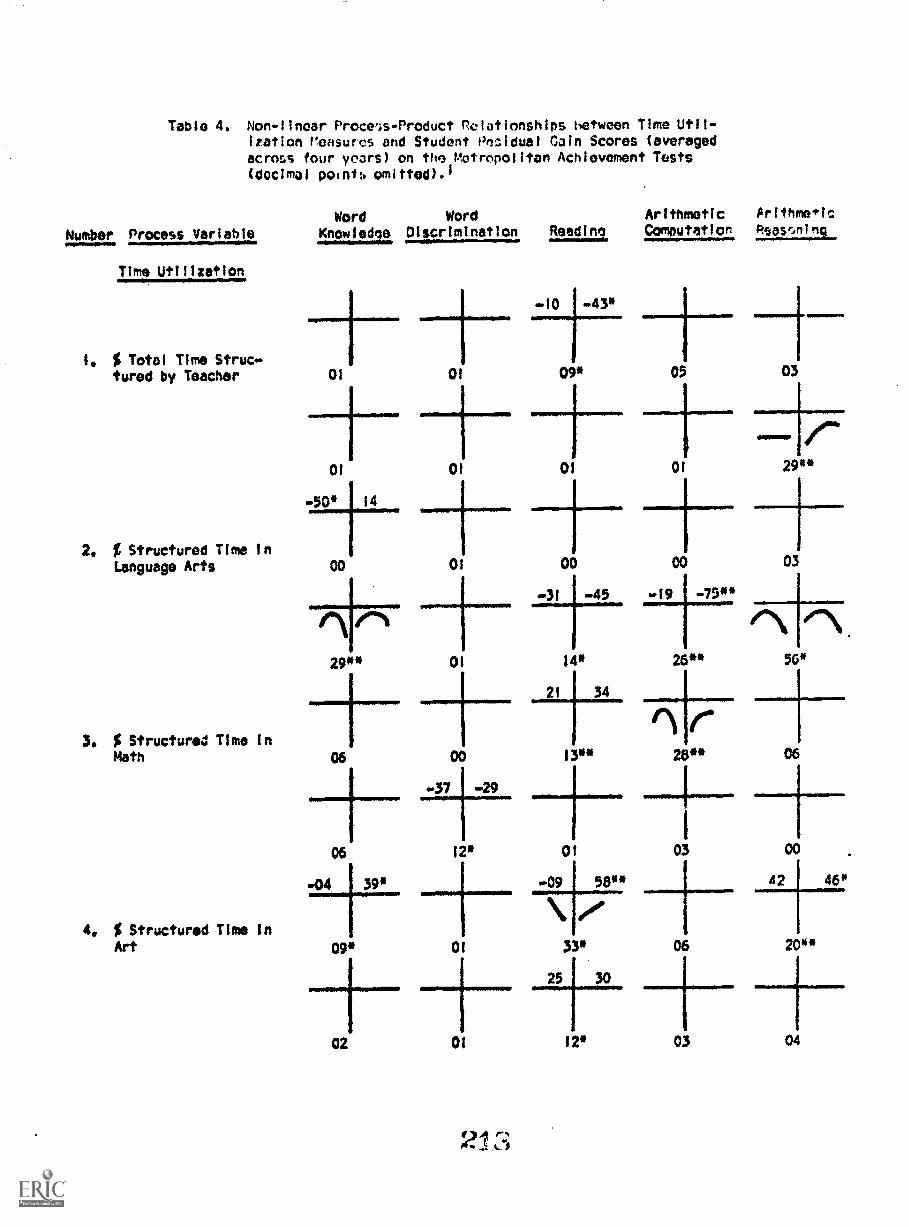
Table 4. Non-linear ProansRroduct Relationships between Time Util-ization i'ensuros and Student Prrzidual Gain Scores (averagedacross tour years) on the Metropolitan Achievement Tests(decimal points omitted).1
Word Word Arithmetic Prithweic
Number Process Variable Snowledge, Discrimination. Reading Computation Rsascm Inc
Time Utilization
1. $ Total Time Struc-tured by Teacher 01 01
0t
40* 14
2. t Structured Time InLanguage Arts 00
"N P1
29** 01
3. $ Structured Time InMath
01
01
4, $ Structured Time InArt
06 00
w3t2906 12*
-04 39* 1
09* 01
02 01
-10 1 -43*
09* 05 03
41011111=1111,1M
01 01 29**
oeb
00
..31
00
-45 -19 -75**
I 1
'1\14* 26** 56.1
21 34
13" 26** 06
01
-09
03
56"
00
42 46*
33*
25
06
30
200*
12. 03 04

Table 4 Cont'd.
Number Process Variable
5. % Structured Time inSpelling
6. % Structured Time InReeding Groups
7. % Structured Time InSocial Studies
8. % Structured Time InTransitions
Word Word Ar thrreti = Ar!ttr.t:"!'.:Knowledge Discrimination Readina Comnutatio0. Pea:,,n,nc
22* 01
30** 25*
38 54* -34
13* 21**
r
V27**
.......
30*
1'-
39 40*
/ \22**
33**
52* -42*
25*
-84**
20**
39
2** 11
20* 00 00 06 13
00 01
.....1.----
00 00
44 I -46
20* 01 00 20** 35**
V A ,35** 18* 43** 00 01
37**
demN
46**
21
et\
28** 29** 54*

Table 4 Cont'd.
Number Process Variable
9. % Structured Time InMorning Routine
10. % Structured Time inSpecial Activities
II. % Time Spent InStructured Seat-work
12. % Time Spent in
Free Choice Seat-work
Word WordXnowledoe Dis Timination
MMOMIIINUNIUMPIONMP 0.11.111NP- .11.MPOPIPOR.R.O.awNPMP
01
03
Arithmetic Aritbme+Ic
Reams dina Computation Reasoning
01
01
-----1.....-
0Q 01
-5900 -02
0
00 03
02 01 03
ND ND
ND
+ND

Table 4 Cont'd.
Number Process VariableWord Word Arithmetic Ar:thm'Ic
Knowledpe Discrimination Reading Comnutatic- Pe.:asr,n7na
(3. % Time Spent WithLeader Othor Than
TeacherND ND ND I ND ND ND NO ND ND
N D
Oi
ND
01
ND ND
16
ND ND
01
ND ND
00
ND
1 Probability values are indicated by asterisks. One asterisk indicates a value of4:.10;
two asterisks indicate a value of .05.

Table 5. Non-linear Process-Product Relationships between Lesson PresentationVariables and Student Residual Gain Scores (averaged across four
years) on the Metropolitan Achievement Tests (decimal points omitted).)
Number Process VariableWord
Knowledge
-32 1 37I. Uses Advance
Organizers
16*
-44 50*2. Review of Old
Material
26**
3. Presentation ofNew Material
00
4. Practice of NewMaterial
03
S. Summarizing Review42** 5Erm
\ /41**
6. Teacher-afforded-64** 46*
Evaluation
30**
ND ND7. Elicited Student
ND NDSelf-evaluation
05
8. Instructions for-47 33
N4Follow-up
18**
Word Arithmetic Arithmetic
Discrimination Reading computation Reasoning
05
00
02
-04 49*
18*
1
-53* I 33
19**
43*
ND 1 ND
ND ND
05
03 65**
37**
'11
01
01
02
00
06
21** 00
06
-48* 1 28
02
ND ND
ND ND
01
°I4N
1800
ND i ND
ND
02
00
ND ND
ND ND ND
04 01 03 05
01 01 02 00
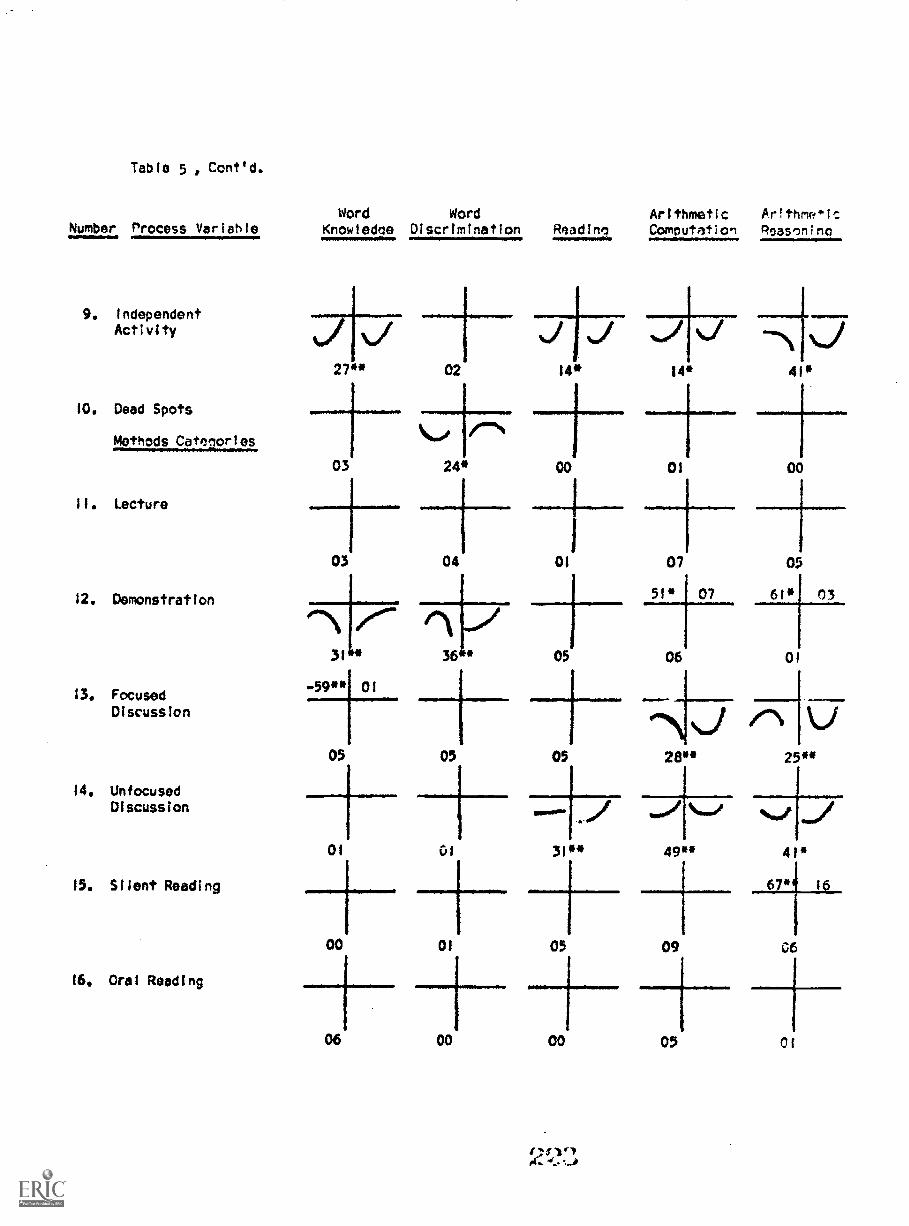
Table 5 Cont'd.
Number Process Variable
9. IndependentActivity
10. Dead Spots
Methods Categories
II. Lecture
12. Demonstration
13.
14.
15.
16.
Word Word Arithmetic Ar1thmoticKnowledge Discrimination Reading Computation Reasoning
27** 02 14*
03 24* 00 0I
03 04 01
31 36 05
Focused-59** 01
Discussion
05
UnfocusedDiscussion
01
Silent Reading
00
Oral Reading
06
05 05
01 31** 49** 41*
1
-----1.----- 67* I
01 05 09 06
.....f...--
07
51* 07
41*
00
05
61* 03
06 Cl
28** 25**
00 00 05 Cl

Table 51 Contld.
Number Process Varinhle
Word Word Arithmetic Ar!thme+ic
Knowledge Discrimination Reading Combutatio.1 f701,50ning_,
Drill-21 1 29
0"15 01 04 01 05
Problem-solving -28 W3** 27 65** 57** 38
Materials Categories38** 30we 33" 14* 12
19, Standardized
20.
21.
1
In mi Jr-51* 51* .18 41
0, ...my
40** 22* 28" 26" WI
Teacher Created6
u6 21* 39* 05 03
A/V Aids58*
..01 /IN
29** 01 37** 00
22. Games /Activities
23. Learning Centers
D e r e÷ a c 21 ...12 .....1d i v i L.........1u a
a on
24. Groups
ND ND ND ND ND
ND
07
ND ND
ND
03
ND
ND
00
ND ND ND
ND
ND
18*
\ft....
ND
NO
06
ND
ND ND ND 1 ND ND ND ND 0 ND
-17
ND
ND
00 01 00 01 05
11.14.01.
20* 02 02 13* 01

Table 5 Cont'd.
Number Process Variable
25. Pairs
26. Individuals
27. Uses non-patterned turns
Word Word.....2i(nc112091 Discrimination iteadind, Computation taitalla.
Arithmetic ArIthmesic
ND
a'N ND
20 01 00 14* 33*
ND ND -35 ND ND
ND ND ND .....\ ND
144-4/ \24 *
-72" -43
31"
44 36
00 IA** 01
.001 %woe
26**
07 04 01 00
1
Probability values are indicated by asterisks. One asterisk indicates a value of < .10;
two aster1sks indicate a valua of;S.05.

Table 6. Non-linear Relationships between leacher Process Variables from theExpanded Prophy-Good N'sorvational !'sistem (morninn observations/ andStudent Residual Hain f)cores (averaoed across four years} on the
Metropolitan Achievemumt lusts (decimal points omitted),I
Number Process Variable
A. Sclintins Pasnendentsto .?:..asticn.i
1. %, Preselects RoseondentWore AskIng luostion
Word Word Arithmetic Arlthrr,tIc
Knowledee Discrimination Reedinn Comnutatlen P7:lsoniri
04
45 -35
01 00 16**
-52* 13
Ss, woo'
00 13*
2. Calls on Non-Volunteer02 23"
05 03
-27 39 -15 50"
3. Calls on Volunteer17* 24*
4. Student Calls OutAnswers
01 24*
1
02 01
211
08
42'
01
55** -39
23* 01 23*
03
.55** 58**
04
09
01
07
33** 23K*
02 06
01
09 -48'
15*
05
48"

Tab lo 6 , Cont'd.
Number Process VariableWord Word Arithmetic ArIthmettc
Knowledge Discrimination fleclinct Computation Reasonino
B.
5,
Difficulty Levet77177Frons
Process Questions/PrOCOS$ Product 01Questions
20*
-05
6. Choice Questions/
I63**
Process + Product 01+ Choice
01C. Oualltv of Children's
-56* -31Answers
7. % Correct
8. 5 Pert-Correct
01 00
02 02 06
01 . 02
-60** -13 -40 -60** -14
08
01
00 01
e3fr".,fc.
05 16" 11

Table 6, Cont'd.
Number Process Variable
9. $ Wrong
10. % "Don't Know"
11. $ No Response
0. TPachPr rmactionsLorrocr Ans*erS
12. Praise
Word Word Arithmetic Arithr*t1cKnowlcdca Discrimination Resdina Cembetetion Peascntno
V.24** 01
-44 49* -50* 21
0/e
25** 14*
31** 03
00
p27*
37*
00.
27**
13
26* 02
-38 33
05
68** 21
37*
V A33*
03
19** 28**
26** 07
00
39**
05 00 06
01 01 04 00
05
03

Table 6 Cont'd.
Numbm. Procegs VariableWord
Knowleden
ND NP
ND ND
13. CriticismND
ND NU
ND ND
ND
14. Failure to GiveFeedback
Word Arithmetic ArithmeticDiscrimination Reading Comeutation Reasoning
ND
ND
ND
ND
ND
ND
4
ND ND ND ND ND
ND ND ND ND ND
ND ND
ND ND ND ND ND
NO ND ND Ni) ND
ND
ks,
ND ND
ND ND
ND
ND ND
NO ND
ND
n00 31* 39** 27** 31**
05 01 01 00 00
15. Process Feedback
ND ' ND ND ND ND ND ND ND ND ND
ND
00
-44
ND
63**
ND
02
-24
ND ND
00
48* -31
ND
56**
ND
01
ND ND ND
\/36** 08 29* 03 10
-58* 32 -49* .01 -79* 12
\ /116, New Question17* 01 11 0i 30
52* 11
05 Dl 06 01 01

Table 6 , Confide
Number Process Variable,Word
KnowerDiscriminationownIPORNI~O.11161...
WordReadlno
Z. leacher Reactions toND ND ND ND NO ND
Part;torrect Answers,ND ND ND ND ND ND
17. PraiseND ND ND
tt
ND ND ND ND ND 1 ND
ND ND ND NO ND ND
ND ND ND
ND ND ND ND ND ND
ND ND ND ND ND i ND
18, CriticismND ND ND
ND 1 ND ND ND ND ND
ND ND ND ND ND ND
ND ND ND
ND ND ND ND ND ND
ND ND ND ND ND ND
19. ;allure to Give
Feedback ND ND ND
ND ND ND ND ND ND
ND ND ND i ND ND 1 ND
ND ND ND
ND ND ND ND ND ND
ND ND NO ND
20, Process FeedbackND Ni) ND
ND ND ND ND ND 1 ND
ND
ND
ND ND
ND
ND ND
ND
ND
230
Arithmetic ArithmeticComoutation Peascning
ND
ND ND
ND
ND
ND I ND
ND ND
ND
ND I ND
ND i NO
ND
ND
ND
ND
ND
ND
NO .Nn
ND ND
ND
ND Nn
Nt) Nt)
ND
ND ND
ND
ND
NO ND ND
NO ND Nt
ND
ND ND ND
ND ND ND
ND
ND NU
ND ND
N
ND Nn
ND ND
ND
ND ND,
ND ND
ND
ND
ND I ND
ND # ND
ND
ND ND
ND ND
ND
ND NO
ND ND
ND

Table 6, Cont'd.
Word Word Arithmetic ArithmeticNumber Process Variable Knowledge) Discrimination Reading Computation Reasoning
21. Gives the Answer
22. Calls on SomeoneElse
23. Anoth6r StudentCalls Out the
ND
ND
01
ND ND NO
ND
/ND ND ND
116
51** 04 04 03
05 02 00
ND ND ND
ND ND ND
02 05 22 51** 02
29**
ND
'36**
ND
ND de) ND
01
ND t10
ND ND
ND
741-3-1-C7.01 00 02 24*
ND ND Ni) ND ND ND NO ND
ND ND ND ND ND ND ND ND
ND ND ND ND
AnswerND ND ND ND ND ND ND ND ND ND
ND
03
ND
ND ND
00
ND
ND ND
01
ND
t ND ND
01
Ni)
ND ND
02
ND
ND
6011
ND
24. Remeats, Rephrases,
ND ND ND ND
or Asks New Question 08 05 00 46* 19*
02 01 00 01 0
231

Table 6 Cont'd.
Numbnr Process VariableWord Word Arithmetic Arithmetic
Knowiedoe Discrimination Readino Comnutat1on Roasoninn
ND ND NO N!) ND ND ND 1 ND ND
ND ND ND ND ND ND ND NND1 ND ND
25. Repeats Question01 02 10 06 00
ND ND ND ND ND
ND ND #0" ND ND ND
26. Rephrases or GivesClue
00
ND 50*
ND
19**
06
12*
00
ND
ND
43*
00 01
06 50*
09 01 00 02
Ni) ND ND ND ND
ND ND ND ND ND
27, Asks New Question04° 03 . 41* 46** 10
ND ND ND I ND ND I ND ND NO fir.) "ND ND ND I ND ND I ND NO ND !4U ;ID
07 031 03 00 Of)
F. Teacher Reactions to17r767.M611--- ND ND NO 1 ND ND t ND NI ND N'd N')
ND I ND ND I ND ND I ND ND NU U L: N..:
26, FraiseND ND ND ND N!)
ND ND ND ND ND ND ND ND ND ND
ND NI) ND. ND ND ND ND ND NU ND
ND ND ND ND ND

Table 6 Cont'd.
Number Process VariableWord
Knowledoe
ND ND
ND ND
29. CriticismND
ND ND
ND ND
00
ND ND
ND ND
30. Failure to GiveFeedback ND
-46 ND
ND
301111
ND ND
ND ND
31, Process Feedback
32. Gives thP Answer
04
-09
l0
ND
Word Arithmetic ArithmeticDiscrimination Readlne Comnutation Reasoninq
NO
ND
ND
ND
ND
ND
ND
0
ND
-33
ND
ND
17*
£10 ND ND ND I Ni) ND ND
ND
ND
ND
ND
ND
ND
ND
ND
ND
ND
I ND
ND
ND
ND
ND
NI)
ND
ND
ND
ND
06
ND
ND
ND
ND
02
NO
ND
ND
ND
12
ND
ND
ND
ND
NL:
ND
ND
ND
ND
-19
ND
ND
ND
ND
ND
ND
ND
ND
00
ND
NO
29**
ND
ND
ND
01
ND
ND
ND
23**
ND
£40
ND
ND ND ND ND Ni NU
05 01 03 01
44*
00 02 00 03
ND
36**
-18 -40
12*
ND
ND
39**
04
ND 27 ND 34 ND
NU
27" 12* 07
-23 -51" 36 51**
18** 27" 09

Table 6, Cont'd.
Number Process Variable
33. Calls on Someone Else
Word Word
Knowledae Discrimination Readino Computation ReasoninaArithmetic Arithmetic
01 05
03 04
34.
35.
Another StudentCalls Out theAnswer
Repeats, Rephrasesor Asks NowQuestion
ND ND ND
ND
04
ND ND
07
ND
02
ND
00
54* 1
01 01
03 00
36. Repeats Question43** 00
02 01
-64** 20 ND
27* 00
..55** 0i
N D
03
-72** 05
ND
01
ND ND
05
ND ND
01
ND ND
ND
ND
ND
04
ND
ND
ND
00
ND
ND
ND
05
ND
ND
ND
-03
09
44
ND
-24
01
ND
02
ND
ND
17** 00
34 1 37
ND
01
57* 179
10 13*
-17 53**
12
ND
04 11*
ND
46*
o'N
03 42 04

Table 6 Cont/d.
Number Process Variable
37, Reohrases or GivesClue
Word :'?rd Arlthr rtty ArMJ.4mr:qq...
Knowlecic3 .11nation Readinn CombutItic-
ND ND ND ND
ND ND ND ND ND
09 03 18 04 05
63* 15
04 08 07
ND ND
ND ND
38. Asks New Question
ND ND
ND k./ ND
00 00 17 24*
00°1 OPIN rum%
34** 21** 06. 07
G. Teacher Reacilons to ND ND ND ND ND ND ND ND
177777+irn-3767---- ND ND ND L ND ND ND ND NDMIR=39, Criticism ND
ND ND
ND
ND ND
ND
ND ND
ND
ND ND
ND ND ND 1 ND ND ND ND ND
ND ND ND ND
ND ND ND ND ND ND ND ND
ND ND ND ND QED ND ND 110
40. Failure to GiveFeedback ND ND ND ND
ND ND ND I ND ND ND ND ND
ND 1NND ND I ND ND HD ND t ND
00
31 54**
30**
ND ND
ND ND
ND
ND ND
ND ND
ND
ND ND
ND ND
ND
ND ND
NU t ND
ND ND ND ND NO
233

Table 6, Cont/d.
Word WordNunl!)Or Process variable knowledna Discrimination Readinn.41. Glvos the Answer
42. Calls on SomeoneElse
43. Another Student CallsOut the Answer
ND ND
ND ND
ND
ND
ND ND
ND .4D
ND ND
ND ND
ND ND
ND ND
ND ND
ArIthmrsticCommutation
Arithoeflc
Pc.43SrdninnWee~WM
ND ND ND N
ND
ND
ND
ND
ND
ND
ND
ND ND
00 02 02 77** 01
03 00 06
04
ND
ND NO
20**
-08 -75**
OMMINNIN
06
ND ND ND
ND ND
05 19**
-20 -73**
ND
ND ND
agliMINO
t00
0
ND ND
25**
03
00
ND ND
ND ND ND
35**
83"
44** 02 49** 44** 58*
44. Repeats, Rephrases,or Asks Now Question
44** 16 01 06
01
±.06 03
+05 09

Table 6 Conttd.
Number Process VariableWord Word Arithmetic Arithrtir.
Knowledge Discrimination Reading CorNitaticn
45. Repeats Question
07 49*
/ I24* 22* 02 01 08
-45 -39
02 13* 01 01 04
ND ND ND ND ND ND ND ND ND 10
ND ND ND ND ND ND ND ND ND ND
46, Rephrases or GivesClue 16 04 04 00 01
65* 24
00 01 04 03 06
ND ND ND ND ND 1 ND ND ND ND ND
ND ND ND ND ND ND ND ND ND ND
47, Asks New Question 00100 01 01 11
-49 25
14* 08 03
H. Teacher Reaction tobit
48. Criticism
NO ND NO ND ND ND ND ND ND ND
NO ND ND ND ND ND no 4D ND ND
ND ND ND ND ND

Table 6, Cont'd.
Word Word Arithmetic Ar7thnefic
Number Process Variable Knowledoe Discrimination Reading Commutation Reasoning
49. Failure to GiveFeedback
50. Gives the Answer
51. Calls on SomeoneElse
52. Another StudentCalls Out theAnswer
ND ND ND ND ND MD ND ND ND ND
ND ND ND ND ND ND ND ND ND ND
ND ND
ND ND
ND ND ND+ +ND ND ND ND ND ND
ND ND ND ND ND ND
ND ND ND
1 +ND
ND
15
ND I ND ND ND ND ND ND ND ND ND
ND ND ND ND ND ND ND ND ND ND
ND ND ND ND ND

Table 6 , Cont' d.
Number Process VariableWord Word
Knowledce Discrimination Rea! dit)* Comoutaticn RoasorOnoArithmetic Pr!thme*ic
53, Repeats, Rephrasesor Asks Now Ouostion
ND ND -70*
ND
00 24*
54, Repeats Question
ND ND ND ND
ND ND ND ND
55. Rephrases orGives Clue
56, Asks New Question
ND ND
ND N -80** ND -71*
ND ND NO
02 16 31"
ND ND ND
ND ND ND ND. ND ND ND ND ND ND
ND ND ND ND ND ND ND ND ND ND
ND ND ND ND ND
ND ND ND ND ND
ND ND ND ND ND
ND
I ND NO NO
ND ND ND
ND ND
ND
ND
ND
ND
ND

Table 6, Ccnt'd.
Nun mbnr Process Variable
I. Teacher Reaction top(osponsa
57. Criticism
50, Failure toGive Feedback
59. Gives the Answer
60. Calls on SomeoneElse
Word Word Arithmetic Ar!thno+ic
Knowledae Discrtminat on Readinn Commutation Peason'ic
ND
ND ND ND ND ND ND ND ND Nn Nn
ND ND ND ND N U ND ND ND
ND ND ND Ni)
ND ND ND ND ND ND ND ND
ND ND ND ND ND ND ND ND
ND ND ND ND
ND ND ND ND ND
ND ND ND ND ND
00 0 03 26** 01+ + +04 20** 04 01

Table 6 Conttd.
Number Process Variable
61. Another StudentCalls Out thoAnswer
62. Repeats, Rephrasesor Asks New Question
63, Repeats Question
64. Rephrases or Gives
Clue
Word Word Arithmetic Arithmesic
knowledee Discrimination Readinq Combeltion Reasoninc
-10 ND
ND
44**
01
4111M1.00
01
ND -17 ND 07
ND
0
ND
49**
04
ND 24
ND
45**
04 08
01 02 06
al+ +51* 1 12
09
00
3
Of 05
68* 77
04 07

Table 0, Cont'd.
Number Process Variable
65. Asks New Question
J. Teacher ReactionsComtflnel "cross AllIlesnonse Oboortunities
66. Praise
66B. Criticism After AliIncorrect Answers
67, Failure to GiveFeedback
Word Word Arithmetic Arithmetic
Knowiedoe Discrimination Readieo Computation Re.a3onTnq
ND ND -23 ND. ND
ND ND D ND NO
00
02
01
-510 27
17*
I
01
14 07 02 00
01 02 02
21** 03 02
-69** 26 22 46*
23**
#01
05 03 14*
26** 25** 00 30**
00 01 f7a Of

Table ci # Cont'd.
Number Process Vartahlo
613. Process Feedback
69. New Question
70. Repeat, Rephraseor Asks New QuestionAfter Failure toAnswer'
71. Repasts Ouostion AfterFailure to AnswerCorrectly
Word Word Arithmetic Wthmetir;Knowledge Discrimination Readinn Computation Reasemin%
-le 44*
09 06
.27 ND -32
\ ND
11* 24*
03
ND
29*
-83** 05
14 01 01 03
49* 09
04
37
2211*
01 06 02 02
-----I-----
01 01 05 05 07
/25*
-48* 22
01 421 00 l0

Table 6 , Cont'd.
Number Process Variable
72. Gives the AnswerAfter Failure toAnswer Correctly
73. Calls on AnotherStudent AfterFailure toAnswer Correctly
74. Another StudentCells Out AnswerAfter Failure toAnswer,Correctiy
K. Stud "nt Rosnonse
Opportunities
75. Response Orleortunifies/Total Teaching Time
Word Word Arithmetic Ar:/trla
Know.ems
Discrimination Readino P,:,,Ison;r3t
02 48*** 40 138
27** 23*
1
-55** -04
04 03
05 06
60""'
40**
ND 48"
12*
31*
'10 -50**
24*
31** 00
10*
doemm %.00/
40**
ND -56"
34**
-68**
NOPON.
41**
-26 47** -34
04 07
ft0/1\°1
20*
05
4t**
ND -44*
09
00
+-04
tooreN
44**
ND -40
14*
54** -75* .,.r,41110
02 01
fo(?!ye,l
03 04 02

Table ( Cont' d,
Number Process VariableWord Word
knowledne Discrimina on
L. Student initiated ND NDouosrlons ND ND
76. $ IQ's Irrelevant
77. $ Si0ts Called Out
00
ND ND
ND
ND
ND
0
01
78, Praise of Questionafter Relevant stirs
01
ND ND
ND
ND ND
ND
ND ND
ND ND
79. Criticism of Questionafter Relevant SIQ's ND
ND ND
ND ND
ND
Arithmetic Ar?thm.7-elc
Re5dinq Comnut,lticF, 037,,,n7 m0
00
ND
00
ND
05
Nn N.
01
ND
ND
ND
ND
ND
ND
ND ND
ND
ND
ND Ni)
ND
AND
MD
ND ND ND ND
00 00 00 03
ND ND ND ND
ND ND1
ND ND
03 0I 05
ND ND ND ND ND
4D ND ND ND NU
ND ND ND
ND
ND ND
ND ND
ND
ND ND
ND ND
ND
ND
ND
ND
ND
ND
D
07
ND NJ
ND lit)
ND
ND
ND
ND ND ND ND ND
if)
ND
ND
ND
ND
ND
ND
ND
ND

Table u , Cont' d.
Number Procecs Variable
ty
80. IC Relevant Slp's
Given No Feedback
81. % Relevant Si0lsDelayed
82. % Relevant SIQ'sNot Accepted
Word Word Arithmetic Arithme+1.7
Knowledge Discrimination Rendlnn Computation Psasonino
ND ND ND ND
ND ND ND ND
ND ND
ND I ND ND ND
ND ND ND ND
ND ND
ND ND ND NO
ND ND ND ND
NG ND
D ND ND ND
ND ND ND ND
ND MD NO ND ND ND
ND ND ND ND ND NO
ND ND ND
ND ND ND ND NO ND
ND ND ND ND ND ND
ND ND ND
ND ND ND M9 ND ND
ND ND ND
1
ND ND ND
ND ND ND
ND ND ND ND ND Ni?
ND NU ND ND ND
IN
ND
06 03 04 00 05
ND ND ND 1D ND ND ND
N N ND ND 1 ND
ND
-24
ND
41*
ND ND ND
83. % Relevant SlpieGiven Brief
08Feedback
250 00 06 12
.-591 05 24 830* -14
01 00 02
I6S*0
18** 01
WW1

Table 6 Cont' d.
Word Word Arithmetic
Number Process Variable Knowledoo Discrimination Reading Comutatien
ND -56** ND -44* ND ND
ND ND ND ND
84. % Relevant SlQ's
ArithmeicRexirminc
ND -45*
ND
Given Long 32** 06 02 03 09
Feedback-61** 33 -58* 14 -76** 36
85. % Relevant S1Q'sRedirected to
Class
86, Behavioral Praiseof Relevant Sirs
87. Behavioral Criticismof Relevant Sip's
00 00 02 07 24*
ND 14D ND I ND ND ND ND ND ND ND
ND ND ND ND ND ND ND
NO ND ND
ND ND ND ND t D ND
ND
ND ND
ND
ND
ND
ND ND
ND
ND ND
ND
ND
ND ND
ND
ND
NO
ND PID ND ND
ND MU
24f-7
ND
LID
ND
ND
ND t ND
140 ND ND ND
ND
ND ND
ND
ND ND
ND
ND ND
ND
ND ND
ND
ND
ND ND
ND
ND ND
ND
ND ND
ND
ND ND
ND ND
ND
ND ND
ND ND
140
ND ND
ND ND
ND
ND NoND
ND

Table 6, Cont'd.
Number Process Variable
88. Dohavioral Warningafter Relevant SIQ's
89. Criticism of Question
after irrelevant SIQ's
Word Word Arithmetic Ar!thnOlf.:
Knowled,le Discrimination Reading.; Comnutation Peasr..0^0
ND ND ND
ND
ND ND
ND
ND
ND
ND ND
NO ND
ND
ND
ND
ND ND
ND ND
ND ND 40 ND ND Nn
ND
ND
ND
0
ND
ND
ND
ND
i4D
ND
ND
ND
NDND
ND
ND
ND
ND
ND
ND
ND
ND
ND
LID
ND
ND
ND
ND
ND ND ND
1
ND ND
ND ND ND
ND ND NI) ND NI)
ND ND ND ND ND
ND ND ND ND
ND ND ND ND ND ND N
ND ND ND ND ND ND ND
90. t irrelevant SIQ'sUiven No Feedback ND ND ND ND
ND ND ND ND ND ND Ni)
ND ND ND ND
ND ND ND ND ND NO ND
ND ND ND ND ND ND NU
91. % Irrelevant SIQ'sDelayed ND ND ND ND
ND ND ND ND ND ND ND
Ni) ND ND ND ND ND ND
NO ND ND ND
ND
ND
NOND
ND
ND
!!fl
ND
ND
ND ND NDND ND ND
ND
ND ND 'I)
ND ND ND
ND
ND ND I
ND Ti;
ND
'1r

Table 6 Cont'd.
Number Process VariableWord
KnowledonWord
Discrimination ReadinnArithmeticComputation
ND ND ND ND ND ND NND ND ND ND ND ND ND ND
92. % Irrelevant SIQ'sGiven BriefFeedback 19 30 13 04
ND ND ND ND ND ND ND NDND ND
ND ND ND ND
ND ND ND NDND ND ND ND ND ND ND ND
93. % Irrelevant SIQ'sGiven LongFeedback ND ND ND ND
ND ND ND ND NI)
ND ND ND ND ND ND ND
ND ND ND ND
ND ND ND N!) ND ND NDND ND N5 ND ND ND
94, % irrelevant SigtsNot Accepted
9 00 07 13
ND ND ND ND ND ND ND NDND ND ND ND ND ND ND
ND ND ND
ND ND ND ND NE) ND N t4
WC./ ND ND ND ND ND95, le: irrelevant SIQ's
Redirocted to ClassND ND ND ND
ND ND ND NI) ND ND NN' ND ND ND ND ND ND ND
ND ND ND ND
29
Arithmetic
Reasoning
,tr)
ND ND
09
ND t D
ND NI)
I
ND
ND ND
ND
ND ND
ND
ND ND
8
ND NDND ND
ND
NQ tiD
ND ND
NDND ND
ND
ND

Table 6 , Cont'd.
Number Process Variable
WordKnowledne
ND ND
ND
96. Behavior Criticismafter Irrelevant Sip's UD
97. qahavioral Warningafter irrelevant SIQ's
M. Studcryt InitiatedPut)lic interactions
98. Student InitiatedComments and Questic,'s/Total Response Oppor-
tunities
N. Student initiatedCennrs (SRA)
99. % S1C's Relevant
ND
ND NP
ND
ND
ND
ND
ND
NO
ND
NO
ND
ND
-07 -49**
12 **
ND
NO
ND
07
69** -19
00
-40 48*
24"
WordDiscrimination Readino
ArithmeticComnutaticr
Ar1thm t:eil
Peasonine
ND t4D ND ND NU ND ND NI
ND ND ND ND ND ND ND ND
NG ND NO NO
ND ND ND ND ND ND ND ND
ND ND ND NO ND ND ND ND
ND ND ND ND
ND ND ND ND ND ND ND ND
NI) ND ND ND ND ND ND ND
ND ND ND ND
NO NO ND NO ND ND ND ND
ND ND ND ND ND ND ND ND
ND. ND ND
3 47'"
02 4
37 -44 3
16* 05
5 47*
00 19* 18** Oi
70** 04 69** 09 7A,
00 04
02
250
20*
16*
01 66m* 1R
27"
71)114(
5,410

Table 6 0 Cont/d.
Word Word Arithmetic
Number Process Variable Knowtedne Discrimination Readinn Combeltion
100. % SiCts CalledOut
101. Praise of Commentafter RelevantSIG's
102. % Relevant SIC/5elven No Feedback
103. % Relevant SICIsDelayed
ND
ND
02
Ar'i4unt!*
03
01
ND ND
ND
ND
ND ND
ND ND
ND
ND
ND
04
ND ND
04
ND ND
ND
ND ND
ND
00
ND NDNI) ND
1
ND
31* 23*
[-53* 19 -28 45
07
ND
ND ND ND
ND ND ND
ND ND
11*
ND ND NDND ND ND
ND
ND ND
ND ND
ND
06
ND ND
NU D
06
ND ND
ND
ND ND
ND
le!
02
ND
ND
(4*
ND ND ND ND
ND ND ND ND
06
ND
ND
ND4Li
02
p. ND
NDNJ
ND
ND ND
ND tUU
ND
ND
ND
11
ND ND
ND ND
12
ND NDI ND ND ND
ND
ND 10 ND ND
NO
ND
ND ND
ND
ND ND

Table 6, Ccnt'd.
Number Process Variable
104. % relevant SIC'sNot Accepted
105. % relevant SIC'sAccepted
106, % Pelevant SIC'sIntegrated IntoDiscussion Topic
107,
Word Word Arithmetic
Knowledge Discrimination Readinh Computation
ND ND
ND ND
21* 31**
05 03
01 00
01
ND i 08 ND
ND
04
Le22*
00
ND
02
Ar!inme+IcReasoning
ND ND 47** ND
ND
00
-18
ND
27**
44
ND
32**
N\
17* 00 31*
93** 12
00 29** 04
00 01 00
ND
00
05 23**
ND 24 ND 22
ND ND
23** 01*23** 45**
ND ND ND ND ND ND ND ND
ND ND ND ND ND ND ND ND
0 Relevant SIC'sWhich Cause a Shiftin Topic
ND ND ND
ND ND ND ND ND ND ND ND
ND ND ND ND ND ND ND ND
ND ND
2.52
NO
ND ND
ND
ND
ND
ND

Table 6, Cont'd.
Number Process Variable
100. Behavioral Praiseafter Relevant SIC's
109. Behavioral Criticismafter Relevant SiC's
110. Behavioral Warningafter Relevant SIC's
III. Praise of Commentafter Irrelevant SIC's
Word Word Arithmetic Ar:thro.i:
Knowledno Discrimination Readina Comnbtatic-,
ND ND
ND ND
ND
ND
ND ND
ND
ND
ND ND
ND ND
ND
ND
ND
ND ND
ND
ND
ND
ND
ND
ND
ND ND
ND
ND ND
ND ND
ND
ND ND ND ND ND ND ND
ND ND ND ND ND ND
ND
ND
N
ND
N 1 tr.ND ND D
ND ND NI)
ND NO
ND
ND ND ND
ND ND ND
ND
ND
ND ND
ND NO
ND
ND
ND
ND
ND
ND
NO ND ND ND 1 ND ND ND ND N')
NO ND ND ND I ND ND ND ND ND
ND
ND ND ND
ND
NQ
nin
ND
I
ND I ND
ND ND I NO
ND ND
ND ND ND ND ND I ND NO ND ND
ND
ND ND
ND
ND
ND
ND ND
ND
ND
ND ND ND ND ND I ND ND NO ND
ND
ND ND
ND ND
ND
.
ND
ND
ND
ND
ND
ND 1 ND
ND t ND
ND
ND ND
ND ND
ND
ND
ND ND
ND
ND
ND
ND ND
Ni)
ND ND
ND
ND
ND
ND
ND
£10
Ur)
ND
ND
ND ND I ND
ND ND ND ND ND ND
NO ND ND

Table 6 , Cont'd,
Number Process Variable
Word Word Arithmetic Arithmeic
Knowledge Discrimination Readinn Cnmnutaticn 0,,JasonTncl
112. % Irrelevant S"15Given No Feedback
ND NU ND ND ND ND
ND ND ND
ND ND ND ND ND ND
ND ND ND ND NU
ND ND ND
ND ND ND ND ND ND
ND ND ND ND ND ND
113. % Irrelevant SIC's
DelayedND ND ND
ND ND ND ND ND ND
ND ND ND ND ND ND
ND ND ND
ND ND ND ND ND
ND ND ND ND ND ND
114, % Irrelevant SIC'sNot Accepted ND ND ND
ND ND ND ND ND ND
NU ND ND NO ND ND
ND ND ND
NU ND ND
ND ND ND
115. % irrelevant SIC'sAccepted 04 01 01
NI) ND NDND
ND ND
ND ND ND ND
ND ND ND ND
ND ND
ND ND ND ND
ND ND ND ND
ND ND
ND ND ND ND
ND ND ND NO
ND ND
ND N!) ND ND
ND
I
ND ND
ND ND ND
ND ND ND ND
ND ND ND ND
ND ND
ND ND
ND t D ND ND ND r r) ND
ND Nt3 NI) ND ND ND ND
29"
N!) ND NO
,25
ND
00
NI, Ni) ND
ND ND nc.
I
ND

Table 6 , Cont'd.
Number Procecs VariableWord Word Arithmetic ArTthmeti:
Knowledge Discrimination Readlne, Computation Peasrinine
ND ND ND ND ND ND ND ND ND M7
ND ND ND NU ND ND
I
ND ND ND ND
116. % Irrelevant SIC'S 1
Integrated IntoDiccHssion Topic
ND ND ND ND ND
ND ND ND ND ND ND ND ND ND
ND ND ND ND ND ND ND ND ND
ND ND ND ND ND
ND ND ND ND ND ND ND ND ND N7
ND 1 ND ND I ND ND ND ND ND ND N!:
117. % irrelevant SIC'sWhich Cause a Shiftin Topic
ND ND ND ND ND
ND ND ND I ND ND I ND ND I ND ND I ND
ND ND ND I NO ND 1 ND ND 1 ND ND i ND
ND ND ND ND ND
118. Dcinavioral Praiseotter Irrelevant SIC's
ND NO ND ND ND ND ND ND ND N!)
ND NO ND ND ND ND ND NO ND ND
ND ND ND ND ND
ND ND ND N1) ND ND ND ND ND Nr)
ND ND ND ND ND ND ND ND ND AND
119. Behavioral CrIticitmafter Irrelevant SIC's ND ND ND ND ND
ND ND ND ND ND ND ND ND ND ND
ND ND ND ND ND ND ND ND ND ND
ND ND ND ND
255

Table 6, Cont'd,
Number Process Variable
120. Behavioral Warningafter Irrelevant SIC's
0. Self and Opinion
Questions
121. Self Questions/Process+ Product ChoiceQuestions
122. % Self QuestionsWhich WereSubject-MatterRelated
123, % Self QuestionsRelated to rersonalPreference
WordKnowtedae
WordDiscrimination Readinq
ArithmeticComputation
ArithmticPowirdnia
ND ND NO ND ND ND ND N!) ND ND
ND
ND ND
. ND
ND ND
ND
ND ND
NU
ND
ND
ND
ND
ND
ND
ND
:1)
ND
ND
ND NU
ND
NI) N D
ND.
ND NO
ND
ND ND
ND
U.
-22 -43*
14**
-34 -39
13**
ems% 0.01/
21* 24** 25*
LI L
42**
ND ND ND ND ND ND ND ND ND V)
ND ND ND ND ND
i
ND ND ND ND MO
ND
00
ND Nn
ND ND
ND
ND ND ND
00
ND NI)
ND ND
ND
-32 44
/#17*
ND
55**
ND ND
45**
NI) ND
ND 1 ND ND ND
ND ND
43*
NI)
ND
ND
Pte....NE)
01 00 00
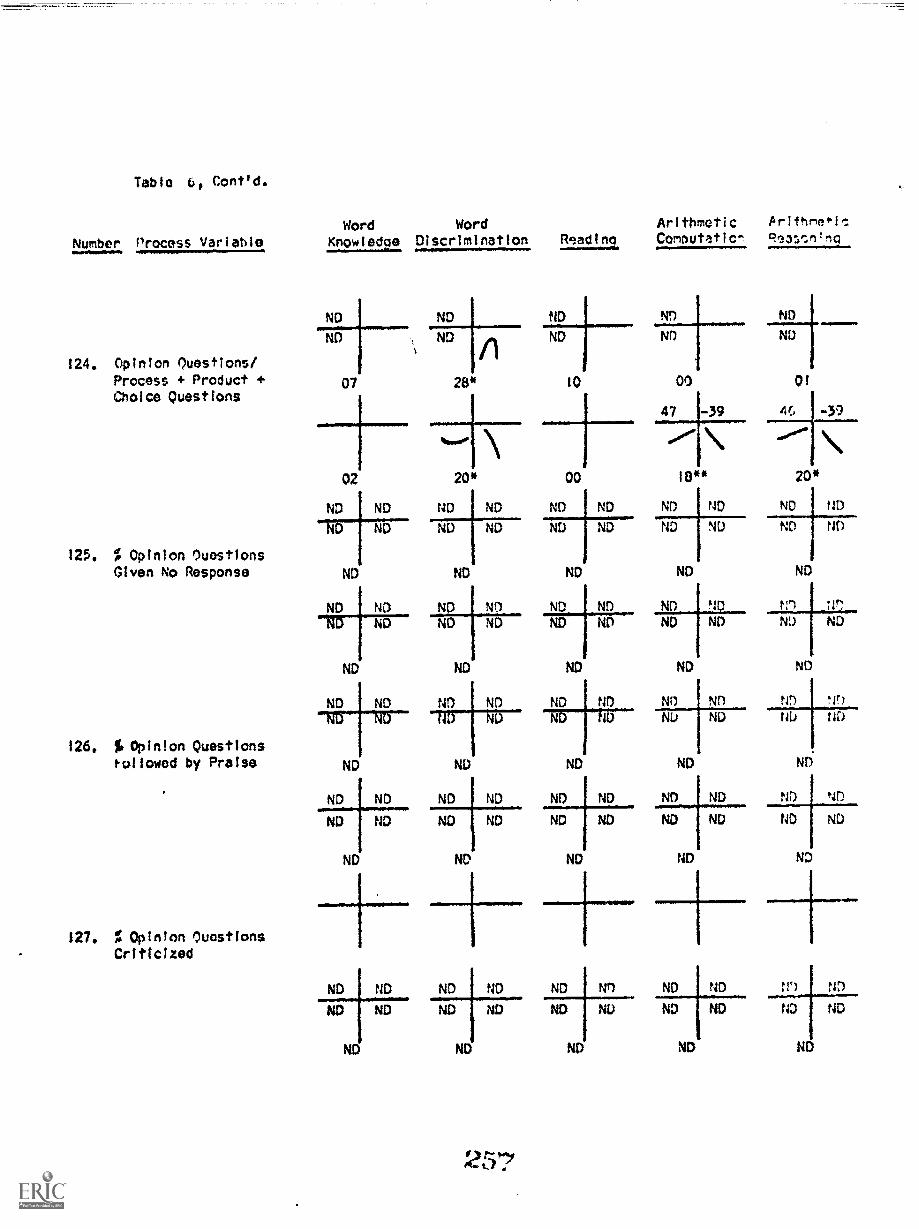
Table bt Cont'd.
Number Process Variable
124. Opinion Questions/Process + Product +Choice Questions
125. % Opinion QuestionsGiven No Response
126. %, Opinion Questions
1-01lowed by Praise
127. % Opinion QuestionsCriticized
Word WordKnowledge Discrimination Reading Computation P?as:n'ng
Arithmetic Arifhneol,.:
ND ND ND Nn ND
ND ND ND ND ND
07 28* 10 00 01
02 20* 00
ND
ND
ND
ND
ND
ND
ND
ND
ND
4647 -39
10** 20*
ND ND ND ND ND ND ND
ND
ND
ND
ND
ND ND
ND
ND
ND
ND
ND
ND
ND
ND
91
ND
ND
NO
ND NO
ND
ND
ND
ND
D
ND
ND
ND
ND
ND
ND
ND
ND
ND
ND Ni) NO
NU
ND
ND
NO
ND
ND ND
1
ND
ND ND
ND
ND ND
ND
ND
ND ND
ND ND
ND
NI tir.
ND ND
ND
ND WIND ND
ND
ND
ND ND
ND
ND ND ND ND ND NI ND ND ND
ND ND ND ND ND ND ND ND ND ND
ND ND ND ND ND

Number
Table 6, Cont'd.
recess Variable
128. % Opinion QuestionsGiven No Feedback
129. % Opinion QuestionsFoilowed by Teacher
Disagreement
130. % Student OpinionsAccepted
131.. % Student OpinionsIntegrated IntoDiscussion Topic
Word Word Arithmetic Arithme.lc
Knowledge Discrimination Reams Computation Reasoning
ND ND ND ND ND ND ND ND ND ND
N ND ND ND ND ND ND ND ND
ND ND ND ND ND
ND ND ND ND ND ND ND ND ND ND
ND ND ND ND ND ND ND ND
ND ND ND ND ND
ND ND I ND i ND11)
ND 1 ND 1 ND ND
01 07 01 01 Of
ND ND ND ND ND ND ND ND ND ND
ND ND ND ND ND ND ND ND ND ND
ND ND ND ND ND
00 04 01
ND ND ND ND ND ND
00
ND
f-
ND
ND
ND ND

Table 6 Cont'd.
Number Process Variable
P. Private DyadicGentl.cfs
% Private ContactsStudent initiated
133. Student InitiatedWork ContactsInvolving Praise
134.
135.
word Word Arithmetic Arithmetic
Knowledee Discrimination Rnadinn Combutaticr t.f.:asr)nino
1/4) LI
6.111.01M14.1.1
18* 01 22* 00 07
190
27 -75**
44**
Student InitiatedWork Contactsinvolv.ing Criticism
01
-21 1 58**
27*
% Private WorkContacts Student 01
Initiated
05
35**
27*
09
00
00
-49* 0
02
-02 -67**
39**
05
-41 1 32 09 f 52**
15* 20**
00 24*
00 00
14" i.)P,
41.1.1.
00
00
03
19
-71"
50* 50**
03 08
01 07
05
1G* 04
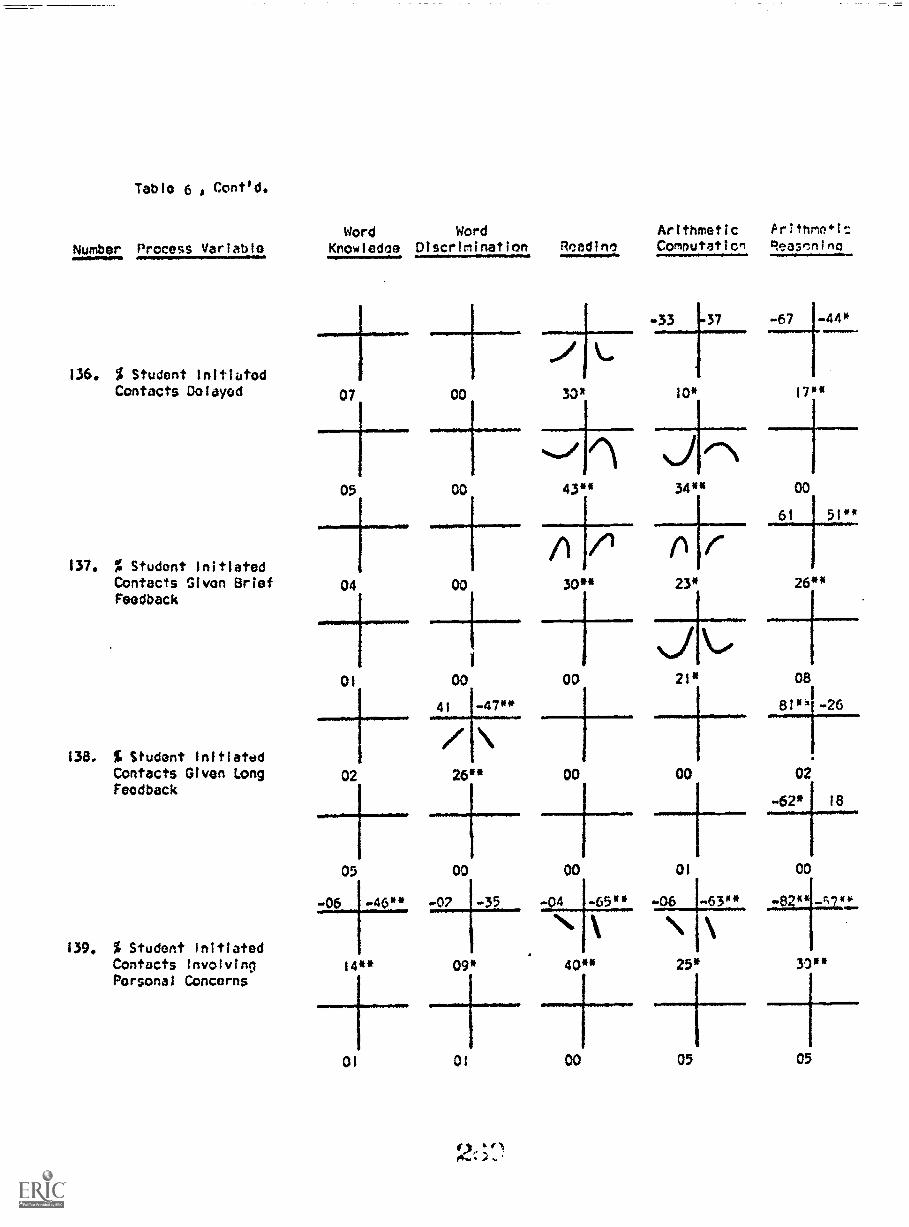
Table 6 . Coned.
Number Process Variable
136. % Student InitiatedContacts Delayed
137. % Student initiatedContacts Given BriefFeedback
138. $ Student InitiatedContacts Given LongFeedback
139. % Student initiatedContacts InvolvingPersonal Concerns
Word WordKnowledae Discrimination ileadina Comm:felon Reascmind
Arithmetic Pritnr*.i:
07
.101101.
00 33*
04
0
02
41
00
-33 37 -67 -44*
10* 17"
43** 34**
747- irl
30**
00 00
-47**
26" 00
23*
21*
00
61 51"
00 02
05
-06
00
-46** -07 -35
14** 09*
01 01
00 01
4 -65w* -06
40"
0
25*
05

Table 6 p Gonttd.
Number Process Variable
140. S Student initiatedRequests Granted
141. % Student InitiatedRequests Delayed
142. % Student initiatede:equusts Not Granted
143. % Student InitiatedContacts Which ArePersonal ExperienceSharing
Word Word Acithmetic Arithmetic
Knower Discrimination Readlnq Comnutation ReasfinIne
02J
51* 37
11*
03
45* 1 -05 52** 27
20* 14 09* 20**
48*
08 -46* 5 49** 54 1-58*
05 02 17* 22*
.0F.111...10.1
29* 41** 01 .
05 05 03 22* 01
a
Y,00-1 I

Table 6 , C:nt'd.
Number Process Variable00.100110...w
144, Private Work Contacts/Private York ContactsPublic ResponseOpportunities
145, Procedural. Contacts/Procedural Contacts +Response Opportunities
146, Teacher Initiated Work
Contacts/TeacherInitiated Work +Procedure Contacts
147, Teacher Initiated WorkContacts involvingPraise
Word Word ArIthmatiC Ar:thmpfle;
Kno%ledon Discrimination Readino Computation Pgansrinina
23* 25** 21*
03
32*
04
-17 .-34
12"
04 05
15* 00
03
36**
48* 18
04
"PH--02
00
39 -43*/18"
01
00
00
-52* -17
04
02
21" 01
07
..041
04 13*
31'
330**
02
01
06
foramMogeme
24**
06+10
02
32**
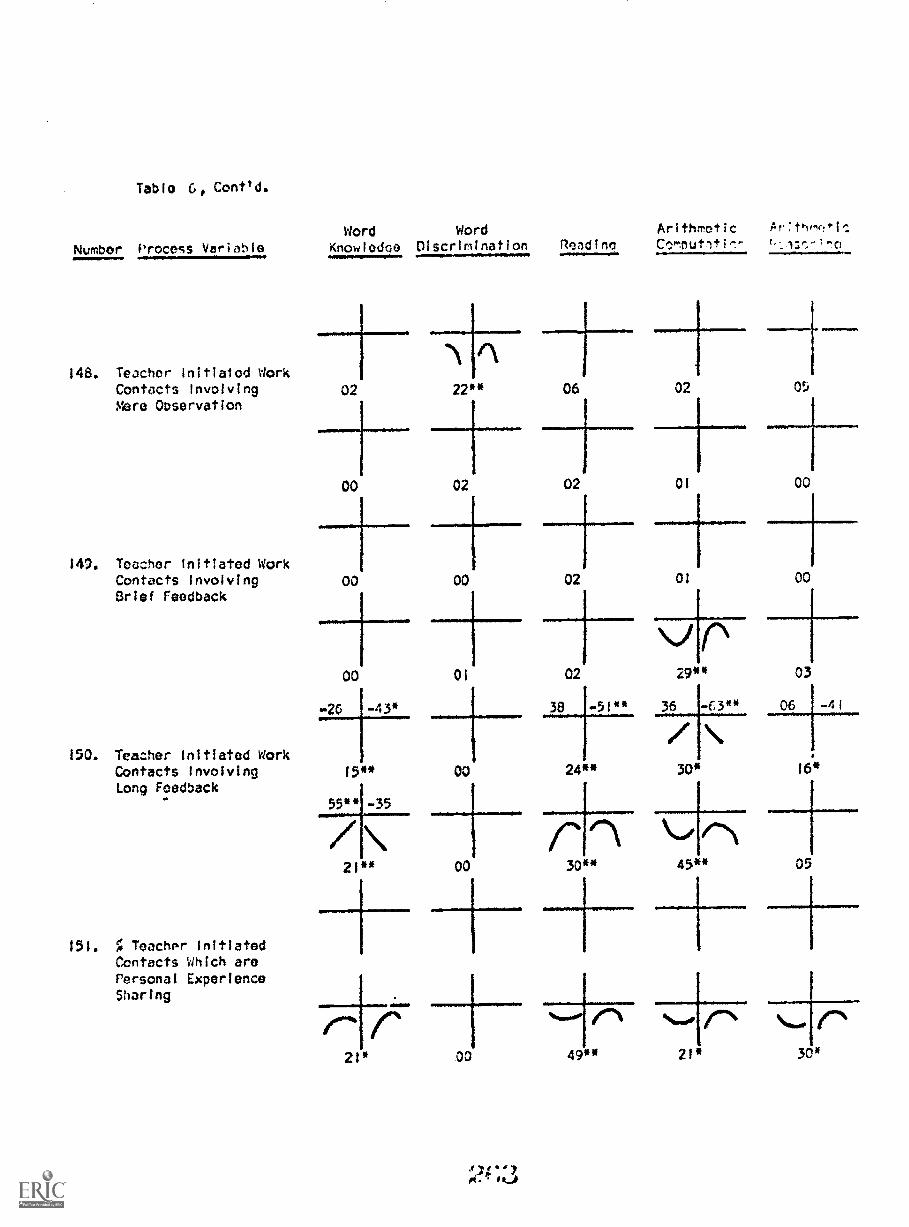
Tablo Go Cont/d.
Numbor Process Variaille
148. Teacher Initialed WorkContacts InvolvingMere Observation
147. Teacher Initiated WorkContacts InvolvingBrief Feedback
ISO. Teacher Initiated WorkContacts InvolvingLong Feedback
151. f: Teacher InitiatedContacts Which arerersonal ExperienceSharing
Word Word Arithmetic
Knowledge Discrimination Nadine;
+Ar:twv!II:
02 22** 06 02 05
02 02
00 00 02
00
-26 -43*
01 02
01 00
01 00
29** 03
36 -63** 06 41
00 24** 30* 16*
00
21* 00
30** 45** 05
49**
+21* 30*

Table 6, Cont'd.
Numbnr Process Variable
152. % Teacher InitiatedProcedural ContactsWhich Were Manage-ment Requests
153. % Teacher ThanksStudent for Doing
a Favr Request
154. % Teacher ThanksStudent Followinga Management Request
Q. Combined Teachertvaluation :;t3to-
71;7111----0.411100....
155. Academic Praise/Academic Praise +Academic Criticism
Word Word Arithmetic Arithme.i.:
Knowlcdqe Discrimination Reading Cormutat Pr:ass-in:pin
ND
13 -52**
35* 06 17**
ND
ND
ND
ND
ND
00 01 01
25**
02
01 19*
07 01
25*
ND
12
ND
ND
ND
00
ND
ND
01
ND
00
ND
00
01 04
ND ND ND ND ND ND ND ND
ND ND ND ND ND ND ND 1..)
01
02
01 06
.5 73
\
16*
ka
11*
00
-47*
ND
ND
ND ND
ND ND
02
41
20*
40** 18** 44** 31** 12
-1-00 00 01 00 01

Table Cont'd.
Numbor Process Variable
156. Bonavioral Praise/Total Behavioral
Contacts
157. Behavioral Warnings/Behavioral Warnings +Bohavioral Criticism
R. Discipline and Control1777;
156. % Discipline ContactsInvolving One or
More Error
159. Targot Errors/Total Errors
Word Word Arithmetic Ar ticKnowlodne Discrimination Readinn Cc*Inutatic
.I
00 02 17* 00
+02 00 OD
35 43*
05 18**
01)
ND ND ND ND
ND NU NU ND
02 00
ND NO ND ND ND ND
ND ND ND ND ND ND
06 03 04
07 06

Table 6 Cont'd.
Nu-1!)elr Process Variable4M111.1./www
IGO. Timing Errors/Total Errors
161. Overreactions/Total Errors
162. Nonverbal ControlContacts/TotalControl Contacts.
S. Combined TeacherFeelb3ck Uate
163. Repeat/Repeat +Rephrase + NewQuestion
Word Word Arithmetic Arlthm+is
Klowledqn Discrimination Readino Combutation Poasf)m;no
05
0
NO ND
13
ND
140
-89** -49
38** 03
NDNI)
00
ND ND ND
" NO ND NDre
46**
ND ND
00 04 0
ND ND ND ND ND ND
ND ND ND ND
15* 22** 25** 14 26*
28** 07 03 00 01+ +00 01 00 01
02 02
-27
02
00
02
44**
eIrsr!t
00

Table 6 Cont'd.
Number Process Variable
164. Rephrase/Repeat +Rephrase + NowQuestion
165. Brief Feedback/Brief + LongFeedback
T. Math Contacts
166. Total Public MathContacts /Total PublicMath Contacts + :1.21Private Math Contacts
167. Total TeacherInitiated PrivateMath Contacts/Total Public mathContacts + TotalPrivate MathContacts
Word Word Arithmetic Arithme+ic
Knowledee Discrimination Readine Computation Reasoning
42*
31 40 45 45*
14*
05 00
15 00
01t
03
00 -62"
19** 01 10
48* -32 34 -59**
/ \ / \ ,FN
13* 26** 49**
-51* 38 -44 45* -09 46*
\ /23** 20** 17**
35**
01
01 01
40 -72** -1 t -78** 12
4#e 401°.
41-** 51 25
33** 02
72**
02
-23 58**
02
19 07
01 10
**

Table 6 , Cont'd.
Number Process vari ah ie
168. Total TeacherAfforded !lath
Contacts/TotalMath Time
169. Total MathResponse °peer-tunitles/TotalMath Time
U. Dyedic. Contacts
170, Total reacherlnittated Contacts/Total TeachingTime 4
Word Word Arithmetic Ar'+hr101:
KnowleCao Discrimination Reading Comnuteic-
EP*
18*
10 74*
37**
51**
IMPIA01001.001 ANMON.IMPOR.
08 59** -09
24
-47
61" 21* 15*
00 16* 00 04 05
I Probability values are indicated by asterisks. One asterisk indicates a value of <
two asterisks indicate a value of.05.
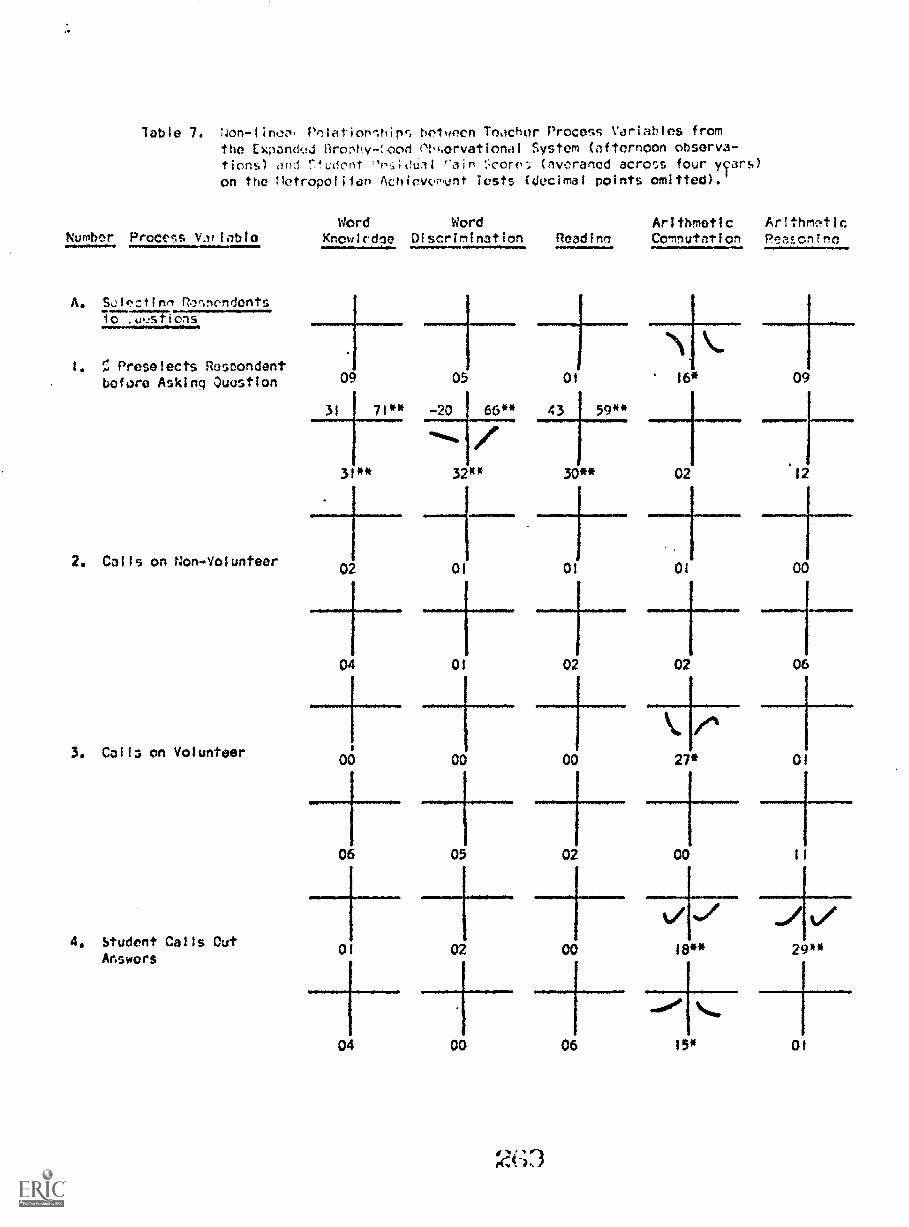
'Table 7. Non-linc:, relationshipr. bolween Teacher Process Variables fromthe Expand...lii ilronhv-oon observational System (afternoon observa-tions) ond !7ludont ons;Otiat "ain '2,core'; (nvcraned across four yyars)
on the notr000lilan Achiovvv.unt Tests (decimal points omitted).
Number Process V.Irlatte
A. Stf,%ctinn QosnondenIo =Ions
1. Preselects Respondentbefore Asking Ouustion
2. Calls on Non-Volunteer
3. Calls on Volunteer
4. Student Calls CutAnswers
Word Word Arithmetic ArlthmticKnowlvdoe Discrimination Readinn Co.nnutation Peasonlne
09
31
05
71** -20 66**
31** 32'c"
02 01
04 01
00 00
06 05
0 02
04 00
----i-----
01 16* 09
/43 59**
30** 02
01 01
02 02
00 27*
02 00
00 18**
06 15*
12
00
06
01
11
29**
01

Table 7, Cont'd.
Number Process Variable
3. Difficulty levelt coast
5. Process Ouestions/r'rocass + Product
Questions
6. Choice Questions/Process + Product+ Choice
C. Oualitv of Children'sAnswers
7. S Correct
8. % Part-Correct
Word Word Arithmetic AritticKnowledne Discrimination Wladina Comnutation Pc.3sonirq
ND ND ND 23 ND ND
ND
03
ND
00
ND ND
15 03
ND
00
+ 109 06 03 04
10 -43*
19* 01 0002
01 01 00 02 00
00 01 00 14* 24*
25** 00
00 04
05 04
05 00
111.MMIIMIPPM109.=
01 24*
01 03
01
03
00

Table 7, Cont'd.
Word Word Arithmetic Arithmetic
Number Process Variable Knowledce Discrimination Readino Computation Reasonino
9. % Wrong
10. % "Don't Know"
11. % No Response
0. Teacher Peactionsto Correct Answers
12. Praise
00 00
-40 70** .43
le*
ND
ND
01.
491*
ND
ND
02
01 05 01
08 50*
05 i3*
NO
14 64**
ND
ND
06
ND
01
23* 03
00 00
03
01
00
02 03
04 10
01 00
27** 04
Op
-74* -24
05
1
-35 -50*
06
-77* -03
01
37**
r at,

Number
Table 7, Cont'd.
recess Varinhie
13. Criticism
14. Failure to GkeFeedback
15. Process Feedback
16. New Question
WordKnowtedrin Disc
ND
ND
ND
ND
ND
ND
ND
Wordimination
ND ND
ND
ND NU
ND
ND
ND
,040* ND
ND
05
ND
ND
ND
2
ND ND ND ND
ND
Arithmetic ArithmeticReadine, Coconut: Lion Pe3;onIng
ND ND ND ND ND
ND ND ND ND N D
ND ND1
29
ND
ND
00
ND
ND
ND MD
ND ND
05
ND
ND
03
ND
ND
00
ND
ND
'tiND
tiCt
0
ND 1
ND
01
ND NO ND ND ND ND
ND ND ND ND
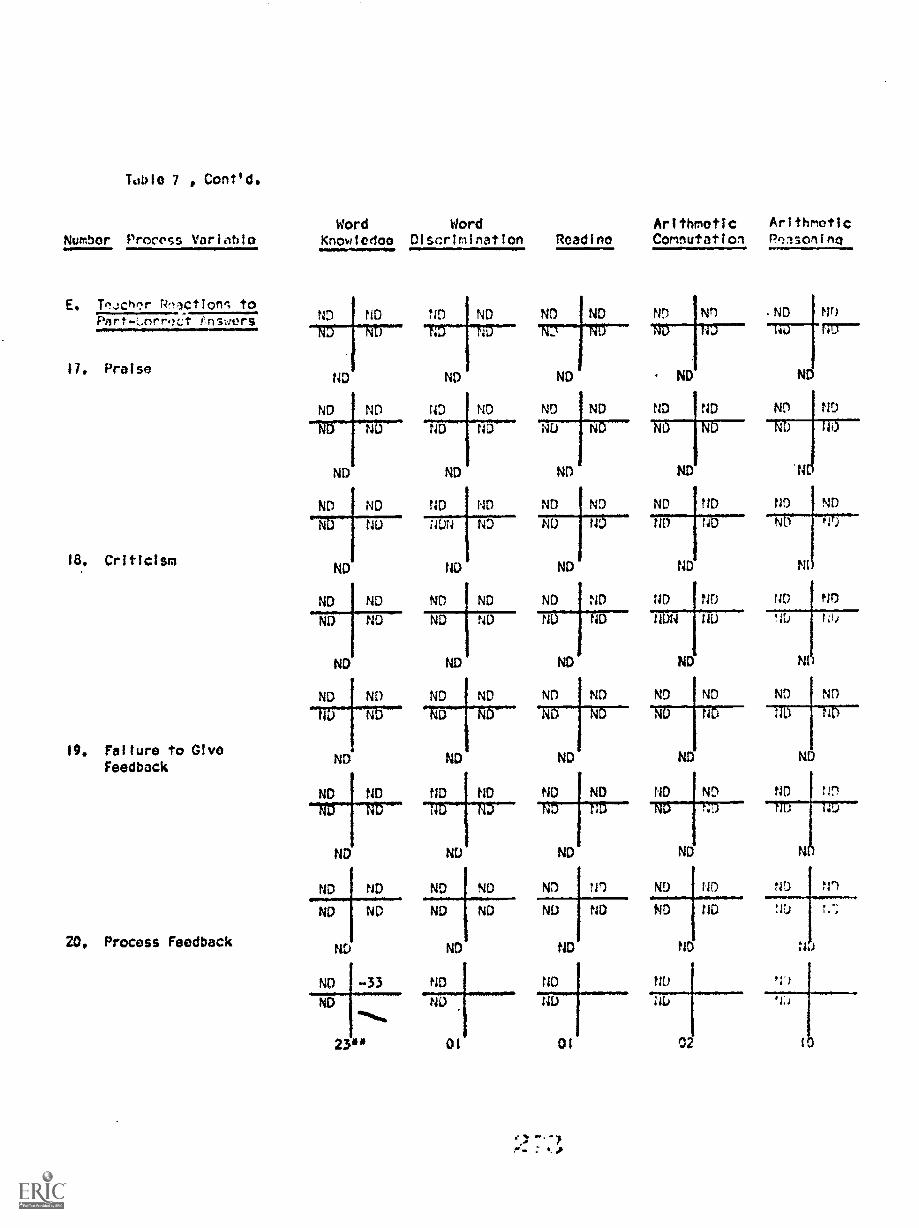
Tulfle 7 , Cont'd.
Number Process Variable
E. TqJchf,r Rf)ictions to
Pnrt-r_nrret hlsvers
17, Praise
Criticism
19. Failure to WyeFeedback
20, Process Feedback
Word Word Arithmetic ArithmeticKnowtedeo Discrimination Readino Comnutation Pr)lsonInci
ND ND
ND
ND ND
NO
ND
ND ND
ND NU
ND
ND ND
ND ND
ND
ND NI)
ND'
ND ND
ND
ND ND
ND ND
ND
ND -33
ND
23**
ND
ND
ND ND
ND ND
ND ND
ND ND ND ND
NUN ND NU N'
ND NDtt
ND I ND ND ND
ND ND
ND
ND ND
ND ND NO ND
ND
ND ND
ND
ND
ND ND
ND ND
ND
NI)
ND
01
ND NI)
Ni) Nt)
ND
ND ND
ND
ND ND
ID N
ND
ND ND
N i1 NU
ND
ND ND
ND
ND ND ND ND
ND ND
ND ND ND ND
ND ND ND ND
ND ND
ND ND
NU at
D i 02
tsr,
rzy--
ND ND
ND ND
'U
NI
ND P11
NI)
ND
D
ND NO
ND
NJ
to

Table 70 Cont'd.
Word WordNumbor Process Variable Know1c:Jin Discrimination
ND ND
ND NO
21. Giros the Answer
22. Calls on SomeoneElse
02
68* 55**
33"
00
40"
ND
ArIthrvItIc Arittic114mdinn CrImnutation
ND
28**
48 44
20**
ND
ND
22"
55 31
14*
ND
715-1.1L
28*
t4r)
01 01 05 09
00 04 03 03
ND ND ND ND ND ND
ND ND ND ND ND ND ND ND
23. Another StudentCalls Out the ND ND ND ND
AnswerND ND ND ND ND ND ND ND
ND ND ND ND 'ND ND ND ND
ND ND ND ND
24, Repeats, Rephrases,or Asks New Question
oel
06 34*
38* 00
-29 -46*
17**
-54* -42
20"
-91**
ND ND
ND ND
ND
ND ND
ND ND
ND
!Ir
ND
17
00 01 31*

'fable 7 , Cont'd.
Number Process Variable
25. Repeats Question
Word WordKnowledne Discrimination
ND
26. Rephrases or Gives
Clue
27. Asks New Question
F. Ieac', iieoctyn: to17;7177R4777---IMPOPEOMAPPM.1710
28. Praise;
ND
NO
12
ND
NO
ND
02
-13 -54*
08
ND
NO
NDND
03
ND IND
ND NDND ND
ND
ND
34
40
09
ND ND
ND ND
ND
ND
01
ND
ND
00
0 ND ND NDND ND
ND
0 ND
ND
ND
Arithmetic ArithmeticNadine Comnutation Reasoning
ND ND
ND ND
18 *
ND
ND
07
ND
ND ND ND ND
26 * 29
ND
ND
06 15
ND
ND
ND
ND ND
NiD
ND
06
30
ND
03
ND
ND
03
ND ND
NO ND
00 01
ND ND
ND ND
02 00
N ND
D ND ND ND
ND 110
ND
ND D ND NDND ND N
ND ND
00
ND
ND
04
ND
[7..0
ND
31
NC) fiDND t4D
ND
ND MD
ND ND
ND

Table 7 Contd.
Ward Word Arithmetic ArithmeticNumber Process Variable Knowledge Di scr I m I nat ion Readina Computation Reasoning
29. Criticism .1NO
24
1NDND
ND ND
ND ND
18 01
ND ND ND ND
ND ND ND Ni) ND
ND ND
NDND ND NO ND ND
ND
ND
30. Failure to GiveFeedback ND
ND ND
ND ND
ND.
ND ND
ND ND
I. Process Feedback
Z. "Ives the Answer
.0
02
-42 -31
ND
ND
ND ND
ND
ND
00
11.1
12 50 *
NO NDVNO
nee 42 *
I mi
01
?4D ND
ND
ND
ND
ND ND
ND
ND ND
ND ND
07-
mn
ND
ND
01
ND'
ND ND
ND ND
11
ND
do
ND ND
NO NO
ND
ND ND
ND ND
ND
ND ND
ND ND
. 07
03 01
r(,.: .41
03 01 01
Irc;
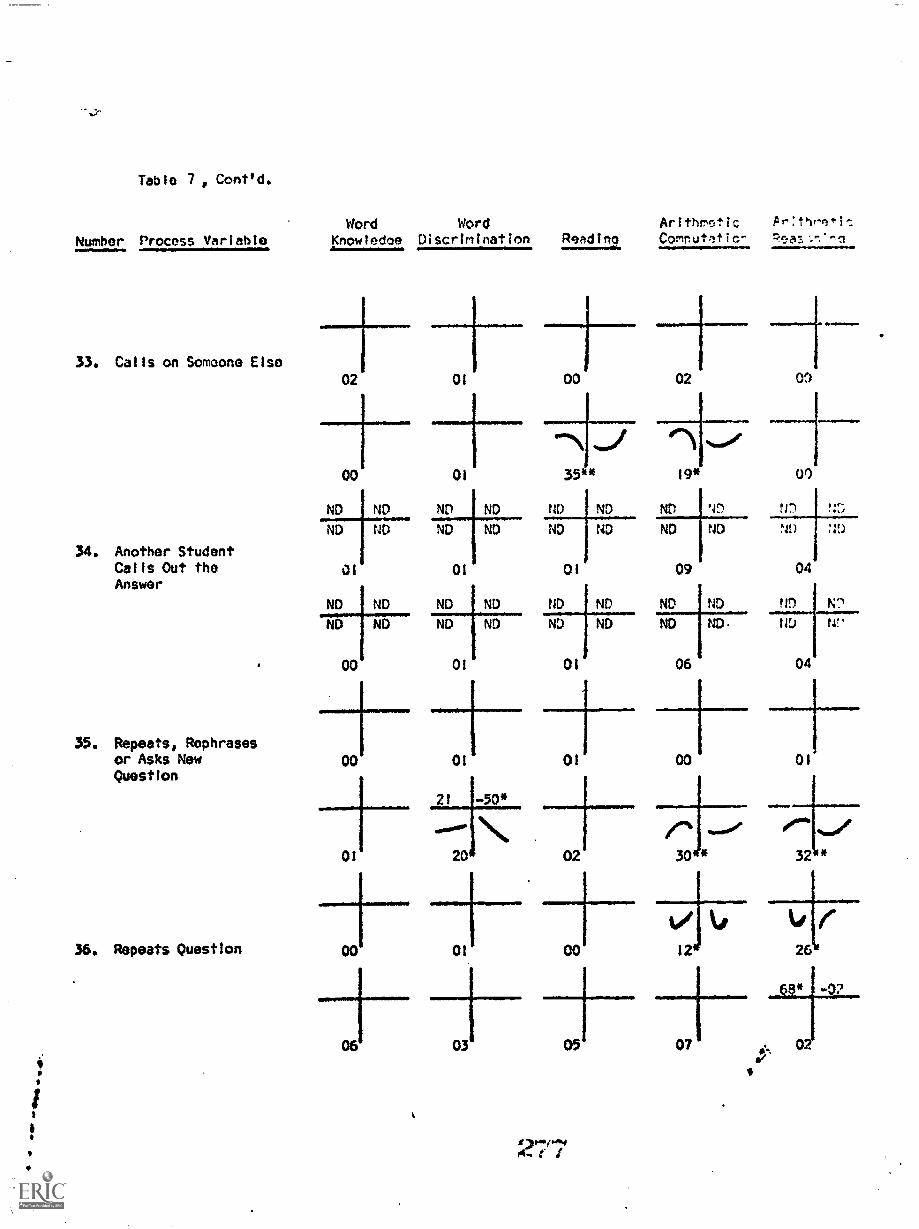
Table 7 , Cont/d.
Number Process Variable
33. Calls on Someone Else
Word Word Arithmetic Pr:thr.ati
Knowledoe Discrimination Roadina Comnutatio- Pen -.' -_,.i
02 01 00 02
00 01
ND ND
ND ND
34. Another StudentCalls Out the 01Answer
ND ND
ND ND
35. Repeats, Rephrasesor Asks NewQuestion
36. Repeats Question
00
00
00
06
01
-47 -"*..3--35** 19*
ND ND ND ND ND
ND ND
01
ND ND
09
ND
ND _ND ND ND ND ND
ND
01
ND ND
01
ND ND
06
ND.
01
21 -50*
01 001
20
\444.
02
ae.
30*
01 00 12
03 05 07
031.0.0414e I
OD
ND
ND ND
04
ND N'.1
NU NI'
04
tor26
68* - ?
02

Table 7, Cont'd.
Number Process Variable
37. Rephrases or GivesClue
38. Asks New Question
G. Teacher Reactions toDon't Know" or
No Response
39. Criticism
40. Failure to GiveFeedback
Word Word Arithmetic Arithme+ic
Knowledge Discrimination Readina Computation 4ea5onina
00 00 01 02 00
01
ND
46** 04 00 00
NDND ND
02 0i 07 14* 01
ND -38 ND
25** 01 36** 30**
ND ND
ND ND
ND
DND
ND
ND 60** ND
16* 15*
ND ND ND
MD ND ND
ND ND
ND I ND ND
ND ND ND
ND ND
N ND ND ND ND ND
ND ND ND ND ND NU ND
ND ND ND
57*ND ND ND
22** 04- 05
N!) ND ND
ND ND ND ND ND ND ND
ND ND ND
AND
ND ND ND ND ND ND ND
ND ND ND
(.1

Tao 7, Cont'd.
Word Word Arithmetic firlthme41c
Numbor Proctis Variable knowledelo Discrimination Reedino Comnutationemovoroww.I.N.
41. Gives the Answer
42. Calls on SomeoneElse
43. Another Student CallsOut the Answer
44. Repeats, Rephrases,or Asks New Question
02
NDFD
46**
Le V20*
01
ND 'It)
17 ND
:f)
27**
00
00
ND
04
NDND
36**
-85*
22* 07 01
-47
Nt)
:ID
00
ND
ND Nn%0 Nu
01
ND40
14'1
ND
170** 41** 68"
±11, 41111.111+
59"
32**
!JD
ND
iL)
00
01
FtG
ND
ND 08 ND
0
1
64* 07
04
44 .66**
37"
NC
02
ND
ND
ND:1)
23 ND
CID
01
ND
ND
29** 310* 41**
18* 01 02
27* 01 45*

Tabio 7, Cont'd.
Numbor Proco-s Variable
45. Repeats Ouostion
46, Rephrases or GivesClue
Word Word Arithmetic Arithme+17.
Knowledge Discrimination Readino Ccrinut.ltien Rason;n0
'ND ND ND ND ND ND ND ND
ND ND AD ND ND ND ND ND
00
00
ND
01
46 -59**
32 *
ND
02
ND
ND ND
ND ND
47, Asks New Question00
NU Nu4
01
M. Teacher Reaction toDif
48. Criticism
ND
ND ND
ND f tg
10
NO
01
ND ND ND ND ND ND
ND ND NU Ni) ND f NO
02 0
ND ND ND ND4.)
ND
ND
03
ND ND
ND
r.
00
I
03
tin 111
OD
ND N. ND N93
ND .

Table 7, Cont'd.
Number Process Variable
49. Failure to Give
Feedback
50. Gives the Ariwer
51. Calls on SomeoneElse
52, Another StudentCalls Out theAnswer
Word Word Arithmetic tar ! thr! i
Knowledge Discrimination Readinn Comnuttic-. Pt2Ascn;ne
ND ND
Nt) ND
ND
ND
ND ND ND ND ND ND ID ND
U D NDNO ND ND ND Nt)
ND ND NO
ND NDND ND ND ND
ND
ND ND ND ND NO ND
-58 -37
21*
ND Nt)
ND :tD ND Nu
02
ND
ND
NDNI)
ND ND ND 10 ND NC) NO 4 ND
ND ND ND ND ND ND ND ND 14.)
82'
pri
ND ND NO ND ND
ND

Table 7 , Cont'd,
Number Procen Variable
53, Repeats, Rephrasesor Asks Now Question
54. Repeats Question
55. Rephrases orGives Glue
56. Asks Now Question
Word Word Arithmetic Prithnesic
Knowledne Discrimination Readinn Comoutatien Peannn;lcMIPMP11.^
1 --I--- -1--NO NO ND ND
ND ND ND ND
01 01
ND ND
ND
ND N
0
ND ND ND NO ND NO
ND ND ND ND ND ND
05 08 2i
ND ND N!) Pt!) N!) ND
NU ND ND ND ND ND
ND ND
HOND
ND ND ND ND ND
ND ND ND ND 110
NO
ND
ND N!) ND ,r)ND ND ND
ND ND ND Nr)
Nr)
ND
ND
ND ND ND ND
ND ND
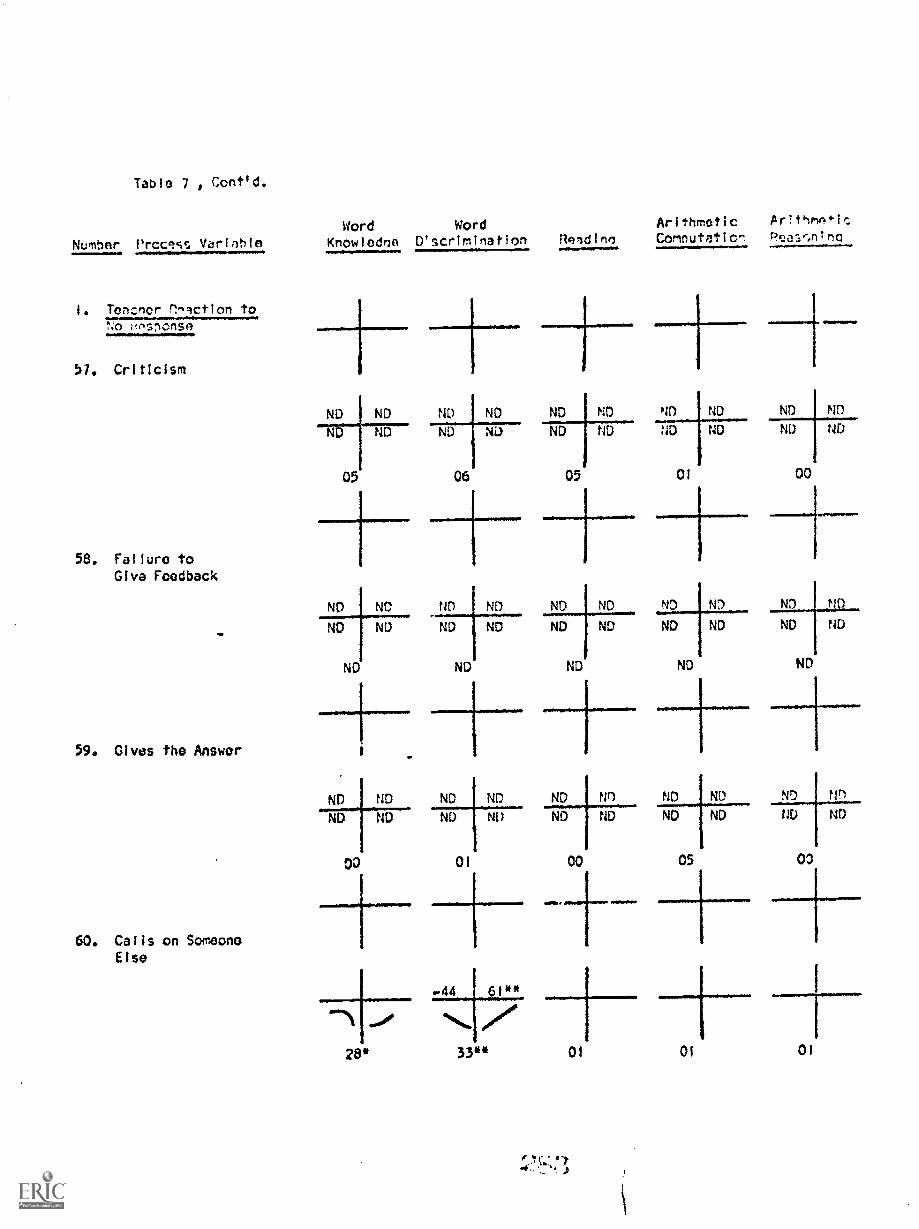
Table 7 , Cont'd.
Number Precgct Variable
I. Tencnor r1,1ction toNo rcr,snonse
57. Criticism
58. Failure toGiva Feedback
*IN
59. Gives the Answer
60. Calls on SomeoneElse
WordKnowIedrn D' scrrinat on
ND ND
10
05
Reldlne,
ArithmeticCombutntion
Ar7thmn41:PcJas,,n1no
ND ND ND ND ND ND ND ND
ND ND ND ND ND ND ND ND
05
ND ND ND
ND ND ND
ND
ND
ND
01 00
ND ND ND ND ND
ND ND ND ND ND ND
ND ND ND ND
ND ND
ND ND
00
ND ND
01
ND ND ND ND ND
ND ND ND ND ND ND

Table 7, Cont`d.
Numbor Proco,;s Variable
61, Anothor StudentCalls Out theAnswer
62. Re oats, Rephrasesor Asks Now Question
63. Repeats Question
64. REphrases or OlvosC ue
Word Word Arithmetic Arithmosi,::
Knowledoe Discrimination Readinq Comoutatic-.
13 ND Ni) trt
NO ND ND ND
00 28** 30** 41**
43 -65**oroftwo.
00 36** 26
40 1-58**
44**
00 30** 06 19* 52**
ND ND
ND ND
ND NO
ND ND
ND
ND
OD 04 01 03 Of
r

Table 7 , Cont'd.
Word Word ArithmesticNumber Process Variable Knowledne Discrimination Readino Comeutaticr
65. Asks Now Ouustion
. Teacher PeactionsCom:Aneo Acros.1'manoro 0Dnorrunities
66. Praise
660. Criticism After AllIncorrect Answers
67. Failure to GiveFeedback
Ur cy 7
ND ND ND ND ND ND ND NTH ND
ND ND rya ND , NO ND ND ND ilil
ND ND ND ND ND
01 22* 00 01 03
02 00 0 04
16* 01 04 00 00
-49* -10
03 02001
02 01
54* -05
1
......- -1
02 00 02 ool+
No

Table 7 Cont' d.
Word Word Arithmetic Ar!thmti,..
Number Process Varlet) e Knowledoe Discrlmination Reldinn Cemnutlticn
68. Process Feedback
69. New Question
70. Repeat, Rephraseor Asks New QuestionAfter Failure toAnswer'
71. Repeats Question AfterFailure to AnswerCorrectly
02 40
11*
-19
18*
18 47* 59** 2
02
02
17** 11*
1
-02 45* +09 06
13
04
01 00 00 03 00
01 04 01 01 00
01
28*
01
534 -47*
26**
-12 -31 1 ND
ND
10*
I
05 08
18* 25** 36*.
01
00 03 01 02 05
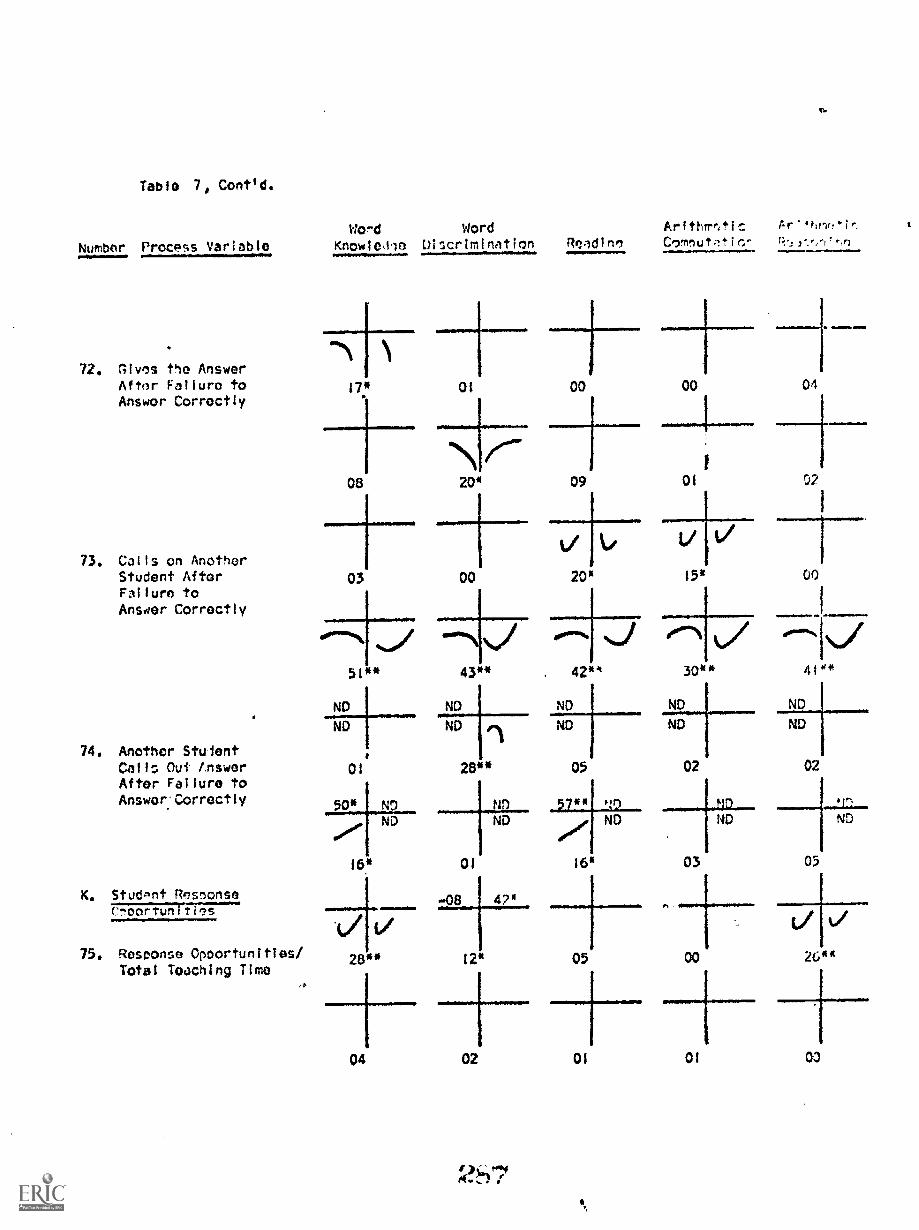
Table 7, Cont'd.
Number Process Variable
72. 31vas the AnswerAfter Failure toAnswer Correctly
73. Cells en AnotherStudent AfterFailure toAnswer Correctly
74. Another StudentCall:. Out tnswerAfter Failure toAnswer' Correctly
K. Student Rpsnonse7.77PcTrtiXriTir
75. Response Opportunities/Total Teaching Time
Word Word ArittIrmtic r'qt07,ir.
Knowlelne Discrimination Readinp C4'nnutptin-
1111.....111011.1=11..1.1=
04
08 20* 09 01 02
77110-703 00 20* 15* 00
51"
ND
ND
01
50* NDND
43**
ND
42"
16*
ND
28"
0
.08
05
30** 41'*
ND ND
ND ND
02 02
ND ND
16* 03 05
1----V vs'
12' 05 00 26**
04 02 01 01 00
if4.*-)7

Table 7 , Cont'd.
Number Procons VoriaNie
L. Student inittltedA7777on.
76. % SI0Is Irrelevant
77, % SIO's Called Out
78. Prala of NestIonafter Reievint 511'4,
Criticism of Duostionafter ReicNant Sirs
Word Word Arithmetic
Knowledoo Discrimination Reldinf, Comnuthtir,.
ND ND ND
ND NO N:7
ND
00 01
ND Ni)
Ni) n Ni)
ND
23* 07
NO ND
ND
01
NI)
ND
ND
ND
01
ND
NO
ND
ND ND
02
PO 01 00
NO ND
ND
ND ND
Nu1
'D
NI)
ND N:)
NU
AID
"Itirr
NI)
717: 177".7ND.1. NC) NI)
ND ND
24*
00
ND ND
ND NE)
02
ND
ND
00
00
NO 'Ii) ND N) ND NC)
ND 177) ND t4D ND ND
ND ND ND
441, ND NO ND NO
41 ND ND ND ND
ND ND
ND ND ND ND ND ND
1717 NU ND ND PlD
Nlh ND ND
ND ND t ) Irj
ND
N4) NU
rte
NU
ND
11:)

Table 7, Contld.
Number Process Variable
80. 5 Relevant S1Q'sGiven No Feedback
81. % Relevant 512'sDelayed
82. % Relevant SIQ'sNot Accepted
83. % Relevant SIO'sGiven BriefFeedback
Word Word Arithmetic ArithmOir;knowledoe Discrimination Readime CommitIticr Reasonino
ND
ND
ND
ND
ND
ND
ND
NDND
ND
ND
ND
ND
ND
ND
tiD
r)
14U N )
ND
ND tlil
0205
ND ND
ND
ND
1:0
03
04
ND ND
ND
ND ND
ND
00
02
21*
03
-58 51* -06
.0°.°
00
ND
ND
NDND
ND ND
ND
ND U)
ND
ND
ND N ND
ND
ND
29**
28 .9
Mr)ND ND
ND
ND
NI)
ND
00
ND
NDND
ND
NI)
140
IF)ND
Ni)
07 25* 410*
ND
02 22* 03
15*
54* -43 44
200 54"

Table 7, Cont'd.
Number Process VariableWord Word Arithmetic Arithmetic
Knowledoe Discrimination Rea Computation ReasonIne
86. Behavioral Praiseof Relevant SIQ's
87. Behavioral Criticismof Relevant SIQ's
ND
ND
ND
ND
ND
NDND
ND
NI)
ND
ND
D
84. % Relevant SIQ'sGiven Long 24*Feedback
ND ND
ND ND
00
ND ND
ND ND
85. % Relevant S1Q'sRedirected to NDClass
ND
ND
ND
ND
ND
ND
ND
N
ND ND
ND
ND
ND
ND
ND ND
ND
ND ND
II
ND ND
ND ND
00
ND__ ND
ND ND
ND
10
N
ND
04
N
ND
ND
ND ND
ND ND
03
ND
ND ND
ND
0I
ND ND ND
ND ND ND
ND ND NDND ND ND ND
ND ND
ND ND ND
ND ND ND
ND
ND ND
ND
ND
ND
ND
ND
ND
ND
ND
ND
ND
ND
ND
ND ND
ND ND
ND ND ND
ND
ND
ND ND
ND ND
ND
ND
0I
ND NO
ND
00
ND MD
ND ND
ND
ND
ND
ND
ND
ND ND
ND ND
ND
ND
ND i 4 D ND no
ND ND
NC' ND ND ND
ND ND ND NI)
290
NI
ND ND
ND ND
ND

Number
Table 7, Coned,
'rocess Variable
88, Oehavioral Warningafter Relevant S1Q's
89. Criticism of Questionafter Irrelevant SIQ's
90. % irrelevant SIQ'sGiven No Feedback
91. % Irrelevant S1Q'sDelayed
Word WordKnowledne Discrimination
ND ND
ND
ND ND
ND ND
ND ND
ND I ND ND ND
ND ND ND
ND ND
ND ND
ND ND
ND
ND ND
Ni) ND
ND
ND ND
ND ND
ND
ND ND
ND
ND N
ND ND
ND
Arithmeticheadine Computation
ND
I
ND ND ND tir...a.u.... .
NO ND ND t1D ND ND
ArIthmleftReasoning
ND
ND ND
ND NU
ND
ND
ND
ND
ND
ND
ND
ND ND
ND ND
ND
ND ND
ND
ND ND
ND ND
ND
ND 14
ND ND ND ND ND
No ND
NDND ND ND ND
ND ND
ttia ND ND ND MD
ND ND ND ND ND
ND ND
ND ND ND ND
ND NDI
MD
ND ND MD
ND
ND MD
ND ND
ND ND
t D
4D ND
ND ND
ND
ND
ND
ND
ND
ND
ND
I
ND ND
ND ND
ND N) ND NDND ND ND ND
ND ND
ND ND ND NnND ND ND
NOND ND
291

Table 7, Cont'd.
Word Word Arithmetic ArIthmnflcNumber Process Variable Knowledoe Discrimination Readlno Comnutation Reasoniny
92, % Irrelevant S1Q'sGiven Brief
ND ND ND 1 ND ND
ND ND ND ND ND
FeedbackND ND
ND ND
ND
ND ND
ND ND
93, % irrelevant SIQ's
Given Long NDFeedback
ND NDND ND
ND
ND ND
ND ND
94, % Irrelevant SIQ'sNot Accepted ND
ND ND
95, % irrelevant SIQ's
Redirected to Class
12
ND ND
ND
NO ND
ND
NO
03
ND ND ND I ND ND
ND ND
ND
ND
ND
88".
ND ND I ND
ND I ND ND
ND ND
ND ND ND
ND
ND ND ND ND MD ND
ND
ND ND
ND
ND
ND
N
ND
ND
ND
NU ND ND ND
ND
ND
ND
ND
MD ND ND NDND ND ND ND
ND
ND
ND
ND
ND
r nND
ND
140
MD ND Nn
ND ND ND
ND ND ND
ND
ND ND ND ND ND ND ND
I0
ND
ND
ND
ND ND ND ND ND
l0
ND
ND ND ND r10 ND ND ND ND
ND ND
2 9 2
23
D
NDND NU 1W ND 0
NO ND ND

Table 7, Cont'd.
Word WordNumber Process variable knowledeo Discrimination Readino Corrout;Iiir:-
I
Arithrwrtic
(ND
ND
96. Behavior Criticismafter Irrelevant SIQ's ND
97, Behavioral Warningafter Irrelevant SIQ's
14. Student initiatedL.157577+16ns
Arfthruftic
1,..Asf,ntrIn
ND ND ND ND ND
ND ND ND ND ND ND ND NO ND
ND ND
ND ND
ND
ND ND
ND
ND ND ND ND
ND ND
ND NDND ND ND ND ND Nn
ND NO ND ND ND ND
ND ND NU ND
ND ND ND ND ND ND ND ND
ND ND ND ND ND ND ND ND
ND ND NO ND
ND ND NiTIND ND N
ND '.71 ND NP
D
ND ND ND ND ND ND
ND ND ND
98, Student InitiatedComments and Questions/ 01
Total Response Oppor-tunities
N? Student initiatedm1777;17;Inrrow-
99, % S1C's Relevant
05
00 07 01 03
09 22* 00
21*
NND ND
07
4
23*
* *
ND ND
05
293
03
ND
02
04
ND ND
ND ND ND
01 02
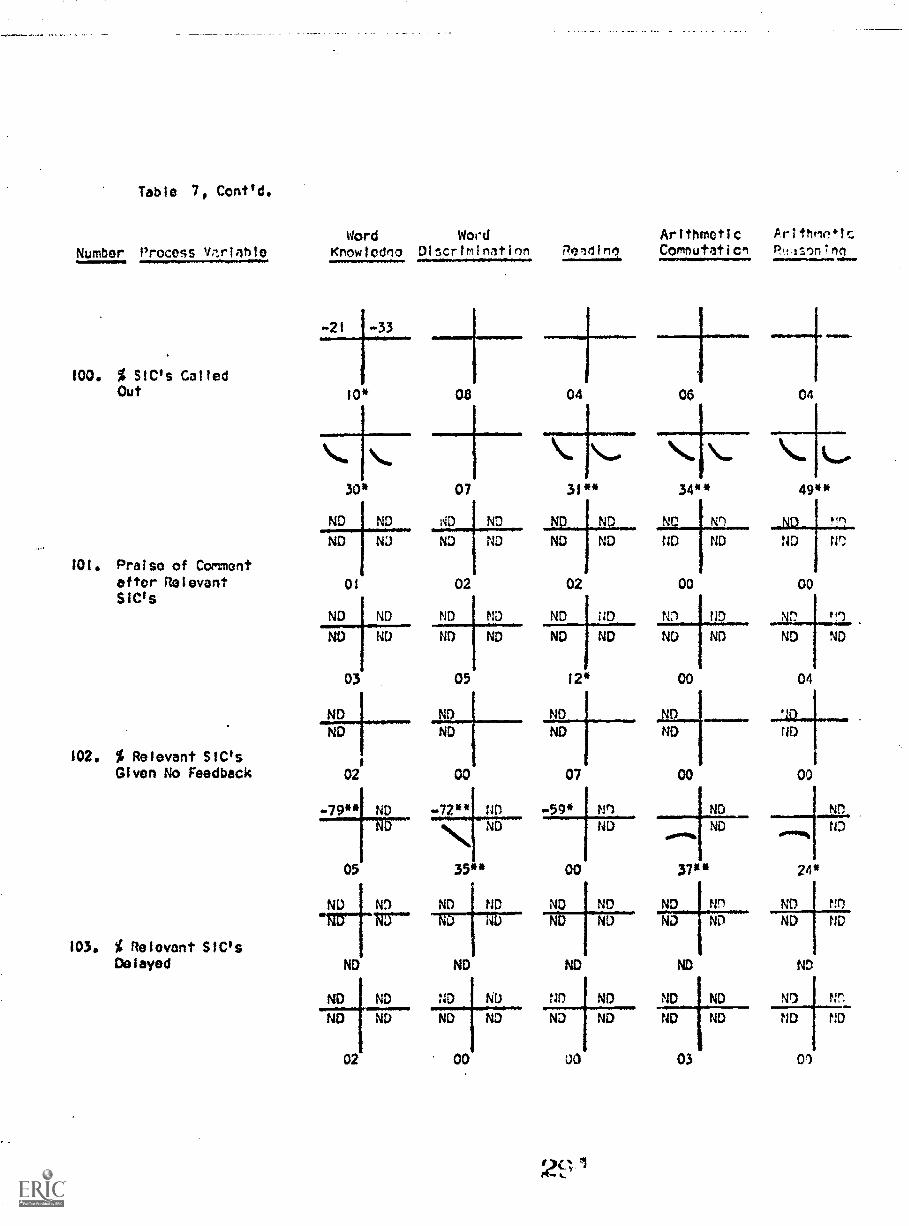
Table 7, Cont'd.
Number Process wtrinhla
100. % S1O's CalledOut
101. Praise of Commentafter RelevantS1C's
102. % Relevant SIC'sGiven No Feedback
103. % Relevant SIC'sDelayed
Word WordKnowtedno Dtscrtminnti n
ArithmeticRandlna Computation
Arithmetic1):sntnn
30* 07
ND ND ND ND
ND ND ND ND
01
ND ND
ND ND
03
NDND
02
02
ND ND
ND ND
05
ND
ND
00
ND
ND
31"
02
\. s..34** 49**
ND N tvl
ND ND ND ND Nr.,
00 00
ND ND ND ND ND fn
ND ND ND ND ND ND
12* 00
ND NDND ND
07
-79** ND -72** t4D .5 t41
ND ND ND
05
NU ND
ND
ND ND
ND ND
02
35**
ND I'D
ND
ND ND
ND ND
00
00
00
37"
ND
ND
04
ND
00
24*
ND
ND
ND ND ND t D ND ttr)N
ND
ND
UO
NI) ND ND ND ND
ND ND ND
ND ND ND ND ND
03
ND
NO
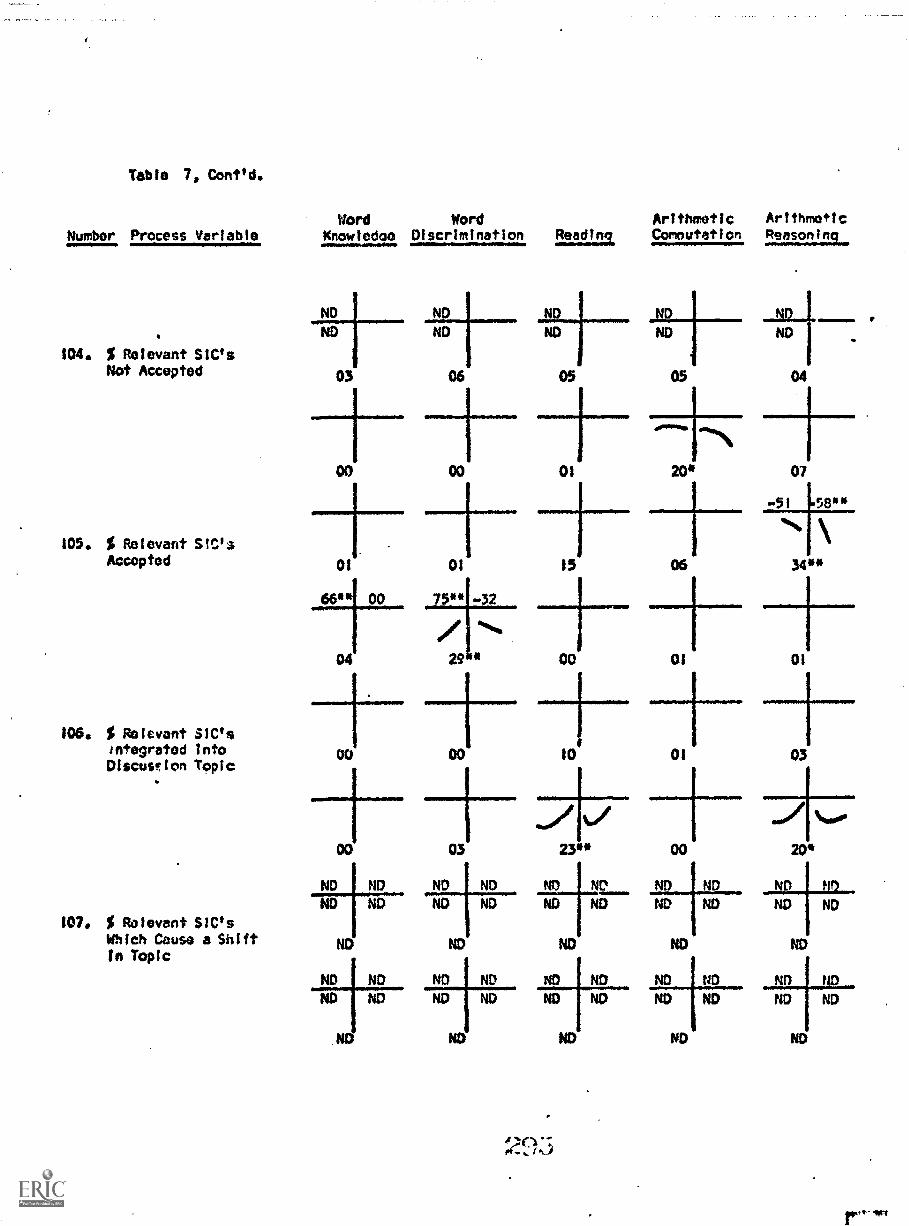
Table 7, Cont'd.
Number Process Variable
104. % Relevant SiC'sNot Accepted
105. % Relevant SIC'sAccepted
106. 5 Relevant SIC'sintegrated intoDiscus "ion Topic
107. 5 Relevant SiC'sWhich Cause a ShiftIn Topic
Word Word Arithmetic ArithmeticKnowledge Discrimination Reading Comnutation Reasoninq
ND ND
ND ND
03
00
01
*I
66*
04
OD
NDND
ND
ND
ND
ND
ND
06
00
01
00 75** -32
/ *429 *
00 10
03 23**
ND ND ND ND NDND NDND
ND ND
NDND ND ND ND
ND ND ND NDND
ND ND
01
15
CO
dePose
20* 07
06 34**
01 01+01 03
00
ND ND
20*
ND
ND ND
ND
ND

Table 7, Cont'd.
Number Process Varin toWord
Knowledoe
ND ND
ND ND
108. Behavioral Pra;seafter Relevant SIG's ND
ND ND
ND ND
ND
ND NU
NO NU
109. Behavioral Criticismafter Relevant SIC's ND
ND ND
ND ND
ND
ND ND
ND ND
110. Behavioral Warningafter Relevant SIC'1 ND
ND ND
ND
ND ND110 ND
111. Praise of Commentafter Irrelevant SIC's ND
Nr
NO
t D
NU
Word Arithmetic Arithmetic
Discrimination Peadine Computation Pra3onine
ND ND ND ND ND
ND ND ND ND ND
ND ND ND
Nn
ND NO
ND
ND ND ND ND ND ND N
ND ND ND ND D
D
NND ND
ND ND ND ND
ND ND ND I ND g) ND ND
ND NU ND 1 ND ND NO Ni)
ND
ND ND
tiO
ND
ND NI)
N NU
ND
ND ND
ND
ND
ND ND
NO
NU ND
ND
29E;
ND NO
ND ND ND ND
ND ND ND ND
ND ND
ND 111) NC) NI) N t,,r1
ND ND 4D ND fit ND
ND
ND
ND
ND
NO
) ND
ND
ND ND
t.D ND ND NI)
NR ND
UU...ND I ND ND NE;
ND
ND
ND
N!)
ND
ND ND ND ND ND NO
NU ND NO

Number
Table 1, Contld.
ocess Varlabte
112. ; irrelevant SIC'sGiven No Feedback
113. % Irrelevant SIC'sDelayed
114. Irrelevant SIC'sNot Accepted
115. % irrelevant SIC'sAccepted
Word Word ArithmeticKnowledge Discrim1flatirn Rlarlinn 0071u/wrier
ND ND ND Ism ND ND
ND NE) NE) ND
00
ND ND
ND ND
02
ND ND
ND ND
15 28
ND ND
07
ND ND
NO
ND ND ND ND ND ND ND ID :I')
NU NO NO ND ND NU ND N.., NU ;JD
28
ND
00
NE)
ND
08
Ar:t..mt,+R
ND
ND
Nil I ND
tg) NI)
01
ND rsn U
ND NU N')
12
ND ND ND
ND
ND
ND ND
ND N ND
ND ND
D
ND ND
ND
ND
12
ND ND
N 41)
ND
NI)
03
NI) ND
04
ND
NU
ND
14
ND ND1-Tzr--
NO
ND
NU
01
ND
30w'
ND
ND
NO
ND
NI)
:ID ND tie
NE) 1;;
ND
13
ND
ND
Ni)
19
ND ND NDND ND FIU ND ND
03
ND
41)
05
ND Nn ND NDND ND ND NU
14 00
trt
thY
N't
05
ND ND
ND ND

Table 7, Contld,
Nu. mber Process Variable
116. % Irrelevant SIC'sInto:rated intoDiscussion Topic
117. % irrelevant SIC'sWhich Cause a Shiftin Topic
118, Behavioral Praiseafter irrelevant SIC's
Word Word Arithmetic ArithmeticKnowledae Discrimination Readino Conoutaticm Reasoning
ND ND ND ti n NO ND
ND ND ND ND ND ND
ND ND ND
Nn ND ND 1 ND ND ND
ND ND ND ND ND ND
ND ND ND
ND ND ND ND ND ND
ND ND ND ND ND ND
ND ND ND
ND ND ND ND ND
NO ND Ni) ND ND ND
ND ND ND
ND
ND
ND ND ND_
ND ND ND
ND
ND ND
1,11)
ND
ND
ND
ND
ND
ND ND
Nil NI)
ND
ID NI)
ND
ND
119, 8ahavloral Criticlimafter Irrelevant SIC', ND

Table 7 Cont/d.
Nurrb'r Process Variable,
120. Donaviorni Warning
after irrelevant SX's NV
ND
ND
0.
121.
Word Word Arithmetic ArithmeticKnowledge Discrimination iMIdima Cry-nutlficn Pcascl2Tno
ND ND
ND ND
ND
ND ND ND ND ND ND I Nn
ND 11D ND
ND ND ND ND ND ND
Nd ND ND i#1; ND
ND Nta ND
ND
Self and Opinion9uostioAs
Self Ouestions/Process+ Product ChoiceQuestions
0
01
27*
#0".1
16'
01
00
03
20**
122. I Self Questionsihich WereSubject-MatterRelated
123. % Self QuestionsRelated to PersonalPreference
ND ND
ND ND-
ND
ND ND
ND
ND
ND ND
ND ND
ND
10
ND
ND ND
ND
07
N
ND :D
00 03
12
NO
'ID ND
ND
ND ND
11)
140
00
00
ND ND
10 0
ND ND
ND ND
01 OD
11
:ID ND ND
ND ND ND
07 30** 03

Table 7; Cont,d,
Word WordNumber Process Variable Knowledee !Discrimination Readtno Computation Reasoeime
Arithmetic Arithmetic
124, Opinion Questions/
Process + Product +
125,
126,
Choice Questions
00 00
ND ND N ND
ND ND ND ND
$ Opinion Questions
liven No Response ND ND
ND ND ND
ND ND ND ND
ND ND
ND ND ND ND
ND ND ND ND
$ Opinion QuestionsFollowed by Praise ND ND
127, % Opinion QuestionsCriticized
04
01 14*
ND
ND ND
ND ND
ND
ND
ND
ND
ND ND
ND ND
01
I I
NDND
03
ND
ND NO
ND ND
ND
00
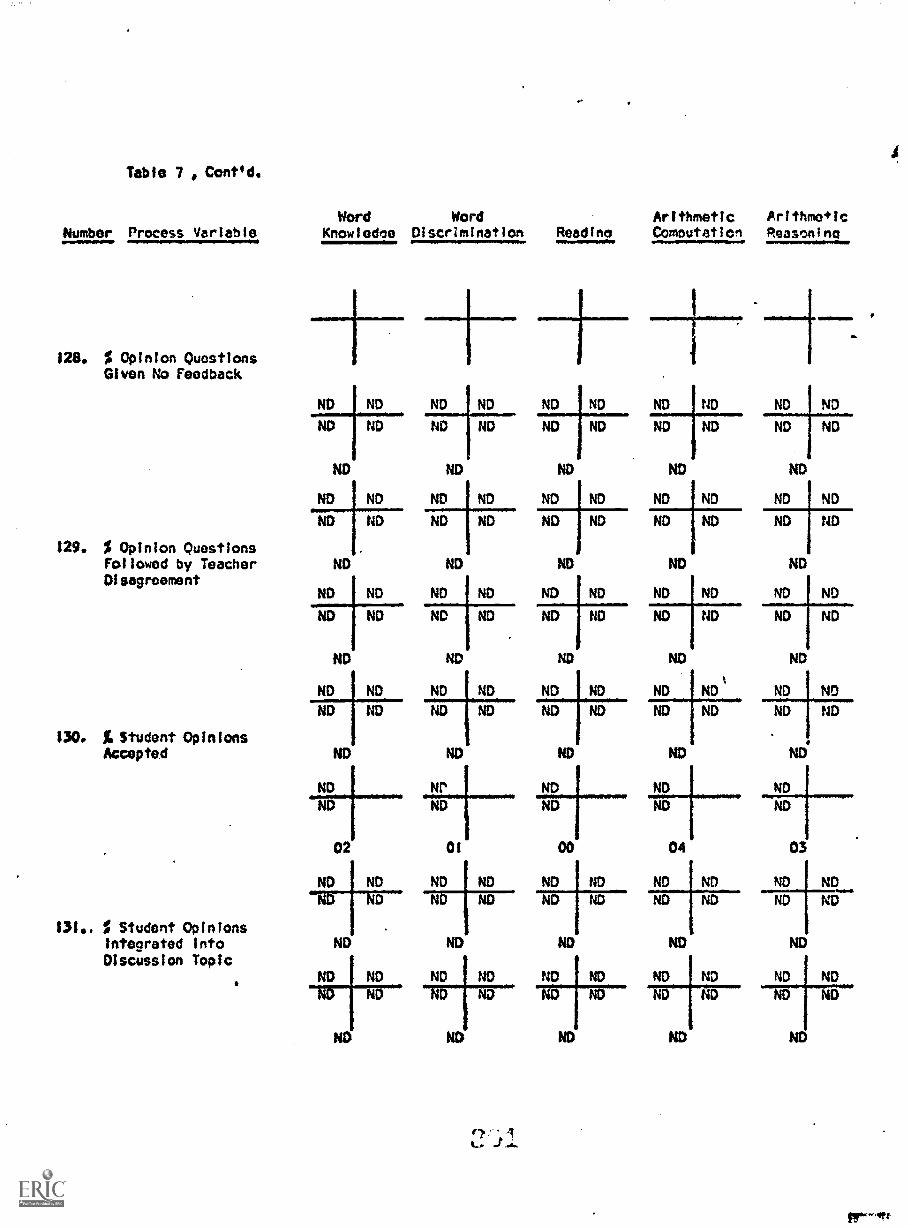
Table 7 Cont'd.
Word Word Arithmetic Arftbme+icNumber Process variable Knowledce Discrimination Redding Computation Reasoning
128. $ Opinion QuestionsGiven No Feedback
ND ND ND ND
ND ND ND ND
ND ND
ND ND ND ND
ND ND ND ND
129. $ Opinion QuestionsFollowed by Teacher ND NDDisagreement
ND ND ND ND
ND ND ND ND
ND ND
ND ND ND ND
ND ND ND ND
130. Student OpinionsAccepted ND ND
ND_ Ni'
ND ND
131.. $ Student OpinionsIntegrated intoDiscussion Topic
02
ND ND
ND
01
ND ND
ND ND
ND ND
ND ND
ND
ND
ND
ND i ND
ND ND ND ND
ND ND ND ND
ND ND
ND ND ND ND
ND ND ND ND
ND
ND ND
ND ND ND ND
ND ND
ND
ND ND
ND
ND
ND
ND ND ND ND ND
ND ND ND ND ND
ND ND ND
ND ND411411.10
ND ND
O0 04
ND ND NDND
ND ND ND
ND ND ND NDND ND ND ND
NO ND
NDND
03
ND
ND
NDND
NDND

Table 7, Cont'd.
Number Process Variable
P. Private DyadicContacts
132. % Private ContactsStudent initiated
133. Student InitiatedWork ContactsInvolving Praise
134. Student InitiatedWork ContactsInvolving Criticism
135. % Private WorkContacts Studontinitiated
Word Word ArltbmticKnowlodoo Discrimination Rqndtmn Combutatir;n
04 00
00 28*
02 00
00 20
-01 46** 40 26
23* 10*
06 01
00 06
01 00
01
p
04
07
ro
01
00 02 17* 18*
-52* 06
03 02 03 02 06
kof
00 00 28** 24* 01+ + +00 16* 00 02 00

Table 7, Cont'd.
Number Process Variable
136. % Student initiatedContacts Delayed
137. % Student InitiatedContacts Given BriefFeedback
138. % Student InitiatedContacts Given Leftl
Feedback
139. % Student InitiatedContacts involvingPersonal Concerns
Word Word Arithmetic Arithmetic
Knowledde Discrimination Reading Computation PrJascning
00 06
MIrar,
es"ft
25* 02
00 01 01+61* 0034 42
18** 08 03
± 1-----01 08 03
+- ±00 00 03
\ ± +33
00 04
+00 02 00
-71-7 + +24** 19** 01
29 * Oi
00 00
00 02
00 00
00 01
04 01
18*
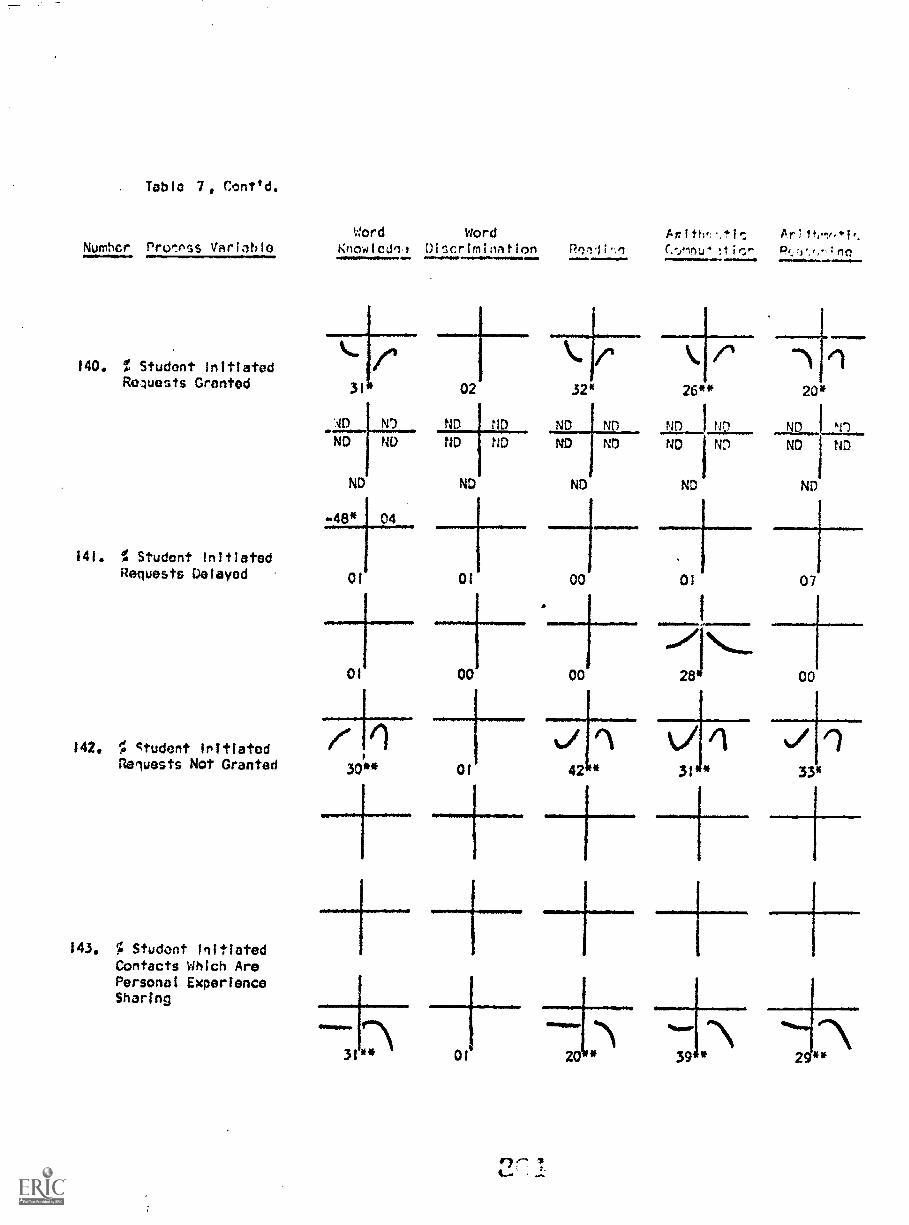
. Table 7, Cont'd.
Number Pro,:nss Vadat) t0
140.
Word Arithf:%ti:Knowlednl Discrimination 80,111%1 Pr::1;f10....n11.1020 Wwwww
% Student Initiatedipt
Requests Granted31 02
AD ND NDND ND ND ND
141 % Student initiatedRequests Delayed
142. % ctudent initiatedRequests Not Granted
143. ; Student initiatedContacts Which ArePersonal ExperienceSharing
ND ND
=iI tel
32* 26** 20*
ND N ND I NO ND N')
ND ND ND NDND ND
ND ND ND
00 01 07
01 00
I
00
I
284 00
30** 01 42 * 33*
+20 * 34 *

Table 7, Cont'd.
Number Process Variable
_144. Private Work Contacts/Private Work Contacts +Public ResponseOpportunities
145. Procedural Contacts/Procedural Contacts +Response Opportunities
146. Tischer initiated WorkContacts/TeacherInitiated Work +Procedure Contacts
147. Teacher initiated WorkContacts InvolvingPraise
Word Word Arithmetic Arlihme+P:Knowledge Discrimination Reading Comnutation Reasoning
01 01 05 02
02 22* 00 02
00 Of 01 00
05
00
05
01
264*
45 34N%
18* 00
3n5
-17 -48**
-.019
23** 30
03
15 .46*
04
04
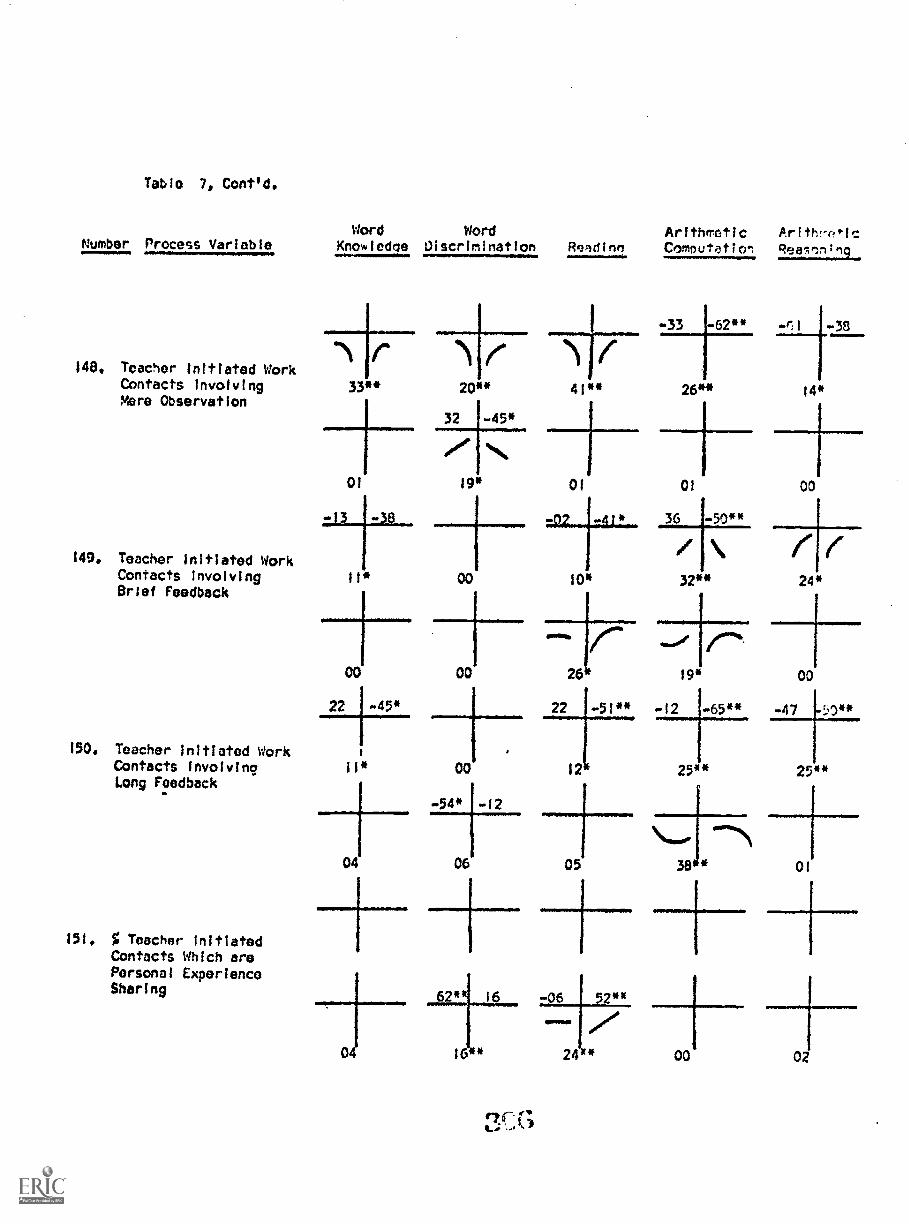
Table 7, Cont'd,
Number Process Variable
148. Teacher Initiated WorkContacts InvolvingMere Observation
149, Teacher initiated WorkContacts involvingBrief Feedback
150. Teacher Initiated WorkContacts Involving 11*Long Feedback
Word WordKnowledoe OiscrImination Reldinn Computtion RealnrOng
Arithmetic Arlth!-04-1c.
33** 20**
32 -45*
01 19* 01 0I
3G -50**
32**
00
22 -45*
151. % Teacher initiated
Contacts Which arePersonal ExperienceSharing
OD 26* 19*
22 -51** ..12 -65**
00 12 25
-54* -12
04 06 05 38 *
+ +r06 52**
16 24 * 00
00
24*
-47
00
t **
25**
01

Table 7, Cont'd.
Number Process VariableWord Word Arithmetic Arlihme*IC
knowledne Discrimination Readino Comnutation 0....,ason!ne
152. % Teacher InitiatedProcedural Contacts 00
Which Wore Manage-ment Requests
00 01
153. % Teacher ThanksStudent for Doinga Favor Request
02
01 01
ND ND
ND ND
154 % Teacher ThanksStudent Followinga Management Request
05 02
0. Corblned Teachertval7511777777a-menrs---m-
155. Academic Praise,/Academic PraiseAcademic Criticism -26 6
03 00
23
00
00
00
01
00 04
07 01
02 02
01
ND
ND
6ND
ND
22**
00
k, in I1
,ND
tiD
24** 25**
00" \
43 31 32 45*
13 25*
00 47 ** 27 *" 25**
17 03 02
Inotwwi
00 01

Table 7 Cont/d.
Number Process Variable
156. Behavioral Praise/
Word WordKnowledno Discrimination
ND
ND
ND
ND
Total BehavioralContacts
157. Behavioral Warnings/Behavioral WorninasBehavioral Criticism
R. Discipline and ControlErrors
158. $ Discipline ContactsInvolving One orMore Error
159. Target Errors/Total Errors
00 00
-44 1-28
04 11*
00 00
ReadinnArithmeticComneltin-.
Arithmr!*1,7;
Q,J3scm7n0
ND NI) 07 mn
00
-82** 02
ND
II*-57P* 4
NO
00
-65r n1
01 03 OT
04 06 02
00 10 00 02 03
82'
03 00 05 00 02
01
ND
00
ND
03
00 00 01 00
1
ND
25' 01 02 00
ND ND
ND NQ 11017-1------
46** 00 00 00
'13

Table 7, Cont/d.
Number Process Variable
10. Timing Errors/
Word WordKnowledno Discrimination Rendlnm Comnutntion RO3SonTmq
ND -64
ND
ND
ND
ND
ND
Arithmetic Arlihme*Ic
ND
ND
MD
ND
Total Errors 00. 01 00 04
ND NDND
ND NDND
161. Overreactions/Total Errors
00 05 01 00
ND ND
ND 06 ND
12 14
ND ND
ND ND
I01 02
162. Nonverbal ControlContacts/TotalControl Contacts.
S. Combined Teacherr"---7eout,i171775"---
163. Ropeatikepeat +Rephrase + NewQuestion
06 06
ND
ND
11 00
ND I ND
ND ND
00
ND
ND
N
ND ND
ND1/
ND
30
ND
ND
OCt'
00 01
01 00

Table 7 Cont'd.
Number Process Variable
164. Rephrase/Repeat +Rephrase + NewQuestion
165. Brief Feedback/Brief + LongFeedback
T. Math Contacts
166, Total Public MathContacts/Total PublicMath Contacts + TotalPrivate Math Contacts
167. Total TeacherInitiated Privateath Contacts/Total Public MathContacts + TotalPrivate MathContacts
Word Word Arithmetic Ar!thr101,7Knowindelo Discrimination Remdfmq Comnutatic-, RoasfAi7no
n170
00
/I V22"
-14 450
02
iel 11 "In37*0 18° 00 00
-22 -50' 110111.010.1
09 03 OD 240
00 01 06 09
gliwas0"
01 08 29" 220

Table 7, Ccnt'd.
Nur,!)nr ProcessWord Word
Knowledne Discrimination eaR Computntic., Ruasf:mino
Arithmetic Prithmttic
160. Total ToacherAfforded MathContacts / Total ND ND
Math Time ND ND
ND
159. Total pathResponse Opportunities/TotalMath Time ND NO
U. Dyadic Contacts,
170. Tbtal TeacherInitiated Contacts/Total TeachingTime '
ND
ND ND
ND ND
ND ND ND ND ND ND
ND ND ND ND ND ND
ND ND ND
ND ND ND ND
ND ND ND ND
ND ND
000/
03 07 02 15
ND
ND
ND ND
ND
1 Probability values are indicated by asterisks. One asterisk Indicates a V8416 oft;.10;
two asterisks indicate a value of,i',.05.

Tibia 8. Non-linear Rolationships bet worn Teacher rroco.ls Viiriables fromthe rxpandod itrophy.*aood nbsnrvational System treading group ohser-yations) and Student 1!fm.,Iduot train Scorns (averannd across four year,)on the Motropo;itan Achlevrm "nt TVA'S taocimol points omittedi.1
Numbor PreCOSS VnriablaWord Word Arithmetic Ariihmetic
Knowledng Discrimination Rgading COmnutsttlon Perrlonino000A.
1.
SolgAing Respondentsit -63** 04 -61**7771=tiOns
% Prosglocts RescondIntbefore Asking Question 34* 05 19**
oil"' 0,0" 01 /...
44** 30** 46**
2. Calls on Non-Volunteer00 01 01
03 OD 06
3. Calls on Volunteer
4, Student Calls OutAnswers
50** 47**
-14 1 54* -05 62"
06 180
02 02
.7;17;i7.
19** 03
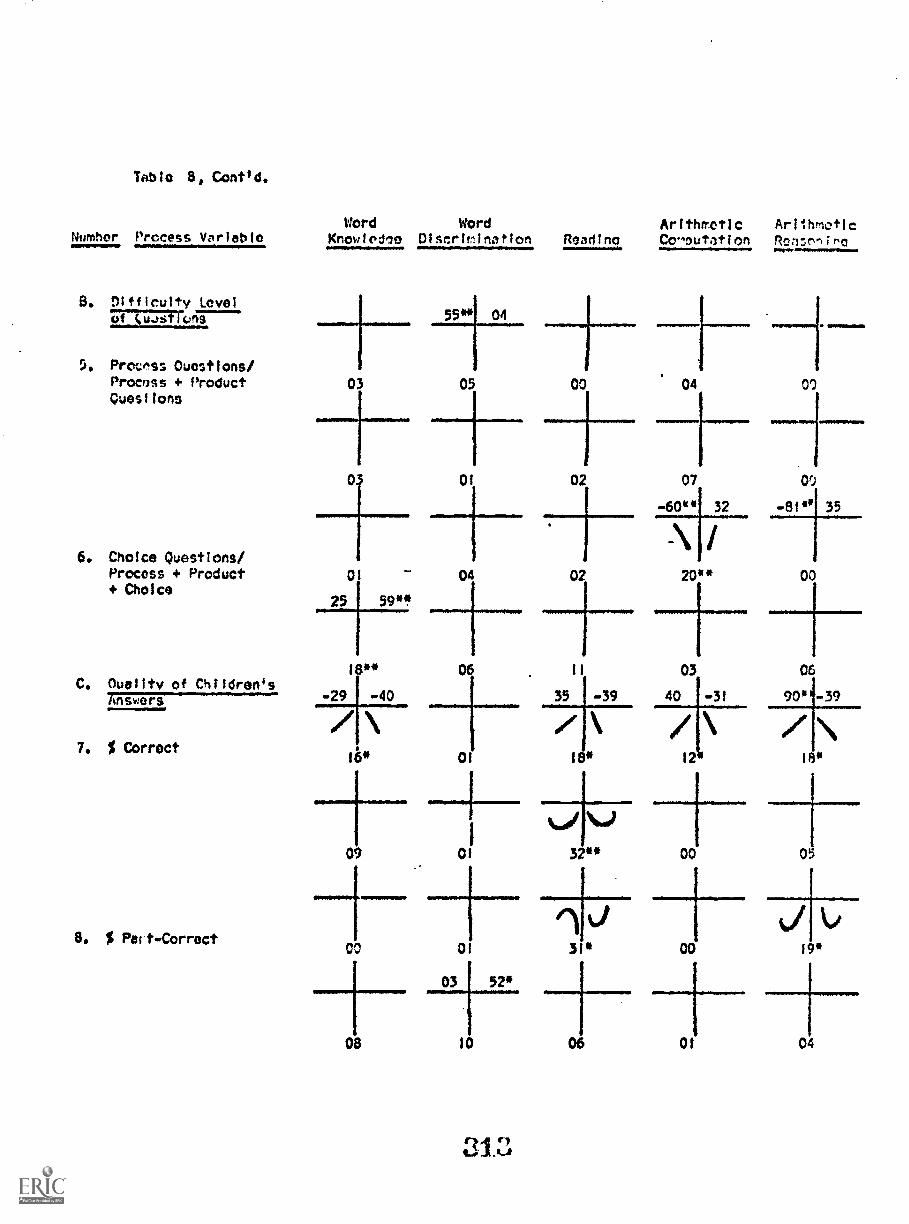
'Table 13, Contld.
Numher Process Variable
B. Difficulty Level
5. Process Questions/Process ProductQuestions
6. Choice Questions/Process + Product+ Choice
C. Ouelitv of Children'sAnswers
7. $ Correct
8. Z Part-Correct
Word Word Arithmetic ArilhtioticKnowledlo Discrimination Reading Cer,eutetion Ronsnnire
03
55° 04
05 00 04 OF)
0
25 59"04
09I
0t
02 20" 00
Ii 03 06
35 -39 40 -31 90' -39
/ \I12 18*
32" 00 05
03 52*
OS 10 06 01 04

Table 8, Cont'd.
Number Process Variable
9. $ Wrong
10. % "Don't Know"
11. $ NO Response
D. Tnecher Reactionslo Correct Ani-wes
12. Praise
Word Word Arithmetic ArithmeticKnowledge Discrimination Reading Computation Reasoning
-39
/44*
20**
LI
00
23** 39*
-60** 3'
01 22**
%%Raw
43**
to/
03
42**
'32*
01 01 00
01 15
00 04
+ 02
03 00
8--"t"---
00
00 01
02 03
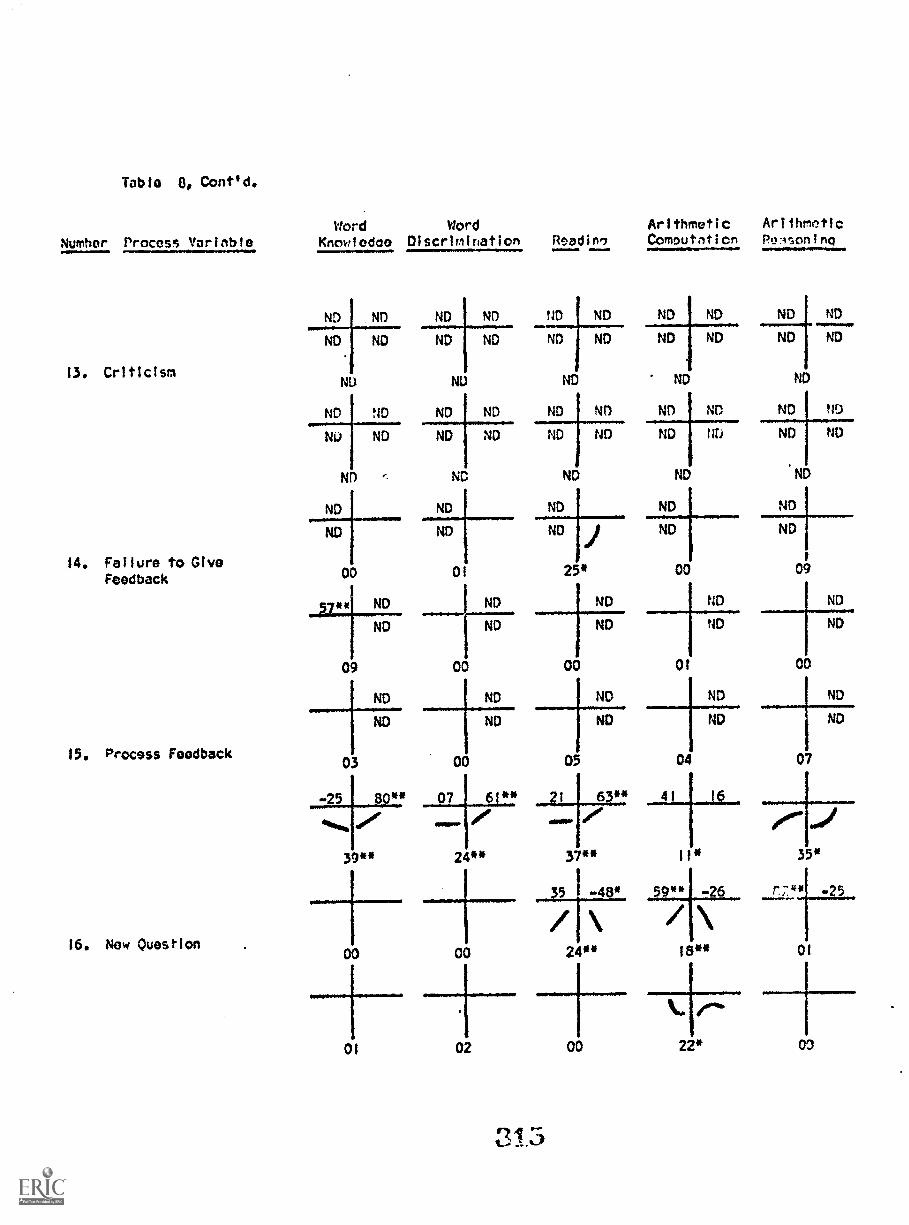
Table 8, Cont'd.
Number Process Verinble
13. Criticism
14. Failure to GiveFeedback
15. Process Feedback
16. Now Question
WordKnowledoe
WordDiscrimination Roadie/
ArithmeticComputeticn
ArithmeticPolsoning
ND ND ND NO ND ND ND ND ND ND
ND
N
ND
ND
ND
ND
NU
ND
ND
ND
ND
ND
ND
ND
ND
ND
ND
ND
ND
ND
ND
ND
NQ
ND
ND
Nu
NI)
ND
ND ND
ND
ND
ND ND
ND
ND
ND ND
ND
ND
tlb ND
ND
ND
ND
ND ND dt ND ND
00
ND
ND
09
ND
ND
03
-25 80**
*60. 4#
39**
01
ND
ND
00
ND
ND
25* 00
I ND I ND
ND
00
ND
ND
0/
09
ND
00
ND
07
07 6 ** 21 6
24"
* *
370* It*
5 I -48* 59** -26/ I \00 24** IS**
35*
.25
01
01 02 00 22* 00
31.5

Table gR Cont'd.
NumhN- Process Variable
E. loacner Po:xtions to"art-Ur.rr.w.t Answers
17, Praise
Wordknowledon
ND ND
ND ND
ND
IND ND
ND ND
ND
116, Criticism
19. Failure to GiveFeedback
20, Process raedback
Word Arithmetic ArithmeticDiscrimination Readino Computation Pcasonino
ND ND
NO ND
ND
ND ND ND ND ND ND
ND ND ND ND NO MD
ND ND ND
ND ND ND ND ND ND ND ND
ND ND ND ND ND ND ND ND
ND' NI)
ND ND ND ND ND t ND
ND ND ND ND ND 1 ND
ND ND ND
ND
ND ND
ND ND
ND
ND ND ND ND ND ND ND
ND
ND ND
ND ND
ND
ND NI) ND
ND ND ND ND ND ND ND
ND
1
ND ND ND NDN ND ND
ND
ND
ND ND ND
ND ND ND
ND ND ND ND ND ND ND ND ND ND
ND
ND
ND I ND ND
ND
ND NO ND ND
ND
ND
N
ND
ND
ND
ND
NO
ND
ND
ND ND ND
ND ND 140 ND
ND
ND ND ND ND ND ND
ND
ND
ND ND
ND
ND ND ND ND
ND
ND
ND ND
ND ND ND
ND ND ND
04 01 06
ND ND
ND :r
Ni)
ND
ND ND

Table 8 Cont' d.
Numhor Process VariahleIP WordKnowledno
WordDiscrimination Readinn
Arithmetic PrithmeficComnut;rtion
ND 46* ND 59** ND t 42 ND ND
ND ND ND ND01.1.1.10.1.101.del
ND
21. Gives the Answer13* 35* 12* 00 01
66** 35
16" 07 11 00 02
22. Cells on SomeoneElse
23. Another StudentCalls Out theAnswer
24. Repeats, Rephrases,or Asks Now Question
ND
ND
N
03 00
[C57** 40*
ND
ND
ND
ND
00
0?
UNDND ND
NOND 13 ND
01 9* 00
04 00 08
ND ND ND ND ND ND ND NO ND
ND
ND
ND
ND
ND
ND
ND
ND
ND
ND 1
ND
ND
ND
ND
ND
ND
ND
ND
ND
ND
ND
ND
ND ND
00
ND ND
02
ND ND
00
ND ND
00
ND
) P' )32 25
NDD
31" 30** 07 02 0

Table Pi Cont'd.
NtvrtYlr Process Voriable
25. Repeats Question
26. Rephrases or GivesClue
27. Asks New Question
F.
28.
Word Word Arithmetic ArithmeticKnowledne Discrimination Readinn Comnutation Rensoninq
ND NDND ND
Of 25*
-68** -09
06
NDND
Di
13* 10 26** 02
02
03 -62**
22*
0111110001111.4
00
.1P.OUNIMNINIONI58* -21
00
ND
ND
09
14* 07
01
20*
Teacher React ons 0
ND ND -48 ND -56*
ND ND
N
22**
ND ND
07
ND Hn rin Nn:112271, Answws
PraiseND
ND
ND
ND
ND
ND
ND
ND
ND
G ND
NO
4D ND
ND
ND
ND
ID
ND
ND
ND
ND ND.
ND
ND ND ND
ND
ND ND
ND
ND
ND
01
NDND
0
00
ND
ND
14
ND
NO NONU 4
NO
ND ND
ND ND
ND
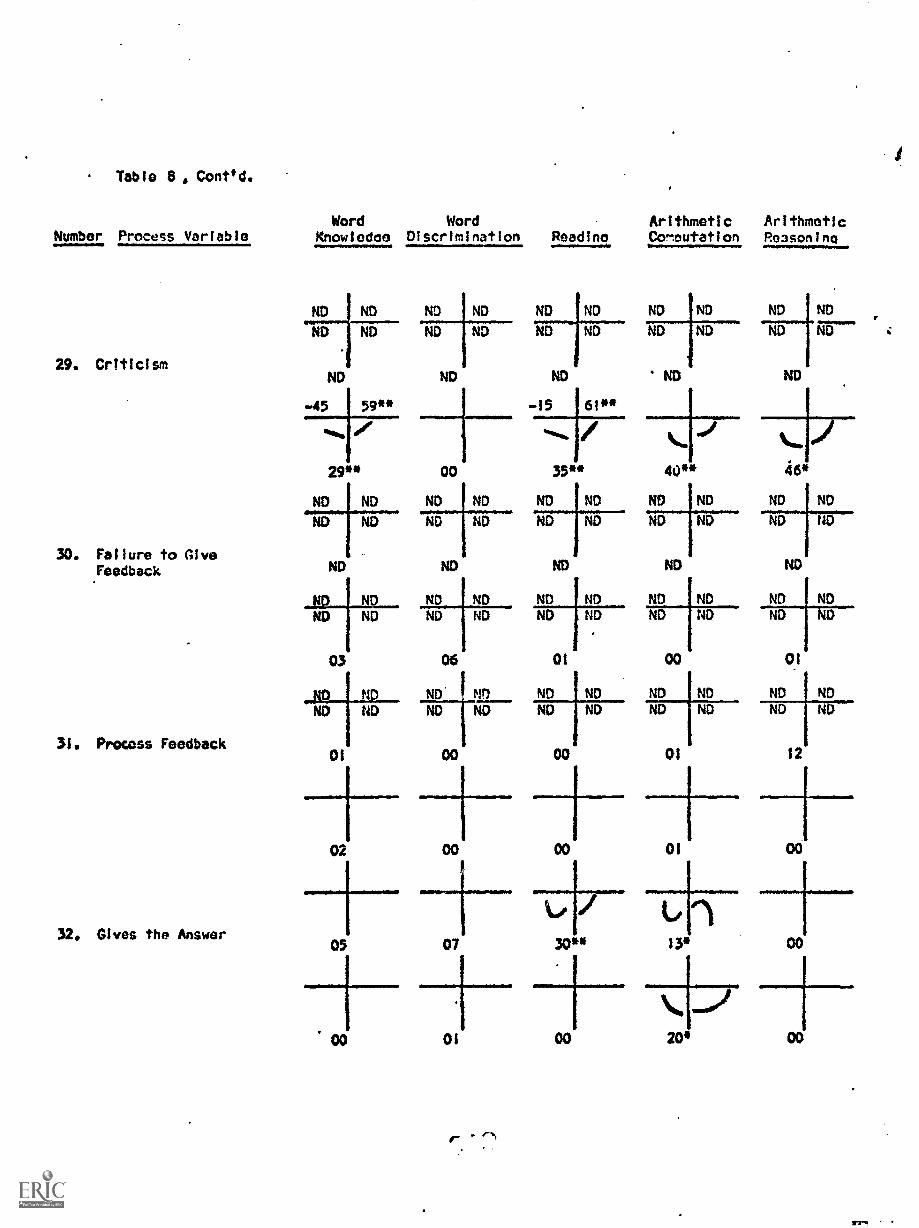
Table 8 , Conttd.
Number Process Variable
29. Criticism
30. Failure to GiveFeedback
31. Process Feedback
32. Gives the Answer
Word Word Arithmetic ArithmeticKnowiedoe Discrimination Reams dino Co!leutation Re3sonine
ND ND
ND ND ND
.I
ND
I
-45 59**
goes. of
29**
ND ND.
ND ND
ND
ND ND
00
ND ND
ND ND
ND ND ND ND ND NDND
ND ND ND ND ND ND
I
ND N0 ND
-15 1 61**
35** 40** 46*
ND ND ND ND ND ND
ND ND ND ND ND ND
ND ND ND
NDND ND ND ND ND ND
ND NDND ND
ND ND ND ND ND ND
06 01 00 01
NDND ND NDND' / ND ND ND
ND ND ND ND ND ND
01 00 00 01 12
02
05
00
00
07
I00 01 00
7,17 de)13* 00iii
01 00 00

Table 8, Cont'd.
Word Word Arithfrr:tic
Number Process Variable knowledge Discrimination Reading Comnutat;
33. Calls on Someone Else
34. Another StudentCalls Out theAnswer
35. Repeats, Rephrasesor Asks NewQuestion
20 50*
14*
NDND
01
ND
05
-5400 ND
08
ND
27*
ND
ND
01
ND
08
03
00 07 00
NOND
Of
00
Pt
ttD
+-01 01 02
0 09 30** 02 01
-02 .47*
N%
01 23* 30 01
09 -40
36, Repeats Question
64`...
1 *

Table 8, Cont'd.
Number Prncess Variable
37. Rephrases or GivesClue
38. Asks New Question
Word WordKnowledae Discrimination Rendime, Comnutatior Psas,pnino
Arithmetic Arithmeic
00 00 18* 02 07
00 00 01 02 00
48t02
Of 00 02 03 01
ND ND ND ND
ND ND ND ND
OD 01 03 03
ND
ND
02
Trirla5onse111 Jon/t no" or ND ND ND ND NDKw ND NDND
G. Teacher Reactions to ND ND ND ND ND ND ND MD ND
39. Criticism ND ND ND
40. Failure to GiveFeedback
ND ND
ND
ND t ND
ND
ND ND
U
03
ND ND
ND
ND ND
ND
ND ND
00
ND ND
ND
ND ND
01
ND
ND ND
ND
ND ND
03
ND
ND NDND VD
ND
ND ND
ND ND
ND
ND ND
01

Table 8, Cont/d.
Number Procecs Variable
41. Givos the Answer
42. Calls on SomeoneElse
43. Mother Student CallsCut the Answer
44. Repeats, Rephrases,or Asks New Question
Word Word Arithr*tic Ar!thme*icKnowiedoe Discrtmlnation Readinn Coolnutetic-
ND ND
ND
ND ND
ND ND ND ND
ND
04 02 07
ND
ND
ND
02
ND
ND
Pr)
ND
02
tar)
ND
03 04 00 03 00
01 05
-65** 48*
\ /32**
01
+35**
.37* 16'
ND ND ND ND ND ND
ND ND ND ND ND ND
01 03 04
42 -42
24 00
08 OD
1":41)(,)
ND

Table 8, Gont'd.
Word Word Arithmetic Artthmel:Number Process Variable Knowledoe Discrimination fitadira Computation Rea3onin
45. Repeats Question
03
..52* 44
08
1
08 04
46. Rephrases or GivesClue 00 30*
02. 00
ND .ND ND ND
ND ND ND ND
47, Ask New Question
04 06
ND ND ND ND
ND ND ND ND
02 05
H. Teacher Reaction toDK
48. Criticism
DND
.laND ND
ND ND
323
-61** -34 -56' 10
16** 09
00 05
if25** 03
...7701.12.c.
40** 24*
NDND
01
79** -03
08
N
ND_
D
08
ewa
59**
ND ND ND ND ND ND
ND
02
Nn
ND
I .
ND
ND
06
ND
ND
ND
ND
08
ND 1
ND
ND
ND ND ND ND ND ND
04 02 03
ND
ND
MD ND
ND

Table 8 Cont'd.
Number Process Variable
49. Failure to GiveFeedback
50. Gives the Answer
Word Word Arithmctic ArithmeticKnowledoe Discrimination Readinn ComnutAtior Reason:no
411MIMINt
ND ND ND ND ND ND ND ND NO NOND ND ND ND ND ND ND ND ND ND
ND ND ND ND ND
ND ND ND ND
ND ND NO ND
ND
51. COls on SomeoneElse
-37 63*
01 32**
52. Another StudentCalls Out theAnswer
ND ND ND ND
D ND ND
ND ND ND ND NO ND
ND NO ND ND ND NO
ND ND ND
39** 33**
ND i ND NO
NO i ND
ND ND ND
ND ND
62"
0111011.1
ND ND
ND ND
ND

Table 8, Cont'd.
Number Prccess Variable
53, Popeats, Roahrasesor Askc Now Question
54. Rnpeats Question
55. Rephrases orGives Clue
56. Asks New Question
Word Word Arithmetic Prithmo+ftknewledeo Discrimination Nadine Computation Pe4s,-..nine
IWO
ND ND ND ND ND ND ND NDND ND ND ND JD ND ND ND
ND ND ND
ND ND
ND
ND ND
ND
ND
ND
ND ND
ND ND
ND ND
NO ND ND ND ND ND
ND ND ND ND ND NDND No
ND ND
ND NO ND ND
ND NC) ND ND ND NDND ND ND ZND ; Z11;
NO ND NDND + +ND ND ND ND ND ND ND ND NDND ND ND ND ND ND ND ND ND
ND ND ND ND
l
ND

Table. 8, Contld.
Number Process VariabIe
Tencner Reaction toNo !esponso
57. Criticism
58. Failure toGive Feedback
59. Gives the Answer
60. Calls on SomeoneElse
Word WordKnowledco Discrimination Readinn
ND ND ND ND 242
ND ND ND ND ND
ArithmeticComnutitic Pc:as-,-"na11.0 m.MNINNINw01.
ND N r
ND NDND ND
N )
ND ND ND ND ND
ND ND
ND ND
ND ND N
ND ND ND NO NP
ND ND
NO
ND D
ND Ni?
ND ND
ND ND ND ND ND
a
02 00 04 02+-75** 43 -74** 3i
29* 01 32** 38**
flte%rori
18°
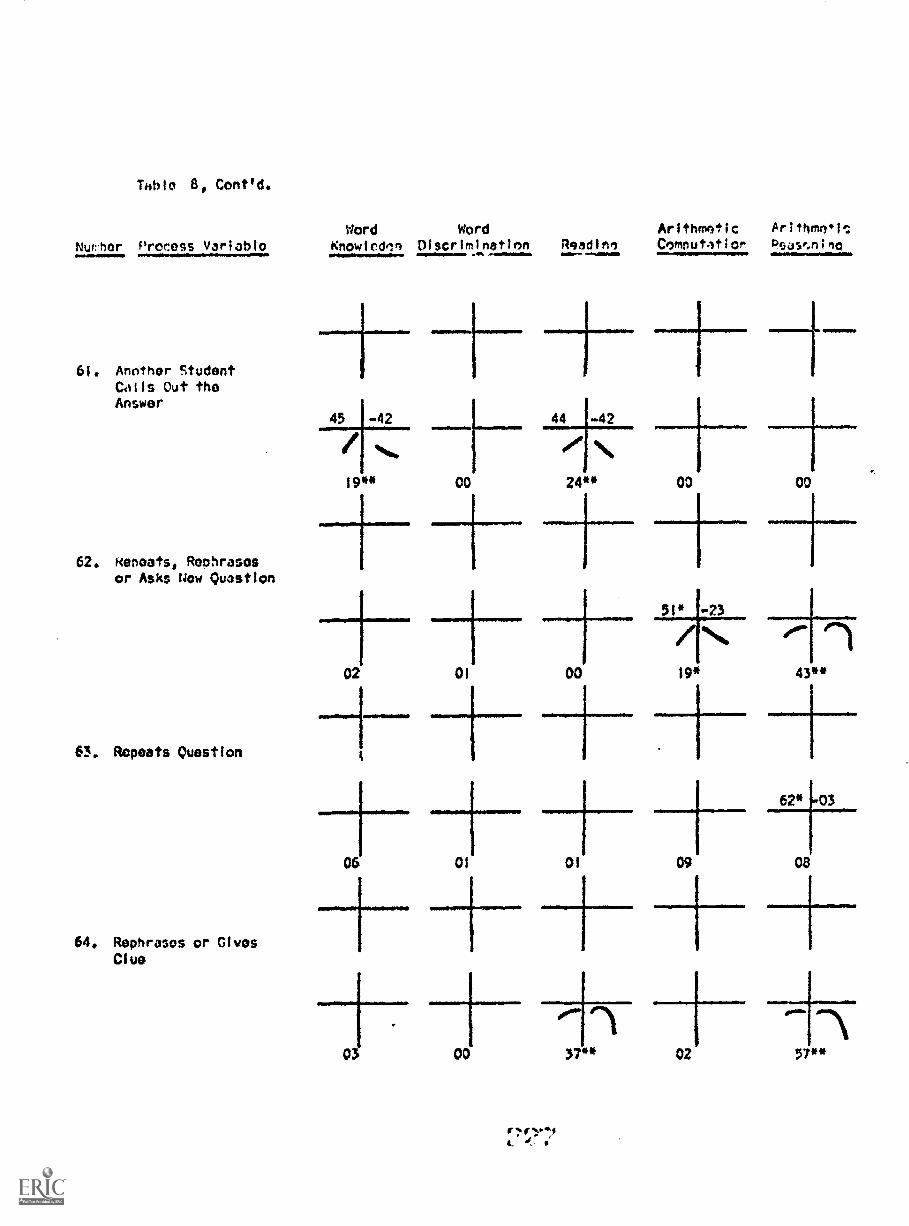
Table 6, Contid.
Nuwher Process Variable
61. Another studentCalls Out theAnswer
62. Reneats, Rephrasesor Asks Wow Question
63. Repeats Question
64. Rephrases or GivesClue
Word WordKnewledoe Discrimination
.1% noIMIIIIMMIII
45 -42
19"I
00
Readinn11 -.40=1
44 -42
24**
02 01 00
Arithmetic ArithmoltComnutatior Poase.ninc
00
03 00 37** 02* 57"

Tablo 8, Cont'd.
Number Process Variable
65. Asks New Question
Tencner ;InactionsAcrcl; All
IT,rouse Onnortunitios
66. Praise
6613. Criticism After AllIncorrect Answers
67. Failure to GiveFeedback
Word word ArltbmticKno Discrimination Re)adinn Comnutatic,
ND ND NC)N NE) ND i n
ND
ND
ND ND
ND
ND ND
ND
ND
01 01 04
N7 N7 In ND
Ni) ND ND ND
ND N1
00 02
46 Di
14 0105 01
4
451111'
73** -32 66** -19 63**
34** 36**
00
rr17,0-..
01 32**
06 01
1:701

Table 8, cent'd.
NNmbor Process vriabln
68. Process Feedback
69. New Question
70. Repeat, Rephraseor Asks New QuestionAfter Failure toAnswer'
71. Repeats Question AfterFailure to AnswerCorrectly
Word Word Arithmetic Arithme4.1e;
Knowledce Discrimination Rqadino Computation ReasfAlna
02
-10
32**
* *
00
01
/46 44*
07
08 27*
34 -52**
03 10
13* 13
59** i 83 28
00 27 29 02
02 00 01 01
-43
00 31 *

Table 8, Conttd.
Number Process Variable
72. Gives the AnswerAfter Failure toAnswer Correctly
73. Calls on AnotherStudent AfterFailure toAnswer Correctly
74. Another StudentCalls Out AnswerAfter Failure toAnswer' Correctly
K. Student PosocnseOrnortvnirios
75. Re cone OrnortunitiosiTotal Teaching Time
Word Word Arithmetic Ar7thrpicKnowledee Discrimination Readine Comautation 4r.,3st-dn;nel
-41 1 40
17**
-24 37
16*
08 02
-24 55**
27** 03
.124 66** 33 35
..1
-56*l 16
.000°
25** 12* 38*
. -61 *11 09
-74*
01 01 00
00
01
40/
21** 05
02
810100,411.
/-* I %.44*
01
01
31 -39
20*
17
01
91
00
25" 00
00 00
02 01 01 04
%woe 1114111440 \ow. Sw we
29** 44* 19* 34**
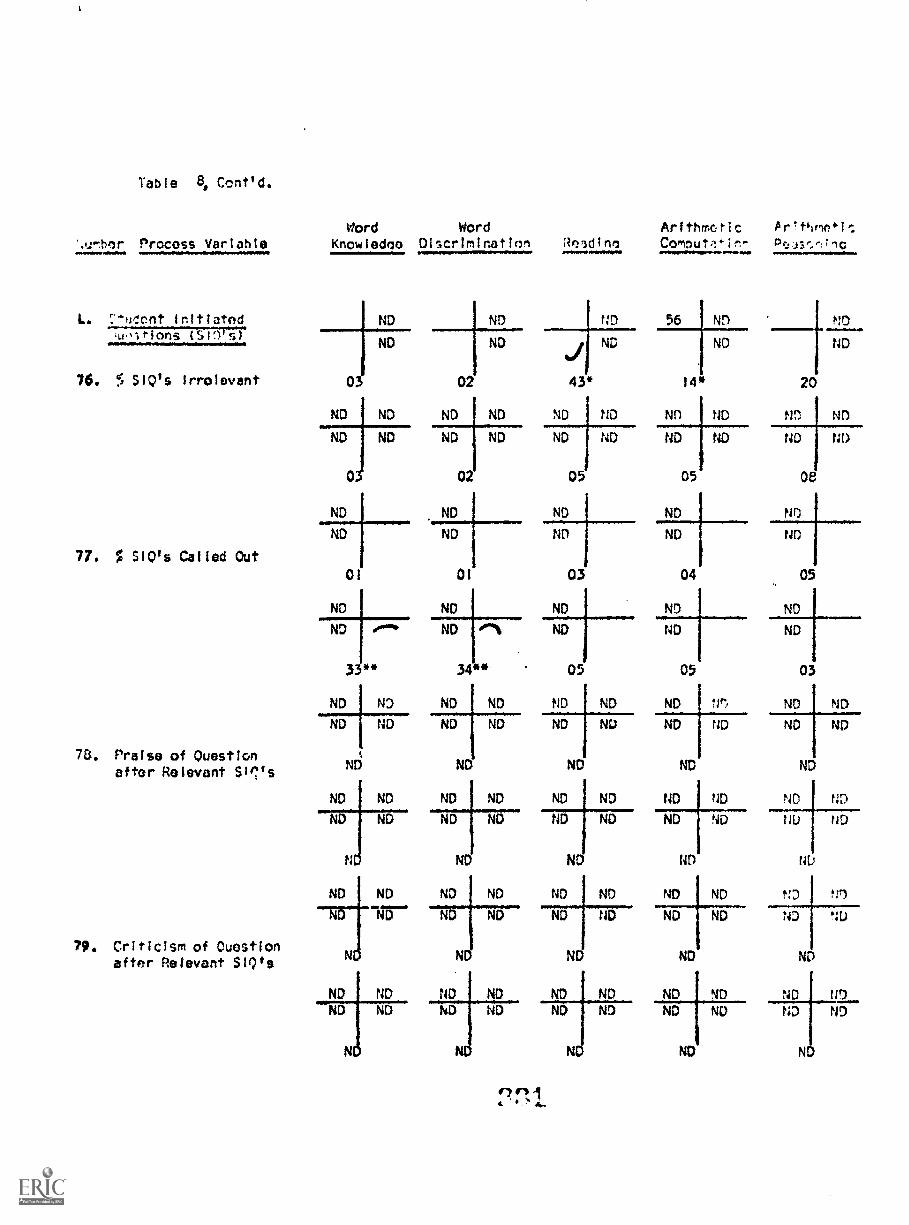
Table B. Oent'd.
'.1.2-11or Process VariableWord Word Arithmetic
Knowledge Discrimination Reldlna Comnut;l*in-
L. r:tucnt Initiated ND
ND
76. 5 S1Q's Irrolevant 03
ND ND
ND ND
77. % SlOts Called Out
70. Praise of Questionafter Relevant Slirs
79. Criticism of Questionafter Relevant SIQ's
ND
ND
01
N
ND
33**
ND ND
ND t ND
ND
ND
NDND
NO
ND
ND
ND
NDND
Ar!timptl:
tD1:!jSr..":T1C
ND 110 56 ND
20
ND
02
ND
ND
ND
43*
ND
ND
ND
14*
ND ND
ND
ND
02
ND ND
05
ND ND
05
ND ND
08
ND
ND ND ND
ND
01
ND
ND
03
ND
ND
04
ND
05
_ND
IND
ND
34**
01
05
ND
05
ND
03
ND ND ND ND ND Nr*/ ND ND
ND ND ND NU ND ND ND ND
N ND ND ND
ND ND ND I ND ND ND ND ND
ND ND ND ND ND ND E11.4 ?JD
ND ND ND N
ND ND ND ND ND ND ND '11
ND ND ND ND ND ND Ni)
ND ND NO
ND ND ND ND ND ND ND NO
ND ND NDI
ND ND NO ND ND
ND ND ND ND

Table 8, Cont'd.
Word Word Arithmetic Ar'tslme*icNumber Process Variable Knowledge Discrlmina
80. % Relevant Stn'sGiven No Feedback
ion Readinn Cornoutetion Pe35,%n1no
\
ND ND ND ND ND 1 ND ND ND
ND ND ND 1 NO ND 1 ND ND ND ND ND
ND ND ND ND ND
ND ND ND ND ND No ND ND ND ND
ND ND ND ND ND ND ND ND ND ND
81. % Relevant SirsDelayed ND ND ND ND ND
ND ND ND ND ND ND ND ND ND NDND ND ND ND ND ND ND ND ND ND
ND ND ND ND
ND ND ND ND ND NO ND ND ND ND
ND N 141D 140 ND ND ND ND ND ND
82. % Relevant Sirs1
Not Accepted ND ND ND ND ND
ND ND ND ND ND ND ND ND ND ND
IUD ND
ND ND ND ND ND
ND 60** ND 6F1** ND 77** ND 66** ND ,6"
ND ND ND ND ND83. % Peievant SW's
Given Urief 25" 34** 51" 27" 37**Feedback
09 02
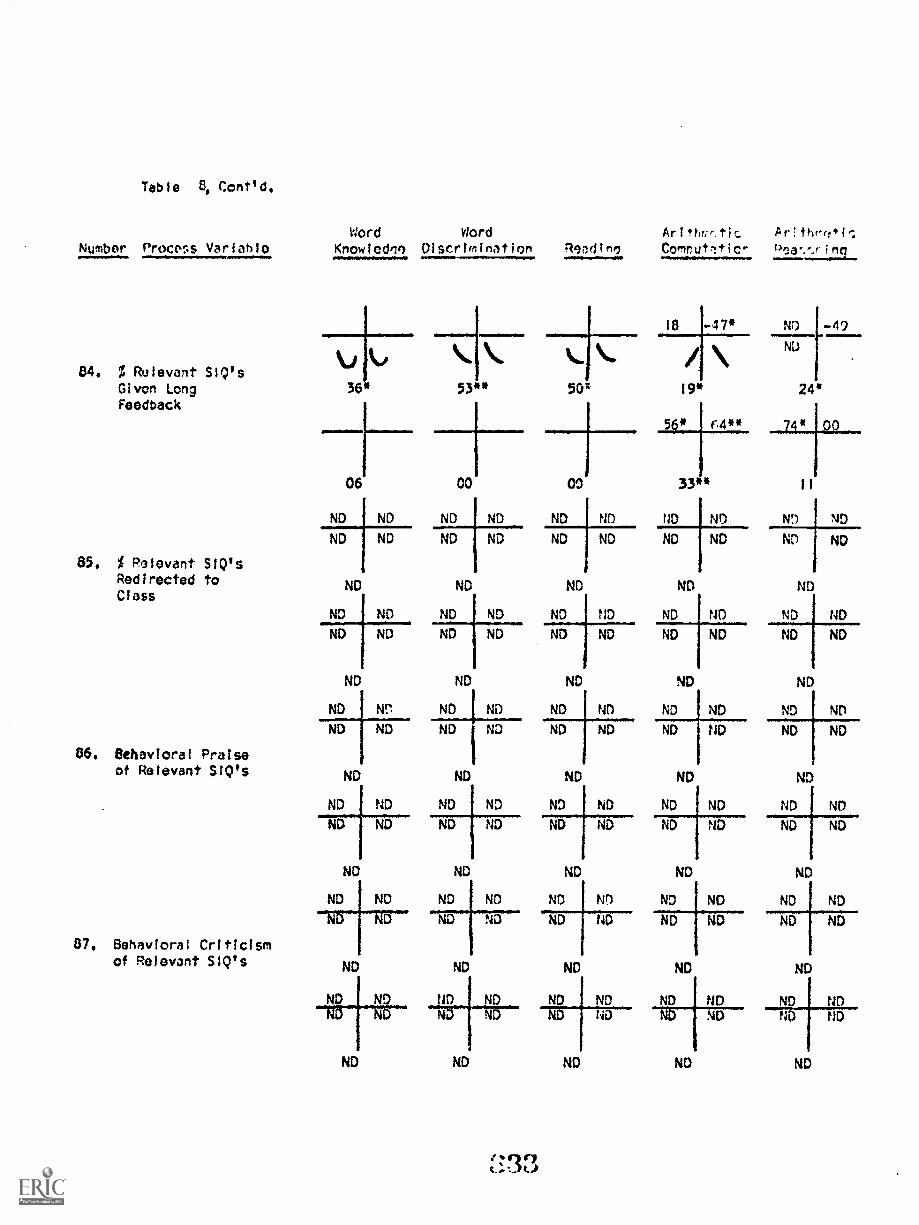
Table 6, Cont'd.
Number Procer.s Variable
84. % Relevant S1Q'sGiven longFeedback
Word Word Arittw,:tic Ar!fhrrf.f:Knowlednq Discrimination Reladine, Comnutf!tic-
11100.11.11...s1
36 53** 50*
06 00 00
ND ND ND ND ND
ND ND ND ND ND
85, % Relevant SIO'sRedirected to ND ND NDClass
ND ND ND ND ND
ND ND ND ND ND
ND ND ND
ND Nr ND ND ND
ND ND ND ND ND
86. Behavioral Praiseof Relevant S1Q's ND ND ND
ND ND ND ND ND
ND ND ND ND ND
ND ND ND
ND ND ND ND ND
ND ND
87, Behavioral Criticismof Relevant SIQ's ND ND ND
ND ND ND ND ND
ND ND ND
L.33
18 -47*
19*
ND -49
NI)
24*
ND ND ND ND
ND ND ND ND ND
ND
ND
ND
ND
ND
ND
ND
ND ND
ND t D
ND
ND ND ND
ND ND
ND
ND NO ND
ND ND ND
ND
ND ND NDND
NO
ND
ND ND
ND ND
ND
ND ND
ND ND
ND
ND ND
ND ND
ND
ND ND
ND ND
ND
ND Ni)ND ND
ND

Table 8, Cont'd.
Number Process Variable
88. Behavioral Warningafter Relevant SIQ's
89. Criticism of Questionafter Irrelevant SIQ's
90. % Irrelevant SIQ's3ivan No Feedback
91. % Irrelevant SIQ's
Delayed
Knowledqe Discrimination
ND
Word Word
ND
ND ND Na ND
ND
ND
ND ND ND ND
ND ND ND ND
ND
ND
ND ND
ND ND
ND
ND
ND
NO
ND ND ND ND ND ND ND ND
ND ND ND ND
ND
ND
ND ND
NO ND
ND
ND NO
ND
ND ND
ND ND
ND ND
ND ND
NO
ND
ND
ND
ND
ND ND
ND ND ND ND
ND ND
ND ND
ND
ND
ND ND ND ND
ND
ND ND ND
ND ND
Arlthmotic ArithmeflCReadino Comnutation Psase:,ntna
ND
ND
ND
ND ND
ND ND
ND
ND ND
ND ND
ND
ND ND
ND
ND
ND
ND ND ND ND
ND ND ND ND
ND
ND
ND ND
ND ND
ND
ND ND
ND
ND
ND ND
ND
ND
ND
ND ND
ND ND ND
ND
ND ND ND ND ND
ND ND
ND ND
ND
ND
ND
ND
ND ND
ND
ND
ND
ND
ND ND
ND
ND
ND ND ND ND
ND
ND ND ND ND
IND ND ND
ND ND ND
331
ND
ND
ND
ND
ID FID ND
ND
ND ND ND
ND

Table 8 , Cont'd.
Number Process VariableWord Word Arithmetic Ar:thrp:c
Knowlodoe Discrimination Readinn Comnutetion Pea3cnimo
ND ND ND NDND ND ND ND
92. % irrelevant SIQ'sGiven BriefFeedback
12 12
ND ND ND NDND ND ND ND
27 66*
ND ND ND ND
ND ND ND ND
93. % irrelevant S1Q;sGiven Long ND1
Feedback
ND ND ND ND
NO ND ND ND
94, % Irrelevant SIQ'sNot Accepted
ND NO ND ND
95. 5 Irrelevant SIQ'sRedirected to Class
ND N!)
ND ND
ND ND
ND ND ND 1 NnND ND ND ND
22 11
ND NO Nn NDND ND ND ND
10 04
ND i D ND ND
ND ND ND ND
ND
ND
ND
ND
ND ND ND
ND ND ND
ND
ND ND
NO ND
ND NDND
ND ND
ND ND
ND
ND ND ND NDND ND ND ND ND ND
ND ND'
ND ND ND ND ND ND
ND ND ND ND
ND
ND NDNO
38
FIT)
ND
NDND
66*
N ND
ND ND
ND
ND ND
ND ND
ND ND
ND ND
ND
N!)
ND ND
ND ND

Table 8, Conttd.
Nuc,,nr Process Variable
96. Behavior Criticismafter irrelevant SIQ's
97, Behavioral Warningafter irrelevant SIQ's
M. Student Initiatedubllc Interactions
98. Student InitiatedComments and Ouestioncti 314 01 00 00 01Total Response Oppor-tunities
Word Word ArIthrmticKnowiedce Discrimination Readino Comnutatic,1
ND ND ND ND ND ND ND NDND ND ND ND ND ND ND ND
1
ND ND ND ND
ND ND ND ND ND ND ND NDND ND ND ND ND ND ND ND
ND ND ND ND
ND ND ND ND ND ND ND NDND ND ND ND ND ND ND ND
ND ND ND ND
ND ND ND ND ND ND ND NDND ND ND ND ND ND ND ND
ND ND ND ND
Arithme+1,;
0.,.!ason'ne
ND
ND
ND
mm.n.a.p.me
ND
tcr
ND ND
ND
ND ND
ND ND
ND
ND
ND ND
NO
ND
N. Student initiatedComments 1SfV's)
99. % SIC's Relevant
51
f00 08 02 12* 07
ND 1
ND
00 03 00 00 01
OD 05 00 01 Of

Table Bo Cant' d.
Number Process Variable
100. % SIC's CalledOut
101.
102.
103.
Word Word ArIthmeltic Ar!thmOlsKnowledge Discrimination Rgmdino Comnutatic".
ND ND NO ND ND
ND ND ND ND ND
22 02
03 00 04 0
06
03
ND ND ND ND ND ND ND ND ND 1
ND ND ND ND ND ND ND ND ND ND
Praise of Commentafter Relevant ND ND ND ND NDSIC's
ND ND ND ND ND
ND ND ND ND ND
01 01 01 06 08
% Relevant SIC's
ND ND ND ND
Given No Feedback 02
ND NDND ND
03 00
ND ND ND ND
ND ND ND ND
% Relevant SIC'sDelayed ND ND
ND NO ND ND
ND ND ND ND
ND ND
ND 1 ND
00
ND
02
ND
02
ND
15*
ND
ND
ND
ND
ND
04
ND
ND
01
ND
ND
NO
ND ND tin ND fri
ND ND ND ND Litt
ND ND

Table 8, Cont'd.
Numbor Process variable
104. % Relevant S1C'sNot Accepted
105. % Relevant SIC'sAccepted
106. % Relevant SIG'sintegrated IntoDiscussion Topic
107. % Relevant SICIsWhich Cause a Shiftin Topic
Word Word Arithmetic ArithmoicKnowledge 01scrlmlnatlon Readinc Computation Reavming
ND ND ND 32 ND
ND ND ND ND
01
40"
04
39 -65**
00 12* 06 06
39** 01 01 06
1 NI
04 25*
56 61** -02 -57**
imam. \33**
651 23
37** 32*
10 05 00
02
ND ND
00
ND Ni)
03
ND
ND
04
ND 1410
07
ND ND
01
ND ND ND
ND ND ND
ND
* *
20"
03
00
00
41"
14'
NDD
01
0I
ND ND ND fdfx D
ND
ND
ND
07
ND
ND
ND
r:D
00
ND
ND
ND
ND ND ND MD ND
ND ND ND
3
ND
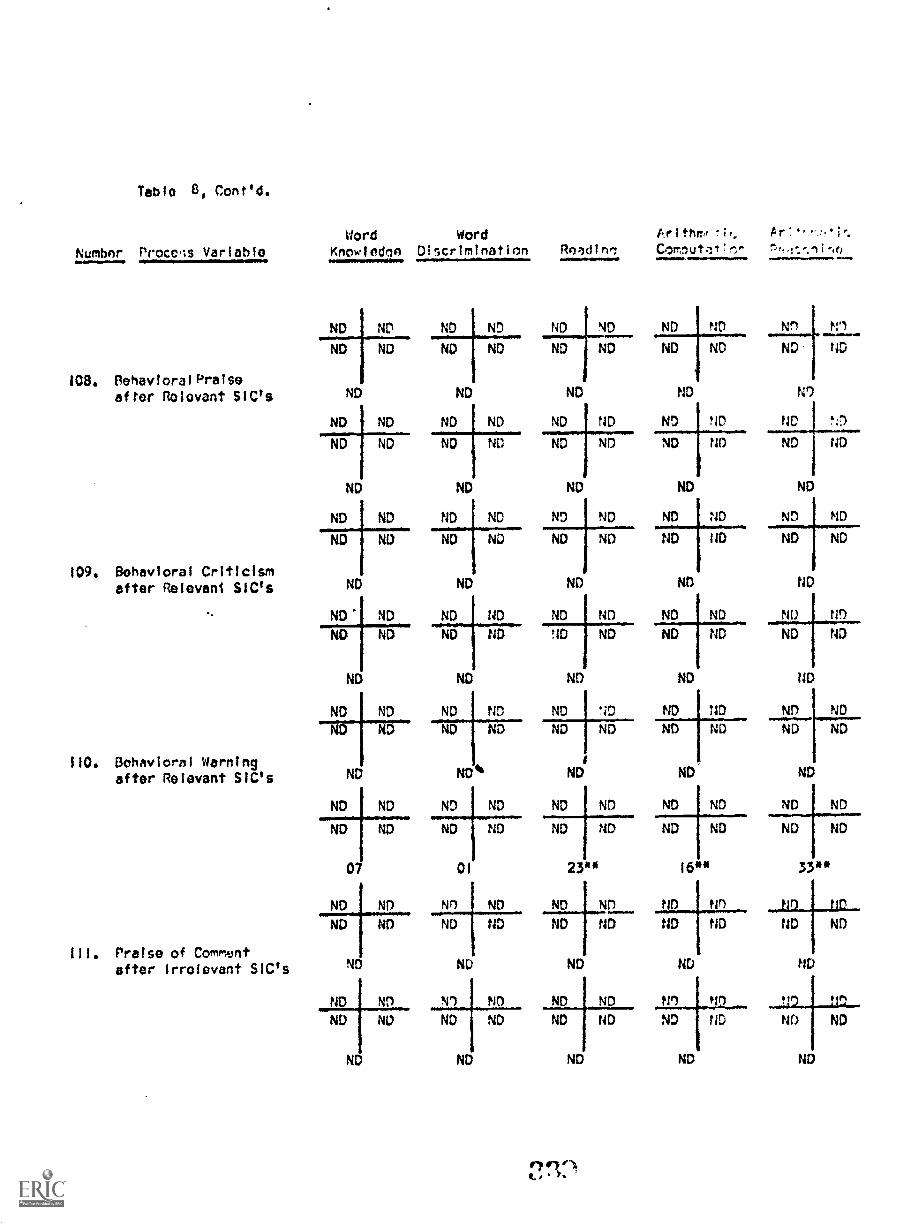
Teblo 8, Cont'd.
Nurnbnr Proceqs Variable
108. SehavioralPralseafter Relevant SIC's
109. Behavioral Criticismafter Relevani S1C's
110. Behavioral Warningafter Relevant S1C's
III. Praise of Commyntafter Irrelevant SIC's
Word Word Ar thm, !
KnowIedne Discrimination Roldinl comnut,:.Hn,.
ND ND ND ND ND
I
ND ND ND ND ND
ND ND ND
ND ND ND ND ND
ND ND ND ND ND
ND ND
ND ND ND ND
ND ND ND ND
ND ND
ND ND ND ND
ND ND ND ND
ND ND
ND ND ND
ND ND ND
ND ND*
ND ND ND ND
ND
N
ND
ND
ND
ND
ND
ND
ND
ND
I
ND
ND ND
ND ND
ND ND
ND ND ND
NDND NE)
23"
ND ND ND
ND ND N1 ND ND
ND 1 ND ND ND ND
ND ND ND
ND ND ND Nn
ND ND ND ND
NE)
ND
ND ND Nn ND
ND ND ND ND ND
ND ND
ND
ND
ND ND ND ND
NO ND i ND ND ND
ND
ND ND ND ND ND
ND ND ND ND ND
ND ND
ND
Ni) tO Nn
ND ND Ni)
ND
ND
ND ND
ND ND
ND ND ND ND
110
16**
ND
ND
ND ND
ND
ND
11D
ND
33"
ND
ND
1411
ND
ND
ND
ND
ND
ND NI N
ND ND ND ND ND

Table 8, Cont'd,
Number Prococs VariableWord
KnowiedeeWord
Discrimination ReadimoArithmeticComutatio.,
ND ND ND ND ND ND ND NDND ND 1,D ND ND ND ND ND
112, % Irrelevant SIC'sGiven No Feedbac%
ND ND ND ND
ND NND N NDND 0 ND
13 00 03 04
ND I ND ND I ND ND ND ND ND
ND I ND ND I ND ND ND ND ND
113. % Irrelevant SIC'sDelayed
NU ND ND ND
ND ND ND ND ND ND ND ND
ND ND ND ND ND ND ND ND
ND WE' ND ND
ND ND ND ND ND ND ND NND ND ND ND ND ND ND ND
114. % Irrelevant SIC'sNot Accepted 07 11 04 18
ND ND ND ND ND ND ND 110
ND ND ND ND
ND ND ND ND ND ND ND
ND ND ND ND ND
115. % Irrelevant SIC'sAccepted 04 01 01 00
48 46
22** 03 03
ArIthmOlc
NO ND
ND ND
Nh
110
ND
06
ND ND
ND ND
ND
ND
ND
ND
ND
ND
NDND ND
ND
ND ND
ND ND
00
13 QD

Table B, Cont.d.
Number Process VariableWord
KnowledneWord
Discrimin,tion ReaninnArithmeticComoutatior,
ArTlf",n..."10.
ND ND ND ND ND ND ND ND ND ND
ND ND ND ND ND ND ND ND ND ND116. % Irrelevant SiC's
Intenrated intoDiscussion Topic
ND ND ND ND ND
ND ND ND ND ND ND ND ND ND ND
ND Nis ND ND ND ND ND ND ND ND
ND NO ND ND ND
ND ND ND ND ND ND ND t41) ND ND
ND ND ND ND ND ND ND ND ND ND117. % Irrolovant SICts
Which Cause a ShiftIn Topic
ND ND ND ND ND
ND ND ND ND ND ND ND ND ND ND
ND ND ND ND ND ND ND ND ND ND
ND ND ND ND ND
11B. Behavioral PraiseOtter Irrelevant SiC's
ND ND ND ND ND ND ND ND ND ND
ND ND ND ND ND ND ND ND ND ND
ND ND ND ND ND
ND ND ND ND ND ND ND ND ND ND
ND ND ND ND ND ND tYt ND ran
119. Behavioral Criticidmafter Irrelevant SiC's ND ND ND ND f D
ND ND ND t4D ND ND ND ND ND ND
ND ND ND ND ND ND ND NO ND ND
ND ND ND ND ND

Table 8, Coned.
Number Process Variable
WordKnowlednn
WordDiscrimination Roadinn
ArithmeticComnu1ition
ArltheIntic
Pnasonfne
10
ND ND ND ND ND ND MO 4U ND ND
120. Behavioral Warning
after irrelevant SIC's ND ND ND ND ND
ND ND ND ND D N r D Nn 1 ND ND ND ND ND ND ND ND ND ND
ND ND ND ND ND
O. Solf and Opinion,92astlens,
121. Self OuestInng/Process+ Proouct + ChoiceQuestions
122. % Self QuestionsWhich WereSubject-!tatterRelated
% Self OuestlonsRelated to PersonalPreference
114* 37 01 00 01
01 01 00 05 01
ND ND ND ND NE) ND !ID ND Np JD
ND ND ND ND NO ND ND ND ND NO
ND ND, ND ND
03
ND ND
ND ND
it
I
09 01 00 00
ND ND
ND ND
ND
ND ND ND ND NI ND
ND ND ND ND ND ND
ND ND D
-41 -38
N40# %me
34** 15
07

Table 8, font' d.
Nufrr Proccss VariahieemIWINONMOI.OPe
124, ()Onion OucsflonsfProcess + Product +ChOiC0 Questions
125. R Oolnien QuestionsGiven No Response
126. 60pinlon Questionsrbilowed by Praise
127. % Opinion QuestionsCriticized
Word Word Arithmetic ArithmeticKnowiedne Discrimination Rqadinn Computation Reesr,n;ncl
olowee,ms
02 02 03 05 03
04 01 01 03 18*
ND
ND
ND
ND
ND
ND
ND
ND
ND
ND
ND
ND
ND
ND
ND
ND
ND
ND
ND
ND
ND
ND
ND
NC
ND
ND
ND
ND
ND
ND
ND
70*J
ND
ND
NO
ND
NQ
ND
ND
ND
ND
ND
ND
* 00
ND
26**
ND
ND ND ND NO NOND ND ND
ND
ND ND
ND
ND
ND ND
ND
ND
ND ND
ND ND
ND
ND
ND
00
ND ND
ND
ND ND
ND
ND ND
ND
ND
ND
ND ND ND ND
ND ND

Table 8, Cont'd.
Number Procecs VariableWord Word Arithmetic Ar7ttimffbic
Knowiedqe Disorimineion Readinl Comnutltion
128. % Opinion OuostionsGiven No Feedback
ND ND
ND ND
ND
ND ND
ND NI)
129. % Opinion OuestlonsFollowed by Teacher NDDisagreement
ND ND
ND I ND
10
ND .ND
133, % Student OpinionsAccepted 05
ND ND
ND ND
131, % Student Opinionsintegrated into NDDiscussion Topic
ND ND
ND ND
ND
=1.104.1M11.1.10~4r11
ND ND ND ND ND
ND ND ND ND ND
ND ND
ND NI)
ND ND
ND ND
NO ND ND VI ND
ND
ND
ND
ND ND ND
ND ND
ND ND f ND NO 1 Ni)
ND ND ND ND ND
36"
15
00
1
24"
05
ND
ND
ND
ND
ND
11') 1;i
ND
ND(f
Nr; / Nr)
ND N;1)
14
ND
ND
Un
07 fl
74-\1701 22* 00
ND UD ND ND
ND I ND ND ND
ND ND
ND ND ND ND
ND ND NO ND
ND ND
ND
ND
ND
ND
ND
ND ND
ND ND N!)
ND
ND ND ND
ND ND ND
ND

Table 0. Ccnt'd.
Num!)or Process Variable
P. Private Dyadiccot:tants
132. % Private ContactsStudent Initiated
133. Student InitiatedWork Contactsinvolving Praise
134. Student InitiatedWork ContactsInvolving Criticism
135. % Private Work
Contacts StudentInitiated
Word Word Arithmetic Pr!thre'icKnowledoe Discrimination Peadine Comnutatior Reasrntno
07 38«* 15
00 05 01 01
NO ND ND ND ND ND ND ND ND ND
ND ND ND ND ND ND ND ND ND F ND
20"
00
01
01
43"*
07 15
00
ND ND ND ND ND ND ND ND ND !,1D
ND ND ND ND ND ND ND UD ND ND
ND. ND ND ND ND
ND
ND
00 0 1 12* 04 Of
01 01
111*e28**
...."""""h00 01
4r1411/4 J,

Table 8, Cont'd.
Word Word Arithmetic Prithme41,-.Number Process Variat0 Knowtedoe Discrimination itqadinn Comnutatien ptason7n0
136. % Student initiatedContacts Delayed
137. % Student InitiatedContacts Given BriefFeedback
138.
139.
ND 42
ND
4*
-04 63"
ND
Na ND
61*
19 66"
36
21*
somil%
ND
ND
04 17
13* 23** 44* 24* 22**
04 01 20** 09 05
dr Student initiated
05
03 -53**
Contacts Given Long 15*
Feedback
00
% Student InitiatedContacts Involving 07Personal Concerns
15*
17* 01 00 35**
24* 10
I
09
03 04 21**
19*
NDND
00
00 11 11 04
00 21* 01 00

Table 8, Cont'd.
Number Process variable
140. % Student InitiatedRequests Granted
141. % Student InitiatedRequests Delayed
142. % Student initiatedRequests Not Granted
143. Student InitiatedContacts Which ArePersonal ExperienceSharing
Word Word Arithmetic ArTihmoyi,:
Knowledge Discrimination Rtmdinq CornutAtic-,
00 OQ
08 08 01
04
71.* 29l'IfE)
19* 15
4:703 09 424* 39** 43*
09 15*
:I-1

Table 4 Cont.d.
Number Process VariableWord Word Arithwitic Arithmtic
Knowledne Discrimination Readinn Comnutation Peasrdnina
144. Private Work Contacts/Private Work Contacts + 01Public ResponseOpportunities -41 -27
145. Procedural Contacts/ProceSurol Contacts +Response Opportunities
14G. Teacher Initiated Work
Contacts /TeacherInitiated Work +Procedure Contacts
147. Teacher Initiated WorkContacts involvingPraise
12* 00
02 02
29"
32"
00
37 -69**
32**
00 01
45
00
9
00 24* 17*
00 00 00
00 05 00
03
I25" 46*
33*
ND
ND
01
19**
ND
ND
20*
04 00 00 00
,rit./1 ITN
04

Table 3, Cont'd.
Number Process variable11111101.6
143. Teocher Initiated WorkContacts InvolvingMere Observation
149. Teacher initiated WorkContacts involvingBrief Feedback
150. Teacher initiated WorkContacts InvolvingLong Feedback
151. % Teacher InitiatedContacts Which arePersonal ExperienceSharing
WordKnowledge
WordDiscrimination P,v1dinn
Ar1thmeti,:
Ca^nutrtir;^ r:a ^ .
ND NO ND ND ND ND NO P rID
ND ND ND NI ND ND ND ND ND 'fir:
ND ND ND ND ND
-CO" ND 1.76**
42**
2211
23 4
12* 15** 00 08
-56* 35 -47
10
08
cm'
04 20* 00 18" 41**
01
I
31*
39
15* 04

Table 8 Cont'd.
Nu,,,ber Provers Varlahia
152. % Teacher initiatedProc:qdural Contactswhich Ware Manage-ment Requests
153. % Teacher ThanksStudent for Doinga Favor Request
154. ; Teacher ThanksStudent Followinga Management Request
Q. Comb i fled inacSer
rva 1 ua t i on TraTh-,monks
155. Academic Praise/Academic Praise +Academic Criticism
Word WordKnowledne Discrimination
11.11P.11\ AMP
ND ND ND j not ND 1 NO
07
ArithmeticReadinn Computation
22"
04
ND ND
Arithme,*ic
Peascn:ne
04 00 05
*
08 04 00 00
NDNO
17* 20* 01
ND 49 41
ND ND
27"
03
00
01
22* 19*
05 02
45 -60" 41 -54*
29** 25"
ND
01
02
49"
04
wwwwime.
06
ND
ND
03 04
ND
*
05
09
78*
03
04

Table 8, Contld.
Number Process Variable
156.
Word Word Arithmetic ArlthmeicKnowledca Discrimination Rea dinn Computatien Reasr.lnincl
ND ND ND ND ND ND0 0 ND N ND
Behavioral Praise/Total Behavioral ND ND
ContactsND ND ND
157. Behavioral Warnings/Behavioral Warnings +Behavioral Criticism
0
ND
ND
25 *
ND
ND
00
01
0000
ND
ND.
04
R.
158.
Discinttne and Control ND ND ND ND ND NDrrtarS
ND
04
ND ND
0
ND ND ND
0% Discipline ContactsInvolving One orMore Error
41 a
ND ND ND ND ND
ND ND ND ND ND ND
159. Target Errors/Total Errors ND ND ND
1
ND ND ND ND ND NDND ND ND ND ND ND
ND ND ND
N,
ND
ND
0t
00
NDND
ND
ND
00
ND
ND
rmND
04
ND ND
ND N
ND
ND ND
ND ND
ND
ND Mn
4D ND
ND
ND t4D
ND ND
ND

Tabio 8, Cont'd.
Number Process VariableWord
Kncwiedao.11inpv.eme
ND ND
ND ND
I160. Timinq Errors/
Total Errors ND
ND ND
ND ND
ND
ND ND
ND
161, Overreactions/Total Errors ND
ND
ND
1
15
-37
ND
162. Nonverbal ControlContacts/Tot31Control Contacts. 13*
10 -59**
S. Combined Teacher6:77,76=---
163. Repeat/Repeat +Rephrase + NewQuestion
WordDiscrtmin tlon
ArlthmticRearlino Comnut;!tion
Ar:thrifsie,
r""liW17'In
ND 1 ND ND ND NtD N' N" NDND ND ND ND ND ND ND ND
I
ND
ND ND
ND ND
ND
ND
ND ND
ND
ND NDND ND ND
ND ND
ND ND ND ND ND
ND
ND
ND
NI) ND
ND IT)
ND
!1.7)
NU ND ND ND ND ND ND tr
ND
NI)
ND
M38**
ND
07
ND ND ND
ND 7E ND 2** ito
ND ND ND
ND
00 14*
23* 79**
34 ND
ND ND
IS
20* 06 55** 20* 21*
01 08 07 00 01
WIRINIMIlmw111
38** 30** 43* 00 01
r-,,

Table 8, Cont'd.
Number Process Variable
164. Rephrase /RepeatRephrase + NewQuestion
165, Brief Feedback/
Brief + LongFeedback
T, Math Contacts
166. Total Public MathContacts/Total Publicmath Contacts +Private Math Contacts
167. Total Teacherinitiated PrivateMath Contacts/Total Public 'lathContacts + TotalPrivate !lath
Contacts
Word Word Arithmetic Ar!thri!'iCKnowledge Discrimination ileadinc Combutetien
36**
33*
22**
34**
-34 63**
36**
18* 35**
I
00 01
35**
00 02 28**
es.00.1opm
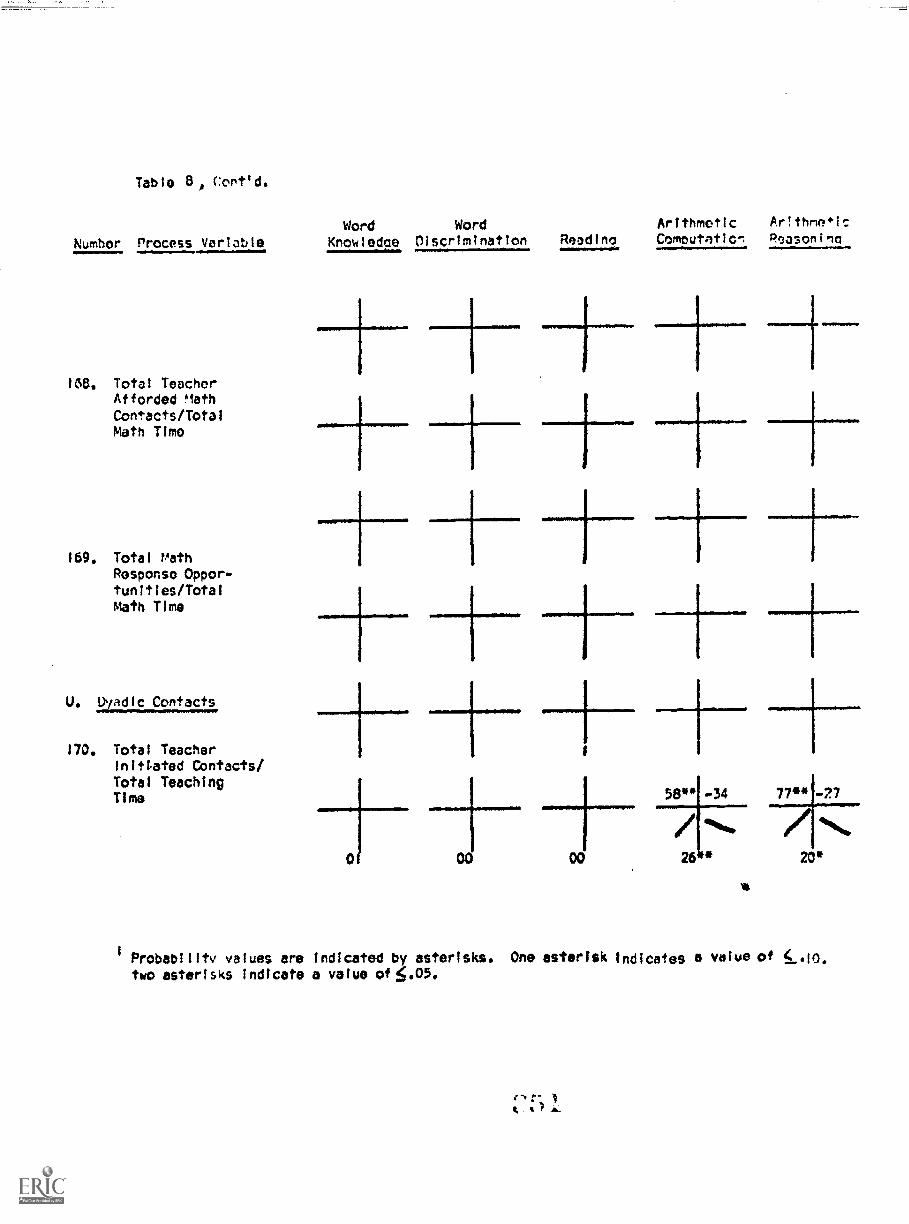
Table 8 Cont' d.
Word Word Arithmetic Ar ! Mr-101C
Numhor Process variable knowledee Discrimination
168. Total TeacherAfforded "lath
Contacts/TotalMath Time
169. Total PathResponse Oppor-tunities /TotalMath Time
U. Uyad c Contacts
170. Total TeacherIniti.ated Contacts/Total TeachingTime
+- I
Reedino
I
Computation asonina
58** 34 77** .7
414,40,
00 00 26
ve
1
Probability values are indicated by asterisks. One asterisk indicates a value of < .10,two asterisks indicate a value of!5.05.

Tale 9. !len-linpur Pr(..s01,"ruduct T.1dchnr tiCaft';'4J0ent r",ain c,corpl, iovrroef,d fvur
yudr0 On tr000litop ic;ts ciPAI 7rilted).1
Number Prase:10 V3rinblo
t. High % of ObjectiveGrading
2. rreounnt DisciplineProble:',Iue to Lack
of intorost in SupjectMatter
3. Teacher Stays at Hur DeskHigh r of Time
4. High % of Locturos andDemonstrations
5. High of Questions withOneCt-,rrect Answer
6. High % of ErrorlessPerformance Qtiouired for
rieneral Class Discussion
7. Ideal Errorless Ratein Reading Groups
8. High % of Context, WholeWord Approach in i'oadine
9. High % of SliontReading in ReadingGroups
Word WordKnowledge DiscrImInaticn Reldlnr.
ArithnwlekCom^ut:!tis-
01 07 06 07 01
-7ni" -V5
04 14* 05 281* 3'3*
06
01
31 -541*
.01 N if"\ Le
25** 27*
...71.-----
00 02
30"
as
/14
43* 08
-39 -40
01 14*
01 06
02
-52" n7
05
07 01 00
flor.11a)
27*
-29 1-53"
04 17**
-19 1-51*
12* 06
12R 08
01 -52**
17*
01
31*

Table 9 Cont'd.
Number Presaa Vartahle
10. High % of IndividualReading in ReadingGroup
Allows Studontsto Call Out
Comments
12. Favors SocialPromotion
13. Takes NeatnessInto Account forGrading Purposes
14. Washroom located Out-side the Classroom
15. Achievement Test Scores
are Mtre Valuable thanGrades for Informdtionabout Students
16. Mark Only AbsenteesInstead of CallingRoll ail Year
17. "Dresses up" a Lessonto Make it More Inter-esting
Word Word Arithmetic Ar!ihmsic
Knowledge Discrimination Rendin* COmbutatic*, Rea:1,.mtn9
NJ I'm% %.1 00N
23 35**
ND ND
ND ND
03 00
ND ND ND1
ND
ND ND ND ND
ND ND
ND ND ND
ND ND ND ND
04 00
ND 4 ND ND I ND
ND
ND ND ND ND
10 12
0 01
04 02 31*
33 ND ND ND2a
ND ND ND
10* 10 05
ND ND ND ND ND ND
ND ND ND NO ND ND
ND ND ND
ND ND ND ND ND ND
aND ND ND ND ND ND
01 00 01
N'ti I ND ND ND ND ND
ND ND ND ND ND NDd
14** 30 * 23**
03 00 00
ND ND ND N-D ND ND ND ND ND ND
ND ND ND ND ND ND ND ND ND ND d d
00 00 03 07 00
ND ND ND ND ND ND ND ND ND ND
ND ND ND ND ND NO ND ND ND ND a a
ND ND ND ND ND

Table 9 Conted,
Word Word Arithmetic ArithmeticNumber Prcsace Variahlc KAowledm, Discrimination Readinn Clmnutation r,i.avAnima
18. Assigns Large Amountof Seatwork
02
19. Assigns Large Amount 14 1 NDof Homework
ND
Believe Success is indicated By: 19"
20, Class is Well Behaved
21, Children Enjoy School
22, Children Work onTheir Own
Correct Seatwork By:
23, Having Teacher AideDolt
24. Doing it Yourself
25. Having High AchieversCorrect it
08
ND
ND
ND
ND
ND
ND
ND
ND
ND
ND ND
ND ND
ND
ND ND
ND ND
00
ND ND
ND ND
ND
18*
ND
ND
07
05
42. ND
ND
24**
02 06 03 05
ND
01
-27 ND
ND
31** 12*
01
-69** ND
ND
ND ND ND ND ND No ND ND
ND ND ND ND ND ND ND ND
ND ND ND ND
ND ND ND ND ND ND ND ND
ND ND ND ND1 ND ND ND ND
ND ND ND ND
ND ND ND ND ND ND ND ND
ND ND ND ND ND ND ND ND
ND ND ND ND
ND ND ND ND NO ND ND ND
ND ND ND ND ND ND ND ND
00 01 01 00
ND 1 ND ND ND ND ND ND NDd
ND ND ND ND ND ND ND ND
ND ND ND ND
d

Number
Table 9 , Cont"d.
,resIrlo 'l sridrle
26, Having the ChildrenTrade Papers
27. Goino Over 11 Orally
28. Other tcethods (NotSpecif10)
Preparation,
29, Use Both Unit andLesson Plans
30.Aim Instruction toMiddle Achievers
31, Aim Instruction to LowAchievers
32, Require Students to Stayon Lines Only for Printing NDand Writing Assignments
word Word Arithmetic Pr:411(10.k
Knowle6.;) Discrimination Reaffirm Comnutatio-,
00
ND ND
ND
ND ND
ND ND
02 02
ND
ND
00 DO
ND
ND
01 08 02 no
0t 0
ND 1 ND
ND ND 1 ND
ND
ND I ND
ND ND
ND
ND
ND ND
ND ND
ND
ND ND NDND
ND ND ND ND
ND
ND ND
ND
ND ND
pest Way to include Parents
33. in PTA and ProjectsND
34. To Cooperate with Schoolby Disciplining Childat Home
ND ND ND
00
ND ND ND
ND ND ND ND
0004
ND
ND
ND
02 00
ND
04 07
ND ND ND Ni) ND ND
ND ND ND ND ND NDa
ND ND ND
ND ND ND ND ND ND
aND ND ND ND ND ND
ND ND ND
ND ND ND NO ND ND
ND ND ND ND ND ND
ND ND ND
ND ND ND ND ND ND
ND ND ND ND ND NO
04 04 05
ND NO ND ND ND NDa
ND ND ND ND ND ND
02 00 00
ND ND NDa
ND ND ND
06 07 00

Number
Table 9, Ccnt'd.
r'resene V2riable
35. To Provide WarmsPositive HomeEnvironment
36. To Provide EnrichingMaterials at Home
..11..1.1.0.10111
37. Conscious of VoiceQuality Almost Always
38. Hirsh Frequency of
Severe Disruptions
39. Publicly Praises a ChildFrequently as 'fotivationto Others
40. Found SatisfactoryRapport with StudentsThis Year
41, Use individual andGroup Competition asmotivation
42. High Number of DifferentAssignments on Any GivenDay
WordKnowledge
ND ND
ND
10*
ND
ND
ND
02
ND
i ND
ND
21
ND
*
03
Word
Discrimination ReadlneArithmeticComnutatior,
ND ND ND ND ND ND
ND
02
ND
ND
ND
01
ND
ND
ND
04
ND
ND
01ii
ND t
ND
ND
01
ND
ND
ND
00
ND
ND
ND
ND
12
ND ND
11*
ND NO
07
ND
10 41 24
Arithme.l
Reason;nq
ND ND
ND NDa a
140
ND
aND
00
ND I ND
ND ND
29 *
04
49* 45*
12
04
ND
ND
04
ND ND
ND ND
10*
00
ND
17** 1300 05
ND ND ND
ND ND ND ND
00 03 06 0
ND ND ND ND ND ND
ND ND ND ND ND ND
04 03 09
00 23* 00 01 06
a
a
a
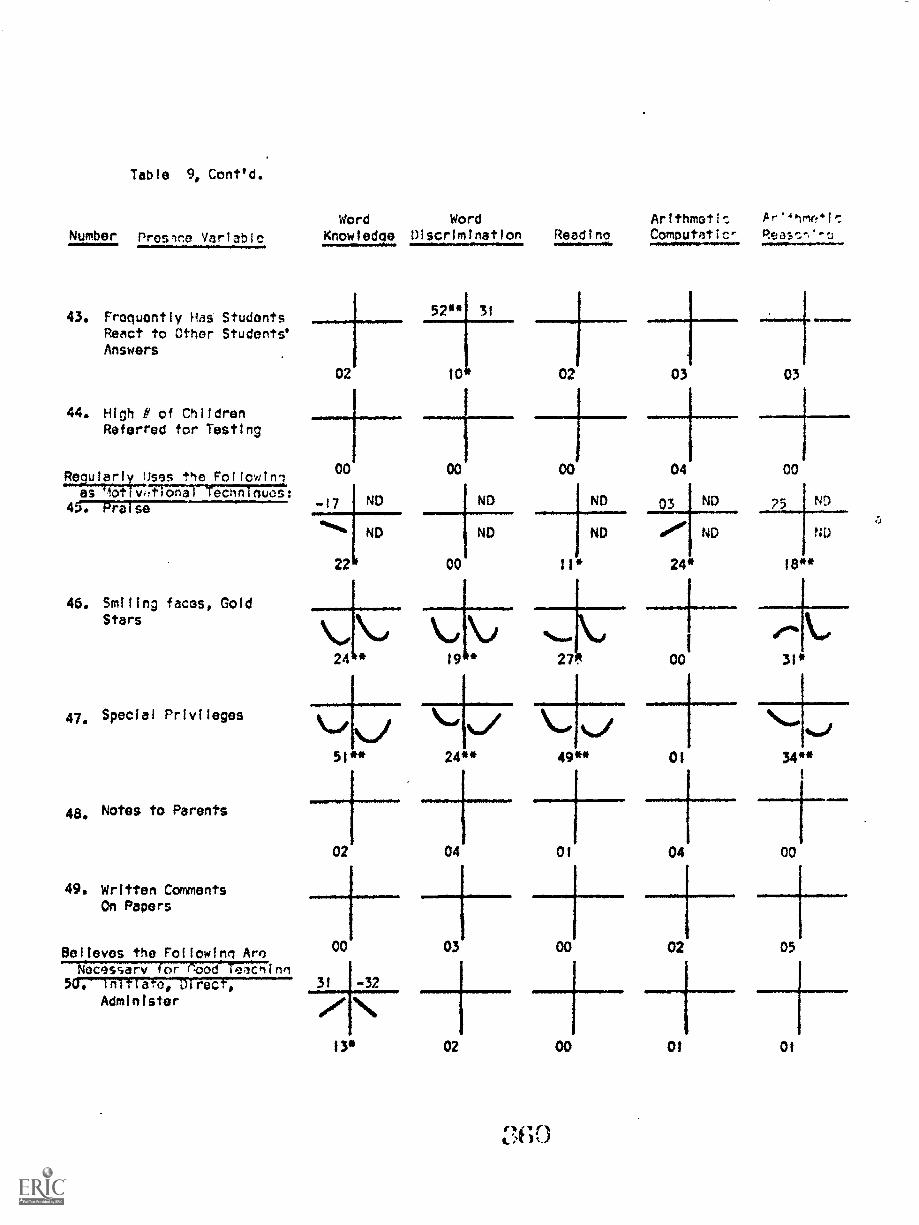
Table 9, Cont'd.
Number PresIne Variable
43. Frequently Has StudentsReact to Other Students'Answers
44. High # of ChildrenReferred for Testing
Word Word ArIthmeti:Knowledge Discrimination Reading Combutatic- Reas:n'.1
Regularly US9S the Followin00
as Motivi,tIona echn chugs:
4$. Praise -17
46. Smiling facos, Gold
Stars
47. Special Privileges
48. Notes to Parents
49. Written CommentsOn Papers
Believes the Followinn AroNecessary for ("cod TeIchinn
Administer
%is
22
ND
ND
52** 3,
to
00
ND
00
ND
02 03 03
00
ND
ND
II*
4..1
51** 24**
04 00
Q3 ND
40°° ND
24*
1
00 31*+49** 01 34**
02 04 01
00
31 32
v\
13*
04 00
03 00 02 05
02 00 01 01

Number
Table 9, Cont'd.
nres;10 Vortatite
51, Unify the Group
52, Give Security
53, Diagnose LearningProblems
Word Word Arithmetic ArIthme'01,..
Knowledge Discrimination Readinn Computation Peasf;ning
01 00 18** 01 00
01 02 01 02 04
ND
ND
22 *
ND ND ND
ND ND r ND01%
25 * 13* 00
54, Make Curriculum Materials r19 16
55, Evaluate, Record, andReport
56, Expose Children toEnriching Community
Activity
57, Participate in SchoolActivities
58. Participate in Profes-sional and Civic Life
ND -13 ND
ND 41%44. ND
19 01
00
ND
ND
36**
%ft, left
20* 15* 3
ND ND ND
ND ND ND
02 02 01
-56** 17 -72** 09 -66**
00 26** 01
07 02 00
03001
01
0*
02

Table 9, Cont'd.
Number Presace Variable
59. Develop Curiosity andCreativity
60. Involve Students inUgly or DistressfulAsbecis of Subject
61. Quickly Tell StudentsWhether Answers are Cor-rect or incorrect
62. Encourage Tackling HardProblems
63, Give Exact Instructionson Each Task
64. Provide Exact Model forStudent's Work
Word Word ArithmeticKnowledge Oiscrimination Rendini Cemnutatic- PS37''..fCrC
00 01 02 00 01
-580* -12
07 00 06 01 00
-1-- -I--15 02 05 07 01
0
65, Engage Students in -31 -36
Drama and Music
66. Engage in Peer Tutoring
28 45*
10* 00
21**
'Ni'25**
03 48*
04
00 00
01 00 01 00
05
ND ND
ND ND
02 01
06
-28 ND
ND
-37 -21
10
ND
14* 01
ND
01
ND
01

Number
Table 9, Cont'd.
Presalc Var ai)
67. Patience
66. Knowledge of SubjectMatter
69. Frequent Praise
70. Prepare Students forMetropolitan andStanford Tests
71. Use Slang With Students
72. Arrange AttractiveBulletin Boards
73. Develop Good Rapportwith Children
74. Be Involved fn Out-of-school Problems
WordKnowiedao
WordDiscrimination Readinn
Arithmr$tic Ar!t1,m,*1:
aND ND ND ND ND ND ND ND ND
ND
01
ND
ND
ND
ND
01
ND
ND
ND
ND
1
00
ND
ND
ND
ND
04
ND
ND
ND
ND
01
ND
ND
ND
ND ND ND ND ND ND ND ND ND ND
a
03 160* 00 05 04
-71** 15 -159** -153* 04
01 01
-45 -32
05 11*
03 03 04
-+-08 01 01
18**
-33
05
42 3 -58**
15* 26**
01 00
20* 03
-1-09 07 03 06 04
03 03 24** 23** 38**
a

Table 9, Cont'd.
Nu,mber iirs000 Var Pie
75. Svc That StudentsSupplies at Uesk
Gain High Satisfaction From:
76. Vacations and Free Time
77. Working with Books andIdeas
78. Working with OtherTeachers
79. Non-teaching Duties
80. Salary and Benefits
Always Do the Followtno W-enresent nn
Si. Present New Material
82. Summarize New Material
Word Word Arithmetic Arithme*ic
Knowledge Discrimination Reading Computation Reasoning
01
00
ND
ND
02
00
01
ND
ND
01
00
01
ND 1 44* ND
02
00 00
ND
12*
00 07
48* ND 62**
ND ND
12* 28**
00
ND
ND
03 00
01
01
00
03 02
a
00
-40 47*
27
ND ND ND ND
ND
01
ND
00
ND
00
ND
00
-58* 19
00 00 01 00
CO 03 21*

Number
Table 9, Cont' d.
Prosanb Varlahle
63. Practice
84. Show Students 'ilstakesand Have Them CorrectThem
85, Give Directions forFollow-up Seatwork
86. Allow Independent Seatwork
67. High Number of TimesWhole Class Lines Up
Fvdrn Are HostmZortant for Assigning
grades88. ET for+
89. Success or Failure InAssigned Work
Importance for Deciding Aboutudent:
40, Standardized AchievementTests
Word WordKnowledoe Discrimination
ArithmeticReidinn Comnutatic-
Ar'fhrffik.
j4nno
34 -27 -28'
01 00 00 10* 07
00
-32
00
15
06 02
-45* 39
16** 01
02 03
-15
00
-57* 35
.\
22*
00 02
22** 03 02
18* 00
04
02
71[;71i-
35** 07

Table 9, Cr,ntid.
Numblr rrcc:'!elAMMW111111.0.1111.10
91. TeacherMade Tests
92, Seltwork A, Homework
9.5. observations About
Student
FreqUniit US9 of Fol!owin,-1
lr!acer :.e5eurces
94, LearnIni Uentecrs without
A/V Alas
95. Student Toacers
Consider roilowine SeriousTeach6r 1Jroefems
96717=Ta Ire--61 StudentAchievement
97, Nature d Quality ofinstructional Materials
90. Rapid Rate of CurriculumChange
Word WordKnowlednn Discrimination Readlne Computatiler, Pas,,ninn
Arithmetic hr;thrtr i
N
ND"1
ND
40**
ND
23*
ND
ND ND ND
32** 28* 01
00 00 00 04 02
ND ND ND ND ND ND ND NI)
ND ND ND ND ND ND ND ND ND ND
ND ND ND ND ND
-2B -36
01 10* 03
00 02 04
ND ND 65** ND
ND ND ND
03 01 06
10* 15*
-----1-----
01 04
ND ND
ND ND
00 00
01 01 01 16* 00
01 03 01 00 00

Table 9, Lontid.
Number Presa,p Vario5lo
Requim More Help Prom:
99. Secretariat cr ClericalStaff
Need ":,re Tire to:
100.
101.
102.
Word Word Arithmeticknowledde Discriminjtion Readinn Comnutaticr
06 02
Dovelop Now Programs -51** OB
02
Plan Daily Activities
02
Work with FellowTeachers
01
103. Relax and Think ND
ND
Ooncerninn Oninions About Teaching
PatlfiN2121129021IIII=Els'22ci6
104.
105.
flDBost to Uso Pointer withBlackboard
ND_
ND ND
00
Gradins: is One of "ostimnortant. Functions of
ND ND
Teacher ND ND
07
106. School Legirnind Shouldbe Acquisition of Speci-fied Content
00
02
01
Pr174Adtr,r0,f,4.01mw.nyee.....
08 22*
00
-27 41
15*
00
03
07
03
0c 00
ND ND ND ND
ND
00
ND 1 ND
ND
3100
ND ND
ND
44
ND ND
ND
08
ND
ND
00
ND
ND
ND
ND
DI
ND
ND
ND
ND
01
ND
ND
ND
ND
04
ND
ND ND ND ND ND ND ND
00
ND
ND a
ND
NO
± ±0* 03
01 00 00 01

Table 9, Cont'd.
Number Prr,3o70 Vnrhibic
107. Avoid Competitionin Front of Whole
Class
106. Facts Co-le Before
Generalizations
109. Good Teacher AdmitsIgnorance Openly
110. Do Not Enter GradesWhile Kids risotto
111. math is as Easy toLearn as Any OtherSubject
112. Use Difficult 4cirdsto Help StudentsLearn them
113. Punishment for PoorWork is Repetition
114. Authority Can be an
Obstacle to ThoseWho Want to Learn
Word Word
Knowtedce Discrimination Reldin,7
01
ND
ND
00
ND
ND
36
-50* -12
08
ND
ND
00
ND
ND
04
00
ND
ND
00
ND
Arithmst;cCrJmbsite
-59** 21
20**
ND
ND
00
54** ND 7511111
24* 38"
22 00 01 01
45* 1 -14 53 * *I 12
00
ND ND
ND ND
00
-41
06
ND ND
ND ND
00
00
ND ND
ND ND
00
-49* -32
15 12*
01
ND ND
ND ND
00
-56** -21
03
ND
ND
01
ND 59**
ND
35**
03
ND
28 *
ND
00
12 04
01 06 01 00
r-ri
ND
ND

Table C)
Number Prclol:: 7.1r101.ic
115. Gear Teaching to City-Wide Tests
116. Teacher's Personality isMoro Important thanMethods Used
Word Word
Knowtedein Discrimination
-38
13 03
-48* 19
Ill, Not Necessary to Repeat ND
or Rephrase When Introduc-NDIns New Concept
118. Learning by Memorizing,or Copying fty DeterProblem Solving Ability
119, Effective TeachingRequires Teacher toKnow Backgroud ofStudent
120. Giving Right AnswerSis Less Effective ThanGuidance in ProblemSolving
121. dithout Proper Train-inn, Mental AbilitiesRemain Undeveloped
00 00
ND ND Ni)
ND ND ND
01 00
NDND
ND
07
ND ND
ND
to ND122. Encourage Student*Disagree With Teachers'
Statements ND
ND
ND
08
30
ND
ND
r\ND
ND
t rileAritrmr.4*-..
Ceonnutl*1";.
02 03
-04
200 08
ND ND ND ND
ND ND ND ND
01 01
ND ND
ND
50*
ND
00
04 65**
ND
35 *
ND
ND ND
01
05
r.10
77V.
35
ND
ND
ND
ND
08 01 07 02
. 1
07 01 02 28* 41**
07
ND I NDIM11.11M
ND ND "
00
ND
ND
02
ND ND
ND
12*
ND
ND ND ND ND ND
ND ND ND ND ND
a
ND ND ND NDa z:
ND ND ND ND
04 00 00 00 00

Table J, Lont'd.
Number ,'rrsa7.,
123, Te,..chorls 'lain Job
is Intellectual TrainingFor Students
124. SOTO Stuents AskToo klany Nestions
125. Small Croup DiscussionsAre Important
128. Problem Solvinn IsOne of rain PurposesOf Schooling
127. Good Teacher AvoidsDoing Student's Work
for Him
128. Natural & Hnalthy ForKid to Resist Teacher
129. Teacher Should TalkTo Kid as to Adult
(30. Waste of Time for KidsTo Discuss Work AmongThemselves
Word Word
Knowtodoo Discrimination Peedinn
ArNhr-.'7:Lomrut;!.!,-,-
ND
00 01
ND
ND
ND
18
%"'
-55**
ND
21
ND
%,../
ND
ND
25
ND
ND
0
ND ND
ND ND ND ND
01
-39 44*
22
0
04
06 35"
ND
ND
00
ND -35
ND
ND ND ND
ND ND
03
12*
20 * 00
ND1
ND
00 00
ND
ND
ND ND t.D
ND
04
28
ND ND ttD
0
3554**
-44* 40 -09
""%lb
00 02 17"
t4D ND ND ND ND
ND NO ND ND ND
04 08 00
ND
61"
7**
25"
23** 07
ND ND ND ND
ND ND !JD ND riD
01 01

Number
Table 9,
P 1Sdr4.1 VarLbto
(Si. Go'd Teacher Lets KidsDo the Work
132. Oat, .,'portent
Thing to Teach IsPrinciple
133, t.romotion Should
GP Based on AcademicAchievement
134. Explanation Shouldfin Short to DetainInterest
135, Peer Tutoring is Good
136. Tell or Explain NothingStudent Can Got Alone
137. Assign aterial ThanInsure Studentework
Word Word Ar'
Knowledge Uts- tmlnation
10'
ND -55**
ND
01
ND
ND ND ND
ND ND ND ND
25** 05
ND -45* ND
31*
r%
19
ND
ND
04
02
ND
ND
ND
ND
21"
fir23*
ND
ND
02 03 15*
NI) ND ND ND ND ND
ND ND ND ND ND ND
12* 01 02
ND
ND
ND
ND
ND
ND
08 31** 33**
17 01 01 03
ND 1 ND ND ND
ND
02
ND
ND
ND
06
ND
ND
ND
CO
ND
ND
ND
00
ND
ND
138, Kids Should 'InferMaterial Whethsir orNot Interesting
ND
05
ND
OA
ND
05
ND
27*
ND
N3
MIN
ND ND ND ND
00 00 00 00

Table go contld.
word Word ArithmeticNurf;!:Ir :nr!,!1!:! ;)iscrtninitinn R(1-1,1in,t Connutl-tin-4.M
139. 51rong L;hould Co
Put en r3;tory c)f Su'.)irct
Vatter Jr14 Mer;,ri,,:aticin of
Facts
140. important Function is to 47Acquire Knowledgq Basicto Satisfying Family Life
141. Advance Organizers AreImportant
142. Teacher Should AskFrequently If StudentsUnderstand
143. Some Review is GoodEveryday
144. Allow Students to ChooseAssignments Instead ofMaking One Assignment forAlt
145. A Teacher ShouldDiscourage StudentsFrom Moving Aroundthe Room Freely
146. Directive TeachingProduces MorePassive Student
147. Ignore Mistakes toAvoid Interruption
ND
01 00 01 05 03
-50*
02 16* 06 12*
ND
ND
ND
20
ND ND
ND ND
ND
ND
ND
01
ND
ND
01
ND
ND
16*
ND 61 * *1 ND
ND ND
00 05
ND ND ND NO
ND ND ND ND
ND
ND ND
ND
ND
ND
NO
ND
00
48* ND
ND
ND
00
ND
ND ND
05 00
ND ND ND ND
ND ND ND 111)
ND ND
ND
ND ND
ND
05 21** 01
00 00
ND
ND
06
ND
03
ID
03
00
-----[-----
00 17* 01
ND
04 02
ND ND
00 00
ND
-56
N.)
qtrND
02

Tae
Number Presa-.11 Vario!sle
148. Encourage Kids toBolievq They CanSucceed
149. Memory AssignmentsShould bo Frequent
150. Often Ignore Student
Who Continually RaiseTheir HuntIS
151. Show Students Purposeof Work
152. "Practice Makes Perfect"Sums up Learning
153. Praise In Some WayAll Kids'Work
154. Require Same AmountOf Work From AllStudents
155. Don't Allow Deviationfrom Instruction
Word Word ArithmeticKnowledge Discrimination Readlnn Cgmnutatio- Reasrnino
ND
ND
06
ND
ND
-46* ND -45* ND -2? ND -35 a
ND ND
12* 14*20*
ND
14"
-----1-----
OD 04 OD
-05 58** 1 33 60** 04 73** 04 68**
I I I I I I I I
27
ND
ND
01
01 22
ND ND
ND ND
00 04
32"
ND
ND
..--
43**
ND
ND
02 01
06 01 06 05 07
ND ND ND ND ND
aND ND ND ND ND
02 06 01 00 03
ND ND ND ND ND ND ND ND ND ND
ND ND ND ND ND ND ND ND ND NO
0
ND ND ND ND ND
ND ND ND ND ND ND ND ND NO ND
ND ND ND ND ND ND ND ND ND ND
01 03 07 06 00
d

Table 9, Cunttd.
Number FIre5o 'foria!)le,
156. Good Text is Store-house of Facts
157, Teach Students Howto Learn Effectively
158. Good Teacher Needs toSpend Little Time onClarification
159. Students Should StandWhile Reciting
160, Most Visual Aids AreNotes Good As PrintedWord
161. Effective Learning ComesFrom Logically OrganizedText
162, Teachers Who RelyHeavily on TextsAre Not as Effective
163. Teachers Should BeWrong Sometimes
Word WordKnowledQe Discrimination
ND ND
ND ND
00 02
ND
ND ND ND ND
01 01
ND ND ND I
ND ND ND NO
NI)
ND
ND ND Nip
ND
ND ND ND ND
ND ND ND ND
01 00
ArithmtirlRc;Aini COmmitatin-.
0.00.11.4.01.11.11,
01 01 06
ND ND ND ND ND
ND
ND
ND
ND ND
ND
ND ND
ND ND
ND
ND ND
ND ND ND ND ND
07 04 03
ND
ND
02
00
00
00
03 04 02
00 01 00
10 06 05

NuP.lw, Prky, ie
164. PriTary JooExplalninq Su5ject
?litter
165, relitnd Kis To Ask0)..:n They Don't Under-
stand
166, No Specific RulesFor Effective Teach-ing
167, Routine Can Adversely
Affect Learning
168, Teaching Should BeEvaluated trideoendentof Learning Results
169. Without Practical
Usefulness Knowledgeis Without Value
170 Teaching TechniquesMust Be Adapted toindividual ,Students
171. Impact of Teacher IsFar More ImportantThan Rest of SchoolEnvironment
Word Word Arlthmstio ArIthrnolr;
Knowledge Di crlmination PeadInn Cornnutntin-
ND
ND
30**
75** 10
23* 28** 35**
ND -51**ND -20 ND
ND N\
44*
ND
ND N ND
_58**
20 **
ND
ND
ND
01
24**
-55** ND -42 ND
NO
-58** 16
12*
ND
00
ND
00 18* 32**tA
21**
-53** ND
02 23**
ND
N6.1 rut%
27**
00 00
ND ND ND
ND ND ND ND
12* 12*
00
ND I -50* ND
05
ND \ ND
22* 00
ND ND
ND ND
01 00
00 03 02
27
#01?
-55"
02 22** 05
ND ND ND ND
ND ND ND ND ND ND
00 01 05
ND ND
ND
ND
00
ND
00
1410

Table 9, Cont' d.
Number LlauLyariable
172. In Most Classes, StudentsShould Be AbilityGrouped
173.
174.
175.
176.
177,
Word WordKnowledqe Discrimination Rfladinn
Arithmc,tir_
Computatin-
ND ND ND ND
ND ND ND N
Pr thrac. I P:
i'4-Jason;na
ND
ND
19** 14" 03 08 22**
Teachers Should UseSome of Students' Linqo
01 00 00 00
Good Teaching and ND ND ND Ni)
General AffectionAre Separate ND ND ND ND
leacher Should Reward
05 03 02 00
Effort and Penalize Lackof It Regardless ofMastery Achieved
04 04 01 00 01
Teacher Should Avoid ND ND ND ND ND
Use of SlangND ND ND ND ND
02 02 01 04 03
Good Teacher Never_510* -22 -48* -22 -60* -12
Uses Compulsion
12* 12* 01 03 09
178. In Average CIL aroomof 20+, Its Unnecessaryto Know Individual
Students Well
179. Objective Exams Are NotGood; No OrIdeas
ND
ND
26**
ND
ND
00
-33 590*
29**
ND
ND
00
FIN 4.1'41*
ND ND
ND ND
41**
36 35
16*
54*
-49 48*
ci

Nurnbor
180.
181,
182.
latsle a. Cent
Presa win! It)
WordKnowledgeIM111111
Stud(!n! Should P,?poat
grammar ConstructionUntil Correct
ND
ND
00
Relevancy Will Not ND ND
Help DisinterestedStudent ND ND
important to Make
04
Definite Rules AboutGood Teaching
01
183. Teacher Should BeExpected to Spend SomeFree Time With Studentif it Will Help ThemLearn
184. Unrealistic ThatStudent Set AlongWithout Teachers
185. Good Teaching ImpliesMuch Teacher Talk
186. Teachina Should ProceedOn Principle ThatIntellectual Learningis Pleasurable
'187. Usually Teacher'sFault When bfudent Does
Not Understand Assignment
28**
WordDiscrimination 7eidinn
ArithmeticC'Jmnut;)tic.40Menreegew
ND ND.
ND ND
ND
410*
ND ND
ND
01
ND ND
ND
01
ND ND
ND
00
NO ND
d
ND ND ND ND ND ND ND NDd
00 04 08
00
ND
ND
23**
ND
20 48
16* 14**
ND
ND
21** 36*
ND /41\
13 -52** 02
22*
ND I ND
00
ND ND
0""22*
ND
ND
10
ND
ND
ND
ND
04
ND
ND
ND
ND
02
ND
ND
00
ND ND
01
ND NDdA00
05 02
-51**
04
57* 48*
,6*0
ND
ND
34**
24* 00
ND ND ND ND ND
ND ND ND ND ND d
08 04
ND ND ND ND 1 ND
ND ND
02
4.....1110± MINNOW, Hrtowal.
0/ 00
.111..1%=1011ft
ND NU
05
00
;1

Table 9, Cf.mt'd.
Numher Pres:1-n VariahlqWord Word
Knowledne Discrimination Readin^
les. One Should Not DoA Lot of Oral Et/Mc:a-l-
ing of A Student'sWork
ND ND -52** ND
01
ND ND \ NG
12
189. Insi:iht Into Nature
of Our NL,,ber System WillNot redu-,e rr,ouo, of
Drill Necessary
190. All Excapt ExceptionalStudent Should AcquireSame Knowledge andSkills At Same Time
191, Praising Others DoesLittle to AlmulateAchievement
192. Teaching is An ArtNot a Science
193. Teacher: Should CheckTo See if ExplanationHas Left Sore StudenT;Puzzled
194. Agree That if InstructionIs Clear Few DisciplineProblem Cccur
ND ND
ND ND
02
ND
ND
08
ND
ND
11
ND ND
ND
04
ND
01
ND ND
ND ND
05
ND
ND
00
ND
ND
01
ND ND
ND ND
01
Arithrnc'7-
ND
03
03 CO
ND ND
ND ND
i 00
ND ND
ND
0 00
ND 57" ND
ND ND
Ite 07
ND ND
ND ND
ND ND
/101101M111.11.
ND
ND 1 ND
ND ND
0
ND ND
00
is Q
ND
00
ND01011111011
ND
00
ND
ND
02
ND 46*
ND
NDr..ND
ND ND
ND
00
a
a aND
-54 -31
195. Disagree That NonachleverSNDShould £3e Failed
NO
0
-48*
10'
01
ND
ND
04
35w*
ND -50* ND
ND
27" 00
r?"44r.,ti
ND
14
NI)
ND
03

Table 9, 1/4unfid.
Number rresDT.1
196. Lecturo Method isSeldom Desirable
197. Comoetition in "Boos"An, Desirable learningActivity
198, Maximum Loarninl n ceurs
When lo,-Icher and StudentHave a Definite idea
of What is To Be Done
199. Batter to Err inUndorexolainingThan Ovoroxplaining
Extremely Concernrid with:
200, Tho Naturo and OualityOf Instructional9aterials
201. Frustration With Routineand Inflexibility ofSituation
'202. Bocoming Too PersonallyInvolved With Studonts
203. The Wide Ranlo ofStudont Achievement
Word WordKnowledoe Discrimination
ND
ND
00
1
00
Arithmeti:Readinn Combutatic-
ND -39 ND
ND NN4' ND
11*
ND
06
ND
24*
ND ND
ND
02
ND
ND
ND
01
ND
ND
02
ND
01
ND
-78
*INN%
30**
64** -28
04
"1" 1/41
31*
02
ND -r641
ND
-46* 55**
28**
ND Ni) ND
ND ND ND
01
ND
ND
00
-57** 30
130*
06
44*
ND NO ND
ND ND ND
00 00
ND ND
ND ND
00 00
06 04
54** 30 55** 27 56** 07 73**
40.0e/28* 14
OD 01
46**
02
02 00 08 03 06
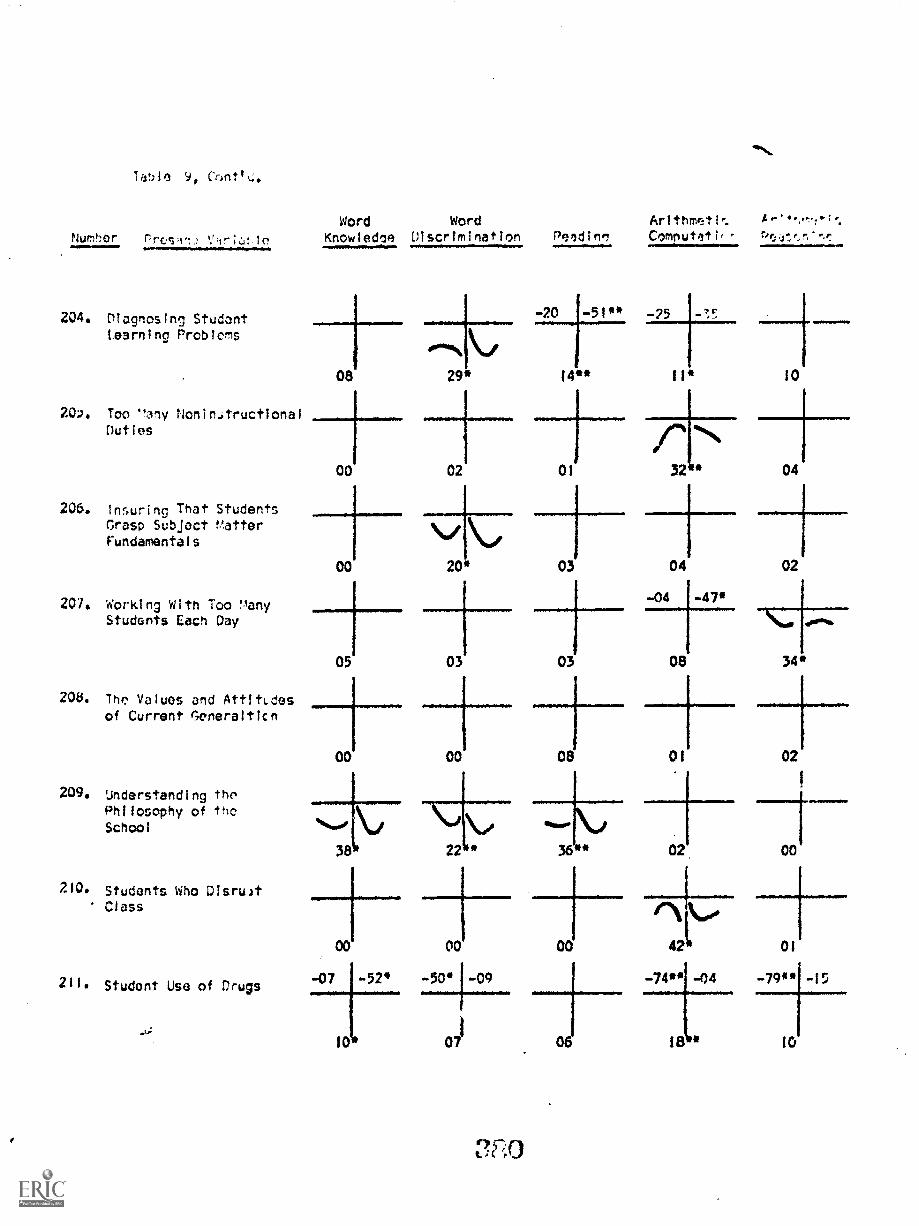
Tahle 9, Cont'.
Number Prcsi
204. Diagnosing Studentbaerning Problems
20'). Too '`:any Nonin..tructional
Duties
206. Insuring That StudentsGrasp Subject ratterFundamentals
207. Working With Too ianyStudents Each Day
208. Inc, Values and AttitLdesof Current Generaltien
209. Understanding tho
Philosophy of the
School
210. Students Who Disru)tClass
211. Studont Use of Drugs
Word Word Arlthmeti:Knowledoe Discrtmlnation Peadin/ Comnutet ri
----....-
08
.00fte%
29*
-20 51** -25 -!":
14** 11* 10
00 02 01
00 20* 03
00 00 08
32 04
04 02
1
-04 -47*
08
01
02
34*
02
-07 ..52* 50
07I
-74** .04 -79** 15
18 10

Ta:110
Number Prrs,), VorLcou
212. Whothor Unch StudentIs Getting What HeNeeds
213. Emotiondl 4Ind SocialNeeds of Students
214. The Wide Divers17y of
Student Ethnic and Socio-economic background
215. Motivate by UsingPublic Rewards
216, Believe in CzoodOrganization ofMaterials andProcedures
217. Focus on Cafvful in-structional Organiza-tion and SystematicTeaching Methods
218. rmehasize Good Class-room Control
219. Believe in the Import-ance of IndividualizingStudent Learning
Word WordKnowtedqa UiSCriminatinr. rbOmnutl,
Pr\25* 17
04
03
03
27**
03 18**
10*
00
25* 06
oo 00
100
01 00
19** 15*
07 13
01 00 00 00 04
%01 eiN
26** 00
01 01
eft,-7\417\.
30 17* 34*
08. 24** 00

Nu/;hor0.411.1.1.11.111.40
22.). Pellevn ID lho Imnort-ancenf Ornani7Ing andMetiv4t1ng
221, Pvlievo in the Import-ance of HfoctiveAspects of Touching
222. Gains Satisfactionfrom Working withPeonle
223. rains Stisfactionfrom IntellectualStimulation and PublicRecognition
224. Gains Satisfactionfrom Dedication toDifficult TeachingProblems
225, Academic Grades do Muchto Encourage Students
226, Gains 5atisfactionFrom Constructing andMarking Homework andTests
227. Exams are Good Devicesto Help the TeacherEvaluate StudentLearning
Word WordKnowledge Discrimdmatlon
ArithmeticR9,01,1,3 Comoutatic-
ie"N
20** 21*
16* 02
01 00
07 00
PUS:ntn0
-47* -20 -65** 07
00 10*
01 03
00 00
01 00
22 47*
25" 02
03 10*
12*
00
07
01
00
01
01
16 50*
22**
08 11
+04 02
01 0013 03 20**

Table 9' cont.d.
Word WordNumber r'resIni Var7,1!)1 Knowledno DiscrImination
223. 10 Is tmoortant inTeaching and Evaluating
Students
229, Tests Sh.uld be Usedto improve Teachinn,Not to EvaluateStudents
230. The School is Not asResponsive to StudentNeeds as it Should Re
231, Curriculum and AcademicMaterials are inappro-priate but Unavoidable
232, Teachers Need flora MeloFrom Others so TheyCan Have More Timewith Students
233. Concerned with DoingJob Well and BeingLiked by Studentsfor It
234. Concerned with GettingAlong with Children
and School Personnel
03 00
11!
40/ kJ
29**
Artirsmcl.N,
Cnm.lut;11.;-,'
tr7t.
02
Illiewila.0101
00 00 00 02 02
03 00 01 00 00
00 00 00 00 03
-31 26
02
Reality-basedinstruction
Individualized and235. Concerned with Providing
01
00
ezi cc,"t
Od 10 07
-----.1-------
03 04 01

NuMher111101.
Tat,10
c't-10",esemyromMIINNIP
Cort'd.
236. Concerned with CuldlnoStudents and ProvidingStable Emotional andIntellectual Climate
237. Concerned with PhysicalLimitations in Terms ofTire and Materials
230. Concerned AboutBeing Favorably Eval-uated for Doing aGood Job
239. Feels it is Necessaryto Teach ParticularFacts
240. Class Is CenteredAround StudentInput
241. Lessons are Flexibleand Open to AcademicStudent Input
242. It's important to Sumand Review Lessons toMake Sure EverybodyUnderstands
243. Teach Facts Rather thanMore Global Concepts
Word WordKnowledr,e Discrimination .10 MOMmor
00
-46* -15
21*
Remlini CF,nutatir,. 1.11..... .11p.411..
00 04 00
00
05
woos.
04 02
05 0
00 01
-08 -51*
211" 30
02 02 01
00 00 00
01 121
3S1
00
07
:51* 24
17"
28
10
22 -47*
07
80111 !1
28**

Table 9, Cont' d,
Number rresarl:t nrimhte
244. Prefers Lecture orExplanation toMulti-modia Present-ation
245. Teacher Alone ShouldDetermine SubjectMatter and Methods
Word Word
Knowledge UlscrImination
°gig\ re
32**
ArithmeticRe4dinn Computativ-
30**
2.46. invnlvo Parents Directly34
In Classroom
247. Prefe- to BringResources Into ClassRather Than Take Child-ren Out of Class
248. Use A-V Aids
249. Use Visitors fromCommunity
250. Competition isDesirable
251. Elaborate Planningand Preparation isNot Necessary
00 00
-36 44* -28
17* 15*
00
00
00
00
13
Pr!thmif.Poasrntno
r r33** 30
02 00 00
01 02 01
00 03 00
01 01
03 03
0404
01
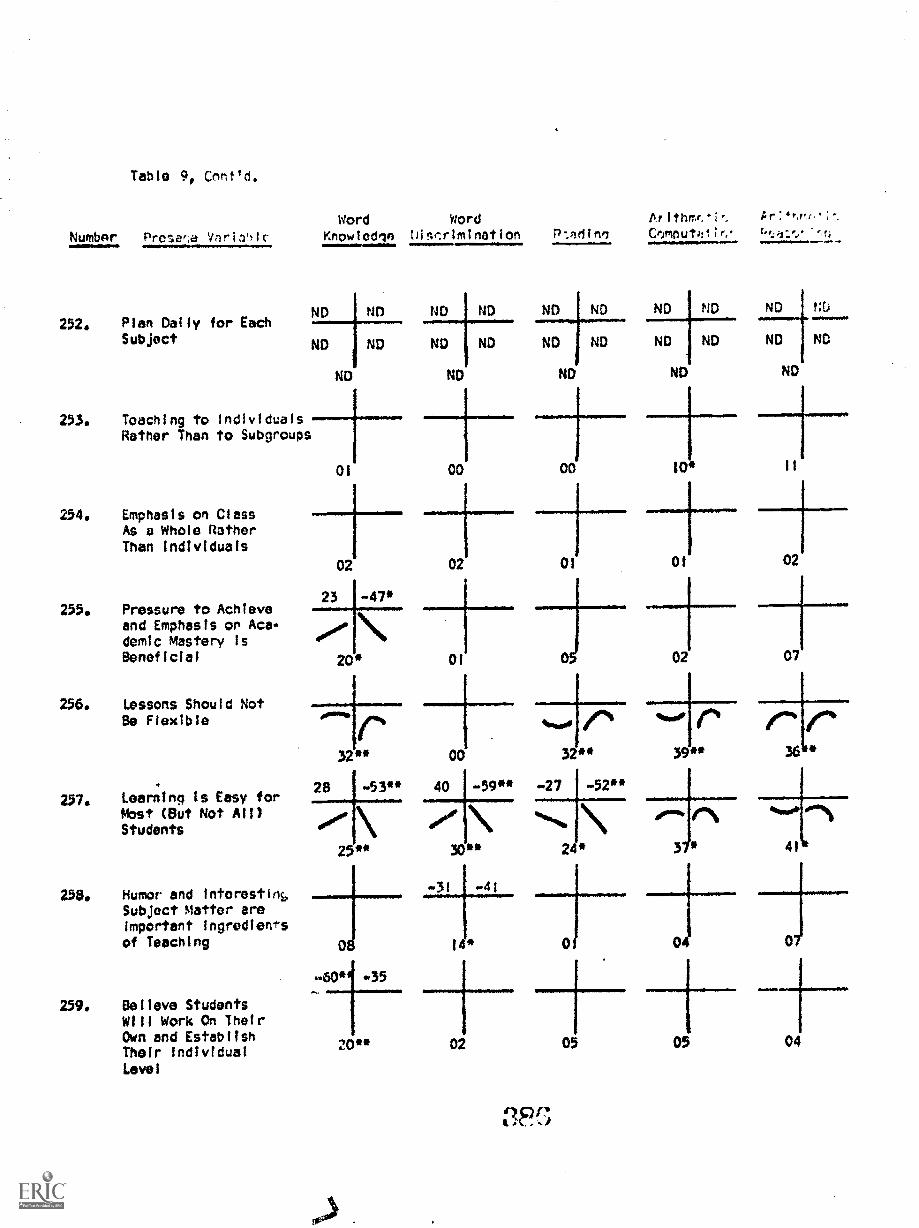
Numbnr
Table 9, Cnnt'd.
p csa,4,, V rin!Ilc
252. Plan Daily for EachSubject
253. Teaching to individualsRather Than to Subgroups
254. Emphasis on ClassAs a Whole RatherThan Individuals
255. Pressure to Achieveand Emphasis on Aca-demic Mastery isBeneficial
256. Lessons Should NotBe Flexible
257. Learning is Easy forMost (But Not All)Students
258. Humor and interestin6Subject Matter areImportant ingredientsof Teaching
259. Believe StudentsWill Work On TheirOwn and EstablishTheir Individual
Level
Word WordKnowlodem DiSCriminatiOn Cembut;otr,.
ND
ND
ND
11
ND ND ND ND ND ND ND ND NL,
ND ND ND ND ND ND ND ND ND
ND ND ND ND
-----i------ +10* 1101 00 00
02 02 Di 01 02
23 -47*
20*
28 -53**
25**
01
%%010 CS
00 32**
40 -59** -27 -52**
30"
02 0
+20** 02 05 05 04

Table 9, cont'd.
Number =o Verfl',1,1
260. Personal and SocialGrowth is Mr,u ImportantThan Acadom!,., Growth
261. Emphasize Disciplineand Academic Work
262. Teachers Should MakeLessons Interesting
263. Learning Is More Impor-tant than Attitudesand Happiness ofStudents
264. Learning Should beinteresting, Not
Laborious
265. Measure Success byClass Work Habitsand Success in Teach-ing Slower Children
Word Word Arithmoi..
Knowledne Discriminntion Readin,1 Compute 1r.,
03 01 00 00 00
03 04
00
01 07 04
01
00
266. Measure Success Through24
Student's Understanding
267. Drill and ExcessiveProblem-solving isDeneilcial in TeachingMath Well
I
06 00 01 01
d'N %Iwo
76 30
-47* 24 52** -20 46*
21*
55** 06
05
40/
22"
52" 79
13*
13"
00
%NO
28
01
03
I
%moo
36
-03 -53"
09
03

Number
Table 9, Cont'd.
Prosano vario a
268. Teachinn StrategiesShould Be Teacher-Centered and WellStructured
269. Believe Subjoct Mat-ter is More ImportantThan Social - Emotional
Factors
270. Believe Teacher'sJob includes HelpingChild to Teach Nim-self Along With SomeParent Duties
271. Recognizes importanceof Integmtion of Sub.fact Matter for Teach-ing Large Class
272. Preference for andUrientatIon to HighAchievers
273. instruction TimeIS Low Because ofControl Problemsand Too Few Personnel
274, Feel Problems StemFrom Children Them-selves and TheirEnvironment
275. inierested in Out-of.Classroom Aspects ofTeaching
Word Word ArIthmetp-, Ar!thmi,*R
Knowledoo Discrimination Raading Comnutatic-.
04
01
00 02
-54* 08
02
00 00
48"
01 00
-39 30 -42 41
14* 24
23 * 00
27** 00
CO
29**
02 01 01
(2r,,Line,
36a.
05
26"

Table 9 Cont' d.
Word Word Arithmetic
Number Pres., P ariable Knowiedee Discrimination RnIdinr,mow, wilmosomPo
COMOUtatier,
276. Use Student Conductand Personal DualitiesIn Assigning AcademicGrades
01
-01 49*
1 -I
08 02 06
1 Probability values are indicated by asterisks. One asterisk indicates a value of
5010; two asterisks indicate a value of x.05.
2 Where dashes appear instead of correlation coefficients, variance on the item wastoo low to permit analvcs for one or both suborouns or for the total proud. in
these cases subjects tended to be nearly unanimous in anreeinn or disanreeinnwith the item. A (agree) or D (disagree) are typed in the riehthand column to in-
dicate the reason for low variance. Where ND appears but no notation Is made inthe column, analyses could not be run for other reasons, such as low N.

Table 10. iZon-linv:Ir Oresane-rroduct Relationshi
view Variables (tednq combined scores)Scores (nverancd arce5s lour vkAr5i ynmen) Tests (dciral points omiltnd).'
Word WordKnowledoe DiscriminationNumber Prnsae Variable
I. Teacher PlacesRestrictions00 Parental involve-ment
06 25
2. Parents Play anImportant Role inTeacher-Child Rapport
3. Teacher DefinesParental Cooper-ation By interestIn Child, Not Teacher
4, School Open toParent's VisitsWithout Restrictions
5, Teacher Names Disad-vantage of BusingIn Terms of Chlidren'sEmotional Harm
6, Teacher Names BlackStudents' Needs AsInstructional, Not
Social-Emotional
7, Teacher Dces IndividualReading About Educa-tion
8. Teacher SubscribesTo Magazines
pc between Teacher Inter-end !Auden? Residbui neinthn rr!trorofilon Achieve-
Arithmeticileadinn Comeutetia
05
Ar:4hmo*i;
Dro:rAlne
%..."
25* 35**
ND ND ND ND ND ND ND ND ND ND
ND ND ND ND ND ND ND ND ND ND
ND ND ND ND
00 01 02 01 00
00 00 01 03 06
54 ** 14
00 10 01 04 01
03
38 -46* 34 -43
fr's#\{
,°.
23 * 1$ 00 02 0
ND ND ND ND ND ND ND ND ND ND
ND
1
ND NDi
ND ND NI) ND ND ND
I
ND
ND ND ND ND ND

?able lo, (:ant' d.
Nun Prolnlo Verinhle
9. Teacher Reties OnSchool Part,onnel ForAdvice Abair+ Teaching
10. Teacher Uses Psycho-logical services
11. Teacher Implies SheTakes Active r4o1eIn Individual Re-Teaching
12. Teacher Makes DirectEffort to RespondTo MotivationProblems
13. Teacher ExhibillFavorable AttitudeToward ConductGrades
14. Teacher Uses OwnDiagnosis to PlanTeaching
15. Teacher Uses Non-Objective Records
16. Teacher Uses Her OwnJudgment Based on Child'sPerformance Dion-Testing)
Word Word Arithmetil: Ar'itImerRKnowledoo Discrimination ilqadlnl Comnutatin% wies;ronc
_
00 03 00 00 01
02 01
57** 06
02 06 03
MINOMP.
14 * 07
N....,
30**
%./
03 CC
ND ND ND ND ND ND ND ND ND ND
ND
I
ND
ND ND
qil
ND ND
ND'
ND ND
ND
ND ND
ND
ND
19*
04
ND ND
ND ND
ND
53** 1
07
%Noir
27**
ND ND
ND ND
ND
01
47* -25 440 -39 32 -460
UPIIIIMPOn
00 01
00 20 **
ND ND ND ND
ND ND ND ND ND ND
ND
01'26*
ND
ND ND
00 00 00 01

Tablet°, Cont' d.
Number Presppe Varintte
(7. Teacher Used OnlySubjective CriterionTo Judge Her Success
(8. teacher Bases ResponseTo A Mistake On TheChild's Explanation
19. Teacher Keeps Up PaceOf Class, Not Waiting,Sustaining, or Correct-ing
20. Teacher Has A SpecificApproach to No Responses,Instead of SimplyWaiting
21. Teacher SustainsChild Who is NotPaying Attention
22. Teacher SustainsStudent if She GetsAn incorrect Response
23. Teacher Uses SpecialTechniques to TeachLanguage Arts
24. Limits Use of KidsAt Board in SomeWay
Word Word
Knoviedqn Discrlminz4tion ?ladini Crimputntic
Arithm4tit:
7**
00 03' 04
01
14**
01
68**
11
02
00
00 00 03
15*
rs(12
kal if""4 .41
ewl%
33**
36**
02
ND
ND
NO
fit-1r)I 140
00
-26
01
01 02
03 05
03 G5+0/ 00
00 00
21* 39**
12*
ND
ND
ND
01
ND ND
ND
00
ND ND

Table 10, Cont'd.
Number Presana Variable
25. Use of Came Type
Activities ToTeach Language Arts
26. Belief That CauseFor Reading Failurethee in Child
27. Use of Non-RookMaterials To TeachReading
28. Teacher Arranges StudentActivities Which Do NotRequire Direct Super-vision
29. Use of TV Shows
30. We of Patterned TurnsIn Reading Group
31. High Use of SpellingBees
32, Teacher Rases Judge'.
ment of innovationsen Their Social -Emotional Effect
Word WordKnowledoe Discrimination Readino Computation Rease:ntmil
Arithmetic Prithmeils
ND ND
ND ND
ND
ND i ND
ND
ND ND
ND t ND ND ND
ND ND
ND
ND I ND
NO
ND
ND i ND
ND
ND
ND ND
10* 07 25" SD"
.65"1
,/40*e
166
wit
e."1k
07 10
43
NDlaND
O 1
NO ND
41"
ND ND
44"
ND ND
72"
ND ND
ND
ND
ND ND
ND
ND ND
ND
ND ND
ND
ND ND
N
ND
23 01 07 CO 01
24 12* 10* 01 00

Table IN Ccnt'd.
Number prosame Vnr ab!e
33. Problems With RapportStem From Child
Word Word Arithmetic Wthmo'lt
Knowledela Discrimination Readlne Comnutatior Peawaninc
06 01 20
34. Teacher Mentions Concern *52" 02With Social - Emotional
Needs of Mexican-AmericanChildren
-42 47*
04
35. Positive AttitudesToward TV
35. Judges Disadvantages ofInnovations By TheirEffects On Students,Rather Than Herself
37. Reaction to A1SDCurriculum ChangesWas Change in Teaching
38. Teache.r Names DifferentWays to Plan Lessons(Subject, Unit, Time)
39. Does Not PublicizeTest Scores
40. Believe, That Under-standing is MereImportant Than Confida.
once In Teaching aCurriculum
31
23 *
55**
02' 22 **
03
01
04
I49* 23
00 oo
00001
07 151*
49*
11 03 14 01
44 -10 47*x'222
18 00
ftimmem
18 01 03
-20 ,-71* -12
01
ND ND
00
ND NO
08
ND ND
11
NDND
I:51**
ND ND NC
ND
ND
ND ND ND
ND
ND
ND
ND ND ND
ND
ND

Table 10, Cont'd.
Nu, mber eratelt:LIIII
Word Word Arithmetic Ar'thmeic
kn!wledqe Discrimination Reedlna Co/mutat or ats2112...
41.
42,
Uses a HumanisticApproach, Tries To
Sea Child's Side
Punishment: Use of
19* 02 25** 0I
Nonpunftive TechniquesInstead of Isolation or
SI.OV% %../
Loss of Privilege01 01 16* 17* 00
43, Teacher Involves KidsIn Determining Class-room Rules
%00 %%pie eN
23 32" 00 05 01
44, Most Common DisciplineProblem Is Noise, Not
57**
Children's Disrespect %.00f
For Each Other04 20* 21** 04 01
1 Probability values are Indicated by asterisks. One asterisk indicates a value of COO;
tweesterfsks indicate a value of 1L.05.