structure determination of polyacetals by liquid chromatography and hyphenated techniques
TRANSCRIPT

Structure Determination of Polyacetals by Liquid
Chromatography and Hyphenated Techniques
Frank Rittig,*1 Nick Fandrich,1,2 Melanie Urtel,1 Wolfgang Schrepp,1 Ulrich Just,3 Steffen M. Weidner3
1 BASF Aktiengesellschaft, Polymer Research, 67056 Ludwigshafen, GermanyFax: þ49 621 66 95224; E-mail: [email protected]
2 HS Magdeburg-Stendal (FH) Fachbereich Chemie/Pharmatechnik, 39011 Magdeburg, Germany3 Bundesanstalt fur Materialforschung und -prufung (BAM), D-12200 Berlin, Unter den Eichen 87, Germany
Received: January 22, 2006; Revised: April 10, 2006; Accepted: April 11, 2006; DOI: 10.1002/macp.200600030
Keywords: hyphenated techniques; liquid chromatography; polyacetals; polyoxymethylene; structure
Introduction
Polymers are complex multicomponent materials. They are
composed of macromolecules that vary in chain length,
chemical composition, and architecture. Depending on the
composition of the monomer feed and the polymerization
procedure, different types of molecular heterogeneities may
become relevant.
A very efficient approach for the analysis of the molecular
heterogeneity of complex polymers is their liquid chromato-
graphic separation by a combination of different separation
mechanisms. A typical experimental protocol includes the
separation of the sample according to composition, which
yields fractions that are chemically homogeneous. These
fractions are transferred to a size-selective separation method
and analyzed with respect to molar mass. As a result of this
two-dimensional (2D) separation, information on both types
of heterogeneity is obtained. Another useful approach is the
combination of a selective chromatographic technique with a
powerful spectroscopic method like NMR spectroscopy[1–5]
or matrix-assisted laser desorption/ionization time-of-flight
mass spectrometry (MALDI-TOF MS).[6,7]
There are numerous selective modes for the liquid
chromatography (LC) of polymers, including liquid chro-
matography at the critical point of adsorption (LCCC)[8–10]
and isocratic or gradient polymer elution chromatography
(GPEC).[11,12] Using these techniques, polymers can be
separated selectively with regard to chemical composition or
functionality, as it has been shown for macromonomers,
random and block copolymers, and polymer blends.[12–15]
Summary: The structure of polyacetal copolymers withrespect to their end groups is investigated. Several techni-ques, such as liquid chromatography, MALDI-TOF MS, IRand NMR spectroscopy, as well as combined techniques like2D chromatography have been applied. Cyclic oligomers andpolymers with formyl, hydroxy, and aliphatic end groups areidentified. 2D chromatography shows that all the separatedspecies are homogenously distributed with respect to theirmolar mass.
2D chromatograms of sample F97B3.
Macromol. Chem. Phys. 2006, 207, 1026–1037 � 2006 WILEY-VCH Verlag GmbH & Co. KGaA, Weinheim
1026 DOI: 10.1002/macp.200600030 Full Paper

LCCC or GPEC are prominent techniques for the first
dimension in a 2D chromatography setup. They can be
combined with size exclusion chromatography (SEC) in the
second dimension to result in the corresponding molar mass
distribution. So far, 2D chromatography has been applied
mostly to polymers that are soluble in organic solvents.
Typically, in the first dimension binary eluents are used,
e.g., tetrahydrofuran (THF)/hexane, while in the second
dimension THF is often the eluent.
There are several challenges related to the use of more
polar solvents such as 1,1,1,3,3,3-hexafluoroisopropyl
alcohol (HFIP) or aqueous mobile phases.[16,17] In the case
of the highly crystalline performance (co)polymers like
polyacetals or polyamides, HFIP is the solvent of choice in
polymer chromatography.[18–20] Even the established SEC
analysis of copolymers analyzed in HFIP is not straightfor-
ward.[18] In addition, only a very limited number of
stationary phases is available for SEC using HFIP, the
experiments in most cases cannot be conducted in pure
HFIP. Because of the high polarity of the polymer, ion-
pairing reagents have to be added to the eluent to screen
ionic interactions with the stationary phase (for more details
see Mori and Barth[21]). Salt solutions, on the other
hand, can cause serious problems for the SEC detector.
As for LC in HFIP mobile phases, there are only a few
applications described in the literature so far.[7,19,20]
With regards to performance polymers, only a few HPLC
or 2D applications are known.[22] Examples are polyamide
6[19] and polyamide 6.6,[7,20] polycarbonates,[23] and
polyesters.[24–27]
Polyacetals are mainly formed by the cationic copoly-
merization of 1,3,5-trioxane, which is the trimer of formal-
dehyde. ‘Polyformaldehyde’ tends to undergo thermal
depolymerization by an unzipping mechanism, which starts
at the end group, to form formaldehyde. Therefore, a
stabilization of the polymer is necessary. There are two
common methods: i) a comonomer is incorporated into the
polymer chain, which acts as a stopper in the unzipping
mechanism by inhibiting the formation of formaldehyde,
and ii) in the case of the anionic homopolymerization of
formaldehyde, the unstable hydroxy end groups are modi-
fied by treating them with acetic anhydride, so that a stable
acetyl end group is formed.[28,29]
The cationic polymerization can lead to unstable chain
ends, like hydroxy end groups. In order to obtain stable
polyacetals chains, the crude polyacetal has to be degraded
to result in a stable ethanolic –OC2H5 (from dioxolane), or
butanolic –OC4H9 [from butane-1,4-diolformal (Bufo)],
end group. This can be achieved in a hydrolytic or thermal
process. Besides other superior properties, the polymer is
resistant against chemicals like solvents. It is only sensitive
to strong acids.[30]
Herein, the kinds of end groups that can be formed are
described. The results of a study applying MALDI-TOF MS
enhanced by a pre-separation SEC is shown. The results of a
newly developed gradient polymer elution chromatography
(GPEC) system, which separates the polymer according to
its polarity including the structure determination by
MALDI-TOF MS, FT-IR, and NMR spectroscopy are
discussed. Finally, GPEC is combined with SEC to allow
correlation between the molar mass and chemical compo-
sition.
Synthetic Routes to Polyacetals andPotential End Groups
Trioxane, Bufo, and butylal as chain transfer agent are
polymerized in bulk. Perchloric acid HClO4 dissolved in
triethylene glycol dimethyl ether (triglyme) is used as an
initiator. Adding an aqueous solution of a buffer stops the
reaction. This crude polyacetal has to be stabilized by a
thermal degradation step on the extruder, which stops at
the first comonomer unit. The polymer is degassed on
the extruder, the formaldehyde formed is removed and at
the same time, the additive batch is added.
The protonation of trioxane by the protonic acid leads to
hydroxy end groups (Scheme 1).
The hydride shift, a side reaction, results in the formation
of methoxy and formyl end groups (Scheme 2).
Butoxy end groups are formed by the reaction of the
chain transfer agent butylal with an active polymer chain
end (Scheme 3).
The solvent of the initiator triglyme (See Figure 1) can
also react as a chain transfer agent and forms methoxy end
groups.
If water is present, it can react with cationic chain ends
under the formation of unstable hydroxy end groups. These
unstable end groups are degraded thermally. The degrada-
tion stops at the comonomer unit to result in (CH2)4OH end
groups.
Scheme 1.
Scheme 2.
Structure Determination of Polyacetals by Liquid Chromatography and Hyphenated Techniques 1027
Macromol. Chem. Phys. 2006, 207, 1026–1037 www.mcp-journal.de � 2006 WILEY-VCH Verlag GmbH & Co. KGaA, Weinheim

In summary, the following end groups can occur: –OH,
–CHO, –OCH3, –C4H9, and none (cyclic oligomer).
Experimental Part
Samples
The trioxane (90 g) or a mixture of trioxane (M¼ 90.09 g �mol�1, d¼ 1.17 g �L�1) and Bufo (M¼ 102.13 g �mol�1,d¼ 0.98) were heated to 80 8C under stirring. At thistemperature, 2 ppm of 70 wt.-% perchloric acid was added asinitiator. The polymerization was complete within a fewseconds and resulted in a colorless, tough block. A summary ofthe applied samples is given in Table 1.
The samples were dissolved in HFIP at 50 8C for 4 h and thenfiltered using 0.2 mm polytetrafluoroethylene (PTFE) filters. Incase of the GPEC experiments, pure freshly distilled HFIP wasused. In case of the SEC experiments the samples weredissolved in the eluent.
Chromatographic System
An Agilent 1100 system was used comprising a binary pump,an autosampler, a UV detector (at 220 nm), and an RI-detector(for the SEC experiments). For the GPEC and 2D experimentsan evaporative light scattering detector ELS 1000 (PolymerLaboratories, UK) and an additional pump were added.
Conventional Size-Exclusion Chromatography
The experiments were performed in HFIP with 0.05 wt.-%potassium trifluoroacetate at 40 8C using a guard column and astandard HFIP-gel column provided by Polymer Laboratories.The flow was set to 0.5 mL �min�1 and 60 mL of a 1.5 g �L�1
polymer solution were injected. The differential refractiveindex detector (RI) was used for the conventional SEC.Narrowly distributed PMMA-standards were used for calibra-tion to obtain the relative molar mass distribution.
Gradient Polymer Elution Chromatography
The samples were dissolved in HFIP at 50 8C for 4 h and thanfiltered using 0.2mm PTFE filters. Typically, a volume of 20mLwith a concentration of 4 g �L�1 was injected. The mobilephase was changed gradually (see Table 2). The gradient was
applied from a water/HFIP mixture to pure HFIP. A reverse-phase column (HyPurity Aquastar, 250� 4.6 mm2, 5 mm) wasused as the stationary phase.
Peculiarities in a 2D Experiment
The SEC eluent contained 0.05 wt.-% ammonium formate(SEC in a 2D experiment) instead of potassium trifluoroacetate(KTFA), and an evaporative light scattering detector (ELSD)was used for better sensitivity. The major drawback was thepossible non-linearity of the detector response.[31]
MALDI-TOF MS
The mass spectrometric investigations of the various poly-acetal samples were performed on a Bruker Biflex III (BrukerDaltonics GmbH, Bremen) MALDI-TOF mass spectrometer.In general, to obtain mass spectra, the analyte has to bedissolved and mixed with a matrix solution. The principle ofMALDI-TOF MS is described in ref.[32]. The solvent for thematrix and sample was HFIP. The analyte was dissolved at aconcentration of 10 g �L�1 in the matrix, dithranol (1,8,9-trihydroxyanthracene). KTFA was used as cationizing agent.Usually, 1 mL was added in a concentration of 0.1 mol �L�1 tothe 1:1 mixture of 10 mL analyte and 10 mL matrix solutions. Aspray interface, described earlier, was used to spot the sampleonto the MALDI target.
To detect differences in chemical composition, the GPECseparation was combined with FT-IR detection through theLC-transform interface. The design, concept, and the operationof the interface is described in ref.[33,34]. In short, the eluate thatleaves the chromatographic separation system was sprayed
Scheme 3.
Figure 1. Structure of triglyme.
Table 1. Investigated samples.
Sample Mwa) mol-%
C4H8OCH2O(total)
wt.-%C4H8OCH2O
‘blocky’b)
wt.-%C4H8OCH2O‘statistical’c)kg �mol�1
F0B100 18 100 100 0F10B90 86 97 81.7 12.8F20B80 45 92 34.0 41.2F40B60 15 80 18.6 35.7F70B30 0.66 52 5.2 18.7F90B10 0.81 33 1.3 11.6F97B3 146 11 0 3.5
a) According to SEC analysis (relative to PMMA equivalent).b) Having no two CH2O neighbors, determined according to NMR
analysis.c) Having two CH2O neighbors, determined according to NMR
analysis.
1028 F. Rittig, N. Fandrich, M. Urtel, W. Schrepp, U. Just, S. M. Weidner
Macromol. Chem. Phys. 2006, 207, 1026–1037 www.mcp-journal.de � 2006 WILEY-VCH Verlag GmbH & Co. KGaA, Weinheim

onto a rotating disc through a heated nebulizer nozzle. Themobile phase evaporated and the polymer fractions weredeposited as tracks of solid material. After depositing allfractions, the disk was placed in the spectrometer and spectrawere taken from all positions of the disc. For each of thefractions the measurements yielded a separate spectrum, whichcould be used for identification.
The MALDI-TOF MS spectra were recorded in the so-calledreflector mode (voltage 19.5 kV), to enhance mass resolution.Because of the addition of the potassium salt, mainly Kþ
adducts were recorded in the spectra.In considering the MALDI spectra, it had to be kept in mind
that for polymers with a polydispersity greater than about 1.3the spectra are not representative of the real molecular weightdistribution. Typically, mass spectra that more or less displayedthe low-molecular-weight wing of the distribution wereobtained. The upper molecular-weight limit in these casesmay reach up to 50 kg �mol�1,[35] in the case of polyacetals ofaround 3 kg �mol�1.
NMR Spectroscopy
1H NMR spectra were acquired in 1 mL of HFIP-d2 using aBruker DPX 401 spectrometer. Thirty-two free inductiondecays were accumulated with a T1 relaxation delay of 5 s.
Infrared Spectroscopy
A Vector 22 spectrometer (Bruker, Germany) was used forinfrared investigations. Polymer solutions prepared for chro-matography were used for IR spectroscopy as well. Typically, afew drops of a sample solution were deposited onto a silicondisc. After evaporation of the solvent at ambient atmosphere 64single scans (from 400 to 4 000 cm�1) were accumulated foreach spectrum.
The samples for the spectra in Figure 13 (see below) havebeen ‘prepared’ using the spray interface (LC transform). Eachposition of the germanium wafer and the background positionwere scanned 11 000 times in the mid-infrared range from 400to 4 000 cm�1 with a spectral resolution of 1 cm�1.
Results and Discussion
SEC and MALDI-TOF MS
A typical molar mass distribution for sample F97B3 is shownin Figure 2. Different MALDI-TOF MS spectra have beentaken from the fractions 1 to 5 indicated in Figure 2, and theyare presented in Figure 3.
One would expect the absolute masses measured usingMALDI-TOF MS to increase monotonically with the order ofthe fraction. But it is found that in this case the molar mass infraction 1 is higher than in fraction 2 and increases up tofraction 4 and then decreases again.
This may indicate that a separation according to a differentchemical composition is already occurring. Other authorsalso mention that the low-molar-mass peak contains mainlycyclic oligomers,[30] since the hydrodynamic radius can beassumed to be smaller than for a linear chain. Thus, the earliereluting species might be smaller in size but would have alarger absolute mass. This has been corroborated by theobservation where the fraction having the highest molar masselutes first.
Table 2. GPEC Gradient profile.
Time HFIP H2O
min vol.-% vol.-%
0 50 5012.5 80 2022.5 100 052.5 100 057.5 50 50
0.0
0.1
0.2
0.3
0.4
0.5
0.6
0.7
0.8
0.9
1.0
M/g/mol
1e 3 1e 4 1e 5 1e 6
))M(
gol(W
1 2 3 4 5
Figure 2. Molar mass distribution of sample F97B3a.
Structure Determination of Polyacetals by Liquid Chromatography and Hyphenated Techniques 1029
Macromol. Chem. Phys. 2006, 207, 1026–1037 www.mcp-journal.de � 2006 WILEY-VCH Verlag GmbH & Co. KGaA, Weinheim

In Figure 4, magnified spectra of fractions 1 and 4 are shown.The residual mass (of the end group) and/or the compositioncan be calculated from the total masses.[32]
Unfortunately, because of potentially having a variety ofdifferent end group combinations and an unknown comonomercomposition, each mass might appear several times. This is aresult of the low molar mass of the monomers (particularlyformaldehyde¼ 30 g �mol�1), and a distinct identificationusing this approach is not achievable with respect to the lowmolar-mass resolution of the MALDI-TOF MS experiment(approx. 6 000). For example, a copolymer with the structureshown in Figure 5 would have the same nominal mass for n¼ 8,m¼ 71 (M¼ 2 946 g �mol�1, x(C4H8OCH2O)¼ 10 mol-%)and n¼ 3 and m¼ 88 (M¼ 2 946 g �mol�1, x(C4H8O-CH2O)¼ 3 mol-%) but different compositions. In addition,the mass of both end groups would be 60 g �mol�1, whichmeans a cyclic oligomer (mass of the end group¼ 0 g �mol�1)having n¼ 0 and m¼ 19 or n¼ 5 and m¼ 2 would exhibitidentical spectra. Consequently, a simple MS technique withthe present mass resolution will not be sufficient to elucidatethe structure within polyacetals.
GPEC
GPEC is designed as a high-performance precipitation liquidchromatography technique.[11] The formaldehyde-rich sam-
ples are completely precipitated and the Bufo-rich samples aremainly adsorbed onto the column head at 50 vol.-% HFIP in thestarting eluent. A typical series of chromatograms is shown inFigure 6. It becomes evident that apart from the main peaks allsamples show a common maximum at roughly 15 mL.
In addition, a UVactivity at 220 nm for the peak at 15 mL inFigure 7 is observed, which is not expected for polyacetals. Inorder to elucidate the effect, a pure HFIP sample is also injected(see Figure 8).
The first peak occurs at 3 mL, which can be assigned to thesolvent peak. Again, at about 14.5 mL, a strong peak is showneven when the chromatographic system has been flushed for24 h. This peak might be a result of the formation of HFIP/water aggregates, which are formed through hydrogenbridging.[36] This effect is not the focus of the present study.Therefore, this second ‘system peak’ is excluded in thefollowing figures.
However, there is still a separation of the material, which isachieved by the different solubility of the components and/oradsorption between the monomers and the solid phase.Reasons for the different polarity may be: i) differentcompositions, e.g., ratio of the comonomers, ii) different endgroups and, of course iii) different molar masses. A typicalchromatogram of the sample F10B90 that contains more than90% Bufo is shown in Figure 9.
The separation in several small peaks at elution volumesbetween 8 and 12 mL and the increasing intensity of the peaksindicates a separation of low-molar-mass oligomers and givesthe opportunity to study the separation mechanism. Therefore,MALDI-TOF MS is applied at several spots in the chromato-gram using an offline technique described earlier.[33,34] Themass spectra are shown in Figure 10.
Figure 3. MALDI-TOF spectra of the individual fractions ofFigure 2.
Figure 4. Magnified MALDI-TOF spectra of fractions 1 and 4 ofFigure 2.
Figure 5. General structure of a Poly-Bufo copolymer.
Figure 6. ELSD traces of the samples F97B3 (*), F90B10 (~),F10B90 (line), F0B100 (!) (for samples see Table 1).
1030 F. Rittig, N. Fandrich, M. Urtel, W. Schrepp, U. Just, S. M. Weidner
Macromol. Chem. Phys. 2006, 207, 1026–1037 www.mcp-journal.de � 2006 WILEY-VCH Verlag GmbH & Co. KGaA, Weinheim

The most intense signals (indicated with A) of spot 1 can beexplained by six Bufo units (mass 612) plus cationization byKþ (mass 39), which results in a residual mass of 90 for the endgroups (see discussion below). The following two ‘A’ signalsshow a mass increase of 30 relating to one or two –[CH2O]–repeat units. The ‘B’ signal series might be explained asoriginating from five Bufo units, and the ‘D’ ones as originatingfrom seven Bufo units. Also indicated by ‘B’ and ‘C’ are therespective cyclic molecules (the ‘B’-mass at 549 g �mol�1
consists of five Bufo units plus potassium). Likewise in spot 2,
the most intense peak at mass 945 marks eight Bufo units, onepotassium ion, and a rest mass of 90 for the end groups. Theother signals might be explained in analogy to spot 1.
When the first peak is composed of n Bufo units and aremaining mass of 90 g �mol�1 (see, e.g., Figure 10, ‘A’signals), two different molecular structures could explainthe 90 g �mol�1, either a copolymer with a methoxy/formylend group combination as shown in Figure 11a or a copo-lymer with hydroxy end groups on both chain ends (seeFigure 11b).
0.00
0.05
0.10
0.15
0.20
0.25
0.30
0.35
0.40
0.45
0.50
Ve [ml]
2 4 6 8 10 12 14 16 18
]V[ langi
S
Figure 7. Chromatograms of sample F10B90 (full line: ELSD trace, dashed line: UV trace).
0.000
0.025
0.050
0.075
0.100
0.125
0.150
0.175
0.200
0.225
0.250
0.275
0.300
Elutions Volumen [-]
3 4 5 6 7 8 9 10 11 12 13 14 15
]-[ langi
S rotketeD
Figure 8. Chromatogram of pure HFIP (dashed line: UV trace, full line: ELSD trace).
Structure Determination of Polyacetals by Liquid Chromatography and Hyphenated Techniques 1031
Macromol. Chem. Phys. 2006, 207, 1026–1037 www.mcp-journal.de � 2006 WILEY-VCH Verlag GmbH & Co. KGaA, Weinheim
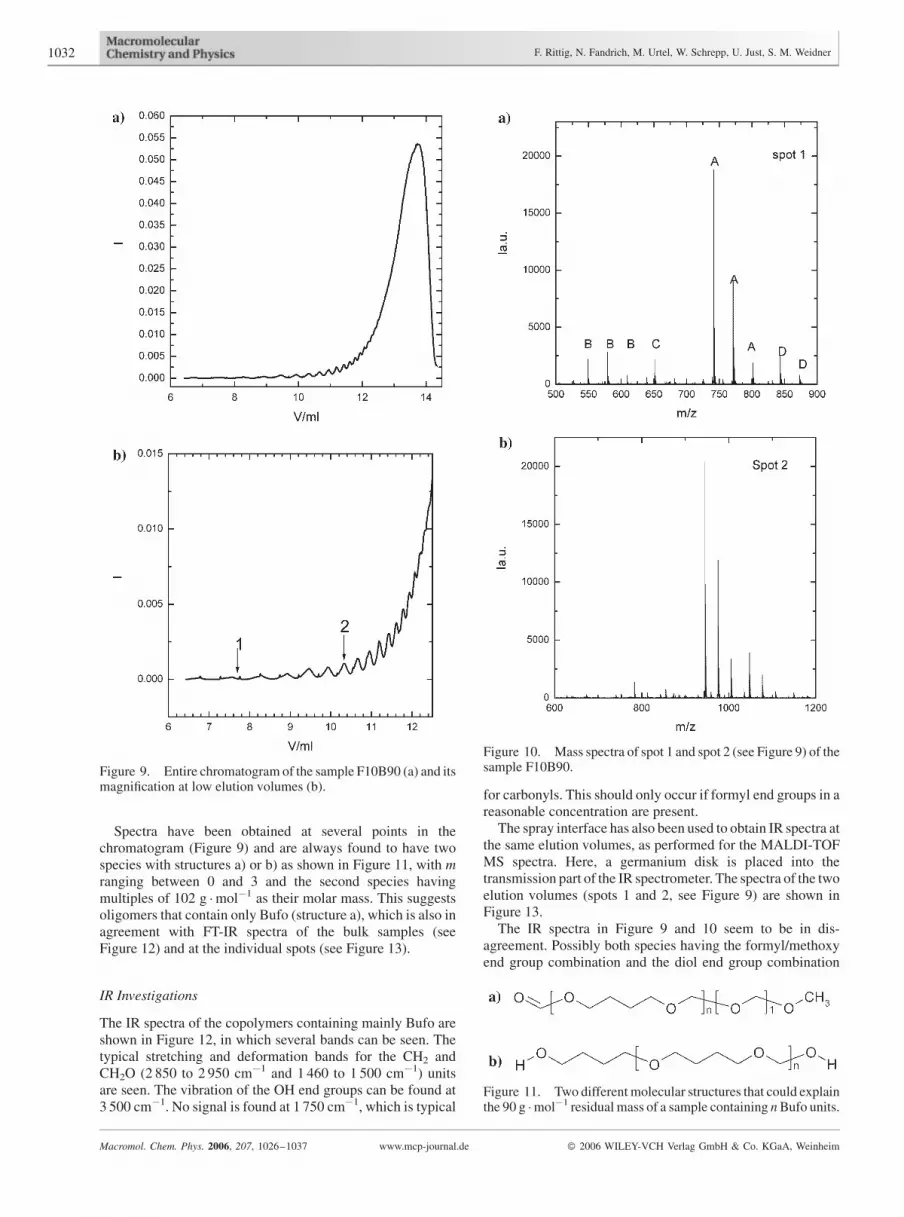
Spectra have been obtained at several points in thechromatogram (Figure 9) and are always found to have twospecies with structures a) or b) as shown in Figure 11, with mranging between 0 and 3 and the second species havingmultiples of 102 g �mol�1 as their molar mass. This suggestsoligomers that contain only Bufo (structure a), which is also inagreement with FT-IR spectra of the bulk samples (seeFigure 12) and at the individual spots (see Figure 13).
IR Investigations
The IR spectra of the copolymers containing mainly Bufo areshown in Figure 12, in which several bands can be seen. Thetypical stretching and deformation bands for the CH2 andCH2O (2 850 to 2 950 cm�1 and 1 460 to 1 500 cm�1) unitsare seen. The vibration of the OH end groups can be found at3 500 cm�1. No signal is found at 1 750 cm�1, which is typical
for carbonyls. This should only occur if formyl end groups in areasonable concentration are present.
The spray interface has also been used to obtain IR spectra atthe same elution volumes, as performed for the MALDI-TOFMS spectra. Here, a germanium disk is placed into thetransmission part of the IR spectrometer. The spectra of the twoelution volumes (spots 1 and 2, see Figure 9) are shown inFigure 13.
The IR spectra in Figure 9 and 10 seem to be in dis-agreement. Possibly both species having the formyl/methoxyend group combination and the diol end group combination
Figure 10. Mass spectra of spot 1 and spot 2 (see Figure 9) of thesample F10B90.
Figure 11. Two different molecular structures that could explainthe 90 g �mol�1 residual mass of a sample containing nBufo units.
Figure 9. Entire chromatogram of the sample F10B90 (a) and itsmagnification at low elution volumes (b).
1032 F. Rittig, N. Fandrich, M. Urtel, W. Schrepp, U. Just, S. M. Weidner
Macromol. Chem. Phys. 2006, 207, 1026–1037 www.mcp-journal.de � 2006 WILEY-VCH Verlag GmbH & Co. KGaA, Weinheim

occur, but the extinction coefficient is greater for the carbonylend group than for the OH end group. On the other hand, the(existing) Bufo homopolymer might have more OH endgroups. Therefore, the signal intensity of the OH end groupswould dominate the bulk spectra. The relative signal intensityof the CHO-end group in spots 1 and 2 decreases with respect tothe CH2 main chain because the sample is separated accordingto its oligomers.
In addition, cyclic oligomers can be assigned from the massspectra. The cyclic oligomers and the linear chain only differby one Bufo unit, which means that the number of repeat unitsis smaller for the cyclic oligomers than for the linear chain byone. Consequently, the separation criterion appears to bepolarity, since the linear chain is more polar than the cyclicoligomers as a result of the polar end group combination (OHor CHO). A higher amount of low polarity monomers (Bufo)
Figure 12. FT-IR spectra of different polyacetal copolymers:F40B60, F20B80, and F10B90 having different amounts of Bufoas indicated.
Figure 13. FT-IR spectra of spot 1 and 2 (see Figure 9) of thesample F10B90.
Figure 14. Chromatograms of sample F97B3: a) entire chroma-togram, and b) magnification of (a).
Structure Determination of Polyacetals by Liquid Chromatography and Hyphenated Techniques 1033
Macromol. Chem. Phys. 2006, 207, 1026–1037 www.mcp-journal.de � 2006 WILEY-VCH Verlag GmbH & Co. KGaA, Weinheim

for the linear chain is needed to exhibit the same retention as thecyclic oligomer. Indeed, GPEC experiments with differentamounts of Bufo homopolymer indicate that the dominatingmechanism is an adsorption mechanism in a reverse phasesystem, meaning the more polar a component is, the earlier itselution occurs. Besides the elucidation of the principalseparation mechanism, the method developed also allowsthe separation of sample F97B3 according to its comonomercontent, since more Bufo units would imply less polarmacromolecules.
After studying polyacetals with high amounts of (CH2)4O-CH2O constituents, a study of the opposite situation has beenundertaken, i.e., polyacetals with high amounts of ‘poly-formaldehyde’, such as sample F97B3.
A typical chromatogram for sample F97B3, which consistsof 97% CH2O and 3% (CH2)4OCH2O, is shown in Figure 14,in which three different peaks can be identified. MALDI-TOFMS is applied to the entire chromatogram, but only spectrafor the first peak are obtained. The spectra at the elutionvolumes marked in Figure 14 as 1 and 2 are shown inFigure 15.
The spectra show multimodal distributions wherein bothdistributions one would expect the number of Bufo units toincrease. This should result in a difference of the peak maximaof 102 Da. As can be inferred from Figure 15 this is definitelynot the case: in spot 1 the peak difference is about 390 Da,in spot 2 it is 600 Da. One possible explanation for thisdiscrepancy might be that the chromatographic separationhas not only occurred with respect to the end group but isshowing some influence of molecular weight of the mainchain. In addition, the spectra could be resolved for mole-cules having an end-group combination such as formyl/methoxy. The formyl end group has been found using FT-IRspectroscopy at the individual spots (see Figure 16). OH-groups could not be identified, which does not mean thatthey do not exist, since the extinction coefficients might bedifferent.
The MALDI-TOF MS spectra (Figure 15) at differentpositions in the chromatogram show a clear correlationbetween the increasing amount of Bufo units and elutionvolume. This is in agreement with the results for the sampleF10B90 (see above). All peaks are fractionated and analyzedusing 1H NMR spectra. The resulting spectra are shown inFigure 17. The assignment of the chemical shifts of the protonsof the main chain are presented in Table 3 (see Figure 18 formain chain numbering).
Additional signals are found at 0.9 and 1.35 ppm for thefraction between 10 and 12 mL (see Figure 14), which can beassigned to an aliphatic end group with a low polarity thatleads to high retention. The additive butylal has formed the endgroup. The amount of this end group is approximately 3.5 mol-% in the last peak, which means each chain has one aliphaticend group. At this point it cannot be concluded if theseparation occurs because of the aliphatic end group or as aresult of a molar mass effect (e.g., a smaller molar masscomponent will elute later). Therefore, molar mass informa-tion is needed for each peak. Consequently, a 2D experiment isperformed where the chemical separation via GPEG iscombined with a molar-mass sensitive separation, e.g., SECseparation.
Figure 15. MALDI spectra of spots 1 (a) and 2 (b) as indicated inFigure 14. Spots are marked in Figure 13. The number of Bufounits are indicated in the spectra.
Figure 16. Typical FT-IR spectra of sample F97B3.
1034 F. Rittig, N. Fandrich, M. Urtel, W. Schrepp, U. Just, S. M. Weidner
Macromol. Chem. Phys. 2006, 207, 1026–1037 www.mcp-journal.de � 2006 WILEY-VCH Verlag GmbH & Co. KGaA, Weinheim

2D Chromatography
2D Chromatography usually links two different separationexperiments together. By applying 2D chromatography theresolution can in principle be greatly increased depending onthe resolution of both dimensions.[37] The task of elucidatingthe correlation between molar mass distribution and endgroups and/or Bufo content, respectively, calls for 2Dexperiments that combine GPEC and SEC, which are desir-able. Typically, a 2D experiment is performed using a transfer
loop. This loop usually has a volume of about 100 mL. In orderto achieve a 100% transfer, the flow rate of the first dimensionshould be lower than 0.1 mL �min�1. The chromatograms atdifferent flow rates are compared in Figure 19.
Figure 17. 1H NMR spectra of the total sample (black) and the fraction between 10 and 12 mL (gray,see Figure 14a): a) overview spectrum, and b) zoom (see also Figure 18 and Table 3).
Figure 18. The assignment of the chemical shifts of the protonsof the main chain (see also Table 3).
Structure Determination of Polyacetals by Liquid Chromatography and Hyphenated Techniques 1035
Macromol. Chem. Phys. 2006, 207, 1026–1037 www.mcp-journal.de � 2006 WILEY-VCH Verlag GmbH & Co. KGaA, Weinheim

It becomes obvious that the elution can be reproduced at aflow rate of 0.6 mL �min�1 but not at 0.1 mL �min�1. Theresults imply a precipitation mechanism where the redissolu-tion is kinetically hindered. Consequently, a 2D experimentcannot be performed with the current technology. A commer-cially available and automated fraction collector has been used.The fraction collector was provided by BAI (Probot). Usingthis setup, the GPEC experiment can be performed with a flowrate of 0.6 mL �min�1. A drawback is the higher samplingvolume (300 mL). The final 2D plot can be constructed in thetypical way. The results for sample F97B3 are shown inFigure 20.
Figure 20 shows the 2D plot as a contour plot. Differentcolors denote different intensities on a logarithmic scale. Thegradient elution is shown on the y axis and the molar mass onthe x axis. The two main peaks from the gradient elution show ahomogeneous molar mass and the small peak at low elutionvolumes has a lower molar mass but the fractionation has beenperformed using a fraction collector with rather large fractionvolumes (300 mL), which reduces the resolution. Obviously,
this is the pre-peak in the molar mass distribution, whichcontains a relatively high fraction of Bufo or cyclic oligomers.
The molar mass distributions of the two main populationsare similar. It can be concluded that: i) the latest peak (in theGPEC experiment) has an aliphatic end group, and ii) no endgroup is formed for a particular molar mass. A mean molarmass, Mw, of 110 kg �mol�1 has been obtained for sampleF97B3. This is significantly lower than previously reported(see Table 1) but the reason for the deviation might be that the2D experiment is monitored by an evaporative light scatteringdetector which has a non-linear response behavior.[31] There-fore, a different weighting of the different molar mass slicesmight happen and should lead to a deviation. The low-molar-mass peak exhibits anMw of 2.5 kg �mol�1 F97B3, but here theerrors are higher because of low intensities (approx. 20%).
The peaks show a kind of tailing in the low-molar-massrange, which may indicate some adsorption. For the peakbetween 9.5 and 11 mL (y axis) this must be considered sincethe molecules have an aliphatic end group and the polarity forthe low-molar-mass species is low in a quite polar solvent(HFIP). However the tailing is observed for all species and notonly for molecules having a lower polarity. Therefore, the low-molar-mass fraction is rather a typical property of the polymerobtained using this particular synthesis.
Conclusion
We have characterized a series of polyacetals using differentchromatographic and spectroscopic techniques. It has beendemonstrated that the polymers contain formyl/methoxy end-group combinations. We can also separate a fraction containinglong aliphatic end groups. Both populations show identicalmolar mass distributions, which exhibit a nearly Gaussianshape. In addition, we could separate a fraction having a highBufo content. We have further studied a sample containing90% Bufo. For this sample we did not find any indication offormyl end groups but the interpretation of the mass spectra and
Table 3. 1H chemical shift of chain (see Figure 18 for main chainnumbering).
Signal no. Chemical shift
ppm
1 4.982 5.013 4.884 3.715 1.71
Figure 20. 2D chromatograms of sample F97B3.
Figure 19. Chromatograms of the sample F97B3 at differentflow rates: 0.6 mL �min�1 (a, full line, dashed line) and 0.1mL �min�1 (b, c, d).
1036 F. Rittig, N. Fandrich, M. Urtel, W. Schrepp, U. Just, S. M. Weidner
Macromol. Chem. Phys. 2006, 207, 1026–1037 www.mcp-journal.de � 2006 WILEY-VCH Verlag GmbH & Co. KGaA, Weinheim

FT-IR spectra lead to the conclusion that the sample consists oflinear chains with H/OH end-group combinations and cyclicoligomers.
[1] K. Albert, ‘‘On-Line LC NMR and Related Techniques’’,Wiley, Chichester 2002.
[2] H. Pasch, W. Hiller, Macromolecules 1996, 29, 6556.[3] I. Kramer, H. Pasch, H. Handel, K. Albert,Macromol. Chem.
Phys. 1999, 200, 1734.[4] I. Kramer, W. Hiller, H. Pasch, Macromol. Chem. Phys.
2000, 201, 1662.[5] W. Hiller, H. Pasch, Polym. Prepr. (Am. Chem. Soc., Div.
Polym. Chem.) 2001, 42, 66.[6] H. Pasch, Adv. Polym. Sci. 2000, 150, 1.[7] S. Weidner, U. Just, W. Wittke, F. Rittig, F. Gruber, J.
Friedrich, Int. J. Mass Spectrom. 2004, 238, 235.[8] S. G. Entelis, V. V. Evreinov, A. V. Gorshkov, Adv. Polym.
Sci. 1986, 76, 129.[9] S. G. Entelis, V. V. Evreinov, A. I. Kuzaev, ‘‘Reactive
Oligomers’’, Khimiya, Moscow 1985.[10] H. Pasch, Adv. Polym. Sci. 1997, 128, 1.[11] G. Glockner, ‘‘GradientHPLCandChromatographicCross-
Fractionation’’, Springer, Heidelberg 1991.[12] H. Pasch, B. Trathnigg, ‘‘HPLC of Polymers’’, Springer,
Heidelberg 1997.[13] H. Pasch, C. Brinkmann, Y. Gallot, Polymer 1993, 34, 4099.[14] H. Pasch, Y. Gallot, B. Trathnigg, Polymer 1993, 34, 4986.[15] H. Pasch, E. Esser, C. Kloninger, H. Iatrou, N. Hadjichris-
tidis, Macromol. Chem. Phys. 2001, 202, 1424.[16] H. Pasch, M. Adler, F. Rittig, S. Becker, Macromol. Rapid
Commun. 2005, 26, 438.[17] M. Adler, F. Rittig, S. Becker, H. Pasch, Macromol. Chem.
Phys. 2005, 206, 2269.[18] J. Chen, W. Radke, H. Pasch, Macromol. Symp. 2003, 193,
107.
[19] Y. Mengerink, R. Peters, C. G. deKoster, Sj. van der Wal,H. A. Caessens, C. A. Cramers, J. Chromatogr. A 2001,914, 131.
[20] Y. Mengerink, R. Peters, Sj. van der Wal, H. A. Caessens,C. A. Cramers, J. Chromatogr. A 2002, 949, 337.
[21] S. Mori, H. G. Barth, ‘‘Size Exclusion Chromatography’’,Springer, Heidelberg 1999.
[22] F. Rittig, H. Pasch, in preparation.[23] L. Coulier, E. R. Kaal, T. Hankemeier, J. Chromatogr. A
2005, 1070, 79.[24] R.-P. Kruger, H. Much, G. Schulz, J. Liq. Chromatogr. 1994,
17, 3069.[25] R.-P. Kruger, H. Much, G. Schulz, O. Wachsen, Macromol.
Symp. 1996, 110, 155.[26] T. Biela, A. Duda, K. Rode, H. Pasch, Polymer 2003, 44,
1851.[27] T. Biela, A. Duda, S. Penczek, K. Rode, H. Pasch, J. Polym.
Sci., Part A: Polym. Chem. 2002, 40, 2884.[28] W. Kern, H. Cherdron, V. Jaacks, H. Baader, H. Deibig, A.
Giefer, L. Hohr, A. Wildenau, Angew. Chem. 1961, 73, 177.[29] J. Masamoto, Prog. Polym. Sci. 1993, 18, 1.[30] M. Hasegawa, K. Yamamoto, T. Shiwaku, T. Hashimoto,
Macromolecules 1990, 23, 2629.[31] R. Schultz, H. Engelhardt, Chromatographia 1990, 29,
517.[32] H. Pasch, W. Schrepp, ‘‘MALDI-TOF Mass Spectrometry of
Synthetic Polymers’’, Springer, Heidelberg 2003.[33] L. M. Wheeler, J. N. Willis, Appl. Spectrosc. 1993, 47,
1128.[34] J. N. Willis, J. L. Dwyer, L. M. Wheeler, Polym. Mater. Sci.
1993, 69, 120.[35] C. N. McEwen, C. Jackson, B. Larsen, Int. J. Mass Spectrom.
1997, 160, 387.[36] K. Yoshida, T. Yamaguchi, T. Adachi, T. Otomo, D. Matsuo,
T. Takamuku, N. Nishi, J. Chem. Phys. 2003, 119, 6132.[37] P. Kilz, H. Pasch, ‘‘Coupled Liquid Chromatographic
Techniques in Molecular Characterization’’, in: Encyclope-dia of Analytical Chemistry, R. A. Meyers, Ed., Wiley,Chichester 2000.
Structure Determination of Polyacetals by Liquid Chromatography and Hyphenated Techniques 1037
Macromol. Chem. Phys. 2006, 207, 1026–1037 www.mcp-journal.de � 2006 WILEY-VCH Verlag GmbH & Co. KGaA, Weinheim