response normalized liquid chromatography nanospray ionization mass spectrometry
TRANSCRIPT

Response Normalized Liquid ChromatographyNanospray Ionization Mass Spectrometry
Ragu Ramanathan, Ruyun Zhong, Neil Blumenkrantz,Swapan K. Chowdhury, and Kevin B. AltonDepartment of Drug Metabolism and Pharmacokinetics, Schering-Plough Research Institute, Kenilworth,New Jersey, USA
The widely different LC-MS response observed for many structurally different compoundslimits the use of LC-MS in full scan detection mode for quantitative determination of drugsand metabolites without using reference standard. The recently introduced nanosprayionization (NSI) technique shows comparable MS response for some compounds undernon-LC-MS conditions. However, in the presence of numerous endogenous compoundscommonly associated with biological samples such as urine, plasma, and bile, LC-MS isrequired to separate, detect, identify, and measure individual analytes. An LC-NSI-MS systemwas devised and the MS response obtained in this system for a variety of pharmaceutical drugsand their metabolites. The set-up involves two high-performance liquid chromatography(HPLC) systems, a chip-based NSI source and a quadrupole-time-of-flight (Q-TOF) massspectrometer. Herein this is referred to as the response normalized-liquid chromatographyNSI-MS (RNLC-NSI-MS) system. One HPLC unit performs the analytical separation, while theother unit adds solvent post-column with an exact reverse of the mobile phase compositionsuch that the final composition entering the NSI source is isocratic throughout the entire HPLCrun. The data obtained from four different structural classes of compounds [vicriviroc (VCV),desloratadine (DL), tolbutamide, and cocaine] and their metabolites indicate that by maintain-ing the solvent composition unchanged across the HPLC run, the influence of the solventenvironment on the ionization efficiency is minimized. In comparison to responses obtainedfrom radiochromatograms, responses from conventional LC-ESI-MS overestimated the VCVand DL responses, respectively, by 6- and 20-fold. Although VCV and DL responses obtainedusing LC-NSI-MS are within 2- to 6-fold from the respective radiochromatographic responses,the response normalization modification results in nearly uniform LC-NSI-MS response for allcompounds evaluated. (J Am Soc Mass Spectrom 2007, 18, 1891–1899) © 2007 AmericanSociety for Mass Spectrometry
Liquid chromatography-mass spectrometry (LC-MS) with atmospheric pressure ionization (API)has become the preferred tool in the pharmaceu-
tical industry for qualitative and quantitative determi-nation of drugs and their metabolites in biologicalmatrices. The widely different LC-MS responses ob-served for compounds with structural changes, such asthose resulting from metabolism, however, limits theuse of LC-MS in full scan detection mode for quantita-tive determination of drugs and/or metabolites. LC-MS/MS based assays involving selected reaction mon-itoring (SRM) or multiple reaction monitoring (MRM)techniques are routinely used for quantitative determi-nation of drugs and/or metabolites in biological matri-ces [1–7]. LC-MS/MS techniques for quantitation re-quire reference and internal standard(s), so that LC-MS/MS responses from unknown quantities of relevantdrug-related peaks can be related back to responses
Address reprint requests to Dr. R. Ramanathan, Schering-Plough Research
Institute, 2015 Galloping Hill Road, K15-3-3700, Kenilworth, NJ 07033, USA.E-mail: [email protected] and [email protected]© 2007 American Society for Mass Spectrometry. Published by Elsevie1044-0305/07/$32.00doi:10.1016/j.jasms.2007.07.022
obtained using known quantities of each analyte. Usu-ally a standard curve is generated for each and everyanalyte to be quantified [6]. Although reference stan-dards may be available for the parent drug, it is veryunlikely to have standards for metabolites available inearly stage of drug discovery and development therebymaking conventional LC-MS/MS based quantitation ofmetabolites impractical.
Nanospray ionization (NSI), introduced by Wilmand Mann in the 1990s [8], has been used to identifyproteins [9 –13] and drug metabolites [14], quantifypharmaceutical drugs [15, 16], study absorption, distri-bution, metabolism and excretion (ADME) properties ofdrugs [17], and employed in various other applica-tions [12, 13, 15, 16, 18–34]. NSI-MS has the followingadvantages over conventional flow ESI-MS: (1) highersensitivity, (2) lower rate of sample consumption, and(3) improved signal-to-noise ratio (S/N). Although bothon- and off-line NSI-MS have been developed, off-lineNSI-MS methods have been more frequently used be-cause of the technical difficulties associated with inter-
facing conventional flow LC systems with NSI andr Inc. Received May 31, 2007Revised July 22, 2007
Accepted July 23, 2007

1892 RAMANATHAN ET AL. J Am Soc Mass Spectrom 2007, 18, 1891–1899
interrogating an ion of interest with multiple MS andMS/MS experiments on a given LC time scale. Further-more, the flow rate at which a compound is introducedinto the mass spectrometer influences ionization effi-ciency and therefore variability in LC-MS response[35-37].
Recently, using a silicon microchip, Hop et al. [36]and a custom-built pulled capillary, Valaskovic et al.[29], studied the NSI-MS response of different classes ofdrugs and their metabolites by infusing directly into theNSI-MS system. Hop et al. [36] compared ionizationefficiencies of drugs and metabolites in conventionalflow (500-�L/min) LC-MS using electrospray ioniza-tion with that in a microchip based infusion NSI-MSand showed that in the latter technique the ionizationefficiencies vary to a much lesser extent. Valaskovic etal. [29] demonstrated that as the flow rate in nanosprayis reduced, the differences in ionization efficienciesamong various compounds also reduce and at a flowrate of about 10 nL/min most compounds show similarionization efficiency.
These encouraging results were obtained by directinfusion of analytes into NSI-MS systems. However,analysis of drugs and metabolites are usually per-formed from biological matrices or extracts. Metabo-lites, which are likely to be isobaric (same modificationat different sites) and accompanied by endogenoussalts, fatty acids, peptides, and proteins require chro-matographic separation before analysis. Therefore, anNSI-MS system coupled to a HPLC is the most desirableapproach for metabolite characterization.
In this paper, results from an investigation of anon-line LC-NSI-MS system and the role of mobile phasecomposition on the variation of ionization efficiencies ofdifferent classes of drugs [vicriviroc (VCV), deslorata-dine (DL, Clarinex), tolbutamide (TOL) and cocaine],and their metabolites are described. The analysis of aseries of DL- and VCV-related compounds were per-formed directly from urine. These data were furthercompared with those from conventional LC-MS withelectrospray ionization using the same gradient forseparation.
Experimental
Materials
HPLC grade acetonitrile and methanol were from Bur-dick and Jackson (Muskegon, MI). Water was purifiedusing the Millipore Milli-Qplus water purification sys-tem (Bedford, MA). Acetic acid and ammonium acetatewere from Sigma-Aldrich (St. Louis, MO). Cocaine andbenzoylecgonine were obtained from Cerilliant Corpo-ration (Round Rock, TX) as 1 mg/mL free base inacetonitrile and methanol, respectively. Solutions werefurther diluted in 1:1 mixture of methanol:acetonitrile toa final solution containing 20 �M each cocaine andbenzoylecgonine. Tolbutamide (TOL) and hydroxytol-
butamide (OH-TOL) were purchased from Sigma-Al-drich as powders, dissolved and diluted in methanol toa final concentration of 20 �M. All other reagents andsolvents were obtained from commercial sources. A 25�L aliquot of the standard mixture was injected for allLC-MS experiments.
Capsules containing 14C-VCV {1-[[(4,6-dimethyl-5-pyrimidinyl)carbonyl]-4-[4-[2-methoxy-1(R)-(4-triflu-oromethyl)phenyl]ethyl]-3(S)-methyl-1-piperazinyl]-4-methylpiperidine, 14C-SCH 417690} were formulated,manufactured and released at the Schering-Plough Re-search Institute (Kenilworth, NJ). As detailed elsewhere[38-41], urine was collected in block intervals for 10 dfollowing a single 50 mg administration of 14C-VCV(�100 �Ci) to six healthy volunteers. This was a Phase Iopen-label study designed to characterize the absorp-tion, metabolism, and excretion of 14C-VCV. Followingcentrifugation, a 100 to 150 �L aliquot of urine (0 to 6 h)from a single subject was injected for all LC-MS exper-iments. The radioactivity content in the urine was about60 DPM/�L.
14C-DL [8-chloro-6, 11-dihydro-11-(4-piperidyli-dene)-5H-benzo [5,6] cyclohepta [1,2-b]pyridine, 14C-SCH 34117] was synthesized at Schering-Plough Re-search Institute (Kenilworth, NJ) and had �99%radiochemical purity. As described elsewhere [42, 43],monkeys (n � 3) were administered a single oral dose in0.4% aqueous methylcellulose by gavage at a targeteddose level of 6.5 mg [14C]DL/kg (80 �Ci/kg). Urine wascollected at selected intervals through 240 h post-dose.Urine samples were pooled by taking 10% to 25% of thevolume collected over each time interval. Equal vol-umes from each individual pool were mixed together toobtain a pooled 0 to 24 h composite urine. Followingcentrifugation, a 100-�L aliquot of the pooled compos-ite urine sample was injected for LC-MS analysis within-line radioactivity detection (FSA). The radioactivitycontent of the urine was about 500 DPM/�L.
LC-ESI-MS
All LC-ESI-MS experiments were performed using aTSQ Quantum mass spectrometer (Thermo ElectronCorp., San Jose, CA) equipped with a vendor suppliedsource operated in the positive ionization mode. ESIsource and MS conditions were optimized using reser-pine (10 ng/�L) to avoid preferential MS conditions forany one of the metabolites or drugs. The mass spec-trometer was nominally operated with the spray needlevoltage, capillary offset and capillary temperature set at4.0 kV, 35 V, and 300 °C, respectively. For all LC-MSexperiments, the Q1 resolution (FWHM, full width athalf-maximum) and the first/last mass were set at 0.7Th and 100/1100 Da, respectively.
A Waters Alliance HPLC system (Alliance Model2690; Waters Corp., Milford, MA) and a 4.6 mm � 250mm Luna Phenyl-Hexyl column (Phenomenex, Tor-rance, CA) were used for all LC separations. Thecolumn was maintained at room temperature. The
mobile phase, 95% 10 mM ammonium acetate with 5%
1893J Am Soc Mass Spectrom 2007, 18, 1891–1899 RESPONSE NORMALIZED MASS SPECTROMETRY
acetonitrile, adjusted to pH 6.0 with acetic acid (A) and95% acetonitrile with 5% water (B), was delivered at aconstant flow rate (1 mL/min). The linear gradientsused in this investigation are shown in Table 1.
For all experiments involving radioactive samples,15% of the column effluent was utilized for LC-ESI-MSexperiment while 85% of the column effluent wasdiverted to a Model 500TR (Packard Instrument Co.,Meriden, CT) flow scintillation analyzer (FSA)equipped with a 250-�L liquid flow cell (Packard In-strument Co., Meriden, CT). Flo-Scint III cocktail (Pack-ard Instrument Co., Meridian, CT) was used as scintil-lation fluid at a flow rate of 2.4 mL/min. FSA wascontrolled by FLO-ONE for Windows software (version3.65, Packard Instrument Co., Meriden, CT). All radio-activity data were processed and integrated using thesame software. This simultaneous detection of all drug-derived material by an MS and an FSA providedconfirmation of the molecular weight of all radioactivepeaks in a simple LC-MS experiment. For all non-radioactive samples, 15% of the flow was diverted tothe mass spectrometer and the remainder to waste.
Following LC-MS/FSA analysis, the area of eachdetected radioactive peak in the FSA was expressed asa percent of peak area of the most abundant peak (set to100%) in the radiochromatogram. Similarly, fromLC-MS spectra, peak areas of the metabolites and thecorresponding parent drug were integrated using Xcali-bur software (ThermoFinnigan, San Jose, CA) and thennormalized to the peak area of the most abundant peak.For comparison the integrated peak areas of metabolitesand the parent drug from radiochromatograms (onlyfor VCV and DL) and LC-MS spectra were plotted usingExcel (Microsoft Corporation, Red Bank, WA) to gener-ate bar graphs.
Nanoelectrospray Ionization (NSI) Source
All LC-NSI experiments were performed using an au-tomated chip-based Triversa NanoMate (Advion Bio-Sciences, Ithaca, NY) source operated by ChipSoft soft-ware operating under Windows XP. The TriversaNanoMate source provided options to perform: (1)
Table 1. Linear LC-MS gradients used in this study
VCV and DLExperiments
TolbutamideExperiments
CocaineExperiments
Time(min) %A %B
Time(min) %A %B
Time(min) %A %B
0 90 10 0 98 2 0 98 210 70 30 15 10 90 20 10 9040 30 70 15.1 98 2 20.1 98 240.1 10 90 20 98 2 25 98 250 10 9050.1 90 1060 90 10
infusion from a 96-well sample plate using a rack of
96-disposable conductive pipette tips connected to arobotic mandrill, (2) on-line fraction collection into96-well plate during LC-MS experiments, and (3)LC-MS experiments using a conductive re-usable pi-pette tip based LC coupler. All experiments describedin this paper used a silicon wafer based microchipconsisting of a 20 � 20 array of non-reusable nozzlesfabricated by proprietary etching techniques. Each noz-zle had an i.d. of 5.5 �m and the nozzle design allowedflow rates between 200 and 500 nL/min. For optimalperformance, the microchip was positioned about 4.5mm from the sampling cone of a quadrupole time-of-flight (Q-TOF Global) mass spectrometer (Waters Cor-poration, Beverly, MA). To improve the nozzle-to-nozzle reproducibility and to maintain continuousspray during an LC run, the ChipSoft software moni-tored the ion current. When the ion current fell below 20nA or went over 400 nA, the spray was automaticallyswitched over to the next nozzle.
LC-NSI-MS
All LC-NSI-MS analyses were performed using a Q-TOF Global (Waters Corporation) mass spectrometerequipped with an automated chip based Triversa Nano-Mate NSI source described above. All MS conditionsand NSI source orientations were optimized by infusingreserpine. Typical NanoMate infusion conditions aredescribed elsewhere [15]. For all LC-NSI-MS experi-ments, the Q-TOF mass spectrometer was operated asfollows: ionization mode, positive; spray voltage, 1.7 to1.9 kV; cone voltage, 45 V; source temperature, 45 °C;collision gas, 1.5 mTorr; scan range, 100 to 1100; inter-scan time, 0.1 s. Data for each sample was acquired overthe entire LC run time in the profile mode with massresolution for reserpine set at 8000 (full width at halfmaximum).
Chromatographic separations in LC-NSI-MS experi-ments were achieved using the same linear gradients,mobile phases and analytical column (4.6 mm � 250mm Luna Phenyl-Hexyl; Phenomenex, Torrance, CA)used for LC-ESI-MS. The HPLC unit consists of Shi-madzu LC-10AD vp pumps and a SIL-10AD vp au-tosampler (Shimadzu Corporation, Kyoto, Japan). Thissystem is hereafter termed the “analytical HPLC” sys-tem. For all LC-NSI-MS experiments (Figure 1), thecolumn effluent was split such that most (�85%) of theeffluent was directed into the FSA (for VCV and DLexperiments) or to waste and the remainder (�15%)diverted to the TriVersa NanoMate NSI source. Withinthe TriVersa NanoMate, the HPLC flow (�15% or 150�L/min) was further split to deliver about 200 to 500nL/min to the NanoMate chip via the LC couplingdevice and the rest to NanoMate fraction collector orwaste. All split ratios were adjusted by varying ID andlengths of PEEK tubing (all connections exterior toNanoMate) and fused silica capillary (all connectionswithin the NanoMate). Split ratios were verified by
injecting radioactive samples, collecting effluent, and
-NSI
1894 RAMANATHAN ET AL. J Am Soc Mass Spectrom 2007, 18, 1891–1899
counting aliquots using liquid scintillation spectrome-try (LSS). All LC-MS data were processed and inte-grated using the MassLynx software.
RNLC-NSI-MS
The response normalized liquid chromatography(RNLC)-NSI-MS (Figure 1) experiments utilized twoHPLC systems: an “analytical HPLC” and a “responsenormalizing (RN) HPLC”. The RN-HPLC is used todeliver mobile phase post column with a gradientprogram exactly reversed from that used for analyticalseparation [37]. A Waters Alliance HPLC system (Alli-ance Model 2690; Waters Corp., Milford, MA) was usedas the RN-HPLC. The flow rate of the RN-HPLC systemwas varied between 50 �L/min to 250 �L/min andoptimized using an equimolar mixture of TOL andOH-TOL. RN-HPLC flow was optimized at 0.15 mL/min. The presplit flow rate of the “analytical LC”system was 1.0 mL/min.
Results and Discussion
The response of different analytes under LC-MS condi-tions was investigated for both higher flow rate (�150�L/min) ESI-MS and lower flow rate (200 to 500nL/min) NSI-MS using DL, VCV, and their respective
Autosampler
AnalyticHPLC
al
Column
Guard Column
~0.1 – 0.3 mL/min~ 0.7-0.9 mL/min
1.0 mL/min
To 14C-detectoror anyother detector
Pump A: AqueousMobile Phase
Pump B: OrganicMobile Phase
Mixing Tee-1 (T-1) Mixing Tee-2 (
Nanoma
Inline Check Valve
AutosamplerAutosampler
AnalyticHPLC
al
Column
Guard Column
~0.1 – 0.3 mL/min~ 0.7-0.9 mL/min
1.0 mL/min
To 14C-detectoror anyother detector
To 14C-detectoror anyother detector
Pump A: AqueousMobile Phase
Pump B: OrganicMobile Phase
Mixing Tee-1 (T-1) Mixing Tee-2 (
Inline Check Valve
Nanoma
Figure 1. A schematic of the experimental set-nanospray ionization mass spectrometry (RNLC
metabolites. The amounts of material injected in the
four experiments reported here are provided in Table 2.The ionization efficiency in LC-NSI-MS was furtherinvestigated by reducing the variability in solvent com-position that occurs during a gradient analysis byadding a solvent mixture post-column with an exactreverse gradient to that used for analytical separation.The latter procedure is referred hereafter as RNLC-NSI-MS.
The first set of experiments involved LC-MS of urinecollected following administration of 50 mg 14C-VCV tohealthy male volunteers. A comparison of LC-MS re-sponses of VCV and its metabolites (M2/M3, M15, M35,and M41) (Figure 2) obtained using ESI and NSI asionization modes with and without RN flow along withthe corresponding radioactivity (LC-FSA) data is shownin Figure 3. All LC-MS and LC-FSA data (peak areas)are an average of three separate analyses and the
200-500 nL/minMS
~0.2 – 0.6 mL/min
To fractioncollectoror to waste
TriVersa Nanomateor any other nanoflowelectrospray ionizationsource
ESI chip wheNanomate
n using
esponseormalizing HPLCPump A: OrganicMobile Phase
Pump B: AqueousMobile Phase
Guard Column
0.1 – 0.3 mL/min
Make-up flow arrangementfor normalization of
trosprays spectrometry
responses
nanoflow elecionization mas
lkhead
200-500 nL/minMSMS
~0.2 – 0.6 mL/min
To fractioncollectoror to waste
To fractioncollectoror to waste
TriVersa Nanomateor any other nanoflowelectrospray ionizationsource
ESI chip wheNanomate
n using
esponseormalizing HPLCPump A: OrganicMobile Phase
Pump B: AqueousMobile Phase
Guard Column
0.1 – 0.3 mL/min
Make-up flow arrangementfor normalization of
trosprays spectrometry
responses
nanoflow elecionization mas
lkhead
r response normalized liquid chromatography-MS).
Table 2. The amounts of material injected
SampleVolumeinjected
Amount oncolumn
Tolbutamide andhydroxytolbutamide
25 �L 125 �g each
Cocaine andbenzoylecgonine
25 �L 125 �g each
14C-VCV derived radioactivity 150 �L 1.9 �g total14
RN
~
T-2)
te Bu
RN
~
T-2)
te Bu
up fo
C-DL derived radioactivity 50 �L 1.6 �g total

aboli
1895J Am Soc Mass Spectrom 2007, 18, 1891–1899 RESPONSE NORMALIZED MASS SPECTROMETRY
responses were normalized to the major radioactivepeak. M35 or VCV-O-desmethyl-glucuronide was themajor human urinary metabolite and therefore MSresponses of all other drug-derived analytes were nor-malized to this compound to facilitate a comparison.LC-FSA detection is nondiscriminating with respect to
Figure 3. Comparison of LC-MS responses obNSI-MS, and radioactivity detection for vicriviroto the major metabolite (M35)]
F
FF
O
CH3
N
F
FF
OH
F
FF
O
C
O
OHOH
OH
O
N N
N
CH3CH3
O
CH3
N
N
F
FF
CH3
O
OH
Vicriviro(SCH 41
M15 (O-desmeth
M35 (O-desmethyl-vicriviroc-glucuronide)
M2/M3 (Vi
(m
(m/z 696)
Figure 2. Structures of Vicriviroc and its met
molecular weight, chemical structure and is relatively
immune to most matrix effects. As demonstrated inFigure 3, the LC-ESI-MS detector signal differed muchmore widely for VCV and its metabolites in comparisonto those obtained using a radioactivity detector (FSA).Had this study been conducted using non-radiolabeleddrug and only the LC-ESI-MS response used (without
d using conventional flow LC-ESI-MS, RNLC-its metabolites. [All responses were normalized
N N
N
CH3CH3
O
CH3
N N
N
CH3C3
O
H3
N N
N
CH3CH3
O
CH3
N
NH
CH3
N+
ON
N
CH3CH3
O
CH3
N
3
)
M41 (N-desalkyl-vicriviroc, SCH 496903)
iroc, SCH 495415)
-N-oxide, SCH 643188)
)
/z 550)
(m/z 332)
tes that were evaluated using NRLC-NSI-MS.
tainec and
N
N
CH3
H
C
N
CH3
N
H3
CH
c7690
yl-vicriv
criviroc
/z 520
(m
deriving concentrations from a calibration curve) to esti-

1896 RAMANATHAN ET AL. J Am Soc Mass Spectrom 2007, 18, 1891–1899
mate relative amounts of metabolites in human urine,unchanged drug (VCV) would have been grossly overes-timated (identified as the major urinary drug-related ma-terial). Similarly, the relative amounts of all metaboliteswould have been underestimated. With M35 the majormetabolite underestimated by a factor of six.
The MS response obtained in the LC-NSI-MS for thesame urine sample shows a marked contrast to thosedata obtained using LC-ESI-MS (Figure 3). Without anyRN flow in LC-NSI-MS, M35 is the most abundantdrug-related material as shown by radioactivity traces.The responses for M41, M2/M3, and VCV decreasedrelative to M35, although, M2/M3 and VCV would stillhave been overestimated by a factor of 2 to 3. Thedifferences in the NSI-MS response of various com-pounds in LC-NSI-MS were further reduced whenresponse normalizing (RN) flow was added. The LC-NSI-MS responses of VCV and metabolites with RNflow rates of 0.15 and 0.2 mL/min are comparable to
N
Cl
NH
([M + H]+ @ m/z 311)
Desloratadine (DL, Clarinex)
N
Cl
NH
OH
N
Cl
NH
OH
O
OHOH
OH
OH
O
O
N
Cl
NH
O
OHOH
OH
OH
O
O
N
Cl
NH
([M + H]+ @ m/z 327)
M33 (5-OH-DL, SCH 39091)([M + H]+ @ m/z 327)
M31 (6-OH-DL, SCH 39090)
([M + H]+ @ m/z 503)
M7 (5-OH-DL-glucuronide)
([M + H]+ @ m/z 503)
M9 (6-OH-DL-glucuronide)
Figure 4. Structures of desloratadine and its metabolites thatwere evaluated using NRLC-NSI-MS.
Table 3. Comparison of peak area normalized data for conventiand its metabolites
Drug/metabolites(mass-to-charge ratio) Radioactivity
WithounormaliziHPLC flo
DL (m/z 311) 2.63 61.5M31&M33 (m/z 327) 37.0 378M9 (m/z 503) 100 100
M7 (m/z 503) 38.2 23.9those obtained on an LC-FSA system. Additional exper-iments employing 0.16 and 0.18 mL/min RN flow ratesdid not bring the LC-NSI-MS responses any closer tothe radioactivity data. Therefore, the RN flow rate wasclose to optimal at about 0.15 mL/min. This could bepotentially due to the similarity between the RN flowand the flow reaching the NSI source as described in theexperimental section, resulting in an isocratic finalsolvent composition (50:50 � aqueous:organic) reach-ing the NSI source throughout the LC run in thisRNLC-NSI-MS experiment.
While LC-FSA responses showed that M15 was atabout 25% of M35, RN normalized LC-NSI-MS responsesshowed M15 to be about 15% of M35. This discrepancywas carefully evaluated and later attributed to a metabo-lite at an m/z 494 co-eluting with M15. The contribution ofthis metabolite was inseparable in the radioactivity peakbut did not contribute to the NSI response of M15.
The second set of experiments involved pooled (n � 3)0 to 24 h urine collected following oral administration of8 mg 14C-DL/kg to male monkeys (Figure 4). In additionto obtaining radiochromatograms using LC-FSA, LC-MSanalysis was performed in four different modes: LC-ESI-MS, RNLC-ESI-MS, LC-NSI-MS, and RNLC-NSI-MS. Thedata from these four experiments and from LC-FSA areprovided in Table 3. A comparison of the responses of DLand its metabolites in five different detection/analysismodes showed that under conventional flow LC-ESI-MSconditions, the levels of DL and M31/M33 are overesti-mated by about twenty and ten times, respectively whencompared to the radioactivity responses. The responses inLC-NSI-MS without RN normalization are much closer tothe data obtained using LC-FSA (Table 3). The addition ofthe RN flow brought down the response of DL closer tothe radioactivity value, however, the responses for M31/M33 were reduced. In LC-NSI-MS with and without RNflow, the response for M7 was underestimated. This wasagain attributed to two other co-eluting metabolites con-tributing to LC-FSA integrated peak area for M7. Becauseof the m/z difference, these metabolites did not contributeto the XIC peak area for M7. It should be noted that theRN flow addition had no effect on the MS response of DLand metabolites in the conventional flow LC-ESI-MS.
As a further demonstration of the potential forresponse normalization in LC-NSI-MS, the NSI-MS re-sponses of equimolar mixtures (20 �M each, 25 �L
flow LC-ESI-MS and nano flow LC-ESI-MS for desloratadine
-ESI-MS LC-NSI-MS
0.15 mL/minnormalizingHPLC flow
WithoutnormalizingHPLC flow
0.15 mL/minnormalizingHPLC flow
50.8 5.0 2.52371.2 33.1 26.6100 100.0 100
onal
LC
tngw
23.4 13.4 14.8
ng (R
1897J Am Soc Mass Spectrom 2007, 18, 1891–1899 RESPONSE NORMALIZED MASS SPECTROMETRY
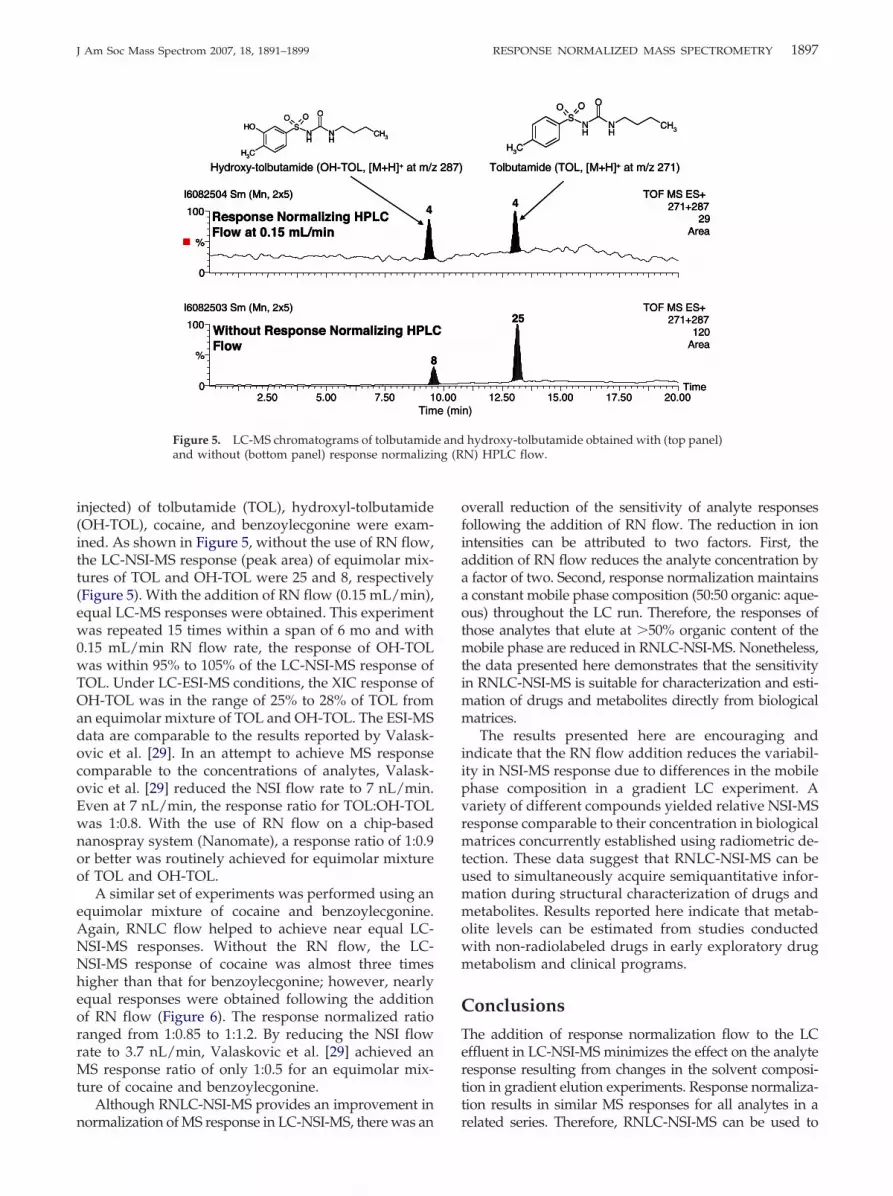
injected) of tolbutamide (TOL), hydroxyl-tolbutamide(OH-TOL), cocaine, and benzoylecgonine were exam-ined. As shown in Figure 5, without the use of RN flow,the LC-NSI-MS response (peak area) of equimolar mix-tures of TOL and OH-TOL were 25 and 8, respectively(Figure 5). With the addition of RN flow (0.15 mL/min),equal LC-MS responses were obtained. This experimentwas repeated 15 times within a span of 6 mo and with0.15 mL/min RN flow rate, the response of OH-TOLwas within 95% to 105% of the LC-NSI-MS response ofTOL. Under LC-ESI-MS conditions, the XIC response ofOH-TOL was in the range of 25% to 28% of TOL froman equimolar mixture of TOL and OH-TOL. The ESI-MSdata are comparable to the results reported by Valask-ovic et al. [29]. In an attempt to achieve MS responsecomparable to the concentrations of analytes, Valask-ovic et al. [29] reduced the NSI flow rate to 7 nL/min.Even at 7 nL/min, the response ratio for TOL:OH-TOLwas 1:0.8. With the use of RN flow on a chip-basednanospray system (Nanomate), a response ratio of 1:0.9or better was routinely achieved for equimolar mixtureof TOL and OH-TOL.
A similar set of experiments was performed using anequimolar mixture of cocaine and benzoylecgonine.Again, RNLC flow helped to achieve near equal LC-NSI-MS responses. Without the RN flow, the LC-NSI-MS response of cocaine was almost three timeshigher than that for benzoylecgonine; however, nearlyequal responses were obtained following the additionof RN flow (Figure 6). The response normalized ratioranged from 1:0.85 to 1:1.2. By reducing the NSI flowrate to 3.7 nL/min, Valaskovic et al. [29] achieved anMS response ratio of only 1:0.5 for an equimolar mix-ture of cocaine and benzoylecgonine.
Although RNLC-NSI-MS provides an improvement in
2.50 5.00 7.50 10
100
%
0
100
%
I6082504 Sm (Mn, 2x5)
4
I6082503 Sm (Mn, 2x5)
8
CH3
SNH
NH
CH3
OOOOH
Hydroxy-tolbutamide (OH-TOL, [M+H]+ at m/z
Response Normalizing HPLC Flow at 0.15 mL/min
Without Response Normalizing HPLCFlow
Tim2.50 5.00 7.50 1
0
100
%
0
100
%
I6082504 Sm (Mn, 2x5)
4
I6082503 Sm (Mn, 2x5)
8
CH3
SNH
NH
CH3
OOOOH
Hydroxy-tolbutamide (OH-TOL, [M+H]+ at m/z
Response Normalizing HPLC Flow at 0.15 mL/min
Without Response Normalizing HPLCFlow
2.50 5.00 7.50 10
100
%
0
100
%
I6082504 Sm (Mn, 2x5)
0
100
%
I6082504 Sm (Mn, 2x5)
4
I6082503 Sm (Mn, 2x5)
8
CH3
SNH
NH
CH3
OOOOH
Hydroxy-tolbutamide (OH-TOL, [M+H]+ at m/z
Response Normalizing HPLC Flow at 0.15 mL/min
Without Response Normalizing HPLCFlow
Tim
Figure 5. LC-MS chromatograms of tolbutamidand without (bottom panel) response normalizi
normalization of MS response in LC-NSI-MS, there was an
overall reduction of the sensitivity of analyte responsesfollowing the addition of RN flow. The reduction in ionintensities can be attributed to two factors. First, theaddition of RN flow reduces the analyte concentration bya factor of two. Second, response normalization maintainsa constant mobile phase composition (50:50 organic: aque-ous) throughout the LC run. Therefore, the responses ofthose analytes that elute at �50% organic content of themobile phase are reduced in RNLC-NSI-MS. Nonetheless,the data presented here demonstrates that the sensitivityin RNLC-NSI-MS is suitable for characterization and esti-mation of drugs and metabolites directly from biologicalmatrices.
The results presented here are encouraging andindicate that the RN flow addition reduces the variabil-ity in NSI-MS response due to differences in the mobilephase composition in a gradient LC experiment. Avariety of different compounds yielded relative NSI-MSresponse comparable to their concentration in biologicalmatrices concurrently established using radiometric de-tection. These data suggest that RNLC-NSI-MS can beused to simultaneously acquire semiquantitative infor-mation during structural characterization of drugs andmetabolites. Results reported here indicate that metab-olite levels can be estimated from studies conductedwith non-radiolabeled drugs in early exploratory drugmetabolism and clinical programs.
Conclusions
The addition of response normalization flow to the LCeffluent in LC-NSI-MS minimizes the effect on the analyteresponse resulting from changes in the solvent composi-tion in gradient elution experiments. Response normaliza-tion results in similar MS responses for all analytes in a
12.50 15.00 17.50 20.00Time
TOF MS ES+271+287
29Area
4
TOF MS ES+271+287
120Area
25
CH3
SNH
NH
CH3
OOO
Tolbutamide (TOL, [M+H]+ at m/z 271)
n)12.50 15.00 17.50 20.00
Time
TOF MS ES+271+287
29Area
4
TOF MS ES+271+287
120Area
25
CH3
SNH
NH
CH3
OOO
Tolbutamide (TOL, [M+H]+ at m/z 271)
12.50 15.00 17.50 20.00Time
TOF MS ES+271+287
29Area
TOF MS ES+271+287
29Area
4
TOF MS ES+271+287
120Area
25
CH3
SNH
NH
CH3
OOO
Tolbutamide (TOL, [M+H]+ at m/z 271)
n)
hydroxy-tolbutamide obtained with (top panel)N) HPLC flow.
0.00
287)
e (mi0.00
287)
0.00
287)
e (mi
e and
related series. Therefore, RNLC-NSI-MS can be used to

N) H
1898 RAMANATHAN ET AL. J Am Soc Mass Spectrom 2007, 18, 1891–1899
improve quantitative estimates for metabolite levels inexploratory and early clinical drug metabolism studieswhen radiolabeled drugs are typically not available orwhen impractical to administer to humans. Other appli-cations may include determination of impurity levels indrug substance/products from manufacturing processesand reaction byproducts during chemical synthesis.
AcknowledgmentsThe authors thank Dr. Jack Henion and Dr. Gary Schultz (AdvionBioSciences Inc., Ithaca, NY) for many helpful discussions. Theauthors also thank Mr. Kenneth Eriksen (Waters Corporation,Milford, MA) for all the help with the Q-TOF mass spectrometer.
References1. Jemal, M.; Ouyang, Z.; Powell, M. L. A Strategy for a Post-Method-
Validation Use of Incurred Biological Samples for Establishing the Accept-ability of a Liquid Chromatography/Tandem Mass-Spectrometric Methodfor Quantitation of Drugs in Biological Samples. Rapid Commun. MassSpectrom. 2002, 16, 1538–1547.
2. Jemal, M. High-Throughput Quantitative Bioanalysis by LC/MS/MS.Biomed. Chromatogr. 2000, 14,(6), 422–429.
3. Onorato, J. M.; Henion, J. D.; Lefebvre, P. M.; Kiplinger, J. P. SelectedReaction Monitoring LC-MS Determination of Idoxifene and Its Pyrro-lidinone Metabolite in Human Plasma Using Robotic High-Throughput,Sequential Sample Injection. Anal. Chem. 2001, 73(1), 119–125.
4. Poquette, M. A.; Lensmeyer, G. L.; Doran, T. C. Effective Use of LiquidChromatography-Mass Spectrometry (LC/MS) in the Routine ClinicalLaboratory for Monitoring Sirolimus, Tacrolimus, and Cyclosporine.Ther. Drug Monit. 2005, 27(2), 144–150.
5. Srinivas, N. R. Applicability of Bioanalysis of Multiple Analytes in DrugDiscovery and Development: Review of Select Case Studies IncludingAssay Development Considerations. Biomed. Chromatogr. 2006, 20(5),383–414.
6. Vengurlekar, S. S.; Heitkamp, J.; McCush, F.; Velagaleti, P. R.; Brisson,
Response NormalizingHPLC Flow at 0.15 mL/min
Without ResponseNormalizing HPLCFlow
2.00 4.00 6.00 8.00 10.00 12
Tim
0
100
%
I7011813 Sm (SG, 2x5)
616
0
100
%
I7011819 Sm (SG, 2x5)450
O
O
NCH3
OOH
Benzoylecgonine (O-desmethyl-Cocaine)([M + H]+ @ m/z 290)
Response NormalizingHPLC Flow at 0.15 mL/min
Without ResponseNormalizing HPLCFlow
2.00 4.00 6.00 8.00 10.00 12
Tim
0
100
%
I7011813 Sm (SG, 2x5)
616
0
100
%
I7011819 Sm (SG, 2x5)450
O
O
NCH3
OOH
Benzoylecgonine (O-desmethyl-Cocaine)([M + H]+ @ m/z 290)
Figure 6. LC-MS chromatograms of cocaine awithout (bottom panel) response normalizing (R
J. H.; Bramer, S. L. A Sensitive LC-MS/MS Assay for the Determinationof Dextromethorphan and Metabolites in Human Urine—Application
for Drug Interaction Studies Assessing Potential CYP3A and CYP2D6Inhibition. J. Pharm. Biomed. Anal. 2002, 30(1), 113–124.
7. Chowdhury, S. K. Early Assessment of Human Metabolism: Why, How,Challenges, and Opportunities. Proceedings of the ASMS Conference onMass Spectrometry and Allied Topics; Indianapolis, IN, June, 2007.
8. Wilm, M.; Mann, M. Analytical Properties of the Nanoelectrospray IonSource. Anal. Chem. 1996, 68(1), 1–8.
9. Gatlin, C. L.; Eng, J. K.; Cross, S. T.; Detter, J. C.; Yates, I. J. R. AutomatedIdentification of Amino Acid Sequence Variations in Proteins byHPLC/Microspray Tandem Mass Spectrometry. Anal. Chem. 2000, 72(4),757–763.
10. Figeys, D.; Aebersold, R. Nanoflow Solvent Gradient Delivery from aMicrofabricated Device for Protein Identifications by Electrospray Ion-ization Mass Spectrometry. Anal. Chem. 1998, 70(18), 3721–3727.
11. Figeys, D.; Ning, Y.; Aebersold, R. A. Microfabricated Device for RapidProtein Identification by Microelectrospray Ion Trap Mass Spectrome-try. Anal. Chem. 1997, 69(16), 3153–3160.
12. Zhang, S.; Van Pelt, C. K.; Henion, J. D. Automated Chip-BasedNanoelectrospray-Mass Spectrometry for Rapid Identification of Pro-teins Separated by Two-Dimensional Gel Electrophoresis. Electrophore-sis. 2003, 24(21), 3620–3632.
13. Henion, J.; Pace, E.; Howe, K.; Zhang, S.; Van Pelt, C. Chip-basedelectrospray mass spectrometry applied to large and small molecules.Abstracts, 35th Central Regional Meeting of the American Chemical Society;Pittsburgh, PA, October, 2003, p 9.
14. Borts, D. J.; Cooks, S. T.; Bowers, G. D.; O’Mare, M. J.; Quinn, K. E. Useof Automated Nanoelectrospray for Drug Metabolite Structure Eluci-dation. Proceedings of the ASMS Conference on Mass Spectrometry andAllied Topics; Nashville, TN, May, 2004.
15. Balimane, P. V.; Pace, E.; Chong, S.; Zhu, M.; Jemal, M.; Van Pelt,C. K. A. Novel High-Throughput Automated Chip-Based Nanoelectro-spray Tandem Mass Spectrometric Method for PAMPA Sample Anal-ysis. J. Pharm. Biomed. Anal. 2005, 39(1/2), 8–16.
16. Dethy, J. M.; Ackermann, B. L.; Delatour, C.; Henion, J. D.; Schultz, G. A.Demonstration of Direct Bioanalysis of Drugs in Plasma Using Nano-electrospray Infusion from a Silicon Chip Coupled with Tandem MassSpectrometry. Anal. Chem. 2003, 75(4), 805–811.
17. Van Pelt, C. K.; Zhang, S.; Fung, E.; Chu, I.; Liu, T.; Li, C.; Korfmacher,W. A.; Henion, J. A Fully Automated Nanoelectrospray Tandem MassSpectrometric Method for Analysis of Caco-2 Samples. Rapid Commun.Mass Spectrom. 2003, 17(14), 1573–1578.
18. Zhang, S.; Van Pelt, C. K.; Wilson, D. B. Quantitative Determination ofNoncovalent Binding Interactions Using Automated NanoelectrosprayMass Spectrometry. Anal. Chem. 2003, 75(13), 3010–3018.
19. Froesch, M.; Bindila, L. M.; Baykut, G.; Allen, M.; Peter-Katalinic, J.;
14.00 16.00 18.00 20.00 22.00 24.00
in)
TOF MS ES+
290+304
4.26e3
Area
2017
TOF MS ES+
290+304
3.28e3
Area477
O
O
NCH3
OO
CH3
Cocaine
([M + H]+ @ m/z 304)
RNLC-NSI-MS
LC-NSI-MS
14.00 16.00 18.00 20.00 22.00 24.00
in)
TOF MS ES+
290+304
4.26e3
Area
2017
TOF MS ES+
290+304
3.28e3
Area477
O
O
NCH3
OO
CH3
Cocaine
([M + H]+ @ m/z 304)
RNLC-NSI-MS
LC-NSI-MS
enzoylecgonine obtained with (top panel) andPLC flow.
.00
e (m.00
e (m
nd b
Zamfir, A. D. Coupling of Fully Automated Chip Electrospray toFourier Transform Ion Cyclotron Resonance Mass Spectrometry for

1899J Am Soc Mass Spectrom 2007, 18, 1891–1899 RESPONSE NORMALIZED MASS SPECTROMETRY
High-Performance Glycoscreening and Sequencing. Rapid Commun.Mass Spectrom. 2004, 18(24), 3084–3092.
20. Zamfir, A.; Vakhrushev, S.; Sterling, A.; Niebel, H. J.; Allen, M.;Peter-Katalinic, J. Fully Automated Chip-Based Mass Sspectrometry forComplex Carbohydrate System Analysis. Anal. Chem. 2004, 76(7), 2046–2054.
21. Zhang, L.; Laycock, J. D.; Miller, K. J. Quantitative Small MoleculeBioanalysis Using Chip-Based NanoESI-MS/MS. JALA. 2004, 9(3), 109–114.
22. Ackermann, B. L.; Dethy, J.-M. Understanding the Role and Potential ofInfusion Nanoelectrospray Ionization for Pharmaceutical Bioanalysis.In Using Mass Spectrometry for Drug Metabolism Studies, KorfmacherW., ed, CRC Press, Boca Raton, FL, 2005, pp. 329–356.
23. Corkery, L. J.; Pang, H.; Schneider, B. B.; Covey, T. R.; Siu, K. W. M.Automated Nanospray Using Chip-Based Emitters for the QuantitativeAnalysis of Pharmaceutical Compounds. J. Am. Soc. Mass Spectrom.2005, 16(5), 798.
24. Yu, L. J.; Chen, Y.; DeNinno, M. P.; O’Connell, T. N.; Hop, C. E. C. A.Identification of a Novel Glutathione Adduct of Diclofenac, 4=-Hy-droxy-2=-Glutathione-Deschlorodiclofenac Upon Incubation with Hu-man Liver Microsomes. Drug Metab. Dispos. 2005, 33(4), 484–488.
25. Corso, T. N.; Li, J.; Van Pelt, C. K. Ultra-low Volume Fraction Analysisby Chip-based Nanoelectrospray for Increased Peptide Coverage. Ab-stracts, 35th Northeast Regional Meeting of the American Chemical Society;Binghamton, NY, October 2006, NRM-474.
26. Tomkins, B. A.; Van Berkel, G. J.; Jenkins, R. A.; Counts, R. W. Quantitationof Cotinine in Nonsmoker Saliva Using Chip-Based NanoelectrosprayTandem Mass Spectrometry. J. Anal. Toxicol. 2006, 30(3), 178–186.
27. Wickremsinhe, E. R.; Ackermann, B. L.; Chaudhary, A. K. ValidatingRegulatory-Compliant Wide Dynamic Range Bioanalytical Assays Us-ing Chip-Based Nanoelectrospray Tandem Mass Spectrometry. RapidCommun. Mass Spectrom. 2005, 19(1), 47–56.
28. Wickremsinhe, E. R.; Singh, G.; Ackermann, B. L.; Gillespie, T. A.;Chaudhary, A. K. A Review of Nanoelectrospray Ionization Applica-tions for Drug Metabolism and Pharmacokinetics. Curr. Drug Metab.2006, 7(8), 913–928.
29. Valaskovic, G. A.; Utley, L.; Lee, M. S.; Wu, J. T. Ultra-Low FlowNanospray for the Normalization of Conventional Liquid Chromatog-raphy/Mass Spectrometry Through Equimolar Response: StandardFree Quantitative Estimation of Metabolite Levels in Drug Discovery.Rapid Commun. Mass Spectrom. 2006, 20(7), 1087–96.
30. Valaskovic, G. A.; Murphy, J. P., III; Lee, M. S. Automated OrthogonalControl System for Electrospray Ionization. J. Am. Soc. Mass Spectrom.2004, 15(8), 1201–15.
31. Schultz, G. A.; Corso, T. N.; Prosser, S. J.; Zhang, S. A Fully IntegratedMonolithic Microchip Electrospray Device for Mass Spectrometry. Anal.Chem. 2000, 72(17), 4058–4063.
32. Corso, T. N.; Van Pelt, C. K.; Zhang, S.; Prosser, S. J.; Schultz, G. A.Integrated Microchip-Based Nanoelectrospray Device for High-
Throughput Mass Spectrometry. Proceedings of SPIE-The InternationalSociety for Optical Engineering; New York, May 2001, p. 4265. (BiomedicalInstrumentation based on Micro- and Nanotechnology), pp. 81–90.
33. Henion, J. Chip-Based Automated Nanoelectrospray LC/MS for theEfficient Qualitative and Quantitative Determination of Metabolites andBiomarkers. Abstracts, 38th Middle Atlantic Regional Meeting of the Amer-ican Chemical Society; Hershey, PA, June, 2006; p. MRM-269.
34. Alfazema, L. N.; Richards, D. S.; Gelebart, S.; Mitchell, J. C.; Snowden,M. J. Rapid, Accurate, and Precise Quantitative Drug Analysis: Com-paring Liquid Chromatography Tandem Mass Spectrometry and Chip-Based Nanoelectrospray Ionization Mass Spectrometry. Eur. J. MassSpectrom. 2005, 11(4), 393–402.
35. Schmidt, A.; Karas, M.; Dulcks, T. Effect of Different Solution FlowRates on Analyte Ion Signals in Nano-ESI MS, or: When Does ESI TurnInto Nano-ESI? J. Am. Soc. Mass Spectrom. 2003, 14(5), 492–500.
36. Hop, C. E.; Chen, Y.; Yu, L. J. Uniformity of Ionization Response ofStructurally Diverse Analytes Using a Chip-Based NanoelectrosprayIonization Source. Rapid Commun. Mass Spectrom. 2005, 19(21), 3139–42.
37. Gorecki, T.; Lynen, F.; Szucs, R.; Sandra, P. Universal Response inLiquid Chromatography Using Charged Aerosol Detection. Anal. Chem.2006, 78(9), 3186–3192.
38. Ramanathan, R.; Zhong, R.; Alvarez, N.; Kennedy, C.; Grotz, D.; Rindgen,D.; Cox, K.; Chowdhury, S.; Wirth, M.; Alton, K. Comparative Metabolismand Excretion of a Novel CCR5 Receptor Antagonist, SCH 417690 (Vicri-viroc), in Human, Monkey, and Rat. Drug Metab. Rev. 2005, 37(4), 725–726.
39. Ramanathan, R.; Ghosal, A.; Miller, M. W.; Chowdhury, S. K.; Alton,K. B. Piperazine Derivatives and Their Preparation, PharmaceuticalCompositions, and Use as CCR5 Antagonists for Treatment of HumanImmunodeficiency Virus or Inflammatory Diseases. US Patent Appli-cation 2006105964, May, 2006.
40. Marozsan, A. J.; Kuhmann, S. E.; Morgan, T.; Herrera, C.; Rivera-Troche,E.; Xu, S.; Baroudy, B. M.; Strizki, J.; Moore, J. P. Generation andProperties of a Human Immunodeficiency Virus Type 1 Isolate Resis-tant to the Small Molecule CCR5 Inhibitor, SCH-417690 (SCH-D).Virology. 2005, 338(1), 182–199.
41. Strizki, J. M.; Tremblay, C.; Xu, S.; Wojcik, L.; Wagner, N.; Gonsiorek,W.; Hipkin, R. W.; Chou, C.-C.; Pugliese-Sivo, C.; Xiao, Y.; Tagat, J. R.;Cox, K.; Priestley, T.; Sorota, S.; Huang, W.; Hirsch, M.; Reyes, G. R.;Baroudy, B. M. Discovery and Characterization of vicriviroc (SCH417690), a CCR5 Antagonist with Potent Activity Against HumanImmunodeficiency Virus Type 1. Antimicrob. Agents Chemother. 2005,49(12), 4911–4919.
42. Ramanathan, R.; Su, A. D.; Alvarez, N.; Feng, W.; Chowdhury, S. K.;Stauber, K.; Reyderman, L.; Alton, K. B.; Wirth, M.; Patrick, J. E.Metabolism and Excretion of Desloratadine (Clarinex) in Mice, Rats,Monkeys, and Humans. Drug Metab. Rev. 2006, 38(4), 725–726.
43. Ramanathan, R.; Alvarez, N.; Su, A. D.; Chowdhury, S.; Alton, K.;
Stauber, K.; Patrick, J. Metabolism and Excretion of Loratadine in Maleand Female Mice, Rats, and Monkeys. Xenobiotica. 2005, 35(2), 155–189.