structural engineering design of rc structure using staad
TRANSCRIPT

November 2009
PROJECT REPORT
Structural Design Report for the Powerhouse Building
at Sondu Miriu Hydropower Station
2
CERTIFICATION
I, the undersigned certify that I have read and hereby recommends for acceptance by the Engineers
Registration Board the report entitled: “Structural Design Report for the Powerhouse building”, as
original and true works of the applicant, Mr. Stephen M.Wasike, in partial fulfillment of the
requirements for registration by the Engineers Registration Board of Kenya.
_________________________________ ____________
Eng. K.Tireito Date
0BSupervisor
3
1 2
3'
3 4
5'
5 6 7
C
D
B
A
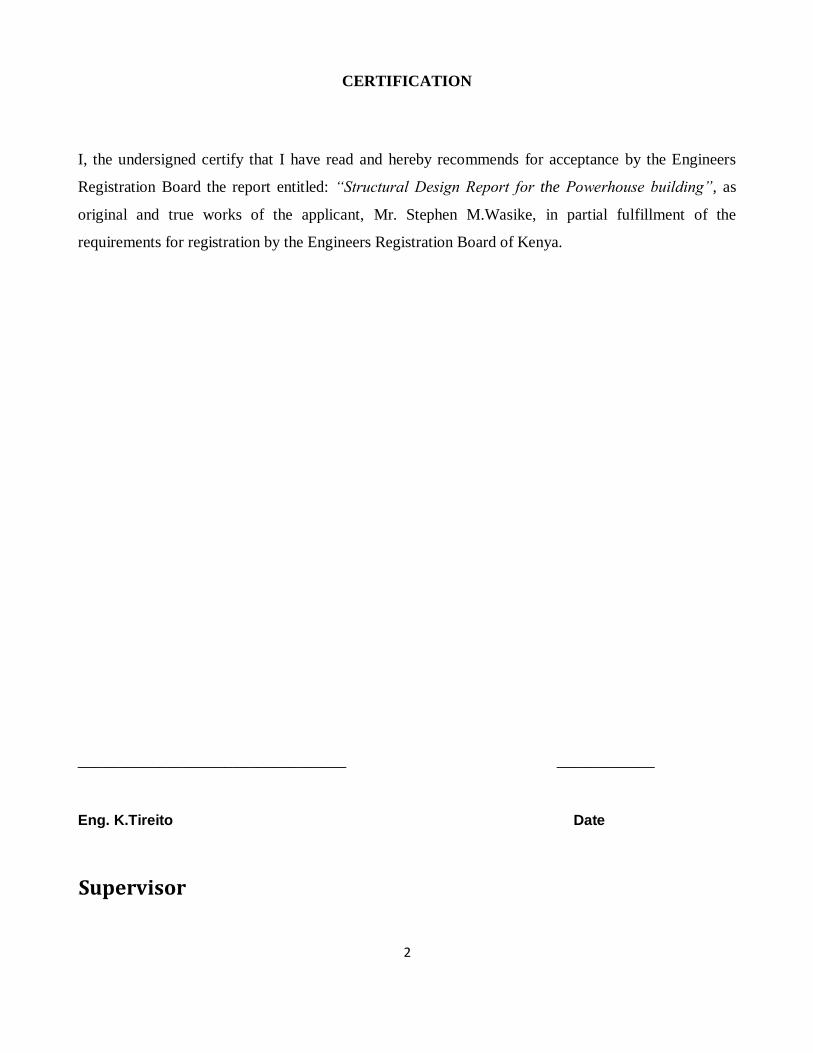
FRAMING PLAN EL. 1,215.3
4
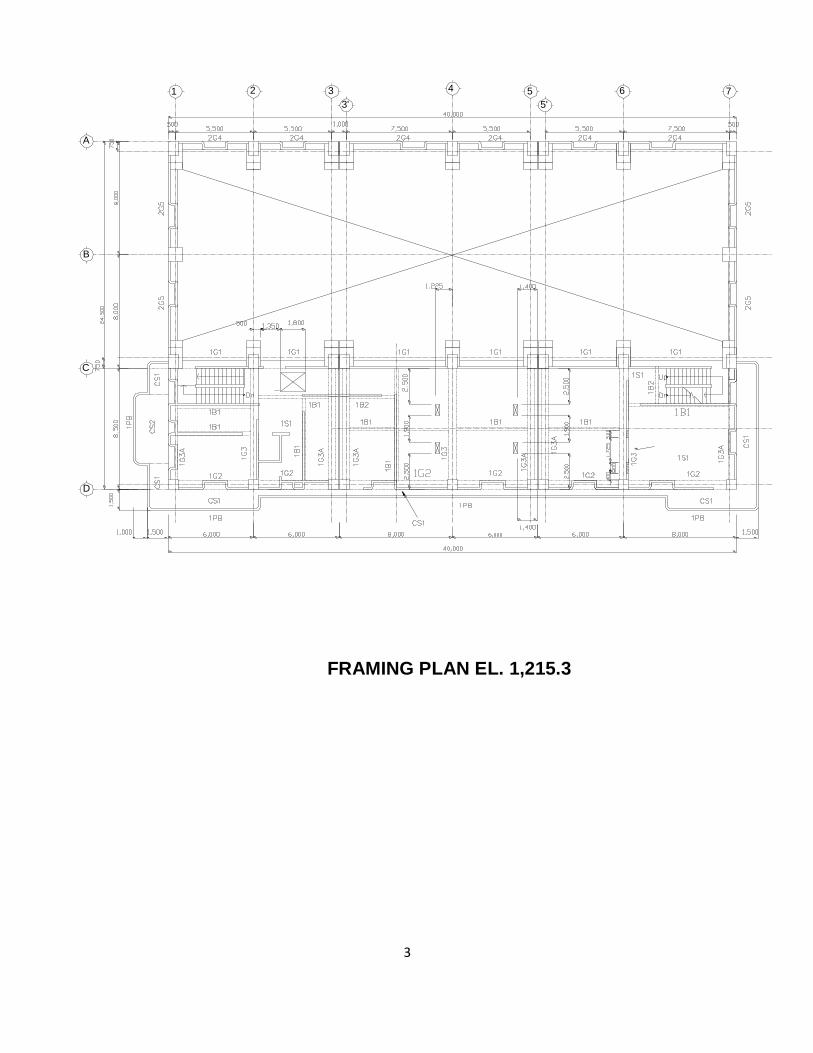
FRAMING PLAN EL. 1,210.5
D
A
1 22 43
3'
65
5'
7
5
2 4 76
5'
5
3'
321
A
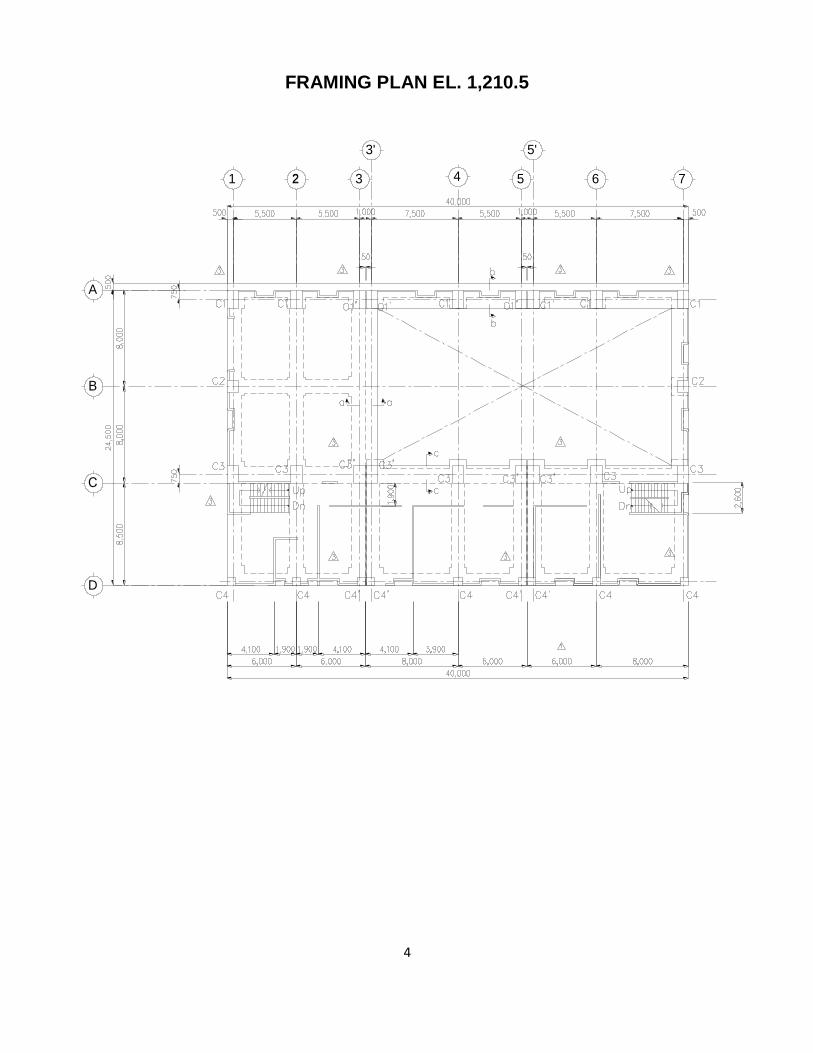
FRAMING PLAN EL. 1,220.8 ~ 1,221.0
6
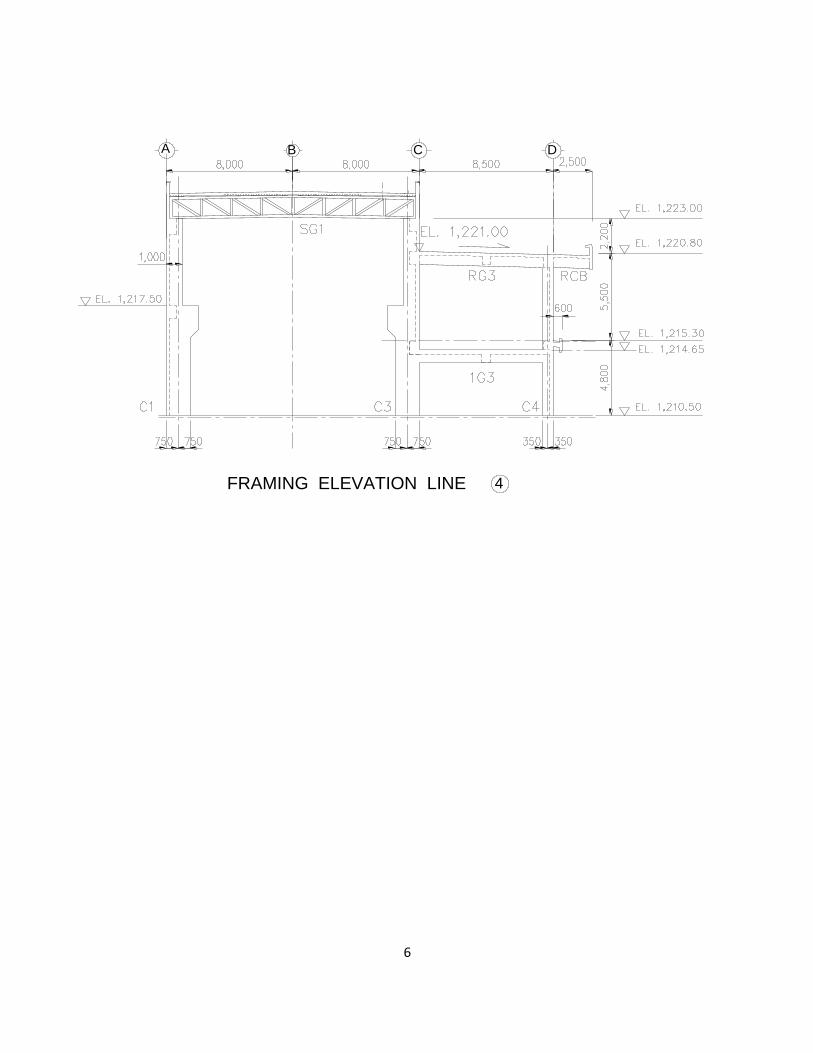
FRAMING ELEVATION LINE 4
A B C D

7
1 5
5'
62 3
3'
4 7
ROOF STEEL TRUSS FRAMING PLAN
A
C
8
BS 8110
REF. CALCULATIONS OUTPUT
2.4.1
BS 8110 Clause 2.4
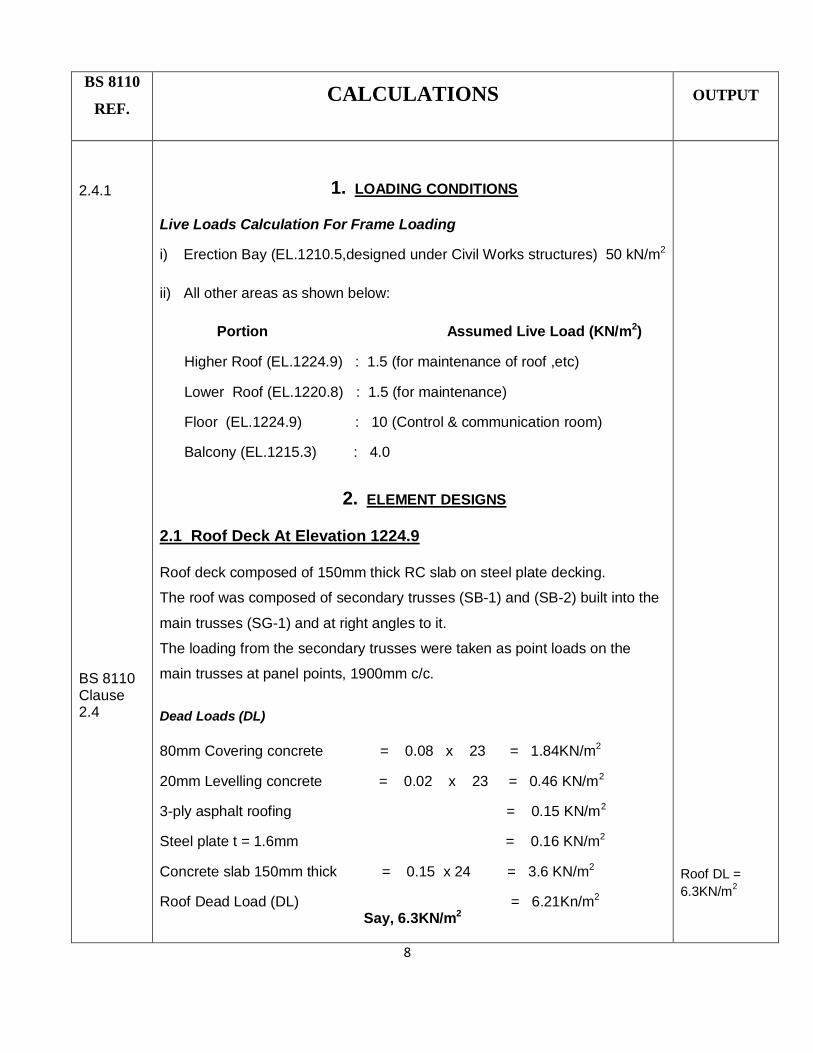
1. LOADING CONDITIONS
Live Loads Calculation For Frame Loading
i) Erection Bay (EL.1210.5,designed under Civil Works structures) 50 kN/m2
ii) All other areas as shown below:
Portion Assumed Live Load (KN/m2)
Higher Roof (EL.1224.9) : 1.5 (for maintenance of roof ,etc)
Lower Roof (EL.1220.8) : 1.5 (for maintenance)
Floor (EL.1224.9) : 10 (Control & communication room)
Balcony (EL.1215.3) : 4.0
2. ELEMENT DESIGNS
2.1 Roof Deck At Elevation 1224.9
Roof deck composed of 150mm thick RC slab on steel plate decking.
The roof was composed of secondary trusses (SB-1) and (SB-2) built into the
main trusses (SG-1) and at right angles to it.
The loading from the secondary trusses were taken as point loads on the
main trusses at panel points, 1900mm c/c.
Dead Loads (DL)
80mm Covering concrete = 0.08 x 23 = 1.84KN/m2
20mm Levelling concrete = 0.02 x 23 = 0.46 KN/m2
3-ply asphalt roofing = 0.15 KN/m2
Steel plate t = 1.6mm = 0.16 KN/m2
Concrete slab 150mm thick = 0.15 x 24 = 3.6 KN/m2
Roof Dead Load (DL) = 6.21Kn/m2 Say, 6.3KN/m2
Roof DL =
6.3KN/m2
9
BS 8110
REF.
CALCULATIONS
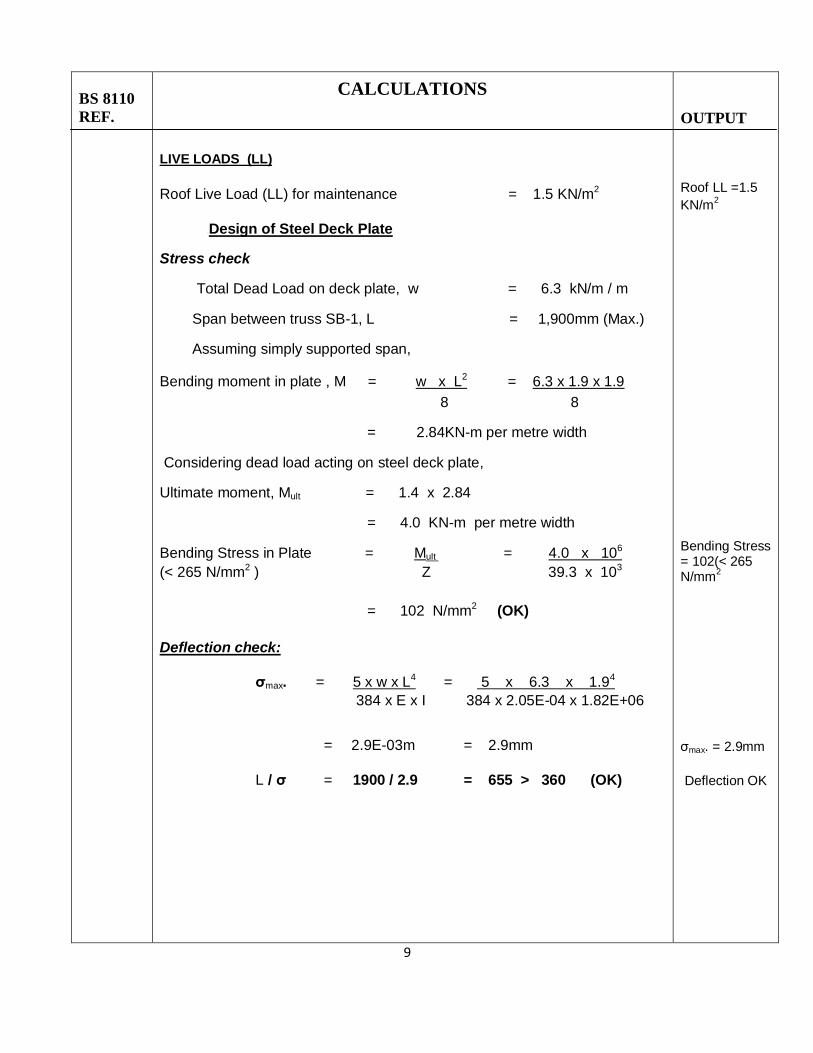
LIVE LOADS (LL)
Roof Live Load (LL) for maintenance = 1.5 KN/m2
11BDesign of Steel Deck Plate
Stress check
Total Dead Load on deck plate, w = 6.3 kN/m / m
Span between truss SB-1, L = 1,900mm (Max.)
Assuming simply supported span,
Bending moment in plate , M = w x L2 = 6.3 x 1.9 x 1.9
8 8
= 2.84KN-m per metre width
Considering dead load acting on steel deck plate,
Ultimate moment, Mult = 1.4 x 2.84
= 4.0 KN-m per metre width
Bending Stress in Plate = Mult = 4.0 x 10⁶
(< 265 N/mm2 ) Z 39.3 x 103
= 102 N/mm2 (OK)
Deflection check:
σmax. = 5 x w x L4 = 5 x 6.3 x 1.94
384 x E x I 384 x 2.05E-04 x 1.82E+06
= 2.9E-03m = 2.9mm
L / σ = 1900 / 2.9 = 655 > 360 (OK)
OUTPUT
Roof LL =1.5
KN/m2
Bending Stress = 102(< 265 N/mm
2
σmax. = 2.9mm
Deflection OK
10
BS 8110
REF.
Table 3.1
Clause
3.3.6
3.3
Table 3.4
Table 3.5
CALCULATIONS
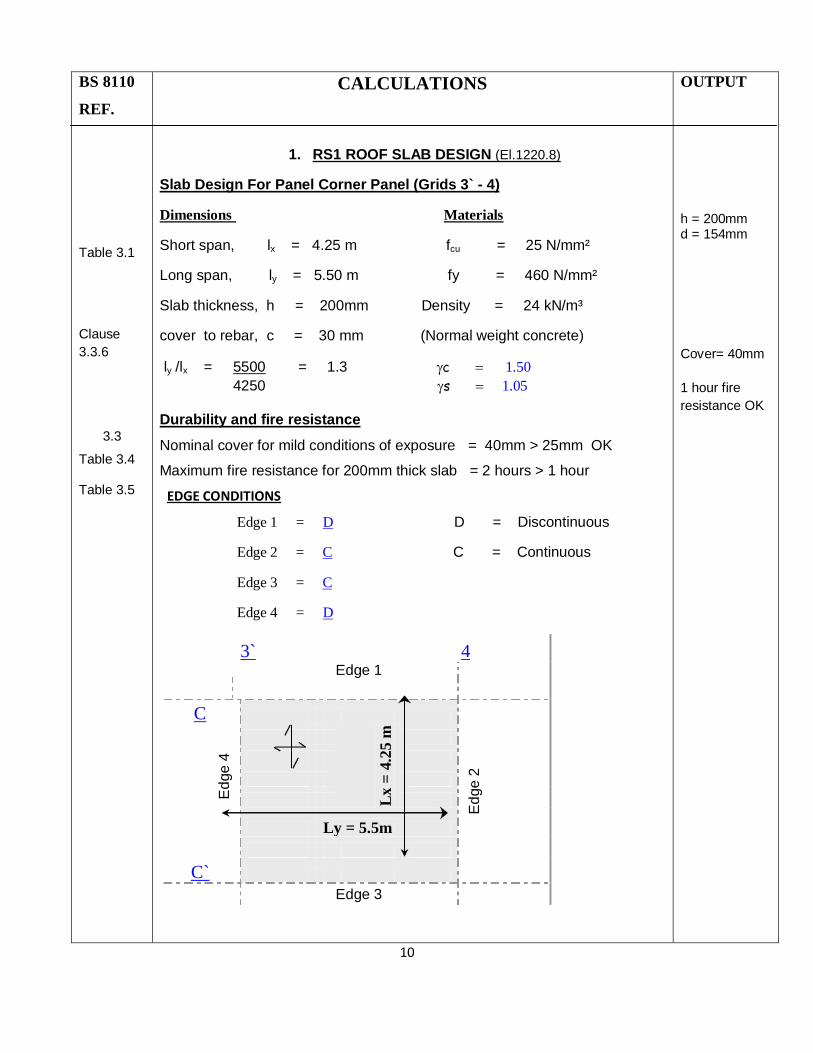
1. RS1 ROOF SLAB DESIGN (El.1220.8)
Slab Design For Panel Corner Panel (Grids 3` - 4)
Dimensions Materials
Short span, lx = 4.25 m fcu = 25 N/mm²
Long span, ly = 5.50 m fy = 460 N/mm²
Slab thickness, h = 200mm Density = 24 kN/m³
cover to rebar, c = 30 mm (Normal weight concrete)
ly /lx = 5500 = 1.3 c1.50
4250 s1.05
Durability and fire resistance
Nominal cover for mild conditions of exposure = 40mm > 25mm OK
Maximum fire resistance for 200mm thick slab = 2 hours > 1 hour
EDGE CONDITIONS
Edge 1 = D D = Discontinuous
Edge 2 = C C = Continuous
Edge 3 = C
Edge 4 = D
3` 4
Edge 1
C
Ed
ge
2
Lx =
4.2
5 m
Ed
ge
4
Ly = 5.5m
C`
Edge 3
OUTPUT
h = 200mm d = 154mm
Cover= 40mm
1 hour fire
resistance OK
11
BS 8110 Ref.
Clause
3.5.2.4
Table 3.13
Table 3.15
3.5.3.4
Clause
3.4.4.4
Table 3.15
Clause
3.4.4.4
CALCULATIONS
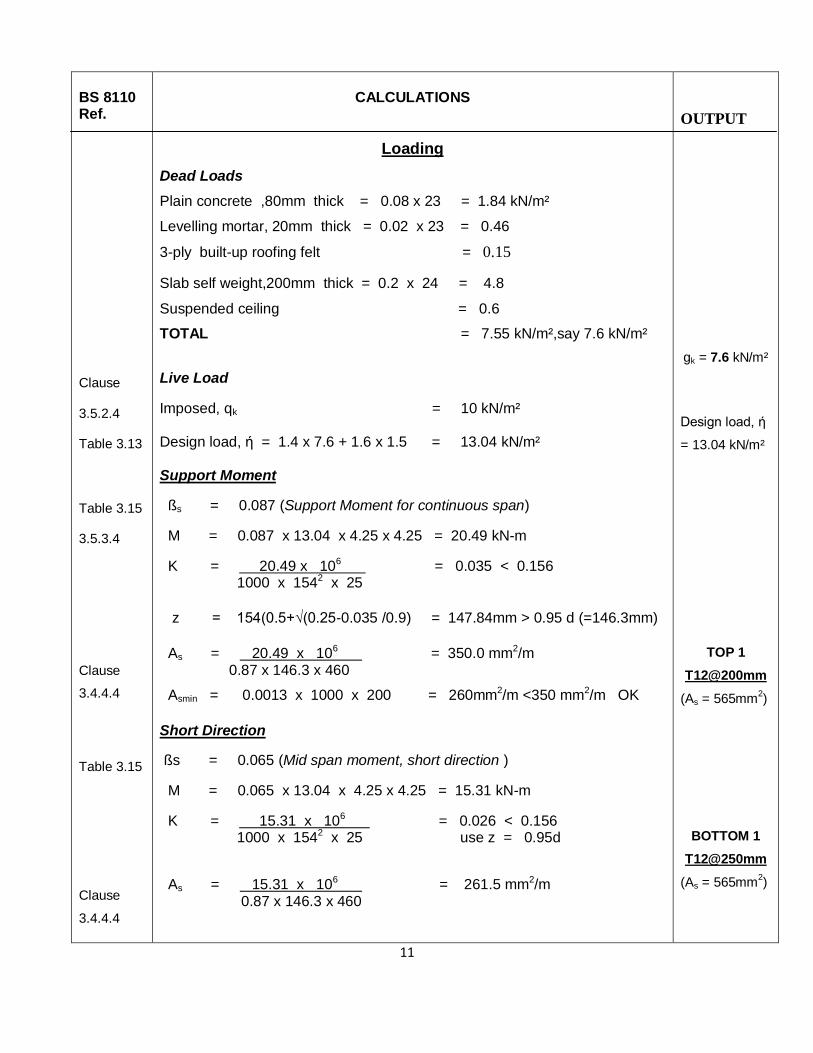
Loading
Dead Loads
Plain concrete ,80mm thick = 0.08 x 23 = 1.84 kN/m²
Levelling mortar, 20mm thick = 0.02 x 23 = 0.46
3-ply built-up roofing felt = 0.15
Slab self weight,200mm thick = 0.2 x 24 = 4.8
Suspended ceiling = 0.6
TOTAL = 7.55 kN/m²,say 7.6 kN/m²
Live Load
Imposed, qk = 10 kN/m² Design load, ή = 1.4 x 7.6 + 1.6 x 1.5 = 13.04 kN/m² Support Moment
ßs = 0.087 (Support Moment for continuous span)
M = 0.087 x 13.04 x 4.25 x 4.25 = 20.49 kN-m
K = 20.49 x 106 = 0.035 < 0.156 1000 x 1542 x 25
z = 154(0.5+√(0.25-0.035 /0.9) = 147.84mm > 0.95 d (=146.3mm)
As = 20.49 x 106 = 350.0 mm2/m 0.87 x 146.3 x 460
Asmin = 0.0013 x 1000 x 200 = 260mm2/m <350 mm2/m OK
Short Direction
ßs = 0.065 (Mid span moment, short direction )
M = 0.065 x 13.04 x 4.25 x 4.25 = 15.31 kN-m
K = 15.31 x 106 = 0.026 < 0.156 1000 x 1542 x 25 use z = 0.95d
As = 15.31 x 106 = 261.5 mm2/m 0.87 x 146.3 x 460
OUTPUT
gk = 7.6 kN/m²
Design load, ή
= 13.04 kN/m²
TOP 1
T12@200mm
(As = 565mm2)
BOTTOM 1
T12@250mm
(As = 565mm2)
12
Bs 8110 Ref.
Table 3.27
3.4.5.4
Table 3.16
Table 3.9
3.4.6
Table 3.11
3.12.11.2.7
clause 3.9.3
clause
3.9.4.19
CALCULATIONS
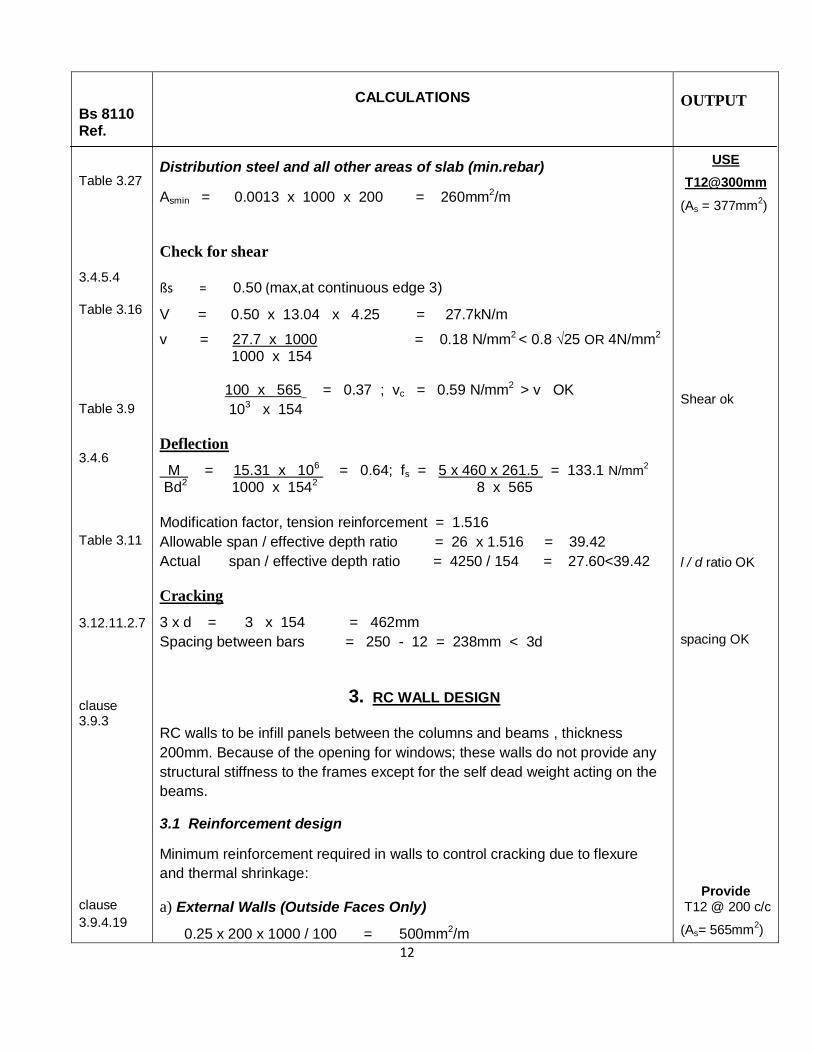
Distribution steel and all other areas of slab (min.rebar)
Asmin = 0.0013 x 1000 x 200 = 260mm2/m
Check for shear
ßs = 0.50 (max,at continuous edge 3)
V = 0.50 x 13.04 x 4.25 = 27.7kN/m
v = 27.7 x 1000 = 0.18 N/mm2 < 0.8 √25 OR 4N/mm2 1000 x 154 100 x 565 = 0.37 ; vc = 0.59 N/mm2 > v OK
103 x 154
Deflection
M = 15.31 x 106 = 0.64; fs = 5 x 460 x 261.5 = 133.1 N/mm2
Bd2 1000 x 1542 8 x 565
Modification factor, tension reinforcement = 1.516
Allowable span / effective depth ratio = 26 x 1.516 = 39.42
Actual span / effective depth ratio = 4250 / 154 = 27.60<39.42
Cracking
3 x d = 3 x 154 = 462mm
Spacing between bars = 250 - 12 = 238mm < 3d
3. RC WALL DESIGN
RC walls to be infill panels between the columns and beams , thickness
200mm. Because of the opening for windows; these walls do not provide any
structural stiffness to the frames except for the self dead weight acting on the
beams.
3.1 Reinforcement design
Minimum reinforcement required in walls to control cracking due to flexure
and thermal shrinkage:
a) External Walls (Outside Faces Only)
0.25 x 200 x 1000 / 100 = 500mm2/m
OUTPUT
USE
T12@300mm
(As = 377mm2)
Shear ok
l / d ratio OK
spacing OK
Provide T12 @ 200 c/c
(As= 565mm2)

13
BS 8110
REF.
CALCULATIONS
OUTPUT
3.2.1.3
b) Internal Walls (Both Faces)
provide T10 @ 200 c/c = 393mm2/m
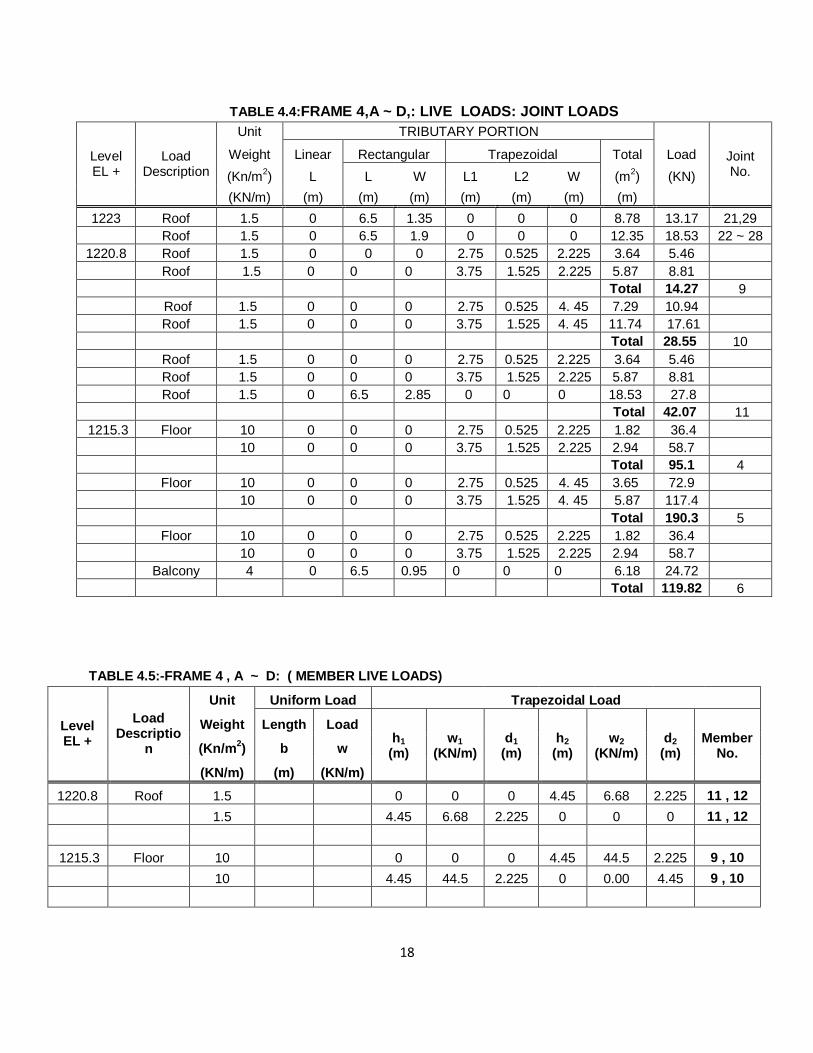
4. FRAME LOADING CALCULATIONS – INPUT LOADS
1BDead Loads (DL)
The dead loads used in the analysis were derived from knowledge of the
weights of various materials used. The calculated values are summarized in
tables 2 and 3 as shown underneath.
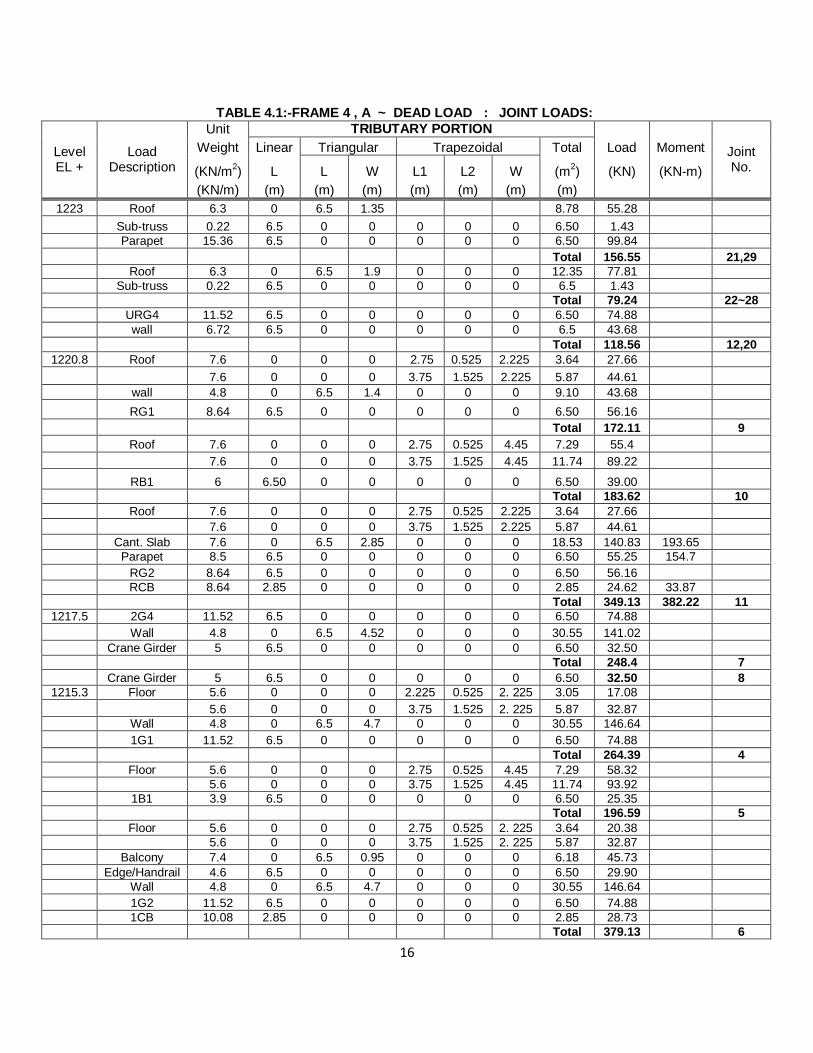
Sample calculation for Dead loads on Joint No. 21, 29 (Table 4.1)
Roof at elevation 1223:DL = 6.3KN/m2
Contributing Area: Length = (7.5 + 5.5 ) / 2 = 6.50m
Width = (1.9 / 2 + 0.4) = 1.35m
Area = 6.5 x 1.35 = 8.775m2
Total load on joint no. 21or 29 = DL (KN/m2) x Area (m2)
= 6.3 x 8.775 = 55.28KN
Weight of Sub-Truss SB-1/SB-2 = 0.22KN/m
Total length for load on joint = (7.5 + 5.5 ) / 2 = 6.50m
Total load on joint no. 21or 29 = 0.22 x 6.5 = 1.43KN
Similarly, Parapet wall on joint = 15.36 x 6.5 = 99.84KN
TOTAL POINT LOAD (DL) = ( 99.84 + 1.43 + 55.28) = 156.55KN
Computation for the rest of the joint loads is as shown in table 4.1 below.
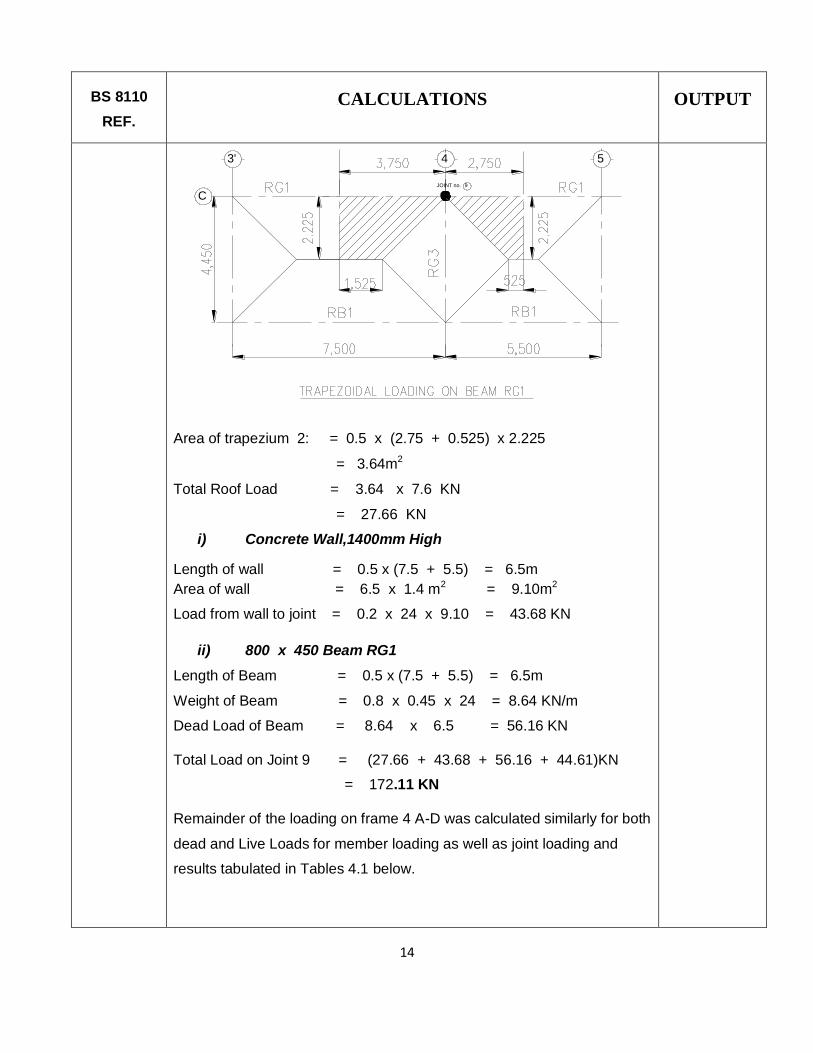
Sample calculation for load distribution from slab to joint no. 9 along gridline 4
- C is demonstrated below for Roof UDL of 7.6KN/m2:
i) Roof
Area of trapezium 1: = 0.5 x ( L1 + L2) x W
= 0.5 x (3.75 + 1.525) x 2.225 = 5.87 m2
Total Roof Load = 5.87 x 7.6 KN = 44.61 KN
Provide
T10 @ 200 c/c
(As= 393mm2
14
2BBS 8110
REF.
3BCALCULATIONS 4BOUTPUT
4 53'
9JOINT no.
C
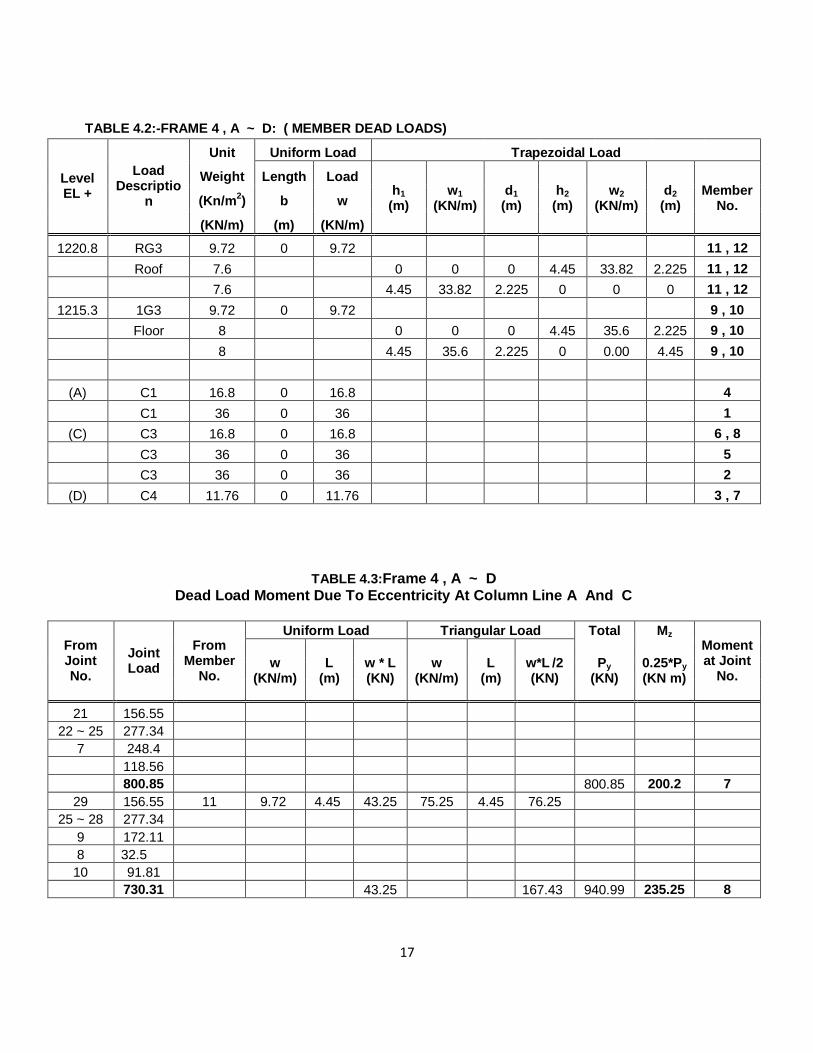
Area of trapezium 2: = 0.5 x (2.75 + 0.525) x 2.225
= 3.64m2
Total Roof Load = 3.64 x 7.6 KN
= 27.66 KN
i) Concrete Wall,1400mm High
Length of wall = 0.5 x (7.5 + 5.5) = 6.5m
Area of wall = 6.5 x 1.4 m2 = 9.10m2
Load from wall to joint = 0.2 x 24 x 9.10 = 43.68 KN
ii) 800 x 450 Beam RG1
Length of Beam = 0.5 x (7.5 + 5.5) = 6.5m
Weight of Beam = 0.8 x 0.45 x 24 = 8.64 KN/m
Dead Load of Beam = 8.64 x 6.5 = 56.16 KN
Total Load on Joint 9 = (27.66 + 43.68 + 56.16 + 44.61)KN
= 172.11 KN
Remainder of the loading on frame 4 A-D was calculated similarly for both
dead and Live Loads for member loading as well as joint loading and
results tabulated in Tables 4.1 below.
15
BS 8110 REF.
CALCULATIONS OUTPUT
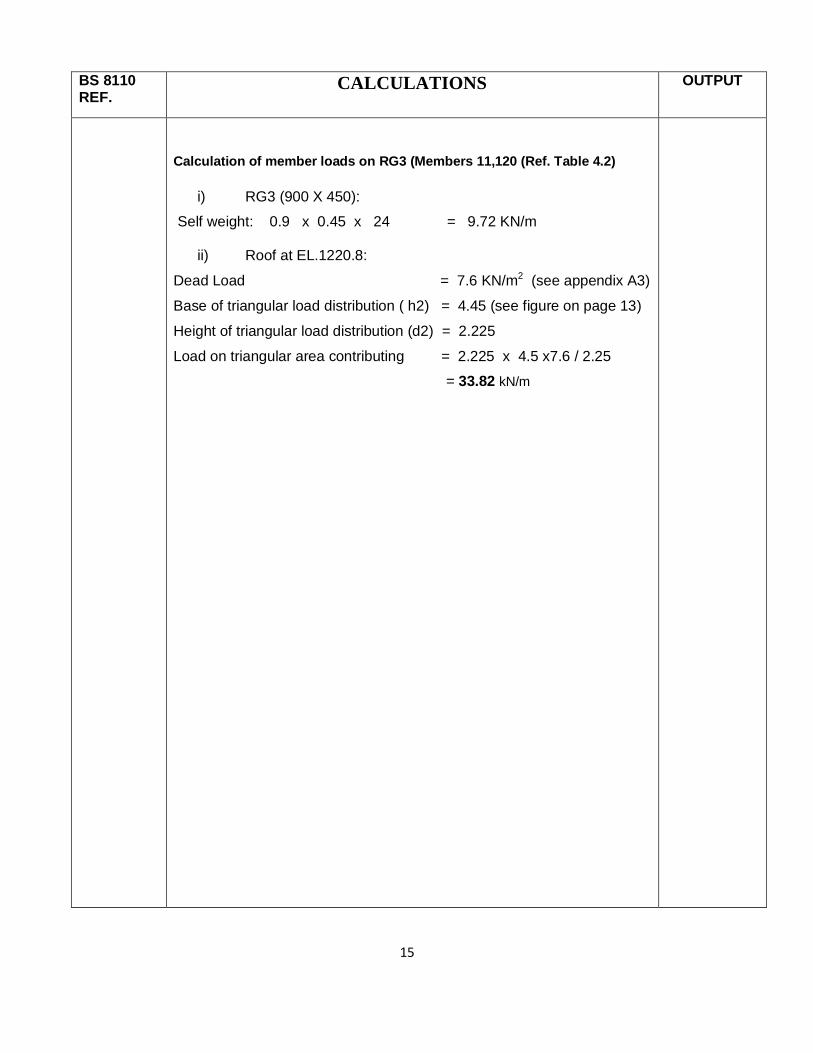
Calculation of member loads on RG3 (Members 11,120 (Ref. Table 4.2)
i) RG3 (900 X 450):
Self weight: 0.9 x 0.45 x 24 = 9.72 KN/m
ii) Roof at EL.1220.8:
Dead Load = 7.6 KN/m2 (see appendix A3)
Base of triangular load distribution ( h2) = 4.45 (see figure on page 13)
Height of triangular load distribution (d2) = 2.225
Load on triangular area contributing = 2.225 x 4.5 x7.6 / 2.25
= 33.82 kN/m
16
TABLE 4.1:-FRAME 4 , A ~ DEAD LOAD : JOINT LOADS:
Level EL +
Load Description
Unit TRIBUTARY PORTION
Joint No.
Weight Linear Triangular Trapezoidal Total Load Moment
(KN/m2) L L W L1 L2 W (m
2) (KN) (KN-m)
(KN/m) (m) (m) (m) (m) (m) (m) (m)
1223 Roof 6.3 0 6.5 1.35 8.78 55.28
Sub-truss 0.22 6.5 0 0 0 0 0 6.50 1.43
Parapet 15.36 6.5 0 0 0 0 0 6.50 99.84
Total 156.55 21,29
Roof 6.3 0 6.5 1.9 0 0 0 12.35 77.81
Sub-truss 0.22 6.5 0 0 0 0 0 6.5 1.43
Total 79.24 22~28
URG4 11.52 6.5 0 0 0 0 0 6.50 74.88
wall 6.72 6.5 0 0 0 0 0 6.5 43.68
Total 118.56 12,20
1220.8 Roof 7.6 0 0 0 2.75 0.525 2.225 3.64 27.66
7.6 0 0 0 3.75 1.525 2.225 5.87 44.61
wall 4.8 0 6.5 1.4 0 0 0 9.10 43.68
RG1 8.64 6.5 0 0 0 0 0 6.50 56.16
Total 172.11 9
Roof 7.6 0 0 0 2.75 0.525 4.45 7.29 55.4
7.6 0 0 0 3.75 1.525 4.45 11.74 89.22
RB1 6 6.50 0 0 0 0 0 6.50 39.00
Total 183.62 10
Roof 7.6 0 0 0 2.75 0.525 2.225 3.64 27.66
7.6 0 0 0 3.75 1.525 2.225 5.87 44.61
Cant. Slab 7.6 0 6.5 2.85 0 0 0 18.53 140.83 193.65
Parapet 8.5 6.5 0 0 0 0 0 6.50 55.25 154.7
RG2 8.64 6.5 0 0 0 0 0 6.50 56.16
RCB 8.64 2.85 0 0 0 0 0 2.85 24.62 33.87
Total 349.13 382.22 11
1217.5 2G4 11.52 6.5 0 0 0 0 0 6.50 74.88
Wall 4.8 0 6.5 4.52 0 0 0 30.55 141.02
Crane Girder 5 6.5 0 0 0 0 0 6.50 32.50
Total 248.4 7
Crane Girder 5 6.5 0 0 0 0 0 6.50 32.50 8
1215.3 Floor 5.6 0 0 0 2.225 0.525 2. 225 3.05 17.08
5.6 0 0 0 3.75 1.525 2. 225 5.87 32.87
Wall 4.8 0 6.5 4.7 0 0 0 30.55 146.64
1G1 11.52 6.5 0 0 0 0 0 6.50 74.88
Total 264.39 4
Floor 5.6 0 0 0 2.75 0.525 4.45 7.29 58.32
5.6 0 0 0 3.75 1.525 4.45 11.74 93.92
1B1 3.9 6.5 0 0 0 0 0 6.50 25.35
Total 196.59 5
Floor 5.6 0 0 0 2.75 0.525 2. 225 3.64 20.38
5.6 0 0 0 3.75 1.525 2. 225 5.87 32.87
Balcony 7.4 0 6.5 0.95 0 0 0 6.18 45.73
Edge/Handrail 4.6 6.5 0 0 0 0 0 6.50 29.90
Wall 4.8 0 6.5 4.7 0 0 0 30.55 146.64
1G2 11.52 6.5 0 0 0 0 0 6.50 74.88
1CB 10.08 2.85 0 0 0 0 0 2.85 28.73
Total 379.13 6
17
TABLE 4.2:-FRAME 4 , A ~ D: ( MEMBER DEAD LOADS)
Level EL +
Load Descriptio
n
Unit Uniform Load Trapezoidal Load
Weight Length Load h1
(m) w1
(KN/m) d1
(m) h2
(m) w2
(KN/m) d2
(m) Member
No. (Kn/m2) b w
(KN/m) (m) (KN/m)
1220.8 RG3 9.72 0 9.72 11 , 12
Roof 7.6 0 0 0 4.45 33.82 2.225 11 , 12
7.6 4.45 33.82 2.225 0 0 0 11 , 12
1215.3 1G3 9.72 0 9.72 9 , 10
Floor 8 0 0 0 4.45 35.6 2.225 9 , 10
8 4.45 35.6 2.225 0 0.00 4.45 9 , 10
(A) C1 16.8 0 16.8 4
C1 36 0 36 1
(C) C3 16.8 0 16.8 6 , 8
C3 36 0 36 5
C3 36 0 36 2
(D) C4 11.76 0 11.76 3 , 7
TABLE 4.3:Frame 4 , A ~ D Dead Load Moment Due To Eccentricity At Column Line A And C
From Joint No.
Joint Load
From Member
No.
Uniform Load Triangular Load Total Mz Moment at Joint
No. w
(KN/m) L
(m) w * L (KN)
w (KN/m)
L (m)
w*L /2 (KN)
Py (KN)
0.25*Py (KN m)
21 156.55
22 ~ 25 277.34
7 248.4
118.56
800.85 800.85 200.2 7
29 156.55 11 9.72 4.45 43.25 75.25 4.45 76.25
25 ~ 28 277.34
9 172.11
8 32.5
10 91.81
730.31 43.25 167.43 940.99 235.25 8
18
TABLE 4.4:FRAME 4,A ~ D,: LIVE LOADS: JOINT LOADS
Level EL +
Load Description
Unit TRIBUTARY PORTION
Joint No.
Weight Linear Rectangular Trapezoidal Total Load
(Kn/m2) L L W L1 L2 W (m
2) (KN)
(KN/m) (m) (m) (m) (m) (m) (m) (m)
1223 Roof 1.5 0 6.5 1.35 0 0 0 8.78 13.17 21,29
Roof 1.5 0 6.5 1.9 0 0 0 12.35 18.53 22 ~ 28
1220.8 Roof 1.5 0 0 0 2.75 0.525 2.225 3.64 5.46
Roof 1.5 0 0 0 3.75 1.525 2.225 5.87 8.81
Total 14.27 9
Roof 1.5 0 0 0 2.75 0.525 4. 45 7.29 10.94
Roof 1.5 0 0 0 3.75 1.525 4. 45 11.74 17.61
Total 28.55 10
Roof 1.5 0 0 0 2.75 0.525 2.225 3.64 5.46
Roof 1.5 0 0 0 3.75 1.525 2.225 5.87 8.81
Roof 1.5 0 6.5 2.85 0 0 0 18.53 27.8
Total 42.07 11
1215.3 Floor 10 0 0 0 2.75 0.525 2.225 1.82 36.4
10 0 0 0 3.75 1.525 2.225 2.94 58.7
Total 95.1 4
Floor 10 0 0 0 2.75 0.525 4. 45 3.65 72.9
10 0 0 0 3.75 1.525 4. 45 5.87 117.4
Total 190.3 5
Floor 10 0 0 0 2.75 0.525 2.225 1.82 36.4
10 0 0 0 3.75 1.525 2.225 2.94 58.7
Balcony 4 0 6.5 0.95 0 0 0 6.18 24.72
Total 119.82 6
TABLE 4.5:-FRAME 4 , A ~ D: ( MEMBER LIVE LOADS)
Level EL +
Load Descriptio
n
Unit Uniform Load Trapezoidal Load
Weight Length Load h1
(m) w1
(KN/m) d1
(m) h2
(m) w2
(KN/m) d2
(m) Member
No. (Kn/m2) b w
(KN/m) (m) (KN/m)
1220.8 Roof 1.5 0 0 0 4.45 6.68 2.225 11 , 12
1.5 4.45 6.68 2.225 0 0 0 11 , 12
1215.3 Floor 10 0 0 0 4.45 44.5 2.225 9 , 10
10 4.45 44.5 2.225 0 0.00 4.45 9 , 10
19
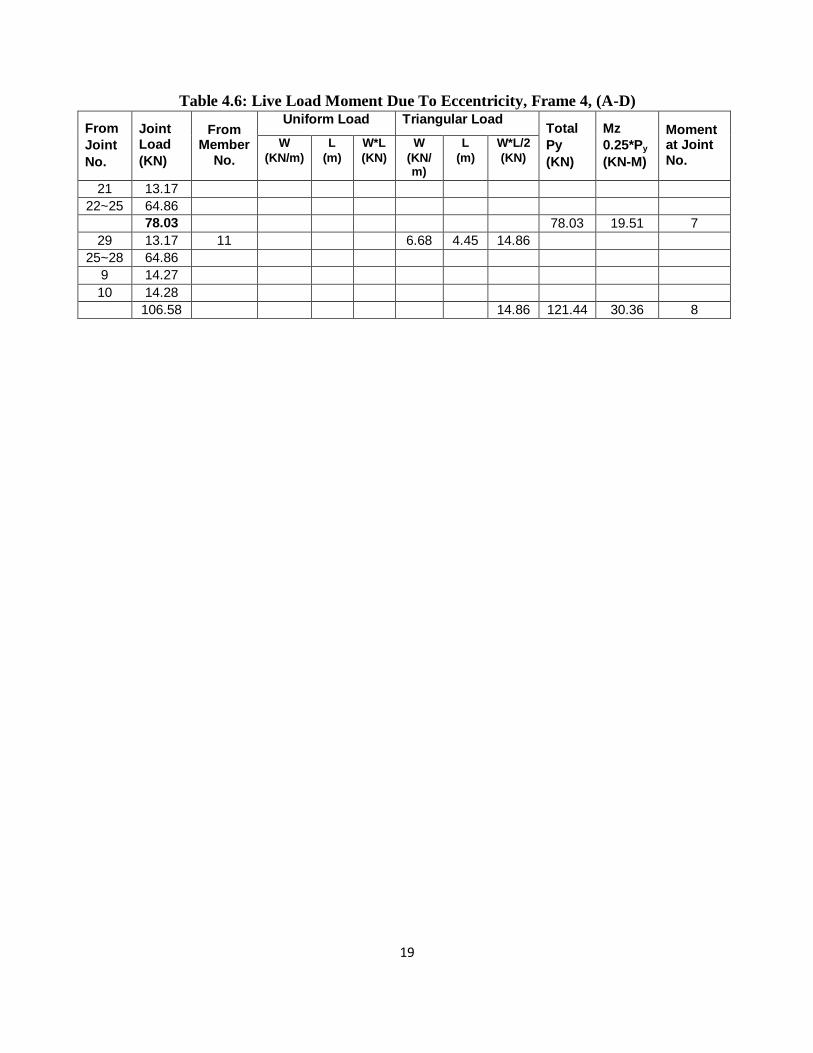
Table 4.6: Live Load Moment Due To Eccentricity, Frame 4, (A-D)
From
Joint
No.
Joint Load
(KN)
From Member
No.
Uniform Load Triangular Load Total
Py
(KN)
Mz
0.25*Py
(KN-M)
Moment at Joint No.
W
(KN/m)
L
(m)
W*L
(KN)
W
(KN/m)
L
(m)
W*L/2
(KN)
21 13.17
22~25 64.86
78.03 78.03 19.51 7
29 13.17 11 6.68 4.45 14.86
25~28 64.86
9 14.27
10 14.28
106.58 14.86 121.44 30.36 8
20
5BBS 8110 REF.
6BCALCULATIONS 7BOUTPUT
5. MONORAIL HOIST LOAD FOR DRAFT TUBE GATE (HL)
( FRAME 4, A ~ D)
8BLong Term Case:
Hoist, Self weight = 10 kN
Lifted Load = 75 kN
Total Point Load, P = (75 + 10) KN = 85 KN
Moment (joint No.11) : M = 1.7 x 85 = 144.5 KN-m
9BShort Term case
Short term Load, P = 200 kN
Hoist self weight = 10 kN,
Total Point Load, P = (200 + 10)KN = 210 KN
Moment (joint No.11) : M = 210 x 1.7 = 357 KN-m
6. SEISMIC LOAD (SL) (UBC)
seismic loads I are considered the as 10% of Y direction loads of Dead Load, (DL),
Live Load, (LL), and Crane Dead Load (CDL). This load is applied this to the
frame in the X- direction and determined the seismic coefficient thus:
V = Z I C
Where :
Z = 0.15 (Zone 2A)
I = 1.25
RW = 5.0
C = 1.25 S S = 1.0 Site Coefficient (Given in Table 16-J)
T = Ct hn3/4 Ct = 0.0731; hn = 1223 - 1210.5 = 12.5m
RW
W
T2/3
21
BS 8110 REF.
CALCULATIONS
OUTPUT
T = 0.49 Sec
C = 1.25 x 1.0 / 0.492/3 = 2.01
V = 0.15 x 1.25 x 2.01 / 5.0 x W
= 0.08 x W , Say 0.10 x W
Sample of seismic load calculation for joint loads in table 4.1 are shown in table 4.7
below. In each case, the joint loads are multiplied by a factor of 0.1:
Table 6.1:Seismic Joint Load Calculation
Level EL + Joint Dead Load (KN) Seismic Load (KN) Joint No.
1223 156.55 156.55 x 0.1 = 15.66 21,29
79.24 79.24 x 0.1 = 7.92 22~28
118.56 118.56 x 0.1 = 11.86 12,20
1220.8 172.11 172.11 x 0.1 = 17.21 9
183.62 183.62 x 0.1 = 18.36 10
7. TEMPERATURE EFFECTS (TE)
The concrete structure was subjected to stresses due to temperature changes of.
+10 degrees and -10 degrees centigrade. The temperature load was calculated
directly by STAAD programme, using the following commands:
TEMPERATURE LOAD
1 TO 12 TEMP 10
LOAD 16 -1.0 TE
TEMPERATURE LOAD
1 TO 12 TEMP -10
22
BS 2573
REF.
CALCULATIONS
OUTPUT
Appendix A,
Table 25
Tables 1,2,3 and 25
Bs 6399:
general
purpose
cranes
8. CRANE LOADS (CDL, COL)
8.1 Specification of Crane
Design Crane capacity : 1000 KN
Design Crane Capacity : 13 m
Number of Wheels : 8 pieces
Design Wheel span : 4.1 m
Crane Loads
Dead load , W = 750.0KN (including trolley)
Maximum wheel load , Pmax = 340.0KN
Minimum wheel load , Pmin = 97.5 KN
Average wheel load , Pav = 93.8 KN
Impact Loads
Vertical Loads, Pv = 0.25 P
Transverse Horizontal Surge Load, PHT = 0.10 P
Longitudinal Horizontal Surge Load, PHL = 0.05 P
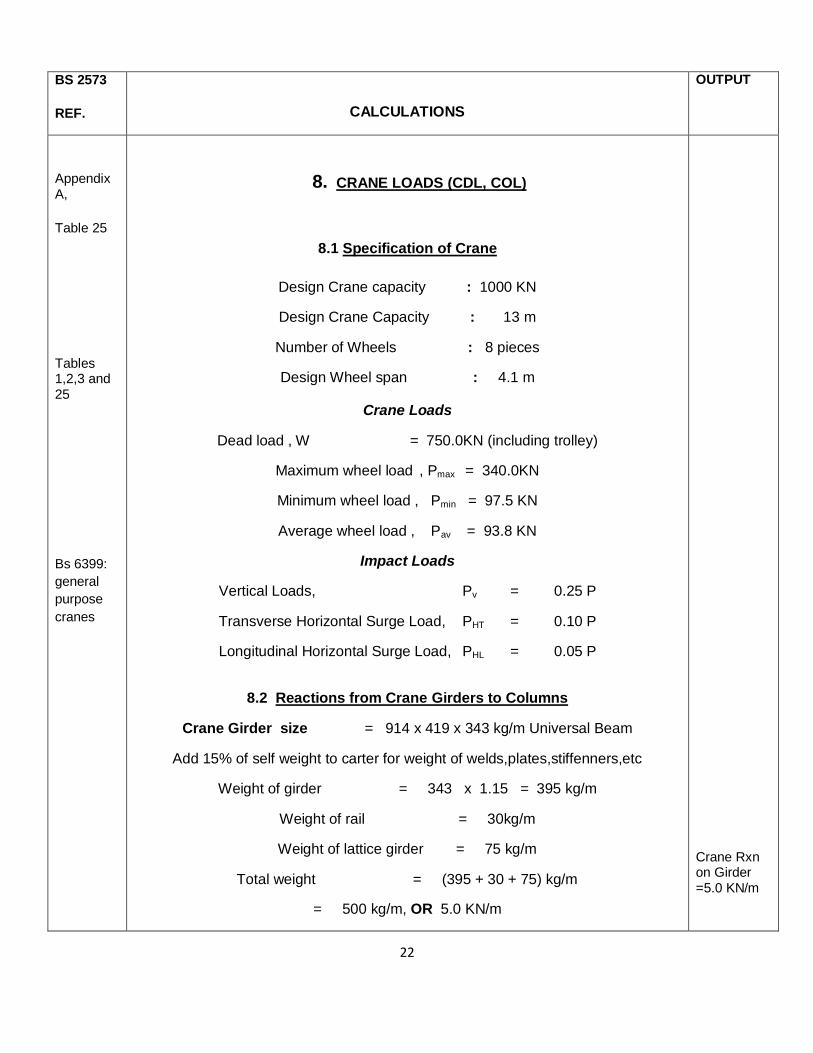
8.2 Reactions from Crane Girders to Columns
Crane Girder size = 914 x 419 x 343 kg/m Universal Beam
Add 15% of self weight to carter for weight of welds,plates,stiffenners,etc
Weight of girder = 343 x 1.15 = 395 kg/m
Weight of rail = 30kg/m
Weight of lattice girder = 75 kg/m
Total weight = (395 + 30 + 75) kg/m
= 500 kg/m, OR 5.0 KN/m
Crane Rxn on Girder =5.0 KN/m
23
BS 8110 REF.
CALCULATIONS
OUTPUT
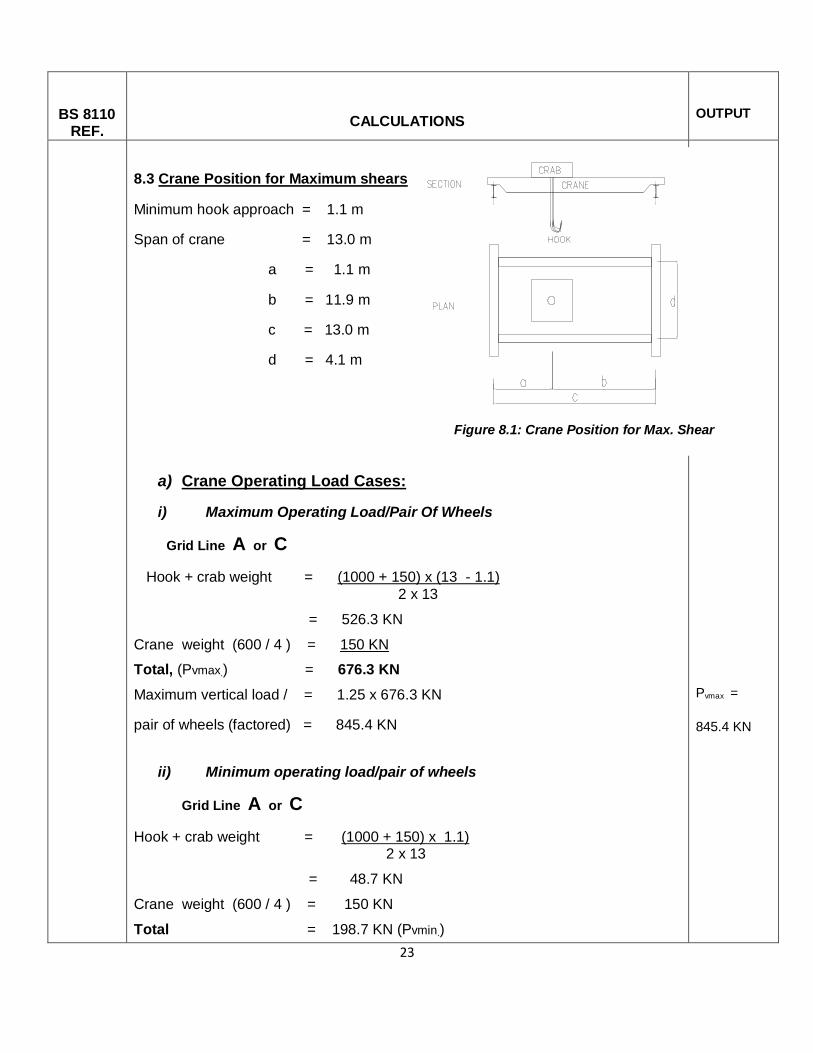
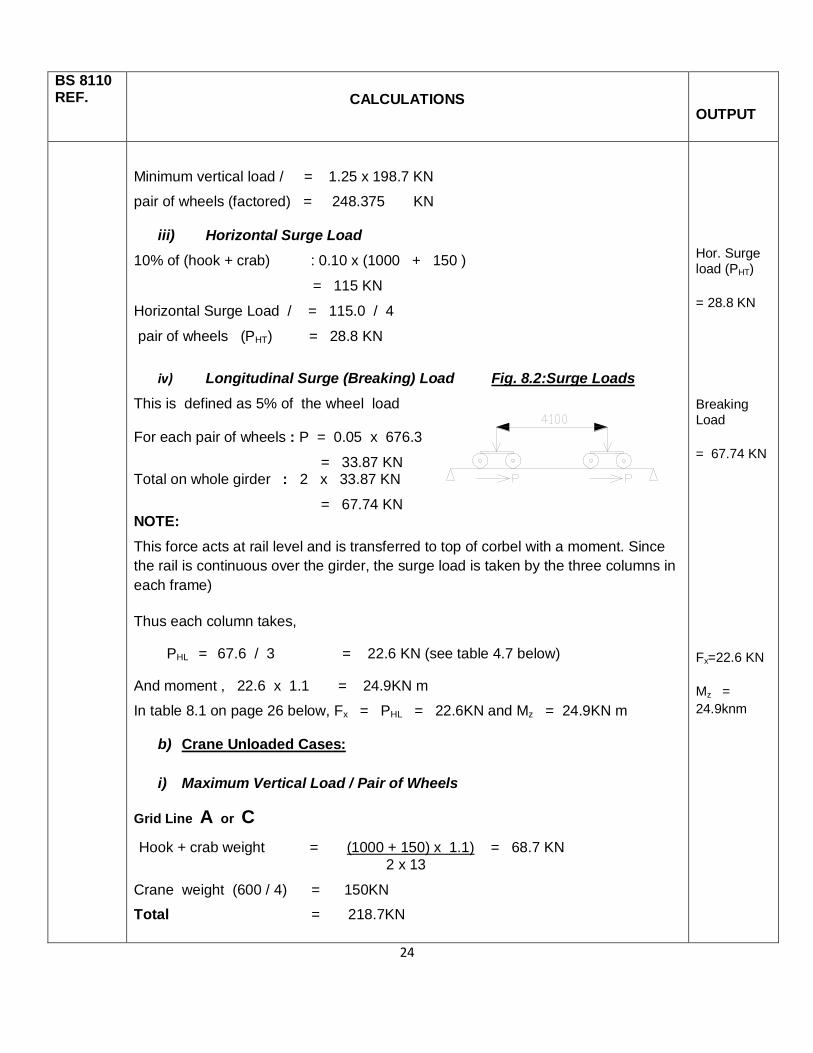
8.3 Crane Position for Maximum shears
Minimum hook approach = 1.1 m
Span of crane = 13.0 m
a = 1.1 m
b = 11.9 m
c = 13.0 m
d = 4.1 m
a) Crane Operating Load Cases:
i) Maximum Operating Load/Pair Of Wheels
Grid Line A or C
Hook + crab weight = (1000 + 150) x (13 - 1.1)
2 x 13
= 526.3 KN
Crane weight (600 / 4 ) = 150 KN
Total, (Pvmax.) = 676.3 KN
Maximum vertical load / = 1.25 x 676.3 KN
pair of wheels (factored) = 845.4 KN
ii) Minimum operating load/pair of wheels
Grid Line A or C
Hook + crab weight = (1000 + 150) x 1.1) 2 x 13
= 48.7 KN
Crane weight (600 / 4 ) = 150 KN
Total = 198.7 KN (Pvmin.)
Pvmax =
845.4 KN
Figure 8.1: Crane Position for Max. Shear
24
BS 8110 REF. CALCULATIONS
OUTPUT
Minimum vertical load / = 1.25 x 198.7 KN
pair of wheels (factored) = 248.375 KN
iii) Horizontal Surge Load
10% of (hook + crab) : 0.10 x (1000 + 150 )
= 115 KN
Horizontal Surge Load / = 115.0 / 4
pair of wheels (PHT) = 28.8 KN
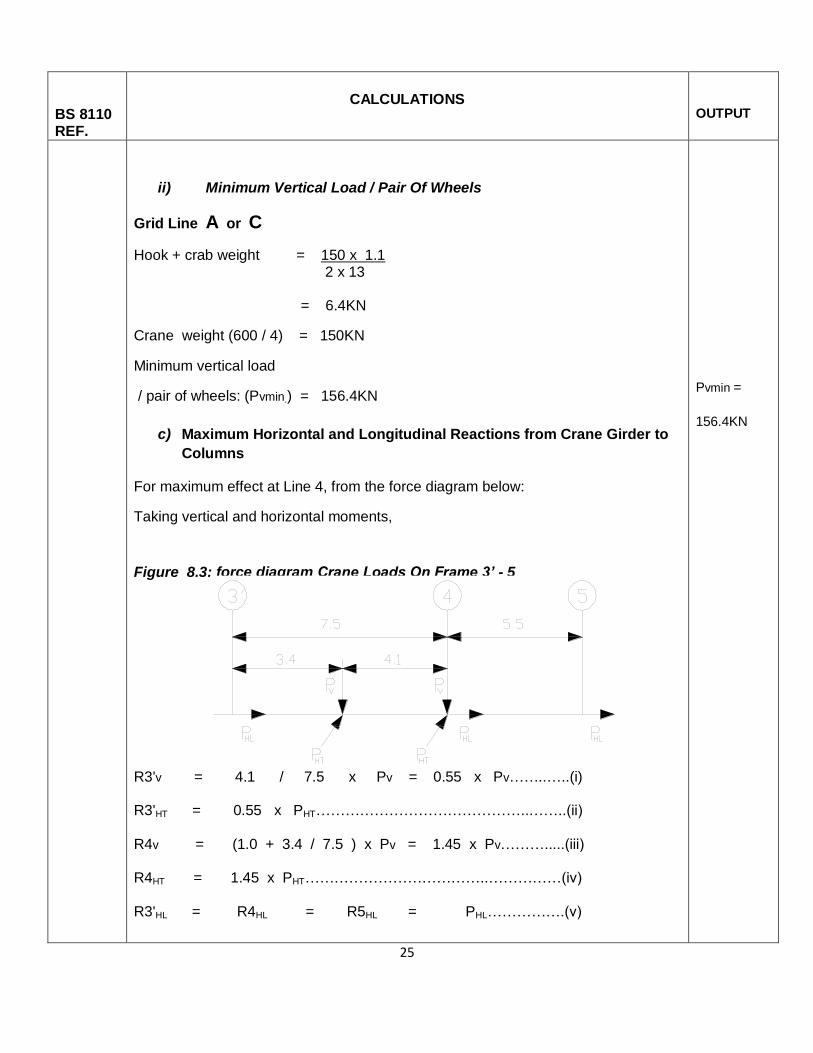
iv) Longitudinal Surge (Breaking) Load Fig. 8.2:Surge Loads
This is defined as 5% of the wheel load For each pair of wheels : P = 0.05 x 676.3
= 33.87 KN
Total on whole girder : 2 x 33.87 KN
= 67.74 KN NOTE:
This force acts at rail level and is transferred to top of corbel with a moment. Since
the rail is continuous over the girder, the surge load is taken by the three columns in
each frame)
Thus each column takes,
PHL = 67.6 / 3 = 22.6 KN (see table 4.7 below)
And moment , 22.6 x 1.1 = 24.9KN m
In table 8.1 on page 26 below, Fx = PHL = 22.6KN and Mz = 24.9KN m
b) Crane Unloaded Cases:
i) Maximum Vertical Load / Pair of Wheels
Grid Line A or C
Hook + crab weight = (1000 + 150) x 1.1) = 68.7 KN
2 x 13
Crane weight (600 / 4) = 150KN
Total = 218.7KN
Hor. Surge load (PHT)
= 28.8 KN
Breaking Load
= 67.74 KN
Fx=22.6 KN
Mz =
24.9knm
25
BS 8110 REF.
CALCULATIONS
OUTPUT
ii) Minimum Vertical Load / Pair Of Wheels
Grid Line A or C
Hook + crab weight = 150 x 1.1 2 x 13 = 6.4KN
Crane weight (600 / 4) = 150KN
Minimum vertical load
/ pair of wheels: (Pvmin.) = 156.4KN
c) Maximum Horizontal and Longitudinal Reactions from Crane Girder to
Columns
For maximum effect at Line 4, from the force diagram below:
Taking vertical and horizontal moments,
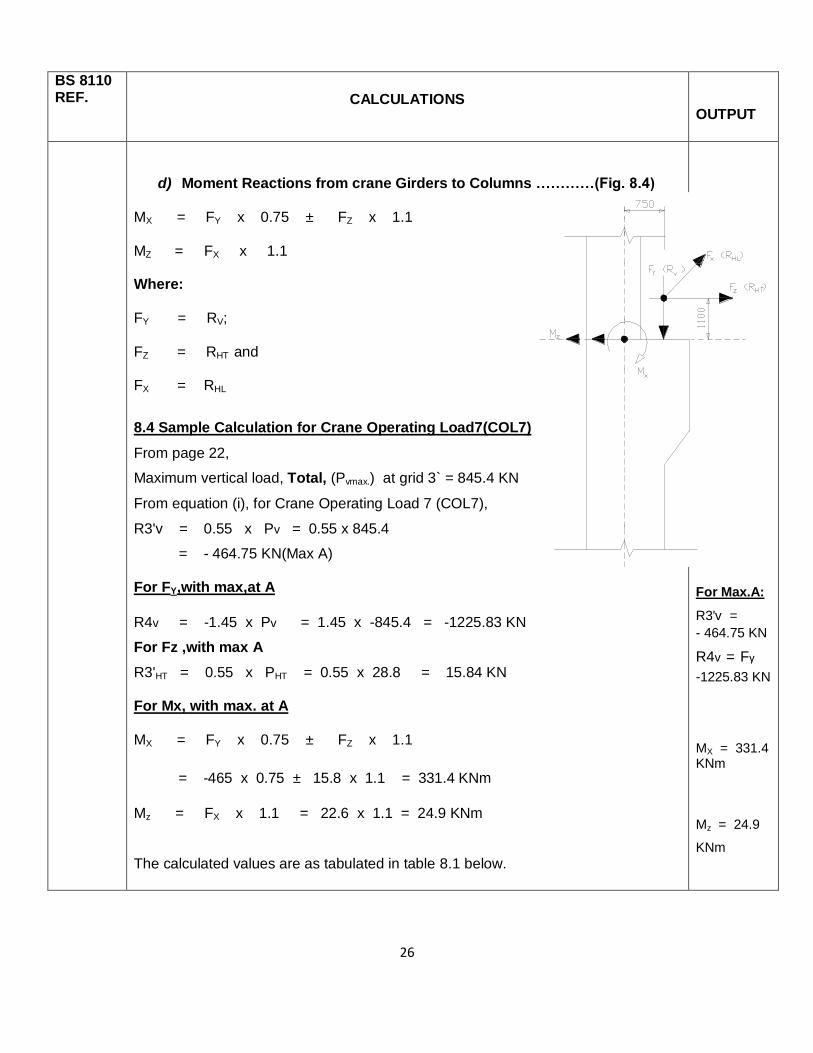
Figure 8.3: force diagram Crane Loads On Frame 3’ - 5
R3'v = 4.1 / 7.5 x Pv = 0.55 x Pv……..…..(i)
R3'HT = 0.55 x PHT……………………………………..……..(ii)
R4v = (1.0 + 3.4 / 7.5 ) x Pv = 1.45 x Pv……….....(iii)
R4HT = 1.45 x PHT………………………………..……………(iv)
R3'HL = R4HL = R5HL = PHL…………….(v)
Pvmin =
156.4KN
26
BS 8110 REF. CALCULATIONS
OUTPUT
d) Moment Reactions from crane Girders to Columns …………(Fig. 8.4)
MX = FY x 0.75 ± FZ x 1.1 MZ = FX x 1.1 Where:
FY = RV;
FZ = RHT and
FX = RHL
8.4 Sample Calculation for Crane Operating Load7(COL7)
From page 22,
Maximum vertical load, Total, (Pvmax.) at grid 3` = 845.4 KN
From equation (i), for Crane Operating Load 7 (COL7),
R3'v = 0.55 x Pv = 0.55 x 845.4
= - 464.75 KN(Max A) For FY,with max,at A
R4v = -1.45 x Pv = 1.45 x -845.4 = -1225.83 KN
For Fz ,with max A
R3'HT = 0.55 x PHT = 0.55 x 28.8 = 15.84 KN For Mx, with max. at A
MX = FY x 0.75 ± FZ x 1.1
= -465 x 0.75 ± 15.8 x 1.1 = 331.4 KNm
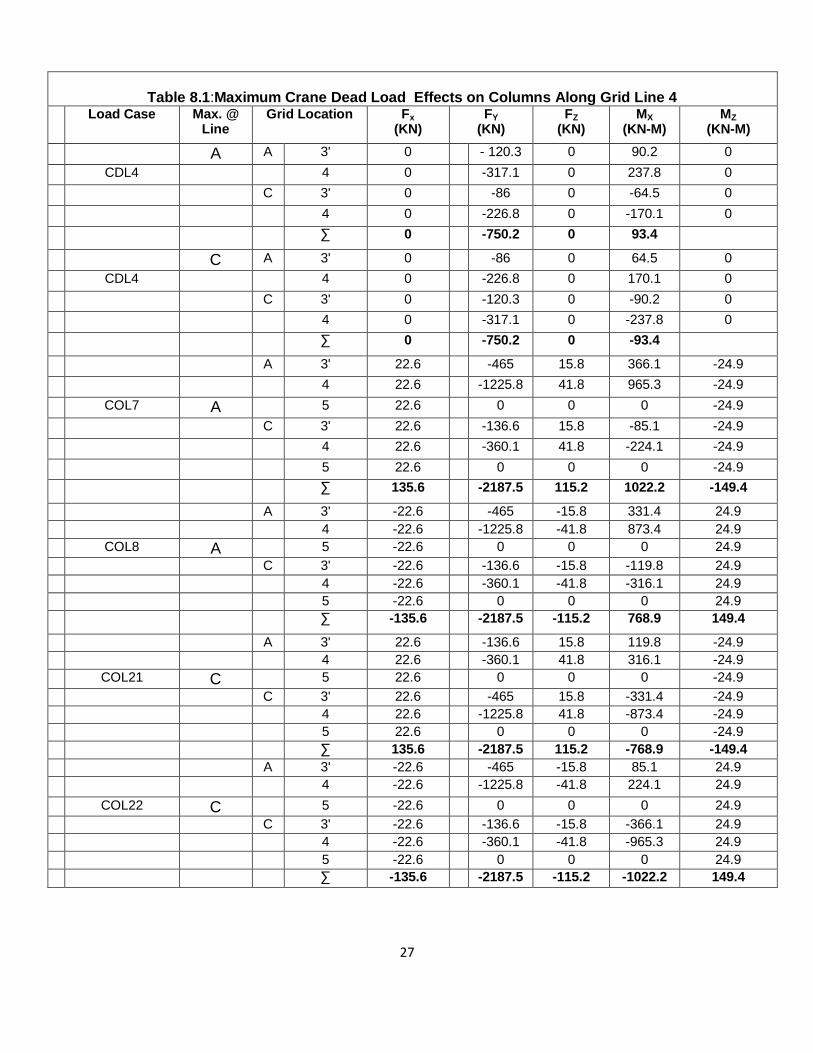
Mz = FX x 1.1 = 22.6 x 1.1 = 24.9 KNm The calculated values are as tabulated in table 8.1 below.
For Max.A:
R3'v =
- 464.75 KN
R4v = Fy
-1225.83 KN
MX = 331.4 KNm
Mz = 24.9
KNm
27
Table 8.1:Maximum Crane Dead Load Effects on Columns Along Grid Line 4
Load Case Max. @ Line
Grid Location Fx (KN)
FY (KN)
FZ (KN)
MX (KN-M)
MZ (KN-M)
A A 3' 0 - 120.3 0 90.2 0
CDL4 4 0 -317.1 0 237.8 0
C 3' 0 -86 0 -64.5 0
4 0 -226.8 0 -170.1 0
∑ 0 -750.2 0 93.4
C A 3' 0 -86 0 64.5 0
CDL4 4 0 -226.8 0 170.1 0
C 3' 0 -120.3 0 -90.2 0
4 0 -317.1 0 -237.8 0
∑ 0 -750.2 0 -93.4
A 3' 22.6 -465 15.8 366.1 -24.9
4 22.6 -1225.8 41.8 965.3 -24.9
COL7 A 5 22.6 0 0 0 -24.9
C 3' 22.6 -136.6 15.8 -85.1 -24.9
4 22.6 -360.1 41.8 -224.1 -24.9
5 22.6 0 0 0 -24.9
∑ 135.6 -2187.5 115.2 1022.2 -149.4
A 3' -22.6 -465 -15.8 331.4 24.9
4 -22.6 -1225.8 -41.8 873.4 24.9
COL8 A 5 -22.6 0 0 0 24.9
C 3' -22.6 -136.6 -15.8 -119.8 24.9
4 -22.6 -360.1 -41.8 -316.1 24.9
5 -22.6 0 0 0 24.9
∑ -135.6 -2187.5 -115.2 768.9 149.4
A 3' 22.6 -136.6 15.8 119.8 -24.9
4 22.6 -360.1 41.8 316.1 -24.9
COL21 C 5 22.6 0 0 0 -24.9
C 3' 22.6 -465 15.8 -331.4 -24.9
4 22.6 -1225.8 41.8 -873.4 -24.9
5 22.6 0 0 0 -24.9
∑ 135.6 -2187.5 115.2 -768.9 -149.4
A 3' -22.6 -465 -15.8 85.1 24.9
4 -22.6 -1225.8 -41.8 224.1 24.9
COL22 C 5 -22.6 0 0 0 24.9
C 3' -22.6 -136.6 -15.8 -366.1 24.9
4 -22.6 -360.1 -41.8 -965.3 24.9
5 -22.6 0 0 0 24.9
∑ -135.6 -2187.5 -115.2 -1022.2 149.4
28
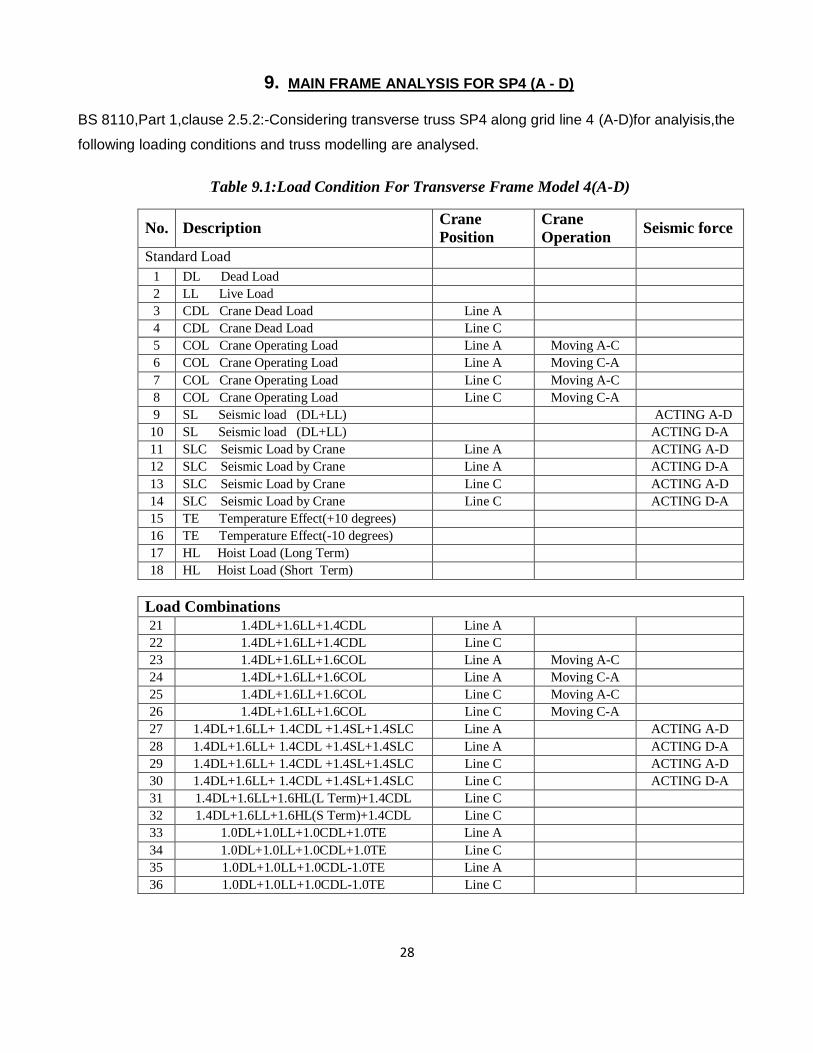
9. MAIN FRAME ANALYSIS FOR SP4 (A - D)
BS 8110,Part 1,clause 2.5.2:-Considering transverse truss SP4 along grid line 4 (A-D)for analyisis,the
following loading conditions and truss modelling are analysed.
10BTable 9.1:Load Condition For Transverse Frame Model 4(A-D)
No. Description Crane
Position
Crane
Operation Seismic force
Standard Load
1 DL Dead Load
2 LL Live Load
3 CDL Crane Dead Load Line A
4 CDL Crane Dead Load Line C
5 COL Crane Operating Load Line A Moving A-C
6 COL Crane Operating Load Line A Moving C-A
7 COL Crane Operating Load Line C Moving A-C
8 COL Crane Operating Load Line C Moving C-A
9 SL Seismic load (DL+LL) ACTING A-D
10 SL Seismic load (DL+LL) ACTING D-A
11 SLC Seismic Load by Crane Line A ACTING A-D
12 SLC Seismic Load by Crane Line A ACTING D-A
13 SLC Seismic Load by Crane Line C ACTING A-D
14 SLC Seismic Load by Crane Line C ACTING D-A
15 TE Temperature Effect(+10 degrees)
16 TE Temperature Effect(-10 degrees)
17 HL Hoist Load (Long Term)
18 HL Hoist Load (Short Term)
Load Combinations
21 1.4DL+1.6LL+1.4CDL Line A
22 1.4DL+1.6LL+1.4CDL Line C
23 1.4DL+1.6LL+1.6COL Line A Moving A-C
24 1.4DL+1.6LL+1.6COL Line A Moving C-A
25 1.4DL+1.6LL+1.6COL Line C Moving A-C
26 1.4DL+1.6LL+1.6COL Line C Moving C-A
27 1.4DL+1.6LL+ 1.4CDL +1.4SL+1.4SLC Line A ACTING A-D
28 1.4DL+1.6LL+ 1.4CDL +1.4SL+1.4SLC Line A ACTING D-A
29 1.4DL+1.6LL+ 1.4CDL +1.4SL+1.4SLC Line C ACTING A-D
30 1.4DL+1.6LL+ 1.4CDL +1.4SL+1.4SLC Line C ACTING D-A
31 1.4DL+1.6LL+1.6HL(L Term)+1.4CDL Line C
32 1.4DL+1.6LL+1.6HL(S Term)+1.4CDL Line C
33 1.0DL+1.0LL+1.0CDL+1.0TE Line A
34 1.0DL+1.0LL+1.0CDL+1.0TE Line C
35 1.0DL+1.0LL+1.0CDL-1.0TE Line A
36 1.0DL+1.0LL+1.0CDL-1.0TE Line C
29
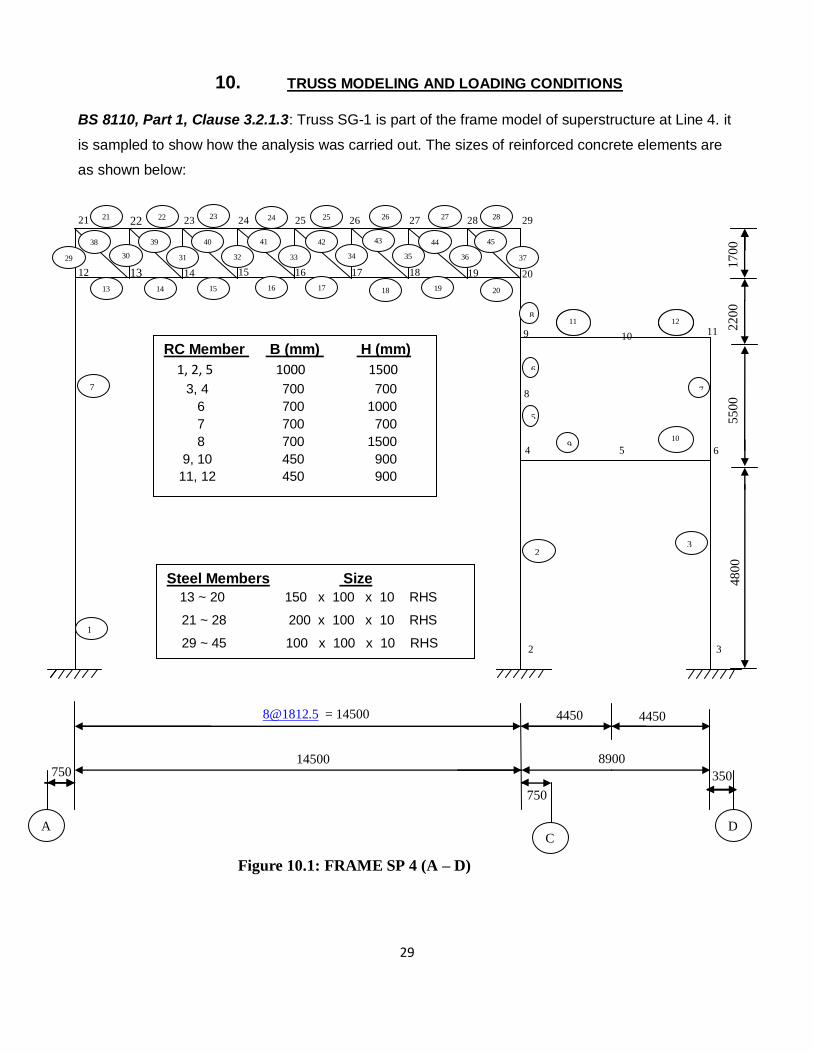
10. TRUSS MODELING AND LOADING CONDITIONS
BS 8110, Part 1, Clause 3.2.1.3: Truss SG-1 is part of the frame model of superstructure at Line 4. it
is sampled to show how the analysis was carried out. The sizes of reinforced concrete elements are
as shown below:
Figure 10.1: FRAME SP 4 (A – D)
1700
22
00
550
0
48
00
21
12
22
13
23
14
24
15
25
16
26
17
27
18
28
19
29
20
29
13
14
22
39
38
21
30
15
40
23
32
31
25
42
16
33
24
41
34
18
35
26
43
36
20
37
28
45
19
17
27
44
8
11
12
11
12
9
10
9
5
10
4
6
5
8
2
C
2
3
3
11
6
7
4450 4450
8900
[email protected] = 14500
14500
A
D
350
750
750
RC Member B (mm) H (mm)
1, 2, 5 1000 1500
3, 4 700 700
6 700 1000
7 700 700
8 700 1500
9, 10 450 900
11, 12 450 900
Steel Members Size
13 ~ 20 150 x 100 x 10 RHS
21 ~ 28 200 x 100 x 10 RHS
29 ~ 45 100 x 100 x 10 RHS
1
7
30
BS 8110 REF.
CALCULATIONS
OUTPUT
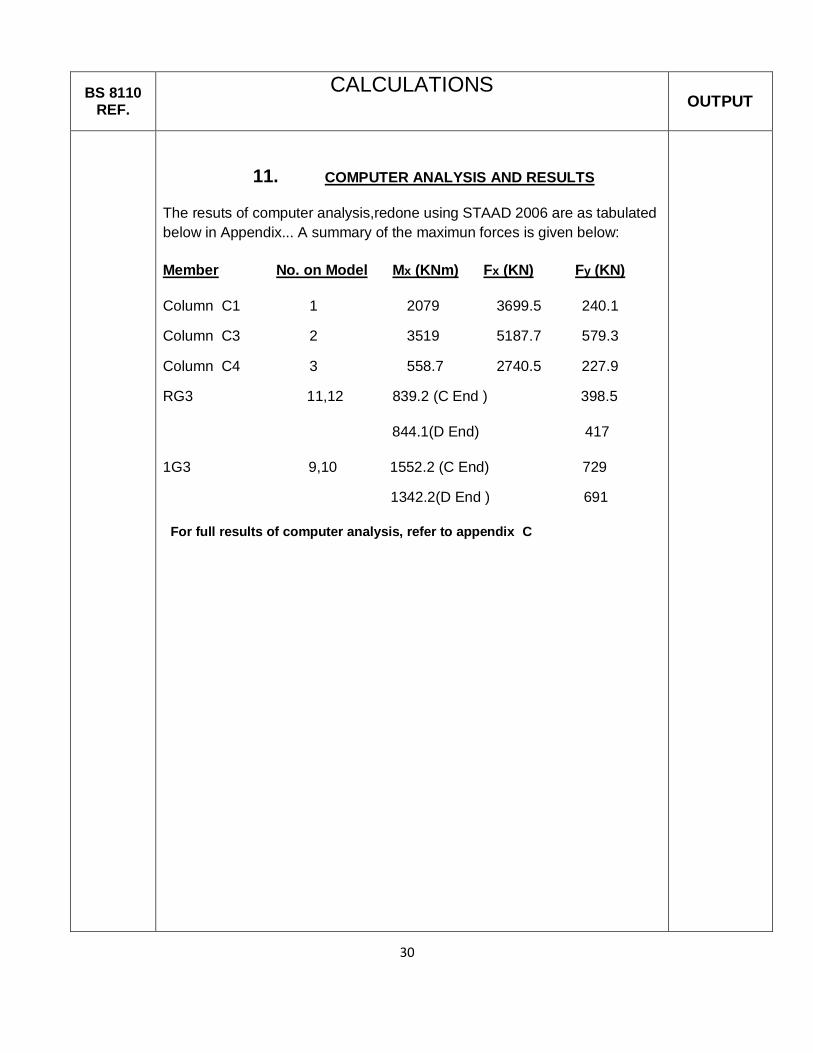
11. COMPUTER ANALYSIS AND RESULTS
The resuts of computer analysis,redone using STAAD 2006 are as tabulated
below in Appendix... A summary of the maximun forces is given below:
Member No. on Model Mx (KNm) Fx (KN) Fy (KN)
Column C1 1 2079 3699.5 240.1
Column C3 2 3519 5187.7 579.3
Column C4 3 558.7 2740.5 227.9
RG3 11,12 839.2 (C End ) 398.5
844.1(D End) 417
1G3 9,10 1552.2 (C End) 729
1342.2(D End ) 691
For full results of computer analysis, refer to appendix C
31
BS 8110 REF.
CALCULATIONS
OUTPUT
Clause 2.5.3
Clause 3.4
Clause 3.4.4.4
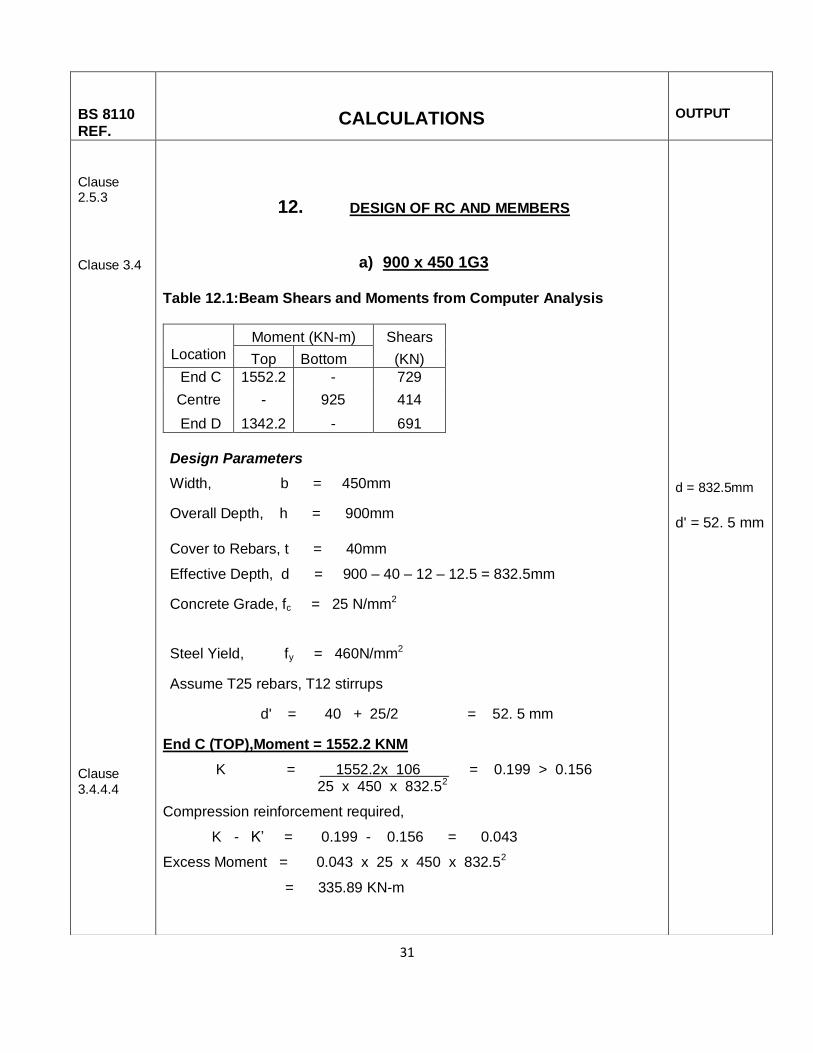
12. DESIGN OF RC AND MEMBERS
a) 900 x 450 1G3
Table 12.1:Beam Shears and Moments from Computer Analysis
Location
Moment (KN-m) Shears
Top Bottom (KN)
End C 1552.2 - 729
Centre - 925 414
End D 1342.2 - 691
Design Parameters
Width, b = 450mm
Overall Depth, h = 900mm
Cover to Rebars, t = 40mm
Effective Depth, d = 900 – 40 – 12 – 12.5 = 832.5mm
Concrete Grade, fc = 25 N/mm2
Steel Yield, fy = 460N/mm2
Assume T25 rebars, T12 stirrups
d' = 40 + 25/2 = 52. 5 mm
End C (TOP),Moment = 1552.2 KNM
K = 1552.2x 106 = 0.199 > 0.156 25 x 450 x 832.52
Compression reinforcement required,
K - K’ = 0.199 - 0.156 = 0.043
Excess Moment = 0.043 x 25 x 450 x 832.52
= 335.89 KN-m
d = 832.5mm
d' = 52. 5 mm
32
BS 8110 REF. CALCULATIONS
OUTPUT
3.4.5.2
Table 3.8
Table 3.7
3.4.5.3
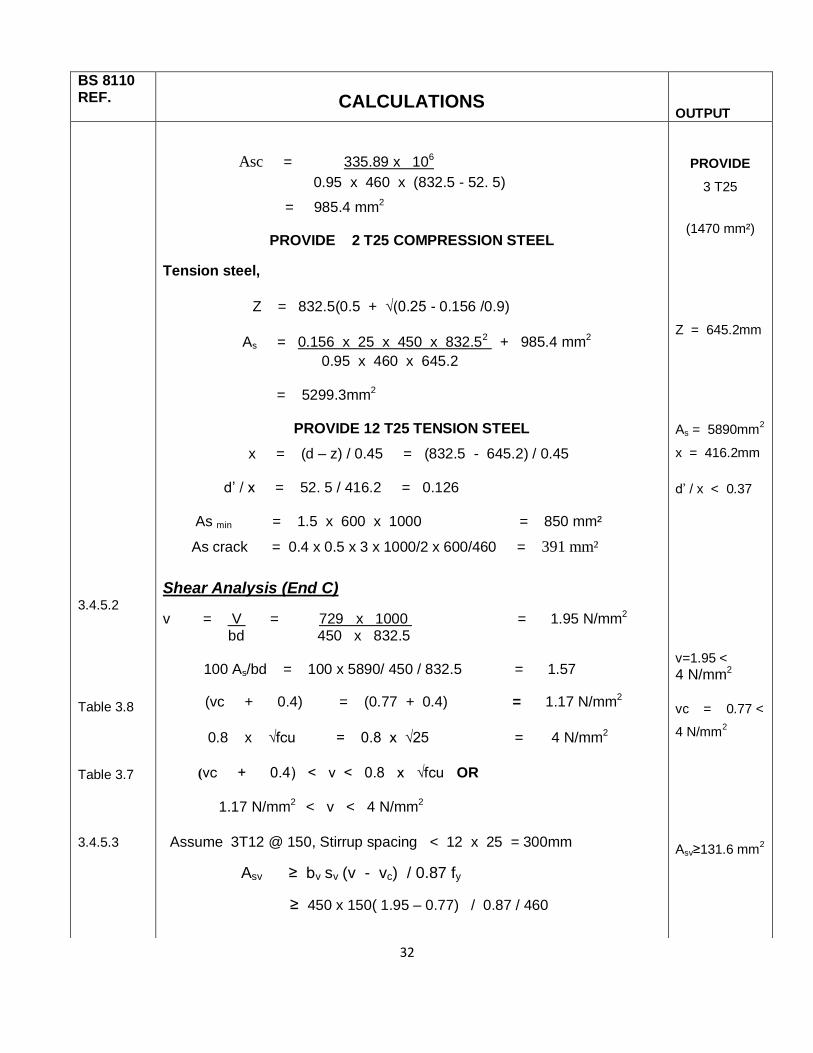
Asc = 335.89 x 10⁶
0.95 x 460 x (832.5 - 52. 5)
= 985.4 mm2
PROVIDE 2 T25 COMPRESSION STEEL
Tension steel,
Z = 832.5(0.5 + √(0.25 - 0.156 /0.9)
As = 0.156 x 25 x 450 x 832.52 + 985.4 mm2
0.95 x 460 x 645.2
= 5299.3mm2
PROVIDE 12 T25 TENSION STEEL
x = (d – z) / 0.45 = (832.5 - 645.2) / 0.45
d’ / x = 52. 5 / 416.2 = 0.126
As min = 1.5 x 600 x 1000 = 850 mm²
As crack = 0.4 x 0.5 x 3 x 1000/2 x 600/460 = 391 mm²
Shear Analysis (End C)
v = V = 729 x 1000 = 1.95 N/mm2 bd 450 x 832.5
100 As/bd = 100 x 5890/ 450 / 832.5 = 1.57
(vc + 0.4) = (0.77 + 0.4) = 1.17 N/mm2
0.8 x √fcu = 0.8 x √25 = 4 N/mm2
(vc + 0.4) < v < 0.8 x √fcu OR
1.17 N/mm2 < v < 4 N/mm2
Assume 3T12 @ 150, Stirrup spacing < 12 x 25 = 300mm
Asv ≥ bv sv (v - vc) / 0.87 fy
≥ 450 x 150( 1.95 – 0.77) / 0.87 / 460
PROVIDE
3 T25
(1470 mm²)
Z = 645.2mm
As = 5890mm2
x = 416.2mm
d’ / x < 0.37
v=1.95 <
4 N/mm2
vc = 0.77 <
4 N/mm2
Asv≥131.6 mm2
33
BS 8110 REF.
CALCULATIONS
OUTPUT
cl.3.4.5.5
Clause 3.8.2.1
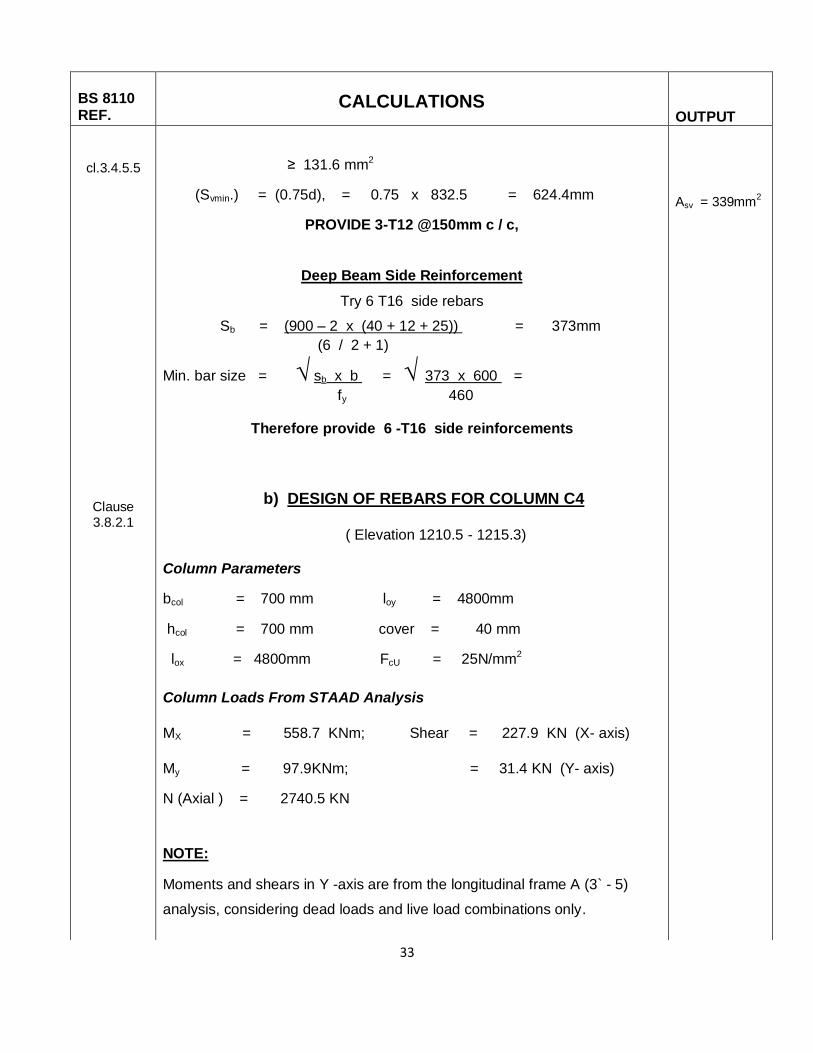
≥ 131.6 mm2
(Svmin.) = (0.75d), = 0.75 x 832.5 = 624.4mm
PROVIDE 3-T12 @150mm c / c,
Deep Beam Side Reinforcement
Try 6 T16 side rebars
Sb = (900 – 2 x (40 + 12 + 25)) = 373mm
(6 / 2 + 1)
Min. bar size = √ sb x b = √ 373 x 600 =
fy 460
Therefore provide 6 -T16 side reinforcements
b) DESIGN OF REBARS FOR COLUMN C4
( Elevation 1210.5 - 1215.3)
Column Parameters
bcol = 700 mm loy = 4800mm
hcol = 700 mm cover = 40 mm
lox = 4800mm FcU = 25N/mm2
Column Loads From STAAD Analysis
MX = 558.7 KNm; Shear = 227.9 KN (X- axis)
My = 97.9KNm; = 31.4 KN (Y- axis)
N (Axial ) = 2740.5 KN
NOTE:
Moments and shears in Y -axis are from the longitudinal frame A (3` - 5)
analysis, considering dead loads and live load combinations only.
Asv = 339mm2
34
BS 8110
REF.
CALCULATIONS
OUTPUT
3.8.1.6.2
Table 3.20
3.8.1.6.1
3.8.4.5
equation 40
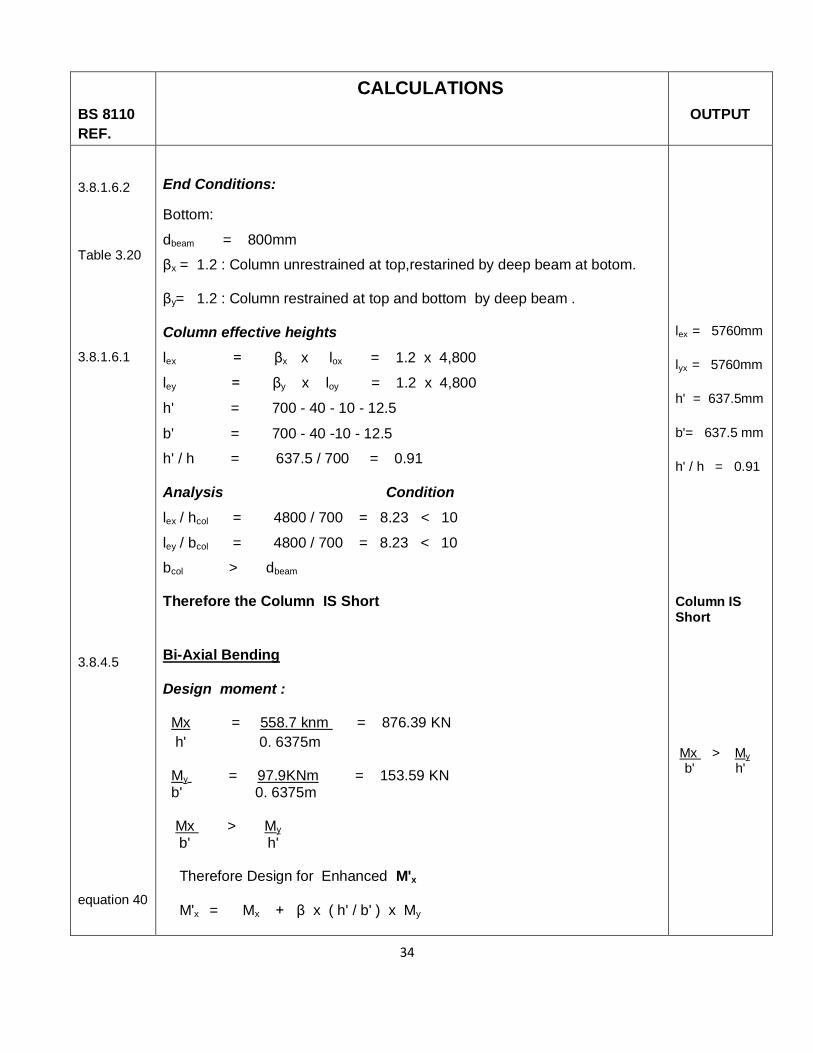
End Conditions:
Bottom:
dbeam = 800mm
βx = 1.2 : Column unrestrained at top,restarined by deep beam at botom.
βy= 1.2 : Column restrained at top and bottom by deep beam .
Column effective heights
lex = βx x lox = 1.2 x 4,800
ley = βy x loy = 1.2 x 4,800
h' = 700 - 40 - 10 - 12.5
b' = 700 - 40 -10 - 12.5
h' / h = 637.5 / 700 = 0.91
Analysis Condition
lex / hcol = 4800 / 700 = 8.23 < 10
ley / bcol = 4800 / 700 = 8.23 < 10
bcol > dbeam
Therefore the Column IS Short
Bi-Axial Bending
Design moment :
Mx = 558.7 knm = 876.39 KN
h' 0. 6375m My = 97.9KNm = 153.59 KN b' 0. 6375m Mx > My b' h' Therefore Design for Enhanced M'x
M'x = Mx + β x ( h' / b' ) x My
lex = 5760mm
lyx = 5760mm
h' = 637.5mm
b'= 637.5 mm
h' / h = 0.91
Column IS Short
Mx > My b' h'
35
BS 8110
REF.
CALCULATIONS
OUTPUT
Table 3.22.
Part 3
Chart No.25
3.8.4.6
Table 3.9
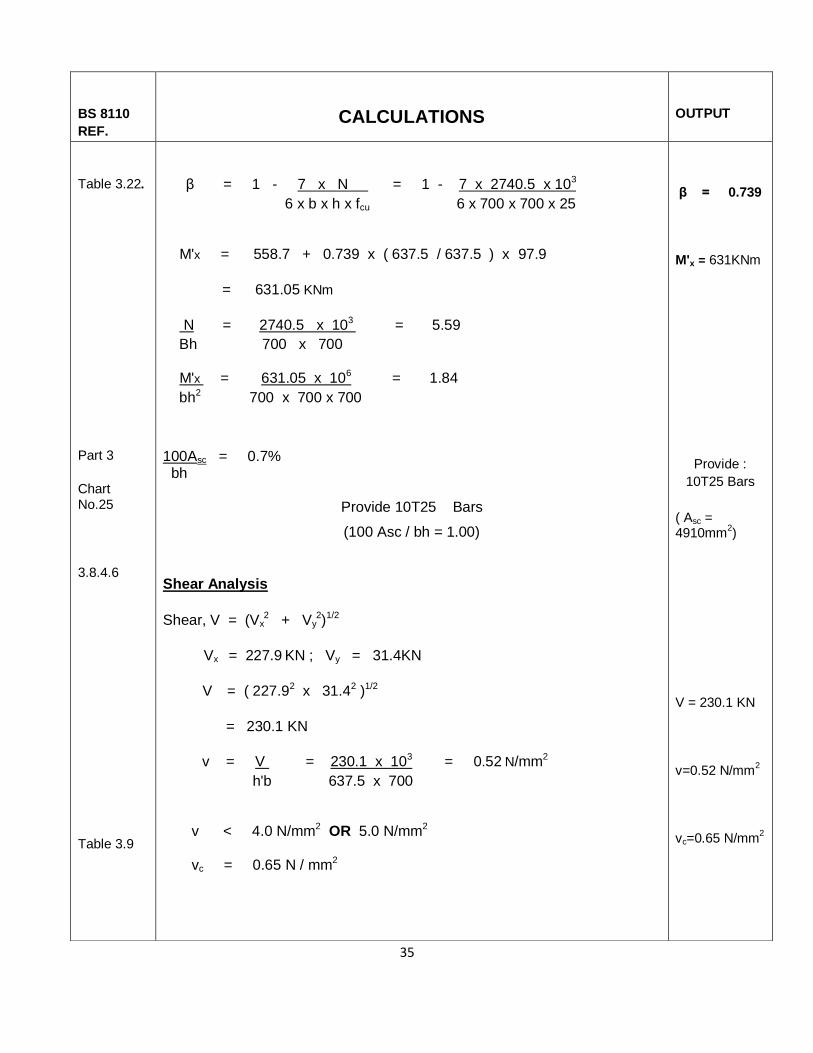
β = 1 - 7 x N = 1 - 7 x 2740.5 x 103
6 x b x h x fcu 6 x 700 x 700 x 25
M'x = 558.7 + 0.739 x ( 637.5 / 637.5 ) x 97.9
= 631.05 KNm
N = 2740.5 x 103 = 5.59
Bh 700 x 700 M'x = 631.05 x 106 = 1.84
bh2 700 x 700 x 700
100Asc = 0.7% bh
Provide 10T25 Bars
(100 Asc / bh = 1.00)
Shear Analysis
Shear, V = (Vx2 + Vy
2)1/2
Vx = 227.9 KN ; Vy = 31.4KN
V = ( 227.92 x 31.42 )1/2
= 230.1 KN
v = V = 230.1 x 103 = 0.52 N/mm2
h'b 637.5 x 700 v < 4.0 N/mm2 OR 5.0 N/mm2 vc = 0.65 N / mm2
β = 0.739
M'x = 631KNm
Provide :
10T25 Bars
( Asc = 4910mm
2)
V = 230.1 KN
v=0.52 N/mm2
vc=0.65 N/mm2
36
BS8110
REF.
CALCULATIONS
OUTPUT
Clause
3.4.5.12
3.4.7
Clause 5.2.3.4
v'c = vc + 0.60 N / Ac V h' / M
Ac = h = 0.49m2;
M = 631.05 KNm
Hence v'c = 0.65 + 0.60 x 2740.5
0.49 x 230.1 x 0.6375 x 631.05
= 0.69 N /mm2
Therefore provide min. Hoops:
Max. spacing = 0.75 x h' = 0.75 x 637.5 = 478.12mm;
Min. Size of Hoop = 25 / 4 = 6.25mm
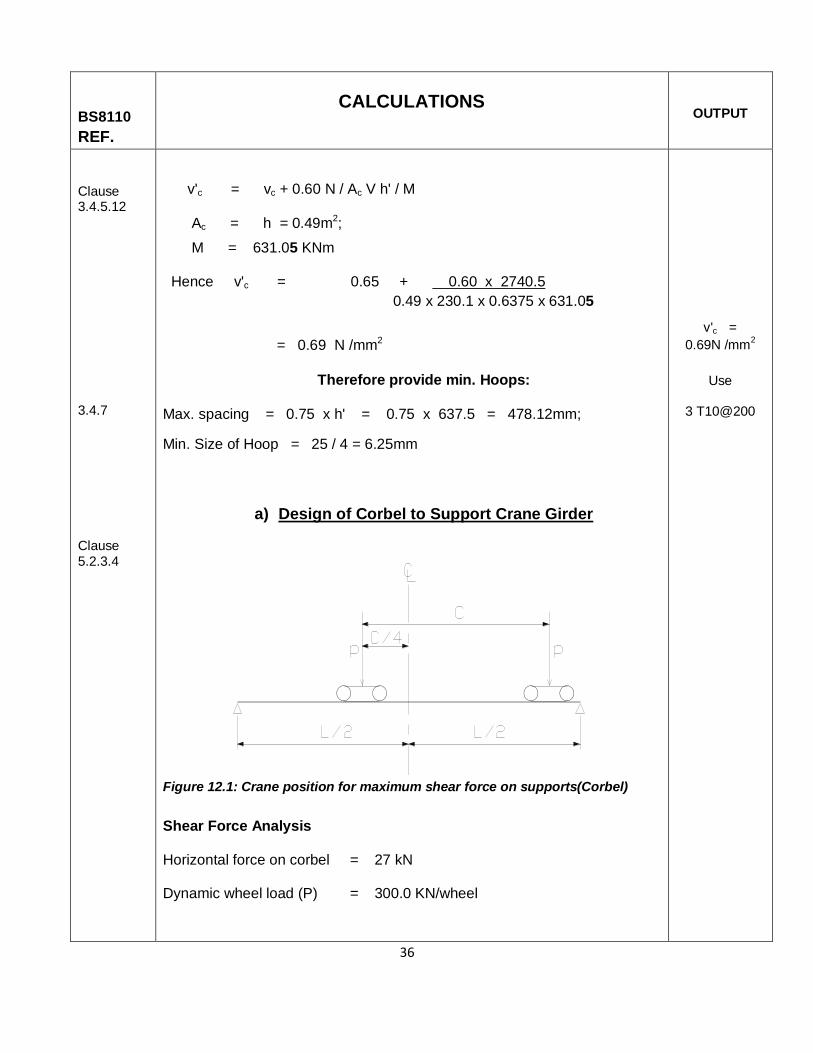
a) Design of Corbel to Support Crane Girder
Figure 12.1: Crane position for maximum shear force on supports(Corbel)
Shear Force Analysis
Horizontal force on corbel = 27 kN
Dynamic wheel load (P) = 300.0 KN/wheel
v'c =
0.69N /mm2
Use
3 T10@200
37
BS8110
REF. CALCULATIONS
OUTPUT
Clause 5.2.7.1
Impact factor (wheels) = 1.25
Therefore factored load = 1.25 x 300 = 375.0 KN
Ultimate load,Pf = 1.4 x 375.0 = 525 KN
C = 4.34m (c/c spacing of Crane wheels)
Pf = 525 KN/ wheel (Factored Load)
L = 7.5 m (Max span of Girder)
Wswt = 5 KN/m (Assumed Girder self weight)
PT = 2 x Pf = 2 x 525 = 1050 KN
Max. shear force due to wheel loads = PT x ( 2 - C/L )
1050 x ( 2 - 4.34/7.5 ) = 1492.4 KN
Girder self weight. = 5 x 7.5/2 = 18.8 KN
Total Shear force, Vx = 1492.4 + 18.8 = 1511.2 KN
Concrete strength fcu = 25 N/mm2 ; fy = 460N/mm2
Maximum bearing stress at contact surface = 0.8 x 25 = 20N/mm2
Minimum Length of bearing plate = 470mm
Required minimum width of Bearing Plate = 1511.2 x 103
(20 x 470)
= 160mm
minimum width of Bearing Plate provided = 370 > 160mm OK
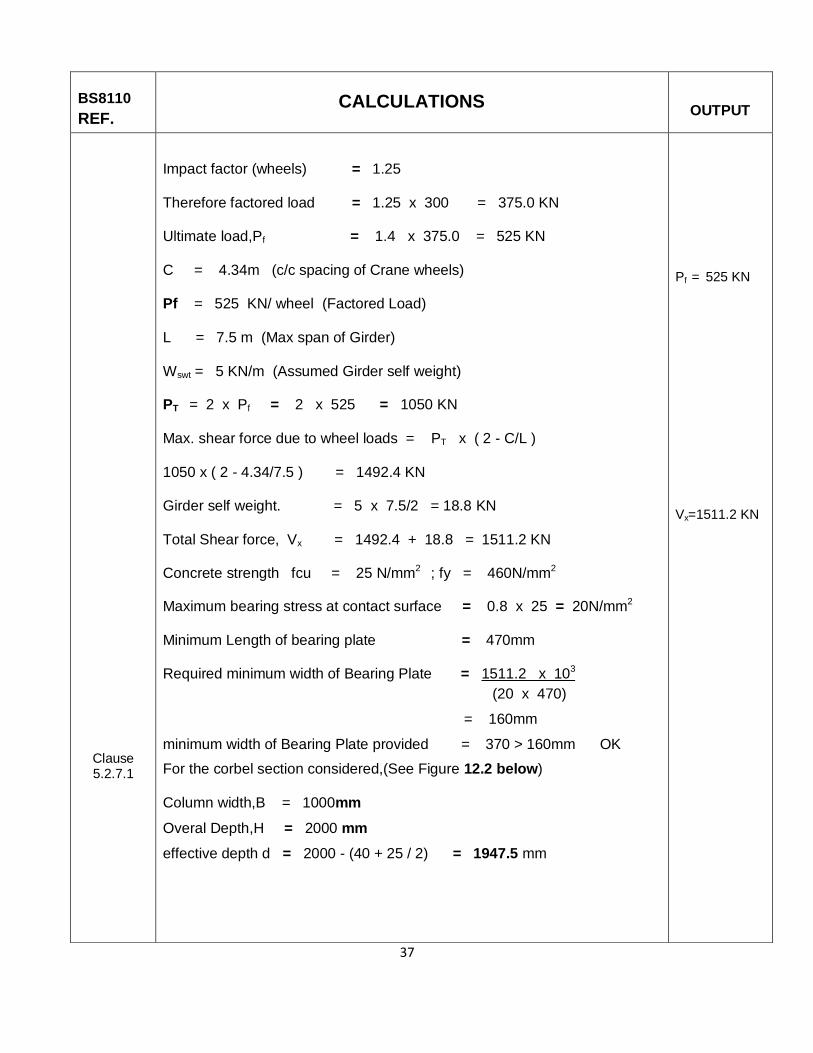
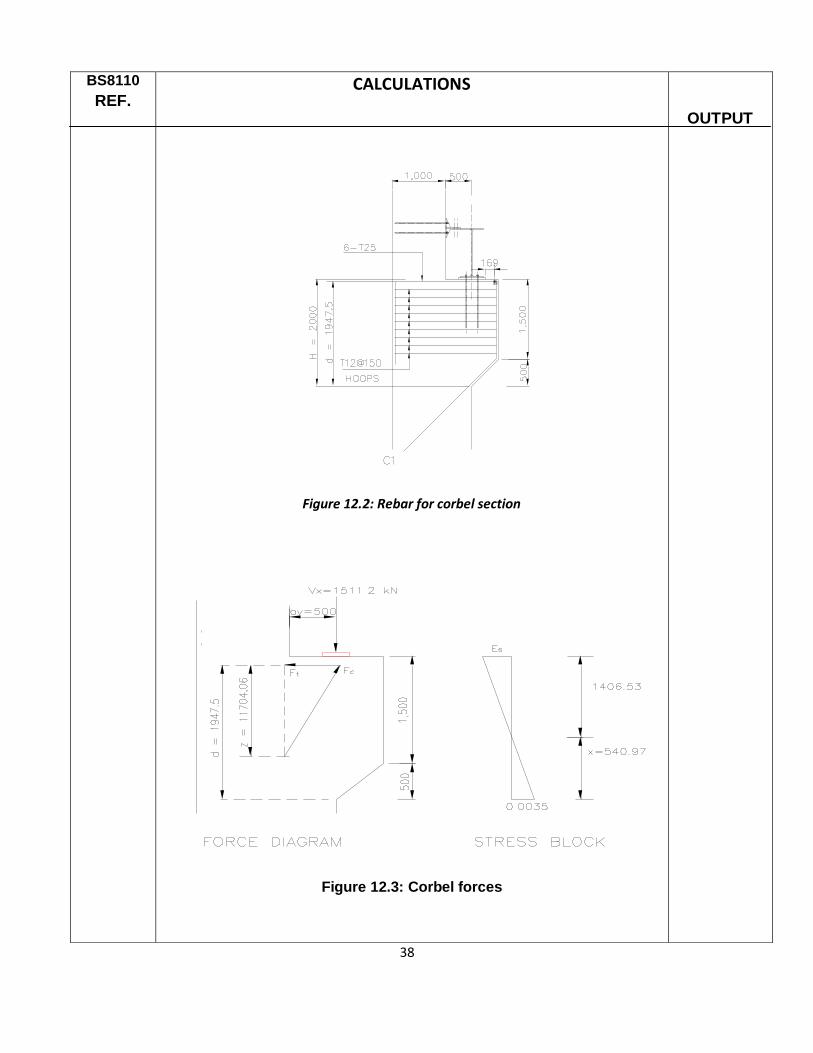
For the corbel section considered,(See Figure 12.2 below)
Column width,B = 1000mm
Overal Depth,H = 2000 mm
effective depth d = 2000 - (40 + 25 / 2) = 1947.5 mm
Pf = 525 KN
Vx=1511.2 KN
38
BS8110
REF.
CALCULATIONS
Figure 12.2: Rebar for corbel section
Figure 12.3: Corbel forces
OUTPUT
39
BS8110
REF.
clause 5.2.7.2.3
BS table
3.9
CALCULATIONS
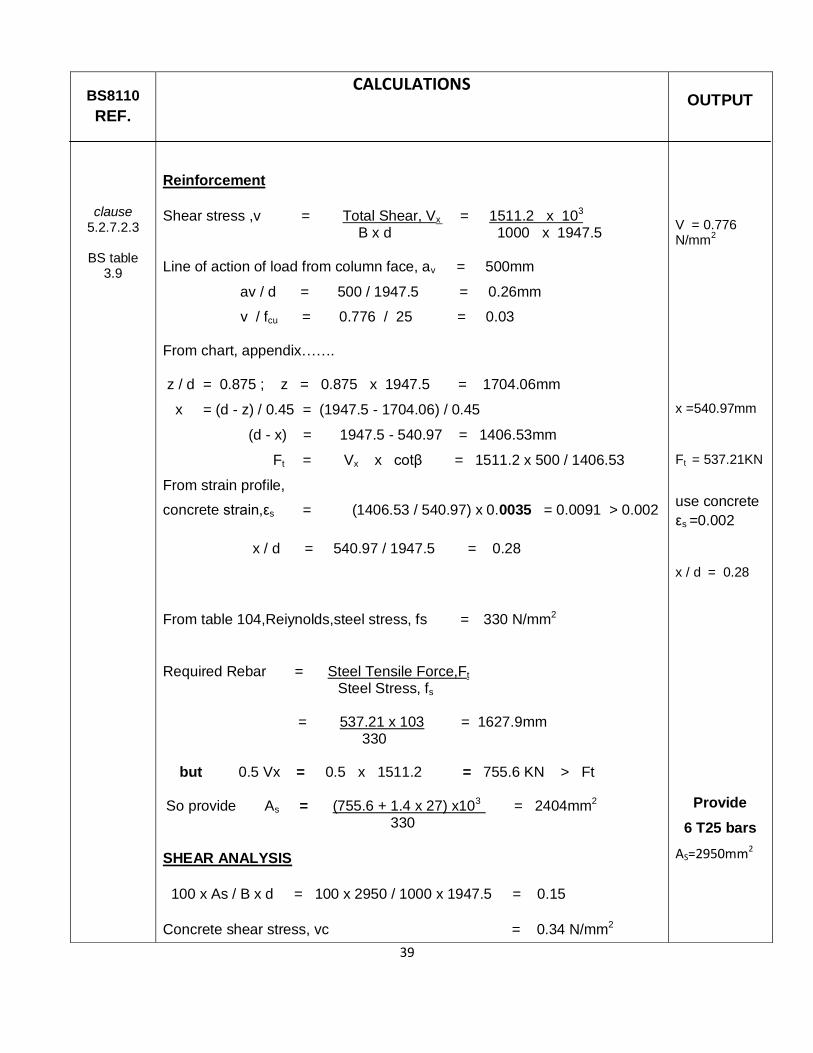
Reinforcement
Shear stress ,v = Total Shear, Vx = 1511.2 x 103 B x d 1000 x 1947.5
Line of action of load from column face, av = 500mm
av / d = 500 / 1947.5 = 0.26mm
v / fcu = 0.776 / 25 = 0.03 From chart, appendix…….
z / d = 0.875 ; z = 0.875 x 1947.5 = 1704.06mm
x = (d - z) / 0.45 = (1947.5 - 1704.06) / 0.45
(d - x) = 1947.5 - 540.97 = 1406.53mm
Ft = Vx x cotβ = 1511.2 x 500 / 1406.53
From strain profile,
concrete strain,εs = (1406.53 / 540.97) x 0.0035 = 0.0091 > 0.002
x / d = 540.97 / 1947.5 = 0.28
From table 104,Reiynolds,steel stress, fs = 330 N/mm2
Required Rebar = Steel Tensile Force,Ft Steel Stress, fs
= 537.21 x 103 = 1627.9mm 330 but 0.5 Vx = 0.5 x 1511.2 = 755.6 KN > Ft
So provide As = (755.6 + 1.4 x 27) x103 = 2404mm2 330
SHEAR ANALYSIS
100 x As / B x d = 100 x 2950 / 1000 x 1947.5 = 0.15
Concrete shear stress, vc = 0.34 N/mm2
OUTPUT
V = 0.776 N/mm
2
x =540.97mm
Ft = 537.21KN
use concrete
εs =0.002 x / d = 0.28
Provide
6 T25 bars
AS=2950mm2
40
BS5950
REF.
BS 5950, Part 4.6.1
CALCULATIONS
Links required : As / sv = B(v - vc)
= 1000(0.878-0.34) = 538 mm2/m
Minimum area of links = 0.5 x Rebar area
= 0.5 x 2950 = 1473mm2
Notes
1.) The main tension bars to be welded to a cross bar of equal size and strength.
2.) 2).The distance between the edge of the bearing plate and the inside
face of the cross bar (169mm) > cover to main tension bars.
13. DESIGN OF MAIN TRUSS MEMBERS (SG-1)
From STAAD analysis, maximum axial forces( KN ) are :
Tension compression
Bottom Members (Nos. 13 – 20) : 1116.8
Top Members (Nos. 21 – 28) : 1205.9
Internal Members (Nos. 29– 45) : 749.1 749.10
Consider member No. 17 with tensile force = 1141.05 KN
For welded connections, allowable tensile force, Pt,
Pt = Ae x Py ; Ae = gross area of section.
Try 150 x 100 x 10mm RHS section
Allowable tensile force = 55.5 x 102 x 275 x 10-3
= 1526.25 KN > 1141.05 KN OK
OUTPUT
Provide:
T12@150 C/C
AS=754mm2/m
Provide 7
legs@226
AS= 1582mm2
Use 150x100x10mm
RHS
41
BS8110
REF.
BS 5950, 4.7.3.2
Table 27(a)
CALCULATIONS
Member with max. compressive force (No.24) = 1205.92 KN
Panel points for secondary trusses = 1812.5mm
Effective length, LE = 1812.5 x 1.0 mm
Try 200 x 100 x 10mm RHS
Radius of gyration = 7.0 x 10mm
Λ = 1812.5 / 7.0 x 10mm = 25.9
pc = 269 N/mm2
allowable compressive force Pc = pc x Ag ; Ag = 55.5cm2
Pc = 269 x10-3 x 55.5 x 102 = 1492.95 > 1205.92 KN OK
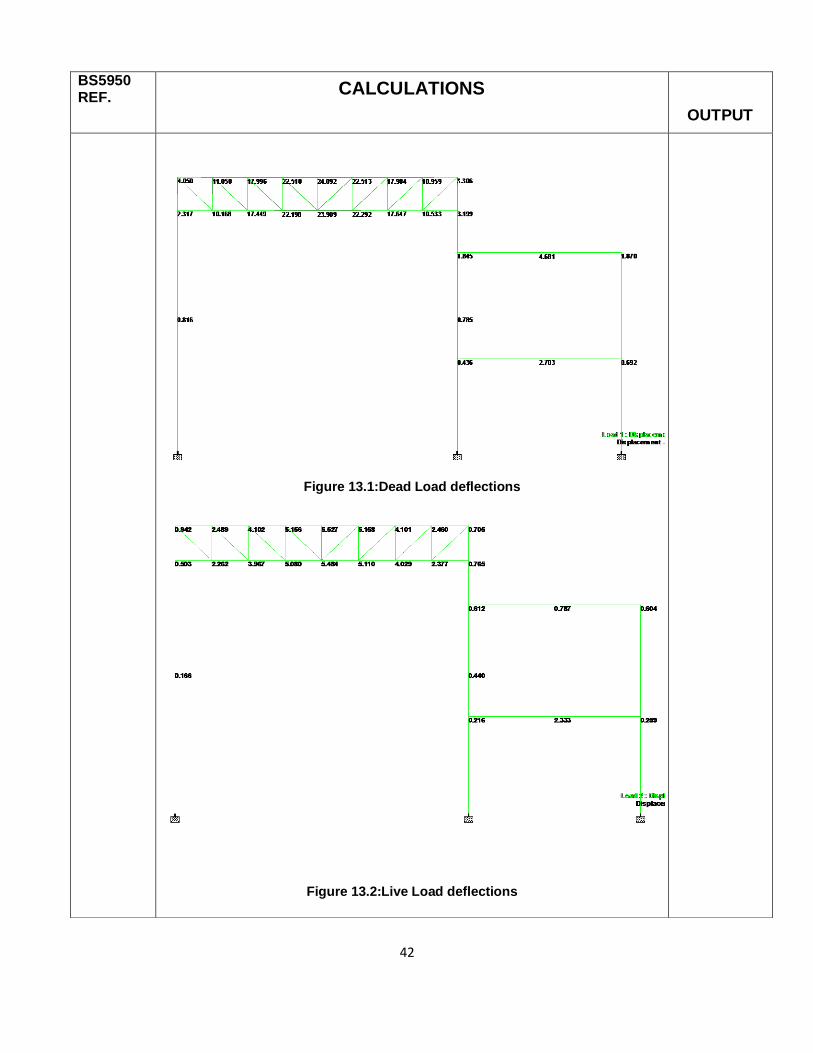
Deflection check for truss SG-1:
Displacement diagrams (figs.13.1 &13.2) below depict the deflection of truss
SG-1. On frame 4 A-D.
i) Determination of max deflection due to Dead Load (See fig.13.1)
σDL = 23.91 – (2.32 + 3.20) = 21.15 mm ………(i) 2
ii) Determination of max deflection due to Live Load (See fig.13.2)
σLL = 5.48 – (0.50 + 0.77) = 4.85 mm ………(ii)
2
i) Computation of maximum total deflection due to combined Dead
Load and Live Load
σmax = σDL + σLL
= (21.15 + 4.85) mm = 26.0 mm
i) Check on limiting deflection ratio (L / σ)
L / σ = 15,200 / 26.0 = 584.6 > 360 OK
OUTPUT
Use 200x100x10mm
RHS
σDL= 21.15mm
σLL = 4.85 mm
σmax= 26.0mm
L / σ > 360
OK
42
BS5950 REF.
CALCULATIONS
OUTPUT
Figure 13.1:Dead Load deflections
Figure 13.2:Live Load deflections
43

44

45

46
SECTION B: BILLS OF QUANTITIES
BILLS OF QUAN TITIES
GENERAL NOTES:
47
Whenever in the contractors priced bill of quantities no price appears against an item,the value of s
uch item shall be deemed to have been included in his prices for the other items in the bill of
quantities.
Abbreviations
Throughout the bill of quantities,units of measurements and the terms are abbreviated and shall be
interpreted as follows:
M shall mean linear metre
Sm shall mean square metre
Cm shall mean cubic metre
Mm shall mean millimeter
Kg shall mean kilogramme
Ditto shall mean the whole of the preceeding description except as qualified in the description
in which it occurs.

48
Column C1

49

50
APPENDICES
51
APPENDIX A:
FRAME MODELLING
52
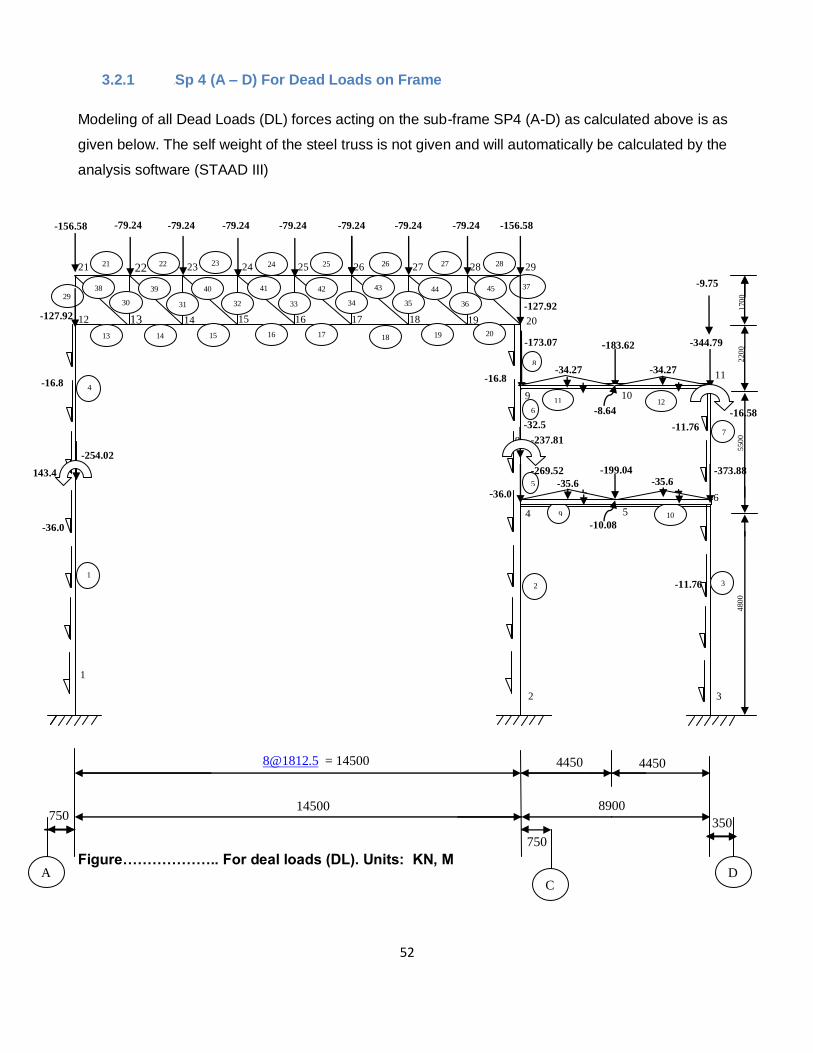
3.2.1 12BSp 4 (A – D) For Dead Loads on Frame
Modeling of all Dead Loads (DL) forces acting on the sub-frame SP4 (A-D) as calculated above is as
given below. The self weight of the steel truss is not given and will automatically be calculated by the
analysis software (STAAD III)
Figure……………….. For deal loads (DL). Units: KN, M
170
0
220
0
550
0
480
0
21
12
22
13
23
14
24
15
25
16
26
17
27
18
28
19
29
20
29
13
14
22
39
38
21
30
15
40
23
32
31
25
42
16
33
24
41
34
18
35
26
43
36
20
37
28
45
19
17
27
44
8
11
12
9
10
9
5
10
4
6
5
8
2
C
2
3
3
11
6
7
4450 4450
8900
[email protected] = 14500
14500
A
D
350
750
750
-156.58 -79.24 -79.24
-79.24
-79.24
-79.24
-79.24
-79.24
-156.58
-183.62
-173.07
-344.79
-9.75
-127.92
-199.04
-237.81
-269.52
-34.27
-34.27
-16.58
-373.88
-11.76
-11.76
-8.64
-10.08
-32.5
-35.6
-35.6
-36.0
-16.8
143.4
-254.02
-16.8
4
1
1
-36.0
-127.92
53
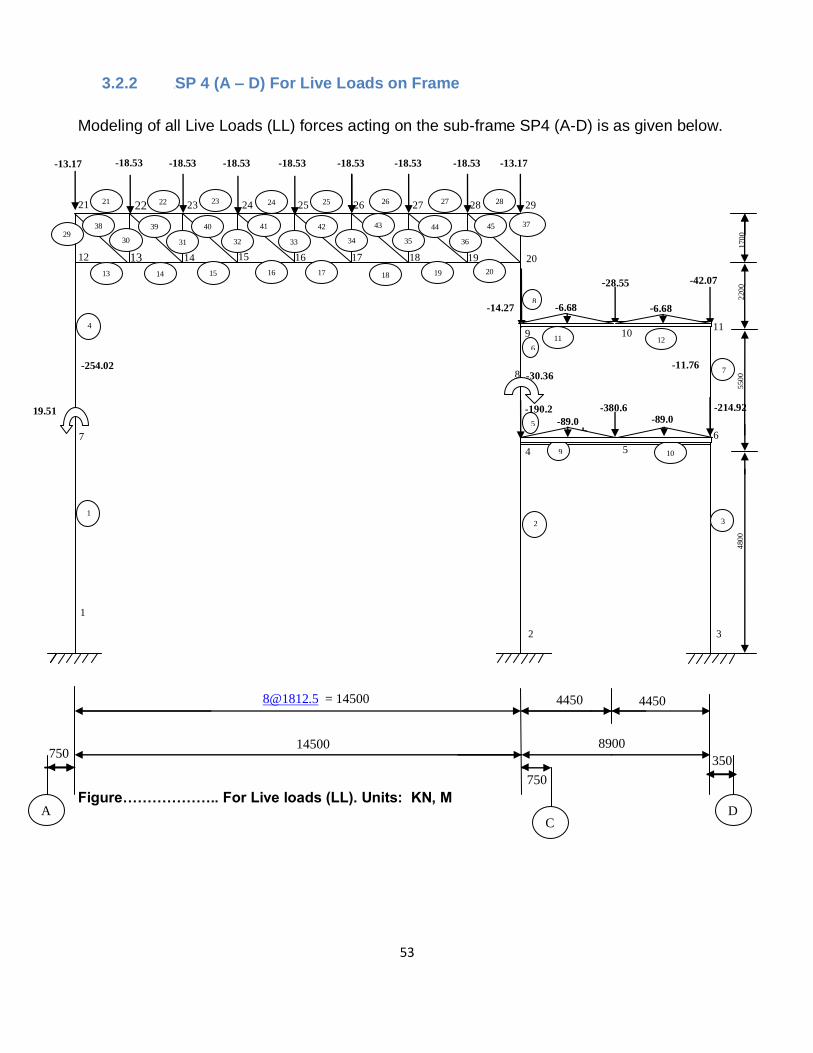
3.2.2 13BSP 4 (A – D) For Live Loads on Frame
Modeling of all Live Loads (LL) forces acting on the sub-frame SP4 (A-D) is as given below.
Figure……………….. For Live loads (LL). Units: KN, M
170
0
220
0
550
0
480
0
21
12
22
13
23
14
24
15
25
16
26
17
27
18
28
19
29
20
29
13
14
22
39
38
21
30
15
40
23
32
31
25
42
16
33
24
41
34
18
35
26
43
36
20
37
28
45
19
17
27
44
8
11
12
9
10
9
5
10
4
6
5
8
2
C
2
3
3
11
6
7
4450 4450
8900
[email protected] = 14500
14500
A
D
350
750
750
-13.17 -18.53 -18.53
-18.53
-18.53
-18.53
-18.53
-18.53
-13.17
-28.55
-14.27
-42.07
-380.6
-30.36
-190.2
-6.68
-6.68
-214.92
-11.76
-89.0
-89.0
19.51
-254.02
4
1
1
7
54
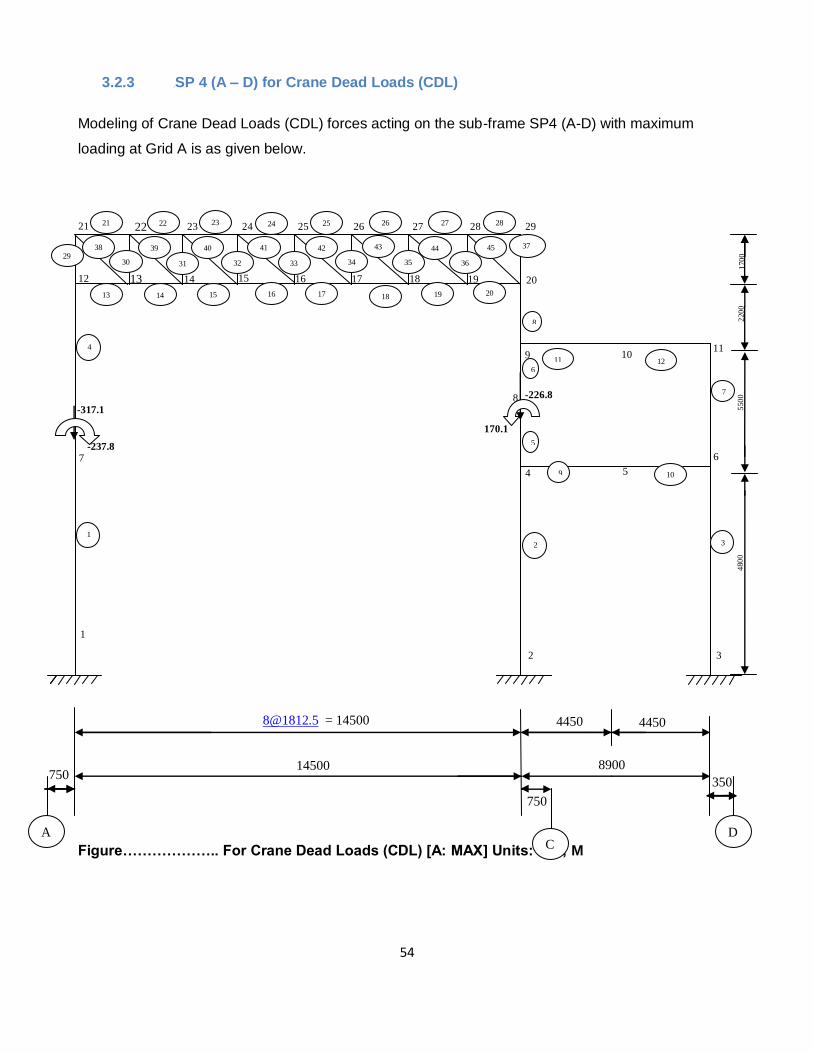
3.2.3 14BSP 4 (A – D) for Crane Dead Loads (CDL)
Modeling of Crane Dead Loads (CDL) forces acting on the sub-frame SP4 (A-D) with maximum
loading at Grid A is as given below.
Figure……………….. For Crane Dead Loads (CDL) [A: MAX] Units: KN, M
170
0
220
0
550
0
480
0
21
12
22
13
23
14
24
15
25
16
26
17
27
18
28
19
29
20
29
13
14
22
39
38
21
30
15
40
23
32
31
25
42
16
33
24
41
34
18
35
26
43
36
20
37
28
45
19
17
27
44
8
11
12
9
10
9
5
10
4
6
5
8
2
C
2
3
3
11
6
7
4450 4450
8900
[email protected] = 14500
14500
A
D
350
750
750
-226.8
170.1
-237.8
-317.1
4
1
1
7
55
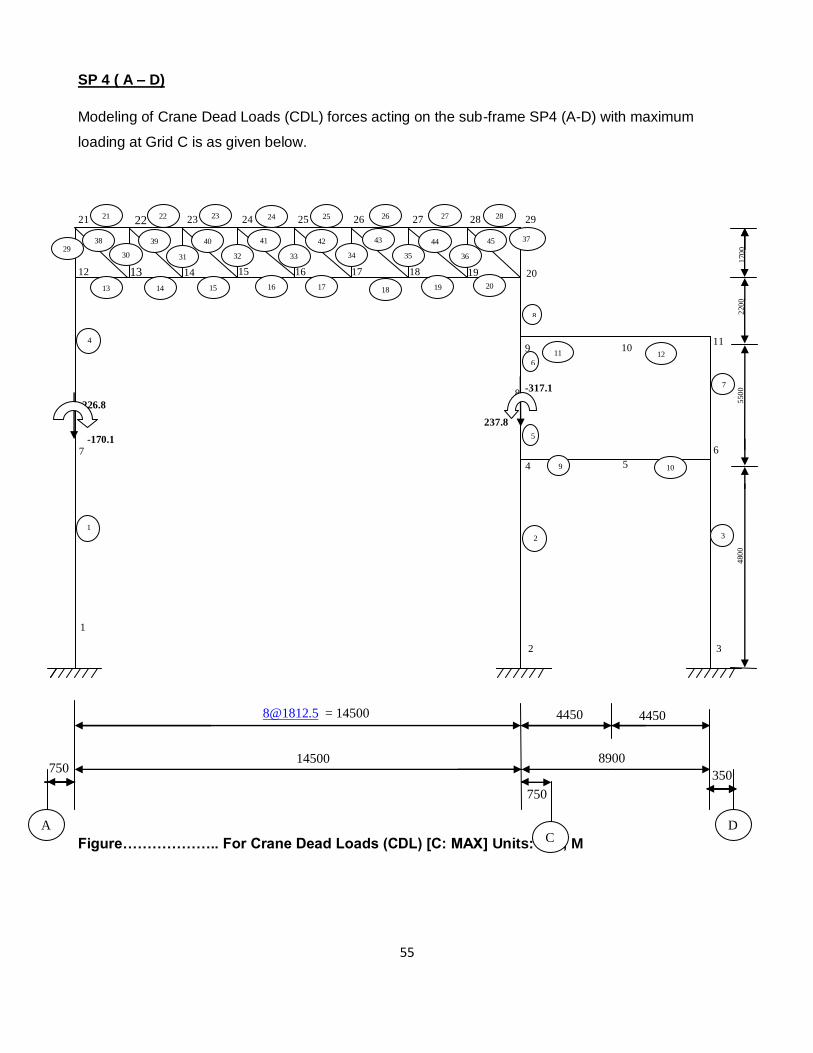
SP 4 ( A – D)
Modeling of Crane Dead Loads (CDL) forces acting on the sub-frame SP4 (A-D) with maximum
loading at Grid C is as given below.
Figure……………….. For Crane Dead Loads (CDL) [C: MAX] Units: KN, M
170
0
220
0
550
0
480
0
21
12
22
13
23
14
24
15
25
16
26
17
27
18
28
19
29
20
29
13
14
22
39
38
21
30
15
40
23
32
31
25
42
16
33
24
41
34
18
35
26
43
36
20
37
28
45
19
17
27
44
8
11
12
9
10
9
5
10
4
6
5
8
2
C
2
3
3
11
6
7
4450 4450
8900
[email protected] = 14500
14500
A
D
350
750
750
-317.1
237.8
-170.1
-226.8
4
1
1
7
56
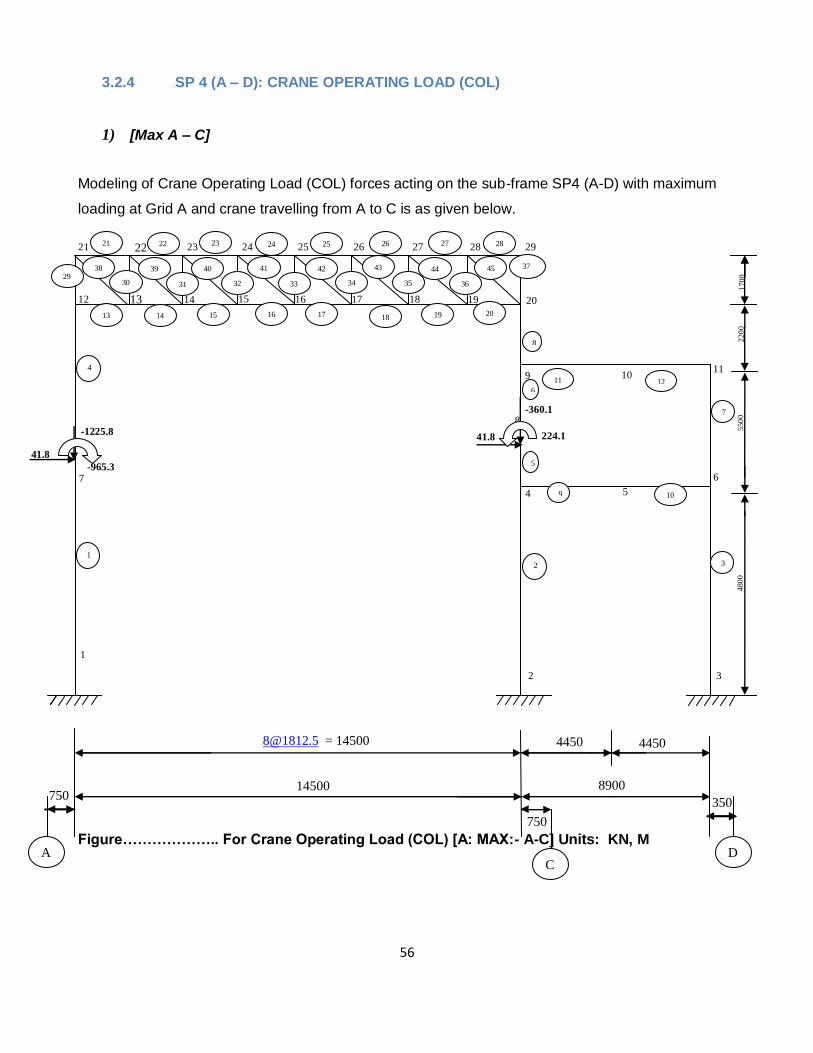
3.2.4 15BSP 4 (A – D): CRANE OPERATING LOAD (COL)
1) [Max A – C]
Modeling of Crane Operating Load (COL) forces acting on the sub-frame SP4 (A-D) with maximum
loading at Grid A and crane travelling from A to C is as given below.
Figure……………….. For Crane Operating Load (COL) [A: MAX:- A-C] Units: KN, M
170
0
220
0
550
0
480
0
21
12
22
13
23
14
24
15
25
16
26
17
27
18
28
19
29
20
29
13
14
22
39
38
21
30
15
40
23
32
31
25
42
16
33
24
41
34
18
35
26
43
36
20
37
28
45
19
17
27
44
8
11
12
9
10
9
5
10
4
6
5
8
2
C
2
3
3
11
6
7
4450 4450
8900
[email protected] = 14500
14500
A
D
350
750
750
-360.1
224.1
-965.3
-1225.8
4
1
1
7
41.8
41.8
57
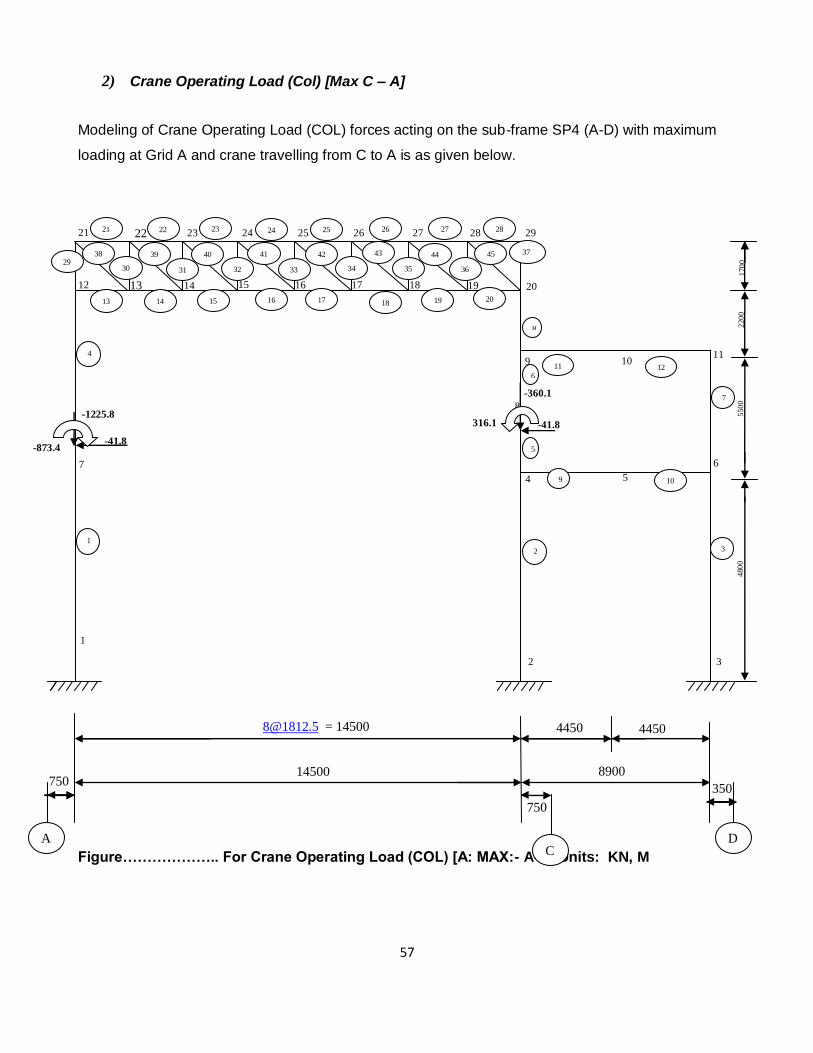
2) Crane Operating Load (Col) [Max C – A]
Modeling of Crane Operating Load (COL) forces acting on the sub-frame SP4 (A-D) with maximum
loading at Grid A and crane travelling from C to A is as given below.
Figure……………….. For Crane Operating Load (COL) [A: MAX:- A-C] Units: KN, M
170
0
220
0
550
0
480
0
21
12
22
13
23
14
24
15
25
16
26
17
27
18
28
19
29
20
29
13
14
22
39
38
21
30
15
40
23
32
31
25
42
16
33
24
41
34
18
35
26
43
36
20
37
28
45
19
17
27
44
8
11
12
9
10
9
5
10
4
6
5
8
2
C
2
3
3
11
6
7
4450 4450
8900
[email protected] = 14500
14500
A
D
350
750
750
-360.1
-41.8 -41.8
-1225.8
4
1
1
7
-873.4
316.1

58
3) Crane Operating Load (Col) [Max A – C]
Modeling of Crane Operating Load (COL) forces acting on the sub-frame SP4 (A-D) with maximum
loading at Grid C and crane travelling from A to C is as given below.
Figure……………….. For Crane Operating Load (COL) [C: MAX:- A-C] Units: KN, M
170
0
220
0
550
0
480
0
21
12
22
13
23
14
24
15
25
16
26
17
27
18
28
19
29
20
29
13
14
22
39
38
21
30
15
40
23
32
31
25
42
16
33
24
41
34
18
35
26
43
36
20
37
28
45
19
17
27
44
8
11
12
9
10
9
5
10
4
6
5
8
2
C
2
3
3
11
6
7
4450 4450
8900
[email protected] = 14500
14500
A
D
350
750
750
-1225.8
873.4
-316.1
-360.1
4
1
1
7
41.8
41.8
59
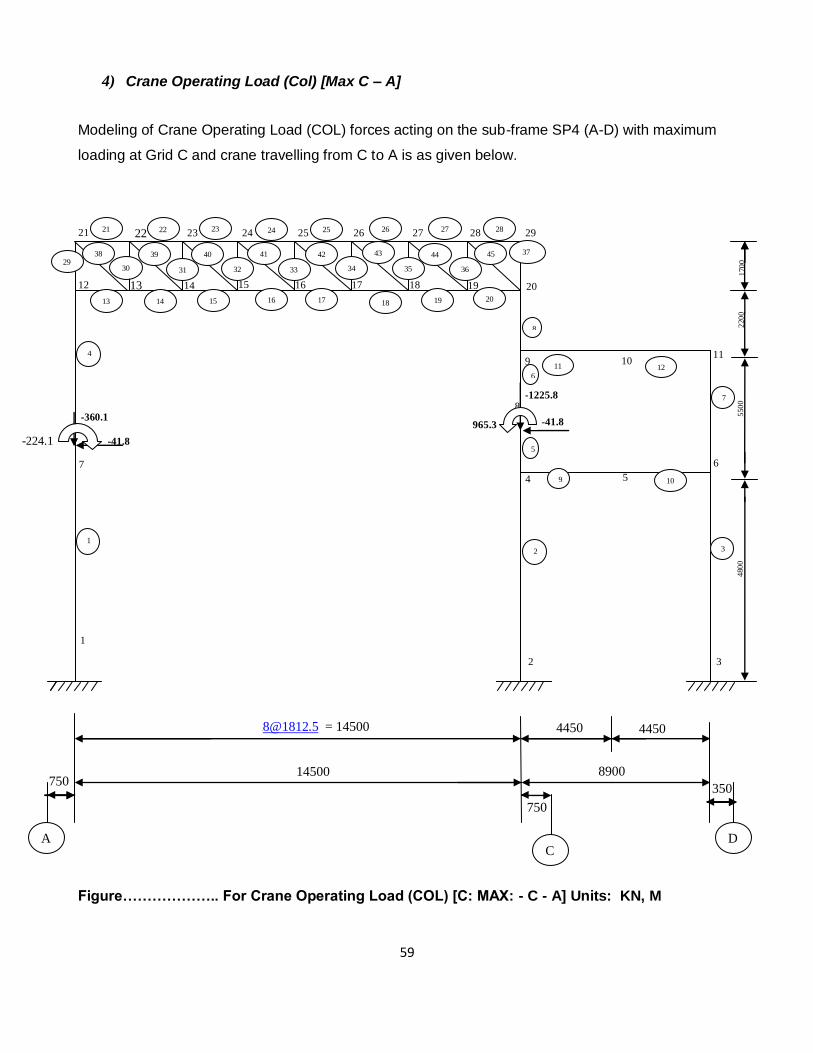
4) Crane Operating Load (Col) [Max C – A]
Modeling of Crane Operating Load (COL) forces acting on the sub-frame SP4 (A-D) with maximum
loading at Grid C and crane travelling from C to A is as given below.
Figure……………….. For Crane Operating Load (COL) [C: MAX: - C - A] Units: KN, M
170
0
220
0
550
0
480
0
21
12
22
13
23
14
24
15
25
16
26
17
27
18
28
19
29
20
29
13
14
22
39
38
21
30
15
40
23
32
31
25
42
16
33
24
41
34
18
35
26
43
36
20
37
28
45
19
17
27
44
8
11
12
9
10
9
5
10
4
6
5
8
2
C
2
3
3
11
6
7
4450 4450
8900
[email protected] = 14500
14500
A
D
350
750
750
-1225.8
-41.8
-41.8
-360.1
4
1
1
7
-224.1
965.3
60
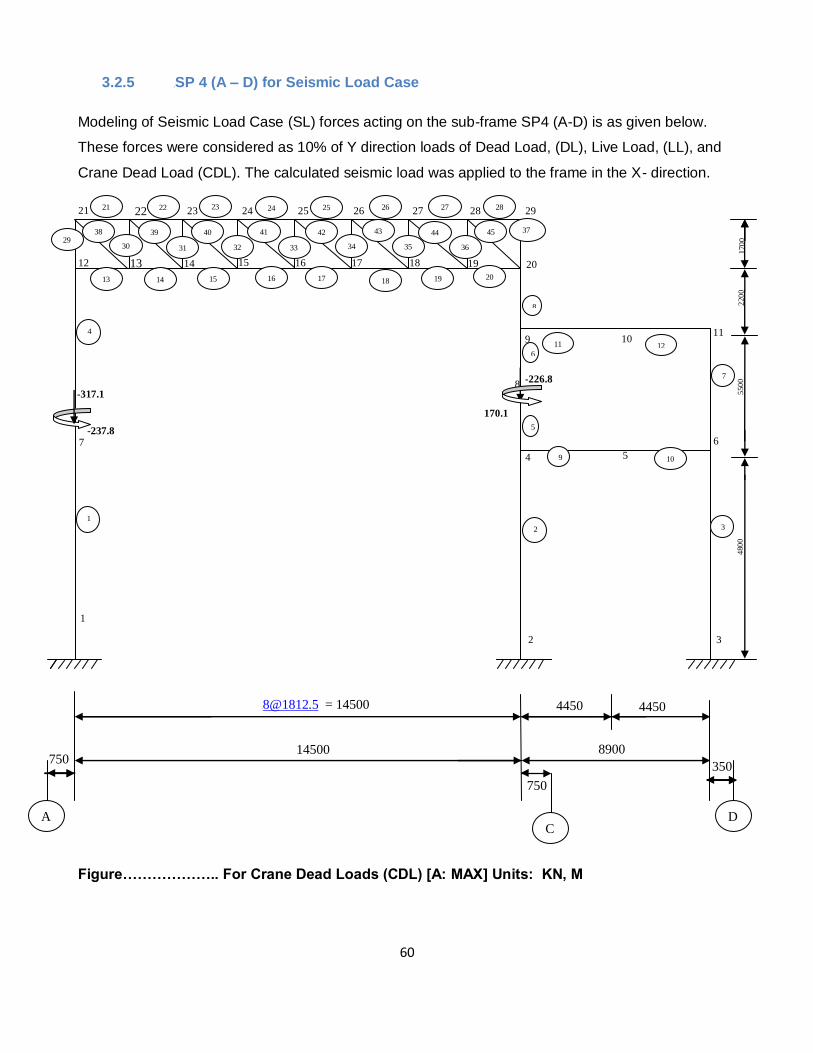
3.2.5 16BSP 4 (A – D) for Seismic Load Case
Modeling of Seismic Load Case (SL) forces acting on the sub-frame SP4 (A-D) is as given below.
These forces were considered as 10% of Y direction loads of Dead Load, (DL), Live Load, (LL), and
Crane Dead Load (CDL). The calculated seismic load was applied to the frame in the X- direction.
Figure……………….. For Crane Dead Loads (CDL) [A: MAX] Units: KN, M
170
0
220
0
550
0
480
0
21
12
22
13
23
14
24
15
25
16
26
17
27
18
28
19
29
20
29
13
14
22
39
38
21
30
15
40
23
32
31
25
42
16
33
24
41
34
18
35
26
43
36
20
37
28
45
19
17
27
44
8
11
12
9
10
9
5
10
4
6
5
8
2
C
2
3
3
11
6
7
4450 4450
8900
[email protected] = 14500
14500
A
D
350
750
750
-226.8
170.1
-237.8
-317.1
4
1
1
7
61
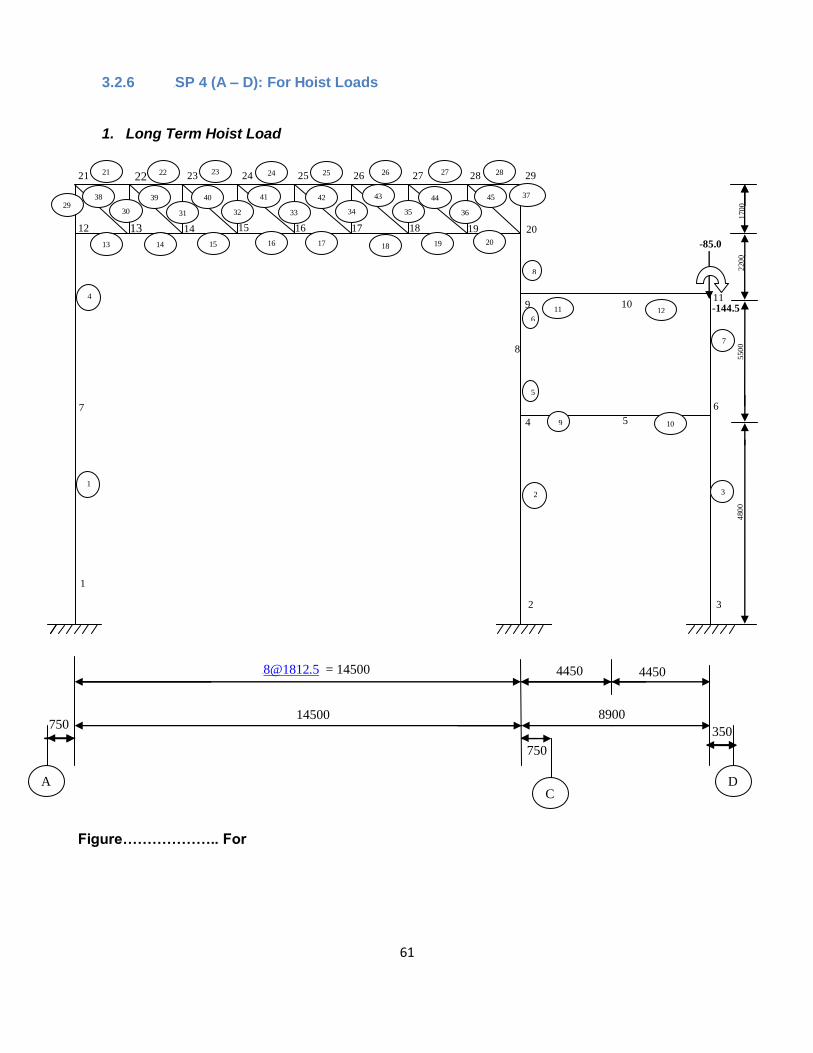
3.2.6 17BSP 4 (A – D): For Hoist Loads
1. Long Term Hoist Load
Figure……………….. For
170
0
220
0
550
0
480
0
21
12
22
13
23
14
24
15
25
16
26
17
27
18
28
19
29
20
29
13
14
22
39
38
21
30
15
40
23
32
31
25
42
16
33
24
41
34
18
35
26
43
36
20
37
28
45
19
17
27
44
8
11
12
9
10
9
5
10
4
6
5
8
2
C
2
3
3
11
6
7
4450 4450
8900
[email protected] = 14500
14500
A
D
350
750
750
-144.5
4
1
1
7
-85.0
62
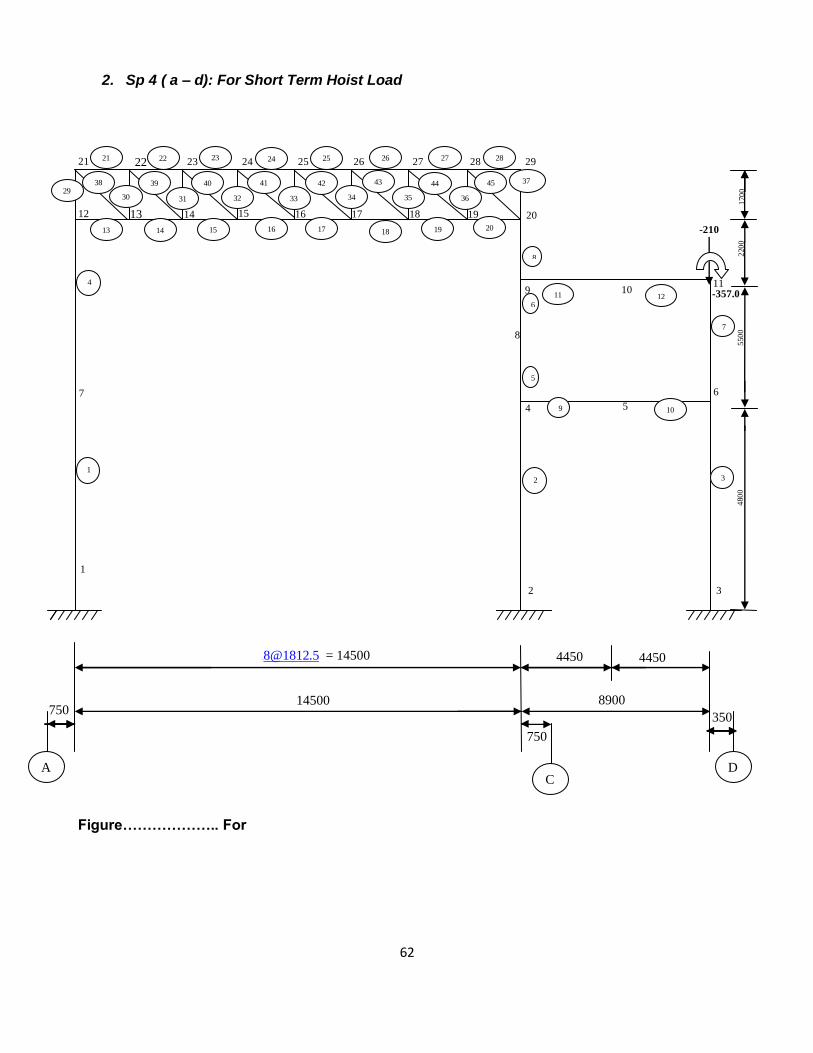
2. Sp 4 ( a – d): For Short Term Hoist Load
Figure……………….. For
170
0
220
0
550
0
480
0
21
12
22
13
23
14
24
15
25
16
26
17
27
18
28
19
29
20
29
13
14
22
39
38
21
30
15
40
23
32
31
25
42
16
33
24
41
34
18
35
26
43
36
20
37
28
45
19
17
27
44
8
11
12
9
10
9
5
10
4
6
5
8
2
C
2
3
3
11
6
7
4450 4450
8900
[email protected] = 14500
14500
A
D
350
750
750
-357.0
4
1
1
7
-210