structural analysis of an aluminum pedestrian
TRANSCRIPT
STRUCTURAL ANALYSIS OF AN ALUMINUM PEDESTRIAN BRIDGE
IN CONFORMITY TO AASHTO SPECIFICATIONS FOR HIGHWAY BRIDGES &
THE ALUMINUM ASSOCIATION DESIGN MANUAL
A Thesis
Presented to
The Graduate Faculty of The University of Akron
In Partial Fulfillment
of the Requirements for the Degree
Master of Science
Ramon Ortiz-Morgado
August 2006
ii
STRUCTURAL ANALYSIS OF AN ALUMINUM PEDESTRIAN BRIDGE
IN CONFORMITY TO AASHTO SPECIFICATIONS FOR HIGHWAY BRIDGES &
THE ALUMINUM ASSOCIATION DESIGN MANUAL
Ramon Ortiz-Morgado
Thesis
Approved: Accepted:
________________________________ ________________________________ Advisor Dean of the College Dr. Craig Menzemer Dr. George K. Haritos
________________________________ ________________________________ Co-Advisor Dean of Graduate School Dr. Teresa Cutright Dr. George R. Newkome
________________________________ ________________________________ Department Chair Date Dr. Wieslaw Binienda
iii
ABSTRACT
This thesis project was developed with the main objective to present the results
obtained from a structural analysis performed on a bridge system patented and produced
by PML LOGIS Bridge System Company from Singen, Germany. Its design is intended
primarily for pedestrian or bicycle traffic, however it could also be conceived for any
possible equestrian or snowmobile passage. In general, the target of the designer is to
introduce this bridge concept into the ongoing expanding market for aluminum
transportation facilities in the United States. In view of such prospective applications, the
groundwork for such structural evaluation consist of the specifications provided by the
governing agency which is the American Association of State and Highway
Transportation Officials and in consideration of those design provisions stipulated by the
Aluminum Association. Its distinctive design, although incorporates simple structural
features from a conventional, sturdy and well-built half-through truss, it does show
various deficiencies which may possibly put at risk the overall integrity of the system
under certain loading and geometric conditions. Therefore, the subject matter of this
evaluation is to examine the system response to a set of prescribed load combinations
considering the applicable standards and to identify the areas with such potential
deficiencies with the intention to delineate appropriate corrective actions.
iv
TABLE OF CONTENTS
Page LIST OF TABLES..…………………………………………………………….…...…. vi
LIST OF FIGURES ………………………………………………………..…...….…. viii
CHAPTER
I. INTRODUCTION…………………………………………………………….… 1
II. LITERATURE RIVIEW………………………………………………………… 9
III. ANALYTICAL APPROACH AND METHODOLOGY……………………… 24
IV. DISCUSSION OF ANALYSIS RESULTS…………………………………….. 41
V. CONCLUSION………………………………………………………………… 79
BIBLIOGRAPHY……………………………………………………………………… 85
APPENDICES …………………………………………………………………………. 86
APPENDIX A - EFFECTIVE MOMENT OF INERTIA FOR COMPOSITE SECTION…………………….…………………………….…... 87
APPENDIX B - EFFECTIVE LENGTH FACTOR FOR COMPRESSIVE MEMBER, K…………….………………………………..… 97
APPENDIX C - EQUIVALENT SLENDERNESS RATIO FOR FLEXURAL BUCKLING….………………………………………………… 103
APPENDIX D - PEDESTRIAN AND BICYCLE RAILING COMBINED STRESSES…...………………………………………………… 124
APPENDIX E - TENSILE CAPACITY OF BOTTOM CHORD…………..... 139
APPENDIX F - TENSILE CAPACITY OF DIAGONALS………………….. 144
v
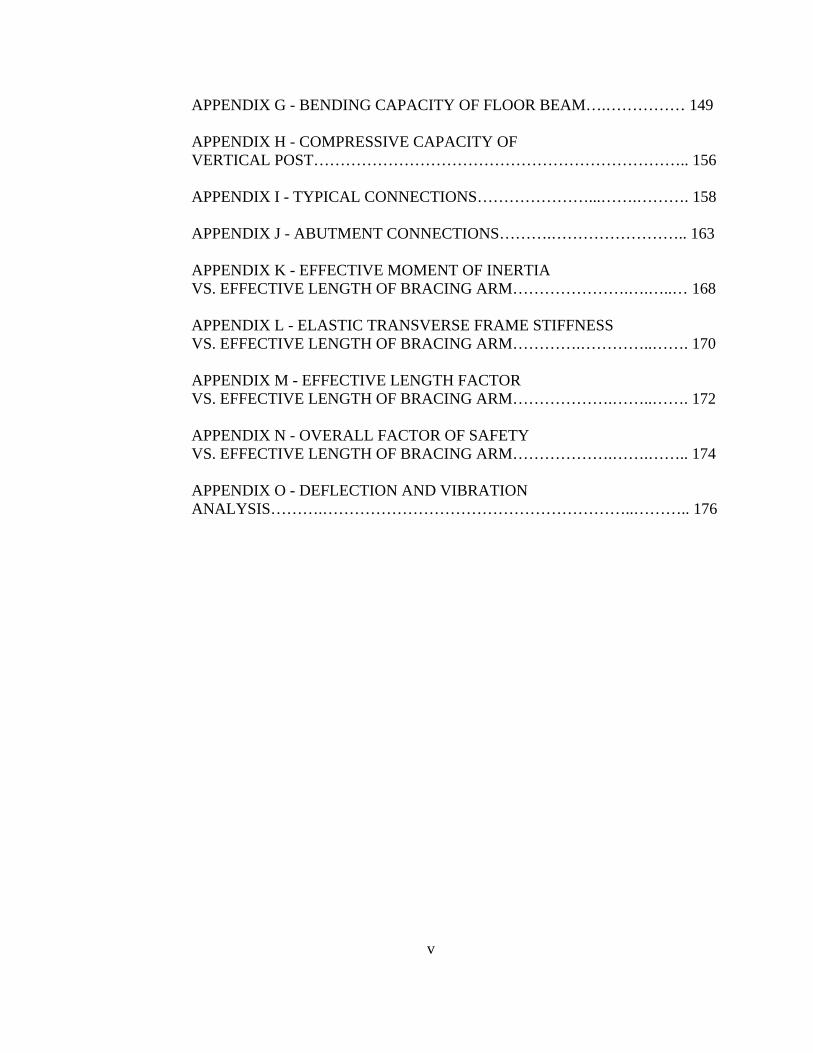
APPENDIX G - BENDING CAPACITY OF FLOOR BEAM….…………… 149
APPENDIX H - COMPRESSIVE CAPACITY OF VERTICAL POST…………………………………………………………….. 156 APPENDIX I - TYPICAL CONNECTIONS…………………...…….………. 158
APPENDIX J - ABUTMENT CONNECTIONS……….…………………….. 163 APPENDIX K - EFFECTIVE MOMENT OF INERTIA VS. EFFECTIVE LENGTH OF BRACING ARM………………….….…..… 168 APPENDIX L - ELASTIC TRANSVERSE FRAME STIFFNESS VS. EFFECTIVE LENGTH OF BRACING ARM………….…………..……. 170 APPENDIX M - EFFECTIVE LENGTH FACTOR VS. EFFECTIVE LENGTH OF BRACING ARM……………….……..……. 172 APPENDIX N - OVERALL FACTOR OF SAFETY VS. EFFECTIVE LENGTH OF BRACING ARM……………….…….…….. 174 APPENDIX O - DEFLECTION AND VIBRATION ANALYSIS……….…………………………………………………..……….. 176
vi
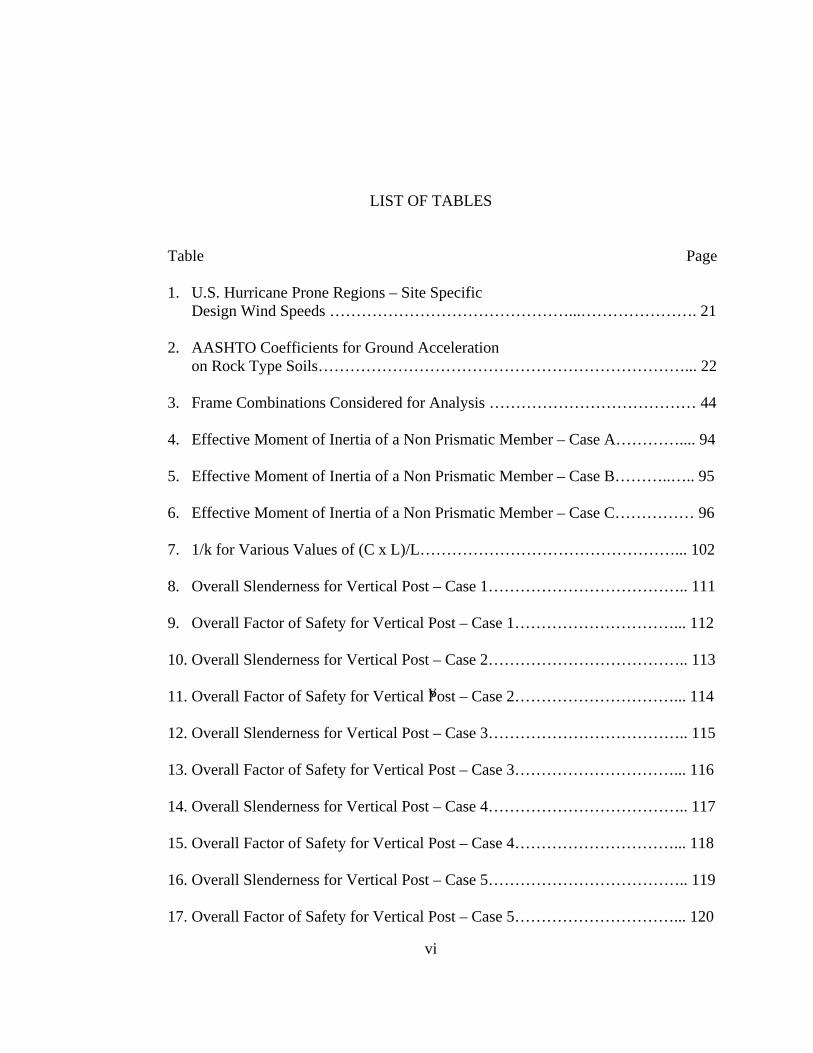
LIST OF TABLES
Table Page
1. U.S. Hurricane Prone Regions – Site Specific Design Wind Speeds ………………………………………...…………………. 21
2. AASHTO Coefficients for Ground Acceleration on Rock Type Soils……………………………………………………………... 22
3. Frame Combinations Considered for Analysis ………………………………… 44
4. Effective Moment of Inertia of a Non Prismatic Member – Case A………….... 94
5. Effective Moment of Inertia of a Non Prismatic Member – Case B………..….. 95
6. Effective Moment of Inertia of a Non Prismatic Member – Case C…………… 96
7. 1/k for Various Values of (C x L)/L…………………………………………... 102
8. Overall Slenderness for Vertical Post – Case 1……………………………….. 111
9. Overall Factor of Safety for Vertical Post – Case 1…………………………... 112
10. Overall Slenderness for Vertical Post – Case 2……………………………….. 113
11. Overall Factor of Safety for Vertical Post – Case 2…………………………... 114
12. Overall Slenderness for Vertical Post – Case 3……………………………….. 115
13. Overall Factor of Safety for Vertical Post – Case 3…………………………... 116
14. Overall Slenderness for Vertical Post – Case 4……………………………….. 117
15. Overall Factor of Safety for Vertical Post – Case 4…………………………... 118
16. Overall Slenderness for Vertical Post – Case 5……………………………….. 119
17. Overall Factor of Safety for Vertical Post – Case 5…………………………... 120
v
vii
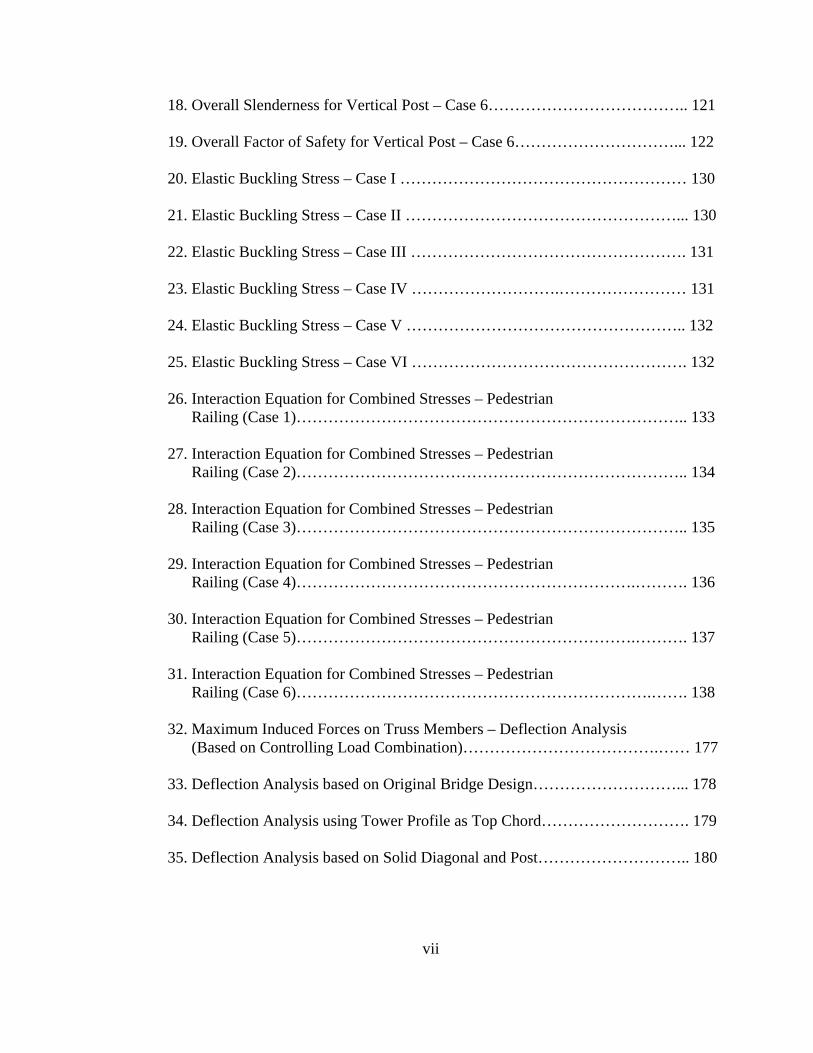
18. Overall Slenderness for Vertical Post – Case 6……………………………….. 121
19. Overall Factor of Safety for Vertical Post – Case 6…………………………... 122
20. Elastic Buckling Stress – Case I ……………………………………………… 130
21. Elastic Buckling Stress – Case II ……………………………………………... 130
22. Elastic Buckling Stress – Case III ……………………………………………. 131
23. Elastic Buckling Stress – Case IV ……………………….…………………… 131
24. Elastic Buckling Stress – Case V …………………………………………….. 132
25. Elastic Buckling Stress – Case VI ……………………………………………. 132
26. Interaction Equation for Combined Stresses – Pedestrian Railing (Case 1)……………………………………………………………….. 133
27. Interaction Equation for Combined Stresses – Pedestrian Railing (Case 2)……………………………………………………………….. 134
28. Interaction Equation for Combined Stresses – Pedestrian Railing (Case 3)……………………………………………………………….. 135
29. Interaction Equation for Combined Stresses – Pedestrian Railing (Case 4)……………………………………………………….………. 136
30. Interaction Equation for Combined Stresses – Pedestrian Railing (Case 5)……………………………………………………….………. 137
31. Interaction Equation for Combined Stresses – Pedestrian Railing (Case 6)………………………………………………………….……. 138
32. Maximum Induced Forces on Truss Members – Deflection Analysis (Based on Controlling Load Combination)……………………………….…… 177
33. Deflection Analysis based on Original Bridge Design………………………... 178
34. Deflection Analysis using Tower Profile as Top Chord………………………. 179
35. Deflection Analysis based on Solid Diagonal and Post……………………….. 180
viii
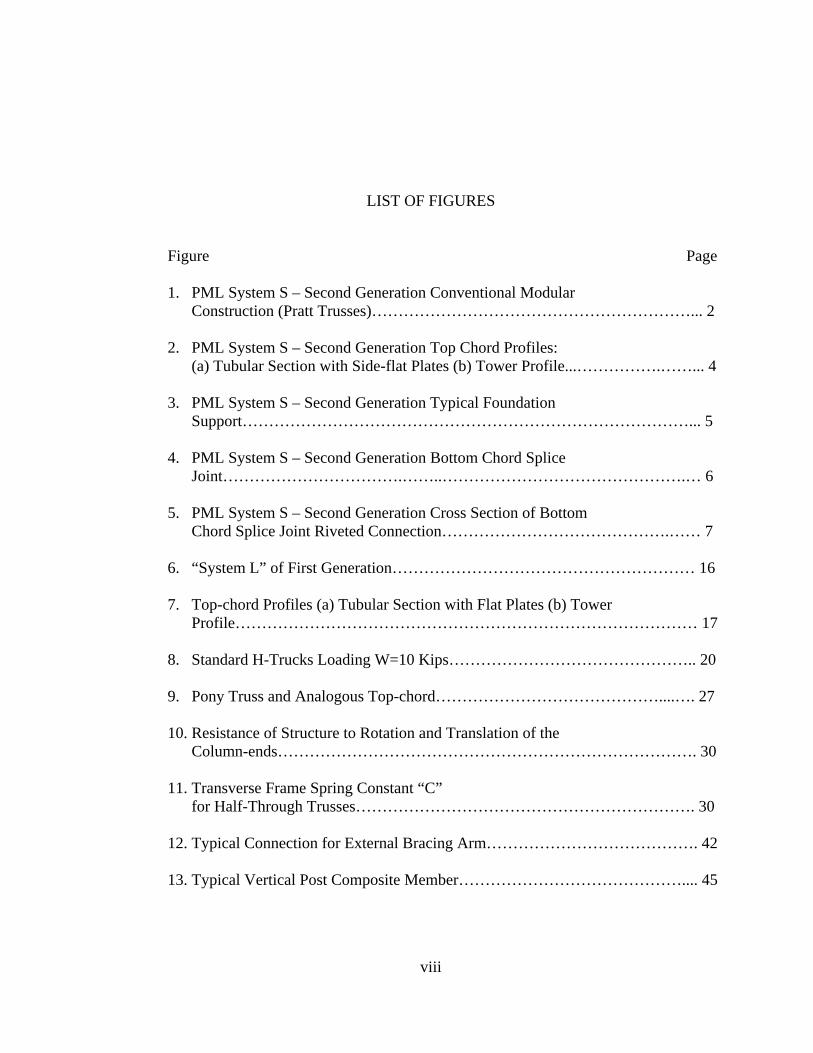
LIST OF FIGURES
Figure Page
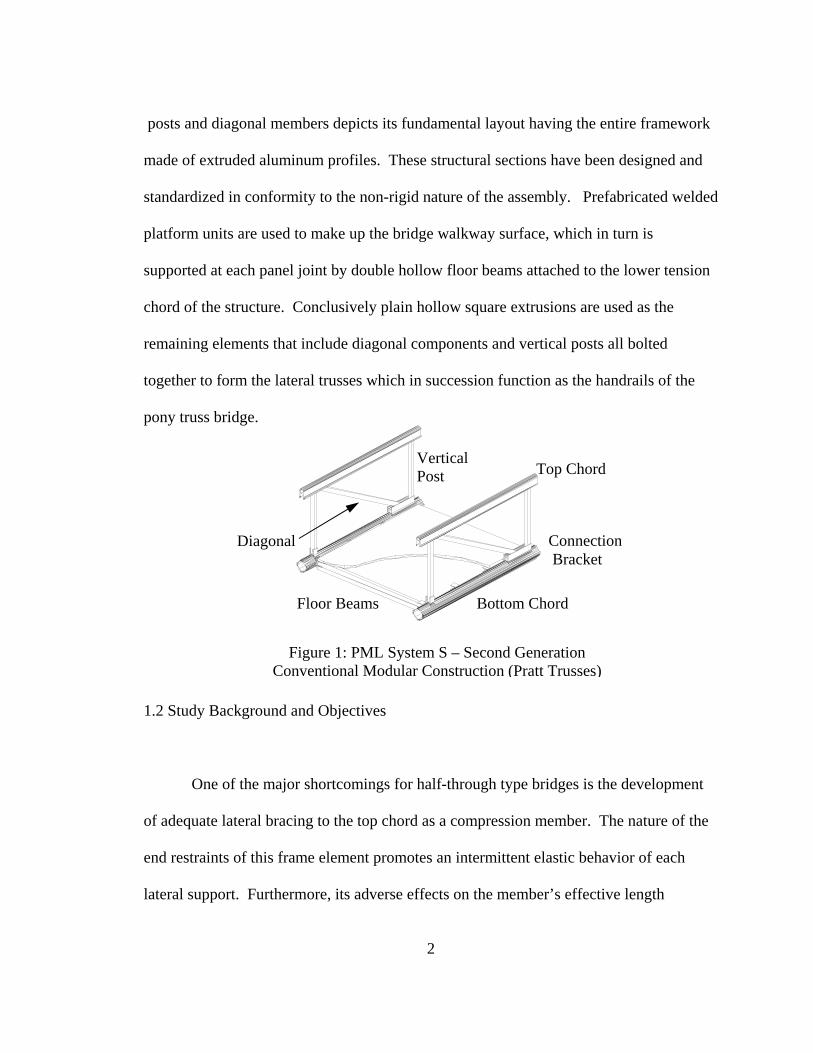
1. PML System S – Second Generation Conventional Modular Construction (Pratt Trusses)……………………………………………………... 2
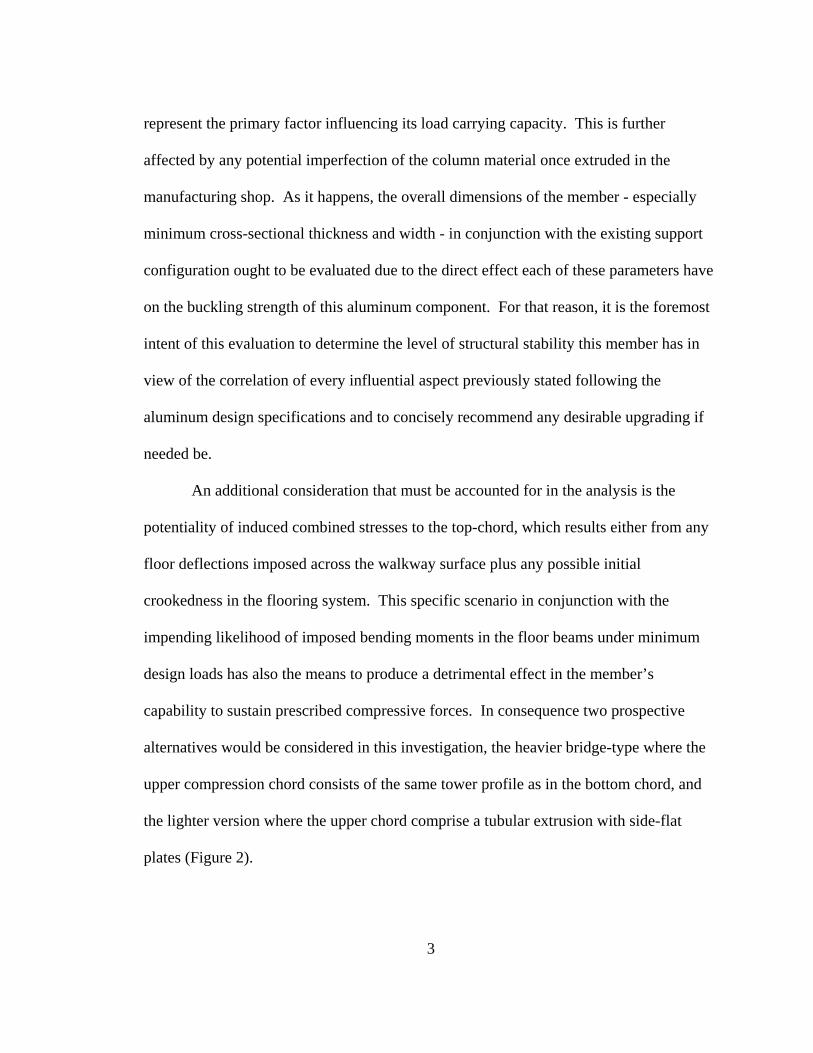
2. PML System S – Second Generation Top Chord Profiles: (a) Tubular Section with Side-flat Plates (b) Tower Profile...…………….……... 4
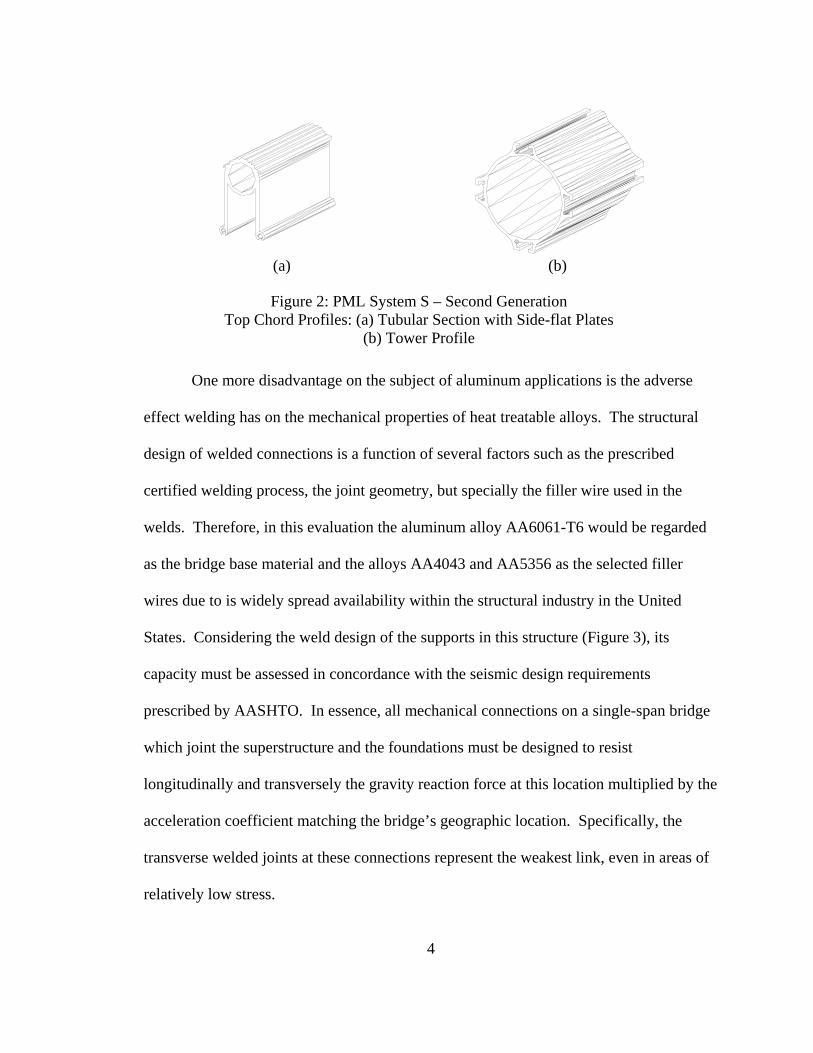
3. PML System S – Second Generation Typical Foundation Support…………………………………………………………………………... 5
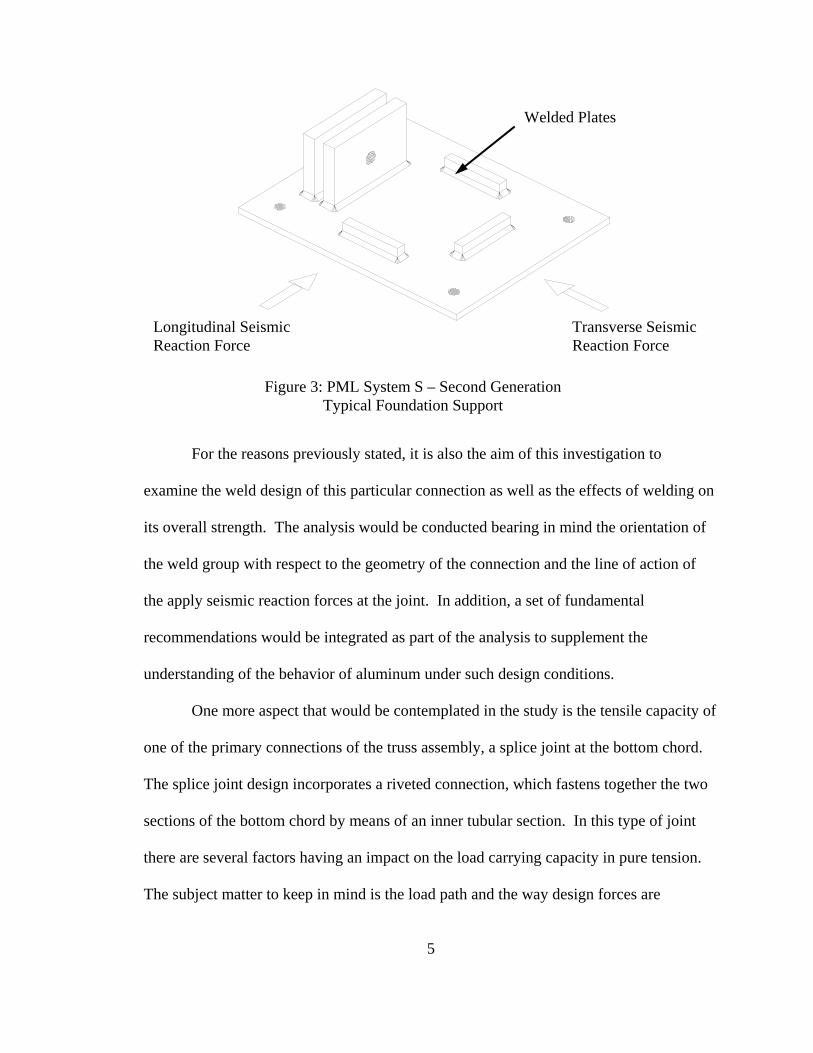
4. PML System S – Second Generation Bottom Chord Splice
Joint…………………………….……..……………………………………….… 6
5. PML System S – Second Generation Cross Section of Bottom Chord Splice Joint Riveted Connection…………………………………….…… 7
6. “System L” of First Generation………………………………………………… 16
7. Top-chord Profiles (a) Tubular Section with Flat Plates (b) Tower Profile…………………………………………………………………………… 17
8. Standard H-Trucks Loading W=10 Kips……………………………………….. 20
9. Pony Truss and Analogous Top-chord……………………………………....…. 27
10. Resistance of Structure to Rotation and Translation of the Column-ends……………………………………………………………………. 30
11. Transverse Frame Spring Constant “C” for Half-Through Trusses………………………………………………………. 30
12. Typical Connection for External Bracing Arm…………………………………. 42
13. Typical Vertical Post Composite Member…………………………………….... 45
ix
14. Comparison of Buckling Axis to the Axis of Symmetry for Equivalent Section of Top Chord (Post-buckling Strength)……………………. 50
15. Splice Connection at Bottom Chord via Inner Tube……………………………. 54
16. Rivet Pattern at Typical Splice Connection on Bottom Chord…………………. 55
17. Blind Rivet……………………………………………………………………… 56
18. Diagonal Member (Top Chord/Diagonal Bolt Pattern)………………………… 60
19. Block Shear Failure Paths in Diagonal Member………………………………... 63
20. (a) Double-solid Floor Beam and (b) Equivalent Rectangular Profile to evaluate Lateral Torsional Buckling…………………………..………………70
21. U-Bracket Beam Support………………………………………………………. 73
22. (a) Bridge Support A (b) Bridge Support B…………………………………….. 76
23. U-Bracket……………………………………………………………………….. 78
24. Bridge Typical Cross Section …………...…………………...……………….. 87
25. Vertical Post Composite Section – Hollow/Hollow……………………………. 88
26. Vertical Post Composite Section – Solid/Solid………………………………… 89
27. Vertical Post Composite Section – Hollow/Solid…………………….………… 90
28. Typical Arrangement for Composite Member (Vertical Post and Bracing Arm)……………………………………………….. 91
29. Analogy Diagram for Composite Member……………………………………... 92
30. Transverse Frame Spring Constant……………………………………...……… 97
31. Top Chord Sectional View (a) Original Section (b) Equivalent Section……….. 98
32. Top Chord Equivalent Channel Section……………………….……………… 104
33. Vertical Post Composite Member – Effect of Bracing Arm on Factor of Safety……………………………………………… 123
34. Typical Truss Panel – Pedestrian Railing Biaxial Bending and Axial Compression ……………………………….……. 124
x
35. Allowable Tensile Capacity of Bottom Chord
@ Splice Connection ….……………………………………………………… 139
36. Typical Bolt Groups on Diagonal Members………………………………..… 148
37. Typical & Equivalent Cross Section for Floor Beam……………...………….. 155
38. Vertical Post Layout……………………………………….………………….. 156
39. Vertical Post Cross Section…………………………………………………… 156
40. Diagrams for Typical Connections……………………………………………. 158
41. Bridge Supports: (a) Abutment Support I (b) Abutment Support II……….…. 167
42. Composite Member ………………………………………………………….... 168
43. Vertical Post Composite Member – Effect of Bracing Arm on Effective Moment of Inertia………………………………………………... 169
44. Elastic Transverse Frame Stiffness – Sectional View …………………..……. 170 45. Vertical Post Composite Member – Effect of Bracing
Arm on Truss Lateral Stiffness……………………………………………...….171
46. Composite Section – Column Line Diagram …………….…………………….172 47. Vertical Post Composite Member – Effect of Bracing Arm
on Column Effective Length Factor, k………………….……………………...173 48. Vertical Post Composite Member – Factor of Safety ………………………….174
49. Vertical Post Composite Member – Effect of Bracing Arm on Top Cord
Compressive Capacity (Factor of Safety)……………………………………... 175
50. Bridge Layout…………………………………………………………..……... 176
1
CHAPTER I
INTRODUCTION
1.1 General Information
An innovative and modern bridge system for pedestrian, bicycle, and conceivably
equestrian or snowmobile traffic has been patented and produced by PML LOGIS Bridge
System Company from Singen, Germany. This distinct design is the bridge’s second
generation (see Figure 1), which assimilates structural features from the conventional
design and whose creators are attempting to introduce into the expanding market for
transportation facilities in the United States. The overall construction integrity of this
system is the subject matter of this evaluation accounting for all applicable federal, state,
and local standards and design specifications. As such, the specifications of the
governing agency – the American Association of State and Highway Transportation
Officials – in conjunction with those stipulated by the Aluminum Association would be
the set of rules delimiting the comprehensive assessment of this pedestrian overpass. As
illustrated, the PML system bridge incorporates modular construction as typically
resembled by Pratt Trusses. A parallel top and bottom chord connected to vertical
2
Bottom Chord
Connection Bracket
Diagonal
Vertical Post
Figure 1: PML System S – Second Generation Conventional Modular Construction (Pratt Trusses)
Top Chord
Floor Beams
posts and diagonal members depicts its fundamental layout having the entire framework
made of extruded aluminum profiles. These structural sections have been designed and
standardized in conformity to the non-rigid nature of the assembly. Prefabricated welded
platform units are used to make up the bridge walkway surface, which in turn is
supported at each panel joint by double hollow floor beams attached to the lower tension
chord of the structure. Conclusively plain hollow square extrusions are used as the
remaining elements that include diagonal components and vertical posts all bolted
together to form the lateral trusses which in succession function as the handrails of the
pony truss bridge.
1.2 Study Background and Objectives
One of the major shortcomings for half-through type bridges is the development
of adequate lateral bracing to the top chord as a compression member. The nature of the
end restraints of this frame element promotes an intermittent elastic behavior of each
lateral support. Furthermore, its adverse effects on the member’s effective length
3
represent the primary factor influencing its load carrying capacity. This is further
affected by any potential imperfection of the column material once extruded in the
manufacturing shop. As it happens, the overall dimensions of the member - especially
minimum cross-sectional thickness and width - in conjunction with the existing support
configuration ought to be evaluated due to the direct effect each of these parameters have
on the buckling strength of this aluminum component. For that reason, it is the foremost
intent of this evaluation to determine the level of structural stability this member has in
view of the correlation of every influential aspect previously stated following the
aluminum design specifications and to concisely recommend any desirable upgrading if
needed be.
An additional consideration that must be accounted for in the analysis is the
potentiality of induced combined stresses to the top-chord, which results either from any
floor deflections imposed across the walkway surface plus any possible initial
crookedness in the flooring system. This specific scenario in conjunction with the
impending likelihood of imposed bending moments in the floor beams under minimum
design loads has also the means to produce a detrimental effect in the member’s
capability to sustain prescribed compressive forces. In consequence two prospective
alternatives would be considered in this investigation, the heavier bridge-type where the
upper compression chord consists of the same tower profile as in the bottom chord, and
the lighter version where the upper chord comprise a tubular extrusion with side-flat
plates (Figure 2).
4
One more disadvantage on the subject of aluminum applications is the adverse
effect welding has on the mechanical properties of heat treatable alloys. The structural
design of welded connections is a function of several factors such as the prescribed
certified welding process, the joint geometry, but specially the filler wire used in the
welds. Therefore, in this evaluation the aluminum alloy AA6061-T6 would be regarded
as the bridge base material and the alloys AA4043 and AA5356 as the selected filler
wires due to is widely spread availability within the structural industry in the United
States. Considering the weld design of the supports in this structure (Figure 3), its
capacity must be assessed in concordance with the seismic design requirements
prescribed by AASHTO. In essence, all mechanical connections on a single-span bridge
which joint the superstructure and the foundations must be designed to resist
longitudinally and transversely the gravity reaction force at this location multiplied by the
acceleration coefficient matching the bridge’s geographic location. Specifically, the
transverse welded joints at these connections represent the weakest link, even in areas of
relatively low stress.
Figure 2: PML System S – Second Generation Top Chord Profiles: (a) Tubular Section with Side-flat Plates
(b) Tower Profile
(a) (b)
5
Longitudinal Seismic Reaction Force
Transverse Seismic Reaction Force
Figure 3: PML System S – Second Generation Typical Foundation Support
Welded Plates
For the reasons previously stated, it is also the aim of this investigation to
examine the weld design of this particular connection as well as the effects of welding on
its overall strength. The analysis would be conducted bearing in mind the orientation of
the weld group with respect to the geometry of the connection and the line of action of
the apply seismic reaction forces at the joint. In addition, a set of fundamental
recommendations would be integrated as part of the analysis to supplement the
understanding of the behavior of aluminum under such design conditions.
One more aspect that would be contemplated in the study is the tensile capacity of
one of the primary connections of the truss assembly, a splice joint at the bottom chord.
The splice joint design incorporates a riveted connection, which fastens together the two
sections of the bottom chord by means of an inner tubular section. In this type of joint
there are several factors having an impact on the load carrying capacity in pure tension.
The subject matter to keep in mind is the load path and the way design forces are
6
transferred between via the mechanical connection. This riveted joint is designed under
the assumption that the connected parts can slip in relation to each other. Hence, the joint
is basically a bearing type connection having the rivets bearing on the side of each hole
once the primary connection elements have slipped under the prescribed design loads.
Once displacement occurs along the longitudinal axis of the bottom chord and the rivets
bear against each hole, then the design tensile forces are transmitted from the bottom
chord into the inner tubular section by means of shearing forces imposed across the cross
section of each rivet. That is the load path to follow in between the connected parts
(Figure 4).
Thus, the bearing capacity of the bottom chord as well as the inner tubular section
ought to be evaluated in addition to the overall shear strength of the rivet group in this
connection. What's more, the aluminum design specifications state that the yield tensile
strength on the gross area and the ultimate tensile strength at the net section on all the
primary members – bottom chord and inner tubular section – must also be accounted for
Figure 4: PML System S – Second Generation Bottom Chord Splice Joint
Bottom Chord Section 1
Bottom Chord Section 2
Inner Tubular Section
7
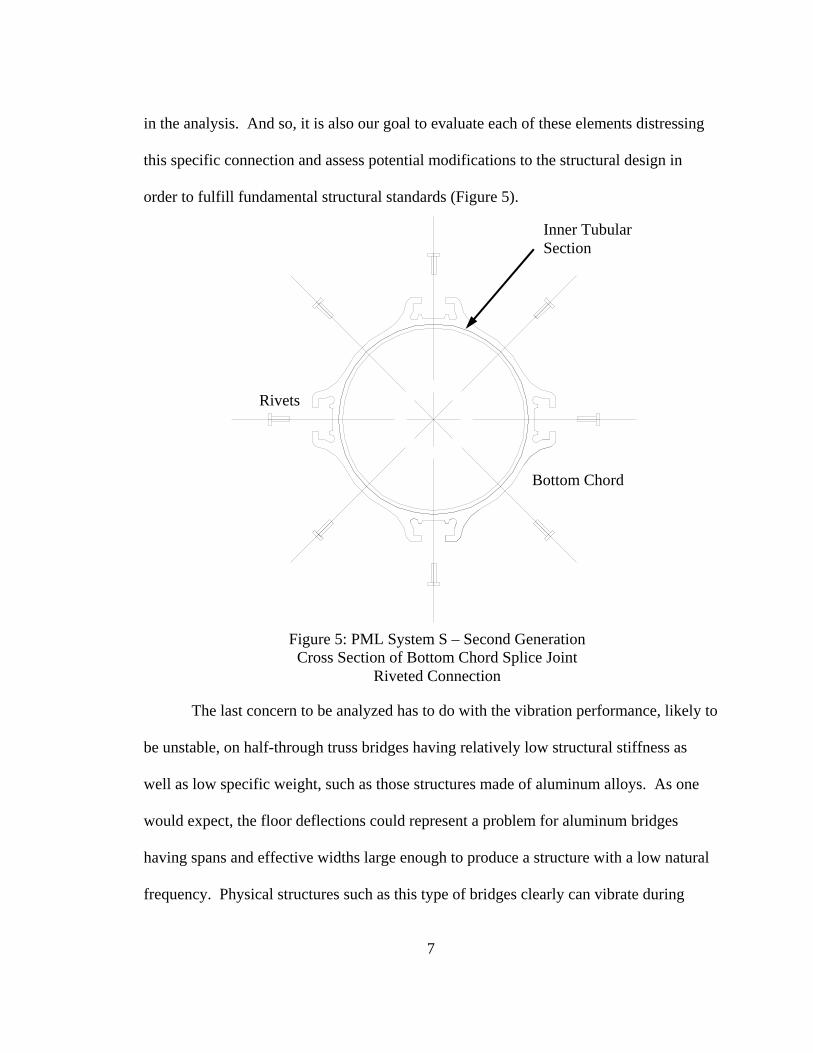
in the analysis. And so, it is also our goal to evaluate each of these elements distressing
this specific connection and assess potential modifications to the structural design in
order to fulfill fundamental structural standards (Figure 5).
The last concern to be analyzed has to do with the vibration performance, likely to
be unstable, on half-through truss bridges having relatively low structural stiffness as
well as low specific weight, such as those structures made of aluminum alloys. As one
would expect, the floor deflections could represent a problem for aluminum bridges
having spans and effective widths large enough to produce a structure with a low natural
frequency. Physical structures such as this type of bridges clearly can vibrate during
Figure 5: PML System S – Second Generation Cross Section of Bottom Chord Splice Joint
Riveted Connection
Inner Tubular Section
Rivets
Bottom Chord
8
cyclical loadings such as those imposed by a large group of people crossing the bridge at
any single time, any seismic activity or possibly because of a hurricane wind forces. In
turn this could cause the structure to vibrate with large and/or increasing amplitudes if the
loading conditions facilitate such behavior. This cyclical flexing could potentially put
undesired stresses at specific locations on the structure. The main concern is that back
and forth behavior in the same place, which could exceed the allowable capacity of the
bridge weakening in turn the structures at these flexing points and resulting in potential
damage or failure. However, there are cases when these types of bridges have been
determined to be relaxed enough by the consideration of high damping values. Damping
refers to the dissipation of vibration energy, which in turn could reduce the overall
motion or acceleration of the framework system under this kind of critical cyclical
loading.
The Light Metal Structures division at the Technical University of Munich,
Germany, has been carrying out a series of experimental and field studies pertaining to
the bridge structural integrity, vibration behavior, and its service life performance. In
concurrence with the German DIN 4113 specification and the European ENV 1999
Design Codes, the AASHTO Guide Specification for Pedestrian Bridges, and the
Aluminum Design Manual provided by the Aluminum Association, a comparative design
analysis focusing on these structural issues will be presented. Further an examination of
the conformity to governing U.S. design guidelines will be offered for the purpose of
providing the necessary alternatives to improve the required structural functionality and
the service life reliability of this bridge system.
9
CHAPTER II
LITERATURE RIVIEW
2.1 Aluminum Systems – General Findings
The design of aluminum structures for civil engineering applications is
significantly different from conventional construction materials, such as for steel or
reinforced concrete. This distinctive nature emerges from the physical and mechanical
properties inherent to these types of metal alloys [1]. Indisputably, the freedom designers
have to place the material where it is mostly needed on the member’s cross section by
means of the extrusion process represents the foremost benefit in aluminum design.
Along with the capability to create detailed and precise cross sectional shapes for
optimized extrusion design, the assortment of possible uses is relatively unlimited in the
construction industry. The freedom attained by conceiving any necessary extrusion
profile to fulfill a particular need is the key to achieve the most advantageous structural
shapes and consequently practical and cost efficient aluminum structures. In spite of
everything the overall design does not merely rely on structural mechanics alone, but also
10
on the efficiency of the manufacturing processes, the erection techniques available as
well as maintenance constraints, governing design restrictions, and the constant human
tendency to use traditional construction materials, which are all major factors to consider
in any particular application. The use of aluminum in the design of such bridge structures
has been documented worldwide. As well many countries favor its use given the
material’s physical and mechanical properties. Despite the potential advantages, the
tendency in structural designs is to avoid its widespread use in the field of construction.
The dilemma of countless engineers having not sufficient knowledge and
experience in aluminum design remains an ongoing influential fact. It is common in the
construction industry that structural designs tend to be traditional, repetitive, and
conservative in view of the limited time and restricted budgets for detailed calculations.
In specific situations where design restrictions are questionable, the loading conditions
might be exceedingly severe, the mechanical behavior is in doubt, or the architectural
demands are beyond measure, is then that the mechanical behavior of such required
structures is considered more thoroughly. On the other hand, it is a fact that ever-
increasing demands on the infrastructure will result in the need to optimize the existing
structural systems by means of using high performance materials like aluminum alloys.
It was a reality that 50 years ago aluminum production and its applications in
construction were priced significantly higher than customary materials like steel and
reinforced concrete. These past days, material manufacturers, extruders, and designers in
the United States and Canada have continually searched for attractive, potentially viable,
and economically feasible production methods and construction techniques to promote
the increasing use of aluminum alloys. This is particularly true for construction materials
11
used in special applications in civil engineering, as is the case for pedestrian bridges. The
derived benefit from the use of aluminum is promoted in structures where dead loads and
increasing live loads remain a primary concern. In such diverse cases like large clear-
span dome roofs and bridges, tractor-trailer frames, and even crane booms, the reduced
dead loads allows for the consideration of a much higher minimum design live load.
Decreased dead weight, in any case, is the key aspect in possible future renovations by
enhancing the simplification of assembly, erection, transportation costs, in addition to the
service performance of any particular structure.
Furthermore, the consideration of aluminum alloys is favorable for civil
engineering applications because of its good strength and toughness properties, excellent
workability and durability, relatively low maintenance, and high corrosion resistance.
These are intrinsic properties suitable for special applications in aggressive environments.
On the other hand, consideration must be given to its relatively low modulus of elasticity,
just about one third that of steel, in addition to its low melting point and low strength at
higher temperatures. The susceptibility to fatigue and buckling is much higher than that
of other comparable structural materials and it is a aspect that could not be overlooked
during the design process.
2.2 Historical Perspective of Aluminum Bridges in the United States
Most of the existing aluminum bridges in the United States were built within the
last forty years [2], and they were in fact structural designs conceived for experimental
purposes. It has been the past experience that these bridges had safely withstood the
12
stresses induced by the continuously increasing traffic loads throughout their service life
and yet required relatively low maintenance or retrofitting. It has been establish that
these structures remain strong enough to uphold the latest minimum design loads as
prescribed by the governing codes by firmly supporting the unexpected boost in the
applied stresses. They have been ranked as functional, yet aesthetically pleasing. It’s
essential characteristics including high-strength, lightweight, corrosion resistance, and
ease of production and construction have fulfilled the prescribed serviceability and
strength requirements.
It is of great significance to recognize though that neither in the United States nor
in Canada there is a single federal authority that provides specific design data on
constructed aluminum bridges. The only resources for statistics on structural
performance have been technical journal articles from either international or local
conference meetings, as well as the different U.S. State Departments of Transportation.
These sources in fact show and make reference only to the large highway structures along
which various deck restoration projects had been performed by the use of aluminum
structures. It has been concluded that their records – which are extracts from the
inspection database – provide only from time to time information about the structural
performance and long-term behavior of these structures [3].
The first application in the United States of aluminum in bridges took place in
1933, when Alcoa succeeded with the city of Pittsburgh in replacing a timber and steel
floor system on the Smithfield Street Bridge. As an expected result, the bridge whose
construction took place originally in 1882 was subjected to an increase in its live load
carrying capacity as the lightweight of the aluminum alloys used in its replacement
13
reduced the dead load on its foundations. In 1946, the first aluminum bridge conceived
and constructed using aluminum plate girders had a deck span of 100 feet and it was a
railroad line serving an Alcoa smelter. This span was one out of seven others rebuilt in
an effort to restore the existing bridges crossing the Grass River near the city of Massena
in the state of New York. The first aluminum highway bridge was designed and built
with a span of 290 feet over the Sanguinity River near Arvida, Canada, and it design
incorporated a riveted box arch having multiple 20 feet approach spans. Seven additional
highway bridges of this type were manufactured and put together for public service
between 1958 and 1963 using structural aluminum. One reason for the application was
the shortage of prefabricated structural steel at that time.
After 1963 an increase in the use of aluminum bridges took place all around the
United States, as well as in some locations in Canada. In the state of Colorado, for
instance, three additional aluminum bridges extending over 20 feet were designed and
built using hollow rectangular box girders [3]. These aluminum-deck overpasses were
conceived to carry vehicular traffic on regional areas having a relatively small average
daily traffic counts. In contrast, the state of Georgia commissioned two bridge designs,
one that incorporated an aluminum plate arch to function concurrently as a culvert to
carry traffic on Mt. Zion Road in Rockdale County, and the other aluminum multi-beam
stringer bridge to service a highway overpass on top of the Dry Creek in Walker County.
Frequent state bridge inspections revealed that the structural operation and functionality
of these structures was adequate. The state of New Mexico, on the other hand, is one
location that has a high concentration of aluminum bridges in the western United States.
14
There are a total of fourteen single-span aluminum bridges in the state, some of which
consists of through-type trusses and others single deck-beam type of bridge. These all
serve highways that cross over water.
With these thoughts in mind it should be recognize there is not much information
available on pedestrian bridges made of aluminum alloys in the USA. In contrast, the
general aptitude in the industry has been changing considering that the state of Michigan
took the initiative in using aluminum bridges for pedestrian applications during the early
seventies. In 1972, a five span pedestrian bridge was constructed in the city of Saginaw
to cross over the C&O Railroad. Some corrosion was detected during its last inspection,
as well as cracking on some welded stiffeners and other truss members. The Michigan
Department of Transportation has two other pedestrian bridges in their inventory, both of
which are located in Wayne County. These bridges consist of a through-type and an
arch-type truss, which were built in the late sixties and early seventies respectively. All
members in both bridges consisted of aluminum wide flange beams made up by welding
two T-sections together. Stainless steel fasteners in turn fastened all these members in
this bridge. In the city of Anchorage in Alaska, a pedestrian bridge made of aluminum
spans 170 feet over the Glen Highway and it was built in 1974.
2.3 PML Half-through Bridges: System Description & Design
Footbridges and stairways produced by PML are of a traditional modular
construction completely engineered and designed using extruded aluminum (6061-T6)
profiles [4]. The basic building unit is a truss panel. Its standardized construction is
15
derived from the precise structural design of these aluminum-extruded sections. This
inventive bridge system, primarily conceived for pedestrian, bicycle, and most likely also
equestrian or snowmobile traffic, was developed in 1996 and patented by PML LOGIS
Bridge Systems Company from Germany. The bridge system was produced and is
intended to be consistent with the design specifications and minimum design loads
requirements as prescribed by the German DIN 4113 and the Eurocode ENV 1999. Two
generations of the bridge - system Type-L and Type-S - were initially conceived and are
set apart from each other by design features. Such distinctive features are the extent of
their maximum free spans in conjunction with variable effective widths.
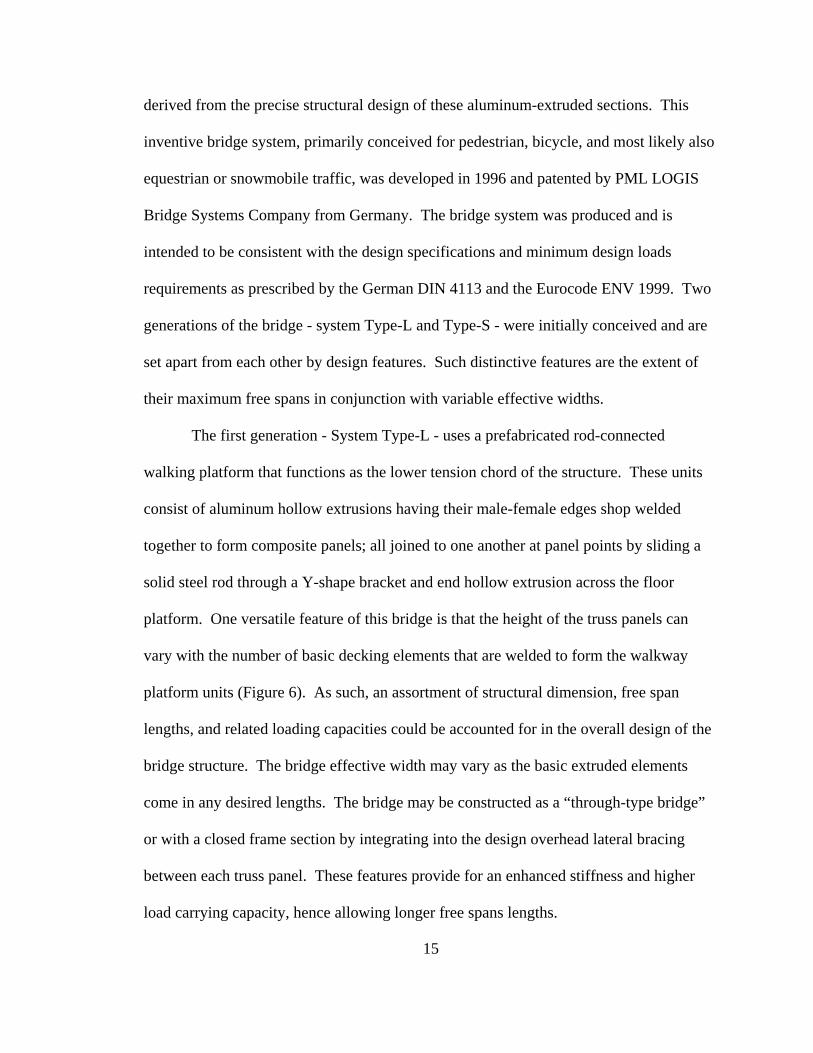
The first generation - System Type-L - uses a prefabricated rod-connected
walking platform that functions as the lower tension chord of the structure. These units
consist of aluminum hollow extrusions having their male-female edges shop welded
together to form composite panels; all joined to one another at panel points by sliding a
solid steel rod through a Y-shape bracket and end hollow extrusion across the floor
platform. One versatile feature of this bridge is that the height of the truss panels can
vary with the number of basic decking elements that are welded to form the walkway
platform units (Figure 6). As such, an assortment of structural dimension, free span
lengths, and related loading capacities could be accounted for in the overall design of the
bridge structure. The bridge effective width may vary as the basic extruded elements
come in any desired lengths. The bridge may be constructed as a “through-type bridge”
or with a closed frame section by integrating into the design overhead lateral bracing
between each truss panel. These features provide for an enhanced stiffness and higher
load carrying capacity, hence allowing longer free spans lengths.
16
The System-S, or the so-called tower-profile type bridge is the structural system
to be evaluated in this particular evaluation. It does incorporate into a typical Pratt truss a
set of independent tubular sections fabricated by means of extrusion shapes (Figure 1).
Unique profiles outline the main framework of the truss providing to the system a distinct
but conventional approach to achieve redundancy when the load transfer takes place.
That is quite a different scheme as compared to its first generation. All together as
designed in this second generation, these longitudinal tubular shapes are all joined
together by extruded double floor beams which subsequently are bolted to the modified
shop welded floor units as used in the System Type-L. The prefabricated rod-connected
walking platforms, Y-Shape brackets, and sliding steel rods system are replaced by a
more conventional design. Special tubular extruded shapes enable easy on-site assembly.
In addition, vertical posts and attached stiffeners yield higher structure stiffness. The
Figure 6: “System L” of First Generation
Y-Shape Bracket
Top Chord
Shop-welded Deck
Diagonal
17
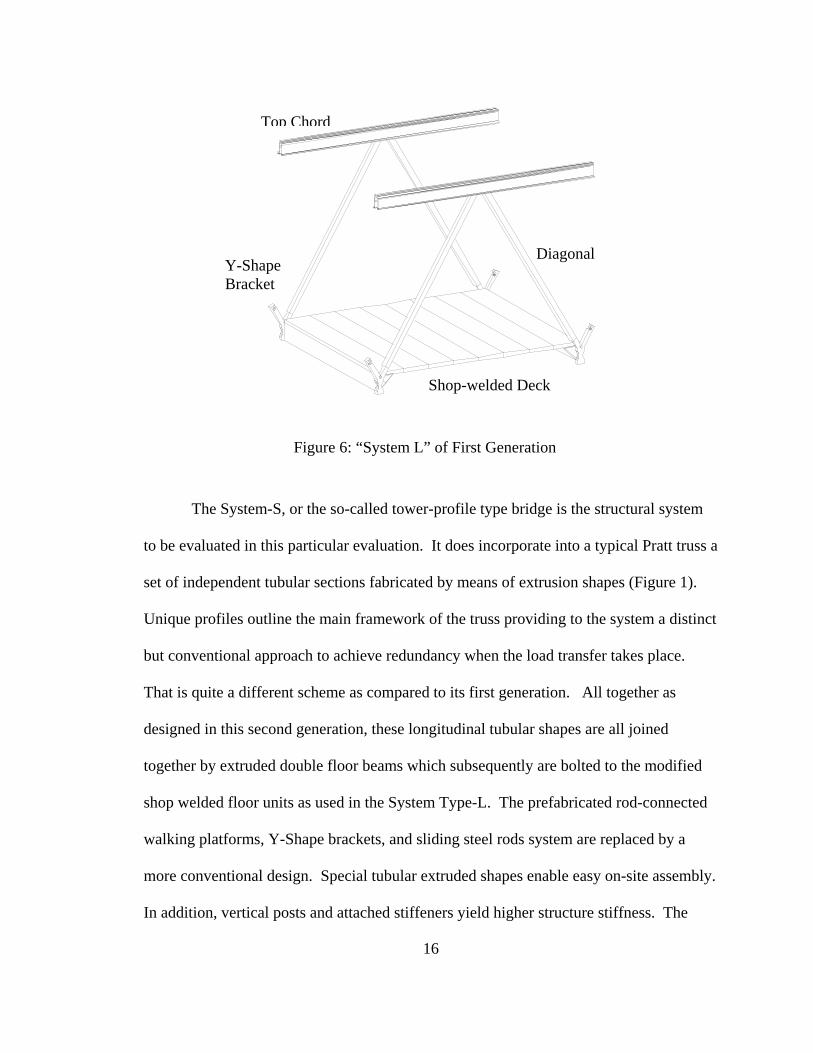
upper truss member of this pedestrian bridge functions as both a handrail as well as the
top compression chord, and is either the identical “tower profile”, or a lighter tubular
extrusion with flap-plates (Figure 7).
Both bridge systems consist of aluminum structural parts weighting less than 110
pounds (50 kilograms) each. The system allow for repetitive construction and rapid
assembly. In general the system is designed to withstand a surface load of around 103
psf (500 kg/m2) and corresponds to the controlling guidelines provided in the German
loading and latest European design specifications. AASHTO design guidelines and the
corresponding provisions of the Aluminum Design Manual [5] have also been accounted
for in the system’s development. It has been known that AASHTO Specifications ask for
a lower live load capacity as compared to European codes. On the other hand, there are
certain discrepancies with regards to allowable stresses for welded joints, particularly
where seismic design provisions are a concern. However, these aspects represent some
of the structural issues to be assessed and corresponding code requirements compared in
the bridge design.
Figure 7: Top-chord Profiles (a) Tubular Section with Flat Plates (b) Tower Profile
(b) (a)
18
2.4 AASHTO Minimum Design Loads and Specifications
These applicable design specifications are intended primarily for pedestrian and
pedestrian/bicycle bridges, which function as a fundamental part of highway facilities and
therefore designed in conformance to AASHTO Standard Specifications for Highway
Bridges. The term “primarily pedestrian and/or bicycle traffic” implies that the bridge
does not carry a public highway or vehicular roadway, yet the design provisions allow for
the passage of an occasional small maintenance or service vehicle. This specification
allows for the use of both an Allowable Stress Design (ASD) and Load Resistance and
Factor Design (LRFD) methods. The former approach is the one selected for this
assessment.
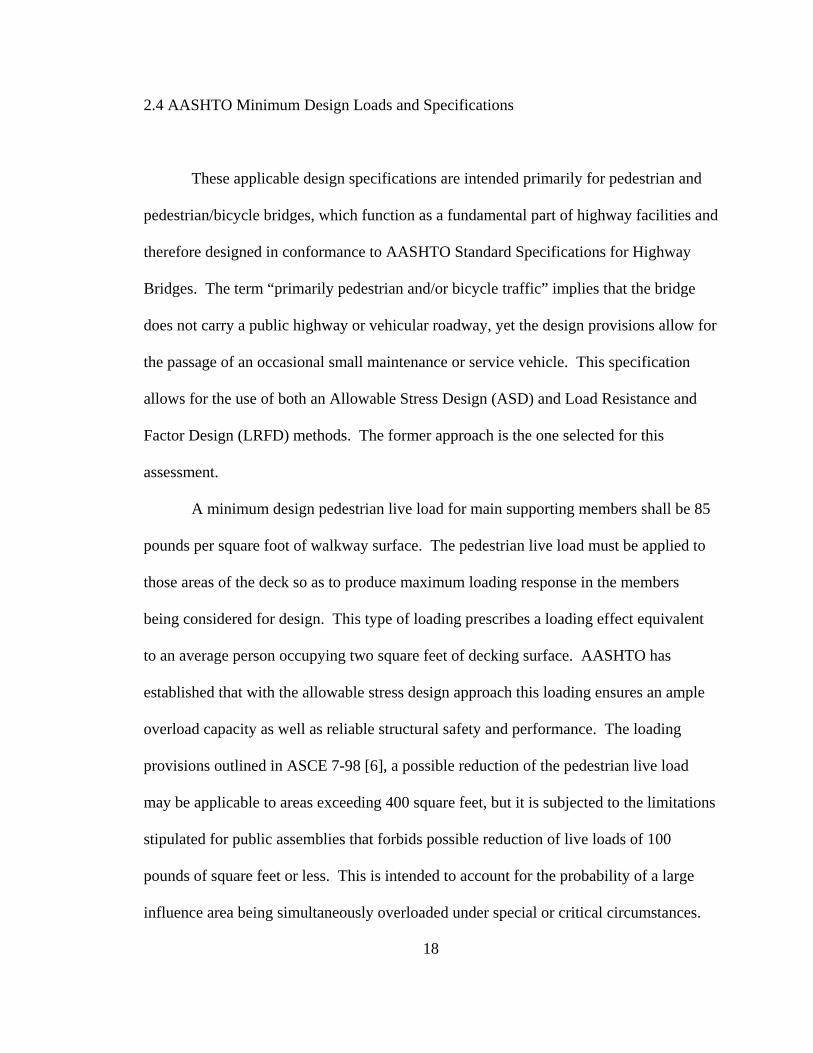
A minimum design pedestrian live load for main supporting members shall be 85
pounds per square foot of walkway surface. The pedestrian live load must be applied to
those areas of the deck so as to produce maximum loading response in the members
being considered for design. This type of loading prescribes a loading effect equivalent
to an average person occupying two square feet of decking surface. AASHTO has
established that with the allowable stress design approach this loading ensures an ample
overload capacity as well as reliable structural safety and performance. The loading
provisions outlined in ASCE 7-98 [6], a possible reduction of the pedestrian live load
may be applicable to areas exceeding 400 square feet, but it is subjected to the limitations
stipulated for public assemblies that forbids possible reduction of live loads of 100
pounds of square feet or less. This is intended to account for the probability of a large
influence area being simultaneously overloaded under special or critical circumstances.
19
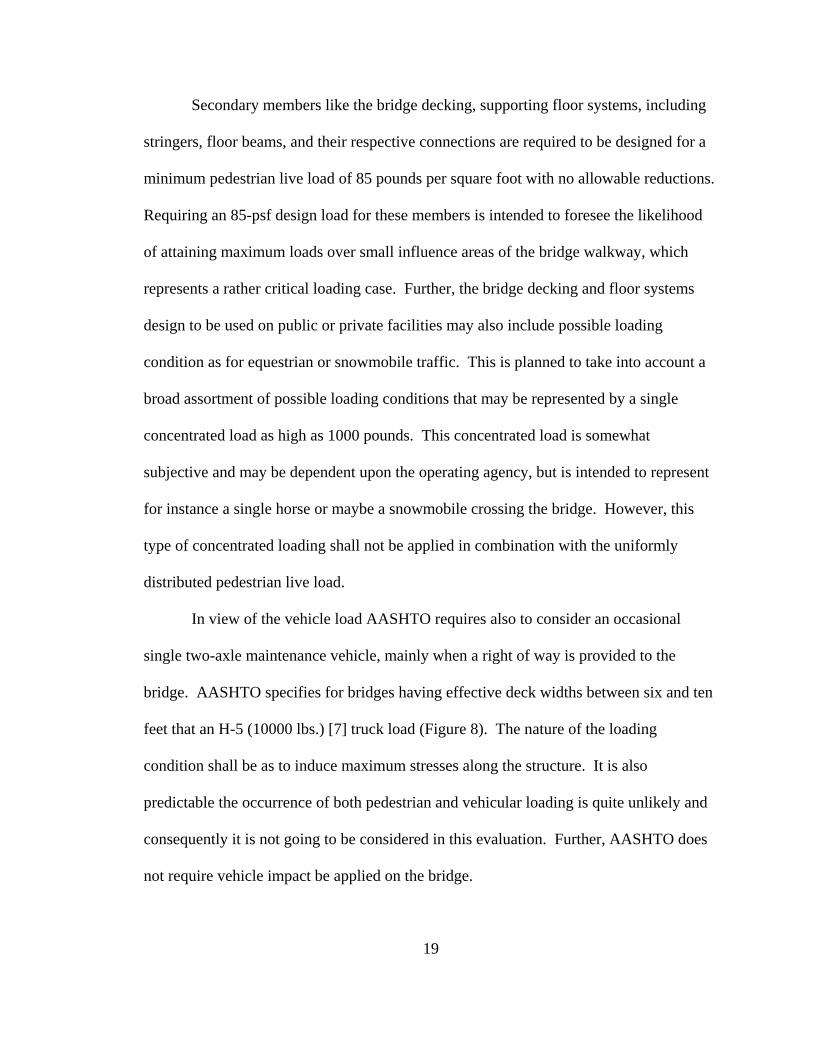
Secondary members like the bridge decking, supporting floor systems, including
stringers, floor beams, and their respective connections are required to be designed for a
minimum pedestrian live load of 85 pounds per square foot with no allowable reductions.
Requiring an 85-psf design load for these members is intended to foresee the likelihood
of attaining maximum loads over small influence areas of the bridge walkway, which
represents a rather critical loading case. Further, the bridge decking and floor systems
design to be used on public or private facilities may also include possible loading
condition as for equestrian or snowmobile traffic. This is planned to take into account a
broad assortment of possible loading conditions that may be represented by a single
concentrated load as high as 1000 pounds. This concentrated load is somewhat
subjective and may be dependent upon the operating agency, but is intended to represent
for instance a single horse or maybe a snowmobile crossing the bridge. However, this
type of concentrated loading shall not be applied in combination with the uniformly
distributed pedestrian live load.
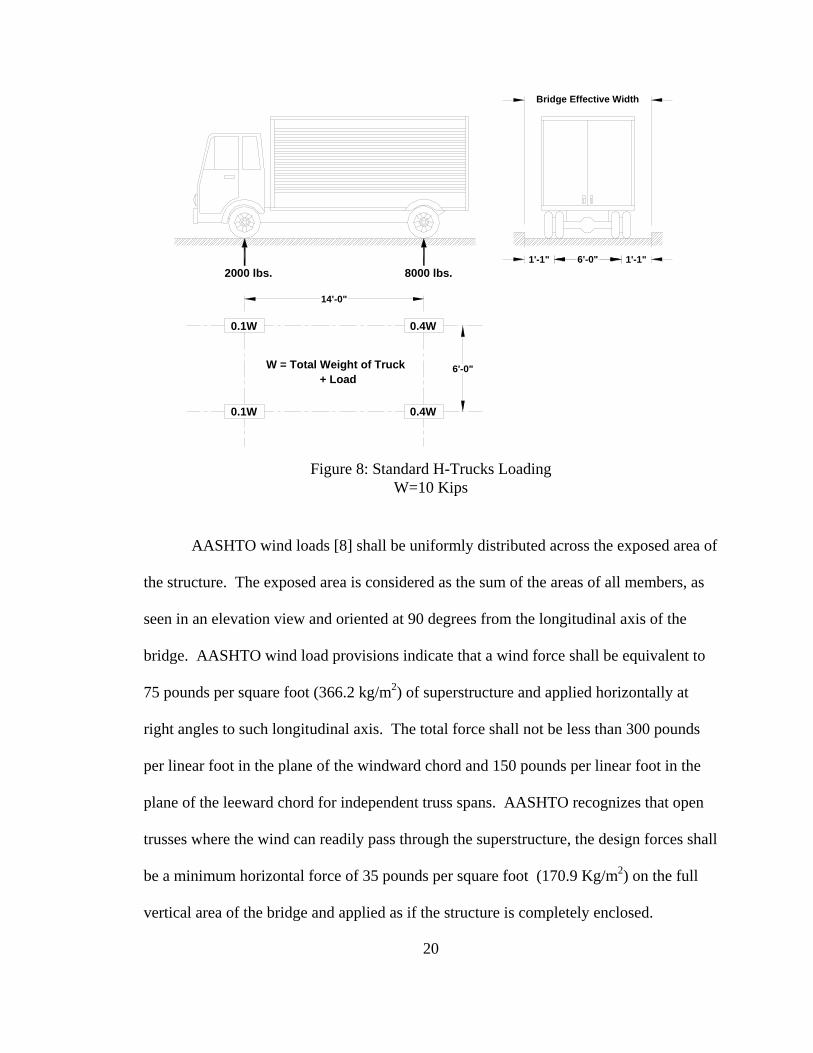
In view of the vehicle load AASHTO requires also to consider an occasional
single two-axle maintenance vehicle, mainly when a right of way is provided to the
bridge. AASHTO specifies for bridges having effective deck widths between six and ten
feet that an H-5 (10000 lbs.) [7] truck load (Figure 8). The nature of the loading
condition shall be as to induce maximum stresses along the structure. It is also
predictable the occurrence of both pedestrian and vehicular loading is quite unlikely and
consequently it is not going to be considered in this evaluation. Further, AASHTO does
not require vehicle impact be applied on the bridge.
20
AASHTO wind loads [8] shall be uniformly distributed across the exposed area of
the structure. The exposed area is considered as the sum of the areas of all members, as
seen in an elevation view and oriented at 90 degrees from the longitudinal axis of the
bridge. AASHTO wind load provisions indicate that a wind force shall be equivalent to
75 pounds per square foot (366.2 kg/m2) of superstructure and applied horizontally at
right angles to such longitudinal axis. The total force shall not be less than 300 pounds
per linear foot in the plane of the windward chord and 150 pounds per linear foot in the
plane of the leeward chord for independent truss spans. AASHTO recognizes that open
trusses where the wind can readily pass through the superstructure, the design forces shall
be a minimum horizontal force of 35 pounds per square foot (170.9 Kg/m2) on the full
vertical area of the bridge and applied as if the structure is completely enclosed.
Figure 8: Standard H-Trucks Loading W=10 Kips
0.1W
0.1W 0.4W
0.4W
14'-0"
2000 lbs. 8000 lbs.6'-0" 1'-1"1'-1"
Bridge Effective Width
6'-0"W = Total Weight of Truck + Load
21
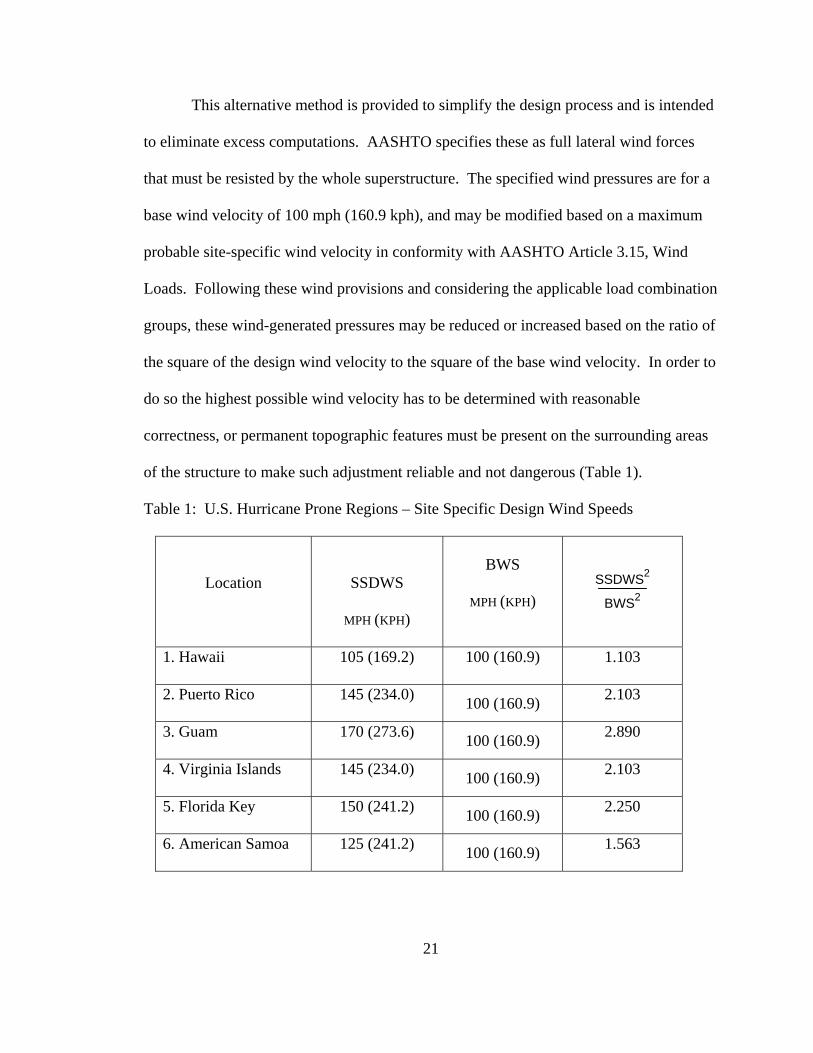
This alternative method is provided to simplify the design process and is intended
to eliminate excess computations. AASHTO specifies these as full lateral wind forces
that must be resisted by the whole superstructure. The specified wind pressures are for a
base wind velocity of 100 mph (160.9 kph), and may be modified based on a maximum
probable site-specific wind velocity in conformity with AASHTO Article 3.15, Wind
Loads. Following these wind provisions and considering the applicable load combination
groups, these wind-generated pressures may be reduced or increased based on the ratio of
the square of the design wind velocity to the square of the base wind velocity. In order to
do so the highest possible wind velocity has to be determined with reasonable
correctness, or permanent topographic features must be present on the surrounding areas
of the structure to make such adjustment reliable and not dangerous (Table 1).
Table 1: U.S. Hurricane Prone Regions – Site Specific Design Wind Speeds
Location
SSDWS
MPH (KPH)
BWS
MPH (KPH)
1. Hawaii 105 (169.2) 100 (160.9) 1.103
2. Puerto Rico 145 (234.0) 100 (160.9) 2.103
3. Guam 170 (273.6) 100 (160.9) 2.890
4. Virginia Islands 145 (234.0) 100 (160.9) 2.103
5. Florida Key 150 (241.2) 100 (160.9) 2.250
6. American Samoa 125 (241.2) 100 (160.9) 1.563
SSDWS2
BWS2
22
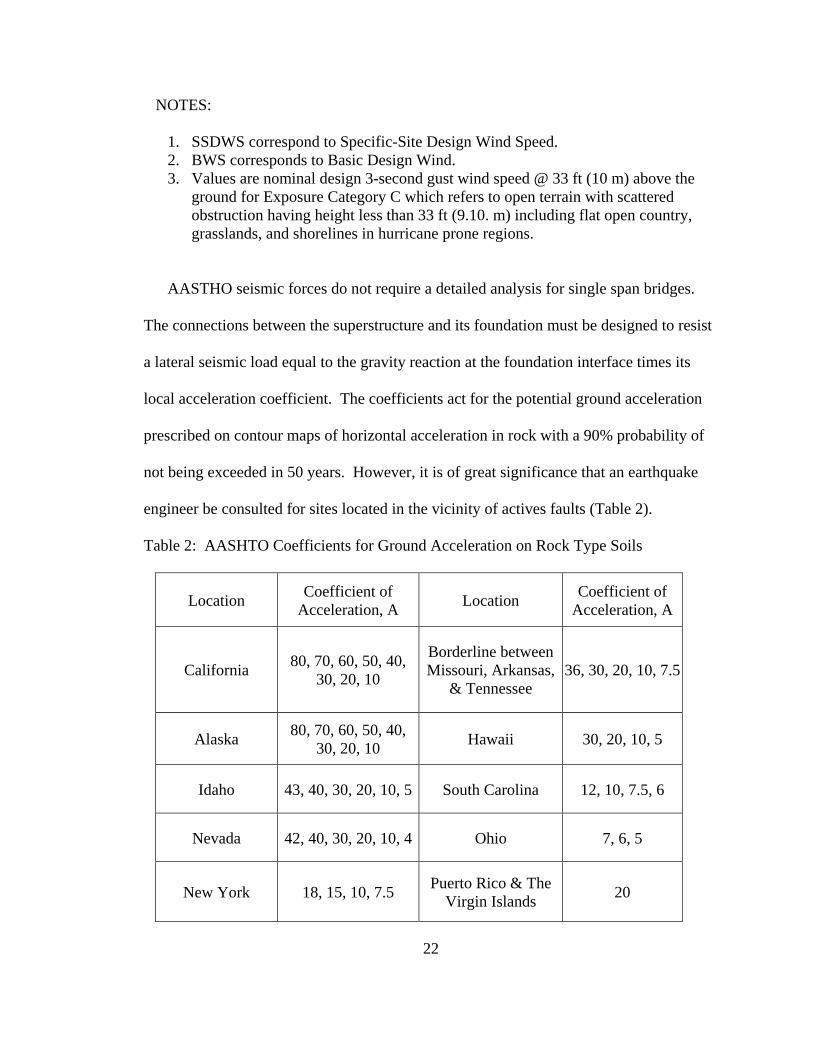
NOTES:
1. SSDWS correspond to Specific-Site Design Wind Speed. 2. BWS corresponds to Basic Design Wind. 3. Values are nominal design 3-second gust wind speed @ 33 ft (10 m) above the
ground for Exposure Category C which refers to open terrain with scattered obstruction having height less than 33 ft (9.10. m) including flat open country, grasslands, and shorelines in hurricane prone regions.
AASTHO seismic forces do not require a detailed analysis for single span bridges.
The connections between the superstructure and its foundation must be designed to resist
a lateral seismic load equal to the gravity reaction at the foundation interface times its
local acceleration coefficient. The coefficients act for the potential ground acceleration
prescribed on contour maps of horizontal acceleration in rock with a 90% probability of
not being exceeded in 50 years. However, it is of great significance that an earthquake
engineer be consulted for sites located in the vicinity of actives faults (Table 2).
Table 2: AASHTO Coefficients for Ground Acceleration on Rock Type Soils
Location Coefficient of Acceleration, A Location Coefficient of
Acceleration, A
California 80, 70, 60, 50, 40, 30, 20, 10
Borderline between Missouri, Arkansas,
& Tennessee 36, 30, 20, 10, 7.5
Alaska 80, 70, 60, 50, 40, 30, 20, 10 Hawaii 30, 20, 10, 5
Idaho 43, 40, 30, 20, 10, 5 South Carolina 12, 10, 7.5, 6
Nevada 42, 40, 30, 20, 10, 4 Ohio 7, 6, 5
New York 18, 15, 10, 7.5 Puerto Rico & The Virgin Islands 20
23
In turn further loading conditions must be accounted for in the analysis of the
bridge system. The railing framework of the bridge must resist a lateral load of to 50
pounds per linear foot, which is applied all at once transversely and vertically to all
railing members. The loads are going to be applied to the entire top chord of the truss
frame. However, design loads for rail members located more than 54 inches (1.37 m)
above the walkway surface shall be determined by the design engineer. The minimum
height of a railing to protect a bicyclist are these 54 inches measured from the top of the
walkway surface on which the bicyclist rides to the top side of the top rail. In addition,
the vertical posts shall be designed for a transversely applied uniform distributed load
equivalent to (W X L), where “L” is the post spacing between panel points and W is
equivalent to 50 pounds per linear foot. Since railing components must be proportioned
accounting for any expected pedestrian or bicycle traffic, strong consideration to safety is
as essential as any structural requirement is in the design of these members.
As a final note on load combinations and allowable stress percentages for service
load design, the guide specifications for pedestrian bridges accounts for several
modifications. AASHTO considers it is improbable that wind forces and live loads, such
as those induced by pedestrian traffic, would occur with the occasional maintenance
vehicle. Moreover, because the longitudinal forces that might be induced by pedestrian
or bicycle traffic are relatively small, it is rather unrealistic to take into consideration
these forces in the bridge design. The standard specifications states that each single
component of the structure, including the foundations on which it rests, to be properly
design and proportioned to withstand safely all group loading combinations that are
applicable to this type of bridge and it represents the overall objective of this evaluation.
24
CHAPTER III
ANALYTICAL APPROACH AND METHODOLOGY
3.1 AASHTO Standard Specifications for Highway Bridges
The compilation of these design guidelines was intended to serve as a model or
set of guiding rules for the preparation of State specifications and as reference to bridge
engineers in the construction industry. For the most part, these specifications outline
minimum design requirements in agreement with recent practices; then again some
modifications may be necessary to accommodate local design restrictions. The point of
these Specifications is to produce “safe” structures to serve the general public by means
of providing structural integrity under the estimated minimum design loads, along with
small or no damage or with no injury or loss of life because of any possible failure.
These apply to ordinary highway bridges, yet supplemental specifications are available
for unusual type of structures. Members of the Association are the fifty State Highway or
Transportation Departments, the District of Colombia, and Puerto Rico. Each member
has a vote, yet the U.S. Department of Transportation is a non-voting member.
25
3.2 Guide Specifications for Aluminum Highway Bridges
Distinct design provisions stipulated in these specifications are intended to
transcend Section 11.2, Aluminum Design of Bridges, in Division I of the existing
AASHTO Standard Specifications for Highway Bridges. AASHTO in this section
designates design requirements for aluminum structures as issued by the Aluminum
Association to serve as the standard protocols to be applied to “Bridges and Similar Type
Structures”. Engineers and fabricators of aluminum bridges and railing structures using
the alloys registered with the Aluminum Association consider these guiding principles as
the primary reference. The objective of these procedures is to enable designers, who may
not know much about aluminum alloys, to more assertively design and construct
aluminum structures. These design provisions attain this objective by simplifying the
selection of materials and by specifying those alloys and corresponding tempers whose
performance has already been proven in the construction of aluminum highway bridges.
3.2.1 Top Compression Chord: Members with Elastic Lateral Restraints
Following the AASHTO design guidelines for aluminum bridges, the top
compression chords in half-through trusses are considered as columns elastically
restrained by intermittent lateral supports at each truss-panel connection. In trusses with
floor systems in the plane of the lower tension chords and where vertical clearance
requirements may forbid direct lateral bracing, each panel point will provide both vertical
26
support and elastic lateral restraint for the top chord. The overload buckling response of
this compression members falls between two limiting extremes [9]. Exceedingly stiff
elastic restrains could produce nodal points at each restraint location. In contrast, if
restraints were too flexible the buckling response could occur in the shape of a single
half-wave over the full member length. The overall buckled shape of the column will
include a number of half-waves not larger than the total number of spaces at the lateral
supports.
The analysis and design of these type of elastically restraint compression
members is be based on the so determined critical buckling force, which shall exceed the
maximum force produced by the controlling combined forces by not less than 50 percent;
given that vehicle impact allowance is not required for pedestrian bridges [10]. As a
result of any initial crookedness and because of moments induced by bending of the floor
beams, the design of this compression chord must also account for the possibility of
combined stresses. As such, the design will then incorporate the effects produced by
these potential induced deflections across the floor system. These current provisions are
based on a semiempirical theory in which satisfactory stiffness of the lateral supports on
the compression-chord is achieved by designing them for a fictitious horizontal load. The
point of application shall be at each panel points of the top-chord and normal to the plane
of each truss. The overall design of each truss transverse frames – floor beams, truss
verticals, and connecting bracing – will have a direct effect on the general behavior and
structural performance of these members and it is essential for the overall safety and
reliable serviceability of any half-through structure.
27
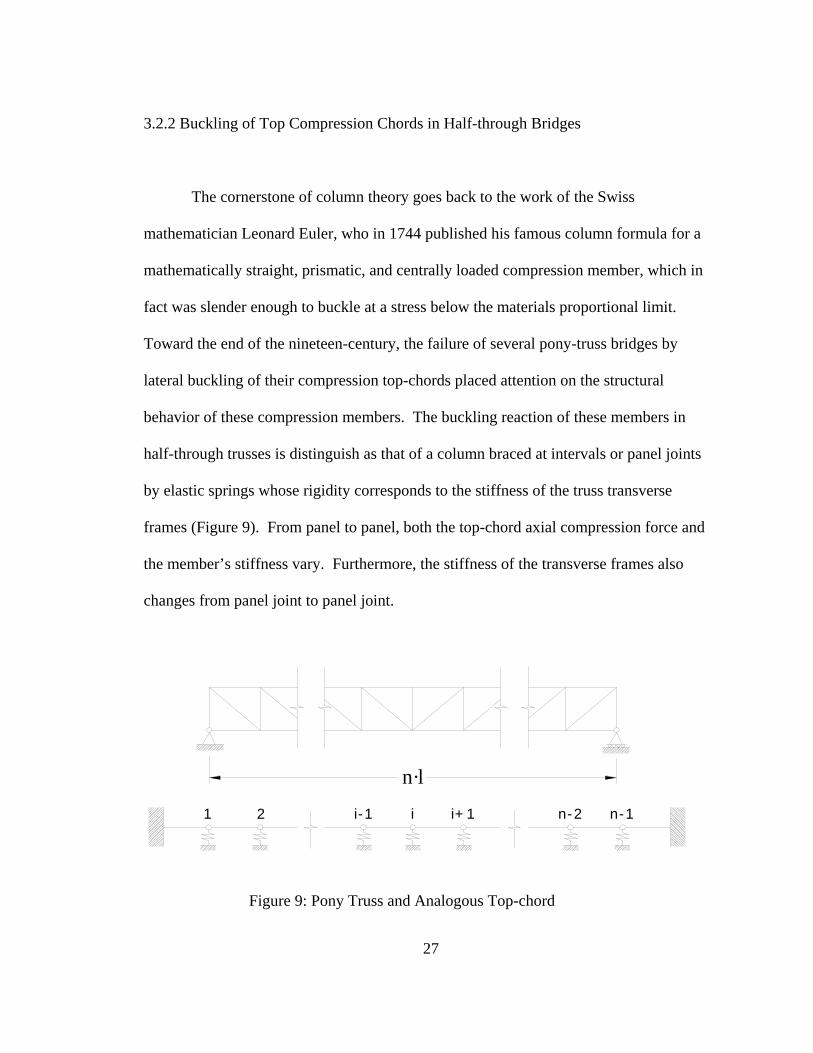
3.2.2 Buckling of Top Compression Chords in Half-through Bridges
The cornerstone of column theory goes back to the work of the Swiss
mathematician Leonard Euler, who in 1744 published his famous column formula for a
mathematically straight, prismatic, and centrally loaded compression member, which in
fact was slender enough to buckle at a stress below the materials proportional limit.
Toward the end of the nineteen-century, the failure of several pony-truss bridges by
lateral buckling of their compression top-chords placed attention on the structural
behavior of these compression members. The buckling reaction of these members in
half-through trusses is distinguish as that of a column braced at intervals or panel joints
by elastic springs whose rigidity corresponds to the stiffness of the truss transverse
frames (Figure 9). From panel to panel, both the top-chord axial compression force and
the member’s stiffness vary. Furthermore, the stiffness of the transverse frames also
changes from panel joint to panel joint.
1 2 i-1 i i+1 n-2 n-1
n·l
Figure 9: Pony Truss and Analogous Top-chord
28
Engesser in 1884 was the first to present a straightforward and approximate
formula for the required stiffness - Creq - for elastic lateral supports that are equally
spaced between the ends of a hinged-end column of prismatic cross section. Engesser’s
solution incorporated the following simplifying assumptions. First, he assumed that the
top-chords and the end posts were completely straight from top to bottom having a
uniform cross section. Secondly, ends restraints were conceived as pin-connected and
rigidly supported. And lastly, the equally spaced elastic lateral supports were conceived
having the same stiffness in addition to the constant axial compressive force through the
chord’s length. Engesser’s approach can be applied with reasonable accuracy in any case
where the lateral support is supplied by equally spaced springs, provided that the half-
wavelength of the buckled shape of the continuously supported member is at least 1.8
times the spring spacing. Also, Engesser’s formulation is accurate if the compression
members are stable as two-hinge columns carrying the same axial load and with a
member length no less than 1.3 times the spring spacing. Engesser’s solution for the
required stiffness of a half-through truss transverse frame is given as:
Creq = Pc2 • l / 4 E I
where Creq is the required elastic stiffness of the transverse frame at each panel point.
This stiffness will ensure that the overall chord, having panel length “l” and flexural
rigidity “EI”, will attain the buckling force, Pc. It is important to recognize that if the
proportional limit of the column member is exceeded upon the imposed external loading,
the modulus of elasticity “E” should be replaced by the tangent modulus “Et”.
29
Engesser’s simplifying statement, which assumes the top chord end restraints as
pin-connected, may result in notably unsafe errors in the estimation of Creq for short
trusses. Holt (1952-56) instead provided an alternate design procedure not requiring
Engesser’s simplifying assumptions. His research is the guiding principle for design
incorporated in the guide specifications for pedestrian bridges and made available by
AASHTO [11]. Holt’s solution for the buckling load of the compression chord on pony
trusses is based on the following postulations. Holt’s theory states that transverse frames
at all panel points have identical stiffness. He assumes the top-chord and end post having
the same radii of gyration and the top-chord members with the same allowable unit stress,
hence their areas and moment of inertia are proportional to the compressive forces.
The connections between the top-chord and the end posts are pinned, and each
end posts act as cantilever springs supporting the ends of the top-chord. A uniformly
distributed force is the basis for the analysis. The results of Holt’s studies provide the
reciprocal of the effective length factor “K” as a function of “n” – the number of truss
panels in the frame – and Cl/P, where C is the stiffness at the top of the least stiff
transverse frame. In determining an effective length for compression member the entire
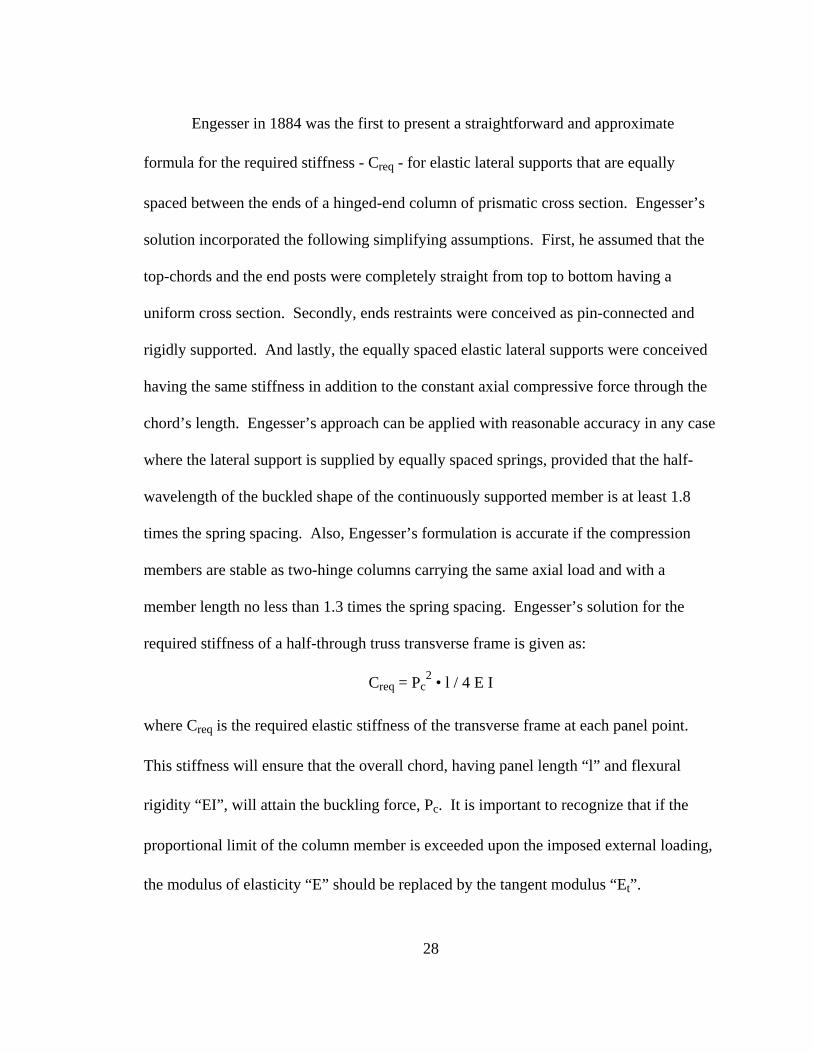
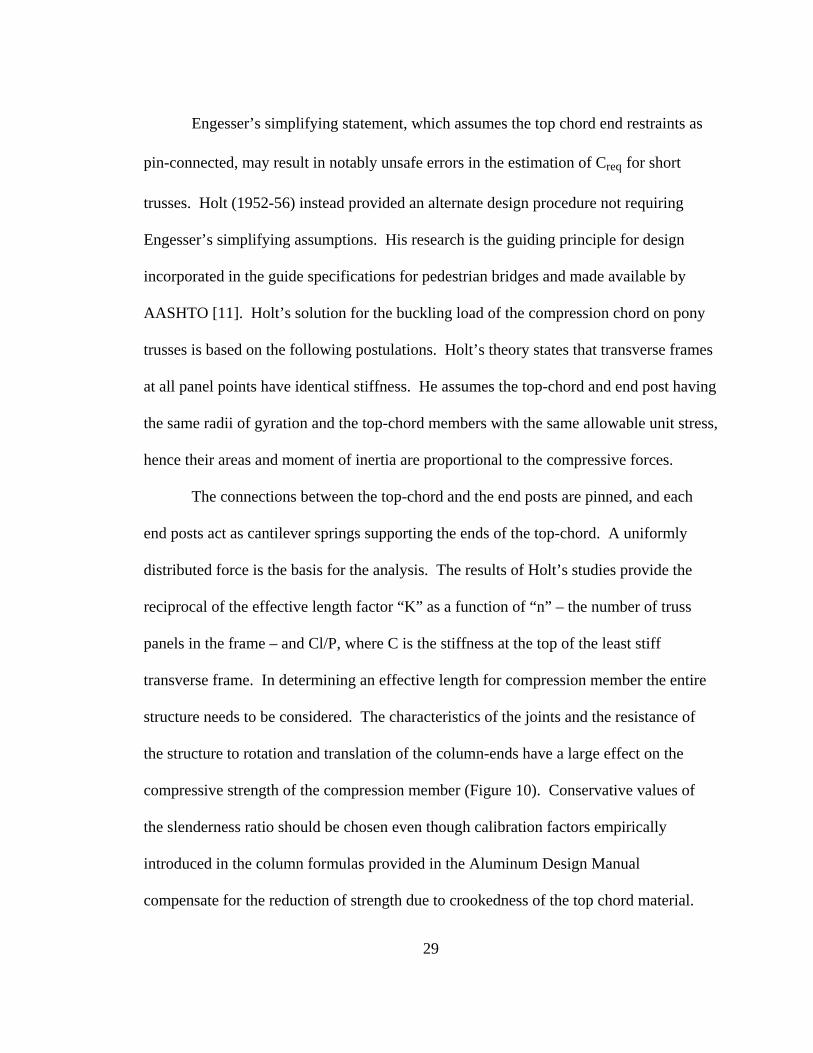
structure needs to be considered. The characteristics of the joints and the resistance of
the structure to rotation and translation of the column-ends have a large effect on the
compressive strength of the compression member (Figure 10). Conservative values of
the slenderness ratio should be chosen even though calibration factors empirically
introduced in the column formulas provided in the Aluminum Design Manual
compensate for the reduction of strength due to crookedness of the top chord material.
30
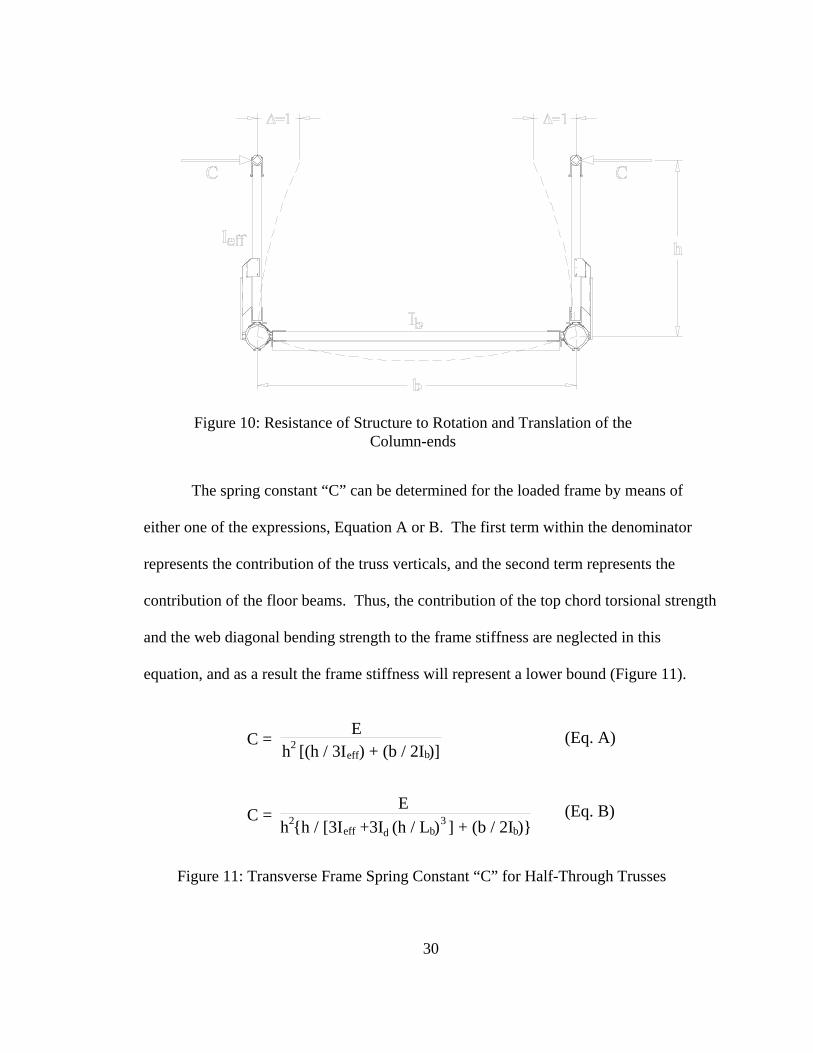
C = E2h [(h / 3I ) + (b / 2I )]eff b
h {h / [3I +3I (h / L ) ] + (b / 2I )}2beff d
3b
EC =
(Eq. A)
(Eq. B)
Figure 10: Resistance of Structure to Rotation and Translation of the Column-ends
Figure 11: Transverse Frame Spring Constant “C” for Half-Through Trusses
The spring constant “C” can be determined for the loaded frame by means of
either one of the expressions, Equation A or B. The first term within the denominator
represents the contribution of the truss verticals, and the second term represents the
contribution of the floor beams. Thus, the contribution of the top chord torsional strength
and the web diagonal bending strength to the frame stiffness are neglected in this
equation, and as a result the frame stiffness will represent a lower bound (Figure 11).
31
3.2.3 Additional Requirements for Top-chord in Half-trough Bridges
AASHTO stipulates as supplementary design requirement that for structural
component of individual trusses connected by either by welds, rivets, and/or bolts
consideration must be given in avoiding laterally unsupported hip joints. Preference
should also be given to trusses whose members are symmetrical about the central plane of
the truss. Furthermore, each panel should have inclined end posts. If the overall shape of
the structure permits, compression chords shall also be continuous. With regard to
secondary stresses, the design and structural details shall be such that secondary stress
levels will be as small as practicable. Secondary stresses due to any truss distortion or
induced deflections on the floor-beams usually need not to be considered in any member,
the width of which, measured parallel to the plane of distortion, is less than one-tenth of
its length. If the secondary stresses exceed 4 ksi for tension members and 3 ksi for
compression members, the excess shall be treated as primary stresses. Stresses induced
by flexural dead load moments of the member shall be taken into consideration as an
additional secondary stress.
3.3 Aluminum Welded Members
Though on occasion aluminum alloys are regarded as a challenging material to
weld. The designer shall be aware that aluminum is one of the most readily weldable of
all metals, including steel. It has in contrast certain intrinsic characteristics that should be
32
thoroughly understood. One of the most crucial factors in welding aluminum is
oxidation, a transparent layer of aluminum oxide that forms on the surface almost
instantaneously upon experiencing contact with the surrounding atmosphere [12].
Though aluminum gains its corrosion resistance from this oxide film, it has to be
completely removed before sound welding can be made on the parts to be joined. Its
removal can become a very difficult task to accomplish, just by the fact that the oxide
film has a much higher melting point than that of the base metal. Unless this oxide film
is properly removed preceding or broken up during welding, the temperature differential
produced in the heated affected zone can allow the aluminum base metal to melt before
the oxide film does, therefore precluding suitable coalescence between the deposited
filler metal and the base material.
Furthermore, the overall cleanness of the areas to be welded is critical considering
that moisture, grease, oil films, and any other foreign substance sitting on the edges to be
joined can cause welds to be of poor quality. The difficulty arises when the contaminants
breakdown into hydrogen and other gases that become entrapped in the weld deposit.
These trapped gases produce porosity that affecting adversely the weld strength and its
ductility. Welding aluminum members also reduces the strength of the base material.
Most structural alloys attain their strength by heat treatment and/or strain hardening or
cold work. Welding causes local annealing, which introduces a zone of lower strength
along both sides of the weld. Because of its apparent weakness at high temperatures,
many aluminum alloys are partially molten over a wide range of temperature if enough
care is not taken during the manufacturing process. When temperatures are reached
33
during welding at which partial melting occurs, the aluminum alloy will show a tendency
to collapse. However, the proper selection of filler material should overcome this
concern.
It is important to realize that the range of temperatures achieved in welding
aluminum is not within the visible light range. In consequence, it is very difficult to
conclude that any component of the piece of metal being welded has melted down
adequately reaching suitable fusion. It is therefore an unquestionably critical safety issue
that must not be overlooked during the fabrication process considering the design
requirements of the welded detail. This is contrary to the circumstances in welding of
most other metals, such as steel, where welders know the temperature by the color of the
heated piece; therefore they can heat to any desire range. This condition also necessitates
precaution to avoid subjecting the hot metal to shrinkage and reaction stresses because of
the high thermal conductivity of aluminum in view of the high thermal conductivity of
these types of alloys.
3.3.1 Metallurgical Effects of Welding
The characteristics of aluminum parts are to a great extent influenced by
microstructural changes that take place during welding. An understanding of these
changes is necessary to predict the mechanical properties and ultimate performance of
weldments. When a fusion weld is made in aluminum, two basic types of materials must
be considered [13]. These are the weld metal having a cast structure and the base metal
34
that may be wrought or cast. The properties of the cast aluminum in the welded zone are
affected by the composition and rate of solidification. The rate of solidification of the
welded metal depends on the welding process plus the factors affecting the heat input and
transfer away from the molten pool. A higher rate of solidification rarely produces a
finer microstructure and an enhanced strength. The effects of welding on aluminum-base
metals change with the distance from the weld and may be divided into areas that reflect
the temperature attained by the metal during welding. The widths of these areas and their
distances from the welds vary with the welding process, the thickness or geometry of the
part, and the speed at which welding is performed. Within each area certain
microstructural changes take place upon welding that largely determine the as-welded
properties of the alloy.
The heat-treatable aluminum alloys contain elements that exhibit a marked change
in solubility with temperature changes. These elements are quite soluble in aluminum at
high temperature, despite the fact they have low solubility at room temperatures. They
have a tendency to break up as various microconstituents in the base metal structure. The
high strength of the heat-treatable alloys is due to the controlled solution and
precipitation of some of these microconstituents. Conversely most of the difficulties in
welding these alloys are due to the uncontrolled melting, solution, and precipitation of
these elements. These alloying ingredients are dissolved into the aluminum at very high
temperatures by means of solution heat-treatment. These are maintained in solid solution
by rapidly quenching from these elevated temperatures governing the strength of these
alloys in the as-quenched temper.
35
Additional increases in the strength of welded parts are affected by the
precipitation of portions of the soluble elements in a finely divided form. This
precipitation may take place at room temperature after quenching or accelerated by a
thermal treatment at a fairly elevated temperature, usually in the range of 210 - 350 °F.
Heat-treatable alloys may be reheated after welding to bring the base metal in the heat-
affected zone back to nearly its original strength. The strength achieved in the weld
metal after reheat-treatment will depend on the filler metal used. In cases where filler
metal of other than base metal composition is used, the overall strength of the joined parts
will depend upon the percent dilution of filler metal within the base metal. In situations
where complete reheat-treatment of weldments is not practical and realistic, parts can be
welded in the solution heat-treated condition and then artificially aged after the welding
process. The properties and performance of weldments are greatly influenced by factors
such as composition, form and temper of the base material, the filler alloy, and the
welding techniques including the rate of cooling and the weld design. These effects and
other variables must be considered in any particular application.
3.3.2 Cracking
Cracking in the heat-affected zone is a primary structural deficiency for any
welded component in aluminum alloys. However, these deficiencies could be overcome
if adequate fabrications techniques are applied. The cracks in welded metals are usually
in the shape of either a crater or of an elongated form. Crater cracks often occur when
36
the welding is quickly broken. Crater cracks are certainly detrimental considering the
strength of the weld and especially when these are located in highly stressed areas. The
defect may be prevented by proper torch handling or by a buttoning technique or current
control devices used to the fill craters. Longitudinal cracks are usually the result of
improper filler metal choice or poor welding procedures. High stresses imposed during
welding, mainly in restrained joints, may also produce longitudinal cracks by exceeding
the strength of the metal when the weld bead is small enough or the filler metal is of poor
strength. Cracking in the heat-affected zone of base metals takes place primarily with
heat treatable alloys. Usually, it is related to the precipitation of brittle constituents at the
grain boundaries within the weld structure. To prevent this it is necessary to use a higher
welding speed to diminish heat input to the base metal and employ filler alloys with
lower melting points than the base metal. To reduce heat-affected zone cracking
attention to lessen the restraint imposed during welding and cooling is important. High
welding speeds are advantageous as well as the selection of the filler alloy, which may be
critical. Heat-treatable alloys welded in the solution-treated condition are slightly less
subject to this cracking when they are in the fully heat-treated and aged condition.
3.3.3 Porosity
Gas pockets or voids in the welded metal are often observed in cross sections of
fusion-welded joints in aluminum applications. A slightly small amount of porosity
spread uniformly throughout the welds has little or no influence on the strength of joints
37
in these metals. If clusters or gross porosity are present, they can have an adverse effect
on the performance of the welded joints. Numerous welding codes regulate the amount
and allocation of porosity in aluminum-welded joint. Hydrogen is a main source of
porosity as it is very soluble in molten aluminum but has low solubility in solid
aluminum. In consequence, hydrogen can be easily picked up by the molten weld pool
during welding and be released upon solidification during the cooling process. The
presence of foreign substances such as moisture, oil films, grease, or heavy oxides in the
area during welding can produce porosity within the weld structure. Other contributing
items that could produce gross porosity are improper voltage or arc length and an
improper or erratic wire feed in gas metal welding. Filler wire contaminated either
during its manufacture or shop handling, a leaky torch, and moist or contaminated inert
shielding gas or insufficient shielding gases when employed are all sources of porosity.
Since welding speeds in combination with good quality arc transfer are also linked with
metal soundness, it may require selecting a welding process with a proper solidification
rate to aid in the reduction of porosity.
3.3.4 Incomplete Fusion
Incomplete fusion is depicted as a failure to fuse adjacent layers of weld metal or
weld metal to base metal. In aluminum weldments the two most common causes are
incomplete removal of the oxide film prior to welding or unsatisfactory cleaning among
passes at some stage in welding. The applied weld bead will, on average, have a dirty
38
gray appearance when the pre-weld or inter-pass weld cleaning is not properly done. Not
enough bevel angles or back-chipping, or unsuitable amperage or voltage often plays an
important part in incomplete fusion. This type of defect may be identified by means of
radiographic or ultrasonic inspection. However, if the incomplete fusion is not oriented
in a plane parallel to the X-ray beam, it may be perceived by the method of radiography.
3.3.5 Inadequate Penetration
Inadequate penetration comes about when the weld does not penetrate the full
depth of a prepared joint or it does not penetrate to the indicated depth. In both groove
and fillets welds, inadequate penetration can be the result of low welding current,
improper filler metal size, improper joint preparation, or excessive welding speeds for the
amount of amperage or voltage used during the welding process.
3.3.6 Inclusions
Weld inclusions in aluminum alloys are of two types: metallic and non-metallic.
In gas tungsten arch welding (GTAW) too much current for a given electrode size will
trigger melting and the resulting deposit of tungsten within the weldments. If
rectification of the alternating current and the required adjustments for the high frequency
are improperly set, this may also result in tungsten inclusions. Tungsten inclusions can
be credited to welds starting with a cold electrode, also by dropping the electrode into the
39
weld pool, or by touching the filler rod to the electrode. Fine widely scattered particles of
tungsten do not have too much of an effect on the mechanical properties of the gas
tungsten arch weld, however, code specifications may call for welds that are free of these
types of defects. Copper inclusions are possible in gas metal welding as a consequence
of a burn back of the electrode to the contact tube. Copper inclusions will produce a
brittle weld structure and can lead to a serious corrosion problem and should be removed
from the weld deposit as much as possible. Inappropriate use of wire brushes during
cleaning the weld groove or between passes also results in metallic inclusions if the
bristles from the wire brush become entrapped in the weld. Nonmetallic inclusions are
often the result of poor base metal cleaning when using soldering or brazing procedures
or when flux shielded metal-arc welding is improperly employed.
3.3.7 Additional Requirements for Welded Members
AASHTO specifies that the aluminum alloy to be welded, the filler alloy, and the
corresponding welding details conform to the requirements of the latest edition of AWS
D1.2, Structural Welding Code – Aluminum. It is also important that welding symbols as
well as fabrication processes conform to these specifications. With regard to end returns,
fillet welds that are subjected to tensile forces not parallel to the axis of the weld, or
which are proportioned to withstand repeated stresses, shall not terminate at corners of
parts or members. Instead it is specified that end returns shall be turned continuously
around the corner of the part being welded for a length equivalent to twice the weld size,
40
where such return can be made in the same plane of the weld. The end returns shall also
be specified and indicated on design and detail drawings. With respect to the required
minimum effective size for fillet welds, these shall be such that the stresses induced in the
adjacent base material do not exceed the allowable stresses presented by AASHTO [2].
It is specified also that the maximum size for fillet welds that may be used along edges of
connected parts must be equal either to the thickness of the part being welded, if the part
is less than 0.250 inches thick. In the case of edges of material 0.250 inches thick or
more, the maximum size shall be 0.0625 inches less than the thickness of the material,
unless is specially designated on the detail drawings to be built out to achieve full throat
thickness.
3.4 Deflections
The term “deflection” as used herein shall be the deflection computed in
accordance with the assumption made for loading when computing the stress in a
member. AASHTO specifies that members with either simple or continuous spans
should be proportioned so that the deflection due to the service live load on bridges in
urban areas used in part by pedestrians do not exceeds L/1000, where L represents the
clear span of the structure. In the case of cantilever systems, as is the case for the
overhang side of this pedestrian bridge, the deflection due to the minimum service live
load should be limited to L/375. It is also stipulated that when deflections of beams and
girders are estimated, the moment of inertia of the gross cross sectional area be used.
41
CHAPTER IV
DISCUSSION OF ANALYSIS RESULTS
4.1 Analysis of Top Chord
Top chord of members are structural elements subjected primarily to axial
compressive forces. At any time compression takes place in engineered structures
instability concerns certainly become a design consideration. The member’s overall
dimensions – particularly the unbraced length, cross-sectional widths and thicknesses –
and the actual nature of its end-restraints strongly influence the buckling response of
these types of components. In half-through bridges (i.e. pony trusses), the top
compression chords are idealized as laterally restrained by intermittent elastic supports at
each panel point. Furthermore, these axially loaded members are vertically supported at
the same locations by each truss post. It is well recognized in this type of bridge that the
buckling behavior of these compression components is a function of the minimum lateral
support provided by the members defining the transverse frames. This investigation
examines an array of external bracing in conjunction with a set of combination of
42
Vertical Post
Bracing Arm
Bottom Chord
U-Bracket
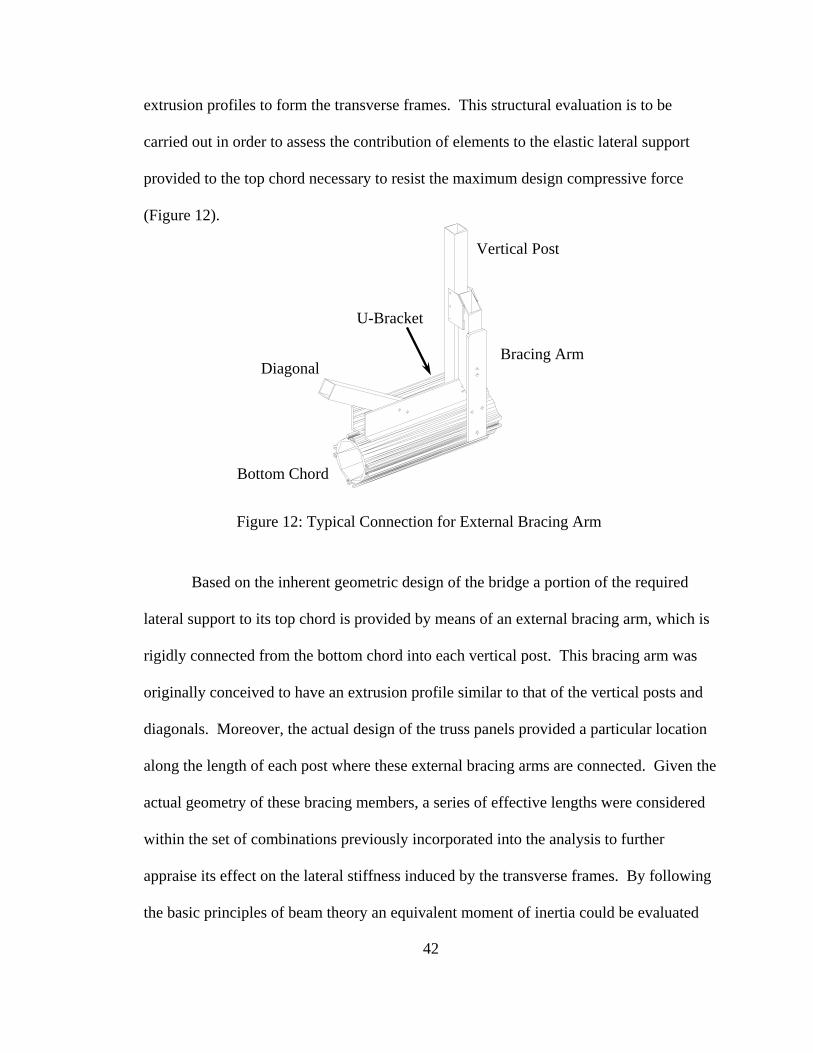
Figure 12: Typical Connection for External Bracing Arm
Diagonal
extrusion profiles to form the transverse frames. This structural evaluation is to be
carried out in order to assess the contribution of elements to the elastic lateral support
provided to the top chord necessary to resist the maximum design compressive force
(Figure 12).
Based on the inherent geometric design of the bridge a portion of the required
lateral support to its top chord is provided by means of an external bracing arm, which is
rigidly connected from the bottom chord into each vertical post. This bracing arm was
originally conceived to have an extrusion profile similar to that of the vertical posts and
diagonals. Moreover, the actual design of the truss panels provided a particular location
along the length of each post where these external bracing arms are connected. Given the
actual geometry of these bracing members, a series of effective lengths were considered
within the set of combinations previously incorporated into the analysis to further
appraise its effect on the lateral stiffness induced by the transverse frames. By following
the basic principles of beam theory an equivalent moment of inertia could be evaluated
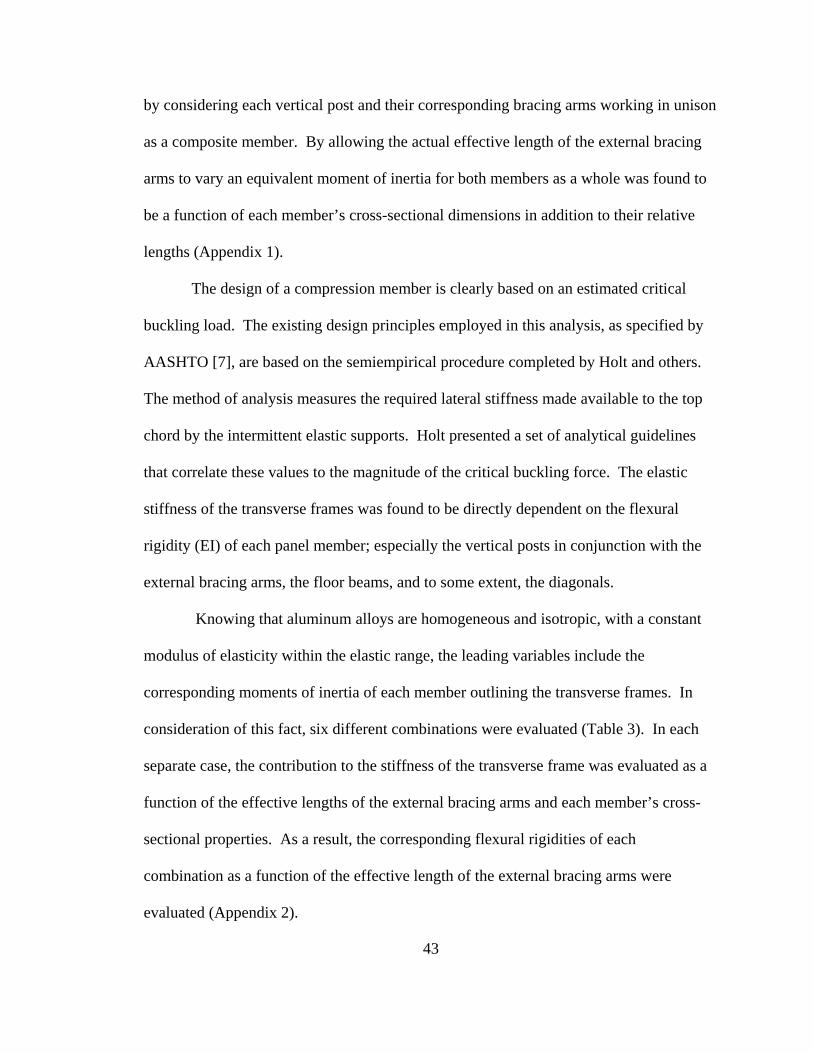
43
by considering each vertical post and their corresponding bracing arms working in unison
as a composite member. By allowing the actual effective length of the external bracing
arms to vary an equivalent moment of inertia for both members as a whole was found to
be a function of each member’s cross-sectional dimensions in addition to their relative
lengths (Appendix 1).
The design of a compression member is clearly based on an estimated critical
buckling load. The existing design principles employed in this analysis, as specified by
AASHTO [7], are based on the semiempirical procedure completed by Holt and others.
The method of analysis measures the required lateral stiffness made available to the top
chord by the intermittent elastic supports. Holt presented a set of analytical guidelines
that correlate these values to the magnitude of the critical buckling force. The elastic
stiffness of the transverse frames was found to be directly dependent on the flexural
rigidity (EI) of each panel member; especially the vertical posts in conjunction with the
external bracing arms, the floor beams, and to some extent, the diagonals.
Knowing that aluminum alloys are homogeneous and isotropic, with a constant
modulus of elasticity within the elastic range, the leading variables include the
corresponding moments of inertia of each member outlining the transverse frames. In
consideration of this fact, six different combinations were evaluated (Table 3). In each
separate case, the contribution to the stiffness of the transverse frame was evaluated as a
function of the effective lengths of the external bracing arms and each member’s cross-
sectional properties. As a result, the corresponding flexural rigidities of each
combination as a function of the effective length of the external bracing arms were
evaluated (Appendix 2).
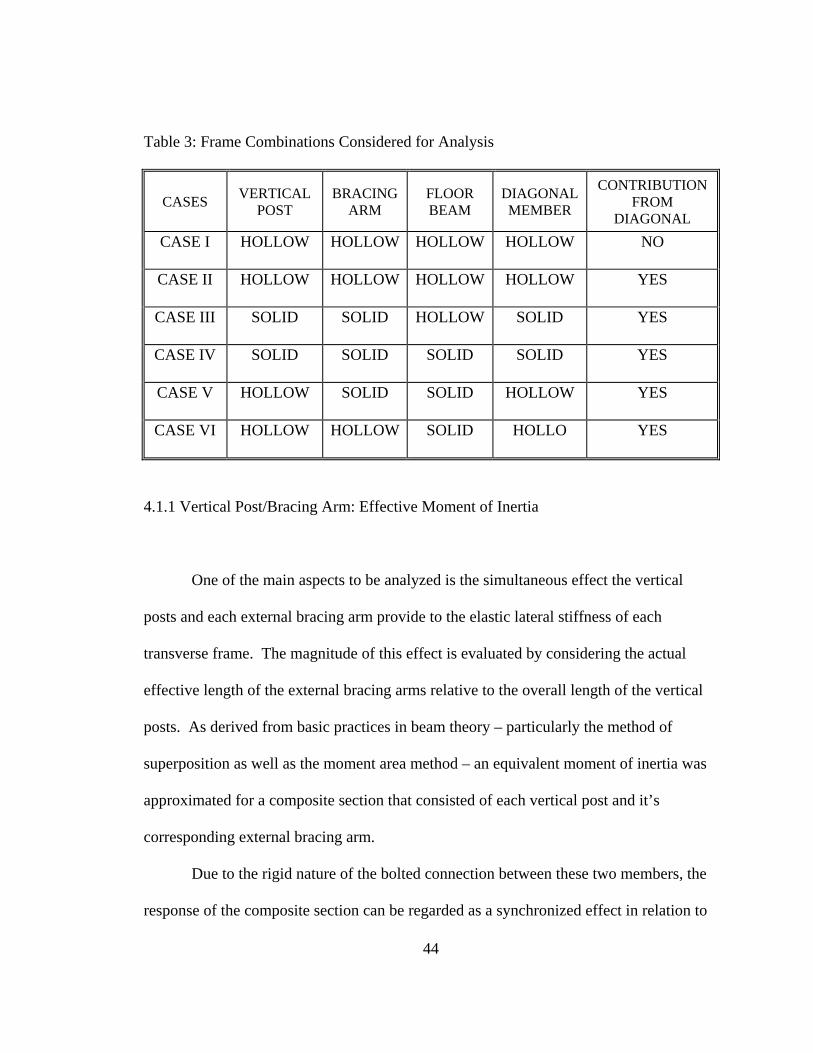
44
Table 3: Frame Combinations Considered for Analysis
CASES VERTICAL POST
BRACING ARM
FLOOR BEAM
DIAGONAL MEMBER
CONTRIBUTION FROM
DIAGONAL CASE I HOLLOW HOLLOW HOLLOW HOLLOW NO
CASE II HOLLOW HOLLOW HOLLOW HOLLOW YES
CASE III SOLID SOLID HOLLOW SOLID YES
CASE IV SOLID SOLID SOLID SOLID YES
CASE V HOLLOW SOLID SOLID HOLLOW YES
CASE VI HOLLOW HOLLOW SOLID HOLLO YES
4.1.1 Vertical Post/Bracing Arm: Effective Moment of Inertia
One of the main aspects to be analyzed is the simultaneous effect the vertical
posts and each external bracing arm provide to the elastic lateral stiffness of each
transverse frame. The magnitude of this effect is evaluated by considering the actual
effective length of the external bracing arms relative to the overall length of the vertical
posts. As derived from basic practices in beam theory – particularly the method of
superposition as well as the moment area method – an equivalent moment of inertia was
approximated for a composite section that consisted of each vertical post and it’s
corresponding external bracing arm.
Due to the rigid nature of the bolted connection between these two members, the
response of the composite section can be regarded as a synchronized effect in relation to
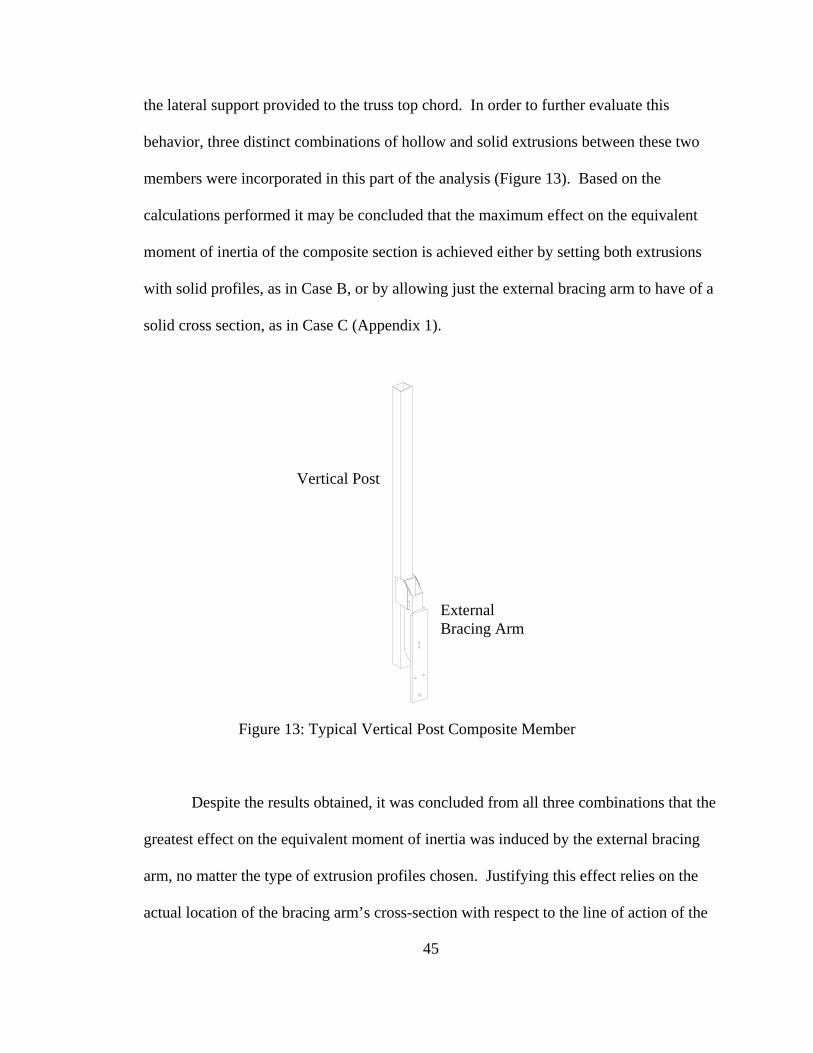
45
the lateral support provided to the truss top chord. In order to further evaluate this
behavior, three distinct combinations of hollow and solid extrusions between these two
members were incorporated in this part of the analysis (Figure 13). Based on the
calculations performed it may be concluded that the maximum effect on the equivalent
moment of inertia of the composite section is achieved either by setting both extrusions
with solid profiles, as in Case B, or by allowing just the external bracing arm to have of a
solid cross section, as in Case C (Appendix 1).
Despite the results obtained, it was concluded from all three combinations that the
greatest effect on the equivalent moment of inertia was induced by the external bracing
arm, no matter the type of extrusion profiles chosen. Justifying this effect relies on the
actual location of the bracing arm’s cross-section with respect to the line of action of the
Figure 13: Typical Vertical Post Composite Member
Vertical Post
External Bracing Arm
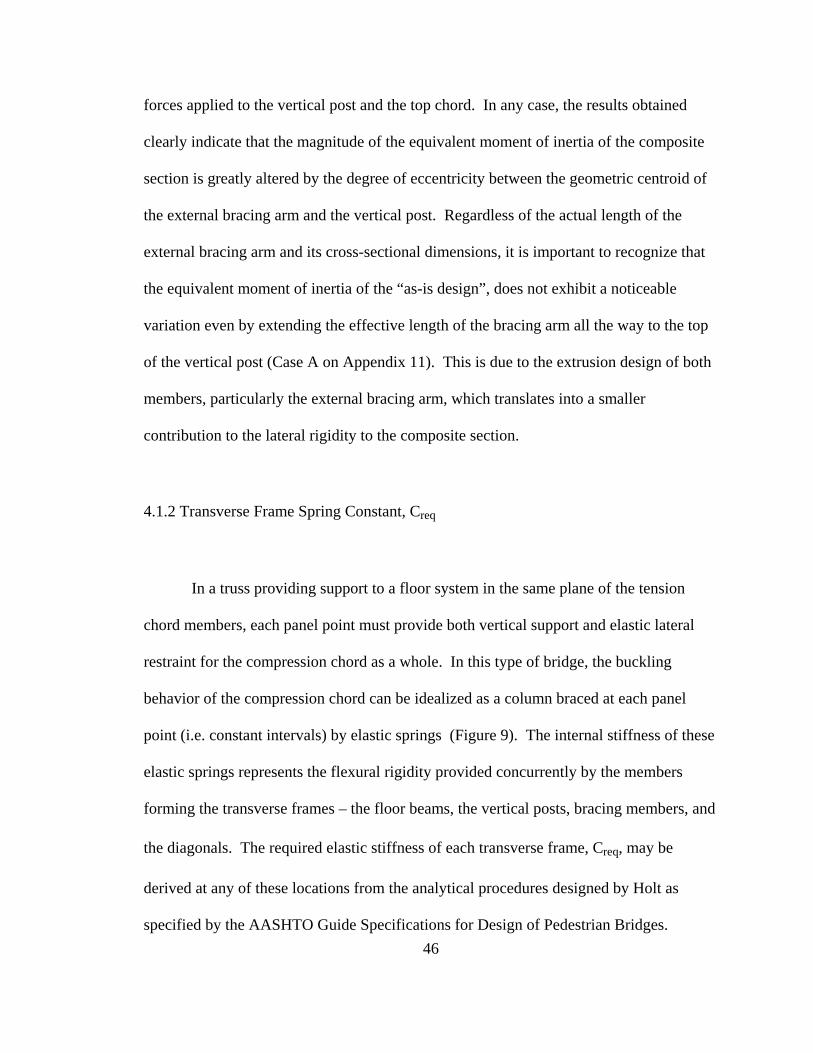
46
forces applied to the vertical post and the top chord. In any case, the results obtained
clearly indicate that the magnitude of the equivalent moment of inertia of the composite
section is greatly altered by the degree of eccentricity between the geometric centroid of
the external bracing arm and the vertical post. Regardless of the actual length of the
external bracing arm and its cross-sectional dimensions, it is important to recognize that
the equivalent moment of inertia of the “as-is design”, does not exhibit a noticeable
variation even by extending the effective length of the bracing arm all the way to the top
of the vertical post (Case A on Appendix 11). This is due to the extrusion design of both
members, particularly the external bracing arm, which translates into a smaller
contribution to the lateral rigidity to the composite section.
4.1.2 Transverse Frame Spring Constant, Creq
In a truss providing support to a floor system in the same plane of the tension
chord members, each panel point must provide both vertical support and elastic lateral
restraint for the compression chord as a whole. In this type of bridge, the buckling
behavior of the compression chord can be idealized as a column braced at each panel
point (i.e. constant intervals) by elastic springs (Figure 9). The internal stiffness of these
elastic springs represents the flexural rigidity provided concurrently by the members
forming the transverse frames – the floor beams, the vertical posts, bracing members, and
the diagonals. The required elastic stiffness of each transverse frame, Creq, may be
derived at any of these locations from the analytical procedures designed by Holt as
specified by the AASHTO Guide Specifications for Design of Pedestrian Bridges.
47
In view of the six frame-combinations incorporated into this study, the goal is to
estimate an effective length factor that will correspond to the nature of the lateral
constraint provided to the top chord by each of the frame combinations. As stated by
Holt, there is an empirical correlation as a function of the reciprocal of the effective
length factor (e.i. 1/K) between the ratio of the required transverse frame spring constant,
Creq, and the ultimate buckling force applied to the top chord (Creq • l / Pcr). This
empirical correlation is dependent on the number of truss panels in the bridge, and in this
particular case, it is clearly dependent upon the actual effective length of the external
bracing arms relative to the height of the vertical posts. In consideration of the six cases
reviewed, it was concluded that the longer the external bracing arm the stiffer the
transverse frames. And this is the result of the actual contribution provided by the
composite section to flexural rigidity of the transverse frames. This effect can be
rationalized by evaluating Equations A & B designed by Holt to approximate the
transverse frame spring constants (Figure 11). As previously explained, these two
equations were evaluated as a function of the effective length of the external bracing arms
relative to the constant length of the vertical post. As the external bracing member is
extended upward from its original location the contribution made available by the
composite section as a whole amplifies the resulting rigidity of the transverse frames.
What is concluded can be mathematically contemplated by evaluating the term
related to the composite section (i.e. vertical post and external bracing arm) in the
denominator of either Equation A or B. Following the prescribed range of effective
lengths for the external bracing arms it may be inferred that the closer this member comes
to the top chord the higher the transverse frame spring constant could become (i.e. frame
48
flexural rigidity or elastic stiffness). This is expected because as the effective length of
the external bracing members increases, the equivalent moment of inertia of the
composite section increases as well. Accordingly, as the ratio of the equivalent moment
of inertia and the overall height of the vertical post decreases, the lower the absolute
value of the denominator. A higher elastic transverse spring constant, Creq, results.
Following this analogy, the fundamental effect that is achieved by increasing the
effective length of the external bracing arm is an overall reduction in the effective length
factor applied to the top chord. This is quite obvious since these values are inversely
proportional to each other. Consequently, the longer the bracing arms, the higher the
frame stiffness and the closer the nature of the lateral restraint on the top chord will be to
that of an pin-ended column (Appendix 2). It may be concluded from the numerical
results obtained in the analysis that the frame combinations – Cases IV through VI – were
the most significant with regard to the estimated effective length factor and to the overall
slenderness ratio for the truss top chord. Even though the contribution from the diagonals
was incorporated in all Cases, the actual effect on the flexural rigidity of the transverse
frames was not appreciable as you might expect.
4.1.3 Compressive Capacity of Top Chord
Extruded aluminum profiles that can be fabricated by standard practices in the
industry may take practically any shape. In engineered aluminum components, their
cross sections are considered to be made-up of one or more elements connected only
along their edges to other elements. For design purposes these profile elements are
49
characterized as plates, either rectangular or curved in cross section with diverse edge
supports. It is well know that singly symmetric profiles subjected to compressive forces,
such as the extrusion profile of the top chord, may be restricted in their design by flexural
or flexural-torsional buckling, or by local buckling of a particular cross sectional element
over a length about equal to the width of that specific element. Flexural or torsional –
flexural buckling occurs over the length of the member or from panel to panel. For this
main reason there are no buckling modes that can be dismissed without consideration in
this particular type of axially loaded member. It is important to discuss the subject of
local buckling behavior of slender plate elements for this specific type of extrusion
profile (i.e. singly symmetric). Once a slender plate element with at least one edge
supported on the cross section has buckled, in the elastic regime, this cross sectional
component is capable of supporting additional load. This additional local load carrying
capacity is referred to as post-buckling strength. However, post-buckling strength will
only be acknowledged in singly symmetric compression members whose overall
buckling-axis is an axis of symmetry.
Even though the actual overall buckling axis for the top chord is an axis of
symmetry, the local buckling mode does not control the ultimate collapse behavior.
Disregarding the weighted average allowable compressive stress due to inaccuracies in
estimating cross sectional areas of individual plate elements, the flexural-torsional
buckling response of this member controls its collapse behavior when subjected to its
critical buckling force. Furthermore, in aluminum compression members an interaction
may occur between overall and local buckling modes. This interaction may actually
cause the actual overall buckling capacity of the member to be reduced if local buckling
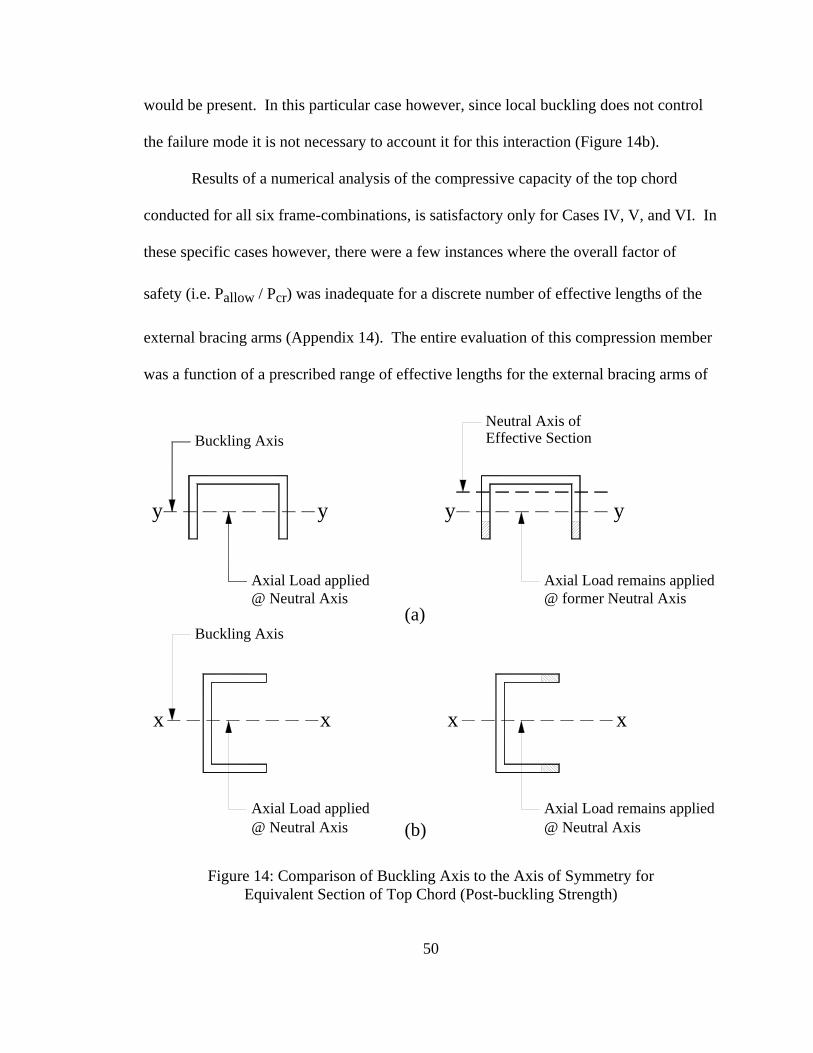
50
would be present. In this particular case however, since local buckling does not control
the failure mode it is not necessary to account it for this interaction (Figure 14b).
Results of a numerical analysis of the compressive capacity of the top chord
conducted for all six frame-combinations, is satisfactory only for Cases IV, V, and VI. In
these specific cases however, there were a few instances where the overall factor of
safety (i.e. Pallow / Pcr) was inadequate for a discrete number of effective lengths of the
external bracing arms (Appendix 14). The entire evaluation of this compression member
was a function of a prescribed range of effective lengths for the external bracing arms of
x
Axial Load applied
Buckling Axis
x
y
Axial Load applied
y
Buckling Axis
Axial Load remains applied
x x
Axial Load remains applied
y
Neutral Axis of
y
@ former Neutral Axis@ Neutral Axis
@ Neutral Axis@ Neutral Axis
Effective Section
(a)
(b)
Figure 14: Comparison of Buckling Axis to the Axis of Symmetry for Equivalent Section of Top Chord (Post-buckling Strength)
51
the vertical posts. As the fundamental impediment to this type of structure (i.e. half-
through bridges) is that of adequate lateral stability, enough lateral restraint needs to be
provided by the transverse frames to enable of this compression chord be like that of a
pin-ended column. It may be concluded, based on the minimum design loads and design
specifications provided by the governing agencies, that this compression member is
acceptable under specific loading and lateral restraint conditions.
Safety requirements will rely on the actual geometry of the external bracing arms
in conjunction with the original profile of the top chord. Assumptions were made in this
analysis regarding the extrusion profile of this compression member. It was decided at
the early stages of this investigation that an equivalent channel shape would be chosen to
a represent the lower bound behavior of the original extrusion profile for the top chord. It
may be concluded, based on these assumptions, that some level of conservatism has been
incorporated into this structural assessment. Nonetheless, the compressive load carrying
capacity of the top chord will be adequate under the provided guidelines if strict
restrictions are placed on the effective length of the external bracing arms and extrusion
profiles of the members outlining the transverse frames.
4.1.4 Pedestrian / Bicycle Railing – Combined Stresses
AASHTO requires pedestrian and bicycle railings be sized for two uniformly
distributed forces (50 plf each) imposed along the longitudinal axis of the top chord.
These sets of forces are applied simultaneously in a vertical and horizontal plane and in
combination with the maximum compressive axial force on the top chord. Thus, this
52
design provision accounts for the effects imposed by combined stresses induced by the
axial load as well as biaxial bending of the bridge railing. The Aluminum Specifications
also states that if a member is subjected to bending moments in conjunction with axial
compression, that the component be proportioned following two interaction equations.
These must be evaluated when the average compressive stress is greater than 15% of its
allowable compressive stress as for axially loaded columns. This is the actual case in this
specific rail (Appendix 4).
The buckling strength of the top chord in this type of bridge is a function of the
lateral support provided by the members comprising the transverse frames. Six different
combinations for the transverse frames were chosen, and the lateral restrain provided by
each was examined as a function of the effective length of the external bracing arms. The
overall behavior of the bridge rail under combined stresses will rely upon the effective
length of the external bracing arm as well. Given that three distinct stress conditions are
evaluated, the load carrying capacity of the bridge rail in the case of biaxial bending will
be controlled by two different failure parameters – one for each plane of bending.
Examination of the bending strength about the strong axis of the rail, flexural buckling
will govern the allowable compressive stress. In contrast, bending strength about the
weak axis is controlled by local buckling strength of the plate elements.
Based on the numerical analysis performed for all combinations as specified by
the Aluminum Specifications, the failure response of the rail varies with the effective
length of the external bracing arms. Taking into account just a discrete range of effective
lengths coming from these lateral support components, the failure mode of the rail is
characterized by overall flexural buckling. Moreover, this failure response is restricted
53
the member’s bending strength given that the average combined compressive stress
imposed on the top chord is greater than the allowable buckling stress, regardless of the
overall slenderness considered in the analysis (Appendix 4). In order to achieve a
reliable load capacity, the average compressive stress on the top chord needs to be
restricted to values so it does not exceed its allowable compressive stresses. Given that
the original design of the top chord, which uses the tubular profile with the side-plates,
does not fulfill the load-carrying capacity required consideration must be given to use the
tower profile as the top chord or redesign the former tubular profile.
4.2 Bottom Chord - Allowable Tensile Capacity at Splice Net Section
The main distinction between this type of axially loaded member and the top
chord is the nature of the applied loads. Tension members are defined as structural
elements that are subjected to axial tensile forces. For any material, the only significant
factor under these loading conditions is the member’s cross sectional area. In spite of this
fact, it is important to recognize that if the cross section varies along the length. The
induced stresses will be a function of the particular section under consideration. The
actual presence of holes, as in the splice connection of the bottom chord, the load
distribution and magnitude of the stresses developed across the cross section is affected
(Figure 15). At any of these locations, the cross sectional area is reduced by an amount
equal to area of the holes. This generates a more highly stressed section as compared to
the gross cross sectional area in the member. Tension members may fail either by
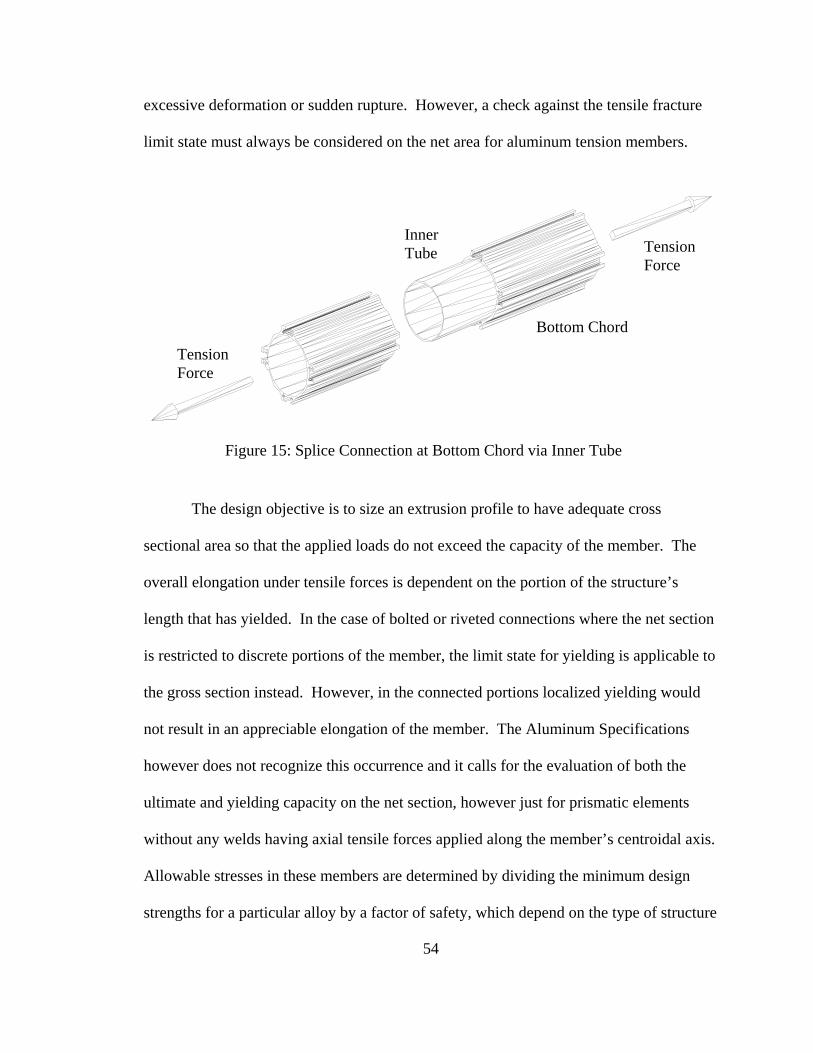
54
excessive deformation or sudden rupture. However, a check against the tensile fracture
limit state must always be considered on the net area for aluminum tension members.
The design objective is to size an extrusion profile to have adequate cross
sectional area so that the applied loads do not exceed the capacity of the member. The
overall elongation under tensile forces is dependent on the portion of the structure’s
length that has yielded. In the case of bolted or riveted connections where the net section
is restricted to discrete portions of the member, the limit state for yielding is applicable to
the gross section instead. However, in the connected portions localized yielding would
not result in an appreciable elongation of the member. The Aluminum Specifications
however does not recognize this occurrence and it calls for the evaluation of both the
ultimate and yielding capacity on the net section, however just for prismatic elements
without any welds having axial tensile forces applied along the member’s centroidal axis.
Allowable stresses in these members are determined by dividing the minimum design
strengths for a particular alloy by a factor of safety, which depend on the type of structure
Tension Force
Tension Force
Bottom Chord
Inner Tube
Figure 15: Splice Connection at Bottom Chord via Inner Tube
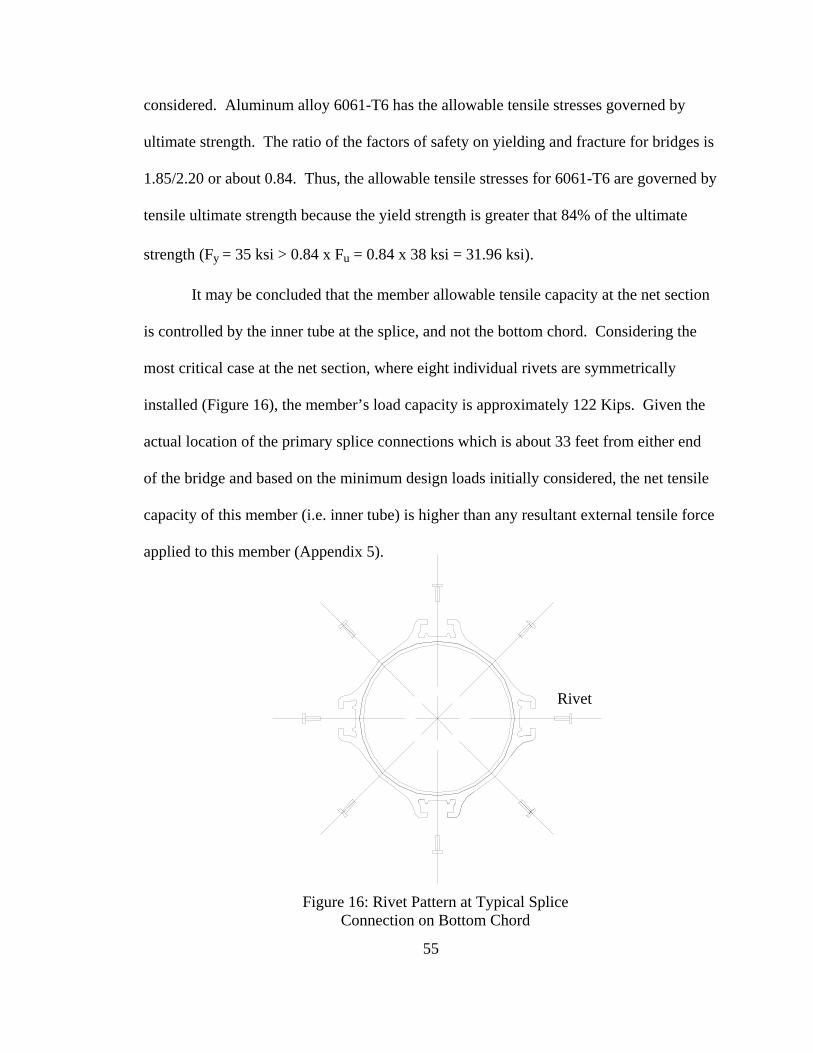
55
Figure 16: Rivet Pattern at Typical Splice Connection on Bottom Chord
Rivet
considered. Aluminum alloy 6061-T6 has the allowable tensile stresses governed by
ultimate strength. The ratio of the factors of safety on yielding and fracture for bridges is
1.85/2.20 or about 0.84. Thus, the allowable tensile stresses for 6061-T6 are governed by
tensile ultimate strength because the yield strength is greater that 84% of the ultimate
strength (Fy = 35 ksi > 0.84 x Fu = 0.84 x 38 ksi = 31.96 ksi).
It may be concluded that the member allowable tensile capacity at the net section
is controlled by the inner tube at the splice, and not the bottom chord. Considering the
most critical case at the net section, where eight individual rivets are symmetrically
installed (Figure 16), the member’s load capacity is approximately 122 Kips. Given the
actual location of the primary splice connections which is about 33 feet from either end
of the bridge and based on the minimum design loads initially considered, the net tensile
capacity of this member (i.e. inner tube) is higher than any resultant external tensile force
applied to this member (Appendix 5).
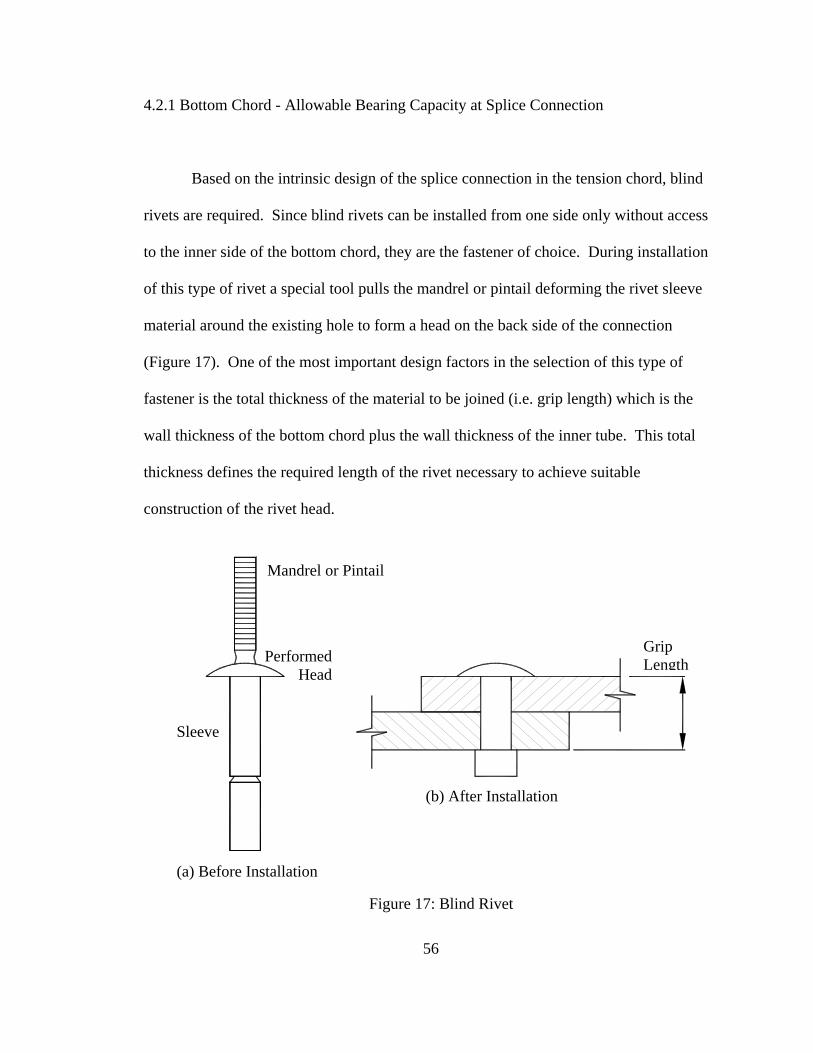
56
4.2.1 Bottom Chord - Allowable Bearing Capacity at Splice Connection
Based on the intrinsic design of the splice connection in the tension chord, blind
rivets are required. Since blind rivets can be installed from one side only without access
to the inner side of the bottom chord, they are the fastener of choice. During installation
of this type of rivet a special tool pulls the mandrel or pintail deforming the rivet sleeve
material around the existing hole to form a head on the back side of the connection
(Figure 17). One of the most important design factors in the selection of this type of
fastener is the total thickness of the material to be joined (i.e. grip length) which is the
wall thickness of the bottom chord plus the wall thickness of the inner tube. This total
thickness defines the required length of the rivet necessary to achieve suitable
construction of the rivet head.
Figure 17: Blind Rivet
Mandrel or Pintail
Performed Head
Sleeve
Grip Length
(a) Before Installation
(b) After Installation
57
The Aluminum Specifications stipulates that blind rivets shall not be used except
when the grip lengths and required rivet-hole tolerances are as those suggested by the
rivet manufacturer. Furthermore, if the grip length of the rivets exceeds four and a half
times the diameter, the allowable load per rivet should be reduced in accordance to a
correlation between the grip length and the nominal diameter of the rivet. Since the total
grip length in this particular connection (total thickness of metal being fastened is 0.590
inches), is less than the reduction requirement, this design provision does not apply to this
splice connection. Additional design requirements called for by the Aluminum
Specification are the minimum center-to-center spacing (defines as 3 times the nominal
rivet diameter) as well as the edge distance (specified to be no more than 2 times the
nominal rivet diameter). The latter is taken from the center of the rivet hole. Based on
the overall geometry of the splice connection, the edge distance is again controlled by the
dimensions of the inner tube, and evidently the center-to-center spacing remains the same
for both members. The existing center-to-center spacing is about 1.97 inches, over 2-1/2
times the minimum required and is adequate. As to the actual edge distance, this
dimension is about 0.87 inches, which exceeds 1-1/2 times the minimum edge distance
specified, and is sufficient as well.
As to the bearing capacity of this member, the Aluminum Specifications defines
the allowable bearing load per rivet as the product of the allowable stress for the material
being connected times the effective bearing area of the fastener used. The allowable
bearing stress is further defined as twice the ultimate tensile strength of the material
divided by its corresponding factor of safety (i.e. 2 x Fu / nu). It is important to point out
58
the allowable bearing stress is used only for a ratio of edge distance to fastener diameter
of 2 or greater. In cases where smaller ratios are contemplated, the calculated allowable
bearing stress shall be reduced based on the following: edge distance/2 x fastener
diameter. However, in this particular case, the reduction is not applicable. The effective
bearing area is characterized by the specifications as the grip length times the effective
rivet diameter. Moreover, the effective rivet diameter shall be taken as the actual
diameter of the hole. Design specifications restrict the overall size of the rivet hole to not
more than the actual nominal diameter of the rivet plus an additional 4%. As a result of
our evaluation, the calculated bearing strength of this riveted joint at the splice
connection is about 95 Kips. It may be concluded that this load carrying capacity
exceeds the maximum tensile force induced by the minimum design loads in this member
(Appendix 5).
4.2.2 Bottom Chord - Allowable Shear Capacity of Rivets at Splice Connection
Structural design of fasteners for any given material is based on the specifications
for the alloy used to fabricate the fastener. Aluminum blind rivets are the type of fastener
selected for this evaluation. The Aluminum Specifications call for shear stresses to be
calculated on what is defined as the effective area of the rivets. This effective area shall
be based on the effective diameter of the rivet. The design provision stipulate that the
allowable shear loads on aluminum rivets shall be the product between the effective shear
area of the rivet times the minimum shear strength of material divided by a factor of
safety of 2.64 (i.e. bridges).
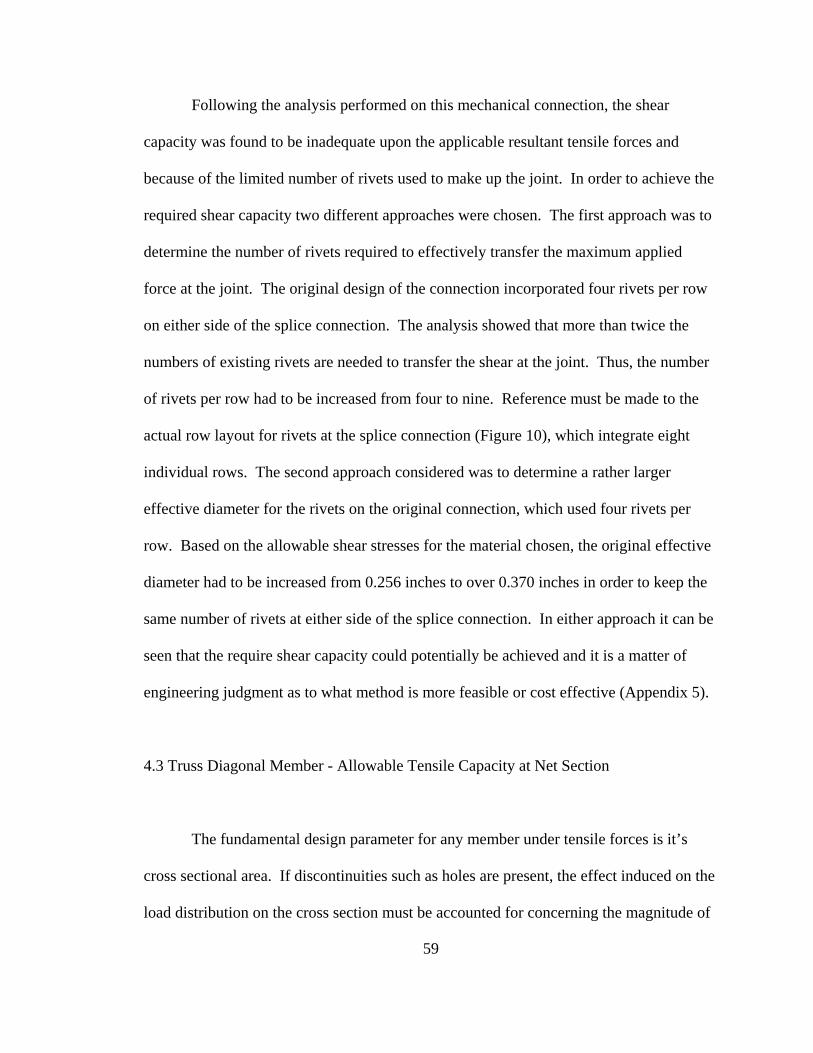
59
Following the analysis performed on this mechanical connection, the shear
capacity was found to be inadequate upon the applicable resultant tensile forces and
because of the limited number of rivets used to make up the joint. In order to achieve the
required shear capacity two different approaches were chosen. The first approach was to
determine the number of rivets required to effectively transfer the maximum applied
force at the joint. The original design of the connection incorporated four rivets per row
on either side of the splice connection. The analysis showed that more than twice the
numbers of existing rivets are needed to transfer the shear at the joint. Thus, the number
of rivets per row had to be increased from four to nine. Reference must be made to the
actual row layout for rivets at the splice connection (Figure 10), which integrate eight
individual rows. The second approach considered was to determine a rather larger
effective diameter for the rivets on the original connection, which used four rivets per
row. Based on the allowable shear stresses for the material chosen, the original effective
diameter had to be increased from 0.256 inches to over 0.370 inches in order to keep the
same number of rivets at either side of the splice connection. In either approach it can be
seen that the require shear capacity could potentially be achieved and it is a matter of
engineering judgment as to what method is more feasible or cost effective (Appendix 5).
4.3 Truss Diagonal Member - Allowable Tensile Capacity at Net Section
The fundamental design parameter for any member under tensile forces is it’s
cross sectional area. If discontinuities such as holes are present, the effect induced on the
load distribution on the cross section must be accounted for concerning the magnitude of
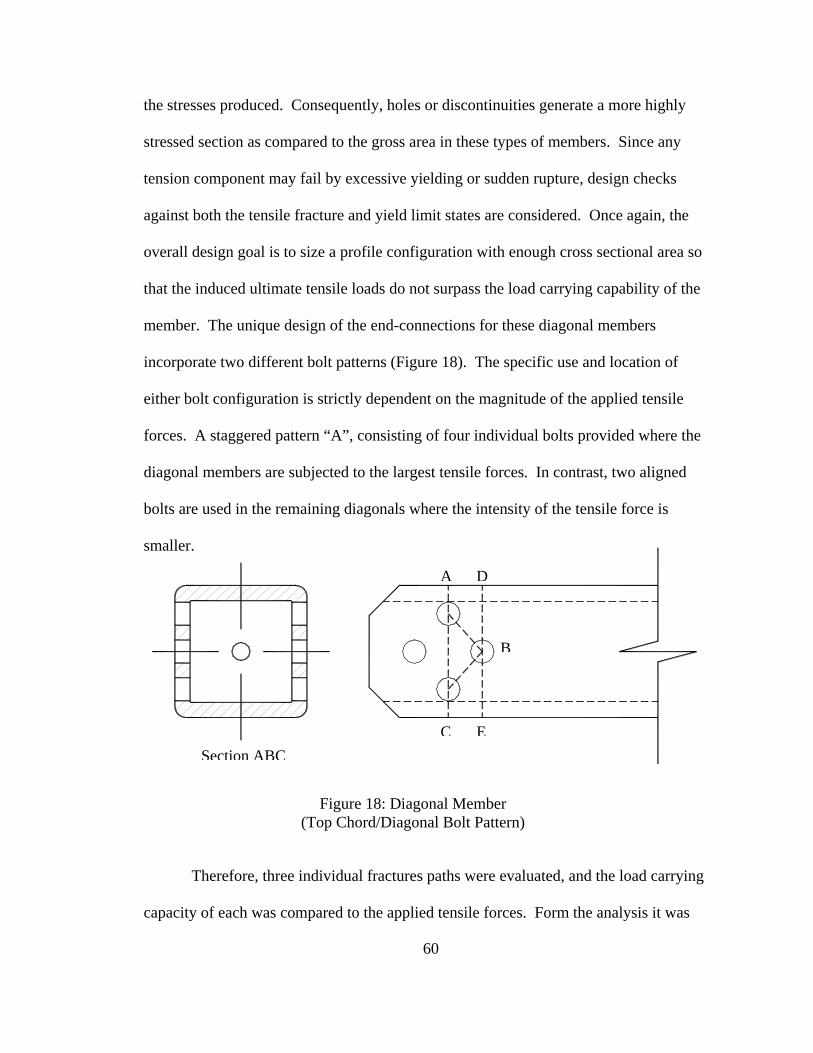
60
Section ABC
Figure 18: Diagonal Member (Top Chord/Diagonal Bolt Pattern)
D
B
A
C E
the stresses produced. Consequently, holes or discontinuities generate a more highly
stressed section as compared to the gross area in these types of members. Since any
tension component may fail by excessive yielding or sudden rupture, design checks
against both the tensile fracture and yield limit states are considered. Once again, the
overall design goal is to size a profile configuration with enough cross sectional area so
that the induced ultimate tensile loads do not surpass the load carrying capability of the
member. The unique design of the end-connections for these diagonal members
incorporate two different bolt patterns (Figure 18). The specific use and location of
either bolt configuration is strictly dependent on the magnitude of the applied tensile
forces. A staggered pattern “A”, consisting of four individual bolts provided where the
diagonal members are subjected to the largest tensile forces. In contrast, two aligned
bolts are used in the remaining diagonals where the intensity of the tensile force is
smaller.
Therefore, three individual fractures paths were evaluated, and the load carrying
capacity of each was compared to the applied tensile forces. Form the analysis it was
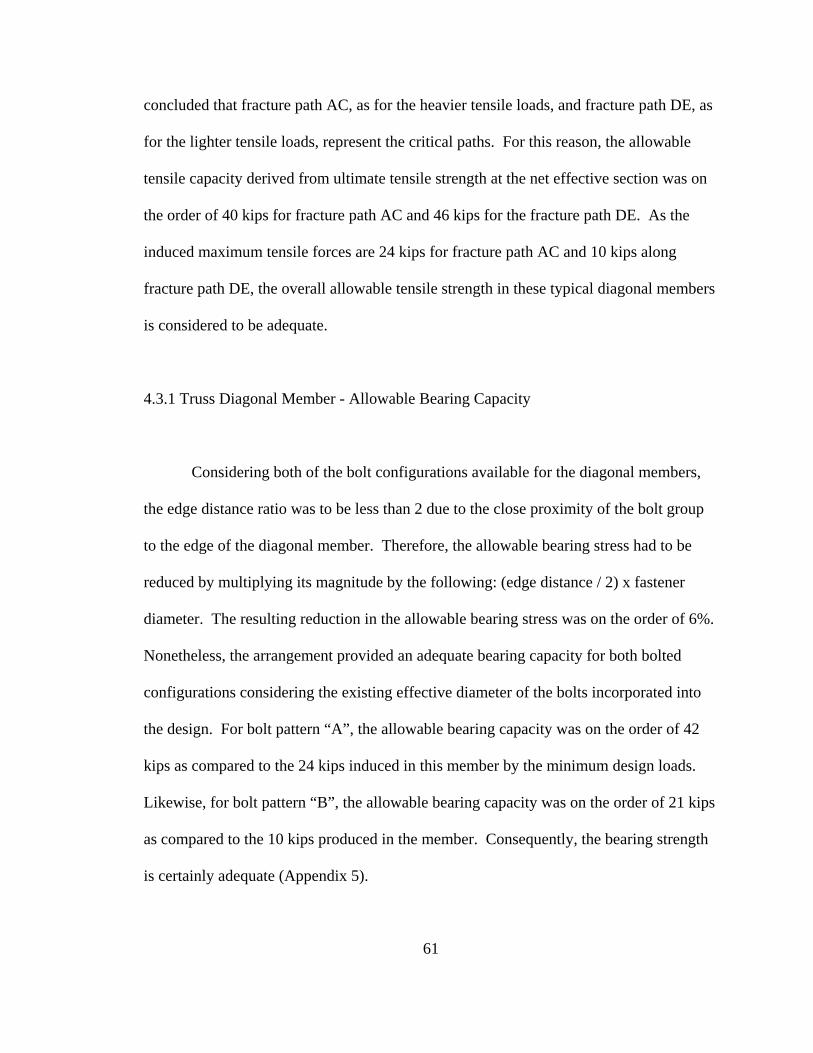
61
concluded that fracture path AC, as for the heavier tensile loads, and fracture path DE, as
for the lighter tensile loads, represent the critical paths. For this reason, the allowable
tensile capacity derived from ultimate tensile strength at the net effective section was on
the order of 40 kips for fracture path AC and 46 kips for the fracture path DE. As the
induced maximum tensile forces are 24 kips for fracture path AC and 10 kips along
fracture path DE, the overall allowable tensile strength in these typical diagonal members
is considered to be adequate.
4.3.1 Truss Diagonal Member - Allowable Bearing Capacity
Considering both of the bolt configurations available for the diagonal members,
the edge distance ratio was to be less than 2 due to the close proximity of the bolt group
to the edge of the diagonal member. Therefore, the allowable bearing stress had to be
reduced by multiplying its magnitude by the following: (edge distance / 2) x fastener
diameter. The resulting reduction in the allowable bearing stress was on the order of 6%.
Nonetheless, the arrangement provided an adequate bearing capacity for both bolted
configurations considering the existing effective diameter of the bolts incorporated into
the design. For bolt pattern “A”, the allowable bearing capacity was on the order of 42
kips as compared to the 24 kips induced in this member by the minimum design loads.
Likewise, for bolt pattern “B”, the allowable bearing capacity was on the order of 21 kips
as compared to the 10 kips produced in the member. Consequently, the bearing strength
is certainly adequate (Appendix 5).

62
4.3.2 Truss Diagonal Member - Allowable Block Shear Rupture Strength
Another potential limit state for some bolted connections results when a portion of
material tears out around the periphery of the bolt group. This limit state is based on a
combination between shear and tension precipitating the failure. The failure process will
induce fracture in some parts of the member, while at the same time other parts will
experience yielding. The overall behavior of the connection upon failure is characterized
by a sudden shear fracture accompanied by tension yielding, or by tensile rupture
accompanied by shear yielding. However, both failure modes contribute to the strength
of the mechanical connection. As a result, the total resistance to block shear will be the
sum of the shear and tensile strengths of these two portions respectively.
The Aluminum Specification requires that the block shear rupture allowable
force, Psr, induced on the anticipated failure paths, shall be determined by comparing the
ultimate strength of the net surfaces in tension versus the ultimate strength of the net
surfaces in shear (Figure 19A and 19B). The most likely failure paths of the two
diagonal member bolt group are shown. Examination of the geometry of bolt
configuration “A” with respect to the line of action of the applied external forces, results
in two-inclined failure surfaces (Figure 19). It is well known that these inclined surfaces
will develop internally shear and tensile stresses that contribute concurrently to the
overall resistance of the connection against block shear. Despite this fact, it was
conservatively assumed that only tensile stresses would develop along the inclined
surfaces.
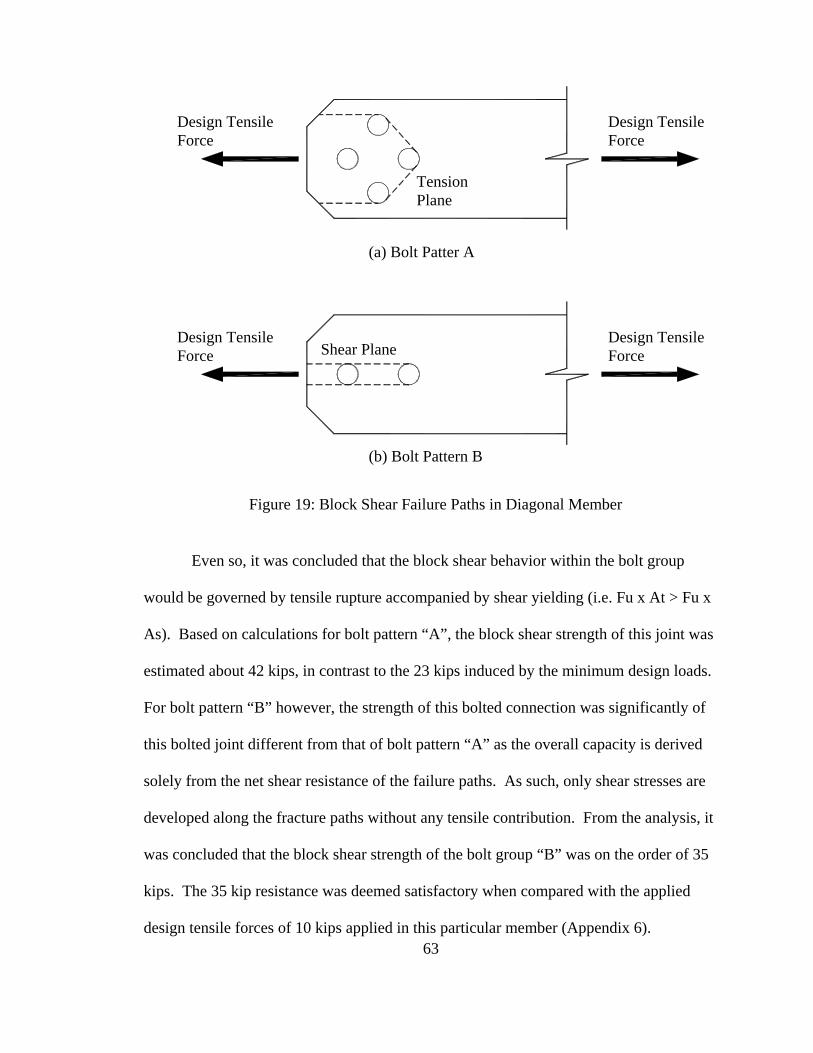
63
Figure 19: Block Shear Failure Paths in Diagonal Member
Even so, it was concluded that the block shear behavior within the bolt group
would be governed by tensile rupture accompanied by shear yielding (i.e. Fu x At > Fu x
As). Based on calculations for bolt pattern “A”, the block shear strength of this joint was
estimated about 42 kips, in contrast to the 23 kips induced by the minimum design loads.
For bolt pattern “B” however, the strength of this bolted connection was significantly of
this bolted joint different from that of bolt pattern “A” as the overall capacity is derived
solely from the net shear resistance of the failure paths. As such, only shear stresses are
developed along the fracture paths without any tensile contribution. From the analysis, it
was concluded that the block shear strength of the bolt group “B” was on the order of 35
kips. The 35 kip resistance was deemed satisfactory when compared with the applied
design tensile forces of 10 kips applied in this particular member (Appendix 6).
Design Tensile Force
Design Tensile Force
Design Tensile Force Shear Plane
(a) Bolt Patter A
(b) Bolt Pattern B
Design Tensile Force
Tension Plane
64
4.3.3 Truss Diagonal Member - Allowable Shear Capacity of Bolt Group
In aluminum structures the selection of fasteners is a matter of choice, and the
available options are rather varied. However, it is essential to realize the importance of
selecting the appropriate material for the application. Typically, aluminum structures are
considered when operating environments are hostile. In these cases, carbon steel fastener
are not suitable unless properly coated or in the case that stainless steel materials are
used. Furthermore, while different metals are used for fasteners and the members they
join, the occurrence of galvanic corrosion is imminent. The difference in electrical
potential between different metals gives riser to the possibility of corrosion. Depending
on the type of environment and the difference in electrical potential, current will flow
from one material (i.e. the anode) to the other material (i.e. the cathode), resulting in the
physical deterioration or corrosion. This may be avoided by using fasteners with similar
electrical potential. Since the electric potential of aluminum alloys is reasonably small,
aluminum bolts do not undergo significant galvanic corrosion when used to joint
aluminum members. Thus, aluminum alloy 6061-T6 is the material of choice in this
evaluation to eliminate this design concern.
Besides galvanic corrosion, minimum mechanical properties for fasteners are
another design consideration for any type of connection. Moreover, alloy specifications
require that factors of safety be applied to the minimum design strengths for each
fastener. For this particular type of structure (i.e. bridge) the factor of safety would be
2.64. Based on the alloy chosen, the shear strength per bolt in double shear is nearly 4.4
kips/bolt. As such, the overall capacity of bolt pattern “A” is about 17.6 kips, and
65
inadequate when compared to the applied design tensile force of 24 kips. The overall
shear capacity for bolt patter “B” is on the order of 8.8 kips and is inadequate as well
when compared to the applied design tensile force of 10 kips. As a result, it may be
concluded that the aluminum alloy 6061-T6 does not provided the required minimum
shear resistance to overcome the applied tensile forces in these diagonal members. Thus,
the total number of bolts in the connection group must have to be increased accordingly.
The Aluminum Specifications also provide allowable shear stresses for other
aluminum fasteners, including those made of 2024-T4 and 7075-T73. In addition, bolts
used in aluminum structures may be made of other material such as the 300 Series
stainless steel as well as galvanized carbon steel fasteners. Considering all alternatives,
only 2024-T4 would not develop the required shear resistance. Therefore, the remaining
alloys 7075-T73, 300 Series Stainless, plated galvanized carbon steel, or even coated
A325 carbon steel bolts could represent the feasible choices to provide adequate shear
resistance in either bolt pattern (Appendix 6).
4.4 Floor Beams
Beams are structural members that support external transverse forces and
primarily subjected to flexure or bending. Even though some degree of axial loading
may be induced in beams, compressive effects often are negligible. As a result, internal
bending moments give rise to two distinct types of internal stresses, tensile and
compressive. It is well known that aluminum alloys are linear elastic materials up to a
point, and regarded as homogeneous and isotropic. Thus, the bending stress distribution
66
across any particular cross section is consider to be uniform, given that the strain varies
linearly with the distance from the member’s neutral axis. It is required that the
member’s cross-section to have a vertical axis of symmetry and the applied transverse
forces to be aligned with this particular axis (i.e. no eccentric loading).
There are several limit states to consider for aluminum components subjected to
flexure, and include yielding and fracture, overall buckling, and local buckling. It is
essential to explain in detail the analytical approach considered for flexural members with
respect to the applied loading conditions and the potential failure modes. Two distinct
loadings were imposed on the floor beams as specified by AASHTO. Because of the
overall clear width of this bridge, a pair of concentrated live loads produced by a
maintenance vehicle was considered to be the first loading condition (Figure 4). This
moving load was to act in conjunction with any uniformly distributed dead loads. The
second loading condition was a uniformly distributed live load of 85 psf imposed on the
full walkway area of the bridge, in addition to the dead loads.
Following a preliminary deflection analysis on the original floor, it was
determined that the maximum allowable deflection as specified by AASHTO (i.e. L / 500
= 98.42 in. / 500 = 0.197 in.) was exceeded by either load case. The maximum deflection
under the maintenance vehicle was Δmax = 0.486 inch and Δmax = 0.333 inch for the
uniformly distributed load. Therefore, the original double-hollow profile did not provide
adequate stiffness to properly sustain the prescribe live loads. As the deflection in
members subjected to internal bending are a function of the moment of inertia of the
cross section, an alternate solution to the original double-hollow profile included the use
of a solid section instead. The imposed deflections produced by the two load cases were
67
once again evaluated. It was determined based on the calculations that the deflections
still exceeded the maximum allowable for the loads imposed by the maintenance vehicle.
It is important to recognize that structures must be safe, as well as serviceable. A
serviceable structure is one that performs satisfactorily, not causing discomfort or
perceptions of unsafe for the occupants or users. For a beam, being serviceable typically
means that the induced deformations, primarily the vertical deflections must be limited.
Too much deflection is always indicative of a rather flexible member, which may bring
about problems if components connected to the beam can be damaged by the distortions.
From this discussion it can be concluded that even though the overall clear width of the
pedestrian bridge provides ample access for a maintenance vehicle to pass, this
prescribed load condition exceeds the serviceability requirements for this member.
Therefore, the alternate double-solid profile for the floor beams subjected only to the
second load condition would be the only extrusion configuration to be considered for
evaluation or the flooring system would have to be re-design.
4.4.1 Floor Beams - Bending Tensile Yielding and Fracture
The failure mode for bending tension in flexural members – either yielding or
fracture – is to some extent alike to that anticipated for loaded components in axial
tension. The similarity hinge on the overall behavior of the loaded material, which is
limited by its excessive deformation or fracture strength. For that reason, it is the
primary objective in the designing process of these components to determine what
bending moments could produce such conditions. When aluminum alloys are loaded in
68
flexure, its internal stress response is linear to some degree. However, once the imposed
forces in the member provoke any permanent deformation of the material, this linear
array of internal stresses is perturbed. Depending on geometry and how the material is
distributed on the cross section of the member about its neutral axis, its response to any
given loading condition may differ from any another member with a difference cross
sectional distribution. This difference, in addition to the internal stress response of any
member, is accounted for with shape factor. Unlike steel, which has a wide diversity of
standard shapes, aluminum designs could incorporate any conceivable cross sectional
shape so as to maximize the member’s effectiveness in responding to any loading
condition. Consequently, the corresponding shape factors for such out of the ordinary
sections would have to be calculated accordingly since they are a function of the overall
dimensions and geometry of the cross section.
For 6061-T6, the ratio of the corresponding factors of safety between the yielding
and fracture is 1.85/2.20 or about 0.84. Allowable tensile stresses are strictly governed
by the tensile ultimate strength of the material given that the yield strength is in fact
greater that 84% of the ultimate strength (Fy = 35 ksi > 0.84 x Fu = 0.84 x 38 ksi = 31.96
ksi). For this reason, the tensile fracture capacity is more critical than yielding. Derived
from the imposed loading condition in this flexural member – 85 psf imposed on the full
walkway area of the bridge plus the tributary dead load – the actual bending stress at the
extreme fiber in the tension side of the cross section is in the order of 1000 psi. It may be
concluded that the allowable tensile strength is much larger than the induced bending
stresses and is adequate.
69
4.4.2 Floor Beams - Flexural Buckling
When a beam bends as a result of the imposed external forces, the compression
region just above the neutral axis behaves as a column. From a design standpoint, the
member will buckle if in between its lateral supports it is slender enough. Unlike a
column however, the tension portion just below the neutral axis restrains the compression
portion of the beam’s cross-section. As a result, the overall response is an additional
twisting about the longitudinal axis of the beam. This form of lateral instability is
defined as Lateral Torsional Buckling and is dependent on the lateral bracing (i.e.
unbraced length) provided to the compression zone of the beam. If the internal
compressive stresses due to bending do not exceed the buckling capacity of the beam,
then these stresses can be resolved in the same way as the tensile bending stresses
previously discussed. However, if buckling is imminent the strength of the beam will
depend on how is laterally braced along its compression flange. Naturally, one strength
is also dependent on the cross sectional properties of the member, specifically the
correlation between its moment of inertia and cross sectional area.
The Aluminum Specifications however do not provide a specific case to assess
the allowable bending stresses for the alternate double-solid profile of the floor beams.
As a result, an equivalent solid rectangular profile was considered for evaluation. For
analysis purposes, the actual height of the equivalent rectangular cross section was
restricted to that of the original double-solid profile of the floor beam (Figure 20). The
equivalent width or thickness was derived from its actual moment of inertia (Appendix
3). Based upon the calculations, the allowable bending compressive stress at the extreme
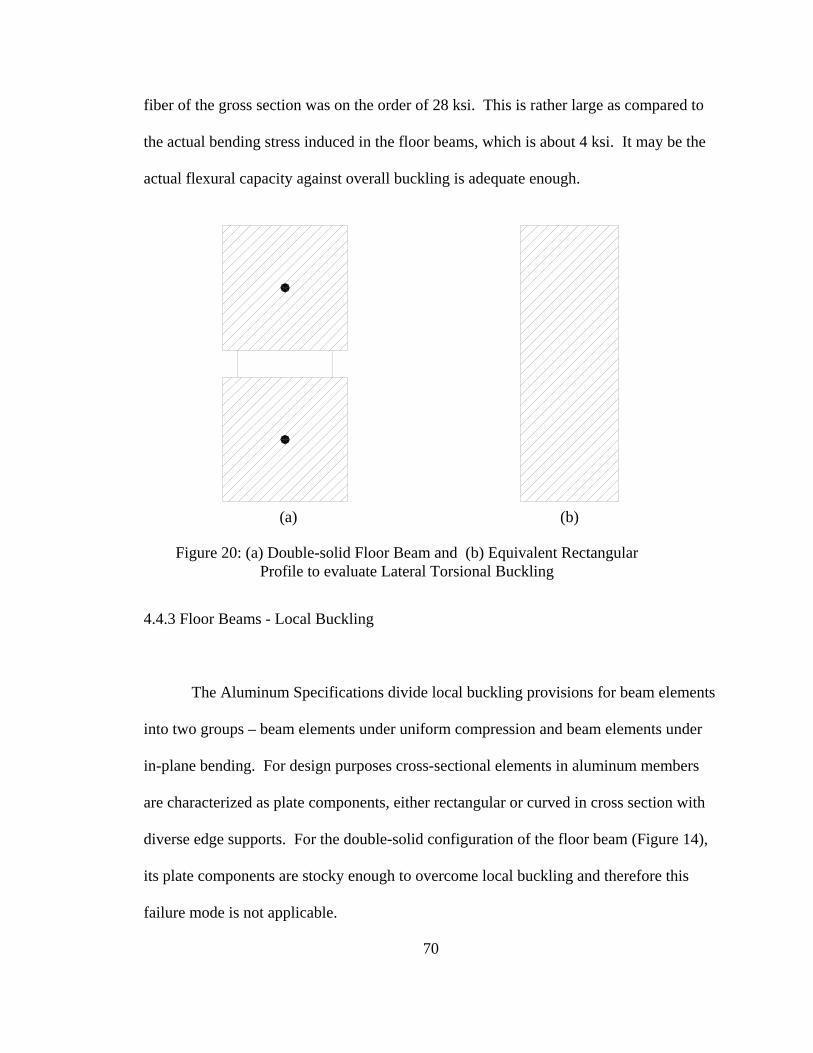
70
fiber of the gross section was on the order of 28 ksi. This is rather large as compared to
the actual bending stress induced in the floor beams, which is about 4 ksi. It may be the
actual flexural capacity against overall buckling is adequate enough.
4.4.3 Floor Beams - Local Buckling
The Aluminum Specifications divide local buckling provisions for beam elements
into two groups – beam elements under uniform compression and beam elements under
in-plane bending. For design purposes cross-sectional elements in aluminum members
are characterized as plate components, either rectangular or curved in cross section with
diverse edge supports. For the double-solid configuration of the floor beam (Figure 14),
its plate components are stocky enough to overcome local buckling and therefore this
failure mode is not applicable.
Figure 20: (a) Double-solid Floor Beam and (b) Equivalent Rectangular Profile to evaluate Lateral Torsional Buckling
(a) (b)
71
4.4.4 Floor Beams Shear
In aluminum members, the bending shear corresponds to another buckling mode
that may occur along a slender web of a beam. Based on mechanics, a web element
oriented at 45 degrees from the longitudinal axis of a beam under pure bending is
subjected to pure shear. However, just above the neutral axis, any portion of the cross-
section is subjected to compressive stresses as a result of the bending. For this reason, if
the compressive stress is too large then buckling might occur. However, the double-solid
profile considered for the floor beams does not have a slender web. Therefore, buckling
due to bending shear can be disregarded as a potential failure mode for this member.
Nonetheless, the average shear stress across the beam’s cross section was estimated to be
about 921 psi (see Appendix 7) taking into account the imposed load condition
previously chosen for analysis. As the design provisions give an allowable shear stress of
12 ksi as a lower bound for this particular cross section, it may be concluded that is
overly conservative.
4.4.5 Floor Beam - Shear Strength of U-Bracket at Lower Standing Leg
The actual restraint provided by the beam’s end-supports lends itself to a simply
supported idealization. Based on the design of these end-connections, the alternate
double-solid profile used for the floor beams is supported only at the top by an U-Bracket
similar to that used to connect the vertical posts and diagonals to the bottom chord (see
Figure 15). Due to the nature of the support provided by these connections, each U-
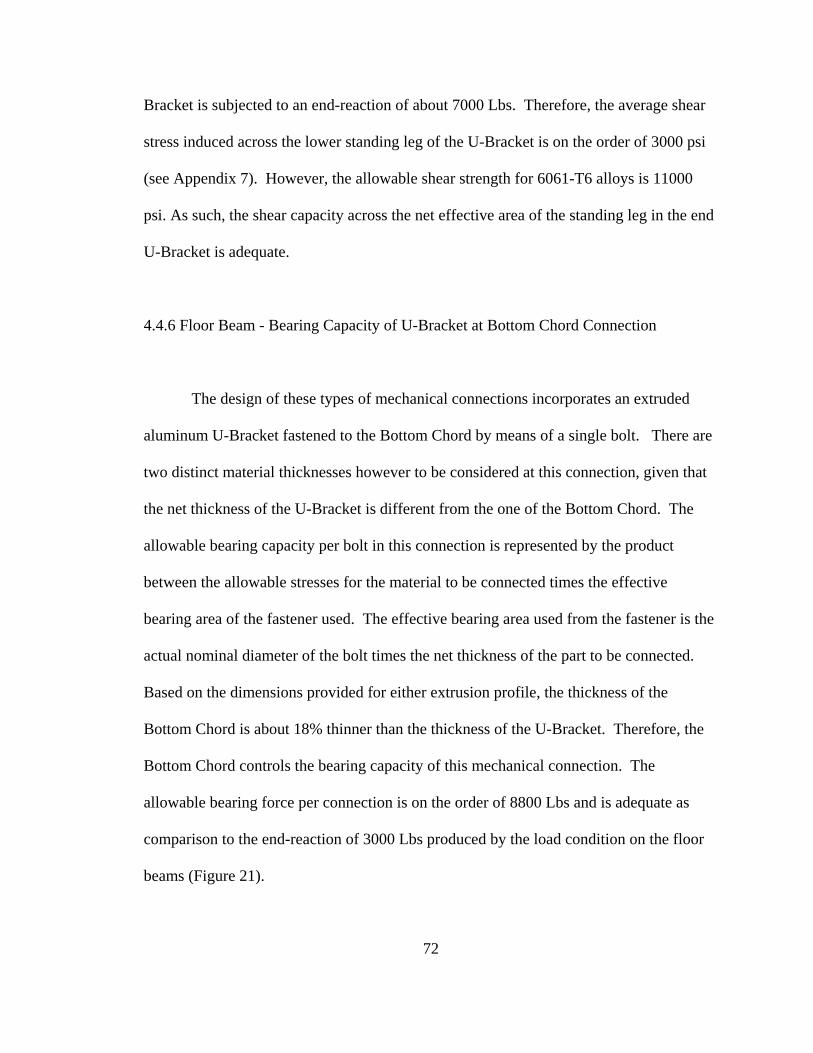
72
Bracket is subjected to an end-reaction of about 7000 Lbs. Therefore, the average shear
stress induced across the lower standing leg of the U-Bracket is on the order of 3000 psi
(see Appendix 7). However, the allowable shear strength for 6061-T6 alloys is 11000
psi. As such, the shear capacity across the net effective area of the standing leg in the end
U-Bracket is adequate.
4.4.6 Floor Beam - Bearing Capacity of U-Bracket at Bottom Chord Connection
The design of these types of mechanical connections incorporates an extruded
aluminum U-Bracket fastened to the Bottom Chord by means of a single bolt. There are
two distinct material thicknesses however to be considered at this connection, given that
the net thickness of the U-Bracket is different from the one of the Bottom Chord. The
allowable bearing capacity per bolt in this connection is represented by the product
between the allowable stresses for the material to be connected times the effective
bearing area of the fastener used. The effective bearing area used from the fastener is the
actual nominal diameter of the bolt times the net thickness of the part to be connected.
Based on the dimensions provided for either extrusion profile, the thickness of the
Bottom Chord is about 18% thinner than the thickness of the U-Bracket. Therefore, the
Bottom Chord controls the bearing capacity of this mechanical connection. The
allowable bearing force per connection is on the order of 8800 Lbs and is adequate as
comparison to the end-reaction of 3000 Lbs produced by the load condition on the floor
beams (Figure 21).
73
4.5 Vertical Post - Allowable Compressive Capacity
As described in Section 4.1, compression members are structural elements
subjected primarily to axial compressive forces. Whenever compression takes place in
engineered components, buckling instability is a concern that requires due consideration.
The member’s overall dimensions, including the unbraced lengths and cross-sectional
widths and thicknesses, in addition to the level of restraint provided by end supports
influences the buckling response. In this specific case, the doubly symmetric profile of
this member defines the type of buckling modes to be considered. These modes include
torsional, flexural, and local buckling. For torsional buckling, this limit state is not
applicable to closed cross-sections as the internal shear forces uniformly distributed over
the thickness of the cross section counteract any induced twisting. It follows that overall
flexural and local buckling modes may be the controlling limit states for the vertical posts
considering their actual design spacing in the trusses being evaluated in this analysis.
Figure 21: U-Bracket Beam Support
74
4.5.1 Vertical Post - Overall Buckling versus Local Buckling
Based on the evaluation of the vertical post it was determined that overall flexural
buckling governs its compressive design. However, there were two separate slenderness
ratios considered in the analysis, each corresponding to the buckling modes considered.
The first slenderness ratio (i.e. k x L / r) was used to assess the axial compression on the
gross area of the vertical post. The second slenderness ratio (i.e. b / t) was necessary to
measure the axial compression on the gross section of each individual plate component of
the post cross-section and consequently, the allowable stress for local buckling. It was
determined, that both global and local buckling response was characterized by inelastic
behavior. Further, the stress analysis revealed that the allowable column-stress for global
buckling was on the order of 13 ksi (Appendix 8). What’s more, the effect of local
buckling on the member performance is not applicable to this particular member since the
slenderness ratios calculated for all the plate elements on the cross section do not exceed
the limitations stipulated on the Aluminum Specifications. Given the values obtained
form the analysis, the overall load carrying capacity of the vertical posts are larger than
the imposed compressive forces induced by the minimum design loads.
4.5.2 Bearing Capacity on Bolted Connections – Vertical Post
The connections in this type of component are of significant importance
considering it original design. In view of the applicable external compressive forces, the
load transfer could cause a structural failure by excessive deformation of the joints if
75
these are poorly design. Even though the spacing in between the holes is different, as
compared to the bolt group at the ends of the diagonal members, the overall bearing
capacity per bolthole remains the same in consideration of the same premises used
before. It may be concluded that the bearing capacity of the connections in the vertical
post is sufficient. The maximum compressive force in the vertical post is about 12 kips at
the midspan of the bridge structure (Appendix 8).
4.6 Abutment Bridge Supports
AASHTO design specifications do not require a detail seismic analysis for single
span bridges. However, there are some design parameters to be considered when sizing
primary connections between the superstructure and substructure. In seismic prone
regions, the bridge support connections and the abutments need to resist, both
transversely and longitudinally, a seismic load of a prescribed magnitude. The
earthquake load to be chosen for design shall be equivalent to the bridge support reaction
induced by the self weight of the bridge times the coefficient of ground acceleration at
the geographic site. Coefficients of horizontal acceleration are site-specific design values
representing the fraction of dead load force to be imposed on these connections. Because
of the intrinsic geometric design of these supports, the overall strength is a combination
between the allowable bearing capacities of the weld-affected base material plus the
allowable shear strength of the filler alloy chosen to weld these members. There are two
distinct designs incorporated into these support connections (Figure 22).
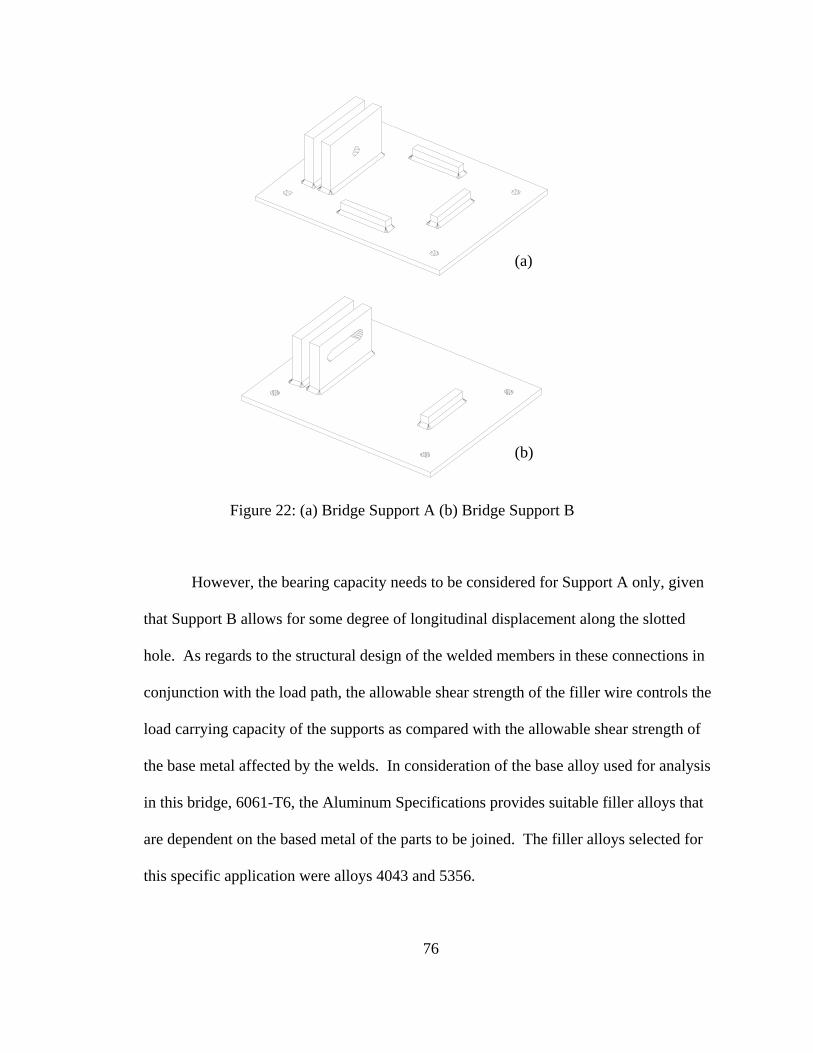
76
However, the bearing capacity needs to be considered for Support A only, given
that Support B allows for some degree of longitudinal displacement along the slotted
hole. As regards to the structural design of the welded members in these connections in
conjunction with the load path, the allowable shear strength of the filler wire controls the
load carrying capacity of the supports as compared with the allowable shear strength of
the base metal affected by the welds. In consideration of the base alloy used for analysis
in this bridge, 6061-T6, the Aluminum Specifications provides suitable filler alloys that
are dependent on the based metal of the parts to be joined. The filler alloys selected for
this specific application were alloys 4043 and 5356.
Figure 22: (a) Bridge Support A (b) Bridge Support B
(a)
(b)
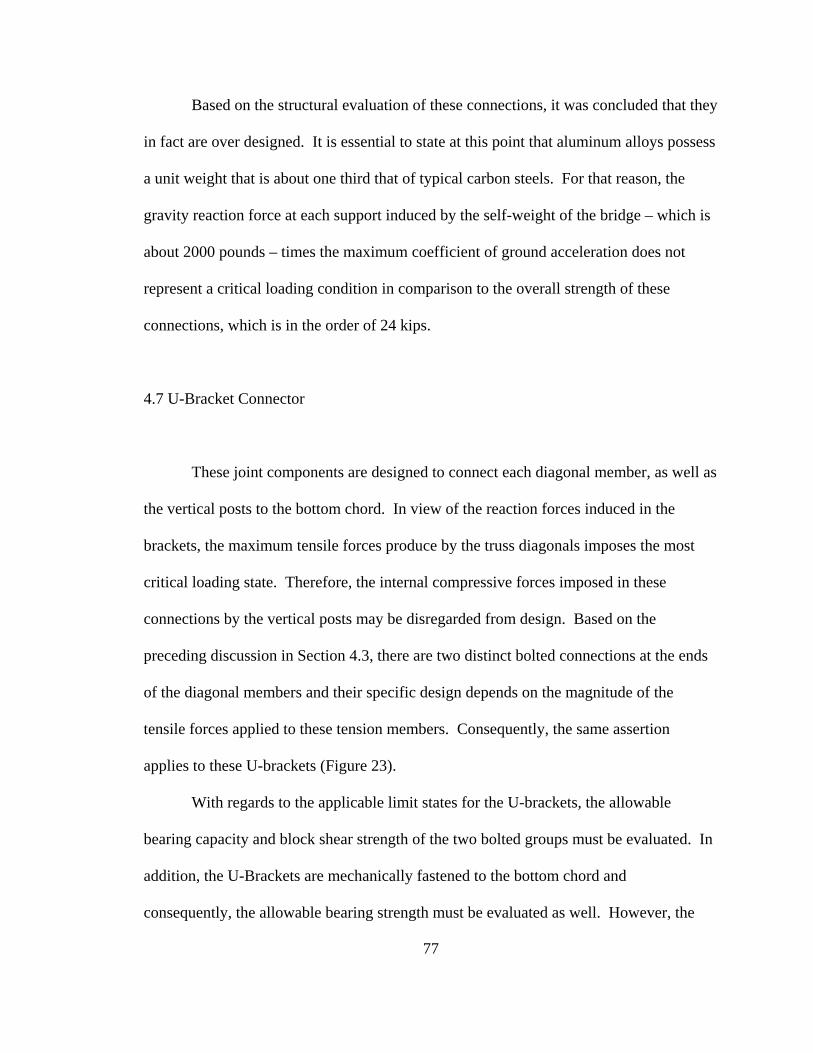
77
Based on the structural evaluation of these connections, it was concluded that they
in fact are over designed. It is essential to state at this point that aluminum alloys possess
a unit weight that is about one third that of typical carbon steels. For that reason, the
gravity reaction force at each support induced by the self-weight of the bridge – which is
about 2000 pounds – times the maximum coefficient of ground acceleration does not
represent a critical loading condition in comparison to the overall strength of these
connections, which is in the order of 24 kips.
4.7 U-Bracket Connector
These joint components are designed to connect each diagonal member, as well as
the vertical posts to the bottom chord. In view of the reaction forces induced in the
brackets, the maximum tensile forces produce by the truss diagonals imposes the most
critical loading state. Therefore, the internal compressive forces imposed in these
connections by the vertical posts may be disregarded from design. Based on the
preceding discussion in Section 4.3, there are two distinct bolted connections at the ends
of the diagonal members and their specific design depends on the magnitude of the
tensile forces applied to these tension members. Consequently, the same assertion
applies to these U-brackets (Figure 23).
With regards to the applicable limit states for the U-brackets, the allowable
bearing capacity and block shear strength of the two bolted groups must be evaluated. In
addition, the U-Brackets are mechanically fastened to the bottom chord and
consequently, the allowable bearing strength must be evaluated as well. However, the
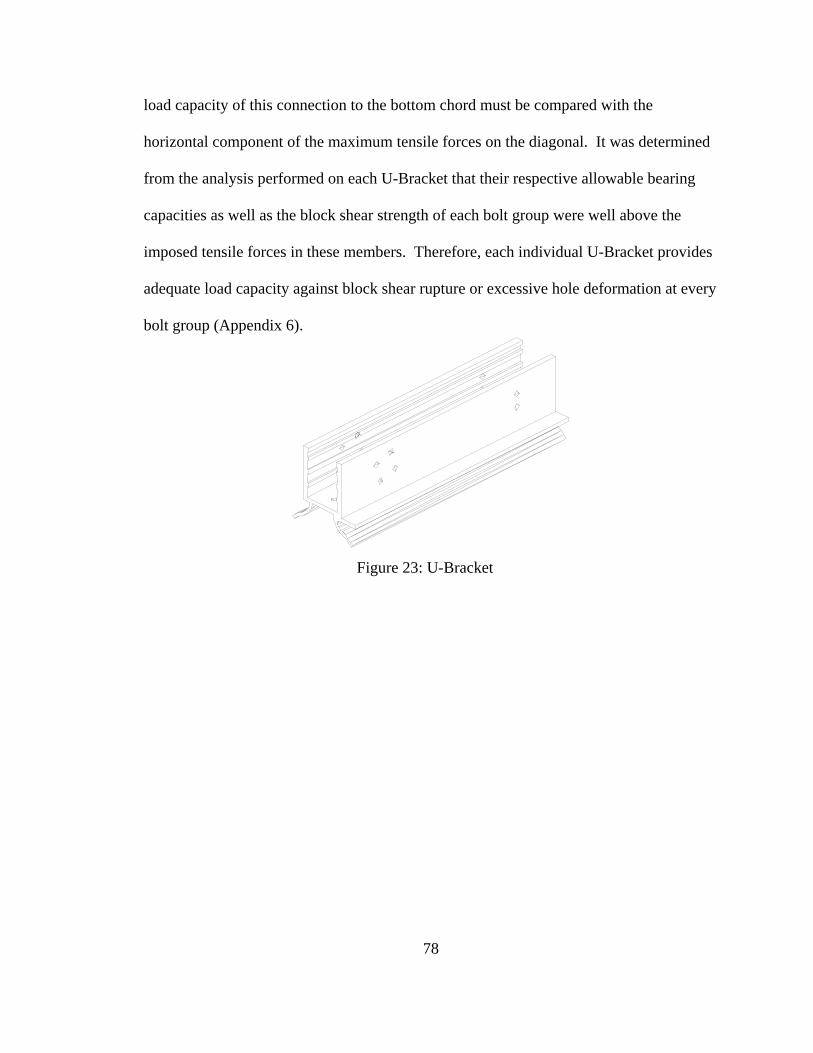
78
Figure 23: U-Bracket
load capacity of this connection to the bottom chord must be compared with the
horizontal component of the maximum tensile forces on the diagonal. It was determined
from the analysis performed on each U-Bracket that their respective allowable bearing
capacities as well as the block shear strength of each bolt group were well above the
imposed tensile forces in these members. Therefore, each individual U-Bracket provides
adequate load capacity against block shear rupture or excessive hole deformation at every
bolt group (Appendix 6).
79
CHAPTER V
CONCLUSION
The structural integrity of any engineered component as part of a system is a
major design factor. A suitable design requires the appropriate selection of cross sections
comprised of individual elements, and the determination of the overall proportions and
dimensions of all supporting members. Structural safety, serviceability, and economic
factors shall be accounted for so as to achieve a cost efficient and safe design. In order
to achieve the anticipated service life or performance of a structure, some margin of
safety must also be incorporated into its design. This may be attained either by
proportioning the framework to factored external loads or by scaling down the stresses
that represent the material strength to allowable values. Other than safety, a structure
must be serviceable in the sense that it has to perform the intended function satisfactorily.
A structure should not cause a perception of functional distress or produce uneasiness to
the occupants or users. What's more, the engineer is required to select and assess in
detail the overall structural system in order to generate an economical structure. That
requires a well-organized and conscious use of construction materials and labor.
80
It is essential to recognize that any structure be design and constructed in
agreement to provisions established by the governing building codes. These building
codes embody legal records that consist of predefined requirements related to the
structural reliability and serviceability that corresponds to that particular structure. These
building codes have the capacity to impose governing laws. For that reason they are
administered by governmental entities such as municipalities, cities, counties, and even
states. On the other hand, however, these building codes do not furnish specific design
procedures, but instead stipulate design requirements and constraints that must be
satisfied. In contrast to building codes though, all design specifications provide detailed
guidance for the proportioning of structural members and their connections. They
present the foremost criteria to enable structural engineers to attain the primary objectives
mandated by the governing building codes. These design specifications represent what
are approved practices based on the latest advances in the industry.
During the evaluation of the second generation of PML LOGIS-Bridge System,
several design specifications and codes were considered for its analysis. It is imperative
to elucidate at this point the overall design of this pedestrian bridge was originally
conceived at Singen, Germany. As such, its design was different as compared to those
applicable in the United States. As a result, the primary objective of this investigation
was to evaluate this bridge following the design specifications stated by the governing
agency, the American Association of State Highway and Transportation Officials (i.e.
AASHTO). In conjunction with the AASHTO Guide Specification for Design of
Pedestrian Bridges, the leading design provisions for aluminum structures as established
81
by the Aluminum Association were considered the core specifications for the structural
analysis of this bridge. In addition to all these provisions, the latest version of the
Minimum Design Loads for Building and Other Structures as provided by the American
Society of Civil Engineers was considered as a supplementary reference for the
estimation of all the applicable external loads for this structure.
The overall outcome of this structural evaluation is that of a rather sound
pedestrian bridge, under well-defined restrictions. However, there are several limit states
not fulfilled as based on the controlling design requirements provided by and The
Aluminum Design Manual. A limit state is a condition that defines the limit of structural
usefulness, and it may be categorized as that due to serviceability or allowable strength
requirements. The primary concern for this type of structure (i.e. half-through trusses) is
the lack of lateral stability of the top chord. Flexural-torsional buckling is the controlling
limit state for the compressive design of this component. Nonetheless, its load carrying
capacity in compression can exceed the maximum compressive force imposed provided
the effective length of the external bracing arm is kept to a restricted range. Furthermore,
AASHTO requires this particular member to be proportioned to sustain 50 pounds per
linear feet applied both vertically and horizontally, as well as the maximum compressive
force imposed by the estimated minimum design loads. Under these combined load
conditions, this member does not provide adequate resistance against combined stresses,
no matter the magnitude of the lateral support. This is one of the limit states not satisfied.
The interaction between the induced biaxial bending and the compressive force on
the top chord needs to be of such magnitude not to exceed an interaction equation limit.
82
That was not the case in this particular structure, and the determining factor was the ratio
of the average compressive stress on the top chord to the allowable compressive stress.
There are several ways to overcome this, and these are all subject to engineering
judgment. Either the effective width of the bridge may be reduced, or the height of the
trusses increased in order to reduce the imposed compressive force on the top chord.
Furthermore, the extrusion profile may be modified, and it’s cross sectional area
increased so as to further reduce the average compressive stress in this member. These
are all reasonable alternatives that need further evaluation.
In the case of the floor system, AASHTO requires that bridges over a certain
width to be design for a moving load, as produced by a passing maintenance vehicle.
Based on the double-hollow design of the floor beams, the allowable deflection for this
component is exceeded and therefore, this beam profile does not provide suitable
stiffness to overcome this serviceability requirement. However, strength wise, this
member provides adequate bending resistance against the induced stresses imposed by
the load combination. As previously assumed, if a double-solid profile with similar
geometry were selected, this serviceability requirement would not be a concern.
The load carrying capacity of the bottom chord was governed by the shear
strength of the blind rivets at the splice connection. The single shear strength of the
rivets themselves was not sufficient enough to sustain the maximum tensile force induced
in this joint. Two approaches may be followed to solve the problem. The first approach
was to increase the quantity of rivets to be a function of the maximum tensile force
imposed in the bottom chord. The second approach was to estimate a new diameter.
83
Since the other applicable limit states of this component were adequate, the shear
capacity of the riveted connection is the weak link. In regards to the remaining members
outlining the trusses of this bridge and their corresponding connections, their load
carrying capacities were greater than any anticipated external loads. Based on the
numerical evaluation performed on each particular component, the imposed internal
forces in each member are in well below the allowable stresses as defined by the
Aluminum Design Manual.
For structural engineers, the issue of structural reliability is strictly dependent on
the applicability of available techniques to carefully design structures, so that the chance
of exceeding a prescribed limit state is acceptably small. However, the likelihood for a
limited or total collapse in well-designed structures due to catastrophic events such as
earthquakes, severe windstorms, or accidental overloads cannot be overlooked. The sole
intent should be to limit human loss not necessarily property. The correct determination
of the applicable limit state is crucial, given that instability might frequently come about
with no preceding warning. It may even bring on a catastrophic collapse, as it has been
exemplified by classic failures in the history of structural engineering.
The limit states for structural instability are affected by many variables including
material properties, geometry, the magnitude and nature of the applied forces, structural
imperfections, the assumptions underlying the theory, the assessment of boundary
conditions, and so on. Each of these effects may be random in nature, however this
randomness is not completely arbitrary since design rules and prescribed tolerances limit
the extent of this variability. However, the reliability of the final overall design rests on

84
the care taken through the whole process of analysis and design. Identifying the limit of
a structure’s usefulness and providing adequate safeguards against reaching that limit
states are what design specifications are about.
85
BIBLIOGRAPHY
[1] Kissel, J.R & Ferry, R.L., Aluminum Structures: A Guide to their Specifications Design, 1st ed., John Wiley and Sons, 1995. [2] Aluminum Association, Aluminum Now: Bridges Aluminum High’s Strength and Durability Offers New Structural Possibilities, www.aluminum.org/aluminumnow. [3] Plecher, Robert, Aluminum Applications in the United States, 2000. [4] Kosteas, D., Aluminum Bridges: Comparative Design Cases, Proceedings Alumitech ’97, 2nd International Conference and Trade Exposition, May 1997. [5] Aluminum Design Manual, Specifications and Guidelines for Aluminum Structures, The Aluminum Association, 2000. [6] ASCE 7-98 Minimum Design Load for Building and Other Structures, Article 4.8.4 Special Occupancies, pp. 9. [7] AASHTO, Guide Specifications of Pedestrian Bridges, 1997. [8] AASHTO Standard Specifications for Highway Bridges, 15th ed., 1992. [9] Galambos, T.V., Guide to Stability Design Criteria for Metal Structures, 4th ed., 1966.
[10] AASHTO Guide Specifications for Aluminum Highway Bridges, 1991.
[11] AASHTO Guide Specifications for Design of Pedestrian Bridges, Section 1.3.6 Half-through Truss Spans, August 1997. [12] Welding Aluminum and Aluminum Alloys, American Welding Society, 5th ed., 1966. [13] Evans, Fernard M., Stress Analysis of Shear Panels in Design of a Semi-Monococue Aluminum Highway Bridge, June 1960

86
APPENDICES
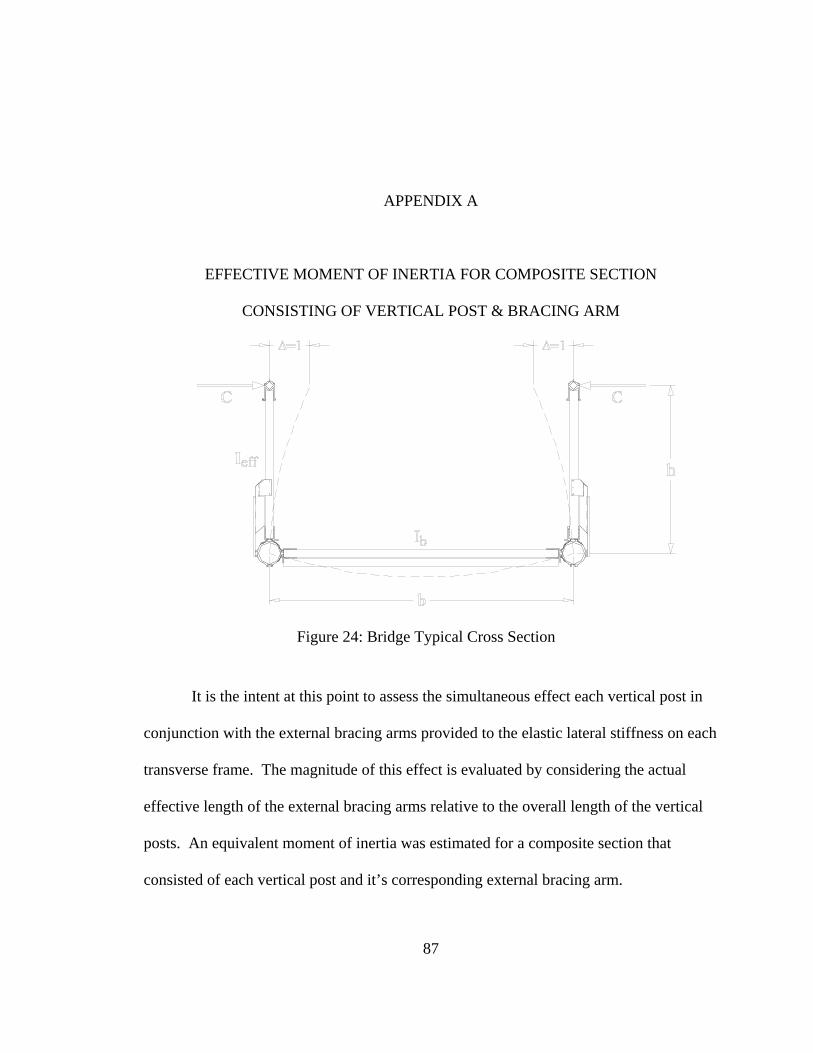
87
APPENDIX A
EFFECTIVE MOMENT OF INERTIA FOR COMPOSITE SECTION
CONSISTING OF VERTICAL POST & BRACING ARM
It is the intent at this point to assess the simultaneous effect each vertical post in
conjunction with the external bracing arms provided to the elastic lateral stiffness on each
transverse frame. The magnitude of this effect is evaluated by considering the actual
effective length of the external bracing arms relative to the overall length of the vertical
posts. An equivalent moment of inertia was estimated for a composite section that
consisted of each vertical post and it’s corresponding external bracing arm.
Figure 24: Bridge Typical Cross Section
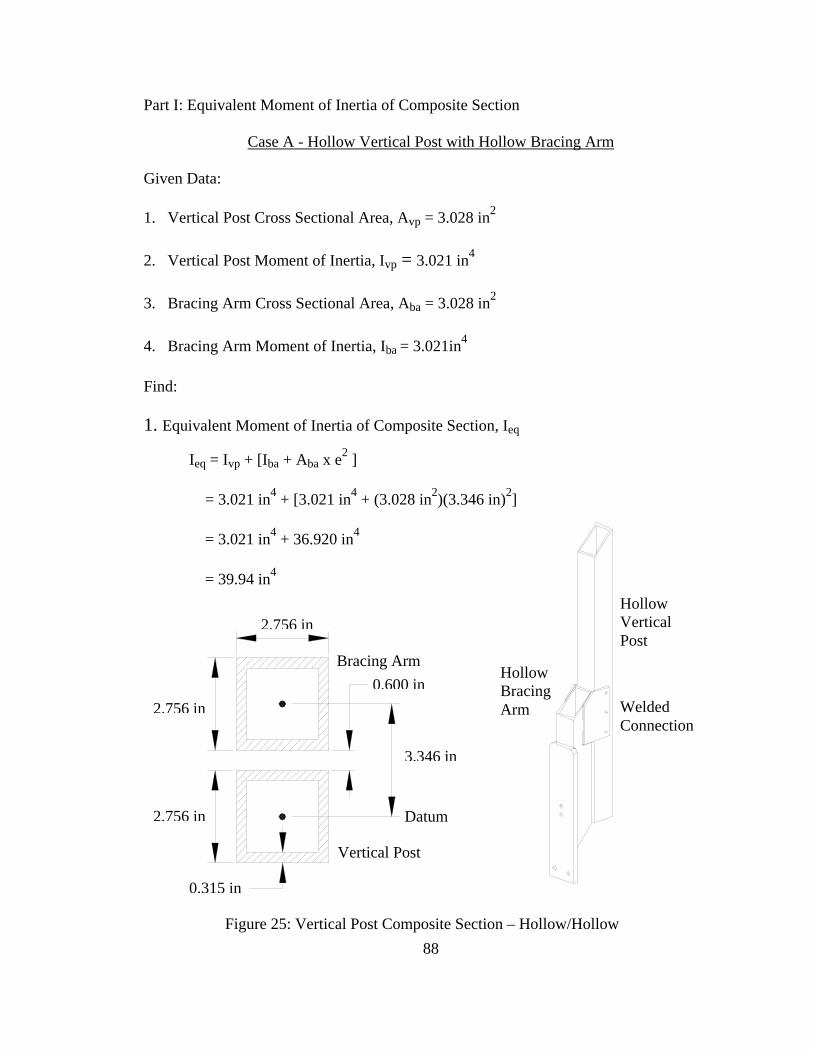
88
Part I: Equivalent Moment of Inertia of Composite Section
Case A - Hollow Vertical Post with Hollow Bracing Arm
Given Data: 1. Vertical Post Cross Sectional Area, Avp = 3.028 in2
2. Vertical Post Moment of Inertia, Ivp = 3.021 in4
3. Bracing Arm Cross Sectional Area, Aba = 3.028 in2
4. Bracing Arm Moment of Inertia, Iba = 3.021in4
Find:
1. Equivalent Moment of Inertia of Composite Section, Ieq
Ieq = Ivp + [Iba + Aba x e2 ] = 3.021 in4 + [3.021 in4 + (3.028 in2)(3.346 in)2] = 3.021 in4 + 36.920 in4
= 39.94 in4
Hollow Vertical Post
Hollow Bracing Arm Welded
Connection
Figure 25: Vertical Post Composite Section – Hollow/Hollow
2.756 in
2.756 in
2.756 in
0.315 in
3.346 in
0.600 in Bracing Arm
Vertical Post
Datum
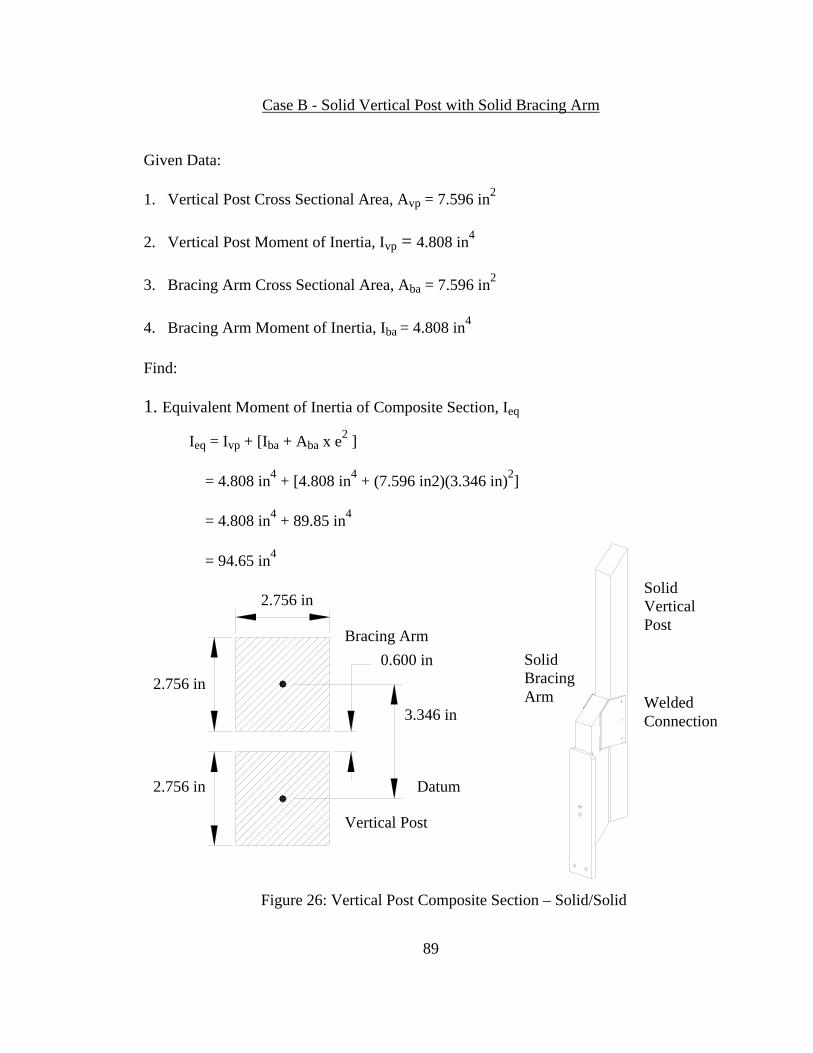
89
Case B - Solid Vertical Post with Solid Bracing Arm
Given Data: 1. Vertical Post Cross Sectional Area, Avp = 7.596 in2
2. Vertical Post Moment of Inertia, Ivp = 4.808 in4
3. Bracing Arm Cross Sectional Area, Aba = 7.596 in2
4. Bracing Arm Moment of Inertia, Iba = 4.808 in4
Find:
1. Equivalent Moment of Inertia of Composite Section, Ieq
Ieq = Ivp + [Iba + Aba x e2 ] = 4.808 in4 + [4.808 in4 + (7.596 in2)(3.346 in)2] = 4.808 in4 + 89.85 in4
= 94.65 in4
2.756 in
2.756 in
2.756 in
3.346 in
0.600 in
Datum
Bracing Arm
Vertical Post
Solid Vertical Post
Welded Connection
Solid Bracing Arm
Figure 26: Vertical Post Composite Section – Solid/Solid
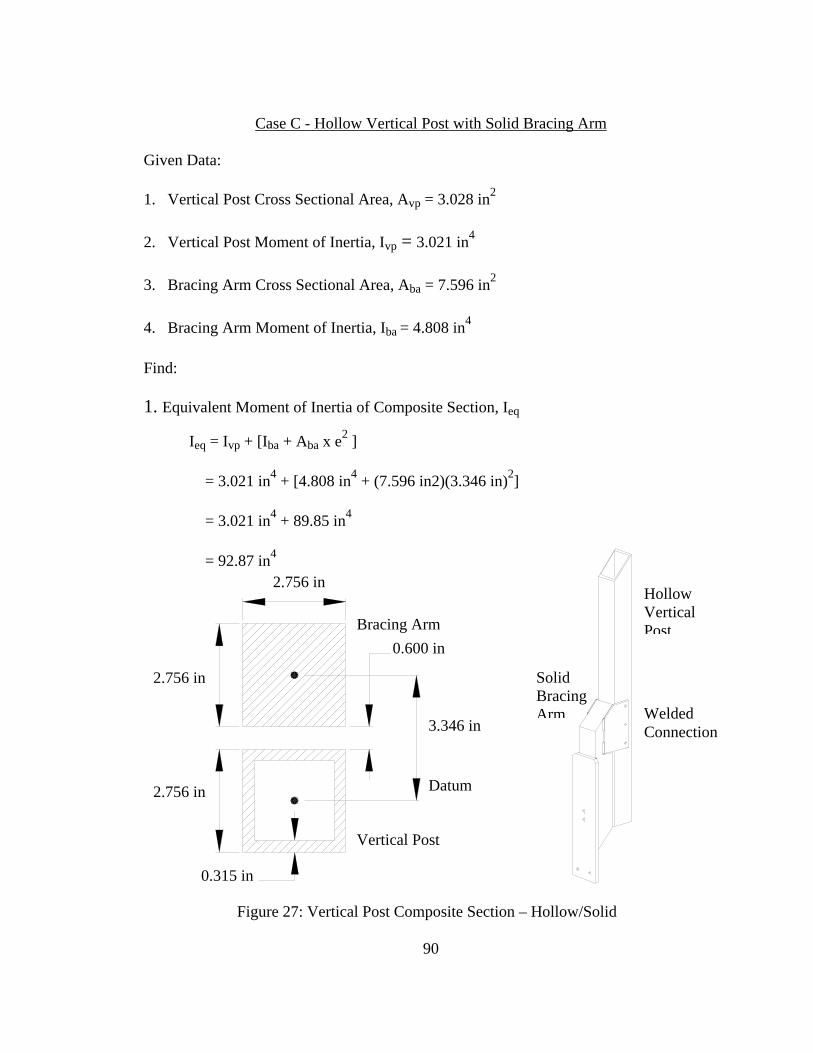
90
Case C - Hollow Vertical Post with Solid Bracing Arm
Given Data: 1. Vertical Post Cross Sectional Area, Avp = 3.028 in2
2. Vertical Post Moment of Inertia, Ivp = 3.021 in4
3. Bracing Arm Cross Sectional Area, Aba = 7.596 in2
4. Bracing Arm Moment of Inertia, Iba = 4.808 in4
Find:
1. Equivalent Moment of Inertia of Composite Section, Ieq
Ieq = Ivp + [Iba + Aba x e2 ] = 3.021 in4 + [4.808 in4 + (7.596 in2)(3.346 in)2] = 3.021 in4 + 89.85 in4
= 92.87 in4
Hollow Vertical Post
Welded Connection
Solid Bracing Arm
2.756 in
2.756 in
2.756 in
0.315 in
Bracing Arm
Vertical Post
0.600 in
3.346 in
Datum
Figure 27: Vertical Post Composite Section – Hollow/Solid
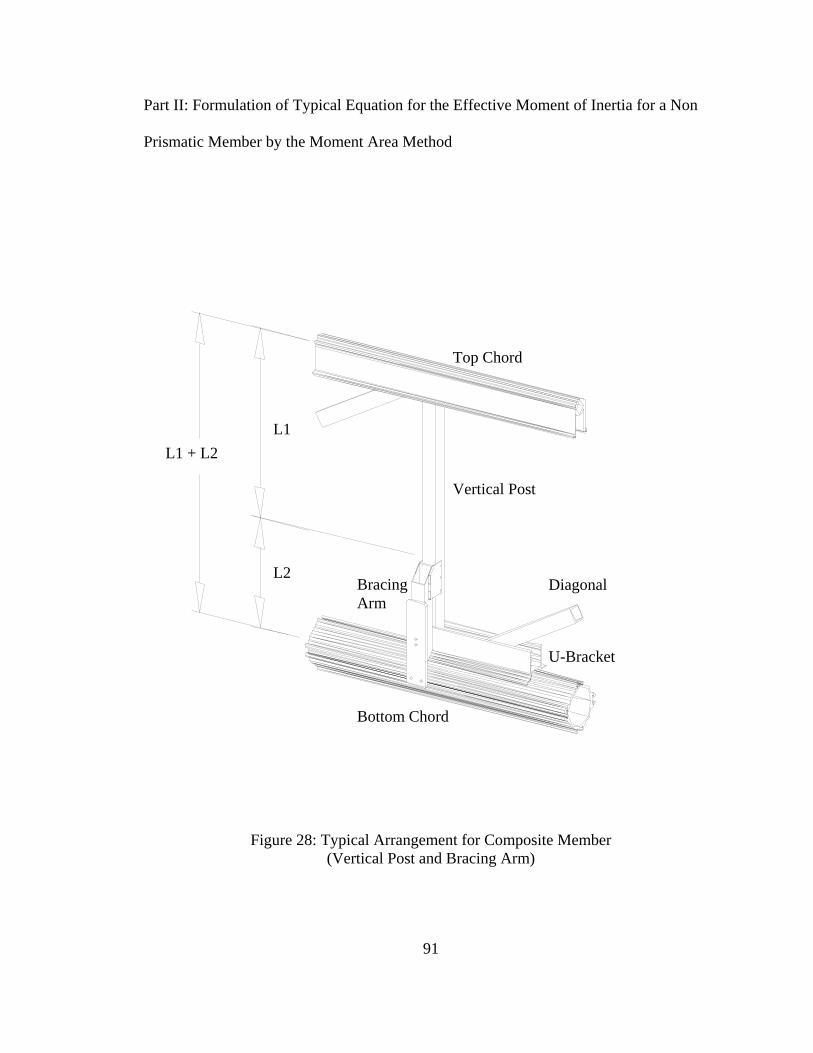
91
Part II: Formulation of Typical Equation for the Effective Moment of Inertia for a Non
Prismatic Member by the Moment Area Method
Top Chord
Vertical Post
Diagonal
U-Bracket
Bracing Arm
Bottom Chord
L1
L2
L1 + L2
Figure 28: Typical Arrangement for Composite Member (Vertical Post and Bracing Arm)
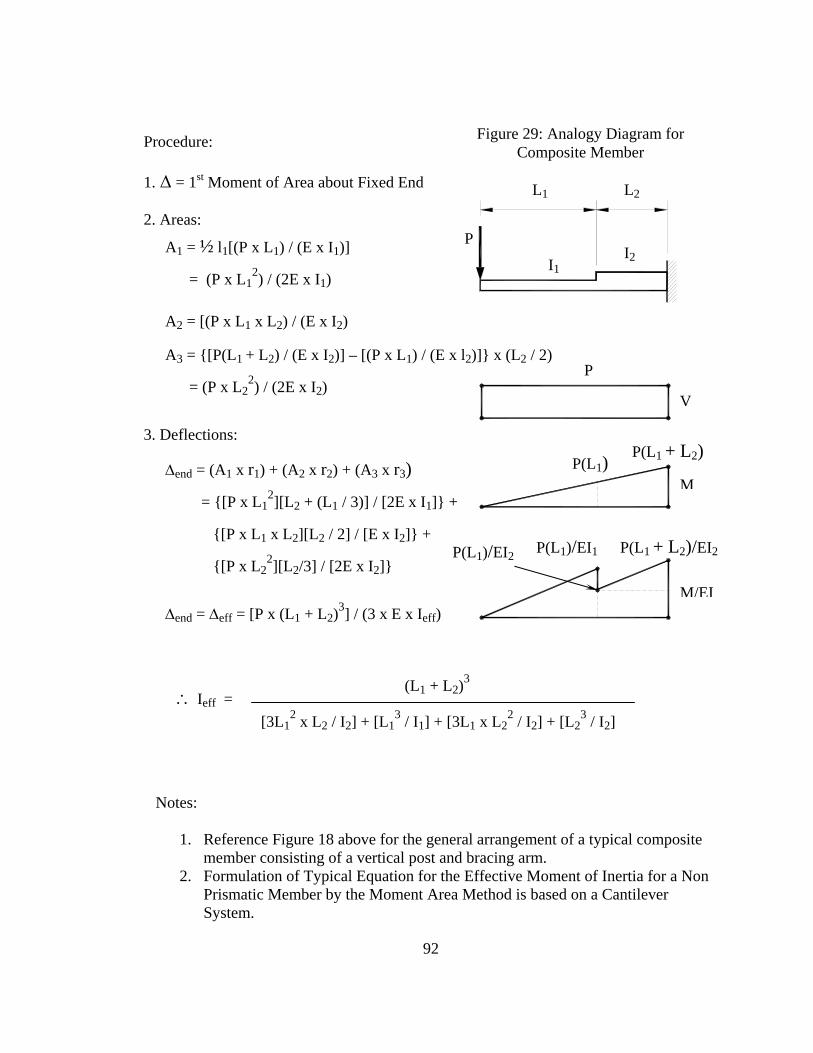
92
P(L1)/EI2
Procedure:
1. Δ = 1st Moment of Area about Fixed End 2. Areas:
3. Deflections:
Notes:
1. Reference Figure 18 above for the general arrangement of a typical composite member consisting of a vertical post and bracing arm.
2. Formulation of Typical Equation for the Effective Moment of Inertia for a Non Prismatic Member by the Moment Area Method is based on a Cantilever System.
A1 = ½ l1[(P x L1) / (E x I1)]
= (P x L12) / (2E x I1)
A2 = [(P x L1 x L2) / (E x I2)
A3 = {[P(L1 + L2) / (E x I2)] – [(P x L1) / (E x l2)]} x (L2 / 2)
= (P x L22) / (2E x I2)
Δend = (A1 x r1) + (A2 x r2) + (A3 x r3)
= {[P x L12][L2 + (L1 / 3)] / [2E x I1]} +
{[P x L1 x L2][L2 / 2] / [E x I2]} +
{[P x L22][L2/3] / [2E x I2]}
Δend = Δeff = [P x (L1 + L2)3] / (3 x E x Ieff)
∴ Ieff = (L1 + L2)3
[3L12 x L2 / I2] + [L1
3 / I1] + [3L1 x L22 / I2] + [L2
3 / I2]
L1 L2
I1 I2
P
P(L1) P(L1 + L2)
P(L1)/EI1 P(L1 + L2)/EI2
V
M
M/EI
P
Figure 29: Analogy Diagram for Composite Member
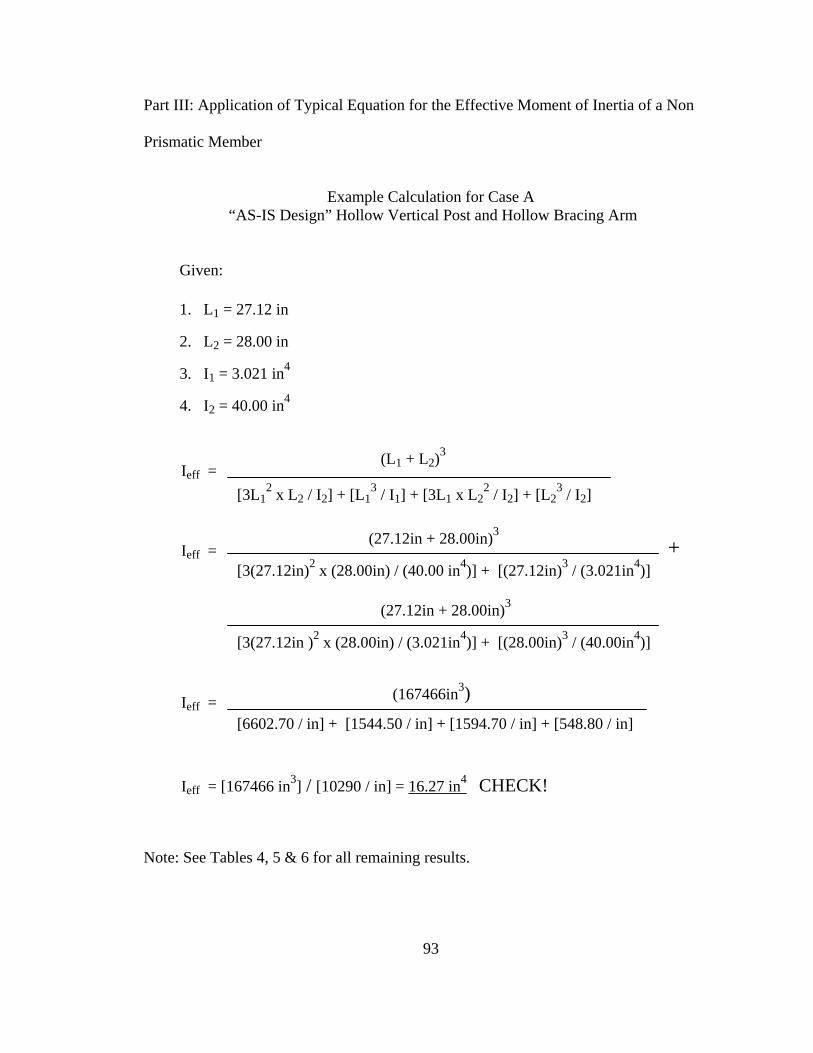
93
Part III: Application of Typical Equation for the Effective Moment of Inertia of a Non
Prismatic Member
Example Calculation for Case A
“AS-IS Design” Hollow Vertical Post and Hollow Bracing Arm
Given: 1. L1 = 27.12 in
2. L2 = 28.00 in
3. I1 = 3.021 in4
4. I2 = 40.00 in4
Note: See Tables 4, 5 & 6 for all remaining results.
Ieff = (L1 + L2)3
[3L12 x L2 / I2] + [L1
3 / I1] + [3L1 x L22 / I2] + [L2
3 / I2]
(27.12in + 28.00in)3
[3(27.12in)2 x (28.00in) / (40.00 in4)] + [(27.12in)3 / (3.021in4)]
(27.12in + 28.00in)3
[3(27.12in )2 x (28.00in) / (3.021in4)] + [(28.00in)3 / (40.00in4)]
+ Ieff =
Ieff = (167466in3) [6602.70 / in] + [1544.50 / in] + [1594.70 / in] + [548.80 / in]
Ieff = [167466 in3] / [10290 / in] = 16.27 in4 CHECK!
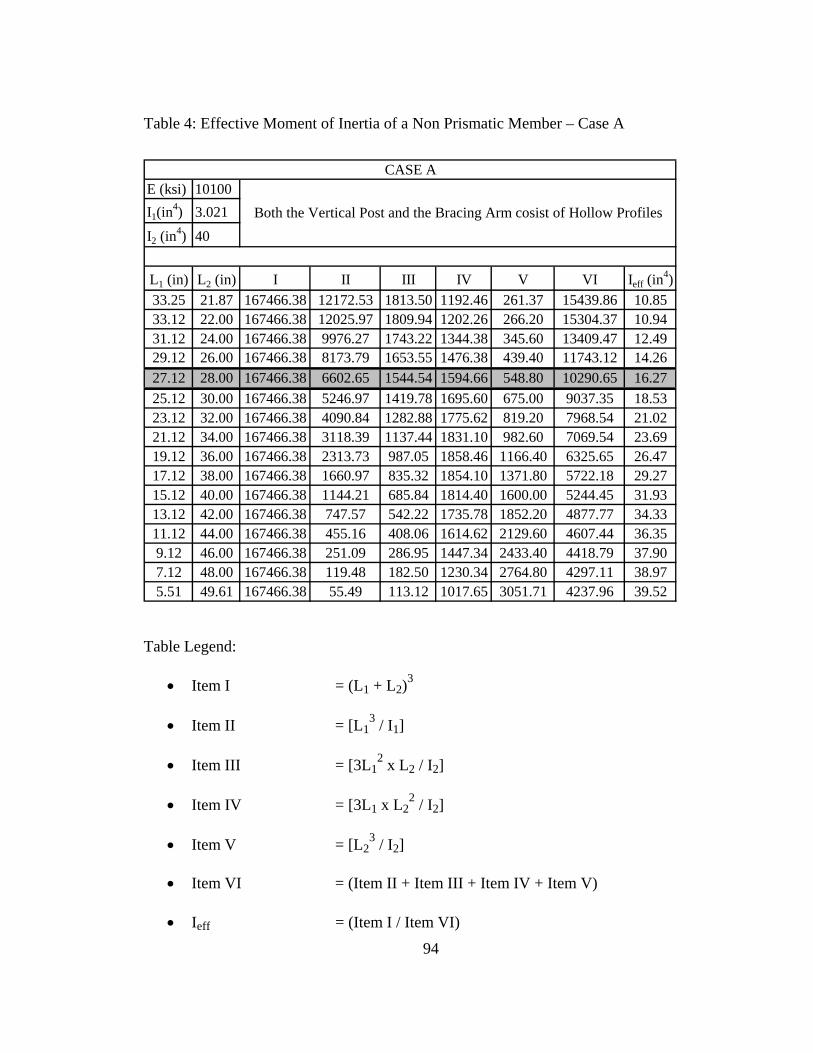
94
E (ksi) 10100I1(in
4) 3.021
I2 (in4) 40
L1 (in) L2 (in) I II III IV V VI Ieff (in4)
33.25 21.87 167466.38 12172.53 1813.50 1192.46 261.37 15439.86 10.8533.12 22.00 167466.38 12025.97 1809.94 1202.26 266.20 15304.37 10.9431.12 24.00 167466.38 9976.27 1743.22 1344.38 345.60 13409.47 12.4929.12 26.00 167466.38 8173.79 1653.55 1476.38 439.40 11743.12 14.2627.12 28.00 167466.38 6602.65 1544.54 1594.66 548.80 10290.65 16.2725.12 30.00 167466.38 5246.97 1419.78 1695.60 675.00 9037.35 18.5323.12 32.00 167466.38 4090.84 1282.88 1775.62 819.20 7968.54 21.0221.12 34.00 167466.38 3118.39 1137.44 1831.10 982.60 7069.54 23.6919.12 36.00 167466.38 2313.73 987.05 1858.46 1166.40 6325.65 26.4717.12 38.00 167466.38 1660.97 835.32 1854.10 1371.80 5722.18 29.2715.12 40.00 167466.38 1144.21 685.84 1814.40 1600.00 5244.45 31.9313.12 42.00 167466.38 747.57 542.22 1735.78 1852.20 4877.77 34.3311.12 44.00 167466.38 455.16 408.06 1614.62 2129.60 4607.44 36.359.12 46.00 167466.38 251.09 286.95 1447.34 2433.40 4418.79 37.907.12 48.00 167466.38 119.48 182.50 1230.34 2764.80 4297.11 38.975.51 49.61 167466.38 55.49 113.12 1017.65 3051.71 4237.96 39.52
CASE A
Both the Vertical Post and the Bracing Arm cosist of Hollow Profiles
Table 4: Effective Moment of Inertia of a Non Prismatic Member – Case A
Table Legend:
• Item I = (L1 + L2)3 • Item II = [L1
3 / I1]
• Item III = [3L12 x L2 / I2]
• Item IV = [3L1 x L2
2 / I2]
• Item V = [L23 / I2]
• Item VI = (Item II + Item III + Item IV + Item V)
• Ieff = (Item I / Item VI)
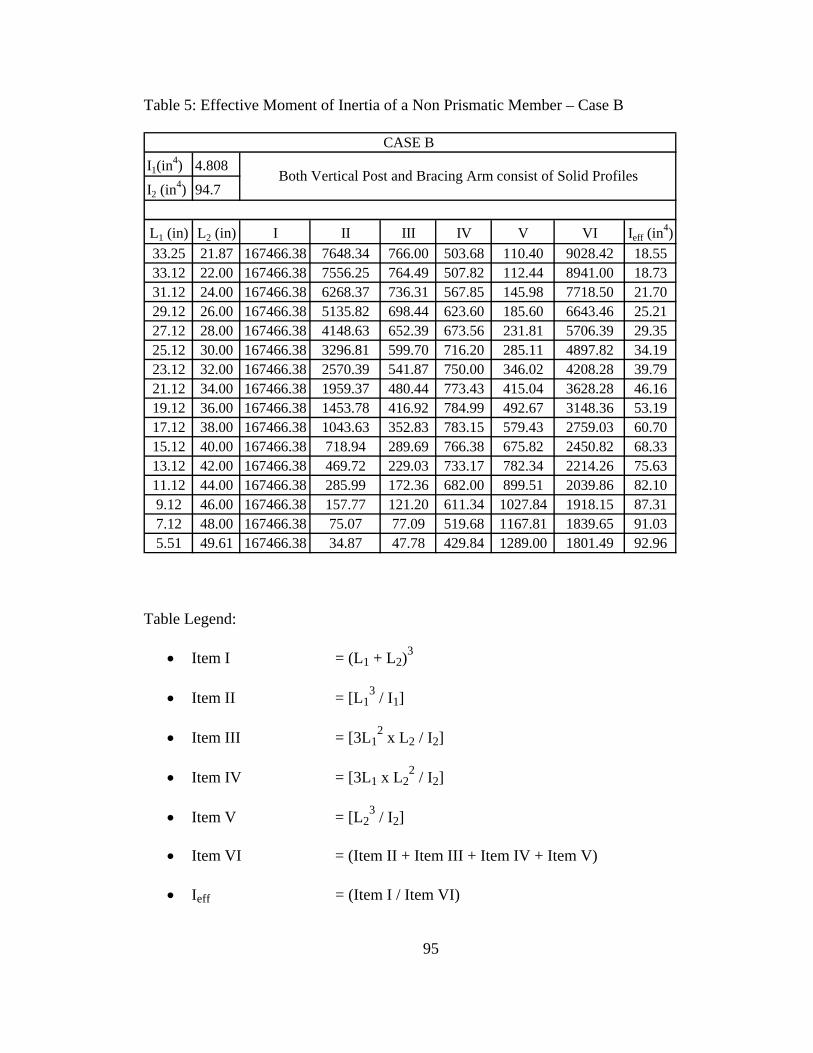
95
Table 5: Effective Moment of Inertia of a Non Prismatic Member – Case B
Table Legend:
• Item I = (L1 + L2)3 • Item II = [L1
3 / I1]
• Item III = [3L12 x L2 / I2]
• Item IV = [3L1 x L2
2 / I2]
• Item V = [L23 / I2]
• Item VI = (Item II + Item III + Item IV + Item V)
• Ieff = (Item I / Item VI)
I1(in4) 4.808
I2 (in4) 94.7
L1 (in) L2 (in) I II III IV V VI Ieff (in4)
33.25 21.87 167466.38 7648.34 766.00 503.68 110.40 9028.42 18.5533.12 22.00 167466.38 7556.25 764.49 507.82 112.44 8941.00 18.7331.12 24.00 167466.38 6268.37 736.31 567.85 145.98 7718.50 21.7029.12 26.00 167466.38 5135.82 698.44 623.60 185.60 6643.46 25.2127.12 28.00 167466.38 4148.63 652.39 673.56 231.81 5706.39 29.3525.12 30.00 167466.38 3296.81 599.70 716.20 285.11 4897.82 34.1923.12 32.00 167466.38 2570.39 541.87 750.00 346.02 4208.28 39.7921.12 34.00 167466.38 1959.37 480.44 773.43 415.04 3628.28 46.1619.12 36.00 167466.38 1453.78 416.92 784.99 492.67 3148.36 53.1917.12 38.00 167466.38 1043.63 352.83 783.15 579.43 2759.03 60.7015.12 40.00 167466.38 718.94 289.69 766.38 675.82 2450.82 68.3313.12 42.00 167466.38 469.72 229.03 733.17 782.34 2214.26 75.6311.12 44.00 167466.38 285.99 172.36 682.00 899.51 2039.86 82.109.12 46.00 167466.38 157.77 121.20 611.34 1027.84 1918.15 87.317.12 48.00 167466.38 75.07 77.09 519.68 1167.81 1839.65 91.035.51 49.61 167466.38 34.87 47.78 429.84 1289.00 1801.49 92.96
Both Vertical Post and Bracing Arm consist of Solid Profiles
CASE B
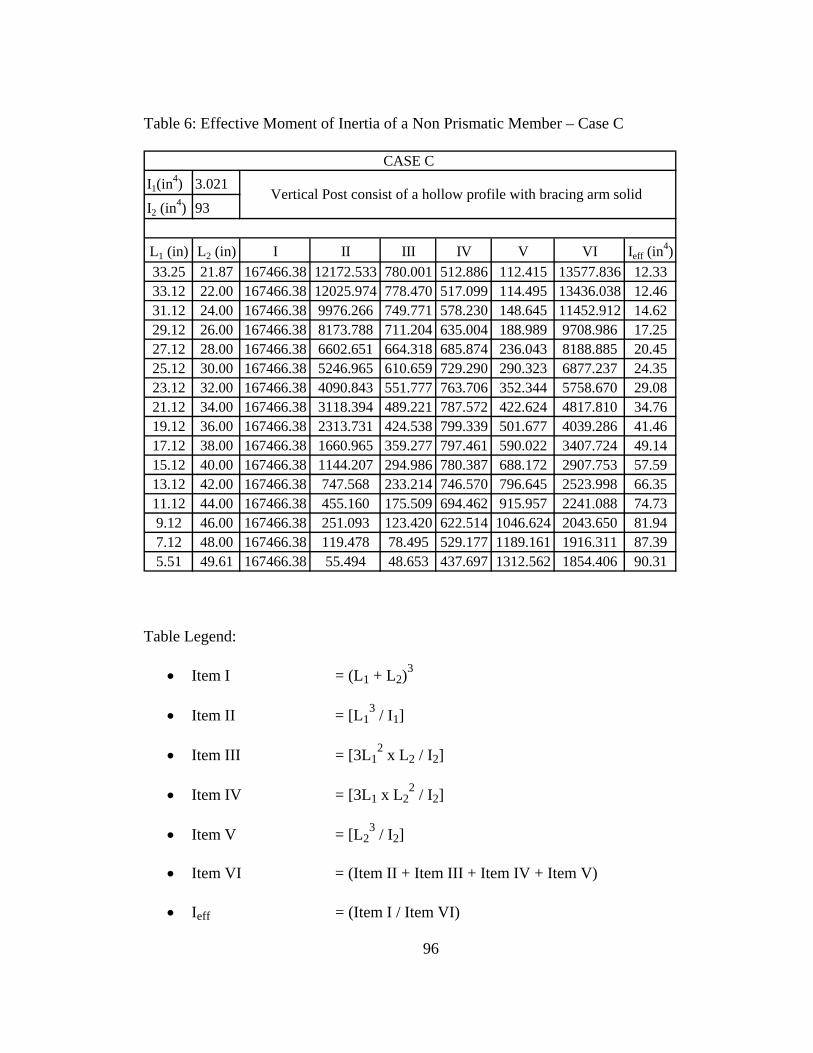
96
Table 6: Effective Moment of Inertia of a Non Prismatic Member – Case C
Table Legend:
• Item I = (L1 + L2)3 • Item II = [L1
3 / I1]
• Item III = [3L12 x L2 / I2]
• Item IV = [3L1 x L2
2 / I2]
• Item V = [L23 / I2]
• Item VI = (Item II + Item III + Item IV + Item V)
• Ieff = (Item I / Item VI)
I1(in4) 3.021
I2 (in4) 93
L1 (in) L2 (in) I II III IV V VI Ieff (in4)
33.25 21.87 167466.38 12172.533 780.001 512.886 112.415 13577.836 12.3333.12 22.00 167466.38 12025.974 778.470 517.099 114.495 13436.038 12.4631.12 24.00 167466.38 9976.266 749.771 578.230 148.645 11452.912 14.6229.12 26.00 167466.38 8173.788 711.204 635.004 188.989 9708.986 17.2527.12 28.00 167466.38 6602.651 664.318 685.874 236.043 8188.885 20.4525.12 30.00 167466.38 5246.965 610.659 729.290 290.323 6877.237 24.3523.12 32.00 167466.38 4090.843 551.777 763.706 352.344 5758.670 29.0821.12 34.00 167466.38 3118.394 489.221 787.572 422.624 4817.810 34.7619.12 36.00 167466.38 2313.731 424.538 799.339 501.677 4039.286 41.4617.12 38.00 167466.38 1660.965 359.277 797.461 590.022 3407.724 49.1415.12 40.00 167466.38 1144.207 294.986 780.387 688.172 2907.753 57.5913.12 42.00 167466.38 747.568 233.214 746.570 796.645 2523.998 66.3511.12 44.00 167466.38 455.160 175.509 694.462 915.957 2241.088 74.739.12 46.00 167466.38 251.093 123.420 622.514 1046.624 2043.650 81.947.12 48.00 167466.38 119.478 78.495 529.177 1189.161 1916.311 87.395.51 49.61 167466.38 55.494 48.653 437.697 1312.562 1854.406 90.31
CASE C
Vertical Post consist of a hollow profile with bracing arm solid
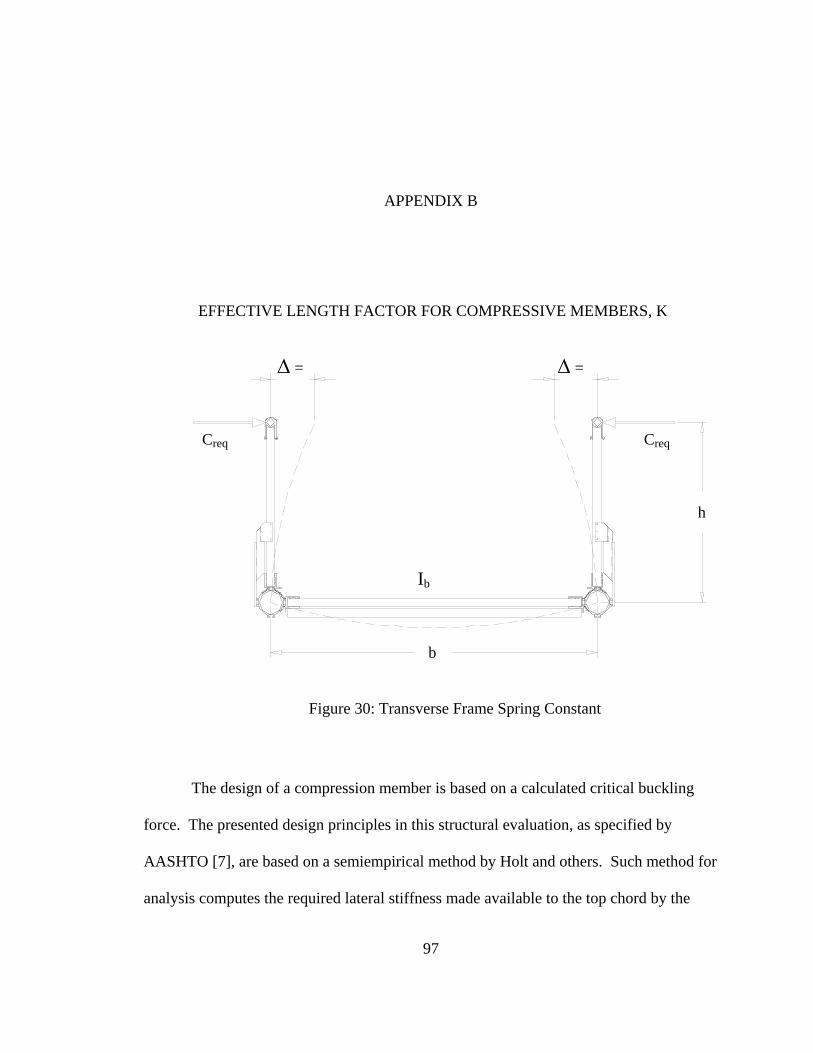
97
Δ = Δ =
Creq Creq
Ib
b
h
APPENDIX B
EFFECTIVE LENGTH FACTOR FOR COMPRESSIVE MEMBERS, K
The design of a compression member is based on a calculated critical buckling
force. The presented design principles in this structural evaluation, as specified by
AASHTO [7], are based on a semiempirical method by Holt and others. Such method for
analysis computes the required lateral stiffness made available to the top chord by the
Figure 30: Transverse Frame Spring Constant
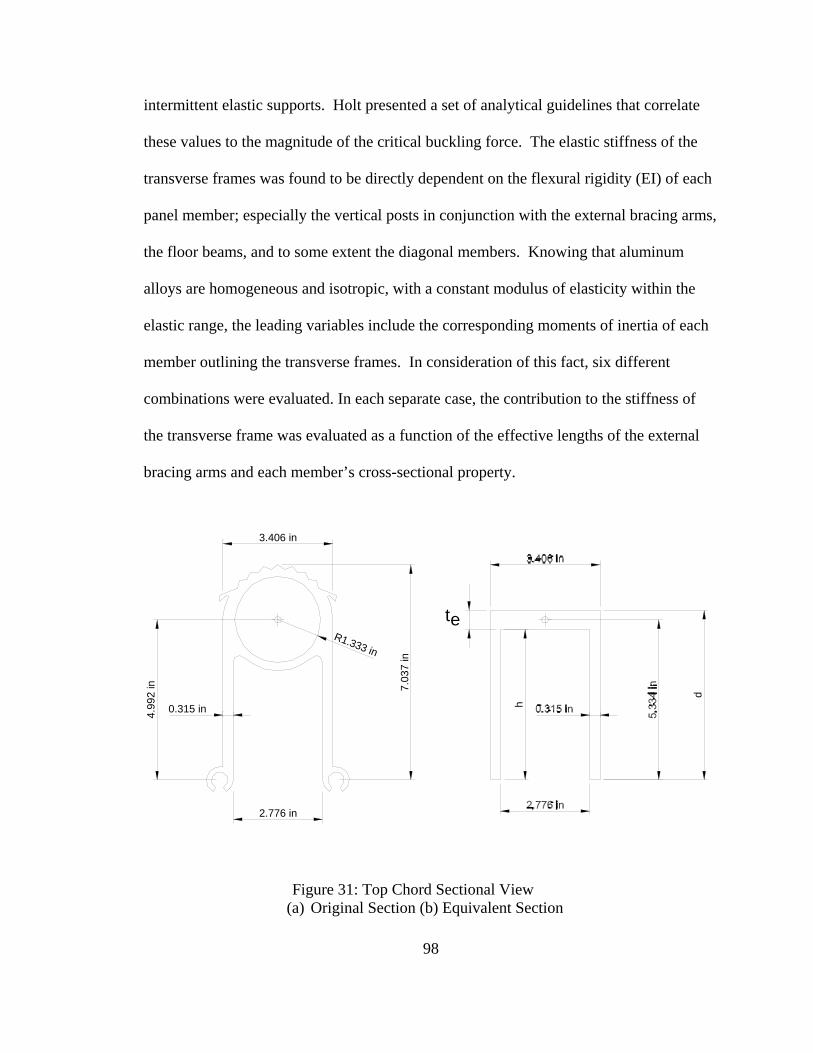
98
3.406 in
4.99
2 in 7.
037
i n
2.776 in
0.315 in
R1.333 in
te
d
h
intermittent elastic supports. Holt presented a set of analytical guidelines that correlate
these values to the magnitude of the critical buckling force. The elastic stiffness of the
transverse frames was found to be directly dependent on the flexural rigidity (EI) of each
panel member; especially the vertical posts in conjunction with the external bracing arms,
the floor beams, and to some extent the diagonal members. Knowing that aluminum
alloys are homogeneous and isotropic, with a constant modulus of elasticity within the
elastic range, the leading variables include the corresponding moments of inertia of each
member outlining the transverse frames. In consideration of this fact, six different
combinations were evaluated. In each separate case, the contribution to the stiffness of
the transverse frame was evaluated as a function of the effective lengths of the external
bracing arms and each member’s cross-sectional property.
Figure 31: Top Chord Sectional View (a) Original Section (b) Equivalent Section
99
Transverse Frame Spring Constant, Creq
(Effective Length Factor for Compression Members, k)
Description of Cases Evaluated:
Case I - All frame members are hollow extrusions (as-is design).
Note: Contribution form diagonal members not incorporated into analysis.
Case II - All frame members are hollow extrusions (as-is design).
Note: Contribution form diagonal members are incorporated into analysis.
Case III - Vertical Post and Bracing Arm consist of solid extrusions, however Floor
Beams remain hollow.
Note: Contribution form diagonal members not incorporated into analysis.
Case IV - All frame members consist of solid extrusions.
Note: Contribution form diagonal members are incorporated into analysis.
Case V - Bracing Arm and Floor Beam consist of solid extrusions, however the vertical
post remain hollow.
Note: Contribution form diagonal members are incorporated into analysis.
Case VI - Frame members consist of solid extrusions, except Floor Beams.
Note: Contribution form diagonal members are incorporated into analysis.
100
Truss Top Chord Lateral Support: Half-through Bridge
Overall Slenderness Ratio for Flexural Buckling
Equivalent Channel Cross Section
American Association of State Highway and Transportation Officials:
A. Section 1.3.6 Guide Specifications for Design of Pedestrian Bridges
1. Vertical posts, floor beams, and their connections shall be proportionate to resist a
lateral force applied @ the top of the vertical post that is not less than 0.01/k times
the average design compressive force in the two adjacent top chord members.
2. "k" is the effective length factor for the individual top chord member supported
between the truss vertical post and it represents the nature of the lateral restraint
against rotations and the resistance to lateral deflection at the end of the unbraced
length of the top chord.
3. In no case shall the value for 0.010/k be less than 0.003 when determining the
minimum lateral force regardless of the effective length factor used to determine
the compressive capacity of the top chord.
B. Example Procedure: Case II (As-Is design)
1. Case Description - All members outlining the transverse frame consist of hollow
extrusions (as-is design) and the contribution of the diagonal members is
incorporated into the evaluation of the transverse frame spring constant.
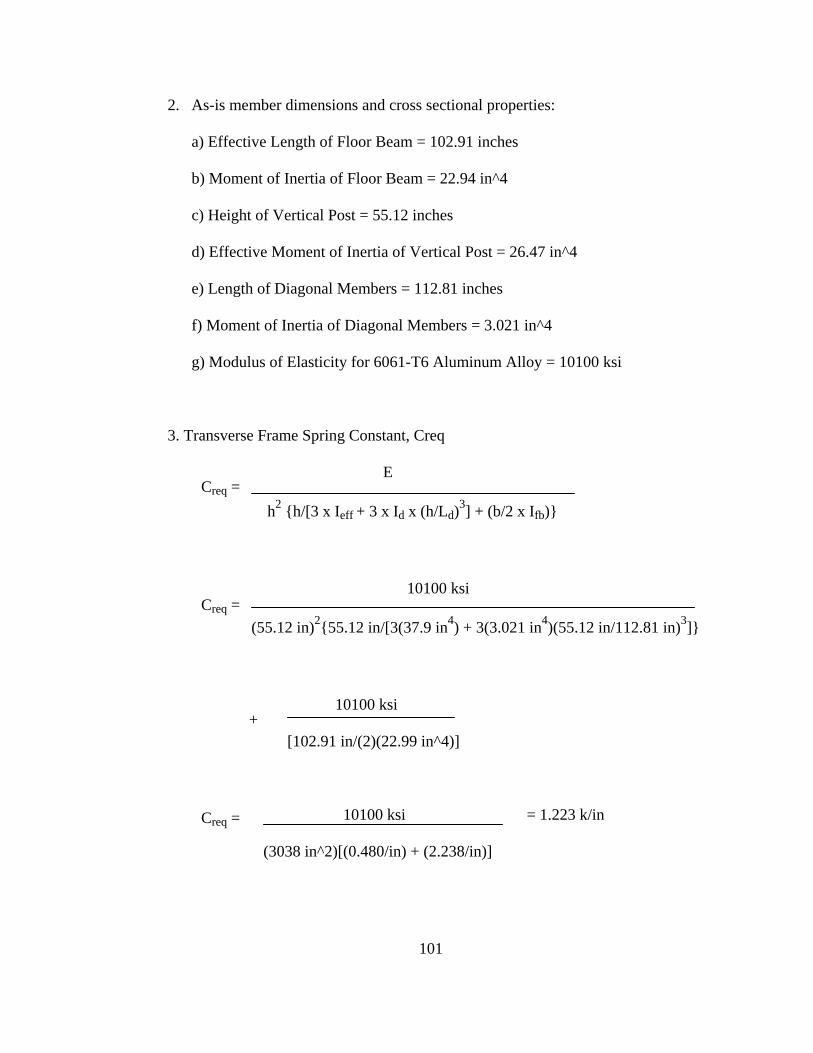
101
2. As-is member dimensions and cross sectional properties:
a) Effective Length of Floor Beam = 102.91 inches
b) Moment of Inertia of Floor Beam = 22.94 in^4
c) Height of Vertical Post = 55.12 inches
d) Effective Moment of Inertia of Vertical Post = 26.47 in^4
e) Length of Diagonal Members = 112.81 inches
f) Moment of Inertia of Diagonal Members = 3.021 in^4
g) Modulus of Elasticity for 6061-T6 Aluminum Alloy = 10100 ksi
3. Transverse Frame Spring Constant, Creq
E
h2 {h/[3 x Ieff + 3 x Id x (h/Ld)3] + (b/2 x Ifb)}
10100 ksi
(55.12 in)2{55.12 in/[3(37.9 in4) + 3(3.021 in4)(55.12 in/112.81 in)3]}
10100 ksi
[102.91 in/(2)(22.99 in^4)]
10100 ksi = 1.223 k/in
(3038 in^2)[(0.480/in) + (2.238/in)]
+
Creq =
Creq =
Creq =
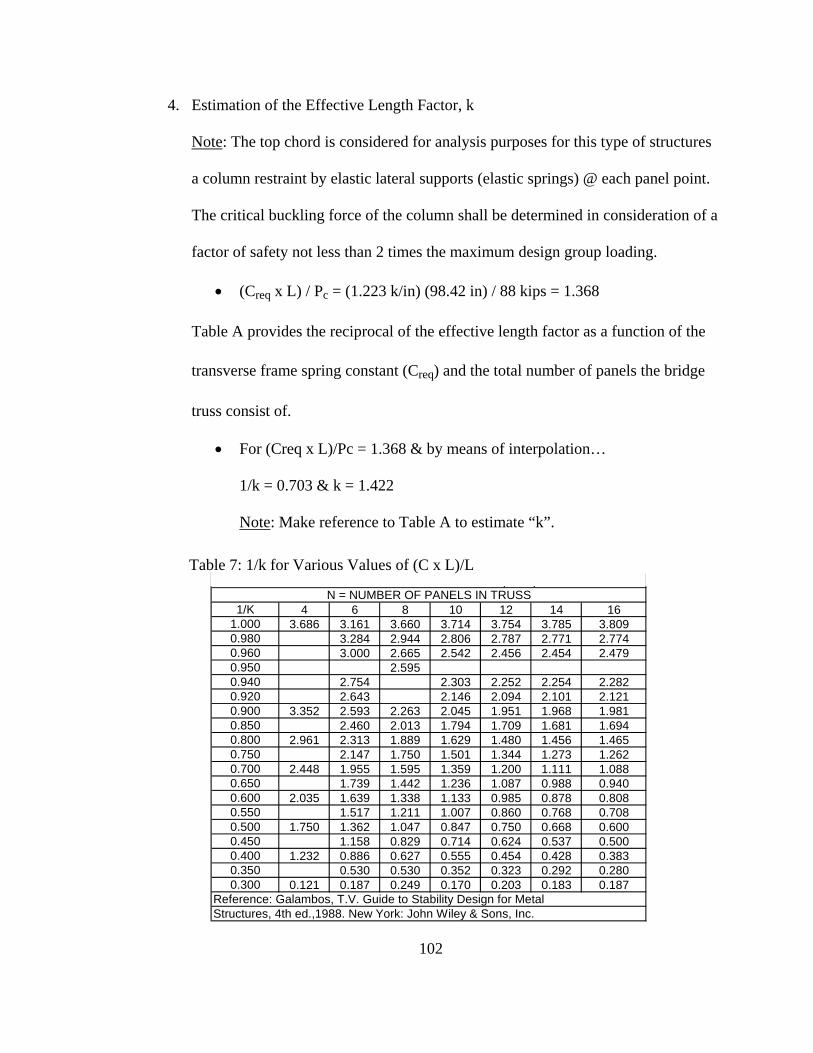
102
4. Estimation of the Effective Length Factor, k
Note: The top chord is considered for analysis purposes for this type of structures
a column restraint by elastic lateral supports (elastic springs) @ each panel point.
The critical buckling force of the column shall be determined in consideration of a
factor of safety not less than 2 times the maximum design group loading.
• (Creq x L) / Pc = (1.223 k/in) (98.42 in) / 88 kips = 1.368
Table A provides the reciprocal of the effective length factor as a function of the
transverse frame spring constant (Creq) and the total number of panels the bridge
truss consist of.
• For (Creq x L)/Pc = 1.368 & by means of interpolation…
1/k = 0.703 & k = 1.422
Note: Make reference to Table A to estimate “k”.
4 6 8 10 12 14 163.686 3.161 3.660 3.714 3.754 3.785 3.809
3.284 2.944 2.806 2.787 2.771 2.7743.000 2.665 2.542 2.456 2.454 2.479
2.5952.754 2.303 2.252 2.254 2.2822.643 2.146 2.094 2.101 2.121
3.352 2.593 2.263 2.045 1.951 1.968 1.9812.460 2.013 1.794 1.709 1.681 1.694
2.961 2.313 1.889 1.629 1.480 1.456 1.4652.147 1.750 1.501 1.344 1.273 1.262
2.448 1.955 1.595 1.359 1.200 1.111 1.0881.739 1.442 1.236 1.087 0.988 0.940
2.035 1.639 1.338 1.133 0.985 0.878 0.8081.517 1.211 1.007 0.860 0.768 0.708
1.750 1.362 1.047 0.847 0.750 0.668 0.6001.158 0.829 0.714 0.624 0.537 0.500
1.232 0.886 0.627 0.555 0.454 0.428 0.3830.530 0.530 0.352 0.323 0.292 0.280
0.121 0.187 0.249 0.170 0.203 0.183 0.187Reference: Galambos, T.V. Guide to Stability Design for Metal Structures, 4th ed.,1988. New York: John Wiley & Sons, Inc.
0.9800.960
1.000
( )N = NUMBER OF PANELS IN TRUSS
1/K
0.9500.9400.9200.900
0.500
0.8500.8000.7500.7000.6500.6000.550
0.4500.4000.3500.300
Table 7: 1/k for Various Values of (C x L)/L
103
APPENDIX C
EQUIVALENT SLENDERNESS RATIO FOR
FLEXURAL TORTIONAL BUCKLING
For design purposes the slenderness ratio is a way to measure the tendency of
compression member to buckle under a prescribed force. A clear advantage of extruded
aluminum profiles however is that practically any shape can be fabricated by standard
practices in the industry. Consequently, this buckling tendency could be restrained to
some extent considering that by means of the extrusion process any cross section could
be designed by putting the material where it is needed. However for singly symmetric
profiles subjected to compressive forces, such as the extrusion profile of the top chord,
their behavior is restricted by flexural, flexural-torsional buckling, or by local buckling.
The intent in this particular section is to estimate the tendency of the top chord to buckle
by means of flexural torsional buckling considering a representative channel shape with
the equivalent cross sectional area from the original top chord. The evaluation of such
buckling response of this member has been evaluated in conformity to the level of lateral
restraint imposed onto the top chord by the external bracing arms.
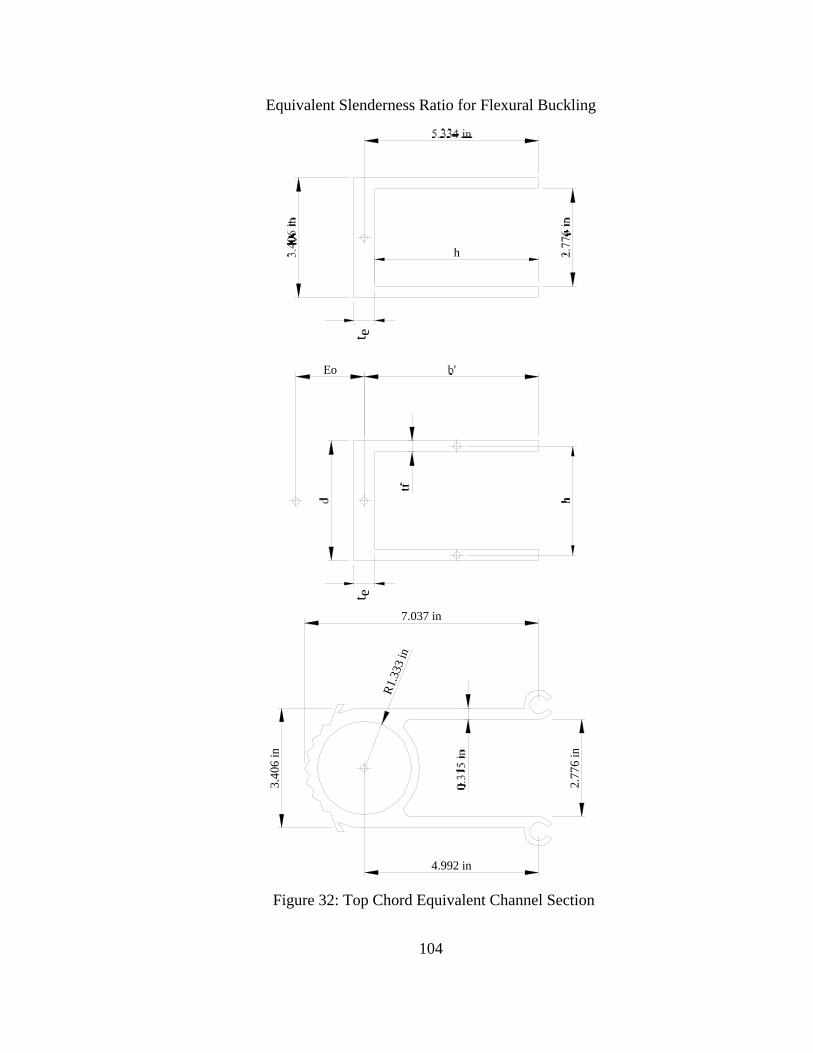
104
3.40
6 in
4.992 in
7.037 in
2.77
6 in
R1.3
33 in
t e
h
Eoet
Equivalent Slenderness Ratio for Flexural Buckling
Figure 32: Top Chord Equivalent Channel Section
105
A. Total Cross Sectional Area of Original Extrusion Profile:
1. At = 6.273 in2
B. Find:
1. Equivalent Web Thickness, te (in.)
2. New Cross Sectional Properties for Equivalent Channel Section
i. Centroid, y
ii. Moment of Inertia, Ixx and Iyy
iii. Warping Constant, Cw
iv. Radius of Gyration, rxx and ryy
v. Torsional Constant, J
vi. Polar Radius of Gyration, ro
3. Equivalent Slenderness Ratio for Flexural Torsional Buckling
C. Procedure:
1. Equivalent Web Thickness, te
i. Atotal = (2)(Aflange + Aweb) = 6.273 in2
= 2[(3.79 in + 1.535 in - te/2)(0.315 in)] + (3.406 in)(te)
= (7.598 in + 3.069 in - te)(o.315 in) + (3.406 in)(te)
= [2.393 in2 + 0.967 in2 - 0.315 x te]
= (6.273 in2 - 2.393 in2 - 0.967 in2)/(3.406 in - 0.315 in)
∴ te = 0.942 inches
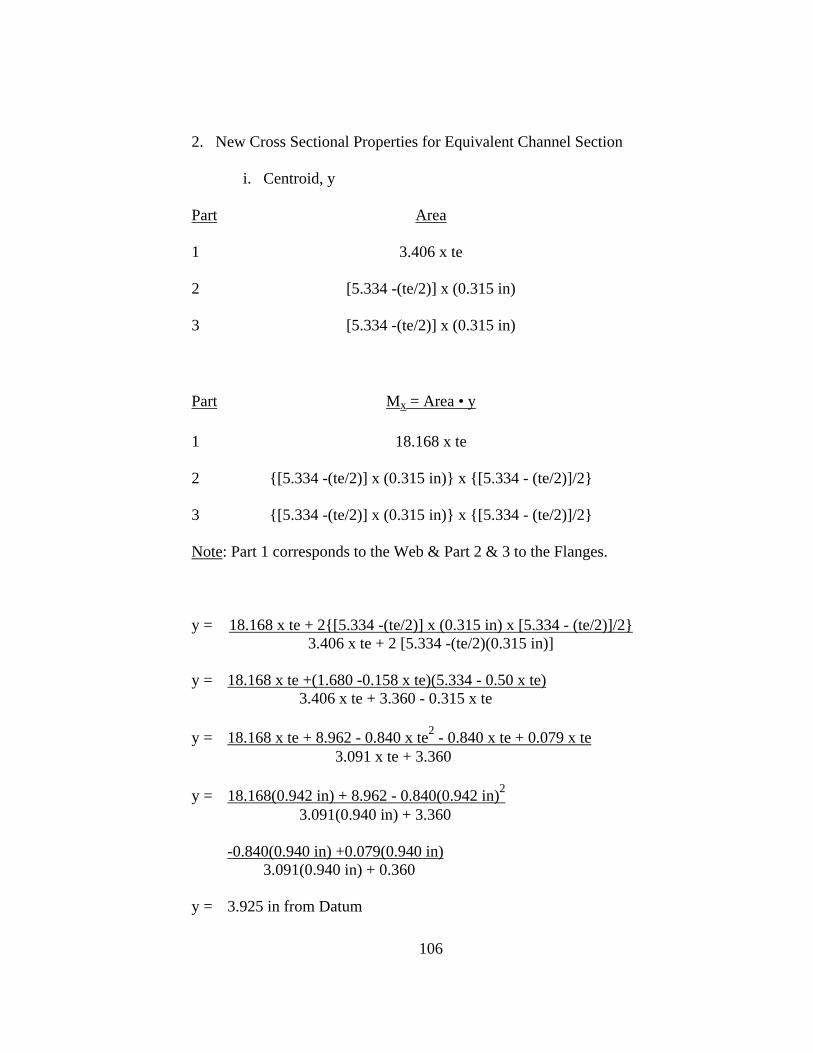
106
2. New Cross Sectional Properties for Equivalent Channel Section
i. Centroid, y
Part Area
1 3.406 x te
2 [5.334 -(te/2)] x (0.315 in)
3 [5.334 -(te/2)] x (0.315 in)
Part Mx = Area • y
1 18.168 x te
2 {[5.334 -(te/2)] x (0.315 in)} x {[5.334 - (te/2)]/2}
3 {[5.334 -(te/2)] x (0.315 in)} x {[5.334 - (te/2)]/2}
Note: Part 1 corresponds to the Web & Part 2 & 3 to the Flanges.
y = 18.168 x te + 2{[5.334 -(te/2)] x (0.315 in) x [5.334 - (te/2)]/2} 3.406 x te + 2 [5.334 -(te/2)(0.315 in)]
y = 18.168 x te +(1.680 -0.158 x te)(5.334 - 0.50 x te) 3.406 x te + 3.360 - 0.315 x te
y = 18.168 x te + 8.962 - 0.840 x te2 - 0.840 x te + 0.079 x te 3.091 x te + 3.360
y = 18.168(0.942 in) + 8.962 - 0.840(0.942 in)2 3.091(0.940 in) + 3.360
-0.840(0.940 in) +0.079(0.940 in) 3.091(0.940 in) + 0.360
y = 3.925 in from Datum
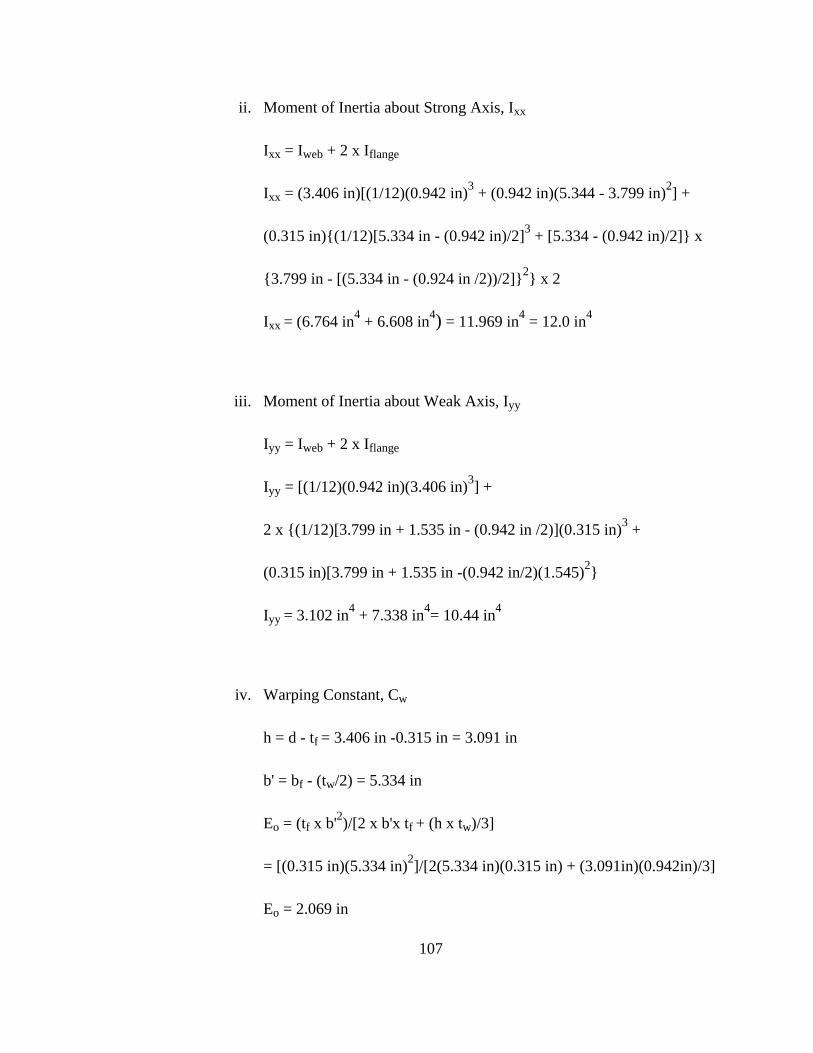
107
ii. Moment of Inertia about Strong Axis, Ixx
Ixx = Iweb + 2 x Iflange
Ixx = (3.406 in)[(1/12)(0.942 in)3 + (0.942 in)(5.344 - 3.799 in)2] +
(0.315 in){(1/12)[5.334 in - (0.942 in)/2]3 + [5.334 - (0.942 in)/2]} x
{3.799 in - [(5.334 in - (0.924 in /2))/2]}2} x 2
Ixx = (6.764 in4 + 6.608 in4) = 11.969 in4 = 12.0 in4
iii. Moment of Inertia about Weak Axis, Iyy
Iyy = Iweb + 2 x Iflange
Iyy = [(1/12)(0.942 in)(3.406 in)3] +
2 x {(1/12)[3.799 in + 1.535 in - (0.942 in /2)](0.315 in)3 +
(0.315 in)[3.799 in + 1.535 in -(0.942 in/2)(1.545)2}
Iyy = 3.102 in4 + 7.338 in4= 10.44 in4
iv. Warping Constant, Cw
h = d - tf = 3.406 in -0.315 in = 3.091 in
b' = bf - (tw/2) = 5.334 in
Eo = (tf x b'2)/[2 x b'x tf + (h x tw)/3]
= [(0.315 in)(5.334 in)2]/[2(5.334 in)(0.315 in) + (3.091in)(0.942in)/3]
Eo = 2.069 in
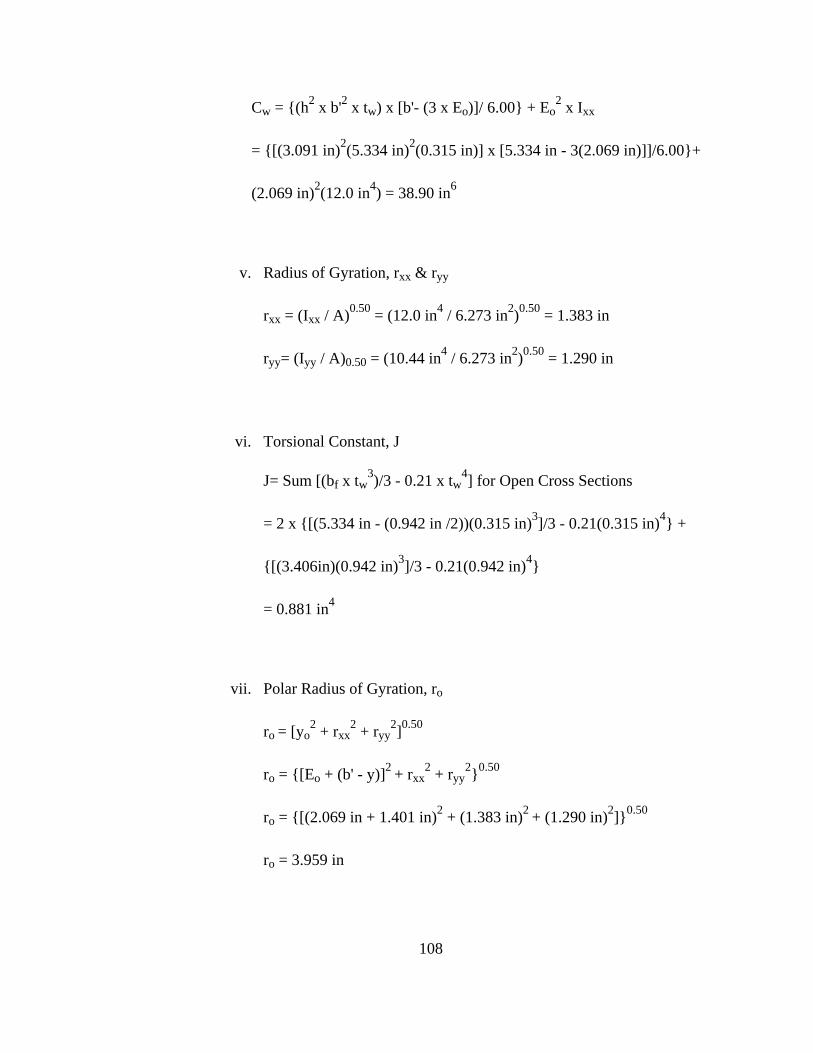
108
Cw = {(h2 x b'2 x tw) x [b'- (3 x Eo)]/ 6.00} + Eo2 x Ixx
= {[(3.091 in)2(5.334 in)2(0.315 in)] x [5.334 in - 3(2.069 in)]]/6.00}+
(2.069 in)2(12.0 in4) = 38.90 in6
v. Radius of Gyration, rxx & ryy
rxx = (Ixx / A)0.50 = (12.0 in4 / 6.273 in2)0.50 = 1.383 in
ryy= (Iyy / A)0.50 = (10.44 in4 / 6.273 in2)0.50 = 1.290 in
vi. Torsional Constant, J
J= Sum [(bf x tw3)/3 - 0.21 x tw
4] for Open Cross Sections
= 2 x {[(5.334 in - (0.942 in /2))(0.315 in)3]/3 - 0.21(0.315 in)4} +
{[(3.406in)(0.942 in)3]/3 - 0.21(0.942 in)4}
= 0.881 in4
vii. Polar Radius of Gyration, ro
ro = [yo2 + rxx
2 + ryy2]0.50
ro = {[Eo + (b' - y)]2 + rxx2 + ryy
2}0.50
ro = {[(2.069 in + 1.401 in)2 + (1.383 in)2 + (1.290 in)2]}0.50
ro = 3.959 in
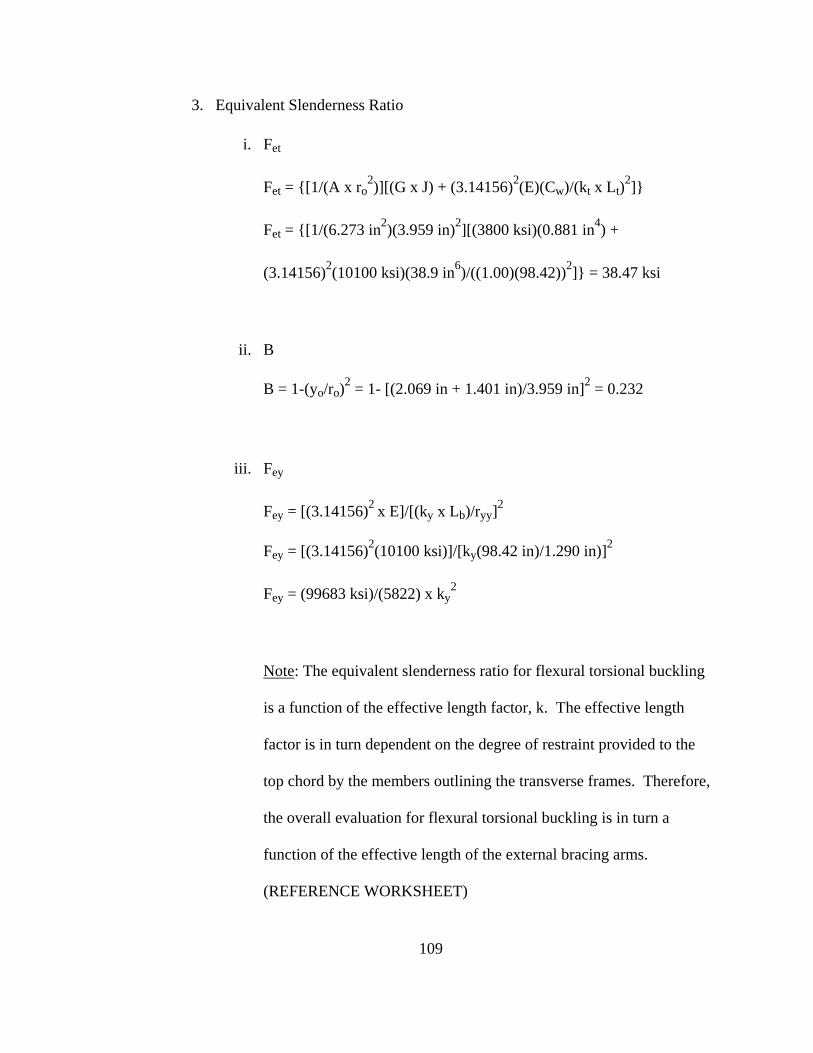
109
3. Equivalent Slenderness Ratio
i. Fet
Fet = {[1/(A x ro2)][(G x J) + (3.14156)2(E)(Cw)/(kt x Lt)
2]}
Fet = {[1/(6.273 in2)(3.959 in)2][(3800 ksi)(0.881 in4) +
(3.14156)2(10100 ksi)(38.9 in6)/((1.00)(98.42))2]} = 38.47 ksi
ii. B
B = 1-(yo/ro)2 = 1- [(2.069 in + 1.401 in)/3.959 in]2 = 0.232
iii. Fey
Fey = [(3.14156)2 x E]/[(ky x Lb)/ryy]2 Fey = [(3.14156)2(10100 ksi)]/[ky(98.42 in)/1.290 in)]2
Fey = (99683 ksi)/(5822) x ky2
Note: The equivalent slenderness ratio for flexural torsional buckling
is a function of the effective length factor, k. The effective length
factor is in turn dependent on the degree of restraint provided to the
top chord by the members outlining the transverse frames. Therefore,
the overall evaluation for flexural torsional buckling is in turn a
function of the effective length of the external bracing arms.
(REFERENCE WORKSHEET)
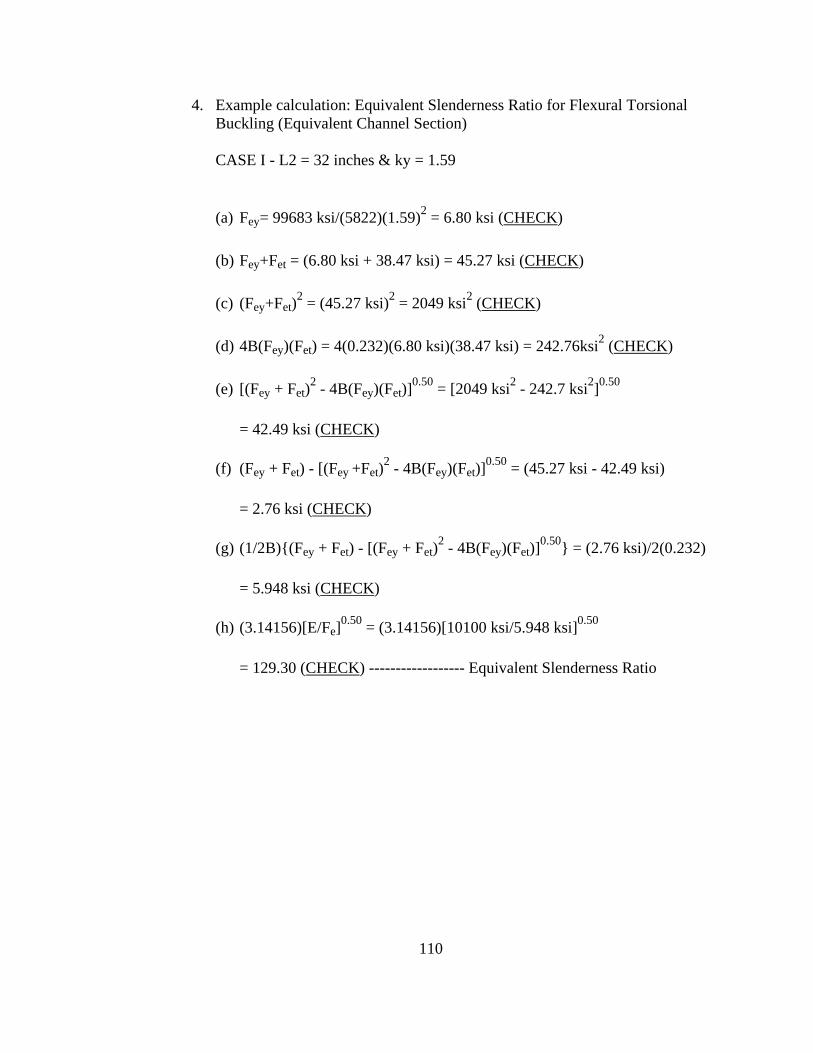
110
4. Example calculation: Equivalent Slenderness Ratio for Flexural Torsional Buckling (Equivalent Channel Section) CASE I - L2 = 32 inches & ky = 1.59 (a) Fey= 99683 ksi/(5822)(1.59)2 = 6.80 ksi (CHECK)
(b) Fey+Fet = (6.80 ksi + 38.47 ksi) = 45.27 ksi (CHECK)
(c) (Fey+Fet)2 = (45.27 ksi)2 = 2049 ksi2 (CHECK)
(d) 4B(Fey)(Fet) = 4(0.232)(6.80 ksi)(38.47 ksi) = 242.76ksi2 (CHECK)
(e) [(Fey + Fet)2 - 4B(Fey)(Fet)]
0.50 = [2049 ksi2 - 242.7 ksi2]0.50
= 42.49 ksi (CHECK)
(f) (Fey + Fet) - [(Fey +Fet)2 - 4B(Fey)(Fet)]
0.50 = (45.27 ksi - 42.49 ksi)
= 2.76 ksi (CHECK)
(g) (1/2B){(Fey + Fet) - [(Fey + Fet)2 - 4B(Fey)(Fet)]
0.50} = (2.76 ksi)/2(0.232)
= 5.948 ksi (CHECK)
(h) (3.14156)[E/Fe]0.50 = (3.14156)[10100 ksi/5.948 ksi]0.50
= 129.30 (CHECK) ------------------ Equivalent Slenderness Ratio
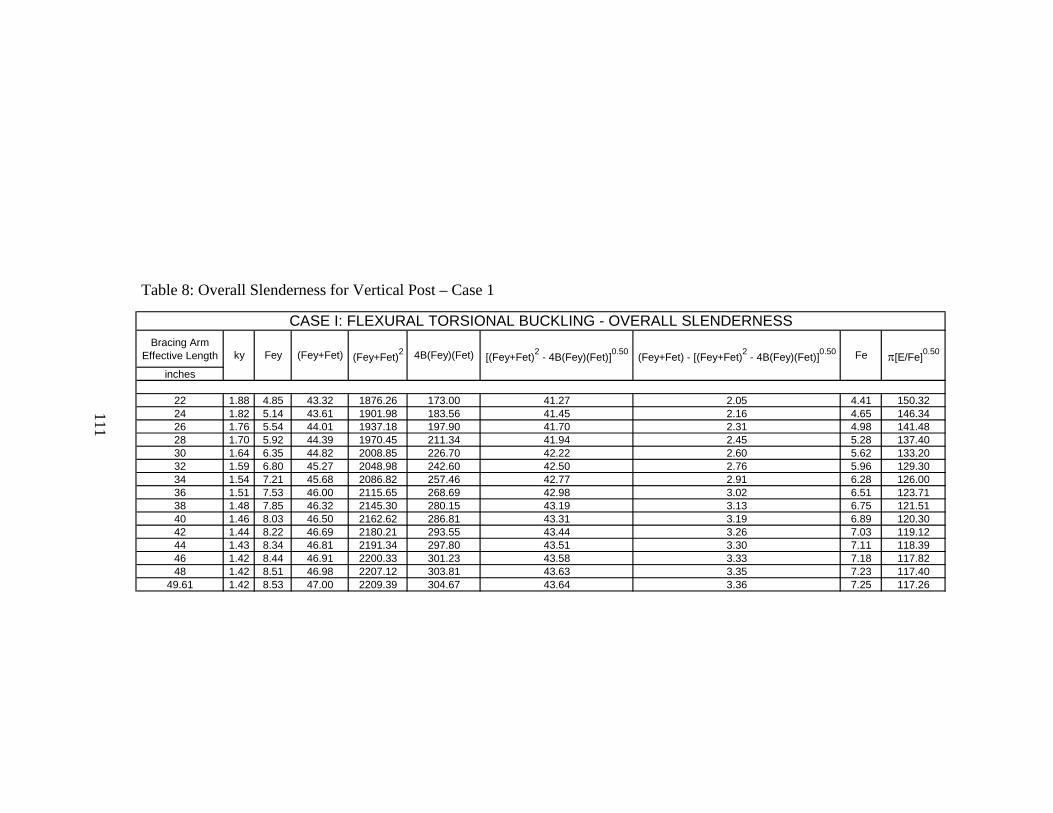
Bracing Arm Effective Length
inches
22 1.88 4.85 43.32 1876.26 173.00 41.27 2.05 4.41 150.3224 1.82 5.14 43.61 1901.98 183.56 41.45 2.16 4.65 146.3426 1.76 5.54 44.01 1937.18 197.90 41.70 2.31 4.98 141.4828 1.70 5.92 44.39 1970.45 211.34 41.94 2.45 5.28 137.4030 1.64 6.35 44.82 2008.85 226.70 42.22 2.60 5.62 133.2032 1.59 6.80 45.27 2048.98 242.60 42.50 2.76 5.96 129.3034 1.54 7.21 45.68 2086.82 257.46 42.77 2.91 6.28 126.0036 1.51 7.53 46.00 2115.65 268.69 42.98 3.02 6.51 123.7138 1.48 7.85 46.32 2145.30 280.15 43.19 3.13 6.75 121.5140 1.46 8.03 46.50 2162.62 286.81 43.31 3.19 6.89 120.3042 1.44 8.22 46.69 2180.21 293.55 43.44 3.26 7.03 119.1244 1.43 8.34 46.81 2191.34 297.80 43.51 3.30 7.11 118.3946 1.42 8.44 46.91 2200.33 301.23 43.58 3.33 7.18 117.8248 1.42 8.51 46.98 2207.12 303.81 43.63 3.35 7.23 117.40
49.61 1.42 8.53 47.00 2209.39 304.67 43.64 3.36 7.25 117.26
π[E/Fe]0.50
CASE I: FLEXURAL TORSIONAL BUCKLING - OVERALL SLENDERNESS
ky Fey (Fey+Fet) (Fey+Fet)2 4B(Fey)(Fet) [(Fey+Fet)2 - 4B(Fey)(Fet)]0.50 (Fey+Fet) - [(Fey+Fet)2 - 4B(Fey)(Fet)]0.50 Fe
111
Table 8: Overall Slenderness for Vertical Post – Case 1
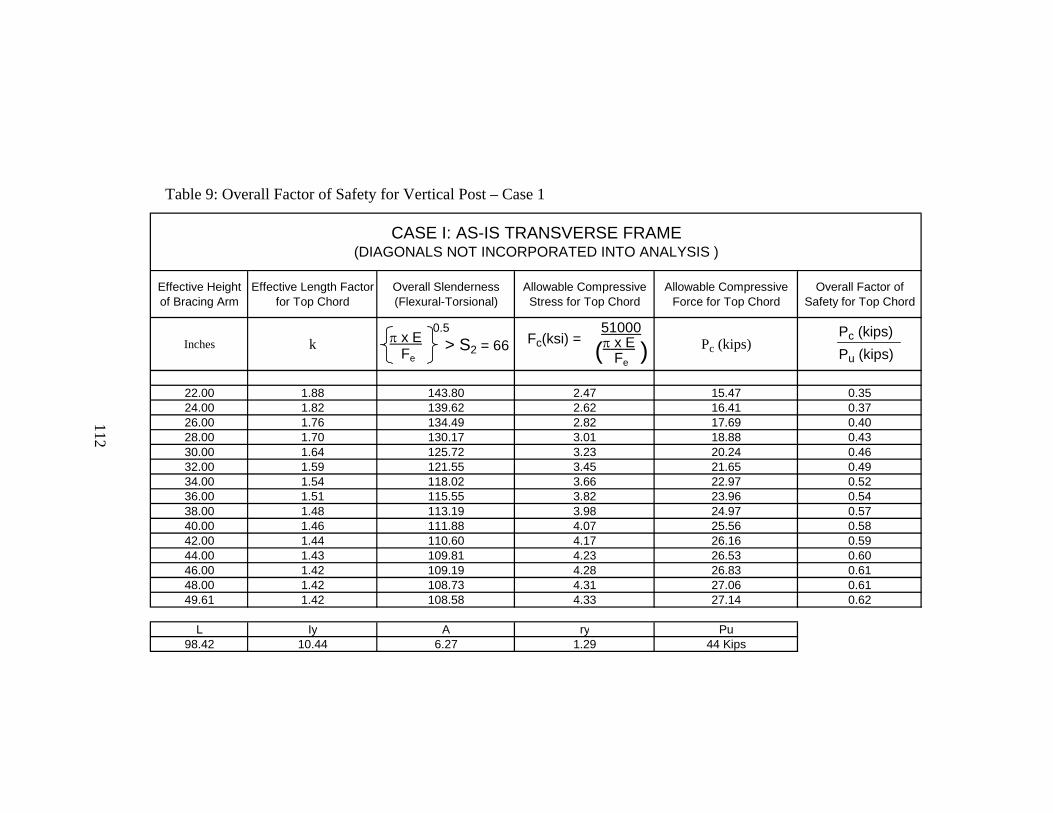
Effective Height of Bracing Arm
Effective Length Factor for Top Chord
Overall Slenderness (Flexural-Torsional)
Allowable Compressive Stress for Top Chord
Allowable Compressive Force for Top Chord
Overall Factor of Safety for Top Chord
Inches k Pc (kips)
22.00 1.88 143.80 2.47 15.47 0.3524.00 1.82 139.62 2.62 16.41 0.3726.00 1.76 134.49 2.82 17.69 0.4028.00 1.70 130.17 3.01 18.88 0.4330.00 1.64 125.72 3.23 20.24 0.4632.00 1.59 121.55 3.45 21.65 0.4934.00 1.54 118.02 3.66 22.97 0.5236.00 1.51 115.55 3.82 23.96 0.5438.00 1.48 113.19 3.98 24.97 0.5740.00 1.46 111.88 4.07 25.56 0.5842.00 1.44 110.60 4.17 26.16 0.5944.00 1.43 109.81 4.23 26.53 0.6046.00 1.42 109.19 4.28 26.83 0.6148.00 1.42 108.73 4.31 27.06 0.6149.61 1.42 108.58 4.33 27.14 0.62
L Iy A ry Pu98.42 10.44 6.27 1.29 44 Kips
CASE I: AS-IS TRANSVERSE FRAME (DIAGONALS NOT INCORPORATED INTO ANALYSIS )
π x EFe
> S2 = 66 π x EFe
Fc(ksi) =51000
( )Pc (kips)Pu (kips)
0.5
112
Table 9: Overall Factor of Safety for Vertical Post – Case 1
Bracing Arm Effective Length
inches
22 1.87 4.92 43.39 1882.61 175.61 41.32 2.07 4.47 149.3024 1.81 5.24 43.71 1910.21 186.92 41.51 2.19 4.73 145.1526 1.75 5.62 44.09 1944.07 200.69 41.75 2.34 5.04 140.6028 1.69 6.00 44.47 1977.63 214.22 41.99 2.48 5.34 136.5830 1.63 6.41 44.88 2014.47 228.94 42.26 2.63 5.67 132.6332 1.58 6.86 45.33 2054.86 244.92 42.54 2.79 6.01 128.7734 1.54 7.26 45.73 2090.89 259.05 42.80 2.93 6.31 125.6736 1.50 7.57 46.04 2119.84 270.31 43.01 3.04 6.55 123.3938 1.48 7.82 46.29 2143.16 279.33 43.17 3.12 6.73 121.6640 1.46 8.06 46.53 2164.80 287.65 43.33 3.20 6.91 120.1542 1.44 8.25 46.72 2182.43 294.40 43.45 3.27 7.04 118.9744 1.43 8.37 46.84 2193.58 298.66 43.53 3.30 7.13 118.2546 1.42 8.46 46.93 2202.59 302.08 43.59 3.34 7.20 117.6848 1.42 8.53 47.00 2209.39 304.67 43.64 3.36 7.25 117.26
49.61 1.41 8.56 47.03 2211.66 305.53 43.66 3.37 7.27 117.12
π[E/Fe]0.50
CASE II: FLEXURAL TORSIONAL BUCKLING - OVERALL SLENDERNESS
ky Fey (Fey+Fet) (Fey+Fet)2 4B(Fey)(Fet) [(Fey+Fet)2 - 4B(Fey)(Fet)]0.50 (Fey+Fet) - [(Fey+Fet)2 - 4B(Fey)(Fet)]0.50 Fe
113
Table 10: Overall Slenderness for Vertical Post – Case 2
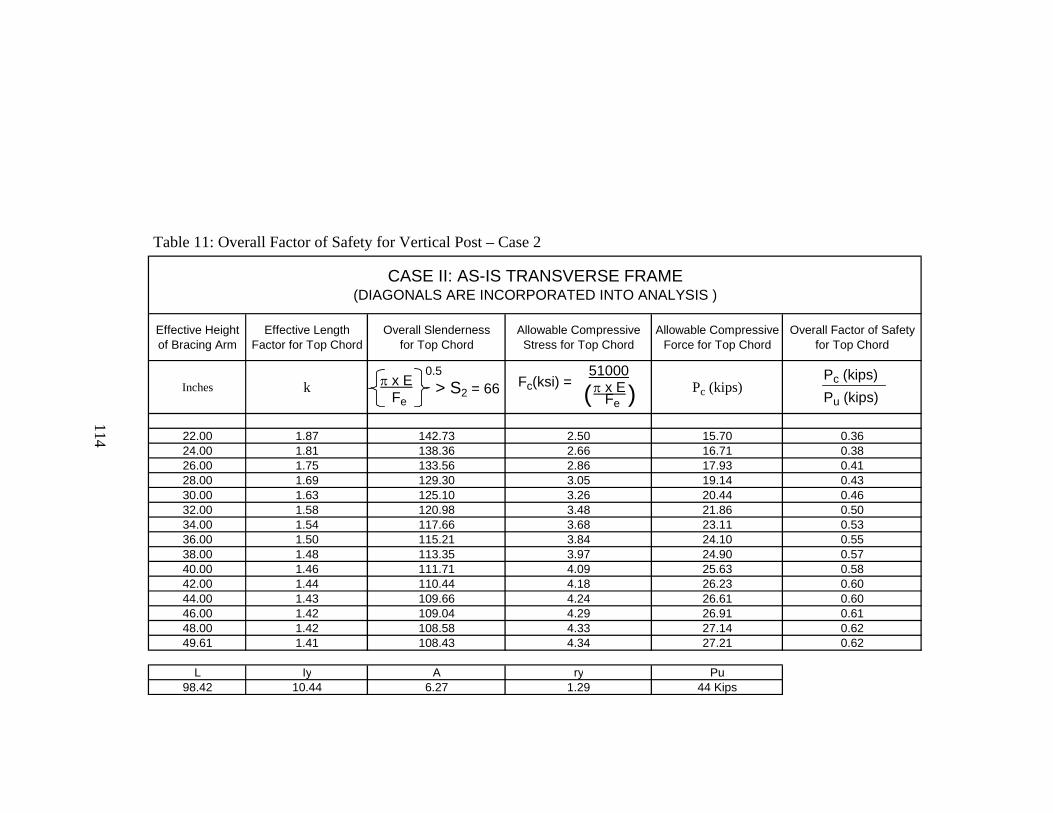
Effective Height of Bracing Arm
Effective Length Factor for Top Chord
Overall Slenderness for Top Chord
Allowable Compressive Stress for Top Chord
Allowable Compressive Force for Top Chord
Overall Factor of Safety for Top Chord
Inches k Pc (kips)
22.00 1.87 142.73 2.50 15.70 0.3624.00 1.81 138.36 2.66 16.71 0.3826.00 1.75 133.56 2.86 17.93 0.4128.00 1.69 129.30 3.05 19.14 0.4330.00 1.63 125.10 3.26 20.44 0.4632.00 1.58 120.98 3.48 21.86 0.5034.00 1.54 117.66 3.68 23.11 0.5336.00 1.50 115.21 3.84 24.10 0.5538.00 1.48 113.35 3.97 24.90 0.5740.00 1.46 111.71 4.09 25.63 0.5842.00 1.44 110.44 4.18 26.23 0.6044.00 1.43 109.66 4.24 26.61 0.6046.00 1.42 109.04 4.29 26.91 0.6148.00 1.42 108.58 4.33 27.14 0.6249.61 1.41 108.43 4.34 27.21 0.62
L Iy A ry Pu98.42 10.44 6.27 1.29 44 Kips
CASE II: AS-IS TRANSVERSE FRAME (DIAGONALS ARE INCORPORATED INTO ANALYSIS )
π x EFe
> S2 = 66 π x EFe
Fc(ksi) =51000
( )Pc (kips)Pu (kips)
0.5
114
Table 11: Overall Factor of Safety for Vertical Post – Case 2
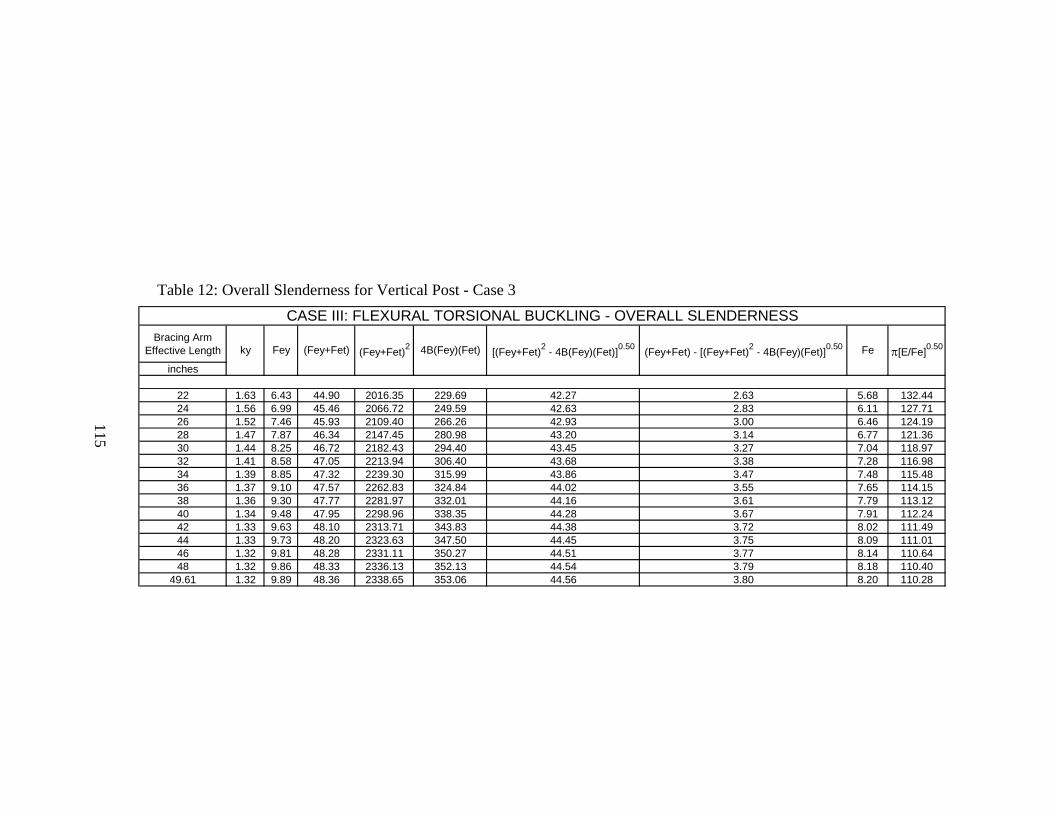
Bracing Arm Effective Length
inches
22 1.63 6.43 44.90 2016.35 229.69 42.27 2.63 5.68 132.4424 1.56 6.99 45.46 2066.72 249.59 42.63 2.83 6.11 127.7126 1.52 7.46 45.93 2109.40 266.26 42.93 3.00 6.46 124.1928 1.47 7.87 46.34 2147.45 280.98 43.20 3.14 6.77 121.3630 1.44 8.25 46.72 2182.43 294.40 43.45 3.27 7.04 118.9732 1.41 8.58 47.05 2213.94 306.40 43.68 3.38 7.28 116.9834 1.39 8.85 47.32 2239.30 315.99 43.86 3.47 7.48 115.4836 1.37 9.10 47.57 2262.83 324.84 44.02 3.55 7.65 114.1538 1.36 9.30 47.77 2281.97 332.01 44.16 3.61 7.79 113.1240 1.34 9.48 47.95 2298.96 338.35 44.28 3.67 7.91 112.2442 1.33 9.63 48.10 2313.71 343.83 44.38 3.72 8.02 111.4944 1.33 9.73 48.20 2323.63 347.50 44.45 3.75 8.09 111.0146 1.32 9.81 48.28 2331.11 350.27 44.51 3.77 8.14 110.6448 1.32 9.86 48.33 2336.13 352.13 44.54 3.79 8.18 110.40
49.61 1.32 9.89 48.36 2338.65 353.06 44.56 3.80 8.20 110.28
π[E/Fe]0.50
CASE III: FLEXURAL TORSIONAL BUCKLING - OVERALL SLENDERNESS
ky Fey (Fey+Fet) (Fey+Fet)2 4B(Fey)(Fet) [(Fey+Fet)2 - 4B(Fey)(Fet)]0.50 (Fey+Fet) - [(Fey+Fet)2 - 4B(Fey)(Fet)]0.50 Fe
115
Table 12: Overall Slenderness for Vertical Post - Case 3
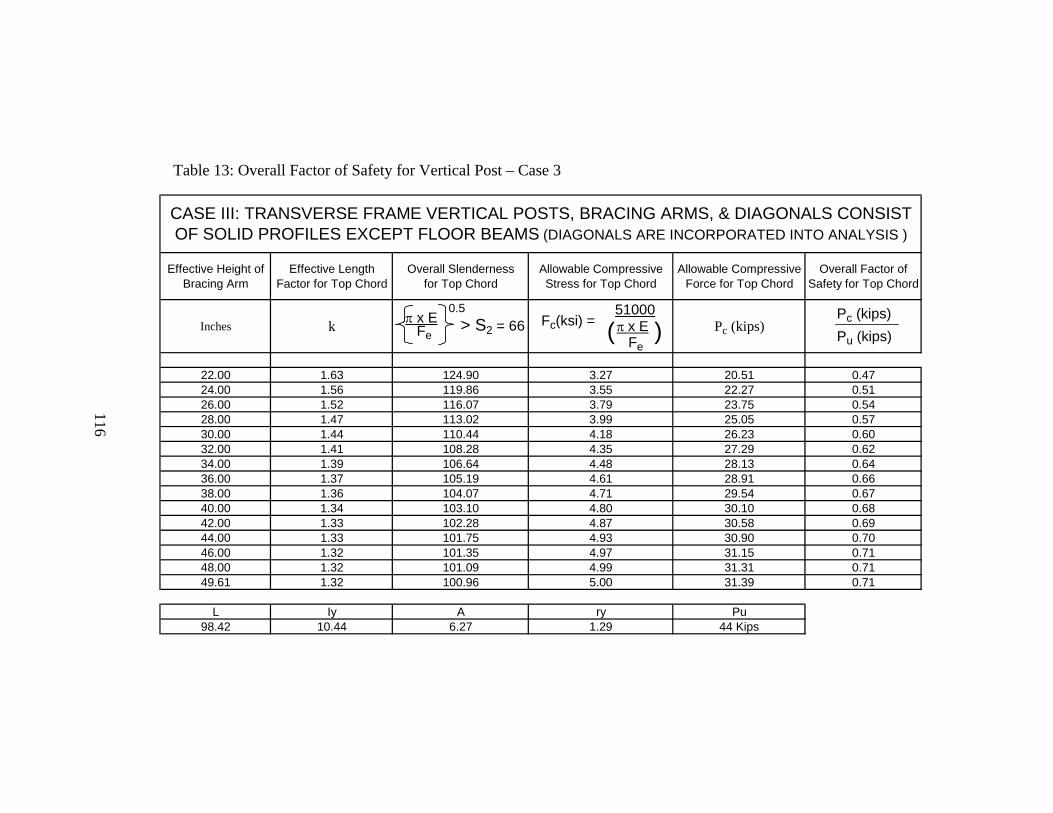
Effective Height of Bracing Arm
Effective Length Factor for Top Chord
Overall Slenderness for Top Chord
Allowable Compressive Stress for Top Chord
Allowable Compressive Force for Top Chord
Overall Factor of Safety for Top Chord
Inches k Pc (kips)
22.00 1.63 124.90 3.27 20.51 0.4724.00 1.56 119.86 3.55 22.27 0.5126.00 1.52 116.07 3.79 23.75 0.5428.00 1.47 113.02 3.99 25.05 0.5730.00 1.44 110.44 4.18 26.23 0.6032.00 1.41 108.28 4.35 27.29 0.6234.00 1.39 106.64 4.48 28.13 0.6436.00 1.37 105.19 4.61 28.91 0.6638.00 1.36 104.07 4.71 29.54 0.6740.00 1.34 103.10 4.80 30.10 0.6842.00 1.33 102.28 4.87 30.58 0.6944.00 1.33 101.75 4.93 30.90 0.7046.00 1.32 101.35 4.97 31.15 0.7148.00 1.32 101.09 4.99 31.31 0.7149.61 1.32 100.96 5.00 31.39 0.71
L Iy A ry Pu98.42 10.44 6.27 1.29 44 Kips
CASE III: TRANSVERSE FRAME VERTICAL POSTS, BRACING ARMS, & DIAGONALS CONSIST OF SOLID PROFILES EXCEPT FLOOR BEAMS (DIAGONALS ARE INCORPORATED INTO ANALYSIS )
π x EFe
> S2 = 66 π x EFe
Fc(ksi) =51000
( )Pc (kips)Pu (kips)
0.5
116
Table 13: Overall Factor of Safety for Vertical Post – Case 3

Bracing Arm Effective Length
inches
22 1.14 13.08 51.55 2657.29 466.92 46.80 4.75 10.24 98.6624 1.11 13.90 52.37 2742.56 496.21 47.40 4.97 10.73 96.3926 1.08 14.65 53.12 2821.72 523.00 47.94 5.17 11.16 94.5028 1.06 15.19 53.66 2879.74 542.40 48.35 5.32 11.47 93.2330 1.05 15.52 53.99 2914.65 553.98 48.59 5.40 11.65 92.5032 1.04 15.88 54.35 2953.73 566.85 48.86 5.49 11.85 91.7334 1.03 16.14 54.61 2982.59 576.31 49.05 5.56 11.99 91.1836 1.02 16.41 54.88 3011.84 585.84 49.25 5.63 12.13 90.6338 1.02 16.51 54.98 3022.90 589.44 49.33 5.65 12.19 90.4340 1.02 16.54 55.01 3026.60 590.64 49.36 5.66 12.21 90.3742 1.02 16.61 55.08 3034.02 593.05 49.41 5.68 12.24 90.2344 1.01 16.65 55.12 3037.74 594.25 49.43 5.68 12.26 90.1746 1.01 16.68 55.15 3041.47 595.46 49.46 5.69 12.28 90.1048 1.01 16.68 55.15 3041.47 595.46 49.46 5.69 12.28 90.10
49.61 1.01 16.68 55.15 3041.47 595.46 49.46 5.69 12.28 90.10
π[E/Fe]0.50
CASE IV: FLEXURAL TORSIONAL BUCKLING - OVERALL SLENDERNESS
ky Fey (Fey+Fet) (Fey+Fet)2 4B(Fey)(Fet) [(Fey+Fet)2 - 4B(Fey)(Fet)]0.50 (Fey+Fet) - [(Fey+Fet)2 - 4B(Fey)(Fet)]0.50 Fe
117
Table 14: Overall Slenderness for Vertical Post - Case 4
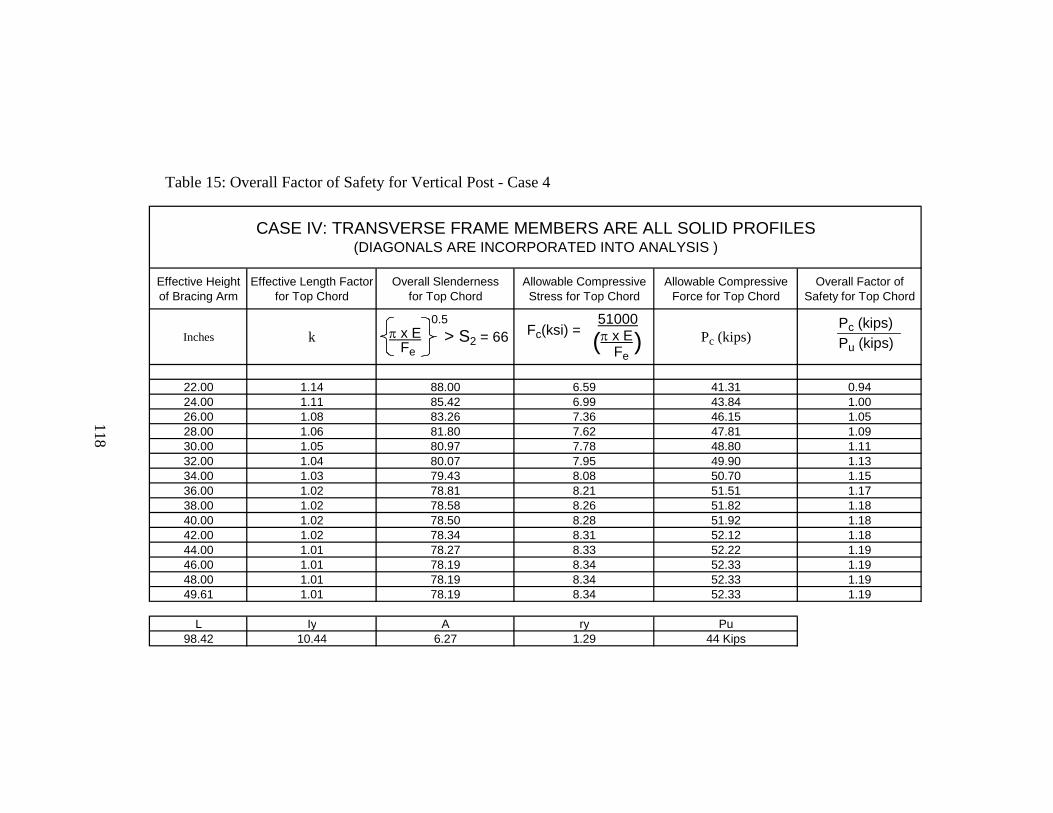
Effective Height of Bracing Arm
Effective Length Factor for Top Chord
Overall Slenderness for Top Chord
Allowable Compressive Stress for Top Chord
Allowable Compressive Force for Top Chord
Overall Factor of Safety for Top Chord
Inches k Pc (kips)
22.00 1.14 88.00 6.59 41.31 0.9424.00 1.11 85.42 6.99 43.84 1.0026.00 1.08 83.26 7.36 46.15 1.0528.00 1.06 81.80 7.62 47.81 1.0930.00 1.05 80.97 7.78 48.80 1.1132.00 1.04 80.07 7.95 49.90 1.1334.00 1.03 79.43 8.08 50.70 1.1536.00 1.02 78.81 8.21 51.51 1.1738.00 1.02 78.58 8.26 51.82 1.1840.00 1.02 78.50 8.28 51.92 1.1842.00 1.02 78.34 8.31 52.12 1.1844.00 1.01 78.27 8.33 52.22 1.1946.00 1.01 78.19 8.34 52.33 1.1948.00 1.01 78.19 8.34 52.33 1.1949.61 1.01 78.19 8.34 52.33 1.19
L Iy A ry Pu98.42 10.44 6.27 1.29 44 Kips
CASE IV: TRANSVERSE FRAME MEMBERS ARE ALL SOLID PROFILES (DIAGONALS ARE INCORPORATED INTO ANALYSIS )
π x EFe
> S2 = 66 π x EFe
Fc(ksi) =51000
( )Pc (kips)Pu (kips)
0.5
118
Table 15: Overall Factor of Safety for Vertical Post - Case 4

Bracing Arm Effective Length
inches
22 1.31 9.99 48.46 2348.75 356.78 44.63 3.83 8.27 109.8124 1.23 11.37 49.84 2484.30 406.01 45.59 4.25 9.18 104.2226 1.17 12.58 51.05 2605.60 448.93 46.44 4.61 9.93 100.1828 1.13 13.50 51.97 2701.01 482.00 47.11 4.86 10.49 97.4730 1.09 14.49 52.96 2804.96 517.36 47.83 5.13 11.07 94.8932 1.06 15.13 53.60 2872.83 540.10 48.30 5.30 11.43 93.3734 1.05 15.55 54.02 2918.18 555.14 48.61 5.41 11.67 92.4336 1.04 15.94 54.41 2960.91 569.21 48.91 5.51 11.88 91.5938 1.03 16.28 54.75 2997.17 581.07 49.15 5.59 12.06 90.9040 1.02 16.48 54.95 3019.21 588.24 49.30 5.64 12.17 90.5042 1.02 16.54 55.01 3026.60 590.64 49.36 5.66 12.21 90.3744 1.02 16.61 55.08 3034.02 593.05 49.41 5.68 12.24 90.2346 1.01 16.65 55.12 3037.74 594.25 49.43 5.68 12.26 90.1748 1.01 16.68 55.15 3041.47 595.46 49.46 5.69 12.28 90.10
49.61 1.01 16.68 55.15 3041.47 595.46 49.46 5.69 12.28 90.10
π[E/Fe]0.50
CASE V: FLEXURAL TORSIONAL BUCKLING - OVERALL SLENDERNESS
ky Fey (Fey+Fet) (Fey+Fet)2 4B(Fey)(Fet) [(Fey+Fet)2 - 4B(Fey)(Fet)]0.50 (Fey+Fet) - [(Fey+Fet)2 - 4B(Fey)(Fet)]0.50 Fe
119
Table 16: Overall Slenderness for Vertical Post - Case 5
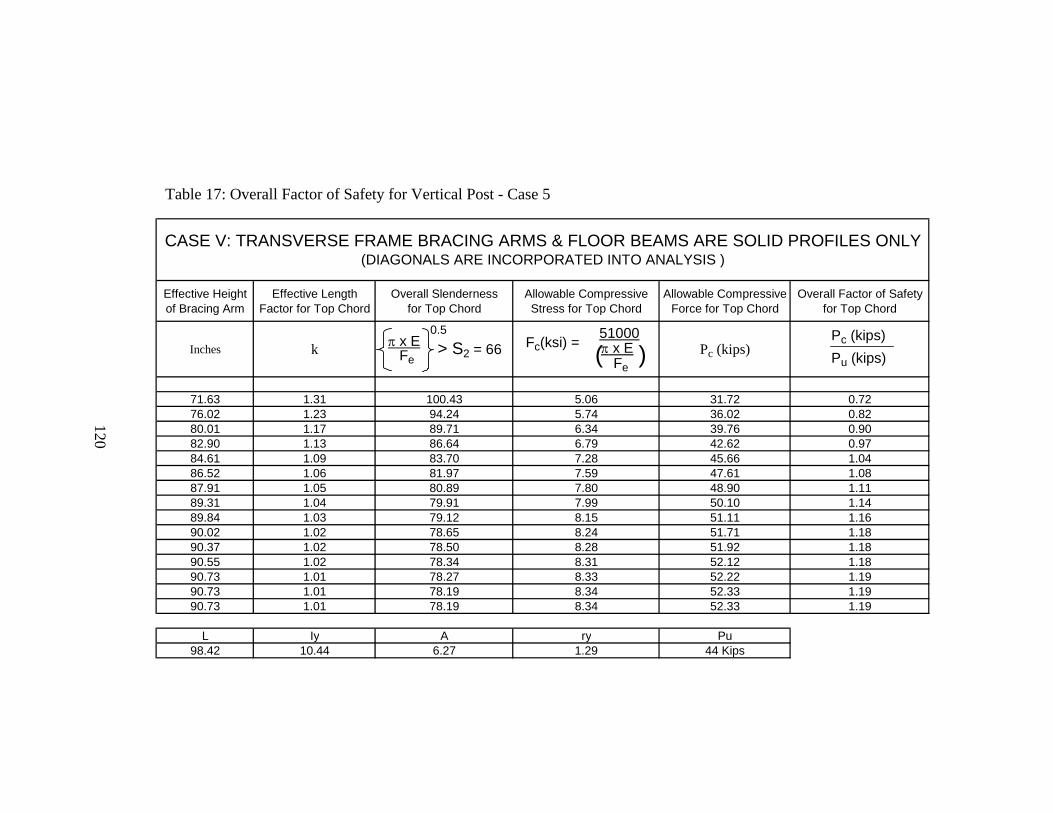
Effective Height of Bracing Arm
Effective Length Factor for Top Chord
Overall Slenderness for Top Chord
Allowable Compressive Stress for Top Chord
Allowable Compressive Force for Top Chord
Overall Factor of Safety for Top Chord
Inches k Pc (kips)
71.63 1.31 100.43 5.06 31.72 0.7276.02 1.23 94.24 5.74 36.02 0.8280.01 1.17 89.71 6.34 39.76 0.9082.90 1.13 86.64 6.79 42.62 0.9784.61 1.09 83.70 7.28 45.66 1.0486.52 1.06 81.97 7.59 47.61 1.0887.91 1.05 80.89 7.80 48.90 1.1189.31 1.04 79.91 7.99 50.10 1.1489.84 1.03 79.12 8.15 51.11 1.1690.02 1.02 78.65 8.24 51.71 1.1890.37 1.02 78.50 8.28 51.92 1.1890.55 1.02 78.34 8.31 52.12 1.1890.73 1.01 78.27 8.33 52.22 1.1990.73 1.01 78.19 8.34 52.33 1.1990.73 1.01 78.19 8.34 52.33 1.19
L Iy A ry Pu98.42 10.44 6.27 1.29 44 Kips
CASE V: TRANSVERSE FRAME BRACING ARMS & FLOOR BEAMS ARE SOLID PROFILES ONLY (DIAGONALS ARE INCORPORATED INTO ANALYSIS )
π x EFe
> S2 = 66 π x EFe
Fc(ksi) = 51000
( )Pc (kips)Pu (kips)
0.5
120
Table 17: Overall Factor of Safety for Vertical Post - Case 5
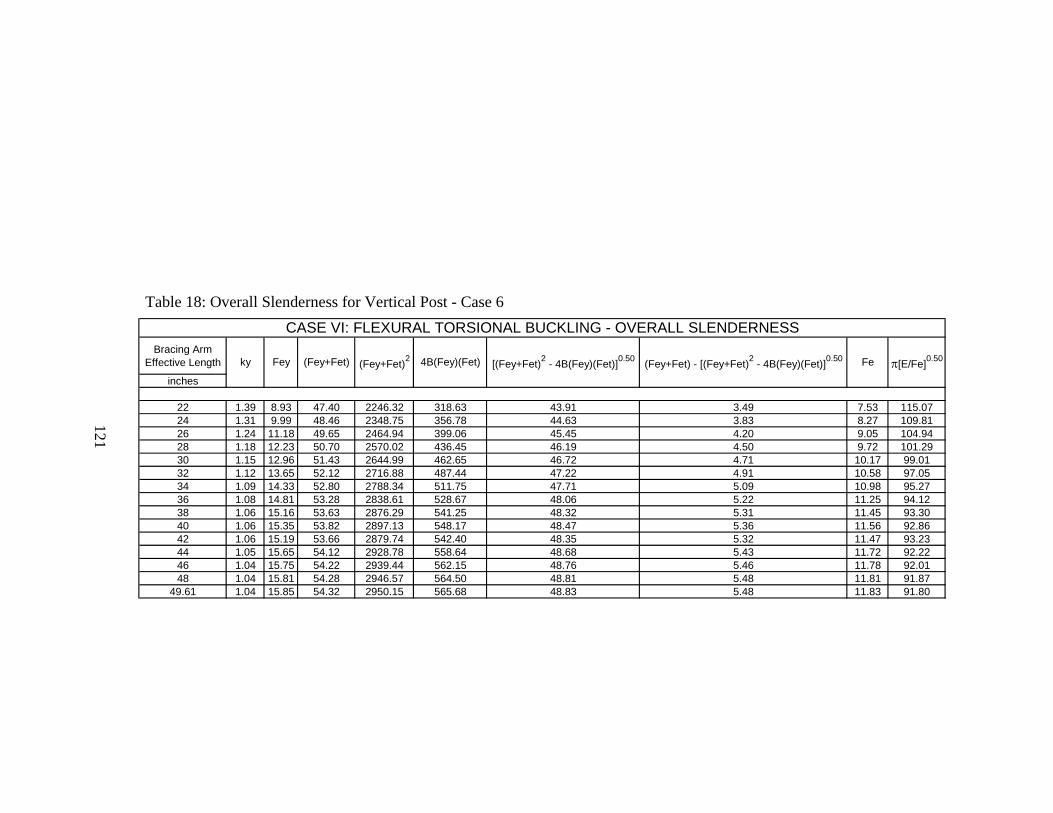
Bracing Arm Effective Length
inches
22 1.39 8.93 47.40 2246.32 318.63 43.91 3.49 7.53 115.0724 1.31 9.99 48.46 2348.75 356.78 44.63 3.83 8.27 109.8126 1.24 11.18 49.65 2464.94 399.06 45.45 4.20 9.05 104.9428 1.18 12.23 50.70 2570.02 436.45 46.19 4.50 9.72 101.2930 1.15 12.96 51.43 2644.99 462.65 46.72 4.71 10.17 99.0132 1.12 13.65 52.12 2716.88 487.44 47.22 4.91 10.58 97.0534 1.09 14.33 52.80 2788.34 511.75 47.71 5.09 10.98 95.2736 1.08 14.81 53.28 2838.61 528.67 48.06 5.22 11.25 94.1238 1.06 15.16 53.63 2876.29 541.25 48.32 5.31 11.45 93.3040 1.06 15.35 53.82 2897.13 548.17 48.47 5.36 11.56 92.8642 1.06 15.19 53.66 2879.74 542.40 48.35 5.32 11.47 93.2344 1.05 15.65 54.12 2928.78 558.64 48.68 5.43 11.72 92.2246 1.04 15.75 54.22 2939.44 562.15 48.76 5.46 11.78 92.0148 1.04 15.81 54.28 2946.57 564.50 48.81 5.48 11.81 91.87
49.61 1.04 15.85 54.32 2950.15 565.68 48.83 5.48 11.83 91.80
π[E/Fe]0.50
CASE VI: FLEXURAL TORSIONAL BUCKLING - OVERALL SLENDERNESS
ky Fey (Fey+Fet) (Fey+Fet)2 4B(Fey)(Fet) [(Fey+Fet)2 - 4B(Fey)(Fet)]0.50 (Fey+Fet) - [(Fey+Fet)2 - 4B(Fey)(Fet)]0.50 Fe
121
Table 18: Overall Slenderness for Vertical Post - Case 6
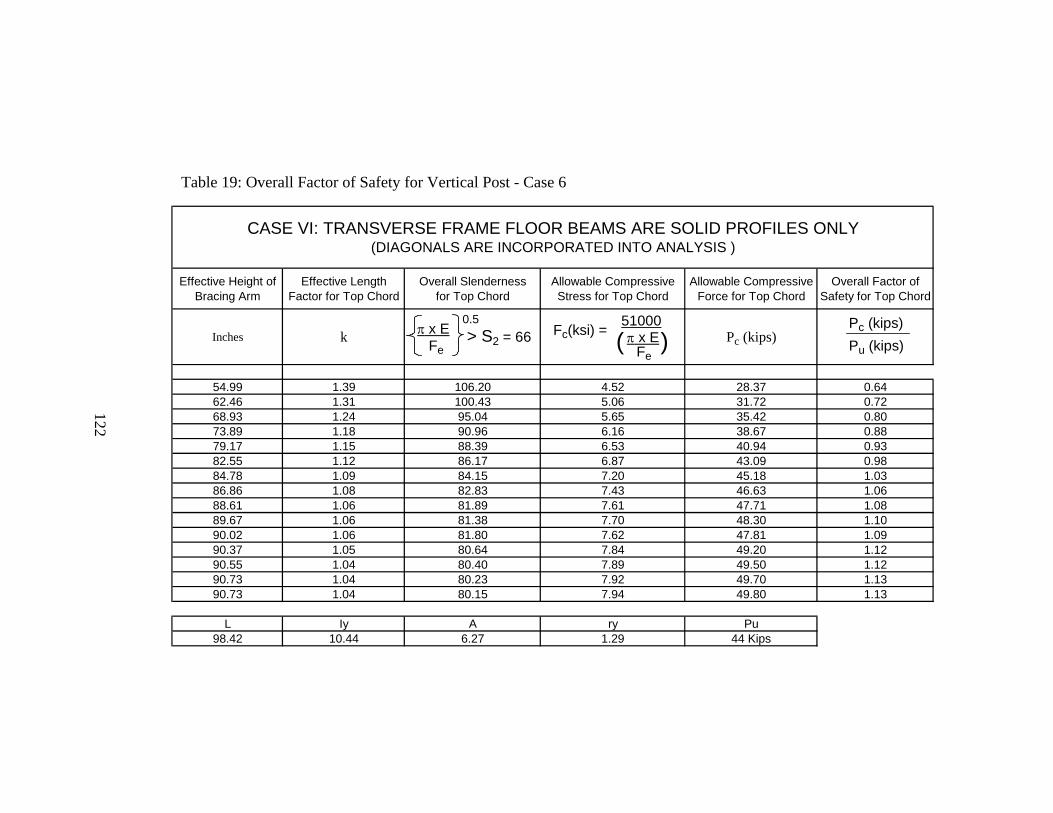
Effective Height of Bracing Arm
Effective Length Factor for Top Chord
Overall Slenderness for Top Chord
Allowable Compressive Stress for Top Chord
Allowable Compressive Force for Top Chord
Overall Factor of Safety for Top Chord
Inches k Pc (kips)
54.99 1.39 106.20 4.52 28.37 0.6462.46 1.31 100.43 5.06 31.72 0.7268.93 1.24 95.04 5.65 35.42 0.8073.89 1.18 90.96 6.16 38.67 0.8879.17 1.15 88.39 6.53 40.94 0.9382.55 1.12 86.17 6.87 43.09 0.9884.78 1.09 84.15 7.20 45.18 1.0386.86 1.08 82.83 7.43 46.63 1.0688.61 1.06 81.89 7.61 47.71 1.0889.67 1.06 81.38 7.70 48.30 1.1090.02 1.06 81.80 7.62 47.81 1.0990.37 1.05 80.64 7.84 49.20 1.1290.55 1.04 80.40 7.89 49.50 1.1290.73 1.04 80.23 7.92 49.70 1.1390.73 1.04 80.15 7.94 49.80 1.13
L Iy A ry Pu98.42 10.44 6.27 1.29 44 Kips
CASE VI: TRANSVERSE FRAME FLOOR BEAMS ARE SOLID PROFILES ONLY (DIAGONALS ARE INCORPORATED INTO ANALYSIS )
π x EFe
> S2 = 66 π x EFe
Fc(ksi) = 51000( )
Pc (kips)Pu (kips)
0.5
122
Table 19: Overall Factor of Safety for Vertical Post - Case 6
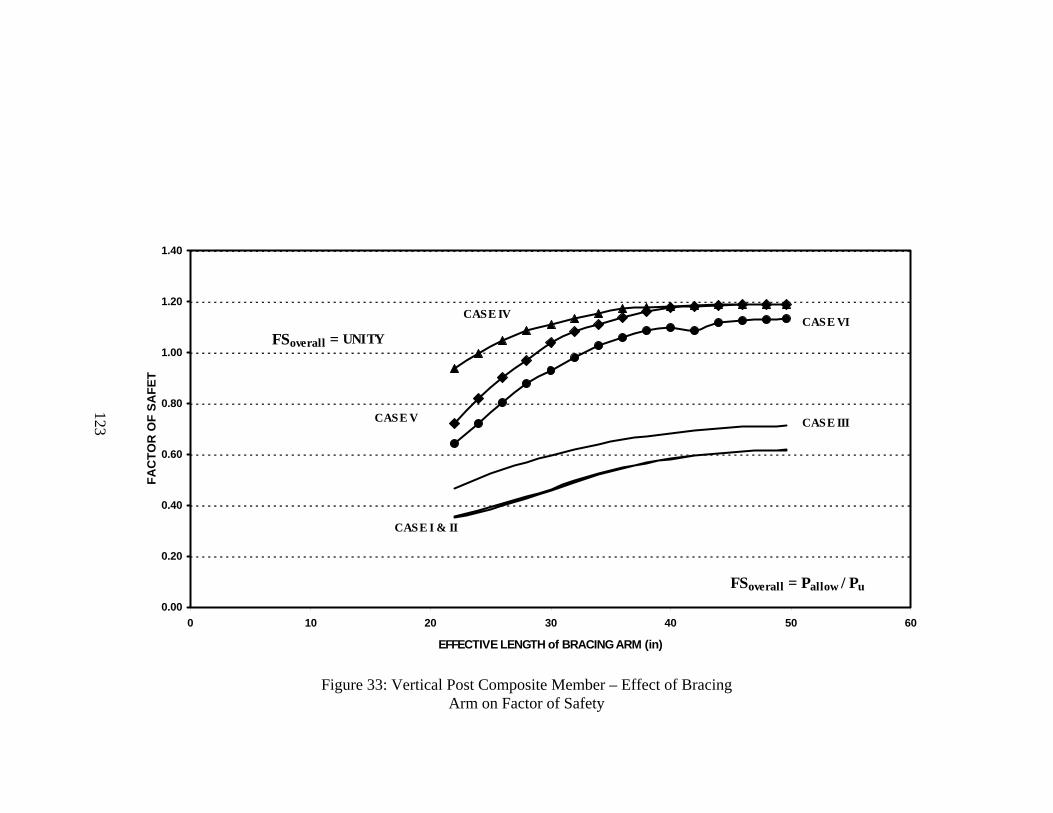
0.00
0.20
0.40
0.60
0.80
1.00
1.20
1.40
0 10 20 30 40 50 60
EFFECTIVE LENGTH of BRACING ARM (in)
FAC
TOR
OF
SAFE
T
CASE I & II
CASE III
CASE VI
CASE V
CASE IV
FSoverall = Pallow / Pu
FSoverall = UNITY
123
Figure 33: Vertical Post Composite Member – Effect of Bracing Arm on Factor of Safety
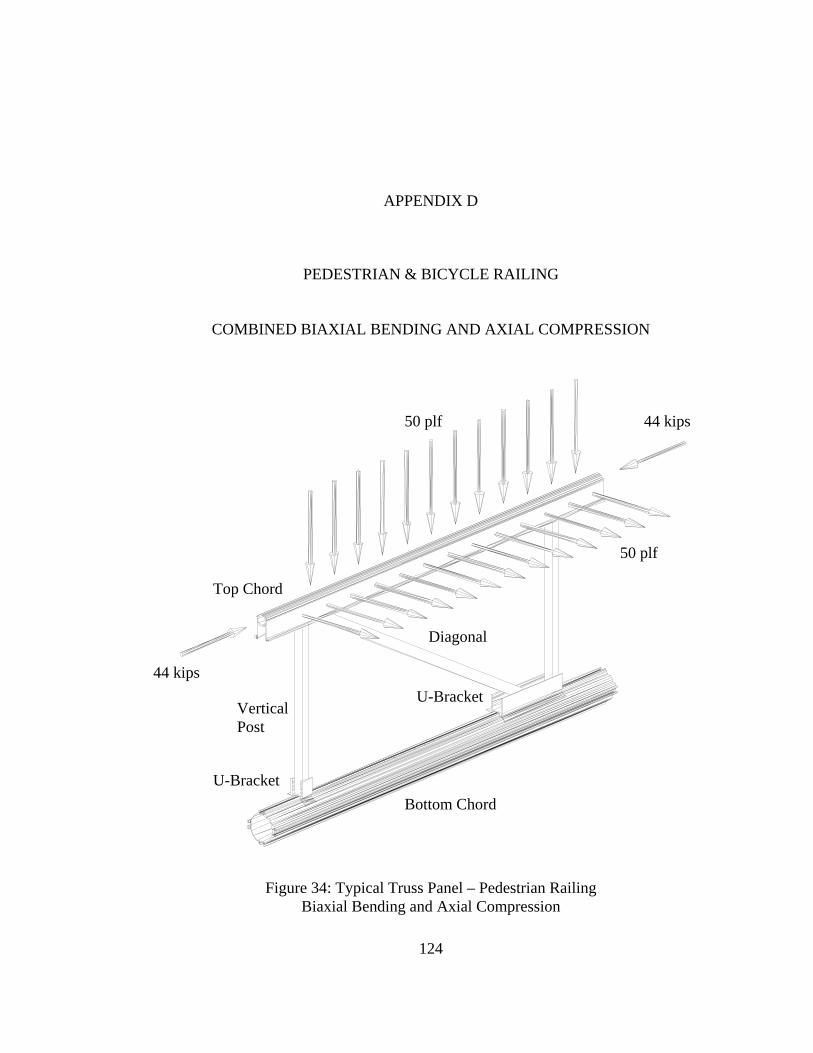
124
APPENDIX D
PEDESTRIAN & BICYCLE RAILING
COMBINED BIAXIAL BENDING AND AXIAL COMPRESSION
50 plf
50 plf
44 kips
44 kips
Top Chord
Bottom Chord
Diagonal
Vertical Post
Figure 34: Typical Truss Panel – Pedestrian Railing Biaxial Bending and Axial Compression
U-Bracket
U-Bracket
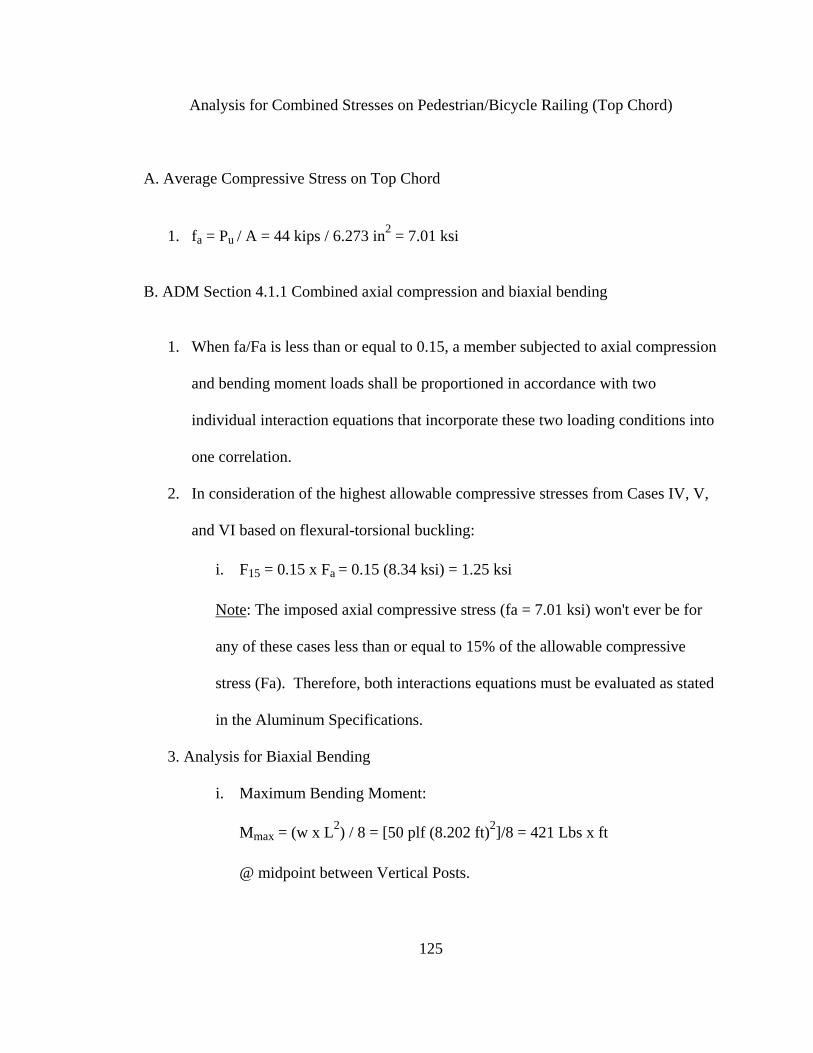
125
Analysis for Combined Stresses on Pedestrian/Bicycle Railing (Top Chord) A. Average Compressive Stress on Top Chord
1. fa = Pu / A = 44 kips / 6.273 in2 = 7.01 ksi
B. ADM Section 4.1.1 Combined axial compression and biaxial bending
1. When fa/Fa is less than or equal to 0.15, a member subjected to axial compression
and bending moment loads shall be proportioned in accordance with two
individual interaction equations that incorporate these two loading conditions into
one correlation.
2. In consideration of the highest allowable compressive stresses from Cases IV, V,
and VI based on flexural-torsional buckling:
i. F15 = 0.15 x Fa = 0.15 (8.34 ksi) = 1.25 ksi
Note: The imposed axial compressive stress (fa = 7.01 ksi) won't ever be for
any of these cases less than or equal to 15% of the allowable compressive
stress (Fa). Therefore, both interactions equations must be evaluated as stated
in the Aluminum Specifications.
3. Analysis for Biaxial Bending
i. Maximum Bending Moment:
Mmax = (w x L2) / 8 = [50 plf (8.202 ft)2]/8 = 421 Lbs x ft
@ midpoint between Vertical Posts.
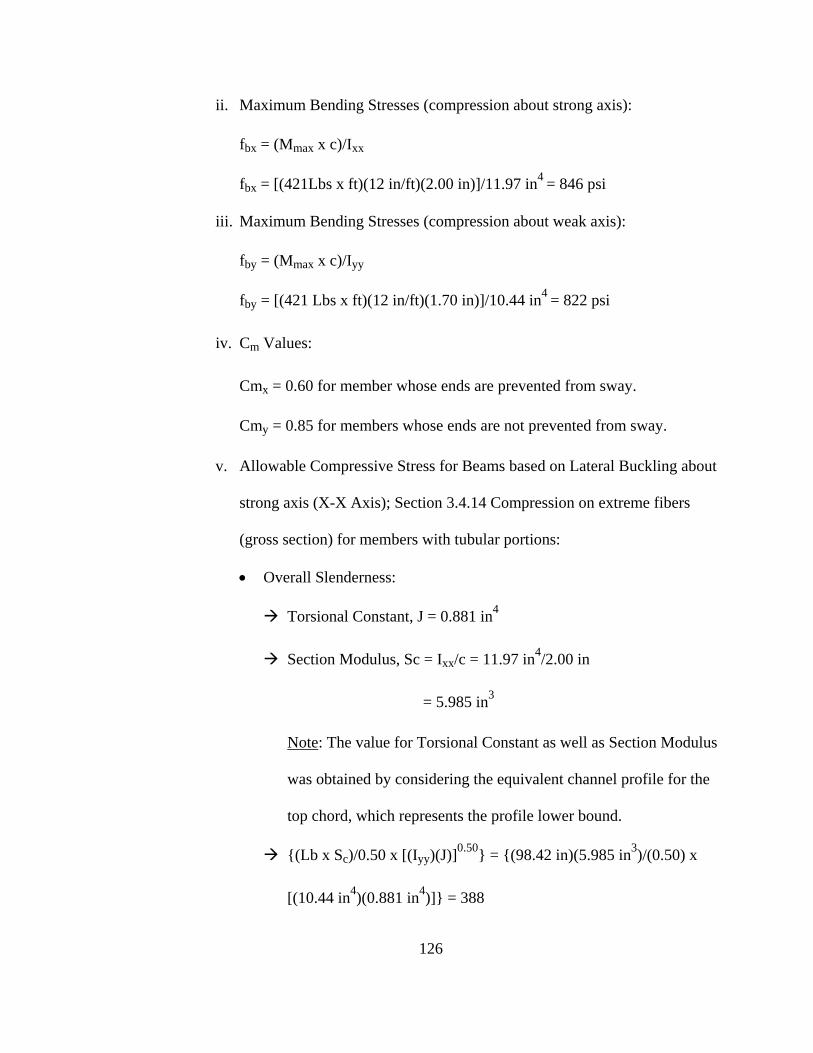
126
ii. Maximum Bending Stresses (compression about strong axis):
fbx = (Mmax x c)/Ixx fbx = [(421Lbs x ft)(12 in/ft)(2.00 in)]/11.97 in4 = 846 psi
iii. Maximum Bending Stresses (compression about weak axis):
fby = (Mmax x c)/Iyy fby = [(421 Lbs x ft)(12 in/ft)(1.70 in)]/10.44 in4 = 822 psi
iv. Cm Values:
Cmx = 0.60 for member whose ends are prevented from sway. Cmy = 0.85 for members whose ends are not prevented from sway.
v. Allowable Compressive Stress for Beams based on Lateral Buckling about
strong axis (X-X Axis); Section 3.4.14 Compression on extreme fibers
(gross section) for members with tubular portions:
• Overall Slenderness:
Torsional Constant, J = 0.881 in4
Section Modulus, Sc = Ixx/c = 11.97 in4/2.00 in
= 5.985 in3
Note: The value for Torsional Constant as well as Section Modulus
was obtained by considering the equivalent channel profile for the
top chord, which represents the profile lower bound.
{(Lb x Sc)/0.50 x [(Iyy)(J)]0.50} = {(98.42 in)(5.985 in3)/(0.50) x
[(10.44 in4)(0.881 in4)]} = 388
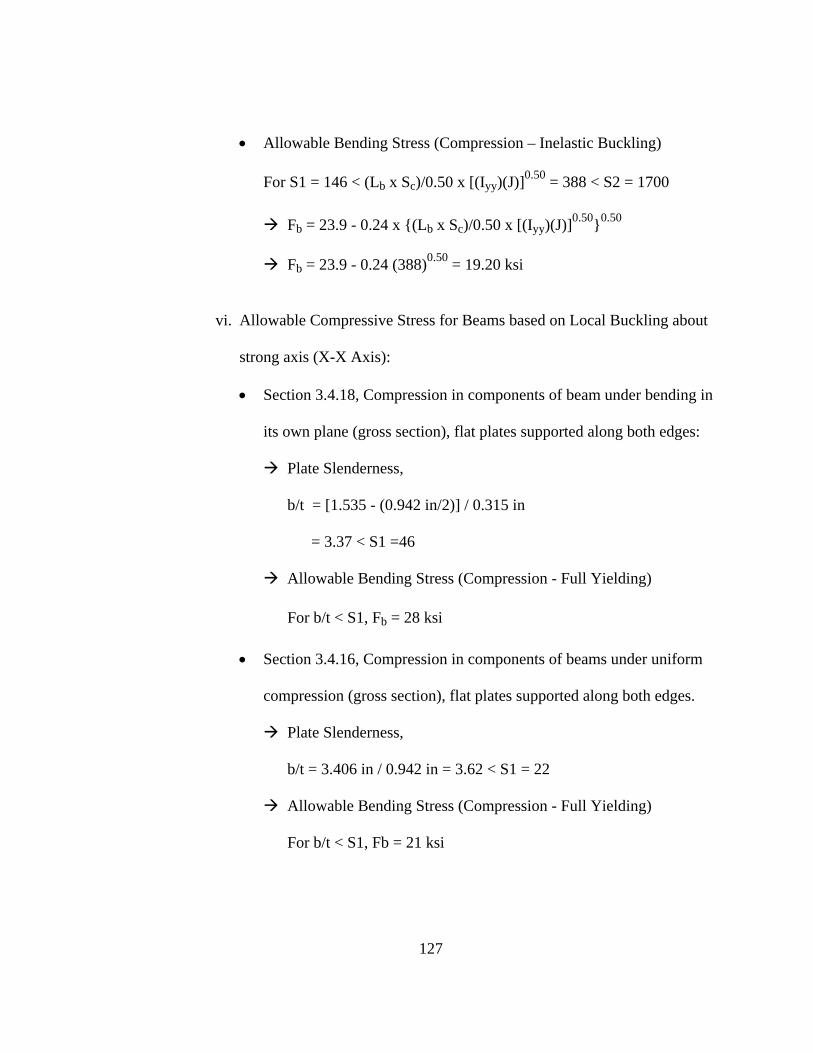
127
• Allowable Bending Stress (Compression – Inelastic Buckling)
For S1 = 146 < (Lb x Sc)/0.50 x [(Iyy)(J)]0.50 = 388 < S2 = 1700
Fb = 23.9 - 0.24 x {(Lb x Sc)/0.50 x [(Iyy)(J)]0.50}0.50
Fb = 23.9 - 0.24 (388)0.50 = 19.20 ksi
vi. Allowable Compressive Stress for Beams based on Local Buckling about
strong axis (X-X Axis):
• Section 3.4.18, Compression in components of beam under bending in
its own plane (gross section), flat plates supported along both edges:
Plate Slenderness,
b/t = [1.535 - (0.942 in/2)] / 0.315 in
= 3.37 < S1 =46
Allowable Bending Stress (Compression - Full Yielding)
For b/t < S1, Fb = 28 ksi
• Section 3.4.16, Compression in components of beams under uniform
compression (gross section), flat plates supported along both edges.
Plate Slenderness,
b/t = 3.406 in / 0.942 in = 3.62 < S1 = 22
Allowable Bending Stress (Compression - Full Yielding)
For b/t < S1, Fb = 21 ksi
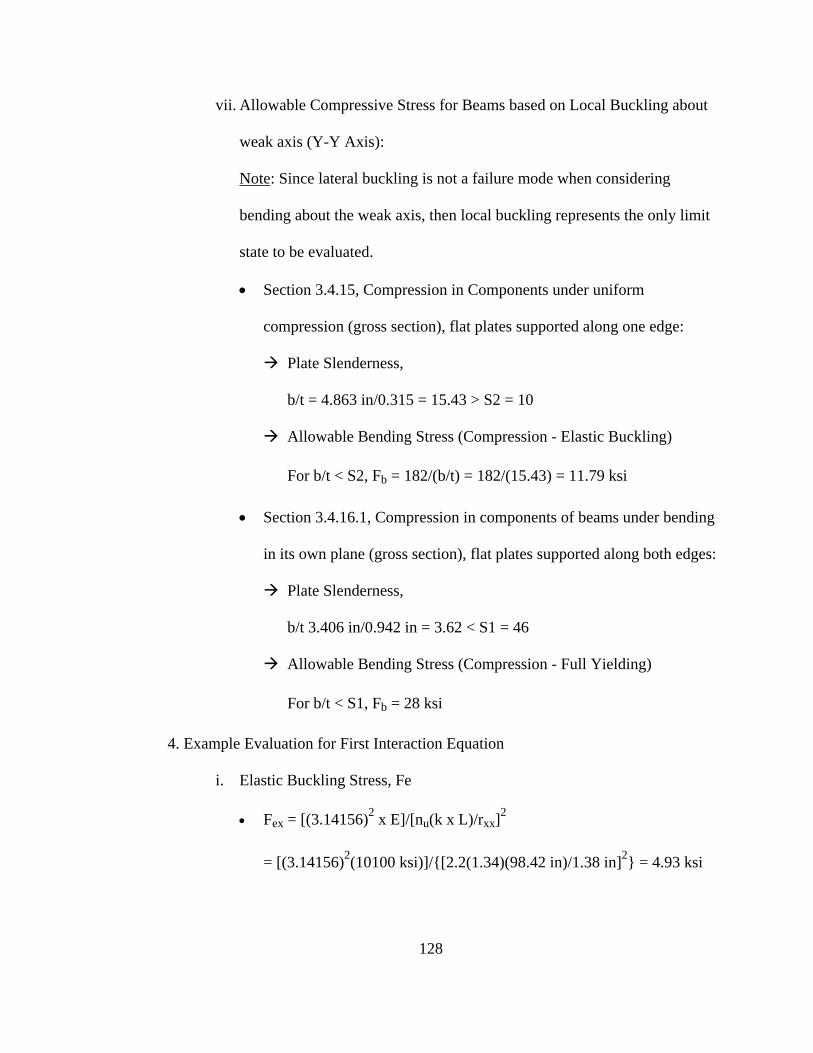
128
vii. Allowable Compressive Stress for Beams based on Local Buckling about
weak axis (Y-Y Axis):
Note: Since lateral buckling is not a failure mode when considering
bending about the weak axis, then local buckling represents the only limit
state to be evaluated.
• Section 3.4.15, Compression in Components under uniform
compression (gross section), flat plates supported along one edge:
Plate Slenderness,
b/t = 4.863 in/0.315 = 15.43 > S2 = 10
Allowable Bending Stress (Compression - Elastic Buckling)
For b/t < S2, Fb = 182/(b/t) = 182/(15.43) = 11.79 ksi
• Section 3.4.16.1, Compression in components of beams under bending
in its own plane (gross section), flat plates supported along both edges:
Plate Slenderness,
b/t 3.406 in/0.942 in = 3.62 < S1 = 46
Allowable Bending Stress (Compression - Full Yielding)
For b/t < S1, Fb = 28 ksi
4. Example Evaluation for First Interaction Equation
i. Elastic Buckling Stress, Fe
• Fex = [(3.14156)2 x E]/[nu(k x L)/rxx]2
= [(3.14156)2(10100 ksi)]/{[2.2(1.34)(98.42 in)/1.38 in]2} = 4.93 ksi
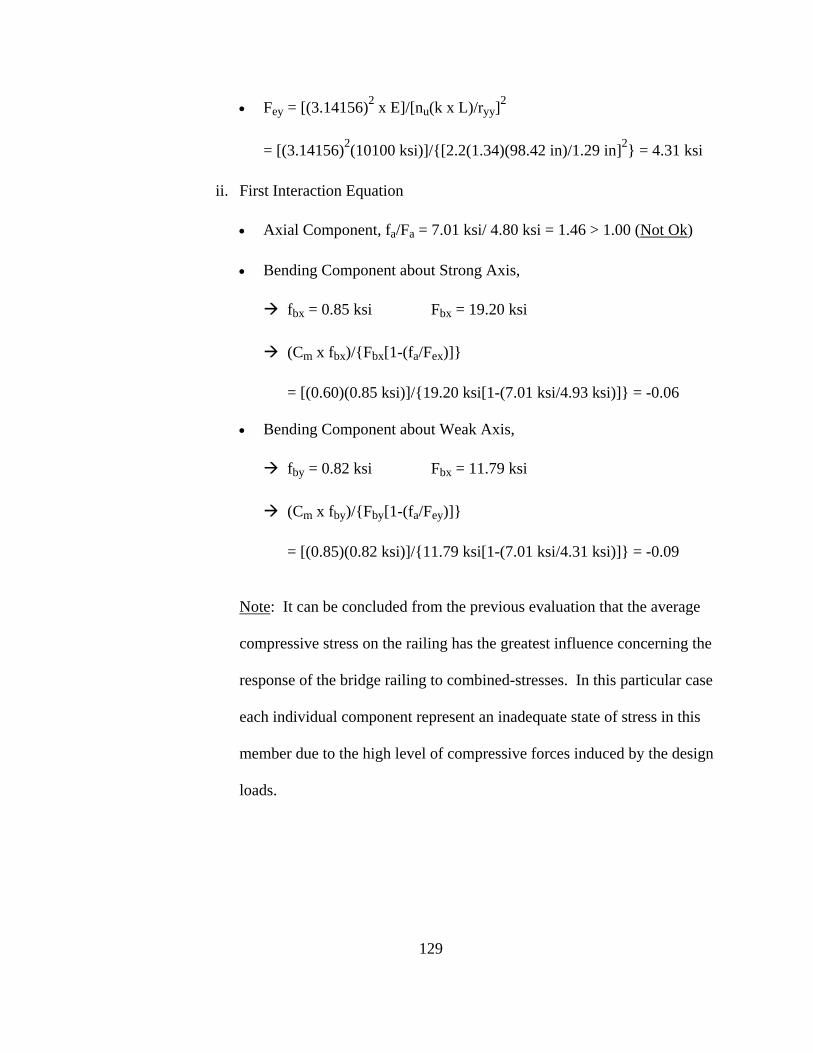
129
• Fey = [(3.14156)2 x E]/[nu(k x L)/ryy]2
= [(3.14156)2(10100 ksi)]/{[2.2(1.34)(98.42 in)/1.29 in]2} = 4.31 ksi
ii. First Interaction Equation
• Axial Component, fa/Fa = 7.01 ksi/ 4.80 ksi = 1.46 > 1.00 (Not Ok)
• Bending Component about Strong Axis,
fbx = 0.85 ksi Fbx = 19.20 ksi
(Cm x fbx)/{Fbx[1-(fa/Fex)]}
= [(0.60)(0.85 ksi)]/{19.20 ksi[1-(7.01 ksi/4.93 ksi)]} = -0.06
• Bending Component about Weak Axis,
fby = 0.82 ksi Fbx = 11.79 ksi
(Cm x fby)/{Fby[1-(fa/Fey)]}
= [(0.85)(0.82 ksi)]/{11.79 ksi[1-(7.01 ksi/4.31 ksi)]} = -0.09
Note: It can be concluded from the previous evaluation that the average
compressive stress on the railing has the greatest influence concerning the
response of the bridge railing to combined-stresses. In this particular case
each individual component represent an inadequate state of stress in this
member due to the high level of compressive forces induced by the design
loads.
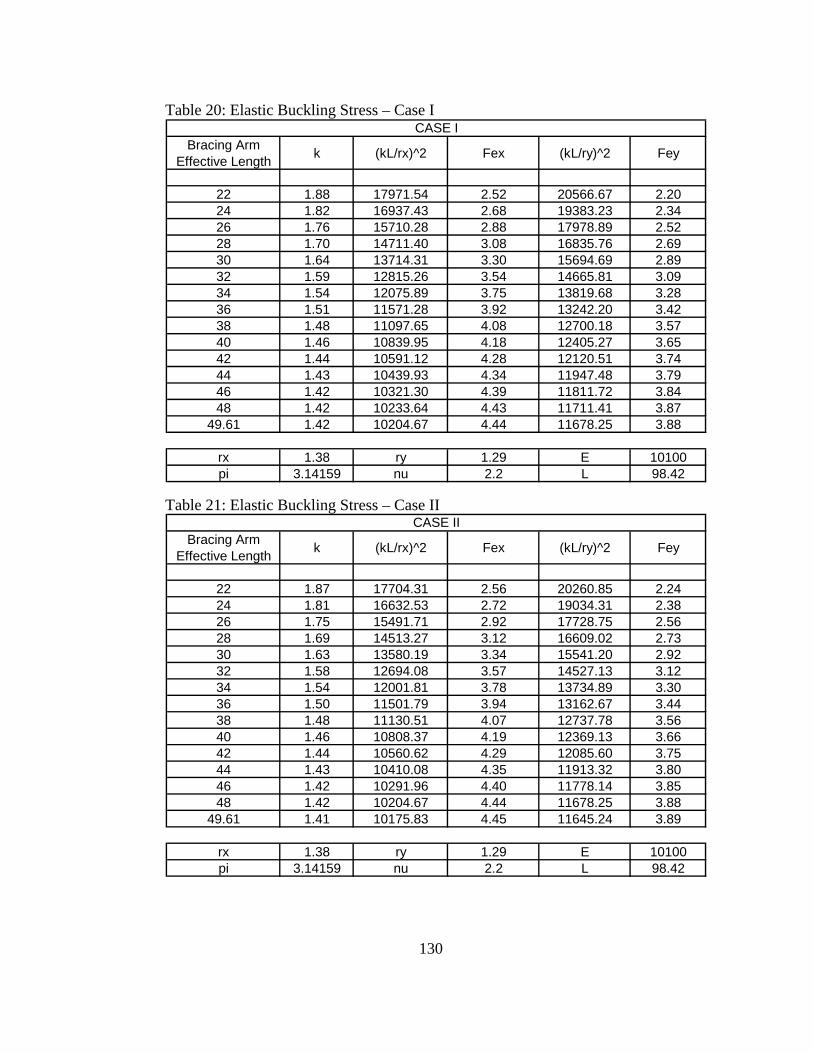
130
Table 20: Elastic Buckling Stress – Case I
Table 21: Elastic Buckling Stress – Case II
Bracing Arm Effective Length k (kL/rx)^2 Fex (kL/ry)^2 Fey
22 1.88 17971.54 2.52 20566.67 2.2024 1.82 16937.43 2.68 19383.23 2.3426 1.76 15710.28 2.88 17978.89 2.5228 1.70 14711.40 3.08 16835.76 2.6930 1.64 13714.31 3.30 15694.69 2.8932 1.59 12815.26 3.54 14665.81 3.0934 1.54 12075.89 3.75 13819.68 3.2836 1.51 11571.28 3.92 13242.20 3.4238 1.48 11097.65 4.08 12700.18 3.5740 1.46 10839.95 4.18 12405.27 3.6542 1.44 10591.12 4.28 12120.51 3.7444 1.43 10439.93 4.34 11947.48 3.7946 1.42 10321.30 4.39 11811.72 3.8448 1.42 10233.64 4.43 11711.41 3.87
49.61 1.42 10204.67 4.44 11678.25 3.88
rx 1.38 ry 1.29 E 10100pi 3.14159 nu 2.2 L 98.42
Bracing Arm Effective Length k (kL/rx)^2 Fex (kL/ry)^2 Fey
22 1.87 17704.31 2.56 20260.85 2.2424 1.81 16632.53 2.72 19034.31 2.3826 1.75 15491.71 2.92 17728.75 2.5628 1.69 14513.27 3.12 16609.02 2.7330 1.63 13580.19 3.34 15541.20 2.9232 1.58 12694.08 3.57 14527.13 3.1234 1.54 12001.81 3.78 13734.89 3.3036 1.50 11501.79 3.94 13162.67 3.4438 1.48 11130.51 4.07 12737.78 3.5640 1.46 10808.37 4.19 12369.13 3.6642 1.44 10560.62 4.29 12085.60 3.7544 1.43 10410.08 4.35 11913.32 3.8046 1.42 10291.96 4.40 11778.14 3.8548 1.42 10204.67 4.44 11678.25 3.88
49.61 1.41 10175.83 4.45 11645.24 3.89
rx 1.38 ry 1.29 E 10100pi 3.14159 nu 2.2 L 98.42
CASE I
CASE II
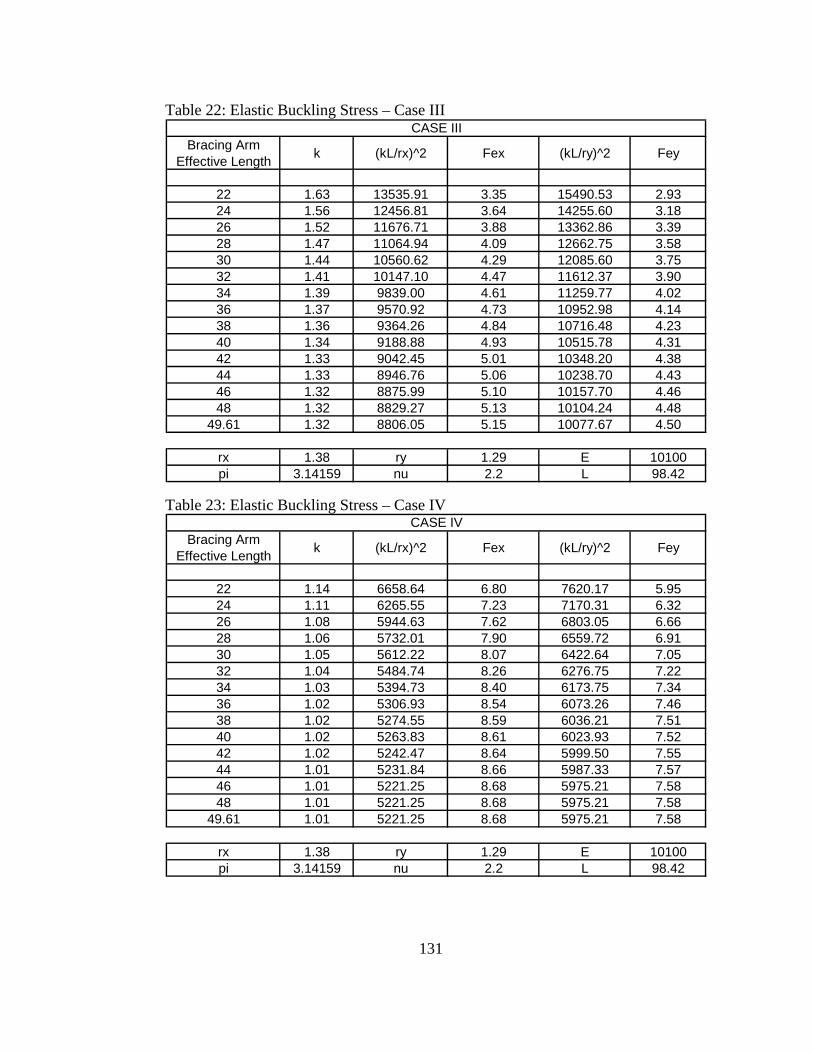
131
Bracing Arm Effective Length k (kL/rx)^2 Fex (kL/ry)^2 Fey
22 1.63 13535.91 3.35 15490.53 2.9324 1.56 12456.81 3.64 14255.60 3.1826 1.52 11676.71 3.88 13362.86 3.3928 1.47 11064.94 4.09 12662.75 3.5830 1.44 10560.62 4.29 12085.60 3.7532 1.41 10147.10 4.47 11612.37 3.9034 1.39 9839.00 4.61 11259.77 4.0236 1.37 9570.92 4.73 10952.98 4.1438 1.36 9364.26 4.84 10716.48 4.2340 1.34 9188.88 4.93 10515.78 4.3142 1.33 9042.45 5.01 10348.20 4.3844 1.33 8946.76 5.06 10238.70 4.4346 1.32 8875.99 5.10 10157.70 4.4648 1.32 8829.27 5.13 10104.24 4.48
49.61 1.32 8806.05 5.15 10077.67 4.50
rx 1.38 ry 1.29 E 10100pi 3.14159 nu 2.2 L 98.42
Bracing Arm Effective Length k (kL/rx)^2 Fex (kL/ry)^2 Fey
22 1.14 6658.64 6.80 7620.17 5.9524 1.11 6265.55 7.23 7170.31 6.3226 1.08 5944.63 7.62 6803.05 6.6628 1.06 5732.01 7.90 6559.72 6.9130 1.05 5612.22 8.07 6422.64 7.0532 1.04 5484.74 8.26 6276.75 7.2234 1.03 5394.73 8.40 6173.75 7.3436 1.02 5306.93 8.54 6073.26 7.4638 1.02 5274.55 8.59 6036.21 7.5140 1.02 5263.83 8.61 6023.93 7.5242 1.02 5242.47 8.64 5999.50 7.5544 1.01 5231.84 8.66 5987.33 7.5746 1.01 5221.25 8.68 5975.21 7.5848 1.01 5221.25 8.68 5975.21 7.58
49.61 1.01 5221.25 8.68 5975.21 7.58
rx 1.38 ry 1.29 E 10100pi 3.14159 nu 2.2 L 98.42
CASE III
CASE IV
Table 22: Elastic Buckling Stress – Case III
Table 23: Elastic Buckling Stress – Case IV
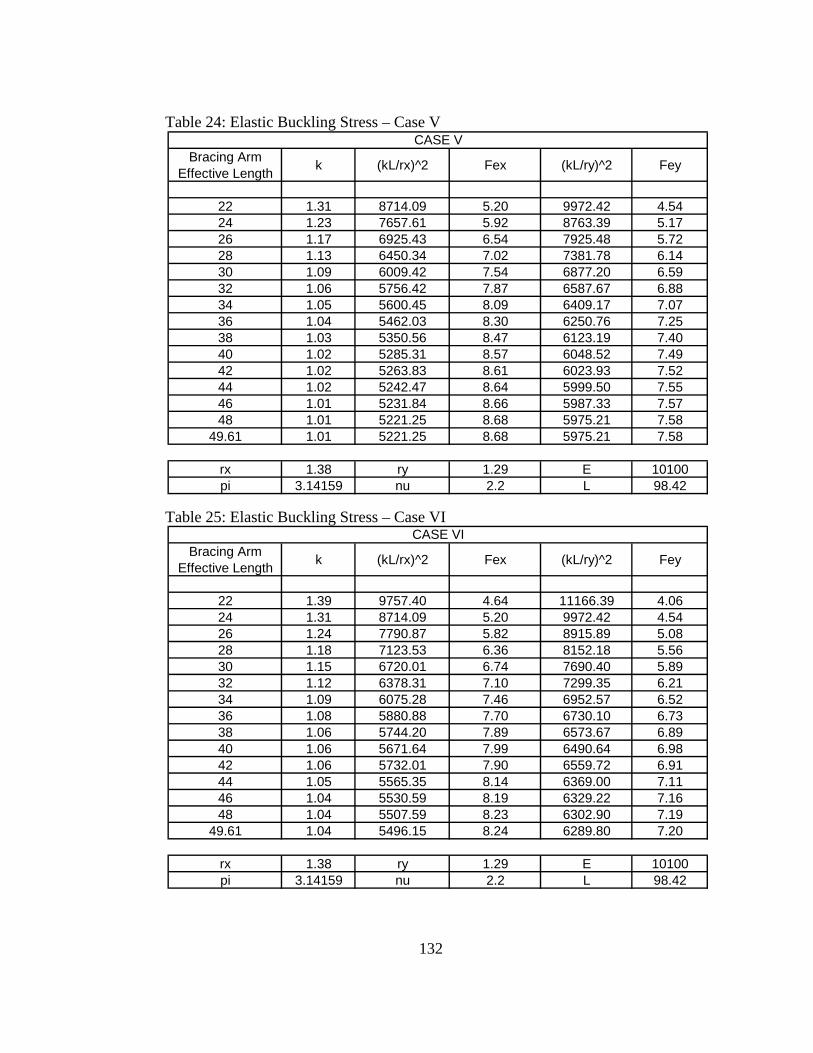
132
Table 24: Elastic Buckling Stress – Case V
Table 25: Elastic Buckling Stress – Case VI
Bracing Arm Effective Length k (kL/rx)^2 Fex (kL/ry)^2 Fey
22 1.31 8714.09 5.20 9972.42 4.5424 1.23 7657.61 5.92 8763.39 5.1726 1.17 6925.43 6.54 7925.48 5.7228 1.13 6450.34 7.02 7381.78 6.1430 1.09 6009.42 7.54 6877.20 6.5932 1.06 5756.42 7.87 6587.67 6.8834 1.05 5600.45 8.09 6409.17 7.0736 1.04 5462.03 8.30 6250.76 7.2538 1.03 5350.56 8.47 6123.19 7.4040 1.02 5285.31 8.57 6048.52 7.4942 1.02 5263.83 8.61 6023.93 7.5244 1.02 5242.47 8.64 5999.50 7.5546 1.01 5231.84 8.66 5987.33 7.5748 1.01 5221.25 8.68 5975.21 7.58
49.61 1.01 5221.25 8.68 5975.21 7.58
rx 1.38 ry 1.29 E 10100pi 3.14159 nu 2.2 L 98.42
Bracing Arm Effective Length k (kL/rx)^2 Fex (kL/ry)^2 Fey
22 1.39 9757.40 4.64 11166.39 4.0624 1.31 8714.09 5.20 9972.42 4.5426 1.24 7790.87 5.82 8915.89 5.0828 1.18 7123.53 6.36 8152.18 5.5630 1.15 6720.01 6.74 7690.40 5.8932 1.12 6378.31 7.10 7299.35 6.2134 1.09 6075.28 7.46 6952.57 6.5236 1.08 5880.88 7.70 6730.10 6.7338 1.06 5744.20 7.89 6573.67 6.8940 1.06 5671.64 7.99 6490.64 6.9842 1.06 5732.01 7.90 6559.72 6.9144 1.05 5565.35 8.14 6369.00 7.1146 1.04 5530.59 8.19 6329.22 7.1648 1.04 5507.59 8.23 6302.90 7.19
49.61 1.04 5496.15 8.24 6289.80 7.20
rx 1.38 ry 1.29 E 10100pi 3.14159 nu 2.2 L 98.42
CASE V
CASE VI
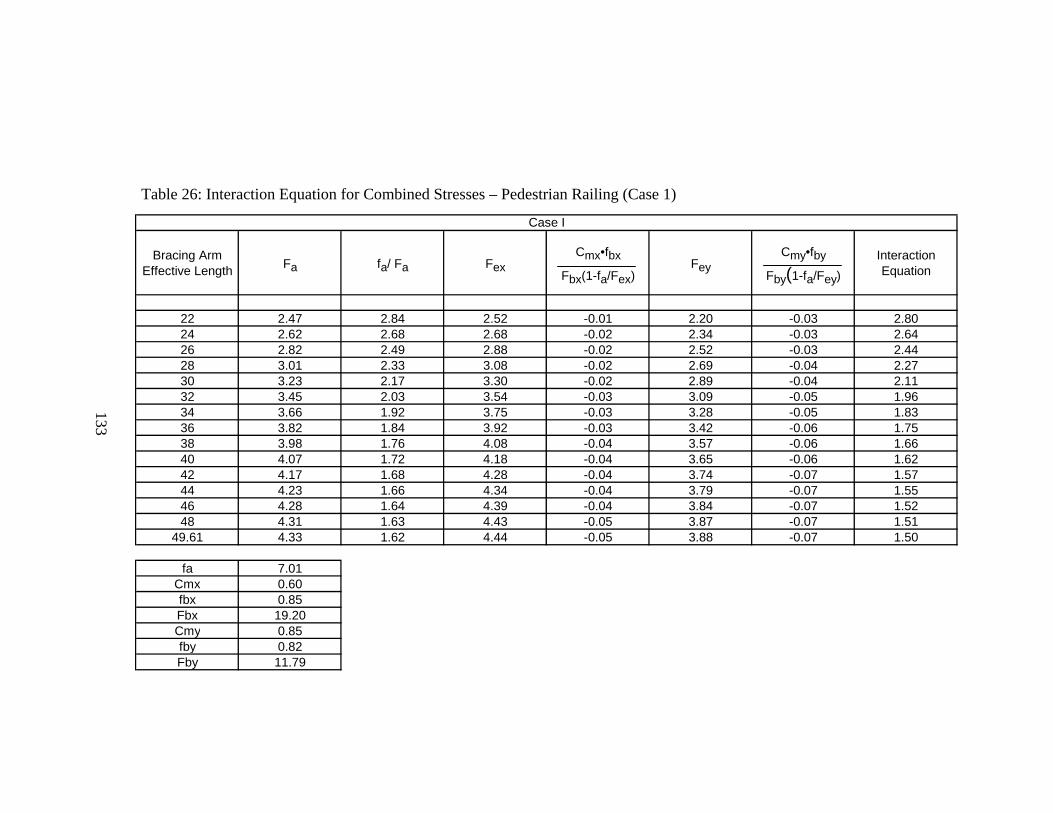
Bracing Arm Effective Length Fa fa/ Fa Fex
Cmx•fbx
Fbx(1-fa/Fex)Fey
Cmy•fby
Fby(1-fa/Fey)Interaction Equation
22 2.47 2.84 2.52 -0.01 2.20 -0.03 2.8024 2.62 2.68 2.68 -0.02 2.34 -0.03 2.6426 2.82 2.49 2.88 -0.02 2.52 -0.03 2.4428 3.01 2.33 3.08 -0.02 2.69 -0.04 2.2730 3.23 2.17 3.30 -0.02 2.89 -0.04 2.1132 3.45 2.03 3.54 -0.03 3.09 -0.05 1.9634 3.66 1.92 3.75 -0.03 3.28 -0.05 1.8336 3.82 1.84 3.92 -0.03 3.42 -0.06 1.7538 3.98 1.76 4.08 -0.04 3.57 -0.06 1.6640 4.07 1.72 4.18 -0.04 3.65 -0.06 1.6242 4.17 1.68 4.28 -0.04 3.74 -0.07 1.5744 4.23 1.66 4.34 -0.04 3.79 -0.07 1.5546 4.28 1.64 4.39 -0.04 3.84 -0.07 1.5248 4.31 1.63 4.43 -0.05 3.87 -0.07 1.51
49.61 4.33 1.62 4.44 -0.05 3.88 -0.07 1.50
fa 7.01Cmx 0.60fbx 0.85Fbx 19.20Cmy 0.85fby 0.82Fby 11.79
Case I
133
Table 26: Interaction Equation for Combined Stresses – Pedestrian Railing (Case 1)
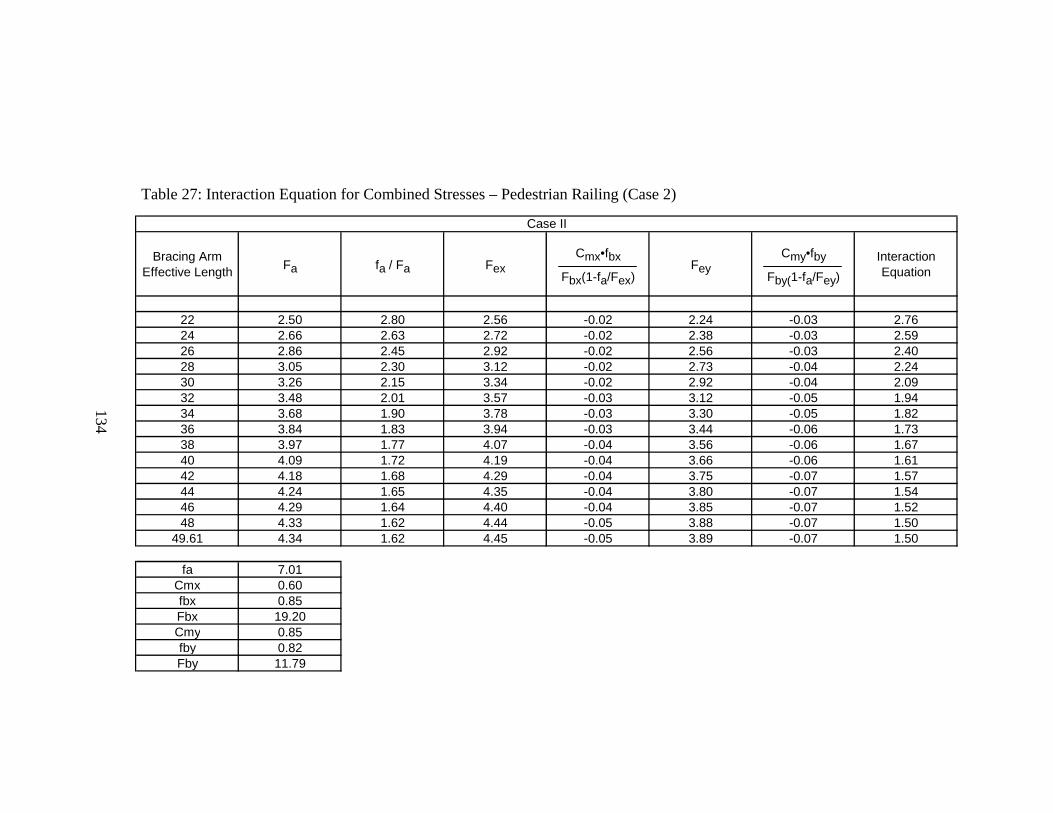
Bracing Arm Effective Length Fa fa / Fa Fex
Cmx•fbx
Fbx(1-fa/Fex)Fey
Cmy•fby
Fby(1-fa/Fey)Interaction Equation
22 2.50 2.80 2.56 -0.02 2.24 -0.03 2.7624 2.66 2.63 2.72 -0.02 2.38 -0.03 2.5926 2.86 2.45 2.92 -0.02 2.56 -0.03 2.4028 3.05 2.30 3.12 -0.02 2.73 -0.04 2.2430 3.26 2.15 3.34 -0.02 2.92 -0.04 2.0932 3.48 2.01 3.57 -0.03 3.12 -0.05 1.9434 3.68 1.90 3.78 -0.03 3.30 -0.05 1.8236 3.84 1.83 3.94 -0.03 3.44 -0.06 1.7338 3.97 1.77 4.07 -0.04 3.56 -0.06 1.6740 4.09 1.72 4.19 -0.04 3.66 -0.06 1.6142 4.18 1.68 4.29 -0.04 3.75 -0.07 1.5744 4.24 1.65 4.35 -0.04 3.80 -0.07 1.5446 4.29 1.64 4.40 -0.04 3.85 -0.07 1.5248 4.33 1.62 4.44 -0.05 3.88 -0.07 1.50
49.61 4.34 1.62 4.45 -0.05 3.89 -0.07 1.50
fa 7.01Cmx 0.60fbx 0.85Fbx 19.20Cmy 0.85fby 0.82Fby 11.79
Case II
134
Table 27: Interaction Equation for Combined Stresses – Pedestrian Railing (Case 2)
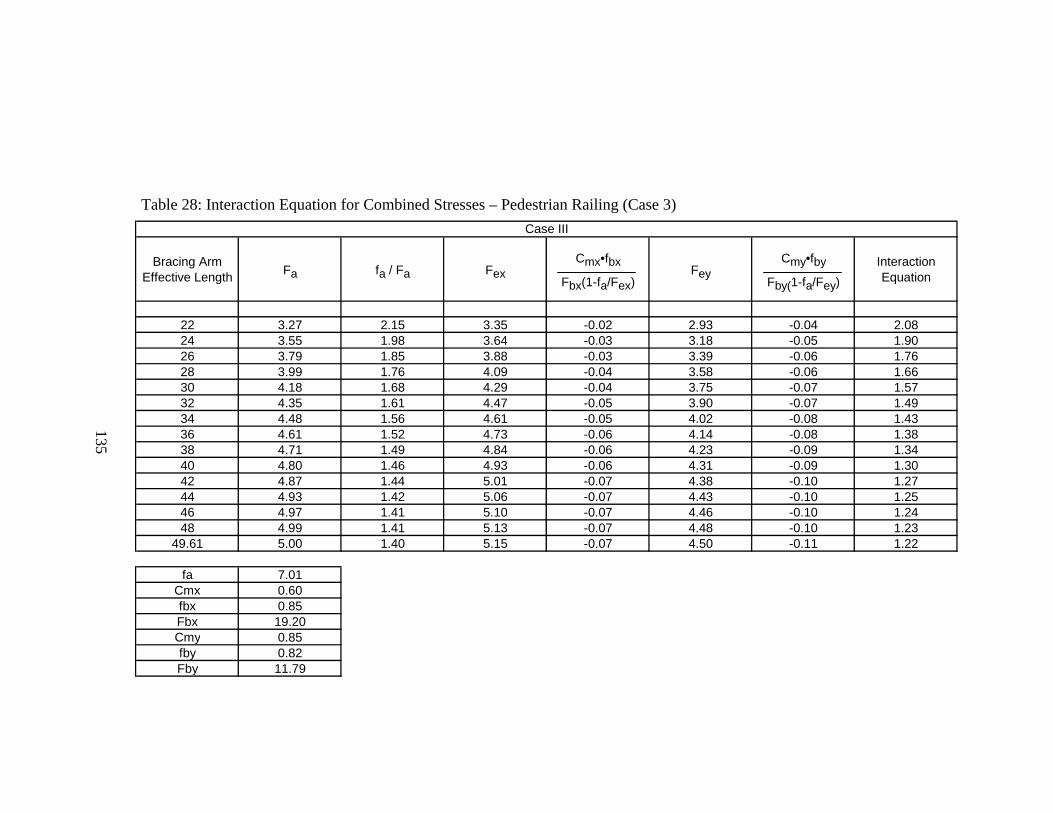
Bracing Arm Effective Length Fa fa / Fa Fex
Cmx•fbx
Fbx(1-fa/Fex)Fey
Cmy•fby
Fby(1-fa/Fey)Interaction Equation
22 3.27 2.15 3.35 -0.02 2.93 -0.04 2.0824 3.55 1.98 3.64 -0.03 3.18 -0.05 1.9026 3.79 1.85 3.88 -0.03 3.39 -0.06 1.7628 3.99 1.76 4.09 -0.04 3.58 -0.06 1.6630 4.18 1.68 4.29 -0.04 3.75 -0.07 1.5732 4.35 1.61 4.47 -0.05 3.90 -0.07 1.4934 4.48 1.56 4.61 -0.05 4.02 -0.08 1.4336 4.61 1.52 4.73 -0.06 4.14 -0.08 1.3838 4.71 1.49 4.84 -0.06 4.23 -0.09 1.3440 4.80 1.46 4.93 -0.06 4.31 -0.09 1.3042 4.87 1.44 5.01 -0.07 4.38 -0.10 1.2744 4.93 1.42 5.06 -0.07 4.43 -0.10 1.2546 4.97 1.41 5.10 -0.07 4.46 -0.10 1.2448 4.99 1.41 5.13 -0.07 4.48 -0.10 1.23
49.61 5.00 1.40 5.15 -0.07 4.50 -0.11 1.22
fa 7.01Cmx 0.60fbx 0.85Fbx 19.20Cmy 0.85fby 0.82Fby 11.79
Case III
135
Table 28: Interaction Equation for Combined Stresses – Pedestrian Railing (Case 3)
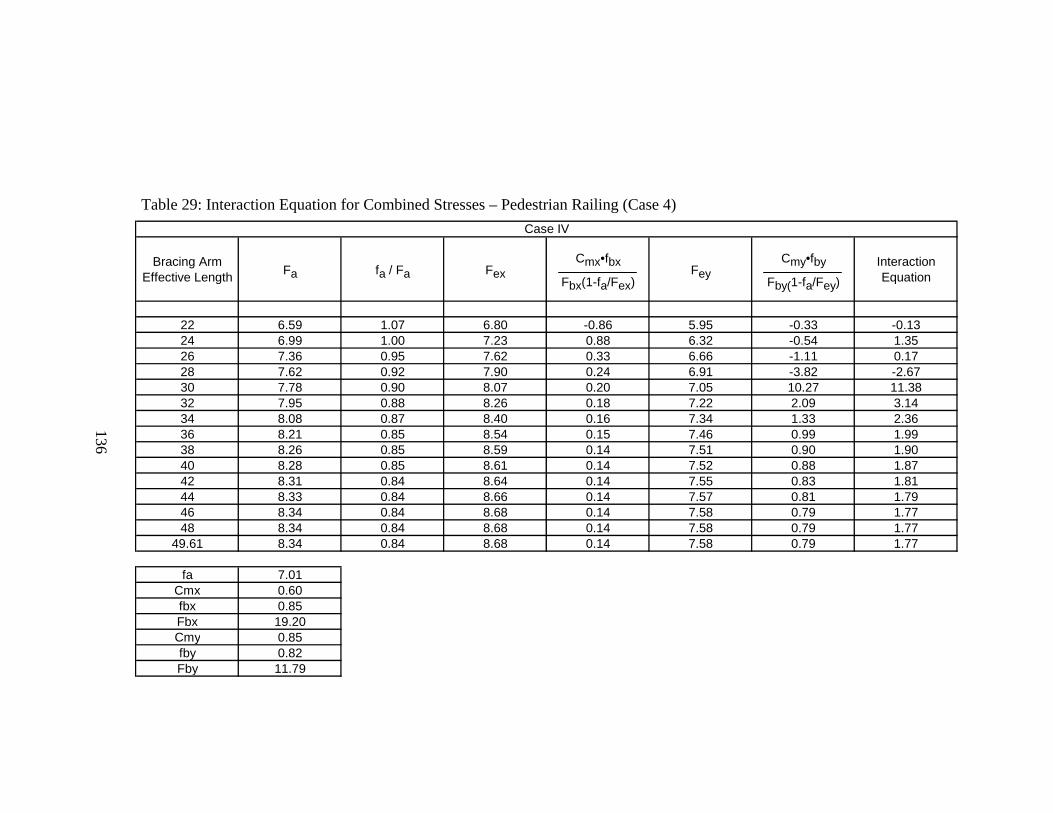
Bracing Arm Effective Length Fa fa / Fa Fex
Cmx•fbx
Fbx(1-fa/Fex)Fey
Cmy•fby
Fby(1-fa/Fey)Interaction Equation
22 6.59 1.07 6.80 -0.86 5.95 -0.33 -0.1324 6.99 1.00 7.23 0.88 6.32 -0.54 1.3526 7.36 0.95 7.62 0.33 6.66 -1.11 0.1728 7.62 0.92 7.90 0.24 6.91 -3.82 -2.6730 7.78 0.90 8.07 0.20 7.05 10.27 11.3832 7.95 0.88 8.26 0.18 7.22 2.09 3.1434 8.08 0.87 8.40 0.16 7.34 1.33 2.3636 8.21 0.85 8.54 0.15 7.46 0.99 1.9938 8.26 0.85 8.59 0.14 7.51 0.90 1.9040 8.28 0.85 8.61 0.14 7.52 0.88 1.8742 8.31 0.84 8.64 0.14 7.55 0.83 1.8144 8.33 0.84 8.66 0.14 7.57 0.81 1.7946 8.34 0.84 8.68 0.14 7.58 0.79 1.7748 8.34 0.84 8.68 0.14 7.58 0.79 1.77
49.61 8.34 0.84 8.68 0.14 7.58 0.79 1.77
fa 7.01Cmx 0.60fbx 0.85Fbx 19.20Cmy 0.85fby 0.82Fby 11.79
Case IV
136
Table 29: Interaction Equation for Combined Stresses – Pedestrian Railing (Case 4)

Bracing Arm Effective Length Fa fa / Fa Fex
Cmx•fbx
Fbx(1-fa/Fex)Fey
Cmy•fby
Fby(1-fa/Fey)Interaction Equation
22 5.06 1.39 5.20 -0.08 4.54 -0.11 1.2024 5.74 1.22 5.92 -0.14 5.17 -0.17 0.9126 6.34 1.11 6.54 -0.37 5.72 -0.26 0.4828 6.79 1.03 7.02 18.10 6.14 -0.41 18.7230 7.28 0.96 7.54 0.38 6.59 -0.91 0.4332 7.59 0.92 7.87 0.24 6.88 -2.99 -1.8234 7.80 0.90 8.09 0.20 7.07 7.54 8.6436 7.99 0.88 8.30 0.17 7.25 1.83 2.8838 8.15 0.86 8.47 0.15 7.40 1.13 2.1540 8.24 0.85 8.57 0.15 7.49 0.93 1.9342 8.28 0.85 8.61 0.14 7.52 0.88 1.8744 8.31 0.84 8.64 0.14 7.55 0.83 1.8146 8.33 0.84 8.66 0.14 7.57 0.81 1.7948 8.34 0.84 8.68 0.14 7.58 0.79 1.77
49.61 8.34 0.84 8.68 0.14 7.58 0.79 1.77
fa 7.01Cmx 0.60fbx 0.85Fbx 19.20Cmy 0.85fby 0.82Fby 11.79
Case V
137
Table 30: Interaction Equation for Combined Stresses – Pedestrian Railing (Case 5)
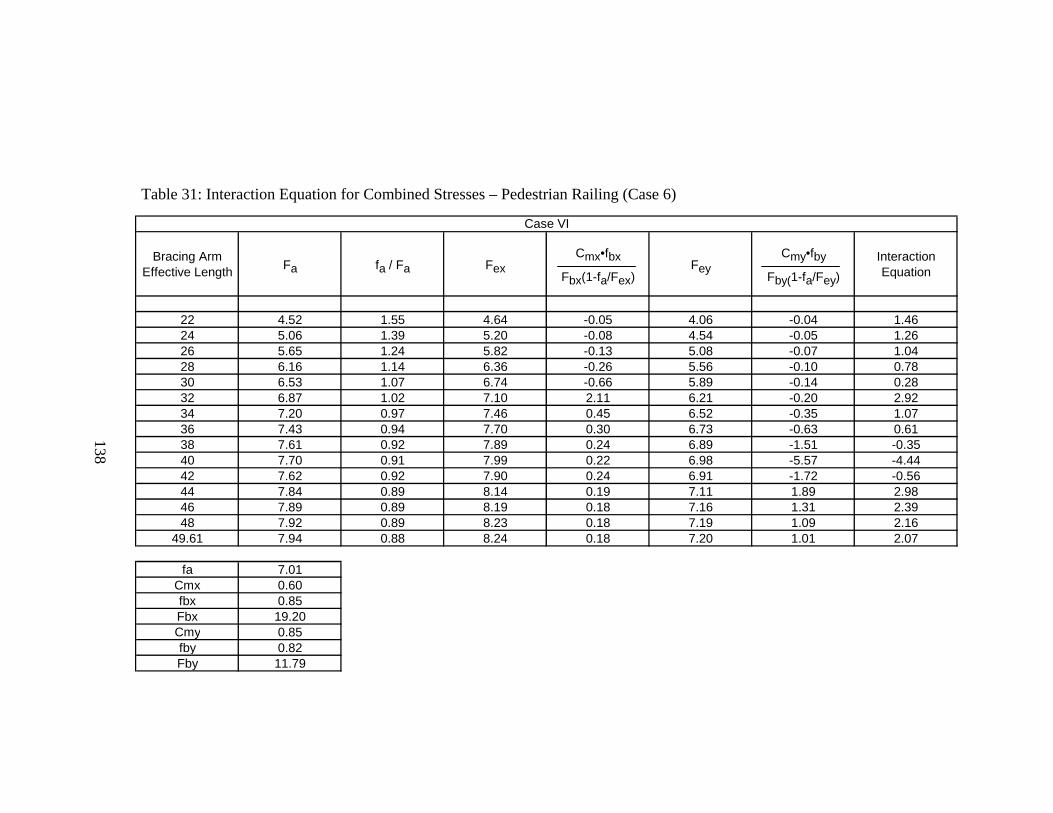
Bracing Arm Effective Length Fa fa / Fa Fex
Cmx•fbx
Fbx(1-fa/Fex)Fey
Cmy•fby
Fby(1-fa/Fey)Interaction Equation
22 4.52 1.55 4.64 -0.05 4.06 -0.04 1.4624 5.06 1.39 5.20 -0.08 4.54 -0.05 1.2626 5.65 1.24 5.82 -0.13 5.08 -0.07 1.0428 6.16 1.14 6.36 -0.26 5.56 -0.10 0.7830 6.53 1.07 6.74 -0.66 5.89 -0.14 0.2832 6.87 1.02 7.10 2.11 6.21 -0.20 2.9234 7.20 0.97 7.46 0.45 6.52 -0.35 1.0736 7.43 0.94 7.70 0.30 6.73 -0.63 0.6138 7.61 0.92 7.89 0.24 6.89 -1.51 -0.3540 7.70 0.91 7.99 0.22 6.98 -5.57 -4.4442 7.62 0.92 7.90 0.24 6.91 -1.72 -0.5644 7.84 0.89 8.14 0.19 7.11 1.89 2.9846 7.89 0.89 8.19 0.18 7.16 1.31 2.3948 7.92 0.89 8.23 0.18 7.19 1.09 2.16
49.61 7.94 0.88 8.24 0.18 7.20 1.01 2.07
fa 7.01Cmx 0.60fbx 0.85Fbx 19.20Cmy 0.85fby 0.82Fby 11.79
Case VI
138
Table 31: Interaction Equation for Combined Stresses – Pedestrian Railing (Case 6)
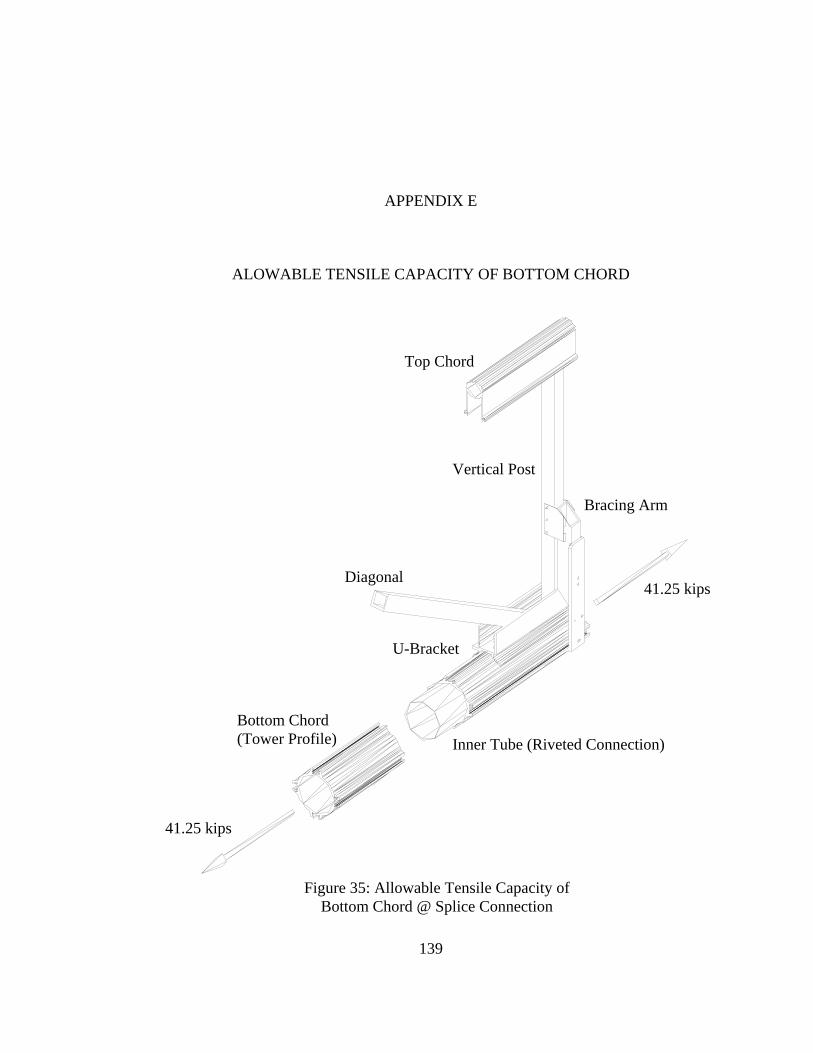
139
APPENDIX E
ALOWABLE TENSILE CAPACITY OF BOTTOM CHORD
41.25 kips
41.25 kips
Inner Tube (Riveted Connection) Bottom Chord (Tower Profile)
Figure 35: Allowable Tensile Capacity of Bottom Chord @ Splice Connection
Top Chord
Bracing Arm
Vertical Post
Diagonal
U-Bracket
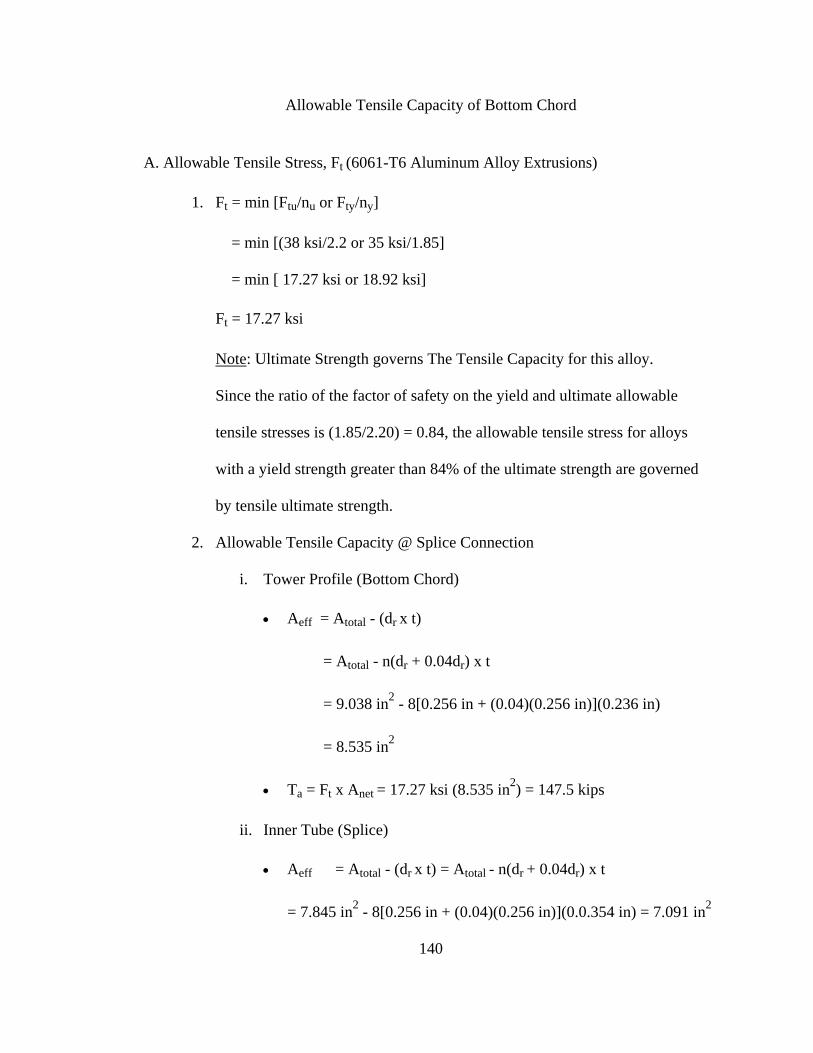
140
Allowable Tensile Capacity of Bottom Chord A. Allowable Tensile Stress, Ft (6061-T6 Aluminum Alloy Extrusions)
1. Ft = min [Ftu/nu or Fty/ny]
= min [(38 ksi/2.2 or 35 ksi/1.85]
= min [ 17.27 ksi or 18.92 ksi]
Ft = 17.27 ksi
Note: Ultimate Strength governs The Tensile Capacity for this alloy.
Since the ratio of the factor of safety on the yield and ultimate allowable
tensile stresses is (1.85/2.20) = 0.84, the allowable tensile stress for alloys
with a yield strength greater than 84% of the ultimate strength are governed
by tensile ultimate strength.
2. Allowable Tensile Capacity @ Splice Connection
i. Tower Profile (Bottom Chord) • Aeff = Atotal - (dr x t)
= Atotal - n(dr + 0.04dr) x t
= 9.038 in2 - 8[0.256 in + (0.04)(0.256 in)](0.236 in)
= 8.535 in2
• Ta = Ft x Anet = 17.27 ksi (8.535 in2) = 147.5 kips
ii. Inner Tube (Splice)
• Aeff = Atotal - (dr x t) = Atotal - n(dr + 0.04dr) x t
= 7.845 in2 - 8[0.256 in + (0.04)(0.256 in)](0.0.354 in) = 7.091 in2
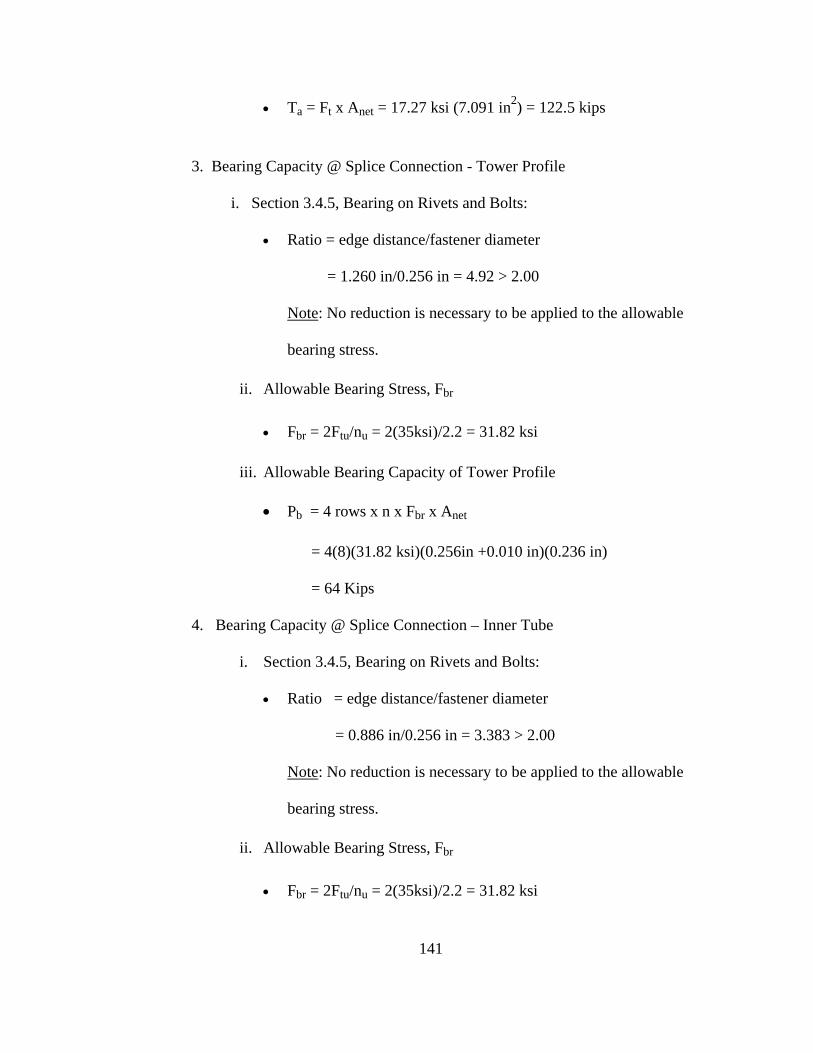
141
• Ta = Ft x Anet = 17.27 ksi (7.091 in2) = 122.5 kips
3. Bearing Capacity @ Splice Connection - Tower Profile
i. Section 3.4.5, Bearing on Rivets and Bolts:
• Ratio = edge distance/fastener diameter
= 1.260 in/0.256 in = 4.92 > 2.00
Note: No reduction is necessary to be applied to the allowable
bearing stress.
ii. Allowable Bearing Stress, Fbr
• Fbr = 2Ftu/nu = 2(35ksi)/2.2 = 31.82 ksi
iii. Allowable Bearing Capacity of Tower Profile
• Pb = 4 rows x n x Fbr x Anet
= 4(8)(31.82 ksi)(0.256in +0.010 in)(0.236 in)
= 64 Kips
4. Bearing Capacity @ Splice Connection – Inner Tube
i. Section 3.4.5, Bearing on Rivets and Bolts:
• Ratio = edge distance/fastener diameter
= 0.886 in/0.256 in = 3.383 > 2.00
Note: No reduction is necessary to be applied to the allowable
bearing stress.
ii. Allowable Bearing Stress, Fbr
• Fbr = 2Ftu/nu = 2(35ksi)/2.2 = 31.82 ksi
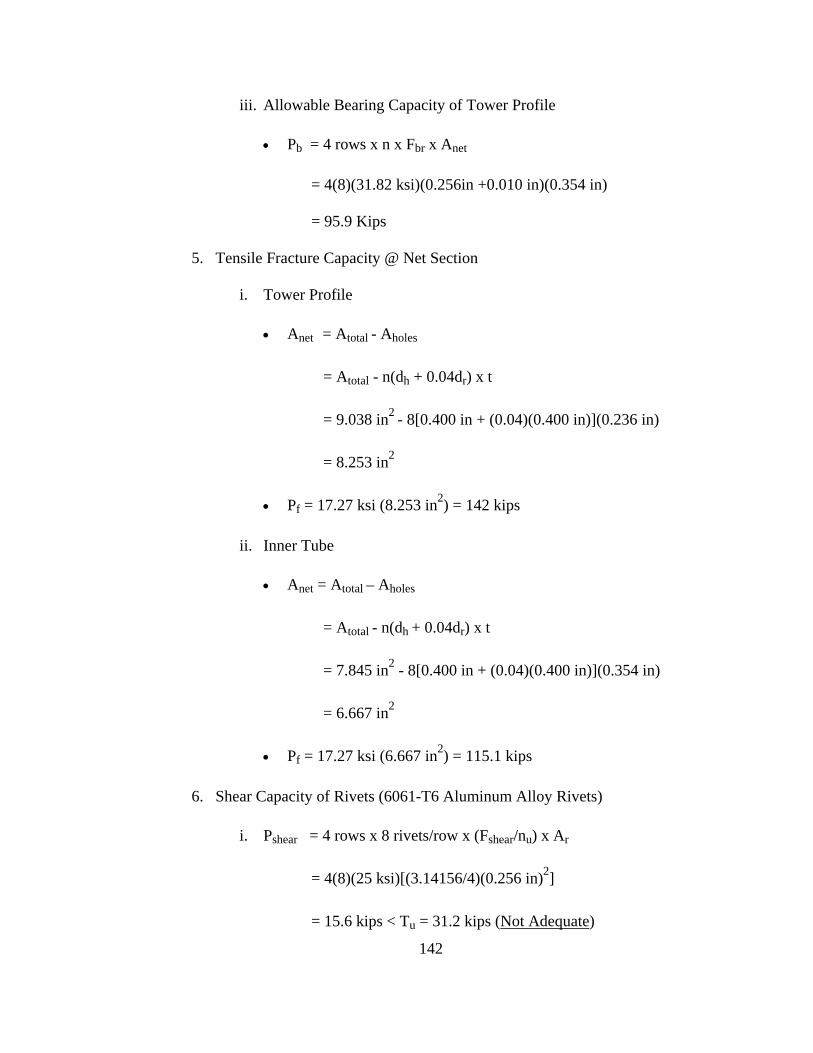
142
iii. Allowable Bearing Capacity of Tower Profile
• Pb = 4 rows x n x Fbr x Anet
= 4(8)(31.82 ksi)(0.256in +0.010 in)(0.354 in)
= 95.9 Kips
5. Tensile Fracture Capacity @ Net Section
i. Tower Profile
• Anet = Atotal - Aholes
= Atotal - n(dh + 0.04dr) x t
= 9.038 in2 - 8[0.400 in + (0.04)(0.400 in)](0.236 in)
= 8.253 in2
• Pf = 17.27 ksi (8.253 in2) = 142 kips
ii. Inner Tube
• Anet = Atotal – Aholes
= Atotal - n(dh + 0.04dr) x t
= 7.845 in2 - 8[0.400 in + (0.04)(0.400 in)](0.354 in)
= 6.667 in2
• Pf = 17.27 ksi (6.667 in2) = 115.1 kips
6. Shear Capacity of Rivets (6061-T6 Aluminum Alloy Rivets)
i. Pshear = 4 rows x 8 rivets/row x (Fshear/nu) x Ar
= 4(8)(25 ksi)[(3.14156/4)(0.256 in)2]
= 15.6 kips < Tu = 31.2 kips (Not Adequate)
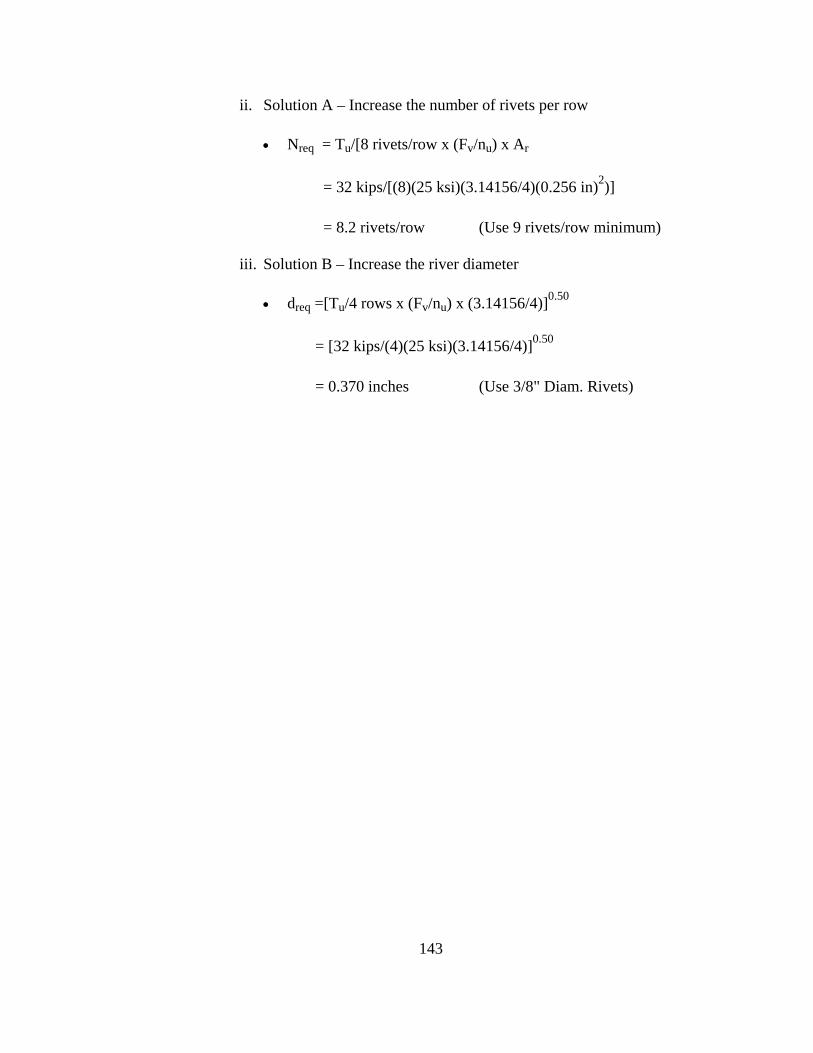
143
ii. Solution A – Increase the number of rivets per row
• Nreq = Tu/[8 rivets/row x (Fv/nu) x Ar
= 32 kips/[(8)(25 ksi)(3.14156/4)(0.256 in)2)]
= 8.2 rivets/row (Use 9 rivets/row minimum)
iii. Solution B – Increase the river diameter
• dreq =[Tu/4 rows x (Fv/nu) x (3.14156/4)]0.50
= [32 kips/(4)(25 ksi)(3.14156/4)]0.50
= 0.370 inches (Use 3/8" Diam. Rivets)
144
APPENDIX F
ALOWABLE TENSILE CAPACITY OF DIAGONAL MEMBERS
A. Allowable Tensile Stress, Ft (6061-T6 Aluminum Alloy Extrusions)
1. Ft = min [Ftu/nu or Fty/ny]
= min [(38 ksi/2.2 or 35 ksi/1.85]
= min [ 17.27 ksi or 18.92 ksi]
Ft = 17.27 ksi
Note: Tensile Capacity for this alloy is governed by Ultimate Strength since
the ratio of the factor of safety on the yield and ultimate allowable tensile
stresses is (1.85/2.20) = 0.84, the allowable tensile stress for alloys with a
yield strength greater than 84% of the ultimate strength are governed by
tensile ultimate strength.
2. Allowable Bearing Strength @ End Connection for Bolt Group A & B
(Bolt Group A = 4 Bolts and Bolt Group B = 2 Bolts)
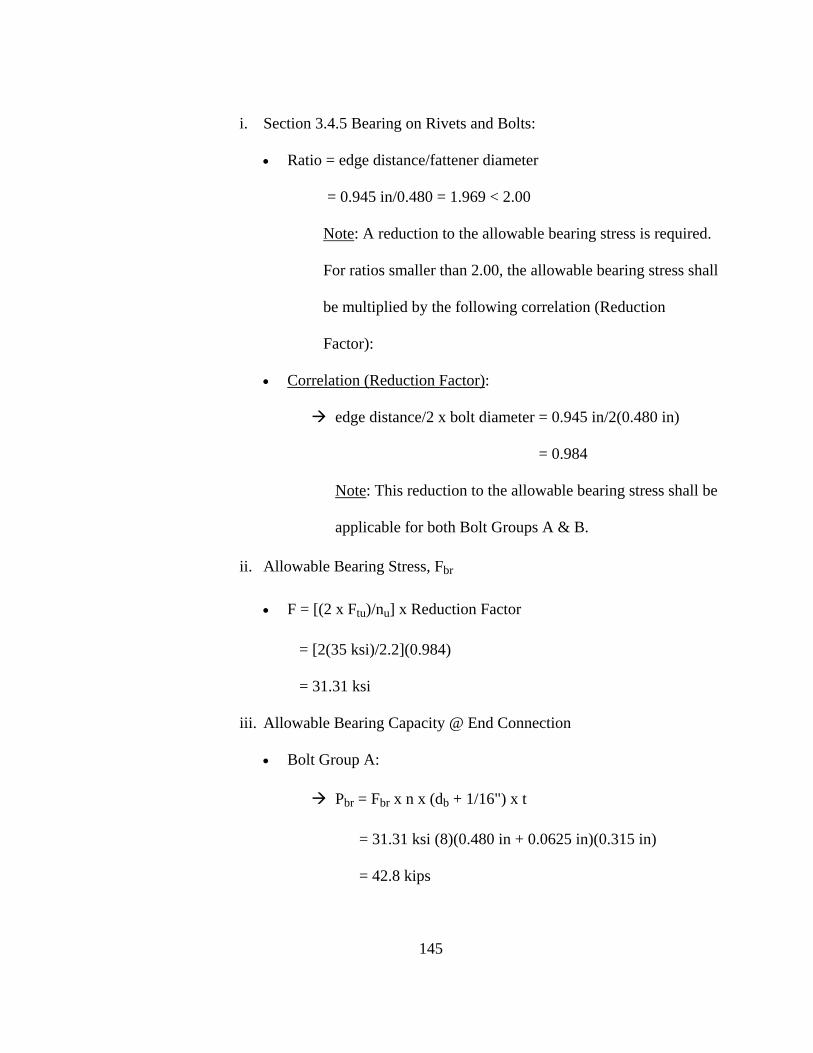
145
i. Section 3.4.5 Bearing on Rivets and Bolts:
• Ratio = edge distance/fattener diameter
= 0.945 in/0.480 = 1.969 < 2.00
Note: A reduction to the allowable bearing stress is required.
For ratios smaller than 2.00, the allowable bearing stress shall
be multiplied by the following correlation (Reduction
Factor):
• Correlation (Reduction Factor):
edge distance/2 x bolt diameter = 0.945 in/2(0.480 in)
= 0.984
Note: This reduction to the allowable bearing stress shall be
applicable for both Bolt Groups A & B.
ii. Allowable Bearing Stress, Fbr
• F = [(2 x Ftu)/nu] x Reduction Factor
= [2(35 ksi)/2.2](0.984)
= 31.31 ksi
iii. Allowable Bearing Capacity @ End Connection
• Bolt Group A:
Pbr = Fbr x n x (db + 1/16") x t
= 31.31 ksi (8)(0.480 in + 0.0625 in)(0.315 in)
= 42.8 kips
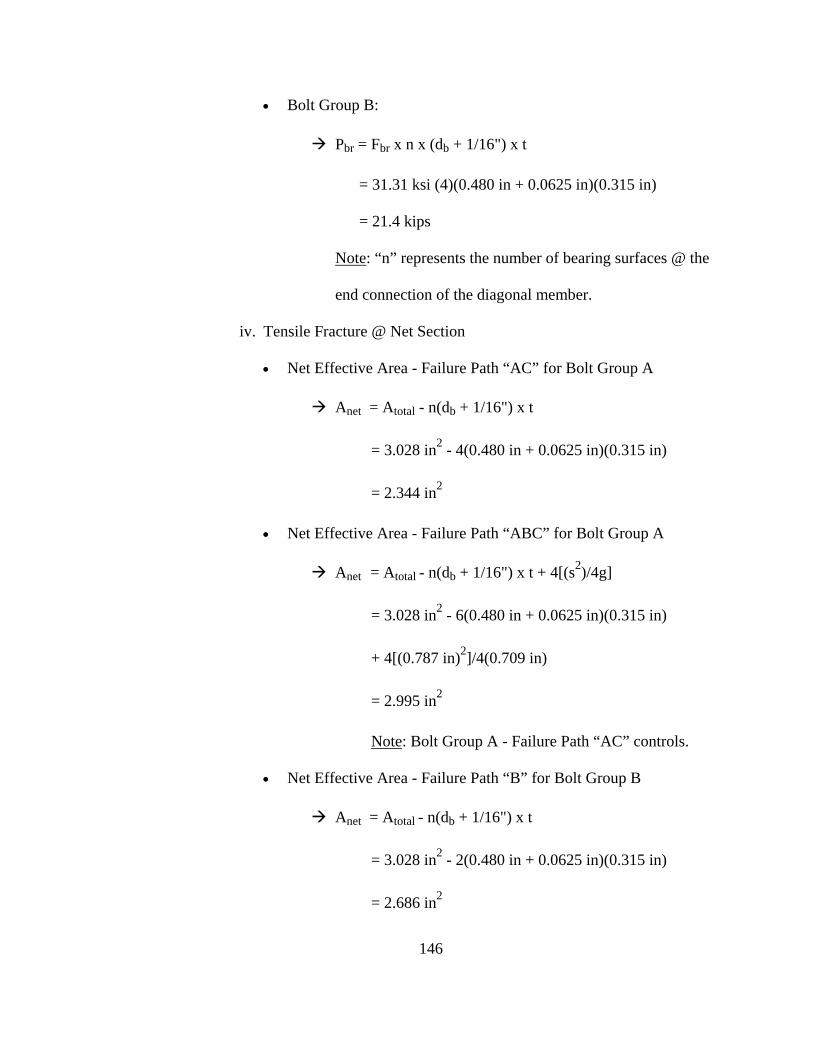
146
• Bolt Group B:
Pbr = Fbr x n x (db + 1/16") x t
= 31.31 ksi (4)(0.480 in + 0.0625 in)(0.315 in)
= 21.4 kips
Note: “n” represents the number of bearing surfaces @ the
end connection of the diagonal member.
iv. Tensile Fracture @ Net Section
• Net Effective Area - Failure Path “AC” for Bolt Group A
Anet = Atotal - n(db + 1/16") x t
= 3.028 in2 - 4(0.480 in + 0.0625 in)(0.315 in)
= 2.344 in2
• Net Effective Area - Failure Path “ABC” for Bolt Group A
Anet = Atotal - n(db + 1/16") x t + 4[(s2)/4g]
= 3.028 in2 - 6(0.480 in + 0.0625 in)(0.315 in)
+ 4[(0.787 in)2]/4(0.709 in)
= 2.995 in2
Note: Bolt Group A - Failure Path “AC” controls.
• Net Effective Area - Failure Path “B” for Bolt Group B
Anet = Atotal - n(db + 1/16") x t
= 3.028 in2 - 2(0.480 in + 0.0625 in)(0.315 in)
= 2.686 in2
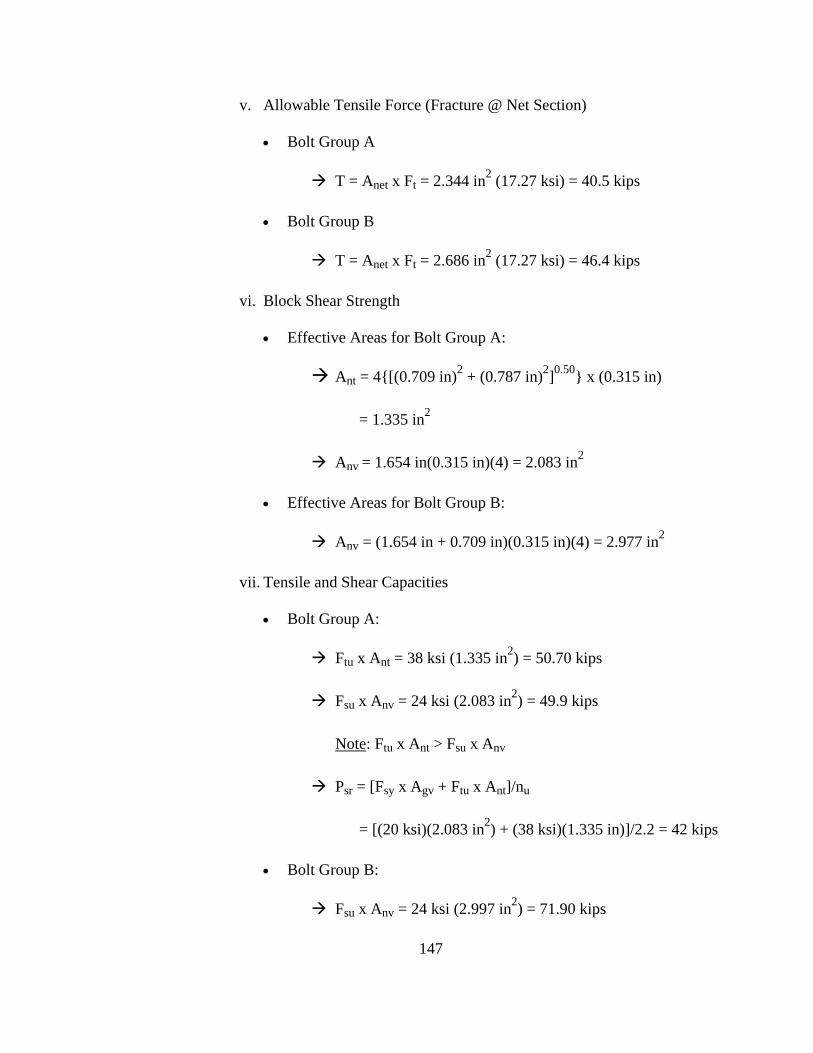
147
v. Allowable Tensile Force (Fracture @ Net Section)
• Bolt Group A
T = Anet x Ft = 2.344 in2 (17.27 ksi) = 40.5 kips
• Bolt Group B
T = Anet x Ft = 2.686 in2 (17.27 ksi) = 46.4 kips
vi. Block Shear Strength
• Effective Areas for Bolt Group A:
Ant = 4{[(0.709 in)2 + (0.787 in)2]0.50} x (0.315 in)
= 1.335 in2
Anv = 1.654 in(0.315 in)(4) = 2.083 in2
• Effective Areas for Bolt Group B:
Anv = (1.654 in + 0.709 in)(0.315 in)(4) = 2.977 in2
vii. Tensile and Shear Capacities
• Bolt Group A:
Ftu x Ant = 38 ksi (1.335 in2) = 50.70 kips
Fsu x Anv = 24 ksi (2.083 in2) = 49.9 kips
Note: Ftu x Ant > Fsu x Anv
Psr = [Fsy x Agv + Ftu x Ant]/nu
= [(20 ksi)(2.083 in2) + (38 ksi)(1.335 in)]/2.2 = 42 kips
• Bolt Group B:
Fsu x Anv = 24 ksi (2.997 in2) = 71.90 kips
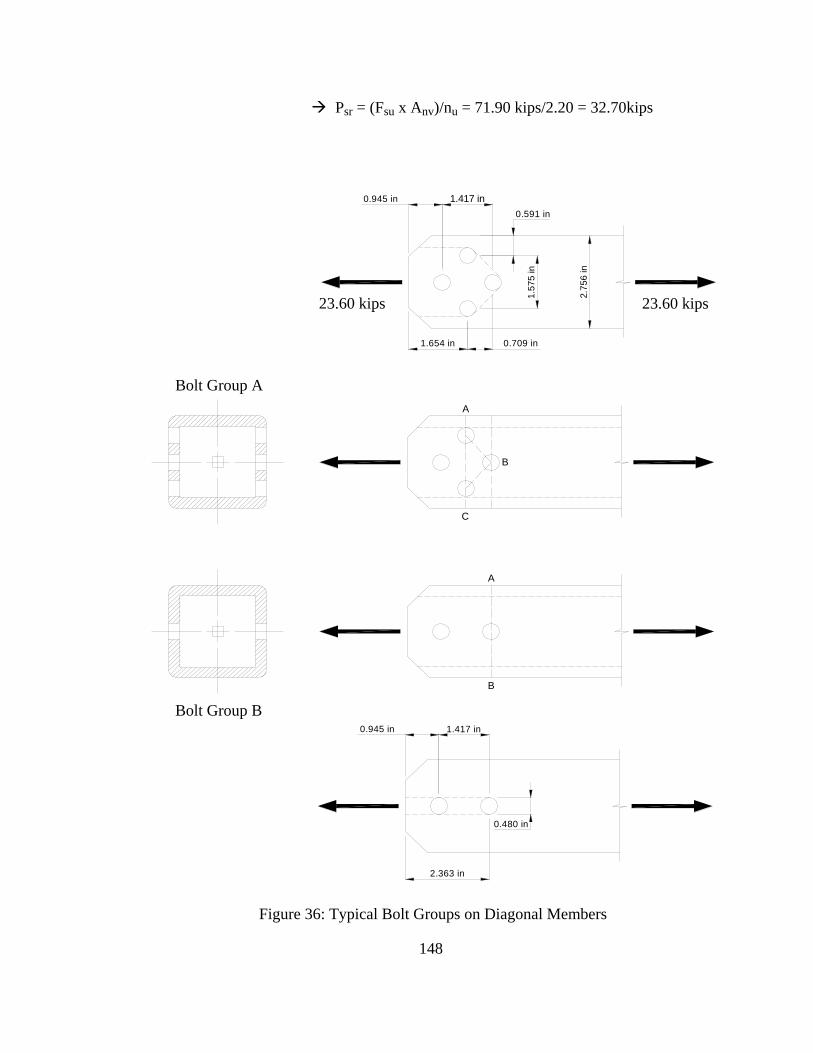
148
A
B
C
B
A
1.417 in
1.654 in 0.709 in
0.591 in0.945 in
1.57
5 in
2.75
6 in
1.417 in0.945 in
2.363 in
0.480 in
Psr = (Fsu x Anv)/nu = 71.90 kips/2.20 = 32.70kips
23.60 kips 23.60 kips
Bolt Group A
Bolt Group B
Figure 36: Typical Bolt Groups on Diagonal Members
149
APPENDIX G
ALOWABLE FLEXURAL CAPACITY OF FLOOR BEAMS
A. Allowable Tensile Stress, Ft (6061-T6 Aluminum Alloy Extrusions)
1. Ft = min [Ftu/nu or Fty/ny]
= min [(38 ksi/2.2 or 35 ksi/1.85]
= min [ 17.27 ksi or 18.92 ksi]
Ft = 17.27 ksi
Note: The ratio of the factor of safety on the yield and ultimate allowable
tensile stresses is (1.85/2.20) = 0.84, therefore the allowable tensile stress with
yield strength greater than 84% of the ultimate strength is governed by tensile
ultimate strength.
2. Bending Compression (Hollow Cross Section)
i. Lateral Torsional Buckling
• Torsional Constant, J
J = [4 x Ao2]/[Sum (Si/ti)]
= {4[(2.756 in - 0.315 in)2]2}/[4(2.756 in/0.315 in)] = 4.06 in4
150
• Section Modulus for Compression Side, Sc
Sc = Ixx/c = 23 in4/(1.673 in + 1.378 in) = 7.54 in3
• Critical Slenderness
[Lb x Sc] / 0.50[Iyy x J]0.50 = (98.42 in)(7.54 in3) ÷
{0.50[(6.04 in4)(4.06 in4)]0.50} = 300
• Allowable Bending Stress, Fb
Section 3.4.14 Compression in beams extreme fibers
(gross section):
For S1 = 146 < [Lb x Sc]/0.50[Iyy x J]0.50 = 300 < S2 = 1700
Fb = 23.9 - 0.24 x {[Lb x Sc]/0.50[Iyy x J]0.50}0.50
= 23.9 - 0.24 (300)0.50 = 19.70 ksi
ii. Local Buckling Stress
• Plate Slenderness, b/t
b/t = 2.756 in / 0.315 in = 8.75
• Allowable Bending Stress, Fb
Section 3.4.16 Beam components under uniform compression
(gross section), flat plates supported along both edges:
For b/t = 8.75 < S1 = 22 Fb = 21 ksi
151
Section 3.4.18 Components of beams under bending in its own
plane (gross section) flat plates supported along both edges:
For b/t = 8.75 < S1 = 46 Fb = 28 ksi
iii. Conclusion:
For lateral torsional buckling the allowable bending stress in
compression controls (Fb = 19.70 ksi)
3. Internal Bending Stress caused by External Design Forces, fb
(Hollow Cross Section)
i. Load Case 1 - H5-44 Vehicle Load, Wv = 10 kips
• Reaction Force = 0.40(10 kips) = 4 kips
• Maximum Bending Moment, Mmax
Mmax = (P x L)/4 + (w x L2)/8
= 4 kips (8.202 ft)/4 + [0.07 klf (8.202 ft)2]/8
= 5.03 kips x ft
• Maximum Internal Bending Stress, fb
fb = (Mmax x c)/Ixx
= (5.03 kips x ft)(12 in/ft)(1.673 in + 1.378 in)/23 in4
= 8.00 ksi
ii. Load Case 2 - Pedestrian Live Load
• w = 85 psf x (8.222 ft) = 699plf Say 700 plf
152
• Maximum Bending Moment, Mmax
Mmax = (w x L2)/8 = [(700 + 62)plf (8.202 ft)2]/8
= (6407 Lbs x ft)(1 kip/ 1000 lbs) = 6.41 kips x ft
• Maximum Internal Bending Stress, fb
fb = (Mmax x c)/Ixx
= (6.41 kips x ft)(12 in/ft)(1.673 in + 1.378 in)/23 in4
= 10.20 ksi
iii. Conclusion: The bending stresses from either load combination is
lower as compared to the allowable bending stress for lateral torsional
buckling.
4. Deflection Analysis (Double Hollow Cross Section)
i. Deflection for Uniformly Distributed Dead Load, w
• D = (5)(5.167E-3 kips/in)[(98.42 in)4] / (384)(10100 ksi)(23 in4)
= 0.027 in
ii. Deflection for H5-44 Truck Live Load, P
• D = (4 kips)(24 in)[3(98.42 in)2 - 4(24 in)2] ÷
[(24)(10100 ksi)(23in4)] = 0.461 in
iii. Deflection for Pedestrian Live Load, wp
• D = (5)(5.833E-2 kips/in)[(98.42 in)4]/(384)(10100 ksi)(23 in4)
= 0.307 in
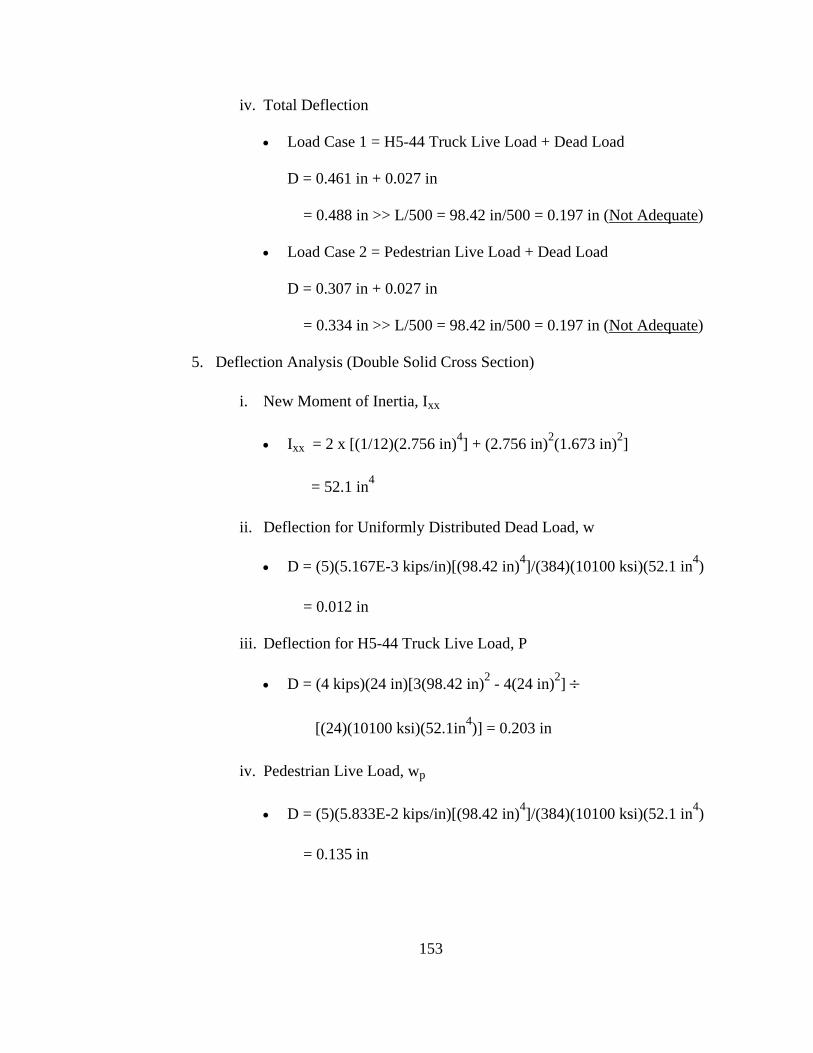
153
iv. Total Deflection
• Load Case 1 = H5-44 Truck Live Load + Dead Load
D = 0.461 in + 0.027 in
= 0.488 in >> L/500 = 98.42 in/500 = 0.197 in (Not Adequate)
• Load Case 2 = Pedestrian Live Load + Dead Load
D = 0.307 in + 0.027 in
= 0.334 in >> L/500 = 98.42 in/500 = 0.197 in (Not Adequate)
5. Deflection Analysis (Double Solid Cross Section)
i. New Moment of Inertia, Ixx
• Ixx = 2 x [(1/12)(2.756 in)4] + (2.756 in)2(1.673 in)2]
= 52.1 in4
ii. Deflection for Uniformly Distributed Dead Load, w
• D = (5)(5.167E-3 kips/in)[(98.42 in)4]/(384)(10100 ksi)(52.1 in4)
= 0.012 in
iii. Deflection for H5-44 Truck Live Load, P
• D = (4 kips)(24 in)[3(98.42 in)2 - 4(24 in)2] ÷
[(24)(10100 ksi)(52.1in4)] = 0.203 in
iv. Pedestrian Live Load, wp
• D = (5)(5.833E-2 kips/in)[(98.42 in)4]/(384)(10100 ksi)(52.1 in4)
= 0.135 in
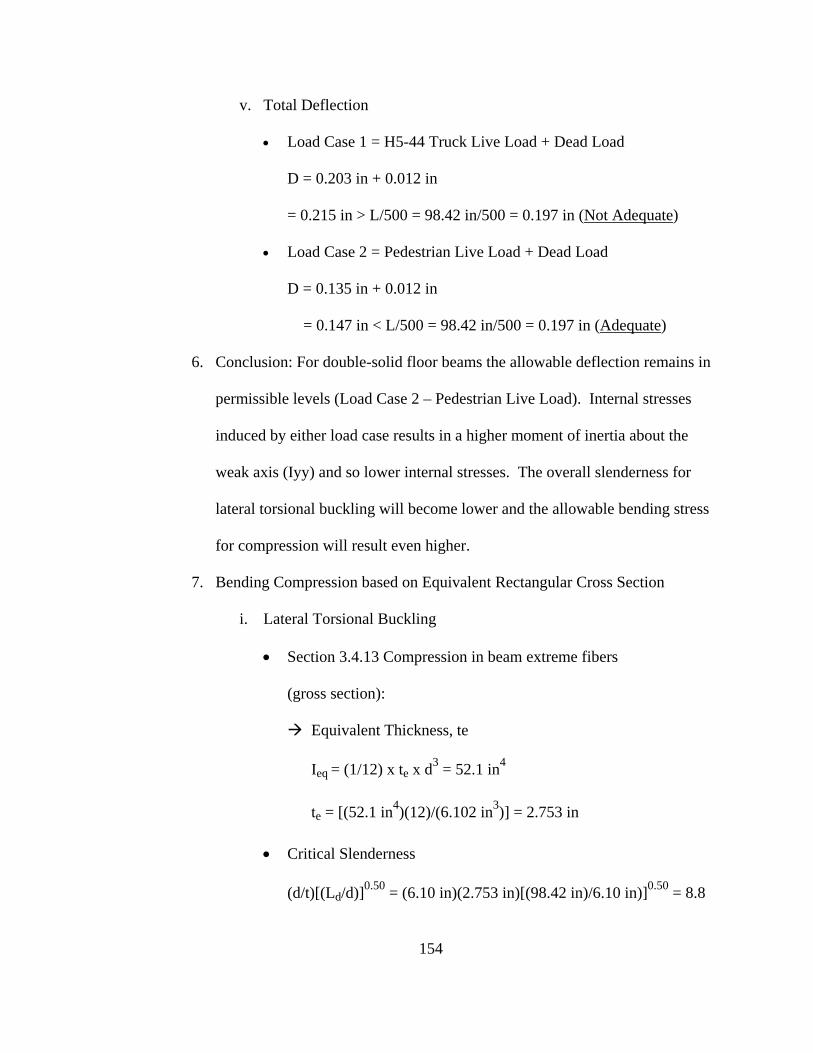
154
v. Total Deflection
• Load Case 1 = H5-44 Truck Live Load + Dead Load
D = 0.203 in + 0.012 in
= 0.215 in > L/500 = 98.42 in/500 = 0.197 in (Not Adequate)
• Load Case 2 = Pedestrian Live Load + Dead Load
D = 0.135 in + 0.012 in
= 0.147 in < L/500 = 98.42 in/500 = 0.197 in (Adequate)
6. Conclusion: For double-solid floor beams the allowable deflection remains in
permissible levels (Load Case 2 – Pedestrian Live Load). Internal stresses
induced by either load case results in a higher moment of inertia about the
weak axis (Iyy) and so lower internal stresses. The overall slenderness for
lateral torsional buckling will become lower and the allowable bending stress
for compression will result even higher.
7. Bending Compression based on Equivalent Rectangular Cross Section
i. Lateral Torsional Buckling
• Section 3.4.13 Compression in beam extreme fibers
(gross section):
Equivalent Thickness, te
Ieq = (1/12) x te x d3 = 52.1 in4
te = [(52.1 in4)(12)/(6.102 in3)] = 2.753 in
• Critical Slenderness
(d/t)[(Ld/d)]0.50 = (6.10 in)(2.753 in)[(98.42 in)/6.10 in)]0.50 = 8.8
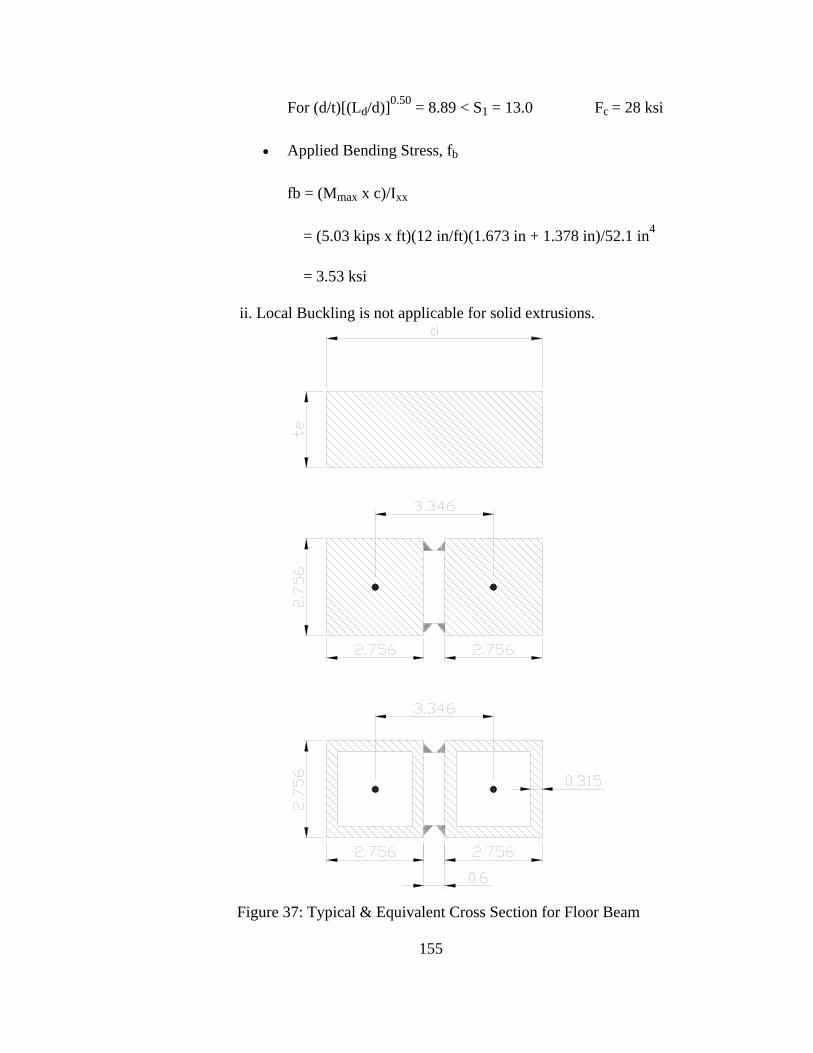
155
For (d/t)[(Ld/d)]0.50 = 8.89 < S1 = 13.0 Fc = 28 ksi
• Applied Bending Stress, fb
fb = (Mmax x c)/Ixx
= (5.03 kips x ft)(12 in/ft)(1.673 in + 1.378 in)/52.1 in4
= 3.53 ksi
ii. Local Buckling is not applicable for solid extrusions.
Figure 37: Typical & Equivalent Cross Section for Floor Beam
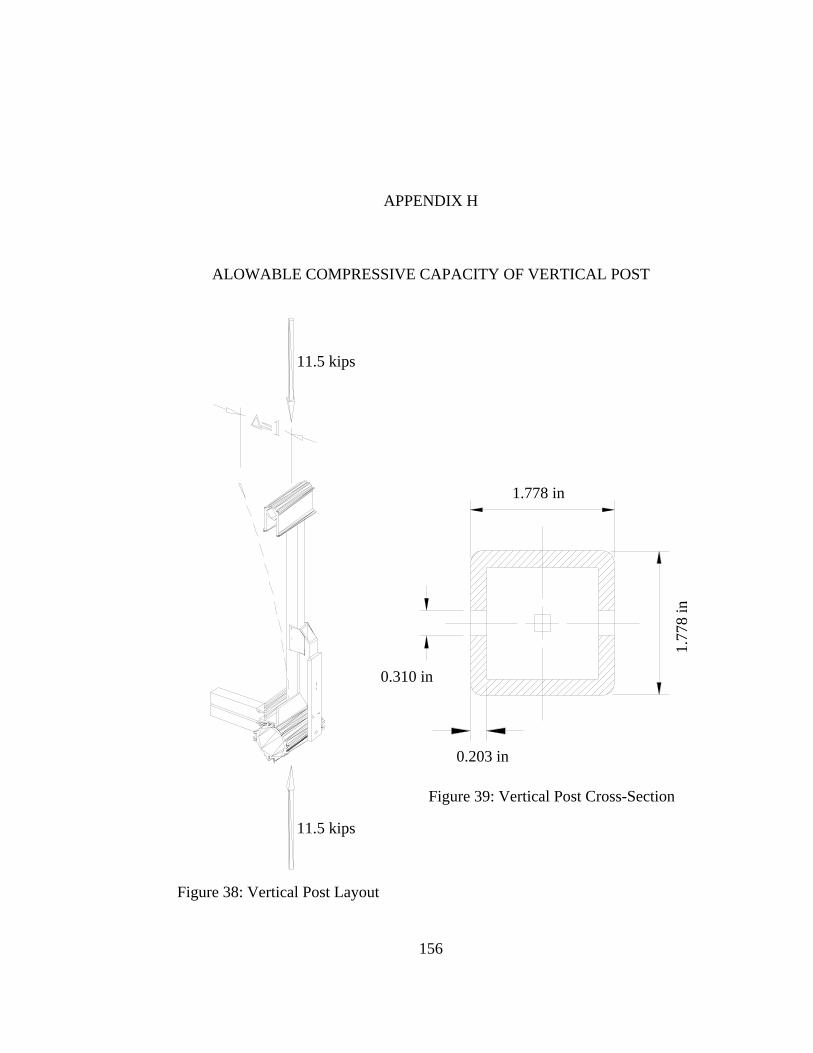
156
APPENDIX H
ALOWABLE COMPRESSIVE CAPACITY OF VERTICAL POST
11.5 kips
11.5 kips
0.310 in
1.778 in
1.77
8 in
0.203 in
Figure 39: Vertical Post Cross-Section
Figure 38: Vertical Post Layout
157
Allowable Compressive Capacity of Vertical Post A. Slenderness Ratio:
i. Overall Flexural Buckling
• (k x L)/r = 1.0(55.12 in).0.999 in = 55.2
ii. Local Buckling
• b/t = 2.756 in/0.315 in = 8.75
B. Allowable Compressive Stress
i. Overall Flexural Buckling
• Section 3.4.7, Compression in all column (gross section)
For S1 = 0 < (k x L)/r = 55.2 < S2 = 66
Fc = 20.2 - 0.126[(k x L)/r] = 20.2 - 0.126(55.2) = 13.2 ksi
ii. Local Buckling
• Section 3.4.9, Compression in components of columns (gross section)
For S1 = 8.4 < b/t = 8.75 < S2 33
Fc = 23.1 - 0.25(b/t) = 23.1 - 0.25(8.75) = 20.9 ksi C. Effect of Local Buckling on member performance
i. This design restriction is not applicable to this member given that the slenderness ratio for the plate element does not exceeds the Slenderness Limit S2. Therefore, there won't be any elastic local buckling in this member.
D. Conclusion: Overall Flexural Buckling is the failure mode that controls the design of
this member, Fc = 13.2 ksi E. Allowable Compressive Force, Pc
i. Pc = 13.2 ksi (3.028 in2) = 39.9 kips
ii. Pu = 11.5 kips FS = 39.9 kips/11.5 kips = 3.47
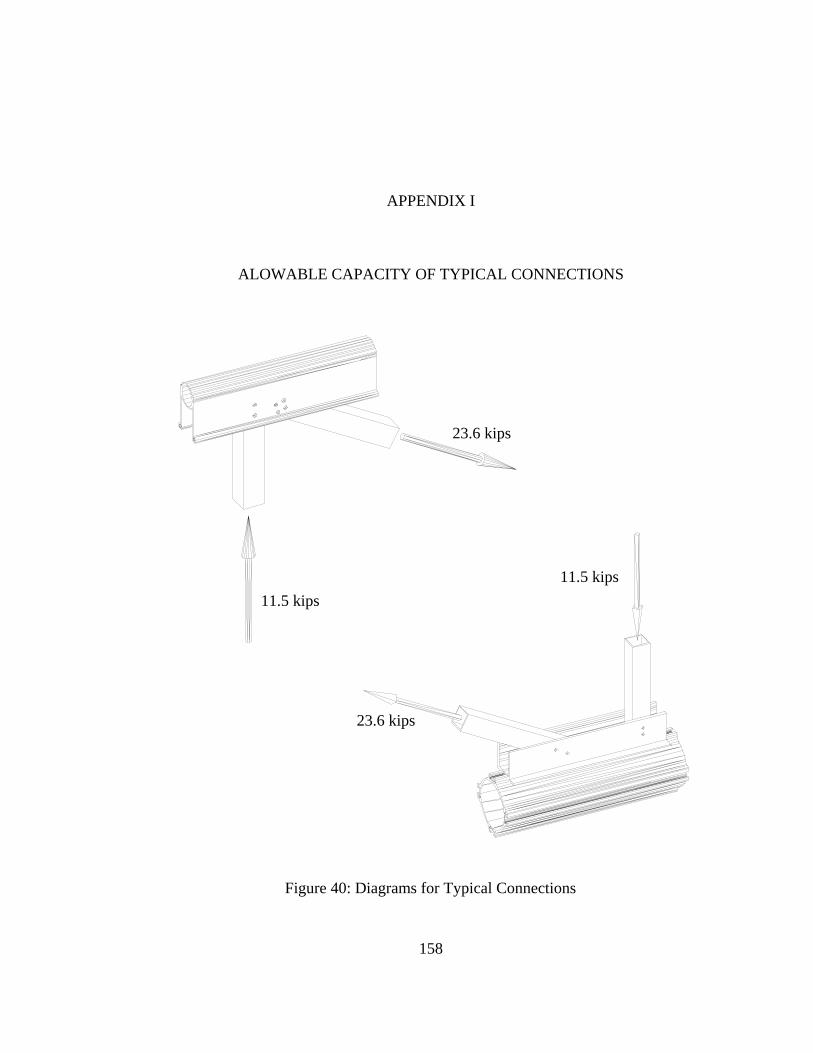
158
23.6 kips
11.5 kips 11.5 kips
23.6 kips
Figure 40: Diagrams for Typical Connections
APPENDIX I
ALOWABLE CAPACITY OF TYPICAL CONNECTIONS
159
Typical Bolted Connections
A. Bolted Connection between Top Chord and Diagonal Members
i. Bearing Capacity of Bolt Group A (4 Bolts)
• Allowable Bearing Stress Reduction Factor
Ratio = edge distance/fastener diameter
= 3.117 in / 0.480 in = 6.49 < 2.00
Note: Reduction factor does not apply.
• Allowable Bearing Stress for 6061-T6 Aluminum Alloy, Fbr
Fbr = 2 x Ftu / nu = 2 (35 ksi) / 2.20 = 31.82 ksi
• Allowable Bearing Force, Pbr
Pbr = Fbr x Abr
= (4)(31.82 ksi)(0.480 in)(0.315 in) = 38.5 kips
ii. Bearing Capacity of Bolt Group B (2 Bolts)
• Allowable Bearing Stress Reduction Factor
Ratio = edge distance/fastener diameter
= 3.117 in / 0.480 in = 6.49 < 2.00
Note: Reduction factor does not applies
• Allowable Bearing Stress for 6061-T6 Aluminum Alloy, Fbr
Fbr = 2 x Ftu / nu = 2 (35 ksi) / 2.20 = 31.82 ksi
160
• Allowable Bearing Force, Pbr
Pbr = Fbr x Abr
= (2)(31.82 ksi)(0.480 in)(0.315 in) = 19.24 kips
iii. Block Shear of Bolt Group A (4 Bolts)
• Psr = 41.99 kips
Note: The load carrying capacity of the Top Chord against this failure
mode is equivalent to the one on the Diagonal Members given that the bolt
layout is identical as well as the wall thickness of the free standing flat
plates on the Top Chord.
iv. Block Shear of Bolt Group B (2 Bolts)
• Psr = 19.24 kips
Note: The load carrying capacity of the Top Chord against this failure
mode is similar to the one on the Diagonal Members since the bolt layout
is identical as well as the wall thickness of the free standing flat plates on
the Top Chord.
B. Bolted Connection between Diagonal Members and U-Bracket A
i. Bearing Capacity of Bolt Group A (4 Bolts)
• Allowable Bearing Stress Reduction Factor
Ratio = edge distance/fastener diameter
= 2.900 in / 0.480 in = 6.04 < 2.00
Note: Reduction factor does not apply.
161
• Allowable Bearing Stress for 6061-T6 Aluminum Alloy, Fbr
Fbr = 2 x Ftu / nu = 2 (35 ksi) / 2.20 = 31.82 ksi
• Allowable Bearing Force, Pbr
Pbr = Fbr x Abr
= (4)(2)(31.82 ksi)(0.480 in)(0.354 in) = 43.25 kips
ii. Bearing Capacity of Bolt Group B (2 Bolts)
• Allowable Bearing Stress Reduction Factor
Ratio = edge distance/fastener diameter
= 2.900 in / 0.480 in = 6.04 < 2.00
Note: Reduction factor does not apply.
• Allowable Bearing Force, Pbr
Pbr = Fbr x Abr
= (2)(2)(31.82 ksi)(0.480 in)(0.354 in) = 21.70 kips
C. Bolted Connection between U-Bracket A and Bottom Chord
i. Bearing Capacity of Bolt Group C on U-Bracket (6 Bolts)
• Allowable Bearing Stress Reduction Factor
Ratio = edge distance/fastener diameter
= 0.984 in / 0.480 in = 2.05 < 2.00
Note: Reduction factor does not apply.
• Allowable Bearing Force, Pbr
Pbr = Fbr x Abr
= (6)(31.82 ksi)(0.480 in)(0.289 in) = 26.50 kips
162
ii. Bearing Capacity of Bolt Group C on Bottom Chord (6 Bolts)
• Pbr = Fbr x Abr
= (6)(31.82 ksi)(0.480 in)(0.236 in) = 21.60 kips
D. Bolted Connection between U-Bracket B and Bottom Chord
i. Bearing Capacity of Bolt Group C on U-Bracket (4 Bolts)
• Allowable Bearing Stress Reduction Factor
Ratio = edge distance/fastener diameter
= 0.984 in / 0.480 in = 2.05 < 2.00
Note: Reduction factor does not apply.
• Allowable Bearing Force, Pbr
ii. Bearing Capacity of Bolt Group C on Bottom Chord (4 Bolts)
• Pbr = Fbr x Abr
= (4)(31.82 ksi)(0.480 in)(0.236 in) = 14.40 kips
Note: The load carrying capacity of the bolted connections in between the
U-Brackets (A & B) and the Bottom Chord has to be compared with the
horizontal component of the corresponding maximum tensile forces
applied to the Diagonal Members.
163
APPENDIX J
ALOWABLE CAPACITY OF ABUTMENT CONNECTIONS
Load Carrying Capacity of Bridge Main Supports
A. AASHTO Design Requirements for Single Span Bridges (Earthquakes)
Section 4.5 is a design provision obtained from AASHTO Standard Specifications for
Highway Bridges, Seismic Design. It states that a detailed seismic analysis is not
required for single span bridges. However, connections between the bridge span and the
abutments shall be designed longitudinally and transversally to resists a force with a
magnitude equivalent to the gravity reaction (dead load) at the abutment support times
the Acceleration Coefficient at the site.
Section 3.2 provides contour maps from the United States and its territories where these
Acceleration Coefficients can be determined. These contour values are expressed as
percentages and the corresponding multiplier can be obtained by dividing these
coefficients by 100. These values of horizontal ground acceleration are determined in
rock with a 90% probability of not being exceeded in 50 years as stated by the United
States Geological Survey, 1988.
164
B. Abutment Support I (Longitudinal Direction)
i. Bearing Capacity of Standing Plates
• Allowable Bearing Stress Reduction Factor
Ratio = edge distance/fastener diameter
= 2.953 in / 0.728 in = 4.06 < 2.00
Note: Reduction factor does not apply.
ii. Allowable Bearing Stress for 6061-T6 Aluminum Alloy, Fbr
• Fbr = 2 x Ftu / nu = 2 (35 ksi) / 2.20 = 31.82 ksi
iii. Allowable Bearing Force, Pbr
• Pbr = Fbr x Abr
= 31.82 ksi (0.625 in)(0.787 in)(2) = 23.6 kips
iv. Weld Shear Capacity
• Shear Strength of Filler Alloy
For 4043 Aluminum Alloy, Fv = 4.4 ksi
For 5356 Aluminum Alloy, Fv = 7.0 ksi
Note: These allowable shear values are for bridge type structures.
v. Weld Shear Capacity
• Shear Strength of Base Metal
For Tension Failure, Fv = 1.41 (24 ksi)(0.90)/2.34(1.0) = 13 ksi
For Shear Failure, Fv = 1.41 (15 ksi)/2.34 = 9 ksi
Conclusion: Allowable shear stress is controlled by the shear capacity of
the filler alloy selected to make the welds.
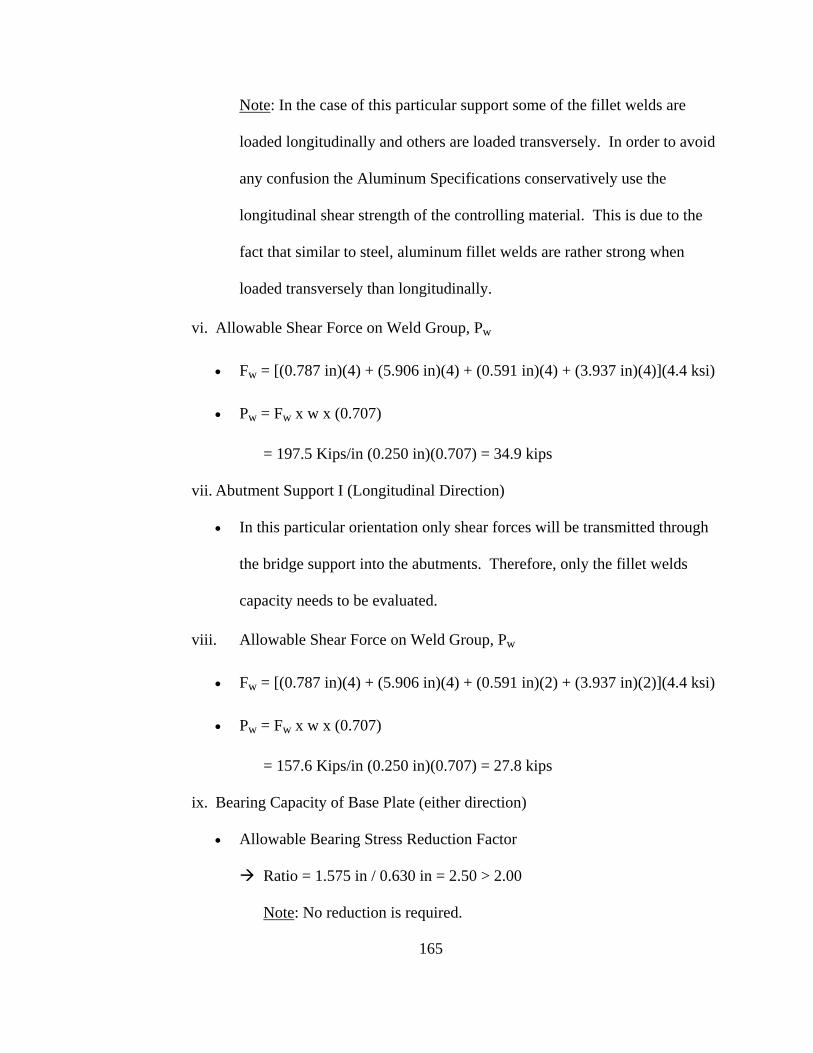
165
Note: In the case of this particular support some of the fillet welds are
loaded longitudinally and others are loaded transversely. In order to avoid
any confusion the Aluminum Specifications conservatively use the
longitudinal shear strength of the controlling material. This is due to the
fact that similar to steel, aluminum fillet welds are rather strong when
loaded transversely than longitudinally.
vi. Allowable Shear Force on Weld Group, Pw
• Fw = [(0.787 in)(4) + (5.906 in)(4) + (0.591 in)(4) + (3.937 in)(4)](4.4 ksi)
• Pw = Fw x w x (0.707)
= 197.5 Kips/in (0.250 in)(0.707) = 34.9 kips
vii. Abutment Support I (Longitudinal Direction)
• In this particular orientation only shear forces will be transmitted through
the bridge support into the abutments. Therefore, only the fillet welds
capacity needs to be evaluated.
viii. Allowable Shear Force on Weld Group, Pw
• Fw = [(0.787 in)(4) + (5.906 in)(4) + (0.591 in)(2) + (3.937 in)(2)](4.4 ksi)
• Pw = Fw x w x (0.707)
= 157.6 Kips/in (0.250 in)(0.707) = 27.8 kips
ix. Bearing Capacity of Base Plate (either direction)
• Allowable Bearing Stress Reduction Factor
Ratio = 1.575 in / 0.630 in = 2.50 > 2.00
Note: No reduction is required.
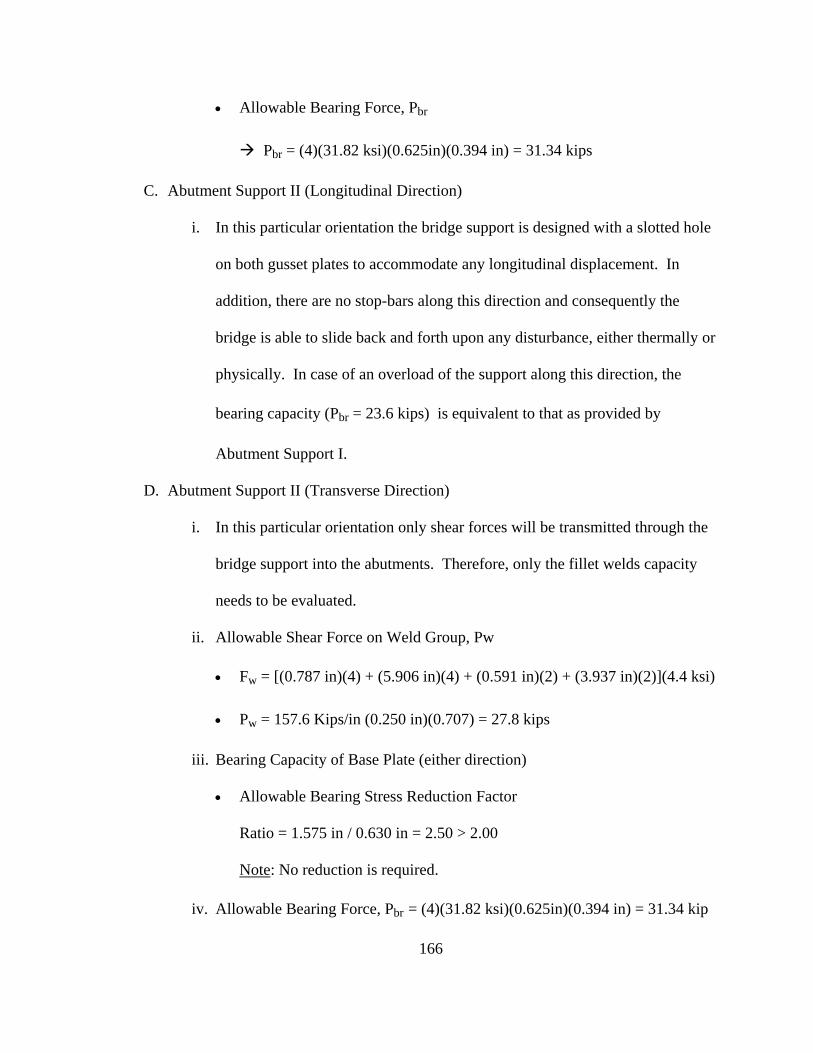
166
• Allowable Bearing Force, Pbr
Pbr = (4)(31.82 ksi)(0.625in)(0.394 in) = 31.34 kips
C. Abutment Support II (Longitudinal Direction)
i. In this particular orientation the bridge support is designed with a slotted hole
on both gusset plates to accommodate any longitudinal displacement. In
addition, there are no stop-bars along this direction and consequently the
bridge is able to slide back and forth upon any disturbance, either thermally or
physically. In case of an overload of the support along this direction, the
bearing capacity (Pbr = 23.6 kips) is equivalent to that as provided by
Abutment Support I.
D. Abutment Support II (Transverse Direction)
i. In this particular orientation only shear forces will be transmitted through the
bridge support into the abutments. Therefore, only the fillet welds capacity
needs to be evaluated.
ii. Allowable Shear Force on Weld Group, Pw
• Fw = [(0.787 in)(4) + (5.906 in)(4) + (0.591 in)(2) + (3.937 in)(2)](4.4 ksi)
• Pw = 157.6 Kips/in (0.250 in)(0.707) = 27.8 kips
iii. Bearing Capacity of Base Plate (either direction)
• Allowable Bearing Stress Reduction Factor
Ratio = 1.575 in / 0.630 in = 2.50 > 2.00
Note: No reduction is required.
iv. Allowable Bearing Force, Pbr = (4)(31.82 ksi)(0.625in)(0.394 in) = 31.34 kip
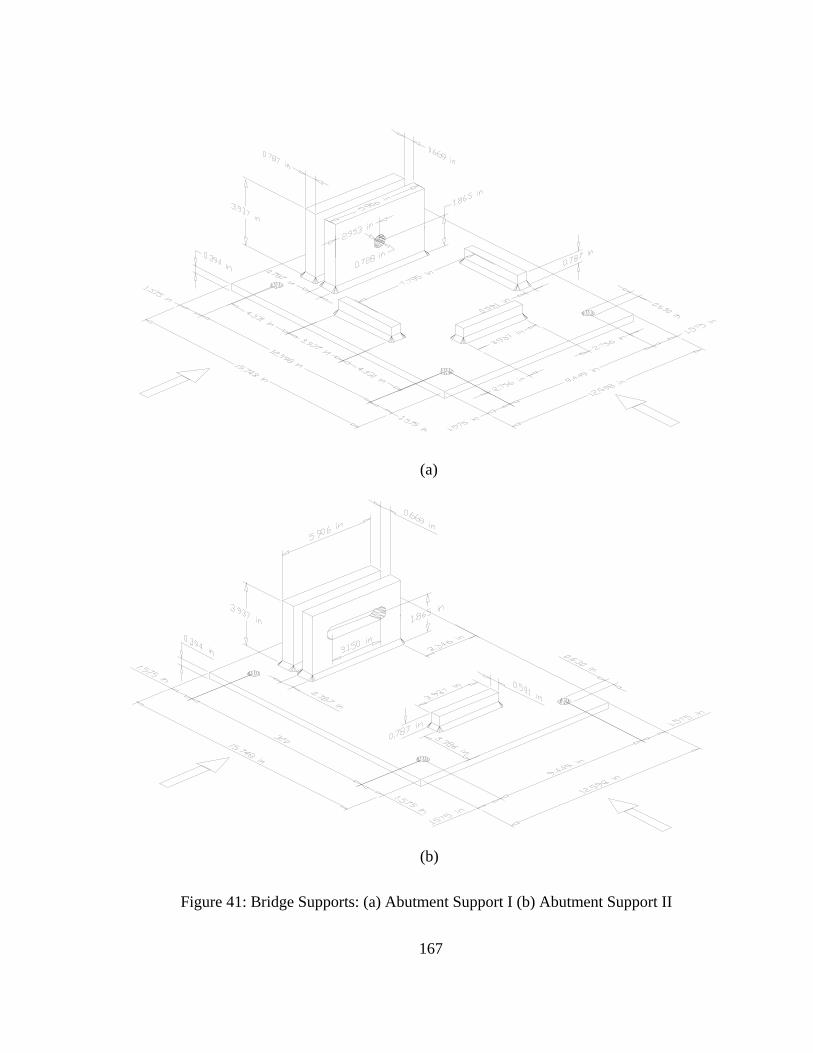
167
Figure 41: Bridge Supports: (a) Abutment Support I (b) Abutment Support II
(b)
(a)
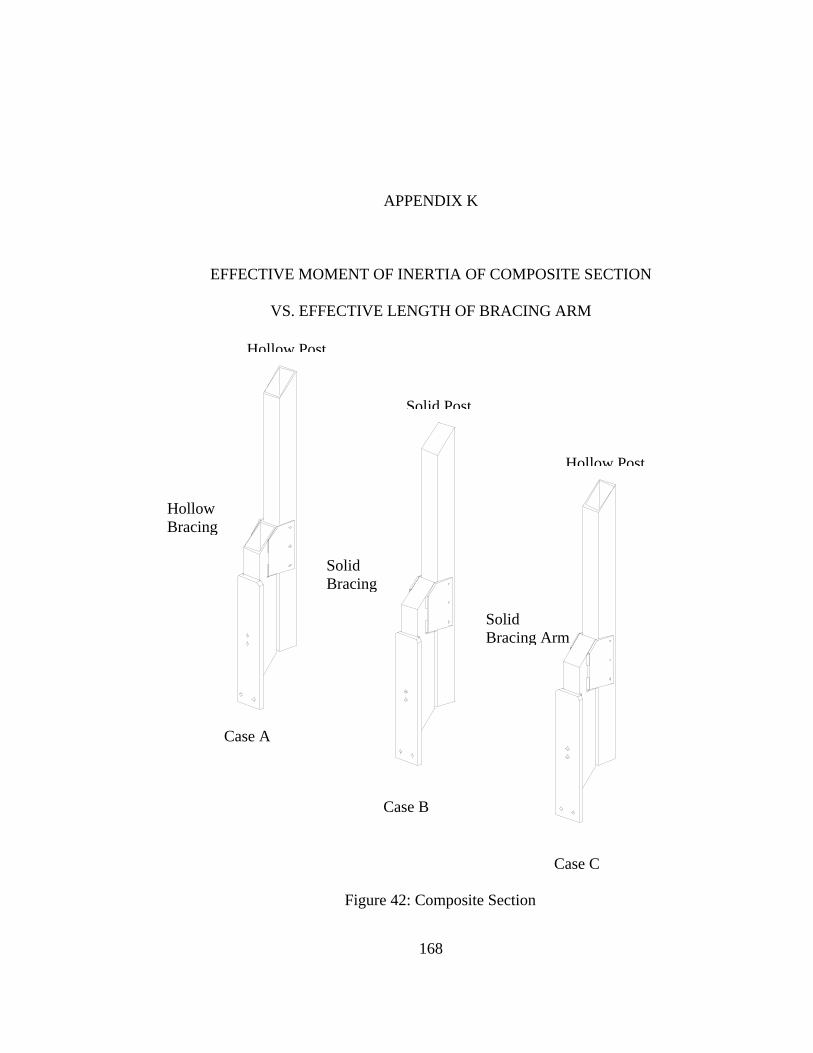
168
APPENDIX K
EFFECTIVE MOMENT OF INERTIA OF COMPOSITE SECTION
VS. EFFECTIVE LENGTH OF BRACING ARM
Case A
Case B
Case C
Hollow Post
Solid Post
Hollow Post
Hollow Bracing
Solid Bracing
Solid Bracing Arm
Figure 42: Composite Section
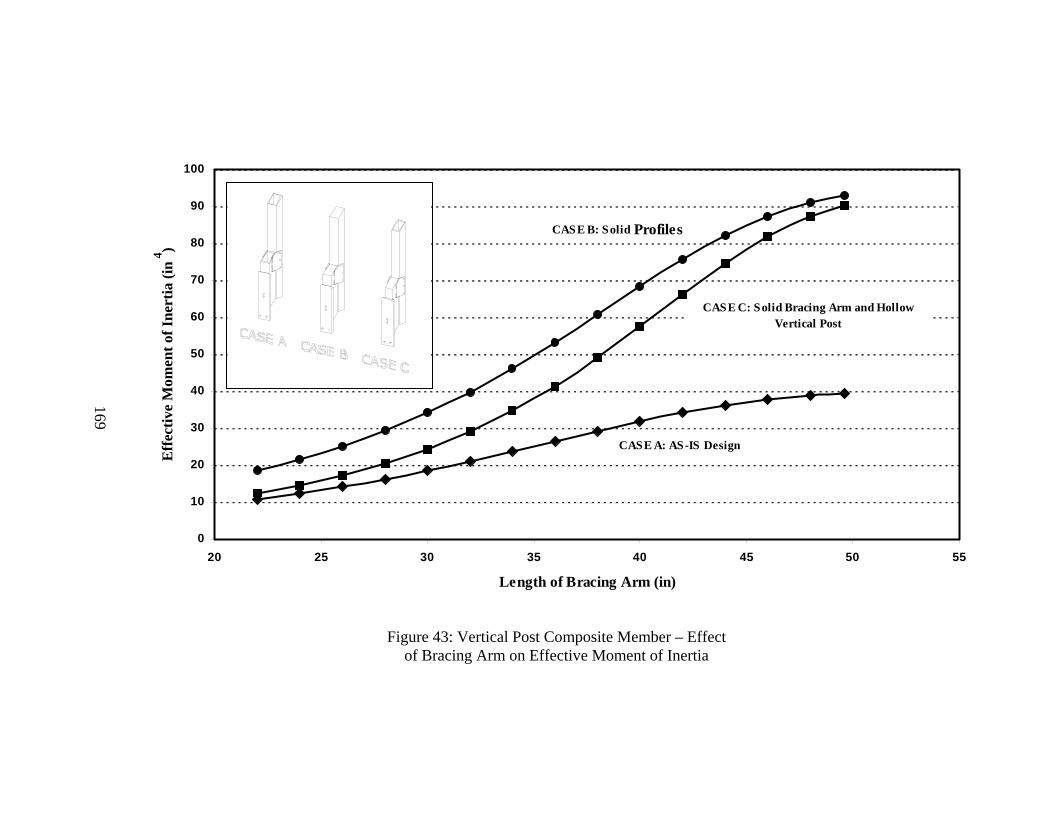
0
10
20
30
40
50
60
70
80
90
100
20 25 30 35 40 45 50 55
Length of Bracing Arm (in)
Eff
ectiv
e M
omen
t of I
nert
ia (i
n4 )
CASE A: AS-IS Design
CASE B: Solid Profiles
CASE C: Solid Bracing Arm and Hollow Vertical Post
169
Figure 43: Vertical Post Composite Member – Effect of Bracing Arm on Effective Moment of Inertia
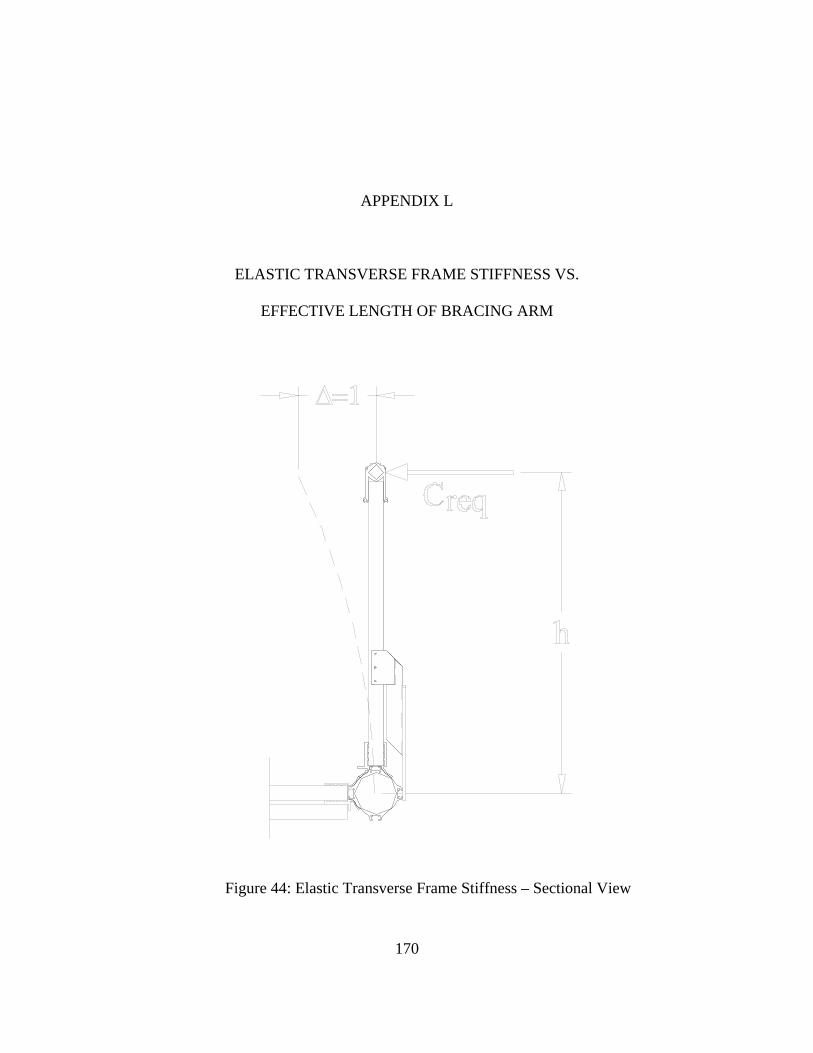
170
APPENDIX L
ELASTIC TRANSVERSE FRAME STIFFNESS VS.
EFFECTIVE LENGTH OF BRACING ARM
Figure 44: Elastic Transverse Frame Stiffness – Sectional View
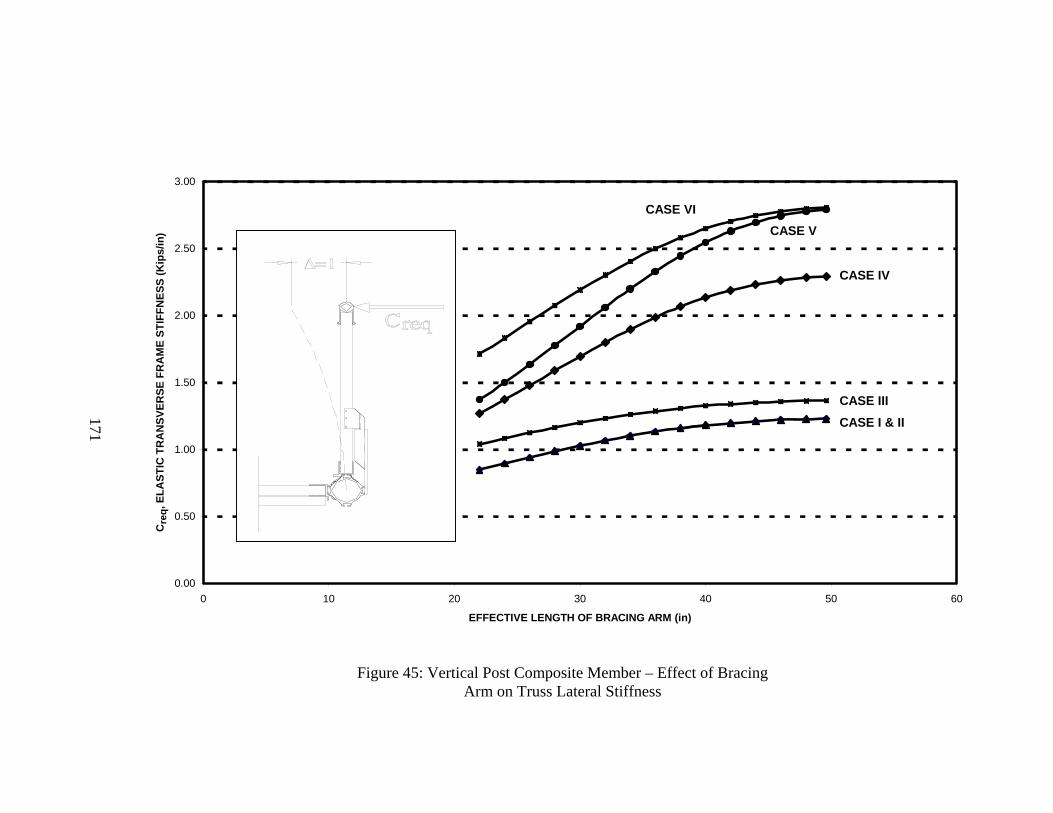
0.00
0.50
1.00
1.50
2.00
2.50
3.00
0 10 20 30 40 50 60
EFFECTIVE LENGTH OF BRACING ARM (in)
Cre
q, E
LAST
IC T
RA
NSV
ERSE
FR
AM
E ST
IFFN
ESS
(Kip
s/in
)
CASE I & IICASE III
CASE IV
CASE VCASE VI
171
Figure 45: Vertical Post Composite Member – Effect of Bracing Arm on Truss Lateral Stiffness
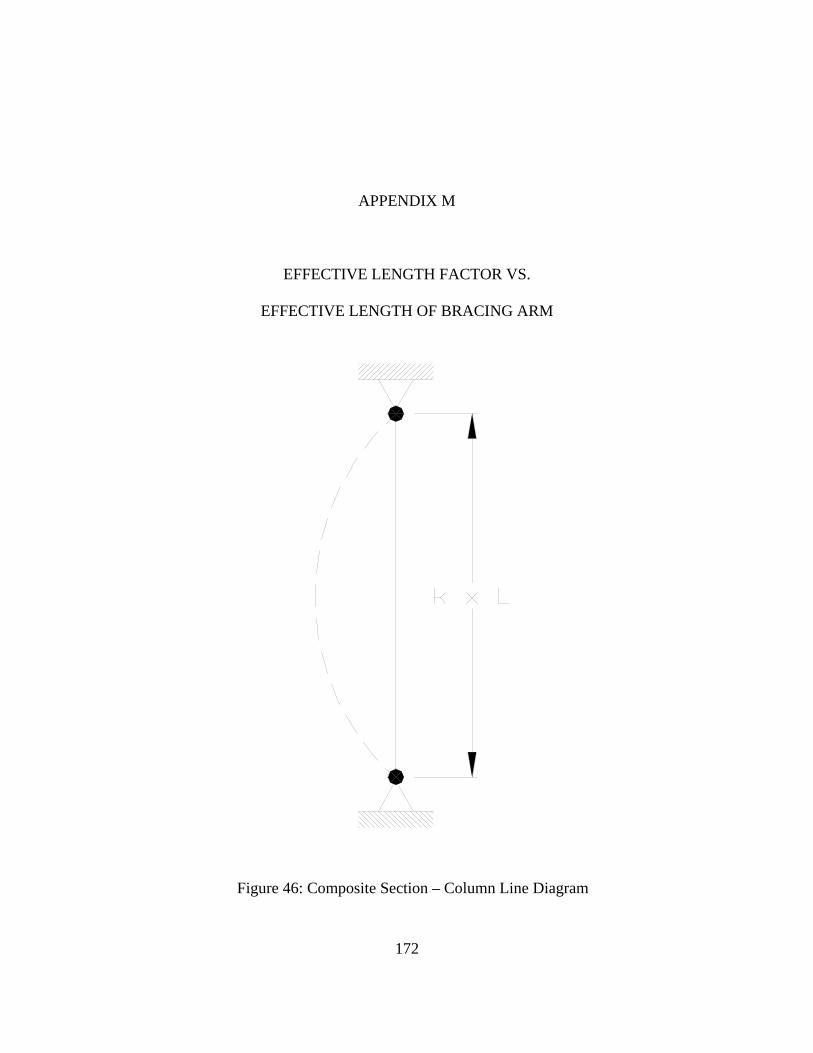
172
APPENDIX M
EFFECTIVE LENGTH FACTOR VS.
EFFECTIVE LENGTH OF BRACING ARM
Figure 46: Composite Section – Column Line Diagram
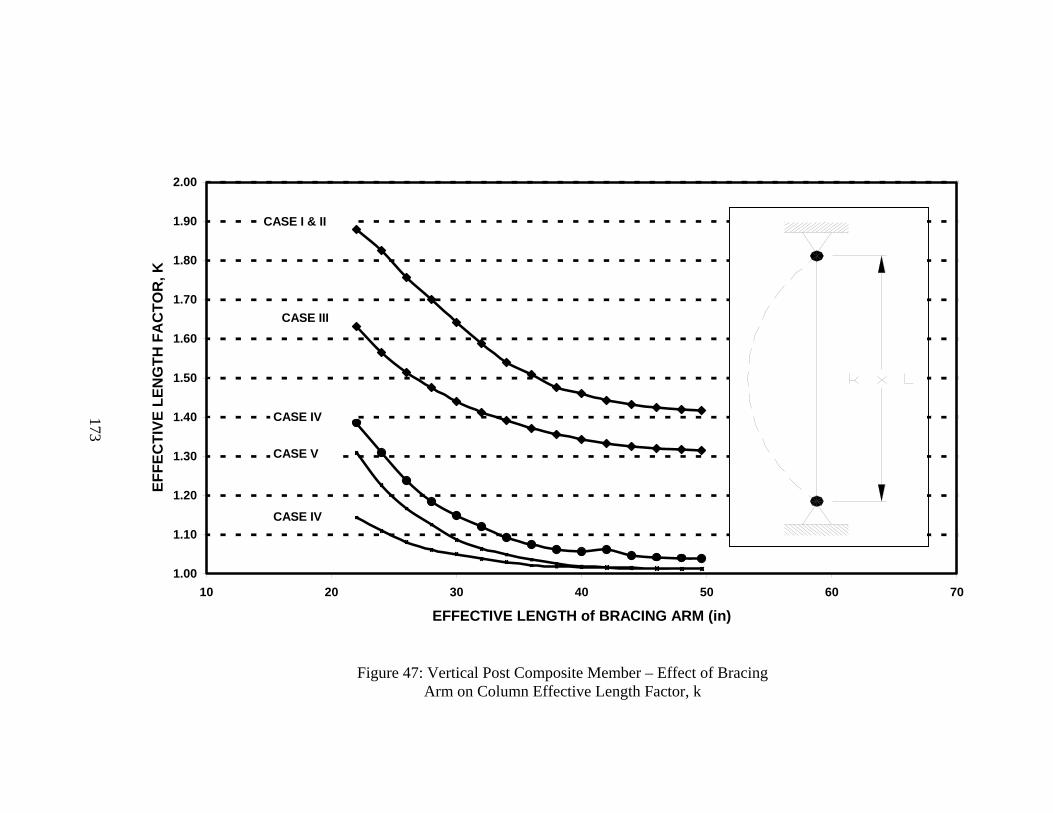
1.00
1.10
1.20
1.30
1.40
1.50
1.60
1.70
1.80
1.90
2.00
10 20 30 40 50 60 70
EFFECTIVE LENGTH of BRACING ARM (in)
EFFE
CTI
VE L
ENG
TH F
AC
TOR
, K
CASE IV
CASE V
CASE IV
CASE III
CASE I & II
173
Figure 47: Vertical Post Composite Member – Effect of Bracing Arm on Column Effective Length Factor, k
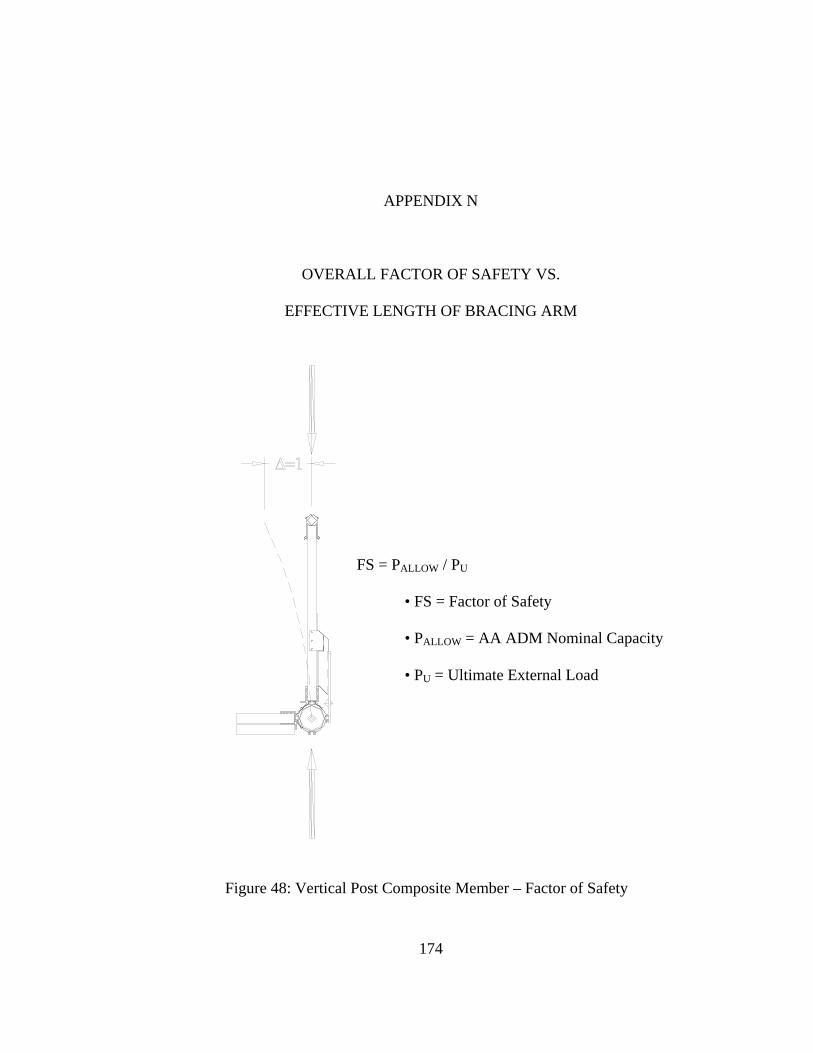
174
APPENDIX N
OVERALL FACTOR OF SAFETY VS.
EFFECTIVE LENGTH OF BRACING ARM
Figure 48: Vertical Post Composite Member – Factor of Safety
FS = PALLOW / PU
• FS = Factor of Safety
• PALLOW = AA ADM Nominal Capacity
• PU = Ultimate External Load
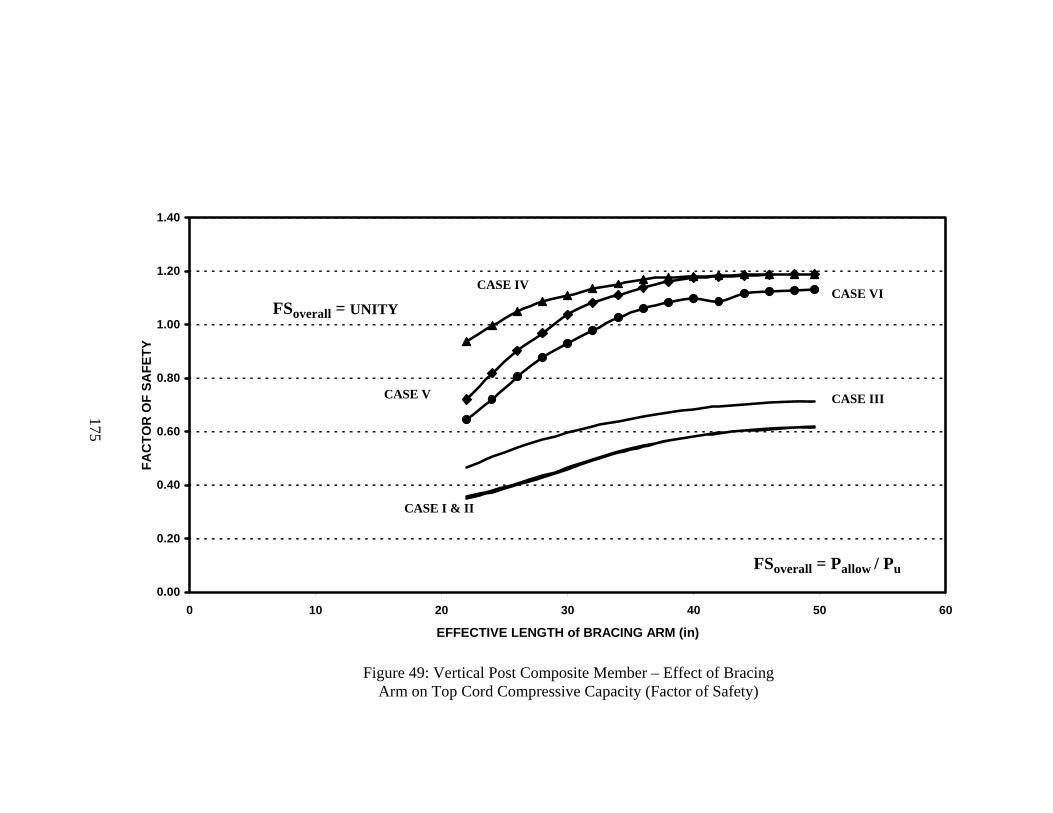
0.00
0.20
0.40
0.60
0.80
1.00
1.20
1.40
0 10 20 30 40 50 60
EFFECTIVE LENGTH of BRACING ARM (in)
FAC
TOR
OF
SAFE
TY
CASE I & II
CASE III
CASE VI
CASE V
CASE IV
FSoverall = Pallow / Pu
FSoverall = UNITY
175
Figure 49: Vertical Post Composite Member – Effect of Bracing Arm on Top Cord Compressive Capacity (Factor of Safety)
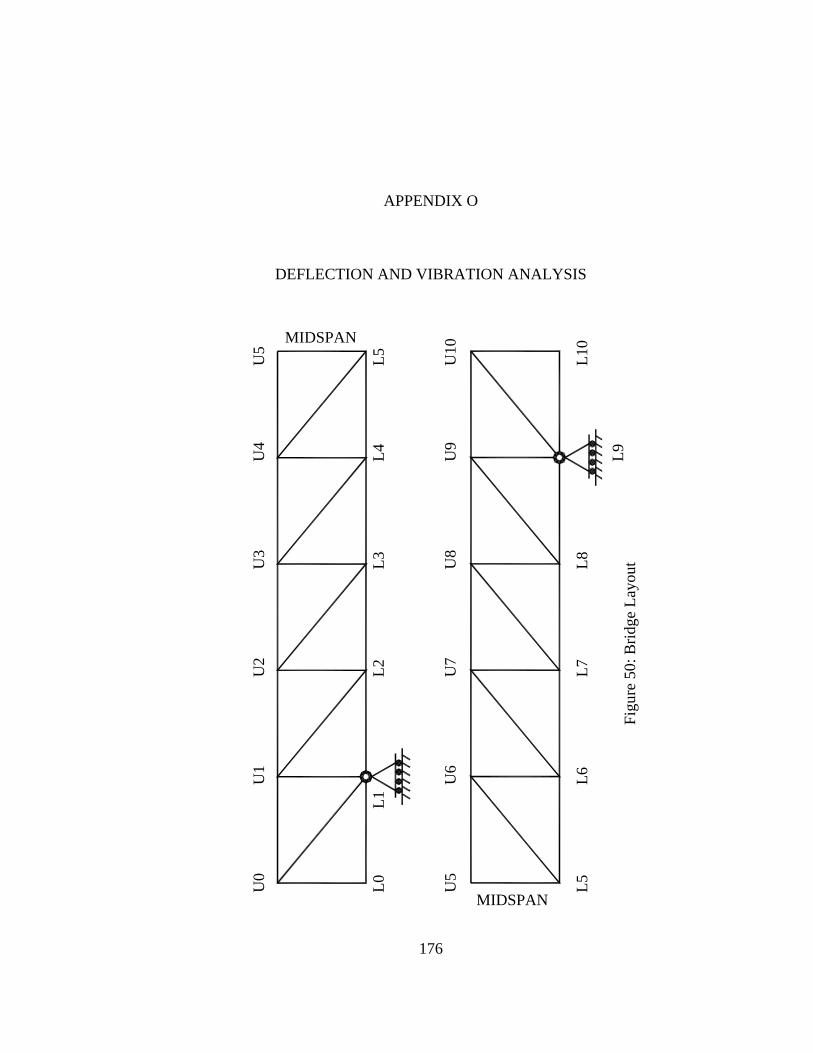
176
APPENDIX O
DEFLECTION AND VIBRATION ANALYSIS
U6
U5
U5
U4
U3
U2
U1
U0
L8
L5
L4
L5
L3
L2
L1
L0
U10
U
9 U
8 U
7
L7
L6
L10
L9
MIDSPAN
MIDSPAN
Figu
re 5
0: B
ridge
Lay
out
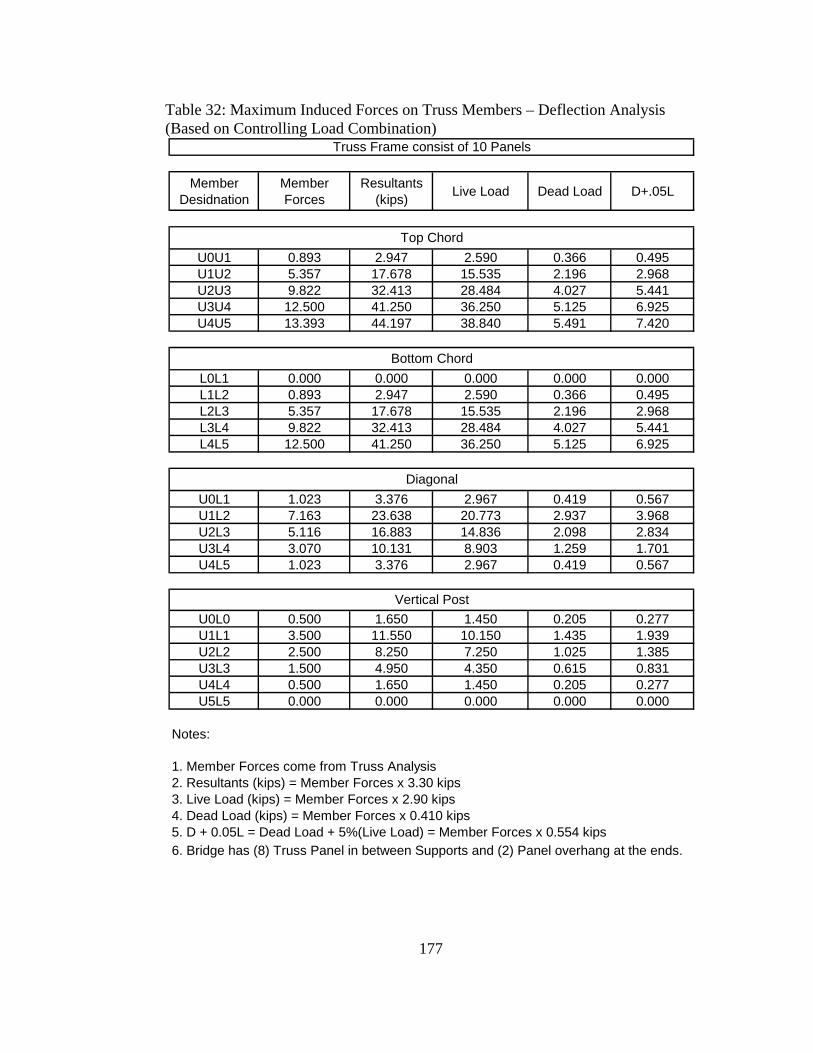
177
Member Desidnation
Member Forces
Resultants (kips) Live Load Dead Load D+.05L
U0U1 0.893 2.947 2.590 0.366 0.495U1U2 5.357 17.678 15.535 2.196 2.968U2U3 9.822 32.413 28.484 4.027 5.441U3U4 12.500 41.250 36.250 5.125 6.925U4U5 13.393 44.197 38.840 5.491 7.420
L0L1 0.000 0.000 0.000 0.000 0.000L1L2 0.893 2.947 2.590 0.366 0.495L2L3 5.357 17.678 15.535 2.196 2.968L3L4 9.822 32.413 28.484 4.027 5.441L4L5 12.500 41.250 36.250 5.125 6.925
U0L1 1.023 3.376 2.967 0.419 0.567U1L2 7.163 23.638 20.773 2.937 3.968U2L3 5.116 16.883 14.836 2.098 2.834U3L4 3.070 10.131 8.903 1.259 1.701U4L5 1.023 3.376 2.967 0.419 0.567
U0L0 0.500 1.650 1.450 0.205 0.277U1L1 3.500 11.550 10.150 1.435 1.939U2L2 2.500 8.250 7.250 1.025 1.385U3L3 1.500 4.950 4.350 0.615 0.831U4L4 0.500 1.650 1.450 0.205 0.277U5L5 0.000 0.000 0.000 0.000 0.000
Notes:
6. Bridge has (8) Truss Panel in between Supports and (2) Panel overhang at the ends.
Vertical Post
Diagonal
1. Member Forces come from Truss Analysis2. Resultants (kips) = Member Forces x 3.30 kips3. Live Load (kips) = Member Forces x 2.90 kips
Bottom Chord
Top Chord
Truss Frame consist of 10 Panels
4. Dead Load (kips) = Member Forces x 0.410 kips5. D + 0.05L = Dead Load + 5%(Live Load) = Member Forces x 0.554 kips
Table 32: Maximum Induced Forces on Truss Members – Deflection Analysis (Based on Controlling Load Combination)
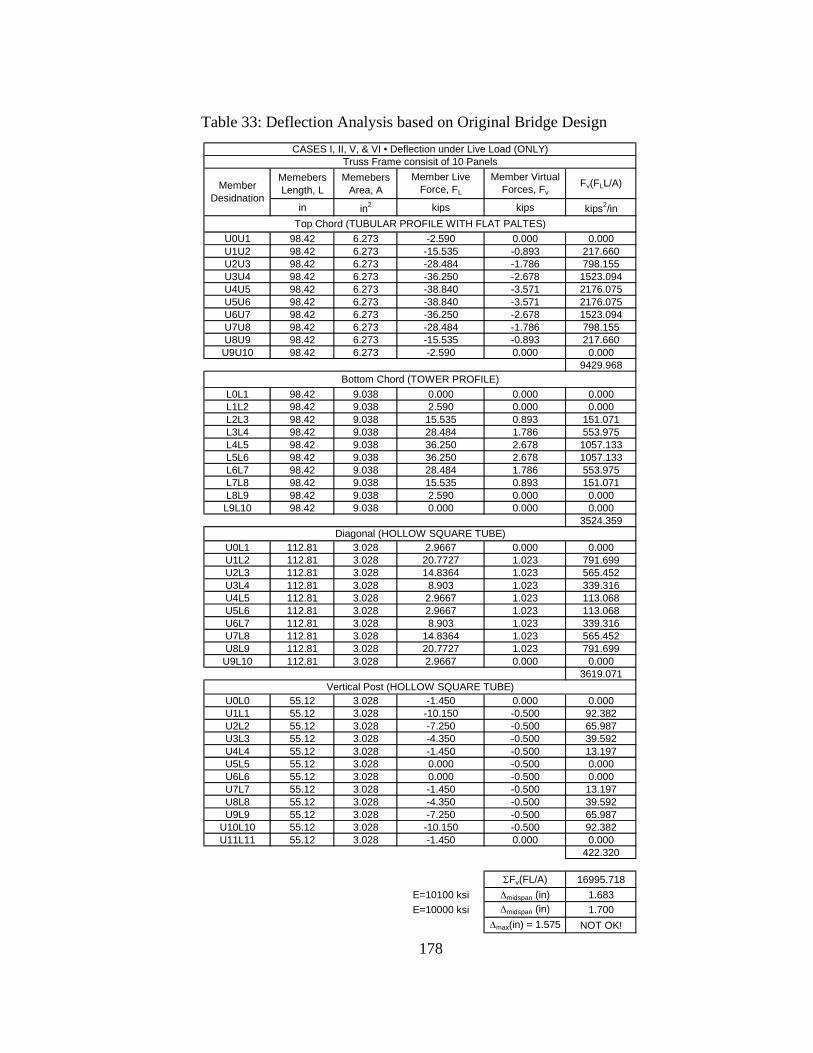
178
Memebers Length, L
Memebers Area, A
Member Live Force, FL
Member Virtual Forces, Fv
Fv(FLL/A)
in in2 kips kips kips2/in
U0U1 98.42 6.273 -2.590 0.000 0.000U1U2 98.42 6.273 -15.535 -0.893 217.660U2U3 98.42 6.273 -28.484 -1.786 798.155U3U4 98.42 6.273 -36.250 -2.678 1523.094U4U5 98.42 6.273 -38.840 -3.571 2176.075U5U6 98.42 6.273 -38.840 -3.571 2176.075U6U7 98.42 6.273 -36.250 -2.678 1523.094U7U8 98.42 6.273 -28.484 -1.786 798.155U8U9 98.42 6.273 -15.535 -0.893 217.660U9U10 98.42 6.273 -2.590 0.000 0.000
9429.968
L0L1 98.42 9.038 0.000 0.000 0.000L1L2 98.42 9.038 2.590 0.000 0.000L2L3 98.42 9.038 15.535 0.893 151.071L3L4 98.42 9.038 28.484 1.786 553.975L4L5 98.42 9.038 36.250 2.678 1057.133L5L6 98.42 9.038 36.250 2.678 1057.133L6L7 98.42 9.038 28.484 1.786 553.975L7L8 98.42 9.038 15.535 0.893 151.071L8L9 98.42 9.038 2.590 0.000 0.000
L9L10 98.42 9.038 0.000 0.000 0.0003524.359
U0L1 112.81 3.028 2.9667 0.000 0.000U1L2 112.81 3.028 20.7727 1.023 791.699U2L3 112.81 3.028 14.8364 1.023 565.452U3L4 112.81 3.028 8.903 1.023 339.316U4L5 112.81 3.028 2.9667 1.023 113.068U5L6 112.81 3.028 2.9667 1.023 113.068U6L7 112.81 3.028 8.903 1.023 339.316U7L8 112.81 3.028 14.8364 1.023 565.452U8L9 112.81 3.028 20.7727 1.023 791.699U9L10 112.81 3.028 2.9667 0.000 0.000
3619.071
U0L0 55.12 3.028 -1.450 0.000 0.000U1L1 55.12 3.028 -10.150 -0.500 92.382U2L2 55.12 3.028 -7.250 -0.500 65.987U3L3 55.12 3.028 -4.350 -0.500 39.592U4L4 55.12 3.028 -1.450 -0.500 13.197U5L5 55.12 3.028 0.000 -0.500 0.000U6L6 55.12 3.028 0.000 -0.500 0.000U7L7 55.12 3.028 -1.450 -0.500 13.197U8L8 55.12 3.028 -4.350 -0.500 39.592U9L9 55.12 3.028 -7.250 -0.500 65.987
U10L10 55.12 3.028 -10.150 -0.500 92.382U11L11 55.12 3.028 -1.450 0.000 0.000
422.320
ΣFv(FL/A) 16995.718E=10100 ksi Δmidspan (in) 1.683E=10000 ksi Δmidspan (in) 1.700
Δmax(in) = 1.575 NOT OK!
Member Desidnation
CASES I, II, V, & VI • Deflection under Live Load (ONLY)
Vertical Post (HOLLOW SQUARE TUBE)
Truss Frame consisit of 10 Panels
Top Chord (TUBULAR PROFILE WITH FLAT PALTES)
Bottom Chord (TOWER PROFILE)
Diagonal (HOLLOW SQUARE TUBE)
Table 33: Deflection Analysis based on Original Bridge Design
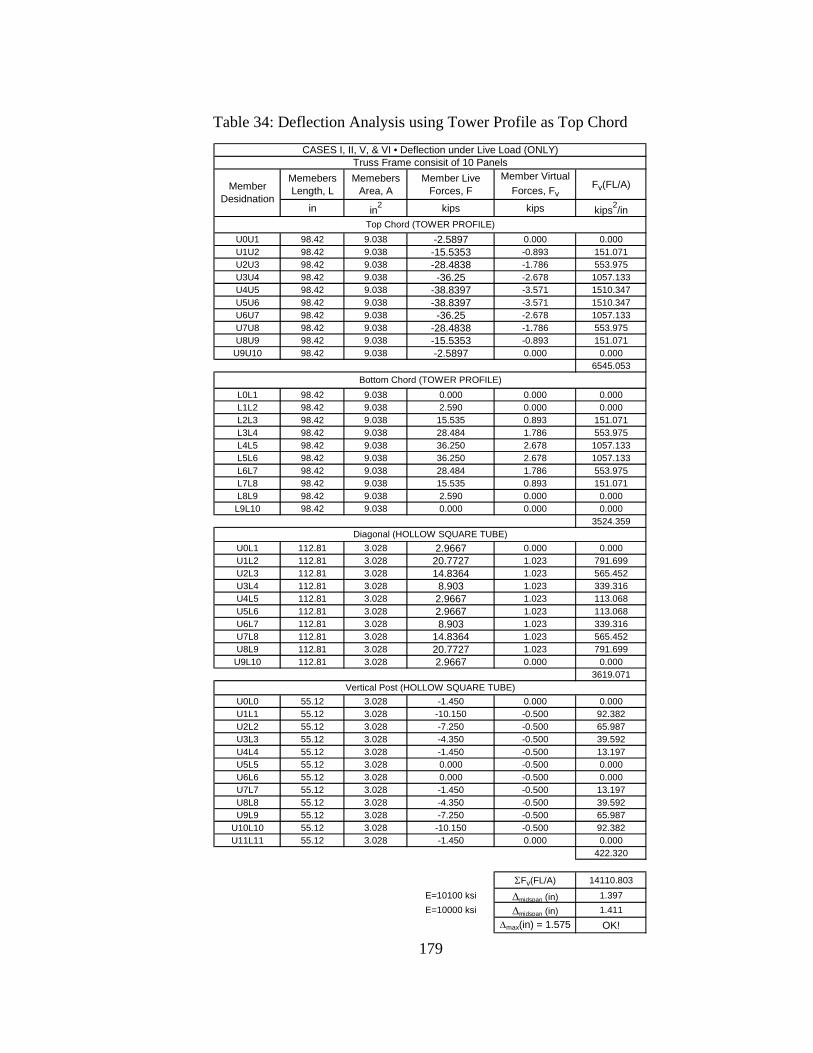
179
Memebers Length, L
Memebers Area, A
Member Live Forces, F
Member Virtual Forces, Fv
Fv(FL/A)
in in2 kips kips kips2/in
U0U1 98.42 9.038 -2.5897 0.000 0.000U1U2 98.42 9.038 -15.5353 -0.893 151.071U2U3 98.42 9.038 -28.4838 -1.786 553.975U3U4 98.42 9.038 -36.25 -2.678 1057.133U4U5 98.42 9.038 -38.8397 -3.571 1510.347U5U6 98.42 9.038 -38.8397 -3.571 1510.347U6U7 98.42 9.038 -36.25 -2.678 1057.133U7U8 98.42 9.038 -28.4838 -1.786 553.975U8U9 98.42 9.038 -15.5353 -0.893 151.071
U9U10 98.42 9.038 -2.5897 0.000 0.0006545.053
L0L1 98.42 9.038 0.000 0.000 0.000L1L2 98.42 9.038 2.590 0.000 0.000L2L3 98.42 9.038 15.535 0.893 151.071L3L4 98.42 9.038 28.484 1.786 553.975L4L5 98.42 9.038 36.250 2.678 1057.133L5L6 98.42 9.038 36.250 2.678 1057.133L6L7 98.42 9.038 28.484 1.786 553.975L7L8 98.42 9.038 15.535 0.893 151.071L8L9 98.42 9.038 2.590 0.000 0.000L9L10 98.42 9.038 0.000 0.000 0.000
3524.359
U0L1 112.81 3.028 2.9667 0.000 0.000U1L2 112.81 3.028 20.7727 1.023 791.699U2L3 112.81 3.028 14.8364 1.023 565.452U3L4 112.81 3.028 8.903 1.023 339.316U4L5 112.81 3.028 2.9667 1.023 113.068U5L6 112.81 3.028 2.9667 1.023 113.068U6L7 112.81 3.028 8.903 1.023 339.316U7L8 112.81 3.028 14.8364 1.023 565.452U8L9 112.81 3.028 20.7727 1.023 791.699
U9L10 112.81 3.028 2.9667 0.000 0.0003619.071
U0L0 55.12 3.028 -1.450 0.000 0.000U1L1 55.12 3.028 -10.150 -0.500 92.382U2L2 55.12 3.028 -7.250 -0.500 65.987U3L3 55.12 3.028 -4.350 -0.500 39.592U4L4 55.12 3.028 -1.450 -0.500 13.197U5L5 55.12 3.028 0.000 -0.500 0.000U6L6 55.12 3.028 0.000 -0.500 0.000U7L7 55.12 3.028 -1.450 -0.500 13.197U8L8 55.12 3.028 -4.350 -0.500 39.592U9L9 55.12 3.028 -7.250 -0.500 65.987
U10L10 55.12 3.028 -10.150 -0.500 92.382U11L11 55.12 3.028 -1.450 0.000 0.000
422.320
ΣFv(FL/A) 14110.803E=10100 ksi Δmidspan (in) 1.397E=10000 ksi Δmidspan (in) 1.411
Δmax(in) = 1.575 OK!
Bottom Chord (TOWER PROFILE)
Diagonal (HOLLOW SQUARE TUBE)
Vertical Post (HOLLOW SQUARE TUBE)
CASES I, II, V, & VI • Deflection under Live Load (ONLY)Truss Frame consisit of 10 Panels
Member Desidnation
Top Chord (TOWER PROFILE)
Table 34: Deflection Analysis using Tower Profile as Top Chord
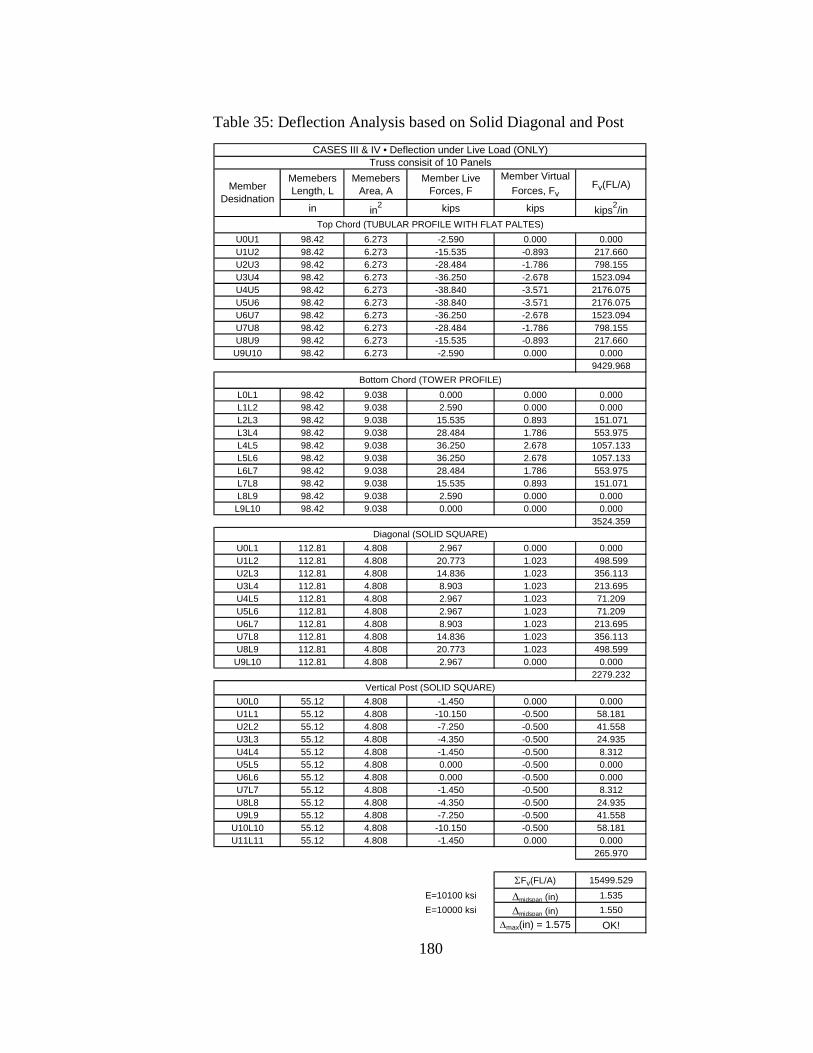
180
Memebers Length, L
Memebers Area, A
Member Live Forces, F
Member Virtual Forces, Fv
Fv(FL/A)
in in2 kips kips kips2/in
U0U1 98.42 6.273 -2.590 0.000 0.000U1U2 98.42 6.273 -15.535 -0.893 217.660U2U3 98.42 6.273 -28.484 -1.786 798.155U3U4 98.42 6.273 -36.250 -2.678 1523.094U4U5 98.42 6.273 -38.840 -3.571 2176.075U5U6 98.42 6.273 -38.840 -3.571 2176.075U6U7 98.42 6.273 -36.250 -2.678 1523.094U7U8 98.42 6.273 -28.484 -1.786 798.155U8U9 98.42 6.273 -15.535 -0.893 217.660
U9U10 98.42 6.273 -2.590 0.000 0.0009429.968
L0L1 98.42 9.038 0.000 0.000 0.000L1L2 98.42 9.038 2.590 0.000 0.000L2L3 98.42 9.038 15.535 0.893 151.071L3L4 98.42 9.038 28.484 1.786 553.975L4L5 98.42 9.038 36.250 2.678 1057.133L5L6 98.42 9.038 36.250 2.678 1057.133L6L7 98.42 9.038 28.484 1.786 553.975L7L8 98.42 9.038 15.535 0.893 151.071L8L9 98.42 9.038 2.590 0.000 0.000L9L10 98.42 9.038 0.000 0.000 0.000
3524.359
U0L1 112.81 4.808 2.967 0.000 0.000U1L2 112.81 4.808 20.773 1.023 498.599U2L3 112.81 4.808 14.836 1.023 356.113U3L4 112.81 4.808 8.903 1.023 213.695U4L5 112.81 4.808 2.967 1.023 71.209U5L6 112.81 4.808 2.967 1.023 71.209U6L7 112.81 4.808 8.903 1.023 213.695U7L8 112.81 4.808 14.836 1.023 356.113U8L9 112.81 4.808 20.773 1.023 498.599
U9L10 112.81 4.808 2.967 0.000 0.0002279.232
U0L0 55.12 4.808 -1.450 0.000 0.000U1L1 55.12 4.808 -10.150 -0.500 58.181U2L2 55.12 4.808 -7.250 -0.500 41.558U3L3 55.12 4.808 -4.350 -0.500 24.935U4L4 55.12 4.808 -1.450 -0.500 8.312U5L5 55.12 4.808 0.000 -0.500 0.000U6L6 55.12 4.808 0.000 -0.500 0.000U7L7 55.12 4.808 -1.450 -0.500 8.312U8L8 55.12 4.808 -4.350 -0.500 24.935U9L9 55.12 4.808 -7.250 -0.500 41.558
U10L10 55.12 4.808 -10.150 -0.500 58.181U11L11 55.12 4.808 -1.450 0.000 0.000
265.970
ΣFv(FL/A) 15499.529E=10100 ksi Δmidspan (in) 1.535E=10000 ksi Δmidspan (in) 1.550
Δmax(in) = 1.575 OK!
Diagonal (SOLID SQUARE)
Vertical Post (SOLID SQUARE)
CASES III & IV • Deflection under Live Load (ONLY)Truss consisit of 10 Panels
Member Desidnation
Top Chord (TUBULAR PROFILE WITH FLAT PALTES)
Bottom Chord (TOWER PROFILE)
Table 35: Deflection Analysis based on Solid Diagonal and Post
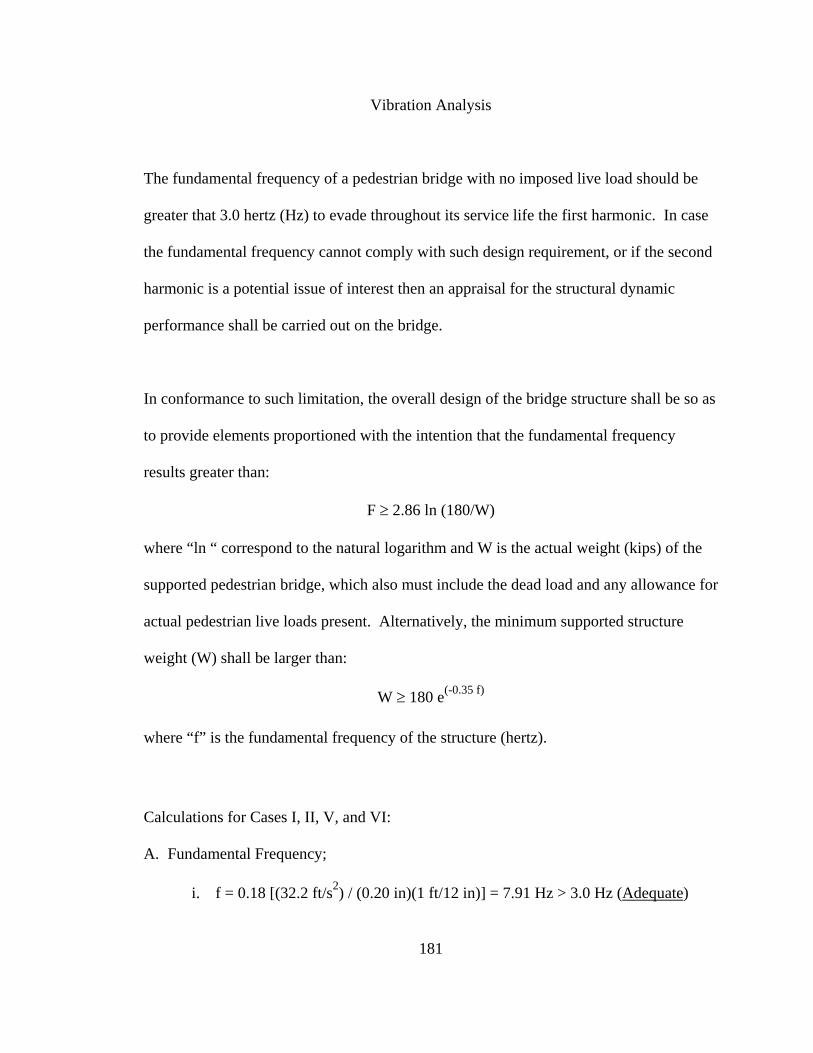
181
Vibration Analysis
The fundamental frequency of a pedestrian bridge with no imposed live load should be
greater that 3.0 hertz (Hz) to evade throughout its service life the first harmonic. In case
the fundamental frequency cannot comply with such design requirement, or if the second
harmonic is a potential issue of interest then an appraisal for the structural dynamic
performance shall be carried out on the bridge.
In conformance to such limitation, the overall design of the bridge structure shall be so as
to provide elements proportioned with the intention that the fundamental frequency
results greater than:
F ≥ 2.86 ln (180/W)
where “ln “ correspond to the natural logarithm and W is the actual weight (kips) of the
supported pedestrian bridge, which also must include the dead load and any allowance for
actual pedestrian live loads present. Alternatively, the minimum supported structure
weight (W) shall be larger than:
W ≥ 180 e(-0.35 f)
where “f” is the fundamental frequency of the structure (hertz).
Calculations for Cases I, II, V, and VI:
A. Fundamental Frequency;
i. f = 0.18 [(32.2 ft/s2) / (0.20 in)(1 ft/12 in)] = 7.91 Hz > 3.0 Hz (Adequate)
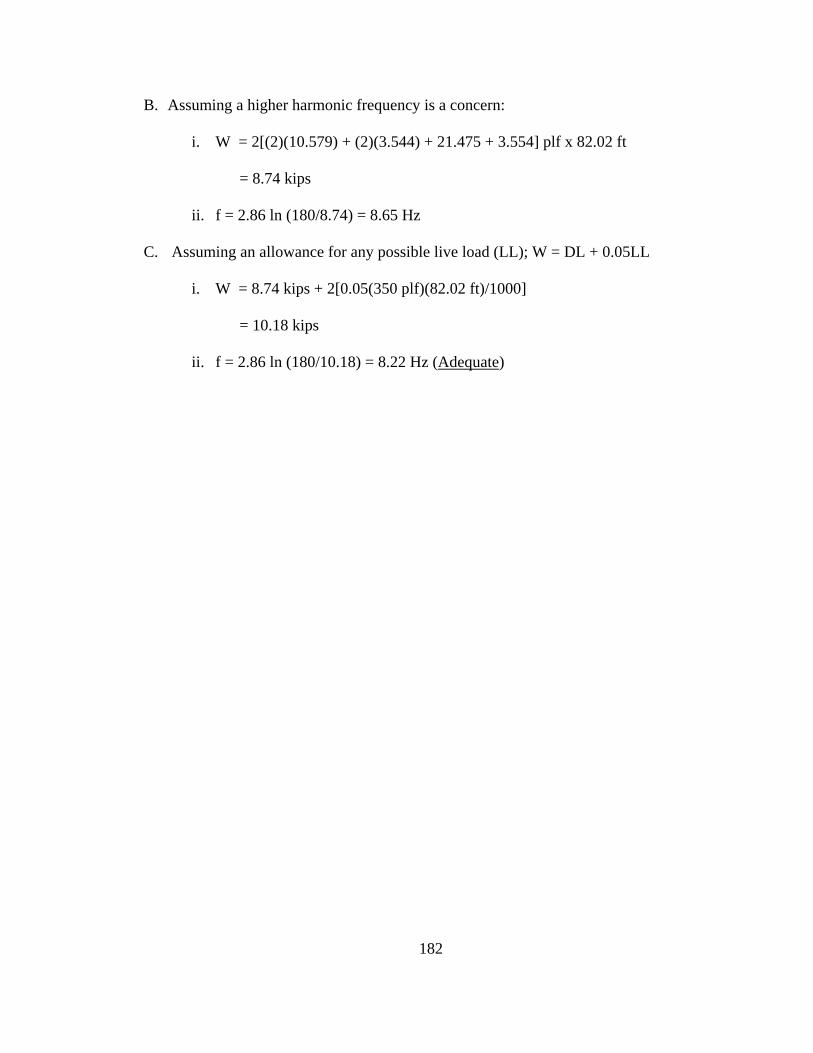
182
B. Assuming a higher harmonic frequency is a concern:
i. W = 2[(2)(10.579) + (2)(3.544) + 21.475 + 3.554] plf x 82.02 ft
= 8.74 kips
ii. f = 2.86 ln (180/8.74) = 8.65 Hz
C. Assuming an allowance for any possible live load (LL); W = DL + 0.05LL
i. W = 8.74 kips + 2[0.05(350 plf)(82.02 ft)/1000]
= 10.18 kips
ii. f = 2.86 ln (180/10.18) = 8.22 Hz (Adequate)