traffic & pedestrian risk inference using harmonic systems
TRANSCRIPT
Traffic & Pedestrian risk inference using Harmonic Systems
I. Acuña Barrios1, E. García2, D. López De Luise3, C. Paredes4, A. Celayeta5, M. Sandillú6, W. Bel7
Abstract – Vehicle and pedestrian risks can be modeled in order to advice drivers and persons. A good model requires the ability to adapt itself to several environmental variations and to preserve essential information about the area under scope. This paper aims to present a proposal based on a Machine Learning extension for timing named Harmonic Systems. A global description of the problem, its relevance and status of the field are also included.
Keywords – Risk prediction, Harmonic Systems, Time mining.
1 Introduction
Traffic bottlenecks and environmental hazards are a big concern [1] [2] [3] [4]. This problem, that affects many cities in the world, is very complex and carries
1Researcher at CI2S Lab, Pringles 10 2nd FL, C1183ADB, Buenos Aires, Argentina, +54 3442 540410, [email protected]
2Researcher at CI2S Lab, Pringles 10 2nd FL, C1183ADB, Buenos Aires, Argentina, +54 3442 646004, [email protected]
3Director of CI2S Lab, CI2S Lab, Pringles 10 2nd FL, C1183ADB, Buenos Aires, Argentina, +54 11 49586991, [email protected]
4Researcher at CI2S Lab, CI2S Lab, Pringles 10 2nd FL, C1183ADB, Buenos Aires, Argentina, +54 3442 556018, [email protected]
5Researcher at CI2S Lab, CI2S Lab, Pringles 10 2nd FL, C1183ADB, Buenos Aires, Argentina, +54 3445 478898, [email protected]
6Researcher at CI2S Lab, CI2S Lab, Pringles 10 2nd FL, C1183ADB, Buenos Aires, Argentina, +54 3442 621288, [email protected]
7Researcher at CI2S Lab, CI2S Lab, Pringles 10 2nd FL, C1183ADB, Buenos Aires, Argentina, +54 3442 621288, [email protected]
2
out many consequences. Among others, collisions involving pedestrians. They are a leading cause of death and injury in many countries [1] [2]. Risk in roads is hight for vehicles and for pedestrian, which are considered vulnerable due to their lack of protection and limited biomechanical tolerance to violent forces if hit it by a vehicle [5].
The risk of pedestrian injuries is increased by a number factors that relate to the road environment, including:
high speed of traffic (increases severity) poorly maintained, obstructed footpaths inadequate crossing facilities lack of pedestrian crossing opportunities (traffic vol.) number of lanes to cross complexity and unpredictability of traffic movements at intersection inadequate separation from traffic poor crossing sight distance
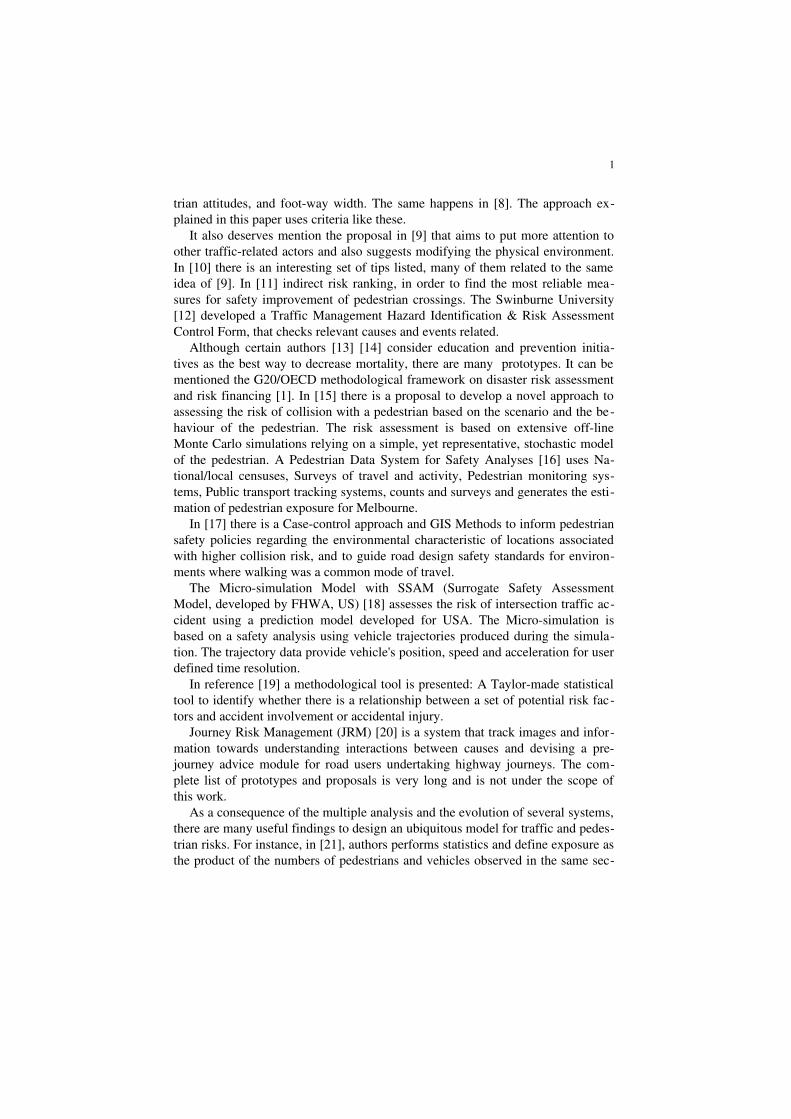
The city has certain key locations for vehicle inputs and movement. In figure 1 there is a map showing those places that are relevant.
Fig. 1. Buenos Aires traffic flow
Orange dots represent the input locations, with the amount of transportation in numbers. The thickness of the blue lines indicate the number of vehicles moving in every main street. The precise numbers are detailed in blue, next to every road.
There are many studies that precede this project and serve as a basis for it. Among others Cathy evaluated the incidence age of pedestrian [6], but organizations like TFL [7] consider more subtle tips such as crowd management, pedes
1
trian attitudes, and footway width. The same happens in [8]. The approach explained in this paper uses criteria like these.
It also deserves mention the proposal in [9] that aims to put more attention to other trafficrelated actors and also suggests modifying the physical environment. In [10] there is an interesting set of tips listed, many of them related to the same idea of [9]. In [11] indirect risk ranking, in order to find the most reliable measures for safety improvement of pedestrian crossings. The Swinburne University [12] developed a Traffic Management Hazard Identification & Risk Assessment Control Form, that checks relevant causes and events related.
Although certain authors [13] [14] consider education and prevention initiatives as the best way to decrease mortality, there are many prototypes. It can be mentioned the G20/OECD methodological framework on disaster risk assessment and risk financing [1]. In [15] there is a proposal to develop a novel approach to assessing the risk of collision with a pedestrian based on the scenario and the behaviour of the pedestrian. The risk assessment is based on extensive offline Monte Carlo simulations relying on a simple, yet representative, stochastic model of the pedestrian. A Pedestrian Data System for Safety Analyses [16] uses National/local censuses, Surveys of travel and activity, Pedestrian monitoring systems, Public transport tracking systems, counts and surveys and generates the estimation of pedestrian exposure for Melbourne.
In [17] there is a Casecontrol approach and GIS Methods to inform pedestrian safety policies regarding the environmental characteristic of locations associated with higher collision risk, and to guide road design safety standards for environments where walking was a common mode of travel.
The Microsimulation Model with SSAM (Surrogate Safety Assessment Model, developed by FHWA, US) [18] assesses the risk of intersection traffic accident using a prediction model developed for USA. The Microsimulation is based on a safety analysis using vehicle trajectories produced during the simulation. The trajectory data provide vehicle's position, speed and acceleration for user defined time resolution.
In reference [19] a methodological tool is presented: A Taylormade statistical tool to identify whether there is a relationship between a set of potential risk factors and accident involvement or accidental injury.
Journey Risk Management (JRM) [20] is a system that track images and information towards understanding interactions between causes and devising a prejourney advice module for road users undertaking highway journeys. The complete list of prototypes and proposals is very long and is not under the scope of this work.
As a consequence of the multiple analysis and the evolution of several systems, there are many useful findings to design an ubiquitous model for traffic and pedestrian risks. For instance, in [21], authors performs statistics and define exposure as the product of the numbers of pedestrians and vehicles observed in the same sec
2
tion in the same 5min. interval. Other approaches are traditional averages or simple sexspecific weighted averages [22].
This paper describes a proposal based on Harmonics Systems [3], an approach that takes events as data vectors that can resonate certain patterns and consequently fire specific modeling features. This is a kind of plastic, flexible and selftrained learning from data. A resonance in this context can be though as a pattern matching with weighted features and changing patterns. This modeling approach is being applied as the KRONOS prototype, an Intelligent System for pedestrian and car risk evaluation. Additionally, the model allow performing advices for intersection of streets, and any other place in a map under the system's control.
As the prototype is still under construction, it is not possible to perform real tests. Therefore, statistical evaluation is not under the scope of this paper.
The following sections describe the status and relevance of traffic and pedestrian security (section II), the overall architecture of KRONOS prototype (section III), a general presentation of the model knowledge inferred (section IV), conclusions and future work (section V).
2 Traffic and Pedestrian
Intelligent Systems (IS), like Kronos, have been used in the past after several years as an complement of traditional methods. They reached also the transport field, playing a key role in these last years and will become the most promissory industry in the next years and will be an important part of transportation and infrastructure sectors [23] [24].
Kronos is a smart system that can assess the risk for accidents in certain locations, advice alternate paths and learning dynamically from contextual information. Due the high number of human beings lost it is intended to avoid or reduce crashes and any other accidents and thereby the number of victims [25]. For that reason we consider it is relevant to be able to have a system able to detect anomalies and risks on the fly. According to Dr. Pablo Martínez Carignano, chair of the public guard of Buenos Aires city, users most vulnerable are pedestrians: About 3O% of deaths in traffic accidents. Furthermore he explained that bikers' deaths increased by 300% between years 2004 and 2010 due the increase of bottlenecks in main cities of the country [26].
Almost 3500 persons die every day in streets, and about 100000 persons are injured. This way traffic is one of the most important death causes in the world, with 1.3 million deceases every year, as claimed by the (World Health Organization). For that reason traffic accidents may be considered as epidemic. 90% of deceases for this reason take place in locations with medium to low income.
3
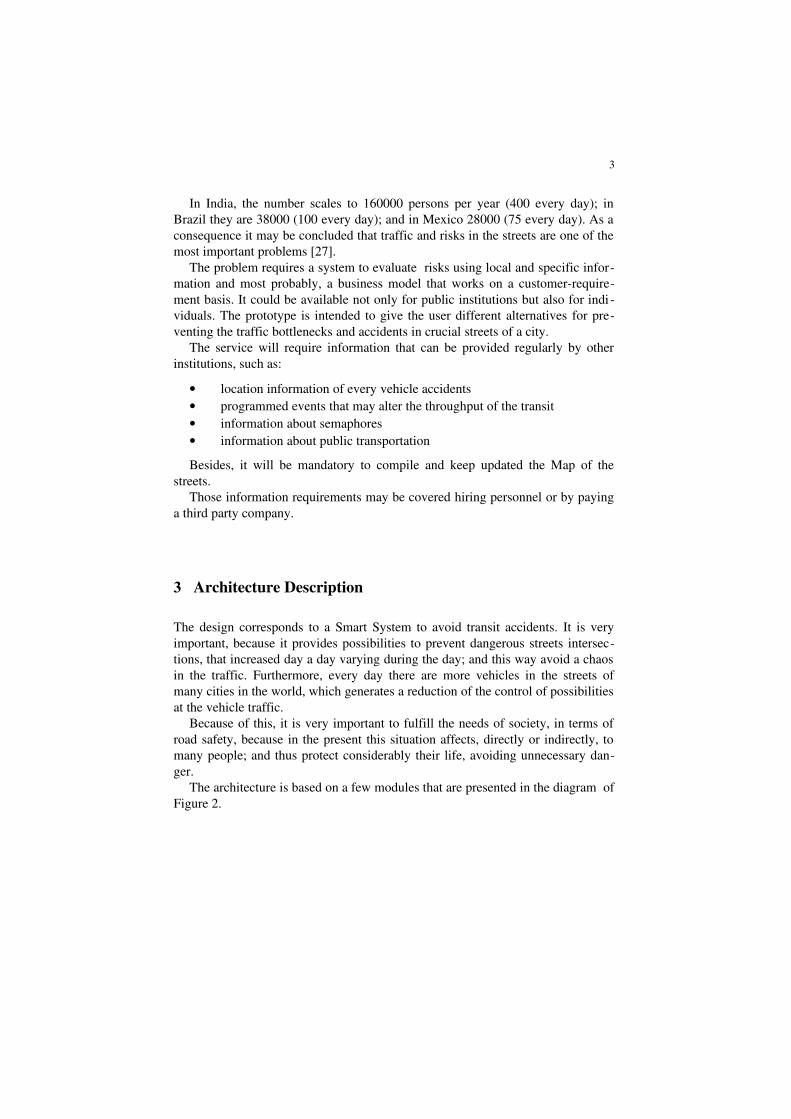
In India, the number scales to 160000 persons per year (400 every day); in Brazil they are 38000 (100 every day); and in Mexico 28000 (75 every day). As a consequence it may be concluded that traffic and risks in the streets are one of the most important problems [27].
The problem requires a system to evaluate risks using local and specific information and most probably, a business model that works on a customerrequirement basis. It could be available not only for public institutions but also for indi viduals. The prototype is intended to give the user different alternatives for preventing the traffic bottlenecks and accidents in crucial streets of a city.
The service will require information that can be provided regularly by other institutions, such as:
location information of every vehicle accidents programmed events that may alter the throughput of the transit information about semaphores information about public transportation
Besides, it will be mandatory to compile and keep updated the Map of the streets.
Those information requirements may be covered hiring personnel or by paying a third party company.
3 Architecture Description
The design corresponds to a Smart System to avoid transit accidents. It is very important, because it provides possibilities to prevent dangerous streets intersections, that increased day a day varying during the day; and this way avoid a chaos in the traffic. Furthermore, every day there are more vehicles in the streets of many cities in the world, which generates a reduction of the control of possibilities at the vehicle traffic.
Because of this, it is very important to fulfill the needs of society, in terms of road safety, because in the present this situation affects, directly or indirectly, to many people; and thus protect considerably their life, avoiding unnecessary danger.
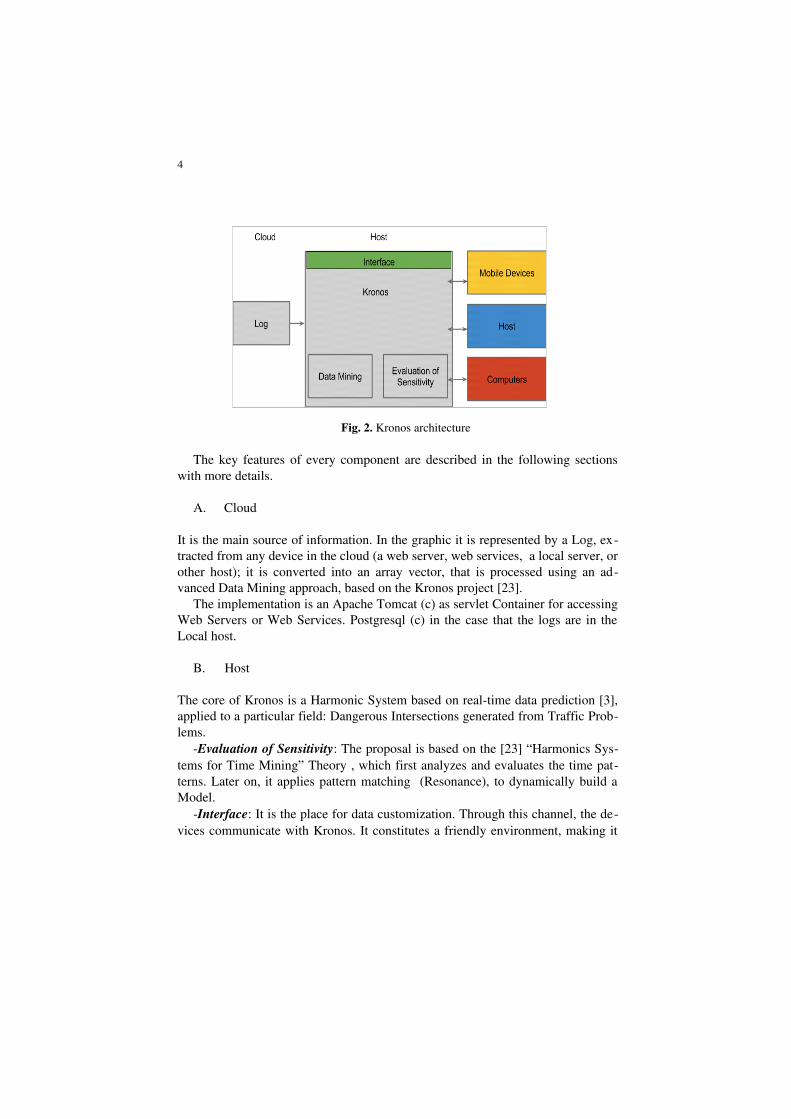
The architecture is based on a few modules that are presented in the diagram of Figure 2.
4
Fig. 2. Kronos architecture
The key features of every component are described in the following sections with more details.
A. Cloud
It is the main source of information. In the graphic it is represented by a Log, extracted from any device in the cloud (a web server, web services, a local server, or other host); it is converted into an array vector, that is processed using an advanced Data Mining approach, based on the Kronos project [23].
The implementation is an Apache Tomcat (c) as servlet Container for accessing Web Servers or Web Services. Postgresql (c) in the case that the logs are in the Local host.
B. Host
The core of Kronos is a Harmonic System based on realtime data prediction [3], applied to a particular field: Dangerous Intersections generated from Traffic Problems.
Evaluation of Sensitivity: The proposal is based on the [23] “Harmonics Systems for Time Mining” Theory , which first analyzes and evaluates the time patterns. Later on, it applies pattern matching (Resonance), to dynamically build a Model.
Interface: It is the place for data customization. Through this channel, the devices communicate with Kronos. It constitutes a friendly environment, making it
5
simple for the user to interact with the System. The technology uses Java Development Kit, for programming the modules.
Data mining: several traditional algorithms are implemented to produce intermediate results with Java Development Kit, for programming the modules.
Kronos: Implements the core of the Harmonic Systems using Java Development Kit, for programming the modules.
C. Devices
There are two Mobile Devices: One designed to use “Android Flow Monitoring – Flowoid”, that supports Mo
bile's users. Location LOCS. Used for finding the user’s location. It can receive informa
tion and notifications about dangerous locations, depending on the current position.
D. Special remarks
The WEB may be used as another market target of the information by using personal email accounts and providing customized information.
In all the cases it may be possible to insert adds along with the information.
4 Model Support
The model has to learn using the techniques described in [23]. To show the complexity of the model following is a list of some rules automatically learn from data.
System Traffic information balance [22], patterns of injury considering age and gender, typified risk factors [28], main risk factors [21] [3], driver conditions [11], sidewalks, intersections, curbs, ramps, and landings for people with disabilities, bicycles [16], opportunities for crashes and conflicts [10], are some of the sources of general information and validation criteria.
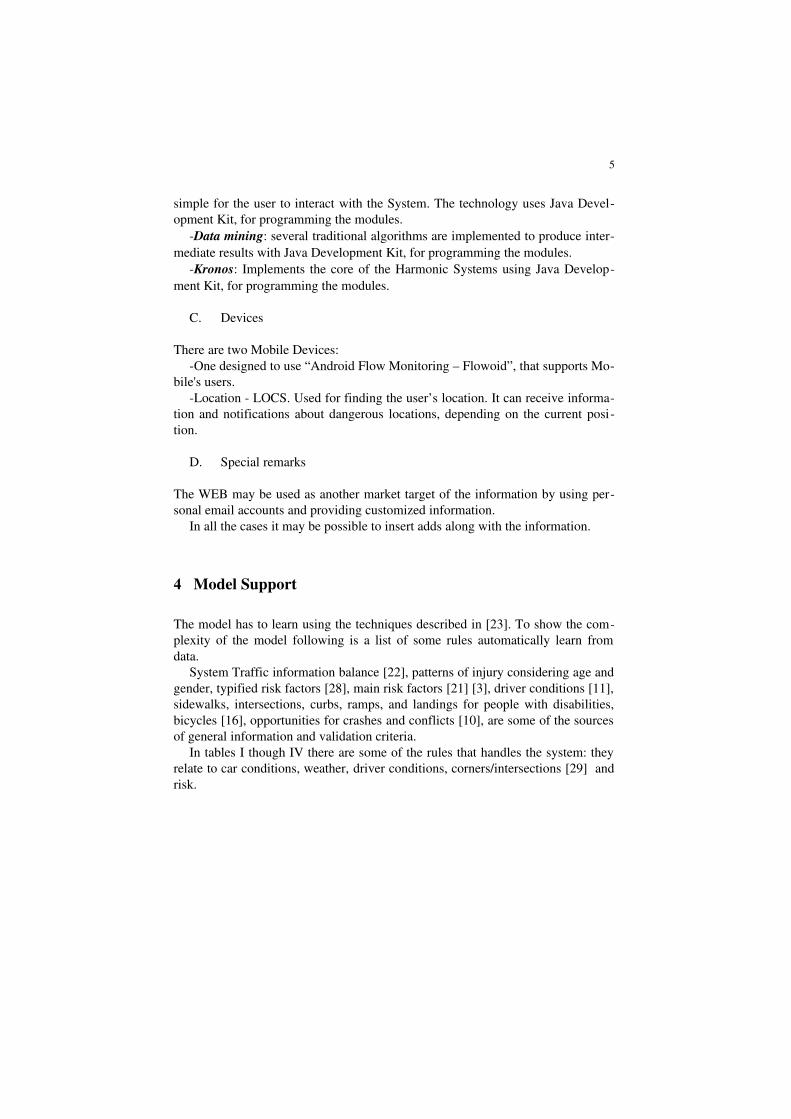
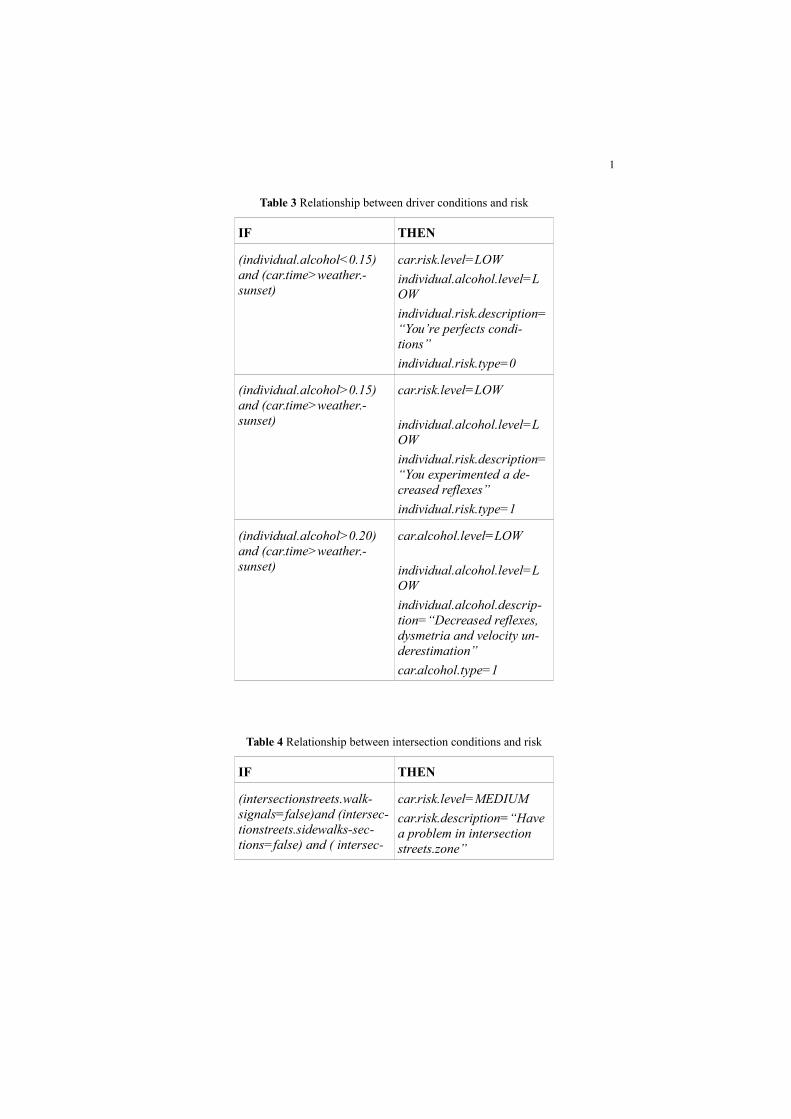
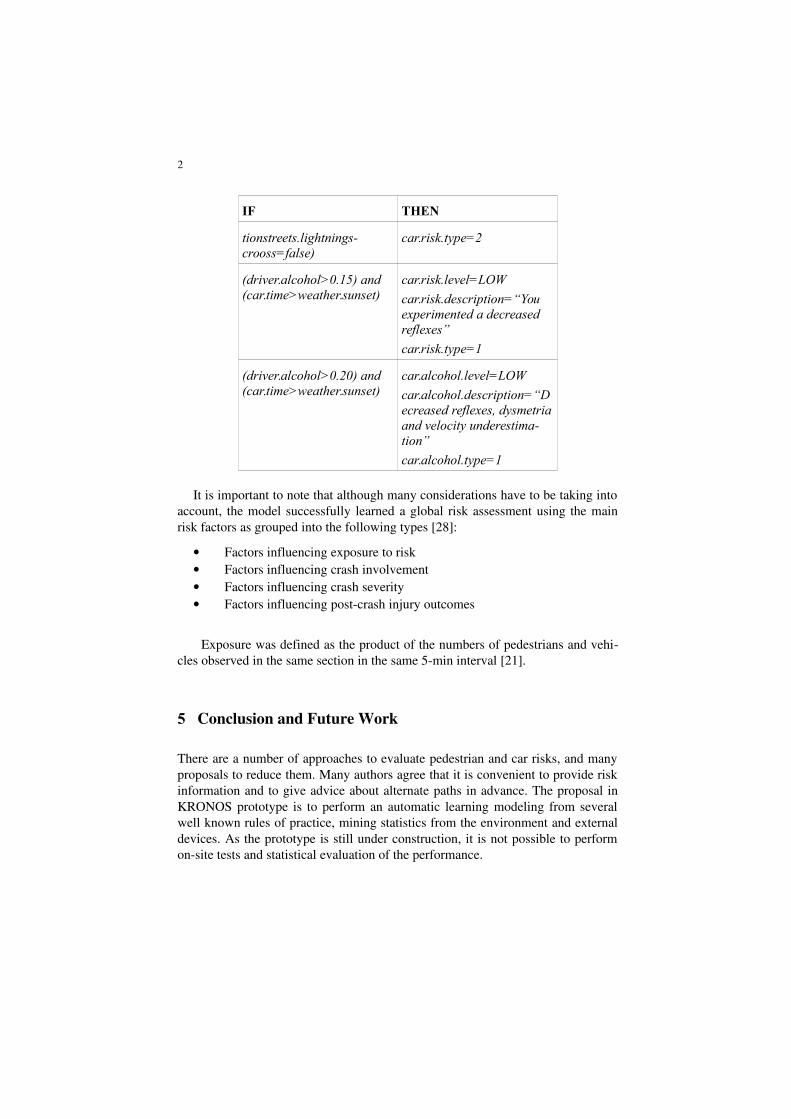
In tables I though IV there are some of the rules that handles the system: they relate to car conditions, weather, driver conditions, corners/intersections [29] and risk.
6
Table 1. Relationship between car conditions and risk
IF THEN
(car.speed>120) and
(car.zone=1) and
(num.car >10) and (car.-time=>wheater.sunset)
car.risk.level=HIGH
car.risk.description=“You exposed an risk accident”
car.risk.type=1
(car.lightning=false) and (car.breaking=false) and (car.documents=false)
car.risk.level=HIGH
car.risk.description=“You exposed an risk accident”
car.risk.type=1
(car.dimensions>=(4365,2113,1639)) and (car.velocity>=30Km/hs)
car.risk.level=MEDIUM
car.risk.description=(“You’re exposed to the risk of a severe accident”)
car.risk.type=3
Table 2. Relationship between weather conditions and risk
IF THEN
(wheater.visibility<15km) and (weather.wind>30 Km/hs) and (car.time>weather.sunset)
car.risk.level=HIGH
car.risk.description=“The weather and time, you ex-posed an risk accident”
car.risk.type=2
(accident.state= true) and (acciden.croossing=false) and (traffic.num=>10)
car.risk.level=LOW acci-dent.description=”A acci-dent took place close to a crossing, but not exactly at a crossing”
car.risk.type=4
1
Table 3 Relationship between driver conditions and risk
IF THEN
(individual.alcohol<0.15) and (car.time>weather.-sunset)
car.risk.level=LOW
individual.alcohol.level=LOW
individual.risk.description=“You’re perfects condi-tions”
individual.risk.type=0
(individual.alcohol>0.15) and (car.time>weather.-sunset)
car.risk.level=LOW
individual.alcohol.level=LOW
individual.risk.description=“You experimented a de-creased reflexes”
individual.risk.type=1
(individual.alcohol>0.20) and (car.time>weather.-sunset)
car.alcohol.level=LOW
individual.alcohol.level=LOW
individual.alcohol.descrip-tion=“Decreased reflexes, dysmetria and velocity un-derestimation”
car.alcohol.type=1
Table 4 Relationship between intersection conditions and risk
IF THEN
(intersectionstreets.walk-signals=false)and (intersec-tionstreets.sidewalks-sec-tions=false) and ( intersec-
car.risk.level=MEDIUM
car.risk.description=“Have a problem in intersection streets.zone”
2
IF THEN
tionstreets.lightnings-crooss=false)
car.risk.type=2
(driver.alcohol>0.15) and (car.time>weather.sunset)
car.risk.level=LOW
car.risk.description=“You experimented a decreased reflexes”
car.risk.type=1
(driver.alcohol>0.20) and (car.time>weather.sunset)
car.alcohol.level=LOW
car.alcohol.description=“Decreased reflexes, dysmetria and velocity underestima-tion”
car.alcohol.type=1
It is important to note that although many considerations have to be taking into account, the model successfully learned a global risk assessment using the main risk factors as grouped into the following types [28]:
Factors influencing exposure to risk Factors influencing crash involvement Factors influencing crash severity Factors influencing postcrash injury outcomes
Exposure was defined as the product of the numbers of pedestrians and vehicles observed in the same section in the same 5min interval [21].
5 Conclusion and Future Work
There are a number of approaches to evaluate pedestrian and car risks, and many proposals to reduce them. Many authors agree that it is convenient to provide risk information and to give advice about alternate paths in advance. The proposal in KRONOS prototype is to perform an automatic learning modeling from several well known rules of practice, mining statistics from the environment and external devices. As the prototype is still under construction, it is not possible to perform onsite tests and statistical evaluation of the performance.
3
References
1. OECD. Organization for Economic Co-operation and Development (OECD). http://www.oecd.org. 2014.
2. D. Alex Quistberg, J. Jaime Miranda, Beth Ebel. Reducing pedestrian deaths and injuries due to road traffic injuries in Peru: interventions that can work. Revista Peruana de Medicina Experimen-tal y Salud Pública. Rev Peru Med Exp Salud Publica vol. 27 n. 2 Lima Apr/Jun 2010. ISSN 1726-4634. http://dx.doi.org/10.1590/S1726-46342010000200014
3. D. López De Luise. Harmonics Systems for Time Mining. International Journal of Modern Engi-neering Research (IJMER). Vol. 3, Issue. 6. 3 pp-2719-2727. ISSN: 2249-6645. 2013.
4. O. Wash. Assessing pedestrian risk locations : a case study of WSDOT efforts. Department of Transportation. Washington State Library. Electronic State Publications. 1998
5. J. Oxley. Improving Pedestrian Safety. Curtin - Monash Accident Research Centre. Fact Sheet No. 6. 2004.
6. T. Cathy, D. Packman. Risk and safety on the roads: the older pedestrian. Foundation for Safety Research. New Casttle University. 1995.
7. TFL. Transport for London Surface. Transport Roads Directorate Guidance on the Assessment of Pedestrian Guardrail. SQA-00234. 2012.
8. TSO. Generic Risk Assessment 4.1. TSO Publisher. www.tsoshop.com.uk. 2009.
9. M. Rodríguez-Hernández, J. Campuzano-Rincón. Primary prevention measures for controlling pedestrian injuries and deaths and improving road safety. Revista Salud Pública. Rev. salud pública vol. 12 no. 3. 2010.
10. L. Thomas, C. Hamlett, W. Hunter, D. Gelinne. Final Report to North Carolina Department of Transportation. North Carolina Department of Transportation, Traffic Engineering and Safety Sys-tems Branch. 2009.
11. D. Antov, T. Rõivas, I. Antso & P. Sürje. A method for pedestrian crossing risk assessment. Trans-action of Wessex Institute. DOI: 10.2495/UT110501. 2011
12. Traffic Management Hazard Identification & Risk Assessment Control Form. Swinburne Univer-sity of Technology. http://www.docstoc.com/docs/24507714/Traffic-Management-Health--Safety-Checklist. 2009.
13. J. Hart, Measuring Pedestrian Risk and Identifying Methods to Prevent Pedestrian Accidents in Langley Park. NAtional Fire Academy. 2004.
14. Health and Safety Comission. Reducing at-work road traffic incidents. Report to Government and the Health and Safety Commission. DTLR. 2001.
15. H. Alavi, J. Charlton, S. Newstead, J. Archer. A Pedestrian Data System for Safety Analyses. Monash University Accident Research Center (MUARC), Melbourne, Victoria, Australia. 2014.
1
16. G. De Nicolao, A. Ferrara, L. Giacomini. On-board Sensor-Based Collision Risk Assessment to Improve Pedestrians' Safety. Vehicular Technology, IEEE Transactions on (Volume: 56, Issue: 5). DOI: 10.1109/TVT.2007.899209. pp. 2405 - 2413. 2007
17. J. Jiao, A. Moudon. Using a Case-control approach and GIS Methods to Assess the Risk of Pedes -trian Collision In Seattle, USA.
18. K. KIM, J. Sul. Development of Intersection Traffic Accident Risk Assessment Model Transporta-tion & Environment Research Institute Ltd. [email protected], 82-(0)2-10-8752-1851. 2001.
19. H. Hautzinger. Analysis Methods for Accident and Injury Risk Studies. Project No. 027763 TRACE. Deliverable 7.3.2007.
20. Journey Risk Management® (JRM®). HTTP://www.irte.com/journey-risk-management.html.
21. M. H. Cameron, A method of measuring exposure to pedestrian accident risk. Accident Analysis & Prevention. Elsevier. Volume 14, Issue 5, Pages 397–405. 1982.
22. D. Chisholm, H. Naci. HSF Discussion paper Road traffic injury prevention: an assessment of risk exposure and intervention cost-effectiveness in different world regions. World. Health Organiza-tion. Department of Health Systems Financing. 2008.
23. D. López De Luise. La tecnología al servicio del transporte inteligente. ITS Argentina. n. 86. 2012.
24. J. María. Improvements on the enforcement process based on Intelligent Transportation Tech-niques. Model and mechanisms for electronic reporting, offense notification and evidence genera-tion. Universidad Carlos III de Madrid. 2012.
25. D. Quinti. Más autos y atascos en la calle, y crecen los tiempos de viaje. Clarín Ciudades. 2013. http://www.clarin.com/ciudades/atascos-calle-crecen-tiempos-viaje_0_955704555.html
26. J. Leonetti. La voz del tránsito. Control de Transito. 2013. http://www.controldetransito.com.ar
27. B. Bazán. El Metrobus porteño entre los peores del mundo. PropAMBA. 2013. http://propamba.-wordpress.com/2013/10/16
28. Indian Institute of Technology and WHO. Risk factors for road traffic injuries. Transport Research and Injury Prevention Programme (TRIPP). Training Manual. 2006.
29. https://www.cesvi.com.ar/revistas/r87/alcohol.pdf