strengthening the commonwealth advantage. - tralac
TRANSCRIPT
Commonwealth Trade Review 2018
Strengthening the Commonwealth Advantage.Trade, Technology, Governance
Key Issues and Findings for Africa
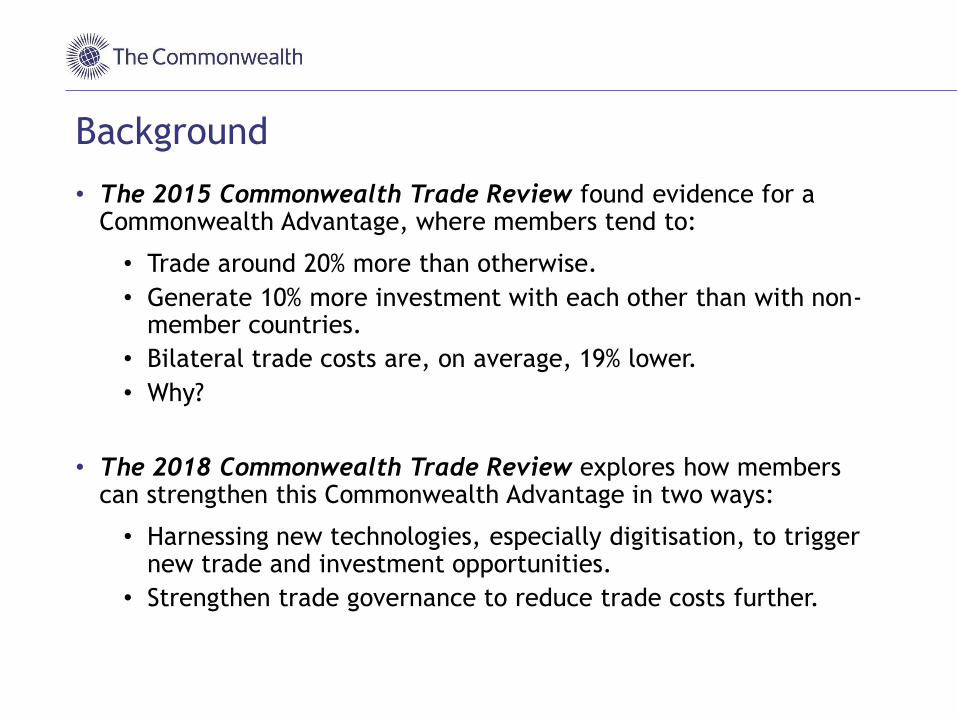
Background
• The 2015 Commonwealth Trade Review found evidence for a Commonwealth Advantage, where members tend to:
• Trade around 20% more than otherwise.
• Generate 10% more investment with each other than with non-member countries.
• Bilateral trade costs are, on average, 19% lower.
• Why?
• The 2018 Commonwealth Trade Review explores how members can strengthen this Commonwealth Advantage in two ways:
• Harnessing new technologies, especially digitisation, to trigger new trade and investment opportunities.
• Strengthen trade governance to reduce trade costs further.
Part 1: Commonwealth trade and investment trends
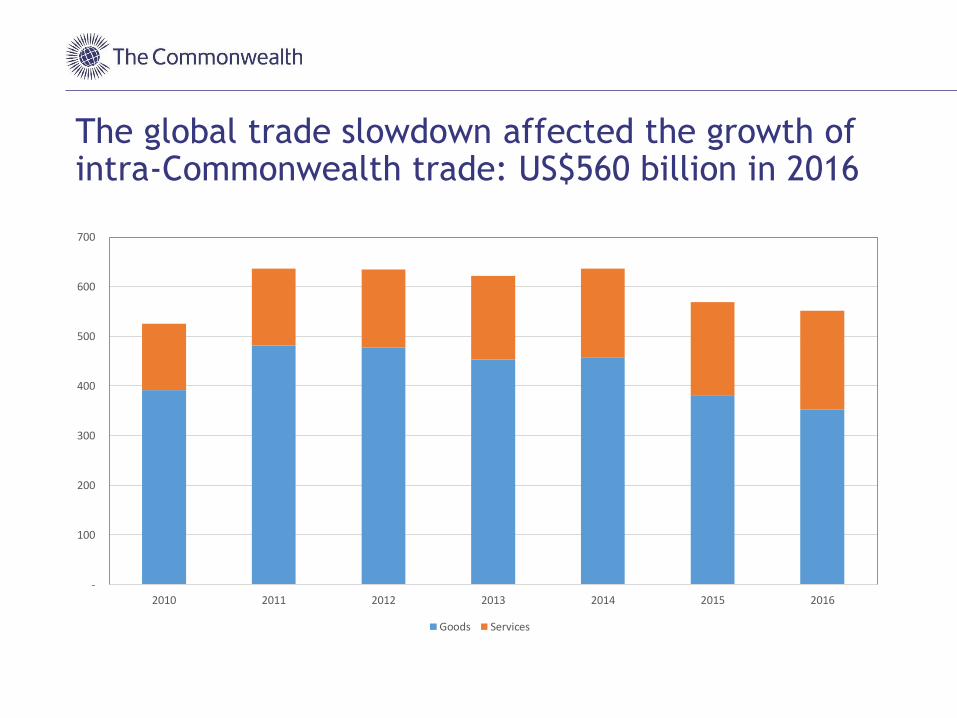
The global trade slowdown affected the growth of intra-Commonwealth trade: US$560 billion in 2016
-
100
200
300
400
500
600
700
2010 2011 2012 2013 2014 2015 2016
Goods Services
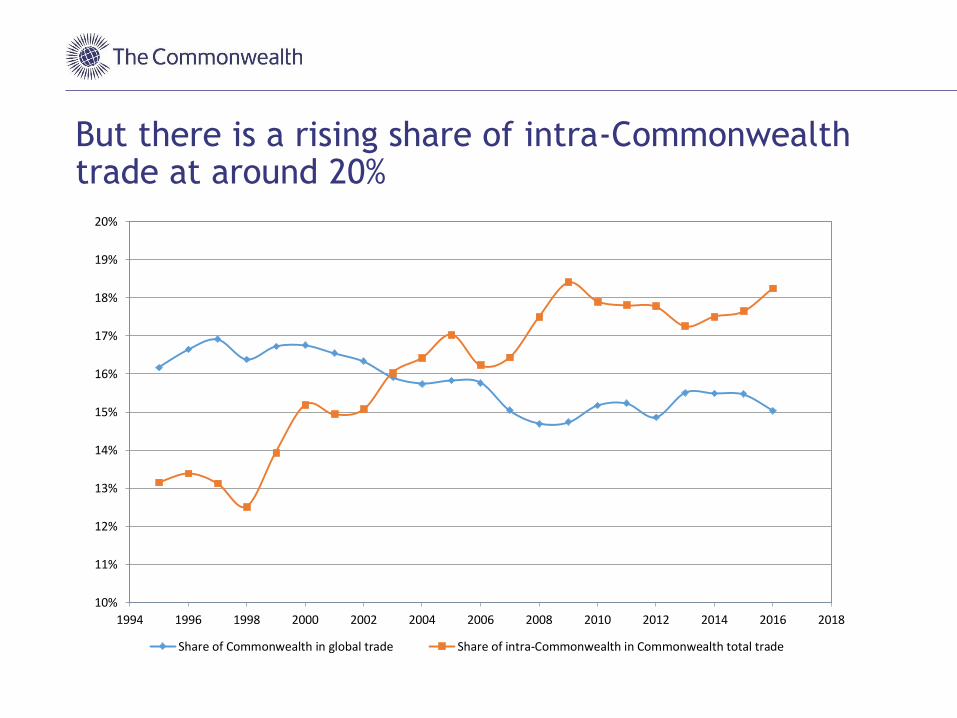
But there is a rising share of intra-Commonwealth trade at around 20%
10%
11%
12%
13%
14%
15%
16%
17%
18%
19%
20%
1994 1996 1998 2000 2002 2004 2006 2008 2010 2012 2014 2016 2018
Share of Commonwealth in global trade Share of intra-Commonwealth in Commonwealth total trade
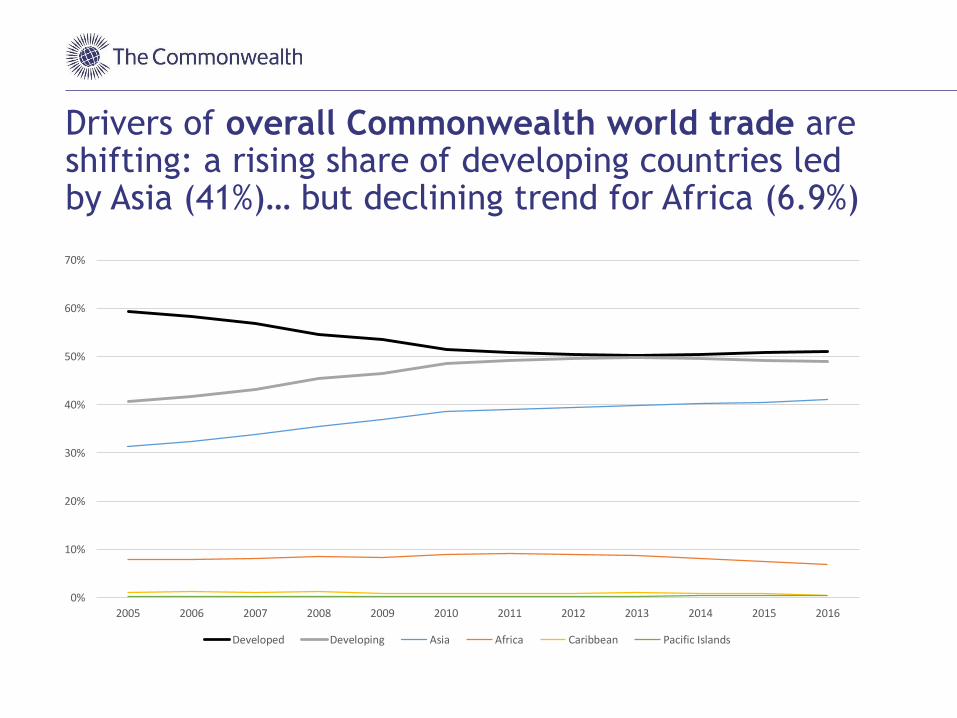
Drivers of overall Commonwealth world trade are shifting: a rising share of developing countries led by Asia (41%)… but declining trend for Africa (6.9%)
0%
10%
20%
30%
40%
50%
60%
70%
2005 2006 2007 2008 2009 2010 2011 2012 2013 2014 2015 2016
Developed Developing Asia Africa Caribbean Pacific Islands
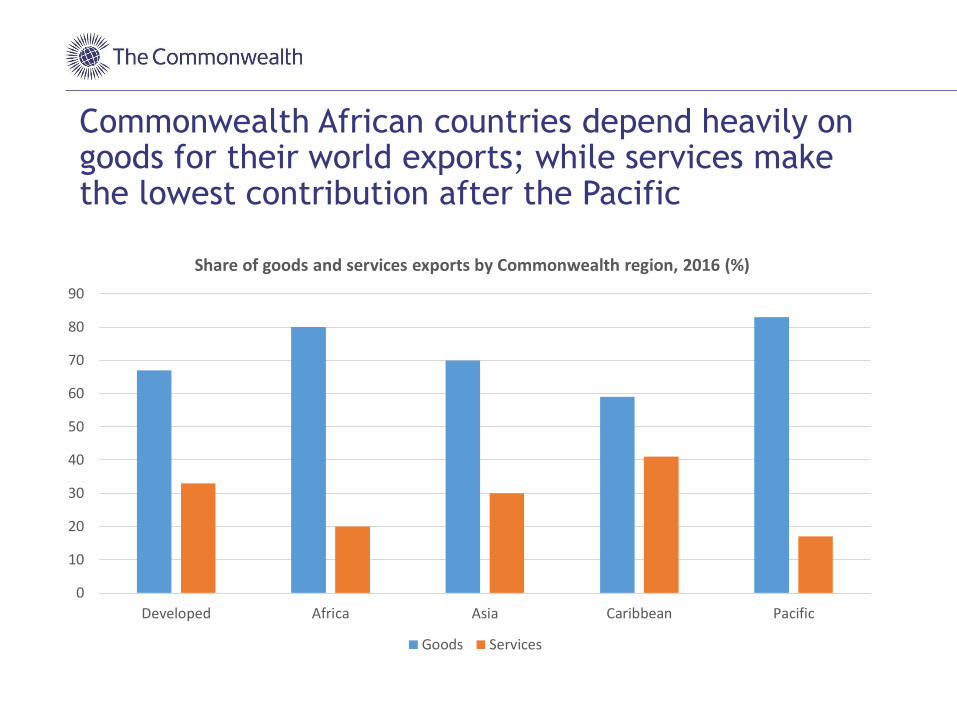
Commonwealth African countries depend heavily on goods for their world exports; while services make the lowest contribution after the Pacific
0
10
20
30
40
50
60
70
80
90
Developed Africa Asia Caribbean Pacific
Share of goods and services exports by Commonwealth region, 2016 (%)
Goods Services
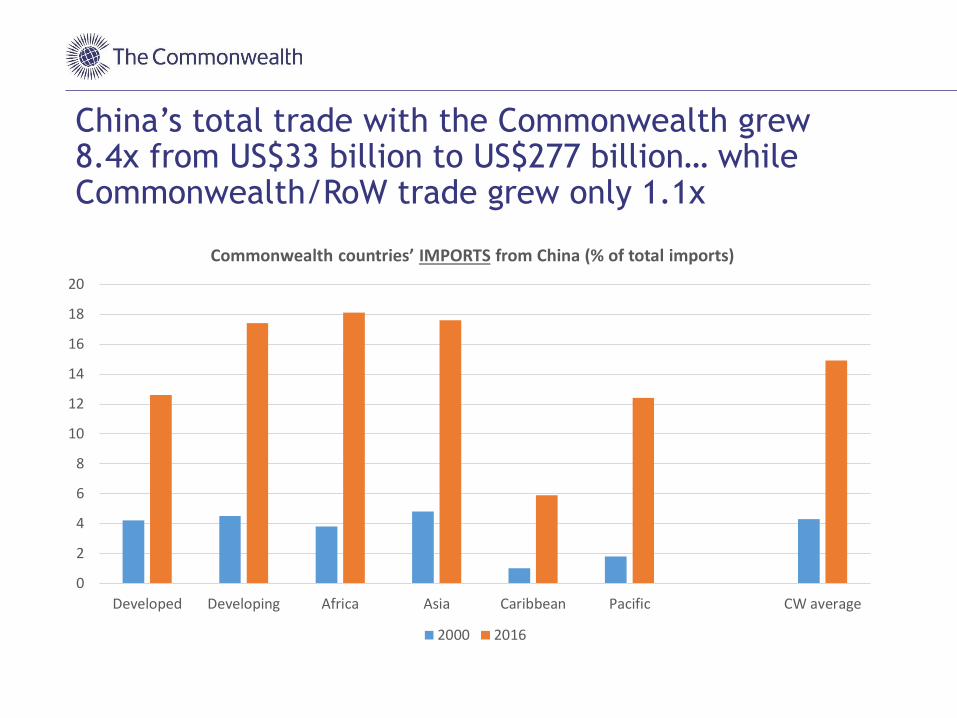
China’s total trade with the Commonwealth grew 8.4x from US$33 billion to US$277 billion… while Commonwealth/RoW trade grew only 1.1x
0
2
4
6
8
10
12
14
16
18
20
Developed Developing Africa Asia Caribbean Pacific CW average
Commonwealth countries’ IMPORTS from China (% of total imports)
2000 2016
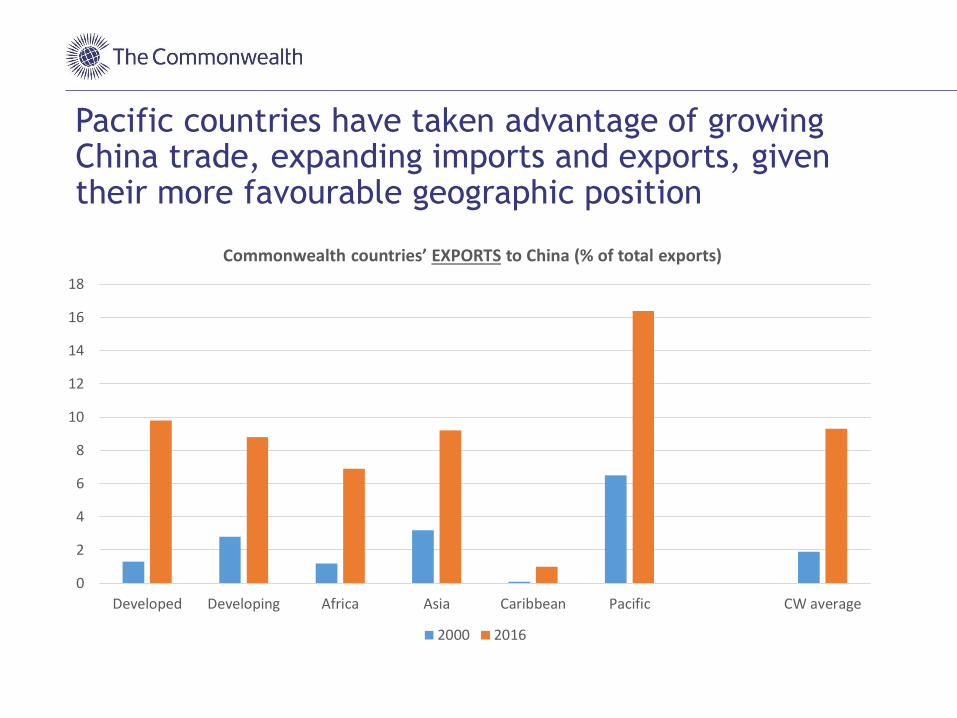
Pacific countries have taken advantage of growing China trade, expanding imports and exports, given their more favourable geographic position
0
2
4
6
8
10
12
14
16
18
Developed Developing Africa Asia Caribbean Pacific CW average
Commonwealth countries’ EXPORTS to China (% of total exports)
2000 2016

Small states depend heavily on Commonwealth trade, especially SACU… bigger economies (SA, Nigeria) less
GOODS exports (2013-15 average) % of world exports going to the Commonwealth
SERVICES exports (nearest year)
Botswana, Lesotho, Namibia, Nauru,eSwatini
More than 70%
Papua New Guinea, Tonga, Tuvalu Between 60% and 70%
Fiji, Kiribati, Malawi, Samoa, Solomon Islands, Vanuatu
Between 50% and 60% Solomon Islands, New Zealand, Fiji, eSwatini
Brunei Darussalam, Dominica, Uganda, Mozambique, Zambia
Between 40% and 50% Samoa, Kiribati, Papua New Guinea, Botswana, Brunei Darussalam, Tonga, Malawi, Bangladesh, Vanuatu, Sri Lanka
Bangladesh, Grenada, Mauritius, Rwanda, St Vincent and the Grenadines,
Seychelles, Sri Lanka
Between 30% and 40% Mauritius, Lesotho, Barbados, Uganda, Zambia, Guyana, Australia, Kenya, Namibia, Ghana
Antigua and Barbuda, Barbados, Cameroon, Ghana, Guyana, Kenya, New Zealand, Sierra
Leone, Tanzania
Between 20% and 30% Tanzania, Malaysia, South Africa, Mozambique, Rwanda,Malta, Pakistan, The Bahamas, Trinidad and Tobago, Nigeria, Grenada, Antigua and Barbuda, Seychelles, St Vincent and the Grenadines, India, Sierra Leone
Australia, The Bahamas, The Gambia, India, Jamaica, Malaysia, Malta, Nigeria, Pakistan,
St Kitts and Nevis, Saint Lucia, Singapore, South Africa
Between 10% and 20% Singapore, Cameroon, Jamaica, Cyprus, Saint Lucia, St Kitts and Nevis, Belize, Dominica, United Kingdom,Canada
Belize, Canada, Cyprus, Trinidad and Tobago, United Kingdom
Up to 10%
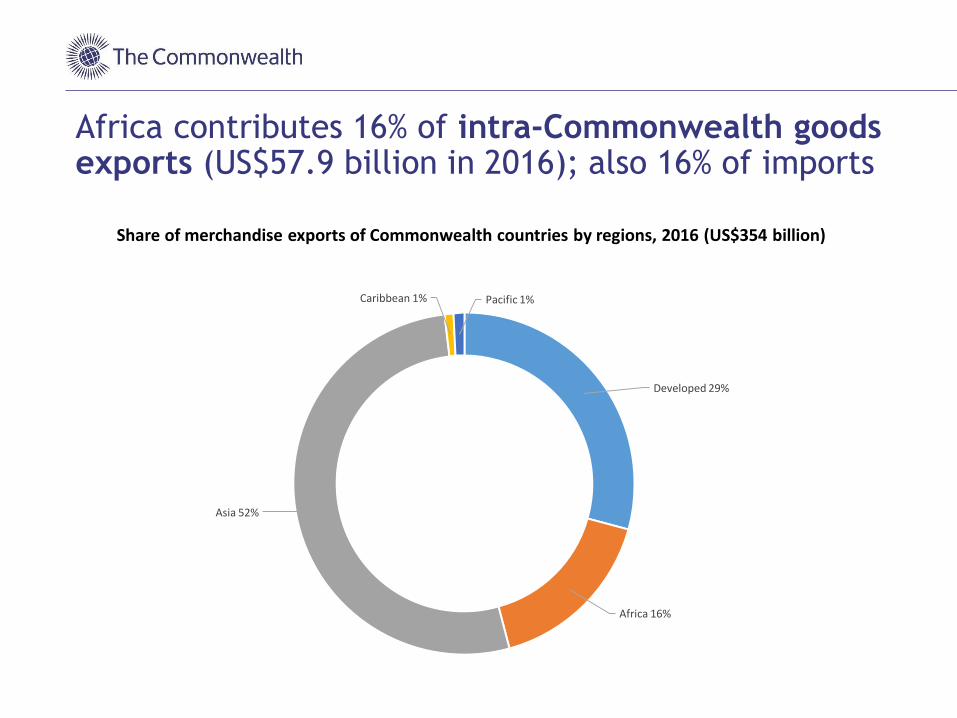
Africa contributes 16% of intra-Commonwealth goods exports (US$57.9 billion in 2016); also 16% of imports
Developed 29%
Africa 16%
Asia 52%
Caribbean 1% Pacific 1%
Share of merchandise exports of Commonwealth countries by regions, 2016 (US$354 billion)
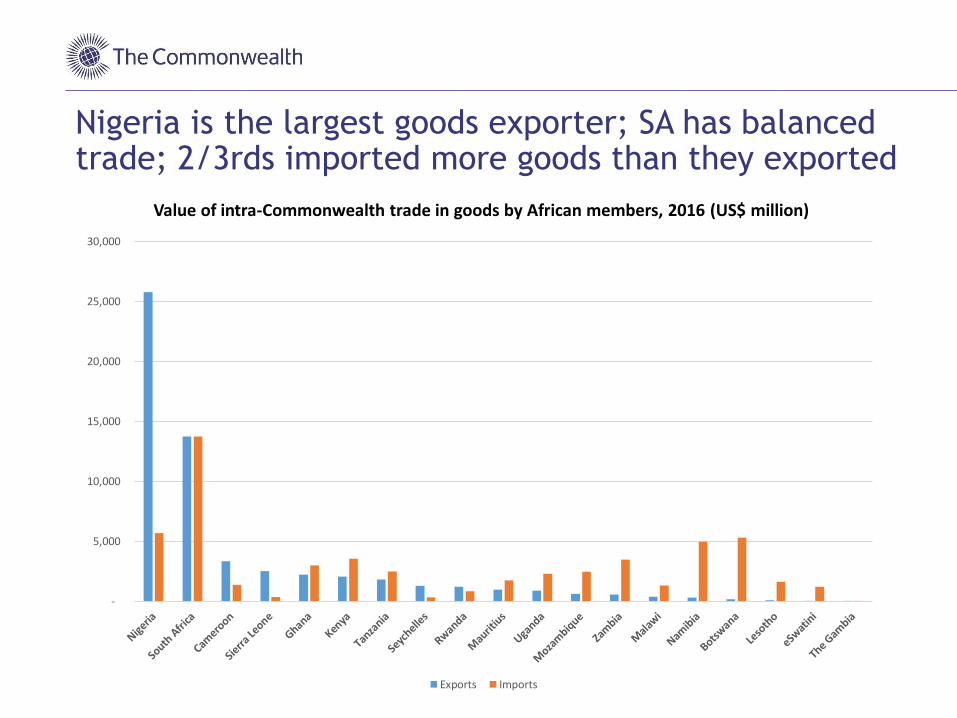
Nigeria is the largest goods exporter; SA has balanced trade; 2/3rds imported more goods than they exported
Value of intra-Commonwealth trade in goods by African members, 2016 (US$ million)
-
5,000
10,000
15,000
20,000
25,000
30,000
Exports Imports
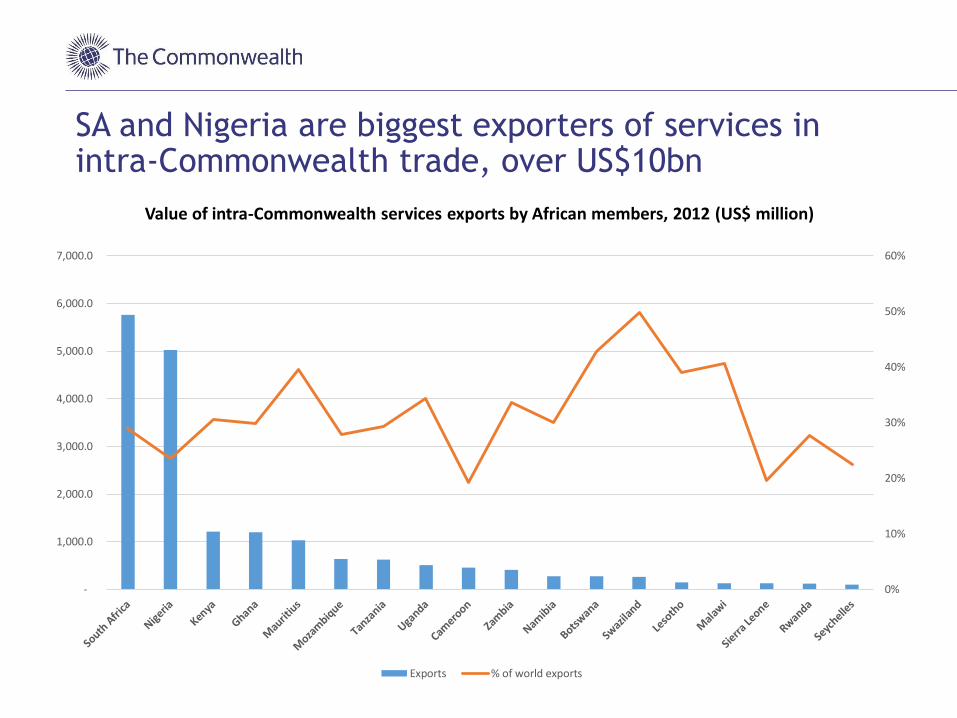
SA and Nigeria are biggest exporters of services in intra-Commonwealth trade, over US$10bn
Value of intra-Commonwealth services exports by African members, 2012 (US$ million)
0%
10%
20%
30%
40%
50%
60%
-
1,000.0
2,000.0
3,000.0
4,000.0
5,000.0
6,000.0
7,000.0
Exports % of world exports
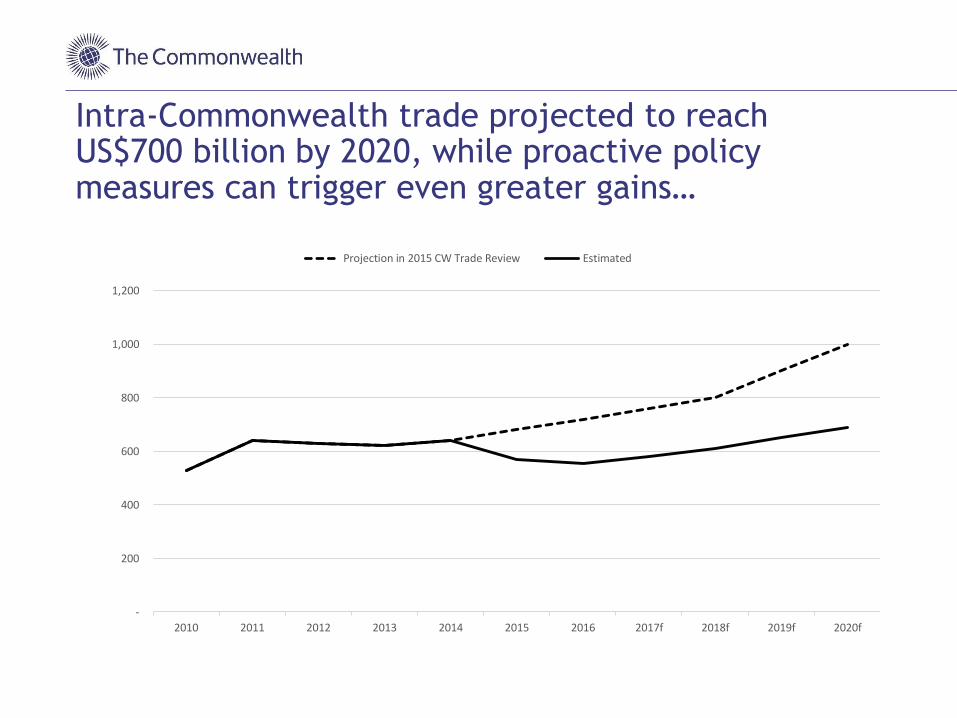
Intra-Commonwealth trade projected to reach US$700 billion by 2020, while proactive policy measures can trigger even greater gains…
-
200
400
600
800
1,000
1,200
2010 2011 2012 2013 2014 2015 2016 2017f 2018f 2019f 2020f
Projection in 2015 CW Trade Review Estimated
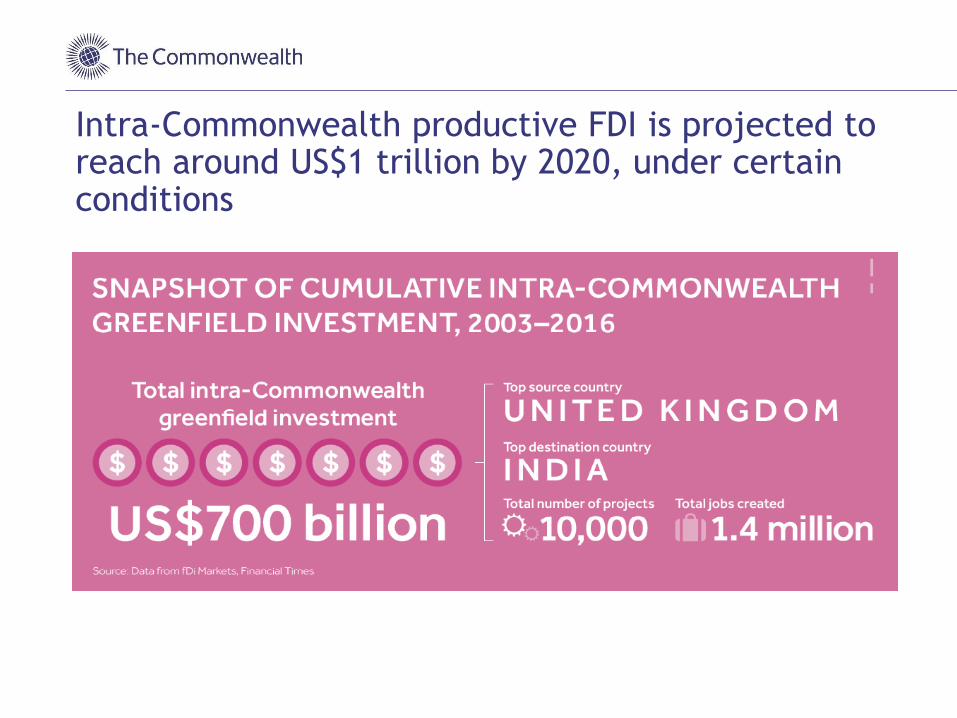
Intra-Commonwealth productive FDI is projected to reach around US$1 trillion by 2020, under certain conditions
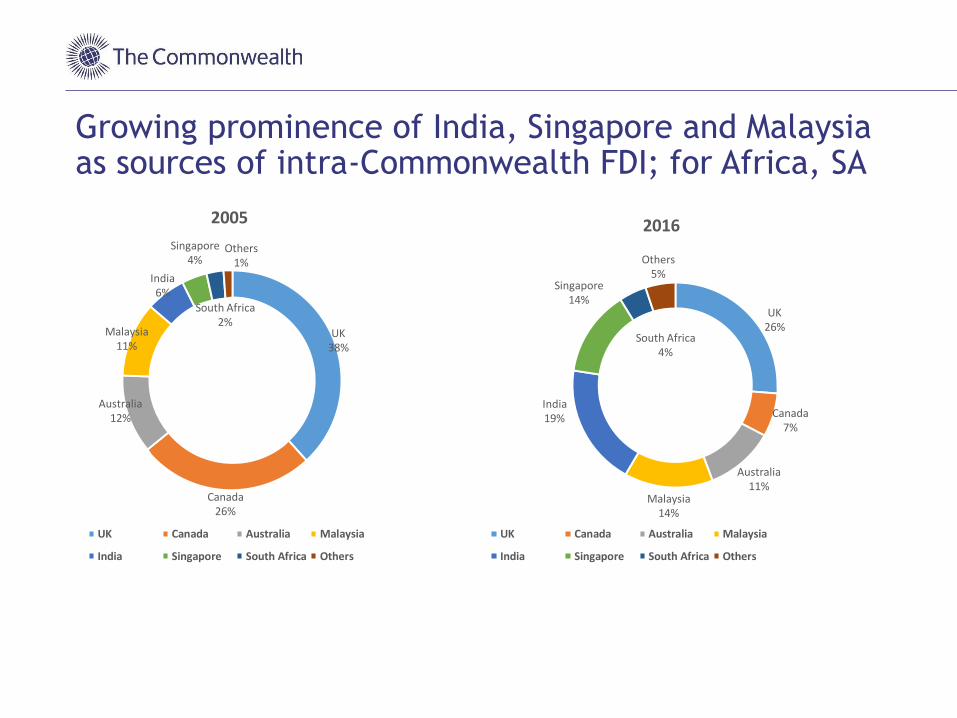
Growing prominence of India, Singapore and Malaysia as sources of intra-Commonwealth FDI; for Africa, SA
UK38%
Canada26%
Australia12%
Malaysia11%
India6%
Singapore4%
South Africa2%
Others1%
2005
UK Canada Australia Malaysia
India Singapore South Africa Others
UK26%
Canada7%
Australia11%
Malaysia14%
India19%
Singapore14%
South Africa4%
Others5%
2016
UK Canada Australia Malaysia
India Singapore South Africa Others
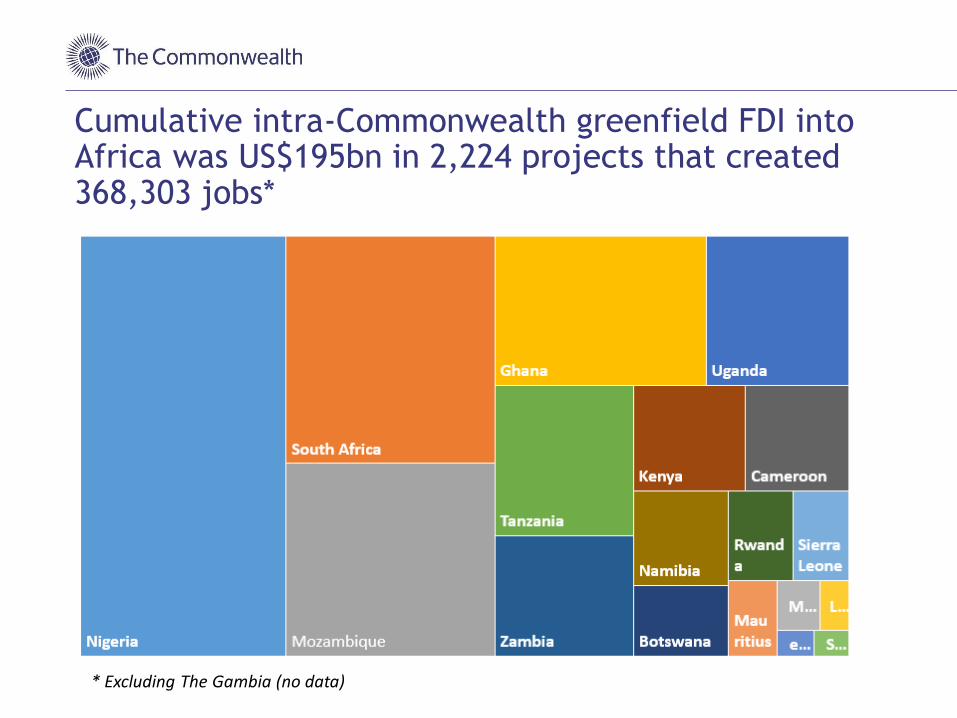
Cumulative intra-Commonwealth greenfield FDI into Africa was US$195bn in 2,224 projects that created 368,303 jobs*
* Excluding The Gambia (no data)
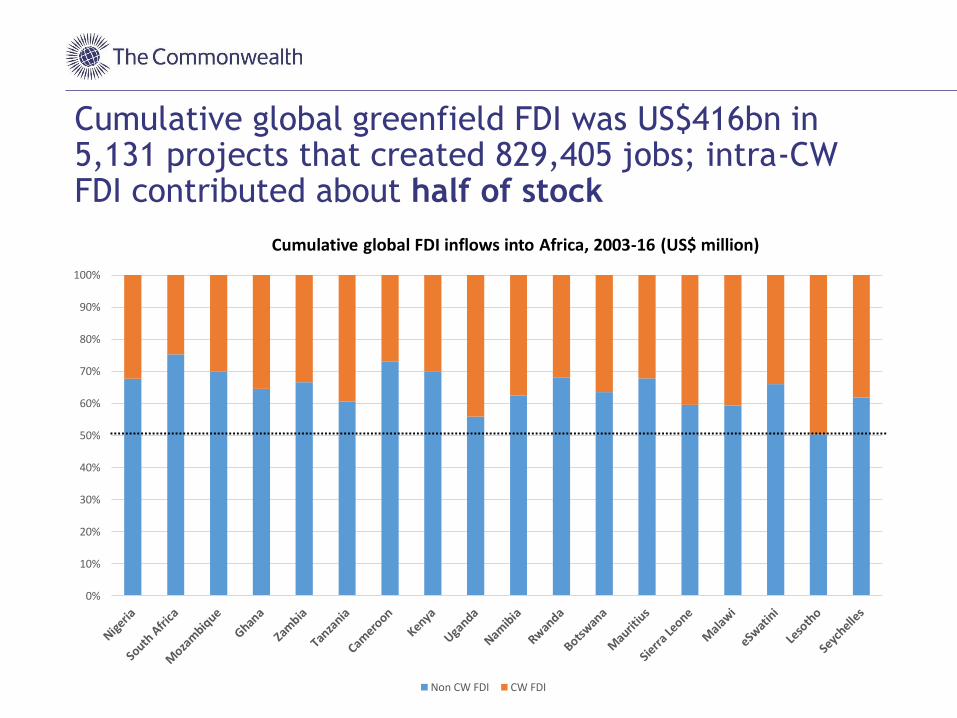
Cumulative global greenfield FDI was US$416bn in 5,131 projects that created 829,405 jobs; intra-CW FDI contributed about half of stock
Cumulative global FDI inflows into Africa, 2003-16 (US$ million)
0%
10%
20%
30%
40%
50%
60%
70%
80%
90%
100%
Non CW FDI CW FDI
Part 2: The Commonwealth in multilateral and regional trade
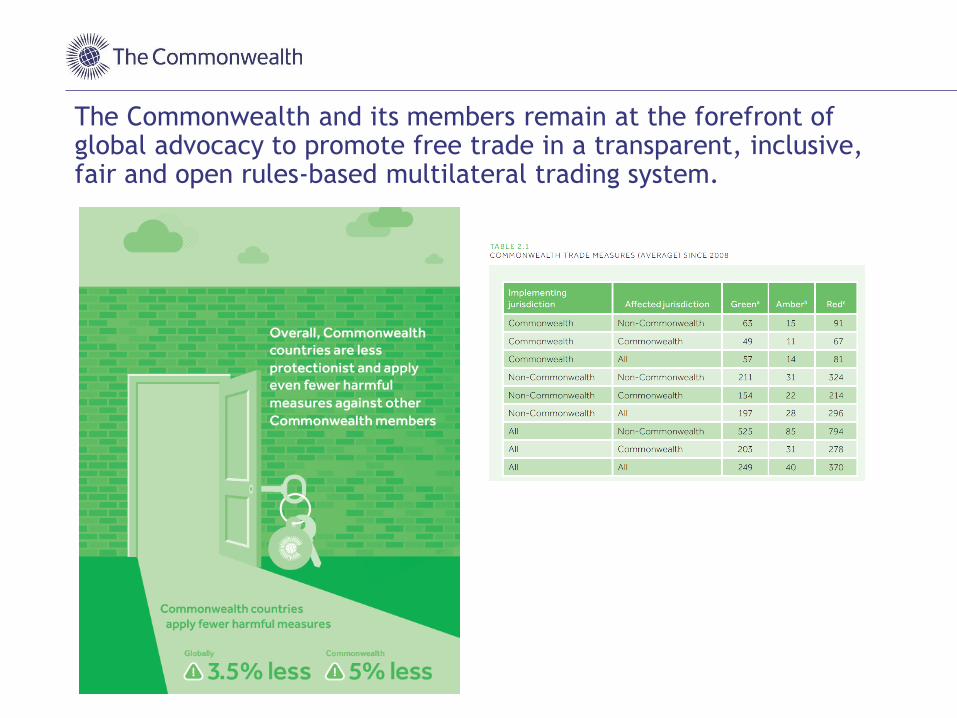
The Commonwealth and its members remain at the forefront of global advocacy to promote free trade in a transparent, inclusive, fair and open rules-based multilateral trading system.
Part 3: Harnessing digitisation for Commonwealth trade, investment and prosperity
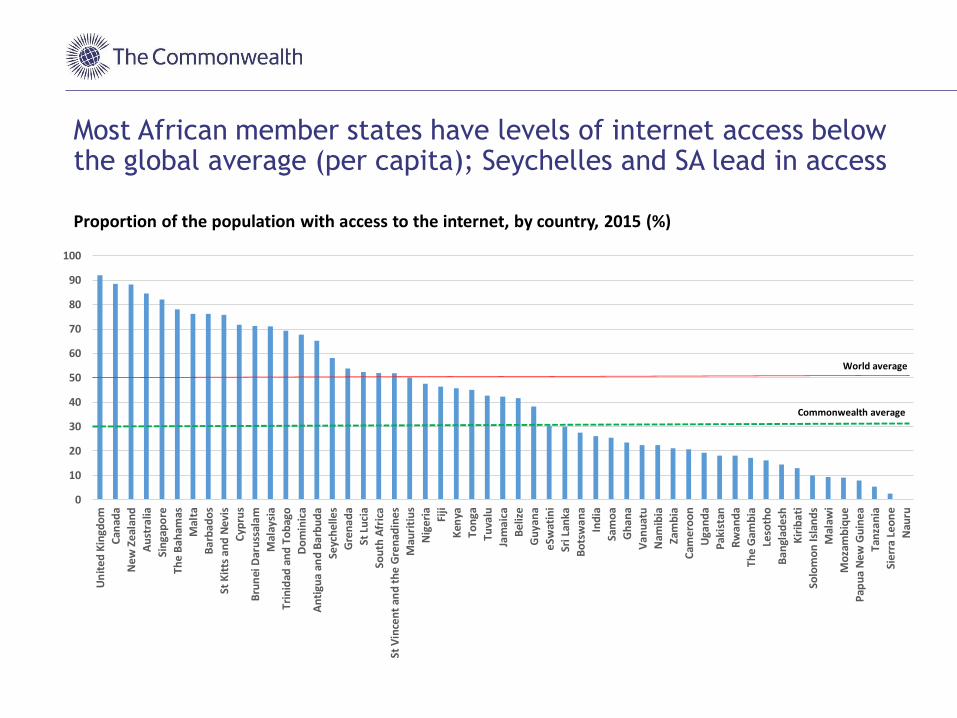
Most African member states have levels of internet access below the global average (per capita); Seychelles and SA lead in access
0
10
20
30
40
50
60
70
80
90
100
Un
ited
Kin
gdo
m
Can
ada
New
Zea
lan
d
Au
stra
lia
Sin
gap
ore
The
Bah
amas
Mal
ta
Bar
bad
os
St K
itts
an
d N
evis
Cyp
rus
Bru
nei
Dar
uss
alam
Mal
aysi
a
Trin
idad
an
d T
ob
ago
Do
min
ica
An
tigu
a an
d B
arb
ud
a
Seyc
hel
les
Gre
nad
a
St L
uci
a
Sou
th A
fric
a
St V
ince
nt
and
th
e G
ren
adin
es
Mau
riti
us
Nig
eria Fiji
Ken
ya
Ton
ga
Tuva
lu
Jam
aica
Bel
ize
Gu
yan
a
eSw
atin
i
Sri L
anka
Bo
tsw
ana
Ind
ia
Sam
oa
Gh
ana
Van
uat
u
Nam
ibia
Zam
bia
Cam
ero
on
Uga
nd
a
Pak
ista
n
Rw
and
a
The
Gam
bia
Leso
tho
Ban
glad
esh
Kir
ibat
i
Solo
mo
n Is
lan
ds
Mal
awi
Mo
zam
biq
ue
Pap
ua
New
Gu
inea
Tan
zan
ia
Sier
ra L
eon
e
Nau
ru
Proportion of the population with access to the internet, by country, 2015 (%)
World average
Commonwealth average
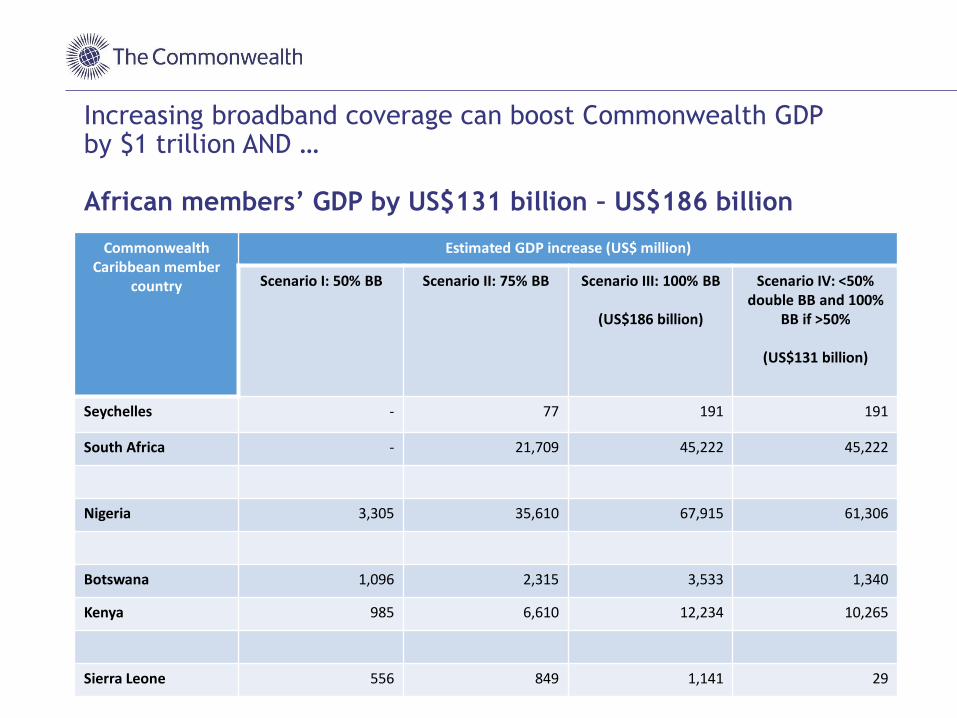
Increasing broadband coverage can boost Commonwealth GDP by $1 trillion AND …
African members’ GDP by US$131 billion – US$186 billion
Commonwealth Caribbean member
country
Estimated GDP increase (US$ million)
Scenario I: 50% BB Scenario II: 75% BB Scenario III: 100% BB
(US$186 billion)
Scenario IV: <50% double BB and 100%
BB if >50%
(US$131 billion)
Seychelles - 77 191 191
South Africa - 21,709 45,222 45,222
Nigeria 3,305 35,610 67,915 61,306
Botswana 1,096 2,315 3,533 1,340
Kenya 985 6,610 12,234 10,265
Sierra Leone 556 849 1,141 29
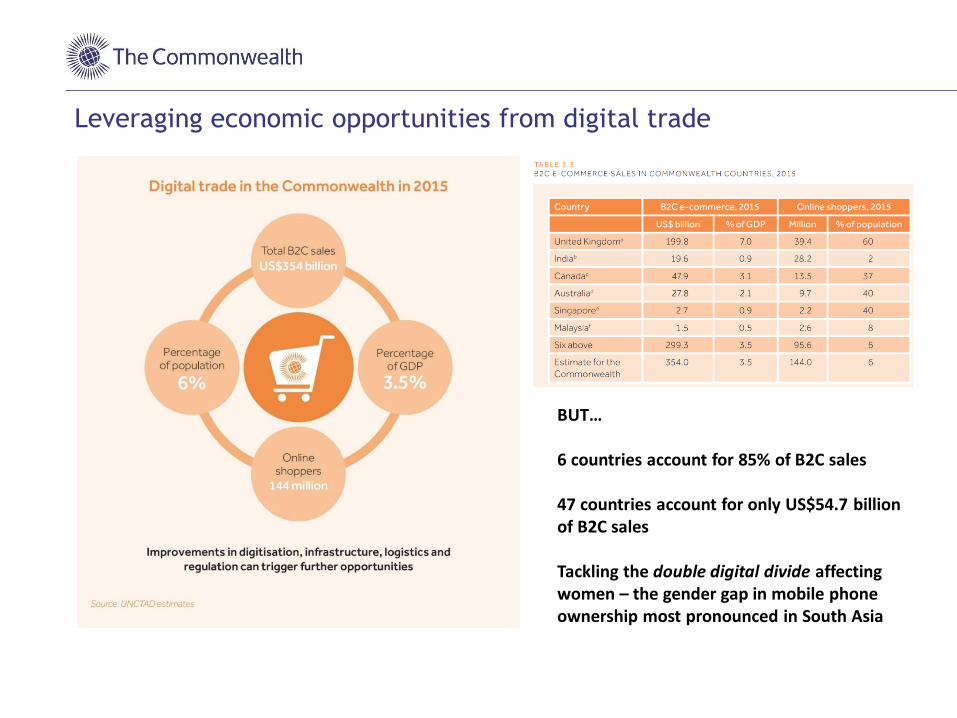
BUT…
6 countries account for 85% of B2C sales
47 countries account for only US$54.7 billion of B2C sales
Tackling the double digital divide affecting women – the gender gap in mobile phone ownership most pronounced in South Asia
Leveraging economic opportunities from digital trade
Part 4: Deepening the Commonwealth advantage through 21st-century trade governance
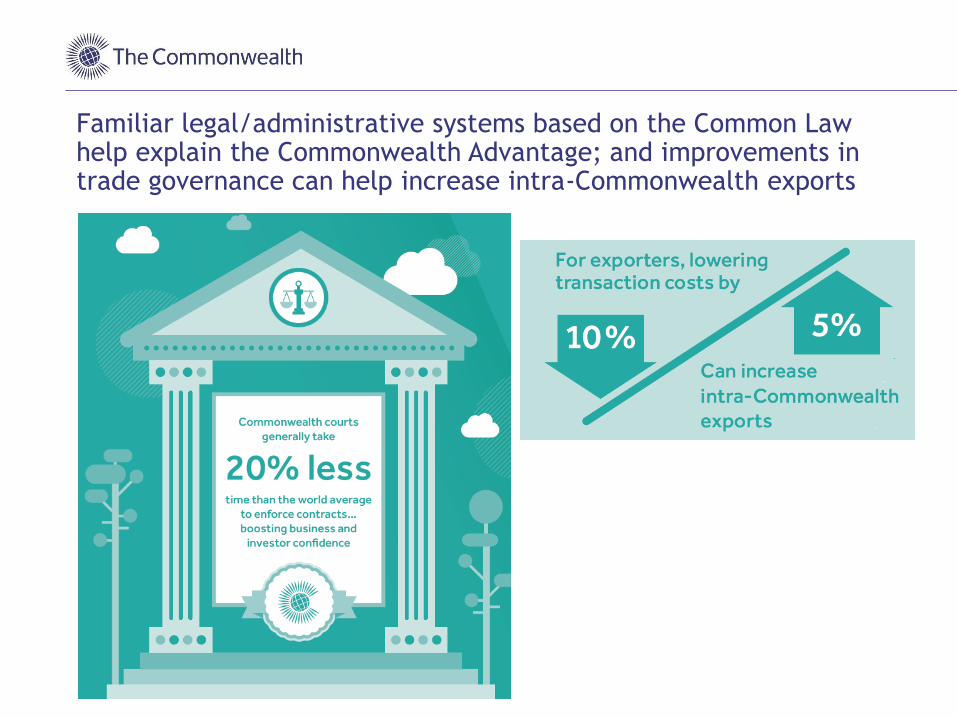
Familiar legal/administrative systems based on the Common Law help explain the Commonwealth Advantage; and improvements in trade governance can help increase intra-Commonwealth exports
Recommendations:
Boosting Commonwealth trade and investment
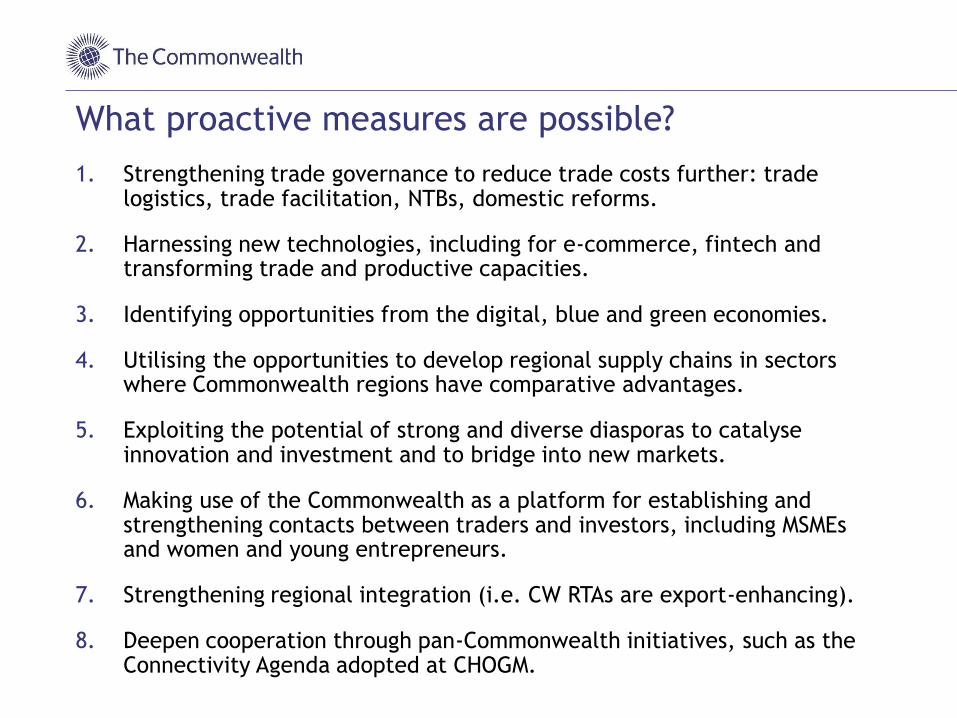
What proactive measures are possible?
1. Strengthening trade governance to reduce trade costs further: trade logistics, trade facilitation, NTBs, domestic reforms.
2. Harnessing new technologies, including for e-commerce, fintech and transforming trade and productive capacities.
3. Identifying opportunities from the digital, blue and green economies.
4. Utilising the opportunities to develop regional supply chains in sectors where Commonwealth regions have comparative advantages.
5. Exploiting the potential of strong and diverse diasporas to catalyse innovation and investment and to bridge into new markets.
6. Making use of the Commonwealth as a platform for establishing and strengthening contacts between traders and investors, including MSMEs and women and young entrepreneurs.
7. Strengthening regional integration (i.e. CW RTAs are export-enhancing).
8. Deepen cooperation through pan-Commonwealth initiatives, such as the Connectivity Agenda adopted at CHOGM.
Thank you
Dr. Brendan VickersEconomic Adviser, International Trade PolicyCommonwealth SecretariatLondon