section 1: global developments - commonwealth
TRANSCRIPT

Section 1: Global Developments
Future Fragmentation ProcessesEffectively Engaging with the Ascendency of Global Value Chains
SMALL STATES
LDCs
SUB-SAHARAN
AFRICA
N O R T H A M E R I C A
E U RO P E
A S I A
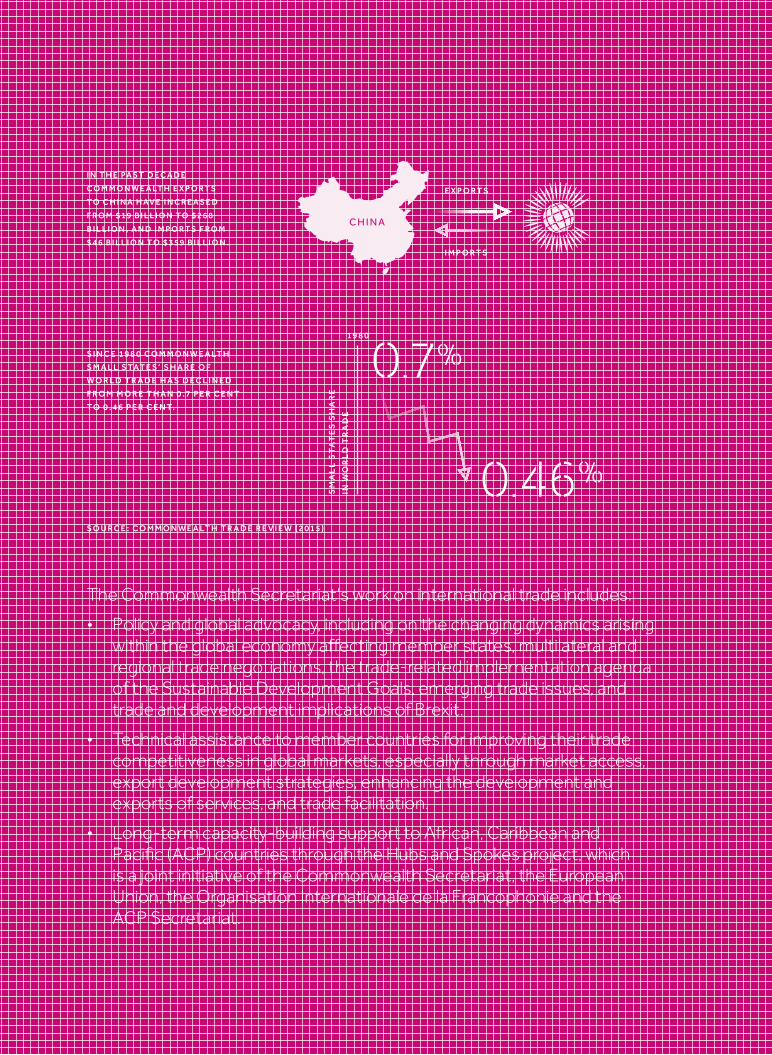
S I N C E 1 9 8 0 C O M M O N W E A LT H
S M A L L S TAT E S ’ S H A R E O F
W O R L D T R A D E H A S D E C L I N E D
F R O M M O R E T H A N 0 . 7 P E R C E N T
T O 0 . 4 6 P E R C E N T.
1 9 8 0S
MA
LL
ST
AT
ES
SH
AR
E
IN W
OR
LD
TR
AD
E
I N T H E PA S T D E C A D E
C O M M O N W E A LT H E X P O R T S
T O C H I N A H AV E I N C R E A S E D
F R O M $ 1 9 B I L L I O N T O $ 2 6 8
B I L L I O N , A N D I M P O R T S F R O M
$ 4 6 B I L L I O N T O $ 3 5 9 B I L L I O N .
E X P O R T S
I M P O R T S
C H I N A
The Commonwealth Secretariat’s work on international trade includes:
• Policy and global advocacy, including on the changing dynamics arising within the global economy affecting member states, multilateral and regional trade negotiations, the trade-related implementation agenda of the Sustainable Development Goals, emerging trade issues, and trade and development implications of Brexit.
• Technical assistance to member countries for improving their trade competitiveness in global markets, especially through market access, export development strategies, enhancing the development and exports of services, and trade facilitation.
• Long-term capacity-building support to African, Caribbean and Pacific (ACP) countries through the Hubs and Spokes project, which is a joint initiative of the Commonwealth Secretariat, the European Union, the Organisation Internationale de la Francophonie and the ACP Secretariat.
S O U R C E : C O M M O N W E A LT H T R A D E R E V I E W ( 2 0 1 5 )

ContextProfound shifts in the trade–growth nexus have occurred in recent years, with implications for conventional trade-led growth models. Since the Great Recession, which began in 2008 after the global financial crisis (GFC), policy-makers around the world have been grappling with the profound implications of the ascendency of global value chains (GVCs) for conventional trade policy-making. This is because the principles and models that have underpinned trade policy-making in the past are based on trade in final goods between separate firms based in sovereign states, with perfect competition assumed. As has become increasingly obvious in recent years, this is far from the case. New forms of trading relationships are arising as a result of profound technological advances, inducing heightened connectivity to global markets.
The unprecedented synchronised global trade shock of 2008–09 revealed the deeply interconnected nature of global trade, investment and finance. As a consequence, international institutions with a mandate for the oversight and supervision of global trade were charged by the G20 with reaching a better understanding of the mechanisms through which the crisis occurred. The result has been the construction of new quantitative databases that measure trade in value added. By identifying the contribution of imports to final goods trade, these new databases provide a more realistic picture of trade patterns. They also help to improve how we account for growth induced through trade.
However, although these new databases provide constructive insights, it is simply not possible to obtain a complete understanding of the operation of GVCs through one type of research method. Data are missing for many Commonwealth countries. Other information gaps persist, not least in view of the tightly co-ordinated nature of global trade, which has arisen as production has been fragmented and dispersed through the networks of transnational firms. All governments continue to grapple with this reality, which comes with a realisation that many of the conventional tools at their disposal to influence participation, as well as outcomes, have been profoundly altered.
Within the context of the current global trade slowdown, new leverage points and more effective dialogue mechanisms are required to more effectively realise the potential gains from trading within GVCs, which are the new trade
Executive Summary

reality. Management of the disruptive forces unleashed by new technologies, avoidance of future financial crises and advancement of public policy objectives in view of the universally adopted Sustainable Development Goals (SDGs) requires reflection on the appropriateness of regulatory frameworks, within as well as across countries.
The potential to further leverage the ‘Commonwealth Effect’1 on contemporary trade and investment flows and linkages requires further reflection on the potential trajectory of future fragmentation processes. New drivers of GVCs are likely to emerge at the regional level and within sectors where firms are just beginning their internationalisation strategies. In view of these future developments, and learning from past experiences, in Section 1 of this publication we reflect on the changing dynamics of the GVC fragmentation mechanism at the global level.
Within this scene setting article, we draw attention to some of the profound shifts in the trade–growth nexus arising. These include the changing role of ‘Factory Asia’ within global production networks, and services-induced GVC participation. Finally, the changing relationship between trade in commodity-based GVCs and trade in services - particularly financial services - is critically reviewed. The common elements of each of the three articles in this Section include: an emphasis on creating technological capabilities; overcoming the challenges of geographical distance, including through interventions designed to increase access to tacit knowledge; and, finally, reducing information asymmetries through creating appropriate market information systems.
HighlightsThere has been a recognition in recent years that the wave of fragmentation which underpinned the GVC mechanism in previous decades may have reached its limit. This realisation, along with other noticeable trends, such as the increasing outpacing of growth in trade in services compared to goods, have prompted a period of introspection in the international trade community. Although some of the ensuing actions at the National level arising from this realisation resemble forms of protectionism, the overarching objective in most cases is to enhance domestic value addition processes and bolster productive capacity.
The articles in this scene-setting section of Future Fragmentation are intended to draw the reader’s attention to developments at the macro level that are likely to influence future fragmentation processes and the possible trajectory of the GVC mechanism. They also provide for a more careful examination of GVCs at the sectoral level, covering manufacturing, services and commodity

trade. Given that the overwhelming majority of the 52 Commonwealth member countries are small states, and around one fifth are Least Developed Countries, understanding how dynamics are unfolding at the sectoral level is critical to encouraging more gainful GVC participation.
Slowdown in Asia’s global value chains and industrial latecomers
In the first article, Wignaraja draws attention to the profound shifts that are under way in the GVC fragmentation mechanism and in the role of ‘Factory Asia’. This includes the structural shift in China’s growth pattern, which has become less dependent on investments and exports; the increasing role of regional economies within GVCs; and the surge in trade protectionism that has become apparent in recent years. It is argued that, as a result of the combination of these developments, the GVC fragmentation mechanism has entered a new phase. As a consequence, trade-led growth models require some refinement as firms modify their business strategies within the more supportive domestic frameworks provided by governments. Proactive foreign direct investment (FDI) strategies are required to leverage the potential of digital trade. A greater focus on the process by which firms join GVCs, including the implications of mergers and acquisitions for firm growth and the building of technological capabilities, is also required.
Overcoming scale and distance and upgrading in global value chains
In the second article, Sturgeon, Farole, Ortega Moncada and Pietrobelli describe why distance exerts a strong influence on GVC participation, due in part to the costs of co-ordination and a reduction in the exchange of tacit knowledge arising from interactions between buyers and sellers; distance can, therefore, reduce the potential for ‘learning by exporting’. Although small states may find it easier to insert themselves into GVCs through specialisation in a narrow range of tasks, overcoming some of the challenges of distance requires strong interventions designed to foster exposure to high-value activity hubs that specialise in research and development (R&D) and marketing, with targeted skill development and active linkage development. In this regard, particular emphasis is placed on information and communications technology (ICT) and connectivity. These technologies transform not only conventional business models but also how buyers and sellers interact.
The changing landscape in commodity markets and trade: implications for development
Finally, Nissanke describes how commodity markets have developed in recent years, with a deepening relationship between commodities that

are traded physically (by transnational corporations) and those that are traded virtually (within derivative portfolios on financial markets). The combined effect of these transformations has altered conventional processes of price discovery and risk hedging, with implications for managing price volatility at the producer level. Proactive measures are needed to counteract some of the potentially adverse effects of these transformations on producers. Invariably, this entails critical reflection on the institutional framework within which GVCs operate.
Note1 See Commonwealth Trade Review (2015).
Chapter 1
Slowdown in Asia’s Global Value Chains and Industrial Latecomers
Ganeshan Wignaraja1
1.1 Introduction
The rich industrial history and trade performance of the economies of developing Asia during the past several decades have been associated with global value chains (GVCs), a novel form of industrial organisation. The emergence of GVCs in developing Asia during the 1980s powered the region’s ascent and its integration into global production networks, resulting in rapid GDP growth. Two decades of unprecedented prosperity followed for the region. However, slowing global trade growth since the 2008–09 global financial crisis (GFC) has begun to cast a shadow on the dynamism of developing Asia’s GVCs and has prompted a review of the effectiveness of the region’s cherished trade-led growth model. This paper examines the recent slowdown in developing Asia’s trade and GVC participation by focusing on the following questions:
• What explains the rise of GVCs in Asia?
• Why have Asia’s trade and GVCs slowed since the crisis?
• What are the prospects for latecomers?
• What affects firms in Asia joining GVCs?
• What public policies support GVCs?
1.2 The rise of ‘Factory Asia’
GVCs are sometimes called ‘production fragmentation’, ‘global production networks’
or ‘global supply chains’, but these terms essentially refer to the same basic concept, with subtle differences. This type of sophisticated industrial organisation is different from the simple textbook notion of a single, large, vertically integrated factory situated in a country. It involves the geographical location of stages of production (e.g. design, production, assembly, marketing, and service activities) in a cost-effective manner (Baldwin and Gonzalez 2014). Different production stages are increasingly located in different countries, linked by a complex web of trade in intermediate inputs and final goods. A lead company, often a multinational corporation such as Apple, Samsung or Toyota, co-ordinates the various production stages.
For example, the Toyota Prius – a hybrid electric mid-size hatchback car – for the US market was designed and assembled in Japan. However, some parts and components for the Prius are made by industrial suppliers in the People’s Republic of China (PRC), Thailand and other regional economies, with Toyota co-ordinating the process. Toyota also undertakes global branding, marketing and after-sales service activities for the Prius.
GVCs have been an important feature of the world economy for decades. This pattern of international specialisation is intertwined with the international integration processes of globalisation and regionalisation. It is also underpinned by the corporate strategies of
5

multinational firms, technological advances (e.g. information, communications and transport technologies), developments in logistics, and falling barriers to trade and investment.
GVCs in the developing economies of Asia probably emerged during the 1980s in the clothing and electronics sectors, and have since penetrated a wide range of industries across the region, including consumer goods, food processing, automotives, electronics and machinery. The role of services in GVCs in East Asia, including engineering services, information technology services and professional services, is increasingly important but has been underestimated as a result of serious data problems.
A combination of factors influenced the spread of GVCs in developing Asia. One was the Plaza Accord of 1985, an agreement among advanced economies to manipulate exchange rates by depreciating the US dollar relative to the Japanese yen and the German Deutschmark. Its intention was to correct trade imbalances between the USA and Germany and the USA and Japan. Rising wages and other industrial costs in Japan induced its multinationals to use advanced manufacturing process outsourcing and ‘just-in-time’ manufacturing to create GVC production that criss-crossed East Asia. The Republic of Korea, Taiwan, Singapore and Hong Kong were part of the first wave of GVC activity. Other states in Southeast Asia soon followed suit.
A second factor that influenced the spread of GVCs was that developing East Asian economies pursued outward-oriented development strategies, taking advantage of cheap and literate labour, a booming world economy and a strategic geographical location. Central to such strategies was attracting export-oriented foreign direct investment (FDI) using incentives and export processing zones alongside gradual import liberalisation in the domestic manufacturing sector.
The third and probably the most important factor was the PRC joining the World Trade Organization (WTO) in 2001. WTO membership helped to consolidate and lock in the PRC’s gradual economic reforms, which it had been begun making in 1991 in an attempt to shift towards a more market-oriented economy. The rapid industrialisation of the PRC and its emergence as a regional manufacturing hub led to increased demand for parts and components from the rest of East Asia.
The structural transformation of developing East Asia from a poor, less developed, agricultural periphery region to a wealthy global factory is considered an economic miracle. The extent of developing East Asia’s participation in GVCs is significantly greater than that of the rest of Asia and has spurred the region’s global rise to coveted ‘Factory Asia’ status, with rapid economic growth over a long period (Athukorala 2011).
A simple and convenient proxy to illustrate GVC trade over time is share of world production network exports. Table 1.1 shows the shares of world production network exports of the advanced economies, developing Asia and other groupings of developing economies.
Developing Asia’s share of world production network exports rose from an annual average of 28.5 per cent in 2001–04 to 41.4 per cent in 2009–2013 (Wignaraja 2016). The PRC is the leading player within developing Asia, with its annual average share rising from 13 per cent to 25 per cent between 2001–04 and 2009–2013. In the same period, the Republic of Korea’s share rose from 4.2 per cent to 4.9 per cent, and the share of the ten member countries of the Association of Southeast Asian Nations (ASEAN) remained at just above 9 per cent. India and the rest of South Asia also saw an increase between the two sub-periods, but their shares were less than 1 per cent in 2009–2013.
6 Future Fragmentation Processes
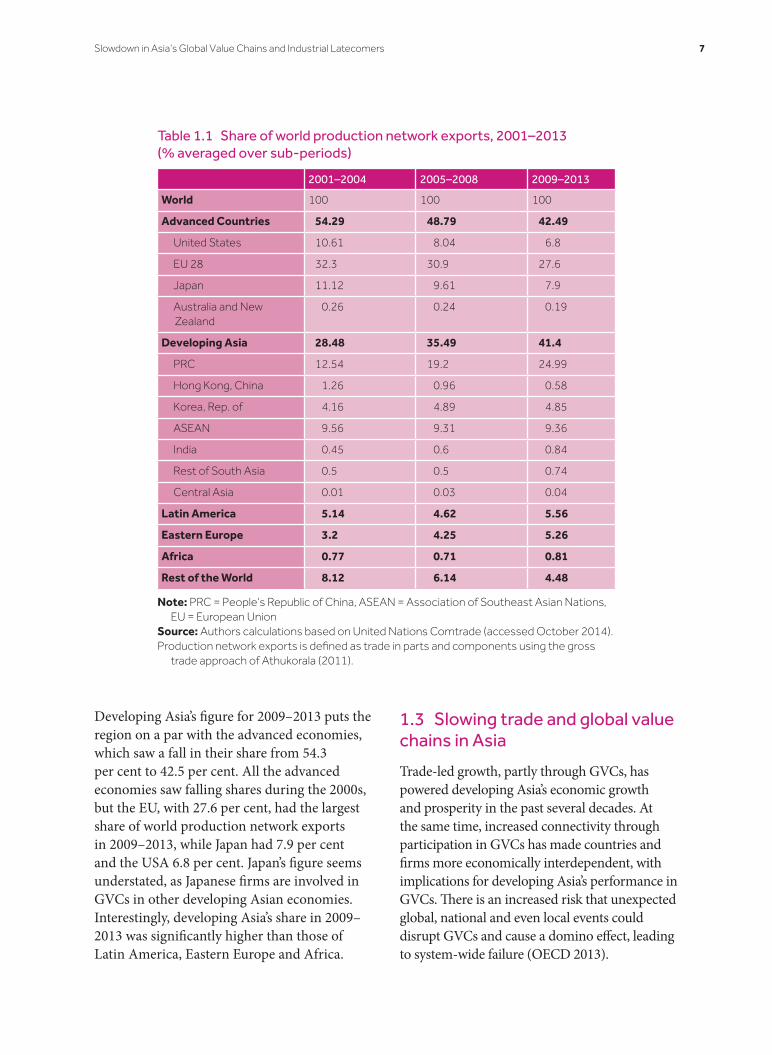
Developing Asia’s figure for 2009–2013 puts the region on a par with the advanced economies, which saw a fall in their share from 54.3 per cent to 42.5 per cent. All the advanced economies saw falling shares during the 2000s, but the EU, with 27.6 per cent, had the largest share of world production network exports in 2009–2013, while Japan had 7.9 per cent and the USA 6.8 per cent. Japan’s figure seems understated, as Japanese firms are involved in GVCs in other developing Asian economies. Interestingly, developing Asia’s share in 2009–2013 was significantly higher than those of Latin America, Eastern Europe and Africa.
1.3 Slowing trade and global value chains in Asia
Trade-led growth, partly through GVCs, has powered developing Asia’s economic growth and prosperity in the past several decades. At the same time, increased connectivity through participation in GVCs has made countries and firms more economically interdependent, with implications for developing Asia’s performance in GVCs. There is an increased risk that unexpected global, national and even local events could disrupt GVCs and cause a domino effect, leading to system-wide failure (OECD 2013).
Table 1.1 Share of world production network exports, 2001–2013 (% averaged over sub-periods)
2001–2004 2005–2008 2009–2013
World 100 100 100
Advanced Countries 54.29 48.79 42.49
United States 10.61 8.04 6.8
EU 28 32.3 30.9 27.6
Japan 11.12 9.61 7.9
Australia and New Zealand
0.26 0.24 0.19
Developing Asia 28.48 35.49 41.4
PRC 12.54 19.2 24.99
Hong Kong, China 1.26 0.96 0.58
Korea, Rep. of 4.16 4.89 4.85
ASEAN 9.56 9.31 9.36
India 0.45 0.6 0.84
Rest of South Asia 0.5 0.5 0.74
Central Asia 0.01 0.03 0.04
Latin America 5.14 4.62 5.56
Eastern Europe 3.2 4.25 5.26
Africa 0.77 0.71 0.81
Rest of the World 8.12 6.14 4.48
Note: PRC = People’s Republic of China, ASEAN = Association of Southeast Asian Nations, EU = European Union
Source: Authors calculations based on United Nations Comtrade (accessed October 2014).Production network exports is defined as trade in parts and components using the gross
trade approach of Athukorala (2011).
Slowdown in Asia’s Global Value Chains and Industrial Latecomers 7
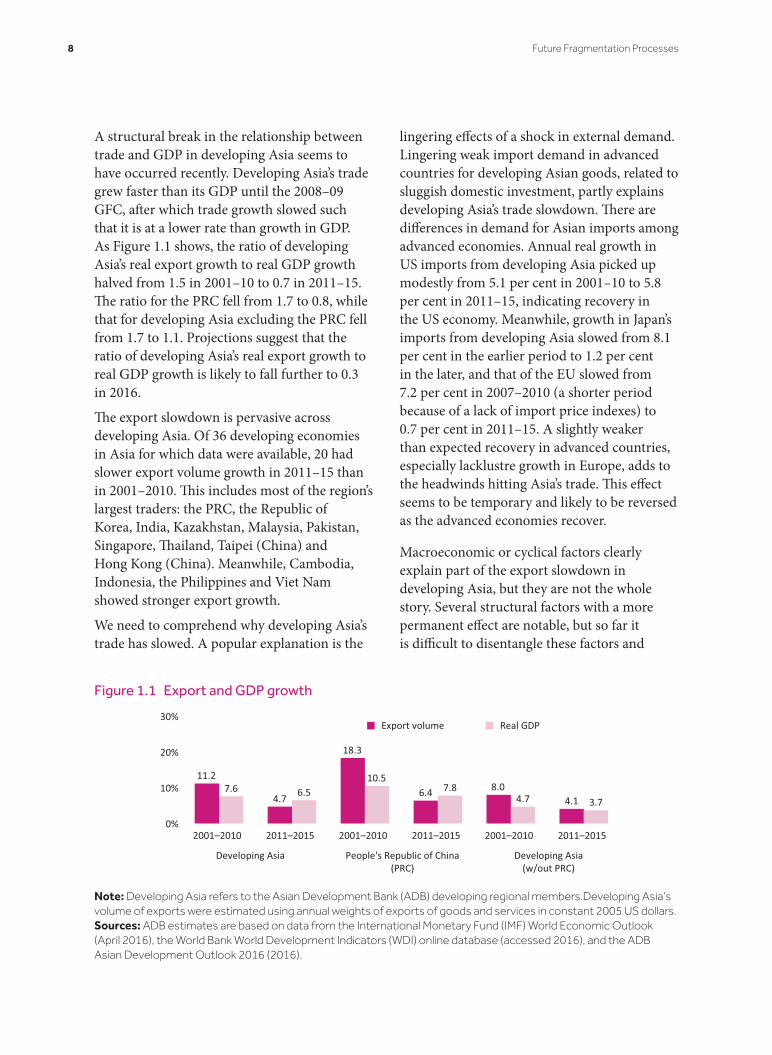
A structural break in the relationship between trade and GDP in developing Asia seems to have occurred recently. Developing Asia’s trade grew faster than its GDP until the 2008–09 GFC, after which trade growth slowed such that it is at a lower rate than growth in GDP. As Figure 1.1 shows, the ratio of developing Asia’s real export growth to real GDP growth halved from 1.5 in 2001–10 to 0.7 in 2011–15. The ratio for the PRC fell from 1.7 to 0.8, while that for developing Asia excluding the PRC fell from 1.7 to 1.1. Projections suggest that the ratio of developing Asia’s real export growth to real GDP growth is likely to fall further to 0.3 in 2016.
The export slowdown is pervasive across developing Asia. Of 36 developing economies in Asia for which data were available, 20 had slower export volume growth in 2011–15 than in 2001–2010. This includes most of the region’s largest traders: the PRC, the Republic of Korea, India, Kazakhstan, Malaysia, Pakistan, Singapore, Thailand, Taipei (China) and Hong Kong (China). Meanwhile, Cambodia, Indonesia, the Philippines and Viet Nam showed stronger export growth.
We need to comprehend why developing Asia’s trade has slowed. A popular explanation is the
lingering effects of a shock in external demand. Lingering weak import demand in advanced countries for developing Asian goods, related to sluggish domestic investment, partly explains developing Asia’s trade slowdown. There are differences in demand for Asian imports among advanced economies. Annual real growth in US imports from developing Asia picked up modestly from 5.1 per cent in 2001–10 to 5.8 per cent in 2011–15, indicating recovery in the US economy. Meanwhile, growth in Japan’s imports from developing Asia slowed from 8.1 per cent in the earlier period to 1.2 per cent in the later, and that of the EU slowed from 7.2 per cent in 2007–2010 (a shorter period because of a lack of import price indexes) to 0.7 per cent in 2011–15. A slightly weaker than expected recovery in advanced countries, especially lacklustre growth in Europe, adds to the headwinds hitting Asia’s trade. This effect seems to be temporary and likely to be reversed as the advanced economies recover.
Macroeconomic or cyclical factors clearly explain part of the export slowdown in developing Asia, but they are not the whole story. Several structural factors with a more permanent effect are notable, but so far it is difficult to disentangle these factors and
Figure 1.1 Export and GDP growth
11.2
4.7
18.3
6.4 8.04.1
7.6 6.510.5
7.84.7 3.7
0%
10%
20%
30%
2001–2010 2011–2015 2001–2010 2011–2015 2001–2010 2011–2015
Developing Asia People's Republic of China(PRC)
Developing Asia(w/out PRC)
Export volume Real GDP
Note: Developing Asia refers to the Asian Development Bank (ADB) developing regional members.Developing Asia’s volume of exports were estimated using annual weights of exports of goods and services in constant 2005 US dollars.Sources: ADB estimates are based on data from the International Monetary Fund (IMF) World Economic Outlook (April 2016), the World Bank World Development Indicators (WDI) online database (accessed 2016), and the ADB Asian Development Outlook 2016 (2016).
8 Future Fragmentation Processes

establish their individual influence on Asia’s export slowdown.
First, after years of extraordinary growth, the PRC is naturally arriving at a new normal growth pattern less dependent on investment and exports. This structural shift in the PRC is linked to rising wages and industrial costs, real exchange rate appreciation and a declining working-age population, among other factors. The PRC’s demand for primary commodity imports and intermediate imports for its factories has fallen, causing ripples throughout developing Asia and the global economy.
Second, FDI flows to developing Asia – much of which has historically gone into the tradeable goods sector – have slowed. FDI has recently contributed less to the investment ratio in developing Asia than in previous years and may be less of a catalyst for domestic investment in the same fields. FDI inflows as a percentage of gross fixed capital formation in developing Asia fell from 9.9 per cent per year in 2001–10 to 6.4 per cent per year in 2011–14. Furthermore, the region risks being deprived of critical ingredients for productivity and trade, including technology, skills and connections to overseas markets. The slow in FDI flows is linked to the PRC’s falling attractiveness as an investment destination, rising industrial costs and a bout of risk aversion in relation to emerging markets.
A third, closely related, reason is slowing growth of GVCs, affecting trade in intermediate goods in the region. Imports of parts and components as a proportion of manufacturing exports – a crude proxy for GVC trade – fell in developing Asia from 66.6 per cent in 2000 to 51.0 per cent in 2015 (see Table 1.2). This reflects a fall in the PRC’s figure from 62.5 per cent to 37.8 per cent and the Republic of Korea’s from 49.5 per cent to 39.6 per cent, as well as a rise for other regional economies from 62.9 per cent to 73.4 per cent. These include Hong Kong (China), the ASEAN countries,
India and the rest of South Asia. Developing Asia is highly reliant on the PRC as the main regional assembly hub in GVCs, particularly in automotives, electronics and machinery. Some other regional economies, however, are starting to play an increasing role in GVCs.
Fourth, trade protectionism has been rising in the post-crisis era. Decades of trade liberalisation has resulted in historically low import tariffs in developing Asia, averaging 7.9 per cent in 2014. However, there has been a rise in murky non-tariff measures such as anti-dumping duties, safeguards, pre-shipment inspection, sanitary and phytosanitary measures, technical barriers to trade, and export subsidies. The number of non-tariff measures imposed on developing Asia by outsiders more than tripled, from 2,263 in 2000 to 7,190 in 2015. In the same period, the number imposed by developing Asia more than quadrupled, from 534 to 2,217.
1.4 Prospects for latecomers in global value chains
While developing Asia’s exports and GVCs have slowed, heightened economic pessimism about this trend seems misdirected. A gradual recovery in the advanced economies
Table 1.2 Imported intermediate goods as a proportion of manufacturing exports (%)
2000 2015
Developing Asia 60.6 51.0
Developing Asia (excluding the PRC)
60.0 73.4
Developing Asia (excluding the PRC and the Republic of Korea)
62.9 73.4
PRC 62.5 37.8
Hong Kong (China) 55.9 73.7
Korea, Republic of 49.5 39.6
India 56.9 91.5
ASEAN countries 67.6 64.9
Source: Author’s calculations
Slowdown in Asia’s Global Value Chains and Industrial Latecomers 9
could stimulate new sources of export and GVC growth in developing Asia. Likewise, rebalancing in the PRC will open up new trading opportunities for that economy and the region’s other dynamic economies. Several developments could encourage new sources of export growth.
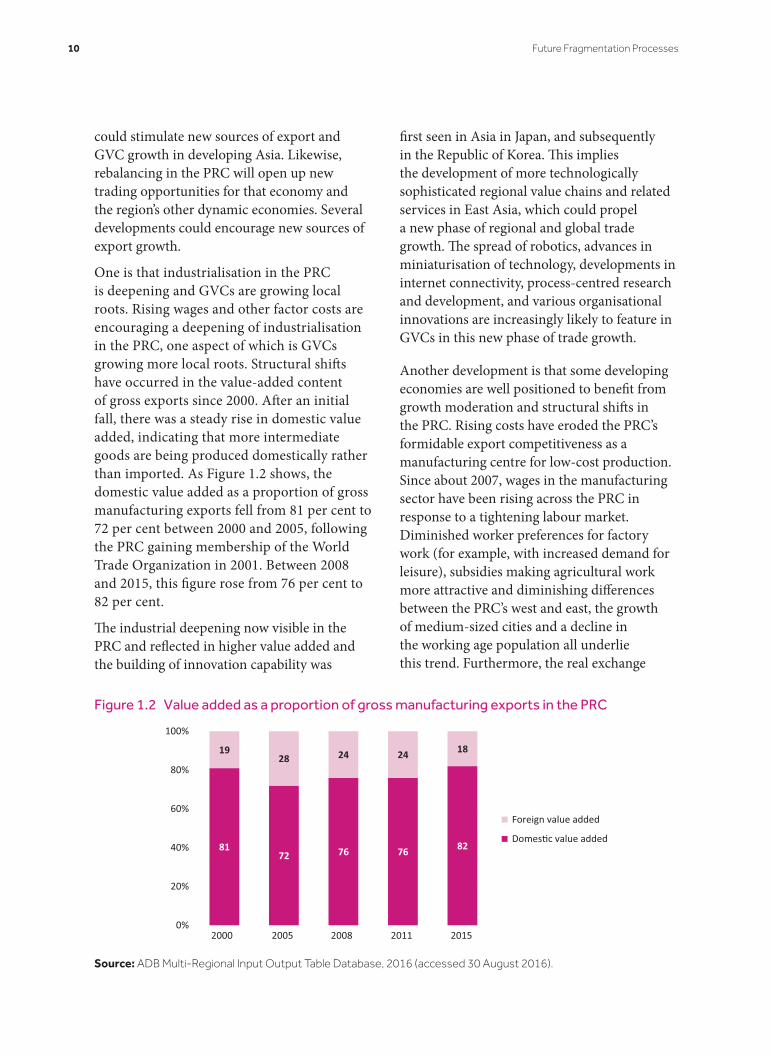
One is that industrialisation in the PRC is deepening and GVCs are growing local roots. Rising wages and other factor costs are encouraging a deepening of industrialisation in the PRC, one aspect of which is GVCs growing more local roots. Structural shifts have occurred in the value-added content of gross exports since 2000. After an initial fall, there was a steady rise in domestic value added, indicating that more intermediate goods are being produced domestically rather than imported. As Figure 1.2 shows, the domestic value added as a proportion of gross manufacturing exports fell from 81 per cent to 72 per cent between 2000 and 2005, following the PRC gaining membership of the World Trade Organization in 2001. Between 2008 and 2015, this figure rose from 76 per cent to 82 per cent.
The industrial deepening now visible in the PRC and reflected in higher value added and the building of innovation capability was
first seen in Asia in Japan, and subsequently in the Republic of Korea. This implies the development of more technologically sophisticated regional value chains and related services in East Asia, which could propel a new phase of regional and global trade growth. The spread of robotics, advances in miniaturisation of technology, developments in internet connectivity, process-centred research and development, and various organisational innovations are increasingly likely to feature in GVCs in this new phase of trade growth.
Another development is that some developing economies are well positioned to benefit from growth moderation and structural shifts in the PRC. Rising costs have eroded the PRC’s formidable export competitiveness as a manufacturing centre for low-cost production. Since about 2007, wages in the manufacturing sector have been rising across the PRC in response to a tightening labour market. Diminished worker preferences for factory work (for example, with increased demand for leisure), subsidies making agricultural work more attractive and diminishing differences between the PRC’s west and east, the growth of medium-sized cities and a decline in the working age population all underlie this trend. Furthermore, the real exchange
Figure 1.2 Value added as a proportion of gross manufacturing exports in the PRC
8172 76 76 82
1928 24 24 18
0%
20%
40%
60%
80%
100%
2000 2005 2008 2011 2015
Foreign value added
Domes�c value added
Source: ADB Multi-Regional Input Output Table Database, 2016 (accessed 30 August 2016).
10 Future Fragmentation Processes

rate has appreciated, further eroding the country’s export competitiveness. As a result, it is becoming more difficult for the PRC to compete on wages against lower cost economies in labour-intensive low-skilled manufacturing sectors such as clothing and textiles (Deloitte 2014). Some of the PRC’s GVC production – particularly in labour-intensive segments – is beginning to shift to lower cost countries such as Viet Nam, Thailand, Cambodia, India and Bangladesh (Abiad et al. 2016). These Asian economies are increasingly open to export-oriented FDI and offer relatively low wages with reasonably good labour productivity.
Furthermore, services are the largest sector in most economies in developing Asia and trade in services is growing. However, trade in services may not be properly reflected in international trade statistics because they are difficult to measure. For instance, one problem in relation to GVCs is how much trade in services is reflected in value added in goods trading, for which there is a paucity of evidence. In addition, the potential for faster growth in trade in services is limited by trade restrictions, skills gaps and problems with internet connectivity. GVC-related services, digital trade, professional services and financial services are areas with potential for trade growth. The PRC is likely to further expand its role as an exporter and importer of services (Constantinescu et al. 2016). Over time, the PRC is likely to develop as a regional GVC-related services hub alongside its role as a regional manufacturing and assembly hub in GVCs. India is also likely to expand its trade in information technology services and witness the emergence of GVC-related services and other commercial services exports. ASEAN and South Asian economies have opportunities to further develop GVC-related services, tourism and other commercial services exports.
To realise these trading opportunities in GVCs, firms in latecomer countries will need to adjust business strategies and governments will
need to develop supportive national policies. Developing Asia’s rich development experience offers some insights into these issues, and these are considered below.
1.5 Entry of firms into global value chains
The role of firms in GVCs in developing Asia is a new frontier in economics. While there are insightful case studies of the organisational aspects of individual firms in GVCs in developing Asia, little research attempts to generalise the findings of case studies to multiple firms though econometric analysis. The recent availability of microdata from enterprise surveys has enabled the identification of characteristics of firms that have successfully joined GVCs in developing Asian economies.
A recent study conducted econometric analysis on about 6,000 firms in ASEAN economies to examine the factors affecting firm-level entry into GVCs (Wignaraja 2015). It underscored the notion of firm heterogeneity in GVCs (i.e. that firms are considered different in terms of efficiency and fixed and variable costs when involved in GVCs). Several different models were estimated, including one for all manufacturing firms. The findings indicate that some firms are better placed than others to join GVCs and that these differences are linked to various factors.
One is that the size of a firm affects the probability of its joining a GVC. This is indicated by the coefficient on firm size being positive and significant in the all-manufacturing firms model. Being a big firm naturally creates advantages to participating in supply chains, due to a larger scale of production, better access to technology from abroad, and the ability to pay higher wages for skilled labour and to spend more on marketing. Firm growth and working with large firms are key for participating in GVCs. Therefore,
Slowdown in Asia’s Global Value Chains and Industrial Latecomers 11
smart business strategies, such as mergers, acquisitions and forming business alliances with multinationals or large local business houses, are rational approaches.
Another factor is that, under some circumstances, nimble small and medium-sized enterprises (SMEs) can also join GVCs. Adding a size squared variable in the all-manufacturing firms model was useful in clarifying the size effect. The coefficient on size squared is negative and significant, implying a non-linear relationship. By clubbing together in industrial clusters, SMEs can overcome some of the disadvantages of being small and rely on the benefits of interdependence. Small firms located in clusters can jointly finance a training centre or a technical consultant to upgrade skills. Business associations can facilitate clustering by mitigating trust deficits to encourage co-operation between SMEs, and by co-ordinating collective actions for cluster formation. For instance, major industrial clusters are located in Viet Nam, near Hanoi and Ho Chi Minh City, where large firms are surrounded by thousands of SME suppliers and subcontractors making garments, agricultural machinery and electronics goods. To overcome the disadvantages of firm size, SMEs can also embark on niche market strategies.
However, firm size is not the whole story of entry into GVCs in ASEAN economies. Efficiency and access to finance also influence the probability of joining GVCs. This is indicated by positive and significant coefficients on the variables capturing technology, skills and access to credit in the all-manufacturing firms model. Firms that have acquired higher levels of technological capabilities are more likely to succeed in GVCs. This requires firms to undertake conscious investments in skills and information to operate imported technologies, rather than simply learning by doing. Having higher levels of human capital, particularly literate secondary-level educated workers and tertiary-level educated
managers, helps with technology absorption and formulating effective business strategies. In the presence of capital market imperfections, well-organised firms with collateral and an established record with commercial banks are more likely than others to join GVCs.
1.6 Public policies for global value chains
A peculiar feature of GVC trade is that intermediate goods can cross many national borders for processing before final assembly occurs. Overall trade costs largely determine entry into GVCs and public policies influence such costs. Successful entry of firms into GVCs in developing Asia was typically supported by outward-oriented market-friendly development strategies that provided a business environment with low trade costs.
While there are subtle differences in the strategies pursued in developing Asia, successful economies commonly emphasised attracting export-oriented FDI along with gradually liberalising imports. An essential ingredient was an FDI strategy based on proactive investment promotion (including overseas representative offices), competitive investment incentives (including tax holidays) and export processing zones (EPZs). FDI brought capital, marketing connections and technology transfer.
Investing in world-class and cost-competitive physical infrastructure – ports, roads from EPZs to ports, airports and reliable electricity supply – is another success factor. Hard infrastructure was complemented by soft infrastructure (e.g. efficient trade facilitation, modern customs procedures and logistics) to keep trade costs low.
Investing in education and training at all levels, including tertiary technical education and firm-level training, improved labour productivity. The coverage and quality of
12 Future Fragmentation Processes

business support services was also important. Better and more affordable types of technical, marketing and professional services facilitated firm growth and entry into GVCs (especially for SMEs). A comprehensive financial system (with specialist products and institutions geared to industry) ensured access to finance at reasonable interest rates. Macroeconomic management was improved and the authorities intensified the use of macroprudential policies and strengthened oversight of corporates and financial institutions.
More controversial perhaps is resorting to industrial policies to support the entry of particular sectors or firms into GVCs. A few governments, particularly in East Asia, supported designated sectors through industrial policies (e.g. import restrictions, local content rules, directed credit and export subsidies). While industrial policies sometimes encourage technological development and joining GVCs, costly failures have been cited in the literature. Some examples include the Republic of Korea’s Heavy-Chemical Industry Drive, Malaysia’s National Car Project (Proton) and the PRC’s home-grown 3G mobile technology (TD-SCDMA). Much debate still surrounds the circumstances under which industrial policy has created GVCs in East Asia.
1.7 Conclusions
While trade and GVCs in developing Asia have slowed since the crisis, it seems premature to write off the region’s trade-led growth model centred on GVCs. Some modification of the model seems inevitable, however, in a sluggish world economy characterised by lacklustre recovery in advanced economies, growth moderation in the PRC and rising protectionism. It will be some time before the future contours of the region’s modified growth model become visible.
GVC activity will remain important in developing Asia’s new growth model. New
technologically sophisticated regional value chains and related services in East Asia are likely to propel a new phase of regional export growth. In addition, some well-positioned developing economies may replace the PRC in segments of GVCs as global demand rises for products ranging from clothing to consumer electronics. Furthermore, GVC-related services, digital trade and other commercial services are potential areas for regional export growth.
Developing Asia’s rich GVC experience offers valuable lessons for industrial latecomers in the developing world. First, participating in GVCs offers a fast-track means to attain higher levels of economic development. Second, it is crucial to focus on the role of firms in joining GVCs. The spotlight needs to be turned on mergers and acquisition for firm growth, industrial clustering for SMEs, the process of building technological capabilities, and improving access to industrial finance. Third, continuity with deep policy reforms provides a supportive business environment for GVCs.
Developing Asia’s experience underlines that there is no one-size-fits-all approach to helping latecomers to join GVCs. Smart business strategies, facilitating business associations and supportive national policies are all useful ingredients, while firms and governments working together is essential to tailor these ingredients to national circumstances. Mainstreaming GVCs into policy dialogues with aid donors and multilateral development banks will help to generate development finance for policy reforms and infrastructure development.
Note1 Advisor, Economic Research and Regional
Cooperation Department, Asian Development Bank. The views expressed here are solely those of the author and should not be attributed to the Asian Development Bank.
Slowdown in Asia’s Global Value Chains and Industrial Latecomers 13
References
Abiad, A, M Lee, M Pundit and A Ramayandi (2016), ‘Moderating growth and structural change in the People’s Republic of China: implications for developing Asia and beyond’, ADB Briefs No 53, Manilla: Asian Development Bank.
Athukorala, P (2011), ‘Production networks and trade patterns in East Asia: regionalization or globalization?’, Asian Economic Papers, Vol. 10, 65–95.
Baldwin, R and JV Gonzalez (2014), ‘Supply-chain trade: a portrait of global patterns and several testable hypotheses’, The World Economy, Vol. 38, 1682–1721. Available online at: DOI 10.111/twec.12189
Constantinescu, C, A Mattoo and M Ruta (2016), Global Trade Watch: Trade
Developments in 2015, World Bank, Washington DC.
Deloitte, (2014), Competitiveness: Catching the Next Wave – China, Deloitte Touche Tohmatsu. Available at www2.deloitte.com
OECD (Organisation for Economic Co-operation and Development) (2013), Interconnected Economies: Benefitting from Global Value Chains, OECD, Paris.
Wignaraja, G (2015), ‘Factors affecting entry into supply chain trade: an analysis of firms in Southeast Asia’, Asia and the Pacific Policy Studies, Vol. 2, 623–642. Available online at: http://onlinelibrary.wiley.com/doi/10.1002/app5.78/abstract
Wignaraja, G (2016), ‘Introduction’, in Wignaraja, G (Ed.), Production Networks and Enterprises in East Asia: Industry and Firm-level Analysis, Springer, New York.
14 Future Fragmentation Processes
Chapter 2
Overcoming Scale and Distance and Upgrading in Global Value Chains
Timothy J. Sturgeon2, Thomas Farole3, Leonardo Ortega Moncada4 and Carlo Pietrobelli5
Abstract1
This paper explores how country size and geographical distance to trading partners mediate global value chain (GVC) participation and upgrading potential. It develops an index of GVC participation to estimate the effects of size and remoteness on GVC participation as measured by export performance in several goods-producing industries that have been important in the rise of GVCs (electronics, automotives, and apparel, footwear and textiles). Invariably, geographical distance exerts a strong influence on GVC participation, due in part to the costs of co-ordination and a reduction in the exchange of tacit knowledge arising from interactions between buyers and sellers; distance can, therefore, reduce the potential for ‘learning by exporting’. Although small states may find it easier to insert themselves into GVCs through specialisation in a narrow range of tasks, some of the challenges of distance are not easily overcome. Nevertheless, the econometric results presented in this paper show how enhancing connectivity increases GVC participation. This aspect of participation is of particular importance, as connectivity can transform not only conventional business models but also how buyers and sellers interact. Strong interventions are required to foster exposure to high-value activity hubs that specialise in research and development and marketing, with targeted skill
development and active linkage development, particularly for small remote economies.
2.1 Introduction
The rise of global value chains (GVCs) has been offered up as the perfect example of technology overcoming geography. Containerisation has slashed transport costs, and information and communication technology (ICT) is facilitating the fragmentation and segmentation of work and its co-ordination and monitoring at a distance (Dicken 2010). Vertical specialisation within GVCs suggests that for some countries, comparative advantage can be won in extremely specialised niches in GVCs. Thus, new trade opportunities are arising through the overcoming of a variety of barriers to network entry: minimum scale economies in production, small market size and underdeveloped national systems of innovation.
One view suggests that, with fragmentation, peripheral locations have new trade opportunities that may enable them to more easily integrate with global hubs of economic activity – ‘Factory USA’, ‘Factory Europe’ and ‘Factory Asia’ – because they can specialise in trade in very narrow product classes and tasks (Lanz et al. 2011). They can focus on the export of intermediate goods and services, earning the benefits of trade without
15

waiting for design capabilities or demanding domestic consumers to emerge (Gereffi and Sturgeon 2013). Participation in GVCs can open conduits for technological learning, process improvements and product upgrading (Humphrey and Schmitz 2002; Pietrobelli and Rabellotti 2011; World Bank 2015). For evidence we need only look to the integration of countries such as the People’s Republic of China (PRC), Mexico, the Philippines and Turkey into production networks driven by ‘lead’ firms based in Europe and the USA (Baldwin 2013).
While we see this view as having merit, it is overly simplified. We agree that GVCs can provide avenues for rapid industrial upgrading and offer opportunities for economic development strategies that extend beyond openness, institutional reform and trade facilitation. However, there are also obvious and significant barriers to upgrading in GVCs, the most important of which stem from the geographical separation of high-value-added business functions, such as design and marketing, from routine functions such as manufacturing and call centre-based customer service. Given this, upgrading may be rapid at first but stall in the long run.
Even for countries that are advantaged in regard to size and location, the benefits of GVC participation are far from automatic. As a result of widespread realisation of this, the focus of GVC-oriented industrial policy has shifted to examine questions of how to foster indigenous innovation that leverages the capabilities and knowledge-intensive intermediate inputs resident in the global supply base (Gereffi and Sturgeon 2013). In this paper, we explore the relationship between size and distance and GVC participation – as well as changes over time – through the concept of ‘remoteness’, an enriched concept of distance that includes factors such as the quality of logistics, common languages and broadband internet penetration.
This last indicator is of particular importance, as it can transform not only conventional business models but also how buyers and sellers interact.
2.2 Global value chains and economic development
Firm-level efforts to learn and benefit from and upgrade as a result of participation in GVCs may not be effective (Morrison et al. 2008), and national innovation systems, including certifications and standards, metrology, testing and quality (SMTQ) systems, may not be sufficient to meet the requirements of foreign buyers or multinational corporation (MNC) affiliates (Pietrobelli and Rabellotti 2011). Since GVCs fragment production systems spatially across vertical business functions, assemblers and suppliers of intermediate inputs may never be exposed to higher value-added functions such as research and development (R&D) and marketing, becoming stuck in subservient roles. Furthermore, even when nationally embedded capabilities are high, openness and trade facilitation cannot overcome all obstacles. This realisation is beginning to stimulate new efforts to foster increased firm-level networking and new forms of private-sector development by governments.
For some countries, the main obstacles to joining and benefiting from GVCs are the same as those that constraint trade more generally, such as: high duties and tariffs, poor trade infrastructure and weak enforcement of business contracts. When these obstacles are removed, the thinking goes, countries can participate in the global economy according to their merits, even when vertical specialisation is optimally narrowed to the point of ‘trade in tasks’ (WTO and IDE-JETRO 2011). However, research has shown that GVCs are multifaceted and have different characteristics and dynamics, and therefore offer different opportunities for economic development, technological learning and industrial upgrading.
16 Future Fragmentation Processes
There are different types of GVCs, which vary according to end markets (Berger et al. 2005), the technical features of transactions (Gereffi et al. 2005), the capabilities in industry-specific and geographically specific supply bases (Ponte and Sturgeon 2014), and the norms of business systems in the home countries of lead firms (Fujimoto 2007). Perhaps most importantly, GVCs vary according to prevailing industries and value chain segment (Sturgeon and Memedovic 2010). This is, in part, because ‘technology – the engineering of the product – dictates the way in which different stages of production fit together’ (Baldwin and Venables 2011).
While these differences are governed by sets of criteria that are often too technical, complex and dynamic for policy-makers to grasp and develop appropriate policy responses to6, this specificity nevertheless opens up a vast field for industrial and innovation policy that is only beginning to be tapped. If there is no single path for upgrading via GVCs, then multiple paths must be considered based on the available evidence. Because most economic statistics are country based, researchers and policy-makers must be creative and innovative in generating information relevant for the policy-making process. Given this, we try to isolate the effects of basic structural characteristics such as size and distance, to provide a starting point for more nuanced policy-making regarding small and remote economies’ GVC participation. Before embarking on that exercise, however, we briefly consider the literature on the effects of size and distance on economic development.
2.3 Size and distance: their importance in economic development, trade and global value chains
Small states face clear disadvantages when engaging with the global marketplace because of their economic size. Of the 49
least developed countries (LDCs), 39 are small (Guillaumont 2007). Small states tend to have higher business costs as a result of a combination of diseconomies of (small) scale and high transaction costs (Winters and Martins 2004). Moreover, many small states have been found to be more vulnerable to economic shocks and less resilient once they occur, because they are unable to rely on intra-state transfers to cushion blows from disasters that affect one region of a larger country and not others (Alesina et al. 2005).
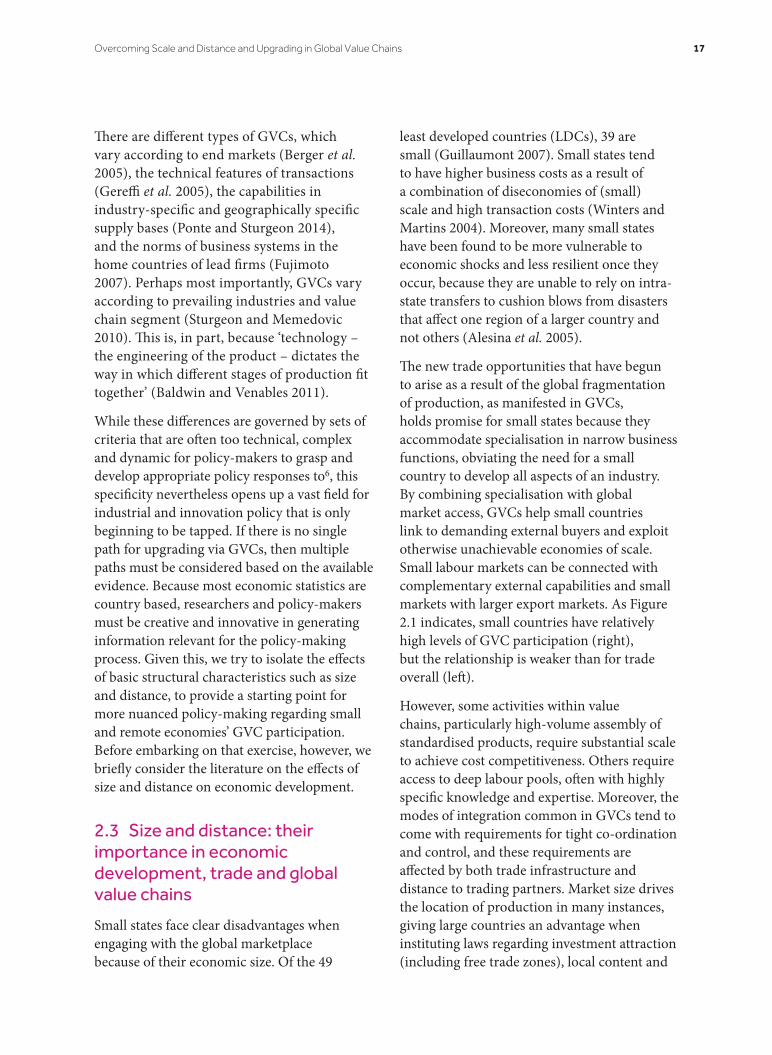
The new trade opportunities that have begun to arise as a result of the global fragmentation of production, as manifested in GVCs, holds promise for small states because they accommodate specialisation in narrow business functions, obviating the need for a small country to develop all aspects of an industry. By combining specialisation with global market access, GVCs help small countries link to demanding external buyers and exploit otherwise unachievable economies of scale. Small labour markets can be connected with complementary external capabilities and small markets with larger export markets. As Figure 2.1 indicates, small countries have relatively high levels of GVC participation (right), but the relationship is weaker than for trade overall (left).
However, some activities within value chains, particularly high-volume assembly of standardised products, require substantial scale to achieve cost competitiveness. Others require access to deep labour pools, often with highly specific knowledge and expertise. Moreover, the modes of integration common in GVCs tend to come with requirements for tight co-ordination and control, and these requirements are affected by both trade infrastructure and distance to trading partners. Market size drives the location of production in many instances, giving large countries an advantage when instituting laws regarding investment attraction (including free trade zones), local content and
Overcoming Scale and Distance and Upgrading in Global Value Chains 17
joint venture requirements, R&D spending schemes and so on.
It is also possible that fragmentation in GVCs can harm small states, depending on the process of GVC engagement. For example, successful start-ups from small remote states tend to be acquired by larger multinationals, with core capabilities subsequently shifted to locations in the hub country to reduce transaction costs. While this dynamic may benefit the immediate entrepreneurs, it is detrimental to the accumulation of scale, agglomeration economies (i.e. clusters), productivity gains and broader-based industrial capabilities in the small remote state.
2.4 Does distance matter?
Challenges increase when small size is combined with large distances to markets. While it may help if countries located far from markets are part of larger political or regulatory arrangements, these cannot fully compensate for the absence of the deeper political and cultural affinities that come with proximity and regional integration. Distance slows transport and raises transport costs for people, goods and communication. This isolation decreases the likelihood that a
state can perform a specialised, high-value-added role; these tend to be performed in a contiguous regional economy, which is more likely to have regulatory integration and the relatively easy and timely flow of people, goods and capital. Indeed, the importance of distance explains why most production networks are regional rather than global, structured around a discrete regional ‘core’ (Lung et al. 2004; Dicken 2010).7 Figure 2.2 (which plots GVC participation against an enhanced index of remoteness8) suggests that global proximity is hugely important for GVC participation – more so than for country size.
In brief, distance has two major influences on how countries connect to GVCs. First, it impacts the cost and time required to get goods to their next stage of production and to receive inputs from their previous stage. Most obviously, distance matters because trade costs matter. The disadvantages of small states (small shipment sizes and inadequate trade infrastructure) are amplified for remote states because of the higher transport costs and the many other disadvantages that come with long transit times for goods (exposure to humidity and high temperature, in-transit obsolescence, price changes, etc.). Less obvious, perhaps, is the time aspect of logistics, which has become
Figure 2.1 Relationship between country size and overall trade (left) and GVC participation (right)
24
22
20
18
Log
popu
la�o
n
Log
popu
la�o
n
16
14
12
100 50 100
Trade share of GDP GVC par�cipa�on index150 200 0.2000 0.3000 0.4000 0.5000 0.6000 0.7000 0.8000 0.9000 1.0000
R2 = 0.1499
R2 = 0.0354
24
22
20
18
16
14
12
10
Source: Population and trade as a proportion of GDP from WDI; GVC Participation Index calculated by authors based on data from the United Nations Conference on Trade and Development (UNCTAD) Eora GVC database, which includes trade in value added from services.
18 Future Fragmentation Processes

increasingly important within GVCs as the ‘just-in-time’ practices of ‘lean production’ and ‘fast supply chains’ spread into more industries. Thus, while geographically peripheral locations may not be entirely shut out of large-scale production of standardised goods, they are very likely to face challenges in a growing category of products: lower volume, higher mix, higher value goods that require substantial delivery flexibility and timeliness.
Second, distance reduces the efficiency of co-ordination and collaboration because it creates barriers to the direct, face-to-face exchange of tacit knowledge. The reduced likelihood of these interactions has the most disadvantageous effect on higher value-added activities in the value chain, such as design and advanced services. While not as sensitive to transport costs, some types of trade in services can also benefit from proximity in many instances. This is the case in particular for complex, non-standard services where contact with consumers and between buyers and suppliers in the value chain benefits from face-to-face interaction to exchange tacit knowledge and uncodified information.
More recently, however, previously unimagined business models9 have arisen to leverage and arbitrage globally ‘distributed’ capabilities,
labour markets, regulatory regimes and markets. Given these developments, there are suggestions that pure distance matters less in contemporary trade within GVCs. This is because within spatially and organisationally fragmented GVCs, high levels of monitoring and control, more precise co-ordination of logistics and the transfer of highly complex design parameters, requirements and instructions are enabled by the computerisation of design and manufacturing processes, low-cost data communications and improved software to manage the flow of information both within and between enterprises. As a result, distance has become less of a hindrance to segmenting and relocating business functions as the international trading system has become more dynamic, flexible, responsive and complex.
Internet retailing allows individual shoppers and businesses to assess and purchase the wares of sellers the world over. R&D and specialised technical tasks have become subject to arbitrage as states are being asked to compete with one another for MNC investments in new international technical centres (Sturgeon 2016). Companies can build sophisticated products based on globally available inputs and technology platforms. What we are witnessing in the new ‘digital economy’ is not a simple fragmentation
Figure 2.2 Relationship between distance from markets and overall trade (left) and GVC participation (right)
9.69.59.49.39.2
Log
dist
ance
9.19
8.98.88.78.6
9.69.59.49.39.2
Log
dist
ance
9.19
8.98.88.78.6
0.2 0.3 0.4 0.5 0.6 0.7 0.8 0.9 10 50 100Trade share of GDP
150 200GVC par�cipa�on index
Source: Authors’ calculations based on data from Centre d’Études Prospectives et d’Informations Internationales (CEPII) and the UNCTAD-Eora database.
Overcoming Scale and Distance and Upgrading in Global Value Chains 19
of existing industrial systems but a basic transformation of how buyers connect to sellers, how work is accomplished, how production is organised and how distribution is co-ordinated.
2.5 Overcoming distance
The discussion above highlights the fact that while proximity matters most for GVC participation, simple considerations of geographical distance may be becoming less relevant given new forms of engagement arising from new business models. Consequently, a more nuanced consideration of proximity and distance must take into account to a greater extent the ways in which GVCs operate. This includes differentiating between the ‘arms-length’ command and control relationships between lead firms and producers at the lower end of value chains, as well as the relationally dependent exchange of highly differentiated products, requiring flows of complex knowledge. Thus, for GVCs, our understanding of distance needs to expand to cover aspects of agility (flexibility and speed to market) as well as measures that capture the degree to which trading partners have the capacity for complex two-exchange. While severe data limitations, especially for trade in services (Low 2016), currently inhibit fully nuanced measures for GVC participation, we have taken an initial step by constructing a measure of remoteness to help explain the determinants of GVC participation with a little more precision.
We did this in a two-step process. First, we tested several factors in an empirical model of the determinants of GVC participation. Based on the results from the model, we then constructed a GVC Remoteness Index (GVC-RI). These two steps are described below.
2.5.1 Step 1: empirical model of the determinants of GVC participation
In this first step, we developed a gravity model for GVC trade, focused on assessing the significance of determinants of participation in
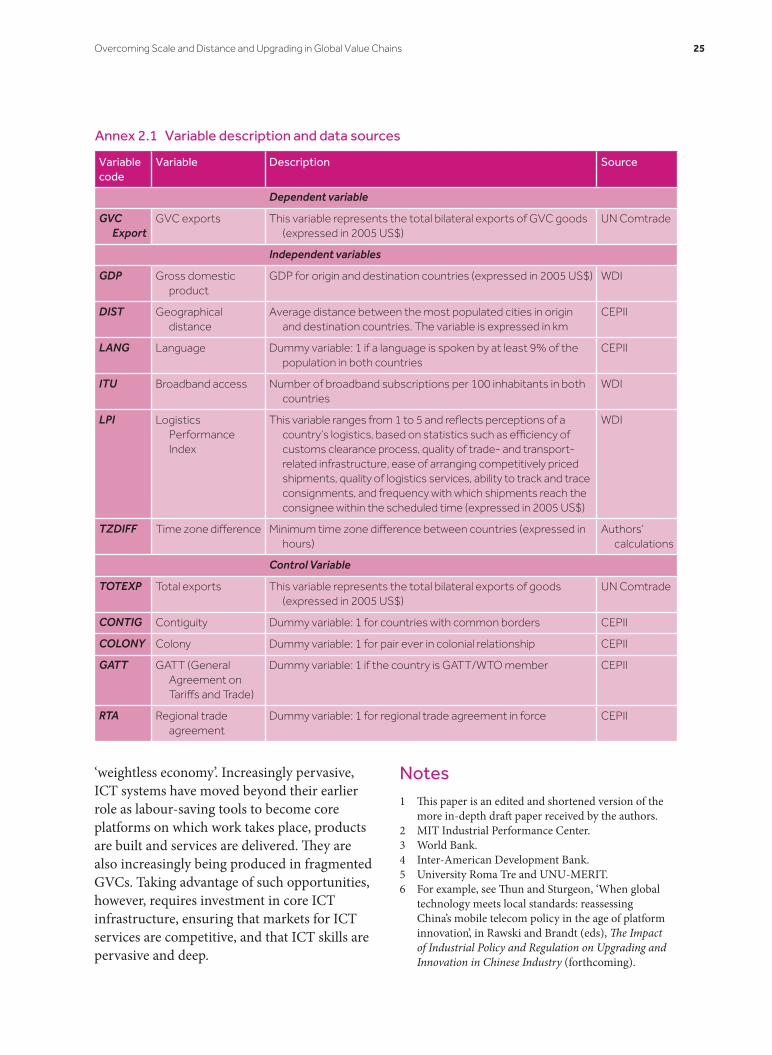
trade of GVC products. We identified a set of factors that we hypothesised were relevant for determining proximity in a GVC context. These factors are described below (details on the variables, their definitions and their sources are available in Annex 2.1).
• GDP: this measures the size of an economy;all things being equal, we expect largereconomies to have more capacity to engagein GVC trade.
• Distance: this is a pure distance indicator,measured as the weighted averagegeographical distance with the rest of theworld; more proximate countries should bemore likely to engage in GVC trade witheach other.
• Logistics capabilities: this is measured by theWorld Bank’s Logistics Performance Index(LPI). Countries with higher quality logistics(trade facilitation, customs, physical logisticsinfrastructure) should be in a better positionto participate in GVC trade as a result oflower costs and faster response times.
• Common language: this measures tradingpartners where at least 9 per cent of thepopulation speaks the same language as itsother trading partners. Countries that havea common language with trading partnersshould trade more and be in a positionto engage in more complex exchanges ofhigher value-added activities in GVCs.
• Time zone: countries in time zoneslongitudinally close to trading partners(regardless of east–west distance) areexpected to be able to manage operationsand therefore GVC trade more effectively(regardless of north–south distance).
• Broadband access: this is measured bythe number of broadband subscribersper 100 inhabitants as published by theInternational Telecommunications Union(ITU). Access to high-quality broadband isincreasingly critical for global connectivityand affects the degree to which a firm
20 Future Fragmentation Processes

communicates with buyers and suppliers in the value chain. While data on trade in services are too poor to include services in our measure of GVC participation, we posit that broadband access is equally important to co-ordinated trade in GVC goods.
To assess how the determinants of goods traded in GVCs differ from those of trade in non-GVC goods, we measured bilateral trade flow using mirror statistics from the UN Comtrade database,10 following the Harmonised System (HS) classification system at 6 digits of disaggregation (around 5,040 product lines). The sample covered 132 countries from 1996 to 2013, representing more than 95 per cent of world trade flows during that period.
We identified the goods that are usually traded in GVCs by using the classification introduced by Sturgeon and Memedovic (2010), which was further refined and updated for public use by the World Bank in 2016.11 Following this approach, HS codes are identified for GVC-traded goods and they are classified as either intermediate or final goods. Three dummy variables are constructed to estimate total GVC exports, intermediate GVC exports and final GVC exports. In addition, using the same classification source, we identified GVC goods within five sectors that were most intensively traded in GVCs: electronics, automotives, and apparel, footwear and textiles. To explore the main determinants for a country’s involvement in GVCs, we estimated a gravity model, where the traditional set-up was modified to include modern notions of proximity (remoteness), as described above. The gravity model estimation is based on the following structure:
GVC Exports
logGDP logGDP logITU
o d t
o t d t o d t
, ,
, , , ,= + + +
+
α β β β
β1 2 5
3llogDIST LANG logLPI
logTZDIFF
o d o d o d t
o d o d t
, , , ,
, , ,
+ +
+ +
β β
β γ4 6
7 X ++ + + +δ δ δo d t o d tu , ,
where X is the vector of control variables.
Table 2.1 shows the results using different specifications of the previous equation. In general, the results are robust to different specifications of the model. We included the ITU and LPI variables in two different ways. First, for each of these variables we included the simple average between the origin and destination country. Second, we included the origin and destination value of ITU and LPI as explanatory variables.
The results show clear and in most cases significant correlations between the measures considered for remoteness and GVC products. What is striking, in most cases, are the differences in results between products traded in the three GVC industries versus those not classified as GVC products. While both GDP (positively) and distance (negatively) show strong, significant associations with exports, the coefficients are markedly higher for GVC exports.
Sharing a common official language with trading partners is significant and positive for GVC products but not for non-GVC products, reinforcing the notion that ease of communication, which may facilitate the exchange of tacit knowledge, is important for co-ordination in GVCs. Similarly, broadband access (of the origin country only12) appears to matter for GVC exports but not for non-GVC exports, while logistics performance (also of the origin country only) is strongly positively associated with GVC exports but (perhaps surprisingly) negatively associated with non-GVC exports.
Finally, turning to sectoral results, we find some differences across the GVC industries, often in line with expectations. The automotive industry stands out from the others in being more regionally oriented and, therefore, more reliant on physical distance measures and regional integration, and less on logistics, language and broadband, as expected; apparel and footwear are more reliant on logistics and broadband access; and electronics (with
Overcoming Scale and Distance and Upgrading in Global Value Chains 21

Table 2.1 Estimation of the gravity model
Log of non GVC exports
Log of GVC exports
Log of electronic GVC exports
Log of autos GVC exports
Log of apparel GVC exports
Log of footwear GVC exports
Log of textiles GVC exports
l_gdp 0.02*** 0.36*** 0.30*** 0.11*** 0.50*** 0.12*** 0.26***
(0.01) (0.02) (0.03) (0.03) (0.03) (0.04) (0.04)
Log of distw −0.07*** −0.65*** −0.62*** −0.59*** −1.14*** −0.90*** −0.81***
(0.02) (0.06) (0.06) (0.08) (0.07) (0.09) (0.08)
1 for common official of primary language
0.03 0.71*** 0.68*** 0.55*** 0.62*** 0.53*** 0.56***
(0.02) (0.07) (0.08) (0.09) (0.09) (0.11) (0.10)
Log of tz_diff −0.02 0.22*** 0.24*** 0.05 0.33*** 0.15** 0.12*
(0.01) (0.04) (0.05) (0.06) (0.06) (0.07) (0.06)
1 for contiguity −0.11* 1.29*** 0.92*** 1.35*** 1.19*** 1.11*** 1.23***
(0.06) (0.19) (0.21) (0.23) (0.23) (0.25) (0.23)
1 for pair ever in colonial relationship
0.02 0.10 0.32** 0.38** 0.57*** 0.81*** 0.32*
(0.05) (0.15) (0.16) (0.18) (0.17) (0.19) (0.18)
1 if origin is GATT/WTO member
0.04* 0.07 0.19** −0.02 −0.02 −0.23** −0.14
(0.02) (0.06) (0.08) (0.09) (0.08) (0.10) (0.10)
1 if destination is GATT/WTO member
0.20 0.15 −0.75 0.29 1.69*** 2.78*** 0.85
(0.13) (0.37) (0.49) (0.63) (0.57) (1.02) (0.76)
1 for regional trade agreement in force
−0.08*** 0.63*** 0.30*** 0.82*** 0.85*** 0.25** 0.69***
(0.02) (0.07) (0.08) (0.10) (0.09) (0.11) (0.10)
Log of total exports 1.03*** 0.52*** 0.52*** 0.57*** 0.41*** 0.45*** 0.49***
(0.00) (0.01) (0.01) (0.01) (0.01) (0.02) (0.02)
Log of itu_o −0.01 0.06*** 0.04*** −0.04*** 0.17*** 0.18*** 0.08***
(0.00) (0.01) (0.01) (0.01) (0.01) (0.02) (0.02)
Log of itu_d −0.01 0.02 0.07** −0.06* 0.04* 0.06 0.01
(0.01) (0.02) (0.03) (0.03) (0.03) (0.04) (0.04)
Log of lpi_o −0.26*** 1.85*** 2.11*** 1.30*** 1.94*** 2.07*** 1.89***
(0.05) (0.13) (0.16) (0.19) (0.16) (0.22) (0.20)
Log of lpi_d −0.05 0.04 0.10 −0.13 0.12 −0.20 −0.48
(0.07) (0.18) (0.23) (0.27) (0.22) (0.35) (0.30)
Constant −0.39* −3.86*** −4.05*** 0.91 −4.22*** 1.84 −3.12***
(0.23) (0.65) (0.78) (0.94) (0.87) (1.22) (1.05)
ObservationsR-squared
18341 18640 16494 13990 15277 10345 12179
Standard errors in parentheses* p < 0.10, **p < .05, ***p < .01
22 Future Fragmentation Processes

greater complexity) is most reliant on having a common language and high-quality logistics.
2.5.2 Step 2: constructing the GVC Remoteness Index
Based on the results from the gravity model, we calculated a remoteness index that incorporates the standard notion of scale measured by GDP and geographical distance to all markets, also including the elaborated measure of distance just discussed: broadband capacity, logistics infrastructure and common language.13 We called this the GVC Remoteness Index (GVC-RI). It is calculated as follows:
GVC Remoteness GDP DIST ITULANG LPI
i t i t i t i t
i t i t
, , , ,
, ,
= − ++ +
where the GDP, ITU and LPI variables are the country-level value of GDP, broadband access and logistical performance. All variables are measured as described above and in the table in Annex 2.1. Since each variable uses a different scale, we standardised them in such way that all have mean equal to 5 and standard deviation equal to 1. A larger GVC-RI score indicates that the country is more remote in terms of scale and the elaborated measure of distance.
The results in Table 2.2 show that the most remote countries in terms of their potential in GVCs in 2015 are Solomon Islands, São Tomé and Príncipe, Haiti, Guinea-Bissau, Comoros and Laos. All of these countries are LDCs. They are all small in population and most are quite distant from large markets. In fact, almost all of the ten most remote countries in the index have populations below 5 million or are islands (many are both).
In comparison, the least remote countries are the USA, the United Kingdom, Canada, France, Switzerland and Germany. This indicates a strong correlation between proximity and level of development. While most of these countries are relatively large in population, this is not exclusively the case. What they do have in
common is proximity to other large markets and high-quality infrastructure. It is clear from Table 2.2 that most proximate countries see relatively little variation in their GVC position over time.
In contrast, the most remote countries show a much greater variability over time and a worse remoteness score than expected based on GDP and location. This underscores the fact that remoteness is not simply a structural issue, but one that can be at least partly determined (or partly overcome) by policy reforms and investments in infrastructure. The country with the best performance in terms of ranking improvement was Mauritius, rising 27 places. Despite its small size and remote location, Mauritius experienced strong improvements in both broadband access and logistics infrastructure; these investments have enabled Mauritius to participate in a range of GVCs.
2.6 Concluding remarks
There is little doubt that skills development must be at the top of the agenda for small and remote states. This is because a failure to invest in skills surely confines any country to rely on cost competitiveness to remain in GVCs. The bigger challenge for remote countries is to move beyond basic low-value, low-wage value chain activities. Case studies underline how both distance (raising co-ordination costs and tacit knowledge exchange) and scale (limited depth of local suppliers) make this next step particularly challenging. In this respect, priorities must be to improve the domestic skills base – of workers and managers – as well as leveraging ICT to carve out niche positions in products, tasks and services where transport and co-ordination costs are less binding. Overcoming some of the challenges of distance requires strong interventions designed to foster exposure to R&D and marketing.
Revolutions in ICT offer some hope for small and, especially, remote states to compete in a
Overcoming Scale and Distance and Upgrading in Global Value Chains 23
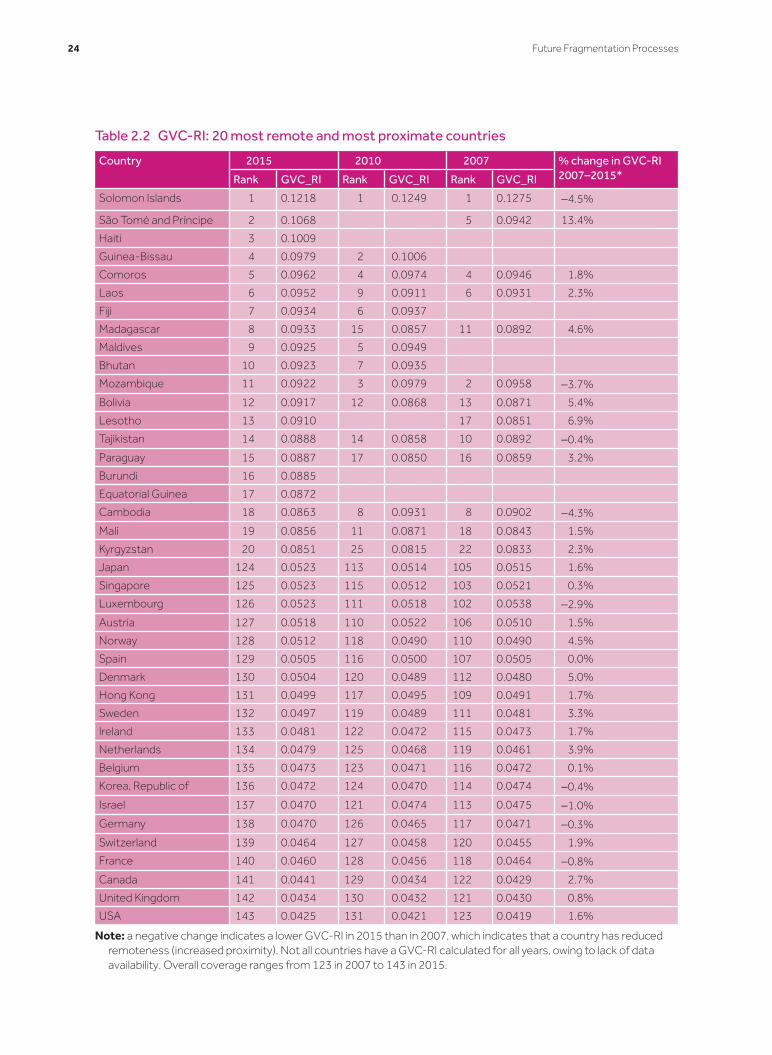
Table 2.2 GVC-RI: 20 most remote and most proximate countries
Country 2015 2010 2007 % change in GVC-RI 2007–2015*Rank GVC_RI Rank GVC_RI Rank GVC_RI
Solomon Islands 1 0.1218 1 0.1249 1 0.1275 −4.5%
São Tomé and Príncipe 2 0.1068 5 0.0942 13.4%
Haiti 3 0.1009
Guinea-Bissau 4 0.0979 2 0.1006
Comoros 5 0.0962 4 0.0974 4 0.0946 1.8%
Laos 6 0.0952 9 0.0911 6 0.0931 2.3%
Fiji 7 0.0934 6 0.0937
Madagascar 8 0.0933 15 0.0857 11 0.0892 4.6%
Maldives 9 0.0925 5 0.0949
Bhutan 10 0.0923 7 0.0935
Mozambique 11 0.0922 3 0.0979 2 0.0958 −3.7%
Bolivia 12 0.0917 12 0.0868 13 0.0871 5.4%
Lesotho 13 0.0910 17 0.0851 6.9%
Tajikistan 14 0.0888 14 0.0858 10 0.0892 −0.4%
Paraguay 15 0.0887 17 0.0850 16 0.0859 3.2%
Burundi 16 0.0885
Equatorial Guinea 17 0.0872
Cambodia 18 0.0863 8 0.0931 8 0.0902 −4.3%
Mali 19 0.0856 11 0.0871 18 0.0843 1.5%
Kyrgyzstan 20 0.0851 25 0.0815 22 0.0833 2.3%
Japan 124 0.0523 113 0.0514 105 0.0515 1.6%
Singapore 125 0.0523 115 0.0512 103 0.0521 0.3%
Luxembourg 126 0.0523 111 0.0518 102 0.0538 −2.9%
Austria 127 0.0518 110 0.0522 106 0.0510 1.5%
Norway 128 0.0512 118 0.0490 110 0.0490 4.5%
Spain 129 0.0505 116 0.0500 107 0.0505 0.0%
Denmark 130 0.0504 120 0.0489 112 0.0480 5.0%
Hong Kong 131 0.0499 117 0.0495 109 0.0491 1.7%
Sweden 132 0.0497 119 0.0489 111 0.0481 3.3%
Ireland 133 0.0481 122 0.0472 115 0.0473 1.7%
Netherlands 134 0.0479 125 0.0468 119 0.0461 3.9%
Belgium 135 0.0473 123 0.0471 116 0.0472 0.1%
Korea, Republic of 136 0.0472 124 0.0470 114 0.0474 −0.4%
Israel 137 0.0470 121 0.0474 113 0.0475 −1.0%
Germany 138 0.0470 126 0.0465 117 0.0471 −0.3%
Switzerland 139 0.0464 127 0.0458 120 0.0455 1.9%
France 140 0.0460 128 0.0456 118 0.0464 −0.8%
Canada 141 0.0441 129 0.0434 122 0.0429 2.7%
United Kingdom 142 0.0434 130 0.0432 121 0.0430 0.8%
USA 143 0.0425 131 0.0421 123 0.0419 1.6%
Note: a negative change indicates a lower GVC-RI in 2015 than in 2007, which indicates that a country has reduced remoteness (increased proximity). Not all countries have a GVC-RI calculated for all years, owing to lack of data availability. Overall coverage ranges from 123 in 2007 to 143 in 2015.
24 Future Fragmentation Processes
‘weightless economy’. Increasingly pervasive, ICT systems have moved beyond their earlier role as labour-saving tools to become core platforms on which work takes place, products are built and services are delivered. They are also increasingly being produced in fragmented GVCs. Taking advantage of such opportunities, however, requires investment in core ICT infrastructure, ensuring that markets for ICT services are competitive, and that ICT skills are pervasive and deep.
Notes1 This paper is an edited and shortened version of the
more in-depth draft paper received by the authors.2 MIT Industrial Performance Center.3 World Bank.4 Inter-American Development Bank.5 University Roma Tre and UNU-MERIT.6 For example, see Thun and Sturgeon, ‘When global
technology meets local standards: reassessing China’s mobile telecom policy in the age of platform innovation’, in Rawski and Brandt (eds), The Impact of Industrial Policy and Regulation on Upgrading and Innovation in Chinese Industry (forthcoming).
Annex 2.1 Variable description and data sources
Variable code
Variable Description Source
Dependent variable
GVC Export
GVC exports This variable represents the total bilateral exports of GVC goods (expressed in 2005 US$)
UN Comtrade
Independent variables
GDP Gross domestic product
GDP for origin and destination countries (expressed in 2005 US$) WDI
DIST Geographical distance
Average distance between the most populated cities in origin and destination countries. The variable is expressed in km
CEPII
LANG Language Dummy variable: 1 if a language is spoken by at least 9% of the population in both countries
CEPII
ITU Broadband access Number of broadband subscriptions per 100 inhabitants in both countries
WDI
LPI Logistics Performance Index
This variable ranges from 1 to 5 and reflects perceptions of a country’s logistics, based on statistics such as efficiency of customs clearance process, quality of trade- and transport-related infrastructure, ease of arranging competitively priced shipments, quality of logistics services, ability to track and trace consignments, and frequency with which shipments reach the consignee within the scheduled time (expressed in 2005 US$)
WDI
TZDIFF Time zone difference Minimum time zone difference between countries (expressed in hours)
Authors’ calculations
Control Variable
TOTEXP Total exports This variable represents the total bilateral exports of goods (expressed in 2005 US$)
UN Comtrade
CONTIG Contiguity Dummy variable: 1 for countries with common borders CEPII
COLONY Colony Dummy variable: 1 for pair ever in colonial relationship CEPII
GATT GATT (General Agreement on Tariffs and Trade)
Dummy variable: 1 if the country is GATT/WTO member CEPII
RTA Regional trade agreement
Dummy variable: 1 for regional trade agreement in force CEPII
Overcoming Scale and Distance and Upgrading in Global Value Chains 25

7 As Baldwin and Venables (2011) put it, ‘The cost and unpredictable delays involved in intercontinental shipping and travel of technicians and managers still matter, particularly with just-in-time management techniques.’
8 This index in constructed as follows: GDP-weighted bilateral distance (60%); GDP-weighted bilateral Logistics Performance Index score (20%); GDP-weighted bilateral trading partners sharing a common official language (20%). Source: CEPII.
9 For example Uber and AirBnB.10 In a perfect world, the value of exports to the
destination country reported by the origin country should correspond to the value of imports from the origin country reported by the destination country. However, significant differences can be found in the UN Comtrade data. One of the reasons for this inconsistency is that UN Comtrade records imports as CIF (cost, insurance and freight), whereas it records exports as FOB (free on board). In order to minimise inconsistencies in trade data, an approach known as ‘export mirror data’ was used, whereby import flows are used to calculate export flows. In this approach, country A’s export flows are calculated by compiling all the import records from the other 131 countries in the sample to country A.
11 See http://wits.worldbank.org/WITS/WITS/AdvanceQuery/GVC/GVCQueryDefination.aspx?Page=GVCIndicator
12 Results are not significant for the destination country.13 Based on the results from the gravity model, we have
decided not to include time zone distance in the index.
References
Alesina, A, E Spolaore and R Wacziarg (2005), ‘Trade, growth and the size of countries’, in Aghion, P and S Durlauf (eds), Handbook of Economic Growth, Elsevier, Amsterdam, 1499–1542.
Baldwin, R (2013), ‘Global supply chains: why they emerged, why they matter, and where they are going’, in Elms, DK and P Low (eds), Global Value Chains in a Changing World, Fung Global Institute, Nanyang Technological University and the World Trade Organization, available at: http://www.wto.org/english/res_e/booksp_e/aid4tradeglobalvalue13_intro_e.pdf
Berger, S and the MIT Industrial Performance Center (2005), How We Compete. New York: Doubleday.
Dickson, P. (2010) Global Shift: Mapping the Changing Contours of the World Economy: SAGE Publications: London.
Fujimoto, T. (2007) “Architecture-Based Comparative Advantage – A Design Information View of Manufacturing” Evol. Inst. Econ. Rev. 4(1): 55–112.
Gereffi, G and T Sturgeon (2013), ‘Global value chain-oriented industrial policy: the role of emerging economies’, in Elms, DK and P Low (eds), Global Value Chains in a Changing World, Fung Global Institute, Nanyang Technological University and the World Trade Organization, available at: http://www.wto.org/english/res_e/booksp_e/aid4tradeglobalvalue13_intro_e.pdf
Gereffi, G, J Humphrey and T Sturgeon (2005), ‘The governance of global value chains’, Review of International Political Economy, Vol. 12, 78–104.
Guillaumont, P (2007), ‘Assessing the economic vulnerability of small island developing states and the least developed countries’, Research Paper No 2007/40, United Nations University World Institute for Development Economics Research (UNU-WIDER): Helsinki.
Lanz, R, S Miroudot and HK Nordås (2011), ‘Trade in tasks’, OECD Trade Policy Working Paper No 117, available at: http://dx.doi.org/10.1787/5kg6v2hkvmmw-en
Low, P. (2016), “Modes of Service Delivery and Global Value Chain Participation”, Commonwealth Trade Hot Topics, No. 135, Commonwealth Secretariat. DOI: http://dx.doi.org/10.14217/5jlr2gdkmvbr-en
Morrison, A, C Pietrobelli and R Rabellotti (2008), ‘Global value chains and technological capabilities: a framework to study learning and innovation in developing countries’, Oxford Development Studies, Vol. 36, 39–58
Pietrobelli, C and R Rabellotti (2011), ‘Global value chains meet innovation systems: are there learning opportunities for developing
26 Future Fragmentation Processes
countries?’, World Development, Vol. 39, 1261–1269.
Ponte, Stefano, and Timothy Sturgeon. “Explaining governance in global value chains: A modular theory-building effort” Review of International Political Economy 21.1 (2014): 195–223.
Sturgeon, T (2016), ‘Brazil in global value chains’, MIT Industrial Performance Center Working Paper 16-001.
Sturgeon, T and O Memedovic (2010), ‘Measuring global value chains: intermediate goods trade, structural change and compressed development’, UNIDO Working Paper, United Nations Industrial Development Organization, Vienna.
Venables, A and R Baldwin. (2011) Relocating the value chain: off-shoring and agglomeration in the global economy,
Economics Series Working Papers 554, University of Oxford, Department of Economics
Winters, LA and P Martins (2004), ‘When comparative advantage is not enough: business costs in small remote economies’, World Trade Review, Vol. 3, 347–383
World Bank (2015), ‘Global value chains’, World Bank, Washington DC, available at: http://www.worldbank.org/en/topic/trade/brief/global-value-chains.
WTO and IDE-JETRO (2011), ‘Trade patterns and global value chains in East Asia: from trade in goods to trade in tasks’, World Trade Organization and Institute of Developing Economies, Geneva and Tokyo, available at: www.ide.go.jp/English/Press/pdf/20110606_news.pdf.
Overcoming Scale and Distance and Upgrading in Global Value Chains 27

Chapter 3
The Changing Landscape in Commodity Markets and Trade: Implications for Development
Machiko Nissanke1
Abstract
This paper describes how commodity markets and trade have evolved over time, which includes the increasing entry of financial investors and heterogeneous traders into commodity markets as well as changes in governance structures in global commodity trade. As investors continuously hold virtual forms of commodities within their asset portfolio by creating derivative products, the prices of commodities have moved further away from market fundamentals, making them more sensitive to volatility in the financial sector. A direct consequence of this phenomenon is manifested in heightened price volatility, which became most apparent at the beginning of the Great Recession (2008–09). This 'financialisation' process of commodity markets has altered conventional processes of price discovery and risk hedging, with implications for managing price volatility at the producer level. Further, the process of market consolidation by very large multinational commodity-trading conglomerates has been intensified across commodities globally. To counteract some of these adverse effects, mitigating strategies should be pursued by producers and producing countries.
3.1 Introduction
As the process of globalisation has intensified over recent decades, the landscape of world commodity markets, trade and production
has undergone significant changes at both the global and the national levels. At the global level, heightened price volatility since the 1990s, which coincided with the collapse of the international commodity agreements (ICAs), led to a rapid expansion of derivative markets across commodities. As demand for risk-hedging instruments from commodity stakeholders has intensified, the rapid growth of derivative markets has in turn attracted new players – financial investors who are not engaged in trading physical commodities – to the trading floors. This has resulted in a radical change in the structures of trading on commodity exchanges.
There is mounting evidence that the unprecedented magnitude of swings and excessive volatility in commodity prices during the past decade reflect the ever-increasing linkages between activities in commodity and financial markets. Through the process of ‘financialisation’ of commodity markets, the volatility in commodity markets and financial markets can feed on each other and constitute an inbuilt mechanism of destabilisation and uncertainty in the world economy.2 The simultaneous appearance of severe strains in both commodity and financial markets in 2007–09 cannot be treated as a mere coincidence, as the major shift in global liquidity conditions induced by the banking crisis at the time was behind the highly charged volatility in both markets.3 Thus, the growing
28
interlinked activities between commodity and financial markets by financial investors could manifest itself in important changes in commodity price dynamics. In the short term, prices have become less reflective of market fundamentals: the actual supply and demand dynamics of physical commodities.
At the same time, fundamental demand–supply relationships in commodity markets continue to shape price cycles in the medium term. For example, the recent commodity price cycle was triggered and sustained by an upsurge in demand for commodities (e.g. oil and metals as well as agricultural commodities) from fast-growing emerging economies such as China and India. This, together with low investment in supply capacities during periods of low and declining real commodity prices in the 1980s and 1990s, had given rise to the ‘commodity super-cycle’ lasting more than 10 years. Likewise, commodity prices started following a clear downwards trend from their peak of 2011–12 across the board, experiencing further intense turbulence throughout 2014–15, led by the dramatic fall of oil prices. The commodity price index as a whole has plummeted since mid-2014. The end of the commodity super-cycle was brought about by and large by reduced demand for commodities in the context of a considerable slowdown of the global economy, in particular that of China and other emerging economies, in addition to the supply glut that arose for a number of hard commodities, resulting from the rise in investment during the boom.
In addition, the process of market consolidation by transnational corporations (TNCs) has been intensifying along the commodity chains over recent decades. Today, TNCs can to a significant extent dictate the patterns of trade through intra-firm trade under their globally integrated production and marketing strategies. TNCs’ activities are strategically organised and integrated horizontally as well as vertically. This
is reflected in their dominance in commodity value chains.
3.2 Changing structures in world commodity markets and excessive price volatilities4
While there have been significant changes in market fundamentals, a question frequently raised is whether ever-increasing volatilities of commodity prices and their co-movements can be explained by shifts in supply–demand relationships alone. As Keynes (1942) observed, financial investors have historically always been active in holding commodities as a part of their portfolios. However, it is the fast expansion of liquid commodity derivatives that have provided them with ideal and cost-effective means to include commodities in their portfolios without bearing the cost of holding commodities physically. This has allowed investors to hold commodities in virtual forms as asset class, with the use of complex derivatives products and financial instruments. Especially after the bursting of the dot-com bubble at the turn of the twenty-first century, financial institutions and investors switched to aggressively targeting commodities as part of their diversification strategy from equity and bond markets. Commodities have become more closely integrated into the asset portfolios of financial institutions and investors.
In response to the increasing interest of financial institutional and private investors, more and more complex commodity-linked financial instruments and products have been launched. For example, commodity index funds were launched specifically as a vehicle for speculating on price movement in commodity futures. To offset their exposure to changes in prices, index traders continuously take a long position in futures markets.5 Treating commodities in aggregate, their trading decisions are rarely undertaken
The Changing Landscape in Commodity Markets and Trade 29

in view of “normal” demand–supply conditions. Consequently, commodity-specific fundamentals feature much less in their positions on futures trading. Furthermore, as a consequence of much of the derivatives trading done in index trading of a bundle of commodities, the prices of various commodities have become highly correlated.
There are three categories of operations in commodity derivatives markets: ‘informed’, ‘uninformed’ and ‘noise’ trading. Informed trading is the approach taken by commodity stakeholders, that is, those with interests in physical trading who use derivatives instruments mainly for risk-hedging purposes. As stakeholders, they try to base trading decisions on the market fundamentals of a particular commodity. However, they are constrained by great uncertainty surrounding the directions of future fundamentals, as well as by the paucity of reliable data on inventories. Therefore, they tend to resort to following market sentiment and the herd. In contrast, the other two trading strategies are likely to be adopted by traders acting for clients who hold virtual commodity stocks (‘open interests’) in their asset portfolios. Managers of money funds or other investment funds are classified as uninformed traders who make profits on futures trading by employing techniques such as chartist analysis or momentum trading on price trends. They actively exploit price volatilities on a high-frequency basis. Noise traders, such as index traders, make strategic decisions on commodity trade in relation to the development of other asset markets as part of investors’ portfolio allocation. Operating across different asset markets, their allocation decisions are subject to swings in market sentiment that determine common cyclical liquidity conditions in assets markets; that is, they are subject to global liquidity cycles.
As price movements mirror changing positions taken in these heterogeneous trading activities,
prices are unlikely to reflect informed decisions based on market fundamentals only. Rather, price signals emanating from futures markets are likely to be contaminated with ‘noises’ unrelated to demand–supply fundamentals. The larger the proportion of noise and uninformed trading in relation to informed trading by physical stakeholders, the further prices are likely to move away from the reality of demand–supply fundamentals.6
Futures markets with sufficient liquidity are indispensable for hedging price risks for those involved in physical trading in the presence of great uncertainty over how demand–supply conditions will evolve in future. Indeed, futures prices posted in world commodity exchanges continue to serve as the benchmark for spot market operations conducted by physical traders and producers.7 Futures prices therefore affect spot prices as well as demand, supply and the level of stock holding.8 Yet only when futures prices correctly reflect collective expectations among physical traders regarding future market fundamentals can futures markets function as a vehicle for price discovery and risk hedging. As the financialisation process has accelerated, the scale of excess in price volatility and deviation from fundamentals can become so large that stakeholders in physical commodities can no longer rely on price signals emanating from futures markets to make informed decisions concerning demand and supply conditions, including those affecting the investment and technological progress required for substitution and conservation of resources. Under such conditions, futures markets might cease to perform their intended function, that of price discovery and risk hedging for physical commodity stakeholders. While excessive volatilities can provide powerful trading houses, TNCs and financial investors with attractive short-term gains, the interests of stakeholders in physical commodities, including those of small-scale producers in commodity value chains, cannot be safeguarded.
30 Future Fragmentation Processes

3.3 Evolving governance in global commodity chains and its developmental implications
How the highly volatile prices are transmitted eventually to producers and economies of producing countries depends critically on evolving governance and marketing structures in commodity chains. In this context, it should be noted that, as globalisation has proceeded at an accelerated pace since the 1980s, vertically integrated TNCs have consolidated their positions over multiple operations (production, processing and marketing) in a commodity chain. Their dominance has continued to grow along supply chains, enhancing their bargaining power in relation to other actors.9 The process of market consolidation by very large multinational commodity-trading conglomerates has been intensified across commodities globally.
At the country level too, there have been significant changes in institutional environments facing producers and farmers engaged in agricultural primary commodity sectors. For example, successive waves of domestic market and trade liberalisation/deregulation have transformed arrangements for the production and marketing of agricultural commodities such as cotton, coffee and cocoa.10 In many sub-Saharan African countries, most state-run marketing boards were dismantled or downsized, and price- and income-stabilisation funds or mechanisms operating domestically ceased to exist. In this new environment, domestic commodity producers and traders became marginalised and isolated as a result of the withdrawal of institutional support from governments and the subsequent loss of their bargaining power.
In fact, the parallel processes of consolidation by TNCs and fragmentation of producers have generally resulted in a hugely skewed distribution of gains and rents from commodity
trade. In the prevailing market structures, the potential benefits of productivity improvements can be largely appropriated by the TNCs and global supermarket chains, rather than going to fragmented producers and farmers. The governance structures of primary commodity value chains have become increasingly buyer-driven, with a shift in the distribution of value skewed in favour of consuming countries (Kaplinsky 2000; Humphrey and Schmitz 2000, 2004; Kaplinsky and Kimmis 2006). Today, commodity chains are increasingly characterised by captive or hierarchical governance structures, in which the degree of co-ordination and power asymmetry is high and market power lies with lead firms and TNCs. In captive or hierarchical governance, the buyer dominates access to knowledge and information and tends to dictate the terms of contractual supply relationships (Gereffi et al. 2005; Keane 2012). The widening gap between producer and retail prices for a composite bundle of commodities11 indicates how much rents can be created and how skewed rent distribution is in most commodity chains. In many cases, a few large TNCs – often the large trading conglomerates – can exercise their market dominance by reducing the producer price to little more than production costs.
Recently, an increasing number of farmers and smallholders have engaged in agricultural production and marketing through new institutional arrangements such as ‘outgrower’ or contract farming.12 Given their informational disadvantages, however, while they may be guaranteed more secure access to inputs such as seeds and fertilisers through contract farming arrangements, farmers and smallholders are often tied to unfavourable contract terms that are geared to serving the interests of large agricultural conglomerates or globally operating supermarket chains. A switch from traditional export crops to non-traditional ones such as horticulture, cut flowers or pineapples has proved not to be an
The Changing Landscape in Commodity Markets and Trade 31

easily available option for smallholders. Due to strict produce standards and a sudden switch in demand for crops from one variety to another, smallholders have in some cases been driven out of export markets as mainstay supply sources in Kenya and Ghana.13
Furthermore, smallholders and producers are now exposed to greater price risks as highly volatile prices are transmitted directly from the downstream commodity chain through the international marketing system to small traders and producers operating in the upstream chain.14 While producers have been increasingly exposed to the vagaries of global market forces (i.e. price volatility transmitted from international markets), they are not adequately equipped to deal with price risks and other marketing risks. Indeed, the collapse of the ICAs to stabilise commodity prices through management of buffer stocks or export quotas, as envisaged in the 1980s, did not lead to a rethinking of international consensus on how to counteract highly volatile markets.15 Rather, the absence of agreed alternative mechanisms and instruments for international action seemed to have provided the global community with justifications for taking a complacent position by accepting the dominant view that such non-market interventions were not necessary. Instead, much attention was paid to enhancing primary producers’ access to market-based risk-management instruments so that markets could operate without undue interference.
Thus, the use of market mechanisms for managing commodity price risks has been advocated by the international donor community for dealing with risks stemming from large price volatility and accompanying income shocks in commodity-dependent developing countries (CDDCs). The international financial institutions (IFIs) and other UN agencies set up the International Task Force on Commodity Risk Management
(ITFCRM). They have actively encouraged agricultural commodity producers and traders to use market-based commodity-linked financial risk-hedging instruments such as futures and options as an effective price-risk-management mechanism. Critically, such a policy recommendation is predicated on the assumption that commodity derivatives markets operate efficiently for risk-hedging purposes.
However, as discussed in Section 3.2, market-based hedging instruments have been ineffective in reducing and hedging price risks. Under the increased financialisation of commodity derivatives markets, the prices of futures markets often don’t reflect fundamental demand–supply conditions. This means they cannot reliably act as a predictor of future spot prices, which could ensure the basis (i.e. the difference between future and spot prices) would narrow as contracts reached maturity.16 Greater divergence between spot prices and futures prices, that is, the failure of convergence, makes it more challenging to hedge the risks of stockholding, as losses in one market cannot be effectively offset by gains in another.
Furthermore, while the use of derivatives instruments for risk hedging has been presented as an answer for small producers at the micro level as well as for governments in CDDCs for macro-hedging, hedging instruments require large resources to cover high transaction costs in accessing up-to-date market information and keeping a close watch on the development of financial and other commodity markets. They also demand the maintenance of high levels of liquidity to respond to sudden margin calls. Effective hedging periods also tend to be short, while organised derivatives markets such as futures and options cater only for standardised commodities, without taking into account quality differences in commodities traded.
32 Future Fragmentation Processes

Large TNCs and commodity trading houses have their own in-house options and futures brokerages, as well as large research departments that follow market trends closely on a daily basis. Their size and financial resources, often combined with diversification across a number of commodities, have allowed them not only to protect their risk exposure in an increasingly volatile market environment but also to derive profit from speculating on hourly price movements. In deciding on their market placements, they are in a position to take into account activities of portfolio investors on derivatives markets, in addition to their specialised knowledge of physical supply and demand fundamentals affecting prices. Smaller, single-commodity trading firms have either been forced out of markets or entered into niche markets, trading in specialty commodities or in targeted markets.17 This strategy allows them to survive without being overly affected by daily volatile price movements on world commodity exchanges.
Issues such as high financial costs, skewed access to information and high technical barriers for small actors make it hard to popularise hedging mechanisms as universally applicable instruments. Local farmers and traders are often forced to use international intermediaries, or branches and subsidiaries of TNCs, to access these instruments and the technical expertise required. A study commissioned by the Common Fund for Commodities (CFC) on the pilot risk-management scheme for cocoa farmers’ co-operatives in Côte d’Ivoire confirms that hedging risks using financial instruments is difficult and costly for local producers.18
More recently (and as explored further in the sectoral studies section of this publication), to build information infrastructure, local commodity exchanges have been established in a number of producing countries, as part of efforts by the ITFCRM to encourage the use of market mechanisms. The emergence of
these exchanges may enhance transparency and efficiency at the local and regional levels. However, it has been suggested that many of these markets are facing a nearly impossible task in attracting sufficient volumes and liquidity. Furthermore, it has proved to be difficult to create an adequate regulatory oversight agency, required for liquid, functioning markets at the local level, in a short timescale.
Given these experiences, the government of Côte d’Ivoire is now in the process of re-establishing a national marketing board for cocoa and turning to Ghana for technical assistance. Indeed, in Ghana, despite the high pressure from the IFIs to abolish the marketing board – Cocobod – it continues to operate as an important national institution for governing cocoa production, marketing and trade. It shields cocoa farmers from price pressure, market risk and high volatility – which emanates largely from the Chicago Board for Trade – and therefore is in a position to guarantee producers a relatively stable income. Ghana’s Cocobod holds equal legal and economic power to multinational buyers in the value chain and absorbs, at least partly, price pressure and market risk.19
Hard commodity exporters of energy, minerals and metals are more susceptible to larger swings of prices in the medium term than those dependent on soft commodities. This makes countries with ‘resource-based’ economies particularly susceptible to shocks of external origin, with serious implications for macroeconomic policy configurations over commodity cycles. Many high- and middle-income countries, such as Norway and Chile, are known to have successfully abated the ‘Dutch disease’ by moderating the transmission of commodity price shocks to the rest of the economy by establishing stabilisation funds.20 A countercyclical fiscal policy entails the accumulation of revenues from the resource sector during booms, and
The Changing Landscape in Commodity Markets and Trade 33

the use of these revenues in situations of falling prices. This policy not only stabilises revenues over the commodity price cycle but also reduces the pressure on the exchange rate to appreciate during the boom. Invariably, a stabilisation policy such as this can be implemented more easily when revenue from natural resources accrues to the government through, for example, state ownership of oil and gas resources, as seen in Norway. A similar policy was successfully implemented in Chile, where government was able to retain 40% of the assets of its previously state-owned copper-mining company, Codelco. It also negotiated reasonable returns, in royalty payments and taxation, from the companies involved in the privatisation process.
3.4 Concluding remarks
This paper examines the changing landscape of commodity markets, trade and production, and its developmental implications, focusing in particular on two aspects: the ‘financialisation’ process of commodity markets, and its impacts on price formation and volatility, and stakeholders’ positions; and the parallel process of the consolidation of TNCs’ dominance and the fragmentation of producers in developing countries, and its effects on rent distribution and price transmission in commodity chains. On both accounts, the relative positions of producers in low-income developing countries and countries heavily dependent on primary commodities for their development aspirations and agenda have been weakened despite the recent ‘commodity super-cycle’. They remain structurally vulnerable to shocks originating in world commodity markets and resulting from the way in which the global commodity chains are governed.
Today, there is still a significant overlap between country groups categorised as LDCs and those categorised as CDDCs. For these countries, commodity dependence is a significant part of their vulnerability. Many of
these countries have found it hard to overcome the ‘commodity dependence development trap’, their historical legacy from the colonial era. It may exist as a specific condition resulting from vulnerability-driven negative feedbacks operating through multiple channels. Commodity production and trade remain their dominant form of link to the world economic system.
An eventual transformation of these economies into more diversified economic structures is the real solution to the commodity-dependence trap. However, heightened price volatility as well as the emerging landscape of commodity marketing and production may have hampered the diversification processes of these economies. Transformation of economic structures as developmental processes would entail structural reallocation of resources from low-productivity, low-value-added activities to high-productivity, high-value-added ones across sectors and within them. This can be realised only through rigorous investment in production capacity and physical and social infrastructures, and through concerted societal efforts to direct public and private investment into new, dynamic, high-value-added activities over time.
To this end, in the transition period, we have to develop a strong production capacity in the commodity sector, where the process of active learning-by-doing experiences and knowledge accumulation is facilitated and promoted. After all, development should entail the process of creating a ‘learning society’ as envisaged by Stiglitz and Greenwald (2014), through learning-by-doing and upgrading activities. In this context, the United Nations Economic Commission for Africa (UNECA) Report (UNECA 2013) argues that there is substantial room for strengthening linkages between the commodities sector and domestic industrial and service sectors. While the case for linkage development is traditionally made on the promotion of downstream forward linkages
34 Future Fragmentation Processes
through processing of raw materials, it points to opportunities for developing upstream backward linkages and horizontal linkages.
Indeed, there may be potential for local firms and enterprises that currently serve large foreign or domestic corporations in commodity sectors to build productive assets by acquiring important organisational skills and management knowledge, and by accumulating capital, which would be transferrable to the rest of an economy through demonstration effects or moving and expanding into new sectors and activities in search of higher private returns. The crux of the matter, then, is the question of how to make sure that these valuable experiences, knowledge and skills acquired through the learning-by-doing process, as well as financial resources accumulated, are directed into sectors promising high value added and societal returns, so that economic structures emerging from the transition period would be well articulated and linked through dynamic externalities.
Such an approach is necessary to counteract the erosion of the institutional environments within which many CDDCs trade. On the one hand, the problems associated with excessive volatility of commodity prices and the resulting income instability have global dimensions and implications, requiring international action in the form of new global facilities of innovative stabilisation schemes and a new compensatory financing facility.21 On the other hand, there are measures that can be taken at the country level. Although in liberalised environments market-based mechanisms are too often presented as a means to deal with the issues raised in this paper, they do not provide a real solution, especially if local institutions and their capacities are too weak to represent stakeholders’ interests on the ground.
Notes1 Emeritus Professor of Economics, School of African
and Oriental Studies, University of London. Contact email address: [email protected]. The author is grateful
to Roland Johnson and Sophie Van Huellen for collecting and collating data used in this short piece.
2 The financialisation of commodity markets was already present in the early 1990s, as observed by Maizels (1992, 1994).
3 See Nissanke (2012) for more detailed discussions on the linkages between commodity markets and financial markets for 2007-09
4 See Nissanke (2012) for a more extensive discussion of this subject, including a detailed analysis of heterogeneous traders’ behaviours and their effects on commodity market structures and an evaluation of empirical evidence of the financialisation of commodity markets.
5 By doing so, index traders tend to gain the roll returns and move futures prices in a unidirectional fashion in the process.
6 The interface among traders with different motivations is very complex and non-linear. When market fundamentals undergo structural changes, market conditions are likely to shift from a fundamental equilibrium to a bubble equilibrium (Nissanke 2012).
7 For example, there is widespread use of ‘price to be fixed contracts’ among international traders and roasters in their dealings with coffee growers. It refers to a contractual arrangement whereby the volume, delivery date and differential price are specified but the final price at which the commodity is exchanged will depend upon the futures price on the date at which the price is fixed. This shows the very close relationship between futures prices and the price at which physical coffee is exchanged.
8 Van Huellen (2015) shows that two theoretical approaches – one based on arbitrage pricing models (a theory of price formation in commodity markets through arbitrage mechanisms between physical and derivative markets) and the other on asset pricing models (a theory of price formation in asset markets) – are required to understand the complex relationship between futures, spot and inventory markets – a complexity peculiar to commodity markets.
9 This trend in commodity chains was already evident in the early 1980s (Maizels 1984).
10 See Newman (2009) and Bargawi (2009) for detailed case studies based on fieldwork in Uganda and Tanzania. A synthesis of their findings is found in Nissanke (2010a).
11 See Morisset (1998) for earlier evidence on this.12 See Oya (2012) for a survey of contract farming
arrangements in Africa.13 See Keane (2016) for a Kenyan cut flower case study
and Asante-Poku (2016) for a Ghanaian pineapple case study.
14 See Baffes and Ajwad (2001) and Fafchamps et al. (2003) for empirical evidence of greater price transmission.
15 See Nissanke (2010b) and key references therein for reasons behind the collapse of the IPAs.
The Changing Landscape in Commodity Markets and Trade 35

16 See Van Huellen (2015) for empirical evidence of this ‘non-convergence’ phenomenon, pointing to non-performance of futures markets in the role of price discovery for commodity traders.
17 For example, in the coffee trade, there is growing demand for ‘speciality’ coffee, such as Fair Trade and organic coffees, in a process of decommodification (Kaplinsky and Fitter 2004).
18 See Nissanke and Kuleshov (2013) for a detailed discussion of this pilot scheme and its outcome, and the way forward in assisting farmers in their risk-mitigation and coping strategies.
19 See Van Huellen (2015) for the unique institutional structure of the Ghanaian cocoa chain.
20 For example, in 2001 Chile formally adopted the Structural Fiscal Balance Policy, in operation since the early 1990s, with a view to developing a cyclically neutral fiscal policy, where current expenditure is stabilised by linking it to the structural level of fiscal income (Ffrench-Davis 2010).
21 See Nissanke and Kuleshov (2013) for the proposed schemes and facilities at the global level.
References
Asante-Poku, NA (2016), ‘Emerging institutional configurations under global value chains: a case study of the Ghanaian pineapple export sector’, PhD Thesis, Department of Economics, School of Oriental and African Studies, University of London.
Baffes, J and MI Ajwad (2001), ‘Identifying price linkages: a review of the literature and an application to the world market of cotton’, Applied Economics, Vol. 33, 1927–1941.
Bargawi, H (2009), ‘Commodity prices and producers in Tanzania’s post liberalisation coffee and cotton sectors’, PhD Thesis, Department of Economics, School of Oriental and African Studies, University of London.
Fafchamps, M, RV Hill, A Kaudha and RW Nsibirwa (2003), ‘The transmission of international commodity prices to domestic producers’, Working Paper Series 197, Centre for the Study of African Economies, Oxford.
Ffrench-Davis, R (2010), ‘Latin America: the Structural Fiscal Balance Policy in
Chile – a move towards counter-cyclical macroeconomics’, Journal of Globalization and Development, Vol. 1, 1–16.
Gereffi, G, J Humphrey and T Sturgeon (2005), ‘The governance of global value chains’, Review of International Political Economy, Vol. 12, 78–104.
Humphrey, J and H Schmitz (2000), ‘Governance and upgrading: linking industrial cluster and global value chain research’, Working Paper 120, Institute of Development Studies, University of Sussex.
Humphrey, J and H Schmitz (2004), ‘Chain governance and upgrading: taking stock’, in Schmitz, H (ed.), Local Enterprises in the Global Economy, Edward Elgar, Cheltenham.
Kaplinsky, R (2000), ‘Globalisation and unequalisation: what can be learnt from global value chain Analysis?’, Journal of Development Studies, Vol. 37, 117–146.
Kaplinsky, R and R Fitter (2004), ‘Technology and globalisation: who gains when commodities are de-commodified?’, International Journal of Technology and Globalisation, Vol. 1, 5–28.
Kaplinsky, R and J Kimmis (2006), Competitions Policy and the Global Coffee and Cocoa Value Chains, Institute of Development Studies, University of Sussex, and Centre for Research in Innovation Management, University of Brighton.
Keane, J (2012), ‘The governance of global value chains and the effects of the global financial crisis transmitted to producers in Africa and Asia’, Journal of Development Studies, Vol. 48, 783–797.
Keane, J (2016), ‘The new trade/new growth nexus for late industrialisers’, PhD thesis, Department of Economics, School of Oriental and African Studies, University of London.
Keynes, JM (1942), ‘The international regulation of primary products’, in Moggridge, D (ed.), Collected Writings of John Maynard Keynes, Vol. 27, Macmillan, London, 1980.
36 Future Fragmentation Processes
Maizels, A (1984), ‘A conceptual framework for analysis of primary commodity markets’, World Development, Vol. 12, 25–41.
Maizels, A (1992), Commodities in Crisis: The Commodity Crisis of the 1980s and the Political Economy of International Commodity Policies, Clarendon Press, Oxford.
Maizels, A (1994), ‘The continuing commodity crisis of developing countries’, World Development, Vol. 22, 1685–1695.
Morisset, J (1998), ‘Unfair trade? The increasing gap between world and domestic prices in commodity markets during the past 25 years’, The World Bank Economic Review, Vol. 12, 503–526.
Newman, S (2009), ‘Financialisation and changes in the social relations along commodity chains: the case of coffee’, Review of Radical Political Economics, Vol. 42, 539–559.
Nissanke, M (2010a), ‘Commodity market structures, evolving governance and policy issues’, in Nissanke, M and G Movrotas (eds), Commodities, Governance and Economic Development Under Globalization, Palgrave Macmillan, London.
Nissanke, M (2010b) ‘Issues and challenges for commodity markets in the global economy’, in Nissanke, M and G Movrotas (eds), Commodities, Governance and Economic Development Under Globalisation, Palgrave Macmillan, London.
Nissanke, M (2012), ‘Commodity market linkages in the global financial crisis: excess
volatility and development impacts’, Journal of Development Studies, Vol. 48, 732–750.
Nissanke, M and A Kuleshov (2013), ‘An Agenda for International Action on Commodities and Development: Issues for EU Agenda beyond the MDGs’, European Report on Development 2013 background paper, European Commission, Brussels, available at: http://ec.europa.eu/europeaid/erd-2013-background-paper-agenda-international-action-commodities-and-development-issues-eu-agenda_en
Nissanke, M (2017), ‘A quest for institutional foundations towards inclusive development in sub-Saharan Africa’ in Nissanke, M and M Ndolo (eds), Poverty Reduction in the Course of African Development, Oxford University Press, March 2017.
Oya, C (2012), ‘Contract farming in sub-Saharan Africa: a survey of approaches, debates and issues’, Journal of Agrarian Change, Vol. 12, 1–33.
Stiglitz, JE and BC Greenwald (2014), Creating a Learning Society, Columbia University Press, New York.
UNECA, Economic Report on Africa 2013, United Nations Economic Commission for Africa, Addis Ababa.
Van Huellen, S (2015), ‘Excess volatility or volatility fundamentals? The impact of financial speculation on commodity markets and implications for cocoa farmers in Ghana’, PhD thesis, Department of Economics, School of Oriental and African Studies, University of London.
The Changing Landscape in Commodity Markets and Trade 37


Uncorrected advanced copy for the upcoming publication: Future Fragmentation Processes: Effectively Engaging with the Ascendency of Global Value Chains
© Commonwealth Secretariat 2017
All rights reserved. No part of this publication may be reproduced, stored in a retrieval system, or transmitted in any form or by any means, electronic or mechanical, including photocopying, recording or otherwise without the permission of the publisher.
Views and opinions expressed in this publication are the responsibility of the author[s] and should in no way be attributed to the institutions to which they are affiliated or to the Commonwealth Secretariat.
Please cite as:
Keane, J (Ed.) (forthcoming 2017), ‘Future Fragmentation Processes: Effectively Engaging with the Ascendency of Global Value Chains’, Commonwealth Secretariat, London.
This set of policy briefings has been developed by Dr Jodie Keane, Economic Adviser (Trade Policy Analysis) at the Commonwealth Secretariat, with support from Roland Baimbill-Johnson, previously Commonwealth Scholar at the School of African and Oriental Studies (SOAS), University of London and currently a SOAS funded PhD candidate, at the Department of Economics. The editors are extremely grateful to all contributors and participants in the a technical workshop held at the Commonwealth Secretariat, 7 October 2016.

The global trade slowdown has been accompanied by profound shifts in the trade-growth nexus, with continued declines in advanced economies' participation in global production network exports. Against this backdrop, this publication presents a collection of think-pieces reflecting on past experiences of global value chain (GVC) engagement and potential future fragmentation processes.
Providing new evidence of participation in GVCs by the Commonwealth, it is intended to spur far more nuanced and country-, as well as region-, specific approaches towards effective and gainful GVC engagement. Policy measures which arise include: overcoming barriers to entry, addressing informational asymmetries, tackling unfair competition and stimulating innovation. These are all areas where the potential of the ‘Commonwealth Effect’ could be further leveraged to enhance trade gains, the necessity of which is heightened in view of the advancement of structural economic transformation to support the Sustainable Development Goals (SDGs).
Future Fragmentation Processes: Effectively Engaging with the Ascendency of Global Value Chains addresses these issues in four parts:
Section 1: Global Developments
Section 2: Thematic Issues
Section 3: Sectoral Developments
Section 4: Policy Perspectives